Embed Size (px)
Citation preview
1957
Paramagnetism of cobalt-doped ZnO nanoparticles obtainedby microwave solvothermal synthesisJacek Wojnarowicz*1, Sylwia Kusnieruk1, Tadeusz Chudoba1, Stanislaw Gierlotka1,Witold Lojkowski1, Wojciech Knoff2, Malgorzata I. Lukasiewicz2, Bartlomiej S. Witkowski2,Anna Wolska2, Marcin T. Klepka2, Tomasz Story2 and Marek Godlewski2
Full Research Paper Open Access
Address:1Institute of High Pressure Physics, Polish Academy of Sciences,Sokolowska 29/37, 01-142 Warsaw, Poland and 2Institute of Physics,Polish Academy of Sciences, Al. Lotników 32/46, 02-668 Warsaw,Poland
Email:Jacek Wojnarowicz* - [email protected]
* Corresponding author
Keywords:cobalt-doped zinc oxide; ferromagnetism; magnetic properties;microwave solvothermal synthesis (MSS); paramagnetism
Beilstein J. Nanotechnol. 2015, 6, 1957–1969.doi:10.3762/bjnano.6.200
Received: 01 June 2015Accepted: 10 September 2015Published: 30 September 2015
Associate Editor: J. J. Schneider
© 2015 Wojnarowicz et al; licensee Beilstein-Institut.License and terms: see end of document.
AbstractZinc oxide nanopowders doped with 1–15 mol % cobalt were produced by the microwave solvothermal synthesis (MSS) technique.
The obtained nanoparticles were annealed at 800 °C in nitrogen (99.999%) and in synthetic air. The material nanostructure was
investigated by means of the following techniques: X-ray diffraction (XRD), helium pycnometry density, specific surface area
(SSA), inductively coupled plasma optical emission spectrometry (ICP-OES), extended X-ray absorption fine structure (EXAFS)
spectroscopy, scanning electron microscopy (SEM), energy dispersive X-ray spectroscopy (EDS) and with magnetometry using
superconducting quantum interference device (SQUID). Irrespective of the Co content, nanoparticles in their initial state present a
similar morphology. They are composed of loosely agglomerated spherical particles with wurtzite-type crystal structure with crys-
tallites of a mean size of 30 nm. Annealing to temperatures of up to 800 °C induced the growth of crystallites up to a maximum of
2 μm in diameter. For samples annealed in high purity nitrogen, the precipitation of metallic α-Co was detected for a Co content of
5 mol % or more. For samples annealed in synthetic air, no change of phase structure was detected, except for precipitation of
Co3O4 for a Co content of 15 mol %. The results of the magentometry investigation indicated that all as-synthesized samples
displayed paramagnetic properties with a contribution of anti-ferromagnetic coupling of Co–Co pairs. After annealing in synthetic
air, the samples remained paramagnetic and samples annealed under nitrogen flow showed a magnetic response under the influ-
ences of a magnetic field, likely related to the precipitation of metallic Co in nanoparticles.
1957
IntroductionNanomaterials have drawn the attention of researchers from all
over the world due to their new, interesting perspectives in
many application areas [1-3]. The most challenging issue nowa-
days is how to produce such advanced nanocrystals with well-
defined and reproducible electronic, optoelectronic and
magnetic properties at low cost.

Beilstein J. Nanotechnol. 2015, 6, 1957–1969.
1958
In the present work we investigate zinc oxide (ZnO), which is
an attractive material with a wide range of applications such as:
transparent transistors based on semiconducting transparent
oxides [4], ultraviolet (UV) light blockers [5], photocatalysts [6]
or antibacterial uses [7]. The energy band gap of ZnO is
≈3.3 eV at room temperature, corresponding to a wavelength of
about 375 nm [8]. Thus, ZnO has been reckoned as an excellent
UV shielding material, characterized by photo-fastness and
absorptivity over a broad UV range, in contrast to other organic
and inorganic UV shielding materials [9]. Moreover, ZnO is
applied to cosmetics [10], optoelectronic devices [11-14], solar
cells [10], catalysts [15], energy storage (battery) materials [16],
fast data storage [17], light-emitting diodes (LEDs) [18], gas
sensors [10], thermoelectric devices [19], varistors [20,21],
window materials for displays [21], laser technology [10],
surface acoustic wave devices [22] and drug delivery [23].
Recently, zinc oxide doped with Mn, Co and Ni has been under
investigation for potential application as a spintronic material
[24-31]. Many experimental and theoretical studies of ZnO
doped with transition metal (TM) elements suggest good
prospects for TM:ZnO for use in diluted magnetic semicon-
ductor (DMS) applications. A recent discussion regarding
magnetic performance of these materials is focused on the
homogeneity of the TM distribution in the host material and on
the phase purity [32].
There are several ways to synthesize TM:ZnO DMS materials,
including physical and chemical approaches. However, the
physical methods suffer from difficulties in controlling thermal
stability and the doping homogeneity in the final products
[32,33]. The chemical approach has also been widely employed
to synthesize ZnO-based DMS materials [32]. The applied tech-
niques include: solvothermal [34,35], hydrothermal [36,37],
sol–gel [38,39] among others. These techniques enabled the
control of the size and morphology of the particles by setting
appropriate conditions, for instance, synthesis temperature,
time, and the concentration of precursors.
For wide application of Zn1−xCoxO in spintronics, a ferromag-
netic response (FM) at room temperature (RT) is required. This
was theoretically predicted [34,35] and there are claims of
experimental confirmation of these predictions [40-42].
However, there were also a number of observations contra-
dicting this prediction [34,36,38,43] and repeatability of results
is a continuing problem [36]. Many papers report a paramag-
netic response [36,42-45]. According to the literature, it can be
conferred that the use of solvothermal synthesis allowed
Co-doped ZnO to be obtained with both ferromagnetic and
paramagnetic properties [46,47]. Using hydrothermal [32,48]
and sol–gel [49,50] synthesis methods, Co-doped ZnO with
both ferromagnetic and paramagnetic properties was obtained
[39,41,42]. These observations questioned the possibility of
producing powders with controllable properties suitable for
practical application as a spintronic material.
Microwave activation of hydrothermal synthesis used to obtain
nano-sized powders has been reported in a number of papers
[51-57]. Microwave ovens were already vastly adopted in the
1980s for the synthesis of organic compounds [58-66]. The
advantages of the method are, in addition to high purity syn-
thesis conditions, a high heating range, precise time control, and
the possibility to obtain fully reacted nanoparticles (which
means no unreacted precursors or hydroxides remain on the
nanoparticle surface) with a narrow grain size distribution. It
has been proved that many reactions based on hydrothermal
synthesis can be carried out with high efficiency and low energy
consumption [67]. Doped nanoparticles can be produced using
these methods as well [67]. Thus, we expected that fully
reacted, Co:ZnO nanoparticles could be produced using
microwave solvothermal synthesis (MSS) [68-71].
Magnetic investigations were performed to verify several
points. First of all, we tested if uniform samples grown by a low
temperature MSS process show paramagnetic response, as
observed in ZnMnO systems [34]. Next, we investigated effects
related to an increased Co concentration in the powders.
Finally, we performed magnetic investigations for samples
annealed under different gas environments, while keeping the
same annealing temperature and process time. Another ques-
tion was also the limit of Co content for paramagnetic behavior,
and also, whether annealing of the synthesized powders will
lead to Co clustering and the appearance of a FM response.
Results and DiscussionNanopowder characterizationSEM images of undoped and 1%, 5%, 10%, and 15% Co-doped
ZnO nanopowders in their as-produced state (before annealing)
and after heat annealing in nitrogen and synthetic air are
presented in Figure 1, Figure 2 and Figure 3, respectively.
According to the SEM investigations, the average particle diam-
eter ranges from 30 to 70 nm (Figure 1). Figure 2 and Figure 3
show particles annealed at 800 °C under a nitrogen and syn-
thetic air environment, respectively. The particle size after
annealing ranges from 30 nm to 2 µm and depending on the
amount of Co, the particle shape has a tendency to change from
spherical to hexagonal or cubic.
The experimentally determined doping level, identified by
means of ICP-OES, as a function of the concentration of
Co2+ ions in solution (nominal concentration) is shown in
Figure 4 and Table 1. The actual doping level is approximately

Beilstein J. Nanotechnol. 2015, 6, 1957–1969.
1959
Figure 1: SEM images of ZnO nanopowders in their as-produced (before annealing) state: (a) undoped, (b) doped with 1 mol % of Co2+,(c) 5 mol % of Co2+, (d) 10 mol % of Co2+, and (e) 15 mol % of Co2+ ions.
Figure 2: SEM images of annealed ZnO nanopowders after annealing at 800 °C in nitrogen: (a) undoped, (b) doped with 1 mol % of Co2+,(c) 5 mol % of Co2+, (d) 10 mol % of Co2+, and (e) 15 mol % of Co2+ ions.
10% lower than the Co concentration in the precursor solution.
The difference between the theoretical and the measured
concentration of cobalt in the Zn1−xCoxO samples is due to the
incomplete degree of reaction of substrates during the synthesis
of Zn1−xCoxO. The pink color of the solution (Figure 5c) after
sedimentation confirms that not all the cobalt in solution was
consumed during the synthesis reaction. Nevertheless, in this
paper, the nominal concentration was used to identify the
samples. The color of synthesized Zn1−xCoxO varied from pure
white (undoped), to light green, to dark green, as the Co com-
position increased from 0 to 15 mol % (Figure 5).
The XRD results for the nanopowders directly after synthesis
and after annealing in nitrogen and synthetic air are presented in
Figure 6, Figure 7 and Figure 8, respectively. For the materials
which were not annealed, the XRD patterns show a single phase
tendency of the samples with a hexagonal wurtzite structure.
Peaks associated with cobalt oxide or cobalt hydroxide phases
such as CoO, Co2O3 or Co(OH)2 were not detected. As
confirmed in Figure 7, annealing at 800 °C in nitrogen atmos-
phere results in the visible precipitation of metallic α-cobalt for
the samples with more than 1 mol % Co ion content [72]. When
annealed in synthetic air, some precipitation of Co3O4 was

Beilstein J. Nanotechnol. 2015, 6, 1957–1969.
1960
Figure 3: SEM images of annealed ZnO nanopowders after annealing at 800 °C in synthetic air: (a) undoped, (b) doped with 1 mol % of Co2+,(c) 5 mol % of Co2+, (d) 10 mol % of Co2+, and (e) 15 mol % of Co2+ ions.
Figure 4: Dependence between the nominal and experimental Codoping concentration for the samples before annealing.
Table 1: Results of the chemical analysis of Co-doped ZnO nanopow-ders for the samples before annealing.
SampleMeasured dopant content
ICP-OESZn (mol %) Co (mol %)
Zn0.99Co0.01O 99.13 0.87Zn0.95Co0.05O 95.50 4.50Zn0.90Co0.10O 90.86 9.14Zn0.85Co0.15O 86.40 13.60
observed in the XRD investigations for the 15 mol % sample
only (Figure 8) [72].
The wurtzite structure of ZnO has a hexagonal unit cell with
two lattice parameters, a and c. The lattice parameters of ZnO
are a = 3.2495 Å and c = 5.2069 Å; their ratio c/a = 1.6024 is
close to the value for the hexagonal close-packed (hcp) crystal
Figure 5: (a) Photographs of the Zn1−xCoxO precursor in ethyleneglycol where the color varies with the composition. (b) Photographs ofnanoparticle dispersions in ethylene glycol after microwavesolvothermal synthesis. (c) Photographs of nanoparticle dispersions inethylene glycol after sedimentation.

Beilstein J. Nanotechnol. 2015, 6, 1957–1969.
1961
Figure 6: XRD patterns for Zn1−xCoxO nanopowders before annealing, with a nominal Co content in solution of 0, 1, 5, 10, and 15 mol %.
Figure 7: XRD patterns for Zn1−xCoxO nanopowders after annealing at 800 °C in nitrogen. The metallic α-Co phase can be seen for 5, 10 and15 mol % samples. The triangle indicates peaks from the metallic α-Co phase.
Figure 8: XRD patterns for Zn1−xCoxO nanopowders after annealing at 800 °C in synthetic air. The Co3O4 phase can be seen for the 15 mol % Coion sample. The star indicates peaks assigned to the Co3O4 phase.

Beilstein J. Nanotechnol. 2015, 6, 1957–1969.
1962
Table 2: Lattice parameters of ZnO and ZnO doped with Co for samples before and after annealing.
SampleBefore annealing After annealing in nitrogen After annealing in synthetic air
a (Å) c (Å) a (Å) c (Å) a (Å) c (Å)
ZnO 3.2497 ± 0.0001 5.2056 ± 0.0003 3.2495 ± 0.0001 5.2053 ± 0.0002 3.2496 ± 0.0001 5.2054 ± 0.0002Zn0.99Co0.01O 3.2503 ± 0.0002 5.2061 ± 0.0004 3.2499 ± 0.0001 5.2053 ± 0.0001 3.2505 ± 0.0002 5.2063 ± 0.0004Zn0.95Co0.05O 3.2514 ± 0.0003 5.2065 ± 0.0006 3.2503 ± 0.0001 5.2048 ± 0.0001 3.2504 ± 0.0001 5.2046 ± 0.0001Zn0.90Co0.10O 3.2515 ± 0.0004 5.2049 ± 0.0004 3.2513 ± 0.0001 5.2046 ± 0.0001 3.2516 ± 0.0001 5.2044 ± 0.0002Zn0.85Co0.15O 3.2520 ± 0.0005 5.2040 ± 0.0008 3.2517 ± 0.0001 5.2044 ± 0.0002 3.2515 ± 0.0001 5.2044 ± 0.0002
Figure 9: Dependence of the a and c lattice parameter on nominal Co content, in mol % for: (a) preannealed samples, (b) after annealing in nitrogen,and (c) after annealing in synthetic air.
structure in the ratio of c/a = 1.6330. CoO has a face-centered
cubic structure characterized by a lattice parameter of 4.260 Å.
To calculate the c and a lattice parameters, the Rietveld analysis
technique [73-76] was used. Zinc (II+) has an ionic radius of
0.74 Å whereas cobalt (II+) has 0.745 Å; therefore, no change
in lattice parameters is expected when Zn is replaced by Co in
the ZnO crystal lattice. We assume, however, that increasing the
concentration of the cobalt dopant should change the lattice
parameters, which is related to the CoO cubic structure. In fact,
the observed change in lattice parameter shown in Table 2 can
be explained by lattice distortions. The lattice parameter a, for
both the pre- and post-annealed sample, increases from 3.249 Å
to 3.252 Å with an increase in Co content. The lattice para-
meter c increases from 5.205 Å (in all cases, 0% Co) up to
5.2065 Å for 5 mol % Co for the preannealed sample, and up to
5.2063 Å for 1 mol % Co after annealing in synthetic air. The c
lattice parameter decreases to ≈5.204 Å with further increase of
the Co content. The data shown in Figure 9 and Table 3 present
the changes in lattice parameters of the samples, indicative of
Co atoms replacing Zn atoms in the ZnO lattice [8]. We also
observed a decrease in the c/a ratio (Table 3), which is caused
by the change in size and the proportion of the unit cell.
The density of Co-doped ZnO powders after synthesis was
≈5.2 g/cm3 and the SSA was ≈38 m2/g (Table 3). Based on the
assumption of spherical particles and on the SSA measure-
ments, the average particle diameter was calculated
(Equation 1) to be 31 nm (Table 4). Based on the Scherrer equa-
tion, the size of crystalline particles in powder form was calcu-
lated (Equation 2) to be ≈26 nm (Table 4).
(1)
where D is the mean particle size (µm), N is a factor dependent
on the shape of the particles (for spherical particles N = 6), SSA

Beilstein J. Nanotechnol. 2015, 6, 1957–1969.
1963
Table 3: Ratio of the lattice parameters for ZnO and ZnO doped with Co for samples before and after annealing.
SampleBefore annealing After annealing in nitrogen After annealing in synthetic air In hcp structure, ZnO
c/a c/a c/a
ZnO 1.6019 1.6018 1.6019
1.6330Zn0.99Co0.01O 1.6017 1.6017 1.6017Zn0.95Co0.05O 1.6013 1.6013 1.6012Zn0.90Co0.10O 1.6008 1.6008 1.6006Zn0.85Co0.15O 1.6003 1.6005 1.6006
Table 4: Skeleton density and SSA of ZnO and ZnO doped with Co for samples before and after annealing.
Sample
Before annealing After annealing in nitrogen After annealing in synthetic airSSA by gasadsorption,
as ± σ (m2/g)
Skeleton density bygas pycnometry,ρs ± σ (g/cm3)
SSA by gasadsorption,
as ± σ (m2/g)
Skeleton density bygas pycnometry,ρs ± σ (g/cm3)
SSA by gasadsorption,
as ± σ (m2/g)
Skeleton density bygas pycnometry,ρs ± σ (g/cm3)
ZnO 39 ± 1 5.20 ± 0.01 3 ± 1 5.64 ± 0.03 3 ± 1 5.64 ± 0.03Zn0.99Co0.01O 38 ± 1 5.16 ± 0.02 3 ± 1 5.61 ± 0.04 3 ± 1 5.62 ± 0.03Zn0.95Co0.05O 39 ± 1 5.11 ± 0.02 3 ± 1 5.64 ± 0.04 3 ± 1 5.61 ± 0.02Zn0.90Co0.10O 37 ± 1 5.16 ± 0.01 3 ± 1 5.64 ± 0.04 3 ± 1 5.60 ± 0.01Zn0.85Co0.15O 37 ± 1 5.15 ± 0.02 3 ± 1 5.64 ± 0.02 3 ± 1 5.63 ± 0.02
Table 5: Grain size of undoped nanopowders and those doped with Co for samples before and after annealing.
Sample
Before annealing After annealing innitrogen
After annealing insynthetic air
Average grain size fromSSA (BET), d ± σ (nm)
Average crystallite size(Scherrer’s formula,
based on XRD), d (nm)
Average grain size fromSSA (BET), d ± σ (nm)
Average grain size fromSSA (BET), d ± σ (nm)
ZnO 30 ± 1 da = 25, dc = 28 355 ± 133 355 ± 133Zn0.99Co0.01O 31 ± 1 da = 24, dc = 26 355 ± 133 350 ± 133Zn0.95Co0.05O 30 ± 1 da = 22, dc = 23 355 ± 133 351 ± 133Zn0.90Co0.10O 32 ± 1 da = 23, dc = 24 355 ± 133 353 ± 133Zn0.85Co0.15O 32 ± 1 da = 25, dc = 23 355 ± 133 355 ± 133
is the specific surface area (m2/g), and ρ is the density (g/cm3).
The Scherrer equation,
(2)
can be used to calculate the mean particle diameter, DXRD,S,
where K is a dimensionless shape factor with a value close to
unity (the shape factor has a typical value of about 0.9, but
varies with the actual shape of the crystallite), λ is the X-ray
wavelength, β is the line broadening at half of the maximum
intensity (FWHM), and Θ is the Bragg angle.
As shown in Table 5, the results of the grain size calculations
obtained with use of BET theory and XRD methods were
similar. Such a good agreement of the two values is an indica-
tion that the nitrogen used in the SSA experiment easily pene-
trates between the particles (i.e., they are not sintered to each
other). The density of the nanoparticles was lower as compared
to a similar conventional material (Table 4). This is because the
nanoparticle density is reduced due to a high contribution of the
surface layers that were packed less densely than the bulk and
include some adsorbed molecules from the ambient atmosphere
[77]. The theoretical density for the ZnO micropowder is
5.61 g/cm3 [78]. The density of Zn1−xCoxO NPs decreases
following an increase in Co content, which is a result of the
lower atomic weight of Co atoms (58.69) as compared to Zn
(65.38) as shown in Table 4. The density of Co-doped ZnO
powders after annealing was ≈5.6 g/cm3, as expected, since the
contribution of surface layers to the density becomes negligible
Beilstein J. Nanotechnol. 2015, 6, 1957–1969.
1964
for a large grain size. The low SSA of 3 m2/g (Table 3) was
caused by an increase in crystallite size, which can be observed
in the SEM images (Figure 2 and Figure 3). Based on the SSA
measurements, after annealing, the average particle diameter
was calculated to be 350 nm (Table 4).
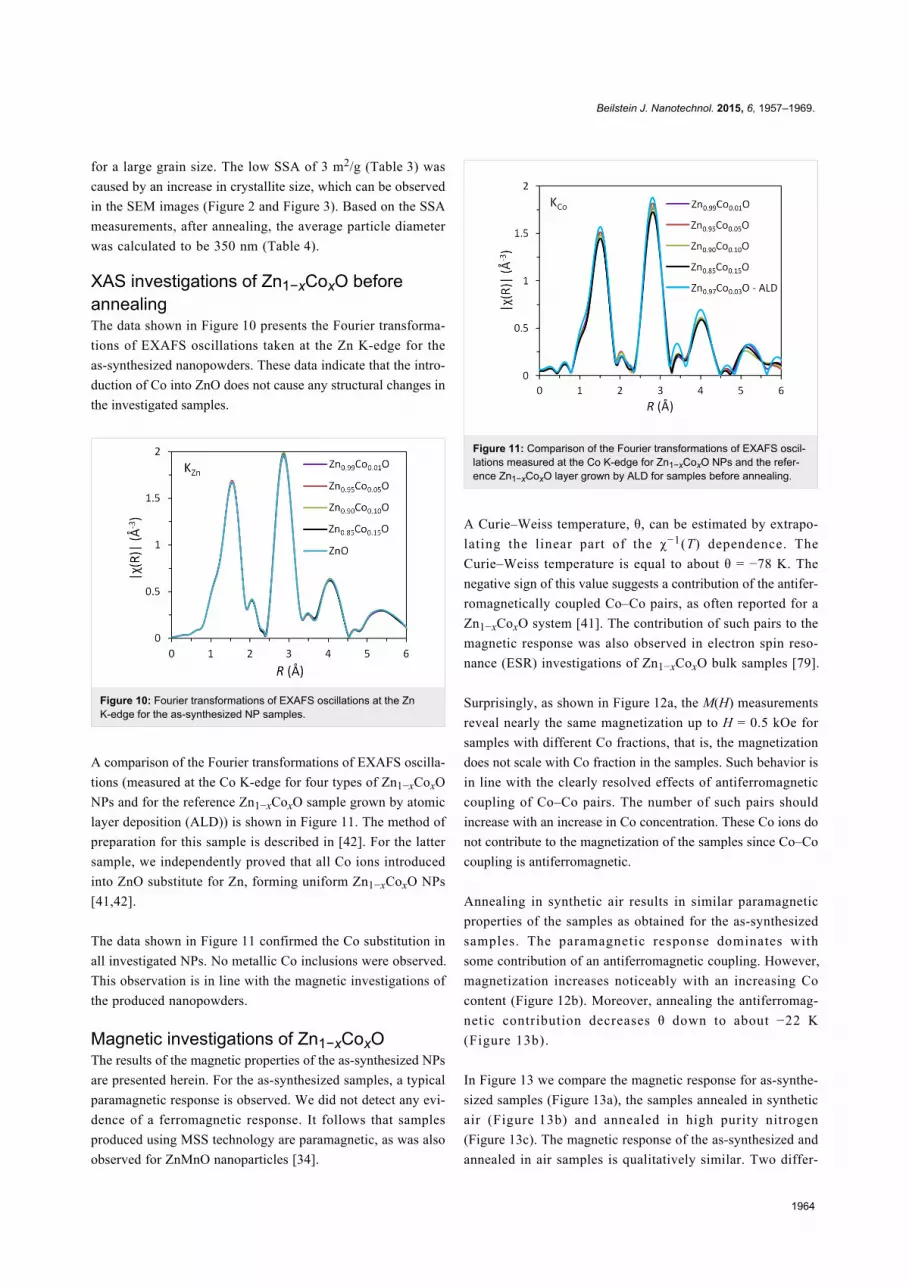
XAS investigations of Zn1−xCoxO beforeannealingThe data shown in Figure 10 presents the Fourier transforma-
tions of EXAFS oscillations taken at the Zn K-edge for the
as-synthesized nanopowders. These data indicate that the intro-
duction of Co into ZnO does not cause any structural changes in
the investigated samples.
Figure 10: Fourier transformations of EXAFS oscillations at the ZnK-edge for the as-synthesized NP samples.
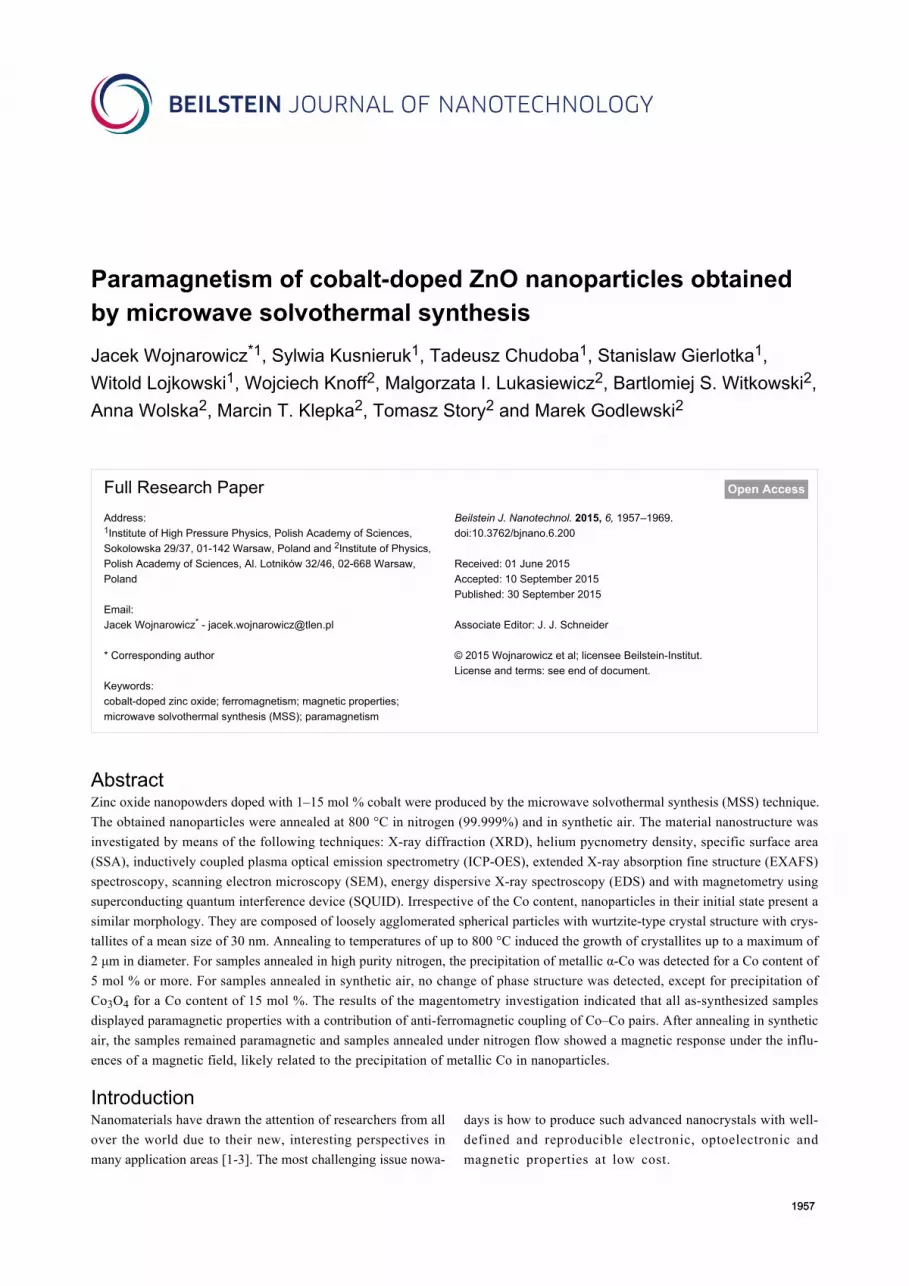
A comparison of the Fourier transformations of EXAFS oscilla-
tions (measured at the Co K-edge for four types of Zn1−xCoxO
NPs and for the reference Zn1−xCoxO sample grown by atomic
layer deposition (ALD)) is shown in Figure 11. The method of
preparation for this sample is described in [42]. For the latter
sample, we independently proved that all Co ions introduced
into ZnO substitute for Zn, forming uniform Zn1−xCoxO NPs
[41,42].
The data shown in Figure 11 confirmed the Co substitution in
all investigated NPs. No metallic Co inclusions were observed.
This observation is in line with the magnetic investigations of
the produced nanopowders.
Magnetic investigations of Zn1−xCoxOThe results of the magnetic properties of the as-synthesized NPs
are presented herein. For the as-synthesized samples, a typical
paramagnetic response is observed. We did not detect any evi-
dence of a ferromagnetic response. It follows that samples
produced using MSS technology are paramagnetic, as was also
observed for ZnMnO nanoparticles [34].
Figure 11: Comparison of the Fourier transformations of EXAFS oscil-lations measured at the Co K-edge for Zn1−xCoxO NPs and the refer-ence Zn1−xCoxO layer grown by ALD for samples before annealing.
A Curie–Weiss temperature, θ, can be estimated by extrapo-
lating the linear part of the χ−1(T) dependence. The
Curie–Weiss temperature is equal to about θ = −78 K. The
negative sign of this value suggests a contribution of the antifer-
romagnetically coupled Co–Co pairs, as often reported for a
Zn1−xCoxO system [41]. The contribution of such pairs to the
magnetic response was also observed in electron spin reso-
nance (ESR) investigations of Zn1−xCoxO bulk samples [79].
Surprisingly, as shown in Figure 12a, the M(H) measurements
reveal nearly the same magnetization up to H = 0.5 kOe for
samples with different Co fractions, that is, the magnetization
does not scale with Co fraction in the samples. Such behavior is
in line with the clearly resolved effects of antiferromagnetic
coupling of Co–Co pairs. The number of such pairs should
increase with an increase in Co concentration. These Co ions do
not contribute to the magnetization of the samples since Co–Co
coupling is antiferromagnetic.
Annealing in synthetic air results in similar paramagnetic
properties of the samples as obtained for the as-synthesized
samples. The paramagnetic response dominates with
some contribution of an antiferromagnetic coupling. However,
magnetization increases noticeably with an increasing Co
content (Figure 12b). Moreover, annealing the antiferromag-
netic contribution decreases θ down to about −22 K
(Figure 13b).
In Figure 13 we compare the magnetic response for as-synthe-
sized samples (Figure 13a), the samples annealed in synthetic
air (Figure 13b) and annealed in high purity nitrogen
(Figure 13c). The magnetic response of the as-synthesized and
annealed in air samples is qualitatively similar. Two differ-

Beilstein J. Nanotechnol. 2015, 6, 1957–1969.
1965
Figure 12: The magnetization dependence on the external magnetic field: (a) for as-synthesized Zn1−xCoxO NPs with various Co content (in mol %)and (b) for annealed Zn1−xCoxO NPs in synthetic air with various Co content (in mol %).
Figure 13: Magnetic susceptibility dependence on temperature for Zn0.85Co0.15O powder: (a) as-synthesized, b) annealed in synthetic air, and c)annealed in nitrogen. The Curie–Weiss temperature was estimated from 1/χ(T) data for an as-synthesized and annealed in synthetic air,Zn0.85Co0.15O sample. The data were taken for samples with a nominal 15% Co fraction.
ences are as follows. First, the difference in the Curie tempera-
ture can be seen. Secondly, the magnetization increases with the
Co fraction increase for the annealed sample.
The situation changes drastically for samples annealed in high
purity nitrogen gas (Figure 13c). The reciprocal magnetic
susceptibility is only weakly temperature dependent for
T > 20 K (Figure 13c) and then at low temperature, it drops
rapidly to zero at T > 0 K. For this material, the XRD investi-
gation shows formation of metallic inclusions. Thus, we assume
that the situation closely follows that observed for Zn1−xCoxO
N layers grown by ALD [41]. For the ALD samples grown at a

Beilstein J. Nanotechnol. 2015, 6, 1957–1969.
1966
temperature greater than 220 °C, the presence of Co metal
inclusions was detected in TEM investigations [41]. For rela-
tively low concentrations, we observed super-paramagnetism
only, because even though each inclusion was in a ferromag-
netic state, they did not interact with one another. Only when
the Co metal inclusions were dense were they coupled and a
ferromagnetic response resulted [41]. The present results are in
line with that observed for Zn1−xCoxO films grown by ALD. No
ferromagnetic response was detected in a zero magnetic field.
Once the field was turned on, the magnetization was nearly
saturated and the reciprocal magnetic susceptibility was practi-
cally temperature independent.
The results of the magnetic studies for samples annealed at
800 °C may shed light on the origin of often very confusing
reports of Zn1−xCoxO samples. For those prepared using MSS,
paramagnetic NPs were obtained. Annealing in the presence of
oxygen (even trace amounts) led to formation of various Co
oxides, and the paramagnetic behavior was preserved. On the
other hand, Co metal inclusions were formed when annealing
was performed under a reducing atmosphere, leading to ferro-
magnetic response.
The sensitivity of the Zn1−xCoxO NP properties on synthesis
conditions may explain the reported difficulties in reproducing
the magnetic properties of Zn1−xCoxO powders and layers.
Summary of resultsFor application as magnetic labels or in spintronics, Zn1−xCoxO
NPs should show a ferromagnetic response at room tempera-
ture. However, such a response was not present in our prepared
samples made using the microwave solvothermal process. In the
MSS process, the particles were produced at 220 °C, a rela-
tively low temperature, and the result was NPs with Co substi-
tuting for Zn. Such samples are paramagnetic. Annealing in a
nitrogen (reducing) atmosphere leads to precipitation of
metallic Co inclusions. The presence of such inclusions leads to
a ferromagnetic response [80,81]. Samples annealed up to
800 °C in an oxygen containing atmosphere remain paramag-
netic. Thus, annealing in different gasses shows quite different
magnetic responses. These different responses can be related to
the Co metal inclusions and the formation of various foreign
phases.
ConclusionThe microwave solvothermal synthesis allows for the prepar-
ation of a uniform, nanocrystalline Zn1−xCoxO sample with a
high Co concentration of up to 15 mol %. The Zn1−xCoxO NPs
have a fully pure, single phase, wurtzite, crystalline structure
corresponding to zinc oxide. No other secondary phase such as
Co(OH)2, CoO, Co3O4 or Co metal was found for x ≤ 0.15,
which shows that the doped Co ions are substituted at the Zn
ion sites. As shown, the MSS method produced Zn1−xCoxO NPs
samples of very high purity, as demonstrated by XRD and
EXAFS analysis. The average grain size of the Zn1−xCoxO NPs
was in the 30 nm range and the shape of the Zn1−xCoxO NPs
was spherical. There was no effect due to the change in the
morphology caused by increasing the cobalt dopant.
Zn1−xCoxO NPs produced at low temperature (220 °C) by the
MSS method are paramagnetic for Zn1−xCoxO in the range of
0–15 mol %. Annealing at 800 °C in nitrogen causes the forma-
tion of metallic inclusions, while their annealing in artificial air
preserves the paramagnetic properties. The obtained results
clearly show that quite different magnetic responses of
Zn1−xCoxO NP samples may result depending on the synthesis
conditions and post-growth processing. However, the
Zn1−xCoxO NPs with Co substituted for Zn is paramagnetic
with some antiferromagnetic coupling.
ExperimentalPreparation of Zn1−xCoxO nanopowdersA solid mixture with concentration of 1, 5, 10 and 15 mol % of
C o ( C H 3 C O O ) 2 · 4 H 2 O ( p u r e f o r a n a l y s i s ) i n
Zn(CH3COO)2·2H2O (pure for analysis) was dissolved in
ethylene glycol (EG, pure, Chempur). The metal acetates were
purchased from Sigma-Aldrich and Chempur and used without
further purification. Zinc oxide was obtained by microwave
solvothermal synthesis (MSS) [68]. MSS permits rapid and
uniform heating, and synthesis under high purity conditions in a
closed vessel with precise control of the reaction time. The
microwave-driven reaction was conducted in a teflon vessel in a
Magnum II reactor (Ertec, Poland) at 220 °C. EG is an excel-
lent absorber of microwave radiation. The reaction duration for
all experiments was 25 min under a constant pressure of
0.1 MPa at a microwave power of 600 W. At the end of the
reaction, the precipitate was sedimented, washed two times with
deionized water and ethanol, centrifuged and dried in a laminar
chamber for 24 h. Magnetic investigations were performed both
for as-produced dried powders and after annealing at 800 °C for
0.5 h in high purity (99.999%) nitrogen (Messer, Poland) and
synthetic air (Multax, Poland) in a tube furnace (PR-60/1200,
PIE, Poland).
X-ray powder diffraction analysisThe X-ray diffraction (XRD) patterns were collected in the 2Θ
range of 20–100° at room temperature, with a step increment of
0.02° using an XRD diffractometer (X’Pert PRO diffractometer,
Cu Kα radiation; PANalytical BV, Almelo, The Netherlands).
Based on the XRD patterns, the average crystallite size was
determined using the Scherrer’s formula [82], and lattice para-
meters were calculated using the Rietveld method.
Beilstein J. Nanotechnol. 2015, 6, 1957–1969.
1967
Skeletal density and SSA measurementsSkeletal density measurements were carried out using a helium
pycnometer (AccuPyc II 1340, Micromeritics, USA) using an
in-house procedure [83]. This method enabled the skeletal
density of ZnO nanopowders to be measured with an accuracy
of 0.01 g/cm3. The SSA of the powders was measured by gas
adsorption and analyzed with BET theory (Gemini 2360,
Micromeritics, USA). The powders were subjected to desorp-
tion at 150 °C for 2 h prior to the measurement [69]. The
measurement of the average diameter of the particles was taken
based on the SSA, density, and the assumption that all particles
were spherical and identical [68,83].
Morphology analysis and elementalcomposition of samplesThe nanopowders were sprayed with a thin layer of carbon
using a sputter coater (SCD 005/CEA 035, BAL-TEC, Switzer-
land). The morphology of the nanopowders was investigated
with SEM (Ultra Plus; Carl Zeiss Meditec AG, Jena, Germany).
Chemical composition of the powdersThe experimentally measured ion content in the powders may
not be identical to that in the solutions. The chemical compos-
ition analysis of powders was examined by inductively coupled
plasma optical emission spectrometry (ICP-OES) with induc-
tion in argon plasma (Thermo Scientific, iCAP 6000 series,
United Kingdom).
The samples for analysis with ICP-OES were prepared as
follows: 5 mg of powder was weighed in a 110 mL teflon vessel
and 15 mL of deionized water (HLP 20UV, Hydrolab, Poland)
was added. Then, 6 mL of HNO3 was added and the solution
was subjected to one microwave heating cycle in the Magnum
II reactor. After cooling, the sample volume was filled to 50 mL
with deionized water.
EXAFS investigations of Zn1−xCoxOThe local atomic structure of Co in Zn1−xCoxO NPs with
concentrations of 1%, 5%, 10% and 15% Co were determined
from the extended X-ray absorption fine structure (EXAFS)
measurements. EXAFS measurements at the K-edge of Zn and
Co were performed at Deutsches Elektronen-Synchrotron
(DESY), Hasylab (C1 and A1 stations) at 140 °C using a
7-element silicon fluorescence drift detector for the Co K-edge
and in transmission mode for the Zn K-edge. The data were
compared with two types of reference samples: ZnO NPs and
Zn1−xCoxO layers grown by ALD, studied separately [84].
Magnetic investigationsThe measurement of the magnetic properties of both as-grown
and annealed Zn1−xCoxO NPs were performed by a custom-
built SQUID magnetometry experiment for the temperature
range T = 5–200 K at an external magnetic field of up to
H = 0.5 kOe.
AcknowledgementsThe work reported here was conducted under the NanoFATE,
Collaborative Project, CP-FP 247739 (2010–2014) under the
7th Framework Programme of the European Commission (FP7-
NMP-ENV-2009, Theme 4), coordinated by C. Svendsen
(Natural Environment Research Council Centre for Ecology and
Hydrology, United Kingdom). M. Godlewski acknowledges the
National Science Centre (Poland) project (Decision No.
DEC2012/06/A/ST7/00398). The EXAFS experiments were
funded by the European Community’s Seventh Framework
Programme (FP7/2007-2013) under grant agreement number
226716.
References1. Rodgers, P. Nanoscience and Technology: A Collection of Reviews
from Nature Journals; Nature Publishing Group: London, UnitedKingdom, 2009.
2. George, S.; Pokhrel, S.; Xia, T.; Gilbert, B.; Ji, Z.; Schowalter, M.;Rosenauer, A.; Damoiseaux, R.; Bradley, K. A.; Mädler, L.; Nel, A. E.ACS Nano 2010, 4, 15–29. doi:10.1021/nn901503q
3. Yan, L.; Zhao, F.; Li, S.; Hu, Z.; Zhao, Y. Nanoscale 2011, 3, 362–382.doi:10.1039/C0NR00647E
4. Subramanian, V.; Bakhishev, T.; Redinger, D.; Volkman, S. K.J. Disp. Technol. 2009, 5, 525–530. doi:10.1109/JDT.2009.2029124
5. Becheri, A.; Dürr, M.; Lo Nostro, P.; Baglioni, P. J. Nanopart. Res.2008, 10, 679–689. doi:10.1007/s11051-007-9318-3
6. Beydoun, D.; Amal, R.; Low, G.; McEvoy, S. J. Nanopart. Res. 1999, 1,439–458. doi:10.1023/A:1010044830871
7. Seil, J. T.; Webster, T. J. Nanotechnology 2012, 23, 495101.doi:10.1088/0957-4484/23/49/495101
8. He, R.; Hocking, R. K.; Tsuzuki, T. Mater. Chem. Phys. 2012, 132,1035–1040. doi:10.1016/j.matchemphys.2011.12.061
9. Tsuzuki, T.; Robinson, J. S.; McCormick, P. G. J. Aust. Ceram. Soc.2002, 38, 15–19.
10. Kołodziejczak-Radzimska, A.; Jesionowski, T. Materials 2014, 7,2833–2881. doi:10.3390/ma7042833
11. Gruzintsev, A. N.; Volkov, V. T.; Yakimov, E. E. Semiconductors 2003,37, 259–262. doi:10.1134/1.1561514
12. Hayashi, H.; Ishizaka, A.; Haemori, M.; Koinuma, H. Appl. Phys. Lett.2003, 82, 1365. doi:10.1063/1.1554767
13. Liu, M.; Kitai, A. H.; Mascher, P. J. Lumin. 1992, 54, 35–42.doi:10.1016/0022-2313(92)90047-D
14. Sharma, P.; Sreenivas, K.; Rao, K. V. J. Appl. Phys. 2003, 93,3963–3970. doi:10.1063/1.1558994
15. Curri, M. L.; Comparelli, R.; Cozzoli, P. D.; Mascolo, G.; Agostiano, A.Mater. Sci. Eng., C 2003, 23, 285–289.doi:10.1016/S0928-4931(02)00250-3
16. Cauda, V.; Pugliese, D.; Garino, N.; Sacco, A.; Bianco, S.; Bella, F.;Lamberti, A.; Gerbaldi, C. Energy 2014, 65, 639–646.doi:10.1016/j.energy.2013.12.025
17. Song, J.; Zhang, Y.; Xu, C.; Wu, W.; Lin Wang, Z. Nano Lett. 2011, 11,2829–2834. doi:10.1021/nl2011966

Beilstein J. Nanotechnol. 2015, 6, 1957–1969.
1968
18. Kim, H.; Horwitz, J. S.; Kim, W. H.; Mäkinen, A. J.; Kafafi, Z. H.;Chrisey, D. B. Thin Solid Films 2002, 420–421, 539–543.doi:10.1016/S0040-6090(02)00836-2
19. Ohtaki, M.; Tsubota, T.; Eguchi, K.; Arai, H. J. Appl. Phys. 1996, 79,1816–1818. doi:10.1063/1.360976
20. Kutty, T. R. N.; Raghu, N. Appl. Phys. Lett. 1989, 54, 1796–1798.doi:10.1063/1.101267
21. Chen, M.; Pei, Z. L.; Sun, C.; Gong, J.; Huang, R. F.; Wen, L. S.Mater. Sci. Eng., B 2001, 85, 212.doi:10.1016/S0921-5107(01)00584-0
22. Lee, J.-B.; Lee, H.-J; Seo, S.-H.; Park, J.-S. Thin Solid Films 2001,398–399, 641. doi:10.1016/S0040-6090(01)01332-3
23. Fakhar-e-Alam, M.; Rahim, S.; Atif, M.; Hammad Aziz, M.;Imran Malick, M.; Zaidi, S. S. Z.; Suleman, R.; Majid, A.Laser Phys. Lett. 2014, 11, 025601.doi:10.1088/1612-2011/11/2/025601
24. Matsumoto, Y.; Murakami, M.; Shono, T.; Hasegawa, T.; Fukumura, T.;Kawasaki, M.; Ahmet, P.; Chikyow, T.; Koshihara, S.-y.; Koinuma, H.Science 2001, 291, 854–856. doi:10.1126/science.1056186
25. Chambers, S. A.; Thevuthasan, S.; Farrow, R. F. C.; Marks, R. F.;Thiele, J. W.; Folks, L.; Samant, M. G.; Kellock, A. J.; Ruzycki, N.;Ederer, D. L.; Diebold, U. Appl. Phys. Lett. 2001, 79, 3467.doi:10.1063/1.1420434
26. Matsumoto, Y.; Takahashi, R.; Murakami, M.; Koida, T.; Fan, X.-J.;Hasegawa, T.; Fukumura, T.; Kawasaki, M.; Koshihara, S.-Y.;Koinuma, H. Jpn. J. Appl. Phys., Part 2 2001, 40, L1205.doi:10.1143/JJAP.40.L1204
27. Park, W. K.; Ortega-Hertogs, R. J.; Moodera, J. S.; Punnoose, A.;Seehra, M. S. J. Appl. Phys. 2002, 91, 8093. doi:10.1063/1.1452650
28. Stampe, P. A.; Kennedy, R. J.; Xin, Y.; Parker, J. S. J. Appl. Phys.2003, 93, 7864. doi:10.1063/1.1556119
29. Punnoose, A.; Seehra, M. S.; Park, W. K.; Moodera, J. S.J. Appl. Phys. 2003, 93, 7867. doi:10.1063/1.1556121
30. Kim, D. H.; Yang, J. S.; Lee, K. W.; Bu, S. D.; Kim, D.-W.; Noh, T. W.;Oh, S.-J.; Kim, Y.-W.; Chung, J.-S.; Tanaka, H.; Lee, H. Y.; Kawai, T.;Won, J. Y.; Park, S. H.; Lee, J. C. J. Appl. Phys. 2003, 93, 6125.doi:10.1063/1.1568524
31. Rameev, B. Z.; Yildiz, F.; Tagirov, L. R.; Aktaş, B.; Park, W. K.;Moodera, J. S. J. Magn. Magn. Mater. 2003, 258–259, 361–364.doi:10.1016/S0304-8853(02)01088-0
32. Fu, J.; Ren, X.; Yan, S.; Gong, Y.; Tan, Y.; Liang, K.; Du, R.; Xing, X.;Mo, G.; Chen, Z.; Cai, Q.; Sun, D.; Wu, Z. J. Alloys Compd. 2013, 558,212–221. doi:10.1016/j.jallcom.2013.01.029
33. Joseph, D. P.; Venkateswaran, C. J. At., Mol., Opt. Phys. 2011, 2011,No. 270540. doi:10.1155/2011/270540
34. Tomaszewska-Grzęda, A.; Opalińska, A.; Grzanka, E.; Łojkowski, W.;Gedanken, A.; Godlewski, M.; Yatsunenko, S.; Osinniy, V.; Story, T.Appl. Phys. Lett. 2006, 89, p242102. doi:10.1063/1.2404599
35. Dietl, T.; Ohno, H.; Matsukura, F.; Cibert, J.; Ferrand, D. Science 2000,287, 1019. doi:10.1126/science.287.5455.1019
36. Ueda, K.; Tabata, H.; Kawai, T. Appl. Phys. Lett. 2001, 79, 988.doi:10.1063/1.1384478
37. Park, J. H.; Kim, M. G.; Jang, H. M.; Ryu, S.; Kim, Y. M.Appl. Phys. Lett. 2004, 84, 1338. doi:10.1063/1.1650915
38. Norton, D. P.; Overberg, M. E.; Pearton, S. J.; Preusser, K.;Budai, J. D.; Boatner, L. A.; Chisholm, M. F.; Lee, J. S.; Khim, Z. G.;Park, Y. D.; Wilson, R. G. Appl. Phys. Lett. 2003, 83, 5488.doi:10.1063/1.1637719
39. Hays, J.; Reddy, K. M.; Graces, N. Y.; Engelhard, M. H.;Shutthanandan, V.; Luo, M.; Xu, C.; Giles, N. C.; Wang, C.;Thevuthasan, S.; Punnoose, A. J. Phys.: Condens. Matter 2007, 19,266203. doi:10.1088/0953-8984/19/26/266203
40. Ramachandran, S.; Tiwari, A.; Narayan, J. Appl. Phys. Lett. 2004, 84,5255–5257. doi:10.1063/1.1764936
41. Sawicki, M.; Guziewicz, E.; Łukasiewicz, M. I.; Proselkov, O.;Kowalik, I. A.; Lisowski, W.; Dłużewski, P.; Wittlin, A.; Jaworski, M.;Wolska, A.; Paszkowicz, W.; Jakieła, R.; Witkowski, B. S.;Wachnicki, L.; Klepka, M. T.; Luque, F. J.; Arvanitis, D.;Sobczak, J. W.; Krawczyk, M.; Jablonski, A.; Stefanowicz, W.;Sztenkiel, D.; Godlewski, M.; Dietl, T. Phys. Rev. B 2013, 88, 085204.doi:10.1103/PhysRevB.88.085204
42. Godlewski, M.; Guziewicz, E.; Łukasiewicz, M. I.; Kowalik, I. A.;Sawicki, M.; Witkowski, B. S.; Jakieła, R.; Lisowski, W.; Sobczak, J. W.;Krawczyk, M. Phys. Status Solidi B 2011, 248, 1596.doi:10.1002/pssb.201001142
43. Ando, K.; Saito, H.; Jin, Z.; Fukumura, T.; Kawasaki, M.;Matsumoto, Y.; Koinuma, H. Appl. Phys. Lett. 2001, 78, 2700–2702.doi:10.1063/1.1368375
44. Mandal, S. K.; Das, A. K.; Nath, T. K.; Karmakar, D.; Satpati, B.J. Appl. Phys. 2006, 100, 104315. doi:10.1063/1.2360387
45. Lim, S.-W.; Hwang, D.-K.; Myoung, J.-M. Solid State Commun. 2003,125, 231–235. doi:10.1016/S0038-1098(02)00804-9
46. Djerdj, I.; Garnweitner, G.; Arčon, D.; Pregelj, M.; Jagličić, Z.;Niederberger, M. J. Mater. Chem. 2008, 18, 5208–5217.doi:10.1039/b808361d
47. Lommens, P.; Loncke, F.; Smet, P. F.; Callens, F.; Poelman, D.;Vrielinck, H.; Hens, Z. Chem. Mater. 2007, 19, 5576–5583.doi:10.1021/cm071623f
48. Li, W.; Kang, Q.; Lin, Z.; Chu, W.; Chen, D.; Wu, Z.; Yan, Y.; Chen, D.;Huang, F. Appl. Phys. Lett. 2006, 89, 112507. doi:10.1063/1.2352726
49. Ahmed, F.; Kumar, S.; Arshi, N.; Anwar, M. S.; Koo, B. H.; Lee, C. G.Microelectron. Eng. 2012, 89, 129–132. doi:10.1016/j.mee.2011.03.149
50. Shi, T.; Xiao, Z.; Yin, Z.; Li, X.; Wang, Y.; He, H.; Wang, J.; Yan, W.;Wei, S. Appl. Phys. Lett. 2010, 96, 211905. doi:10.1063/1.3437082
51. Bondioli, F.; Ferrari, A. M.; Leonelli, C.; Siligardi, C.; Pellcani, G. C.J. Am. Ceram. Soc. 2001, 84, 2728–2730.doi:10.1111/j.1151-2916.2001.tb01084.x
52. Huang, J. R.; Xiong, Z. X.; Fang, C.; Feng, B. L. Mater. Sci. Eng., B2003, 99, 226–229. doi:10.1016/S0921-5107(02)00541-X
53. Komarneni, S.; Roy, R.; Li, Q. H. Mater. Res. Bull. 1992, 27,1393–1405. doi:10.1016/0025-5408(92)90004-J
54. Komarneni, S.; Bruno, M.; Mariani, E. Mater. Res. Bull. 2000, 35,1843–1847. doi:10.1016/S0025-5408(00)00385-8
55. Opalinska, A.; Leonelli, C.; Lojkowski, W.; Pielaszek, R.; Grzanka, E.;Chudoba, T.; Matysiak, H.; Wejrzanowski, T.; Kurzydlowski, K. J.J. Nanomater. 2006, 2006, No. 98769. doi:10.1155/JNM/2006/98769
56. Palchik, O.; Zhu, Z.; Gedanken, A. J. Mater. Chem. 2000, 10,1251–1254. doi:10.1039/a908795h
57. Palchik, O.; Gedanken, A.; Palchik, V.; Slifkin, M. A.; Weiss, A. M.J. Solid State Chem. 2002, 165, 125–130. doi:10.1006/jssc.2002.9513
58. Gedye, R.; Smith, F.; Westaway, K.; Ali, H.; Baldisera, L.; Laberge, L.;Rousell, J. Tetrahedron Lett. 1986, 27, 279–282.doi:10.1016/S0040-4039(00)83996-9
59. Giguere, R. J.; Bray, T. L.; Duncan, S. M.; Majetich, G.Tetrahedron Lett. 1986, 27, 4945–4948.doi:10.1016/S0040-4039(00)85103-5
60. Hayes, B. L. Microwave Synthesis: Chemistry at the Speed of Light, 1sted.; CEM Publishing: Matthews, NC, U.S.A., 2002.

Beilstein J. Nanotechnol. 2015, 6, 1957–1969.
1969
61. Perreux, L.; Loupy, A. Tetrahedron 2001, 57, 9199–9223.doi:10.1016/S0040-4020(01)00905-X
62. Kappe, C. O. Angew. Chem., Int. Ed. 2004, 43, 6250–6284.doi:10.1002/anie.200400655
63. de la Hoz, A.; Díaz-Ortiz, Á.; Moreno, A. Chem. Soc. Rev. 2005, 34,164–178. doi:10.1039/b411438h
64. Kappe, C. O. Chimia 2006, 60, 308–312.doi:10.2533/000942906777836273
65. Kappe, C. O.; Dallinger, D. Mol. Diversity 2009, 13, 71–193.doi:10.1007/s11030-009-9138-8
66. Kappe, C. O.; Dallinger, D.; Murphree, S. S. Practical MicrowaveSynthesis for Organic Chemists: Strategies, Instruments, andProtocols; Wiley-VCH: Weinheim, Germany, 2009.
67. Leonelli, C.; Lojkowski, W. Chim. Oggi 2007, 25, 34–38.68. Lojkowski, W.; Gedanken, A.; Grzanka, E.; Opalinska, A.;
Strachowski, T.; Pielaszek, R.; Tomaszewska-Grzeda, A.;Yatsunenko, S.; Godlewski, M.; Matysiak, H.; Kurzydłowski, K. J.J. Nanopart. Res. 2009, 11, 1991–2002.doi:10.1007/s11051-008-9559-9
69. Fidelus, J.; Piticescu, R. R.; Piticescu, R. M.; Lojkowski, W.; Giurgiu, L.Z. Naturforsch., B: J. Chem. Sci. 2008, 63, 725–729.
70. Majcher, A.; Wiejak, J.; Przybylski, J.; Chudoba, T.; Wojnarowicz, J.Int. J. Chem. React. Eng. 2013, 11, 361–368.doi:10.1515/ijcre-2012-0009
71. Lojkowski, W.; Leonelli, C.; Chudoba, T.; Wojnarowicz, J.; Majcher, A.;Mazurkiewicz, A. Inorganics 2014, 2, 606–619.doi:10.3390/inorganics2040606
72. Lomot, D.; Juszczyk, W.; Karpinski, Z.; Larsson, R.J. Mol. Catal. A: Chem. 2002, 186, 163–172.doi:10.1016/S1381-1169(02)00119-X
73. David, W. I. F. J. Appl. Crystallogr. 2004, 37, 621–628.doi:10.1107/S0021889804013184
74. Hill, R. J.; Howard, C. J. J. Appl. Crystallogr. 1987, 20, 467–474.doi:10.1107/S0021889887086199
75. Wiles, D. B.; Young, R. A. J. Appl. Crystallogr. 1981, 14, 149–151.doi:10.1107/S0021889881008996
76. Shankland, K. J. Res. Natl. Inst. Stand. Technol. 2004, 109, 143–154.doi:10.6028/jres.109.011
77. Chang, J.; Johnson, E. Philos. Mag. 2005, 85, 3617–3627.doi:10.1080/14786430500228663
78. Birnboim, A.; Gershon, D.; Calame, J.; Birman, A.; Carmel, Y.;Rodgers, J.; Levush, B.; Bykov, Y.; Eremeev, A. G.; Holoptsev, V. V.;Semenov, V. E.; Dadon, D.; Martin, L. P.; Rosen, M.; Hutcheon, R.J. Am. Ceram. Soc. 1998, 81, 1493–1501.doi:10.1111/j.1151-2916.1998.tb02508.x
79.Łukasiewicz, M. I.; Wójcik-Głodowska, A.; Guziewicz, E.; Wolska, A.;Klepka, M. T.; Dłużewski, P.; Jakieła, R.; Łusakowska, E.; Kopalko, K.;Paszkowicz, W.; Wachnicki, Ł.; Witkowski, B. S.; Lisowski, W.;Krawczyk, M.; Sobczak, J. W.; Jabłoński, A.; Godlewski, M.Semicond. Sci. Technol. 2012, 27, 074009.doi:10.1088/0268-1242/27/7/074009
80. Ivill, M.; Pearton, S. J.; Rawal, S.; Leu, L.; Sadik, P.; Das, R.;Hebard, A. F.; Chisholm, M.; Budai, J. D.; Norton, D. P. New J. Phys.2008, 10, 065002. doi:10.1088/1367-2630/10/6/065002
81. Glaspell, G.; Dutta, P.; Manivannan, A. J. Cluster Sci. 2005, 16,523–536. doi:10.1007/s10876-005-0024-y
82. Yogamalar, R.; Srinivasan, R.; Vinu, A.; Ariga, K.; Bose, A. C.Solid State Commun. 2009, 149, 1919–1923.doi:10.1016/j.ssc.2009.07.043
83. Wejrzanowski, T.; Pielaszek, R.; Opalinska, A.; Matysiak, H.;Łojkowski, W.; Kurzydłowski, K. J. Appl. Surf. Sci. 2006, 253, 204–208.doi:10.1016/j.apsusc.2006.05.089
84. Wolska, A.; Klepka, M. T.; Witkowski, B. S.; Łukasiewicz, M. I.;Guziewicz, E.; Godlewski, M. Acta Phys. Pol., A 2012, 121, 883–887.
License and TermsThis is an Open Access article under the terms of the
Creative Commons Attribution License
(http://creativecommons.org/licenses/by/2.0), which
permits unrestricted use, distribution, and reproduction in
any medium, provided the original work is properly cited.
The license is subject to the Beilstein Journal of
Nanotechnology terms and conditions:
(http://www.beilstein-journals.org/bjnano)
The definitive version of this article is the electronic one
which can be found at:
doi:10.3762/bjnano.6.200


