Embed Size (px)
Citation preview
PARLIAMENTARY ELECTIONS AND POLITICAL PARTIES
Jayesh Kumar
We discuss here the probability of incumbent part.\"s winning the election from the same constit-uency..We est-imate the probabilitl, of winning by the ruling parl,, irrespective of whether that parb,formsa coalition during election, has been ct member of the last government in the centre. We istimate theaverage probabilin' of winning in India's general elections from 197 1 to 1999, under the given electoralsystem, using a panel data Binary Choice Model.
India having the largest electoral mandate andmultiparty electoral college in the world is the mostsuitable candidate for analysing elections. India hasthe large base of polit ical parties (over 670) and, aspolit ical parties are indispensable fbr the successfulworking of any democracy, they offer a lot of choiceto voters. This article tries to explain the behaviourof electorates. We try to model the chances of anincumbent getting re-elected in the election. Inparticular, we attempt to answer whether the sex ofcandidates affects the outcome of any election?Does the identity of a party in terms of national ys.
regional matter' l
At the heart of any electoral democracy is theidea of 'one person, one vote, and one value ' , i .e . ,anyone's vote should not have higher weight thanthat of another. In India, the discrepancy betweenelectoral constituencies is enormous. The largestconstituency in 1999, forexample, Outer-Delhi, hadnearly 86 times more voters than Lakshadweep, thesmallest constituency. It shows that the vote ofLakshadweep's voters has more weight than that ofthe Outer-Delhi's in choosing their representativesin Parliament. Multiparty elections for Parliament,state legislature, and local legislature are a keyvehicle fbr the expression of ideological diversity.Elections also provide a forum for advances inwomen's polit ical participation. Women have hadthe right fbrever, but the recent trends toward morepluralist elections have made their participationsomewhat more mcanineful. Indian women arc
woefully underrepresented in elected office, andfemale candidates are few. However. women arenow competing fiom almost every constituency.and in some constituencies the number of womencontestants rivals men's. Ruling parties and theirsupporters swept almost every electoral contestduring 1950-90, only a handful of times haveopposition candidates won a plurality in nationalelections. Several factors explain the poor per-formance. The non-Congress opposition lacked thegrassrootsupportunti l l the 1980s. The ruling partiesenjoy extensive patronage networks and havesuperior access to the national/regional media. The'winner-takes-all ' system, used in most consti lu-encies. benef , i t incumbent par t ies.
In parliamentary systems with proportionalrepresentation and multiple parties, the primeminister and hisftrer cabinet are dependent on thesupport and confidence of more than one parlia-mentary party. Such coalit ion governments areformed anew after each election, in which voterschoose parties and not coalit ions or governments.Coalit ional options are discussed during the electioncampaigns but not all options turn out to be feasibleonce the elections-returns become known. Contraryto two-party parliamentary systems, the electorate'ssignals for a new government are ambiguous, givingthe party leaders some leeway in coalit ion bar-gaining. In order to fulf i l most of there promises.parties have not only to enter a winning coalit ion,but they have to reach a coalit ion agreement that
Jayesh Kumar is Research Scholar , IndiraGandhi Inst i tute of Development Research Mumbai. eMai l : jayesh@igidr .ac. inJEL Classification: C25. N45. Keywords: coalition, electoral system, and ruling party.
This paper is a modified version of the paper presented at the 9th Intemational Conference of Forum for Interdisciplinar.yMathematics on Statistics. Combinatorics and Related Areas (SCRA-FIM-lX) at Allahabad, December2l -23.2002. Author'thank.sall panicipants for their comments. In addition many thanks are extended to Kausik Chaudhuri forhelpful commenrs and suggesrrons.Special thanks are due to the Journal's Editor and an anonymous referee for detailed comments and suggestions. whiih helpedsubstant ia l ly in improving the presentat ion. The usual d isc la i rner appl ies.
puts the promised policies on the governmentagenda. In this context, parliamentary electionsprovide an important experimental setting to studythe voter's choice behaviour in choosing their rep-resenlatives in Parliament for the functioning ofdemocratic institutions. Moreover, in segmentedsocieties l ike India developments certain in the1990s have changed the context in which theyfunction. Performance of democratic institutions issubstantially a function of networks of trust andcivic engagements among cit izens by participatingin coordinated collcctive action. For any democracywith such a large electoral mandate, elections canhardly be over-emphasised. Elections and electoralanalysis have always been of high priority in anydemocratic country. In this context, polit ical econ-omics with public choioe has a lot to offer rnincreasing our understanding of the voter's chorcebehaviour in elections. In the arena of multi partyelections, the presence of electoral all iances is themainstay o1' democratic governance.
In order to test fbr the basics of the presence ofvoter's choicc behaviour, we flrsl look at theprobabil ity of an incumbent getting re-elected fromthe same constituency. Further, in this study, wemake an attempl at examining the behaviouralpattern followed by other electoral variables span-ning the electoral terms. By means of extensiveempirical analysis, the study explores first, whetherthe national parties have better odds of getting re-elected than the regional parties or vice-versa.Second, does the sex of candidates make anydifference in electoral outcome? Third, doesincreased voter-turnout in any election mean anti-incumbency voting behaviour? Fourth, does a largenumber of candidates cut on the vote share of therncumbent, resulting in losing the election?
The remainder o1'the study is organised as fbl-lows: We discuss the existing research in this areain Section 2, followed by the Indian scenario and itselectoral system in Section 3. We propose a simpleeconometric model and explore econometric issues
JOURNAL OF INDIAN SCHOOL OF POLITICAL ECONOMY JULY.SEPT', 2003
that arise in the specification of the model in Section4, lbllowed by the empirical resulrs in Section 5.with discussion on some interesting implications.Section 6 concludes the work.
LiteratLrre Review
In this study, we model the winnings o1' anincumbent party. We assume that all the candidatesare equally l ikely to be elected (i.e., there is a randomselection procedure of candidates), and the el'fectson outcome are not individual specific but partyspecific (Which is not a very restrictive assumption,as most of the electoral results are driven by theincumbent's party rather than the incumbentthemselves, barring some exceptions.). We estimatethe probabil ity of winning of the incumbent party(i.e., the party, which has also won the last election ).irrespective of whether it has been a member of'coalit ion (during/afier elections), the governin_eparty any. or one of the members of the governingparty, in case of a coalit ion government. For, we areinterested in taking account of constituency-wiseruling (winning) by parties rather than the ruling atthe center. We estimate the average probabil ity ofwinning, given that the party has won the lastelection, using constituency-wise data of the gener-aleleclions fiom 1967 to 1999 under rhe Indianelectoral system, using a Panel Data Binary ChoiceModel (Generalised Estimation Equations Popula-tion Averaged Model). This exercise gives us theidea of the incumbent's performance and its chancesto come lnto power again, under the assumption ofrational voters in the constituency (whrch is verywidely used in existing polit ical economy litera-ture).
The probabil ity that a party wins the elecriondepends on various factors, viz., the state to whichthe constituency belongs, the inherent characteris-tics of the population, and various other socio-economic and cultural factors (caste, religion. etc.).One of the potential factors that might aff'ect thewinning of a party is that the same party has won
vot.. t5 No. 3
the last election. This seems quite a probable caseand India, with its socio-polit ical set-up, providesan incentive to test the hypothesis that having accessto power aff-ects the outcome of elections in futureor does not.
Researchers have done significant amount ofwork in this area mostly with data the US or fromthe European countries. Katz, Honaker, and King
[2001] improve upon their original model, IKatz andKing, 1999, Pp. l5-321 in b ias, var iance, numer icalstabil ity, and computational speed, making itquicker to estimate. the dif{ 'erence here being thatthe problem of ef1'ective voting, which is treated asmissing data in the original model. They argue thatordinary least squares (OLS) regression is inap-propriate when, the dependent variable measuresthe share of the vote going to each party, andrecommend a superior technique. Unfbrtunately,the Katz-King model requires a high level of sta-tistical expertise, and is computationally impracti-cal fbr more than three polit ical parties, as thcirmodel is based on the principle of the two politrcalparties competin-{ l 'or the constituency seat. Jackson
[2001] tries to give a simpler estimation procedure,using a seemingly unrelated regression (SUR)model (with a multinomial logistic function).
There are some relatively recent studies that gobeyond the examination of particular cases, andassess the impact on national elections. Conley[2002],using the 1990s census and electoral data ofthe Canadian ridings, f inds significant incumbencyeffects for members of parliament (MPs), and noevidence of any significant increase in incumbencyadvantage in the last decade. Pappi and Gabriele
[1998. Pp. 229-55], using survey data for the Eastand West Germany, proposes how party preferencesof voters in a multiparty system are measured,compared, and aggregated. Normal, et al, 11998,Pp.251 -93) considered a stochastic model of vorerresponse, based on multinomial probit estimation,using Euro-barometer survey data and European
P ARLI AM ENTA RY ELECTI O N S AN D P O L|TI CAL P A RTI ES
elite survey data fiom 1979. They argue that max-imisation of expected vote, in general, is not arational party strategy in multiparty politicalsystems, which are based on proportional reprc-sentatlon.
The development of methods to examine mul-tiparty elections has clearly caught the attention ofthe profession/discipline, judging by the number ofrecent papers on the topic following the initial Karzand King [999, Pp. 15-32] paper. Tomz, et ol,[2002, Pp. 66-83], make importanr sreps in thisdirection, as their model is based on standard l inearmodel and offers a sophisticated yet convenientalternative that involves seemingly unrelatedregression (SUR). Gelman and King [1990, 1994,Pp.5 l4-541 analyse elections in all state legislatureselected from a single member district over the period1968-88 in the US and conclude thar redistrictingincreases electoral responsiveness, and it leads toless bias towards a majority of voters than would beexpected ifno redistricting had occurred. Before theredistricting, in case of large legislatures, therepresentation of voters was biased towards pow-erful representatives, which leads to unequal drs-tribution of power among voters. Katz and KingI I 999, Pp. 1 5 -32], King, er al, [200 l, Pp. 49 -69] andGelman and Katz [200 ] I develop methodologies toestimate the 'effbctive' vote in partially contested(re-elections), multiparty elections. They trear par-tially contested elections as missing data probleni.and use an algorithm procedure to recovercontesting parties' estimated vote shares. We don'tsee any reason to expect that, had a party contestedelections, other parties, vote shares would have beenchanged because, ifa party is not contesting fiom aparticular constituency, it must be the case thateither the party is contesting the election indirectly(may be a coalit ion), or in the party's assessment, itdoes not have any chance of winning from thatconstituency. Merri l l [ 1994] provides evidenoe thatboth the pure proximity and the pure directionalmodels fall short of accounting fbr the spatialdistribution of voters by party. Gelman and Katz
[2001], gives the strength of voting, giving us aninsight of the inter-l inkages between voting, coali-t ions and the electoral college. However, no workhas so far been done in greater detail to explain thewinnings of any party based on their base andperformance in the constituency-ruling rather thanthat in the ruhng at center.
Though survey research has enormous advan-tages for studying individual-level pref'erences, yetas analyses of random selections of isolatedindividuals from unknown geographical locations,they necessarily miss much of electoral polit ics. Assuch, they are often best complemented with studresof aggregatc electoral returns.
Indian Scenario
The electoral system oflndia is largely based onthe British pattern. The Constitution did not provideany details about the electoral system, and left it toParliament to determine. Accordingly, Parliamentpassed a number of laws to regulate the electoralsystem. Some prominent laws enacted for thispurpose include the Representation of People Act,1950 and 1951, the Presidential and Vice-Presidential Election Act. 1952. and the Delimita-tion Act, 1952, etc.
India remains by far the largest democracy in lheworld. with almost 600 mill ion voters. India'sparliamentary government and the First-Past-the-Post (FPTP) electoral system are a legacy of theBrit ish colonialism, which ended in 1947. TheIndian Constitution provides that all adult cit izens,who are l8 years or more of age, and who are nototherwise debarred from voting, can exercise theirright to the franchise. Voters elect a 543-memberLok Sabha (the lower house), from single-memberconstituencies. and each of India's states hasadopted a similar system. By contrast, members ofthe lower house of Parliament and of the statelegislative assemblies members of indirectly electRajya Sabha or the Council of States, as well as those
JULY.SEPT.2OO.]
of the corresponding upper houses of the states.There are also the (non-executive) President and theVice-President, elected by the members of Parlia-ment and state legislative assemblies.
General elections are held once every l ive years,but the President may dissolve the Lok Sabha on theadvice of the prime minister befbre its term is over.as in 1971 and in 1997 or , i fhe or she is convincedthat no stable government can be formed, as in 199 Iand 1998. The prime minister holds office as longas he or she can command a majority in Lok Sabha.All the successive governments of the Congressparty, which ruled India continuously unti l 1977.servcd a full term in office. Since 1977, govern-ments have been less stable, and a number of primeministers have had to resign, as aresult of party splitsor no-confidence votes before comoletine their fullterm.
The major effect of the electoral system, at leastunti l 1977, was to guarantee majority governmentsbased on a majority of voter suppor-r. The FPTPelectoral system resulted in the ruling Congressparty securing stable majorit ies in Lok Sabha.usually against a fragmented opposition. However.since 1977, when the opposition parties combinedto form coalitions and started putting up commoncandidates against the Congress candidates (as wasthe case inrhe 1911 and 1989 general elections). theCongress majorit ies have vanished. Moleover, thenature of the system is that small changes in voteshare often have a dramatic impact upon the shapeof the resulting Parliament.
The overall results of elections to Lok Sabhahave never been proportional. Because the candi-date, who obtains the most votes polled but notnecessarily a majority of voters is declared elected,support can often be divided by setting candidatesof the same caste, religion, or legion against eachother. However, despite the divided nature o1India's multi-ethnic democracy, the electoral sys-tem has retained a considerable degree of support,
JOURNAL OF INDIAN SCHOOL OF POLITICAL ECONOMY
voL. l5 No.3
due in part to the practice of reserving seats forsocially underprivileged groups. The Indian Con-stitution, reserves 22 per cent of all seats for hrs-torically disadvantaged groups, known asScheduled Castes (79 reserved seats) and ScheduledTribes (41 reserved seats). In these constituencies,only a member of the Scheduled Castes or Tribesmay contcst the polls, although all electors havevoting rights. It has cnsured that their parliamentaryrepresentation is in l ine with their proportion of thepopulation. A constitutional amendment, whichseeks to reserve 33 per cent of seats for womenrepresentatives, is currently being considered.
In the first Lok Sabha general election (1951)there were single seated, double seated and tripleseated constituencies. There were 401 constituen-c ies, out of which 314 were s ingle seated const i tu-encies ( I 0 fbr STs), 86 double-seated constituenciesresulting in 172 seats (71 fbr SCs and l5 for STs),and one was triple seated, resulting in three seats(one fbr SCs, one for STs). Thus, there were total489 seats in 195 I parliamentary elections. NorthBengal (Wcst Bengal) constituency was the onlyconstituency, which had three seats.
In the second Lok Sabha general election ( I 957),there were only single and double seated constitu-encies. There were 403 constituencies, out of which312 (16 for STs) single seated and 91 were doublescated constituencies, resulting in a total of 182 ("16I'or SCs and l5 for STs). Thus, there were 494 seatsin Parliament. Since the third Lok Sabha (1962)onwards. there have been only single seat constit-uencies, and these seats have been varying between5 l8 to 543 seats.
Model Specffication
The probabi l i ty o i a par ty winning consecut iveelections in a constituency depends on the party'sruling in that constituency. We have tried to takeinto account a set of factors that might be potentiallyresponsible fbr a party's wining in a particular
PARLIAMENTARY ELECT IONS AND POLIT]CAL PARTIES 6-17
constituency. It is very diff icult to take into con-sideration all the factors (especially the socio-cultural factors that one might think of to be relatedto a party's winning), due to lack of data availabil ity.We have taken only those variables, which seem tobe the most important in terms of their effect on thelog-odds of an incumbent's winning, and for whichreliable data is available. There l ies the opportunityto increase the richness ofthe data set and get moreprecise estimates, but considering the length of thepaper, we restrict ourselves only to these variables.For, we are more interested to enrich our under-standing than predicting the probabil ity.
Anti-incumbency effects may be sensitive tovoter-turnout. There are competing hypothesesabout the direction of the turn-out variable fbr voteshares of a party. A popular incumbent mightincrease loyal voters' desire to go to the polls. Yet,some voters may stay home, if the 'saf-e seat'incumbent seems sure to win. The potential forturnout to damage candidates' fortunes is mostlikely, when voters are unhappy with the incumbent,and go to the polls to register their dissatisfaction[Hin ich, et aL, 1999, Conley, 2002] .
Electoral size is included in the model indirectlybecause electoral constituencies in India. unlikethose in the United States, are not of equal size.Electoral size may be important to candidates inseveral ways: First, the potential obstacles toreaching voters during the campaign may increasein proportion to total population. An incumbent'sname and recognition may not be as grear in biggerconstituencies as in small. Second. as an electoralsize increases, the MP's abil ity to provide constlt-uency services to voters may diminish to reduce thevalue of incumbency status.
Dummy variables for the states are brou_9ht tobear in the model to control for regional effects notcaptured otherwise. A detailed treatment of differ'-ences in state/ regional polit ical culture is wellbeyond the scope of this work. Yet, historiczrl,
6 3 8
economic, and cultural fbundations, that distinguishthe Indian states and regions fiom one another, mayexert a significant influence on electoral outcomes.
The model proposed here is:
(wins),, = cx.0 + Br(national party),, + Br(reserved),+ p.,(sex.y,, + B.(electors),, + B.(valid votes)',+ p(,(vorers),, + pr(candidates),,
+ Br(duration),, + Br(state), + Br0(time), + u,l
We have taken the dependent variable as adichotomous variable (wins), which takes two val-ues, i.e., I i f the incumbent party wins the election,and 0 otherwise. The explanatory variables used rnthe model are:
L Voters' turnout in the constituency (poll per-centage) is the percentage turnout of voters in thatelection, showing the effect of the public desire fora change or the extent of anti-incumbent voting.
2. Categorical variable for the category of theconstituency (reserved).
There is general perception that reservation of aparticular seat can give undesired favour to somepolit ical parties compared to others, for example,regional parties may have better penetration rnreserved seats than national parties. This variabletakes value of 1, if the seat is reserved, 0 otherwise.
3. Categorical variable for the sex of the candi-dates (scx) .
Indian case, it is assumed that males have mclreaccess to power than women, which gives themundue favour. This variable controls the eff'ect ofsex discrimination. It takes value of l, i f the winnerand loser are of the same sex, 0 otherwise.
JULY.SEP7.. 2OO.]
4. Dummy variable for the party being a nationalparty or not (national party).
This is to control the national party's abil ity toget more resources and its access to power, whichcan influence on the result. One may argue that if acandidate is from National party, his/her promiscsare more l ikely to be fulf i l led, compared to others.or candidates may get the thvour due to thefavourable scenario for the oartv.
5. Duration is the gap between two consecutiveelections measured in years, to control for the effectof t ime gap to fulf i l l one's promises before goingfor the next election.
6. Valid votes comprise the ratio of total validvotes polled to the size ofelectorate, i.e.. the variableto control fbr thc education (knowledge,) level in theconstituency. We assume here that the knowl-edgeable person would caste his/her vote withproper caution, reducing the ratio of invalid votes.It is a proxy used to control for the knowledge ofvoters in the constituencv.
7. Candidates comprise the number o1'candidatescontesting. This variable controls fbr the eff 'ect ofcompetit ion in the constituency. One may treat thlsvariable as a control fbr the dummv candidates.
8. Time dummies to capture the effect of currentsocio-economic-polit ical scenario at the time ofe lect ion on the outcome.
This is to capture the eflect of the currentscenario, rather than the effect of the ruling period(which is captured through duration). For example,in year 1980 we find that the year dummy issignificant and negative this could be explained asthe after effect ofthe emergency period that resultedin the results against the ruling party Congress.
JOURNAL OI: IND]AN SCHOOL OF POLITICAI- ECONOM'I
voL. t5 No 3
9. State dummies to control the unobserved statecharacteristics.
As the dependent variable is dichotomous, weare using the Binary Choice (Logit) model. Weestimate population-averaged panel-data modelsusing GEE. This approach estimates cross-sectionaltime-series models. In particular, it estimates gen-eral l inear models, and allows specrfying withingroup corelation structure fbr panels. Thisproduces valid standard errors, even if the correla-tions within group are not as hypothesised by thespecified correlation structure.
For a thorough discussion of GEE in the esti-mation of GLM (Generalised Linear Models), Isee,Zeger and Liang, 1986(a)(b), Pp. 13-22, Pp.121- 1301. Further information on l inear models canbe found in Nelder and Wedderburn [972, Pp.370-3841. Finally, there have been a number ofi l luminating articles on various applications of GEEin Zeger, Liang, and Albert [988, Pp. 1049-60],Zeger and Liang [1986(aXb), Pp. 13-22, Pp.121-1301, and Liang [987, Pp. 695-702]. Pender-gast et al., I I 996, Pp. 89- I I 8] provide a nice surveyofthe current methods for analyzing clustered datain regard to binary response data. Our implemen-tation fbllows that of Zeger and Liang [ 986(a)(b),Pp. l3-22,Pp. I 2 l - I 301 whichhasbeen summarisedin Appendix. fbr the convenience of the reader. Wegeneralized l inear models of Y,, with covariates X1,,
Empirical Analysis
This section is divided into two Sub-sections:sub-section I focuses on the data whereas emoiricalresul ts are prcscntec i in Sub-sect ion 2.
Data
The data used for the analysis is obtained fromlhe Reports of Election Commission of India. Thedataset consists o[ general election data from1961-1999. The first election-year for our study is1967. The data from 1967 is used to folm rhe
PARLIAM ENTARY ELECTIONS AND POLIT]CAL PARTIES
required variable yulns, as the prior election data isnot readiiy available for each constituency, due toreconstruction of the constituencies. It leaves uswith the election data from 1971-1999 (i.e.. 1771,1911, 1980,1984 (1985*) , 1989, 1991 (1992*) ,1996, 1998 and 1999). This, accounts for l0 elec-tions out of total l3 held so far. We haven't takendata befbre 1967 elections, as there has been majolrestructuring of the boundaries of constituenciesbefore l97l election.
Thus, we end up with 4,143 constituency-elections, which consist of minimum five andmaximum nine elections per constituency, as lnsome constituencies, election had not been held artimes. In some states had not been held elections atthe time of general elections but later on we havetreated; those elections only have taken place at thesame time. For example, in Punjab that the electionfor 1984 took place in 1985. In such cases. we havetreated them as ifthey had been hcld in 1984 only.
Entpirical Results
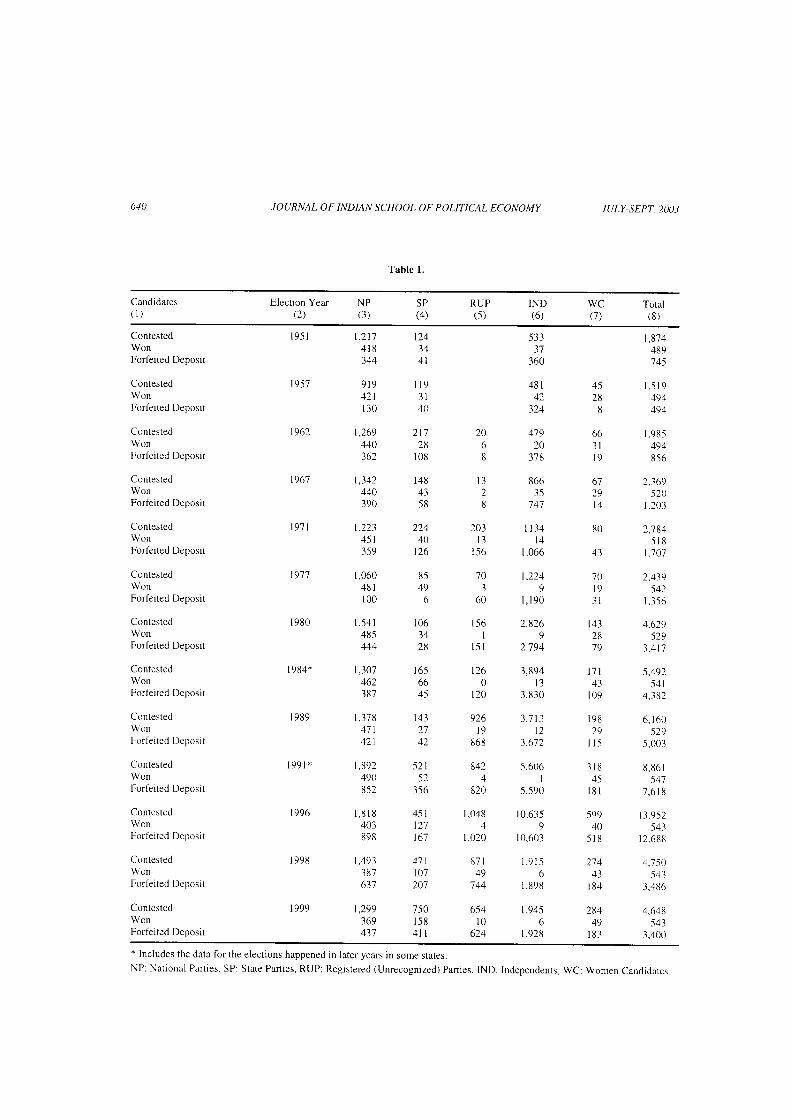
Table I represents the basic characteristics of theIndian Lok Sabha elections in terms of number ofcandidates, contestants forfeiting deposits, numberof women candidates, candidates belonging to dif-f 'erent polit ical parties (in terms of national orregional). The number of candidates contesting inelections has increased ti l l 1996. after which itstarted declining. In 1957, there were I ,5 l9 candi-dates contesting for the election of 494 seats, whilein 1996 for 543 seats total of 13.952 candidatescontested. These increasing numbers of contestantswere mainly from independent category, and mostof them could not save their deposits. Deposits arefbrleited if the candidate is not able to bag even 3percent of votes polled. One may algue that thesecandidates were used as dummy candidate to cut onrival candidates vote share on the base of religion,sex, caste and other socio-economic factors. In1951, 360 candidates from independent categorylost their deposits from the total of 533 candidates;while in 1996, out of 13,952 candidates. 12,688candidates' deposits were forfeited.
6-19
640 JOURNAL OF INDIAN SCHOOL OF POLITICAL ECONOMY
Table l
JULY-SEPT.2AO3
Candidates0 )
Election Year(2 )
N P(3 )
S P(4)
RUP(5 )
IND(6 )
WC(7)
Total( 8 )
ContestedWonForfeited Deposit
ContestedWonFort'eited Deposit
ContestedWonForfeited Deposit
ContestedWonForferted Deposit
ContestedWonForf-eited Deposit
ContestedWonForfeited Deposit
ContestedWonForfeited Deposit
ContestedWonForfeited Deposit
ContestedWonForfeitcd Deposit
ContestedWonForfeited Deposit
ContestedWonForfeited Deposit
ContestedWonForl'eited Deposit
ContestedWonForfeited Deposit
1 9 5 I
1957
t962
t96'7
197 |
t97'7
t980
I 984*
I 989
l 9 9 l *
1996
l 99u
t999
| 1 t ' 7
4 1 8344
9t94211 3 0
1.269440362
t,342440390
t .2234 5 1359
1.0604 8 1100
1 , 5 4 1485444
l ,307462387
1 , 3 7 811 |421
I , 8 9 2490852
l , 8 l 8403898
t.493381631
| )ao369431
1432112
521) l
356
4 5 1127167
17 1t 0 l207
7501 5 84 l t
7068
l 326
203l 3
1 5 6
703
60
1 5 6I
l 5 t
1260
120
926l 9
868
8421
820
1.0481
I,020
8 7 119
744
b ) 4
l 0o/+
53331
360
4 8 1r '1
324
47920
378
86635
747
I 1 3 4t 4
1 ,066
t .2249
I , 1 9 0
2,8269
2,794
3,894l 3
3 .830
3 , 7 t 3l 2
3.672
5.606I
5.590
10,6359
10.603
1 , 9 t 56
l , 8 9 8
I,9456
l ,928
4528
6
663 lt 9
o /
29I 4
80
43
70l 93 t
I '132879
t7 l+-1
1 0 9
1 9 829
l l 5
3 1 84 )
l 8 l
59940
5 1 8
214;+3
l u 4
28449
1 8 3
I ,874,+89145
1 , 5 l 9191494
1 . 9 8 5494856
) 1 6 q
5201.20_1
2..7845 1 8
t .707
2.439542
1.356
1.629529
3.417
5 4 q l
5.r I4 .382
6 , 1 6 0529
5.003
8 . 8 6 1547
7.61 8
13.952543
12.688
4.750543
3.,+86
4,648543
3,400
12434
l l 93 l40
z t 728
108
148
5 8
) a A
40t26
85496
106t+
28
1 6 56645
* Includes the data for the elections happened in later years in some states.NP: National Parties. SP: State Panies, RUP: Registered (Unrecognized) Parties, IND: Independents. WC: Women Candidates
vqL. 15 NO. 3 P ARLI A M ENTA RY EI,ECTI O N S AN D P O I.I7'I CAL P ART I E S
ooo,oG
o
os
1 0 09080-7rl
OU504030
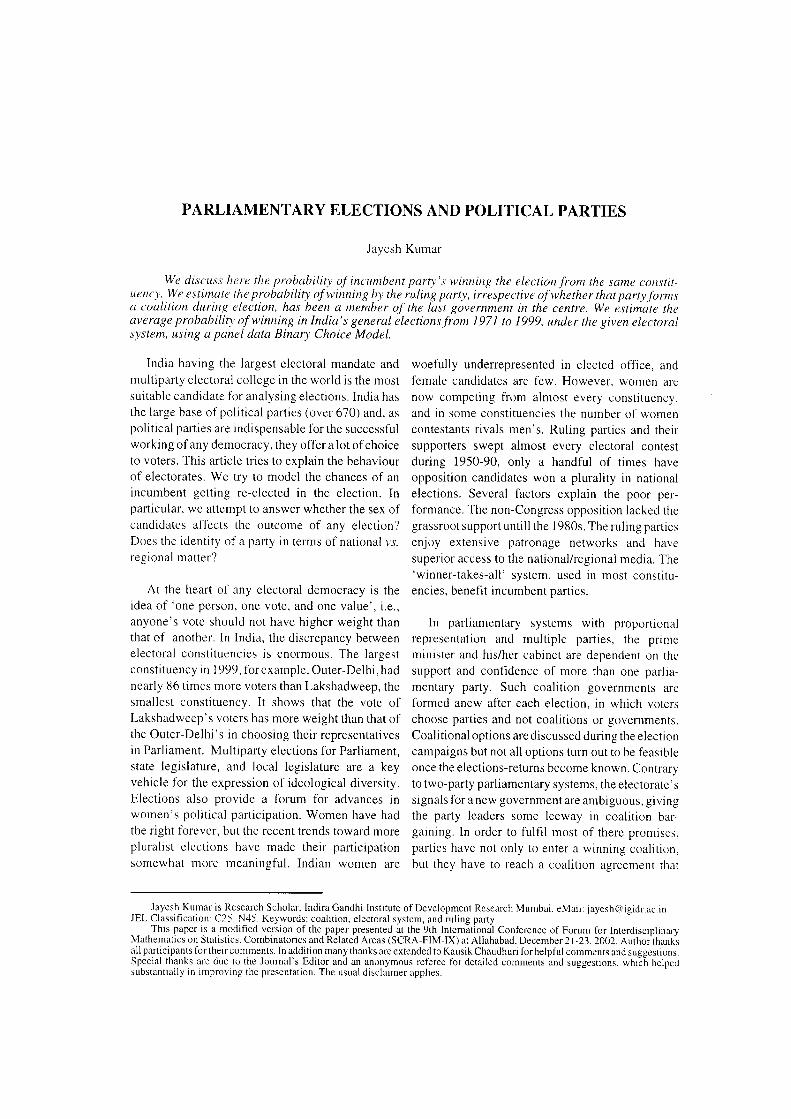
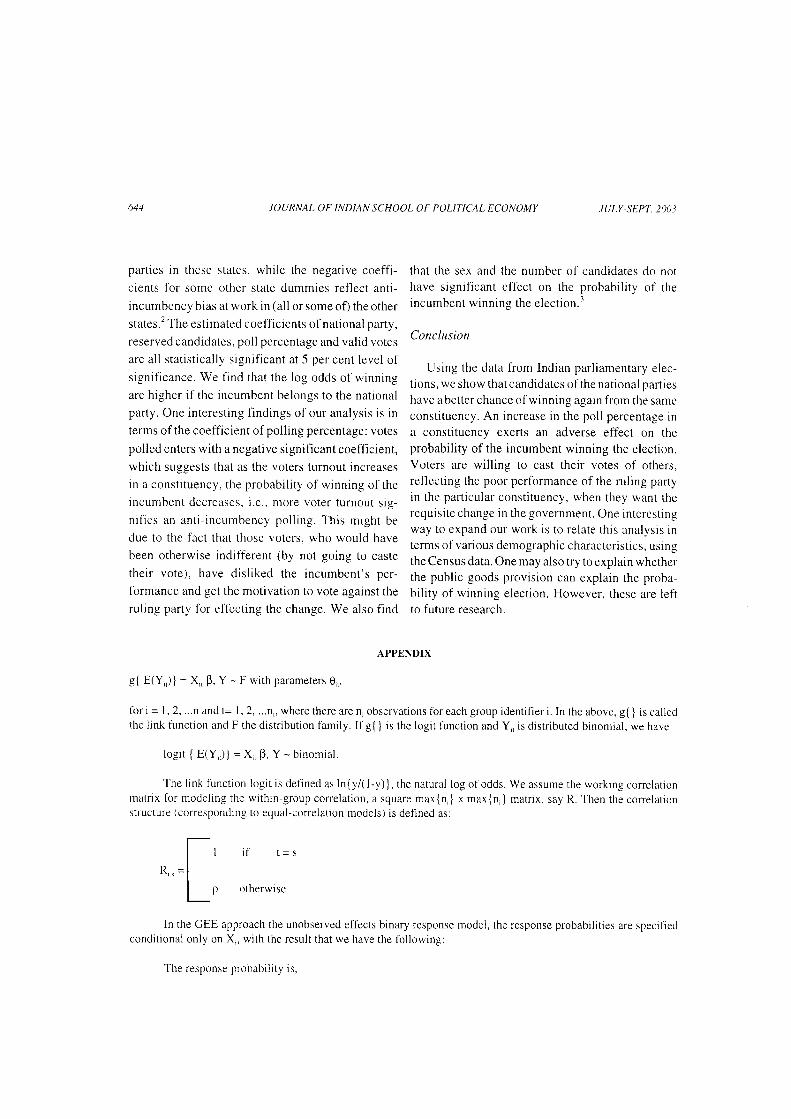
Figure l Winnings by National Parties
1 970 t v / 5 1 9 8 0 1 9 8 5 1 9 9 0
Election Year
1 995 2000
oGo@
clo
obS
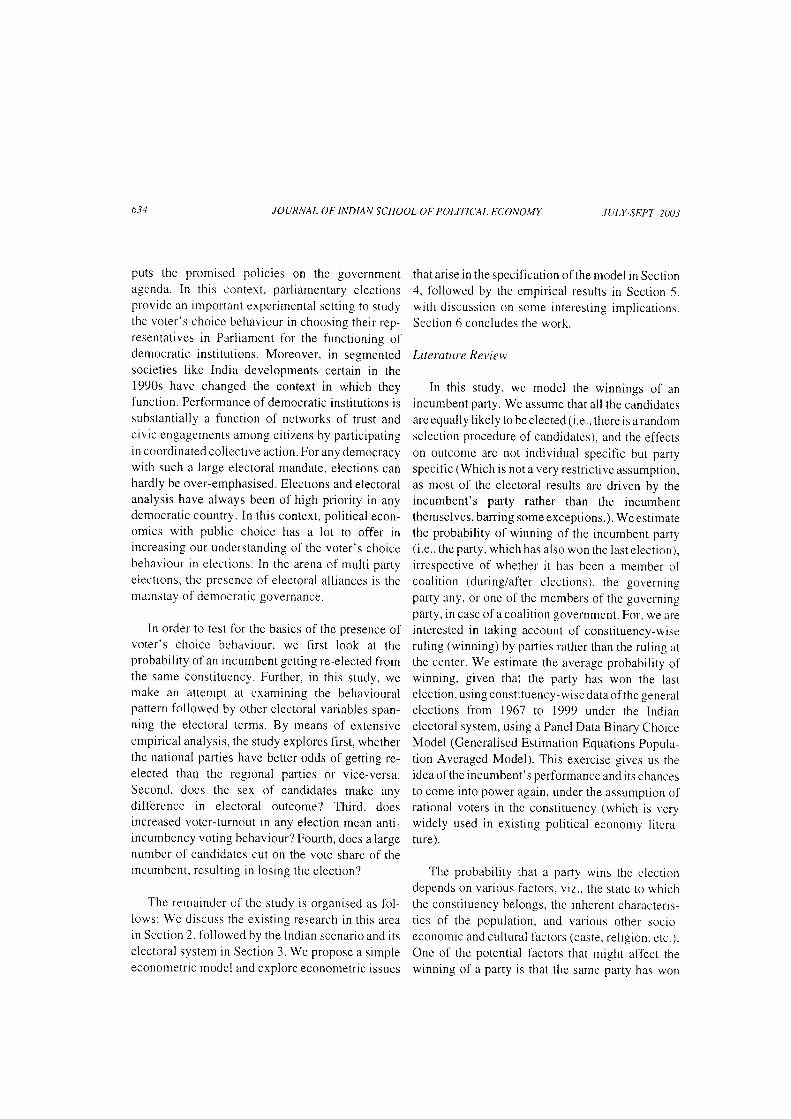
Figure 2 Incumbent's Winning
1970 1 975
OU
40
zv
0
1IL
1980 1985 1990
Election Year
1 995 2000
oGoo(!
o
o;s
1051009590B5BO
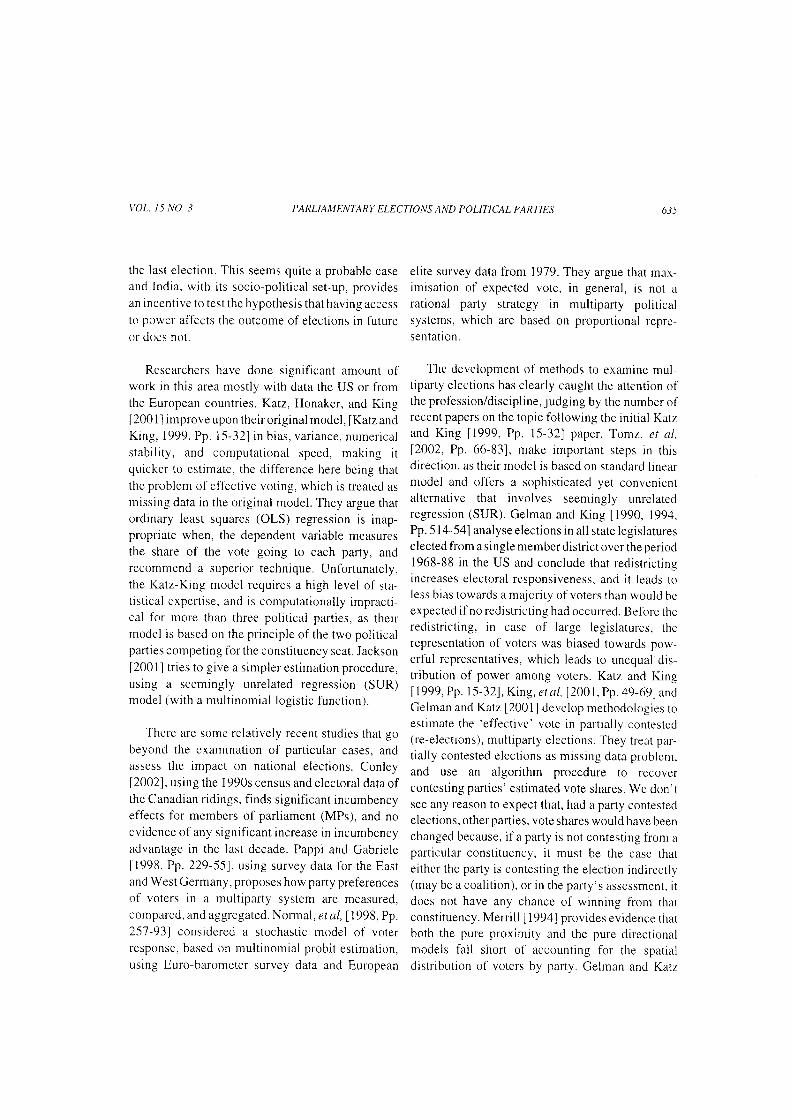
Figure 3 Sex-wise distribution
1980 1985 1990
Election Year
1 970
We also observe increasing participation offemale contestants, although sti l l the participationis l imited in nature. In 1951 election. 45 womencontested for the election, out of which 28 won andonly 8 losr rheir deposits. In 1999 election 284women contested,49 won and 183 lost theirdepositsi.e. out of 4,648 candidates only 284 were womenand only 49 got elected in 543 seats parliament.
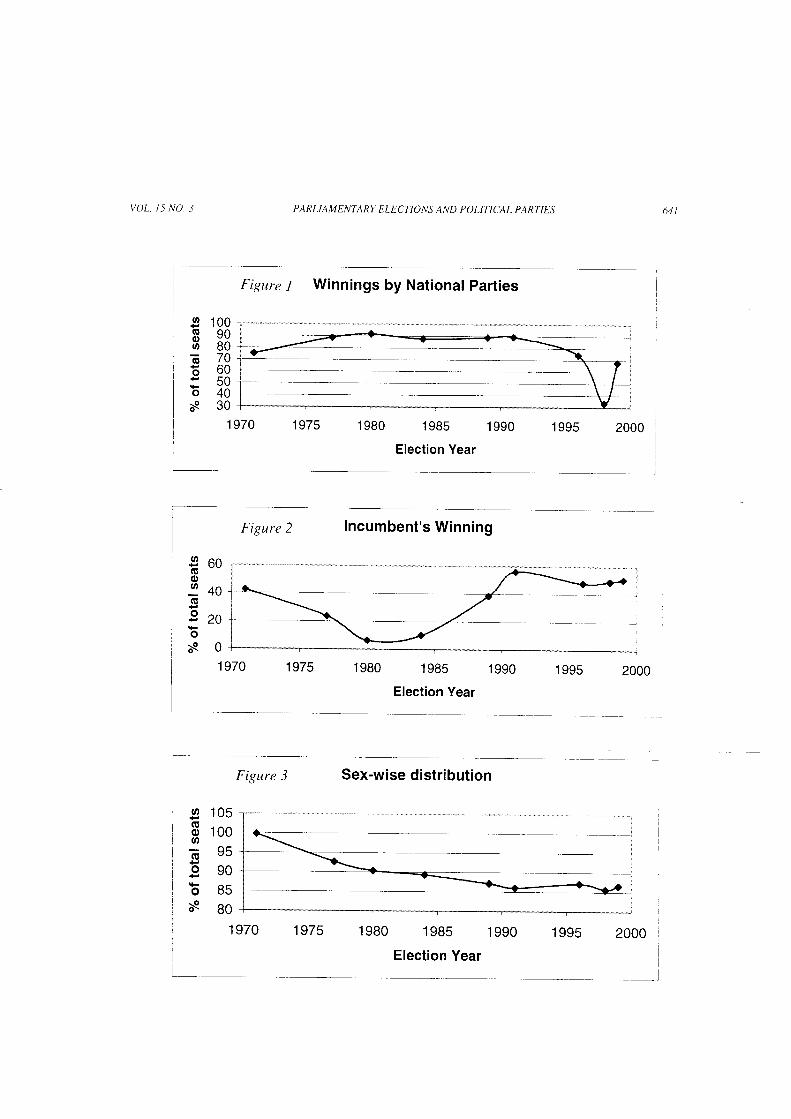
Figure I shows that the national parties ys. othershave performed well init ially winning about 80 percent of the total seats. which dropped dramaticallyin 1998 election, rhcy recovered in 1999 elecrion to70 per cent oftotal seats. In Figure 2, we show thepattcrn of incumbents getting re-eleoted, the cycli-cal behaviour of the percentage of seats won by theincumbent is apparent here, this also reflects in theregression results. we flnd that the year dummiesfor the third and folth period is negative and srg-nificant while for all other years is positive andsignificant. Which shows, there wereanti-incumbency bias in those periods. In 1984election, Congress won almost all the seats in theparliamentary electron which may be influenced bythe sympathetic behaviour of the voters due toassassination of Indira Gandhi. This effect may notbe captured through the duration variable. Asduration would be same for 1989 elecrion (1984-89)as wel l as for 1996 e lect ion (1991-96) but thesocio-economic-polit ical scenario would beentirely differcnt. In this case also the coefficientfor the year dummy is negative and significant,implying an anti-incumbency voting behavior of thevoters by and large. For rest ofthe election years thecoefTicient for the year dummy is significant andpositive, which implies that there were positiveincumbency bias for the ruling parties. This is asexpected since the parties in the power have bettercontrol over the f 'actors which may influence theoutcome of the elections. This trend in the electionalso helps in explaining the cyclical behavior of thepercentage of seats won by the incumbent party. Onecan clearly see that the coefficients ol' the timedummy with reference to the year 1977 for the years
JULY-SEPT. 2OO.]
1980 and 1984 is negative and significant. Thisimplies there is an anti-incumbency bias in theseelection years, which resulted in the cyclical beha-viour of the seats won by the national parties. In1980 election due to the emergency in the earlierperiod led to negative impact on the incumbentparties' performance. One other explanation canalso be provided to explain this cyclical behaviourof the incumbent's winning. One may argue that inthe initial elections the winning parties enjoyed thepower but didn't perform well which resulted in thenegative impact on their performance and resultedin the downward trend in the winning of theincumbent parties. Whereas in the later period after-1980 election the incumbents gained their voters,trust and worked for the well being of the voters.This resulted in an increased trend towards winningof the incumbent. This trend continued ti l l the 199 Ielection. In 1996 election, due ro high volati lepolit ical and economic scenario results are againagainst the incumbents. One may argue that oncethe incumbent parties are in power fbr longer per-iodtheir performance goes down and then in the nexrelection they loose. The voters give the power to theothers for providing better governance. Figure 3shows, how the sex of opposing candidates differ.ln 1911 election, most of the winning and losing(here we define losing candidate as runner up can-didate) candidates are of the same sex, which hasreduced to 87 per cent from 100 per cent in 1999election.
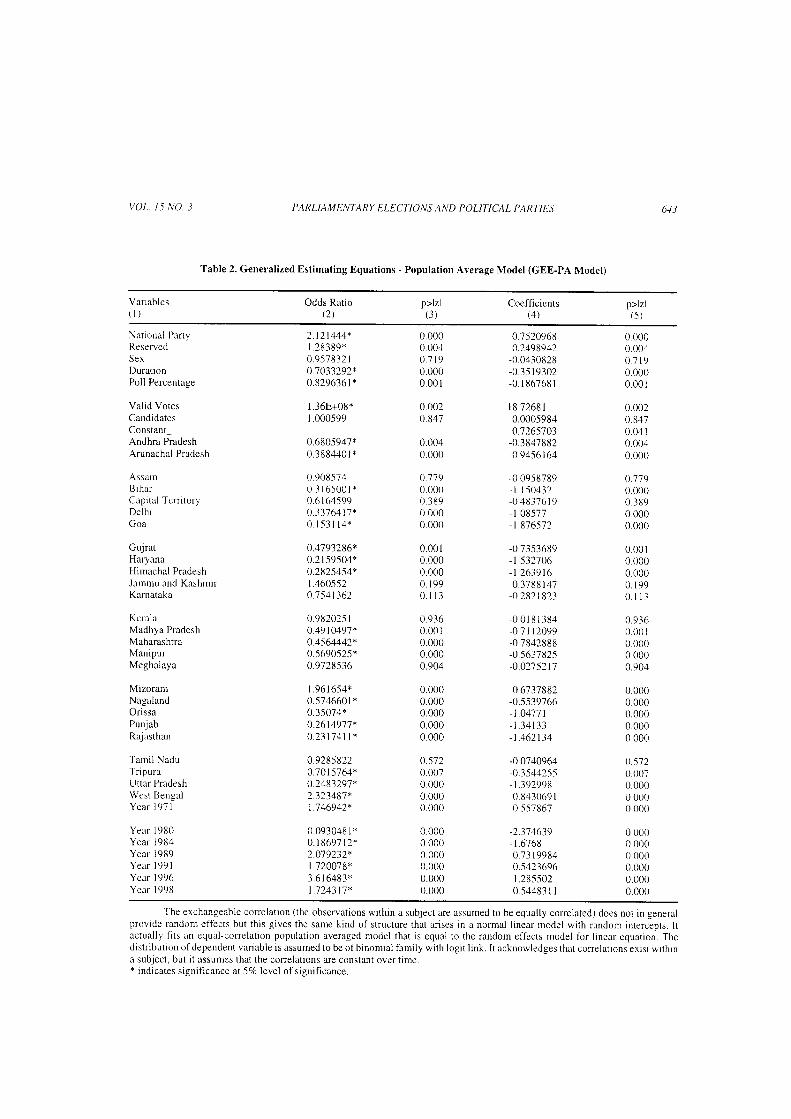
We now shift our attention to the outcome of ourregression analysis. The results ofthe regression arereportcd in the Table 2. We find thar the sign of thecoefl ' icients of sex. duration and poll percentage isnegative, and the sign ofnational party and reservedcandidates are positive. All of the state dummieshave negative coefficients except Jammu andKashmir, Mizoram and West Bengal.r The coeff i-cient of state dummy for Jammu and Kashmir is notsignificant, whereas it is signifioanr for Mizoramand West Bengal, this significant and posttivecoefficient could reflect the persistence ofthe sarne
JOURNAL OF INDIAN SCHOOL OF POLIT lCAL ECONOMY
YOL. t5 NO.3 P AR LIA M ENTA RY EI,ECI' I O N S AN D P OL]T I CAL P ARTI ES
Table 2. Generalized Estimating Equations - Population Average Model (GEE-PA Model)
613
Vanables( l )
Odds Ratio(2 )
p>lz l( 3 )
Coefficients(4 )
p>lz l( 5 )
National PanyReservcdSexDurationPoll Percentage
Valid VotesCandidatesConstant_Andhra PradeshArunachal Pradesh
AssamB iha rCaprtal TerntoryDelhrGoa
GujratHaryanaHimachal PradeshJammu and KashmirKarnataka
KeralaMadhya PradeshMaharashtraManipurMeghalaya
MizoramNagalandOrissaPunjabRajasthan
Tamil NaduTripuraUttar PradeshWest BengalYear I 97 I
Year I 980Year 1984Year I 989Year I 99 IYear I 996Year I 998
2.121444*1 .28389*0 .957832 I0.1033292*0 .8296361 x
1.36E+08*1.000599
0.6805947*0.3884401 x
0 90857.10 3 I 6 5 0 0 1 *0 6 l 645990.33764t7*0 l 5 3 l l 4 +
0.4793286*0.2 I 59504*0.2825454*1 4605520.7541362
0.982025 I0.49 I 0497*0.4564442*0.569052-5*0.9128536
I .96 t 654+0.5746601 x0.35074*0.261497'7*0.23t741t*
0.92858220.10157 64*0.2483291*2.323487*| .7 469424
0.093048 I *0.18691t?-42.079232*1.720078x3.6 I 6483*l .724 l t ]E
0.0000 0040 7 l 90.0000.001
0.0020.847
0 0040.000
0.1790.0000.3890.0000.000
0.0010.0000.0000 . 1 9 90 l t 3
0 9360 0010.0000.0000.904
0.0000.0000.0000.0000.000
0.5720.0070.0000.0000.000
0.0000 0000 0000.0000.0000.000
0.75209680.2498942
-0 0430828-0.35 I 9302-0. I 86768 I
l 8.7268 I0.00059840.'7265'703
-0.3 847 882-0.9456164
-0.0958789, l I50432-0..18376 r9- 1 08577-t.876572
-0 73-53689-t 532106-t.2639t60.3788 I 47
-0 282 1 823
- 0 0 1 8 I 3 8 4-0.7 il2099-0 7842888-0.5637825-0.02752t7
0.6737882-0.-5-s39766-t.041t I- 1 . 3 4 1 3 3-t.462t34
-0.0140964-0.3544255- 1 3929980.843069 I0.557867
-2.374639- I 67680.73 199840.54236961 2855020.54483 I I
0 0000 0040 . 7 1 90.0000.001
0.0020.8470 0410 0040.000
0.1790.0000.3890 0000 000
0 0010.0000.0000 . 1 9 90 l t l
0 .9360 0010.0000 0000.904
0.0000.0000.0000.0000.000
o.5720.0070.0000.0000.000
0.0000 0000 0000.0000 0000 000
The exchangeable correlation (the observations within a subject are assumed to be equally correlated) does not in generarprovide random effects but this gives the same kind of structure that anses in a normal linear model with random intercepts. Itactually lits an equal-correlatron population averaged model that is equal to the random effects model for linear equation. Thedistribution ofdependent variable is assumed to be ofbinomial family with logit link. It acknowledges that correlations exrst wlthlna subject, but it assumes that the correlations are constant over tlme.* indicates significance at 5% level of sisnificance.
VOL. 15 NO.3 PARL|AM ENTARY ELECTIONS AND POLITICAL PARTIES
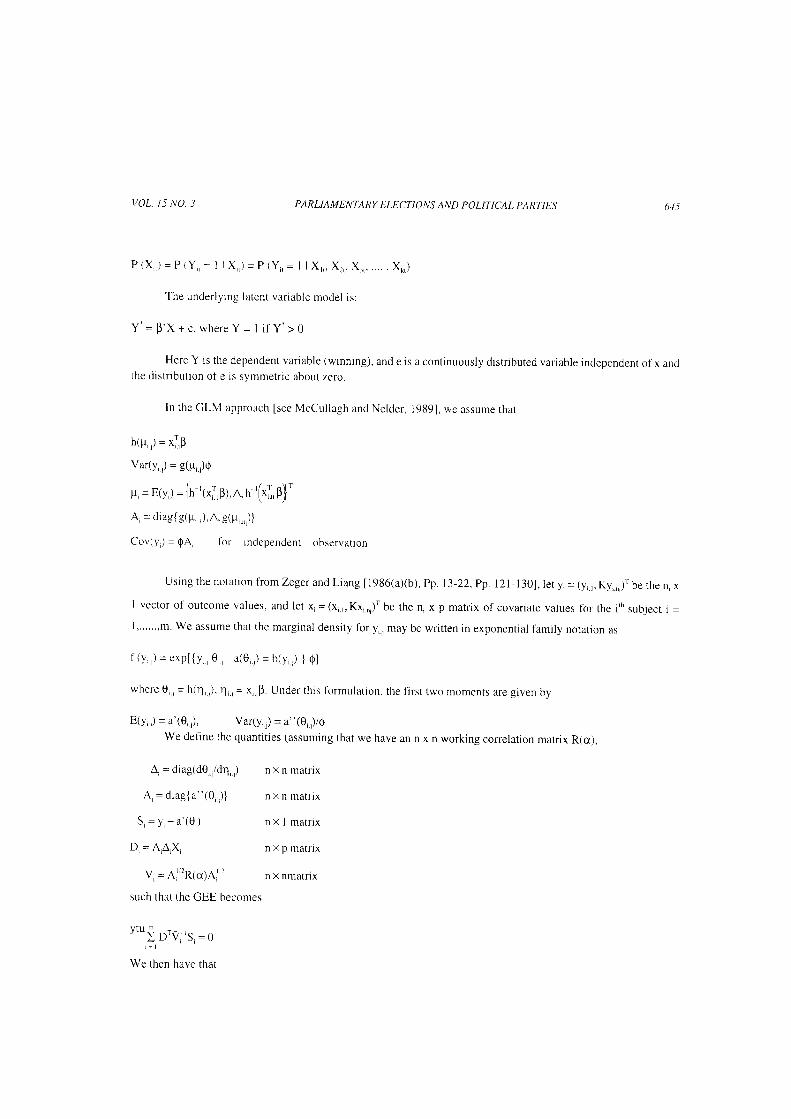
P ( X , , 1 = P ( Y , , = I 1 X , , ) = P ( Y r , = I I X r , , X . , , X . , , . . . . , X k , )
The underlyrng latent variable model is:
Y"= B 'X + c , where Y = I i f Y- > 0
Here Y is the dependent variable (winning), and e is a continuously distr ibutecl variable independent ofx anclthe distr ibution of e is symmetric about zero.
In the GLM approach Isee McCullagh and Nelder, 19891, we assume thar
h1p,,) = xiF
Var(y,. ,) = C(prj)O
[ , = E(y , ) = h - ' rx ] ,F r .n . h ' ( * : , ,8 ] '
A, = dia-u{g(p, ,) , A, C(p,,, ,)}
Cov(y,) = 0A, l i rr independent observarion
U s i n g t h e n o t a t i o n t i o m Z e g e r a n d L i a n g l l g 8 6 ( a x b ) , p p . 1 3 - 2 2 , p p . l 2 l - 1 3 0 1 , l e r y , = ( y i . r , K y , . , , ) ' r b e r h e n , x
I vector of outcome values, and let x, = (x,.,,Kx,.",)t be the n, x p matrix of covariate values fbr the irh suhiect i -
1,. . . ,m. We assume that the marginal density fbr yi . ; may be writ ten in exponential family notat ion as
| (y , i ) = cxp [ {y r r 0 , , - a (0 , , ) = b (y r . , ) } 0 l
where 0,., = h(L.,), l r ; = x,. ,B. Under this fbrmulation. the f irst two moments are given by
E(y 'J = a ' (0 , ) , var (y , . ' ) = a" (0 , ) i0We define the quantities (assuming that we have an n x n working correlation matrix R(a),
A , = d i a g { d 0 , , , d 4 , , t n r n m a t r i x
n , - d i rg {a t0 , , t } n . r n mar r ix
5 , = y , - a ' ( 0 , ) n x I m a r r i x
D = A , A , X , n . p m a r r i x
v , = A ' t R { c r ) A " n x n m a t r r x
such that the GEE becomes
vru I- ) D, ' ,v, 'S, = (r
We then have that
644
parties in these states, while the negative coetfi-cients for some other state dummies reflect anti-
incumbency bias at work in (all or some of) the otherstates.2 The estimated coefficients of national party,
reserved candidates, poll percentage and valid votes
are all statistically signrficant at 5 per cent level of
significance. We find that the log odds of winning
are higher if the incumbent belongs to the nationalparty. One interesting findings of our analysis is interms of the coefficient of polling percentage: votes
polled enters with a negative significant coefficient,which suggests that as the voters turnout increasesin a constituency, the probabil ity of winning of theincumbent decreascs. i.e., more voter turnout sig-n i f ies an ant i - incumbency pol l ing. This might bedue to the fact that those voters. who would havebeen otherwise indiffbrent (by not going to castetheir vote), have disliked the incumbent's per-fbrmance and get the motivation to vote against theruling party fbr effecting the change. We also find
JULY-SEPT,2OO.]
that the sex and the number of candidates do nothave significant effect on the probabil ity of theincumbent winning the e lect ion. '
ConcLusion
Using the data from Indian parliamentary elec-tions, we show thatcandidates ofthe national partieshave a better chance of winning again from the samcconstituency. An increase in the poll percentage ina constituency exerts an adverse etfect on theprobabil ity of the incumbent winning the election.Voters are willing to cast their votes of others,reflecting the poor performance of the ruling partyin the particular constituency, when they want therequisite change in the government. One interestingway to expand our work is to relate this analysis interms of various demographic characteristics, usingthe Census data. One may also try to explain whetherthe public goods provision can explain the proba-bil ity of winning election. However, these are leftto future research.
JOURNAL OF INDIAN SCHOOL OF POLITICAL ECONOMY
APPENDIX
g{ E(Yt,)}= X,, F, Y - F with parameters 0,,.
l, 2, ...n,, where there are n, observations tbr each group identilier i. In the above, g{ } is calledF the distr ibution lamily. I f g{ } is the logit function and Y,, is distr ibured binomial, we have
= X,, 0, Y - binomial.log i t { E(Y, ) }
The l ink function logit is defined as ln{y/( l-y)}, the natural log of odds. We assume the working correlarionrnatr ix for modeling the within-group correlat ion, a square max{n,} x max{n, } matr ix, say R. Then the correlat ionstructure (correspondrng to equal-correlat ion models) is defined as:
i f
R,.. =
otherwise
for i = l , 2 , . . .n and t=the link function and
In the GEE approach the unobserved eft-ectscondit ional only on X,, with the result that we have
binary response model, the response probabilities are specifiedthe fbllowine:
The response probabil i ty is,
6.t6 JOURNAL OF INDIAN SCHOOL OF POLITICAL ECONOMY JULY.SEPT 200.]
B,-, = F, -
where the term
is what we call the IRLS variance estimate (iteratively reweighed least squares). It is used to calculate the standarderrors.
I i oto,,o,' r0: rn,t0:i' l,i ol,B,,o'',p.rrs r0r j
'l iolt F: lv;' t o, )D,( Bi)i
NOTES
l. We have also performed the regression with regionaldummies instead of state dummies, but qualitatively resultsreported in Table 2 remain unaltered.
2. Thanks to the anonymous referee for providing thisexplanation.
3. Introduction of the lagged values of the dependent varr-ables do not change the results significantly. The only noticeablechange is the significance of duration, which turns out to beinsigniticant afier introduction of lagged values in the rnodel.
RI,FI'RENCES
Conley, S.R.. 2002; 'Const i tuency Contexts, Incurnbency, andParty Competition in Canadian Ridings in 1990s', Univerrr4,ol Murthnd Working Puper.
Gelman. A. and G. King, 1990; 'Estimating the ElectoralConsequences of Legislative Redistricting', Jountul rlA me ricun Stu is tit ul As soc iut kttt.
Celman. A. and G. King. I9941 'A Uni f ied Method of Evaluat ingElcctoral Systems and Redistricting Plans', AtneritonJotrrnul o. f Pol i t t tu l St ience. Vol . 38. No. 2.
Gc lman . A . and J .N . Ka t z .200 l : 'How Much Does A Vo teCount? Voting Power, Coalitions and theElectoral College',Sot:ittl Science Working Puper I ,l2l , California Institute ofTechnology.
Hinich, M.; J. Valer i , P.C. Ordershook, 1999; 'Ukraine's 1998Parliamentary Elections: A Spatial Analysis', Post-SoyietA l Jh i r s ,Yo l . 15 , No .2 .
Jackson. J.8. . 2001I 'A Seemingly Unrelated Regression Modelfbr Analyzing Multiparty Elections', Annual SumnterP o I i t Lt: aL M e t hotlo I o gt' Co nle re n c e, Emory University.
Katz. J.N. l J . Honaker and G. King, 20011 'An lmprovedStatistrcal Model for Multiparty Electoral Dara', .locialSt'rence Working Puper I I I | , Califbrnia Institute Of Tech-nology.
Katz, J.N. and G. King, 1999: 'A Stat is t ical Model for Mul t ipartyElectoral Data' , Anrericur Journul of Political Science, Y ol.9 3 . N o l .
King, G.; J . Honaker, A. Joseph and K. Scheve. 200 I I 'Analyzing
Incomplete Political Science Data: An Alternative Algorithmfor Multiple lmputation'. Americut Politicul SL:ient:eRevleu' . Vol . 95. No. L
Lrang, K.Y., 19871 'Estimating Functions and ApproxtrnateConditional Likelihood'. Biometriku, Vol. 1.
McCullagh, P. and J.A. Nelder, 19891 'Generalised LinearModels ' ,2nd edn. , Chapman & Hal l , London.
Merrill, S. IIl., 1994; 'A Probabilistic Model for the SparialDistribution of Party Support in Multiparty Electorates'.J o u ntu I ol A nte ri c trn S tu t i s t it' ul A s,t t t c itLt io n.
Nelder, J .A. and R.W.M. Wedderburn. 1972; 'General iscu
Linear Models ' , Jourrut l of the Rr l l i l Stut is t icul Soden.Ser ie.r A. Vo1. 135.
Normal. S. ; M.D. Andrew, Q.M. Kevin and W. Andreu, . 1998;'Multiparty Electoral Competition in the Netherlands andGermany: A Model Based on Multinomial Prcbit', PubtkChoice. Yol.9'7 .
Pappi, F.U. and E. Gabriele, 19981 'Voter's Parry Preferences inMultiparty Systems and Their Coalirional and SpatialIrnplications: Cermany after Unification'. Public Choite,V o l . 9 7 .
Pendergast . J .F. lS.J. Gange, M.A. Newton, M.J. L indstorni . M.Pat la and M.R. Fisher, 1996: 'A Survey of Methods fbrAnalyzing Clustered Binary Response Data', InternutionulSnui . t t icd Revrerr , Vol . 64.
Tomz, M.; T.A. Joshua and J. Wittenberg,2002:'An Easy andAccurate Regression Model for Multiparty Electoral Data'.Politiul Anulysis, Vol. 10, No. l.
Wooldridge J.M., 20021 Econonetri( Anah'sls tl Cxtss Setrrortund Panel Dutu, The MIT Press.
Zeger, S.L. ; K.Y. L iang and P.S. Alben. 1988: 'Models forLongi tudinal Data: A General ised Est imat ing EquatronApproach', Biometric.t, Y ol. 44.
Zeger, S.L. and K.Y. L iang, 1986a; 'Longi tudinal Data AnalysrsUsing Generalised Linear Models'. Biometriku. Y ol. 73.
Zeger, S.L. and K.Y. L iang, 1986b: 'Longi tudinal Dara Analysrsfor Discrete and Continuous Outcomes' . Biometrics. Vol. :12.