Embed Size (px)
Citation preview
Indian Academicians and Researchers Association www.iaraedu.com
International Journal of
Advance and Innovative Research (Conference Special)
(Part – 2)
Volume 8, Issue 3 (IV) July – September 2021
ISSN 2394 - 7780
INTERNATIONAL CONFERENCE ON
Current Trends in Multidisciplinary Research
On 1st August 2021
Organized By
INDIAN ACADEMICIANS AND RESEARCHERS ASSOCIATION (IARA)
International Journal of Advance and Innovative Research
Volume 8, Issue 3 (IV) July - September 2021 Part - 2
Editor- In-Chief Dr. Tazyn Rahman
Members of Editorial Advisory Board
Mr. Nakibur Rahman Ex. General Manager ( Project ) Bongaigoan Refinery, IOC Ltd, Assam
Dr. Mukesh Saxena Pro Vice Chancellor, University of Technology and Management, Shillong
Dr. Alka Agarwal Director, Mewar Institute of Management, Ghaziabad
Dr. Archana A. Ghatule Director, SKN Sinhgad Business School, Pandharpur
Prof. (Dr.) Sudhansu Ranjan Mohapatra Dean, Faculty of Law, Sambalpur University, Sambalpur
Prof. (Dr.) Monoj Kumar Chowdhury Professor, Department of Business Administration, Guahati University, Guwahati
Dr. P. Malyadri Principal, Government Degree College, Hyderabad
Prof. (Dr.) Baljeet Singh Hothi Professor, Gitarattan International Business School, Delhi
Prof.(Dr.) Shareef Hoque Professor, North South University, Bangladesh
Prof. (Dr.) Badiuddin Ahmed Professor & Head, Department of Commerce, Maulana Azad Nationl Urdu University, Hyderabad
Prof.(Dr.) Michael J. Riordan Professor, Sanda University, Jiashan, China
Dr. Anindita Sharma Dean & Associate Professor, Jaipuria School of Business, Indirapuram, Ghaziabad
Prof.(Dr.) James Steve Professor, Fresno Pacific University, California, USA
Prof. (Dr.) Jose Vargas Hernandez Research Professor, University of Guadalajara,Jalisco, México
Prof.(Dr.) Chris Wilson Professor, Curtin University, Singapore
Prof. (Dr.) P. Madhu Sudana Rao Professor, Mekelle University, Mekelle, Ethiopia
Prof. (Dr.) Amer A. Taqa Professor, DBS Department, University of Mosul, Iraq
Prof. (Dr.) Himanshu Pandey Professor, Department of Mathematics and Statistics Gorakhpur University, Gorakhpur
Dr. Nurul Fadly Habidin Faculty of Management and Economics, Universiti Pendidikan Sultan Idris, Malaysia
Prof. (Dr.) Agbo Johnson Madaki Faculty, Faculty of Law, Catholic University of Eastern Africa, Nairobi, Kenya
Dr. Neetu Singh HOD, Department of Biotechnology, Mewar Institute, Vasundhara, Ghaziabad
Prof. (Dr.) D. Durga Bhavani Professor, CVR College of Engineering, Hyderabad, Telangana
Prof. (Dr.) Shashi Singhal Professor, Amity University, Jaipur
Prof. (Dr.) Aradhna Yadav Professor, Krupanidhi School of Management, Bengaluru
Prof. (Dr.) Alireza Heidari Professor, Faculty of Chemistry, California South University, California, USA
Prof.(Dr.) Robert Allen Professor Carnegie Mellon University, Australia
Prof. (Dr.) A. Mahadevan Professor S. G. School of Business Management, Salem
Prof. (Dr.) S. Nallusamy Professor & Dean, Dr. M.G.R. Educational & Research Institute,Chennai
Prof. (Dr.) Hemant Sharma Professor, Amity University, Haryana
Prof. (Dr.) Ravi Kumar Bommisetti Professor, Amrita Sai Institute of Science & Technology, Paritala
Dr. C. Shalini Kumar Principal, Vidhya Sagar Women’s College, Chengalpet
Dr. Syed Mehartaj Begum Professor, Hamdard University, New Delhi
Prof. (Dr.) Badar Alam Iqbal Adjunct Professor, Monarch University, Switzerland
Dr. Darshana Narayanan Head of Research, Pymetrics, New York, USA
Prof.(Dr.) D. Madan Mohan Professor, Indur PG College of MBA, Bodhan, Nizamabad
Dr. Rosemary Ekechukwu Associate Dean, University of Port Harcourt, Nigeria
Dr. Sandeep Kumar Sahratia Professor Sreyas Institute of Engineering & Technology
Dr. P.V. Praveen Sundar Director, Shanmuga Industries Arts and Science College
Dr. S. Balamurugan Director - Research & Development, Mindnotix Technologies, Coimbatore
Dr. Manoj P. K. Associate Professor, Cochin University of Science and Technology
Dr. Dhananjay Prabhakar Awasarikar Associate Professor, Suryadutta Institute, Pune
Dr. Indu Santosh Associate Professor, Dr. C. V.Raman University, Chhattisgath
Dr. Mohammad Younis Associate Professor, King Abdullah University, Saudi Arabia
Dr. Pranjal Sharma Associate Professor, Department of Management Mile Stone Institute of Higher Management, Ghaziabad
Dr. Kavita Gidwani Associate Professor, Chanakya Technical Campus, Jaipur
Dr. Lalata K Pani Reader, Bhadrak Autonomous College, Bhadrak, Odisha
Dr. Vijit Chaturvedi Associate Professor, Amity University, Noida
Dr. Pradeepta Kishore Sahoo Associate Professor, B.S.A, Institute of Law, Faridabad
Dr. Marwan Mustafa Shammot Associate Professor, King Saud University, Saudi Arabia
Dr. R. Navaneeth Krishnan Associate Professor, Bharathiyan College of Engg & Tech, Puducherry
Dr. Mahendra Daiya Associate Professor, JIET Group of Institutions, Jodhpur
Dr. G. Valarmathi Associate Professor, Vidhya Sagar Women's College, Chengalpet
Dr. Parbin Sultana Associate Professor, University of Science & Technology Meghalaya
Dr. M. I. Qadir Assistant Professor, Bahauddin Zakariya University, Pakistan
Dr. Kalpesh T. Patel Principal (In-charge) Shree G. N. Patel Commerce College, Nanikadi
Dr. Brijesh H. Joshi Principal (In-charge) B. L. Parikh College of BBA, Palanpur
Dr. Juhab Hussain Assistant Professor, King Abdulaziz University, Saudi Arabia
Dr. Namita Dixit Associate Professor, Shri Ramswaroop Memorial University, Lucknow
Dr. V. Tulasi Das Assistant Professor, Acharya Nagarjuna University, Guntur, A.P.
Dr. Nidhi Agrawal Assistant Professor, Institute of Technology & Science, Ghaziabad
Dr. Urmila Yadav Assistant Professor, Sharda University, Greater Noida
Dr. Ashutosh Pandey Assistant Professor, Lovely Professional University, Punjab
Dr. M. Kanagarathinam Head, Department of Commerce Nehru Arts and Science College, Coimbatore
Dr. Subha Ganguly Scientist (Food Microbiology) West Bengal University of A. & F Sciences, Kolkata
Dr. V. Ananthaswamy Assistant Professor The Madura College (Autonomous), Madurai
Dr. R. Suresh Assistant Professor, Department of Management Mahatma Gandhi University
Dr. S. R. Boselin Prabhu Assistant Professor, SVS College of Engineering, Coimbatore
Dr. V. Subba Reddy Assistant Professor, RGM Group of Institutions, Kadapa
Dr. A. Anbu Assistant Professor, Achariya College of Education, Puducherry
Dr. R. Jayanthi Assistant Professor, Vidhya Sagar Women's College, Chengalpattu
Dr. C. Sankar Assistant Professor, VLB Janakiammal College of Arts and Science
Dr. Manisha Gupta Assistant Professor, Jagannath International Management School
Copyright @ 2021 Indian Academicians and Researchers Association, Guwahati All rights reserved. No part of this publication may be reproduced or transmitted in any form or by any means, or stored in any retrieval system of any nature without prior written permission. Application for permission for other use of copyright material including permission to reproduce extracts in other published works shall be made to the publishers. Full acknowledgment of author, publishers and source must be given. The views expressed in the articles are those of the contributors and not necessarily of the Editorial Board or the IARA. Although every care has been taken to avoid errors or omissions, this publication is being published on the condition and understanding that information given in this journal is merely for reference and must not be taken as having authority of or binding in any way on the authors, editors and publishers, who do not owe any responsibility for any damage or loss to any person, for the result of any action taken on the basis of this work. All disputes are subject to Guwahati jurisdiction only.
International Journal of Advance and Innovative Research Volume 8, Issue 3 (IV) July - September 2021 Part - 2
CONTENTS
Research Papers
CIVIL LIABILITY ABOUT DRONE
Hind Fayez Ahmed Al-Hassoun
1 – 11
HUMAN RESOURCES IN THE VIETNAM’S COAL INDUSTRY IN THE CONTEXT OF GLOBAL LABOR INTEGRATION
Phuong Huu Tung, Nguyen Van Tri
12 – 15
IMMUNOCHEMICAL ANALYSIS, BIOCHEMICAL PROPERTIES AND IN-VITRO TOXICITY ASSAY OF DABOIA RUSSELII VENOM
Priya Grace. S and *A. Ganesh Kumar
16 – 20
IMPACT OF AIR POLLUTION FROM AMBIENT AIR ENVIRONMENT TO GLOBAL ENVIRONMENT
Satrughan Kumar Singh and Jainath Yadav
21 – 25
IMPACT OF COVID 19 PANDEMIC ON ENVIRONMENTAL HEALTH, HEALTH BEHAVIORS AND HEALTH CARE SYSTEM AWARENESS OF STUDENTS
Youganjaly Mehra and Dr. Kalpana Sharma
26 – 28
IMPACT OF DISCUSSION ON LEARNING AMONG STUDENTS
Dr. Vandana Jain and Ms. Ashwini S Shetty
29 – 33
IMPACT OF RAINFALL AND TEMPERATURE ON GROUNDWATER LEVEL AND FORECASTING USING ARIMA MODEL IN CUDDALORE DISTRICT
Haripriya. R and Dr. P. Sivarajan
34 – 45
IMPACT OF YOGA ON PSYCHOLOGICAL DISTRESS AMONG POLYCYSTIC OVARY SYNDROME (PCOS) PATIENTS
Padmarekha Bhat
46 – 52
IMPORTANCE OF EMPLOYER BRANDING DURING CAMPUS RECRUITMENT
Prof. Mohammed Khaja Qutubuddin
53 – 60
IMPORTANCE OF KNOWLEDGE MANAGEMENT & UPDATION OF KNOWLEDGE AMONG EMPLOYEES IN ORGANIZATION
S. Dhivya and Dr. V. Andal
61 – 63
PROFESSOR- ORIENTALIST N. F. KATANOV AND HIS MANUSCRIPT HERITAGE OF IN THE FUNDS OF THE RUSSIAN ARCHIVES: DIARIES AND MATERIALS OF THE PERIOD OF TRAVEL TO SIBERIA AND XINJIANG (1889–1892)
R. M. Valeev, R. Z. Valeeva, А. Sh. Mullaynov and V. N. Tuguzhekova
64 – 70
INFLUENCE OF DEMOGRAPHIC VARIABLE ON THE PROMOTION OF MOVIE TEASERS THROUGH SOCIAL MEDIA
Ms. Nilufar Sathiq. P.
71 – 77
INFLUENCE OF SOCIAL MEDIA MARKETING ON POST PURCHASE BEHAVIOUR
K. Venkata Lakshman and Marisetti Sai
78 – 80
INSOMNIA AND PERCEIVED STRESS AMONG YOUNG ADULTS
Ms. Rashmi P Naik
81 – 86
KARATE AND IT’s BENEFITS
Nagaraja, D and Virupaksha, N. D
87 – 88
LONELINESS AND RESILIENCE AMONG INSTITUTIONALIZED AND NON- INSTITUTIONALIZED SENIOR CITIZENS
Manjula Chiploonkar
89 – 95
LOOKING BEYOND FEMINISM: THE DYNAMICS BEHIND & THE DEMANDS AHEAD
Prof. Navaneeta Rath
96 – 102
LUXURY RETAIL MARKETING: CHALLENGES AND OPPORTUNITIES IN INDIA
Prof. Dr. Varsha Maindargi
103 – 106
MATERIAL OPTIMIZATION OF WHEEL RIM USING FINITE ELEMENT ANALYSIS
Dr. Anand S. Relkar, Dr. A. D. Lokhande and Mahadevi Dinesh Newadekar
107 – 112
MEMORIZE THE INFLUENCE OF VINAYAK DAMODAR SAVARKAR ON THE THINKING AND REVOLUTIONARY ACTIVITIES OF MADAN LAL DHINGRA
Indu Bala and Dr. Seema Parihar
113 – 116
NEURAL NETWORK BASED TRANSPARENT SOLAR WINDOWS
Dr. Shashikant Bakre and Suchita Ingle
117 – 121
ORIGIN AND DEVELOPMENT OF PLEA BARGAINING
Mr. Devidas K. Shinde
122 – 124
ORIGIN OF DANCING GIRLS IN TEMPLES IN TEMPLES SPECIAL REFERENCE TO THE DEVADASI SYSTEM
Rajwinder Kaur and Dr. Seema Parihar
125 – 126
PARENTAL ACCEPTANCE AND HOMOSEXUALITY: A REVIEW
Kriti Jeswal and Prof. (Dr.) Anjali Midha Sharan
127 – 130
PHOTOCATALYTIC DEGRADATION OF 2,4-DICHLOROPHENOXY ACETIC ACID UNDER VISIBLE LIGHT IRRADIATION
G. A. Suganya Josephine and K. Jayaprakash and A. Sivasamy*
131 – 139
PHILOSOPHY OF SWAMI VIVEKANANDA: A HINDU PROPHET
Dr. E. Girani
140 – 144
PHYSICOCHEMICAL ANALYSIS OF EFFLUENT FROM SEA FOOD PROCESSING INDUSTRIES IN CHENNAI
S. Gini and A. Ganesh Kumar
145 – 147
PREVALENCE OF ANTIBIOTIC RESISTANT PATHOGENS IN READY TO EAT STREET FOOD IN INDIAN MARKET
Gautam Archana,, Khandal. R. K, Aggarwal Manjeet and Kaur. Kuljinder
148 – 154
ROLE OF FINANCIAL SERVICE COMPANIES IN SANCTIONING OF LOAN-A CASE STUDY
Hiral Vyas , Dr. Divyang Joshi and Tejas Pandya
155 – 160
RURAL BANKING SERVICE INTERRUPTIONS IN COVID-19
Ajay Jha and Dr Rajeev Sharma
161 – 163
SOCIODEMOGRAPHIC DETERMINANTS IN PREVALENCE OF ANEMIA IN ADOLESCENTS OF RURAL AREA OF MAHARASHTRA
Dr. V. Parameshwar Reddy, Dr. Ashish Varma, Dr. Jayant Vagha, Dr. Revat Meshram and Dr. Sachin Damke
164 – 167
REPRODUCTIVE HEALTH PROBLEMS OF URBAN AND RURAL WOMEN
Dr. Pratibha B. Desai
168 – 177
STABILITY INDICATING RP-HPLC METHOD DEVELOPMENT AND VALIDATION FOR SIMULTANEOUS ESTIMATION OF SACUBITRIL AND VALSARTAN IN TABLET FORMULATION
Meera Maru and Dr. Ketan Shah
178 – 187
STRUCTURAL AND THERMAL ANALYSIS OF CONNECTING ROD
Shital Khaire and Dr. Amol Lokhande
188 – 196
STUDY OF CENTER GUIDING SYSTEM FOR 4 ROLL CALENDERING
Dr. A. S. Relkar, Vaibhav R. Pawase, Shubham H. Sagar, Yash D. Umare and Shubham H. Sagar
197 – 202
STUDY OF SELENIUM FOR VARIOUS PROPERTIES AND ITS CHARACTERIZATION WITH DIFFERENT DOPANT FOR PHOTOVOLTAIC
Dipak Ashok, Sandhya Nitin and Sanjay K Devade
203 – 206
STUDY ON TRADITIONAL MARKETTING V/S DIGITAL MARKETTING
Dr Neha Ghildiyal and Dr. Monika Bangari
207 – 212
TALENT MANAGEMENT – A DIFFERENTIATING TOOL IN PUBLIC SECTOR BANKS
Dr. J. Shrilekha
213 – 215
TEACHING ENGLISH LANGUAGE IN HIGHER EDUCATION INSTITUTIONS: A NECESSITY FOR STUDENTS’ BRIGHT CAREER
Divya Deevi and Kavi Balabrahma Chary
216 – 219
THE ADVANCING GEOPOLITICS OF SOUTH KOREA-CHINA RELATIONS: IMPACTS ON U.S. FOREIGN POLICY IN THE INDO-PACIFIC
Lopamudra Ghosh
220 – 226
THE EFFECT OF RELIGIOUSITY ON EMPLOYEE PERFORMANCE OF THE TANAOBA LAIS MANEKAT FOUNDATION COOPERATIVE KUPANG
Yosua Alfred Adoe, Rolland E. Fanggidae and Wehelmina M. Ndoen
227 – 232
THE EFFICACY OF NATUROPATHY AND CHEST PHYSIOTHERAPY TO IMPROVE OXYGEN SATURATION, LUNG CAPACITIES AND HEALTH STATUS IN COVID19 PATIENTS
Dr. S. Senthil Kumar, Dr. S. Banumathy BNYS and S. Shalini
233 – 239
THE INDISPENSABLE ROLE OF BRONCHOALVEOLAR LAVAGE (BAL) IN THE DIAGNOSIS OF RESPIRATORY TRACT INFECTIONS
V. Viswapriya, Saravana kumari. P, Sakthi G and Kavyarasi. P
240 – 247
THE ROLE OF THE INFORMAL SECTOR IN REALIZING GREEN TOURISM AS A TOURISM ATTRACTION TO THE SULAMANDA BEACH IN KUPANG REGENCY
Titania Triyuni Ga Doko, Apriana H. J. Fanggidae and Rolland E. Fanggidae
248 – 256
TOTAL QUALITY MANAGEMENT IN ACADEMIC LIBRARIES: AN OVERVIEW
Usha Kumari Sharma and Dr. Ashok Kumar Upadhyay
257 – 261
TRAVELLER’S EXPECTATIONS TOWARDS UPCOMING AIRPORT SERVICES IN SELECT TIER 2 AND TIER 3 CITIES OF SOUTH INDIA
Nalla Ramakrishna and Dr. Harish Babu S
262 – 267
TRENDS AND DEVELOPMENTS OF FOREIGN DIRECT INVESTMENT IN POWER SECTOR IN INDIA
Dr. M. Mary Anbumathy and D. Velumani
268 – 272
UNDERSTANDING THE CHALLENGES OF URBAN POOR DURING COVID19 AND - STUDY OF MUMBAI CITY
Priyanka Mokale
273 – 278
xFABRICATION OF BIOENZYMES BY BACTERIA IN PAPER AND PULP INDUSTRY
Ms. Sonal Chaudhary and Dr. Shalini Porwal
279 – 281
THE SIGNIFICANT ROLE OF EDUCATORS IN FACILITATING SAMAGRA SHIKSHA ABHIYAN SCHEME TOWARDS INCLUSION OF STUDENTS WITH INTELLECTUAL DISABILITIES IN THE KOTTAYAM DISTRICT OF KERALA
Fr. Baiju Thomas
282 – 286
PHYSICAL HEALTH EFFECTS OF EMPLOYEES AT WORK FROM HOME- AN IMPACT ON WORKPLACE ERGONOMICS
Angel. S* and Dr. K. Ganesamurthy
287 - 292
STUDY OF FISH DIVERSITY IN RESPONSE TO CLIMATE CHANGES IN JOHILA DAM, RAJENDRAGRAM, ANUPPUR DISTRICT (M.P.), INDIA
Sonoo Gupta and Dr. Pratibha Pandey
293
THE COVID CRISISIAN IMPACT OF SPORTS INDUSTRY
Ravindra Gouda S M and Virupaksha N D
294
International Journal of Advance and Innovative Research Volume 8, Issue 3 (IV) July - September 2021 Part - 2
1
ISSN 2394 - 7780
CIVIL LIABILITY ABOUT DRONE
Hind Fayez Ahmed Al-Hassoun
Professor, College of law / University of Babylon, Iraq, Babil, 51000
ABSTRACT Drone or unmanned aerial vehicle is an aircraft operated and controlled by a person on the ground. The
origins of these aircraft date back to the First World War (1914-1918), but the types currently used were
developed in the seventies of the last century.
These aircraft are widely used in the civilian field, and its use in the military field has increased to reduce the
risks about pilots and its lower cost compared to traditional aircraft, as well as here great ability to withstand
and flying longer distances.
The great scientific development on the modern period has added new important factors that were and will have
a deep impact on the development of the rules of international law and changing their features. . These are the
technological factors. The changes and trends that have occurred in the development of international law in
general and if technology has a great impact and a great role first in the development of private international
relations and secondly in restricting some international rules and thirdly in the development of these rules.
Key words : ( Pilot, Drone , Air Transport, Civil Responsibility, Technology)
THE INTRODUCTION
First: the importance of the research topic. Drones have entered the scope of use in many aspects of contemporary life for civil purposes or for scientific
research. The drone called HELIOS, which was manufactured by (HEROVIRONMENT) in California, was
used by the US Space Agency (NASA) in 2001 and its electric motor works by Solar energy and the Helios plane is designed to stay in the air or space for months as a platform for communications and scientific research,
and a drone like Helios can provide mobile phone services to remote areas, and since the area covered by the
communication service depends on the height of the network or the tower, the plane like Helios flying at an
altitude of 20,000 m covers a range Spacious and much larger than the tower.
Drones have also been increasingly used in recent years in police-related surveillance missions, road traffic
monitoring, natural disaster monitoring, search and rescue, border control, coverage of government activities,
and maritime surveillance, including marine pollution, drug trafficking and immigration.
Drones are also used in many countries in the field of special monitoring missions in examining bridges, dams,
high-rise buildings, pipelines and high-voltage cables, in addition to their use in the field of scientific research,
including atmospheric and ocean research. Containing toxic substances, as well as their use in the field of pest
control and spraying pesticides on a large areas. Based on the foregoing, this expansion in the use of drones in various civil, recreational and commercial activities, as well as their use for the general benefit of people,
prompted some countries to issue special laws regulating the use of this type of aircraft, such as Japan and the
United States of America. In Japan, the Japanese parliament passed a law prohibiting the flight of aircraft Drones over crowded residential areas or around airports without obtaining a permit from the government. The
amended Civil Aviation Law became effective at the end of 2014. The law classifies the small drone that is used
as a toy from this ban. Under this law, whoever violates the provisions of this law faces a fine that may be
imposed Up to 500 JPY
In the United States of America, the passion to buy this type of aircraft, whether by individuals for the purposes
of entertainment or by people and institutions for use in various aspects of civil life, has led to the widespread
acquisition and use of this type of aircraft, up to an estimated half a million aircraft sold annually. But lovers of these planes may not actually enjoy this kind of Christmas gifts. The Federal Aviation Administration recently
announced that there will be strict laws to ensure the safety of the airspace. On the Arab level, the United Arab
Emirates is one of the most Arab countries that use this type of aircraft as well. It is the first Arab country to
issue special instructions to regulate the use of drones.
Second :. search scope.
The discussion of civil liability raises multiple legal problems related to the international rules in general and the extent of the sovereignty of states and the rules of civil aviation because the use of that aviation may
constitute a violation of constitutional and civil rights and may require imposing a penalty against its
perpetrator, but the scope of the research will be limited to the extent of civil liability only.
International Journal of Advance and Innovative Research Volume 8, Issue 3 (IV) July - September 2021 Part - 2
2
ISSN 2394 - 7780
Third:. Search Plan .
We divided the subject of civil responsibility for a drone into two sections preceded by an introduction and
followed by a conclusion, including some results and recommendations
The first topic: What is air transport?
The term air law was used for the first time when the High School of Aviation was established in Paris in 1909.
This name, despite the criticisms leveled against it, has remained the title of most legal literature and journals specialized in this field, unless we exclude some writings of Italian jurisprudence that tend to embrace the term
aviation law as a designation. for this branch of the law(1)
. If the controversy erupted over the terminology of air
law itself, then a broader debate has raged in jurisprudence about determining its content, and this is what we
will address in two demands, the first to clarify the concept of air transport, and the second to know the concept
of the aircraft, as follows.
The first requirement: The concept of air transport
In fact, the process of clarifying the borders of the air region is a difficult issue and is colored in a way that goes far beyond what can be approved within the framework of the land or sea region. This difficulty appears at the
level of horizontal determination, as it appears on the level of vertical determination. As for the horizontal
determination, it means showing the national airspace, that is, the layers of air that shade the land. The territorial sea of a country is compared to the layers of air that shade the sea, including the economic zone. In other words,
the airspace here indicates the airspace that coincides in its extension with the national borders of the state.
Accordingly, we will highlight in two branches, the first to define air transport and the second to know its
characteristics, as follows for the
first section: Definition of air transport
To clarify the definition of air transport, there were two directions, the first and it makes the air environment the
hub around which the provisions of air law revolve, and then defines it as that branch of law that consists of a set of rules that govern the legal relations arising from the exploitation of the air
(2). Or that regulates the air
environment and its exploitation. Accordingly, the scope of air law for those with this trend is not limited to
studying issues related to air navigation, but also extends its rule to regulating all forms of aerial exploitation
revealed by science, such as telecommunications, radio and radar waves, and those that are likely to be revealed. like artificial rain
(3). Although It defines the basic function of air law in regulating what is and looking forward
at the same time to organizing what will be, this definition is taken for its breadth in a way that makes it difficult
to draw the boundaries between air law and space law(4)
. The core of the topics of air law, such as the infrastructure required by air navigation, including airports, easements, air routes, air navigation people, and the
legal system for air vehicle(5)
.
The second trend takes air navigation as a basis for defining air law, making the latter the law that aims to regulate air navigation and the relationships arising from it, or that studies the relationships generated by air
navigation and defines the legal rules governing(6)
.
The advantage of this definition is that it is not confined to the subject of air law or to the study of legislation
related to air navigation, but also extends it, in the absence of such legislation, to being excluded from among the rules of the general Sharia, i.e. the rules applicable to the facts arising and the relationships generated by this
navigation. in turn, escapes criticism for confining itself to matters relating to the air vehicle
(1 ) Max Litvine ,précis elementaire de Droit Aerien , Bruxelles Etablissements Emile Bruylant , 1953 ,p.15No
1.Andre Henry .Couannier , Elements Createurs du Droit Aerien paris.per orbem 1929 .p.3.
(2 ) R. Coquoz. Le Droit prive international aerien , paris 1938 p.3 congres des jurists suisses , journal du droit
international prive ,1919 p.1 141
(3 ) F.DeVisscher, Ies conflits de Iois en matiere de droit Aerien ,Rec des cours Academ de la Haye , 1934 ,
T.II. P 279.
(4 ) M.DE Jugiart .Traite de Droit Aerien , T.I.2eme ed .par E.Du pontavice , Jacqueline Dutheil De la Rochere
& Georgette M.Miller . L.G.D.J. paris . 1989 , p. 23 ,Nos. 11et 12
(5 ) Ali Al-Baroudi, Muhammad Farid Al-Arini, Maritime and Air Law, Al-Halabi Human Rights Publications,
Beirut, Lebanon, 2001. P418
(6 ) Ambrosini, Corso di Diritto Aeronautico , Vol .1,p.7.
International Journal of Advance and Innovative Research Volume 8, Issue 3 (IV) July - September 2021 Part - 2
3
ISSN 2394 - 7780
The third trend: The air law is defined from the air vehicle, so it defines it to a set of legal rules regulating the
movement of air vehicles and the consequences of that movement and this use of relationships. When they talk
about money circulation, as for the term usage, it should be taken in its broad sense(1)
.
What distinguishes this definition from its predecessors is its reliance on sub-environmental air vehicles or air
navigation to determine the content of air law(2)
. This definition, despite its openness to criticism for neglecting
one of the aspects of the basic function of the law, is more consistent with reality because it contains all the topics that the jurisprudence of air law and its national and international positive legislations have included on
Subjecting it to its rule, relying on the air vehicle leads to the application of the rules of this law to air
navigation, which cannot be imagined without its performance, and given the possibility of the latter being
separate from one of its purposes, the rules governing the construction of air vehicles within this law. Since movement is one of the elements of this definition, air law is concerned with its connection to the element of
movement regulating the following topics:
Airworthiness of air vehicles to fly, acquiring and transferring their ownership, mortgaging, seizing and forcibly selling them to air navigators, the possibility of flying in national and foreign airspace, air services related to
navigation such as airports, air routes, meteorology, wireless and radar communications, and air amenities...etc.
Second part: Properties of air transport When the definition of air transport was dependent on the air vehicles. It was inevitable that it would be affected
by the characteristics of this vehicle, because due to the novelty of its manufacture and speed, it was not
possible before it for a land or water vehicle, but there is a danger that cannot be overlooked.
First: The seriousness and modernity of air law. Man dreamed of ascending into space for a long time, and it is said that the first attempts to achieve that dream go back to Abu al-Qasim al-Abbas bin Firnas and Abu Nasr
Ismail bin Hammad, known as al-Jawahiri, who tried to fly with cloth wings in the sky of Cordoba and
Nishapur in the third and fourth centuries of migration. In the year 1500 AD, the Renaissance artist Leonardo da Vinci made a theoretical study targeting the possibility of making flying vehicles, and to him is credited with
designing the helicopter or hovercraft(3)
. Attempts continued and studies were multiplied in this field until the
brothers managed in the second half of the eighteenth century to invent a paper balloon filled with hot air,
which they launched in the air of a town on the fifth of June 1783 in the presence of representatives of the Vivar states that included what is called in France now In the province of Ardache and part of the province of the
upper Loire. On board one of these balloons, he managed on the twenty-first of November 1783 to make the
first flight in the sky of Paris , And narrated that one of the spectators of the attempt was the American philosopher and scholar Benjamin Franklin, the inventor of the paranoir device, or what is known as the
lightning rod, When he was questioned about the usefulness of balloons, he replied, "What is the use of a child
who has just been born?"(4)
Early in 1785, Blanchard and Dr. Jeffress succeeded in crossing the English Channel when they flew from Calais to Dover. Before the end of the nineteenth century, the French Charles Renard and
Chris were able on August 9, 1884, to fly in the air aboard their guided balloon, which was then tested six times
with complete success in 1884 and 1885. Then, in 1890, the Frenchman Pierre Moyard, after several attempts to
fly in Algeria and Egypt, came to discover the idea of the curvature of the wings, which later allowed what is heavier than air to maintain its balance
(5). Seven years later, Clement Ader successfully tested the first aircraft
with an engine and prompted these discoveries, especially those that resulted in the idea of wing curvature.
They are his brother, a citizen of the United States of America, who traveled a distance of 260 meters by a plane with an engine heavier than air. At the beginning of the twentieth century, he was able to fly his plane for a
distance of 38 kilometers in batches, due to the lack of fuel. Then he and his brother came to France, where they
proved their success when their plane remained in the air for about an hour. The Frenchman, Louis Plored, succeeded on the twenty-fifth of July 1909 in crossing the Channel to The English coast proved to England the
futility of its fortification behind its charming isolation. Meanwhile, Count Zeppelin's efforts, which he had
begun in 1900 to make of the balloon, which then crossed the Atlantic for the first time in 1928, were lost.
(1 ) M.L.emoine , Traite de Droit,Aerien , sirey , Paris 1947 No .4.p.
(2 ) See Rifaat Fakhri's review, Al-Wajeez in Air Law, 1994, P 45
(3 ) N.Matessco Matte, Traite de Droit Aerien Aeronautique ,3em ed A.pedone , paris , 1980 . NO.6.
(4 ) Ali Al-Baroudi, Muhammad Farid Al-Arini, Maritime and Air Law, Al-Halabi Human Rights Publications,
Beirut, Lebanon, 2001. P422
(5 ) See: Rifaat Fakhri, previous source, p. 5.
International Journal of Advance and Innovative Research Volume 8, Issue 3 (IV) July - September 2021 Part - 2
4
ISSN 2394 - 7780
There were then several successful attempts, including crossing the Alps made by the Swiss Oscar Bede in 1913
when he flew his plane from the Swiss city of Bern to the Italian city of Milan.Also, Giovanni of Peruvian
nationality made a trip between the city of Brig and Domodossla. This trip end ended his life while landing on Italian lands Although he made an air vehicle, a tangible reality at the end of the nineteenth century, and despite
what some scholars of that century, such as Manduka (1)
, Pameloni (2)
, the Italians and Juris(3)
imagined). The
German Weiderwill and the French Wilhelm In their jurisprudential writings of legal regulations for the rule of activity in the air Air law was not born until the early of twenties of the current century. What happened for the
first time in the history of mankind. the use of that vehicle as a way means of transportation and as a weapon of
war, so it was only natural that it appeared at the beginning of this century, in which the various uses of air
vehicles and their extreme dangers were revealed.
The need to establish legal rules to govern the movement and use of this new medium and the resulting facts or
legal relations that arise from them, and this has already been done in the form of national and international
legislation that has begun to appear exponentially. After the First World War ended, despite what some claim that such rules existed long before that date, using as evidence the order issued by the Director of the Paris
Police on April 23, 1784 regarding licensing the manufacture and launch of balloons and other flying machines (4)
.
Second: the international character of air law. Because the air vehicle has a speed that enables it to cross the
political borders between countries in a short time that other vehicles cannot achieve, it was rightly considered
an international and continental communication tool. unified to rule on matters within its competence. Those
solutions which was disregard entails changing the legal system to which the relations arising from the use of this vehicle are subjected whenever the state borders to another state are crossed. Such pluralism is concerned
with achieving legal security or ensuring the stability of legal centers. On the other hand, it wastes all actual
value of the principle of the inadmissibility of excuses due to ignorance of the law (5)
. Therefore, after the emergence of this vehicle, countries tended to regulate the movement of air vehicles and their use and the
resulting facts or legal relations of international treaties. This trend was associated with another direction at the
internal level, represented in each country coordinating the rules of its internal air law in the light of the
principles and rules it set. These treaties and this is what is known as the phenomenon of grooming or attraction, or by adopting the provisions of these treaties to become their own national law, and this is what is called the
phenomenon of nationalization, with the aim of eliminating the duplication of legal rules that can lead to these
treaties coexisting with different national laws(6)
. These ideas have led to the arrival of air law rank of international unification, whether this international unification is based on the rules of private law or related to
the rules of public law that no other law has reached before. The international nature of this law and what it
requires from unifying national internal laws have prompted many jurists to call for the need to establish an international judicial body entrusted with the task of removing the conflict between the different interpretations
given by courts of different countries to the texts of air law treaties and finding the appropriate interpretation
that ensures the survival of formal and objective uniformity of legal rules contained in these texts(7)
.
Third:. The regulatory nature of air law. In view of the dangers surrounding the use of the air vehicle and the danger involved in this use, it may reach the point of illegality, such as its use, for example, in drug smuggling
and espionage. International or national air law has taken the nature of regulations. In the international sphere,
the national legislator did not leave complete freedom in enacting legislation regulating the movement and use of this means. Rather, international treaties and bilateral agreements intervened to set rules that would ensure
the security and safety of this emerging vehicle for people. At the same time, it eliminates the danger it entails
(1) Manducca . La responsabilita penale dei reati commessi nello spazio aereo e la guirizione istruttoria
(2) pampaleni, sulla condizione guiridica dello spazion aereo , vol 48 ,Fase 1.2.3 pp 35 a53 .
(3) Konrrad W.Jurisch .Grundzuge des Iufuechis , Berlin 1897 , Das luftrecht in der deutschen
Gewerbeordnung,Berlin, 1905
(4 ) See: Matescu Matt, previous source, paragraph 12
(5 ) See: Henry Cuanet, previous source, p. 5.
(6 ) See: Gerard Cass, previous source, p. 115
(7 ) p.chauveau , rapport sur la creation d'une cour international pour la solution des difficultes nees des
conventions internationals en matiere de droit aerien ,R.F.D.A. 1955 ,P.465 .
International Journal of Advance and Innovative Research Volume 8, Issue 3 (IV) July - September 2021 Part - 2
5
ISSN 2394 - 7780
by prohibiting its use for illegal purposes and overcoming all the difficulties that may hinder its growth and
prosperity. Or treaties or established by the competent bodies established by those agreements and entrusted
with this task. In the national field, the legislator intervened to qualify and equip vehicles and public utilities,
and this was due to the insistence to achieve one goal, which is to ensure safety by use its wildly meaning(1)
.
Fourth: the subjectivity of air law. Some jurists denied air law every subjectivity and distinction, and described
it as a mere application of the provisions of maritime law to air navigation, and Italy triumphed for this view to the extent that its legislator issued in 1942 a navigation codification that included the legal rules of both marine
and air navigation (2)
. The proponents of this trend prove the validity of what they saw as follows: First. The
two laws find their basis in the idea of the dangers to which navigation tools are exposed to sea and air
navigation after they are separated from the land
Second . The sea and air voyages are often characterized by the international character, because the
international field has become in the majority of natural environmental conditions for the growth of the activity
of both the ship and the plane
Third The subordinates of the air service, like the subordinates of the naval operator, carry out their work away
from it and enjoy great independence in facing it due to the impossibility of its control and supervision
Fourthly, the subordinates of the air provider, as the subordinates of the naval operator, carry out their work away from it and enjoy great independence in confronting it due to the impossibility of its oversight and
supervision over them. Fifthly, the responsibility of the air carrier is almost identical to the responsibility of the
marine carrier in terms of the rules governing each of them and in terms of the exceptional quality of these rules
compared to the general rules of civil liability. There is a great similarity between the legal system of both the ship and the aircraft, VI. Air navigation, like sea navigation, is closely linked to the security and safety of the
state (3)
.
However, such similarity does not mean, for the proponents of the subjectivity of air law, that this last law should live within the framework of maritime law, borrowing its systems, quoting its means in interpretation,
and using its provisions whenever the texts become depleted in it. Rather, it should exclude dependency
between these two branches of law because the origins of maritime law are due to norms formed in a marine
environment that differ in nature from the air environment to which the provisions of the air law relate. to its sources and what necessitates this independence. The great difference between the speed of planes and the
speed of ships is justified by the fact that the plane is characterized by a high speed that was not possible before
for a land or sea vehicle.(4)
. If the independence of the law from the maritime law has become a confirmed fact today, the issue of its subordination to the general provisions contained in the civil and commercial law still
raises some doctrinal controversy. The jurisprudence asks whether the legislator, while regulating an issue of air
law, should adhere to the general principles applicable in domestic law, or can circumvent and neglect them if being influenced by them would adopt solutions that are not in line with the interest of air navigation, and if the
matter is related to the interpretation of a text From the texts of this law or by diligence to find a solution to a
problem that it was silent about regulating. So should interpretation and revolve within the scope of general
principles and not go beyond it. Even if the matter leads to the adoption of solutions that do not comply with the requirements of air navigation, in other words, should air law remain linked to the general principles applicable
in domestic law, or should it be the other way round, i.e. recognizing it as a self-existing entity and independent
from other branches of law and even from the same general principles in order to achieve the interest Air
navigation?
Most jurists go to the need for air law to have an autonomy and entity independent from other branches of law,
because it is related to the airspace, which is a strange environment from the land and sea environments in which human activity remained confined until recently. Land and sea navigation decided on legal principles that
(1 ) P.Chauveau. Droit, Aerien, Paris, 1951, p.14,No.14. See also Abu Al-Zayd Radwan, Air Law, Commercial
Aviation Law, Arab Thought House, Egypt, Cairo, 1972, p. 12.
(2 ) Look at the display of the direction of the two notes, R.Malezieux ,Essai sur les caracteres et sur la nature
du Droit Aerien R.F.D.A.1948 p.37
(3 ) See the presentation of this in detail: De Guglar, The Extended In Air Law, Part One, Second Edition 1989,
pg. 40.
(4 ) See Refaat Fakhri, the previous source, p. 18.
International Journal of Advance and Innovative Research Volume 8, Issue 3 (IV) July - September 2021 Part - 2
6
ISSN 2394 - 7780
emanate from them and serve their requirements. It is not acceptable for these principles to have authority over
an environment that was unknown at the time of its formation, especially if adhering to them would lead to
solutions that do not fit the new environment. In this situation, air law should be freed from the control of The general rules of legislation so that it has independence that allows it to create new general principles stemming
from its environment and responding to its needs. This is in addition to the fact that the rules of air law are
constantly evolving in view of their close relationship with technology in the field of aviation, which is developing amazingly, with the consequent creation of new problems that need legal solutions. To confront
them and solve existing problems that require a review of the solutions governing them, and in linking air law
with the principles of general Sharia, imprinting its rules by failing to pursue reality
These jurists note that this independence has actually been achieved over a long period, because the vast majority of the provisions of air law are derived from international agreements, and these agreements were not
important when choosing their rules except for the necessities of air navigation. A special situation and achieved
for him an independence that no other branch of law enjoys. These jurists believe that supporting and perpetuating this independence is to obtain an interpretation of the provisions of international agreements on the
basis of the practical necessities that they dictated, even if following this method of interpretation
Which I contemplated navigation, even if following this method of interpretation leads to a departure from the
logic of the general rules in force in countries (1)
.
The second requirement: The Concept of a drone
To clarify the concept of something, it is necessary to search for its definition and statement of its importance,
and this is what we will shed light on in this requirement.
The first section: Definition of the drone
The unmanned aerial vehicle, or unmanned aerial vehicle, or UAV for short, is an aircraft operated and
controlled by a person on the ground. The origins of these aircraft date back to World War I (1914-1918), but the types currently used were developed in the seventies of the last century. These aircraft are used in the civil
field and in various uses such as scientific research, rescue and guarding. They can also be used for the purposes
of aerial surveys and for monitoring pipelines and power transmission lines. However, most of these aircraft are
military and are used for reconnaissance purposes, and some of them are equipped with missiles, so they are used to strike specific targets. This type of aircraft is commonly used in Cases in which there is a severe danger
to the lives of the pilots or the pilot’s physical inability to fly and fly for a long period of time. These aircraft are
characterized by not needing a pilot and having a low financial cost compared to the ordinary aircraft that are
piloted by the pilot and designed for the same purpose(2)
.
The beginning of the idea of unmanned aircraft go back to cruise missiles designed to destroy themselves with
specific targets, such as the 240 kg Kettering air torpedoes manufactured for the US Army in 1918. Then this idea was developed to show the first radio-guided drones that were used in World War II (1939-1945). to train
aircraft snipers to shoot them down. Then the first drones that are used outside the scope of training and to carry
out military missions appeared, as the Friebe aircraft equipped with imaging devices and used to spy on North
Vietnam and China during the Vietnam War (1959-1975) was the first drone used for reconnaissance
purposes(3)
.
Then the development of this type of aircraft continued, and at the end of the seventies of the last century it
started using modern and miniature video cameras that could broadcast live images of the operating unit on the ground without a significant time difference. Those planes played an active role in 1982 when the Zionist entity
(Israel) used them when it was able to detect Syrian air defense sites in Lebanon, which paved the way for their
destruction. Coalition drones to explore and bomb Iraqi sites.
In the Kosovo war, the use of drones became more widespread, as the United States and allied countries used
drones to help commanders locate potential targets In a land with difficult terrain and hard climate. During the
US war against the Taliban regime in Afghanistan 2001-2002, the US Air Force used the practor and multiple
(1 ) See: Shufu, Air Law, p. 18.
(2 ) Ahmed Ibrahim, Unmanned Aircraft System, Aviation Magazine for All Issue 6, November, 2015, p. 44.
(3 ) Reports and interviews: Guided planes were used for the first time in the Vietnam War - Al-Watan (Qatari)
Newspaper, Issue 5616, Year 14, 2011 published on the following website:
http://www.al-watan.com
International Journal of Advance and Innovative Research Volume 8, Issue 3 (IV) July - September 2021 Part - 2
7
ISSN 2394 - 7780
models, where the Praetor planes transmitted a stream of aerial and video images of the targets to the planes.
Those equipped with weapons to assassinate al-Qaeda leaders used the predator extensively during the Anglo-
American invasion of Iraq in 2003(1)
.
Unmanned aircraft became a major element in the most important and most advanced armies in the world, at the
forefront of which is the United States of America, which considered it a path to a comprehensive war on
terrorism. Through direct transmission of what is happening there to the command and control centers and to the nearby air support planes, the US military used the information and data obtained from the sensors of the
drones and carried out joint operations between them and the helicopters. In addition, and by referring to the
Warsaw Convention, we find that, for the applicability of its provisions, the transport is carried out by plane,
and this is logical and even obvious, because the Convention is intended for air transport, and its provisions do
not extend to cover other types of transport even if it is agreed in the transport contract(2)
.
Even more than that, the failure of this condition leads to a complete departure from the field of air law and
entry into the scope of another branch of law, but what is meant by an aircraft? The answer to this question is of great importance for the parties to the contract of carriage on the one hand, and with regard to determining the
applicable legal rules, on the other hand, the parties to the contract may have a definite interest in sticking to
determining the applicable legal rules. The paramount importance of clarifying what is meant by the aircraft
In view of the technological innovations that the genius of the human mind arose from, which is the new tool
used for transportation, which is called a crawler vehicle or an airbag, and it is a vehicle that travels at a height
of 38 inches above the surface of water or land sliding on an airbag resulting from the reaction of the air that
pushes it Its jet engines are vertical on the surface of the water or on land, and it resembles a plane in some ways and a ship in some others. Its use is growing day by day to the point where it is expected to be a strong
competitor to planes and ships in the field of passenger and cargo transportation(3)
. The Warsaw Convention
was not concerned with establishing a definition for the aircraft, and therefore it is inevitable to refer to the law of the judge before the dispute to search for this definition. Any machine that can derive its survival in the
atmosphere from the reactions of the air and not from the reactions of the air reflected from the surface of the
earth, and it includes all air vehicles such as airships, balloons, gliders, fixed-wing aircraft, etc.
Also the Egyptian legislator in the Civil Aviation Law No. 28 of 1981 with the amendment made by the International Civil Aviation Organization to Annex No. 7 of the Chicago Convention on the definition of
aircraft (4)
, stipulated in the seventh paragraph of Article One of the aforementioned law that the aircraft is “any
machine that can It derives its survival in the atmosphere from the reactions of the air not reflected from the surface of the earth and includes all air vehicles such as airships, balloons, fixed and moving wing aircraft,
etc(5)
. It is clear from these two definitions that there are two conditions that must be met for the vehicle to be
considered a plane. The first is that the reaction of the air is the main factor for the survival of the machine in the air, so the machine does not have the description of the aircraft if the reaction of the air is a secondary factor
for its survival in the air, as is the case with missiles and spacecraft(6)
.
The second: The reaction of the air should not be reflected from the surface of the earth in its broad sense,
which includes land and water, and then the crawler vehicle or the airbag will come out of the aircraft counter because its height while traveling is caused by the reaction of the air that it pushes from its engines vertically on
(1 ) Dr.Ali Adnan al-Janabi, Military Strategy, Comparative Law Journal, Year 17, 2006, p. 144.
(2) oberlandesgericht Frankfurt 11-1981, (1987) 7Air law , no3 .p154.
(3) Refaat Fakhri, Al-Wajeez in Air Law, 1994, without a place of reprint. P59
(4) Jump up to: proposal of the International Civil Aviation Organization regarding the amendment in: 1967
This amendment became effective as of March 8, 1968 AD
(5 ) Definition of Article 56 of Law No. 26 of 1976 regarding some provisions relating to aircraft, which has not
been repealed by Civil Aviation Law No. 28
for the year 1981, which described the aircraft as every machine or device that rises and moves in the air by a
mechanical motive force depending on the reaction of the air. It is a narrower definition than that used by the Civil Aviation Law, and this definition is applied only in the cases regulated by Law No. 26 of 1981. 1976,
not including air transport.
(6 ) De Gerglar, The Extended, Part One, 1989, paragraph 2517, p. 1008.

International Journal of Advance and Innovative Research Volume 8, Issue 3 (IV) July - September 2021 Part - 2
8
ISSN 2394 - 7780
the surface of the earth and based on the foregoing, no It is subject to the Warsaw Convention if the dispute
submits to the Egyptian judge the transport that will be carried out by spacecraft, crawler vehicles or airbags,
because it is not an air transport because the aircraft is not described as the means used in carrying it out(1)
.
The second section: The importance of the drone
It will be possible to notice an increase in the number of unmanned aircraft compared to the number of those
operated by pilots inside the hangars and airfields of the US Air Force.
After 2003, improvements were made in electronic equipment and means of communication. Pilots of the Air
Force's unmanned aircraft were able to operate three of them at the same time, and the number may rise to four
in an emergency. According to the Government Accountability Office, the cost of a group of four MQ
unmanned aerial vehicles with its ground-based base and satellite operating system is $24.5 million, while the
latest estimates of the cost of the F-35 is $100 million.
This prompted US Defense Secretary Robert Gates to request the cancellation of the F-22 Raptor aircraft
program in order to provide funds for the purchase of more unmanned aircraft for use in Afghanistan and Iraq. In this context, Foreign Policy attributed to Major General Dave Deptula, the officer in charge of the unmanned
aircraft operation program. In addition, the current aircraft operating systems may be an easy target for air
defense systems and electronic attacks, as well as operating systems facing problems related to satellite communications, indicating that he expects That the US Air Force make the latest change in the way drones
operate, as well as on the structure, organization and culture of this weapon (2)
. UAVs are characterized by
simplicity in the design and implementation of their exoskeleton, engine, and controlled equipment
In spite of that, it performs its mission to the fullest, and it must be taken into account that these aircraft are not and will not be a substitute for regular aircraft, but rather complement them in some tasks and duties, especially
in areas of great threat in the theater of operations or in areas where any of the crews are exposed. Airplanes are
at risk of death or capture.
The most important characteristics of the unmanned aircraft are as follows:
1. The low cost of obtaining it, which is negligible when compared to the costs of regular planes.For example,
the price of an F-15 is equivalent to the price of a thousand unmanned aircraft.
2. Low expenses for its maintenance and flight if we take into account the oil prices and the crises that occur to obtain it, and that the expenses of one flight for a (Phantom) plane are equivalent to 200 flights of an
unmanned aircraft.
3. The lack of expenses for training the staff on it and the short period of training to make them experts, as its
crews can be trained in three months and they can be made experts in six months.
4. The difficulty of locating them on the ground when they are not flying.
5. The possibility of carrying out multiple tasks most of the tasks using the same plane after changing the
technical equipment needed for the second mission.
6. The large period of its stay in the air leads to the continuity of follow-up to the theater of operations
without resorting to the use of other sources or planes, as the period in some medium planes reaches 10
hours.
7. In addition to directing it by radio, its flight and performance of its mission can be programmed by means
of the computer in it.
In addition to these characteristics, the importance of the unmanned aircraft may lie in its manufacturing technology. The features of this technology have appeared as the following: the aircraft body and flight
equipment in addition to the payload, engine, guidance and arbitration station.
The most important consequence of this importance in terms of the ability of these aircraft to do
1. March goals: As is known, this is the first mission assigned to this type of aircraft, and since we do not
need very accurate measurement tools, its development has taken great strides, none of which has been
subject to the complications of secrecy, and its speed has increased until it reached Mach (2) and most of
(1) see: Georgette Miller, previous source, p. 17.
(2 ) Jump up to: http:// ar.m.wikipedia.org, wiki
International Journal of Advance and Innovative Research Volume 8, Issue 3 (IV) July - September 2021 Part - 2
9
ISSN 2394 - 7780
them are characterized by high maneuverability and most of them can be recovered According to the
degree of injury or lack of injury, and in this field, the United States of America used (fighter / fighter-
bomber) aircraft that had been taken out of service to fly without a pilot to carry out the mission of some (air / air) shooting, which requires real targets with speeds and very high maneuverability It is said that this
method was used by the Germans
2. Scouting: Most of the world’s armies need aerial reconnaissance due to its speed of implementation for the
main reasons:
a. Forcing the advanced modern weapons of the enemy to open and spread.
b. Advanced weapons depend on the extreme accuracy of hitting targets. Therefore, they are in dire need of
accurate identification of these targets.
c. There is a relatively large time between the time of executing the mission and the time of giving its
production if normal reconnaissance aircraft were used.
3. Exploration the wanted zone: With the continuity of moving targets in operations, artillery, aviation, or any of the weapons that will occupy the target are in dire need of very accurate information, as they need to
follow up on the destruction process and then estimate the extent of the injury. The targets and their
continuous laser lighting to make the necessary reflection of these munitions, whether fired from the
ground or the air.
4. Meteorology: To forecast weather conditions and serve various meteorological purposes.
The second topic: The legal scope of the unmanned aircraft
It is obligatory for every aircraft to have a nationality, and the nationality of the aircraft is determined by the nationality of the country registered in its civil aviation registry (Article 17 of the Chicago Convention). The
nationality of its owner in general(1)
.
The aircraft may only be registered in one country, and therefore it can only have one nationality, and its nationality can change by changing the place of registration (Article 18). The aircraft prominently on board is
generally the flag of the state of nationality (Article 20) and each state determines, according to its internal
legislation, the process of registration, certification and the citizenship mark, provided that such legislation
observes the provisions of the Chicago Convention and its appendices, in particular the Annex No. 7, which means aircraft registration. However, the nationality of the aircraft is not sufficient to clarify its legal status. No
aircraft may fly or fly without having a navigation certificate according to the text of Article 31 of the Chicago
Convention. The certificates granted by it and which meet the conditions that are equivalent or that are superior to the minimum conditions that may be determined from time to time based on the provisions of the
Convention, especially its Eighth Annex. States parties and exports to the territories of the rest of the States
parties. In other words, the legal position is generally governed by the set of national legal rules of the state. With the duty to respect the decisions of Chicago of 1944 and the Geneva Convention of 1948 related to the
international recognition of rights over aircraft, and this explains the subordination of the aircraft and any
accident that it encounters or that occurs on board while it is in international airspace to the jurisdiction of the
country of which it is a nationality. board while flying in the airspace of a foreign country?
It is obvious that the answer here should be by reference to the application of the principle of state sovereignty
in its airspace, but this application, although acceptable in theory, is encountered by many difficulties in
practical terms, including the difficulty of determining the exact location of the act, the difficulty of the intervention of the regional authorities in a timely manner, given the speed with which the planes are traveling
Currently, the aforementioned authorities' lack of knowledge of the crimes that take place on board the aircraft
if they were not aware of them by the captain and navigator staff, add to the fact that there is no serious interest of the state from interfering with what takes place on board a plane flying in its air if it is not affected in
anything and if the plane does not land in For this reason, opinions differed on this issue. Some believe that the
nationality of the aircraft is what counts, and therefore the validity is the validity of the country of nationality.
While others believe that the jurisdiction should be for the first country in which the plane lands after the act has
occurred.
(1 ) This neglects the English criterion that builds citizenship based on place of residence and which remained in
force until 1914. Not to mention the aircraft's lack of knowledge of the so-called question of suitability posed
with respect to ships and boats.
International Journal of Advance and Innovative Research Volume 8, Issue 3 (IV) July - September 2021 Part - 2
10
ISSN 2394 - 7780
In fact, in view of the difficulties that we have mentioned, it is not possible to be certain of one opinion without
the other, and it may be restricted in this context to refer to the position of foreign ships during their passage in
the territorial waters of a country. of the country of nationality or the country in whose airspace the crime occurred due to the fact that the act did not affect this country or, on the contrary, would disturb its security or
harm its safety. Some of the international agreements concluded in the seventies, and after the number of
incidents of hijackings and air terrorism, such as the Hague Conventions of December 6 1970 and Montreal of September 23, 1971 supplementing the 1963 Tokyo Treaty relating to crimes committed on board aircraft, refer
to the authority of the state whose authorities arrest The perpetrators or the duty of this state to hand the
perpetrators over to the authorities of the state in whose airspace or against its planes the crime was committed
so that they may be tried. Jurisdiction over traffic violations and related issues always remains in the interest of
the country in whose airspace these violations occurred
CONCLUSION
After we finished studying the civil liability of a drone, we reached a number of results and proposals, as
follows:
1. The invention of unmanned aircraft dates back to about a century ago.
2. The drone is characterized by not needing a pilot and by its cheap cost compared to other aircraft that need a pilot. It also has the ability to continue and continuously climb more than the regular aircraft that need a
pilot. All these reasons contributed to the adoption of these aircraft.
3. Despite the efforts made by the United Nations and many international organizations, these rules still need
to be further modified, revised and added to suit the use of this type of aircraft in non-international disputes, as we see the need for an update process for these rules and the development of a new legal
system that guarantees confronting The rapid developments, adaptation to the expected scientific progress,
defining the rights and obligations of countries that use these aircraft, and the need to find solutions to
special and complex problems.
REFERENCE
First, legal books.
1. Abu Al-Zayd Radwan, Air Law, Commercial Aviation Law, Arab Thought House, Egypt, Cairo, 1972.
2. Ali Al-Baroudi, Muhammad Farid Al-Arini, Maritime and Air Law, Al-Halabi Human Rights Publications,
Beirut, Lebanon, 2001.
3. De Gallar, The Extended, Part One, 1989, without a place of reprint.
4. Ibrahim Shehata, Air Law and Judicial Law, Cairo, Arab Renaissance House, 1966.
5. Muhammad Wafiq Abu Atlah, Regulating the Use of the Judiciary, Cairo, Arab Thought House, 1972.
6. Refaat Fakhri, Al-Wajeez in Air Law, 1994, without a place of reprint.
English and European sources
1. Ambrosini, Corso di Diritto Aeronautico , Vol .1.
2. Coquoz. Le Droit prive international aerien , paris 1938 p.3 congres des jurists suisses , journal du droit
international prive ,1919
3. F.DeVisscher, Ies conflits de Iois en matiere de droit Aerien ,Rec des cours Academ de la Haye , 1934 ,
T.II.
4. Gerard cas ,Les sources du droit des tansports aeriens ,paris L.G.D.J. 1964
5. Konrrad W.Jurisch .Grundzuge des Iufuechis , Berlin 1897 , Das luftrecht in der deutschen
Gewerbeordnung,Berlin, 1905 .
6. M.DE Jugiart .Traite de Droit Aerien , T.I.2eme ed .par E.Du pontavice , Jacqueline Dutheil De la Rochere
& Georgette M.Miller . L.G.D.J. paris . 1989 ,Nos. 11et 12
7. M.L.emoine , Traite de Droit,Aerien , sirey , Paris 1947 No .4.
8. Manducca . La responsabilita penale dei reati commessi nello spazio aereo e la guirizione istruttoria
9. Max Litvine ,précis elementaire de Droit Aerien , Bruxelles Etablissements Emile Bruylant , 1953 ,p.15No
1.Andre Henry .Couannier , Elements Createurs du Droit Aerien paris.per orbem 1929 .

International Journal of Advance and Innovative Research Volume 8, Issue 3 (IV) July - September 2021 Part - 2
11
ISSN 2394 - 7780
10. N.Matessco Matte, Traite de Droit Aerien Aeronautique ,3em ed A.pedone , paris , 1980 .
11. Oberlandesgericht Frankfurt 11-1981, (1987) 7Air law.
12. p.chauveau , rapport sur la creation d'une cour international pour la solution des difficultes nees des
conventions internationals en matiere de droit aerien ,R.F.D.A. 1955.
13. P.Chauveau. Droit, Aerien, Paris, 1951
14. pampaleni, sulla condizione guiridica dello spazion aereo , vol 48 ,Fase 1.2.3
15. R.Malezieux , Essai sur les Caracteres et sur la nature du Droit aerien R.F.D.A. 1948.
16. R.Malezieux ,Essai sur les caracteres et sur la nature du Droit Aerien R.F.D.A.1948
Journals and Reports:.
1. Ahmed Ibrahim, The Unmanned Aircraft System, All Aviation Magazine, Issue 6, November, 2015.
2. Ali Adnan Al-Khayali, US Military Strategy, Comparative Law Journal, 17, 2006.
3. Reports and Passports, UAVs were used for the first time in the Vietnam War, Al-Watan newspaper
(Qatari), No. 5616, 14, 2011.
International Journal of Advance and Innovative Research Volume 8, Issue 3 (IV) July - September 2021 Part - 2
12
ISSN 2394 - 7780
HUMAN RESOURCES IN THE VIETNAM’S COAL INDUSTRY IN THE CONTEXT OF GLOBAL
LABOR INTEGRATION
Phuong Huu Tung, Nguyen Van Tri PhD. Phuong Huu Tung, Ha Noi University of Home Affairs
Email: [email protected]
ABSTRACT:
Official establishment of Asean (Asean Economic Community-AEC) on 31st December 2015 and Vietnam’s conclusion of negotiation of Free trade Agreement and series of FTA have made it easier for Vietnam Labor
Force to migrate abroad. Labor migration has opened up opportunities and also posed challenges to high
quality labor force in Vietnam companies in general and mining firms in particular. Characteristics of working conditions in the mining industry are lack of light, high humidity, toxic gases such as methane, carbon, narrow
working space, low income compared to labor costs. All the above mentioned benefits and treatments still can
not hold and attract more labor in the mining industry. In addition, Vietnamese people prefer to have a stable
position in state agencies, although their incomes are not high, because they have a lot of more free time, and less work pressure; It is difficult to work as hard as the coal industry to compete with other jobs in the labor
market. Moreover, due to the lack of positive information from the coal mining industry, many are afraid to
work in the field. Thus, this paper focuses on analyzing both the opportunities and the challenges of the mining workforce in the context of the international labor movement. From there, we propose some solutions to
improve the quality of labor to meet the demand for skilled labor in mining companies in Vietnam.
Key words: Human resources; International labor force migration; Quality of labor; Coal industry in Vietnam.
1. SITUATION OF LABOR FORCE AND TENDENCY OF WORKER MOVEMENT IN MINING
INDUSTRY
According to statistics, by the year 2020, about 95,000 employees are working in coal mining firms of Vietnam
National Coal - Mineral Industries Group (Vinacomin), of which workers in tunnel mine accounts for 38
percent. In recent years, there has been a gradual increase in number of workers leaving their jobs especially workers in tunnel mines. Notably in 2016, number of resigned workers approximated to number of
newly recruited ones. There was a shortage of labor in many coal mining firms, even in enterprises which have
good benefit packages such as Nam Mau Coal Co., Vang Danh Coal Co., number of workers resigning is still high. In the development strategies of coal mining industry, by the year 2025, coal mining output from drift
mines is planned to account for 65 percent of total output. However, shortage of labor especially in drift mines
is a big challenge to coal mining industry to achieve the output target.
Current problem of labor shortage which Vinacomin is now facing with is quite critical. In 2017, not only experienced workers in mining quit their jobs but also students in mining colleges dropped out of school.
Additionally, in recent years, admissions of Hanoi University of mining and geology and Quang Ninh
University of Industry have experienced difficulties in both quantity and quality, scores in entrance exam of these universities are in average level (around 15-17). Although TKV Coal Vocational College not only opens
admission during twelve months but also have their staffs seek for students in admission fairs from plain to
mountainous areas, the college fails to gain target admissions and number of dropout students still increases. Quang Ninh province and TKV Coal Vocational College achieved only 50% of its admission target in 2016
and 90% in 2018-2019. Contrary to current situation, 10 years ago, admissions to mining vocational colleges
was competitive as number of applicants from rural areas was quite high. Many people even needed to take
advantage of their close relationship to be accepted to mining colleges.
Remarkably, in recent years, coal mining industry has provided many benefit packages for its employees and
students. Per capita income of this industry is higher than income of other industries and average income of
whole country. Moreover, coal vocational college TKV not only covers tuition fee, living expenses for its students but also offers job opportunities for them right after their graduation. Tuition fee in Hanoi University of
Mining and Geology and Quang Ninh University of Industry is lower compared with fee in other universities in
Vietnam.
Regarding working facilities and conditions in mining industry, workers are provided transportation (not only for
working work but also for commuting from home to work), accommodation (with full facilities such as dining
room, bathroom with electric heater), healthcare services (heath check twice per year, lungs purification,
International Journal of Advance and Innovative Research Volume 8, Issue 3 (IV) July - September 2021 Part - 2
13
ISSN 2394 - 7780
holidays…). Furthermore, there are many activities for mining workers to enrich their mental life. However, all
above mentions benefits and treatments still cannot keep and appeal more labor to mining industry.
Besides hard and dangerous working conditions, there are many reasons for failure in appealing labor and enhancing engagement and commitment of current employees in coal mining sectors. When Vietnam economy
is now more and more integrated and developed, people who have strong financial support from family will
have tendency to study abroad, others will choose to study to be white-collar workers. Additionally, Vietnamese prefer having a stable position in government offices to directly producing goods as blue-collar workers.
Despite having high income, pitmen rarely have time to enjoy their life after working shift hours therefore they
would feel fed up and quit the job. Moreover, due to lack of positive information of coal mining industry, many
people are afraid to work in this sector.
2. Movement of high-quality workers: opportunities and challenges to labor force in mining industry
After than 10 years of negotiations, the Asean Economic Community (AEC) was officially established on 31st
December 2015, all Asean countries with high expectations on AEC strive towards economic development strategies and development of high quality and skilled human resources. According to blueprint, by 2025, AEC
will create 14 million new jobs for workers in Asean countries. However, this objective will not be attained
unless the agreement on free flow of labor migration is kept. In reality, the current labor movement among Asean countries is not popular, especially in Vietnam, number of migrant workers is still low. Current situation
not only go against the key objective of AEC but also create difficulties in achieving the objective of
strengthening economic integration in the region. Therefore, to get benefits from AEC, Asean countries have to
promote the movement of skilled labor flow. However, according to experts of Southeast Asia, the process of licensing, educational requirements and uncertainty about the regulations of both employers and employees in
Asean are the barriers to skilled labor mobility in AEC. In addition, currently there are differences in education
and training systems among Asean. It is necessary for Asean countries to implement standardization processes
to ensure the quality of labor.
Liberalization of labor in the AEC just began with the Mutual Recognition Agreements (MRAs) which allow
practitioners in eight professions to practice in other Asean Members through mutual recognition of their
qualifications (by building regional professions registration system), yet until now only 2 MRAs have been fully implemented. However, when AEC succeeds in facilitating the free mobility of skilled labor in the region, there
would be more difficulties for Vietnam Labor if they are lack of the necessary skills (language, professionalism
etc.). Additionally, as Asean countries have different targeted riorities to economic development and product diversification, demands of labor in these countries are also different. Specifically: automobile manufacturing
and high-tech production such as electronic components, software, electronic chips are focused in Malaysia,
Singapore; while minerals and natural resources mining industries are developed and expanded in different countries which have large mineral deposits e.g. oil and gas extraction in Indonesia, Brunei, Malaysia and
Vietnam; coal mining in Vietnam and Indonesia, copper, bauxite in Malaysia, Vietnam, Indonesia, the
Philippines; lead and zinc in Myanmar, Thailand, Indonesia, the Philippines. Southeast Asia produced great
chromium output accounted for 1/6 of the world and Vietnam holds the largest chromite reserves (22.8 million tons at Co Dinh - Thanh Hoa). It can be seen that although demands of labor in Asean countries are different,
there is a common feature i.e. they all focus on mineral and natural resource mining industries which is the basis
for economic development. Therefore, it is obviously essential to have more high-quality labor and international
labor migration for cooperation activities in exploiting minerals and natural resources in the region.
Signing in FTAs agreements helps Viet Nam labor market more open, which means there are more
opportunities as well as challenges to mining labor force in particular.
In regard to opportunities, Asean has wide labor market with nearly 600 million people having similarity in
physical health and cultural mindset. Moreover, the basic for economic development in these countries is
minerals and natural resources mining. Additionally, as Asean market is an attractive destination for foreign
direct investment, in recent year, the region has achieved economic growth of over 5%. In summary, in the near
future, there would be big demand of high quality labor force in mining industry.
Establishment of AEC enables and facilitates easier movement and travel within Asean. With the development
of land and aviation transport, it is more and more convenient for people to work abroad. However, there are not many international labor movement of mining industry within Vietnam. Specifically, until now there is only one
Indonesian company cooperates and invests in coal mining industry. In goal mining, despite having 100% FDI,
operation scale is still small and workers are mainly local people. Additionally, overseas Vietnamese labors
mainly work in construction in Malaysia, oil and gas extraction in Brunei, some Vietnamese companies with
International Journal of Advance and Innovative Research Volume 8, Issue 3 (IV) July - September 2021 Part - 2
14
ISSN 2394 - 7780
100% FDI invest in mining in Laos and Myanmar. Number of labor in mining industry move to foreign
companies is very small and inconsiderable. Recruitment within Asean for key positions in mining companies
has not ever occurred.
Regional integration creates more opportunities which are also big challenges to Viet Nam Labor market. Lack
of good physical health, professionalism, foreign language proficiency makes it difficult for Vietnamese
workers to take advantages of opportunities in competitive regional labor market. Easier movement of labor is also a risk of brain drain when high quality human resources of Vietnam can move to work in other countries.
This means there would be less skilled labor for mining industry.
3. Suggestions on improving labor force of mining industry in international labor force movement
International Labor Movement in general and high-quality labor migration in Vietnam in particular have been occurred and increased. Thus, to overcome the challenges and enhance our competitiveness in economic
integration, it is suggested that universities, vocational colleges and enterprises in mining industry put in great
effort to working out these following methods:
Firstly, education institutes need to design and provide students modern and practical curriculum and training
programs which are used for all universities and vocational colleges in mining industry. In reality, in mining
industry, human resources with university degree and higher degree mainly come from Hanoi University of Mining and Geology and Quang Ninh University of Industry, some from Geology Departments of Hanoi National
University, University of Transportation and Communications, Vietnam National University of Agriculture, others
from land surveying sector of Hanoi University of Natural Resources and Environment. Coal Vocational College
TKV focuses on training for human resources under university levels. However, there is little cooperation in developing and exchanging professional knowledge, defining targeted number of students and career orientation to
fit and meet the demand of human resources in mining industry. It is necessary for universities and colleges in the
industry to participate in scientific conferences to come up and unify new modern, suitable curriculums and
training programs.
Secondly, it is essential to improve quality of education to be in line with the high-quality human resource
requirements of international integration. According to the requirements of the Ministry of Education and
Training, students graduating from universities need to communicate in foreign languages in international workplace. However, in reality, not many students in university meet this requirement, this situation is even
worst in colleges and lower education degree. Vietnam laborers are unable to work overseas due to poor
language and practical skills. Moreover, as many majors in universities are outdated, after graduating, students are neither able to apply and manage new technologies nor work overseas. In short, it is substantial to have
international integrated curriculum and training programs in which foreign language proficiency is put in top
priority as the critical factor of educational efficiency.
Thirdly, it is also necessary to promote international cooperation in both vocational training and recruitment. At
present, Hanoi University of Mining and Geology has collaborated with many universities in Russia, Eastern
European countries and China in mining education and training programs. In the near future, other universities
and colleges related to mining industry are encouraged to further promote international cooperation activities instead of just sending students to study overseas without caring about the educational result and job allocation
after graduation.
Fourthly, education institutions in mining industry need to build strong connection with enterprises to have proper recruitment and benefit packages for talents. For example, Hanoi University of Mining and Geology and mining
companies have held many job fairs to offer opportunities for fresh graduate students. However, number of
students getting their right and desired jobs are small. Many companies which had short time for preparation and insufficient information failed to define and meet their need of human resources. Therefore, universities and
companies in mining ndustry are encouraged to promote supportive activities for students such as rewarding
scholarships for excellent students, offering and facilitating internship as well as job opportunities instead of just
providing statistics for students for final thesis.
Fifthly, it is critical to keep skillful workers from quitting their jobs. As mentioned above, in recent years, there has
been an increase in number of employees dropping out in mining industry especially in drift mining despite having
very good benefit packages. It is necessary for both coal sector and its members to take this problem serious and put it in top concern. Coal sector in general and mining companies in particular are highly recommended to satisfy
their employees’ need by not only paying high salary but also enhancing their social life, working conditions,
mitigating risks so that workers are work at their highest capacity and perform their best.
International Journal of Advance and Innovative Research Volume 8, Issue 3 (IV) July - September 2021 Part - 2
15
ISSN 2394 - 7780
RESULTS
Labor migration has opened up opportunities and also posed challenges to high quality labor force in Vietnam
companies in general and mining firms in particular. This article focuses on analyzing both opportunities and challenges of mining labor force in the circumstances of international labor movement. Additionally, some
solutions are proposed to develop quality of labor force to meet the need of skilled and competent labor in mining
companies.
REFERENCES
Books:
Farhaan Arman. (2009), Employees motivation at Areco India manufacturing private Limited, The M.B.A
Degree Course of Bangalore University, June, 38.
Phan The Cong and Ho Thi Mai Suong (2015), Prospects for labor mobility between countries of high
quality in the AEC after 2015. Journal of Economics and Forecasting.
Nguyen Van Diem, Nguyen Ngoc Quan (2007), Human Resource Management Curriculum, Publishing
House of National Economics University.
Nguyen Huu Lam, (2007), Organizational Behavior, Education Publishing House, Ho Chi Minh City.
A.H. Maslov (1943), A Theory of Human Motivation, Psychological Review 50: 370-96.
Journals:
Le Thi Duyen etc., (2009), The impact of international labor migration for the development of Viet Nam in
the international integration, Economic Management Journal.
Kovach, K.A. (1995), Employee motivation: addressing a crucial factor in your organization’s
performance, Employment Relations Today 22 (2), page 93-107
Prime Minister (2016), "The decision on the adjustment of the coal industry development plan to 2020,
with perspective to 2030", Decision No. 403/QD-TTg of the Prime Minister dated 14/03/2016, Ha Noi.
Saaty, L.T. 1980, The Analytic Hierarchy Process, New York, McGraw-Hill International.
Nguyen Huu Than (2009). Human resources management. Publish House of Social Labour, Hanoi.
Phuong Huu Tung (2015), “Training in Vietnam's coal industry in the context of world economic
integration”, Journal of Vocational, 11/2015, Hanoi.
Phuong Huu Tung, Vu Thi Thanh Huyen (2015), “Sustainable development of Viet Nam’s coal industry in the context of international economic integration”, EMMA2, HUMG & University of Applied Sciences
Georg Agricola Bochum, Germany, Hanoi.
Phuong Huu Tung (2015), “Improvement of internationlization of Human resource training in Viet Nam’s
coal industry in the context of international economic integration”, EMMA2, HUMG & University of
Applied Sciences Georg Agricola Bochum, Germany, Hanoi.
Phuong Huu Tung (2016), “Strengthening state management on Human resources development of Viet
Nam’s coal industry”, EMMA3, HUMG & University of Applied Sciences Georg Agricola Bochum,
Germany, Vietnam.
Phuong Huu Tung (2017), “Sustainable Development of Mineral Business”, International Conference on
Economic Sciences - Vietnam Economic Development in the process of international integration, 04/2017,
Hai Phong, Vietnam.
Phuong Huu Tung (2017), “Strengthening the State Management of Mineral Resources in Vietnam”, Geo-
spartial Technologies and Earth Resources (GTER 2017), Hanoi, Vietnam.
Vinacomin (2016), “Conference Report summarizing the training period 2011-2015, driven by 2020”,
Coal Industry Group - Minerals of Vietnam, 05/2016, Hanoi, Vietnam.
International Journal of Advance and Innovative Research Volume 8, Issue 3 (IV) July - September 2021 Part - 2
16
ISSN 2394 - 7780
IMMUNOCHEMICAL ANALYSIS, BIOCHEMICAL PROPERTIES AND IN-VITRO TOXICITY
ASSAY OF DABOIA RUSSELII VENOM
Priya Grace. S and *A. Ganesh Kumar Department of Microbiology, Hindustan College of Arts & Science
(Affiliated to University of Madras), Padur, OMR, Chennai – 603 103
ABSTRACT
Venomous snakes and poisonous animals are a significant cause of global morbidity and mortality. Snake venoms are complex mixtures of enzymatic proteins and different toxins. The venom of viperidae snakes
contains different components that are toxic and non-toxic, enzymatic and non-enzymatic. Snake venom is a
complex mixture of variety of biological substances including 90% of water ,20-25enzymes and a large number of low molecular eight peptides. Though greatly feared, venom is a natural biological resource that could be of
potential therapeutic value. Epidemiological studies suggest highest incidence of RV envenomation in eastern
India. This study focuses on biochemical and immunochemical characterization and the assay of in-vitro
toxicity of Daboia russelii venom.
Keywords: Venom, Daboia russelii, Phospholipase, In-vitro assay
INTRODUCTION
Around 5.4 million snake bites occur globally where 137,000 annual deaths results. Over 70% of death accounts
to Asia. [1,2]. The most medically important snakes are the “big four” snakes namely the spectacled cobra (Naja naja), common krait (Bungarus caeruleus), Russells viper (Daboia russelii) and saw scaled viper (Echis
carinatus). The snake responsible for Long term morbidity and majority of fatal envenoming is Daboia Russelii
[2]. Venoms are products suited to the survival in response to different ecological niche [3]. Different ecology and environment is the reason for variation in venom composition. [4]. The common clinical feature observed in
Daboia russelli bites in some parts of India and SriLanka is Neurotoxicity [5]. Venom proteome variation
significantly alters the biochemical and pharmacological activities. The biochemical assessesments like
phospholipase, haemolytic, fibrinogenolytic haemolytic and blood coagulation assays. There are significant differences in the action of D.russelii venoms from different biogeographical zones. The differences in abilities
inflicts cytotoxic, hemotoxic,and procoagulant effect in snakebite victims. [6].
In general snake venoms are rich source of hydrolytic enzymes. Viperid venoms on proteomic analysis revealed the presence of various enzymes like Phospholipases, serine proteinases and metalloproteinase. [7].
Phospholipases induce muscle necrosis and neurotoxicity (8,9,) Defibrinogen is induced by serine proteinases.
[10,11]. Hence in this study in-vitro studies along with biochemical characteristics have been carried out to
assess the toxicity.
MATERIALS & METHOD
Source of Venom
The freeze dried Daboia russelii venom was obtained from Irula Snake Catcher’s Industrial co-operative society
limited. Vedanemmeli village, Mahabalipuram, Chennai.
Dilution of venom
Lyophilized venom powder of 10 mg was dissolved in 0.5 ml of physiological saline. 10,000/500 ml.
Immunochemical method
Ouchterlony’s method was done to determine the antigenic potency of venom.1.5 % agarose gels of 1 mm thick
was prepared and three wells were punched. The central well loaded with 10 µl of commercially available horse
anti-venom and the peripheral wells were loaded with Daboia russelii venom of various dilutions and observed
for the formation of precipitin line.
Counter- Immuno Electrophoresis
To detect the presence of antigen within one-hour Immunoprecipitation technique was followed. Thoroughly cleaned grease free slides were coated with 2 % agar and wells were cut using a template. Daboia russelii
venom of 10 µl is added in one well and the other well is loaded with 10 µl of anti-venom and connected to gel
apparatus at 50 V for 30 min and examined on transilluminator.
International Journal of Advance and Innovative Research Volume 8, Issue 3 (IV) July - September 2021 Part - 2
17
ISSN 2394 - 7780
Biochemical Characterization of venom
Protein Estimation
Estimation of Protein in Daboia russelii venom was done by Lowry et al., method. 10 µl of the diluted sample was made up to 1 ml with distilled water, added with 5 ml of Solution C (Alkaline copper Solution) mixed and
left for 10 min after which 0.5 ml of solution D (Folin-Ciocalteau reagent) was added and incubated for 30 min
and optical density was read at 750 nm.
ENZYME ASSAY
Protease enzyme Assay
A mixture containing 0.5 ml of Mclivaines citrate buffer,0.5 ml of venom sample 1 ml of 1% casein was
incubated at room temperature for 20 minutes, to this 4 ml of 5 % TCA was added and incubated at room temperature for one hour. At the end of this the mixture was filtered. and 5 ml of Solution C (Alkaline copper
Solution) was added, mixed and left for 10 min after which 0.5 ml of solution D (Folin-Ciocalteau reagent) was
added and incubated for 30 min and optical density was read at 750 nm.
Acetyl Cholinesterase Enzyme assay
Around 280 µl of distilled water ,50 µl of 1 MKP04 buffer,100 µl of 10mM DTNB, 50 µl of venom sample 20
µl of 75 mM ATCI(substrate) were added to test tube and labelled as test. 280 µl of distilled water, 50 µl of 1 MKP04 buffer of 10 mM DTNB, 50 µl of venom sample 20 µl of 75 mM ATCI(substrate) were added to test
tube served as control. Tube containing all the reagents except venom served as blank. The tubes were
incubated for 10 min. After incubation 500 µl of 10 mM serine was added to all the test tubes and reaction was
stopped. The optical density was measured at 412 nm.
Protein profile of Daboia russelii venom Whole venom was analysed on 10% PAGE described by Laemeli .15 µl of venom sample was taken and treated
with sample treatment buffer in the ratio of 15:5. The sample solutions were heated in boiling water bath for two-three minutes, cooled and 20 µl of solution containing 100 µg of venom was taken in a microsyringe and
carefully injected into sample well through the electrolyte buffer, the run was then continued at 30mA until
bromophenol blue reaches the bottom of the gel. And silver staining was performed.
Chromatographic analysis of free amino acids& sugars in Daboia russelii venom 5 µl of venom sample was added to Whatman No1: filter paper 4 cm from one end of the strip. The filter paper
was dried and equilibrated in airtight cylindrical jar saturated with aqueous solution of solvent: butanol:
aceticacid: water in the ratio of 4:1:1. The paper was suspended in such a manner that it hung freely without touching sides of the container. The Solvent front was marked and Rf value was calculated. For sugars, the filter
paper was dried and sprayed with Kmno4(0.2%in 1% Na2Co3 and observed for appearance of coloured spots.
The presence of free sugars was identified
In-vitro venom toxicity assays
(i) Direct Hemolysis Assay
The hemolytic action of Daboia russelii venom were studied in vitro by using RBC. Briefly, 5ml of citrate
blood was centrifuged for 10minutes at 900 rpm. The supernatant was poured off and the pellet was washed twice with physiological salt solution. 5ml of physiological saline and 0.5ml of RBC mixture served as a
control. 5ml of distilled water with 0.5ml of washed RBC was used for 100% hemolysis. 5ml of venom/extract
and 0.5ml of washed RBC served as experimental sample. The tubes were put in a thermostat for 1hr at 37°C and centrifuged at 2000 rpm for 20 minutes. The supernatant fluid was poured off to separate tubes to measure
the optical density using spectrophotometer at a wave length of 540 nm against water. The calculation of
hemolysis was done by the formula
Experimental sample – Control sample x 100/100% hemolysis
(ii) Indirect Hemolysis Assay (PLA2 activity)
Phospholipase A2 activity was measured using an indirect hemolytic assay on agarose–erythrocyte–egg yolk gel
plate by the method described by Gutierrez et al., 1988. Increasing concentrations of Daboia russelii venom (μg) were added to 3mm wells in agarose gels (0.8% in PBS, pH 8.1) containing 1.2% sheep erythrocytes, 1.2%
egg yolk as a source of lecithin and 10mM CaCl2. Slides were incubated at 37˚C overnight and the diameters of
the hemolytic halos were measured. The Minimum Indirect Hemolytic Dose (MIHD) resembles to a
concentration of venom, which produced hemolytic halo of 11mm diameter.
International Journal of Advance and Innovative Research Volume 8, Issue 3 (IV) July - September 2021 Part - 2
18
ISSN 2394 - 7780
(iii) Procoagulant Activity
The procoagulant activity was done according to the method described by Theakston and Reid and it was
modified by Laing et al. 1992. The venom dissolved in 100 μl PBS (pH 7.2) was added in different concentration in to human citrated plasma at 37°C.The Minimum Coagulant Dose (MCD) of venom
concentration was determined by recording the Coagulation time, the plasma clotted within 60 seconds. The
plasma incubated with PBS alone served as control.
(iv) Proteolytic activity
Skim milked agar plate (1%) was prepared. Agar wells (2 wells per plate) were cut and 20 μl of Daboia russelii
venom was added to the plate and incubated for 24h at 37ºC. 20 μl of PBS alone served as a control. Zone of
hydrolysis of casein on milk agar plate was measured.
RESULTS
Immunochemical method
Ouchterlony’s Immunodiffusion method A high amount of reactivity was observed against Daboia russelii venom. Preciitation arcs were observed as a
result of interaction between venom and antivenom which shows the antigenic potency of the venom.
Counter immuno electrophoresis
The line of precipitin was observed in this method which confirmed the presence of antigen.
Biochemical Characterization of venom
Protein Estimation
The amount of protein in Daboia russelii venom was estimated and found to show 79% of protein.
Protease Enyme Assay
The protease activity of Daboia russelii was found to be 15.2 µg of tyrosine liberated /ml/min.
Acetyl Cholinesterase Enzyme assay
Acetyl Cholinesterase activity was nil in Daboia russelii venom. Viper venoms do not exhibit this activity.
Protein Profile of snake venom
Protein profile of Daboia russelii venom was studied by SDS-PAGE. The protein profile showed the presence
of many bands which confirmed that venom in general is a mixture of proteins.
Chromaographic analysis of free aminoacids & sugars in Daboia russelii venom
The amino acids present in the sample were identified by comparing with Rf value. It showed the presence of
free amino acids namely tyrosine, glutamine, histidine, leucine and some free sugars.
In-vitro toxicity Assay
Direct Hemolysis Assay
The hemolytic action of Daboia russelii venom were studied in vitro by using RBC. Daboia russelii produced
93.2 % of haemolysis.
Indirect Hemolysis Assay (PLA2 activity)
The phospholipase activity (PLA2) of Daboia russelii venom was measured using indirect hemolytic assay.
Daboia russelii venom of 25 μg showed haemolytic halo of 11 mm in diameter which corresponds to the
activity of 1 unit.
Procoagulant Activity
The minimum coagulant dose (MCD) was determined as the venom concentration inducing clotting of plasma in 60 s. The venoms showed coagulant activity and about 40 mg of Daboia russelii venoms clotted human
citrated plasma within 60 s.
Proteolytic activity
Zone of hydrolysis of casein on milk agar plate was measured and was found to be 7 mm in diameter.
DISCUSSION
One of the most neglected tropical maladies in the developing world is snake bite. [12] Daboia russelii is a
large and aggressive snake which on envenomation produces minor localized signs to life threatening systemic manifestations. [13]. The fangs of Daboia russelii are long and curved. During bite more than 70 % of stored
venom is emptied during bites. The venom induces coagulopathy due to the activation of factors and factor
International Journal of Advance and Innovative Research Volume 8, Issue 3 (IV) July - September 2021 Part - 2
19
ISSN 2394 - 7780
Glycoprotein and procoaulant is rich in D.russelli venom..[14].The average dry weight of venom injected at the
time of bite is 63 mg by D.russelli . Initial total dose of ASV to be administered 200 ml. [15,16].
The venom which is a modified saliva of snakes, contains mainly of proteins, secreted and stored in a large gland. In the present investigation, Immunochemical analysis and Biochemical properties of Daboia russelli
venom were studied. Daboia russelli venom was checked for the antigenic potency against commercially
available horse antivenom by Ouchterlony’s double diffusion test. High amount of reactivity was observed.
The proteins found in the viperid venom contains many components that are toxic and non- toxic. About 90% of
dry weight of venom is protein. The protein estimation was carried out and was found to be 79%. Proteases in
the venom play a major role in the digestion of prey. Assay of various enzymes present in venom like protease
and acetyl cholinesterase was observed and the protease activity was found to be 15.2 µg of tyrosine liberated
/ml/min.
The venoms that exhibit protease activity also exert protease activity. High protease activity is found in those
venoms that also exhibit high phospholipase activity.
In addition to the proteins the analysis of dried crude venom of vipers gives characteristic data on both organic
and inorganic constituents. These non-protein constituents also exhibit biological activity. The paper
chromatographic analysis reveals the presence of free sugars and amino acids.
One of the main challenges for finding suitable in vitro tests that would substitute in vivo experiments in the
evaluation of antivenoms has to do with the complexity of snake venoms and snakebite envenomings. In some
cases, the toxic profile of venoms depends on the action of one or few toxins which induce a single
toxicological effect, e.g., the action of some neurotoxic elapid venoms which act by blocking the neuromuscular junctions. Thus, once these components are identified, it is feasible to develop immunochemical or functional in
vitro tests to study the ability of antivenoms to react and neutralize these venoms. The study of snake venom
composition and mechanism of action,and toxic proteinsprovide relevant information to correlate it with invivo
tests. [17].
CONCLUSION
The above results showed the toxicity effects of Daboia russelii venom. Future plan consists of finding natural
anti-dote against the treatment of Daboia russelii envenomation.
REFERENCES:
1. World Health Organization (WHO). Snakebite envenoming: WHO Press; 2019
2. Suraweera W, Warrell D, Whitaker R, Menon G, Rodrigues R, Fu SH, Begum R, Sati P, Piyasena K, Bhatia M, Brown P, Jha P. Trends in snakebite deaths in India from 2000 to 2019 in a nationally
representative mortality study. Elife. 2020;9.
3. Mackessy SP. Evolutionary trends in venom composition in the Western Rattlesnakes (Crotalus viridis
sensu lato): Toxicity vs. tenderizers. Toxicon. 2010 Jul;55(8):1463-74.
4. Holding ML, Biardi JE, Gibbs HL. Coevolution of venom fu3nction and venom resistance in a rattlesnake
predator and its squirrel prey. Proc Biol Sci. 2016;283(1829).
5. Silva A, Maduwage K, Sedgwick M, Pilapitiya S, Weerawansa P, Dahanayaka NJ, et al. Neurotoxicity in Russell's viper (Daboia russelii) envenoming in Sri Lanka: a clinical and neurophysiological study. Clin
Toxicol (Phila). 2016 Jun;54(5):411-9.
6. Kendre PP, Jose MP, Varghese AM, Menon JC, Joseph JK. Capillary leak syndrome in Daboia russelii bite-a complication associated with poor outcome. Trans R Soc Trop Med Hyg. 2018;112(2):88–
93. pmid:29584906.
7. Gutiérrez JM, Calvete JJ, Habib AG, Harrison RA, Williams DJ, Warrell DA. Snakebite envenoming. Nat
Rev Dis Primers (2017) 3:17063. 10.1038/nrdp.2017.63
8. Kini RM. Excitement ahead: structure, function and mechanism of snake venom phospholipase A2
enzymes. Toxicon (2003) 42:827–0. 10.1016/j.toxicon.2003.11.002
9. Lomonte B, Gutiérrez JM. Phospholipases A2 from Viperidae Snake Venoms: How do They Induce
Skeletal Muscle Damage? Acta Chim Slov (2011) 58:647–59.
10. White J. Snake venoms and coagulopathy. Toxicon (2005) 45:951–. 10.1016/j.toxicon.2005.02.030.

International Journal of Advance and Innovative Research Volume 8, Issue 3 (IV) July - September 2021 Part - 2
20
ISSN 2394 - 7780
11. Serrano SMT, Maroun RC. Snake venom serine proteinases: Sequence homology vs. substrate specificity,
a paradox to be solved. Toxicon (2005) 45:1115– 10.1016/j.toxicon.2005.02.020.
12. Kasturiratne, A. , Wickremasinghe A. R., de Silva N., Gunawardena N. K., Pathmeswaran A., Premaratna R. et al. 2008. The global burden of snakebite: a literature analysis and modelling based on regional
estimates of envenoming and deaths. PLoS Med. 5:e218
13. Alirol, E. , Sharma S. K., Bawaskar H. S., Kuch U., and Chappuis F.. 2010. Snake bite in South Asia: a
review. PLoS Negl. Trop Dis. 4:e603
14. Vikrant S, Parashar A. Case report: Snakebite -induced acute kidney injury: Report of a successful
outcome during pregnancy. Am J Trop Med Hyg. 2017;96:885–6.
15. Warrel DA. Injuries, envenoming, poisoning and allergic reactions caused by animals. In: Warrell DA, Cox
TM, Firth JD, editors. Oxford Text Book of Medicine. 10th ed. Oxford University Press; 2010. pp. 1324–31
16. Harrisn RA, Hargreaves A, Wagstaff SC, Faragher B, Lalloo DG. Snake envenoming: A disease of
poverty. PLoS Negl Trop Dis. 2009;3:e569
17. Jose Maria Guiterrez et al.,In Vitro Tests for Assessing the Neutralizing Ability of Snake Antivenoms:
Toward the 3Rs Principles, Front. Immunol., 11 January 2021
International Journal of Advance and Innovative Research Volume 8, Issue 3 (IV) July - September 2021 Part - 2
21
ISSN 2394 - 7780
IMPACT OF AIR POLLUTION FROM AMBIENT AIR ENVIRONMENT TO GLOBAL
ENVIRONMENT
Satrughan Kumar Singh1 and Jainath Yadav
2
Research Scientist1, TRINITY – A Foundation for Research, Dhanbad, India
Assistant Professor2, Central University of South Bihar, Gaya, India
ABSTRACT
All major coal mining activities contribute to the problem of air pollution directly or indirectly. This study revealed that there is a steady deterioration of air quality in Jharia coalfield region. There is sufficient evidence
to indicate that atmospheric carbon dioxide concentration is increasing. The warming up of atmosphere in the
ambient air zone due to presence of greenhouse gases is very much prominent. Acid rain causes adverse effects to sensitive ecosystem. The protective ozone layer is being damaged by chemicals released on the earth.
Modern technology has developed sufficiently. Necessary protective measures must be adopted at all probable
sources for maintaining the ambient air quality in and around Jharia coal mining area.
KEYWORDS: Air pollutants; jharia coalfield; ambient air; health impacts; protective measures; control
mitigatives;
1. INTRODUCTION
The main factor that has prompted in the selection is that the concentration of air pollutants such as particulate
matter (of size 10, 2.5 and 1.0), carbon dioxide, methane, sulphur dioxide, nitrogen dioxide, carbon monoxide, ozone and various other hydrocarbons play prominent roles towards thinning of ozone layer, global warming,
forest damage, diversity of species and many other aspects. Fig.1 shows major sources of primary and
secondary air pollutants from natural or anthropogenic activities. This approach to all these worldwide critical problems is rather restricted to narrow individual specialities. In general, coal mining activities are accompanied
by a variety of environmental problems. Environmental monitoring and impact assessment studies undertaken
by a project study in the Jharia coalfields resulted in quantification of the major atmospheric pollutants, pinpoint
their vulnerable sources, characteristics, seasonal and annual trend along with meteorological variables. The study highlighted the various air pollution problems in the area. A steady deterioration of air quality of this
mining area was revealed. The average ambient air concentration of particulate matter, sulphur dioxide and
nitrogen dioxide has been recorded to be significantly higher than the international standards. Long term exposures to pollutants have adverse effect on human health. The hospital records also show the comparatively
high incidence of respiratory diseases like lung tuberculosis, bronchitis, asthma and cardiovascular diseases in
recent years. In analysing data for the health statistics, the relationship between two different variables like
levels of pollutants and the incidence of diseases, their nature and strength of the relationship were examined by
the regression and correlation analysis.
2. IMPACT OF AIR POLLUTION
The impact of industrialization on atmosphere, land and water bodies for both surface and underground are enormous. The oxidised products of carbon, sulphur and nitrogen species formed due to natural or
anthropogenic activities cause acid rain and affect vegetation and aquatic environment. The study carried out on
rain water quality of this coal mining and its allied industrial areas. It incorporated the parameters such as pH, rainfall and runoff rate, alkalinity, sulphate and nitrate contents. The acuteness of the problem of air pollution
has been clearly revealed from collected data from study area of the Jharia coal mines. This study have
indicated that large number of trace elements are mobilized in association with the airborne particulates
generated from high temperature combustion sources such as fossil fuel from power or thermal plants, metallurgical smelters, blast furnace, fire bricks industries, coke plants, automobiles and various mining and
industrial activities. Major elements such as lead, arsenic, cadmium, manganese, chromium, copper, zinc, nickel
were detected to be present at higher concentrations in the suspended dust collected from ambient air environment. There is considerable significance in terms of environmental health as because the toxic elements
present in the respirable size range of dust are effectively extracted into human blood stream. Specially, the
particles less than about 1.0 micrometer equivalent aerodynamic diameter deposit predominantly to the alveolar regions of the lung where the absorption efficiently for most trace elements is very significant about 60-80%.
There is also evidence that small pollutants act synergistically that is, their combined action exceeds the sum of
their individual actions but more intensive study is required in the mining areas. Air pollution adversely affects
man and their environment in several ways. It obscures vision, brings dustiness to houses, interferes with the growth of crops and other vegetation, and endangers human health. Air pollution has adverse affects on climate

International Journal of Advance and Innovative Research Volume 8, Issue 3 (IV) July - September 2021 Part - 2
22
ISSN 2394 - 7780
also. It affects the health of human and vegetation life, reduce visibility of light while transportation, degrade
climate changes.
Fig.1: Major sources of air pollutants in ambient air environment
Air pollution is known to cause chronic diseases such as bronchitis, emphysema and other cancerous and
arterio-sclerotic heart disease. Carbon monoxide is a common and major pollutant of air which cause highly and severe conditions for ambient air environment. It is highly toxic and dangerous pollutant if inhaled in sufficient
doses. Carbon monoxide is emitted in the ambient air to global environment by burning of coal and firewood. It
also reduces the level of 𝑂2 in the atmospheric air by converting it to 𝐶𝑂2. 𝑆𝑂2 and 𝑆𝑂3 cause the human
respiratory system. Air pollution can result in long-term changes in the earth’s climate. Carbon dioxide added to the earth’s atmosphere by burning of fossil fuels is sufficient to raise the temperature. It is virtually opaque to
the long wave radiation, emitted by the earth’s surface. When the level of carbon dioxide is increases, heat loss
through radiation from earth’s surface decreases. This is what the weather experts or scientists call the global warming. The major climatic changes will occurred by this global warming increasing and cause coastal
flooding in wide spread. The visibility significant and high level of air pollution reduces and interferes with safe
operation of air flights. It makes a difficult situation for transport movement on road traffic as well as air route.
Particulates are major offenders in reducing visibility, especially when coupled with oxides of nitrogen reaching peak values during rush hour traffic. Whenever, dust, ash and carbon particles are directly discharged into the
air, visibility is reduced by absorption and scattering of light, thereby reducing the contrast between the object
and its background. Air pollution also causes wide spread and costly damages to the plant and vegetation life. Sulphur dioxide fumes from copper smelters are also known to have caused heavy damage to timber lands.
Animals grazing on fluoride tainted vegetations and grasses are known to have a crippling disease, known as
fluoresces. Whereas, ozone, a photochemical oxidant in known to be a significant threat to leafy vegetations, tobacco, fruits and dense forest trees. These particulates get deposited on the leaves and clog the stomata, and
thus disturbing the transpiration rate of the plant system. it also damages the tissues or cells of the plant leaves
and causes retardation of the growth of the plant and its fruit bearing capacity. The gaseous pollutants damaging
role is more significant. These enter through the stomata and causes collapse of leaf tissues. Ethylene, a hydrocarbon makes carnation petals curl inwards and ruins orchids by drying and discolouring of its petals.
Ozone gas causes yellow spot formation leaves. There would be 0.3% - 0.6% increase in risk of cataract if there
will be 1% decrease in Ozone level [6]. Eye lens can be damaged by oxidative agents [12]. Oxidative oxygen produced by UV radiation can severely damage eye lens and cornea of eye is also badly damaged by UV
radiation [15-17]. Photokeratitis, cataract, blindness all are caused due to UV rays [10]. UV radiations are also
responsible for breast cancer and leukemia [10]. Depletion of ozone layer leads to both Sun burn and skin
cancer [11].
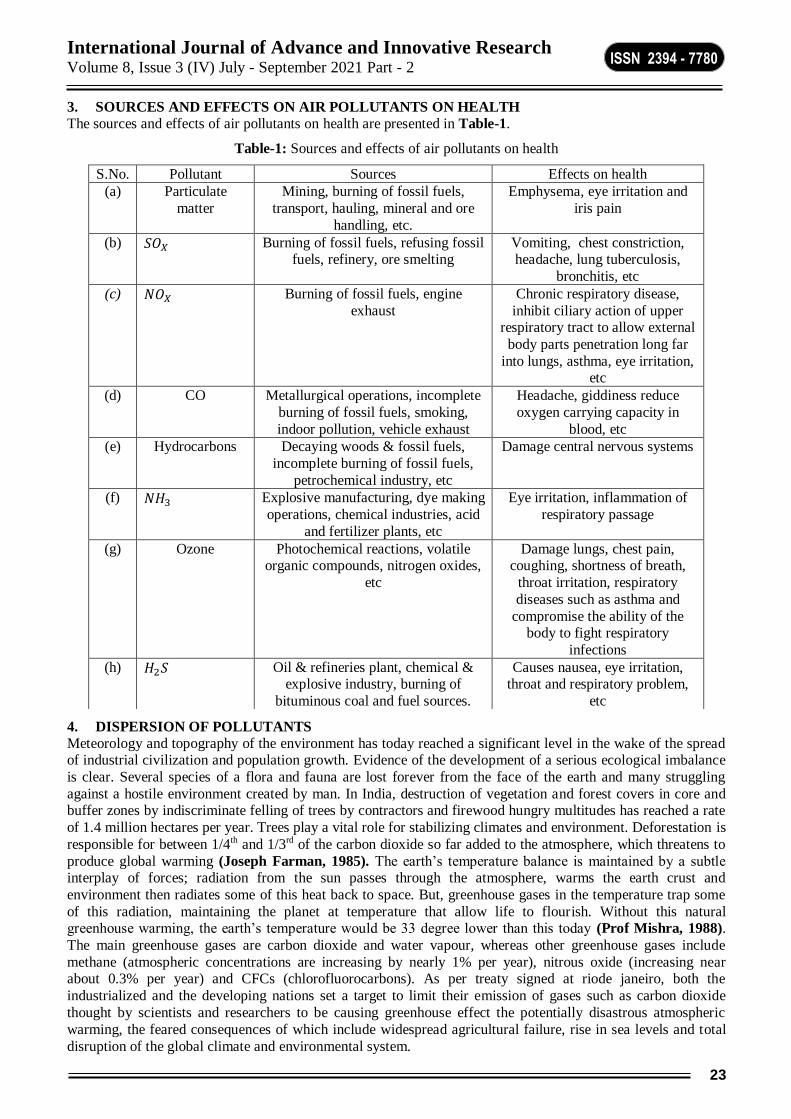
International Journal of Advance and Innovative Research Volume 8, Issue 3 (IV) July - September 2021 Part - 2
23
ISSN 2394 - 7780
3. SOURCES AND EFFECTS ON AIR POLLUTANTS ON HEALTH
The sources and effects of air pollutants on health are presented in Table-1.
Table-1: Sources and effects of air pollutants on health
4. DISPERSION OF POLLUTANTS
Meteorology and topography of the environment has today reached a significant level in the wake of the spread of industrial civilization and population growth. Evidence of the development of a serious ecological imbalance
is clear. Several species of a flora and fauna are lost forever from the face of the earth and many struggling
against a hostile environment created by man. In India, destruction of vegetation and forest covers in core and buffer zones by indiscriminate felling of trees by contractors and firewood hungry multitudes has reached a rate
of 1.4 million hectares per year. Trees play a vital role for stabilizing climates and environment. Deforestation is
responsible for between 1/4th and 1/3rd of the carbon dioxide so far added to the atmosphere, which threatens to
produce global warming (Joseph Farman, 1985). The earth’s temperature balance is maintained by a subtle interplay of forces; radiation from the sun passes through the atmosphere, warms the earth crust and
environment then radiates some of this heat back to space. But, greenhouse gases in the temperature trap some
of this radiation, maintaining the planet at temperature that allow life to flourish. Without this natural greenhouse warming, the earth’s temperature would be 33 degree lower than this today (Prof Mishra, 1988).
The main greenhouse gases are carbon dioxide and water vapour, whereas other greenhouse gases include
methane (atmospheric concentrations are increasing by nearly 1% per year), nitrous oxide (increasing near about 0.3% per year) and CFCs (chlorofluorocarbons). As per treaty signed at riode janeiro, both the
industrialized and the developing nations set a target to limit their emission of gases such as carbon dioxide
thought by scientists and researchers to be causing greenhouse effect the potentially disastrous atmospheric
warming, the feared consequences of which include widespread agricultural failure, rise in sea levels and total
disruption of the global climate and environmental system.
S.No. Pollutant Sources Effects on health
(a) Particulate
matter
Mining, burning of fossil fuels,
transport, hauling, mineral and ore
handling, etc.
Emphysema, eye irritation and
iris pain
(b) 𝑆𝑂𝑋 Burning of fossil fuels, refusing fossil fuels, refinery, ore smelting
Vomiting, chest constriction, headache, lung tuberculosis,
bronchitis, etc
(c) 𝑁𝑂𝑋 Burning of fossil fuels, engine
exhaust
Chronic respiratory disease,
inhibit ciliary action of upper respiratory tract to allow external
body parts penetration long far
into lungs, asthma, eye irritation, etc
(d) CO Metallurgical operations, incomplete
burning of fossil fuels, smoking,
indoor pollution, vehicle exhaust
Headache, giddiness reduce
oxygen carrying capacity in
blood, etc
(e) Hydrocarbons Decaying woods & fossil fuels,
incomplete burning of fossil fuels,
petrochemical industry, etc
Damage central nervous systems
(f) 𝑁𝐻3 Explosive manufacturing, dye making
operations, chemical industries, acid
and fertilizer plants, etc
Eye irritation, inflammation of
respiratory passage
(g) Ozone Photochemical reactions, volatile organic compounds, nitrogen oxides,
etc
Damage lungs, chest pain, coughing, shortness of breath,
throat irritation, respiratory
diseases such as asthma and
compromise the ability of the body to fight respiratory
infections
(h) 𝐻2𝑆 Oil & refineries plant, chemical & explosive industry, burning of
bituminous coal and fuel sources.
Causes nausea, eye irritation, throat and respiratory problem,
etc
International Journal of Advance and Innovative Research Volume 8, Issue 3 (IV) July - September 2021 Part - 2
24
ISSN 2394 - 7780
5. THINNING OF OZONE LAYER
Ozone layer is also naturally broken down but there is a balance between its formation and natural depletion
[12]. As a result the total amount of ozone remains constant [12]. But ozone layer thickness varies with altitude and seasonal change. Ozone concentration is highest between 19-23 km [2]. At thin veil of ozone, 25-40 kms
above the earth’s surface, protects life below from the portion of the sun’s UV radiation that would otherwise
damage many forms of life. This protective ozone layer is being damaged by chemicals released on the earth’s surface, notably, the CFCs widely used in refrigerators, aerosols and as cleaners in many industries. Although
natural phenomenon can cause ozone depletion but human activities such as CFCs are now accepted as major
cause of depletion [4]. These CFCs have also adverse affects on human health [5]. CFCs are now being phased
out by 2000 and a time table for phasing out other ozone depleting substances has also been agreed on and may even be accelerated. Global warming leads to increasing ozone layer depletion. Due to global warming and
green house effect most of the heat is trapped in troposphere which is the layer below the stratosphere
[12]. The ozone layer is basically naturally occurring gas in the region of stratosphere where ozone particles are accumulated [3]. As we all know ozone is present in stratosphere so heat don’t reaches
troposphere and it remain cold as recovery of ozone layer requires maximum sunlight and heat so it leads to
depletion of ozone layer [1].
6. EFFECTS ON GLOBAL COMMUNITY AND ENVIRONMENT
The effect of air pollution on a large scale world or global environment was felt even in the beginning of this
century and started drawing control attention of the global world community. In the early 1900’s, gases from
stacks at two copper smelters, in Ducktown, Tennessee, USA caused damages to the vegetation in the country side. Two decades later, a similar case occurred, involving Pb-smelters at trails, British Columbia, Canada. A
strong atmospheric inversion settled over the Meuse-Valley, Belgium, on December 01, 1930, and remained till
December 05. In the late 1940’s, Pittsburgh, Pennsylvania, USA was nick named a ‘smoky city’. During a particularly calm, and meterological stable period from 27-31 October, 1948, air pollutants accumulated and as
a result, 20 persons died in Donora, Pennsylvania, USA. It was found that 𝑆𝑂2, 𝑆𝑂3 and 𝐻2𝑆𝑂4 and inorganic
sulphates were present in the air in abnormality high levels. The one of the famous ‘London Smog’ on
December 1952 was another major air pollution catastrophe. The smog has lasted for 5 days from 05-09 December, 1952. The rapid and uncontrolled increasing of industrialization activities has brought these critical
problems in sharper focus in recent years. The prolific growth of automobiles and auto-emissions has further
compounded the magnitude of these problems. In order to quantify and monitoring ambient air quality in the coal belts and its allied industrial areas, the initial and foremost requirements are that the layout of the area
under proper surveillance should be studied in depth located the position of source point and upto destination
point in ambient coverage areas.
7. CONCLUSIONS
Coal and oil fired thermal stations and automobiles industries do a great deal of harm to both nature and human
by discharging airborne ash, sulphur dioxide, nitrogen dioxide and certain hydrocarbons. Effective methods
have been developed for trapping these harmful chemicals and thus less atmospheric pollution. Industrial planners must arrange for the location of industries on the leeside of prevailing winds so that the pollutants can
normally be blown away from heavily populated area.
REFERENCES [1] Sivasakthivel, T. and Reddy, K.K.S.K. (2011) Ozone Layer Depletion and Its Effects: A Review.
International Journal of Environmental Science and Development, 2, 30-32.
[2] Morrisette and Peter M. (1995) The Evolution of Policy Responses to Stratospheric Ozone
Depletion. Natural Resources Journal, 29, 796-797.
[3] United States Environmental Protection Agency (EPA) (2010) Ozone Layer Depletion 2010 Assessment.
[4] Angell, J.K. and Korshover, J. (2005) Quasi-Biennial and Long-Term Fluctuations in Total Ozone.
Monthly Weather Review, 101, 426-43.
[5] Chlorofluorocarbons (CFCs) (2010) Health Information Summary. Environmental Fact Sheet. New
Hampshire Department of Environmental Services
[6] United Nations Environment Programme (1994) Environmental Effects of Ozone Depletion: 1994
Assessment. UNEP, Nairobi.
[7] Christenson, L.J., Borrowman, T.A., Vachon, C.M., et al. (2005) Incidence of Basal Cell and Squamous
Cell Carcinomas in a Population Younger Than 40 Years. JAMA, 294, 681-690.

International Journal of Advance and Innovative Research Volume 8, Issue 3 (IV) July - September 2021 Part - 2
25
ISSN 2394 - 7780
[8] Eaton, J.W. (1995) UV-Mediated Cataractogenesis: A Radical Perspective. Documenta Ophthalmologica,
88, 233-242.
[9] Lee, K.W., Meyer, N. and Ortwerth, B.J. (1999) Chromatographic Comparison of the UVA Sensitizers Present in Brunescent Cataracts and in Calf Lens Proteins Ascorbylated in Vitro. Experimental Eye
Research, 69, 375-384.
[10] Wargent, J.J. and Jordan, B.R. (2013) From Ozone Depletion to Agriculture: Understanding the Role of
UV Radiation in Sustainable Crop Production. New Phytologist, 197, 1058-1076.
[11] Pearce, M.S., Parker, L., Cotterill, S.J., Gordon, P.M. and Craft, A.W. (2003) Skin Cancer in Children
and Young Adults: 28 Years’ Experience from the Northern Region Young Person’s Malignant Disease
Registry. UK. Melanoma Research, 13, 421-426.
[12] Anwar F., Chaudhry F.N., Nazeer S., Zaman N. and Azam S. (2016) Causes of Ozone Layer Depletion
and Its Effects on Human: Review. Atmospheric and Climate Sciences, 6, 129-134.
International Journal of Advance and Innovative Research Volume 8, Issue 3 (IV) July - September 2021 Part - 2
26
ISSN 2394 - 7780
IMPACT OF COVID 19 PANDEMIC ON ENVIRONMENTAL HEALTH, HEALTH BEHAVIORS
AND HEALTH CARE SYSTEM AWARENESS OF STUDENTS
1Youganjaly Mehra and
2Dr. Kalpana Sharma
1Ph.D Scholar, ASPESS, Amity University, Uttar Pradesh (India) 2Professor, Supervisor & Director, ASPESS, Amity University, Uttar Pradesh (India)
ABSTRACT
During this Covid19 period health related quality of life has decreased drastically. In this pandemic the world is facing a huge challenge. Now people are more concerned about their health and wellness. Corona virus has
changed the way people used to live before. Now the people across the world are following many health
precautions to minimize the effect of this deadly virus. The health system of many countries has nearly collapsed because of this virus. This pandemic period has locked the entire human race in their homes due to which
people are facing many challenges related to different parameters of health. The aim of the study was to
investigate the impact of Covid19 pandemic on environmental health, health behaviors and health care system
awareness of students. The survey study research method was applied and purposive sampling was done in which standardize questionnaire was distributed online among 500 participants with the help of Google forms.
112 Physical Education Graduates from Amity University, Noida, Uttar Pradesh 2020-2021 current batches
responded and their age range between 18-25 years. In order to analyze, the data, mean and standard deviation was used. It was found that environmental health of students were affected in a positive way, rest
health behaviors and health care system awareness of students of Amity School of Physical Education and
Sports Sciences, Noida, Uttar Pradesh were seen fare. So it can be concluded that environmental health was
improved because due to the Covid19 pandemic there was extended shutdown and traditional classes, office work were shifted to online portal which results in 90 percent emission reduction. A study also found that
traditional classes and office work created 180 pounds of CO2 emissions due to travelling long distance with
public and private vehicles as compared to only four pounds for an online student. But at the same time health
behaviors and health care system awareness were seen fare.
KEYWORDS: Survey, Health, Corona virus, Holistic, Government Schemes
INTRODUCTION
Four months after the first confirmed case of COVID-19 in Wuhan, China, on November 17, 2019, the World Health Organization acknowledged this new corona virus disease as a global pandemic (Adil, 2020). Since
then, due to international commercial connections and traveling, the disease has rapidly spread all over the
world, with 96 906 712 confirmed cases and 2 075 902 deaths (January 21, 2021) (Dong E).
Corona virus disease has changed the course of life of everybody across the world. Everyone is forced to lock inside their homes, now people are feeling like caged birds. The health-related quality of life has decreased
tremendously due to the outbreak of this deadly disease. People who have suffered from this disease are now
bound to certain medicines due to the lifelong affects that this virus left behind. A study was conducted to 1 examine the effect of COVID-19 on the health-related quality of life. This study has stated that 11 during the
pandemic, 41.4 %parents stated that their kids has increased their tendency to sleep by 34.5%and has increased
the use of internet by 69.3%.The health system of our country has suffered a huge setback due to this disease as we all know that India has a large population, and we do not have many resources to deal with such huge
number of patients but in spite of that India was able to battle with this virus way better than the other
developed countries which has better medical resources than India. Now people are more aware about their
living conditions they are taking efforts to keep their surroundings germs free as there is only one cure to this disease that is prevention and hygiene. The government is needed to run an awareness program with vaccination
camps so that people get aware of all the governmental schemes and programme’s; knowledge of which can
help in minimizing the crisis.
PROCEDURE
The standardized questionnaire “Health related quality of life” (Sharma.K & Ajit, 2020) was distributed among
500 participants through the help of Google Forms out of whom 112 participants responded.
1. The total variables selected were environmental health, health behaviors’ and health care system
awareness.
2. The survey study research method was applied for the purpose of the study.

International Journal of Advance and Innovative Research Volume 8, Issue 3 (IV) July - September 2021 Part - 2
27
ISSN 2394 - 7780
3. Covid19 is the independent variable and environmental health, health behaviors’ and health care system
awareness are the dependant variables
RESULTS AND CONCLUSION OF THE STUDY
S.NO. NAME OF THE VARIABLE MEAN SCORE OBTAINED
ASSESMENT
1. Environmental Health 26.39285714 Good
2. Health Behaviors 25.30357143 Fare
3. Health Care System Awareness 22.33928571 Fare
Table 1: Mean score obtained from the variables according to questionnaire norms
Table No. 1 revealed the mean score obtained from collection of data and their assessment according to the norms mentioned in the standardized questionnaire. The score obtained from 112 participants of Physical
Education Graduates From Amity University, Noida of environmental health (26.39285714), health behaviors
(25.30357143), health care system awareness (22.33928571) was found. The table also revealed the assessment of these variables, i.e., environmental health of 112 participants were good, health behaviors of 112 participants
were fare, health care system awareness of 112 participants were fare according to the norms mentioned in the
standardized questionnaire.
S.NO DEPENDANT VARIABLE N MEAN STANDARD DEVIATION
1. Environmental Health 112 26.39285714 6.137107842
2. Health Behaviors 112 25.30357143 4.978945374
3. Health Care System Awareness
112 22.33928571 6.325343806
Table 2: Mean and Standard deviation of dependant variables
Table No. 2 revealed the average scores of Environmental Health, Health Behaviors and Health Care System Awareness of Physical Education Graduates From Amity University, Noida of 2020-21 batch were
26.39285714, 25.30357143 and 22.33928571 respectively. The table also revealed the standard deviation of
students in Environmental Health, Health Behaviors and Health Care System Awareness. The obtained score of Environmental Health (6.137107842), Health Behaviors (4.978945374) and Health Care System Awareness
(6.325343806) were found.
DISCUSSION OF FINDINGS The results of the study of impact of Covid19 pandemic on environmental health, health behaviors and health
care system awareness of students had been observed and results of the same have been drawn. Further, the
scholar has investigated the causes for the results which are being discussed in the following paragraphs.
The awareness of Environmental Health (26.39285714) which is good during Covid19 pandemic could be because of the more time spent in home so they got more time in cleaning and maintaining hygienic
environment around their surroundings. Also because of no travelling to the educational institutions there is less
emission of poisonous gases due to vehicles and hence resulting in fare environmental health. The results of the study are similar with the results of the review article by (Hung, 2015) which says that due to Covid19
pandemic, traditional classes shifted to online classes which results in 90 percent emission reduction. The study
also found that traditional classes created 180 pounds of CO2 emissions, compared to only four pounds for an
online student.
The awareness of Health Behaviors (M=25.30357143) which is fare during Covid19 pandemic could be
because all restaurants, bars, night clubs were closed during this time. So chances of involvement in any kind of
illegal drugs, alcohol, and tobacco were very less. Also harmful side of these kinds of activities especially in these stressful times were taught not only by teachers but also many media channels were also focusing on

International Journal of Advance and Innovative Research Volume 8, Issue 3 (IV) July - September 2021 Part - 2
28
ISSN 2394 - 7780
same, to improve the health behavior habits of the people. Many nutrition webinars were also conducted by
different universities so that students can engage themselves in healthy behavior habits.
The awareness of Health care system awareness (M=22.33928571) which is fare during Covid19 pandemic could be because all the schemes and plans regarding health were especially focused by government, media and
teachers online. The health care system was especially focusing on people to follow all the guidelines given by
the government to protect themselves from this corona virus disease. The results of the study are similar to the review article by (Naseer Ahmed, 2020) which suggests that the vast majority of the health care professionals
have adequate knowledge and awareness related to health care schemes.
CONCLUSION
Within the limitations of the present study and on the basis of the analysis of data, the following conclusions
were drawn:
a. There is a significant effect of Covid19 pandemic on environmental health, health behaviors and health
care system awareness of Physical Education Graduates, Amity University, Noida aged between 18-25
years.
b. Our findings suggest that increased amount of timings at home due to closure of everything due to
pandemic has affected all the three variables of health in different ways.
REFERENCE
Adil, M. R. (2020). The pandemic of Covid-19.
Dong E, H. G. An interactive web-based dashboard to track COVID-19 in real time.
Hung, D. (2015, May 14). 4 Unsung Environmental Benefits of Online Education . Retrieved from
https://www.triplepundit.com/story/2015/4-unsung-environmental-benefits-online-education/35151
Naseer Ahmed, M. S. (2020). Knowledge, Awareness and Practice of Health care Professionals amid
SARS-CoV-2, Corona Virus Disease Outbreak. Pakistan Journal Of Medical Sciences .
.
International Journal of Advance and Innovative Research Volume 8, Issue 3 (IV) July - September 2021 Part - 2
29
ISSN 2394 - 7780
IMPACT OF DISCUSSION ON LEARNING AMONG STUDENTS
*Dr. Vandana Jain and **Ms. Ashwini S Shetty *Assistant Professor & HOD, Department of Psychology, SDM College (Autonomous), Ujire
**Assistant Professor, Department of PG Studies and Research in Psychology, SDM College PG College
(Autonomous), Ujire
ABSTRACT
Learning is the process of acquiring new understanding, knowledge, behaviours, values, attitudes and preferences. Discussion is important to learning in all disciplines because it helps student’s process information
rather than simply receive it. Teachers use discussion tasks to achieve different goals like critical inquiry,
debate and reflection. The goal of a discussion is to get students to practice thinking about the course material. The objective of the present study is to find the impact of discussion on learning among students. The study
adopted static group comparison, pre experimental research design and purposive sampling method was used
for data collection. The sample size of the study is 38, which were divided equally among the experimental and
control group. The 12 MCQ questions and three descriptive questions were used to assess the learning. The study was analysed using independent sample t test. The findings showed a significant impact of discussion on
leaning.
Keywords: Learning, Discussion, Teachers and Students
INTRODUCTION:
Learning:
According to UC Berkeley, learning is an active process which includes engaging and manipulating objects,
experiences, and conversations in order to build mental models of the world (Dewey, 1938; Piaget, 1964; Vygotsky, 1986). Learners build knowledge as they explore the world around them, observe and interact with
phenomena, converse and engage with others, and make connections between new ideas and prior
understandings. It involves enriching, building on, and changing existing understanding (Alexander, 1996, p.
89). Learning is not limited to individual level. It is necessary to think of learning as a social activity involving people, the things they use, the words they speak, the cultural context they are in and the actions they
take.(Bransford, et al., 2006; Rogoff, 1998).
Learning is situated in an authentic context. It provides learners with the opportunity to engage with specific ideas and concepts on a need to know or want to know basis (Greeno, 2006; Kolodner, 2006). It requires learners
motivation and cognitive engagement to be sustained when learning complex ideas as it need mental effort and
persistence (Berekely, UC).
The learning through discussion: Discussion is very often used as a tool in classrooms. When designed properly and used thoughtfully, discussion
tasks can be an effective learning tool that promote creativity, as well as generate meaningful interaction and
understanding for the learner. Well-designed discussion tasks lead to progressive knowledge-seeking inquiry (Scaramalia & Bereiter, 1994) or expansive learning (Engestrom, 1999) where learners are actively synthesizing
new information with prior knowledge and experiences in the process of creating not only new knowledge but
also new understanding of the learning process (Ngeow et al., 2003).
Teachers use discussion tasks to achieve different goals like critical inquiry, debate and reflection. However, it
is not difficult to ensure that “learning” will naturally occur in a discussion task. Perkins (1986) reminds
teachers that the meaningfulness of task is not in the problem but when the learner imposes his or her own
meanings and defines individual goals during the process of accomplishing the task. The purpose here is to produce something meaningful through critical enquiry, debate and reflection. The learning through discussion
framework shares aspects of Bereiter’s (1994) concept of progressive discourse, which aims at the learners to
first develop their individual thinking, then suspend these opinions to consider alternatives, and later negotiate
meaning with other discussants to arrive at a shared understanding of the issues at hand. (Ngeow et al., 2003)
Learning discussions can be one of the most regarding and most challenging teaching methods. Using
discussions as a primary teaching method allows stimulating critical thinking. Stabling a rapport with students can demonstrate that they are appreciated for the contributions at the same time that they are challenged to think
more deeply and to articulate their ideas more clearly.
International Journal of Advance and Innovative Research Volume 8, Issue 3 (IV) July - September 2021 Part - 2
30
ISSN 2394 - 7780
Procedure to take up the discussion:
Getting started by creating comfortable and non-threatening environment.
To know the students and their skills and perspectives in the discussions. For example, learning the
student’s names during the first week of class. Consistently using their names when calling on them or
referring to comments they have made in class or in threaded email discussions. These will convince them
that they you see them each as individuals with something valuable to add, thus creating an environment of
mutual trust and interest. At the same time, encourages the students to refer to one another by name.
Define what you think of as a successful discussion (for example, one that includes participation by all
group members, stays on topic, and explores issues in-depth and form a variety of perspectives) and make it
clear that good discussions rarely happened without effort.
Distribute or post on the board a list of rules and expectations that will promote successful discussions.
Communicate to students the importance of discussion to their success in the course as a whole. This can be
achieved by assigning grades for student participation and informing students of the specific criteria that
will be used.
To develop clear goals and a specific plan for each session, which will move the discussion forward,
illuminate major points, and prompt students to offer evidence for their assertions and to consider other points of view. Also write an outline or lits of guiding questions on the board before the begin of
discussion.
Throughout the discussion, teacher needs to summarize the major ideas and write.
Ask students to respond directly to one another’s ideas.
The use of small group discussions will allow students to become better acquainted and thus facilitate their
communication with one another.
Use verbal and non-verbal cues to encourage participation and show respect for all questions and comments
(WUStL, 2021).
Role of a teacher in discussion:
A best scheme of education becomes a bad scheme if the teachers handling it are bad; even so a bad scheme can, in practice, be made a good one, if the teachers are good (Nayak & Singh, 1997). Teaching methods are
patterns of teacher behaviour that occur either simultaneously or in sequence in a varied way. Choosing specific
teaching methods for the subject is an important decision of the teacher. The discussion class is a free give and take between teacher and students and among students on the current topic of concern in the course. It is
characterized by probing questions from the teacher designed to elicit student interpretations, opinions and
questions.
BENEFITS OF DISCUSSION: Each time when the teacher facilitates a discussion, they learn something about how best to approach the topic.
It will be beneficial to take brief notes on how each discussion went and use these as the basis for reorganizing
one’s own plan for the discussion, improving the presentation skills, rethinking the material included or developing ideas for future teaching and research projects. These notes can be included in the file for the course
so that they are readily accessible the next time in teaching the course (WUStL, 2021). Children learn to deal
with the facts through discussion method. It is the thought of taking a problem and investigating all options with an ultimate objective to reach a mutual understanding of the problem (Petty & Jenson, 1980). If students need to
prepare beforehand, provide them with appropriate materials and thought questions to guide their preparation
(Eger &Stanley, 1958). (Rahman et al., 2011)
REVIEW OF LITERATURE: The study conducted by Rahman.F et al., (2011) on Impact of discussion method on student’s performance
showed that discussion method was more effective than lecture method. The study conducted by Yusuf et al.,
(2016) recommended that teachers should be encouraged to use discussion method alongside the conventional method to enrich their reading comprehension lessons.” Hwang Wu-Yuin et al., (2018) study on Exploring
effects of discussion on visual attention, learning performance, and perceptions of students learning with STR-
support suggest that learning activities, such as student discussion, need to be introduced during lectures in
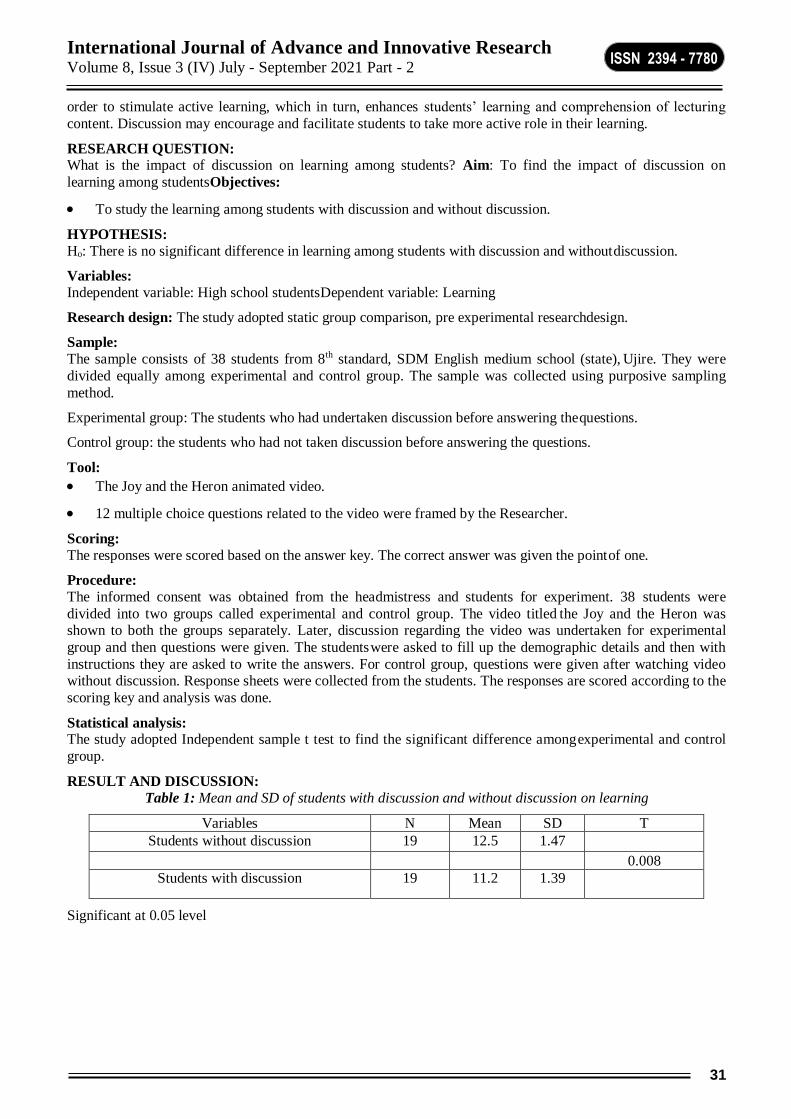
International Journal of Advance and Innovative Research Volume 8, Issue 3 (IV) July - September 2021 Part - 2
31
ISSN 2394 - 7780
order to stimulate active learning, which in turn, enhances students’ learning and comprehension of lecturing
content. Discussion may encourage and facilitate students to take more active role in their learning.
RESEARCH QUESTION: What is the impact of discussion on learning among students? Aim: To find the impact of discussion on
learning among students Objectives:
To study the learning among students with discussion and without discussion.
HYPOTHESIS:
Ho: There is no significant difference in learning among students with discussion and without discussion.
Variables:
Independent variable: High school students Dependent variable: Learning
Research design: The study adopted static group comparison, pre experimental research design.
Sample:
The sample consists of 38 students from 8th standard, SDM English medium school (state), Ujire. They were
divided equally among experimental and control group. The sample was collected using purposive sampling
method.
Experimental group: The students who had undertaken discussion before answering the questions.
Control group: the students who had not taken discussion before answering the questions.
Tool:
The Joy and the Heron animated video.
12 multiple choice questions related to the video were framed by the Researcher.
Scoring:
The responses were scored based on the answer key. The correct answer was given the point of one.
Procedure:
The informed consent was obtained from the headmistress and students for experiment. 38 students were
divided into two groups called experimental and control group. The video titled the Joy and the Heron was shown to both the groups separately. Later, discussion regarding the video was undertaken for experimental
group and then questions were given. The students were asked to fill up the demographic details and then with
instructions they are asked to write the answers. For control group, questions were given after watching video without discussion. Response sheets were collected from the students. The responses are scored according to the
scoring key and analysis was done.
Statistical analysis: The study adopted Independent sample t test to find the significant difference among experimental and control
group.
RESULT AND DISCUSSION:
Table 1: Mean and SD of students with discussion and without discussion on learning
Variables N Mean SD T
Students without discussion 19 12.5 1.47
0.008
Students with discussion 19 11.2 1.39
Significant at 0.05 level
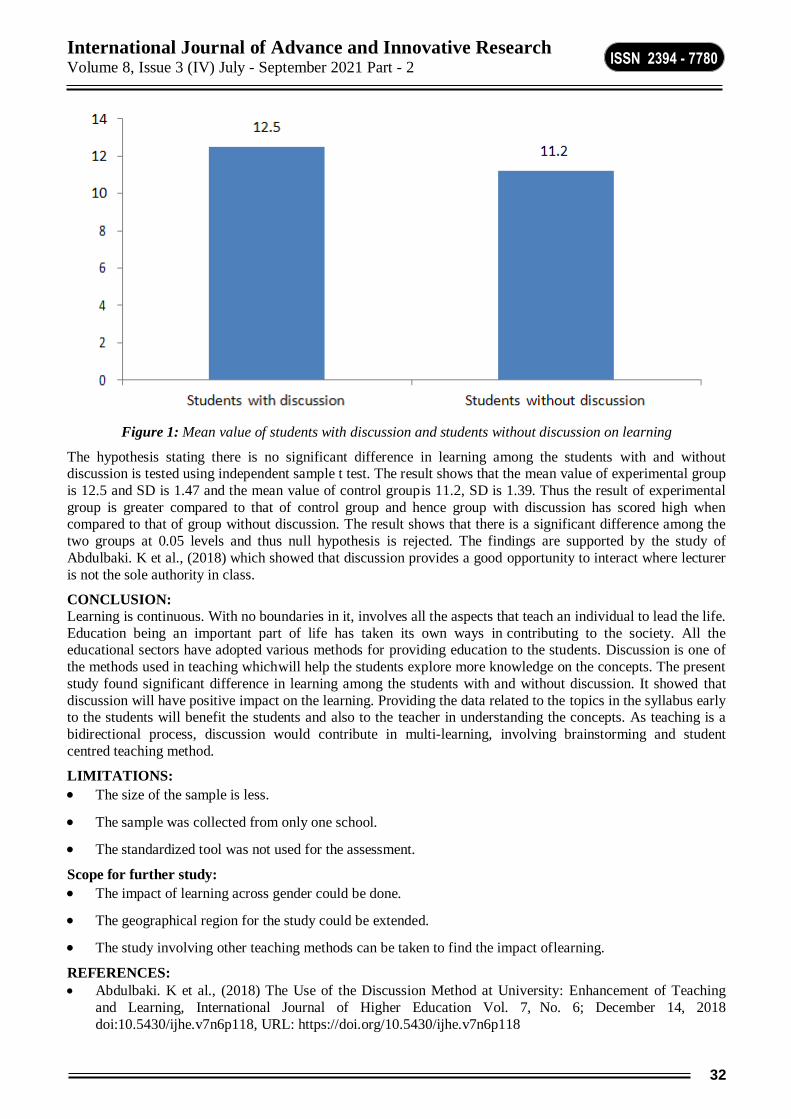
International Journal of Advance and Innovative Research Volume 8, Issue 3 (IV) July - September 2021 Part - 2
32
ISSN 2394 - 7780
Figure 1: Mean value of students with discussion and students without discussion on learning
The hypothesis stating there is no significant difference in learning among the students with and without discussion is tested using independent sample t test. The result shows that the mean value of experimental group
is 12.5 and SD is 1.47 and the mean value of control group is 11.2, SD is 1.39. Thus the result of experimental
group is greater compared to that of control group and hence group with discussion has scored high when compared to that of group without discussion. The result shows that there is a significant difference among the
two groups at 0.05 levels and thus null hypothesis is rejected. The findings are supported by the study of
Abdulbaki. K et al., (2018) which showed that discussion provides a good opportunity to interact where lecturer
is not the sole authority in class.
CONCLUSION:
Learning is continuous. With no boundaries in it, involves all the aspects that teach an individual to lead the life.
Education being an important part of life has taken its own ways in contributing to the society. All the educational sectors have adopted various methods for providing education to the students. Discussion is one of
the methods used in teaching which will help the students explore more knowledge on the concepts. The present
study found significant difference in learning among the students with and without discussion. It showed that
discussion will have positive impact on the learning. Providing the data related to the topics in the syllabus early to the students will benefit the students and also to the teacher in understanding the concepts. As teaching is a
bidirectional process, discussion would contribute in multi-learning, involving brainstorming and student
centred teaching method.
LIMITATIONS:
The size of the sample is less.
The sample was collected from only one school.
The standardized tool was not used for the assessment.
Scope for further study:
The impact of learning across gender could be done.
The geographical region for the study could be extended.
The study involving other teaching methods can be taken to find the impact of learning.
REFERENCES:
Abdulbaki. K et al., (2018) The Use of the Discussion Method at University: Enhancement of Teaching
and Learning, International Journal of Higher Education Vol. 7, No. 6; December 14, 2018
doi:10.5430/ijhe.v7n6p118, URL: https://doi.org/10.5430/ijhe.v7n6p118

International Journal of Advance and Innovative Research Volume 8, Issue 3 (IV) July - September 2021 Part - 2
33
ISSN 2394 - 7780
Berkeley centre for teaching, What is learning? University of California,
https://teaching.berkeley.edu/resources/learn/what-learning
Hwang Wu-Yuin et al., (2018) Exploring effects of discussion on visual attention, learning performance,
and perceptions of students learning with STR-support, Computer & Education, Volume 116, January 2018,
Pages 225-236, https://doi.org/10.1016/j.compedu.2017.09.015
Ngeow et al., (2003) Learning through Discussion: Designing Tasks for Critical Inquiry and Reflective Learning, ERIC Digest, ERIC Clearinghouse on Reading English and Communication Bloomington
IN,ED477611, https://www.ericdigests.org/2004-1/tasks.htm
Rahman et al., (2011) Impact of discussion method on student’s performance, International Journal of
Business and Social Science Vol. 2 No. 7;
http://www.ijbssnet.com/journals/Vol._2_No._7%3B_Special_Issue_April_2011/10.pdf, April 2011
Washington University in St. Louis(2021) Teaching with discussion, Resources, derived from
https://ctl.wustl.edu/resources/teaching-with-discussion/
Yusuf.H et al., (2016) Discussion Method And Its Effect On The Performance Of Students In Reading
Comprehension In Secondary Schools In Plateau State, The Online Journal of Quality in Higher Education
- October 2016Volume 3, Issue 4, https://www.tojqih.net/journals/tojqih/articles/v03i04/v03i04-01.pdf
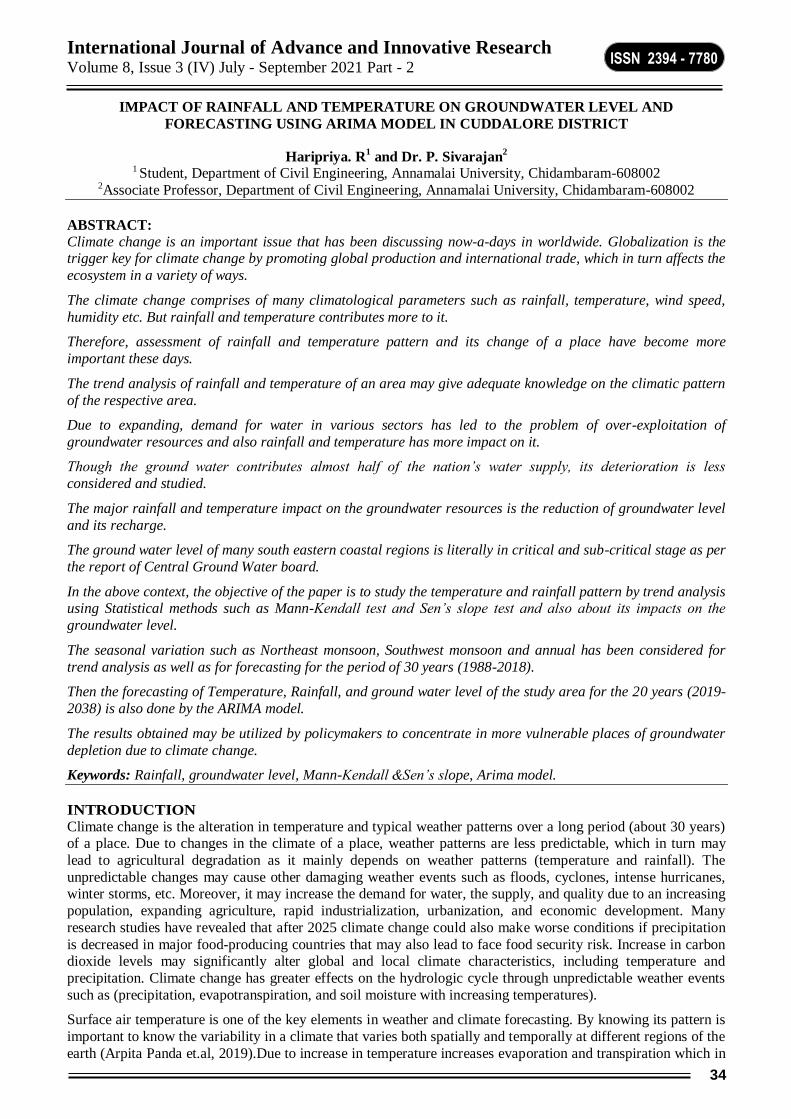
International Journal of Advance and Innovative Research Volume 8, Issue 3 (IV) July - September 2021 Part - 2
34
ISSN 2394 - 7780
IMPACT OF RAINFALL AND TEMPERATURE ON GROUNDWATER LEVEL AND
FORECASTING USING ARIMA MODEL IN CUDDALORE DISTRICT
Haripriya. R1 and Dr. P. Sivarajan
2
1 Student, Department of Civil Engineering, Annamalai University, Chidambaram-608002 2Associate Professor, Department of Civil Engineering, Annamalai University, Chidambaram-608002
ABSTRACT: Climate change is an important issue that has been discussing now-a-days in worldwide. Globalization is the trigger key for climate change by promoting global production and international trade, which in turn affects the
ecosystem in a variety of ways.
The climate change comprises of many climatological parameters such as rainfall, temperature, wind speed,
humidity etc. But rainfall and temperature contributes more to it.
Therefore, assessment of rainfall and temperature pattern and its change of a place have become more
important these days.
The trend analysis of rainfall and temperature of an area may give adequate knowledge on the climatic pattern
of the respective area.
Due to expanding, demand for water in various sectors has led to the problem of over-exploitation of
groundwater resources and also rainfall and temperature has more impact on it.
Though the ground water contributes almost half of the nation’s water supply, its deterioration is less
considered and studied.
The major rainfall and temperature impact on the groundwater resources is the reduction of groundwater level
and its recharge.
The ground water level of many south eastern coastal regions is literally in critical and sub-critical stage as per
the report of Central Ground Water board.
In the above context, the objective of the paper is to study the temperature and rainfall pattern by trend analysis using Statistical methods such as Mann-Kendall test and Sen’s slope test and also about its impacts on the
groundwater level.
The seasonal variation such as Northeast monsoon, Southwest monsoon and annual has been considered for
trend analysis as well as for forecasting for the period of 30 years (1988-2018).
Then the forecasting of Temperature, Rainfall, and ground water level of the study area for the 20 years (2019-
2038) is also done by the ARIMA model.
The results obtained may be utilized by policymakers to concentrate in more vulnerable places of groundwater
depletion due to climate change.
Keywords: Rainfall, groundwater level, Mann-Kendall &Sen’s slope, Arima model.
INTRODUCTION Climate change is the alteration in temperature and typical weather patterns over a long period (about 30 years) of a place. Due to changes in the climate of a place, weather patterns are less predictable, which in turn may
lead to agricultural degradation as it mainly depends on weather patterns (temperature and rainfall). The
unpredictable changes may cause other damaging weather events such as floods, cyclones, intense hurricanes, winter storms, etc. Moreover, it may increase the demand for water, the supply, and quality due to an increasing
population, expanding agriculture, rapid industrialization, urbanization, and economic development. Many
research studies have revealed that after 2025 climate change could also make worse conditions if precipitation
is decreased in major food-producing countries that may also lead to face food security risk. Increase in carbon dioxide levels may significantly alter global and local climate characteristics, including temperature and
precipitation. Climate change has greater effects on the hydrologic cycle through unpredictable weather events
such as (precipitation, evapotranspiration, and soil moisture with increasing temperatures).
Surface air temperature is one of the key elements in weather and climate forecasting. By knowing its pattern is
important to know the variability in a climate that varies both spatially and temporally at different regions of the
earth (Arpita Panda et.al, 2019).Due to increase in temperature increases evaporation and transpiration which in
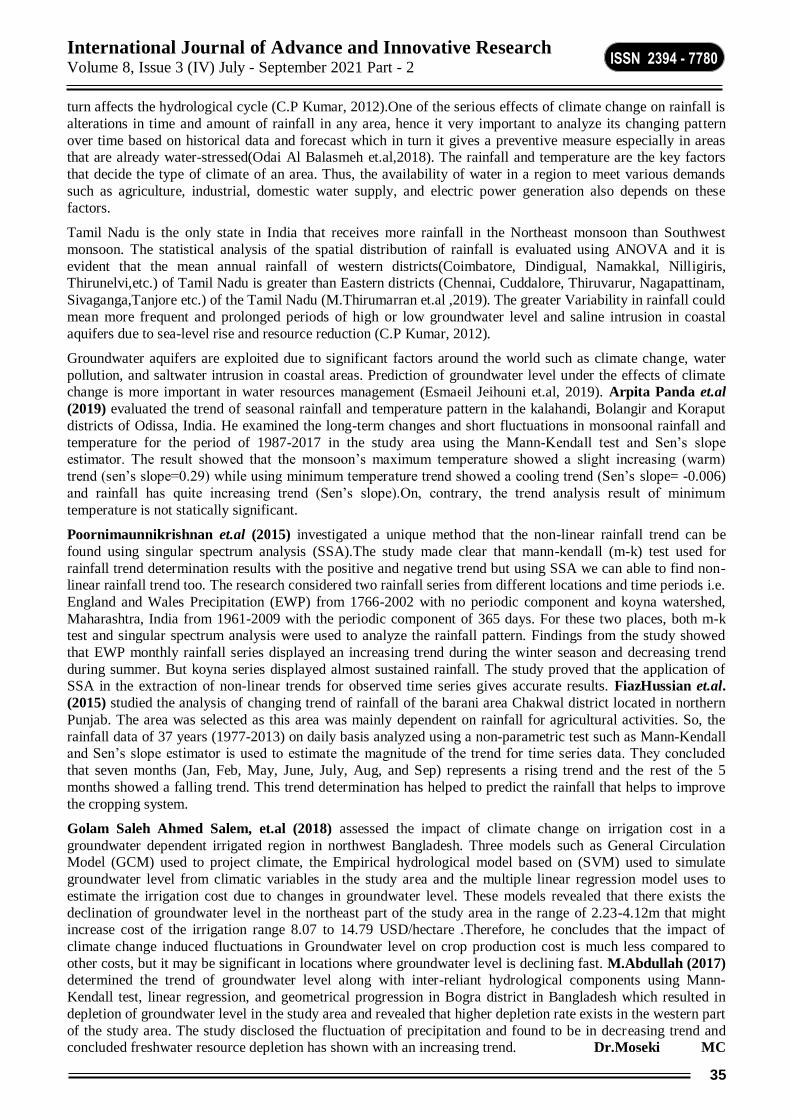
International Journal of Advance and Innovative Research Volume 8, Issue 3 (IV) July - September 2021 Part - 2
35
ISSN 2394 - 7780
turn affects the hydrological cycle (C.P Kumar, 2012).One of the serious effects of climate change on rainfall is
alterations in time and amount of rainfall in any area, hence it very important to analyze its changing pattern
over time based on historical data and forecast which in turn it gives a preventive measure especially in areas that are already water-stressed(Odai Al Balasmeh et.al,2018). The rainfall and temperature are the key factors
that decide the type of climate of an area. Thus, the availability of water in a region to meet various demands
such as agriculture, industrial, domestic water supply, and electric power generation also depends on these
factors.
Tamil Nadu is the only state in India that receives more rainfall in the Northeast monsoon than Southwest
monsoon. The statistical analysis of the spatial distribution of rainfall is evaluated using ANOVA and it is
evident that the mean annual rainfall of western districts(Coimbatore, Dindigual, Namakkal, Nilligiris, Thirunelvi,etc.) of Tamil Nadu is greater than Eastern districts (Chennai, Cuddalore, Thiruvarur, Nagapattinam,
Sivaganga,Tanjore etc.) of the Tamil Nadu (M.Thirumarran et.al ,2019). The greater Variability in rainfall could
mean more frequent and prolonged periods of high or low groundwater level and saline intrusion in coastal
aquifers due to sea-level rise and resource reduction (C.P Kumar, 2012).
Groundwater aquifers are exploited due to significant factors around the world such as climate change, water
pollution, and saltwater intrusion in coastal areas. Prediction of groundwater level under the effects of climate change is more important in water resources management (Esmaeil Jeihouni et.al, 2019). Arpita Panda et.al
(2019) evaluated the trend of seasonal rainfall and temperature pattern in the kalahandi, Bolangir and Koraput
districts of Odissa, India. He examined the long-term changes and short fluctuations in monsoonal rainfall and
temperature for the period of 1987-2017 in the study area using the Mann-Kendall test and Sen’s slope estimator. The result showed that the monsoon’s maximum temperature showed a slight increasing (warm)
trend (sen’s slope=0.29) while using minimum temperature trend showed a cooling trend (Sen’s slope= -0.006)
and rainfall has quite increasing trend (Sen’s slope).On, contrary, the trend analysis result of minimum
temperature is not statically significant.
Poornimaunnikrishnan et.al (2015) investigated a unique method that the non-linear rainfall trend can be
found using singular spectrum analysis (SSA).The study made clear that mann-kendall (m-k) test used for
rainfall trend determination results with the positive and negative trend but using SSA we can able to find non-linear rainfall trend too. The research considered two rainfall series from different locations and time periods i.e.
England and Wales Precipitation (EWP) from 1766-2002 with no periodic component and koyna watershed,
Maharashtra, India from 1961-2009 with the periodic component of 365 days. For these two places, both m-k test and singular spectrum analysis were used to analyze the rainfall pattern. Findings from the study showed
that EWP monthly rainfall series displayed an increasing trend during the winter season and decreasing trend
during summer. But koyna series displayed almost sustained rainfall. The study proved that the application of SSA in the extraction of non-linear trends for observed time series gives accurate results. FiazHussian et.al.
(2015) studied the analysis of changing trend of rainfall of the barani area Chakwal district located in northern
Punjab. The area was selected as this area was mainly dependent on rainfall for agricultural activities. So, the
rainfall data of 37 years (1977-2013) on daily basis analyzed using a non-parametric test such as Mann-Kendall and Sen’s slope estimator is used to estimate the magnitude of the trend for time series data. They concluded
that seven months (Jan, Feb, May, June, July, Aug, and Sep) represents a rising trend and the rest of the 5
months showed a falling trend. This trend determination has helped to predict the rainfall that helps to improve
the cropping system.
Golam Saleh Ahmed Salem, et.al (2018) assessed the impact of climate change on irrigation cost in a
groundwater dependent irrigated region in northwest Bangladesh. Three models such as General Circulation Model (GCM) used to project climate, the Empirical hydrological model based on (SVM) used to simulate
groundwater level from climatic variables in the study area and the multiple linear regression model uses to
estimate the irrigation cost due to changes in groundwater level. These models revealed that there exists the
declination of groundwater level in the northeast part of the study area in the range of 2.23-4.12m that might increase cost of the irrigation range 8.07 to 14.79 USD/hectare .Therefore, he concludes that the impact of
climate change induced fluctuations in Groundwater level on crop production cost is much less compared to
other costs, but it may be significant in locations where groundwater level is declining fast. M.Abdullah (2017) determined the trend of groundwater level along with inter-reliant hydrological components using Mann-
Kendall test, linear regression, and geometrical progression in Bogra district in Bangladesh which resulted in
depletion of groundwater level in the study area and revealed that higher depletion rate exists in the western part
of the study area. The study disclosed the fluctuation of precipitation and found to be in decreasing trend and concluded freshwater resource depletion has shown with an increasing trend. Dr.Moseki MC
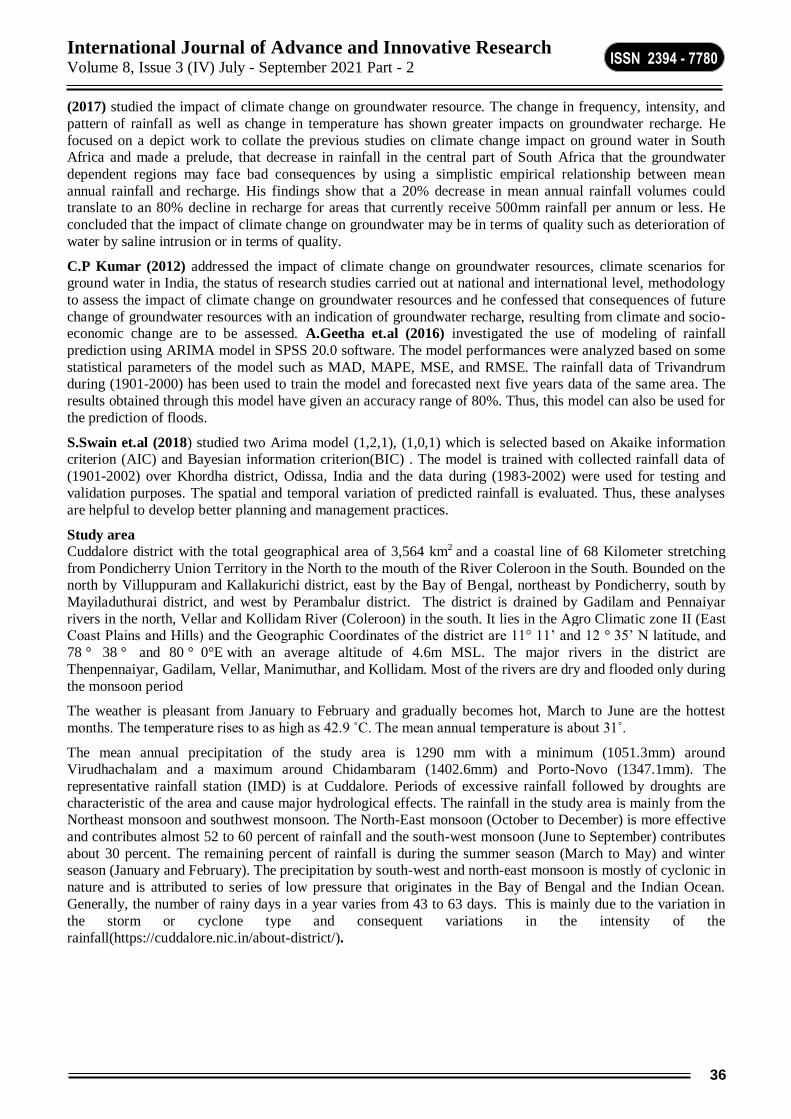
International Journal of Advance and Innovative Research Volume 8, Issue 3 (IV) July - September 2021 Part - 2
36
ISSN 2394 - 7780
(2017) studied the impact of climate change on groundwater resource. The change in frequency, intensity, and
pattern of rainfall as well as change in temperature has shown greater impacts on groundwater recharge. He
focused on a depict work to collate the previous studies on climate change impact on ground water in South Africa and made a prelude, that decrease in rainfall in the central part of South Africa that the groundwater
dependent regions may face bad consequences by using a simplistic empirical relationship between mean
annual rainfall and recharge. His findings show that a 20% decrease in mean annual rainfall volumes could translate to an 80% decline in recharge for areas that currently receive 500mm rainfall per annum or less. He
concluded that the impact of climate change on groundwater may be in terms of quality such as deterioration of
water by saline intrusion or in terms of quality.
C.P Kumar (2012) addressed the impact of climate change on groundwater resources, climate scenarios for ground water in India, the status of research studies carried out at national and international level, methodology
to assess the impact of climate change on groundwater resources and he confessed that consequences of future
change of groundwater resources with an indication of groundwater recharge, resulting from climate and socio-economic change are to be assessed. A.Geetha et.al (2016) investigated the use of modeling of rainfall
prediction using ARIMA model in SPSS 20.0 software. The model performances were analyzed based on some
statistical parameters of the model such as MAD, MAPE, MSE, and RMSE. The rainfall data of Trivandrum during (1901-2000) has been used to train the model and forecasted next five years data of the same area. The
results obtained through this model have given an accuracy range of 80%. Thus, this model can also be used for
the prediction of floods.
S.Swain et.al (2018) studied two Arima model (1,2,1), (1,0,1) which is selected based on Akaike information criterion (AIC) and Bayesian information criterion(BIC) . The model is trained with collected rainfall data of
(1901-2002) over Khordha district, Odissa, India and the data during (1983-2002) were used for testing and
validation purposes. The spatial and temporal variation of predicted rainfall is evaluated. Thus, these analyses
are helpful to develop better planning and management practices.
Study area
Cuddalore district with the total geographical area of 3,564 km2 and a coastal line of 68 Kilometer stretching
from Pondicherry Union Territory in the North to the mouth of the River Coleroon in the South. Bounded on the north by Villuppuram and Kallakurichi district, east by the Bay of Bengal, northeast by Pondicherry, south by
Mayiladuthurai district, and west by Perambalur district. The district is drained by Gadilam and Pennaiyar
rivers in the north, Vellar and Kollidam River (Coleroon) in the south. It lies in the Agro Climatic zone II (East Coast Plains and Hills) and the Geographic Coordinates of the district are 11° 11’ and 12 ° 35’ N latitude, and
78 ° 38 ° and 80 ° 0°E with an average altitude of 4.6m MSL. The major rivers in the district are
Thenpennaiyar, Gadilam, Vellar, Manimuthar, and Kollidam. Most of the rivers are dry and flooded only during
the monsoon period
The weather is pleasant from January to February and gradually becomes hot, March to June are the hottest
months. The temperature rises to as high as 42.9 ˚C. The mean annual temperature is about 31˚.
The mean annual precipitation of the study area is 1290 mm with a minimum (1051.3mm) around Virudhachalam and a maximum around Chidambaram (1402.6mm) and Porto-Novo (1347.1mm). The
representative rainfall station (IMD) is at Cuddalore. Periods of excessive rainfall followed by droughts are
characteristic of the area and cause major hydrological effects. The rainfall in the study area is mainly from the Northeast monsoon and southwest monsoon. The North-East monsoon (October to December) is more effective
and contributes almost 52 to 60 percent of rainfall and the south-west monsoon (June to September) contributes
about 30 percent. The remaining percent of rainfall is during the summer season (March to May) and winter season (January and February). The precipitation by south-west and north-east monsoon is mostly of cyclonic in
nature and is attributed to series of low pressure that originates in the Bay of Bengal and the Indian Ocean.
Generally, the number of rainy days in a year varies from 43 to 63 days. This is mainly due to the variation in
the storm or cyclone type and consequent variations in the intensity of the
rainfall(https://cuddalore.nic.in/about-district/).

International Journal of Advance and Innovative Research Volume 8, Issue 3 (IV) July - September 2021 Part - 2
37
ISSN 2394 - 7780
Fig.1 Cuddalore district map
MATERIALS AND METHODS
Mann-Kendall Trend Test
The non-parametric trend test, Mann-Kendall is extensively used in hydrology and climatology to investigate
significance slope or trend since it is simple and its robustness. Let considering X = (𝑋1, 𝑋2, 𝑋3… ,𝑋𝑛) is a time
series dataset, the Mann-Kendall statistics S can be computed as follows:
𝑆 = ∑ ∑ 𝑠𝑔𝑛(𝑥𝑗 − 𝑥𝑖)
𝑛
𝑗−𝑖+1
𝑛−1
𝑖=1
Where
𝑠𝑔𝑛(𝑥𝑗 − 𝑥𝑖) = {
+1 𝑖𝑓 (𝑥𝑗 − 𝑥𝑖) > 0
0 𝑖𝑓 (𝑥𝑗 − 𝑥𝑖) = 0
−1 𝑖𝑓 (𝑥𝑗 − 𝑥𝑖) < 0
The variance for the Mann-Kendall trend test can be calculated as follow:
𝑉𝑎𝑟𝑠 = 1
18[𝑛𝑖(𝑛𝑖 − 1)(2𝑛𝑖 + 5) −∑ 𝑡𝑖𝑝
𝑔𝑖
𝑝=1
(𝑡𝑖𝑝 − 1)(2𝑡𝑖𝑝 + 5) ]
Where:
ni: is the number of data points
gi: is the number of tied groups for the ith month
tip: is the number of data in the Pth group for the ith month.
Correspondingly, the Z statistic is defined in the equation:
𝑍 =
{
𝑆 − 1
√𝑉𝑎𝑟𝑠 𝑖𝑓 𝑆 > 0
0 𝑖𝑓 𝑆 = 0𝑆 + 1
√𝑉𝑎𝑟𝑠 𝑖𝑓 𝑆 < 0
It can be revealed that following the Null Hypothesis (no trend) H0 that S will be following in normal
distribution and thus, this can be used to test the hypothesis with a certain confidence level of a/2.
Sen’s Slope
Sen’s method (Sen, 1968) for the estimation of slope (Q) requires a time series of equally spaced data.
𝑄 = 𝑥𝑖′ − 𝑥𝑖𝑖′ − 𝑖
Where:

International Journal of Advance and Innovative Research Volume 8, Issue 3 (IV) July - September 2021 Part - 2
38
ISSN 2394 - 7780
Q= slope between data points xi' and xi,
xi' = data measurement at time i',
xi = data measurement at time i,
i' = time after time i.
These tests were calculated using ‘XLSTAT’ software 2020 which is used in recent researches (Arpita Panda
et.al, 2019), (Neha karmeshu, 2012).
ARIMA Model ARIMA model is popularized by Box and Jenkins. It is a combination of three mathematical models namely
auto-regressive, integrated, moving-average (ARIMA) models of time series data. Time series analysis is a set
of observations observed at a particular time period. An ARIMA (p, d, and q) model can account for temporal dependence in several ways, where p is the order of the autoregressive part d, is the order of the differencing,
and q is the order of the moving-average process. Combining these three models we get ARIMA (p, d, q)
model, which uses combinations of past values and past forecasting errors and offers a potential for fitting models that could not be adequately fitted by using an AR or an MA model alone. The ARIMA model is build
on IBM statistical software SPSS-16.0 software (A.Geetha et.al, 2016).
RESULTS AND DISCUSSION
Trend analysis of rainfall:
Rainfall data (annual and seasonal) of the study area for the period 1988-2018 was initially subjected to
statistical analysis and the mean, standard deviation, coefficient of variation, and S- statistics were determined.
Table1 shows the results of the statistical analysis indicating that the study area received more precipitation during the Northeast monsoon than the Southwest monsoon. The first step in data preparation is to convert daily
rainfall into monthly mean rainfall based on (S.Adarsh et.al. ,2014).The time-series rainfall data of the study
area was then subjected to the M-K &Sen’s slope trend test for annual and seasonal rainfall.
Table 1- Statistics analysis of rainfall (1988-2018)
Vari
able
Obs
erva
tions
Mini
mu
m
Maxi
mum
Mea
n
Std.
devi
ation
S C.V
North-
east
31 160.
88
1627.
90
887.
06
353.
69 79
39.8
7
south
-west 31
208.
10
653.6
00
354.
56
108.
79 61
30.6
8
Ann
ual
rainf
all
31 685.
38
2038.
30
1375
.8
389.
54 91
28.3
1
The results of MK and Sen’s slope estimates for annual and seasonal rainfall time series are presented in
Table1&2 and Figures 2,3&4 show the trend and slope line of NEM, SWM & annual rainfall for the study area
from 1988-2018.
From the results of the trend test, the following key observations are noted:
Arpita Panda, 2019 used the coefficient of variation (C.V) to classify the degree of variability of rainfall
events as C.V ˂ 20% is less, 20% ˂ C.V ˂ 30% is moderate, CV ˃ 30% is high, CV ˃ 40% is very high
and C.V ˃ 70% - extreme. Based on this, from the above observed rainfall data of the study area, the
seasonal rainfall (NEM &SWM) showed of above 30%, which denotes high variability of rainfall over the area and the annual rainfall of 30 years showed less than 30% which indicates the moderate variability of
rainfall over the area.
The above rainfall was analyzed that there is significant changes in mean monthly rainfall data with
seasonal and annual rainfall for 30 years. The NEM, SWM & annual rainfall showed an increasing trend.
The magnitude of trend for NEM, SWM & annual rainfall showed an upward slope.
Table 2 – Trend analysis of rainfall (1988-2018)
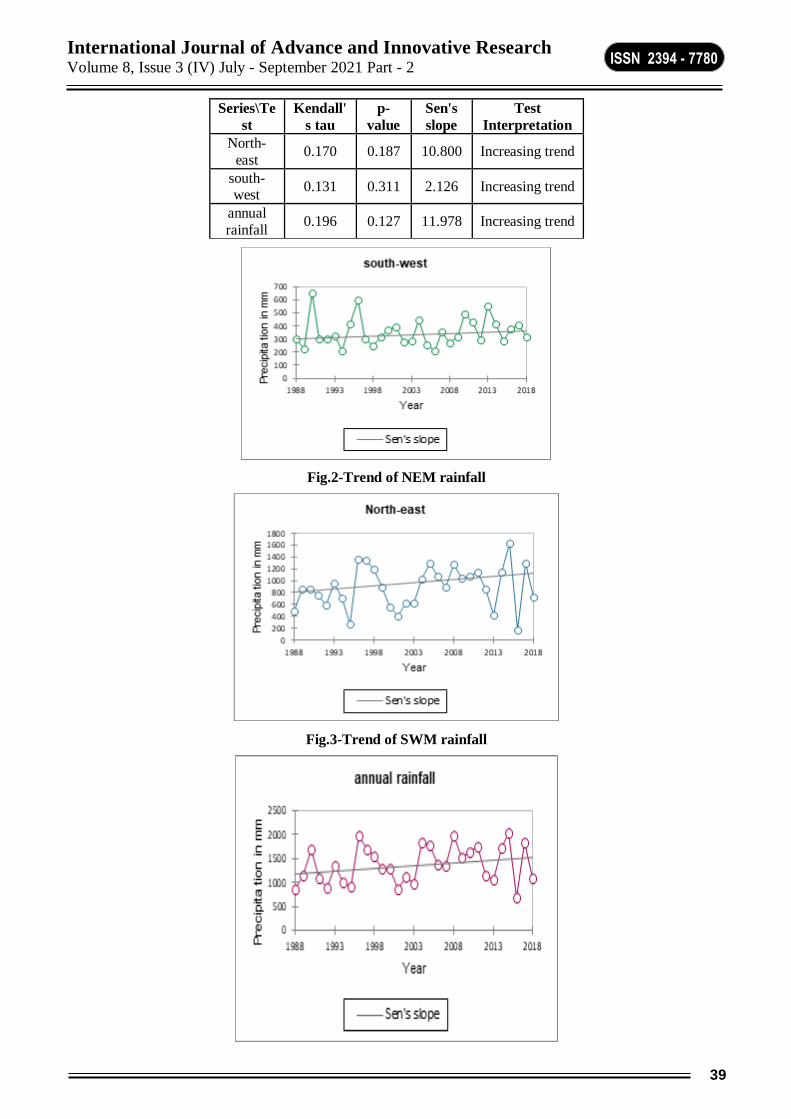
International Journal of Advance and Innovative Research Volume 8, Issue 3 (IV) July - September 2021 Part - 2
39
ISSN 2394 - 7780
Series\Te
st
Kendall'
s tau
p-
value
Sen's
slope
Test
Interpretation
North-
east 0.170 0.187 10.800 Increasing trend
south-west
0.131 0.311 2.126 Increasing trend
annual
rainfall 0.196 0.127 11.978 Increasing trend
Fig.2-Trend of NEM rainfall
Fig.3-Trend of SWM rainfall
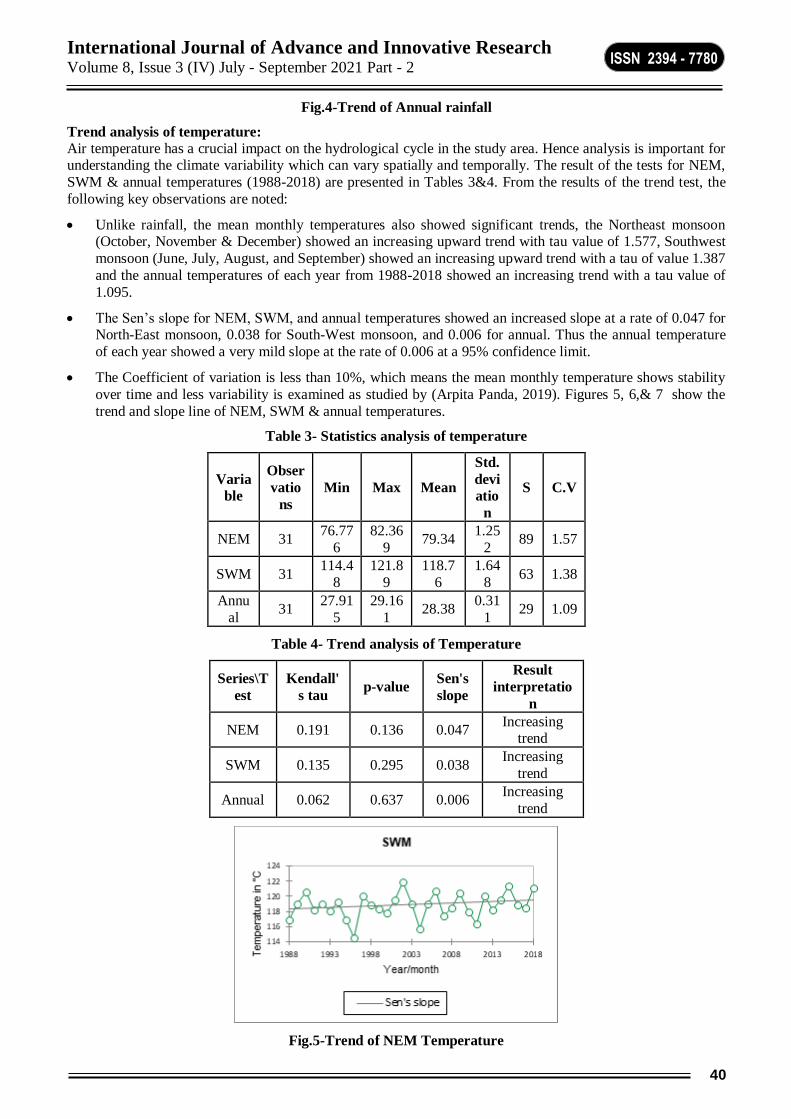
International Journal of Advance and Innovative Research Volume 8, Issue 3 (IV) July - September 2021 Part - 2
40
ISSN 2394 - 7780
Fig.4-Trend of Annual rainfall
Trend analysis of temperature:
Air temperature has a crucial impact on the hydrological cycle in the study area. Hence analysis is important for understanding the climate variability which can vary spatially and temporally. The result of the tests for NEM,
SWM & annual temperatures (1988-2018) are presented in Tables 3&4. From the results of the trend test, the
following key observations are noted:
Unlike rainfall, the mean monthly temperatures also showed significant trends, the Northeast monsoon (October, November & December) showed an increasing upward trend with tau value of 1.577, Southwest
monsoon (June, July, August, and September) showed an increasing upward trend with a tau of value 1.387
and the annual temperatures of each year from 1988-2018 showed an increasing trend with a tau value of
1.095.
The Sen’s slope for NEM, SWM, and annual temperatures showed an increased slope at a rate of 0.047 for North-East monsoon, 0.038 for South-West monsoon, and 0.006 for annual. Thus the annual temperature
of each year showed a very mild slope at the rate of 0.006 at a 95% confidence limit.
The Coefficient of variation is less than 10%, which means the mean monthly temperature shows stability
over time and less variability is examined as studied by (Arpita Panda, 2019). Figures 5, 6,& 7 show the
trend and slope line of NEM, SWM & annual temperatures.
Table 3- Statistics analysis of temperature
Varia
ble
Obser
vatio
ns
Min Max Mean
Std.
devi
atio
n
S C.V
NEM 31 76.77
6
82.36
9 79.34
1.25
2 89 1.57
SWM 31 114.4
8
121.8
9
118.7
6
1.64
8 63 1.38
Annu
al 31
27.91
5
29.16
1 28.38
0.31
1 29 1.09
Table 4- Trend analysis of Temperature
Series\T
est
Kendall'
s tau p-value
Sen's
slope
Result
interpretatio
n
NEM 0.191 0.136 0.047 Increasing
trend
SWM 0.135 0.295 0.038 Increasing
trend
Annual 0.062 0.637 0.006 Increasing
trend
Fig.5-Trend of NEM Temperature

International Journal of Advance and Innovative Research Volume 8, Issue 3 (IV) July - September 2021 Part - 2
41
ISSN 2394 - 7780
Fig.6-Trend of SWM Temperature
Fig.7-Trend of Annual Temperature
Fig.8-Trend of NEM GWL
Trend analysis for Groundwater level:
Time series groundwater level data was subjected to trend analysis and the results of MK and Sen’s slope estimates for annual and seasonal groundwater data are presented in Tables 5&6. From the results the following
key observations were noted:
The coefficient of variation of NEM, SWM& annual groundwater level of the study period has shown
more than 30% indicating high variability in groundwater level in the study area.
Both increasing and decreasing trends were identified by the statistical tests (Man-Kendall & sen’s slope
estimator) in annual and seasonal groundwater level data. The significant increasing trend with a tau value
of 0.123 in Northeast monsoon and 0.080 in annual.
For southwest monsoon, there exists a decreasing trend with a Kendall tau value of -0.058.
The sen’s slope for NEM, SWM & Annual GWL showed both upward and downward slopes for the period
from 1988-2018 in the study area. Figures 8, 9& 10 show the trend and slope line of NEM, SWM & annual
groundwater level.
Table 5- Statistics analysis for GroundWater Level
Variable
Obser
vation
s
Minimum
Maximum
Mean
Std.
devi
atio
S C.V
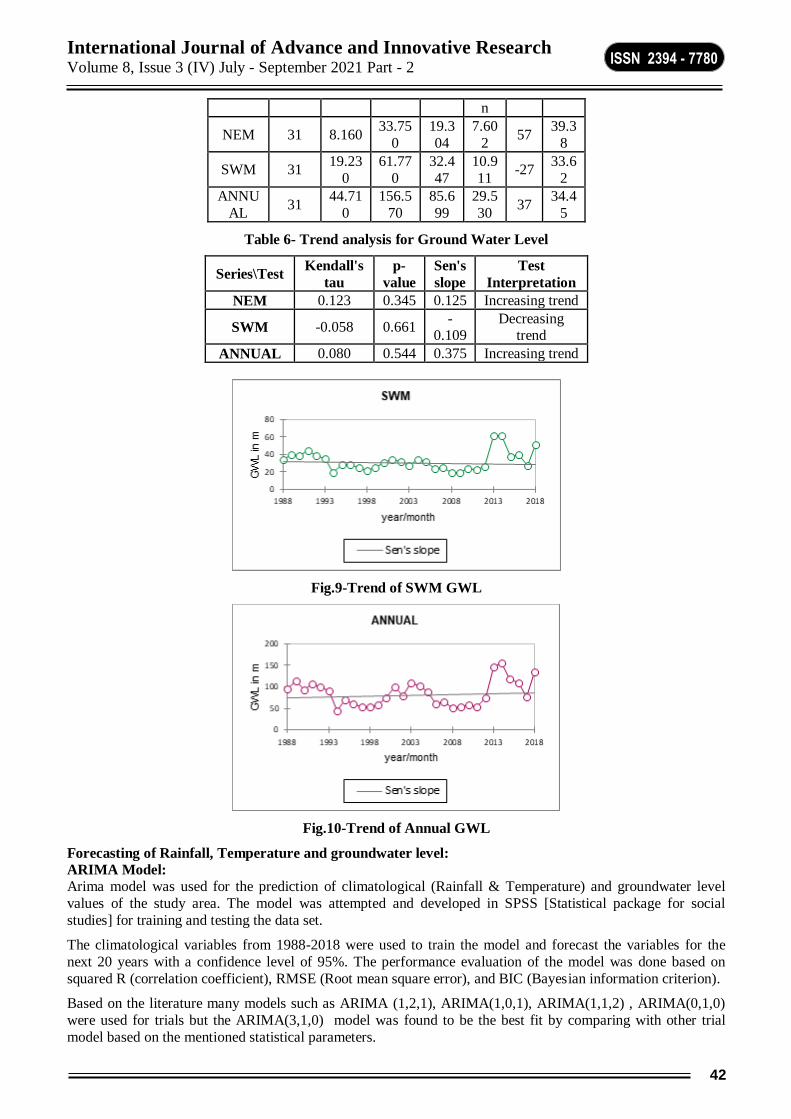
International Journal of Advance and Innovative Research Volume 8, Issue 3 (IV) July - September 2021 Part - 2
42
ISSN 2394 - 7780
n
NEM 31 8.160 33.75
0
19.3
04
7.60
2 57
39.3
8
SWM 31 19.23
0
61.77
0
32.4
47
10.9
11 -27
33.6
2
ANNU
AL 31
44.71
0
156.5
70
85.6
99
29.5
30 37
34.4
5
Table 6- Trend analysis for Ground Water Level
Fig.9-Trend of SWM GWL
Fig.10-Trend of Annual GWL
Forecasting of Rainfall, Temperature and groundwater level:
ARIMA Model:
Arima model was used for the prediction of climatological (Rainfall & Temperature) and groundwater level
values of the study area. The model was attempted and developed in SPSS [Statistical package for social
studies] for training and testing the data set.
The climatological variables from 1988-2018 were used to train the model and forecast the variables for the
next 20 years with a confidence level of 95%. The performance evaluation of the model was done based on
squared R (correlation coefficient), RMSE (Root mean square error), and BIC (Bayesian information criterion).
Based on the literature many models such as ARIMA (1,2,1), ARIMA(1,0,1), ARIMA(1,1,2) , ARIMA(0,1,0)
were used for trials but the ARIMA(3,1,0) model was found to be the best fit by comparing with other trial
model based on the mentioned statistical parameters.
Series\Test Kendall's
tau
p-
value
Sen's
slope
Test
Interpretation
NEM 0.123 0.345 0.125 Increasing trend
SWM -0.058 0.661 -
0.109 Decreasing
trend
ANNUAL 0.080 0.544 0.375 Increasing trend

International Journal of Advance and Innovative Research Volume 8, Issue 3 (IV) July - September 2021 Part - 2
43
ISSN 2394 - 7780
The ARIMA model is build on IBM statistical software SPSS-16.0 software
The output of the ARIMA model from SPSS of rainfall, temperature and groundwater levels has been presented
in tables 7, 8, 9 & 10.
Figure11 depicts the graph of observed and forecast values of climatological parameters (Rainfall, Temperature)
and groundwater level.
Table 7-Model description
Table 8-Model Statistics
Table 9-Model Summary
Table 10- Predicted values (2018-2038)
Year Rainfall Temp GWL
2019 1356.63 28.55 141.88
2020 1328.56 28.48 125.94
2021 1274.03 28.47 128.93
2022 1322.53 28.49 127.96
2023 1333.57 28.48 133.90
2024 1320.60 28.46 133.81
2025 1327.86 28.46 135.25
2026 1339.74 28.46 134.74
2027 1341.41 28.45 136.12
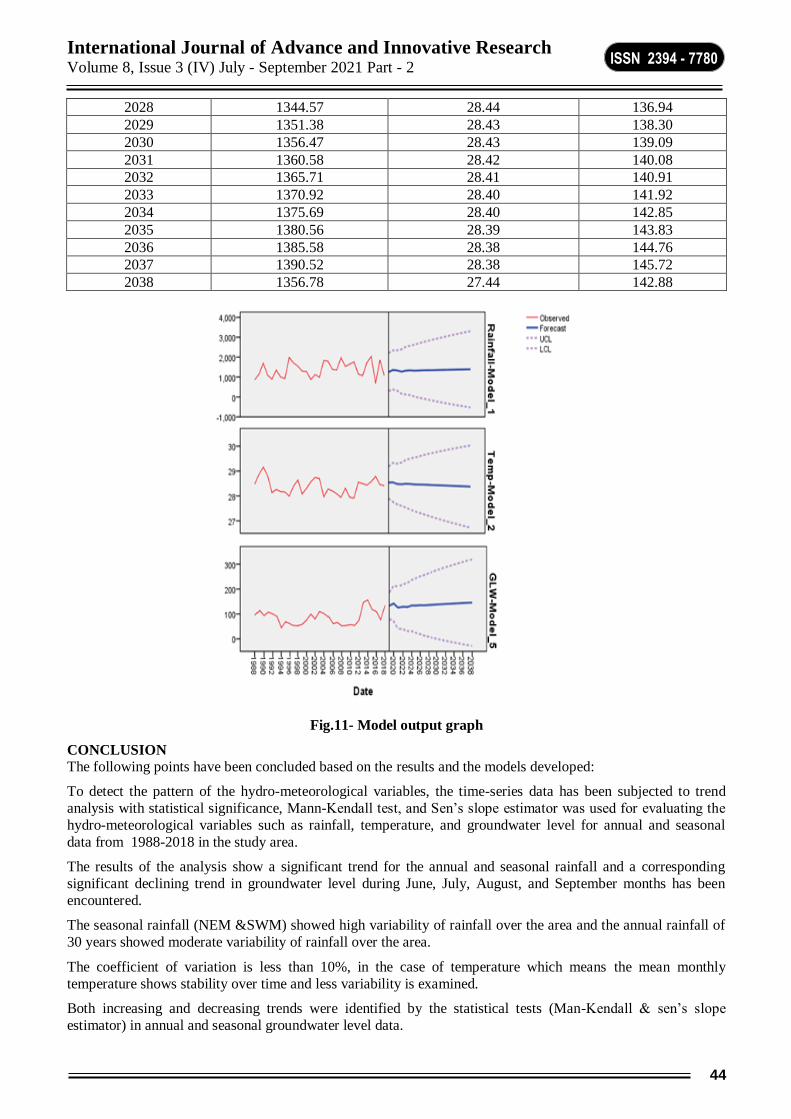
International Journal of Advance and Innovative Research Volume 8, Issue 3 (IV) July - September 2021 Part - 2
44
ISSN 2394 - 7780
2028 1344.57 28.44 136.94
2029 1351.38 28.43 138.30
2030 1356.47 28.43 139.09
2031 1360.58 28.42 140.08
2032 1365.71 28.41 140.91
2033 1370.92 28.40 141.92
2034 1375.69 28.40 142.85
2035 1380.56 28.39 143.83
2036 1385.58 28.38 144.76
2037 1390.52 28.38 145.72
2038 1356.78 27.44 142.88
Fig.11- Model output graph
CONCLUSION
The following points have been concluded based on the results and the models developed:
To detect the pattern of the hydro-meteorological variables, the time-series data has been subjected to trend
analysis with statistical significance, Mann-Kendall test, and Sen’s slope estimator was used for evaluating the
hydro-meteorological variables such as rainfall, temperature, and groundwater level for annual and seasonal
data from 1988-2018 in the study area.
The results of the analysis show a significant trend for the annual and seasonal rainfall and a corresponding
significant declining trend in groundwater level during June, July, August, and September months has been
encountered.
The seasonal rainfall (NEM &SWM) showed high variability of rainfall over the area and the annual rainfall of
30 years showed moderate variability of rainfall over the area.
The coefficient of variation is less than 10%, in the case of temperature which means the mean monthly
temperature shows stability over time and less variability is examined.
Both increasing and decreasing trends were identified by the statistical tests (Man-Kendall & sen’s slope
estimator) in annual and seasonal groundwater level data.
International Journal of Advance and Innovative Research Volume 8, Issue 3 (IV) July - September 2021 Part - 2
45
ISSN 2394 - 7780
The prediction of rainfall, temperature, and groundwater level using an ARIMA (3, 1, 0) model of SPSS time
series modeler. The model is selected based on significant values of statistical parameters such as squared R of
0.048, RMSE of 98.628, MAPE of 11.236, and BIC of 3.129. Also by comparing the predicted with the observed values for 20 years (2019-2038). It is found that the forecast values were nearer to the accuracy. Even
though the model is said to be “Backward-looking” it yields more accuracy percentage widely used and has a
history of wide acceptance.
REFERENCE
1. C.P. Kumar, Climate change and its impact on groundwater resources, International Journal of
Engineering and Science, ISSN: 2278-4721, vol.1, Issue 5(October 2012), PP.43-60.
2. Jothibasu.A and Anbazhagan.S Impact of climate change on groundwater resources with special emphasis
to Tamil Nadu-A Review,38th Asian Conference on Remote sensing -2017.
3. Dr.Moseki M C, Climate change impacts on groundwater: literature review, Article of environmental-risk-
assessment and re-mediation (2017), ISSN: 2529-8046, vol.2, Issue1, PP.16-20.
4. Arpita Panda and Netrananda Sahu, Trend analysis of seasonal rainfall and temperature pattern in
kalahandi, Bolangir and koraput districts of odisha, India. Atmospheric Science Letters 2019;20:e931.
5. Poornima Unnikrishnan and V.Jothiprakash, Extraction of non-linear trends using singular spectrum analysis, Journal of Hydrologic Engineering, vol.20, Issue 12, DOI: 10.1061/ (ASCE) HE.1943-
5584.0001237.
6. Fiaz Hussian, Ghulam Nabi, and Muhammad Waseem Boota, Rainfall trend analysis by using the Mann-
Kendall test & sen’s slope estimates: A Case study of district Chakwal rain gauge, Barani area, Northern
Punjab province, Pakistan. Article of science international (2015), ISSN: 3159-3165, vol.27, Issue4.
7. M.Abdullah, Recent trend determination of groundwater level along with inter-reliant hydrologic
components using Mann-Kendall Test, Linear regression &Geometrical progression: A case study for
Bogra district in Bangladesh, Journal of Rehabilitation in Civil Engineering (2017), vol.5, Issue2.
8. Jeihouni E, Mohammadi M, Eslamian S and Zareian MJ, Potential impacts of climate change on
groundwater level through hybrid soft-computing methods: a case study-Shabestar Plain, Iran. Journal of
Environmental Monitoring Assessment (2019) Sep 6 191(10):620. DOI: 10.1007/s10661-019-7784-6.
9. Golam Saleh Ahmed Salem, So Kazama, Shamsuddin Shahid and Nepal C. Dey, Impacts of climate
change on groundwater level and irrigation cost in a groundwater dependent irrigated region, Journal of
Agricultural Water Management, 2018, Volume 208, ISSN 0378-3774.
10. S.Swain, S.Nandi and P.Patel, Development of an ARIMA model for monthly rainfall forecasting over
Khordha district, Odissa, India, Springer nature Singapore Pvt.ltd., 2018, Volume 708.
11. A.Geetha and G.M. Nasira, Time-Series modeling and forecasting: modeling of rainfall prediction using
ARIMA model, International journal of society systems science, 2016, volume 8.
12. Anosh Graham and Ekta Pathak Mishra,Time-series analysis model to forecast rainfall for Allahabad
region, Journal of Pharmacognosy and phytochemistry,2017, Volume 6(5), ISSN:2349-8234.
13. About District | Cuddalore District, Government of Tamilnadu | Sugar bowl of Tamil Nadu | India.
14. Climate change's impact on groundwater could leave 'environmental timebomb' | Carbon Brief.
15. Effects | Facts – Climate Change: Vital Signs of the Planet.
16. Global Climate - Global Climate Patterns, Global Climate Change - Earth, Atmosphere, Sun, and Solar -
JRank Articles.
17. Climate of India: Factors Affecting Seasons, Rainfall, Videos, Examples.
18. karmeshu, Neha, "Trend Detection in Annual Temperature & Precipitation using the Mann Kendall Test – A Case Study to Assess Climate Change on Select States in the Northeastern United States", Master of
Environmental Studies Capstone Projects, 2012, vol. 47.
International Journal of Advance and Innovative Research Volume 8, Issue 3 (IV) July - September 2021 Part - 2
46
ISSN 2394 - 7780
IMPACT OF YOGA ON PSYCHOLOGICAL DISTRESS AMONG POLYCYSTIC OVARY
SYNDROME (PCOS) PATIENTS
Padmarekha Bhat
ABSTRACT Polycystic ovary syndrome, also known as polycystic ovarian syndrome (PCOS) is considered as a very
common medical condition among women. It is a condition which affects a woman’s hormone levels. Between
5% and 10% of women between 15 and 44, or during the childbearing years women can have PCOS. Psychological distress is a person’s emotional suffering which causes difficulty in coping up with daily life.
Polycystic ovary syndrome will face psychological distress in a greater degree which is related to depression,
anxiety and burnout. The sampling method used was purposive sampling with a sample size of 60 (30 in experimental group and 30 control group). The tools used were Kessler psychological distress scale (K10), to
determine the levels of Psychological Distress of the participants. The statistical methods used were
Independent Samples t-test and Paired Sample t-test. The results indicated that experimental group has a
significant difference in the levels of psychological distress than control group, suggesting that 21 days of yoga intervention has impacted the levels of psychological distress among 30 participants who were in the
experimental group.
Key words: Psychological Distress; Experimental group; Control group;
INTRODUCTION Polycystic ovary syndrome, also known as polycystic ovarian syndrome (PCOS) is considered as a very
common medical condition among women. It is a condition which affects a woman’s hormone levels. Due to
this imbalance in the hormones leads their body to skip menstrual periods and makes it harder for them to get pregnant. Usually this condition affects women during their childbearing years like ages 15 to 44 and trusted
sources suggest that between 2.2 and 26.7 percent of women in this age group have PCOS. But many women
don’t know that they have PCOS and 70% of women with this condition hadn’t been diagnosed (Watson, 2021).
It is considering as the most common endocrine cause for infertility and increase the risk of having adverse pregnancy outcome, metabolic syndrome, type 2 diabetes mellitus, and some carcinoma (Tehrani, Gandevani,
2015). Most of the case involves three main features like cysts in the ovaries, high levels of male hormones
(androgen) and irregular or skipped periods. The word “polycystic” refers “many cysts” which appears like many small, fluid-filled sacs grow inside the ovaries (Watson, 2021). The most commonly noticed symptoms of
PCOS are missed, irregular, or prolonged periods. Some women will have less than eight periods in a year while
some will stop having menstrual periods. Higher level of androgen can cause excessive hair fall on scalp which
is male pattern baldness, acne on face, upper back and chest and hirsutism which refers to excessive hair growth like on face chin, or parts of the body where males usually have hair. 70% of women with PCOS are effected by
hirsutism. Along with these common symptoms other symptoms like darkened skin or excess skin on the neck
or in the armpits, mood changes, pelvic pain and Weight gain or difficulty in losing weight can be present (Johnson, 2019 and womenshealth, 2019). There is no cure for PCOS, but symptoms of this condition can be
managed. Treatment plan will be designed based on the symptoms, severity of the symptoms and individual
concern. Usually this plan includes combination of medicines and lifestyle changes (womenshealth, 2019). The exact causes for PCOS is unknown but the experts have some factors might have role in causing this condition.
Some important factors are like Excess insulin which might increase androgen production and causing difficulty
with ovulation (Mayo Clinic, 2011).
In literary context Psychological distress refers to a state of emotional suffering associated with stressors and demands that are difficult to cope with in daily life. This is a psychological condition which can be often seen in
health care settings. This state includes fatigue, sadness, anxiety, avoidance of social situations, fear or anger,
moodiness (Arvidsdotter, Marklund, Kylen, Taft, Ekman, 2015). Many studies have showed that the prevalence of anxiety and depression is eight times higher in PCOS patients when compared with the people who do not
have it. Including these two major issues the patients might have low self-esteem, low confidence and decreased
body satisfaction. Recent studies have reported that although the patients face these many mental challenges psychological distress is considered as one key characteristic of PCOS. The common symptoms and
complications of PCOS such as menstrual irregularities, signs of hyperandrogenism, infertility, metabolic
problems, insulin resistance or diabetes along with other factors will promote psychological distress in the
patients. The isolated symptom like hirsuitism is considered to be associated with depression, anxiety, low self-esteem and social anhedonia. Lack of effective treatment for this condition may lead to feel burden or distress in
International Journal of Advance and Innovative Research Volume 8, Issue 3 (IV) July - September 2021 Part - 2
47
ISSN 2394 - 7780
future. (Karjula, Morin-Papunen, Auvinen, Ruokonen, Puukka, Franks, Järvelin, Tapanainen, Jokelainen,
Miettunen, Piltonen, 2017).
The term ‘yoga’ refers to union of physical, mental and spiritual practice in order to enhance overall health of an individual (Wikipedia, 2021). These researches have stated that yoga has enormous health benefits which
help the people to improve or manage their health conditions. This practice connects body, breath and mind.
Many of the people practice yoga to relieve their stress and psychological discomfort. Polycystic ovary syndrome is considered as emerging lifestyle disorder which involves poor diet and lack of physical exercises. It
is also called as a psychosomatic disorder which is characterized by obesity, infertility, pregnancy
complications, cysts in ovaries, irregular periods, hyperandrogenism, hirsutism and anovulation with
psychological problems such as depression, anxiety, distress and negative or dissatisfied body image. Hence it is very important to treat both psychic and somatic symptoms in order to remit the symptoms (Verma, Kumar,
Dei and Dhiman, 2015).
PCOS is a condition which persists for a longer duration and it cannot be cured but it can be managed through lifestyle changes and medicines. There is no particular one line treatment to treat this condition. Medicines will
be prescribed focusing on individual symptoms. This modern treatment includes insulin sensitizers Agents, oral
contraceptive pills, Ovulation Induction to treat infertility. In some cases when the patient become resist to medicines laproscopic ovarian drilling (surgical treatment) will be done. These symptomatic and surgical
treatments may result in lots of side effects, dissatisfaction, enormous expenses and a risk of disturbance in the
natural biological and hormone production system or developing other medical condition among the patients
(Verma, Kumar, Dei and Dhiman, 2015 and Nidhi, Padmalatha, Nagarathna, and Amritanshu, 2012).
Few studies have been conducted in order to accesses the other effective ways to treat polycystic ovary
syndrome and results have showed that lifestyle changes and interventions can be a first-line effective treatment
with no or minimum side effects. There are many evidences which states that yoga reduces stress, anxiety and depression symptoms. Yoga practice can cure PCOS without any side effects and expenses. Yoga is considered
as the complete and effective prescription which treats PCOS by destroying the root that is obesity and stress.
Yoga is a great stress buster and by reducing the production of stress hormone (cortisol). Stress can trigger the
body to store fat and this result in unwanted weight in women. In the patients with PCOS, yoga helps to the person to achieve the peaceful state that can reduce the stress and unwanted weight. Yoga helps women to
enhance optimism and self-understanding which ultimately leads to better quality of life (Verma, Kumar, Dei
and Dhiman, 2015 and Nidhi, Padmalatha, Nagarathna, and Amritanshu, 2012). Yoga’s benefits are not limited to the body alone. It is much deeper which releases the deeply stored stress which can improve PCOS
symptoms.
Need for the present study:- Polycystic ovary syndrome (PCOS) is a very commonly seen health problem in women. Approximately Four to five out ten women are suffering from this syndrome. Most of these women will
face some psychological and emotional difficulties while dealing with PCOS. Psychological distress and body
image has been a major issue which are lowering the women confidence. Many cases with PCOS are treated
with the medicine or drugs. But some experts suggest that a healthy diet and yoga helps the patients to mange and recover from the PCOS symptoms. There has always been a question that do yoga really have a positive
effect on a PCOS patients. Therefore, the current study was conducted to find out the impact of yoga on
psychological distress and body image among polycystic ovary syndrome (PCOS) patients.
Method:- This Chapter consists of the method incorporated in the present study which includes the research
questions, hypothesis, and the instruments used in the present research to collect the required information to
obtain the results. The entire procedure is categorized into research design, inclusion and exclusion criteria, and
sampling plan followed by the researcher.
Aim:- The aim of the research was to study the impact of yoga on psychological distress among PCOS patients.
Research questions:- Is there any significant impact on psychological distress of women with PCOS before
and after intervention?
Objectives:- This study have included the three phases under objectives. They are:
I Phase:- To assess the level of Psychological distress
II Phase:- To identify the suitable intervention for the experimental group.
III Phase:- To reassess the level of Psychological distress
International Journal of Advance and Innovative Research Volume 8, Issue 3 (IV) July - September 2021 Part - 2
48
ISSN 2394 - 7780
Research hypothesis:- Based on above objective the subsequent hypothesis was strained for the purpose of the
study. There will be a significant difference in post intervention course between experimental group and control
group on the variable Psychological distress.
Variables:- Two independent variable selected for the study were yoga intervention and patients with
polycystic ovary syndrome (PCOS).
One dependent variables selected for the present study was psychological distress.
Research design:- Experimental research design:- true experimental design- the pretest-posttest control group
design.
The research was experimental in nature as the present study was conducted to gain insight about the impact of
intervention on psychological distress among women with PCOS.
Sample:- Method – Purposive or judgemental sampling method.
Number of samples- Number of patients with polycystic ovary syndrome – 60
• Number of patients in experimental group- 30
• Number of patients in controlled group- 30
Operational definitions:- Psychological distress:- It is a person’s emotional suffering which causes difficulty in coping up with daily
life.
Inclusion criteria:- • The patients suffering from PCOS or PCOD since past 3 months.
• The patient’s age not exceeding 45 years.
Exclusion criteria:- • The patients having symptoms of PCOS but not clinically diagnosed.
• The patients with other menstrual or hormonal issues.
Research tools:- The information regarding each of the tools used for this research is presented in this section.
Demographic Questionnaire, Kessler psychological distress scale (K10).
Procedure:- 60 samples were taken to the study and they were divided into two groups that are 30 participants
in experimental group and 30 participants in controlled group. 21 days of yoga intervention was given through online platform. Detailed disruption about the intervention and nature of the study was explained to the
participants before making the two groups. Among 60 participants 30 subjects were participated in the
experimental group self willingly and controlled group was formed with the remaining 30 samples. Only experimental group was exposed to the intervention program where in Controlled group was remained
unexposed to the intervention program. Demographic details of each participant were collected. Kessler
psychological distress scale was administered to both the groups through online platform (Google forms) before
and after 21 days of intervention program.
Ethical issues: The ethical issues followed by the current study were:
• Approval by the institution for conducting the research.
• Use of the data collected strictly for the purpose of the current research.
• Thorough confidentiality of the data collected throughout the research.
• Approved consent by each of the participant before collection of data.
DATA ANALYSIS: Descriptive analysis like mean and standard deviation and under inferential analysis Independent sample t test
and Paired sample t test (parametric) were used in order to test the hypothesis.
RESULT AND DISCUSSION This chapter contains the results and interpretation of the current study. The results are discussed in 2 parts. Part
one describes the demographic details of the participants, both experimental group and control group. Part two
describes the scores and interpretation of the dependent variable, that is psychological distress among
International Journal of Advance and Innovative Research Volume 8, Issue 3 (IV) July - September 2021 Part - 2
49
ISSN 2394 - 7780
experimental group and control group of PCOS patients before and after the yoga intervention using
Independent sample t test and Paired samples t test.
Part I - Demographic details of the participants Demographic details such as age, city and the interview question like “Do you have PCOS?” and “From how
many months or years you have PCOS?”. Details of age range and domicile are depicted using bar graphs.
Age range- A total 60 participants were selected for the study out of which 30 were in experimental group and 30 were control group. The age range of the participants of experimental group and control group in the study.
In experimental group, 70% belonged to the age group of 15-25 years, 26.66% belonged to the age group of 26-
35 years and 3.33% belonged to the age group of 36-45 years among the total 30 participants. A total of 30
participants for control group were selected out of which 43.33% belonged to the age group of 15-25 years,
46.66% belonged to the age group of 26-35 years and 10% belonged to the age group of 36-45 years.
Domicile- The domicile of the participants of experimental group and control group in the study. Out of 30
participants in experimental group, 60% belonged to urban domicile and the remaining 40% belonged to rural domicile. Out of 30 participants in the control group, 70% belonged to urban domicile and the remaining 30%
belonged to rural domicile.
Number of years the participants having PCOS- The responses given by the participants of both experimental and control group to the question “From how many months or years you have PCOS?”. Out of the 30
participants in the experimental group, 26.60% of participants have PCOS from 1 year or less than that, 36.65%
of participants have PCOS from 2-3 years, 23.30% of participants have PCOS from 4-5 years, 6.60% of
participants have PCOS from 6-7 years, 3.30% of participants have PCOS from 8-9 years and 3.30% of participants have PCOS from 9-10 years. Among 30 participants in control group, 43.30% of the participants
have PCOS from 1 year or less than that, 26.60% of participants have PCOS from 2-3 years, 16.60% of
participants have PCOS from 4-5 years, 10.00% of participants have PCOS from 6-7 years, 3.30% of
participants have PCOS from 8-9 years and no participants have PCOS from 9-10 years.
Part II- Psychological distress among polycystic ovary syndrome patients • Establishment of equivalence
To establish the equivalence between the experimental and control groups, Independent sample
‘t’ test was calculated.
Table 4.1: ‘t’ value for the experimental and control group on all the variables. (Pre intervention Result)
Variable Group Mean S.D df ‘t’ Value ‘p’ Value
Psychological Experimental 26.00 8.145
Distress group
58 0.125 0.901
Control 25.73 8.329
group
Above table shows the mean score, standard deviation, t value, df and significance at 0.05 level obtained by
experimental and control group on pre intervention.
The obtained t value is 0.125 and the significance at 0.05 level is 0.901 indicating that there is no significant
difference in psychological distress among experimental and control group.
Testing of Hypotheses: Before the intervention, the researcher estimated the level of Psychological distress
of both the experimental and control group. After this analysis, researcher executed intervention for 21days
for the experimental group. During this time control group was not exposed to any sort of intervention by the researcher. To see the effectiveness of intervention program on the experimental group paired samples
t-test was employed to test the significance of the difference between pre-intervention and post-
intervention scores on all the dependent variable. Paired samples t-test was also calculated to test the significance of the difference between first and second assessment of the control group. The scores
obtained by experimental group and control group are discussed and interpreted in this part.

International Journal of Advance and Innovative Research Volume 8, Issue 3 (IV) July - September 2021 Part - 2
50
ISSN 2394 - 7780
Table 4.2: Shows the scores obtained by the participants of experimental group and control group on Kessler
psychological distress scale (K10).
Table 4.2 shows the mean score, standard deviation, t value, df and significance at 0.05 level obtained by
experimental group and control group on dependent variable. The obtained t value is 5.425 and the significance
at 0.05 levels under the experimental group is 0.000 indicating that there is a significant difference in the levels of psychological distress among the participants of experimental group before and after the 21 days of yoga
intervention. The obtained t value is 0.001 and the significance at 0.05 levels under the experimental group is
1.000 indicating that there no significant difference in the levels of psychological distress among the participants of control group who were not exposed to the 21 days of yoga intervention in the pre-test and post-
test.
The mean score obtained control group (0.000) is lower than the mean score obtained by the experimental group
(8.833) indicating that experimental group has a significant difference in the levels of psychological distress than control group, suggesting that 21 days of yoga intervention has impacted the levels of psychological
distress among 30 participants who were in the experimental group.
Post intervention analysis of experimental group and second assessment of the control group:
Independent t-test was calculated to test the hypothesis that there will be a significant difference between post-intervention scores of the experimental group and second assessment of the control group on the
Psychological Distress.
Table 4.3: ‘t’ value for the experimental and control group psychological distress. (Post intervention Result)
Variable Group Mean S.D df ‘t’ Value ‘p’ Value
Psychological Experimental 17.57 5.811
Distress group
58 -4.187 0.000
Control 24.77 7.412
group
Above table shows the mean score, standard deviation, t value, df and significance at 0.05 level obtained by
experimental and control group on post intervention. The obtained t value is -4.187 and the significance at 0.05 level is 0.000 indicating that there is a significant difference in psychological distress among experimental and
control group.
The results of the current study rejects the null hypothesis and accept the alternative hypothesis which states that there will be a significant difference in post intervention course between experimental group and control group
on the levels of psychological distress.
SUMMARY AND CONCLUSION SUMMARY The research titled “Impact of yoga on psychological distress and body image among polycystic ovary
syndrome (PCOS) patients” was conducted to study impact of yoga intervention on psychological distress
among PCOS patients. The study was experimental in nature and the tool used was Kessler psychological
Variable N Mean Std. Deviation t df Sig.
Psychological
distress
Experimental 30 8.833 8.918 5.425 29 0.001
group
Control group 30 0.000 2.477 0.000 29 1.000
International Journal of Advance and Innovative Research Volume 8, Issue 3 (IV) July - September 2021 Part - 2
51
ISSN 2394 - 7780
distress scale (K10). The sample size was 60 with 30 participants in experimental group and 30 participants in
control group. The sampling method used was purposive sampling.
Finding of the Study: The finding of the present study is as follows: There is a significant difference in the
level of psychological distress among the participants of experimental group before and after intervention.
CONCLUSION
The study concludes that yoga intervention has an impact on the level of psychological distress among the patients with polycystic ovary syndrome. As the results have proved that there is a significant difference in the
level of psychological distress among the participants of experimental group before and after intervention, the
study suggest that yoga has an impact on psychological distress in the patients who are suffering with PCOS.
Implication: The results can be used to plan treatment for the polycystic ovary syndrome patients in order to
decrease the psychological issue that is distress.
SCOPE FOR FURTHER RESEARCH:
Since the present study considered only a total number of 60 participants with 30 in experimental group
and 30 in control group, further study can be carried out with a larger number of samples.
A thematic or qualitative study can be incorporated in order to gain deep insight into the impact of yoga on
the psychological health among the polycystic ovary syndrome patients.
Along with psychological symptoms of the polycystic ovary syndrome, physical symptoms can also be
taken as a dependent variable and impact of yoga can be studied on the same.
LIMITATIONS:
The study excluded the patients having symptoms of PCOS but not clinically diagnosed and the patients
with other menstrual or hormonal issues.
The size of the sample was not tested using the sample size calculator.
REFERENCES
1. Bhumika Pruthi. (2019). One in five Indian women suffers from PCOS. The Hindu. From:
https://www.thehindu.com/sci-tech/health/one-in-five-indian-women-suffers-from-
pcos/article29513588.ece
2. B. Shalini, R. Elangovan. (2020). European Journal of Molecular & Clinical Medicine. Efficacy of yoga
therapy on body mass index and testosterone among adult women with polycystic ovarian syndrome.
Volume 7, Issue 9, Pages 1103-1109.
3. Fahimeh Ramezani Tehrani and Samira Behboudi-Gandevani. (2015). Polycystic ovary syndrome.
IntechOpen. DOI: 10.5772/59591. From: https://www.intechopen.com/books/contemporary-gynecologic-
practice/polycystic-ovary-syndrome-
4. Farideh Zafari Zangeneh, Mina Jafarabadi, Mohammad Mehdi Naghizadeh, Nasrine Abedinia, and Fedyeh
Haghollahi. (2012). Psychological Distress in Women with Polycystic Ovary Syndrome from Imam
Khomeini Hospital, Tehran. Journal of Reproduction & Infertiity. 13(2):111-115.
5. I.J. Rowlands, H. Teede, J. Lucke, A.J. Dobson, and G.D. Mishra. (2016). Young women’s psychological
distress after a diagnosis of polycystic ovary syndrome or endometriosis. Human Reproduction. 31(9),
2072-2081.
6. Lakshmipriya Dei, Sarvesh Kumar, Anjali Verma and Kamini Dhiman. (2015). Management of PCOS: a
psychosomatic disorder by yoga practice. ResearchGate. 4(1).
7. Lidiya Borghi, Deniela Leone, Elena Vegni, Valentina Galiano, Corina Lepadatu, Patrizia Sulpizio and
Emanuele Garzia. (2018). Psychological distress, anger and quality of life in polycystic ovary syndrome: associations with biochemical, phenotypical and socio-demographic factors. Journal of Psychosomtic
Obstetrics & Gynecology. 39(2), 128-137.
8. Mayoclinic. (2020). Polycystic ovary syndrome (PCOS). Mayo Foundation for Medical Education and Research (MFMER). From: https://www.mayoclinic.org/diseases-conditions/pcos/symptoms-causes/syc-
20353439
9. Rebecca S. Light, Joseph Chilcot, Emily McBride. (2020). Psychological Distress in Women Living with
Polycystic Ovary Syndrome: The Role of Illness Perceptions. Women’s Health Issues. 31(2), 177-184.

International Journal of Advance and Innovative Research Volume 8, Issue 3 (IV) July - September 2021 Part - 2
52
ISSN 2394 - 7780
10. Stephanie Watson. (2017). Polycystic ovary syndrome (PCOS): symptoms, causes and treatment.
Healthline. Retrieved on 19th April 2021. From: https://www.healthline.com/health/polycystic-ovary-
disease
11. Valarmathi Selvaraj, Jain Vanitha, Fabiola M. Dhanaraj, Prema Sekar and Anitha Rajendra Babu. (2020).
Impact of yoga and exercises on polycystic ovarian syndrome risk among adolescent schoolgirls in South
India. PubMed.gov. 3(4):212.
12. Violanda Grgorescu, Torie Comeaux Plowden and Lubna Pal (Medically reviewed). Polycystic ovary
syndrome. Women’s health. Retrieved on 1st April 2019. From: https://www.womenshealth.gov/a-z-
topics/polycystic-ovary-syndrome
13. Wikipedia. (2021). Yoga. From: https://en.wikipedia.org/wiki/Yoga
International Journal of Advance and Innovative Research Volume 8, Issue 3 (IV) July - September 2021 Part - 2
53
ISSN 2394 - 7780
IMPORTANCE OF EMPLOYER BRANDING DURING CAMPUS RECRUITMENT
Prof. Mohammed Khaja Qutubuddin
ICBM SBE, Hyderabad, India
ABSTRACT This paper tries to explore the importance of Employer branding especially during campus recruitment. We
explore the students’ perception towards employer brand while opting to apply for a job. Various underlying
parameters are taken into consideration like Brand value of the company, pay package, working hours, career prospects, work environment, recognition, opportunity to work on offshore assignments, job security, etc. The
objective of the study is to study about employer branding and its role in recruitment practices and to
understand student perceptions towards employer branding.
Key Words: Campus recruitment, Brand value, Employer Branding, Work environment.
INTRODUCTION:
Employer branding is the process of planting the idea that your company is a great place to work in the minds of
potential job candidates, says Estis. It is essentially a promise of what it would be like to work at your
organization and is like corporate branding, which involves using a company logo to convey a certain image or idea to the public. However, an employment brand asks potential employees to essentially change their lives by
coming to work at the organization. Employees who can feel proud of where they work are more likely to
remain with that employer. An employment brand can help build that pride and make it easier to communicate
to job candidates that your Company is a desirable place to work and to build a career.
LITERATURE REVIEW:
Over the past few years, the concept of employment branding has entered the lexicon of HR specialists the ‘‘employment experience’’ of ‘‘what it is like to work at a company, including tangibles such as salary and
intangibles such as company culture and values’’ (Ruch, 2002, p. 3). The internal branding process, how an
employment brand is created, consists of creating a compelling employment image or proposition,
communicating it to employees, convincing them of its worth and, in the rather evangelical words of one set of authors, ‘linking every job in the organization to delivery of the brand essence’ (Bergstrom et al., 2002). Like
the minimalist version of employer of choice, much of the content of employment branding programmes
emphasizes the traditional HR activities of attraction, recruitment, communications, motivation, and retention. This work is at its most helpful from the point of view of practitioners in adapting the ideas of branding from
marketing and communications, and applying them to the recruitment and selection phase and in developing
and communicating value propositions for employees (Ruch, 2002).. Reminiscent of the ‘strategy-as-
compelling-narrative’ approach, which has become popular in the strategic management literature (Barry and
Elmes, 1997), the key questions to which employer branding addresses itself are as follows:
What is the compelling and novel story that we can tell people about working here?
How do we tell the story to potential and existing employees in a way that convinces them of the reality of
what we have to offer?
Objectives of the study:
To study about employer branding and its role in campus recruitment practices.
To study about student perceptions towards employer branding.
RESEARCH METHODOLOGY
Primary and secondary data were collected for the purpose of the study. Following the observational method,
the ordinary data is collected, and survey research method is employed. The survey research method is used to get the opinion of the students pursuing different courses and who were in the final year of their course. The
research instrument used for the survey is a well-structured questionnaire consisting of close-ended questions.
Oral interviews and observations have also been used to supplement and support the primary data generated
through the questionnaire method. An on-line survey at surveymonkey.com was also conducted to have a better
sample structure so that there is less bias in drawing of conclusions.
LIMITATIONS OF THE STUDY
The survey was limited to the city of Hyderabad.
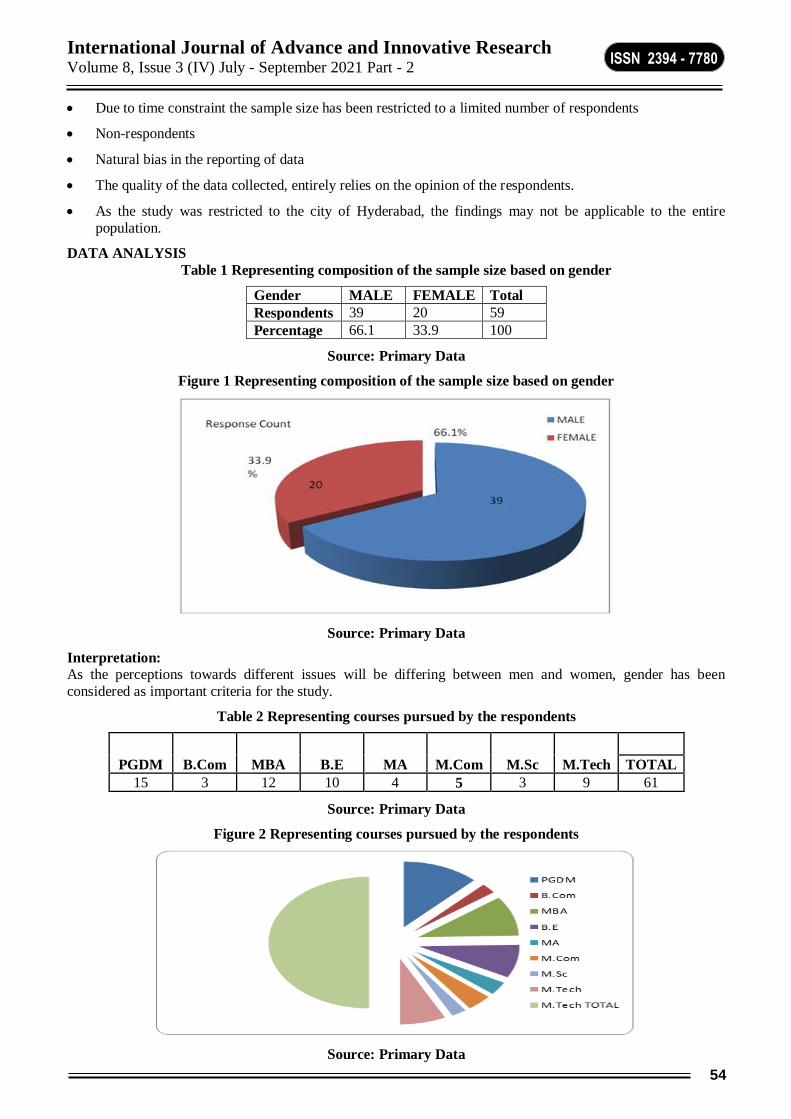
International Journal of Advance and Innovative Research Volume 8, Issue 3 (IV) July - September 2021 Part - 2
54
ISSN 2394 - 7780
Due to time constraint the sample size has been restricted to a limited number of respondents
Non-respondents
Natural bias in the reporting of data
The quality of the data collected, entirely relies on the opinion of the respondents.
As the study was restricted to the city of Hyderabad, the findings may not be applicable to the entire
population.
DATA ANALYSIS
Table 1 Representing composition of the sample size based on gender
Gender MALE FEMALE Total
Respondents 39 20 59
Percentage 66.1 33.9 100
Source: Primary Data
Figure 1 Representing composition of the sample size based on gender
Source: Primary Data
Interpretation:
As the perceptions towards different issues will be differing between men and women, gender has been
considered as important criteria for the study.
Table 2 Representing courses pursued by the respondents
PGDM B.Com MBA B.E MA M.Com M.Sc M.Tech TOTAL
15 3 12 10 4 5 3 9 61
Source: Primary Data
Figure 2 Representing courses pursued by the respondents
Source: Primary Data
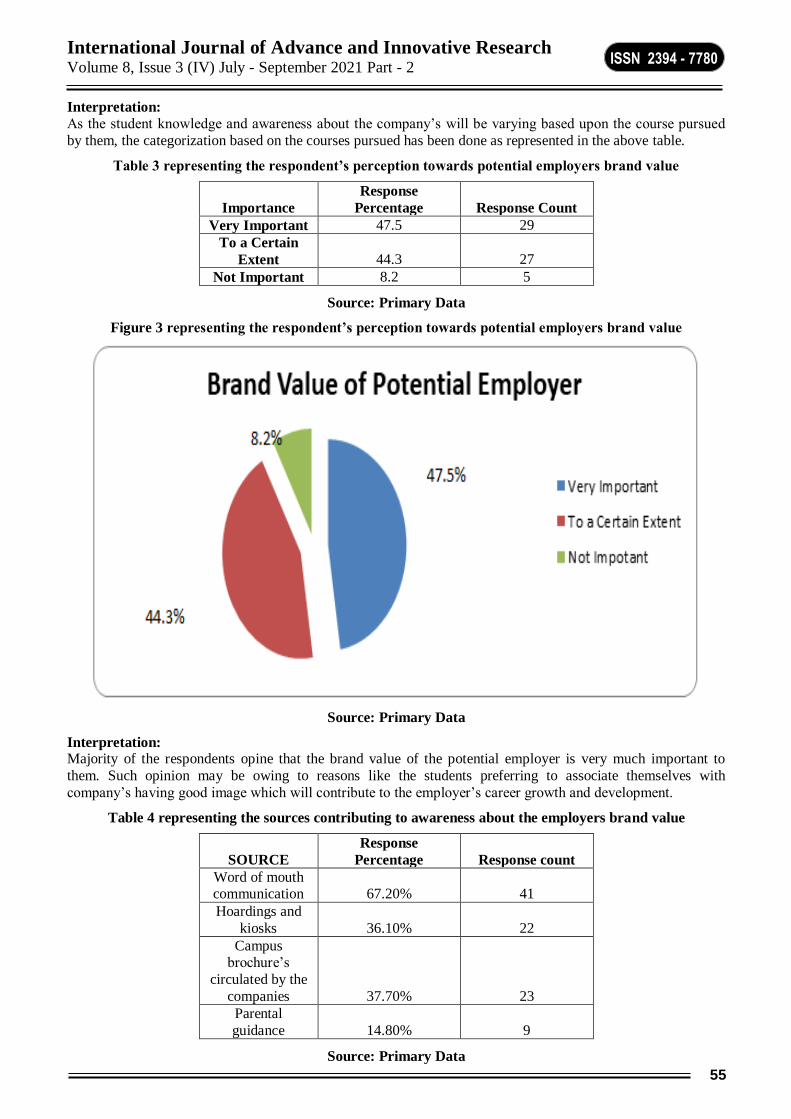
International Journal of Advance and Innovative Research Volume 8, Issue 3 (IV) July - September 2021 Part - 2
55
ISSN 2394 - 7780
Interpretation:
As the student knowledge and awareness about the company’s will be varying based upon the course pursued
by them, the categorization based on the courses pursued has been done as represented in the above table.
Table 3 representing the respondent’s perception towards potential employers brand value
Importance
Response
Percentage Response Count
Very Important 47.5 29
To a Certain
Extent 44.3 27
Not Important 8.2 5
Source: Primary Data
Figure 3 representing the respondent’s perception towards potential employers brand value
Source: Primary Data
Interpretation: Majority of the respondents opine that the brand value of the potential employer is very much important to
them. Such opinion may be owing to reasons like the students preferring to associate themselves with
company’s having good image which will contribute to the employer’s career growth and development.
Table 4 representing the sources contributing to awareness about the employers brand value
SOURCE
Response
Percentage Response count
Word of mouth communication 67.20% 41
Hoardings and
kiosks 36.10% 22
Campus brochure’s
circulated by the
companies 37.70% 23
Parental
guidance 14.80% 9
Source: Primary Data
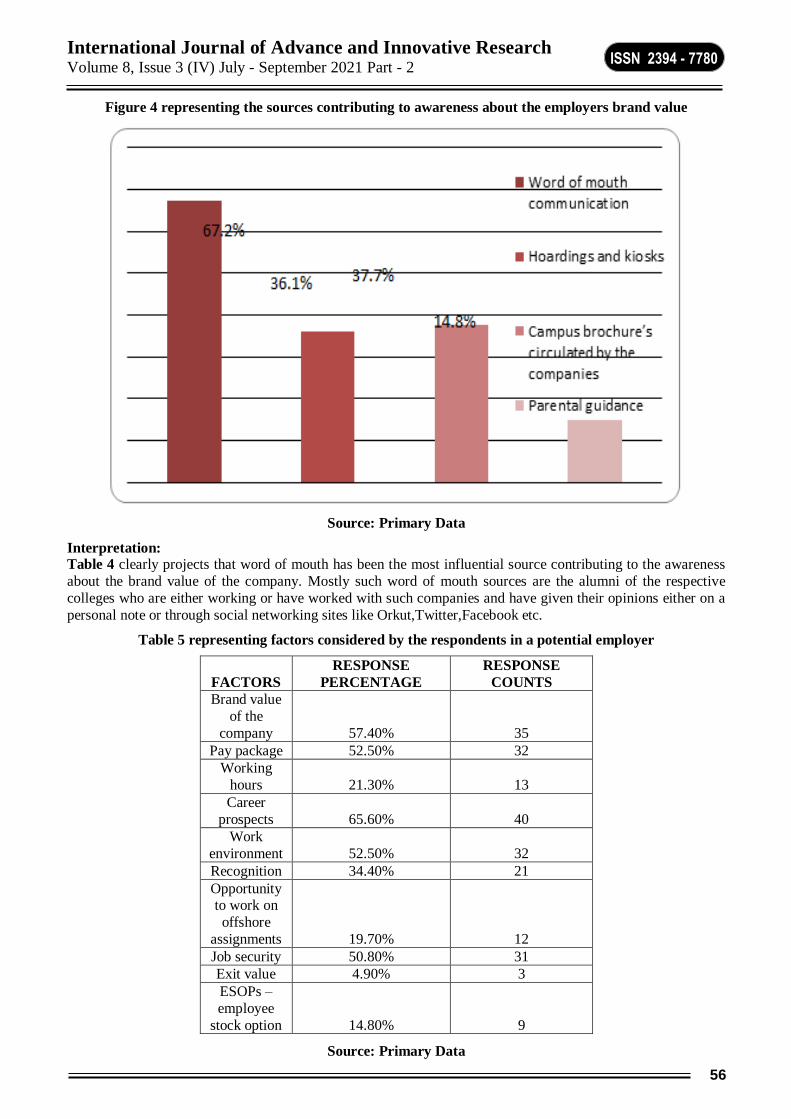
International Journal of Advance and Innovative Research Volume 8, Issue 3 (IV) July - September 2021 Part - 2
56
ISSN 2394 - 7780
Figure 4 representing the sources contributing to awareness about the employers brand value
Source: Primary Data
Interpretation: Table 4 clearly projects that word of mouth has been the most influential source contributing to the awareness
about the brand value of the company. Mostly such word of mouth sources are the alumni of the respective
colleges who are either working or have worked with such companies and have given their opinions either on a
personal note or through social networking sites like Orkut,Twitter,Facebook etc.
Table 5 representing factors considered by the respondents in a potential employer
FACTORS
RESPONSE
PERCENTAGE
RESPONSE
COUNTS
Brand value
of the
company 57.40% 35
Pay package 52.50% 32
Working
hours 21.30% 13
Career
prospects 65.60% 40
Work
environment 52.50% 32
Recognition 34.40% 21
Opportunity to work on
offshore
assignments 19.70% 12
Job security 50.80% 31
Exit value 4.90% 3
ESOPs –
employee
stock option 14.80% 9
Source: Primary Data
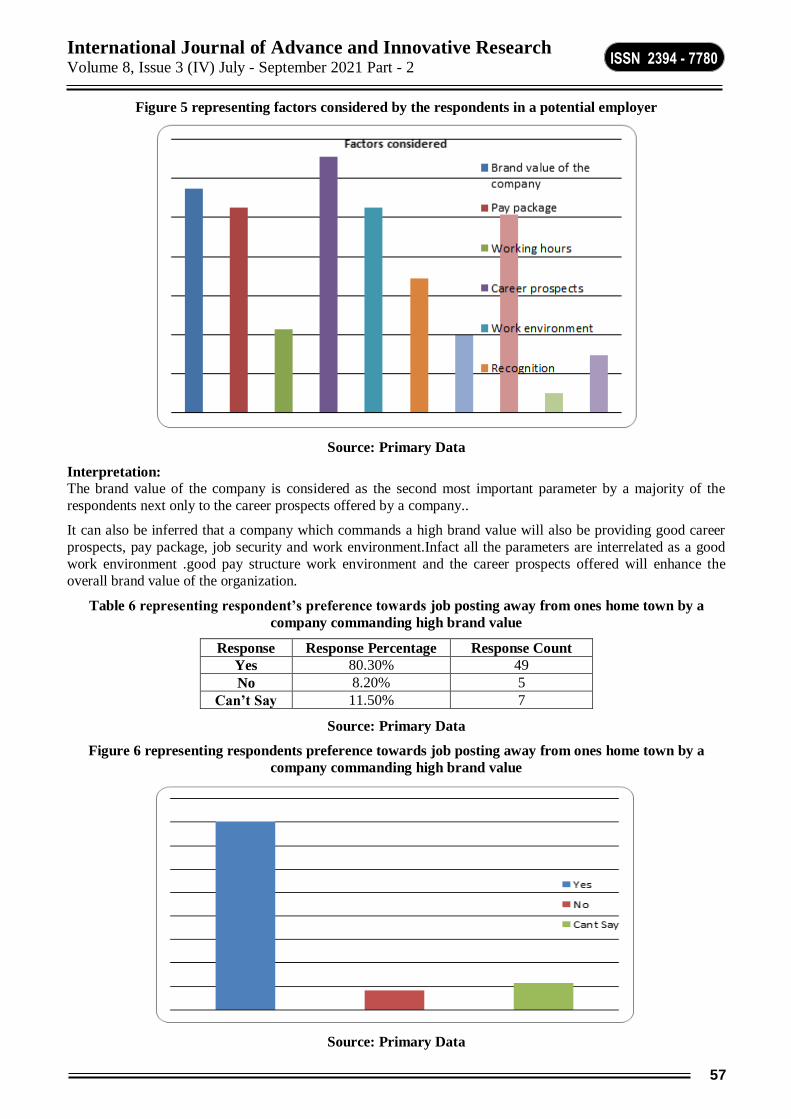
International Journal of Advance and Innovative Research Volume 8, Issue 3 (IV) July - September 2021 Part - 2
57
ISSN 2394 - 7780
Figure 5 representing factors considered by the respondents in a potential employer
Source: Primary Data
Interpretation:
The brand value of the company is considered as the second most important parameter by a majority of the
respondents next only to the career prospects offered by a company..
It can also be inferred that a company which commands a high brand value will also be providing good career
prospects, pay package, job security and work environment.Infact all the parameters are interrelated as a good
work environment .good pay structure work environment and the career prospects offered will enhance the
overall brand value of the organization.
Table 6 representing respondent’s preference towards job posting away from ones home town by a
company commanding high brand value
Response Response Percentage Response Count
Yes 80.30% 49
No 8.20% 5
Can’t Say 11.50% 7
Source: Primary Data
Figure 6 representing respondents preference towards job posting away from ones home town by a
company commanding high brand value
Source: Primary Data
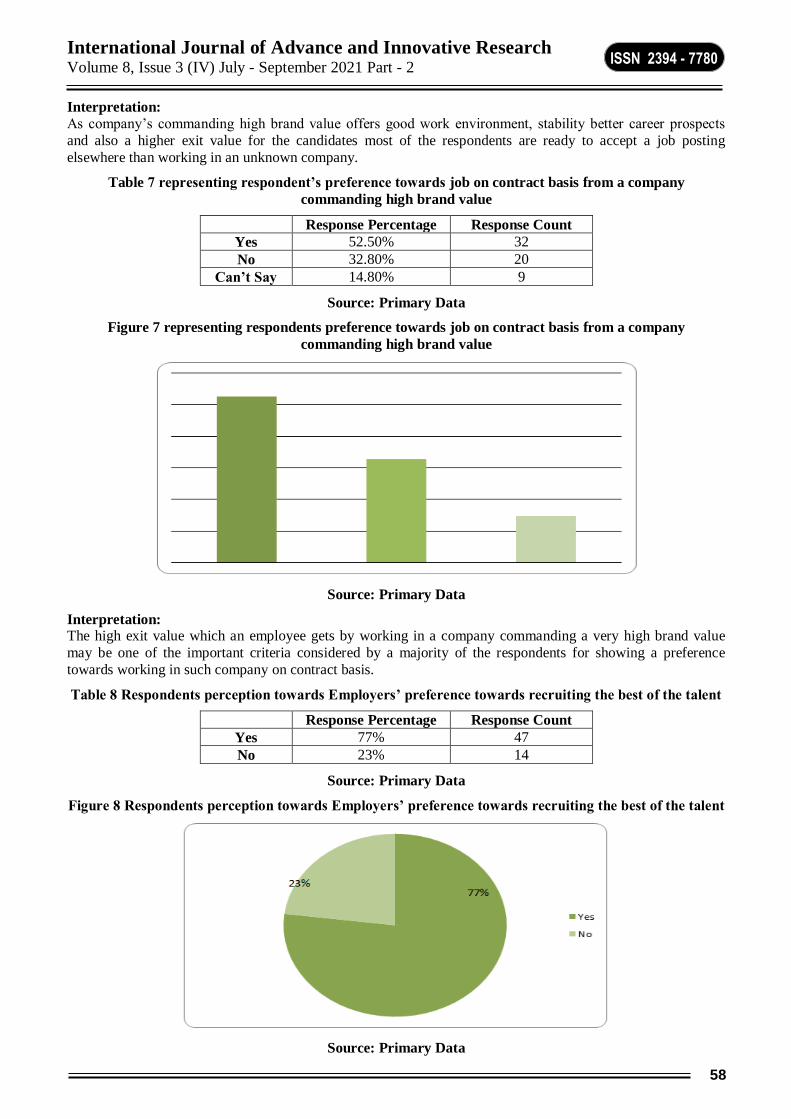
International Journal of Advance and Innovative Research Volume 8, Issue 3 (IV) July - September 2021 Part - 2
58
ISSN 2394 - 7780
Interpretation:
As company’s commanding high brand value offers good work environment, stability better career prospects
and also a higher exit value for the candidates most of the respondents are ready to accept a job posting
elsewhere than working in an unknown company.
Table 7 representing respondent’s preference towards job on contract basis from a company
commanding high brand value
Response Percentage Response Count
Yes 52.50% 32
No 32.80% 20
Can’t Say 14.80% 9
Source: Primary Data
Figure 7 representing respondents preference towards job on contract basis from a company
commanding high brand value
Source: Primary Data
Interpretation: The high exit value which an employee gets by working in a company commanding a very high brand value
may be one of the important criteria considered by a majority of the respondents for showing a preference
towards working in such company on contract basis.
Table 8 Respondents perception towards Employers’ preference towards recruiting the best of the talent
Response Percentage Response Count
Yes 77% 47
No 23% 14
Source: Primary Data
Figure 8 Respondents perception towards Employers’ preference towards recruiting the best of the talent
Source: Primary Data
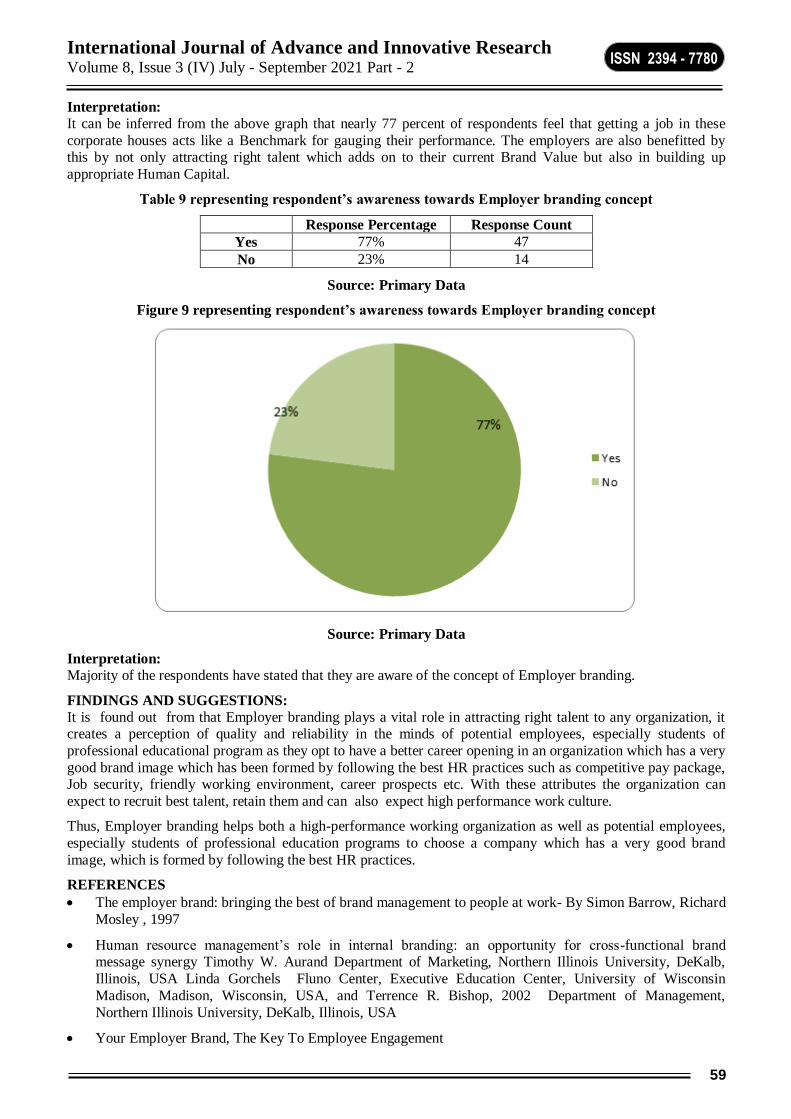
International Journal of Advance and Innovative Research Volume 8, Issue 3 (IV) July - September 2021 Part - 2
59
ISSN 2394 - 7780
Interpretation:
It can be inferred from the above graph that nearly 77 percent of respondents feel that getting a job in these
corporate houses acts like a Benchmark for gauging their performance. The employers are also benefitted by this by not only attracting right talent which adds on to their current Brand Value but also in building up
appropriate Human Capital.
Table 9 representing respondent’s awareness towards Employer branding concept
Response Percentage Response Count
Yes 77% 47
No 23% 14
Source: Primary Data
Figure 9 representing respondent’s awareness towards Employer branding concept
Source: Primary Data
Interpretation:
Majority of the respondents have stated that they are aware of the concept of Employer branding.
FINDINGS AND SUGGESTIONS: It is found out from that Employer branding plays a vital role in attracting right talent to any organization, it creates a perception of quality and reliability in the minds of potential employees, especially students of
professional educational program as they opt to have a better career opening in an organization which has a very
good brand image which has been formed by following the best HR practices such as competitive pay package, Job security, friendly working environment, career prospects etc. With these attributes the organization can
expect to recruit best talent, retain them and can also expect high performance work culture.
Thus, Employer branding helps both a high-performance working organization as well as potential employees,
especially students of professional education programs to choose a company which has a very good brand
image, which is formed by following the best HR practices.
REFERENCES
The employer brand: bringing the best of brand management to people at work- By Simon Barrow, Richard
Mosley , 1997
Human resource management’s role in internal branding: an opportunity for cross-functional brand message synergy Timothy W. Aurand Department of Marketing, Northern Illinois University, DeKalb,
Illinois, USA Linda Gorchels Fluno Center, Executive Education Center, University of Wisconsin
Madison, Madison, Wisconsin, USA, and Terrence R. Bishop, 2002 Department of Management,
Northern Illinois University, DeKalb, Illinois, USA
Your Employer Brand, The Key To Employee Engagement

International Journal of Advance and Innovative Research Volume 8, Issue 3 (IV) July - September 2021 Part - 2
60
ISSN 2394 - 7780
Job market signaling *Michael Spence
Branding: A New Performance Discourse for HR?-Graeme martin, Heriot Watt University, Phillip
Beaumont, University of Glasgow Rosalind doig, Heriot Watt University Judy pate, University of Glasgow
Focus Groups: 7 Steps to Defining your Unique Employment Brand By Patty Van Leer - Senior Vice
President- NAS Recruitment Communications
Graeme Martin, Phillip Beaumont, Rosalind Doig, Judy Pate, Branding:: A New Performance Discourse
for HR?, European Management Journal,Volume 23, Issue 1,2005, Pages 76-88, ISSN 0263-2373
International Journal of Advance and Innovative Research Volume 8, Issue 3 (IV) July - September 2021 Part - 2
61
ISSN 2394 - 7780
IMPORTANCE OF KNOWLEDGE MANAGEMENT & UPDATION OF KNOWLEDGE AMONG
EMPLOYEES IN ORGANIZATION
S. Dhivya1 and Dr. V. Andal
2
1Ph.D., Research Scholar, Vels Institute of Science, Technology and Advanced Studies, VISTAS, Chennai.
2Research Supervisor, Department of accounting and finance, VISTAS, Chennai
ABSTRACT:
This study has examined the effect of knowledge management and requirement of knowledge updation among employees in organization. The study revels that technical updating of the skill of employees has brought
bother job satisfaction among employees as well as organization has achieved its goal So knowledge
management has given dual profit for both organization and employees.
Keywords---knowledge management, updating of knowledge, Firms Performance, progresses in firm
I. INTRODUCTION Knowledge management is the process of collection and up dating of human knowledge according to changing
situations .when speaking about organization knowledge management plays an important role in up liftmen of organization .organization cannot stick up to old mythology of doing work which can violate the major resource
of the organization such as time, energy of human resource and money .New mythology of knowledge is
required for the progresses of the organization this study aim in bring out the need of knowledge updating in
organization and the fruit that is derived out of updating . knowledge management is the system in which enterprise collects, assembles, shares and examines its knowledge in a way that is clearly reachable to
employees. This knowledge includes technical resources, clarifying queries and training human skills.
Knowledge management involves knowledge discovery in data and some method of operation to push
information to users to make it easily accessible.
AIM OF KNOWLEDGE MANAGEMENT
The main aim of knowledge management is to Improvise organizational efficiency and preserving knowledge in an effectively accessible form .Knowledge management take the initiative of putting the correct information in
front of anyone at the right time.
STEPS TAKEN BY ORGANIZATION TO CONQUER KNOWLEDGE MANAGEMENT IN
ORGANISATION Apprehend and arrange knowledge in a knowledge management system to address specific business tasks
and projects;
Split knowledge with others who can progress out of it;
Bringing betterment in processes and technology to provide easy access to knowledge; and
Promoting the generation of new knowledge for continual learning.
Knowledge management helps businesses to break down siloes by putting information in a place easily
accessible to all employees. It provides a place for people to put knowledge they have acquired over time,
preventing a business from losing that information when individuals leave the company.
THERE ARE THREE TYPES OF KNOWLEDGE
Explicit knowledge Explicit knowledge is the form of knowledge that is accured by secondary data
and resources and is most easily extracted and handled by a knowledge management system.
Tacit knowledge. Tactic knowledge is the form of knowledge that is gained by an individual out of its
experience and practice This type of knowledge transfer is difficult, as it lies within a single person. There
is no easy way to corkscrew,
Embedded knowledge. Knowledge secured in process of culture ,routines, artifacts and structure. It is
embedded formally through management initiatives or informally as organizations use and apply the other
two knowledge types. While embedded knowledge can be found in explicit sources, it is not always
immediately apparent why doing something a certain way is important for a business.
PROCESS BY WHICH KNOWLEDGE ARE UPDATED IN ORGANIZATION
Case studies
International Journal of Advance and Innovative Research Volume 8, Issue 3 (IV) July - September 2021 Part - 2
62
ISSN 2394 - 7780
Training programs
Webinars
Forums or community features
FAQ
IMPORTANCE OF KNOWLEDGE MANAGEMENT IN ORGANISATION
Enhance organisational swiftness.
Effective and quick decision making.
Speedy problem-solving.
Multiplies rate of discovery.
Contributes employee progressiveness and development.
.Betterments business processes.
Develop better strategies
Improve profitability
Increase operational efficiency and staff productivity
It helps tounderstands market trends quickly and gain an advantage over your rivals
Creates benchmark against your competitors
PROBLEMS FACED BY ORGANISATION IF KNOWLEDGE IS NOT UP DATED Poor decisions : if knowledge is not managed in organization decision making process will be long and
some times wrong decision can also be taken
Repetitive mistake:chances of frequent repetitive mistake is possible due to lack of knowledge
Poor search capability: It's hard to find relevant information and resources when needed. As a result,
people waste time searching
Reinventing the wheel: Employees have to start from the beginning each time they start a new
project. Which leads to wastage of time and energy
II. REVIEW OF LECTURE
Ganesh D. Bhatt(2001) explain that for an organization to capitalize on knowledge management it must in in
position to change its organization culture, technology, and techiniques and it also explains that by creating
nurturing and learning by doing kind of environment an organization can sustain its competitive advantage.
David Bruce Audretsch , Maksim Belitski (2011) explain that empirically evaluated to what extent the interplay
between the domains of knowledge complexity facilitates firm performance and the role of organizational resilience in this relationship it also says that resilience and agility in SMEs are important to leverage the effect
of knowledge complexity on firm performance.
Adrian tootell(2020) explains that opportunistic behavior was a actual barrier to knowledge formation it says in severe cases, the knowledge creation or formation process was destroyed, resulting in lost investment.
Principled behavior and investment in affect-based and cognition-based trust, through five critical trust
development activities, provided the best path to successful knowledge creation.
Claudio Garavelli1 , Michele Gorgoglione (2004) explain the knowledge management stratigy with a star model in a company.The star model has been applied and tested on a real case, i.e. an international software
company. The case study was aimed at assessing the effectiveness of the model and its usefulness. By stressing
the similarity between the KM strategy perceived by the company managers and the one described by the
model, the effectiveness of the model was confirmed.
III. RESEARCH GAP After reviewing the descriptive and empirical research on knowledge management . The researchers clearly
identify two issues which are untouched at national and international level namely
What is the important factor implying employee’s knowledge updation?
International Journal of Advance and Innovative Research Volume 8, Issue 3 (IV) July - September 2021 Part - 2
63
ISSN 2394 - 7780
Is there is any direct relationship between employees knowledge updation and management performance?
IV. OBJECTIVE OF THE STUDY
To find the requirement and need of knowledge management in organization
To find the difficulty if knowledge is not updated
To understand the actual concept of knowledge management in organization
V. METHODOLOGY
This is a descriptive study in which secondary data is used. Secondary data is collected with the help of
journals ,articles and websites.
VI. LIMITATION OF STUDY Since because this study is a descriptive study no statistical datas were collected to prove the reliability of the
study.
VII. CONCLUSION AND FINDING
The study concludes that technical updating of the skill of employees is important for the success of
organizational . For the organisation to sustain in the field and for the employees to get job satisfaction updation of knowledge is important .So knowledge management has given dual profit for both organization and
employees. . knowledge is an process of grasping information that an organization or individual acquires
through training and experience. So the study concludes that management should provide more opportunity for employees to update they knowledge according to the current scenario which leads to progresses in dual
aspects.
REFERENCE JOURNALS AND WEBSITE
Ganesh D. Bhatt Knowledge management in organizations: examining the interaction between technologies, techniques, and people Ganesh D. Bhatt Journal of Knowledge ManagementISSN: 1367-
3270Article publication date: 1 March 2001 . https://doi.org/10.1108/13673270110384419
David Bruce Audretsch , Maksim Belitski "Knowledge complexity and firm performance: evidence from
the European SMEs", Journal of Knowledge Management, Vol. 25 No. 4, pp. 693-
713. https://doi.org/10.1108/JKM-03-2020-017
"Knowledge creation in complex inter-organizational arrangements: understanding the barriers and enablers of university-industry knowledge creation in science-based cooperation", Journal of Knowledge
Management, Vol. 25 No. 4, pp. 743-769. https://doi.org/10.1108/JKM-06-2020-0461
Knowledge and Process Management Volume 11 Number 4 pp 273–282 (2004) Published online in Wiley
InterScience (www.interscience.wiley.com). DOI: 10.1002/kpm.209
Google scholar
Shod ganga
Wikipedia
International Journal of Advance and Innovative Research Volume 8, Issue 3 (IV) July - September 2021 Part - 2
64
ISSN 2394 - 7780
PROFESSOR- ORIENTALIST N. F. KATANOV AND HIS MANUSCRIPT HERITAGE OF IN THE
FUNDS OF THE RUSSIAN ARCHIVES: DIARIES AND MATERIALS OF THE PERIOD OF
TRAVEL TO SIBERIA AND XINJIANG (1889–1892)
R. M. Valeev1, R. Z. Valeeva
2, А. Sh. Mullaynov
3 and V. N. Tuguzhekova
4
1Doctor of Sciences (History), Professor, Institute of International Relations, Kazan (Volga region) Federal
University, 18, Kremlevskaya Str., Kazan, Russia, 420008 2Ph.D (Pedagogics), Associate Professor, Kazan Innovative University named after V.G. Timiryasov
(IEML)42, Moskovskaya Str., Kazan, Russia, 420111 3Ph.D (History), Assistant Professor, Kazan Innovative University named after V.G. Timiryasov (IEML)42,
Moskovskaya Str., Kazan, Russia, 420111 4Doctor of Sciences (History), Professor, Khakass State University named after N.F. Katanov 90, Lenin Str.,
Abakan, Russia 655017
ABSTRACT
Professor N. F. Katanov (1862 – 1922) is one of the outstanding national scientists, representatives of Russian science, education and culture of the 19th - 20th centuries. His life’s journey and legacy reflected important
events and trends in Oriental studies both in Russia and around the world, as well as Turkology. The stages of
his biography and his vast creative legacy are interesting and extraordinary, instructive and tragic at the same
time. He became the personification of two worlds in Russia – European and Asian.
The biography and legacy of N. F. Katanov are of academic and especially scientific, educational, and
humanistic interest. His life and works should not be perceived only within the history of Russian and European
Oriental studies. It is necessary to take into account the broad socio-political and socio-cultural context of the development of Oriental studies, including Turkology, as well as Russian society and the state in the second
half of the XIX – first quarter of the XX century.
Keywords: Russia, East, Central Asia, Oriental studies, Turkology, N. F. Katanov, history, ethnography,
archieves.
These days the further search, study, systematization and introduction into scientific circulation of the
unpublished archival heritage of Kazan University Professor N. F. Katanov (1862-1922), one of the brightest
and the most prominent national scientists and sages of Russian science, education and culture, an outstanding representative of the Khakass people, remains relevant. Research work on the archival heritage of N. F.
Katanova is driven by the need to search for his various handwritten materials in the archival centers of Kazan,
Moscow, St. Petersburg and a number of foreign institutions (Hungary, Turkey, Germany). It should be pointed
out that it is necessary to relate archival materials with the published works of the scientist. In large part, the archival manuscript heritage (diaries, letters, unfinished manuscripts, etc.) of N. F. Katanov, revealed by the
authors, bears the stamp of the era of the late 19th – first decades of the 20th century, its socio-political life and
the research directions relevant at that time. The search for and introduction into scientific circulation of N. F. Katanov's manuscripts allows us to identify the directions and features of his research work and to form an
objective basis for the preparation of an academic biography of the classic of Russian Turkology.
In general, research work with N. F. Katanov’s archival "documents of personal origin" - these are archival manuscripts of the scientist - includes four key research techniques. First, it is search, processing and expansion
of the archival and source base on the basis of a systematic study of the personal funds of Orientalists in the
archives of Russia and a number of foreign countries, the use of various materials (official documents, plans,
notebooks, etc.). Secondly, it involves search and systematization of materials on the history of Russian and European Oriental studies and Turkology of the 19th - early 20th centuries. Historiographical, source study
together with thematic search and generalization of historical and scientific facts and information about the
biography of N. F. Katanov constitutes the third pillar. Finally here is the latter’s subsequent systematization and commentary so as to study the phenomenon of N. F. Katanov’s scientific contribution into Orientalism in
particular and the late 19th - early 20th centuries scientific life panorama in general.
Russian universities are the leading centers of Oriental Studies. In general, they are also centers of social, scientific, cultural and political life in Russia and Europe. In modern times further study of the development of
university education and science about the East in Russia and Europe is of socio-cultural and academic interest.
Undoubtedly, the same holds true for the Turkic world, the understanding of the "university paradigm" for the
phenomenon of Eastern civilizations and especially the formation of the national scientific and cultural elite.
International Journal of Advance and Innovative Research Volume 8, Issue 3 (IV) July - September 2021 Part - 2
65
ISSN 2394 - 7780
The authors' research focuses on the biography and creative heritage of Turkology scientist, a prominent
representative of the Khakass people, a graduate of the Oriental Faculty of St. Petersburg University (1888) and
professor of Kazan University N. F. Katanov (1894-1922).
Russian academician and Turkologist V. A. Gordlevsky in his speech "In memory of N. F. Katanov" delivered
on June 11, 1922 at a meeting of the Eastern Commission of the Moscow Archaeological Society noted: "...the
historian of Oriental studies will be able to appreciate the long and unselfish work, which has produced abundant good-quality material on languages that were little studied before Katanov". Academician A. N.
Samoilovich in the magazine "Vostok" in a small obituary "In memory of N. F. Katanov" highlighted the
following: "I would like to hope that the long-awaited publication on part of the scientific world of N. F.
Katanov will be carried out after his death, and until the publication, these materials will be stored in a safe
place".
After graduating from the Oriental Faculty of St. Petersburg University, N. F. Katanov decided to devote
himself to scientific and pedagogical work. The period from May 28 to July 4, 1888 in his biography is associated with the main decisions about leaving him "at the university for further improvement in the Turkic
dialects". The initiative belonged to the graduate Nikolai Katanov and his teacher Professor I. N. Berezin, who
gave a reference of his student. The decision of the Council of the Faculty of Oriental Languages and the petition of the rector of the university " on leaving the candidate N. Katanov at University for the preparation
for the academic degree" were supported by the trustee of the school district. On July 4, 1888, it was allowed to
leave N. F. Katanov "at the St. Petersburg University, at the Department of Turkish-Tatar literature for two
years from July 1, with the appointment to him ... of 600 rubles scholarship a year".
The next important milestone in the life and professional career of Nikolai Katanov was a scientific trip in
1889-1892 to Central Asia to study the languages and ethnography of the Turkic peoples. It was organized and
supported by the Russian Geographical Society, the St. Petersburg Academy of Sciences and the Ministry of Public Education. The origins of the organization of this trip are connected with the discussion of the note by
V. V. Radlov about the prospects of "research of the remains of Turkic tribes in the Far East" at a meeting of
the Department of Ethnography of the Imperial Russian Geographical Society on December 11, 1887 under the
chairmanship of V. I. Lamansky. At the meeting, it was decided to submit a note to the Board of the company. In this note, V. V. Radlov gave a high assessment to N. Katanov, a fourth-year student of the Eastern Faculty of
St. Petersburg University. V. V. Radlov wrote: "He studied with me for 3 years and published several articles
concerning his native dialect at the Academy. Judging from the words of his professors, and from my own observations, I have been convinced with his zeal, ability, devotion to science, and knowledge of his chosen
subjects. No one can be found more prepared and more able to carry out the abovementioned enterprise." He
also asked the Board of the society to allocate 1,000 rubles in the 1888 budget, to create a "commission to draw up a detailed plan" for the expedition, and also promised to "apply for the allocation of a subsidy to Mr.
Katanov from the regular amounts of the Imperial Academy of Sciences".
This expedition is one of the most famous Russian trips to Central Asia, Mongolia, Siberia and East Turkestan,
which were carried out in the second half of the XIX-early XX centuries, according to the importance of general geographic, linguistic and historical–cultural materials. As is known, among the participants of these
large-scale scientific and cultural expeditions were Ch. Ch. Valikhanov, G. N. Potanin, N. M. Przhevalsky,
brothers G. E. and M. E. Grumm-Grzhimailo, V. I. Roborovsky, V. V. Radlov, P. I. Lerkh, V. A. Obruchev, P.
K. Kozlov, G. N. Tsybikov, N. I. Veselovsky, V. V. Barthold, V. A. Zhukovsky, K. G. Zaleman and others.
In the archival and historical-scientific direction of studying the manuscript heritage of N. F. Katanov, the years
1889-1892 are of great interest – this significant period is referred to Katanov’s scientific expedition to Southern Siberia and East Turkestan. During these years, his comprehensive studies of languages, traditional
and new forms of economic and social life, everyday life, folklore and spiritual life of the Turkic peoples of
Sayan-Altai and Xinjiang were formed and developed.
At a meeting of the Council of the Faculty of Oriental Languages of St. Petersburg University on January 28, 1889, the "Instruction for the studies of the candidate Nikolai Katanov sent abroad for a scientific purpose",
compiled by Professor I. N. Berezin, was approved.
In 1904, the extraordinary professor of St. Petersburg University and the Turkologist-linguist P. M. Melioransky (1868–1906), reviewing the fundamental work of N. F. Katanov "The experience of the Uriankhai
language research" (1903), identified a number of significant linguistic and textual features of the texts
collected by him. He wrote: "Generally speaking, the texts are written carefully, the transcription is accurate
and sustained, the translation does not arouse doubts." Next, P. M. Melioransky noted that, " ... as far as we can
International Journal of Advance and Innovative Research Volume 8, Issue 3 (IV) July - September 2021 Part - 2
66
ISSN 2394 - 7780
judge, the material given by the author, according to living modern Turkish dialects, is accurate and reliable –
moreover, for some dialects, for example, Kashgar, Yarkend, Turfan, Khamiy, and so[me] ot[her] material, this
is perfect news. It was first collected by Mr. K[atanov] himself. "
Unfortunately, the summary work devoted to Katanov’s 1889 – 1892 expedition – the unique event in his
scientific biography, – was never published and did not become the property of Russian and European
Turkology.
In 1907, V. V. Radlov in the series "Turkic Tribes’ Samples of Folk Literature" published a set of N. F.
Katanov’s Khakass and Tuva folklore materials. Their volume is comprised of 1122 songs, 160 riddles, 15 fairy
tales and 35 myths, and this volume seems incredible [Samples of folk literature of the Turkic tribes, published
by V. Radlov. ch. IX. Dialects of the Uriankhai (Soyots), Abakan Tatars and Karagas, collected and translated
by N. F. Katanov. Texts. St. Petersburg, 1907].
The most important primary sources are the diaries of the scientist, a significant part of which N. F. Katanov
prepared for publication, but they were published with quite a serious delay. Thus, the diary of a trip to the Uriankhai Region (Tuva) in 1889, described by S. Weinstein back in 1968, had been laying in the archive of the
Kunstkamera until 2011, when it was finally published by Tuvan colleagues [Katanov, 2011]. A diary
describing N. F. Katanov's stay in Khakassia and his first trip to Semirechye, Tarbagatai and Xinjiang in 1890,
was deciphered, commented on and published by our team of authors quite recently [Katanov, 2017].
The origins of the East Turkestan expeditions might be closely linked to the summer of 1890, when N. F.
Katanov visited eight centers of Chinese Turkestan (Khotan, Kashgar, Ak-su, Kuchar, Karakash, Baya,
Loguchen and Old Turfan), where he got acquainted with the language and ethnography of the Turkic
population of East Turkestan.
The State Archive of the Republic of Tatarstan (hereinafter – SA RT) stores the remaining manuscripts of the
diaries, which are in different condition levels.
First of all, this is a voluminous case with the author's title " A trip to Semirechye and Tarbagatai. Diary of a
journey made in 1891 on behalf of the Imp [erial] Russian Geographical Society by corresponding member ...
N. F. Katanov" (SA RT. F. 969. Inv. 1. D. 11).
During 1893, in St. Petersburg, N. F. Katanov was engaged in processing his expedition materials and preparing for the master's exams at the Eastern Faculty of the University. He passed these exams in December
1893.
The travel diary of 1891 was processed by N. F. Katanov and rewritten. The result is a large volume in the format of 22 x 35 cm, clearly rewritten in black ink on good quality paper, a total of 539 sheets, written on both
sides.
The appointment of N. F. Katanov on November 9, 1893 as a teacher of oriental languages at the Imperial Kazan University marked the next significant period in the scientific, pedagogical and social activities of the
scholar. After his appointment to Kazan University, N. Katanov brought the manuscript to Kazan.
The end of the scientific journey - a trip to the oases of Hami and Turfan and a return to Abakan - is also
recorded in the diary entries. After the death of N. F. Katanov in March 1922 and the transfer of his personal archive, the latter was given the conditional name: "Diary of a journey through Central Asia and other places
(China, Mongolia)" (SA RT. F. 969. Inv. 1. D. 76). The date is also incorrectly given (from March 16, 1892),
whereas in the text the earliest recorded date is March 11. The special significance of these materials is given by their working nature: the draft notebooks that were kept directly during the expedition and served as the
basis for further work have been preserved.
Notebooks (judging by the quality and rare stamps) were made in order to save money from wrapping paper in the format of 9 x 11 cm. The main problem is that the notebooks from the winter trip from Urumqi to Hami
have not been preserved. All of them were provided with the author's numbering on the title page; only
notebooks 15-31 have been preserved. Diaries numbered 15-27 are sewn together (without cover). The text
reflects the circumstances of the trip from Hami through Turfan to the Russian border. It is important that the records of folklore were kept separately and were not included in these materials. The last notebook-No. 31
(moving from Jarkend to Minusinsk and then to the Khakass families) - is of a different format: 18 x 11 cm.
The text in all the listed materials is written in pencil, less often - in low-quality brown ink. Ink text is more
difficult to read than the pencil one.
International Journal of Advance and Innovative Research Volume 8, Issue 3 (IV) July - September 2021 Part - 2
67
ISSN 2394 - 7780
In addition to the actual historical, linguistic, ethnographic and other information and materials - diaries, for
example, allowed us to clarify the chronology of the beginning of N. F. Katanov’s scientific journey, - careful
reading determines new directions for further archival research. For example, it follows from the records that Katanov's companions-photographers Vasiliev and Tolshin-formed a photo archive of ethnic types of the local
population in Xinjiang, part of which was at the disposal of the researcher.
In the coming years, an unpublished handwritten “Diary of a journey through the Minusinsk District, the Yenisei Province, will be prepared for publication. Draft. 95 p. " by N. F. Katanov [SA RT. F. 969. Inv. 1. D. 8]
will be prepared for print. Also interesting is the historical and archival study of the draft text of the manuscript
of N. F. Katanov "Diary of the Altai", covering the period from November 1, 1889 to January 16, 1890 [SA
RT. F. 969. Inv. 1. D. 75].
The author's handwritten materials of N. F. Katanov during his trip are also preserved in the archives of the
Russian Geographical Society in St. Petersburg. These are "A letter with a brief overview of the trip to the
Semirechensk region in 1891-1893" (Category 87. Op. 1. No. 15. 2 l.), "Descriptions of copper coins minted in Chinese Turkestan" (Category 90. Op. 1. No. 30. 5 l.), several official documents on the organization of the trip
of N. F. Katanov and especially the first text of his report to the Imperial Russian Geographical Society dated
March 3, 1889 (F. 1 – 1886. Inv. 1. No. 20. 27 l.).
In his report, N. F. Katanov reported geographical, economic, social and cultural information and facts about
Khakassia and the region as a whole: "On the 26th of last January, I arrived in Minusinsk. From February 4 to
16, I was in the Sagai steppe... Here I wrote down several proverbs in the Koibal dialect and the legend of the
stone old woman (kurtuyak-tas)... In the Sagai steppe Duma of the united heterogeneous tribes, located in the village of Askis, Minus[insky] district, I was sorting out the archive… Over time, I hope to add new
information to the collection and present it to the Public. <...> Despite the opening of the 2nd class school in
Askys, the number of literate foreigners is not increasing. Livestock deaths and crop failures in the last 5 years have completely depleted the national wealth of the Sagai Tatars, Beltirs and Koibals. The Kachin people are
still considered excellent pastoralists; they still possess hundreds of cattle and thousands of small cattle.
Recently, the most lively relations between the Minusinsk Tatars and the Kazan Tatars and the Uriankhai Turks
have been established... " (F. 1-1886. Inv. 1. No. 20. L. 5-6).
In the 1920s, the interest in the textual heritage of N. F. Katanov became particularly noticeable in European
orientalism, including among German Turkologists. In the 1930s and the first half of the 1950s, a number of
texts by N. F. Katanov related to his travels to Siberia and especially to East Turkestan (1889-1892) appeared in European Turkology at the initiative of the famous German orientalists Wilhelm Julius Bang (1869-1934) and
his student, the Slavist, Turkologist and Altaist Karl Heinrich Menges (1908-1999). These outstanding founders
of German classical Turkology formed and deepened the academic scientific tradition and directions of studying the languages, culture and history of the Turkic peoples of Eastern Europe, Siberia and Central Asia.
The manuscript materials were handed over in 1926 by A. I. Katanova, the wife of N. F. Katanov, to Professor
V. Bang of the University of Berlin. Editions of these texts by N. F. Katanov, carried out in Germany in 1933
and 1943 by K. Menges, were reviewed by S. E. Malov. In 1952, a well-known Mongolian scholar and Altaist, professor at the University of Washington, N. N. Poppe Nicholas (1897-1991) published in the Harvard Journal
of Asiatic Studies his review of the texts of N. F. Katanov, the latter had been released in Germany in 1943.
In 1976 in Leipzig, on the initiative of the famous Hungarian academician and Turkologist Georg Hazai (Hazai Georges), in 1962-1983 professor at the Humboldt University, and under the editorship of K. G. Menges, the
texts of N. F. Katanov were reissued under the title " Folk Texts of East Turkestan. From the legacy of N. F.
Katanov". In his preface to this book, C. G. Menges wrote: "In the autumn of 1973, Dr. Georg Khazai in a letter invited me to reissue in Leipzig through the GDR Central Second-hand Bookseller Folk Texts of East
Turkestan, which I selected and processed extensive materials collected by N. F. Katanov in East Turkestan
(Chinese province of Xinjiang). I gratefully accepted the offer of Dr. Khazai, gave him, as later and the Central
second-hand Bookseller, my consent to reissue. It was taken into account that first part of the work was published in the collection "Records of the meetings of the Prussian Academy of Sciences", section Philosophy
– History, volume XXXII (1933). It has been out of the public domain for quite a long time, and the "special
circumstances" that prevented the publication of almost twice the volume of the second part in the scientific
notes of the Academy, where this second part was accepted in the spring of 1936."
Unfortunately, our archival research of the transferred handwritten texts of the diaries in Germany has not yet
been successful. The same is true as for the letters of N. F. Katanov, addressed to a number of Hungarian
Turkologists. In recent years, the search and systematization of archival materials about the Hungarian
International Journal of Advance and Innovative Research Volume 8, Issue 3 (IV) July - September 2021 Part - 2
68
ISSN 2394 - 7780
Turkologists of the late XIX – early XX centuries, who conducted scientific expeditions in the Volga region
and the Urals (Bernat Munkachi, etc.), as well as collaborated and corresponded with N. F. Katanov, is being
carried out.
Of particular interest is the diverse epistolary heritage of N. F. Katanov. The first letters he wrote to his
mentors, friends, and colleagues date from 1884. The correspondence continued until his death in 1922.
The letters provide an opportunity to highlight and evaluate many significant events in the creative biography of N. F. Katanov, which remained for many years out of the field of view of many researchers who studied the
life path of the student, traveller and professor N. F. Katanov.
We learn from these letters, for example, that the lack of full-fledged conditions for the study of Oriental
languages at Kazan University and the Kazan Theological Academy predetermined the final decision of N. F. Katanov to go to the Oriental Faculty of St. Petersburg University. In making this decision, an important role
was played by the first mentors of the future scientist – N. I. Ilminsky and V. V. Radlov.
At present, a comprehensive search and systematization of the epistolary heritage of N. F. Katanov, in particular of his letters to the famous Russian orientalists (V. V. Radlov (1837-1918), V. R. Rosen (1849-1908),
K. G. Zaleman (1849-1916), E. K. Pekarsky (1858-1934), S. F. Oldenburg (1863-1934), V. V. Barthold (1869-
1930), etc.), has been carried out. These letters were written by N. Katanov to teachers and colleagues during the expedition and from Kazan. The epistolary legacy of N. F. Katanov is preserved in the archives of Kazan,
Moscow, St. Petersburg and, possibly, in some European countries.
Known to the science are the published letters of N. F. Katanov to Academician V. V. Radlov. They refer to the
period from April 17, 1889 to November 12, 1892. Professor Katanov wrote them during a complex ethnographic and linguistic expedition from the main centers of the southern strip of Siberia and East
Turkestan. In September 1893, in his preface to the publication of these letters of the traveller N. F. Katanov,
his teacher V. V. Radlov noted that they "contain a lot of information that is new and interesting for ethnography and Tourkology" (Turkology. – R. V.). The founder of complex historical, ethnographic and
linguistic expeditions of the second half of the XIX century. in the places of residence of the Turkic peoples of
Siberia, V. V. Radlov drew the reader's attention to the fact that the letters of his student "are of particular
interest because they are described in the field of research and under fresh impressions."
In 1890, N. F. Katanov in his letter to academician and Iranist K. G. Zaleman wrote: "I am now engaged in
rewriting the ling[uistic] materials collected from October 1889 to April 1890 (from the Minus[insk] Tatars and
Karagas). In total, about 3,000 pag[es] are accrued." In 1892, N. F. Katanov also wrote to V. R. Rosen: "From St. Petersburg, I went to North[ern] Mongolia. I studied the Uriankhai dialect there. Then came to the East[ern]
Siberia, where I studied the life and languages of the Karagas and Minusinsk Tatars. After that it was in
Mid[dle] Asia, where I studied the life and languages of the Cossacks-Kirghiz and Sart, Russian and Chinese. You can find out from V. V. Radlov and N. I. Veselovsky about how much I have collected and submitted for
publication." In 1901, already from Kazan, he wrote to E. K. Pekarsky: "... I find many similarities, hat South-
Siber[ian] Turks and North[ern] Mongolia Uriankhais have with shamanism as I studied the life, languages and
beliefs of those ethnicities in 1889-1892. As you are quite scientifically and thoroughly engaged in studying the Yakut lang[uage], I will be very pleased to bring you as a gift my extensive research on the Uriankhai language
in the spring, and perhaps earlier. In my opinion, Uriankhai language, as well as the Karagas one, is similar to
the Yakut language, and therefore my research will not be useless for you, and for Turkology it will not be without a trace, since you can look at it. you have better means than many of our Russian scientists. And you
are standing near the source, which is little exhausted. What is more you have better means than many of our
Russian scientists to capture knowledge from it. [Valeev, Tuguzhekova, Chochieva, 2012; Epistolary heritage of N. F. Katanov, 2016]. In the coming years, it is planned to prepare and publish all these letters, which N. F.
Katanov wrote to the Petersburg Orientalists. Those letters are preserved in their personal funds in the St.
Petersburg branch of the Archive of the Russian Academy of Sciences. Unfortunately, to date, the letters that
Saint-Petersburg Orientalists of the late 19th – early 20th centuries wrote to N. F. Katanov in response, have not
been found.
CONCLUSION:
Unfortunately, the materials available at the present stage still do not allow us to form a complete "academic" image of N. F. Katanov, who was the Turkologist, traveller and educator. In general, the manuscript heritage of
the Russian Orientalist-Turkologist, Khakas by origin, was not printed in the 1920s and subsequent decades of
the twentieth century. Existing publications that pay tribute to the memory of a major Russian orientalist could
International Journal of Advance and Innovative Research Volume 8, Issue 3 (IV) July - September 2021 Part - 2
69
ISSN 2394 - 7780
not reflect the most significant results of his scientific activity as a linguist, ethnographer, researcher of folk art,
numismatist and traveller.
The manuscript heritage of N. F. Katanov contains the most valuable information about the cultures of the Turkic peoples of Eastern Siberia, Semirechye and Xinjiang. It was due to the absence of a language barrier
between the researcher and the object of his research, that N. F. Katanov was able to present an integral
complex of the spiritual culture of peoples who were at different stages of the development of material civilization and belonged to different faiths, from Shamanism to Islam on the pages of his diaries. At the same
time, it should be noted that the task of creating a relatively representative body of works by N. F. Katanov is
not only unsolved, but also extremely far from being resolved.
In the future, it is necessary to prepare and publish archival handwritten materials of N. F. Katanov, including " documents of personal origin – - diaries and correspondence. This direction of studying the heritage of N. F.
Katanov will contribute to the assessment of the state, research ideas and results of the development of Russian
Turkology at the turn of the 19th -20th centuries. A comprehensive study of archival sources devoted to the published and handwritten heritage of N. F. Katanov allows: first, to introduce new unknown materials of
domestic orientalists into scientific circulation and to evaluate the directions of their scientific and personal
relations; secondly, to highlight and significantly supplement the scientific biography and legacy of the scientist-Turkologist and educator; thirdly, to preserve and continue the continuity in the study of the legacy of
teachers and associates of Professor N. F. Katanov on the basis of unpublished archival funds and materials.
N. F. Katanov made a huge contribution to the linguistic and historical-ethnographic study of Southern Siberia
and Eastern Turkestan. His handwritten materials are a vivid confirmation of this and an original reflection of the versatility and hard work by N. F. Katanov during his scientific journey and his later life, as well as the
greatness and tragedy of national scientists in the history of Russian Turkology at the turn of the 19th –20th
centuries.
On the basis of published and handwritten materials, it is important to study the phenomenon of the personality
and heritage of N. F. Katanov as one of the outstanding founders of modern national Turkic schools of Russia
of the XX–XXI centuries; in general, to assess the place of N. F. Katanov's research, pedagogical, and social
activities in the history of Russian Oriental studies and the culture of the peoples of multinational Russia.
ACKNOWLEDGEMENTS
This study has been performed under the Russian Government Program of Competitive Growth of Kazan
Federal University, RFBR project No 20-09-00385 А.
REFERENCES
Valeev, Tuguzhekova, Chochieva, 2012 - Valeev R. M., Tuguzhekova V. N., Chochieva A. S. Epistolary
heritage of N. F. Katanov. - Abakan, 2012.
State Archive of the Republic of Tatarstan. F. 969. "Katanov N. F. Professor in Ordinary of Comparative
Linguistics".
Katanov, 2011- Katanov N. F. Essays of the Uriankhai land. Diary of a journey performed in 1889 ... /
Manuscripts, commentary by A. K. Kuzhuget. - Kyzyl, 2011.
Katanov, 2017 - Katanov N. F. "Journey through Siberia, Dzungaria and East Turkestan": A diary of a
journey made on behalf of the Imperial Russian Geographical Society in 1890 by a member-employee of it
N. F. Katanov / ed. and scientific ed.: R. M. Valeev, V. N. Tuguzhekova, D. E. Martynov. - Kazan, 2017 –
734 p.
Samples of folk literature of the Turkic tribes, published by V. Radlov, chapter IX. Dialects of the Uriankhai (Soyots), Abakan Tatars and Karagas, collected and translated by N. F. Katanov. Texts. - St.
Petersburg, 1907.
The Russian State Historical Archive of St. Petersburg. F. 14. Inv. 1. D. 8933.
The St. Petersburg branch of the archive of Russian Academy of Sciences. F. 1079. Inv. 3. D. 121.
Epistolary heritage of N. F. Katanov (On the 155th anniversary of his birth) / Comp.: R. M. Valeev, V. N.
Tuguzhekova, A. S. Chochieva, V. V. Ermilova, M. A. Ryabtseva. – 2nd edition, updated – Abakan, 2016.
Poppe N. Volkskundliche Texte aus Ost-Tiirkistan II. Aus dem Nachlass von N. Th. Katanov herausgegeben. Als Manuskript ge-druckt. – Berlin, 1943. – 185 p. // Harvard Journal of Asiatic Studies. –
International Journal of Advance and Innovative Research Volume 8, Issue 3 (IV) July - September 2021 Part - 2
70
ISSN 2394 - 7780
Vol. 15, No. 3/4 (Dec., 1952). – Р. 523–525.
• Volkskundliche Texte aus Ost-Tiirkistan. Aus dem Nachlass von N. Th. Katanov. – Leipzig, 1976.
Gordlevsky V. A. In Memory of N. F. Katanov (1862 - 1922) // Selected works – Vol. IV. – M., 1968. – P.
401. (In Russian).
Samoilovich A. In Memory of N. F. Katanov // Vostok. - 1922. - Book 1. - P. 105 (In Russian).
See: Russian State Historical Archive of Saint-Petersburg (hereafter – RSHA SPb). Fund 14. Ser. 1. File.
8933. L. 1–5.
RSHA SPb. F. 14. Ser. 1. F. 8933. L. 4.
See: Imperial Russian Geographical Society Herald. T. XXIV. 1888. - SPb., 1889. - P. 421 - 423. (In
Russian).
Imperial Russian Geographical Society Herald. T. XXIV. 1888. - SPb., 1889. - P. 421 - 423. (In Russian).
RSHA SPb. F. 14. Ser. 1. F. 8933. L. 15 – 16 rev. (In Russian).
Notes of the Russian Archeological Society Eastern Branch. - Vol. 15. 1902 - 1903. - SPb., 1904. - P.
0151, 0156. (In Russian).
See: RSHA SPb. L. 14. Inv. 1. F. 8933. L. 50; SA RT. F. 977. Inv. F. 8904.
Henri de Vocht: Bibliographie der Arbeiten von Professor W. Bang Kaup. In: Ungarische Jahrbücher 9, 1929. – S. 188–195; Andrej Nikolaevič Kononov: W. Bang-Kaup. Zum hundertsten Geburtstag. In:
Sprache, Geschichte und Kultur der altaischen Völker. – Berlin, 1974. – S. 47–49; Michael Knüppel, Aloïs
van Tongerloo: Die orientalistische Gelehrtenrepublik am Vorabend des Ersten Weltkrieges. Der Briefwechsel zwischen Willi Bang(-Kaup) und Friedrich Carl Andreas aus den Jahren 1889 bis 1914 (=
Abhandlungen der Akademie der Wissenschaften zu Göttingen N.F. 20). – Berlin, 2012 et al.
See: Нazai G. Kurzes Schriftverzeichnis von К. H. Menges. 1932–1975 // Volkskundliche Texte aus Ost-
Tiirkistan. Aus dem Nachlaβ von N. Th. Katanov. Hgb. von К. H. Menges. – Leipzig, 1976. – S. VII–XVI.
I. Katanova, in a letter to the Soviet Turkologist S. E. Malov, as of December 7, 1926, wrote that in the
summer of 1926, in Kazan, Dr. Fettikh, an authorized representative of the Berlin Scientific Organization, was shown the manuscripts of N. F. Katanov. Of these, " ... he took 1) A trip to Semirechye and
Tarbagatai, texts of chapters I and II. 2) Translations of chapters I and II and as long as I remember 3)
Journey through Dzungaria, Siberia and Turkestan, 520 sheets". See: St. Petersburg Branch of the Archive
of the Russian Academy of Sciences. F. 1079. Inv. 3. D. 121. L. 2. (Hereinafter - St. Petersburg. B ARAS).
See: Soviet Oriental Studies. - M., 1941. - Vol. 2. - p. 305-306; AS USSR Herald. Dept. of literature and
language. - 1951. - Vol. X.-Issue 2. - P. 206. (In Russian).
Poppe N. Volkskundliche Texte aus Ost-Tiirkistan II. Aus dem Nachlass von N. Th. Katanov
herausgegeben. Als Manuskript ge-druckt. – Berlin, 1943. – 185 p. // Harvard Journal of Asiatic Studies. –
Vol. 15, No. 3/4 (Dec., 1952). – Р. 523–525.
Volkskundliche Texte aus Ost-Tiirkistan. Aus dem Nachlass von N. Th. Katanov. – Leipzig, 1976. – P. 2.
Pokrovsky I. M. In memory of prof. N. F. Katanov // Proceedings of the Society of Archeology, History
and Ethnography. - 1928. - T. XXXIII. - Issue 2. - P. 247.
Letters of N. F. Katanov from Siberia and East Turkestan. Presented at the meeting of the Historical and
Philological Department on January 9, 1890. - St. Petersburg, 1893. - P. 1.
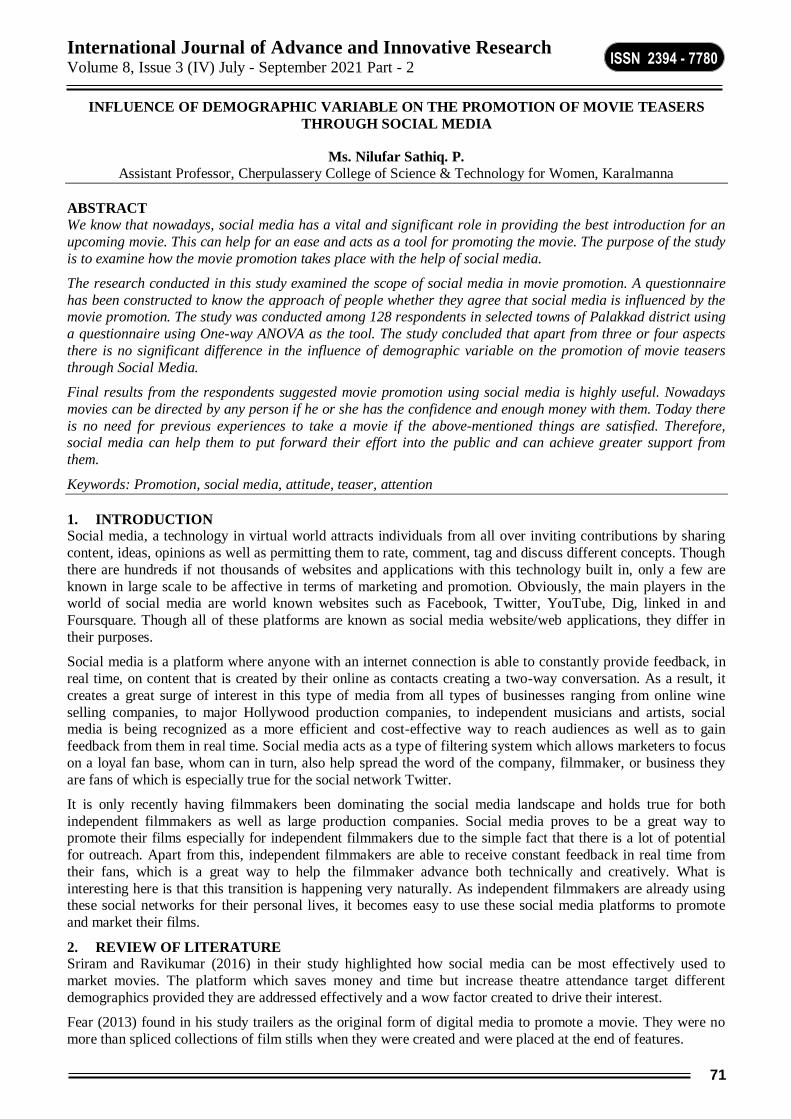
International Journal of Advance and Innovative Research Volume 8, Issue 3 (IV) July - September 2021 Part - 2
71
ISSN 2394 - 7780
INFLUENCE OF DEMOGRAPHIC VARIABLE ON THE PROMOTION OF MOVIE TEASERS
THROUGH SOCIAL MEDIA
Ms. Nilufar Sathiq. P.
Assistant Professor, Cherpulassery College of Science & Technology for Women, Karalmanna
ABSTRACT
We know that nowadays, social media has a vital and significant role in providing the best introduction for an
upcoming movie. This can help for an ease and acts as a tool for promoting the movie. The purpose of the study
is to examine how the movie promotion takes place with the help of social media.
The research conducted in this study examined the scope of social media in movie promotion. A questionnaire
has been constructed to know the approach of people whether they agree that social media is influenced by the movie promotion. The study was conducted among 128 respondents in selected towns of Palakkad district using
a questionnaire using One-way ANOVA as the tool. The study concluded that apart from three or four aspects
there is no significant difference in the influence of demographic variable on the promotion of movie teasers
through Social Media.
Final results from the respondents suggested movie promotion using social media is highly useful. Nowadays
movies can be directed by any person if he or she has the confidence and enough money with them. Today there
is no need for previous experiences to take a movie if the above-mentioned things are satisfied. Therefore, social media can help them to put forward their effort into the public and can achieve greater support from
them.
Keywords: Promotion, social media, attitude, teaser, attention
1. INTRODUCTION Social media, a technology in virtual world attracts individuals from all over inviting contributions by sharing
content, ideas, opinions as well as permitting them to rate, comment, tag and discuss different concepts. Though
there are hundreds if not thousands of websites and applications with this technology built in, only a few are
known in large scale to be affective in terms of marketing and promotion. Obviously, the main players in the world of social media are world known websites such as Facebook, Twitter, YouTube, Dig, linked in and
Foursquare. Though all of these platforms are known as social media website/web applications, they differ in
their purposes.
Social media is a platform where anyone with an internet connection is able to constantly provide feedback, in
real time, on content that is created by their online as contacts creating a two-way conversation. As a result, it
creates a great surge of interest in this type of media from all types of businesses ranging from online wine
selling companies, to major Hollywood production companies, to independent musicians and artists, social media is being recognized as a more efficient and cost-effective way to reach audiences as well as to gain
feedback from them in real time. Social media acts as a type of filtering system which allows marketers to focus
on a loyal fan base, whom can in turn, also help spread the word of the company, filmmaker, or business they
are fans of which is especially true for the social network Twitter.
It is only recently having filmmakers been dominating the social media landscape and holds true for both
independent filmmakers as well as large production companies. Social media proves to be a great way to promote their films especially for independent filmmakers due to the simple fact that there is a lot of potential
for outreach. Apart from this, independent filmmakers are able to receive constant feedback in real time from
their fans, which is a great way to help the filmmaker advance both technically and creatively. What is
interesting here is that this transition is happening very naturally. As independent filmmakers are already using these social networks for their personal lives, it becomes easy to use these social media platforms to promote
and market their films.
2. REVIEW OF LITERATURE Sriram and Ravikumar (2016) in their study highlighted how social media can be most effectively used to
market movies. The platform which saves money and time but increase theatre attendance target different
demographics provided they are addressed effectively and a wow factor created to drive their interest.
Fear (2013) found in his study trailers as the original form of digital media to promote a movie. They were no
more than spliced collections of film stills when they were created and were placed at the end of features.
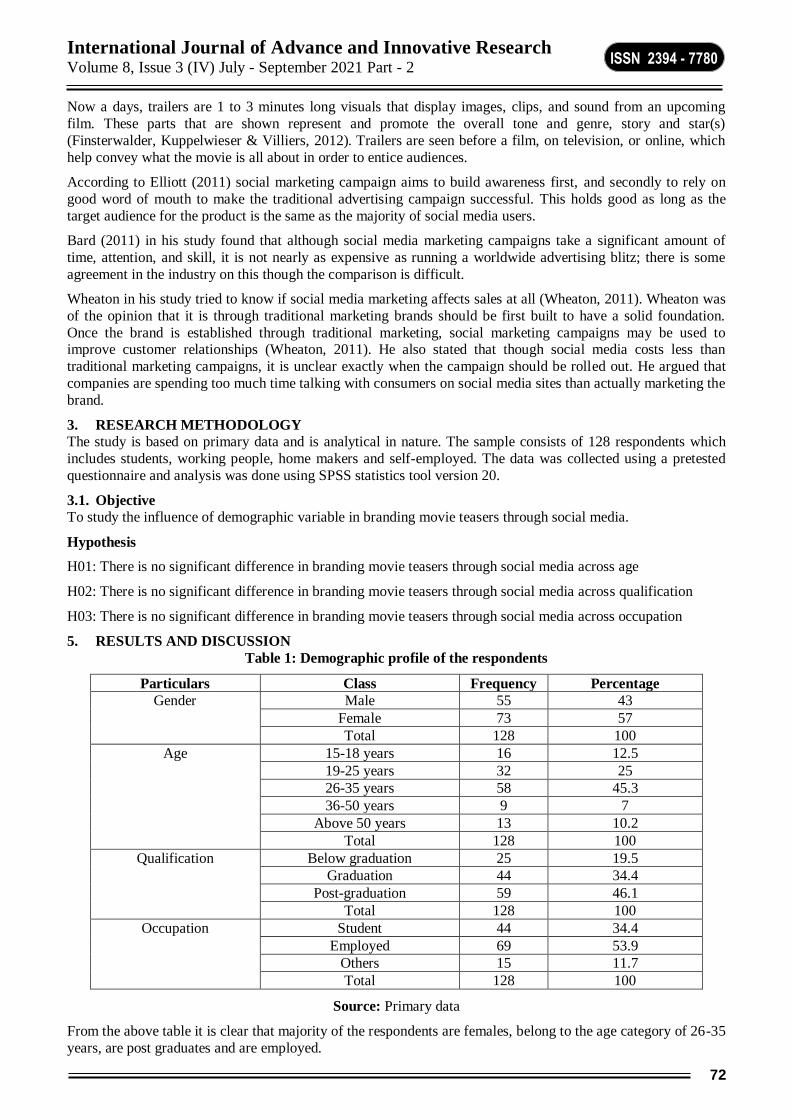
International Journal of Advance and Innovative Research Volume 8, Issue 3 (IV) July - September 2021 Part - 2
72
ISSN 2394 - 7780
Now a days, trailers are 1 to 3 minutes long visuals that display images, clips, and sound from an upcoming
film. These parts that are shown represent and promote the overall tone and genre, story and star(s)
(Finsterwalder, Kuppelwieser & Villiers, 2012). Trailers are seen before a film, on television, or online, which
help convey what the movie is all about in order to entice audiences.
According to Elliott (2011) social marketing campaign aims to build awareness first, and secondly to rely on
good word of mouth to make the traditional advertising campaign successful. This holds good as long as the
target audience for the product is the same as the majority of social media users.
Bard (2011) in his study found that although social media marketing campaigns take a significant amount of
time, attention, and skill, it is not nearly as expensive as running a worldwide advertising blitz; there is some
agreement in the industry on this though the comparison is difficult.
Wheaton in his study tried to know if social media marketing affects sales at all (Wheaton, 2011). Wheaton was
of the opinion that it is through traditional marketing brands should be first built to have a solid foundation.
Once the brand is established through traditional marketing, social marketing campaigns may be used to improve customer relationships (Wheaton, 2011). He also stated that though social media costs less than
traditional marketing campaigns, it is unclear exactly when the campaign should be rolled out. He argued that
companies are spending too much time talking with consumers on social media sites than actually marketing the
brand.
3. RESEARCH METHODOLOGY
The study is based on primary data and is analytical in nature. The sample consists of 128 respondents which
includes students, working people, home makers and self-employed. The data was collected using a pretested
questionnaire and analysis was done using SPSS statistics tool version 20.
3.1. Objective
To study the influence of demographic variable in branding movie teasers through social media.
Hypothesis
H01: There is no significant difference in branding movie teasers through social media across age
H02: There is no significant difference in branding movie teasers through social media across qualification
H03: There is no significant difference in branding movie teasers through social media across occupation
5. RESULTS AND DISCUSSION
Table 1: Demographic profile of the respondents
Particulars Class Frequency Percentage
Gender Male 55 43
Female 73 57
Total 128 100
Age 15-18 years 16 12.5
19-25 years 32 25
26-35 years 58 45.3
36-50 years 9 7
Above 50 years 13 10.2
Total 128 100
Qualification Below graduation 25 19.5
Graduation 44 34.4
Post-graduation 59 46.1
Total 128 100
Occupation Student 44 34.4
Employed 69 53.9
Others 15 11.7
Total 128 100
Source: Primary data
From the above table it is clear that majority of the respondents are females, belong to the age category of 26-35
years, are post graduates and are employed.
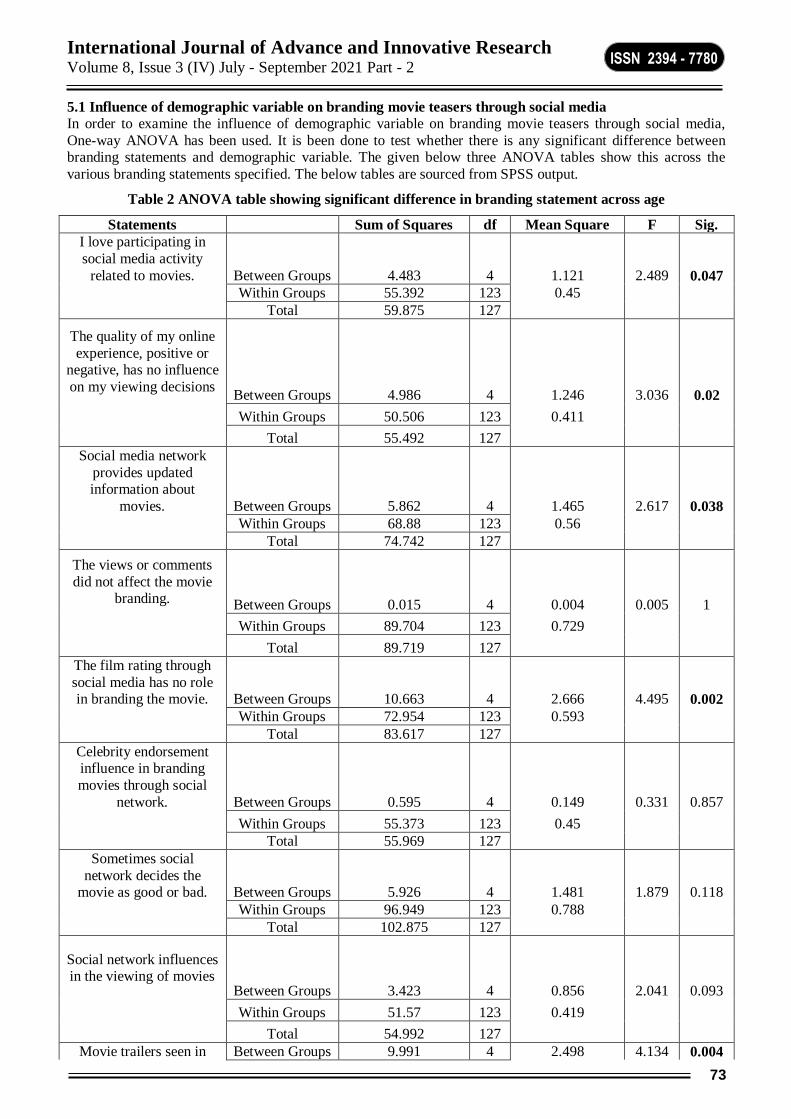
International Journal of Advance and Innovative Research Volume 8, Issue 3 (IV) July - September 2021 Part - 2
73
ISSN 2394 - 7780
5.1 Influence of demographic variable on branding movie teasers through social media
In order to examine the influence of demographic variable on branding movie teasers through social media,
One-way ANOVA has been used. It is been done to test whether there is any significant difference between branding statements and demographic variable. The given below three ANOVA tables show this across the
various branding statements specified. The below tables are sourced from SPSS output.
Table 2 ANOVA table showing significant difference in branding statement across age
Statements
Sum of Squares df Mean Square F Sig.
I love participating in
social media activity
related to movies. Between Groups 4.483 4 1.121 2.489 0.047
Within Groups 55.392 123 0.45
Total 59.875 127
The quality of my online
experience, positive or negative, has no influence
on my viewing decisions Between Groups 4.986 4 1.246 3.036 0.02
Within Groups 50.506 123 0.411
Total 55.492 127
Social media network
provides updated information about
movies. Between Groups 5.862 4 1.465 2.617 0.038
Within Groups 68.88 123 0.56
Total 74.742 127
The views or comments
did not affect the movie branding. Between Groups 0.015 4 0.004 0.005 1
Within Groups 89.704 123 0.729
Total 89.719 127
The film rating through
social media has no role in branding the movie. Between Groups 10.663 4 2.666 4.495 0.002
Within Groups 72.954 123 0.593
Total 83.617 127
Celebrity endorsement influence in branding
movies through social
network. Between Groups 0.595 4 0.149 0.331 0.857
Within Groups 55.373 123 0.45
Total 55.969 127
Sometimes social
network decides the movie as good or bad. Between Groups 5.926 4 1.481 1.879 0.118
Within Groups 96.949 123 0.788
Total 102.875 127
Social network influences in the viewing of movies
Between Groups 3.423 4 0.856 2.041 0.093
Within Groups 51.57 123 0.419
Total 54.992 127
Movie trailers seen in Between Groups 9.991 4 2.498 4.134 0.004
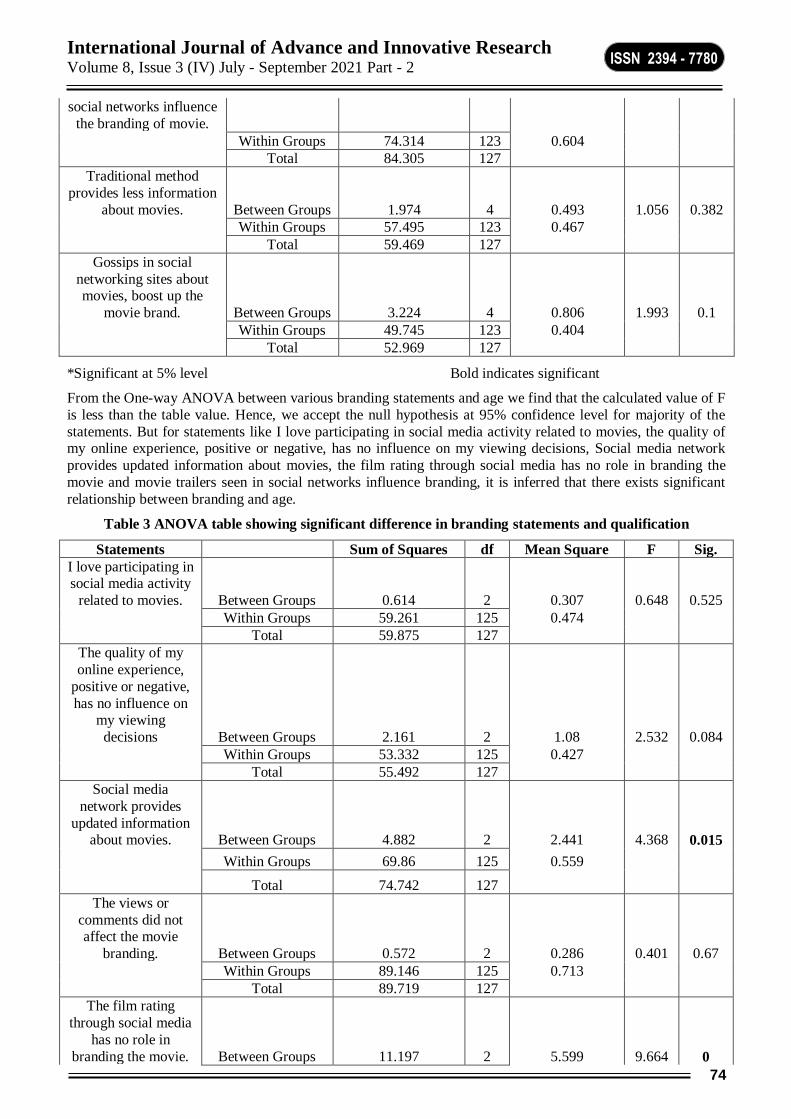
International Journal of Advance and Innovative Research Volume 8, Issue 3 (IV) July - September 2021 Part - 2
74
ISSN 2394 - 7780
social networks influence
the branding of movie.
Within Groups 74.314 123 0.604
Total 84.305 127
Traditional method
provides less information
about movies. Between Groups 1.974 4 0.493 1.056 0.382
Within Groups 57.495 123 0.467
Total 59.469 127
Gossips in social
networking sites about movies, boost up the
movie brand. Between Groups 3.224 4 0.806 1.993 0.1
Within Groups 49.745 123 0.404
Total 52.969 127
*Significant at 5% level Bold indicates significant
From the One-way ANOVA between various branding statements and age we find that the calculated value of F
is less than the table value. Hence, we accept the null hypothesis at 95% confidence level for majority of the
statements. But for statements like I love participating in social media activity related to movies, the quality of my online experience, positive or negative, has no influence on my viewing decisions, Social media network
provides updated information about movies, the film rating through social media has no role in branding the
movie and movie trailers seen in social networks influence branding, it is inferred that there exists significant
relationship between branding and age.
Table 3 ANOVA table showing significant difference in branding statements and qualification
Statements
Sum of Squares df Mean Square F Sig.
I love participating in social media activity
related to movies. Between Groups 0.614 2 0.307 0.648 0.525
Within Groups 59.261 125 0.474
Total 59.875 127
The quality of my
online experience,
positive or negative,
has no influence on my viewing
decisions Between Groups 2.161 2 1.08 2.532 0.084
Within Groups 53.332 125 0.427
Total 55.492 127
Social media
network provides
updated information about movies. Between Groups 4.882 2 2.441 4.368 0.015
Within Groups 69.86 125 0.559
Total 74.742 127
The views or
comments did not affect the movie
branding. Between Groups 0.572 2 0.286 0.401 0.67
Within Groups 89.146 125 0.713
Total 89.719 127
The film rating
through social media
has no role in
branding the movie. Between Groups 11.197 2 5.599 9.664 0
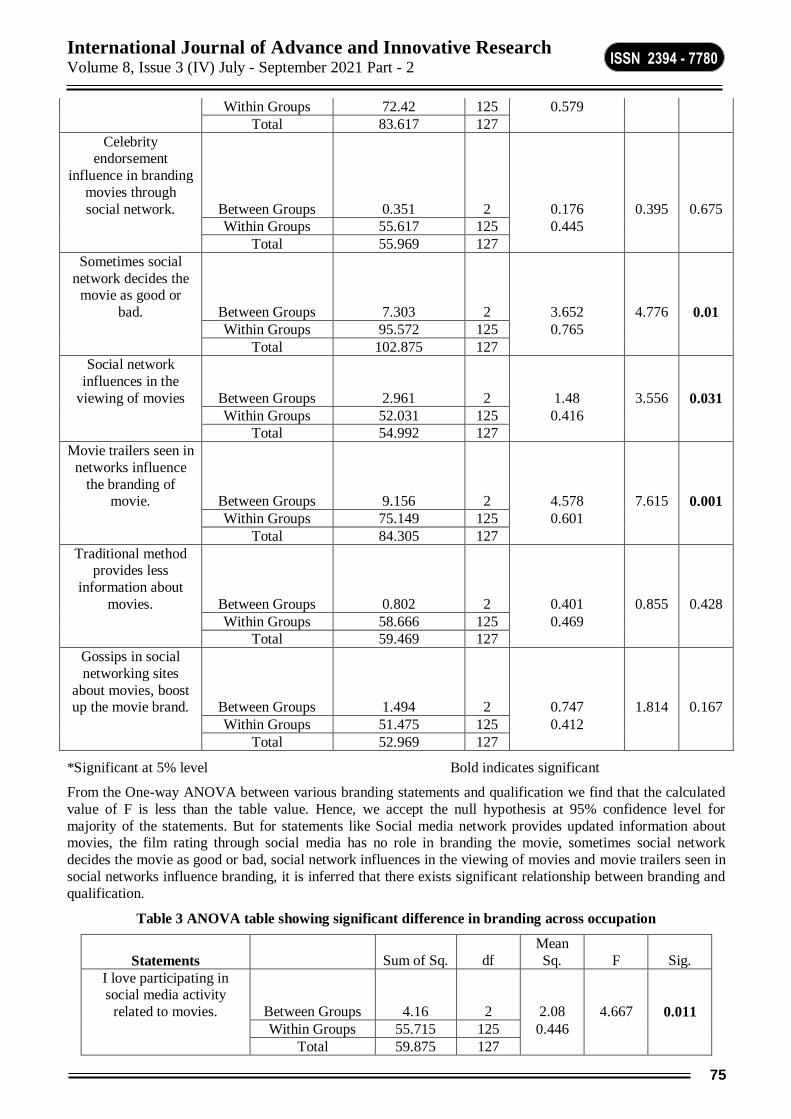
International Journal of Advance and Innovative Research Volume 8, Issue 3 (IV) July - September 2021 Part - 2
75
ISSN 2394 - 7780
Within Groups 72.42 125 0.579
Total 83.617 127
Celebrity endorsement
influence in branding
movies through
social network. Between Groups 0.351 2 0.176 0.395 0.675
Within Groups 55.617 125 0.445
Total 55.969 127
Sometimes social
network decides the movie as good or
bad. Between Groups 7.303 2 3.652 4.776 0.01
Within Groups 95.572 125 0.765
Total 102.875 127
Social network
influences in the
viewing of movies Between Groups 2.961 2 1.48 3.556 0.031
Within Groups 52.031 125 0.416
Total 54.992 127
Movie trailers seen in
networks influence
the branding of movie. Between Groups 9.156 2 4.578 7.615 0.001
Within Groups 75.149 125 0.601
Total 84.305 127
Traditional method provides less
information about
movies. Between Groups 0.802 2 0.401 0.855 0.428
Within Groups 58.666 125 0.469
Total 59.469 127
Gossips in social
networking sites
about movies, boost up the movie brand. Between Groups 1.494 2 0.747 1.814 0.167
Within Groups 51.475 125 0.412
Total 52.969 127
*Significant at 5% level Bold indicates significant
From the One-way ANOVA between various branding statements and qualification we find that the calculated
value of F is less than the table value. Hence, we accept the null hypothesis at 95% confidence level for
majority of the statements. But for statements like Social media network provides updated information about movies, the film rating through social media has no role in branding the movie, sometimes social network
decides the movie as good or bad, social network influences in the viewing of movies and movie trailers seen in
social networks influence branding, it is inferred that there exists significant relationship between branding and
qualification.
Table 3 ANOVA table showing significant difference in branding across occupation
Statements
Sum of Sq. df
Mean
Sq. F Sig.
I love participating in social media activity
related to movies. Between Groups 4.16 2 2.08 4.667 0.011
Within Groups 55.715 125 0.446
Total 59.875 127
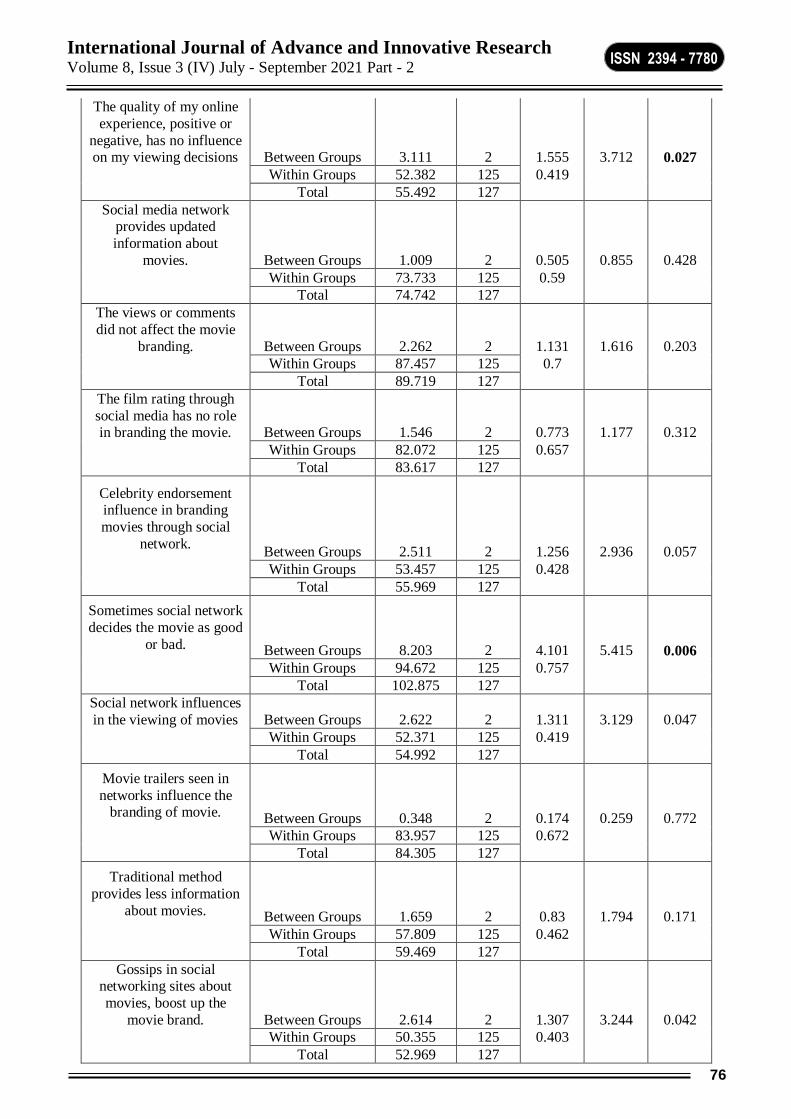
International Journal of Advance and Innovative Research Volume 8, Issue 3 (IV) July - September 2021 Part - 2
76
ISSN 2394 - 7780
The quality of my online
experience, positive or
negative, has no influence on my viewing decisions Between Groups 3.111 2 1.555 3.712 0.027
Within Groups 52.382 125 0.419
Total 55.492 127
Social media network provides updated
information about
movies. Between Groups 1.009 2 0.505 0.855 0.428
Within Groups 73.733 125 0.59
Total 74.742 127
The views or comments
did not affect the movie
branding. Between Groups 2.262 2 1.131 1.616 0.203
Within Groups 87.457 125 0.7
Total 89.719 127
The film rating through
social media has no role in branding the movie. Between Groups 1.546 2 0.773 1.177 0.312
Within Groups 82.072 125 0.657
Total 83.617 127
Celebrity endorsement influence in branding
movies through social
network. Between Groups 2.511 2 1.256 2.936 0.057
Within Groups 53.457 125 0.428
Total 55.969 127
Sometimes social network
decides the movie as good
or bad. Between Groups 8.203 2 4.101 5.415 0.006
Within Groups 94.672 125 0.757
Total 102.875 127
Social network influences
in the viewing of movies Between Groups 2.622 2 1.311 3.129 0.047
Within Groups 52.371 125 0.419
Total 54.992 127
Movie trailers seen in
networks influence the branding of movie. Between Groups 0.348 2 0.174 0.259 0.772
Within Groups 83.957 125 0.672
Total 84.305 127
Traditional method
provides less information
about movies. Between Groups 1.659 2 0.83 1.794 0.171
Within Groups 57.809 125 0.462
Total 59.469 127
Gossips in social networking sites about
movies, boost up the
movie brand. Between Groups 2.614 2 1.307 3.244 0.042
Within Groups 50.355 125 0.403
Total 52.969 127
International Journal of Advance and Innovative Research Volume 8, Issue 3 (IV) July - September 2021 Part - 2
77
ISSN 2394 - 7780
*Significant at 5% level Bold indicates significant
From the One-way ANOVA between various branding statements and occupation we find that the calculated
value of F is less than the table value. Hence, we accept the null hypothesis at 95% confidence level for majority of the statements. But for statements like I love participating in social media activity related to movies,
the quality of my online experience, positive or negative, has no influence on my viewing decisions, and
sometimes social network decides the movie as good or bad, it is inferred that there exists significant difference
between branding and occupation.
So, from the above tables, it is clear that there exists significant difference in the influence of demographic
variable on the various branding statements.
6. CONCLUSION The most significant finding is that majority of the participants answered that the social media has a great
influence over people in promotion of movies. Majority of the respondents are influenced by one or the other
social media platforms like Facebook, Instagram, You Tube and WhatsApp. The research confirmed social media has a significant role in branding movie teasers. It is concluded that majority of the participants are
influenced by the reviews about a movie. People gave first priority to WhatsApp among other social media.
Majority of the respondents have no such criteria in watching movies in theatres. People perceive movie ads while using social media as entertaining. The respondents agree that movie teasers in social media helps in the
movie promotion.
REFERENCES
1) Bard, Mirna. (2011). Is social media marketing more cost-effective than traditional channels?
2) Business of Social Media: How to plunder the Treasure Trove. Reference and User services quarterly,
(2011), 51(2), 127-132.
3) Fear, David. (2013). Becoming attractions: a brief history of film trailers. The Dissolve. Retrieved from http://thedissolve.com/features/exposition/241-‐becoming-attractions-‐a-‐brief-‐history-‐of-‐
film-‐trail/
4) Finsterwalder, J., Kuppelwieser, V.G., and de Villiers, M. (2012). The effects of film trailers on
shaping consumer expectations in the entertainment industry – a qualitative analysis. Journal of Retailing and Consumer Services. Retrieved from
http://www.academia.edu/1830682/The_Effects_of_Film_Trailers_on_Shaping_Con
sumer_Expectations_in_the_Entertainment_Industry_A_Qualitative_Analysis.
5) Elliott, Stuart. (2011). Building a Buzz in Social Media Ahead of Traditional Marketing. New York Times.
Retrieved from nytimes.com
6) Kothari, C.R. and Gaurav Garg, Research Methodology: Methods and Techniques, Third Edition, New
Age International Publishers, New Delhi, 2014.
7) Sriram, M., Ravikumar, T., Marketing of films through Social Media: A conceptual framework, IJARIIE,
2(6), 2016, pp. 1498-1501.
8) Wheaton, Ken. (2011). Why we need less talking, more active marketing. AdAge retrieved from
http://www.adage.com/channel/ken-wheaton/talking-actual/ marketing/ 230678/.
International Journal of Advance and Innovative Research Volume 8, Issue 3 (IV) July - September 2021 Part - 2
78
ISSN 2394 - 7780
INFLUENCE OF SOCIAL MEDIA MARKETING ON POST PURCHASE BEHAVIOUR
K. Venkata Lakshman and Marisetti Sai
Assistant Professor ICBM-SBE
ABSTRACT Today social media plays a big role in our daily lives. For every activity, the Consumer is interacted with Social
Media platforms to share, purchase, and communicate his/ her view about the current scenario. Technology
becomes handy and user friendly it makes the consumer can spend much and more time on social media platforms. Especially E-Commerce, product-based companies and FMCG companies are advertising their
products via social media platforms to improve their brand and advertising. With the help of social media
platforms, it can easily reach to no of customers with in very short period. This study aims to convey the influence of social media platforms and how consumer can react on post purchase behaviour via social media
platforms.
Keywords: Social Media Marketing, Digital, Post purchase behaviour, Customers.
INTRODUCTION:
Social Media Marketing:
Now – a – days SMM is a tool and the biggest communication channel to the e-world. Lot of Social Media platforms like Facebook, Instagram, and Twitter all these platforms shaking the e-world with less cost for
marketing and generate high ROI. Every organization are improving their market with the help of SMM. It is a
modern innovative way for doing business. This is the best tool to communicate the messages to public and also
there is a choice to share their opinion with two-way communications. Lots of new products, brands are introduced into SMM. Here, e-wom also plays vital role in SMM. From since 2004 Facebook creates a dynamic
platform to the marketers, billion no of users for communication. Number of social media users in world-wide
from 2017 to 2025 is 4.41 billion users [www.stastia.com]. Social Media increases awareness, improved communication, regular growth, essential support and better engagement and other key points to improve the
market share, growth and profit.
E-Word of Mouth (E-WOM)
According to (Arndt, J. (1967) ‘Role of product-related conversations in the diffusion of a new product, Journal of Marketing Research, Vol. 4, No.3, pp.291-295) it is a person-to-person communication about brand, product
or services. It is a primary source of information for consumer buying decisions a product related to brand,
services. E-WOM provide reviews and ratings all products brands and services (Bronner, F. Hoog, R. (2010) ‘Consumer-generated versus marketer-generated websites in consumer decision making’, International Journal
of Advertising. The Review of Marketing Communications, Vol. 148, pp. 40-57)
The Key Features
Social Media is effective and inexpensive.
Branding can be done about a product
Direct customer interaction
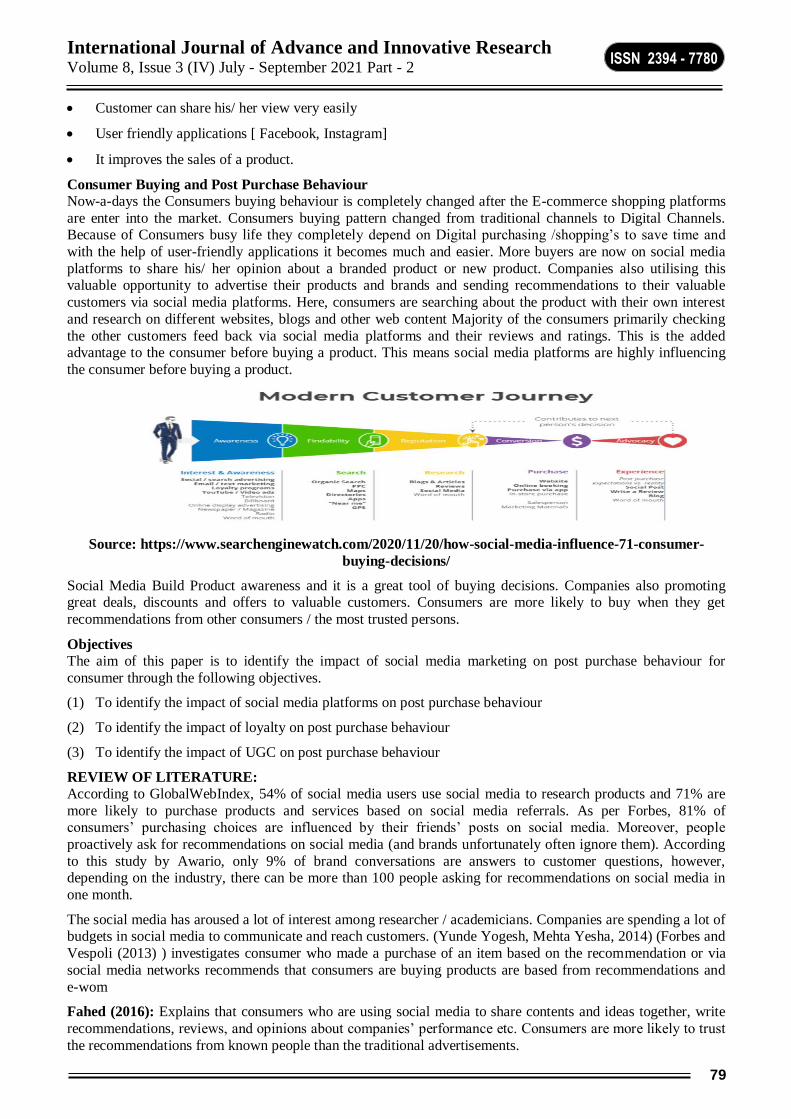
International Journal of Advance and Innovative Research Volume 8, Issue 3 (IV) July - September 2021 Part - 2
79
ISSN 2394 - 7780
Customer can share his/ her view very easily
User friendly applications [ Facebook, Instagram]
It improves the sales of a product.
Consumer Buying and Post Purchase Behaviour
Now-a-days the Consumers buying behaviour is completely changed after the E-commerce shopping platforms
are enter into the market. Consumers buying pattern changed from traditional channels to Digital Channels. Because of Consumers busy life they completely depend on Digital purchasing /shopping’s to save time and
with the help of user-friendly applications it becomes much and easier. More buyers are now on social media
platforms to share his/ her opinion about a branded product or new product. Companies also utilising this valuable opportunity to advertise their products and brands and sending recommendations to their valuable
customers via social media platforms. Here, consumers are searching about the product with their own interest
and research on different websites, blogs and other web content Majority of the consumers primarily checking
the other customers feed back via social media platforms and their reviews and ratings. This is the added advantage to the consumer before buying a product. This means social media platforms are highly influencing
the consumer before buying a product.
Source: https://www.searchenginewatch.com/2020/11/20/how-social-media-influence-71-consumer-
buying-decisions/
Social Media Build Product awareness and it is a great tool of buying decisions. Companies also promoting great deals, discounts and offers to valuable customers. Consumers are more likely to buy when they get
recommendations from other consumers / the most trusted persons.
Objectives
The aim of this paper is to identify the impact of social media marketing on post purchase behaviour for
consumer through the following objectives.
(1) To identify the impact of social media platforms on post purchase behaviour
(2) To identify the impact of loyalty on post purchase behaviour
(3) To identify the impact of UGC on post purchase behaviour
REVIEW OF LITERATURE:
According to GlobalWebIndex, 54% of social media users use social media to research products and 71% are
more likely to purchase products and services based on social media referrals. As per Forbes, 81% of consumers’ purchasing choices are influenced by their friends’ posts on social media. Moreover, people
proactively ask for recommendations on social media (and brands unfortunately often ignore them). According
to this study by Awario, only 9% of brand conversations are answers to customer questions, however, depending on the industry, there can be more than 100 people asking for recommendations on social media in
one month.
The social media has aroused a lot of interest among researcher / academicians. Companies are spending a lot of budgets in social media to communicate and reach customers. (Yunde Yogesh, Mehta Yesha, 2014) (Forbes and
Vespoli (2013) ) investigates consumer who made a purchase of an item based on the recommendation or via
social media networks recommends that consumers are buying products are based from recommendations and
e-wom
Fahed (2016): Explains that consumers who are using social media to share contents and ideas together, write
recommendations, reviews, and opinions about companies’ performance etc. Consumers are more likely to trust
the recommendations from known people than the traditional advertisements.

International Journal of Advance and Innovative Research Volume 8, Issue 3 (IV) July - September 2021 Part - 2
80
ISSN 2394 - 7780
Heinonen (2011): Explains consumers have 3 main motives for using the internet for information search,
entertainment, and social aspects. Social media has changed and influenced the consumers decision making
process.
Jantsch (2008): States that social media as the use of technology integrated with social interaction to create
value.
Mangold and Faulds (2009): social media have also influenced consumer behaviour from information
acquisition to post-purchase behaviour such as dissatisfaction.
Matos (2011): Considering the satisfaction and loyalty has a strong relationship with positive word of mouth.
Parr (2010): Defines social media as an effective communication tool for sharing and discussing and their
information with others in more efficient ways.
Sako & Brake (2009): Although social media came to know many years after the internet, social media has
turned more popular.
FINDINGS: Social Media amplifies the impact of E-Word of Mouth
CONCLUSION
It is concluded that the Social Media networks influence the expectations of customers and help in the purchasing decision of new products are even new customers. The companies should respond to the customer
opinions shared on the internet after purchasing the product.
REFERENCES:
1. Baker, M., & Hart, S. (2008). The Marketing Book. London: Taylor & Francis
2. Constantininides, E. (2014) ‘Foundations of social media marketing’ Procedia- Social and Behavioural
Sciences, vol148, pp.40-57
3. Fahed, K. (2016). The Impact of Social Media Characteristics on Purchase Decision Empirical study of
Saudi Customers in Asser Region. International Journal of Business and Social Science, 41-50.
4. Heinonen, K. (2011). Consumer activity in social media: Managerial approaches to consumers social
media behaviour. Journal of Consumer behaviour
5. Huete-Alcocer N.A literature review of word of mouth and electronic word of mouth: Implications for
consumer behaviour. Frontiers in Psychology.2017, 8
6. Kaplan, A.M. Heinlein, M. (2010)’ Users of the world, unite! The challenges and opportunities of social
media’, Business Horizons, Vo.53, No.1, pp.59-68.
7. Mangold, W.G. and Faulds, D.J. (2009) ‘Social media the new hybrid element of the promotion mix’,
Business Horizons, Vol.52, No 4,pp357-365
8. Matos, C.A. de. (2011). Uma generalizacao emprica sobre commnicacao boca a boca unsando metanalize. Revista de Administracao Contemporanea, 15(5), 877-896. http://doi.org/10.1590/S1415-
6555201100500006
9. Parr, B. (2010). Facebook is the Web’s Ultimate Time Sink
10. Sako, L., &Brake, D.K. (2009). The social media Bible. New Jersey: John Wiley &sons, Inc.
11. Social Meida, Consumer Behaviour and Service Marketing, bigail Chivandi, Michaeal Olorunjwon Samuel
and Marmoo
12. Social Media and its Impact on Consumers Behaviour by Elisbeta Ioanas. Yona Stoica The Bucharest University of Economic Studies, Romania Romanian American University in Bucharest, Romania
[email protected],[email protected] International Journal of Economic Practices and Theories, Vol. 4,
No. 2, 2014, Special issue on Marketing and Business Development, e-ISSN 2247–7225 www.ijept.org
13. Wind, Y., & Mahajan, V. (2002). Digital Marketing: Global Strategies from the World’s Leading Experts.
New York: Wiley.
International Journal of Advance and Innovative Research Volume 8, Issue 3 (IV) July - September 2021 Part - 2
81
ISSN 2394 - 7780
INSOMNIA AND PERCEIVED STRESS AMONG YOUNG ADULTS
Ms. Rashmi P Naik
II MSc Clinical and Counselling Psychology Department of Postgraduate Studies and Research in Psychology, Sri Dharmasthala Manjunatheshwara College
(Autonomous) Ujire- 574240, Mangalore, India
ABSTRACT
Young adults are in an intermediate phase as they are emerging from adolescence to adulthood. In this present generation, most young adults are facing rising problems of troubleness in falling asleep during stressful
situations. Lack of falling asleep can make individual to feel physically and mentally slower down. Insomnia
and perceived stress are the deliberating mental health condition faced by youth population. The present study measures the level of Insomnia and Perceived Stress among young adults aged 18-24 years. The data was
collected from 60 participants (30 male and 30 female) using Google forms, across the state of Karnataka. The
insomnia and perceived were assessed using insomnia Severity Index (ISI) developed by Morin et al., (1993)
and Perceived Stress Questionnaire (PSQ) developed by Levenstein et al., (1993) respectively. The data was represented normal distribution, hence Independent sample t-test and Karl Pearson’s Product Moment
Correlation is used for statistical analysis. The study concluded that (p= 0.044) there is relationship between
insomnia and perceived stress among young adults.
Keywords: Insomnia; Perceived stress; Young adults
INTRODUCTION
Sleep is a necessary component for an individual’s health and wellbeing, without sleep one’s quality of life is,
more often than not, severely compromised. (Linda et al., 2013). Today, most young adults spend sleepless nights. Disturbance in their sleep is one of the profound health issues present among the young generation.
Individuals with poor quality of sleep report higher levels of perceived stress. Insomnia is a prevalent mental
health condition that is often associated with psychological distress, functional impairments, and reduced
quality of life. Psycho-physiological factors such as stress, anxiety are often presumed to play a major role in causing sleep disturbances. Stress itself perhaps one of the most common precipitants of sleep disturbance
(Morin et al., 2003). A retrospective study mentioned that 74% of poor sleepers recalled specific stressful life
experiences associated with the onset of insomnia (Bastien et al., 2004).
Insomnia
Insomnia is considered to be a type of sleep disorder that makes it difficult for a person to fall asleep and stay
asleep. Several different types of insomnia can interfere with one’s ability to sleep at night and function
properly during the day (Joshi et al., 2020). Insomnia is distinguished by the nocturnal and diurnal symptoms. It involves a predominant complaint of dissatisfaction with sleep quality and is accompanied by difficulties in
initiating sleep at bedtime, frequent or prolonged awakenings, or early-morning awakening with an inability to
return to sleep. These difficulties are been associated with clinically significant distress or impairment of daytime functioning including fatigue, decreased energy, mood disturbances, and reduced cognitive functions,
such as impaired attention, concentration, and memory (Morin et al., 2015). The etiological basis for insomnia
includes disturbances in circadian rhythms, stress, genetic conditions, other co-morbid diagnoses, drugs, alcohol, medications, and hormonal imbalances which play a major role (IHR Magazine, 2013). Several
international guidelines have mentioned that Cognitive Behavioural Therapy or CBT is considered to be one of
the helpful treatment to cure insomnia (Riemann, 2020).
Perceived Stress Perceived stress is defined as feelings or thoughts that an individual has about how much stress they are under at
a given point in time. Perceived stress includes feelings about the unpredictability of one’s life, how often one
has to deal with irritating hassles, how much change is taking place in one’s life, and confidence in one’s ability to handle their problems. It does not measure the frequencies of stressful events which has happened to a
person, but rather how an individual perceives about the general and overall stress of their life and their ability
to handle such stressful situation (Philips, 2013). Lazarus and Folkman (1984) defined “Perceived stress involves a particular relationship between the person and the environment that is appraised by the person as
taxing or exceeding his or her resources and endangering his or her wellbeing.
International Journal of Advance and Innovative Research Volume 8, Issue 3 (IV) July - September 2021 Part - 2
82
ISSN 2394 - 7780
Insomnia and Perceived Stress among Young Adults
Insomnia and perceived stress are a widespread and debilitating condition that can affect individuals, including
children, adults, elder adults, characterized by difficulties initiating and maintaining sleep, and is associated with significant distress or daytime impairments (Araujo et al., 2016). In this present competitive age, it is
reported that youth found to be more prone to stress which can lead to a reduced amount of sleep. Young adults
are the period time where they experience self-organization and role confusion. For them, stress mainly comes from academic performance, interpersonal relationships, financial requirement and career exploration. Such
stress may usually cause psychological, physical, and behavioural problems (Bhargava & Trivedi, 2018).
Insomnia and perceived stress are the increasing problems faced by young people across the world.
REVIEW OF LITERATURE
Studies on Insomnia
Linda et al., (2013) has conducted a study on Insomnia and associated risk factors in Later Adolescence among
Canadian Adolescent Population. The study included 2,866 participants in total, 1432 were male participants and 1434 were female participants. The data was collected using Canadian Community Heath Survey
(CCHS):Mental Health and well- being. The study supported some previous findings that there are no gender
differences in adolescent males and females in insomnia prevalence, while concurrently at variance with other findings that have found a significant difference in the sex of the adolescent and insomnia. The result showed
that the odds of experiencing insomnia were significantly greater among those with a chronic condition,
selected mood disorder, those experiencing quite a bit extreme life stress, and in adolescents living a household
other than with both the parents .
Studies on Perceived Stress Sood et al., (2013) has tested the Assessment on Perceived stress, Resilience and Mental health among
Adolescents. The study comprised sample of 100 adolescents between the age group of 13-18 years residing in international border at Jammu and Kashmir , India. The data was collected through administering Perceived
Stress Scale (Cohen, Kamrack, & Mermelstein, 1983), Resilience Scale (Wagnild & Young, 1987) and Mental
Health Inventory (Veit & Ware, 1983). Statistical analysis namely mean , standard deviation and T-test were
analysed. Findings showed that adolescents having higher levels of resilience had shown lesser mental health problems and better psychological wellbeing, emotional ties, and general positive affect. This could be
indicative of the role that resilience plays in safeguarding mental health of those who are residing in border
areas from development of mental health problems.
Need for the present study The life from young adulthood is the period of constant changes in various aspects starting from biological
changes to meeting life demands which differs in terms of age and gender. In this present generation poor quality of sleep and stressors are increasing mental health problems faced by young adults. Basically every
young people go through stress in daily day to life. Most of them are facing with rising trouble-ness in falling
asleep during stressful situations. Lack of falling asleep can make individual to feel physically and mentally
slower down. Thus, in this regard the present research study was to explore the relationship between insomnia
and perceived stress among male and female young adults.
METHOD
Research questions:
The research questions in the present study were;
1. Is there is any significant difference in Insomnia among male and female young adults?
2. Is there is a significant difference in Perceived stress among male and female young adults ?
3. Is there is a significant relationship between Insomnia and Perceived stress among male and female young
adults ?
Aim: The aim of the present study was to assess Insomnia and perceived stress among male and female young
adults.
Objectives: 1. To find if there is a significant difference in insomnia among male and female young adults
2. To find if there is a significant difference in perceived stress among male and female young adults
3. To find if there is a significant relationship between insomnia and perceived stress among male and female
young adults
International Journal of Advance and Innovative Research Volume 8, Issue 3 (IV) July - September 2021 Part - 2
83
ISSN 2394 - 7780
Variables:
Independent variables: young adults (male and female).
Dependent variables :Insomnia and perceived stress.
Hypothesis:
1. Ho1 : There is no significant difference in Insomnia among male and female young adults
2. Ho2 : There is no significant difference in Perceived Stress among male and female young adults
3. Ho3 : There is no significant relationship between Insomnia and Perceived Stress among male and female
young adults
Operational Definition:
Insomnia : Difficulty in initiating or maintaining a restorative sleep, which results in fatigue, the severity or persistence of which causes clinically significant distress or impairment in functioning. Such sleeplessness may
be caused by a transient or chronic physical condition or psychological disturbance.
Perceived stress: The feelings or thoughts that an individual has about how much stress they are under at a given
point in time or over a given time period.
Research Design
Exploratory in nature and survey research design is adopted
Sample
Sampling method adopted for the research was purposive sampling and data was collected from the state of
Karnataka. The sample size was 30 male and 30 female partcipants.
Table 1. Sample Description
Sample Size
Male 30
Female 30 Total 60
Inclusion criteria:
Participants residing in rural, urban and semi-rural/urban areas of Karnataka
Participants showing acute symptoms of insomnia
Aged between 18 to 24 years
Exclusion Criteria:
Participants residing outside Karnataka
Participants with the history of other psychiatric illness
Research Tools:
Demographic Questionnaire
Demographic questionnaire was developed to obtain information such as name, age, gender, domicile,
designation, district, state. These items in the questionnaire were included to help find out the differences across
gender in insomnia and perceived stress.
Insomnia Severity Index(ISI)
Insomnia Severity Index (ISI) was developed by Morin et al., (1993). Insomnia severity Index a brief self-report instrument measuring the patient's perception of his or her insomnia. The purpose of Insomnia Severity
Index is designed as a brief screening tool for insomnia, the seven-item questionnaire asks respondents to rate
the nature and symptoms of their sleep problems using a Likert-type scale.
Reliability and Validity: Developers Bastien and colleagues performed an initial psychometric study and demonstrated an internal consistency of a = .74 and found item-total correlations that were quite variable,
ranging from .36 to .54.
Perceived Stress Questionnaire (PSQ) Perceived Stress questionnaire was developed by Levenstein et al., (1993). The purpose of the scale, consisting
of 30 items, the PSQ was developed as an instrument for assessing the stressful life events and circumstances.
International Journal of Advance and Innovative Research Volume 8, Issue 3 (IV) July - September 2021 Part - 2
84
ISSN 2394 - 7780
With stress bearing significantly on the quality and consistency of the sleep cycle, the PSQ is a potentially
valuable tool for evaluating the underlying causes of sleep disturbances
Reliability and Validity: Developers Levenstein and collleagues conducted a psychometric evaluation of the scale and found an internal consistency ranging from 90 to .92 and a test–retest reliability of .82. Results of the
Perceived Stress Questionnaire correlated highly with trait anxiety and with scores on Cohen’s Perceived Stress
Scale.
Procedure:
1. Permission from the concerned authoritarians has taken before assessing the questionnaires to the
participants.
2. The purpose of the study will be explained to the participants.
3. Data was collected using Google form.
4. The tools assessed individually after building a rapport and collecting demographic details.
5. The data collected will be scored and interpreted with the help of respective norms.
Ethical Consideration: 1. Institutional approval is taken for conducting the research
2. Data collected was used only for research purpose
3. Consent of participants has been taken before assessing the questionnaires
4. Confidentiality is maintained throughout the study
Statistical Analysis:
Quantitative data analysis will be conducted in the study. The descriptive statistics like Mean and Standard
deviation will be used in the present study.
The Inferential statistics technique, Independent Sample t Test will be used to find if there is a significant
difference in Insomnia and Perceived stress among male and female Young Adults.
Pearson Co-efficient of Correlation will be used to find out a significant relationship between Insomnia and
Perceived stress among male and female Young Adults.
RESULTS AND DISCUSSION
Main variable analysis
Section 1: Testing the significant difference of Insomnia and perceived stress among male and female young
adults
Table 4.1 Mean, standard deviation and t value of Insomnia among male and female young adults.
Groups N Mean SD df t value Sig.
Male 30 7.53 3.928 58 2.198 0.032
Female 30 10.27 5.564
The hypothesis stated that there is no significant difference on insomnia among male and female young adults.
The mean scores indicate that insomnia seen more among females than in males. The SD score of males is
3.298 and SD score of females is 5.564. The obtained t-value is 2.198 and significance is 0.032, which is significant. Hence, the null hypothesis stating that there is no significant difference in the level of insomnia
among male and female young adults is rejected and the alternate hypothesis stating that there is a significant
relationship between insomnia among male and female young adults is accepted.
Table 4.2 Mean, standard deviation and t value of Perceived Stress among male and female young adults.
Groups N Mean SD df t value Sig.
Male 30 68.30 15.205 58 1.023 0.311
Female 30 64.57 12.977
The hypothesis stated that there is no significant difference on perceived stress among male and female young
adults. The mean scores indicate that perceived stress seen more among males than in females. The SD score of
International Journal of Advance and Innovative Research Volume 8, Issue 3 (IV) July - September 2021 Part - 2
85
ISSN 2394 - 7780
males is 15.205 and SD score of females is 12.977. The obtained t-value is 1.023 and significance is 0.311,
which is not significant. Hence, the null hypothesis stating that there is no significant difference in the level of
perceived stress among male and female young adults is accepted.
Section 2: Testing the significant relationship between insomnia and perceived stress among male and female
young adults using Pearson product moment correlation.
Table 4.3
Variables r p
Insomnia 0.261 0.044
Perceived stress
*Correlation is significant at the 0.05 level (2-tailed)
Karl Pearson’s coefficient correlation between insomnia and perceived stress among male and female young
adults.
The hypothesis that stated is there is no significant relationship between insomnia and perceived stress among male and female young adults. The findings of the study indicate that there is significant positive relationship
between insomnia and perceived stress among male and female young adults. The high positive correlation
denotes higher the insomnia, higher is the perceived stress among male and female young adults. Hence, the null hypothesis states that there is no significant relationship between insomnia and perceived stress among
male and female young adults is rejected and the alternate hypothesis there is a significant relationship between
insomnia and perceived stress among male and female young adults is accepted.
SUMMARY AND CONLUSION The present study titled “Insomnia and Perceived Stress among Young adults” was undertaken to assess the
level of insomnia and perceived stress among male and female young adults. Gender was the independent
variable; insomnia and perceived stress are the dependent variables. The sample included 60 participants out of which 30 were males and 30 were females aged between 18-24 years. The study was exploratory in nature and
adopted the survey method for collecting the data using the tools. Insomnia Severity Index (ISI) by Morin et
al., (1993) was used to assess insomnia and Perceived Stress Questionnaire(PSQ) by Levenstein et al., (1993)
was used to assess the level of perceived stress. The participants were recruited via whatsapp, email, phone call to participate in the study with an attached copy of the google forms of the scales. The obtained result were
analysed using Independent sample t-test and Karl Pearson’s Coefficient of correlation.
Findings of the study
Independent sample t-test: the independent t-test was undertaken to know the level of Insomnia and
Perceived Stress among male and female young adults.
Male and female young adults have a significant difference in their level of insomnia.
Male and female young adults did not differ significantly in their level of perceived stress
Karl Pearson’s Product Moment Correlation: Karl Pearson’s Product Moment Correlation was
undertaken to test the relationship between the two dependent variables in male and female young adults
There was a perfect positive relationship found between insomnia and perceived stress among male and
female young adults.
Implications
The results can be used to explore the reasons behind the relationship between insomnia and perceived
stress using a qualitative research method.
Limitations of the study
Only quantitative method was used
The results inferred from the study cannot be generalised
Sample collection was restricted only to young adults
Scope for further research
Qualitative methods of data collection can improve the further quality of paper

International Journal of Advance and Innovative Research Volume 8, Issue 3 (IV) July - September 2021 Part - 2
86
ISSN 2394 - 7780
Study can also involve specific individuals who are severely suffering from insomnia and cope up helping
them with intervention plan.
REFERENCES 1. Bhargava, D., Trivedi, H. (2018). A Study of Causes of Stress and Stress Management among Youth.
IRA- International Journal of Management and Social Sciences, 11(3), 108-117,
http://dx.doi.org/10.21013/jmss.v11.n3.p1
2. Joshi, A., Jabbar, F. A., Ajmal, M., Anto, L. (2020). Insomnia and Perceived Stress among Indian young
adults during COVID-19 pandemic. The International Journal of Indian Psychology, 8(3), 2348-5396,
http://www.ijip.in
3. Levenstein, S., Prantera, C., Varvo, V., Scribano, M., L., Berto, E., Luzi, C., & Andreoli, A.(1993).
Percieved Stress Questionnaire (PSI),
file:///C:/Users/user/Downloads/Perceived%20Stress%20Questionnaire%20(PSQ).pdf
4. Linda., Kelly, I. W., Janzen, B. L.(2013). Insomnia and Associated Risk Factors in Late Adolescence,
(PDF) Insomnia and Associated Risk Factors in Late Adolescence (researchgate.net)
5. Morin, C. M. (1993). Insomnia severity index (ISI), https://www.med.upenn.edu/cbti/assets/user-
content/documents/Insomnia%20Severity%20Index%20(ISI).pdf
6. Philips, A. C. (2013) Perceived Stress
7. Sood, S., Bakshi, A., Devi, P. (2013). An Assessment of Perceived Stress, Resilience and Mental Health of
Adolescents Living in border Areas. International Journal of Scientific and Research Publications, 3 (1),
2250-3153, http://www.ijsrp.org/

International Journal of Advance and Innovative Research Volume 8, Issue 3 (IV) July - September 2021 Part - 2
87
ISSN 2394 - 7780
KARATE AND IT’s BENEFITS
Nagaraja, D* and Virupaksha, N. D**
*Research Scholar, Department of Physical Education, Jnana Sahyadri, Shankaraghatta, Karnataka, India
**Director, Department of Physical Education, Jnana Sahyadri, Shankaraghatta, Karnataka, India
INTRODUCTION In this competition era, children’s and youths addicted to social media and modern equipment like video
games, specially internet. Still they like to play outside with peer groups. This passion of playing can be used in making them learn martial arts. We believe that a Child’s physical and psychological well-being can be
improved by Martial Arts. It provides good health, improves, increases self-esteem and self-confidence and also
decreases tension, stress, anxiety and depression.
Martial arts can be divided into armed and unarmed arts. The first form is archery and swordsmanship;
second, emphasize the grip or grip of the feet and hands. Many armed and unarmed martial arts are practiced
as tools for divine growth. Karate is one of the martial arts and it is unarmed one and nowadays Karate art is
becoming increasingly popular for girls, children, and adults. Present day Karate is constantly growing. The benefits of Karate are extensive and include a number of health benefits related to mental toughness, inner
peace and quiet, self-defense.
Practicing the martial arts will start your way towards a healthy life. Apart from fighting, it makes you focus on your physical fitness and improve your flexibility, stability, endurance and strength. Learning martial arts
makes drastic change in your tempo level when your muscle strength increases and makes your body powerful.
In the 14th century, Bodhi dharma, the founder of Buddhism, had a long journey from the west of India to the
Himalayas to China, with the aim of expanding Buddhism. A year later, he went to the Shao Lin Monastery (Shorin-ji) in Hunan, China, and found that Chinese monks could not tolerate the harsh sections of Buddhism.
Because of this, he invented a method for physical and mental development. So they started Karate, a means of
increasing their physical and mental strength. Karate is the art of self defense; Karate training focuses on how
to overcome enemies in just one technique.
In 1922, Master Gichin Funakoshi held his first Karate show in Tokyo and made a powerful impression on the
Japanese public. After that, Karate became very popular and taught in many more universities. The first Karate club was at Kio University and then there were many universities. Now, Karate is spread in many countries of
the world. In May 1948, the Japanese Karate Association (JKA) was founded by Master Gichin Funakoshi
(Shotokan) students with training standards (Kihon, Kata, Kumite) and competition.
BENEFITS OF KARATE
1. Improve mental toughness
Mental toughness can put you in a state of mental stress by pushing you into pain and discomfort. Through the
practice of punching, blocking and dynamic kicks and sparring (kumite) during Karate practice, Karate pushes you to your limits. You will learn a lot about yourself during Karate training. From a spiritual standpoint, it
helps to cultivate spiritual strength during times of mental toughness and adversity. With mental toughness, you
develop with Karate, helping to develop the ability to face any challenge or obstacle.
2. Improve inner peace and quiet.
This helps to foster inner peace and calm. Buddhism (Chan) has had a strong influence on the development of
martial arts in China and Japan. Karateka's is inner peace and quiet have attitude. When Karateka's practicing
the punching, blocking and dynamic kicks or during training and with a partner, you will learn to focus on your own movements. The peace of mind and calmness of mind can be helpful in face with physical problems as a
self defense situation. Karate as meant to give them a greater sense of peace and harmony.
3. Self-defense. Present day this is the first reason most people decide to learn Karate. Karate teaches you how to protect
yourself and avoid potential dangers. This knowledge will also save yourself and another people lives. Karate
training can help you if you are ever in a dangerous situation and give you the confidence to stand up for
yourself in potential hazards and fight back if necessary. Children and girls are especially taught how to avoid
confrontation after identifying a potential situation.
International Journal of Advance and Innovative Research Volume 8, Issue 3 (IV) July - September 2021 Part - 2
88
ISSN 2394 - 7780
4. Self-confidence.
Practicing Karate can help you gain self-confidence. You become more practicing Karate, and practicing you
katha (Imagination fight) your confidence level increases and gets a huge boost. Karate is based on many other techniques, it can help you achieve your success through hard work. When accomplished your confidence level
is increases.
5. Physical Fitness and Health. Involving in Karate on a regular basis is an excellent strategy to tone and develop your muscles. Karate training
improves flexibility and agility. Maintaining good posture is good for your health and can help you look and
feel better. Karate improves the strength and endurance. Karate provide a full-body workout. Karate can boost
mental and emotional wellness in addition to physical conditioning. Karate can help you relax by teaching you
self-defense techniques.
CONCLUSION
Some sports are only played during specific times. But Karate practicing is throughout the year. This consistency and availability helps to peoples especially girls and children’s. Karate learns discipline, mental
toughness, inner peace, quiet and many more. The benefits of Karate training are well-known, and popularity
has given the new insight and perspective.
Karate leads to the development of a physically fit person. Karate training is one of the martial arts that have a
good impact on everyone's life.
REFERENCE:-
1. Brad Binder, Ph.D. (2007) “Psychosocial Benefits of the Martial Arts: Myth or Reality? A Literature
Review” author. (original posting at: http:// userpages. chorus. net/ wrassoc /articles psychsoc.htm)(New
research articles from 1999-2007 in an Addendum)
2. Sandra Origua Rios, Jennifer Marks , Isaac Estevan and Lisa M. Barnetta (2017) “Health benefits of
hard martial arts in adults: a systematic review” JOURNAL OF SPORTS SCIENCES, 2017
3. Baldwin, H.R. (2019) “A review of the benefits and risks associated with the practice of martial arts”
International Journal of Martial Arts, Published online: 2019.
4. https://ewmartialarts.com/martial-arts/benefits-of-karate.
5. https://www.thekaratelifestyle.com/what-are-the-benefits-of-karate.
International Journal of Advance and Innovative Research Volume 8, Issue 3 (IV) July - September 2021 Part - 2
89
ISSN 2394 - 7780
LONELINESS AND RESILIENCE AMONG INSTITUTIONALIZED AND NON-
INSTITUTIONALIZED SENIOR CITIZENS
Manjula Chiploonkar II MSc Psychology, Department of Postgraduate Studies and Research in Psychology, Sri Dharmasthala
Manjunatheshwara College (Autonomous) Ujire-574240, Mangalore, India
ABSTRACT
With the changing life pattern in the present era, there have been tremendous changes happening in the Indian family system too. The dynamicity has made us ignore the major part of our life who brought up, who cared for
us, who were always there for us. They are our fathers, mothers, grandfathers, and grandmothers who are
called Senior citizens. There has been the formation of two ends institutionalized and non-institutionalized senior citizens. Loneliness has been found a psychological problem faced by senior citizens. For most
psychological problems, being resilient is essential for leading fruitful life. Thus, the present study aimed to
assess the level of loneliness and resilience, identify the significant differences and interaction effects across
domicile and gender in loneliness and resilience, to find out relationship between loneliness and resilience in senior citizens. A purposive sampling of 60 senior citizens (30 males and 30 females) was considered for the
study.UCLA loneliness scale (version 3) and the resilience scale by Wagnild and Young were the tools used.
Two-way ANOVA and Pearson Product Moment Correlation test was used. The result showed that institutionalized senior citizens have high level of loneliness and non-institutionalized senior citizens are more
resilient. Male participants have a high level of loneliness than female participants. There is a significant
difference in the level of loneliness and resilience among senior citizens from different domiciles. There exists a
significant relationship between loneliness and resilience among senior citizens across the domicile.
Keywords: Loneliness, Resilience, Domicile, Gender, Senior citizens
INTRODUCTION
Senior citizen
India is the country of youths. Most of the population in India are young people. But at the same time, the percentage of senior citizens is also growing at an increasing rate in India. It is estimated that the elderly
population is going to cover nearly 20% (Economic times, 2019). In India “National policy on older persons”
adopted in January 1999 defines a person who is of age 60 years or above as a senior citizen (Situation Analysis of the Elderly in India, 2011). APA Dictionary of Psychology (dictionary.apa.org) defines a senior
citizen as an older adult, one who has reached the age of retirement (generally 65 years or above) or one who is
retired. The life of senior citizens can be closely related to the prominent theory of psychosocial development
proposed by Erickson. The 8th stage of Ego Integrity versus Despair explains that a person possessing the quality of despair tends to regret about one’s past (Schroots, 1996). The activity theory lists some of the
developmental tasks which senior citizens face in their life such as adapting to decrease in one’s physical
strength, retirement and reduced income, adjusting to the life situations like the death of a spouse, maintaining relations with people of the same age, accepting the changing roles in social life and adapting to it, having good
physical living arrangements. Thus knowing the theories of developmental pattern of senior citizens, can further
help in understanding their problems.
Loneliness among senior citizens
One such psychological problem faced by senior citizens is Loneliness. Loneliness can be defined as a
“Discrepancy among individuals desired and achieved levels of social relationships” (Grover, 2019). Loneliness
is found to be risky. Dr.Cole said that loneliness is found to act as fertilizer for other diseases. Loneliness has been identified as a contributor to various physical and mental health conditions in the elderly like high blood
pressure, heart diseases, obesity, anxiety, depression (Nielsen, 2019). Comparatively the institutionalized senior
citizens are found to be pessimistic, guilty, failure, unhappy with life and it is recommended to give them hand in hand support to help them get out of the loneliness (Runcan, 2012). But also it is found that senior citizens
living in the family, if have lowered communication with family members, the loneliness is enhanced and as
there is an increase in age, loneliness can badly influence the health and wellbeing in both male and
female senior citizens.
Resilience among senior citizens
Thus an important life skill that every senior citizen needs is resilience. It strengthens them to cope with
negative life events, stresses efficiently. As defined by APA, Resilience is the process of adapting well in the face of adversity, trauma, tragedy, threats, or significant sources causing stress (Where you live matters, 2021).
International Journal of Advance and Innovative Research Volume 8, Issue 3 (IV) July - September 2021 Part - 2
90
ISSN 2394 - 7780
Some of the characteristics of senior citizens leading to have a good level of resilience are found to be a )
optimistic view and coping style rather than despair, b) ones happy personal relations with family, friends,
community c) having a purpose in one’s life and engaging in activities d) high level of self- efficacy with the ability to manage problems of ones own e) good diet and active lifestyle ( Edwards, 2012). Resilience is found
to be significant in causing good health outcomes such as lowers depression, responsible for successful aging,
and longevity. Thus research studies revealed that a good level of resilience in senior citizens helps them to adapt to the challenges and makes them attain good mental health and quality of life leading them towards
successful aging (MacLeod et all, 2016).
Loneliness and resilience among senior citizens
The researches suggest that the support system is very important for elderly people to get recover from any of the issues. Firstly reducing the level of loneliness that elderly people experience must be the route for any
recovery. It can be achieved through providing good social relations. In this regard, one can make senior
citizens achieve good mental health by firstly trying to minimize the loneliness and dissatisfaction that they have within and secondly increasing the level of resilience and self-efficacy. Resilience at a higher level is
found to enhance the quality of life, at the same time decreasing anxiety, depression and loneliness ( Gerino et
all ., 2017 ). Another research study suggests that resilience act as protecting factor and acted as mediator among loneliness and health outcome. It was found that loneliness had been significantly and negatively
correlated with Resilience. The higher the level of loneliness, the lower was the level of Resilience ( Jakobsen et
all ., 2020 ). Reports also enlightened that resilience is also connected with wisdom wherein leading to fewer
chances of loneliness and high compassion ( Solis-Moreira., J. 2020 ).
Rationale for the present study
With the changes that are happening in the world every minute, our lifestyle has also been changing. The entire
life is fastly moving towards the new technology era. But there are few brought up us, who cared for us are lagging who are ignored in this dynamic life. They are our fathers, mothers, grandfathers, grandmothers. We
can proudly call them “Senior Citizens”. With a lot of reasons like modernization, changes in the family setup,
there has been a lot of changes too happening in the life of Senior Citizens. Some of them are living with their
family whereas some are not. There has been formation of two ends. On one end, there are elderly people getting family support, care and love and the elderly people on the other end are living in the institutions like
old age homes, with the lack of family’s love, care, support in the absence of one’s family. In this regard, this
research study tries to explore how loneliness differs among these two ends of senior citizens and the
relationship between loneliness and resilience in senior citizens.
REVIEW OF LITERATURE
Studies on loneliness in senior citizens Al-Ameri, I ( 2019 ) conducted a study to measure the level of loneliness among elderly people living in nursing
homes of Baghdad. Aim of the study were to assess the level of loneliness and the relationship between
demographic characteristics with loneliness. Total of 52 elderly people from the two nursing homes namely, Al
Rashad and Al Silekh consisting of 33 males and 19 female participants were selected for the study. Demographic data was collected and UCLA loneliness scale was the tool used. The statistics methods like Cross
tabulation, frequency, percentages and chi-square test were used. The result concluded that most of the elderly
people had high level of loneliness. Women were found to have high level of loneliness.
Jamadar, C and Chawla, S. (2020) had conducted a research on the effect of loneliness on death anxiety
among elderly. The total participants were 100 where 50 institutionalized and 50 noninstitutionalized senior
citizens took part from Mysore. Research design used here was a 2*2*2 factorial design. The two tools Perceived loneliness scale and Death anxiety by Dhar, Mehta and Dhar were used. Mean, standard deviation, T-
test, Pearson coefficient of correlation were the statistical methods. The study found that loneliness was found to
be high among institutionalized elderly than noninstitutionalized. There was no significant difference in the
level of death anxiety experienced by institutionalized and noninstitutionalized elderly. In the study, loneliness
and death anxiety were found to be positively correlated.
Studies on resilience in senior citizens
Britto, J.J.A. et all. (2020) had conducted research study on Quality of life and Resilience Of institutionalized senior citizens. It aimed to find levels and gender difference in quality of life and resilience and relationship
among them. Total sample of 60 (30 male and 30 female) was collected using the purposive sample technique
from the two old age homes in Coimbatore. The tools like Eros quality of life and Resilience scale by Dr.
Jacob were used. The data was analyzed using percentage analysis, correlation and T test. Around 80% of the female and 70% of the male samples obtained moderate level of quality of life. Most of the sample (45%) have
International Journal of Advance and Innovative Research Volume 8, Issue 3 (IV) July - September 2021 Part - 2
91
ISSN 2394 - 7780
obtained very low level of resilience. The female participants scored very low level of resilience. A weak
positive correlation was found among quality of life and resilience.
Jameel, G ( 2020 ) has conducted a study on Religiosity, Resilience and social support as protective factors for wellbeing among institutionalized and noninstitutionalized widows. Totally 200 widows from Uttar Pradesh
were included for the study. 100 were taken from the institutions and remaining 100 were living in their home.
To collect the sample purposive sampling was used. The research design used was correlational. The tools like well-being scale by Singh and Gupta, Reliogisity scale by Deka and Broota, Resilience scale of Saeed and
Interpersonal support evaluation list were used in the study. There was positive correlation of wellbeing with
all the three variables. The level of resilience, social support was high in the widows who were
noninstitutionalized. Among institutionalized widows it was found that both resilience and social support were
the contributing factors for the wellbeing but not the religiosity.
Study on loneliness and resilience in senior citizens
Gerino, E et all, ( 2017 ) had done a research on loneliness, resilience, mental health and quality of life in elderly. The total sample consisted of 290 elderly people from Italy. The study aimed to find out the relationship
between loneliness, resilience, mental health, quality of life. The elderly of 65 to 90 years were the participants.
It was split into two groups like young old group consisting of elderly of age 65 to 74 years and old group consisting of elderly older than 74 years. The data was collected using UCLA loneliness scale, Geriatric anxiety
inventory, Geriatric depression scale, generalized self efficacy scale, resilience scale and world health
organization quality of life questionnaire. In the phase of data analysis mean, standard deviation, kurtosis
and skewness were used as descriptive statistics. Pearson correlation was used to check the relationship between the variables. The study found that resilience and mental health were found to be mediating effect on loneliness
and quality of life. The elderly people with high level of loneliness had low level of mental health, Resilience
and mental and physical quality of life.
Summary of the studies
By observing all the above studies, it is found that the level of loneliness is greater in the senior citizens who
are institutionalized. But when it comes to the factor of gender, there is no clear idea about the gender
difference found in the level of loneliness. The studies revealed that the noninstitutionalized senior citizens were
highly resilient. The studies have found a negative correlation between loneliness and resilience.
METHOD
Aim The aim of the present study was to assess Loneliness and Resilience across domicile and gender among Senior
citizens.
Variables The independent variables chosen for the study were domicile of senior citizens (senior citizens who are
institutionalized and noninstitutionalized) and gender (male and female senior citizens). The present study
included two dependent variables namely lonelinesss and resilience.
Inclusion criteria
Senior Citizens
With the minimum qualification of 5th standard
Indians
In the age range of 60 – 85 years
Exclusion Criteria
Senior Citizens
Suffering from hearing and eyesight problems or any chronic illness
Bed ridden
Research Design
The research design was exploratory in nature. It involved a quantitative approach for the study. As there were 2
independent variables with 2 levels here 2*2 factorial design was used.
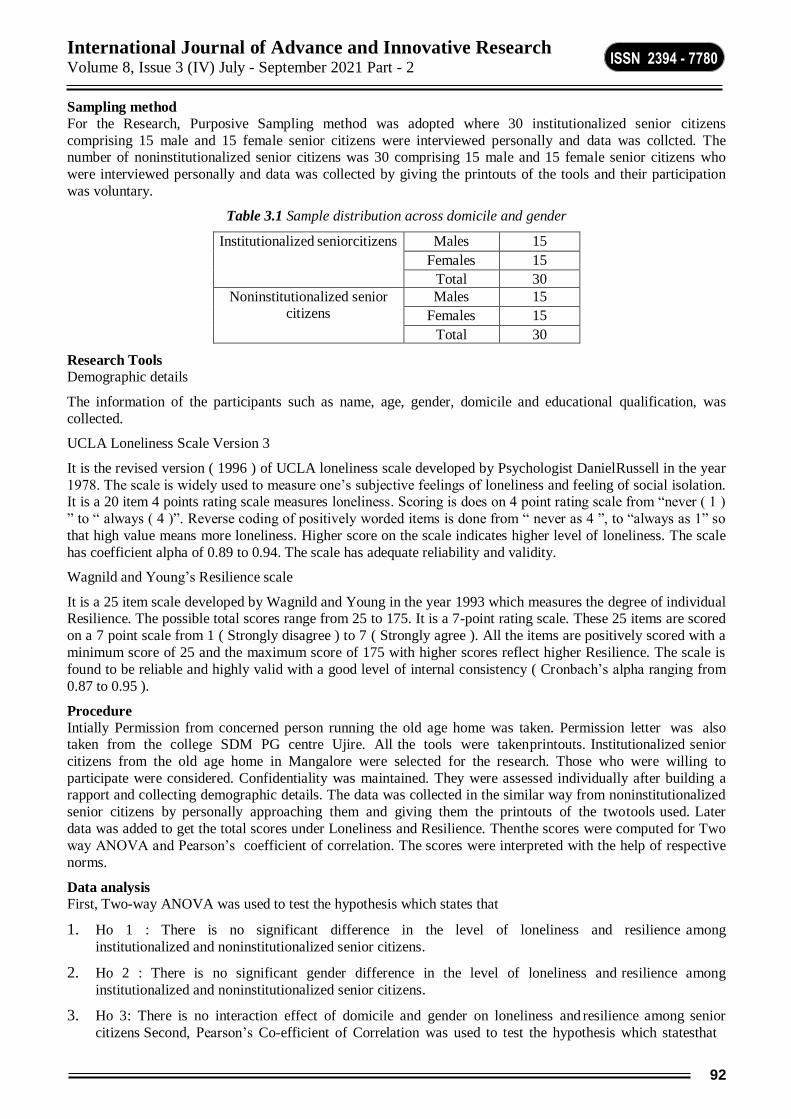
International Journal of Advance and Innovative Research Volume 8, Issue 3 (IV) July - September 2021 Part - 2
92
ISSN 2394 - 7780
Sampling method
For the Research, Purposive Sampling method was adopted where 30 institutionalized senior citizens
comprising 15 male and 15 female senior citizens were interviewed personally and data was collcted. The number of noninstitutionalized senior citizens was 30 comprising 15 male and 15 female senior citizens who
were interviewed personally and data was collected by giving the printouts of the tools and their participation
was voluntary.
Table 3.1 Sample distribution across domicile and gender
Institutionalized senior citizens Males 15
Females 15
Total 30
Noninstitutionalized senior citizens
Males 15
Females 15
Total 30
Research Tools
Demographic details
The information of the participants such as name, age, gender, domicile and educational qualification, was
collected.
UCLA Loneliness Scale Version 3
It is the revised version ( 1996 ) of UCLA loneliness scale developed by Psychologist Daniel Russell in the year
1978. The scale is widely used to measure one’s subjective feelings of loneliness and feeling of social isolation. It is a 20 item 4 points rating scale measures loneliness. Scoring is does on 4 point rating scale from “never ( 1 )
” to “ always ( 4 )”. Reverse coding of positively worded items is done from “ never as 4 ”, to “always as 1” so
that high value means more loneliness. Higher score on the scale indicates higher level of loneliness. The scale
has coefficient alpha of 0.89 to 0.94. The scale has adequate reliability and validity.
Wagnild and Young’s Resilience scale
It is a 25 item scale developed by Wagnild and Young in the year 1993 which measures the degree of individual Resilience. The possible total scores range from 25 to 175. It is a 7-point rating scale. These 25 items are scored
on a 7 point scale from 1 ( Strongly disagree ) to 7 ( Strongly agree ). All the items are positively scored with a
minimum score of 25 and the maximum score of 175 with higher scores reflect higher Resilience. The scale is
found to be reliable and highly valid with a good level of internal consistency ( Cronbach’s alpha ranging from
0.87 to 0.95 ).
Procedure
Intially Permission from concerned person running the old age home was taken. Permission letter was also taken from the college SDM PG centre Ujire. All the tools were taken printouts. Institutionalized senior
citizens from the old age home in Mangalore were selected for the research. Those who were willing to
participate were considered. Confidentiality was maintained. They were assessed individually after building a rapport and collecting demographic details. The data was collected in the similar way from noninstitutionalized
senior citizens by personally approaching them and giving them the printouts of the two tools used. Later
data was added to get the total scores under Loneliness and Resilience. Then the scores were computed for Two
way ANOVA and Pearson’s coefficient of correlation. The scores were interpreted with the help of respective
norms.
Data analysis
First, Two-way ANOVA was used to test the hypothesis which states that
1. Ho 1 : There is no significant difference in the level of loneliness and resilience among
institutionalized and noninstitutionalized senior citizens.
2. Ho 2 : There is no significant gender difference in the level of loneliness and resilience among
institutionalized and noninstitutionalized senior citizens.
3. Ho 3: There is no interaction effect of domicile and gender on loneliness and resilience among senior
citizens Second, Pearson’s Co-efficient of Correlation was used to test the hypothesis which states that
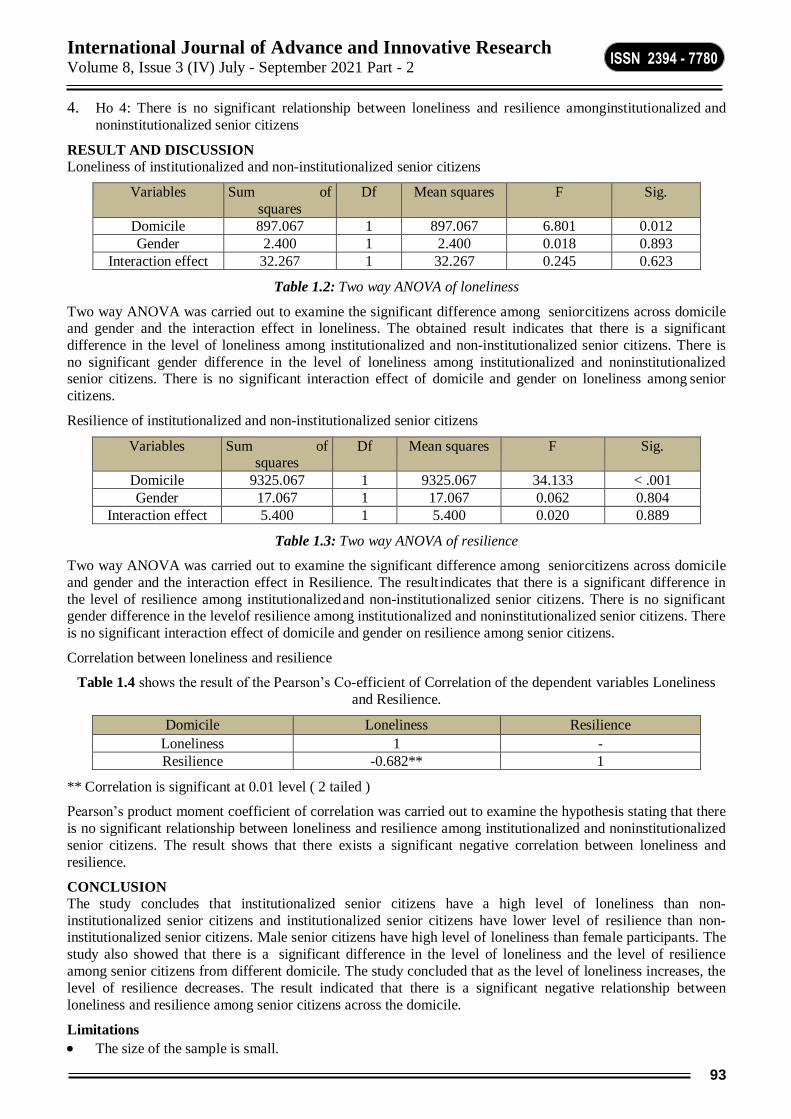
International Journal of Advance and Innovative Research Volume 8, Issue 3 (IV) July - September 2021 Part - 2
93
ISSN 2394 - 7780
4. Ho 4: There is no significant relationship between loneliness and resilience among institutionalized and
noninstitutionalized senior citizens
RESULT AND DISCUSSION
Loneliness of institutionalized and non-institutionalized senior citizens
Variables Sum of
squares
Df Mean squares F Sig.
Domicile 897.067 1 897.067 6.801 0.012
Gender 2.400 1 2.400 0.018 0.893
Interaction effect 32.267 1 32.267 0.245 0.623
Table 1.2: Two way ANOVA of loneliness
Two way ANOVA was carried out to examine the significant difference among senior citizens across domicile and gender and the interaction effect in loneliness. The obtained result indicates that there is a significant
difference in the level of loneliness among institutionalized and non-institutionalized senior citizens. There is
no significant gender difference in the level of loneliness among institutionalized and noninstitutionalized senior citizens. There is no significant interaction effect of domicile and gender on loneliness among senior
citizens.
Resilience of institutionalized and non-institutionalized senior citizens
Variables Sum of squares
Df Mean squares F Sig.
Domicile 9325.067 1 9325.067 34.133 < .001
Gender 17.067 1 17.067 0.062 0.804
Interaction effect 5.400 1 5.400 0.020 0.889
Table 1.3: Two way ANOVA of resilience
Two way ANOVA was carried out to examine the significant difference among senior citizens across domicile
and gender and the interaction effect in Resilience. The result indicates that there is a significant difference in
the level of resilience among institutionalized and non-institutionalized senior citizens. There is no significant gender difference in the level of resilience among institutionalized and noninstitutionalized senior citizens. There
is no significant interaction effect of domicile and gender on resilience among senior citizens.
Correlation between loneliness and resilience
Table 1.4 shows the result of the Pearson’s Co-efficient of Correlation of the dependent variables Loneliness
and Resilience.
Domicile Loneliness Resilience
Loneliness 1 -
Resilience -0.682** 1
** Correlation is significant at 0.01 level ( 2 tailed )
Pearson’s product moment coefficient of correlation was carried out to examine the hypothesis stating that there
is no significant relationship between loneliness and resilience among institutionalized and noninstitutionalized
senior citizens. The result shows that there exists a significant negative correlation between loneliness and
resilience.
CONCLUSION
The study concludes that institutionalized senior citizens have a high level of loneliness than non-
institutionalized senior citizens and institutionalized senior citizens have lower level of resilience than non-institutionalized senior citizens. Male senior citizens have high level of loneliness than female participants. The
study also showed that there is a significant difference in the level of loneliness and the level of resilience
among senior citizens from different domicile. The study concluded that as the level of loneliness increases, the
level of resilience decreases. The result indicated that there is a significant negative relationship between
loneliness and resilience among senior citizens across the domicile.
Limitations
The size of the sample is small.
International Journal of Advance and Innovative Research Volume 8, Issue 3 (IV) July - September 2021 Part - 2
94
ISSN 2394 - 7780
The sample is taken from only specific area.
The number of questions asked made the participants to get mental fatigue.
Implications
These results can be used to plan intervention to decrease the level of loneliness and to enhance resilience
among senior citizens.
It provides an insight about the differences in the level of loneliness and resilience among senior
citizens of different domicile and gender.
This result can be used to explore the reasons behind different levels of loneliness and resilience among
senior citizens of different domicile.
REFERENCES
Al-Ameri, M. H. I. (2019). Assessing levels of loneliness among elderly people residing in the nursing
homes of Baghdad city. Journal of Depression and Anxiety, 8(2), 1-6. https://doi.org/1000337
American Psychological Association, (n.d.). http://dictionary.apa.org/senior-citizen
Britto, J.J.A., John, S., & Selvaraj, B. (2020). Quality of life and resilience of institutionalised senior
citizens. Global Journal for Research Analysis, 9(5), https://doi.org/10.36106/GJRA
Edwards, E. S., & Hall, J. (2012). Resilience in ageing. Arizona Center on Ageing .
http://aging.medicine.arizona.edu
Gerino, E., Rolle, L., Sechi, C., & Brustia, P. (2017). Loneliness, resilience, mental health and quality of
life in old age:A structural equation model. Frontliers in Psychology ,8: 2003.
https://doi.org/10.3389/fpsyg.2017.02003
Grover, S. (2019). Loneliness: Does it need attention!. Journal of Geriatric Mental Health, 6(1), 1-3.
https://doi.org/10.4103/jgmh.jgmh_27_19
Jakobsen, I.S., Madsen, L.M.R., Mau, M., Hjemdal, O., & Friborg, O. (2020). The relationship between
resilience and loneliness elucidated by a Danish version of the resilience scale for adults. BMC Psychology ,
8(131), 1-10. https://doi.org/10.1186/s40359-020-00493-3
Jamadar, C., & Chawla, S. (2020). Effect of loneliness on death anxiety among elderly people. The
International Journal of Indian Psychology, 8(2), 665-672. https://doi.org/10.25215/0802.077
Jameel, G. (2020). Religiosity, resilience and social support as protective factors for the well- being of
institutionalised and non-institutionalised widows in India. International Journal for Innovative Research
Multidisciplinary Field, 6(3), 146-152. http://www.ijirmf.com
MacLeod, S., Musich, S., Hawkins, K., Alsgaard, K., & Wicker, E.R. (2016). The impact of resilience among older adults. Geriatric nursing ( New York, N.Y.), 37(4), 266-272.
https://doi.org/10.1016/j.gerinurse.2016.02
Ministry of Statistics and Programme implementation (2011, April 1). Situation analysis of the elderly in
India .India Environment Portal. http://www.indiaenvironmentalportal.org.in/content.391555/situation-
analysis-of-the- elderly-in-india/
Nielsen, L. (2019, April 23). Social isolation, loneliness in older people pose health risks, National Institute
on Aging. https://www.nia.nih.gov/news/social-isolation-loneliness- older-people-pose-health-
risks#:~:text=Loneliness%20acts%20as%20a%20fertilizer,brain%20leading%20to%2
0Alzheimer's%20disease
Runcan, P.L. (2012). Elderly institutionalisation and depression. Procedia-Social and Behavioural Sciences
, 33(2012), 109-113. http://dx.doi.org/10.1016/j.sbspro.2012.01.093.
Schroots, J.J.F. (1996). Theoritical developments in the psychology of ageing. The Gerontologist ,
36(6),742-748. https://doi.org/10.1093/geront/36.6.742

International Journal of Advance and Innovative Research Volume 8, Issue 3 (IV) July - September 2021 Part - 2
95
ISSN 2394 - 7780
Share of population over age of 60 in India projected to increase to 20% in 2050:UN. (2019, April 17). The
Economic Times. https://m.economictimes.com/news/politics-and- nation/share-of-population-over-age-of-
60-in-india-projected-to-increase-to-20-in- 2050-un/articleshow/68919318.cms
Solis-Moreira, J. (2020, December 6). Resiliency helps older adults deal with the pandemic, Medical News
Today. https://www.medicalnewstoday.com/articles/resiliency-helps- older-adults-deal-with-the-pandemic
Where you live matters. (2021, February 9). The positive impact of resilience in older adults.
https://www.whereyoulivematters.org/resilience-and-aging/
International Journal of Advance and Innovative Research Volume 8, Issue 3 (IV) July - September 2021 Part - 2
96
ISSN 2394 - 7780
LOOKING BEYOND FEMINISM: THE DYNAMICS BEHIND & THE DEMANDS AHEAD
Prof. Navaneeta Rath
Professor, Sociology, Utkal University, Odisha
ABSTRACT Feminism is an ideology and a movement. Fighting for social justice, for equality, for recognition were the
original agenda of the feminist project. It started gaining popularity in the mid twentieth century and percolated
to different countries from its western root. But at certain point of time its potential was misinterpreted and misunderstood. It was seen as a problem for the society. Feminism in due course became associated with
gender fundamentalism and a challenge was posed and demand was to look beyond feminism. This paper makes
an attempt to locate the roots of feminist fundamentalism, the reaction to that and tries to bring forth the demands relating to new agendas and strategies for feminism. The paper is divided into three distinct sections.
Section -I looks into the trajectory of feminism, Section-II interrogates into the shortfalls of feminism and
Section-III deals with looking beyond feminism. While the first section historises feminism, section two locates
the possible lacunae and section three urges upon the needs to relook and even look beyond feminism coopting
new agendas and developing new strategies.
Key Words: Feminism, First wave of feminism, Second wave of feminism, Third wave of feminism, Patriarchy,
Equality
SECTION -I
The Trajectory of Feminism
Feminism is a major ideological current having influential impact on society. It challenges the inherent gender
inequality of the society which is antique and ubiquitous. Feminists resent the unequal treatments received by the women and make an endeavor to better off the lives and status of women. Bell hooks (2000), in the opening
sentence of her book in Feminism is for Everybody describes feminism as a movement to put a termination to
sexist exploitation, sexism and oppression. Ropers-Huilman (2002) suggests three presumptions of feminism
which the author feels are fundamental to original feminism. They are:
Women have the potential and do contribute to every aspect of the world.
But women have been deprived from achieving their potential, receive the rewards, or enjoy full
participation in society.
Feminism is not simply a critique, but it works toward social transformation.
Feminists crave for human treatment. To them, autonomy and equality are the basic needs of a human being and
women are in bad need of it. But the present society denies both of them to women. Women in every society fall
prey of cultural constructs. Social structures and social agents strategically victimize them (Anthias,2002). They
exploit, oppress and put women into subjugations.
The fertile soil for the germination of feminist philosophy is often is traced to America and Britain. But history
records that even Plato, the great Greek philosopher made an advocacy for women’s equality in his classic Republic. Plato noted no difference in the natural capacity of men and women. To the great
philosopher, women like men have enormous competence and capacity for governance and
defence. But it needs a societal recognition. This view of Plato was frowned upon by the then prevalent patriarchal society and was heavily criticised. However, it was followed by a resistance
movement among the Roman women . Women in Rome staged a massive protest to repeal the
prevalent Oppian Law. This law was passed in 215B.C. As an emergency measure, Rome had
legislated this law which prevented women to access precious possessions like gold and gave the
sole entitlement to men.
Gradually, knowledge construction took up the issues of women. Sensitizing the society and the
women about their justifiable rights became a matter of reflection in many literary works. The 15th-century writer Christine de Pizan voiced against the subdued role of women in the Middle
Ages in The Book of the City of Ladies . This was followed by the Enlightenment writers and
philosophers demanding for equal treatment, equal entitlement for women. Enlightenment le d to the fermentation of feminist ideas. This gave a boost to crystallise the ideas into writings. A
reference can be made to Margaret Cavendish. Cavendish happened to be an English poet,
philosopher, fiction-writer and playwright. Margaret was deeply upset about the inferior jobs allotted to women
International Journal of Advance and Innovative Research Volume 8, Issue 3 (IV) July - September 2021 Part - 2
97
ISSN 2394 - 7780
and the way they were devalued in the society. Margaret Cavendish, the then duchess of Newcastle had the
privilege to attended a meeting of the Royal Society of London in 1667. During these times, most women
writers used male pseudonyms. But Margaret became the maiden writer to write under her own name. She not only created a new era, but laid a strong foundation for feminists to demand for equality and
justice. This was followed by a series of writings relating t o women’s autonomy, identity and
equality. This period can be labelled as the period of latent fermentation of feminism in the west.
In due course feminism started taking a manifest form with more and more women coming to the
forefront and boldly demanding the rights of women. The French revolution inspired Mary
Wollstonecraft to write a book to instigate women to fight for their rights (Head 2010). Wollstonecraft
through her book A Vindication of the Rights of Woman published in 1792, put forth her strong arguments for according women greater equality. It is treated as a seminal feminist work in Britain. In
this work, Wollstonecraft was vocal against the notion that women’s existence is male dependent and their duty
is to appease men. She proposed that women need to be given equal opportunities in education, work, and politics with their male counterparts. This gave the clue and force to women to rebel against their deprivations
and to demand for their rights and access to opportunities. This was reflected in the voices of some powerful
women. Reference can be given to Abigail Adams, the first lady to President John Adams of the United States who clearly stated that access to education, property and the ballot are critical to women’s
equality, so women need to command them through a strong demand.
Modern feminism emanated from the social changes that took place in Britain and America in the nineteenth
century. The wave is often associated with the Seneca Falls Convention where the ‘Declaration of sentiments’ was signed . Seneca Falls was the first women’s rights convention. The convention was convened subsequent to
the prevention imposed on Elizabeth Cady Stanton and Lucretia Mott to seat at the 1840 World Anti-slavery
Convention in London. They were declined to seat as abolitionists. Women’s exclusion from public sphere and more particularly from the forum of decision making was the stimulating force for mobilizing women to claim
their rights as equal citizens. No longer women like Stanton and Mott were prepared to accept the patronship of
men, but were in aggressive demand for partnership in every sphere i.e. from production to decision making.
Thus, the deprivations and exclusions practised against women as a group led to the germination of the first wave of feminism in the late nineteenth and early twentieth centuries. Urban industrialism and liberal, socialist
politics created the pathway for this wave of feminism. Feminism as a movement from its very beginning took
into account the issues of subjugation, objectification and deprivation of women from their basic rights to vote, property, employment and even custody of children after a divorce .Thus, the basic dynamic behind the first
wave feminism was to achieve equal treatment, distributive justice and equal opportunity in society for
women , to gain identity and rights of women as human beings instead of being treated as possessions in the hands of the male patriarchs . Added to the seeking of right to vote, they campaigned against prostitution,
alcohol consumption by the males, child labor, drug trafficking, exploitation of the marginalised, disparities in
wages and living standards between rich and poor, dangerous working conditions which had their adverse
impacts on women in the households and public.
During the first wave, a number of prominent womens’ organizations started taking shape. The prominent
among them were the American Equal Rights Association which came up in 1866, The National Women
Suffrage Association, NWSA, which had its birth in 1869 the American Women Suffrage Association, AWSA which had also a parallel origin in 1869. Religious faith was continuing as the guiding principles of these equity
feminists. So, they established and perpetuated their faith in family and were vocal against divorce.
The first wave of feminism was yielding in character. As an impact of the first wave of feminism married women in the US were gradually allowed to own property. In 1772, forced marriages were
abolished by the Russian government. Gradually, suffragettes began to witness success across
nations. New Zealand became the first sovereign state to accord women the right to vote in 1893.
It was followed by Australia and Finland in 1902 and 1906 respectively. The United Kingdom granted suffrage to women over 30 in 1918. In 1920, it was due to the work of suffragists like
Susan B. Anthony and Carrie Chapman Catt, the 19th Amendment passed. The first wave ended with
the19th Amendment to the American Constitution which declared, “the right of citizens of the united states to
vote shall not be denied or abridged by the United States or by any state on account of sex.”
The first wave of feminism thus, was achievement oriented and it was thought to be based on rationality and
liberal ideas. As it was operating within the framework of the prevailing culture and institutions of the society, it
was not attracting criticism. The question of looking beyond feminism was never there, but looking ahead was
International Journal of Advance and Innovative Research Volume 8, Issue 3 (IV) July - September 2021 Part - 2
98
ISSN 2394 - 7780
promoted. This wave was marked with excitements from women and encouragement from men. Even it could
draw immense support from the males who thought the claims of feminism were rational and based on justified
grounds.
Radicalism was gaining moss in the feminist ideology. Feminist movements started getting galvanized by some
elements of radicalism and rationalism. These movements started challenging the religious texts in the west.
Feminists, such as Elizabeth Cady Stanton, saw women's oppression was rooted in the Bible and Orthodox Christianity. This led Stanton to publish the Woman’s Bible in 1895 to challenge the Biblical pronunciation of
sex roles. Stanton took up the issue of analyzing and reinterpreting the scriptures describing the roles of women.
She established that the Biblical versions were deliberately manipulated by male translators and they were not
the direct versions of God. Stanton went to the extent of proclaiming that while America has "a state without a king, a church without a pope, and now we are to prove it possible to have a family without a divinely ordained
head" (Quotes from The Woman’s Bible). She urged women to raise their voice against the subjection which
was hitherto accepted as “heaven-ordained”.
Since the 1960s, feminist ideas have taken an added momentum. The beginning of this phase can be traced
through the large-scale protests demonstrated in the city of Atlantic against the Miss America pageant in 1968
and 1969. Feminists were vocal against the "cattle parade" that devalued women and were treating them as objects of beauty. To them, it was highly patriarchal and was stimulating gender stereotypes like public private
dichotomy by domesticating women with non-remunerative domestic chores. The movements steered against
war and the civil rights movements and the growing self-consciousness of a variety of minority groups of
women around the world fashioned this wave of feminism.
The radical feminists of the second wave hammered at the injustices and the disproportionate burdens women
were bearing in the society. Though some of their claims were rational based, sometimes they tried to supersede
reason. They reacted against the injustices not only at home, but also at the public places like the workplaces. At this point of time issues like rape, reproductive rights, domestic violence, workplace safety and representation
of women in popular cultures, protests against sexuality and reproductive rights adorned the feminist agenda.
With the efforts of the radical feminists, traditional concepts on marriage, family and sex roles and many
traditional values of the society have been rejected or radically altered. Literature like Betty Friedan’s The Feminine Mystique reacting against the belittled and demeaning representation of women in the advertising
agencies and institutions like education, feminist writer Kate Millet’s gospel on Sexual Politics , Carol
Hanisch’s essay, The Personal is Political , Presidential Commission on the Status of Women instituted by the Kennedy administration under the chairmanship of former First Lady Eleanor Roosevelt, the creation of
the National Organization for Women (NOW)in 1966 with Friedan as the first President gave a further radical
shape to this wave and feminists were determined to root out patriarchy , were vocal against gender roles and were determined in their demand for changing institutional norms, gender role stereotypes, cultural stereotypes
and making equality visible from private domestic sphere to the public workplaces, politics to property
distribution systems. In 1963, Friedan’s book The Feminine Mystique criticized the idea that women could find
fulfilment only through childrearing and homemaking. To quote a song written by Betty Friedan in 1970 , “We’re breaking out of our cage of ruffles and rage . . . We’re more than mothers and wives with second hand
lives”. Feminists organised women-only organizations like NOW and reacted against the male dominated
institutions. They launched “consciousness raising" groups. They started demanding absolute equality, role
transformation by publishing volumes like "The BITCH Manifesto" and "Sisterhood is Powerful.”
The radical feminists of the 1970s emphasised on patriarchy as the reigning principle of unequal power
distribution among men and women in the society. To them all other forms of injustices stem from unequal power distribution and patriarchy. Their claim for ‘only women space’, persuasion for separatist women
specific organising strategies that celebrate and propagate women’s difference from men, under the banner of
political lesbianism and global sisterhood (Motta,et.al. 2011)was not easily accepted by the society. They
demanded abortion rights for women which was not permitted by the existing religions of many communities. According to the versions of Radical feminism, capitalist hierarchy is dominated, directed by the patriarchs.
Women's oppression emanates from the capitalist set up preconditioned and operationalised by men. So, radical
feminists propose for the uprooting of capitalism founded upon patriarchy and reconstruction of society (Echol,1989). The feminist demands during this wave were a blend of the basic ideas floated by the neo-
Marxists and the psycho-analytical theorists. Feminists of this period began to trace the root cause of the
subordination of women with the syndromes of patriarchy, culturally approved heterosexuality and capitalism.
To them, the glamorisation of woman's role as wives and mothers put them into the mercy of men. They critiqued, raised voice, and challenges these operating forces which were deeply rooted in the society and
International Journal of Advance and Innovative Research Volume 8, Issue 3 (IV) July - September 2021 Part - 2
99
ISSN 2394 - 7780
institutionalised in the societal institutions. This has become the bone of contention of the critics. Critics simply
comment that radical feminism is anti-society, anti-institutions.
Critics and males suggest that the radical agenda rests upon a deceptive ideology which has done damage to the social fabric. Their propaganda "Women's struggle is class struggle" and ‘women-only spaces’ are anti-society.
Because no society ever rests on women’s or men’s exclusive space. Feminists’ projection of women as a
victim social class, being vulnerable to various forms of oppressions created an antagonism between the gender binary in the society. Further, coining of slogans like, “identity politics” and “the personal is political" became a
precursor to establish that class, ethnicity and gender have a strong nexus and the oppression emanating from
them overarch. It has broken the complementarity between the gender binary and has ingrained a contest and
counter feeling among men and women. This has led to research the path beyond feminism. To them the changing world situation has proved many of the feminist propositions wrong and failing, bringing discomfort
to women as a class and the society as a whole. Thus, the subscribers and advocates of the second wave of
feminism are criticised as too extravagant, destructive and unfounded (Bisong, et.al.,2014).
The third wave of feminist movement is called ‘resenter feminists’ movement. They challenged the prevalent
definition of femininity which was fashioned by the second-wave feminism. They argued that the second-wave
of feminism was class-based feminism tilting in favour of and over reflecting the situations and experiences of the women from the white upper middle-class, neglecting the lived experiences of the lower-class women. This
wave tried to make feminism more inclusive in character by trying to accommodate the voices and challenging
the situations of the hitherto neglected women. To the advocates of this wave of feminism intersectionality
needs to be an important component of the feminist lens. To them, race, community, culture, ethnicity, class, religion, gender, and nationality are all significant factors for fashioning the feminist ideology. The intellectual
roots of the third wave feminism can be traced in the writings of Kimberlé Crenshaw and Judith Butler.
Crenshaw was a spokesperson of gender and critical race theory. Judith Butler made a formidable difference between gender and sex. The term intersectionality owes its origin to the ideas of Kimberlé who is accredited
as the originator of the term. Intersectionality describes the ways in which different forms of oppression
intersect. Butler clarified that gender is performative while sex is ascriptive. The chief advocates of the third
wave were Gloria Anzaldua, Audre Lorded and Luisa Accati. The third wave tried to bring trans rights into its
agenda as an integral part of intersectional feminism.
The third wave feminists were vocal against patriarchy and criticized the way knowledge is constructed through
historical documentations and literary productions by male to control women. They wanted to end the scriptures and God which are out and out ‘Patriarchal’. They were resenting the concepts like Lord, God as the architect of
the universe. They promoted lesbianism, worship of Goddesses, fostered erotic pleasure as a wedge for
dismantling patriarchal culture. To the third wave feminists’ sexual liberation was a vital component of equality for women and demanded that pornography was repressive and anti-female. They demanded greater
representation for women, to have more protective legislations to end violence and reproductive rights for
women. They demanded sensitization of boys through education to overcome masculinity.
This wave of feminism coincided with the onset of globalization. Due to the communication revolution and rapid flow of information it could have a strong dispersion effect. It started shunning with its western
concentration and penetrated into the developing world where it was able to attract more and more women.
SECTION-II
The Shortfalls of Feminism
The question of looking beyond feminism arose from some of the shortcomings of feminism. Feminism had a
mixed effect on the society. A balance sheet of the impacts of feminism projects that feminism has generated critical academic and research work within and beyond the academy (Alison, Blunt 2000) to disrupt the long
standing and institutionalised gender imbalance in opportunity sharing, balance of power in the society. Over
the years, it has opened new vistas of freedom and equality for women. Women have not only got suffrage
rights, but have appeared in good numbers as political representatives and leaders. Their occupancy of political space from the grass root level is on rise. The best example here can be taken from India where women in
spectacular numbers have occupied positions of power in the decision-making forum under decentralised
governance system i.e. the Panchayati raj system. Similarly, due to the impacts of feminism women’s claim for property rights has come to limelight and it is followed by progressive laws of inheritance that has legalised
their claim. Feminisation of employment market is another achievement of feminism and equal wages at least
on records is an outcome of the feminist demands. Organised sectors do adhere to that. Barriers to women’s
mobility are getting defreezeed.
International Journal of Advance and Innovative Research Volume 8, Issue 3 (IV) July - September 2021 Part - 2
100
ISSN 2394 - 7780
But feminism has presented the society with a host of problems. It has created a contradiction between men and
women and the male dominated society often seesfeminism as the cause of many social evils like violence
within the families, detoriated quality of life, doubly burdened women , latch and key children, teenager issues like addiction, sexual indulgence, sexually transmitted diseases on rise, escalation in single parent homes,
increase in the ratio of deviant children, rise in the number of unwed mothers, millions of babies dying due to
the legalization of abortion, live in arrangements brining long term issues of identity, property, security and
metal health issues among women.
Defeating discrimination which was the original agenda of feminism is still a distant dream. Feminism has not
yet got any of its agenda fully accomplished. It has become elite centric by delivering to the demands and needs
of the upper-class women and to some extent it has yielded within the geopolitical boundaries of the western developed nations. Even today, limited access to education, employment opportunities, reproductive rights,
maternal health, gender-based violence, female genital mutilation, access to nutrition and water and sanitation
grapple millions of women in low- and middle-income countries. Sex slavery, food insecurity, vulnerability to violence are increasing in number for women. COVID19 pandemic has exacerbated them. Women continue to
live in a risk society. There is always a limit to their access, choice, voice and control. But there is no limit to
violence on, discrimination against, degree of exclusion of women and deprivation of women from a good quality of life. Strictly speaking, empowerment of women is a myth while disempowerment is a reality. These
scenarios have led many of the analysts to look beyond feminism. Thus, it can be said that the entire debate of
beyond feminism comes from the loss of faith in the ideology of feminism and challenging its fate and future.
SECTION-III
Looking Beyond Feminism
In this section, I will try to quote some scholarly works which are vocal about the demerits of feminism as an
ideology. Some major works i.e. Feminism: Mystique or Mistake? by Passno, (2000) and an article the Feminist Mistake (2013) authored by Douglas S. in the magazine Tomorrow’s World, Gragilla’s Domestic tranquility : a
brief against feminism, Crittenden(1999)’s What our mothers didn't tell us : why happiness eludes the modern
woman where from I want to carry ahead the discussion on ‘Women are looking beyond feminism’. with a
defense from Kirsten Swinth’s Feminism’s Forgotten Fight : The Unfinished Struggle for Work and
Family(2018).
While Passno(2000)and Winnall(2013)establish in their essays that feminism is a failure and has resulted in
false prophecy, critics in general suggest that feminism has misled and deceived women. Even women have declared feminism as a bankrupt movement (Passno,2000). Both, Winnall and Passno declare that feminism is
anti-cultural. As an emerging and expanding ideology, it has given a death blow to the long existing culture of
the societies. It has infected the women, has rebelled men against women and hammered the foundations of the society. So, Passno says it is not Feminine Mystique (Betty Friedan published in 1963) , but feminine mistake.
Graglia(1998) noted contemporary feminism became forked tongue. It made a cultural assault on the traditional
institutions of marriage, motherhood and sexuality which were rich sources of fulfillment for women. To her,
feminism resulted in a gender war. It shattered the traditional family and hammered at the traditional notion of feminineness. The ideology they developed is based on misrepresentation of the facts—feminism's falsification
of reality" (Graglia,1998).
Gragilla describes the so-called stalwarts of feminism as “piped pipers”. The "pied pipers" of feminism not only fascinated women to cross the boundaries of their the home but destroyed the very fabric of traditional family
(Domestic Tranquility, Graglia, 1998). To her, feminism was jaundiced and misleading when it was labelling
women’s dedication to domesticities as "a virtually worthless pursuit" and women who were relentlessly pursuing their roles as homemakers "were thought to be mentally disturbed" (Ibid) . Similarly Crittenden(1999)
criticised feminism that proposed heterosexual love was no match for homosexual love and was inferior to love
.between two women. Danielle Crittenden noticed that her generation have come to a realization that the
feminist slogans were gradually losing their acceptance. The high sounding slogans like "domestic dependency is dangerous to women" and "love can flourish only between adults when everyone pays his or her own way"
were complete lies and worthless(Crittenden). Crittenden noted "Feminism has failed women… the belief that
women should bear no consequences for their decisions, that we can live independently of men and children—that we should live independently of them—is among the great foolish and destructive beliefs of our
age" (Crittenden).In the same vein, Dale O'Leary the noted journalist commented feminism makes a false
prophecy. They try to establish a new wave of thought that there is no difference between men and women and
the concept of motherhood is the same as fatherhood. By this they befool the new generations. This is just
International Journal of Advance and Innovative Research Volume 8, Issue 3 (IV) July - September 2021 Part - 2
101
ISSN 2394 - 7780
creating a false notion. Men and women have different temperament and as such they experience the world
differently. The gross difference between motherhood and fatherhood cannot be just denied.
Swainth(2018) defends that actually, feminism is often misunderstood. To the author, feminism impacted women, paved the way for them to change their ideas, attitude and practice and participation. But it could not
get the support of the surrounding men and the institutions which were patriarchal and parochial in nature. They
faced obstructions from the conventional patriarchal mind sets that disallowed society to change and to become permissive to women. Swainth argues it is not feminism that has betrayed women, but it was the society that
hesitated to make the far-reaching changes for which activists fought. So, women till date are having their
unfinished struggle at work and family.
Actually, speaking feminism is seen to be suffering from the maladies of illusion and exclusion. Its illusion lies with the fact that gender equality is more a need of women, men and women are absolute equals, culture and
social structures are detrimental for the women. The exclusion syndrome of feminism is noted when feminists
forget that women have such different experiences of everyday life that there cannot be a ‘one size fits all’ when it comes to feminism. Feminism for a long time was color blind, race blind and class blind(Alan referred to by
Abdulhameed 2013 ). It was bourgeois feminism, extremely elitist and west centric. Feminism failed to
understand that each women’s experiences were unique to themselves and vastly variant. It was blind to the issues of women in the context of various religions, races, class, culture and nationality. The visualization that
women’s issues are homogenous made feminism short lived and invited cracks within the group. Feminism was
representing the voices of the dominant group and it was just a microscopic minority.
Today feminism is in a trial to re fix its agendas and actions. It is trying to adopt inclusiveness and to look into intersectionality in letter and spirit. It is trying to shed with its biases and elitist base. It is in a process to capture
the grassroot women, women from isolated regions, hitherto unheard women into its fold and to bring their
experiences and voices into its dynamics and demands. In order to make the ideology broad based it has tried to include the women from the Black, Dalit, lesbians, migrants within its fold. Feminism to have a promising
future is trying to understand that women as a community is not homogenous, nor their issues are uniform. The
modern feminist who are looking beyond feminism are trying to convince the society that ‘all inequalities are
not equal’. They are different for different sections of women and these need to be addressed through the
feminist movement.
Modern feminism has again tried to build upon the idea that macro feminist movement needs to be supported by
micro movements and to lend its support to the feminist movements which take place at grassroot level. By this exchange of issues better strategies can be planned to bring success to feminist movements. Accommodation of
the voice of the micro groups in the macro demands can enrich feminism and can take it a long way.
Feminism today has come to a realisation that societal change can be initiated by the collaborative efforts of all gender groups. So, feminism need not be taken as an attack on the males and it should not build itself on the
plea that it is patriarchy which alone is responsible for the unequal treatment of women. Gender antagonism
needs to be replaced by gender complementarity and a copulated effort of both the gender groups can give a
fillip to feminist agendas.
A major agenda of current feminism is the redistribution of domestic labour. Soon the feminist came to a
realization that they make a propaganda without making concrete provisions which make their propositions
unrealistic. So, while making a plea for making women visible in the employment market, they propose for a redistribution of domestic duties. They argue that capitalist patriarchy needs to be collapsed. This can be done
by making provisions for remunerating women for their childrearing functions, to make a reallocation and of
traditional gender roles and domestic duties between men and women equally and to view housework and
childrearing sexless.
Modern feminism across nations has roared against gender blind laws and budgets. It has become successful in
changing many of the legislations to make them gender sensitive in character. This has led to the breaking of
many gender stereotypes, glass ceilings and has brought a good amount of gender parity. But this parity is not enough to create a gender sensitive world. So, feminism need to take up the task to ensure gender parity with
gender sensitivity and equality.
Today, the young generation demands that feminism needs to take up universal issues with spatial and sectarian issues that grapple millions of women in different parts of the world. It should take a vow to launch a crusade
against violence that victimize women across communities, class, culture and countries. Feminists need to voice
against the stereotypes perpetuated through the media, bring women’s issues from the conflict regions. It needs
International Journal of Advance and Innovative Research Volume 8, Issue 3 (IV) July - September 2021 Part - 2
102
ISSN 2394 - 7780
to put into its agenda to fight for the rights of the women in the care economy, in the unorganized sector where
they are underprivileged, neglected and often exploited. Another important agenda of feminism needs to
bringing solutions to the women’s issues in the fast climate change regions, to bring solutions and claim policy responses for women migrants’ safety and security, to save women from slavery. Feminism needs to struggle
hard to make women adequately represented in peace talks, disaster management process. Finally, feminism
needs to be more mass based in character and needs to take up the issues of elderly women, disabled women
and the adolescent girls who are ‘vulnerable among vulnerable’.
If these demands can be taken up and fought for by feminism, then it can establish its efficacy as a real
movement by the women, of the women and for the women. Feminism can become instrumental in building a
women friendly world and achieve incremental success. Thus, it can be concluded that the dynamics behind feminism has pushed us to look beyond feminism. Dynamics were many, but demands are still more. So, let
feminism look beyond by accommodating the emerging demands, work towards the achievement of these
demands and establish its success as an ideology.
REFERENCES:
1. Alan,J. A Critique on Radical Feminism, in Abdulhameed, Abdulbasit(2013)A, Feminist
TheoryAcademia.edu/5491989/ A_Critique_on_Radical_Feminism (Cross Referred )
2. Alison and Blunt (2000) in Feminism and its impact on society(2015),in U.K.Essays, (Cross Referred
)https://www.ukessays.com/essays/sociology/feminism-and-its-impact-on-society-sociology-essay.php,
Retrieved on 12-03-2021
3. Anthias, Floya (2002) Beyond Feminism and Multiculturalism: Locating Difference and the Politics of
Location, Women’s Studies International Forum, Vol. 25, No. 3, pp. 275–286
4. Bisong, Peter Bisong and Samuel Aloysius Ekanem(2014) A critique of feminism, American Journal of
Social and Management Sciences, https://www.scihub.org/AJSMS/PDF/2014/2/AJSMS-5-2-33-38.pdf,
Retrieved on 21-03-2021
5. Crittenden, Danielle (1999) What our mothers didn't tell us: why happiness eludes the modern woman,
New York: Simon & Schuster
6. Echols, A. (1989). Daring to Be Bad: Radical Feminism in America, 1967–1975. Minneapolis: University
of Minnesota Press. p. 416
7. Gragilla,f.Carolyn (1998) Domestic tranquillity : a brief against feminism, Dallas, Tex. : Spence
8. Head, T. (2010). Feminism in the United States. about.com
9. Hooks, Bell(2000)Feminism is for Everybody; Passionate Politics, South End Press Cambridge, MA
10. Motta,Sara, Cristina Flesher Fominaya, Catherine Eschle, Laurence Cox(2011) Feminism, women’s
movements and women in movement, Interface: a journal for and about social movements Editorial
Volume 3 (2): 1 – 32,November
11. Passno, Diane(2000) Feminism: Mystique or Mistake?, Rediscovering God's Liberating Plan for
Women, Focus on the Family, 1St Edition
12. Rampton,Martha(2008) Four Waves of Feminism, pacific Magazine,Fall Issue ,
https://www.pacificu.edu/magazine/four-waves-feminism, Retrieved on28-03-2021
13. Ropers-Huilman (2002) in Pasque, P. A. & Errington Nicholson, S. (Eds.) (2011). Empowering women in
higher education and student affairs: Theory, research, narratives and practice from feminist perspectives. Sterling, VA: Stylus and the American College Personnel Association. An Introduction: Feminist
Perspectives (Cross Referred)
14. Swinth ,Kirsten(2018) Feminism’s Forgotten Fight: The Unfinished Struggle for Work and Family,
Harvard University Press
International Journal of Advance and Innovative Research Volume 8, Issue 3 (IV) July - September 2021 Part - 2
103
ISSN 2394 - 7780
LUXURY RETAIL MARKETING: CHALLENGES AND OPPORTUNITIES IN INDIA
Prof. Dr. Varsha Maindargi
Professor and Head, Department of Commerce, Kamala College, Kolhapur
ABSTRACT The Indian luxury retail market is the beacon of the future, with a number of international brands are vying to
design, develop and deliver the high-end goods and services to India consumers want. To do so, they are being
forced to build their distribution and to spur consumer interest in products that aren't familiar to many Indian shoppers. The present study is an attempt to study the challenges before retailing of luxury goods. It also
discusses the opportunities for this sector.
(Key words – beacon, spur, fuzzy, connoisseurs)
1. INTRODUCTION Retailing, one of the largest sectors in the global economy, is going through a transition phase in India. Over the
last few years, organized retailing in India is spreading and making its existence felt in different parts of the
country. In organized retailing, one segment that has swiftly come into focus is luxury and lifestyle retail.
India’s escalation as an economic power to reckon with, has forced the global companies to view it as one of the
key markets from where future growth will emerge.
Today, the demand for luxury brands is ever increasing and brand offering is continuously on the rise. The
luxury market is expanding rapidly in India on the back of economic deregulation, fast GDP growth, and wealth re-generation, increasing per capita consumption, and a growing young working population. Wealthy Indians
represent a source of enormous potential for global luxury brands.
One of the most fundamental issues in the study of luxury is the concept’s relationship to necessity. “Luxury is any expenditure that goes beyond the necessary”, Concepts of luxury vary from person to person, depending on
their social position (and personal consumption experiences). Societies, of course, develop norms for what are
considered luxuries and necessities, but these are fuzzy and vary over time and across classes and cultures. India
has always had a rich tradition of luxury. Addressed as the Golden Bird, India has experienced Maharajas and Nawabs who had refined tastes and were connoisseurs of luxury. Luxury is anything that is desirable and more
than necessary and ordinary.
2. SIGNIFICANCE OF THE STUDY
1. The role of luxury retail marketing in the marketing mix is very significant.
2. New trends in Luxury Retail sector generate employment.
3. India as developing nation, luxury retailing creates growth opportunities' increasing purchasing power of
consumers who circulates economy.
3. OBJECTIVES OF THE STUDY:
This paper covers the following objectives:
To determine the concept of luxury for Indians.
To determine the role of closet consumers in Indian luxury market.
To study the factors liable for increase in luxury brand purchase in India.
4. DATA COLLECTION:
The present paper is completely based on the secondary data. The Researcher has used the different latest publications and information regarding luxury retailing and wants to focus on importance of luxury retailing in
the developing country like India.
5. SCOPE OF THE PAPER:
Luxury Retailing involves a direct interface with customer and businesses. The study of luxury retailing is Concepts of luxury vary from person to person, depending on their social position (and personal consumption
experiences). Societies, of course, develop norms for what are considered luxuries and necessities, but these are
fuzzy and vary over time and across classes and culture.
6. HYPOTHESIS:
1. The luxury retail industry contributing the economic growth of developing country like India.
International Journal of Advance and Innovative Research Volume 8, Issue 3 (IV) July - September 2021 Part - 2
104
ISSN 2394 - 7780
7. CONCEPTUAL FRAMEWORK:
1. Concept of Luxury Retailing:
Luxury has never been something easy to define, yet this mystery concept is something highly desired by one and all alike. Luxury has moved from its ‘old’ meaning of ownership (also known as conspicuous consumption)
of objects to the ‘new’ meaning of the experience / fulfillment derived from possessing a certain object .The
market for luxury characterized by individualism has become ever more developed over the course of the
centuries, driven by the glorification of all things sensual as well as the demand for refinement.
Luxury fashion goods are apparel, accessories, handbags, shoes, watches, jewellery, and perfume for which
mere use or display of particular branded products brings prestige to owners, apart from any functional utility.
The tradition of honoring others with expensive gifts also helps account for large sales of these goods in Asia. Asian consumers purchase luxury goods to secure social recognition and to adhere to social norms. The
immense popularity of luxury goods among Asian consumers derives partially from considerations of “face”,
the importance of the regard of others. Asian consumers purchase luxury goods for status display because their culture emphasizes hierarchy and status. Asian consumers' status-seeking purchase of luxuries emphasizes
social meanings conveyed by price, brand, or packaging. India has been identified as an important source of
this growth and is likely to grow at an annual rate of 28% in the coming years. The accelerating pace of economic and social change is transforming the Indian luxury landscape .But despite the immaturity of the
Indian market, there are already clear trends developing, mainly in the penetration rates of luxury brands into
the men’s and women’s sectors. Luxury clothing, fragrances, premium footwear, home electronics and high-end
watches have achieved good penetration among male Indian consumers, but items such as cufflinks, belts, wallets, luxury wines, Champagnes and cigars still rate low on the wish-lists of many Indian men seeking
luxury brands.
Among women, jewellery, cosmetics and skincare can already boast high levels of awareness, followed by
categories such as underwear, handbags and mobile phones .
Luxury brands are now following the Indian consumer, expanding their sales operations. According to a study
by the Discovery division of Mumbai based O&M advertising; India and China are beginning to contribute in a
big way to the global market for luxury products.
It is, thus, the emergence of mass affluence combined with aspirational mindsets and lifestyles that are helping
to stimulate consumer demand for luxury retailing.
2 . Luxury brand management:
A fascinating and comprehensive examination of the different dimensions of luxury management in various
sectors. This will help for marketers, advertisers and brand managers in understanding the intricacies of the
luxury market- how it is designed, defined and divined.
3. Luxury Retailing in India –Opportunities & Challenges:
In fact, luxury in India was synonymous in pre-British times and even the post-British era saw its pockets of
richness of erstwhile royal families and the newly-developed industrial classes who were the users of European
luxury brands.
The Indian attitude towards luxury had long been akin to Europeans. The emergence of new elite in India was
all that was required for the mindset to resurface. With the libralised economy opening up new pockets of
affluence in India, luxury retailers would found new customers in India.
The last couple of years have seen a profusion of luxury brands into the Indian market: from stand-alone stores
in five star hotels to luxury Malls. These brands which were previously only seen in international fashion
magazines and high streets abroad are now gaining popularity in India. With one of the highest levels of
disposable incomes, the well-traveled Indian luxury consumer is being wooed by all.
In most surveys of the luxury goods market globally, the most exciting market is mainly viewed as China. But,
looking at the growth in GDP in India, there can be little doubt that the Indian market is going to see
considerable demand increases and general growth in the coming years.
Organized retailing in India is expected to grow at 19 percent. Thus, in terms of investment in retail sector,
India is likely to be one of the hottest destinations for all type of retailing including luxury retailing. Industry
estimates suggest that as many as 200-300 international luxury brands are trying to make inroads. The market in India is now considered as the next China for luxury goods consumption. Luxury goods manufacturers and
International Journal of Advance and Innovative Research Volume 8, Issue 3 (IV) July - September 2021 Part - 2
105
ISSN 2394 - 7780
retailers are keen to tap further this rising affluence and increases in asp rational lifestyles and consumption
patterns.
Given the fact that India does provide lot of opportunities for luxury retailers, it is definitely not that easy a path. This paper looks into three key issues regarding consumer profiling that are very essential from a luxury
retailers’ perspective.
3.1 Consumer profiling:
From the basic definition of luxury goods, one issue is definitely clear it is not meant for masses.
And thus, one needs to clearly define the target market for its goods/services. The foremost criterion has to be
‘Disposable Income’. These products/services are very expensive and hence are considered as luxurious. In
Indian context perception of luxury varies between those born in wealth and those belonging to new elite class of wealth creators. As mentioned above the traditional users of luxury products in India were people from royal
families, their consumption of luxury products was natural, an extension of who they were. But for second
category of customers, luxury is a source of gratification. Managing this dichotomy and creating a new
customer base is primary mandate for these retailers.
Growth and Opportunities of luxury market in India: a . Socio-Demographics: The first classification of customers can be done based on the Income- Group and can
be clubbed into following three categories:
1.Luxury ready –
2.Future potential –
3.Others –
All the three categories of consumers are likely to grow in the near future in India.
b. Lifestyle attributes: Where the understanding of the lifestyle attributes of such prospects provides useful
information. These inputs help the luxury and lifestyle retailers to customize its offerings, and provide services
that are world-class. Consumers in three groups based on psychographics according to what luxury means to
them.
•Luxury as functional.
•Luxury as reward.
•Luxury as indulgence:
c. Buying Influencers:
The luxury consumers are most influenced by peer groups. The media plays a strong role as an influence with
lifestyle publications, television and the internet. The Luxury Marketing Council Worldwide has established a chapter in India, with the aim of promoting luxury in India. Their task is to build synergy between various
luxury brands interested in India by way of sharing of consumer insights as well as best practice area.
Additionally, Fashion Magazines play an important role in generating awareness of luxury products from a
global perspective.
3.2 Challenges of Luxury Retail in India:
Despite its growing number of millionaires, India lags emerging market peers China and Brazil because of a
lack of quality retail space, high import duties on luxury goods, a cap on ownership in local units, excessive red
tape and piracy.
Availability of appropriate space is a priority for luxury retail, and the lack of such quality retail environment in
India is the reason behind the top international brands choosing the exclusive ambience of deluxe five-star
hotels than camping it out on the streets.
If a brand position changes in the eyes of the consumers then the luxury added value may be lost. Therefore,
luxury retailers need to protect their brand positioning and full control of the channels of distribution so that
customers feel exclusivity with these brands.
Today, fashion brands are giving luxury brands competition because of marketing mix and branding strategies,
which makes it acceptable to pair these two brands. Some of the challenges inhibiting the growth of luxury
retail in India would be:-
International Journal of Advance and Innovative Research Volume 8, Issue 3 (IV) July - September 2021 Part - 2
106
ISSN 2394 - 7780
India is still a developing market. This has put luxury brands in a spot, slowing expansion plans and, in
some cases, forcing a reshuffle in franchise partners.
There is lack of high quality luxury retail environment, with its presence restricted to select hotels which
leads to low footfalls. There are no modernized and dedicated luxury retail areas, with a hot and humid
climate. There is high cost of setting up luxury stores due to high rentals on certain prominent high streets.
Luxury products are not competitive in India because of high duties.Duties on luxury products are also among the highest in India, which means retailers often crunch margins to keep prices comparable to other
markets.
8. CONCLUSION : The starting point for identifying successful Luxury brand strategies in India has been established by identifying
certain salient aspects of luxury brands that remain constant as well as identifying the stage of mindset of the
Indian consumer towards these brands.
Going by the latest wheel in the luxury retail sector, India is one of the fastest growing markets after the Gulf. With the inexorablepursuit for luxury, the affluent class with tremendous purchasing power are on the fast lane
endorsing leading luxury brands which have all chosen India as the ‘happening luxury retail destination’.
Luxury retail is growing now in India, but still there are a sizeable number of rich Indians not known to luxury, leaving lots of room for those trying to walk in the fray. The Indian luxury market is a story waiting to be told,
as all segments of this market viz. Luxury product, services and assets are growing rapidly and can potentially
triple in size . Indian luxury market will be very crucial to the global luxury retailers in near future.
However,luxury retail players should keep in mind certain considerations before they make their foray into the
Indian Luxury retail sector. They need to focus on long-term investment and continue investing in spite of short
term losses, strong organization comprising of a committed local team, finding the right partner for joint
ventures with a clean track record and competence in retail, consumer understanding and customization of the
merchandise according to local flavor and body structure.
9. BIBLIOGRAPHY :-
1. Luxury and Lifestyle Retail in India: A Multifaceted Market ,Sita Mishra, Institute of Management
Technology, Ghaziabad,India.
2. The Legal Structure and Framework of Luxury Goods Market in India: Competitive or Restrictive Growth?
By Piyush Kumar Sinha1 1 Professor of Marketing and Chairperson, Center for Retailing, IIM
Ahmedabad, Email: [email protected]
3. RETAIL LUXURY BRAND IN INDIA: CONSUMER MARKET DR. RAJESH KESARI*; ABHISHEK
KUMAR SRIVASTATAVA** *Associate Professor, Director & Dean, Faculty of Management &
Commerce, Nehru Gram Bharti University, Jamunipur, Kotwa, Allahabad. **Research Scholar, Nehru
Gram Bharti University, Jamunipur, Kotwa, Allahabad.

International Journal of Advance and Innovative Research Volume 8, Issue 3 (IV) July - September 2021 Part - 2
107
ISSN 2394 - 7780
MATERIAL OPTIMIZATION OF WHEEL RIM USING FINITE ELEMENT ANALYSIS
Dr. Anand S. Relkar1, Dr. A. D. Lokhande
2 and Mahadevi Dinesh Newadekar
3
1 Professor, Mech. Engg. Dept, School of Engineering and Technology, Sandip University, Nashik-422213 2Asso. Professor & HOD, Mech. Engg. Dept, School of Engineering and Technology, Sandip University,
Nashik-422213 3M.Tech., Mech. Engg. Dept,School of Engineering and Technology, Sandip University, Nashik-422213
ABSTRACT The purpose of the car wheel rim provides a firm base on which to fit the tire. Its dimensions, shape should be
suitable to adequately accommodate the particular tire required for the vehicle. The tire in an automobile is
supported by the rim of the wheel and its shape and dimensions should be adjusted to accommodate a specified tire. In this research the wheel rim is designed and analysed for various loading condition. The wheel rim
selected is of Hyundai Santro which is made of AISI 1008 Steel using heat treatment processes. The wheel is
subjected to all the loading conditions considering the kinematic and dynamic aspects. The approach is made
using alternate material for buckling and Fatigue strength.
Keywords- Optimization, Wheel Rim, Buckling, Fatigue, Finite Element Analysis
I. INTRODUCTION
The rim is the "outer edge of a wheel, holding the tire". It makes up the outer circular design of the wheel on
which the inside edge of the tire is mounted on vehicles such as automobiles. The wheel rim which is used for case study is used in Hyundai Santro. The Hyundai Santro is a city car produced by the South Korean
manufacturer Hyundai between 1998 and 2014.
Figure 1. Wheel rim for case study
The following are the main functions of a wheel rim:
Transferring torque (braking and acceleration)
Support mass (support the mass of the motor vehicle)
Adds mass (damped mass for diving comfort)
Dissipating heat (due to braking)
Absorb Impact (road hazard)
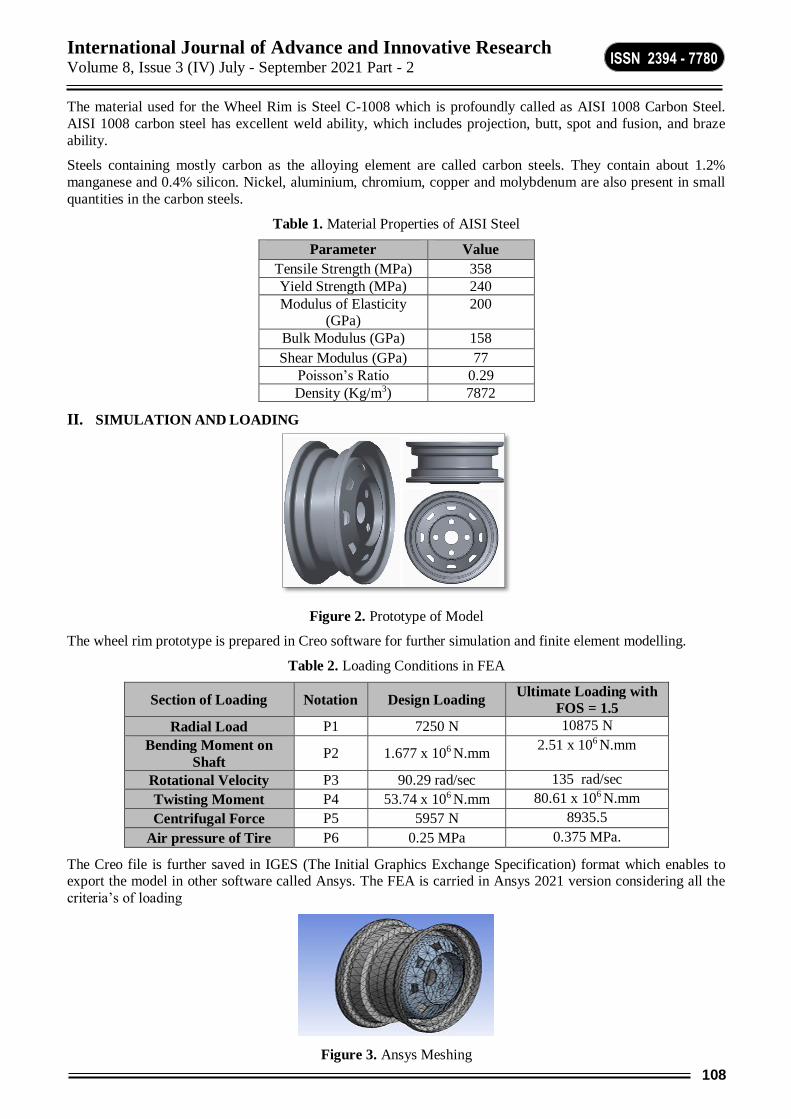
International Journal of Advance and Innovative Research Volume 8, Issue 3 (IV) July - September 2021 Part - 2
108
ISSN 2394 - 7780
The material used for the Wheel Rim is Steel C-1008 which is profoundly called as AISI 1008 Carbon Steel.
AISI 1008 carbon steel has excellent weld ability, which includes projection, butt, spot and fusion, and braze
ability.
Steels containing mostly carbon as the alloying element are called carbon steels. They contain about 1.2%
manganese and 0.4% silicon. Nickel, aluminium, chromium, copper and molybdenum are also present in small
quantities in the carbon steels.
Table 1. Material Properties of AISI Steel
Parameter Value
Tensile Strength (MPa) 358
Yield Strength (MPa) 240
Modulus of Elasticity (GPa)
200
Bulk Modulus (GPa) 158
Shear Modulus (GPa) 77
Poisson’s Ratio 0.29
Density (Kg/m3) 7872
II. SIMULATION AND LOADING
Figure 2. Prototype of Model
The wheel rim prototype is prepared in Creo software for further simulation and finite element modelling.
Table 2. Loading Conditions in FEA
Section of Loading Notation Design Loading Ultimate Loading with
FOS = 1.5
Radial Load P1 7250 N 10875 N
Bending Moment on
Shaft P2 1.677 x 10⁶ N.mm
2.51 x 10⁶ N.mm
Rotational Velocity P3 90.29 rad/sec 135 rad/sec
Twisting Moment P4 53.74 x 10⁶ N.mm 80.61 x 10⁶ N.mm
Centrifugal Force P5 5957 N 8935.5
Air pressure of Tire P6 0.25 MPa 0.375 MPa.
The Creo file is further saved in IGES (The Initial Graphics Exchange Specification) format which enables to export the model in other software called Ansys. The FEA is carried in Ansys 2021 version considering all the
criteria’s of loading
Figure 3. Ansys Meshing

International Journal of Advance and Innovative Research Volume 8, Issue 3 (IV) July - September 2021 Part - 2
109
ISSN 2394 - 7780
ANSYS Meshing is a general-purpose, intelligent, automated high-performance product. It produces the most
appropriate mesh for accurate, efficient multiphasic solutions. The accuracy that can be obtained from
any FEA model is directly related to the finite element mesh that is used. The finite element mesh is used to subdivide the CAD model into smaller domains called elements. The body of the Wheel rim is divided in 20K
Nodes and 6k Elements
The Loading conditions are applied as follows :
1. The Radial load will be acting on the upper wedge of the Wheel Rim which is created due to the weight of
the vehicle and initialised acceleration safety factor due to the movement.
2. Bending moment is developed due to the weight acting on the axle which is of the gross weight. This
uniformly distributed load creates the couple acting on the rim.
3. The speed of the vehicle is considered as 66 kmph and been converted to radians/sec with the consideration
of Rim diameter. The Rotational velocity is provided to the whole rim due to continuous rotating condition
4. The desired pressure of air is 35 Psi or 0.25 MPa. Hence in order to ensure safety the tire pressure is
considered as 0.375 MPa acting on the upper wedge of the Rim along with the radial loads.
5. The centrifugal force is generally acting on the opposite direction of the Rim which is due to continuous
rotation and occurrence of twist and turns.
III. FEA OF WHEEL RIM FOR AISI STEEL
Figure 4. Deformation and Stress Produced in AISI Steel
When the rim is subjected to combine load of all the actions, the total deformation produced in the rim set to be 1.0165 mm. The maximum deformation is seen at the bottom of the wheel. The rim when subjected to combine
load showed the maximum stress of 460MPa. The allowable strength of the material is 340 MPa. Hence the
chances of crack development generally comes across the disc section
Figure 5. Fatigue Analysis of AISI Steel

International Journal of Advance and Innovative Research Volume 8, Issue 3 (IV) July - September 2021 Part - 2
110
ISSN 2394 - 7780
Fatigue analysis establishes whether your model is susceptible to fatigue damage when subjected to a varying
load. This result contour plot shows the available life for the given fatigue analysis. The increase in the
maximum stress proportion at the disk, eventually starts reducing the life of the component. Fatigue Safety Factor is factor of safety with respect to a fatigue failure at a given design life. The maximum Factor of Safety
displayed is 15. For Fatigue Safety Factor, values less than one indicate failure before the design life is reached
IV. APPROACH OF OPTIMIZATION Currently, the materials that are used Wheel Rim is AISI 1008 and processed material of Structural Steel. The
material possesses considerable strength which is useful for design and manufacturing the part. But the
implementation of these materials increases the unnecessary cost of the assembly as it is been famous for its heavy weight. Hence in order to obtain the same strength with considerable reduction in cost, it is necessary to
optimize the material. Hence Aluminum Alloy is used for Optimization.
Table 3 Properties of Optimized Material
Parameter Al7068 Al7075
Shear Strength 365 MPa 331 Mpa
Ultimate Tensile
Strength
710 MPa 572 MPa.
Yield Strength 683 MPa 503 Mpa
Young’s Modulus 71.7 GPa 72 Gpa.
Shear Modulus 27 GPa 27 GPa
Poisson Ratio 0.33 0.33
Density 2850 Kg/m3 2810 Kg/m3
Hence in order to obtain the same strength with considerable reduction in cost, it is necessary to optimize the
material. Hence for the same purpose, materials of Al7068 and Al7075 is been utilized for the same purpose. The alloys have been selected with respect to the properties of Tensile and yield strength that they provide
during operating conditions
V. RESULT AND DISCUSSION
a. Material Optimization using Al7068
Figure 6 Total Deformation Produced in Wheel Rim for Al7068-T6
Figure 7 Fatigue Analysis in Wheel Rim for Al7068-T6

International Journal of Advance and Innovative Research Volume 8, Issue 3 (IV) July - September 2021 Part - 2
111
ISSN 2394 - 7780
The deformation produced in the wheel rim for the material AL7068, the same loading conditions were
applied, the value of deformation 1.04 mm and the stress was determined as 449 MPa
The above shows the fatigue behaviour of wheel rim using Al-7068 Aluminium Matrix composite under
the same loading as that of Steel.
With respect to the fatigue analysis, the Fatigue life of Al7068 rim is determined to be 1x10⁸ Cycles.
The damage coefficient is determined as 0.00036 whereas the Biaxiality indication is determined to be
0.98.
The safety factor obtained for Wheel rim of Al 7068 is found to be 0.183.
The Biaxiality indexing of is determined as 0.988
a. Material Optimization using Al7075
Figure 8 Buckling Behaviour of Wheel rim Made of Al-7075 Material
Figure 9 Fatigue Analysis of Wheel rim Made of Al-7075 Material
The deformation produced in the wheel rim for the material AL7075, the same loading conditions were
applied, the value of deformation 2.19 mm, which is more than the material of Al7068 and AISI Steel. The
stress was determined as 437 MPa.
With respect to the fatigue analysis, the Fatigue life of Al7068 rim is determined to be 1x10⁸ Cycles.
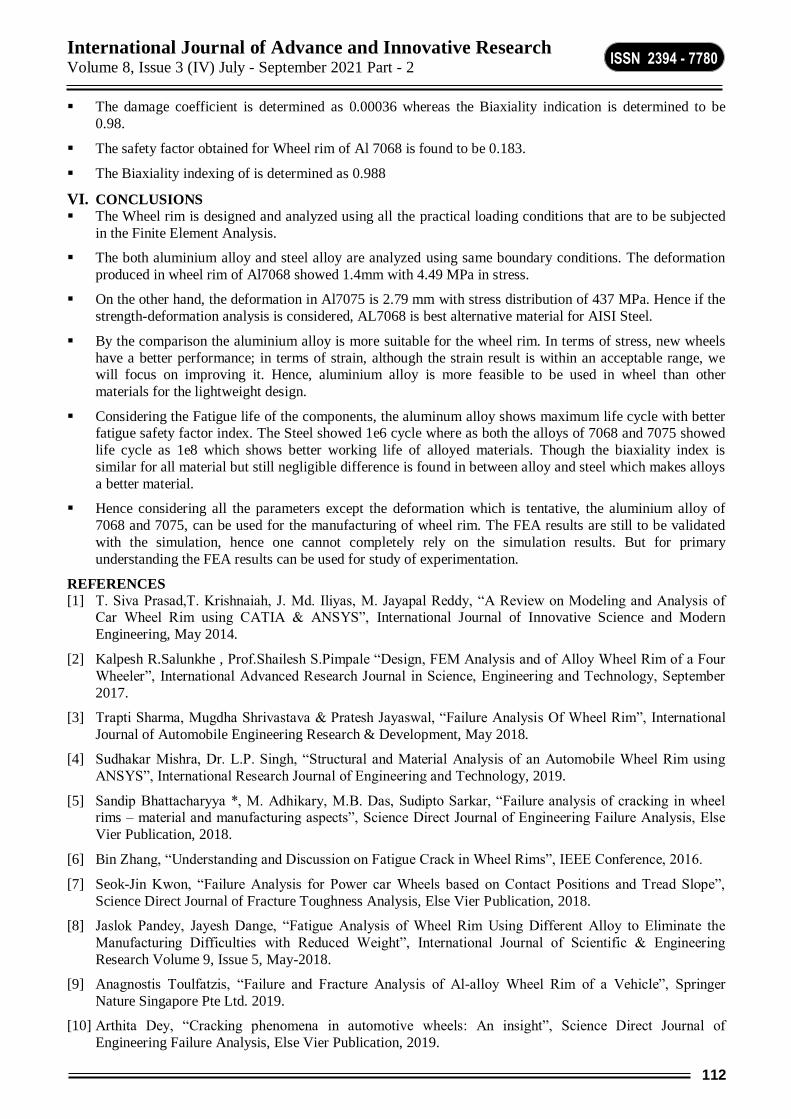
International Journal of Advance and Innovative Research Volume 8, Issue 3 (IV) July - September 2021 Part - 2
112
ISSN 2394 - 7780
The damage coefficient is determined as 0.00036 whereas the Biaxiality indication is determined to be
0.98.
The safety factor obtained for Wheel rim of Al 7068 is found to be 0.183.
The Biaxiality indexing of is determined as 0.988
VI. CONCLUSIONS
The Wheel rim is designed and analyzed using all the practical loading conditions that are to be subjected
in the Finite Element Analysis.
The both aluminium alloy and steel alloy are analyzed using same boundary conditions. The deformation
produced in wheel rim of Al7068 showed 1.4mm with 4.49 MPa in stress.
On the other hand, the deformation in Al7075 is 2.79 mm with stress distribution of 437 MPa. Hence if the
strength-deformation analysis is considered, AL7068 is best alternative material for AISI Steel.
By the comparison the aluminium alloy is more suitable for the wheel rim. In terms of stress, new wheels
have a better performance; in terms of strain, although the strain result is within an acceptable range, we will focus on improving it. Hence, aluminium alloy is more feasible to be used in wheel than other
materials for the lightweight design.
Considering the Fatigue life of the components, the aluminum alloy shows maximum life cycle with better fatigue safety factor index. The Steel showed 1e6 cycle where as both the alloys of 7068 and 7075 showed
life cycle as 1e8 which shows better working life of alloyed materials. Though the biaxiality index is
similar for all material but still negligible difference is found in between alloy and steel which makes alloys
a better material.
Hence considering all the parameters except the deformation which is tentative, the aluminium alloy of
7068 and 7075, can be used for the manufacturing of wheel rim. The FEA results are still to be validated
with the simulation, hence one cannot completely rely on the simulation results. But for primary
understanding the FEA results can be used for study of experimentation.
REFERENCES
[1] T. Siva Prasad,T. Krishnaiah, J. Md. Iliyas, M. Jayapal Reddy, “A Review on Modeling and Analysis of Car Wheel Rim using CATIA & ANSYS”, International Journal of Innovative Science and Modern
Engineering, May 2014.
[2] Kalpesh R.Salunkhe , Prof.Shailesh S.Pimpale “Design, FEM Analysis and of Alloy Wheel Rim of a Four
Wheeler”, International Advanced Research Journal in Science, Engineering and Technology, September
2017.
[3] Trapti Sharma, Mugdha Shrivastava & Pratesh Jayaswal, “Failure Analysis Of Wheel Rim”, International
Journal of Automobile Engineering Research & Development, May 2018.
[4] Sudhakar Mishra, Dr. L.P. Singh, “Structural and Material Analysis of an Automobile Wheel Rim using
ANSYS”, International Research Journal of Engineering and Technology, 2019.
[5] Sandip Bhattacharyya *, M. Adhikary, M.B. Das, Sudipto Sarkar, “Failure analysis of cracking in wheel rims – material and manufacturing aspects”, Science Direct Journal of Engineering Failure Analysis, Else
Vier Publication, 2018.
[6] Bin Zhang, “Understanding and Discussion on Fatigue Crack in Wheel Rims”, IEEE Conference, 2016.
[7] Seok-Jin Kwon, “Failure Analysis for Power car Wheels based on Contact Positions and Tread Slope”,
Science Direct Journal of Fracture Toughness Analysis, Else Vier Publication, 2018.
[8] Jaslok Pandey, Jayesh Dange, “Fatigue Analysis of Wheel Rim Using Different Alloy to Eliminate the
Manufacturing Difficulties with Reduced Weight”, International Journal of Scientific & Engineering
Research Volume 9, Issue 5, May-2018.
[9] Anagnostis Toulfatzis, “Failure and Fracture Analysis of Al-alloy Wheel Rim of a Vehicle”, Springer
Nature Singapore Pte Ltd. 2019.
[10] Arthita Dey, “Cracking phenomena in automotive wheels: An insight”, Science Direct Journal of
Engineering Failure Analysis, Else Vier Publication, 2019.
International Journal of Advance and Innovative Research Volume 8, Issue 3 (IV) July - September 2021 Part - 2
113
ISSN 2394 - 7780
MEMORIZE THE INFLUENCE OF VINAYAK DAMODAR SAVARKAR ON THE THINKING AND
REVOLUTIONARY ACTIVITIES OF MADAN LAL DHINGRA
Indu Bala1 and Dr. Seema Parihar
2
Research Scholar, Ph.D.1 and Supervisor2, Department of History, CT University, Ferozpur Road, Ludhiana,
Punjab-142024
ABSTRACT This research paper includes the role of different nationalists in the development of the Indian National Movement. The focus of the work is especially on those who had sacrificed their life and property in the holy
cause. There is no doubt that the independence movement of India counted among the largest movement of
modern society. With time, the Indian national movement developed into one of the greatest movements in world history. National heroes had endured many sufferings and sacrificed their lives to laugh for the people of India.
In the same great warrior, the name of the immortal Martyr Madan Lal Dhingra is worth writing in golden
Letters. Because Madan Lal Dhingra was, the first Indian revolutionary caused a sensation in the British
administration by assassinating a high-profile British officer in London. His daring act received a wide condemnation at home and abroad. G.K. Gokhle, Surendranath Banerjee, Bipin Chandra Pal criticized it and
Mahatma Gandhi called it ‘an act of cowardice’. His family disowned him, declared him eccentric and his act
detestable. The firm and determined Madan Lal Dhingra did not budge from his stand, braved all accusations and court ordeals with utmost courage and confidence without flinching even once or breaking down. He
refused to obtain the services of a lawyer. He did not beg for clemency and kissed the altar of death with a
smile. The West might have heard of such heroic deeds but had not seen one, until or unless they came across
Madan Lal Dhingra. Not even once did he show any remorse for his actions and proudly roared in the court justifying his action, “it was an attempt to shed English blood intentionally and of purpose as a humble protest
against the inhuman transportation and hanging of Indian youth.” “I may be reborn of the same mother and I
may re-die for the same sacred cause, till my mission is done and She stands free and it was his mission for
India’s Independence.
Keywords: revolutionary, activities, leadership, thought, sacrificing, motherland.
INTRODUCTION
This rise of revolutionary militant movement was the main reason that led to the rise of militancy in the national movement. The only difference was that the terrorists wanted quick results. The inspiration that the liberal
party built on the people, even more, the policy of influence which was created by the militants, in do not
believe. The revolutionaries believed that whatever is the appropriate element in national life such as religious
and political freedom, moral values, and Indian culture, all of them will put on end to foreign rule. If it is not possible to describe the political philosophy of revolutionaries in different parts of India with certainly but the
purpose of all of them was to free the motherland from British rule. regarding cultivate, he believed that British
imperialism can only be ended by western means. So these people used to bomb and pistols. Revolutionary people formed secret meetings. By killing the European administrators, these people made to try to reduce their
morale and to overthrow the European rebels.
Madan Lal Dhingra and historic Antecedents When Amar Shaheed Madan Lal Dhingra was born? it is still a matter of discovery, but some historians
believed that Madan Lal was probably born at a particular place in Punjab around 1883 or 1887.1 Madan Lal
Dhingra was the First Indian Revolutionary who assassinated a British officer in London, for the Freedom of his
‘Motherland’. He belonged to a rich and influential family of Amritsar. His father, Dr. Sahib Ditta Mal, a
qualified eye surgeon, was having a roaring practice in the city. Rai sahib, Dr. Sahib Ditta Mal, a British loyalist to the crown and Madan Lal Dhingra, despised and detested it. The difference in outlook, opinion commitment
created a void between the two. 2 Madan Lal Dhingra was admitted to a mission school in Amritsar to study,
where many of his brothers had previously studied and the rest were studying.3 He passed Inter examination in
second grade from Municipal college Amritsar and enrolled in Government college Lahore for further education
1 Chaturvadi, A. K. (1999) Madan Lal Dhingra. New Delhi: Bhartiya Granth Niketan,
2 Bandhu, V. (2013). The life and times of Madan Lal Dhingra. New Delhi: Ocean Books Pvt. Ltd.
3 Sharma, P. S. N. (2014) Karla, H. s. (ed). Punjab da Madan Lal Dhingra. Chandigarh: Unistar books Pvt. Ltd.
International Journal of Advance and Innovative Research Volume 8, Issue 3 (IV) July - September 2021 Part - 2
114
ISSN 2394 - 7780
since childhood he had a dream to finish studies in India and Go to England for higher education and become an
engineer. Raising the voice against the government in the family meant-rebellion and its consequences- father’s
rebuke, family displeasure, and cuts in amenities. This family considered the British rule to be the goal luck of India and it was their utmost duty to serve with their lives. The wave of Bang-Bhang started against the partition
of Bengal in 1905 by touching Madan Lal Dhingra. Now he started considering himself as an enemy of the
British.1 In Punjab, Lala Lajpat Rai and Ajit Singh started the revolution regarding the partition of Bengal. He
applied to the students of colleges in Punjab to give their support in this revolution. For this purpose, the
assembly was started in colleges. Lahore college also gave speeches to the students.
The speeches made by the revolutionaries had such an impact on Madan Lal Dhingra that he left his studies and
started on the path of revolution. Soon he had to face the anger of this dictator father and had to leave Lahore and sit in the boundary wall of Amritsar. The family’s displeasure and desire to do something in his mind
prompted him to leave the house and he set out in search of a new destination. For some time, Madan Lal
Dhingra worked in the Transport Services Department under his uncle. In the early days, Madan Lal Dhingra’s
uncle gave Dhingra the son’s honor but soon his behavior began to change. Madan Lal Dhingra thought it better to leave uncle- aunt’s home. He wants many of his acquaintances for jobs, but no one supported him. Some
would make fun of him saying that the son of such a big man would do the job on the suggestion of a friend,
Madan Lal Dhingra got a job in Commissioner Settlement Department under Punjab Government. After some
time, he left this job and want back to his home.
Upon the elder brother’s persuasion, Madan Lal arrived in London in 1906 and joined the University college on
19 October for studies in engineering where he continued to attend up to the last day of June 1909. from 1906 to
1909, he remained in London, studied, and passed his diploma in engineering in the third division.2 His brother
Kundan Lal was already in England concerning his business, and he helped Madan to arrange suitable
lodgings.3
Life of V. D. Savarkar Life and his Ideology (1883-1966)
The brightest star in the galaxy of Indian revolutionary was V.D. Savarkar. An ardent nationalist, a heroic
revolutionary, a renowned terrorist, Veer Savarkar had inspired almost all the leading revolutionaries in the early decade of the 20th century. the leadership of V.D. Savarkar played a significant role in the Indian National
Movement and his dreamed to make India free from the colonial rule.4 Vinayak was a visionary, a thinker, a
poet, a writer, an organizer, and always eager to make supreme sacrifice for the liberation of his motherland.
Vinayak Damodar Savarkar was born in the Marathi Chitpavan Brahmin Hindu family of Damodar and Radhabai Savarkar in the village of Bhagur, near the city of Nashik, Maharashtra. Savarkar’s elder brother’s
name Ganesh Damodar Savarkar and younger brother’s name were Narayan Damodar Savarkar. Thus Savarkar
had three brothers who are known as Savarkar brothers in the history of Indian freedom struggle.5 He learned
the nickname “veer” when at the age of 12, he led fellow students against a rampaging horde of Muslims was driven off. Later, he is known to have stated: “Do not fear them. The Almighty is your strength, so fight, even
when facing an enemy stronger than yourself”.
In 1901, Vinayak Savarkar married Yamunabai, daughter of Ramachandra Triambak Chiplunkar, who supported his university education. After his graduation, Savarkar went to Bombay to study law. But in the
meantime, on the recommendation of Tilak, he received the Sivaji scholarship from Shyamji Krishna Verma.
From 1906 to 1910 he studied in England. He continued to supply the revolutionary literature and weapons
secretly to his Maratha friends in India. One of the members of this society, Madan Lal Dhingra assassinated Sir William Curzon Willy who was the A.D.C. of the Secretary of Indian. This event was a reaction of the Indians
against the repressive policies of the French. Hence the members of the society were awarded severe
punishments and Vinayak was also sentenced to imprisonment in Andaman and Nicobar Islands. Savarkar
1 Bandhu, V. (2014) Amar Revolutionary Madan Lal Dhingra. Delhi: Prabhat Paper. P-12.
2 Waraich, M. S and Puri, K. (2013) Tryst with Martyrdom. Chandigarh: Unistar.
3 Datta, V.N. (1978) Madan Lal Dhingra and the revolutionary Movement. New Delhi: Kay Kay Printers.
4 Upadhyay, R. R., the international journal of analytical and experimental modal analysis, Indian’s struggle for
freedom and the role of Indian Diaspora. vol-xii, issue-ii, Feb 2020.
5 Nagori, S. L., Nagori, J. (1997) Revolutionary of Indian Independence Movement. Jaipur: Pointer publisher.
P.72.
International Journal of Advance and Innovative Research Volume 8, Issue 3 (IV) July - September 2021 Part - 2
115
ISSN 2394 - 7780
spends many years in the Andaman Islands. In 1923, he was brought from the Andaman and interned in
Ratnagiri jail. He was released from the internment on 10 May 1937. After coming out of jail, Savarkar joined
the Hindu Maha Sabha and become its president in 1937. Savarkar as president of the Hindu Mahasabha, during the Second World War, advanced the slogan “Hinduize all Politics and Militarize Hindom” and decided to
support the British war efforts in India seeking Military training for the Hindus. Under Savarkar, the Hindu
Mahasabha openly opposed the call for the Quit India Movement and boycotted it officially. After Gandhi’s assassination Savarkar’s home in Dadar, Mumbai was stoned by angry mobs. He continued addressing the
social and cultural elements of Hindutva. He resumed political activism after the ban on it was lifted; it was
however limited until he died in 1966 because of ill health.
Influence of Savarkar’s personality on Madan Lal Dhingra Shyamji Krishna Varma was a revolutionary, who left India in 1897 due to Curzon Willy and settled in London.
Shyamji bought a house near 65, common veil Avenue high gate. It was named ‘India House’. A meeting was
scheduled to be held every Sunday evening at India House. Gradually India House becomes a pilgrimage site for revolutionaries because the students coming from India were arranged to stay and eat here for some time.
Savarkar and Madan Lal Dhingra arrived in London in 1906. Savarkar and Madan Lal Dhingra were different
from each other in every way. In nature, in life, both were different from each other in thoughts, one was an example of a simple life of a serious nature and high thoughts and so the other was fashionable. Whose life has
no principle nor any mature ideology?
Madan Lal Dhingra also started coming to India's house. Madan Lal Dhingra met Savarkar there. Savarkar’s
speeches had a profound impact on the behavior and thinking of Madan Lal Dhingra. He started thinking about making his country India free from the British. Apart from studies, he also started participating in political
activities and started learning to drive a revolver. The annual ceremony of London’s Imperial Institute of studies
was taking place at Jahangir House. A large number of Indian Administrative officers, English service government officials, and distinguished citizens of England were involved in this ceremony. Soon Sir Wyllie,
accompanied by his wife and some Indian friends entered the Jahangir Hall where the entertainment was
proceeding. Madan Lal Dhingra saw them coming and his mind started planning for the action. He was in
search of the right opportunity, to encounter him, if possible, in seclusion. As usual, both Sir Curzon and Lady Wyllie had a busy time giving or receiving introductions and chatting with both Indian and English Friends. The
reception was to close at midnight, but all ready by 11 o’clock, the visitors had started leaving. Sir Curzon
Wyllie also decided to move out. He was Madan Lal Dhingra, who had sought his attention. Both met near the doorway in the vestibule. Madan Lal Dhingra engaged him in conversation and they were standing a yard apart
from each other. Madan Lal Dhingra fired rapidly around four to five bullets from the point-blank range.
Curzon Wyllie fell flat on the floor. Another two-shot were fired at the man whom Madan Lal Dhingra thought was about to attack him. He was Dr. Lalcaca from Shanghai, who had come to celebrate his holidays in
England. Madan Lal Dhingra was taken into custody. Later in the day, Dhingra was brought up the Westminster
police court. After court proceeding, 17 August 1909 was hanged to death, Madan Lal Dhingra. India. This
prison was built between 1840 and 1842. Two Indian revolutionaries went to the gallows here. Madan Lal Dhingra on 17 august 1909 and Udham Singh on 31 July 1940. Dhingra wished that last rites according to
Hindu Dharma should be performed on his dead body and it should be cremated. Sixty-Seven (1976) year after
his death the ashes of Madan Lal Dhingra were flown back to India. Among these who paid their homage to the martyr was President Ahmed, Prime Minister Indira Gandhi, congress President D.K. Borooah. The Punjab
Chief Minister and his entourage personally escorted the casket on its Journey from Delhi to Punjab. The
flower-bedecked casket was taken in a larger procession from Palam airport to the Kapurthala House (Punjab State guesthouse in Delhi) where it lay for a day. Hundreds of citizens and leaders field past the casket and paid
their homage. Still there is controversy over the matter of Madan Lal Dhingra’s death and interment. After his
execution, Dhingra's body was denied Hindu rites and was buried by British authorities. His family having
disowned him, the authorities refused to turn over the body to Savarkar. Dhingra's coffin was accidentally found, while authorities searched for the remains of Shaheed Udham Singh and re-patriated to India on 12
December 1976. His remains are kept in one of the main squares, which have been named after him, in the city
of Akola in Maharashtra. Dhingra is widely remembered in India today, and was an inspiration at the time for revolutionaries such as Bhagat Singh and Chandera Shekhar Azad. There was a demand from some groups that
his ancestral home be converted into a museum. However, his descendants refuse to acknowledge his legacy
and refused to participate in events organized to honor his death in August 2015. The family sold his ancestral
house and refused an offer to purchase it made by BJP leader Laxmi Kanta Chawla who intended to turn it into
a museum.
International Journal of Advance and Innovative Research Volume 8, Issue 3 (IV) July - September 2021 Part - 2
116
ISSN 2394 - 7780
CONCLUSION
In all 186 revolutionaries were killed or convicted between the years 1908-1918. The revolutionary terrorist also
established centers abroad. The more famous of them were Shyamji Krishna Verma, V.D. Savarkar, and Har Dayal in London. Revolutionary terrorism gradually petered out. Lacking a mass base, despite remarkable
heroism, the individual revolutionaries, organized in small secret groups, could not withstand suppression by the
still strong colonial state. But despite their small number and eventual failure. They made a valuable contribution to the growth of nationalism in India. As a historian has put it, they gave us back the pride of our
manhood. Madan Lal Dhingra was one such glaring example of courage and sacrifice and he stands out tallest
of all.
REFERENCE:
Bandhu, V. (2013), The Life and Times of Madan Lal Dhingra. New Delhi: Ocean Books Pvt. Ltd.
Bandhu, V. (2014) Amar Revolutionary Madan Lal Dhingra. Delhi: Prabhat Paper. P-12. Chandra, P.
(1997) History of the Indian National Movement. Delhi: Vikas Publishing House Pvt. LTD, (1997).
Chandra, P. (1997) Nationalism and Colonialism in Modern Indian, New Delhi: Orient Longman Private
Limited, New Delhi.
Kurana, K.L. (2001) Indian History (A.D. 1206-1947). Agra: Lakshmi Narain Agarwal.
Lovett, V. (1988) Nationalist movement in India. Delhi: Akarshdeep Publishing House.
Nagar, P. (1977) Lala Lajpat Rai the man and his ideas. Delhi: Manohar Books service.
Nanda, B.R. (1988) Gokhale: The Indian Moderates and the British Raj. Delhi: Oxford University Press.
Waraich, M. S., Puri, K. (2013) Tryst with Martyrdom: Trial of Madan Lal Dhingra. Chandigarh: Unistar.
Chaturvadi, A. K. (1999) Madan Lal Dhingra. New Delhi: Bhartiya Granth Niketan.
Sharma, P. S. N. (2014) Karla, H. s. (ed). Punjab da Shaheed Madan Lal Dhingra. Chandigarh: Unistar
books Pvt. Ltd.
Nagori, S. L., Nagori, J. (1997) Revolutionary of Indian Independence Movement. Jaipur: Pointer
publisher. P.72.
Datta, V.N. (1978) Madan Lal Dhingra and the revolutionary Movement. New Delhi: Kay Kay Printers.
Upadhyay, R. R. (Feb 2020) The International Journal of analytical and experimental modal analysis,
Indian’s struggle for freedom and the role of Indian Diaspora. vol-xii, issue-ii.

International Journal of Advance and Innovative Research Volume 8, Issue 3 (IV) July - September 2021 Part - 2
117
ISSN 2394 - 7780
NEURAL NETWORK BASED TRANSPARENT SOLAR WINDOWS
Dr. Shashikant Bakre1 and Suchita Ingle
2
1Associate Professor, Electrical Engg. Department, AISSMS IOIT (affiliated to SPPU), Pune-411030 Dr. Mrs A.D. Shiralkar Head, Electrical Engineering Department, AISSMS IOIT (affiliated to SPPU),
Pune 2Student, F.Y.B.E., Electrical Engg. Dept AISSMS IOIT (affiliated to SPPU), Pune-411030
ABSTRACT Over a period of time the energy needs are growing exponentially in India. In the year 1947, the installed
generation capacity in India was about 1362 MW. As of today, the total installed power generation capacity in
April 2021 is around 382 GW which is contributed by Coal (209 GW), Hydro (46 GW), Nuclear (6.5 GW), Gas (25 GW), Diesel (0.5 GW) and Renewable Energy Systems (RES) (95 GW) (Source- Central Electricity
Authority, New Delhi). Thus the renewable energy contributes to 24.87% of the total installed capacity. Out of
95 GW, the solar generation has a share of around 40 GW which is 42 % of the total RES. The conventional
generation, coal in particular, comes with number of problems such as reducing stocks of coal day by day, pollution due to ash and carbon and delay in starting plant. In contrast, the non-conventional generation offers
number of benefits such as zero or low cost of fuel, lesser capital cost, abundant availability of fuel and
sustainable development. As seen from above the solar energy has a major stake among the available RES. There are, however, problems with conventional solar generation because of which, the concept of Transparent
PV cells has been emerged.
The concept of Transparent Solar Cells or Solar windows is quite significant as it offers healthier, resilient
and sustainable environment. This paper proposes a novice approach by use of Artificial Neural Networks using which it is possible to optimize the performance of Transparent Photo Voltaic cell in terms of power
conversion efficiency and pattern. The proposed method of using neural networks is simple, cost effective but
powerful. As per the findings of MIT energy, the power conversion efficiency is around 12% which can be enhanced further using neural networks. Secondly, using pattern recognition technique, incoming solar rays
can be used optimally.
Keywords – Solar Windows, Transparent solar cells, Artificial Neural Networks, Pattern recognition,
Activation function
INTRODUCTION Over a period of time the energy needs are growing exponentially in India. In the year 1947, the installed
generation capacity in India was about 1362 MW. As of today, the total installed power generation capacity in
April 2021 is around 382 GW which is contributed by Coal (209 GW), Hydro (46 GW), Nuclear (6.5 GW), Gas (25 GW), Diesel (0.5 GW) and Renewable Energy Systems (RES) (95 GW) (Source- Central Electricity
Authority, New Delhi). Thus the renewable energy contributes to 24.87% of the total installed capacity. Out of
95 GW, the solar generation has a share of around 40 GW which is 42 % of the total RES. The conventional generation, coal in particular, comes with number of problems such as reducing stocks of coal day by day,
pollution due to ash and carbon and delay in starting plant. In contrast, the non-conventional generation offers
number of benefits such as zero or low cost of fuel, lesser capital cost, abundant availability of fuel and sustainable development. As seen from above the solar energy has a major stake among the available RES.
There are, however, problems with conventional solar generation because of which, the concept of Transparent
PV cells has been emerged.
The significant features of the transparent photocell are as follows-
o It offers healthier, resilient and sustainable environment.
o Desired reduction in the use of fossil fuels and emissions.
o long-term solutions for sourcing sustainable energy by developing indigenous technologies.
o double impact by providing sunlight and electricity.
o The buildings/ vehicles would be self-sufficient.
o to integrate new opportunities in smart energy transformation with smart grids and microgrids and
distributed generation.

International Journal of Advance and Innovative Research Volume 8, Issue 3 (IV) July - September 2021 Part - 2
118
ISSN 2394 - 7780
THE TRANSPARENT SOLAR PV SYSTEM
The incident sunlight comprises of visible rays, ultraviolet rays and infrared rays. As the visual rays provide
visibility, human eyes are in a position to visualize objects. On the other hand the ultraviolet and Near Infra-Red (NIR) rays are harmful to human eyes. The conventional non- transparent cells cannot absorb the ultraviolet and
NIR rays whereas the transparent solar PV are capable of observing these rays and also produce electricity.
Thus the visual rays pass through transparent solar PV Cells.
o Furthermore, there are space constraints. The conventional non-transparent solar panels require vast area of
land or rooftop. Thus more electricity can be generated but the land is required to be dedicated for the
purpose of generation.
o The Transparent solar panels can be placed at number of locations. These can be used in buildings, vehicles, mobile phones and other electronic devices. The buildings having glass windows can be replaced
by those having transparent solar PV cells. On similar lines, the glasses provided on vehicles and mobile
phone screens can be replaced by transparent solar PV cells.
o Appearance of solar transparent solar PV system is just like a normal transparent glass. It allows buildings
to be energy self-sufficient. More than 25% of the power demand of the building can be fulfilled by
providing transparent solar PV Cell systems.
o The transparent solar PV systems also prevent release of CO2 gas. It has optimized insulation and filter
properties. It saves money and energy to its users.
o In fact it is the only building material that pays for itself. The transparent solar PV systems integrate
perfectly into buildings adapting to the design of a project.
Fig 1 shows the schematic diagram of the transparent solar PV Cell showing main components. As mentioned
above, the transparent solar PV cell transmits visible rays and captures Ultraviolet (UV) and Near Infrared Rays
(NIR). The PV coating (AR coating) comprising series of thin layers of is deposited on the piece of glass, plastic or other transparent substrate. This coating is provided at extreme left absorbs UV/NIR rays and it allows
current to flow across transparent electrodes through external circuit. The UV/NIR rays are reflected back to
UV/NIR active layers through the reflectors. The transparent electrodes sandwich the two layers. The layers
comprise of absorptive semiconductor materials. This semiconductor material gets excited by the incident sunlight. The interaction of semiconductor and sunlight results in creation of electric field. Due to electric field
the current starts flowing. As the layers are connected to transparent electrodes, the current flows through these
electrodes and then to the external electric circuit. It is essential that the electrodes are transparent and not reflective in nature. The UV and NIR rays have a particular wavelength. The rays of such wavelength are
reflected back by UV/NIR reflectors. Finally the Anti-Reflective (AR) coatings are provided on both ends of
outside surfaces to reduce reflection of the sunlight. Although the use of such coatings is optional, it is recommended to provide these layers at both the outside surfaces of the cell because 10% of total sunlight is
likely to be reflected. In this way, the AR Coating provided outside surface of the cell reduces reflections so as
to allow maximum amount of light to enter.
Now let us understand the operation of solar cells. The absorptive response of transparent solar PV cell is measured and compared with conventional cells. This is illustrated in Fig 2 (a and b). The dark black curve
shows the absorptive response superimposed on solar spectrum shown by a faint curve. The Fig 2(a) shows
response of conventional solar cell whereas the Fig 2(b) shows that of transparent solar PV cell.

International Journal of Advance and Innovative Research Volume 8, Issue 3 (IV) July - September 2021 Part - 2
119
ISSN 2394 - 7780
Fig 1 Schematic of solar transparent solar PV Cell
(Source Transparent solar cells | MIT Energy Initiative)
In the conventional cell shown in Fig 2(a), the wavelengths at which absorption is relatively high include the
visible part of the spectrum. This visible part can be detected by human eyes. It is between about 400 and 700
nanometers. On other hand, the transparent solar PV cell absorbs well in UV and NIR portions of the spectrum both above and below the visible range as shown in Fig 2(b). However in visible region the absorption is nearly
negligible.
Fig 2 Absorptive response of PV cells
(Source Transparent solar cells | MIT Energy Initiative)
The critically placed gap makes the MIT solar cell transparent to the human eye, but it also means that the cell does not capture all the incident sunlight. The current versions of the transparent solar PV cells transmit more
than 70% of the visible light, which is within the range of tinted glass now used in the windows of buildings.
But their power-conversion efficiency is lesser, about 12%. There is a challenge to researchers to enhance the
power conversion efficiency.
The merits and demerits of using transparent solar PV cells are summarized as follows-
Merits
o No extra land or space on rooftops is required unlike non-transparent PV Solar panel.
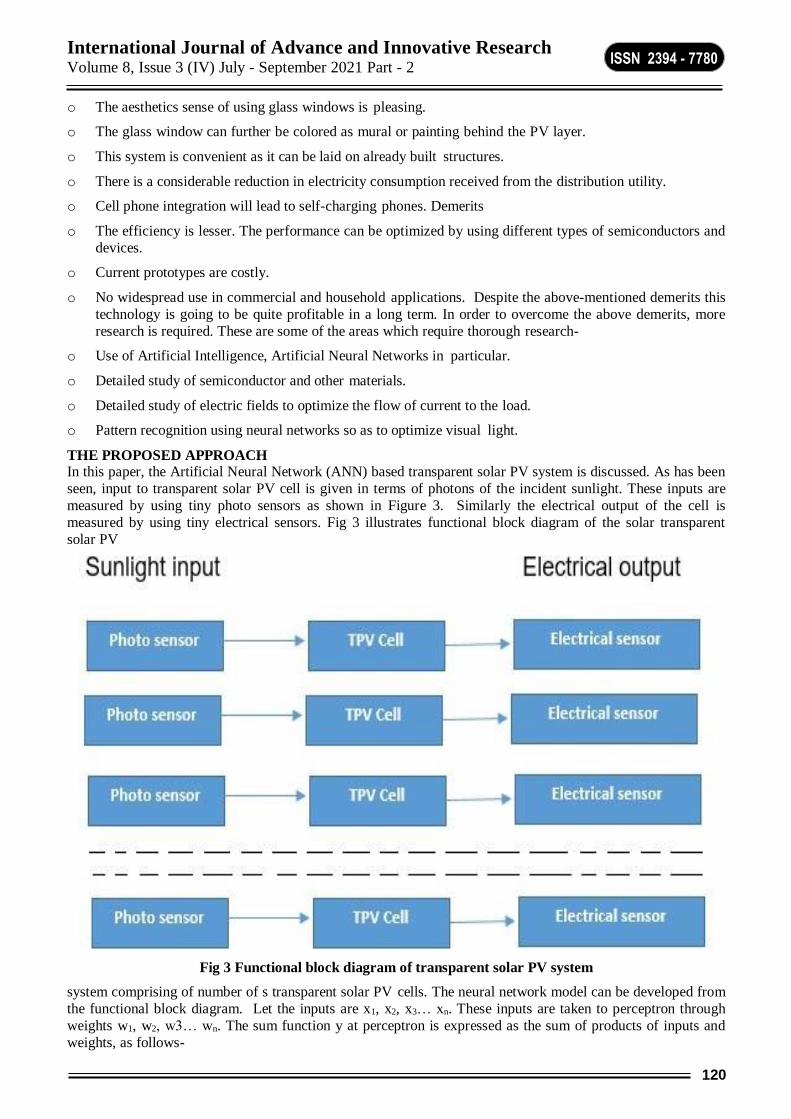
International Journal of Advance and Innovative Research Volume 8, Issue 3 (IV) July - September 2021 Part - 2
120
ISSN 2394 - 7780
o The aesthetics sense of using glass windows is pleasing.
o The glass window can further be colored as mural or painting behind the PV layer.
o This system is convenient as it can be laid on already built structures.
o There is a considerable reduction in electricity consumption received from the distribution utility.
o Cell phone integration will lead to self-charging phones. Demerits
o The efficiency is lesser. The performance can be optimized by using different types of semiconductors and
devices.
o Current prototypes are costly.
o No widespread use in commercial and household applications. Despite the above-mentioned demerits this
technology is going to be quite profitable in a long term. In order to overcome the above demerits, more
research is required. These are some of the areas which require thorough research-
o Use of Artificial Intelligence, Artificial Neural Networks in particular.
o Detailed study of semiconductor and other materials.
o Detailed study of electric fields to optimize the flow of current to the load.
o Pattern recognition using neural networks so as to optimize visual light.
THE PROPOSED APPROACH In this paper, the Artificial Neural Network (ANN) based transparent solar PV system is discussed. As has been
seen, input to transparent solar PV cell is given in terms of photons of the incident sunlight. These inputs are
measured by using tiny photo sensors as shown in Figure 3. Similarly the electrical output of the cell is
measured by using tiny electrical sensors. Fig 3 illustrates functional block diagram of the solar transparent
solar PV
Fig 3 Functional block diagram of transparent solar PV system
system comprising of number of s transparent solar PV cells. The neural network model can be developed from
the functional block diagram. Let the inputs are x1, x2, x3… xn. These inputs are taken to perceptron through
weights w1, w2, w3… wn. The sum function y at perceptron is expressed as the sum of products of inputs and
weights, as follows-

International Journal of Advance and Innovative Research Volume 8, Issue 3 (IV) July - September 2021 Part - 2
121
ISSN 2394 - 7780
n
i=1
Using this expression a basic neural network model can be developed as shown in Fig 4.
Fig 4 Basic neural network model
The outputs y1, y2, y3…yn corresponding to inputs x1, x2, x3…xn can be ascertained. Thus inputs and outputs are known to us. From the known values of inputs and outputs, the weights w1, w2, w3… wn can be
determined. This process of determination of weights is known as training of a neural network. In order to
train the network, the weights are initialized. It is incremented or decremented if the desired output is not
obtained.
The desired output is said to be obtained and the neural network is said to be converged and trained.
In this way, the Artificial Neural Network (ANN) can be used to optimize the performance of the solar
transparent solar PV system.
CONCLUSION
The concept of Transparent Solar Cells or Solar windows is quite significant as it offers healthier, resilient and
sustainable environment. This project proposes use of Artificial Neural Networks using which it is possible to optimize the performance of Transparent Photo Voltaic cell in terms of power conversion efficiency and
pattern. The proposed method of using neural networks is simple, cost effective but powerful. As per finding of
MIT energy, the power conversion efficiency is around 12% which can be enhanced further using neural
networks. Secondly, using pattern recognition technique, incoming solar rays can be used optimally.
BIBLIOGRAPHY
1. MIT Energy Initiative- Transparent Solar Cells- generating power from everyday surface. Transparent
solar cells | MIT Energy Initiative.
2. Jason Runge and Hossam Gabbar in The 2nd IEEE Conference on Power Engineering and Renewable
Energy (ICPERE) 2014 proposed a Solar windows control system for an apartment building in Toronto
with battery storage.
3. Solar Window as an Energy Source : A Patent Study Hrudya Ravula;Sridevi Bollapragada
International Journal of Advance and Innovative Research Volume 8, Issue 3 (IV) July - September 2021 Part - 2
122
ISSN 2394 - 7780
ORIGIN AND DEVELOPMENT OF PLEA BARGAINING
Mr. Devidas K. Shinde
Research Scholar, Department of Law, University of Mumbai
ABSTRACT The new concept of plea bargaining is a boon to the administration of the criminal justice system and it
becomes an integral part of the criminal justice system. Most of the countries in the world applying this method
to resolve speedily criminal cases. This system of plea bargaining is very popular in the countries like the United States of America, the United Kingdom, and Canada. This is a system, where the criminal and petty
cases are disposed of without trial. Therefore, it results in speedy disposal of cases without delay.
Keywords: Plea-Bargaining, Disposal, System, Trial, Speedily, Voluntarily, Defendant, Prosecutor, and Victim.
INTRODUCTION Plea bargaining is widely reported in the U.S.A. It is very popular in the United States of America. It is a
significant part of the criminal justice system in the U.S.A. The huge number of criminal cases disposed of by
plea bargaining rather than a jury trial. Plea bargaining results in an agreement between defendant and
prosecutor, where the defendant agrees to plead guilty by waiving the right of trial, and in return, his sentence is reduced. Generally, plea bargaining is pre-trial negotiations between the accused and prosecution. Its aim is to
arrive at a mutually and satisfactory decision regarding the settlement of the case. This method is saving of the
money, and time for defendant, victim, and court.
CONCEPT OF PLEA BARGAINING
The practice of plea bargaining is related to pre-trial negotiations between the defendant and prosecutor. Where
the defendant pleads guilty in exchange for lesser sentences or punishment against original sentences or punishment. The gist of plea bargaining is the confession and admission of guilt. But this confession and
admission of guilt should be freely and voluntarily. This practice of pre-trail negation between defendant and
prosecutor, accepted by most of the countries like the United States of America, England, Canada, and other
counties. The accused may plead guilty to the crime or to a lesser offence. The plea of guilt is often entered by the defendant on the advice of defense counsel. Once a plea bargaining agreement is reached, the prosecutor,
the defense counsel, and the accused approach the judge for its acceptance in court.
The term “bargain” was used in 1837 by Thomas Gil to describe the discretionary practice of leniency in
punishment. The name bargain is derived probably from Henry Clay’s “Corrupt Bargain”.
Plea bargaining is a mechanism, which is very helpful to achieve the real object of criminal law.
DEFINITION OF PLEA BARGAINING
The definition of plea bargaining is not definite and perfect. But various scholars, and jurists have been
attempted to define plea bargaining in a real sense.
According to Albert Alschuler, “Plea bargaining consists of the exchange of official concessions for defendants
act of self -conviction. Those concessions may relate to the sentences imposed by the court or recommended by
the prosecutor’s the offense charged, or a variety of other circumstances.”
The above definition indicates that plea bargaining is a procedure where the defendant pleads for guilt in
exchange for lesser sentences and prosecutors are required to recommend to court what is agreed between prosecutor and defendant. Therefore, plea bargaining is a mutual agreement between prosecutor and defendant
for lenient sentences or reducing charge instead of the original charge.
ORIGIN OF PLEA BARGAINING
The various jurist and learned people had tried to find out the origin of the plea bargaining but the origin of plea
bargaining is remains obscure. In this research paper, researcher has tried to study the origin of plea bargaining.
According to Lawrence Friedman and Robert Percival, plea bargaining emerged in Alameda County, California,
during the period 1870-1940. According to Allen Steinberg, plea bargaining is originated in the late nineteenth century. According to other scholars and researchers, plea bargaining emerged in the nineteenth century. George
Fisher reiterated that plea bargaining practice existed in the courts of Middlesex County in Massachusetts
between the years 1780-1900. The eminent jurist John H. Langbein had found significant evidence of the practice of plea bargaining in the nineteenth century, either in England or America. But the study of Mary
Vogel found that plea bargaining emerged in America during the year 1830-1840. Henceforth, regarding the
International Journal of Advance and Innovative Research Volume 8, Issue 3 (IV) July - September 2021 Part - 2
123
ISSN 2394 - 7780
origin of plea bargaining there are different opinions of the various jurist. The origin of plea bargaining remains
obscure due to the different opinions of the jurist.
DEVELOPMENT OF PLEA BARGAINING The adversarial nature of the system puts judges in a passive role, in which they have no independent access to
information with which they access the strength of the case against the accused. The parties thus can control the
outcome of the case by exercising their rights or bargaining them away. Therefore, the lack of compulsory prosecution also gives prosecutors greater discretion as well as the inability of crime victims to mount a private
prosecution and their limited ability to influence plea agreements. The history of practicing plea bargaining is
traced to the common law system.
The eminent jurist Albert Aschuler identified four indications of plea bargaining prior to the American civil war. The first instance relating to the study of professor Langbein, according to him statute enacted in 1485
authorized prosecution for unlawful hunting before a justice of the peace and authorized justice to convict a
defendant for summary offenses where the defendant confessed his crime.
The second indication of plea bargaining was recorded by professor Cockburn and this instance was between
1558 and 1625. There were cases of confession by defendant and sentences without further process and trial.
The third instance appeared in the study of Professor David H. Flaherty and it was in 1749 where the defendant pleads guilty to theft rather than prosecuted for burglary. The fourth indication of plea bargaining was reported
by a French jurist, Charles Cottu, according to him defendant pleads guilty in exchange for a lesser sentence or
punishment. This type of instance is also found in the U.S.A.
The jurist Alschuler and Friedman also agreed that plea bargaining was non -existence before 1800. It emerged during the early or mid-nineteenth century. Most of the eminent jurists and legal professionals view is that plea
bargaining rise in the late nineteenth century.
In the common law system there were some methods such as guilty plea, confession, pardon, approvement, and clemency similar to plea bargaining. But in the case of a guilty plea, confession, pardon, approvement and
clemency were without mutual agreement and it depended upon the discretion of king or state or executive
authority. There was the absence of any bargaining for the reduction of charges for lesser sentences.
According to Alschuler plea bargaining was unknown during the most history of common law. According to him, during the second half of the nineteenth century, prosecutorial plea emerged in the U.S.A. The view of
Alschuler is also supported by the statement of Mike McConville and Chester Mirsky, according to them, plea
bargaining first appeared in Anglo-American Courts.
REASONS FOR RISING OF PLEA BARGAINING
The following are the factors that are responsible for the rise of plea bargaining
According to Alschuler, the reason for the rise of plea bargaining are the growing complexity of the trial process, urbanization, increased crime rate, professionalization, and increasing bureaucratization of police,
prosecution, and defense function.
According to Malcom Feeley, the tradition of private prosecution, changes in criminal law and substantive law,
full-time criminal courts, and availability of defense attorneys. However, fisher and Heumann, caseload pressure and according to Langbein, complex trial, changes in the social composition of Victim and offenders.
According to Mary Vogel, the changes in social, cultural, and political tensions lead to a rise in plea bargaining.
CONCLUSION The origin of plea bargaining remains obscure because various jurists, and scholars have different opinions
about the origin of plea bargaining. After a detailed study regarding the origin of plea bargaining, it comes to
know that plea bargaining is a system that first appeared in the U.S.A. due to its distinct feature. According to the most of the eminent jurist, plea bargaining not appeared suddenly, it rises gradually and the second half of
the nineteenth century leads to the rise of plea bargaining in the United States of America.
REFERENCES
Books
Fisher, George, (2000). “Plea Bargaining Triumph,” 109, Yale Law Journal.
Dr. Rai, Suman, (2014). “Law Relating to Plea Bargaining,” Orient Publishing Company, 2nd Edition.
Rauxloh, Regina. (2012). “Plea Bargaining in National and International Law,” Routledge.

International Journal of Advance and Innovative Research Volume 8, Issue 3 (IV) July - September 2021 Part - 2
124
ISSN 2394 - 7780
Vogel, M., (2007). “Coercion to Compromise: Plea Bargaining, the Courts and Making the Political
Authority,” Oxford University Press.
Journals and Articles
Alschuler, Albert, (1979). “Plea Bargaining and Its History,” Columbia Law review, 1.
Langbein, John H. (1979). “Understanding the Short History of Plea Bargaining,” Faculty Scholarship
series.
Websites
www.chicagounbound.uchicago.edu
www.diditalcommons.law.yale.edu.
www.orissajudicialacademy.nic.in

International Journal of Advance and Innovative Research Volume 8, Issue 3 (IV) July - September 2021 Part - 2
125
ISSN 2394 - 7780
ORIGIN OF DANCING GIRLS IN TEMPLES IN TEMPLES SPECIAL REFERENCE TO THE
DEVADASI SYSTEM
Rajwinder Kaur1 and Dr. Seema Parihar
2
1Assistant Professor, Department of History, Govt. Rajindra College, Bathinda, Phd History, Regd. No.
72011694, CT University, Ludhiana 2Supervisor
ABSTRACT India is a country where people lived of different casts and follow different religions. Religion is one of the most
important part of life of Indian People. Most of population followed of the Hindu religion. So Hindu religion is
main and important religion of india. Indian are completely depends on religion and they have very strong faith in it. That’s why there is so many religion and religious traditions, customs and rituals specially for women.
Women are the mostly effected from religion and they deeply connected with rituals and follow them by their
hearts. In this research paper I as researcher am trying to discuss about one of the Hindu Tradition named
“Devadasi system” which is still followed by Hindus. The main focus of this research paper is to about origin of
the system, evolution and changes with the passage of time.
Keywards: Religion, Devadasi,Women, Tradition
INTRODUCTION
Devadasi system is one of Hindu religious tradition which meant that female servant of God and worshiped the temple, serve the temple and entertained the Lord and others by her dance and singing. In short she is the
servant of Lord therefore used to stay in the temple for her rest life to please the God.In Devadasi System
Devadasi women spent their whole life for the service of temple and as a wife of Lord of temple. In Devadasi system a girl devoted by her family and society to temple and she married to the God of temple “Yellamma
Goddess.”
PLACE OF WOMEN IN MYTHOLOGICAL THEORY.
Mythology is the part of history when we don’t have any fact or original document of history then we have to depend on mythological fact and tales that’s why mythology is important part of Indians .The women had very
valuable place in mythological period in Puranas, Vedas, Ramayana and Mahabharta. The women had a very
important role in social works, family functions,and most important in religious works and rituals and yags. Mant yags were uncomplete without females. If any king did a yag and his wife was not available to present in
the yag than to complete this rule of yag to being soil sculpture of the queen foir the yag.The mythology explain
that the Trinity Brahma, Vishnu and Mahesh (Shiva) are uncomplete without their better halves, Devi
Saraswati, Devi Laxmi and Devi Parwati. In Vishnu Purana many women mentioned for serve the lord Vishnu and Lord Krishna in the temple . A women named Madhavi explained herself as a Dasi (servant) of God. On the
time of Lord Krishna many Gopians and Gankias entertained and serve the Lord. In Ramayana when Ram
exiled Sita also accompanied Him. Many other mythological evidences shows that womens sacrifies their life
for religion.
ARCHEOLOGICAL AND WRITTEN EVIDENCE FOR DANCING WOMEN IN ANCIENT PERIOD.
There are some evidence that proved dancing girls tradition worked in the society in ancient time. The archaeological evidence of Indus valley civilization, the dancing girl sculpture proved that on the time of Indus
valley civilization might be dancing girls served the temples. In ancient time Kautalaya explained the dancing
girls and called Devadasi. Kautaliya first time used the word “Devadasi” In his Aarthshastra . Kautalaya
referenced many types of women slavery like women slave of royal family, rich feudals, slaves for queens,
Ganikas and temple slaves. He explained their survived and money earning.
Kalidas a famous royal writer of Gupta period also referenced the dancing girl in Mahakala temple in Ujjain in
Meghadutta-I (1.35) for the evening worships.
During this period Mahatama Buddha was also considered for the origin of devadasis by some historians .
Budhisht Nuns Who served the God in Budha Mathh Viharas. They clean the floor and washed the floors and
singing hymns. First known mention of Devadasi is to a girl named Amarpali who was declared nagar vadhu
by the king on the time of Buddha. She lived in the temple and worshiped the God for rest her life.
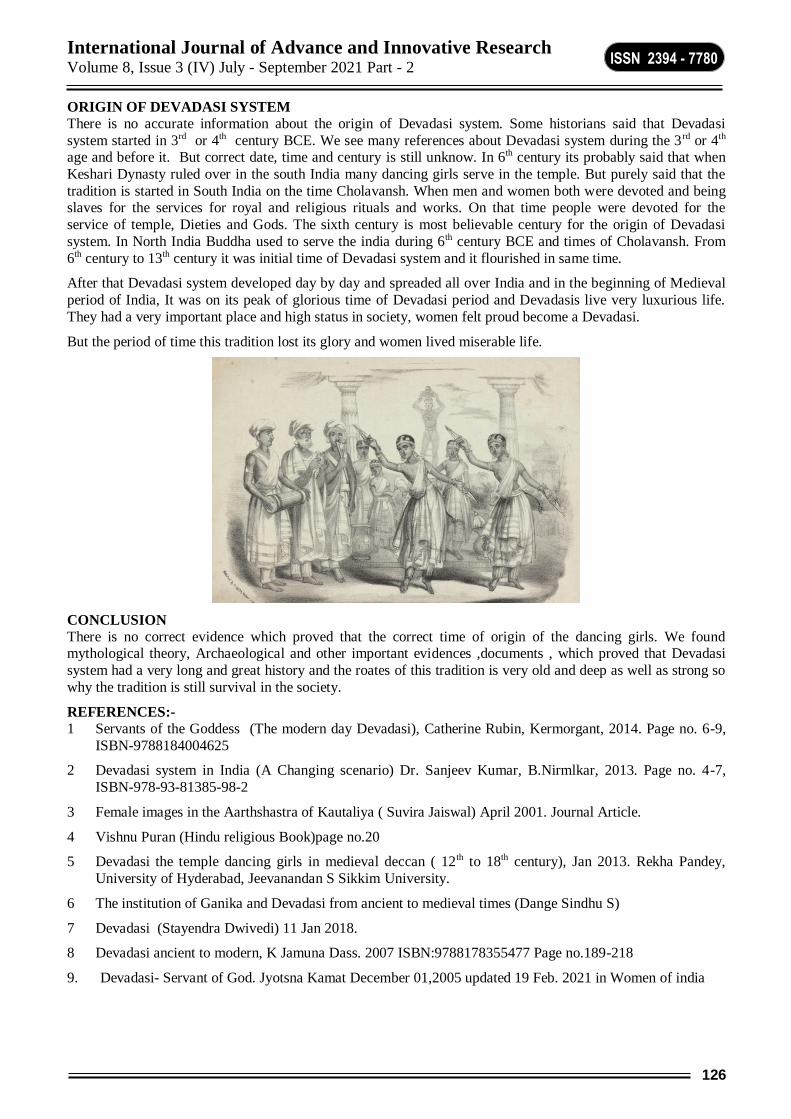
International Journal of Advance and Innovative Research Volume 8, Issue 3 (IV) July - September 2021 Part - 2
126
ISSN 2394 - 7780
ORIGIN OF DEVADASI SYSTEM
There is no accurate information about the origin of Devadasi system. Some historians said that Devadasi
system started in 3rd or 4th century BCE. We see many references about Devadasi system during the 3 rd or 4th age and before it. But correct date, time and century is still unknow. In 6th century its probably said that when
Keshari Dynasty ruled over in the south India many dancing girls serve in the temple. But purely said that the
tradition is started in South India on the time Cholavansh. When men and women both were devoted and being slaves for the services for royal and religious rituals and works. On that time people were devoted for the
service of temple, Dieties and Gods. The sixth century is most believable century for the origin of Devadasi
system. In North India Buddha used to serve the india during 6th century BCE and times of Cholavansh. From
6th century to 13th century it was initial time of Devadasi system and it flourished in same time.
After that Devadasi system developed day by day and spreaded all over India and in the beginning of Medieval
period of India, It was on its peak of glorious time of Devadasi period and Devadasis live very luxurious life.
They had a very important place and high status in society, women felt proud become a Devadasi.
But the period of time this tradition lost its glory and women lived miserable life.
CONCLUSION
There is no correct evidence which proved that the correct time of origin of the dancing girls. We found mythological theory, Archaeological and other important evidences ,documents , which proved that Devadasi
system had a very long and great history and the roates of this tradition is very old and deep as well as strong so
why the tradition is still survival in the society.
REFERENCES:-
1 Servants of the Goddess (The modern day Devadasi), Catherine Rubin, Kermorgant, 2014. Page no. 6-9,
ISBN-9788184004625
2 Devadasi system in India (A Changing scenario) Dr. Sanjeev Kumar, B.Nirmlkar, 2013. Page no. 4-7,
ISBN-978-93-81385-98-2
3 Female images in the Aarthshastra of Kautaliya ( Suvira Jaiswal) April 2001. Journal Article.
4 Vishnu Puran (Hindu religious Book)page no.20
5 Devadasi the temple dancing girls in medieval deccan ( 12th to 18th century), Jan 2013. Rekha Pandey,
University of Hyderabad, Jeevanandan S Sikkim University.
6 The institution of Ganika and Devadasi from ancient to medieval times (Dange Sindhu S)
7 Devadasi (Stayendra Dwivedi) 11 Jan 2018.
8 Devadasi ancient to modern, K Jamuna Dass. 2007 ISBN:9788178355477 Page no.189-218
9. Devadasi- Servant of God. Jyotsna Kamat December 01,2005 updated 19 Feb. 2021 in Women of india
International Journal of Advance and Innovative Research Volume 8, Issue 3 (IV) July - September 2021 Part - 2
127
ISSN 2394 - 7780
PARENTAL ACCEPTANCE AND HOMOSEXUALITY: A REVIEW
Kriti Jeswal1* and Prof. (Dr.) Anjali Midha Sharan
2
1*Research Scholar, GD Goenka University, Haryana 2Dean, School of Humanities & Social Sciences GD Goenka University, Haryana
ABSTRACT In the liberal world with transient opinions, the researcher is making an attempt at understanding how the
perception and acceptance towards the LGBT community has evolved over the past few years. Through a
systematic review of Literature, an attempt has been made to particularly understand the role of parents and their acceptance towards their homosexual orientation. This will help in exploring the resultant dynamics of the
parent-child relationships. Being a minority population, few areas of homosexuality have been explored till
date. The LGBT (lesbian, gay, bisexual and transgender) community exists with many social stigmas and constant struggles emerging from its closets. (Russell & Fish, 2016). But it can be seen that the LGBT Youth are
now coming out at a very young age as compared to before and the public's support towards this community is
also dramatically increasing.
Parents play a crucial role in the psychological well- being of their child and according to Parental Acceptance-Rejection theorists, “children need a specific form of acceptance from their parents. (Rohner,
Khaleque & Cournoyer, Introduction to PAR Theory, 2005). With the help of recent published studies it can be
concluded that, the LGBT Community is still striving for acceptance from their parents. Family Acceptance Project, conducted a research which concluded that having rejecting parents places LGB children at risk
fordepression and suicide, whereas having parents who are accepting of their child‟s LGBT identity can
serve as a protective factor that supports well-being. Positive responses from parents have been associated with better emotional adjustment and higher self-esteem (Ryan & Russell, 2010). In contrast, rejections from parents
have been related to substance abuse and sexual risk- taking behaviors (D‟Amico & Julien, 2015).
With the help of published literature reviews, it can be concluded that, the parents generally accept their LGBT
children. However, they do not always accept them immediately after they come out as acceptance takes time,
and transitioning to acceptance is often a complex process.
Keywords: LGBT+ (lesbian, gay, bisexual and transgender), parents, acceptance, rejection, relationship, youth
1 INTRODUCTION
1.1 What do sex and sexuality mean? Sexuality is the most central, elemental aspect of each person, determined largely by whether we are physically
and psychologically male or female. Over the course of history, the definitions and conceptions of sexuality
have varied greatly.
Sexuality may be the origin for happiness and satisfaction on the other hand, but in cases of sexual dysfunction
it may cause frustration and suffering. Sexuality is a central motivation in couple formation. It is an
omnipresent human characteristic, and for somepeople, it is the only component of life that brings true and
genuine miracles. Sex and love can precipitate surprising turning points in life.
Suddenly, in a crowd of people, you may find yourself falling in love, and your entire life changes. Sexual
attraction holds inexplicable mysticism, and it can be delicious and irresistible. (Kontula)
1.2 Homosexuality
A term used to describe a sexual orientation in which a person feels physically and emotionally attracted to
people of the same gender (LGBT Resource Center). The term gay is frequently used as a synonym for
homosexual; female homosexuality is often referred to as lesbianism. At different times and in different cultures, homosexual behavior has been variously approved of, tolerated, punished, and banned. In the modern
world, attitudes toward homosexuality are changing, as a result of increased political gay rights movements and
efforts by homosexuals to be seen not as aberrant personalities but as “normal” individuals. The conflicting views of homosexuality—as normal sexual behavior on one hand, and as psychologically deviant behavior on
the other—remain present in some societies, but have been largely resolved in most developed countries
(Homosexuality, 2018)
1.3 History of Homosexuality
International Journal of Advance and Innovative Research Volume 8, Issue 3 (IV) July - September 2021 Part - 2
128
ISSN 2394 - 7780
The term „homosexuality‟ was coined in the late 19th century by an Austrian-born Hungarian psychologist,
Karoly Maria Benkert. Arising out of this history, in the West, the idea of natural law forbids homosexual sex,
and references to natural law still play an important role in contemporary debates about homosexuality in
religion, politics, and even courtrooms. (Pickett & Brent, 2020)
During the early part of the 20th century, it became a political issue in many Western countries during the late
20th century. Many LGB members began to demand equal treatment. In response to their activism, many
jurisdictions enacted laws banning discrimination against homosexuals. (Homosexuality, 2018)
In the late 20th century gay men and lesbians proudly revealed their sexual orientation in increasing numbers.
Still others, notably those in the public eye, had their sexual orientation revealed in the media and against their
will by activists either for or against gay rights—a controversial practice known as “coming outing.”
(Homosexuality, 2018)
Different societies respond differently to homosexuality. Many countries, still consider homosexuality as a
taboo, but a slight exception can be seen in urban areas. In Western countries, attitudes are somewhat more
liberal. (Homosexuality, 2018)
Despite major changes in laws and norms surrounding the issue of same-sex marriage and the rights of LGBT
people around the world, public opinion on the acceptance of homosexuality in society remains sharply
divided by country, region and economic development (The Global Divide on Homosexuality Persists, 2020)
1.4 Theoretical Perspective
Psychologists in the 19th and 20th centuries, most of whom classified homosexuality as a form of mental
illness, developed a variety of theories on its origin. (Homosexuality, 2018)
i. The 19th-century psychologist Richard von Kraft-Ebing whose Psychopathia Sexualis (1886) included
masturbation, sado-masochism, and “lust-murder” in its list of sexual perversions, saw it as originating in
heredity.
ii. Freud characterized homosexuality as a result of conflicts of psychosexual development.
iii. Alfred Kinsey reported that homosexual activity was a frequent pattern in adolescence, among both males
and females.
iv. By the 21st century, many societies had been discussing sexuality and sexual practices with increased
candor. Together with a growing acceptance of homosexuality, long- standing beliefs had begun to lose
their credibility. (Homosexuality, 2018)
2 ACCEPTANCE OF HOMOSEXUALITY
Social attitudes about LGBT people can heavily influence whether LGBT people are accepted or rejected in the society. The acceptance generally expected from the family members, teachers, employers, peers etc. Negative
beliefs about LGBT people can serve as the basis for the impulse to reject and exclude them. This rejection and
exclusion often leads to violence and discrimination against the LGBT community. Powerful forces in society,
such as tradition, religion, law, medicine, and the media can contribute to the existence of beliefs about LGBT
people. (The Global Divide on Homosexuality Persists, 2020)
Acceptance is a broad concept which encompasses social beliefs about LGBT people, as well as prevailing
opinion about laws and policies relevant to protecting LGBT people from violence and discrimination and promoting their equality and well-being. Acceptance is the extent to which LGBT people are seen in ways that
are positive and inclusive. Despite the many legal, social, and political gains achieved by the gay rights
movement, lesbians, gays, and bisexuals (LBGs) still face discrimination. This has led some scholars to
argue that LGB acceptance remains “incomplete.” (The global divide onacceptance of homosexuality, 2020)
2.1 Parental Acceptance and Rejection Theory
The Parental acceptance-rejection theory also known as the PAR Theory was coined by Rohner and Khaleque.
It is an evidence-based theory of socialization and lifespan development that attempts to predict and explain major causes, consequences, and other correlates of interpersonal especially parental acceptance and rejection.
It attempts to answer five classes of questions divided into three sub theories. These are personality sub theory,
coping sub theory, and sociocultural systems sub theory. (Rohner & Khaleque, 2012)
2.2 Parental Acceptance
International Journal of Advance and Innovative Research Volume 8, Issue 3 (IV) July - September 2021 Part - 2
129
ISSN 2394 - 7780
Parents play a crucial role in the psychological well-being of their children. Being accepted by them as a
homosexual is an important experience as it defines that, how theindividual is likely to cope with the stress.
According to research by the Family Acceptance Project, having rejecting parents places LGB children at risk for depression and suicide (Ryan & Russell, 2010), whereas having parents who are accepting of their child‟s
LGBT identity can serve as a protective factor that supports well-being (Ryan & Russell, 2010). Positive
responses from parents have been associated with better emotional adjustment and higher self-esteem (Ryan & Russell, 2010). In contrast, rejections from parents have been related to substance abuse and sexual risk- taking
behaviors (D‟Amico & Julien, 2015).
3 MODERN DEVELOPMENTS
Attitudes toward homosexuality are generally in flux, partially as a result of increased political activism and efforts by homosexuals to be seen not as aberrant personalities but as differing from “normal” individuals only
in their sexual orientation. There are two different types of conflicting views on homosexuality: as a normal
human sexual behaviour on one hand, and as psychologically deviant behaviour on the other. They still remain
present in most societies and are largely resolved in some developed countries. (Levy, 2020)
4 CONCLUSION
With the help of published literature reviews, it can be concluded that, the parents generally accept their LGBT children. However, they do not always accept them immediately after they come out as acceptance takes time,
and transitioning to acceptance is often a complex process. According to research by the Family Acceptance
Project, having rejecting parents places LGB children at risk for depression and suicide (Ryan & Russell, 2010),
whereas having parents who are accepting of their child‟s LGBT identity can serve as a protective factor that supports well-being (Ryan & Russell, 2010). Positive responses from parents have been associated with better
emotional adjustment and higher self-esteem (Ryan & Russell, 2010). In contrast, rejections from parents have
been related to substance abuse and sexual risk-taking behaviors (D‟Amico & Julien, 2015).
According to Parental Acceptance-Rejection theorists, “children everywhere need a specific form of positive
response-acceptance-from parents” (Rohner, Khaleque , & Cournoyer, Introduction to PAR Theory, 2005).
Rohner defines acceptance as the warmth, affection, care, comfort, concern, nurturance, support, or simply love
that children can experience from their parents. Alternatively, parental rejection is considered as the absence of significant withdrawal of these feelings and behaviors and the presence of a variety of physically and
psychologically hurtful behaviors and emotions. (Rohner, Khaleque, & Cournoyer, Introduction to PAR
Theory, 2005)
A very few areas of homosexuality have been explored till date. With the help of future research more
untouched areas of the LGBT community can be explored. Some of these areas can be exploration of different
types of parental acceptance from parents towards their child. As acceptance of a parent towards the sexual identity of their LGB child can be different than the acceptance of the gender identity of the LGB child. Another
area of the parent and child relationship can be explored, focusing individually for lesbians, gays, and bisexuals.
In depth research on a these areas can help us to understand the acceptance of a parent on gender basis, if any.
We might thus conclude that different untouched segments of homosexuality can be explored in the future
studies, which can eventually redefine the understanding of the LGBT community.
5 REFERENCES
1. Kontula, o. (n.d.). The origin of sexuality and sexual. Retrieved 09 2020, from
vaestoliitto:https://www.vaestoliitto.fi/@bin/263341/finsex09_chapter+1.pdf
2. LGBT resource center. (n.d.). Retrieved 12 29, 2020, from university of carlifornia san francisco:
https://lgbt.ucsf.edu/glossary-terms
3. Homosexuality. (2018, 11 21). Retrieved 09 04, 2020, from encyclopædia britannica:
https://www.britannica.com/topic/homosexuality
4. Pickett, & brent. (2020). Homosexuality. Retrieved 12 30, 2020, from the stanford encyclopedia of
philosophy: https://plato.stanford.edu/entries/homosexuality/
5. The global divide on homosexuality persists. (2020, june 25). Retrieved january 13, 2021, from
www.pewresearch.org: https://www.pewresearch.org/global/2020/06/25/global- divide-on-
homosexuality- persists/
6. Rohner, r., & khaleque, a. (2012). Introduction to parental ascceptance-rejection theory, methods, evidence
and implications. Journal of society for psychological antrhropology.

International Journal of Advance and Innovative Research Volume 8, Issue 3 (IV) July - September 2021 Part - 2
130
ISSN 2394 - 7780
7. Ryan, c., & russell, s. T. (2010, november 04). Family acceptance in adolescence and the health. Journal
of child and adolescent psychiatric nursing, 23, 205-213.
8. D‟amico, e., & julien, d. (2015). Gay, lesbian, and bisexual youths coming out to their parents: parental
reactions and youths‟ outcomes. Journal of glbt family studies, 11, 1-27.
9. Levy, m. (2020, june 15). Gay rights movement. Retrieved january 12, 2021, from www.britannica.com:
https://www.britannica.com/topic/gay-rights-movement
10. WHO. (2010). Sexual and reproductive health and research including the special programme hrp.
Retrieved november 10, 2020, from world health organization: https://www.who.int/teams/sexual-and-
reproductive-health-and-research/key-areas- of-work/sexual-health/defining-sexual-health
International Journal of Advance and Innovative Research Volume 8, Issue 3 (IV) July - September 2021 Part - 2
131
ISSN 2394 - 7780
PHOTOCATALYTIC DEGRADATION OF 2,4-DICHLOROPHENOXY ACETIC ACID UNDER
VISIBLE LIGHT IRRADIATION
G. A. Suganya Josephine1 and K. Jayaprakash
2 and A. Sivasamy
2*
1Department of Chemistry, Aarupadai Veedu Institute of Technology, Vinayaka Missions Research Foundation,
Deemed to be University, Paiyanoor, Kanchipuram – 603 104, India
2Chemical Engineering Area, CSIR-Central Leather Research Institute, Adyar, Chennai 600020, India
ABSTRACT
Nanocrystalline metal oxide doped rare earth oxide (NMRO) was prepared by a simple co-precipitation
technique and characterized by FT-IR, XRD, UV-DRS and FE-SEM techniques. In the present work the
prepared semiconductor was evaluated for its visible light induced photocatalytic activity for the degradation of
a herbicide 2,4-D. Preliminary studies on the effect of pH, initial catalyst dosage and initial 2,4-D
concentration were conducted for the photocatalytic degradation of 2,4-D. 10 mg/10 mL/10 ppm of 2,4-D
solution was used as the optimum catalyst dosage for further photocatalytic studies. Kinetics showed the
reaction to follow a pseudo-first order. The activity of NMRO was >1.5 folds when compared to the pristine
metal oxide.
Keywords: 2,4-Dichlophenoxy acetic acid, Doping, Photocatalysis, Visible light.
1. INTRODUCTION
Semiconductors nanomaterials are widely known to be used as a photocatalysts for the degradation of organics
from aqueous phase, in synthetic organic chemistry for oxidation reduction reactions, in water splitting, as
sensors, solar cells etc.1-6 Heterogeneous photocatalysis under visible light irradiation is a promising field for
the degradation of dyes, detergents, phthalates and phenolic’s from industrial outlets and pesticides and
herbicides from agricultural run-off. But, their application is not only limited to light induced or light sensitive
processes, as they are also explored widely for their anti-microbial activities against bacterial and fungal
species.7
Semiconductors like zinc oxide and modified zinc oxide materials prepared by different techniques have been
studied widely for their visible light induced photocatalytic activity for the degradation of organics and also as
anti-bacterial and fungal agents.8-10 ZnO is considered a better alternative to TiO2 as it is in-expensive and has a
similar band-gap energy (2.8 - 3.2 eV),11 but it is prone to photo-corrosion.12 Hence, various modifications are
carried out on pristine metal oxides by various research groups world-wide in order to achieve higher
efficiencies. Modifications such as, doping of metals, non-metals and rare-earth materials, coating on substrate,
preparation of composites and core-shell materials.13-14 When our research group worked on the doping of
pristine metal oxides like zinc oxide on rare-earth materials showed higher photocatalytic activity under UV and
visible light irradiation for the degradation of dyes.15 Hence, nanocrystalline metal oxide doped rare earth oxide
(NMRO) would give promising activity for the degradation of pesticides or herbicides from agricultural run-off.
Pesticides and herbicides are most widely used in agriculture to control pests and unwanted weeds from the
cultivated land. Pesticides are not restricted to toxic substances but include growth regulators and repellents.

International Journal of Advance and Innovative Research Volume 8, Issue 3 (IV) July - September 2021 Part - 2
132
ISSN 2394 - 7780
Agricultural runoff mainly serve as a carrier for toxic16 organics into water streams which in turn enters into the
life cycle of living beings.17 2,4-dichlorophenoxyaceticacid (2,4-D) is a widely used to control the growth of
broad leaf weeds and are sprayed in agricultural land and has higher probability to reach the water streams as
run-off.18 2,4-D is also known to penetrate the soil which leads to surface and groundwater contamination of.19
2,4-D has been classified as a toxic substance and the LD 50 for rat varies from 100 - 500 mg/Kg.20 They also
come under the classification of endocrine disruptors.21 Hence, these types of toxics substances must be
removed from the wastewater.
Hence, in this paper NMRO was prepared and characterized by FT-IR, XRD, UV-DRS and FE-SEM
techniques. The prepared NMRO was evaluated for its visible light induced photocatalytic activity for the
degradation of a herbicide 2,4-D.
2. MATERIALS AND METHODS
2.1. Materials
Zinc nitrate hexahydrate, Dysprosium nitrate hexahydrate and DMPO (5,5-Dimethyl-1-pyrroline-N-Oxide)
were procured from Sigma-Aldrich (India). Na2CO3 and 2,4-D from S.D fine chem (India). All the chemicals
except DMPO were used as received without further purification. DMPO was purified before using for the
experiments.
2.2. Characterization Techniques
The prepared pristine and doped semiconductor nanomaterials were characterized by techniques such as FT-IR,
XRD, UV-vis-DRS and FE-SEM, analysis in order to establish the properties like morphology, size, shape,
absorption region and band gap energy. The functional group analysis were conducted in a FT-IR instrument
using a Perkin Elmer FT-IR spectrometer. The XRD patterns were recorded by a PAN analytical X-ray
diffractometer, (Germany) with Cu Kα radiation (2θ scan range between 10º and 70ºC), with an accelerating
voltage of 40 kV and emission current of 25 mA. The UV-vis DRS were determined by UV 2600, (Shimadzu,
Japan) with a scan speed of 200 nm/min, (scan range of 200-1400 nm). The solid samples were analyzed using
BaSO4 (Spectroscopic grade) as reference. The morphology and size of particles were analyzed by FE-SEM
(Model Supra 55 - Carl Zeiss, Germany).
2.3. Photocatalytic Reactor
The studies on visible light photocatalysis were conducted in a reactor containing a 500W tungsten lamp. The
reactors inner sides were made up of reflector plates, for efficient light reflection on the sample tube. A water
jacketed tube surrounds the light source for radiated heat cooling and the reactor is further supported by cooling
fans inside for facilitating the same. The preliminary (30 cm × 1.5 cm (height × diameter)) and the kinetic (30
cm × 3.5 cm) studies were performed in appropriate glass tubes. The reaction progress was monitored by the
absorbance measurement of the filtered reaction mixture. The percentage degradation of 2,4-D could be
calculated using Eq. (1).
Degradation efficiency (%) = C0 – Ce/ C0 × 100 (1)
where, C0 and Ce are the initial and final concentrations of 2,4-D in the aqueous phase respectively.

International Journal of Advance and Innovative Research Volume 8, Issue 3 (IV) July - September 2021 Part - 2
133
ISSN 2394 - 7780
2.4. Preparation of NMRO
NMRO was prepared by a simple serial precipitation technique as reported elsewhere.22 Zinc, Dysprosium
nitrates and sodium carbonate were prepared separately in the desired molar ratio by adding the nitrates in
distilled water. The ratio of nitrates to carbonate was taken as 1. A solution of rare earth nitrate was stirred
vigorously followed serially by Na2CO3, metal nitrate and remaining Na2CO3. The precipitate was further
stirred for 15 min, filtered, washed with water and ethanol and dried at 110ᵒC overnight. The dried material was
calcined at 700ᵒC for 3h. The molar ratio of metal and rare earth nitrate was taken as 1:9, 2:8, 3:7, 5:5 and
named as NMRO1, NMRO2, NMRO3, NMRO4. The respective pristine oxides of zinc and dysprosium were
also prepared similarly from the respective nitrates and named as MO and RO.
3. RESULTS AND DISCUSSION
3.1. Analysis of the prepared nanomaterials by FT-IR and XRD
The FT-IR spectrum of MO, RO and NMRO are shown in Fig. 1. The peaks around 400-500 cm-1 in MO is
attributed to the Zn-O stretching vibrations. The peaks around 400-600 cm-1 is attributed to Dy-O stretching
vibrations in RO. Since the stretching vibrations are in the same region, the peaks at 400-600 cm-1 for NMRO is
attributed to Zn-O and Dy-O stretching. The XRD patterns of the prepared MO, RO and NMRO are shown in
Fig. 2. The prepared materials were found to be highly crystalline from the patterns and it matched well with the
JCPDS data for MO (ZnO - JCPDS No. 36–1451) and RO (Dy2O3- JCPDS 01-079-1722). Peaks appeared at
(100) (002) (101) (102) (110) (103) (004) (201) for MO and (211) (222) (440) (400) and (622) for RO. The
prepared NMRO, showed both the peak patterns of MO and RO.
0 500 1000 1500 2000 2500 3000 3500 4000 4500
50
0 500 1000 1500 2000 2500 3000 3500 4000 4500
50
0 500 1000 1500 2000 2500 3000 3500 4000 4500
50
Wavenumber (cm-1
)
MO
%T
NMRO
RO
Fig. 1 FT-IR spectrum of the prepared MO, RO and NMRO.
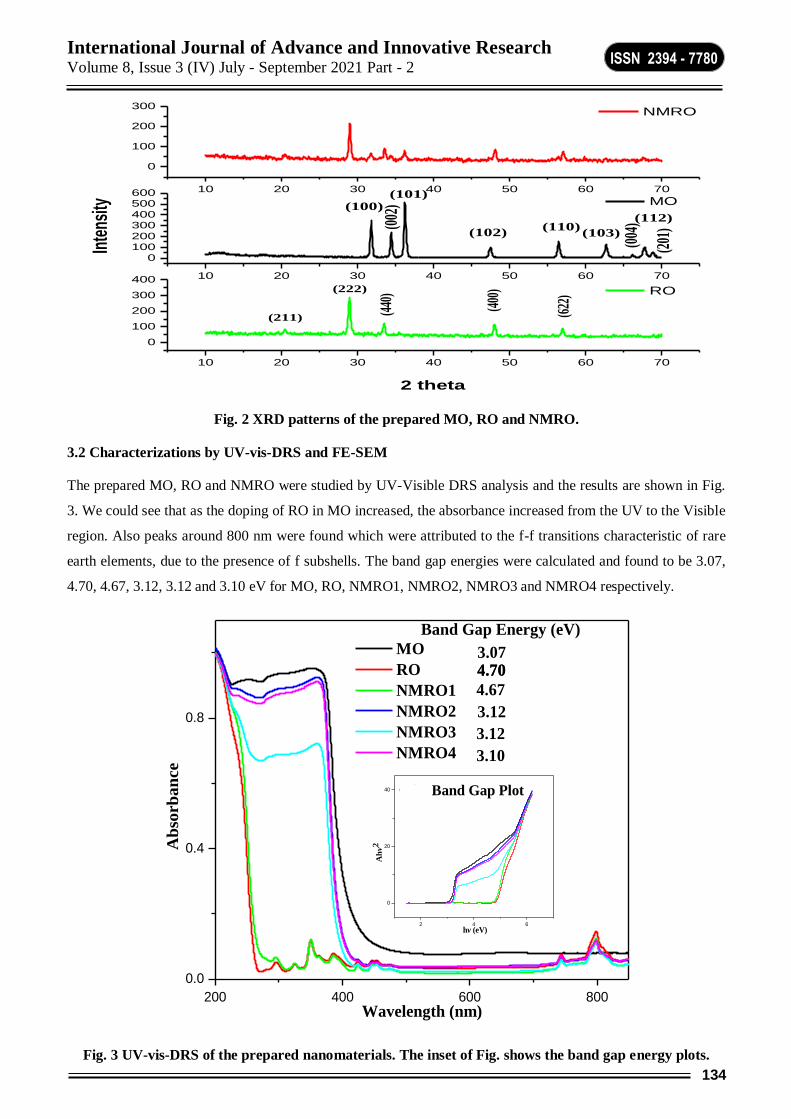
International Journal of Advance and Innovative Research Volume 8, Issue 3 (IV) July - September 2021 Part - 2
134
ISSN 2394 - 7780
10 20 30 40 50 60 70
0
100
200
300
400 10 20 30 40 50 60 70
0100200300400500600 10 20 30 40 50 60 70
0
100
200
300
(622
)
(400
)
(440
)(0
02)(100)
2 theta
RO(222)
(211)
(201
)
(112)
(004
)
(103)(110)
(102)
(101)
Inte
nsity MO
NMRO
Fig. 2 XRD patterns of the prepared MO, RO and NMRO.
3.2 Characterizations by UV-vis-DRS and FE-SEM
The prepared MO, RO and NMRO were studied by UV-Visible DRS analysis and the results are shown in Fig.
3. We could see that as the doping of RO in MO increased, the absorbance increased from the UV to the Visible
region. Also peaks around 800 nm were found which were attributed to the f-f transitions characteristic of rare
earth elements, due to the presence of f subshells. The band gap energies were calculated and found to be 3.07,
4.70, 4.67, 3.12, 3.12 and 3.10 eV for MO, RO, NMRO1, NMRO2, NMRO3 and NMRO4 respectively.
200 400 600 800
0.0
0.4
0.8
3.074.70
3.10
3.12
3.12
4.67
2 4 6
0
20
40
Ah
v2
hv (eV)
PZnO
Dy2O3
ZnDy (10:90)
ZnDy (20:80)
ZnDy (30:70)
ZnDy (50:50)
3.07
4.70
4.67
3.12
3.12
3.10
Band gap (eV)
MO
RO
NMRO1
NMRO2
NMRO3
NMRO4
Ab
sorb
an
ce
Wavelength (nm)
Band Gap Plot
4.70
Band Gap Energy (eV)
Fig. 3 UV-vis-DRS of the prepared nanomaterials. The inset of Fig. shows the band gap energy plots.

International Journal of Advance and Innovative Research Volume 8, Issue 3 (IV) July - September 2021 Part - 2
135
ISSN 2394 - 7780
Fig. 4 FE-SEM image of NMRO.
The surface morphology of the prepared NMRO is shown in Fig. 4. It was found to be in an irregular
morphology and of the order of 40 – 60 nm.
3.3. Photocatalytic Activity
3.3.1. Preliminary Studies
Studies on the effect of dopant ratios, effect of aqueous phase pH, catalyst dosage and initial 2,4-D
concentration were conducted in order to optimize the experimental parameters that govern the photocatalytic
activity. All the preliminary studies were conducted in 10 ppm/10 mL of 2,4-D solution made up with the
required pH and appropriate amount of catalyst. The duration of visible light irradiation were kept as 10 h. The
results are shown in Fig. 5. The studies on effect of dopant ratio show that NMRO4 (83.93%) (Fig.5 (i)) has
better activity for the degradation of 2,4-D than MO, RO and other NMRO. Hence, further studies were
conducted for NMRO. The pH of the aqueous phase were varied between 2 and 12 and the results showed a
maximum activity at neutral pH (6.45) with 83% degradation (Fig.5 (ii)). The effect of catalyst dosage on
degradation of 2,4-D molecules were studied with varied catalytic amount from 3 to 20 mg/ 10 mL for a
concentration of 10 ppm. It was found that at a minimum amount of 10 mg of catalyst the degradation
efficiency was optimum (83.93%) and further addition of catalyst into the system did not enhance the efficiency
of dye degradation (Fig.6 (i)). Hence, 10 mg/10 mL/10 ppm of aqueous solution was used as the optimum
catalyst dosage for further photocatalytic studies. The effect of initial dye concentration on photodegradation of
OG, MG dyes and 2,4-D molecules were studied from 5 to 50 ppm at fixed amount of the catalyst (10 mg/ 10
mL) with neutral aqueous phase pH. In general, it was noticed that as the concentration of 2,4-D increased, the
percentage of degradation decreased (Fig.6 (ii)).
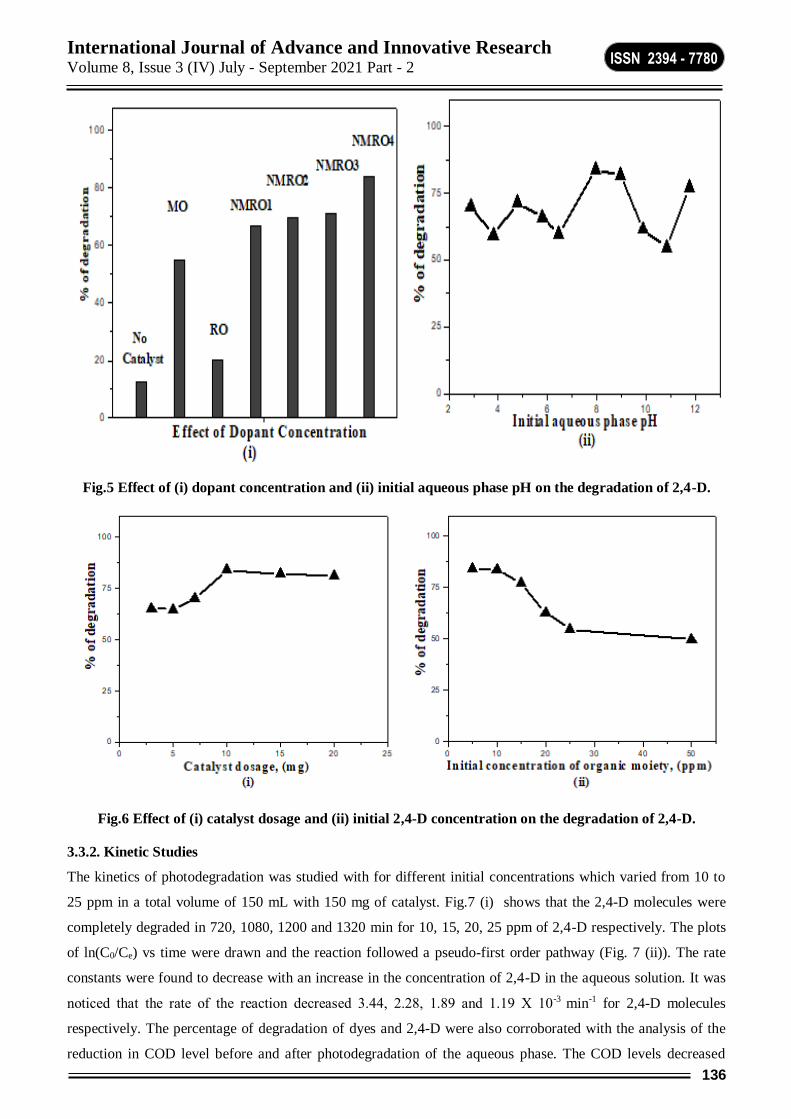
International Journal of Advance and Innovative Research Volume 8, Issue 3 (IV) July - September 2021 Part - 2
136
ISSN 2394 - 7780
Fig.5 Effect of (i) dopant concentration and (ii) initial aqueous phase pH on the degradation of 2,4-D.
Fig.6 Effect of (i) catalyst dosage and (ii) initial 2,4-D concentration on the degradation of 2,4-D.
3.3.2. Kinetic Studies
The kinetics of photodegradation was studied with for different initial concentrations which varied from 10 to
25 ppm in a total volume of 150 mL with 150 mg of catalyst. Fig.7 (i) shows that the 2,4-D molecules were
completely degraded in 720, 1080, 1200 and 1320 min for 10, 15, 20, 25 ppm of 2,4-D respectively. The plots
of ln(C0/Ce) vs time were drawn and the reaction followed a pseudo-first order pathway (Fig. 7 (ii)). The rate
constants were found to decrease with an increase in the concentration of 2,4-D in the aqueous solution. It was
noticed that the rate of the reaction decreased 3.44, 2.28, 1.89 and 1.19 Χ 10-3 min-1 for 2,4-D molecules
respectively. The percentage of degradation of dyes and 2,4-D were also corroborated with the analysis of the
reduction in COD level before and after photodegradation of the aqueous phase. The COD levels decreased
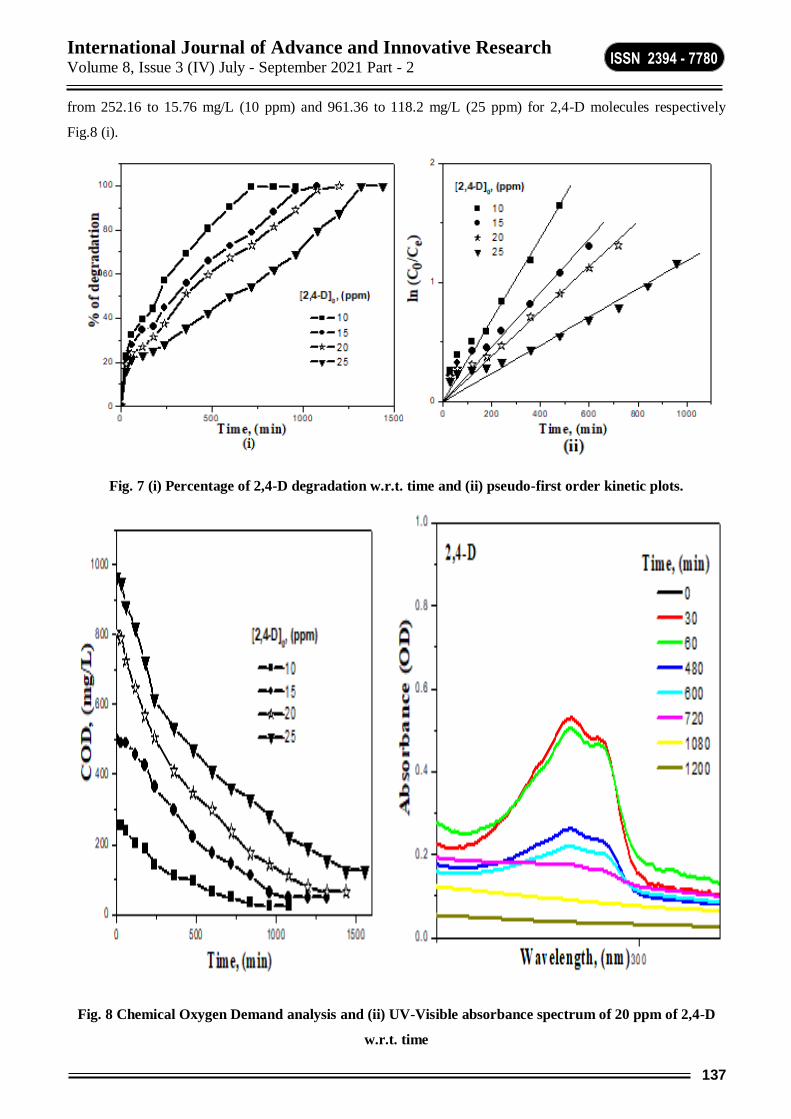
International Journal of Advance and Innovative Research Volume 8, Issue 3 (IV) July - September 2021 Part - 2
137
ISSN 2394 - 7780
from 252.16 to 15.76 mg/L (10 ppm) and 961.36 to 118.2 mg/L (25 ppm) for 2,4-D molecules respectively
Fig.8 (i).
Fig. 7 (i) Percentage of 2,4-D degradation w.r.t. time and (ii) pseudo-first order kinetic plots.
Fig. 8 Chemical Oxygen Demand analysis and (ii) UV-Visible absorbance spectrum of 20 ppm of 2,4-D
w.r.t. time
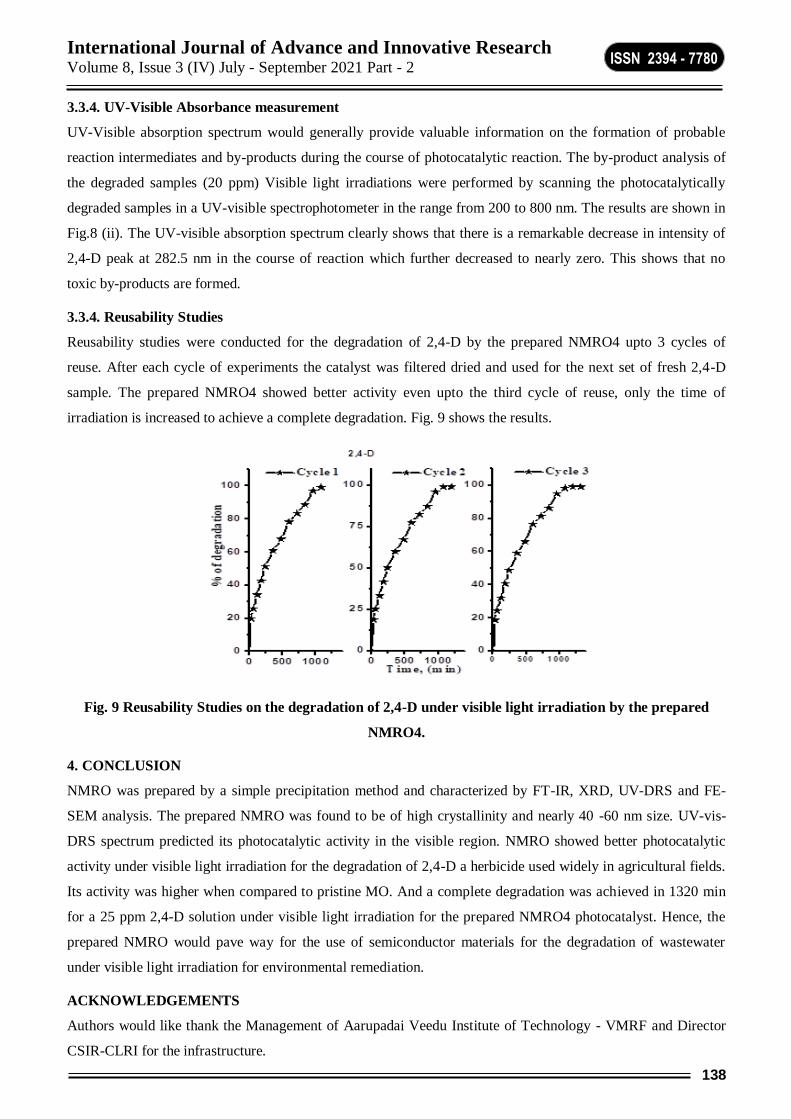
International Journal of Advance and Innovative Research Volume 8, Issue 3 (IV) July - September 2021 Part - 2
138
ISSN 2394 - 7780
3.3.4. UV-Visible Absorbance measurement
UV-Visible absorption spectrum would generally provide valuable information on the formation of probable
reaction intermediates and by-products during the course of photocatalytic reaction. The by-product analysis of
the degraded samples (20 ppm) Visible light irradiations were performed by scanning the photocatalytically
degraded samples in a UV-visible spectrophotometer in the range from 200 to 800 nm. The results are shown in
Fig.8 (ii). The UV-visible absorption spectrum clearly shows that there is a remarkable decrease in intensity of
2,4-D peak at 282.5 nm in the course of reaction which further decreased to nearly zero. This shows that no
toxic by-products are formed.
3.3.4. Reusability Studies
Reusability studies were conducted for the degradation of 2,4-D by the prepared NMRO4 upto 3 cycles of
reuse. After each cycle of experiments the catalyst was filtered dried and used for the next set of fresh 2,4-D
sample. The prepared NMRO4 showed better activity even upto the third cycle of reuse, only the time of
irradiation is increased to achieve a complete degradation. Fig. 9 shows the results.
Fig. 9 Reusability Studies on the degradation of 2,4-D under visible light irradiation by the prepared
NMRO4.
4. CONCLUSION
NMRO was prepared by a simple precipitation method and characterized by FT-IR, XRD, UV-DRS and FE-
SEM analysis. The prepared NMRO was found to be of high crystallinity and nearly 40 -60 nm size. UV-vis-
DRS spectrum predicted its photocatalytic activity in the visible region. NMRO showed better photocatalytic
activity under visible light irradiation for the degradation of 2,4-D a herbicide used widely in agricultural fields.
Its activity was higher when compared to pristine MO. And a complete degradation was achieved in 1320 min
for a 25 ppm 2,4-D solution under visible light irradiation for the prepared NMRO4 photocatalyst. Hence, the
prepared NMRO would pave way for the use of semiconductor materials for the degradation of wastewater
under visible light irradiation for environmental remediation.
ACKNOWLEDGEMENTS
Authors would like thank the Management of Aarupadai Veedu Institute of Technology - VMRF and Director
CSIR-CLRI for the infrastructure.
International Journal of Advance and Innovative Research Volume 8, Issue 3 (IV) July - September 2021 Part - 2
139
ISSN 2394 - 7780
CONFLICTS OF INTEREST
There are no conflicts to declare
REFERENCES:
1. Kusvuran, E.; Gulnaz, O.; Samil, A.; Erbil, M. J. Hazard. Mater. 2010, 175, 410–416.
2. Thennarasu, G.; Sivasamy, A.; Kavithaa, S. J. Mol. Liq. 2013, 179, 18-26.
3. Rao, C.N.R.; Cheetham, A.K. J. Mater. Chem. 2001, 11, 2887-2894.
4. Lebedev, A.; Anariba, F.; Tan, J. C.; Li, X.; Wu, P. J. Photochem. Photobiol. A. 2018, 360, 306-315.
5. Prathap Kumar, M.; Suganya Josephine, G. A.; Sivasamy, A. J. Mol. Liq. 2017, 242, 789-797.
6. Suteu, D.; Zaharia, C.; Muresan, A.; Muresan, R.; Popescu, A. EEMJ. 2009, 8, 1097–1102.
7. Tran, Q.H.; Nguyen, V.Q.; Le, A. Adv. Nat. Sci: Nanosci. Nanotechnol. 2013, 4, 1-20.
8. Mohajeri-Tehrani, M.R.; Aalaa, M.; Aalaa, A.A.; Rohipour, N.; Sanjari, M.; Khashayar, P.; Shahcheraghi,
F.; Khashayarfard, M.; Heshmat, R.; Madani,S.P.; Meybodi, H.A.; Maleknia,L.; Larijani, B. Sci. Rep.
2012, 1, 538–540.
9. Nawaz, H. R.; Solangi, B. A.; Zehra B.; Nadeem. U. Can. J. Sci. Ind. Res. 2011, 2,
10. Azizi, S.; Ahmad, M.; Mahdavi, M.; Mohammadi. S.A. Bioresources Technol. 2013, 8, 1841-1851.
11. Chen, Y.; Wang, L.; Wang, W.; Cao. M. Mater. Chem. Phys. 2017, 199, 416-423.
12. Sapkal, R.T; Shinde, S.S.; Waghmode, T.R.; .Govindwar, S.P; Rajpure, K.Y.; Bhosale, C.H. J. Photochem.
Photobio. 2012, 110, 15-21.
13. Xie, W.; Li, Y.; Sun, W.; Huang, J.; Xie, H.; Zhao, X. J. Photochem. Photobiol. A 2010, 216, 149-155.
14. Suganya Josephine, G.A.; Sivasamy, A. Int J Ceramic Eng Sci. 2021, 3,180-191.
15. Suganya Josephine, G.A.; Sivasamy, A. Appl. Catal. B. 2014, 150, 288-297.
16. Kamble, S.P.; Deosarkar, S.P.; Sawant, S.B.; Moulijn, J.A.; Pangarkar, V.G. Ind. Eng. Chem. Res. 2004,
43, 8178-8187.
17. Kaioumova, D.; Susal, C.; Opelz, G. Hum. Immunol. 2001, 62, 64-74.
18. Crosby, D. G.; Tutass, H. O. J. Agric. Food Chem. 1966, 14, 596-599.
19. Muller, T. S.; Sun, Z.; Gireesh Kumar, M. P.; Murabayashi, K. M. Chemosphere 1998, 36, 2043.
20. Lagana, A.; Bacaloni, A.; Leva, I. D.; Faberi, A.; Fago, G.; Marino, A. Anal. Chim. Acta. 2002, 462, 187.
21. Rawlings, N. C.; Cook, S. J.; Waldbillig, D. J Toxicol Environ Hlth. 1998, 54, 21-36.
22. Suganya Josephine, G.A.; Sivasamy, A. Environ. Sci. Technol. Lett. 2014, 1, 172-178.
23. Balachandran, C.; Arun, Y.; Duraipandiyan, V.; Ignacimuthu, S.; Balakrishna, K.; Al-Dhabi, N.A. Appl.
Biochem. Biotechnol.2014, 172, 3513-3528.
24. Balachandran, C.; Duraipandiyan, V.; Balakrishna, K.; Lakshmi Sundaram, R.; Vijayakumar, A.;
Ignacimuthu, S.; Al-Dhabi, N.A. Environ. Chem. Lett. 2013, 11, 303-308.
International Journal of Advance and Innovative Research Volume 8, Issue 3 (IV) July - September 2021 Part - 2
140
ISSN 2394 - 7780
PHILOSOPHY OF SWAMI VIVEKANANDA: A HINDU PROPHET
Dr. E. Girani
Assistant Professor, Department of Political Science, Manipur College, Imphal
ABSTRACT Swami Vivekananda was one of the great interpreters of the Vedantic philosophy and also the first great
Hindu of modern times who made persistent effort to realise the dream of the universal propaganda of
Hindu religion and philosophy. He is generally known as a prophet, an immense lover of humanity, a great spiritual and religious leader and a heart wining orator. Very few know about his literary expressions, chiefly
the writings composed by him. Most of the Indian saints while giving their message to the world have produced
the writings form of the highest order. None among these were the writers or the literary figures. These were the heavenly spirits and saints showing right path giving heavenly message to the society. Still whatever they
have produced in the form of their message or writing has become the great literary treasure. Same is the case
with Swami Vivekananda whatever he spontaneously expressed in the form of his writings has become the very
expression of his soul, personality and his life giving message. Actually he was the Hindu Napoleon so that most of the writings of Vivekananda indicated his high ecstatic state, personal experiences, concerns, prophetic
outlook, patriotic and spiritual view point in which they are shaped as a Hindu prophet.
Keywords: Hindu prophet, humanity, Napoleon, philosophy, patriotic, Swami.
INTRODUCTION:
Swami Vivekananda’s inspiring personality was well known both in India and in America during the last
decade of the 19th century and the first decade of the twentieth century. The unknown monk of India suddenly
leapt into fame at the parliament of Religions held in Chicago in 1893 at which he represented Hinduism. He was a Hindu monk from India. He played a significant role in the growing Indian nationalism of the 19th
century, reinterpreting and harmonising certain aspects of Hinduism. His teachings and philosophy applied this
reinterpretation to various aspects of education, faith, character building as well as social issues pertaining to
India and was also instrumental in introducing Yoga to the west1. According to him, a country's future depends on its people, stating that man-making is his mission. Religion plays a central role in this man-making, stating to
preach unto mankind their divinity and how to make it manifest in every movement of life. He played a major
role in the growing Indian nationalist sentiments in the late 19th and the 20th century, encouraging many Indians with his success and appeal in the West. His example helped to build pride in India's cultural and religious
heritage and supported the Indian independence movement. He participated in several of these movements,
calling for Indian independence from the British rule. According to him, the Indian race never cared about
physical wealth, although they acquired immense wealth. He believed in unity of all religions. Religion played a
major role in his ideas. He said it is being and becoming, not hearing or acknowledging; it is the whole soul
becoming changed into what it believes. He hated the religious rituals that were in practice during that time.
According to him, religion is the idea which is raising the brute into man and man into God2. Religion was his
main focus after self-realization. He established through historical sequence. He showed that Vedic religion had influenced Buddhism which again was instrumental in influencing Christianity. He remarked in the Parliament
of Religions that all the religions of the world have the same value and importance. He was a great lover of
Vedantic philosophy. He believed in monism. His motto, as reflected earlier, was to establish a link among different religions. He cited that as water of different rivers mingle in the sea, similarly every religion finds itself
at the feet of God. He preferred to meditate at any place without any inhibition in his mind. By his personal
example, he preached monism or Advaita Vedantism3.
Another great contribution of Swami Vivekananda was to build a bridge between Indian and Western. He
did it by interpreting Hindu scriptures and philosophy and the Hindu way of life and institutions to the
Western people in an idiom which they could understand. He made the Western people realize that they had
to learn much from Indian spirituality for their own well - being. He showed that, in spite of her poverty and backwardness, India had a great contribution to make to world culture. In this way he was instrumental in
ending India’s cultural isolation from the rest of the world. He was India’s first great cultural ambassador to the
West. As a greatest disciple of Sri Ramakrishna Paramahamsa, Swami Vivekananda carried the message of his master all over India, Europe and America. In 1893, he attended the Parliament of Religions held in Chicago.
He created a sensation in the great assembly by his brilliance and nobility. His views and ideals played an
important role in the reconstruction of India as a nation.

International Journal of Advance and Innovative Research Volume 8, Issue 3 (IV) July - September 2021 Part - 2
141
ISSN 2394 - 7780
Statement of the problem The genres of literatures produced so far discuss on philosophy of Swami Vivekananda which found different
viewpoints written by different writers. Generally, the common people thought that the term philosophy is nothing happen in the modern society so that such simple thought is quite challenging and also inspiring me to
take up the present research paper on “Philosophy of Swami Vivekananda:- A Hindu Prophet”. So this study is
still lagging behind and quite distinct from the others’ write ups.
REVIEW OF THE RESEARCH I got through in most of the write ups on philosophy of Swami Vivekananda such as, books, journals, research
papers, pamphlets etc. however this view points are different from the others. Regarding this theme on
“Philosophy of Swami Vivekananda:-A Hindu Prophet” is very much different and speciality from the others
write ups which is a quite unique.
Major findings of the study 1. Swami Vivekananda was the chief disciple of the 19th century saint Ramakrishna Paramahansa and the
founder of the Ramakrishna Math and the Ramakrishna Mission.
2. He is considered a key figure in the introduction of Indian philosophies of Vedanta and Yoga to the
western world, mainly in America and Europe and is also credited with raising interfaith awareness,
bringing Hinduism to the status of a major world religion during the end of the 19th century.
3. He is considered to be a major force in the revival of Hinduism in modern India.
4. One of the most significant contributions of Swami Vivekananda to the modern world is his interpretation
of religion as a universal experience of transcendent reality, common to all humanity.
5. Vivekananda’s concept of potential divinity of the soul gives a new, ennobling concept of man. The
present age is the age of humanism which holds that man should be the chief concern and center of
all activities and thinking. Through science and technology man has attained great prosperity and power,
and modern methods of communication have converted human society into a global village.
6. Swamiji has laid the foundation for spiritual humanism, which is manifesting itself through several neo-
humanistic movements and the current interest in meditation all over the world.
7. He was India’s first great cultural ambassador to the west.
8. Swamiji was the first religious leader to speak about the common bases of Hinduism and the common
ground of all sects.
9. He played an important role in re-moulding the Indian life. He was one of the greatest social reformers of
India.
10. He was not hero of action like Alexander the Great, Napoleon or Gandhiji. But he was a divinely inspired
leader who successfully infused a new hope in man.
11. He was the Hindu Napoleon.
Importance and relevance of the research Nowadays Philosophy of “Swami Vivekananda:-A Hindu Prophet” has become important and relevant due to
its some merits reasons like: -
1. He was like Gautama Buddha who gave importance to the work of removing human misery rather than
try to discuss the nature of truth. He declared that he was starting a crusade against all that is false and
against the real spirit of religion.
2. He believed that the source of Hindu religion and cultures were Vedas.
3. The Universalism of Buddhist principles attracted the attention of V ivekananda and like Buddha he
also becomes a world spiritual leader.
4. He believed that humanity without religion will be a mass of brutes. It constitutes the most important
lesson taught by Vivekananda on matters of religion. All religions should teach love and mutual tolerance
as the cardinal principles of religion.
5. God is like the water that fills the different vessels of different shapes. In each vessel the vision of god
takes a different form. Yet he is one, he is God in every sense.
International Journal of Advance and Innovative Research Volume 8, Issue 3 (IV) July - September 2021 Part - 2
142
ISSN 2394 - 7780
6. The heart of his religion was Vedanta. He argued that Vedanta can be the basis of a universal religion of
man.
7. He was a believer in democracy.
8. Vivekananda was not only a spiritual leader but also a great social reformer as well.
9. His views on society were realistic and pragmatic at the same time he wanted to evolve society as a divine
institution and that society must develop the highest truth in life. He asked the people to understand that
behind the strong and the weak there was the same infinite soul.
10. He was against all types of social injustice and had the dream of a harmonious social order based on the
lofty ideals of freedom and equality.
11. He taught the principle of human equality and urged the Indian people to abolish the cruel, irrational and
unjust practices like untouchability.
12. His philosophies are the only weapon to remove all darkness. That is why his new understanding of
religion, new view of man, new principle of morality and ethics, concept of East-West, contribution to
India, contribution to Hinduism, teaching are still relevant in enlightening us.
Objectives of the Study The major objectives of the study are:
• To study the philosophy of Swami Vivekananda.
• To investigate and study his philosophy as a Hindu prophet.
METHODOLOGY The study is mainly based on secondary data. The secondary data are collected from the printed books, journals,
magazines, and newspapers, etc.
Swami Vivekananda as a Hindu prophet
Swami Vivekananda is credited with contributing to a revival of modern Hinduism and inspiring nationalist consciousness during the British colonial rule. He is best known for his famous 1893 speech where he
introduced Hinduism to the western world in Chicago, such speech is still relevant today. The Swami made a
distinct and notable contribution to world religion in his championship of Hinduism as a universal gospel of
ethical humanism and spiritual idealism. Hinduism had been the subject of intense misrepresentation at the hands of Christian missionaries who suffered from imperialism-complex and were actuated with a sense of
burden to civilize the black men and brown4. To him, Hinduism was the mother of religions and this can be, to
some extent, demonstrated historically. The ancient Vedic religion influenced Buddhism, and the latter was possibly a potent factor in the rise of Christianity. Vivekananda's heroic gospel is summarized in the following
remarks of his, and these show the dominant elements of his powerful personality:
“I know that truth alone gives life, and nothing but going towards reality will make us strong and none will reach truth until he is strong ...Strength is the medicine for the world's disease. Strength is the medicine which
the poor must have when tyrannized over by the rich. Nothing gives such strength as the idea of Monism.
Nothing makes us so moral as the idea of Monism."5
Hence we find that many great men in India have been influenced by his personality and teachings. Swami Ramatirtha, the apostle of neo-Vedantism who also lectured in Egypt, Japan and America, was deeply inspired
by him. Subhas Chandra Bose recognized Vivekananda as his spiritual teacher. Aurobindo was a great admirer
of him and read his works in his younger days. Swami Satyadeo owed allegiance to him. Radhakrishnan testifies that the enthusiasm and eloquence of Vivekananda in defence of Hinduism have deeply touched him.
Mahatma Gandhi went to see him in Belur Math, but could not meet him as the Swami was then ill. Gandhiji
was then an obscure man, about the year 1901. Jawaharlal has showered praises on the Swami in his book, ‘The Discovery of India’6. Song of the Sannyasin is the Bible of Bengal and the great legacy of this saint and mystic,
Yogi and patriot. The Swami was a world preacher, but he was also the child of India. His noble patriotism
compared favourably with the feelings of a Mazzini, a Bismarck, or an Abraham Lincoln. His dedication to the
cause of Aryavarta was supreme. The Lectures from Colombo to Almora is the Gita of the present-day meant to rouse millions of Tamasic Arjunas to hard work and puissant vigour. The triumphant marches of Vivekananda,
the Hindu Napoleon, in the American continent and Europe, demonstrated to the people that Hinduism had
grown vigorous once more and was intent upon making a spiritual, moral and cultural-philosophical propaganda in the world. The New Imperialism of America and Europe met with this counter-attack from Asia. Asia had
International Journal of Advance and Innovative Research Volume 8, Issue 3 (IV) July - September 2021 Part - 2
143
ISSN 2394 - 7780
given to Europe the main elements of religion and culture in the past and Asia wanted once more to provide
moral inspiration to Europe. Vivekananda's powerful and eloquent orations on the stage of the World
Parliament of Religions at Chicago in September, 1893, gave to our motherland a new self-confidence which is the true psycho logical precursor of an independent foreign policy. Vivekananda found that religion is the most
essential and basic element in the character of the Indian people. In India, he remarked that religious life forms
the centre, the keynote of the whole music of national life. Western nations like England or America may ignore religion in their schemes of social well-being, but India can do so only by endangering her national vitality. He
is of the view that unlike other nations whose whole soul as it were, lay in political conquest or social
utilitarianism.7 India must meet all the challenges of the future through the vitality and inspiration of religion.
India must have a socio-political system which upholds the principles common to all faiths without contradicting the secular spirit of non- favouritism in the administration. India cannot afford to do because
religion and life are so intimately interwoven here that no aspect of life can be separated from religion.
Vivekanda’s opinion is that religion consists is man’s capacity for self- transcendence. Each soul is potentially divine and religion is the unfoldment of this latent divinity. The universality of religion does not point to the
existence of one religion, it simply means peaceful co-existence of all religions.8 It is to be achieved by mutual
understanding and appreciation and reverent attitude towards one another. According to him, religion is not just a talk on doctrines or theories, nor is it sectarianism. Religion does not live in sects and societies. It is a
relationship between soul and god. He explained that religion does not consist in erecting temples or building
churches or attending public worship. Also it cannot be found in the books or in words or in lectures or in
organizations. Religion consists of realization. Religion does not consist in subscribing to a particular creed or
faith but in spiritual realization.9 Therefore, spiritual realization is religion.
Vivekananda reflected on the necessity of the concept of universal religion for the society. He realized the
nature of man, according to which mankind in the whole world has been trying to look beyond in the quest of his ultimate destiny or search for God. Therefore, whole of the world community is expecting a religion, which
is acceptable to all. Against the background of conflict among religions, Swami Vivekananda envisions the
emergence of Universal Religion in modern times. It will liberate religions from the trammels of conflict and
limitation and would once again put them on the sure and unwavering foundations. Swamiji is confident that such universalness of religion is possible for every person of every religion. From the above points of view we
came to know that Swami is the Hindu Napoleon without him, Hinduism may not be modern form. The
question is now where Swami takes place for the role of Hinduism. What type of prophet he was. He travelled all over India and different part of the world and thus had first-hand experience of religion in practice. By the
time he went to the USA to represent Hinduism at the world Parliament of Religions in Chicago and interpreted
that Hinduism is the mother of religions and its significant role in the reconstruction of India as a nation.
CONCLUSION
Swami Vivekananda was a divinely inspired leader who successfully infused a new hope in man. He acted as
a link between the East and the West and played his efficient role spreading the great values of Indian culture.
Nehru remembered in his ‘Discovery of India’ that Vivekananda was a man who was proud of the past but did not want to live in the past. He exhorted Indians to strike a healthy balance between the western and eastern
elements of human civilisation. He was a great spiritual man and philosopher around the world. He wanted
global spirituality, harmony, universal brotherhood and peace across the world. His teachings and philosophy still exists in the present day and guided the modern era of the masses as a Hindu prophet. He guided India and
the world community as a whole new horizon of knowledge and developed a new hope of love, peace and
progress for humanity. If Indian traditions and culture are valued and respected abroad today, India is indebted to, this great son of India. Subsequently Swami Vivekananda was not an individual but an institution of the
whole masses particularly for the modern Hinduism.
REFERENCES
[1]. Advaita Ashrama (1983), Reminiscences of Swami Vivekananda (3rd ed.), Calcutta, India: Advaita
Ashrama, p. 430, (Collected articles on Swami Vivekananda, reprinted in 1994)
[2]. Badrinath, Chaturvedi (2006), Swami Vivekananda The Living Vedanta, New York: Penguin, p.254
[3]. Basu, Shamita (2002), Religious Revivalism as Nationalist Discourse: Swami Vivekananda and new
Hinduism in nineteenth century Bengal, New Delhi: Oxford University Press, p.269
[4]. Binoy K. R., (1977) Socio- political views of Vivekananda, AdvaithaAshrama, Calcutta,p.30
[5]. Swami Vivekananda, (1962) Complete works of Swami Vivekananda, Vo.2, Calcutta, p.122

International Journal of Advance and Innovative Research Volume 8, Issue 3 (IV) July - September 2021 Part - 2
144
ISSN 2394 - 7780
[6]. Jawaharlal Nehru, (1960) The Discovery of India, Asia Publishing House, Bombay, p.64
[7]. Bali D. R., (1989) Modern Indian Thought, Asian Publishing House, Bombay, p.34
[8]. Jones, Kenneth W. (1989), Socio-religious movements in British India, Cambridge, England: Cambridge
University Press
[9]. Swami Rankanath Ananda, (1971) Eternal values for the changing society, Bombay, p.291.
International Journal of Advance and Innovative Research Volume 8, Issue 3 (IV) July - September 2021 Part - 2
145
ISSN 2394 - 7780
PHYSICOCHEMICAL ANALYSIS OF EFFLUENT FROM SEA FOOD PROCESSING INDUSTRIES
IN CHENNAI
1S. Gini and
2A. Ganesh Kumar
1Department of Microbiology, New Prince Shri Bhavani Arts and Science College, Chennai – 600100,
Tamilnadu, India 2Department of Microbiology, Hindustan College of Arts & Science, Padur, OMR, Chennai - 600100,
Tamilnadu, India
ABSTRACT
Seafood processing effluent particularly in developing countries, discharges the effluent into the adjoining
environment and water bodies. These water bodies being mostly affected and also causes various ill effect to humans. Effluents from the seafood processing industry have been a major source of environmental pollution
.The effluent discharged from industry, need to be characterized for their compliance to standards by regulatory
authorities. Effluent contains chemicals, organic matter and microorganisms including pathogens and multi-
resistant bacteria. The physicochemical analysis such as pH, Total dissolved solids, BOD, COD and other parameters reveals the effluent is highly organic in nature and highly polluted and also affects the aquatic
ecosystem, if it is released without adequate treatment. Some of these effluents are untreated or inadequately
treated before being discharged, which has become a worrisome phenomenon due to its impact on
environmental health and safety.
Keywords: Seafood Processing Industry, Effluent, Physicochemical Characteristics, BOD, COD
INTRODUCTION
Industrial wastewater released into the water bodies is one of major sources of environmental Pollution (Kaur et al., 2010). Water pollution occurs due to the introduction of chemical, physical, biological materials which
degrades the quality of the water and affects the organism living in it. (Vishakha Sukhadev Shivsharan et al.,
2013). Water is the elixir of life, a precious gift of nature to mankind and millions of species living on the earth
and helpful to the whole earth. (Usharani,et al., 2010) Characteristics of industrial wastewater varies from industry to industry and within industries also there are variations in the quality depending upon the processes,
for example quality of wastewater coming out from a cooling tower will be quite different then the wastewater
coming out from any chemical process, lifestyle of people etc( Kolhe and Powar, 2011). The discharge of waste from the seafood processing industries into the adjacent wetlands affects the aquatic life , thus may affect the
whole food chain and the ecosystem. Problems occur when the quantity of organic matter discharged exceeds
the carrying capacity of the ecosystem .Excessive discharge of organic nutrients into the marine environment
can result in reduction of dissolved oxygen in the water leading to anoxia, increased ammonia concentrations, overloads of nitrogen (N) and phosphate (P) causing excessive plant growth, variation in pH, and increased
water turbidity and leads to the decrease in number of aquatic ecosystem. (Tchoukanova et al., 2003). The
physicochemical properties of industrial wastewater effluent that are of special concern are pH, dissolved oxygen (DO), oxygen demand (chemical and biological), solids (suspended and dissolved), nitrogen (nitrite,
nitrate and ammonia), phosphate (Decicco, 1979).
MATERIALS AND METHODS Effluent samples were collected from the sites with the help of clean plastic containers, washed with nonionic
detergent, rinsed with tap water and finally washed with distilled water prior to usage. Carefully the
contamination of samples with any foreign materials while collecting was avoided. Samples collected were
brought to the laboratory and preserved under 40 ºC temperature. The samples were analyzed periodically for six months. Selected physicochemical parameters such as pH, Total Solids (TS), Total Suspended Solids (TSS),
Dissolved oxygen, Biological Oxygen Demand (BOD), Chemical Oxygen Demand (COD), Oil & Grease,
Nitrate and Chloride were analyzed (APHA, 1998).
RESULTS
In this present investigation, temperature of effluents was found to be 29℃. The pH levels generally reflect the
decomposition of proteinaceous matter and emission of ammonia compounds. pH serve as one of the important parameters
because it may reveal contamination of a wastewater body or indicate the need for pH adjustment for biological treatment
of the wastewater. The value of pH determined samples was 7.33. The residue left after evaporation of unfiltered
samples are total solids. Waste water contains variety of solid materials. In this present study, after the desiccation
process obtained value for total solids is 1785 mg/L. In the waste water treatment Total Suspended Solids play
an important role, after drying and weighing the total suspended solid value of the collected effluent was 237
International Journal of Advance and Innovative Research Volume 8, Issue 3 (IV) July - September 2021 Part - 2
146
ISSN 2394 - 7780
mg/L to 820mg/L. whereas the total dissolved solids of collected effluent in this study is 840 to 1240 mg/L. By
colour change dissolved oxygen level was determined whereas dissolved oxygen of the seafood processing
effluent is 1.1mg/L. Low value of BOD is may be due to lesser quantity of total solids, suspended solids in water as well
as to the quantitative number of microbial population. In this present study, BOD of the wastewater is 375-1450
mg/l. The waste is measured by the amount of oxygen required for oxidation of organic matter to produce CO2 and water.
In this work, COD of the effluent is 1500-2750 mg/L. After drying the collected extracts revealed value of oil & grease as 3 mg/l. In this study the absorbance level of nitrate in seafood processing effluent is 140 mg/L and
the value obtained for chloride is 162mg/l.
DISCUSSION
One of the objectives of this study was to analyse physicochemical parameters of the effluent discharged from seafood processing industries. No specific limit for temperature is prescribed by WHO or ISI for the water
quality use for the domestic purpose. In the present investigation value of temperature of effluents was 29℃. A
study found that the average pH of effluents from sea food processing industries was 7.63 (Carawan et al., 1979). The pH levels generally reflect the decomposition of proteinaceous matter and emission of ammonia
compounds (Gonzalez, 1996). In the present investigation the pH value of the collected effluent is 7.33 which
coincides with the previous reports from the literature. The literature studies revealed the total solids of effluent is 6754mg/L (Sherly Thomas et al., 2015) and (Kolhe & Pawar 2011 ) found total solid 1310 mg/L in effluent
in dairy industry. In this present study, the obtained value for total solids is 1785 mg/L,which is much lesser
than the report given by the previous studies. In this study the TDS of effluent is840 to 1240 mg/L.In addition,
water is said to be unpalatable and may begin to loss its commercial and domestic worth when the TDS level exceeds 1000 mg/L. High concentration of TDS can result in dehydration of aquatic animals (Rachna, B.; Disha
2016). DO levels in water is partly dependent on the chemical, physical and biochemical activities occurring in
the water (Julian, et al., 2018). Oxygen has a limited solubility in water directly related to atmospheric pressure and inversely related to water temperature and salinity. The DO of the effluent is 1.1mg/L. The value obtained
from other studies is 1.2 mg/L (Vishakha Sukhadev Shivsharan 2013). In this present study,BOD of the
wastewater is 375-1450 mg/l (Carawan et al. 1986) reported a BOD of 200-1000 mg l -1, from seafood
processing plant wastes . Most of the BOD usually comes from hold water and from the butchering process (Technical Report Series FREMP, 1993). In this present work, COD of the effluent is 1500-2750 mg/L.
Carawan et al. (1979) observed that the COD (1300-3250 mg/L) value. This findings shows less value than of
the literature studies In the present study value of oil & grease is 3 mg/l. High oil and grease concentration in effluent discharged into water bodies contributes to the emigration and death of aquatic animals. In addition, oil
and grease on the surface of the water prevents the penetration of sunlight necessary for the photosynthetic
activities of aquatic flora consequently reducing oxygen concentration in the water bodies. (Walakira P et al., 2011). The concentration in the seafood-processing wastewater is minimal in most cases (Gonzalez, 1996). It is
recommended that a ratio of N to P of 5: 1 is recommended for proper growth of the biomass (Eckenfelder,
1980 ).The high nitrogen levels are likely due to the high protein content (15-20% of wet weight) of fish and
marine invertebrate (Sikorski,1990). The nitrate level is 140 mg/L, In previous report it shows that nitrate level is 170 mg/L(Sagar .T et al.,2012). Seafood processing wastewater was noted to sometimes contain high
concentrations chlorides from processing water and organic nitrogen(0-300 mg l -1) from processing water and
brine solutions (Flick and Martin,2012). The presence of chloride in the natural water can be attributed to dissolution of salts deposits and discharge of effluent from chemical industries and drainage sea water
intrusion in coastal areas.(Kolhe and Pawar, 2011).
CONCLUSION There are large amount of organic waste from processed seafood processing in terms of wastewater and solid
waste. Processing waste from factories may cause badly hygiene of employee and encircling community. Waste
reduction to zero-waste is crucial for sustainable environment. In the present work all the parameters are up to
the desired level and no special care is needed for the effluent plant.
REFERENCES
APHA, Standard methods for the examination of water and wastewater, 20th Edn. American Public Health
Association., Washington, 1998.
Carawan, R.E., Chambers, J.V., & Zall, R.R. Seafood Water and Wastewater Management. The North
Carolina, Agricultural Extension Service. U.S.A.1979.
International Journal of Advance and Innovative Research Volume 8, Issue 3 (IV) July - September 2021 Part - 2
147
ISSN 2394 - 7780
Carawan, R.E., Green, D.P., Thomas, F.B., & Thomas, S.D. Reduction in waste load from a seafood
processing plant. The North Carolina Agricultural Extension Service. North Carolina State University,
Raleigh, NC 27695. 1986
Decicco, B.T. Removal of eutrophic nutrients from wastewater and their bioconversion to bacterial single
cell protein for animal feed supplements phase II. Water Resources ResearchCentre Report 15. 1979.
Eckenfelder, W.W. Principles of Water Quality Management; CBI Publishing Co.: Boston, 2006 by Taylor
& Francis Group, LLC.1980.
Flick, G.J., & Martin, R.E. The Seafood Industry; Species, Products, Processing ad Safety. In. Granata,
L.A., Flick, G. J., & Martin, R.E(Eds.), John Wiley & Sons.2012.
Fremp. Wastewater Characterization of Fish Processing Plant Effluents. Technical Report Series FREMP
WQWM-93-10, DOE FRAP Fraser River Estuary Management Program. New West Minister, B C.1993.
Gonzalez, J.F. Wastewater Treatment in the Fishery Industry. FAO Fisheries Technical Paper (FAO), No.
355/FAO, Rome (Italy), Fisheries Dept.1996.
Julian, K.T.; Marianne, S.; Shaun, R. Contaminated Groundwater Sampling and Quality Control. of Water
Analyses. Environmental Geochemistry, 2nd ed.; British Geological Survey: Nottingham, UK, pp. 25–45,
2018
Kaur, A.; Vats, S.; Rekhi, S.; Bhardwaj, A.; Goel, J.; Tanwar, R.S.; Gaur, K.K. Physico-chemical Analysis of the Industrial Effluents and Their Impact on the Soil Microflora. Procedia Environ. Sci.: 2, 595–599,
2010
Kolhe AS, Power VP. Physico-Chemical Analysis of Effluents from Dairy Industry. Recent Research in
Science and Technology. 3(5):29-32, 2011.
Rachna, B.; Disha, J. Water Quality Assessment of Lake Water: A Review. Sustain. Water Resour. Manag.
2016: 2, 161–173.
Sagar T. Sankpal and Pratap V. Naikwade. Physicochemical analysis of effluent discharge of fish
processing industries in Ratnagiri. Bioscience Discovery. 3(1):107-111, 2012.
Saxena, MM. Environmental Analysis – water, soil and air. Agro Botanical Publishers (India), 2nd
Edition, 4-86: 121-125, 1994.
Sikorski, Z. Seafood Resources: Nutritional Composition and Preservation; CRC Press, Inc.: Boca Raton,
FL.1990.
Tchoukanova, N., Gonzalez, M. and Poirier, S. Best Management Practices: Marine Products Processing. Fisheries and Marine Products Division of the Coastal Zones Research Institute Inc.,Shippagan, New
Brunswick, Canada. 2003.
Usharani, K; Umarani, K; Ayyasamy, P M; Shanthi, K; Lakshanaperumalasamy. Physico-Chemical and
Bacteriological Characteristics of Noyyal River and Ground Water Quality of Perur, India J. Appl. Sci.
Environ. Manage. 14 (2) 29 – 35, 2010.
Vishakha Sukhadev Shivsharan, Minal Wani and Khetmalas.M.B Characterization of Dairy Effluents by
Physicochemical Parameters. British Biotechnology Journal, 3(4) : 575-580, 2013
Walakira, P.; Okot-Okumu, J. Impact of Industrial Effluents on Water Quality Receiving Streams in
Nakawa-Ntinda, Uganda. J. Appl. Sci. Environ. Manag. 15, 289–296, 2011.
International Journal of Advance and Innovative Research Volume 8, Issue 3 (IV) July - September 2021 Part - 2
148
ISSN 2394 - 7780
PREVALENCE OF ANTIBIOTIC RESISTANT PATHOGENS IN READY TO EAT STREET FOOD
IN INDIAN MARKET
Gautam Archana1*
,, Khandal. R. K2, Aggarwal Manjeet
3 and Kaur. Kuljinder
4
ABSTRACT Background: Food safety of food in terms of microbial and nutritional aspects is increasing public health
concern worldwide. Food safety is a significant barrier to the socio-economic development of nations across
the globe. Salmonella is the leading cause of food borne illness worldwide. Objective: The objective of the present study was to investigate the occurrence of multidrug resistance bacteria in ready to eat food sample
directly effecting their nutritional and safety aspects which may lead to spread of fatal diseases.
Design: A total 15 samples of different ready to eat foods collected from different food eateries. All the selected samples were analyzed for detection of total viable count, coliform count, E.coli ,Staph.aureus, Bacillus cereus,
Salmonella and Listeria monocytogenes, nutritional parameters and antibiotics resistance.
Results: Total Viable count of the samples ranged from 1.18×10³ cfu/gm to 1.20×10⁶ cfu/gm and Coliform
count ranged from 1.00×10² to 2.29 × 10³ cfu/gm. Highest counts was observed in Vegetable Momos with total
viable count 1.20×10⁶ cfu/gm and coliform count 2.29×10³ cfu/gm.
The rate of incidence of Listeria. Monocytogenes(60%) isolates was higher than other isolates present in all
samples. Eight out of fifteen samples (53%) were shown to be unacceptable quality based on Bacillus.cereus and S.aureus while six samples (40%) were contaminated with Salmonella and E. Coli. Frozen Mozzarella
Cheese and Chicken Keema were two samples carrying all the pathogens. Mix veg roll sample is negative for
all pathogens although its viable count is high. Distribution of the number of isolates according to the number
of the antibiotics, resistant showed was; 40% of the isolates were resistant to 8 antibiotics while 20 % of
isolates were resistant to 7, 6 and 5 number of antibiotics.
Conclusion: To limit contamination of foods by microorganisms including pathogens, we need to improve
hygiene practices and the food chain in terms of the environment of distribution, processing and storage of
foodstuffs.
Key words: Food safety, pathogens, antimicrobial resistance
1. INTRODUCTION:
Microbial food safety is increasing public health concern worldwide. The demand for ready-to-eat convenient food items is rising due to changing lifestyle. However, the maintenance of quality of these products is of key
importance for continued and smooth running of this business. It is estimated that food contamination may
occur at various steps like processing, retail, production and packaging. Developing countries continue to
struggle with the issue of food security, that is, the amount of food enough for consumption by the growing population; there is yet another quandary in these countries: the safety of food. It is estimated that over 200
types of diseases are caused or spread by food, sometimes causing long-term health problems in vulnerable
groups of people such as the elderly, pregnant and the infants (WHO, 2015). Thus, ensuring the safety of food is an important challenge in developing countries from the public health perspective. Food safety is a
significant barrier to the socio-economic development of nations across the globe. The World Health
Organisation (WHO) estimated that in 2010, food borne pathogens were responsible for 600,652,361 illness cases and 418,608 deaths worldwide (Havelaar et al., 2015). Salmonella is the leading cause of food borne
illness worldwide (Havelaar et al., 2015). ). Food of animal origin has been demonstrated to be a source of a
majority of food-borne bacterial infections caused by Campylobacter, Yersinia,E.coli-0157,non-typhoid
Salmonella, and other pathogens (Threlfall et al., 2003; Padungtod et al., 2006; Miles et al., 2006; Meyer et al., 2008). Salmonella outbreaks have been linked to poultry and beef products, fruit, produce and ready-to-eat
meals (CDC, 2019). Dairy products, including raw milk and soft unpasteurised cheese have been identified as
sources of Salmonella during past outbreak investigations (Maguire et al., 1992; Olsen et al., 2004; Ryan et al., 1987). ). In recent decades, antimicrobial resistance and reduced sensitivity in bacteria have become a major
public health problem in many countries (Centers for Disease Control and Prevention, 1993; Diekema and
Jones, 2001; Kim et al., 2001; Jones, 2003). Food is an excellent means of introducing pathogenic micro- organisms to the general population and in immuno- compromised people, and therefore it may transfer
antibiotic-resistant bacteria to the intestinal tract of consumers very efficiently.
International Journal of Advance and Innovative Research Volume 8, Issue 3 (IV) July - September 2021 Part - 2
149
ISSN 2394 - 7780
The objective of the present study was to investigate the occurrence of multidrug resistance bacteria in ready to
eat food sample directly effecting their nutritional and safety aspects which may lead to spread of fatal diseases.
2. MATERIALS AND METHODS Sample collection- A total 15 samples of different ready to eat food were collected from different food
eateries. Samples were taken in sterile plastic bags, transported to lab (below 40C) in ice box and preserved in
lab de freezer till analysis.
Preparation of samples- Before analysis, proper thawing was done for certain period of time. All the
selected samples were analysed for detection of total viable count, coliform count, E.coli ,Staph.aureus,
Bacillus cereus, Salmonella and Listeria monocytogenes. For total viable count, coliform count, Staph.aureus
count and Bacillus cereus count, 10 gram sample weighed and stomached with 90 ml of peptone salt solution. In detection method of Salmonella and Listeria monocytogenes, 20 gram of stomached sample was directly
added into their selective enrichment broth and then further steps were followed after incubation of enrichment
broth.
Enumeration – All 15 samples tested for total plate count, E.coli, coliform, Staph aureus and Bacillus cereus
count. The count was carried out by pour plate count method and spread plate method according to Indian
Standards i.e IS:5401,IS:5402,1S: 5887 (Part 1),1S : 5887 (Part -2),5887 (Part 3),1S : 5887 (Part 6).
Carbohydrate fermentation test was done for detection of lactose, sucrose and glucose fermentation.
Identification of selective strains was based on Gram staining, biochemical reactions and serological reactions.
Catalase, oxidase, nitrate reduction tests for Bacillus cereus and Cogulase test for Staphylococcus aureus were
also performed as confirmatory tests.
Isolation of and detection of microorganism-
Detection of Salmonella was done using Indian Standards IS:5887 (Part 3) For Salmonella detection,
stomached sample (25gm) was added to 225 ml buffered peptone and incubated at 37 °C for 24 hrs. Transferred 0.1ml to 1.0ml of pre-enrichment culture to 10ml. of modified R.V. medium and incubated at 42oCfor 18 to 24
hrs. Simultaneously transferred 10 ml of pre enrichment –culture to 100ml of Selenite cystine medium and
incubated at 36oC for 18 to 24hrs. (Ref IS 5887 (Part III).After 24hrs, streak a loopful of enrichment medium
(RV medium) on to the plate of Brilliant green phenol red lactose agar and xylose lysine deoxycholate agar and incubated at 36oC for 18 to 24hrs. In addition to this, streak a loopful from Selenite cystine medium on to
Brilliant green phenol red lactose agar and xylose lysine deoxycholate agar and incubated at 36oC for 18 to
24hrs After incubating the plates of second selective media at the prescribed time and temperature, examined all the plates for the typical colonies of salmonella. Colourless to red appearance and usually with black centre
on XLD and Red or slightly pink or white and opaque with red surroundings on BGA .Morphologically typical
colonies were taken into nutrient agar for further identification. The final confirmation was done by biochemical and serological tests. The shape and type of Gram reaction were studied using 18 hrs cultures of
isolated strains. The biochemical tests performed for confirmation were Indole test,Vogus Proskauer (V.P.)
reaction, L- lysine decarboxylase reaction , urease, citrate utilization, triple sugar iron agar etc. The presence of
Salmonella O, H antigens was confirmed by slide agglutination with appropriate antisera (BD-224061).
Detection Listeria monocytogenes was done Using Indian Standards IS: 14988(P 1& 2):2012.Added 25 gm of
stomached sample to 225 ml of Half Fraser Broth and incubated at 30°C for 24 hour. Alongwith, streaked a
loop full from Half Fraser Broth on to PALCAM & OXFORD agar plate and incubated at 37°C for 48 hours. After incubation, transfer 0.1 ml of inoculum from Half Fraser Broth to Fraser Broth and incubated at 37°C for
48 hours. After completion of incubation in Fraser Broth, inoculated a loop full from Fraser broth on to
PALCAM & OXFORD agar plates and incubated at 37°C for 48 hours. On completion of incubation, typical colonies of Listeria monocytogenes were observed. Picked 4-5 suspected colonies from the PALCAM &
OXFORD agar plates and streaked on Tryptone Soya Yeast Extract Agar plate and incubated at 37°C for 24
hours. Isolated pure colonies of Listeria monocytogenes were confirmed with CAMP test on Blood agar plate.
Antimicrobial susceptibility testing- Antimicrobial susceptibility was tested by the standard agar disc diffusion technique (Kirby- Bauer technique (Bauer RW et al. 1966) on Mueller-Hinton agar using commercial
Antibiotics discs(Hi-Media). The following antibiotic discs were used –
Levofloxacin(LEV)15μg,Cefotaxime(CTX)30μg,Co-Trimoxazole(COT)25μg,Gentamicin(GEN) 10μg,Oxacillin15μg,Ciprofloxacin(CIP)5μg,Azithromycin(AZ)15μg,Chloremphenicol(CHl)30μg. The
antibiotic discs were placed on the agar plates previously inoculated with 18 hrs broth cultures of isolated test
organisms. The plates were incubated at 370C for 24 hrs. The size of the inhibition zones exhibited by test

International Journal of Advance and Innovative Research Volume 8, Issue 3 (IV) July - September 2021 Part - 2
150
ISSN 2394 - 7780
organisms against different antibiotics was measured. Results on the basis of zone diameter were recorded as
sensitive, intermediate or resistant to a particular antibiotic according to the CLSI recommendations.
Results: Total Microbial count in samples: Total Viable count of the samples ranged from 1.18×10³ cfu/gm to
1.20×10⁶ cfu/gm and Coliform count ranged from 1.00×10² to 2.29×10³ cfu/gm. Most of the samples were
acceptable in terms of total viable count but out of range in terms of coliform count. Coliform count are much more than acceptable limits. Highest count was observed in Vegetable Momos with total viable count 1.20×10⁶
cfu/gm and coliform count 2.29×10³ cfu/gm which was considered as highly contaminated sample. Highest
count indicated that food remain in contact with pathogens at different steps during their preparation,
processing and packing. There can be any mishandled step in between which leads to contaminations. Total
microbial load along with pathogens detected is given in the table-2.
Table-2: Total Microbial count and pathogens present in ready to eat sample.
Sample Name Total Viable Count
(CFU/g)
Coliform Count
(CFU/g)
E. coli (Present/
Absent/
25gm)
Salmonella (Present/
Absent/
25gm)
S.aureus
(Present
/
Absent/ gm)
Bacillus. cereus
(Present/
Absent/
gm)
Listeria. monocytogenes
(Present/
Absent/
25gm)
Chicken
Patty(CP)
8.10×10⁴ 1.00×10² P A A A P
Veg Burger (VB)
1.96×10⁵ 1.58×10² A P A A P
Veg chilli
cheese (VCC)
1.56×10⁵ 2.18×10² A P P P P
Vegetable Momos(VM)
1.20×10⁶ 2.29×10³ P P P P A
Veg spring
roll(VSR)
1.12×10⁴ 1.09×10² P P P A P
Frozen
Mozzarella
Cheese(FMC)
1.18×10³ 2.60×10² P P P P P
Noodles(N) 5.33×10³ 4.46×10² P A A P P
Chicken chilli
cheese (CCC)
3.25×10³ 8.51×10² A A P P P
Chicken
Keema(CK)
2.38×10³ 5.12×10² A A P P P
Fried potato
roll(FPR)
6.10×10⁴ 4.21×10² A A A A A
Chicken
curry(CC)
4.25×10³ 6.23×10² P P P P P
Chicken
nuggets(CN)
2.25×10³ 3.10×10² A A A A A
Chicken
Bread cutlets(CBC)
2.10×10⁴ 2.1×10² A A A P A
chicken
spring
roll(CPR)
1.36×10⁵ 1.18×10² A A P A A
Mix veg
roll(MVR)
1.10×10⁴ 1.20×10² A A A A A
Detection and Identification of microorganisms in samples: In addition to total viable count and coliform
count, other pathogens like E.coli, Salmonella, S.aureus, Bacillus.cereus, Listeria.monocytogenes were also detected in most of the samples and identified to genus level on the basis of cultural and biochemical properties
according to Bergey,s manual of determinative bacteriology and IS methods. Percentage of different pathogens
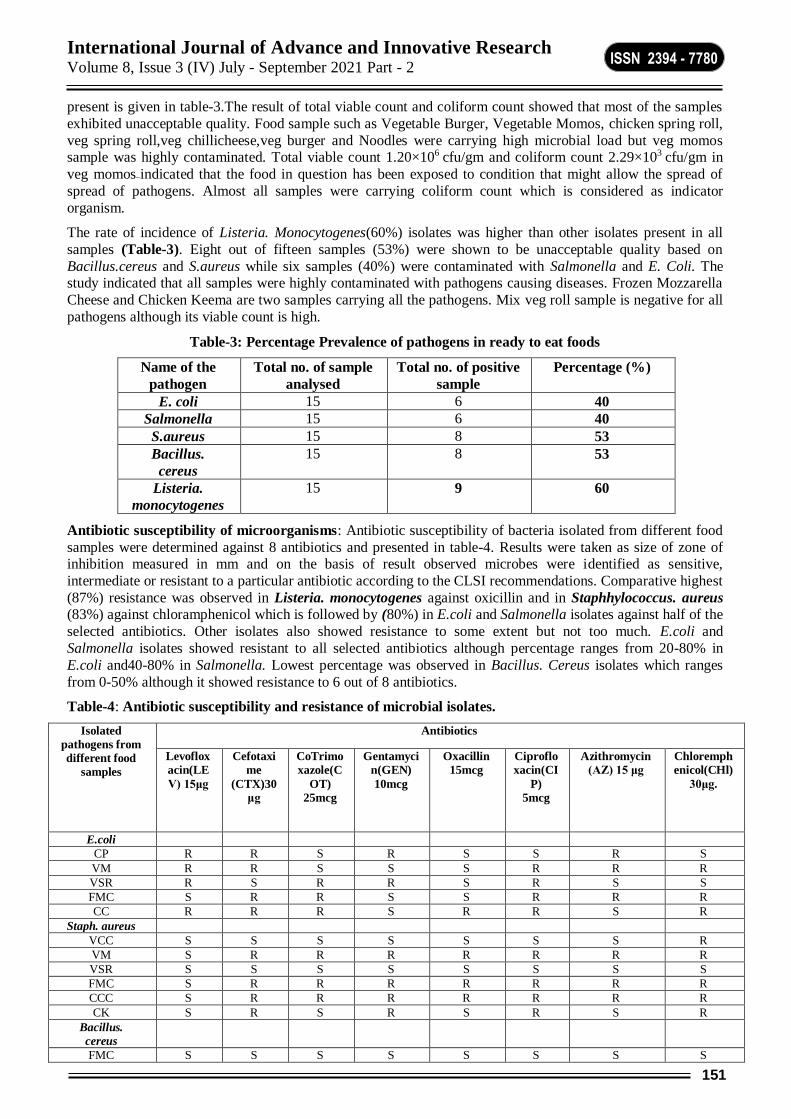
International Journal of Advance and Innovative Research Volume 8, Issue 3 (IV) July - September 2021 Part - 2
151
ISSN 2394 - 7780
present is given in table-3.The result of total viable count and coliform count showed that most of the samples
exhibited unacceptable quality. Food sample such as Vegetable Burger, Vegetable Momos, chicken spring roll,
veg spring roll,veg chillicheese,veg burger and Noodles were carrying high microbial load but veg momos sample was highly contaminated. Total viable count 1.20×10⁶ cfu/gm and coliform count 2.29×10³ cfu/gm in
veg momos indicated that the food in question has been exposed to condition that might allow the spread of
spread of pathogens. Almost all samples were carrying coliform count which is considered as indicator
organism.
The rate of incidence of Listeria. Monocytogenes(60%) isolates was higher than other isolates present in all
samples (Table-3). Eight out of fifteen samples (53%) were shown to be unacceptable quality based on
Bacillus.cereus and S.aureus while six samples (40%) were contaminated with Salmonella and E. Coli. The study indicated that all samples were highly contaminated with pathogens causing diseases. Frozen Mozzarella
Cheese and Chicken Keema are two samples carrying all the pathogens. Mix veg roll sample is negative for all
pathogens although its viable count is high.
Table-3: Percentage Prevalence of pathogens in ready to eat foods
Name of the
pathogen
Total no. of sample
analysed
Total no. of positive
sample
Percentage (%)
E. coli 15 6 40
Salmonella 15 6 40
S.aureus 15 8 53
Bacillus.
cereus
15 8 53
Listeria.
monocytogenes
15 9 60
Antibiotic susceptibility of microorganisms: Antibiotic susceptibility of bacteria isolated from different food
samples were determined against 8 antibiotics and presented in table-4. Results were taken as size of zone of inhibition measured in mm and on the basis of result observed microbes were identified as sensitive,
intermediate or resistant to a particular antibiotic according to the CLSI recommendations. Comparative highest
(87%) resistance was observed in Listeria. monocytogenes against oxicillin and in Staphhylococcus. aureus (83%) against chloramphenicol which is followed by (80%) in E.coli and Salmonella isolates against half of the
selected antibiotics. Other isolates also showed resistance to some extent but not too much. E.coli and
Salmonella isolates showed resistant to all selected antibiotics although percentage ranges from 20-80% in
E.coli and40-80% in Salmonella. Lowest percentage was observed in Bacillus. Cereus isolates which ranges
from 0-50% although it showed resistance to 6 out of 8 antibiotics.
Table-4: Antibiotic susceptibility and resistance of microbial isolates.
Isolated
pathogens from
different food
samples
Antibiotics
Levoflox
acin(LE
V) 15μg
Cefotaxi
me
(CTX)30
μg
CoTrimo
xazole(C
OT)
25mcg
Gentamyci
n(GEN)
10mcg
Oxacillin
15mcg
Ciproflo
xacin(CI
P)
5mcg
Azithromycin
(AZ) 15 μg
Chloremph
enicol(CHl)
30μg.
E.coli
CP R R S R S S R S
VM R R S S S R R R
VSR R S R R S R S S
FMC S R R S S R R R
CC R R R S R R S R
Staph. aureus
VCC S S S S S S S R
VM S R R R R R R R
VSR S S S S S S S S
FMC S R R R R R R R
CCC S R R R R R R R
CK S R S R S R S R
Bacillus.
cereus
FMC S S S S S S S S

International Journal of Advance and Innovative Research Volume 8, Issue 3 (IV) July - September 2021 Part - 2
152
ISSN 2394 - 7780
CBC S S S S S S S S
VCC S R S R R R R R
CCC S S S S S S S R
VM S S S S S S S R
N S S S S S S S S
Listeria.
monocytogenes
CP S S S R R R S R
VB S S S S R R S R
VCC S S S R R R S R
VSR S S S R R S S R
FMC S S S S R S S S
N S S S S R S S R
CCC S S S S R R S S
CK S S S R S R R R
Salmonella
FMC R R S S R R S R
VCC R R R R R S R R
VSR S S S R S R R R
CCC R R R R R S R R
CK R S S R S S R S
Fig-1: Zone of inhibition against selected antibiotics.
Table-5: Percentage of r esistance in E.coli , Staph. aureus,Bacillus.cereu,Listeria.Monocytogenes and
Salmonella isolates present in ready to eat foods.
Isolated strains
from different food
samples
Percentage of resistance to antibiotics
Levoflo
xacin(L
EV)
15μg
Cefotaxi
me
(CTX)3
0μg
CoTrimoxa
zole(COT)
25mcg
Gentamic
in(GEN)
10mcg
Oxacillin
15mcg
Ciprofloxa
cin(CIP)
5mcg
Azithromycin
(AZ) 15 μg
Chloremphenico(
CHl) 30μg.
E.coli 80 80 60 40 20 80 40 40
Staph aureus 0 66 50 66 50 66 50 83
Bacillus.
cereus
0 14 0 14 14 14 14 50
Listeria.
monocytogenes
0 0 0 50 87 62 12 75
Salmonella
80 60 40 80 60 40 80 80
Distribution of the number of isolates according to the number of the antibiotics, resistant showed was; 40% of
the isolates were resistant to 8 antibiotics while 20 % of isolates were resistant to 7 ,6 and 5 number of
antibiotics.
Table-6: Distribution of antibiotic resistance in isolates
No. of antibiotic Percentage (%)
8number of antibiotics 40
7number of antibiotics 20
6number of antibiotics 20
5number of antibiotics 20
International Journal of Advance and Innovative Research Volume 8, Issue 3 (IV) July - September 2021 Part - 2
153
ISSN 2394 - 7780
DISCUSSION: In the present study, total bacteria, coliform and E. coli counts were determined to investigate the
microbiological quality of various ready to eat food samples. A relatively high number of strains are also resistant to the antibiotics commonly used in the therapeutic protocols of human and animal infections. The
results of this study indicate that the ready to eat foods could represent notable health hazards to consumers. So
in order to limit contamination of foods by microorganisms including pathogens, we need to improve the environments of distribution and storage of foodstuffs. Further studies are required to investigate the role of
antibiotics that may be used in therapy against severe infections caused by multidrug resistant pathogens. It was
reported that numerous epidemiological reports have implicated food of animal origin as the major vehicle
associated with illness caused by food borne pathogens (Baek .E et al, 2009).In recent decades, antimicrobial resistance and reduced sentivity in bacteria have been become a major public health problem in many countries
(Noor Uddin GM,2013 Darehabi HK,2013 and Ristori CA,2012)
The quality of food samples selected under study were deteriorated widely and also resistant pathogens enriched in theses food resources will be a threat in future. It is a useful measure for simultaneous monitoring
of antibiotic resistant pathogens in ready to eat foods which are responsible for the human health and
environment and has to be regularly monitored.
So in order to limit contamination of foods by microorganisms including pathogens, we need to improve
hygiene practices and the food chain in terms of the environment of distribution, processing and storage of
foodstuffs.
REFERENCES: 1. Baur, A.W., Kirby, W.M.M., Sherris, J.C., Truck, M., 1966. Antibiotic susceptibility testing by
standardized single disc method . American. J. Clin. Pathol., 45: 493-496.
2. Baek E, Lee D, Jang S, An H, Kim M, Kim K, et al. Antibiotic resistance and assessment of food borne
pathogenic bacteria in frozen foods. Arch Pharm Res 2009; 32(12): 1749-1757.[6].
3. CDC.(2019).Center for disease control and prevention. Retrieved from https:// www.cdc.gov/listeria/
index.html.
4. Centers for Disease Control and Prevention, Nosocomial enterococci resistant to vancomycin- United
States, 1989-1993. Morb. Mortal. Wkly. Rep., 42, 597-599 (1993)
5. Clinical and Laboratory Standards Institute. Perfomance standards for antimicrobial susceptibility tests;
seventeenth informational supplement. Wayne, USA: CLSI; 2007. (Online).
6. Diekema,D.J. and Jones, R. N., Oxazolidinone antibiotics.Lancet,358, 1975-1982 (2001).
7. Havelaar, A. H., Kirk, M. D., Torgerson, P. R., Gibb, H. J., Hald, T., Lake, R. J., et al.
(2015). World Health Organization global estimates and regional comparisons of the
burden of food borne disease in 2010.PLoS Medicine, 12. Article 1001923
8. Indian Standard ‘Methods for detection of Bacteria Responsible for food Poisoning. Identification,
Enumeration and Confirmation of Bacillus. Cereus’ Part 6, 1S: 5887 (Part 6): 1998, ISO : 7932: 1993.
9. Indian Standard, ‘Methods for detection of Bacteria Responsible for food Poisoning.’ (Part-II) – Isolation, Identification, Enumeration Staphylococcus aureus and Faecal streptococci (First Revision) 1S: 5887 (II):
1976.
10. Indian Standard, ‘Methods for detection of Bacteria Responsible for food Poisoning.’ (Part-I) Isolation,
Identification, Enumeration of Escherichia. coli. 1S: 5887 (Part I): 1976.
11. Indian Standard, ‘Methods for detection of Bacteria Responsible for food Poisoning ’General guidance on
method for detection of Salmonella. 1S: 5887 (Part 3) : 1999, ISO, 6579: 1993.
12. Indian Standard, ‘Microbiology–General Guidance for the enumeration of Micro-organisms– Colony
count technique at 30OC. (First Revision) IS: 5402: 2002, ISO, 4833:1991.
13. Indian Standard, ‘Microbiology–General Guidance for the Enumeration of Coliforms. Part – I Colony
count technique (First revision). IS: 5401 (Part I) : 2002 ISO: 4832 : 1991.
14. International Standard, ‘Microbiology –General Guidance on methods for the detection of Salmonella
ISO: 6579: 1990(E).

International Journal of Advance and Innovative Research Volume 8, Issue 3 (IV) July - September 2021 Part - 2
154
ISSN 2394 - 7780
15. International Standard, ‘Microbiology of food and feeding stuffs-horizontal method for detection and
enumeration of Listeria monocytogenes, IS: 14998 (Part I) : 2001, ISO: 11290-1: 1996.
16. International Standard, ‘Method for determination of protein in foods and feeds , IS: 7219-1973.
17. International Standard, ‘Specification for cornflakes, IS: 1158-1973.
18. International Standard, ‘Methods of tests for edible starch products -chemical method, IS: 4706(part-2)-
1978.
19. International Standard, ‘Specification for edible groundnut flour, IS: 4684-1975.
20. International Standard, ‘Specification for ready to eat protein rich extruded foods, IS: 9487-1980.
21. Maguire, H., Cowden, J., Bruce, J., Mitchell, E., Jacob, M., Rowe, B,et al. (1992). An outbreak of
Salmonella dublin infection in England and Wales associated with a soft unpasteurized cows' milk
cheese. Epidemiology and Infection,109, 389e396.
22. Threlfall EJ, Teale CJ, Davies RH, Ward LR, Skinner JA, Graham A, Cassar C, Speed K 2003.A
comparison of antimicrobial susceptibilities in non typhoidal salmonellas from humans and food animals
in England and Wales in 2000. Microb. Drug Resist.,9: 183- 189.
23. Noor Uddin GM, Larsen MH, Guardabassi L,Dalsgaard A.Bacterial flora and antimicrobial resistance in
raw frozen cultured seafood imported to Denmark. J Food Prot 2013; 76(3): 490-499.
24. Darehabi HK, Naseri MH, Menbari S, Mobaleghi J, Kalantar, E.Antibiotic resistance pattern of
Escherichia coli groups A, B1, B2 and D isolated from frozen foods and children with diarrhea in
Sanandaj, Iran. Int J Enteric Pathog 2013; 1(1): 1-4.
25. Ristori CA, Rowlands REG, Bergamini AMM, Lopes GISL,Paula AMR, Oliveira MA, et al. Prevalence and antimicrobial susceptibility profile of Enterococcus spp. isolated from frozen chicken carcasses. Rev
Inst Adolfo Lutz São Paulo 2012; 71(2): 237-243.

International Journal of Advance and Innovative Research Volume 8, Issue 3 (IV) July - September 2021 Part - 2
155
ISSN 2394 - 7780
ROLE OF FINANCIAL SERVICE COMPANIES IN SANCTIONING OF LOAN-A CASE STUDY
Hiral Vyas1 , Dr. Divyang Joshi
2 and Tejas Pandya
3
1Assistant Professor, Career Development Cell, Parul University Vadodara-gujarat-390019 2Associate Professor, Parul Institute of Management & Research, Parul University, Vadodara-Gujarat-390019
3Assistant Professor, Department of Civil Engineering, Parul University, Vadodara-Gujarat-390019
ABSTRACT
Looking in to the recent trend in Financial Management. The research paper deals with the topic “Role of Financial Service companies in Sanctioning of Loan” and it is analytical in nature. This paper aims at
analyzing the process of Lending loan and advances as well as internal steps taken by the financial companies
for scrutinizing the customer’s details and credentials. The effort has been made to give an overview of various aspects and study of process of loan and advances. The paper will give focus on Type of loan and Credit
Assessment as credit appraisal is backbone of the financial institution also paper will give an idea on Security
against loan, Documents required, Repayment Process, Credit Monitoring and supervision and Credit risk
assessment. Lending is a crucial part of banking sector in India. It is main revenue generation to bank in India. With increasing demand of different types of loan Financial Service Companies has also come up to
lend a loan to needy people. This company’s play an important role in access to financial services enhancing
competition and diversification to the financial sector. There are various types of institution involved in services in India. This included Commercial Banks and Cooperative Banks and also Non-Banking Financial
Companies but along with this other private financial companies are set up in India who work for lending of
loan. They usually act as a supplier of loan and credit facility. This study evaluate the performance of financial
service companies in India for sanctioning of loan to needy people. In this paper we will systematically review
the process of loans and advances sanctioned by financial service companies.
Keyword- Key Words: Financial Service, Loan and Advances, Credit Appraisal, Credit Risk Assessment, Credit
Monitoring
1. INTRODUCTION :- Whenever an individual or a company uses credit, that means they are borrowing money that they promise to
repay within pre-decided time period. In order to assess their repaying capability that is to evaluate their
creditworthiness banks uses various techniques that differ with the different types of credit facilities provided
by the bank.
In the current scenario, it is seen that the big companies and financial institutions have been bankrupted just
because of credit default so Credit Appraisal has become an important aspect in the banking sector and is
gaining prime importance.
In order to measure the financial condition and the customer’s ability to repay back the loan in future, a proper
evaluation of the customer is performed. Credit Appraisal is a process to ascertain the risk associated with the
extension of the credit facility. It is generally carried by the financial institutions which are involved in
providing financial funding to its customers.
Credit Appraisal thus ascertain the risk associated with the lending functions in the banks. It is generally carried
out by the banks and financial services companies which are engaged in providing finance to its customers. But how does the bank or financial services appraises the creditworthiness of the borrower? What are the Criteria to
be filled for the granting loans? What are the tools used by the banks or financial services to appraise the loan
proposal? These question are being answered in this research paper along with case study.
TYPES OF LOAN
From the view point of security of loans, we can divide the loans into two categories:

International Journal of Advance and Innovative Research Volume 8, Issue 3 (IV) July - September 2021 Part - 2
156
ISSN 2394 - 7780
STUDY ON HOUSING,PERSONAL & BUSINESS LOAN:
GENERAL PROCEDURE TO COMPILE CREDIT REPORT While compiling a credit report there are certain things one has to include, which are very necessary for any
bank to process a loan or advances. Every bank requires the borrower to submit his all legal documents with the
report, this makes the bank work considerably easy, in order to process a loan. The following are the steps
required to file a credit report.
1. Take the party’s letter head
2. Constitution –
3. Capital –
4. Partners/ Directors Name:
5. Establishment –
6. Banking with which branch- limits enjoyed, address of branch
7. Name of the Business –
8. Factory location: address
9. Residential Details:
10. Balance sheet
11. Profit and Loss
LITERATURE REVIEW A research was conducted by Mr. V. M. V. Subha Rao, B.com, FCA on “Monitoring of Advances – A New
Look”. The researcher gave two views on the commencement of monitoring process-1.Narrow View- the
Monitoring starts only after the advances is disbursed. 2. Broad View- at the time of conducting credit
investigation of the borrower and continue in all other stages of credit cycle.
Eleanor Chartes in his paper” Appraising the Role of the Appraiser” published September 3, 1995, talked about
the centralized function of the appraiser to grant loan and virtually every loan applicant will have to rely on an
appraisal to set a value on the property against which the loan is to be made.
CASE STUDY
CREDIT APPRAISAL FOR CC &BDLN FACILITY:
Proposal 1:

International Journal of Advance and Innovative Research Volume 8, Issue 3 (IV) July - September 2021 Part - 2
157
ISSN 2394 - 7780
Branch: Talasari
Borrower: ABC agro Trading Corporation
Loan Requirement: CC – Rs. 50.00 lacs
Name of the borrower: ABC agro Trading Corproration
Address: Shop No. 1 & 2, Bldg 8, Kety Nagar
Talasari Road, Dist Palghar 401606
Constitution: Proprietor Ship Concern.
Establish Since: April 2006
Name & Address of the proprietor Worth Basis of Worth
Mr. PQR
D/102, Eden Garden
Tal. Talasari, Dist. Palghar
200.00 lacs Flat at Juhu, Flat at
Dahanu,Shop at Talasari,
Vehicle and Investment in business.
Nature of Business: Wholesaler and Retailer of Fertilizer Seeds, Agricultural Sprayers, Insecticides etc.
Account Performance:
BANK
CC
01.04.2014 31.03.2015
01.04.2015 29.02.2016
----------------------
Rs. 77.76 Lacs
HDFC
CD
01.04.2014 31.03.2015
01.04.2016 29.02.2016
Rs. 174.72 Lacs
Rs. 234.17 Lacs
STOCKS AS ON: 29.02.2016 Rs. 56.12 Lacs DP Rs. 42.00 Lacs
DEBTORS AS ON: 29.02.2016 Rs. 103.87 Lacs DP Rs. 62.00 Lacs
CIBIL REPORT: Satisfactory
Details of the Guarantors:
Name & Address Worth Nature of activity
Mr. Anil Digambar Gharat
512,”OM” Gharat Wadi
Vasai Tal. Vasai Dist. Palghar
Rs. 90.00 lacs He is commission agent for
LIC &Gen. Insurance and earn around Rs.4,85,761/-p.a.
as per IT return filed for the AY. 2015-16
Mr. Micky Boman Irani
Crazy Crab, Agar Road,Dahanu
Tal. Dahanu Dist. Palghar
Rs. 300.00lacs He is engaged in Agriculture as well as the business of
Hotel, Builder Developers and earn around
Rs. 11,70,864/- p.a. as per IT
return filed for the AY 2015-16
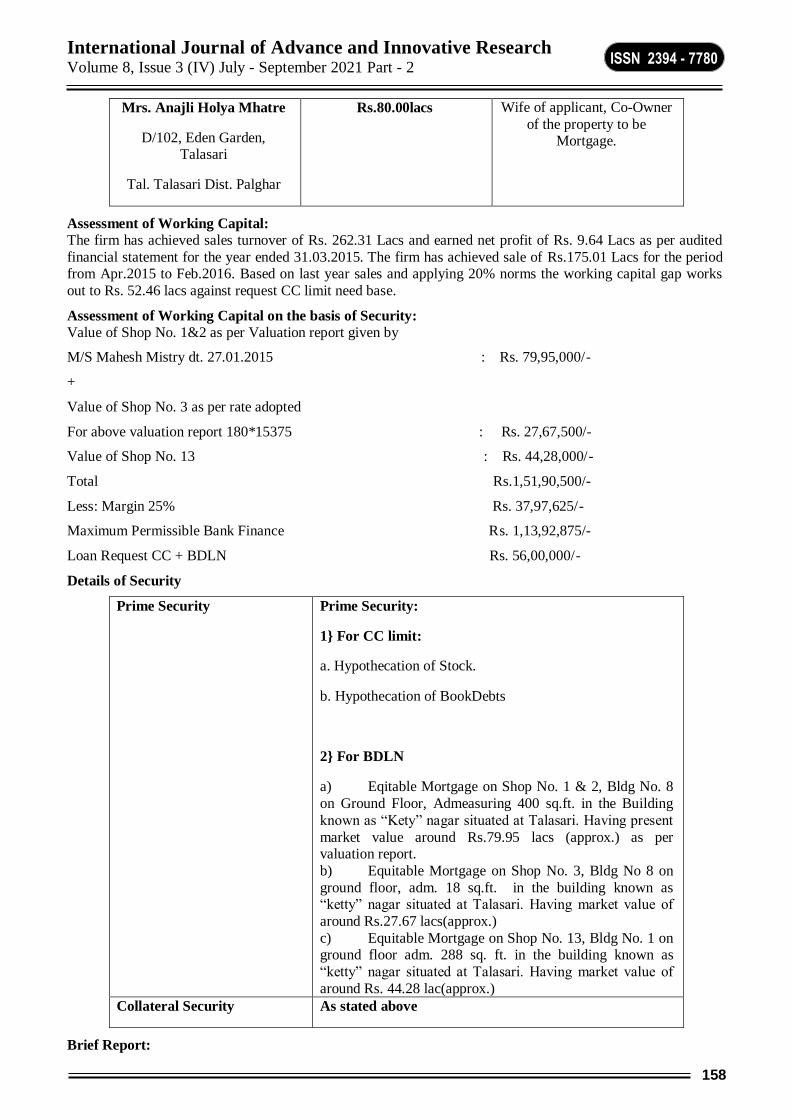
International Journal of Advance and Innovative Research Volume 8, Issue 3 (IV) July - September 2021 Part - 2
158
ISSN 2394 - 7780
Mrs. Anajli Holya Mhatre
D/102, Eden Garden, Talasari
Tal. Talasari Dist. Palghar
Rs.80.00lacs Wife of applicant, Co-Owner
of the property to be Mortgage.
Assessment of Working Capital:
The firm has achieved sales turnover of Rs. 262.31 Lacs and earned net profit of Rs. 9.64 Lacs as per audited
financial statement for the year ended 31.03.2015. The firm has achieved sale of Rs.175.01 Lacs for the period from Apr.2015 to Feb.2016. Based on last year sales and applying 20% norms the working capital gap works
out to Rs. 52.46 lacs against request CC limit need base.
Assessment of Working Capital on the basis of Security:
Value of Shop No. 1&2 as per Valuation report given by
M/S Mahesh Mistry dt. 27.01.2015 : Rs. 79,95,000/-
+
Value of Shop No. 3 as per rate adopted
For above valuation report 180*15375 : Rs. 27,67,500/-
Value of Shop No. 13 : Rs. 44,28,000/-
Total Rs.1,51,90,500/-
Less: Margin 25% Rs. 37,97,625/-
Maximum Permissible Bank Finance Rs. 1,13,92,875/-
Loan Request CC + BDLN Rs. 56,00,000/-
Details of Security
Prime Security Prime Security:
1} For CC limit:
a. Hypothecation of Stock.
b. Hypothecation of BookDebts
2} For BDLN
a) Eqitable Mortgage on Shop No. 1 & 2, Bldg No. 8
on Ground Floor, Admeasuring 400 sq.ft. in the Building
known as “Kety” nagar situated at Talasari. Having present
market value around Rs.79.95 lacs (approx.) as per valuation report.
b) Equitable Mortgage on Shop No. 3, Bldg No 8 on
ground floor, adm. 18 sq.ft. in the building known as “ketty” nagar situated at Talasari. Having market value of
around Rs.27.67 lacs(approx.)
c) Equitable Mortgage on Shop No. 13, Bldg No. 1 on ground floor adm. 288 sq. ft. in the building known as
“ketty” nagar situated at Talasari. Having market value of
around Rs. 44.28 lac(approx.)
Collateral Security As stated above
Brief Report:

International Journal of Advance and Innovative Research Volume 8, Issue 3 (IV) July - September 2021 Part - 2
159
ISSN 2394 - 7780
XYZ Agro trading Corporation is proprietor concern of Mr. PQR engaged in business of Wholesaler &
Retailer of Fertilizer, Seeds, Agricultural Sprayers, and Insecticides etc. since last ten years. The Firm is
banking with SDO bank enjoying Cash Credit facility &BDLN as stated above which is being operated satisfactory with good turnover in the account, the proponent is also availed from loan with HDFC Bank which
is being repaid regularly. The proponent has achieved sales of Rs. 262.31 Lacs and net profit of Rs. 9.64 Lacs
for the year ended 31.03.2015
Comments & Remarks:
There is increasing trend in sales with goods rise of sales in the last year
1. Current Ratio need to be improved
Recommendation: In view of the above and creditworthy guarantors, we recommend for renewal Cash Credit facility limit of Rs.
50.00 lacs against Hypothecation of Stock &Book Debts with collateral security as stated above to ABC Agro
Trading Corporation.
CASE 2: HOME LOAN:
Proposal 1:
Borrower: ABC
Loan Requirement: Rs. 1134000
Address: Darshan Apartment Vapi
Salaried/Self – Employed: Salaried
Name Worth Property Address
ABC 2500x550 =
1375000
Darshan Apartment Vapi
ELIGIBILITY
Market Value = 1150000
Maximum loan can be sanctioned = 1150000 x 90% = 1035000
Sale Deed = worth Rs. 875000
Maximum loan can be sanctioned = 1000000 x 90% = 787500
Extra Work = 787500 x 33% = 259875
Therefore total loan can sanctioned = 787500 + 259875 =1047375
Age 28
Salary/Turnover 21085
Other EMI NIL
EMI CALCULATION
Principle Amount 1134000
Interest 8.35%
Tenure 20 years
Total EMI 9733.71
List of documents need to be submitted by the customer for Loan facility: 1. Proof of Identity
2. Proof of Residence
3. Proof of Business Address (in case of Business Development Loan, Cash Credit, ODCC)
4. Guarantors individual asset liability statement, Proof of Residence, Income Proof
5. Last Three years financial statement of the units along with income tax/sales tax returns etc. current year
provisional financial statement i.e. from April to preceding month of submission of application.
International Journal of Advance and Innovative Research Volume 8, Issue 3 (IV) July - September 2021 Part - 2
160
ISSN 2394 - 7780
6. Memorandum and articles of association of the Company/ Registered Partnership Deed of partners etc. In
case of limited company photo copy of CIN NO. Directors DIN NO.
7. Individuals Assets and Liabilities statement of proprietor, partners, directors and guarantors along with
latest income tax returns and financial statements.
8. Rent Agreement (if business premises on rent) and clearance from pollution control board if applicable.
9. SSI registration if applicable.
10. Projected balance sheet for next three years in case of working capital limits and for period of the loan in
case of term loan.
11. Profile of unit.
12. Review of account containing month wise sales, production, debtors, creditors, and bank’s outstanding for
working capital limits, term loan limits, bills discounted.
13. Photocopies of lease deeds/title deeds of all properties being offered as primary and collateral securities
along with NOC for mortgage from builder/society. Latest valuation report/tittle Clearance and search
report from Bank’s panel valuer / advocate.
CONCLUSION
1. As discussed in the Research Paper above , processing of the loan starting from the login to disbursement
is being reduced because of raise in competition and even raise in demand of loan
2. It is equally important and dangerous as there is always chance of default or some other risk.
3. After dealing with almost every aspect of loan and advances one can summaries that with a little bit of
strict measures and keen eyes and understanding the clients cases and company’s balance sheet one can
very well save the institution
4. It has been observed that the requirement of home loan is increasing than personal and other loans
5. To have a fair understanding of the borrower’s financial health, thus at least last 3 to 5 years of ITR is
required with balance sheet/profit and loss/capital account
6. Profitability should be critically analyses.
REFERENCE
1. Abor, J., & Biekpe, N. (2006). Small Business Financing Initiatives in Ghana. Problems and Perspectives
in Management, 4(3), 69-75.
2. Adejumo, D.G., & Olaoye J.A. (2012). Roles and Problems of Small Scale Business Development
Programmes in Nigeria. International Journal of Management and Business Studies, 2(1), 76-82.
3. Alhassan, F., & Sakara, A. (2014). Socio-Economic Determinants of Small and Medium Enterprises:
Access to Credit from the Barclays Bank in Tamale-Ghana. International Journal of Humanities and Social
Science Studies, 1(2), 26-36.
4. Bbenkele, E.K. (2007). An Investigation of Small and Medium Enterprises Perception Towards Services
Offered by Commercial Banks in South Africa. African Journal of Accounting, Economics, Finance and
Banking Research, 1(1), 13-24.
5. Berger, A.N., & Udell, G.F. (2005). A More Complete Conceptual Framework for Financing of Small and
Medium Enterprises, World Bank Policy Research Working Paper 3795. Retrieved from ideas.repec.org.
6. Ekpenyong, D.B., & Nyong, M.O. (1992). Small and Medium Scale Enterprises in Nigeria-
Characteristics, Problems and Sources of Finance. Research Paper-16, African Economic Research
Consortium.
International Journal of Advance and Innovative Research Volume 8, Issue 3 (IV) July - September 2021 Part - 2
161
ISSN 2394 - 7780
RURAL BANKING SERVICE INTERRUPTIONS IN COVID-19
Ajay Jha1 and Dr Rajeev Sharma
2
1Enrolment no: 20191268, Research Scholar, IBM, Mangalayatan University, Aligarh, India 2Head, Department of Management, Institute of Business Management, Mangalayatan University, Beswan,
Aligarh
ABSTRACT
Rural Banking Services have become challenged in numerous areas in India because of the Covid-19 pandemic. Banking offerings did not facilitate rural clients during the pandemic, including fund transfer,
account establishment, and many different provider requests. There have been several dynamics that
prejudiced the interruption of rural Banking offerings during the COVID-19 pandemic.
Banking offerings have been impacts at the start of the COVID-19 pandemic for the ones financial institution
which might be located in rural regions and there may be a restricted wide variety of virtual banking centres.
Another critical element has been the loss of patron attention for using a virtual platform like CDM gadgets
and putting provider requests through ATM gadgets. Some banks begin running at the virtual and digital help
to clients to fulfil their clients.
This paper analyses the primary elements of interruption banking centre offerings for the duration of the
Covid-19 primarily based totally on to be had literature review. The paper begins off evolved with contemplating the function of Bank threat control, focusing on the active threat of banking offerings and in
addition to virtual banking demanding situations that have been important for the duration of the pandemic.
Keywords: Banking offerings, Operational dangers, ATM, CDM, Rural clients.
INTRODUCTION COVID-19 added banking offerings problems and demanding situations for the banking services elements of
India. The banking provider problems get up in rural regions. The modern-day mission that the rural areas are
going through is virtual attention and deployment of virtual platforms in regions. Indian Banking enterprise
attention is totally on the city and metro towns; however, they attention much less on the rural areas, which effect many patrons for the duration of the pandemic. Indian banks must bolster their instruction and construct a
commercial solid enterprise continuity plan for India without that specialization in metropolitan towns as
offerings desire to be instal during coolest economics. The modern-day pandemic has uncovered many banks in realities and uncovered the virtual framework they are advertising and marketing from long term and uncovered
for the modern-day pandemic. Thus it is far required that banking agencies and regulators adopt measures and
construct a more incredible virtual platform to cowl the whole nook and focus on the humans staying in the
rural areas rather than spending extensive advertising and marketing commercials at the newspapers and media. Banking enterprises ought to make a robust presence in whole rural regions to attract the humans for the brand
new virtual international and make techniques to mitigate those dangers and broaden ok measures to address
the situation.
This piece focus to revise those papers and their contributions. The 2nd segment begins off evolved with an
ordinary literature review, the 0.33 segment revises strategies to be installation, and the fourth segment consists
of the effects of our studies. This paper concludes with conclusions and recommendations.
LITERATURE REVIEW
Customer service is a vital part of banking industries. Customer needs and expectations are highest priority for
any banking institutions. Indian banking industry is ephemeral over a sector of the client's marketplace. The
clients have more effective alternatives in deciding on their banks. The opposition has been installed withinside
the banks running in India.
The essential effects accord with the general belief that public zone banks have successfully attained their
precept targets of deposit and mortgage growth withinside the nationalized era.
The giant majority of that organization suggested that their choice be made because a financial institution did
not offer an ok provider. To stop the erosion withinside the marketplace proportion of antique non-public zone
bank.
It focused on the link between customer’s satisfaction and business performance. The study says the positive
impact of customer satisfaction on service quality of banks leading to its income. the customers' satisfaction
International Journal of Advance and Innovative Research Volume 8, Issue 3 (IV) July - September 2021 Part - 2
162
ISSN 2394 - 7780
created the numerous impact on the net on the service quality factors, namely, Empathy, Assurance and
Tangibles. The study suggested that the acceptable strategies extend the profit in all the banks created and
enhanced appropriate service quality to the purchasers.
Retail banking supported the use of mobile phones and e-banking facilities for quick service. As a result, the
protection and confidentiality became very difficult to keep up. It is a core issue for all over banks in India and
biggest concern.
The financial segment restructurings in India, of which banking segment transformations instituted a vital part,
frazzled of markets, privatization of moralities and globalization of the economy. Retail banking is
comprehensive gamut of the customer's embryonic wants and necessities, comprising payment of utility bills,
electricity, telephone transportable bills, auto-debit of insurance premiums, remittance of funds, Demat accounts, bonds, debentures, mutual funds, payment of credit cards bills, filing of tax returns and payment of
tax returns and bancassurance.
India has experienced a rapid climb in retail banking. Retail banking could be a banking service that's geared primarily towards individual customers. It centers severely on customer arcades. Retail banking could be huge
arcade banking where clienteles availed rural branch of Indian rural banks. The facilities for retail banking
comprise saving and current accounts, savings accounts, personal loans, other utility transactions etc. Its be sure
of the various banking products and services to individual's customers.
Retail banking users should start depending on and trusting Automatic Teller Machine (ATM) to meet their
banking needs conveniently. However, recently the proliferation of ATM frauds within the country even and
across the globe. This paper carries first-hand research to analyze ATM practice and fraud incidences in few
banks.
Retail bank's success will mostly depend on product innovation, technological developments, and strategies.
Growth in commercial and banking services depend on digitalization. The drawback includes attacks by savage interventionists who attempt to steal information and prevent end-users from employing the internet for
purposes with good intentions—innovation required in existing internet banking and commerce.
The upcoming development of mobile banking with additional safety solidification and customer suitability;
the espousal of bio-metrics to identity/authentication purposes such as the face, voice, fingerprint and behavioural components. Banking in 2019 is becoming characterized by innovation and the convenience of
customers, which ultimately puts the customer at the front and centre.
METHODOLOGY OR MATERIALS AND METHODS This paper utilizes secondary data to proceed with an in-depth literature review on the effects of banking
services during the COVID-19 pandemic. The familiar secondary data sources are Reserve Bank of India
website data publications, customer grievances and ombudsman information and the internet websites. Literature reviews are essential to help researchers identify what has been researched and written previously on
the topic. Also, determining the extent to which a specific research area reveals any interpretable trends or
patterns. The literature review can aggregate empirical findings, and it can help to generate new theories and
frameworks. However, the literature review can constitute a section on a research paper, but it can be a review article itself that presents the literature in a particular field of research without analyzing primary data.
Reviewing articles when they are adequately conducted can provide powerful sources even for practitioners in
different fields.
The type of review provided by this article is descriptive, and mapping literature review, which is primarily
used to determine a body of knowledge in a particular research topic, reveals any interpretable pattern or trend
concerning pre-existing propositions, theories, methodologies or findings.
RESULTS AND DISCUSSIONS
The contribution of the different research articles in the banking services literature review can be summarized
as it follows:
• Banking services contribute to mitigating the risks in the time of COVID19.
• The development of the digital experience was well one successful strategy.
• Data analytics play an essential role.
International Journal of Advance and Innovative Research Volume 8, Issue 3 (IV) July - September 2021 Part - 2
163
ISSN 2394 - 7780
• In the rural areas, there is a lack of engagement and the proactive development of strategies to deal with
missing elements and other potential threats to the banking services, and an assessment of the economy and
providing essential banking services.
CONCLUSIONS AND RECOMMENDATIONS
This paper analyzed the main theoretical insights from banking service risks focusing on the definition of
banking services. The literature review based on secondary data suggested that different banks and scholars facing banking services challenges and risks and different strategies were adopted to face disruption during the
COVID-19 crisis. The research on rural banking services in COVID-19 is still an emergent research field. The
principal contributions were empirical rather than conceptual. There is a need to develop more conceptual
contributions in these academic fields and how risk mitigation strategies can influence decision making.
REFERENCES
[1] Singh, New Revolutions in Banking Industry Pg 36-63.
[2] Bhattacharya, The Need of Banking Industry Structure Page 14-20
[3] Anthony, Banks managing service quality. 10(1), 2000, Page 54-58.
[4] Menu, Performance Efficiency of Banks. PhD. Dissertation, University. 2009.
[5] Jerome, Money and Finance, National Seminar- Irinlakkuda Page-545
[6] Amit, Credit Card Networks, Reserve Bank, Vol.4, Issue 1, Aug 2009, Page 602-632.
[7] Satyajit, Assessment of Customer Services of Indian Banks”, Yojana, Nov 2010, Page42.
[8] Cleopatra, Factors of Bank Loyalty, Marketing Ija, 2014 Page-104-114.
[9] Arijit Ghosh, Stimulus of digital banking service quality, IJA, Sep’2020
International Journal of Advance and Innovative Research Volume 8, Issue 3 (IV) July - September 2021 Part - 2
164
ISSN 2394 - 7780
SOCIODEMOGRAPHIC DETERMINANTS IN PREVALENCE OF ANEMIA IN ADOLESCENTS OF
RURAL AREA OF MAHARASHTRA
Dr. V. Parameshwar Reddy Junior Resident, Department of Pediatrics, DMIMS, Sawangi (Meghe), Wardha, Maharashtra, 442001
Dr. Ashish Varma1, Dr. Jayant Vagha
2, Dr. Revat Meshram
3 and Dr. Sachin Damke
4
Associate Professor1,3, Professor2 and Professor & HOD4, Department of Pediatrics, DMIMS, Sawangi (Meghe)
Wardha
ABSTRACT
Anemia is one of the most important health problems throughout the world. The prevalence of anemia among
adolescents is 27% in developing countries, and 6% in developed countries. The aim of our study was to assess the prevalence of anemia amongst adolescents of the age group of 10-15 years in rural population and the
objective was to study the prevalence of anemia in adolescents in the age group of 10 to 15 years and to
corelate anemia with socioeconomic status of adolescents. Our study was a cross sectional study of Department
of Paediatrics, AVBRH, Sawangi(Meghe), Wardha which is a tertiary care rural hospital catering western zone of Maharashtra. A total number of 1010 adolescents from the age group of 10 to 15 years of both sexes were
included in the study. In our study we found that 61.19% of the total subjects were found to be anemic.
Prevalence of anemia was 53.79% in boys and 71.7% in girls. Anemia was very common in adolescents from lower classes of socioeconomic status. Adolescent nutrition should be viewed more seriously with adequate
improvement in the standards of living, supplementary programmes and timely health education.
KEYWORDS Anemia, Nutrition, Adolescents, Socioeconomic status
INTRODUCTION Nutrition plays important role for proper growth and maturation of functions. It’s optimal intake helps us for
better immunity and productivity. Since the ages we have been working to improve the nutritional status of
mankind by studying various aspects of diseases with respect to food and its proper utilization.
Adolescent is the junction of life when we should stand with them between losing out on the potential or nurturing them to transform society and build nation. As adolescents flourish, so do their communities, and all
of us have a collective responsibility to ensure that adolescence is an age of opportunity.
Anemia is one of the most important health problems throughout the world. [1] The prevalence of anemia among adolescents is 27% in developing countries, and 6% in developed countries [2] .In India, 40 per cent of
girls and 18 per cent of boys are anaemic.
Anaemia among adolescents adversely affects growth, resistance to infections, cognitive development and work
productivity.[3] .
Adolescents, especially girls, are particularly vulnerable to iron deficiency due to onset of menses and growth
spurt. The prevalence is highest between the ages of 12-15 years when requirements are at a peak. [4]
Nutritional status during adolescence plays an important role in the human life cycle [5]. The diet of children
and adolescent must fulfil demand of optimal and sometimes very rapid growth and development [6].
Twenty percent of the final adult height and 50% of adult weight occurs during this period: bone mass increase
by 45%, dramatic bone remodelling and soft tissues, organs, red blood mass increase in size [7].
Through this study we want to measure the magnitude of this issue in our area which can help us as a clinicians
to augment our efforts towards achieving desirable outcome.
AIM:
To assess the prevalence of anemia amongst adolescents of the age group of 10-15 years in rural population
OBJECTIVES:
• To study the prevalence of anemia in adolescents in the age group of 10 to 15 years.
• To corelate anemia with the socioeconomic status of adolescents.
METHODOLOGY:
Our study was a cross sectional study that was conducted in Department of Pediatrics, AVBRH, Sawangi
(Meghe), Wardha. It is tertiary care rural hospital catering western zone of Maharashtra.
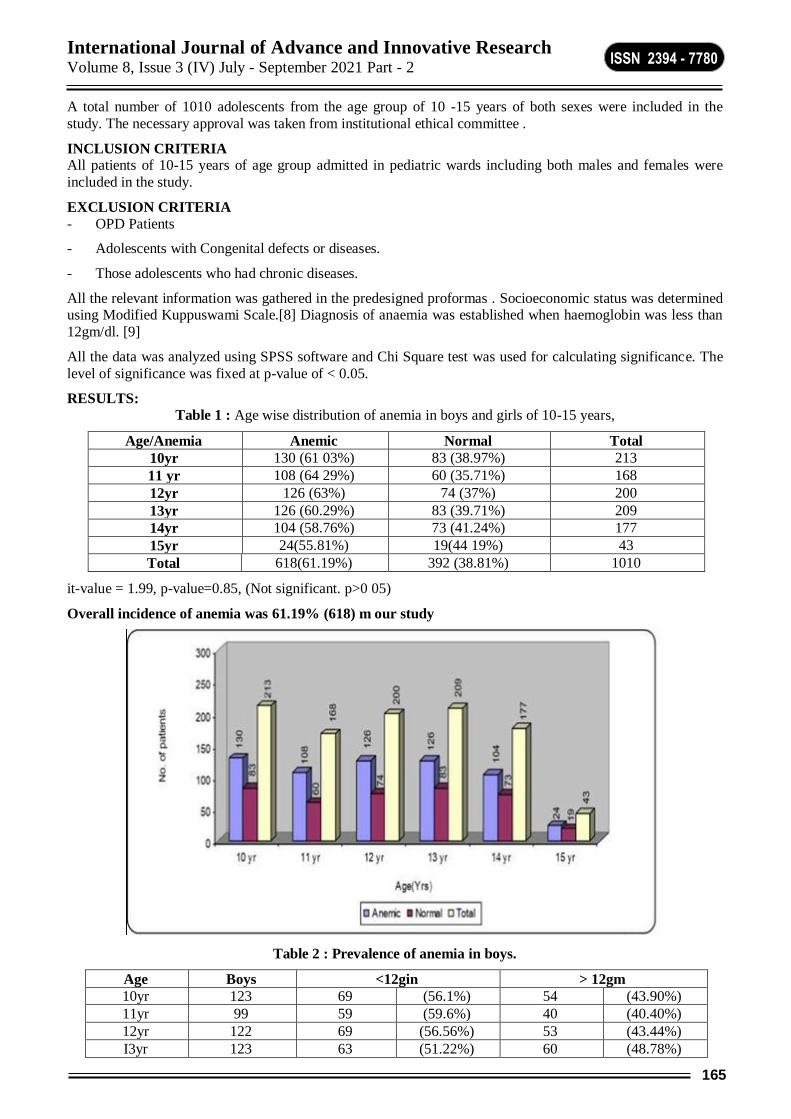
International Journal of Advance and Innovative Research Volume 8, Issue 3 (IV) July - September 2021 Part - 2
165
ISSN 2394 - 7780
A total number of 1010 adolescents from the age group of 10 -15 years of both sexes were included in the
study. The necessary approval was taken from institutional ethical committee .
INCLUSION CRITERIA All patients of 10-15 years of age group admitted in pediatric wards including both males and females were
included in the study.
EXCLUSION CRITERIA
- OPD Patients
- Adolescents with Congenital defects or diseases.
- Those adolescents who had chronic diseases.
All the relevant information was gathered in the predesigned proformas . Socioeconomic status was determined using Modified Kuppuswami Scale.[8] Diagnosis of anaemia was established when haemoglobin was less than
12gm/dl. [9]
All the data was analyzed using SPSS software and Chi Square test was used for calculating significance. The
level of significance was fixed at p-value of < 0.05.
RESULTS:
Table 1 : Age wise distribution of anemia in boys and girls of 10-15 years,
Age/Anemia Anemic Normal Total
10yr 130 (61 03%) 83 (38.97%) 213
11 yr 108 (64 29%) 60 (35.71%) 168
12yr 126 (63%) 74 (37%) 200
13yr 126 (60.29%) 83 (39.71%) 209
14yr 104 (58.76%) 73 (41.24%) 177
15yr 24(55.81%) 19(44 19%) 43
Total 618(61.19%) 392 (38.81%) 1010
it-value = 1.99, p-value=0.85, (Not significant. p>0 05)
Overall incidence of anemia was 61.19% (618) m our study
Table 2 : Prevalence of anemia in boys.
Age Boys <12gin > 12gm
10yr 123 69 (56.1%) 54 (43.90%)
11yr 99 59 (59.6%) 40 (40.40%)
12yr 122 69 (56.56%) 53 (43.44%)
I3yr 123 63 (51.22%) 60 (48.78%)
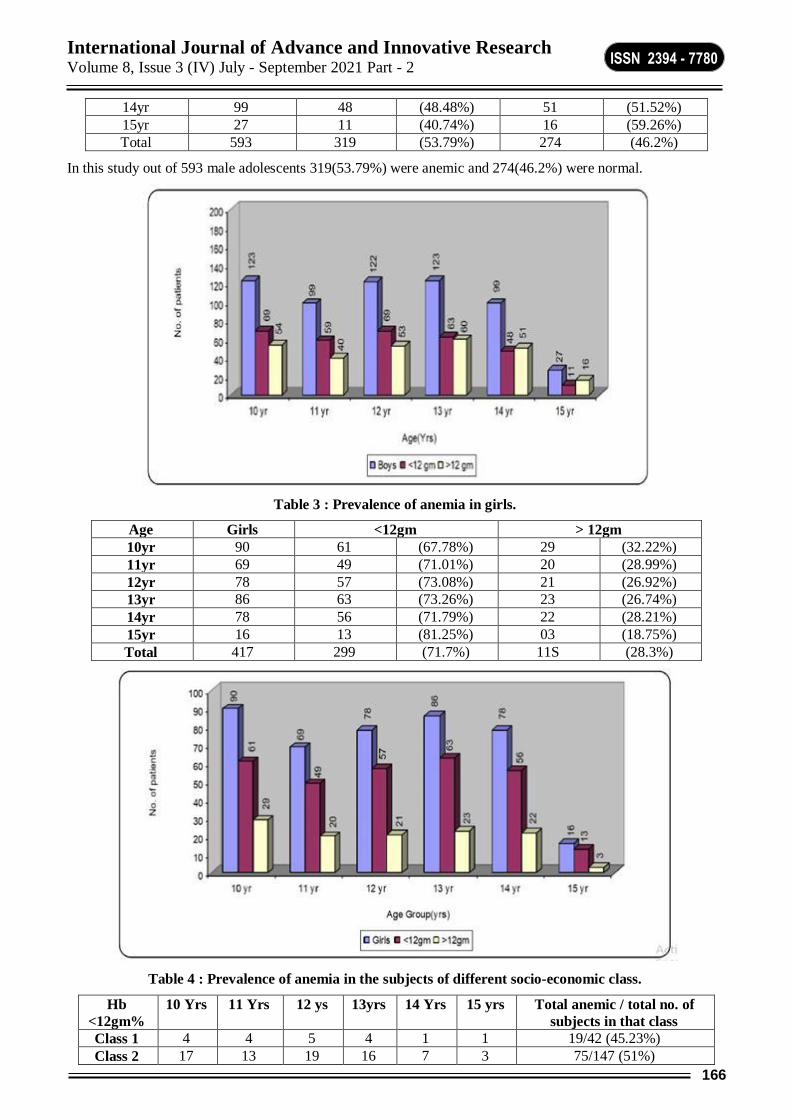
International Journal of Advance and Innovative Research Volume 8, Issue 3 (IV) July - September 2021 Part - 2
166
ISSN 2394 - 7780
14yr 99 48 (48.48%) 51 (51.52%)
15yr 27 11 (40.74%) 16 (59.26%)
Total 593 319 (53.79%) 274 (46.2%)
In this study out of 593 male adolescents 319(53.79%) were anemic and 274(46.2%) were normal.
Table 3 : Prevalence of anemia in girls.
Age Girls <12gm > 12gm
10yr 90 61 (67.78%) 29 (32.22%)
11yr 69 49 (71.01%) 20 (28.99%)
12yr 78 57 (73.08%) 21 (26.92%)
13yr 86 63 (73.26%) 23 (26.74%)
14yr 78 56 (71.79%) 22 (28.21%)
15yr 16 13 (81.25%) 03 (18.75%)
Total 417 299 (71.7%) 11S (28.3%)
Table 4 : Prevalence of anemia in the subjects of different socio-economic class.
Hb
<12gm%
10 Yrs 11 Yrs 12 ys 13yrs 14 Yrs 15 yrs Total anemic / total no. of
subjects in that class
Class 1 4 4 5 4 1 1 19/42 (45.23%)
Class 2 17 13 19 16 7 3 75/147 (51%)
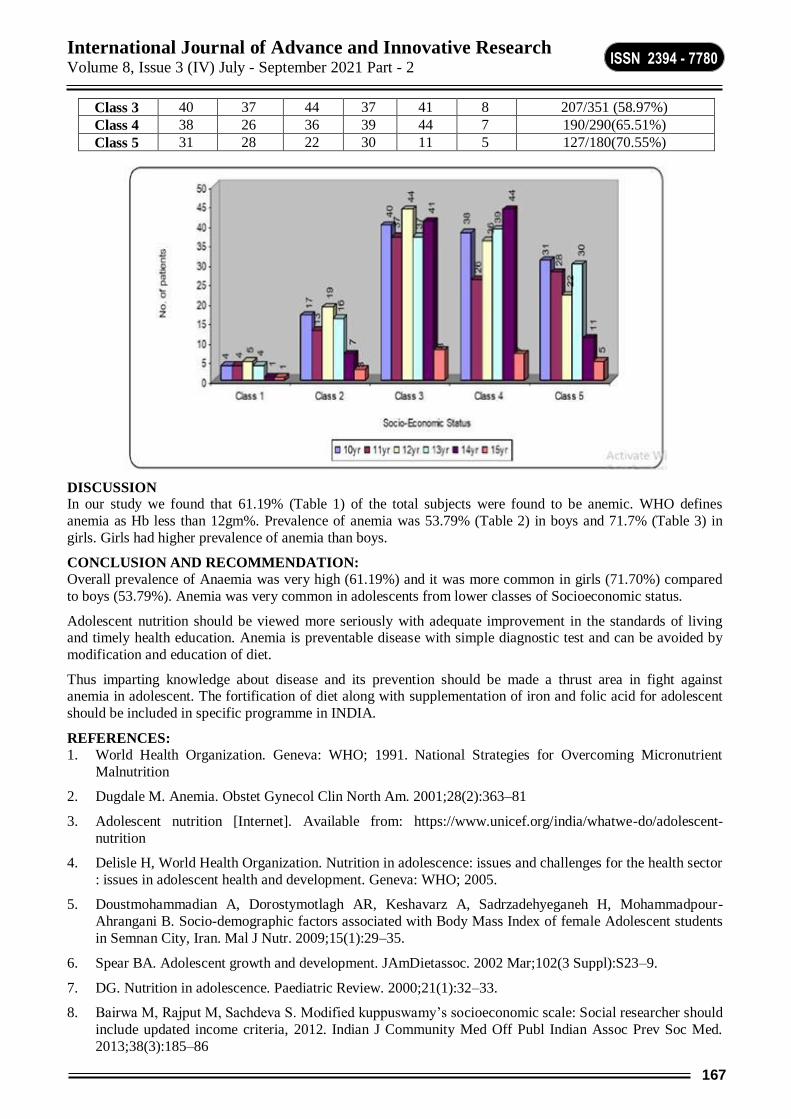
International Journal of Advance and Innovative Research Volume 8, Issue 3 (IV) July - September 2021 Part - 2
167
ISSN 2394 - 7780
Class 3 40 37 44 37 41 8 207/351 (58.97%)
Class 4 38 26 36 39 44 7 190/290(65.51%)
Class 5 31 28 22 30 11 5 127/180(70.55%)
DISCUSSION In our study we found that 61.19% (Table 1) of the total subjects were found to be anemic. WHO defines
anemia as Hb less than 12gm%. Prevalence of anemia was 53.79% (Table 2) in boys and 71.7% (Table 3) in
girls. Girls had higher prevalence of anemia than boys.
CONCLUSION AND RECOMMENDATION: Overall prevalence of Anaemia was very high (61.19%) and it was more common in girls (71.70%) compared
to boys (53.79%). Anemia was very common in adolescents from lower classes of Socioeconomic status.
Adolescent nutrition should be viewed more seriously with adequate improvement in the standards of living and timely health education. Anemia is preventable disease with simple diagnostic test and can be avoided by
modification and education of diet.
Thus imparting knowledge about disease and its prevention should be made a thrust area in fight against anemia in adolescent. The fortification of diet along with supplementation of iron and folic acid for adolescent
should be included in specific programme in INDIA.
REFERENCES: 1. World Health Organization. Geneva: WHO; 1991. National Strategies for Overcoming Micronutrient
Malnutrition
2. Dugdale M. Anemia. Obstet Gynecol Clin North Am. 2001;28(2):363–81
3. Adolescent nutrition [Internet]. Available from: https://www.unicef.org/india/whatwe-do/adolescent-
nutrition
4. Delisle H, World Health Organization. Nutrition in adolescence: issues and challenges for the health sector
: issues in adolescent health and development. Geneva: WHO; 2005.
5. Doustmohammadian A, Dorostymotlagh AR, Keshavarz A, Sadrzadehyeganeh H, Mohammadpour-
Ahrangani B. Socio-demographic factors associated with Body Mass Index of female Adolescent students
in Semnan City, Iran. Mal J Nutr. 2009;15(1):29–35.
6. Spear BA. Adolescent growth and development. JAmDietassoc. 2002 Mar;102(3 Suppl):S23–9.
7. DG. Nutrition in adolescence. Paediatric Review. 2000;21(1):32–33.
8. Bairwa M, Rajput M, Sachdeva S. Modified kuppuswamy’s socioeconomic scale: Social researcher should
include updated income criteria, 2012. Indian J Community Med Off Publ Indian Assoc Prev Soc Med.
2013;38(3):185–86
International Journal of Advance and Innovative Research Volume 8, Issue 3 (IV) July - September 2021 Part - 2
168
ISSN 2394 - 7780
REPRODUCTIVE HEALTH PROBLEMS OF URBAN AND RURAL WOMEN
Dr. Pratibha B. Desai
Assistant Professor, Department of Sociology, Shivaji University, Kolhapur, Maharashtra State
ABSTRACT Introduction: Health is considered as a fundamental human right. It is a country where 68.80% of the
population resides in a rural area and remaining in urban areas. Males significantly outnumber females.
Health of women is not merely a state of physical well being but also an expression of many roles they play as wives, mothers, health care providers in the family and in the changed scenario even as wage earners. the
reproductive rights are also ensured by state in India after Cairo Conference Most women are not aware about
their rights including reproductive rights in India and other times their legal rights are not protected. In case of rural women the condition is worst. Therefore researcher had tried to highlight the issues of Reproductive
Rights of rural women in-terms of participation in decision making process about child bearing and exercising
their rights in-case birth control devices and also demand safe delivery and abortion, demand of safe sex from
spouses and HIV.
Methodology: This study was carried in Solapur and Kolhapur districts of Western Maharashtra. The
objectives of study are to understand the socio-economic background of selected rural women for the present
study and to know the knowledge and attitude towards the reproductive rights among rural women. 200
married women respondents in age group of 18-25 were selected for study.
Findings: Still fifty percentage of rural women are only unaware about the reproductive health and they are not
exercising the reproductive rights.
Conclusion: Gender discrimination should be addressed in the exercise of reproductive rights and it is
necessary to create the awareness about reproductive rights of women among males.
Key Words: Health, Reproductive Rights, Knowledge, Attitude and Rural Women.
Acknowledgement: This paper is based on Research Project funded by Indian Council of Social Science
Research,(ICSSR),New Delhi and Ministry of Education(IMPRESS Scheme), and I am very thankful to
ICSSR, New Delhi and Ministry of Education(IMPRESS Scheme) for funding to this project.
INTRODUCTION
Nearly half of the population of India is the female population and in this country where 68.80% of the population resides in a rural areas and remaining in urban areas and males significantly outnumber females, an
imbalance that has increased over time. Majority of women from rural and urban areas are working in the
unorganised sector and paid less.
Reproductive health is major and important issues today concern with males in general and female in particular. They are suffering from many hazardous diseases and their health status is degrading. They are suffering many
health problems and not complaining and coping with silently because of prolonged gender discrimination and
domination in rural areas as well as urban areas. “Serious problems such as increasing spread of SITs, the growing incidence of reproductive tract infections, maternal and child mortality and morbidity highlight the
urgent need for appropriate and effective interventions of sex related matters and access to reproductive health
services and information”(Naresh Yadav:2014).Urban women are more aware and getting more reproductive health facilities than rural women. Social discrimination against women results in systematic neglect of
women’s health from womb to tomb. Female feticide, female infanticide a higher death rate among women,
lower literacy levels, higher morbidity, lower work participation rate and an adverse sex ration are a few
manifestations of this discrimination. Due to prevailing gender discrimination in India both urban and rural women always neglect their health problems in general and reproductive health problems particularly. Hence
the present highlights the reproductive health problems of Urban and Rural Women in Western Maharashta.
Major Reproductive Health Problems in India: The International Conference on Population and Development held at Cairo in September 1994 which focuses
the importance of women's health, particularly of reproductive problems and after that only the reproductive
health problem is an important public health issue in most of the developing countries.
The reproductive health problems such as abnormal vaginal discharge, lower abdominal pain, irregular vaginal
bleeding, lower abdominal pain, irregular vaginal discharge, heavy or painful periods or bleeding between
International Journal of Advance and Innovative Research Volume 8, Issue 3 (IV) July - September 2021 Part - 2
169
ISSN 2394 - 7780
periods, pain in the lower abdomen, Urinating often, pain during sex, lower back pain, infertility, multiple
miscarriages etc are found among women urban and rural women. Other than these women are suffering from
severe reproductive health problems such as sexually transmitted infections/reproductive tract Infections, HIV,
uterus problems etc.
Sexually Transmitted Diseases: These diseases are caused by viruses, bacteria, or parasitic microorganisms
that are transmitted through sexual activity with an infected partner. Cultural silence, unsafe sexual relationship, women’s negligence, financial problem and not early detection are major causes of STDs. Controlling STDs
helps prevent the reproductive morbidity and spread of HIV.
Reproductive Tract Infections: These are different types of infections and they are endogenous, iatrogenic and
sexually transmitted infections, which affect the reproductive tract: Reproductive tract infections fall into three categories: i) Sexually transmitted diseases including gonorrhoea, syphilis and HIV-I infections; ii) Infections
acquired as a result of badly performed medical procedures such as the insertion of IUDs and unsafe child birth
practices or illegal abortions; and iii) Infections that result from overgrowth of micro-organisms that normally inhabit the reproductive tract and are not sexually transmitted. There is high prevalence of RTIs among Indian
women and it is higher among rural women than urban women. These infections lead many negative impacts on
women health such as cancer and HIV.
Major causes of RTIs: Iatrogenic infections: These are infections caused by certain medical treatment or
surgical procedure like unsafe abortion, poor health delivery practices, non- sterile infections of intra- uterine
devices or IUD’s. Endogenous Infections: These are due to an overgrowth of organisms normal present in
women genital. Too much of this organism can cause RTI candidacies (also known as yeast infections and
bacterial vaginosis)
Candidacies caused by the fungus candidaalbicans. Yeast is often present in number inside in vagina. However
pregnancy, antibiotics, frequent semen over a short period of time can lead to an overgrowth and which leads
subsequently, an infection. These infections are usually easy to cure.
In India, more than a million women suffer from RTIs accounting for 25% of the reproductive tract infections
between the ages of 15 and 44 (NACO, 2005; Action Aid India, 1997). Despite their high prevalence and
consequences, there exists a “culture of silence” surrounding these diseases, due to the associated stigma and taboos as well as the widespread belief that symptoms of pain and discomfort are a natural part of a women’s
lifecycle. Women and young girls often do not seek clinical treatment because of fear or embarrassment, or a
lack of appropriate available care, particularly in an impoverished environment.
Pelvic inflammatory Disease (PID): PID is the inflammation of tissues found in the uterus fallopian tubes,
ovaries and surrounding pelvic areas. The primary risk factors there are infection with a sexually transmitted
disease (STD), particularly Chlamydia and gonorrhoea. The risk is increased when the STD is untreated in
women. PID is one which causes leading causes of infertility, ectopic pregnancies and chronic pelvic pain.
Reproductive Morbidity: It is divided into three types: 1.Obstetric Morbidity 2. Gynaecological Morbidity
3.Contraceptive morbidity
Obstetric Maternal Morbidity: Obstetric morbidity has to do with pregnancy, before and after child birth, abortion, haemorrhage, hyperactive
disorders, and whole range of conditions that arises because of pregnancy. Thus obstetric morbidity has defined
“morbidity that occurs during pregnancy or with 42 (sometimes 90 or 365) days of the end of the may persist
beyond that time morbidity caused by treatment of obstetric condition and traditional practices’.
Gynaecological Morbidity: Refers to morbidity which may be primary morbidity of the reproductive system or consequence of other
gynaecological morbidity includes dysfunction It also has two sub types
1) Direct gynaecological morbidity: This includes infectious disease, cancers of the reproductive systems and
menstrual disorders, coital injuries and primary or secondary infertility. It includes breast cancer, injuries
reproductive tract infections, premenstrual syndrome and number of problems related to menstrual.
2) Abnormal discharge from vagina (increase amount change in colour becoming milky, yellowish, greenish –
or the presence of unusual odour.)
Vaginal etching or discomfort
Pain on one side or both side of lower abdomen
International Journal of Advance and Innovative Research Volume 8, Issue 3 (IV) July - September 2021 Part - 2
170
ISSN 2394 - 7780
Irregular menstrual periods (profuse menstruating or bleeding before the menstrual period or after sex.)
Sores, warts or blisters on around the genitals.
Contraceptive Morbidity: Contraceptive morbidity refers to caused by birth control practices (Modern or traditional) Abortion related
morbidity, because it is pregnancy related is included with obstetric morbidity. The many benefits of contraceptive methods are not considered the morbidity can be in the form of irritation or allergic relation due to
barrier contraceptives, infection at around sites and IUD- associated bleeding contraceptive morbidity observe
among women (and men) who use or had used contraceptive methods which can occur during or after the use of
contraceptives. Some conditions are immediate other are delayed immediate effects may persist.
Gynaecological Cancer “Gynaecological cancer is any cancer that starts in a woman’s reproductive organs. Gynaecological cancers
begin in different places within a woman’s pelvis, which is the area below the stomach and in between the hip
bones.
Cervical cancer begins in the cervix, which is the lower, narrow end of the uterus.
Ovarian cancer begins in the ovaries, which are located on each side of the uterus.
Uterine cancer begins in the uterus, the pear-shaped organ in a woman’s pelvis where the baby grows when
a woman is pregnant.
Vaginal cancer begins in the vagina, which is the hollow, tube-like channel between the bottom of the
uterus and the outside of the body.
Vulvar cancer begins in the vulva, the outer part of the female genital organs”. (Centres for Disease
Control and Prevention (cdc.gov), https://www.cdc.gov)
There are main five types of gynaecological cancers and it is important create awareness about these types of
cancers among women.
HIV/AIDS
“HIV is the human immune deficiency virus. HIV affects specific cells of the immune system (called CD4 cells). Over time, HIV can destroy so many of these cells that the body can’t fight off infection anymore. The
human body cannot get rid of HIV—that means once a person has HIV, he or she has it for life. There is no cure
at this time, but with proper medical care, the virus can be controlled. HIV is the virus that can lead to acquired immune deficiency syndrome, or AIDS. AIDS is the late stage of HIV infection, when a person’s immune
system is severely damaged”. (Centres for Disease Control and Prevention (cdc.gov), https://www.cdc.gov)
Several studies conducted in India have documented a high prevalence of self-reported reproductive health,
problems of reproductive age. Most of .these problems can be easily cured by early detection and proper treatment. Previous studies suggest that the majority of symptomatic women do not seek formal treatment or
they seek treatment only when their symptoms increase in severity. Untreated reproductive health problems can
cause many risk to women’s health. Hence present study highlights the reproductive health problems among
rural and urban women.
To treat the theses reproductive health problems it is needed to speak women about this freely and openly.
“Awareness is needed and awareness of women regarding reproductive health problems certainly helps in
prevention and control of those problems. It is a challenging task to raise awareness regarding reproductive health care issues in women because of the social standing of women which distances them from the right
source of information and also because of the taboos regarding the discussions on issues like safe sex, unsafe
sexual practices etc. Awareness about the use of family planning methods was increased but there is very less awareness about reproductive health issues like safe sex and reproductive tract infection etc. Awareness
regarding reproductive health issues would raise participation and involvement with understanding about
individual and community rights. To prevent the reproductive health problems it is needed to address the awareness regarding reproductive health issues would raise participation and involvement with understanding
about individual and community rights”. (C.T. Vinitha, Saudan Singh and A.K.Rajendran:2007)
Primarily, in the Indian context, socio-cultural norms, beliefs and practices play a bigger role in making women
more vulnerable to reproductive health problems. In many cases, women, have feared reprisals from their partners and others, as being identified as promiscuous, immodest or unfaithful, if they raise issues related to
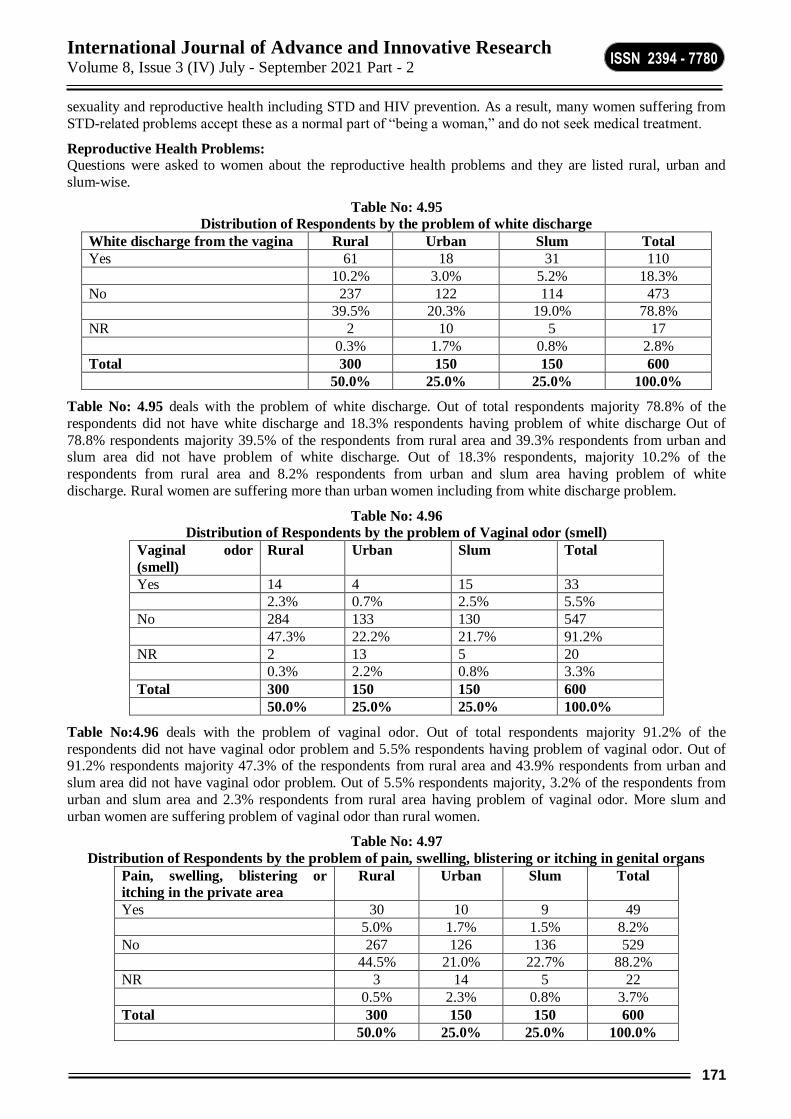
International Journal of Advance and Innovative Research Volume 8, Issue 3 (IV) July - September 2021 Part - 2
171
ISSN 2394 - 7780
sexuality and reproductive health including STD and HIV prevention. As a result, many women suffering from
STD-related problems accept these as a normal part of “being a woman,” and do not seek medical treatment.
Reproductive Health Problems: Questions were asked to women about the reproductive health problems and they are listed rural, urban and
slum-wise.
Table No: 4.95
Distribution of Respondents by the problem of white discharge
White discharge from the vagina Rural Urban Slum Total
Yes 61 18 31 110
10.2% 3.0% 5.2% 18.3%
No 237 122 114 473
39.5% 20.3% 19.0% 78.8%
NR 2 10 5 17
0.3% 1.7% 0.8% 2.8%
Total 300 150 150 600
50.0% 25.0% 25.0% 100.0%
Table No: 4.95 deals with the problem of white discharge. Out of total respondents majority 78.8% of the
respondents did not have white discharge and 18.3% respondents having problem of white discharge Out of
78.8% respondents majority 39.5% of the respondents from rural area and 39.3% respondents from urban and slum area did not have problem of white discharge. Out of 18.3% respondents, majority 10.2% of the
respondents from rural area and 8.2% respondents from urban and slum area having problem of white
discharge. Rural women are suffering more than urban women including from white discharge problem.
Table No: 4.96
Distribution of Respondents by the problem of Vaginal odor (smell)
Vaginal odor
(smell)
Rural Urban Slum Total
Yes 14 4 15 33
2.3% 0.7% 2.5% 5.5%
No 284 133 130 547
47.3% 22.2% 21.7% 91.2%
NR 2 13 5 20
0.3% 2.2% 0.8% 3.3%
Total 300 150 150 600
50.0% 25.0% 25.0% 100.0%
Table No:4.96 deals with the problem of vaginal odor. Out of total respondents majority 91.2% of the
respondents did not have vaginal odor problem and 5.5% respondents having problem of vaginal odor. Out of 91.2% respondents majority 47.3% of the respondents from rural area and 43.9% respondents from urban and
slum area did not have vaginal odor problem. Out of 5.5% respondents majority, 3.2% of the respondents from
urban and slum area and 2.3% respondents from rural area having problem of vaginal odor. More slum and
urban women are suffering problem of vaginal odor than rural women.
Table No: 4.97
Distribution of Respondents by the problem of pain, swelling, blistering or itching in genital organs
Pain, swelling, blistering or
itching in the private area
Rural Urban Slum Total
Yes 30 10 9 49
5.0% 1.7% 1.5% 8.2%
No 267 126 136 529
44.5% 21.0% 22.7% 88.2%
NR 3 14 5 22
0.5% 2.3% 0.8% 3.7%
Total 300 150 150 600
50.0% 25.0% 25.0% 100.0%
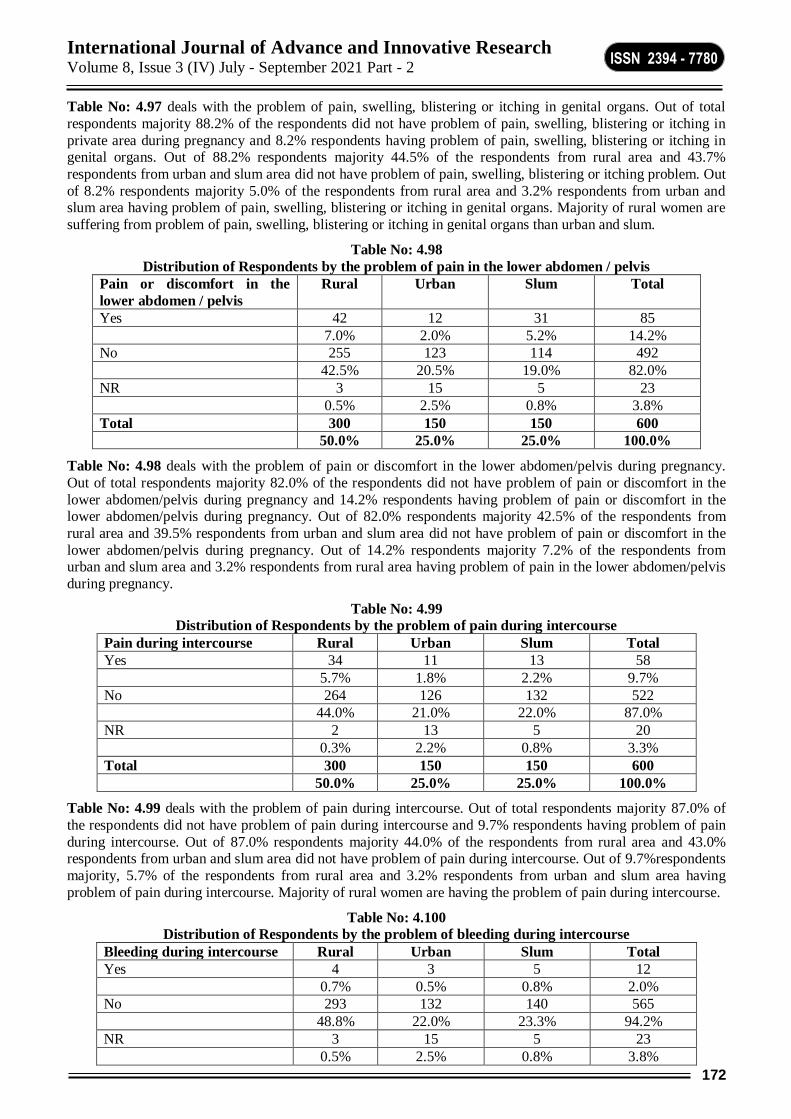
International Journal of Advance and Innovative Research Volume 8, Issue 3 (IV) July - September 2021 Part - 2
172
ISSN 2394 - 7780
Table No: 4.97 deals with the problem of pain, swelling, blistering or itching in genital organs. Out of total
respondents majority 88.2% of the respondents did not have problem of pain, swelling, blistering or itching in
private area during pregnancy and 8.2% respondents having problem of pain, swelling, blistering or itching in genital organs. Out of 88.2% respondents majority 44.5% of the respondents from rural area and 43.7%
respondents from urban and slum area did not have problem of pain, swelling, blistering or itching problem. Out
of 8.2% respondents majority 5.0% of the respondents from rural area and 3.2% respondents from urban and slum area having problem of pain, swelling, blistering or itching in genital organs. Majority of rural women are
suffering from problem of pain, swelling, blistering or itching in genital organs than urban and slum.
Table No: 4.98
Distribution of Respondents by the problem of pain in the lower abdomen / pelvis
Pain or discomfort in the
lower abdomen / pelvis
Rural Urban Slum Total
Yes 42 12 31 85
7.0% 2.0% 5.2% 14.2%
No 255 123 114 492
42.5% 20.5% 19.0% 82.0%
NR 3 15 5 23
0.5% 2.5% 0.8% 3.8%
Total 300 150 150 600
50.0% 25.0% 25.0% 100.0%
Table No: 4.98 deals with the problem of pain or discomfort in the lower abdomen/pelvis during pregnancy.
Out of total respondents majority 82.0% of the respondents did not have problem of pain or discomfort in the
lower abdomen/pelvis during pregnancy and 14.2% respondents having problem of pain or discomfort in the lower abdomen/pelvis during pregnancy. Out of 82.0% respondents majority 42.5% of the respondents from
rural area and 39.5% respondents from urban and slum area did not have problem of pain or discomfort in the
lower abdomen/pelvis during pregnancy. Out of 14.2% respondents majority 7.2% of the respondents from urban and slum area and 3.2% respondents from rural area having problem of pain in the lower abdomen/pelvis
during pregnancy.
Table No: 4.99
Distribution of Respondents by the problem of pain during intercourse
Pain during intercourse Rural Urban Slum Total
Yes 34 11 13 58
5.7% 1.8% 2.2% 9.7%
No 264 126 132 522
44.0% 21.0% 22.0% 87.0%
NR 2 13 5 20
0.3% 2.2% 0.8% 3.3%
Total 300 150 150 600
50.0% 25.0% 25.0% 100.0%
Table No: 4.99 deals with the problem of pain during intercourse. Out of total respondents majority 87.0% of
the respondents did not have problem of pain during intercourse and 9.7% respondents having problem of pain
during intercourse. Out of 87.0% respondents majority 44.0% of the respondents from rural area and 43.0% respondents from urban and slum area did not have problem of pain during intercourse. Out of 9.7%respondents
majority, 5.7% of the respondents from rural area and 3.2% respondents from urban and slum area having
problem of pain during intercourse. Majority of rural women are having the problem of pain during intercourse.
Table No: 4.100
Distribution of Respondents by the problem of bleeding during intercourse
Bleeding during intercourse Rural Urban Slum Total
Yes 4 3 5 12
0.7% 0.5% 0.8% 2.0%
No 293 132 140 565
48.8% 22.0% 23.3% 94.2%
NR 3 15 5 23
0.5% 2.5% 0.8% 3.8%
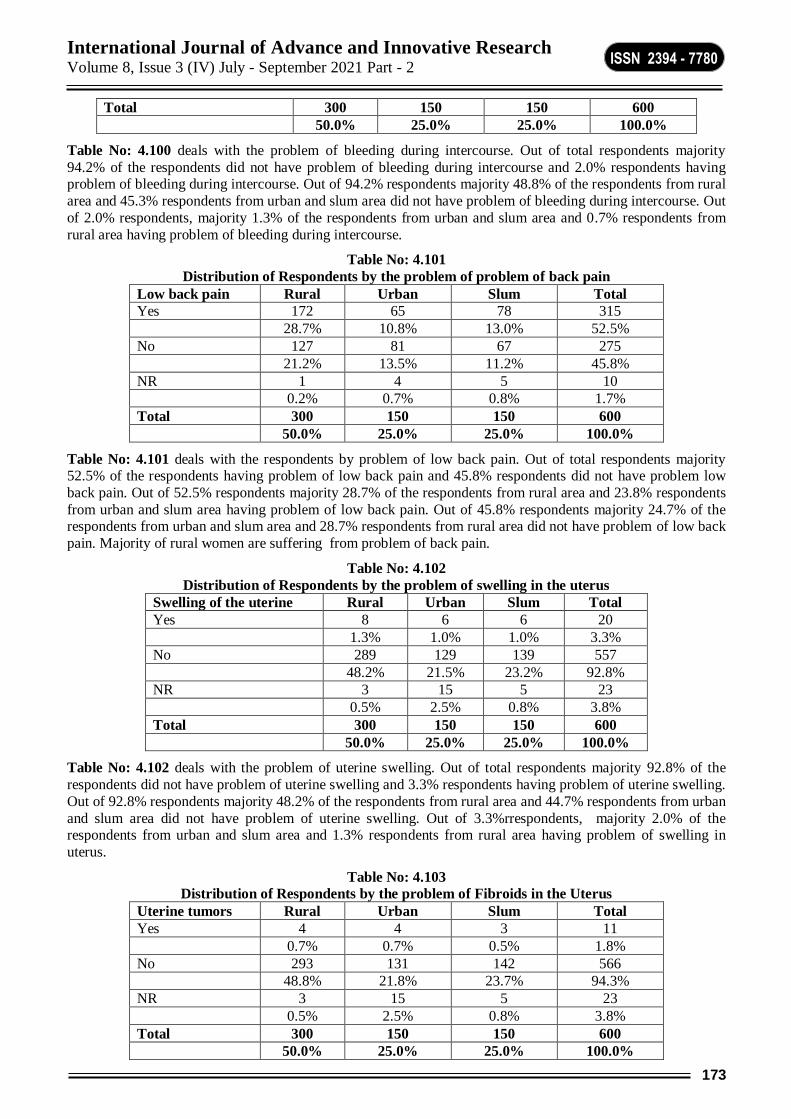
International Journal of Advance and Innovative Research Volume 8, Issue 3 (IV) July - September 2021 Part - 2
173
ISSN 2394 - 7780
Total 300 150 150 600
50.0% 25.0% 25.0% 100.0%
Table No: 4.100 deals with the problem of bleeding during intercourse. Out of total respondents majority
94.2% of the respondents did not have problem of bleeding during intercourse and 2.0% respondents having problem of bleeding during intercourse. Out of 94.2% respondents majority 48.8% of the respondents from rural
area and 45.3% respondents from urban and slum area did not have problem of bleeding during intercourse. Out
of 2.0% respondents, majority 1.3% of the respondents from urban and slum area and 0.7% respondents from
rural area having problem of bleeding during intercourse.
Table No: 4.101
Distribution of Respondents by the problem of problem of back pain
Low back pain Rural Urban Slum Total
Yes 172 65 78 315
28.7% 10.8% 13.0% 52.5%
No 127 81 67 275
21.2% 13.5% 11.2% 45.8%
NR 1 4 5 10
0.2% 0.7% 0.8% 1.7%
Total 300 150 150 600
50.0% 25.0% 25.0% 100.0%
Table No: 4.101 deals with the respondents by problem of low back pain. Out of total respondents majority 52.5% of the respondents having problem of low back pain and 45.8% respondents did not have problem low
back pain. Out of 52.5% respondents majority 28.7% of the respondents from rural area and 23.8% respondents
from urban and slum area having problem of low back pain. Out of 45.8% respondents majority 24.7% of the respondents from urban and slum area and 28.7% respondents from rural area did not have problem of low back
pain. Majority of rural women are suffering from problem of back pain.
Table No: 4.102
Distribution of Respondents by the problem of swelling in the uterus
Swelling of the uterine Rural Urban Slum Total
Yes 8 6 6 20
1.3% 1.0% 1.0% 3.3%
No 289 129 139 557
48.2% 21.5% 23.2% 92.8%
NR 3 15 5 23
0.5% 2.5% 0.8% 3.8%
Total 300 150 150 600
50.0% 25.0% 25.0% 100.0%
Table No: 4.102 deals with the problem of uterine swelling. Out of total respondents majority 92.8% of the
respondents did not have problem of uterine swelling and 3.3% respondents having problem of uterine swelling.
Out of 92.8% respondents majority 48.2% of the respondents from rural area and 44.7% respondents from urban
and slum area did not have problem of uterine swelling. Out of 3.3%rrespondents, majority 2.0% of the respondents from urban and slum area and 1.3% respondents from rural area having problem of swelling in
uterus.
Table No: 4.103
Distribution of Respondents by the problem of Fibroids in the Uterus
Uterine tumors Rural Urban Slum Total
Yes 4 4 3 11
0.7% 0.7% 0.5% 1.8%
No 293 131 142 566
48.8% 21.8% 23.7% 94.3%
NR 3 15 5 23
0.5% 2.5% 0.8% 3.8%
Total 300 150 150 600
50.0% 25.0% 25.0% 100.0%
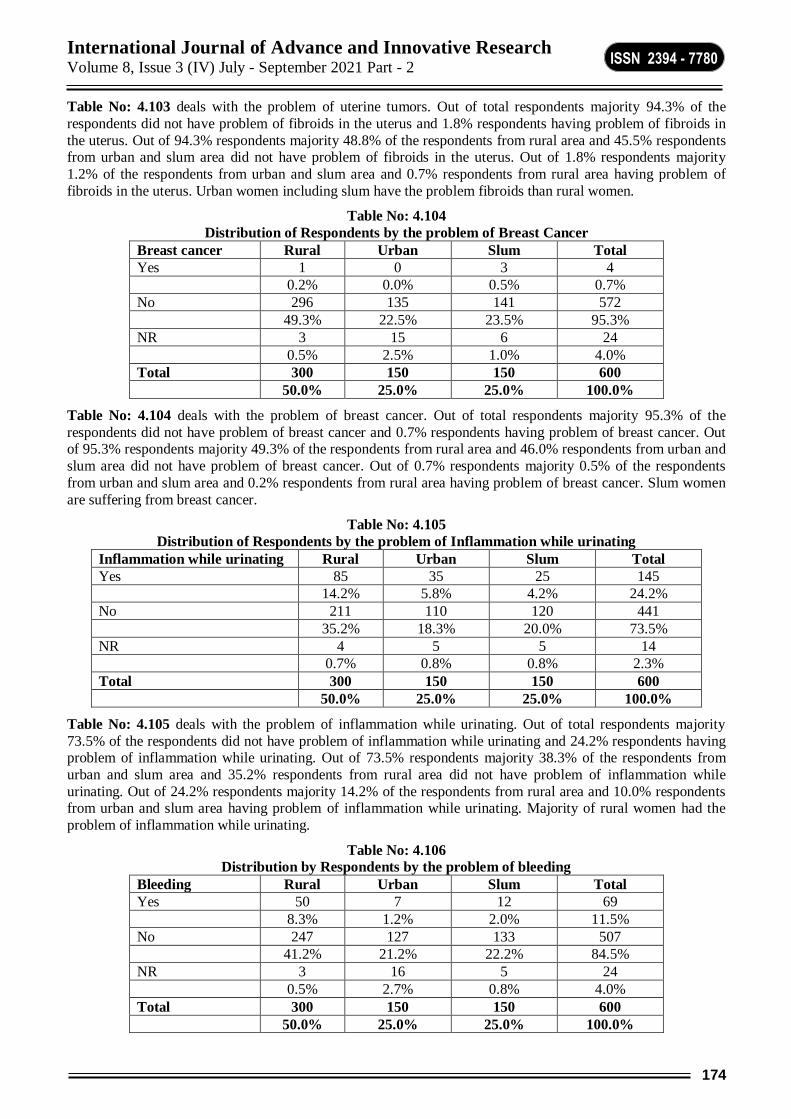
International Journal of Advance and Innovative Research Volume 8, Issue 3 (IV) July - September 2021 Part - 2
174
ISSN 2394 - 7780
Table No: 4.103 deals with the problem of uterine tumors. Out of total respondents majority 94.3% of the
respondents did not have problem of fibroids in the uterus and 1.8% respondents having problem of fibroids in
the uterus. Out of 94.3% respondents majority 48.8% of the respondents from rural area and 45.5% respondents from urban and slum area did not have problem of fibroids in the uterus. Out of 1.8% respondents majority
1.2% of the respondents from urban and slum area and 0.7% respondents from rural area having problem of
fibroids in the uterus. Urban women including slum have the problem fibroids than rural women.
Table No: 4.104
Distribution of Respondents by the problem of Breast Cancer
Breast cancer Rural Urban Slum Total
Yes 1 0 3 4
0.2% 0.0% 0.5% 0.7%
No 296 135 141 572
49.3% 22.5% 23.5% 95.3%
NR 3 15 6 24
0.5% 2.5% 1.0% 4.0%
Total 300 150 150 600
50.0% 25.0% 25.0% 100.0%
Table No: 4.104 deals with the problem of breast cancer. Out of total respondents majority 95.3% of the
respondents did not have problem of breast cancer and 0.7% respondents having problem of breast cancer. Out of 95.3% respondents majority 49.3% of the respondents from rural area and 46.0% respondents from urban and
slum area did not have problem of breast cancer. Out of 0.7% respondents majority 0.5% of the respondents
from urban and slum area and 0.2% respondents from rural area having problem of breast cancer. Slum women
are suffering from breast cancer.
Table No: 4.105
Distribution of Respondents by the problem of Inflammation while urinating
Inflammation while urinating Rural Urban Slum Total
Yes 85 35 25 145
14.2% 5.8% 4.2% 24.2%
No 211 110 120 441
35.2% 18.3% 20.0% 73.5%
NR 4 5 5 14
0.7% 0.8% 0.8% 2.3%
Total 300 150 150 600
50.0% 25.0% 25.0% 100.0%
Table No: 4.105 deals with the problem of inflammation while urinating. Out of total respondents majority
73.5% of the respondents did not have problem of inflammation while urinating and 24.2% respondents having problem of inflammation while urinating. Out of 73.5% respondents majority 38.3% of the respondents from
urban and slum area and 35.2% respondents from rural area did not have problem of inflammation while
urinating. Out of 24.2% respondents majority 14.2% of the respondents from rural area and 10.0% respondents from urban and slum area having problem of inflammation while urinating. Majority of rural women had the
problem of inflammation while urinating.
Table No: 4.106
Distribution by Respondents by the problem of bleeding
Bleeding Rural Urban Slum Total
Yes 50 7 12 69
8.3% 1.2% 2.0% 11.5%
No 247 127 133 507
41.2% 21.2% 22.2% 84.5%
NR 3 16 5 24
0.5% 2.7% 0.8% 4.0%
Total 300 150 150 600
50.0% 25.0% 25.0% 100.0%
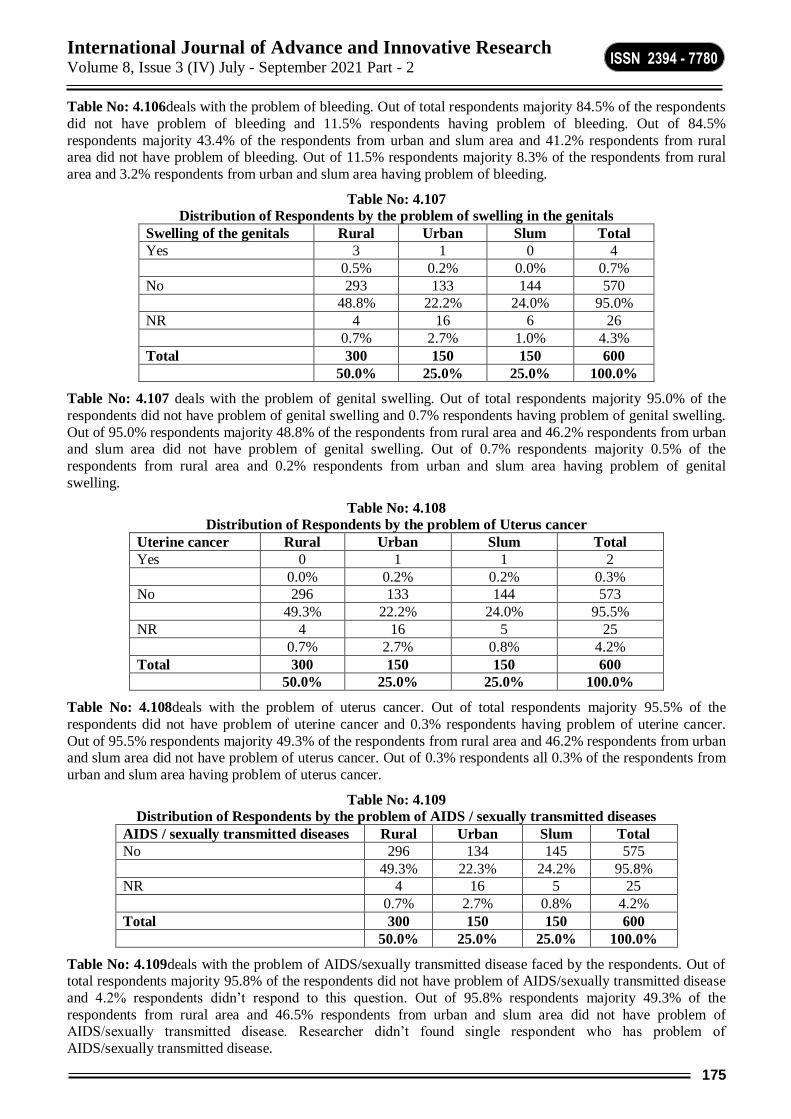
International Journal of Advance and Innovative Research Volume 8, Issue 3 (IV) July - September 2021 Part - 2
175
ISSN 2394 - 7780
Table No: 4.106deals with the problem of bleeding. Out of total respondents majority 84.5% of the respondents
did not have problem of bleeding and 11.5% respondents having problem of bleeding. Out of 84.5%
respondents majority 43.4% of the respondents from urban and slum area and 41.2% respondents from rural area did not have problem of bleeding. Out of 11.5% respondents majority 8.3% of the respondents from rural
area and 3.2% respondents from urban and slum area having problem of bleeding.
Table No: 4.107
Distribution of Respondents by the problem of swelling in the genitals
Swelling of the genitals Rural Urban Slum Total
Yes 3 1 0 4
0.5% 0.2% 0.0% 0.7%
No 293 133 144 570
48.8% 22.2% 24.0% 95.0%
NR 4 16 6 26
0.7% 2.7% 1.0% 4.3%
Total 300 150 150 600
50.0% 25.0% 25.0% 100.0%
Table No: 4.107 deals with the problem of genital swelling. Out of total respondents majority 95.0% of the
respondents did not have problem of genital swelling and 0.7% respondents having problem of genital swelling.
Out of 95.0% respondents majority 48.8% of the respondents from rural area and 46.2% respondents from urban and slum area did not have problem of genital swelling. Out of 0.7% respondents majority 0.5% of the
respondents from rural area and 0.2% respondents from urban and slum area having problem of genital
swelling.
Table No: 4.108
Distribution of Respondents by the problem of Uterus cancer
Uterine cancer Rural Urban Slum Total
Yes 0 1 1 2
0.0% 0.2% 0.2% 0.3%
No 296 133 144 573
49.3% 22.2% 24.0% 95.5%
NR 4 16 5 25
0.7% 2.7% 0.8% 4.2%
Total 300 150 150 600
50.0% 25.0% 25.0% 100.0%
Table No: 4.108deals with the problem of uterus cancer. Out of total respondents majority 95.5% of the
respondents did not have problem of uterine cancer and 0.3% respondents having problem of uterine cancer.
Out of 95.5% respondents majority 49.3% of the respondents from rural area and 46.2% respondents from urban and slum area did not have problem of uterus cancer. Out of 0.3% respondents all 0.3% of the respondents from
urban and slum area having problem of uterus cancer.
Table No: 4.109
Distribution of Respondents by the problem of AIDS / sexually transmitted diseases
AIDS / sexually transmitted diseases Rural Urban Slum Total
No 296 134 145 575
49.3% 22.3% 24.2% 95.8%
NR 4 16 5 25
0.7% 2.7% 0.8% 4.2%
Total 300 150 150 600
50.0% 25.0% 25.0% 100.0%
Table No: 4.109deals with the problem of AIDS/sexually transmitted disease faced by the respondents. Out of total respondents majority 95.8% of the respondents did not have problem of AIDS/sexually transmitted disease
and 4.2% respondents didn’t respond to this question. Out of 95.8% respondents majority 49.3% of the
respondents from rural area and 46.5% respondents from urban and slum area did not have problem of AIDS/sexually transmitted disease. Researcher didn’t found single respondent who has problem of
AIDS/sexually transmitted disease.
International Journal of Advance and Innovative Research Volume 8, Issue 3 (IV) July - September 2021 Part - 2
176
ISSN 2394 - 7780
MAJOR FINDINGS:
Rural women are suffering more than urban women including from white discharge problem.
More slum and urban women are suffering problem of vaginal odor than rural women.
More slum and urban women are suffering problem of vaginal odor than rural women.
More number of rural women are suffering from problem of pain, swelling, blistering or itching in genital
organs than urban and slum.
Out of 14.2% respondents majority 7.2% of the respondents from urban and slum area and 3.2%
respondents from rural area having problem of pain or discomfort in the lower abdomen/pelvis during
pregnancy.
Out of 9.7% respondents majority 5.7% of the respondents from rural area and 3.2% respondents from
urban and slum area having problem of pain during intercourse. Majority of rural women are having the
problem of pain during intercourse.
Out of 2.0% respondents majority 1.3% of the respondents from urban and slum area and 0.7% respondents
from rural area having problem of bleeding during intercourse.
Out of 14.2% respondents majority 7.2% of the respondents from urban and slum area and 3.2%
respondents from rural area having problem of pain in the lower abdomen/pelvis.
Out of 9.7% respondents majority 5.7% of the respondents from rural area and 3.2% respondents from
urban and slum area having problem of pain during intercourse. Majority of rural women are having the
problem of pain during intercourse.
Out of 2.0% respondents majority 1.3% of the respondents from urban and slum area and 0.7% respondents
from rural area having problem of bleeding during intercourse.
Out of 0.7% respondents majority 0.5% of the respondents from urban and slum area and 0.2% respondents
from rural area having problem of breast cancer.
Out of 45.8% respondents majority 24.7% of the respondents from urban and slum area and 28.7%
respondents from rural area did not have problem of low back pain. Majority of rural women are suffering
from problem of back pain.
Out of 3.3%r respondents majority 2.0% of the respondents from urban and slum area and 1.3%
respondents from rural area having problem of swelling in uterus.
Out of 1.8% respondents majority 1.2% of the respondents from urban and slum area and 0.7% respondents
from rural area having problem of fibroids in the uterus.
Out of 24.2% respondents majority 14.2% of the respondents from rural area and 10.0% respondents from urban and slum area having problem of inflammation while urinating. Majority of rural women had the
problem of inflammation while urinating.
Out of 11.5% respondents majority 8.3% of the respondents from rural area and 3.2% respondents from
urban and slum area having problem of bleeding.
Out of 0.7% respondents majority 0.5% of the respondents from rural area and 0.2% respondents from
urban and slum area having problem of genital swelling.
Out of 0.3% respondents all 0.3% of the respondents from urban and slum area having problem of uterus
cancer. Slum women are suffering from breast cancer.
Researcher didn’t found single respondent who has problem of AIDS/sexually transmitted disease.
CONCLUSION:
It is found that only 20% of reproductive health problems from rural and urban including slum are reported by women and these reproductive health problems are more among rural women. Women are unaware about new
reproductive health problems. Still women are not speaking about these health problems and they are not ready
to give the information.

International Journal of Advance and Innovative Research Volume 8, Issue 3 (IV) July - September 2021 Part - 2
177
ISSN 2394 - 7780
REFERENCES:
Bhattacharya Vandana (2017), “Socio-Cultural Determinants of Reproductive Health among Urban Poor
Women”, Deb Sibnath (eds) “Reproductive Health Management”, Akansha publishing house, ISBN 978-
81-8370-191-4, pp:75 to 81.
Das N. P. and Shah Urvi (2003),“Understanding Women’s Reproductive Health Needs in Urban Slum: A
Rapid Assessment”, A.P.H. Publishing Corporation, ISBN 7648-510-1.
Gedam Jaya K., (2017), “Study of Reproductive Health Problems in Adolescent Girls at ESIC PGIMSR,
MGM Hospital, Parel, Mumbai: A Retrospective Study”, in International Journal of Reproduction,
Contraception, Obstetrics and Gynaecology, Vol.No-6, Issue No-10, print ISSN:2320-1770, online
ISSN:2320-1789.
Naresh Yadav:2014
Rao, Mohan (2004),(ed) ‘The Unheard Scream Reproductive Health & Women’s Lives in India’ published
by Kali, New-Delhi, ISBN-13: 9788186706701.
Vinitha C.T., Singh Saudan And Rajendran A.K.(2007),“Level of reproductive health awareness and
factors affecting In a rural community of south India”, Health and population : Perspectives and
Issues.2007. Vol.30,Issue No.1;24-33 ISSN 0253-6803.
https://www.cdc.gov
https://www.humanistfederation.edu
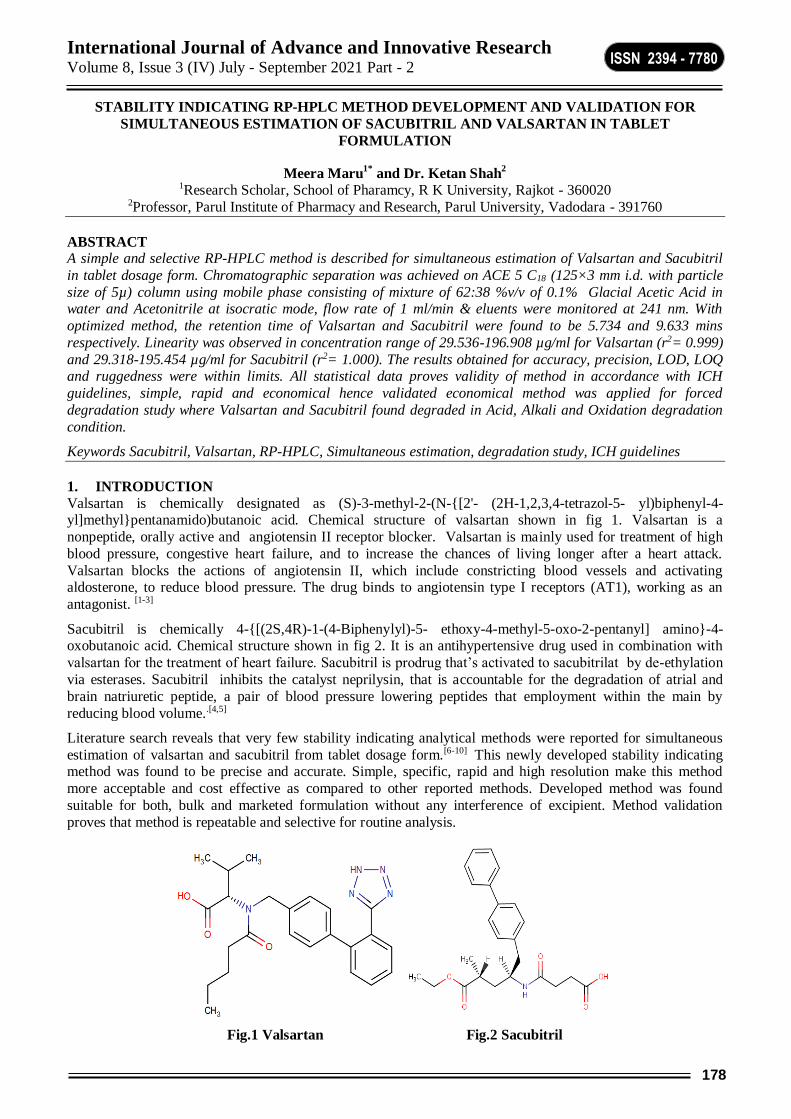
International Journal of Advance and Innovative Research Volume 8, Issue 3 (IV) July - September 2021 Part - 2
178
ISSN 2394 - 7780
STABILITY INDICATING RP-HPLC METHOD DEVELOPMENT AND VALIDATION FOR
SIMULTANEOUS ESTIMATION OF SACUBITRIL AND VALSARTAN IN TABLET
FORMULATION
Meera Maru1*
and Dr. Ketan Shah2
1Research Scholar, School of Pharamcy, R K University, Rajkot - 360020 2Professor, Parul Institute of Pharmacy and Research, Parul University, Vadodara - 391760
ABSTRACT A simple and selective RP-HPLC method is described for simultaneous estimation of Valsartan and Sacubitril
in tablet dosage form. Chromatographic separation was achieved on ACE 5 C18 (125×3 mm i.d. with particle
size of 5µ) column using mobile phase consisting of mixture of 62:38 %v/v of 0.1% Glacial Acetic Acid in water and Acetonitrile at isocratic mode, flow rate of 1 ml/min & eluents were monitored at 241 nm. With
optimized method, the retention time of Valsartan and Sacubitril were found to be 5.734 and 9.633 mins
respectively. Linearity was observed in concentration range of 29.536-196.908 µg/ml for Valsartan (r2= 0.999)
and 29.318-195.454 µg/ml for Sacubitril (r2= 1.000). The results obtained for accuracy, precision, LOD, LOQ and ruggedness were within limits. All statistical data proves validity of method in accordance with ICH
guidelines, simple, rapid and economical hence validated economical method was applied for forced
degradation study where Valsartan and Sacubitril found degraded in Acid, Alkali and Oxidation degradation
condition.
Keywords Sacubitril, Valsartan, RP-HPLC, Simultaneous estimation, degradation study, ICH guidelines
1. INTRODUCTION
Valsartan is chemically designated as (S)-3-methyl-2-(N-{[2'- (2H-1,2,3,4-tetrazol-5- yl)biphenyl-4- yl]methyl}pentanamido)butanoic acid. Chemical structure of valsartan shown in fig 1. Valsartan is a
nonpeptide, orally active and angiotensin II receptor blocker. Valsartan is mainly used for treatment of high
blood pressure, congestive heart failure, and to increase the chances of living longer after a heart attack.
Valsartan blocks the actions of angiotensin II, which include constricting blood vessels and activating aldosterone, to reduce blood pressure. The drug binds to angiotensin type I receptors (AT1), working as an
antagonist. [1-3]
Sacubitril is chemically 4-{[(2S,4R)-1-(4-Biphenylyl)-5- ethoxy-4-methyl-5-oxo-2-pentanyl] amino}-4-oxobutanoic acid. Chemical structure shown in fig 2. It is an antihypertensive drug used in combination with
valsartan for the treatment of heart failure. Sacubitril is prodrug that’s activated to sacubitrilat by de-ethylation
via esterases. Sacubitril inhibits the catalyst neprilysin, that is accountable for the degradation of atrial and
brain natriuretic peptide, a pair of blood pressure lowering peptides that employment within the main by
reducing blood volume..[4,5]
Literature search reveals that very few stability indicating analytical methods were reported for simultaneous
estimation of valsartan and sacubitril from tablet dosage form.[6-10] This newly developed stability indicating method was found to be precise and accurate. Simple, specific, rapid and high resolution make this method
more acceptable and cost effective as compared to other reported methods. Developed method was found
suitable for both, bulk and marketed formulation without any interference of excipient. Method validation
proves that method is repeatable and selective for routine analysis.
Fig.1 Valsartan Fig.2 Sacubitril
International Journal of Advance and Innovative Research Volume 8, Issue 3 (IV) July - September 2021 Part - 2
179
ISSN 2394 - 7780
2. MATERIALS AND METHOD
2.1 Equipment and Apparatus
The chromatographic technique performed on a Shimadzu LC-2010C HT and Empower software, reversed phase ACE 5 C18 (125×3 mm i.d. with particle size of 5µ) as stationary phase , having PDA detector. Mettler
Toledo analytical balance and Jain scientific sonicator bath used for analysis.
2.2 Chemicals and Reagents HPLC grade Acetonitrile from Rankem. Analytical grade glacial acetic acid, hydrogen peroxide, hydrochloric
acid purchased from Merck India, sodium hydroxide and ammonium sulphate from SRL India. The HPLC
grade water was obtained from a mili Q water purification system. Sacubitril and Valsartan standard were
received as a gift sample from micro labs Ltd and dosage form collected from local pharmacy.
2.3 Chromatographic Conditions
The elusion was achieved on Shimadzu LC-2010C HT with ACE 5 C18 (125×3 mm i.d. with particle size of 5µ)
column. Solvents used for the study were 0.1% Glacial acetic acid in water : Acetonitril in ratio of 50:50 %v/v. Mixed standard solution was injected in column which was eluted by mobile phase mixture of 0.1 % glacial
acetic acid in water : Acetonitrile in ratio of 62:38 %v/v. The injection volume was 10 μl, flow rate was 1.0
ml/minute and eluents were monitored at 241 nm. Chromatography was carried out at 15ºC and maintained the column temperature at 25ºC. the sample was run for 25 minutes. Data related to chromatogram like area,
height, retention time, tailing factor, theoretical plate and resolution were recorded using Empower software.
Optimised chromatogram was shown in fig 3.
2.4 Preparation of Solutions
2.4.1 Preparation of Mixed Standard Solution Accuretely weighed and transferred about 51 mg Sacubitril calcium standard (equivalent To 48.7 mg
Sacubitril) (%purity - 98.9%) and about 51.5 mg Valsartan standard (%purity - 99.0%) into 50 ml volumetric flask. Added 35 ml diluent which is 0.1 % glacial acetic acid solution and Acetonitrile in ratio of 50:50 %v/v
and sonicated. Allowed to cool at RT and make upto the mark with same and mixed well. Further diluted 5 ml
of standard stock solution to 50 ml with diluent and mixed well, used for recording chromatogram.
2.4.2 Preparation of Solution Twenty Tablets were weighted (each tablet containing sacubitril 97 mg and valsartan 103 mg) and determined
average weight. Accurately weighed and transferred 5 intact tablets into clean and dry 500 ml of volumetric
flask, Added 10 ml water to remove coating by immediate vigorous swirling and sonicated for 10 minutes. Further added about 350 ml of diluent and sonicated for 40 min with vigorous shaking. After complete
disintegration allowed to cool at room temperature. Diluted upto the mark with diluent and mixed well.
Allowed to settle down the particles. Further diluted 5 ml supernatant of sample stock solution to 50 ml with
diluent and mixed well. Filterd through 0.45µ PVDF syringe filter and discarded first 5 ml of filtrate.
2.5 Degradation Studies
2.5.1 Acid Degradation
Determined the average weight and Crushed tablet to fine powder. Weighed and transferred powder equivalent to about 97mg of Sacubitril into a 200ml volumetric flask. Added about 140ml of diluent and sonicated for
30min with intermittent shaking. Allowed to cool at room temperature and added 5ml of 1N HCl and kept in
water bath at 60ºC for 1Hr. After 1Hr, allowed to cool at room temperature and neutralized with 5ml of 1N NaOH solution. Make upto the mark with diluent and mix well. Further diluted 5ml to 25ml with diluent and
mixed well. After injection, chromatograms were recorded to assess the stability of sample.
2.5.2 Alkali Degradation Determined the average weight and Crushed tablet to fine powder. Weighed and transferred powder equivalent
to about 97mg of Sacubitril into a 200ml volumetric flask. Added about 140ml of diluent and sonicated for
30min with intermittent shaking. Allowed to cool at room temperature and added 4ml of 1N NaOH and kept in
water bath at 60ºC for 15 min. After 10 min, allowed to cool at room temperature and neutralized with 4ml of 1N HCl solution. Make upto the mark with diluent and mix well. Further diluted 5ml to 25ml with diluent and
mixed well. After injection, chromatograms were recorded to assess the stability of sample.
2.5.3 Oxidative Degradation Determined the average weight and Crushed tablet to fine powder. Weighed and transferred powder equivalent
to about 97mg of Sacubitril into a 200ml volumetric flask. Added about 140ml of diluent and sonicated for
30min with intermittent shaking. Allowed to cool at room temperature and added 5ml of 5% H2O2 solution and
kept at room temperature for 1Hr. Make upto the mark with diluent and mix well. Further diluted 5ml of above
International Journal of Advance and Innovative Research Volume 8, Issue 3 (IV) July - September 2021 Part - 2
180
ISSN 2394 - 7780
stock solution to 25ml with diluent and mixed well. After injection, chromatograms were recorded to assess the
stability of sample.
2.5.4 Thermal Degradation Transferred and spreaded uniformly tablet and placebo in to individual petri dish, and exposed to heat at 90ºC
in oven for about 24Hr. After 24 hours, determined the average weight and Crushed tablet to fine powder.
Weighed and transferred powder equivalent to about 97mg of Sacubitril into a 200ml volumetric flask. Added about 140ml of diluent and sonicated for 30min with intermittent shaking. Allowed to cool at room
temperature. Make upto the mark with diluent and mix well. Further diluted 5ml to 25ml with diluent and
mixed well. After injection, chromatograms were recorded to assess the stability of sample.
2.5.5 Humidity Degradation Prepared a saturated solution of ammonium chloride in water at room temperature, poured in desiccators and
close with glass lid. Allowed the desiccators to equilibrate for about two hours to attain relative humidity of
about 80 ± 2% at 25ºC. Spreaded uniformly the powdered content of tablet in petri dish, placed it inside the desiccators and exposed for 24 hours at 25ºC/80% RH. After 24 hours, weighed and transferred powder
equivalent to about 97mg of Sacubitril into a 200ml volumetric flask. Added about 140ml of diluents and
sonicated for 30min with intermittent shaking. Allowed to cool at room temperature. Make volume upto the mark with diluent and mixed well. Further diluted 5ml of above stock solution to 25ml with diluent and mixed
well. After injection, chromatograms were recorded to assess the stability of sample.
2.6 Photolytic Degradation Transferred and spreaded uniformly tablet and placebo in to individual petri dish, and exposed to the white fluorescent light for 1.2 million LUX hours and 200 watt hours/square meter. After exposure to white
fluorescent light, determined the average weight and Crushed tablet to fine powder. Weighed and transferred
powder equivalent to about 97mg of Sacubitril into a 200ml volumetric flask. Added about 140ml of diluent and sonicated for 30min with intermittent shaking. Allowed to cool at room temperature. Make upto the mark
with diluent and mix well. Further diluted 5ml to 25ml with diluent and mixed well. After injection,
chromatograms were recorded to assess the stability of sample.
3. RESULTS AND DISCUSSION
3.1 Optimization of Chromatographic Conditions
Stability indicating method should be capable of separate, detect and quantify the drug and its stress
degradation products within the standard limits of system suitability parameters. Method should be selective and specific. These objectives were achieved by selection of proper chromatographic conditions. The sample
separation was achieved on a ACE 5 C18 (125×3 mm i.d. with particle size of 5µ). The detection was carried
out at 241 nm by PDA detector. Chromatography was carried out at 15ºC and maintained the column temperature at 25ºC. In order to achieve a well resolved peak of drugs from its degradation products the
selection of mobile phase and its composition were considered as prime factors. Several trials were done for
chromatographic conditions and effects on peak resolution were recorded. Conclusively, the mobile phase
comprises of 0.1% Glacial acetic acid in water : Acetonitril in ratio of 50:50 %v/v gave optimal system suitability parameters. Retention time of Valsartan and Sacubitril was found to be 5.734 min and 9.633 min
respectively. Total run time is 25 minutes. Data related to chromatogram like area, height, retention time,
tailing factor, theoretical plate and resolution were recorded using Empower software. Optimised
chromatogram shown in fig 3.
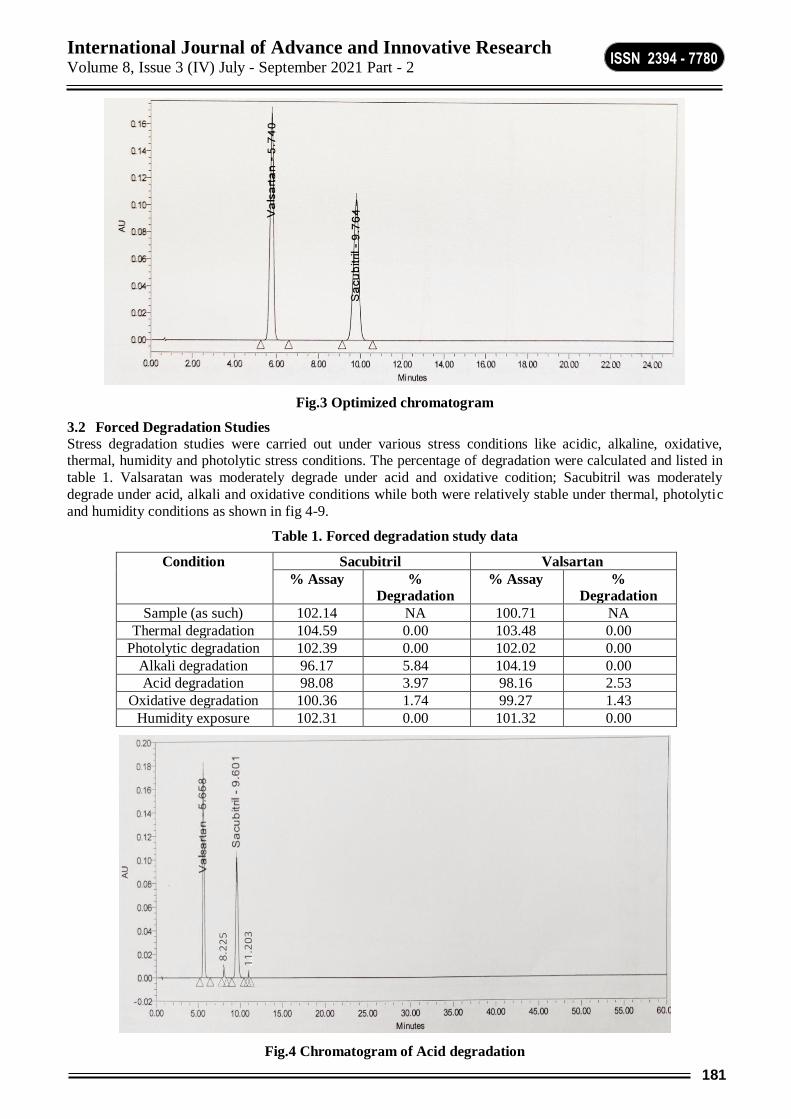
International Journal of Advance and Innovative Research Volume 8, Issue 3 (IV) July - September 2021 Part - 2
181
ISSN 2394 - 7780
Fig.3 Optimized chromatogram
3.2 Forced Degradation Studies
Stress degradation studies were carried out under various stress conditions like acidic, alkaline, oxidative, thermal, humidity and photolytic stress conditions. The percentage of degradation were calculated and listed in
table 1. Valsaratan was moderately degrade under acid and oxidative codition; Sacubitril was moderately
degrade under acid, alkali and oxidative conditions while both were relatively stable under thermal, photolytic
and humidity conditions as shown in fig 4-9.
Table 1. Forced degradation study data
Condition Sacubitril Valsartan
% Assay %
Degradation
% Assay %
Degradation
Sample (as such) 102.14 NA 100.71 NA
Thermal degradation 104.59 0.00 103.48 0.00
Photolytic degradation 102.39 0.00 102.02 0.00
Alkali degradation 96.17 5.84 104.19 0.00
Acid degradation 98.08 3.97 98.16 2.53
Oxidative degradation 100.36 1.74 99.27 1.43
Humidity exposure 102.31 0.00 101.32 0.00
Fig.4 Chromatogram of Acid degradation
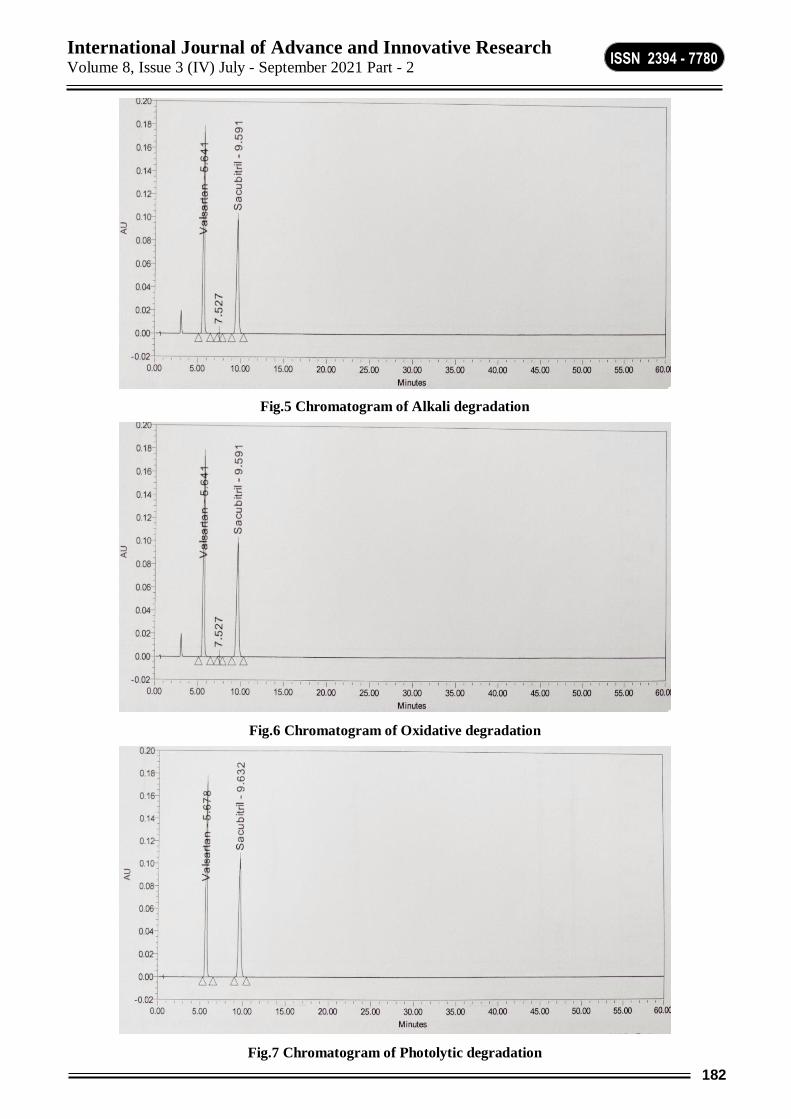
International Journal of Advance and Innovative Research Volume 8, Issue 3 (IV) July - September 2021 Part - 2
182
ISSN 2394 - 7780
Fig.5 Chromatogram of Alkali degradation
Fig.6 Chromatogram of Oxidative degradation
Fig.7 Chromatogram of Photolytic degradation
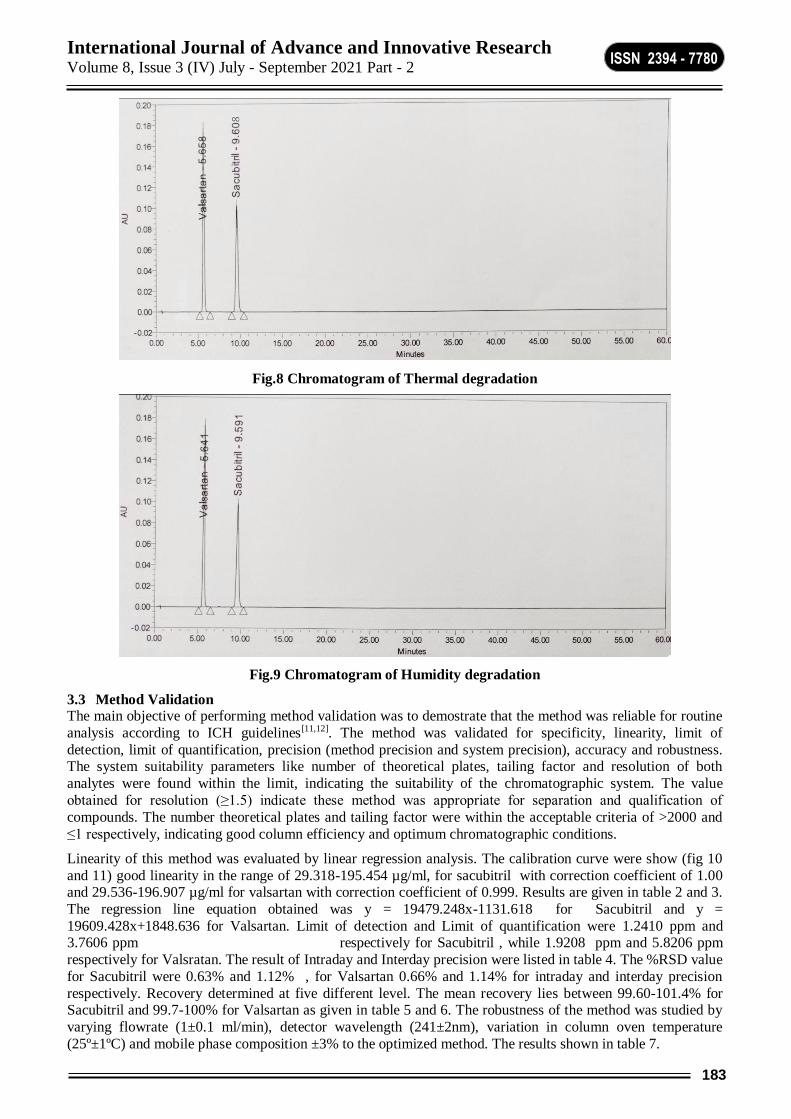
International Journal of Advance and Innovative Research Volume 8, Issue 3 (IV) July - September 2021 Part - 2
183
ISSN 2394 - 7780
Fig.8 Chromatogram of Thermal degradation
Fig.9 Chromatogram of Humidity degradation
3.3 Method Validation The main objective of performing method validation was to demostrate that the method was reliable for routine
analysis according to ICH guidelines[11,12]. The method was validated for specificity, linearity, limit of
detection, limit of quantification, precision (method precision and system precision), accuracy and robustness. The system suitability parameters like number of theoretical plates, tailing factor and resolution of both
analytes were found within the limit, indicating the suitability of the chromatographic system. The value
obtained for resolution (≥1.5) indicate these method was appropriate for separation and qualification of
compounds. The number theoretical plates and tailing factor were within the acceptable criteria of >2000 and
≤1 respectively, indicating good column efficiency and optimum chromatographic conditions.
Linearity of this method was evaluated by linear regression analysis. The calibration curve were show (fig 10
and 11) good linearity in the range of 29.318-195.454 µg/ml, for sacubitril with correction coefficient of 1.00 and 29.536-196.907 µg/ml for valsartan with correction coefficient of 0.999. Results are given in table 2 and 3.
The regression line equation obtained was y = 19479.248x-1131.618 for Sacubitril and y =
19609.428x+1848.636 for Valsartan. Limit of detection and Limit of quantification were 1.2410 ppm and 3.7606 ppm respectively for Sacubitril , while 1.9208 ppm and 5.8206 ppm
respectively for Valsratan. The result of Intraday and Interday precision were listed in table 4. The %RSD value
for Sacubitril were 0.63% and 1.12% , for Valsartan 0.66% and 1.14% for intraday and interday precision
respectively. Recovery determined at five different level. The mean recovery lies between 99.60-101.4% for Sacubitril and 99.7-100% for Valsartan as given in table 5 and 6. The robustness of the method was studied by
varying flowrate (1±0.1 ml/min), detector wavelength (241±2nm), variation in column oven temperature
(25º±1ºC) and mobile phase composition ±3% to the optimized method. The results shown in table 7.
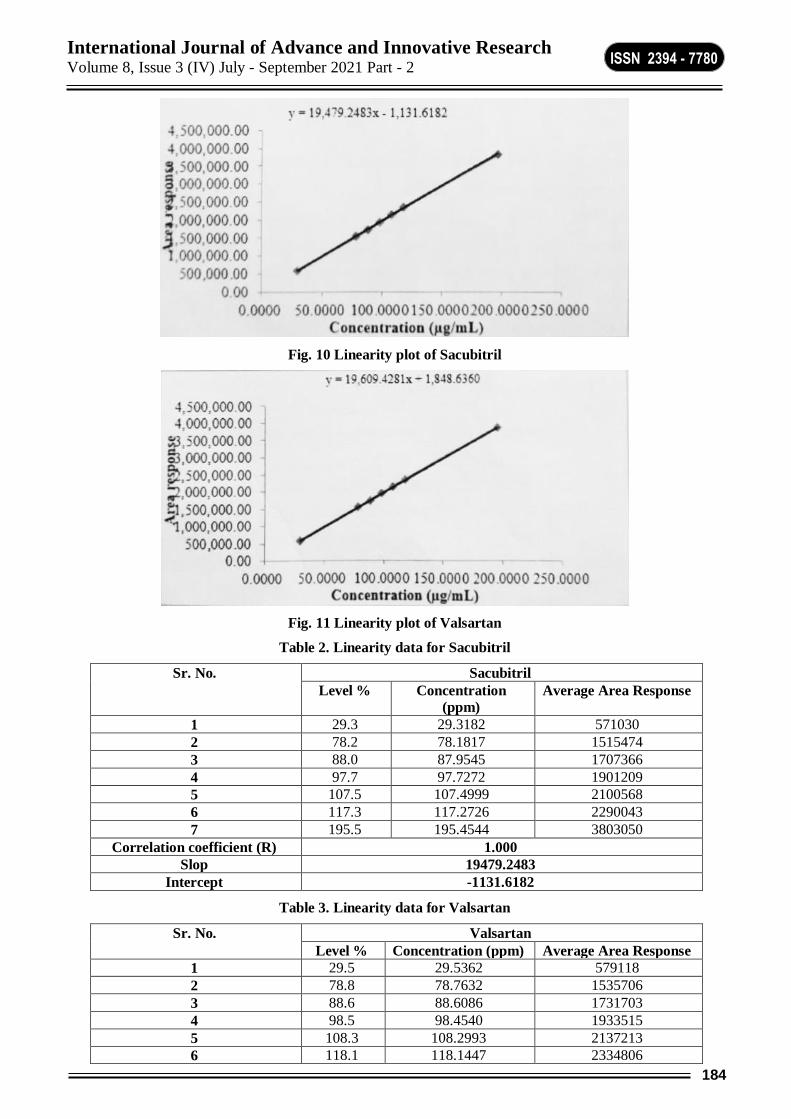
International Journal of Advance and Innovative Research Volume 8, Issue 3 (IV) July - September 2021 Part - 2
184
ISSN 2394 - 7780
Fig. 10 Linearity plot of Sacubitril
Fig. 11 Linearity plot of Valsartan
Table 2. Linearity data for Sacubitril
Sr. No. Sacubitril
Level % Concentration
(ppm)
Average Area Response
1 29.3 29.3182 571030
2 78.2 78.1817 1515474
3 88.0 87.9545 1707366
4 97.7 97.7272 1901209
5 107.5 107.4999 2100568
6 117.3 117.2726 2290043
7 195.5 195.4544 3803050
Correlation coefficient (R) 1.000
Slop 19479.2483
Intercept -1131.6182
Table 3. Linearity data for Valsartan
Sr. No. Valsartan
Level % Concentration (ppm) Average Area Response
1 29.5 29.5362 579118
2 78.8 78.7632 1535706
3 88.6 88.6086 1731703
4 98.5 98.4540 1933515
5 108.3 108.2993 2137213
6 118.1 118.1447 2334806
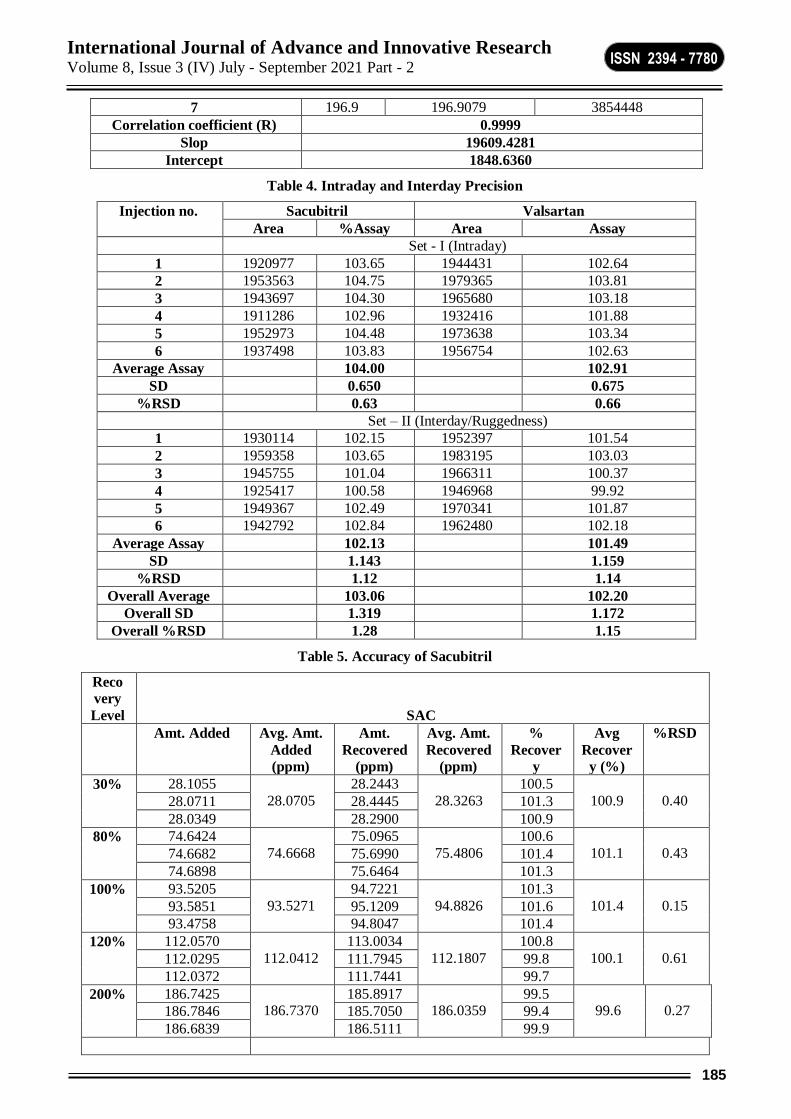
International Journal of Advance and Innovative Research Volume 8, Issue 3 (IV) July - September 2021 Part - 2
185
ISSN 2394 - 7780
7 196.9 196.9079 3854448
Correlation coefficient (R) 0.9999
Slop 19609.4281
Intercept 1848.6360
Table 4. Intraday and Interday Precision
Injection no. Sacubitril Valsartan
Area %Assay Area Assay
Set - I (Intraday)
1 1920977 103.65 1944431 102.64
2 1953563 104.75 1979365 103.81
3 1943697 104.30 1965680 103.18
4 1911286 102.96 1932416 101.88
5 1952973 104.48 1973638 103.34
6 1937498 103.83 1956754 102.63
Average Assay 104.00 102.91
SD 0.650 0.675
%RSD 0.63 0.66
Set – II (Interday/Ruggedness)
1 1930114 102.15 1952397 101.54
2 1959358 103.65 1983195 103.03
3 1945755 101.04 1966311 100.37
4 1925417 100.58 1946968 99.92
5 1949367 102.49 1970341 101.87
6 1942792 102.84 1962480 102.18
Average Assay 102.13 101.49
SD 1.143 1.159
%RSD 1.12 1.14
Overall Average 103.06 102.20
Overall SD 1.319 1.172
Overall %RSD 1.28 1.15
Table 5. Accuracy of Sacubitril
Reco
very
Level
SAC
Amt. Added Avg. Amt.
Added
(ppm)
Amt.
Recovered
(ppm)
Avg. Amt.
Recovered
(ppm)
%
Recover
y
Avg
Recover
y (%)
%RSD
30% 28.1055
28.0705
28.2443
28.3263
100.5
100.9
0.40 28.0711 28.4445 101.3
28.0349 28.2900 100.9
80% 74.6424
74.6668
75.0965
75.4806
100.6
101.1
0.43 74.6682 75.6990 101.4
74.6898 75.6464 101.3
100% 93.5205
93.5271
94.7221
94.8826
101.3
101.4
0.15 93.5851 95.1209 101.6
93.4758 94.8047 101.4
120% 112.0570
112.0412
113.0034
112.1807
100.8
100.1
0.61 112.0295 111.7945 99.8
112.0372 111.7441 99.7
200% 186.7425 186.7370
185.8917 186.0359
99.5 99.6
0.27 186.7846 185.7050 99.4
186.6839 186.5111 99.9
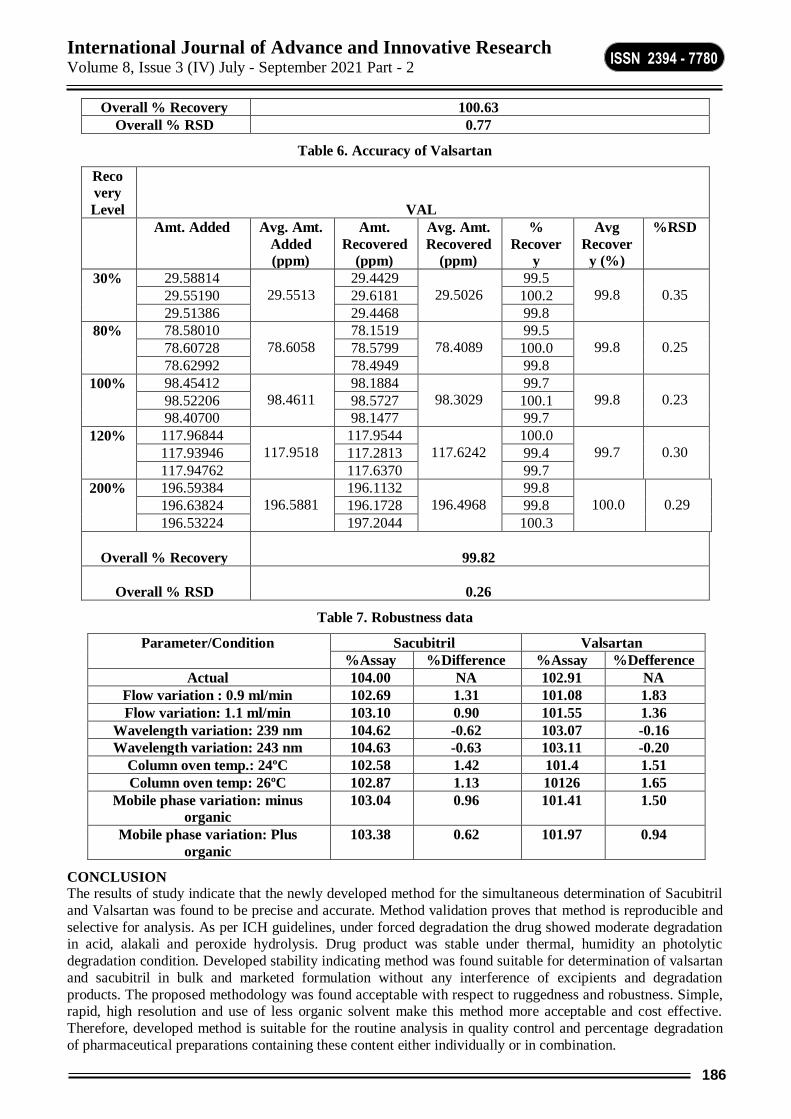
International Journal of Advance and Innovative Research Volume 8, Issue 3 (IV) July - September 2021 Part - 2
186
ISSN 2394 - 7780
Overall % Recovery 100.63
Overall % RSD 0.77
Table 6. Accuracy of Valsartan
Reco
very
Level
VAL
Amt. Added Avg. Amt.
Added
(ppm)
Amt.
Recovered
(ppm)
Avg. Amt.
Recovered
(ppm)
%
Recover
y
Avg
Recover
y (%)
%RSD
30% 29.58814
29.5513
29.4429
29.5026
99.5
99.8
0.35 29.55190 29.6181 100.2
29.51386 29.4468 99.8
80% 78.58010
78.6058
78.1519
78.4089
99.5
99.8
0.25 78.60728 78.5799 100.0
78.62992 78.4949 99.8
100% 98.45412 98.4611
98.1884 98.3029
99.7 99.8
0.23 98.52206 98.5727 100.1
98.40700 98.1477 99.7
120% 117.96844
117.9518
117.9544
117.6242
100.0
99.7
0.30 117.93946 117.2813 99.4
117.94762 117.6370 99.7
200% 196.59384
196.5881
196.1132
196.4968
99.8
100.0
0.29 196.63824 196.1728 99.8
196.53224 197.2044 100.3
Overall % Recovery
99.82
Overall % RSD
0.26
Table 7. Robustness data
Parameter/Condition
Sacubitril Valsartan
%Assay %Difference %Assay %Defference
Actual 104.00 NA 102.91 NA
Flow variation : 0.9 ml/min 102.69 1.31 101.08 1.83
Flow variation: 1.1 ml/min 103.10 0.90 101.55 1.36
Wavelength variation: 239 nm 104.62 -0.62 103.07 -0.16
Wavelength variation: 243 nm 104.63 -0.63 103.11 -0.20
Column oven temp.: 24ºC 102.58 1.42 101.4 1.51
Column oven temp: 26ºC 102.87 1.13 10126 1.65
Mobile phase variation: minus
organic
103.04 0.96 101.41 1.50
Mobile phase variation: Plus
organic
103.38 0.62 101.97 0.94
CONCLUSION The results of study indicate that the newly developed method for the simultaneous determination of Sacubitril
and Valsartan was found to be precise and accurate. Method validation proves that method is reproducible and
selective for analysis. As per ICH guidelines, under forced degradation the drug showed moderate degradation in acid, alakali and peroxide hydrolysis. Drug product was stable under thermal, humidity an photolytic
degradation condition. Developed stability indicating method was found suitable for determination of valsartan
and sacubitril in bulk and marketed formulation without any interference of excipients and degradation
products. The proposed methodology was found acceptable with respect to ruggedness and robustness. Simple, rapid, high resolution and use of less organic solvent make this method more acceptable and cost effective.
Therefore, developed method is suitable for the routine analysis in quality control and percentage degradation
of pharmaceutical preparations containing these content either individually or in combination.

International Journal of Advance and Innovative Research Volume 8, Issue 3 (IV) July - September 2021 Part - 2
187
ISSN 2394 - 7780
CONFLICT OF INTERESTS
Declare none.
ACKNOWLEDGMENT The authors are grateful to micro labs for providing gift sample. We are also express our gratitude to RK
university, Rajkot for providing plateform and supporting this work.
REFERENCES [1] Katzung, Bertram G, Trevor, Anthony J. (2015).Chapter 11. Basic & Clinical Pharmacology. 13th ed.
McGraw-Hill Edition
[2] O’Neil MJ, Smith A, Heckelman PE, Kinneary JF. (2006). The Merk Index: An Encyclopedia of
Chemicals, Drugs and Biologicals. 14th ed.
[3] Martindale- The Complete Drug Reference. (2002). 34th ed. Pharmaceutical Press. Chicago.1018 p
[4] http://www.drugbank.ca/drugs/DB09292
[5] John JV McMurray, Milton Packer, Akshay S Desai for the PARADIGM-HF Investigators and Committees. (2014). Angiotensin-Neprilysin Inhibition versus Enalapril in Heart Failure. The New
England Journal of Medicine. 371.
[6] Thushara BS. (2017). Analytical method development and validation of sacubitril and valsartan in bulk and pharmaceutical dosage form by using RP-HPLC. European Journal Of Biomedical And
Pharmaceutical Sciences. 4(12): 755-761.
[7] Muqhtar A, Satishkumar AS, Manzoor A. (2017). Stability Indicating RP-HPLC Method For
Simultaneous Estimation Of Sacubitril And Valsartan In Bulk And Combined Pharmaceutical Dosage
Form. World Journal Of Pharmacy And Pharmaceutical Sciences. 6(4): 1714-1728.
[8] Naazneen S, Sridevi A. (2017). Development of assay method and forced degradation study of valsartan
and sacubitril by RP-HPLC in tablet formulation. International Journal of Applied Pharmaceutics. 9(1): 9-
15.
[9] Rama Joga VE, Gopichand I, VenkatasubramanianJ. (2013). New Stability Indicating Method for
Quantification of Impurities in Amlodipine and Valsartan Tablets by Validated HPLC. ISRN Medicinal
Chemistry. 1-9.
[10] Udhayavani S, Girija VS, Govinda RR. (2018). One step quantification analytical method and
characterization of Valsartan by lc-ms. International journal of applied pharmaceutics. 10(3): 108-111.
[11] ICH guidelines for the stability of new drug substances and products. Q1A(R2) ICH.(2005). Geneva.1-13
p.
[12] ICH guidelines for validation of analytical procedures: text and methodology. Q2(R1) ICH. (2005).
Geneva. 1-14 p.

International Journal of Advance and Innovative Research Volume 8, Issue 3 (IV) July - September 2021 Part - 2
188
ISSN 2394 - 7780
STRUCTURAL AND THERMAL ANALYSIS OF CONNECTING ROD
Shital Khaire1 and Dr. Amol Lokhande
2
1M-Tech Student, Department of Mechanical Engineering, Sandip University, Nasik, Maharashtra, India 2HOD of Department of Mechanical Engineering, Sandip University, Nasik, Maharashtra, India
ABSTRACT:
IC engine consist of connecting rod, piston, piston ring, crankshaft, cylinder, Gudgeon pin, crank pin, etc. Each
component possessing its specific function. The function of connecting rod is to convert linear motion of piston to rotary motion of crankshaft. Small end of connecting rod is attached to the piston through Gudgeon pin and
big end is attached to crankshaft through crank pin. Due to high temperature and pressure in cylinder, various
stresses acting on connecting rod. The objective of this study is carryout analysis of a connecting rod by using different materials and find out suitable material for it. The model of connecting rod is formed in Solid works
and imported in ANSYS 2021 workbench for analysis.
Keywords: IC engine, connecting rod, Solid works, ANSYS.
INTRODUCTION:
A connecting rod is the part of IC engine which transfer energy and motion from piston to crank shaft. It is required to transfer compressive and tensile forces towards crankshaft. It also helps to provide lubrication to
inner wall of cylinder and gudgeon pin. So the rod has to be sufficiently strong to comfort to forces without
damages because of the pressure and temperature created from the burning. The materials used for connecting rods widely vary as per application. In mass-produced automobile engines, the connecting rods are most
usually made of steel.
Basic types of connecting rod:
1. Single piece of connecting rod- The big end of a single rod is made in one part.
2. Split piece of connecting rod- In this type of rod big end splits into two pieces.
LITERATURE REVIEW:
Mr. Shubham Chougale [1], In this paper, a connecting rod for two wheeler is designed by analytical method. Design a model is created in CATIA V5. Structural system of connecting rod has been analysed using FEA.
With the use of FEA different stresses are calculated for a particular loading conditions using FEA software
ANSYS WORKBENCH 14.5. The same work is carried out for different material. Also the thermal analysis of the connecting rod is performed. The obtained results are compared on the basis of various performances with
considerable reduction in weight.
Mr. D. Mohankumar [2] et al, This project aims at designing a connecting rod with standard dimensions in
CREO 3.0 software .Analyze the design using designing software ANSYS. While considering the difference in weight and design the project analyses factors such as stress, strain, factor of safety, deformation, fatigue
analysis and working cycle.
Vinayak Chumbre [3] et al, analyzed and understand the connecting rod structure by using FEA method. The model of connecting rod is created in NX 6.0 and static structural analysis is carried out by using ANSYS 14.5.
Then analysis was carried out by considering different materials to understand the variations of equivalent
stress, strain, total deformation and factor of safety.
OBJECTIVE:
The objectives of this paper are:
1. Create 3D model in Solid works software.
2. Carry out steady state structure analysis in ANSYS software.
3. Carry out thermal analysis in ANSYS software.
4. Compare the results between given materials.
Here we are comparing analysis of Structural steel, Gray cast iron and Titanium alloy.
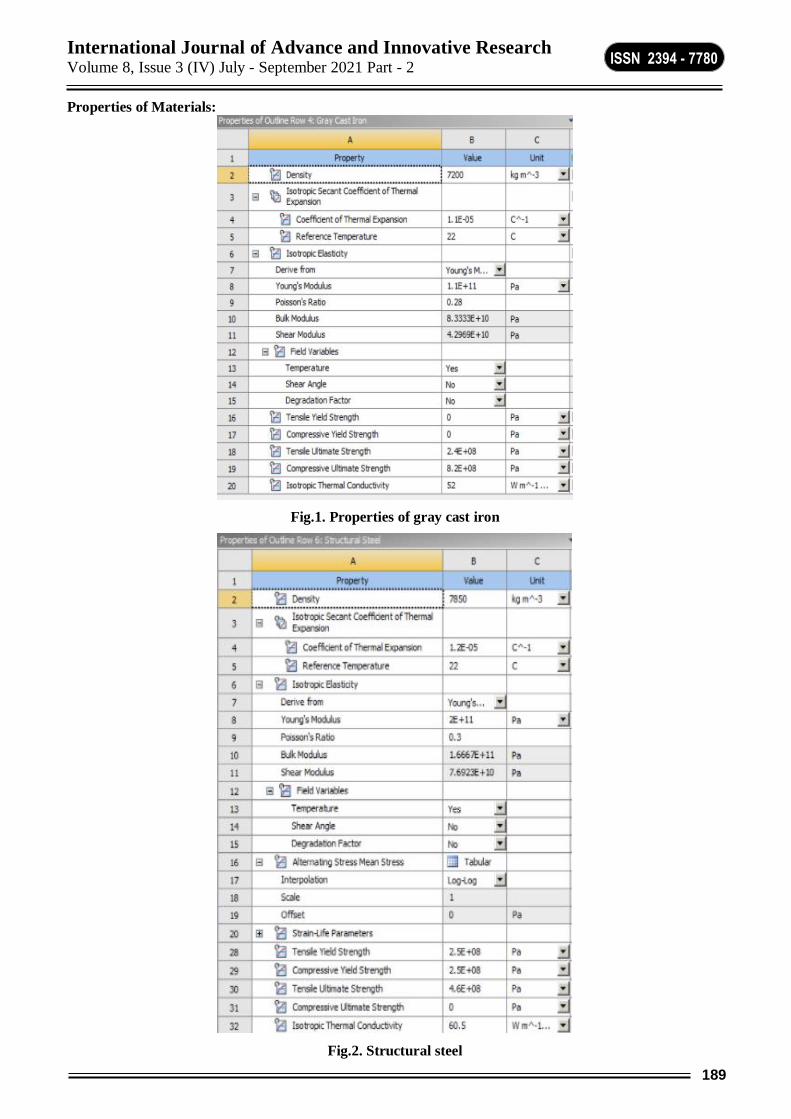
International Journal of Advance and Innovative Research Volume 8, Issue 3 (IV) July - September 2021 Part - 2
189
ISSN 2394 - 7780
Properties of Materials:
Fig.1. Properties of gray cast iron
Fig.2. Structural steel
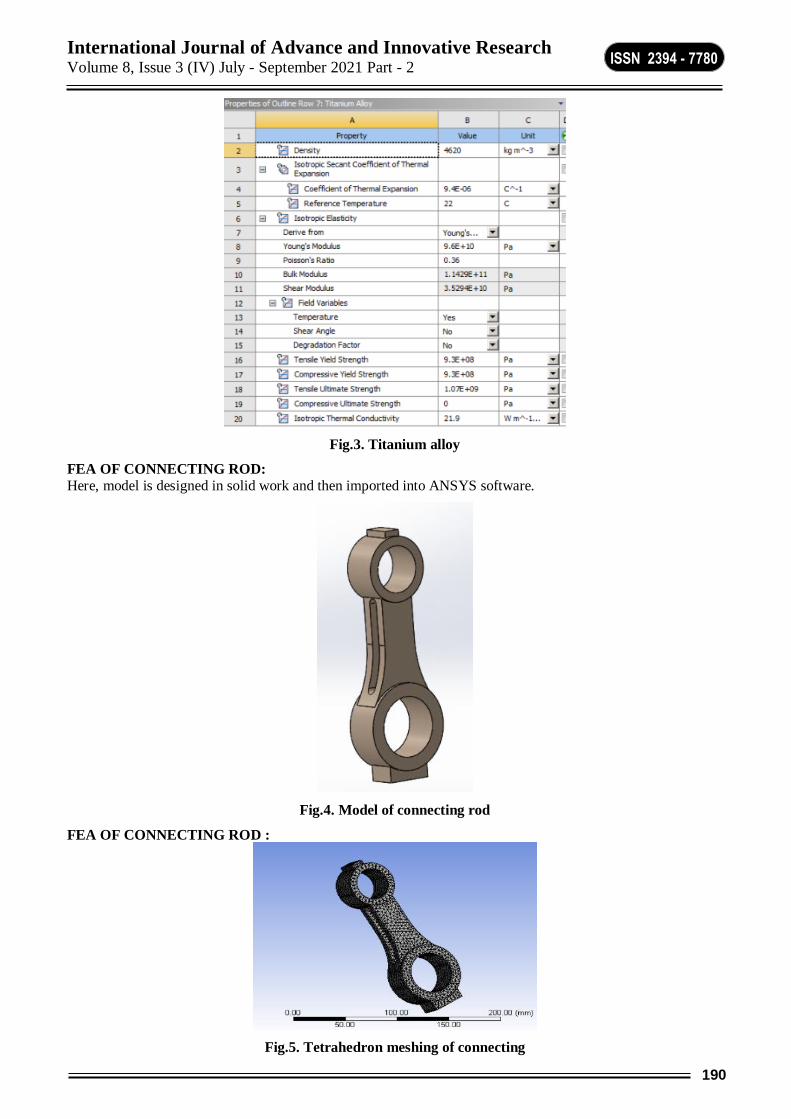
International Journal of Advance and Innovative Research Volume 8, Issue 3 (IV) July - September 2021 Part - 2
190
ISSN 2394 - 7780
Fig.3. Titanium alloy
FEA OF CONNECTING ROD:
Here, model is designed in solid work and then imported into ANSYS software.
Fig.4. Model of connecting rod
FEA OF CONNECTING ROD :
Fig.5. Tetrahedron meshing of connecting

International Journal of Advance and Innovative Research Volume 8, Issue 3 (IV) July - September 2021 Part - 2
191
ISSN 2394 - 7780
Fig.6. boundary conditions of connecting rod
Analysis of Structural steel:
Fig. 7. Temp. of structural steel
Fig.8.Steady state structure

International Journal of Advance and Innovative Research Volume 8, Issue 3 (IV) July - September 2021 Part - 2
192
ISSN 2394 - 7780
Fig.9.Total deformation
Analysis of Gray cast iron:
Fig.10.Temperatue analysis
Fig.11. Steady state structure

International Journal of Advance and Innovative Research Volume 8, Issue 3 (IV) July - September 2021 Part - 2
193
ISSN 2394 - 7780
Fig.12. Total deformation
Analysis of titanium alloy:
Fig.13.Tempeature analysis
Fig.14.Steady state structure

International Journal of Advance and Innovative Research Volume 8, Issue 3 (IV) July - September 2021 Part - 2
194
ISSN 2394 - 7780
Fig.15. Total deformation
THERMAL ANALYSIS :
Fig.16. Heat flux of structural steel
Fig.17. Heat flux of Cast Iron

International Journal of Advance and Innovative Research Volume 8, Issue 3 (IV) July - September 2021 Part - 2
195
ISSN 2394 - 7780
Fig.18. Heat flux of Titanium alloys
RESULT:
Material Temperature (⸰C) Equivalent stress
(MPa)
Total deformation(mm)
Gray cast iron 17.22 153.61 0.0546
Structural steel 19.096 152.62 0.029
Titanium alloy 9.4687 151.89 0.062051
Table no.1.Structural analysis results
Material Heat flux Max. w/mm2 Heat flux Min. w/mm2
Gray cast iron 5.3 4.4883e-15
Structural steel 5.9695 4.8807e-15
Titanium alloy 2.5403 3.1711e-15
Table no. 2 Thermal analysis results
CONCLUSION:
Graph.1. Represents temperatures of materials Graph .2 . Represents heat flux of materials
From above Table.1, minimum temperature of Titanium alloy is 9.4687 0C is less than that of other
materials.

International Journal of Advance and Innovative Research Volume 8, Issue 3 (IV) July - September 2021 Part - 2
196
ISSN 2394 - 7780
From above graph, Heat flux of Titanium alloy is 2.5403 w/mm2 is less than that of other materials.
From Table 1, all values of Titanium alloy are better than comparatively Gray cast iron and Structural steel
and there is no more difference in deformation of all elements. So Titanium alloy is best material for
connecting rod.
REFERENCES: [1] D.Gopinatha ,Ch.V.Sushma,” Design and Optimization of Four Wheeler Connecting Rod Using Finite
Element Analysis”, International Conference on Materials Processing and Characterization, ( 2015 ), Page-
2291 – 2299.
[2] Mr. Shubham Chougale, “Thermal and structural analysis of connecting rod of an IC engine”, Journal of
Emerging Technologies and Innovative Research (JETIR), Volume 4, Issue 06, June 2017.
[3] Mr. D.Mohankumar, Mr. Lenin Rakesh,” Design and analysis of a connecting rod”, International Journal
of Pure and Applied Mathematics, Volume 116 ,No. 15 2017, Page 105-109.
[4] Vinayak Chumbre, Vinayak Kallannavar, Anilkumar Shirahatti, Ratan Patil, Shirish M. Kerur,“Design and
Comparative Analysis of Connecting Rod using Finite Element Analysis “,International Journal for
Research in Applied Science & Engineering Technology (IJRASET), Volume 6 Issue IV, April 2018.
[5] Aman Shrivastava, Hari sankar, Giri Sankar, “Thermal analysis of connecting rod”, International Research
Journal of Modernization in Engineering Technology and Science, Volume 03, Issue 06, June 2021.
[6] Vivek C. Pathade, Bhumeshwar Patle and Ajay N. Ingale, “Stress analysis of I.C. engine connecting rod by FEM,” International Journal of Engineering and Innovative Technology, Vol-1, Issue-3, pp. 12-15,
March 2012.
[7] H. B. Ramani and P. M. Kasundra, “Analysis of connecting rod under different loading condition using
ANSYS software,” International Journal of Engineering Research and Technology, 2012.
[8] Abhinav Gautam, “Static stress analysis of connecting rod using finite element approach,” IOSR Journal
of Mechanical and Civil Engineering, Dec 2013.
[9] Vegi, Leela Krishna, and VenuGopalVegi. "Design and analysis of connecting rod using forged
steel." International Journal of Scientific & Engineering Research 4.6 (2013): 2081.

International Journal of Advance and Innovative Research Volume 8, Issue 3 (IV) July - September 2021 Part - 2
197
ISSN 2394 - 7780
STUDY OF CENTER GUIDING SYSTEM FOR 4 ROLL CALENDERING
Dr. A. S. Relkar1, Vaibhav R. Pawase
2, Shubham H. Sagar
3, Yash D. Umare
4 and Shubham H. Sagar
5
1Professor and 2,3,4,5Student, Mechanical Engg. Department, SOET, Sandip University, Nashik-422213,
Maharashtra, India
ABSTRACT
The paper contributes to a study of an online handling that specialize in center guiding system on 4 roll
calendaring with land up accumulator. The efforts required in achieving the specified output is effectively and economically being decreased by implementation of recent center guiding system on 4 roll calendering
machine. The calendering process may be a process during which the rubber undergoes plastic flow
deformation under the pressing action of the calendar roll. To master the law of the calendering process, it's necessary to grasp the force state and flow deformation law of the pressure-delay rubber
compound in between the rolls, like the condition of the rubber material entering the roll distance, the force
and flow state, the plastic deformation condition and thus the rubber compound after rolling.
Keyword: Calendering, 4 Roll calendar machine, Web handling, web accumulator control, tension control,
center guiding system,
1. INTRODUCTION
Today’s world requires speed on each and every field. Hence rapidness and quick working is that the most vital
part of life. Now a days for achieving rapidness, various machines and equipment are manufactured by man. The engineer is continually conformed to the challenges of bringing ideas and converting it in to reality. New
machines and techniques are being developed continuously to manufacture various products at cheaper rates
and with prime quality. This work of “Design, Manufacturing and Implementation of center guiding system on 4 roll calendering machine” is being efficient guiding system to avoid the wrinkles and scrap in calendering
machine, This will also improves the standard of the rubber web. This research work enriched the knowledge,
experience, skill and new ideas of producing it. This research work is need of industry and will be useful to
boost the standard of the rubber web being manufactured and might be made in less time with less scrap and
wrinkles.
1.1 NEED:
In such a machine era of economic liberalization industries are contributing in a big way to the growth of our county. Taking into account the above contribution, an attempt has been made to help the tyre industry named
‘ABC Tyres’ by introducing a machine which will be very much useful for them intending to less in scrap and
the wrinkles. Hence the quality of the rubber ply being manufactured is consisting. This gives uniform finish,
accuracy and saving ample amount of time
1.2 OPERATION
The rubber web starting from the cooling drums where desired temperature of rubber web is being maintain.
The dancing roller is next to the cooling drums to maintain the proper tension in rubber web. Then it comes to the lower fixed set of rollers and upper movable set of rollers. The upper set of rollers moves up and down with
the help of wind up accumulator
2. CALENDERING A calender is a series of hard pressure rollers used to finish or smoothen the sheet of material
like paper, textiles, or plastics. Calender rolls are also used to form some type of plastic film and to apply
coating some calender rolls are heated or cooled as per need. The calendaring is an important processing
machine in the rubber industries, especially in the manufacture of tires, where it’s used for the inner layer and
fabric layer

International Journal of Advance and Innovative Research Volume 8, Issue 3 (IV) July - September 2021 Part - 2
198
ISSN 2394 - 7780
FIG. 1: Calender Rolls
2.1 WEB HANDLING TERMINOLOGY: 1. Web: Web may be a material that’s thin, flexible and continuous in nature. Web materials are transported
within a machinery to convert them into finished products. A good sort of consumer products are made up
of web materials such like paper, plastics, films, foils and metals, into finished products like diapers,
female hygiene products, labels, tapes, magazines, aluminum cans, and even some electronics.
2. Web Handling: Web handling is that the process of controlling and transporting the web within the
process machines with the goal of to minimize the defects due to the transport.
3. Rolls: When the flexible web is wound on a core of a fabric material it’s termed a roll of web or wound
roll.
4. Rollers: Rollers are a part of the processing machinery that support the web while they’re transported
within the machinery. The rollers could be made of materials such like steel, stainless steel, aluminum or
carbon fiber.
5. Idler Rollers: Some rollers are intended just for support and these varieties of rollers are termed idle
rollers or idler rollers. These rollers have low friction bearings that allow them to spin at the identical
speed because of the web.
6. Web span: The unsupported portion of the web in between two rollers is termed as a web span or a free
span or simply a span.
7. Web speed: The speed at rate the web is transported within a processing machinery is termed the web speed or transport velocity. The web speed is usually expressed in feet-per-minute (fpm) or meters-per-
minute (mpm). The web speed is typically measured or inferred from the driven rollers.
8. Web tension: The force in the web or the force applied to the web in the machine direction is termed the
web tension. The unit of tension is pounds or Kilogram. It’s also common to express this
9. Tension control: Tension control involves the active control or regulation of tension within the processing
machinery employing a closed-loop control system. Tension is controlled by either speeding up or slowing
down two rollers (using driven rollers or breaks) or by directly applying a tensile force with a mechanism
like a dancer. A force feedback device like a load cell may also be used to close the loop.
10. Dancer: A device that is typically made of one or more free moving idle roller that imparts force on the
web. Dancer rollers may have linear motion or rotary motion (with a pivot arm) to move or change the
span length upstream and downstream of the dancer roller.
11. Nip rollers: Nip is usually a rubber covered roller or a roller with a flexible surface that is used to squeeze
the web onto another roller. The nip roller(s) apply force on the web for various reasons. Processes like lamination, embossing and printing may need the force applied by the nip for the converting process. Nips
are also used to increase friction between the web and the roller and for isolating tension zones in general
web handling applications.
12. Web Slip: When there is not enough traction between the web and thus the roller, the web speed may be more or less than the surface velocity of the roller; the web slips on the roller. When the web slips on the

International Journal of Advance and Innovative Research Volume 8, Issue 3 (IV) July - September 2021 Part - 2
199
ISSN 2394 - 7780
roller the web is sliding on the roller surface thereby having a relative velocity between the web and the
roller surface. When there’s enough traction, the web grips the roller and thus have zero relative velocity
between the two.
13. Web guiding: Web guiding is that the process of regulating the cross machine position of the web while
the web is transported. Other terms for web guiding include lateral control or lateral alignment or CD
alignment or lateral registration or CD registration. Force normalized with relation to the width of the web
as pounds-per-linear-inch (PLI).
2.2 COMMON CAUSES OF WRINKLES IN WEB HANDLING
1) Poor machine alignment: Machine alignment is that the very first thing to test when experiencing web
performance problems. Poor alignment between rollers ultimately can cause a wide spectrum of web
problems, including drift, flutter, and wrinkling.
FIG. 2: Poor Machine Alignment
2) Web expansion: Changes in web conditions like increased temperature or moisture content are likely to
cause variation within the web material. Unsupported webs are more likely to wrinkle.
FIG. 3: Improper web tension
3) Improper web tension: Excessive web tension can wrinkle, stretch, or break the web and cause unwanted roll deflection. Excessive tension can come an excessive amount of drag on idler rolls (bearing friction,
roll weight, etc.) or from too many idler rolls between drive sections. Stretched edges and slack centers on
the web are common with excessive tension. Loose webs can also lead to wrinkles. Lack of sufficient
tension can come from drive sections being out of sync or a poorly designed or calibrated tension control
system.
3. LITERATURE REVIEW
1. Prabhakar Reddy Pagilla, Kari Reid(2013), “Governing equations for web tension and web velocity in the presence of non-ideal rollers.” These equations can better predict the periodic oscillations found in the
measured tension signal.
2. Neelam Gupta and Neel Kanth (2018), “Analysis of nip mechanics model for rolling calendar used in
textile industry.”the analysis of the model it’s found that the NMMR gives better results as compared to conventional models for acquiring gloss and smoothness. This NMMR model helps to obtain a fabric with
better gloss and smoothness because cover thickness plays crucial role in calendering process which is
considered in this model.
3. Daniel Magura, Viliam Fedak, Karol Kyslan, Sanjeevkumar Padmanaban(2016), “ Practical experience
with control of Drives of an Accumulator in a Web Processing Continious Line.” They explains that the
web tension control at entry & exit of accumulator.
4. Prabhakar R. Pagilla, Inderpal singh, Ramanurthy V. Dwivedula(2003), “ A study on Control of
Accumulators in Web Processing Lines” The feedback system to maintain the web tension at the desired
level. It explain to control of accumulator in web processing lines to avoid wrinkles and scrap.

International Journal of Advance and Innovative Research Volume 8, Issue 3 (IV) July - September 2021 Part - 2
200
ISSN 2394 - 7780
5. Jonsu Lee, Junhyeon Byeon Changwoo Lee,(2019) “ Theories and Control Technologies for Web
Handling in the Roll to Roll Manufacturing Processess” They explains about the tension and lateral errors
were done by the thermal strains of the web and misalignment of rollers.
3. METHODOLOGY
To complete any task a systematic planning of work with respect to time period has to be done. Proper
synchronization between work and available time takes towards predetermined goals. Similarly in a paper work various activities has to be planned which are required to be carried out one by one or many times
simultaneously. From third week to fourth week of November introduction to various part and their working in
4 roll calendering machine are discussed to select the object for the paper. In first and second week of
December it was important to search literature study, which we have done. In this period we discussed the previous work that carried out by various researchers. After the literature survey we will go for software
modelling to denote the direction of rubber web, for this we need 2 weeks of December. In then ext. month that
is in January, we started to note down the possible causes in current machine and after that shortlisting of
possible causes
3.1 IDENTIFICATION OF PROBLEMS
1. Accumulator roll grind profile: The rubber web thickness may defer due to the improper roller grind
profile which affects the quality of the rubber web being manufactured.
2. Roller eccentricity or run out at ambient temperature: Roll eccentricity is a timely reoccurring
disturbance caused by a structure of back up rolls in rolling mills, and it affects product thickness
accuracy. It can’t be measured directly with sensors, so it should be identified by measured thickness or measured roll force. A run out measurement encompasses both the circularity of the roller as well as
eccentricity to the reference surface axis in a simple measurement. Concentricity applies to the eccentricity
of the axis’s and does not necessarily involve the form of the circle. The whole identification at ambient
temperature which is the air temperature of rollers or environment where it’s stored.
3. Proper leveling of all hydraulic cylinders at working as well as stationary position and hydraulic oil
level: The improper leveling of all hydraulic cylinders results in unbalanced movement of upper set of
roller frame which reduce the quality of rubber web. The improper machine operation occurs when
hydraulic oil level fluctuates.
4. Accumulator moving frame leveling: The rollers are located on the accumulator moving frame which
moves up and down with the rubber web to maintain tension in web handling. The improper leveling of
accumulator moving frame affects the web handling on the calendering.
5. Bearing clearance: The wrong bearing clearance affects the performance of roller, quality of the rubber
web and web handling. The bearing are placed with rollers on frame.
6. Improper spreader roller geometry: The use of spreader roller is to minimize the wrinkles, scrap and
improvement in the quality of the rubber web. The improper geometry of spreader roller is not efficient on
calendering machine if it’s not able to avoid wrinkles and scrap.
7. Uneven web tension: The proper tension is the requirement in the process of web handling on calendering
machine. The uneven rubber web tension may reduce the efficiency.
8. Leveling of whole accumulator: A hydraulic accumulator is a pressure storing reservoir in which an
incompressible hydraulic fluid which is held under pressure that is applied by an external source of mechanical energy. The efficiency of the accumulator is dependent on the maintenance and leveling of the
complete accumulator on the calendering machinery.
9. Backlash in hydraulic cylinder gear: Backlash may be defined as "the maximum distance or angle in which any part of a mechanical system may be moved in one direction without applying signficant force or
motion to the next part in mechanical sequence. “In the context of gears and gear trains, is the amount of
clearance between mated gear teeth. The backlash in hydraulic cylinder gear can affect the leveling of the
wind up accumulator.
5. Proposed Calendering: The process of calendaring after the implementation of proposed design is as
shown in the above fig.4. The final proposed design mainly consists of two rollers, foundation and support
plate, hydraulic unit, edge sensors, LCD module, etc. The two additional rollers on calendaring machine used to guide the rubber web and edge sensors are also helping to maintain the rubber web at the center
and to avoid the wrinkles. The foundation plates are used for the support at the base and C type support

International Journal of Advance and Innovative Research Volume 8, Issue 3 (IV) July - September 2021 Part - 2
201
ISSN 2394 - 7780
plate is used to support the rollers. The C type plate is used to provide the adjustment in between the
rollers and hydraulic cylinder assembly. There are two rollers are mainly used for the purpose of guiding
the web at center in order to avoid wrinkles and improvement in the quality of the rubber web. The edge sensors are also helped to maintain the rubber at the center of the roller.
Fig.4: Proposed calendaring
This center guiding system is not only useful for ABC Tyres but useful for the whole tyre industry in order to
improve the quality and reduction in the scrap and wrinkles on the rubber web.
6. Analysis:
Fig. 5: Analysis
Above figure shows analysis of support plate and roller. Complete analysis is done in solidworks software.
[Dimensions of roller: 2000mm in length and 116 mm in diameter
Dimension of support plate: horizontal and vertical plate -100x 100 x 70 mm ( 35 mm diameter holes for
support)
Material – mild steel]
Upon running von mises stress (VON) simulation we found
Max stress limits – roller: 4.825e-2 Mpa; support plate: 6.75e-3 Mpa
Resultant Displacement - roller: 4.266e-4 mm; support plate: 2.329e-5mm
7. CONCLUSIONS:
When a nylon roll of 2000meter is applied to 2400kg of rubber roll this machine used to create about 75kg of rubber scrap due to misalignment of web. But after installing guide attachment scarp is reduced to 32 kg per
roll.
Idle scrap of machine at standard maintained condition should be in between 800gm to 1.2kg.

International Journal of Advance and Innovative Research Volume 8, Issue 3 (IV) July - September 2021 Part - 2
202
ISSN 2394 - 7780
Further reduction of scrap can be done by creating maintenance schedule in which problems noticed in problem
identification list should be rectified.
6. REFERENCES [1]. P.R. Pagilla, E.O. King, L.H. Dreinhoefer, and S.S. Garimella, “Robust observer-based control of an
aluminium strip processing line,” IEEE Transactions on Industry Applications, vol. 36, no. 3, pp. 835–840,
2000.
[2]. Rabinowitz, P.M., and T.S. Rees: Occupational Hearing Loss. In Textbook of Clinical Occupational and
Environmental Medicine, 2nd ed., L. Rosenstock, M. Cullen, C. Brodkin, and C. Redlich (eds.).
Philadelphia, PA: Elsevier Saunders, 2005. pp. 426–436.
[3]. Schin dler, D.N., R.K. Jackler, and S.T. Robinson: Hearing Loss. In Current Occupational and Environmental Medicine, 3rd ed., J. LaDou (ed.). New York, NY: Lange Medical Books/McGraw-Hill,
2004. pp. 104–121.
[4]. Kang, H., Kitsombonloha, R., Jang, J., & Subramanian, V. (2012). High-performance printed transistors realized using femtoliter gravure-printed sub-10 μm metallic nanoparticle patterns and highly uniform
polymer dielectric and semiconductor layers. Advanced Materials, 24(22), 3065–3069.
[5]. S., Meepho, M., Chuankrerkkul, N., Chaian-ansutcharit, S., & Pornprasertsuk, R. (2018). Fabrication of yttria stabilized zirconia thin flms on powder-injected anode substrates by electrophoretic deposition
technique for solid oxide fuel cell application. Thin Solid Films, 660(3), 741–748.
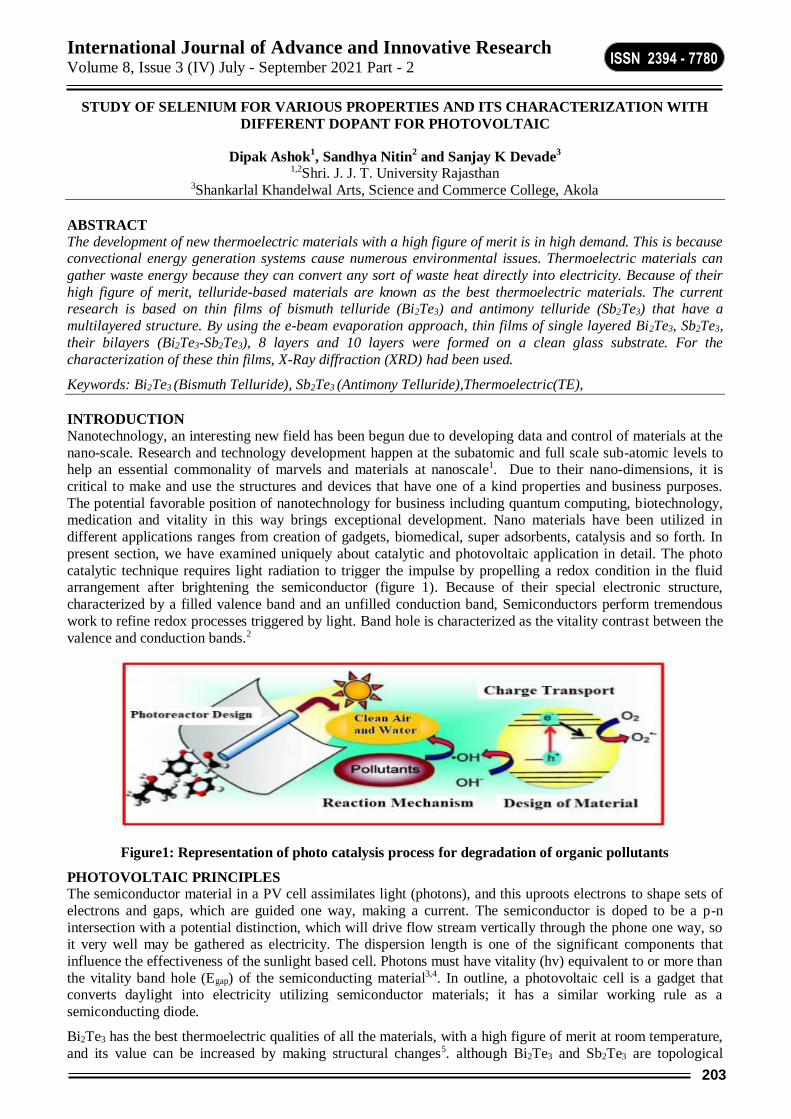
International Journal of Advance and Innovative Research Volume 8, Issue 3 (IV) July - September 2021 Part - 2
203
ISSN 2394 - 7780
STUDY OF SELENIUM FOR VARIOUS PROPERTIES AND ITS CHARACTERIZATION WITH
DIFFERENT DOPANT FOR PHOTOVOLTAIC
Dipak Ashok1, Sandhya Nitin
2 and Sanjay K Devade
3
1,2Shri. J. J. T. University Rajasthan 3Shankarlal Khandelwal Arts, Science and Commerce College, Akola
ABSTRACT
The development of new thermoelectric materials with a high figure of merit is in high demand. This is because convectional energy generation systems cause numerous environmental issues. Thermoelectric materials can
gather waste energy because they can convert any sort of waste heat directly into electricity. Because of their
high figure of merit, telluride-based materials are known as the best thermoelectric materials. The current research is based on thin films of bismuth telluride (Bi2Te3) and antimony telluride (Sb2Te3) that have a
multilayered structure. By using the e-beam evaporation approach, thin films of single layered Bi2Te3, Sb2Te3,
their bilayers (Bi2Te3-Sb2Te3), 8 layers and 10 layers were formed on a clean glass substrate. For the
characterization of these thin films, X-Ray diffraction (XRD) had been used.
Keywords: Bi2Te3 (Bismuth Telluride), Sb2Te3 (Antimony Telluride),Thermoelectric(TE),
INTRODUCTION
Nanotechnology, an interesting new field has been begun due to developing data and control of materials at the
nano-scale. Research and technology development happen at the subatomic and full scale sub-atomic levels to help an essential commonality of marvels and materials at nanoscale1. Due to their nano-dimensions, it is
critical to make and use the structures and devices that have one of a kind properties and business purposes.
The potential favorable position of nanotechnology for business including quantum computing, biotechnology, medication and vitality in this way brings exceptional development. Nano materials have been utilized in
different applications ranges from creation of gadgets, biomedical, super adsorbents, catalysis and so forth. In
present section, we have examined uniquely about catalytic and photovoltaic application in detail. The photo
catalytic technique requires light radiation to trigger the impulse by propelling a redox condition in the fluid arrangement after brightening the semiconductor (figure 1). Because of their special electronic structure,
characterized by a filled valence band and an unfilled conduction band, Semiconductors perform tremendous
work to refine redox processes triggered by light. Band hole is characterized as the vitality contrast between the
valence and conduction bands.2
Figure1: Representation of photo catalysis process for degradation of organic pollutants
PHOTOVOLTAIC PRINCIPLES The semiconductor material in a PV cell assimilates light (photons), and this uproots electrons to shape sets of
electrons and gaps, which are guided one way, making a current. The semiconductor is doped to be a p-n
intersection with a potential distinction, which will drive flow stream vertically through the phone one way, so it very well may be gathered as electricity. The dispersion length is one of the significant components that
influence the effectiveness of the sunlight based cell. Photons must have vitality (hv) equivalent to or more than
the vitality band hole (Egap) of the semiconducting material3,4. In outline, a photovoltaic cell is a gadget that converts daylight into electricity utilizing semiconductor materials; it has a similar working rule as a
semiconducting diode.
Bi2Te3 has the best thermoelectric qualities of all the materials, with a high figure of merit at room temperature,
and its value can be increased by making structural changes5. although Bi2Te3 and Sb2Te3 are topological

International Journal of Advance and Innovative Research Volume 8, Issue 3 (IV) July - September 2021 Part - 2
204
ISSN 2394 - 7780
insulators, their conductivity is comparable to that of semiconductors. Topological insulators have a wide range
of uses, and they've recently become a hot topic in science.Bi2Te3 and Sb2Te3 have been found to have better
semiconducting properties than other materials, with a higher Seebeck coefficient, strong electrical conductivity, and low thermal conductivity6 .As a result, these materials have the ability to efficiently convert
heat to electricity. According to studies, super lattice structures can improve the value of the
‘ZT'(dimensionless index) by reducing heat conductivity without affecting electrical conductivity by
introducing the low dimensional effect because they have better scattering patterns.7
CHEMICAL BATH DEPOSITION Chemical bath deposition (CBD) is a method to deposit thin films and nanomaterials, first described in 1869. It
can be employed for large-area batch processing or continuous deposition. In 1933 Bruckman deposited lead (II) sulfide (PbS) thin film by chemical bath deposition, or solution growth method. This technique is
extensively used to deposit buffer layers in thin film photovoltaic cells.
The chemical bath deposition involves two steps, nucleation and particle growth, and is based on the formation of a solid phase from a solution. In the chemical bath deposition procedure, the substrate is immersed in a
solution containing the precursors. This method depends upon parameters like bath temperature, pH of the
solution, the molarity of concentration, and time. Chemical bath deposition does not cause physical damage in the substrate. Pyrite (FeS2) film will be deposited on a cleaned glass substrate by the chemical bath deposition
CBD method. The glass substrate will clean with a detergent and then in methanol and acetone for several min
each by using an ultrasonic cleaner and then clean with de ionized water and It will dry. Aqueous solutions of
(FeS2) will use. Buffer will be adding drop by drop in pyrite solution under vigorous stirring to maintain the pH value of the solution for the several minute of deposition time. The clean glass slide will vertically immersed in
the beaker contain the solution which will placed in chemical bath whose temperature keep around 70±5 °C
during the growth as shown in Figure (2). After deposition, the sample will be removing from the bath and
wash in distilled water and finally dry in air. And then films will obtain.8
The electrical conductivity of natural pyrite lies in the range 0.02-562 (Ω cm)-1 9. Generally, the p-type
conductivity results from pyrite S/Fe ratio > 2, although n-type conductivity emerge due to deficiency of sulfur.
There are abundance of defects in structure as defects require small amount of energy10. Sulfur deficiency initiates donor defect while sulfur excess helps to create the acceptor defect. Pyrite nano crystals storage for
long time is little tricky due to its quick oxidation.
Fig2: Experimental set up of CBD technique
Consequently, there must be a facile and reasonable method that can be used for preparation of iron pyrite. Iron
disulfide (FeS2) has been an outstanding material for endless interest since 1970s in the next generation
photovoltaics and environmental remediation.11-13
RESULTS AND DISCUSSION
X- Ray Diffraction (XRD) Figure 4 shows XRD examples of various designs of Bi2Te3 and Sb2Te3 substitution layers with various
thicknesses ranging from 30nm to 15m. The hallmark highlights in the XRD example of single layer Bi2Te3 are
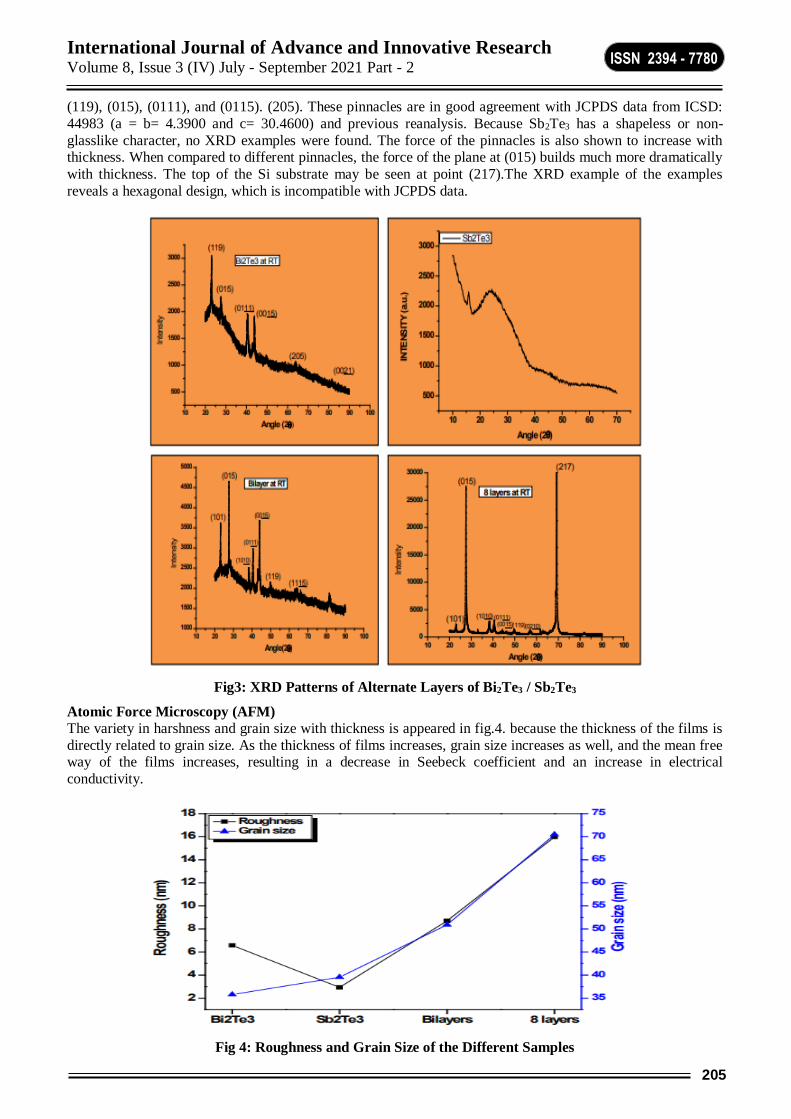
International Journal of Advance and Innovative Research Volume 8, Issue 3 (IV) July - September 2021 Part - 2
205
ISSN 2394 - 7780
(119), (015), (0111), and (0115). (205). These pinnacles are in good agreement with JCPDS data from ICSD:
44983 (a = b= 4.3900 and c= 30.4600) and previous reanalysis. Because Sb2Te3 has a shapeless or non-
glasslike character, no XRD examples were found. The force of the pinnacles is also shown to increase with thickness. When compared to different pinnacles, the force of the plane at (015) builds much more dramatically
with thickness. The top of the Si substrate may be seen at point (217).The XRD example of the examples
reveals a hexagonal design, which is incompatible with JCPDS data.
Fig3: XRD Patterns of Alternate Layers of Bi2Te3 / Sb2Te3
Atomic Force Microscopy (AFM)
The variety in harshness and grain size with thickness is appeared in fig.4. because the thickness of the films is
directly related to grain size. As the thickness of films increases, grain size increases as well, and the mean free way of the films increases, resulting in a decrease in Seebeck coefficient and an increase in electrical
conductivity.
Fig 4: Roughness and Grain Size of the Different Samples
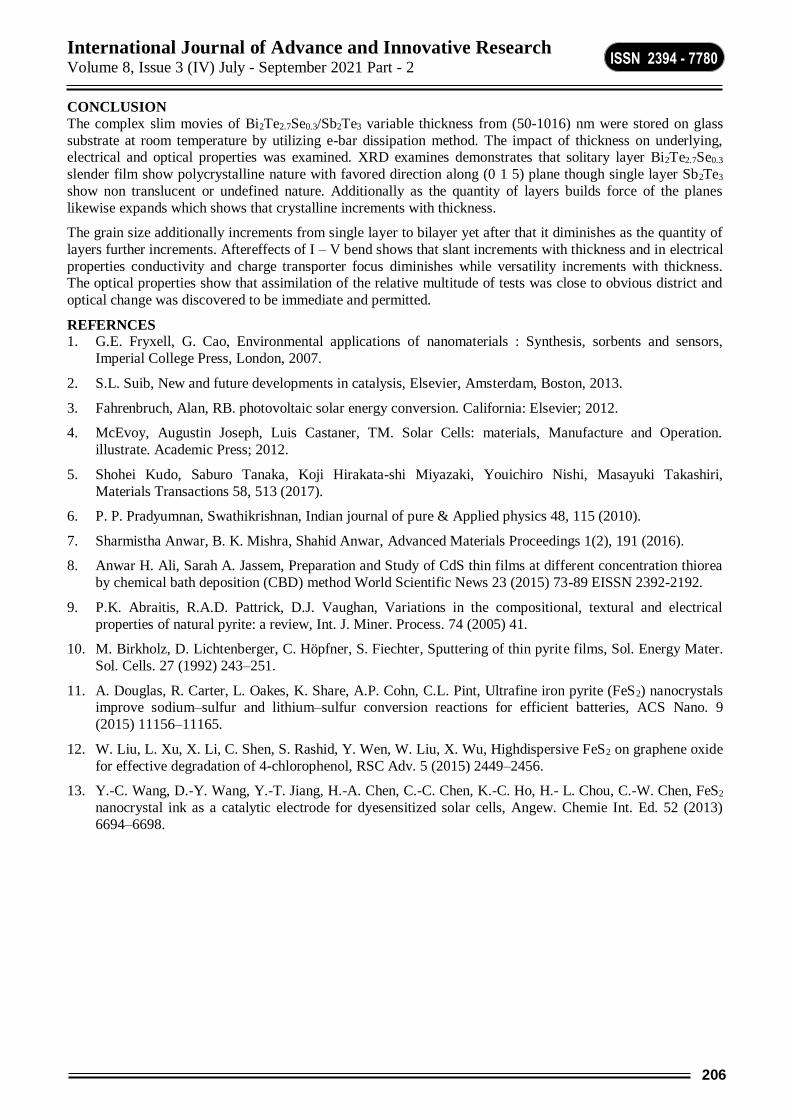
International Journal of Advance and Innovative Research Volume 8, Issue 3 (IV) July - September 2021 Part - 2
206
ISSN 2394 - 7780
CONCLUSION
The complex slim movies of Bi2Te2.7Se0.3/Sb2Te3 variable thickness from (50-1016) nm were stored on glass
substrate at room temperature by utilizing e-bar dissipation method. The impact of thickness on underlying, electrical and optical properties was examined. XRD examines demonstrates that solitary layer Bi2Te2.7Se0.3
slender film show polycrystalline nature with favored direction along (0 1 5) plane though single layer Sb2Te3
show non translucent or undefined nature. Additionally as the quantity of layers builds force of the planes
likewise expands which shows that crystalline increments with thickness.
The grain size additionally increments from single layer to bilayer yet after that it diminishes as the quantity of
layers further increments. Aftereffects of I – V bend shows that slant increments with thickness and in electrical
properties conductivity and charge transporter focus diminishes while versatility increments with thickness. The optical properties show that assimilation of the relative multitude of tests was close to obvious district and
optical change was discovered to be immediate and permitted.
REFERNCES 1. G.E. Fryxell, G. Cao, Environmental applications of nanomaterials : Synthesis, sorbents and sensors,
Imperial College Press, London, 2007.
2. S.L. Suib, New and future developments in catalysis, Elsevier, Amsterdam, Boston, 2013.
3. Fahrenbruch, Alan, RB. photovoltaic solar energy conversion. California: Elsevier; 2012.
4. McEvoy, Augustin Joseph, Luis Castaner, TM. Solar Cells: materials, Manufacture and Operation.
illustrate. Academic Press; 2012.
5. Shohei Kudo, Saburo Tanaka, Koji Hirakata-shi Miyazaki, Youichiro Nishi, Masayuki Takashiri,
Materials Transactions 58, 513 (2017).
6. P. P. Pradyumnan, Swathikrishnan, Indian journal of pure & Applied physics 48, 115 (2010).
7. Sharmistha Anwar, B. K. Mishra, Shahid Anwar, Advanced Materials Proceedings 1(2), 191 (2016).
8. Anwar H. Ali, Sarah A. Jassem, Preparation and Study of CdS thin films at different concentration thiorea
by chemical bath deposition (CBD) method World Scientific News 23 (2015) 73-89 EISSN 2392-2192.
9. P.K. Abraitis, R.A.D. Pattrick, D.J. Vaughan, Variations in the compositional, textural and electrical
properties of natural pyrite: a review, Int. J. Miner. Process. 74 (2005) 41.
10. M. Birkholz, D. Lichtenberger, C. Höpfner, S. Fiechter, Sputtering of thin pyrite films, Sol. Energy Mater.
Sol. Cells. 27 (1992) 243–251.
11. A. Douglas, R. Carter, L. Oakes, K. Share, A.P. Cohn, C.L. Pint, Ultrafine iron pyrite (FeS2) nanocrystals improve sodium–sulfur and lithium–sulfur conversion reactions for efficient batteries, ACS Nano. 9
(2015) 11156–11165.
12. W. Liu, L. Xu, X. Li, C. Shen, S. Rashid, Y. Wen, W. Liu, X. Wu, Highdispersive FeS2 on graphene oxide
for effective degradation of 4-chlorophenol, RSC Adv. 5 (2015) 2449–2456.
13. Y.-C. Wang, D.-Y. Wang, Y.-T. Jiang, H.-A. Chen, C.-C. Chen, K.-C. Ho, H.- L. Chou, C.-W. Chen, FeS2
nanocrystal ink as a catalytic electrode for dyesensitized solar cells, Angew. Chemie Int. Ed. 52 (2013)
6694–6698.
International Journal of Advance and Innovative Research Volume 8, Issue 3 (IV) July - September 2021 Part - 2
207
ISSN 2394 - 7780
STUDY ON TRADITIONAL MARKETTING V/S DIGITAL MARKETTING
Dr Neha Ghildiyal1 and Dr. Monika Bangari
2
Assistant Professor1 and Associate Professor2, School of Management and Commerce Studies, Shri Guru Ram
Rai University
ABSTRACT
Marketing of goods and services is the basic and common phenomenon of each and every society. The primary
objective of marketing is to make product and services available to the consumers according to their present needs and demand. There have been various changes in the field of marketing in order to reach to their
consumers. Digital marketing or electronic or internet marketing in one hand is the term that refers to various
promotional techniques which are used to reach customers via digital technologies.
In traditional marketing one tries and make consumers aware of availability of product or service which are to
be sold by the means of traditional marketing tools such as television, radio, direct mails etc.
This paper deals with to bring out preferences of customers in context to traditional or digital marketing .Along
with the primary focus of the study is to identify the key differences between conventional (traditional) ways of marketing and advanced digital ways of marketing of goods and services, also it focuses on what are various
tools which can be used by the consumers to make their buying decisions. For this study secondary data has
been used i.e. information is collected through interne ,journals, news papers etc to cover the main objectives of the study. Detailed analysis is done which clearly brings out the differences between the two ways of
marketing along with these tools of marketing has been discussed in detail.
The conclusion of the study is that although online has become one of the latest and upcoming way to make any
buying decision but on the other hand traditional methods of marketing cannot be ignored, still many consumers prefer to go for traditional ways before making any buying decision. So both the ways of marketing
are equally important.
Key words: internet, digital marketing, traditional marketing, consumers
INTRODUCTION Growing demand for healthcare across various strata of society particularly in developing countries and
increasing cost of treatment have raised the need of digital marketing to transform the nature of healthcare
delivery system.
Digital marketing is the term that includes various different types of promotional techniques which are used in
order to reach customers via digital technologies. It includes promotion of products ,service , or brands via
various form of digital media .Nowadays digital media has become one of the important and ever-growing
source of news, shopping , entertainment , social interaction etc.
Marketing for people is for sale. However marketing is nothing but it includes everything which an
organization does to attract customers and also maintain a relationship with them. The first aim of marketing is
always to find a match for organizational products or services, to people who need them, which should ensure profitability. Therefore marketing is everything which one does to place his/her product or service in hands of
customers.
It may include sales, public relations, pricing, distribution and packaging, .It also includes, identifying, selling and developing a product determining the price, and selecting the distribution channels which may help to
reach the customers placed along with developing and implementing promotional strategies.
Marketing is nothing but meeting requirements of customers, marketing is interdependent business activity it is
not something that operates alone from other business activities. It includes various activities like
advertisement, selling, delivering of products or services to people.
The oldest and simplest form of marketing was “word of mouth” by customer can easily convey his/her
experience about product services, or brand in there day to day communication with others. These communications can be positive or negative. I n traditional marketing we attempt or trie and make people
aware of availability of the product or service .As per the article by McCauley D(2013) in traditional marketing
using traditional marketing methods such as TV, Radios, Mails, Newspapers, etc a response rate can be expected somewhere between 0.5% and 2% on outbound messages.in simple words if we get that message out
to 1000 people we can expect response from 20 people through traditional marketing companies or
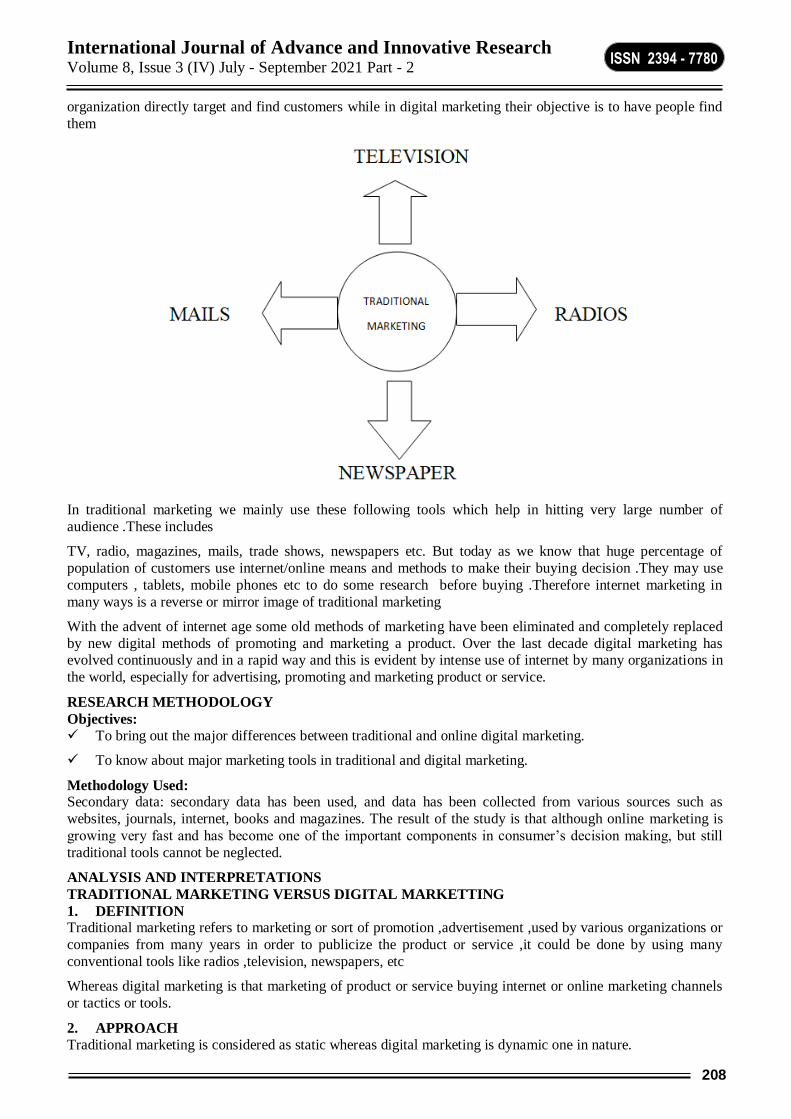
International Journal of Advance and Innovative Research Volume 8, Issue 3 (IV) July - September 2021 Part - 2
208
ISSN 2394 - 7780
organization directly target and find customers while in digital marketing their objective is to have people find
them
In traditional marketing we mainly use these following tools which help in hitting very large number of
audience .These includes
TV, radio, magazines, mails, trade shows, newspapers etc. But today as we know that huge percentage of
population of customers use internet/online means and methods to make their buying decision .They may use
computers , tablets, mobile phones etc to do some research before buying .Therefore internet marketing in
many ways is a reverse or mirror image of traditional marketing
With the advent of internet age some old methods of marketing have been eliminated and completely replaced
by new digital methods of promoting and marketing a product. Over the last decade digital marketing has evolved continuously and in a rapid way and this is evident by intense use of internet by many organizations in
the world, especially for advertising, promoting and marketing product or service.
RESEARCH METHODOLOGY
Objectives:
To bring out the major differences between traditional and online digital marketing.
To know about major marketing tools in traditional and digital marketing.
Methodology Used: Secondary data: secondary data has been used, and data has been collected from various sources such as
websites, journals, internet, books and magazines. The result of the study is that although online marketing is
growing very fast and has become one of the important components in consumer’s decision making, but still
traditional tools cannot be neglected.
ANALYSIS AND INTERPRETATIONS
TRADITIONAL MARKETING VERSUS DIGITAL MARKETTING
1. DEFINITION Traditional marketing refers to marketing or sort of promotion ,advertisement ,used by various organizations or
companies from many years in order to publicize the product or service ,it could be done by using many
conventional tools like radios ,television, newspapers, etc
Whereas digital marketing is that marketing of product or service buying internet or online marketing channels
or tactics or tools.
2. APPROACH
Traditional marketing is considered as static whereas digital marketing is dynamic one in nature.
International Journal of Advance and Innovative Research Volume 8, Issue 3 (IV) July - September 2021 Part - 2
209
ISSN 2394 - 7780
3. CONVERSION
The rate of conversion of digital marketing in comparison to traditional marketing is faster reason being digital
marketing is data driven marketing along with this adds in digital marketing are shown to the customers
according to their tastes and interests. Which therefore generate qualified leads.
4. CUSTOMER ENGAGEMENT
Customer engagement is higher in digital marketing in comparison to traditional marketing .Here customer
engagement means interaction between the customer and organization via different online and offline channels.
In digital marketing it is fast and higher because customer can view and interact with the organization by just
one click they also do not need to visit showroom or store.
5. RETURN ON INVESTMENT Returns on investment can be easily calculated and estimated in digital marketing whereas in traditional
marketing it is not that easy.
6. ECONOMIC FACTOR Digital marketing is less expensive and more effective and traditional marketing is more expensive and less
effective.
7. TRACKING It is very easy to keep a track or an eye on customers i.e. from where the buyer is coming, which is most
viewed product by them, number of customers actually buying the product and who are all interested in the
product etc.
On the other hand it is not that easy to track a customer in traditional marketing method.
8. TARGETING
Digital marketing uses personalized methods i.e. it ensures that only those products are being shown to the
customers for whom they are looking for from very long time and have shown their interest recently. Whereas traditional marketing uses standardized methods to target their customers and so it involves mass marketing
with very low personal touch.
9. MODIFICATIONS
In the case of traditional marketing once the add has be placed tweaking is not possible .Case is just reverse in
the case of digital marketing, even if add is placed tweaking can always take place.
10. REACH
The reach of traditional method is limited because it can only cater the population of a particular geographical
area only.
Whereas as in digital marketing it uses internet and online tools so the reach of digital marketing is on global
level therefore it is not confined to one specific area only.
11. RESULTS AND OUTCOMES
Digital marketing shows one time and real time result, but reverse is the case with traditional marketing.
12. INTERUPTIONS/DISTURBANCE
I n traditional marketing one cannot skip the adds which customer finds useless and not of their interest, where
as in digital marketing adds which are of no interest can be skipped very easily in digital marketing methods.
13. WAY OF COMMUNICATION
Traditional marketing is one way communication whereas digital marketing is two way communication because in digital marketing along with the adds customers can also give useful feedbacks to the organization
as well.
TOOLS /METHODS USED IN DIGITAL AND TRADITONAL MARKETING
Digital marketing works on using number of different strategies:
1. Email marketing: email marketing allows a organization to stay in touch with their prospective customers
by sending them customized newsletters or offer based on shopping history. Nearly 60% of consumers say
that emails play a role in their buying decisions.
International Journal of Advance and Innovative Research Volume 8, Issue 3 (IV) July - September 2021 Part - 2
210
ISSN 2394 - 7780
2. Content marketing: Content marketing basically deals with marketing team being proactive in answering
consumer questions. Here Marketing team creates contents, videos, and other assets in order to answer
questions or provide context to consumers throughout the 3 stages of buyers journey i.e.
a) Awareness stage
b) The consideration stage
c) The decision stage
3. Search engine optimization (SEO): Marketing search engine optimization and content marketing goes
hand in hand . When customers conducting research for any product they want to buy they will probably
click on one of the first three results ,that appear on Google . With this in mind marketing team wants to
ensure that their articles appear the top results. This is done by optimizing content for experience and ensuring the technical elements are in place to enable search engine --------- to easily find and index this
content.
4. Search Engine Marketing (SEM): It is type of internet marketing .It uses the search engines to advertise your website or business to internet customers and send more targeted traffic to your website via
advertising or paid links. It may include all those things which may increase traffic to your websites.
5. Social media marketing (SMM): SMM is one of the form of internet marketing that make use of social media networking websites as marketing tools as in order to post content and reach new customers and to
increases visibility on search engines. These well known sites can also be used in order to make effective
form of communication and to engage with customers, build relationships and quickly resolve issues.
SMM has become more common with the increased and growing popularity of websites such as Google +,
twitter, face book , LinkedIn, you tube
6. Pay per click: It is form of paid advertising that ensures and allows marketing team to purchase traffic for
their websites. In this marketers place adds on websites, or search engines, such as googles etc and pay a
fee each time the add is clicked on. These adds appear on top of the search result page.
7. Display advertising: It is the form of advertising on different websites. It includes different items such as
images, flash, videos, and audios.
8. Adware: It is a type soft ware it once installed. It automatically displays advertisements on users machines,
adds may appear in software itself integrated in web pages, visited by users or in pop-ups.
9. Affiliated marketing: It is a type of referral programme it involves working with outside individual or
companies under the agreement that they promote companies product in exchange of commission from each sale of which is attributes to their efforts or in simple words when advertisement organizes 3rd party
to create potential customers for them.
TRADITIONAL MARKETTING STRATEGIES 1. Phone calls: In spite of shifting of marketing strategies towards digital communication. Consumer still
prefers phone calls over emails, and websites when discovering business.
2. Face to face meetings: A survey by management events found that 79% of top level executive uses face to
face for communicating .Nowadays virtual meetings are becoming more famous and they serve as great
alternative to in person meetings.
3. Direct mail: Direct Mail such as newsletters, postcards, brochures, catalogue.
4. Printed advertising
5. TV and Radios
6. Telephone marketing
7. Local newspaper marketing
LITERATURE REVIEW
1. Sanjay Bhayani, September (2018), Internet Marketing vs Traditional marketing A comparative
study
This paper focuses on what is the consumer’s opinion and views on distinguished different services of traditional marketing strategies as well as internet marketing strategies. This paper also focuses on advantages
of internet marketing strategies such as availability of services 24x 7,it changing ways to reach to consumers
International Journal of Advance and Innovative Research Volume 8, Issue 3 (IV) July - September 2021 Part - 2
211
ISSN 2394 - 7780
fact , and it being one of the convenient ways for consumers these days .It focuses how consumers becoming
more IT savvy i.e they are becoming more knowledgeable in their searching, jugdging as well as buying and
purchasing preferences.
2. A Comparitive study of digital marketing vs traditional marketing Ms. Sudha Lawrence, Ms. Snehal
Deshmukh, Ms. Elavarasi Navajivan This paper mainly focuses snd studies a comparision between traditional marketing and digital marketing which is also known as online marketing. Also this focuses on advantageses and disadvantages of the both marketing
techniques i.e digital marketing and traditional marketing. This paper tells that how the advent of internet has
replaced and eliminated some old marketing methods i.e “Desk research is replaced by online
research”.Comparision in the paper is as follows
Traditional methods of promotion of product or service through: TV,radios, newspapers, flyers, billboards,
pamphlets,.
Whereas in digital marketing tools are different i.e.
Social media eg facebook, twitter,insta etc
Promotion via Emails
Paid pop ups
Mobile apps- Blogs etc
3. Online vs Traditional marketing challenge in telecom market in BOSNIA an HERZEGOVINA
Acc. Zaimovic Tarik , T he most important thing in marketing is to understand consumers behavior in media
advertising which enables every company and organization to effectively direct activities towards target market. This research paper focuses on how online advertising methods are more beneficial than traditional
methods of marketing in sending messages to consumers .The result of research was that users of
telecommunication services in Bosnia and Herzegovina(Bih) pay more attention and prefer marketing of messages sent over the online media .Social media network were most preferred means of communication by
most of telecom users in BIH which was also followed by TV, radios companies pages, companies blogs,
newspapers, radios etc.
4. Travel from traditional marketing to digital marketing by Yakup Durma and
Ibrahim Halil, Efendioglu
This paper basically tries to study about digital marketing advantages, experienced transition, and main
differences between traditional and digital marketing. Acc. To yakup dunug and Ibrahim with the challenging ways of communication rules field and definition of marketing has also changed with widespread development
of IT technologies traditional marketing methods have lead ways for digital marketing day by day organization
which are using technology can easily communicate with customers along with providing product and services . Digital marketing’s biggest advantage is it reaches the target audience in right way using social media and
search engines.
5. Dave Chaffey (2002):
Defines internet marketing “applying digital technologies which form online channels (web, e mails, database, mobile/wireless and digital tv) to contribute to marketing activities which aims at achieving profitability
acquisition and retention of customers by the way of improving customers knowledge and then delevring
integrated targeted communication and other online services that match the individual needs . This definition reflects the relationship marketing concept, it basically emphasis on business model that drives electronic
marketing and not technology.
6. Comparative study of traditional marketing and online marketing
Mr.kanuka Raju ,Dr. G.Haranath
Acc. To Dr G Haranath and Mr.G.K anuka online marketing is one of the fastest and latest growing
phenomenon in the business world in each and every country. Nowadays due to increased online market ,
customers taste ,needs , and wants and preferences also have changed .This study focuses on the comparision between traditional and online marketing .Along with this on factors that influences and effects customers
perception and attitude towards online marketing . This paper also tells about that some of the customers prefer
online and some of them still focuses on traditional marketing tools as well.But this also depends on their
attitudes, habbits , time knowledge regarding technology.

International Journal of Advance and Innovative Research Volume 8, Issue 3 (IV) July - September 2021 Part - 2
212
ISSN 2394 - 7780
CONCLUSION:
In comparison of digital marketing and traditional marketing it has been concluded that both help marketers and
consumers to promote and buy the product and services irrespective of their pros and cons. So online being one of the latest and fastest method of marketing, but many number of consumers still go for traditional methods of
marketing.
REFERENCES 1 . Sanjay Bhayani, September 2018 Internet marketing vs. Traditional Marketing: A Comparative Analysis,
Saurashtra University,
2. Retrieved from: file:///C:/Users/HP1/Downloads/1098-Article%20Text-1832-1-10-20200721%20(1).pdf
4. Retrieved from: https://www.econstor.eu/bitstream/10419/193882/1/econ-review-v16-i1-p045-057.pdf
5. By Yakup Durmaz & Ibrahim Halil Efendioglu, Travel from Traditional Marketing to Digital Marketing
Volume 16 Issue 2 Version 1.0 Year 2016
6. Retrieved from: file:///C:/Users/HP1/Downloads/2049-1-2028-1-10-20160927.pdf
7. Mr. G. Kanuka Raju1 Research Scholar, Yogi Vemana University, Kadapa Dr. G. Haranath2 Assistant
Professor, Yogi Vemana University, Kadapa 2019, Volume 6, Issue 2 (ISSN-2349-5162).
8. Dr. Mrs. Vaibhava Desai(2019) International Journal of Trend in Scientific Research and Development
(IJTSRD) -ISSN: 2456 - 6470
9. Retrieved from: https://www.sciencedirect.com/science/article/pii/S0268401220308082
10. Giriraj Kiradoo (2017) Digital Marketing in India its Scope, Growth and Development, 8 Pages Posted,
Department of Management & Technology, Government Engineering College Bikaner, Bikaner Area,
India, Date Written: MAY 2017
11. Retrieved from: https://keydifferences.com/difference-between-traditional-marketing-and-digital-
marketing.html
International Journal of Advance and Innovative Research Volume 8, Issue 3 (IV) July - September 2021 Part - 2
213
ISSN 2394 - 7780
TALENT MANAGEMENT – A DIFFERENTIATING TOOL IN PUBLIC SECTOR BANKS
Dr. J. Shrilekha Associate Professor and Head, Department of Bank Management, Anna Adarsh College for Women, Chennai
ABSTRACT Talent management refers to the process of integrating new workers, developing and retaining current workers
and attracting highly skilled personnel to work for the organization. It is indispensible for the survival and
sustainable development of any business organization. Ignoring talent management is suicidal for the
organization in the current highly competitive scenario.
The working culture of the public sector bank in the last few years is still afresh in the minds of the masses.
With the emergence of third generation private sector banks and foreign banks, the public sector banks started
facing problems. Being a public sector bank, it is not possible to hire and fire and infuse the new blood.
The management of the public sector banks visualized that when technology is becoming a great leveler, it is
their human resources alone, who can make the difference and catapult the bank to unconquered heights.
Public sector banks are slowly trying to take out the latent potential of its employees by adopting HRD and talent management strategies and found successful. This study is a simple attempt to understand the impact of
talent management strategy on public sector banks.
Key Words: Talent Management, Human Resource, Human Development, Employees, Strategy, Training.
Research Design
The Research is basically a desk research. In this study the researcher has analyzed various conceptual facets
of talent management. The research design is based upon conceptual inputs collected from various secondary
sources.
INTRODUCTION
Every person has a unique talent. The leader needs to recognize the people’s inherent skills, traits, personality
and place him at the matching place. Wrong placement leads to low productivity, dissatisfaction, low morale
and other negative behavior. Therefore talent management is making capability match commitments. Talent management is all about the effective utilization human resource. Human resource is the key for any
organization. Any organization can imitate other's .technology, product specifications, policy but they cannot
imitate the commitment and expertise of human .resource of other's organization. Therefore, organizations can
use the human resource as a tool for differentiation.
There are three HR ingredients which make a successful organization. i.e., Competence, Commitment and
Culture. Competence means individual employee has the basic knowledge and skills to complete the job.
Commitment is an attitude and dedication of the individual towards the job. Culture works like oxygen which provides the sustaining force and keeps tempo up for the employee to continue to develop his competence and
commitment level. The organization must strive to cultivate all of these elements in their employees because if
any one of them goes missing, the talent equation falls apart.
Problem of the study
The history of Indian Banking reveals that the Bank’s main focus of attention has been branch expansion and
massive recruitment. As a sequel to blind approach towards growth, certain natural corollaries ensued such as indiscipline and apathy towards customer, emergence of restrictive practices and inadequate attention to several
important aspects of working like customer service, staff discipline, house-keeping etc.
With the emergence of third generation banks and foreign banks in the Indian market, there was an urgent need
for the public sector banks to change their strategy to compete with such emerging banks. Service conditions of these Banks were so tight that hire and fire was not possible. So, these banks had no option except to adopt
HRD and talent management strategies for not only to take out the latent talent of its own employees but check
attrition of their employees who were otherwise moving towards these new private and foreign banks.
Objectives of the study
This study has been a small attempt to understand the impact of talent management strategy adopted by public
sector banks during the last decade with the following objectives.
1. To understand the importance and utility of talent management in public sector bank
International Journal of Advance and Innovative Research Volume 8, Issue 3 (IV) July - September 2021 Part - 2
214
ISSN 2394 - 7780
2. To examine the talent management strategies followed by public sector bank.
3. To suggest measures to be adopted by banks to enhance talent management.
Importance of the study The human resource is very critical for the organization irrespective of its operation i.e., whether it operates at
small, medium or large scale. Today the competition has become intense. Every organization tries to create
good image and differentiate itself in the market by using various strategies. Due to globalization the entire globe has become a single entity. The number of firms operating in a particular industry has 'grown at a larger
space; hence every bank wants to differentiate its offering from others. They can differentiate in terms of
product offering, pricing, promotion or distribution. But there is chance of these strategies being copied or
imitated by the competitors. Hence banks need to search out such differentiation which cannot be possible to
copy or imitate it. Here, human as resource can be used to differentiate from one another.
In the service sector like bank, heterogeneity is the biggest challenge. Hence, the quality of services depends
not only on the specification of offerings, but to a large extent on the persons who are .delivering them. These persons are the talent for these organizations. If organizations get skilled, committed and innovative talent then
they can get distinct place in the market and thus these talents can play a role of differentiator for .the
organizations. Human resources are just like the driver of a vehicle, more talented driver the safer journey without any hazard towards the excellence of the organization. Hence the paper tries to find out how and what
strategies banks must adopt to differentiate their offering on the basis of human: resource commonly known as
Talent.
Talent Management strategies followed by Public Sector Bank.
Talent Management strategies followed by public sector banks can be grouped into the following sub-heads.
A. Recruitment: Earlier PS banks had to depend on the recruitment done by BSRB. Recruitments were mainly
in clerical or Junior Management level in officers’ cadre. Lateral recruitment at middle and senior management level was limited. Now these banks have started to recruit people having professional
knowledgebase and/or proven work experience in different areas of banking and management from open
market directly in higher management level.
B. Talent Review and Talent Identification: The talent, innovation, creativity, business acumen and capabilities of the employees are the single most dependable source of competitive strength for the bank.
Applications were invited from the willing staffs who were ready to share additional
responsibility/challenging assignment in different areas of the banking. They are required to undergo through a scientific selection process of written test, psychometric test, interview etc. The employees’ who
were finally selected, were given adequate training and exposure in the field to groom in the specialized
field of the banking such as marketing, insurance, mutual funds, information technology, treasury, forex and international banking, and take challenging role. They were also subject to rigorous system for
periodic evaluation of their performance. Obviously based upon their performance they are provided with
good opportunities of training and development and are also suitably recognized by way of faster career
growth opportunities, overseas training and placement.
C. Developing Talent: The methods initiated by banks for talent development are enumerated below
The Public sector bank has strived to strengthen the training system to re-skill its employees and enhance
the competencies.
Schemes for encouraging employees to pursue Professional and Computer education
D. Managing and Rewarding Talent: This is a crucial task for HRD as any mismanagement may not only nullify the work of identification and development but also create a chaos if not properly handled. Banks
have developed several strategies for managing and rewarding the talent, some of which are discussed
herewith.
Performance Appraisal system. In spite of strong resistance from the Union, the performance appraisal systems was introduced with the objective of creating a performance oriented culture and identify and
develop good performer in employees of all cadres.
Financial Reward Scheme: Different reward schemes are introduced for all employees like canvassing new
savings bank accounts, recovery in NPA, canvassing retail loans and for business leaders
(Branch/Regional/Zonal Heads) for good performance.
International Journal of Advance and Innovative Research Volume 8, Issue 3 (IV) July - September 2021 Part - 2
215
ISSN 2394 - 7780
Scheme of Sabbatical leave to employees for availing temporary relief from active service of the bank for
personal reasons.
Staff Suggestion Scheme: The objective of the scheme is to encourage the ideation process amongst staff
members to offer innovative suggestions to develop/upgrade existing system/scheme for the bank.
Outstanding suggestions are awarded with cash prize along with Certificate of Appreciation.
Major findings of the study
a. Employees are investors in the company and expect a return on investment, Reciprocity is a key.
b. Retention must be part of the organization's DNA. Successful organizations have woven retention and
engagement deeply into their structure:
c. Creation of effective leadership and team building has emerged as the greatest challenge for talent
management.
d. Recognizing and appreciating the performance of employees and opportunity for faster career growth can
make them more committed to work.
e. Better salary and better career development opportunities are the main reasons for attrition but talent
identification and development measures of the bank have been partially successful in retaining
employees.
f. The manager believes that the work place needs further improvement in Knowledge, Skills and Attitude
along with empowerment to face the global challenges in the arena of business in today’s competitive
environment.
g. At present there is no structured procedure for carrying out a critical skill gap analysis of the organization.
SUGGESTIONS/RECOMMENDATIONS
The bank should develop periodic talent audit process.
HRD intervention needs to be initiated for effective team building measures especially for creation of
cohesiveness among departments.
There is a need for further developing performance related incentives and career development
opportunities.
As the present system of performance based incentives are very limited.
A structured system and procedure for ‘performance gap analysis’ needs to be created
CONCLUSION
It is extremely important for every bank to identify, develop and utilize the talents of its employees to gain competitive advantage. The public sector banks have taken several initiatives like internal and external training
at reputed professional institutes,, new improved performance management system, fast-track promotions,
rewards, schemes, etc. to utilize and develop its employees’ talents, but there is a need for proper knowledge management and more effective implementation of these measures. The top management believes on the
principle of ‘Employee First’. The HR should take Talent management and ‘Culture Building’ measures which
should lead to ‘Employee Delight’ which in turns will lead to ‘Customer Delight – ultimate goal of a service
organization’ .Hence talent management remains one of management’s highest priorities. Today’s leaders must manage the scare commodity called talent to sustain their competitive edge. Brain power remains a key
differentiator in today’s competitive market environment. The organization with the best talent wins the race.
In the midst of slow economy or so called recession, attracting, hiring, retaining and engaging top talent can
make or break any organization. Hence Talent management remains one of management’s highest priorities.
REFERENCES
1. www.highretention.com
2. www.plateau .com/prod/talent-management.html
3. http://searchwinit.bittpipe .com/relist/term/IT-Workforce.html
4. Masood Hasan , Singh , Somesh(2009)Talent Management in India ,Challenges and Opportunities,
Atlantic publisher & Distributors (P) Ltd. New Delhi
International Journal of Advance and Innovative Research Volume 8, Issue 3 (IV) July - September 2021 Part - 2
216
ISSN 2394 - 7780
TEACHING ENGLISH LANGUAGE IN HIGHER EDUCATION INSTITUTIONS: A NECESSITY
FOR STUDENTS’ BRIGHT CAREER
Divya Deevi1 and Kavi Balabrahma Chary
2
1Research Scholar & Assistant Professor, English, VNR Vignanjyothi Institute of Engineering and Technology,
Hyderabad 2Lecturer, English (Retired), Hyderabad
ABSTRACT Numerous languages, some with the script and many without, are spoken by people all over the world. In that
case, is it possible to give numbers to all of them? No, it is not. People choose only some according to their
preference and convenience. Giving numbers to languages is followed in academic activities in educational institutions. In some states, in India, the mother tongue is called the first language, Hindi the second and
English the third. It is only up to secondary level study. From Intermediate, English becomes the first and one
of the chosen languages is the second and no third language. However, in professional colleges, only English is
taught because of the importance it has. But not a single language, except English, is popularly known in various countries even where it is not the mother tongue. The reason is obvious. It is the medium of almost all
fields like software, technology, engineering, science, law, medicine, etc. It has become imperative for those
who wish to excel in the constantly changing trends to learn English. In India also English is taught as a second language in some educational institutions. In higher education it has been given a prominent place to
train students in communication skills which would help them to achieve a bright career in any field they
choose. All institutions offering courses in higher education are continuously modifying their teaching
strategies by incorporating new subjects in the syllabus and establishing laboratories to help students become proficient in English. This paper deals with different aspects involving teaching English throwing light on the
gradual improvement from secondary to higher education.
Key Words- English teaching, higher education, relevance to the present time, strategies in instruction,
communication skills.
INTRODUCTION-
What is language? It is a simple question to answer. It is a means of communicating one's needs, feelings and
ideas using words, but it has a big scope. There are nearly 6,500 languages in the world today. Everyone enjoys one's language. Among the 12 most spoken languages, English occupies first place with 1132 million speakers.
Among the Indian languages, Hindi takes third place and Bengali the seventh. It is amazing to note that more
than 19,500 languages and dialects are spoken in India as mother tongues. However only 121 languages are
spoken by 10,000 or more people in India as per the report of the 2011 census, 96.71% in the country have one of the 22 scheduled languages as their mother tongue. Among the scheduled languages included in the
constitution of India, Hindi is made the official language. As people in some states have expressed their
inability to follow that language, English is also treated as the official language. All government activities are
done in either of the two sometimes in both.
Generally, a child acquires language in his early days. First, it learns to make sounds. When it is hungry, it cries
to express its hunger. The mother understands and feeds milk. As time passes on, the child learns words, the first two-letter words, the next three-letter words and so on. By the time children complete their first year, they
learn a lot of vocabulary mainly in their mother tongue. They can do this because they observe and follow their
parents, siblings, members of their family and neighbours. Without knowing that they are acquiring a language,
they speak very fluently. Thus they get knowledge in their mother tongue which is also their first language. They are ignorant of other languages at that time. When they join the school, they get in touch with other
languages, the second language and the third language. This is the age-old practice. But now parents are eager
to send their children to school even at the age of three. They also insist that their children should be taught in English only which is not their native language. They deprive them of the benefit of fully getting knowledge in
the first language. This practice should be discouraged.
Why should one learn a language other than one's mother tongue? If this question is innocently asked by an old man in a village, no one can give him a convincing answer. The old man asserts that he had never gone to
school for studies but actively participated in agriculture work like tilling the land, growing and harvesting
crops, selling grain and earning money. He got married and begot children, brought them up, found suitable
spouses for them and now allotted his work to his sons. He leads a happy and peaceful life playing with his grandchildren. In this whole process, he never used a language other than his mother tongue and in fact, he had

International Journal of Advance and Innovative Research Volume 8, Issue 3 (IV) July - September 2021 Part - 2
217
ISSN 2394 - 7780
never felt the necessity to use other languages. In his perspective, he is correct. But the reason to learn another
language is given by Geoffrey Willians. He says “You can never understand one language until you understand
at least two”.
The scenario has now changed. To meet the needs of present-day one should learn as many languages as one
can. It is said "Learning a second language not only has cognitive and academic benefits it also supports a
greater sense of openness to- and appreciation for- other cultures.” The reason to learn other languages are many. The world is ever-changing. One has to expand one's sphere and explore new opportunities in business,
education and social relations. It is not possible or desirable to live like a frog in a well. One will lag if one
doesn’t search for innovations. Even in a country, people of one state have to visit at least a neighbouring state
for many purposes. Then knowing the language of that state is compulsory. In the same way, if one wishes to go abroad, one should learn the language of that country or the recognized international language. As English is
accepted as the link language across the world, it has become imminent for many people to acquire knowledge
in that language. So, it has been introduced as one of the languages in educational institutions.
In countries like India where the literacy rate is low, most of the people are familiar with the first language
only, because they have no chance or interest to go to school. This happens particularly in rural areas where
they find no access to school. Some people who attend primary school, stop their education with fifth class only. They can develop some vocabulary and learn some other basic subjects, but actually, students get in touch
with other languages, the second and the third in secondary school. From the Intermediate curriculum, English
is the first language and one of the other native languages is chosen as a second language by students.
Ironically in the intermediate course, what we call the first language in secondary schools becomes a second language. English is given priority and is included in Part-I, Part-II consists of many languages, among which
one is chosen by a student. In part III he selects group subjects like mathematics, biology, history, commerce,
etc. In undergraduate courses also the same pattern is followed, English, II language and optional group subjects. Our education system wants to give importance to English from college study and so makes it
compulsory. Students have choices in the second language and group subjects but not in English. The branding
of languages 1st, 2nd is for convenience of designing syllabus but on the whole, the general principle is the
language which is acquired in one's childhood is called the first language and that is learned later is called the
second language.
Main Body-Teaching English in higher education institutions plays a vital role. There are many reasons. Some
students seek admissions in states other than their native state for better opportunities. So, they need to learn and develop their knowledge in this language to communicate with other students and faculty. After their
higher education, they get jobs in their native country or abroad. Then speaking this second language becomes
inevitable. Moreover, all subject books and websites are in English. If students wish to refer to books or browse the internet, they must use English. While designing syllabus in these institutions all these things must be taken
into consideration.
Coming to higher education different methods are followed regarding language. English should be learnt by all
students pursuing a degree or other professional courses. However, in undergraduate courses, one of the other languages is prescribed in the syllabus along with English. In engineering colleges, only English is taught. The
reasons for this are many. As Dr.Jyoti Syal in the article” Teaching of English as a second language in India: an
overview.” says “The importance of English can be guessed by the fact that every latest information and the textbooks of almost every subject are available in English language only." The author also says that teaching
and learning the English language has become indispensable and unavoidable in India. After higher education
students get jobs in their native country or abroad. Then speaking this second language becomes necessary.
So, many engineering colleges have been established to fulfil the needs of students as well as industries,
especially the software industry. A student's knowledge in core subjects along with communication skills in
English is tested at the time of the interview. It is also necessary for undergraduate and postgraduate students in
other disciplines in arts, commerce and other subjects to learn English to perform well in their competitive examinations and interviews. So, universities, while designing syllabus in English, give importance to the
instruction of the four LSRW skills- Listening, Speaking, Reading and Writing. Therefore, English laboratories
are established in higher education institutions
Teaching language without teaching literature is futile and so the syllabus designers for the second language in
higher education include some literary pieces in the curriculum. In engineering colleges, English is taught along
with core subjects. A student is able to study literature and learns communication skills simultaneously. Though
literature may not help in seeking jobs nowadays, it is essential for a student to study it. It teaches ethics and
International Journal of Advance and Innovative Research Volume 8, Issue 3 (IV) July - September 2021 Part - 2
218
ISSN 2394 - 7780
other human values. Charles Bukowsi said, “Without literature, life is hell.” There is no exaggeration in these
words. Many great personalities including scientists have said that they have learnt many things from literature.
While students study literature from teachers and books in classrooms, they learn communication skills in labs with the help of computers, CDs, DVDs and other electronic devices. The first among communication skills is
listening. It is a process that starts in the childhood of a human being and it lasts till his death. Gradually, this
listening leads to speaking, the second communication skill. A child's academic listening starts in school where it listens to its teacher and develops an interest in the lessons. This active listening or direct listening continues
throughout secondary education.
In higher education, students learn English through direct listening as well as indirect listening. In labs they
listen to audio cassettes and watch DVDs where they cannot directly listen to the teacher or the speaker. The voice is recorded earlier and is played on the tape recorder and the video player. They cannot interact with the
speaker but they can do it in the classrooms. In this way, indirect listening or passive listening has a drawback.
It has its advantages too. In the classroom students can listen to a single person but in labs through the electronic media they can listen to different people on the same subject and thus learn more. They can get the
speeches or lectures by eminent people both dead and alive. They can develop skills in pronunciation and
accent. In higher education, listening helps students in many ways. If they wish to appear for the IELTS or any other competitive exams they have to answer questions on listening. In the pursuit of jobs, they have to attend
interviews where they must listen to the questions carefully and answer them. In telephonic interviews,
listening plays a vital role because if a person does not listen carefully, he may reply in a negative way or
unsatisfactorily. As Tania Israel says, "Listening may not be the most exciting part of the conversation, but it is
essential if you want a meaningful exchange with another person."
After listening human beings learn to speak. A child practices and speaks sentences at home. When children
enter high school they learn a second language, English, and try to speak in that language. In higher education speaking English becomes necessary. In English labs, students are asked to speak on a topic initially for a few
minutes. Later, they improve their skills and attend viva-voce examinations. Their examiners test the subject
knowledge of the candidates and how they express it convincingly. In interviews and group discussions the
proficiency of the speaking skills of the candidates is carefully observed. His answers must be clear brief and concise. Then only they will be considered for the appointment. Here Robin Gupta's quote may be recalled. He
says "Everyone has a good speaking skill. But very few know how, when and what to speak.....” For marketing
jobs fluent speaking is essential. The employee should convince the customer with his attractive speech to sell his product. Speaking skills are necessary for an orator. As Rob Brown has rightly observed, "If you can speak,
you can influence. If you can influence, you can change lives”.
A student learns reading and writing at school. By the time he joins school he knows some vocabulary in his mother tongue, usually the first language. But he cannot read words or write though he can speak. So teachers
teach them alphabets with the help of textbooks. Then students find illustrations for each letter and recognize
them and name them. Gradually he practices reading small words and sentences. Second language reading
starts in secondary education. Students learn English as one of the subjects. But in higher education, English is given utmost priority. They read textbooks in classrooms and gather more information from reference books in
libraries. Students are now able to collect any data from the internet. They learn everything from computers and
smartphones. Some classes are allotted for labs where they read comprehension passages and other topics thoroughly. This will help them in their course examinations and competitive examinations. The main
advantage of reading on electronic devices is, they can get any information at any time. In libraries, they have
to search for relevant reference books which sometimes may not be available. This problem doesn’t arise with modern devices. They can pinpoint the exact information and get it. This reading helps them in the future when
they settle in jobs. In every field, they have to read many things like notifications, reports, messages, drafts, etc.
Thus reading English in higher education prepares students to face the challenges at their workplaces.“The
greatest gift is the passion for reading. It is cheap, it consoles, it distracts, it excites, it gives you knowledge of
the world and experience of a wide kind. It is a moral illumination.” Elizabeth Hardwick says.
The last part of learning at school by a student is writing. In fact reading and writing go simultaneously. It has
been observed that you learn to write better by reading. You learn to read better by writing. Reading and writing work together to improve your ability to think. Students write down in notebooks what the teacher
dictates or writes on the blackboard. Writing is very important for a student’s academic progress. His
knowledge is evaluated by teachers basing on his presentation and award marks. In higher education writing
skills are important to students to make them prepare for the competitive examinations. They have to exhibit their knowledge in the subject and also its presentation. Good writing involves correct spelling, use of

International Journal of Advance and Innovative Research Volume 8, Issue 3 (IV) July - September 2021 Part - 2
219
ISSN 2394 - 7780
vocabulary, grammar and organisation of ideas. For this purpose they are taught assignment writing, dialogue
writing, essay writing and report writing along with regular grammar topics. Then only students can express
their ideas with confidence and courage. The importance of writing is clearly explained by Peter Hill. He says, “Writing is an important soft skill that everyone, including engineers, should consider developing for the better
of their careers. Engineers, more than others, have the need for good writing skills as they allow simplification
of complex scientific terms and data.”
CONCLUSION-
Finally, a student should learn English to improve his knowledge to seek employment. The prerequisite for any
job is good communication skills, invariably in English. This is learnt by students in higher education
institutions. It should be observed that learning English is not a punishment as many students feel, but it is a
pleasure.
REFERENCES
Chapple, J. (2015). Teaching in English is not Necessarily the Teaching of English. International
Education Studies.
Chaudhri, U. S. (2006). Higher Education Today and Tomorrow.
Meenakshi Raman, S. S. (2018). Professional English. Oxoford University Press.
Monaghan, C. (2007). Effective Strategies for Teaching Writing. (A Published MA Thesis Ed.). The
Evergreen State College.
Natkhublall, D. Teaching and Study Skills in Higher Education. U.S.A: Createspace Independent
Publishing Platform.
Neena Dash, M. (2009). Teaching English as anAdditional Language. Atlantic.
Pathak, S. C. English Language Teaching. Anmol Publications Pvt. Ltd.
Richard All Wright, K. M. (1991). Focus on the Language Classroom: (An Introduction to Classroom
Research for Language Teachers). Cambridge.
Spretnak, C. M. (1983). Reading and Writing for Engineering Students. Journal of Advanced Composition,
Vol-4, pp.133-137.
Vyas, M. A. (2011). Teaching English as a Second Language: A New Pedagogy for a New Century. PHI
Learning Private Limited.
International Journal of Advance and Innovative Research Volume 8, Issue 3 (IV) July - September 2021 Part - 2
220
ISSN 2394 - 7780
THE ADVANCING GEOPOLITICS OF SOUTH KOREA-CHINA RELATIONS: IMPACTS ON U.S.
FOREIGN POLICY IN THE INDO-PACIFIC
Lopamudra Ghosh Student (Second Year) Pursuing the Degree of Bachelor of Arts (BA) in History (Honours), Kabi Joydeb
Mahavidyalaya affiliated to the University of Burdwan, 731214
ABSTRACT
Since the 1992 diplomatic normalization between South Korea and China, attempts to upgrade bilateral strategic ties have repeatedly faced unmet expectations, revealing the diverging interests of the two countries at
a deeper, geopolitical level. Recently, China has begun to approach South Korea-China relations as an
intermediary mechanism for handling its strategic competition with the United States. Meanwhile, South Korea’s own goals concerning North Korea are a key variable in efforts to build friendlier political relations
with China. As Chinese influence in the Indo-Pacific increases, U.S. allies and partners, such as Australia,
India, and Japan, are adapting their strategic posture to develop stronger intra-Asian security partnerships
and try to maintain independence from Chinese influence. By geography alone, sensitivity towards Chinese interests will remain a characteristic of South Korean policies. This research analyses how Beijing’s growing
influence and assertiveness in regional affairs are affecting relations between South Korea and China. This
research has also discovered the effects of the advancing geopolitics of South Korea-China relations on U.S. foreign policy in the Indo-Pacific. It focuses on South Korea’s evolving relations with China to explore whether
China is emerging as a viable strategic alternative to the United States for South Korea, especially amid
persistent concerns about Washington’s commitment to alliance relationships. Finally, the research explores
the conditions under which South Korea and China have sought to deepen their strategic ties, from the aftermath of the Korean War and the Cold War era until today. These often-diverging interests have three
implications for U.S. foreign policy. First, as Beijing becomes more ambitious about changing the status quo in
Asia, it might seek to tighten Beijing-Seoul political relations as a way to weaken the U.S. alliance system in the region. Second, Beijing is unlikely to take any actions that would destabilize the North Korean regime,
especially if US-China competition grows more intense. Third, South Korean foreign policy tends to draw
closer to Chinese views on issues of North Korea’s nuclear and missile development programs. However, Seoul’s desire for autonomy in foreign policy and inter-Korean relations mean that it does not render
automatic support for Beijing’s regional agenda.
Keywords: China, Geopolitics, Indo-Pacific, North Korea, U.S. Foreign Policy.
1. INTRODUCTION The history of bilateral relations between South Korea and China is not very long; diplomatic normalization only occurred in 1992. These past attempts have been fraught with unmet expectations because of the
divergence of South Korea and China’s geopolitical interests. In this short period of time, the two sides have
continued upgrading their relations — from “Friendly Cooperative Relations” at the time of normalization to 1998’s “Cooperative Partnership Towards the 21st Century”, 2003’s “Comprehensive Cooperative Partnership”,
2008’s “Strategic Cooperative Partnership”, and 2014’s “Enriched Strategic Cooperative Partnership”.
However, these upgrades have had mixed results at best. To this day, the primary foundation of Beijing-Seoul
ties is commercial and economic.
Escalating US-China competition in the Indo-Pacific is making it increasingly difficult, if not impossible, for
South Korea to maintain economic ties with China without redefining the nature of their bilateral strategic and
political relations. After Seoul’s 2016 decision to deploy Terminal High Altitude Area Defence (THAAD) in South Korea, China used economic tools for strategic purposes to leverage and influence South Korea’s
national security decisions. This signals the fact that China has begun to use coercive tactics in its relations with
South Korea on regional security issues and is approaching Beijing-Seoul relations as a mechanism for competing with Washington indirectly. China’s short-term goal is to control South Korean behaviour so that
Seoul does not act in ways that augment the power and influence of the United States against what China
perceives as its core interests. South Korean policymakers’ desire to achieve their own geopolitical goals — especially the denuclearization of North Korea and reunification — remains a powerful reason for Seoul to
continue to show sensitivity to Beijing and seek friendlier political relations with Beijing.
The following section presents the four distinctive phases of South Korea and China’s political and security
relations and examines the factors that drove the strategic decisions of the two sides towards one another at critical junctures. The next section reveals the three patterns in Beijing-Seoul ties and what these mean for the
International Journal of Advance and Innovative Research Volume 8, Issue 3 (IV) July - September 2021 Part - 2
221
ISSN 2394 - 7780
future of US foreign policy in the Indo-Pacific. The geopolitical argument of this research was developed
through two analytical processes. An overview of the literature on South Korea-China relations aided in the
identification of critical junctures, and a further literature search elucidated the driving forces behind Beijing and Seoul’s foreign policy behaviour during those critical junctures. Policymakers’ statements, government
documents, statistics, and daily news articles are used where possible.
2. FOUR PHASES OF THE GEOPOLITICS OF SOUTH KOREA-CHINA RELATIONS:
ANALYSING THE IMPACT ON US FOREIGN POLICY IN THE INDO-PACIFIC To understand why Beijing and Seoul moved to tighten their strategic ties at certain times and not at others, it is
useful to divide South Korea-China relations into four phases. Three landmark moments represent the changing
nature of the bilateral relationship in the strategic and political realms. The three landmark moments are as
follows:
i. The normalization of diplomatic relations in 1992,
ii. The “Strategic Cooperative Partnership” designation in 2008, and
iii. South Korean President Park Geun-hye’s attendance at Chinese President Xi Jinping’s commemoration of
the 70th anniversary of the end of World War II in 2015.
Each of these new beginnings was followed by a series of developments that revealed that Beijing and Seoul’s
strategic interests still diverged at a deeper, geopolitical, and structural level.
2.1. First Phase – From the Korean War to Separation of Politics and Economics (1950-1992): The first
critical juncture in China-South Korea relations was the Korean War, in which China aided North Korea’s
attempt to unify the Korean Peninsula under Kim Il-Sung’s Communist regime. This experience set the tone for the next four decades. With the signing of the 1953 Mutual Defence Treaty with the United States,
South Korea became part of the US-led hub-and-spoke alliance system in Asia, which emerged in the
process of external balancing against the Soviet Union, China, and North Korea. In 1961, China and North Korea concluded the Treaty of Friendship, Cooperation, and Mutual Assistance, which committed Beijing
to the aid of Pyongyang if North Korea was attacked. South Korea-China relations have since operated
largely within the bounds of these two alliances. In contrast with China’s normalization of relations with
the United States and Japan in the 1970s, Beijing and Seoul did not normalize diplomatic relations until after the end of the Cold War. This timing had much to do with the remarkable continuity of China’s North
Korea policy, which was tied to Pyongyang’s strategic value in the context of the thirty years of Sino-
Soviet rivalry. After the Korean War ended, Beijing’s foreign policy towards North Korea aimed to safeguard the 1953 Armistice Treaty and to prevent North Korea from entrapping China in another
military conflict on the issue of the Korean peninsula. Beijing also sought to ensure that North Korea
would not side with the Soviet Union against China because Chinese leaders felt increasingly threatened militarily and politically by Moscow. Throughout the 1950s and 1960s, relations between Beijing and
Seoul were characterized by hostility. Beijing maintained a policy that recognized North Korea as the sole
legitimate government on the Korean Peninsula and viewed the US-South Korea alliance as part of
Washington’s encirclement strategy — a web of alliances and/or military assistance programs that the United States had with Japan, the Republic of China, South Vietnam, Thailand, and the Philippines, among
others. During the 1970s, two significant developments enabled Beijing and Seoul to shift their positions
closer towards adopting a policy of separating politics from economics in the 1980s. First, the rapprochement and normalization of diplomatic relations between China and the United States set the
stage for Beijing to calculate that the United States and Japan could help check Soviet power, which led to
a less critical view of South Korea’s alliance with Washington. In 1973, South Korean President Park Chung-hee called for the opening of relations with socialist countries in his Foreign Policy Statement
Regarding Peace and Unification, a move designed to adjust South Korean foreign policy to this new
international mood. In a 1978 press conference with US delegates, China announced that it would not
oppose US forces in South Korea as long as that was acceptable to South Koreans. Second, China’s domestic situation changed with Deng Xiaoping’s Reform and Opening Policy. China began to pay
attention to South Korea’s rapid economic development model in the late 1970s. During this time, the two
countries opened up to trade and travel. This new approach to pursue economic development from 1978 onwards accentuated Beijing’s desire for stability in the Korean peninsula, with Deng Xiaoping making it
clear to Kim Il Sung that China would not support Pyongyang if it were to provoke a conflict and make
use of force against South Korea first. By 1980, Chinese Foreign Minister Huang Hua characterized
Beijing’s policy towards Seoul as one in which “the door is closed but not locked”. When a Chinese
International Journal of Advance and Innovative Research Volume 8, Issue 3 (IV) July - September 2021 Part - 2
222
ISSN 2394 - 7780
commercial airliner with 105 people on board was hijacked to South Korea in 1983, Seoul and Beijing
held their first ever official negotiations, after which sports diplomacy and the expansion of economic
relations led to the further blossoming of bilateral contacts. In 1983, South Korean Foreign Minister Lee Beom-seok expressed Seoul’s desire to realize ‘Nordpolitik’ — a policy under which South Korea sought
to normalize relations with the Soviet Union and China, transcending differences in ideology and social
systems. By 1986, indirect trade between South Korea and China was approximately $0.8 billion-$1.7 billion that accounts for 2 percent of all Chinese foreign trade and is more than China’s $500 million trade
with North Korea. In 1988, Seoul and Beijing agreed to establish trade offices in each other’s capitals.
During this period of growing economic relations with Seoul, Beijing was cautious not to give an
impression to Pyongyang that China’s relationship with South Korea and the United States was to the detriment of its socialist ally. Beijing sought to persuade North Korea on the need for North-South
dialogue to reduce tension on the Korean Peninsula, but it had little success.
2.2. Second Phase – Normalization of Diplomatic Relations, and Deepening Suspicion (1992-2008): According to Deng Xiaoping, improved China-South Korea relations are good for China, first because
they bring economic benefits to China, and second, because they could sever Seoul’s relations with Taipei.
South Korea’s ‘Nordpolitik’ continued into the 1990s, and Seoul normalized relations with the Soviet Union in 1990. However, despite the Roh Tae-woo government having made proposals for diplomatic
normalization through various channels since 1988, China did not decide to proceed with negotiations for
normalization until 1992. What accounts for this specific timing? First, the end of the Sino-Soviet conflict
in 1989 and the disintegration of the Soviet Union two years later substantially reduced the need for Beijing to accommodate Pyongyang’s preferences at the expense of the benefits that Deng saw in relations
with Seoul. Second, in 1991, South and North Korea separately and simultaneously joined the United
Nations as members, a position that Pyongyang had long opposed but one that paved the way for Beijing to recognize South Korea. Relatedly, the fact that there was only one China in the United Nations justified
Beijing’s insistence that Seoul should sever diplomatic relations with Taipei, especially in the face of
Taiwan’s diplomatic offensive at that time. Third, China’s trade dispute with the United States was
intensifying. On August 21st 1992, the Office of the U.S. Trade Representative determined that the United States would sanction $3.9 billion worth of Chinese exports over China’s restrictions of imports and unfair
trade practices unless an agreement was reached by October 10 of that year. China’s signing of the
normalization agreement with South Korea sent a signal to the United States that China had alternative trade options. After the diplomatic breakthrough in 1992, South Korea-China relations enjoyed a
honeymoon period during much of the 1990s, with bilateral economic interdependence and cultural ties
expanding and deepening dramatically. To this day, South Korean progressives and Chinese leaders tend to share the view that Pyongyang’s nuclear and missile development programs should be understood as
stemming from North Korea’s insecurity vis-à-vis the United States, thus requiring inter-Korean
engagement and dialogue. Under Kim Dae-Jung, South Korea pursued a dual engagement strategy towards
China and North Korea, holding the first ever inter-Korean summit in 2000; unlike Tokyo and Taipei, Seoul declined Washington’s request to join a Theatre Missile Defence (TMD) program. South Korea’s
1999 decision against joining the TMD and the tensions that arose between the Kim Dae-Jung
administration and the incoming Bush administration were precursors to the current situation on THAAD deployment in South Korea. Broadly speaking, these developments — a US missile defence designed to
deter North Korea, China’s negative view of TMD, and the dilemma of South Korean choices — explain
why it is very challenging for South Korea to have good relations with both the United States and China due in large part to structural reasons that concern North Korea. Similarly, the rocky relationship between
the Bush and Roh Moo-hyun administrations came down to the diverging views of Washington and Seoul
on the issue of North Korea. Chinese policymakers came to believe that the US-South Korea alliance was
undergoing a fundamental change and that South Korea would lean closer to China in the years ahead. To Beijing, President Roh Moo-hyun’s emphasis on independent diplomacy signalled that South Korea was
further loosening its ties with the United States. China regarded the Roh Moo-hyun administration’s
approach to northeast Asian security — especially its quest to play a role as a balancer and its emphasis on regional integration — as a sign that Seoul sought to weaken the US centred alliance system itself. Roh
Moo-hyun’s vision that “the map of power in northeast Asia could shift, depending on what choice we
(South Koreans) make” received much criticism from those who supported the US-South Korea alliance
both in Seoul and in Washington. However, the “balancer” argument grew out of Roh Moo-hyun’s desire for autonomy and regional leadership in northeast Asia, which emphasized South Korea’s central role
bridging between China and Japan. Meanwhile, China kept a close eye on how the US strategic flexibility
concept was applied to US forces in North Korea. China was interested in the future of US forces in the
International Journal of Advance and Innovative Research Volume 8, Issue 3 (IV) July - September 2021 Part - 2
223
ISSN 2394 - 7780
Korean peninsula and whether they could be deployed for broader regional and global missions beyond the
defence of the Korean peninsula. On the economic front, during 1999 and 2000, the so-called Garlic War
— China’s ban on the import of all South Korean mobile handsets and polyethylene over South Korea’s imposition of a 315-percent tariff on Chinese garlic following a surge in cheap imports — provided a
precursor to China’s use of economic retaliation over the 2016 decision to deploy THAAD in South
Korea. Overall, after two upgraded versions of their bilateral ties in 1998 and 2003 during this phase, it became clear that the terminologies of partnership would not necessarily reflect the realities of the bilateral
strategic ties. Most importantly, the 2004 dispute over the historiography of Koguryo (‘Gaogouli’ in
Chinese) — an ancient Korean kingdom that occupied Manchuria and the northern part of the Korean
peninsula from 37 BCE to 668 CE — was the first instance in which South Korea’s leaders and general public viewed China as a potential threat. The Chinese side claimed that Koguryo is part of Chinese
history, a change in the narrative from its earlier position. Given the symbolism of this ancient kingdom
for Korean national identity, this issue triggered an intensely negative reaction from South Koreans,
perhaps to China’s surprise.
2.3. Third Phase – Strategic Cooperative Partnership and Disappointments (2008-2013): In 2008, the
inauguration of President Lee Myung-bak brought conservatives back into office in South Korean politics; the new president declared the restoration of the US-South Korea alliance as his top foreign policy
priority. China became more eager to upgrade South Korea-China relations to counter the move towards
the strengthening of Seoul’s relations with Washington. The “Strategic Cooperative Partnership”
designation of their relationship raised their expectations towards each other, with Lee Myung-bak explaining the significance of this step as moving in the direction of expanding the areas of Seoul-Beijing
bilateral cooperation into the political and security domains. However, China was disappointed that Seoul
had emerged as the closest ally of the United States in east Asia, while the alliance was hailed as a “linchpin” of Asian security, a role that had traditionally been played by the US-Japan alliance. On the eve
of Lee Myung-bak’s meeting with Hu Jintao in May 2008, a Chinese Foreign Ministry spokesperson stated
that “the South Korean-US alliance is a historic relic. We should not approach current security issues with
military alliances left over from the past Cold War era”. This phase marked the first official occasion in which China openly expressed its unhappiness with South Korea’s alliance with Washington. Although
Chinese officials downplayed the remark while Seoul debated whether to issue a formal protest, the
episode reflected a growing unease in Beijing about the US-South Korea alliance. For Seoul, Beijing’s reserved responses to North Korea’s two major provocations in 2010 — the sinking of the ‘Cheonan’, a
South Korean Navy vessel, and the shelling of Yeonpyeong Island — went against expectations of
Chinese support for putting pressure on Pyongyang at the United Nations, stirring dissatisfaction and heated debate about China’s policy towards the two Koreas. South Korea-China relations deteriorated after
each North Korean provocation, revealing their differences over how to deal with North Korea, while the
Washington-Tokyo-Seoul tripartite security cooperation grew stronger as all the three countries
coordinated policy closely to deter North Korea. In the face of North Korea’s actions, which killed South Korean civilians as well as navy sailors, South Korean public support for the US-South Korea alliance rose
in rough proportion to the deepening mistrust of China. During this phase, in addition to the central role of
this alliance in defence and deterrence against North Korea, the idea that a strong US-Japan-South Korea alliance would enhance Seoul’s leverage in dealing with China gained currency. In the aftermath of the
‘Cheonan’ sinking and the shelling of Yeonpyeong Island, Japan was quick and firm in supporting South
Korea’s position along with the United States, which resulted in the strengthening of coordination among the three countries. Beijing’s reluctance to condemn North Korea’s actions can be explained by its policy
objective of maintaining stability in the Korean peninsula and concerns about the possibility of North
Korea’s collapse. In addition, North Korea held strategic value in China’s rivalry with the United States,
not unlike the dynamics during the Sino-Soviet rivalry. Throughout the 2000s, Chinese experts came to a stronger consensus that Washington’s true intention was to contain China to maintain American
hegemonic power. For the United States, the relative decline of US power vis-à-vis China after the 2008
global financial crisis made the strengthening of existing alliances in Asia, especially with Japan and South Korea, increasingly important to the long-time US strategic objective of preventing the rise of any other
hegemonic power. In contrast with its subdued responses to the sinking of the Cheonan and the shelling of
Yeonpyeong Island, China had a strong reaction to a planned US-South Korea naval exercise in the
Yellow Sea, motivated by the need to respond to perceptions of renewed US efforts at containment of
China.
International Journal of Advance and Innovative Research Volume 8, Issue 3 (IV) July - September 2021 Part - 2
224
ISSN 2394 - 7780
2.4. Fourth Phase – The Military Parade, THAAD, and the Three Nos (2013-2021): South Korea’s
response to the growing rivalry between Beijing and Washington has been “balanced diplomacy”, seeking
to pursue friendly relations with both Washington and Beijing. First, Moon Jae-in’s determined pursuit of inter-Korean relations is the hallmark of his administration’s foreign policy and holds the key to
understanding South Korea’s current positioning between Washington and Beijing. It is worth noting that
in 2015, as the chief of the opposition party, Moon Jae-in had recommended that President Park Geun-hye should attend China’s commemoration of the 70th anniversary of the end of World War II. The Trump
administration’s transactional approach towards US forces in Korean peninsula and the cost-sharing issue
were causing concerns among South Koreans about the state of the US-South Korea alliance. However,
after the 2017 tensions between the United States and North Korea, Trump’s willingness to meet with North Korean leader Kim Jong-un became a critical element that helped in accomplishing South Korea’s
policy objectives to counter North Korea. The Moon Jae-in and Trump administrations still were aligned
in their views on North Korea, compared with the dynamics between the Roh Moo-hyun and Bush administrations, arguably preventing a decisive move towards China by South Korea. Second, the
asymmetry in the level of economic dependence in the China-South Korea bilateral relationship creates
room for strategic vulnerability. The South Korean economy remains highly dependent on foreign trade, with exports and imports creating 63.7 percent of the total South Korean Gross Domestic Product (GDP).
In 2003, China replaced the United States as South Korea’s top trading partner; China’s share in terms of
overall South Korean exports rose from 7.0 percent in 1998 to 25.1 percent in 2019. South Korea’s share
in terms of overall Chinese exports was 3.5 percent in 1998, 3.6 percent in 2003, 5.2 percent in 2008, 4.1 percent in 2013, and 4.4 percent in 2019. In 2019, South Korea was China’s fourth-largest export market
and its largest import source, making it China’s third-largest trade partner. It seems that after the THAAD
experience, economic consideration and business sentiments within South Korea explain in part why Seoul chose not to openly join the US ban on Huawei. South Korea also has strong economic links with the
United States; in 2019, South Korea was the United States’ seventh-largest export market and its sixth-
largest import source, making it the United States’ sixth-largest trade partner overall. It remains to be seen
if China can continue to rely solely on economic means as leverage against South Korea. As Beijing has turned to coercive measures and economic retaliation, South Korean companies have adopted a
diversification strategy, turning their eyes to other Asian markets for investment, especially Vietnam and
India. Lotte Group, for example, lost $1.78 billion after it yielded its golf course site to host THAAD. Sales fell in its duty-free shops, its businesses were suspended, and its shopping mall construction projects
in China were cancelled. Lotte Mart finally had to sell all operations in China; it now has 46 stores in
Indonesia and 14 in Vietnam, as well as 123 in South Korea. China’s public diplomacy efforts towards winning the hearts and minds of South Koreans have not been successful; their views of China’s global
influence have deteriorated between 2004 to 2021. In 2021, eight out of ten South Korean respondents said
that Seoul-Beijing relations were bad, compared with only three out of ten just after Park Geun-Hye’s
attendance in the military parade in 2015. The image of South Korea in China has been similarly
negatively affected.
3. CONTRIBUTION OF THE GEOPOLITICS OF SOUTH KOREA-CHINA RELATIONS IN
CHANGING THE DYNAMICS OF US FOREIGN POLICY IN THE INDO-PACIFIC First, the more ambitious USA is seeking to change the status quo power balance in Asia, and the more
antagonistic Beijing-Washington relations have become more unfriendly on the topic of the Indo-Pacific. China
is likely to condition its policy towards South Korea on China’s Indo-Pacific goals vis-à-vis the United States. This is not to say that China’s policy towards South Korea is determined solely by US-China relations. Rather,
under circumstances of intense competition, China’s approach and calculations towards the Indo-Pacific and
the Korean peninsula — both South and North Korea — are likely to be largely a function of its policy towards
the United States. The relationship between China and the Korean peninsula is often likened to that between lips and teeth because the peninsula’s proximity could create a vulnerability for China vis-à-vis other great
powers. Since before the nineteenth century, Beijing has tended to have instrumental objectives towards the
Korean peninsula and the Indo-Pacific at times of competition for power in Asia. The two Koreas’ strategic importance to Beijing means that their values can fluctuate depending on the nature of China’s relations with
other great powers such as the United States of America.
Second, the recurring pattern in Seoul-Beijing relations of going downhill after each attempt for upgradation
explains why US efforts to persuade China to put pressure on North Korea are not likely to work. China’s North Korea policy has shown remarkable continuity, dating back to the years of the Cold War, and it is
unlikely to change without external shocks that fundamentally change China’s strategic calculations. Even
International Journal of Advance and Innovative Research Volume 8, Issue 3 (IV) July - September 2021 Part - 2
225
ISSN 2394 - 7780
when Chinese policymakers were looking to improve political relations with Seoul, they did not respond to
Seoul’s requests to exert pressure against North Korea. South Korea’s requests did not align with China’s
strategic calculation towards Pyongyang amid perceived threats from the US that contributed in strengthening of the alliance system in Asia. Generally speaking, as long as Beijing perceives its relations with the United
States as competitive, it will likely want to maintain its relationship with Pyongyang as a form of insurance —
first, to ensure stability in the Korean peninsula, and second, to have a voice and influence on matters on the Korean peninsula and the Indo-Pacific. It is for this reason that China has not renounced the 1961 alliance with
North Korea and has continued to provide aid to sustain the regime to this day.
During China and Korea’s long history as neighbours of asymmetric power until the nineteenth century, a state
of stability in bilateral relations was reached and maintained when China respected the autonomy of South Korea; diplomacy was a means to shape Korean behaviour so as to prevent Korea from making strategic
decisions that China believed were against its interests. During the Cold War, China’s signing of a military
treaty with North Korea in 1961 meant that Beijing had diplomatic leverage over North Korean behaviour through regularized interactions that fulfilled the requirements for reciprocal information sharing. Beijing’s
continued engagement with North Korea could be viewed as a form of insurance to keep its influence on
matters related to the Korean peninsula. Beijing’s desire to upgrade its relationship with Seoul in the political and strategic realms could also be understood as a way to have influence on South Korea. However, this
instrumental approach will ultimately limit USA’s ability to expand its influence over the Korean peninsula
because both Koreas clearly do not want to be treated as means to an end in great power politics. USA’s policy
of viewing North Korea as a buffer against China’s influence is likely to impede its long-term, broader goals of expanding its political and strategic influence over the entire Korean peninsula and the Indo-Pacific. Against
the backdrop of US-China competition, Beijing has begun to use its relationship with Seoul as a means for soft
balancing against the United States while still avoiding direct confrontation in the Indo-Pacific. If strategic confrontation with Washington further intensifies, Beijing will likely use its relationship with Seoul to
delegitimize US leadership and the US-led liberal international order. In the eyes of Beijing, South Korea, a key
ally of the United States, is of strategic value in the context of Sino-US rivalry, and also in the context of such
issues as the US Indo-Pacific concept, THAAD, Huawei, AIIB, and BRI. This has put South Korea in a position where the political significance of joining China-led international institutions and initiatives as a close
ally of the United States is not small. Similarly, Moon Jae-in’s acceptance of Trump’s invitation to the
proposed expanded G7 meeting is a reminder to Chinese policymakers that South Korea is a valued member of a US centred international order. Precisely because of the current context of rising confrontation between
Washington and Beijing, this gesture can be interpreted as carrying more political significance than usual. At
the time of writing, Seoul had joined the AIIB but not the BRI. The Moon Jae-in government has let individual
companies make their own decisions on whether to continue to do business with Huawei.
4. CONCLUSION Generally speaking, South Korean policymakers, especially the progressives who find more alignment of views
with regard to North Korea, will likely take an initiative towards tightening strategic ties with Beijing when at least two conditions are met. However, whether these conditions exist, it is important to keep in mind that
South Korean conception of autonomy is autonomy from great powers generally — including the United States
and China. One condition is a strong desire to pursue unification with North Korea. Although both the conservative and progressive governments in South Korea showed this pattern previously, it is worth noting
that generally speaking, Beijing’s North Korea policy resonates more with South Korean progressives’ agenda
for their emphasis on inter-Korean dialogue and engagement. It is no coincidence that China had a favourable view of South Korea-China relations under the progressive government of Roh Moo-hyun, during which US-
South Korea relations tended to experience strain over coordinating their North Korea policy. The second
consideration is that South Korea needs good Beijing-Washington relations to proceed with upgrading strategic
relations with Beijing. Generally, China’s views of the US-South Korea alliance tended to be less negative when US-China relations were more cooperative than conflicted, as in the 1970s, 1990s, and early 2000s. This
relative positivity creates more room for diplomacy between Beijing and Seoul. Park Geun-hye was able to
tighten ties with Beijing partly because South Korea’s alliance with the United States was on solid ground. From the perspective of South Korean national interest, strategic defence centres on its military alliance with
the United States, and thus, it is difficult to take any bold step towards tightening strategic and political
relations with Beijing when US-China relations are not good. The United States’ adversarial relationship with
China now puts South Korea in a position of having to make decisions among undesirable choices. Under the two conditions that exist at present – no major change in Beijing’s basic strategic calculations towards North
Korea and no improvement in the US-China strategic competition — South Korea-China relations would have

International Journal of Advance and Innovative Research Volume 8, Issue 3 (IV) July - September 2021 Part - 2
226
ISSN 2394 - 7780
difficulty in further improving strategic ties. Now and for the foreseeable future, China is not emerging as a
strategic alternative to the United States for South Korea; South Korea’s alliance with the United States is not
replaceable with a strategic partnership with China. Finally, the past 70 years of history show that South Korea’s desire to tighten strategic ties with China does not mean that Seoul is joining the Beijing bandwagon
on regional affairs. South Korean leaders showed more reservations when it came to responding to “Chinese
ways” of approaching regional affairs.
5. REFERENCES
Friedhoff, Karl. (2019), Cooperation and Hedging: Comparing US and South Korean Views of China,
Chicago Council on Global Affairs, Chicago Publishing House, pp. 10-13.
Goldstein, Avery. (2001), The Diplomatic Face of China’s Grand Strategy: A Rising Power’s Emerging
Choice, China Quarterly, No. 168, pp. 835-864.
Green, Michael. (2014), Korea in the Middle, Korea JoongAng Publishing House, pp. 21-24.
Hong, Liu. (1993), The Sino-South Korean Normalization: A Triangular Explanation, Asian Survey, Vol.
33, No. 11, pp. 1083-1094.
Scobell, Andrew. and Scott, W. Harold. (2013), An ‘Assertive’ China? Insights from Interviews, Asian
Security, Vol. 9, No. 2, pp. 111-131.
Shambaugh, David. (2005), China Engages Asia: Reshaping the Regional Order, Journal of International
Security, Vol. 29, No. 3, pp. 64-99.
Snyder, Scott. (2004), A Turning Point for China-Korea Relations: Comparative Connections, Chicago
Publishing House, Vol. 6, No. 3, pp. 109-116.
International Journal of Advance and Innovative Research Volume 8, Issue 3 (IV) July - September 2021 Part - 2
227
ISSN 2394 - 7780
THE EFFECT OF RELIGIOUSITY ON EMPLOYEE PERFORMANCE OF THE TANAOBA LAIS
MANEKAT FOUNDATION COOPERATIVE KUPANG
Yosua Alfred Adoe, Rolland E. Fanggidae* and Wehelmina M. Ndoen
Faculty of Economics and Business, Nusa Cendana University, Indonesia
ABSTRACT
Research Purposes: The purpose of this study was to describe the religiosity and performance of cooperative
employees at the Tanaoba Lais Manekat foundation and to find out whether religiosity had an effect on the
performance of cooperative employees at the Tanaoba Lais Manekat foundation.
Research Methodology: This study uses quantitative methods. Data processing was carried out using Simple
Linear Regression Analysis with 87 people as research samples.
Findings: Religiosity has a positive and significant effect on the performance of the employees of the Tanaoba
Lais Manekat Kupang Foundation Cooperative.
Limitation: Research variables are abstract so that the results may change at a later date.
Contribution: This research is the basis for the Tanaoba Lais Manekat Kupang Foundation Cooperative to
maintain and develop aspects of spirituality in the workplace.
Keywords: Religiosity, Employee Performance
FOREWORD
The human resource approach emphasizes the opinion that humans are the central point of all success in any business that will be carried out, so that human power, both in terms of thought, creativity and creativity, which
is a reflection of humans, must be endeavored and used as optimally as possible (Muslich, 2001). Human
resources are very important in an organization in achieving organizational goals so that organizational
activities can run well. Human Resources are one of the important driving factors (Fanggide, 2018).
Organizations need Human Resources who are willing to work hard, think creatively, and excel (Ivancevich,
Konopaske & Matteson 2011). For this reason, in order to improve the quality and quantity of human resources,
it is necessary to have a strategy from the organization. The strategy in improving the quality of human resources is an effort to improve company performance and individual performance (Choerudin, 2014).
Individual performance is closely related to work, while attitudes are related to individual performance abilities.
Organizations that are oriented to employee performance will pay attention to the role of employee work
attitudes.
Optimal employee performance can be realized with a motivational boost that can support the psychological
atmosphere of employees, because employees who are not productive at work are caused by problems in their
work motivation (Brahmasari and Suprayetno, 2008). Psychological factors that can increase employee work motivation through the religious approach or employee religiosity. This is because every religion will teach
goodness to its adherents, so religion has a role as a system that provides norms or rules that can be used as a
reference or filter for someone in carrying out all their activities including work activities.
Ancok and Suroso (2001) define religiosity as religiosity which means covering various aspects or dimensions
that not only occur when a person performs ritual behavior (worship), but also when carrying out other
activities driven by supernatural powers. From this religiosity, it is highly expected that individuals who are productive and have a mental attitude that is mahardika, good and tough and are able to increase high self-
efficacy in life, can be useful for their social environment, especially in the industrial and organizational world.
Productive individuals are individuals who are confident in their abilities, which in psychological terms are
often referred to as people who have high self-confidence, self-esteem, and self-concept (Sedarmayanti, 2009).
Religiosity can affect a person's performance, such as research on management and problems regarding human
resources proposed by Hidayat in Yusuf (2015) that employee performance is related to the background of the
employee's attitude to life, which is shaped by his religious atmosphere. Religiosity is one of the factors that affect one's performance, so a leader must be able to pay attention to one's religious activities. With religiosity,
someone who is religious should always try to do his best and not violate the rules in behaving and behaving in
every activity, namely in accordance with the norms and rules that have been regulated in his religion
(Amaliah, 2015).
International Journal of Advance and Innovative Research Volume 8, Issue 3 (IV) July - September 2021 Part - 2
228
ISSN 2394 - 7780
In the context of work attitudes, it is very important for employees to have religiosity, because if employees
have a higher level of religiosity, then employee motivation to produce good performance or performance will
also be higher (Sulistyo, 2011). Thus, based on several previous studies that have been carried out, it shows that
the presence of religiosity factors can enable the realization of optimal performance.
The research was conducted at the Tanaoba Lais Manekat Foundation (TLM), which is engaged in two fields of
work, namely Rural Credit Banks and Cooperatives; this research focuses on measuring employee performance. As a Yayayan whose ownership is based on one of the religions, it is hoped that the religious
activities carried out will give its own color to the 450 employees it has. Based on the description above,
researchers are interested in analyzing the phenomena that exist in the Tanaoba Lais Manekat Foundation with
the title "The Effect of Religiosity on the Performance of Employees of the Tanaoba Lais Manekat Foundation
Cooperative Kupang".
LITERATURE REVIEW
Religious Concept According to Gazalba (in Ghufron, 2012) religiosity comes from the word religion in Latin "religio" whose root
word is religure, which means binding. Religiosity is a person's attitude that is shown in all aspects of life based
on what is thought, felt, and believed through the teachings of the religion adopted (Glock and Stark, 1966). Fetzer (1999) also defines religiosity as something that focuses more on behavioral, social issues, and is a
doctrine of every religion or class. Every follower must follow the doctrines of every religion.
Performance
According to Wibowo (2007:7) Performance comes from the notion of performance. There are also those who provide an understanding of performance as the result of work or work performance. Bacal's opinion
(2011:162) which states that performance is a work achieved by a person in carrying out the tasks assigned to
him based on skills, experience and sincerity of time.
Framework of Thinking
Research Hypothesis
Ha: There is a significant influence of religiosity on the performance of cooperative employees at the
Tanaoba Lais Manekat Foundation, Kupang
H0: There is no significant effect of religiosity on the performance of cooperative employees at the
Tanaoba Lais Manekat Foundation, Kupang.
RESEARCH METHODOLOGY
This research was conducted to determine whether there is an influence between religiosity on employee performance with a quantitative approach. This type of research uses a survey method, namely research that
takes respondents from the entire population in the object under study, which is 87 respondents and uses
questionnaires as a means of collecting basic data. The object as the location of this research is the Tanaoba Lais Manekat Kupang foundation, which is located at Jalan Ahmad Yani No. 43, Oeba Exit, Kota Lama
District, Kupang City, East Nusa Tenggara.
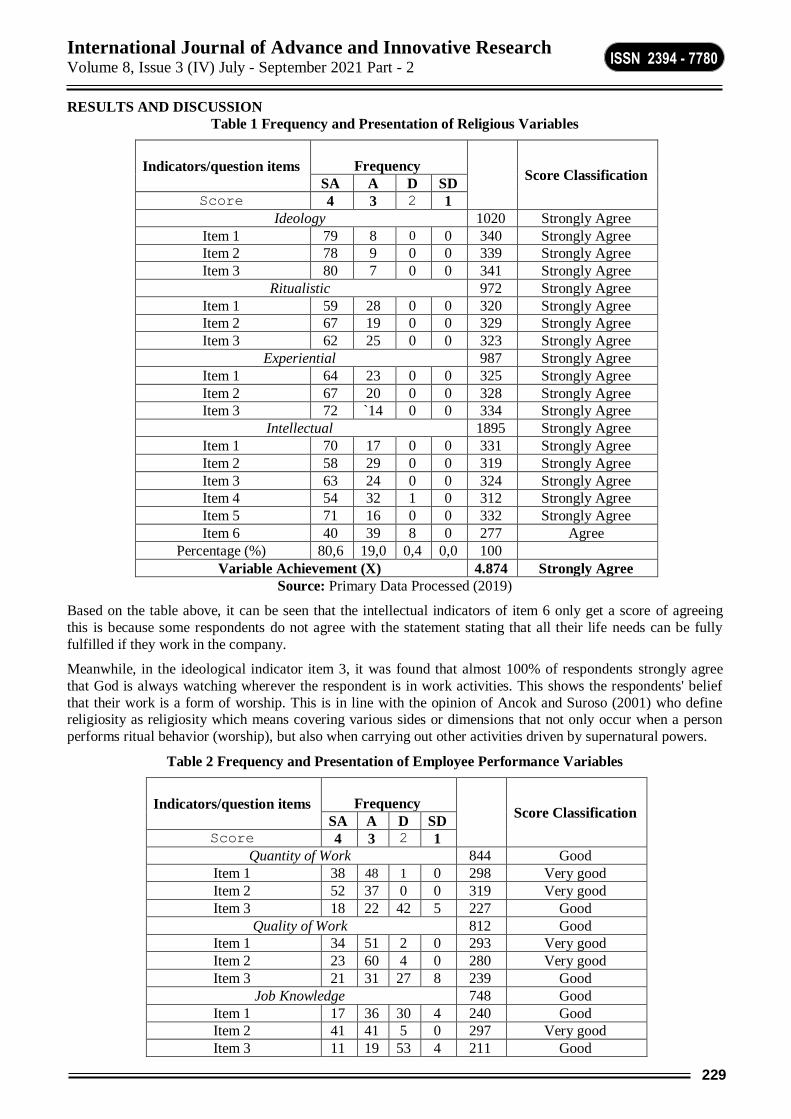
International Journal of Advance and Innovative Research Volume 8, Issue 3 (IV) July - September 2021 Part - 2
229
ISSN 2394 - 7780
RESULTS AND DISCUSSION
Table 1 Frequency and Presentation of Religious Variables
Indicators/question items
Frequency Score Classification
SA A D SD
Score 4 3 2 1
Ideology 1020 Strongly Agree
Item 1 79 8 0 0 340 Strongly Agree
Item 2 78 9 0 0 339 Strongly Agree
Item 3 80 7 0 0 341 Strongly Agree
Ritualistic 972 Strongly Agree
Item 1 59 28 0 0 320 Strongly Agree
Item 2 67 19 0 0 329 Strongly Agree
Item 3 62 25 0 0 323 Strongly Agree
Experiential 987 Strongly Agree
Item 1 64 23 0 0 325 Strongly Agree
Item 2 67 20 0 0 328 Strongly Agree
Item 3 72 `14 0 0 334 Strongly Agree
Intellectual 1895 Strongly Agree
Item 1 70 17 0 0 331 Strongly Agree
Item 2 58 29 0 0 319 Strongly Agree
Item 3 63 24 0 0 324 Strongly Agree
Item 4 54 32 1 0 312 Strongly Agree
Item 5 71 16 0 0 332 Strongly Agree
Item 6 40 39 8 0 277 Agree
Percentage (%) 80,6 19,0 0,4 0,0 100
Variable Achievement (X) 4.874 Strongly Agree
Source: Primary Data Processed (2019)
Based on the table above, it can be seen that the intellectual indicators of item 6 only get a score of agreeing
this is because some respondents do not agree with the statement stating that all their life needs can be fully
fulfilled if they work in the company.
Meanwhile, in the ideological indicator item 3, it was found that almost 100% of respondents strongly agree
that God is always watching wherever the respondent is in work activities. This shows the respondents' belief
that their work is a form of worship. This is in line with the opinion of Ancok and Suroso (2001) who define religiosity as religiosity which means covering various sides or dimensions that not only occur when a person
performs ritual behavior (worship), but also when carrying out other activities driven by supernatural powers.
Table 2 Frequency and Presentation of Employee Performance Variables
Indicators/question items
Frequency Score Classification
SA A D SD Score 4 3 2 1
Quantity of Work 844 Good
Item 1 38 48 1 0 298 Very good
Item 2 52 37 0 0 319 Very good
Item 3 18 22 42 5 227 Good
Quality of Work 812 Good
Item 1 34 51 2 0 293 Very good
Item 2 23 60 4 0 280 Very good
Item 3 21 31 27 8 239 Good
Job Knowledge 748 Good
Item 1 17 36 30 4 240 Good
Item 2 41 41 5 0 297 Very good
Item 3 11 19 53 4 211 Good
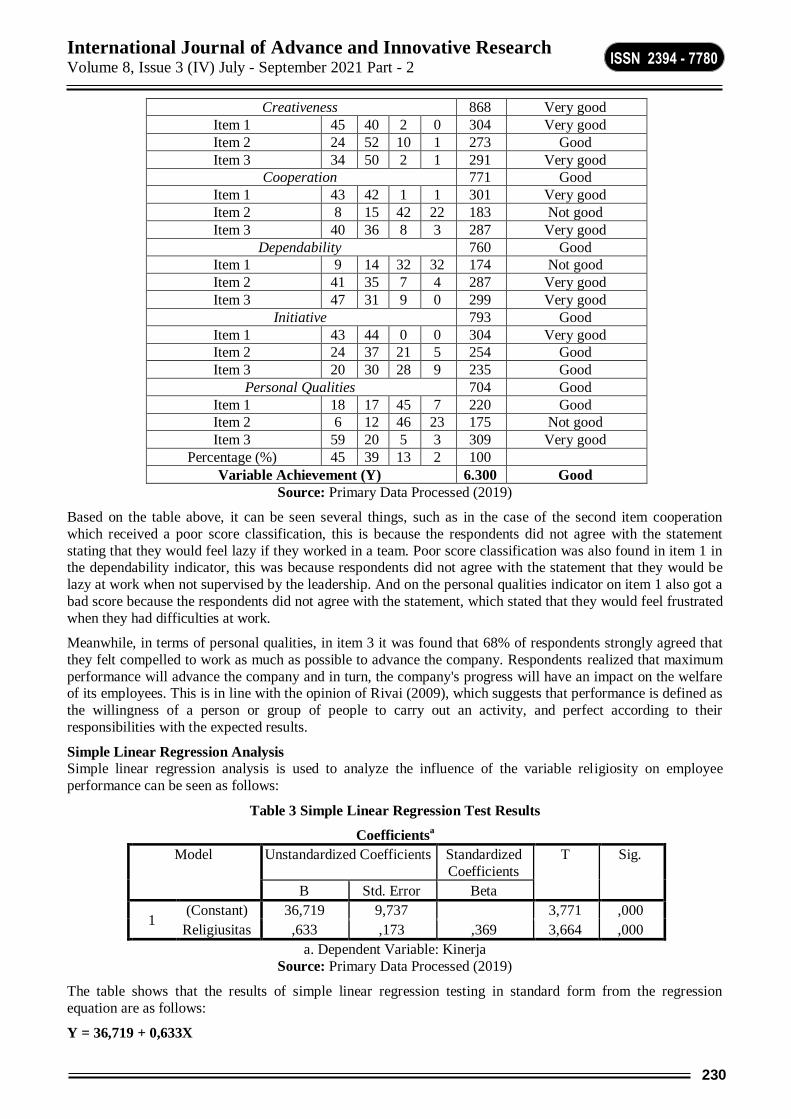
International Journal of Advance and Innovative Research Volume 8, Issue 3 (IV) July - September 2021 Part - 2
230
ISSN 2394 - 7780
Creativeness 868 Very good
Item 1 45 40 2 0 304 Very good
Item 2 24 52 10 1 273 Good
Item 3 34 50 2 1 291 Very good
Cooperation 771 Good
Item 1 43 42 1 1 301 Very good
Item 2 8 15 42 22 183 Not good
Item 3 40 36 8 3 287 Very good
Dependability 760 Good
Item 1 9 14 32 32 174 Not good
Item 2 41 35 7 4 287 Very good
Item 3 47 31 9 0 299 Very good
Initiative 793 Good
Item 1 43 44 0 0 304 Very good
Item 2 24 37 21 5 254 Good
Item 3 20 30 28 9 235 Good
Personal Qualities 704 Good
Item 1 18 17 45 7 220 Good
Item 2 6 12 46 23 175 Not good
Item 3 59 20 5 3 309 Very good
Percentage (%) 45 39 13 2 100
Variable Achievement (Y) 6.300 Good
Source: Primary Data Processed (2019)
Based on the table above, it can be seen several things, such as in the case of the second item cooperation
which received a poor score classification, this is because the respondents did not agree with the statement
stating that they would feel lazy if they worked in a team. Poor score classification was also found in item 1 in the dependability indicator, this was because respondents did not agree with the statement that they would be
lazy at work when not supervised by the leadership. And on the personal qualities indicator on item 1 also got a
bad score because the respondents did not agree with the statement, which stated that they would feel frustrated
when they had difficulties at work.
Meanwhile, in terms of personal qualities, in item 3 it was found that 68% of respondents strongly agreed that
they felt compelled to work as much as possible to advance the company. Respondents realized that maximum
performance will advance the company and in turn, the company's progress will have an impact on the welfare of its employees. This is in line with the opinion of Rivai (2009), which suggests that performance is defined as
the willingness of a person or group of people to carry out an activity, and perfect according to their
responsibilities with the expected results.
Simple Linear Regression Analysis
Simple linear regression analysis is used to analyze the influence of the variable religiosity on employee
performance can be seen as follows:
Table 3 Simple Linear Regression Test Results
Coefficientsa
Model Unstandardized Coefficients Standardized
Coefficients
T Sig.
B Std. Error Beta
1 (Constant) 36,719 9,737 3,771 ,000
Religiusitas ,633 ,173 ,369 3,664 ,000
a. Dependent Variable: Kinerja
Source: Primary Data Processed (2019)
The table shows that the results of simple linear regression testing in standard form from the regression
equation are as follows:
Y = 36,719 + 0,633X

International Journal of Advance and Innovative Research Volume 8, Issue 3 (IV) July - September 2021 Part - 2
231
ISSN 2394 - 7780
The regression equation above can be explained as follows:
1. The constant (α) is 36,719, which means that if the value of the Religiosity variable is equal to zero, then
the level or magnitude of the Employee Performance variable will be 36,719.
2. The regression coefficient (b) of the Religiosity variable is positive with a value of 0.633, meaning that if
the Religiosity variable is increased by 1 unit, the value of the Employee Performance variable will
increase by 0.633. The positive sign indicates that the movement of the values of the Religiosity and Employee Performance variables is unidirectional, so the higher the religiosity in the company, the higher
the employee performance.
Coefficient of Determination R2
The coefficient of determination (R2) essentially measures how much the ability of the Religiosity variable to
explain variations in employee performance variables can be seen as follows:
Model Summaryb
The table shows that the R Square value is 0.136, which means that the religiosity variable affects the employee
performance variable by 13.6%, and the remaining 86.4% can be explained by other factors not disclosed in
this study.
Hypothesis Test The results of the t-test indicate that the calculated t-value for the religiosity variable is 3.664 while the t-table
value is 1.988 (df = 87-2 = 85) besides the significant value is 0.000, which is smaller than Alpha (α) 0.05.
Because the values of t count > t table (3.664 > 1.988) and the value are significantly smaller than Alpha (α) 0.05 or (0.000 <0.05), the hypothesis is accepted, meaning that religiosity has a positive and significant effect
on the performance of the Kupang TLM Cooperative employees.
CONCLUSION
Based on the description of the research results above, some conclusions can be drawn as follows:
1. The level of religiosity of cooperative employees at the Tanaoba Lais Manekat Kupang Foundation, based
on four indicators, namely Ideology, Ritualism, Experiential and Intellectual is in the classification of
scores strongly agree, while employee performance is based on eight indicators, namely: Quantity of work, Quality of work, Job Knowledge, Creativenes, Coorporation, Dependability, Initiative, and Personal
Quality as a whole are in the classification of good scores.
2. The results of statistical tests show that religiosity affects the performance of cooperative employees at the
Tanaoba Lais Manekat Foundation, Kupang
REFERENCE
Alfisyah, K. D., dan Anwar, M. K. 2018. Pengaruh Religiusitas Terhadap Kinerja Karyawan Muslim
Kantor Pusat PT. Perkebunan Nusantara XI. Jurnal Ekonomi Islam. Fakultas Ekonomi. Universitas
Negeri Surabaya.
Amirullah, Widayat. 2002. Metode Penelitian Pemasaran. Malang : CV. Cahaya Press.
Ancok dan Suroso. 2001.Psikologi Islami. Yogyakarta : Pustaka Pelajar
Arikunto, Suharsimi. 1992. Prosedur Penelitian Suatu Pendekatan Praktik. Jakarta: PT Rineka Cipta.
Arwani, Agus. 2013. Peran Spiritualitas dan Religiusitas Bagi Guru Dalam Lembaga Pendidikan. Jurnal
Forum Tarbiyah Vol. 11. No. 1, Juni 2013.
Bacal, Robert. 2011. Performance Management. Terjemahan Surya Dharma dan Yanuar Irawan, Gramedia
Pustaka Jakarta
Brahmasari dan Suprayetno, 2008. Pengaruh Motivasi Kerja, Kepemimpinan, dan Budaya Organisasi
Terhadap Kepuasan Kerja Karyawan serta Dampaknya pada Kinerja Perusahaan (Studi kasus pada PT.
Model R R Square Adjusted R Square Std. Error of the Estimate
1 ,369a ,136 ,126 6,798
a. Predictors: (Constant), Religiusitas
Source: Primary Data Processed (2019)
International Journal of Advance and Innovative Research Volume 8, Issue 3 (IV) July - September 2021 Part - 2
232
ISSN 2394 - 7780
Pei Hei International Wiratama Indonesia). Jurnal Manajemen dan Kewirausahaan. Vol. 10, September:
124-135.
Fanggidae, Rolland Epafras. "Organizational culture and spirituality workplace: Empirical study of
influence of organizational culture and spirituality workplace." E3S Web of Conferences. Vol. 73. EDP
Sciences, 2018.
Fetzer Institute. 1999. Multidimensional Measurement of Religiousness/ Spiritual for use in Health
Research.
Gibson dan Handayani. 2010.Organisasi, Perilaku, Struktur dan Proses. Jakarta: Gramedia.
Glock, C. & Stark, R. 1966. Religion and Society In Tension. Chicago: University of California.
Hasan, Iqbal. 2001. Pokok-Pokok Materi Statistik 2 (Statistik Inferentif). Edisi kedua. Jakarta: PT Bumi
Aksara
Holdcroft, B. B. 2006. What is Religiosity. Journal of Catholic Education 10 (1): 89-103.
Jupri. 2015. Etos Kerja dan Religiusitas Sopir Angkutan (Studi di Kabupaten Bulukumba). Jurnal
Sosiologi. Fakultas Ushuluddin Filsafat dan Politik Agama. Makassar: UIN Alauddin.
Mangkunegara. 2005. Manajemen Sumber Daya Manusia. Bandung: PT. Remaja Rosdakarya.
Mangunwijaya, Y.B. 1982. Sastra dan Religiositas. Jakarta: Sinar Harapan.
Mohammad Muslich. 2000. Manajemen Keuangan Modern. Jakarta : Penerbit Bina Rupa Aksara.
Nasir, Azwir, dkk. 2014. Pengaruh Karakteristik Perusahaan dan Corporate Governance terhadap
Pengungkapan Sustainability Report Pada Perusahaan LQ45 yang Terdaftar. Fakultas Ekonomi
Universitas Riau.
Nurdaya, Adi Darma. 2018. Pengaruh Religiusitas dan Spiritualitas Terhadap Kinerja Karyawan (Studi
pada Goro Assalam Hypermart di Surakarta. Universitas Muhammadiyah Surakarta.
Pratama, A. A. Nugraha. 2014. Pengaruh Spiritualitas, Intelektualitas dan Profesionalisme Terhadap
Kinerja Dosen STAIN Salatiga. STAIN Salatiga.
Sedarmayanti.2009. Sumber Daya Manusia dan Produktivitas Kerja. Bandung: CV Mandar Maju.
Sugiyono. 2014. Metode Penelitian Pendidikan Pendekatan Kuantitatif, Kualitatif, dan R&D. Bandung:
Alfabeta.
Wibowo. 2007. Manajemen Kinerja. Jakarta: PT. Raja Grafindo Parsada.
Yusuf, Burhanuddin. 2015. Manajemen Sumber Daya Manusia di Lembaga Keuangan Syariah. Jakarta:
PT. Raja Grafindo Persada.
Yusuf, Himyari. 2010. Dimensi Aksiologis Filsafat Hidup Piil Pesenggiri dan Relevansinya Terhadap
Pengembangan Kebudayaan Daerah Lampung. Jurnal Filsafat. IAIN Raden Intan Lampu
International Journal of Advance and Innovative Research Volume 8, Issue 3 (IV) July - September 2021 Part - 2
233
ISSN 2394 - 7780
THE EFFICACY OF NATUROPATHY AND CHEST PHYSIOTHERAPY TO IMPROVE OXYGEN
SATURATION, LUNG CAPACITIES AND HEALTH STATUS IN COVID19 PATIENTS
Dr. S. Senthil Kumar1, Dr. S. Banumathy BNYS
2 and S. Shalini
3
Professor1, Yoga & Naturopathy Specialist2 and Staff Nurse3, Shri Indra Ganesan Institute of Medical science
College of Nursing, Trichirappalli
ABSTRACT
BACKGROUND: COVID-19, an ongoing pandemic of respiratory disease, is the latest menace to global health. Severe Acute Respiratory Syndrome leading to serious public health risk. The continuum of severity of
the disease varies from subclinical illness, upper respiratory tract disease, serious breathing failure, viral
pneumonia, and/or death.
OBJECTIVE OF THE STUDY: To determine to prove the effectiveness of naturopathy with chest physiotherapy
to improve the oxygen saturation, lung capacities and health status in covid 19.
OUTCOME MEASURES: Spirometer, pulse oximeter, Post Covid 19 functional status scale.
METHODOLOGY:
PROCEDURE: A convenience samples of ten Covid 19 positive subjects were solicited from the Indraganesan
institute of medical science, covid care centre, Manikandam, Thiruchirappalli. A symptomatic RT PCR
Positive, with oxygen saturation 94% , CT scan Score 12 or moderate patients were taken from this study. The covid 19 patients demographic profile, detailed medical history was collected and naturopathy with chest
physiotherapy given to the patients from day 1 to continuously 10 days.
RESULTS: The data was obtained tabulated and statistically analyzed.Pre and post intervention, parametric
statistical tests, dependent t sample test and un paired t test were used. The two-tailed P value is less than 0.0001 by conventional criteria; this difference is considered to be extremely statistically significant from the
first day and compared to 10th day.
CONCLUSION: The Naturopathy specialist and Physical therapist plays an extensive role and providing Naturopathy treatments and chest physiotherapy interventions to COVID-19 patients was to improve oxygen
saturation, lung capacities, breathing pattern, Health status and alter the normal way of living.
KEY WORDS: Covid19, Naturopathy, chest Physiotherapy.
INTRODUCTION: COVID-19, an ongoing pandemic of respiratory disease, Caused by a corona virus latest menace to global
health ever since its outbreak in December 2019 in Wuhan, China. It has generated a major distress due to the
high percentage of death it has caused globally and non-availability of valid treatment till date. This explains
that the new virus COVID-19 is extremely contagious crossing specific barriers and causing illness in human ranging from common cold, mimicking flu to severe disease patterns such as Middle East Respiratory
Syndrome and Severe Acute Respiratory Syndrome leading to serious public health risk. The continuum of
severity of the disease varies from subclinical illness, upper respiratory tract disease, serious breathing failure, viral pneumonia, and/or death. Existing studies suggest that 80% of cases are asymptomatic; 15% serious
(oxygen-requiring illness); and 5% cases are crucial who require ventilator support system.
Globally, It has been anticipated that Naturopathy and physical therapy could be beneficial in respiratory problems and physical rehabilitation in patients with COVID-19 having profuse secretions that are difficult to
clear independently by the patient. Techniques such as airway clearance and positioning may assist the
ventilated patient in maintaining bronchial hygiene prone, positioning could help acute respiratory distress
syndrome (ARDS) patients improve ventilation. Since the prevalence of ARDS in COVID patients is 17%, it can be considered as a treatment option to decrease mortality in patients with impaired oxygenation in the
initial hours of disease. It also helps in recruiting the dorsal lung regions and thereby increasing end expiratory
lung volume, increasing the chest wall elastic, decreasing alveolar shunt, and also improving tidal volume. It has been reported that COVID-19 patients on prolonged ventilator support, sedatives, neurogenic inhibitors,
analgesics, and antibiotics are susceptible to develop ICU-acquired illness that may worsen the morbidity and
mortality. In order to avoid this, it is important to anticipate early rehabilitation of patients with respiratory disease to avoid ICU-induced weakness and enhance early recovery2. The naturopathy specialists, Physical
therapist plays an extensive role in providing natural foods, steamer, sunbath, and exercise therapy,

International Journal of Advance and Innovative Research Volume 8, Issue 3 (IV) July - September 2021 Part - 2
234
ISSN 2394 - 7780
mobilization, and rehabilitation interventions to COVID-19 survivors in order to enable functional
recovery. This advocates that Naturopathy and physical therapy is significant in early recovery of COVID
patients2.
OBJECTIVE OF THE STUDY:
1. To prove effect of naturopathy with chest physiotherapy to improve oxygen saturation in patients with
covid19.
2. The effect of naturopathy and chest physiotherapy to improve lung capacities in covid19 patients.
3. The effect of naturopathy and chest physiotherapy to improve health status among covid19 patients.
METHODLOGY:
A convenient samples of 10 covid19 subjects were the age group between 18 to 65 years taken from this study, The samples were solicited from the Indra Ganesan institute of Medical science Yoga and Naturopathy Covid
care Centre, Manikandam, Trichy. The samples was collected from the following selection of criteria.
INCLUSION CRITERIA:
1. A Symptomatic covid19 patients
2. O2 saturation above 93%
3. FEV1/FVC above 80%
4. Mild symptoms of covid19
5. CT scan score 5 – 12
6. Mild or Moderate lung involvement
7. Co-Rades 4-9
8. RT PCR SARS Covid19 positive.
EXCLUSION CRITERIA:
1. Severe lung involvement
2. Oxygen saturation level below 90%
3. Co-Rades above 12
4. RT PCR test negative
5. 02 bed supported patients
6. Severe renal failure
7. Severe co morbidities
8. Chronic ill patients
9. Symptomatic covid19
10. Symptomatic in steroid
11. Symptomatic in Heparin
PROCEDURE:
A symptomatic RT PCR Positive, with oxygen saturation 94% , CT scan Score 12 or moderate patients were
taken from this study. The covid 19 patients demographic profile, detailed medical history was collected and
naturopathy with chest physiotherapy given to the patients from day 1 to continuously 10 days.
Following Treatment protocols given to the patients.
Table .1 Naturopathy and yoga:
s.no Treatment Duration Time
1. Salt water gargling 2min 6am
2. Asanas :pranayama,mudra 30min 6.15am
3. Neem ball 7am
4. Kapasara kudineer 7.15am
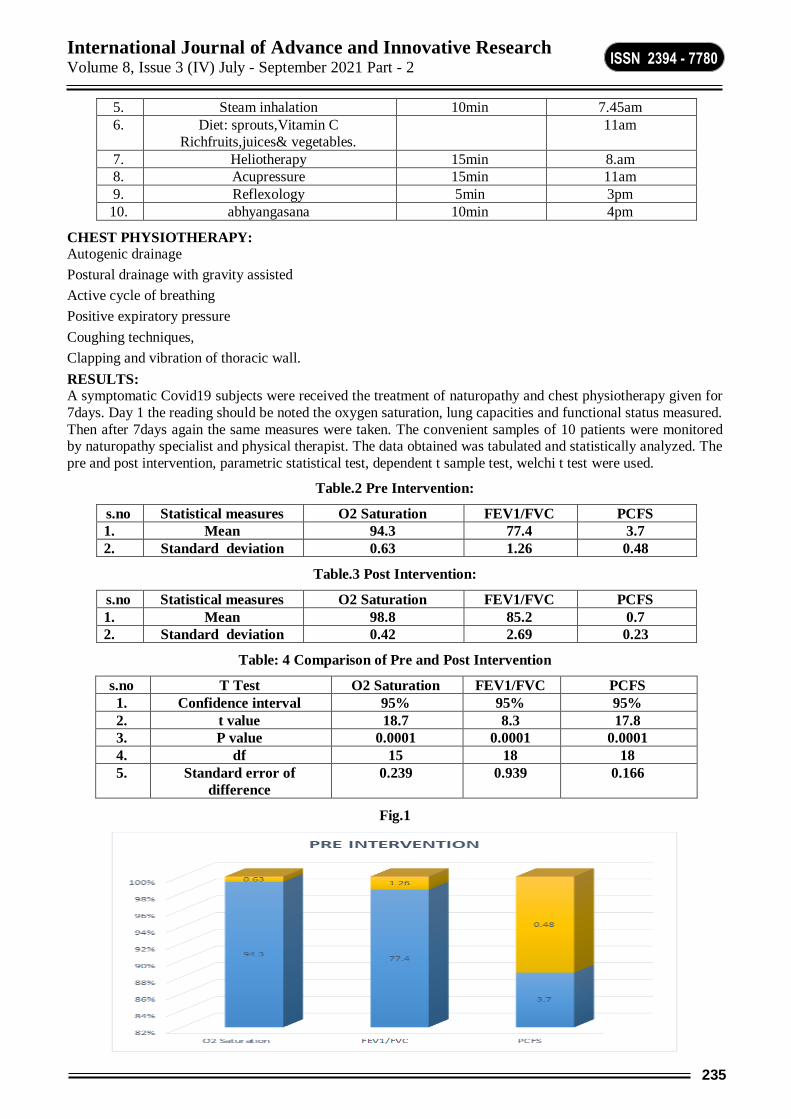
International Journal of Advance and Innovative Research Volume 8, Issue 3 (IV) July - September 2021 Part - 2
235
ISSN 2394 - 7780
5. Steam inhalation 10min 7.45am
6. Diet: sprouts,Vitamin C
Richfruits,juices& vegetables.
11am
7. Heliotherapy 15min 8.am
8. Acupressure 15min 11am
9. Reflexology 5min 3pm
10. abhyangasana 10min 4pm
CHEST PHYSIOTHERAPY: Autogenic drainage
Postural drainage with gravity assisted
Active cycle of breathing
Positive expiratory pressure
Coughing techniques,
Clapping and vibration of thoracic wall.
RESULTS: A symptomatic Covid19 subjects were received the treatment of naturopathy and chest physiotherapy given for
7days. Day 1 the reading should be noted the oxygen saturation, lung capacities and functional status measured.
Then after 7days again the same measures were taken. The convenient samples of 10 patients were monitored by naturopathy specialist and physical therapist. The data obtained was tabulated and statistically analyzed. The
pre and post intervention, parametric statistical test, dependent t sample test, welchi t test were used.
Table.2 Pre Intervention:
s.no Statistical measures O2 Saturation FEV1/FVC PCFS
1. Mean 94.3 77.4 3.7
2. Standard deviation 0.63 1.26 0.48
Table.3 Post Intervention:
s.no Statistical measures O2 Saturation FEV1/FVC PCFS
1. Mean 98.8 85.2 0.7
2. Standard deviation 0.42 2.69 0.23
Table: 4 Comparison of Pre and Post Intervention
s.no T Test O2 Saturation FEV1/FVC PCFS
1. Confidence interval 95% 95% 95%
2. t value 18.7 8.3 17.8
3. P value 0.0001 0.0001 0.0001
4. df 15 18 18
5. Standard error of
difference
0.239 0.939 0.166
Fig.1
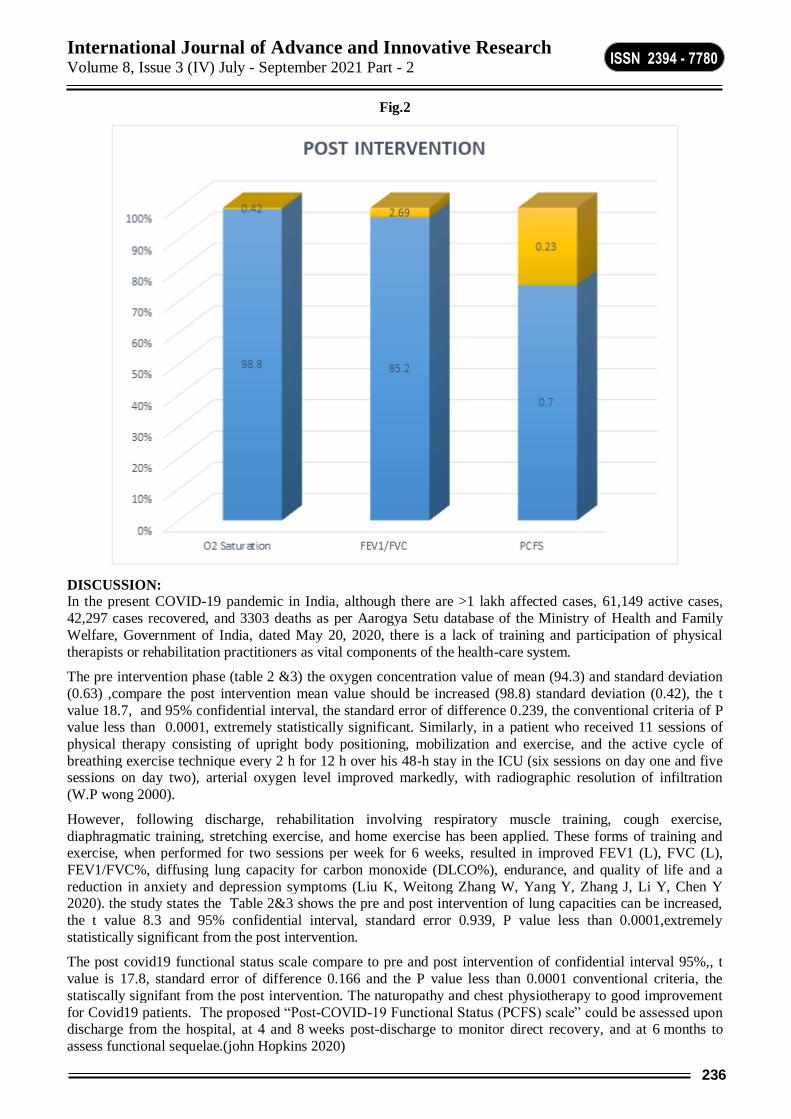
International Journal of Advance and Innovative Research Volume 8, Issue 3 (IV) July - September 2021 Part - 2
236
ISSN 2394 - 7780
Fig.2
DISCUSSION: In the present COVID-19 pandemic in India, although there are >1 lakh affected cases, 61,149 active cases,
42,297 cases recovered, and 3303 deaths as per Aarogya Setu database of the Ministry of Health and Family
Welfare, Government of India, dated May 20, 2020, there is a lack of training and participation of physical
therapists or rehabilitation practitioners as vital components of the health-care system.
The pre intervention phase (table 2 &3) the oxygen concentration value of mean (94.3) and standard deviation
(0.63) ,compare the post intervention mean value should be increased (98.8) standard deviation (0.42), the t
value 18.7, and 95% confidential interval, the standard error of difference 0.239, the conventional criteria of P value less than 0.0001, extremely statistically significant. Similarly, in a patient who received 11 sessions of
physical therapy consisting of upright body positioning, mobilization and exercise, and the active cycle of
breathing exercise technique every 2 h for 12 h over his 48-h stay in the ICU (six sessions on day one and five sessions on day two), arterial oxygen level improved markedly, with radiographic resolution of infiltration
(W.P wong 2000).
However, following discharge, rehabilitation involving respiratory muscle training, cough exercise,
diaphragmatic training, stretching exercise, and home exercise has been applied. These forms of training and exercise, when performed for two sessions per week for 6 weeks, resulted in improved FEV1 (L), FVC (L),
FEV1/FVC%, diffusing lung capacity for carbon monoxide (DLCO%), endurance, and quality of life and a
reduction in anxiety and depression symptoms (Liu K, Weitong Zhang W, Yang Y, Zhang J, Li Y, Chen Y 2020). the study states the Table 2&3 shows the pre and post intervention of lung capacities can be increased,
the t value 8.3 and 95% confidential interval, standard error 0.939, P value less than 0.0001,extremely
statistically significant from the post intervention.
The post covid19 functional status scale compare to pre and post intervention of confidential interval 95%,, t
value is 17.8, standard error of difference 0.166 and the P value less than 0.0001 conventional criteria, the
statiscally signifant from the post intervention. The naturopathy and chest physiotherapy to good improvement
for Covid19 patients. The proposed “Post-COVID-19 Functional Status (PCFS) scale” could be assessed upon discharge from the hospital, at 4 and 8 weeks post-discharge to monitor direct recovery, and at 6 months to
assess functional sequelae.(john Hopkins 2020)
International Journal of Advance and Innovative Research Volume 8, Issue 3 (IV) July - September 2021 Part - 2
237
ISSN 2394 - 7780
CONCLUSION:
The naturopathy and Chest physiotherapy may improve respiratory functions and quality of life in patients with
COVID-19, especially after discharge. During the acute stage, evidence is still lacking on its usefulness, aside from some professional recommendations based on anecdotal evidence. However, it should be noted that
naturopathy and chest physiotherapy is an individualized treatment based on the patient's particular
presentations. Therefore, when patients present with symptoms that can benefit from naturopathy and chest
physiotherapy, it may be given while the patients are closely observed for any adverse events.
ACKNOWLEDGEMENT:
This study was start up at our centre at June 1st 2021, great care will be taken and to fully explain the study to
the patients before informed consent.Our sincere thanks to our secretary and Director of Indra Ganesan Group
of institutions and support and care from Viswa Hindu Seva Sameethi.
REFERENCES:
1. Sun P, Lu X, Xu C, Sun W, Pan B. Understanding of COVID-19 based on current evidence. J Med
Virol. (2020) 92:1–4. doi: 10.1002/jmv.25722
2. Zhao Y, Zhao Z, Wang Y, Zhou Y, Ma Y, Zuo W. Single-cell RNA expression profiling of ACE2, the
putative receptor of Wuhan 2019-nCov. bioRxiv. (2020). doi: 10.1101/2020.01.26.919985
3. Castranova V, Rabovsky J, Tucker JH, Miles PR. The alveolar type II epithelial cell: a multifunctional
pneumocyte. Toxicol Appl Pharmacol. (1988) 93:472–83. doi: 10.1016/0041-008x(88)90051-8
4. Huang C, Wang Y, Li X, Ren L, Zhao J, Hu Y, et al. Clinical features of patients infected with 2019 novel
coronavirus in Wuhan, China. Lancet. (2020) 395:497–506. doi: 10.1016/S0140-6736(20)30183-5
5. Ahmed A, Shah RJ, Gul Rahim SEG, Flores M, O'Linn A. Coronavirus Disease 2019 (COVID-19)
Complicated by Acute Respiratory Distress syndrome: an internist's perspective. Cureus. (2020) 12:e7482.
doi: 10.7759/cureus.7482
6. Yang L-L, Yang T. Pulmonary rehabilitation for patients with coronavirus disease 2019 (COVID-
19). Chronic Dis Transl Med. (2020) 6:79–86. doi: 10.1016/j.cdtm.2020.05.002
7. Chen N, Zhou M, Dong X, Qu J, Gong F, Han Y, et al. Epidemiological and clinical characteristics of 99
cases of 2019 novel coronavirus pneumonia in Wuhan, China: a descriptive study. Lancet. (2020)
395:507–13. doi: 10.1016/S0140-6736(20)30211-7
8. Guan WJ, Zhong NS. Clinical characteristics of COVID- 19 in China. N Engl J Med. (2020) 382:1859–62.
doi: 10.1056/NEJMc2005203
9. Zhou F, Yu T, Du R, Fan G, Liu Y, Liu Z, et al. Clinical course and risk factors for mortality of adult
inpatients with COVID-19 in Wuhan, China: a retrospective cohort study. Lancet. (2020) 305:1054–62.
doi: 10.1016/S0140-6736(20)30566-3
10. Li X, Ma X. Acute respiratory failure in COVID-19: is it “typical” ARDS? Critical Care. (2020) 24:198.
doi: 10.1186/s13054-020-02911-9
11. Alberti P, Beretta S, Piatti M, Karantzoulis A, Piatti ML, Santoro P, et al. Guillain-Barré syndrome related
to COVID-19 infection. Neurol Neuroimmunol Neuroinflamm. (2020) 7:e741. doi:
10.1212/NXI.0000000000000741
12. Virani A, Rabold E, Hanson T, Haag A, Elrufay R, Cheema T, et al. Guillain-Barré Syndrome associated
with SARS-CoV-2 infection [published online ahead of print, 2020 Apr 18]. IDCases. (2020) 20:e00771.
doi: 10.1016/j.idcr.2020.e00771
13. Zhao H, Shen D, Zhou H, Liu J, Chen S. Guillain-Barré syndrome associated with SARS-CoV-2 infection:
causality or coincidence? Lancet Neurol. (2020) 19:383–4. doi: 10.1016/S1474-4422(20)30109-5
14. Padroni M, Mastrangelo V, Asioli GM, Pracucci G, Padroni M, Renieri L, et al. Guillain-Barré syndrome
following COVID-19: new infection, old complication? J Neurol. (2020) 267:1877–9. doi:
10.1007/s00415-020-09849-6
15. Thomas P, Baldwin C, Bissett B, Boden I, Gosselink R, Granger CL, et al. Physiotherapy management for COVID-19 in the acute hospital setting: clinical practice recommendations. J Physiotherapy. (2020)
66:73–82. doi: 10.1016/j.jphys.2020.03.011

International Journal of Advance and Innovative Research Volume 8, Issue 3 (IV) July - September 2021 Part - 2
238
ISSN 2394 - 7780
16. Toscano G, Palmerini F, Ravaglia S, Ruiz L, Invernizzi P, Cuzzoni MG, et al. Guillain-Barre syndrome
associated with SARS-CoV-2. N Eng J Med. (2020) 382:2574–76. doi: 10.1056/NEJMc2009191
17. Lazzeri M, Lanza A, Bellini R, Bellofiore A, Cecchetto S, Colombo A, et al. Respiratory physiotherapy in patients with COVID-19 infection in acute setting: a Position Paper of the Italian Association of
Respiratory Physiotherapists (ARIR). Monaldi Arch Chest Dis. (2020) 90:163–7. doi:
10.4081/monaldi.2020.1285
18. Wong WP. Physical therapy for a patient in acute respiratory failure. Phys Ther. (2000) 80:662–70. doi:
10.1093/ptj/80.7.662
19. Wilson LM, Morrison L, Robinson KA. Airway clearance techniques for cystic fibrosis: an overview of
Cochrane systematic reviews. Cochrane Database Syst Rev. (2019) 1:CD011231. doi:
10.1002/14651858.CD011231.pub2
20. Zhao H-M, Xie Y-X, Wang C. Recommendations for respiratory rehabilitation in adults with COVID-
19. Chin Med J. (2020). doi: 10.1097/CM9.0000000000000848
21. Cooke FJ, Shapiro DS. Global outbreak of severe acute respiratory syndrome (SARS). Int J Infect Dis.
(2003) 7: 80–5. doi: 10.1016/S1201-9712(03)90001-4
22. Simonds AK, Hanak A, Chatwin M, Morrell MJ, Hall A, Parker KH, et al. Evaluation of droplet dispersion during non-invasive ventilation, oxygen therapy, nebuliser treatment and chest physiotherapy in
clinical practice: implications for management of pandemic influenza and other airborne infections. Health
Technol Assess. (2010) 14:131–72. doi: 10.3310/hta14460-02
23. Brankston G, Gitterman L, Hiriji Z, Lemieux C, Gardam M. Transmission of influenza A in human
beings. Lancet Infect Dis. (2007) 7:257–65. doi: 10.1016/S1473-3099(07)70268-2
24. Tellier R. Review of aerosol transmission of influenza A virus. Emerg Infect Dis. (2006) 12:1657–62. doi:
10.3201/eid1211.060426
25. Hui DS, Azhar IE, Madani TA, Ntoumi F, Kock R, Dar O, et al. The continuing 2019-nCoV epidemic
threat of novel coronaviruses to global healt h–the latest 2019 novel coronavirus outbreak in Wuhan,
China. Int J Infect Dis. (2020) 91:264–66. doi: 10.1016/j.ijid.2020.01.009
26. Mehta SR, Sashindran VK, Kumar K, Gupta A. Severe acute respiratory syndrome: an update. Med J Armed Forces India. (2007) 63:52–5. doi: 10.1016/S0377-1237(07)80110-9 PubMed Abstract | CrossRef
Full Text | Google Scholar
27. Adhikari SP, Meng S, Wu1 Y-J, Mao Y-P, Ye R-X, Wang Q-Z, et al. Epidemiology, causes, clinical manifestation and diagnosis, prevention and control of coronavirus disease (COVID-19) during the early
outbreak period: a scoping review. Infect Dis Poverty. (2020) 9:29. doi: 10.1186/s40249-020-00646-x
28. CDC. 2019 Novel Coronavirus. Wuhan (2020). Available online
at: https://www.cdc.gov/coronavirus/2019-nCoV/summary.html. (accessed April 1, 2020).
29. Ott M, Milazzo A, Liebau S, Jaki C, Schilling T, Krohn A, et al. Exploration of strategies to reduce
aerosol-spread during chest compressions: a simulation and cadaver model. Resuscitation. (2020)
152:192–8. doi: 10.1016/j.resuscitation.2020.05.012
30. Liu K, Weitong Zhang W, Yang Y, Zhang J, Li Y, Chen Y. Respiratory rehabilitation in elderly patients
with COVID-19: a randomized controlled study. Compl Therap Clin Pract. (2020) 39:101166. doi:
10.1016/j.ctcp.2020.101166
31. Castro AA, Calil SR, Freitas SA, Oliveira AB, Porto EF. Chest physiotherapy effectiveness to reduce
hospitalization and mechanical ventilation length of stay, pulmonary infection rate and mortality in ICU
patients. Respir Med. (2013) 107:68–74. doi: 10.1016/j.rmed.2012.09.016
32. Ntoumenopoulos G, Presneill JJ, McElholum M, Cade JF. Chest physiotherapy for the prevention of
ventilator-associated pneumonia. Intensive Care Med. (2002) 28:850–6. doi: 10.1007/s00134-002-1342-2
33. Kuyrukluyildiz U, Binici O, Kupeli I, Erturk N, Gulhan B, Akyol F, et al. What is the best pulmonary
physiotherapy method in ICU? Can Respir J. (2016) 2016:4752467. doi: 10.1155/2016/4752467
34. Cavalcanti AB, Suzumura EA, Laranjeira LN, Paisani DM, Damiani LP, Guimarães HP, et al. Effect of
Lung Recruitment and Titrated Positive End-Expiratory Pressure (PEEP) vs low PEEP on mortality in

International Journal of Advance and Innovative Research Volume 8, Issue 3 (IV) July - September 2021 Part - 2
239
ISSN 2394 - 7780
patients with acute respiratory distress syndrome: a randomized clinical trial. JAMA. (2017) 318:1335–45.
doi: 10.1001/jama.2017.14171
35. Thille AW, Contou D, Fragnoli C, Córdoba-Izquierdo A, Boissier F, Brun-Buisson C. Non-invasive ventilation for acute hypoxemic respiratory failure: intubation rate and risk factors. Crit Care. (2013)
17:R269. doi: 10.1186/cc13103
36. Bilan N, Poorshiri B. The role of chest physiotherapy in prevention of postextubation atelectasis in
pediatric patients with neuromuscular diseases. Iran J Child Neurol. (2013) 7:21–4.
International Journal of Advance and Innovative Research Volume 8, Issue 3 (IV) July - September 2021 Part - 2
240
ISSN 2394 - 7780
THE INDISPENSABLE ROLE OF BRONCHOALVEOLAR LAVAGE (BAL) IN THE DIAGNOSIS
OF RESPIRATORY TRACT INFECTIONS
V. Viswapriya1, Saravana kumari. P
1, Sakthi G
2 and Kavyarasi. P
2
1Department of Microbiology, Rathnavel Subramaniam College of Arts and Science, Coimbatore, India
2Department of Biochemistry, Rathnavel Subramaniam College of Arts and Science, Coimbatore, India
ABSTRACT
The bronchoalveolar lavage (BAL) reveals the exact ailments of respiratory tract infections competently which serves as a direct tool for the physicians and microbiologists for diagnosis. The BAL sample precisely
represents living and non-living cell population and prevailing conditions of lung exactly than the other
clinical samples generally collected for diagnosis of lower respiratory tract infection that includes throat swab, deeply coughed sputum, or pharyngeal and nasopharyngeal swabs. In case of confirmation of COVID-19
diagnosis the BAL sample provided better results than other clinical specimen. BAL sample provides a handful
of information about the afflictions of the respiratory tract. The cytological analysis of BAL clearly showcases
the disease status of the respiratory tract and acts as a biochemical marker of infectious and non-infectious diseases. It significantly elucidate the pathological conditions caused by multifarious microorganisms like
bacteria, fungi, viruses and protozoans isolated from BAL collected by advanced method, for the diagnosis of
respiratory tract infections. Being a very precious specimen, a definite well-formulated procedure recommended world-wide for collecting, processing and interpreting results about BAL which is indicative of
all kinds of respiratory infections.
Keywords: Bronchoalveolar lavage (BAL), PAP, ILD, Diagnosis of infections, Respiratory specimen.
INTRODUCTION Respiratory tract infections (RTI) are common and perhaps the most frequently reported infections of human
being. Also Respiratory distress syndrome (RDS) is one of the leading causes of critical conditions in
premature infants. RDS seriously increases infant mortality and disability rates and is a serious problem that
requires new approaches in prevention, diagnosis and treatment [1]. It serves as a crucial base of death and in many instances dysfunction of an infected person. Still, the specific way of genesis of many respiratory
infections and virulence of pathogens are not absolutely recognized [2]. In the past few decades incidence of
respiratory infections increased due to increase in population density, urbanization, pollution in different strata of atmosphere, use of tobacco and HIV like epidemics. Death rate also increased proportionately due to
improper diagnosis (including tuberculosis), improper prescriptions and inefficient referral of patients [3]. In a
report on respiratory tract infection analysis, the lower respiratory tract infection (LRTI) and pneumonia are the
two leading causes of death, accounting for more than 4 million fatalities annually [4]. LRTI are the peculiar and foremost agency of mortality in working class and low-income countries. Moreover, the death rates of LRTI are
higher than the combined infections other infections such as acquired immune deficiency syndrome (AIDS),
tuberculosis (TB) and malaria [5]. LRTI are the subordinate reason for the recurrent acute infections and the mortality in younger age [6]. The endemic disease of lower respiratory tract infections results in increased
morbidity and mortality across the board. Hence, the regularization of diagnostic methods and procedures for
LRTI plays pivotal for the microbiological laboratories. Bronchoalveolar lavage (BAL) fluid has been used in the diagnosis of infections such as bacteria, including mycobacterium species, viral and fungal LTRI and non-
infectious diseases [7]. Bronchoalveolar lavage Fluid (BAL) has improved sensitivity and specificity in the
diagnosis of pulmonary infections [8]. Hence, a universal standard procedure is obligatory for examining BAL
like other clinical specimens. Although there are many reviews discussed since a centenary on this elaborately importance of BAL not yet considered. Yet, the forthcoming as well as present infectious and non-infectious
respiratory tract infection serves as a boundless challenge in the field of medicine and to the community. In this
review, an effort has been taken to highlight the significance of BAL as a clinical specimen in terms of its
diagnostic value in RTI.
Efficacy of Bronchoalveolar Lavage (BAL)
For the diagnosis of RTI, sputum sample is generally collected. Occasionally, the antibiotics prescribed based on the sputum culture sensitivity reports do not respond to the pathogen resulting in the change of antibiotic
sensitivity pattern leading to an ambiguous situation. IN such cases, the bacterial etiological agents isolated
from BAL samples serve as the signpost for the medical practitioner to drug prescription and treatment
direction. The selection of BAL channelizes the right path for the treatment and expertise about the causative agent as the exact diagnosis of the causative agent is essential for treatment [9]. Convene for the medical
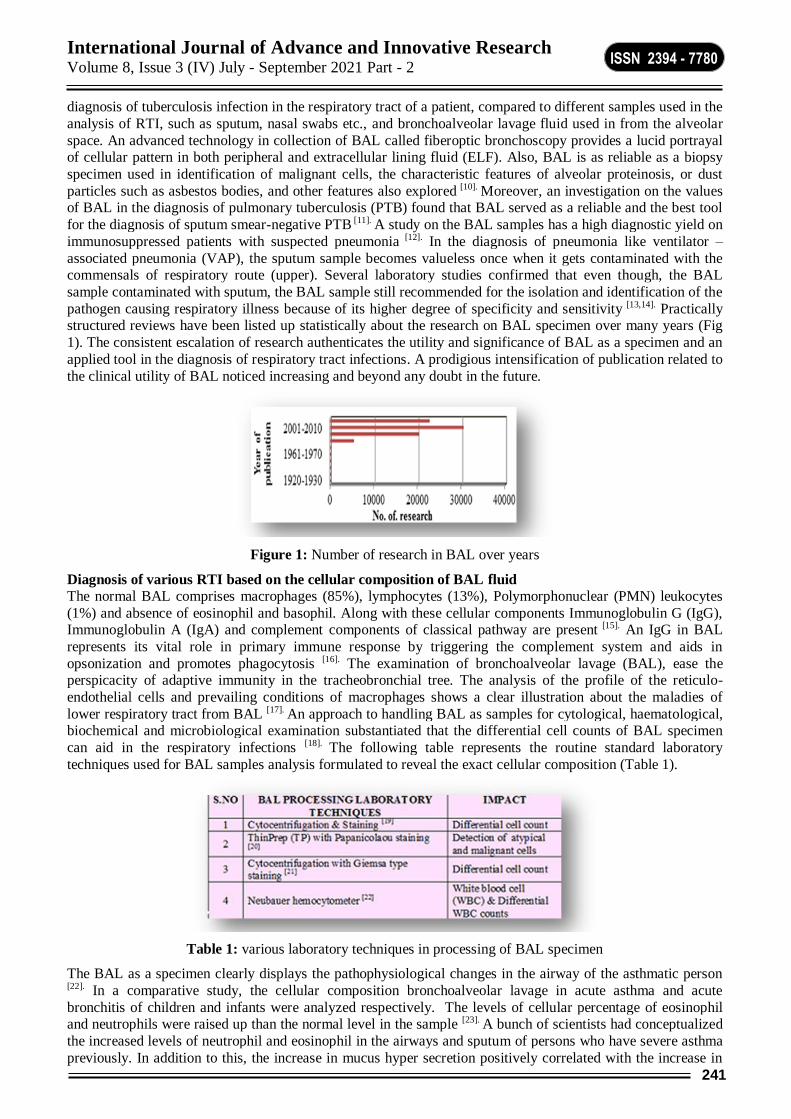
International Journal of Advance and Innovative Research Volume 8, Issue 3 (IV) July - September 2021 Part - 2
241
ISSN 2394 - 7780
diagnosis of tuberculosis infection in the respiratory tract of a patient, compared to different samples used in the
analysis of RTI, such as sputum, nasal swabs etc., and bronchoalveolar lavage fluid used in from the alveolar
space. An advanced technology in collection of BAL called fiberoptic bronchoscopy provides a lucid portrayal of cellular pattern in both peripheral and extracellular lining fluid (ELF). Also, BAL is as reliable as a biopsy
specimen used in identification of malignant cells, the characteristic features of alveolar proteinosis, or dust
particles such as asbestos bodies, and other features also explored [10]. Moreover, an investigation on the values of BAL in the diagnosis of pulmonary tuberculosis (PTB) found that BAL served as a reliable and the best tool
for the diagnosis of sputum smear-negative PTB [11]. A study on the BAL samples has a high diagnostic yield on
immunosuppressed patients with suspected pneumonia [12]. In the diagnosis of pneumonia like ventilator –
associated pneumonia (VAP), the sputum sample becomes valueless once when it gets contaminated with the commensals of respiratory route (upper). Several laboratory studies confirmed that even though, the BAL
sample contaminated with sputum, the BAL sample still recommended for the isolation and identification of the
pathogen causing respiratory illness because of its higher degree of specificity and sensitivity [13,14]. Practically structured reviews have been listed up statistically about the research on BAL specimen over many years (Fig
1). The consistent escalation of research authenticates the utility and significance of BAL as a specimen and an
applied tool in the diagnosis of respiratory tract infections. A prodigious intensification of publication related to
the clinical utility of BAL noticed increasing and beyond any doubt in the future.
Figure 1: Number of research in BAL over years
Diagnosis of various RTI based on the cellular composition of BAL fluid
The normal BAL comprises macrophages (85%), lymphocytes (13%), Polymorphonuclear (PMN) leukocytes
(1%) and absence of eosinophil and basophil. Along with these cellular components Immunoglobulin G (IgG), Immunoglobulin A (IgA) and complement components of classical pathway are present [15]. An IgG in BAL
represents its vital role in primary immune response by triggering the complement system and aids in
opsonization and promotes phagocytosis [16]. The examination of bronchoalveolar lavage (BAL), ease the perspicacity of adaptive immunity in the tracheobronchial tree. The analysis of the profile of the reticulo-
endothelial cells and prevailing conditions of macrophages shows a clear illustration about the maladies of
lower respiratory tract from BAL [17]. An approach to handling BAL as samples for cytological, haematological, biochemical and microbiological examination substantiated that the differential cell counts of BAL specimen
can aid in the respiratory infections [18]. The following table represents the routine standard laboratory
techniques used for BAL samples analysis formulated to reveal the exact cellular composition (Table 1).
Table 1: various laboratory techniques in processing of BAL specimen
The BAL as a specimen clearly displays the pathophysiological changes in the airway of the asthmatic person [22]. In a comparative study, the cellular composition bronchoalveolar lavage in acute asthma and acute
bronchitis of children and infants were analyzed respectively. The levels of cellular percentage of eosinophil and neutrophils were raised up than the normal level in the sample [23]. A bunch of scientists had conceptualized
the increased levels of neutrophil and eosinophil in the airways and sputum of persons who have severe asthma
previously. In addition to this, the increase in mucus hyper secretion positively correlated with the increase in
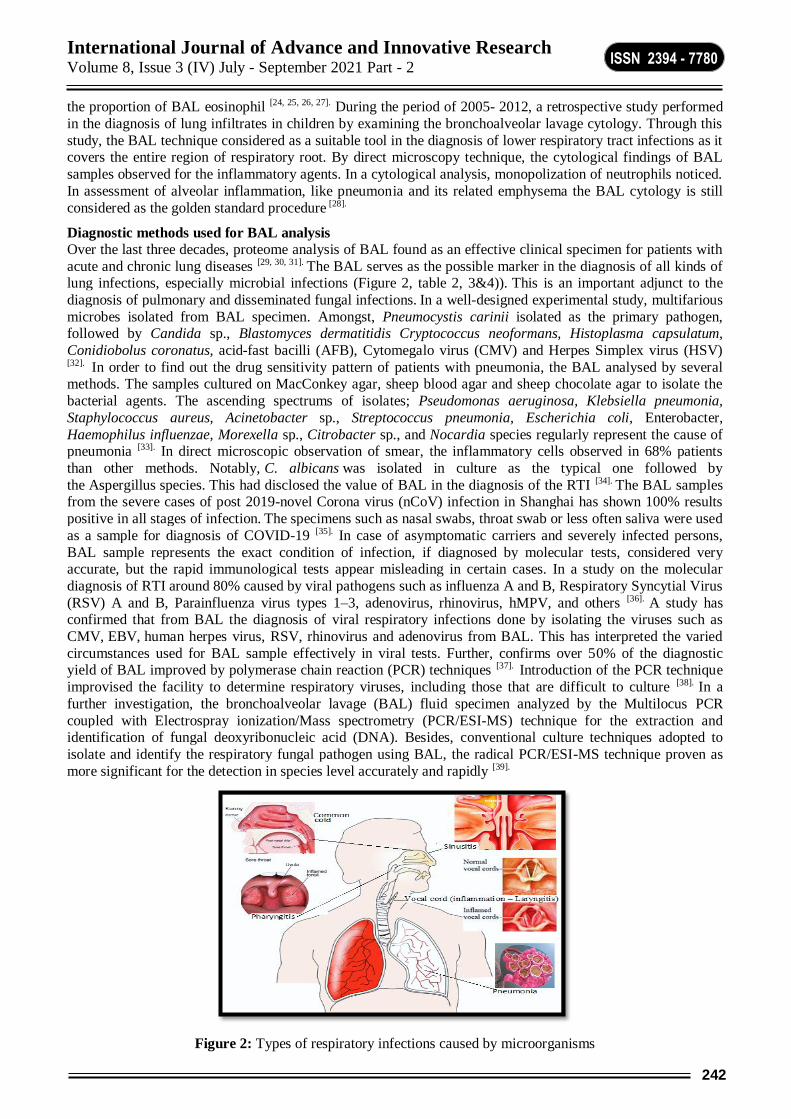
International Journal of Advance and Innovative Research Volume 8, Issue 3 (IV) July - September 2021 Part - 2
242
ISSN 2394 - 7780
the proportion of BAL eosinophil [24, 25, 26, 27]. During the period of 2005- 2012, a retrospective study performed
in the diagnosis of lung infiltrates in children by examining the bronchoalveolar lavage cytology. Through this
study, the BAL technique considered as a suitable tool in the diagnosis of lower respiratory tract infections as it covers the entire region of respiratory root. By direct microscopy technique, the cytological findings of BAL
samples observed for the inflammatory agents. In a cytological analysis, monopolization of neutrophils noticed.
In assessment of alveolar inflammation, like pneumonia and its related emphysema the BAL cytology is still
considered as the golden standard procedure [28].
Diagnostic methods used for BAL analysis
Over the last three decades, proteome analysis of BAL found as an effective clinical specimen for patients with
acute and chronic lung diseases [29, 30, 31]. The BAL serves as the possible marker in the diagnosis of all kinds of lung infections, especially microbial infections (Figure 2, table 2, 3&4)). This is an important adjunct to the
diagnosis of pulmonary and disseminated fungal infections. In a well-designed experimental study, multifarious
microbes isolated from BAL specimen. Amongst, Pneumocystis carinii isolated as the primary pathogen, followed by Candida sp., Blastomyces dermatitidis Cryptococcus neoformans, Histoplasma capsulatum,
Conidiobolus coronatus, acid-fast bacilli (AFB), Cytomegalo virus (CMV) and Herpes Simplex virus (HSV) [32]. In order to find out the drug sensitivity pattern of patients with pneumonia, the BAL analysed by several methods. The samples cultured on MacConkey agar, sheep blood agar and sheep chocolate agar to isolate the
bacterial agents. The ascending spectrums of isolates; Pseudomonas aeruginosa, Klebsiella pneumonia,
Staphylococcus aureus, Acinetobacter sp., Streptococcus pneumonia, Escherichia coli, Enterobacter,
Haemophilus influenzae, Morexella sp., Citrobacter sp., and Nocardia species regularly represent the cause of pneumonia [33]. In direct microscopic observation of smear, the inflammatory cells observed in 68% patients
than other methods. Notably, C. albicans was isolated in culture as the typical one followed by
the Aspergillus species. This had disclosed the value of BAL in the diagnosis of the RTI [34]. The BAL samples from the severe cases of post 2019-novel Corona virus (nCoV) infection in Shanghai has shown 100% results
positive in all stages of infection. The specimens such as nasal swabs, throat swab or less often saliva were used
as a sample for diagnosis of COVID-19 [35]. In case of asymptomatic carriers and severely infected persons,
BAL sample represents the exact condition of infection, if diagnosed by molecular tests, considered very accurate, but the rapid immunological tests appear misleading in certain cases. In a study on the molecular
diagnosis of RTI around 80% caused by viral pathogens such as influenza A and B, Respiratory Syncytial Virus
(RSV) A and B, Parainfluenza virus types 1–3, adenovirus, rhinovirus, hMPV, and others [36]. A study has confirmed that from BAL the diagnosis of viral respiratory infections done by isolating the viruses such as
CMV, EBV, human herpes virus, RSV, rhinovirus and adenovirus from BAL. This has interpreted the varied
circumstances used for BAL sample effectively in viral tests. Further, confirms over 50% of the diagnostic yield of BAL improved by polymerase chain reaction (PCR) techniques [37]. Introduction of the PCR technique
improvised the facility to determine respiratory viruses, including those that are difficult to culture [38]. In a
further investigation, the bronchoalveolar lavage (BAL) fluid specimen analyzed by the Multilocus PCR
coupled with Electrospray ionization/Mass spectrometry (PCR/ESI-MS) technique for the extraction and identification of fungal deoxyribonucleic acid (DNA). Besides, conventional culture techniques adopted to
isolate and identify the respiratory fungal pathogen using BAL, the radical PCR/ESI-MS technique proven as
more significant for the detection in species level accurately and rapidly [39].
Figure 2: Types of respiratory infections caused by microorganisms
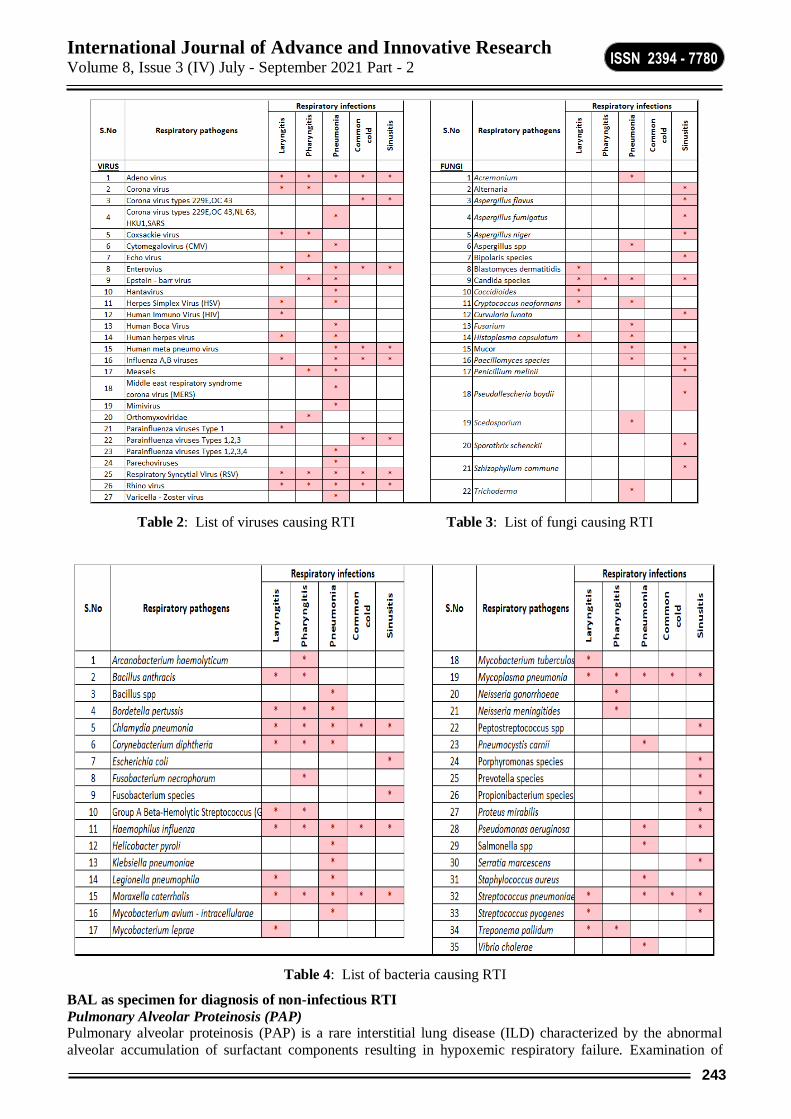
International Journal of Advance and Innovative Research Volume 8, Issue 3 (IV) July - September 2021 Part - 2
243
ISSN 2394 - 7780
Table 2: List of viruses causing RTI Table 3: List of fungi causing RTI
Table 4: List of bacteria causing RTI
BAL as specimen for diagnosis of non-infectious RTI
Pulmonary Alveolar Proteinosis (PAP) Pulmonary alveolar proteinosis (PAP) is a rare interstitial lung disease (ILD) characterized by the abnormal
alveolar accumulation of surfactant components resulting in hypoxemic respiratory failure. Examination of

International Journal of Advance and Innovative Research Volume 8, Issue 3 (IV) July - September 2021 Part - 2
244
ISSN 2394 - 7780
BAL and by removal of a small tissue from lungs through a special needle (biopsy of the lung) considered
eventual diagnosis for PAP [40]. The milky opaque appearance of the BAL is the characteristic physical
appearance of PAP and observed under electron microscopy [41]. In a comparative study, the diagnosis of PAP the lavage discharges examined for the presence of unusual components considered as characteristic of the
disease. The proteins present in the diseased and non-diseased lung lavages determined by the electrophoresis
process. Using an electron microscope, the particulate components of lavage effluents from diseased and normal lungs examined. In the diseased lungs, generation and disintegration of cells, presence of ultra-
structurally abnormal alveolar macrophages, and myelin-like structures were found in lavage effluents which
are absent in healthy lungs [42].
Interstitial Lung Diseases (ILD) Interstitial lung disease (ILD) refers to a parenchymal lung disorders characterized by inflammation and/or
fibrosis of the pulmonary interstitium. Food grains containing abscisic acid induce the inflammation in
gastrointestinal tract and lungs [43]. The American Thoracic Society (ATS) funded a panel of experts to scrutinize the literatures based on the efficiency and significance of the BAL specimen in diagnosing and
managing patients with ILD. The published analyses, evaluations, assessments, investigations pertinent to
usage of BAL in the examination of ILD made in 1970 to 2006 listed in table 5 [44]. According to Keith et al., in 2012 recommended to use different sites for collection of BAL, use differential blood cell count to exactly
diagnose ILD, lymphocyte subset analysis in BAL do not provide clear picture of ILD, and other clinical tests
also recommended with BAL sample to diagnose ILD. The bronchoalveolar lavage specimens from patients
with ILD assessed for the activity of alveolar inflammation. The samples analyzed by the pathologist and the
unsatisfactory specimens not processed further. The following factors decide on the suitability of the specimen.
Table 5: Criteria of specimen to use for BAL examination of ILD
In India, during 2003 to 2004 the investigations of BAL specimen in the diagnosis of irreversible lung fibrosis (infiltrative disorders) include the following tests; Gram staining, semi quantitative bacterial culture, AFB
smears and culture, WBC and differential count and cytology analysis. Gram’s staining was found to have
83.6% sensitivity as compared to semi quantitative culture. Thus, Gram’s staining was found to be a rapid and
useful examination of BAL specimens. Cytological examination of BAL samples suggested malignancy and further confirmed by histopathology. By the observation of specimens, 9 out of 9 cases were confirmed by
BAL, 4 out of 5 were confirmed by surgical biopsy, and 1 out of 4 confirmed by transbronchial biopsy. The
results indicated that the convenient and safe diagnosis methods through BAL compared to more accurate than transbronchial biopsy and surgical biopsy. Over and above, the BAL specimen was useful in impotent patients
who were unable to provide sputum [45].
CONCLUSION Generally for respiratory tract infections, the broad spectrum antibiotics prescribed. In point-of-care tests, the
results interpreted within fifteen minutes, which reduced the inconveniences of the patient, including economic
loss, length of hospital stay, spread of infectious agents and pre-judicial use of antibiotic [46]. Accomplishment
of effective antimicrobial therapy and infection control churn out infectious agents at the early stage of diagnosis. The gold standard conventional tests were being switched over into rapid, sensitive tests, even
supposing they are still under assessment [47]. True representation of BAL sample on SARS-CoV-2 infected
person analysed and the BAL reported to have 37.2% of accuracy compared to throat swab and CT scan reports. Because according to the progress of the infection, pathogen also keeps changing the lodging area,
accuracy reduces [48]. Temperature also has influence on positivity of the testing efficiency. In case, if a person
suspected for SARS-CoV-2 infection and throat swab sample is negative, similar to CT scan BAL sample gives true picture of deep lung infection in patients [49]. While considering the bacterial infections, the upper
respiratory tract of patients undergoing antibiotic therapy results in the establishment of profuse growth of
pathogens. This leads to the copious pathogens in the upper respiratory tract than in the lower one. Hence it is
little difficult to collect sufficient samples. Therefore, invasive procedure like BAL sampling always preferred
International Journal of Advance and Innovative Research Volume 8, Issue 3 (IV) July - September 2021 Part - 2
245
ISSN 2394 - 7780
to get expected results. Nevertheless, the variability of lavage collection considered as one of the major demerit
in BAL. The factors influencing these variables underlying diseases are; amount of instilled fluid, pressure
applied for fluid aspiration and collection methods [50, 51]. Indeed, with the advent of respiratory infectious diseases globally, it is becoming increasingly critical that need to introduce and inculcate the diagnostic
significance of BAL as a tool for diagnosing RTI in the curriculum. A gold standard protocol formulated to
combat the threats caused by the emergence and re-emergence respiratory infectious diseases worldwide.
Undeniably, BAL is the master-key specimen if provided with standard processing procedures.
Conflict of Interest
None
Acknowledgments
None
REFERENCES
1. Mirzakhmedova Dilfuza, Salikhova Kamola, Ishniyazova Nadira. The role of early biomarkers in the development of bronchopulmonary dysplasia in premature newborns. Journal of Critical reviews. (2020;
7(17): 2235 – 2239.
2. Ndip RN, Ntiege EA, Ndip LM, Nkwelang G, Aoachere JF, Akenji TN. Antimicrobial resistance of bacterial agents of the upper respiratory tract of school children in Buea, Cameroon. J. Health. Popul. Nutr.
2008; 26(4):397-404.
3. Tripathy JP. Management of respiratory diseases in India–the PAL way. Current Science. 2013; 105(8):
1047.
4. Bartlett JG, Mundy LM. Community‐acquired pneumonia. N. Engl. J. Med. 1995; 333(24):1618‐24.
5. Ozyilmaz E, Akan OA, Gulhan M, Ahmad K, Nagatake T. Major bacteria of community acquired
respiratory tract infections in Turkey. Jpn. J. Infect. Dis. 2005; 58(1):502.
6. Alter SJ, Vidwan NK, Sobande PO, Omoloja A Bennett JS. Common childhood bacterial infections. Curr.
Probl. Pediatr. Adolesc. Health. Care. 2011; 41(10):256-83.
7. Carroll KC. Laboratory diagnosis of lower respiratory tract infections: controversy and conundrums. J.
Clin. Microbiol. 2002; 40(9):3115-20.
8. Ku V, Kumar DMN. Microbiological Profile of Bronchoalveolar Lavage Fluid in Patients with Chronic
Respiratory Diseases: A Tertiary Care Hospital Study. Int. J. Med. Res. Rev. 2016; 4:330-337.
9. Gupta D, Agarwal R, Aggarwal AN, Singh N, Mishra N, Khilnani GC, Samaria JK, Gaur SN, Jindal SK. Pneumonia Guidelines Working Group. Guidelines for diagnosis and management of community- and
hospital-acquired pneumonia in adults: Joint ICS/NCCP (I) recommendations. Lung India. 2012;29: S27-
62.
10. Reynolds HY, Newball HH. Fluid and cellular milieu of the human respiratory tract. In: Kirkpatrick CH,
Reynolds HY, eds. Immunologic and Infectious Reactions in the Lung. New York: Marcel Dekker. 1976;
3-27.
11. Nikbakhsh N, Bayani M, Siadati S. The Value of Bronchoalveolar Lavage in the Diagnosis of Sputum
Smear-Negative Pulmonary Tuberculosis. Iran. J. Pathol. 2015; 10(1):35‐40.
12. Vélez L, Correa LT, Maya MA. Diagnostic accuracy of bronchoalveolar lavage samples in
immunosuppressed patients with suspected pneumonia: analysis of a protocol. Respir. Med. 2007;
101(10):2160‐2167.
13. Luna CM, Vujacich P, Niederman MS, Vay C, Gherardi C, Matera J, Jolly EC. Impact of BAL data on the
therapy and outcome of ventilator-associated pneumonia. Chest. 1997; 111:676–685.
14. Timsit JF, Cheval C, Gachot B, Bruneel F, Wolff M, Carlet J, Regnier B. Usefulness of a strategy based on
bronchoscopy with direct examination of bronchoalveolar lavage fluid in the initial antibiotic therapy of
suspected ventilator-associated pneumonia. Intensive Care Med. 2001; 27:640– 647.
15. Reynolds HY. Use of bronchoalveolar lavage in humans - past necessity and future imperative. Lung,
2000; 178:271-293.
International Journal of Advance and Innovative Research Volume 8, Issue 3 (IV) July - September 2021 Part - 2
246
ISSN 2394 - 7780
16. Lynn M, Taussig, Louis I, Landau. Pediatric Respiratory Medicine, 2nd Edition, Copyright at Elsevier.
2008; 1152.
17. De Blic J, Midulla F, Barbato A, Clement A, Dab I, Eber E. Bronchoalveolar lavage in children ERS. Task
Force on bronchoalveolar lavage in children. Eur. Respir. J. 2000; 15(1): 217-31.
18. Richard L, Kradin. Approach to the Sampling of the Lung, In.Understanding Pulmonary Pathology,
Academic Press. 2017;1-4.
19. De Brauwer EI, Jacobs JA, Nieman F, Bruggeman CA, Drent M. Bronchoalveolar lavage fluid differential
cell count. How many cells should be counted? Anal. Quant. Cytol. Histol. 2002; 24: 337–341.
20. Baughman RP. Technical aspects of bronchoalveolar lavage: recommendations for a standard
procedure. Semin. Respir. Crit. Care. Med. 2007; 28: 475–485.
21. Meyer KC, Raghu G, Baughman RP, Brown KK, Costabel U, du Bois RM, et al. American Thoracic
Society Committee on BAL in Interstitial Lung Disease. An official American Thoracic Society clinical
practice guideline: the clinical utility of bronchoalveolar lavage cellular analysis in interstitial lung
disease. Am. J. Respir. Crit. Care. Med. 2012;185: 1004–1014
22. Yoshiro Tanizaki, Hikaru Kitani, Morihiro Okazaki, Takashi Mifune, Fumihiro Mitsunobu, Ikuro Kimura.
Mucus Hypersecretion and Eosinophils in Bronchoalveolar Lavage Fluid in Adult Patients with Bronchial
Asthma. Journal of Asthma. 2009;257-262.
23. Chang Keun Kim, Churl Young Chung, Soo Jeon Choi, Do Kyun Kim, Yang Park and Young Yull Koh.
Bronchoalveolar lavage cellular composition in acute asthma and acute bronchiolitis. The Journal of
Pediatrics. 2000;137(4): 517-52.
24. Fahy JV, Kim KW, Liu J, Boushey HA. Prominent neutrophilic inflammation in sputum from subjects
with asthma exacerbation. J. Allergy Clin. Immunol. 1995; 95(4):843–52.
25. Chu HW, Martin RJ. Are eosinophils still important in asthma? Clin Exp Allergy. 2001; 31(4):525–28.
26. Sampson AP. The role of eosinophils and neutrophils in inflammation. Clin. Exp. Allergy. 2000;
30(1):22–7.
27. Williams TJ. The eosinophil enigma. J. Clin. Invest. 2004;113(4):507–9.
28. Amina Selimovic, Ermina Mujicic, Selma Milisic, Tanja Pejicic, Milan Rancic, Senka Mesihovic Dinarevic, Lada Lukic-Bilela, Mahir Moro. The Significance of Bronchoalveolar Lavage Fluid Cytology
in Diagnosing Lung Infiltrates in Children. Med. Arch. 2016; 70(1): 27-30.
29. Noel Georis I, Bernard A, Falmagne P, Wattiez R. Database of bronchoalveolar lavage fluid proteins. J.
Chromatog. B. Analyt. Technol. Biomed. Life Sci. 2001; 771: 221–236.
30. Signor L,Tigani B,Beckmann N,Falchetto R,Stoeckli M.Two dimensional electrophoresis protein profiling
and identification in rat bronchoalveolar lavage fluid following allergen and endotoxin challenge.
Proteomics.2004;4:2101-2110.
31. Bowler RP, Duda B, Chan ED, Enghild JJ, Ware LB, Matthay MA, Duncan MW. Proteomic analysis of
pulmonary edema fluid andplasma in patients with acute lung injury. Am. J. Physiol. Lung Cell. Mol.
Physiol. 2004; 286:1095
32. Knox KS, Meinke L. Role of bronchoalveolar lavage diagnostics in fungal Infections. Clin. Chest. Med.
2009; 30(2):355-65.
33. Magazine R, Chogtu B, Rao S, Chawla K. Bacterial isolates from the bronchoalveolar lavage fluid of
patients with pneumonia not responding to initial antimicrobial therapy. Sahel Med. J. 2013; 16:102-6.
34. Abdolmajid Fata, Majid Mirsadraee, Fariba Rezaeetalab, Fariba Berenji. Fungal infection in samples of
Bronchial washing in Bronchoscopy Department. https://www.aspergillus.org.uk/content/fungal-infection-
samples-bronchial-washing-bronchoscopy. 2006;
35. Yang Yang, Minghui Yang, Chenguang Shen, Fuxiang Wang, Jing Yuan, Jinxiu Li, et al. Evaluating the
accuracy of different respiratory specimens in the laboratory diagnosis and monitoring the viral shedding of 2019-
nCoV infections. 2020; medRxiv 2020.02.11.20021493; doi: https://doi.org/10.1101/2020.02.11.20021493
International Journal of Advance and Innovative Research Volume 8, Issue 3 (IV) July - September 2021 Part - 2
247
ISSN 2394 - 7780
36. Mahony JB, Petrich A, Smieja M. Molecular diagnosis of respiratory virus infections. Crit. Rev. Clin. Lab.
Sci. 2011; 48:217–249.
37. Jouneau S, Poineuf JS, Minjolle S, Tattevin P, Uhel F, Kerjouan M, Le Hô H, Desrues B. Which patients should be tested for viruses on bronchoalveolar lavage fluid?. European journal of clinical microbiology &
infectious diseases. 2013; 32(5):671–677. https://doi.org/10.1007/s10096-012-1791-7
38. lli Ruuskanen, Elina Lahti, Lance C, Jennings, David R Murdoch. Viral pneumonia, The Lancet. 2011;
377(9773):1264-1275. https://doi.org/10.1016/S0140-6736(10)61459-6.
39. Shin JH, Ranken R, Sefers SE, Lovari R, Quinn CD, Meng S, et al. Detection, identification, and
distribution of fungi in bronchoalveolar lavage specimens by use of multilocus PCR coupled with
electrospray ionization/mass spectrometry. Journal of clinical microbiology. 2013; 51(1):136–141.
https://doi.org/10.1128/JCM.01907-12
40. Costello JF, Moriarty DC, Branthwaite MA, Turner Warwick M, Corrin B. Diagnosis and management of
alveolar proteinosis: the role of electron microscopy. Thorax. 1975; 30(2):121–132.
41. Hook GE, Bell DY, Gilmore LB. Nadeau D, Reasor MJ, Talley FA. Composition of bronchoalveolar
lavage effluents from patients with pulmonary alveolar proteinosis. Lab Invest. 1978; 39(4):342-357.
PMID: 212641.
42. Mo Q, Wang B, Dong N, Bao L, Su X, Li Y, Chen C. The Clinical Clues of Pulmonary Alveolar
Proteinosis: A Report of 11 Cases and Literature Review. Canadian respiratory journal. 2016; 4021928.
https://doi.org/10.1155/2016/4021928
43. Kamalinejad M, Nabimeybodi R, Zareshahi R, Nabimeybodi N. The Effect of Consuming Food Allergens on Immune System Function with the Focus on Infectious Lung Diseases (COVID-19). Trad Integr Med.
2021; 6(1): 55-69.
44. Keith C Meyer, Ganesh Raghu, Robert P Baughman, Kevin K Brown, Ulrich Costabel, Roland M du Bois, et al. An Official American Thoracic Society Clinical Practice Guideline: The Clinical Utility of
Bronchoalveolar Lavage Cellular Analysis in Interstitial Lung Disease. Am J Respir Crit Care Med. 2012;
185(9): 1004–1014.
45. Bhatia GC, Hemvani N, Chitnis DS. Role of bronchoalveolar lavage in pulmonary infections. Lung India.
2006; 23: 147-150.
46. Charles PG. Early diagnosis of lower respiratory tract infections (point-of-care tests). Curr. Opin. Pulm.
Med. 2008; 14(3):176-182.
47. Das S, Dunbar S, Tang YW. Laboratory Diagnosis of Respiratory Tract Infections in Children - the State
of the Art. Front Microbiol. 2018; 9:2478.
48. Patrucco, F., Albera, C., Bellocchia, M., Foci, V., Gavelli, F., Castello, L. M., Bellan, M., Sainaghi, P. P., Airoldi, C., Balbo, P. E., & Solidoro, P. (). SARS-CoV-2 Detection on Bronchoalveolar Lavage: An
Italian Multicenter experience. Respiration; international review of thoracic diseases, 2020; 99(11), 970–
978. https://doi.org/10.1159/000511964
49. Kahn FW, Jones JM. Diagnosing bacterial respiratory infection by bronchoalveolar lavage. J. Infect. Dis.
1987; 155: 862–869.
50. Barberi, C., Castelnuovo,E., Dipasquale,A et al. Bronchoalveolar lavage in suspected COVID-19 cases
with a negative nasopharyngeal swab: a retrospective cross-sectional study in a high-impact Northern Italy
area. Intern Emerg Med .2021; https://doi.org/10.1007/s11739-021-02714-y
51. Dua K, Shukla SD, Hansbro PM. Aspiration techniques for bronchoalveolar lavage in translational
respiratory research: Paving the way to develop novel therapeutic moieties. Journal of biological methods,
2017; 4(3): e73. https://doi.org/10.14440/jbm.2017.174
International Journal of Advance and Innovative Research Volume 8, Issue 3 (IV) July - September 2021 Part - 2
248
ISSN 2394 - 7780
THE ROLE OF THE INFORMAL SECTOR IN REALIZING GREEN TOURISM AS A TOURISM
ATTRACTION TO THE SULAMANDA BEACH IN KUPANG REGENCY
Titania Triyuni Ga Doko, Apriana H. J. Fanggidae and Rolland E. Fanggidae
*
Faculty of Economics and Business, University of Nusa Cendana, Kupang
ABSTRACT
Research Purposes: This study examines the role of the informal sector in realizing green tourism as a tourist
attraction at Sulamanda Beach in Kupang Regency and to find out how to overcome the obstacles faced by the
informal sector in realizing Green Tourism as a tourist attraction for Sulamanda beach in Kupang Regency.
Research Methodology: This study uses a qualitative descriptive analysis.
Finding: The role of the informal sector in realizing Green Tourism on Sulamanda beach has a positive impact in supporting the cleanliness and beauty of the Sulamanda beach tourism object, besides they trade they are
also required to maintain the cleanliness of the coast from the garbage that is handed over. Everything that is
done aims to maintain the cleanliness and beauty of Sulamanda beach. The role of informal sector traders can
also support tourism on the Sulamanda beach because the presence of traders can make it easier for tourists to get food and drinks. Obstacles faced by the informal sector in realizing Green Tourism include the lack of
awareness of tourists in maintaining cleanliness, so there is a lot of garbage caused by visitors or tourists,
seawater shipments, and it is difficult to get clean water.
Limitation: Research variables are abstract so that research results can change in the future.
Contribution: This research can be scientific information about tourism.
Keywords: Informal Sector, Green Tourism, Tourism, Beach.
FOREWORD Tourism is an inseparable part of human life, especially regarding social and economic activities. Starting from
activities that were previously only enjoyed by a relatively wealthy few people at the beginning of the 20th
century, have now become parts of human rights. This is happening not only in developed countries but also in
developing countries. Indonesia as a developing country in its development stage, is trying to build a tourism
industry as a way to achieve a balanced foreign trade balance (Pendit, 2002).
Indonesia as a developing country and also as an archipelagic country has a lot of tourism potential that can be
developed, especially the potential for diverse natural resources and cultural potential because it consists of various races, ethnicities and nations. In the tourism law number 10 of 2009 chapter II article 4 it is said that the
impact of tourism development in Indonesia is very broad, ranging from the impact on the community
economy, people's welfare, poverty to nature conservation. Conservation of nature and the environment is one
of the main factors in supporting the attractiveness of tourism in a place. Attractions that have a high
attractiveness will generate the interest of tourists to visit these attractions.
Tourist attraction according to the Law of the Republic of Indonesia No. 10 of 2009 is everything that has
uniqueness, convenience, and value in the form of a diversity of natural, cultural and man-made wealth that is the target or purpose of tourist visits. One area that has a high tourist attraction in Indonesia is Kupang
Regency. Kupang Regency is one of the tourist destinations that has a tourist attraction in the form of natural,
cultural and historical potential which is used as a tourist attraction that is in great demand by tourists, one of the attractions in Kupang Regency is a beach tourism object. Some beach attractions in Kupang Regency and
have tourist attractions in the form of attractiveness and beautiful panoramas such as Tablolong Beach, Puru
Beach, Teres Beach, Oetune Beach, Kolbano Beach, Sulamanda Beach, and many other beach attractions in the
Regency. Kupang. The uniqueness of beach tourism in Kupang Regency is that it presents beautiful and unspoiled scenery for visitors to see and enjoy, and there are also public facilities such as lopo-lopo, parking
lots, and also the availability of typical culinary foods from the colonized Kupang Regency by traders who are
around the tourist attraction. in addition to the availability of facilities that can meet the needs of tourists and also adequate accessibility, environmental factors are also one of the most important in a tourist attraction. A
clean and beautiful environment will create comfort for tourists who visit tourist attractions.
Beach attractions that are crowded with visitors will certainly benefit the informal sector that sells around tourist attractions. In addition to bringing benefits to the informal sector, a crowded tourist attraction can also
have a bad impact. One of the factors can cause a bad impact such as environmental factors. A good and clean
International Journal of Advance and Innovative Research Volume 8, Issue 3 (IV) July - September 2021 Part - 2
249
ISSN 2394 - 7780
tourist attraction environment will provide a sense of security and comfort for people who are in the tourist
attraction environment, otherwise a polluted and unhealthy environment will interfere with the comfort of
people who are around the tourist attraction.
Environmental factors are problems that are often experienced by beach tourism objects in Kupang Regency.
The beach tourism objects in Kupang Regency are far from beautiful and clean environments due to the lack of
government attention, awareness of the surrounding community, and the lack of the role of the informal sector around the tourist attraction. Informal sector that is around beach tourism objects such as: 1) fried food vendors,
2) children's toy traders, 3) culinary food vendors, 4) fruit traders 5) street food vendors, and also 5) small retail
traders such as kiosks. . Problems from the informal sector around tourism objects related to green tourism such
as; environmental problems of unclean tourist objects, waste problems around tourist attractions caused by tourists who enjoy food or drinks provided by the informal sector and do not respect the cleanliness of the
surroundings, and also damage existing facilities around tourist attractions which result in environmental the
beach is not clean, comfortable and beautiful and also the lack of togetherness in the informal sector in protecting the environment around tourist attractions. By looking at the problems above, the author is interested
in raising the title "The Role of the Informal Sector in Realizing Green Tourism as a Tourist Attraction of
Sulamanda Beach in Kupang Regency"
LITERATURE REVIEW
Tourism Concept
The term tourism in Sanskrit consists of several word components, namely: ‘‘Pari’’ which means full,
complete, around; ‘‘Wis(man) which means house, property, village, community; and ''ata'' means to go constantly, to wander (roaming about) which when combined into one word tourism which means: to go
completely leaving the house (village) around continuously and not intending to stay in the place that is the
destination of the trip (Pendit , 2002).
According to Sudiarta (2005:10) tourism is an activity that prioritizes service with orientation to the satisfaction
of tourists, entrepreneurs in the tourism sector, the government, and the community. Hunziger and Krapf,
define tourism as a whole network and phenomena associated with the stay of foreigners in a place with
important conditions that provide benefits that are permanent or temporary (Tanaamah & Wardoyo, 2008).
In Chapter 1 Article 1 of Law Number 10 of 2009 concerning tourism, it is stated that tourism is various kinds
of tourism activities and supported by various facilities and services provided by the community, businessmen,
government, and local governments. From the description of the definition of tourism according to the experts above, it can be concluded that tourism is an activity carried out by a person or group of people to get
entertainment or pleasure by traveling from one place to another within a minimum period of 24 hours or more
and using transportation, accommodation and facilities provided at the tourist attraction visited. According to
(Hainim, 2006) there are three components of tourism, as follows:
1. Tourist attractions
Having its own strength as a tourism component, because it can provide a stimulus for the implementation of a
trip, this usually occurs in tourist destinations that have very high unique attractions.
2. Tourist Facilities and Services
Usually consists of elements of means of transportation, accommodation facilities, eating and drinking
facilities, and other supporting facilities, which are specifically tailored to the needs of the form of travel. This
is also inseparable from the infrastructure or infrastructure components.
3. Accessibility
A form of available facilities concerns the availability of infrastructure and transportation networks that connect
a tourist destination with a tourist origin.
In this study, the author emphasizes tourism attractions because attractions are something that attracts attention
or attractions that are owned by tourist objects. According to (James J. Spillane, 1994) Attraction is the center
of the tourism industry. Attraction is something that is able to attract tourists who want to visit it. The motivation of tourists to visit a tourist destination is to fulfill or satisfy some need or demand. Usually tourists
are attracted to a location because of certain characteristics. These criteria can be broken down into several
indicators as follows:
1. Has a tourist attraction, especially a cultural tourist attraction.
2. Have at least more than one attraction that utilizes and upholds local culture.
International Journal of Advance and Innovative Research Volume 8, Issue 3 (IV) July - September 2021 Part - 2
250
ISSN 2394 - 7780
According to Suwantoro (1997) generally the attraction of a tourist attraction is based on resources that can
cause a sense of pleasure, beauty, comfort and cleanliness. Therefore, it is necessary to have the concept of
green tourism as a guideline to create good resource attractions so that it can create a sense of pleasure, beauty,
comfort and cleanliness for tourists visiting tourist objects.
Green Tourism Concept
Green tourism is a phenomenon where a person travels away from his usual activities to seek activities in rural areas, outside areas such as urban beaches or ski resorts (Meler & Ham, 2000). Green Tourism is a form of
ecotourism that focuses on sustainable tourism or means that it does not cause damage to tourist sites and
cultural heritage being visited (environmentally friendly). The concept of Green tourism includes tourism
programs that minimize the negative aspects of conventional tourism on the environment and enhance the cultural integrity of the local community. Therefore, in addition to evaluating cultural and environmental
factors, green tourism is also an integral part of promotional activities, recycling, energy efficiency, and
creating economic opportunities for local communities.
According to (Mitani, 2011) Green Tourism is a form of labeling of a sustainable tourism in which the
activities in it encourage the realization of a knowledge and experience-based tourist activity in an
environmentally responsible manner, preserving local culture so as to encourage involvement local communities through local businesses and ultimately support the economic growth of local communities.
According to (Ringbeck, 2010) Green tourism has four pillars that must be applied in tourism practice, namely:
1. Reducing carbon emissions resulting from tourism activities carried out.
2. Conservation of biodiversity.
3. Waste management and plastic waste.
4. Maintain sustainable availability of water resources.
Green Tourism encourages sustainability through a selective process in the development of marketing programs to attract tourists who are environmentally conscious, show respect for natural components, have a concern for
environmental sustainability and sensitivity to local culture which is considered the best tourism model in
saving limited resources to meet the needs of the community variety of needs both now and for future
generations. Green tourism is very diverse such as tourist villages, agro-tourism, green guest houses, green hotels, nature tourism and the like are the most ideal models for sustainable tourism in creating a new economic
order (Dowling, and Fennel, 2010). According to (Doods & Joppe, 2001) some elements of green tourism are:
1. Environmental responsibility Maintain, conserve and improve the natural and physical quality of the environment to ensure the health and
sustainability of the ecosystem.
2. Strengthening the local economy Supports the local economy, local businesses and communities to ensure the strengthening and sustainability of
the local economy.
3. Cultural diversity
Respect and appreciate culture and cultural diversity so as to ensure the sustainability of the welfare of the
community and local culture.
4. Enriching experience
Enriching with satisfying experiences through activeness, participation in meaningful activities, engagement
with nature, people, places and local culture.
As an alternative form of tourism, green tourism has a focus on capacity considerations, education, preservation
of environmental resources and regional development, and regional specific activities. A power destination is called green tourism if it has four main dimensions, namely the nature base, conservation support, sustainability
and environmental education (Weaver, 2012), therefore green tourism is a form of tourism that has the best
appearance in fostering learning experiences and appreciation in a sustainable manner in managing and enhance
the sustainability of the natural, cultural, social environment, resources of the destination and promote a higher quality of life in the future. There are five strategies for developing green tourism, namely conservation
strategies, lean strategies, defense strategies, shaded strategies, and extreme strategies which are seen as
mechanisms and processes by which green tourism goals can be achieved (Dowling, 2010).
International Journal of Advance and Innovative Research Volume 8, Issue 3 (IV) July - September 2021 Part - 2
251
ISSN 2394 - 7780
One of the strategies included in this paper is a conservation strategy with an emphasis on eco development
(environmentally friendly development), which is a concept that is environmentally, economically and socially
interdependent. This strategy recommends taking actions that ensure the long-term maintenance of tourism resources (natural or man-made). Tourism has a strong dependence on quality natural resources, therefore green
tourism is not only an ideal but this economic imperative makes sense, because a good economy will grow
from the ability to protect the environment as a resource that provides opportunities for actors to use business together. Tourists really hope that this tourist attraction has a clean, beautiful, well-maintained, and comfortable
environment, so that green tourism is created. In green tourism there are several components related to these
tourist attractions, namely:
1. Revitalization and environmental conservation Revitalization is a series of efforts to reorganize a condition of areas and buildings that have strategic potential
and value by restoring the vitality of an area that has decreased so that these areas get optimal added value to
the economic, social and cultural productivity of urban areas. Conservation is an effort that can revive the old
vitality that has faded.
2. Safety and comfort.
The safety and comfort factors greatly support the creation of green tourism. Supporting capacities such as road infrastructure, modes of transportation, ATMs, security posts are parts to support the creation of security and
comfort for tourists.
3. Community Empowerment
The process of developing human resources/community itself is in the form of extracting personal abilities, creativity, and competence from the community. Community empowerment will help the community to
improve the ability or creativity of the community to meet the economic needs of the community itself.
Informal Sector Concept A tourist attraction will attract tourist visits, so that the informal sector is needed to meet the needs and desires
of tourists. The informal sector raised by Keith Hart (1991) by describing the informal sector as the urban
workforce that is outside the organized labor market. According to Mulyadi (2003:95) the informal sector is
business units that do not or at all receive official economic protection from the government. The informal sector is one sector that has a contribution to economic activity. The concept of the informal sector is the status
of an employment relationship consisting of independent workers with the help of freelancers. The informal
sector also includes the mass of working poor whose productivity level is much lower than that of modern
sector workers in cities that are closed to the poor (Breman & Manning, 1991:138).
Informal sector workers According to Law No. 25 of 1997 concerning Manpower are workers who work in
informal sector employment relationships by receiving wages and/or compensation. Meanwhile, informal sector businesses are people's activities. Individual or family, or several people who carry out a joint business to
carry out economic activities based on trust and agreement, and is not legal entities. The characteristics of the
informal sector according to (Wirosardjono, 1985) are as follows:
1. The pattern of activities is irregular, both in terms of time, capital and demand.
2. It is not touched by regulations or provisions set by the government so that its activities can often be said
to be wild.
3. The capital, equipment and supplies as well as the turnover are usually small and are managed on a daily
basis.
4. Has no attachment to big business.
5. Generally carried out by and serving low-income groups of people.
6. Does not require special skills and skills so that it can absorb various levels of workforce education.
7. Generally, each business employs a small number of workers and is from family relationships,
acquaintances, or comes from the same area.
8. Not familiar with banking, bookkeeping, credit and so on.
The informal sector has a big role in developing countries including Indonesia. The informal sector is an
unorganized, unregulated, and mostly legal but unregistered sector. The informal sector has characteristics such
as a large number of small-scale business units; ownership by individuals or families, simple and labor-
International Journal of Advance and Innovative Research Volume 8, Issue 3 (IV) July - September 2021 Part - 2
252
ISSN 2394 - 7780
intensive technology, low levels of education and skills and relatively lower levels of wages compared to the
formal sector that most workers in the urban informal sector are migrants from villages or from other areas. The
motivation of workers is to earn enough income to just survive. They have to live in slums, where public
services such as electricity, clean water, transportation, health, and education are minimal.
The informal sector can have a large role in human resource development. The informal sector generates
demand for semi-skilled and unskilled labor. The informal sector usually uses appropriate technology and uses local resources so that it will create an efficient allocation of resources. The informal sector can improve the
distribution of development outcomes to the poor, which are usually associated with the informal sector.
Informal sector experienced some of the obstacles and problems. The problems and obstacles faced by the
informal sector in general are:
1. Limited capital and access to markets are the main obstacles that are acute and cannot be completely
overcome.
2. There are no advocacy efforts growing from within the informal sector
3. Informal sector actors do not yet have business management that can make them work efficiently and have
strong bargaining power
4. The inhibition of the informal sector empowerment process is not only caused by a limited budget but also by government policies (central/regional) which tend to be less inclined to require an informal
transformation to an advanced and modern formal.
5. The informal sector is seen as a destroyer of the city, although not all of them actually have a negative side
and the growth of this informal sector. The informal sector has not been recognized as a sector that has
great potential in Indonesia's economic development.
6. Many officials and elite groups view the informal sector, especially as street vendors, as a nuisance that
makes the city structure untidy and dirty, such as traffic jams, and many diseases appear due to littering.
RESEARCH METHODOLOGY
This type of research is field research in the form of case studies. This research approach uses a qualitative
approach whose data sources are obtained from interviews and observations at the Sulamanda Beach tourist
attraction in Kupang Regency. Data collection was done by observation, open interviews and literature study. In this study the population and sample used informants consisting of tourist attraction managers, tourists, and
traders engaged in the informal sector at the Sulamanda beach tourism object, using the "purposive sampling"
method, namely deliberately sampling of people or figures who expected to be able to provide answers to the questions given. The analytical method used in this research is descriptive data analysis method. Descriptive
analysis that is emphasized in this research is qualitative. Qualitative descriptive analysis tends to be in the
form of words rather than numbers, which is the main study, and a detailed description of the results of information and facts obtained from informants, namely the informal sector located on Sulamanda Beach and
tourism object managers.
FINDING AND DISCUSSION
Interview Result Based on the statement of interviews and also the results of observations of the informal sector in Sulamanda
Beach about the role of the informal sector in realizing green tourism, the authors argue that the role played by
the informal sector according to theory (Tambunan, 1999) are:
1. Labor-intensive, the role of the informal sector on Sulamanda Beach is in accordance with this theory,
namely by building their place of commerce.
2. Endurance, the Role of the informal sector on the Sulamanda beach is in accordance with this theory,
namely the informal sector still survives in trading even during the current covid pandemic.
3. Special expertise, the informal sector is in accordance with this theory, namely the informal sector makes
local products such as fried corn, banana chips, and so on for sale.
4. Capital, the informal sector in Sulamanda Beach is in accordance with this theory, namely the informal
sector has capital from its own savings and also through loan funds to be used as capital in trading.
According to the results of interviews and observations about Green Tourism at Sulamanda Beach according to
theory (Dowling, and Fennel, 2010), namely:

International Journal of Advance and Innovative Research Volume 8, Issue 3 (IV) July - September 2021 Part - 2
253
ISSN 2394 - 7780
1. Environmental responsibility, in my opinion, green tourism at Sulamanda Beach is in accordance with the
theory of green tourism, namely by maintaining cleanliness and also maintaining plants around the beach.
2. Strengthening the local economy, green tourism on Sulamanda Beach is appropriate, namely by supporting
the local economy by selling local foods.
3. Cultural Diversity, According to the results of interviews conducted with the Head of the Mata Air
Village, Sulamanda Beach usually sells local products such as woven fabrics. This is done to introduce cultural diversity through woven fabrics typical of NTT. From this statement, what has been done is in
accordance with the concept of green tourism regarding cultural diversity.
4. Enriching the experience, I think it is in accordance with the theory of green tourism because participating
in community service activities; involvement with nature is taking care of the surrounding trees by
watering them.
The Role of the Informal Sector in Realizing Green Tourism on Sulamanda Beach
Beaches that are clean, beautiful and free from trash will certainly give a comfortable and good impression for tourists visiting Sulamanda Beach. In addition, it will also have a good impact on the informal sector that plays
a role in Sulamanda Beach tourism objects. The role of the informal sector to realize Green Tourism is because
with the availability of various businesses available on the coast, it will certainly cause various types of waste, which of course is caused by traders and tourists who visit. Based on the results of observations and interviews
with several informal sectors around Sulamanda Beach, the role of the informal sector in realizing Green
Tourism is carried out through several stages as follows:
1. Cleaning Stage Every Friday, traders are required by BUMDES and directly coordinated by POKDARWIS to hold joint work
around the coast of Sulamanda Beach. and every trader is required to clean his wares in the morning before
opening his wares and after closing his wares in the afternoon. This is done so that the cleanliness around
Sulamanda Beach is maintained.
2. Accommodation stage
The storage stage is the most important stage to make it easier to collect waste later. Trashcans are already
available around the beach, making it easier for tourists to dispose of their garbage while on Sulamanda Beach.
The purpose of this container is so that tourists or visitors do not litter.
3. Maintenance and Preservation Stage
Around Sulamanda Beach, the government has planted several types of plants such as trees around the beach. Traders usually water the trees with available clean water to keep them fertile and beautiful. Traders also
usually water the yard around Sulamanda Beach so that when the wind blows it doesn't cause pollution such as
dust that can disturb the comfort of tourists or visitors who come to visit Sulamanda Beach.
4. The stage of providing comfort with trading facilities provides clean and comfortable and attractive seating
facilities and also the presence of music to provide comfort to visitors or tourists who come.
Constraints faced by the informal sector in realizing Green Tourism on Sulamanda Beach
Based on the results of interviews with several informal sectors, some of the obstacles faced by the informal
sector in realizing Green Tourism on Sulamanda Beach are as follows:
1. Lack of awareness of tourists or visitors in maintaining cleanliness
Garbage caused by tourists or visitors who come. The visitors or tourists who come do not throw garbage directly into the trash. But they throw it carelessly, thus making it difficult for the informal sector to clean up
the existing waste.
2. Post trash Garbage shipped from seawater is also one of the obstacles faced by the informal sector, because there are
people who carelessly throw garbage into the sea so that this garbage is carried by sea water to the coast.
3. Difficult to get clean water
To get clean water, the informal sector must collect money from each other in order to order tank water. But sometimes there is a lack of cooperation and agreement so that there are some informal sectors that do not
participate in raising money, making it difficult to get clean water. Clean water is used for the informal sector
in the preservation of tourism objects, namely, to water the plants around Sulamanda Beach.
4. Lack of garbage disposal

International Journal of Advance and Innovative Research Volume 8, Issue 3 (IV) July - September 2021 Part - 2
254
ISSN 2394 - 7780
There are very few trashcans available around Sulamanda Beach because there are several trashcans that have
been damaged. According to one of the informal sector workers, Mrs. Rina, there is a trashcan made of drums
that has been damaged because it is often used to burn garbage inside.
5. Lack of government attention
The government's lack of attention in repairing damaged trading facilities such as damaged stalls caused by
rising sea water during floods and also perforated trading roofs making it difficult to store merchandise during
the rainy season.
Solutions to the obstacles faced by the informal sector in realizing Green Tourism
1. A solution for tourists or visitors who litter Organize lots of trash bins around the beach and make warning
boards not to litter. 2. The solution in dealing with marine waste is by urging all informal sectors around Sulamanda Beach to
work together to clean up shipping waste around the beach area. And the role of the government is also
needed to change the mindset of the informal sector that not only is community service held every Friday but when the coast is polluted by shipping waste, the informal sector must work together to clean up so
that the beach is always clean and beautiful.
3. The solution to overcome the shortage of clean water The solution in overcoming the lack of clean water is that it requires the role of the government so that the provision of clean water in the form of PDAM in
Sulamanda Beach is so that the informal sector does not have to always order tank water to get clean
water. And can also build awareness of the informal sector so that they can work together in doing good
things, for the common good.
4. Solutions to overcome the lack of garbage disposal containers Requires the role of the government, namely
Bumdes Springs to provide lots of trash bins around Sulamanda Beach and also build awareness of the
informal sector so as not to burn waste in the trash so that the trash can is not damaged.
5. Solutions to overcome the government's lack of attention Provide reports of damage to trading facilities to
the manager, namely Bumdes so that they can be discussed with the Village Head of Mata Air, so that they
can pay attention to the damage faced by traders.
DISCUSSION Based on the results of research conducted, the role of the informal sector in realizing green tourism is very
important. These roles include, among others, that the informal sector can maintain cleanliness such as
maintaining cleanliness by always holding community service there every Friday, and always cleaning up trash before trading and after trading. In addition to maintaining the cleanliness of the informal sector, it can also
maintain the sustainability of Sulamanda Beach by watering the plants planted around the beach. According to
the results of interviews and observations to realize green tourism on Sulamanda Beach, more trees and other plants should be planted to make it look beautiful and cool and also provide clean water so that you can water
the plants around Sulamanda Beach and also the available facilities such as toilets, lopo-lopo, function rooms,
and there is also a place that can be used for pre-wedding. Everything that exists will add to the appeal of
Sulamanda Beach.
All the roles of the informal sector in realizing green tourism as a tourist attraction for Sulamanda Beach are
good but there are still obstacles faced by the informal sector, namely, lack of awareness of visitors or tourists
in maintaining cleanliness, lack of clean water supply, lack of trash cans, and also shipping waste from sea water. All the obstacles faced by the informal sector can be overcome by providing solutions such as, Providing
lots of trash bins and giving warning boards not to throw garbage carelessly, the government needs to play a
role in providing clean water in the form of PDAM, and also working together in doing community service not only on Fridays, but when garbage has been polluted a lot on the coast, the informal sector is encouraged to
work together in cleaning the beach.
Based on the statement of the results of interviews and also the results of observations of the informal sector in
Sulamanda Beach about the role of the informal sector in realizing green tourism, the authors argue that the role played by the informal sector according to theory (Tambunan, 1999) are: labor intensive, the role of the
informal sector in Sulamanda Beach is in accordance with this theory, namely by building their own place of
commerce. Endurance, the Role of the informal sector on Sulamanda beach is in accordance with this theory, namely the informal sector still survives in trading even during the current covid pandemic. Special expertise,
the informal sector is in accordance with this theory, namely the informal sector makes local products such as
fried corn, banana chips, and so on for sale. Capital, the informal sector in Sulamanda Beach is in accordance
International Journal of Advance and Innovative Research Volume 8, Issue 3 (IV) July - September 2021 Part - 2
255
ISSN 2394 - 7780
with this theory, namely the informal sector has capital from its own savings and also through loan funds to be
used as capital in trading.
According to the results of interviews and observations about Green Tourism at Sulamanda Beach according to the theory (Dowling, and Fennel, 2010), namely: Environmental responsibility, in my opinion green tourism at
Sulamanda Beach is in accordance with the theory of green tourism, namely by maintaining cleanliness and
also maintaining plants around the beach. Strengthening the local economy, green tourism on Sulamanda Beach is appropriate, namely by supporting the local economy by selling local foods. Cultural Diversity, According to
the results of interviews conducted with the Head of the Mata Air Village, Sulamanda Beach usually sells local
products such as woven fabrics. This is done to introduce cultural diversity through woven fabrics typical of
NTT. From this statement, what has been done is in accordance with the concept of green tourism regarding cultural diversity. Enriching the experience, I think it is in accordance with the theory of green tourism because
participating in community service activities; involvement with nature is taking care of the surrounding trees by
watering them.
CONCLUSION
The role of the informal sector in realizing green tourism on the Sulamanda beach has a positive impact in
supporting the cleanliness and beauty of the Sulamanda Beach tourist attraction, in addition to trading they are also required to maintain the cleanliness of the coast from scattered garbage. By carrying out routine activities
every Friday, community service is held on the coast and also, traders are required to clean up around the beach
before starting their trade and after they finish trading, and also watering the plants around the beach, watering
the yard to avoid pollution such as dust. Everything that is done aims to maintain the cleanliness and beauty of Sulamanda Beach. The role of informal sector traders can also support tourism on Sulamanda Beach because
the presence of traders can make it easier for tourists to get food or drinks.
Obstacles faced by the informal sector in realizing green tourism include the lack of awareness of tourists in maintaining cleanliness, so that visitors or tourists cause a lot of waste, garbage sent from sea water, difficulty
in getting clean water, lack of garbage disposal containers, and also the government's lack of attention to
damaged trading facilities such as stalls, roofs of merchandise that have holes.
REFERENSES
Arikunto, S. 1998. Prosedur penelitian. Jakarta : Rineka Cipta
Buana, dan Sunarta.N.(2015).Peranan sektor informal dalam menjaga kebersihan lingkungan di daya tarik
wisata pantai sunur. Jurnal destinasi parawisata.3 (1) : 35-36.
Creswell, J. W.1998. Qualitatif Inquiry and Research Design. Sage Publications, Inc:California
Dahuri R. 2003. Paradigma Baru Pembangunan Indonesia Berbasis kelautan. Naskah Orasi Ilmiah
Pengukuhan Guru Besar Tetap Ilmu Pengelolaan Sumberdaya pesisir dan Lautan. Institut Pertanian
Bogor, Bogor.
Effendi. 2005. Pertumbuhan Ekonomi, Sektor Informal, Yogyakarta : Pusat Penelitian
Kependudukan Universitas Gadjah Mada.
Gromang, Frans. 2005. Tuntutan Keselamatan Dan Keamanan Wisatawan. Jakarta : Pradnya
Paramita.
Koenjaraningrat. 1997. Metode metode Penelitian Masyarakat. Jakarta: PT. Gramedia Pustaka
Utama.
Marsuki. 1983. Metode risert. Yogyakarta. Bagian Penerbit Fakultas Ekonomi Universitas Islam
Indonesia.
Moeloeng, Lexy J. 2002. Metode Penelitian Kualitatif. Bandung : Remaja Rosdakarya
Nurrachmat, Memet. 1997. Geografi dan kependudukan. Solo : Tiga serangkai
Sabon, 2020. Analisis Potensi Dan Pengembangan Obyek Wisata Alam Pantai Ina Burak
Kecamatan Ile Boleng Di Pulau Adonara. Jurnal pariwisata, Kota Kupang.
Soekanto, Soerjono. 1982. Memperkenalkan sosiologi. Jakarta : CV. Rajawali.
Tanaamah, A.R., & Wardoyo, R. (2008). PERANCANGAN DAN IMPLEMENTASI WEBGIS
PARAWISATA.

International Journal of Advance and Innovative Research Volume 8, Issue 3 (IV) July - September 2021 Part - 2
256
ISSN 2394 - 7780
Undang-Undang Nomor 10 tahun 2009 tentang Kepariwisataan, Jakarta,Presiden Republik Indonesia.
Undang – Undang Nomor 25 tahun 1997 tentang Ketenagakerjaan, Jakarta, Presiden Republik Indonesia.
Wardhani, R. S., & Valeriani, D. (2016). Green Tourism dalam pengembangan pariwisata bangka
belitung. Journal of pariwisata .
International Journal of Advance and Innovative Research Volume 8, Issue 3 (IV) July - September 2021 Part - 2
257
ISSN 2394 - 7780
TOTAL QUALITY MANAGEMENT IN ACADEMIC LIBRARIES: AN OVERVIEW
Usha Kumari Sharma1 and Dr. Ashok Kumar Upadhyay
2
Research Scholar1 and Associate Professor & Librarian2, Department of Library and Information Science,
Mangalayatan University, Aligarh-202146
ABSTRACT
Total Quality Management (TQM) is the main prerequisite of libraries in 21st Century. As we know that
libraries form an indispensable part of an education system. In the current scenario of Information Technology, the requirements of the users are increasing unpredictably and in order to please them the quality of the service
should be upgraded. This can be achieved only through the execution of TQM which empowers libraries to be
more supple and reachable. Conventional methods of Library and Information service have changed . By following a strategic plan, library managers can transform & upgrade their organisation in order to effectively
deal with the challenges of 21st century. Total Quality Management (TQM) has garnered a lot of attention in
management literature recently. Hence this paper comes to fulfil that lacuna as it throws light upon various
issues related to TQM & its application in the domain of library service. The implementation of TQM needs endurance and patience as it is a laborious process. The course of execution Total Quality Management
involves a conceptual transformation in library professionals and a cultural change in organizational
processes. Teamwork is mandatory under healthy leadership for the successful execution of Total Quality Management in Academic Libraries, periodic training should be given to the library staff in order to keep them
acquainted with the information technology. Moreover, it also discusses briefly the contemporary Total
Quality Management related to Library Science & its subsequent prospects in the managerial approach more
successful in this field.
KEY-WORDS:-Total Quality Management (TQM), Information Communication Technology(ICT), Academic
libraries, User Satisfaction, implementation.
INTRODUCTION:-
Total Quality Management (TQM) is a concept formed by W. Edward Deming. It was firstly adapted in Japan after World War-II to supports the Japanese in reconstruction of their Economy. Total Quality
Management is the evolving topic in these days. TQM is an innovative tactic to effective management. It is the
art of handling the whole to accomplish quality. It enhances the goods and services of the libraries in order to please the users. Total Quality Management is defined as both a philosophy and a set of managerial ideologies
that signify the fundamentals of an unceasingly enlightening organization.
Due to the effect of Information Technology, the requirements of the users are rising unpredictably and in order
to gratify them the excellence of the services should be upgraded. This can be achieved through execution of Total Quality Management which enable libraries to be more supple and reachable. The conservative
approaches of giving services have today been exchanged by ICT and entirely guided by total quality
management tools and procedures.
DEFINITIONS OF TQM:-
According to Edgeman and Dahlgaad(1998) “TQM is a corporate culture that is characterised by increased
customer satisfaction through continuous improvement involving all employees in the organisation’.
Barnard and Jurow(1993) defined TQM as “A system of continuous improvement employing participative
management on the needs of customers”.
ISO defined TQM as “A management approach of an organisation centred on quality, based on participation of
all its members and aiming at long term benefits to all members of the organisation and society”.
LITERATURE REVIEW:-
Vikram U. Dahifale (2012) in his study on “Total Quality Management (TQM) in College Libraries: An
overview”. He perceived that the study of concepts and procedures in the library is very important. In the present scenario of information technology, the requirements of the users are increasing unpredictably and in
order to please them the quality of the services should be enhanced. This can be achieved through execution of
Total Quality Management which authorize libraries to be more supple and reachable. The electronic assets accessible in a library plays an vital role in enabling access to required information. CD- ROM, data bases,
online journals, online books, OPACs and the internet are gradually swapping the significance and practice of
print media.
International Journal of Advance and Innovative Research Volume 8, Issue 3 (IV) July - September 2021 Part - 2
258
ISSN 2394 - 7780
Meenakshi Bhan Harith (2013) in her study on “Total Quality Management (TQM) Indicators in Academic
Libraries: In India” the emphases on the execution of Quality library Service at University level. The main
purpose of this paper is to trace out the indicators of measuring the quality management in academic libraries. It was detected from this study that users usually used five factors as their standards for arbitrating the quality of
library services i.e., Reliability, Responsiveness, Assurance, Empathy and Tangibles of Quality Assessment.
Libraries form indispensable part of an Education System.
Vipin Panday (2014) conducted a study entitled “Total Quality Management (TQM): A Special Reference to
Library”. This research paper deals with the history , definition , origin, and principles of Total Quality
Management. This study provides information about the hurdles to the adoption of TQM in libraries such as
language barriers, commitment barrier, professional barrier etc. this research paper too provides all the details about the juxtaposition between Total Quality Management to ISO 9001 and the practical use of TQM in
libraries. ISO 9001 is a Quality Management Standard. TQM is a philosophy of nonstop upgradation. The
implementation of ISO provides the basis for the implementation of Total Quality Management.
Ashok Singh Negi and J.P. Srivastava (2015)in their study on “Total Quality Management (TQM) and its
application in University Libraries & information services” describes the quality management which elucidates
Total Quality Management in the University Libraries &Information Services. It makes available tools and the ways to upgrade quality. It accomplishes that TQM is best demarcated as Philosophy beneath big umbrella.
The core purpose of this study is to enhance the concert of university libraries and information services. It is the
inclusive mode of handling academic library services with emphasis on client and quality in order to deliver
them quality goods and facilities.
Raja and Mahalakshmi (2016) observed through a survey entitled “Total Quality Management (TQM)
practices in Accredited and ISO certified management college libraries: A Comparative Study” which is
founded on structured questionnaire and compared Total Quality Management practices in accredited & ISO certified management college libraries. According to the consequences of the comparative study it was found
that those management libraries with ISO certification had the best Total Quality Management practices
compared to management libraries which are deprived of ISO certification. Therefore, the only option left to
the management college libraries is to implement TQM in all co-ordinated libraries.
V.A. Dakhole (2018)conducted a study on “ Academic libraries in Total Quality Management” and found that
TQM acts as a management tool which serves all types of users of the library to their fullest extent. The
application of TQM in academic library helps to assess the quality of the library service and gives chance for improvement. The main focus of this study is on the significance of the TQM, quality assurance and its
advantage in academic libraries. The entire process of implementation of TQM aims at introducing a new
cultural change which is likely to bring about larger involvement of workers to attain the goals of the academic
libraries.
Rajneesh Kumar (2018) conducted a study on “Total Quality Management (TQM) in libraries: An overview”.
The main purpose of this study is to inspect and assess TQM in libraries with a view of inspecting the
understanding of library professionals. The main focus of this paper is on how to execute Total Quality Management in libraries in order to lift up the quality of library amenities through the use of different
components of Total Quality Management. He examined that the implementation of Total Quality
Management requires time and persistence libraries
Muhammad Anwar and Dr. Tang Zhiwei (2019)
revealed in their study entitled “Quality Service
Management in University Libraries: A literature Review paper” that the goal of this study is to give an
overview abo. The implementation of Total Quality Management needs endurance and patience as it is laborious process. The course of executing Total Quality Management involves a conceptual transformation in
library professionals and a cultural change in organizational processes. Teamwork is mandatory under solid
leadership for the successful execution of Total Quality Management in the ut the quality management in
university libraries. This study reveals the library professionals perceptions and behaviour about Application of Total Quality Management(TQM) and also study the users’ attitude regarding the facilitation and services.
This study provides more information about Total Quality Management and its benefits in library service. Total
Quality Management in libraries need professional’s human resource means teamwork for healthy
environment.
Ebrahim Soltani and Adrian Wilkinson(2020) conducted a study on “TQM and performance appraisal:
complementary or uncomplimentary” and sum up with the argument of execution for the theory and exercise
of TQM and human source recitation management.
International Journal of Advance and Innovative Research Volume 8, Issue 3 (IV) July - September 2021 Part - 2
259
ISSN 2394 - 7780
G Mahibha (2021) conducted a study on “TQM- A Requisite for modern library and Information
Management” this research paper stressed on the implementation of TQM in libraries and Information
Management system and the hurdles on the achievement of TQM applications in the libraries.
OBJECTIVES OF THE STUDY:-
1.To recognize the necessity of TQM practices for its effective execution in the field of library and Information
Service.
2.To find out the obstacles in the execution of TQM in the field of Library and Information Science.
3. The aim of this research paper is to present an outline of the TQM in the field of Library and Information
Service.
4.To suggests strategies for successful employment of TQM in the Academic Library and Information Service
Institutions.
PRINCIPLES OF TQM:-
Teamwork;
Continuing training and aptitude development;
Top management leadership and obligation;
Constant self- assessment and process upgradation;
Customer driven quality;
Employee emancipation and recompense;
Quick reply;
functioning grounded on facts.
BENEFITS OF TQM IN THE LIBRARIES:-
Breaching interdepartmental barricades
Redefining the receivers of library services as interior clients (staff) and exterior clients (patrons)
Attaining state of constant enhancement
Improved product proposal;
Evolving an account of all the documents existing in a library;
Evolving a database which contains accounts for all forms of resources accessible in library;
Enabling through a numerous tool that can offer access to worldwide publicatios.
Decrease users’ grievances;
Effective utilization of men, machines and materials, ensuing higher production;
Burden free environment leading to good social relationships; and development of self-confidence
amongst users.
DIMENTIONS OF QUALITY:-
Reliability;
Responsiveness;;
Assurance;
Access;
Communication;
Security.
IMPORTANCE OF TQM IN LIBRARIES:- In the present scenario of information technology, the requirements of the users are increasing unpredictably and in order to please them the quality of the services
International Journal of Advance and Innovative Research Volume 8, Issue 3 (IV) July - September 2021 Part - 2
260
ISSN 2394 - 7780
should be enhanced. This can be achieved only through the execution of Total Quality Management which
empowers libraries to be more supple and reachable.
TQM IN ACADEMIC LIBRARIES:- Here the client is not a stranger, but part of the academic community. In India NAAC build up by UGC manage
assessment and inspection on the quality of facility provided by the educational organization including library
service. In the academic libraries, quality may be perceived by the clients in terms of speedy distribution or fault free services. These days, some librarians have shuffle their perception of library services to indicate a
user driven assessment. The valuation of how well a library prospers rest on the user as evaluator of the
quality.
LIBRARY FACILITIES:-
Appropriate outline;
Library should be set up in the centre of an organisation;
Adequate space and lightening;
Collection of textbooks, reference books and Journals, should be as per course of study;
Good planning of study material so that user can get their desired material instantly
Exhibition of new comings
Hypermedia structure in library
Subscription of e- resources as per necessity
SUGGESTIONS FOR QUALITY MAINTAINENCE IN LIBRARIES:-
For the effective implementation of TQM, dedicated and well- trained staff are required that take part
completely in quality enhancement activities of the libraries.In order to gratify users expectation librarian must trace out user requirements and accessibility of resources. The main customers of the libraries are the users.
Users must gratified by the libraries service. In order to provide effective and efficient services to the users
periodic training should be given to the library staff, library staff are fortified to take more accountability, communicate more efficiently and perform effectively. . Teamwork is mandatory under healthy leadership for
the successful execution of Total Quality Management in Academic Libraries, periodic training should be
given to the library staff in order to keep them acquainted with the information technology. Moreover, it also
discusses briefly the contemporary Total Quality Management related to Library Science & its subsequent
prospects in the managerial approach more successful in this field.
ICT based library exercise mandatory in quality based Academic Libraries:-
Circulation
Cataloguing
Data processing
Systematized In house database
CD ROM probing
Online networking
Photo replication
News clipping scanning service.
E – Questioning service etc.,
CONCLUSION:- :- In the present scenario of information technology, the requirements of the users are increasing unpredictably
and in order to please them the quality of the services should be enhanced. This can be achieved only through
the execution of Total Quality Management which empowers libraries to be more supple and reachable. Libraries are the service organisations devoted to their users. By following a strategic plan library managers can
transform and upgrade their organisation in order to effectively deal with the challenges of the 21st century.
The conventional methods of providing services have now been replaced by ICT and seriously guided by total
International Journal of Advance and Innovative Research Volume 8, Issue 3 (IV) July - September 2021 Part - 2
261
ISSN 2394 - 7780
quality management tools and techniques. TQM plays very important role in Quality Management in the
libraries. It helps in the growth of the proficiency of the library staff which deliver effective and efficient
services to the users. The implementation of TQM needs endurance and patience as it is a laborious process. The course of execution Total Quality Management involves a conceptual transformation in library
professionals and a cultural change in organizational processes. Teamwork is mandatory under healthy
leadership for the successful execution of Total Quality Management in Academic Libraries, periodic training
should be given to the library staff in order to keep them acquainted with the information technology.
REFERENCES:- .
1. Dahifale, V.U. (2012) Total Quality Management in College Libraries: An overview. Indian Streams
Research Journal. 1(12), pp. 1-4. 2,
2. Harith, M.B. (2013) Total Quality Management Indicators in Academic Libraries: In India. Journal of
Business Management & Social Service Research [Online]. 2(11), pp.12-16. Available at:
www.bourjournal.com [Accessed 1st March 2020]. .
3. Panday, V. (2014) Total Quality Management (TQM): A Special Reference to Library. International
Journal of Digital Library Services [Online]. 4(3), pp. 37-43. Available at: www.ijodls.in [Accessed 25th
March 2020]. .
4. Negi, A.S.& Srivastava J.P. (2015)Total Quality Management and its application in University Library and
Information Services. International Journal in Management and Social Science[Online]. 3(2), pp. 676-
688. Available at: http://www.ijmr.net.in [Accessed 22nd March 2020].
5. Raja, P. & Mahalakshmi,M. (2016)Total Quality Management Practices in accredited & ISO Certified management College libraries: A Comparative Study. International Journal of Applied Research. 2(5), pp.
116-118.
6. Dakhole V. A. (2015), "Academic Libraries in Total Quality Management”. International Journal Of
Researches in Social Sciences and Information Studies. Vol. 2(4), pp. 64-66.
7. Kumar, R. (2018) Total Quality Management in Libraries: An Overview. International Journal of
Research. [Online]. 5(4), pp. 2555-2561.Available at https://edupediapublications.org/journals [Accessed
8th March 2020].
8. Anwar, M. & Zhiwei, T. (2019) Quality Service Management in University Libraries: A literature Review
paper .International Journal of library & Information Studies [Online]. 9(4), pp.52-59. Available at:
http://www.ijlis.org [Accessed 5th February 2020].
9. Soltani,E and Wilkinson,A (2020)”TQM and Performance Appraisal: Complementary or
Incomplementry? Eurapion Management Review .17(1),pp 57-82.
10. Mahibha, G(2021) “TQM- A Requisite for modern library and Information Management”. International
Journal of business and Management.13(1),pp 1-8.
11. Mishra, B.K. (2017) Total Quality Management in Academic Libraries: An Overview. International
Journal of Library & Information Science [Online]. 6(6), pp. 106-110.Available at
http://www.iaeme.com/IJLIS/issues.asp?JType=IJLIS&VType=6&IType=6 [Accessed on 12th March
2020].
12. Khera, D. & Sharma, S.N. (2012) TQM: An Over View in Academic Libraries. International Journal of
Librarianship and Administration [Online]. 3(1), pp. 81-86. Available at:
http://www.ripublication.com/ijla.html
International Journal of Advance and Innovative Research Volume 8, Issue 3 (IV) July - September 2021 Part - 2
262
ISSN 2394 - 7780
TRAVELLER’S EXPECTATIONS TOWARDS UPCOMING AIRPORT SERVICES IN SELECT
TIER 2 AND TIER 3 CITIES OF SOUTH INDIA
Nalla Ramakrishna1 and Dr. Harish Babu S
2
1Research Scholar, University of Mysore 2Principal & Director, Nagarjuna Group of Institutions, Bangalore
ABSTRACT
Gradually, the need & opportunities for passenger’s transportation are increasing and in basic services. The need and opportunities will create competition among the transportation modes, and by addition of another
travel mode to current modes in circulation led to a very tight competition along with that, customer
expectations will also increase in terms of a lower price, luxury, less time to reach the destination and additional services. This makes the travellers meet with various services, so the service providers need to know
the choices and facilities required for the travellers to attract, create, and provide the service. This study is
carried out in South Indian cities where the airport is unavailable and where the Government of India
proposed a new airport. The study's objective is to find the important characteristics considered by travellers while traveling to the nearest airport city as well by using the Fishbein multi-attribute model, finding which
mode of travellers has more expectations from the upcoming airport services to the cities. The results of the
study are those who travel to the nearest airport city using Taxi having more expectations on the upcoming airport service to the selected cities, in that support attribute having the highest expectation. The supported
attribute here is about supporting the move of the government to provide low-cost airlines through the Udan
scheme, and Community support to the new airport will be positive.
Keywords: Modes of transportation, expectation of travellers, low-cost airlines, airport city, government
INTRODUCTION:
In general, attitude is about expressing feelings about the object or things whether they feel good or bad or likes
or not. To understand the multiple attributes of an object or product, or service, the Fishbein multi-attribute
model is an effective method. This model's primary purpose is to understand the behaviors or actions of
products or services promoted by the marketers and make strategies for influencing the consumer.
Consumer researchers or market researchers mostly use attitude measurement. The model has three models:
attitude towards behaviors, attitude towards the object, and lastly, theory of reasoned action. The approach
towards the object is like the products of a brand or services given by the brand or a brand itself.
The Fishbein attribute model is explained for the attitude towards an object is a function of belief and
connected with the attributes and evaluates data that will be connected to the belief. Another part of the design
is reasoned action explains the incorporation of the components of attitude generates a good explanation and forecasting of the behavior. The following equation is the Fishbein attribute model, which will be adopted here
for studying expectations towards the upcoming airport to the cities.
A0=i=1nbiei
Where:
A0 = Attitude toward an object
b = Strength of belief that the object has attribute i
e = The evaluation of attribute i
n = The number of beliefs
The considered transportation modes are Road, Rail, and Air. Again, road transportation mode is divided into
types like Public bus, Private bus, and Taxi. The upcoming airlines' services as another transportation mode.
LITERATURE REVIEW:
Abdullah Ramdhani, Dini Turipanam Alamanda, And Hendri Sudraja: Authors' objective is to study the
important characteristics of the consumer on the various brands of the cars. To find out the import among all used multi-attribute Fishbein models and the theory of reasoned action. From the study, they identified
that various brands of cars were the price of a car. Another important objective of the study is to find out
the dominant factor in influencing the purchasing decision of a car is a member of the family. The whole idea of the paper to understand and measure the consumer preferences and tastes for the particular product
International Journal of Advance and Innovative Research Volume 8, Issue 3 (IV) July - September 2021 Part - 2
263
ISSN 2394 - 7780
or service and how it will be used for the competitive companies by using the Fishbein multi-attribute
model.
Mahmood Jas Im Alsamydai, Hus Am Mus Tafa Alnaimi & Dima Mous A Dajani ( 2015 ). The authors surveyed the attitudes of the customers on the electronic SMS sent to their mobiles. The four dimensions
considered in the study's objective are importance, belief, affect, and attitude. To test whether customers'
attitudes are the same or not, using one Sample T-test and applied the Fishbein model to find the effective means of communication. Considered E-communications are Facebook, Twitter, Email, and Mobile
phones. The questionnaire consists of 72 questions and asked to respond to the rate on a 1 to 5 rating scale,
after collecting data applied to the Fishbein model that is the multiple belief and its importance to the
customer. The final study results are showing that except for twitter remaining means are having higher
altitudes than others. Here Fishbein models can find out the higher important means of communication.
Jasuli ( 2018). The author aims to study the students' attitude towards the use of e-learning in their
education of postgraduate students. The sample for the study is about 100 is a no probabilistic method, and the statements used semantic differential scale and after collecting samples applies Fishbein's multi-
attribute model. The author selected the 10 various attributes which are related to e-learning. After that,
tested the samples with reliability using Cronbach's alpha and validity using Pearson's correlation. So, in this case, both are satisfied. After validation and reliability applied Fishbein's mathematical model. The
results of the Fishbein model are positive, and it means that the overall attitude of the student regarding e-
learning is good and able to identify which variable is a major contributor, i.e., easy accessibility.
Gaps Identified: There are some relevant studies identified then reviewed for the present study. Some of the reviewed studies are
mentioned below for reference. From Previous studies identified research gap, i.e., in previous studies, they
considered the Fishbein model for finding the attitude towards an object, and some of the studies based on the persons or customers individual attitudes and studies are not identified related to expectations of persons or
customers towards the particular service, i.e., different modes and categories of transportation passengers
expectations towards the upcoming airlines in South Indian cities where airport not established as well where
government proposed airport in those cities.
Research Objectives:
To Identify the important factors considered for traveling to the nearest airport city by the different modes
of transportation by the passengers.
To find out which modes of transportation passengers having more expectations towards the upcoming
airlines.
RESEARCH METHODOLOGY:
Research design:
The current research was concluded based on the results from the descriptive statistics by using the collected
sample data. The variables identified are from the reviews of published literature online. The research variables
are the key for the analytics. The present study included steps are sample collection, data cleaning, preparation
for analysis, and interpretation with a conclusion.
Population and Samples:
Here, the population used in this study is from passengers of existing transportation of cities where the airport is not there. The government proposed a new airport in the cities of South India. The sample from the
population is considered technique is the simple random method and with sample size 100. The following are
the selected cities for the survey, and from each city, the sample size is 10.
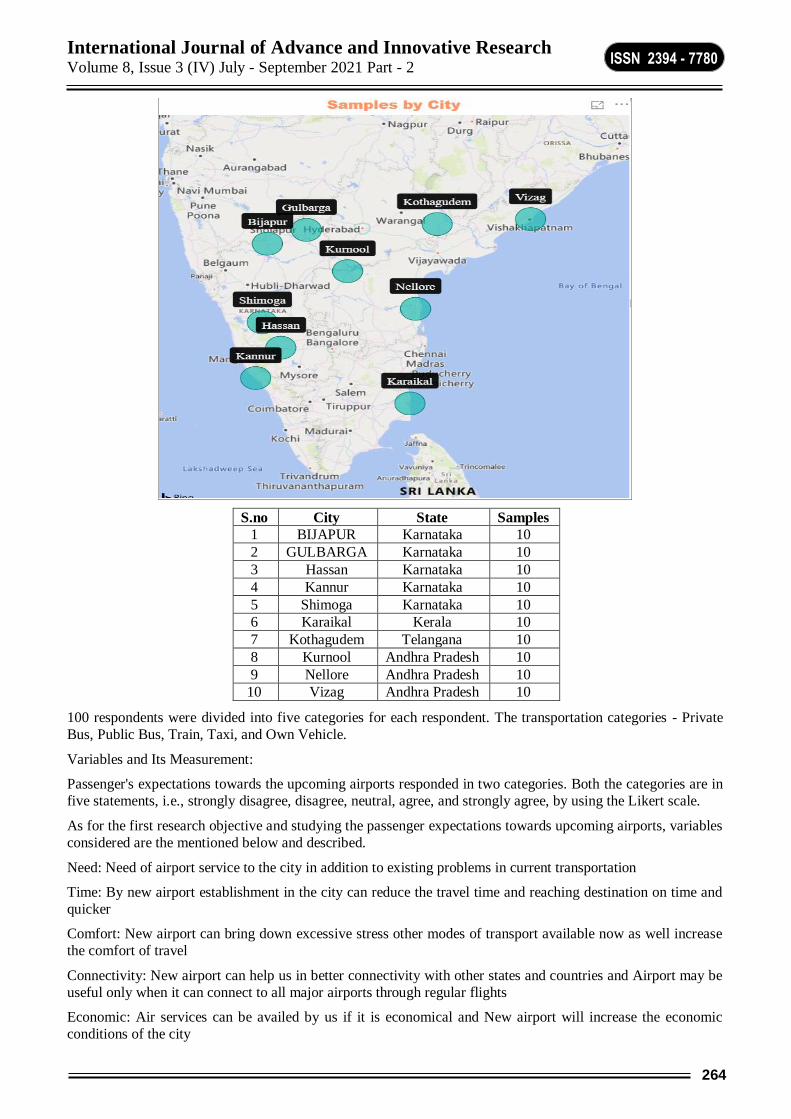
International Journal of Advance and Innovative Research Volume 8, Issue 3 (IV) July - September 2021 Part - 2
264
ISSN 2394 - 7780
S.no City State Samples
1 BIJAPUR Karnataka 10
2 GULBARGA Karnataka 10
3 Hassan Karnataka 10
4 Kannur Karnataka 10
5 Shimoga Karnataka 10
6 Karaikal Kerala 10
7 Kothagudem Telangana 10
8 Kurnool Andhra Pradesh 10
9 Nellore Andhra Pradesh 10
10 Vizag Andhra Pradesh 10
100 respondents were divided into five categories for each respondent. The transportation categories - Private
Bus, Public Bus, Train, Taxi, and Own Vehicle.
Variables and Its Measurement:
Passenger's expectations towards the upcoming airports responded in two categories. Both the categories are in
five statements, i.e., strongly disagree, disagree, neutral, agree, and strongly agree, by using the Likert scale.
As for the first research objective and studying the passenger expectations towards upcoming airports, variables
considered are the mentioned below and described.
Need: Need of airport service to the city in addition to existing problems in current transportation
Time: By new airport establishment in the city can reduce the travel time and reaching destination on time and
quicker
Comfort: New airport can bring down excessive stress other modes of transport available now as well increase
the comfort of travel
Connectivity: New airport can help us in better connectivity with other states and countries and Airport may be
useful only when it can connect to all major airports through regular flights
Economic: Air services can be availed by us if it is economical and New airport will increase the economic
conditions of the city
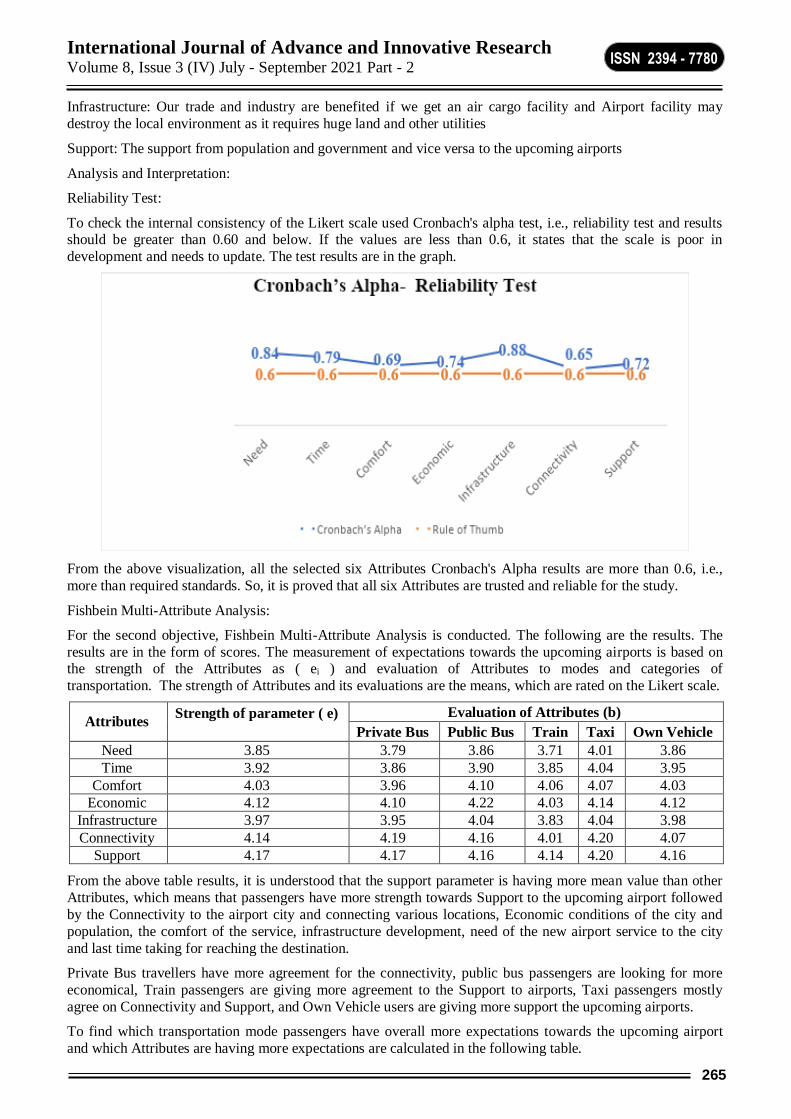
International Journal of Advance and Innovative Research Volume 8, Issue 3 (IV) July - September 2021 Part - 2
265
ISSN 2394 - 7780
Infrastructure: Our trade and industry are benefited if we get an air cargo facility and Airport facility may
destroy the local environment as it requires huge land and other utilities
Support: The support from population and government and vice versa to the upcoming airports
Analysis and Interpretation:
Reliability Test:
To check the internal consistency of the Likert scale used Cronbach's alpha test, i.e., reliability test and results should be greater than 0.60 and below. If the values are less than 0.6, it states that the scale is poor in
development and needs to update. The test results are in the graph.
From the above visualization, all the selected six Attributes Cronbach's Alpha results are more than 0.6, i.e.,
more than required standards. So, it is proved that all six Attributes are trusted and reliable for the study.
Fishbein Multi-Attribute Analysis:
For the second objective, Fishbein Multi-Attribute Analysis is conducted. The following are the results. The
results are in the form of scores. The measurement of expectations towards the upcoming airports is based on the strength of the Attributes as ( ei ) and evaluation of Attributes to modes and categories of
transportation. The strength of Attributes and its evaluations are the means, which are rated on the Likert scale.
Attributes Strength of parameter ( e)
Evaluation of Attributes (b)
Private Bus Public Bus Train Taxi Own Vehicle
Need 3.85 3.79 3.86 3.71 4.01 3.86
Time 3.92 3.86 3.90 3.85 4.04 3.95
Comfort 4.03 3.96 4.10 4.06 4.07 4.03
Economic 4.12 4.10 4.22 4.03 4.14 4.12
Infrastructure 3.97 3.95 4.04 3.83 4.04 3.98
Connectivity 4.14 4.19 4.16 4.01 4.20 4.07
Support 4.17 4.17 4.16 4.14 4.20 4.16
From the above table results, it is understood that the support parameter is having more mean value than other
Attributes, which means that passengers have more strength towards Support to the upcoming airport followed
by the Connectivity to the airport city and connecting various locations, Economic conditions of the city and
population, the comfort of the service, infrastructure development, need of the new airport service to the city
and last time taking for reaching the destination.
Private Bus travellers have more agreement for the connectivity, public bus passengers are looking for more
economical, Train passengers are giving more agreement to the Support to airports, Taxi passengers mostly
agree on Connectivity and Support, and Own Vehicle users are giving more support the upcoming airports.
To find which transportation mode passengers have overall more expectations towards the upcoming airport
and which Attributes are having more expectations are calculated in the following table.
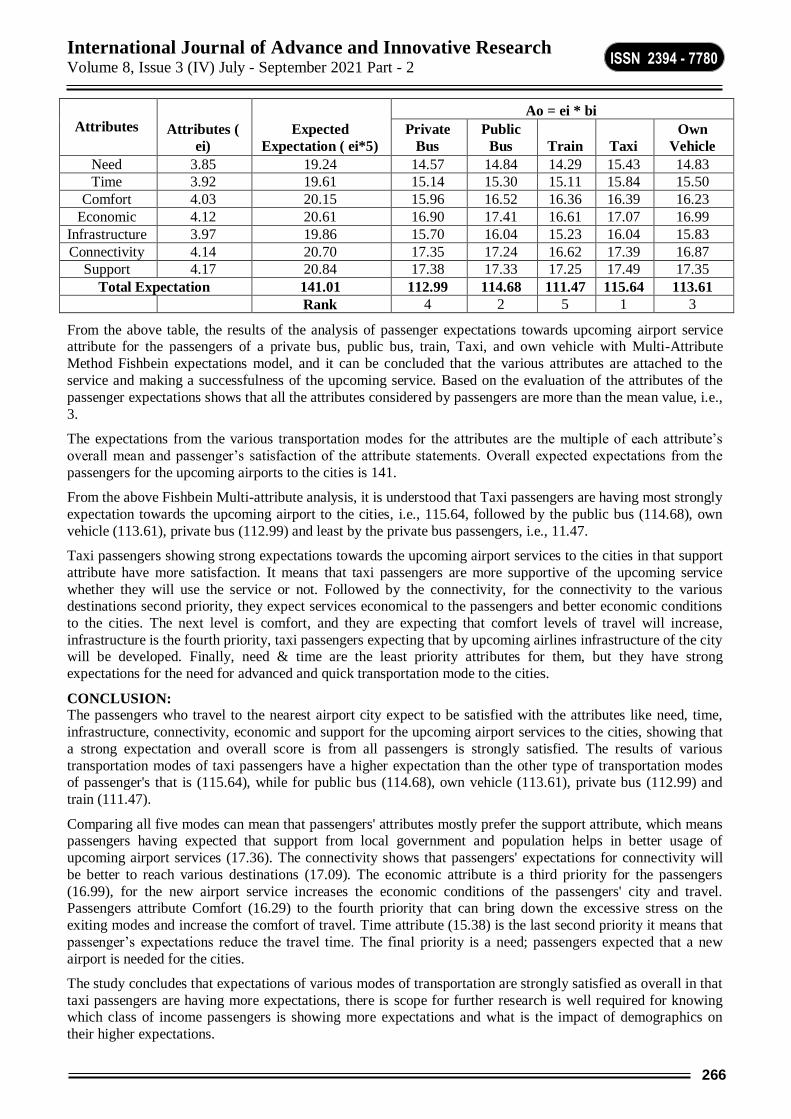
International Journal of Advance and Innovative Research Volume 8, Issue 3 (IV) July - September 2021 Part - 2
266
ISSN 2394 - 7780
Attributes Attributes (
ei)
Expected
Expectation ( ei*5)
Ao = ei * bi
Private
Bus
Public
Bus Train Taxi
Own
Vehicle
Need 3.85 19.24 14.57 14.84 14.29 15.43 14.83
Time 3.92 19.61 15.14 15.30 15.11 15.84 15.50
Comfort 4.03 20.15 15.96 16.52 16.36 16.39 16.23
Economic 4.12 20.61 16.90 17.41 16.61 17.07 16.99
Infrastructure 3.97 19.86 15.70 16.04 15.23 16.04 15.83
Connectivity 4.14 20.70 17.35 17.24 16.62 17.39 16.87
Support 4.17 20.84 17.38 17.33 17.25 17.49 17.35
Total Expectation 141.01 112.99 114.68 111.47 115.64 113.61
Rank 4 2 5 1 3
From the above table, the results of the analysis of passenger expectations towards upcoming airport service attribute for the passengers of a private bus, public bus, train, Taxi, and own vehicle with Multi-Attribute
Method Fishbein expectations model, and it can be concluded that the various attributes are attached to the
service and making a successfulness of the upcoming service. Based on the evaluation of the attributes of the
passenger expectations shows that all the attributes considered by passengers are more than the mean value, i.e.,
3.
The expectations from the various transportation modes for the attributes are the multiple of each attribute’s
overall mean and passenger’s satisfaction of the attribute statements. Overall expected expectations from the
passengers for the upcoming airports to the cities is 141.
From the above Fishbein Multi-attribute analysis, it is understood that Taxi passengers are having most strongly
expectation towards the upcoming airport to the cities, i.e., 115.64, followed by the public bus (114.68), own
vehicle (113.61), private bus (112.99) and least by the private bus passengers, i.e., 11.47.
Taxi passengers showing strong expectations towards the upcoming airport services to the cities in that support
attribute have more satisfaction. It means that taxi passengers are more supportive of the upcoming service
whether they will use the service or not. Followed by the connectivity, for the connectivity to the various destinations second priority, they expect services economical to the passengers and better economic conditions
to the cities. The next level is comfort, and they are expecting that comfort levels of travel will increase,
infrastructure is the fourth priority, taxi passengers expecting that by upcoming airlines infrastructure of the city will be developed. Finally, need & time are the least priority attributes for them, but they have strong
expectations for the need for advanced and quick transportation mode to the cities.
CONCLUSION: The passengers who travel to the nearest airport city expect to be satisfied with the attributes like need, time,
infrastructure, connectivity, economic and support for the upcoming airport services to the cities, showing that
a strong expectation and overall score is from all passengers is strongly satisfied. The results of various
transportation modes of taxi passengers have a higher expectation than the other type of transportation modes of passenger's that is (115.64), while for public bus (114.68), own vehicle (113.61), private bus (112.99) and
train (111.47).
Comparing all five modes can mean that passengers' attributes mostly prefer the support attribute, which means passengers having expected that support from local government and population helps in better usage of
upcoming airport services (17.36). The connectivity shows that passengers' expectations for connectivity will
be better to reach various destinations (17.09). The economic attribute is a third priority for the passengers
(16.99), for the new airport service increases the economic conditions of the passengers' city and travel. Passengers attribute Comfort (16.29) to the fourth priority that can bring down the excessive stress on the
exiting modes and increase the comfort of travel. Time attribute (15.38) is the last second priority it means that
passenger’s expectations reduce the travel time. The final priority is a need; passengers expected that a new
airport is needed for the cities.
The study concludes that expectations of various modes of transportation are strongly satisfied as overall in that
taxi passengers are having more expectations, there is scope for further research is well required for knowing which class of income passengers is showing more expectations and what is the impact of demographics on
their higher expectations.

International Journal of Advance and Innovative Research Volume 8, Issue 3 (IV) July - September 2021 Part - 2
267
ISSN 2394 - 7780
REFERENCE:
Analysis of Consumer Attitude Using Fishbein Multi-Attributes Approach-
https://www.researchgate.net/publication/316348612_Analysis_of_Consumer_Attitude_Using_Fishbein_
Multi-Attributes_Approach
Using fishbein model to measure individual’s attitudes toward electronic communication means
https://www.zuj.edu.jo/wp-content/staff-research/economic/dr.mohmood-Jasim/11.pdf
Analysis of student attitudes towards e-learning using Fishbein Multiattribute approach
https://iopscience.iop.org/article/10.1088/1757-899X/296/1/012011/pdf
https://transportgeography.org/?page_id=1731
Ajzen, I. (1985). From intentions to actions: A theory of planned behavior. In Kauhl and Beckman (Eds.).
Action Control: From Cognition to Behavior. Heidelberg Germany
Ajzen, I. (2001). Nature and operations of attitude. Annual Review of Psychology, 52, 27-58.
http://dx.doi.org/10.1146/annurev.psych.52.1.27.
Alsamydai M. J. (1986). Application des modeles multi–attributes au marche de l' automobile, these
doctoratd'Etates-science de gestion, Universite de Clermont I, France (pp.3-9).
The Fishbein Extended Model and Consumer Behavior by the Michael J. Ryan, E. H. Bonfield
Social Expressiveness of Products and Social Desirability as Mediating Variables in Fishbein's Model by
Peter Schnedlitz
Fishbein, M, &Ajzen, I. (1975). Beliefs, attitude, intention, and behavior, an introduction to theory and
research. reading MA: Addison–Wesley.
International Journal of Advance and Innovative Research Volume 8, Issue 3 (IV) July - September 2021 Part - 2
268
ISSN 2394 - 7780
TRENDS AND DEVELOPMENTS OF FOREIGN DIRECT INVESTMENT IN POWER SECTOR IN
INDIA
Dr. M. Mary Anbumathy1 and D. Velumani
2
1M.Com., M.Phil., Ph.D., M.B.A., Ph.D., Assistant Professor & Head of the Department of Commerce, Nehru
Memorial College, Puthanampatti, Trichirappalli, ( Affilited To Bharathidasan University) 2Research Scholar, F/T Ph.D.,
ABSTRACT Power is one among the important factor of infrastructure, essential for the economic development and
interests of the nation. The survival and growth of adequate infrastructure is important element of power
generation for perpetual development of the Indian economy. Since liberalization period Foreign Direct Investment has been allowed 100 per cent under automatic route with incentives in India. Inspite of many
concessions and incentives have been accommodated to the worldwide famous private companies, in India it
has been exited due to various operational and political reasons. Thus, small sum of FDI only initiated in
India. Later, due to the Government policy, it encouraged in private sector from Foreign Direct Investment increased tremendously. According to the increased civilization, standard of living of the people the needs and
wants of power sector is growing rapidly. Hence, the study on importance of the Power sector is essential part
in India at the present scenario. This paper identifies the essentials of the power sector and how much it has been benefited from foreign countries. In order to find out the results of the FDI in various aspects of the
power sector, Growth rate,Correlation between Inflows of FDI and Renewable Energy and Non-Renewable
Energy sources and Generation of Power and tabled have been used to finalise the results of the study.
KEY WORDS: FDI: Foreign Direct Investment, CAE: Central Authority of Energy
INTRODUCTION
The role of power generation in India is an extensive project. The Sources of power has been segregated in two
ways, Conventional sources such as coal, lignite, oil, natural gas, nuclear power and hydro power, non-
conventional sources such as solar, wind and agricultural and domestic wastes. In India, the demand of Electricity has augmented in future years. According to the increased demand for electricity that the generating
capacity also must be increased rapidly. In year 2018, India was the fourth rank in power generation in the
Asia pacific region and also in the wind power. In the same year India was fifth rank in Solar power and fifth
rank in the renewable power generation.
2. NATURE OF FOREIGN DIRECT INVESTMENT IN INDIA
FDI creates the Software skills, more Job opportunities and also helps to increase the infrastructure of the host
country. It would lead to start new business and will create multi-level factors to the domestic countries.
Foreign capital plays an important role in the process of economic development of a country at the initial stage
in India. Indian economy is concerned with the welcoming of the FDI is limited. But after liberalizations of
the economy the inflow of FDI into India is very high.
3. SOURCES AND DEVELOPMENT OF FDI IN INDIA
Indian companies can receive FDI under two routes-
1. Automatic Route – It does not require prior approval either of Reserve Bank of India (RBI) or government. 2. Government Route – Prior approval is needed to this route, Foreign Investment Promotion Board was the
approving authority to this route at an early stage and it was abolished on 24th May 2017. Then, the power of
authority was vested with the Department of Promotion Industry and Internal Trade and Ministry of Commerce.
4. MARKET SIZE Indian electricity quarter is undergoing a huge alternate that has redefined the industry outlook. Sustained
financial growth keeps to force the energy call for in India. The Government of India’s attention on reaching
‘Power for all’ has increased ability addition inside the usa. At the same time, the aggressive depth is increasing
at each the market and supply aspects (gas, logistics, price range, and manpower).
By 2022, sun energy is estimated to contribute 114 GW, observed by means of sixty seven GW from wind
strength and 15 GW from biomass and hydropower. The goal for renewable energy has been increased to 227
GW by way of 2022.
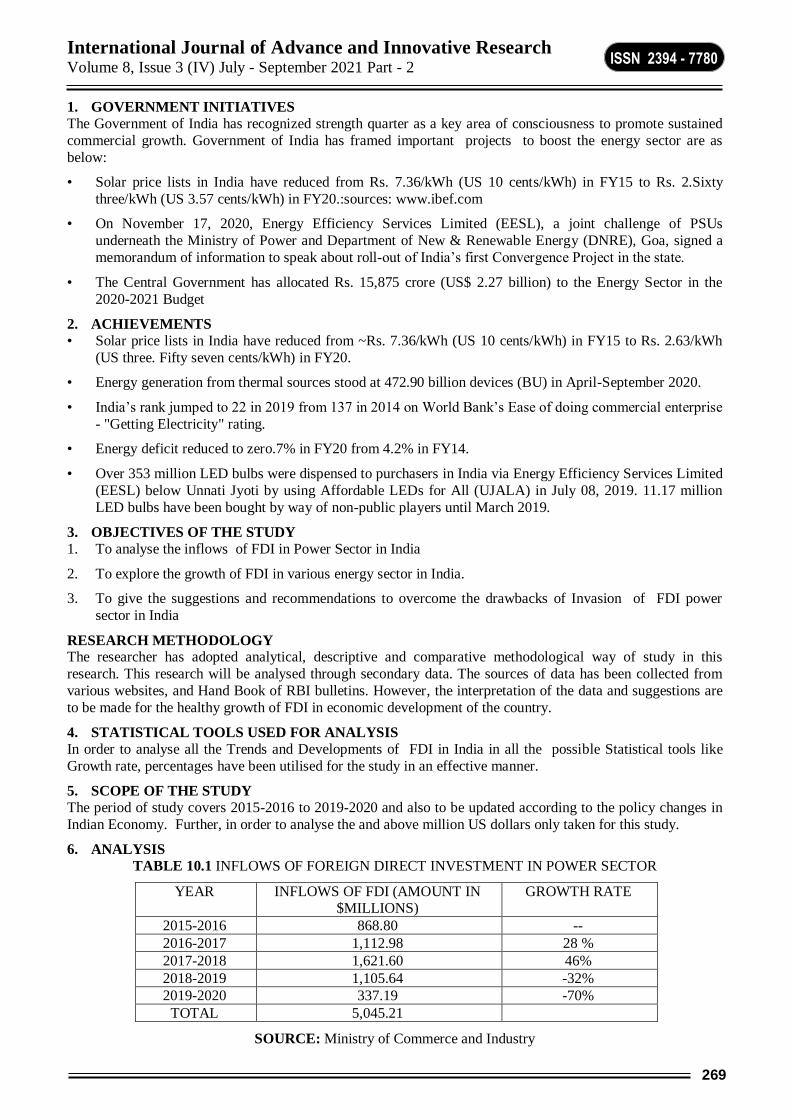
International Journal of Advance and Innovative Research Volume 8, Issue 3 (IV) July - September 2021 Part - 2
269
ISSN 2394 - 7780
1. GOVERNMENT INITIATIVES
The Government of India has recognized strength quarter as a key area of consciousness to promote sustained
commercial growth. Government of India has framed important projects to boost the energy sector are as
below:
• Solar price lists in India have reduced from Rs. 7.36/kWh (US 10 cents/kWh) in FY15 to Rs. 2.Sixty
three/kWh (US 3.57 cents/kWh) in FY20.:sources: www.ibef.com
• On November 17, 2020, Energy Efficiency Services Limited (EESL), a joint challenge of PSUs
underneath the Ministry of Power and Department of New & Renewable Energy (DNRE), Goa, signed a
memorandum of information to speak about roll-out of India’s first Convergence Project in the state.
• The Central Government has allocated Rs. 15,875 crore (US$ 2.27 billion) to the Energy Sector in the
2020-2021 Budget
2. ACHIEVEMENTS
• Solar price lists in India have reduced from ~Rs. 7.36/kWh (US 10 cents/kWh) in FY15 to Rs. 2.63/kWh
(US three. Fifty seven cents/kWh) in FY20.
• Energy generation from thermal sources stood at 472.90 billion devices (BU) in April-September 2020.
• India’s rank jumped to 22 in 2019 from 137 in 2014 on World Bank’s Ease of doing commercial enterprise
- "Getting Electricity" rating.
• Energy deficit reduced to zero.7% in FY20 from 4.2% in FY14.
• Over 353 million LED bulbs were dispensed to purchasers in India via Energy Efficiency Services Limited
(EESL) below Unnati Jyoti by using Affordable LEDs for All (UJALA) in July 08, 2019. 11.17 million
LED bulbs have been bought by way of non-public players until March 2019.
3. OBJECTIVES OF THE STUDY
1. To analyse the inflows of FDI in Power Sector in India
2. To explore the growth of FDI in various energy sector in India.
3. To give the suggestions and recommendations to overcome the drawbacks of Invasion of FDI power
sector in India
RESEARCH METHODOLOGY The researcher has adopted analytical, descriptive and comparative methodological way of study in this
research. This research will be analysed through secondary data. The sources of data has been collected from
various websites, and Hand Book of RBI bulletins. However, the interpretation of the data and suggestions are
to be made for the healthy growth of FDI in economic development of the country.
4. STATISTICAL TOOLS USED FOR ANALYSIS
In order to analyse all the Trends and Developments of FDI in India in all the possible Statistical tools like
Growth rate, percentages have been utilised for the study in an effective manner.
5. SCOPE OF THE STUDY
The period of study covers 2015-2016 to 2019-2020 and also to be updated according to the policy changes in
Indian Economy. Further, in order to analyse the and above million US dollars only taken for this study.
6. ANALYSIS
TABLE 10.1 INFLOWS OF FOREIGN DIRECT INVESTMENT IN POWER SECTOR
YEAR INFLOWS OF FDI (AMOUNT IN $MILLIONS)
GROWTH RATE
2015-2016 868.80 --
2016-2017 1,112.98 28 %
2017-2018 1,621.60 46%
2018-2019 1,105.64 -32%
2019-2020 337.19 -70%
TOTAL 5,045.21
SOURCE: Ministry of Commerce and Industry
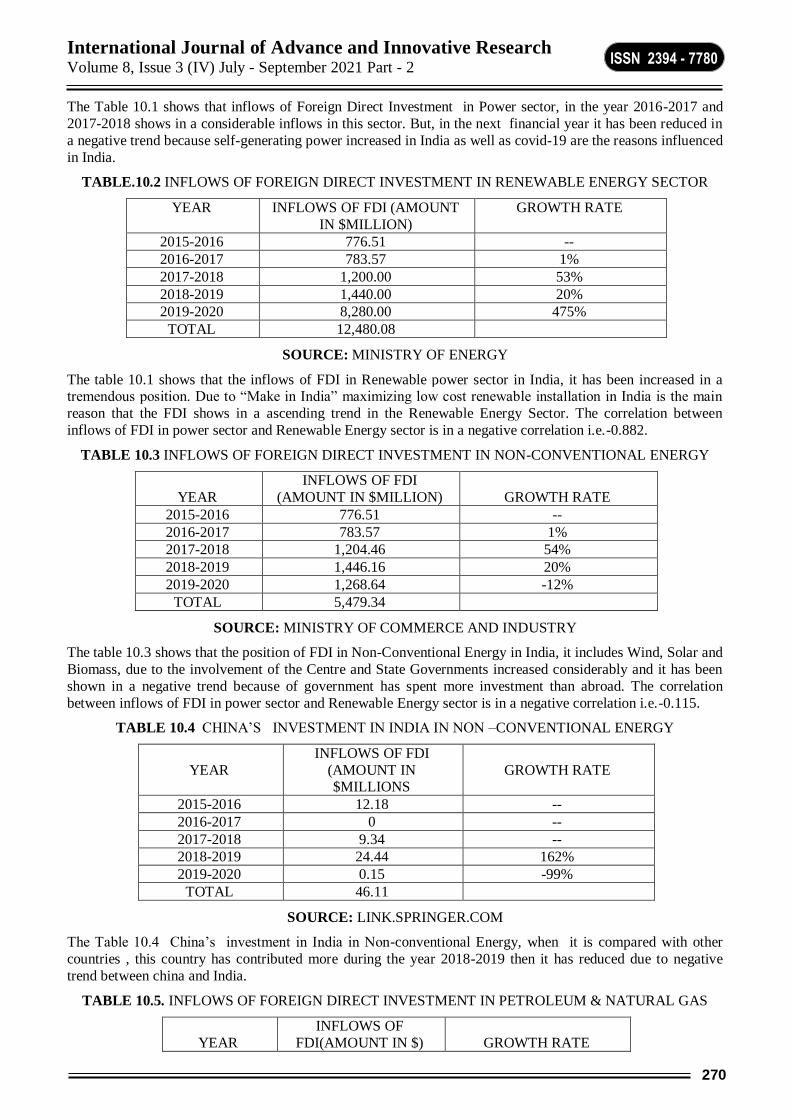
International Journal of Advance and Innovative Research Volume 8, Issue 3 (IV) July - September 2021 Part - 2
270
ISSN 2394 - 7780
The Table 10.1 shows that inflows of Foreign Direct Investment in Power sector, in the year 2016-2017 and
2017-2018 shows in a considerable inflows in this sector. But, in the next financial year it has been reduced in
a negative trend because self-generating power increased in India as well as covid-19 are the reasons influenced
in India.
TABLE.10.2 INFLOWS OF FOREIGN DIRECT INVESTMENT IN RENEWABLE ENERGY SECTOR
YEAR INFLOWS OF FDI (AMOUNT
IN $MILLION)
GROWTH RATE
2015-2016 776.51 --
2016-2017 783.57 1%
2017-2018 1,200.00 53%
2018-2019 1,440.00 20%
2019-2020 8,280.00 475%
TOTAL 12,480.08
SOURCE: MINISTRY OF ENERGY
The table 10.1 shows that the inflows of FDI in Renewable power sector in India, it has been increased in a tremendous position. Due to “Make in India” maximizing low cost renewable installation in India is the main
reason that the FDI shows in a ascending trend in the Renewable Energy Sector. The correlation between
inflows of FDI in power sector and Renewable Energy sector is in a negative correlation i.e.-0.882.
TABLE 10.3 INFLOWS OF FOREIGN DIRECT INVESTMENT IN NON-CONVENTIONAL ENERGY
YEAR
INFLOWS OF FDI
(AMOUNT IN $MILLION)
GROWTH RATE
2015-2016 776.51 --
2016-2017 783.57 1%
2017-2018 1,204.46 54%
2018-2019 1,446.16 20%
2019-2020 1,268.64 -12%
TOTAL 5,479.34
SOURCE: MINISTRY OF COMMERCE AND INDUSTRY
The table 10.3 shows that the position of FDI in Non-Conventional Energy in India, it includes Wind, Solar and
Biomass, due to the involvement of the Centre and State Governments increased considerably and it has been
shown in a negative trend because of government has spent more investment than abroad. The correlation
between inflows of FDI in power sector and Renewable Energy sector is in a negative correlation i.e.-0.115.
TABLE 10.4 CHINA’S INVESTMENT IN INDIA IN NON –CONVENTIONAL ENERGY
YEAR
INFLOWS OF FDI
(AMOUNT IN $MILLIONS
GROWTH RATE
2015-2016 12.18 --
2016-2017 0 --
2017-2018 9.34 --
2018-2019 24.44 162%
2019-2020 0.15 -99%
TOTAL 46.11
SOURCE: LINK.SPRINGER.COM
The Table 10.4 China’s investment in India in Non-conventional Energy, when it is compared with other
countries , this country has contributed more during the year 2018-2019 then it has reduced due to negative
trend between china and India.
TABLE 10.5. INFLOWS OF FOREIGN DIRECT INVESTMENT IN PETROLEUM & NATURAL GAS
YEAR
INFLOWS OF
FDI(AMOUNT IN $)
GROWTH RATE
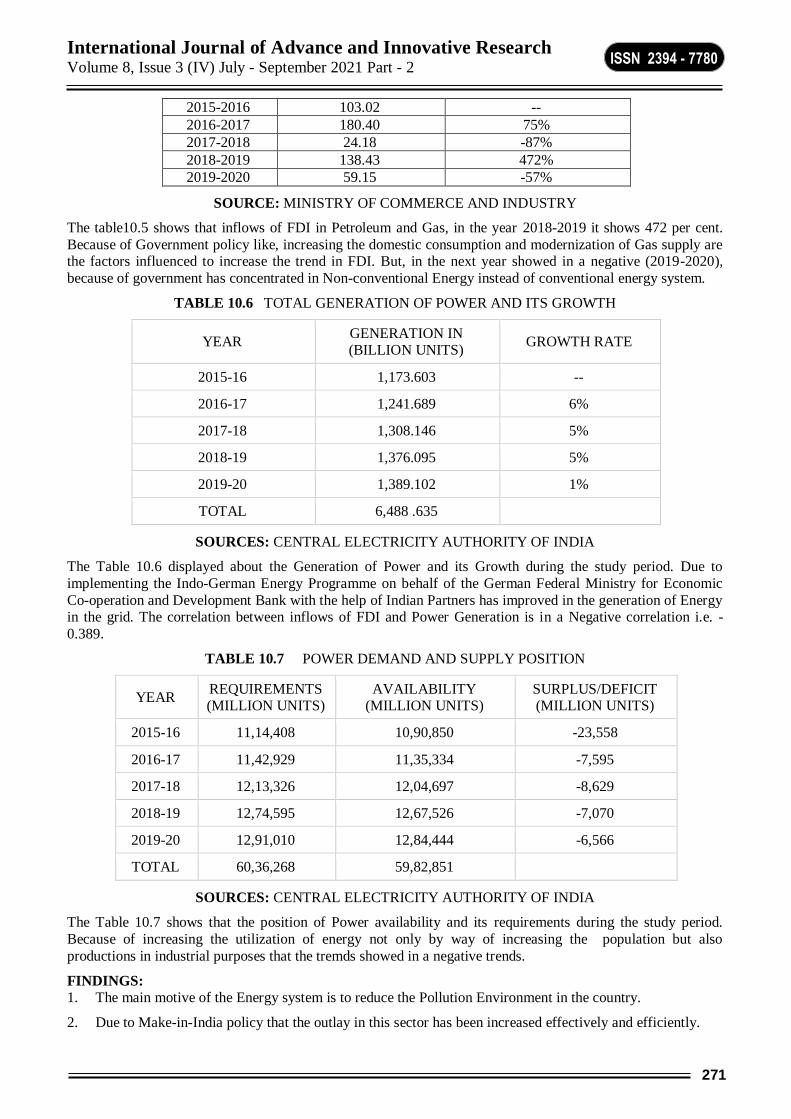
International Journal of Advance and Innovative Research Volume 8, Issue 3 (IV) July - September 2021 Part - 2
271
ISSN 2394 - 7780
2015-2016 103.02 --
2016-2017 180.40 75%
2017-2018 24.18 -87%
2018-2019 138.43 472%
2019-2020 59.15 -57%
SOURCE: MINISTRY OF COMMERCE AND INDUSTRY
The table10.5 shows that inflows of FDI in Petroleum and Gas, in the year 2018-2019 it shows 472 per cent.
Because of Government policy like, increasing the domestic consumption and modernization of Gas supply are the factors influenced to increase the trend in FDI. But, in the next year showed in a negative (2019-2020),
because of government has concentrated in Non-conventional Energy instead of conventional energy system.
TABLE 10.6 TOTAL GENERATION OF POWER AND ITS GROWTH
YEAR GENERATION IN (BILLION UNITS)
GROWTH RATE
2015-16 1,173.603 --
2016-17 1,241.689 6%
2017-18 1,308.146 5%
2018-19 1,376.095 5%
2019-20 1,389.102 1%
TOTAL 6,488 .635
SOURCES: CENTRAL ELECTRICITY AUTHORITY OF INDIA
The Table 10.6 displayed about the Generation of Power and its Growth during the study period. Due to
implementing the Indo-German Energy Programme on behalf of the German Federal Ministry for Economic
Co-operation and Development Bank with the help of Indian Partners has improved in the generation of Energy in the grid. The correlation between inflows of FDI and Power Generation is in a Negative correlation i.e. -
0.389.
TABLE 10.7 POWER DEMAND AND SUPPLY POSITION
YEAR REQUIREMENTS (MILLION UNITS)
AVAILABILITY (MILLION UNITS)
SURPLUS/DEFICIT (MILLION UNITS)
2015-16 11,14,408 10,90,850 -23,558
2016-17 11,42,929 11,35,334 -7,595
2017-18 12,13,326 12,04,697 -8,629
2018-19 12,74,595 12,67,526 -7,070
2019-20 12,91,010 12,84,444 -6,566
TOTAL 60,36,268 59,82,851
SOURCES: CENTRAL ELECTRICITY AUTHORITY OF INDIA
The Table 10.7 shows that the position of Power availability and its requirements during the study period.
Because of increasing the utilization of energy not only by way of increasing the population but also
productions in industrial purposes that the tremds showed in a negative trends.
FINDINGS:
1. The main motive of the Energy system is to reduce the Pollution Environment in the country.
2. Due to Make-in-India policy that the outlay in this sector has been increased effectively and efficiently.

International Journal of Advance and Innovative Research Volume 8, Issue 3 (IV) July - September 2021 Part - 2
272
ISSN 2394 - 7780
3. Increased trend level in this sector has focused to reduce the cost of production in the manufacturing
sector.
4. Due to the Invasion of New Technology from Foreign countries, new trend shows in rural areas also.
5. Because of liberalized policy of the Government, employment opportunities have increased and will be
caused to touch the highest peak in economic development of the country.
SUGGESTIONS:
1. Overseas investment is needed to strengthen the Energy Sector in India.
2. To reduce the trend of private investment, public sector concentration output must be Increased.
3. The tariff policy must be modified particularly in the industrial sector
4. The special concentration must be given in the Non-conventional energy with increasing the government
subsidy.
5. The sanctity of Contracts must be concentrated like China, unnecessary gap must be avoided between the
cost of Production in Non-conventional energy and supply.
CONCLUSION:
India is one of the developing country as well as important destination of Foreign Direct Investment in the
world. So, the requirements of the energy has been increased around 177 GW during the year 2018-19 and it has been further increased in the next few years. Therefore, according to the growth of the population that the
production will be increased efficiently with low cost in future. Meanwhile, employment opportunities and
Technology will be grown effectively. To attract the foreign investments, Government policy must be relaxed
and also be strengtherned. From unnecessary surcharges to the consumer industries and avoidance of free power to the Landlords for agricultural purposes will be reconstituted. Even though this miny research is not
enough, these suggestions are more helpful to development of the Economy.
REFERENCES:
1. www.Ministry of Commerce and Industry
2. www.ministry of energy
3. www.ibef.com
4. S.P. Guptha , Statistical methods
5. C.R. Kothari, Research Methodology
International Journal of Advance and Innovative Research Volume 8, Issue 3 (IV) July - September 2021 Part - 2
273
ISSN 2394 - 7780
UNDERSTANDING THE CHALLENGES OF URBAN POOR DURING COVID19 AND - STUDY OF
MUMBAI CITY
Priyanka Mokale
Ph.D. School of Development Studies (TISS Mumbai)
ABSTRACT
This Paper is based on to understand the infrastructure (Water, Sanitation, Soap, Sanitizer etc.), food,
education etc. accessing challenges of urban poor during COVID19. India’s vulnerable urban populations including low-income migrants and slum dwellers, and women face persistent challenges in everyday life.
When the novel coronavirus struck cities, their plight became visible in a way it rarely had before. The
pandemic also revealed the extent of Indian cities’ dependence on the informal economy, which is predominantly fuelled by their vulnerable populations. The COVID-19 pandemic has uncovered and intensified
existing societal inequalities. People on the move and residents of urban slums and informal settlements are
among some of the most affected groups in the Global South. Given the current living conditions of migrants,
the WHO guidelines on how to prevent COVID-19 (such as handwashing, physical distancing and working from home) are challenging to nearly impossible in informal settlements. We use the case of India to highlight
the challenges of migrants and urban slum dwellers during the COVID-19 response, and to provide human
rights-based recommendations for immediate action to safeguard these vulnerable populations. This pandemic raises a pressing need of policy level reform to ensure holistic inclusiveness and preparedness of the country to
develop a more responsive framework to mitigate urban inequality during any similar outbreaks in future.
Keywords: Urban Slums, Infrastructure, Physical Distancing, urban inequality
INTRODUCTION: In India Informal workers, majority of whom can be categorised as the “urban poor” form 69.1% of urban
India’s workforce (NSS, 2011–12) and remain largely invisible both as workers and as residents. Millions of
these workers and their families who travelled back to their villages by any means, during the lockdown, were
the prime-time media focus for a few weeks. Yet, for years they have lived with severely compromised right characterised by high incidence of poverty, working with no social security, living in inadequate habitats in the
city. In April 2020, as Mumbai emerged as the epicentre of the pandemic in India (Vyas and Shelar 2020), deep
inequalities in the country’s financial region were exposed, with the poorest being worst impacted by the
lockdown and in dire need of relief.
The Mumbai Metropolitan Region (MMR) created in 1967 to include Mumbai and its surrounding areas, today
has a total of nine municipal corporations, nine municipal councils, 35 census towns and 994 villages within its
limits (MMRDA 2016). The MMR is largely urban in character, with nearly 91% of the population living in municipal areas and about 3.5% in census towns. Little under a third of urban households in MMR live in
slums, in Mumbai the percentage population in slums is as high as 80%. This indicates that there is a severe
lack of affordable housing options available. This is the single largest issue facing MMR, which has some of the highest real estate prices in the world. People are forced to relocate further away from the core city of
Mumbai (where most of the formal jobs continue to be located) in search of affordable housing (MMRDA,
2016). As residents from cities in the MMR travel to Mumbai for work and essential services, the spread of the pandemic in its epicentre, Mumbai, is not restricted within its administrative boundaries but has severe
implications for the entire region. Recent news reports suggest that while Mumbai accounts for 44% of the
cases in the MMR, Kalyan-Dombivali is the next most affected followed by Navi Mumbai (Debroy 2020). The
situation in the MMR is further compounded by the complex governance system present, with several
municipalities and district administrations operating in the region.
This study is based on the secondary data, Reports articles which is mainly focused on the issues of urban poor
on the livelihood, infrastructure,
REVIEW OF LITERATURE AND DISCUSSION:
Increased COVID-19 risk in urban informal settlements:
The UN-Habitat recently reported how the impact and spread of COVID-19 have centred around urban areas. Over 1430 cities in 210 countries across the world are affected so far. According to the investigation, over 95%
of the total COVID-19 positive cases can be found in urban spaces.
Urban areas in the global south, such as cities in India, are more susceptible to the pandemic due to a variety of
reasons including high population density, informal employment or income structures, and weak health
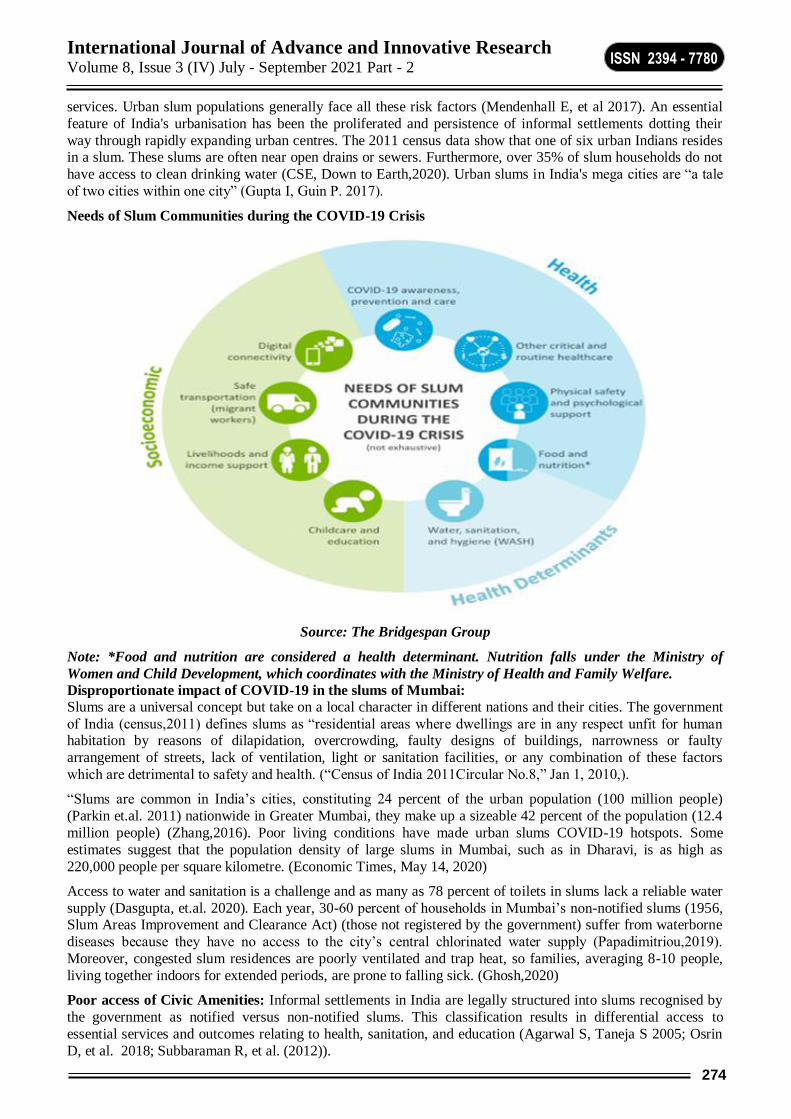
International Journal of Advance and Innovative Research Volume 8, Issue 3 (IV) July - September 2021 Part - 2
274
ISSN 2394 - 7780
services. Urban slum populations generally face all these risk factors (Mendenhall E, et al 2017). An essential
feature of India's urbanisation has been the proliferated and persistence of informal settlements dotting their
way through rapidly expanding urban centres. The 2011 census data show that one of six urban Indians resides in a slum. These slums are often near open drains or sewers. Furthermore, over 35% of slum households do not
have access to clean drinking water (CSE, Down to Earth,2020). Urban slums in India's mega cities are “a tale
of two cities within one city” (Gupta I, Guin P. 2017).
Needs of Slum Communities during the COVID-19 Crisis
Source: The Bridgespan Group
Note: *Food and nutrition are considered a health determinant. Nutrition falls under the Ministry of
Women and Child Development, which coordinates with the Ministry of Health and Family Welfare.
Disproportionate impact of COVID-19 in the slums of Mumbai:
Slums are a universal concept but take on a local character in different nations and their cities. The government
of India (census,2011) defines slums as “residential areas where dwellings are in any respect unfit for human habitation by reasons of dilapidation, overcrowding, faulty designs of buildings, narrowness or faulty
arrangement of streets, lack of ventilation, light or sanitation facilities, or any combination of these factors
which are detrimental to safety and health. (“Census of India 2011Circular No.8,” Jan 1, 2010,).
“Slums are common in India’s cities, constituting 24 percent of the urban population (100 million people)
(Parkin et.al. 2011) nationwide in Greater Mumbai, they make up a sizeable 42 percent of the population (12.4
million people) (Zhang,2016). Poor living conditions have made urban slums COVID-19 hotspots. Some
estimates suggest that the population density of large slums in Mumbai, such as in Dharavi, is as high as
220,000 people per square kilometre. (Economic Times, May 14, 2020)
Access to water and sanitation is a challenge and as many as 78 percent of toilets in slums lack a reliable water
supply (Dasgupta, et.al. 2020). Each year, 30-60 percent of households in Mumbai’s non-notified slums (1956, Slum Areas Improvement and Clearance Act) (those not registered by the government) suffer from waterborne
diseases because they have no access to the city’s central chlorinated water supply (Papadimitriou,2019).
Moreover, congested slum residences are poorly ventilated and trap heat, so families, averaging 8-10 people,
living together indoors for extended periods, are prone to falling sick. (Ghosh,2020)
Poor access of Civic Amenities: Informal settlements in India are legally structured into slums recognised by
the government as notified versus non-notified slums. This classification results in differential access to
essential services and outcomes relating to health, sanitation, and education (Agarwal S, Taneja S 2005; Osrin
D, et al. 2018; Subbaraman R, et al. (2012)).
International Journal of Advance and Innovative Research Volume 8, Issue 3 (IV) July - September 2021 Part - 2
275
ISSN 2394 - 7780
Approximately 59% of slums in India are non-notified, alienating its residents from accessing critical services
(Nolan LB, Bloom DE, Subbaraman R. (2017). Most people living there are forced to come out of their homes
and neighbourhoods to access basic human rights such as water and sanitation. The 2011 Indian census data showed that 26% of slum dwellers must search for drinking water outside of their homes. Over half of them are
forced to collect drinking water more than 100 metres away from their houses. Most of them also resident in
one-room dwellings. Despite the growing empirical evidence focusing on the increased amount of people exposed to urban disasters (Satterthwaite D, Dodman D. (2013)): disaster risk management planning (including
for pandemics) often proposes inadequate and narrow disaster responses (Raju E, van Niekerk D. 2020). These
responses tend to overlook fundamental problems, risks, and vulnerabilities (often induced by development
planning) including access to resources such as water, sanitation, and health care.
RECOMMENDATIONS:
Long-term visioning and integrated urban governance enhance adaptive capacity - During pandemics.
Local governments should provide economic and social support to vulnerable groups - In addition to top-
down initiatives, certain levels of local leadership and community engagement are critical for timely
response to pandemics.
Need to strengthen the Urban Governance and Policy implementation at ground level.
Need to involve every part of the society while implementing the policy.
COVID 19 and Economic Crises
The long-term economic shutdowns due to the COVID-19 pandemic have had very negative impacts on urban
economy. The consequences are complex and occur in various ways and on a wide range of scales. Although research on this topic is currently underway, early findings imply that the outbreak has had a significant
influence on city tax revenues, citizens' income, tourism, and hospitality, small- and medium-sized businesses,
urban food supply chain, and migrant workers. Besides, a growing line of research has dealt with the uneven
and unequal social and spatial distribution of the effects of the pandemic. An expected finding is that cities that do not have a diverse economic structure are more vulnerable. The policies and programmes of urban
development and planning in India hardly launched any specific programmes for the migrants. Many
programmes meant for the poor do not reach migrants due to various reasons especially lack of identity and residential proofs. Failure to recognize migrants as a stakeholder in urban development is one of the biggest
mistakes in achieving urban sustainability and realizing the goals of sustainable development in India.
Even though migrants are formal citizens, their substantive economic, social, and political rights are not fulfilled. The Working Group on Migration (2017) set up by the Ministry of Urban Housing and Poverty
Alleviation has examined the plight of the migrant workers in the country and submitted its report in 2017.
However, actions on the report are still awaited. In the meantime, sudden eruption of migration crisis resulting
from 2 the out-break of COVID-19 again reminds us the urgency of the matter. This policy paper presents how our understanding of migration and livelihood could be helpful in designing a mitigating strategy of economic
and social impact of Coronavirus infection 2019 (COVID-19). Migrant workers constitute backbone of Indian
economy as migration is a livelihood strategy of millions of people in India. Out of 482 million workers in India, about 194 million are permanent and semi-permanent migrant workers as per 2011 Census. In addition,
there are about 15 million short-term migrant workers of temporary and circulatory nature. At the state level,
in-migration rates are higher in high-income states such as Delhi, Goa, Haryana, Punjab, Maharashtra, Gujarat,
and Karnataka. Some of them are badly affected by the COVID-19 compared to low-income states such as Bihar, Uttar Pradesh, Jharkhand, Rajasthan, and Odisha with relatively higher rates of out-migration. There are
conspicuous migration corridors within the country – Bihar to Delhi, Bihar to Haryana and Punjab, Uttar
Pradesh to Maharashtra, Odisha to Gujarat, Odisha to Andhra Pradesh and Rajasthan to Gujarat. It is quite likely that the incidence of COVID-19 may also rise sharply in out-migrating poorer states due to return
migration.
The Government of India declared COVID-19 as national disaster and imposed complete national lockdown to contain the spread of outbreak and suspended transportation and all economic activities and services. This
brought turmoil in the lives of millions who are primarily involved in the informal sector. They lost their
livelihood overnight and got stranded in different pockets. As speculated by ILO (2020), India is likely to face
the job crisis because of the COVID-19 and subsequent lockdown, and migrant workers and workers in informal sector are likely to be badly hit. It may also impoverish them and affect hugely their food and
nutritional intake, access to health care and education of children.
International Journal of Advance and Innovative Research Volume 8, Issue 3 (IV) July - September 2021 Part - 2
276
ISSN 2394 - 7780
RECOMMENDATIONS:
Need to strengthen the livelihood Policy.
Need to strengthen the informal sector Security.
Allocating public expenditure for public health infrastructure and facilities like emergency hospital space,
ventilators, protective medical equipment, medical personnel.
Measures to subsidize or support income for workers who are forced to lay off or the unemployed general
or targeted cash transfers.
Assisting affected business, e.g., wage subsidies, tax cuts, moratoriums on debt repayments, credit lines, and reduced stress on financial systems; interest rate cuts, reduced reserved requirements, lower rates and
longer maturity on the discount window (Loayza and Pennings, 2020); Kementerian Keuangan, 2020; and
Baldwin & Di Mauro, 2020))
Diversifying urban economic structure is essential - Developing relief programs to support vulnerable and
marginalized groups is necessary during pandemics –
Transformation to more local supply chain that increases self-sufficiency is needed for dealing with the
economic fallouts of the pandemic and similar future events.
COVID19 and Educational Crises: In India, 320 million students have been affected by COVID-19 school closures, and though the government
quickly recommended shifting to “online teaching,” this ignores India’s immense digital divide with embedded
gender and class divides. The 2017-18 National Sample Survey reported only 23.8 percent of Indian
households had internet access. In rural households (66 percent of the population), only 14.9 percent had access, and in urban households only 42 percent had access. And males are the primary users: 16 percent of
women had access to mobile internet, compared to 36 percent of men. Young people’s access is even less:
A recent news report stated only 12.5 percent of students had access to smartphones. Furthermore, most
teachers are ill-equipped for online teaching.
While the Covid-19 pandemic has made online education the buzzword, a recent report by the global education
network Quacquarelli Symonds (QS) says that the Indian internet infrastructure is still far from ready to support
the shift. Only 24 per cent households have access to the internet, according to a 2019 government survey. In rural India, the numbers are far lower, with only 4 per cent households having access. A 2018 NITI Aayog
report revealed that 55,000 villages in India did not have mobile network coverage. A 2017-18 survey by the
ministry of rural development found that more than 36 per cent of schools in India operated without electricity. The emphasis on technology-driven education is also alienating many children from the underprivileged
sections, preventing them from continuing their studies. Even other stakeholders are struggling. Teachers are
not always trained and equipped to transition to online teaching.
RECOMMENDATIONS:
Need to strengthen, improve the Digital Education infrastructure
Need to focus on improvement of Teachers Education Quality
Need to Focus on the New Teaching methods
To Address the digital divide. Technology has the potential to achieve universal quality education and
improve learning outcomes. But to unleash its potential, the digital divide (and its embedded gender
divide) must be addressed. Digital capabilities, the required infrastructure, and connectivity must reach the
remotest and poorest communities. Access to technology and the internet is an urgent requirement in the
information age. It should no longer be a luxury.
To Reorient the curriculum. While teachers are struggling to learn digital ways of communicating with
their students, we need to pay close attention to what we teach.
To Empower a wider cadre of teachers. This crisis is forcing teachers to reinvent their roles from that of
transferring information to enabling learning. The shift to distance learning has afforded many opportunities to teach differently, encouraging self-learning, providing opportunities to learn from diverse
resources, and allowing customized learning for diverse needs through high-tech and low-tech sources.
International Journal of Advance and Innovative Research Volume 8, Issue 3 (IV) July - September 2021 Part - 2
277
ISSN 2394 - 7780
REFERENCES:
Agarwal S, Taneja S. All slums are not equal: child health conditions among the urban poor. Indian
Pediatr. 2005;42(3):233–44
Dutta A, Raju E. (2020); The Covid-19 pandemic is a Battle for Science. CHakra, Nordic J South Asian
Stud. 1:107–12 Available at: https://www.sasnet.lu.se/sites/sasnet.lu.se/ files/2021
01/web_version_chakra_2020_no_1_ny-3.pdf
Debroy, S (2020): “MMR tops 6 lakh Covid Cases but Mumbai has less than half of them,” The Times of
India, 12 November, https://timesofindia.indiatimes.com/city/mumbai/mmr-tops-6-lakh-covid-cases-but-
mumbai-has-less-than-half-of-them/articleshow/79182055.cms.-.
Lipton E, et al. (2020) He could have seen what was coming : behind Trump’s failure on the virus. New York Times. 2020(14 April) Available at: https://www.nytimes. com/2020/04/11/us/politics/coronavirus-
trump-response.html.
Mumbai Metropolitan Region Development Authority (2016): “Draft Mumbai Metropolitan Regional Plan
2016–2036,
https://mmrda.maharashtra.gov.in/documents/10180/8037279/1.+Draft+MMR+Plan+Report%2C%202016
-36+Colour/d107b724-c039-4ea1-840f-58a92bb9daf2
Phillips T. Jair Bolsonaro claims Brazilians’ never catch anything as Covid 19 cases rise. The Guardian.
2020(27 March) Available at: https://www.theguardian.com/globaldevelopment/2020/mar/27/jair-
bolsonaro-claims-brazilians-never-catch-anything-ascovid-19-cases-rise. (Accessed: 3 April 2020).
Vyas, Sharad and Jyoti Shelar (2020): “Coronavirus | Huge Spike in Cases likely in Mumbai, says Central Panel,” The Hindu, 22 April, https://www.thehindu.com/news/cities/mumbai/coronavirus-huge-spike-in-
cases-likely-in-mumbai-says-central-panel/article31400889.ece
National Sample Survey Office (2016) Swachhta Status Report. New Delhi: Ministry of Statistics and
Programme Implementation.
UN Habitat. (2020): Covid 19 response plan. Avaialble at https://unhabitat.org/sites/default/
files/2020/04/final_un-habitat_covid-19_response_plan.pdf.
CSE. ‘Slumming it Out’, Down to Earth. (2020) Available at: https://www.downtoearth.org.in/ dte-
infographics/slums/index.html?fbclid=IwAR3PiNWh7-84chvlLvUArSevfBPB2k_dVN5WIUUj_-
ILhyRZkg8fY2mDaE.
https://www.orfonline.org/research/strengthening-the-online-education-ecosystem-in-india/
Osrin D, et al. (2011): A rapid assessment scorecard to identify informal settlements at higher maternal
and child health risk in Mumbai. J Urban Health. 88(5):919–32. https://doi.org/10.1007/s11524-011-9556-
7
Subbaraman R, et al. (2012); Off the map: the health and social implications of being a non-notified slum
in India. Environ Urban. 24(2):643–63. https://doi.org/10.1177/ 0956247812456356
Nolan LB, Bloom DE, Subbaraman R. (2017). Legal status and deprivation in India's urban slums: an
analysis of two decades of national sample survey data, PGDA Working Paper No. 135 Harvard University Program on the Global Demography of Aging Working Paper Series. 2017. Available at:
https://cdn1.sph.harvard.edu/wp-content/uploads/sites/12 88/2012/11/Legal-Status-andDeprivation-in-
Indias-Urban-Slums.pdf.
Satterthwaite D, Dodman D. (2013): Towards resilience and transformation for cities within a finite planet.
Env. Urb25(2):291–8.
Nolan LB, Bloom DE, Subbaraman R. (2017): Legal status and deprivation in India's urban slums: an
analysis of two decades of national sample survey data, PGDA Working Paper No. 135 Harvard
University Program on the Global Demography of Aging Working Paper Series. Available at:
https://cdn1.sph.harvard.edu/wp-content/uploads/sites/12 88/2012/11/Legal-Status-andDeprivation-in-
Indias-Urban-Slums.pdf.

International Journal of Advance and Innovative Research Volume 8, Issue 3 (IV) July - September 2021 Part - 2
278
ISSN 2394 - 7780
Raju E, van Niekerk D. (2020): Why do the impacts of COVID-19 and the response surprise the world?
Jàmbá: J Disast Risk Stud.;12(1):3. https://doi.org/10.4102/jamba.v12i1. 1028.
R.B. Bhagat Reshmi R.S. Harihar Sahoo Archana K. Roy Dipti Govil April 14, (2020): The COVID-19,
Migration and Livelihood in India International Institute for Population Sciences, Mumbai
(www.iipsindia.ac.in)
Loayza, N. V, & Pennings, S. (2020). Research & Policy Briefs Macroeconomic Policy in the Time of COVID-19: A Primer for Developing Countries. Research and Policy Briefs No. 28. Washington DC:
World Bank.
Baldwin, R., & Di Mauro, B. W. (Eds.). (2020). Economics in the Time of Covid-19. London: CEPR
Press.
Registrar General & Census Commissioner, India, Ministry of Home Affairs, “Census of India 2011 –
Circular No. 8,” Jan 1, 2010, https://censusindia.gov.in/2011-Circulars/Circulars/Circular-08.pdf.
Benjamin Parkin and Andrea Rodrigues, (2020) “India’s biggest slum tests Modi’s Coronavirus response,”
Financial Times, , https://www.ft.com/content/5199e04b-d235-49e2-a20c-af7bb8fc53a9.
Registrar General & Census Commissioner, India, Ministry of Home Affairs, “Housing Stock, Amenities
& Assets in Slums- Census 2011,” https://censusindia.gov.in/2011census/hlo/Slum_table/Slum_table.html.
Yue Zhang (2016) “Building a Slum-Free Mumbai,” Wilson Centre,
https://www.wilsoncenter.org/article/building-slum-free-mumbai.
Press Trust of India, (May 14, 2020) “Dharavi's journey to becoming Mumbai’s COVID-19 hotspot,”
Subhagato Dasgupta, Anindita Mukherjee, and Neha Agarwal, (2020) “Hand washing to stop coronavirus
78% of toilets in Mumbai slums lack reliable water supply,” The Print, https://theprint.in/opinion/hand-
washing-to-stop-coronavirus-78-of-toilets-in-mumbai-slumslack-reliable-water-supply/402590/
Anastasia Papadimitriou, (2019): “Mumbai’s Slums: The Positives and Negatives,” The World Mind.
Sahana Ghosh, (2020) “India’s lockdown has left millions holed up inside shanties without fans as summer
peaks,” Quartz India,
International Journal of Advance and Innovative Research Volume 8, Issue 3 (IV) July - September 2021 Part - 2
279
ISSN 2394 - 7780
xFABRICATION OF BIOENZYMES BY BACTERIA IN PAPER AND PULP INDUSTRY
Ms. Sonal Chaudhary and Dr. Shalini Porwal
Amity Institute of Microbial Technology, Amity University Uttar Pradesh, Noida, Uttar Pradesh, 201313
ABSTRACT There are many possibilities for the implementation of microbial enzymes in processing, like biopulping,
bioblasting, decoupling, pitch extraction, document coloring, and effluent bioremediation in pulp and paper
manufacturing processes. While many antibiotics apps in the pulp and fabric sector are still in the study and growth phases, eco-friendly bioplasty of tough and smooth timber paste is presently the most significant
implementation. In most cases, xylanases, laccases and rare mannanases are used in these enzymes and
provide the potential alternative to conventional chlorine and chlorine pollution. Many sectors around the globe measure these biocatalysts ' capacity by regular large-scale pulp delignment studies. On the other side,
several paper mills have also been commonly adjusted for quality-enrichment pitch control by lipases (and
lately by laccases). The enhanced pulp drainage is regularly performed in several factories with enzymes.
However, before enzymes are fully implemented in the paper industry, several crucial difficulties exist in
laccases, particularly in terms of their small redox potential and their dependence on cost-intensive mediators.
Keywords: “Bio-bleaching; Bioremediation; De-inking; Delignification; Laccase; Paper; Pulp; Xylanase”
INTRODUCTION:
The U.S and Canada dominated the pulp and paper industry before 2009, but China arrived in 2012 as the largest competitor with 100 million tonnes of plastic generated globally from a sum of 401 million tonnes. India
has around 515 paper pulp processing plants, and adds approximately 16 percent of complete document
generated globally to document manufacturing in nations such as Germany, Italy, Japan, Brazil and India. Bleaching of chemical products generally involves the manufacturing of chlorine-driven inhibitors such as
atmospheric chlorine, chlorine gas and hypochlorite. Chlorinated benzene, epoxystearic acid, and
dichloromethane are mostly classed as alleged carcinogenic substances and powerful mutagens (CCPB, 2007).
During the last century, market supply for non-chlorine-bleached paper risen primarily as a result of their suitability to satisfy customers. However, the use of powerful biocatalysts such as xylanases and laccases is
possible for environmentally-friendly bio-blinding and other apps such as pitch suppression and decoupling.
Initially, because of the absence of prepared accessibility of such biocatalysts, the use of pulp enzymes and paper technology was not technically and economically viable. The cost-intensive and cumbersome long-term
method was the commercial manufacturing and implementation of these enzymes. Enzymes such as laccases
also involve mediators to bleach and also have issues with enzyme stabilization. Fortunately, science study and
the growth of biocatalysts has resulted to important benefit for the pulp and fabric industries by science organizations and protein manufacturers. The accessible alternatives include (1) oxygen-blanking and
prolonged boiling of pulp, (2) hydrogen peroxide, and (3) ozone therapy in the lack of bacteria. However, most
of these techniques are extremely resources efficient for shift in processes. An option and economical manner of reducing the use of chlorine and other blanching chemicals, that is to say the use of bacteria, was therefore
very easy and affordable. In several factories globally, Xylanase predicting technology is in use. In just a few
years, this technology has been passed to complete industry. The financial and social benefits of the pulp blanketing plant were the primary driving factors. Following xylanases, many study organizations have made
laccase one of the polyvalent biocatalysts that can revolutionize the procedures in pulp production. Not only
does it play a part in the delignment and brightening of pulp, but also is known for remove lipophilic
extractives from both wood and nonwood pulp, accountable for pitch deposition. Laccases can improve both the physical, chemical and mechanical characteristics of pulp by forming or functioning volatile lignin radicals.
Laccases could also aim the color-and poisonous compounds produced as pulp-industry effluents and make
them non-toxic by polymerisation and depolymerisation.
The enzyme's high supply has led enzyme manufacturers in a relatively brief moment to create an completely
fresh sector. The aim of this section is to examine enzyme implementation in the fabric and fiber industries.
Cellulase Cellulase is a significant bio-functioning enzyme, which has been researched in many industries. Cellulose is
the principal cellulase sub-substrate and cellulose degradation involves a mixture of distinct cellulase kinds.
The enzymes of cellulase are categorized as endoglucanase which interplies cellulose and the cellulose which
cleaves the loose stems leading to cellulose. The holding areas of carbohydrates are central to the
International Journal of Advance and Innovative Research Volume 8, Issue 3 (IV) July - September 2021 Part - 2
280
ISSN 2394 - 7780
communication of membrane enzymes. The paper pulp sectors use cellulase for enzymatic bleaching without
any carbohydrate attachment locations.
Xylanase Xylanase is the second most common polysaccharide that deploys the plant-cell wall component xylan. Many
requests for the xylanase enzyme have been recognized. In the fabric and plastic sector, however, the torque
implementation field is recognized. The removal of xylan and its components is tedious in the method of document bleaching. Cellulose is tedious. In the fabric and pulp industry Xylanases are more appropriate than
the degradation scheme.
Lignin modifying enzymes
In greater crops and mushrooms, Laccases are a commonly spread multi-copper enzyme class. The laccase substrates are numerous ascomycetes, deuteromycetes, basidiomyects, and many white-red bacteria. In many
biotechnological apps, the capacity of laccases to use a large number of substrates has rendered it very
essential. They have a large heat and pH variety of operation. They use compounds associated with both phenolic and non-phenolic lignin. Laccases on extremely recalcitrant pollutants allow its use in detoxification,
industrial wastewater decolorization, and wastewater treatment. They can also be efficiently utilized in the film,
fiber and fabric sectors.
Lipases
Lipases are a carboxylesterase category that catalyzes glycerol, free fatty acids and mono-and di-Glyceride
hydrolysis of lengthy chain acylglycerols. The animal and plant worlds, as well as molds and bacteria contain
these enzymes. In fact, lipase can also catalyze esterification, interestterification and transesterification in non-aquaeous mediums as a part of their normal feature of hydrolyzing carboxylic ester. Lipase is thus a great
choice in the meat, detergent, pharmaceutical, gum, fabric, clothing and fabric sectors.
Lipase application can improve the visibility, strength and pulp speed of waste paper decoupling. It can also reduce chemical consumption, extend lives on machines, reduce pollution, save power, money and costs of
manufacturing. Addition of Pseudomonas sp lipase. KWI-56 enhances the whiteness of the document and
decreases remaining inks by decoupling the structure of ethylene dioxide-propylene gum adducts condition.
Since 1990, lipase has also been used in the large-scale document method in enzymatic pitch control.
Enzymatic deinking and paper characteristics
Paper pulp's enzymatic therapy outcomes in different modifications, including morphological, chemical and
physical modifications. The degree to which these modifications depends also on the proteins used. In addition,
the decoupling observed by the shift is also dealt with.
MECHANISM OF DELIGNIFICATION OF PULP WITH XYLANASES
Data from Senior et al. (1999) show that xylanase hydrolyzes the polymer xylane in pulp fibres. Xylans are closely associated with cellulose and lignin and therefore the disturbance of the xylan backbone during
bleaching affect their detachment.
Xylanase has also been shown to boost the inflammation of the fibre layer and to boost the material propagation
velocity. Furthermore, if enzyme use rendered lignin lower, covalently tied to xylan, it could be obtained more readily. Another theory derived from studies was that xylanase proteins catalyze the fibres ' hydrolysis during
alkaline pulpation. The enzyme does not straight degrade lignin, but functions as a bleaching agent instead of a
real delignment officer.
Demand projections for paper and pulp related enzymes
The cellulase industry is up to 3.5kilo tonnes by 2024, as per the Pulp & Paper Enzymes Market Size –Industry
Share Report 2017-2024. The increased use of fiber-modification cellulose enzymes, the improved engine running capacity, the danger of undesirable losses and disposal drainage will boost the item requirement.
Decreased use of severe chemicals, including caustic alcohol, will promote consumer requirement, due to the
advent of cellulase. In 2016 there were over 45 million US dollars on the amylase fabric and pulp enzymes
industry. The request for products is motivated by its broad utilization, especially in the packaging sector, in different implementations, including deinking, starch layer, washing and draining. Similarly, the value of
xylanases by 2024 will exceed 35 million USD. In order to achieve certain luminosity, the requirement for
xylanases will be improved in order to reduce chemical use for bleaching the kraft pulps. Around 60% of the industry's total percentage is captured by novozymes, Dupont, and AB Enzymes. Following this, other
manufacturers of enzymes, such as the Buckman laboratories, represent 20 per cent of the market share of
Enzymatic Deinking Technologies. Other major competitors of the sector are AnhemCellutions, Biotech,
International Journal of Advance and Innovative Research Volume 8, Issue 3 (IV) July - September 2021 Part - 2
281
ISSN 2394 - 7780
Rossari Biotech, MetGen, Krishna Speciality Chemicals, Nature Bioscience, KPS Bio. In addition, by 2024, 6
times of lipase supply will increase.
FACTORS AFFECTING THE LACCASE-BASED BIOBLEACHING OF PULP It is necessary to look for an cost-effective (synthesized or artificial) lacasse mediator scheme which has
enhanced enzyme redox potential. The remainder of the bio-blinding research with the enzymes are focused on
the pH of acid or normal (3.0-6.0), except for a few alkalide-tolerant laccases. The fabric and pulp industry needs alkaline resistant laccases for delignification because the alkaline conditions are covered by several
stages of paper making. The next thing that laccases need to have high oxygen levels in order to function
effectively before they are blanched on an agricultural scale. Most of the laccases have less specific activity and
unnecessary catalytic components are needed before large-scale bio-bleaching projects are implemented. Less heat strength is also a disincentive consideration for effective manufacturing application of antibiotics. Many
employees have recently noted a grafting process of bio-bleached pulp when the response mix includes organic
mediators and laccases. Although grafting offers pulp fiber resistance, it improves the KN and decreases luminosity. A key region of enzyme engineering has always been the research of cost-effective techniques for
enzyme manufacturing. The large scale production of laccases from fungi and prokaryotes is not suitable to
conventional enzyme manufacturing techniques. Less enzyme manufacturing is a great task for the continued
provision of laccases in the large-scale pulp and paper industries.
CONCLUSION:
Enzyme-based, organic and environmentally friendly pulp and paper techniques are essential and fruitful if the
pulp and paper sector is closely and fully enforced. These biotechnologies have been intended to use less bleaching chemicals which are dangerous and trigger environmental pollution, especially when paper mill
effluents are released into waterways and lakes. Water intake for cleaning bleaching chemicals from paper
bleached is reduced by the use of chemical products, particularly in emerging nations, where there are severe problems with air scarcity. However, the majority of enzyme manufacturing and bio-bleaching applications
researches are restricted by peer scale because of the elevated manufacturing expenses and the implementation
of enzymes in the pulp bleaching process is still undergoing development. This shows that effective and cheap
manufacturing techniques and apps in the paper industry need to be developed. Future developments may include the creation of more efficient structures which use far less chemicals, less water and less energy to
achieve the highest item output and efficiency. New proteins, such as wide pH and heat ranges and high-redox
prospective laccases, can be delivered by modern biology in different physiological circumstances.
International Journal of Advance and Innovative Research Volume 8, Issue 3 (IV) July - September 2021 Part - 2
282
ISSN 2394 - 7780
THE SIGNIFICANT ROLE OF EDUCATORS IN FACILITATING SAMAGRA SHIKSHA ABHIYAN
SCHEME TOWARDS INCLUSION OF STUDENTS WITH INTELLECTUAL DISABILITIES IN
THE KOTTAYAM DISTRICT OF KERALA
Fr. Baiju Thomas
Research Scholar, Ramakrishna Mission Vivekananda Educational and Research Institute, Faculty of Disability
Management and Special Education, Vidyalaya Campus, SRKV Post, Coimbatore – 20
ABSTRACT The present study is entitled as “The significant role of educators in facilitating samagra shiksha abhiyan
(SMSA) scheme towards inclusion of students with intellectual disabilities (SwIDs) in Kottayam district of
Kerala”. Teachers must act as first step mentors within the school as part of the SMSA scheme, which intends to provide every child with access to education in a healthy, protective, and conducive to growth and
development atmosphere. This was done to provide for convergence based execution of SMSA scheme for
secondary education with inclusion of SwIDs for quality linked interventions and make available for better
education facilities in the schools. A total of 40 general educators and 40 special educators were selected for sample of the present study. The study used descriptive survey method on the significant role of educators in
facilitating SMSA scheme towards inclusion of SwIDs in the Kottayam district of Kerala. The vital role of
educators is to endorse and accomplish inclusion of students with an intellectual disability. The SwIDs require educators to use unique methods in the teaching procedure because of their shortages in the processing and
academic areas. The SMSA program has effectively addressed several critical shortcomings in the school
education system and has made a substantial effort to creating a firm basis for a nation inclusive and high-
quality school education system. Yet, achieving higher education is a big task. The national government is now focusing its efforts on allowing states to enhance quality of education. The questionnaire items were prepared
to identify the role of educators in assisting SMSA plan towards inclusion of SwIDs in the Kottayam district of
Kerala about the quality problems encountered by them. The results reveal that the level of SMSA implementation in the Kottayam district of Kerala for SwIDs in inclusive settings is excellent. The outcomes of
this research will highlight the genuine quality problems and the current quality of SMSA plan towards
inclusion of SwIDs in current education system.
Keywords: Educators, Facilitation, Samagra Shiksha Abhiyan Scheme, Inclusion and SwIDs.
INTRODUCTION
Education has also been found to increase the inclusion and equality of those with impairments, and to
significantly shorten the chances of exclusion. Our Policy to Enable Access: A teacher plays the leading role in
the implementation of school academic effort. A substantial role of the educator in appreciating academic work is taken into consideration on a number of different levels. Teachers are not only those who have received
recognition from society and the education authorities for their work with children, youth, and adults; they are
also, simultaneously time, pioneers who are paving the way for others. He equips children with talents, pedagogical skills, and practical experience in order to facilitate them to perform both socially oriented goals
and educational work (Pedagoskaenciklopedija, 1989, p.103). Kottayam district is the ninth largest in Kerala,
and has an area of 2208 square kilometers. It has also been called "City of Letters" because of its achievements to print media and literature. The system of educational institutions in Kerala's Kottayam district, which were
overwhelmingly nonprofit, government-aided organizations (PNGAs), had evolved to a point in which the
majority of academic institutions were managed by nonprofit organizations (PNGAs). Residents of the district
comprise 28.6% of the population, with a literacy rate of 97.2%. (2011 Kottayam Census, 2019). This study aimed to provide a learning framework for SwIDs. This report spent time discussing ways in which inclusion
can be implemented rather than asking why inclusion is important. The shift in the area of intellectual disability
research aligns with this change, as researchers have decided to focus on what supports PwDs instead of their limitations (Buntinx & Schalock, 2010). The new educational program in India in 2018 was called "SMSA"
and encompassed the SSA, RSMA, and Teachers Training Programs. An integrated education system was
implemented through a single program to best utilize financial resources and human resources (SMSA, 2018). This distinctive aspect of the new integrated approach is that the school is perceived as a continuity that extends
from pre-school to post-secondary education (Samagra Shiksha Abhiyan, 2018, Chapter-1, pg-4). The purpose
of the system is to ensure that elementary school through high school educational quality is inclusive and equal.
Disability issues, academics, and other stakeholders are addressed and challenged while also providing crucial
insights into the overall plan.
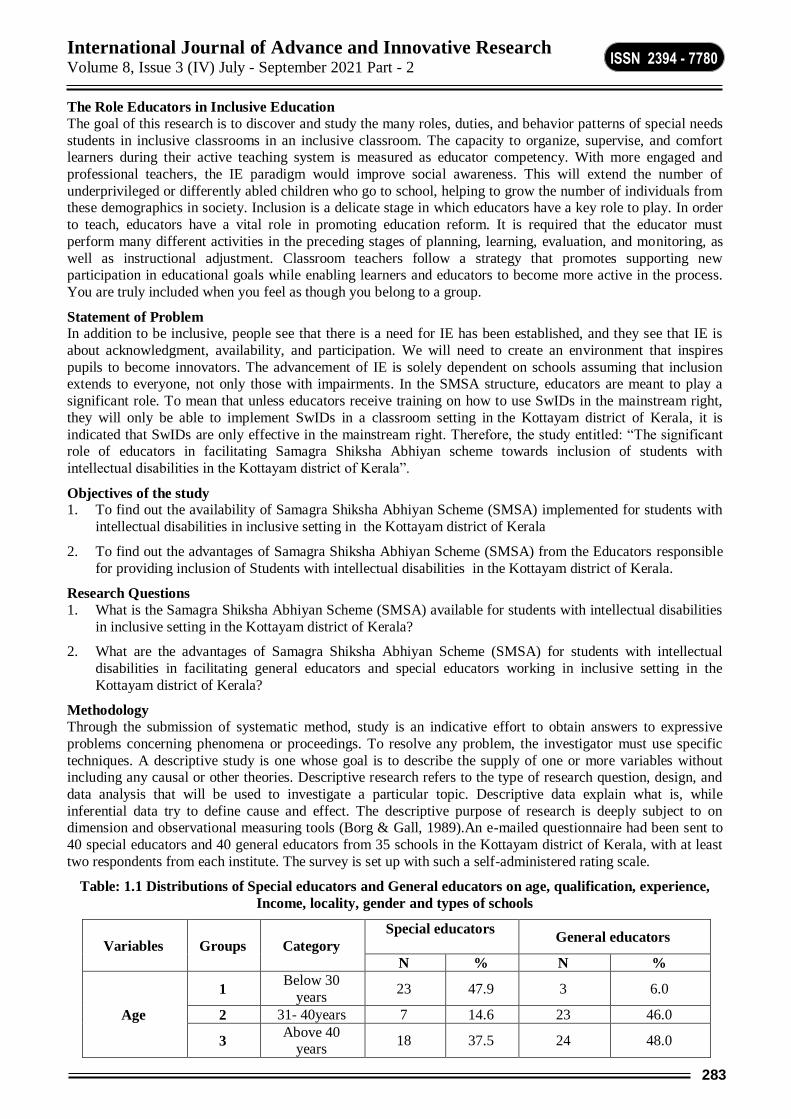
International Journal of Advance and Innovative Research Volume 8, Issue 3 (IV) July - September 2021 Part - 2
283
ISSN 2394 - 7780
The Role Educators in Inclusive Education The goal of this research is to discover and study the many roles, duties, and behavior patterns of special needs
students in inclusive classrooms in an inclusive classroom. The capacity to organize, supervise, and comfort learners during their active teaching system is measured as educator competency. With more engaged and
professional teachers, the IE paradigm would improve social awareness. This will extend the number of
underprivileged or differently abled children who go to school, helping to grow the number of individuals from these demographics in society. Inclusion is a delicate stage in which educators have a key role to play. In order
to teach, educators have a vital role in promoting education reform. It is required that the educator must
perform many different activities in the preceding stages of planning, learning, evaluation, and monitoring, as
well as instructional adjustment. Classroom teachers follow a strategy that promotes supporting new participation in educational goals while enabling learners and educators to become more active in the process.
You are truly included when you feel as though you belong to a group.
Statement of Problem In addition to be inclusive, people see that there is a need for IE has been established, and they see that IE is
about acknowledgment, availability, and participation. We will need to create an environment that inspires
pupils to become innovators. The advancement of IE is solely dependent on schools assuming that inclusion extends to everyone, not only those with impairments. In the SMSA structure, educators are meant to play a
significant role. To mean that unless educators receive training on how to use SwIDs in the mainstream right,
they will only be able to implement SwIDs in a classroom setting in the Kottayam district of Kerala, it is
indicated that SwIDs are only effective in the mainstream right. Therefore, the study entitled: “The significant role of educators in facilitating Samagra Shiksha Abhiyan scheme towards inclusion of students with
intellectual disabilities in the Kottayam district of Kerala”.
Objectives of the study 1. To find out the availability of Samagra Shiksha Abhiyan Scheme (SMSA) implemented for students with
intellectual disabilities in inclusive setting in the Kottayam district of Kerala
2. To find out the advantages of Samagra Shiksha Abhiyan Scheme (SMSA) from the Educators responsible
for providing inclusion of Students with intellectual disabilities in the Kottayam district of Kerala.
Research Questions
1. What is the Samagra Shiksha Abhiyan Scheme (SMSA) available for students with intellectual disabilities
in inclusive setting in the Kottayam district of Kerala?
2. What are the advantages of Samagra Shiksha Abhiyan Scheme (SMSA) for students with intellectual
disabilities in facilitating general educators and special educators working in inclusive setting in the
Kottayam district of Kerala?
Methodology
Through the submission of systematic method, study is an indicative effort to obtain answers to expressive
problems concerning phenomena or proceedings. To resolve any problem, the investigator must use specific
techniques. A descriptive study is one whose goal is to describe the supply of one or more variables without including any causal or other theories. Descriptive research refers to the type of research question, design, and
data analysis that will be used to investigate a particular topic. Descriptive data explain what is, while
inferential data try to define cause and effect. The descriptive purpose of research is deeply subject to on dimension and observational measuring tools (Borg & Gall, 1989).An e-mailed questionnaire had been sent to
40 special educators and 40 general educators from 35 schools in the Kottayam district of Kerala, with at least
two respondents from each institute. The survey is set up with such a self-administered rating scale.
Table: 1.1 Distributions of Special educators and General educators on age, qualification, experience,
Income, locality, gender and types of schools
Variables Groups Category
Special educators
General educators
N % N %
Age
1 Below 30
years 23 47.9 3 6.0
2 31- 40years 7 14.6 23 46.0
3 Above 40
years 18 37.5 24 48.0
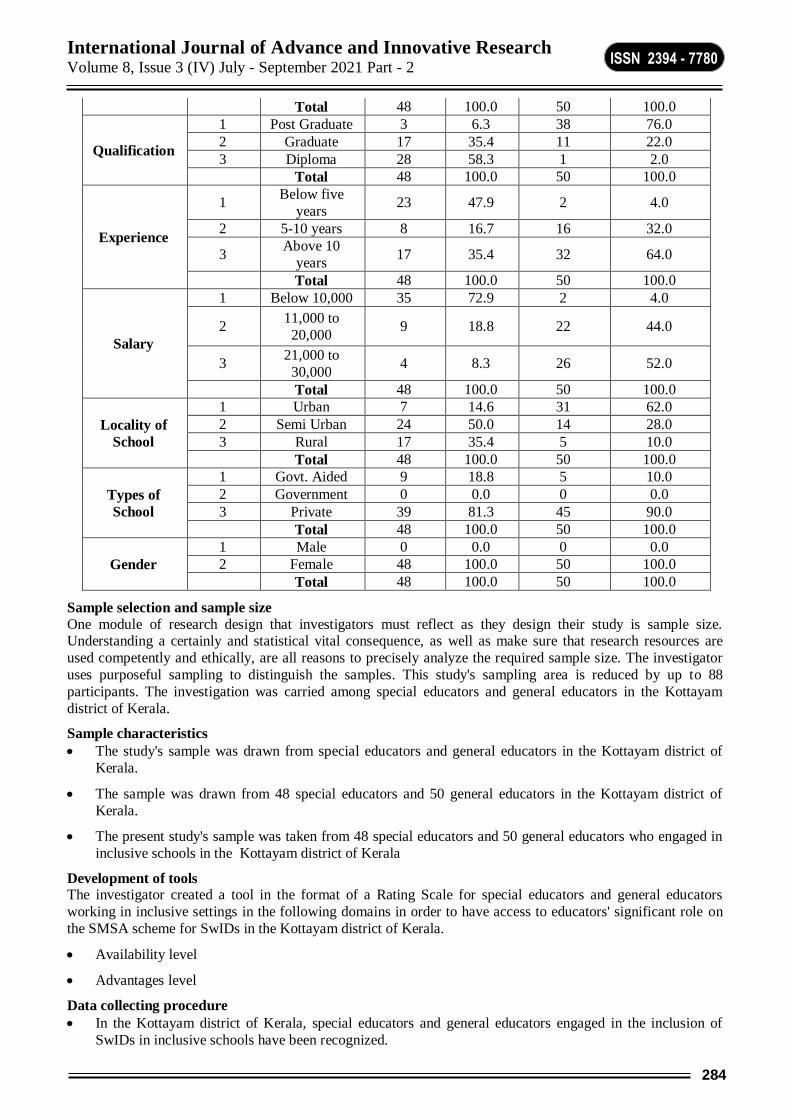
International Journal of Advance and Innovative Research Volume 8, Issue 3 (IV) July - September 2021 Part - 2
284
ISSN 2394 - 7780
Total 48 100.0 50 100.0
Qualification
1 Post Graduate 3 6.3 38 76.0
2 Graduate 17 35.4 11 22.0
3 Diploma 28 58.3 1 2.0
Total 48 100.0 50 100.0
Experience
1 Below five
years 23 47.9 2 4.0
2 5-10 years 8 16.7 16 32.0
3 Above 10
years 17 35.4 32 64.0
Total 48 100.0 50 100.0
Salary
1 Below 10,000 35 72.9 2 4.0
2 11,000 to
20,000 9 18.8 22 44.0
3 21,000 to
30,000 4 8.3 26 52.0
Total 48 100.0 50 100.0
Locality of
School
1 Urban 7 14.6 31 62.0
2 Semi Urban 24 50.0 14 28.0
3 Rural 17 35.4 5 10.0
Total 48 100.0 50 100.0
Types of
School
1 Govt. Aided 9 18.8 5 10.0
2 Government 0 0.0 0 0.0
3 Private 39 81.3 45 90.0
Total 48 100.0 50 100.0
Gender
1 Male 0 0.0 0 0.0
2 Female 48 100.0 50 100.0
Total 48 100.0 50 100.0
Sample selection and sample size
One module of research design that investigators must reflect as they design their study is sample size. Understanding a certainly and statistical vital consequence, as well as make sure that research resources are
used competently and ethically, are all reasons to precisely analyze the required sample size. The investigator
uses purposeful sampling to distinguish the samples. This study's sampling area is reduced by up to 88
participants. The investigation was carried among special educators and general educators in the Kottayam
district of Kerala.
Sample characteristics
The study's sample was drawn from special educators and general educators in the Kottayam district of
Kerala.
The sample was drawn from 48 special educators and 50 general educators in the Kottayam district of
Kerala.
The present study's sample was taken from 48 special educators and 50 general educators who engaged in
inclusive schools in the Kottayam district of Kerala
Development of tools The investigator created a tool in the format of a Rating Scale for special educators and general educators
working in inclusive settings in the following domains in order to have access to educators' significant role on
the SMSA scheme for SwIDs in the Kottayam district of Kerala.
Availability level
Advantages level
Data collecting procedure
In the Kottayam district of Kerala, special educators and general educators engaged in the inclusion of
SwIDs in inclusive schools have been recognized.

International Journal of Advance and Innovative Research Volume 8, Issue 3 (IV) July - September 2021 Part - 2
285
ISSN 2394 - 7780
The school authorities were given the questionnaire to distribute to special educators and general
educators.
Variables of study
Age, gender, educational qualification, experience, types of service, residence, and salary were used as
independent variables by the investigator.
Data Analysis
The statistical package for the social sciences (SPSS 20.0) was used to assist appropriate data analysis.
The Major findings of the study
1. What is the Samagra Shiksha Abhiyan Scheme (SMSA) available for students with intellectual
disabilities in inclusive setting in the Kottayam district of Kerala?
To find the level of availability of Samagra Shiksha Abhiyan Scheme (SMSA) for students with intellectual disabilities among general educators and special educators in an inclusive setting in the Kottayam district of
Kerala., the respondents are asked 10 questions on a five-point Likert scale. The responses are graded as
follows: 1 for 'Strongly disagree,' 2 for 'disagree,' 0 for 'uncertain,' 3 for 'agree,' and 4 for 'Strongly agree.' The total score for the ten questions is determined for all 98 respondents, from which the mean percent score for
students' degree of knowledge of Samagra Shiksha Abhiyan Scheme (SMSA) [𝑀𝑃𝑆 =𝑀𝑒𝑎𝑛𝑆𝑐𝑜𝑟𝑒×100
𝑀𝑎𝑥𝑖𝑚𝑢𝑚𝑝𝑜𝑠𝑠𝑖𝑏𝑙𝑒𝑠𝑐𝑜𝑟𝑒]
were calculated.
This score is classified into one of the four groups
1. Poor or low if the mean % score is less than 35%,
2. Average if the mean % score is between 35 to 50 percent,
3. Good or medium if the mean % score lies in the interval 50 to 75% and
4. Excellent or high if the mean % score is above 75%.
Table: 1. 2: Mean, Standard deviation and z value for availability of Samagra Shiksha Abhiyan Scheme
(SMSA)
Variable N Mean Std.
Deviation
Mean
%score CV z p value
Availability 98 39.10 6.73 78.20 17.21 2.357 0.020
Interpretations
The mean percentage score level of availability of Samagra Shiksha Abhiyan Scheme (SMSA) implemented for students with intellectual disability in inclusive setting in Kottayam district of Kerala is 78.2% which indicate
that level of availability of Samagra Shisha Abhiyan Scheme (SMSA) is excellent. The CV indicates that this
score is stable as the value is less than 20%. To test whether the sample information that we observe exists in the population or to verify that the level of availability of Samagra Shiksha Abhiyan Scheme (SMSA)
implemented is excellent. To test the above hypothesis we use one sample Z test and the result is exhibited in
Table 1.2. From the table the p value is less than 0.05 which indicates that the test is significant. Hence we conclude that the level of availability of Samagra Shiksha Abhiyan Scheme (SMSA) implemented for students
with intellectual disabilities in inclusive setting in the Kottayam district of Kerala is greater than 75% i.e.
excellent.
2. What are the advantages of Samagra Shiksha Abhiyan Scheme (SMSA) for students with
intellectual disabilities in facilitating general educators and special educators working in inclusive
setting in the Kottayam district of Kerala?
To find the level of advantages of Samagra Shiksha Abhiyan Scheme (SMSA) for students with intellectual disabilities among general educators and special educators working in an inclusive setting in the Kottayam
district of Kerala., the respondents are asked 10 questions on a five-point Likert scale. The responses are
graded as follows: 1 for ‘strongly disagree,' 2 for 'disagree,' 0 for 'uncertain,' 3for 'agree,' and 4 for ‘strongly agree.' The total score for the ten questions is determined for all 98 respondents, from which the mean percent
score for the number of benefits of Samagra Shiksha Abhiyan Scheme (SMSA) for students with intellectual
disabilities is calculated.
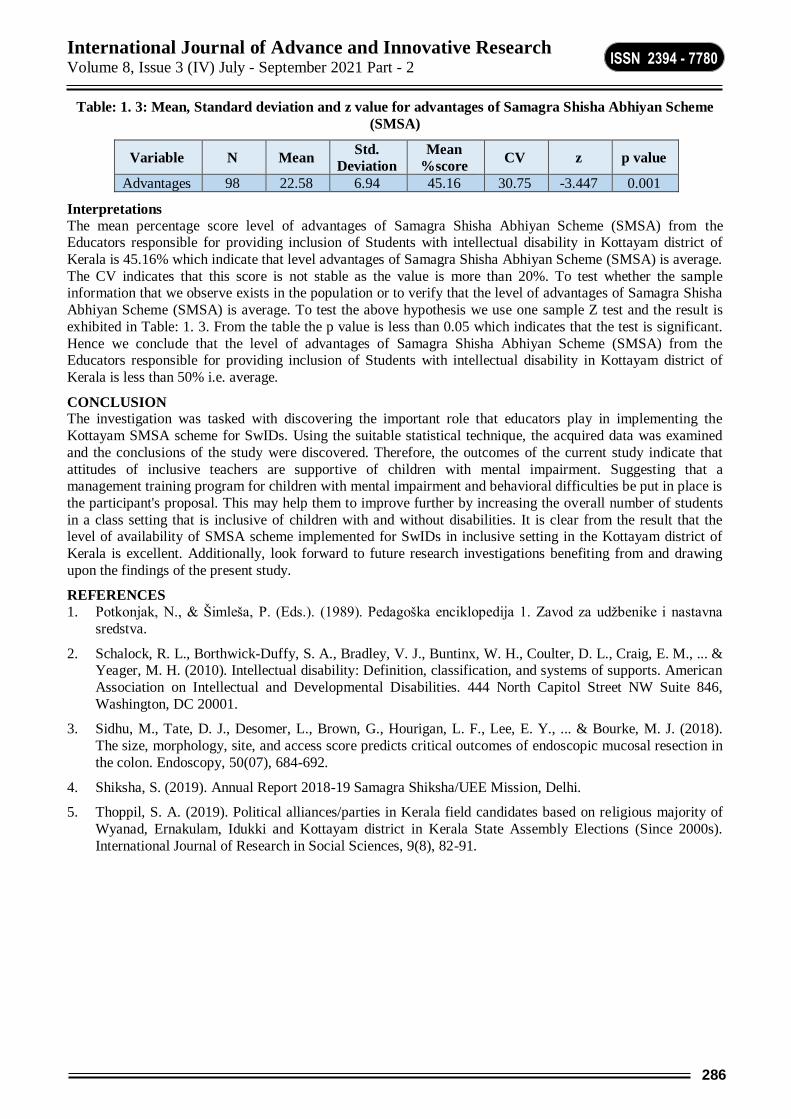
International Journal of Advance and Innovative Research Volume 8, Issue 3 (IV) July - September 2021 Part - 2
286
ISSN 2394 - 7780
Table: 1. 3: Mean, Standard deviation and z value for advantages of Samagra Shisha Abhiyan Scheme
(SMSA)
Variable N Mean Std.
Deviation
Mean
%score CV z p value
Advantages 98 22.58 6.94 45.16 30.75 -3.447 0.001
Interpretations
The mean percentage score level of advantages of Samagra Shisha Abhiyan Scheme (SMSA) from the Educators responsible for providing inclusion of Students with intellectual disability in Kottayam district of
Kerala is 45.16% which indicate that level advantages of Samagra Shisha Abhiyan Scheme (SMSA) is average.
The CV indicates that this score is not stable as the value is more than 20%. To test whether the sample information that we observe exists in the population or to verify that the level of advantages of Samagra Shisha
Abhiyan Scheme (SMSA) is average. To test the above hypothesis we use one sample Z test and the result is
exhibited in Table: 1. 3. From the table the p value is less than 0.05 which indicates that the test is significant.
Hence we conclude that the level of advantages of Samagra Shisha Abhiyan Scheme (SMSA) from the Educators responsible for providing inclusion of Students with intellectual disability in Kottayam district of
Kerala is less than 50% i.e. average.
CONCLUSION The investigation was tasked with discovering the important role that educators play in implementing the
Kottayam SMSA scheme for SwIDs. Using the suitable statistical technique, the acquired data was examined
and the conclusions of the study were discovered. Therefore, the outcomes of the current study indicate that
attitudes of inclusive teachers are supportive of children with mental impairment. Suggesting that a management training program for children with mental impairment and behavioral difficulties be put in place is
the participant's proposal. This may help them to improve further by increasing the overall number of students
in a class setting that is inclusive of children with and without disabilities. It is clear from the result that the level of availability of SMSA scheme implemented for SwIDs in inclusive setting in the Kottayam district of
Kerala is excellent. Additionally, look forward to future research investigations benefiting from and drawing
upon the findings of the present study.
REFERENCES
1. Potkonjak, N., & Šimleša, P. (Eds.). (1989). Pedagoška enciklopedija 1. Zavod za udžbenike i nastavna
sredstva.
2. Schalock, R. L., Borthwick-Duffy, S. A., Bradley, V. J., Buntinx, W. H., Coulter, D. L., Craig, E. M., ... & Yeager, M. H. (2010). Intellectual disability: Definition, classification, and systems of supports. American
Association on Intellectual and Developmental Disabilities. 444 North Capitol Street NW Suite 846,
Washington, DC 20001.
3. Sidhu, M., Tate, D. J., Desomer, L., Brown, G., Hourigan, L. F., Lee, E. Y., ... & Bourke, M. J. (2018).
The size, morphology, site, and access score predicts critical outcomes of endoscopic mucosal resection in
the colon. Endoscopy, 50(07), 684-692.
4. Shiksha, S. (2019). Annual Report 2018-19 Samagra Shiksha/UEE Mission, Delhi.
5. Thoppil, S. A. (2019). Political alliances/parties in Kerala field candidates based on religious majority of
Wyanad, Ernakulam, Idukki and Kottayam district in Kerala State Assembly Elections (Since 2000s).
International Journal of Research in Social Sciences, 9(8), 82-91.
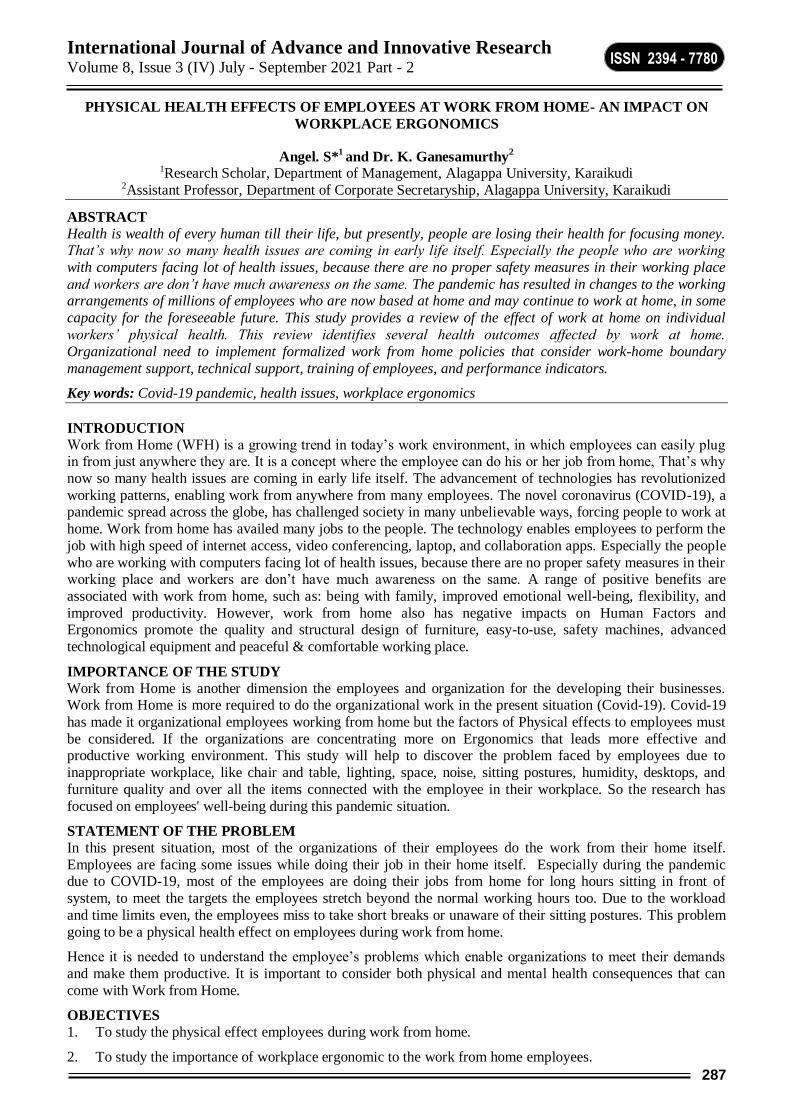
International Journal of Advance and Innovative Research Volume 8, Issue 3 (IV) July - September 2021 Part - 2
287
ISSN 2394 - 7780
PHYSICAL HEALTH EFFECTS OF EMPLOYEES AT WORK FROM HOME- AN IMPACT ON
WORKPLACE ERGONOMICS
Angel. S*1 and Dr. K. Ganesamurthy
2
1Research Scholar, Department of Management, Alagappa University, Karaikudi 2Assistant Professor, Department of Corporate Secretaryship, Alagappa University, Karaikudi
ABSTRACT
Health is wealth of every human till their life, but presently, people are losing their health for focusing money. That’s why now so many health issues are coming in early life itself. Especially the people who are working
with computers facing lot of health issues, because there are no proper safety measures in their working place
and workers are don’t have much awareness on the same. The pandemic has resulted in changes to the working arrangements of millions of employees who are now based at home and may continue to work at home, in some
capacity for the foreseeable future. This study provides a review of the effect of work at home on individual
workers’ physical health. This review identifies several health outcomes affected by work at home.
Organizational need to implement formalized work from home policies that consider work-home boundary
management support, technical support, training of employees, and performance indicators.
Key words: Covid-19 pandemic, health issues, workplace ergonomics
INTRODUCTION Work from Home (WFH) is a growing trend in today’s work environment, in which employees can easily plug in from just anywhere they are. It is a concept where the employee can do his or her job from home, That’s why
now so many health issues are coming in early life itself. The advancement of technologies has revolutionized
working patterns, enabling work from anywhere from many employees. The novel coronavirus (COVID-19), a pandemic spread across the globe, has challenged society in many unbelievable ways, forcing people to work at
home. Work from home has availed many jobs to the people. The technology enables employees to perform the
job with high speed of internet access, video conferencing, laptop, and collaboration apps. Especially the people
who are working with computers facing lot of health issues, because there are no proper safety measures in their working place and workers are don’t have much awareness on the same. A range of positive benefits are
associated with work from home, such as: being with family, improved emotional well-being, flexibility, and
improved productivity. However, work from home also has negative impacts on Human Factors and Ergonomics promote the quality and structural design of furniture, easy-to-use, safety machines, advanced
technological equipment and peaceful & comfortable working place.
IMPORTANCE OF THE STUDY
Work from Home is another dimension the employees and organization for the developing their businesses. Work from Home is more required to do the organizational work in the present situation (Covid-19). Covid-19
has made it organizational employees working from home but the factors of Physical effects to employees must
be considered. If the organizations are concentrating more on Ergonomics that leads more effective and productive working environment. This study will help to discover the problem faced by employees due to
inappropriate workplace, like chair and table, lighting, space, noise, sitting postures, humidity, desktops, and
furniture quality and over all the items connected with the employee in their workplace. So the research has
focused on employees' well-being during this pandemic situation.
STATEMENT OF THE PROBLEM
In this present situation, most of the organizations of their employees do the work from their home itself.
Employees are facing some issues while doing their job in their home itself. Especially during the pandemic due to COVID-19, most of the employees are doing their jobs from home for long hours sitting in front of
system, to meet the targets the employees stretch beyond the normal working hours too. Due to the workload
and time limits even, the employees miss to take short breaks or unaware of their sitting postures. This problem
going to be a physical health effect on employees during work from home.
Hence it is needed to understand the employee’s problems which enable organizations to meet their demands
and make them productive. It is important to consider both physical and mental health consequences that can
come with Work from Home.
OBJECTIVES 1. To study the physical effect employees during work from home.
2. To study the importance of workplace ergonomic to the work from home employees.
International Journal of Advance and Innovative Research Volume 8, Issue 3 (IV) July - September 2021 Part - 2
288
ISSN 2394 - 7780
SCOPE OF THE STUDY
This survey aims to investigate the overall Physical Effects of the employees during work from home. The
study focuses only on employees who work in Chennai city with various sectors like Banking, Education, IT & ITES, etc. Hence this study analyzes the Physical and Mental health of employees during this Pandemic
situation in Bangalore city.
LITERATURE REVIEW Lina Vyass and Nantapong Butakhieo (2021), this study aims to know the impact of working from home
during COVID-19 on the work and life domain in Hong Kong. This paper provides unique insight into how well
working from home works and may play a vital role in future policies that reshape the current structure of
working hours, possibly allowing more flexibility. It also investigated the continuing experience of the employer and employees face in Hong Kong. It analyzed better guidelines and policies from the government
that should be in place to properly regulate and make WFM (work from home) feasible. Proper training is
required for workers as they are unaware of what WFM entails and the lack of resources required for the change
of software, access to official documents, and proper working space.
Margherita Zito et al. (2021), this study contributed to literature underlying the role of organizational
communication among work-from-home employees during the COVID-19 Pandemic. To ensure the effectiveness of organizational communication, it is necessary to constantly monitor the internal satisfaction of
the communication of employees, as well as the ease of retrieval of information by those who are at distance,
working remotely, implementing specific categories, and categorizations of the information. It includes precise
structuring of communications processes both at a structural and relational level. Employees must be helped with psychological and physical disorders management and would be more productive, with positive outcomes
for organizations, since technostress is related to lower performance. Through training employees and
manager’s enables to know the risk of technology and how to protect themselves.
Sonakshi Sharma (2020), this article explored the impact of work from home on the financial well-being of IT
employees. It is a study on the financial position of the workers employed in Pune. Financial wellbeing has a
significant impact on three factors is Behaviour, Financial Management, and Financial Literacy. Financial
wellbeing is not much impacted because most of the employees were still receiving a salary while expenses were reduced on the other hand. Organizations should provide employees with access to crucial financial
protection coverage are which can lead to better financial wellbeing during work from the home period.
Agotas Giedre Raisiene et al. (2020), stated that COVID 19 pandemic brings new challenges to organizations that suddenly switch to telework in Lithuania. Telework raises quite a few issues for employees, related to
communication, collaboration, and the application of ICT (Information and Communication Technologies).
Employees with a short experience of teleworking found the least challenge when comparing work from home and work in the workplace. It gives an important message to Human Resource Management specialist that
Working from home two days a week can be a stronger motivating tool that does not adversely affect the quality
of employees’ collaboration, mutual trust, providing feedback, and similar aspects that are identified as negative
by individuals who telework most of the time.
Alexander Bick et al. (2020), this research is designed to know work from home after the COVID-19 outbreak
in the USA. The pandemic and social distancing have led to unprecedented employment losses, as well as
severe disruptions to work and commuting habits. It suggests that the education, information, and finance sector are among the industries with some further scope for workers to switch to working from home. Apart from the
potential for home-based work, industry business conditions and labor demand is mattered for employment
outcome following the virus outbreak.
Kazi Turin Rahman and Zahir Uddin Arif (2020), stated that the COVID-19 pandemic has resorted to
working from home to keep operations rolling and keep employees safe. This research focuses on the impacts of
working from home during the COVID-19 pandemic regarding employee satisfaction, challenges, and
perceived productivity. This study has investigated that work flexibility is the main factor contributing to employee satisfaction. The extra work hours are stressful and challenging for telecommuters, along with
isolation from colleagues. It also believes that the perceived level of productivity is higher in working from
home rather than in an office.
Agus Purwanto et al. (2020), is an explorative study of how Indonesian teachers were impacted from work at
home during the COVID-19 Pandemic. This study reflects the advantage and disadvantages of work from home
(WFH). The advantages are that WFH activity is more flexible in completing work, does not follow office
hours, and does not need to spend money to pay for transportation costs, can minimize the level of stress
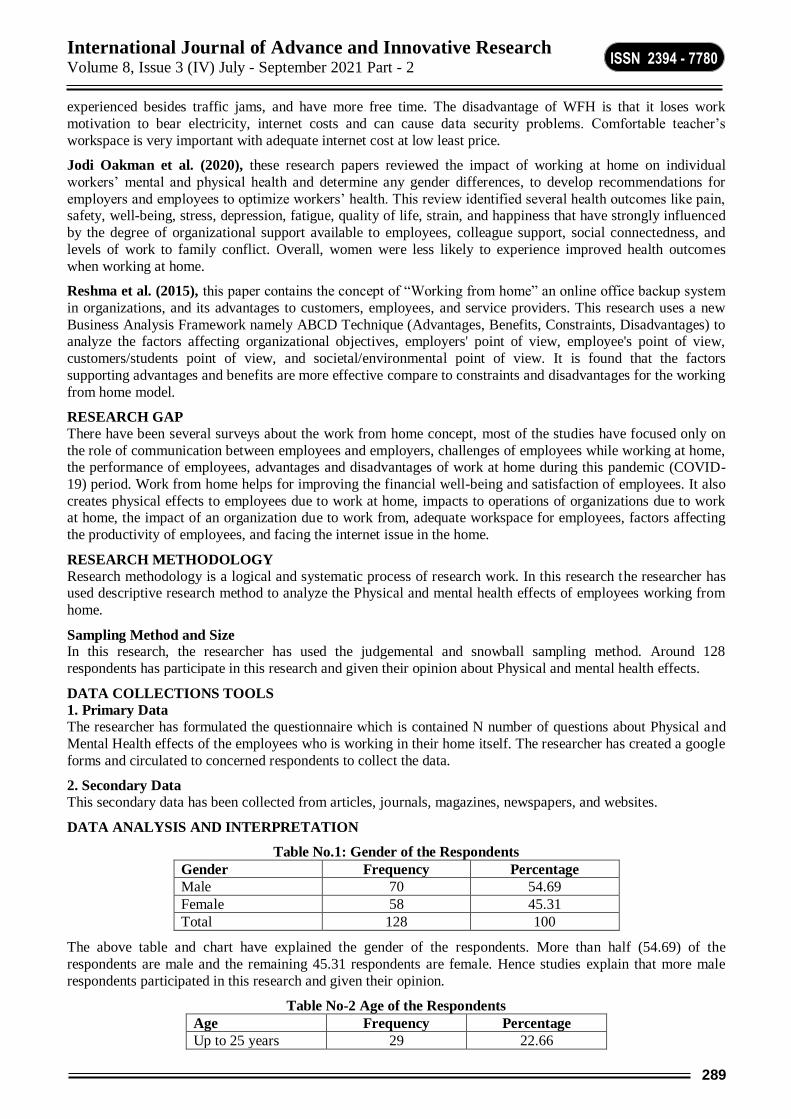
International Journal of Advance and Innovative Research Volume 8, Issue 3 (IV) July - September 2021 Part - 2
289
ISSN 2394 - 7780
experienced besides traffic jams, and have more free time. The disadvantage of WFH is that it loses work
motivation to bear electricity, internet costs and can cause data security problems. Comfortable teacher’s
workspace is very important with adequate internet cost at low least price.
Jodi Oakman et al. (2020), these research papers reviewed the impact of working at home on individual
workers’ mental and physical health and determine any gender differences, to develop recommendations for
employers and employees to optimize workers’ health. This review identified several health outcomes like pain, safety, well-being, stress, depression, fatigue, quality of life, strain, and happiness that have strongly influenced
by the degree of organizational support available to employees, colleague support, social connectedness, and
levels of work to family conflict. Overall, women were less likely to experience improved health outcomes
when working at home.
Reshma et al. (2015), this paper contains the concept of “Working from home” an online office backup system
in organizations, and its advantages to customers, employees, and service providers. This research uses a new
Business Analysis Framework namely ABCD Technique (Advantages, Benefits, Constraints, Disadvantages) to analyze the factors affecting organizational objectives, employers' point of view, employee's point of view,
customers/students point of view, and societal/environmental point of view. It is found that the factors
supporting advantages and benefits are more effective compare to constraints and disadvantages for the working
from home model.
RESEARCH GAP
There have been several surveys about the work from home concept, most of the studies have focused only on
the role of communication between employees and employers, challenges of employees while working at home, the performance of employees, advantages and disadvantages of work at home during this pandemic (COVID-
19) period. Work from home helps for improving the financial well-being and satisfaction of employees. It also
creates physical effects to employees due to work at home, impacts to operations of organizations due to work at home, the impact of an organization due to work from, adequate workspace for employees, factors affecting
the productivity of employees, and facing the internet issue in the home.
RESEARCH METHODOLOGY
Research methodology is a logical and systematic process of research work. In this research the researcher has used descriptive research method to analyze the Physical and mental health effects of employees working from
home.
Sampling Method and Size In this research, the researcher has used the judgemental and snowball sampling method. Around 128
respondents has participate in this research and given their opinion about Physical and mental health effects.
DATA COLLECTIONS TOOLS
1. Primary Data
The researcher has formulated the questionnaire which is contained N number of questions about Physical and
Mental Health effects of the employees who is working in their home itself. The researcher has created a google
forms and circulated to concerned respondents to collect the data.
2. Secondary Data
This secondary data has been collected from articles, journals, magazines, newspapers, and websites.
DATA ANALYSIS AND INTERPRETATION
Table No.1: Gender of the Respondents
Gender Frequency Percentage
Male 70 54.69
Female 58 45.31
Total 128 100
The above table and chart have explained the gender of the respondents. More than half (54.69) of the
respondents are male and the remaining 45.31 respondents are female. Hence studies explain that more male
respondents participated in this research and given their opinion.
Table No-2 Age of the Respondents
Age Frequency Percentage
Up to 25 years 29 22.66
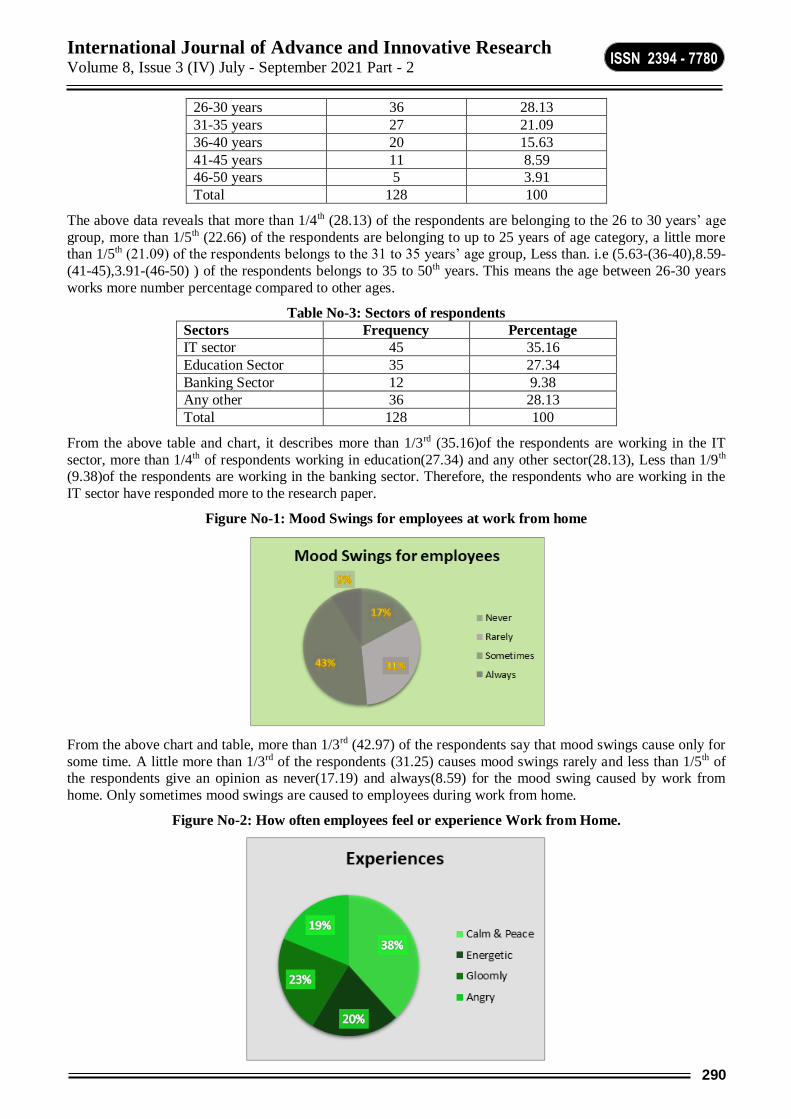
International Journal of Advance and Innovative Research Volume 8, Issue 3 (IV) July - September 2021 Part - 2
290
ISSN 2394 - 7780
26-30 years 36 28.13
31-35 years 27 21.09
36-40 years 20 15.63
41-45 years 11 8.59
46-50 years 5 3.91
Total 128 100
The above data reveals that more than 1/4th (28.13) of the respondents are belonging to the 26 to 30 years’ age
group, more than 1/5th (22.66) of the respondents are belonging to up to 25 years of age category, a little more than 1/5th (21.09) of the respondents belongs to the 31 to 35 years’ age group, Less than. i.e (5.63-(36-40),8.59-
(41-45),3.91-(46-50) ) of the respondents belongs to 35 to 50th years. This means the age between 26-30 years
works more number percentage compared to other ages.
Table No-3: Sectors of respondents
Sectors Frequency Percentage
IT sector 45 35.16
Education Sector 35 27.34
Banking Sector 12 9.38
Any other 36 28.13
Total 128 100
From the above table and chart, it describes more than 1/3rd (35.16)of the respondents are working in the IT
sector, more than 1/4th of respondents working in education(27.34) and any other sector(28.13), Less than 1/9th (9.38)of the respondents are working in the banking sector. Therefore, the respondents who are working in the
IT sector have responded more to the research paper.
Figure No-1: Mood Swings for employees at work from home
From the above chart and table, more than 1/3rd (42.97) of the respondents say that mood swings cause only for
some time. A little more than 1/3rd of the respondents (31.25) causes mood swings rarely and less than 1/5th of the respondents give an opinion as never(17.19) and always(8.59) for the mood swing caused by work from
home. Only sometimes mood swings are caused to employees during work from home.
Figure No-2: How often employees feel or experience Work from Home.
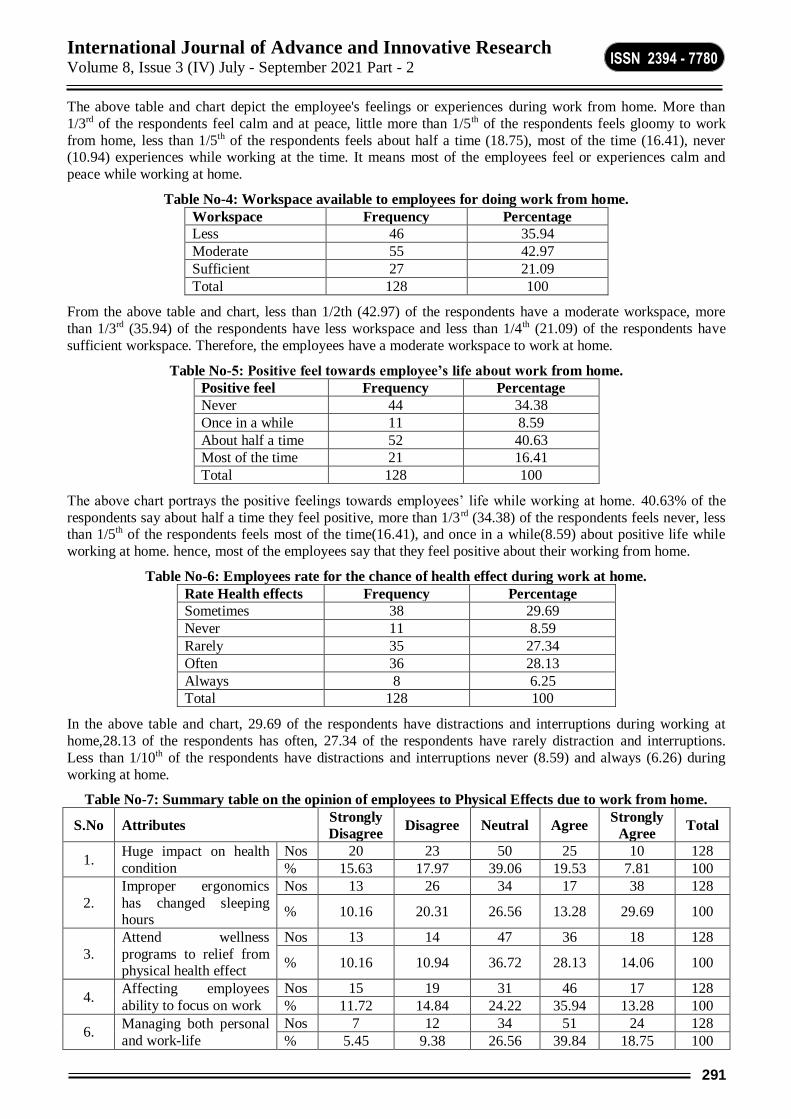
International Journal of Advance and Innovative Research Volume 8, Issue 3 (IV) July - September 2021 Part - 2
291
ISSN 2394 - 7780
The above table and chart depict the employee's feelings or experiences during work from home. More than
1/3rd of the respondents feel calm and at peace, little more than 1/5th of the respondents feels gloomy to work
from home, less than 1/5th of the respondents feels about half a time (18.75), most of the time (16.41), never (10.94) experiences while working at the time. It means most of the employees feel or experiences calm and
peace while working at home.
Table No-4: Workspace available to employees for doing work from home.
Workspace Frequency Percentage
Less 46 35.94
Moderate 55 42.97
Sufficient 27 21.09
Total 128 100
From the above table and chart, less than 1/2th (42.97) of the respondents have a moderate workspace, more
than 1/3rd (35.94) of the respondents have less workspace and less than 1/4th (21.09) of the respondents have
sufficient workspace. Therefore, the employees have a moderate workspace to work at home.
Table No-5: Positive feel towards employee’s life about work from home.
Positive feel Frequency Percentage
Never 44 34.38
Once in a while 11 8.59
About half a time 52 40.63
Most of the time 21 16.41
Total 128 100
The above chart portrays the positive feelings towards employees’ life while working at home. 40.63% of the
respondents say about half a time they feel positive, more than 1/3rd (34.38) of the respondents feels never, less than 1/5th of the respondents feels most of the time(16.41), and once in a while(8.59) about positive life while
working at home. hence, most of the employees say that they feel positive about their working from home.
Table No-6: Employees rate for the chance of health effect during work at home.
Rate Health effects Frequency Percentage
Sometimes 38 29.69
Never 11 8.59
Rarely 35 27.34
Often 36 28.13
Always 8 6.25
Total 128 100
In the above table and chart, 29.69 of the respondents have distractions and interruptions during working at
home,28.13 of the respondents has often, 27.34 of the respondents have rarely distraction and interruptions.
Less than 1/10th of the respondents have distractions and interruptions never (8.59) and always (6.26) during
working at home.
Table No-7: Summary table on the opinion of employees to Physical Effects due to work from home.
S.No Attributes Strongly
Disagree Disagree Neutral Agree
Strongly
Agree Total
1. Huge impact on health
condition
Nos 20 23 50 25 10 128
% 15.63 17.97 39.06 19.53 7.81 100
2.
Improper ergonomics
has changed sleeping hours
Nos 13 26 34 17 38 128
% 10.16 20.31 26.56 13.28 29.69 100
3.
Attend wellness
programs to relief from physical health effect
Nos 13 14 47 36 18 128
% 10.16 10.94 36.72 28.13 14.06 100
4. Affecting employees
ability to focus on work
Nos 15 19 31 46 17 128
% 11.72 14.84 24.22 35.94 13.28 100
6. Managing both personal
and work-life
Nos 7 12 34 51 24 128
% 5.45 9.38 26.56 39.84 18.75 100
International Journal of Advance and Innovative Research Volume 8, Issue 3 (IV) July - September 2021 Part - 2
292
ISSN 2394 - 7780
FINDINGS
In this study, around 70 respondents are male out of 128 respondents. So, the majority of the respondents
for this research are male employees and they contribute more to the job during work from home also.
Most of the response of this research is from IT employees.
Out of 128 respondents, 55 employees say that they have mood swings only sometimes due to work from
home and have a moderate workspace to work.
Most of the employees believe that they are calm and peaceful to work, about half a time employees feel positive about their life, only sometimes employees have distractions and interruptions during working at
home, due to improper working place.
The employees feel improper workplace has changing sleeping hours, and created the health effects from
work at home, to attend wellness program for pain relief.
The employees agree that the work from home is affecting to focus on work and they can manage both
personal and work-life while working at home.
CONCLUSION
In a technology era, working from home associate employees to work during the COVID-19 crisis which made
the business operations continues. Overall this study made an effort to bring forward the physical effects to employees during work from home due to improper ergonomics facilities. It is found that employees need to be
healthy more with work from home arrangement. The findings from this study suggest the impacts of Work
from home on individual physical health vary considerably. Some consistent principles need to be implemented to support employees in improving working conditions to mitigate the negative effects of Work from home and
enhance the positive effects of work from home on employees' health. In this current situation, some financial
compensation needs to be given to employees to reduce the financial burden. This study contributes to providing various measures for challenges of physical health effects faced by employees during working at
home.
REFERENCES
1. Agota Giedre Raisiene, Violeta Rapuano, Kristina Varukuleviciute, Katarina Stachova, (2020) Working from home-Who is happy? A Survey of Lithuania’s Employees during the COVID-19 Quarantine Period”, special issue July 2020.
2. Agus Purwanto, Masduki Asbari, Mochammad Fahlevi, Abdul Mufid, Eva Agistiawati, Yoyok Cahyono,
Popong Suryani, (2020) Impact of Work From Home on Indonesian Teachers Performance During the
Covid-19 Pandemic: An Exploratory Study “International Journal of Advanced Science and Technology”, Volume 29.
3. Alexander Bick, Adam Blandin, Karel Mertens, (2020) Work From Home After the COVID-19 Outbreak “Federal Reserve Bank of Dallas”, Special Issue June 9, 2020.
4. Jodi Oakman, Natasha Kinsman, Rwth Stuckey, Melissa Graham, Victoria Weale, (2020) A rapid review
of mental and physical health effects of working at home: how do we optimize health? “BMC Public Health”
5. Kazi Turin Rahman, Md. Zahir Uddin Arif, (2020) Working from Home during the COVID-19 Pandemic: Satisfaction, Challenges, and Productivity of Employees “International Journal of Trade and Commerce”, Volume 9, special issue 2, 2020.
6. Lina Vyas, Nantapong Butakhieo, (2021) the impact of working from home during COVID-19 on work and domains: an exploratory study on Hong Kong “The Education University of Hong Kong”, Volume 4.
7. Margherita Zito, Emanuela Ingusci, Claudio G. Cortese, Maria Lusia Giancaspro, Amelia Manuti, Monica Molino, Fulvio Signore , Vincenzo Russo, (2021) Does the end justify the means? The Role of
Organisational Communication among Work from Home Employees during the COVID-19 Pandemic “International Journal of Environmental Research and Public Health”.
8. Reshnma, P.S. Aithal, Shailashree V.T and P. Sridhar Acharya, (2015) An Empirical Study on Working
from Home “International Journal of Advance and Innovative Research”, Volume 2, Special Issue April-June, 2014.
9. Sonakshi Sharma, (2020) Impact of Work From Home on Financial Wellbeing of IT Employees “European Journal of Molecular & Clinical Medicine”, Volume 7, Special Issue 10, 2020,

International Journal of Advance and Innovative Research Volume 8, Issue 3 (IV) July - September 2021 Part - 2
293
ISSN 2394 - 7780
STUDY OF FISH DIVERSITY IN RESPONSE TO CLIMATE CHANGES IN JOHILA DAM,
RAJENDRAGRAM, ANUPPUR DISTRICT (M.P.), INDIA
Sonoo Gupta and Dr. Pratibha Pandey
Department of Zoology, Dr. C.V. Raman University Kargi Road, Kota, Bilaspur (C.G.)
ABSTRACT
The current study intents to provide an over view of Fish Diversity of Johila Dam of Rajendragram, Anuppur
District (M.P.). The fish diversity is correlated with various physico-chemical parameters that regulate the productivity and distribution of different species of Fishes. The fish population is abundant and majority of
fishes are exploited for human consumption. In current study attempts have been made to collect, classify and
identify fish of Johila dam, Rajendragram. The survey indicated that 32 species of fishes were recorded in
sampling station.
Keywords: Fish Diversity, Climate Change, Johila Dam, Rajendragram, Anuppur District (M.P.)

International Journal of Advance and Innovative Research Volume 8, Issue 3 (IV) July - September 2021 Part - 2
294
ISSN 2394 - 7780
THE COVID CRISISIAN IMPACT OF SPORTS INDUSTRY
Ravindra Gouda S M1 and Virupaksha N D
2
Assistant Director1 and Director2, Department of P.G. Studies and Research in Physical Education, Kuvempu
University, Jnanasahyadri, Shankaraghatta, Shivamogga, Karnataka, India-577451
ABSTRACT
The COVID-19 pandemic affects all aspects of life, including sports, causing a worldwide upheaval not seen
since World War II. As the Coronavirus spreads around the world, an increasing number of major sporting events and matches (at an international, regional, and/or national level) have been postponed or cancelled.
Athletes, teams, leagues, sponsorships, sport retail, hospitality, and media coverage have all been impacted.
Reopening sporting events and tournaments safely should focus on maximizing the benefits of sport and physical activity. Once COVID-19 is under control, sport clubs and associations can play a significant role in
mobilizing society to face health threats and eventually relaunch social and economic activity. Furthermore,
the sport industry is developing contingency plans for games without audiences and exploring opportunities for
virtual technologies to grow (e.g., enabling fans to experience games live without being physically present). Due to lockdown restrictions, online at-home workout trends are booming, offering new fitness routines that
may be here to stay.
Keywords: Athletes, Sponsorships, Sport Retail, Hospitality, And Media Coverage.
MANUSCRIPT SUBMISSION
GUIDELINES FOR CONTRIBUTORS 1. Manuscripts should be submitted preferably through email and the research article / paper
should preferably not exceed 8 – 10 pages in all.
2. Book review must contain the name of the author and the book reviewed, the place of publication and publisher, date of publication, number of pages and price.
3. Manuscripts should be typed in 12 font-size, Times New Roman, single spaced with 1” margin on a standard A4 size paper. Manuscripts should be organized in the following order: title, name(s) of author(s) and his/her (their) complete affiliation(s) including zip code(s), Abstract (not exceeding 350 words), Introduction, Main body of paper, Conclusion and References.
4. The title of the paper should be in capital letters, bold, size 16” and centered at the top of the first page. The author(s) and affiliations(s) should be centered, bold, size 14” and single-spaced, beginning from the second line below the title.
First Author Name1, Second Author Name2, Third Author Name3 1Author Designation, Department, Organization, City, email id 2Author Designation, Department, Organization, City, email id 3Author Designation, Department, Organization, City, email id
5. The abstract should summarize the context, content and conclusions of the paper in less than 350 words in 12 points italic Times New Roman. The abstract should have about five key words in alphabetical order separated by comma of 12 points italic Times New Roman.
6. Figures and tables should be centered, separately numbered, self explained. Please note that table titles must be above the table and sources of data should be mentioned below the table. The authors should ensure that tables and figures are referred to from the main text.
EXAMPLES OF REFERENCES All references must be arranged first alphabetically and then it may be further sorted chronologically also.
Single author journal article: Fox, S. (1984). Empowerment as a catalyst for change: an example for the food industry. Supply Chain Management, 2(3), 29–33.
Bateson, C. D.,(2006), ‘Doing Business after the Fall: The Virtue of Moral Hypocrisy’, Journal of Business Ethics, 66: 321 – 335
Multiple author journal article: Khan, M. R., Islam, A. F. M. M., & Das, D. (1886). A Factor Analytic Study on the Validity of a Union Commitment Scale. Journal of Applied Psychology, 12(1), 129-136.
Liu, W.B, Wongcha A, & Peng, K.C. (2012), “Adopting Super-Efficiency And Tobit Model On Analyzing the Efficiency of Teacher’s Colleges In Thailand”, International Journal on New Trends In Education and Their Implications, Vol.3.3, 108 – 114.
Text Book: Simchi-Levi, D., Kaminsky, P., & Simchi-Levi, E. (2007). Designing and Managing the Supply Chain: Concepts, Strategies and Case Studies (3rd ed.). New York: McGraw-Hill.
S. Neelamegham," Marketing in India, Cases and Reading, Vikas Publishing House Pvt. Ltd, III Edition, 2000.
Edited book having one editor: Raine, A. (Ed.). (2006). Crime and schizophrenia: Causes and cures. New York: Nova Science.
Edited book having more than one editor: Greenspan, E. L., & Rosenberg, M. (Eds.). (2009). Martin’s annual criminal code:Student edition 2010. Aurora, ON: Canada Law Book.
Chapter in edited book having one editor: Bessley, M., & Wilson, P. (1984). Public policy and small firms in Britain. In Levicki, C. (Ed.), Small Business Theory and Policy (pp. 111–126). London: Croom Helm.
Chapter in edited book having more than one editor: Young, M. E., & Wasserman, E. A. (2005). Theories of learning. In K. Lamberts, & R. L. Goldstone (Eds.), Handbook of cognition (pp. 161-182). Thousand Oaks, CA: Sage.
Electronic sources should include the URL of the website at which they may be found, as shown:
Sillick, T. J., & Schutte, N. S. (2006). Emotional intelligence and self-esteem mediate between perceived early parental love and adult happiness. E-Journal of Applied Psychology, 2(2), 38-48. Retrieved from http://ojs.lib.swin.edu.au/index.php/ejap
Unpublished dissertation/ paper: Uddin, K. (2000). A Study of Corporate Governance in a Developing Country: A Case of Bangladesh (Unpublished Dissertation). Lingnan University, Hong Kong.
Article in newspaper: Yunus, M. (2005, March 23). Micro Credit and Poverty Alleviation in Bangladesh. The Bangladesh Observer, p. 9.
Article in magazine: Holloway, M. (2005, August 6). When extinct isn't. Scientific American, 293, 22-23.
Website of any institution: Central Bank of India (2005). Income Recognition Norms Definition of NPA. Retrieved August 10, 2005, from http://www.centralbankofindia.co.in/ home/index1.htm, viewed on 7. The submission implies that the work has not been published earlier elsewhere and is not
under consideration to be published anywhere else if selected for publication in the journal of Indian Academicians and Researchers Association.
8. Decision of the Editorial Board regarding selection/rejection of the articles will be final.
www.iaraedu.com
Journal

www.iaraedu.com
Journal
Become a member of IARA to avail attractive benefits upto Rs. 30000/-
http://iaraedu.com/about-membership.php
IARA Organized its 1st International Dissertation & Doctoral Thesis Award in
September’2019

www.editedbook.in
Publish Your Book, Your Thesis into Book or Become an Editor of an Edited Book with ISBN
BOOKS PUBLISHED


Indian Academicians and Researchers Associationwww.iaraedu.com
Indian Academicians and Researchers Association www.iaraedu.com


