Embed Size (px)
Citation preview

PART I
PRESENT CONDITIONS
1-1
Chapter 1 Socio-economic Conditions of the Greater Alexandria Port and Egypt
1.1 Population
1.1.1 Population of Arab Republic of Egypt Egypt is the most populous country in the Arab world and has the second largestpopulation in Africa after Nigeria. Population was 30.08 million in 1966, 36.63 million in1976 and 48.25 million in 1986. The preliminary result of the 1996 Census indicated that,the total population inside Egypt reached 59.27 million. Migration has traditionally beennegligible in Egypt. Egyptians living abroad totaled 2.18 million, according to thepreliminary results of the 1996 Population Census. The average annual growth ratedecreased from 2.8% for the period 1976-1986 to 2.1% for the period 1986-1996 (seeTable 1.1.1).
According to the Mid-year Census, Population was 54.44 million in 1991 and 61.40million in 1997. The average annual growth rate is 2.0% for the period 1991-1997 (seeTable 1.1.2). Population of Egypt estimated by the World Bank is shown in Table 1.1.3.There are four urban governorates, nine lower Egypt governorates, nine upper Egyptgovernorate and five frontier governorates in Egypt. Among urban governorates, Cairo hasa population of 6.8 million accounting for 11.5% of the total population, followed byAlexandria (3.3 million), Port Said (0.47million) and Suez (0.42 million) in 1996 (seeTable 1.1.4). Nearly 39.8% of the total urban population lived in two of the world’s oldestcities, namely Cairo and Alexandria.
The problems associated with the rapid rate of population growth are complicated, namelythe extreme scarcity of cultivated land relative to people. Over 97% of the Egyptianpopulation (59.3million) is crowded in about 4% (386,000km2) of the total area of morethan one million square kilometers.
Table 1.1.1 Population of Egypt by Census Years(Unit: thousand)
Item / Year 1960 1966 1976 1986 1996 (2)Total population (1) 26,085 30,076 36,626 48,254 59,272Average annual growthrate (%)
2.5 2.4 2.0 2.8 2.1
Source ) “Statistical Year Book 1991-1996, June 1997” The Central Agency for PublicMobilization and StatisticsRemarks ) (1) Excluding Egyptian abroad, (2) The preliminary result of the 1996 Census
Table 1.1.2 Population of Egypt by Mid-year Census(Unit : thousand)
Item / Year 1991 1992 1993 1994 1995 1996 1997Total population 54,437 55,893 56,434 57,556 58,978 60,236 61,404Annual growth rate (%) 2.9 2.7 1.0 2.0 2.5 2.1 1.9Average annual growth ratefor the 1991-1997 (%) 2.0
Source ) The Central Agency for Public Mobilization and Statistics
1-2
Table 1.1.3 Population of Egypt by the World Bank(Unit : thousand person)
Item / Year 1988 1989 1990 1991 1992 1993 1994 1995 1996
Total population 50,070 51,257 52,442 53,617 54,780 55,930 57,064 58,180 59,272
Annual growth rate (%) 2.4 2.4 2.3 2.2 2.2 2.1 2.0 2.0 1.9
Source ) “World Development Indicator 1998” the World Bank
Table 1.1.4 Number and Percentage of Population, by Governorate and Urban/RuralResidence ( The Preliminary Results of the 1996 Census)
(Unit: thousand persons)Governrate Total Urban Rural UAL
Number Percent Number Percent Number PercentGrand Total 61,452
Total Egyptians Abroad 2,180 Total Population 59,272 100.0 25,471 100.0 33,801 100.0
Urban Gov. 11,005 18.6 11,005 43.2 Cairo 6,789 11.5 6,789 26.7 Alexandria 3,328 5.6 3,328 13.1 Port - Said 470 0.8 470 1.8 Suez 418 0.7 418 1.6
0Lower Egypt Gov. 25,811 43.5 7,108 27.9 18,703 55.3 Damietta 915 1.5 251 1.0 664 2.0 Dakahlia 4,224 7.1 1,175 4.6 3,048 9.0 Sharkia 4,288 7.2 968 3.8 3,319 9.8 Kalyoubia 3,303 5.6 1,346 5.3 1,957 5.8 Kalf - El - Shcikh 2,223 3.8 510 2.0 1,713 5.1 Gharbia 3,405 5.7 1,057 4.2 2,348 6.9 Menoufia 2,758 4.7 549 2.2 2,210 6.5 Behera 3,981 6.7 911 3.6 3,070 9.1 Ismailia 715 1.2 341 1.3 374 1.1
0 0 0 Upper Egypt Gov. 21,640 36.5 6,860 26.9 14,779 43.7 Giza 4,780 8.1 2,590 10.2 2,190 6.5 Beni - Suef 1,860 3.1 438 1.7 1,422 4.2 Fayoum 1,990 3.4 447 1.8 1,543 4.6 Menia 3,309 5.6 643 2.5 2,666 7.9 Asyout 2,802 4.7 763 3.0 2,039 6.0 Suhag 3,123 5.3 684 2.7 2,439 7.2 Qena 2,441 4.1 517 2.0 1,924 5.7 Aswan 974 1.6 417 1.6 557 1.6 Luxur 361 0.6 361 1.4 0 0.0
0 0 0 Frontier Gov. 817 1.4 498 2.0 319 0.9 Red Sea 156 0.3 139 0.5 17 0.1 El - Wadi El - Gidid 142 0.2 68 0.3 73 0.2 Matrouh 212 0.4 112 0.4 99 0.3 North Sinai 253 0.4 149 0.6 104 0.3 South Sinai 54 0.1 29 0.1 25 0.1Source) "Statistical Year Book 1991-1996, June 1997"
Central Agency for Public Mobilization and Statistics
1-3
1.2 Gross Domestic Products (GDP)
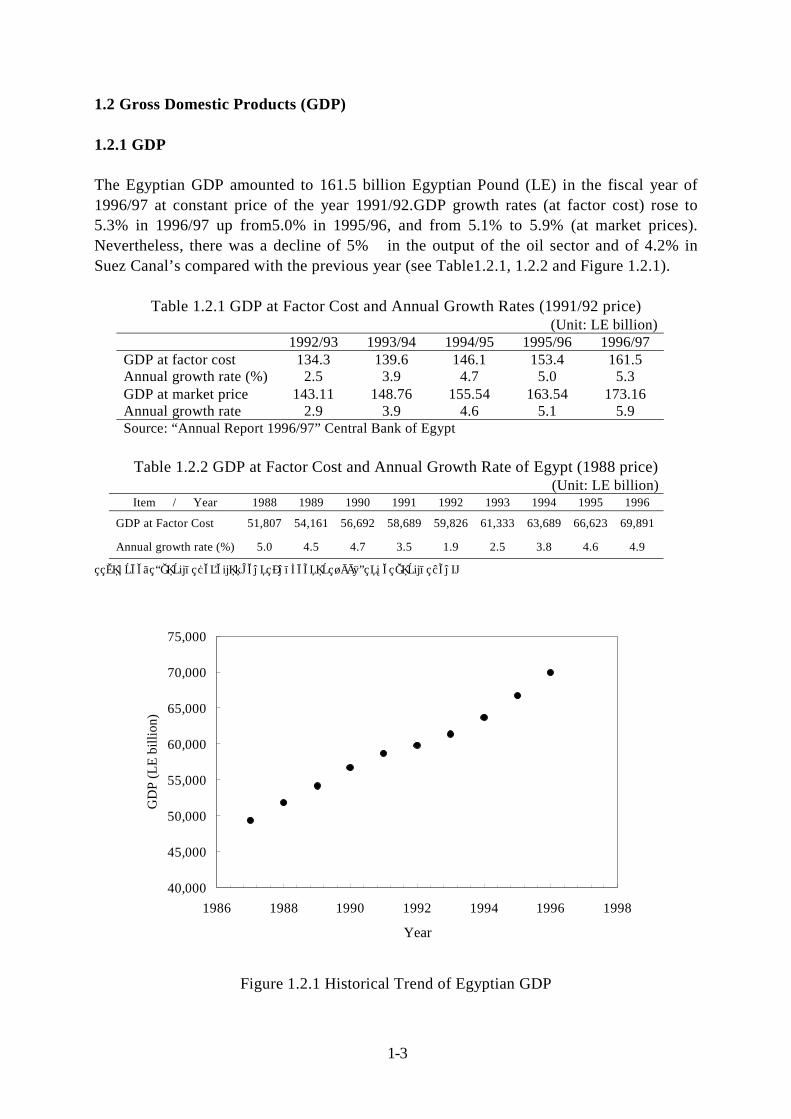
1.2.1 GDP The Egyptian GDP amounted to 161.5 billion Egyptian Pound (LE) in the fiscal year of1996/97 at constant price of the year 1991/92.GDP growth rates (at factor cost) rose to5.3% in 1996/97 up from5.0% in 1995/96, and from 5.1% to 5.9% (at market prices).Nevertheless, there was a decline of 5% in the output of the oil sector and of 4.2% inSuez Canal’s compared with the previous year (see Table1.2.1, 1.2.2 and Figure 1.2.1).
Table 1.2.1 GDP at Factor Cost and Annual Growth Rates (1991/92 price) (Unit: LE billion)
1992/93 1993/94 1994/95 1995/96 1996/97 GDP at factor cost 134.3 139.6 146.1 153.4 161.5 Annual growth rate (%) 2.5 3.9 4.7 5.0 5.3 GDP at market price 143.11 148.76 155.54 163.54 173.16 Annual growth rate 2.9 3.9 4.6 5.1 5.9 Source: “Annual Report 1996/97” Central Bank of Egypt
Table 1.2.2 GDP at Factor Cost and Annual Growth Rate of Egypt (1988 price)
(Unit: LE billion) Item / Year 1988 1989 1990 1991 1992 1993 1994 1995 1996
GDP at Factor Cost 51,807 54,161 56,692 58,689 59,826 61,333 63,689 66,623 69,891
Annual growth rate (%) 5.0 4.5 4.7 3.5 1.9 2.5 3.8 4.6 4.9
Source: “World Development Indicator 1998” the World Bank
Figure 1.2.1 Historical Trend of Egyptian GDP
40,000
45,000
50,000
55,000
60,000
65,000
70,000
75,000
1986 1988 1990 1992 1994 1996 1998
Year
GD
P (L
E bi
llion
)
1-4
1.2.2 GDP by Sector The structure of the national economy underwent some change as the since of theindustrial sector climbed from 16.6% in 1992/93 to 18.1% in 1996/97. Thus, the industrialsector ranked first contributing the bulk of GDP. Conversely, the agriculture sectoraccounted for a lower share of 15.7% in 1996/97 down from 16.5% in 1992/93 (see Table1.2.3). As for commodity sectors, the marked increase in growth rates of non-oil sector nearlyoffset the lower output of the oil sector. Hence, the total growth rate of commodity sectorreach 4.2% against 4.3% a year earlier. The construction sector contributed the highestgrowth rate, following financing reform many of its unit. The industrial sector came sec-ond as it benefited from the newly developed infrastructure and modernization. The elec-tricity and agricultural sector followed suit, realizing increased growth due to the expan-sion of the existing station, the operation of new electricity units, along with the enhance-ment of productivity due to the attention paid to agriculture guidance. On the other hand, production service sectors recorded a growth rate of 6.4% up from5.9%, headed by the tourism sector which was followed by the sectors of finance, trans-portation and communication.
Table 1.2.3 Composition of GDP by Economic Sector at Factor Cost (at 1991/92 prices)(Unit: LE million)
Economic Sector 1991/92 1992/93 1993/94 1994/95 1995/96 1996/97Commodity Sector 65,373 66,886 70,173 73,203 76,361 79,589Agriculture 21,680 22,220 23,072 23,741 24,470 25,310Industry and Mining 21,730 22,360 23,295 25,087 26,970 29,228Petroleum and Oil Products 13,008 13,210 14,345 14,365 14,365 13,650Electricity 2,220 2,296 2,382 2,525 2,658 2,830Construction and Building 6,735 6,800 7,079 7,485 7,898 8,571Productive Services Sector 43,606 44,494 45,592 47,878 50,674 53,923Transportation and Communications 8,710 14,860 9,334 9,906 10,495 11,380Suez Canal 6,125 5,778 5,516 5,621 5,387Trade 21,730 27,109 23,260 24,619 25,936 27,631Finance 4,545 5,080 5,435 5,909 6,454Insurance 76 85 92 104 114Restaurants and Hotels 2,420 2,525 2,055 2,310 2,609 2,957Social Services Sector 22,078 22,955 23,857 25,068 26,334 27,976Real Estate Ownership 2,350 2,878 2,568 2,712 2,819 3,008Public Utilities 401 459 495 532 575Personal Services 9,895 10,245 10,613 11,194 11,833 12,622Government Services 9,345 9,832 10,120 10,565 11,039 11,653Social Insurance 87 97 102 111 118Total GDP 131,057 134,335 139,622 146,149 153,369 161,488Source: Central Bank of Egypt
1-5
1.3 Foreign Trade
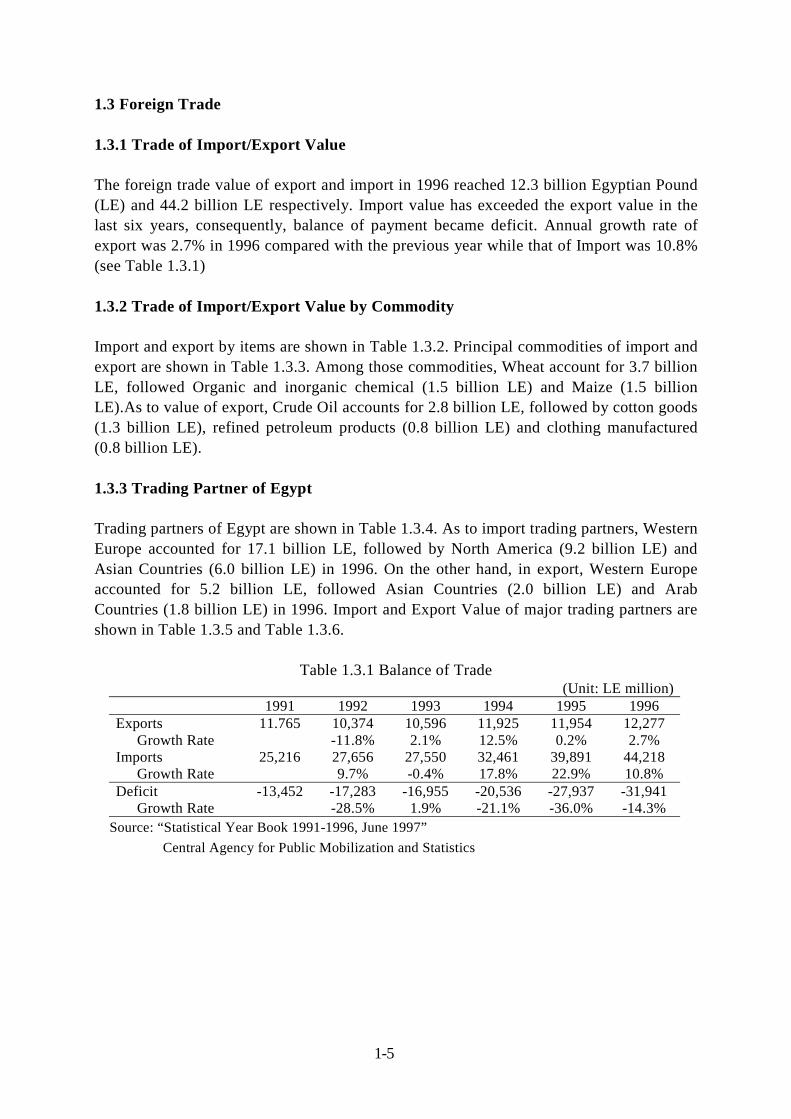
1.3.1 Trade of Import/Export Value The foreign trade value of export and import in 1996 reached 12.3 billion Egyptian Pound(LE) and 44.2 billion LE respectively. Import value has exceeded the export value in thelast six years, consequently, balance of payment became deficit. Annual growth rate ofexport was 2.7% in 1996 compared with the previous year while that of Import was 10.8%(see Table 1.3.1)
1.3.2 Trade of Import/Export Value by Commodity
Import and export by items are shown in Table 1.3.2. Principal commodities of import andexport are shown in Table 1.3.3. Among those commodities, Wheat account for 3.7 billionLE, followed Organic and inorganic chemical (1.5 billion LE) and Maize (1.5 billionLE).As to value of export, Crude Oil accounts for 2.8 billion LE, followed by cotton goods(1.3 billion LE), refined petroleum products (0.8 billion LE) and clothing manufactured(0.8 billion LE).
1.3.3 Trading Partner of Egypt
Trading partners of Egypt are shown in Table 1.3.4. As to import trading partners, WesternEurope accounted for 17.1 billion LE, followed by North America (9.2 billion LE) andAsian Countries (6.0 billion LE) in 1996. On the other hand, in export, Western Europeaccounted for 5.2 billion LE, followed Asian Countries (2.0 billion LE) and ArabCountries (1.8 billion LE) in 1996. Import and Export Value of major trading partners areshown in Table 1.3.5 and Table 1.3.6.
Table 1.3.1 Balance of Trade(Unit: LE million)
1991 1992 1993 1994 1995 1996Exports 11.765 10,374 10,596 11,925 11,954 12,277 Growth Rate -11.8% 2.1% 12.5% 0.2% 2.7%Imports 25,216 27,656 27,550 32,461 39,891 44,218 Growth Rate 9.7% -0.4% 17.8% 22.9% 10.8%Deficit -13,452 -17,283 -16,955 -20,536 -27,937 -31,941 Growth Rate -28.5% 1.9% -21.1% -36.0% -14.3%
Source: “Statistical Year Book 1991-1996, June 1997” Central Agency for Public Mobilization and Statistics
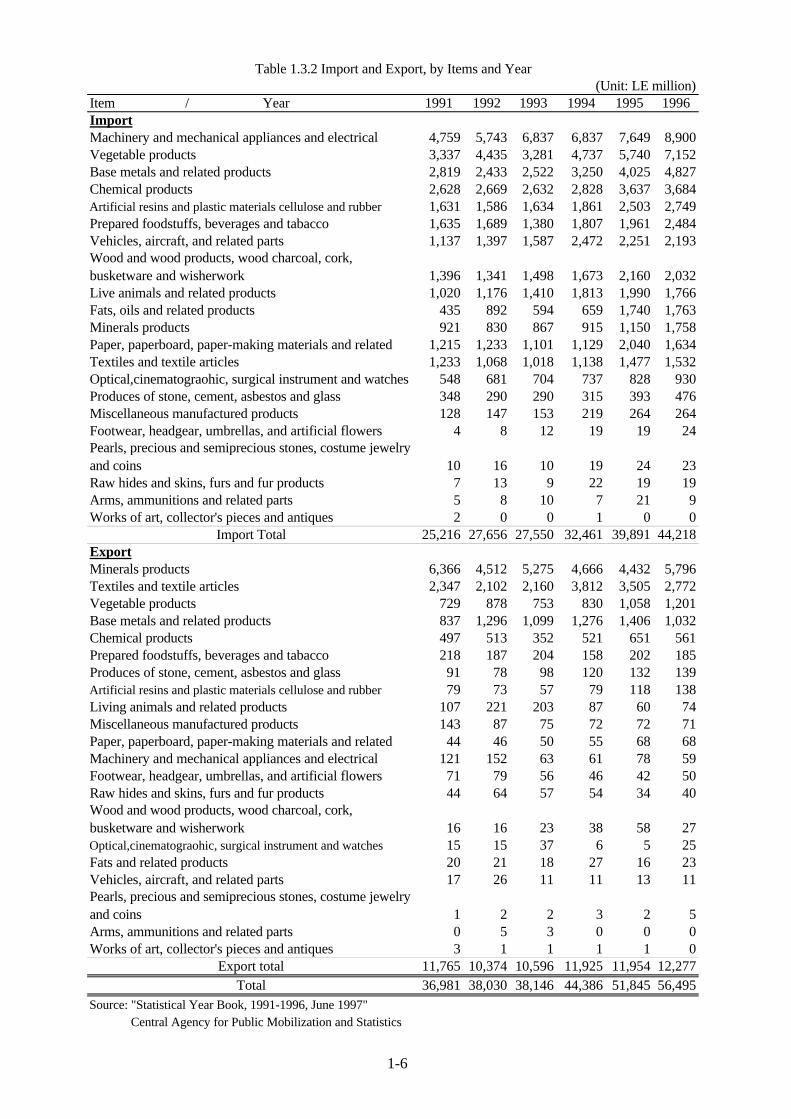
(Unit: LE million)Item / Year 1991 1992 1993 1994 1995 1996ImportMachinery and mechanical appliances and electrical 4,759 5,743 6,837 6,837 7,649 8,900Vegetable products 3,337 4,435 3,281 4,737 5,740 7,152Base metals and related products 2,819 2,433 2,522 3,250 4,025 4,827Chemical products 2,628 2,669 2,632 2,828 3,637 3,684Artificial resins and plastic materials cellulose and rubber 1,631 1,586 1,634 1,861 2,503 2,749Prepared foodstuffs, beverages and tabacco 1,635 1,689 1,380 1,807 1,961 2,484Vehicles, aircraft, and related parts 1,137 1,397 1,587 2,472 2,251 2,193Wood and wood products, wood charcoal, cork,busketware and wisherwork 1,396 1,341 1,498 1,673 2,160 2,032Live animals and related products 1,020 1,176 1,410 1,813 1,990 1,766Fats, oils and related products 435 892 594 659 1,740 1,763Minerals products 921 830 867 915 1,150 1,758Paper, paperboard, paper-making materials and related 1,215 1,233 1,101 1,129 2,040 1,634Textiles and textile articles 1,233 1,068 1,018 1,138 1,477 1,532Optical,cinematograohic, surgical instrument and watches 548 681 704 737 828 930Produces of stone, cement, asbestos and glass 348 290 290 315 393 476Miscellaneous manufactured products 128 147 153 219 264 264Footwear, headgear, umbrellas, and artificial flowers 4 8 12 19 19 24Pearls, precious and semiprecious stones, costume jewelryand coins 10 16 10 19 24 23Raw hides and skins, furs and fur products 7 13 9 22 19 19Arms, ammunitions and related parts 5 8 10 7 21 9Works of art, collector's pieces and antiques 2 0 0 1 0 0
Import Total 25,216 27,656 27,550 32,461 39,891 44,218ExportMinerals products 6,366 4,512 5,275 4,666 4,432 5,796Textiles and textile articles 2,347 2,102 2,160 3,812 3,505 2,772Vegetable products 729 878 753 830 1,058 1,201Base metals and related products 837 1,296 1,099 1,276 1,406 1,032Chemical products 497 513 352 521 651 561Prepared foodstuffs, beverages and tabacco 218 187 204 158 202 185Produces of stone, cement, asbestos and glass 91 78 98 120 132 139Artificial resins and plastic materials cellulose and rubber 79 73 57 79 118 138Living animals and related products 107 221 203 87 60 74Miscellaneous manufactured products 143 87 75 72 72 71Paper, paperboard, paper-making materials and related 44 46 50 55 68 68Machinery and mechanical appliances and electrical 121 152 63 61 78 59Footwear, headgear, umbrellas, and artificial flowers 71 79 56 46 42 50Raw hides and skins, furs and fur products 44 64 57 54 34 40Wood and wood products, wood charcoal, cork,busketware and wisherwork 16 16 23 38 58 27Optical,cinematograohic, surgical instrument and watches 15 15 37 6 5 25Fats and related products 20 21 18 27 16 23Vehicles, aircraft, and related parts 17 26 11 11 13 11Pearls, precious and semiprecious stones, costume jewelryand coins 1 2 2 3 2 5Arms, ammunitions and related parts 0 5 3 0 0 0Works of art, collector's pieces and antiques 3 1 1 1 1 0
Export total 11,765 10,374 10,596 11,925 11,954 12,277Total 36,981 38,030 38,146 44,386 51,845 56,495
Source: "Statistical Year Book, 1991-1996, June 1997" Central Agency for Public Mobilization and Statistics
Table 1.3.2 Import and Export, by Items and Year
1-6
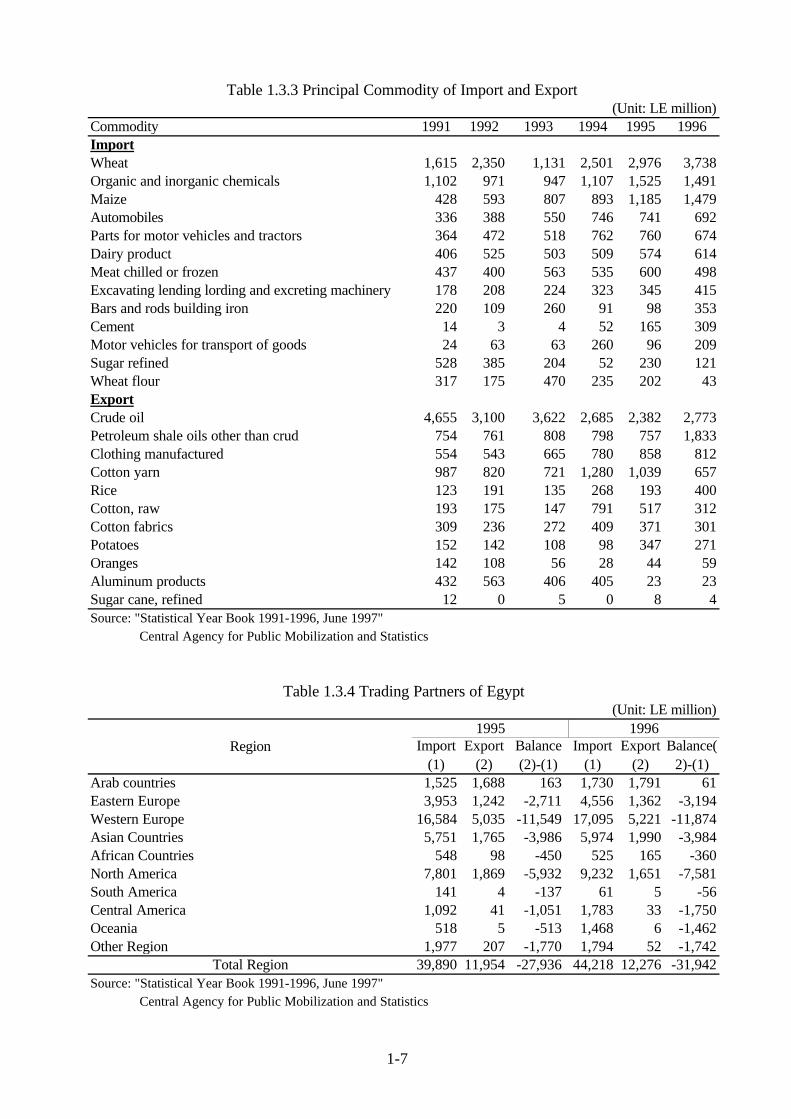
(Unit: LE million)Commodity 1991 1992 1993 1994 1995 1996ImportWheat 1,615 2,350 1,131 2,501 2,976 3,738Organic and inorganic chemicals 1,102 971 947 1,107 1,525 1,491Maize 428 593 807 893 1,185 1,479Automobiles 336 388 550 746 741 692Parts for motor vehicles and tractors 364 472 518 762 760 674Dairy product 406 525 503 509 574 614Meat chilled or frozen 437 400 563 535 600 498Excavating lending lording and excreting machinery 178 208 224 323 345 415Bars and rods building iron 220 109 260 91 98 353Cement 14 3 4 52 165 309Motor vehicles for transport of goods 24 63 63 260 96 209Sugar refined 528 385 204 52 230 121Wheat flour 317 175 470 235 202 43ExportCrude oil 4,655 3,100 3,622 2,685 2,382 2,773Petroleum shale oils other than crud 754 761 808 798 757 1,833Clothing manufactured 554 543 665 780 858 812Cotton yarn 987 820 721 1,280 1,039 657Rice 123 191 135 268 193 400Cotton, raw 193 175 147 791 517 312Cotton fabrics 309 236 272 409 371 301Potatoes 152 142 108 98 347 271Oranges 142 108 56 28 44 59Aluminum products 432 563 406 405 23 23Sugar cane, refined 12 0 5 0 8 4Source: "Statistical Year Book 1991-1996, June 1997" Central Agency for Public Mobilization and Statistics
(Unit: LE million)
Import(1)
Export(2)
Balance(2)-(1)
Import(1)
Export(2)
Balance(2)-(1)
Arab countries 1,525 1,688 163 1,730 1,791 61Eastern Europe 3,953 1,242 -2,711 4,556 1,362 -3,194Western Europe 16,584 5,035 -11,549 17,095 5,221 -11,874Asian Countries 5,751 1,765 -3,986 5,974 1,990 -3,984African Countries 548 98 -450 525 165 -360North America 7,801 1,869 -5,932 9,232 1,651 -7,581South America 141 4 -137 61 5 -56Central America 1,092 41 -1,051 1,783 33 -1,750Oceania 518 5 -513 1,468 6 -1,462Other Region 1,977 207 -1,770 1,794 52 -1,742
Total Region 39,890 11,954 -27,936 44,218 12,276 -31,942Source: "Statistical Year Book 1991-1996, June 1997" Central Agency for Public Mobilization and Statistics
Table 1.3.3 Principal Commodity of Import and Export
Table 1.3.4 Trading Partners of Egypt
Region1995 1996
1-7
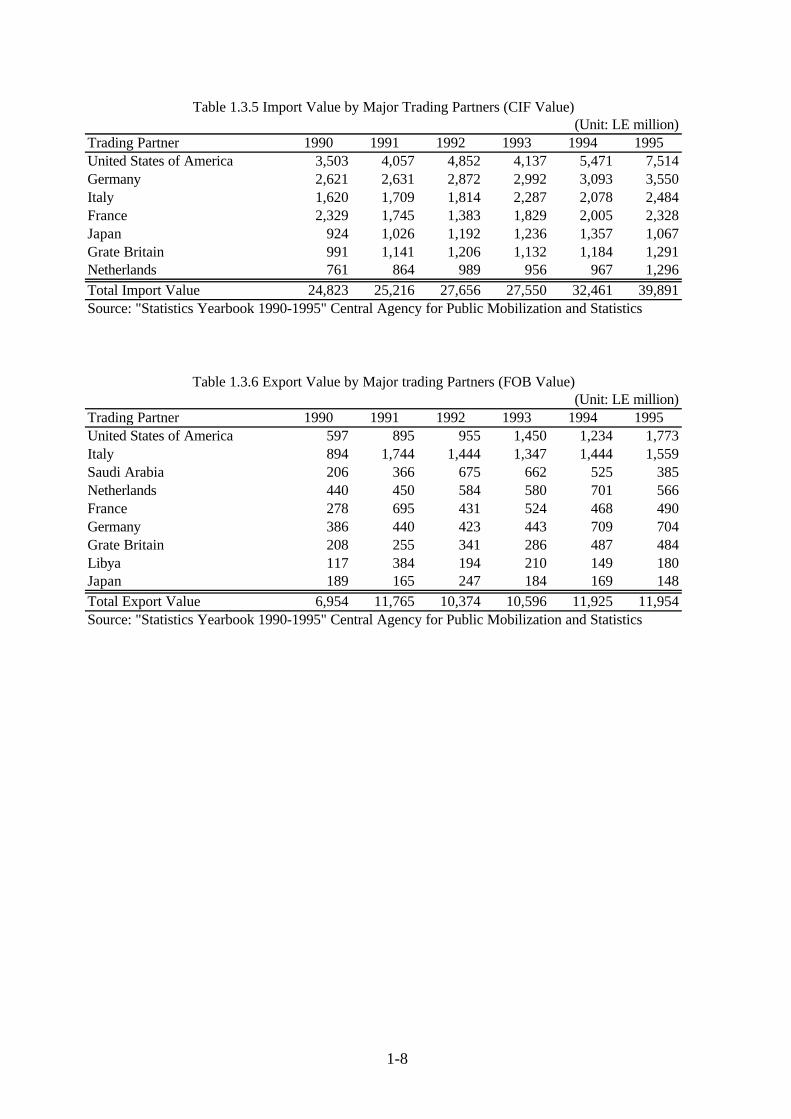
(Unit: LE million)Trading Partner 1990 1991 1992 1993 1994 1995United States of America 3,503 4,057 4,852 4,137 5,471 7,514Germany 2,621 2,631 2,872 2,992 3,093 3,550Italy 1,620 1,709 1,814 2,287 2,078 2,484France 2,329 1,745 1,383 1,829 2,005 2,328Japan 924 1,026 1,192 1,236 1,357 1,067Grate Britain 991 1,141 1,206 1,132 1,184 1,291Netherlands 761 864 989 956 967 1,296Total Import Value 24,823 25,216 27,656 27,550 32,461 39,891Source: "Statistics Yearbook 1990-1995" Central Agency for Public Mobilization and Statistics
(Unit: LE million)Trading Partner 1990 1991 1992 1993 1994 1995United States of America 597 895 955 1,450 1,234 1,773Italy 894 1,744 1,444 1,347 1,444 1,559Saudi Arabia 206 366 675 662 525 385Netherlands 440 450 584 580 701 566France 278 695 431 524 468 490Germany 386 440 423 443 709 704Grate Britain 208 255 341 286 487 484Libya 117 384 194 210 149 180Japan 189 165 247 184 169 148Total Export Value 6,954 11,765 10,374 10,596 11,925 11,954Source: "Statistics Yearbook 1990-1995" Central Agency for Public Mobilization and Statistics
Table 1.3.5 Import Value by Major Trading Partners (CIF Value)
Table 1.3.6 Export Value by Major trading Partners (FOB Value)
1-8
1-9
1.4 Agriculture
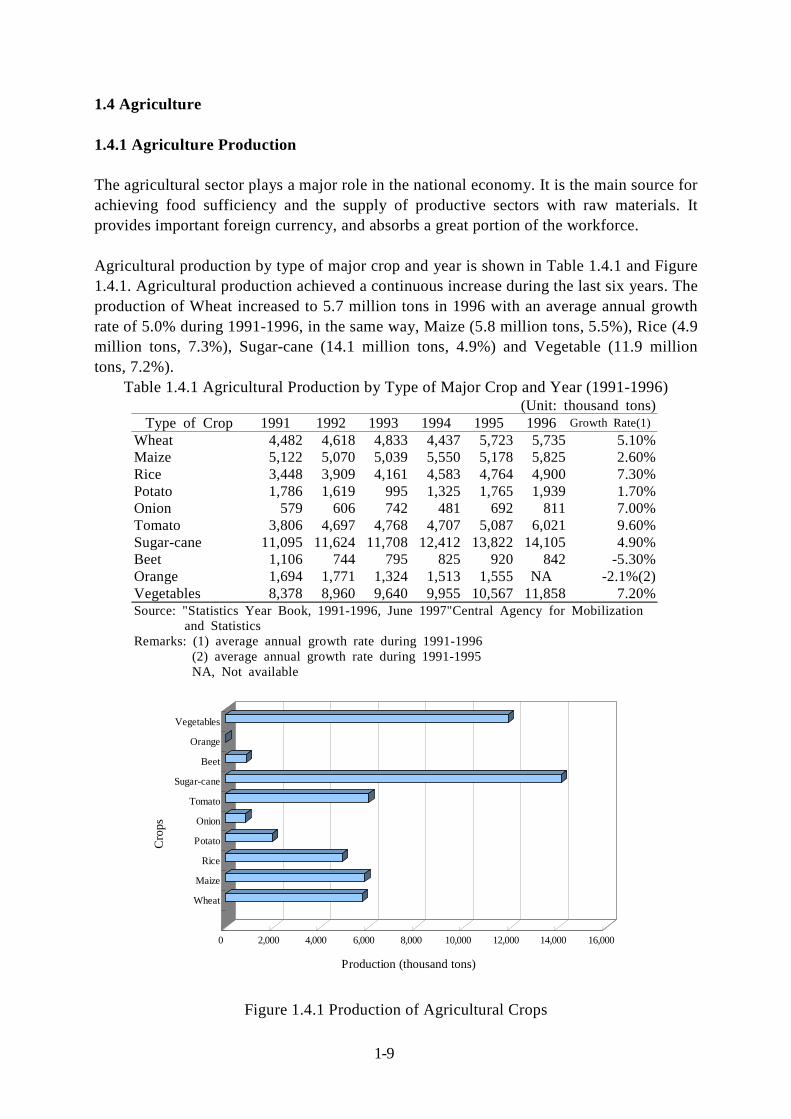
1.4.1 Agriculture Production The agricultural sector plays a major role in the national economy. It is the main source forachieving food sufficiency and the supply of productive sectors with raw materials. Itprovides important foreign currency, and absorbs a great portion of the workforce. Agricultural production by type of major crop and year is shown in Table 1.4.1 and Figure1.4.1. Agricultural production achieved a continuous increase during the last six years. Theproduction of Wheat increased to 5.7 million tons in 1996 with an average annual growthrate of 5.0% during 1991-1996, in the same way, Maize (5.8 million tons, 5.5%), Rice (4.9million tons, 7.3%), Sugar-cane (14.1 million tons, 4.9%) and Vegetable (11.9 milliontons, 7.2%).
Table 1.4.1 Agricultural Production by Type of Major Crop and Year (1991-1996)(Unit: thousand tons)
Type of Crop 1991 1992 1993 1994 1995 1996 Growth Rate(1)Wheat 4,482 4,618 4,833 4,437 5,723 5,735 5.10%Maize 5,122 5,070 5,039 5,550 5,178 5,825 2.60%Rice 3,448 3,909 4,161 4,583 4,764 4,900 7.30%Potato 1,786 1,619 995 1,325 1,765 1,939 1.70%Onion 579 606 742 481 692 811 7.00%Tomato 3,806 4,697 4,768 4,707 5,087 6,021 9.60%Sugar-cane 11,095 11,624 11,708 12,412 13,822 14,105 4.90%Beet 1,106 744 795 825 920 842 -5.30%Orange 1,694 1,771 1,324 1,513 1,555 NA -2.1%(2)Vegetables 8,378 8,960 9,640 9,955 10,567 11,858 7.20%Source: "Statistics Year Book, 1991-1996, June 1997"Central Agency for Mobilization
and StatisticsRemarks: (1) average annual growth rate during 1991-1996
(2) average annual growth rate during 1991-1995NA, Not available
Figure 1.4.1 Production of Agricultural Crops
0 2,000 4,000 6,000 8,000 10,000 12,000 14,000 16,000
Production (thousand tons)
Wheat
Maize
Rice
Potato
Onion
Tomato
Sugar-cane
Beet
Orange
Vegetables
Cro
ps
1-10
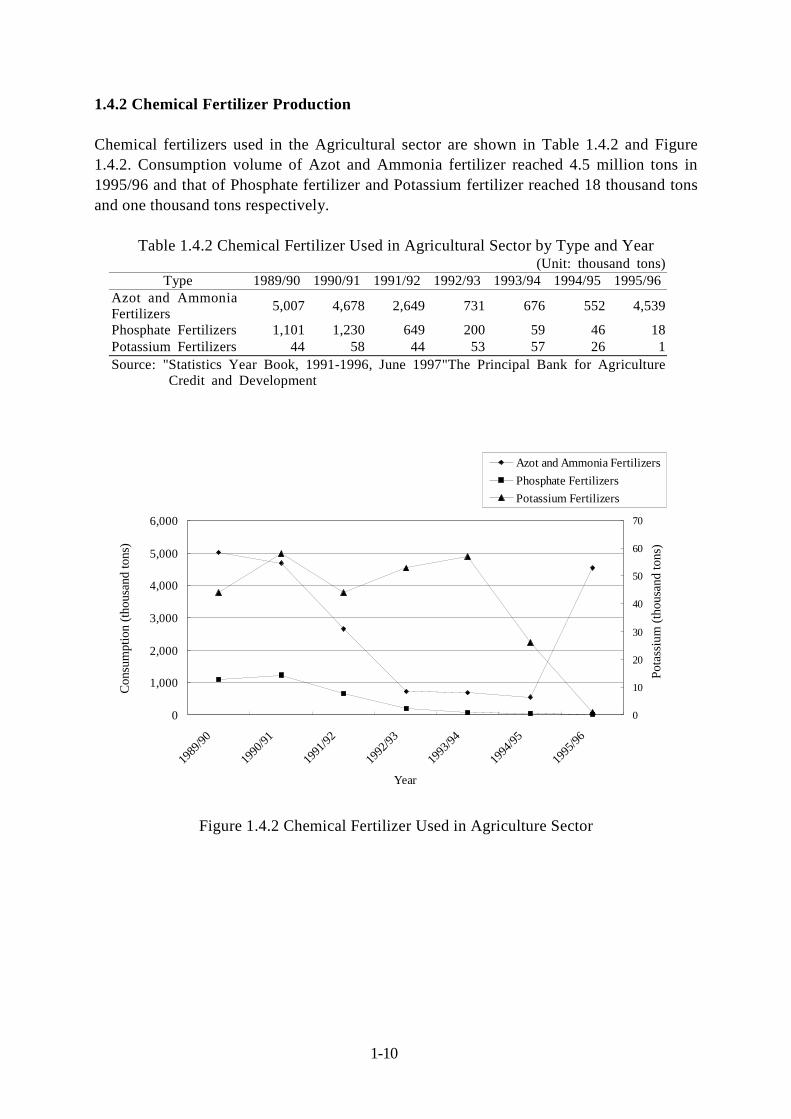
1.4.2 Chemical Fertilizer Production Chemical fertilizers used in the Agricultural sector are shown in Table 1.4.2 and Figure1.4.2. Consumption volume of Azot and Ammonia fertilizer reached 4.5 million tons in1995/96 and that of Phosphate fertilizer and Potassium fertilizer reached 18 thousand tonsand one thousand tons respectively.
Table 1.4.2 Chemical Fertilizer Used in Agricultural Sector by Type and Year(Unit: thousand tons)
Type 1989/90 1990/91 1991/92 1992/93 1993/94 1994/95 1995/96Azot and Ammonia Fertilizers 5,007 4,678 2,649 731 676 552 4,539
Phosphate Fertilizers 1,101 1,230 649 200 59 46 18Potassium Fertilizers 44 58 44 53 57 26 1Source: "Statistics Year Book, 1991-1996, June 1997"The Principal Bank for Agriculture
Credit and Development
Figure 1.4.2 Chemical Fertilizer Used in Agriculture Sector
0
1,000
2,000
3,000
4,000
5,000
6,000
1989
/90
1990
/91
1991
/92
1992
/93
1993
/94
1994
/95
1995
/96
Year
Con
sum
ptio
n (th
ousa
nd to
ns)
0
10
20
30
40
50
60
70
Pota
ssiu
m (t
hous
and
tons
)
Azot and Ammonia FertilizersPhosphate FertilizersPotassium Fertilizers
1-11
1.5 Industry
1.5.1 Industrial Products (1) General Egypt has made great progress in the field of traditional industries namely, spinning,weaving and food industries. Significant progress also has been made in the modernindustries such as engineering, metallurgical and chemical industries. The Statecontributed to a most efficient drive towards increasing production in many industries,such as iron and steel, ceramics and porcelain, cement, paper, fertilizer, pottery andrefractories, and petroleum industry. Coordination between heavy and consumingindustries has been considered in such a way to secure self-sufficiency and reduce the needfor imports. (2) Spinning and Weaving Production Spinning and Weaving Production are shown in Table 1.5.1. Production of Cotton Yarnreached 250 thousand tons in 1995/96 and that of Wool Yarn reached 16 thousand tons.Value of Cotton Textiles and Wool Textiles accounted for 1.56 billion LE and 12 millionLE respectively. (3) Production of Food Industries Production of Food industries is shown in Table 1.5.2. Production of White Sugar Crystaland Refined Sugar reached 282 thousand tons and 745 thousand tons in 1995/96respectively. Production of Molasses reached 259 thousand tons in 1995/96. (4) Metal Industry Products Production of Metal Industries are shown in Table 1.5.3. Production of Steel Billet andSteel Section reached 473 thousand tons in 1995/96 and that of Steel Sheet reached 280thousand tons in 1995/96. (5) Construction Material Industry Production Production of Construction Material Industry is shown in Table 1.5.4. Production ofCement reached 15.6 million tons in 1995/96 with an annual growth rate of 9.4%.
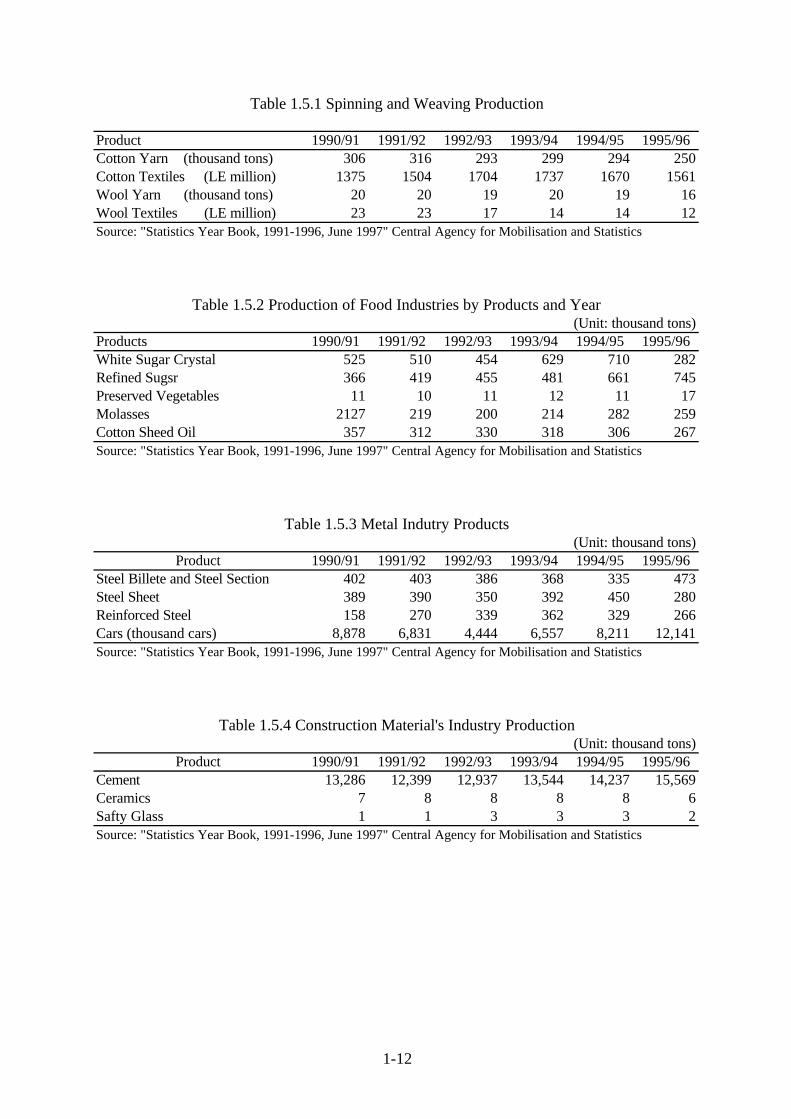
Product 1990/91 1991/92 1992/93 1993/94 1994/95 1995/96Cotton Yarn (thousand tons) 306 316 293 299 294 250Cotton Textiles (LE million) 1375 1504 1704 1737 1670 1561Wool Yarn (thousand tons) 20 20 19 20 19 16Wool Textiles (LE million) 23 23 17 14 14 12Source: "Statistics Year Book, 1991-1996, June 1997" Central Agency for Mobilisation and Statistics
(Unit: thousand tons)Products 1990/91 1991/92 1992/93 1993/94 1994/95 1995/96White Sugar Crystal 525 510 454 629 710 282Refined Sugsr 366 419 455 481 661 745Preserved Vegetables 11 10 11 12 11 17Molasses 2127 219 200 214 282 259Cotton Sheed Oil 357 312 330 318 306 267Source: "Statistics Year Book, 1991-1996, June 1997" Central Agency for Mobilisation and Statistics
(Unit: thousand tons)Product 1990/91 1991/92 1992/93 1993/94 1994/95 1995/96
Steel Billete and Steel Section 402 403 386 368 335 473Steel Sheet 389 390 350 392 450 280Reinforced Steel 158 270 339 362 329 266Cars (thousand cars) 8,878 6,831 4,444 6,557 8,211 12,141Source: "Statistics Year Book, 1991-1996, June 1997" Central Agency for Mobilisation and Statistics
(Unit: thousand tons)Product 1990/91 1991/92 1992/93 1993/94 1994/95 1995/96
Cement 13,286 12,399 12,937 13,544 14,237 15,569Ceramics 7 8 8 8 8 6Safty Glass 1 1 3 3 3 2Source: "Statistics Year Book, 1991-1996, June 1997" Central Agency for Mobilisation and Statistics
Table 1.5.1 Spinning and Weaving Production
Table 1.5.2 Production of Food Industries by Products and Year
Table 1.5.3 Metal Indutry Products
Table 1.5.4 Construction Material's Industry Production
1-12
1-13
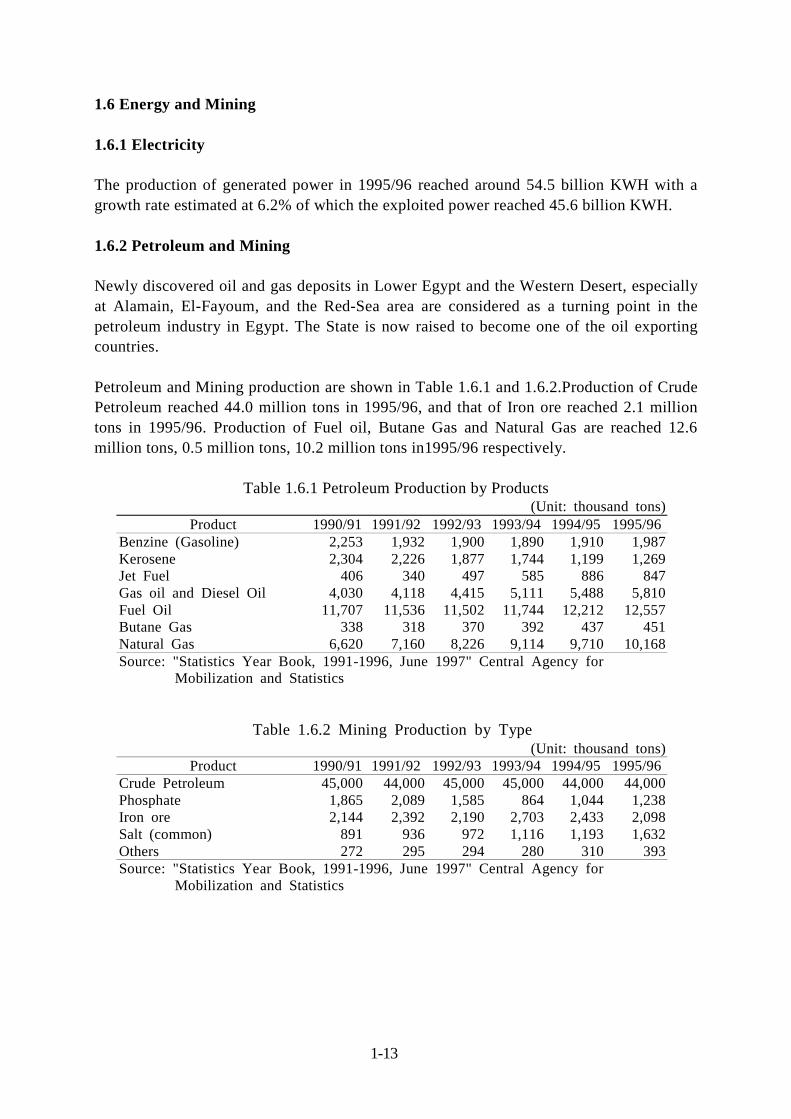
1.6 Energy and Mining
1.6.1 Electricity The production of generated power in 1995/96 reached around 54.5 billion KWH with agrowth rate estimated at 6.2% of which the exploited power reached 45.6 billion KWH. 1.6.2 Petroleum and Mining Newly discovered oil and gas deposits in Lower Egypt and the Western Desert, especiallyat Alamain, El-Fayoum, and the Red-Sea area are considered as a turning point in thepetroleum industry in Egypt. The State is now raised to become one of the oil exportingcountries. Petroleum and Mining production are shown in Table 1.6.1 and 1.6.2.Production of CrudePetroleum reached 44.0 million tons in 1995/96, and that of Iron ore reached 2.1 milliontons in 1995/96. Production of Fuel oil, Butane Gas and Natural Gas are reached 12.6million tons, 0.5 million tons, 10.2 million tons in1995/96 respectively.
Table 1.6.1 Petroleum Production by Products(Unit: thousand tons)
Product 1990/91 1991/92 1992/93 1993/94 1994/95 1995/96Benzine (Gasoline) 2,253 1,932 1,900 1,890 1,910 1,987Kerosene 2,304 2,226 1,877 1,744 1,199 1,269Jet Fuel 406 340 497 585 886 847Gas oil and Diesel Oil 4,030 4,118 4,415 5,111 5,488 5,810Fuel Oil 11,707 11,536 11,502 11,744 12,212 12,557Butane Gas 338 318 370 392 437 451Natural Gas 6,620 7,160 8,226 9,114 9,710 10,168Source: "Statistics Year Book, 1991-1996, June 1997" Central Agency for Mobilization and Statistics
Table 1.6.2 Mining Production by Type(Unit: thousand tons)
Product 1990/91 1991/92 1992/93 1993/94 1994/95 1995/96Crude Petroleum 45,000 44,000 45,000 45,000 44,000 44,000Phosphate 1,865 2,089 1,585 864 1,044 1,238Iron ore 2,144 2,392 2,190 2,703 2,433 2,098Salt (common) 891 936 972 1,116 1,193 1,632Others 272 295 294 280 310 393Source: "Statistics Year Book, 1991-1996, June 1997" Central Agency for Mobilization and Statistics
1-14
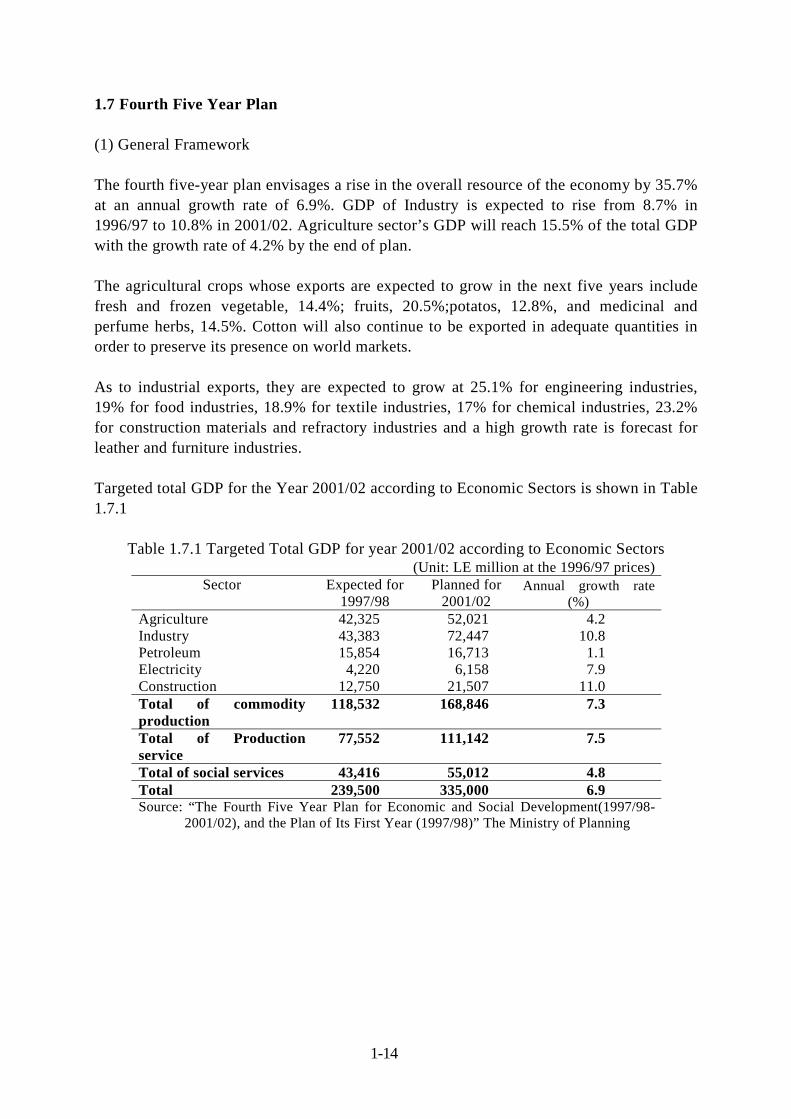
1.7 Fourth Five Year Plan
(1) General Framework The fourth five-year plan envisages a rise in the overall resource of the economy by 35.7%at an annual growth rate of 6.9%. GDP of Industry is expected to rise from 8.7% in1996/97 to 10.8% in 2001/02. Agriculture sector’s GDP will reach 15.5% of the total GDPwith the growth rate of 4.2% by the end of plan. The agricultural crops whose exports are expected to grow in the next five years includefresh and frozen vegetable, 14.4%; fruits, 20.5%;potatos, 12.8%, and medicinal andperfume herbs, 14.5%. Cotton will also continue to be exported in adequate quantities inorder to preserve its presence on world markets. As to industrial exports, they are expected to grow at 25.1% for engineering industries,19% for food industries, 18.9% for textile industries, 17% for chemical industries, 23.2%for construction materials and refractory industries and a high growth rate is forecast forleather and furniture industries. Targeted total GDP for the Year 2001/02 according to Economic Sectors is shown in Table1.7.1
Table 1.7.1 Targeted Total GDP for year 2001/02 according to Economic Sectors (Unit: LE million at the 1996/97 prices)
Sector Expected for1997/98
Planned for2001/02
Annual growth rate(%)
Agriculture 42,325 52,021 4.2 Industry 43,383 72,447 10.8 Petroleum 15,854 16,713 1.1 Electricity 4,220 6,158 7.9 Construction 12,750 21,507 11.0 Total of commodityproduction
118,532 168,846 7.3
Total of Productionservice
77,552 111,142 7.5
Total of social services 43,416 55,012 4.8 Total 239,500 335,000 6.9 Source: “The Fourth Five Year Plan for Economic and Social Development(1997/98-
2001/02), and the Plan of Its First Year (1997/98)” The Ministry of Planning
1-15
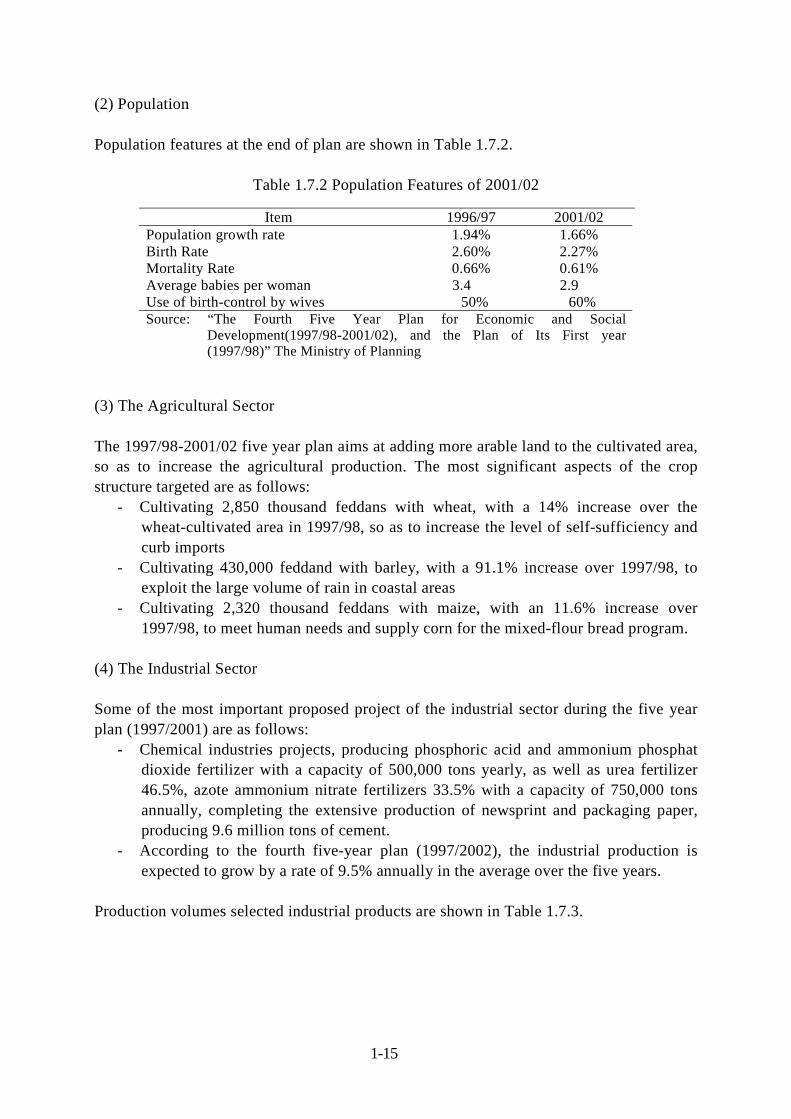
(2) Population Population features at the end of plan are shown in Table 1.7.2.
Table 1.7.2 Population Features of 2001/02
Item 1996/97 2001/02 Population growth rate 1.94% 1.66% Birth Rate 2.60% 2.27% Mortality Rate 0.66% 0.61% Average babies per woman 3.4 2.9 Use of birth-control by wives 50% 60% Source: “The Fourth Five Year Plan for Economic and Social
Development(1997/98-2001/02), and the Plan of Its First year(1997/98)” The Ministry of Planning
(3) The Agricultural Sector The 1997/98-2001/02 five year plan aims at adding more arable land to the cultivated area,so as to increase the agricultural production. The most significant aspects of the cropstructure targeted are as follows:
- Cultivating 2,850 thousand feddans with wheat, with a 14% increase over thewheat-cultivated area in 1997/98, so as to increase the level of self-sufficiency andcurb imports
- Cultivating 430,000 feddand with barley, with a 91.1% increase over 1997/98, toexploit the large volume of rain in coastal areas
- Cultivating 2,320 thousand feddans with maize, with an 11.6% increase over1997/98, to meet human needs and supply corn for the mixed-flour bread program.
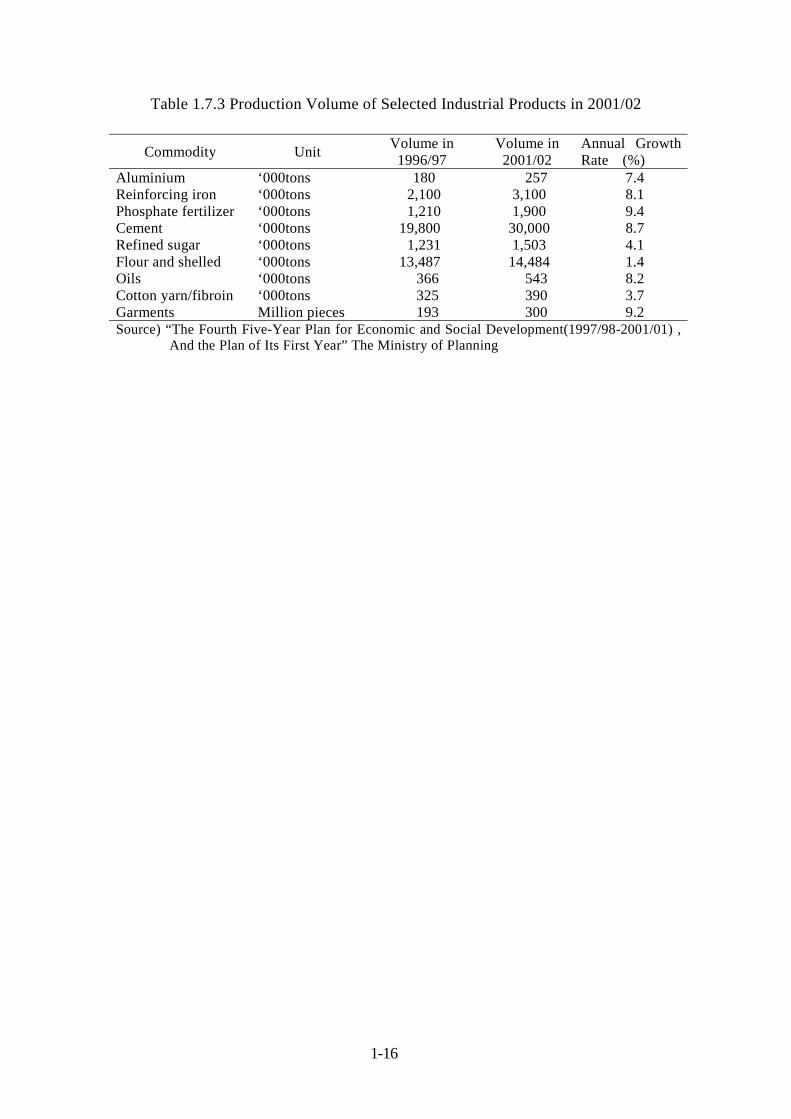
(4) The Industrial Sector Some of the most important proposed project of the industrial sector during the five yearplan (1997/2001) are as follows:
- Chemical industries projects, producing phosphoric acid and ammonium phosphatdioxide fertilizer with a capacity of 500,000 tons yearly, as well as urea fertilizer46.5%, azote ammonium nitrate fertilizers 33.5% with a capacity of 750,000 tonsannually, completing the extensive production of newsprint and packaging paper,producing 9.6 million tons of cement.
- According to the fourth five-year plan (1997/2002), the industrial production isexpected to grow by a rate of 9.5% annually in the average over the five years.
Production volumes selected industrial products are shown in Table 1.7.3.
1-16
Table 1.7.3 Production Volume of Selected Industrial Products in 2001/02
Commodity Unit Volume in1996/97
Volume in2001/02
Annual GrowthRate (%)
Aluminium ‘000tons 180 257 7.4 Reinforcing iron ‘000tons 2,100 3,100 8.1 Phosphate fertilizer ‘000tons 1,210 1,900 9.4 Cement ‘000tons 19,800 30,000 8.7 Refined sugar ‘000tons 1,231 1,503 4.1 Flour and shelled ‘000tons 13,487 14,484 1.4 Oils ‘000tons 366 543 8.2 Cotton yarn/fibroin ‘000tons 325 390 3.7 Garments Million pieces 193 300 9.2 Source) “The Fourth Five-Year Plan for Economic and Social Development(1997/98-2001/01) ,
And the Plan of Its First Year” The Ministry of Planning
1-17
1.8 Egypt in the 21st Century
(1) Population
According to the most reserved estimates, population is projected to reach 80 million in2017, excluding Egyptian expatriates abroad. This requires successful family planning andincreased awareness of the need to maintain the downtrend of population growth rate andbring it gradually to around 1.2% in 2017. (2) Agriculture Development Agriculture development strategy is primarily based on preserving and improving theproductivity of cultivated land, and protecting it from urban expansion. It is also plannedto further enhance the productivity of the newly-reclaimed land since 1982, amounting to1.6 million feddens, adjacent to the boundaries of the Old Valley, and to the east and westof the Delta. It is also targeted to increase agricultural production at a real growth rate ofaround 4% per annum, in order to meet food requirements of the population and cope withthe needs of development. Crop structure should be adjusted in line with an indicative policy, taking intoconsideration water rationing and relationship between water unit and value added for eachcrop, especially rice and sugar cane. Areas for growing grain crops should be expandedand rainy coastal areas exploited. (3) Industrial Development
Industrial development is the mainstay for establishing production bases and maximizingthe export capabilities of the national economy. A growth rate of not less than 9% in theforth five-year plan is targeted which would progressively rise to an average of 11% until2017.
(4) Petroleum
The petroleum sector plays a leading role as a foreign currency-generating activity. It hasbecome the main source of operating electric power, and the basic raw material for someindustries such as Azote fertilizers. The development strategy of this sector is based onintegrated policies based on the following:
- Maximizing the pivotal role of the petroleum sector as a key source of national in-come, foreign exchange , and job opportunity.
- Preserve and protect the environmental against pollution.- Boost development efforts north of the Valley by increasing available refinery ca-
pacity at Wadi Firan refinery. and so on
2-1
Chapter 2 Natural Conditions in and around the Greater Alexandria Port
2.1 General
During the Field Surveys in Egypt, data and project-related information on the natural conditions atthe Greater Alexandria Port were collected from both governmental and non-governmental sourcesof agencies. The data and information collected on the natural conditions will determine the basis forport planning and the criteria for preliminary design of port facilities in order to formulate theconceptual zoning, master planing together with facilities arrangement and designing port facilities.
In addition, a series of site surveys such as topographic survey in port area, bathymetric survey alongthe port access channel and/ at inner port basin and subsoil investigation was executed during thefield survey (I) and (III) in Egypt. The results of these field surveys for natural conditions arepresented in this chapter in details.
2.2 Outline of Natural Conditions
The city of Alexandria is situated upon the western end of the Nile Delta at the distance of aroundsixty kilometers to the west from the river Nile. Along this coastal line of the Nile Delta, there existsa succession of peaks or rocky points separated the coastal zones by bays. The city of Alexandriadeveloped along the coastal area is geographically sandwiched between the Mediterranean Sea to thenorthwest and the lake of Maryut to the southeast and extends as a narrow coastal strip alongnortheast-south west direction. The Alexandria port composes of the eastern fishing harbor and thewestern harbor for international trade. The areas for the Alexandria western port together withDikheila port which was recently developed at about 10 km southwest distance from the Alexandriaport, as called by the Greater Alexandria Port, form integral parts of concern of this study.
The Greater Alexandria Port faces to the sea area limited by the two peaks of Ras El Tin and ElAgami of which distance is about 10 km between them. Along the alignment of these two peaks,there exists a succession of shoals or rocks such as Ras El Tin, El Aramil, El Ikhwan, El Hut, El Kalb,El Qitt, El Far, North Shoal, Hydrographer Shoal, Hommey Shoal, forming underwater shelf with awater depth less than 10 meters. At present, the manmade breakwaters protect the port extendingbetween the two peaks to the west from Ras El Tin and to the east from El Agami covering morethan half distance between the two peaks.
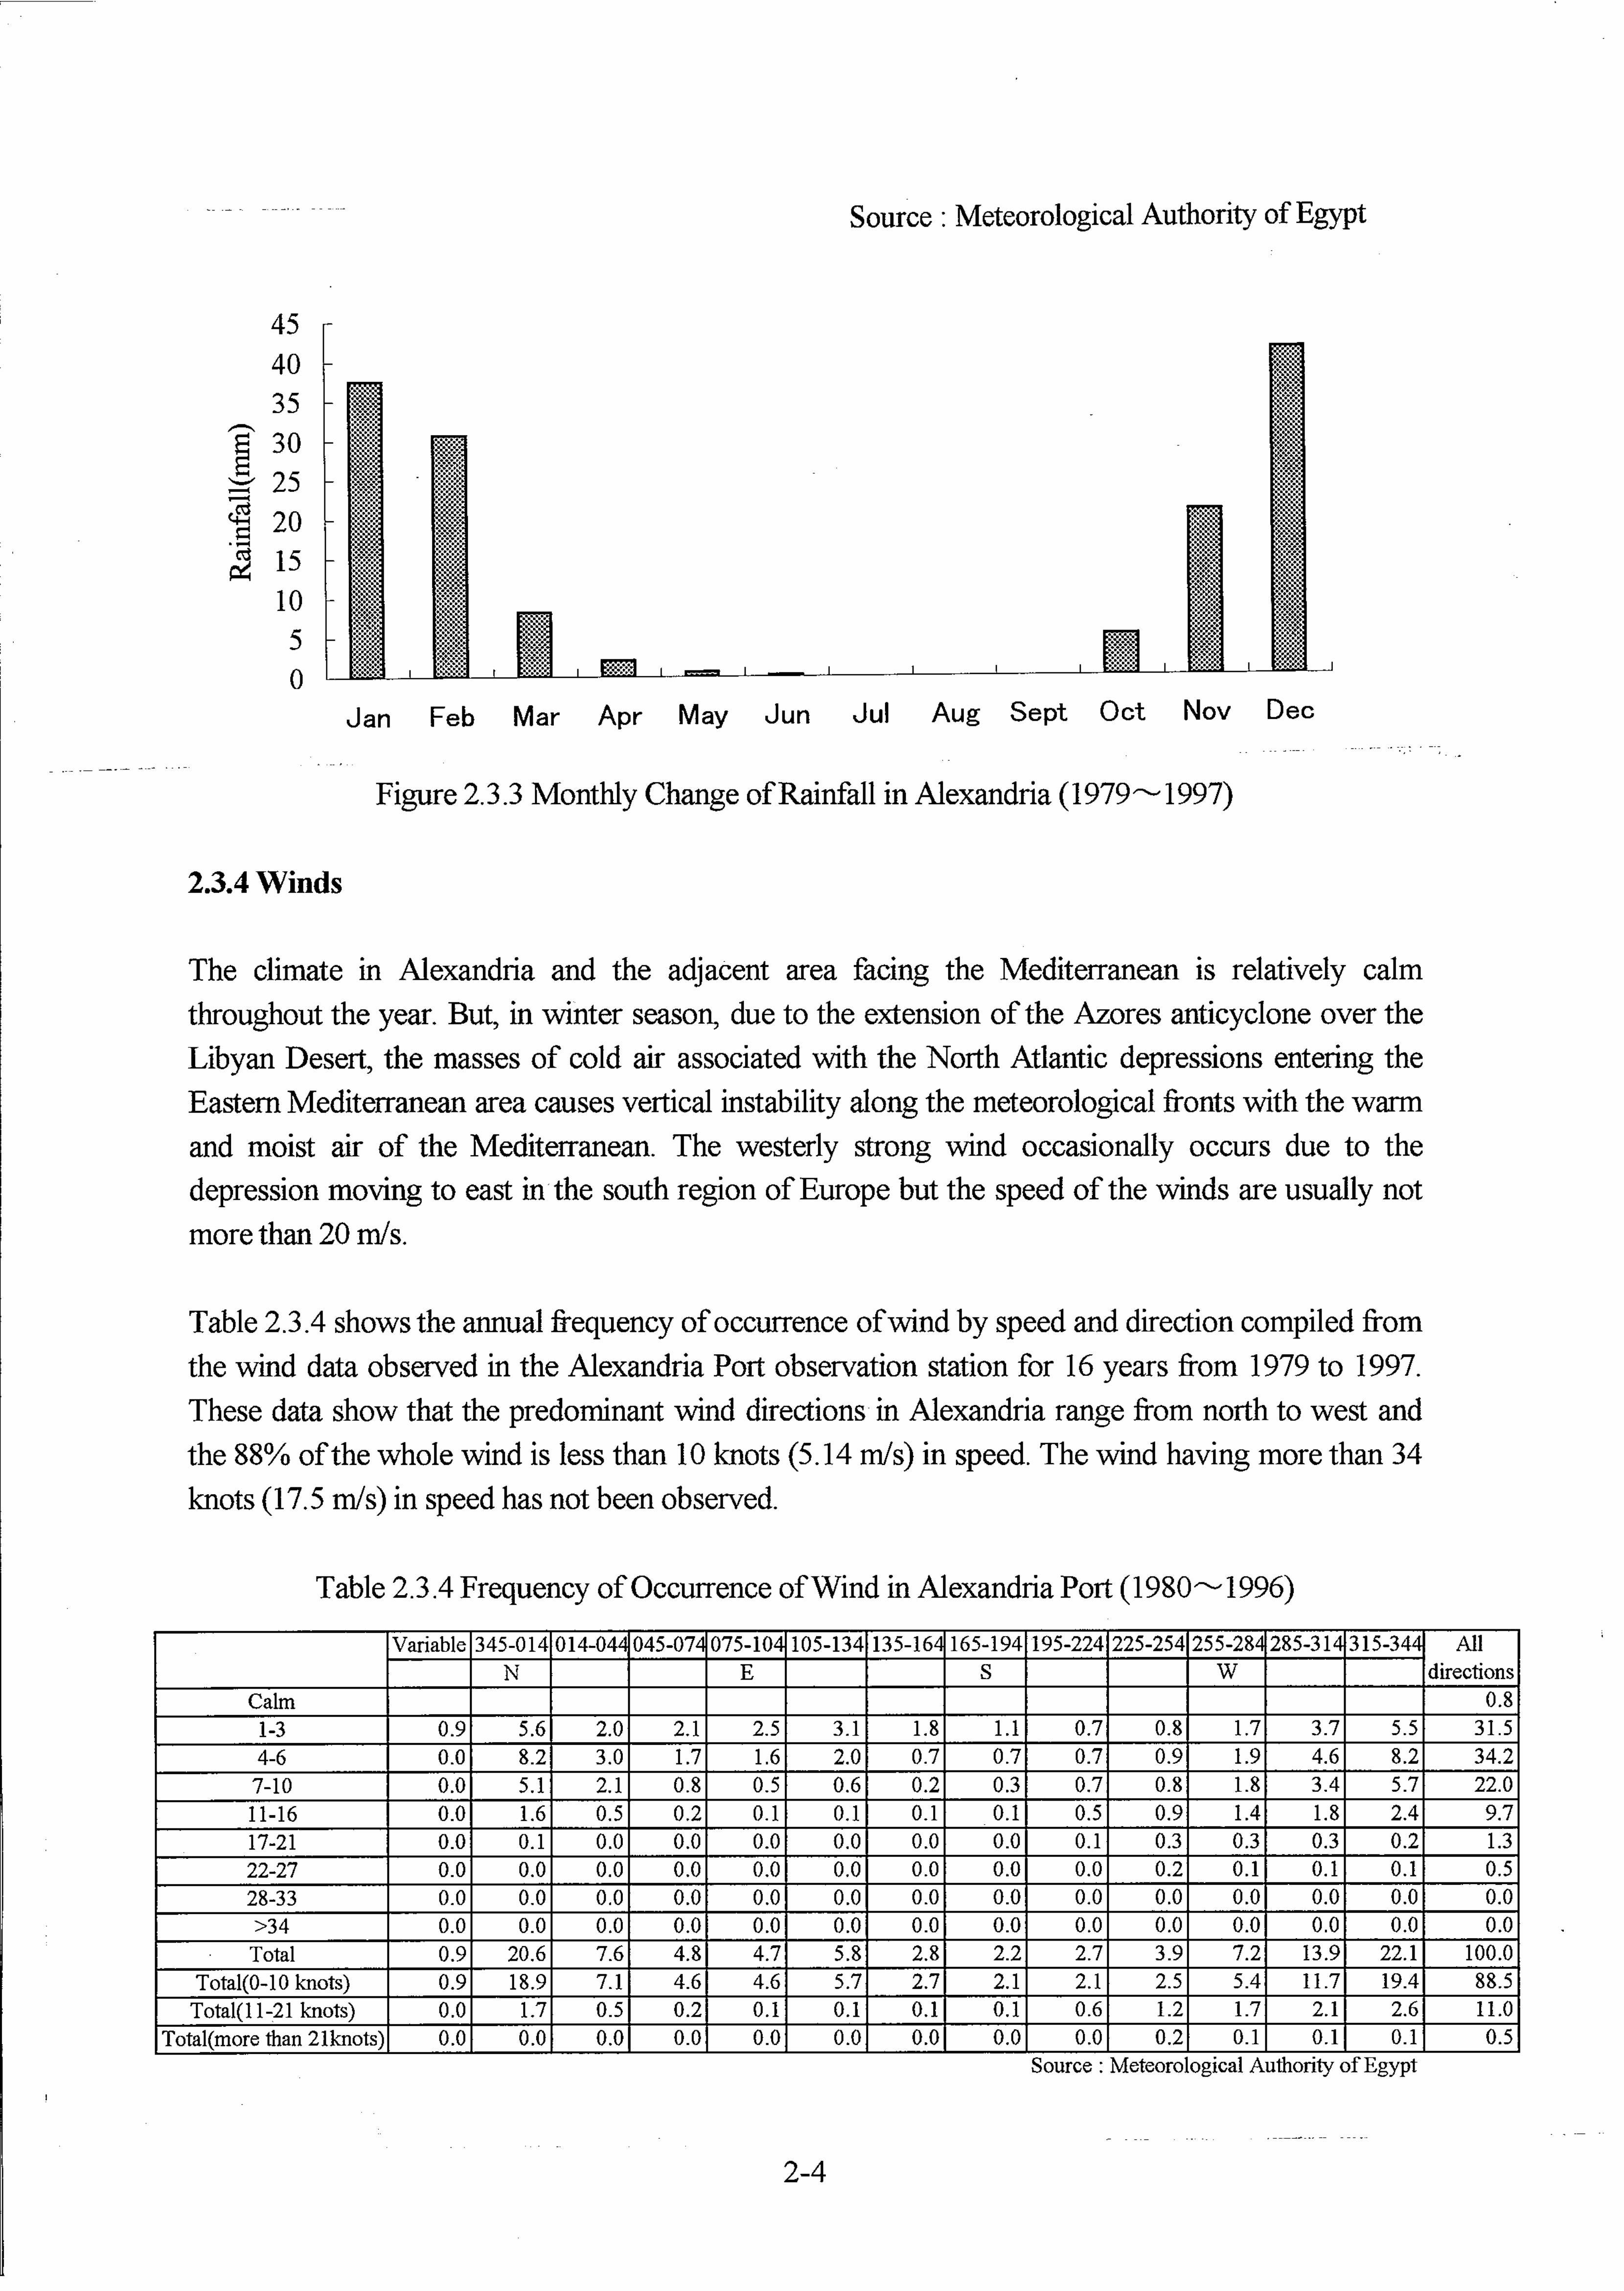
The weather regime of Alexandria belongs to the Mediterranean climate and generally mild andhighly seasonal with a few rainfalls experienced only in winter and therefore oceanographicenvironment is relatively calm and moderate in nature as well.
2.3 Meteorological Conditions
The meteorological information (wind, rainfall, temperature, etc.) in the Alexandria port area hasbeen recorded by the Egyptian Meteorological Authority and collected by the Study Team.
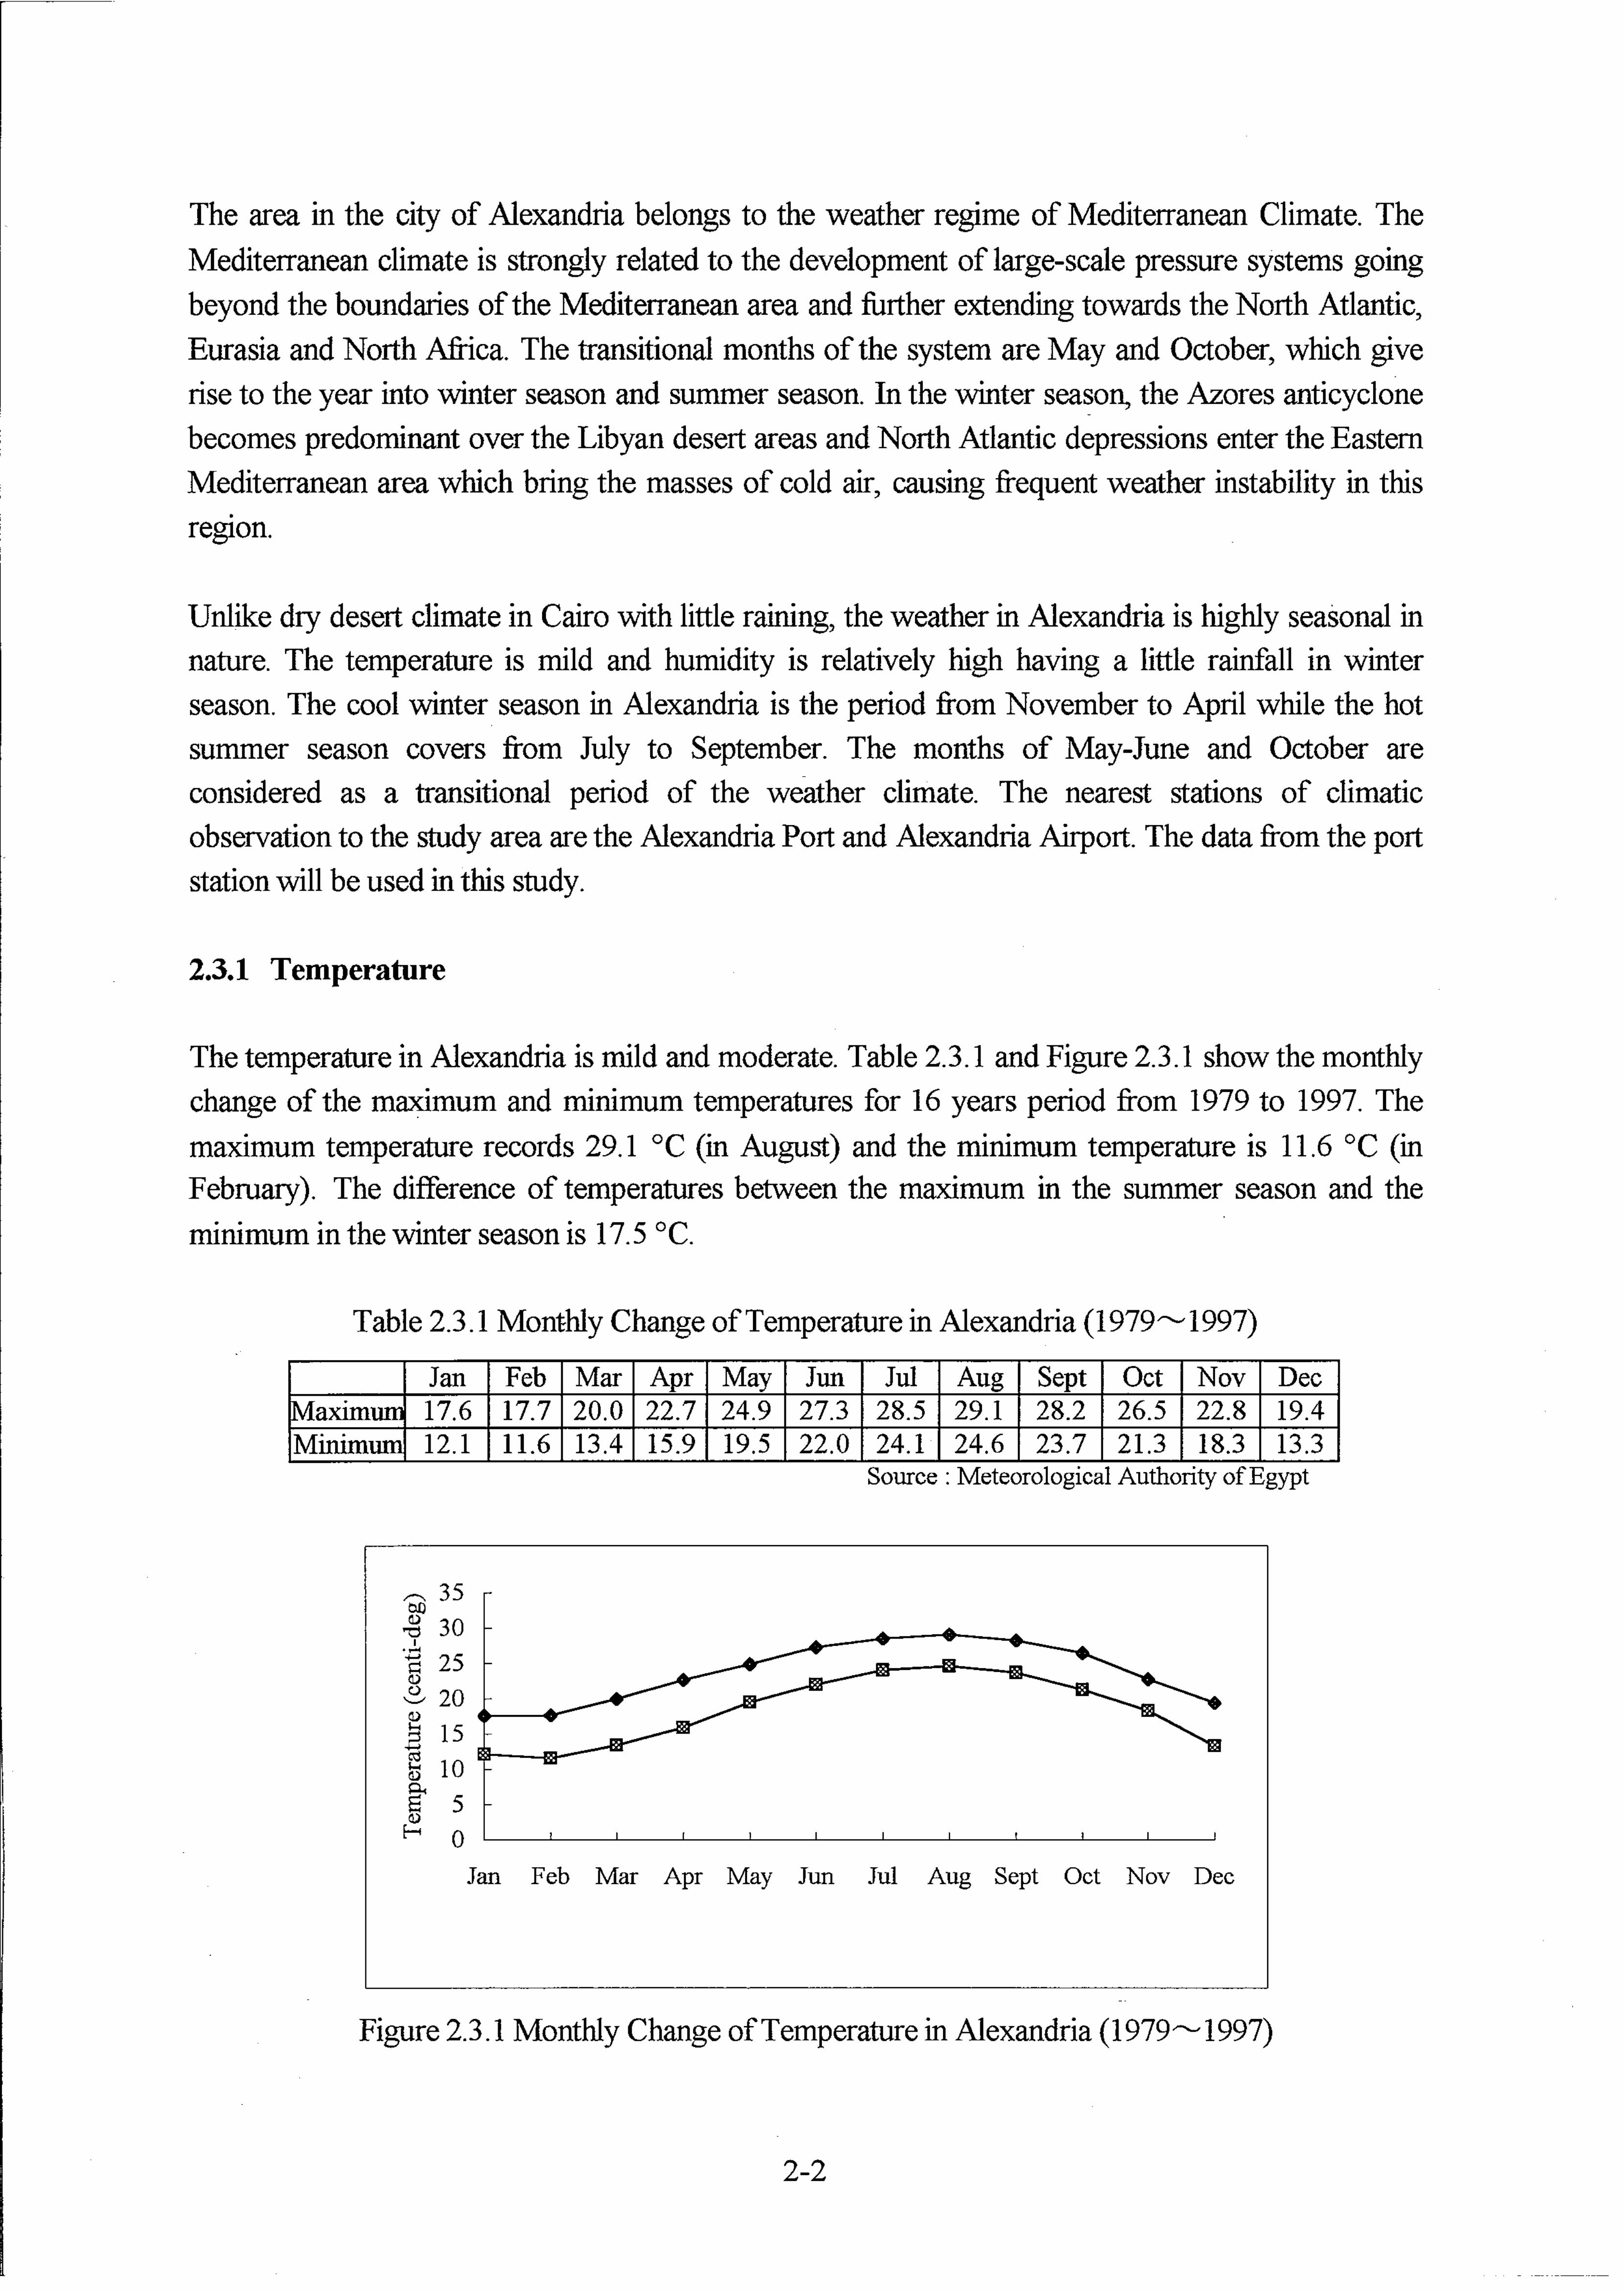
2-6
Table 2.4.2. Annual Tide Levels for the past Five Years
Water Levels `94 `95 `96 `97 ~May,`98 AverageHighest +0.96 +0.90 +0.96 +0.85 +0.84 ---Mean Monthly Highest +0.77 +0.73 +0.80 +0.78 +0.78 +0.77Mean High +0.62 +0.61 +0.67 +0.62 +0.56 +0.61Mean +0.49 +0.48 +0.53 +0.48 +0.42 +0.48Mean Low +0.35 +0.36 +0.39 +0.35 +0.29 +0.34Mean Monthly Lowest +0.19 +0.22 +0.23 +0.23 +0.19 +0.21Lowest +0.20 +0.10 +0.31 +0.18 +0.26 ---
Unit: meter Source: APA
2.4.2 Current
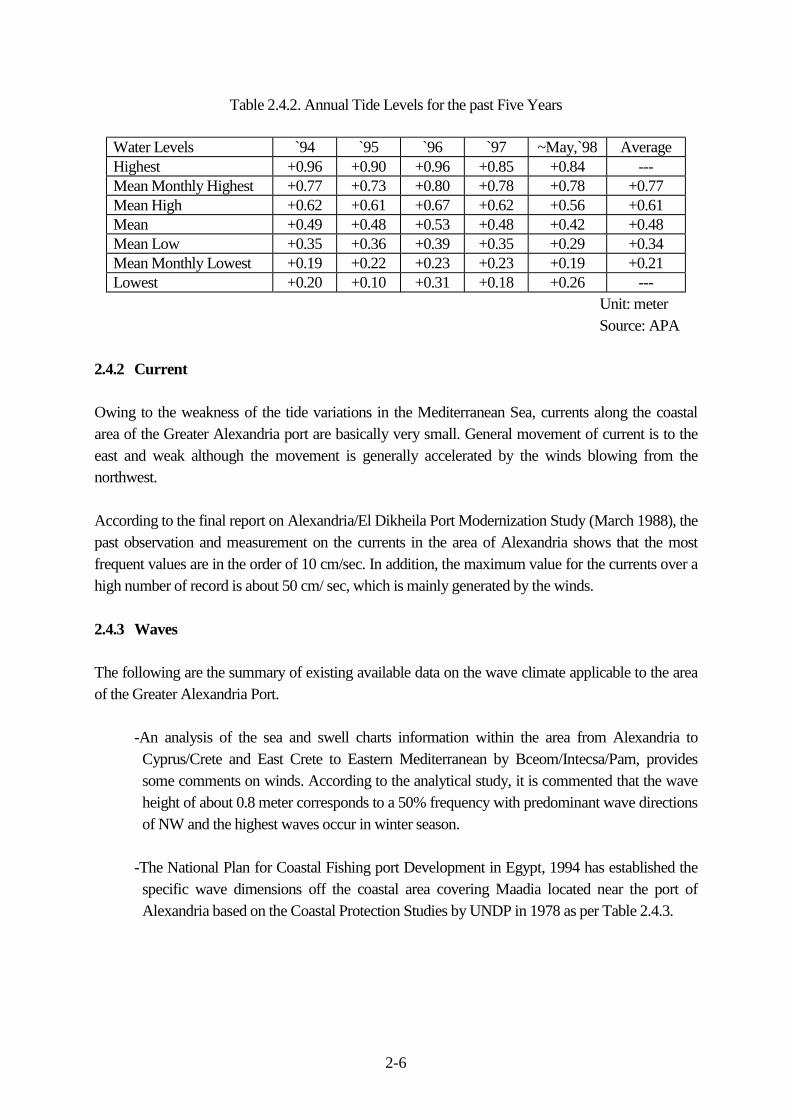
Owing to the weakness of the tide variations in the Mediterranean Sea, currents along the coastalarea of the Greater Alexandria port are basically very small. General movement of current is to theeast and weak although the movement is generally accelerated by the winds blowing from thenorthwest.
According to the final report on Alexandria/El Dikheila Port Modernization Study (March 1988), thepast observation and measurement on the currents in the area of Alexandria shows that the mostfrequent values are in the order of 10 cm/sec. In addition, the maximum value for the currents over ahigh number of record is about 50 cm/ sec, which is mainly generated by the winds.
2.4.3 Waves
The following are the summary of existing available data on the wave climate applicable to the areaof the Greater Alexandria Port.
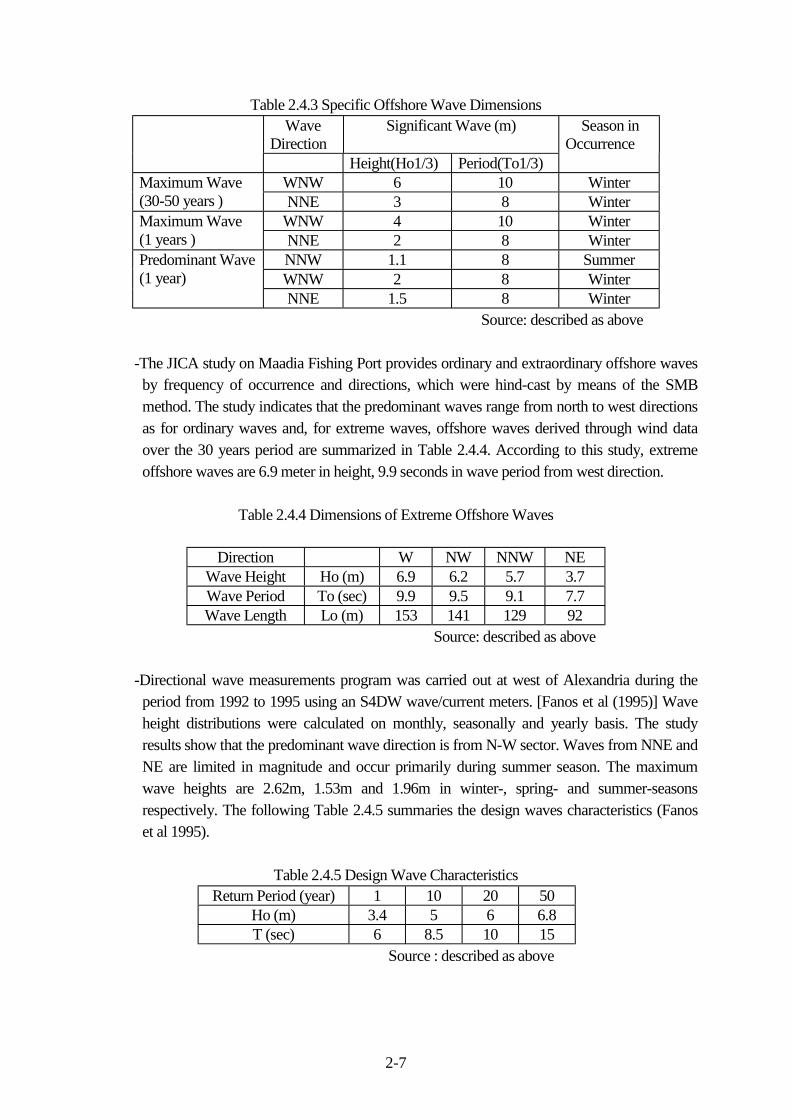
-An analysis of the sea and swell charts information within the area from Alexandria toCyprus/Crete and East Crete to Eastern Mediterranean by Bceom/Intecsa/Pam, providessome comments on winds. According to the analytical study, it is commented that the waveheight of about 0.8 meter corresponds to a 50% frequency with predominant wave directionsof NW and the highest waves occur in winter season.
-The National Plan for Coastal Fishing port Development in Egypt, 1994 has established thespecific wave dimensions off the coastal area covering Maadia located near the port ofAlexandria based on the Coastal Protection Studies by UNDP in 1978 as per Table 2.4.3.
2-7
Table 2.4.3 Specific Offshore Wave Dimensions WaveDirection
Significant Wave (m)
Height(Ho1/3) Period(To1/3)
Season inOccurrence
WNW 6 10 WinterMaximum Wave(30-50 years ) NNE 3 8 Winter
WNW 4 10 WinterMaximum Wave(1 years ) NNE 2 8 Winter
NNW 1.1 8 SummerWNW 2 8 Winter
Predominant Wave(1 year)
NNE 1.5 8 Winter Source: described as above
-The JICA study on Maadia Fishing Port provides ordinary and extraordinary offshore wavesby frequency of occurrence and directions, which were hind-cast by means of the SMBmethod. The study indicates that the predominant waves range from north to west directionsas for ordinary waves and, for extreme waves, offshore waves derived through wind dataover the 30 years period are summarized in Table 2.4.4. According to this study, extremeoffshore waves are 6.9 meter in height, 9.9 seconds in wave period from west direction.
Table 2.4.4 Dimensions of Extreme Offshore Waves
Direction W NW NNW NEWave Height Ho (m) 6.9 6.2 5.7 3.7Wave Period To (sec) 9.9 9.5 9.1 7.7Wave Length Lo (m) 153 141 129 92
Source: described as above
-Directional wave measurements program was carried out at west of Alexandria during theperiod from 1992 to 1995 using an S4DW wave/current meters. [Fanos et al (1995)] Waveheight distributions were calculated on monthly, seasonally and yearly basis. The studyresults show that the predominant wave direction is from N-W sector. Waves from NNE andNE are limited in magnitude and occur primarily during summer season. The maximumwave heights are 2.62m, 1.53m and 1.96m in winter-, spring- and summer-seasonsrespectively. The following Table 2.4.5 summaries the design waves characteristics (Fanoset al 1995).
Table 2.4.5 Design Wave CharacteristicsReturn Period (year) 1 10 20 50
Ho (m) 3.4 5 6 6.8T (sec) 6 8.5 10 15
Source : described as above
2-8
2.5 Previous Observation on Subsoil Conditions and Bathymetry of the Port
2.5.1 Subsoil Conditions inside the Port
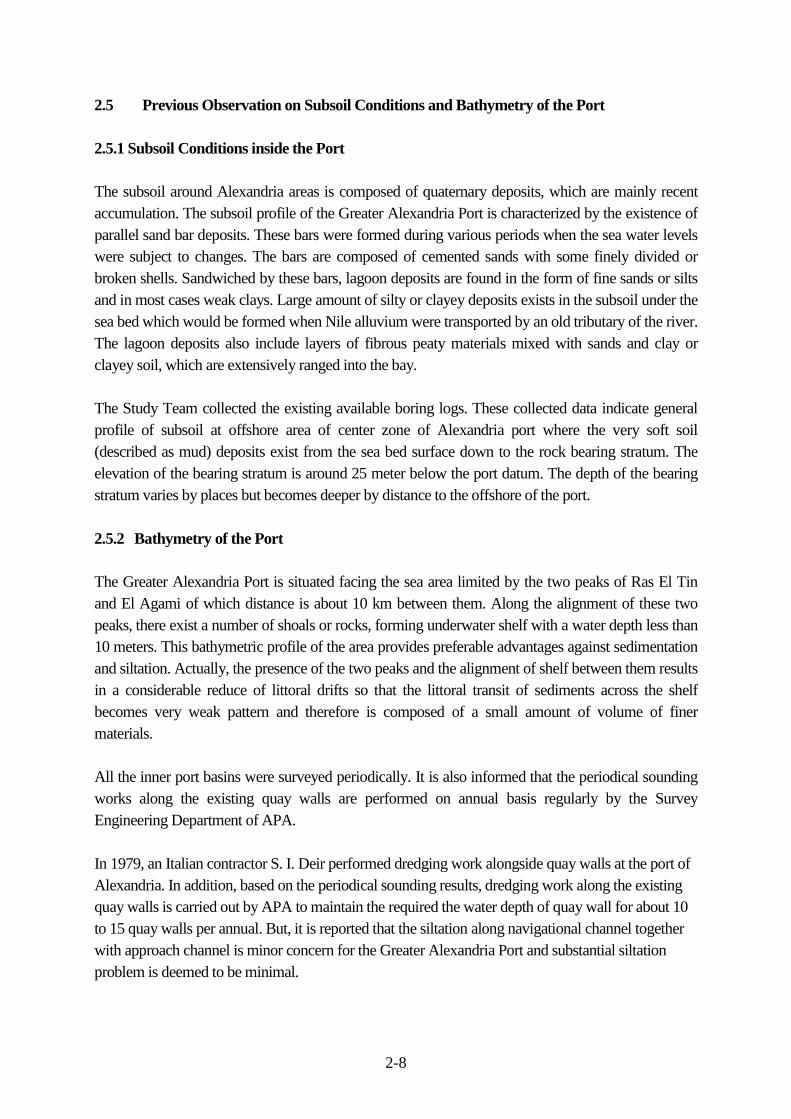
The subsoil around Alexandria areas is composed of quaternary deposits, which are mainly recentaccumulation. The subsoil profile of the Greater Alexandria Port is characterized by the existence ofparallel sand bar deposits. These bars were formed during various periods when the sea water levelswere subject to changes. The bars are composed of cemented sands with some finely divided orbroken shells. Sandwiched by these bars, lagoon deposits are found in the form of fine sands or siltsand in most cases weak clays. Large amount of silty or clayey deposits exists in the subsoil under thesea bed which would be formed when Nile alluvium were transported by an old tributary of the river.The lagoon deposits also include layers of fibrous peaty materials mixed with sands and clay orclayey soil, which are extensively ranged into the bay.
The Study Team collected the existing available boring logs. These collected data indicate generalprofile of subsoil at offshore area of center zone of Alexandria port where the very soft soil(described as mud) deposits exist from the sea bed surface down to the rock bearing stratum. Theelevation of the bearing stratum is around 25 meter below the port datum. The depth of the bearingstratum varies by places but becomes deeper by distance to the offshore of the port.
2.5.2 Bathymetry of the Port
The Greater Alexandria Port is situated facing the sea area limited by the two peaks of Ras El Tinand El Agami of which distance is about 10 km between them. Along the alignment of these twopeaks, there exist a number of shoals or rocks, forming underwater shelf with a water depth less than10 meters. This bathymetric profile of the area provides preferable advantages against sedimentationand siltation. Actually, the presence of the two peaks and the alignment of shelf between them resultsin a considerable reduce of littoral drifts so that the littoral transit of sediments across the shelfbecomes very weak pattern and therefore is composed of a small amount of volume of finermaterials.
All the inner port basins were surveyed periodically. It is also informed that the periodical soundingworks along the existing quay walls are performed on annual basis regularly by the SurveyEngineering Department of APA.
In 1979, an Italian contractor S. I. Deir performed dredging work alongside quay walls at the port ofAlexandria. In addition, based on the periodical sounding results, dredging work along the existingquay walls is carried out by APA to maintain the required the water depth of quay wall for about 10to 15 quay walls per annual. But, it is reported that the siltation along navigational channel togetherwith approach channel is minor concern for the Greater Alexandria Port and substantial siltationproblem is deemed to be minimal.
2-9
2.6.2 Field Survey (I) for Natural Conditions
During the 1st Field Study period in Egypt from March to June 1998, the following field surveyswere carried out.
(1) Topographic survey within the inner area of the Greater Alexandria Port to supplement the lackof indication provided on the existing available map of 1:10,000 scale.
(2) Sounding survey to measure the water depth at the navigational/approach channels and waterarea inside the Greater Alexandria Port
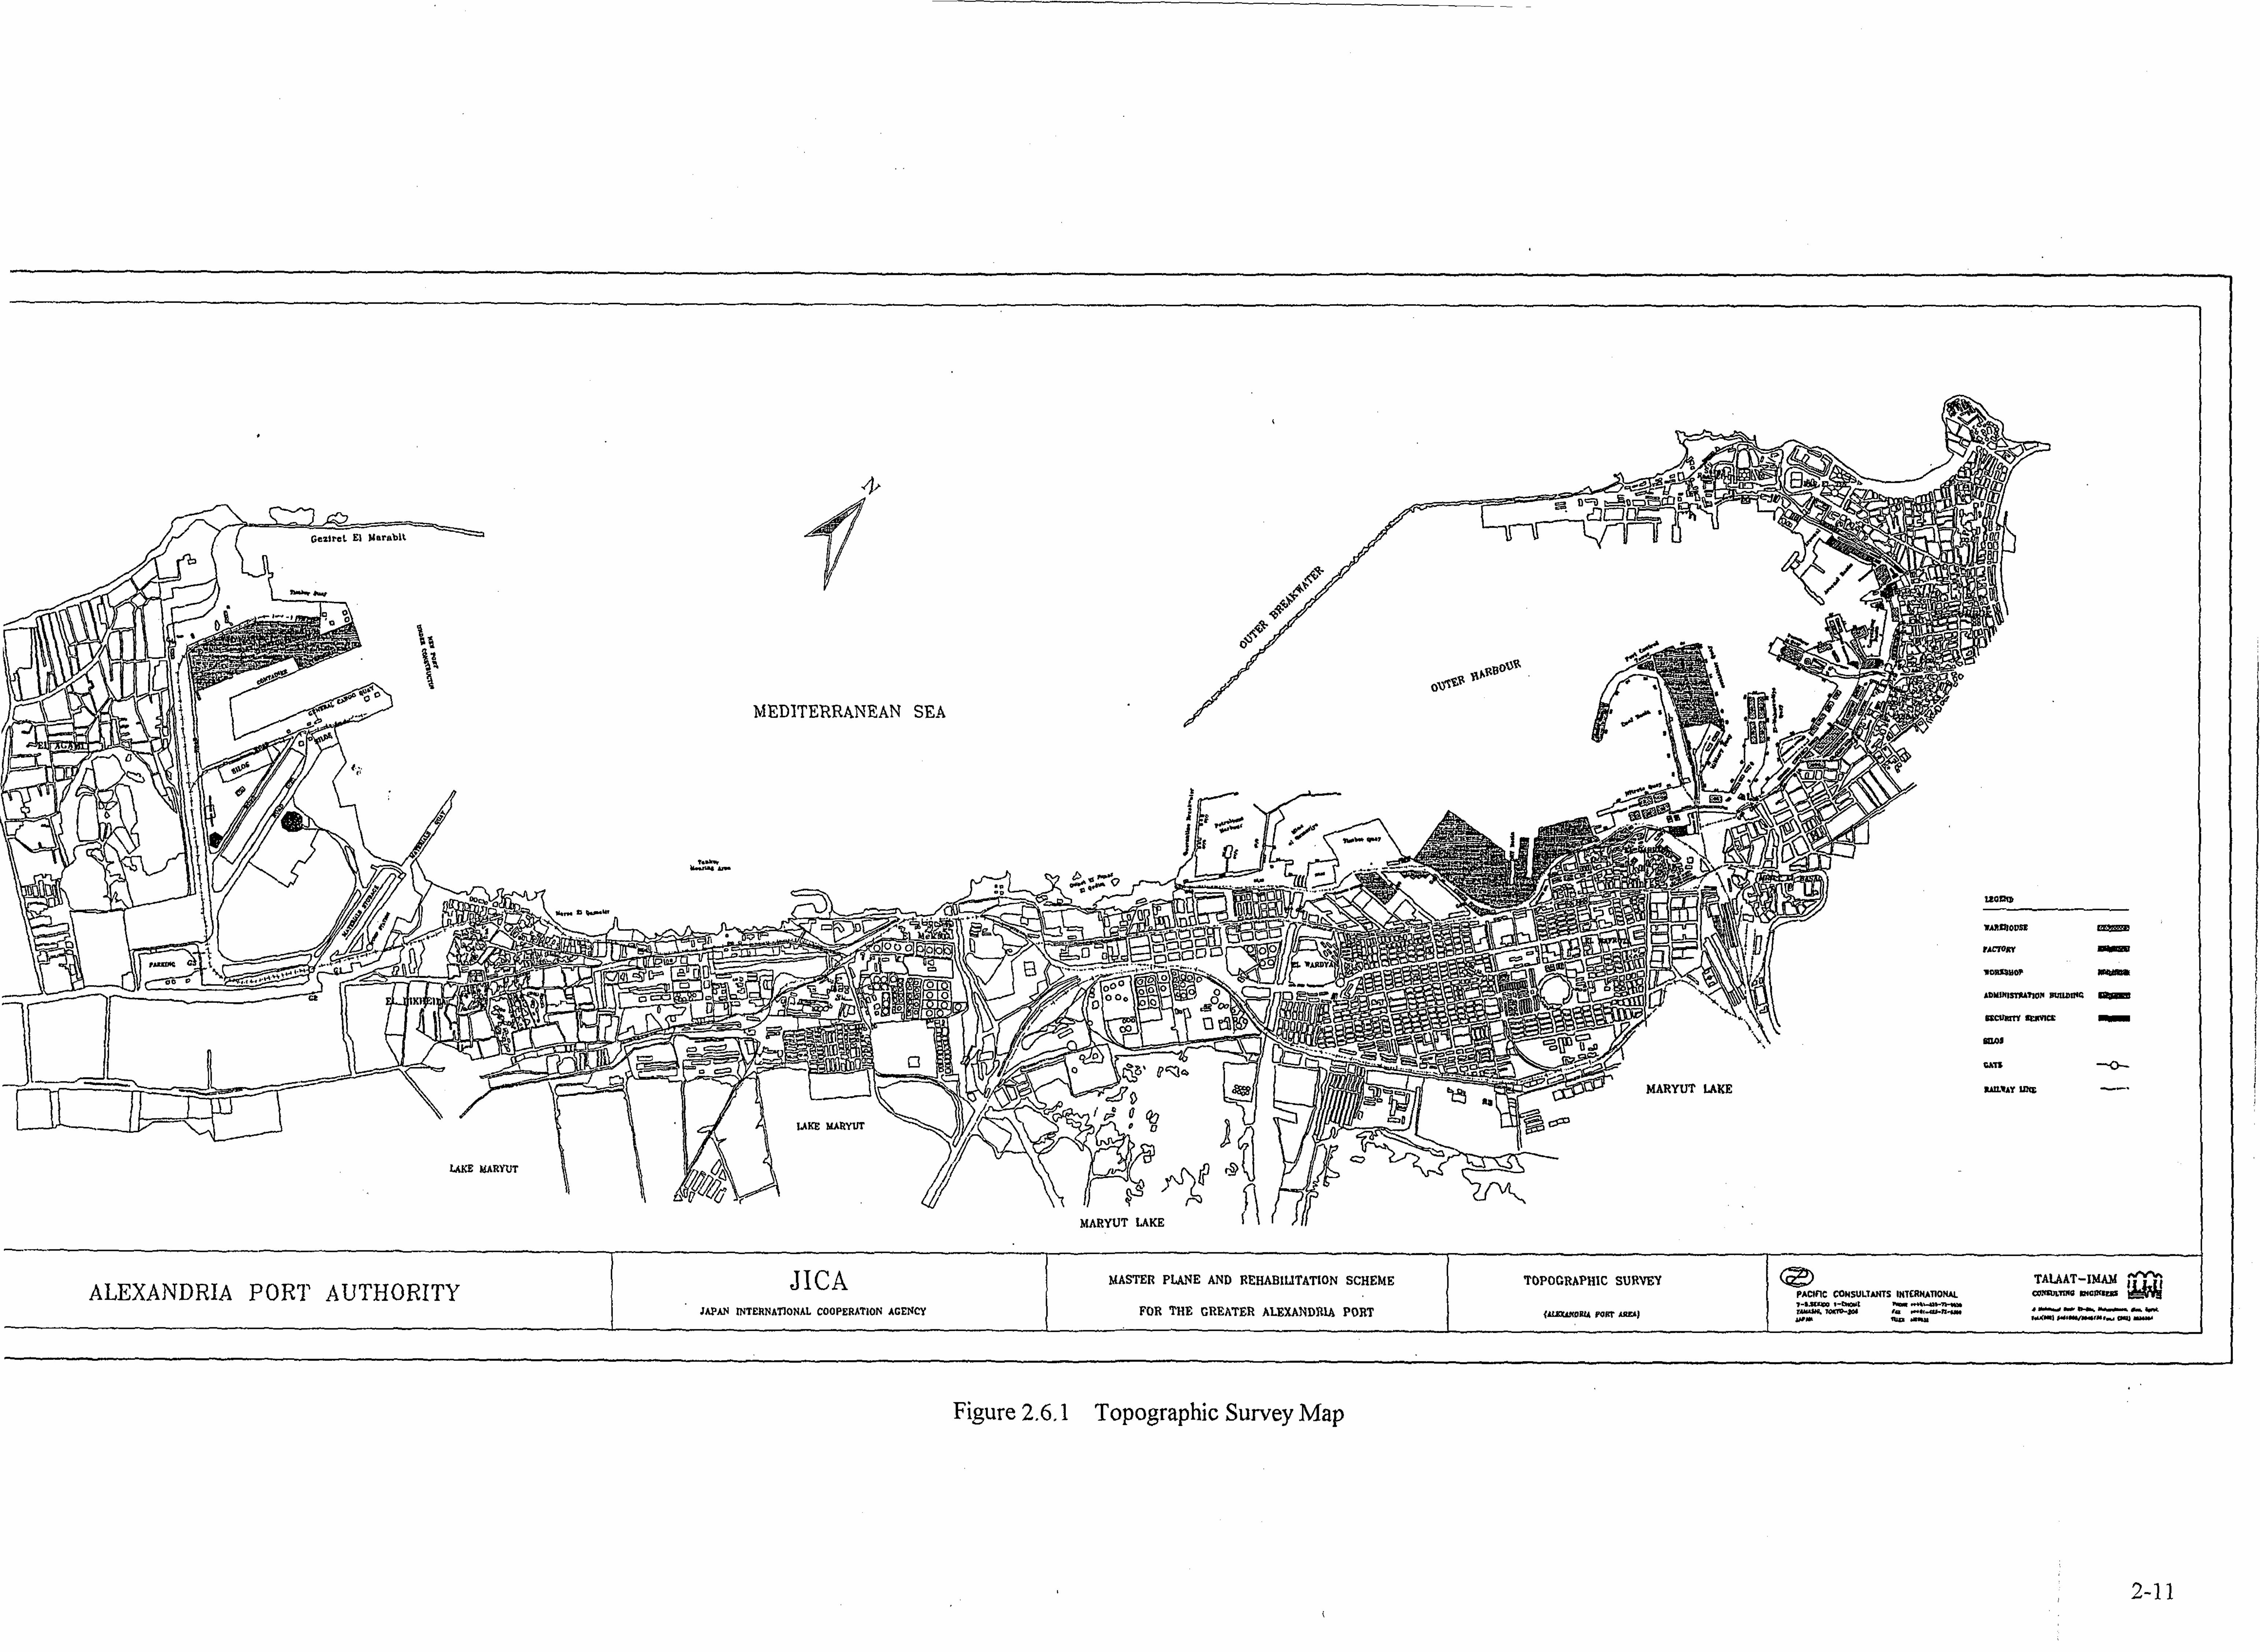
2.6.1 Topographic Survey Topographic survey within the inner ports area of the Greater Alexandria Port (the ports ofAlexandria and Dikheila) was carried out to supplement the lack of indication provided on theexisting available map of 1: 10,000 scale. Prior to conduct of survey, a free tour all over the port wasconducted for searching notable ground spots, existing structures, waterway and other suddenchange of ground features visible as well as a local system grid, zero point locating beside the servicebuilding. The survey control was executed within the framework of vertical and horizontal control system forsurvey references at strategic 10 points within the inner port area considering notable major groundspots and abrupt or sudden change of ground conditions. Three vertical closed loops were conductedfor obtaining the necessary accuracy. A topographic survey map to cover the survey area wasprepared at scale of 1:10,000 based on and referred to the existing available map as shown in Figure2.6.1.
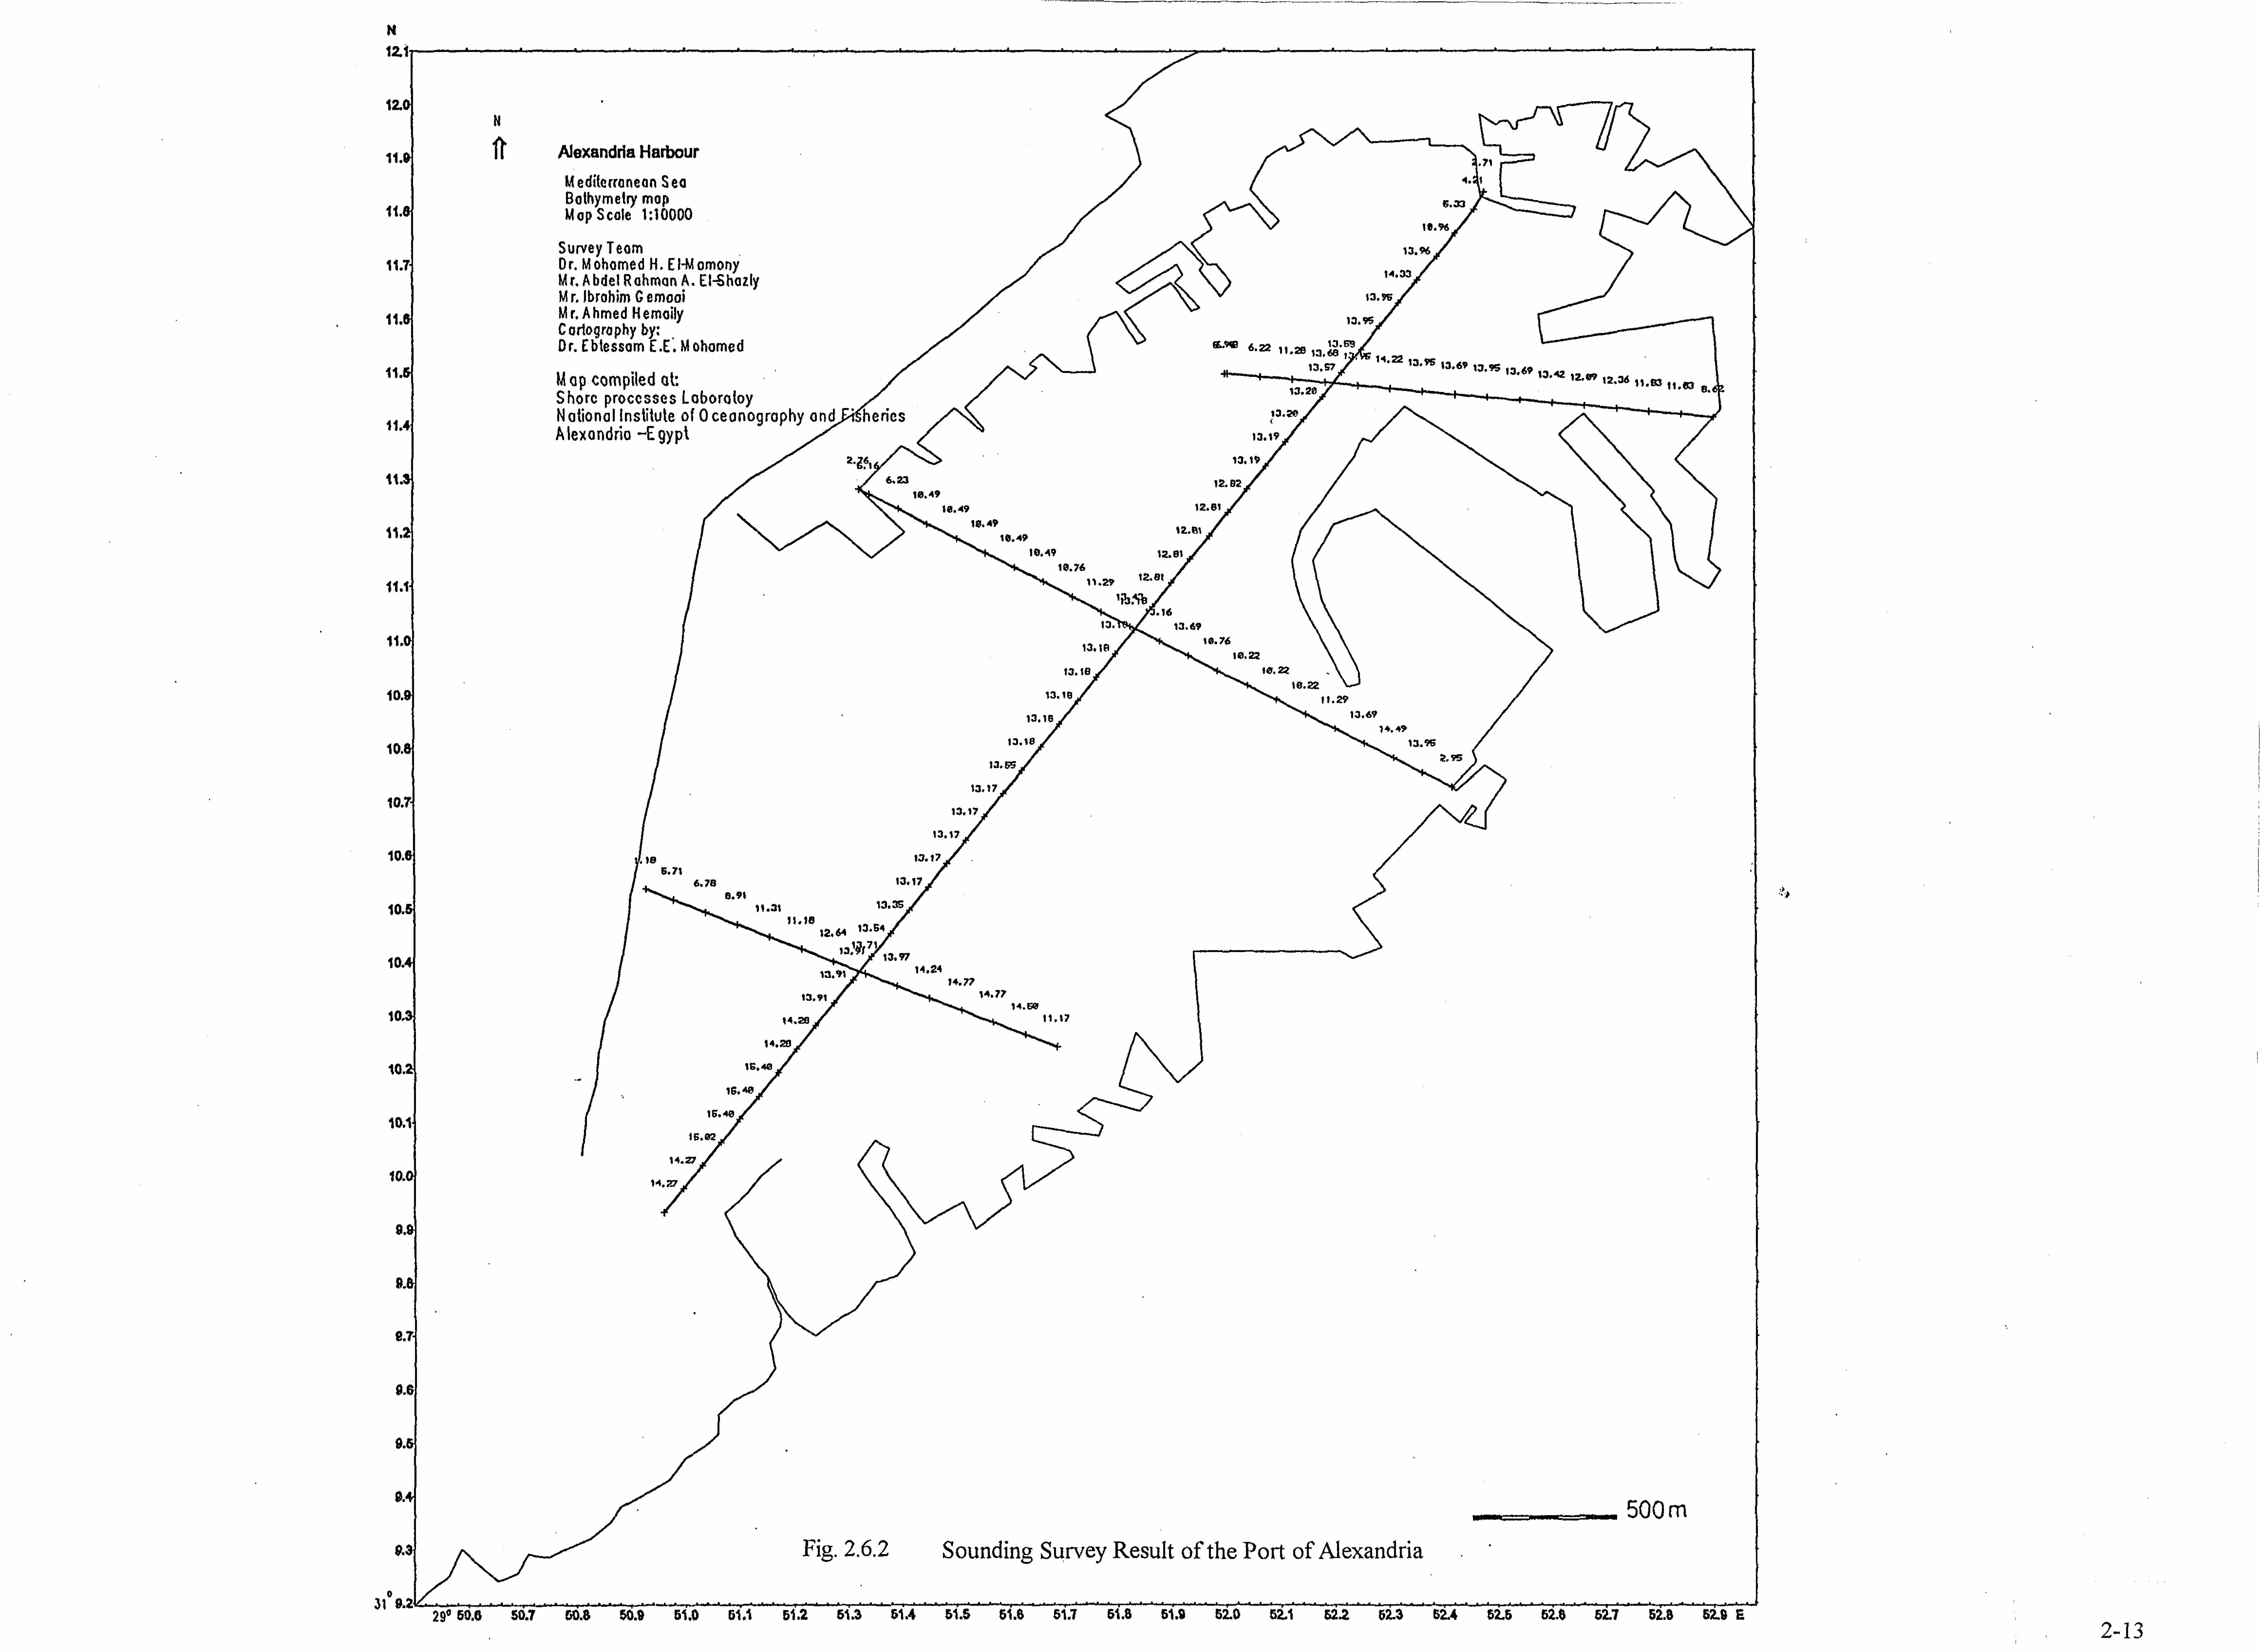
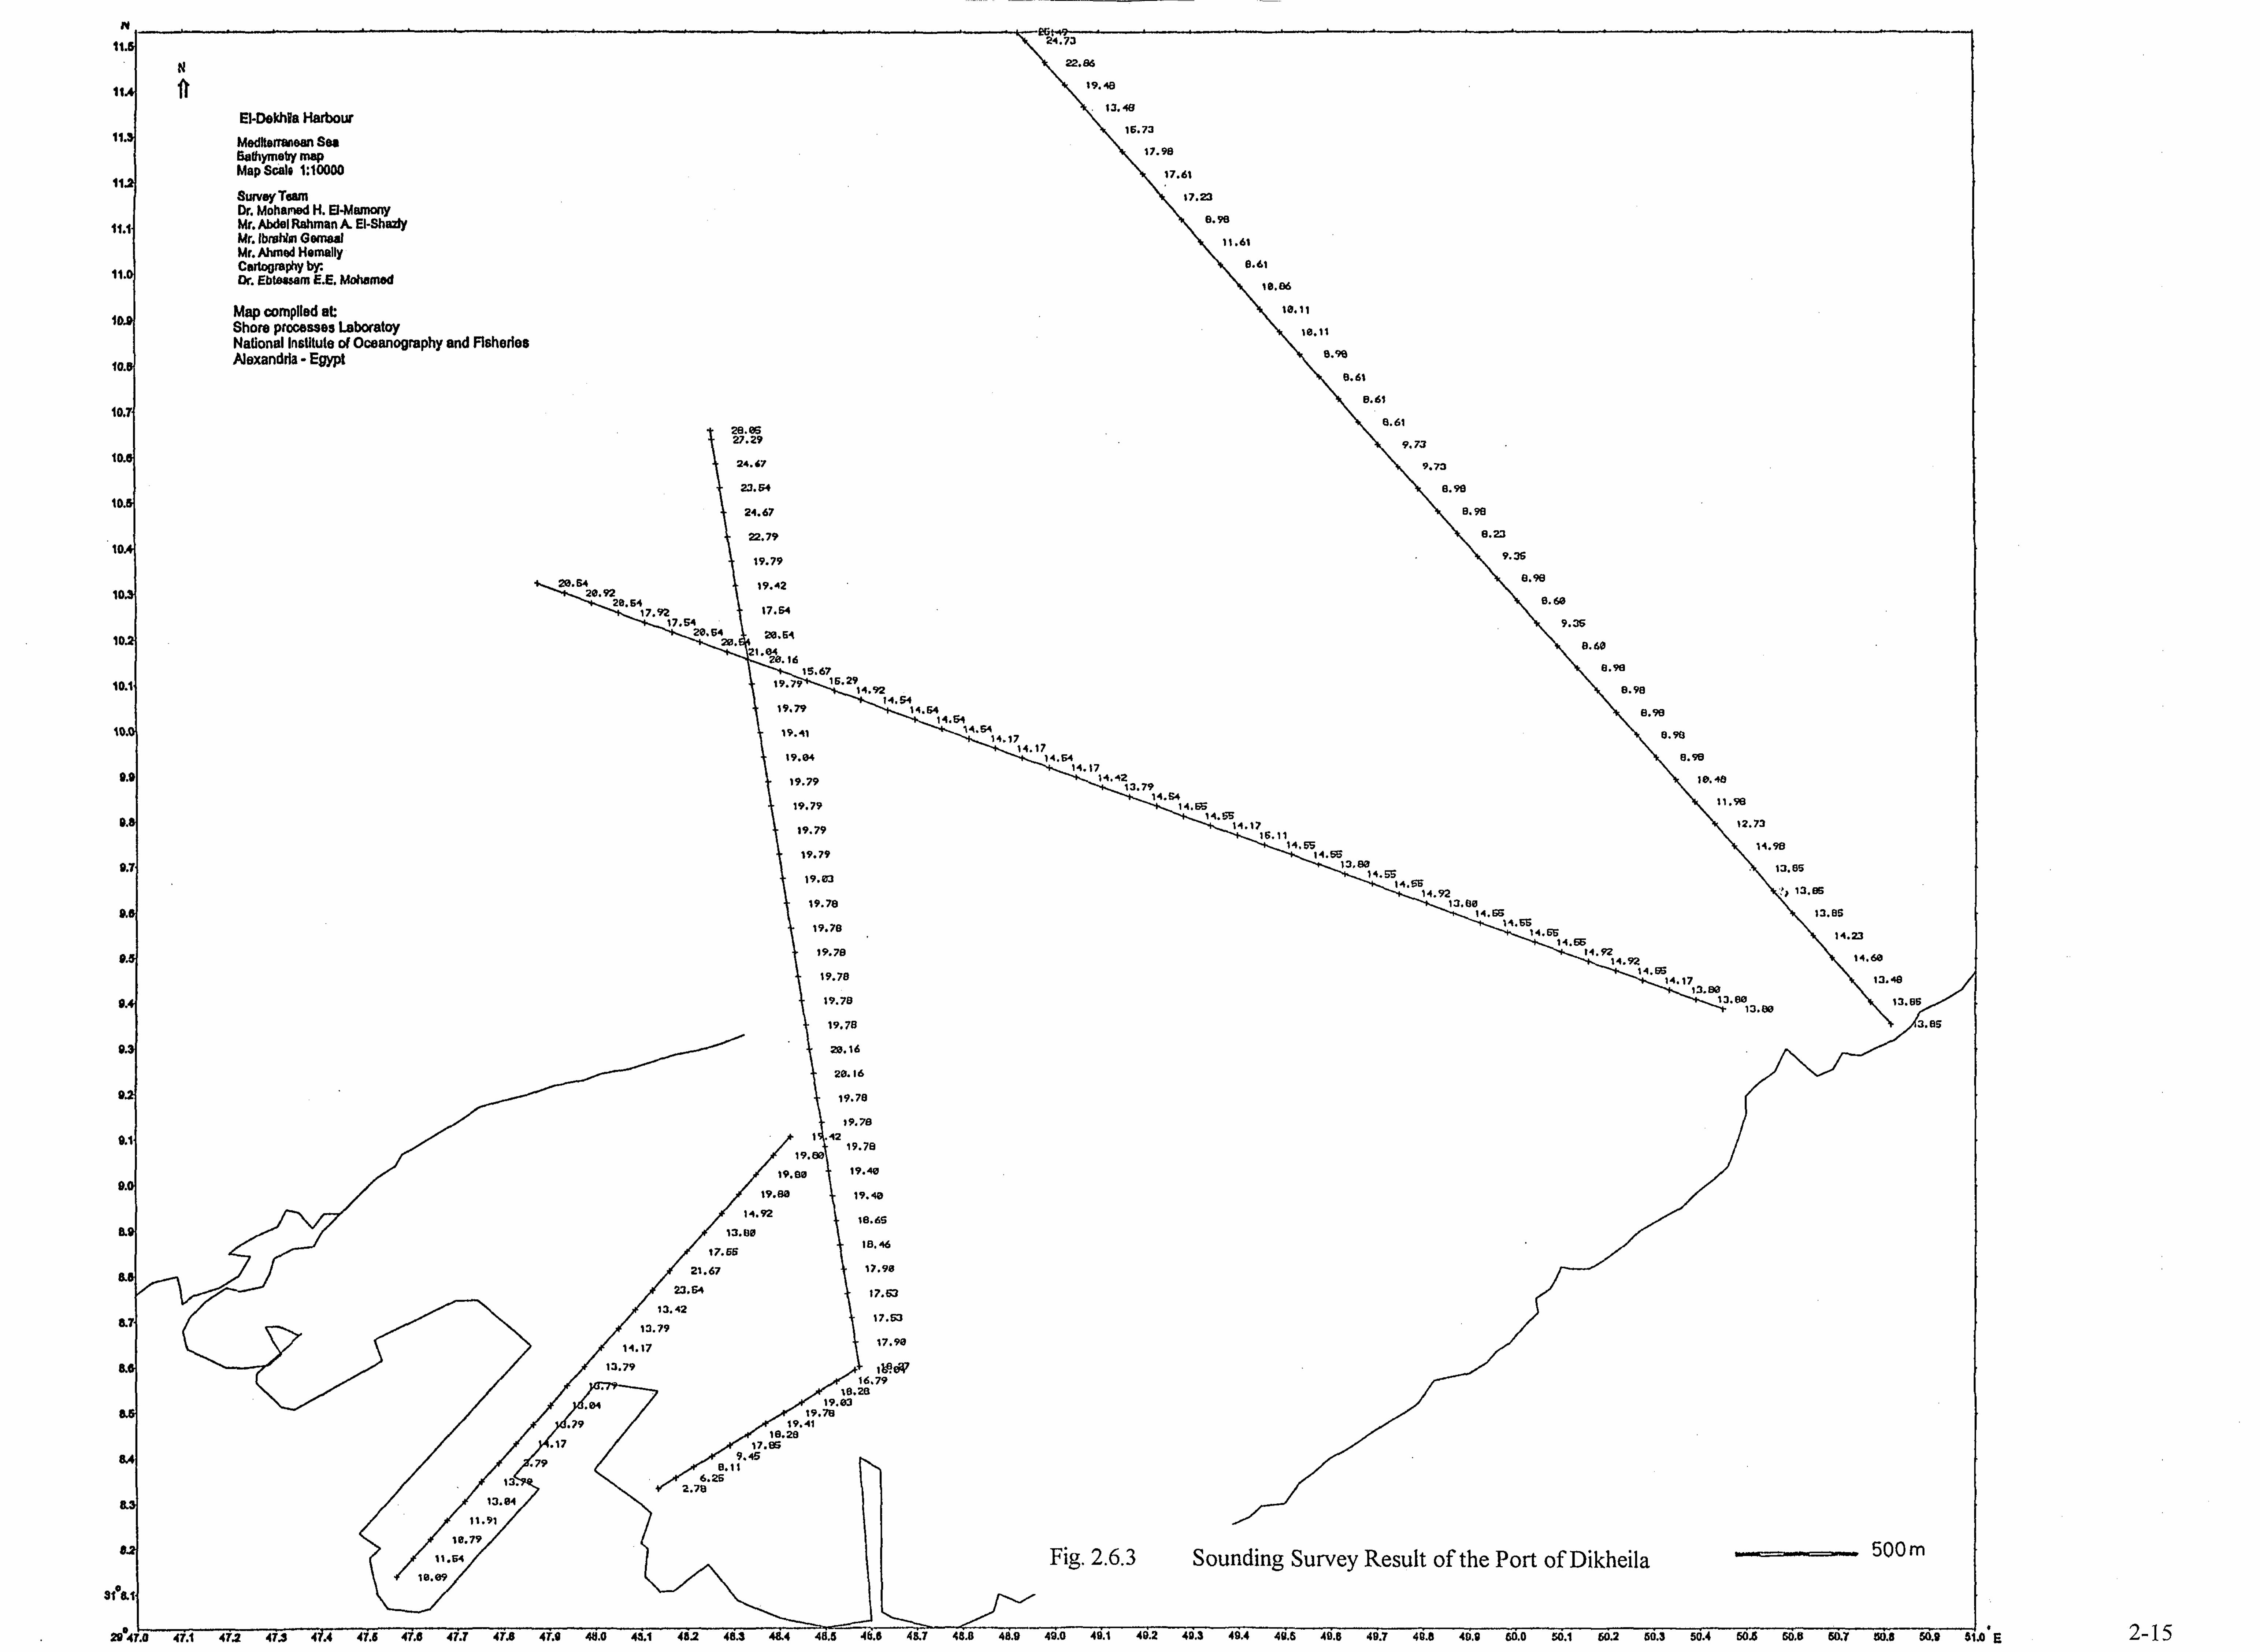
2.6.2 Sounding Survey
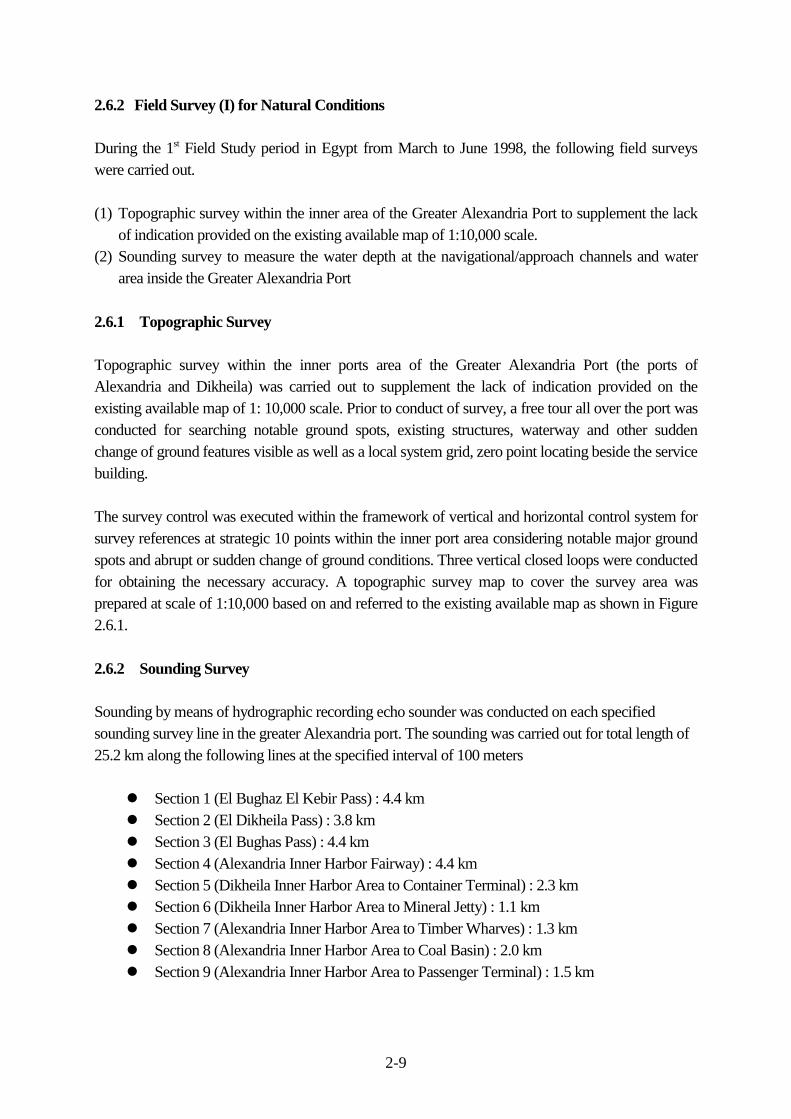
Sounding by means of hydrographic recording echo sounder was conducted on each specifiedsounding survey line in the greater Alexandria port. The sounding was carried out for total length of25.2 km along the following lines at the specified interval of 100 meters
Section 1 (El Bughaz El Kebir Pass) : 4.4 km Section 2 (El Dikheila Pass) : 3.8 km Section 3 (El Bughas Pass) : 4.4 km Section 4 (Alexandria Inner Harbor Fairway) : 4.4 km Section 5 (Dikheila Inner Harbor Area to Container Terminal) : 2.3 km Section 6 (Dikheila Inner Harbor Area to Mineral Jetty) : 1.1 km Section 7 (Alexandria Inner Harbor Area to Timber Wharves) : 1.3 km Section 8 (Alexandria Inner Harbor Area to Coal Basin) : 2.0 km Section 9 (Alexandria Inner Harbor Area to Passenger Terminal) : 1.5 km
2-10
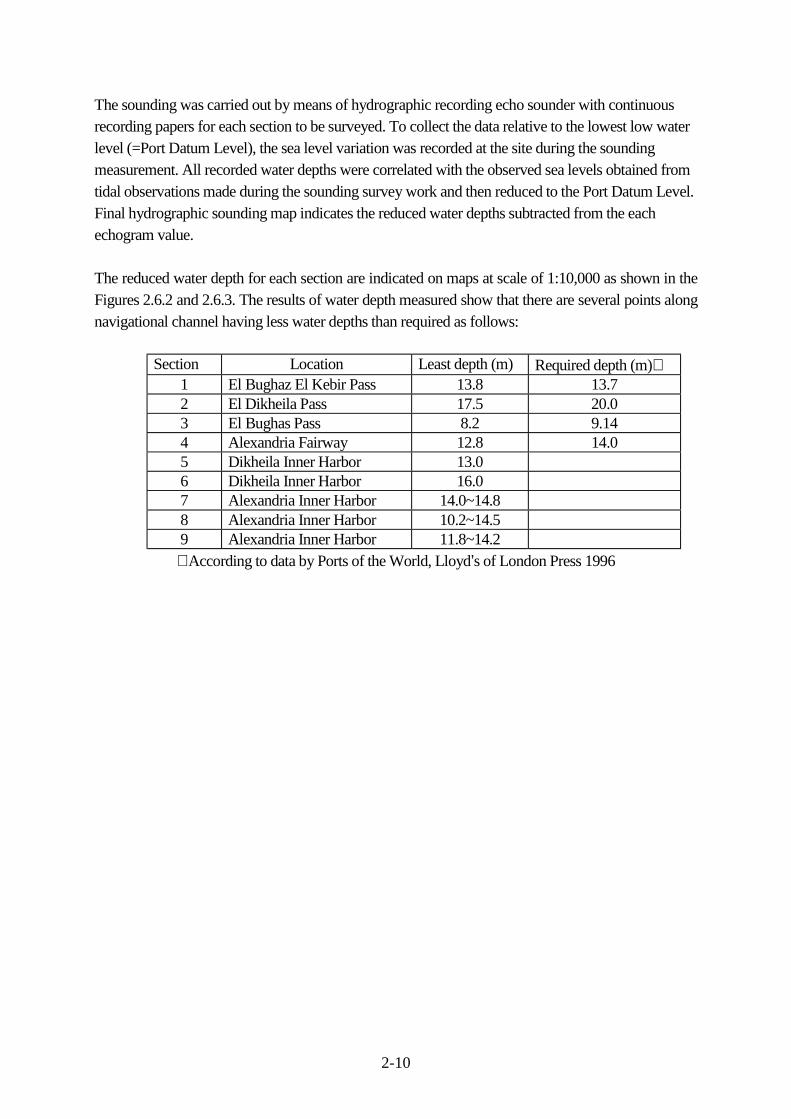
The sounding was carried out by means of hydrographic recording echo sounder with continuousrecording papers for each section to be surveyed. To collect the data relative to the lowest low waterlevel (=Port Datum Level), the sea level variation was recorded at the site during the soundingmeasurement. All recorded water depths were correlated with the observed sea levels obtained fromtidal observations made during the sounding survey work and then reduced to the Port Datum Level.Final hydrographic sounding map indicates the reduced water depths subtracted from the eachechogram value.
The reduced water depth for each section are indicated on maps at scale of 1:10,000 as shown in theFigures 2.6.2 and 2.6.3. The results of water depth measured show that there are several points alongnavigational channel having less water depths than required as follows:
Section Location Least depth (m) Required depth (m)∗1 El Bughaz El Kebir Pass 13.8 13.72 El Dikheila Pass 17.5 20.03 El Bughas Pass 8.2 9.144 Alexandria Fairway 12.8 14.05 Dikheila Inner Harbor 13.06 Dikheila Inner Harbor 16.07 Alexandria Inner Harbor 14.0~14.88 Alexandria Inner Harbor 10.2~14.59 Alexandria Inner Harbor 11.8~14.2∗ According to data by Ports of the World, Lloyd’s of London Press 1996
2-17
2.7 Field Survey (II) for Natural Conditions
During the fields survey (II) in Egypt from April to May 1999, subsoil investigation and water depthsounding were carried out at the area where the short-term development plan were envisaged.
2.7.1 Subsoil Investigation
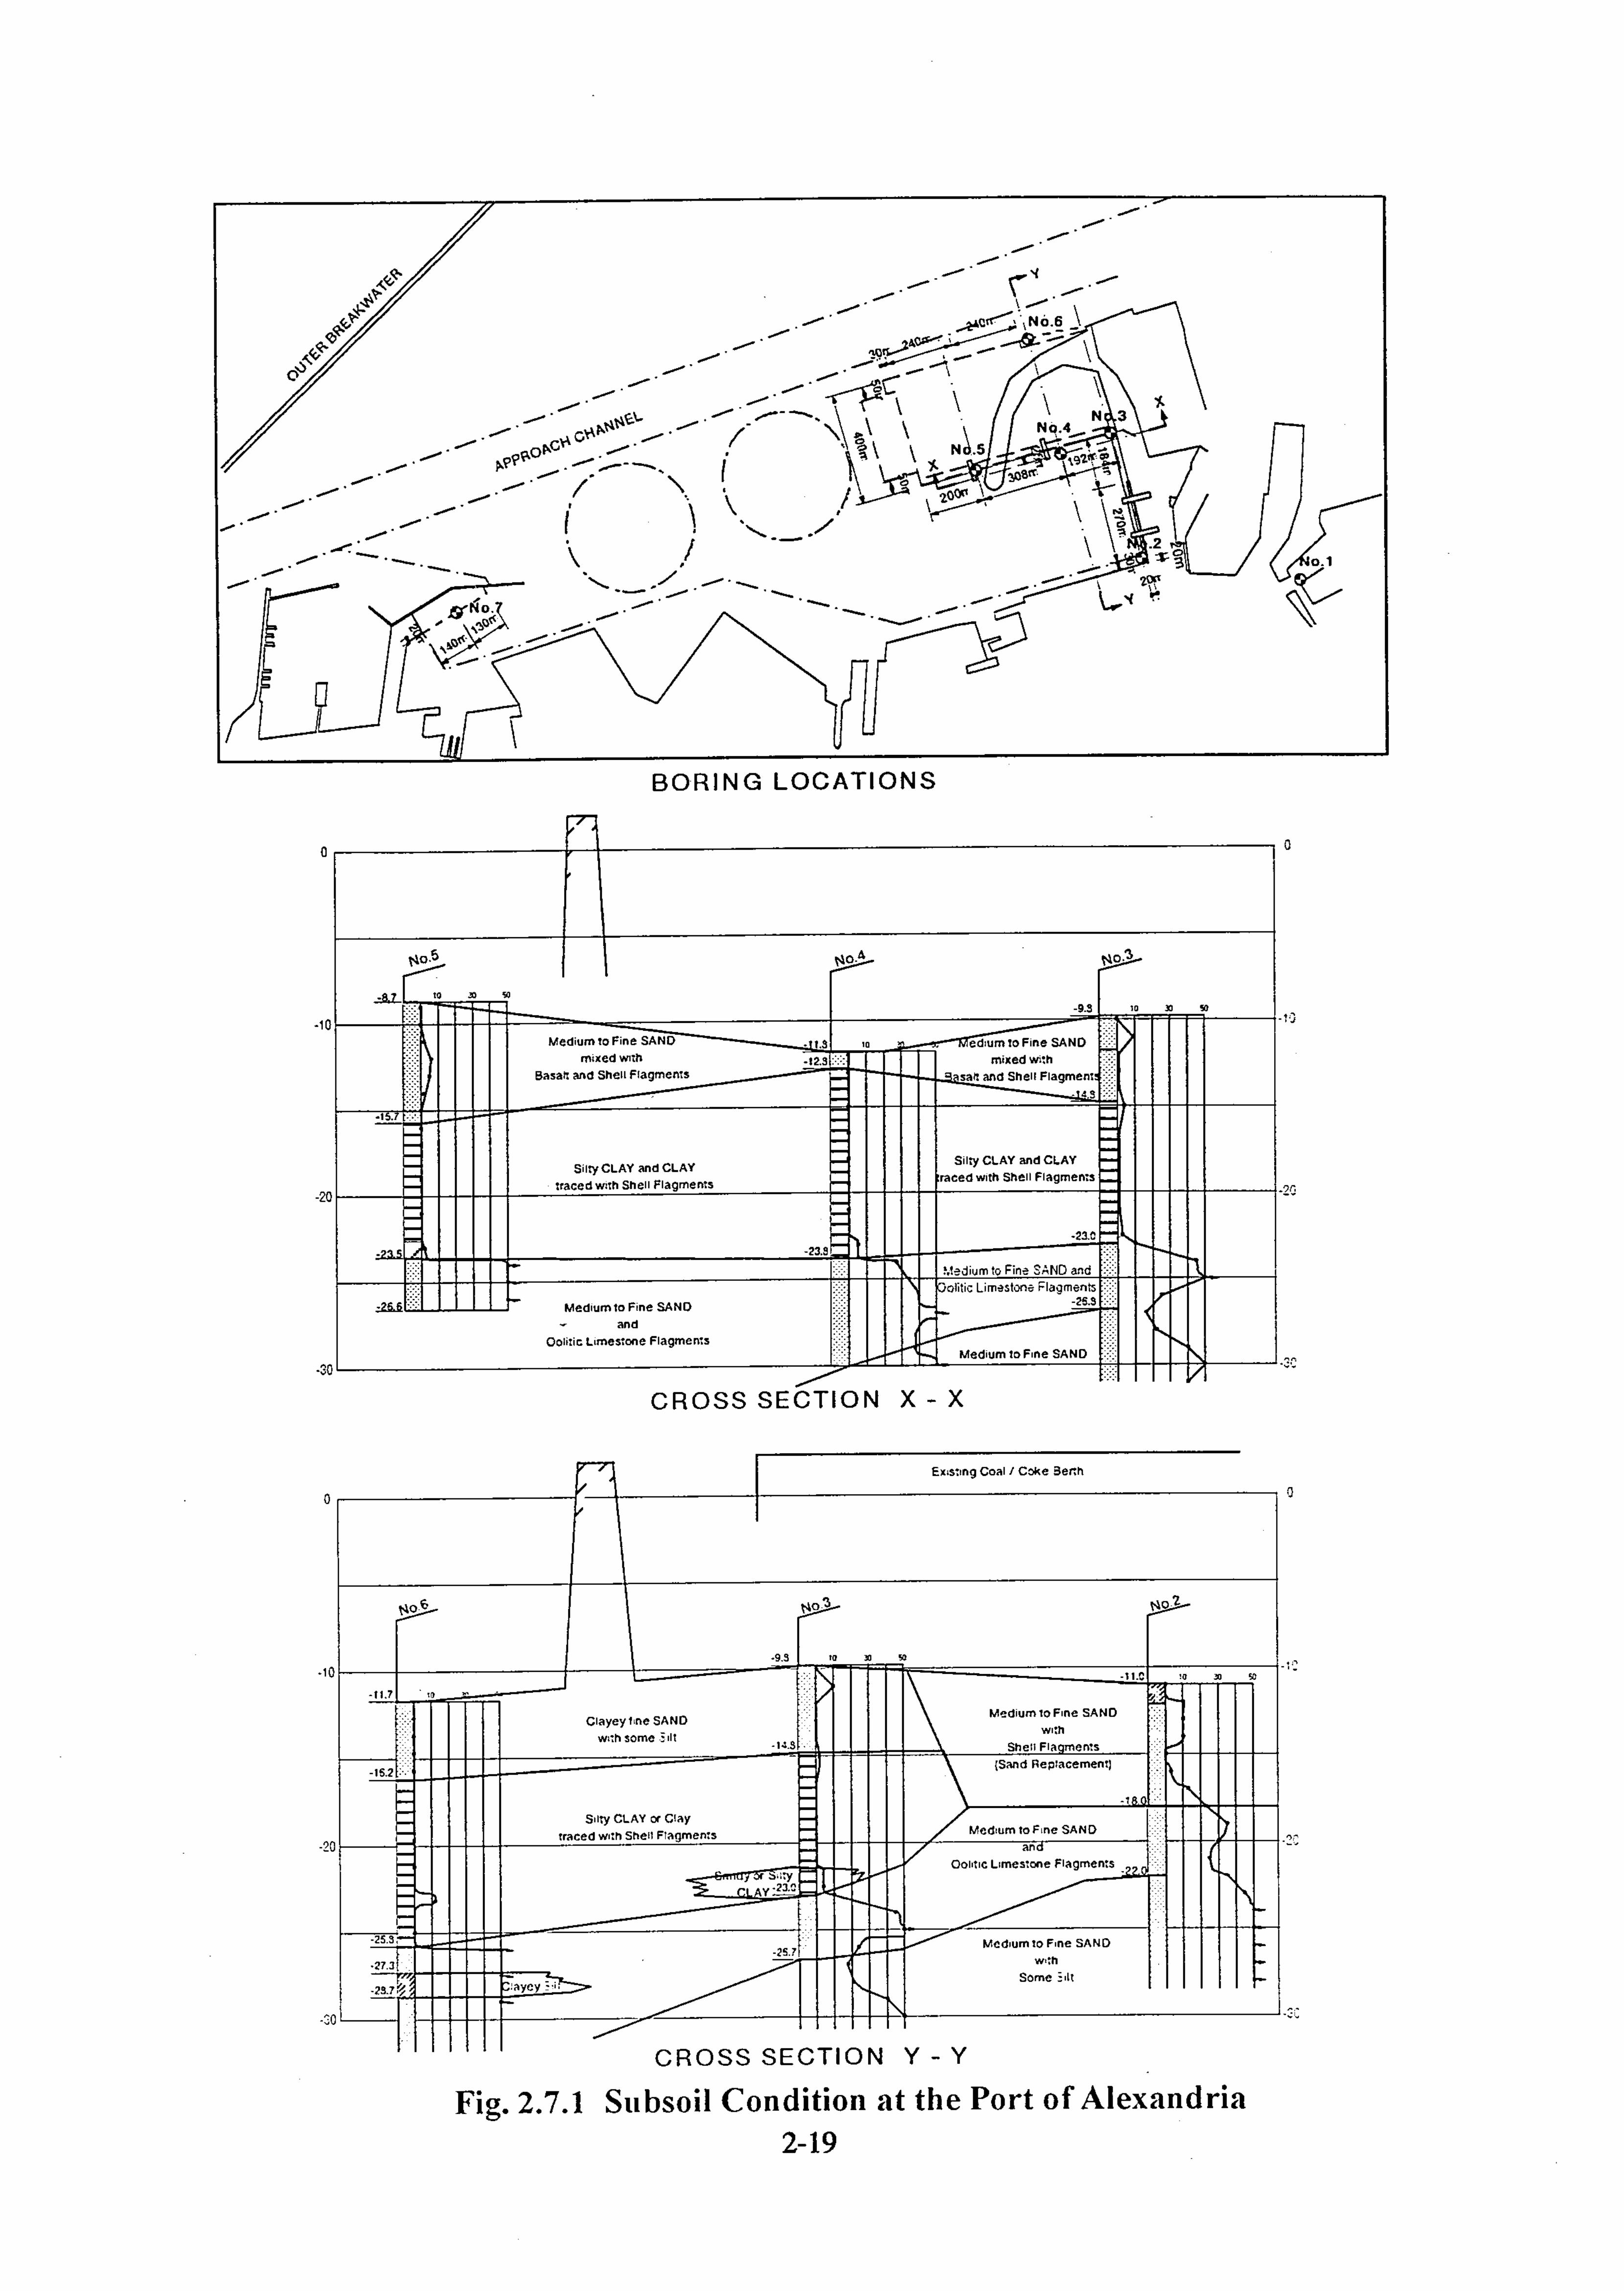
Although the Study Team collected available data on subsoil conditions within the port ofAlexandria, these data show only general profile of subsoil with neither information on N-value ofStandard Penetration Test (SPT) nor physical or mechanical properties of subsoil. In order tosupplement such subsoil information, seven (7) borings which composed of one (1) onshore boringand other six (6) offshore borings were conducted by the Study Team in April to May, 1999 at thelocation shown in Figure 2.7.1.
The objectives of the subsoil investigation are to characterize the site subsoil, define theirgeotechnical conditions and to evaluate soil strength and compressibility parameters relevant tofoundation design and construction. The subsoil investigation includes the execution of boring, in-situ testing, laboratory testing, analysis of field and laboratory test results, evaluation of designsubsoil parameters and preparation of final report.
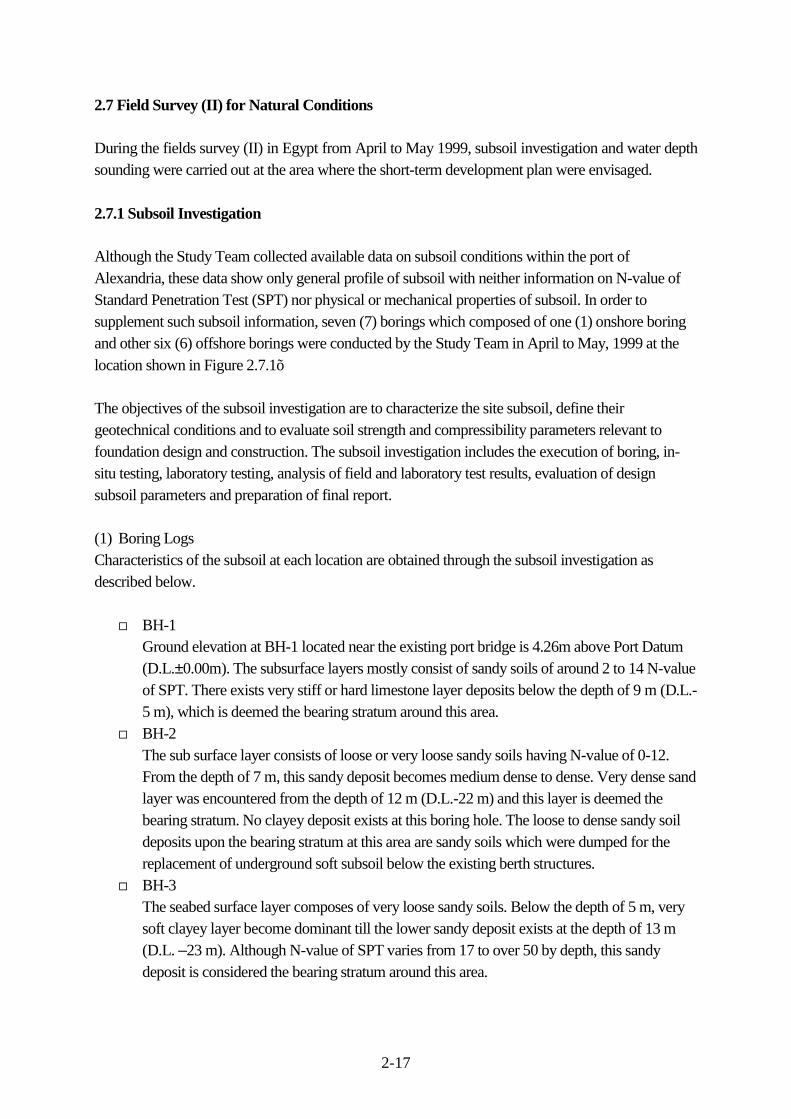
(1) Boring LogsCharacteristics of the subsoil at each location are obtained through the subsoil investigation asdescribed below.
BH-1Ground elevation at BH-1 located near the existing port bridge is 4.26m above Port Datum(D.L.±0.00m). The subsurface layers mostly consist of sandy soils of around 2 to 14 N-valueof SPT. There exists very stiff or hard limestone layer deposits below the depth of 9 m (D.L.-5 m), which is deemed the bearing stratum around this area.
BH-2The sub surface layer consists of loose or very loose sandy soils having N-value of 0-12.From the depth of 7 m, this sandy deposit becomes medium dense to dense. Very dense sandlayer was encountered from the depth of 12 m (D.L.-22 m) and this layer is deemed thebearing stratum. No clayey deposit exists at this boring hole. The loose to dense sandy soildeposits upon the bearing stratum at this area are sandy soils which were dumped for thereplacement of underground soft subsoil below the existing berth structures.
BH-3The seabed surface layer composes of very loose sandy soils. Below the depth of 5 m, verysoft clayey layer become dominant till the lower sandy deposit exists at the depth of 13 m(D.L. –23 m). Although N-value of SPT varies from 17 to over 50 by depth, this sandydeposit is considered the bearing stratum around this area.
2-18
BH-4 to 6Except for very loose sandy subsurface layer of around 2 to 7 m thick, subsoil around thisarea is mostly composed of very soft clayey deposit having N- value of 0 or 1. The sandylayer having N- value of more than 30 deposits below the clayey layer at the depth of D.L –23 to 26m, which forms the bearing stratum at this area.
BH-7The seabed elevation of BH-7 is D.L.-16m due to the dredging of turning basin. A thin layerof very loose sand is sandwiched at the upper layer of very soft clayey soil deposits. Thebearing stratum of more than 50 N-value in SPT exists below the depth of D.L –24 m.
(2) Subsoil ProfileThe sectional subsoil profiles with boring logs at the area from new multipurpose terminal to deepwater coal berth are shown in the Figure 2.7.1.
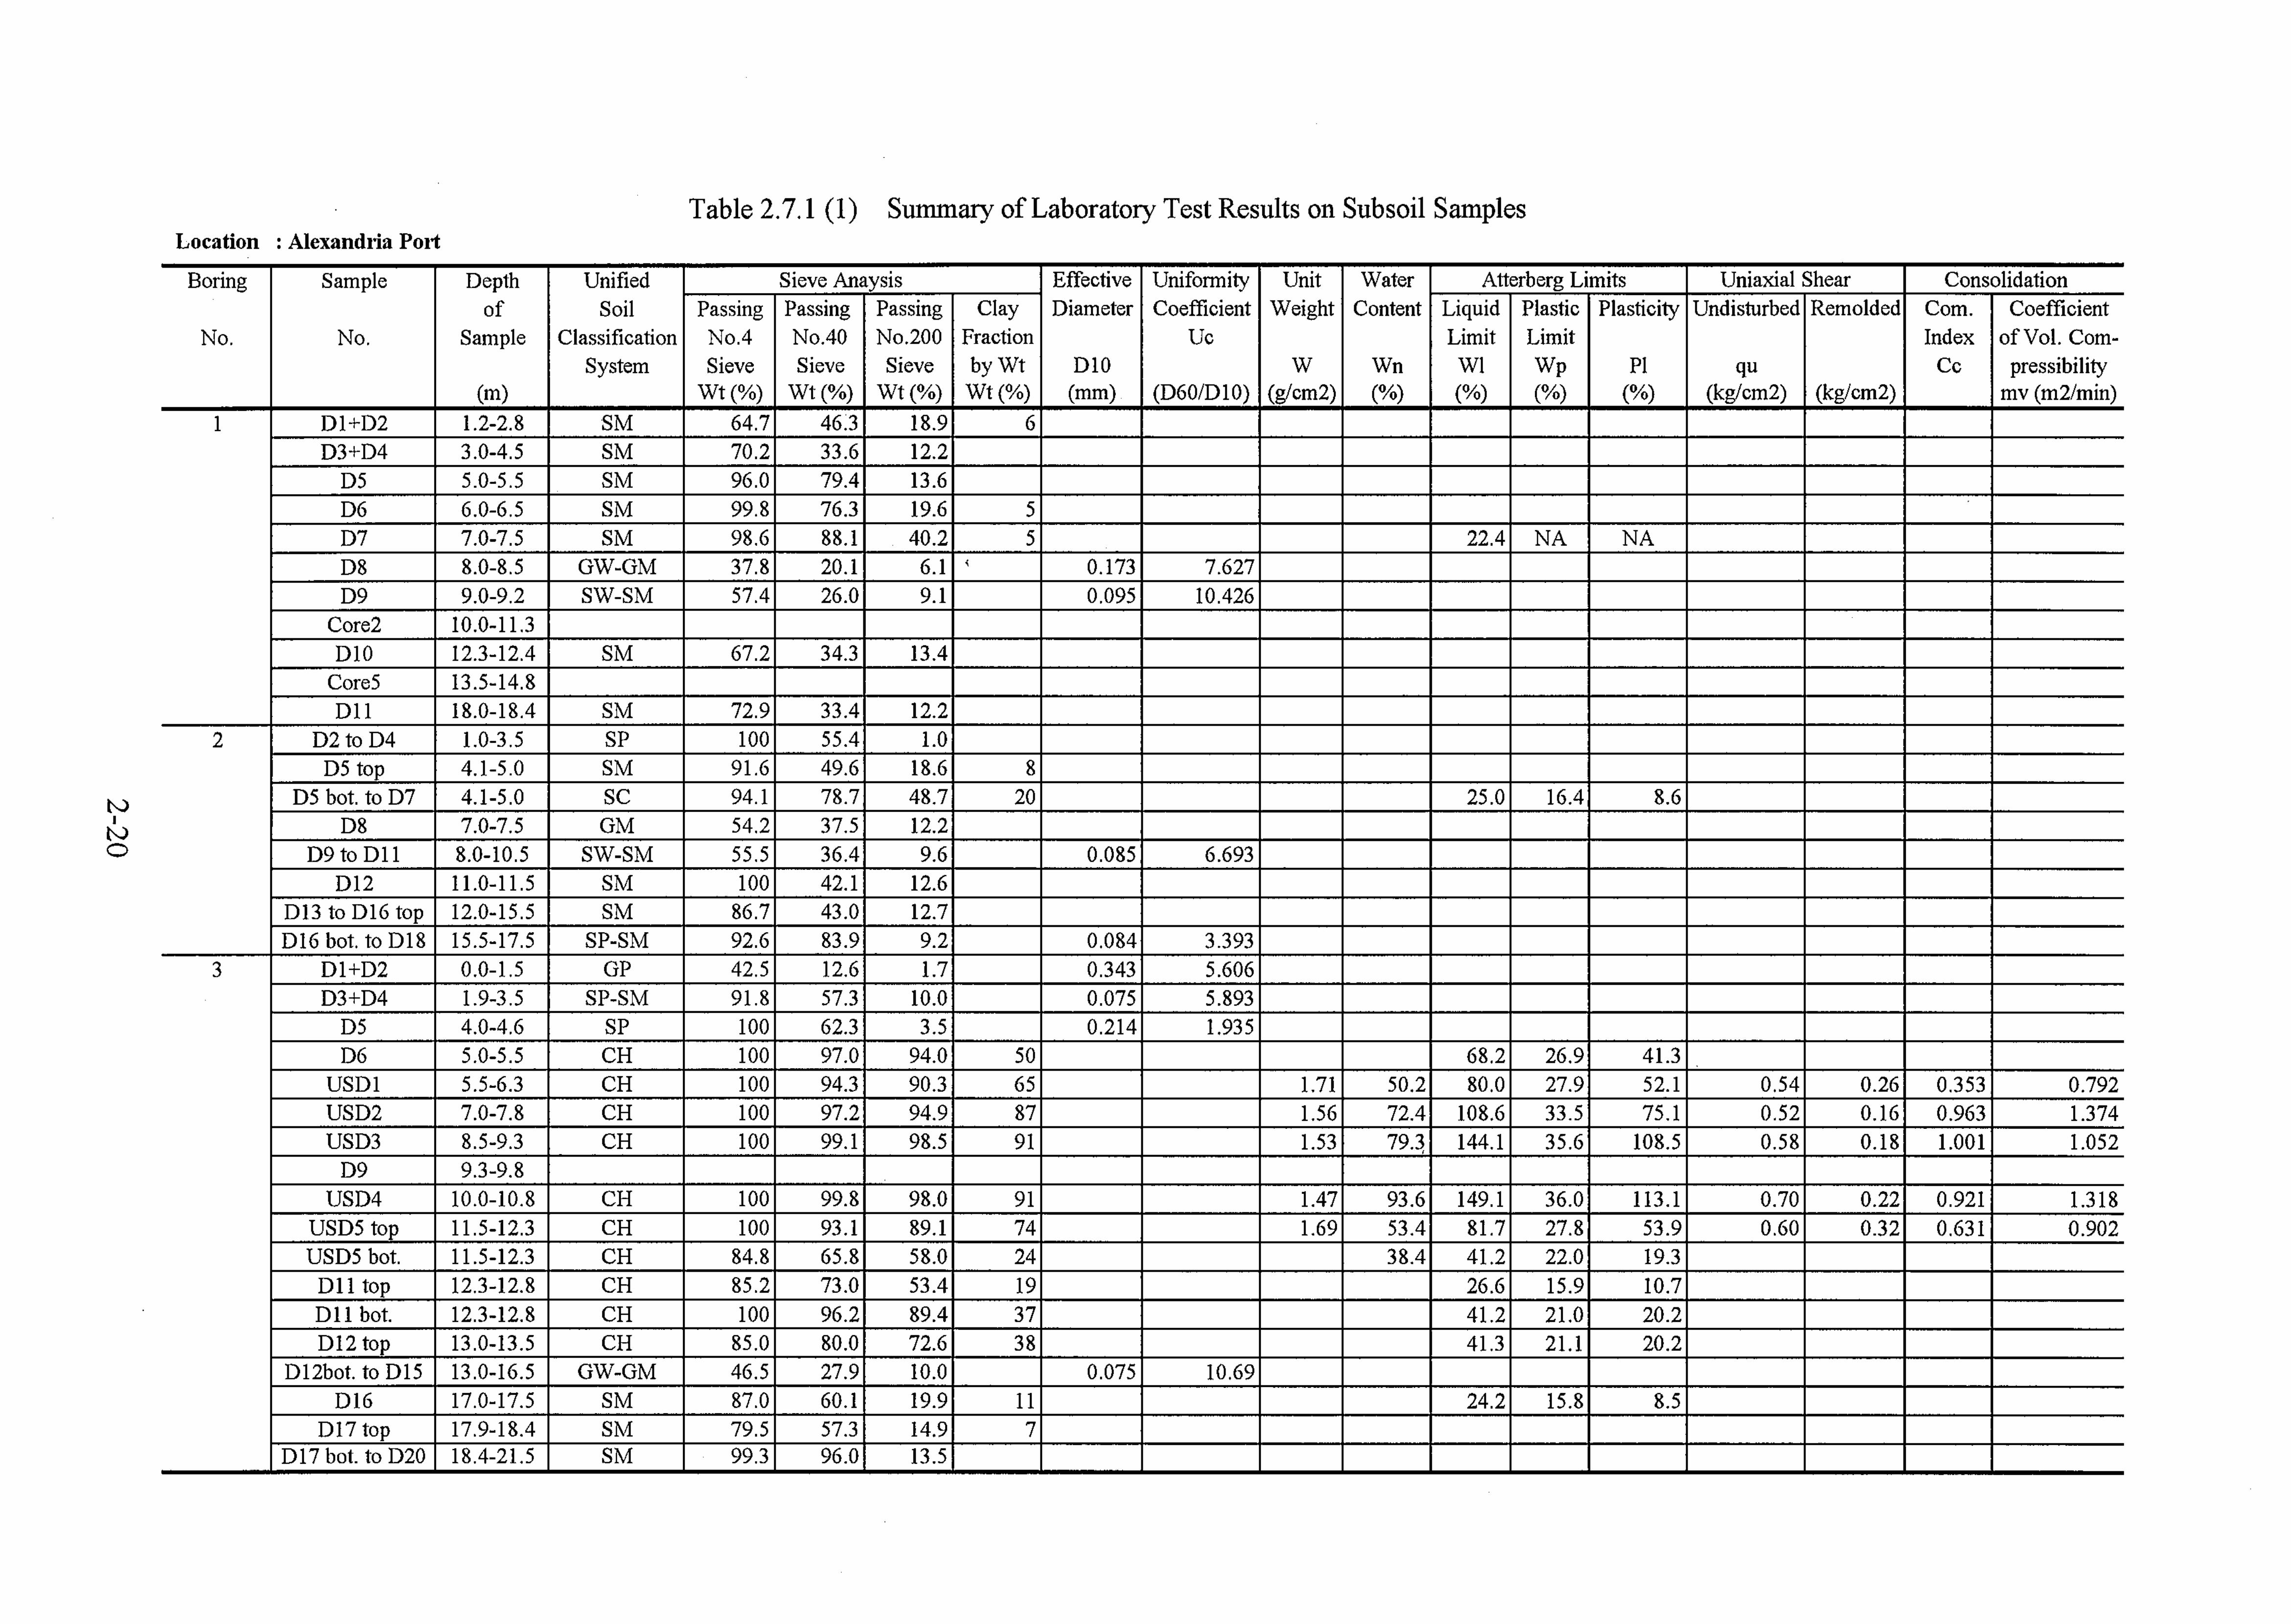
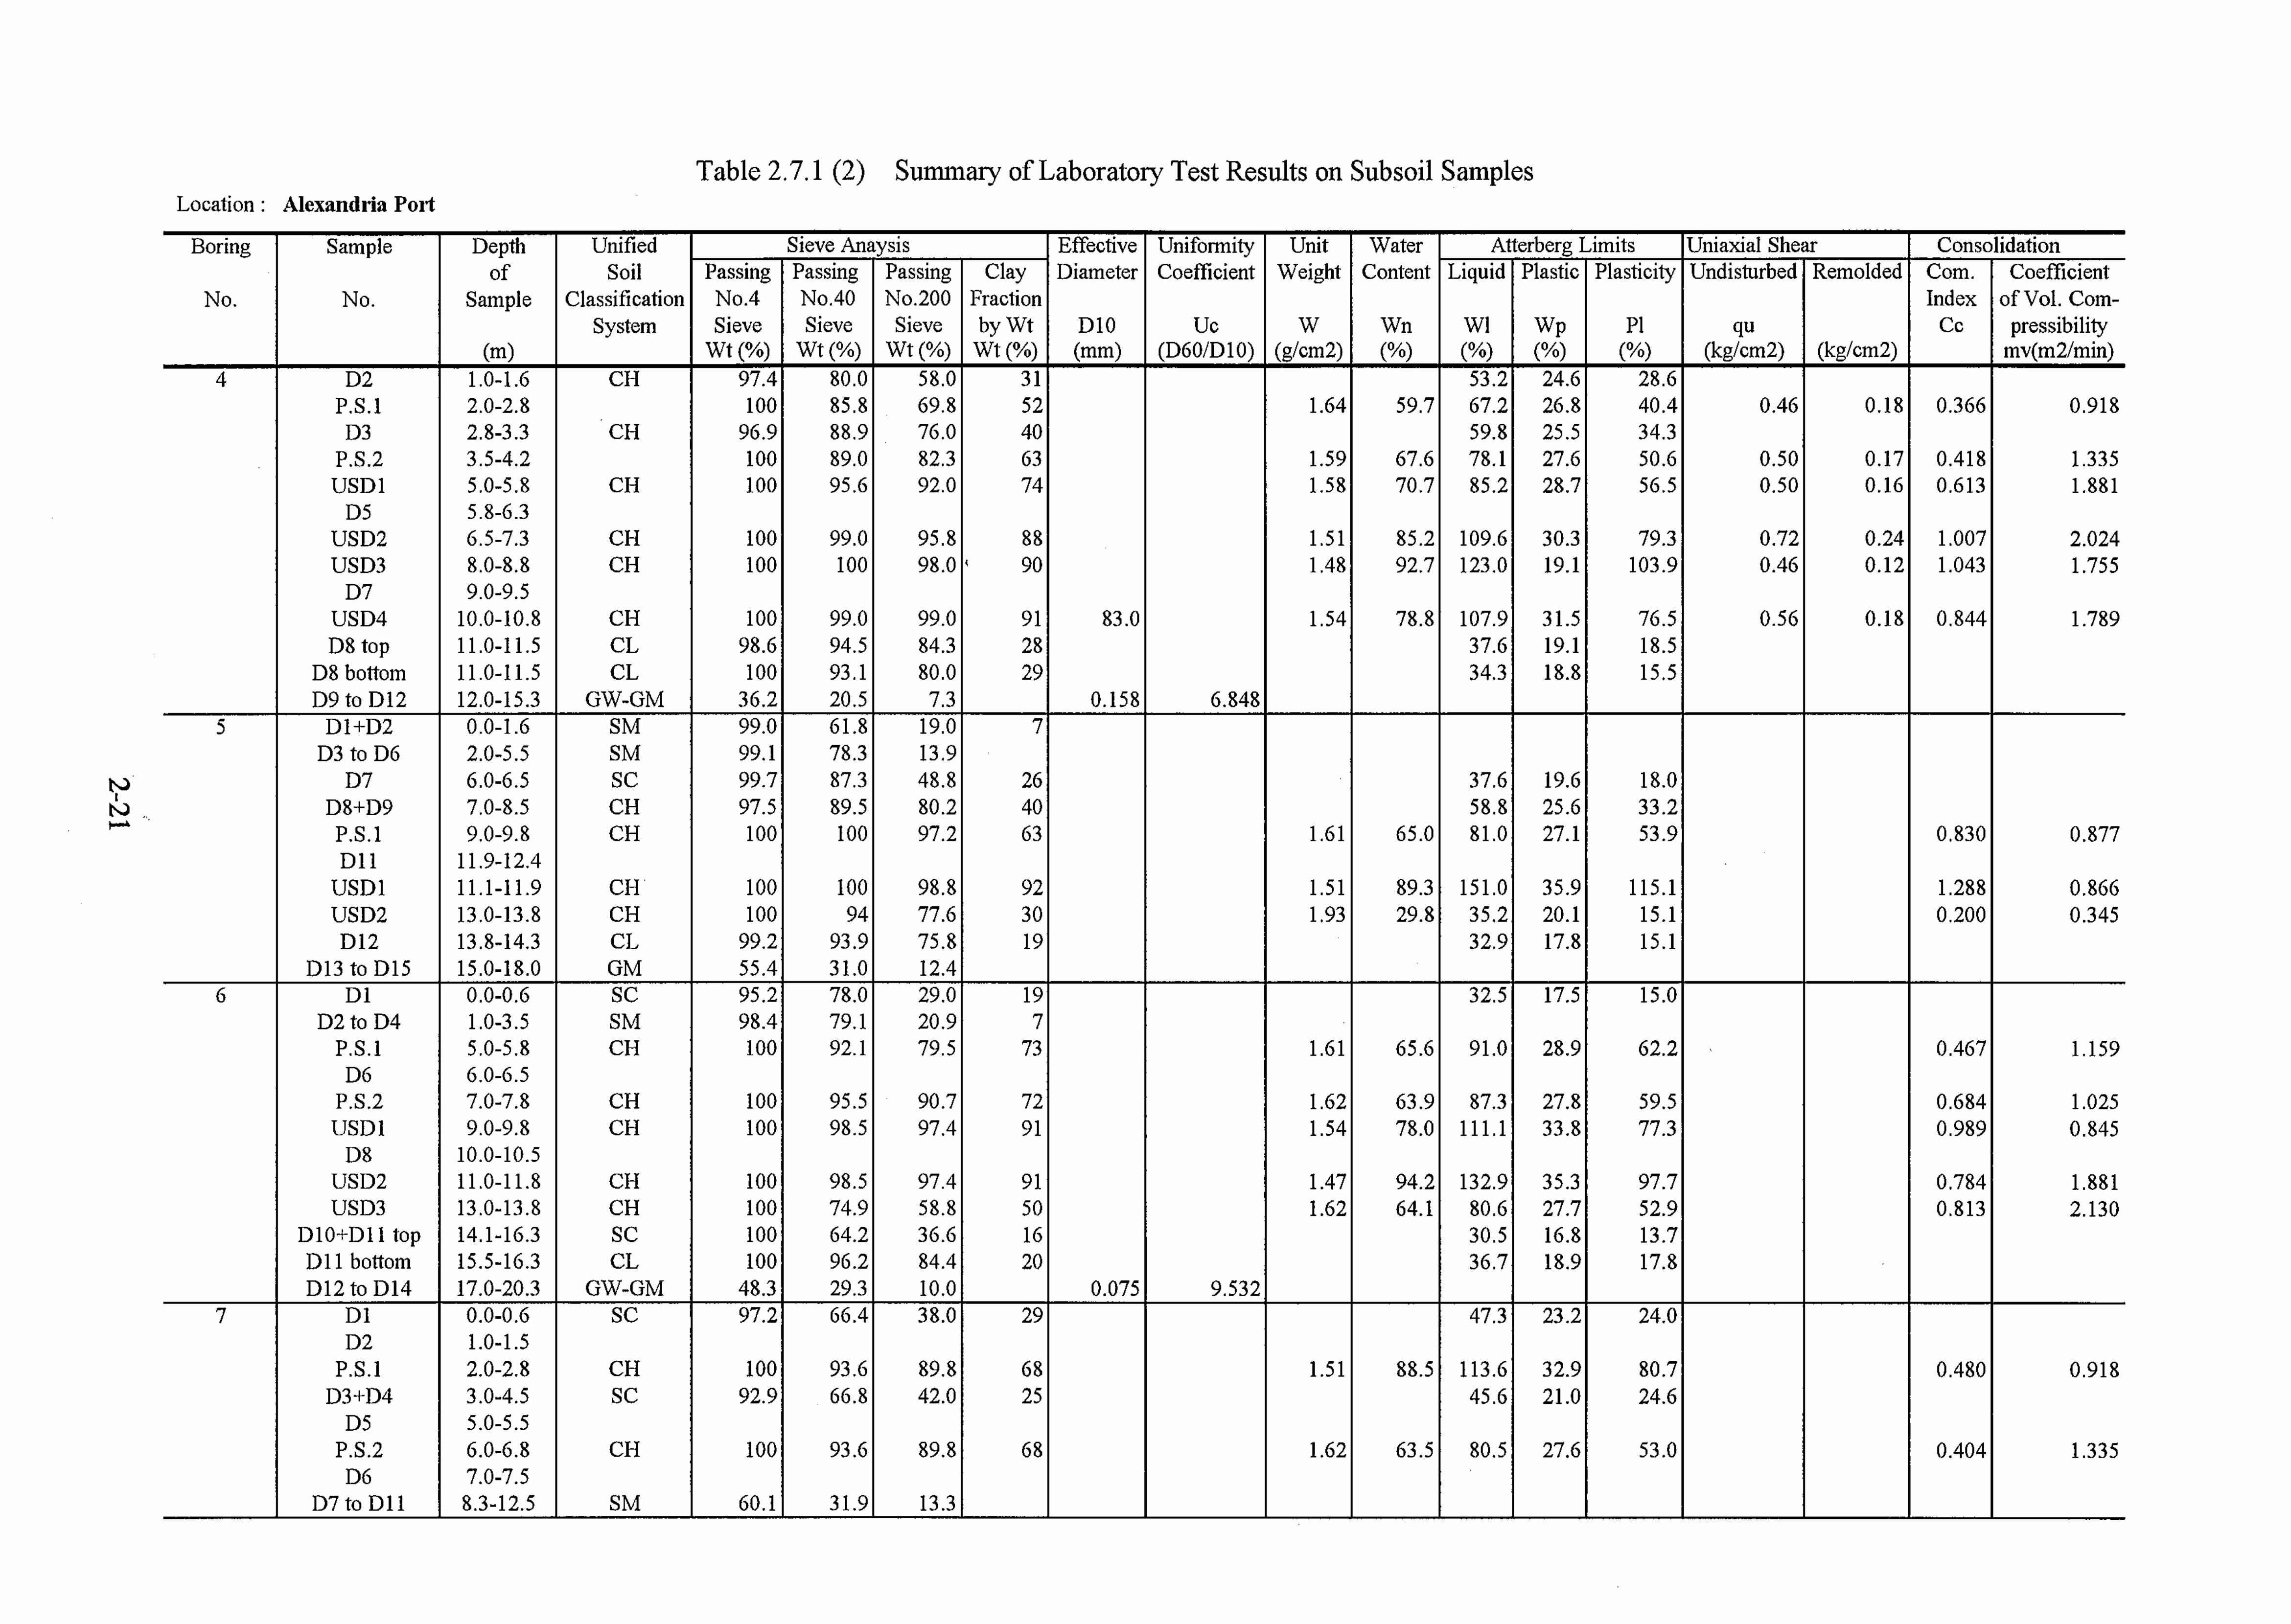
(3) Physical Test ResultsPhysical tests at laboratory were conducted on disturbed or undisturbed samples of each differentlayer of subsoil extracted from the subsoil samplers. The laboratory test result of physical tests foreach bore hole and sample is summarized in Table 2.7.1.
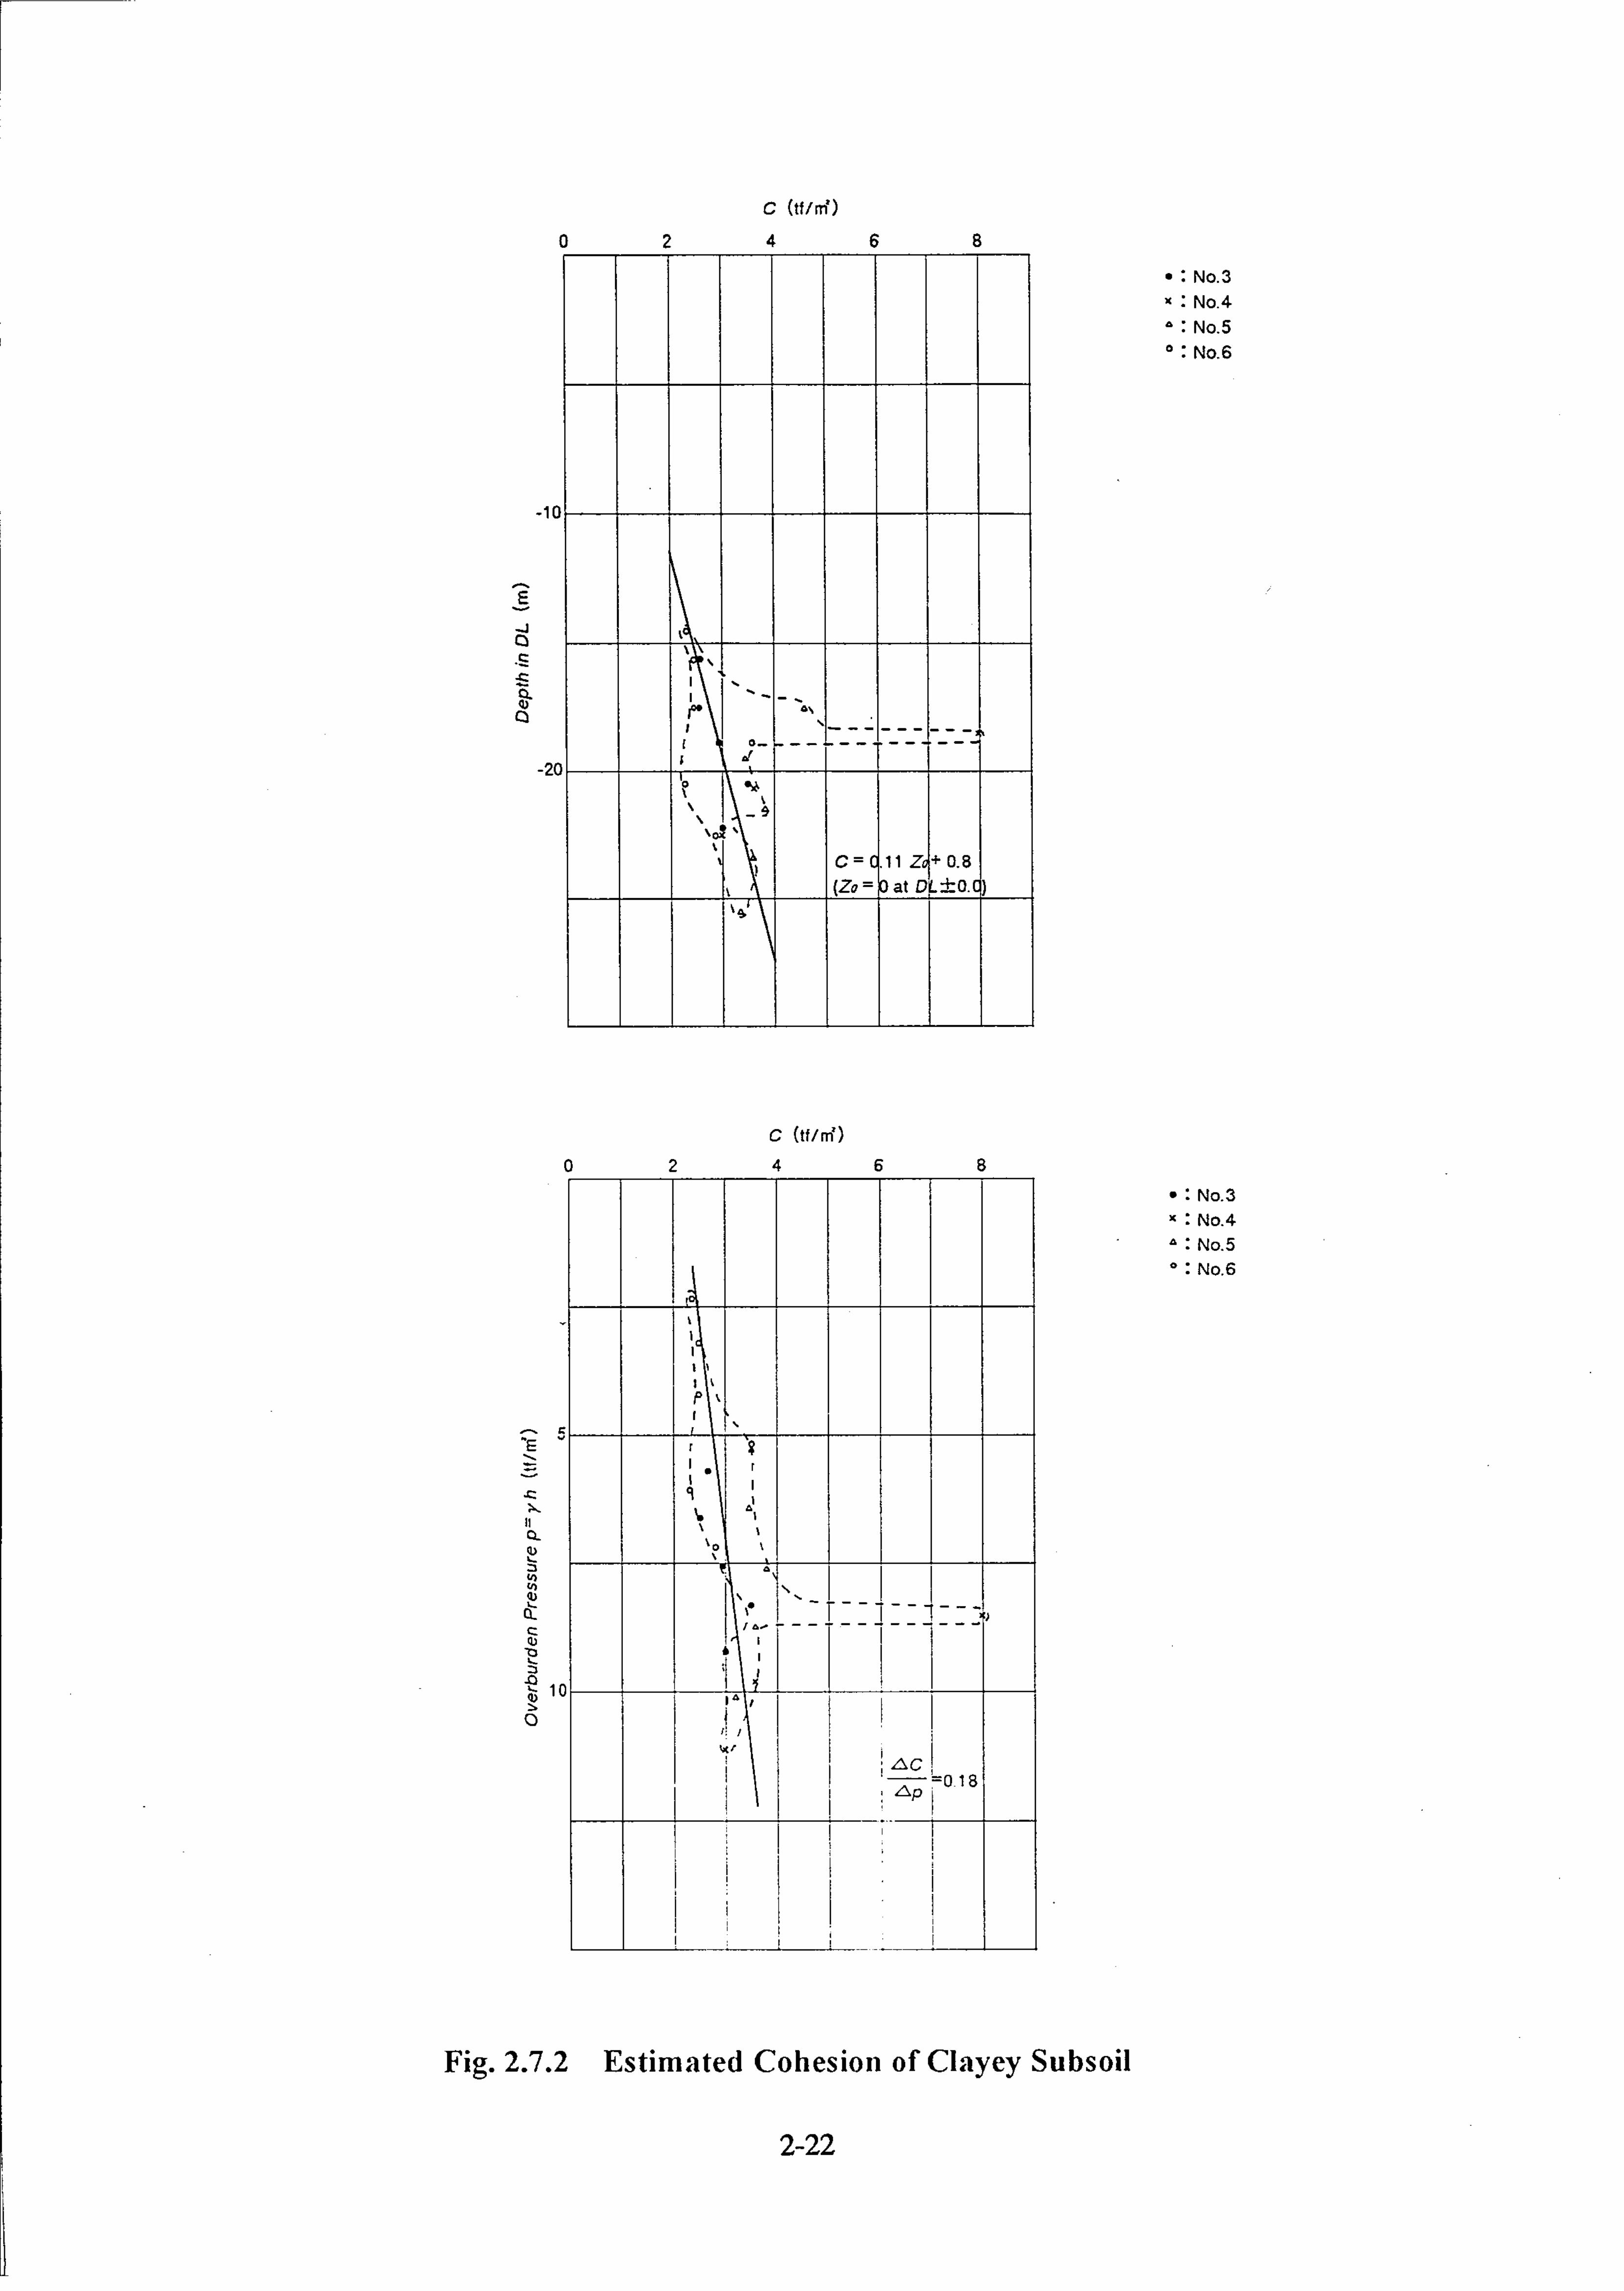
(3) Mechanical Test ResultsThe laboratory test result of uni-axial/unconfined compression tests and consolidation tests for eachbore hole and sample is also summarized in Table 2.7.1. As shown in Fig. 2.7.2, it is evaluated thatcohesion of very soft clay deposit is more or less 0.3 kg/cm2 showing an increase with depth despiteof its very low N-value and its compressibility is very high.
2-23
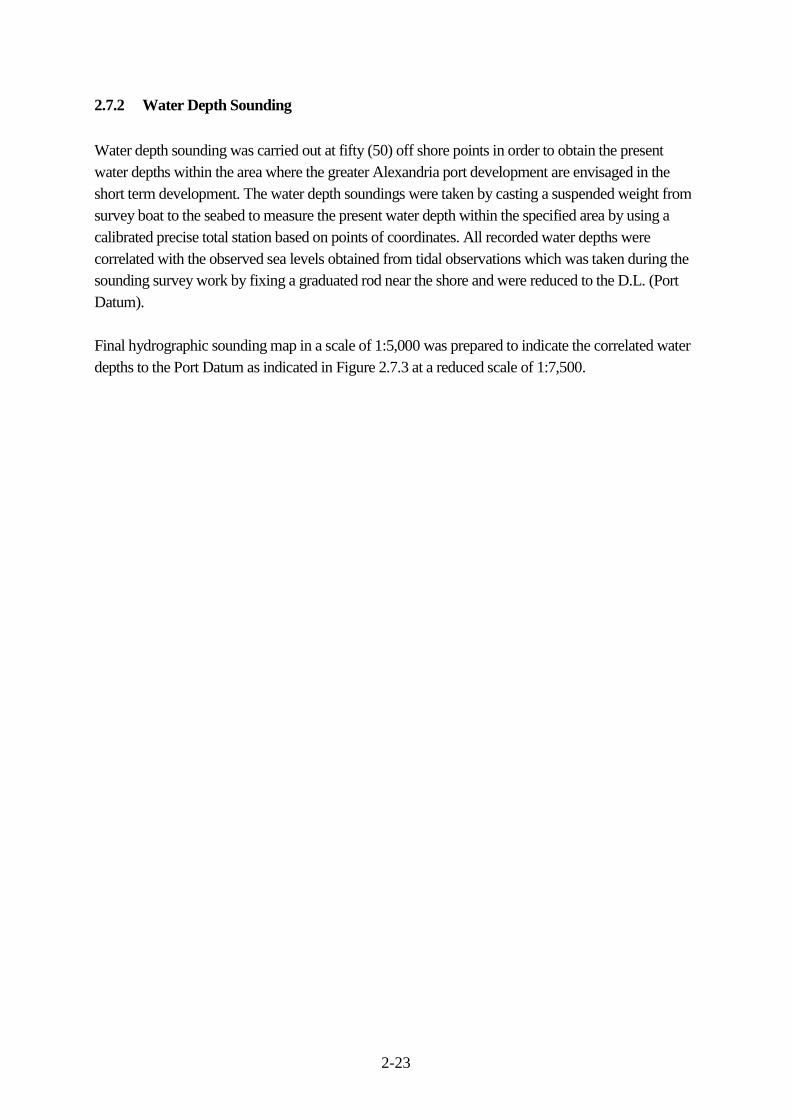
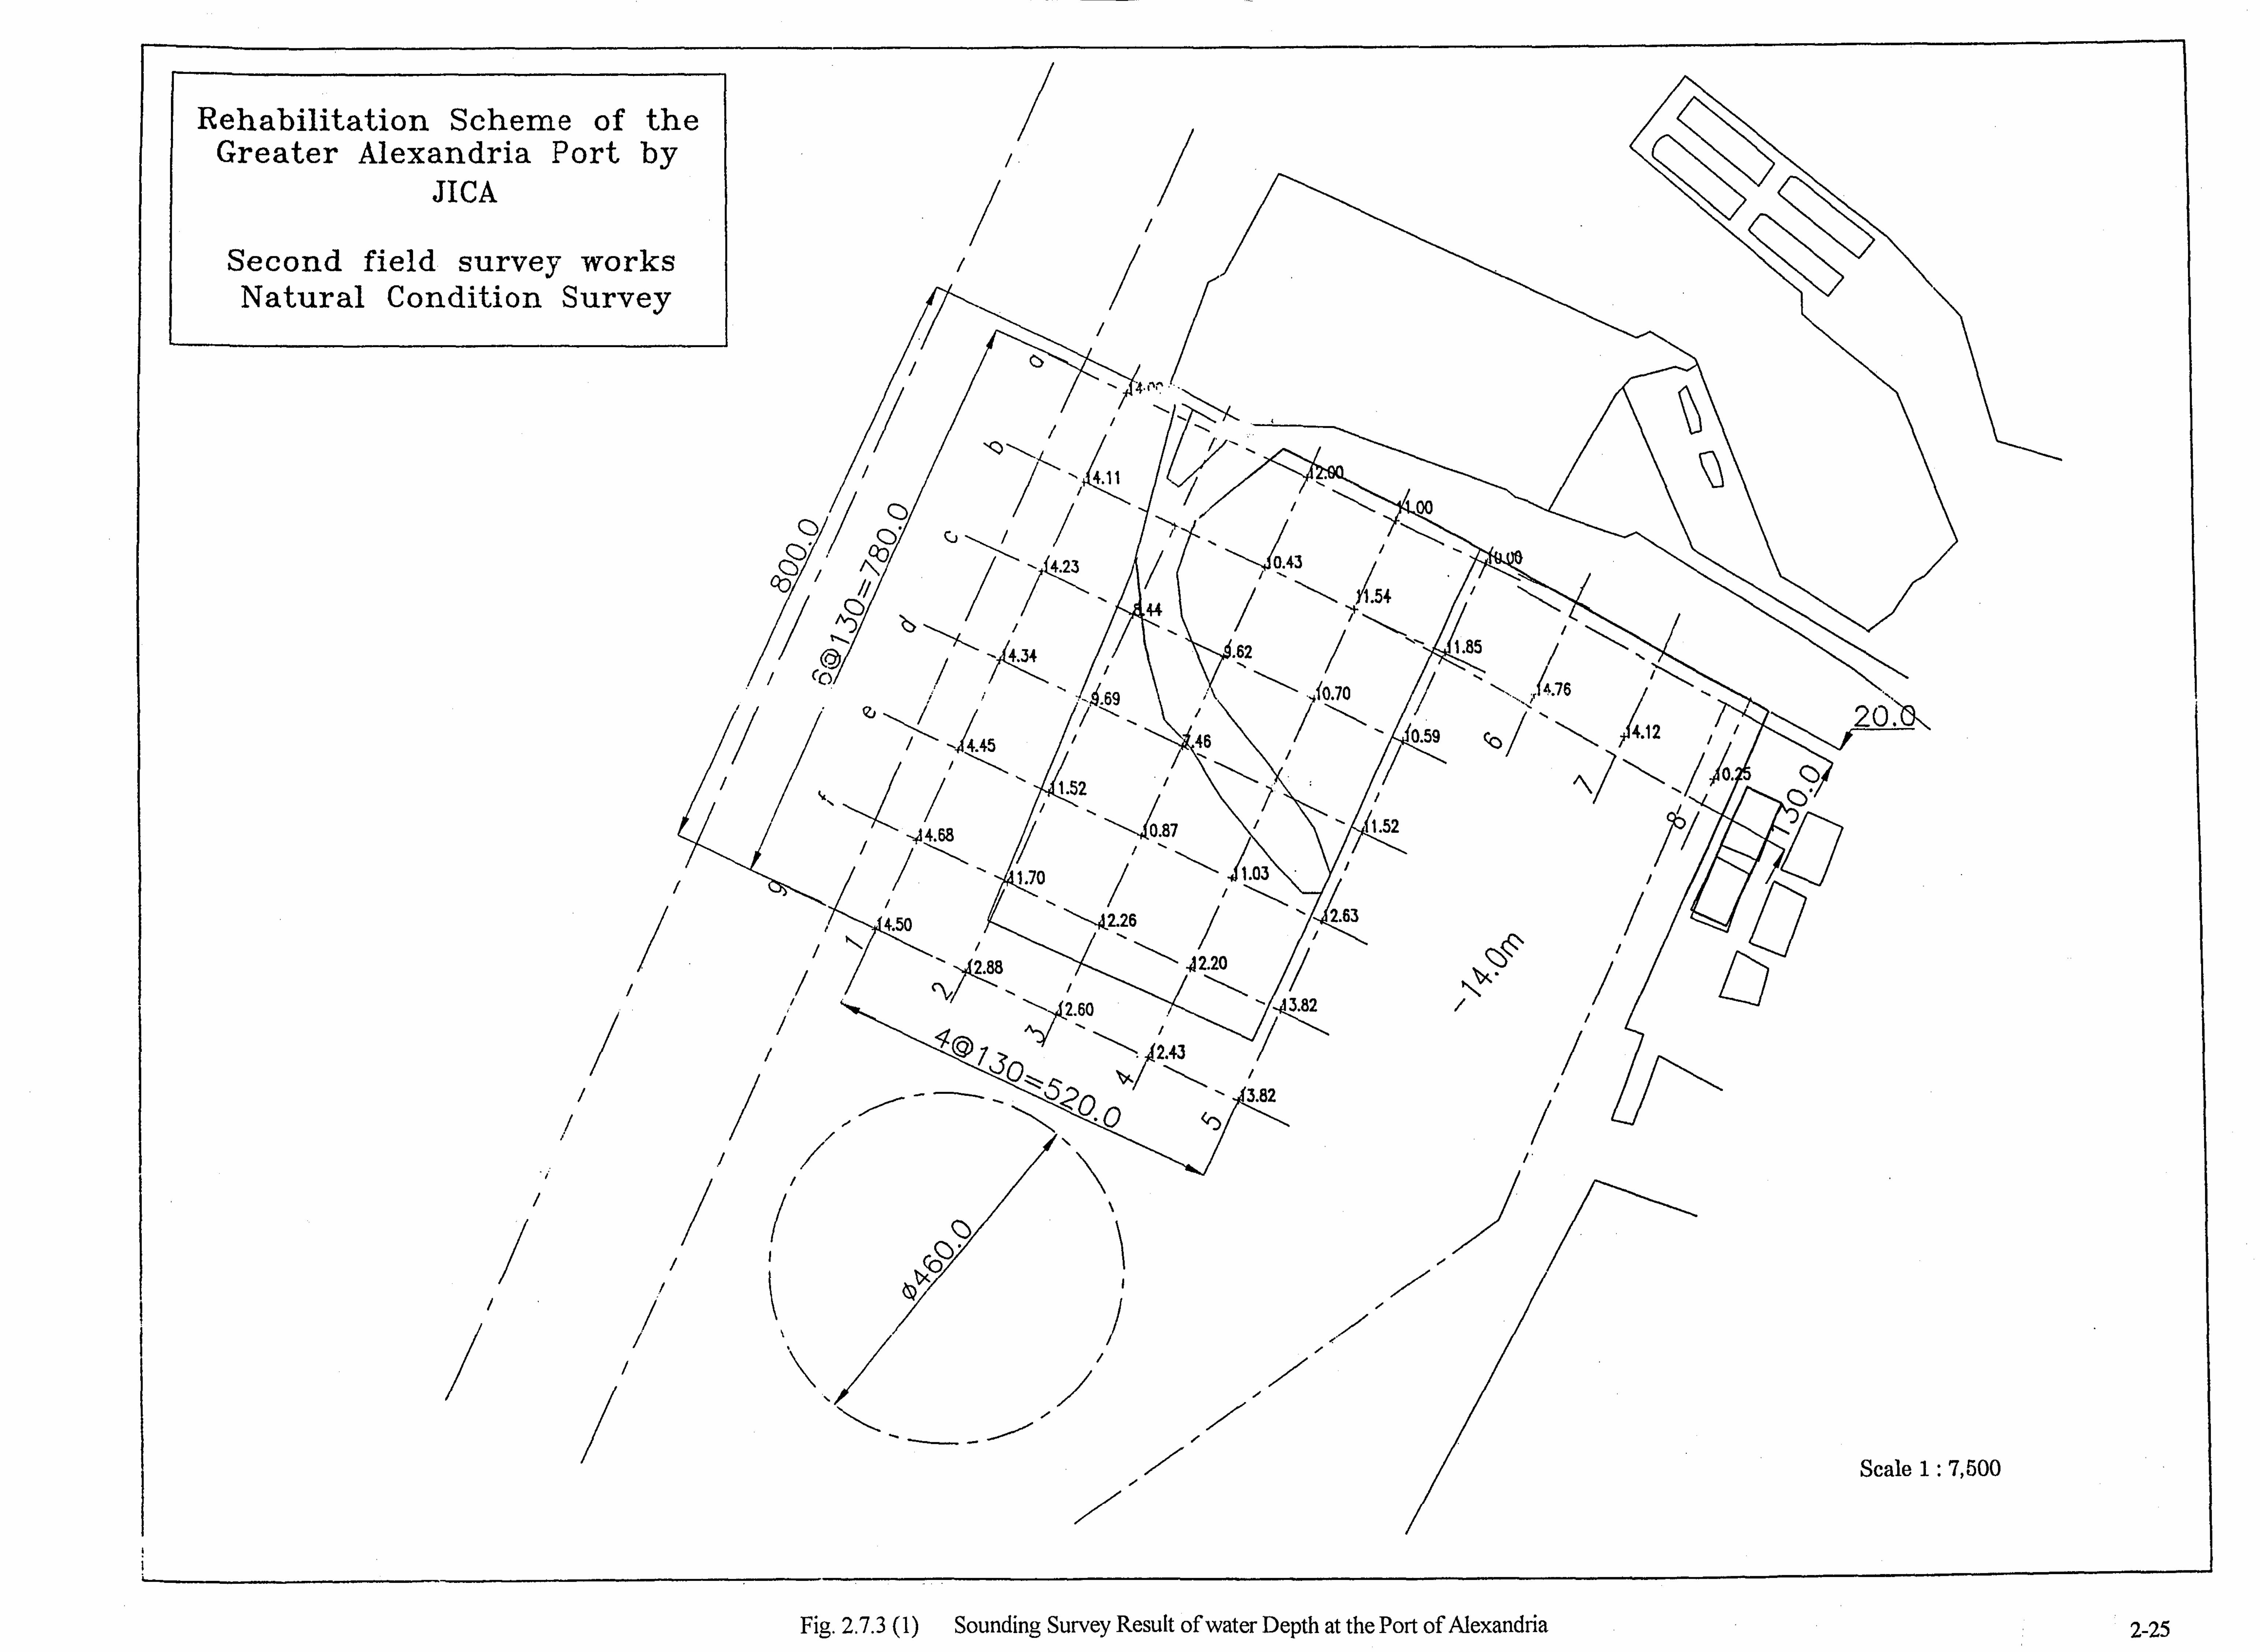
2.7.2 Water Depth Sounding Water depth sounding was carried out at fifty (50) off shore points in order to obtain the presentwater depths within the area where the greater Alexandria port development are envisaged in theshort term development. The water depth soundings were taken by casting a suspended weight fromsurvey boat to the seabed to measure the present water depth within the specified area by using acalibrated precise total station based on points of coordinates. All recorded water depths werecorrelated with the observed sea levels obtained from tidal observations which was taken during thesounding survey work by fixing a graduated rod near the shore and were reduced to the D.L. (PortDatum).
Final hydrographic sounding map in a scale of 1:5,000 was prepared to indicate the correlated waterdepths to the Port Datum as indicated in Figure 2.7.3 at a reduced scale of 1:7,500.
3-1
Chapter 3 Environmental Condition in and around the Greater Alexandria Port
3.1 Overview of Environmental Condition
(1) General
The port city of Alexandria is well known for its more than 2000 years of rich historyand culture. The city was one of the important ancient seat of learning of Greeks andRomans. Still it remains as a major cultural center of Middle East and also as a popularsummer time beach recreation area due to its favorable Mediterranean climate andwhite sand beaches.
The city is basically boxed between the Mediterranean sea to the north and LakeMaryut to the south and extends as a narrow coastal strip along East-West direction. Itsharbors, the Western Harbor and Dekheila Port of Alexandria Port Authority (APA),known as Greater Alexandria Port, for international trade, and the Eastern FishingHarbor are integral parts of the landscape of the city.
(2) Population
The population of Alexandria is estimated at about 4 million permanent residents with asummer time floating population of more than 1 million, resulting in a total summertime population of more than 5 million (ref. Lake Maryut Capacity Building Report,December 1997). The population of Alexandria in the year 1996, as per the nationalcensus, was reported as about 3.3 million (ref. Statistical Year Book, June 1997).
(3) GDP
The total gross national domestic product (GDP) in the fiscal year 1996/1997 wasestimated at 161.5 billion LE (Egyptian Pounds), at 1991-1992 price, with industrialand mining sector being the largest contributor (18%) (Central Bank of Egypt). Sinceno data on gross regional domestic product (GRDP) is available, the GDP contributionof the Alexandria Governorate is not known. Still Alexandria being the largest city nextonly to Cairo with port, tourism, industry and other activities, its GRDP would alsorank second only to Cairo on a national basis.
(4) Historic and cultural assets
Despite its very old and rich history and culture of more than 2000 years, very few suchassets remain intact at present in Alexandria. This is due to its turbulent history andalso the new city being built over its past remains. No historical assets were reported tobe found either in the Western harbour or Dekhela harbour waters, the present port area,though some historical remains were reclaimed from the Eastern (fishing) harbourwaters. Known historical remains of the city like the Roman Theatre are located inlandand being rehabilitated.
3-2
(5) Public health utility
Almost the whole population is served with piped water supply, which is managed bythe Alexandria Water Supply Authority (AWSA). On the other hand, only about 2.5million people or about 50 % of the population is connected to the city sewerage system,which is managed by the Alexandria General Organization for Sanitary Drainage(AGOSD). The city solid waste is independently managed by the 6 local administrativedepartments of the Governorate of Alexandria. The 6 local administrative departmentsare namely, from east to west, El Montazah Department, Eastern Department, CentralDepartment, Western Department, El Gomorok Department and El Amreia Department.
The development and expansion of sewerage system for the city is still ongoing andfunded with financial assistance from USAID (United States Agency for InternationalDevelopment) which is also assisting in the institutional improvement of AGOSD. Thedevelopment of sewerage system has two (2) phases, of which the phase 1 hasessentially been accomplished. Nevertheless, the sewer collection system expansion isstill ongoing. The collected wastewater is conveyed to two independent treatment plants,one serving the eastern part of the city and called ETP (Eastern Treatment Plant) ofcapacity 410,000 m3/day, and the other the western part, WTP (Western TreatmentPlant) of capacity 175,000 m3/day. Both these plants are located at south of the city inthe vicinity of Lake Maryut and became operational since 1993 as the majorcomponents of the Phase 1 sewerage development, and provide primary treatment only,gravity sedimentation, with a treatment efficiency of about 35% (as BOD).
It is further noted that the WTP receives most of the industrial wastewater, since thewestern part of the city adjacent to the port area (in particular, the inland of westernharbor) is the home of most industries in Alexandria.
The treated effluent of both of the treatment plants, still a major source of pollution dueto its primary treatment level only, is disposed to Lake Maryut, that finally ends up inthe port waters through internal canal and pump station (Max pump station near theentrance of Western Harbor).
3.2 Environmental Laws, Regulations and Standards
3.2.1 Environmental Laws and Regulations
(1) General laws and regulationsA comprehensive national environmental law including basic regulations known as Lawfor the Environment was enacted by Presidential Decree in 1994. This environmentallaw is also referred to as Law No. 4 for 1994 (Law No.4/1994) and its executiveregulations. A detailed executive regulations for this Law No.4/1994 was promulgatedby the Prime Ministers` Decree in 1995 (Prime Ministers` Decree No.338/1995). ThisDecree No.338/1995 incorporated some relevant environmental standards as dealt within the subsequent section on Environmental Standards. It is further noted that the firstbasic environmental regulations and standards targeting the protection of River Nile and
3-3
other waterways, except that of coastal (sea) waters, from pollution was enacted in 1982(Law No.48/1982). This law still remains effective since the Law No.4/1994 and thesubsequent Decree No.338/1995 are intended at only supplementing this LawNo.48/1982. The Law No.4/1994 established clearly the basic frame for national environmentalconservation and management for Egypt targeting all three (3) major environmentalcomponents of land, air and water. Moreover, this law (No.4/1994) established EEAA(Egyptian Environmental Affairs Agency) as the principal governmental authority fornational environmental protection and management under the Prime Ministers` cabinet.This law (No.4/1994) defines the basic responsibility of EEAA as follows;The Agency (EEAA) shall formulate the general policy and prepare the necessary plansfor the protection and promotion of environment. Also it shall follow-up theimplementation of such plans in co-ordination with other administrative authorities.
Concerning the protection of water environment, since the port is principally a coastalwater environment, its protection is delegated to a number of administrative agenciesconcerned including that of EEAA as per Item 38 of Article 1 under General Provisionsof Chapter 1 of Law No.4/1994. The Port Authorities of Egypt, which would includeAPA as well, are also identified as competent agencies by the above Article 1.Accordingly this Article 1 grants the basic authority for the environmental protection ofAlexandria Port to APA (Alexandria Port Authority).
Specific articles (Article 48 to 68) of the law (No.4/1994) concerned to the protectionof marine environment including that of port waters are incorporated comprehensivelyunder Chapter 1 on Pollution From Ships of Section 3 (Protection of the WaterEnvironment form Pollution). In particular it is noted that Articles 49,66&67 prohibitsindiscriminate disposal of any waste in the marine waters of Egypt by ships. Moreoverthe Articles 56&68 mandates all national ports to have the necessary ship related wastereception facilities for all types of wastes such as bilge waste, ballast waste and garbage.
(2) Environmental impact assessment (EIA) regulations
The Article 19 of Law No.4/1994 under Section 1 on the Protection of LandEnvironment stipulates the conduct of EIA by the competent authority or licensingauthority concerned to the project development. Moreover the subsequent Article 20mandates the submission of EIA reports to EEAA for evaluation. EEAA is given 60days since the receipt of an EIA report to forward its evaluation results to the relevantauthority.
The Executive Regulations of the Law No.4/1994, the Prime Ministers` DecreeNo.338/1995, further authorizes EEAA to decide the format and specification of EIAreport (refer to Article 10 of Section 1). Moreover the Annex 2 of this Decree(No.338/1995) specifies the project activities subjected to EIA, which includes portdevelopment projects as well under the category of infrastructure projects.
3-4
3.2.2 Environmental Standards
The Executive Regulations of the Prime Ministers` Decree No.338/1995 stipulatesvarious environmental standards in its annexes principally targeting air and noisepollution control, but still including standards limiting the quality of effluents disposedinto coastal marine waters (Annex 1 on Limits and Specifications for Draining andDisposing of Certain Substances in the Marine Environment), the only availablespecific standards for marine waters. Standards of this Decree No.338/1995 is intendedat supplementing those already stipulated by the Law No.48/1982 targeting River Nileand other waterways, but not coastal (sea) waters. It is noted that all the standards ofLaw No.48/1982 are also effluent water quality standards regulating the quality ofeffluents discharged to water bodies other than coastal waters.
Accordingly, the stream (environmental) water quality standards based on the intendeduse of a water body, including that of coastal waters for port use which is also muchrelevant to this port improvement master plan, is yet to be established. In this regard itis noted that the air quality standards as specified by the annexes of DecreeNo.338/1995 is very comprehensive since it covers a spectrum of air relatedenvironmental quality, ambient air (Annex 5), fugitive air emission (Annex 6) and aswell indoor air (Annex 8).
3.3 Environmental Issues of the Port
3.3.1 Issues directly related to Port Operational Activities
The port waters is visibly polluted with floating oil and others including garbage. Thisclearly indicates a lack of commitment on the part of the Alexandria Port Authority(APA) in protecting the port water environment from pollution directly associated withport operation. The significant aspects concerned to port environmental managementare summarized below.
(1) There is no responsible and authority yielding environmental section in the portorganizational structure of the Alexandria Port Authority (APA). So pollutioncontrol due to ship berthing and other port related activities is not yet prioritized.At present port environmental affairs are simply assigned as an additional task ofthe Manager of Professional Health and Safety Unit, who is designated as theManager of Professional Health and Safety and Environment Unit. Also MarineServices Unit is directly involved in the clean-up of harbor waters and has somerelated equipment and facilities.
(2) At present the port has no independent treatment facility either to treat the oil(bilge) waste or the ballast waste from the ships and oil tankers. Howeverinstallation of a ballast waste treatment facility in the port is planned, but itsinstallation is being delayed due to discrepancy in specification requirements.
3-5
(3) The Marine Services Unit has boats with oil skimmer which is used periodically toremove floating oil and other debris from the harbor waters, the capacity of whichis inadequate to effectively remove the floating wastes. It is also noted that clean-up of harbor waters is not the major operational function of Marine Services Unit.Its major function is to provide various assistance to the ship calling in the port,such as to be a harbor master, provision of tug boats, floating crane and otherservices to ships for a fee as required.
(4) Concerning wastes from the general cargo ships, the ships by themselves, throughtheir shipping agents, hire private contractors to haul their wastes. In such instancesa private contractor uses barges and collects the wastes in drums and hauls it toland. Oil wastes from oil tankers are only accepted by the Alexandria PetroleumCompany (APC) for regeneration (separation) of oil, since such oil wastes from oiltankers could be pumped directly via pipe lines only from the petroleum basin (oilberth) of the port to the APC. The other oil wastes collected by private contractorsfrom general cargo ships are sold to furnace companies. Still the oil wastecollected by the clean-up boats of the Marine Services Unit of APA is transportedto the APC for the regeneration of the oil in line with a cooperative agreementbetween APA and APC. Garbage and other non-recyclable wastes are disposed atdesignated areas in desert. However, there are some private contractors who tend todump the hauled wastes in the port waters, especially at night, which may be thecase with some ships as well.
(5) As pointed out above the port waters is visibly polluted with floating oil and otherdebris indicating inadequate measures to protect port water environment from shipberthing activity by APA. Moreover, inefficient cargo handling and the resultantloss of product (cargo) during loading and unloading operation, in particular withrespect to bulk and non-containerized cargo, is also considered as a significantsource of pollution in port waters.
(6) It is emphasized that the Law No. 4/1994 (refer to foregone section) forenvironment as per Article 49 of Section 3 (Protection of the water environmentfrom pollution) forbids disposal of wastes by ships in marine waters of Egypt andalso the subsequent Articles 56&68 mandates major ports of Egypt, which shouldinclude the Greater Alexandria Port as well being the largest national port, to havethe required oil, ballast and other ship related waste reception facilities, includingsolid waste. In this regard, the APA is yet to comply with the Article 56 concerningbilge and ballast (oil) waste reception facility.
3.3.2 Issues concerned to Non-port related Activities
(1) Significant non-port pollution sources
The port water environment is very significantly affected by the discharge of pollutedeffluents of land based industrial, agricultural and domestic activity. The two pollutedcanals of Mahmoudeya and Nubariya discharge directly into the western harbor waters,
3-6
within the hub of port activity. The El Umum canal, which is integrated with the LakeMaryut since it is mostly submerged within the lake, serves as the conduit to pump thepolluted wastewater of Lake Maryut near the entrance of the western harbor, into theMax Bay via the El Max Pump Station. There are also some untreated domestic sewageout-falls discharging directly or indirectly into the harbor waters.
The discharge of these three canals is determined respectively at 10,000 m3/day, 90,000m3/day and 8,000,000 m3/day for Mahmoudeya, Nubariya and El Umum canals (ref.OCDI/MRCC seminar, 1997). Of these 3 canals, the Mahmoudeya canal is evaluated asthe worst polluted simply from visual observation and the offensive odor. The averagewater quality of Nubariya canal and El Umum canal, which is also the quality of LakeMaryut since the drain is submerged within the lake, (at the Max pump station to seanear the entrance to the Alexandria port), based on one year monitoring data of 1994-1995 conducted by the Drainage Research Institute (ref. Final Report on EffluentQuality Reaching El Max Pumping Station, October 1995), was determined respectivelyat about 25 mg. BOD/l (70 mg. COD/l) and 50 mg. BOD/l (150 mg. COD/l), indicatingthat the El. Umum (also the Lake Maryut in El Max area) being more polluted thanNubariya canal.
As pointed out under the section 3.1 the sewage of Alexandria city is treated in twoseparate treatment plants of ETP (East Treatment Plant) and WTP (West TreatmentPlant) to primary treatment level only. These primary treated effluents and otheruntreated domestic wastewater, untreated/inadequately treated industrial wastewater,agricultural run-off from the intensively farmed surrounding Nile delta area and othersare identified as the prime sources of water quality deterioration of not only the abovethree canals but also the Lake Maryut.
In fact most wastewater of all origin including the primarily treated effluents of boththe ETP (average capacity; 410,000 m3/day) and WTP (average capacity; 175,000m3/day) essentially discharged initially into Lake Maryut and then enters into variouscanals including the El Umum and Nubariya, which are an integral part of the overalldrainage system of Alexandria. A significant exception to this intricate Lake Maryutcum canal system is the Mahmoudeya canal which essentially carries independentlydomestic, industrial and other wastewater and hence not a beneficiary of thepurification effect of Lake Maryut. This effect is represented by its low flow (10,000m3/day) and high pollution indicated with the emanation of offensive odor at its finaldisposal location into the western harbor waters.
(2) Wastewater treatment system
As illustrated in the foregone sections, the wastewater generated in the Alexandria cityis treated in the two treatment plants of ETP (East Treatment Plant) and WTP (WestTreatment Plant), respectively for the eastern and western area of the city, since 1993.The treatment provided by both of these plants is primary sedimentation withconventional gravity settling only. These treatment plants and the associated common
3-7
sludge dewatering facility were provided as the major component of Phase-1 seweragedevelopment plan by AGOSD with financial assistance from USAID.Performance of both of these treatment plants were monitored for one year during 1994-1995 by the Drainage Research Institute (DRI) of the Water Research Center, Ministryof Public Works and Water Resources. This monitoring formed an integral part of acomprehensive monitoring program of waste sources entering the Lake Maryut,identified as the most polluted lake in Egypt, and hence the El Max pump station at thesea outlet of the Umum drain (ref. Final Report on Effluent Quality Reaching El MaxPumping Station, October, 1995).
Accordingly, the average and maximum treatment capacity of ETP is reported as410,000 m3/day and 525,000 m3/day and that of WTP as 175,000 m3/day and 280,000m3/day.
The average influent wastewater quality of ETP was about 170 mg. BOD/l (260 mg.COD/l) and that of primary treated effluent was about 100 mg. BOD/l (195 mg. COD/l),resulting in a BOD removal efficiency of about 40%. The corresponding averageinfluent wastewater quality of WTP was about 175 mg. BOD/l (275 mg. COD/l) andthat of primary treated effluent was about 100 mg. BOD/l (235 mg. COD/l), resulting inthe same BOD removal efficiency of about 40% as ETP. The above BOD removalefficiency of both the plants are very satisfactory for a primary wastewater treatmentplant.
Still the treated effluent quality of 100 mg. BOD/l is very unsatisfactory from the viewpoint of water quality improvement of receiving water body, the Lake Maryut andfinally the coastal waters of the Alexandria Port. It is also noted that the Phase 2 of thesewerage development plan is aimed at upgrading these two treatment plants so that thetreated effluent could be reused for agriculture, which in combination with otherpollution control measures including that of industrial pollution would be crucial forboth the restoration of Lake Maryut and hence to limit the pollution load discharge intothe coastal waters including the Alexandria port, thereby mitigating the port waterpollution due to non-port related activities.
Moreover, form both the points of view of sanitation improvement and port waterpollution mitigation, the people living along the port coastal areas need to be connectedto the city sewerage system. It is understood that most people living along both thewestern harbor area and the Dekheila port area are not served by the present system andtheir wastewater is either directly or indirectly discharged into the port waters.
3-8
3.4. Field Survey for Environmental Condition
3.4.1 General
In order to define the baseline port environment as specifically as possible, thefollowing 4 environmental field surveys were carried out in the Alexandria Port area.The field surveys were conducted two (2) times, during April-May, 1998 (first fieldsurvey) and October-November, 1998 (second field survey).
(1) Sea-water quality sampling survey within the port waters of western harbor andDekheila port (the Greater Alexandria Port) at 5 locations but at two differentdepths at each location and at two times, once during the first field survey and theother during the second field survey.
(2) Seabed material sampling survey in the same Greater Alexandria Port at 10locations with 5 locations being the same as above water quality sampling locations.The work was accomplished during the first field survey.
(3) Land utilization survey both within and around the vicinity of the entire GreaterAlexandria Port area. The survey area was about 1500 ha outside the boundary of the portarea and about 350 ha inside the port area. The work was conducted during the first fieldsurvey of April-May, 1998.
(4) Traffic condition survey within the port area including the major gates of the port(Alexandria and Dekheila ports) and the internal road network of the port. The survey wasconducted during the first field survey at 30 selected stations for 2 days (48 hours)including the port gates.
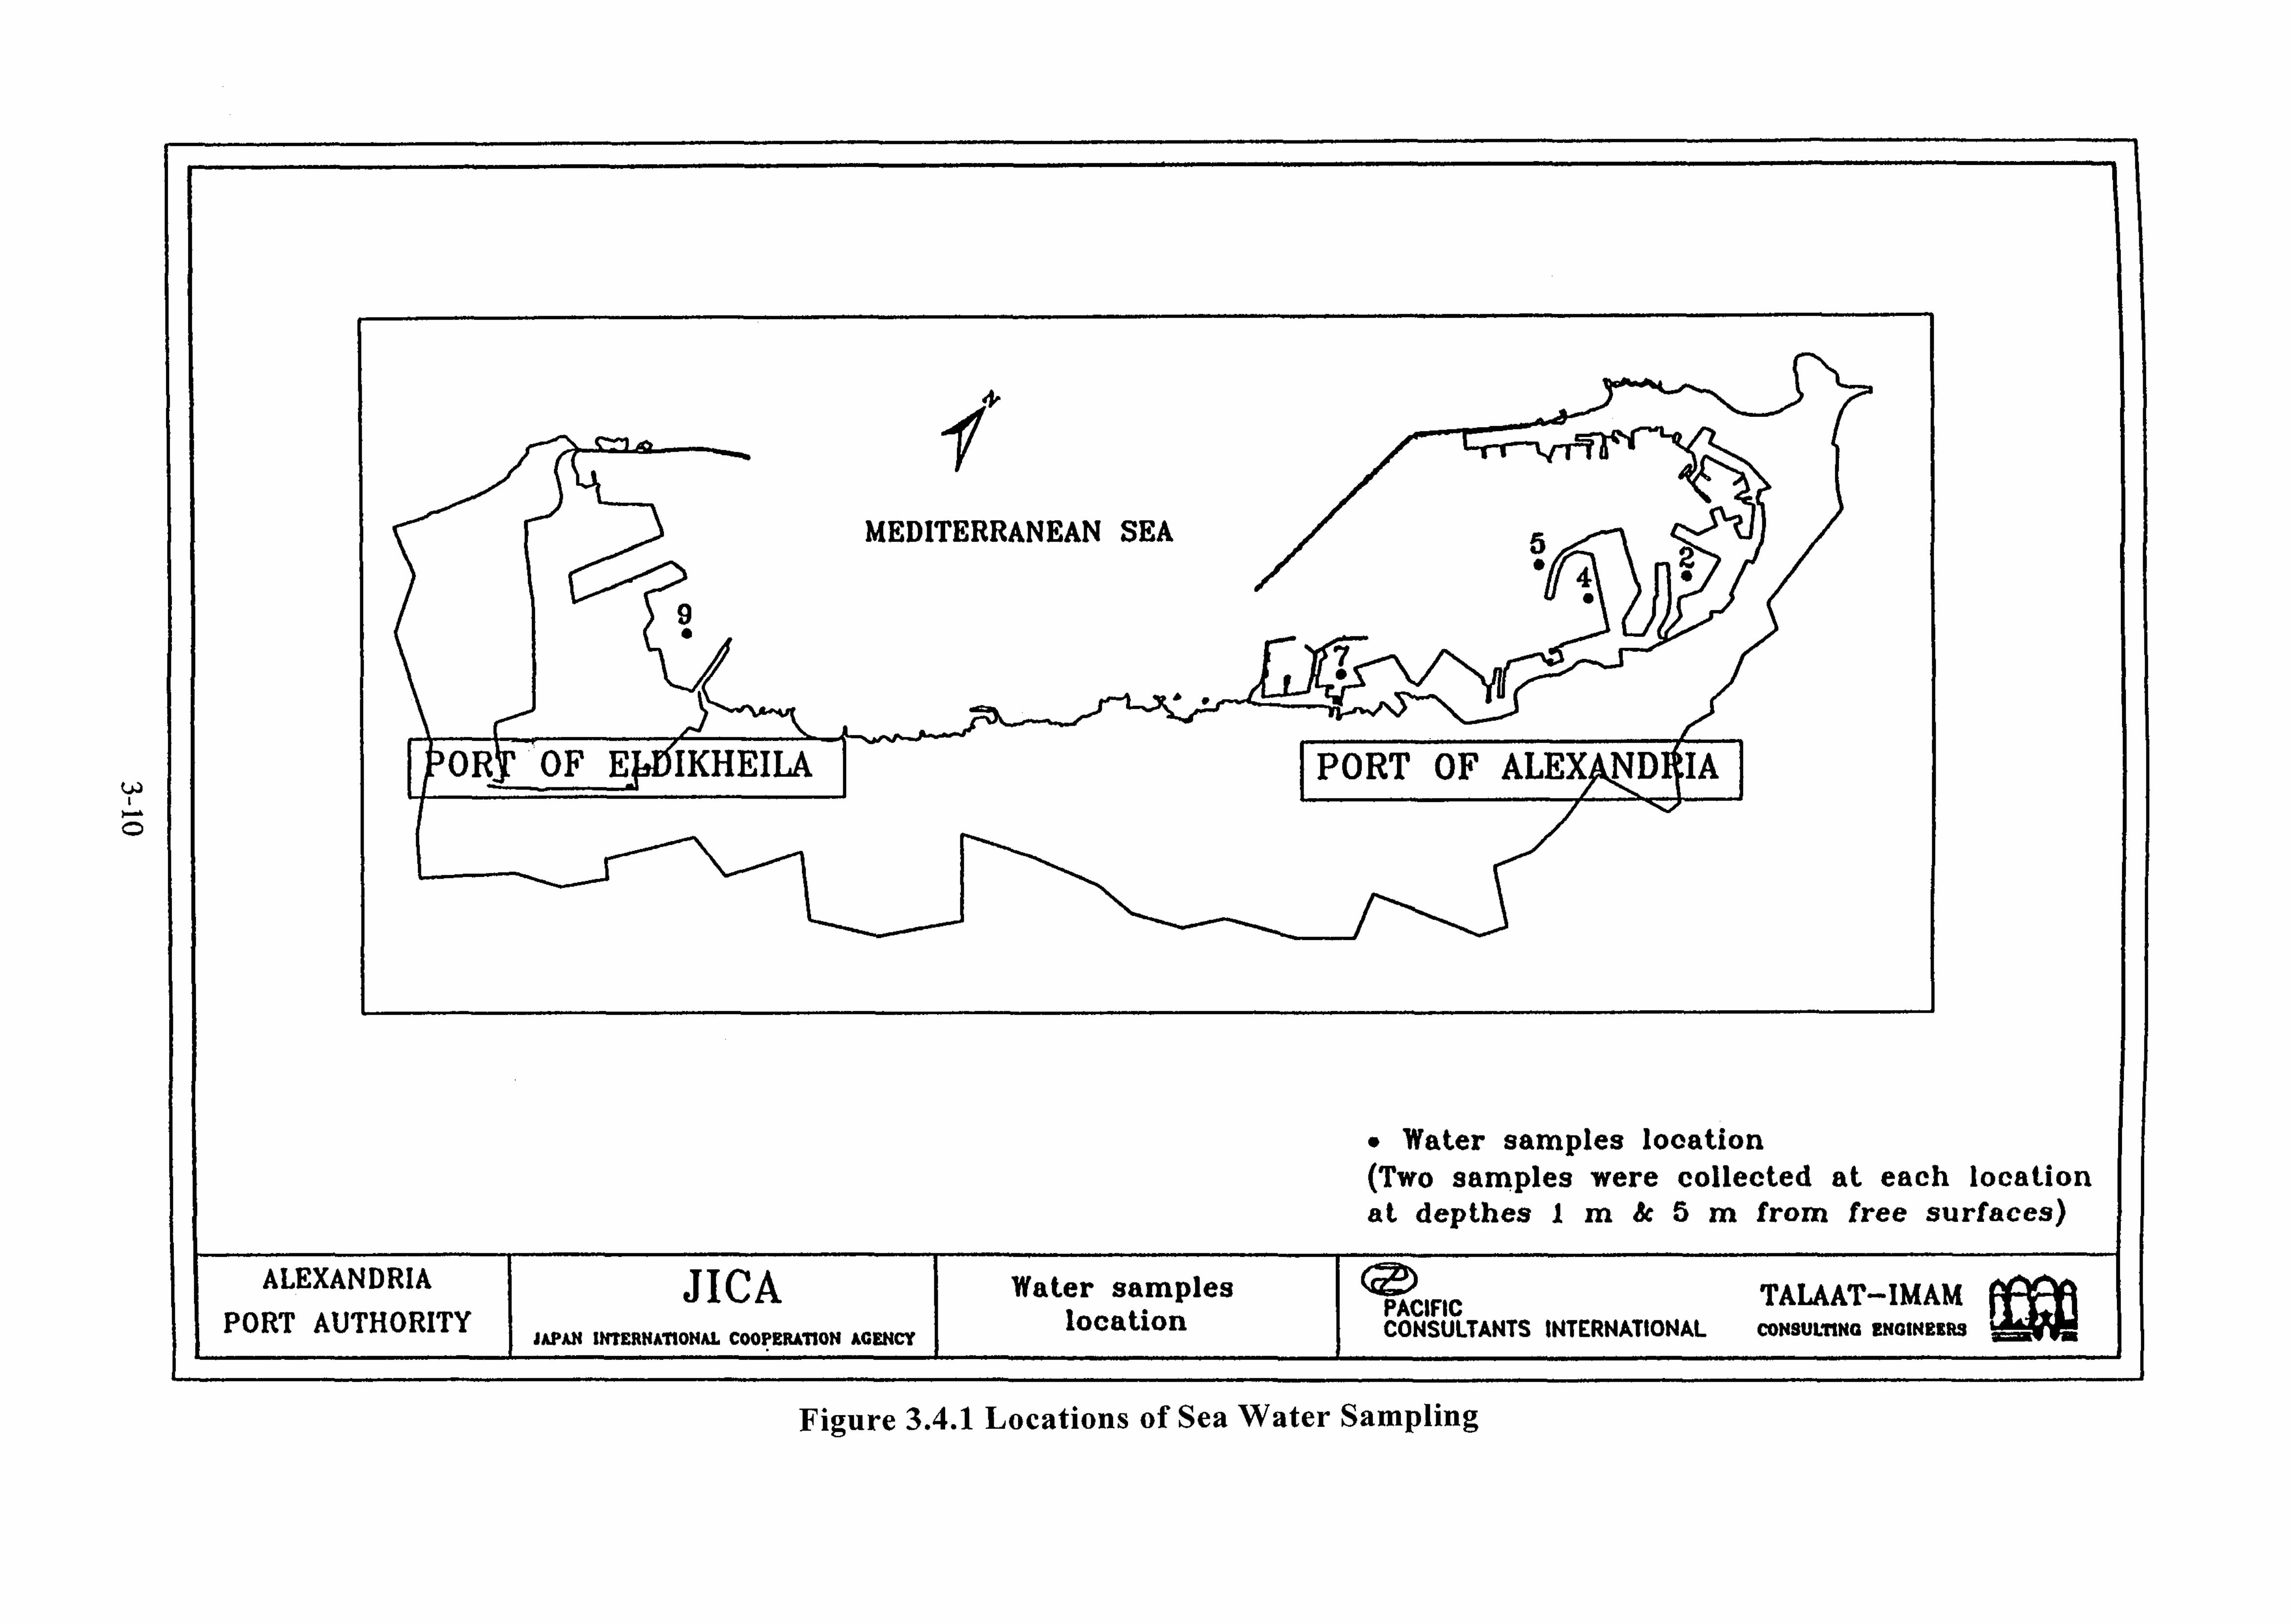
3.4.2 Sea Water Quality Survey
Sampling of sea-water was conducted two times within the port waters of the GreaterAlexandria Port at 5 locations but at two different depths of 1 and 5 meters at eachlocation as shown in Figure 3.4.1. The first sampling was conducted in May 1998during the first field survey and second sampling at the same locations in October 1998during the second field survey.
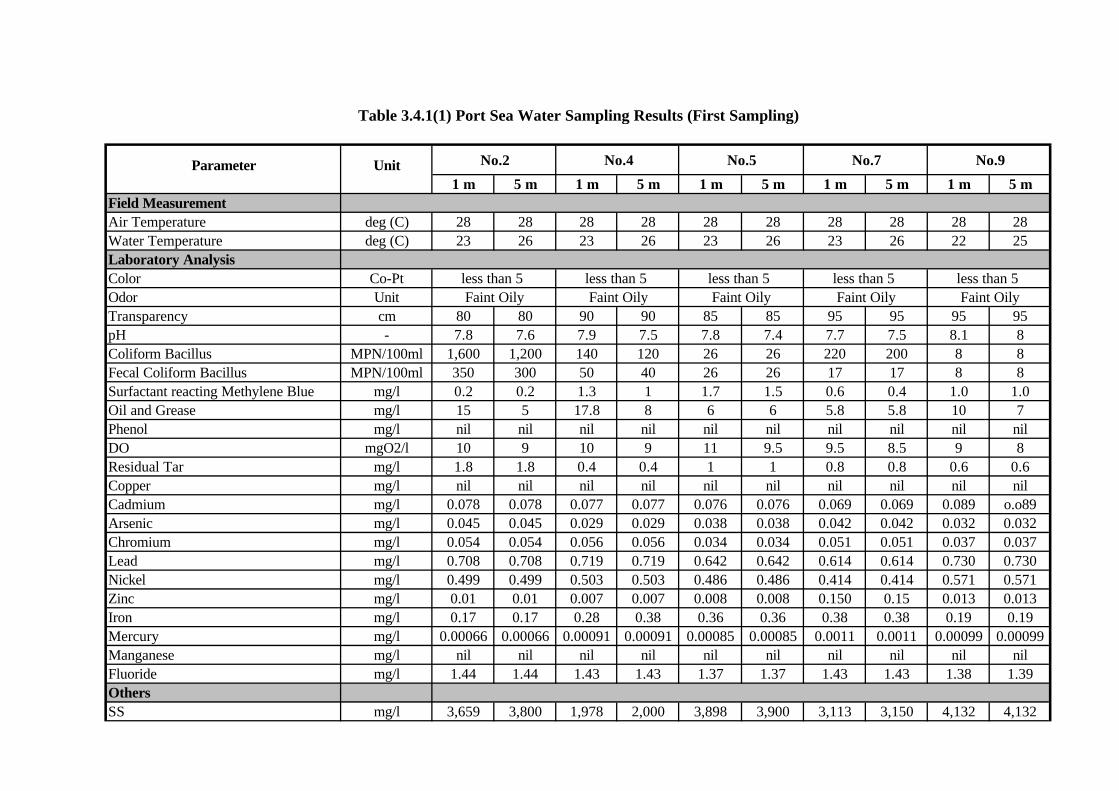
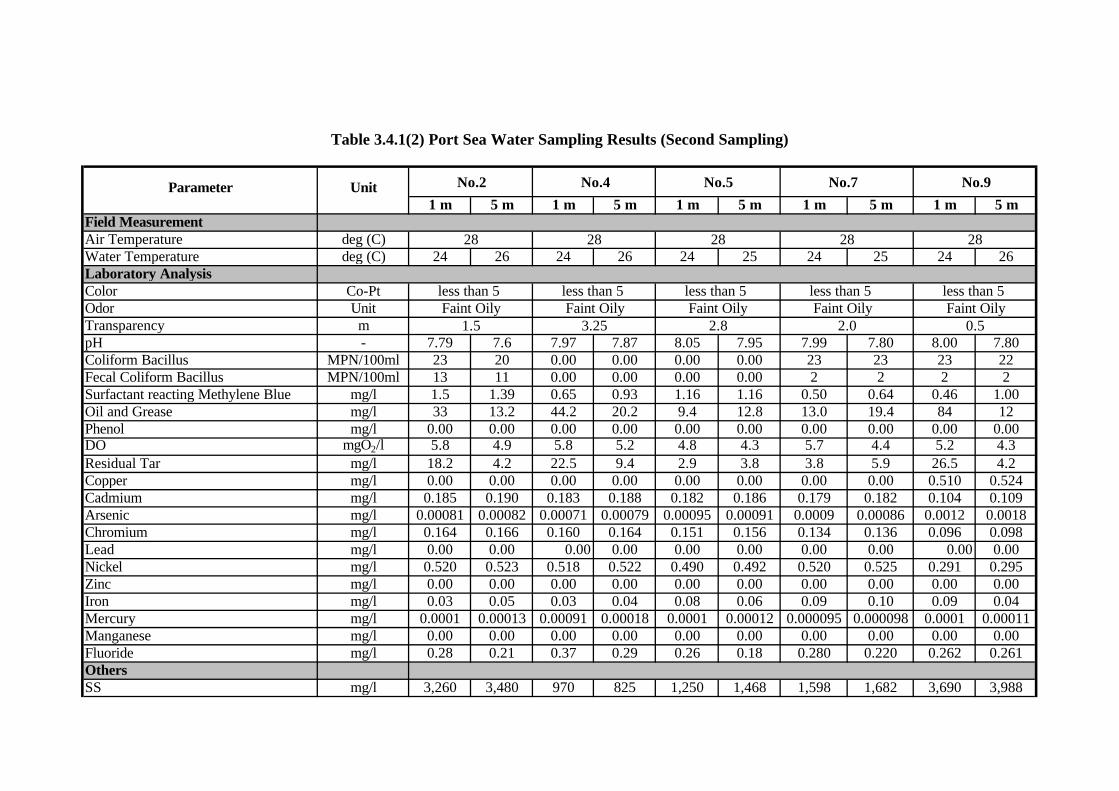
The results of analysis for all the samples is summarized respectively in Table 3.4.1(1)and Table 3.4.1(2) for first sampling (May 1998) and second sampling (October 1998).The quality of the sea water samples was analyzed at the laboratory of NationalResearch Center (NRC), Environmental Consultation and Water Quality Unit in Cairo.The reference for the laboratory analysis method was made to “the Standard Methodsfor the Examination of Water and Wastewater, 19th Edition 1995 APHA, AWWA,WEF”.
The analysis result of water quality clearly indicates highly polluted nature of the portwaters. In particular high suspended solid level in the range of about 1000-4000 mg/l,
3-9
in fact mostly exceeding 2000 mg/l during first sampling was noted. Also high oil andgrease level mostly exceeding 5mg/l, in fact mostly exceeding 10 mg/l during secondsampling with the highest value even exceeding 80 mg/l was noted. These resultsclearly demonstrated the high pollution level of port waters in an overall sense. It isnoted that high oil pollution level in the port waters could be attributed toindiscriminate and perhaps illegal disposal of oily waste (ballast and bilge waste) byships and vessels into the port waters, and hence to improper operational andinadequate surveillance activity of the port authority (APA).
Moreover high metallic pollution level, in particular with respect to the heavy metalparameters of cadmium and chromium was also noted.
Parameter Unit No.2 No.4 No.5 No.7 No.9
1 m 5 m 1 m 5 m 1 m 5 m 1 m 5 m 1 m 5 mField MeasurementAir Temperature deg (C) 28 28 28 28 28 28 28 28 28 28Water Temperature deg (C) 23 26 23 26 23 26 23 26 22 25Laboratory AnalysisColor Co-Pt less than 5 less than 5 less than 5 less than 5 less than 5Odor Unit Faint Oily Faint Oily Faint Oily Faint Oily Faint OilyTransparency cm 80 80 90 90 85 85 95 95 95 95pH - 7.8 7.6 7.9 7.5 7.8 7.4 7.7 7.5 8.1 8Coliform Bacillus MPN/100ml 1,600 1,200 140 120 26 26 220 200 8 8Fecal Coliform Bacillus MPN/100ml 350 300 50 40 26 26 17 17 8 8Surfactant reacting Methylene Blue mg/l 0.2 0.2 1.3 1 1.7 1.5 0.6 0.4 1.0 1.0Oil and Grease mg/l 15 5 17.8 8 6 6 5.8 5.8 10 7Phenol mg/l nil nil nil nil nil nil nil nil nil nilDO mgO2/l 10 9 10 9 11 9.5 9.5 8.5 9 8Residual Tar mg/l 1.8 1.8 0.4 0.4 1 1 0.8 0.8 0.6 0.6Copper mg/l nil nil nil nil nil nil nil nil nil nilCadmium mg/l 0.078 0.078 0.077 0.077 0.076 0.076 0.069 0.069 0.089 o.o89Arsenic mg/l 0.045 0.045 0.029 0.029 0.038 0.038 0.042 0.042 0.032 0.032Chromium mg/l 0.054 0.054 0.056 0.056 0.034 0.034 0.051 0.051 0.037 0.037Lead mg/l 0.708 0.708 0.719 0.719 0.642 0.642 0.614 0.614 0.730 0.730Nickel mg/l 0.499 0.499 0.503 0.503 0.486 0.486 0.414 0.414 0.571 0.571Zinc mg/l 0.01 0.01 0.007 0.007 0.008 0.008 0.150 0.15 0.013 0.013Iron mg/l 0.17 0.17 0.28 0.38 0.36 0.36 0.38 0.38 0.19 0.19Mercury mg/l 0.00066 0.00066 0.00091 0.00091 0.00085 0.00085 0.0011 0.0011 0.00099 0.00099Manganese mg/l nil nil nil nil nil nil nil nil nil nilFluoride mg/l 1.44 1.44 1.43 1.43 1.37 1.37 1.43 1.43 1.38 1.39OthersSS mg/l 3,659 3,800 1,978 2,000 3,898 3,900 3,113 3,150 4,132 4,132
Table 3.4.1(1) Port Sea Water Sampling Results (First Sampling)
Parameter Unit No.2 No.4 No.5 No.7 No.9
1 m 5 m 1 m 5 m 1 m 5 m 1 m 5 m 1 m 5 mField MeasurementAir Temperature deg (C)Water Temperature deg (C) 24 26 24 26 24 25 24 25 24 26Laboratory AnalysisColor Co-Pt less than 5 less than 5 less than 5 less than 5 less than 5Odor Unit Faint Oily Faint Oily Faint Oily Faint Oily Faint OilyTransparency mpH - 7.79 7.6 7.97 7.87 8.05 7.95 7.99 7.80 8.00 7.80Coliform Bacillus MPN/100ml 23 20 0.00 0.00 0.00 0.00 23 23 23 22Fecal Coliform Bacillus MPN/100ml 13 11 0.00 0.00 0.00 0.00 2 2 2 2Surfactant reacting Methylene Blue mg/l 1.5 1.39 0.65 0.93 1.16 1.16 0.50 0.64 0.46 1.00Oil and Grease mg/l 33 13.2 44.2 20.2 9.4 12.8 13.0 19.4 84 12Phenol mg/l 0.00 0.00 0.00 0.00 0.00 0.00 0.00 0.00 0.00 0.00DO mgO2/l 5.8 4.9 5.8 5.2 4.8 4.3 5.7 4.4 5.2 4.3Residual Tar mg/l 18.2 4.2 22.5 9.4 2.9 3.8 3.8 5.9 26.5 4.2Copper mg/l 0.00 0.00 0.00 0.00 0.00 0.00 0.00 0.00 0.510 0.524Cadmium mg/l 0.185 0.190 0.183 0.188 0.182 0.186 0.179 0.182 0.104 0.109Arsenic mg/l 0.00081 0.00082 0.00071 0.00079 0.00095 0.00091 0.0009 0.00086 0.0012 0.0018Chromium mg/l 0.164 0.166 0.160 0.164 0.151 0.156 0.134 0.136 0.096 0.098Lead mg/l 0.00 0.00 0.00 0.00 0.00 0.00 0.00 0.00 0.00 0.00Nickel mg/l 0.520 0.523 0.518 0.522 0.490 0.492 0.520 0.525 0.291 0.295Zinc mg/l 0.00 0.00 0.00 0.00 0.00 0.00 0.00 0.00 0.00 0.00Iron mg/l 0.03 0.05 0.03 0.04 0.08 0.06 0.09 0.10 0.09 0.04Mercury mg/l 0.0001 0.00013 0.00091 0.00018 0.0001 0.00012 0.000095 0.000098 0.0001 0.00011Manganese mg/l 0.00 0.00 0.00 0.00 0.00 0.00 0.00 0.00 0.00 0.00Fluoride mg/l 0.28 0.21 0.37 0.29 0.26 0.18 0.280 0.220 0.262 0.261OthersSS mg/l 3,260 3,480 970 825 1,250 1,468 1,598 1,682 3,690 3,988
28
Table 3.4.1(2) Port Sea Water Sampling Results (Second Sampling)
28
1.5 3.25 2.8 2.0 0.5
28 28 28
3-13
3.4.3 Seabed Material Quality Survey Seabed material sampling survey was conducted simultaneously with sea watersampling in the same Greater Alexandria Port at 10 locations with 5 locations being thesame as the above water quality sampling locations (for locations, refer to Figure 3.4.2).A composite sample, mixture of three (3) spot samples from one seabed surface layer,was collected for each location.
The results of the laboratory analysis for all 10 samples are summarized in Table 3.4.2.The sea bed material (sediment) quality was also analyzed at NRC laboratory in Cairo.The reference for the laboratory analysis method following the elution of constituents tobe measured from the solid media to liquid (water) media was also made to “theStandard Methods for the Examination of Water and Wastewater, 19th Edition 1995APHA, AWWA, WEF”. The analysis results indicate that the sea bed material in the entire port area is highlycontaminated with heavy metals. In particular contamination level of copper (Cu) andcadmium (Cd) is very high as per the Dredged Materials Quality Standards ofNetherlands (1987) as published in the World Bank Technical Paper Number 126 onEnvironmental Considerations for Port and Harbor Developments (1990). It is furthernoted that the eastern most inner port area of the Alexandria Port exhibited extremelyhigh level of heavy metal contamination. The measured ranges of copper (Cu) and cadmium (Cd) in all of the 10 samplinglocations throughout the Greater Alexandria Port area were, respectively, 167-1313mg/l and 12-54 mg/l. Both of these exceeded the permissible limit for unconstrainedopen water disposal of dredged material of 90 mg/l for Cu and 7.5 mg/l for Cd,designated as the Testing Values, as per the above Netherlands Standards. Accordinglyat-least the top layer of the dredged material derived from the port consequent to theimplementation of this master plan is contaminated with high heavy metal content andhence would require controlled disposal.
It is evident from the above that the determination of the vertical depth profile variationin the subsoil seabed material contamination level in an area designated for dredging isrequired for the formulation of cost effective dredged material management plan. Thiswould lead to delineate the potentially contaminated top layer of seabed from that ofuncontaminated bottom layer, there-by limiting the quantity of contaminated dredgedmaterial requiring controlled disposal (in other words dredged material not suited foropen sea disposal).
Accordingly, vertical depth profile variation of contamination level in those areasdesignated for dredging in the port seabed as per the short term development plan ofthis master plan was conducted as supplemental environmental survey and illustrated inthe subsequent section 3.5.
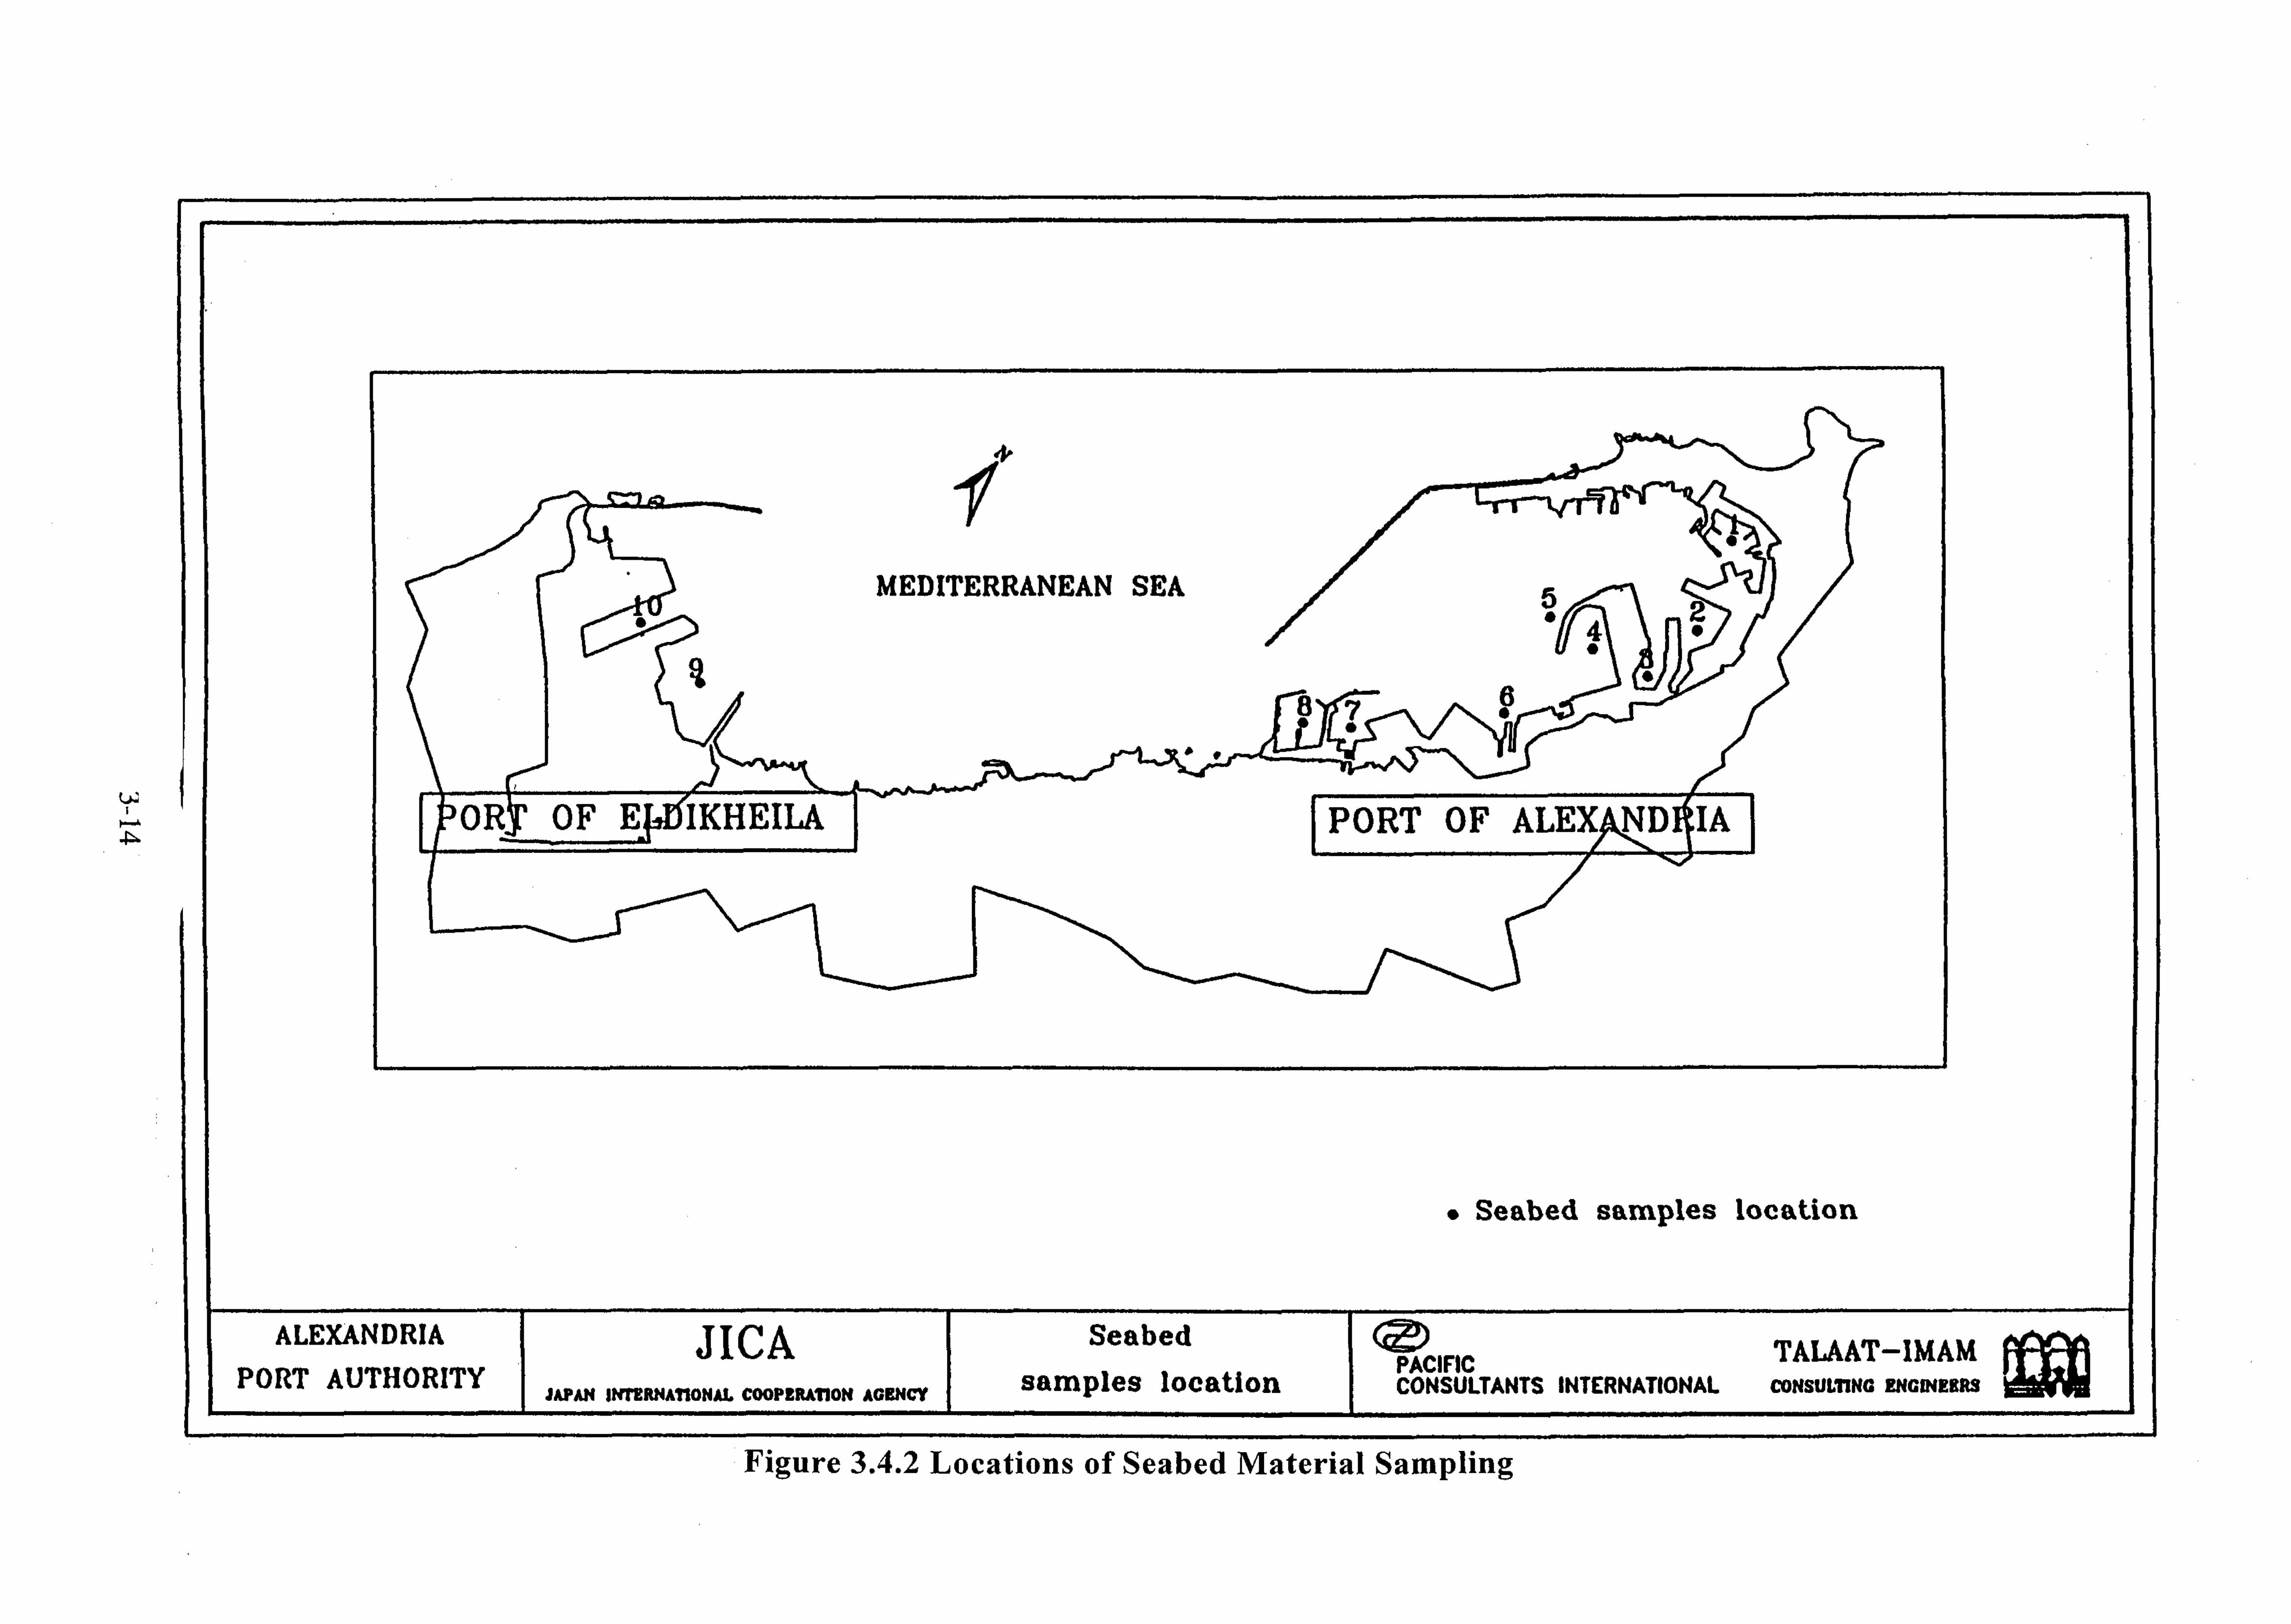
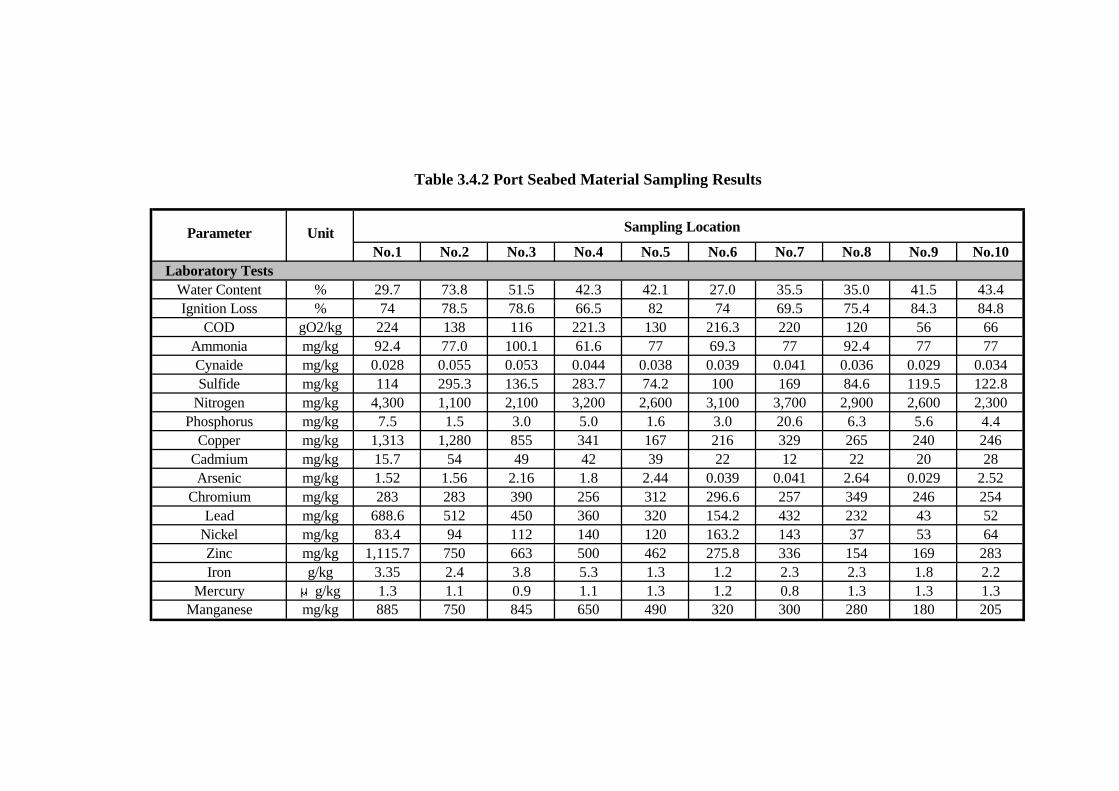
Parameter Unit Sampling Location
No.1 No.2 No.3 No.4 No.5 No.6 No.7 No.8 No.9 No.10Laboratory Tests
Water Content % 29.7 73.8 51.5 42.3 42.1 27.0 35.5 35.0 41.5 43.4Ignition Loss % 74 78.5 78.6 66.5 82 74 69.5 75.4 84.3 84.8
COD gO2/kg 224 138 116 221.3 130 216.3 220 120 56 66Ammonia mg/kg 92.4 77.0 100.1 61.6 77 69.3 77 92.4 77 77Cynaide mg/kg 0.028 0.055 0.053 0.044 0.038 0.039 0.041 0.036 0.029 0.034Sulfide mg/kg 114 295.3 136.5 283.7 74.2 100 169 84.6 119.5 122.8
Nitrogen mg/kg 4,300 1,100 2,100 3,200 2,600 3,100 3,700 2,900 2,600 2,300Phosphorus mg/kg 7.5 1.5 3.0 5.0 1.6 3.0 20.6 6.3 5.6 4.4
Copper mg/kg 1,313 1,280 855 341 167 216 329 265 240 246Cadmium mg/kg 15.7 54 49 42 39 22 12 22 20 28Arsenic mg/kg 1.52 1.56 2.16 1.8 2.44 0.039 0.041 2.64 0.029 2.52
Chromium mg/kg 283 283 390 256 312 296.6 257 349 246 254Lead mg/kg 688.6 512 450 360 320 154.2 432 232 43 52
Nickel mg/kg 83.4 94 112 140 120 163.2 143 37 53 64Zinc mg/kg 1,115.7 750 663 500 462 275.8 336 154 169 283Iron g/kg 3.35 2.4 3.8 5.3 1.3 1.2 2.3 2.3 1.8 2.2
Mercury μg/kg 1.3 1.1 0.9 1.1 1.3 1.2 0.8 1.3 1.3 1.3Manganese mg/kg 885 750 845 650 490 320 300 280 180 205
Table 3.4.2 Port Seabed Material Sampling Results
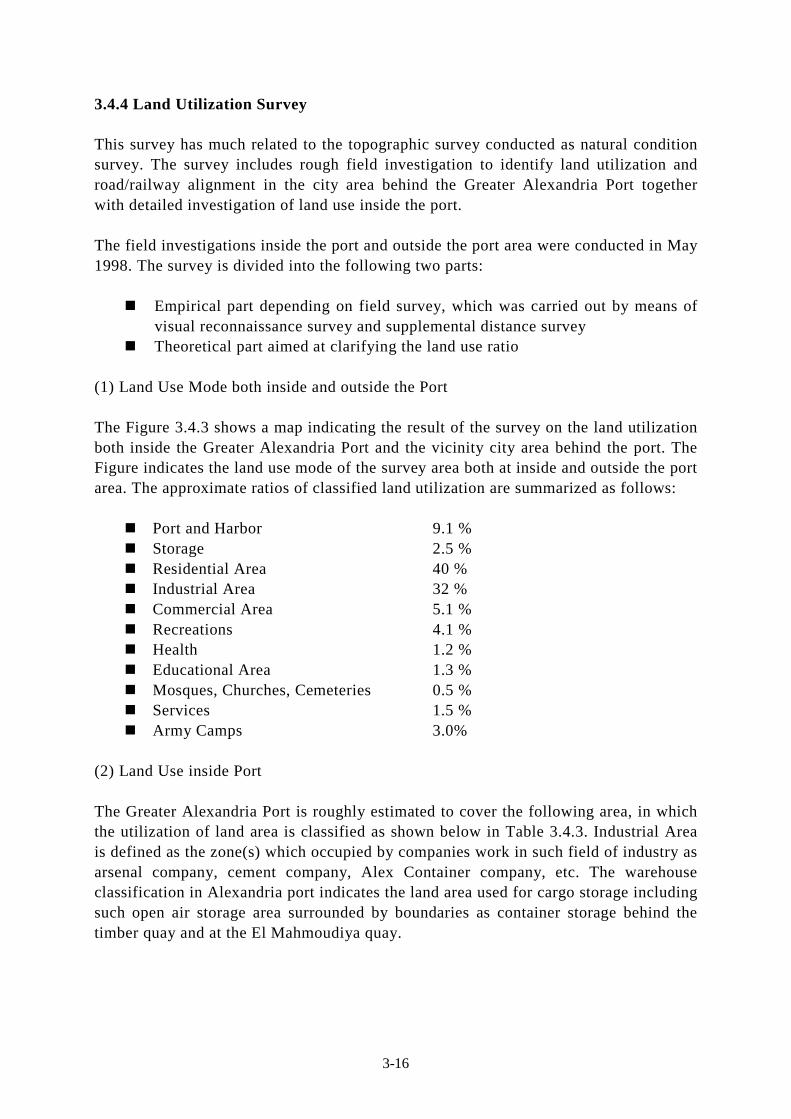
3-16
3.4.4 Land Utilization Survey
This survey has much related to the topographic survey conducted as natural conditionsurvey. The survey includes rough field investigation to identify land utilization androad/railway alignment in the city area behind the Greater Alexandria Port togetherwith detailed investigation of land use inside the port.
The field investigations inside the port and outside the port area were conducted in May1998. The survey is divided into the following two parts:
Empirical part depending on field survey, which was carried out by means ofvisual reconnaissance survey and supplemental distance survey
Theoretical part aimed at clarifying the land use ratio
(1) Land Use Mode both inside and outside the Port
The Figure 3.4.3 shows a map indicating the result of the survey on the land utilizationboth inside the Greater Alexandria Port and the vicinity city area behind the port. TheFigure indicates the land use mode of the survey area both at inside and outside the portarea. The approximate ratios of classified land utilization are summarized as follows:
Port and Harbor 9.1 % Storage 2.5 % Residential Area 40 % Industrial Area 32 % Commercial Area 5.1 % Recreations 4.1 % Health 1.2 % Educational Area 1.3 % Mosques, Churches, Cemeteries 0.5 % Services 1.5 % Army Camps 3.0%
(2) Land Use inside Port
The Greater Alexandria Port is roughly estimated to cover the following area, in whichthe utilization of land area is classified as shown below in Table 3.4.3. Industrial Areais defined as the zone(s) which occupied by companies work in such field of industry asarsenal company, cement company, Alex Container company, etc. The warehouseclassification in Alexandria port indicates the land area used for cargo storage includingsuch open air storage area surrounded by boundaries as container storage behind thetimber quay and at the El Mahmoudiya quay.
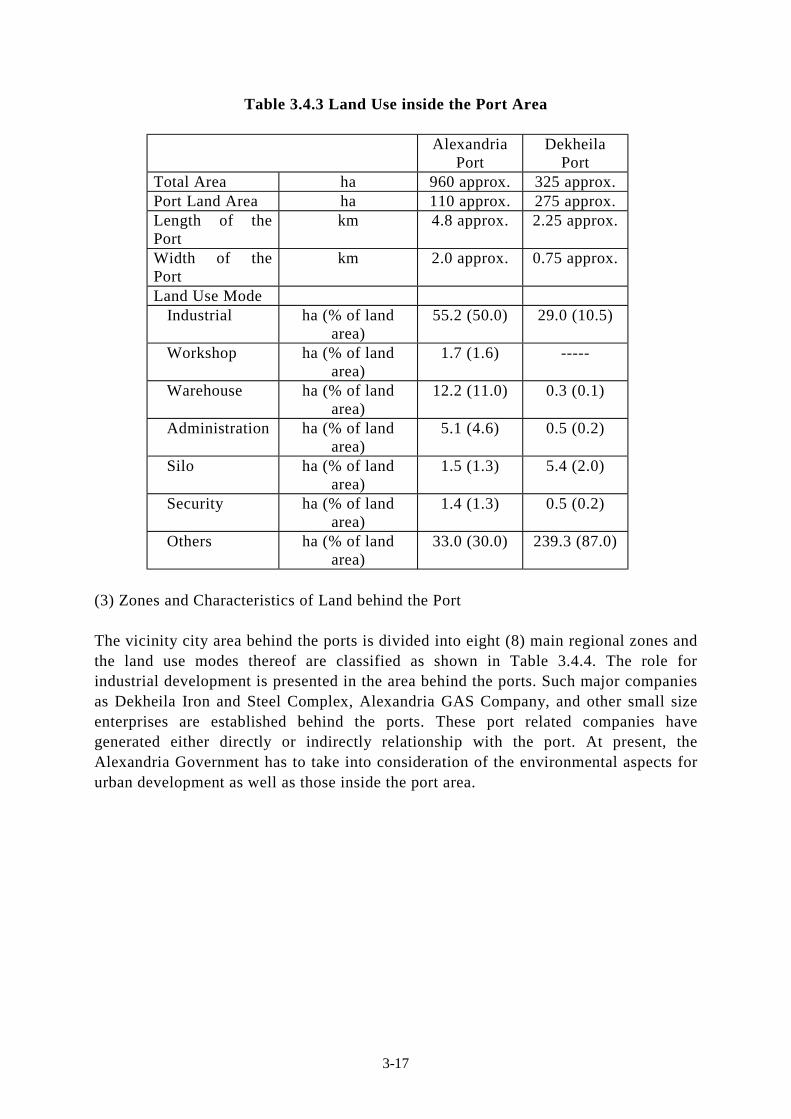
3-17
Table 3.4.3 Land Use inside the Port Area
AlexandriaPort
DekheilaPort
Total Area ha 960 approx. 325 approx.Port Land Area ha 110 approx. 275 approx.Length of thePort
km 4.8 approx. 2.25 approx.
Width of thePort
km 2.0 approx. 0.75 approx.
Land Use Mode Industrial ha (% of land
area)55.2 (50.0) 29.0 (10.5)
Workshop ha (% of landarea)
1.7 (1.6) -----
Warehouse ha (% of landarea)
12.2 (11.0) 0.3 (0.1)
Administration ha (% of landarea)
5.1 (4.6) 0.5 (0.2)
Silo ha (% of landarea)
1.5 (1.3) 5.4 (2.0)
Security ha (% of landarea)
1.4 (1.3) 0.5 (0.2)
Others ha (% of landarea)
33.0 (30.0) 239.3 (87.0)
(3) Zones and Characteristics of Land behind the Port
The vicinity city area behind the ports is divided into eight (8) main regional zones andthe land use modes thereof are classified as shown in Table 3.4.4. The role forindustrial development is presented in the area behind the ports. Such major companiesas Dekheila Iron and Steel Complex, Alexandria GAS Company, and other small sizeenterprises are established behind the ports. These port related companies havegenerated either directly or indirectly relationship with the port. At present, theAlexandria Government has to take into consideration of the environmental aspects forurban development as well as those inside the port area.
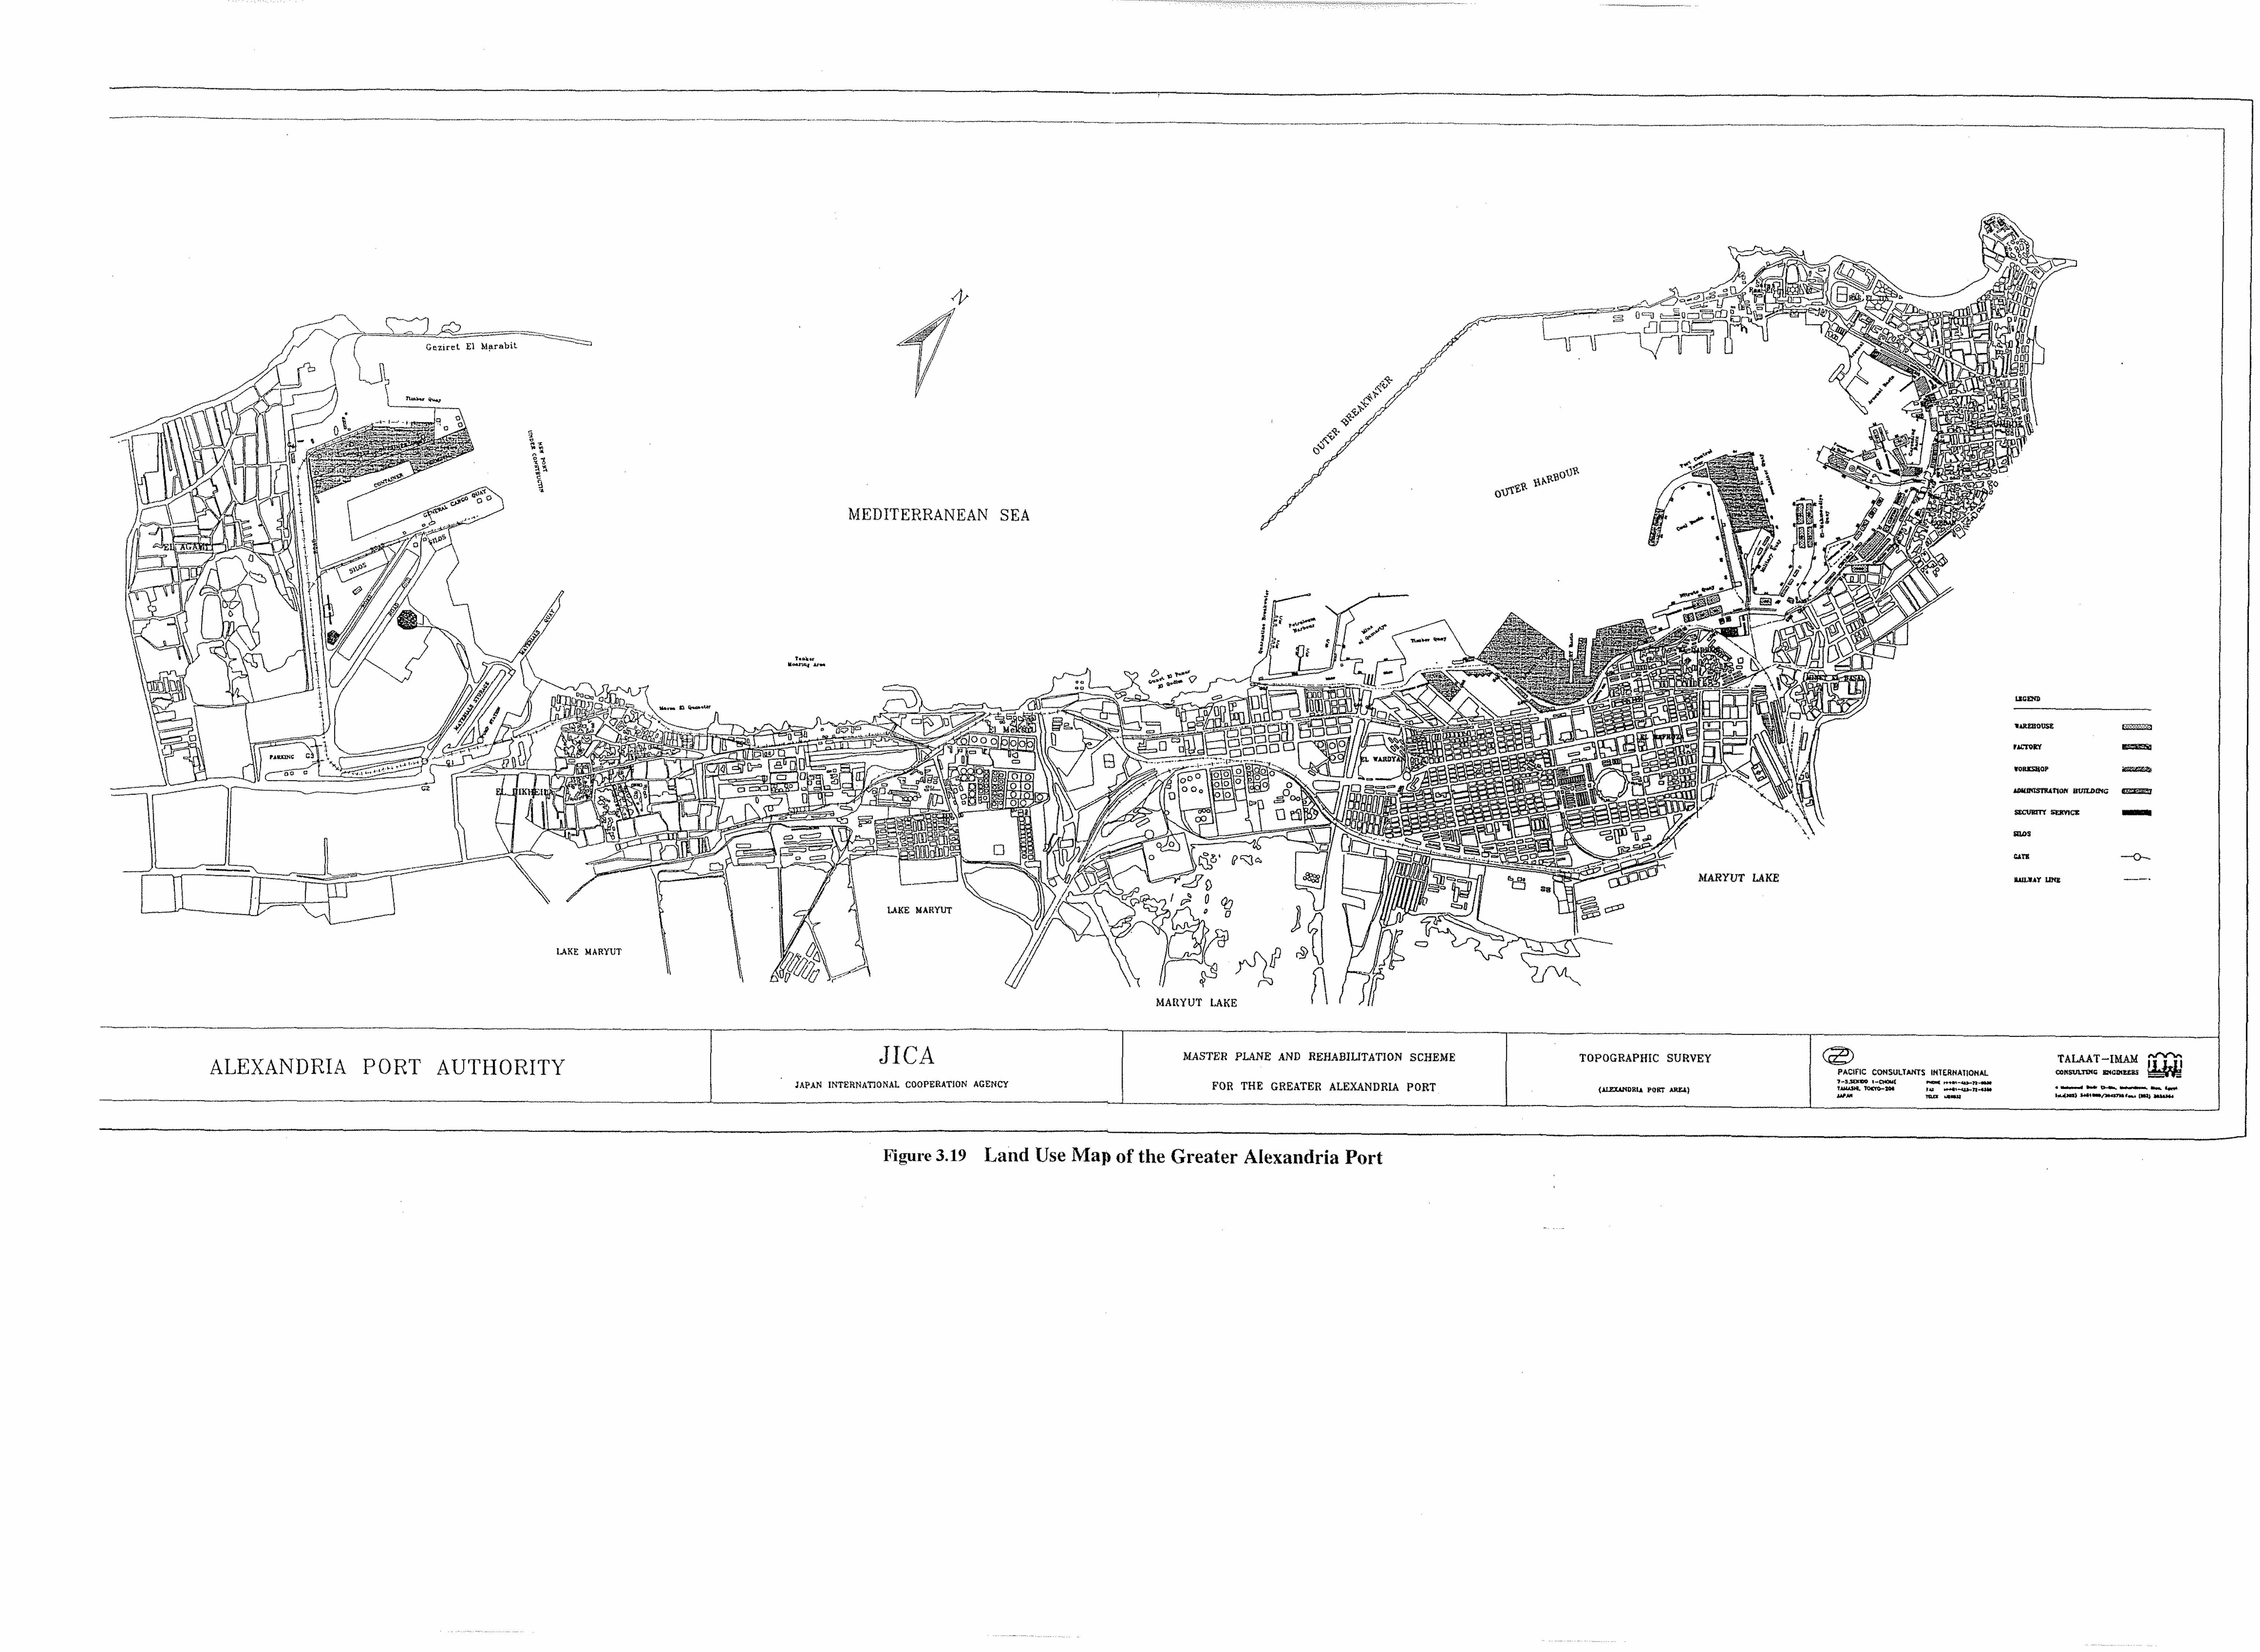
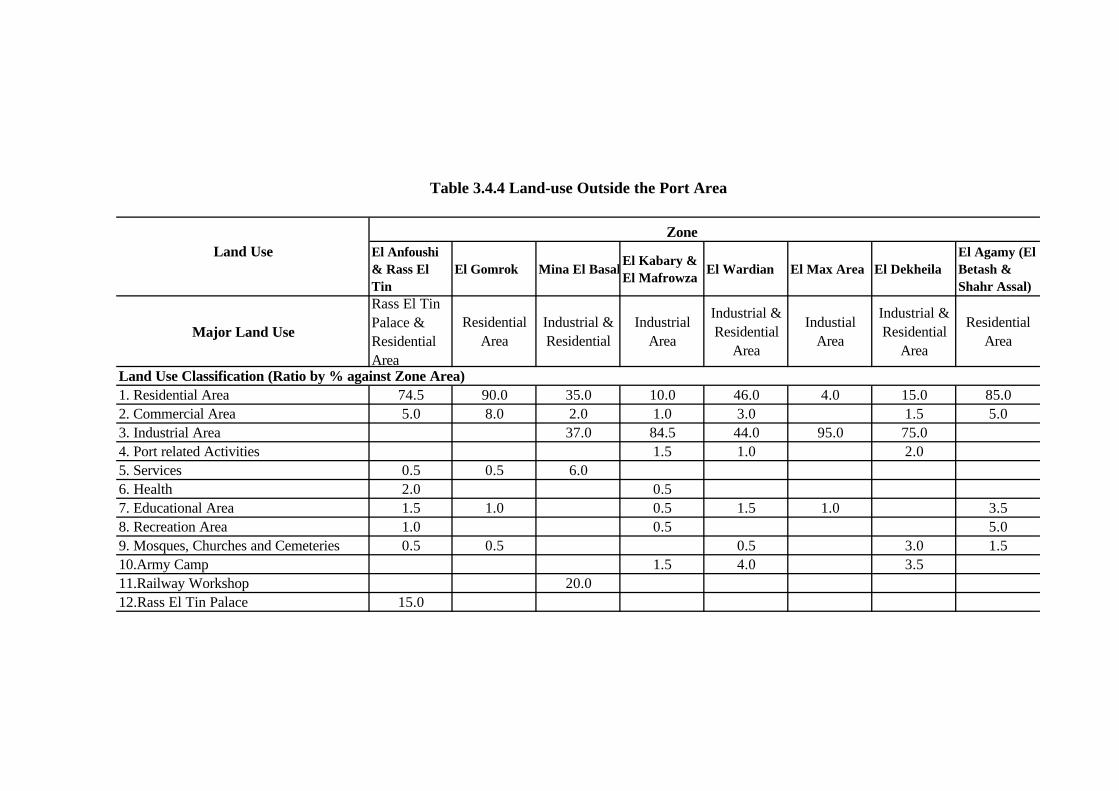
Zone Land Use El Anfoushi
& Rass ElTin
El Gomrok Mina El BasalEl Kabary &El Mafrowza
El Wardian El Max Area El DekheilaEl Agamy (ElBetash &Shahr Assal)
Major Land Use
Rass El TinPalace &ResidentialArea
ResidentialArea
Industrial &Residential
IndustrialArea
Industrial &Residential
Area
IndustialArea
Industrial &Residential
Area
ResidentialArea
Land Use Classification (Ratio by % against Zone Area)1. Residential Area 74.5 90.0 35.0 10.0 46.0 4.0 15.0 85.02. Commercial Area 5.0 8.0 2.0 1.0 3.0 1.5 5.03. Industrial Area 37.0 84.5 44.0 95.0 75.04. Port related Activities 1.5 1.0 2.05. Services 0.5 0.5 6.06. Health 2.0 0.57. Educational Area 1.5 1.0 0.5 1.5 1.0 3.58. Recreation Area 1.0 0.5 5.09. Mosques, Churches and Cemeteries 0.5 0.5 0.5 3.0 1.510.Army Camp 1.5 4.0 3.511.Railway Workshop 20.012.Rass El Tin Palace 15.0
Table 3.4.4 Land-use Outside the Port Area
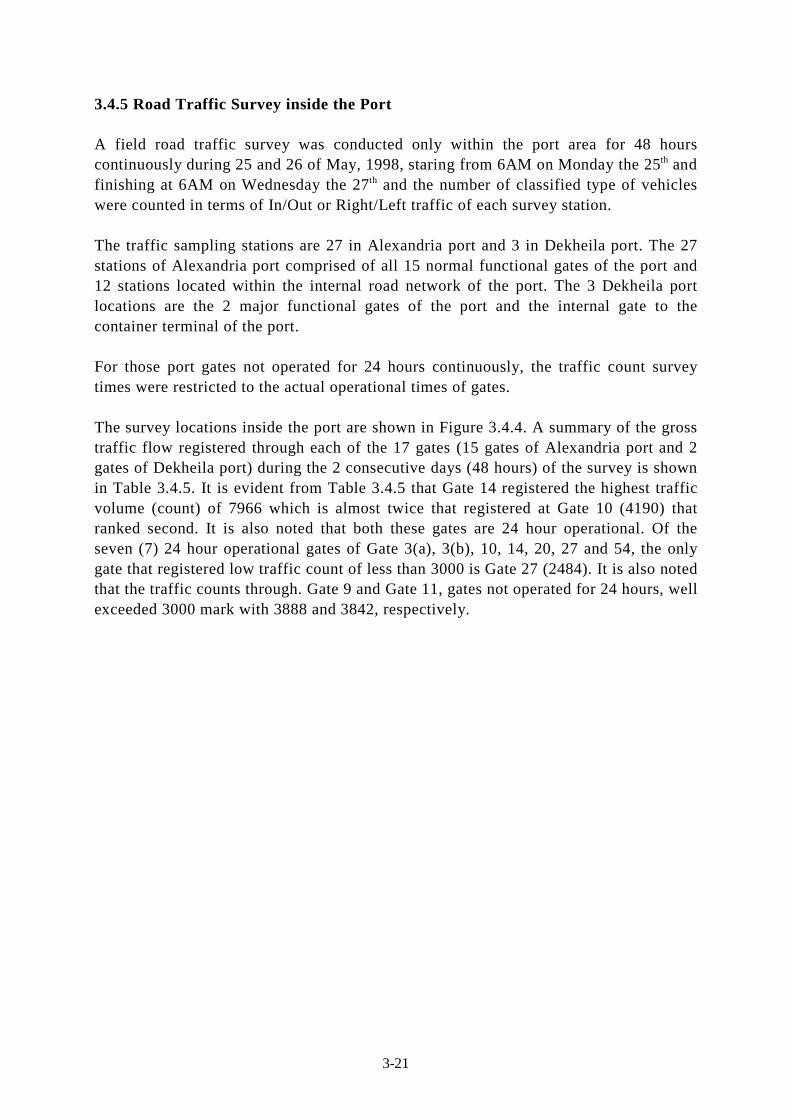
3-21
3.4.5 Road Traffic Survey inside the Port
A field road traffic survey was conducted only within the port area for 48 hourscontinuously during 25 and 26 of May, 1998, staring from 6AM on Monday the 25th andfinishing at 6AM on Wednesday the 27th and the number of classified type of vehicleswere counted in terms of In/Out or Right/Left traffic of each survey station.
The traffic sampling stations are 27 in Alexandria port and 3 in Dekheila port. The 27stations of Alexandria port comprised of all 15 normal functional gates of the port and12 stations located within the internal road network of the port. The 3 Dekheila portlocations are the 2 major functional gates of the port and the internal gate to thecontainer terminal of the port.
For those port gates not operated for 24 hours continuously, the traffic count surveytimes were restricted to the actual operational times of gates.
The survey locations inside the port are shown in Figure 3.4.4. A summary of the grosstraffic flow registered through each of the 17 gates (15 gates of Alexandria port and 2gates of Dekheila port) during the 2 consecutive days (48 hours) of the survey is shownin Table 3.4.5. It is evident from Table 3.4.5 that Gate 14 registered the highest trafficvolume (count) of 7966 which is almost twice that registered at Gate 10 (4190) thatranked second. It is also noted that both these gates are 24 hour operational. Of theseven (7) 24 hour operational gates of Gate 3(a), 3(b), 10, 14, 20, 27 and 54, the onlygate that registered low traffic count of less than 3000 is Gate 27 (2484). It is also notedthat the traffic counts through. Gate 9 and Gate 11, gates not operated for 24 hours, wellexceeded 3000 mark with 3888 and 3842, respectively.
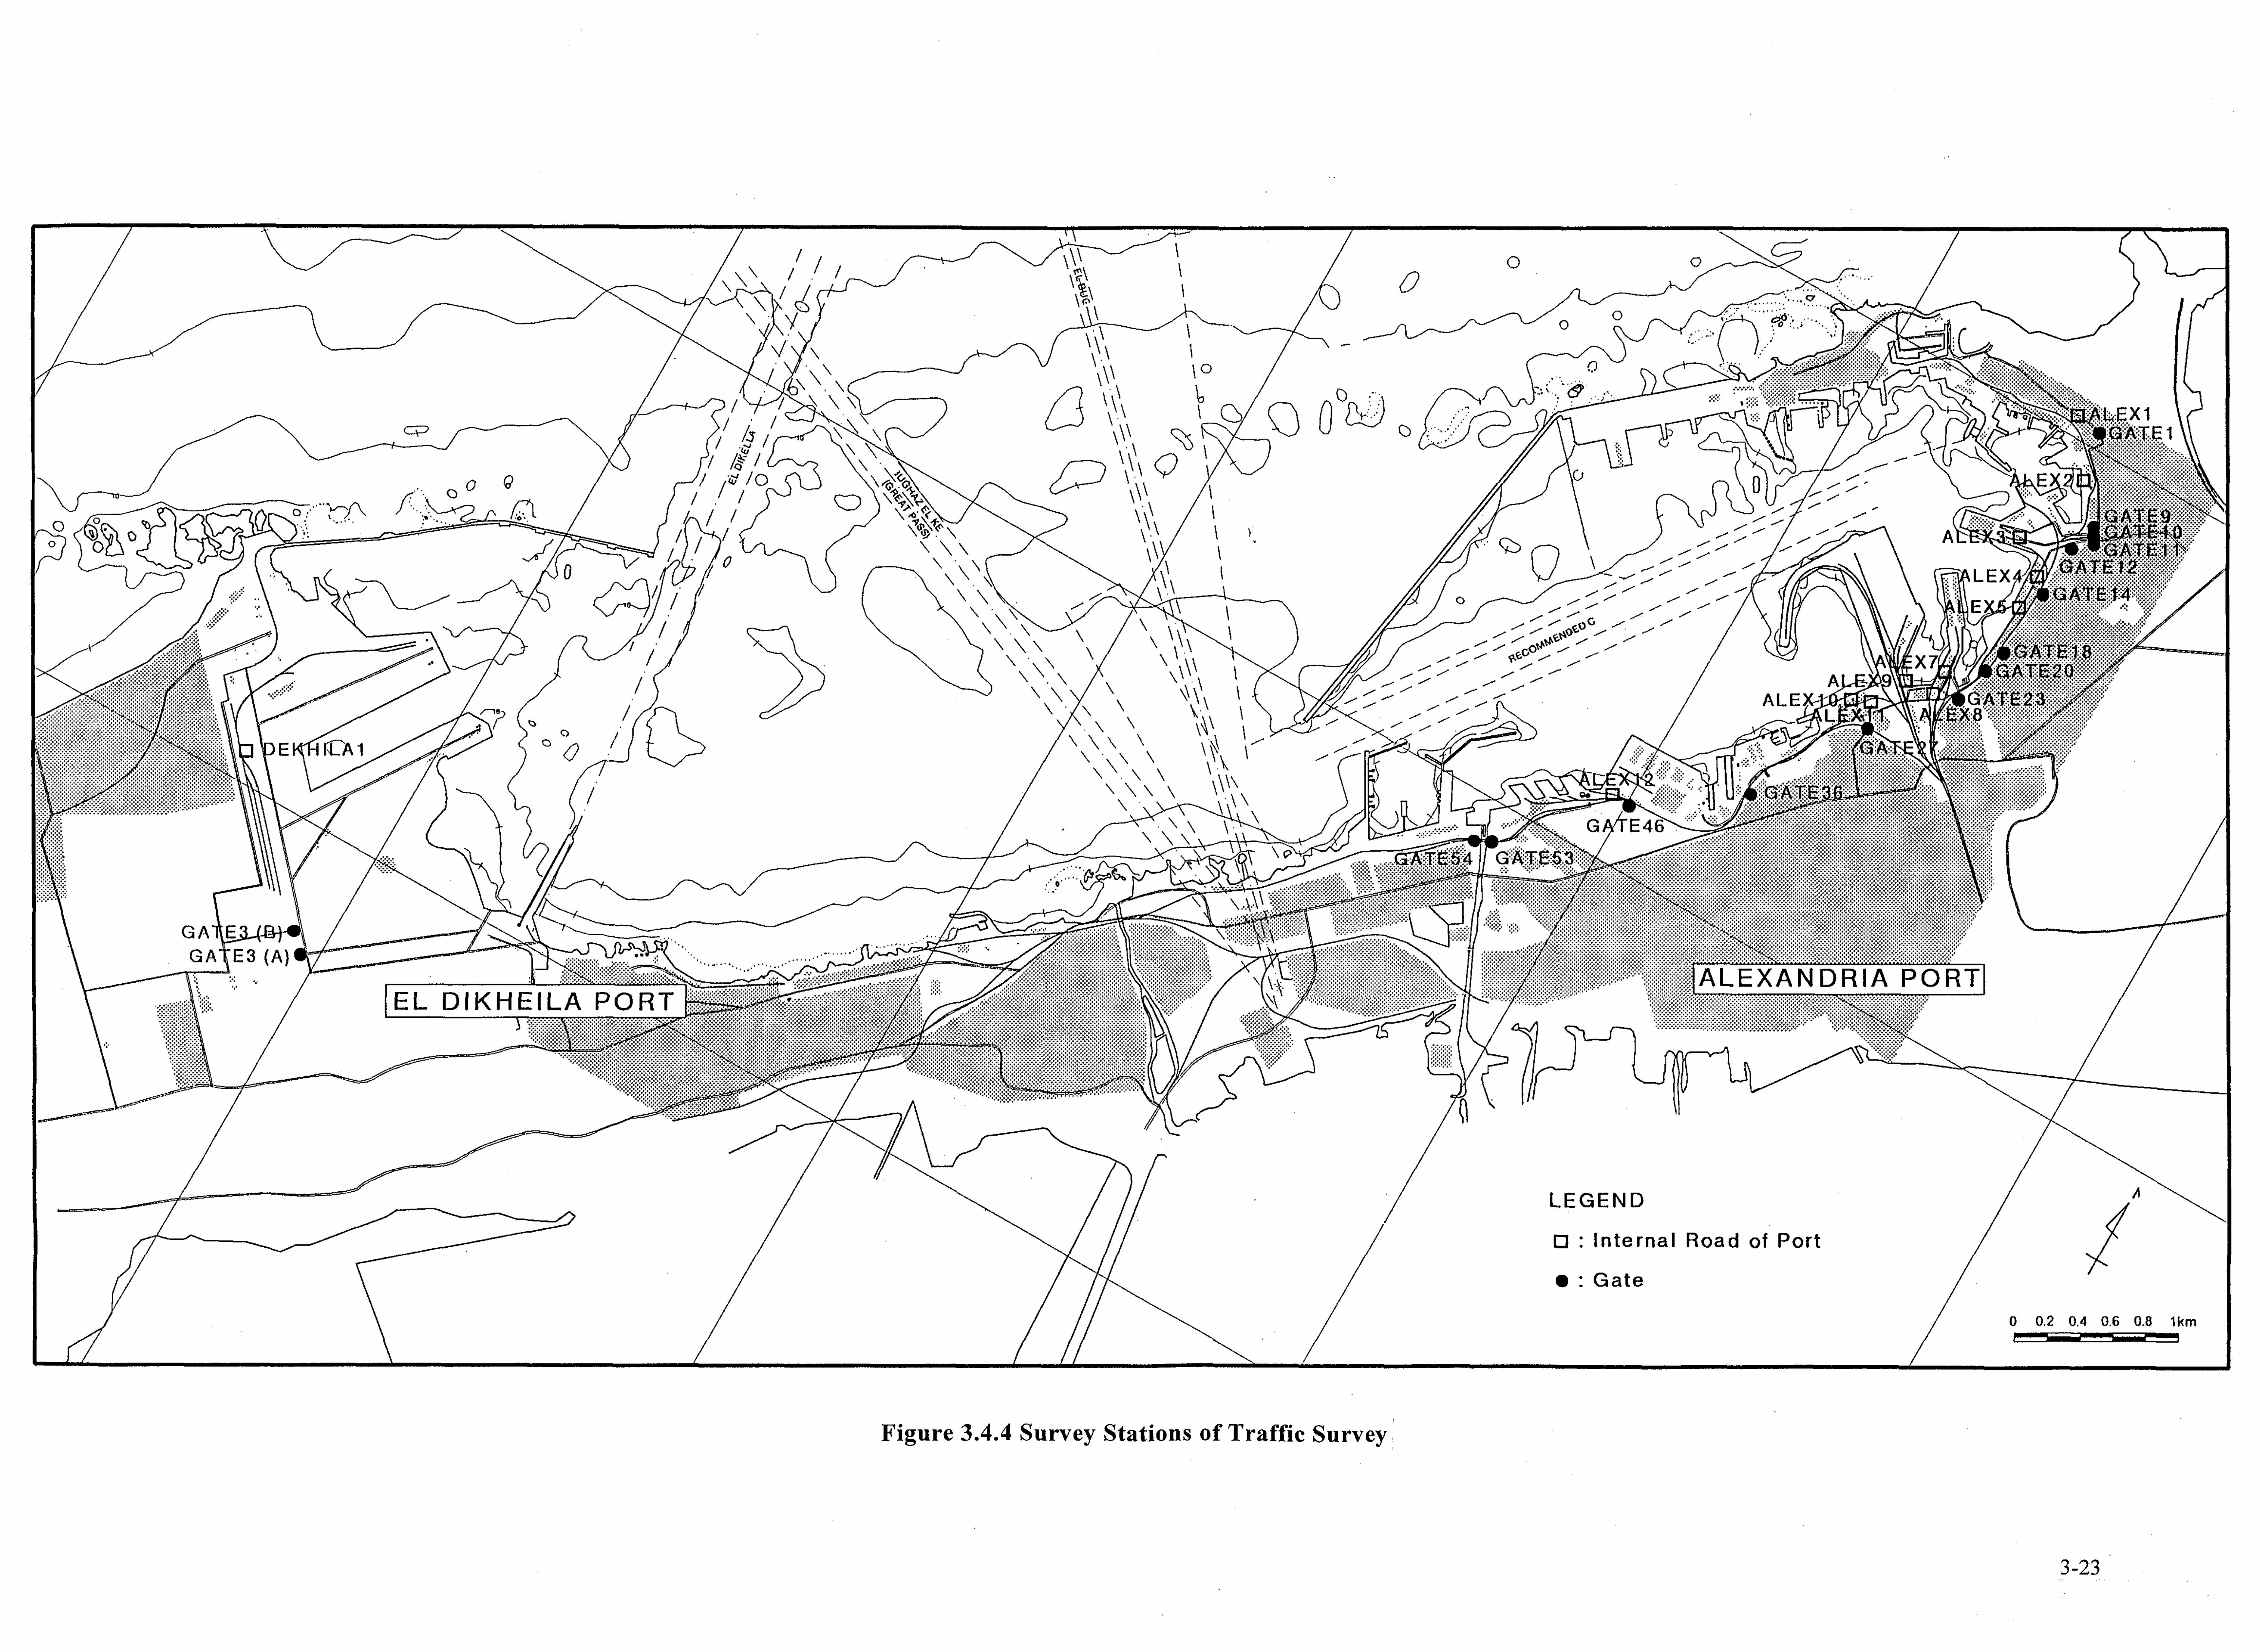
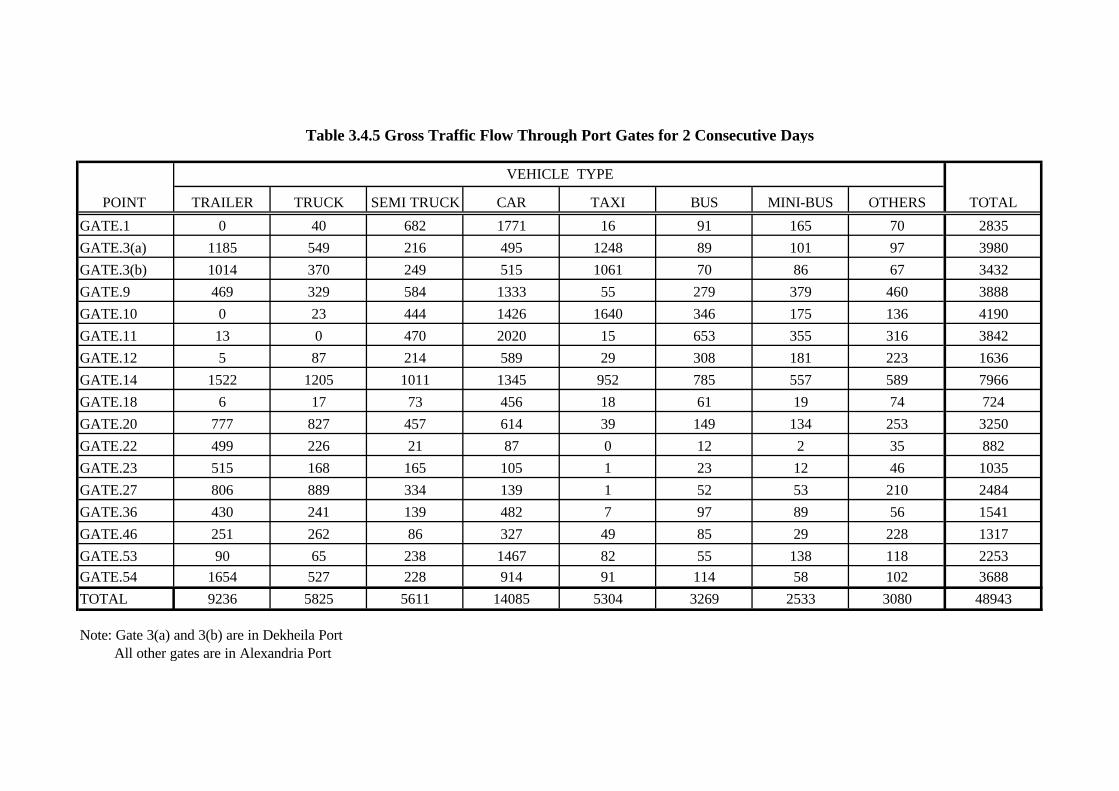
POINT TRAILER TRUCK SEMI TRUCK CAR TAXI BUS MINI-BUS OTHERS TOTAL
GATE.1 0 40 682 1771 16 91 165 70 2835
GATE.3(a) 1185 549 216 495 1248 89 101 97 3980
GATE.3(b) 1014 370 249 515 1061 70 86 67 3432
GATE.9 469 329 584 1333 55 279 379 460 3888
GATE.10 0 23 444 1426 1640 346 175 136 4190
GATE.11 13 0 470 2020 15 653 355 316 3842
GATE.12 5 87 214 589 29 308 181 223 1636
GATE.14 1522 1205 1011 1345 952 785 557 589 7966
GATE.18 6 17 73 456 18 61 19 74 724
GATE.20 777 827 457 614 39 149 134 253 3250
GATE.22 499 226 21 87 0 12 2 35 882
GATE.23 515 168 165 105 1 23 12 46 1035
GATE.27 806 889 334 139 1 52 53 210 2484
GATE.36 430 241 139 482 7 97 89 56 1541
GATE.46 251 262 86 327 49 85 29 228 1317
GATE.53 90 65 238 1467 82 55 138 118 2253GATE.54 1654 527 228 914 91 114 58 102 3688
TOTAL 9236 5825 5611 14085 5304 3269 2533 3080 48943
Note: Gate 3(a) and 3(b) are in Dekheila Port All other gates are in Alexandria Port
VEHICLE TYPE
Table 3.4.5 Gross Traffic Flow Through Port Gates for 2 Consecutive Days
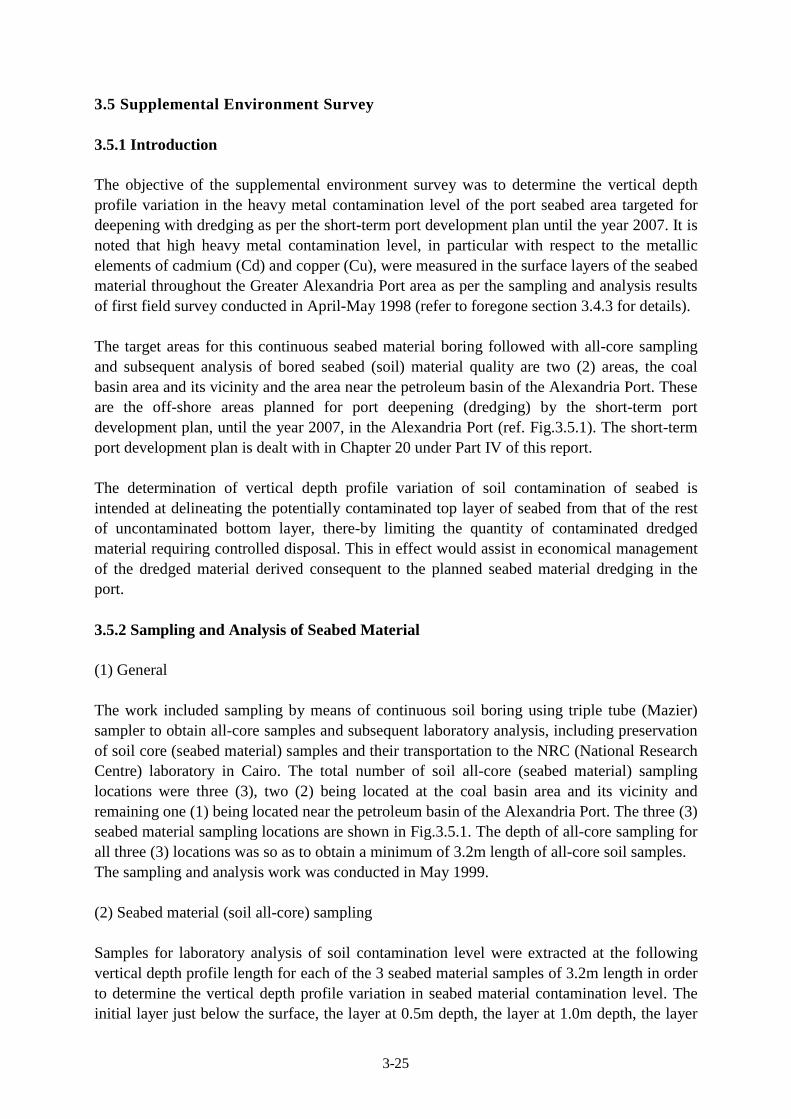
3-25
3.5 Supplemental Environment Survey
3.5.1 Introduction
The objective of the supplemental environment survey was to determine the vertical depthprofile variation in the heavy metal contamination level of the port seabed area targeted fordeepening with dredging as per the short-term port development plan until the year 2007. It isnoted that high heavy metal contamination level, in particular with respect to the metallicelements of cadmium (Cd) and copper (Cu), were measured in the surface layers of the seabedmaterial throughout the Greater Alexandria Port area as per the sampling and analysis resultsof first field survey conducted in April-May 1998 (refer to foregone section 3.4.3 for details).
The target areas for this continuous seabed material boring followed with all-core samplingand subsequent analysis of bored seabed (soil) material quality are two (2) areas, the coalbasin area and its vicinity and the area near the petroleum basin of the Alexandria Port. Theseare the off-shore areas planned for port deepening (dredging) by the short-term portdevelopment plan, until the year 2007, in the Alexandria Port (ref. Fig.3.5.1). The short-termport development plan is dealt with in Chapter 20 under Part IV of this report.
The determination of vertical depth profile variation of soil contamination of seabed isintended at delineating the potentially contaminated top layer of seabed from that of the restof uncontaminated bottom layer, there-by limiting the quantity of contaminated dredgedmaterial requiring controlled disposal. This in effect would assist in economical managementof the dredged material derived consequent to the planned seabed material dredging in theport. 3.5.2 Sampling and Analysis of Seabed Material
(1) General
The work included sampling by means of continuous soil boring using triple tube (Mazier)sampler to obtain all-core samples and subsequent laboratory analysis, including preservationof soil core (seabed material) samples and their transportation to the NRC (National ResearchCentre) laboratory in Cairo. The total number of soil all-core (seabed material) samplinglocations were three (3), two (2) being located at the coal basin area and its vicinity andremaining one (1) being located near the petroleum basin of the Alexandria Port. The three (3)seabed material sampling locations are shown in Fig.3.5.1. The depth of all-core sampling forall three (3) locations was so as to obtain a minimum of 3.2m length of all-core soil samples.The sampling and analysis work was conducted in May 1999. (2) Seabed material (soil all-core) sampling Samples for laboratory analysis of soil contamination level were extracted at the followingvertical depth profile length for each of the 3 seabed material samples of 3.2m length in orderto determine the vertical depth profile variation in seabed material contamination level. Theinitial layer just below the surface, the layer at 0.5m depth, the layer at 1.0m depth, the layer
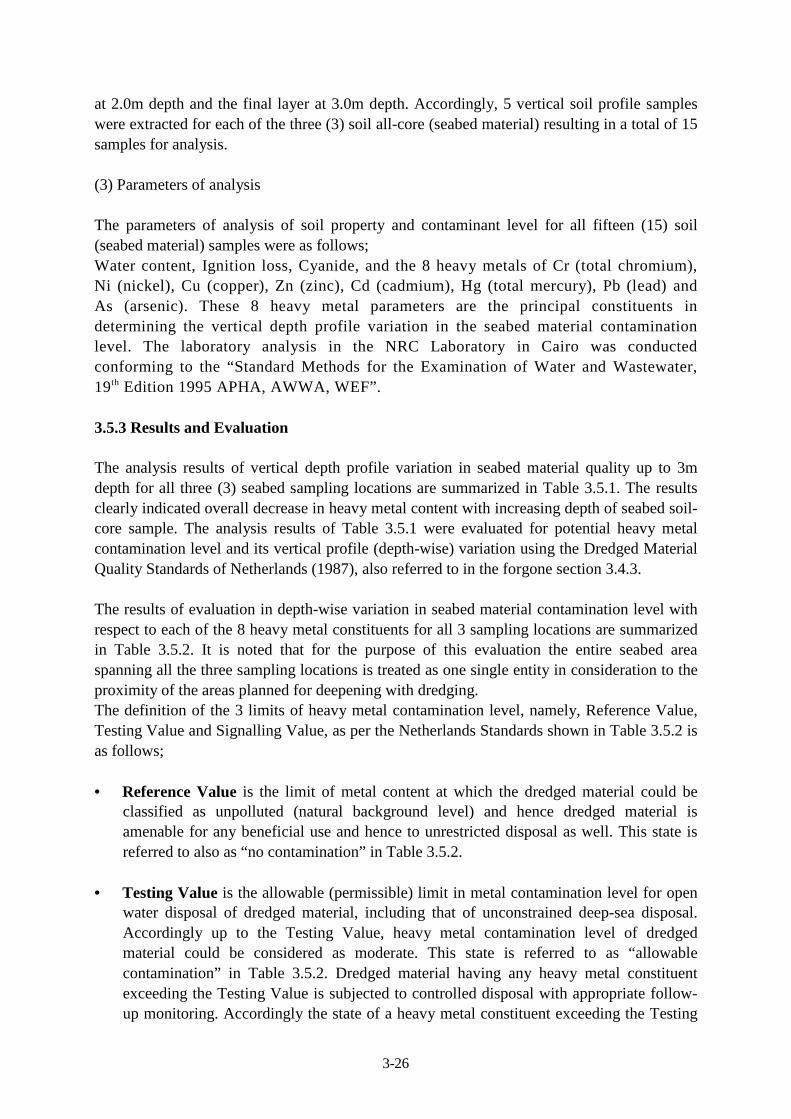
3-26
at 2.0m depth and the final layer at 3.0m depth. Accordingly, 5 vertical soil profile sampleswere extracted for each of the three (3) soil all-core (seabed material) resulting in a total of 15samples for analysis.
(3) Parameters of analysis
The parameters of analysis of soil property and contaminant level for all fifteen (15) soil(seabed material) samples were as follows;Water content, Ignition loss, Cyanide, and the 8 heavy metals of Cr (total chromium),Ni (nickel), Cu (copper), Zn (zinc), Cd (cadmium), Hg (total mercury), Pb (lead) andAs (arsenic). These 8 heavy metal parameters are the principal constituents indetermining the vertical depth profile variation in the seabed material contaminationlevel. The laboratory analysis in the NRC Laboratory in Cairo was conductedconforming to the “Standard Methods for the Examination of Water and Wastewater,19th Edition 1995 APHA, AWWA, WEF”.
3.5.3 Results and Evaluation
The analysis results of vertical depth profile variation in seabed material quality up to 3mdepth for all three (3) seabed sampling locations are summarized in Table 3.5.1. The resultsclearly indicated overall decrease in heavy metal content with increasing depth of seabed soil-core sample. The analysis results of Table 3.5.1 were evaluated for potential heavy metalcontamination level and its vertical profile (depth-wise) variation using the Dredged MaterialQuality Standards of Netherlands (1987), also referred to in the forgone section 3.4.3.
The results of evaluation in depth-wise variation in seabed material contamination level withrespect to each of the 8 heavy metal constituents for all 3 sampling locations are summarizedin Table 3.5.2. It is noted that for the purpose of this evaluation the entire seabed areaspanning all the three sampling locations is treated as one single entity in consideration to theproximity of the areas planned for deepening with dredging.The definition of the 3 limits of heavy metal contamination level, namely, Reference Value,Testing Value and Signalling Value, as per the Netherlands Standards shown in Table 3.5.2 isas follows;
• Reference Value is the limit of metal content at which the dredged material could beclassified as unpolluted (natural background level) and hence dredged material isamenable for any beneficial use and hence to unrestricted disposal as well. This state isreferred to also as “no contamination” in Table 3.5.2.
• Testing Value is the allowable (permissible) limit in metal contamination level for open
water disposal of dredged material, including that of unconstrained deep-sea disposal.Accordingly up to the Testing Value, heavy metal contamination level of dredgedmaterial could be considered as moderate. This state is referred to as “allowablecontamination” in Table 3.5.2. Dredged material having any heavy metal constituentexceeding the Testing Value is subjected to controlled disposal with appropriate follow-up monitoring. Accordingly the state of a heavy metal constituent exceeding the Testing
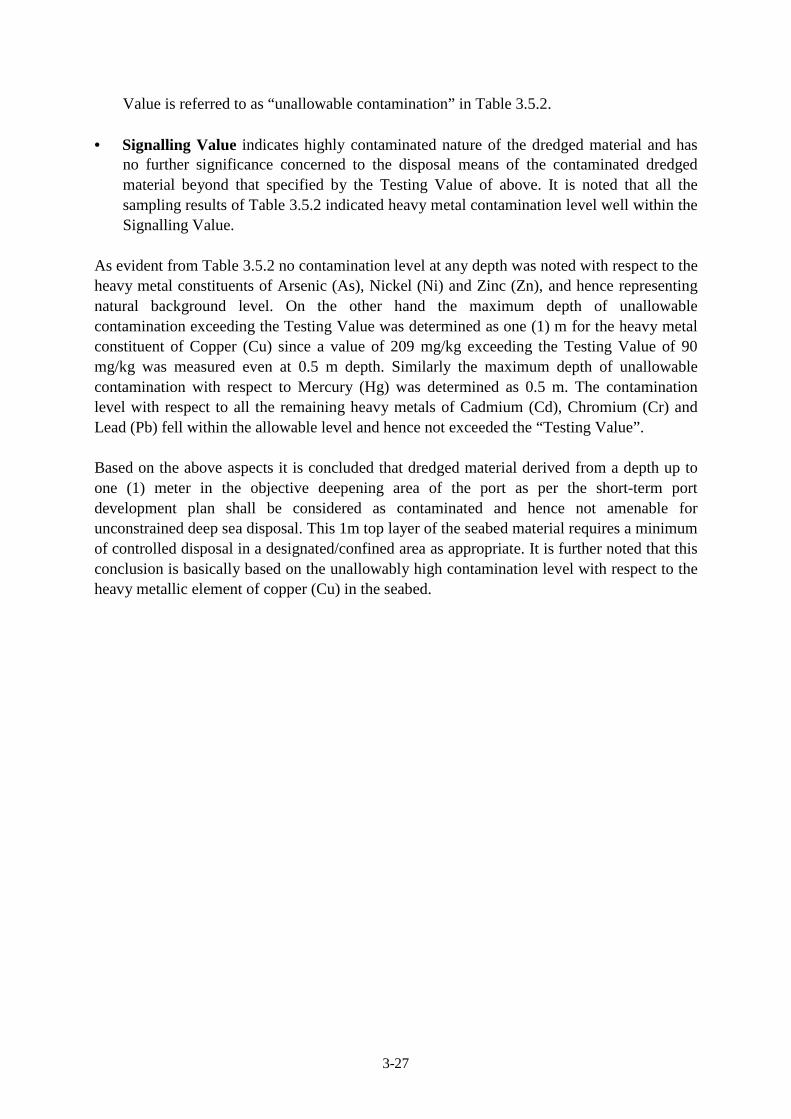
3-27
Value is referred to as “unallowable contamination” in Table 3.5.2.
• Signalling Value indicates highly contaminated nature of the dredged material and hasno further significance concerned to the disposal means of the contaminated dredgedmaterial beyond that specified by the Testing Value of above. It is noted that all thesampling results of Table 3.5.2 indicated heavy metal contamination level well within theSignalling Value.
As evident from Table 3.5.2 no contamination level at any depth was noted with respect to theheavy metal constituents of Arsenic (As), Nickel (Ni) and Zinc (Zn), and hence representingnatural background level. On the other hand the maximum depth of unallowablecontamination exceeding the Testing Value was determined as one (1) m for the heavy metalconstituent of Copper (Cu) since a value of 209 mg/kg exceeding the Testing Value of 90mg/kg was measured even at 0.5 m depth. Similarly the maximum depth of unallowablecontamination with respect to Mercury (Hg) was determined as 0.5 m. The contaminationlevel with respect to all the remaining heavy metals of Cadmium (Cd), Chromium (Cr) andLead (Pb) fell within the allowable level and hence not exceeded the “Testing Value”.
Based on the above aspects it is concluded that dredged material derived from a depth up toone (1) meter in the objective deepening area of the port as per the short-term portdevelopment plan shall be considered as contaminated and hence not amenable forunconstrained deep sea disposal. This 1m top layer of the seabed material requires a minimumof controlled disposal in a designated/confined area as appropriate. It is further noted that thisconclusion is basically based on the unallowably high contamination level with respect to theheavy metallic element of copper (Cu) in the seabed.
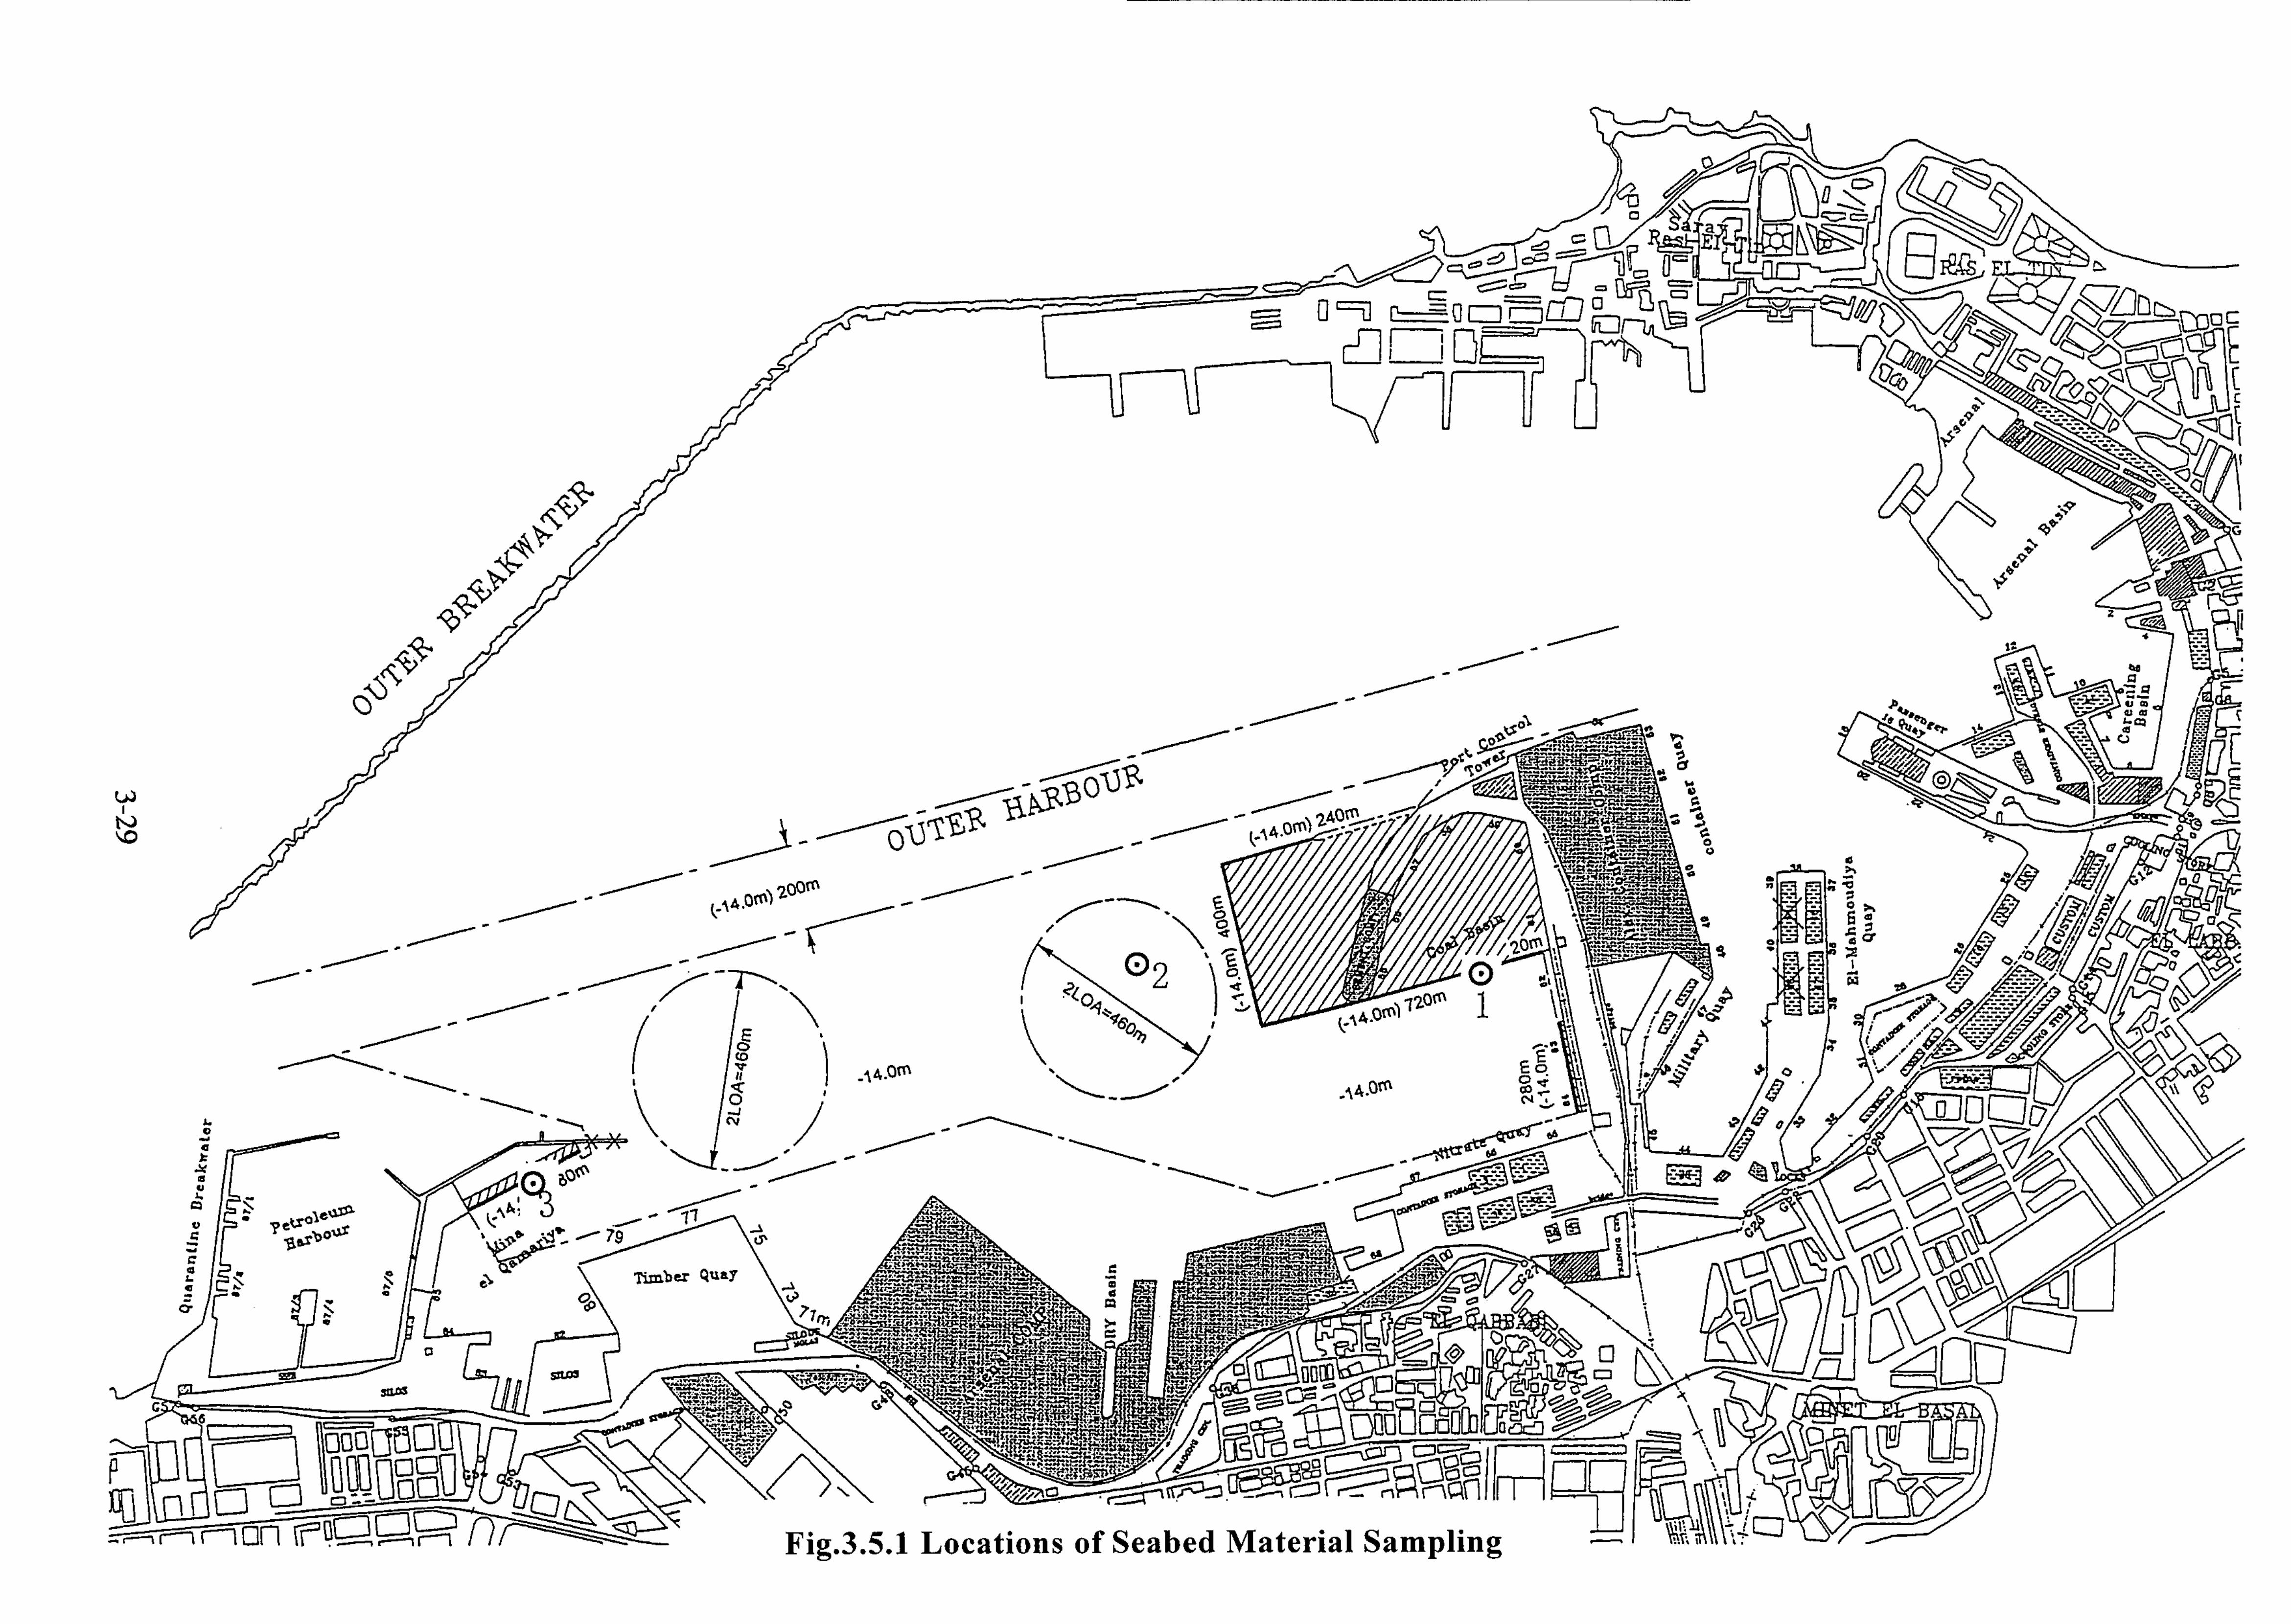
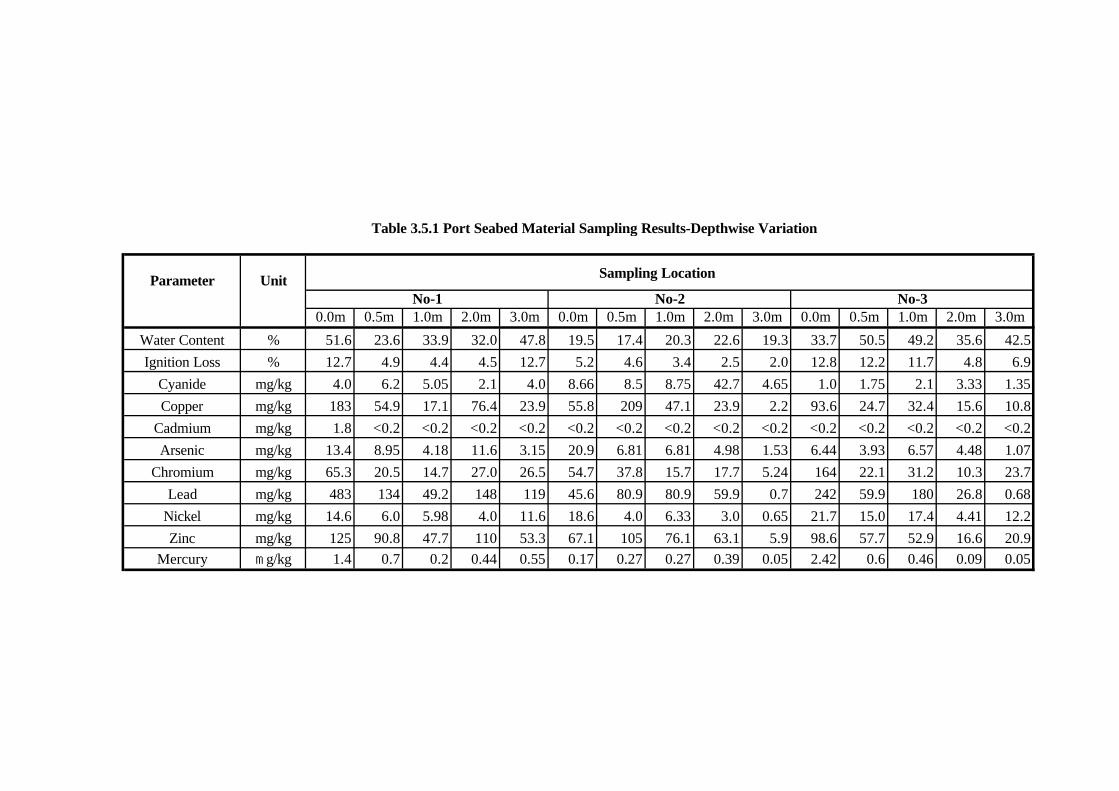
Parameter Unit Sampling Location
No-1 No-2 No-30.0m 0.5m 1.0m 2.0m 3.0m 0.0m 0.5m 1.0m 2.0m 3.0m 0.0m 0.5m 1.0m 2.0m 3.0m
Water Content % 51.6 23.6 33.9 32.0 47.8 19.5 17.4 20.3 22.6 19.3 33.7 50.5 49.2 35.6 42.5
Ignition Loss % 12.7 4.9 4.4 4.5 12.7 5.2 4.6 3.4 2.5 2.0 12.8 12.2 11.7 4.8 6.9
Cyanide mg/kg 4.0 6.2 5.05 2.1 4.0 8.66 8.5 8.75 42.7 4.65 1.0 1.75 2.1 3.33 1.35
Copper mg/kg 183 54.9 17.1 76.4 23.9 55.8 209 47.1 23.9 2.2 93.6 24.7 32.4 15.6 10.8
Cadmium mg/kg 1.8 <0.2 <0.2 <0.2 <0.2 <0.2 <0.2 <0.2 <0.2 <0.2 <0.2 <0.2 <0.2 <0.2 <0.2
Arsenic mg/kg 13.4 8.95 4.18 11.6 3.15 20.9 6.81 6.81 4.98 1.53 6.44 3.93 6.57 4.48 1.07
Chromium mg/kg 65.3 20.5 14.7 27.0 26.5 54.7 37.8 15.7 17.7 5.24 164 22.1 31.2 10.3 23.7
Lead mg/kg 483 134 49.2 148 119 45.6 80.9 80.9 59.9 0.7 242 59.9 180 26.8 0.68
Nickel mg/kg 14.6 6.0 5.98 4.0 11.6 18.6 4.0 6.33 3.0 0.65 21.7 15.0 17.4 4.41 12.2
Zinc mg/kg 125 90.8 47.7 110 53.3 67.1 105 76.1 63.1 5.9 98.6 57.7 52.9 16.6 20.9Mercury mg/kg 1.4 0.7 0.2 0.44 0.55 0.17 0.27 0.27 0.39 0.05 2.42 0.6 0.46 0.09 0.05
Table 3.5.1 Port Seabed Material Sampling Results-Depthwise Variation
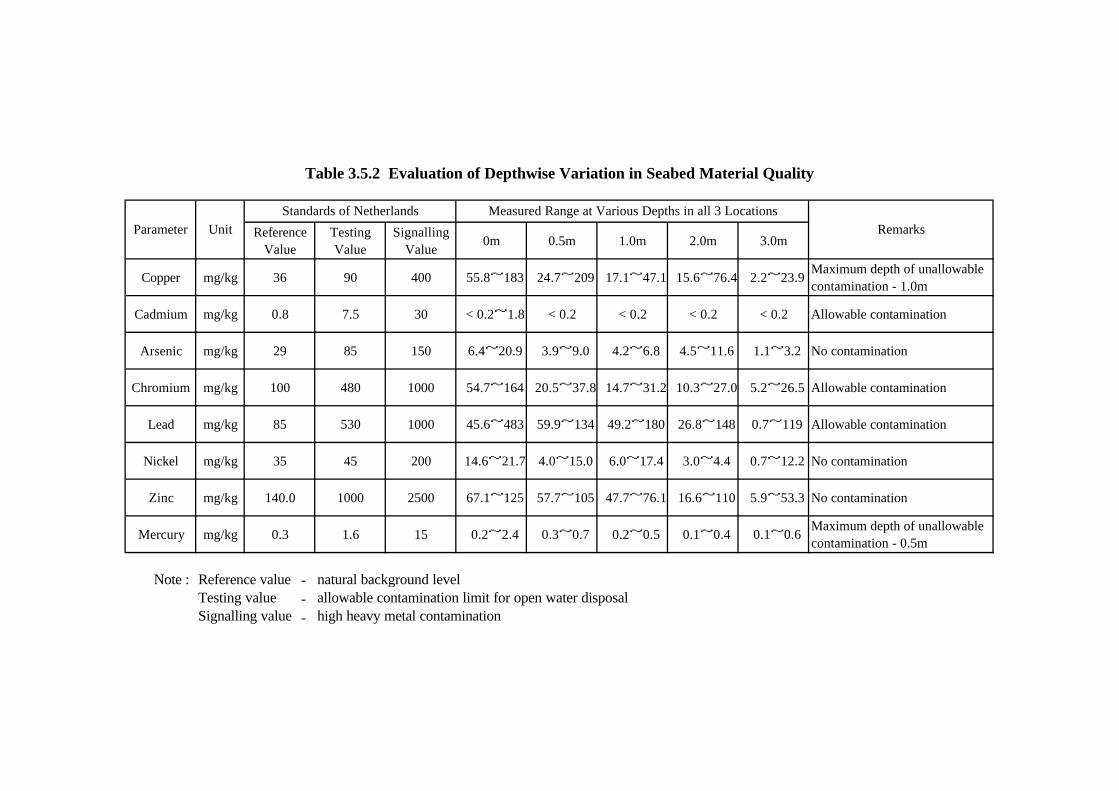
ReferenceValue
TestingValue
SignallingValue
0m 0.5m 1.0m 2.0m 3.0m
Copper mg/kg 36 90 400 55.8~183 24.7~209 17.1~47.1 15.6~76.4 2.2~23.9Maximum depth of unallowablecontamination - 1.0m
Cadmium mg/kg 0.8 7.5 30 < 0.2~1.8 < 0.2 < 0.2 < 0.2 < 0.2 Allowable contamination
Arsenic mg/kg 29 85 150 6.4~20.9 3.9~9.0 4.2~6.8 4.5~11.6 1.1~3.2 No contamination
Chromium mg/kg 100 480 1000 54.7~164 20.5~37.8 14.7~31.2 10.3~27.0 5.2~26.5 Allowable contamination
Lead mg/kg 85 530 1000 45.6~483 59.9~134 49.2~180 26.8~148 0.7~119 Allowable contamination
Nickel mg/kg 35 45 200 14.6~21.7 4.0~15.0 6.0~17.4 3.0~4.4 0.7~12.2 No contamination
Zinc mg/kg 140.0 1000 2500 67.1~125 57.7~105 47.7~76.1 16.6~110 5.9~53.3 No contamination
Mercury mg/kg 0.3 1.6 15 0.2~2.4 0.3~0.7 0.2~0.5 0.1~0.4 0.1~0.6Maximum depth of unallowablecontamination - 0.5m
Note : Reference value natural background levelTesting value allowable contamination limit for open water disposalSignalling value high heavy metal contamination
Remarks
Table 3.5.2 Evaluation of Depthwise Variation in Seabed Material Quality
Standards of NetherlandsParameter Unit
Measured Range at Various Depths in all 3 Locations
---
4-1
Chapter 4 Port Facilities of the Greater Alexandria Port
4.1 General
The Greater Alexandria Port of interest for this study includes the port areas of Alexandria andDikheila districts and is located on the Mediterranean coast near the western part of the Nile RiverDelta. The port is naturally sheltered by a line of shoals and rocky points. Particularly, in the pastdevelopment of the port expansion, the port area is well protected by a succession of man-madebreakwater running roughly parallel to the shoreline to the west in Alexandria port district form Ras-El Tin peak and to the east in Dikheila port district from Tabiyet El Arassiya.
The port of Alexandria has long historical development over thousand years. Homer provides in his“Odyssey Song IV” the most ancient description about Pharous, an isolated island facing to thenorthern Egyptian coast which comprising a good natural harbor used as refuge for vessels. It is RasEl Tin region at present.
Mohamed Ali (1811-1849) was the new creator of modern Alexandria port, establishing Ros-El TinPalace at Phares and supervised the port extension project for Alex yard. After he connected the portof Alexandria directly to the interior of Egypt by the excavation of the Mahoudia Canal, Alexandriaport became the main harbor in Egypt as a gate port to the Mediterranean.
The long history of construction of the port of Alexandria is mainly divided into four phases:(extraction from “LE PORT D’ALEXANDRIE” by B. Malaval, chief engineer of ports &Lighthouses and G. Jondet, assistant chief engineer of ports & Lighthouses, Cairo-1912)
Phase I (1830-1870): The main projects in this phase consist of the construction of two arsenaljetties and basin including dry dock and floating dock.
Phase II (1870-1880): This phase provides the main breakwater (1870-1874) of 2,340 meterstotal length together with 2 branches to form navigational opening of 400 meters wide and theexecution of interior quay walls.
Phase III (1890-1903): The execution of the Begaz Approach Pass of 1,600 meter length, 91 mwidth and 9.25 m depth. The Ras El Tin light house and quay nos. 15-16 of 240 m length, 25m wide and 8 m water depth by adopting floating pontoon were executed. In addition, theconstruction of Gabbary quays (nos. 65-67) was initiated.
Phase IV (1904-1910): The extension and widening of coal mole was executed. Besides, the
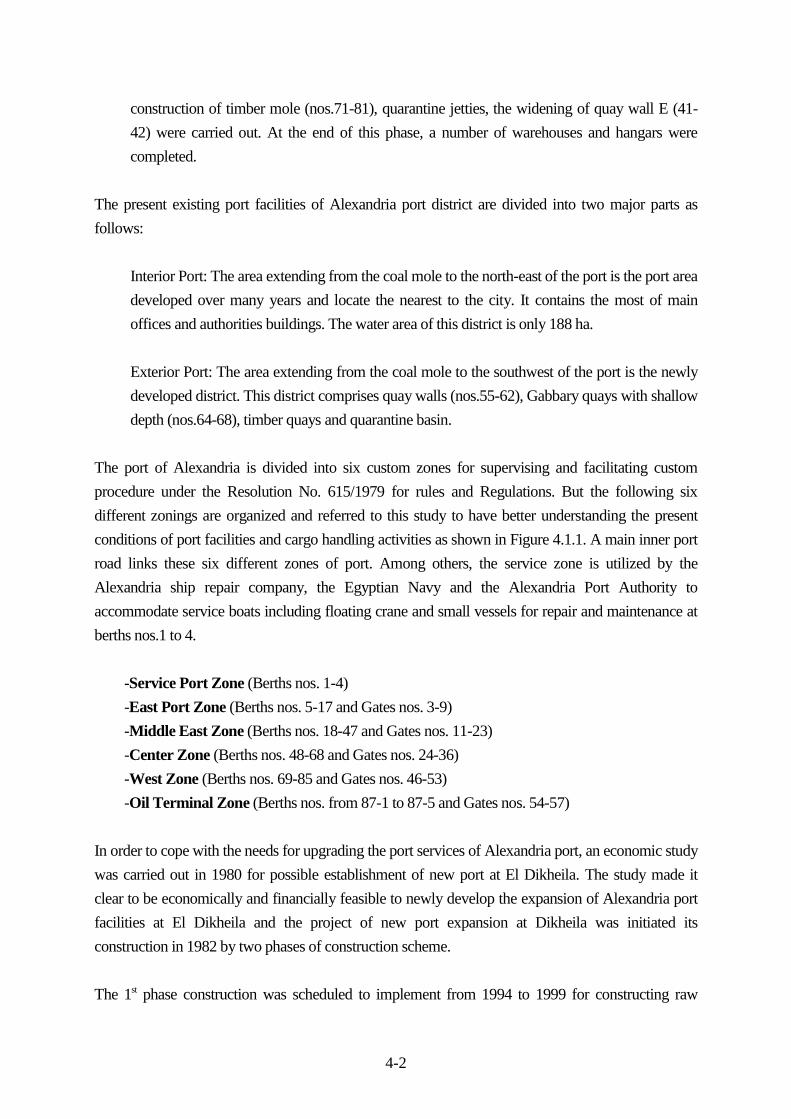
4-2
construction of timber mole (nos.71-81), quarantine jetties, the widening of quay wall E (41-42) were carried out. At the end of this phase, a number of warehouses and hangars werecompleted.
The present existing port facilities of Alexandria port district are divided into two major parts asfollows:
Interior Port: The area extending from the coal mole to the north-east of the port is the port areadeveloped over many years and locate the nearest to the city. It contains the most of mainoffices and authorities buildings. The water area of this district is only 188 ha.
Exterior Port: The area extending from the coal mole to the southwest of the port is the newlydeveloped district. This district comprises quay walls (nos.55-62), Gabbary quays with shallowdepth (nos.64-68), timber quays and quarantine basin.
The port of Alexandria is divided into six custom zones for supervising and facilitating customprocedure under the Resolution No. 615/1979 for rules and Regulations. But the following sixdifferent zonings are organized and referred to this study to have better understanding the presentconditions of port facilities and cargo handling activities as shown in Figure 4.1.1. A main inner portroad links these six different zones of port. Among others, the service zone is utilized by theAlexandria ship repair company, the Egyptian Navy and the Alexandria Port Authority toaccommodate service boats including floating crane and small vessels for repair and maintenance atberths nos.1 to 4.
-Service Port Zone (Berths nos. 1-4)-East Port Zone (Berths nos. 5-17 and Gates nos. 3-9)-Middle East Zone (Berths nos. 18-47 and Gates nos. 11-23)-Center Zone (Berths nos. 48-68 and Gates nos. 24-36)-West Zone (Berths nos. 69-85 and Gates nos. 46-53)-Oil Terminal Zone (Berths nos. from 87-1 to 87-5 and Gates nos. 54-57)
In order to cope with the needs for upgrading the port services of Alexandria port, an economic studywas carried out in 1980 for possible establishment of new port at El Dikheila. The study made itclear to be economically and financially feasible to newly develop the expansion of Alexandria portfacilities at El Dikheila and the project of new port expansion at Dikheila was initiated itsconstruction in 1982 by two phases of construction scheme.
The 1st phase construction was scheduled to implement from 1994 to 1999 for constructing raw

4-3
material berth (No. 1 pier), container berth and general cargo berth. Although the succeeding 2nd
phase construction was included the second raw material berth (No.2), dangerous cargo berth andchemical berth, its implementation is being under suspension at present. Nevertheless, the Dikheilaport now provides 2,210 meters total length of berths having 12 to 20 meters water depths which iscapable of larger size of such vessels as 160,000DWT bulk carrier or Post-Panamax type containercarrier.
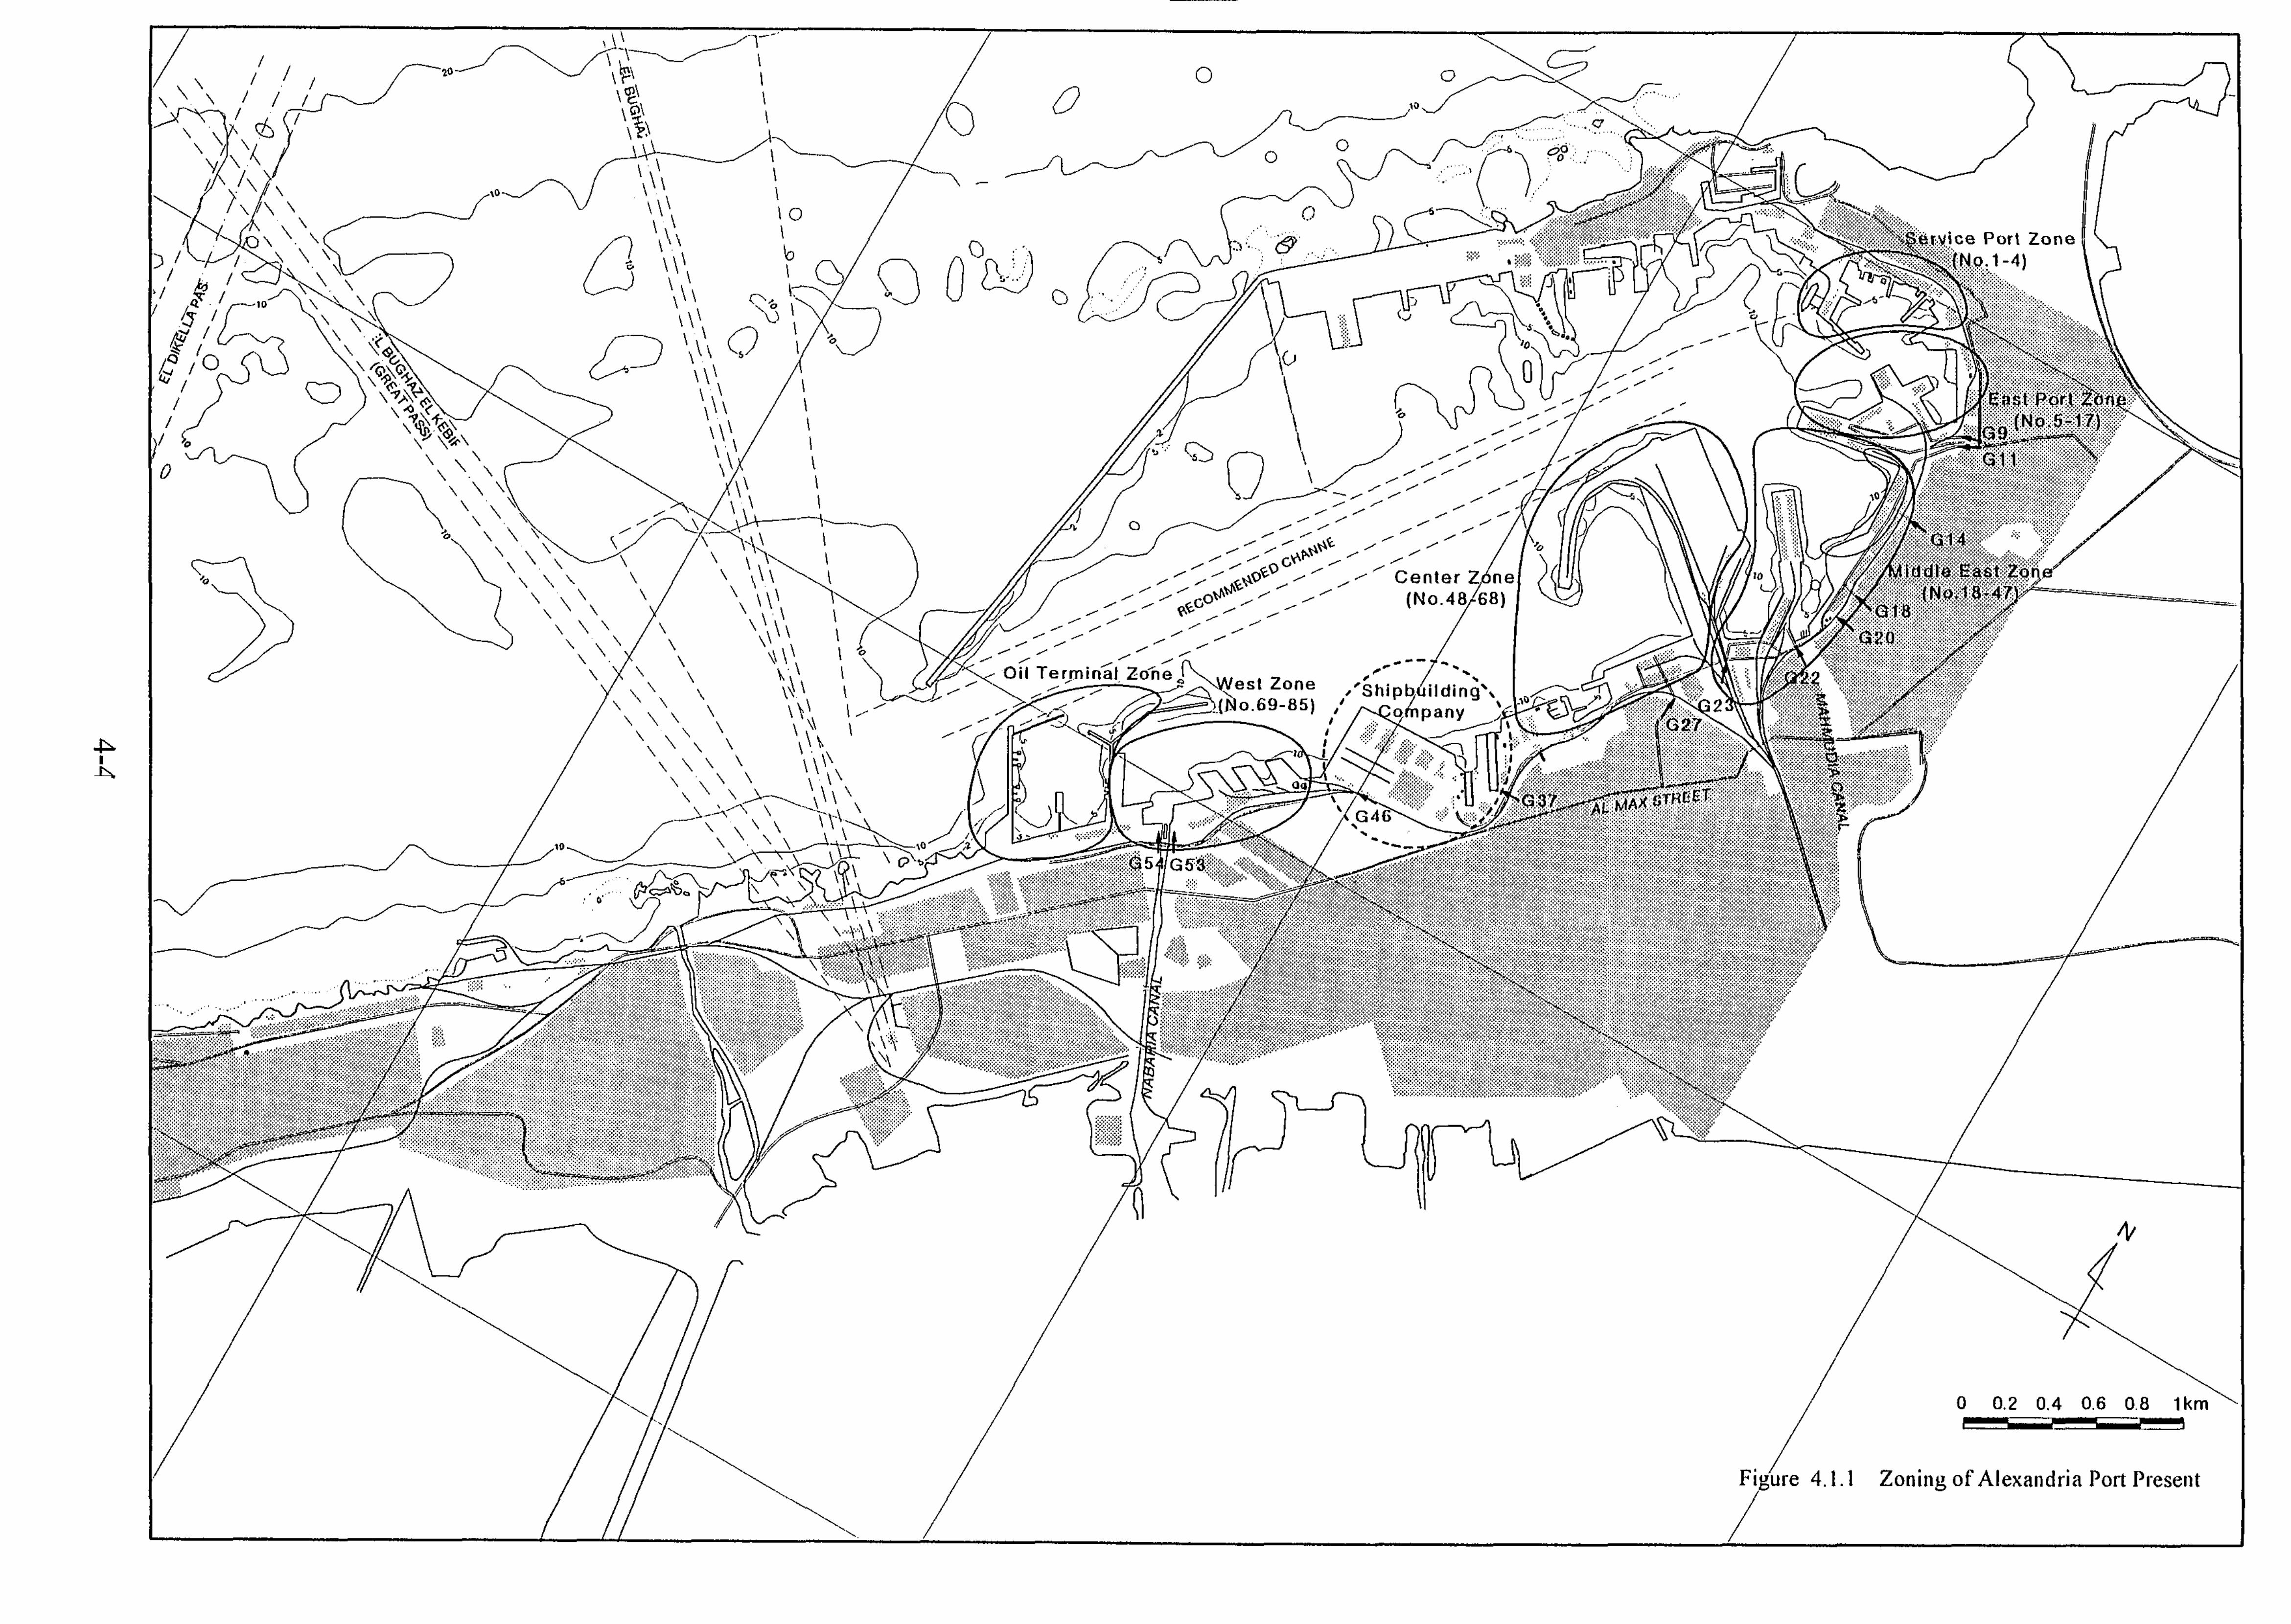
4-5
4.2. Port Facilities
4.2.1 Quay Walls
The port of Alexandria has been developed over many years in the past and in consequence thefeatures of series of berths and basins varies by district of the port in lengths, water depths and shapes.But, the most of quay wall structures are the gravity type of concrete blocks placed upon the rubblemound base on the sea bottom or on the replaced sandy soils for excavated loose sands or soft siltysoils. This standard type of construction by means of concrete block wall structure are typicallyadopted by the APA to recent construction for expansion of existing berth at the Alexandria port aswell as new construction at the Dikheila port. A typical section of the present quay wall structure ispresented in Figure 4.2.1.
The berth facilities at each zone of Alexandria port together with those at Dikheila are listed into theTables 4.2.1 as a summary of berth facilities.
Unlike those newly constructed quay wall structures at Dikheila district, the port facilities ofAlexandria are constituted of an old complicated alignment with water depth full of variety. Due tothe long history of construction, existing quay walls has narrow space of apron and back-up port areawhich are not considered wide enough and not suitable for modern cargo handling operation.
At present, the APA is implementing the modernization of quay wall structures. Among others, thequay walls from berth nos. 71 to 82 at west zone are rehabilitated to form new pier with wide back-port area. The construction for this rehabilitation was completed in summer 1998, by reclaiming ofold fashioned comb shaped piers. The most of newly constructed quay wall except for those of oldstructures are set out at the elevation of quay wall face line of 2.4 meters above the lowest low waterlevel which is equal to the Port Datum Level (D.L.).
The tables 4.2.2 (1) to (6) are a list of the existing quay wall facilities of the port of Alexandria byberth number as well as those of the port of Dikheila.
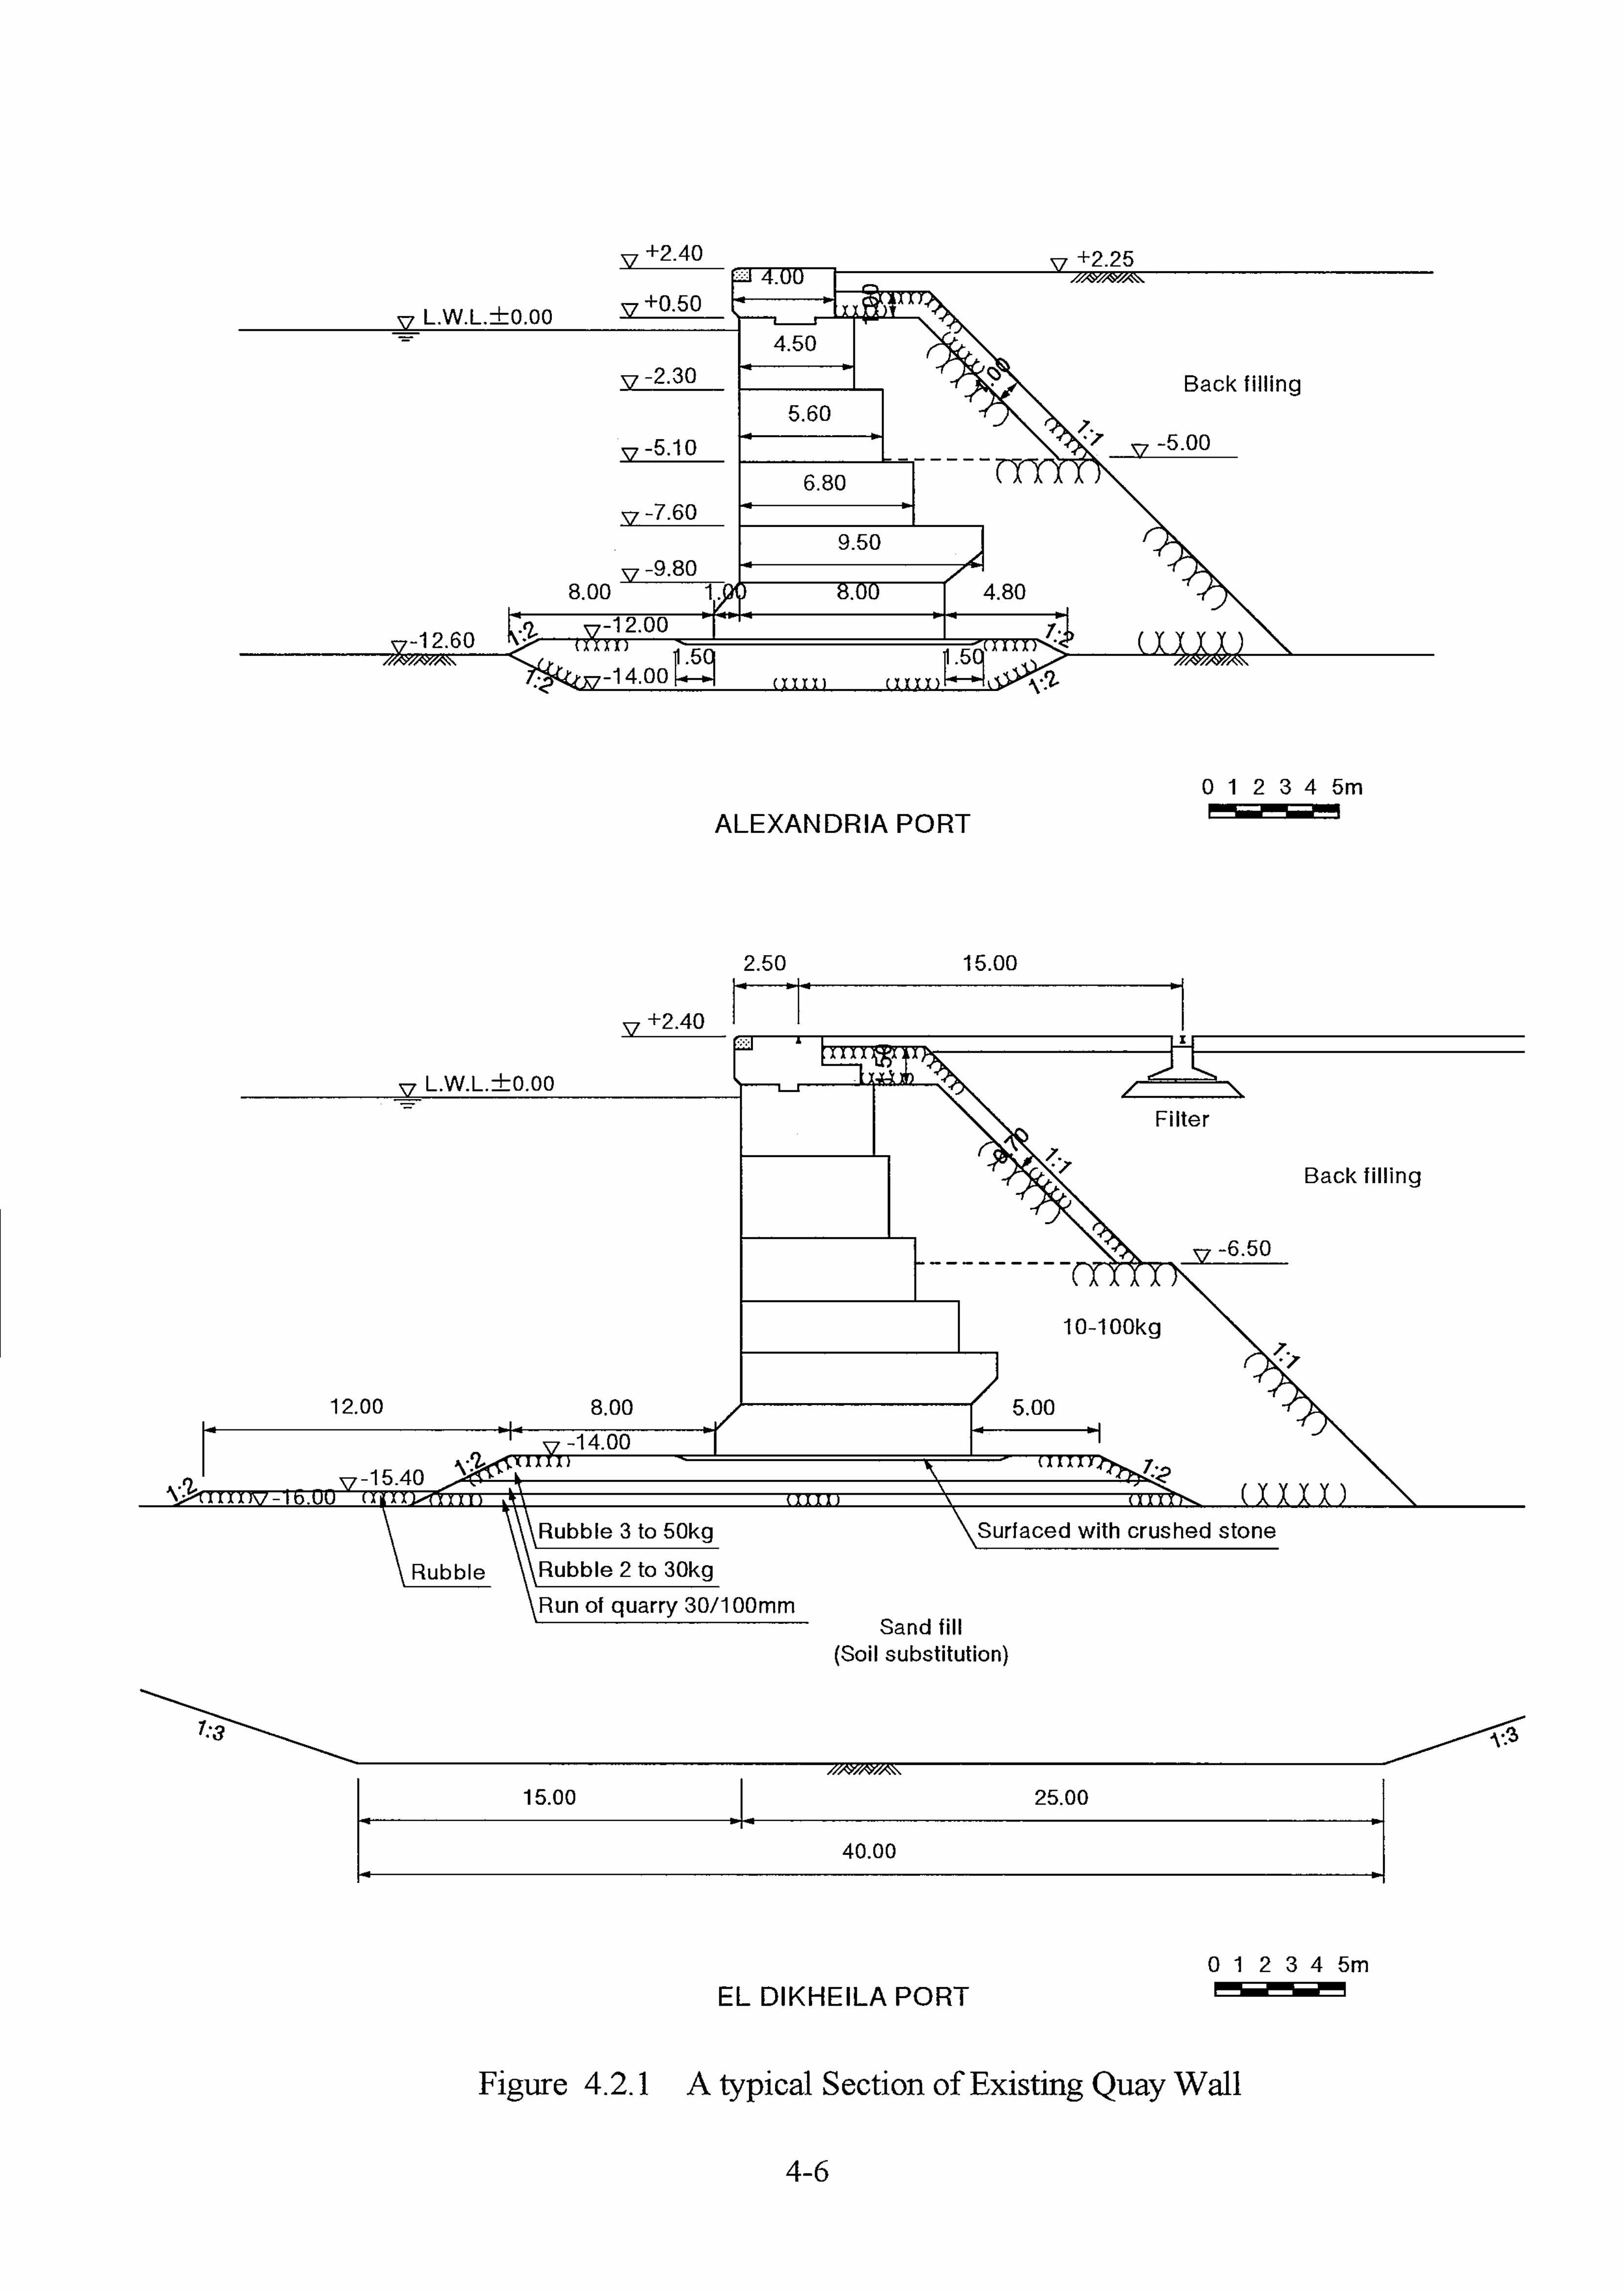
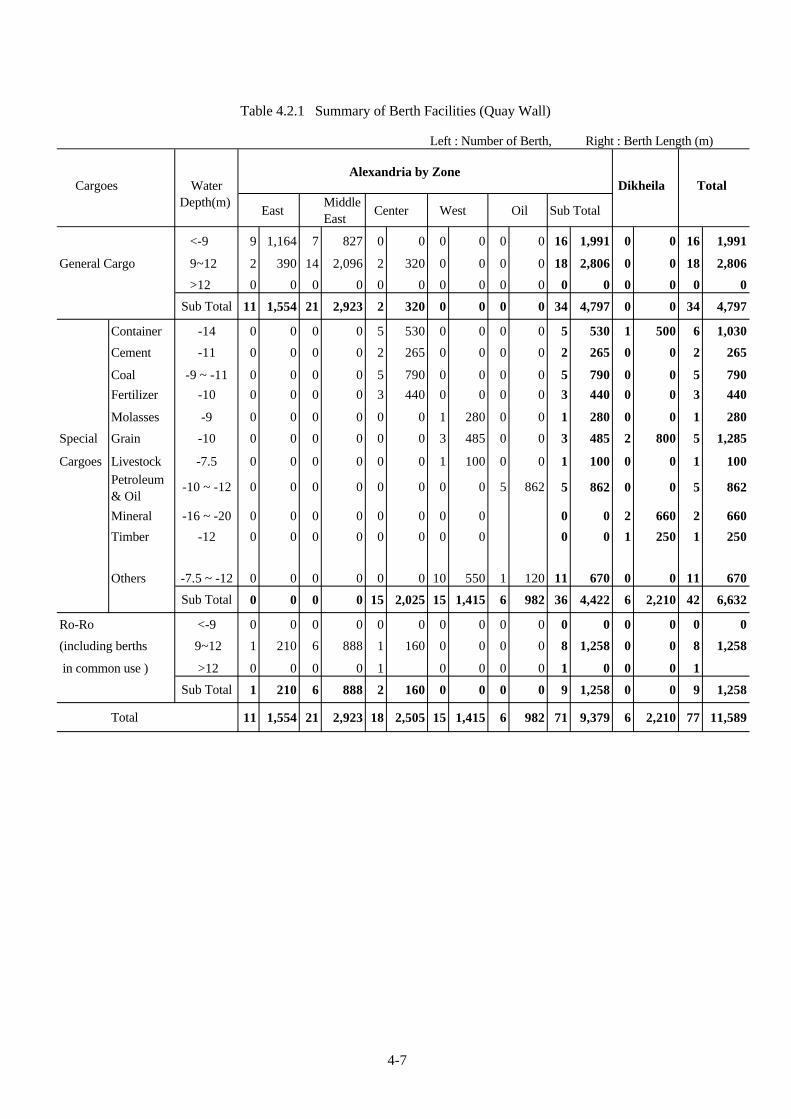
Table 4.2.1 Summary of Berth Facilities (Quay Wall)
Left : Number of Berth, Right : Berth Length (m)
Cargoes Water Alexandria by Zone
Dikheila TotalDepth(m)
East MiddleEast
Center West Oil Sub Total
<-9 9 1,164 7 827 0 0 0 0 0 0 16 1,991 0 0 16 1,991
General Cargo 9~12 2 390 14 2,096 2 320 0 0 0 0 18 2,806 0 0 18 2,806
>12 0 0 0 0 0 0 0 0 0 0 0 0 0 0 0 0
Sub Total 11 1,554 21 2,923 2 320 0 0 0 0 34 4,797 0 0 34 4,797
Container -14 0 0 0 0 5 530 0 0 0 0 5 530 1 500 6 1,030
Cement -11 0 0 0 0 2 265 0 0 0 0 2 265 0 0 2 265
Coal -9 ~ -11 0 0 0 0 5 790 0 0 0 0 5 790 0 0 5 790
Fertilizer -10 0 0 0 0 3 440 0 0 0 0 3 440 0 0 3 440
Molasses -9 0 0 0 0 0 0 1 280 0 0 1 280 0 0 1 280
Special Grain -10 0 0 0 0 0 0 3 485 0 0 3 485 2 800 5 1,285
Cargoes Livestock -7.5 0 0 0 0 0 0 1 100 0 0 1 100 0 0 1 100Petroleum& Oil
-10 ~ -12 0 0 0 0 0 0 0 0 5 862 5 862 0 0 5 862
Mineral -16 ~ -20 0 0 0 0 0 0 0 0 0 0 2 660 2 660
Timber -12 0 0 0 0 0 0 0 0 0 0 1 250 1 250
Others -7.5 ~ -12 0 0 0 0 0 0 10 550 1 120 11 670 0 0 11 670
Sub Total 0 0 0 0 15 2,025 15 1,415 6 982 36 4,422 6 2,210 42 6,632
Ro-Ro <-9 0 0 0 0 0 0 0 0 0 0 0 0 0 0 0 0
(including berths 9~12 1 210 6 888 1 160 0 0 0 0 8 1,258 0 0 8 1,258
in common use ) >12 0 0 0 0 1 0 0 0 0 1 0 0 0 1
Sub Total 1 210 6 888 2 160 0 0 0 0 9 1,258 0 0 9 1,258
Total 11 1,554 21 2,923 18 2,505 15 1,415 6 982 71 9,379 6 2,210 77 11,589
4-7
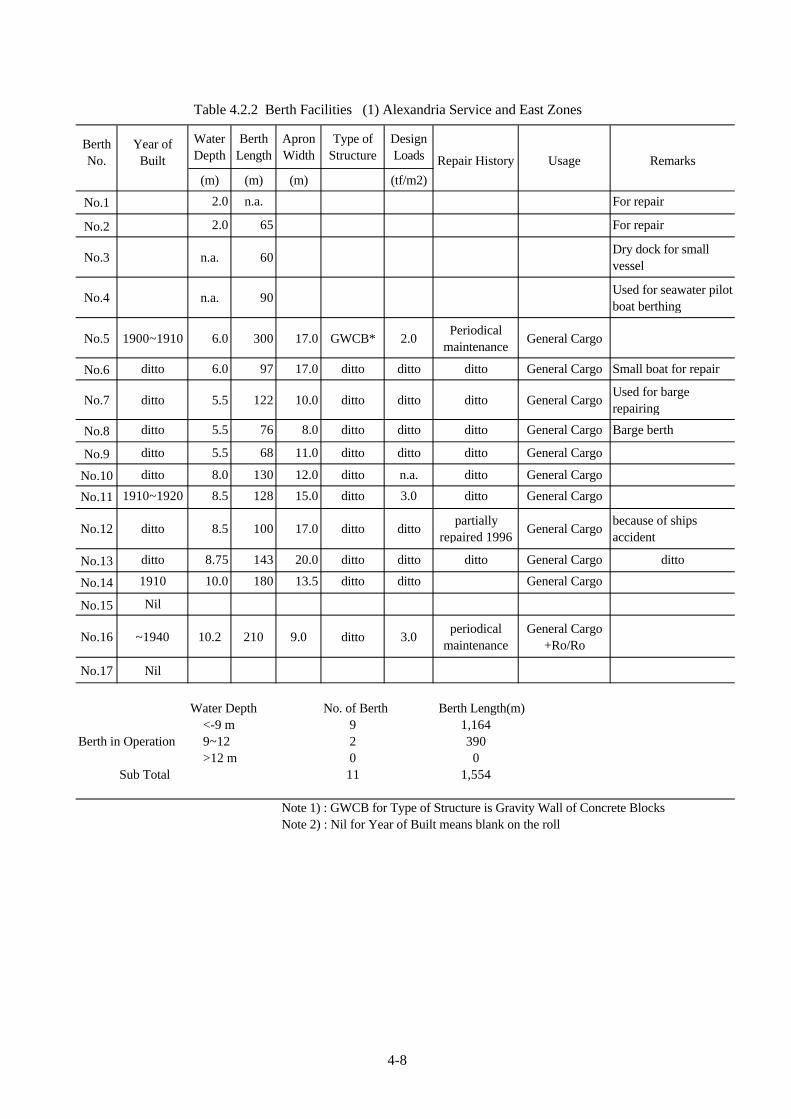
Table 4.2.2 Berth Facilities (1) Alexandria Service and East Zones
BerthNo.
Year ofBuilt
WaterDepth
BerthLength
ApronWidth
Type ofStructure
DesignLoads Repair History Usage Remarks
(m) (m) (m) (tf/m2)
No.1 2.0 n.a. For repair
No.2 2.0 65 For repair
No.3 n.a. 60Dry dock for smallvessel
No.4 n.a. 90Used for seawater pilotboat berthing
No.5 1900~1910 6.0 300 17.0 GWCB* 2.0Periodical
maintenanceGeneral Cargo
No.6 ditto 6.0 97 17.0 ditto ditto ditto General Cargo Small boat for repair
No.7 ditto 5.5 122 10.0 ditto ditto ditto General CargoUsed for bargerepairing
No.8 ditto 5.5 76 8.0 ditto ditto ditto General Cargo Barge berth
No.9 ditto 5.5 68 11.0 ditto ditto ditto General Cargo
No.10 ditto 8.0 130 12.0 ditto n.a. ditto General Cargo
No.11 1910~1920 8.5 128 15.0 ditto 3.0 ditto General Cargo
No.12 ditto 8.5 100 17.0 ditto dittopartially
repaired 1996General Cargo
because of shipsaccident
No.13 ditto 8.75 143 20.0 ditto ditto ditto General Cargo ditto
No.14 1910 10.0 180 13.5 ditto ditto General Cargo
No.15 Nil
No.16 ~1940 10.2 210 9.0 ditto 3.0periodical
maintenanceGeneral Cargo
+Ro/Ro
No.17 Nil
Water Depth No. of Berth Berth Length(m) <-9 m 9 1,164
Berth in Operation 9~12 2 390 >12 m 0 0
Sub Total 11 1,554
Note 1) : GWCB for Type of Structure is Gravity Wall of Concrete Blocks Note 2) : Nil for Year of Built means blank on the roll
4-8
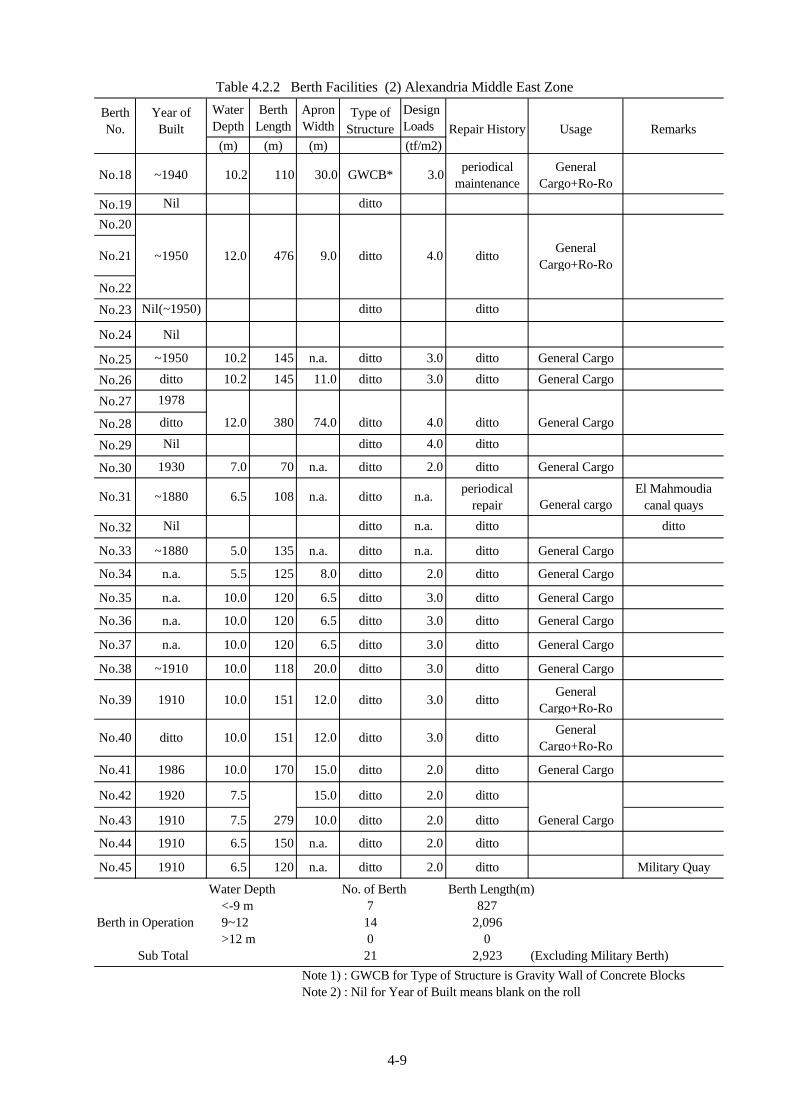
Table 4.2.2 Berth Facilities (2) Alexandria Middle East Zone
BerthNo.
Year ofBuilt
WaterDepth
BerthLength
ApronWidth
Type ofStructure
DesignLoads Repair History Usage Remarks
(m) (m) (m) (tf/m2)
No.18 ~1940 10.2 110 30.0 GWCB* 3.0periodical
maintenanceGeneral
Cargo+Ro-Ro
No.19 Nil ditto
No.20
No.21 ~1950 12.0 476 9.0 ditto 4.0 dittoGeneral
Cargo+Ro-Ro
No.22
No.23 Nil(~1950) ditto ditto
No.24 Nil
No.25 ~1950 10.2 145 n.a. ditto 3.0 ditto General Cargo
No.26 ditto 10.2 145 11.0 ditto 3.0 ditto General Cargo
No.27 1978
No.28 ditto 12.0 380 74.0 ditto 4.0 ditto General Cargo
No.29 Nil ditto 4.0 ditto
No.30 1930 7.0 70 n.a. ditto 2.0 ditto General Cargo
No.31 ~1880 6.5 108 n.a. ditto n.a.periodical
repair General cargoEl Mahmoudia
canal quays
No.32 Nil ditto n.a. ditto ditto
No.33 ~1880 5.0 135 n.a. ditto n.a. ditto General Cargo
No.34 n.a. 5.5 125 8.0 ditto 2.0 ditto General Cargo
No.35 n.a. 10.0 120 6.5 ditto 3.0 ditto General Cargo
No.36 n.a. 10.0 120 6.5 ditto 3.0 ditto General Cargo
No.37 n.a. 10.0 120 6.5 ditto 3.0 ditto General Cargo
No.38 ~1910 10.0 118 20.0 ditto 3.0 ditto General Cargo
No.39 1910 10.0 151 12.0 ditto 3.0 dittoGeneral
Cargo+Ro-Ro
No.40 ditto 10.0 151 12.0 ditto 3.0 dittoGeneral
Cargo+Ro-Ro
No.41 1986 10.0 170 15.0 ditto 2.0 ditto General Cargo
No.42 1920 7.5 15.0 ditto 2.0 ditto
No.43 1910 7.5 279 10.0 ditto 2.0 ditto General Cargo
No.44 1910 6.5 150 n.a. ditto 2.0 ditto
No.45 1910 6.5 120 n.a. ditto 2.0 ditto Military Quay
Water Depth No. of Berth Berth Length(m) <-9 m 7 827
Berth in Operation 9~12 14 2,096 >12 m 0 0
Sub Total 21 2,923 (Excluding Military Berth)
Note 1) : GWCB for Type of Structure is Gravity Wall of Concrete Blocks Note 2) : Nil for Year of Built means blank on the roll
4-9
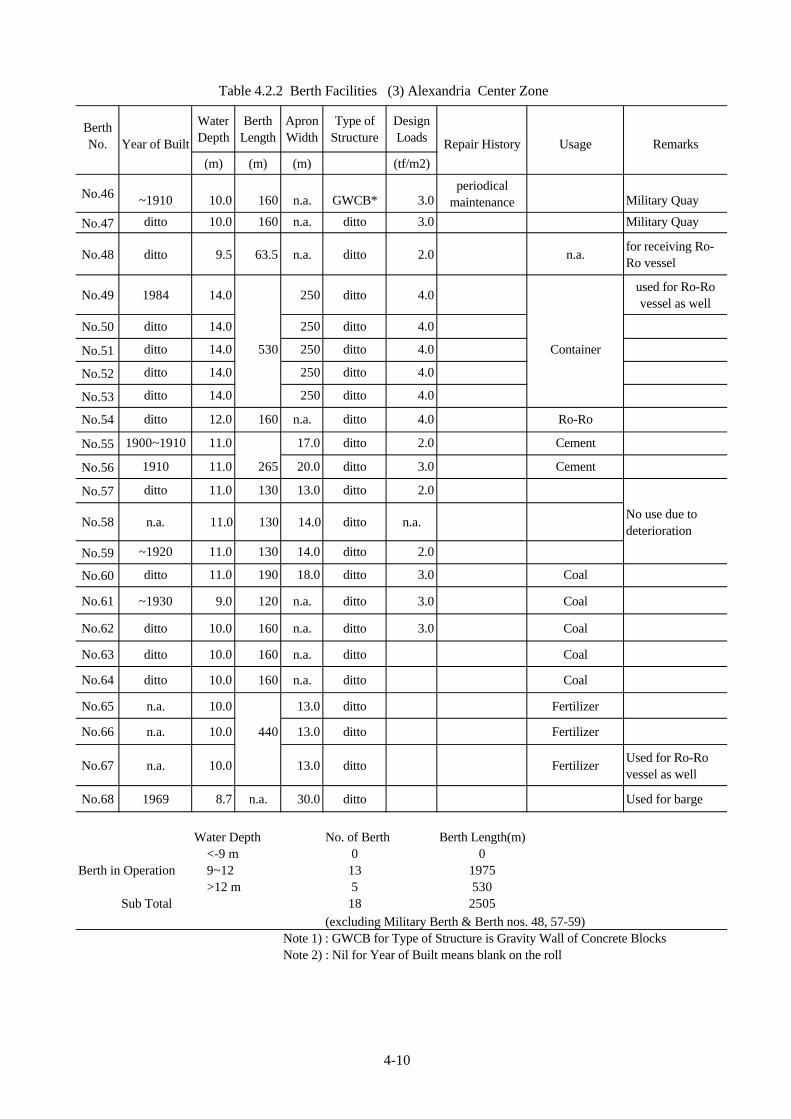
Table 4.2.2 Berth Facilities (3) Alexandria Center Zone
BerthNo. Year of Built
WaterDepth
BerthLength
ApronWidth
Type ofStructure
DesignLoads Repair History Usage Remarks
(m) (m) (m) (tf/m2)
No.46 ~1910 10.0 160 n.a. GWCB* 3.0periodical
maintenance Military Quay
No.47 ditto 10.0 160 n.a. ditto 3.0 Military Quay
No.48 ditto 9.5 63.5 n.a. ditto 2.0 n.a.for receiving Ro-Ro vessel
No.49 1984 14.0 250 ditto 4.0used for Ro-Rovessel as well
No.50 ditto 14.0 250 ditto 4.0
No.51 ditto 14.0 530 250 ditto 4.0 Container
No.52 ditto 14.0 250 ditto 4.0
No.53 ditto 14.0 250 ditto 4.0
No.54 ditto 12.0 160 n.a. ditto 4.0 Ro-Ro
No.55 1900~1910 11.0 17.0 ditto 2.0 Cement
No.56 1910 11.0 265 20.0 ditto 3.0 Cement
No.57 ditto 11.0 130 13.0 ditto 2.0
No.58 n.a. 11.0 130 14.0 ditto n.a.No use due todeterioration
No.59 ~1920 11.0 130 14.0 ditto 2.0
No.60 ditto 11.0 190 18.0 ditto 3.0 Coal
No.61 ~1930 9.0 120 n.a. ditto 3.0 Coal
No.62 ditto 10.0 160 n.a. ditto 3.0 Coal
No.63 ditto 10.0 160 n.a. ditto Coal
No.64 ditto 10.0 160 n.a. ditto Coal
No.65 n.a. 10.0 13.0 ditto Fertilizer
No.66 n.a. 10.0 440 13.0 ditto Fertilizer
No.67 n.a. 10.0 13.0 ditto FertilizerUsed for Ro-Rovessel as well
No.68 1969 8.7 n.a. 30.0 ditto Used for barge
Water Depth No. of Berth Berth Length(m) <-9 m 0 0
Berth in Operation 9~12 13 1975 >12 m 5 530
Sub Total 18 2505(excluding Military Berth & Berth nos. 48, 57-59)
Note 1) : GWCB for Type of Structure is Gravity Wall of Concrete BlocksNote 2) : Nil for Year of Built means blank on the roll
4-10
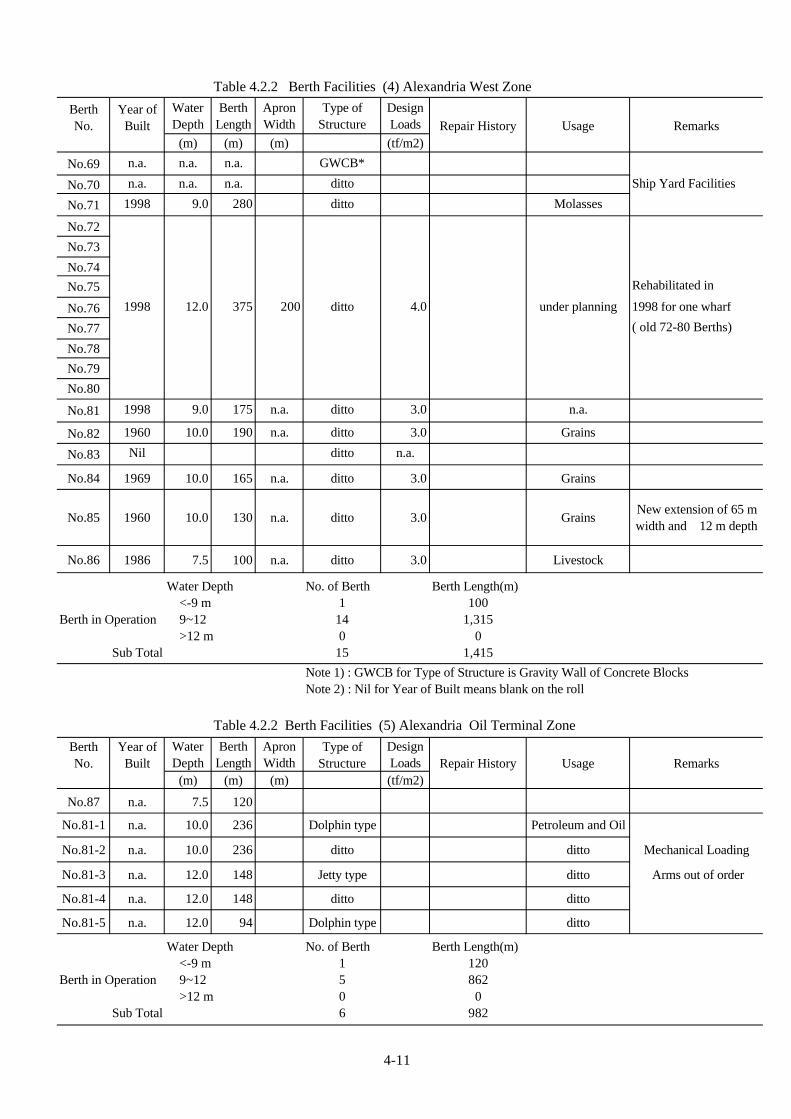
Table 4.2.2 Berth Facilities (4) Alexandria West Zone
BerthNo.
Year ofBuilt
WaterDepth
BerthLength
ApronWidth
Type ofStructure
DesignLoads Repair History Usage Remarks
(m) (m) (m) (tf/m2)
No.69 n.a. n.a. n.a. GWCB*
No.70 n.a. n.a. n.a. ditto Ship Yard Facilities
No.71 1998 9.0 280 ditto Molasses
No.72
No.73
No.74
No.75 Rehabilitated in
No.76 1998 12.0 375 200 ditto 4.0 under planning 1998 for one wharf
No.77 ( old 72-80 Berths)
No.78
No.79
No.80
No.81 1998 9.0 175 n.a. ditto 3.0 n.a.
No.82 1960 10.0 190 n.a. ditto 3.0 Grains
No.83 Nil ditto n.a.
No.84 1969 10.0 165 n.a. ditto 3.0 Grains
No.85 1960 10.0 130 n.a. ditto 3.0 GrainsNew extension of 65 mwidth and 12 m depth
No.86 1986 7.5 100 n.a. ditto 3.0 Livestock
Water Depth No. of Berth Berth Length(m) <-9 m 1 100
Berth in Operation 9~12 14 1,315 >12 m 0 0
Sub Total 15 1,415
Note 1) : GWCB for Type of Structure is Gravity Wall of Concrete BlocksNote 2) : Nil for Year of Built means blank on the roll
Table 4.2.2 Berth Facilities (5) Alexandria Oil Terminal Zone
BerthNo.
Year ofBuilt
WaterDepth
BerthLength
ApronWidth
Type ofStructure
DesignLoads Repair History Usage Remarks
(m) (m) (m) (tf/m2)
No.87 n.a. 7.5 120
No.81-1 n.a. 10.0 236 Dolphin type Petroleum and Oil
No.81-2 n.a. 10.0 236 ditto ditto Mechanical Loading
No.81-3 n.a. 12.0 148 Jetty type ditto Arms out of order
No.81-4 n.a. 12.0 148 ditto ditto
No.81-5 n.a. 12.0 94 Dolphin type ditto
Water Depth No. of Berth Berth Length(m) <-9 m 1 120
Berth in Operation 9~12 5 862 >12 m 0 0
Sub Total 6 982
4-11
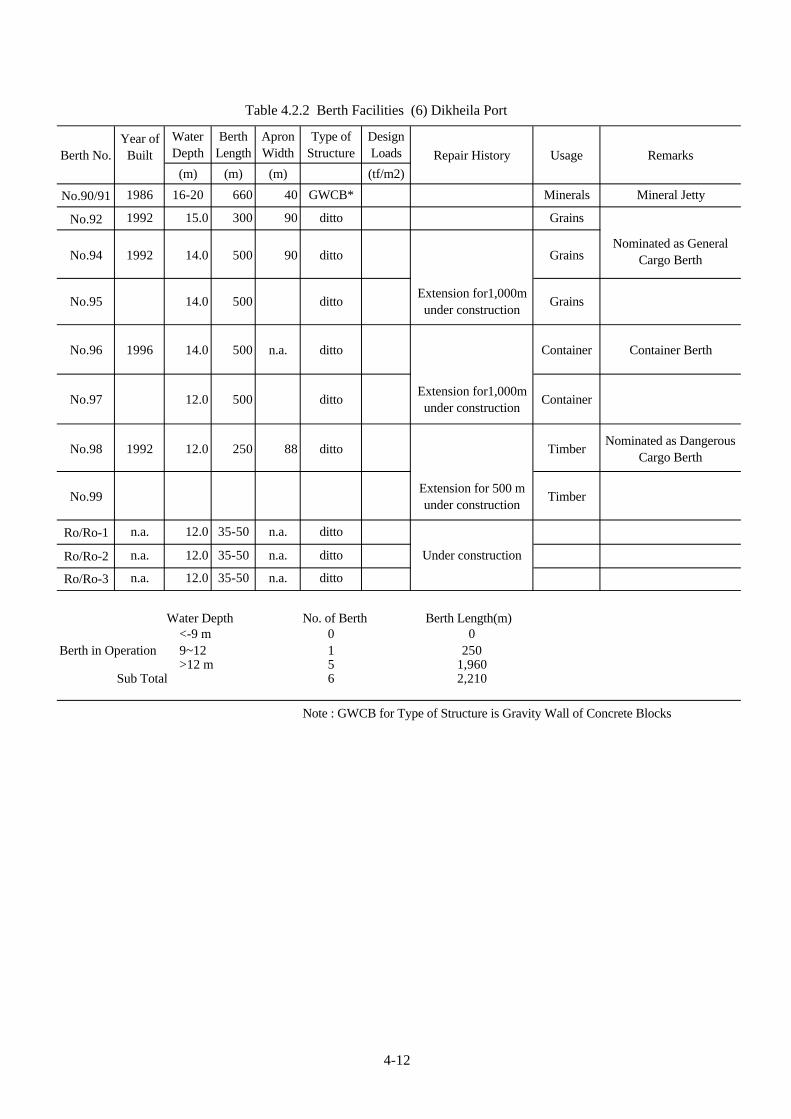
Table 4.2.2 Berth Facilities (6) Dikheila Port
Berth No.Year of
Built
WaterDepth
BerthLength
ApronWidth
Type ofStructure
DesignLoads Repair History Usage Remarks
(m) (m) (m) (tf/m2)
No.90/91 1986 16-20 660 40 GWCB* Minerals Mineral Jetty
No.92 1992 15.0 300 90 ditto Grains
No.94 1992 14.0 500 90 ditto GrainsNominated as General
Cargo Berth
No.95 14.0 500 dittoExtension for1,000munder construction
Grains
No.96 1996 14.0 500 n.a. ditto Container Container Berth
No.97 12.0 500 dittoExtension for1,000munder construction
Container
No.98 1992 12.0 250 88 ditto TimberNominated as Dangerous
Cargo Berth
No.99Extension for 500 munder construction
Timber
Ro/Ro-1 n.a. 12.0 35-50 n.a. ditto
Ro/Ro-2 n.a. 12.0 35-50 n.a. ditto Under construction
Ro/Ro-3 n.a. 12.0 35-50 n.a. ditto
Water Depth No. of Berth Berth Length(m) <-9 m 0 0
Berth in Operation 9~12 1 250 >12 m 5 1,960
Sub Total 6 2,210
Note : GWCB for Type of Structure is Gravity Wall of Concrete Blocks
4-12
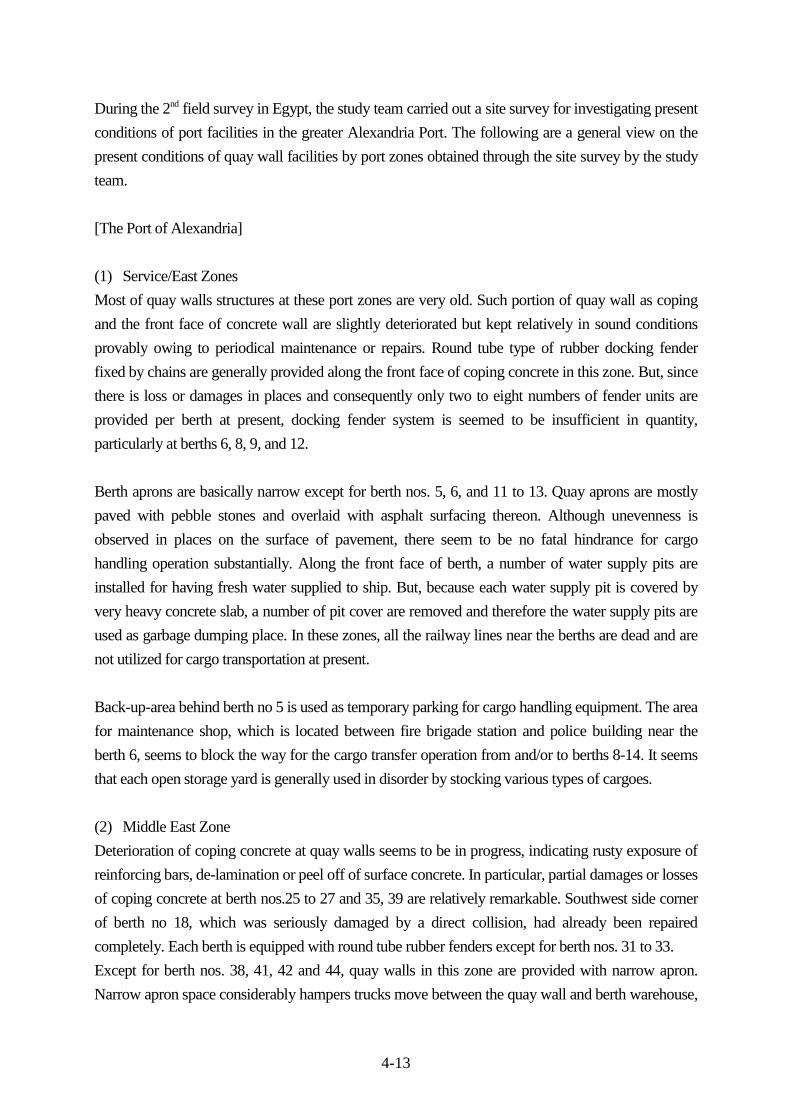
4-13
During the 2nd field survey in Egypt, the study team carried out a site survey for investigating presentconditions of port facilities in the greater Alexandria Port. The following are a general view on thepresent conditions of quay wall facilities by port zones obtained through the site survey by the studyteam.
[The Port of Alexandria]
(1) Service/East ZonesMost of quay walls structures at these port zones are very old. Such portion of quay wall as copingand the front face of concrete wall are slightly deteriorated but kept relatively in sound conditionsprovably owing to periodical maintenance or repairs. Round tube type of rubber docking fenderfixed by chains are generally provided along the front face of coping concrete in this zone. But, sincethere is loss or damages in places and consequently only two to eight numbers of fender units areprovided per berth at present, docking fender system is seemed to be insufficient in quantity,particularly at berths 6, 8, 9, and 12.
Berth aprons are basically narrow except for berth nos. 5, 6, and 11 to 13. Quay aprons are mostlypaved with pebble stones and overlaid with asphalt surfacing thereon. Although unevenness isobserved in places on the surface of pavement, there seem to be no fatal hindrance for cargohandling operation substantially. Along the front face of berth, a number of water supply pits areinstalled for having fresh water supplied to ship. But, because each water supply pit is covered byvery heavy concrete slab, a number of pit cover are removed and therefore the water supply pits areused as garbage dumping place. In these zones, all the railway lines near the berths are dead and arenot utilized for cargo transportation at present.
Back-up-area behind berth no 5 is used as temporary parking for cargo handling equipment. The areafor maintenance shop, which is located between fire brigade station and police building near theberth 6, seems to block the way for the cargo transfer operation from and/or to berths 8-14. It seemsthat each open storage yard is generally used in disorder by stocking various types of cargoes.
(2) Middle East ZoneDeterioration of coping concrete at quay walls seems to be in progress, indicating rusty exposure ofreinforcing bars, de-lamination or peel off of surface concrete. In particular, partial damages or lossesof coping concrete at berth nos.25 to 27 and 35, 39 are relatively remarkable. Southwest side cornerof berth no 18, which was seriously damaged by a direct collision, had already been repairedcompletely. Each berth is equipped with round tube rubber fenders except for berth nos. 31 to 33.Except for berth nos. 38, 41, 42 and 44, quay walls in this zone are provided with narrow apron.Narrow apron space considerably hampers trucks move between the quay wall and berth warehouse,
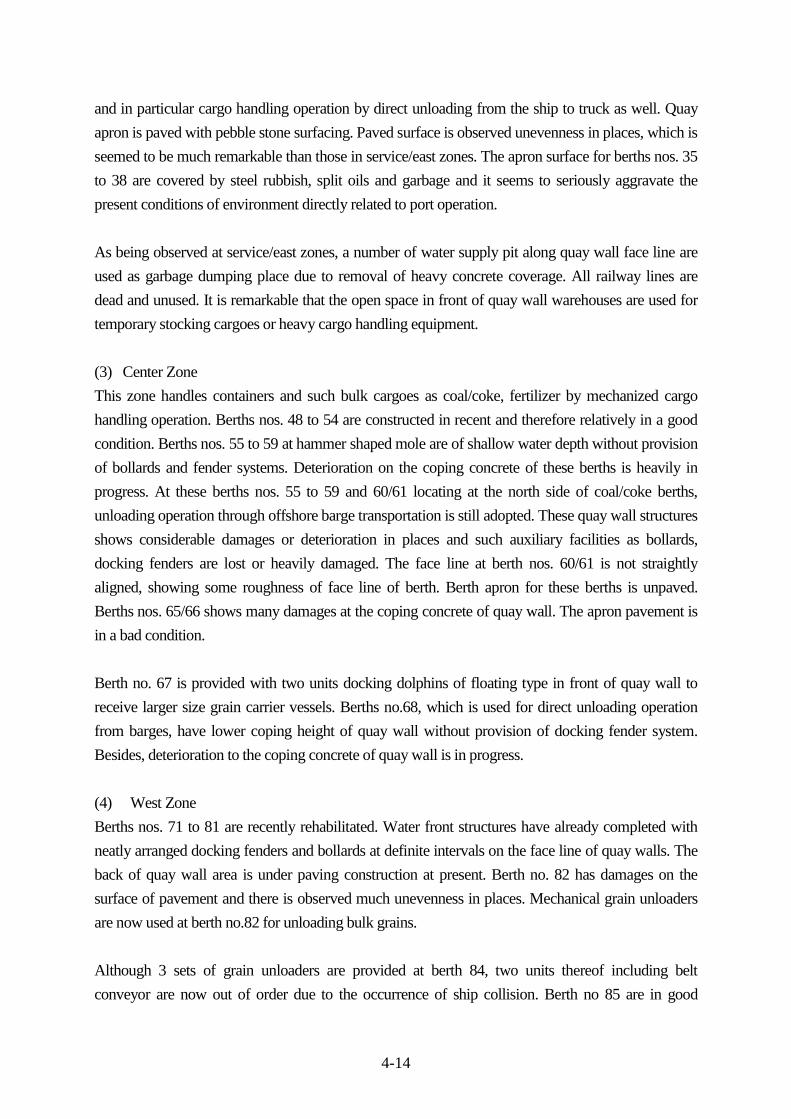
4-14
and in particular cargo handling operation by direct unloading from the ship to truck as well. Quayapron is paved with pebble stone surfacing. Paved surface is observed unevenness in places, which isseemed to be much remarkable than those in service/east zones. The apron surface for berths nos. 35to 38 are covered by steel rubbish, split oils and garbage and it seems to seriously aggravate thepresent conditions of environment directly related to port operation.
As being observed at service/east zones, a number of water supply pit along quay wall face line areused as garbage dumping place due to removal of heavy concrete coverage. All railway lines aredead and unused. It is remarkable that the open space in front of quay wall warehouses are used fortemporary stocking cargoes or heavy cargo handling equipment.
(3) Center ZoneThis zone handles containers and such bulk cargoes as coal/coke, fertilizer by mechanized cargohandling operation. Berths nos. 48 to 54 are constructed in recent and therefore relatively in a goodcondition. Berths nos. 55 to 59 at hammer shaped mole are of shallow water depth without provisionof bollards and fender systems. Deterioration on the coping concrete of these berths is heavily inprogress. At these berths nos. 55 to 59 and 60/61 locating at the north side of coal/coke berths,unloading operation through offshore barge transportation is still adopted. These quay wall structuresshows considerable damages or deterioration in places and such auxiliary facilities as bollards,docking fenders are lost or heavily damaged. The face line at berth nos. 60/61 is not straightlyaligned, showing some roughness of face line of berth. Berth apron for these berths is unpaved.Berths nos. 65/66 shows many damages at the coping concrete of quay wall. The apron pavement isin a bad condition.
Berth no. 67 is provided with two units docking dolphins of floating type in front of quay wall toreceive larger size grain carrier vessels. Berths no.68, which is used for direct unloading operationfrom barges, have lower coping height of quay wall without provision of docking fender system.Besides, deterioration to the coping concrete of quay wall is in progress.
(4) West ZoneBerths nos. 71 to 81 are recently rehabilitated. Water front structures have already completed withneatly arranged docking fenders and bollards at definite intervals on the face line of quay walls. Theback of quay wall area is under paving construction at present. Berth no. 82 has damages on thesurface of pavement and there is observed much unevenness in places. Mechanical grain unloadersare now used at berth no.82 for unloading bulk grains.
Although 3 sets of grain unloaders are provided at berth 84, two units thereof including beltconveyor are now out of order due to the occurrence of ship collision. Berth no 85 are in good
4-15
condition despite of some deterioration on the coping concrete of quay walls. The offshore area ofberth no 85 is already reclaimed partially for the area of 69 meters length by 75 meters wide and isutilized as timber cargo unloading from barges at present. Berth no. 86, which is used for livestock,has wide space behind the quay wall but no docking fender is provided onto the face line of quaywall.
Oil berths nos. 1 to 5 are old structures, but these berth seems to be capable of receiving ship’sdocking without difficulty. In particular, all the unloading mechanical arms including pipelinesprovided to these oil berths are out of order at present. The platform of berth no.1 is used for stockingoil pipeline materials. Since berth nos. 1 and 2 are provided along west breakwater alignment,approaching by maintenance vehicles to these berths is substantially difficult. Although pipelines andpipe supporting racks for berths 1 and 2 are under progress of steel corrosion, necessary maintenanceworks would be troublesome because of impossibility of truck access. No. 5 berth is provided withunpaved access roads as well.
[Dikheila District]Since quay walls at the port of Dikheila are recently constructed, quay wall structures are in goodcondition with such neatly arranged auxiliary facilities as bollards and fender systems. Fendersystems to these berths are of V-shaped rubber fender. Berths nos.95-1 to 3, 97-1 and 2, and 99-1and 2 are under construction at present. Quay wall structures of these berths have already completedand the works for paving, crane rail foundation at the back-of-berth area are now implemented.
4.2.2 Utilities Facilities
(1) Electric Power SupplyThe Electrical Distribution Company provides electric power supply through the electric substationsto the port of Alexandria. There are 8 number of stations inside port to supply electrical power to theport of Alexandria as follows:
1- Workshop Station at Gate no. 12- Passenger Terminal Station3- C-Station at Gate no. 184- B-Station at Gate no.225- No. 40 Station at Berth no.406- The Academy Station at Gate no. 277- The Radar Tower Station8- The Timber Station
4-16
Each station of the above has 2 electrical sources of supply by electrical cable of 300 KVA for powersupply and by generator of 500 KVA power supply for the use of emergency in case of shortage inelectrical current. The electric cable network is buried in culvert or laid directly under the ground.The lightening of the port area is provided by lighting tower with sodium lamps along with the maininternal roads, at quay wall apron and cargo handling yards.
(2) Water SupplyThe water supply to the port of Alexandria is provided by Alexandria Water Supply Authoritythrough water pipelines to various berths and on-land facilities supplemented with supply by tankerbarges. The water pipelines of 3 to 12 inches are connected at various points to the main supply pipesin the city area. The water pipeline network provides water outlets and hazardous hydrants installedat quay walls and yard apron along the water pipelines.
The quay walls equipped with water pipeline are the berth nos. 9-25, 34-41, 50-54, old 71-81, 83, 85and 87-1&-2 at Alexandria and all the berths at Dikheila. In addition, the Water Supply Companyoperates by using a number of self-propelled water supply barges. The average quantity of watersupply in recent 3 months was 85,000 cubic meters to the APA account consumption only(excluding supply to private company) for the port of Alexandria and 129,000 cubic meters for theport of Dikheila.
(3) BunkeringBunkering to ships is done by a fleet of bunker barges, which are operated by one company selectedfrom the lowest bidder among the following three companies:
Shell CompanyEgyptian Corporation CompanyMISR Petroleum Company
4.2.3 Onshore Facilities
(1) Warehouses and Open StorageAll the warehouses inside the port of Alexandria are managed by the General Egyptian WarehouseCompany (G.E.W.C.). But the ownership of warehouses had been transferred to the APA in 1965 bydeclaration by the relevant law. Besides, the open storage areas are still owned by the APA. Thecargoes are allowed to stock in the warehouses for maximum 30 days. The cargoes stocked foradditional 15 days maximum storage are transferred to the annex area that is provided outside theport. The cargoes, which are not withdrawn from warehouse within the allowed period, will beconsidered as neglected cargo and will be stacked onto special yard.
4-17
The open storage areas inside the port are utilized by a number of private cargo handling orstevedoring companies. A list of these warehouses owned by G.E.W.C. and open storage at theAlexandria port are tabulated in Table 4.2.3 for warehouse and in Table 4.2.4 for open storage area.As shown in the Table, allocation of these warehouses is concentrated at the Middle West zone in theport of Alexandria. The total area of warehouses and open storage is reported as follows, althoughthese figures are inconsistent with those provided in the said Tables provably due to errors oromission of data: (data source: the APA)
[Alexandria Port]a) Warehouse within the Port used by G.E.W.C.: 164,000 sq. m (about 188,800 ton capacity)b) Open Storage inside the Port: 190,000sq. mc) Annex outside the Port at El Nobaria: 247,000sq. m (about 140,000 tons capacity)d) Annex outside the Port at El Mex: 600,000sq. m
[El Dikheila Port]a) Total Capacity of 10,300,000 tonsb) Pallets Yard: 36,000sq. m (about 2,000,000 tons capacity)c) Coal Stacking Yard: 18,000sq. m (about 1,200,000tons capacity)d) Scrap Yard: 23,000sq. m (800,000 tons capacity)e) Container Yard: 380,000sq. m (25,000 TEU capacity)f) Timber Yard: 22,000sq. m (about 500,000 tons capacity)g) General Cargo Yard: 220,000 sq. m (2,000,000 tons capacity)
During the 2nd field survey in Egypt, the study team carried out site survey on the present conditionsof warehouses and the following general view thereof are obtained. 1) Service/East ZonesMost of existing warehouses in these zones were constructed before 1920. Therefore, a number ofthe these warehouses are old fashioned type of structure with provision of supporting inner pillarsand generally in bad conditions except for warehouse no. 40 near the berth 14. The structuralconstraint of the existing warehouse hamper cargo-handling operation inside of the warehouse. Butunlike the exterior conditions of the structures, interior thereof is well maintained or repaired.
Some of the existing warehouses are ineffectively utilized or being subject to rehabilitation.Warehouses nos. 1 & 2 are particularly old and no. 1 warehouse is now under rehabilitation for one-third portion of the structure. Warehouse no. 2 is used for agricultural products but most entrancesfacing to the roadside are closed and heavy cargoes are stocked in front of the warehouse.
4-18
One side of entrance for coming and going mostly uses Quay warehouses. There is a tendency thatthe entrance facing quay wall is generally unused for cargo handling operation provably due tostocktaking or security purpose. Outside open space beside warehouse which is facing to quay wallis used for stocking handling cargoes in particular.
2) Middle East ZoneOne beside quay wall and the other at back-of-port area will classify warehouses in this zone intotwo categories. In general, warehouses in this zone are very old and some of these warehouses areineffectively used.
The berths from 25 to 27 at the middle-east zone are provided a number of warehouses, i.e. nos.14 to16. Those warehouses are relatively in good conditions. But these warehouses are very old andconstructed too close to the quay wall face line. Besides, back entrance facing to the inner port mainroad are never used for outgoing cargo handling operation, though these warehouses are welldesigned for loading cargoes onto trucks from the entrance. Warehouses nos.44 to 48 at berths 35 to40 are very old of 2 stories heavy construction by adopting reinforced concrete framing and bearingwalls and therefore interior space are divided into small rooms by interior pillars. Dim interior spacelike a cellar room thereof hampers the cargo handling operation. Berths nos. 42-44 are provided withvery old warehouses in critical structural conditions. Warehouse no.28 is now under rehabilitationand warehouse nominated by “boiler” is used for insect extermination.
Warehouses at back-of-port area are very old fashioned with provision of many inside small pillars.In particular, Tobacco and Homs warehouses are adopted heavy type of 3-story construction butcargoes inside the warehouses are shipshape stocked. Warehouses nos. 19 and 22 are steel framedstructures and the roofing thereof started leaks in places. These warehouses including no. 25 areobserved to accommodate minimal volume of cargoes and still have empty space. There is alsodefinite tendency that the cargo movement for coming and going is done only through one entranceof the warehouse.
3) Center ZoneAt berths 65-67, there are several warehouses located behind the berth apron in suitable shape andneatly arranged. Warehouses nos. 32/35 and 65/66 handle fertilizer products. Although showingprogress of deterioration at present, these warehouses are relatively in good conditions with wideinterior space owing to high roofing design. Very old warehouse no. 34 is divided into five rooms bypartition walls and is heavily deteriorated. Warehouses 36/37 beside of main port road are in goodcondition with wide interior space because of larger spanning of pillar installation, but most of thespaces are not effectively utilized.
4-19
4) West ZoneThis zone is provided with no warehouse except for two units of grain silos located at berths nos. 84and 85. Behind the main port road at berth nos. 82, there are container-stocking yards for receivingempty containers. Due to time spending custom inspection at the gate 53, a number of trucks loadedtimber products are constantly stand-by along the side of the main port road.
(2) Other Storage FacilitiesThe west zone of the port of Alexandria is equipped with two grain silos of 100,000 tons capacity forexport and 48,000 tons capacity for import. These are provided behind berths 84 and 85 togetherwith unloading facilities. A 100,000 tons capacity silo was built in 1984 while 48,000 tons capacitysilo in 1965.
(3) Railways inside the PortThe following are a summary of railways inside the port of Alexandria.
- 2 railways serving military quay- 2 railways serving the coal company- 3 railways serving the Alexandria Container Terminal Company- Railway lines at west zone serving for grain transport- Railway lines passing in front of gate no. 27 serving for timber materials- 2 railways behind berth nos. 65/66
The railway lines serving for hammer-shaped pier at west zone are actively utilized for handling coalcargoes in particular. But, in many places inside port area, the railway lines are interrupted or buriedby the overlaying asphalt paving of roads. It seems that the maintenance of the railway lines is noteffectively carried out in view of recent transition of inner transportation mode from railway to roadnetwork. In addition, railway lines would rather hamper the road traffic inside port area at someplaces, resulting in the unnecessary road traffic congestion due to unavoidable exaction of low-speedtraffic.
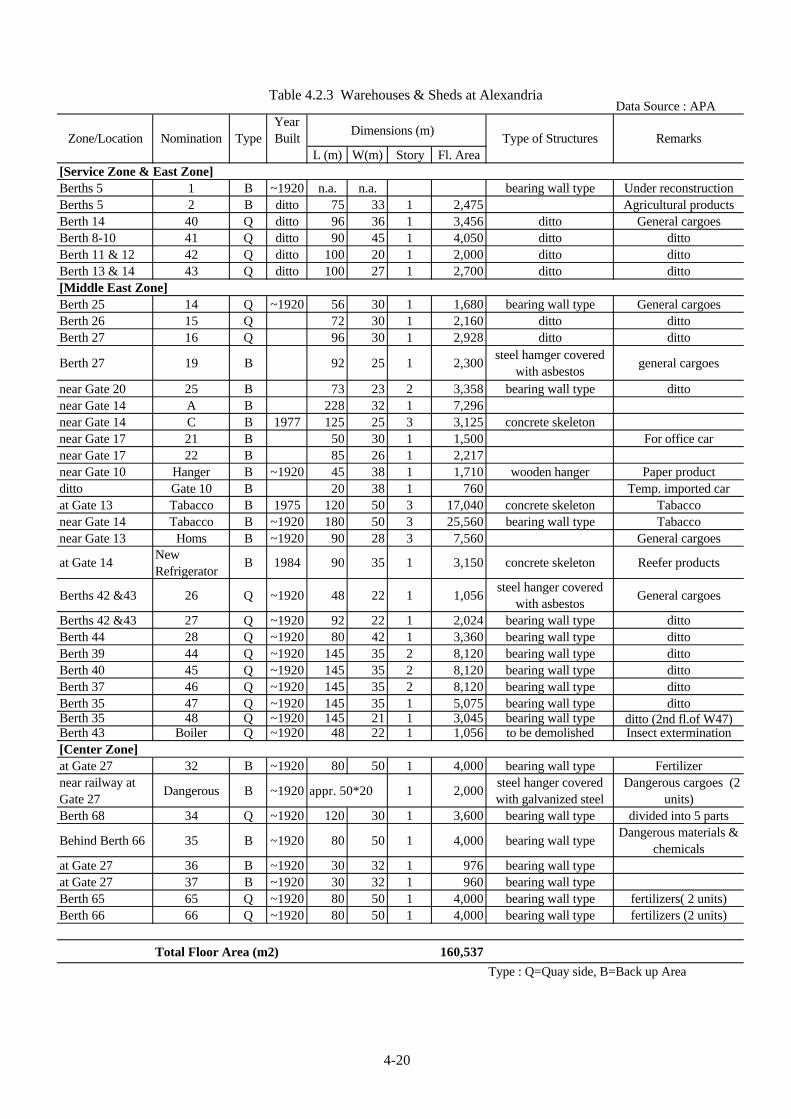
Table 4.2.3 Warehouses & Sheds at AlexandriaData Source : APA
Zone/Location Nomination TypeYearBuilt
Dimensions (m)Type of Structures Remarks
L (m) W(m) Story Fl. Area[Service Zone & East Zone]Berths 5 1 B ~1920 n.a. n.a. bearing wall type Under reconstructionBerths 5 2 B ditto 75 33 1 2,475 Agricultural productsBerth 14 40 Q ditto 96 36 1 3,456 ditto General cargoesBerth 8-10 41 Q ditto 90 45 1 4,050 ditto dittoBerth 11 & 12 42 Q ditto 100 20 1 2,000 ditto dittoBerth 13 & 14 43 Q ditto 100 27 1 2,700 ditto ditto[Middle East Zone]Berth 25 14 Q ~1920 56 30 1 1,680 bearing wall type General cargoesBerth 26 15 Q 72 30 1 2,160 ditto dittoBerth 27 16 Q 96 30 1 2,928 ditto ditto
Berth 27 19 B 92 25 1 2,300steel hamger covered
with asbestosgeneral cargoes
near Gate 20 25 B 73 23 2 3,358 bearing wall type dittonear Gate 14 A B 228 32 1 7,296near Gate 14 C B 1977 125 25 3 3,125 concrete skeletonnear Gate 17 21 B 50 30 1 1,500 For office carnear Gate 17 22 B 85 26 1 2,217near Gate 10 Hanger B ~1920 45 38 1 1,710 wooden hanger Paper productditto Gate 10 B 20 38 1 760 Temp. imported carat Gate 13 Tabacco B 1975 120 50 3 17,040 concrete skeleton Tabacconear Gate 14 Tabacco B ~1920 180 50 3 25,560 bearing wall type Tabacconear Gate 13 Homs B ~1920 90 28 3 7,560 General cargoes
at Gate 14NewRefrigerator
B 1984 90 35 1 3,150 concrete skeleton Reefer products
Berths 42 &43 26 Q ~1920 48 22 1 1,056steel hanger covered
with asbestosGeneral cargoes
Berths 42 &43 27 Q ~1920 92 22 1 2,024 bearing wall type dittoBerth 44 28 Q ~1920 80 42 1 3,360 bearing wall type dittoBerth 39 44 Q ~1920 145 35 2 8,120 bearing wall type dittoBerth 40 45 Q ~1920 145 35 2 8,120 bearing wall type dittoBerth 37 46 Q ~1920 145 35 2 8,120 bearing wall type dittoBerth 35 47 Q ~1920 145 35 1 5,075 bearing wall type dittoBerth 35 48 Q ~1920 145 21 1 3,045 bearing wall type ditto (2nd fl.of W47)Berth 43 Boiler Q ~1920 48 22 1 1,056 to be demolished Insect extermination[Center Zone]at Gate 27 32 B ~1920 80 50 1 4,000 bearing wall type Fertilizernear railway atGate 27
Dangerous B ~1920 appr. 50*20 1 2,000steel hanger coveredwith galvanized steel
Dangerous cargoes (2units)
Berth 68 34 Q ~1920 120 30 1 3,600 bearing wall type divided into 5 parts
Behind Berth 66 35 B ~1920 80 50 1 4,000 bearing wall typeDangerous materials &
chemicalsat Gate 27 36 B ~1920 30 32 1 976 bearing wall typeat Gate 27 37 B ~1920 30 32 1 960 bearing wall typeBerth 65 65 Q ~1920 80 50 1 4,000 bearing wall type fertilizers( 2 units)Berth 66 66 Q ~1920 80 50 1 4,000 bearing wall type fertilizers (2 units)
Total Floor Area (m2) 160,537
Type : Q=Quay side, B=Back up Area
4-20
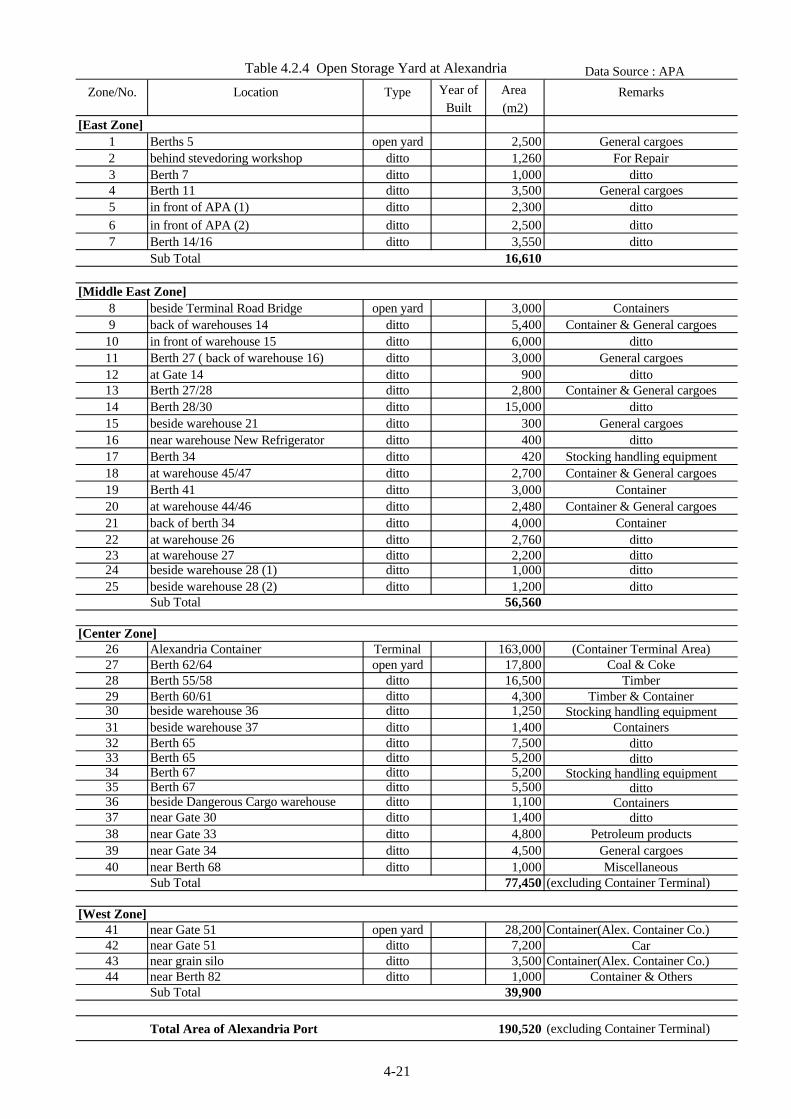
Table 4.2.4 Open Storage Yard at Alexandria Data Source : APA
Zone/No. Location Type Year of Area RemarksBuilt (m2)
[East Zone]1 Berths 5 open yard 2,500 General cargoes2 behind stevedoring workshop ditto 1,260 For Repair3 Berth 7 ditto 1,000 ditto4 Berth 11 ditto 3,500 General cargoes5 in front of APA (1) ditto 2,300 ditto6 in front of APA (2) ditto 2,500 ditto7 Berth 14/16 ditto 3,550 ditto
Sub Total 16,610
[Middle East Zone]8 beside Terminal Road Bridge open yard 3,000 Containers9 back of warehouses 14 ditto 5,400 Container & General cargoes
10 in front of warehouse 15 ditto 6,000 ditto11 Berth 27 ( back of warehouse 16) ditto 3,000 General cargoes12 at Gate 14 ditto 900 ditto13 Berth 27/28 ditto 2,800 Container & General cargoes14 Berth 28/30 ditto 15,000 ditto15 beside warehouse 21 ditto 300 General cargoes16 near warehouse New Refrigerator ditto 400 ditto17 Berth 34 ditto 420 Stocking handling equipment18 at warehouse 45/47 ditto 2,700 Container & General cargoes19 Berth 41 ditto 3,000 Container20 at warehouse 44/46 ditto 2,480 Container & General cargoes21 back of berth 34 ditto 4,000 Container22 at warehouse 26 ditto 2,760 ditto23 at warehouse 27 ditto 2,200 ditto24 beside warehouse 28 (1) ditto 1,000 ditto25 beside warehouse 28 (2) ditto 1,200 ditto
Sub Total 56,560
[Center Zone]26 Alexandria Container Terminal 163,000 (Container Terminal Area)27 Berth 62/64 open yard 17,800 Coal & Coke28 Berth 55/58 ditto 16,500 Timber29 Berth 60/61 ditto 4,300 Timber & Container30 beside warehouse 36 ditto 1,250 Stocking handling equipment31 beside warehouse 37 ditto 1,400 Containers32 Berth 65 ditto 7,500 ditto33 Berth 65 ditto 5,200 ditto34 Berth 67 ditto 5,200 Stocking handling equipment35 Berth 67 ditto 5,500 ditto36 beside Dangerous Cargo warehouse ditto 1,100 Containers37 near Gate 30 ditto 1,400 ditto38 near Gate 33 ditto 4,800 Petroleum products39 near Gate 34 ditto 4,500 General cargoes40 near Berth 68 ditto 1,000 Miscellaneous
Sub Total 77,450 (excluding Container Terminal)
[West Zone]41 near Gate 51 open yard 28,200 Container(Alex. Container Co.)42 near Gate 51 ditto 7,200 Car43 near grain silo ditto 3,500 Container(Alex. Container Co.)44 near Berth 82 ditto 1,000 Container & Others
Sub Total 39,900
Total Area of Alexandria Port 190,520 (excluding Container Terminal)
4-21
4-22
4.3 Cargo Handling Equipment
4.3.1 Equipment Owned by Private Sectors
Most of all cargo handling equipment utilized in the port belong to the private sectors except for suchequipment necessary for port supporting service and maintenance. Among others, United ArabStevedoring Company holds the biggest share of the ownership of these cargo handling equipment tocarried out cargo handling operation in the port. Such specialized cargoes as container, grain bulk orcoal, etc. are handled by their own equipment owned by the terminal operators who are specializedfor these cargoes.
The table 4.3.1 tabulates the list of cargo handling equipment utilized by the private companies inoperation at the Greater Alexandria Port at present.
In particular, the Dikheila district is provided with cargo handling equipment for accommodatinglarger size ocean-going vessels as making special mention of the following.
a) No.90/91 for coal handling for accommodating 160,000DWT2-gantry cranes (1,000 t/hr/unit)Belt conveyor of 5 km length2-stockers (200t/hr/unit)2-reclaimer (800t/hr/unit))
b) No.96 for handling container for Post Panamax container carrier3-quay side gantry cranes for post Panamax (45 t/lift)380,000 sq. m container handling yard
c) No.92/94 (general cargo berth) for handling grains3-unloader (500t/hr)3-silos (130,000 tons and others)
4.3.2 APA Service Supporting Equipment
A number of cargo handling equipment are owned by the Alexandria Port Authority for maintenanceor clearance service and supplemental cargo handling which will be carried out based on the requestsby the private operation company. Among others, the following is a list of equipment and workshopfacilities owned by the APA.
[Floating Equipment]-Weighing equipment (100 tones): 9 units
4-23
-Floating cranes 4 units (2-35, 1-100, 1-150 GRT capacity)-Ship tugboats: 13 vessels (500-3,000Hp)-Service tugboats: 5 vessels-Dredger: 1 unit-Barge: 2units-Grub Crane: 5 units-Oil Scraper: 1 unit-Pilot Launch: 13 units-Service Launch: 19 units
[On-land Equipment]-Transfer Cranes (5 tons capacity): 10 units-Loader: 5 units
[Workshop]-Electrical and Mechanical Workshops-Auxiliary Workshops-Dry Dock for 1,200 tons vessels-Mechanical Lifts for 600 GRT
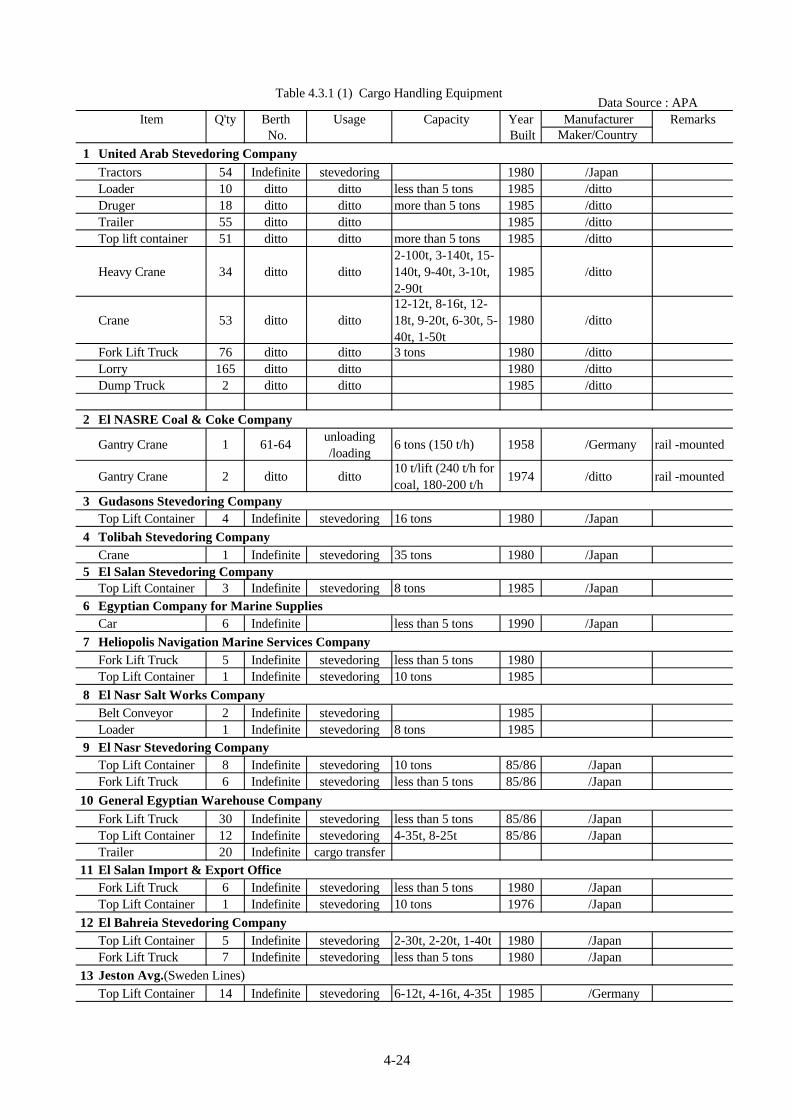
Table 4.3.1 (1) Cargo Handling Equipment Data Source : APA
Item Q'ty Berth Usage Capacity Year Manufacturer Remarks No. Built Maker/Country
1 United Arab Stevedoring CompanyTractors 54 Indefinite stevedoring 1980 /JapanLoader 10 ditto ditto less than 5 tons 1985 /dittoDruger 18 ditto ditto more than 5 tons 1985 /dittoTrailer 55 ditto ditto 1985 /dittoTop lift container 51 ditto ditto more than 5 tons 1985 /ditto
Heavy Crane 34 ditto ditto2-100t, 3-140t, 15-140t, 9-40t, 3-10t,2-90t
1985 /ditto
Crane 53 ditto ditto12-12t, 8-16t, 12-18t, 9-20t, 6-30t, 5-40t, 1-50t
1980 /ditto
Fork Lift Truck 76 ditto ditto 3 tons 1980 /dittoLorry 165 ditto ditto 1980 /dittoDump Truck 2 ditto ditto 1985 /ditto
2 El NASRE Coal & Coke Company
Gantry Crane 1 61-64unloading/loading
6 tons (150 t/h) 1958 /Germany rail -mounted
Gantry Crane 2 ditto ditto10 t/lift (240 t/h forcoal, 180-200 t/h
1974 /ditto rail -mounted
3 Gudasons Stevedoring CompanyTop Lift Container 4 Indefinite stevedoring 16 tons 1980 /Japan
4 Tolibah Stevedoring CompanyCrane 1 Indefinite stevedoring 35 tons 1980 /Japan
5 El Salan Stevedoring CompanyTop Lift Container 3 Indefinite stevedoring 8 tons 1985 /Japan
6 Egyptian Company for Marine SuppliesCar 6 Indefinite less than 5 tons 1990 /Japan
7 Heliopolis Navigation Marine Services CompanyFork Lift Truck 5 Indefinite stevedoring less than 5 tons 1980Top Lift Container 1 Indefinite stevedoring 10 tons 1985
8 El Nasr Salt Works CompanyBelt Conveyor 2 Indefinite stevedoring 1985Loader 1 Indefinite stevedoring 8 tons 1985
9 El Nasr Stevedoring CompanyTop Lift Container 8 Indefinite stevedoring 10 tons 85/86 /JapanFork Lift Truck 6 Indefinite stevedoring less than 5 tons 85/86 /Japan
10 General Egyptian Warehouse CompanyFork Lift Truck 30 Indefinite stevedoring less than 5 tons 85/86 /JapanTop Lift Container 12 Indefinite stevedoring 4-35t, 8-25t 85/86 /JapanTrailer 20 Indefinite cargo transfer
11 El Salan Import & Export OfficeFork Lift Truck 6 Indefinite stevedoring less than 5 tons 1980 /JapanTop Lift Container 1 Indefinite stevedoring 10 tons 1976 /Japan
12 El Bahreia Stevedoring CompanyTop Lift Container 5 Indefinite stevedoring 2-30t, 2-20t, 1-40t 1980 /JapanFork Lift Truck 7 Indefinite stevedoring less than 5 tons 1980 /Japan
13 Jeston Avg.(Sweden Lines)Top Lift Container 14 Indefinite stevedoring 6-12t, 4-16t, 4-35t 1985 /Germany
4-24
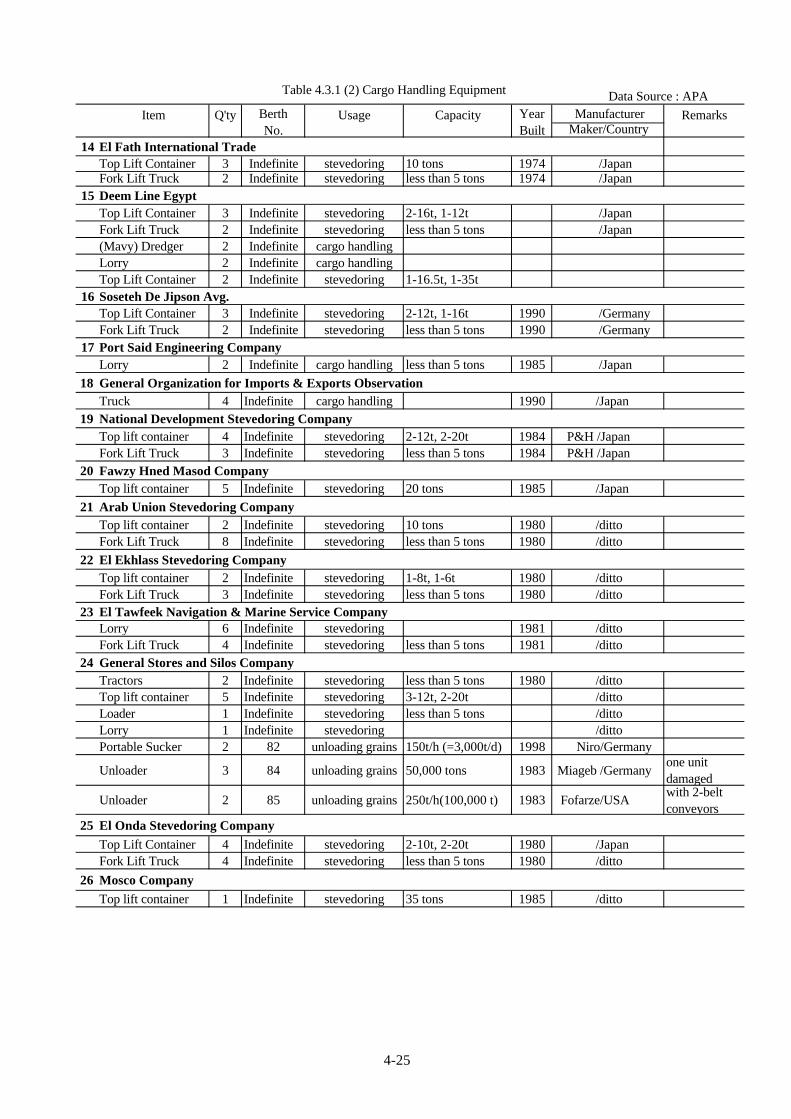
Table 4.3.1 (2) Cargo Handling Equipment Data Source : APA
Item Q'ty Berth Usage Capacity Year Manufacturer RemarksNo. Built Maker/Country
14 El Fath International TradeTop Lift Container 3 Indefinite stevedoring 10 tons 1974 /JapanFork Lift Truck 2 Indefinite stevedoring less than 5 tons 1974 /Japan
15 Deem Line EgyptTop Lift Container 3 Indefinite stevedoring 2-16t, 1-12t /JapanFork Lift Truck 2 Indefinite stevedoring less than 5 tons /Japan(Mavy) Dredger 2 Indefinite cargo handlingLorry 2 Indefinite cargo handlingTop Lift Container 2 Indefinite stevedoring 1-16.5t, 1-35t
16 Soseteh De Jipson Avg.Top Lift Container 3 Indefinite stevedoring 2-12t, 1-16t 1990 /GermanyFork Lift Truck 2 Indefinite stevedoring less than 5 tons 1990 /Germany
17 Port Said Engineering CompanyLorry 2 Indefinite cargo handling less than 5 tons 1985 /Japan
18 General Organization for Imports & Exports ObservationTruck 4 Indefinite cargo handling 1990 /Japan
19 National Development Stevedoring CompanyTop lift container 4 Indefinite stevedoring 2-12t, 2-20t 1984 P&H /JapanFork Lift Truck 3 Indefinite stevedoring less than 5 tons 1984 P&H /Japan
20 Fawzy Hned Masod CompanyTop lift container 5 Indefinite stevedoring 20 tons 1985 /Japan
21 Arab Union Stevedoring CompanyTop lift container 2 Indefinite stevedoring 10 tons 1980 /dittoFork Lift Truck 8 Indefinite stevedoring less than 5 tons 1980 /ditto
22 El Ekhlass Stevedoring CompanyTop lift container 2 Indefinite stevedoring 1-8t, 1-6t 1980 /dittoFork Lift Truck 3 Indefinite stevedoring less than 5 tons 1980 /ditto
23 El Tawfeek Navigation & Marine Service Company Lorry 6 Indefinite stevedoring 1981 /dittoFork Lift Truck 4 Indefinite stevedoring less than 5 tons 1981 /ditto
24 General Stores and Silos CompanyTractors 2 Indefinite stevedoring less than 5 tons 1980 /dittoTop lift container 5 Indefinite stevedoring 3-12t, 2-20t /dittoLoader 1 Indefinite stevedoring less than 5 tons /dittoLorry 1 Indefinite stevedoring /dittoPortable Sucker 2 82 unloading grains 150t/h (=3,000t/d) 1998 Niro/Germany
Unloader 3 84 unloading grains 50,000 tons 1983 Miageb /Germanyone unitdamaged
Unloader 2 85 unloading grains 250t/h(100,000 t) 1983 Fofarze/USAwith 2-beltconveyors
25 El Onda Stevedoring CompanyTop Lift Container 4 Indefinite stevedoring 2-10t, 2-20t 1980 /JapanFork Lift Truck 4 Indefinite stevedoring less than 5 tons 1980 /ditto
26 Mosco CompanyTop lift container 1 Indefinite stevedoring 35 tons 1985 /ditto
4-25
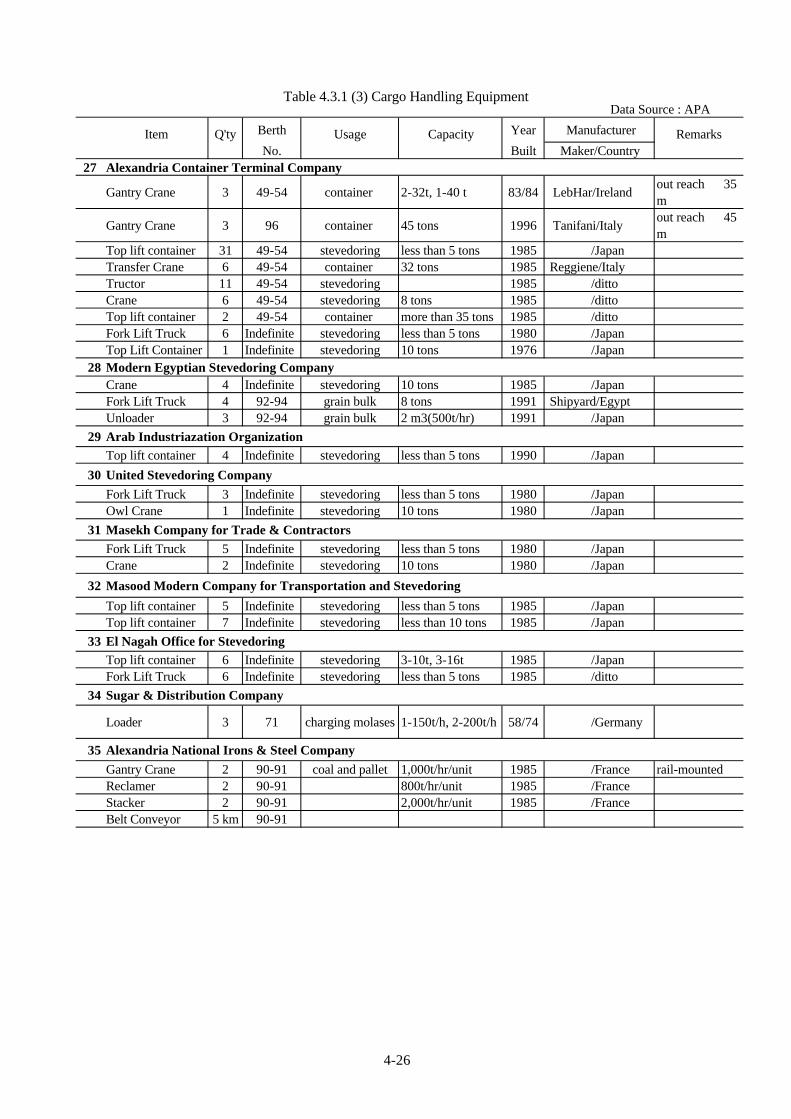
Table 4.3.1 (3) Cargo Handling Equipment Data Source : APA
Item Q'ty Berth Usage Capacity Year Manufacturer RemarksNo. Built Maker/Country
27 Alexandria Container Terminal Company
Gantry Crane 3 49-54 container 2-32t, 1-40 t 83/84 LebHar/Irelandout reach 35m
Gantry Crane 3 96 container 45 tons 1996 Tanifani/Italyout reach 45m
Top lift container 31 49-54 stevedoring less than 5 tons 1985 /JapanTransfer Crane 6 49-54 container 32 tons 1985 Reggiene/ItalyTructor 11 49-54 stevedoring 1985 /dittoCrane 6 49-54 stevedoring 8 tons 1985 /dittoTop lift container 2 49-54 container more than 35 tons 1985 /dittoFork Lift Truck 6 Indefinite stevedoring less than 5 tons 1980 /JapanTop Lift Container 1 Indefinite stevedoring 10 tons 1976 /Japan
28 Modern Egyptian Stevedoring CompanyCrane 4 Indefinite stevedoring 10 tons 1985 /JapanFork Lift Truck 4 92-94 grain bulk 8 tons 1991 Shipyard/EgyptUnloader 3 92-94 grain bulk 2 m3(500t/hr) 1991 /Japan
29 Arab Industriazation Organization Top lift container 4 Indefinite stevedoring less than 5 tons 1990 /Japan
30 United Stevedoring Company
Fork Lift Truck 3 Indefinite stevedoring less than 5 tons 1980 /JapanOwl Crane 1 Indefinite stevedoring 10 tons 1980 /Japan
31 Masekh Company for Trade & ContractorsFork Lift Truck 5 Indefinite stevedoring less than 5 tons 1980 /JapanCrane 2 Indefinite stevedoring 10 tons 1980 /Japan
32 Masood Modern Company for Transportation and Stevedoring
Top lift container 5 Indefinite stevedoring less than 5 tons 1985 /JapanTop lift container 7 Indefinite stevedoring less than 10 tons 1985 /Japan
33 El Nagah Office for StevedoringTop lift container 6 Indefinite stevedoring 3-10t, 3-16t 1985 /JapanFork Lift Truck 6 Indefinite stevedoring less than 5 tons 1985 /ditto
34 Sugar & Distribution Company
Loader 3 71 charging molases 1-150t/h, 2-200t/h 58/74 /Germany
35 Alexandria National Irons & Steel Company
Gantry Crane 2 90-91 coal and pallet 1,000t/hr/unit 1985 /France rail-mountedReclamer 2 90-91 800t/hr/unit 1985 /FranceStacker 2 90-91 2,000t/hr/unit 1985 /FranceBelt Conveyor 5 km 90-91
4-26
4-27
4.4 Facility Design and Cost Estimate
4.4.1 Design of Port Facilities
Such Egyptian design code of practice as for reinforced concrete, the basis and conditions ofmasonry structures and soil mechanics and foundations are collected by the Study Team. In principal,these Egyptian design codes of practice are based on the European codes and are purposed toprovide basis for comprehensive understanding for carrying out investigation and design. For instant,the code for masonry structures consists of eight parts while one for soil mechanics and foundationsconsists of 10 parts of content and these codes provide basis of designing the related structurescontaining descriptions from site investigations, loads to the technical term definition.
But, what code of practice is applied for designing structures are depend upon the designer’sjudgment. Such design codes of practice in developed countries as of British standards, those of anyother European countries or American standards are equally applied in the most cases of thedesigning of structures in Egypt. Therefore, in considering these code of practice currently used inEgypt, preliminary design for the port facilities envisaged in this study will be done on the basis ofthe Japanese design and construction standards since these are deemed to be equivalent to the codeof practice frequently adopted in Egypt.
4.4.2 Project Cost Study
(1) Basic ConsiderationsThe project cost for constructing infrastructures may include such cost components as constructioncost, procurement of equipment and machinery, engineering services and contingencies. The cost ofconstruction, which constitutes large portion of the project cost, will be obtained through combiningsuch major direct cost components for construction as materials cost, depreciation of constructionequipment and machinery, labor wages and indirect cost components. The indirect cost componentswill be estimated as a sum of overhead expenses required to providing temporary works for the site,mobilization cost, managing and operational overheads for site and in common needs and overheadprofits.
In principle, such cargo handling equipment or machinery as port infrastructure of cranes, forklifttrucks, trailer trucks will be procured locally or through importation from the countriesmanufacturing these equipment and machinery.
The project cost will be basically divided into the foreign and local currency components of the costin consideration of possible sources of procurement of necessary input materials and work forces.
4-28
The recent data and survey results related to the construction and cost estimation will be obtainedthrough the first field survey and will be summarized for the use of cost estimation. Preliminary costestimation of the Master Plan will be carried out based on the preliminary engineering design andconstruction plan of port facilities. Considering the site situation of projects, manpower andconstruction materials cost, project cost will be estimated to meet the requirements for possiblefinance of the project in line with international standards. The project cost will be broken down intoforeign and local currency portions.
A cost estimate of the Short-term Development Plan will be performed on the basis of thepreliminary design of proposed facilities and construction program. The cost estimate will include athorough examination of construction equipment and materials obtained locally and/or throughimportation, construction methods, unit price of construction works, labor costs, engineering services,taxes and duties etc. The project cost will be broken down into foreign and local currency portions.
(2) Project Cost ComponentsThe project cost estimate will be broken down into the following cost components below which areapproximately obtainable by adopting certain ratio of indirect cost component against direct cost ofconstruction for estimating the total cost of the project. The ratio to be applicable for certain projectwill be obtained through the scrutiny on the precedent of other project costing for similar project.
1) Direct CostThe major components of direct cost are materials, construction equipment and labor costs which areestimated based currently prevailing cost thereof.
2) Indirect CostThe following rates for indirect cost components were obtained from the interview of marinecontractors who are carrying out on-going projects in the Greater Alexandria Ports.
Common Temporary Cost 3% of Direct CostField (site) Expenses 12% of Direct CostCommon Overhead 10% of Direct Cost
Since the mobilization cost for construction works varies by the construction program and structuraldesigning of facilities, the mobilization cost may be obtained by applying the same procedures as forestimating of direct construction costs. In case of the project being financed by a private sector, thenecessary cost to procure engineering services will be added by about 7 % into the above overheadexpenses and therefor the total overhead will be increased to the possible ratio of 32 %.
4-29
3) Procurement Cost for Equipment and MachineryFor the port construction or other marine related projects in principal, the procurement of equipmentsuch cargo handling and storage equipment as cranes, forklift trucks, trailer-trucks, belt conveyors,weight and truck scale etc. will be imported from the manufacturing countries. The cost forprocurement of these equipment consists of equipment cost on CIF basis, installation cost,mobilization cost and the overhead and basically the cost of procurement of equipment andmachinery will include additional costs for the spare parts for three (3) years operation. But theconstruction machinery and equipment which are not available in Egypt and are temporary importedfrom abroad for construction purpose are estimated as mobilization cost or machinery cost of directcost item. The cost for these items will be included in the depreciation cost items of the directconstruction cost.
4) Engineering Service CostIn common infrastructure projects, engineering services will be required to carry out basic anddetailed design of proposed facilities, preparation of tender documents and construction supervision.The Egyptian port authorities under the Ministry of Maritime Transport, in principal, undertakeengineering services necessary for repair and maintenance of their own marine facilities and theconstruction projects as well. When a project require professional technique or judgment on theirinexperienced structural design or method of execution, they may employ fully experiencedprofessional consultants.
Therefor in this study, the engineering services will be included in the project cost estimate and thecost thereof will be estimated 10 % of the construction cost and 3 % for the procurement ofequipment. In engineering services, General Technical & Department Tax of 6 to 9 % against thecontract amount must be borne by the consulting firms who will undertake the engineering services.
5) ContingenciesThe contingencies for the project consist of physical and price contingencies. Physical contingencyfor the project will be taken as 10 % of the construction cost and 3 % for the procurement ofequipment, which is deemed a proper ratio for preliminary design stage to be carried out for masterplanning study for the project formulation.For price escalation, annual inflation rate is considered to be 5 % for local currency portion, while0 % for foreign currency portion considering the recent stable climate of international market.
4-30
(3) Other Factors affecting the Project Cost
1) Exchange RateRecently, exchange rate of Egyptian Pound (L.E.) is stable against US dollars (US$) since middle of80’s. No shadow price is therefor considered to be necessary for cost estimate for the project in Egypt.In this study, the following exchange rate of L.E. against US$ is used for the cost estimate. Theproject cost is expressed in US$ for foreign currency portion and in L.E. for local currency portionand the total amount of the project cost will be expressed in L.E.
US$ 1.00 = 3.40 L.E. as of May, 1998
2) Sources of Unit Price obtainedThere is no bulletined data regarding the unit prices for the construction industry in Egypt. Therefore,the related prices of materials, construction machinery and equipment available in the country andlabor wages were obtained from such various sources of local markets as Alexandria Port Authority,private construction contractors and consultants, etc. The results of construction cost survey aretabulated in Tables 4.4.2 for construction material unit costs and Table 4.4.2 for fuel cost, laborwages and construction work costs executed.
3) Extra Quantity of MaterialsBased on the investigation done by contractors, major materials specially for the use of underwaterworks in marine construction will be better to consider possible extra quantity required for the workexecution. The following information has been obtained through the interview to the contractor.
(a) Stones / Filling materialsStones and filling materials will be considered by extra ratio as follows:
Table 4.4.1 Extra Ratio for Material CostingNO. Material / Place to use Extra ratio
1 Rubble stone for foundation (underwater) 25%2 Armor/riprap stone for protection (underwater) 10%3 Rubble banking 15%4 Filling sand ( or stone ) for replacement 20%5 Filling soil for reclamation ( under water ) 5%6 Ditto, but(above water), to be compacted 20%7 Stones ; stone revetment/breakwater 20%
(b) Steel Bar (Re-Deformed or Round Bar)

4-31
In consideration of non-standardized work procedures, cutting loss due to limited available length inmarket, poor conditions before delivery on site, steel bars will be considered to estimate an extraquantity by 10 %.
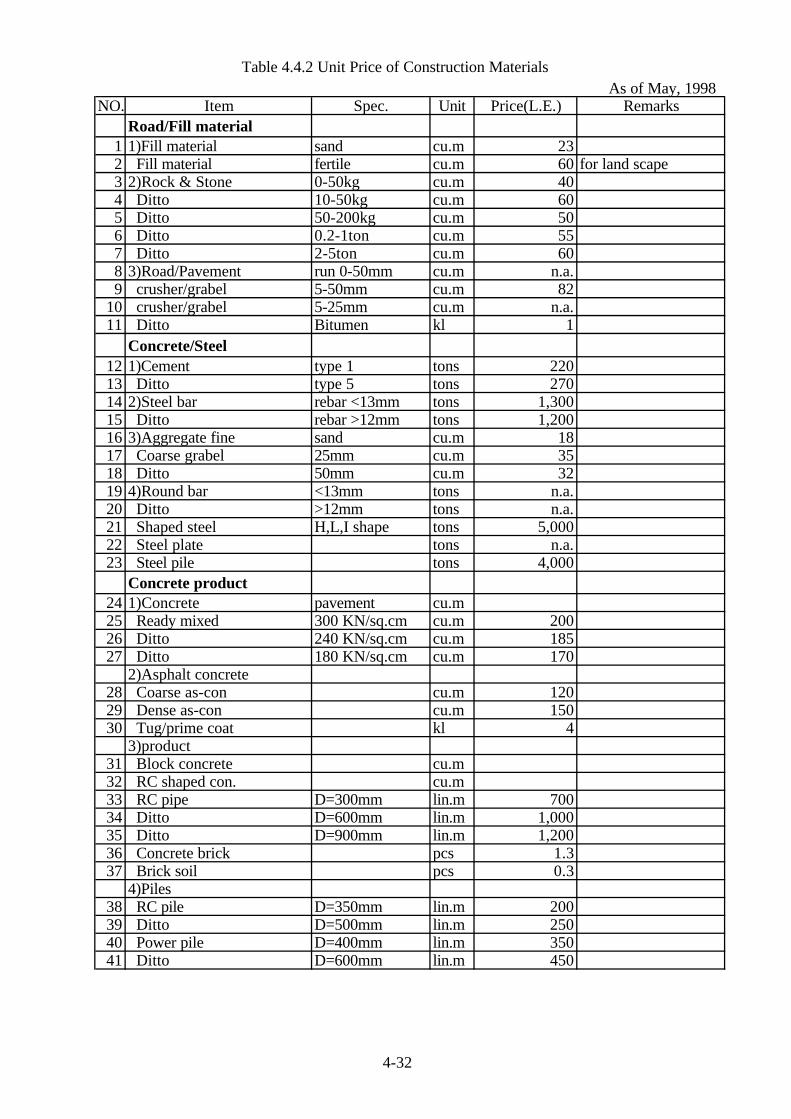
Table 4.4.2 Unit Price of Construction Materials As of May, 1998
NO. Item Spec. Unit Price(L.E.) RemarksRoad/Fill material
1 1)Fill material sand cu.m 232 Fill material fertile cu.m 60 for land scape3 2)Rock & Stone 0-50kg cu.m 404 Ditto 10-50kg cu.m 605 Ditto 50-200kg cu.m 506 Ditto 0.2-1ton cu.m 557 Ditto 2-5ton cu.m 608 3)Road/Pavement run 0-50mm cu.m n.a.9 crusher/grabel 5-50mm cu.m 82
10 crusher/grabel 5-25mm cu.m n.a.11 Ditto Bitumen kl 1
Concrete/Steel12 1)Cement type 1 tons 22013 Ditto type 5 tons 27014 2)Steel bar rebar <13mm tons 1,30015 Ditto rebar >12mm tons 1,20016 3)Aggregate fine sand cu.m 1817 Coarse grabel 25mm cu.m 3518 Ditto 50mm cu.m 3219 4)Round bar <13mm tons n.a.20 Ditto >12mm tons n.a.21 Shaped steel H,L,I shape tons 5,00022 Steel plate tons n.a.23 Steel pile tons 4,000
Concrete product24 1)Concrete pavement cu.m25 Ready mixed 300 KN/sq.cm cu.m 20026 Ditto 240 KN/sq.cm cu.m 18527 Ditto 180 KN/sq.cm cu.m 170
2)Asphalt concrete28 Coarse as-con cu.m 12029 Dense as-con cu.m 15030 Tug/prime coat kl 4
3)product31 Block concrete cu.m32 RC shaped con. cu.m33 RC pipe D=300mm lin.m 70034 Ditto D=600mm lin.m 1,00035 Ditto D=900mm lin.m 1,20036 Concrete brick pcs 1.337 Brick soil pcs 0.3
4)Piles38 RC pile D=350mm lin.m 20039 Ditto D=500mm lin.m 25040 Power pile D=400mm lin.m 35041 Ditto D=600mm lin.m 450
4-32
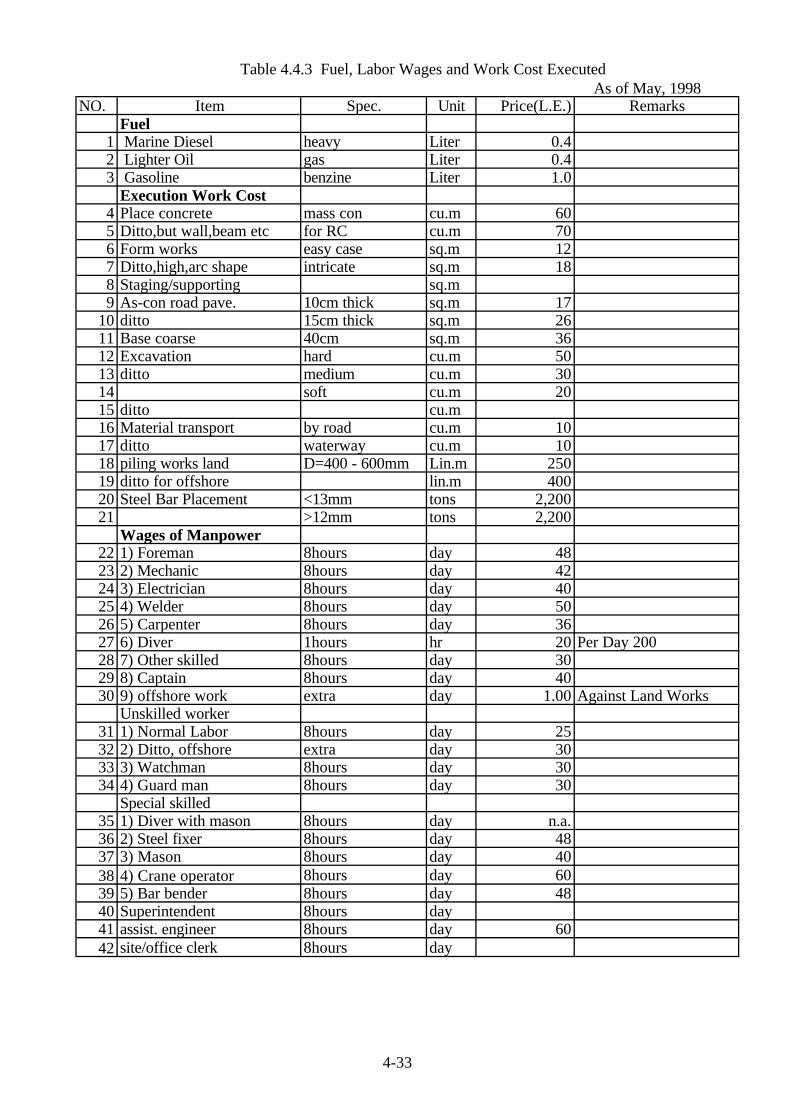
Table 4.4.3 Fuel, Labor Wages and Work Cost Executed As of May, 1998
NO. Item Spec. Unit Price(L.E.) RemarksFuel
1 Marine Diesel heavy Liter 0.42 Lighter Oil gas Liter 0.43 Gasoline benzine Liter 1.0
Execution Work Cost4 Place concrete mass con cu.m 605 Ditto,but wall,beam etc for RC cu.m 706 Form works easy case sq.m 127 Ditto,high,arc shape intricate sq.m 188 Staging/supporting sq.m9 As-con road pave. 10cm thick sq.m 17
10 ditto 15cm thick sq.m 2611 Base coarse 40cm sq.m 3612 Excavation hard cu.m 5013 ditto medium cu.m 3014 soft cu.m 2015 ditto cu.m16 Material transport by road cu.m 1017 ditto waterway cu.m 1018 piling works land D=400 - 600mm Lin.m 25019 ditto for offshore lin.m 40020 Steel Bar Placement <13mm tons 2,20021 >12mm tons 2,200
Wages of Manpower22 1) Foreman 8hours day 4823 2) Mechanic 8hours day 4224 3) Electrician 8hours day 4025 4) Welder 8hours day 5026 5) Carpenter 8hours day 3627 6) Diver 1hours hr 20 Per Day 20028 7) Other skilled 8hours day 3029 8) Captain 8hours day 4030 9) offshore work extra day 1.00 Against Land Works
Unskilled worker31 1) Normal Labor 8hours day 2532 2) Ditto, offshore extra day 3033 3) Watchman 8hours day 3034 4) Guard man 8hours day 30
Special skilled35 1) Diver with mason 8hours day n.a.36 2) Steel fixer 8hours day 4837 3) Mason 8hours day 4038 4) Crane operator 8hours day 6039 5) Bar bender 8hours day 4840 Superintendent 8hours day41 assist. engineer 8hours day 6042 site/office clerk 8hours day
4-33


![Unit 1 present simple and present conti.ppt [Compatibility Mode]](https://img.pdfslide.net/doc/110x75/63364c13d2b7284203084462/unit-1-present-simple-and-present-contippt-compatibility-mode.jpg)


