Embed Size (px)
Citation preview

1
Impact of freezing on the physicochemical and functional properties of low-moisture 1
part-skim Mozzarella 2
3
Chak Ming Toa,b,c, Lien Vermeirb, Ferre Rebryb, Barbara Kerkaerta, Paul Van der Meerenb, 4
Timothy P. Guineec 5
6
aMilcobel CVBA, Industrial Products Division, Kallo, Belgium 7
bParticle and Interfacial Technology Group, Department of Green Chemistry and Technology, 8
Faculty of Bioscience Engineering, Ghent University, Ghent, Belgium 9
cDepartment of Food Chemistry and Technology, Teagasc Food Research Centre Moorepark, 10
Fermoy, Co. Cork, Ireland 11
12
Corresponding author: Chak Ming To 13
E-mail: [email protected] 14
Phone: +32 9 260 99 43 15
Present address: Particle and Interfacial Technology Group, Department of Green Chemistry and 16
Technology, Faculty of Bioscience Engineering, Ghent University, Ghent, Belgium 17
2
Abstract 18
Low-moisture part-skim (LMPS) Mozzarella cheeses were held at 4°C for 0, 2 or 8 d before 19
freezing to -20°C. The cheeses were frozen at a rate of 0.6, 2.0 or 8.0°C h-1 and held frozen at -20
20°C for 1, 6, 12 or 44 weeks. After freezing, cheeses were stored at 4°C for 16-37 d, resulting in 21
a total storage time at 4°C (before and after freezing) of 24-37 d (frozen-thawed Mozzarella). 22
Control Mozzarella was stored at 4°C for 25-37 d. The control and frozen-thawed cheeses were 23
assayed for composition, primary proteolysis, moisture distribution, texture profile analysis and 24
melting characteristics after similar storage times at 4°C. Freezing under the evaluated conditions 25
resulted in reduced firmness of the unheated cheese but did not significantly affect the properties 26
of the heated cheese. The results suggest that freezing may be effectively applied to control or 27
extend the functional shelf-life of LMPS Mozzarella shipped to long-distance markets. 28

3
1. Introduction 29
The production of low-moisture part-skim (LMPS) Mozzarella has grown worldwide because of 30
the increasing popularity of pizza. It is a stretched-curd (pasta-filata) cheese, the manufacture of 31
which typically involves kneading and stretching the fermented curd in hot water or dilute brine 32
until it acquires a uniform molten stretchy consistency. The plasticization process confers the 33
cheese with the ability to stretch and undergo limited oiling-off when subsequently baked on pizza 34
(McMahon & Oberg, 2017). Based on the author’s knowledge of the South-East Asian market, 35
some producers import LMPS Mozzarella from Europe, the United States, Australia and/or New 36
Zealand to compensate issues with local milk quality and supply. Guinee, Mulholland, Mullins, 37
Corcoran & Auty (1999) reported that extended storage of LMPS Mozzarella (e.g. > 60 d at 4ºC) 38
resulted in a deterioration in functionality as manifested by the shredded cheese developing an 39
increased susceptibility to clumping/balling and the baked cheese exuding excess free oil, and 40
having a 'soupy' consistency to a degree dependent on cheese composition and proteolysis. Bertola, 41
Califano, Bevilacqua & Zaritzky (1996a) noted that producers freeze LMPS Mozzarella for long-42
distance export to minimize changes in proteolysis and functionality. Relatively few studies have 43
investigated the effects of freezing on the physicochemical and functional characteristics of LMPS 44
Mozzarella. Ribero, Rubiolo & Zorilla (2007) reported that the freezing point of LMPS Mozzarella 45
ranged between -1.2°C and -2.6°C owing to the presence of solutes (i.e., salts, minerals, N-soluble 46
compounds, lactose and organic acids) in the serum phase. Some studies investigated the effects of 47
freezing on the mechanical characteristics of LMPS Mozzarella (Cervantes, Lund, & Olson, 1983), 48
but did not evaluate other characteristics such as extensibility, consistency and flow of the cooked 49
cheese, which are critical functionalities in pizza application. Potential issues with the freezing of 50
cheese include ice crystallization in the serum phase, mineral deposition, casein dehydration and 51

4
thereby impairment of the functionality of the frozen-thawed cheese (Everett & Auty, 2008; Kuo 52
& Gunasekaran, 2003; Oberg, Merrill, Brown, & Richardson, 1992). Kuo, Anderson & 53
Gunasekaran (2003) monitored the formation of ice crystals in small LMPS Mozzarella plugs (504 54
mm3), exposed to cold air at -40°C, using magnetic resonance imaging (MRI) and found that 55
freezing proceeded symmetrically with the nucleation of ice crystals starting from the outside and 56
progressing inwards during further cooling. The effects of freezing Mozzarella cheeses (5 x 10 x 7 57
cm) at -20°C on the para-casein matrix were determined using nuclear magnetic resonance (NMR) 58
(Kuo et al., 2003) and scanning electron microscopy in a subsequent study (Kuo & Gunasekaran, 59
2009). The authors observed a ruptured para-casein network in frozen-thawed Mozzarella and 60
suggested that formation of large ice crystals or recrystallization of ice crystals during frozen 61
storage could potentially weaken the ability of the para-casein matrix to retain moisture, increase 62
serum leakage after thawing, and reduce the melt and stretch of the baked cheese. Kuo & 63
Gunasekaran (2003) noted that the changes in protein structure, and thereby the changes in 64
functionality, could be limited by ripening LMPS Mozzarella before freezing or partially restored 65
by ripening LMPS Mozzarella after thawing. According to Bertola et al. (1996a), LMPS 66
Mozzarella could be frozen without loss of quality provided that the combined storage time of the 67
cheese before and after freezing ranged from 14 to 21 d. These findings suggested that the duration 68
of storage, and hence the level of proteolysis and water binding by the para-casein network of the 69
cheese, is a critical mediator of functionality and should be tightly controlled when freezing LPMS 70
mozzarella to normalize functional performance. Also, the freezing rate could be controlled to limit 71
the size of the formed ice crystals. Bunker (2016) investigated the effects of the freezing rate, 72
expressed as the time to freeze the center of 4 mm thick cheese slabs to -18°C, on LMPS Mozzarella. 73
The author found that the meltability of the cheese, measured by small-strain oscillation rheology 74
and expressed as the maximum loss tangent upon heating the cheese to 100°C, decreased when the 75

5
time-to-freeze increased from 0 minutes to 95 minutes. In addition, serum relocation from the 76
center of the cheese to its surface was higher when cheeses were frozen to -18°C in 95 minutes as 77
compared to 0 minutes. Conversely, Bertola et al. (1996a) reported that freezing rate, which was 78
defined as the time for the temperature of cheese blocks placed at -20°C to decrease from -1.1 to -79
6.7°C (0.22 or 10 h), had no effects on LMPS Mozzarella. The inter-study discrepancy on the 80
impact of freezing may be related to differences in Mozzarella composition or freezing conditions. 81
The current study reports on the effects of freezing and key freezing conditions, including freezing 82
rate (FR), storage time in the freezer (TIF) and storage time at 4°C before freezing (TBF), on the 83
properties of commercial LMPS Mozzarella, including proteolysis, ratios of soluble-to-total 84
calcium and mobile serum-to-total serum, and functionality. The effects of freezing on these 85
parameters in LMPS Mozzarella have not been clearly exemplified in literature despite of the fact 86
that they are strongly related to textural, viscoelastic, stretch or melt properties (Banville, Morin, 87
Pouliot, & Britten, 2013; Feeney, Fox, & Guinee, 2001; Guinee, Feeney, Auty, & Fox, 2002; Imm, 88
Oh, Han, Oh, Park & Kim, 2003; Smith, Hindmarsh, Carr, Golding, & Reid, 2017). 89
2. Materials and methods 90
2.1. Cheese treatments 91
LMPS Mozzarella cheeses (2.5kg; 28 cm x 10 cm x 8 cm) were supplied by Milcobel cvba 92
(Langemark, Belgium). Seven cheese vats (A, B, C, D, E, F and G) were sampled over the span of 93
1.5 years to take the variability in milk composition and cheese processing into account. For each 94
cheese vat sampled, consecutive cheese blocks were removed from the production line, such that 95
the sampled blocks corresponded to the curd from the middle of the cheese vat. This was chosen 96
to minimize the inter-block variability between cheeses taken from the vat. After sampling, the 97
cheeses were sealed in plastic vacuum bags, placed at 4°C and assigned to various treatments: 98
control cheeses which were stored at 4°C for up to 37 d, and frozen-thawed cheeses, which were 99

6
held at 4°C for 0, 2 or 8 d and frozen to -20°C at different rates (0.6, 2.0 or 8.0°C h-1). The frozen 100
cheeses were held at -20°C for 1, 6, 12 or 44 weeks, and placed at 4°C for a period of 16-37 d. All 101
cheeses were transported chilled to the laboratory (Teagasc, Food Research Centre, Ireland and 102
Ghent University, Belgium), where the characteristics of control and frozen-thawed cheeses were 103
compared after 3 different storage times at 4°C to determine the effects of freezing, storage and 104
possible interaction-effects. 105
2.1.1. Frozen-thawed LMPS Mozzarella 106
The effects of the following freezing conditions were investigated as treatments: freezing rate (FR), 107
time in freezer at -20°C (TIF) and storage time at 4°C before freezing (TBF). The various 108
treatments are described in Tables 1, 2 and 3, respectively, and are discussed in detail below. For 109
each treatment, analyses were performed on 2 cheeses at each storage time at 4°C. 110
2.1.1.1. Effects of the freezing rate (FR) 111
Twenty-four cheeses were taken from cheese vat A (Table 1). Six cheeses were stored at 4°C and 112
analyzed at 4, 15 or 37 d (control). Eighteen cheeses were held at 4°C for 0 d before freezing to -113
20°C. To simulate different cooling rates, 6 cheeses were transferred into a Styrofoam box placed 114
in a chest freezer at -20°C (coded M1), 6 cheeses were placed individually in a chest freezer at -115
20°C (coded M2), and 6 cheeses were transferred into a freezing room at -40°C for 2 hours after 116
which they were transferred to a chest freezer at -20°C (coded M3). Freeze-resistant thermocouples 117
(176T3, Testo, Ternat, Belgium) were used to monitor the temperature at the core and surface of 118
the cheese blocks, and to ensure that the temperature of cheeses placed at -40°C did not decrease 119
to less than -20°C. M1, M2 and M3 resulted in cooling rates of 0.6°C (FR0.6), 2.0°C (FR2.0) and 120
8.0°C h-1 (FR8.0), respectively, as derived from the slope of the cooling curve between the start of 121
cooling and the onset of freezing (i.e., point where latent heat of crystallization became visible). 122
The cheeses were held frozen for 6 weeks, after which they were placed at 4°C and analyzed after 123
7
total storage times at 4°C of 4, 12 or 37 d (Supplement A, Cheese vat A). The effects of FR were 124
determined by comparing cheeses with different FR after similar total storage times at 4°C, while 125
the effects of freezing were determined by comparing each FR cheese with the corresponding 126
control cheeses after similar total storage times at 4°C. Total storage time is defined as the 127
cumulative time for which the cheese was held at 4°C before analysis, i.e., the sum of storage times 128
at 4°C before and after freezing. 129
2.1.1.2. Effects of the time in freezer (TIF) 130
Following manufacture, 40 cheeses were sampled from cheese vat C (Table 2). Eight cheeses were 131
stored at 4°C and analyzed after 4, 10, 16 or 30 d (control). Thirty-two cheeses were held for 2 d 132
at 4°C and transferred to a chest freezer at -20°C. The TIF was varied by holding the cheeses frozen 133
for 1 (TIF1), 6 (TIF6), 12 (TIF12) or 44 weeks (TIF44). After freezing, cheeses were placed at 4°C 134
and analyzed after total storage times at 4°C of 4, 10, 16 or 30 d (Supplement A, Cheese vat C). 135
The effects of TIF were determined by comparing cheeses with different TIF after similar total 136
storage times at 4°C, while the effects of freezing were determined by comparing each TIF cheese 137
with the corresponding control cheeses after similar total storage times at 4°C. 138
2.1.1.3. Effects of the storage time before freezing (TBF) 139
The TBF was varied by holding LMPS Mozzarella cheeses at 4°C for 0, 2 or 8 d before transferring 140
to a chest freezer at -20°C (Table 3). The effects of TBF were evaluated following a between-141
subjects design (i.e., cheese of different vats was subjected to one TBF condition) (Supplement A). 142
This approach ensured a similar sample size for each TBF condition, i.e., 24 cheeses with a TBF 143
of 0 d from vats A and B, 32 cheeses with a TBF of 2 d from vat C and 24 cheeses with a TBF of 144
8 d from vats D, E, F and G. Samples from vats B, D, E, F and G were held frozen for a period of 145
1 week - 6 weeks. After freezing, all cheeses were placed at 4°C and analyzed after different storage 146
times. The effects of freezing at different TBF were determined by comparing the corresponding 147

8
control cheeses with each of the TBF treatments after similar storage times at 4°C. Two cheese 148
blocks from each treatment (control and TBF) were compared after each storage time at 4°C. 149
2.2. Experimental analysis 150
2.2.1. Cheese sampling 151
Cheese blocks were divided into four symmetrical quarters by cutting halfway along the length and 152
width. One quarter was shredded (Robot Coupe CL50, shredding disc, aperture 5mm, Voor ’t Labo 153
CVBA, Eeklo, Belgium) and grated to a particle size of < 1 mm (Food Processor Russell Hobbs, 154
Spectrum Brands Europe GmbH, Sulzbach, Germany). Grated cheese was used for the analysis of 155
composition, soluble calcium and pH 4.6 soluble N. A second quarter was used to prepare six cube 156
samples (25 mm ± 1 mm) (Cheese Blocker, Bos Kaasgereedschap, Boven graven, the Netherlands) 157
for texture profile analysis. The cubes were wrapped tightly in aluminum foil and stored at 4°C for 158
4 h prior to analysis. A third quarter was shredded, stored at 4°C for ~1 d and used for measurement 159
of cheese extensibility. The fourth cheese quarter was used to prepare samples for small strain 160
oscillation rheology (2 discs: 50 mm diameter, 2 mm thick) and flow of the heated cheese by the 161
Schreiber–based test (4 discs: 45 mm in diameter, 4 mm thick). 162
2.2.2. Cheese composition 163
Grated LMPS Mozzarella was analyzed for moisture, total nitrogen (N), salt and total calcium 164
content in duplicate using International Dairy Federation standard methods as described by Guinee, 165
Auty & Fenelon (2000). The pH was measured on a cheese slurry prepared from 20 g of cheese 166
and 12 g H2O after 2 d of storage at 4°C (Guinee et al., 2000). Fat was determined by nuclear 167
magnetic resonance (NMR) (Smart Turbo, CEM Corporation, Matthews, North Carolina, USA). 168
2.2.3. Soluble calcium and pH 4.6 Soluble N (pH4.6SN) 169

9
A water-soluble extract (WSE) of the cheese was prepared by blending distilled water (50°C) and 170
grated cheese at a weight ratio of 2:1 (Stomacher, Lab-Blender 400; Seward Medical, London, UK) 171
for 5 min, holding at 50°C for 1 h, centrifuging at 3000 g for 20 min at 4°C (Sorvall LYNX 6000 172
Superspeed centrifuge, Thermo Scientific, Dublin, Ireland), and filtering through glass wool (Acros 173
organics, Geel, Belgium). A portion (4 mL) of filtrate (WSE) was ashed at 550°C and the ash was 174
analyzed for calcium by flame atomic absorption spectroscopy (ISO 8070, IDF 119:2007). Serum-175
soluble calcium was expressed as a percentage of the total cheese calcium content. A further portion 176
(60 ml) of the WSE was adjusted to pH 4.6 using 10% w/w HCl (Honeywell Fluka™ Chemicals, 177
Offenbach, Germany), centrifuged at 3000 g for 20 minutes at 4°C and filtered through glass wool. 178
The resultant pH 4.6 soluble filtrate was analyzed for N using the macro-Kjeldahl method (ISO 179
8968-1:2014, IDF 20-1:2014) and expressed as a percentage of total cheese nitrogen. 180
Measurements were performed in duplicate per cheese. 181
2.2.4. Time domain 1H NMR relaxometry 182
The T2 relaxation time distribution of LMPS Mozzarella was evaluated by low-field NMR on a 183
benchtop Maran Ultra spectrometer (Oxford instruments, Abingdon, UK), operating at 0.55T (23.4 184
MHz for 1H). The method was described by Vermeir, Declerck, To, Kerkaert & Van der Meeren 185
(2019) who distinguished three serum fractions comprising liquid oil protons and water protons in 186
LMPS Mozzarella with different T2 relaxation times (i.e., the time at which the magnetization 187
signal decays to 37% of its original value). The serum fraction characterized with the longest 188
relaxation time was ascribed to weakly interacting serum protons and could be interpreted as ‘more-189
mobile-serum’. In this study, the relative signal intensity of the more-mobile-serum fraction (A60ms), 190
measured as the ratio of the integrated signal area of the ‘more-mobile-serum’ fraction to the total 191
integrated signal area of all serum fractions, was reported. The latter ratio is indicative of serum 192
that is not immobilized by the calcium-phosphate para-casein network of the cheese, and is 193

10
therefore available for freezing; hence, cheese with a lower A60m is less likely to be impaired by 194
freezing (Kuo et al., 2003). Relaxometry measurements were performed in one TBF0 and one 195
TBF8 experiment, owing to the constraints of analytical time and equipment availability. Triplicate 196
measurements were performed at two separate locations in one Mozzarella block after 0, 1, 2, 4, 8 197
or 16 d storage at 4°C. To report the overall effects of freezing on serum behavior, we included the 198
data as an observation only as the measurements were not included in each freezing experiment. 199
2.2.5. Texture profile analysis (TPA) 200
Cheese cubes were taken individually from the refrigerator and loaded on a TAHdi texture analyzer 201
fitted with a 100 kg load cell (Stable Micro Systems, Goldalming, UK). Each cube was compressed 202
in two consecutive bites at a speed of 1 mm s-1 to 60% of its original height. The method was based 203
on the method applied by Guinee, Pudja, Miocinovic, Wiley & Mullins (2015). The following 204
parameters were derived from the resultant time-force curve: maximum compression force 205
recorded during bite 1 (firmness), the ratio of height to which the cube was compressed at the start 206
of bite 2 relative to the sample’s original height (springiness), the ratio of work required to 207
compress the cube in bite 2 relative to that of bite 1 (cohesiveness) and the product of firmness x 208
springiness x cohesiveness (chewiness). Measurements were performed in sextuplicate per cheese. 209
2.2.6. Extension work (EW) 210
EW was evaluated by a modification of the method described by Guinee et al. (2015). Shredded 211
cheese (60 g) was weighed in a heat resistant vessel (Stable Micro Systems, Goldalming, U.K.) 212
and heated in a microwave oven (Whirlpool MW201, Fonthill Industrial Estate, Dublin, Ireland) 213
set at 750 W for 60s until the cheese temperature was 85 to 95°C. The vessel containing the heated 214
cheese was then loaded on a TAHDi texture analyzer (Stable Micro Systems, Goldalming, UK) 215
and uniaxially extended at a rate of 10 mm s-1 to a height of 380 mm. EW was defined as the 216

11
cumulative work required to extend the hot molten cheese, directly after heating (EW0) and after 217
allowing the cheese to cool down for 5 minutes at room temperature (EW5); EW5 was used to 218
simulate the impact of cooling-induced stiffening of molten cheese on a pizza during consumption. 219
EW0 and EW5 were measured in triplicate and in duplicate, respectively. 220
2.2.7. Small strain oscillation rheology 221
Heat-induced changes in viscoelastic characteristics, including storage modulus, G', loss modulus, 222
G'', and loss tangent, G''/G', on heating from 25°C to 90°C were measured using low amplitude 223
strain oscillation rheology on a strain-controlled rheometer (MCR501, Anton Paar GmbH, Graz, 224
Austria) (Guinee et al., 2015). Cheese discs (50 mm diameter; 2 mm thickness) were prepared and 225
placed between parallel cross-hatched plates (PP50/P2-SN27902; [diameter = 50 mm]; INSET I-226
PP50/SS/P2). The exposed surface of the cheese disc was brushed with a thin layer of silicone oil 227
(silicone oil, Sigma-Aldrich, Arklow, Ireland) to prevent surface dehydration during measurement. 228
Samples were equilibrated at 25°C for 15 minutes and subjected to a low amplitude shear strain (γ 229
= 0.0063) at an angular frequency of 1 Hz, and the temperature was increased from 25°C to 90°C 230
at a rate of 3.25°C min-1. The cross-over temperature (COT), corresponding to the temperature at 231
which G' = G'' (i.e., the point at which the solid index of the sample was equal to its liquid index 232
or the point at which the cheese transitioned from the solid phase into the liquid phase) and the 233
maximum value of loss tangent (LTmax) (i.e., an index for the fluidity of the cheese during heating) 234
were reported. Measurements were performed in duplicate. 235
2.2.8. Schreiber flow 236
Cheese discs (45 mm diameter; 4 mm thickness) were placed on circular glass dishes, heated at 237
280°C for 4 minutes in a convection oven (Binder FD 35, Binder GmbH, Tuttlingen, Germany), 238
removed, allowed to cool at room temperature for 30 min and measured for length along 4 239

12
equidistant diagonals. Flow was defined as the percentage increase in mean diameter during heating. 240
Measurements were performed in quadruplicate. 241
2.2.9. Baking test 242
Frozen pizza bases (25 cm diameter) with tomato paste (Bladerdeeg Van Marcke, Belgium) were 243
thawed for 3 hours at room temperature. Control (75g) and frozen-thawed Mozzarella (75g) shreds 244
were each spread uniformly on opposite halves of the base and baked at 245°C for 5.25 min in a 245
conveyor oven (Lincoln Impinger, Fort Wayne, IN, USA). Following baking, the attributes ‘blister 246
color’, ‘blister coverage’, ‘meltability’, ‘oiling off’, ‘stretch’, ‘first chew’ and ‘chewiness’ were 247
scored sequentially by trained laboratory personnel at Milcobel. A score of 2 was awarded if the 248
characteristic was ‘just right’, a score of < 2 was given when the attribute was subpar, and a score > 249
2 was given if the attribute was more strongly present. Scores of 0 or 4 implied that the measured 250
characteristic was unacceptable because the level of the attribute was either too little or too high, 251
respectively. ‘Blister color’ was indicative of color intensity of the blisters, which ranged from 252
light brown to black, and ‘blister coverage/density’ of the proportion of pizza surface covered by 253
blisters. ‘Meltability’ was a measure of how well the cheese shreds were fused together after baking. 254
‘Meltability’ scores of < 2 were awarded where individual shreds were visible after baking, while 255
scores > 2 were given where cheese was runny. ‘Oiling off’ was a measure of the amount of oil 256
released as a film on top of the pizza after baking. ‘Stretch’ was manually evaluated by lifting 257
cheese from the baked pizza surface using a fork and extending to a maximum height of 30 cm. 258
‘First chew’ and ‘chewiness’ were evaluated by tasting a forkful of the molten Mozzarella. ‘First 259
chew’ was a measure of the resistance perceived during the first bite, while ‘chewiness’ coincided 260
with toughness perceived during overall mastication, as moisture and oil were continuously 261
released from the protein matrix. 262
2.3. Statistical analysis 263

13
A factorial design incorporating two factors, A (cheese treatment) and B (total storage time at 4°C), 264
was used for the analysis of response variables. The main effects of A and B and their interaction 265
effect, A x B, on each response variable was determined separately using two-way analysis of 266
variance. Main effects were compared pair-wise using the Least Significant Difference (LSD) test. 267
In presence of significant interaction effects, a simple main effects analysis, which determines the 268
effects of cheese treatments at each level of the storage time at 4°C, was used. To determine 269
treatment impact on sensory properties, a Kruskal-Wallis test was performed. The level of 270
significance was determined at α = 0.05 throughout. This approach was used to determine the 271
overall effects of freezing and storage time at 4°C on response variables. The effects of specific 272
freezing conditions (e.g., FR, TIF and TBF) were determined likewise. 273
3. Results and discussion 274
3.1. Cheese composition 275
The mean compositions of the cheeses used for comparing the different treatments are given in 276
Table 4. Slight but significant inter-vat differences were found in dry matter, fat, salt, calcium 277
content and pH. This indicated that determining the effects of TBF, which involved cheeses from 278
different vats, may have been somewhat confounded by such compositional variation. The effects 279
of FR and TIF were not affected by inter-vat compositional variation in cheese as cheeses for each 280
of these treatments were taken from the same vat. 281
3.2. Overall changes during storage at 4°C of LMPS Mozzarella 282
The overall comparisons between control and frozen-thawed cheeses, frozen under different 283
conditions, are presented in Fig. 1 and Fig. 2. Each response variable is categorized by two factors: 284
‘cheese treatment’ (control or frozen-thawed cheese) and ‘storage time at 4°C’. The values 285
presented for frozen-thawed cheeses at the different storage times are means of cheeses frozen 286
under different FR, TIF or TBF conditions. First, the interaction-effects between ‘cheese treatment’ 287

14
and ‘total storage time at 4°C’ were determined (Table 5). For each response variable, where no 288
significant interaction-effect could be demonstrated, the effect of cheese treatment was determined 289
by comparing the mean values of control cheeses with those of frozen-thawed cheeses, while 290
keeping the factor ‘storage time at 4°C’ fixed. Likewise, the effects of storage time at 4°C were 291
determined by comparing the mean values between the different storage times, while keeping the 292
factor ‘cheese treatment’ fixed. If a significant interaction effect was found, the effect of cheese 293
treatment was determined at each storage time separately. 294
3.2.1. Physicochemical changes during storage at 4°C 295
Both the control and frozen-thawed cheeses exhibited a reduction in more-mobile-serum fraction 296
(Fig. 1A) and an increase in less-mobile-serum fraction during storage at 4°C (Fig. 1B). This 297
indicated that the more-mobile-serum was gradually ‘immobilized’ during storage at 4°C owing to 298
its uptake into the para-casein network of the cheese matrix. This trend is consistent with the 299
reduction in expressible serum during the storage of LMPS Mozzarella (McMahon and Oberg, 300
2017). Similarly, proteolysis increased progressively in all cheeses on storage at 4°C, as evidenced 301
by the linear increase in pH4.6SN (Fig. 1C). The proximity of dashed trend lines for pH4.6SN of 302
the control and frozen thawed cheeses showed that freezing had no effect on primary proteolysis. 303
A different trend was reported by Bertola et al. (1996b) for concentration of 12% trichloroacetic 304
acid soluble N (TCAN) in low-moisture Mozzarella, whereby cheeses stored for 6 d at 4°C before 305
freezing at -20°C had higher values than the refrigerated control cheeses at similar storage times. 306
However, in the same study, storage of the cheese for 14 d at 4°C before freezing resulted in similar 307
TCAN values as the control cheeses. The relatively low values of pH4.6SN for all cheeses, for 308
example compared to Cheddar cheese, were consistent with those reported previously for LMPS 309
Mozzarella and reflected the high degree of chymosin inactivation during plasticization (Feeney et 310

15
al., 2001). The ratio of soluble-to-total Ca varied from 30% to 45% (Fig. 1D) and was not affected 311
by storage time at 4°C or freezing (P > 0.05) (Table 5). 312
Some studies postulated that freezing could affect the behavior of LMPS Mozzarella owing to 313
protein dehydration concurrent with the formation of ice crystals at the exterior of the Mozzarella 314
cheese, which would promote serum relocation from the core to the exterior of the cheese block 315
(Bunker, 2016; Kuo & Gunasekaran, 2003). Moreover, it would be feasible to assume that 316
precipitation of calcium phosphate by migration of soluble Ca and P to the unfrozen serum may 317
further contribute to para-casein aggregation and thereby reduce the susceptibility to proteolysis 318
(Fox, 1970). However, the current results showed that for the current LMPS Mozzarella cheeses, 319
freezing halted storage-related changes in serum distribution (not statistically verified) and 320
pH4.6SN, and did not influence their levels in the frozen-thawed LMPS Mozzarella (P > 0.05). It 321
is likely that variation in the composition (e.g., moisture content, calcium and pH) and proteolysis 322
of different commercial Mozzarella cheese variant may alter the susceptibility to freezing. 323
3.2.2. Functional characteristics during storage at 4°C 324
Increasing storage time of control and frozen-thawed cheeses resulted in lower values of cheese 325
firmness (Fig. 2A), COT (Fig. 2B) and EW (Fig. 2D and Fig. 2E), and higher values of LTmax (Fig. 326
2C) and flow (Fig. 2F). These changes are consistent with the increase in pH4.6SN and the 327
reduction in more-mobile serum (A60ms) during storage at 4°C (Guinee et al., 2002). 328
Overall, no significant interaction effects could be demonstrated between ‘cheese treatment’ and 329
‘storage time at 4°C’ for most of the response variables, including firmness of the unheated cheese 330
(P > 0.05), and extensibility (EW0, EW5) (P > 0.05) and viscoelastic properties (COT, LTmax) (P > 331
0.05) of the heated cheese (Table 5), which indicated that the rate of storage-related changes of 332
these characteristics at 4°C was similar for the control and frozen-thawed cheeses, as illustrated in 333
Fig. 2. After freezing and thawing, the firmness and chewiness of the unheated cheeses were 334

16
significantly reduced by 10% and 8%, respectively (P < 0.001) (Table 5). However, some studies 335
(Alvarenga, Canada, & Sousa, 2011; Bertola, Califano, Bevilacqua & Zaritzky 1996b) reported 336
that frozen-thawed LMPS Mozzarella had a higher firmness than the corresponding cold-stored 337
cheeses, whereas Cervantes et al. (1983) found that the firmness was unaffected by freezing. No 338
effect of freezing was found for either the cohesiveness (P > 0.05) and springiness (P > 0.05) of 339
the unheated cheeses, or the extensibility (EW0, EW5) (P > 0.05) or viscoelastic properties (COT, 340
LTmax,) (P > 0.05) of the heated cheese. A significant interaction (P = 0.019) was found for 341
Schreiber flow, as illustrated by Fig. 2f where it can be seen that the effects of freezing, relative to 342
the control, depended on the storage time at 4°C. Hence, the effect of freezing on the flow of the 343
heated cheeses was determined at each level of the storage time but no differences could be 344
demonstrated between control and frozen-thawed cheeses (P > 0.05). 345
3.2.3. Baking characteristics during storage at 4°C 346
No clear differences were detected between the control and frozen-thawed cheeses for ‘blister 347
color’, ‘blister coverage’, ‘meltability’, ‘oiling off’, ‘stretch’ and ‘chewiness’ (P > 0.05) after 348
baking on a pizza (Fig. 3). However, the ‘first chew’ of frozen-thawed cheeses received a score of 349
0.3 units less than that of the corresponding control cheeses after a total storage time at 4°C at 16 350
d (P < 0.05), which suggested that freezing resulted in a slightly softer ‘first chew’. This trend was 351
consistent with the reduction in firmness and chewiness of the unheated cheese after freezing and 352
thawing, as measured by TPA. However, no effects of freezing on the attribute ‘first chew’ could 353
be demonstrated at other storage times. 354
3.3. Effects of specific freezing conditions 355
It is possible that the overall effects of freezing, as discussed in Section 3.2, may have been 356
obscured by the effects of specific freezing conditions with opposite effects. Hence, the effects of 357

17
each of the freezing conditions, i.e., FR, TIF and TBF, were investigated separately and are 358
discussed in detail below. 359
3.3.1. Effects of freezing rate (FR) 360
LMPS Mozzarella is commercially frozen in palletized format by placing them in large freezing 361
rooms operating at -20°C. The low heat conductivity of Mozzarella (Dumas & Mittal, 2002), 362
however, results in non-uniform cooling of the pallet with temperatures dropping quickly at the 363
exterior of the pallet and slowly at the core. Mozzarella cheeses were frozen at a rate of 2°C h-1 364
(i.e., individual cheeses placed in a chest freezer at -20°C) or 0.6°C h-1 (i.e., individual cheeses 365
placed in a Styrofoam box in a chest freezer at -20°C) to simulate the freezing of LMPS Mozzarella 366
blocks in the exterior and interior portions of palletized cheese, respectively, when placed at -20°C. 367
Cheeses were also frozen at a rate of 8°C h-1 to investigate the effects of a faster freezing method 368
(e.g., tunnel freezing). 369
The statistical significance (P) for the effects of freezing at different freezing rates, storage time at 370
4°C, and their interaction on the properties of Mozzarella is shown in Table 6. No interaction effect 371
between the cheese treatments and storage time at 4°C could be demonstrated for most response 372
variables. The more-mobile-serum fraction (A60ms) of frozen-thawed samples decreased from 4% 373
to 0% during storage at 4°C, and was not affected by the freezing rate (P < 0.05). As such, the 374
storage-related changes in more-mobile-serum fraction, i.e. its uptake in the calcium-phosphate 375
para-casein network during storage at 4°C, were similar for all freezing rates. Likewise, the 376
proportion of soluble-to-total calcium, which varied from 31% to 36% during storage, and 377
pH4.6SN were unaffected by the freezing rate (P > 0.05). The obtained results further showed no 378
effects of freezing rate on the firmness of the unheated cheese (P > 0.05), or the extensibility (EW0, 379
EW5) (P > 0.05), viscoelastic properties (COT, LTmax) (P > 0.05) or sensory attributes of the heated 380
cheese (P > 0.05). However, a significant interaction was found for the flow of the cheeses, as 381

18
measured by the Schreiber test. After 4 d storage at 4°C (storage time 1, Table 6), frozen-thawed 382
cheeses subjected to freezing rates 2.0°C h-1 or 8.0°C h-1 had a mean flow of 36-38% upon heating 383
for 4 min at 280°C whereas cheese frozen at a rate of 0.6°C h-1 had a flow of 47%. At storage times 384
of 12 d (storage time 2, Table 6), flow plateaued at ~45-48% for all freezing rates. Overall, the 385
results indicated that the FR did not significantly influence storage-related changes in moisture 386
redistribution, primary proteolysis or functional characteristics. Similar conclusions were found for 387
the measured variables of control and frozen-thawed cheeses frozen at different freezing rates. 388
Potentially, the freezable serum of the current LMPS Mozzarella cheese was too limited to induce 389
an effect of freezing, even when cheeses were frozen directly after production and packaging. 390
3.3.2. Effects of time in freezer (TIF) 391
After manufacture and freezing of LMPS Mozzarella, the duration of frozen storage depends on 392
various commercial factors including the dispatch time (i.e., released from the producer to the 393
distributor or harbor), the loading time (i.e., loading of Mozzarella on the ship), the transportation 394
time on the boat, the docking time (i.e., release of Mozzarella at the harbor of the country of 395
destination), the transportation time to the customer and the storage time at -20°C at the customer. 396
To simulate these conditions, LMPS Mozzarella was held at 4°C for 2 d before freezing to -20°C 397
and stored frozen for 6 to 12 (TIF6 and TIF12) weeks to mimic the duration of frozen export, and 398
for 44 weeks (TIF44) to simulate the duration of long-term frozen storage as applied by some 399
customers who on receipt of frozen Mozzarella maintain it frozen for a relatively long time prior 400
to thawing and using. Cheeses were also kept frozen for 1 week (TIF1) to evaluate short periods of 401
frozen storage. 402
Overall, the duration of TIF (1, 6, 12 or 44 weeks) had no effect on most of the evaluated parameters 403
(Table 7), including pH4.6SN (P > 0.05), ratio of soluble-to-total Ca (P > 0.05), LTmax (P > 0.05), 404
extensibility (EW0, EW5) (P > 0.05), Schreiber flow (P > 0.05) and sensory attributes (P > 0.05). 405

19
However, extending the storage from 12 weeks to 44 weeks reduced the firmness (P < 0.001) and 406
chewiness (P < 0.001) of the unheated cheese by 23% on average over the 30 d of total storage 407
time at 4°C, and reduced the COT (P < 0.01) of the heated cheese by 2% on average, i.e., the onset-408
temperature for melting Mozzarella was reduced by 1.3°C. The reduction in melting point was not 409
reflected in the baking test, where panel members gave all TIF treatments similar scores for each 410
sensory attribute (P > 0.05) (Table 5). Moreover, the COT of TIF12 samples did not significantly 411
differ from those of TIF1, TIF6 or TIF44 samples (P > 0.05), which suggested that the effect of 44 412
weeks of frozen storage on the COT of frozen-thawed Mozzarella cheeses was limited. 413
Relative to the control, holding the cheeses at 4°C for 2 d before freezing to -20°C and keeping 414
them frozen for a period between 1 and 12 weeks did not influence the response variables (P > 415
0.05) (Table 7). However, when the cheeses were stored frozen for 44 weeks, firmness and 416
chewiness of cheeses were reduced by 29% (P < 0.001) and 26% (P < 0.001), respectively, whereas 417
the COT of the heated cheese was reduced by 1.7% (P < 0.01). Overall, freezing under these 418
conditions did not affect LTmax (P > 0.05), extensibility (EW0, EW5) (P > 0.05), flow (P > 0.05) or 419
sensory attributes (P > 0.05) of the heated cheese. 420
3.3.3. Effects of time before freezing (TBF) 421
The TBF was varied in a systematic way to evaluate whether the potential detrimental effects of 422
direct freezing could be mitigated by prolonging the storage at 4°C before freezing and thereby 423
allowing the uptake of more-mobile-serum into the calcium-phosphate para-casein network of the 424
cheese (Kuo & Gunasekaran, 2003). Freezing as soon as possible after manufacturing could 425
minimize storage costs. Cheeses were held at 4°C for 0 (TBF0), 2 (TBF2) or 8 d (TBF8) before 426
freezing to -20°C; these cheeses were sampled from vats A and B (TBF0), vat C (TBF2) or vats D, 427
E, F and G (TBF8) (Table 3). Control cheeses, sampled from the different vats (A-G), differed in 428
terms of pH4.6SN (P < 0.001), cohesiveness (P < 0.05), springiness (P < 0.01), LTmax (P < 0.001) 429

20
and EW0 (P < 0.05) after 16 d storage at 4°C, and differed in pH4.6SN (P < 0.001), firmness (P < 430
0.001), cohesiveness (P < 0.05), springiness (P < 0.05), LTmax (P < 0.05) and Schreiber flow (P < 431
0.01) after 30-37 d storage at 4°C, which implied that the effects of TBF were somewhat 432
confounded. Nevertheless, it was possible to compare each TBF treatment with the corresponding 433
control cheese from the same cheese vat (Table 3). 434
No significant differences were found between control cheeses, obtained from vats A or vat B, and 435
the corresponding frozen-thawed cheeses which were held at 4°C for 0 d before freezing to -20°C 436
(TBF0) (Table 5) (discussed in Section 3.3.1). A similar trend was found when comparing the 437
control and frozen-thawed cheeses from vat C (TBF2) (Table 5) (discussed in Section 3.3.2). 438
Likewise, TBF8 cheeses, obtained from 4 different vats, did not significantly differ from the 439
corresponding control cheeses (P > 0.05) (Table 5) with the exception of a significant interaction 440
effect between freezing and storage time at 4°C for firmness of the unheated cheese (P < 0.01). 441
Compared to the corresponding controls, TBF8 cheeses exhibited lower firmness after 10 d storage 442
at 4°C (P < 0.01), but not after other storage times (P > 0.05). 443
Overall, as evident from Fig. 3 and Fig. 4, the current results indicated that there was little effect 444
of holding the cheeses at 4°C for 0, 2 or 8 d before freezing to -20°C on the physicochemical and 445
functional properties of the current variant of LMPS Mozzarella. 446
447
4. Conclusions 448
A total of 132 blocks of LMPS Mozzarella cheese were sampled from a commercial manufacturer 449
over a 1.5 year period. The cheeses were assigned to 2 groups, namely control cheeses which were 450
stored at 4°C for up to 37 d, and frozen-thawed cheeses which were held at 4°C for different times 451
(TBF: 0, 2 or 8 d) before freezing to -20°C at different rates (FR: 0.6, 2.0 or 8.0°C h-1). The frozen 452
cheeses were held at -20°C for different times (TIF: 1, 6, 12 or 44 weeks), and then placed at 4°C 453

21
for up to 37 d to achieve total storage times at 4°C similar to the control. The effects of freezing 454
were determined by comparing the control and frozen-thawed cheeses taken from the same vat, 455
and the effects of different freezing conditions (FR and TIF) by comparing the frozen-thawed 456
cheeses subjected to the different levels of condition. The control and frozen-thawed cheeses were 457
evaluated after similar total storage times at 4°C for composition, primary proteolysis, moisture 458
distribution, texture profile (firmness, springiness, cohesiveness), functional properties 459
(extensibility, viscoelastic behavior and flow of the heated cheese) and baking performance on 460
pizza. Overall, freezing per se did not significantly affect the properties of the cheese. Likewise, 461
there was little difference between frozen-thawed cheeses frozen under the following conditions: 462
FR (0.6, 2.0 or 8.0°C h-1) or TIF (1, 6 or 12 weeks). Extending the TIF from 1, 6 or 12 weeks to 44 463
weeks reduced the firmness and chewiness of the unheated frozen-thawed cheese (by 23% on 464
average), and reduced the melting temperature by 2% during a total storage time at 4°C of 30 d. 465
However, there was no detectable difference in baking performance when the TIF was varied from 466
1 to 44 weeks. 467
Considering the overall effects observed in this study, we conclude that freezing of commercial 468
LMPS Mozzarella cheese (with respective dry matter, fat and protein levels of ~52, 22 and 25 g 469
100 g-1, and a calcium level of ~740 mg 100 g-1) under the applied conditions, halted the physico-470
chemical changes that occur on storage at 4°C without having significant effects on functionality 471
and baking performance. However, the applicability of the findings to commercial Mozzarella in 472
general may vary depending on the manufacturing and compositional characteristics of the cheese, 473
which are likely to impact the degree of aggregation of the calcium-phosphate para-casein matrix 474
and its ability to bind serum. Critical factors affecting aggregation are likely to include cheese 475
moisture, pH, calcium content, ratio of soluble-to-total calcium, and degree of proteolysis. In 476
practice, changes in make procedure which affect cheese composition may therefore necessitate 477

22
tailoring of freezing conditions to ensure comparable functionality of control and frozen-thawed 478
Mozzarella. 479
480
Acknowledgements 481
The authors would like to express their gratitude to Dr. Dirk Van Gaver (Milcobel cvba) and Dr. 482
John Tobin (Teagasc Food Research Centre Moorepark) for the provision of materials, equipment 483
and scientific support. 484
485
Funding 486
This work was supported by the Flemish Agency for Innovation & Entrepreneurship (grant number 487
HBC.2017.0297, VLAIO, Belgium). The Fund for Scientific Research - Flanders (FWO-488
Vlaanderen) is gratefully acknowledged for its financial support for obtaining the time-domain 489
NMR equipment. 490
491
Declaration of interests 492
There are no conflicts of interest. 493

23
References 494
1. Alvarenga, N., Canada, J., & Sousa, I. (2011). Effect of freezing on the rheological, chemical 495
and color properties of Serpa cheese. Journal of Dairy Research, 78, 80-87. 496
2. Banville, V., Morin, P., Pouliot, Y., & Britten, M. (2013). Physical properties of pizza 497
Mozzarella cheese manufactured under different cheese-making conditions. American Dairy 498
Science Association, 96, 4804-4815. 499
3. Bertola, N. C., Califano, A. N., Bevilacqua, A. E., & Zaritzky, N. E. (1996a). Effect of freezing 500
conditions on functional properties of low moisture Mozzarella cheese. Journal of Dairy 501
Science, 79, 185-190. 502
4. Bertola, N. C., Califano, A. N., Bevilacqua, A. E., & Zaritzky, N. E. (1996b). Textural changes 503
and proteolysis of low-moisture Mozzarella cheese frozen under various conditions. LWT - 504
Food Science and Technology, 29, 470-474. 505
5. Bunker, H. (2016). The effect of freezing rate on the quality attributes of low-moisture part-506
skim Mozzarella. Thesis dissertation, Ohio, U.S.A.: Ohio State University. 507
6. Cervantes, M. A., Lund, D. B., & Olson, N. F. (1983). Effects of salt concentration and freezing 508
on Mozzarella cheese texture. Journal of Dairy Science, 66, 204-2013. 509
7. Dumas, C., & Mittal, G.S. (2002), Heat and mass transfer properties of pizza during baking. 510
International Journal of Food Properties, 5, 161-177 511
8. Everett, D. W., & Auty, M. A. (2008). Cheese texture and current methods of analysis. 512
International Dairy Journal, 18, 759-773. 513
9. Feeney, E. P., Fox, P. F., & Guinee, T. P. (2001). Effect of ripening temperature on the quality 514
of low moisture Mozzarella cheese: 1. Composition and proteolysis. Le Lait, 81, 463-474. 515
10. Fox, P.F. (1970). Influence of aggregation on the susceptibility of casein to proteolysis. Journal 516
of Dairy Research, 37, 173-180. 517

24
11. Guinee, T. P., Auty, M. A., & Fenelon, M. A. (2000). The effect of fat content on the rheology, 518
microstructure and heat-induced functional characteristics of Cheddar cheese. International 519
Dairy Journal, 10, 277-288. 520
12. Guinee, T. P., Feeney, E. P., Auty, M. A., & Fox, P. F. (2002). Effect of pH and calcium 521
concentration on some textural and functional properties of Mozzarella cheese. Journal of 522
Dairy Science, 85, 1655-1669. 523
13. Guinee, T. P., Mulholland, E. O., Mullins, C., Corcoran, M. O., & Auty, M. (1999). The effects 524
of processing and ripening on the quality of pizza cheese. Teagasc. Fermoy, County Cork, 525
Ireland. [Cited 2019 October 20] Retrieved from https://t-stor.teagasc.ie/handle/11019/1311 526
14. Guinee, T. P., Pudja, P., Miocinovic, J., Wiley, J., & Mullins, C. M. (2015). Textural and 527
cooking properties and viscoelastic changes on heating and cooling of Balkan cheeses. Journal 528
of Dairy Science, 98, 7573-7586. 529
15. Imm, J. Y., Oh, E. J., Han, K. S., Oh, S., Park, Y. W., & Kim, S. H. (2003). Functionality and 530
physico-chemical characteristics of bovine and caprine Mozzarella cheeses during refrigerated 531
storage. American Dairy Science Association, 86, 2790-2798. 532
16. ISO/IDF. (2007). Milk and milk products – Determination of calcium, sodium, potassium and 533
magnesium contents – Atomic absorption spectrometric method, ISO 8070|IDF119:2007, 534
Brussels, Belgium: International Dairy Federation 535
17. ISO/IDF. (2014). Milk and milk products — Determination of nitrogen content — Part 1: 536
Kjeldahl principle and crude protein calculation, ISO 8968-1:2014|IDF20-1:2014, Brussels, 537
Belgium: International Dairy Federation 538
18. Kuo, M. I., & Gunasekaran, S. (2003). Effect of frozen storage on physical properties of pasta 539
filata and non-pasta filata Mozzarella cheese. Journal of Dairy Science, 86, 1108-1117. 540

25
19. Kuo, M. I., & Gunasekaran, S. (2009). Effect of freezing and frozen storage on microstructure 541
of Mozzarella and pizza cheeses. LWT - Food Science and Technology, 42, 9-16. 542
20. Kuo, M. I., Anderson, M. E., & Gunasekaran, S. (2003). Determining effects of freezing on 543
pasta filata and non-pasta filata Mozzarella cheeses by nuclear magnetic resonance imaging. 544
Journal of Dairy Science, 86, 2525-2536. 545
21. McMahon, D.J., & Oberg, C.J. (2017). Pasta-filata cheeses. In McSweeney, P., Fox, P., Cotter, 546
P., & Everett, D. (4th edn.), Cheese: Chemistry, physics and microbiology (p. 1041-1068). 547
Cambridge, USA: Academic Press. 548
22. Oberg, C. J., Merrill, R. K., Brown, R. J., & Richardson, G. H. (1992). Effects of freezing, 549
thawing and shredding on low moisture, part-skim Mozzarella cheese. Journal of Dairy Science, 550
75, 1161-1166. 551
23. Ribero, G. G., Rubiolo, A. C., & Zorrilla, S. E. (2007). Initial freezing point of Mozzarella 552
cheese. Journal of Food Engineering, 81, 157-161. 553
24. Smith, J. R., Hindmarsh, J. P., Carr, A. J., Golding, M. D., & Reid, D. (2017). Molecular drivers 554
of structural development in Mozzarella cheese. Journal of Food Engineering, 214, 1-9. 555
25. Vermeir, L., Declerck, A., To, C., Kerkaert, B., & Van der Meeren, P. (2019). Water and oil 556
signal assignment in low-moisture Mozzarella as determined by time-domain NMR T2 557
relaxometry. Magnetic Resonance in Chemistry, 57, 674-685 558
26
Figure captions 559
Fig. 1: Overall changes during storage at 4°C in relative signal intensity of (A) more-mobile-serum 560
(A60ms
) and (B) less-mobile-serum (A3ms
) of frozen-thawed LMPS Mozzarella () or control 561
LMPS Mozzarella (). 562
Overall changes during storage at 4°C in (C) pH 4.6 Soluble N and (D) ratio of soluble-to-total Ca 563
of frozen-thawed LMPS Mozzarella cheeses, which were held at 4°C for 0 (Ο), 2 (Δ) or 8 d () 564
before freezing, and of corresponding control cheeses (, and ). Trendlines represent the 565
overall dynamic behavior of frozen-thawed (---) and control (---) cheeses during storage at 4°C. 566
The cheeses were obtained from 7 vats and were frozen under different conditions. 567
568
Fig. 2: Overall changes during storage at 4°C in firmness of the unheated cheese, cross-over 569
temperature (COT), maximum value of the loss tangent (LTmax), extension work at 0 (EW0) or 5 570
(EW5) min after melting and Schreiber flow of frozen-thawed LMPS Mozzarella cheeses, which 571
were held at 4°C for 0 (Ο), 2 (Δ) or 8 d () before freezing, and of corresponding control cheeses 572
(, and ). Trendlines represent the overall dynamic behavior of frozen-thawed (---) and 573
control (---) cheeses during storage at 4°C. The cheeses were obtained from 7 vats and frozen under 574
different conditions. 575
576
Fig. 3: Overall appearance of Mozzarella shreds after baking on a pizza after 2, 16 or 35 d of 577
storage at 4°C. Top row pictures present control Mozzarella and bottom row pictures present 578
frozen-thawed Mozzarella, held at 4°C for 0 days before freezing to -20°C. The cheese was held 579
frozen for 6 weeks. After freezing, cheeses were placed at 4°C for up to 35 d. 580
581

27
Fig. 4: Changes during storage at 4°C in pH 4.6 Soluble N, firmness, cross-over temperature 582
(COT), maximum value of the loss tangent (LTmax), extension work at 0 min after melting (EW0), 583
and Schreiber flow of control and frozen-thawed LMPS Mozzarella cheeses, which were held at 584
4°C for 0 (TBF0) or 8 d (TBF8) before freezing to -20°C. 585
TBF0 samples, sampled from vat A or vat B, were used to determine the effects of holding the 586
cheese at 4°C for 0 d before freezing to -20°C (); the cheeses were frozen at 0.6, 2 or 8°C h-1 and 587
held in the freezer for 6 weeks. Control samples were taken from the same vat (). 588
TBF8 samples, sampled from vat D, E, F or G, were used to determine the effects of holding the 589
cheeses at 4°C for 8 d before freezing to -20°C (); the cheeses were frozen at 2°C h-1 and held in 590
the freezer for 6 weeks. Control samples were taken from the same vats (). 591
Supplement A. Overview of the sampling design per cheese vat. 592
Twenty-four cheeses were sampled from vat A. Six cheeses were control cheeses. Eighteen cheeses 593
were held at 4°C for 0 d before to freezing to -20°C (TBF0) at a rate of 0.6°C (FR0.6), 2.0°C 594
(FR2.0) or 8.0°C h-1 (FR8.0) to evaluate the effects of freezing at different freezing rates (FR). All 595
cheeses were held frozen for 6 weeks (TIF6). 596
Forty cheeses were sampled from vat C. Eight cheeses were control cheeses. Thirty-two cheeses 597
were held at 4°C for 2 d before to freezing to -20°C (TBF2) at a rate of 2.0°C h-1. The frozen 598
cheeses were held for 1 (TIF1), 6 (TIF6), 12 (TIF12) or 44 weeks (TIF44) in the freezer to evaluate 599
the effects of freezing at different holding times in the freezer (TIF). 600
To evaluate the effects of holding time at 4°C before freezing (TBF), cheeses from each vat were 601
subjected to one TBF condition. This approach ensured a similar sample size for each TBF 602
condition. A total of 24, 32 or 24 cheeses were held at 4°C for 0 (TBF0), 2 (TBF2) or 8 d (TBF8) 603
before freezing to -20°C, respectively. After freezing, cheeses were held at 4°C for up to 16 to 37 604

28
d, depending on the vat they were sampled from. Frozen-thawed cheeses (FT cheeses) and control 605
cheeses were evaluated at various storage times at 4°C (ST1, ST2, ST3 or ST4) (total storage time 606
at 4°C) as described in Table 3.607
29
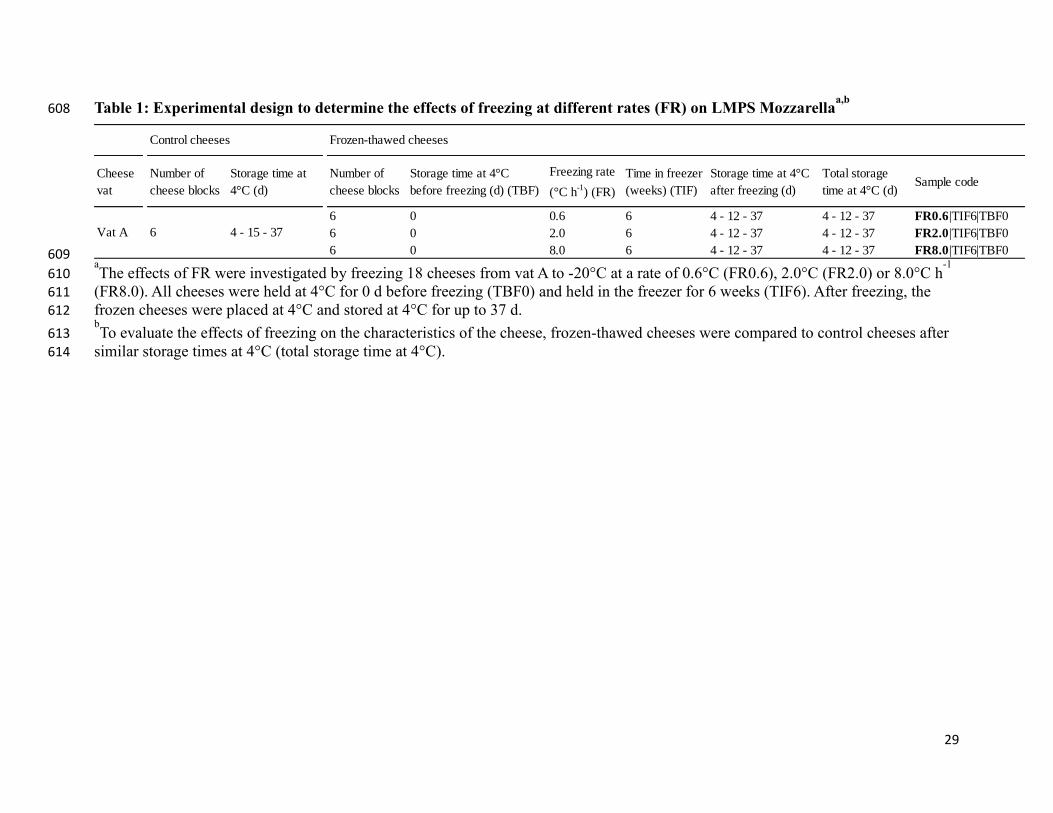
Table 1: Experimental design to determine the effects of freezing at different rates (FR) on LMPS Mozzarellaa,b
608
609
aThe effects of FR were investigated by freezing 18 cheeses from vat A to -20°C at a rate of 0.6°C (FR0.6), 2.0°C (FR2.0) or 8.0°C h
-1 610
(FR8.0). All cheeses were held at 4°C for 0 d before freezing (TBF0) and held in the freezer for 6 weeks (TIF6). After freezing, the 611
frozen cheeses were placed at 4°C and stored at 4°C for up to 37 d. 612 bTo evaluate the effects of freezing on the characteristics of the cheese, frozen-thawed cheeses were compared to control cheeses after 613
similar storage times at 4°C (total storage time at 4°C). 614
Cheese
vat
Number of
cheese blocks
Storage time at
4°C (d)
Number of
cheese blocks
Storage time at 4°C
before freezing (d) (TBF)
Freezing rate
(°C h-1
) (FR)
Time in freezer
(weeks) (TIF)
Storage time at 4°C
after freezing (d)
Total storage
time at 4°C (d)Sample code
6 0 0.6 6 4 - 12 - 37 4 - 12 - 37 FR0.6|TIF6|TBF0
6 0 2.0 6 4 - 12 - 37 4 - 12 - 37 FR2.0|TIF6|TBF0
6 0 8.0 6 4 - 12 - 37 4 - 12 - 37 FR8.0|TIF6|TBF0
Frozen-thawed cheeses
Vat A 4 - 15 - 37
Control cheeses
6

30
Table 2: Experimental design to evaluate the effects of freezing at different storage times in the freezer (TIF) on LMPS 615
Mozzarellaa,b
616
617
aThe effects of TIF were investigated by freezing 32 cheeses from vat C to -20°C and holding the cheeses in the freezer for 1 (TIF1), 6 618
(TIF6), 12 (TIF12) or 44 weeks (TIF44). All cheeses were held for 2 d at 4°C before freezing (TBF2) and were frozen at a rate of 619
2.0°C h-1
(FR2.0). After freezing, the frozen cheeses were held at 4°C and kept at 4°C for up to 28 d. 620 bTo evaluate the effects of freezing on the characteristics of the cheese, frozen-thawed cheeses were compared to control cheeses after 621
similar storage times at 4°C (total storage time at 4°C). 622
Cheese
vat
Number of
cheese blocks
Storage time at
4°C (d)
Number of
cheese blocks
Storage time at 4°C
before freezing (d) (TBF)
Freezing rate
(°C h-1
) (FR)
Time in freezer
(weeks) (TIF)
Storage time at 4°C
after freezing (d)
Total storage
time at 4°C (d)Sample code
8 2 2.0 1 2 - 8 - 14 - 28 4 - 10 - 16 - 30 FR2.0|TIF1|TBF2
8 2 2.0 6 2 - 8 - 14 - 28 4 - 10 - 16 - 30 FR2.0|TIF6|TBF2
8 2 2.0 12 2 - 8 - 14 - 28 4 - 10 - 16 - 30 FR2.0|TIF12|TBF2
8 2 2.0 44 2 - 8 - 14 - 28 4 - 10 - 16 - 30 FR2.0|TIF44|TBF2
Frozen-thawed cheeses
Vat C 8 4 - 10 - 16 - 30
Control cheeses

31
Table 3: Experimental design to determine the effects of freezing at different storage times at 4°C before freezing (TBF) on 623
LMPS Mozzarellaa,b
624
625
aThe effects of TBF were investigated by holding: (i) 18 cheeses from vat A and 6 cheeses from vat B at 4°C for 0 d before freezing 626
(TBF0), (ii) 32 cheeses from vat C at 4°C for 2 d before freezing (TBF2) and (iii) 6 cheeses from each of vats D, E F and G at 4°C for 627
8 d before freezing (TBF8). All cheeses were frozen to -20°C at a rate of 0.6 (FR0.6), 2.0 (FR2.0) or 8.0°C h-1
(FR8.0) and held in the 628
freezer for 1 (TIF1), 6 (TIF6), 12 (TIF12) or 44 (TIF44) weeks. After freezing, frozen cheeses were held at 4°C for up to 16 to 37 d, 629
depending on the vat they were sampled from. This approach ensured a similar sample size for each TBF condition. 630 bTo evaluate the effects of freezing on the characteristics of the cheese, frozen-thawed cheeses were compared to control cheeses after 631
similar storage times at 4°C (total storage time at 4°C). 632
Cheese
vat
Number of
cheese blocks
Storage time at
4°C (d)
Number of
cheese blocks
Storage time at 4°C
before freezing (d) (TBF)
Freezing rate
(°C h-1
) (FR)
Time in freezer
(weeks) (TIF)
Storage time at 4°C
after freezing (d)
Total storage
time at 4°C (d)Sample code
6 0 0.6 6 4 - 12 - 37 4 - 12 - 37 FR0.6|TIF6|TBF0
6 0 2.0 6 4 - 12 - 37 4 - 12 - 37 FR2.0|TIF6|TBF0
6 0 8.0 6 4 - 12 - 37 4 - 12 - 37 FR8.0|TIF6|TBF0
Vat B 6 2 - 16 - 35 6 0 2.0 6 2 - 16 - 35 2 - 16 - 35 FR2.0|TIF6|TBF0
8 2 2.0 1 2 - 8 - 14 - 28 4 - 10 - 16 - 30 FR2.0|TIF1|TBF2
8 2 2.0 6 2 - 8 - 14 - 28 4 - 10 - 16 - 30 FR2.0|TIF6|TBF2
8 2 2.0 12 2 - 8 - 14 - 28 4 - 10 - 16 - 30 FR2.0|TIF12|TBF2
8 2 2.0 44 2 - 8 - 14 - 28 4 - 10 - 16 - 30 FR2.0|TIF44|TBF2
Vat D 8 2 - 8 - 17 - 36 6 8 2.0 1 2 - 8 - 28 10 - 16 - 36 FR2.0|TIF1|TBF8
Vat E 8 2 - 8 - 17 - 25 6 8 2.0 1 2 - 10 - 17 10 - 18 - 25 FR2.0|TIF1|TBF8
Vat F 8 2 - 8 - 16 - 32 6 8 2.0 6 2 - 8 - 16 10 - 16 - 24 FR2.0|TIF6|TBF8
Vat G 8 2 - 8 - 16 - 32 6 8 2.0 6 2 - 8 - 16 10 - 16 - 24 FR2.0|TIF6|TBF8
Vat C 8 4 - 10 - 16 - 30
Control cheeses Frozen-thawed cheeses
Vat A 6 4 - 15 - 37

32
Table 4: Composition of LMPS Mozzarella used in freezing studies 633
Cheese vat Dry matter
(g 100g-1
)
Fat
(g 100g-1
)
Protein
(g 100g-1
)
Salt
(g 100g-1
)
Calcium
(mg 100g-1
)
pH
A 52.1a,b
21.7a 24.4
a 0.9
a 766
a,b 5.53a
B 52.6b 21.8
a,b 25.3
a 1.2
b,c 809
a 5.51a
C 52.0a,b
21.7a 24.8
a 1.1
b 697
c 5.41b,d
D 52.0a,b
22.1c 24.5
a 1.1
b 712
b,c 5.43b
E 51.9a,b
21.7a 25.1
a 1.2
b 696
c 5.34c
F 52.2a,b
22.1b,c
24.8a 1.3
c 735
a,b,c 5.34c
G 51.7a 21.6
a 24.7
a 1.3
c 784
a 5.36c,d
a,b,cValues in columns with different superscripted letters denote a significant difference (P < 0.05). Presented data of dry matter, fat, 634
protein, salt and calcium content are mean values measured on at least four different cheeses per vat. The pH of the cheese was 635 measured on two cheeses per vat after 2 d of storage at 4°C. 636

33
Table 5: Effects of freezing treatments (FR, freezing rate; TIF, storage time in freezer; TBF, storage time at 4°C before 637
freezing), total storage time at 4°C and their interaction on the characteristics of LMPS Mozzarellaa, b, c, d, e, f, g
638
639 aThe statistical significance (P) for treatment effects across the evaluated properties of control and frozen-thawed cheeses is given where 640
P > 0.05, P < 0.05, P < 0.01 and P < 0.001 is denoted by -, *, ** and ***, respectively. 641 bThe effects of freezing (Fr) were determined by comparing the characteristics of the control and frozen-thawed cheeses. 642 cThe effects of total storage time at 4°C (ST) were determined for all cheeses. Cheeses were stored at 4°C for up to 37 d. 643
different conditions at 4°C for 0 d before freezing at 4°C for 2 d before freezing at 4°C for 8 d before freezing
FreezingStorage
Time at 4°CInteraction
Cheese
Treatments
Storage
Time at 4°CInteraction
Cheese
Treatments
Storage
Time at 4°CInteraction
Cheese
Treatments
Storage
Time at 4°CInteraction
(F) (ST) (F*ST) (CT) (ST) (CT*ST) (CT) (ST) (CT*ST) (CT) (ST) (CT*ST)
Unheated cheese
More-mobile-serum (A60ms) n/d n/d n/d - *** - n/d n/d n/d - *** -
Ratio soluble-to-total Ca - - - - - - - - - - - -
pH 4.6 Soluble N - *** - - *** - - *** - - *** -
Firmness *** *** - - *** - *** * - - *** **
Springiness - *** - - *** - - *** - - * -
Cohesiveness - *** - - *** - - *** - - *** -
Chewiness *** *** - - *** - *** *** - - *** *
Heated cheese
COT - *** - - *** - ** *** - - *** -
LTmax - *** - - *** - - *** - - ** -
EW0 - *** - - *** - - *** - - *** -
EW5 - *** - - *** - - *** - - *** -
Shreiber flow - *** * - *** *** - ** - - *** -
'Blister color' - *** n/a - *** n/a - - n/a - *** n/a
'Blister coverage' - *** n/a - *** n/a - - n/a - *** n/a
'Meltability' - *** n/a - *** n/a - *** n/a - *** n/a
'Oiling off' - *** n/a - *** n/a - *** n/a - *** n/a
'Stretch' - *** n/a - *** n/a - - n/a - *** n/a
'First chew' *** *** n/a - *** n/a - *** n/a - *** n/a
'Chewiness' - *** n/a - *** n/a - *** n/a - *** n/a
Effects of freezing cheeses held Effects of freezing cheeses held Effects of freezing cheeses held
Cheese characteristic
Overall effects of freezing at

34
dCheese treatments where cheeses were held at 4°C for 0 d before freezing to -20°C (TBF0) correspond to cheeses frozen at a rate of 0.6, 644
2.0 or 8.0°C h-1. The frozen cheeses were held frozen for 6 weeks in the freezer. Control and frozen-thawed cheeses were sampled from 645 vats A or B. 646 eCheese treatments where cheeses were held at 4°C for 2 d before freezing to -20°C (TBF2) correspond to cheeses frozen at a rate of 647 2.0°C h-1. The frozen cheeses were held frozen for 1, 6, 12 or 44 weeks in the freezer. Control and frozen-thawed cheeses were sampled 648
from vats C. 649 fCheese treatments where cheeses were held at 4°C for 8 d before freezing to -20°C (TBF8) correspond to cheeses frozen at a rate of 650 2.0°C h-1. The frozen cheeses were held frozen for 6 weeks in the freezer. Control and frozen-thawed cheeses were sampled from vats 651
D, E, F or G. 652 gn/d = not determined; n/a = not applicable 653

35
Table 6: Effects of freezing at different rates (FR), total storage time at 4°C and their interaction on the characteristics of 654
LMPS Mozzarellaa, b, c, d
655
Cheese characteristic Control FR0.6 FR2.0 FR8.0 P
Unheated cheese
More-mobile-serum (%)
Storage time 1 3.8 ± 0.2 3.6 ± 0.5 3.3 ± 0.6 3.4 ± 0.9 Cheese treatment (CT) -
Storage time 2 1.9 ± 0.7 1.8 ± 0.5 1.4 ± 0.3 2.1 ± 0.5 Storage time (ST) ***
Storage time 3 0.1 ± 0.4 0.3 ± 0.4 0.3 ± 0.2 0.3 ± 0.2 Interaction (CT x ST) -
pH 4.6 Soluble N (% TN)
Storage time 1 2.6 ± 0.5 2.8 ± 0.1 2.5 ± 0.3 2.3 ± 0.4 Cheese treatment (CT) -
Storage time 2 3.8 ± 5.4 3.8 ± 0.1 3.6 ± 0.2 3.5 ± 0.1 Storage time (ST) ***
Storage time 3 5.4 ± 0.1 6.2 ± 0.6 6.6 ± 0.1 6.0 ± 0.3 Interaction (CT x ST) -
Soluble Ca (% total Ca)
Storage time 1 33 ± 1 35 ± 2 34 ± 2 35 ± 4 Cheese treatment (CT) -
Storage time 2 35 ± 1 33 ± 2 34 ± 4 33 ± 2 Storage time (ST) -
Storage time 3 33 ± 3 33 ± 2 33 ± 2 33 ± 1 Interaction (CT x ST) -
Firmness (N)
Storage time 1 115 ± 13 106 ± 12 108 ± 20 125 ± 14 Cheese treatment (CT) -
Storage time 2 111 ± 10 113 ± 16 102 ± 12 84 ± 10 Storage time (ST) **
Storage time 3 88 ± 14 88 ± 11 84 ± 10 76 ± 7 Interaction (CT x ST) -
Heated cheese
COT (°C)
Storage time 1 58 ± 1 57 ± 1 59 ± 2 59 ± 3 Cheese treatment (CT) -
Storage time 2 56 ± 0 56 ± 1 56 ± 0 56 ± 1 Storage time (ST) ***
Storage time 3 54 ± 0 54 ± 0 54 ± 1 55 ± 1 Interaction (CT x ST) -
Ltmax
Storage time 1 1.8 ± 0.2 2.0 ± 0.2 1.9 ± 0.3 1.7 ± 0.4 Cheese treatment (CT) -
Storage time 2 2.6 ± 0.0 2.6 ± 0.1 2.6 ± 0.1 2.6 ± 0.0 Storage time (ST) ***

36
Storage time 3 2.8 ± 0.2 2.6 ± 0.3 2.8 ± 0.1 2.7 ± 0.2 Interaction (CT x ST) -
EW0 (mJ)
Storage time 1 221 ± 44 207 ± 36 222 ± 22 222 ± 21 Cheese treatment (CT) -
Storage time 2 164 ± 17 130 ± 20 119 ± 18 135 ± 18 Storage time (ST) ***
Storage time 3 81 ± 14 96 ± 7 109 ± 12 105 ± 20 Interaction (CT x ST) -
EW5 (mJ)
Storage time 1 708 ± 183 769 ± 63 830 ± 173 764 ± 54 Cheese treatment (CT) -
Storage time 2 510 ± 73 506 ± 67 462 ± 126 591 ± 64 Storage time (ST) ***
Storage time 3 272 ± 70 336 ± 19 341 ± 16 383 ± 57 Interaction (CT x ST) -
Schreiber flow (%)
Storage time 1 39 ± 4 47 ± 5 36 ± 6 38 ± 6 Cheese treatment (CT) -
Storage time 2 47 ± 6 45 ± 4 46 ± 5 48 ± 4 Storage time (ST) **
Storage time 3 43 ± 5 38 ± 4 46 ± 6 41 ± 4 Interaction (CT x ST) ** 656 aThe statistical significance (P) for treatment effects across the evaluated properties of LMPS Mozzarella is given where P > 0.05, P < 657 0.01 and P < 0.001 are denoted by -, ** and *** respectively. Control and frozen-thawed cheeses were sampled from vat A. 658 bThe different cheese treatments correspond to cheeses frozen to –20°C at 0.6 (FR0.6), 2.0, (FR2.0) or 8.0°C h-1 (FR8.0). The frozen 659 cheeses were held at 4°C for 0 d before freezing and held in the freezer for 6 weeks. 660 cThe different storage times at 4°C (total time at 4°C) correspond to: 4 d (storage time 1), 12-15 d (storage time 2) or 37 d (storage time 661 3) with the exception for the characteristic more-mobile-serum, which was analyzed at 2, 4 or 9 d storage at 4°C 662 dData presented are means ± standard deviation of two Mozzarella blocks per ripening point. 663

37
Table 7: Effects of freezing at different storage times in the freezer (TIF), total storage time at 4°C and their interaction on the 664
characteristics of LMPS Mozzarellaa, b, c, d
665
Cheese characteristic Control TIF1 TIF6 TIF12 TIF44 P
Unheated cheese
pH 4.6 Soluble N (% TN)
Storage time 1 2.4 ± 0.1 2.4 ± 0.0 2.5 ± 0.1 2.5 ± 0.0 2.5 ± 0.1 Cheese treatment (CT) -
Storage time 2 3.7 ± 0.1 4.0 ± 0.2 3.8 ± 0.1 3.8 ± 0.1 3.9 ± 0.7 Storage time (ST) ***
Storage time 3 5.2 ± 0.1 4.7 ± 0.3 4.2 ± 0.2 4.4 ± 0.5 5.6 ± 0.1 Interaction (CT x ST) -
Soluble Ca (% total Ca)
Storage time 1 37 ± 1 39 ± 1 38 ± 2 38 ± 1 39 ± 1 Cheese treatment (CT) -
Storage time 2 39 ± 2 40 ± 2 39 ± 1 39 ± 1 38 ± 2 Storage time (ST) -
Storage time 3 41 ± 1 40 ± 5 38 ± 2 38 ± 2 40 ± 2 Interaction (CT x ST) -
Firmness (N)
Storage time 1 116 ± 18 96 ± 14 101 ± 22 110 ± 13 84 ± 14 Cheese treatment (CT) ***
Storage time 2 134 ± 5 90 ± 17 114 ± 16 108 ± 15 83 ± 7 Storage time (ST) *
Storage time 3 93 ± 12 100 ± 9 78 ± 13 97 ± 8 76 ± 7 Interaction (CT x ST) -
Heated cheese
COT (°C)
Storage time 1 59 ± 2 59 ± 1 58 ± 1 59 ± 0 58 ± 1 Cheese treatment (CT) **
Storage time 2 57 ± 1 57 ± 1 57 ± 1 56 ± 1 55 ± 1 Storage time (ST) ***
Storage time 3 54 ± 1 55 ± 0 56 ± 1 55 ± 1 55 ± 1 Interaction (CT x ST) -
Ltmax
Storage time 1 2.0 ± 0.2 2.0 ± 0.3 2.0 ± 0.1 1.9 ± 0.0 1.9 ± 0.1 Cheese treatment (CT) -
Storage time 2 2.7 ± 0.1 2.6 ± 0.1 2.6 ± 0.1 2.7 ± 0.1 2.6 ± 0.1 Storage time (ST) ***
Storage time 3 3.0 ± 0.1 2.8 ± 0.1 2.8 ± 0.1 2.8 ± 0.1 2.7 ± 0.1 Interaction (CT x ST) -
EW0 (mJ)
Storage time 1 197 ± 26 204 ± 19 195 ± 32 212 ± 16 200 ± 20 Cheese treatment (CT) -
Storage time 2 113 ± 8 106 ± 9 106 ± 16 107 ± 12 101 ± 6 Storage time (ST) ***

38
Storage time 3 75 ± 7 83 ± 10 83 ± 12 90 ± 12 83 ± 13 Interaction (CT x ST) -
EW5 (mJ)
Storage time 1 544 ± 81 591 ± 60 625 ± 93 605 ± 87 683 ± 67 Cheese treatment (CT) -
Storage time 2 308 ± 10 351 ± 38 366 ± 66 340 ± 27 363 ± 49 Storage time (ST) ***
Storage time 3 274 ± 13 311 ± 28 264 ± 24 296 ± 46 286 ± 30 Interaction (CT x ST) -
Schreiber flow (%)
Storage time 1 39 ± 6 42 ± 5 43 ± 7 38 ± 6 41 ± 5 Cheese treatment (CT) -
Storage time 2 52 ± 5 53 ± 7 49 ± 5 52 ± 4 47 ± 4 Storage time (ST) **
Storage time 3 53 ± 10 47 ± 8 48 ± 5 49 ± 6 46 ± 5 Interaction (CT x ST) - 666 aThe statistical significance (P) for treatment effects across the evaluated properties of LMPS Mozzarella is given where P > 0.05, P < 667
0.05, P < 0.01 and P < 0.001 are denoted by -, *, ** and ***, respectively. All cheeses were sampled from vat C. 668 bThe different cheese treatments correspond to cheeses stored frozen for 1 (TIF1), 6 (TIF6), 12 (TIF12) or 44 (TIF44) weeks. The cheeses 669 were held at 4°C for 2 d before freezing to -20°C at a rate of 2°C h-1. 670 cThe different storage times at 4°C (total time at 4°C) correspond to: 4 d (storage time 1), 10 d (not included in table), 16 d (storage time 671 2) or 30 d (storage time 3). 672 dData presented are means ± standard deviation of two Mozzarella blocks per ripening point. 673

39
Fig. 1 674
675

40
Fig. 2 676
677

41
Fig. 3 678
679

42
Fig. 4 680
681

43
Supplement A 682 683
Numberofcheeses=12
FR0.6|TIF6|TBF0 FR2.0|TIF6|TBF0 FR8.0|TIF6|TBF0 FR2.0|TIF6|TBF0
NumberofFTcheeses=6 NumberofFTcheeses=6 NumberofFTcheeses=6 NumberofFTcheeses=6
Storagetime1 Storagetime1 Storagetime1 Storagetime1
NumberofFTcheeses=2 NumberofFTcheeses=2 NumberofFTcheeses=2 NumberofFTcheeses=2
Storagetime2 Storagetime2 Storagetime2 Storagetime2
NumberofFTcheeses=2 NumberofFTcheeses=2 NumberofFTcheeses=2 NumberofFTcheeses=2
Storagetime3 Storagetime3 Storagetime3 Storagetime3
NumberofFTcheeses=2 NumberofFTcheeses=2 NumberofFTcheeses=2 NumberofFTcheeses=2
FR2.0|TIF1|TBF2 FR2.0|TIF6|TBF2 FR2.0|TIF12|TBF2 FR2.0|TIF44|TBF2
NumberofFTcheeses=8 NumberofFTcheeses=8 NumberofFTcheeses=8 NumberofFTcheeses=8
Storagetime1 Storagetime1 Storagetime1 Storagetime1
NumberofFTcheeses=2 NumberofFTcheeses=2 NumberofFTcheeses=2 NumberofFTcheeses=2
Storagetime2 Storagetime2 Storagetime2 Storagetime2
NumberofFTcheeses=2 NumberofFTcheeses=2 NumberofFTcheeses=2 NumberofFTcheeses=2
Storagetime3 Storagetime3 Storagetime3 Storagetime3
NumberofFTcheeses=2 NumberofFTcheeses=2 NumberofFTcheeses=2 NumberofFTcheeses=2
Storagetime4 Storagetime4 Storagetime4 Storagetime4
NumberofFTcheeses=2 NumberofFTcheeses=2 NumberofFTcheeses=2 NumberofFTcheeses=2
Numberofcheeses=14 Numberofcheeses=14 Numberofcheeses=14 Numberofcheeses=14
FR2.0|TIF1|TBF8 FR2.0|TIF1|TBF8 FR2.0|TIF6|TBF8 FR2.0|TIF6|TBF8
NumberofFTcheeses=6 NumberofFTcheeses=6 NumberofFTcheeses=6 NumberofFTcheeses=6
Storagetime1 Storagetime1 Storagetime1 Storagetime1
NumberofFTcheeses=2 NumberofFTcheeses=2 NumberofFTcheeses=2 NumberofFTcheeses=2
Storagetime2 Storagetime2 Storagetime2 Storagetime2
NumberofFTcheeses=2 NumberofFTcheeses=2 NumberofFTcheeses=2 NumberofFTcheeses=2
Storagetime3 Storagetime3 Storagetime3 Storagetime3
NumberofFTcheeses=2 NumberofFTcheeses=2 NumberofFTcheeses=2 NumberofFTcheeses=2
TBF8
CheesevatF CheesevatG
Numberofcheeses=24
TBF0
TBF2
CheesevatD
CheesevatC
Numberofcheeses=40
CheesevatE
CheesevatA CheesevatB
684


