Embed Size (px)
Citation preview

IOP PUBLISHING ENVIRONMENTAL RESEARCH LETTERS
Environ Res Lett 5 (2010) 044011 (10pp) doi1010881748-932654044011
Partial costs of global climate changeadaptation for the supply of raw industrialand municipal water a methodology andapplicationPhilip J Ward14 Kenneth M Strzepek2 W Pieter Pauw1Luke M Brander1 Gordon A Hughes3 and Jeroen C J H Aerts1
1 Institute for Environmental Studies (IVM) VU University Amsterdam The Netherlands2 Joint Program on the Science and Policy of Global Change Massachusetts Institute ofTechnology MA USA3 School of Economics University of Edinburgh UK
E-mail philipwardivmvunl
Received 22 July 2010Accepted for publication 11 November 2010Published 7 December 2010Online at stacksioporgERL5044011
AbstractDespite growing recognition of the importance of climate change adaptation few globalestimates of the costs involved are available for the water supply sector We present amethodology for estimating partial global and regional adaptation costs for raw industrial anddomestic water supply for a limited number of adaptation strategies and apply the methodusing results of two climate models In this paper adaptation costs are defined as those forproviding enough raw water to meet future industrial and municipal water demand based oncountry-level demand projections to 2050 We first estimate costs for a baseline scenarioexcluding climate change and then additional climate change adaptation costs Increaseddemand is assumed to be met through a combination of increased reservoir yield and alternativebackstop measures Under such controversial measures we project global adaptation costs of$12 bn pa with 83ndash90 in developing countries the highest costs are in Sub-Saharan AfricaGlobally adaptation costs are low compared to baseline costs ($73 bn pa) which supports thenotion of mainstreaming climate change adaptation into broader policy aims The methodprovides a tool for estimating broad costs at the global and regional scale such information is ofkey importance in international negotiations
Keywords adaptation climate change costs global hydrology reservoirs water supply
S Online supplementary data available from stacksioporgERL5044011mmedia
1 Introduction
Impacts of climate change on the hydrological cycle arealready evident and these are expected to intensify over the21st century There is growing interest in the assessment of
4 Address for correspondence Institute for Environmental Studies (IVM)Faculty of Earth and Life Sciences VU University Amsterdam De Boelelaan1087 1081 HV Amsterdam The Netherlands
those impacts on water supply and shortage (eg Bates et al2008 Kummu et al 2010) The availability of water willincrease in some parts of the world and decrease in otherswhilst water demand is expected to increase greatly in mostparts of the world (Kundzewicz et al 2007) It is thereforeessential to develop adaptation measures to moderate theimpacts and realize the opportunities associated with climatechange
1748-932610044011+10$3000 copy 2010 IOP Publishing Ltd Printed in the UK1
Environ Res Lett 5 (2010) 044011 P J Ward et al
Studies estimating the costs of climate change in theindustrial and municipal water supply sector remain limitedespecially at the regional and global scale (Adger et al 2007Kuik et al 2008) even though such information is of keyimportance in international negotiations At the local nationaland river basin scales several attempts have been made (egDore and Burton 2001 Kirshen et al 2006 EEA 2007 Vergaraet al 2007) although these are skewed toward developedcountries To our knowledge the only global assessment isthat of Kirshen (2007) which estimated costs of additionalwater infrastructure needed by 2030 to provide sufficient watersupply for over 200 countries The results suggest total costsof $531 bn to5 2030 due to both socioeconomic and climaticchanges This assessment was modified by UNFCCC (2007)in which worldwide adaptation costs to 2030 were estimatedfor two scenarios of the Intergovernmental Panel on ClimateChange (IPCC 2000) ca $639ndash797 bn It was assumed that25 of these costs are specifically related to climate changehence global climate change adaptation costs were estimated at$9ndash11 bn pa
We present a methodology for estimating a subset ofglobal climate change adaptation costs related to the supplyof raw industrial and municipal water We apply the methodfor two simulations of future climate change and discussseveral remaining challenges The work builds on thatof Kirshen (2007) in several ways (a) cost estimates ofreservoir storage are more detailed by incorporating storage-yield curves (b) costs are first estimated for a socioeconomicbaseline without climate change in order to derive an improveddelineation between climate related and non-related costs and(c) the time-horizon of our study (to 2050) is longer
2 Methods
In this study adaptation costs are defined as the costs of thetechnical aspects of providing enough raw water to meet futureindustrial and municipal water demand based on country-level demand projections to 2050 In brief hydrologicalmodels were used to project changes in water availabilitybetween present day and 2050 and national statistics wereused to project changes in water demand Adaptation measureswere then implemented in the models to assess the level ofadaptation required to ensure that all demand can be metand the costs of these measures were estimated Increaseddemand was assumed to be met through reservoir yieldby increasing surface reservoir storage capacity with twoexceptions (a) the average cost of supplying water fromreservoir yield exceeds $030 mminus3 andor (b) reliance onadditional reservoir yield increases withdrawals to more than80 of runoff In these cases supply was assumed to bemet through a combination of alternative backstop measures(recycling rainwater harvesting desalination) at an averagecost of $030 mminus36 This represents only a rough estimate ofthe average costs of these measures globally (eg Sutherland
5 All costs given in USD2005 unless otherwise stated6 The average desalination cost is higher than this but it yields the equivalentof treated water so one must deduct the average cost of water treatment toobtain the average cost of raw water (Hughes et al 2010)
and Fenn 2000 Hughes et al 2010) future studies wouldbenefit from estimating the separate contribution of each ofthese measures based on their own marginal costs Howeverglobal datasets to allow such analyses are currently lackingThe second decision rule is a preliminary attempt to account forecological flow requirements of rivers Smakhtin and Toulouse(1998) showed that for a variety of rivers 20ndash35 of annualflow is required to maintain lsquogoodrsquo conditions our decisionrule is based on the lower bound of this estimate
All analyses were carried out for the following scenarios
bull Socioeconomic baseline (Baseline) accounts for changesin water demand to 2050 (section 22)
bull Baseline and climate change (BampCC) assumes thechanges in water demand under the baseline and accountsfor changes in water availability due to climate change(section 22)
bull Climate change only (CC) difference between Baselineand BampCC scenario
The baseline scenario assumes that without climate changefuture demand is met Since present day demand is not yet metbaseline costs cover both the elimination of any developmentdeficit and the consequences of socioeconomic developmentwithout climate change This allows us to separate adaptationto climate change from the effects of economic development
In our approach we only assessed a specific subsetof adaptation costs in the water supply sector here wedescribe several key sectoral costs that are not includedthough the list is not exhaustive Adaptation costs in theagricultural sector are not considered although agriculturalirrigation accounts for 90 of global consumptive water use(Shiklomanov and Rodda 2003) Furthermore costs associatedwith relocating water infrastructure affected by sea-level riseare not assessed although these can be substantial (Hebergeret al 2009) Moreover we only estimated costs of rawwater supply and not costs associated with infrastructurefor transporting water from sources to consumption pointsAdditional adaptation costs due to changes in water qualityare not considered although it should be noted that climatechange is expected to worsen many forms of water pollution(Kundzewicz et al 2007) Moreover we only examinedthe direct construction implementation and OampM costsassociated with the adaptation measures considered Alladaptation measures entail other costs both direct and indirectFurthermore we did not consider the possible direct andindirect economic benefits of adaptation measures As suchthe study does not provide an economic costndashbenefit analysisbut an assessment of the construction implementation andOampM costs of this limited set of adaptation strategies
The adaptation measures considered are technical andrepresent just a few of the many measures available since fewcost estimates are available for so-called lsquosoftrsquo measures atthe global scale (Gleick 2003 Kundzewicz et al 2007) Thisdoes not mean that we consider the former options preferableto lsquosoftrsquo options An analysis for water utility infrastructurein OECD countries by Hughes et al (2010) found that totalcosts of adaptation can be substantially reduced by usingeconomic incentives designed to hold total water demand
2
Environ Res Lett 5 (2010) 044011 P J Ward et al
Figure 1 Average annual climate change adaptation costs ($ bn pa) per FPU in the industrial and municipal water supply sectors Negativecosts (shown in blue) refer to avoided costs as a result of climate change
constant Hence our analysis should be understood as anupper bound on reasonable adaptation costs The method isspecifically designed for estimating costs at the global andor(sub-) continental scale and is not suitable for local or basin-scale assessments
21 Geographical and temporal scale
All analyses were carried out at the scale of food producingunits (FPUs) of IFPRI (International Food Policy ResearchInstitute) and IWMI (International Water ManagementInstitute) These divide the world into 281 sub-basins(figure 1) representing hybrids between river basins andeconomic regions (Cai and Rosegrant 2002 Rosegrant et al2002 De Fraiture 2007) Cost estimates were then aggregatedto the country level and then to seven regions namely thesix development regions of the World Bank (East Asia andPacific (EAP) Europe and Central Asia (ECA) Latin Americaand Caribbean (LAC) Middle East and North Africa (MNA)South Asia (SAS) and Sub-Saharan Africa (SSA)) with
countries not belonging to these regions being classed as lsquohighincomersquo
Climate change impact projections were carried outfor three periods baseline (1961ndash1990) 2030 and 2050(2030 and 2050 actually refer to 2025ndash2035 and 2045ndash2055 respectively) The required adaptation measureswere determined firstly for 2030 and then for 2050 andimplemented linearly in the intervening years
22 Socioeconomic and climate change scenarios
Projections of urban water demand were taken from Hugheset al (2010) These were derived from econometric equationsusing (a) UN medium fertility projections for population(2008 revision) and urbanization (2006 revision) (b) averagegrowth rates in GDP per person from five integrated economicassessment models for climate change and (c) 2005 data forGDP per person at purchasing power parity The projectionof world GDP in real terms corresponds closely to theA2 SRES scenario Separate equations were estimated for
3
Environ Res Lett 5 (2010) 044011 P J Ward et al
abstraction for industrial and municipal purposes using FAOand World Bank data for a panel of countries over time Thedependent variables are the logs of abstraction per person Theindependent variables in the municipal use equation includelog( urbanization) and a quadratic in log(GDP per person)plus regional dummies and country characteristics as fixedeffects The quadratic term implies that municipal use peaksat an income of about $15 000 per capita in 2005 PPP andfalls thereafter (R2 = 098 n = 366 15 df) Theindependent variables in the industrial use equation includea quadratic in log(GDP per person) and log(population)(but not urbanization) plus regional dummies and countriescharacteristics In this case peak use per person occursat an income of about $12 500 per capita in 2005 (R2 =096 n = 334 21 df) Water prices are not included asindependent variable in the demand equations since suitableprice variables cannot be obtained for a sufficient numberof countries In practice this means that prices are proxiedby country characteristics while the projections are basedon a constant level of real prices The analysis for OECDcountries cited above examined what would happen if priceswere used to hold water abstraction constant given reasonableprice elasticities of demand for municipal and industrial usersThe use of water pricing to influence water demand can reduceadaptation costs quite substantially but developing countrieshave so far been very reluctant to adopt such policies
The water cycle was assessed using the rainfallndashrunoffmodel CLIRUN-II (Strzepek and McCluskey 2010) run ona monthly time-step at a resolution of 05 times 05 Themodel was used to simulate time-series of monthly runofffor the baseline 2030 and 2050 The baseline simulationswere carried out using input climate data from the CRUTS21 dataset (Mitchell and Jones 2005) Future climate time-series were taken from two GCM simulations carried out forthe Fourth Assessment Report (AR4) of IPCC (IPCC 2007)using SRES emissions scenario A2 since this correspondsmost closely to the economic assumptions underpinning thedemand projections The GCMs used are NCAR CCSM3 andCSIRO MK3 hereinafter referred to as NCAR and CSIROrespectively
23 Assessing the costs of additional reservoir capacity
Estimates of current reservoir storage per FPU were takenfrom the World Register of Dams (ICOLD 1998) Additionalcapacity required in each future scenario was calculated usingstorage-yield curves which show the storage capacity neededto provide a given yield Basin yield is a measure of theannually reliable water supply of a basin (figure 2)
Storage-yield curves were established per FPU usingmonthly values based on a modified version (Wiberg andStrzepek 2005) of the sequent peak algorithm approach(Thomas and Fiering 1963) whereby
St =
Rt + Etminus1 minus Ptminus1 minus Qt + Stminus1 if possible
0 otherwise(1)
where S is reservoir storage capacity R is release E isevaporation above reservoir P is precipitation above reservoir
Figure 2 Example of a typical storage-yield curve for a hypotheticalbasin Due to climate change the discharge in the year 2050 is lowerthan in 2010 and therefore the storage-yield curve is lower(diminishing returns of yield for the same level of storage) Thepoints Y2010 and Y2050 show the basin yield for storage capacity K inthe years 2010 and 2050 respectively The distance KndashKprime shows theadditional storage requirement needed to compensate for the loss inbasin yield between 2010 and 2050 due to climate change Based onWorld Bank (2009)
Q is inflow and t is current time period Monthly time-seriesof inflow and net evaporation were derived from CLIRUN-II
To estimate the costs of an additional unit of reservoirstorage capacity we used relationships between mean basinslope and cost per cubic metre for 11 size classes of reservoirsbased on Lof and Hardison (1966) and Wollman and Bonem(1971) The latter studies developed storagendashcost relationshipsfor 11 size classes and ten physiographic zones in the USAwe updated these to USD2005 values As the spectrum ofthese zones encompasses many of the physiographic zoneselsewhere in the world and because the main factor explainingcost differences is the slope (Strzepek 2010) we assumed theserelative cost structures to be similar around the globe (egWiberg and Strzepek 2005) Relationships between slope andconstruction costs per cubic metre for each size class derivedby Strzepek (2010) (supplementary data table 1 available atstacksioporgERL5044011mmedia) were used to estimateconstruction costs per FPU applying construction indexmultipliers (based on civil engineering construction costs) fromCompass International Consultants Inc (2009) to account fordifferences in construction costs between FPUs We validatedthe method against a database of construction costs for 85reservoirs around the world that we developed from publishedliterature (Merrow and Shangraw (1990) World Bank (1996)Aylward et al (2001) and references therein and WorldBank project performance assessment reports implementationcompletion and results reports performance audit reports andproject completion reports)
We assumed reservoir OampM costs of 2 of constructioncosts per annum (Palmieri et al 2001 WCD 2000) There is noglobal database of the size class distribution of planned futurereservoirs Therefore our best estimate assumes that futureconstruction will follow the same size distribution as the 20thcentury sensitivity analysis on this assumption is carried outin section 4
4
Environ Res Lett 5 (2010) 044011 P J Ward et al
Figure 3 Cumulative adaptation costs (in $2005 bn) in the industrial and municipal water supply sectors for the period 2010ndash2050 Theresults are aggregated and displayed for the World Bank development regions (East Asia and Pacific (EAP) Europe and Central Asia (ECA)Latin America and Caribbean (LAC) Middle East and North Africa (MNA) South Asia (SAS) and Sub-Saharan Africa (SSA)) and forcountries not belonging to one of these regions (high income)
It should be noted that the relative costs of damconstruction may increase because existing dams andreservoirs are likely to have used many of the most cost-effective locations Furthermore we did not account foreffects of sedimentation on storage capacity since there are nodatabases describing regional rates of this phenomenon Thiswill lead to an underestimation of costs since either (a) morecapacity will be needed to replace lost capacity (b) moresupply will have to be met through alternative measures andor(c) expensive dredging activities will be necessary
3 Results
Cumulative baseline and adaptation costs over the period2010ndash2050 are shown in figure 3 Globally these estimatesimply that the average adaptation costs over this period are$122 bn pa (CSIRO) or $120 bn pa (NCAR) of which9083 (CSIRONCAR) relate to World Bank countriesHowever global baseline costs ($730 bn pa) are highcompared to the climate change adaptation costs Of thebaseline costs 91 are incurred in World Bank countries Forcompleteness we show adaptation costs per FPU in figure 1However results at this scale should not be used to identifycosts for specific locations because analyses at this scalerequire more localized data and consideration of local andregional socioeconomic conditions policies and geography
The highest baseline costs are in South Asia (SAS)($287 bn pa) where projected water demand increases by
gt200 by 2050 (figure 4) The growth in the baselinecost curve is exponential in comparison adaptation costsare low Over the period 2030ndash2050 both simulations shownegative adaptation costs in this region this is because manyparts of the region are projected to become drier until 2030and wetter thereafter The next highest baseline costs are inEast Asia (EAP) ($208 bn pa) due to large increases indemand (figure 4) adaptation costs here are low ($06 bn paCSIRO$03 bn pa NCAR)
There are two regions in which projected adaptation costsare greater than baseline costs namely Sub-Saharan Africa(SSA) (both GCMs) and Latin America (LAC) (NCAR only)The main cause of the high adaptation costs in SSA is theprojected drying of western Central Africa (figure 5) For LAC(under NCAR) the increase in adaptation costs is mainly dueto increased costs in eastern Brazil (figure 1) due to projectedincreased seasonal and interannual rainfall variability
In table 1 we show average annual baseline and adaptationcosts (2010ndash2050) as a percentage of projected mean regionalGDP whereby the highest baseline costs are in the SAS regionFor SSA the region where adaptation costs are highest inabsolute terms this is more prominent as a percentage of GDPFor high income countries the costs are very low in GDP terms(baseline and climate change)
In this study adaptation costs consist of a componentderived from reservoir storage construction and a componentderived from alternative backstop measures In figure 6 weshow these cost components individually per region (andglobally)
5
Environ Res Lett 5 (2010) 044011 P J Ward et al
Figure 4 Percentage change in industrial and municipal water demand per FPU between 1961ndash1990 and 2050
Figure 5 Change in mean annual runoff (in millimetre) per FPU between 1961ndash1990 and 2050 using the results of climate models(a) CSIRO and (b) NCAR
6
Environ Res Lett 5 (2010) 044011 P J Ward et al
Figure 6 Cumulative costs (baseline and climate change adaptation) (in $2005 bns) in the industrial and municipal water supply sectors forthe period 2010ndash2050 The dotted lines show the costs related to providing extra reservoir storage capacity and the solid lines show the costsrelated to alternative adaptation measures The results are aggregated and displayed for the World Bank development regions (East Asia andPacific (EAP) Europe and Central Asia (ECA) Latin America and Caribbean (LAC) Middle East and North Africa (MNA) South Asia(SAS) and Sub-Saharan Africa (SSA)) and for countries not belonging to one of these regions (high income)
Table 1 Adaptation costs over the period 2010ndash2050 as percentagesof total regional GDP Where net adaptation costs are negative nopercentage is shown
EAP ECA LAC MNA SAS SSAHighincome Global
Costs as of regional GDP
Baseline 009 003 003 017 028 016 001 006CSIRO lt001 001 005 mdash mdash 019 lt001 001NCAR lt001 mdash 001 mdash 002 023 lt001 001
At the global level over the whole period the cost ofalternative backstop measures is considerably greater than thecost of expanding reservoir capacity Nevertheless the resultssuggest a large expansion of reservoir capacity comparedto present (table 2) In the SAS region where total costs(BampCC) are highest the projected increase in capacity isrelatively low (table 2) with most future investment directedtowards alternative backstop measures For EAP the regionwith the second highest total costs this difference is lower(figure 6) and in absolute terms the projected increase inreservoir capacity is higher (table 2) Relatively large increasesin capacity are also projected for SSA and LAC using thedecision rules implemented here only a marginal amount of
Table 2 Total increase in reservoir storage capacity (km3) betweenpresent and 2050 under the B and CC scenario for CSIRO andNCAR (best estimate)
Increase in capacity (km3)
Region CSIRO NCAR
EAP 469 647ECA 77 95LAC 701 789MNA 26 40SAS 298 220SSA 983 420High income 426 591Global 2981 2803
investment is projected in alternative backstop technologies inthe latter region
4 Discussion
Previous studies have shown that the developing world isparticularly vulnerable to the impacts of climate change (Adgeret al 2003 Huq and Reid 2004 IPCC 2007) The costsestimated in this paper for adaptation for raw industrialand municipal water supply are also greater for developing
7
Environ Res Lett 5 (2010) 044011 P J Ward et al
countries than for developed countries both in absolute termsand as a percentage of GDP In most regions baselinecosts far exceed adaptation costs This supports the notionof mainstreaming climate change adaptation and currentand future climate vulnerability into broader policy aims(eg Agrawala and Van Aalst 2005 Dasgupta and Baschieri2010) The largest adaptation costs are projected in Sub-Saharan Africa both in absolute terms and as a percentage ofregional GDP
So far we have examined adaptation costs at the regionalscale by summing positive and negative costs across all FPUsin that region ie net costs However the argument couldbe made that when assessing lsquocostsrsquo for a given region it ismeaningful to ignore those countries for which negative costsare found since a compensatory transfer of funds is unlikelyfrom a country with negative costs to a country facing actualcosts Hence we also estimated gross costs per region byfirst summing all costs at the FPU scale to the country leveland then setting negative costs to zero before summing tothe regional scale These gross global adaptation costs arehigher than the net costs namely $22ndash23 bn pa However weargue that such analyses should only be used across countrieswhen all sectors affected by climate change are considered(eg World Bank 2010) since a given country may be affectedpositively and negatively by climate change in different sectors
Our projections show a significant increase in globalreservoir storage capacity between 2010 and 2050 byca 2800ndash3000 km3 To put this in context Chao et al(2008) estimate current global surface storage capacity to beca 8300 km3 The main regions in which our simulationsproject future reservoir construction are SSA LAC and EAPIn the latter two regions current capacity is relatively low(WCD 2000) which could mean that there is potential for newconstruction at a cost below the $030 backstop implementedhere (ie additional capacity has a relatively large impact onyield) In the EAP region recent years have indeed seenthe commissioning of several large dams especially in ChinaThe IPCC states that new reservoirs are expected to be builtin developing countries in the coming century (Bates et al2008) However addressing water supply issues by increasingreservoir storage is controversial many stakeholders havestrong feelings either for or against this strategy (WCD 2000)The decision of whether or not to build reservoirs is based oncomplex political socioeconomic and environmental factorsIn this paper we limit ourselves to direct costs of reservoirconstruction and OampM However man-made reservoirs havemany (indirect) impacts particularly in environmental andsocial terms (Ward and Stanford 1979 Petts 1984 Poff et al1997 WCD 2000 Poff and Hart 2002) Little informationis available to assess these indirect costs (and benefits) at theglobal scale Such assessments require case specific impactassessments and participatory decision-making processes Ourassessment should therefore be treated as an indication ofadaptation costs assuming the limited number of technicalmeasures described rather than a recommendation to pursuesuch a policy everywhere
Our estimates are based on the assumption that the sizeof future reservoir construction will follow the same size
distribution as the 20th century here we carry out simplesensitivity analysis on this assumption The analyses wererepeated assuming that all future reservoir build would bein the form of small dams (storage capacity lt003 km3) orlarge dams (storage capacity gt123 km3) (the smallest andlargest size classes of Wollman and Bonem (1971)) Globallythe small dams scenario results in higher costs than the bestestimate by a factor of 17 whilst the large dams scenarioresults in lower costs by a factor of 08ndash09 Hence direct costsassociated with our best estimate scenario are only slightlyhigher than those associated with the large dams scenarioit should also be noted that external costs associated withlarge dams are generally higher (WCD 2000) Moreoverthese scenarios refer to heavy infrastructural dams and do notconsider alternative local small scale water storage structuresFor example in the Kitui district of Kenya small sand damsare used to retain groundwater during the dry season Thisavoids some of the negative costs of large infrastructuraldevelopments and the capital costs are relatively low (Lasageet al 2008)
The absolute cost estimates should be treated with cautionbut are indicative of the magnitude of the problem Ouradaptation cost estimates are of the same order of magnitudeas those of UNFCCC (2007) As well as the methodologicallimitations described in section 2 several other limitationsapply The alternative backstop measures considered do notexplicitly include demand-side adaptation since the demandprojections already account for some increase in efficienciesover time However there is substantial scope for economizingon water consumption (Gleick et al 2005 Zhou and Tol 2005Cooley et al 2009 Srinivasan et al 2010) Also we didnot account for water trading between countries or efficientupstreamndashdownstream transboundary user-agreements insome cases this could lead to more efficient water use Sucharrangements need to be negotiated and formalized betweenriparian states and cannot be implemented in such globalmodelling exercises Furthermore we have only assessedadaptation costs for one SRES emissions scenario usingthe results of two GCMs since the aim is to present themethodological framework There are significant differencesin adaptation costs for the two GCMs to 2030 To get a detailedinsight into the size of the uncertainty future research shouldassess impacts under a larger suite of emissions scenarios andGCMs A key benefit of our approach is that it can easily beadapted to assimilate new information for example spatiallydifferentiated environmental flow claims can be implementedin the model chain and cost estimates associated with reservoirconstruction and technologies can easily be adjusted
5 Conclusions
Despite the growing recognition of the importance of climatechange adaptation and a flourishing literature on the impactsof climate change on the hydrological cycle there are fewglobal estimates of adaptation costs in the water supply sectorWe describe a methodology for estimating a subset of thecosts of raw industrial and municipal water supply at thisscale A key feature of our study is that baseline costs without
8
Environ Res Lett 5 (2010) 044011 P J Ward et al
climate change are first calculated with adaptation costs beingassessed in relation to these Given the global nature ofthe method and data the absolute cost estimates should betreated with caution but are indicative of the magnitude of theproblem Another key feature is that new data and insightscan easily be added and incorporated including improved costestimates of alternative water supply methods as global andregional databases become available or are improved
Based on simulations from two GCMs we estimatedadaptation costs over the period 2010ndash2050 at ca $12 bn pa83ndash90 of these costs are in developing countries Globallybaseline costs ($73 bn pa) far exceed adaptation costsThis supports the notion of mainstreaming climate changeadaptation and current and future climate vulnerability intobroader policy aims The largest adaptation costs weresimulated in Sub-Saharan Africa both in absolute terms and asa percentage of regional GDP In some river basins or countriesclimate change will have a positive impact on water supplyleading to reduced costs compared to the baseline Howeveron a global scale and for the majority of regions direct costswill outweigh direct avoided costs
Our projections show a significant increase in globalreservoir storage capacity over the period 2010ndash2050 byca 34ndash36 compared to present Nevertheless despite the factthat this study has mainly assessed physical adaptation optionsthe projected capital investments in alternative backstopmeasures are greater than those projected in the expansion ofreservoir capacity
This study does not provide a costndashbenefit analysis ofadaptation measures nor does it include external costs (orbenefits) but rather estimates a subset of the direct capital costsof adaptation for raw industrial and municipal water supplybased on a limited number of technical adaptation measuresFurthermore the method has only been applied with climatedata from two GCMs further analyses with a larger suite ofmodels and scenarios would give a first order estimate of theuncertainties in the cost estimates associated with uncertaintiesderived from climate models Future research should alsofocus on developing methods and databases for incorporatingfor instance costs of soft measures and of changes in waterquality Nevertheless the method provides a useful tool forestimating broad adaptation costs at the global and regionalscale
Acknowledgments
We would like to thank the Climatic Research Unit (CRU)of the University of East Anglia for providing climate dataand two anonymous reviewers for their useful comments onan earlier version of the manuscript This paper is basedupon work that was commissioned by the World Bank for theEconomics of Adaptation to Climate Change study with fundsprovided by the Governments of the Netherlands Switzerlandand the United Kingdom The analysis results and viewsexpressed in the paper are those of the authors alone and do notrepresent the position of the World Bank or any of its membercountries We would like to thank all members of the EACCteam for their useful contributions to and comments on earlier
versions of this work We are solely responsible for any errorsor opinions in this paper
References
Adger W N Agrawala S Mirza M M Q Conde C OrsquoBrien KPulhin J Pulwarty R Smit B and Takahashi K 2007 Assessmentof adaptation practices options constraints and capacityClimate Change 2007 Impacts Adaptation and VulnerabilityContribution of Working Group II to the Fourth AssessmentReport of the Intergovernmental Panel on Climate Changeed M L Parry O F Canziani J P Palutikof P J van der Lindenand C E Hanson (Cambridge Cambridge University Press)
Adger W N Huq S Brown K Conway D and Hulme M 2003Adaptation to climate change in the developing world ProgDev Stud 3 179ndash95
Agrawala S and Van Aalst M 2005 Bridging the gap between climatechange and development Bridge Over Troubled Waters LinkingClimate Change and Development ed S Argawala (ParisOECD)
Aylward B et al 2001 Thematic review III1 Prepared as input to theWorld Commission on Dams Financial Economic andDistributional Analysis (Cape Town WCD) (available online athttpwwwuneporgDAMSWCD)
Bates B C Kundzewicz Z W Wu S and Palutikof J P 2008 Climatechange and water Technical Paper of the IntergovernmentalPanel on Climate Change (Geneva IPCC)
Cai X and Rosegrant M 2002 Global water demand and supplyprojections Part 1 a modeling approach Water Int 27 159ndash69
Chao B F Wu Y H and Li Y S 2008 Impact of artificial reservoirwater impoundment on global sea level Science 320 212
Compass International Consultants Inc 2009 The 2009 GlobalConstruction Cost and Reference Yearbook (Morrisville PACompass International Consultants)
Cooley H Christian-Smith J and Gleick P H 2009 SustainingCalifornia Agriculture in an Uncertain Future (Oakland CAPacific Institute for Studies in Development Environment andSecurity) (available online at httpwwwpacinstorgreportscalifornia agriculturefinalpdf)
Dasgupta A and Baschieri A 2010 Vulnerability to climate change inrural Ghana mainstreaming climate change inpoverty-reduction strategies J Int Dev 22 803ndash20
De Fraiture C 2007 Integrated water and food analysis at the globaland basin level An application of WATERSIM Water ResManag 21 185ndash98
Dore M and Burton I 2001 The Costs of Adaptation to ClimateChange in Canada A Stratified Estimate by Sectors andRegionsmdashSocial Infrastructure (St Catharines BrockUniversity)
EEA 2007 Climate change the cost of inaction and the cost ofadaptation EEA Technical Report No 132007 (CopenhagenEuropean Environment Agency)
Gleick P H 2003 Global freshwater resources soft-path solutions forthe 21st century Science 302 1524ndash8
Gleick P H Cooley H and Groves D 2005 California Water 2030 AnEfficient Future (Oakland CA Pacific Institute for Studies inDevelopment Environment and Security) (available online athttpwwwpacinstorgreportscalifornia water 2030ca water 2030pdf)
Heberger M Cooley H Herrera P Gleick P H and Moore E 2009The Impacts of Sea-Level Rise on the California Coast(Oakland CA California Climate Change Center) (availableonline at httpwwwpacinstorgreportssea level rise) FinalPaper CEC-500-2009-024-F
Hughes G Chinowsky P and Strzepek K 2010 The costs ofadaptation to climate change for water infrastructure in OECDcountries Util Policy 18 142ndash53
9
Environ Res Lett 5 (2010) 044011 P J Ward et al
Huq S and Reid H 2004 Mainstreaming adaptation in developmentIDS Bull 35 15ndash21
ICOLD 1998 Word register of dams Book and CD-ROM (ParisICOLD)
IPCC 2000 Special Report on Emission Scenarios (New YorkCambridge University Press)
IPCC 2007 Climate Change 2007 Impacts Adaptation andVulnerability Contribution of Working Group II to the FourthAssessment Report of the Intergovernmental Panel on ClimateChange (Cambridge Cambridge University Press)
Kirshen P 2007 Adaptation options and cost in water supply Reportto the UNFCCC Secretariat Financial and Technical SupportDivision (available online at httpunfcccintcooperation and supportfinancial mechanismfinancial mechanism gefitems4054php)
Kirshen P Ruth M and Anderson W 2006 Climatersquos long-termimpacts on urban infrastructures and services the case of MetroBoston Climate Change and Variability Local Impacts andResponses ed M Ruth K Donaghy and P H Kirshen(Cheltenham Edward Elgar Publishers)
Kuik O Buchner B Catenacci M Goria A Karakaya E and Tol R S2008 Methodological aspects of recent climate change damagecost studies Int Assess J Bridg Sci Policy 8 19ndash40
Kummu M Ward P J De Moel H and Varis O 2010 Is physical waterscarcity a new phenomenon Global assessment of watershortage over the last two millennia Environ Res Lett5 034006
Kundzewicz Z W Mata L J Arnell N W Doll P Kabat PJimenez B Miller K A Oki T Sen Z and Shiklomanov I A2007 Freshwater resources and their management ClimateChange 2007 Impacts Adaptation and VulnerabilityContribution of Working Group II to the Fourth AssessmentReport of the Intergovernmental Panel on Climate Changeed M L Parry O F Canziani J P Palutikof P J van der Lindenand C E Hanson (Cambridge Cambridge University Press)
Lasage R Aerts J C J H Mutiso G-C M and de Vries A 2008Potential for community based adaptation to droughts sanddams in Kitui Kenya Phys Chem Earth 33 67ndash73
Lof G O G and Hardison C H 1966 Storage requirements for water inthe United States Water Resour Res 2 323ndash54
Merrow E W and Shangraw R F Jr 1990 Understanding the costs andschedules of World Bank supported hydroelectric projectsIndustry and Energy Department Working Paper Energy SeriesPaper No 31 (Washington DC World Bank)
Mitchell T D and Jones P D 2005 An improved method ofconstructing a database of monthly climate observations andassociated high-resolution grids Int J Climatol 25 693ndash712
Palmieri A Shah F and Dinar A 2001 Economics of reservoirsedimentation and sustainable management of dams J EnvironManag 61 149ndash63
Petts G E 1984 Impounded Rivers Perspectives for EcologicalManagement (Chichester Wiley)
Poff N L Allan J D Bain M B Karr J R Prestegaard K LRichter B D Sparks R E and Stromberg J C 1997 The naturalflow regime a paradigm for conservation and restoration ofriver ecosystems Bioscience 47 769ndash84
Poff N L and Hart D D 2002 How dams vary and why it matters forthe emerging science of dam removal Bioscience 52 59ndash68
Rosegrant M Cai X and Cline S 2002 World Water and Food to2025 Dealing with Scarcity (Washington DC IFPRI)
Shiklomanov I A and Rodda J C 2003 World Water Resources at theBeginning of the 21st Century (Cambridge CambridgeUniversity Press)
Smakhtin V U and Toulouse M 1998 Relationships between low-flowcharacteristics of South African streams Water SA 24 107ndash12
Srinivasan V Gorelick S M and Goulder L 2010 Sustainable urbanwater supply in south India desalination efficiencyimprovement or rainwater harvesting Water Resour Res46 W10504
Strzepek K M 2010 Methodology for surface water storageinvestments WATERSIM (Colombo IWMI)
Strzepek K M and McCluskey A I 2010 Modelling the Impact ofClimate Change on Global Hydrology and Water Availability(Washington DC World Bank) Prepared as input to the WorldBank Economics of Adaptation to Climate Change Projectforthcoming
Sutherland D C and Fenn C R 2000 Thematic review IV3 Preparedas input to the World Commission on Dams (WCD) Assessmentof Water Supply Options (Cape Town WCD)
Thomas H A and Fiering M B 1963 The Nature of the Storage-YieldFunction Operations Research in Water Quality Management(Cambridge MA Harvard University Water Program)
UNFCCC 2007 Investment and Financial Flows to Address ClimateChange Background Paper on Analysis of Existing andPlanned Investment and Financial Flows Relevant to theDevelopment of Effective and Appropriate InternationalResponse to Climate Change (Bonn UNFCCC)
Vergara W Deeb A M Valencia A M Bradley R S Francou BZarzar A Grunwaldt A and Haeussling S M 2007 Economicimpacts of rapid glacier retreat in the Andes Trans AmGeophys Union 88 261
Ward J V and Stanford J A 1979 The Ecology of Regulated Streams(New York NY Plenum)
WCD 2000 Dams and development A new framework fordecision-making The Report of the World Commission on Dams(London Earthscan)
Wiberg D A and Strzepek K M 2005 Development of RegionalEconomic Supply Curves for Surface Water Resources andClimate Change Assessments A Case Study of China(Laxenburg International Institute for Applied SystemsAnalysis) RR-05-001
Wollman N and Bonem G W 1971 The Outlook for Water QualityQuantity and National Growth (Baltimore MD Johns HopkinsPress)
World Bank 1996 The World Bankrsquos Experience with Large Dams APreliminary Review of Impacts (Washington DC World Bank)Report no 15815
World Bank 2009 Water and Climate Change Understanding theRisks and Making Climate-Smart Investment Decisions(Washington DC World Bank)
World Bank 2010 The Costs to Developing Countries of Adapting ToClimate Change New Methods and Estimates The GlobalReport On the Economics of Adaptation to Climate ChangeStudy (Washington DC World Bank) (available athttpsiteresourcesworldbankorgINTCCResourcesEACCReport0928Finalpdf)
Zhou Y and Tol R S J 2005 Evaluating the costs of desalination andwater transport Water Resour Res 41 W03003
10

Environ Res Lett 5 (2010) 044011 P J Ward et al
Figure 1 Average annual climate change adaptation costs ($ bn pa) per FPU in the industrial and municipal water supply sectors Negativecosts (shown in blue) refer to avoided costs as a result of climate change
constant Hence our analysis should be understood as anupper bound on reasonable adaptation costs The method isspecifically designed for estimating costs at the global andor(sub-) continental scale and is not suitable for local or basin-scale assessments
21 Geographical and temporal scale
All analyses were carried out at the scale of food producingunits (FPUs) of IFPRI (International Food Policy ResearchInstitute) and IWMI (International Water ManagementInstitute) These divide the world into 281 sub-basins(figure 1) representing hybrids between river basins andeconomic regions (Cai and Rosegrant 2002 Rosegrant et al2002 De Fraiture 2007) Cost estimates were then aggregatedto the country level and then to seven regions namely thesix development regions of the World Bank (East Asia andPacific (EAP) Europe and Central Asia (ECA) Latin Americaand Caribbean (LAC) Middle East and North Africa (MNA)South Asia (SAS) and Sub-Saharan Africa (SSA)) with
countries not belonging to these regions being classed as lsquohighincomersquo
Climate change impact projections were carried outfor three periods baseline (1961ndash1990) 2030 and 2050(2030 and 2050 actually refer to 2025ndash2035 and 2045ndash2055 respectively) The required adaptation measureswere determined firstly for 2030 and then for 2050 andimplemented linearly in the intervening years
22 Socioeconomic and climate change scenarios
Projections of urban water demand were taken from Hugheset al (2010) These were derived from econometric equationsusing (a) UN medium fertility projections for population(2008 revision) and urbanization (2006 revision) (b) averagegrowth rates in GDP per person from five integrated economicassessment models for climate change and (c) 2005 data forGDP per person at purchasing power parity The projectionof world GDP in real terms corresponds closely to theA2 SRES scenario Separate equations were estimated for
3
Environ Res Lett 5 (2010) 044011 P J Ward et al
abstraction for industrial and municipal purposes using FAOand World Bank data for a panel of countries over time Thedependent variables are the logs of abstraction per person Theindependent variables in the municipal use equation includelog( urbanization) and a quadratic in log(GDP per person)plus regional dummies and country characteristics as fixedeffects The quadratic term implies that municipal use peaksat an income of about $15 000 per capita in 2005 PPP andfalls thereafter (R2 = 098 n = 366 15 df) Theindependent variables in the industrial use equation includea quadratic in log(GDP per person) and log(population)(but not urbanization) plus regional dummies and countriescharacteristics In this case peak use per person occursat an income of about $12 500 per capita in 2005 (R2 =096 n = 334 21 df) Water prices are not included asindependent variable in the demand equations since suitableprice variables cannot be obtained for a sufficient numberof countries In practice this means that prices are proxiedby country characteristics while the projections are basedon a constant level of real prices The analysis for OECDcountries cited above examined what would happen if priceswere used to hold water abstraction constant given reasonableprice elasticities of demand for municipal and industrial usersThe use of water pricing to influence water demand can reduceadaptation costs quite substantially but developing countrieshave so far been very reluctant to adopt such policies
The water cycle was assessed using the rainfallndashrunoffmodel CLIRUN-II (Strzepek and McCluskey 2010) run ona monthly time-step at a resolution of 05 times 05 Themodel was used to simulate time-series of monthly runofffor the baseline 2030 and 2050 The baseline simulationswere carried out using input climate data from the CRUTS21 dataset (Mitchell and Jones 2005) Future climate time-series were taken from two GCM simulations carried out forthe Fourth Assessment Report (AR4) of IPCC (IPCC 2007)using SRES emissions scenario A2 since this correspondsmost closely to the economic assumptions underpinning thedemand projections The GCMs used are NCAR CCSM3 andCSIRO MK3 hereinafter referred to as NCAR and CSIROrespectively
23 Assessing the costs of additional reservoir capacity
Estimates of current reservoir storage per FPU were takenfrom the World Register of Dams (ICOLD 1998) Additionalcapacity required in each future scenario was calculated usingstorage-yield curves which show the storage capacity neededto provide a given yield Basin yield is a measure of theannually reliable water supply of a basin (figure 2)
Storage-yield curves were established per FPU usingmonthly values based on a modified version (Wiberg andStrzepek 2005) of the sequent peak algorithm approach(Thomas and Fiering 1963) whereby
St =
Rt + Etminus1 minus Ptminus1 minus Qt + Stminus1 if possible
0 otherwise(1)
where S is reservoir storage capacity R is release E isevaporation above reservoir P is precipitation above reservoir
Figure 2 Example of a typical storage-yield curve for a hypotheticalbasin Due to climate change the discharge in the year 2050 is lowerthan in 2010 and therefore the storage-yield curve is lower(diminishing returns of yield for the same level of storage) Thepoints Y2010 and Y2050 show the basin yield for storage capacity K inthe years 2010 and 2050 respectively The distance KndashKprime shows theadditional storage requirement needed to compensate for the loss inbasin yield between 2010 and 2050 due to climate change Based onWorld Bank (2009)
Q is inflow and t is current time period Monthly time-seriesof inflow and net evaporation were derived from CLIRUN-II
To estimate the costs of an additional unit of reservoirstorage capacity we used relationships between mean basinslope and cost per cubic metre for 11 size classes of reservoirsbased on Lof and Hardison (1966) and Wollman and Bonem(1971) The latter studies developed storagendashcost relationshipsfor 11 size classes and ten physiographic zones in the USAwe updated these to USD2005 values As the spectrum ofthese zones encompasses many of the physiographic zoneselsewhere in the world and because the main factor explainingcost differences is the slope (Strzepek 2010) we assumed theserelative cost structures to be similar around the globe (egWiberg and Strzepek 2005) Relationships between slope andconstruction costs per cubic metre for each size class derivedby Strzepek (2010) (supplementary data table 1 available atstacksioporgERL5044011mmedia) were used to estimateconstruction costs per FPU applying construction indexmultipliers (based on civil engineering construction costs) fromCompass International Consultants Inc (2009) to account fordifferences in construction costs between FPUs We validatedthe method against a database of construction costs for 85reservoirs around the world that we developed from publishedliterature (Merrow and Shangraw (1990) World Bank (1996)Aylward et al (2001) and references therein and WorldBank project performance assessment reports implementationcompletion and results reports performance audit reports andproject completion reports)
We assumed reservoir OampM costs of 2 of constructioncosts per annum (Palmieri et al 2001 WCD 2000) There is noglobal database of the size class distribution of planned futurereservoirs Therefore our best estimate assumes that futureconstruction will follow the same size distribution as the 20thcentury sensitivity analysis on this assumption is carried outin section 4
4
Environ Res Lett 5 (2010) 044011 P J Ward et al
Figure 3 Cumulative adaptation costs (in $2005 bn) in the industrial and municipal water supply sectors for the period 2010ndash2050 Theresults are aggregated and displayed for the World Bank development regions (East Asia and Pacific (EAP) Europe and Central Asia (ECA)Latin America and Caribbean (LAC) Middle East and North Africa (MNA) South Asia (SAS) and Sub-Saharan Africa (SSA)) and forcountries not belonging to one of these regions (high income)
It should be noted that the relative costs of damconstruction may increase because existing dams andreservoirs are likely to have used many of the most cost-effective locations Furthermore we did not account foreffects of sedimentation on storage capacity since there are nodatabases describing regional rates of this phenomenon Thiswill lead to an underestimation of costs since either (a) morecapacity will be needed to replace lost capacity (b) moresupply will have to be met through alternative measures andor(c) expensive dredging activities will be necessary
3 Results
Cumulative baseline and adaptation costs over the period2010ndash2050 are shown in figure 3 Globally these estimatesimply that the average adaptation costs over this period are$122 bn pa (CSIRO) or $120 bn pa (NCAR) of which9083 (CSIRONCAR) relate to World Bank countriesHowever global baseline costs ($730 bn pa) are highcompared to the climate change adaptation costs Of thebaseline costs 91 are incurred in World Bank countries Forcompleteness we show adaptation costs per FPU in figure 1However results at this scale should not be used to identifycosts for specific locations because analyses at this scalerequire more localized data and consideration of local andregional socioeconomic conditions policies and geography
The highest baseline costs are in South Asia (SAS)($287 bn pa) where projected water demand increases by
gt200 by 2050 (figure 4) The growth in the baselinecost curve is exponential in comparison adaptation costsare low Over the period 2030ndash2050 both simulations shownegative adaptation costs in this region this is because manyparts of the region are projected to become drier until 2030and wetter thereafter The next highest baseline costs are inEast Asia (EAP) ($208 bn pa) due to large increases indemand (figure 4) adaptation costs here are low ($06 bn paCSIRO$03 bn pa NCAR)
There are two regions in which projected adaptation costsare greater than baseline costs namely Sub-Saharan Africa(SSA) (both GCMs) and Latin America (LAC) (NCAR only)The main cause of the high adaptation costs in SSA is theprojected drying of western Central Africa (figure 5) For LAC(under NCAR) the increase in adaptation costs is mainly dueto increased costs in eastern Brazil (figure 1) due to projectedincreased seasonal and interannual rainfall variability
In table 1 we show average annual baseline and adaptationcosts (2010ndash2050) as a percentage of projected mean regionalGDP whereby the highest baseline costs are in the SAS regionFor SSA the region where adaptation costs are highest inabsolute terms this is more prominent as a percentage of GDPFor high income countries the costs are very low in GDP terms(baseline and climate change)
In this study adaptation costs consist of a componentderived from reservoir storage construction and a componentderived from alternative backstop measures In figure 6 weshow these cost components individually per region (andglobally)
5
Environ Res Lett 5 (2010) 044011 P J Ward et al
Figure 4 Percentage change in industrial and municipal water demand per FPU between 1961ndash1990 and 2050
Figure 5 Change in mean annual runoff (in millimetre) per FPU between 1961ndash1990 and 2050 using the results of climate models(a) CSIRO and (b) NCAR
6
Environ Res Lett 5 (2010) 044011 P J Ward et al
Figure 6 Cumulative costs (baseline and climate change adaptation) (in $2005 bns) in the industrial and municipal water supply sectors forthe period 2010ndash2050 The dotted lines show the costs related to providing extra reservoir storage capacity and the solid lines show the costsrelated to alternative adaptation measures The results are aggregated and displayed for the World Bank development regions (East Asia andPacific (EAP) Europe and Central Asia (ECA) Latin America and Caribbean (LAC) Middle East and North Africa (MNA) South Asia(SAS) and Sub-Saharan Africa (SSA)) and for countries not belonging to one of these regions (high income)
Table 1 Adaptation costs over the period 2010ndash2050 as percentagesof total regional GDP Where net adaptation costs are negative nopercentage is shown
EAP ECA LAC MNA SAS SSAHighincome Global
Costs as of regional GDP
Baseline 009 003 003 017 028 016 001 006CSIRO lt001 001 005 mdash mdash 019 lt001 001NCAR lt001 mdash 001 mdash 002 023 lt001 001
At the global level over the whole period the cost ofalternative backstop measures is considerably greater than thecost of expanding reservoir capacity Nevertheless the resultssuggest a large expansion of reservoir capacity comparedto present (table 2) In the SAS region where total costs(BampCC) are highest the projected increase in capacity isrelatively low (table 2) with most future investment directedtowards alternative backstop measures For EAP the regionwith the second highest total costs this difference is lower(figure 6) and in absolute terms the projected increase inreservoir capacity is higher (table 2) Relatively large increasesin capacity are also projected for SSA and LAC using thedecision rules implemented here only a marginal amount of
Table 2 Total increase in reservoir storage capacity (km3) betweenpresent and 2050 under the B and CC scenario for CSIRO andNCAR (best estimate)
Increase in capacity (km3)
Region CSIRO NCAR
EAP 469 647ECA 77 95LAC 701 789MNA 26 40SAS 298 220SSA 983 420High income 426 591Global 2981 2803
investment is projected in alternative backstop technologies inthe latter region
4 Discussion
Previous studies have shown that the developing world isparticularly vulnerable to the impacts of climate change (Adgeret al 2003 Huq and Reid 2004 IPCC 2007) The costsestimated in this paper for adaptation for raw industrialand municipal water supply are also greater for developing
7
Environ Res Lett 5 (2010) 044011 P J Ward et al
countries than for developed countries both in absolute termsand as a percentage of GDP In most regions baselinecosts far exceed adaptation costs This supports the notionof mainstreaming climate change adaptation and currentand future climate vulnerability into broader policy aims(eg Agrawala and Van Aalst 2005 Dasgupta and Baschieri2010) The largest adaptation costs are projected in Sub-Saharan Africa both in absolute terms and as a percentage ofregional GDP
So far we have examined adaptation costs at the regionalscale by summing positive and negative costs across all FPUsin that region ie net costs However the argument couldbe made that when assessing lsquocostsrsquo for a given region it ismeaningful to ignore those countries for which negative costsare found since a compensatory transfer of funds is unlikelyfrom a country with negative costs to a country facing actualcosts Hence we also estimated gross costs per region byfirst summing all costs at the FPU scale to the country leveland then setting negative costs to zero before summing tothe regional scale These gross global adaptation costs arehigher than the net costs namely $22ndash23 bn pa However weargue that such analyses should only be used across countrieswhen all sectors affected by climate change are considered(eg World Bank 2010) since a given country may be affectedpositively and negatively by climate change in different sectors
Our projections show a significant increase in globalreservoir storage capacity between 2010 and 2050 byca 2800ndash3000 km3 To put this in context Chao et al(2008) estimate current global surface storage capacity to beca 8300 km3 The main regions in which our simulationsproject future reservoir construction are SSA LAC and EAPIn the latter two regions current capacity is relatively low(WCD 2000) which could mean that there is potential for newconstruction at a cost below the $030 backstop implementedhere (ie additional capacity has a relatively large impact onyield) In the EAP region recent years have indeed seenthe commissioning of several large dams especially in ChinaThe IPCC states that new reservoirs are expected to be builtin developing countries in the coming century (Bates et al2008) However addressing water supply issues by increasingreservoir storage is controversial many stakeholders havestrong feelings either for or against this strategy (WCD 2000)The decision of whether or not to build reservoirs is based oncomplex political socioeconomic and environmental factorsIn this paper we limit ourselves to direct costs of reservoirconstruction and OampM However man-made reservoirs havemany (indirect) impacts particularly in environmental andsocial terms (Ward and Stanford 1979 Petts 1984 Poff et al1997 WCD 2000 Poff and Hart 2002) Little informationis available to assess these indirect costs (and benefits) at theglobal scale Such assessments require case specific impactassessments and participatory decision-making processes Ourassessment should therefore be treated as an indication ofadaptation costs assuming the limited number of technicalmeasures described rather than a recommendation to pursuesuch a policy everywhere
Our estimates are based on the assumption that the sizeof future reservoir construction will follow the same size
distribution as the 20th century here we carry out simplesensitivity analysis on this assumption The analyses wererepeated assuming that all future reservoir build would bein the form of small dams (storage capacity lt003 km3) orlarge dams (storage capacity gt123 km3) (the smallest andlargest size classes of Wollman and Bonem (1971)) Globallythe small dams scenario results in higher costs than the bestestimate by a factor of 17 whilst the large dams scenarioresults in lower costs by a factor of 08ndash09 Hence direct costsassociated with our best estimate scenario are only slightlyhigher than those associated with the large dams scenarioit should also be noted that external costs associated withlarge dams are generally higher (WCD 2000) Moreoverthese scenarios refer to heavy infrastructural dams and do notconsider alternative local small scale water storage structuresFor example in the Kitui district of Kenya small sand damsare used to retain groundwater during the dry season Thisavoids some of the negative costs of large infrastructuraldevelopments and the capital costs are relatively low (Lasageet al 2008)
The absolute cost estimates should be treated with cautionbut are indicative of the magnitude of the problem Ouradaptation cost estimates are of the same order of magnitudeas those of UNFCCC (2007) As well as the methodologicallimitations described in section 2 several other limitationsapply The alternative backstop measures considered do notexplicitly include demand-side adaptation since the demandprojections already account for some increase in efficienciesover time However there is substantial scope for economizingon water consumption (Gleick et al 2005 Zhou and Tol 2005Cooley et al 2009 Srinivasan et al 2010) Also we didnot account for water trading between countries or efficientupstreamndashdownstream transboundary user-agreements insome cases this could lead to more efficient water use Sucharrangements need to be negotiated and formalized betweenriparian states and cannot be implemented in such globalmodelling exercises Furthermore we have only assessedadaptation costs for one SRES emissions scenario usingthe results of two GCMs since the aim is to present themethodological framework There are significant differencesin adaptation costs for the two GCMs to 2030 To get a detailedinsight into the size of the uncertainty future research shouldassess impacts under a larger suite of emissions scenarios andGCMs A key benefit of our approach is that it can easily beadapted to assimilate new information for example spatiallydifferentiated environmental flow claims can be implementedin the model chain and cost estimates associated with reservoirconstruction and technologies can easily be adjusted
5 Conclusions
Despite the growing recognition of the importance of climatechange adaptation and a flourishing literature on the impactsof climate change on the hydrological cycle there are fewglobal estimates of adaptation costs in the water supply sectorWe describe a methodology for estimating a subset of thecosts of raw industrial and municipal water supply at thisscale A key feature of our study is that baseline costs without
8
Environ Res Lett 5 (2010) 044011 P J Ward et al
climate change are first calculated with adaptation costs beingassessed in relation to these Given the global nature ofthe method and data the absolute cost estimates should betreated with caution but are indicative of the magnitude of theproblem Another key feature is that new data and insightscan easily be added and incorporated including improved costestimates of alternative water supply methods as global andregional databases become available or are improved
Based on simulations from two GCMs we estimatedadaptation costs over the period 2010ndash2050 at ca $12 bn pa83ndash90 of these costs are in developing countries Globallybaseline costs ($73 bn pa) far exceed adaptation costsThis supports the notion of mainstreaming climate changeadaptation and current and future climate vulnerability intobroader policy aims The largest adaptation costs weresimulated in Sub-Saharan Africa both in absolute terms and asa percentage of regional GDP In some river basins or countriesclimate change will have a positive impact on water supplyleading to reduced costs compared to the baseline Howeveron a global scale and for the majority of regions direct costswill outweigh direct avoided costs
Our projections show a significant increase in globalreservoir storage capacity over the period 2010ndash2050 byca 34ndash36 compared to present Nevertheless despite the factthat this study has mainly assessed physical adaptation optionsthe projected capital investments in alternative backstopmeasures are greater than those projected in the expansion ofreservoir capacity
This study does not provide a costndashbenefit analysis ofadaptation measures nor does it include external costs (orbenefits) but rather estimates a subset of the direct capital costsof adaptation for raw industrial and municipal water supplybased on a limited number of technical adaptation measuresFurthermore the method has only been applied with climatedata from two GCMs further analyses with a larger suite ofmodels and scenarios would give a first order estimate of theuncertainties in the cost estimates associated with uncertaintiesderived from climate models Future research should alsofocus on developing methods and databases for incorporatingfor instance costs of soft measures and of changes in waterquality Nevertheless the method provides a useful tool forestimating broad adaptation costs at the global and regionalscale
Acknowledgments
We would like to thank the Climatic Research Unit (CRU)of the University of East Anglia for providing climate dataand two anonymous reviewers for their useful comments onan earlier version of the manuscript This paper is basedupon work that was commissioned by the World Bank for theEconomics of Adaptation to Climate Change study with fundsprovided by the Governments of the Netherlands Switzerlandand the United Kingdom The analysis results and viewsexpressed in the paper are those of the authors alone and do notrepresent the position of the World Bank or any of its membercountries We would like to thank all members of the EACCteam for their useful contributions to and comments on earlier
versions of this work We are solely responsible for any errorsor opinions in this paper
References
Adger W N Agrawala S Mirza M M Q Conde C OrsquoBrien KPulhin J Pulwarty R Smit B and Takahashi K 2007 Assessmentof adaptation practices options constraints and capacityClimate Change 2007 Impacts Adaptation and VulnerabilityContribution of Working Group II to the Fourth AssessmentReport of the Intergovernmental Panel on Climate Changeed M L Parry O F Canziani J P Palutikof P J van der Lindenand C E Hanson (Cambridge Cambridge University Press)
Adger W N Huq S Brown K Conway D and Hulme M 2003Adaptation to climate change in the developing world ProgDev Stud 3 179ndash95
Agrawala S and Van Aalst M 2005 Bridging the gap between climatechange and development Bridge Over Troubled Waters LinkingClimate Change and Development ed S Argawala (ParisOECD)
Aylward B et al 2001 Thematic review III1 Prepared as input to theWorld Commission on Dams Financial Economic andDistributional Analysis (Cape Town WCD) (available online athttpwwwuneporgDAMSWCD)
Bates B C Kundzewicz Z W Wu S and Palutikof J P 2008 Climatechange and water Technical Paper of the IntergovernmentalPanel on Climate Change (Geneva IPCC)
Cai X and Rosegrant M 2002 Global water demand and supplyprojections Part 1 a modeling approach Water Int 27 159ndash69
Chao B F Wu Y H and Li Y S 2008 Impact of artificial reservoirwater impoundment on global sea level Science 320 212
Compass International Consultants Inc 2009 The 2009 GlobalConstruction Cost and Reference Yearbook (Morrisville PACompass International Consultants)
Cooley H Christian-Smith J and Gleick P H 2009 SustainingCalifornia Agriculture in an Uncertain Future (Oakland CAPacific Institute for Studies in Development Environment andSecurity) (available online at httpwwwpacinstorgreportscalifornia agriculturefinalpdf)
Dasgupta A and Baschieri A 2010 Vulnerability to climate change inrural Ghana mainstreaming climate change inpoverty-reduction strategies J Int Dev 22 803ndash20
De Fraiture C 2007 Integrated water and food analysis at the globaland basin level An application of WATERSIM Water ResManag 21 185ndash98
Dore M and Burton I 2001 The Costs of Adaptation to ClimateChange in Canada A Stratified Estimate by Sectors andRegionsmdashSocial Infrastructure (St Catharines BrockUniversity)
EEA 2007 Climate change the cost of inaction and the cost ofadaptation EEA Technical Report No 132007 (CopenhagenEuropean Environment Agency)
Gleick P H 2003 Global freshwater resources soft-path solutions forthe 21st century Science 302 1524ndash8
Gleick P H Cooley H and Groves D 2005 California Water 2030 AnEfficient Future (Oakland CA Pacific Institute for Studies inDevelopment Environment and Security) (available online athttpwwwpacinstorgreportscalifornia water 2030ca water 2030pdf)
Heberger M Cooley H Herrera P Gleick P H and Moore E 2009The Impacts of Sea-Level Rise on the California Coast(Oakland CA California Climate Change Center) (availableonline at httpwwwpacinstorgreportssea level rise) FinalPaper CEC-500-2009-024-F
Hughes G Chinowsky P and Strzepek K 2010 The costs ofadaptation to climate change for water infrastructure in OECDcountries Util Policy 18 142ndash53
9
Environ Res Lett 5 (2010) 044011 P J Ward et al
Huq S and Reid H 2004 Mainstreaming adaptation in developmentIDS Bull 35 15ndash21
ICOLD 1998 Word register of dams Book and CD-ROM (ParisICOLD)
IPCC 2000 Special Report on Emission Scenarios (New YorkCambridge University Press)
IPCC 2007 Climate Change 2007 Impacts Adaptation andVulnerability Contribution of Working Group II to the FourthAssessment Report of the Intergovernmental Panel on ClimateChange (Cambridge Cambridge University Press)
Kirshen P 2007 Adaptation options and cost in water supply Reportto the UNFCCC Secretariat Financial and Technical SupportDivision (available online at httpunfcccintcooperation and supportfinancial mechanismfinancial mechanism gefitems4054php)
Kirshen P Ruth M and Anderson W 2006 Climatersquos long-termimpacts on urban infrastructures and services the case of MetroBoston Climate Change and Variability Local Impacts andResponses ed M Ruth K Donaghy and P H Kirshen(Cheltenham Edward Elgar Publishers)
Kuik O Buchner B Catenacci M Goria A Karakaya E and Tol R S2008 Methodological aspects of recent climate change damagecost studies Int Assess J Bridg Sci Policy 8 19ndash40
Kummu M Ward P J De Moel H and Varis O 2010 Is physical waterscarcity a new phenomenon Global assessment of watershortage over the last two millennia Environ Res Lett5 034006
Kundzewicz Z W Mata L J Arnell N W Doll P Kabat PJimenez B Miller K A Oki T Sen Z and Shiklomanov I A2007 Freshwater resources and their management ClimateChange 2007 Impacts Adaptation and VulnerabilityContribution of Working Group II to the Fourth AssessmentReport of the Intergovernmental Panel on Climate Changeed M L Parry O F Canziani J P Palutikof P J van der Lindenand C E Hanson (Cambridge Cambridge University Press)
Lasage R Aerts J C J H Mutiso G-C M and de Vries A 2008Potential for community based adaptation to droughts sanddams in Kitui Kenya Phys Chem Earth 33 67ndash73
Lof G O G and Hardison C H 1966 Storage requirements for water inthe United States Water Resour Res 2 323ndash54
Merrow E W and Shangraw R F Jr 1990 Understanding the costs andschedules of World Bank supported hydroelectric projectsIndustry and Energy Department Working Paper Energy SeriesPaper No 31 (Washington DC World Bank)
Mitchell T D and Jones P D 2005 An improved method ofconstructing a database of monthly climate observations andassociated high-resolution grids Int J Climatol 25 693ndash712
Palmieri A Shah F and Dinar A 2001 Economics of reservoirsedimentation and sustainable management of dams J EnvironManag 61 149ndash63
Petts G E 1984 Impounded Rivers Perspectives for EcologicalManagement (Chichester Wiley)
Poff N L Allan J D Bain M B Karr J R Prestegaard K LRichter B D Sparks R E and Stromberg J C 1997 The naturalflow regime a paradigm for conservation and restoration ofriver ecosystems Bioscience 47 769ndash84
Poff N L and Hart D D 2002 How dams vary and why it matters forthe emerging science of dam removal Bioscience 52 59ndash68
Rosegrant M Cai X and Cline S 2002 World Water and Food to2025 Dealing with Scarcity (Washington DC IFPRI)
Shiklomanov I A and Rodda J C 2003 World Water Resources at theBeginning of the 21st Century (Cambridge CambridgeUniversity Press)
Smakhtin V U and Toulouse M 1998 Relationships between low-flowcharacteristics of South African streams Water SA 24 107ndash12
Srinivasan V Gorelick S M and Goulder L 2010 Sustainable urbanwater supply in south India desalination efficiencyimprovement or rainwater harvesting Water Resour Res46 W10504
Strzepek K M 2010 Methodology for surface water storageinvestments WATERSIM (Colombo IWMI)
Strzepek K M and McCluskey A I 2010 Modelling the Impact ofClimate Change on Global Hydrology and Water Availability(Washington DC World Bank) Prepared as input to the WorldBank Economics of Adaptation to Climate Change Projectforthcoming
Sutherland D C and Fenn C R 2000 Thematic review IV3 Preparedas input to the World Commission on Dams (WCD) Assessmentof Water Supply Options (Cape Town WCD)
Thomas H A and Fiering M B 1963 The Nature of the Storage-YieldFunction Operations Research in Water Quality Management(Cambridge MA Harvard University Water Program)
UNFCCC 2007 Investment and Financial Flows to Address ClimateChange Background Paper on Analysis of Existing andPlanned Investment and Financial Flows Relevant to theDevelopment of Effective and Appropriate InternationalResponse to Climate Change (Bonn UNFCCC)
Vergara W Deeb A M Valencia A M Bradley R S Francou BZarzar A Grunwaldt A and Haeussling S M 2007 Economicimpacts of rapid glacier retreat in the Andes Trans AmGeophys Union 88 261
Ward J V and Stanford J A 1979 The Ecology of Regulated Streams(New York NY Plenum)
WCD 2000 Dams and development A new framework fordecision-making The Report of the World Commission on Dams(London Earthscan)
Wiberg D A and Strzepek K M 2005 Development of RegionalEconomic Supply Curves for Surface Water Resources andClimate Change Assessments A Case Study of China(Laxenburg International Institute for Applied SystemsAnalysis) RR-05-001
Wollman N and Bonem G W 1971 The Outlook for Water QualityQuantity and National Growth (Baltimore MD Johns HopkinsPress)
World Bank 1996 The World Bankrsquos Experience with Large Dams APreliminary Review of Impacts (Washington DC World Bank)Report no 15815
World Bank 2009 Water and Climate Change Understanding theRisks and Making Climate-Smart Investment Decisions(Washington DC World Bank)
World Bank 2010 The Costs to Developing Countries of Adapting ToClimate Change New Methods and Estimates The GlobalReport On the Economics of Adaptation to Climate ChangeStudy (Washington DC World Bank) (available athttpsiteresourcesworldbankorgINTCCResourcesEACCReport0928Finalpdf)
Zhou Y and Tol R S J 2005 Evaluating the costs of desalination andwater transport Water Resour Res 41 W03003
10
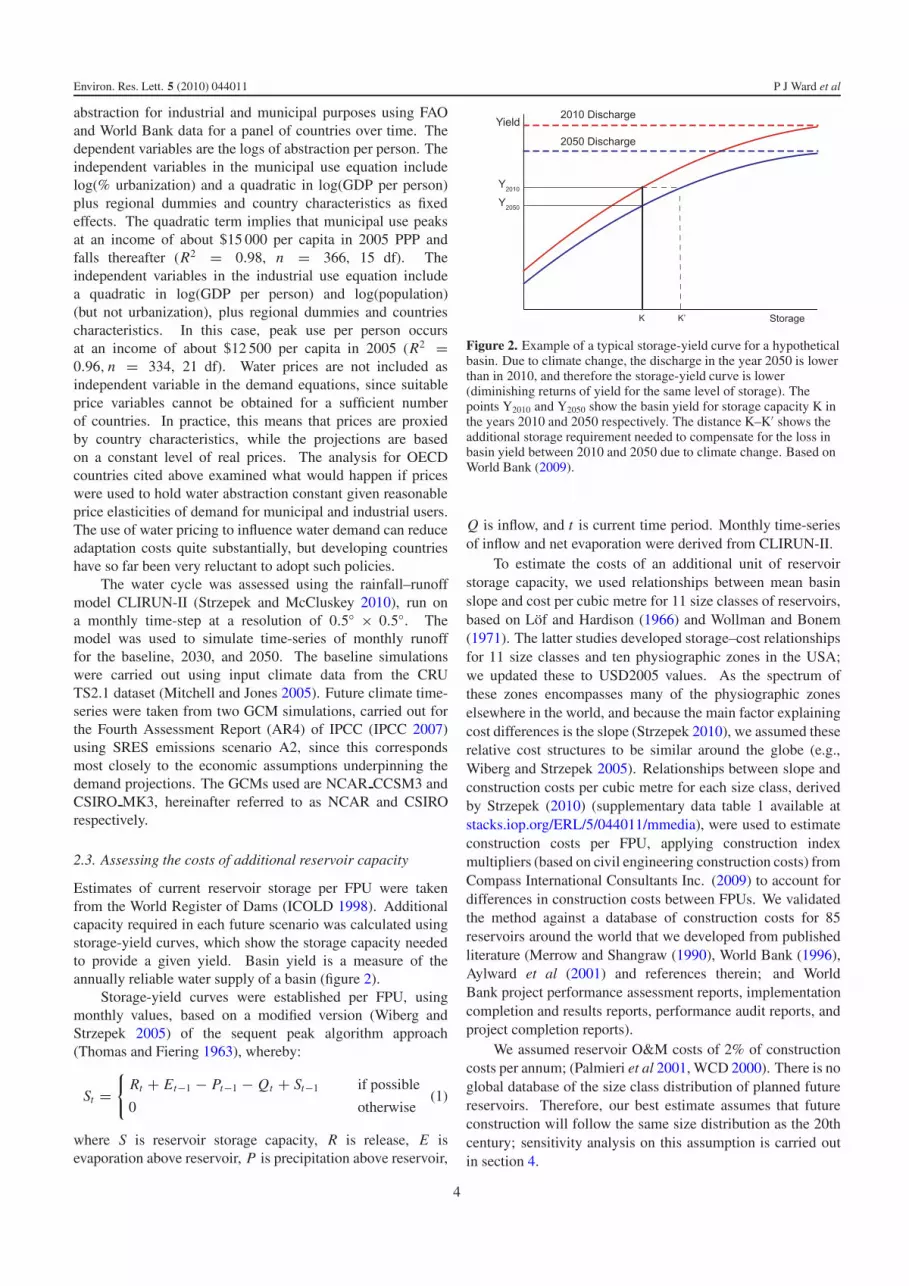
Environ Res Lett 5 (2010) 044011 P J Ward et al
Huq S and Reid H 2004 Mainstreaming adaptation in developmentIDS Bull 35 15ndash21
ICOLD 1998 Word register of dams Book and CD-ROM (ParisICOLD)
IPCC 2000 Special Report on Emission Scenarios (New YorkCambridge University Press)
IPCC 2007 Climate Change 2007 Impacts Adaptation andVulnerability Contribution of Working Group II to the FourthAssessment Report of the Intergovernmental Panel on ClimateChange (Cambridge Cambridge University Press)
Kirshen P 2007 Adaptation options and cost in water supply Reportto the UNFCCC Secretariat Financial and Technical SupportDivision (available online at httpunfcccintcooperation and supportfinancial mechanismfinancial mechanism gefitems4054php)
Kirshen P Ruth M and Anderson W 2006 Climatersquos long-termimpacts on urban infrastructures and services the case of MetroBoston Climate Change and Variability Local Impacts andResponses ed M Ruth K Donaghy and P H Kirshen(Cheltenham Edward Elgar Publishers)
Kuik O Buchner B Catenacci M Goria A Karakaya E and Tol R S2008 Methodological aspects of recent climate change damagecost studies Int Assess J Bridg Sci Policy 8 19ndash40
Kummu M Ward P J De Moel H and Varis O 2010 Is physical waterscarcity a new phenomenon Global assessment of watershortage over the last two millennia Environ Res Lett5 034006
Kundzewicz Z W Mata L J Arnell N W Doll P Kabat PJimenez B Miller K A Oki T Sen Z and Shiklomanov I A2007 Freshwater resources and their management ClimateChange 2007 Impacts Adaptation and VulnerabilityContribution of Working Group II to the Fourth AssessmentReport of the Intergovernmental Panel on Climate Changeed M L Parry O F Canziani J P Palutikof P J van der Lindenand C E Hanson (Cambridge Cambridge University Press)
Lasage R Aerts J C J H Mutiso G-C M and de Vries A 2008Potential for community based adaptation to droughts sanddams in Kitui Kenya Phys Chem Earth 33 67ndash73
Lof G O G and Hardison C H 1966 Storage requirements for water inthe United States Water Resour Res 2 323ndash54
Merrow E W and Shangraw R F Jr 1990 Understanding the costs andschedules of World Bank supported hydroelectric projectsIndustry and Energy Department Working Paper Energy SeriesPaper No 31 (Washington DC World Bank)
Mitchell T D and Jones P D 2005 An improved method ofconstructing a database of monthly climate observations andassociated high-resolution grids Int J Climatol 25 693ndash712
Palmieri A Shah F and Dinar A 2001 Economics of reservoirsedimentation and sustainable management of dams J EnvironManag 61 149ndash63
Petts G E 1984 Impounded Rivers Perspectives for EcologicalManagement (Chichester Wiley)
Poff N L Allan J D Bain M B Karr J R Prestegaard K LRichter B D Sparks R E and Stromberg J C 1997 The naturalflow regime a paradigm for conservation and restoration ofriver ecosystems Bioscience 47 769ndash84
Poff N L and Hart D D 2002 How dams vary and why it matters forthe emerging science of dam removal Bioscience 52 59ndash68
Rosegrant M Cai X and Cline S 2002 World Water and Food to2025 Dealing with Scarcity (Washington DC IFPRI)
Shiklomanov I A and Rodda J C 2003 World Water Resources at theBeginning of the 21st Century (Cambridge CambridgeUniversity Press)
Smakhtin V U and Toulouse M 1998 Relationships between low-flowcharacteristics of South African streams Water SA 24 107ndash12
Srinivasan V Gorelick S M and Goulder L 2010 Sustainable urbanwater supply in south India desalination efficiencyimprovement or rainwater harvesting Water Resour Res46 W10504
Strzepek K M 2010 Methodology for surface water storageinvestments WATERSIM (Colombo IWMI)
Strzepek K M and McCluskey A I 2010 Modelling the Impact ofClimate Change on Global Hydrology and Water Availability(Washington DC World Bank) Prepared as input to the WorldBank Economics of Adaptation to Climate Change Projectforthcoming
Sutherland D C and Fenn C R 2000 Thematic review IV3 Preparedas input to the World Commission on Dams (WCD) Assessmentof Water Supply Options (Cape Town WCD)
Thomas H A and Fiering M B 1963 The Nature of the Storage-YieldFunction Operations Research in Water Quality Management(Cambridge MA Harvard University Water Program)
UNFCCC 2007 Investment and Financial Flows to Address ClimateChange Background Paper on Analysis of Existing andPlanned Investment and Financial Flows Relevant to theDevelopment of Effective and Appropriate InternationalResponse to Climate Change (Bonn UNFCCC)
Vergara W Deeb A M Valencia A M Bradley R S Francou BZarzar A Grunwaldt A and Haeussling S M 2007 Economicimpacts of rapid glacier retreat in the Andes Trans AmGeophys Union 88 261
Ward J V and Stanford J A 1979 The Ecology of Regulated Streams(New York NY Plenum)
WCD 2000 Dams and development A new framework fordecision-making The Report of the World Commission on Dams(London Earthscan)
Wiberg D A and Strzepek K M 2005 Development of RegionalEconomic Supply Curves for Surface Water Resources andClimate Change Assessments A Case Study of China(Laxenburg International Institute for Applied SystemsAnalysis) RR-05-001
Wollman N and Bonem G W 1971 The Outlook for Water QualityQuantity and National Growth (Baltimore MD Johns HopkinsPress)
World Bank 1996 The World Bankrsquos Experience with Large Dams APreliminary Review of Impacts (Washington DC World Bank)Report no 15815
World Bank 2009 Water and Climate Change Understanding theRisks and Making Climate-Smart Investment Decisions(Washington DC World Bank)
World Bank 2010 The Costs to Developing Countries of Adapting ToClimate Change New Methods and Estimates The GlobalReport On the Economics of Adaptation to Climate ChangeStudy (Washington DC World Bank) (available athttpsiteresourcesworldbankorgINTCCResourcesEACCReport0928Finalpdf)
Zhou Y and Tol R S J 2005 Evaluating the costs of desalination andwater transport Water Resour Res 41 W03003
10


