Embed Size (px)
Citation preview
PASSENGER AND LUGGAGE TRACKING SYSTEM USING
SENSOR NETWORKS FOR PUBLIC TRANSPORT
By
George Kasanga
A Dissertation Submitted to the University of Zambia in Partial Fulfillment
of the Requirements for the Degree of Master of Engineering in
Information and Communication Technology Security
THE UNIVERSITY OF ZAMBIA
LUSAKA
2020


i
COPYRIGHT DECLARATION
All rights reserved. No part of this work may be reproduced without prior written consent from the author
or The University of Zambia.

ii
DECLARATION
I, the undersigned, declare that this has not previously been submitted in candidature for any
degree. The dissertation is the result of my work and investigations, except where otherwise
stated. Other sources are acknowledged by giving explicit references. A complete list of
references is appended.
Name :..…………………………………………….
Signature: ………………………………………………. Date: …………………
Supervisor : ..…………………………………………….
Signature :………………………………………………. Date: …………………

iii
CERTIFICATE OF APPROVAL
This document prepared by GEORGE KASANGA is approved as fulfilling the requirements
for the award of the degree of Masters of Engineering in Information and Communication
Technology Security by University of Zambia
Examiner 1 …………………………………………………………………….
Signature: .…………………………… Date: ……………………………….
Examiner 2 …………………………………………………………………….
Signature: .…………………………… Date: ……………………………….
Examiner 3 …………………………………………………………
Signature: .…………………………… Date: ………………………….…….
ChairPerson
Board of Examiner……………………………………………………………………
Signature: .…………………………… Date: ……………………………….

iv
ACKNOWLEDGEMENT
I praise and thank our Almighty God, the creator of Heaven and Earth, through our Lord Jesus
Christ, for giving me good health, understanding and many other blessings during the course
of my study. I am very grateful to Dr Jackson Phiri who helped immensely and guided me with
his knowledge and experience throughout my research to completion. I am also grateful for
his continuous patience, support and encouragement. I am deeply indebted to Mr Chrispine
Kunda, and many others whom I consulted in the course of my research work. I am also
thankful to my co-workers at the University of Lusaka for encouragement and support.

v
DEDICATION
I dedicate this research to my parents, Edmond and Catherine Kasanga for their untiring
support, for always challenging my perceptive of reality and believing in my dreams, my
sisters Clara, Chishimba and Chola have always been my pillars and cheerleaders we
celebrated every little victory along this journey. Last but not the least the woman am spending
the rest of my earthling days with Cecilia Banda thank you for been understanding, supportive
and strong for us when all strength in me wanted to give up.
vi
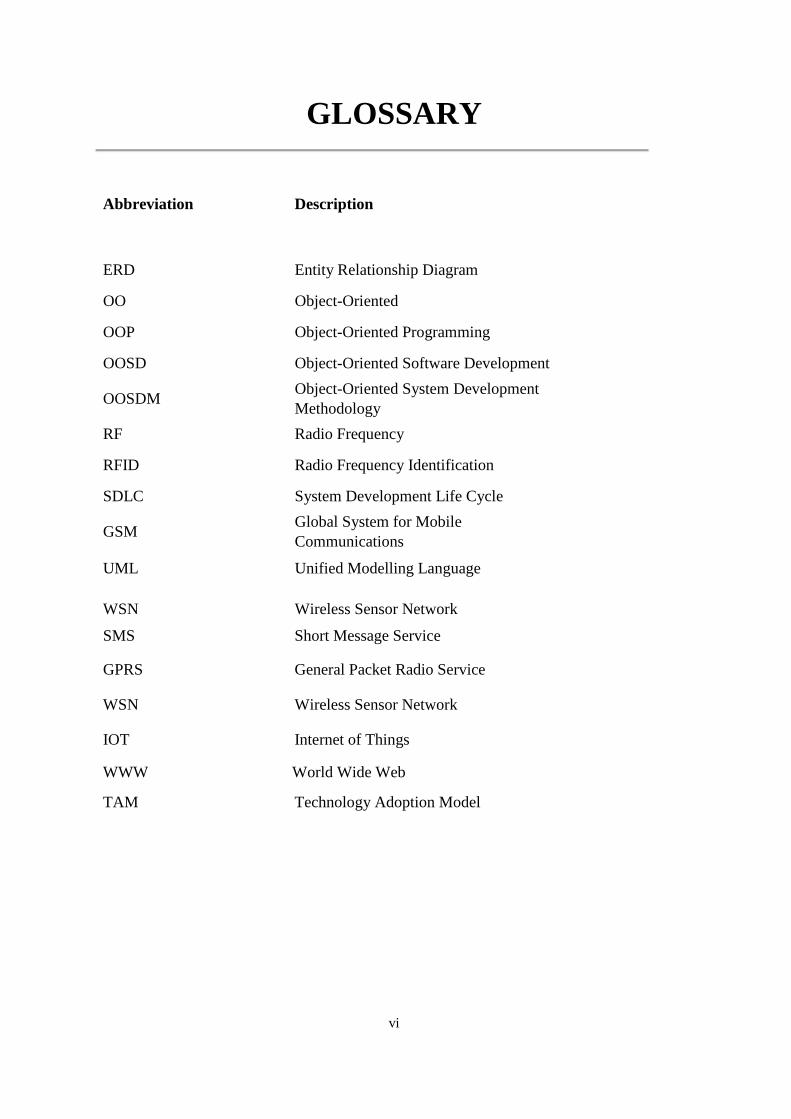
GLOSSARY
Abbreviation Description
ERD Entity Relationship Diagram
OO Object-Oriented
OOP Object-Oriented Programming
OOSD Object-Oriented Software Development
OOSDM
Object-Oriented System Development
Methodology
RF Radio Frequency
RFID Radio Frequency Identification
SDLC System Development Life Cycle
GSM Global System for Mobile
Communications
UML Unified Modelling Language
WSN Wireless Sensor Network
SMS Short Message Service
GPRS General Packet Radio Service
WSN Wireless Sensor Network
IOT Internet of Things
WWW World Wide Web
TAM Technology Adoption Model
vii
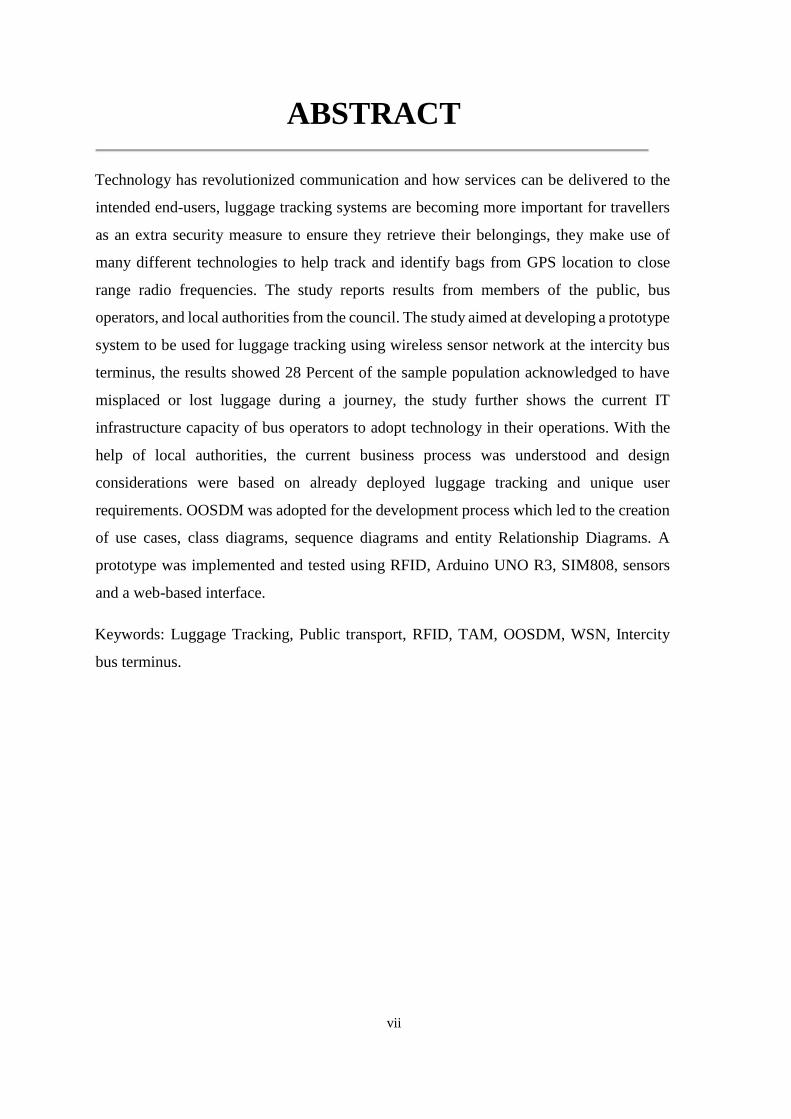
ABSTRACT
Technology has revolutionized communication and how services can be delivered to the
intended end-users, luggage tracking systems are becoming more important for travellers
as an extra security measure to ensure they retrieve their belongings, they make use of
many different technologies to help track and identify bags from GPS location to close
range radio frequencies. The study reports results from members of the public, bus
operators, and local authorities from the council. The study aimed at developing a prototype
system to be used for luggage tracking using wireless sensor network at the intercity bus
terminus, the results showed 28 Percent of the sample population acknowledged to have
misplaced or lost luggage during a journey, the study further shows the current IT
infrastructure capacity of bus operators to adopt technology in their operations. With the
help of local authorities, the current business process was understood and design
considerations were based on already deployed luggage tracking and unique user
requirements. OOSDM was adopted for the development process which led to the creation
of use cases, class diagrams, sequence diagrams and entity Relationship Diagrams. A
prototype was implemented and tested using RFID, Arduino UNO R3, SIM808, sensors
and a web-based interface.
Keywords: Luggage Tracking, Public transport, RFID, TAM, OOSDM, WSN, Intercity
bus terminus.
viii
TABLE OF CONTENTS
DECLARATION ............................................................................................................................................ i
CERTIFICATE OF APPROVAL ................................................................................................................ iii
ACKNOWLEDGEMENT ............................................................................................................................ iv
DEDICATION ............................................................................................................................................... v
GLOSSARY ................................................................................................................................................. vi
ABSTRACT ................................................................................................................................................ vii
TABLE OF CONTENTS ........................................................................................................................... viii
LIST OF TABLES ....................................................................................................................................... xi
LIST OF FIGURES ..................................................................................................................................... xii
CHAPTER ONE: ............................................................................................................................................ 1
INTRODUCTION TO THE RESEARCH ..................................................................................................... 1
1.1 Introduction .......................................................................................................................................... 1
1.2 Introduction to the Research Study ....................................................................................................... 1
1.3 Statement of the Problem ..................................................................................................................... 3
1.4 Aim ....................................................................................................................................................... 3
1.5 Objectives ............................................................................................................................................. 3
1.6 Research Questions .............................................................................................................................. 3
1.7 Motivation and Significance of the Study ............................................................................................ 3
1.8 Scope .................................................................................................................................................... 4
1.9 Research Contributions ........................................................................................................................ 4
1.10 Organization of Dissertation ............................................................................................................... 4
1.11 Summary ............................................................................................................................................ 5
CHAPTER TWO ............................................................................................................................................ 6
LITERATURE REVIEW ............................................................................................................................... 6
2.1 Introduction .......................................................................................................................................... 6
2.2 Review of Literature ............................................................................................................................. 6
2.2.1 Radio Frequency Identification (RFID)............................................................................................. 6
2.2.2 RFID Tag ......................................................................................................................................... 8
2.2.3 RFID Reader ...................................................................................................................................... 9
2.2.4 Central Node (Middleware) ............................................................................................................. 10
2.2.5 RFID Applications ........................................................................................................................... 10
ix
2.2.6 Bar Codes ........................................................................................................................................ 12
2.2.7 QR Code .......................................................................................................................................... 13
2.2.8 Wireless Sensor Networks ............................................................................................................... 16
2.2.9 Software Development Methodology .............................................................................................. 21
2.2.10 Traditional Methodology vs. Object-Oriented Methodology ........................................................ 21
2.2.11 Object-Oriented System Development Methodology .................................................................... 22
2.2.12 Internet of Things (IoT) ................................................................................................................. 25
2.2.13 Internet accessibility survey .......................................................................................................... 29
2.2.11 Data Encryption ............................................................................................................................. 31
2.2.12 Reviewed Luggage tracking Designs ............................................................................................ 33
2.3 Related Works .................................................................................................................................... 37
CHAPTER THREE: ..................................................................................................................................... 43
METHODOLOGY ....................................................................................................................................... 43
3.1 Introduction ........................................................................................................................................ 43
3.2 Baseline Study .................................................................................................................................... 43
3.2.1 Data Collection ................................................................................................................................ 43
3.2.2 Inclusion Criteria ............................................................................................................................. 44
3.2.3 Study Setting ................................................................................................................................... 44
3.2.4 Sampling .......................................................................................................................................... 44
3.2.5 Ethical Considerations ..................................................................................................................... 44
3.2.6 Limitations of the Baseline Study .................................................................................................... 44
3.2.7 Presentation of Findings .................................................................................................................. 44
3.2.8 Technology Adoption Model (TAM) .............................................................................................. 45
3.3 System Implementation and Design ................................................................................................... 51
3.3.1 System Design ................................................................................................................................. 51
3.3.2 System Implementation ................................................................................................................... 61
3.3.6 System Architecture ........................................................................................................................ 62
3.4 Summary............................................................................................................................................. 63
CHAPTER FOUR ........................................................................................................................................ 64
4.1 Introduction ........................................................................................................................................ 64
4.2 Baseline Study Results ....................................................................................................................... 64
4.2.1 Demographic Data ........................................................................................................................... 65
4.2.2 Distribution of Respondents by Age ................................................................................................ 65
4.2.3 Distribution of Respondents by Occupations .................................................................................. 66
4.2.4 Passenger Computer Knowledge ..................................................................................................... 67
x
4.2.5 Passenger Usage of Bus Transportation .......................................................................................... 68
4.2.6 Passenger Luggage Mismanagement ............................................................................................... 68
4.2.7 Bus Owners and Drivers computer knowledge. .............................................................................. 69
4.2.8 Bus Owners Perceived usefulness of the system ............................................................................. 70
4.2.9 Existing IT infrastructure ................................................................................................................. 70
4.2.10 Passenger internet usage experience .............................................................................................. 71
4.2.11 Passenger Daily Internet Consumption.......................................................................................... 72
4.2.12 Perceived Ease of Use ................................................................................................................... 73
4.2.13 Perceived Risk ............................................................................................................................... 74
4.3 Summary............................................................................................................................................. 81
CHAPTER FIVE .......................................................................................................................................... 82
DISCUSSION AND CONCLUSION .......................................................................................................... 82
5.1 Introduction ........................................................................................................................................ 82
5.2 Discussion .......................................................................................................................................... 82
5.2.1 How the Model Operates ................................................................................................................. 84
5.2.3 Prototype development .................................................................................................................... 85
5.4 Recommendations .............................................................................................................................. 86
5.5 Future Works ...................................................................................................................................... 86
REFERENCES ............................................................................................................................................. 88
APPENDIX I SIM808 Features ................................................................................................................... 97
Electronic Characteristics ......................................................................................................................... 97
Hardware .................................................................................................................................................. 98
APPENDIX II Arduino UNO R3 Features ................................................................................................... 99
Hardware ................................................................................................................................................ 100
APPENDIX III SOURCE CODE ............................................................................................................... 101
APPENDIX IV QUESTIONNAIRE. ......................................................................................................... 121
LIST OF PUBLICATIONS ........................................................................................................................ 129
xi
LIST OF TABLES
Table 2.1: Active vs. Passive vs. Semi-Passive Tags [13] ......................................................... 8
Table 2.2 Comparison of Barcode, QR code and RFID [54] ................................................... 15
Table 2.3 Attacks on various layers of a WSN and their countermeasures [103] ................... 18
Table 3.1: Non-Functional Requirements ................................................................................ 53
Table 3.2: Use case text for Login ........................................................................................... 55
Table 3.3: Use case text for Add Manager ............................................................................... 55
Table 3.4: Use case text for Update ......................................................................................... 56
Table 3.5: Use case text for Delete Manager ........................................................................... 56
Table 3.6: Use case text for Search Tag ................................................................................... 56
Table 3.7: Use case text for Add Office ................................................................................... 57
Table 3.8: Use case text for View Managers ........................................................................... 57
Table 3.9: Use case text for View on Map ............................................................................... 57
Table 4.1: Correlation between perceived usefulness and ease of use. ................................... 75
xii
LIST OF FIGURES
Figure 2.1: Shows the components that constitute an RFID system [11]. ................................. 7
Figure 2.2: RFID Tag [27] ......................................................................................................... 8
Figure 2.3: EPC example [41] .................................................................................................... 9
Figure 2.4: Structure of Barcode[41] ....................................................................................... 12
Figure 2.5: QR Code [42] ........................................................................................................ 14
Figure 2.6: Arduino Microcontroller ....................................................................................... 19
Figure 2.7: Breadboard [115] ................................................................................................... 21
Figure 2.8: The layered architectures of IoT (three, four and five layers) [33]. ...................... 26
Figure 2.9: Number of connected IoT devices from 2015 to 2025 [32]. ................................. 27
Figure 2.10: Internet user’s national survey [93] ..................................................................... 30
Figure 2.11: Internet users’ provincial survey[93] ................................................................... 30
Figure 2.12 Real-Time Tracking Management System design [117] ...................................... 34
Figure 2.13 FRA Tracking System design [118] ..................................................................... 35
Figure 2.14 Block diagram [119] ............................................................................................. 36
Figure 2.15 Block-diagram of the considered RTSAL [120] .................................................. 37
Figure 3.1: TAM Model [22] ................................................................................................... 45
Figure 3.3: Shows the observed luggage handling business process ....................................... 47
Figure 3.4: Flow chart of luggage tampering ........................................................................... 49
Figure 3.5: RFID Tag being read ............................................................................................. 49
Figure 3.6: Luggage tracking Module ...................................................................................... 50
Figure 3.7: Use Case diagram for Users .................................................................................. 54
Figure 3.8: System Class Diagram ........................................................................................... 58
Figure 3.9: System Entity Relationship Diagram .................................................................... 60
Figure3.10 Sequence Diagram ................................................................................................. 61
Figure 3.11: Hardware setup .................................................................................................... 61
Figure 3.12: System Architecture ............................................................................................ 62
Figure 3.13: System User Interactions ..................................................................................... 63
Figure 4.9 infrastructure support .............................................................................................. 71
Figure 4.18: Passenger Luggage Tracking System home screen ............................................. 76
Figure 4.19: Administrator login page ..................................................................................... 77
Figure 4.20: The Manage services screen ................................................................................ 77
Figure 4.21: Track luggage screen ........................................................................................... 78
Figure 4.22: Parcel Delivery Status ......................................................................................... 79
Figure 4.23: View Offices of Bus operators ............................................................................ 80
Figure 4.24 Real-Time location of the bus .............................................................................. 80
- 1 -
CHAPTER ONE:
INTRODUCTION TO THE
RESEARCH
1.1 Introduction
In this chapter, the research study is introduced. The motivation and significance of the
research are covered. The scope, problem statement and aim are given. This is then followed
by the objectives, research questions and the research contributions. Finally, the organization
of the dissertation and a summary of the chapter are presented.
1.2 Introduction to the Research Study We live in a World of Sensors. You can find different types of Sensors in our homes, offices,
cars etc. working to make our lives easier by turning on the lights by detecting our presence,
adjusting the room temperature, detect smoke or fire, open garage doors as soon as a car is
near the door and many other tasks.
A sensor is a device that measures physical input from its environment and converts it into
data that can be interpreted by either a human or a machine [1]. Most sensors are electronic
(the data is converted into electronic data), the most frequently used different types of sensors
are classified based on the quantities such as Electric current or Potential or Magnetic or Radio
sensors, Humidity sensor, Fluid velocity or Flow sensors, Pressure sensors, Thermal or Heat
or Temperature sensors, Proximity sensors, Optical sensors, Position sensors, Chemical
sensor, Environment sensor, Magnetic switch sensor.
Speed Sensors used for detecting the speed of an object or vehicle is called a Speed sensor.
There are different types of sensors to detect the speed such as Wheel speed sensors,
speedometers [2].
Passive Infrared (PIR) Sensor used for measuring the infrared light radiation emitted from
objects in its field of view is called as a PIR sensor Every object that has a temperature above
absolute zero emit heat energy in the form of radiation radiating at infrared wavelengths which
is invisible to the human eye but can be detected by special purpose electronic devices such as
PIR motion detectors. Automatic Door Opening System is a typical application of PIR sensors
- 2 -
which is intended for automatic door closing and opening operations based on body movement
near the door. PIR-sensor-based-automatic-door- opening system circuit mainly consists of a
PIR sensor, an 8051 microcontroller, a driver IC, a door motor [3].
Weight Sensors used to measure weight are referred to as load cells or force sensors. There are
many different types of load cells, they measure weight based on the amount of compression
which is detected by the sensors within the cells. Very often strain gauges are used for this
process. Different types of load cells are suitable for different capacities. Some common
applications for load cells are; On-board weighing - the process of weighing the capacity of
what is on-board a truck, lorry or vehicle. Platform scales - used within warehouses to measure
the weight of pallets or boxes [4].
Magnetometer Sensor a device that measures the magnetism direction, strength, or relative
change of a magnetic field at a particular location. The measurement of the magnetization of
a magnetic material Smartphones uses built-in magnetometers to measure magnetic fields and
determine which way is north through the current from the phone itself[5].
Wireless Sensor Networks (WSNs) consist of small nodes with sensing, computation, and
wireless communications capabilities. These sensors can communicate either among each
other or directly to an external base station [6].WSNs have been widely adopted in many areas
such as;
i) Distribution supply chain and logistics
ii) Industrial tracking and visibility
iii) Location awareness and safety
iv) Data centre resource management
Luggage Tracking has been widely adopted in the aviation industry, this is due to high volumes
of domestic, commercial and cargo flights carrying goods and luggage destined to various
parts of the world, to minimise incidences of delayed, lost luggage and been placed on a wrong
flight.
The study focuses on public transportation in Zambia, the most common mode of
transportation been by road, buses are readily available for short and long-distance travel, the
study further focuses on intercity bus terminus in Lusaka, to understand the current business
process, management of luggage and the supporting ICT infrastructure concerning luggage
tracking from the source to the destination.
- 3 -
1.3 Statement of the Problem
The 2019 Global innovation index ranks Zambia 124 out of 129 countries [7], despite the
recognition of ICT’s as enablers for social and economic development. Public transportation
has not made much use of technology to improve the provision of services, there is little
research that has been conducted in developing a luggage tracking system for the public
transportation sector in Zambia. Therefore, this study investigates sensor network technologies
and applications to develop a luggage tracking system for the public transport sector.
1.4 Aim
The study aims to design and develop a passenger luggage system, system models and a
prototype to aid bus operators in managing passenger luggage to improve accountability and
reduce lost customer luggage incidences.
1.5 Objectives
The specific objectives that will enable the achievement this objective are as follows:
i) Assess the level of usage and adoption of technology among operators and passengers.
ii) Analyse technologies, topologies and applications of sensor networks for tracking
systems.
iii) Develop a sensor network luggage tracking system for the public transport sector.
1.6 Research Questions
This research was guided by the following research questions:
i) What are the challenges faced by bus operators and passengers in adopting new
technology?
ii) How can the business processes for tracking Passenger luggage be designed?
iii) How can the firmware for the passenger luggage tracking system, in (ii) be implemented?
1.7 Motivation and Significance of the Study
Zambia like many other developing countries is making strides in the usage of technology, to
improve service delivery to the members of the public by improving workflows, reducing
ques, decentralising operations and promoting the use of online services as opposed to paper-
based operations, this is evident from the smart Zambia initiative fostering E-government and
- 4 -
our seventh national development plan promoting innovation as well as improving ICT
infrastructure. The study will explore how technology can be incorporated in the operations
of intercity bus terminus, in the bid to improve luggage management at our bus stations and
customer experience, by providing a prototype system to help operators and passengers in
tracking and monitoring valuable luggage throughout the journey, this opens an avenue for
further research and adding to the body of existing knowledge.
1.8 Scope
The research was conducted in Lusaka, the capital city of Zambia. A baseline study was done
at the intercity bus terminus, which is our biggest bus station for buses that make trips to other
cities and towns within Zambia as well as neighbouring countries. A detailed literature review
of RFID technology, sensors sensor networks their applications in luggage tracking and
management was conducted to determine the most cost-effective and efficient method to
implement the system.
1.9 Research Contributions
The business processes that will enable automation of the public transportation passenger
luggage management system from the current manual-based processes were mapped.
Implementation of the RFID firmware using C++ language for the intercity bus terminus
passenger luggage management was done. Some of this work has been published in the
Proceedings of the international conference in ICT (ICICT2019) See the list of publications in
the appendix for the research articles published from this work.
1.10 Organization of Dissertation
The work done in this dissertation is organised into five chapters. Chapter 1 is the Introduction
to the Research. In this chapter, a brief overview of the work in this dissertation is given. Then
the problem statement, aims and motivation are presented. This chapter concludes by giving
an outline of the dissertation.
- 5 -
Chapter 2 looks at the background theory and related works. In this chapter, a comprehensive
review and the background theory of Radio Frequency Identification, Wireless Sensor
Networks, GSM, GPRS and IoT are given. Related works regarding object tracking, event
notification and management are presented. The research methodology is given in Chapter 3.
In this chapter, the methods used to conduct the baseline study and implement the system are
presented. In Chapter 4, the research findings of the baseline study and the system
implementation are presented.
Finally, in Chapter 5 the discussion and conclusion are given.
1.11 Summary
In this chapter, the basic introduction of the work in this dissertation was given. The luggage
management highlighting challenges globally, regionally and narrowed it down to Zambia,
was discussed. The motivation, significance and scope of the work in this study were then
outlined. Finally, the problem statement outlined the aims, the research contributions were
given and the chapter was closed with the outline of the dissertation.
- 6 -
CHAPTER TWO
LITERATURE REVIEW
2.1 Introduction In this chapter, the literature and the works related to this research study are reviewed.
Firstly, an extensive review of Radio Frequency Identification and how it can be used to
improve operational efficiency through computerised luggage management is carried out.
This is followed by a brief review of Wireless Sensor Networks, GSM, GPRS and IoT.
Also, a review of the software development approaches is presented in the following
section. Lastly, this chapter closes by looking at related works to Passenger luggage
tracking, and management.
2.2 Review of Literature
2.2.1 Radio Frequency Identification (RFID)
RFID is a non-contact, programmed automatic identification technology that utilizations radio
signal to distinguish, track, sort and identify an assortment of articles including individuals,
vehicles, merchandise and resources without the requirement for direct contact (as found in
magnetic stripe technology) or line of sight contact (as found in bar code technology). RFID
innovation can follow the developments of items through a system of radio-empowered
examining gadgets over the separation of a few meters. A gadget called an RFID tag is a key
segment of the innovation. An RFID tag normally has at any time two components, an
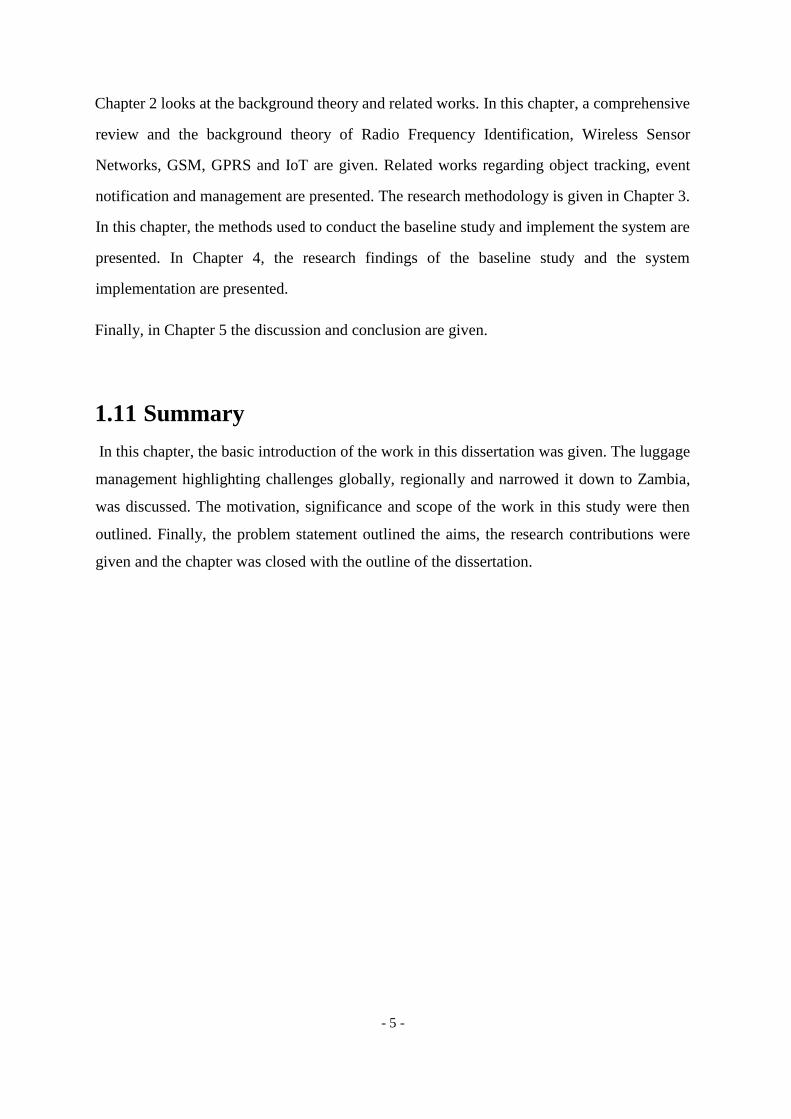
integrated circuit and antenna for getting signals [6]. Figure 2.1 shows the components that
constitute an RFID system.
- 7 -
RFID tags that don't have any incorporated circuit are called chipless RFID labels, RFID tags
can be inserted in an article or can be put inside a package [8]. A regular RFID framework
establishes four essential segments including RFID Tags, readers, antenna and a central node.
A computer system that may house the database server and management software
(middleware) [6] as shown in Figure 2.1.RFID operates at different frequency bands which
are categorized as low, high and ultra-high [9].
i) Low frequency: provides a frequency band 30 kHz to 300 kHz (read range between 0 cm
and 100 cm), reading is too slow but the data rate of piracy is moderate compared to other
frequencies during playback.
ii) High frequency: frequency band 3 MHz to 30 MHz (read range between 10 cm and 1m),
read speed is fast but the piracy rate is higher compared to the low frequency.
iii) Ultra-high frequency: frequency band 300 MHz to 3 GHz (the reading distance can exceed
15 meters), the playback speed is faster, but the piracy rate is still higher compared with
the high frequency, this frequency is used nowadays in different logistics firms, particularly
in the area of storage, inventory and stock management.
A powerful RFID tag can prevent RFID readers without special permission (access control or
right frequency) to read the content. [10] There are 2 main categories of RFID tags, they can
be either passive or active [12]: Passive tag: uses waves to transmit information through the
energy transmitted by the reader, which supplies the on-board electronic circuits. Active Tag:
usually embeds a source of internal energy (battery with up to 10 years autonomy), it sends
the various information stored on the electronic circuit to the RFID server. A hybrid tag can
be considered a comparison of features among active, semi-passive and passive tags is made.
Figure 2.1: Shows the components that constitute an RFID system [11].
- 8 -
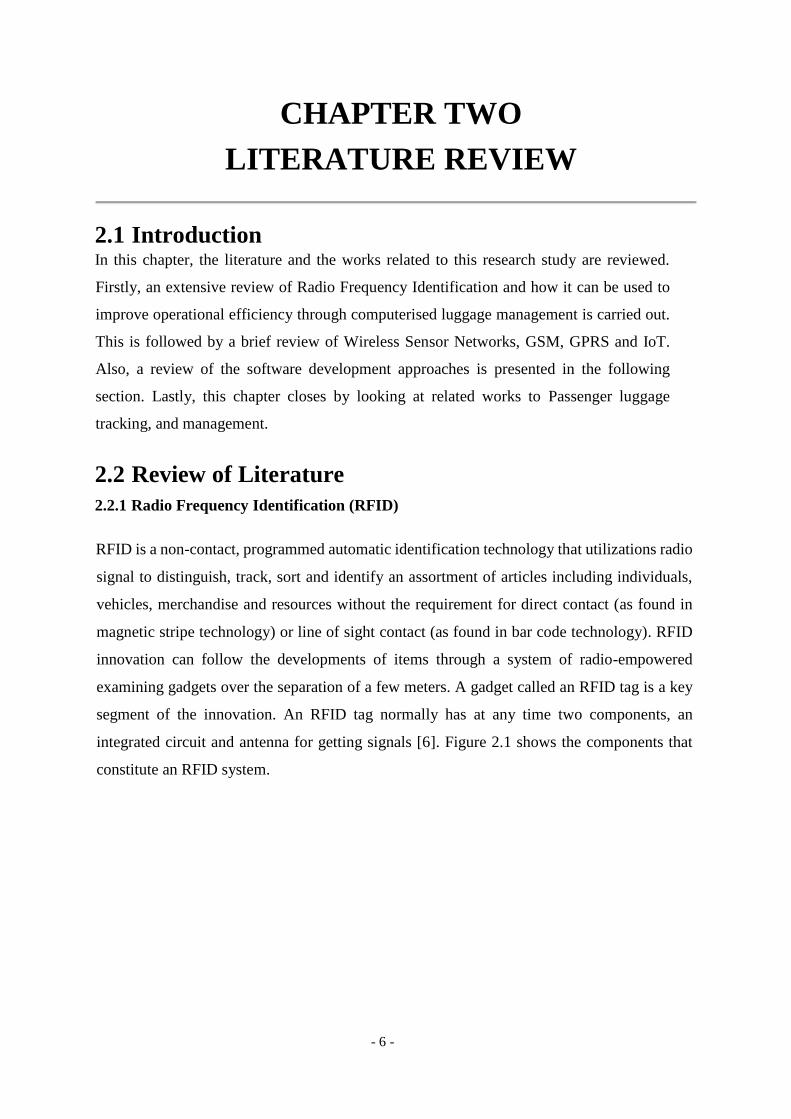
Table 2.1: Active vs. Passive vs. Semi-Passive Tags [13]
Feature Passive Active Semi-Passive
Read Range Short(Up to10cm) Long(Up to100m) Long(Up to100m)
Battery No Yes Yes
Life Validity Up to 20 years Between 5- 10years Up to 10 years
Storage 128 bytes read/write 128 bytes read/write 128 bytes read/write
Cost Cheap Very Expensive Expensive
Application Attendance Management System Monitor the
condition of fresh
produce
Measurement of
temperature periodically
2.2.2 RFID Tag
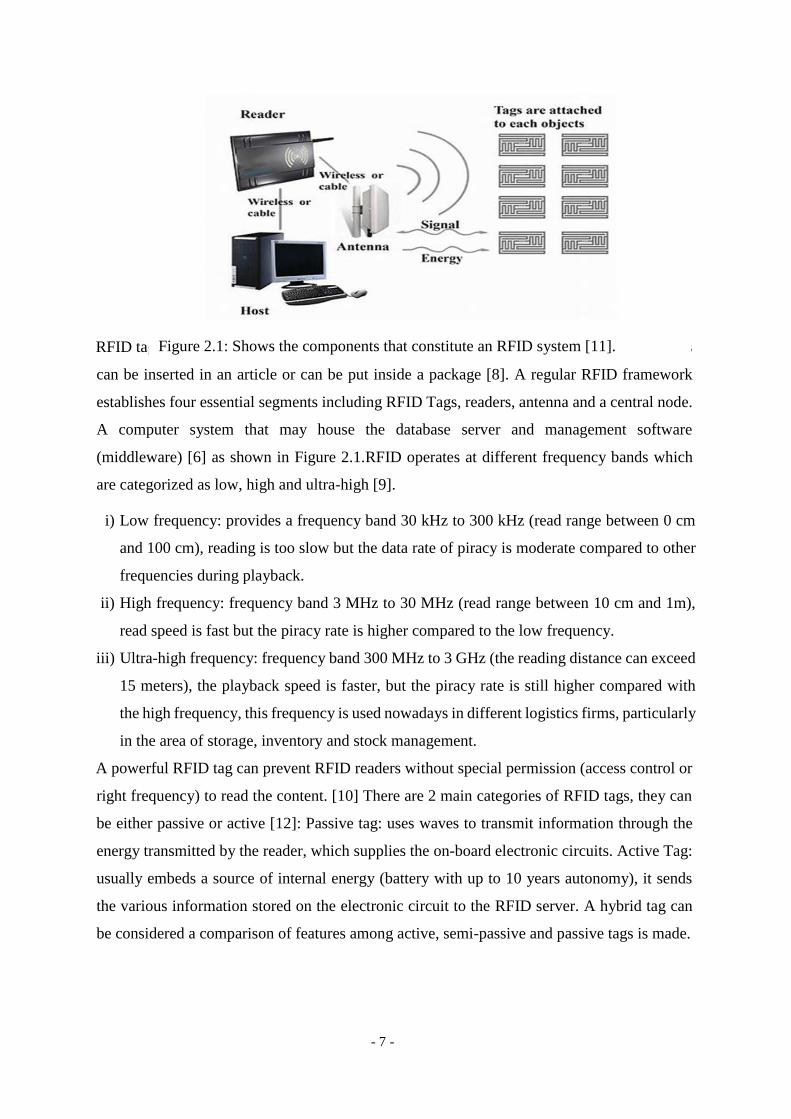
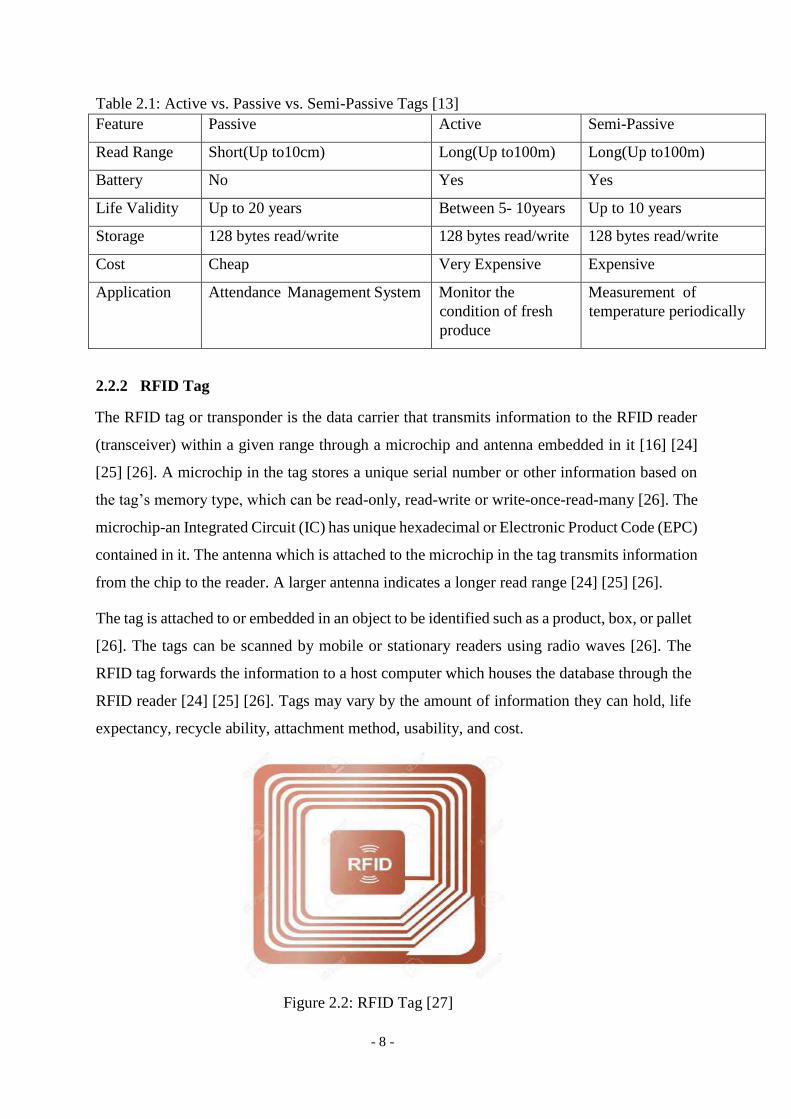
The RFID tag or transponder is the data carrier that transmits information to the RFID reader
(transceiver) within a given range through a microchip and antenna embedded in it [16] [24]
[25] [26]. A microchip in the tag stores a unique serial number or other information based on
the tag’s memory type, which can be read-only, read-write or write-once-read-many [26]. The
microchip-an Integrated Circuit (IC) has unique hexadecimal or Electronic Product Code (EPC)
contained in it. The antenna which is attached to the microchip in the tag transmits information
from the chip to the reader. A larger antenna indicates a longer read range [24] [25] [26].
The tag is attached to or embedded in an object to be identified such as a product, box, or pallet
[26]. The tags can be scanned by mobile or stationary readers using radio waves [26]. The
RFID tag forwards the information to a host computer which houses the database through the
RFID reader [24] [25] [26]. Tags may vary by the amount of information they can hold, life
expectancy, recycle ability, attachment method, usability, and cost.
Figure 2.2: RFID Tag [27]
- 9 -
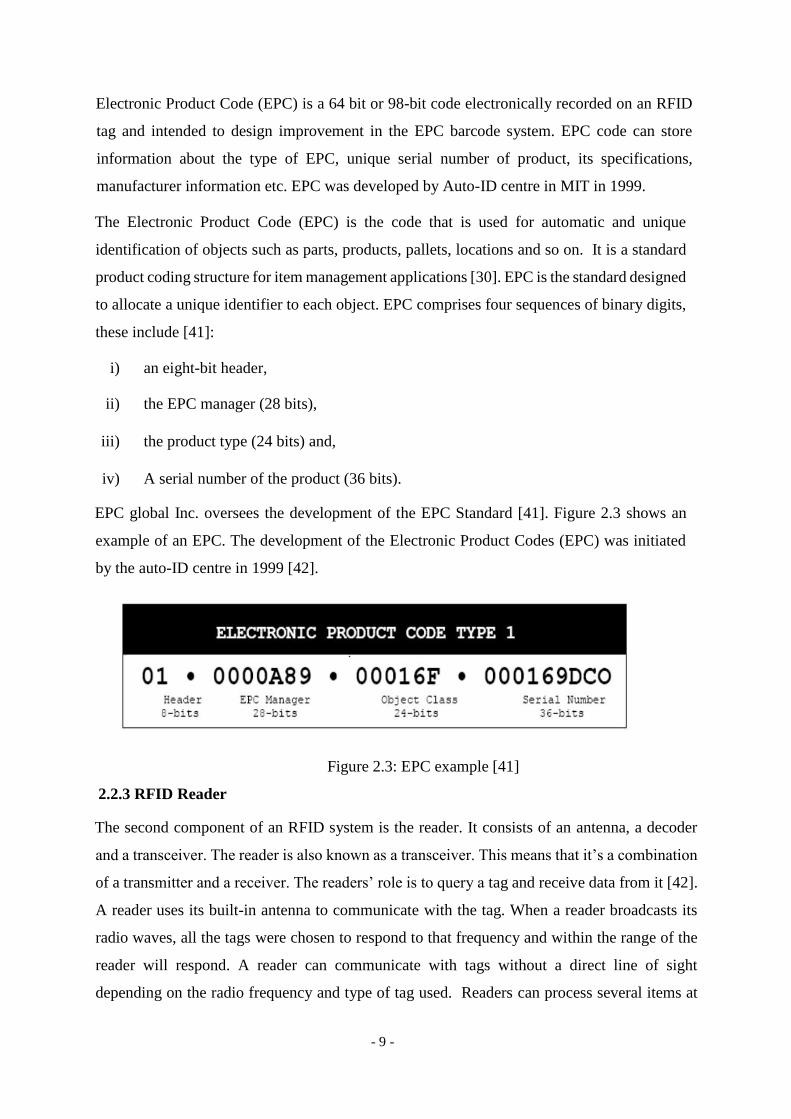
Electronic Product Code (EPC) is a 64 bit or 98-bit code electronically recorded on an RFID
tag and intended to design improvement in the EPC barcode system. EPC code can store
information about the type of EPC, unique serial number of product, its specifications,
manufacturer information etc. EPC was developed by Auto-ID centre in MIT in 1999.
The Electronic Product Code (EPC) is the code that is used for automatic and unique
identification of objects such as parts, products, pallets, locations and so on. It is a standard
product coding structure for item management applications [30]. EPC is the standard designed
to allocate a unique identifier to each object. EPC comprises four sequences of binary digits,
these include [41]:
i) an eight-bit header,
ii) the EPC manager (28 bits),
iii) the product type (24 bits) and,
iv) A serial number of the product (36 bits).
EPC global Inc. oversees the development of the EPC Standard [41]. Figure 2.3 shows an
example of an EPC. The development of the Electronic Product Codes (EPC) was initiated
by the auto-ID centre in 1999 [42].
Figure 2.3: EPC example [41]
2.2.3 RFID Reader
The second component of an RFID system is the reader. It consists of an antenna, a decoder
and a transceiver. The reader is also known as a transceiver. This means that it’s a combination
of a transmitter and a receiver. The readers’ role is to query a tag and receive data from it [42].
A reader uses its built-in antenna to communicate with the tag. When a reader broadcasts its
radio waves, all the tags were chosen to respond to that frequency and within the range of the
reader will respond. A reader can communicate with tags without a direct line of sight
depending on the radio frequency and type of tag used. Readers can process several items at
- 10 -
once, this allows for increased read and processing times [44]. Readers convert radio waves
from tags into a form that can be passed to middleware. Readers accomplish two tasks, these
include, receiving commands from the application software and communicating with tags [42].
Readers fall into two categories. These are active and passive readers. Active readers can detect
an active tag at a few meters to the line of sight. The passive reader, on the other hand, can only
detect passive tags at a few centimetres away from itself [43]. Readers contain built-in anti-
collision schemes. A single reader can operate on multiple frequencies. Readers can be used as
standalone electronic devices or can be integrated with other devices. A Reader consists of
components such as power for running the reader, a communication interface, a
Microprocessor, channels, a controller, a receiver, a transmitter, and memory built into it [45].
A reader can be fixed in a suitable place or hand-held. A hand-held reader is a small, mobile,
lightweight device that is used to receive information from the tag as one moves along
2.2.4 Central Node (Middleware)
Middleware and the database server are at the heart of a comprehensive RFID system [46]
[47] [48]. The data transmitted between the tag and reader is not useful for a commercial
application unless the immense amounts of information are integrated within a larger system
[49]. Middleware, at the central node, manages this incorporation of data. Middleware
manages the information exchange between the readers and the backend database server [42].
Middleware between readers and applications comprises two interfaces, namely the
application interface and the reader interface, to communicate with the environment [40].
Readers are typically connected through middleware to a backend database. Middleware
cleans the data received from communications by eliminating false reads, it also performs
aggregation and filtering of data. Furthermore, by monitoring multiple readers, middleware
can detect the movement of tags as they pass from the read range of one reader to another
[50]. In addition to middleware, servers housing the databases are critical components of a
complete RFID system. Computer database servers provide the data storage, management
and read-write control of the radio frequency tags. They provide the data obtained from the
reader to the software application [51].
2.2.5 RFID Applications
i) Asset Tracking:
Static or in-motion assets tracking or locating, like a healthcare facility, wheelchairs or IV
pumps in, laptops in a corporation and servers in a data centre, was not so easy task.
- 11 -
User can instantly determine the general location of tagged assets anywhere within the facility
with the help of active RFID technology. Control point detection zones at strategic locations
throughout the facility allow the user to define logical zones and monitor high traffic areas.
Tagged assets moving through these control points provide instant location data. Asset tracking
applications will see an almost vertical growth curve in the coming years and the growth rate
in this area will be much higher than the growth rate of the general RFID market.
ii) People Tracking:
People tracking system are used just as an asset tracking system. Hospitals and jails are the
most general tracking required places. Hospital uses RFID tags for tracking their special
patients. In emergency patient and other essential equipment can easily track. It will be mainly
very useful in mental care hospitals where doctors can track every activity of the patient.
Hospitals also use these RFID tags for locating and tracking all the activities of newly born
babies.
The best use of the people tracking system will be in jails. It becomes an easy tracking system
to track its inmates. Many jails of different US states like Michigan, California, and Arizona
are already using RFID-tracking systems to keep a close eye on jail inmates.
iii) Document tracking:
This is the most common problem. Availability of a large amount of data and documents brings
lots of problem in the document management system. An RFID document-tracking system
saves time and money by substantially reducing:
a) Time spent searching for a lost document
b) The financial and legal impact associated with losing documents.
iv) Government library:
Many government libraries use barcode and electromagnetic strips to track various assets.
RFID technology uses for reading these barcodes unlike the self-barcode reader RFID powered
barcode reader can read multiple items simultaneously. This reduces queues and increases the
number of customers using self-check, which in turn will reduce the staff necessary at the
circulation desks.
v) Healthcare:
Patient safety is a big challenge of healthcare vertical. Reducing medication errors, meeting
new standards, staff shortages, and reducing costs are the plus points of use of RFID solutions.
RFID wristbands containing patient records and medication history address several of these
concerns.
- 12 -
vi) Manufacturing & Aerospace:
RFID technology provides an easy way to manage a huge and laborious manufacturing process.
It offers all the benefits of small production parts to batch, processes and manufacturing. This
type of process helps in better analysis, reduce and eliminate bottlenecks, reduced time in
locating parts and products and production process based sensors can be installed to alert any
anomalies. Aerospace industry and the Department of Defence have a lot to gain from RFID
integration into their production and process lines. Boeing and Airbus, according to the
direction of US Federal Aviation Administration, make it mandatory to put an appropriate
tracking mechanism to track the aircraft parts.
vii) Toll Road Payments
Highway toll payment systems [53], uses RFID technology to electronically collect tolls from
passing cars. Instead of stopping at the toll booth, cars pass directly through in the Pass lane
and the toll is automatically deducted from a pre-paid card.
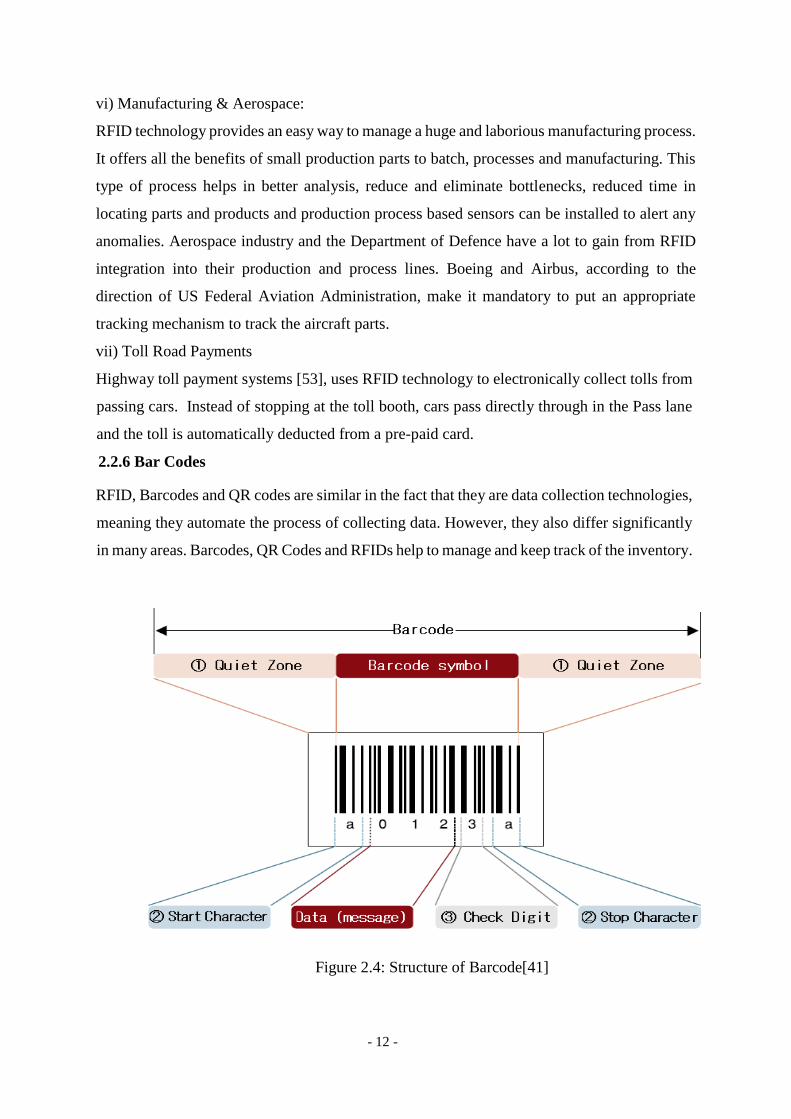
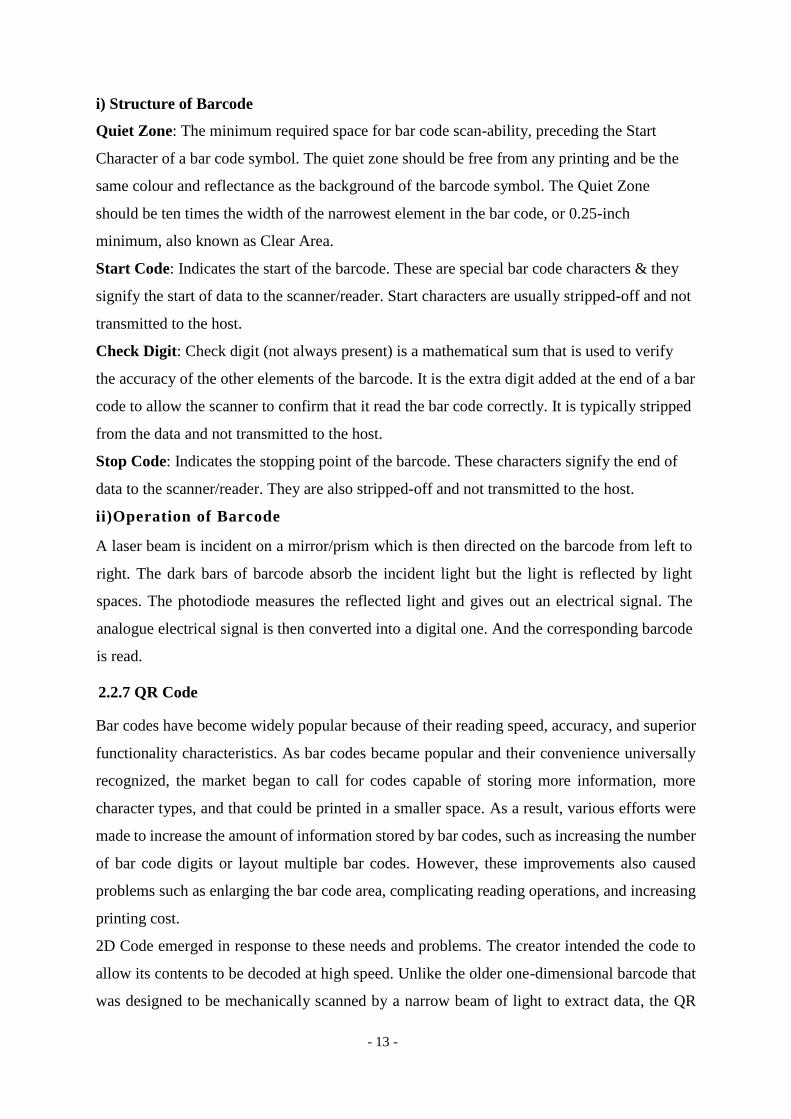
2.2.6 Bar Codes
RFID, Barcodes and QR codes are similar in the fact that they are data collection technologies,
meaning they automate the process of collecting data. However, they also differ significantly
in many areas. Barcodes, QR Codes and RFIDs help to manage and keep track of the inventory.
Figure 2.4: Structure of Barcode[41]
- 13 -
i) Structure of Barcode
Quiet Zone: The minimum required space for bar code scan-ability, preceding the Start
Character of a bar code symbol. The quiet zone should be free from any printing and be the
same colour and reflectance as the background of the barcode symbol. The Quiet Zone
should be ten times the width of the narrowest element in the bar code, or 0.25-inch
minimum, also known as Clear Area.
Start Code: Indicates the start of the barcode. These are special bar code characters & they
signify the start of data to the scanner/reader. Start characters are usually stripped-off and not
transmitted to the host.
Check Digit: Check digit (not always present) is a mathematical sum that is used to verify
the accuracy of the other elements of the barcode. It is the extra digit added at the end of a bar
code to allow the scanner to confirm that it read the bar code correctly. It is typically stripped
from the data and not transmitted to the host.
Stop Code: Indicates the stopping point of the barcode. These characters signify the end of
data to the scanner/reader. They are also stripped-off and not transmitted to the host.
ii)Operation of Barcode
A laser beam is incident on a mirror/prism which is then directed on the barcode from left to
right. The dark bars of barcode absorb the incident light but the light is reflected by light
spaces. The photodiode measures the reflected light and gives out an electrical signal. The
analogue electrical signal is then converted into a digital one. And the corresponding barcode
is read.
2.2.7 QR Code
Bar codes have become widely popular because of their reading speed, accuracy, and superior
functionality characteristics. As bar codes became popular and their convenience universally
recognized, the market began to call for codes capable of storing more information, more
character types, and that could be printed in a smaller space. As a result, various efforts were
made to increase the amount of information stored by bar codes, such as increasing the number
of bar code digits or layout multiple bar codes. However, these improvements also caused
problems such as enlarging the bar code area, complicating reading operations, and increasing
printing cost.
2D Code emerged in response to these needs and problems. The creator intended the code to
allow its contents to be decoded at high speed. Unlike the older one-dimensional barcode that
was designed to be mechanically scanned by a narrow beam of light to extract data, the QR
- 14 -
code is detected as a 2-dimensional digital image by a semiconductor image sensor and is then
digitally analyzed by a programmed processor. The processor locates the three distinctive
squares at the corners of the image and uses a smaller square near the fourth corner to normalize
the image for size, orientation, and angle of viewing. The small dots are then converted to
binary numbers and their validity checked with an error-correcting code.
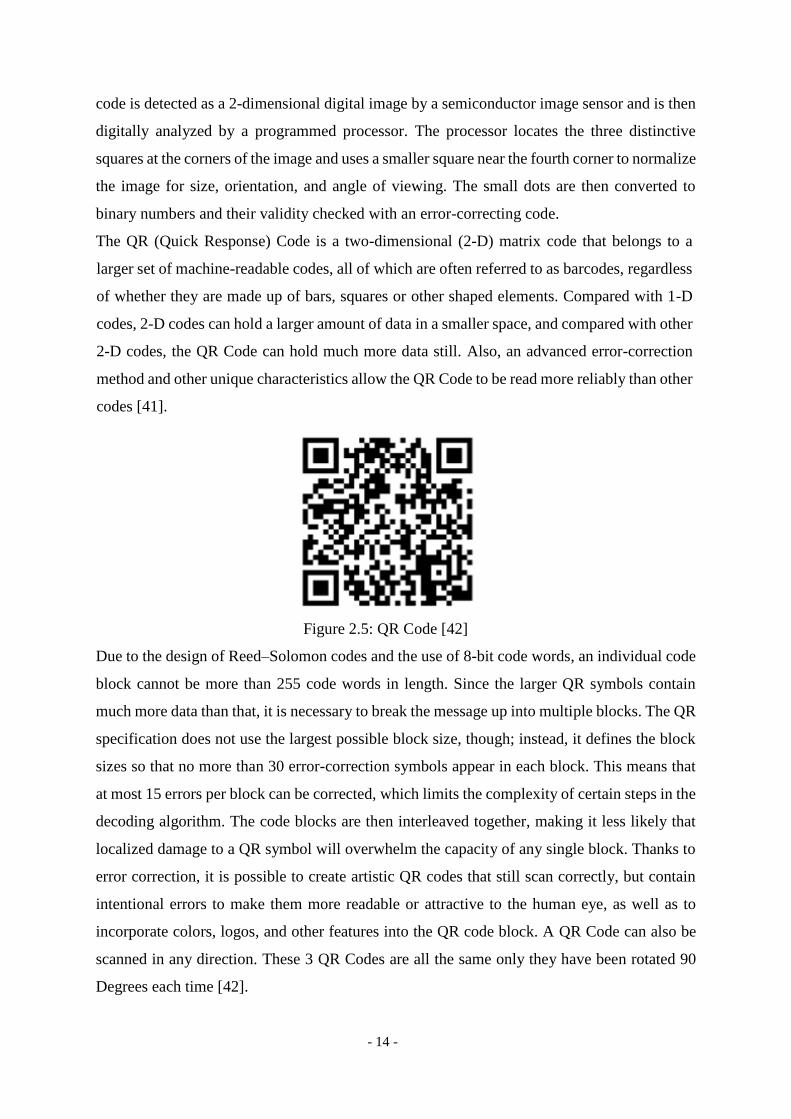
The QR (Quick Response) Code is a two-dimensional (2-D) matrix code that belongs to a
larger set of machine-readable codes, all of which are often referred to as barcodes, regardless
of whether they are made up of bars, squares or other shaped elements. Compared with 1-D
codes, 2-D codes can hold a larger amount of data in a smaller space, and compared with other
2-D codes, the QR Code can hold much more data still. Also, an advanced error-correction
method and other unique characteristics allow the QR Code to be read more reliably than other
codes [41].
Figure 2.5: QR Code [42]
Due to the design of Reed–Solomon codes and the use of 8-bit code words, an individual code
block cannot be more than 255 code words in length. Since the larger QR symbols contain
much more data than that, it is necessary to break the message up into multiple blocks. The QR
specification does not use the largest possible block size, though; instead, it defines the block
sizes so that no more than 30 error-correction symbols appear in each block. This means that
at most 15 errors per block can be corrected, which limits the complexity of certain steps in the
decoding algorithm. The code blocks are then interleaved together, making it less likely that
localized damage to a QR symbol will overwhelm the capacity of any single block. Thanks to
error correction, it is possible to create artistic QR codes that still scan correctly, but contain
intentional errors to make them more readable or attractive to the human eye, as well as to
incorporate colors, logos, and other features into the QR code block. A QR Code can also be
scanned in any direction. These 3 QR Codes are all the same only they have been rotated 90
Degrees each time [42].
- 15 -
i) Scanning of QR-Code
Step 1: Launch the application on your device.
Step 2: Use the viewfinder on the screen of the device to centre the QR code inside the scanner
then hold the device still until the scanner has captured the image. Step 3: Perform the action
indicated on your phone screen to discover what information the QR code contained. For
example, a link to a website could appear on a screen prompting you to click the link and be
directed to the site of the QR code creator.
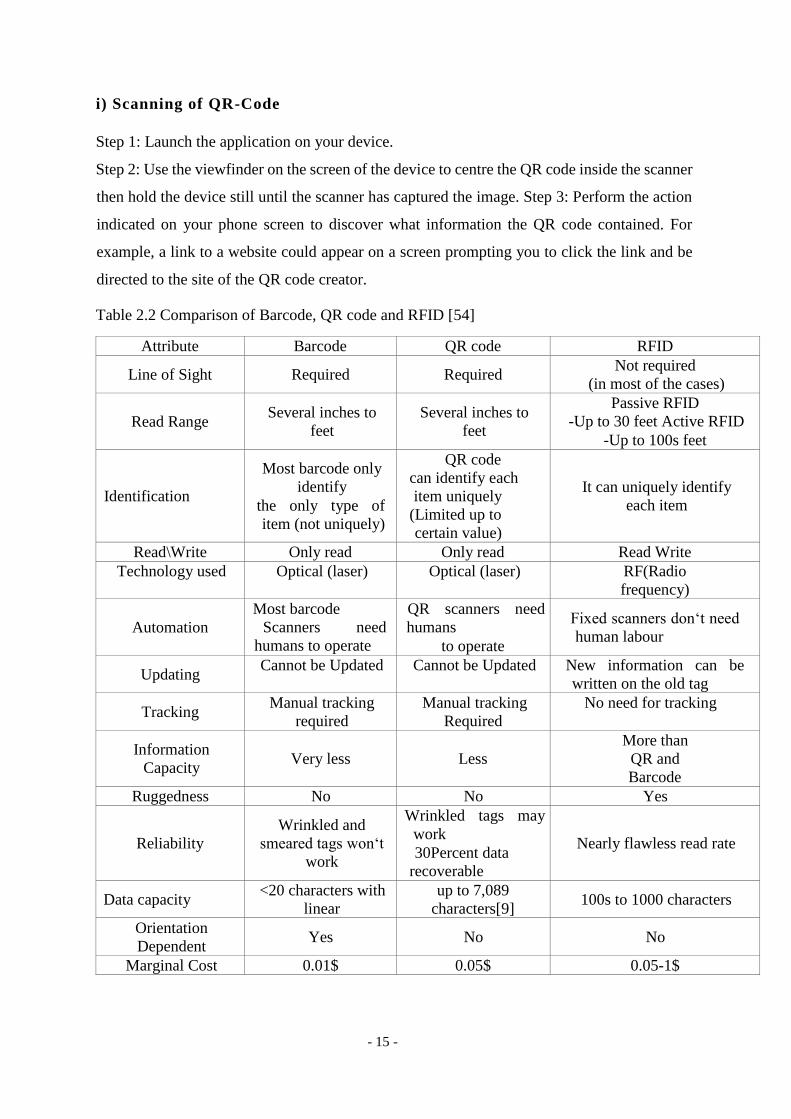
Table 2.2 Comparison of Barcode, QR code and RFID [54]
Attribute Barcode QR code RFID
Line of Sight Required Required Not required
(in most of the cases)
Read Range Several inches to
feet
Several inches to
feet
Passive RFID
-Up to 30 feet Active RFID
-Up to 100s feet
Identification
Most barcode only
identify
the only type of
item (not uniquely)
QR code
can identify each
item uniquely
(Limited up to
certain value)
It can uniquely identify
each item
Read\Write Only read Only read Read Write
Technology used Optical (laser) Optical (laser) RF(Radio
frequency)
Automation
Most barcode
Scanners need
humans to operate
QR scanners need
humans
to operate
Fixed scanners don‘t need
human labour
Updating Cannot be Updated Cannot be Updated New information can be
written on the old tag
Tracking Manual tracking
required
Manual tracking
Required
No need for tracking
Information
Capacity Very less Less
More than
QR and
Barcode
Ruggedness No No Yes
Reliability
Wrinkled and
smeared tags won‘t
work
Wrinkled tags may
work
30Percent data
recoverable
Nearly flawless read rate
Data capacity <20 characters with
linear
up to 7,089
characters[9] 100s to 1000 characters
Orientation
Dependent Yes No No
Marginal Cost 0.01$ 0.05$ 0.05-1$
- 16 -
2.2.8 Wireless Sensor Networks
Sensor systems are utilized in ecological monitoring, for example, forest identification, animal
tracking, flood location, estimating and climate expectation, and in business applications like
seismic exercises forecast and observing. [25] Field of interest and are remotely controlled by
a user. Enemy tracking, security location are likewise performed by utilizing these systems.
[25]Health applications, for example, Tracking and checking of patient’s response to
medication specialists utilize these systems. [25]The most often used wireless sensing element
networks applications is within the field of transport systems, for example, checking of traffic,
dynamic steering the board and observing of parking garages, and so on., utilize these
networks.[25][26]
Characteristics of WSN
These gadgets work under the Transmit, Receive, Idle and Sleep modes having different levels
of energy consumption.
A detecting subsystem: Low power segments can help to fundamentally reduce power
consumption. Since this subsystem (sensors and actuators) is answerable for the sharing of
data between the sensor network and the outside world.
A power supply subsystem: It comprises of a battery which supplies power to the node [26]
Some of the unique characteristics of a WSN include
i) Limited power they can harvest or store.
ii) Ability to withstand harsh environmental conditions
iii) Ability to cope with node failures
iv) Mobility of nodes
v) Dynamic network topology
vi) Communication failures
vii) Heterogeneity of nodes Large scale of deployment
viii) Unattended operation.
In RFID systems, data collected by the RFID reader is normally transmitted to the central node
over a wired connection [49]. Depending on the size of the location, installing the necessary
wired infrastructure may outweigh the small number of benefits of wired networking, such as
reliability and low power consumption [49] [55]. Moreover, the high installation cost in the
implementation of a wired network infrastructure may not be justifiable [49] [55]. Sheridan et
- 17 -
al [49], recommend that the best option to enable reader and central node communication is
by implementing a Wireless Sensor Network (WSN). Sohraby et al. [48] define a sensor
network as an infrastructure comprised of sensing, computing, and communication elements
that give an administrator the ability to instrument, observe, and react to events and
phenomena in a specified environment.
WSN Topologies
Star network: all of the nodes on the network must be connected to one central device. All
traffic that traverses the network passes through the central hub.
Tree network: a central 'root' node (the top level of the hierarchy) is connected to one or more
other nodes that are one level lower in the hierarchy (i.e., the second level) with a point-to-
point link between each of the second-level nodes and the top-level central 'root' node, while
each of the second-level nodes will also have one or more other nodes that are one level lower
in the hierarchy (i.e., the third level) Connected to it.
Mesh network (Partially connected) Some of the nodes of the network are connected to more
than one other node in the network with a point-to-point link – this makes it possible to take
advantage of some of the redundancy that is provided by a physical fully connected mesh
topology without the expense and complexity required for a connection between every node
in the network [39].
WSN Routing Techniques
Almost all of the routing protocols can be classified according to the network structure as flat,
hierarchical, or location-based. In flat routing protocols, all nodes are typically assigned equal
roles or functionality. In hierarchical protocols, the nodes are clustered so that cluster heads
can do some aggregation and reduction of data to save energy location-based protocols utilize
the position information to relay the data to the desired regions rather than the whole network
[39].
- 18 -
WSN Security Challenges
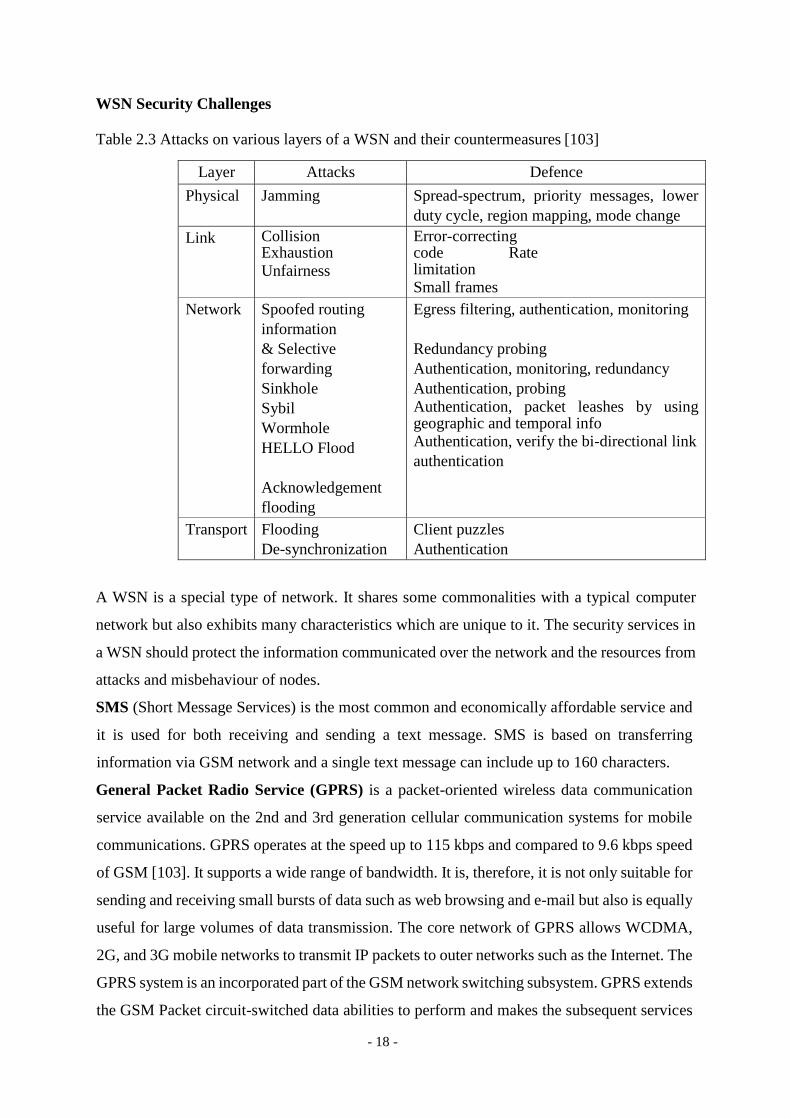
Table 2.3 Attacks on various layers of a WSN and their countermeasures [103]
Layer Attacks Defence
Physical Jamming Spread-spectrum, priority messages, lower
duty cycle, region mapping, mode change
Link Collision Exhaustion
Unfairness
Error-correcting code Rate limitation Small frames
Network Spoofed routing
information
& Selective
forwarding
Sinkhole
Sybil
Wormhole
HELLO Flood
Acknowledgement
flooding
Egress filtering, authentication, monitoring
Redundancy probing
Authentication, monitoring, redundancy
Authentication, probing
Authentication, packet leashes by using geographic and temporal info Authentication, verify the bi-directional link
authentication
Transport Flooding
De-synchronization
Client puzzles
Authentication
A WSN is a special type of network. It shares some commonalities with a typical computer
network but also exhibits many characteristics which are unique to it. The security services in
a WSN should protect the information communicated over the network and the resources from
attacks and misbehaviour of nodes.
SMS (Short Message Services) is the most common and economically affordable service and
it is used for both receiving and sending a text message. SMS is based on transferring
information via GSM network and a single text message can include up to 160 characters.
General Packet Radio Service (GPRS) is a packet-oriented wireless data communication
service available on the 2nd and 3rd generation cellular communication systems for mobile
communications. GPRS operates at the speed up to 115 kbps and compared to 9.6 kbps speed
of GSM [103]. It supports a wide range of bandwidth. It is, therefore, it is not only suitable for
sending and receiving small bursts of data such as web browsing and e-mail but also is equally
useful for large volumes of data transmission. The core network of GPRS allows WCDMA,
2G, and 3G mobile networks to transmit IP packets to outer networks such as the Internet. The
GPRS system is an incorporated part of the GSM network switching subsystem. GPRS extends
the GSM Packet circuit-switched data abilities to perform and makes the subsequent services
- 19 -
possible like Multimedia Messaging Service (MMS), Wireless Application Protocol (WAP),
SMS messaging and broadcasting, Push to talk over the cell phone (PoC) etc. It supports point-
to-point protocol (PPP), Internet protocol (IP) and X.25 connections. Transmission speed,
approx. 28 to 32 SMS per/min maybe achieve over GPRS. It is faster than using the normal
SMS over GSM, whose transmission speed of SMS is about 5 to 10 SMS per/min
Global Positioning System (GPS): GPS is a system composed of a network of 24 satellites
of the US. The satellites periodically emit radio signal to GPS receivers. The GPS receiver
receives the signal from at least three satellites using the triangular technique to compute two-
dimensions, or four satellites to compute three dimensions (latitude, longitude and altitude).
Google Map: Is a version of Google Earth it’s a free software to provide a map by satellite
image, the programming language of Google Map is KML (keyhole mark-up language). It
used to show lines and pins objects.
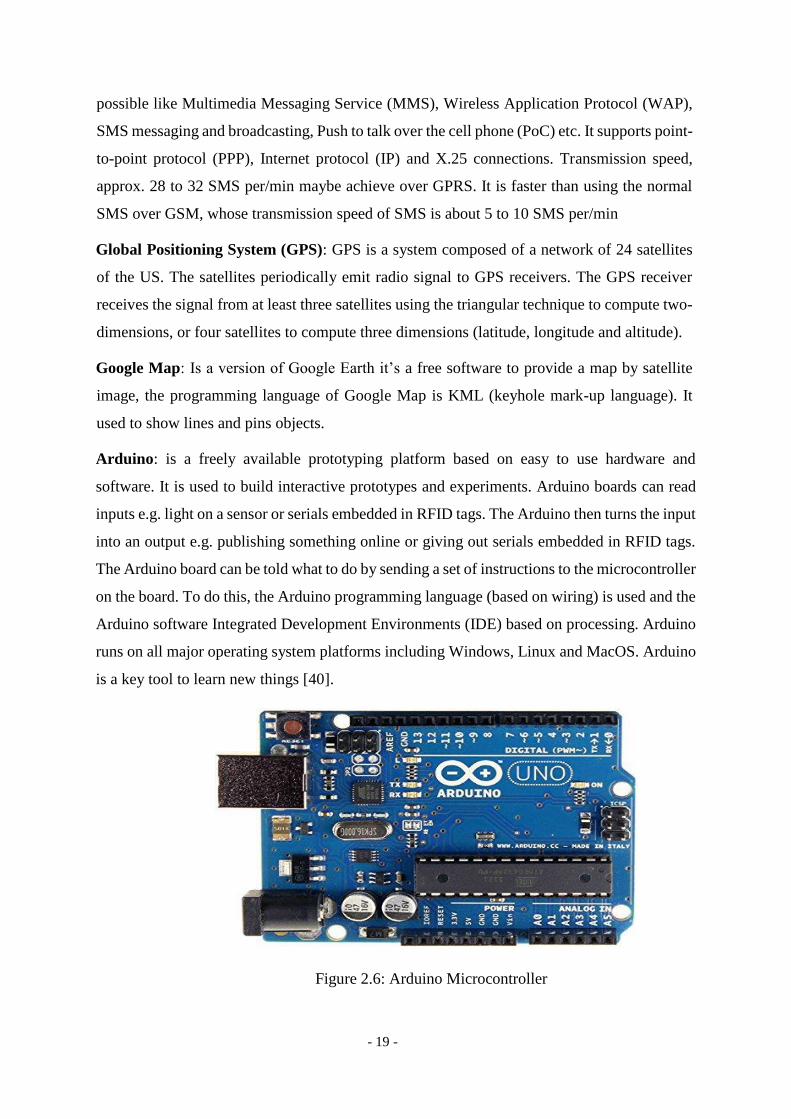
Arduino: is a freely available prototyping platform based on easy to use hardware and
software. It is used to build interactive prototypes and experiments. Arduino boards can read
inputs e.g. light on a sensor or serials embedded in RFID tags. The Arduino then turns the input
into an output e.g. publishing something online or giving out serials embedded in RFID tags.
The Arduino board can be told what to do by sending a set of instructions to the microcontroller
on the board. To do this, the Arduino programming language (based on wiring) is used and the
Arduino software Integrated Development Environments (IDE) based on processing. Arduino
runs on all major operating system platforms including Windows, Linux and MacOS. Arduino
is a key tool to learn new things [40].
Figure 2.6: Arduino Microcontroller
- 20 -
WAMP: is the combination of words Windows, Apache, MySQL, and PHP. It’s a software
stack, which means that when installing WAMP, Apache, MySQL, and PHP services together
on a computer are installed [106] windows referring to the most commonly used operating
system on computers developed by Microsoft, Apache is most commonly used web server
software to make web pages available on the internet, MySQL is a relational database for
holding all the information, PHP (Personal Home Page) a scripting language used for
producing dynamic web pages.
SIM808: This board based on the latest SIMCOM SIM808 GSM/GPS module, it offers
cellular GSM and GPRS data along with GPS technology for satellite navigation, and it
features ultra-low power consumption in sleep mode, giving the project incredibly long
standby times. Furthermore, there's an on-board battery charging circuit that can be used with
LiPo batteries. The GPS receiver is incredibly sensitive with 22 tracking and 66 acquisition
channels, and also supports assisted-GPS (A-GPS) for indoor localisation. The board is
controlled by AT command via UART and supports 3.3V and 5V logical level. It comes with
a mini GPS and GSM antenna, however, a battery is optional, and the board uses the 2G (not
3G or LTE) GSM networks [113].
Buzzer: is an audio signalling device, which may be mechanical, electromechanical, or
piezoelectric (piezo for short). Typical uses of buzzers and beepers include alarm devices,
timers, and confirmation of user input such as a mouse click or keystroke [116].
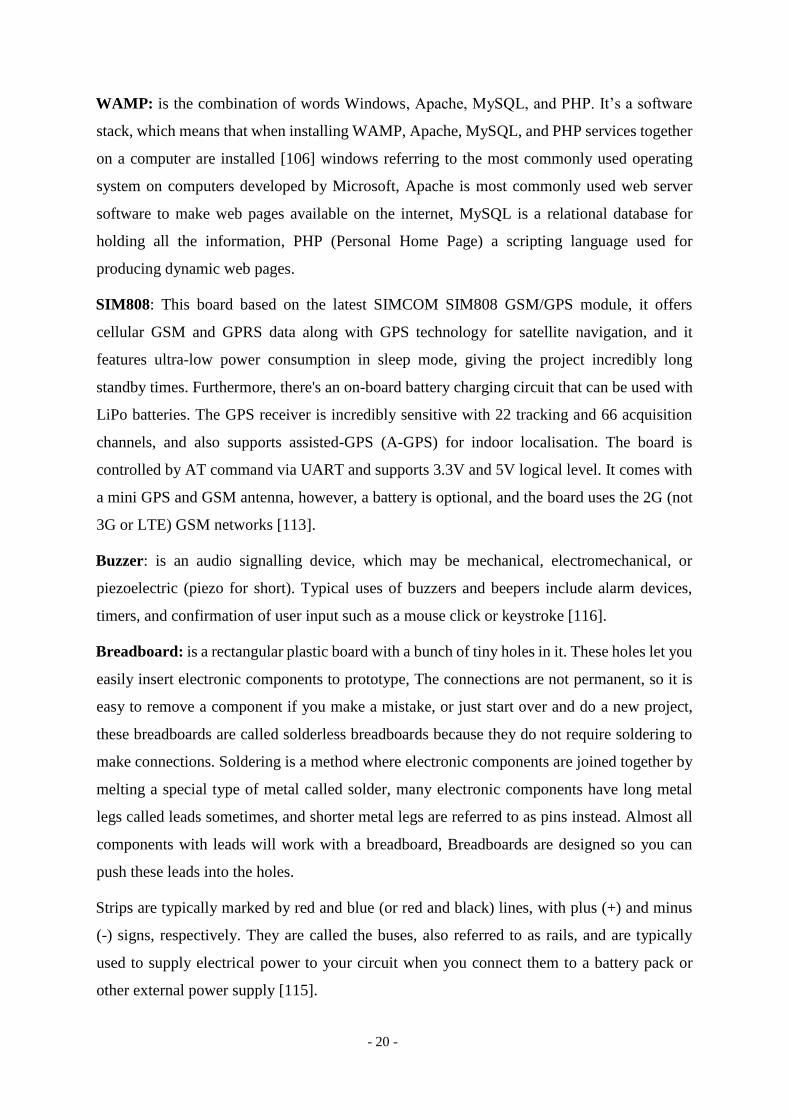
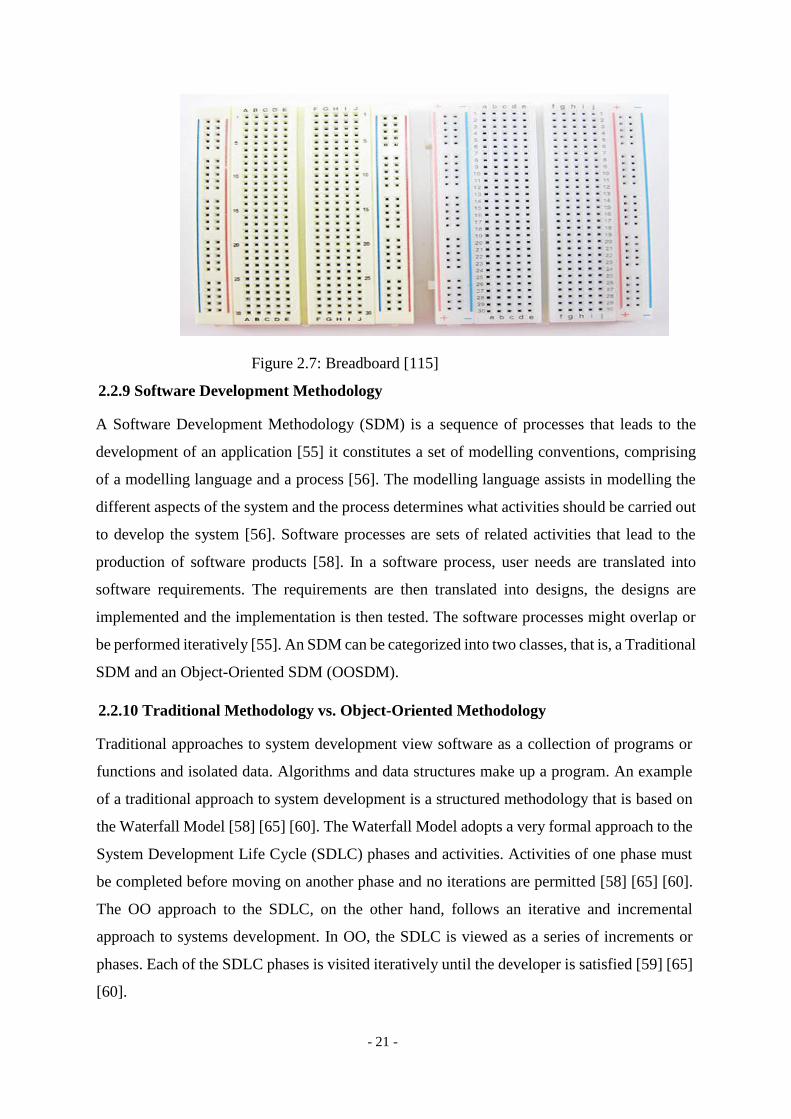
Breadboard: is a rectangular plastic board with a bunch of tiny holes in it. These holes let you
easily insert electronic components to prototype, The connections are not permanent, so it is
easy to remove a component if you make a mistake, or just start over and do a new project,
these breadboards are called solderless breadboards because they do not require soldering to
make connections. Soldering is a method where electronic components are joined together by
melting a special type of metal called solder, many electronic components have long metal
legs called leads sometimes, and shorter metal legs are referred to as pins instead. Almost all
components with leads will work with a breadboard, Breadboards are designed so you can
push these leads into the holes.
Strips are typically marked by red and blue (or red and black) lines, with plus (+) and minus
(-) signs, respectively. They are called the buses, also referred to as rails, and are typically
used to supply electrical power to your circuit when you connect them to a battery pack or
other external power supply [115].
- 21 -
Figure 2.7: Breadboard [115]
2.2.9 Software Development Methodology
A Software Development Methodology (SDM) is a sequence of processes that leads to the
development of an application [55] it constitutes a set of modelling conventions, comprising
of a modelling language and a process [56]. The modelling language assists in modelling the
different aspects of the system and the process determines what activities should be carried out
to develop the system [56]. Software processes are sets of related activities that lead to the
production of software products [58]. In a software process, user needs are translated into
software requirements. The requirements are then translated into designs, the designs are
implemented and the implementation is then tested. The software processes might overlap or
be performed iteratively [55]. An SDM can be categorized into two classes, that is, a Traditional
SDM and an Object-Oriented SDM (OOSDM).
2.2.10 Traditional Methodology vs. Object-Oriented Methodology
Traditional approaches to system development view software as a collection of programs or
functions and isolated data. Algorithms and data structures make up a program. An example
of a traditional approach to system development is a structured methodology that is based on
the Waterfall Model [58] [65] [60]. The Waterfall Model adopts a very formal approach to the
System Development Life Cycle (SDLC) phases and activities. Activities of one phase must
be completed before moving on another phase and no iterations are permitted [58] [65] [60].
The OO approach to the SDLC, on the other hand, follows an iterative and incremental
approach to systems development. In OO, the SDLC is viewed as a series of increments or
phases. Each of the SDLC phases is visited iteratively until the developer is satisfied [59] [65]
[60].
- 22 -
The main distinction between traditional system development methodologies and OOSDMs
depends on their main focus. The traditional approach focuses on the functions of the system.
The OOSD approach, on the other hand, focuses on the Object, which combines data and
functionality [59] [65] [60]. The phases of developing a system, that is, planning-analysis-
design-implementation, do not change. However, the only change that takes place in how they
are performed. The structured approach focuses on understanding a problem using a model
called the Data-Flow Diagram (DFD). Hence, all system components are evolved from the
DFD [59] [65] [60]. Contrariwise, the OO approach uses Use Cases. There are many models
to deal with in the OO approach and there are no clear-cut steps such that the design of the
system components evolves logically from a single model [58] [59] [60].
2.2.11 Object-Oriented System Development Methodology
An Object-Oriented System Development Methodology (OOSDM) can be defined as a system
of principles and procedures applied to Object-Oriented Software Development (OOSD) [61].
OOSD provides a way to develop software by building self-contained modules or objects that
can be easily replaced, modified and reused. Object Orientation (OO) is a way of viewing and
modelling the world or system as a set of interacting and interrelated objects [62]. An Object
may be a tangible physical entity or intangible.
a) Advantages of Object-Oriented System Development
Advantages of using an OOSD approach to system development as opposed to using a
traditional approach are [58] [59]:
i) Object Orientation (OO) provides a higher level of abstraction at the Object level.
Objects encapsulate both data and functions, hence they work at a higher level of
abstraction. Development can proceed at the Object level, ignoring the rest of the
system for as long as necessary; this makes designing, coding, testing and maintaining
the system simpler.
ii) OO provides seamless transition among different phases of software development. OO
uses the same language to talk about analysis, design, programming and database
design. This seamless approach significantly reduces the level of complexity and
redundancy. It makes for clearer, more robust system development. On the other hand,
traditional approaches to system development require different styles and
methodologies for each step of the development process.
- 23 -
iii) OO promotes reusability. Objects are reusable because they are modelled directly from
a real-world problem domain. Each object stands by itself or within a circle of other
objects.
iv) b) Unified Modelling Language
The Modelling Language used in an Object-Oriented SDM is the Unified Modelling Language
(UML). UML is a set of diagramming techniques [60]. The UML uses graphical notations to
express the design of software developments [91]. Examples of design artefacts include
requirements, architecture, design, source code, test cases, prototypes, and so on [62] [63].
Modelling provides a representation or simplification of reality. It provides a blueprint of the
system. UML supports specifications that are independent of particular programming
languages, technologies and development processes [62] [63]. The underlying assumption of
the UML is that no one diagram can capture the different elements of a system in its entirety
[91]. UML consists of three basic building blocks namely, elements, relationships and
diagrams. Elements are the main parts of the model while relationships tie elements together.
Lastly, diagrams provide mechanisms to group collections of elements and relationships.
Example elements in UML, include [62] [63]:
i) Structural: is the static part of the model that represents a conceptual element.
Examples of structural elements include classes, use cases, collaboration and
component.
ii) Behavioural: represent behaviour over time and space. Interaction and state depict
behavioural elements.
iii) UML is characterized by nine major diagrams. A diagram is a graphical presentation
of a set of elements and relationships where nodes are elements and edges are
relationships. The nine major diagrams are class, object, use case, sequence,
collaboration, statechart, activity, component and deployment [62] [63].
iv) Object-Oriented System Development: A Use Case Driven Approach
A use case is an interaction between a user and a system that captures the user’s goals and
needs [89] [63]. The main advantage of a use case driven approach to OOSD is that all design
decisions can be traced back directly to user requirements [64]. OOSDMs consist of an Object-
Oriented System Development Life Cycle (OOSDLC). The OOSDLC consists of three macro
processes namely, Object-Oriented Analysis (OOA), Object-Oriented Design (OOD) and
Object-Oriented Implementation (OOI). The OOSDLC macro processes can be further broken
down into the following phases [62] [63] [65]:

- 24 -
i) Object-Oriented Analysis (OOA) Phase: user requirements are modelled for what the
eventual system must do. OOA affords a way to understand the business needs as well
as to process requirements. OOA’s focus is on developing an object-oriented model of
the problem domain. OOA answers the question of what the system must do. The
output of this phase is a conceptual model consisting of two deliverables, namely, the
Requirements and Object Models.
ii) Object-Oriented Design (OOD) Phase: OOD provides a way of developing object-
oriented models of a software/system to implement the requirements identified during
OOA. The result of OOD is a plan of how the system will do what the Requirements
Analysis model asks for. OOD answers the question of how the system will do it.
iii) Construction Phase: Object-Oriented Programming (OOP) in an OO programming
language and database takes place to produce a software application. Deployment and
user training are also carried out on completion of this phase.
iv) Object-Oriented Testing (OOT) Phase: thorough and complete unit testing of
individual classes and programs is carried out in increments.
v) Maintenance Phase: Bug fixes and enhancements are carried out on the final software
product.
vi) d) Object-Oriented Languages
OOP languages include Java, C-sharp (C#), and C-plus-plus (C++). Java is a portable OOP
language introduced by Sun Microsystems [66] [67]. C# is an OOP language based on C++
and Java and was developed expressly for Microsoft’s .NET platform. Microsoft’s .NET
platform provides developers with the capabilities they need to create and run computer
applications that can execute on computers distributed across the Internet. C++ is an extension
of the “C” language. C++ provides capabilities for OOP. C++ was developed by Bjarne
Stroustrup at Bell Laboratories [67]. Some benefits of using an OOP language as compared to
a non-OOP language are [68]:
i) Improved software-development productivity: OOP is modular, that is, it provides
separation of duties in object-based program development. It is extensible, as objects
can be extended to include new attributes and behaviours. In OOP Objects can be
reused within and across applications. On account of these three factors, that is,
modularity, extensibility, and reusability, OOP provides improved software-
development productivity over traditional procedure-based programming techniques.
- 25 -
ii) Improved software maintainability: For the reasons stated above, object-oriented
software is easier to maintain. Owing to the modularity of the system design, part of
the system can be updated in case of problems without the need to make large-scale
changes.
iii) Faster development: Reusability enables faster development. OOP languages come
with rich libraries of objects. Code developed during projects is also reusable in future
projects.
iv) Lower cost of development: The reuse of software lowers the cost of development.
Usually, more effort is put into the Object-Oriented Analysis and Design (OOAD),
which lowers the overall cost of development.
v) Higher-quality software: Faster development of software and lower cost of
development allows for more time and resources to be used in the verification of the
software. OOP tends to result in higher-quality software.
2.2.12 Internet of Things (IoT)
The internet of things is a concept of a network for information exchange and
communication through extending or stretching its client to goods and goods based on the
internet [32], We can also understand this concept as through radio frequency identification
(RFID), infrared sensors, global positioning systems, information sensing devices or other
laser scanners agreed by the agreement, connected to the Internet to exchange information
and communicate to achieve intelligent identification, location, tracking, monitoring, and
management.
Some of the IoT architectures are European FP7 Research Project: Interoperable IoT
systems like retail, healthcare etc. are connected through the internet with interoperable
technologies like RFID, ZigBee, Bluetooth, etc. ITU Architecture: As recommended by
the International Telecommunication Union (ITU), the architecture of Internet of Things is
similar to the Open Systems Interconnection (OSI) reference model used in computer
networks that consist of Sensing Layer, Access Layer, Network Layer, Data Layer and
Application Layers. IoT Forum Architecture: According to the IoT Forum the Internet of
Things Architecture is categorized into three types namely the applications, processors and
transmission.
Qian Xiaocong, Zhang Jidong Architecture: According to this architecture three layers
namely the perception layer, transportation layer and application layer needed for IoT. IoT
Technologies Radio Frequency Identification (RFID) [13]: It was the RFID application
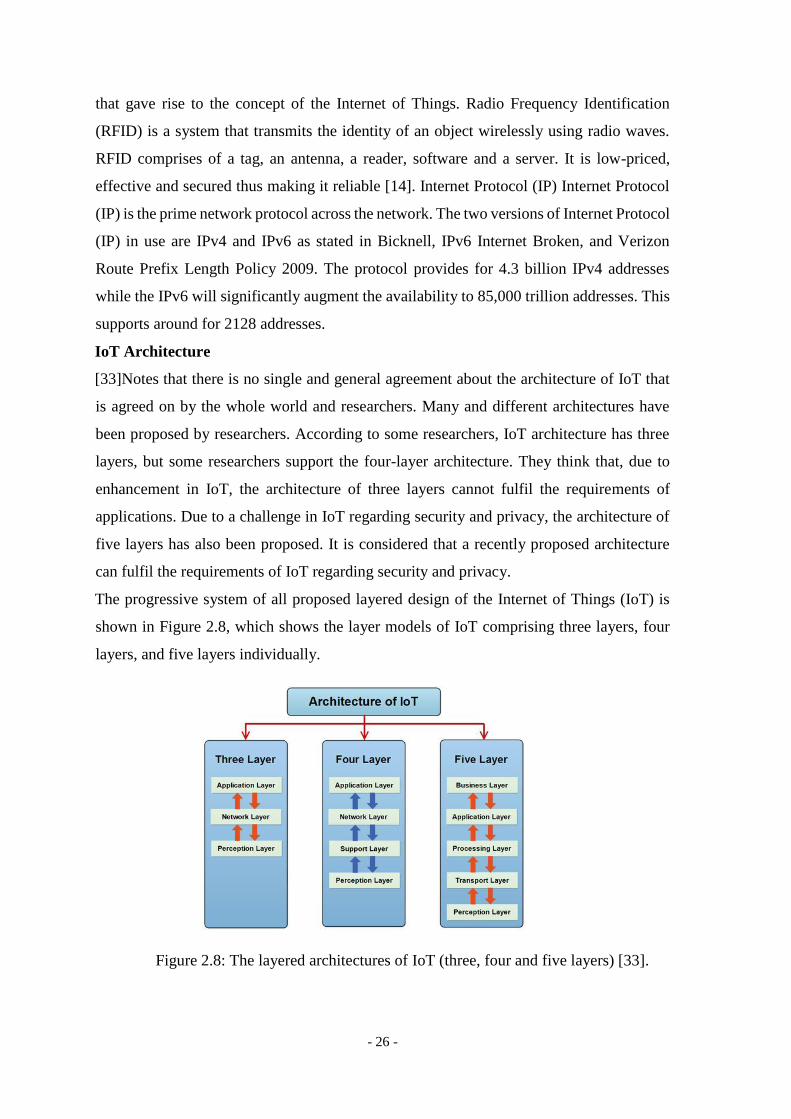
- 26 -
that gave rise to the concept of the Internet of Things. Radio Frequency Identification
(RFID) is a system that transmits the identity of an object wirelessly using radio waves.
RFID comprises of a tag, an antenna, a reader, software and a server. It is low-priced,
effective and secured thus making it reliable [14]. Internet Protocol (IP) Internet Protocol
(IP) is the prime network protocol across the network. The two versions of Internet Protocol
(IP) in use are IPv4 and IPv6 as stated in Bicknell, IPv6 Internet Broken, and Verizon
Route Prefix Length Policy 2009. The protocol provides for 4.3 billion IPv4 addresses
while the IPv6 will significantly augment the availability to 85,000 trillion addresses. This
supports around for 2128 addresses.
IoT Architecture
[33]Notes that there is no single and general agreement about the architecture of IoT that
is agreed on by the whole world and researchers. Many and different architectures have
been proposed by researchers. According to some researchers, IoT architecture has three
layers, but some researchers support the four-layer architecture. They think that, due to
enhancement in IoT, the architecture of three layers cannot fulfil the requirements of
applications. Due to a challenge in IoT regarding security and privacy, the architecture of
five layers has also been proposed. It is considered that a recently proposed architecture
can fulfil the requirements of IoT regarding security and privacy.
The progressive system of all proposed layered design of the Internet of Things (IoT) is
shown in Figure 2.8, which shows the layer models of IoT comprising three layers, four
layers, and five layers individually.
Figure 2.8: The layered architectures of IoT (three, four and five layers) [33].
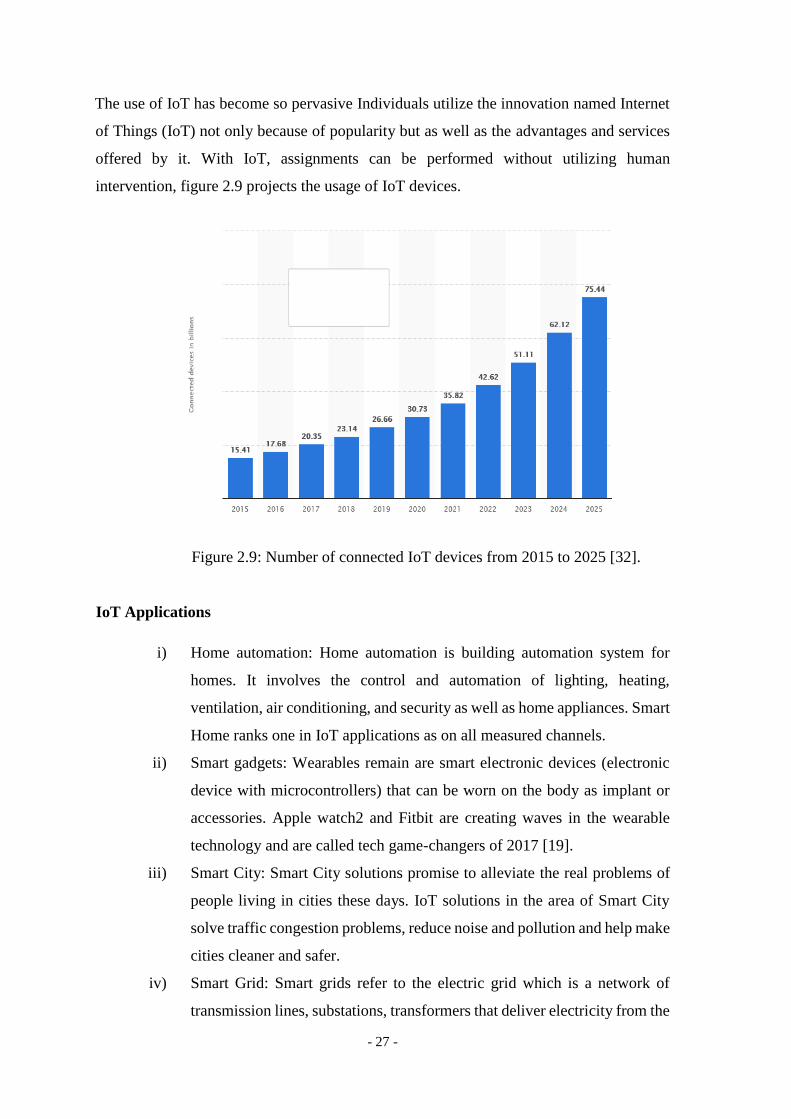
- 27 -
The use of IoT has become so pervasive Individuals utilize the innovation named Internet
of Things (IoT) not only because of popularity but as well as the advantages and services
offered by it. With IoT, assignments can be performed without utilizing human
intervention, figure 2.9 projects the usage of IoT devices.
Figure 2.9: Number of connected IoT devices from 2015 to 2025 [32].
IoT Applications
i) Home automation: Home automation is building automation system for
homes. It involves the control and automation of lighting, heating,
ventilation, air conditioning, and security as well as home appliances. Smart
Home ranks one in IoT applications as on all measured channels.
ii) Smart gadgets: Wearables remain are smart electronic devices (electronic
device with microcontrollers) that can be worn on the body as implant or
accessories. Apple watch2 and Fitbit are creating waves in the wearable
technology and are called tech game-changers of 2017 [19].
iii) Smart City: Smart City solutions promise to alleviate the real problems of
people living in cities these days. IoT solutions in the area of Smart City
solve traffic congestion problems, reduce noise and pollution and help make
cities cleaner and safer.
iv) Smart Grid: Smart grids refer to the electric grid which is a network of
transmission lines, substations, transformers that deliver electricity from the
- 28 -
power plant to your home or business. This automates the distribution
system and reduces power pilferage. It uses information about the
behaviours of electricity suppliers and consumers in an automated fashion
to improve the efficiency, reliability, and economics of electricity.
v) Industrial Internet of Things (IIoT): IIoT is the use of Internet of Things
technologies in manufacturing. It incorporates machine learning, big data,
using sensor data, machine-to-machine (M2M) communication and
automation technologies that have existed in industrial settings for years.
IoT holds great potential for quality control, sustainable and green practices,
supply chain traceability and overall supply chain efficiency.
vi) Smart Car: Connected cars consists of Navigation systems, which will
enable drivers to determine not just the fastest route but also the most fuel-
efficient and Vehicle management systems, which will provide detailed
information about the car’s performance. Price Water Coopers predicts a
bright future for connected cars by 2020.
vii) Connected Healthcare: Connected healthcare management and delivery by
using technology to provide healthcare services remotely.
viii) Smart retail: Retail industry is slowly transforming from an unorganized
sector to an organized one by incorporating technology. Smart retailing is
evolving and proving to be a promising
ix) Smart supply chain: Radio frequency identification (RFID) is the
technology that uses an RFID tag on objects or people, so that they can be
identified, tracked and managed automatically using IoT technology.
Supply chains have already been reaping benefits from IoT.
x) Smart farming: Growing concerns about farming like climate change,
limited arable land, and costs/availability of fossil fuels is reducing
productivity. The remoteness of farming operations and the large number of
livestock that could be monitored the Internet of Things could revolutionize
the way farmers work.
Challenges for IoT
i) Standards: Standardization in the areas of architecture, technology and internet
protocols is needed. IEEE is working to ensure that the IPv6 packets can be routed
across different network types. [39]
- 29 -
ii) Powerful sensors: For Internet of Things to reach its full potential self-sustaining
sensors must be developed where, the sensors generate electricity from
environmental elements like heat, friction, movement etc.
iii) Security: Privacy and security issues are inevitable, arising from the facts that
objects on the IoT transmit information via public data networks, information
gathered is often transmitted to third parties. Privacy and security considerations
have been of minimal concern in the design of IoT devices and the absence of
compliance/ Regulatory body further adds to it.
2.2.13 Internet accessibility survey
Based on the 2018 survey conducted by ZICTA [93] it was established that the proportion of
individuals who indicated that they had used the internet before was 14.3Percent in 2018. This
finding in figure 2.10 represents an increase in the proportion of individuals that had used the
internet from 8.8Percent reported in 2015. However, the proportion of users of the internet in
Zambia who reported using the internet at least once in the 3 months preceding the survey was
11.6 Percent.
The population of active users of the internet was concentrated in urban areas constituting 77.8
Percent compared to 22.2 Percent based in rural areas. However, the proportion of individuals
within the urban areas that had used the internet was 28.1 Percent while only 5.2 Percent of
individuals within the rural areas had used the internet before. The usage of internet services
thus increased from the findings established in 2015 when the proportion of individuals that
had used the internet that was based in urban areas was 16.8 Percent and 3.2 Percent among
individuals that were based in rural areas.
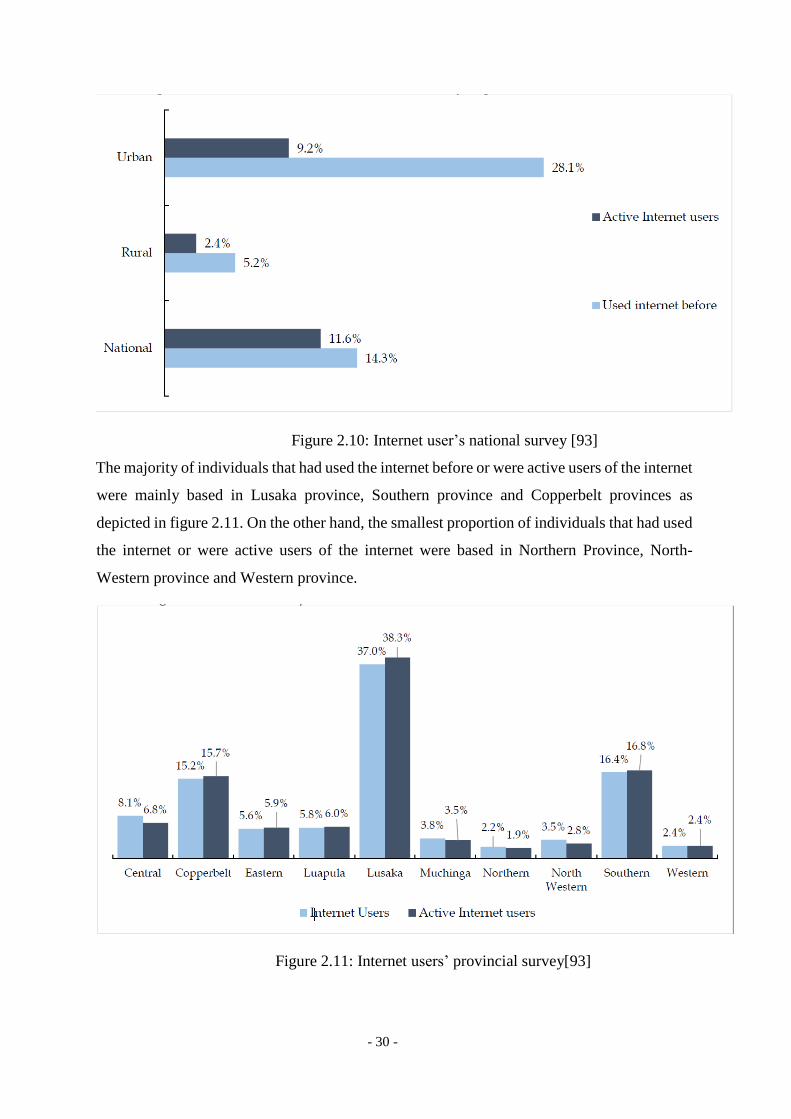
- 30 -
Figure 2.10: Internet user’s national survey [93]
The majority of individuals that had used the internet before or were active users of the internet
were mainly based in Lusaka province, Southern province and Copperbelt provinces as
depicted in figure 2.11. On the other hand, the smallest proportion of individuals that had used
the internet or were active users of the internet were based in Northern Province, North-
Western province and Western province.
Figure 2.11: Internet users’ provincial survey[93]
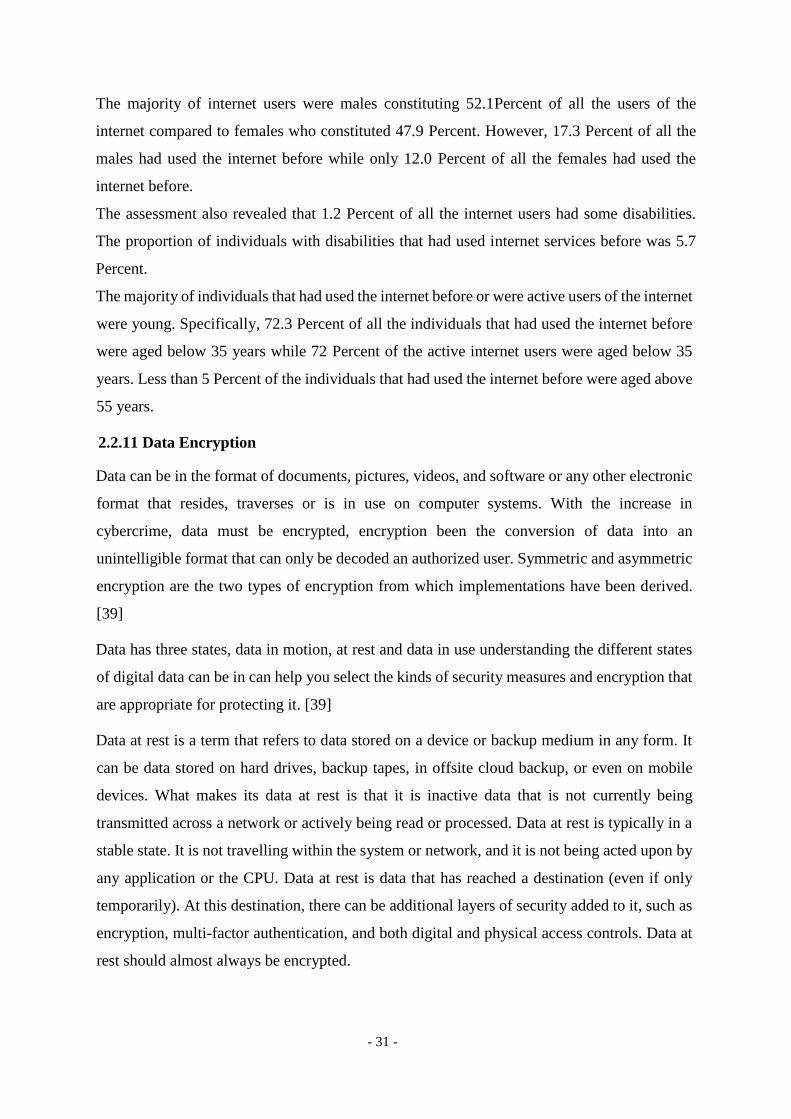
- 31 -
The majority of internet users were males constituting 52.1Percent of all the users of the
internet compared to females who constituted 47.9 Percent. However, 17.3 Percent of all the
males had used the internet before while only 12.0 Percent of all the females had used the
internet before.
The assessment also revealed that 1.2 Percent of all the internet users had some disabilities.
The proportion of individuals with disabilities that had used internet services before was 5.7
Percent.
The majority of individuals that had used the internet before or were active users of the internet
were young. Specifically, 72.3 Percent of all the individuals that had used the internet before
were aged below 35 years while 72 Percent of the active internet users were aged below 35
years. Less than 5 Percent of the individuals that had used the internet before were aged above
55 years.
2.2.11 Data Encryption
Data can be in the format of documents, pictures, videos, and software or any other electronic
format that resides, traverses or is in use on computer systems. With the increase in
cybercrime, data must be encrypted, encryption been the conversion of data into an
unintelligible format that can only be decoded an authorized user. Symmetric and asymmetric
encryption are the two types of encryption from which implementations have been derived.
[39]
Data has three states, data in motion, at rest and data in use understanding the different states
of digital data can be in can help you select the kinds of security measures and encryption that
are appropriate for protecting it. [39]
Data at rest is a term that refers to data stored on a device or backup medium in any form. It
can be data stored on hard drives, backup tapes, in offsite cloud backup, or even on mobile
devices. What makes its data at rest is that it is inactive data that is not currently being
transmitted across a network or actively being read or processed. Data at rest is typically in a
stable state. It is not travelling within the system or network, and it is not being acted upon by
any application or the CPU. Data at rest is data that has reached a destination (even if only
temporarily). At this destination, there can be additional layers of security added to it, such as
encryption, multi-factor authentication, and both digital and physical access controls. Data at
rest should almost always be encrypted.
- 32 -
Data in motion is data that is currently travelling across a network or sitting in a computer’s
RAM ready to be read, updated, or processed. Data crossing over networks from local to cloud
storage or from a central mainframe to a remote terminal should be encrypted so that it cannot
be read or manipulated by any machine or hacker between the data’s source and destination.
This data in motion includes data moving across cables and wireless transmission. It can be
emails or files transferred over FTP or SSH.
Cryptography was originally invented to protect data in motion–such as sensitive
communications between a military general and his army. Protect enterprise data from prying
eyes by encrypting it before it is transmitted beyond the system where it is stored or generated.
Data in use is data that is not just being stored passively on a hard drive or external storage
media. This is data that is being processed by one or more applications. [39]This is data
currently in the process of being generated, updated, appended, or erased. It also includes data
being viewed by users accessing it through various endpoints. Data in use is susceptible to
different kinds of threats depending on where it is in the system and who can use it. The most
vulnerable point for data in use is at the endpoints where users can access and interact with it.
Protecting data in use is a challenging task since there is such a variety in the ways the data
can be accessed and manipulated. One set of data can potentially have multiple users working
with it from multiple endpoints. A large number of in-house systems, devices, and employees
are accessing system data from personal devices, the implication of this is that the data should
be protected through strong user authentication, identity management, and profile permissions.
[39]This will help ensure that only individuals with the proper permission and knowledge can
access and manipulate data. Also, since technology makes it nearly impossible to prevent data
leakage from endpoints, most employers have their employees sign legal agreements that they
will not share private data with anyone that does not have permission to view it.
All true cryptography is composed of three parts: a cipher, an original message, and the resultant
encryption. The cipher is the method of encryption used, Original messages are referred to as
plain text. A hash function is a function that takes in input value, and from that input creates an
output value deterministic of the input value. For any x input value, you will always receive the
same y output value whenever the hash function is run. In this way, every input has a determined
output.
Easy to calculate h(x) from x
- 33 -
Collision Resistance it should be hard to find two different inputs of any length that
result in the same hash or as clear text, a message that is transmitted with encryption is
called ciphertext.
MD5 [94], an upgrade of the prior variant called MD4, is one of the most widely used hash
functions, but it is proved to be broken in practice. MD5 produces a 128-bit hash value and its
only use is as a checksum to verify data integrity because it suffers from extensive vulnerabilities
[95]. The United States National Security Agency designed SHA-1 [96] (Secure Hash
Algorithm 1), a cryptographic
hash function that produces a 160-bit (equivalent to 20-byte) hash value for a given input. SHA-
1 established as a U.S. Federal Information Processing Standard many widely used security
applications and protocols, such as TLS and SSL, PGP, SSH, S/MIME, and IPsec rely on that.
However, since 2005 it has not been considered completely secure and Microsoft [97], Google
[98], Apple [99] and Mozilla [100] have all announced that their respective browsers will stop
accepting SHA-1 SSL certificates by 2017. Because SHA-1 collision attacks have finally
become practical by Stevens et al. [102] which forge two PDF documents with the same SHA-
1 hash in roughly 263.1 SHA-1 evaluations, two upgrades to SHA-1 have been proposed over the
past decade namely SHA-2 and SHA-3 [101] respectively.
2.2.12 Reviewed Luggage tracking Designs
Real-Time Tracking Management System Using GPS, GPRS and Google Earth
The real-time tracking management system is an open system that uses free and open-source
software. The system is composed of three components, a GPS Tracking Device, a server and
a database. The GPS tracking device is an embedded system that transmits location information
to the server through GPRS networks. The server is a personal computer that receives the
information and put it in the database. The database formats the information that can search
and display using Google Earth software or Google Map[117].
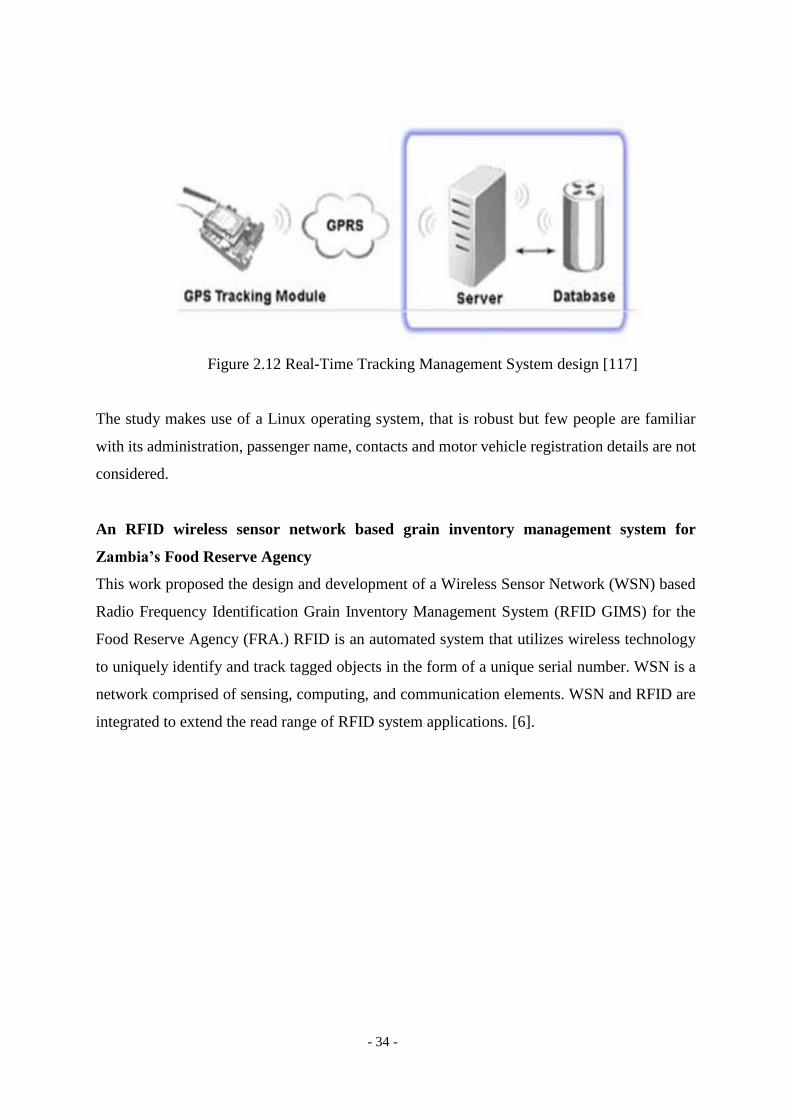
- 34 -
Figure 2.12 Real-Time Tracking Management System design [117]
The study makes use of a Linux operating system, that is robust but few people are familiar
with its administration, passenger name, contacts and motor vehicle registration details are not
considered.
An RFID wireless sensor network based grain inventory management system for
Zambia’s Food Reserve Agency
This work proposed the design and development of a Wireless Sensor Network (WSN) based
Radio Frequency Identification Grain Inventory Management System (RFID GIMS) for the
Food Reserve Agency (FRA.) RFID is an automated system that utilizes wireless technology
to uniquely identify and track tagged objects in the form of a unique serial number. WSN is a
network comprised of sensing, computing, and communication elements. WSN and RFID are
integrated to extend the read range of RFID system applications. [6].
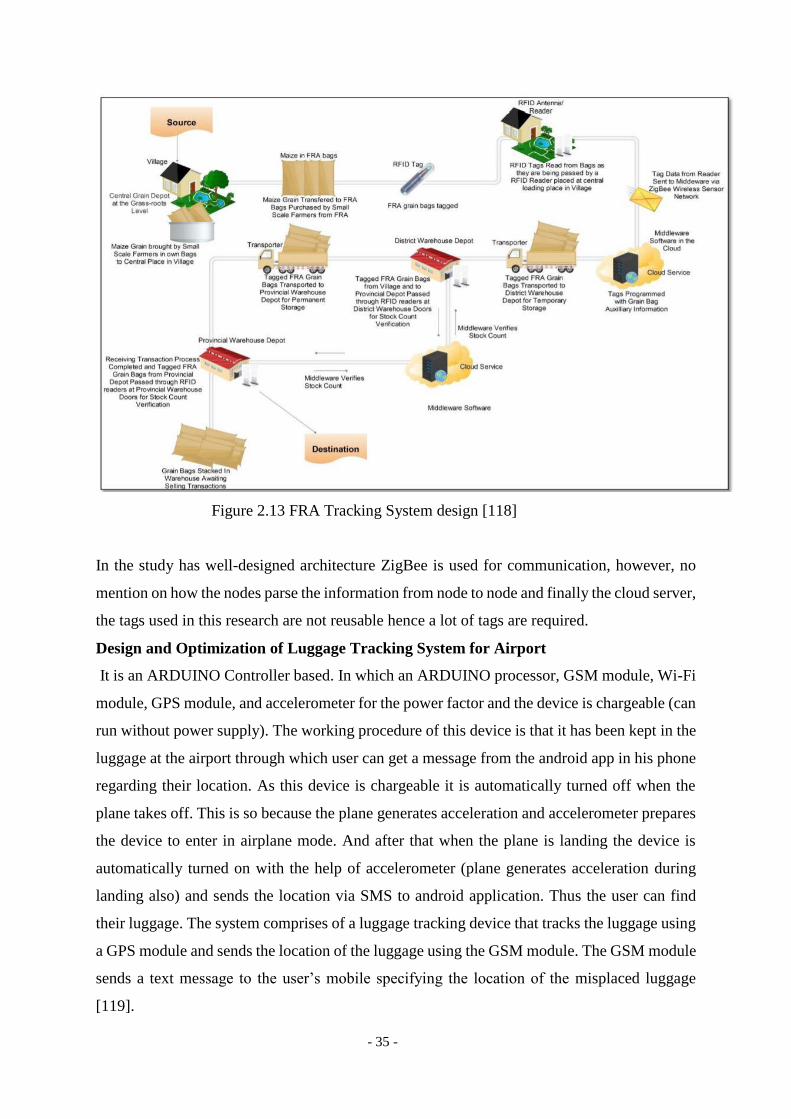
- 35 -
Figure 2.13 FRA Tracking System design [118]
In the study has well-designed architecture ZigBee is used for communication, however, no
mention on how the nodes parse the information from node to node and finally the cloud server,
the tags used in this research are not reusable hence a lot of tags are required.
Design and Optimization of Luggage Tracking System for Airport
It is an ARDUINO Controller based. In which an ARDUINO processor, GSM module, Wi-Fi
module, GPS module, and accelerometer for the power factor and the device is chargeable (can
run without power supply). The working procedure of this device is that it has been kept in the
luggage at the airport through which user can get a message from the android app in his phone
regarding their location. As this device is chargeable it is automatically turned off when the
plane takes off. This is so because the plane generates acceleration and accelerometer prepares
the device to enter in airplane mode. And after that when the plane is landing the device is
automatically turned on with the help of accelerometer (plane generates acceleration during
landing also) and sends the location via SMS to android application. Thus the user can find
their luggage. The system comprises of a luggage tracking device that tracks the luggage using
a GPS module and sends the location of the luggage using the GSM module. The GSM module
sends a text message to the user’s mobile specifying the location of the misplaced luggage
[119].
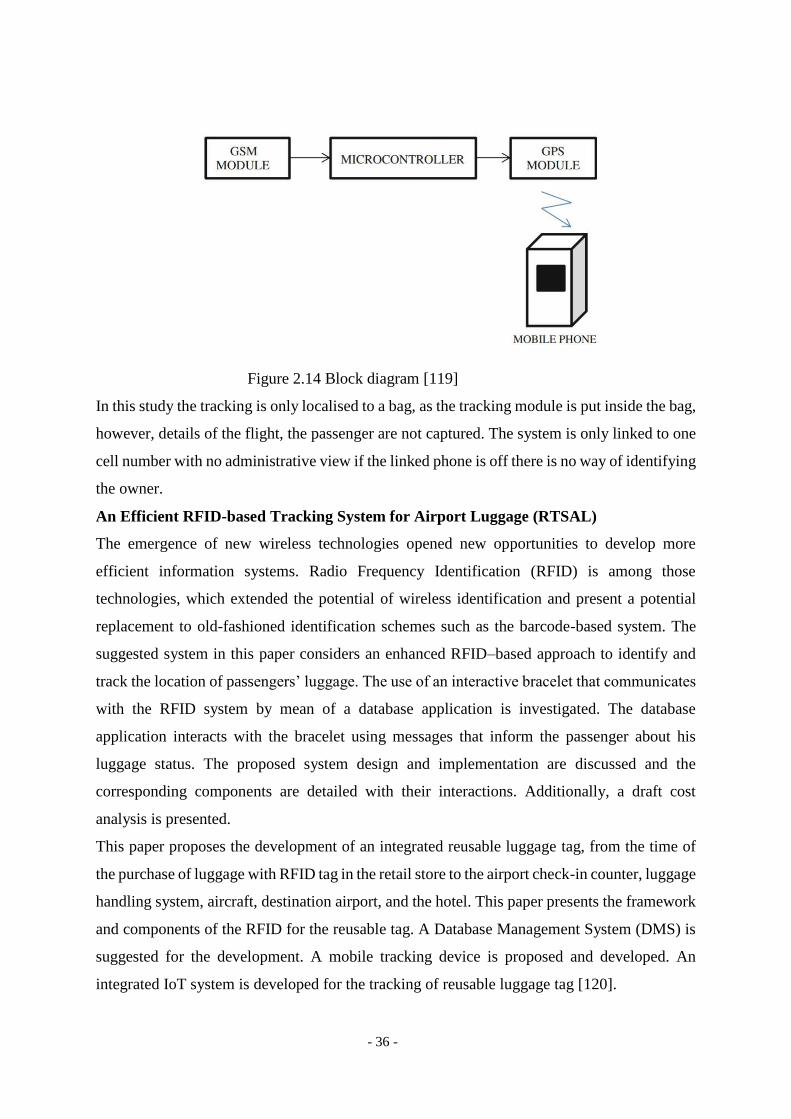
- 36 -
Figure 2.14 Block diagram [119]
In this study the tracking is only localised to a bag, as the tracking module is put inside the bag,
however, details of the flight, the passenger are not captured. The system is only linked to one
cell number with no administrative view if the linked phone is off there is no way of identifying
the owner.
An Efficient RFID-based Tracking System for Airport Luggage (RTSAL)
The emergence of new wireless technologies opened new opportunities to develop more
efficient information systems. Radio Frequency Identification (RFID) is among those
technologies, which extended the potential of wireless identification and present a potential
replacement to old-fashioned identification schemes such as the barcode-based system. The
suggested system in this paper considers an enhanced RFID–based approach to identify and
track the location of passengers’ luggage. The use of an interactive bracelet that communicates
with the RFID system by mean of a database application is investigated. The database
application interacts with the bracelet using messages that inform the passenger about his
luggage status. The proposed system design and implementation are discussed and the
corresponding components are detailed with their interactions. Additionally, a draft cost
analysis is presented.
This paper proposes the development of an integrated reusable luggage tag, from the time of
the purchase of luggage with RFID tag in the retail store to the airport check-in counter, luggage
handling system, aircraft, destination airport, and the hotel. This paper presents the framework
and components of the RFID for the reusable tag. A Database Management System (DMS) is
suggested for the development. A mobile tracking device is proposed and developed. An
integrated IoT system is developed for the tracking of reusable luggage tag [120].
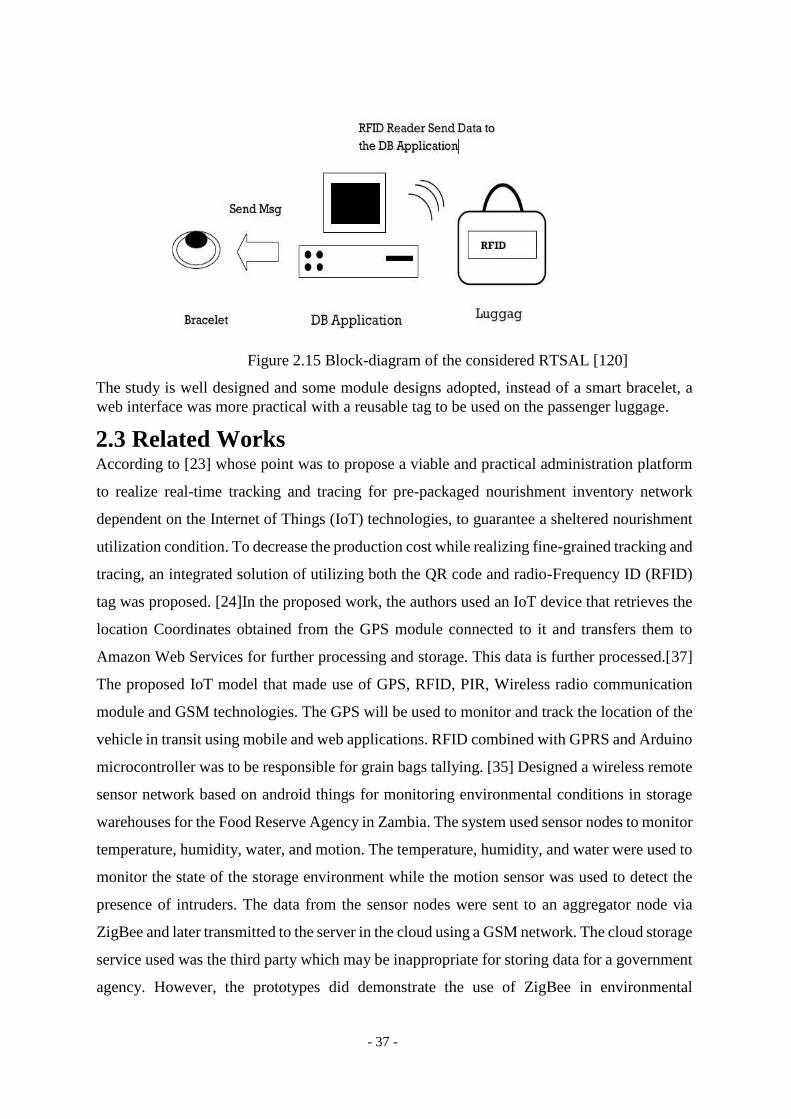
- 37 -
Figure 2.15 Block-diagram of the considered RTSAL [120]
The study is well designed and some module designs adopted, instead of a smart bracelet, a
web interface was more practical with a reusable tag to be used on the passenger luggage.
2.3 Related Works According to [23] whose point was to propose a viable and practical administration platform
to realize real-time tracking and tracing for pre-packaged nourishment inventory network
dependent on the Internet of Things (IoT) technologies, to guarantee a sheltered nourishment
utilization condition. To decrease the production cost while realizing fine-grained tracking and
tracing, an integrated solution of utilizing both the QR code and radio-Frequency ID (RFID)
tag was proposed. [24]In the proposed work, the authors used an IoT device that retrieves the
location Coordinates obtained from the GPS module connected to it and transfers them to
Amazon Web Services for further processing and storage. This data is further processed.[37]
The proposed IoT model that made use of GPS, RFID, PIR, Wireless radio communication
module and GSM technologies. The GPS will be used to monitor and track the location of the
vehicle in transit using mobile and web applications. RFID combined with GPRS and Arduino
microcontroller was to be responsible for grain bags tallying. [35] Designed a wireless remote
sensor network based on android things for monitoring environmental conditions in storage
warehouses for the Food Reserve Agency in Zambia. The system used sensor nodes to monitor
temperature, humidity, water, and motion. The temperature, humidity, and water were used to
monitor the state of the storage environment while the motion sensor was used to detect the
presence of intruders. The data from the sensor nodes were sent to an aggregator node via
ZigBee and later transmitted to the server in the cloud using a GSM network. The cloud storage
service used was the third party which may be inappropriate for storing data for a government
agency. However, the prototypes did demonstrate the use of ZigBee in environmental
- 38 -
monitoring. In their system, there is also no provision of the usage of the Web application for
a more visualized sensor values.
[36]Implemented an animal tracking system for remotely monitoring animal positioning, the
system includes an implant device, a global positioning system, a network, one or more remote
servers, and at least one wireless computing device. The implant device acts as a GPS receiver,
calculating the animal's position and then transmitting the results to the remote server where
they are stored in a database. Owners can remotely access the database via a software
application installed on a wireless computing device. Users can select an acceptable roaming
range for the animal, an acceptable range between the animal and other animals being tracked,
a lack of movement.
[30] States that one of the objectives of smart cities is keeping the environment clean and neat.
This aim is not fulfilled without the garbage bin management system. Hence the paper “IOT
Based Intelligent Bin for Smart Cities” has been developed. Bin management is one of the
major applications of IoT. Here sensors are connected to all the bins in different areas. It senses
the level of garbage in the bin. When it reaches threshold a message is sent via GSM to the
concerned person to clean it as soon as possible. The completed task is done in a lab view
environment.
[31]Proposes a Smart Surveillance System using PIR Sensor with Raspberry pi, by using open-
source software tools such as Python, Raspbian OS, etc. Smart Surveillance System using PIR
Sensor with Raspberry pie merged with the development of the Internet of Things. The basic
concept of the application is to allow the client to uses wireless technology to provide essential
security using the Surveillance system. The proposed security system captures information
and transmits it via a Wi-Fi to static IP, which is viewed using a web browser from any smart
devices. Raspberry pi controls a video camera for surveillance. It streams live video and
records the motion detected part in the cloud and/or in the window shared folder for future
playback. [56]Designed a general-purpose controlling module designed with the capability of
controlling and sensing up to five devices simultaneously. The communication between the
controlling module and the remote server is done using Bluetooth technology. The server can
communicate with many such modules simultaneously. The controller is based on ATMega64
microcontroller and Bluetooth communication TDK Blu2i (Class 1) module which provides a
serial interface for data communication. The designed controller was deployed in a home
automation application for a selected set of electrical appliances.
- 39 -
[58] Proposed a home appliance control system over Bluetooth with a cellular phone, which
enables remote-control, fault-diagnosis and software-update for home appliances through Java
applications on a cellular phone. The system consists of home appliances, a cellular phone and
Bluetooth communication adapters for the appliances. The communication adapter hardware
consists of a 20MHz 16bit CPU, SRAM and a Bluetooth module. The communication adapter
board is connected to the home appliance and the cellular phone through serial ports. The
appliances can communicate with the cellular phone control terminal via Bluetooth SPP.
[59] Proposed a wireless patient monitoring system which integrates Bluetooth and Wi-Fi
wireless technologies. The system consists of the mobile unit, which is set up on the patient’s
side to acquire the patient’s physiological signals, and the monitor units, which enable the
medical personnel to monitor the patient’s status remotely. The mobile unit is based on the
AT89C51 microprocessor. The digitized vital-sign signals are transmitted to the local monitor
unit using a Bluetooth dongle. Four kinds of monitor units, namely, local monitor unit, a
control centre, mobile devices (personal digital assistant; PDA), and a web page were designed
to communicate via the Wi-Fi wireless technology.
[57] Suggested a novel architecture for environmental telemonitoring that relies on GSM for
sampling point delocalization, while on-field nodes implement local subnets based on the
DECT technology. Local subnets contain two major blocks; Acquisition Station (AS) where
sensors and actuators are located and Transmitting Module (TM), i.e., the module that handles
several measurement stations and sends data to the control centre (CC). Each AS acts as a data
logger, storing in its internal memory device field data; communications between AS and TM
are cyclic (round-robin), with a cycle time of about 1–10 min. On the contrary,
Communications between TM and CC occur once a day for data-logging purposes, while
alarms or threshold crossings are communicated asynchronously utilizing Short Message
Service (SMS). Prototypes have been realized to interface with temperature (T, AD590 from
analogue devices), humidity (RH, HumirelHM1500), and carbon monoxide (CO, Figaro
TGS2442) sensors. DECT Siemens module MD32 and GSM module MC35 were used. AS
was based on Microchip's PIC18F452 microcontroller and TM was designed using 32-bit
ARM-based microcontroller from Samsung (S3F441FX).
[86] Described details of the design and instrumentation of variable rate irrigation, a wireless
sensor network, and software for real-time in-field sensing and control of a site-specific
precision linear-move irrigation system. Field conditions were site-specifically monitored by
- 40 -
six in-field sensor stations distributed across the field based on a soil property map, and
periodically sampled and wirelessly transmitted to a base station. An irrigation machine was
converted to be electronically controlled by a programming logic controller (Siemens S7-226
with three relay expansion modules activated electric over air solenoids to control 30 banks of
sprinklers) that updates the geo-referenced location of sprinklers from a differential Global
Positioning System (GPS) (17HVS, Garmin) and wirelessly communicates with a computer
at the base station. Communication signals from the sensor network and irrigation controller
to the base station were successfully interfaced using low-cost Bluetooth wireless radio
communication through Bluetooth RS-232 serial adaptor (SD202, Initium Company).
[104] developed a state of the art WSN based system for monitoring a series of physiological
parameters in the vineyard to prevent plant vine diseases. The different soil moistures in the
same field are used to decide the correct amount of water for irrigation; sandy soils have very
different behaviour to irrigation in respect to clayey ones; water retention capacity is
completely different and measuring it exactly where it is needed can help in controlling the
irrigation system and saving water. Monitoring air temperature and humidity in different parts
of a vine can help in preventing and fighting plants diseases, reducing the number of pesticides
only when and where they are necessary. Each node consists of MIDRA mote is equipped with
868 MHz radio transceiver, Chipcon CC1000TM. The master node of the Wireless Sensor
Network is connected to a GPRS gateway board, forwarding data to a remote server, using the
TCP-IP standard protocol. It included 11 nodes with a total of 35 sensors distributed on 1-
hectare area; monitor common parameter using simple, unobtrusive, commercial and cheap
sensors,
Forwarding their measurements by the means of a heterogeneous infrastructure, consisting of
WSN technology, GPRS communication and ordinary Internet data transfer (TCP-IP
protocol). Data coming from sensors are stored in a database that can be queried by users
everywhere in the world, only using a laptop or a PDA: the Smart User Interface also allows
to read and to analyse data quickly.
[105] describe the emerging wireless sensor networks (WSN) for autonomous Structural
Health monitoring SHM systems for bridges. In Smart Brick Network, the base station and
sensor nodes collect data from the on-board and external sensors. The sensor nodes
communicate their data from quasi-static sensors, e.g., temperature sensors, strain gauges and
seismic detectors to the base station over the ZigBee connection. The base station processes
these data and communicates them, along with any alerts generated, to several destinations
- 41 -
over the GSM/GPRS link provided by the cellular phone infrastructure. The data are reported
by email and FTP to redundant servers, via the Internet, at regular intervals or on an event-
triggered basis. The alerts are sent directly by SMS text messaging and by email. Wireless
sensor networks are the key enabler of the most reliable and durable systems for long-term
SHM and have the potential to dramatically increase public safety by providing early warning
of impending structural hazards.
[107] implemented a wireless medical interface based on ZigBee and Bluetooth technology.
The purpose is to acquire, process, and transfer raw data from medical devices to Bluetooth
network. The Bluetooth network can be connected to PC or PDA for further processing. The
interface comprises two types of device: MDIZ and MDIZB. MDIZ acquires data from a
medical device, processes them using a microcontroller, and transmit the data through ZigBee
network through UART. MDIZB receives data from several MDIZs and transmits them out to
PC through Bluetooth network. MDIZB comprises of ZigBee module, two processors, RAM,
and Bluetooth module. It receives data from the ZigBee network through its ZigBee module.
The data are then sent to processor 1. Processor 1 decides the priority of MDIZs. In processor
1, the data frame is added with Start byte and End byte to mark the beginning and the end of
the data frame. After being processed in processor 1, the data are then sent to processor 2
through SPI (Serial Peripheral Interface). Processor 2 transmits data to the PC through
Bluetooth network. Processor 2 controls Bluetooth module. Initiate recording when motion is
sensed and Raspberry pi devices stores it in a secured folder.
[108] had presented a new strategy for control of baggage handling systems based on
Intelligent Transportation Systems. Here three main control issues in baggage handling
system, routing and scheduling problem, empty cart management, and line balancing are
identified and a combined control approach based on model predictive control is proposed.
The control approach can be formulated as a linear programming problem that can be solved
efficiently, and hence can be extended to large scale handling system.
[109] had proposed design of baggage tracking and handling system which uses smart RFID
and IoT which is based on a cloud server. It has a designed prototype at two locations having
both check-in and check-out processes. A more secured algorithm is used for generating tags
that are attached to printed baggage label with the details of passenger and airline stored in it
and RFID Readers in the check-out areas facilitate step tracking of baggage which prevent
baggage loss. The proposed system ensures less consumption of time, security for baggage.
- 42 -
[110] had proposed design for luggage management which uses RFID tags to enhance the
ability for baggage tracking, dispatching and conveyance, to improve management efficiency
and the user’s satisfaction. It uses an intelligent RFID Reader which has the ability of data
disposal and provides edge savant service is presented. The prototype readers and its
experiment in the airport baggage handling system are also introduced in this proposed model.
[111]Konas bags offers luggage and bag packs that we can track from the smartphone. With
the help of the tracking device present in the bag, we can track the device through the
application installed in the smartphone. The tags don’t provide you with a mobile or computer
frontend interface to track and view the location of the bag, instead, the company owning the
tag would try to track down the location. A lot of trackable tags are available which can be
tied with the bag to track the bags when they are lost. These tags have an inbuilt GPS chip
through which the company would track the lost bag. There are a lot of companies in the
market who are providing these tags with different features like dyno tag, LugLoc and Robot
Check. [112]
Track dot is a luggage tracker device which is placed inside the bag when a person is travelling.
It works on ground-based cellular technology and microelectronics. When in an aeroplane
during take-off, it shuts down automatically and enters in an aeroplane mode and again
activates during landing when the pilot applies brakes. [114]
- 43 -
CHAPTER THREE:
METHODOLOGY
3.1 Introduction
This chapter describes the research methods that were employed in the collection and analysis
of data for this study. In this component, the researcher explains the general plan of how the
research questions were answered. Also, this chapter discusses the credibility of the data
collected and the limitations of the study. Thereafter. Details of the data analysis procedures
that were employed in the research are also discussed. This is followed by the methodology
used to design the models, development and implementation of the prototype.
3.2 Baseline Study Zambia is situated in Central Southern Africa and shares borders with Zimbabwe, Botswana,
Namibia, Angola, DRC, Tanzania, Malawi and Mozambique. It is divided into 10 provinces
and has a population of 15million people [129]. Zambia covers an area of 752,612 Km2 and is
highly urbanized with a population density of 100 people per square kilometre in Lusaka.
Lusaka has a population of at least 2.8million people [130].
A Mixed Methods Research Methodology comprises a combination of qualitative and
quantitative research types [83]. Mixed Methods Research Methodology combines diverse
types of data which provides the best understanding of a research problem. A survey was
conducted to understand the factors affecting technology adoption based on TAM.
3.2.1 Data Collection
Data was collected from the targeted population who are bus operators and passengers within
Lusaka city using interviews and questionnaires. Appendix B contains the questionnaires and
other relevant documents that were used in this research. The data collection commenced in
August 2019 and ended in September 2019. A descriptive research design was used in
describing the current state of affairs, the research employed a mixed-methods approach,
which is a combination of both qualitative and quantitative methods. The study used Purposive
sampling and convenient sampling.
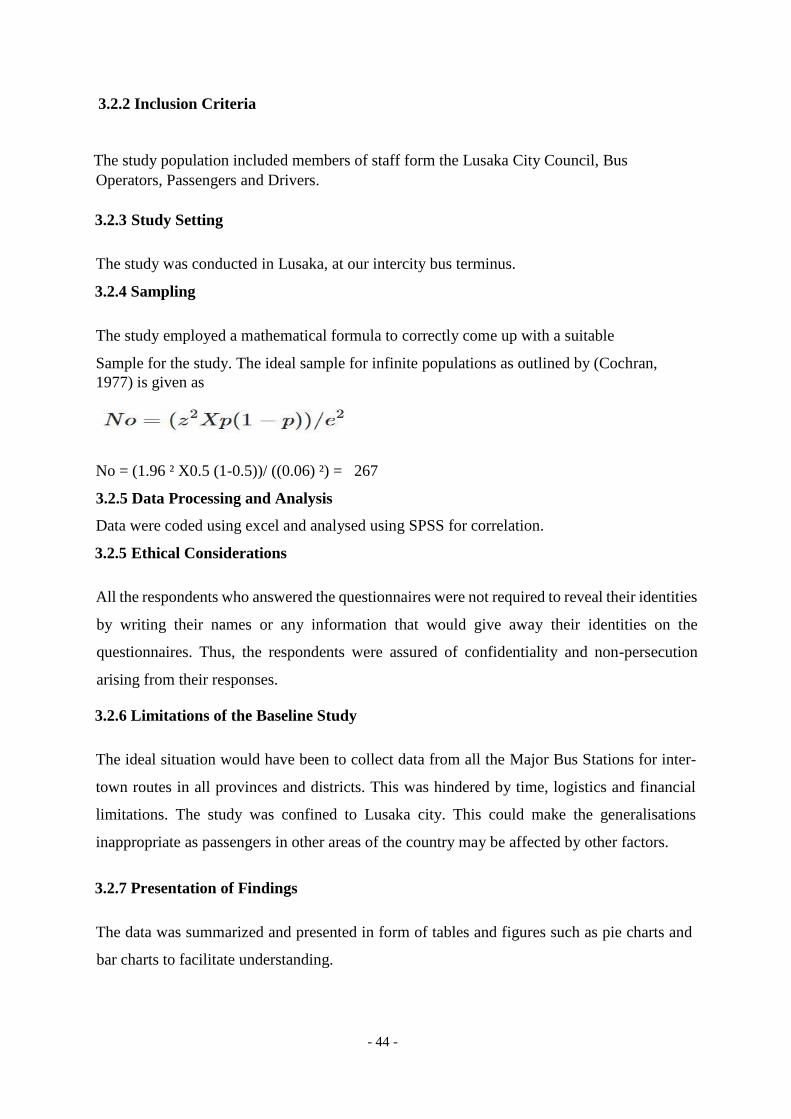
- 44 -
3.2.2 Inclusion Criteria
The study population included members of staff form the Lusaka City Council, Bus
Operators, Passengers and Drivers.
3.2.3 Study Setting
The study was conducted in Lusaka, at our intercity bus terminus.
3.2.4 Sampling
The study employed a mathematical formula to correctly come up with a suitable
Sample for the study. The ideal sample for infinite populations as outlined by (Cochran,
1977) is given as
No = (1.96 ² X0.5 (1-0.5))/ ((0.06) ²) = 267
3.2.5 Data Processing and Analysis
Data were coded using excel and analysed using SPSS for correlation.
3.2.5 Ethical Considerations
All the respondents who answered the questionnaires were not required to reveal their identities
by writing their names or any information that would give away their identities on the
questionnaires. Thus, the respondents were assured of confidentiality and non-persecution
arising from their responses.
3.2.6 Limitations of the Baseline Study
The ideal situation would have been to collect data from all the Major Bus Stations for inter-
town routes in all provinces and districts. This was hindered by time, logistics and financial
limitations. The study was confined to Lusaka city. This could make the generalisations
inappropriate as passengers in other areas of the country may be affected by other factors.
3.2.7 Presentation of Findings
The data was summarized and presented in form of tables and figures such as pie charts and
bar charts to facilitate understanding.
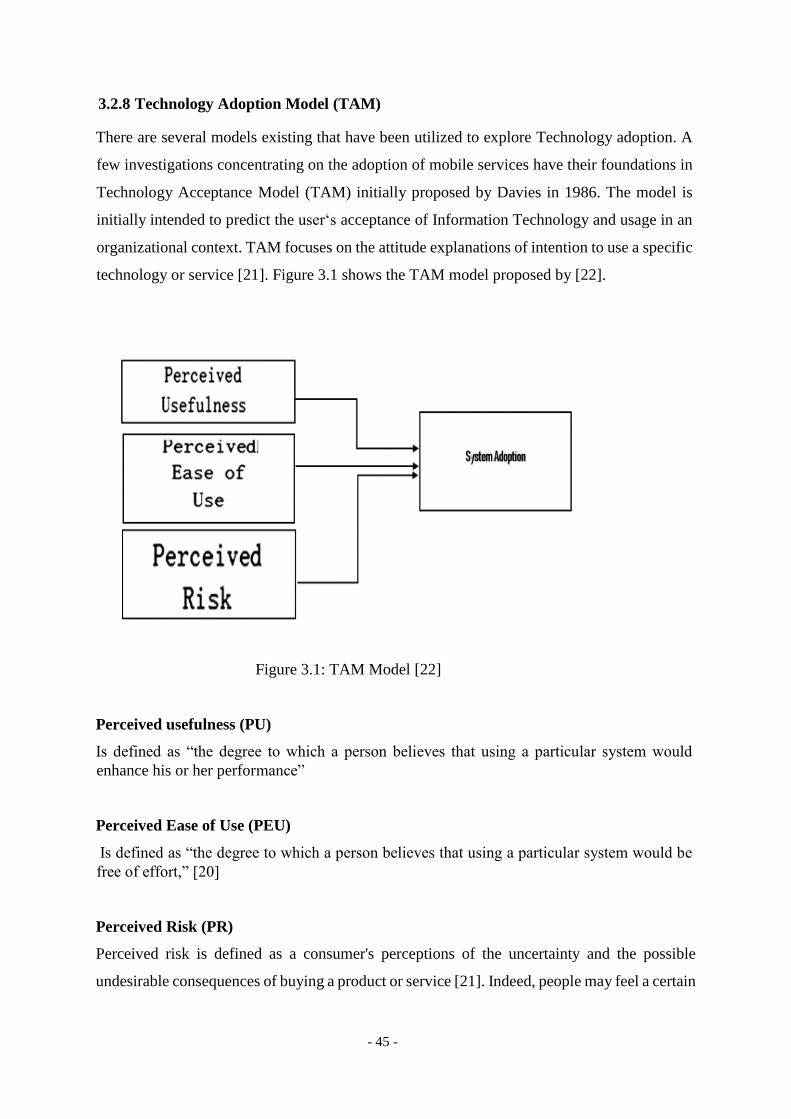
- 45 -
3.2.8 Technology Adoption Model (TAM)
There are several models existing that have been utilized to explore Technology adoption. A
few investigations concentrating on the adoption of mobile services have their foundations in
Technology Acceptance Model (TAM) initially proposed by Davies in 1986. The model is
initially intended to predict the user‘s acceptance of Information Technology and usage in an
organizational context. TAM focuses on the attitude explanations of intention to use a specific
technology or service [21]. Figure 3.1 shows the TAM model proposed by [22].
Figure 3.1: TAM Model [22]
Perceived usefulness (PU)
Is defined as “the degree to which a person believes that using a particular system would
enhance his or her performance”
Perceived Ease of Use (PEU)
Is defined as “the degree to which a person believes that using a particular system would be
free of effort,” [20]
Perceived Risk (PR)
Perceived risk is defined as a consumer's perceptions of the uncertainty and the possible
undesirable consequences of buying a product or service [21]. Indeed, people may feel a certain
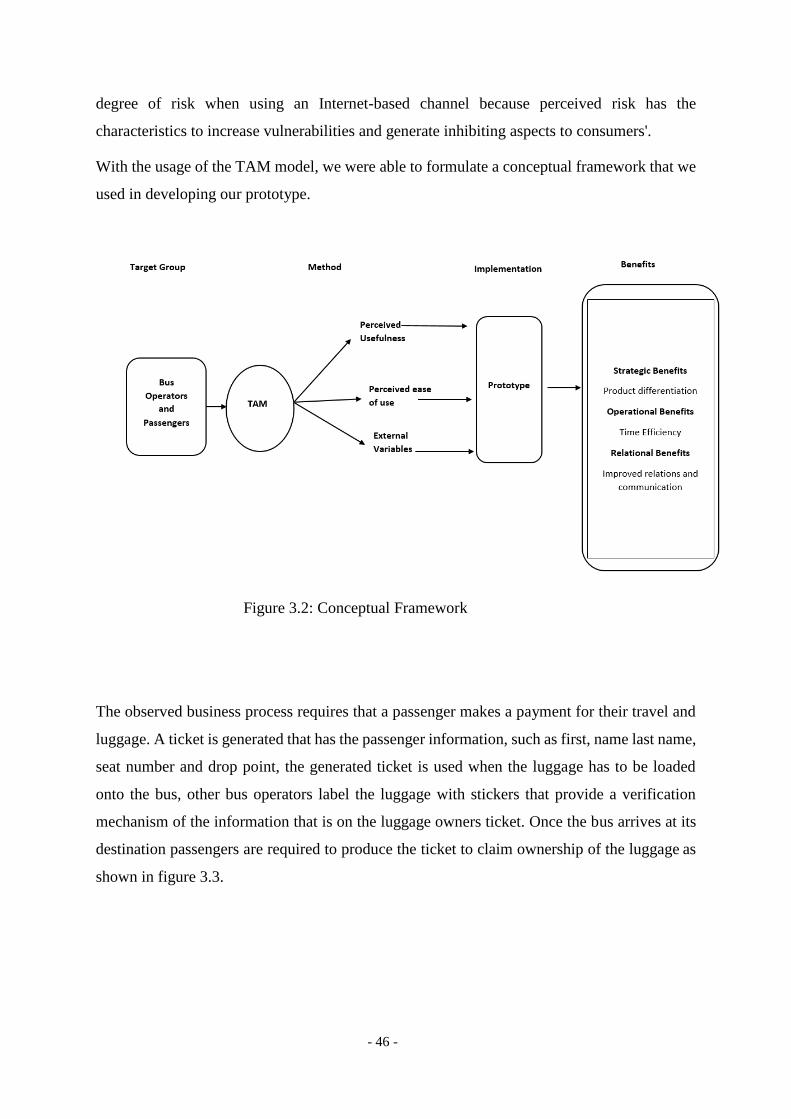
- 46 -
degree of risk when using an Internet-based channel because perceived risk has the
characteristics to increase vulnerabilities and generate inhibiting aspects to consumers'.
With the usage of the TAM model, we were able to formulate a conceptual framework that we
used in developing our prototype.
Figure 3.2: Conceptual Framework
The observed business process requires that a passenger makes a payment for their travel and
luggage. A ticket is generated that has the passenger information, such as first, name last name,
seat number and drop point, the generated ticket is used when the luggage has to be loaded
onto the bus, other bus operators label the luggage with stickers that provide a verification
mechanism of the information that is on the luggage owners ticket. Once the bus arrives at its
destination passengers are required to produce the ticket to claim ownership of the luggage as
shown in figure 3.3.
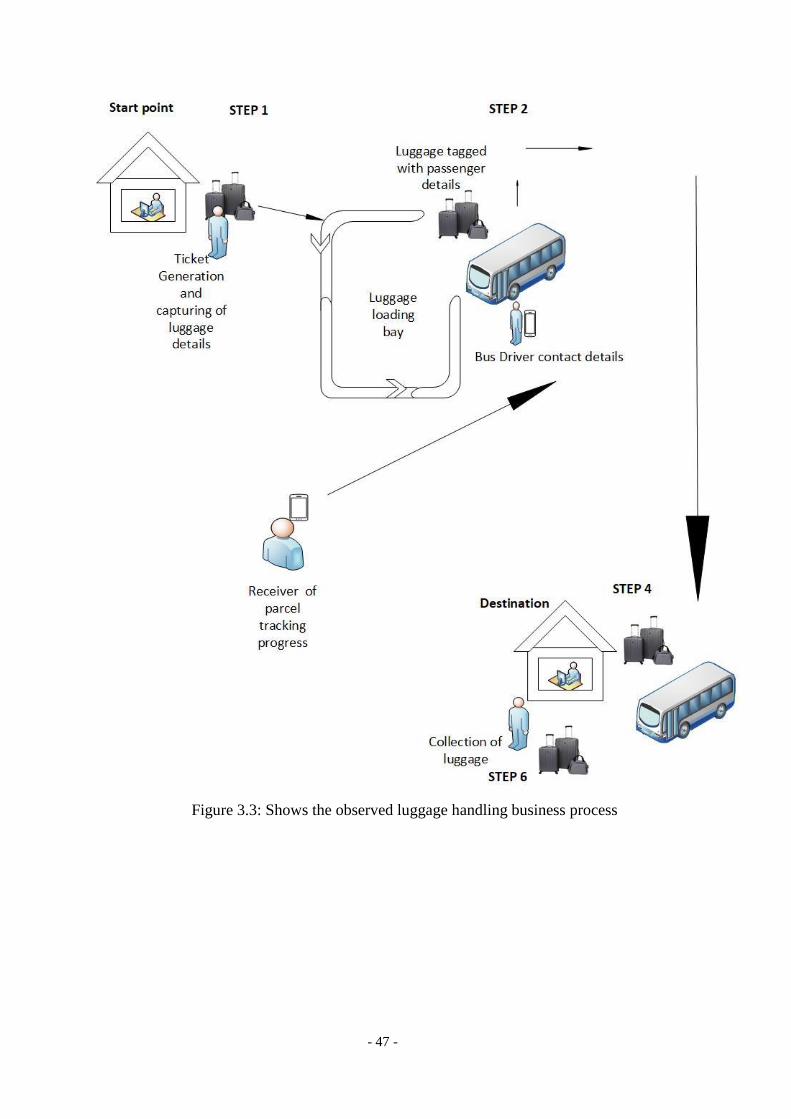
- 47 -
Figure 3.3: Shows the observed luggage handling business process
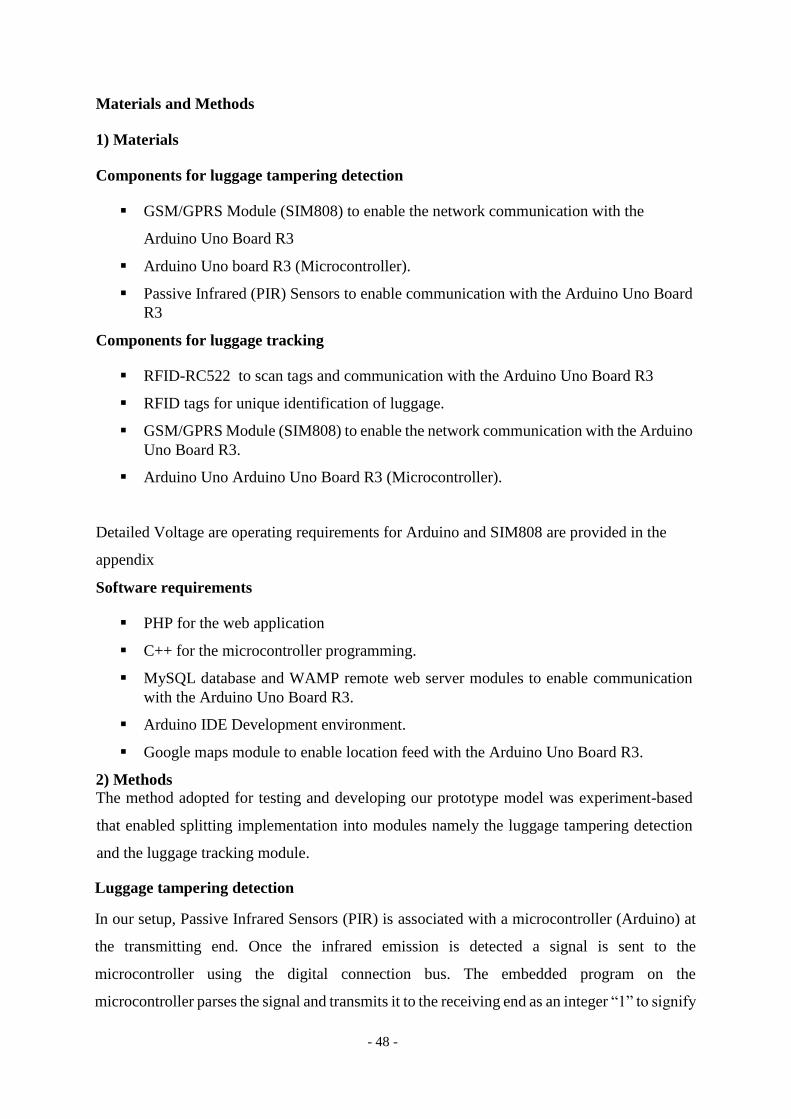
- 48 -
Materials and Methods
1) Materials
Components for luggage tampering detection
GSM/GPRS Module (SIM808) to enable the network communication with the
Arduino Uno Board R3
Arduino Uno board R3 (Microcontroller).
Passive Infrared (PIR) Sensors to enable communication with the Arduino Uno Board
R3
Components for luggage tracking
RFID-RC522 to scan tags and communication with the Arduino Uno Board R3
RFID tags for unique identification of luggage.
GSM/GPRS Module (SIM808) to enable the network communication with the Arduino
Uno Board R3.
Arduino Uno Arduino Uno Board R3 (Microcontroller).
Detailed Voltage are operating requirements for Arduino and SIM808 are provided in the
appendix
Software requirements
PHP for the web application
C++ for the microcontroller programming.
MySQL database and WAMP remote web server modules to enable communication
with the Arduino Uno Board R3.
Arduino IDE Development environment.
Google maps module to enable location feed with the Arduino Uno Board R3.
2) Methods
The method adopted for testing and developing our prototype model was experiment-based
that enabled splitting implementation into modules namely the luggage tampering detection
and the luggage tracking module.
Luggage tampering detection
In our setup, Passive Infrared Sensors (PIR) is associated with a microcontroller (Arduino) at
the transmitting end. Once the infrared emission is detected a signal is sent to the
microcontroller using the digital connection bus. The embedded program on the
microcontroller parses the signal and transmits it to the receiving end as an integer “1” to signify
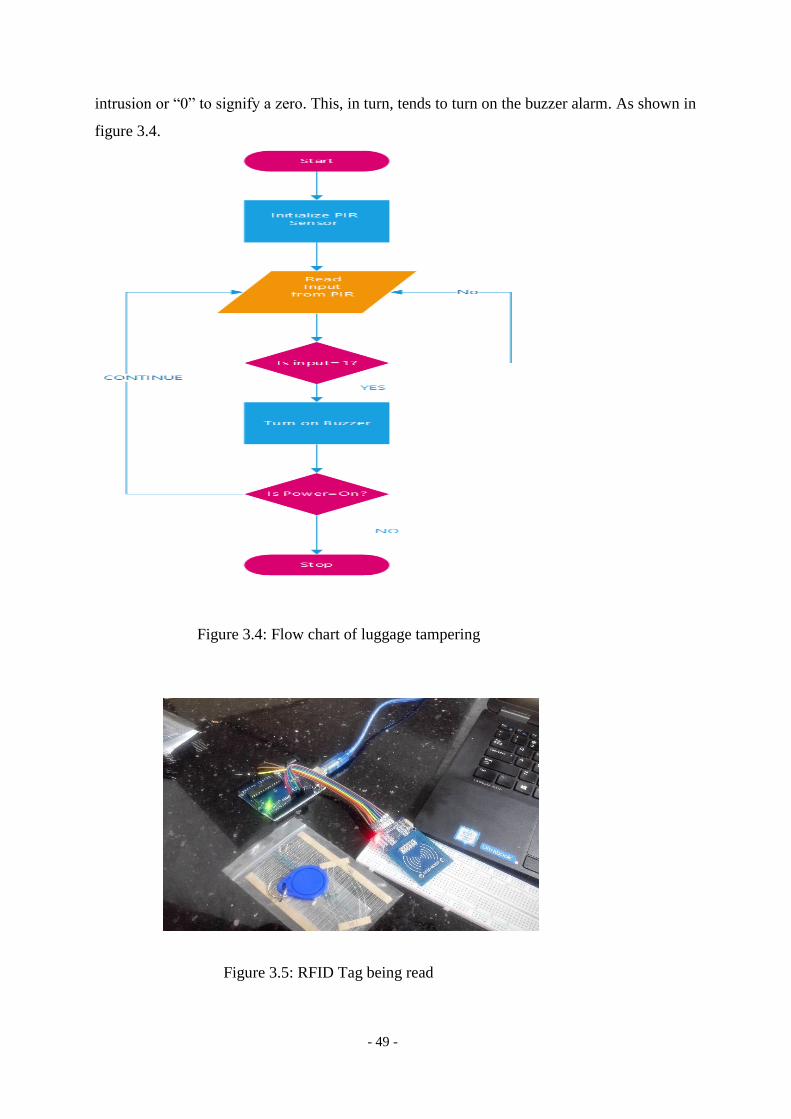
- 49 -
intrusion or “0” to signify a zero. This, in turn, tends to turn on the buzzer alarm. As shown in
figure 3.4.
Figure 3.5: RFID Tag being read
Figure 3.4: Flow chart of luggage tampering
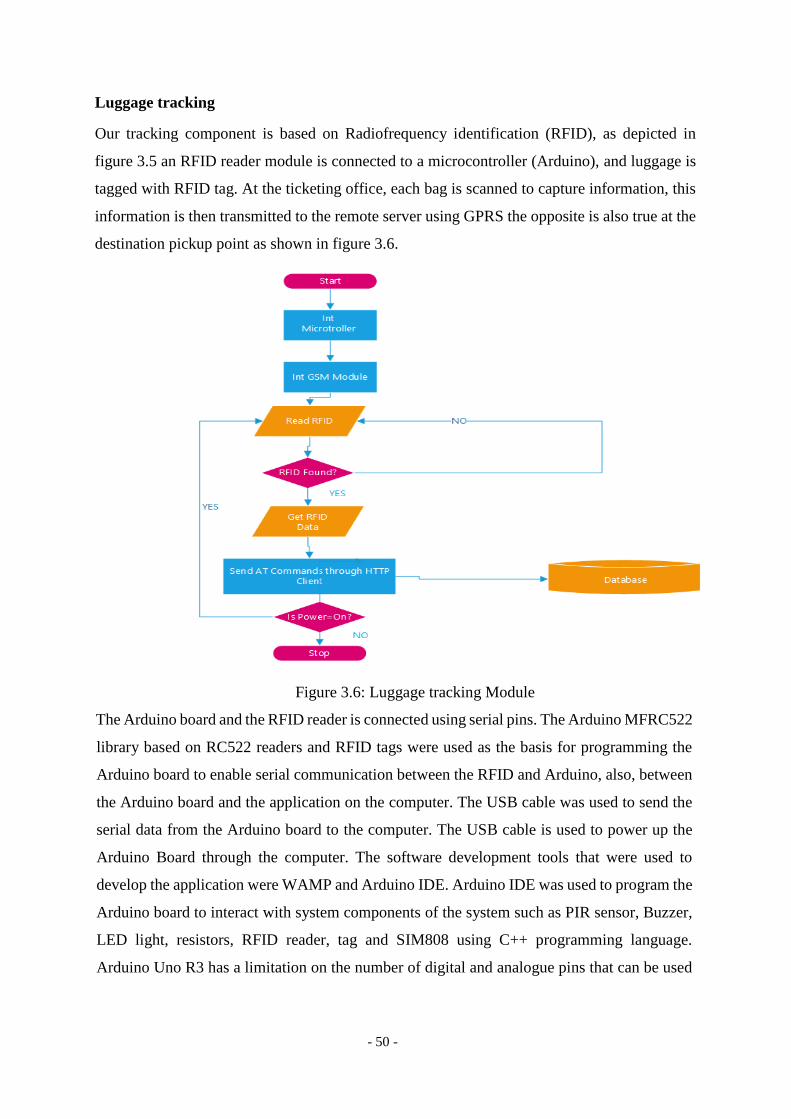
- 50 -
Luggage tracking
Our tracking component is based on Radiofrequency identification (RFID), as depicted in
figure 3.5 an RFID reader module is connected to a microcontroller (Arduino), and luggage is
tagged with RFID tag. At the ticketing office, each bag is scanned to capture information, this
information is then transmitted to the remote server using GPRS the opposite is also true at the
destination pickup point as shown in figure 3.6.
Figure 3.6: Luggage tracking Module
The Arduino board and the RFID reader is connected using serial pins. The Arduino MFRC522
library based on RC522 readers and RFID tags were used as the basis for programming the
Arduino board to enable serial communication between the RFID and Arduino, also, between
the Arduino board and the application on the computer. The USB cable was used to send the
serial data from the Arduino board to the computer. The USB cable is used to power up the
Arduino Board through the computer. The software development tools that were used to
develop the application were WAMP and Arduino IDE. Arduino IDE was used to program the
Arduino board to interact with system components of the system such as PIR sensor, Buzzer,
LED light, resistors, RFID reader, tag and SIM808 using C++ programming language.
Arduino Uno R3 has a limitation on the number of digital and analogue pins that can be used
- 51 -
to connect components, for this reason, a breadboard [115] is introduced to provide pins for
various components to be connected.
3.3 System Implementation and Design
3.3.1 System Design
A system analysis was done to determine the requirements of the system. The Passenger
Luggage Tracking system requirements document was generated. Functional and non-
functional requirements were developed. To develop the requirements, the use case
diagram and use case text were developed.
The Passenger luggage management system has three main actors and these are the system
administrator, operations manager and the passenger.
Both the Operational manager and passengers have to be enrolled on the system. The role
of the administrator is to manage the whole system while the operational managers can
only manage their passengers and officers.
Functional Requirements
Functional requirement [92] defines the function of a system and its component. The
system supports three users, namely; Administrator, Manager and Passenger.
The following are the functional requirements of the system.
Administrator
1) Add Office: The Administrator must be able to create a Company Profile
for a bus operator.
2) Delete Office: The Administrator must be able to delete bus operators that
no longer operational.
3) View Offices: The Administrator must be able to view a list of all operators
currently using the system.
4) Add Manager: The Administrator must be able to create an operations
manager for a bus operator.
5) Delete Manager: The Administrator must be able to delete Operational
Managers.
6) View Managers: The Administrator must be able to view a list of all
operations manager defined in the system.
- 52 -
7) Add Consignment: The Administrator can capture details of the owner of
consignment, destination and tagged for the courier.
8) Update: The Administrator can update the delivery status report.
9) Delivered: The Administrator can view parcels and luggage with the
delivery status.
10) Search: The Administrator can search for consignment using a unique ID.
11) View on Map: The Administrator has access to view real-time location
buses carrying luggage and parcels.
12) Deliveries: The Administrator can view all the luggage and parcels that are
yet to be delivered.
Manager
1) Add Consignment: The Operations Manager can capture details of the
owner of consignment, destination and tagged for the courier.
2) Update: The Operations Manager can update the delivery status report.
3) Delivered: The Operations Manager can view parcels and luggage with the
delivery status.
4) Search: The Operations Manager can search for consignment using a
unique ID.
5) View on Map: The Operations Manager has access to view real-time
location buses carrying luggage and parcels.
6) Deliveries: The Operations Manager can view all the luggage and parcels
that are yet to be delivered.
Passenger
1) The User or passenger has access to tracking the status of the consignment.
Non-Functional Requirements
In requirement engineering, a non-functional requirement [92] is a necessity that specifies
criteria that can be used to judge the operation of a system. Non-Functional requirements
can be further defined as global constraints on the software system and they include
development costs, operational costs, performance, reliability, maintainability, portability,
robustness the non-functional requirements of the application are introduced in Table 3.1.
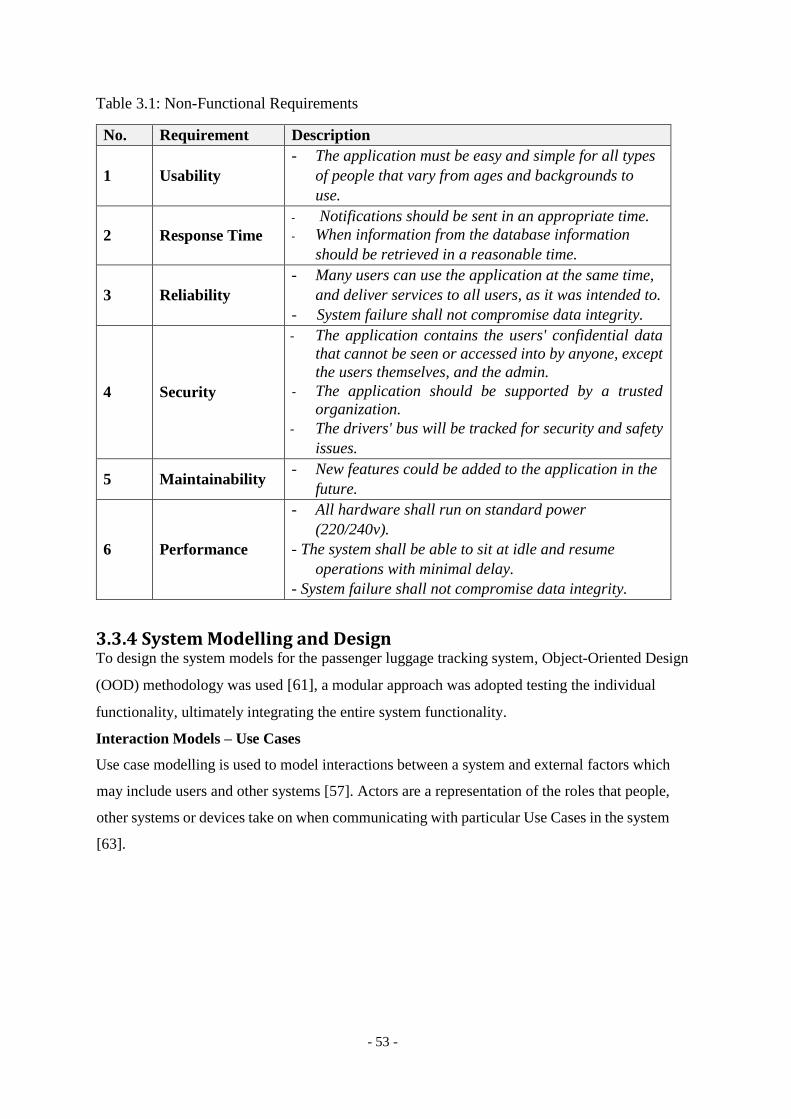
- 53 -
Table 3.1: Non-Functional Requirements
No. Requirement Description
1 Usability
- The application must be easy and simple for all types
of people that vary from ages and backgrounds to
use.
2 Response Time
- Notifications should be sent in an appropriate time.
- When information from the database information
should be retrieved in a reasonable time.
3 Reliability
- Many users can use the application at the same time,
and deliver services to all users, as it was intended to.
- System failure shall not compromise data integrity.
4 Security
- The application contains the users' confidential data
that cannot be seen or accessed into by anyone, except
the users themselves, and the admin.
- The application should be supported by a trusted
organization.
- The drivers' bus will be tracked for security and safety
issues.
5 Maintainability - New features could be added to the application in the
future.
6 Performance
- All hardware shall run on standard power
(220/240v).
- The system shall be able to sit at idle and resume
operations with minimal delay.
- System failure shall not compromise data integrity.
3.3.4 System Modelling and Design To design the system models for the passenger luggage tracking system, Object-Oriented Design
(OOD) methodology was used [61], a modular approach was adopted testing the individual
functionality, ultimately integrating the entire system functionality.
Interaction Models – Use Cases
Use case modelling is used to model interactions between a system and external factors which
may include users and other systems [57]. Actors are a representation of the roles that people,
other systems or devices take on when communicating with particular Use Cases in the system
[63].
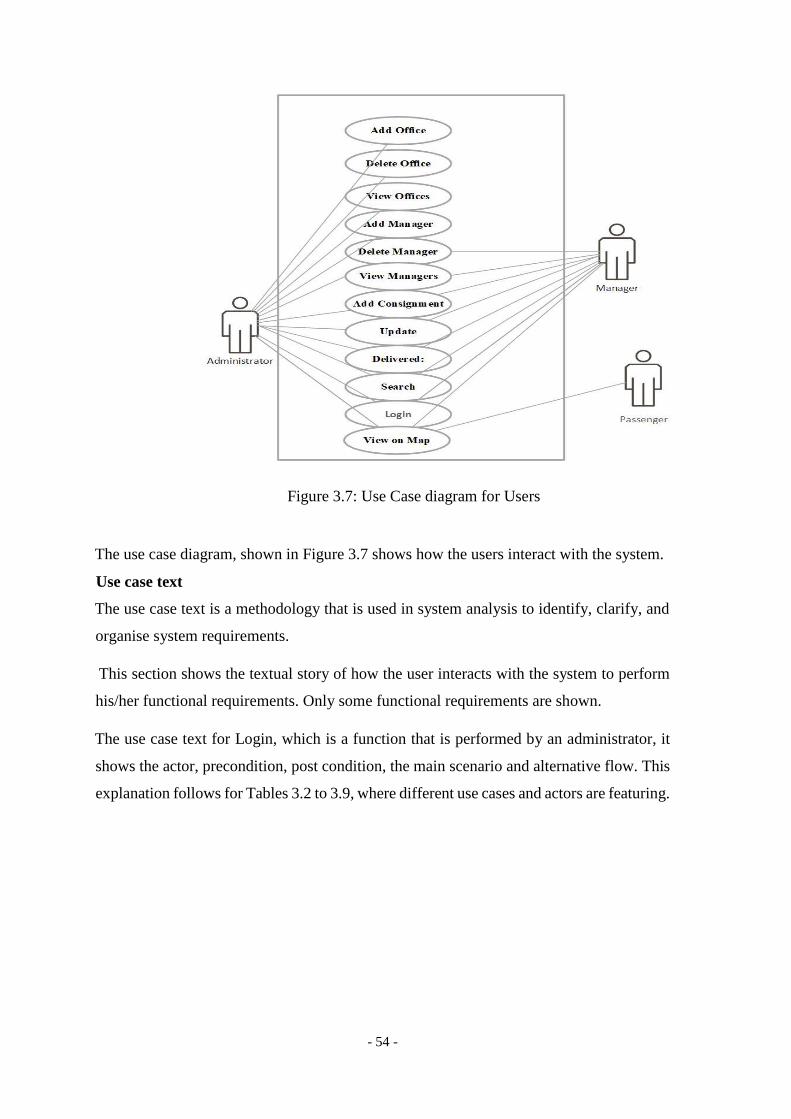
- 54 -
Figure 3.7: Use Case diagram for Users
The use case diagram, shown in Figure 3.7 shows how the users interact with the system.
Use case text
The use case text is a methodology that is used in system analysis to identify, clarify, and
organise system requirements.
This section shows the textual story of how the user interacts with the system to perform
his/her functional requirements. Only some functional requirements are shown.
The use case text for Login, which is a function that is performed by an administrator, it
shows the actor, precondition, post condition, the main scenario and alternative flow. This
explanation follows for Tables 3.2 to 3.9, where different use cases and actors are featuring.
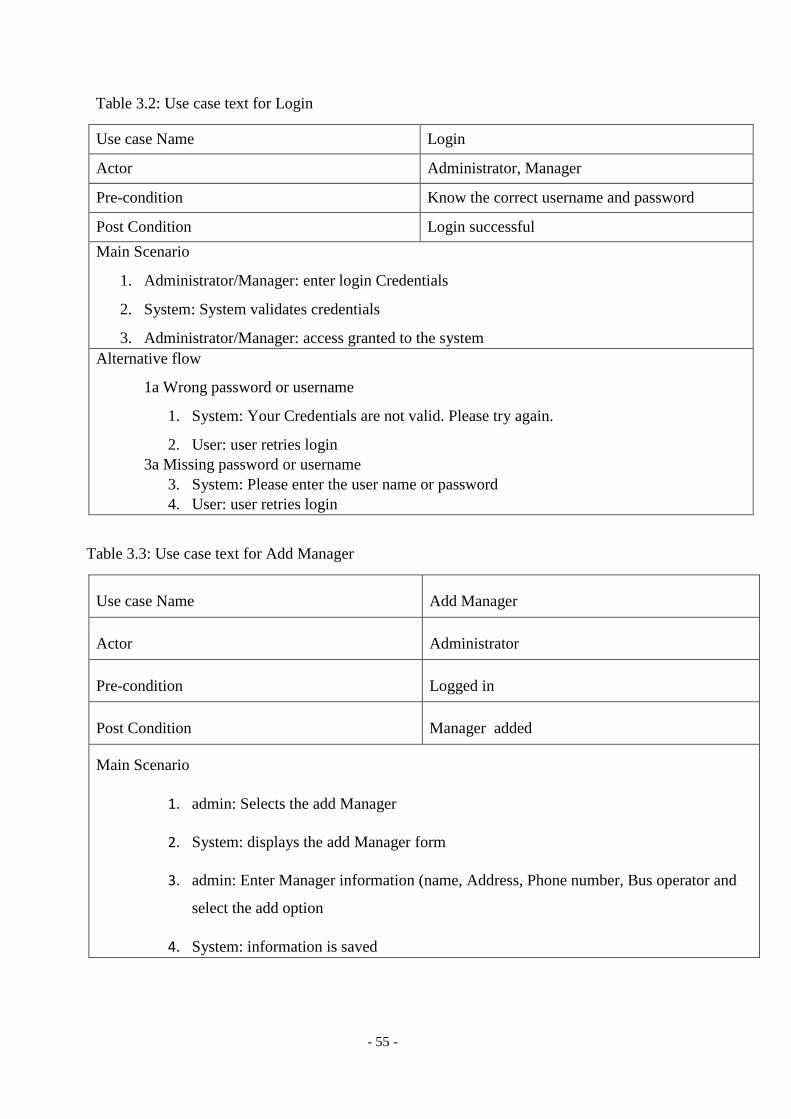
- 55 -
Table 3.2: Use case text for Login
Use case Name Login
Actor Administrator, Manager
Pre-condition Know the correct username and password
Post Condition Login successful
Main Scenario
1. Administrator/Manager: enter login Credentials
2. System: System validates credentials
3. Administrator/Manager: access granted to the system
Alternative flow
1a Wrong password or username
1. System: Your Credentials are not valid. Please try again.
2. User: user retries login
3a Missing password or username
3. System: Please enter the user name or password
4. User: user retries login
Table 3.3: Use case text for Add Manager
Use case Name Add Manager
Actor Administrator
Pre-condition Logged in
Post Condition Manager added
Main Scenario
1. admin: Selects the add Manager
2. System: displays the add Manager form
3. admin: Enter Manager information (name, Address, Phone number, Bus operator and
select the add option
4. System: information is saved
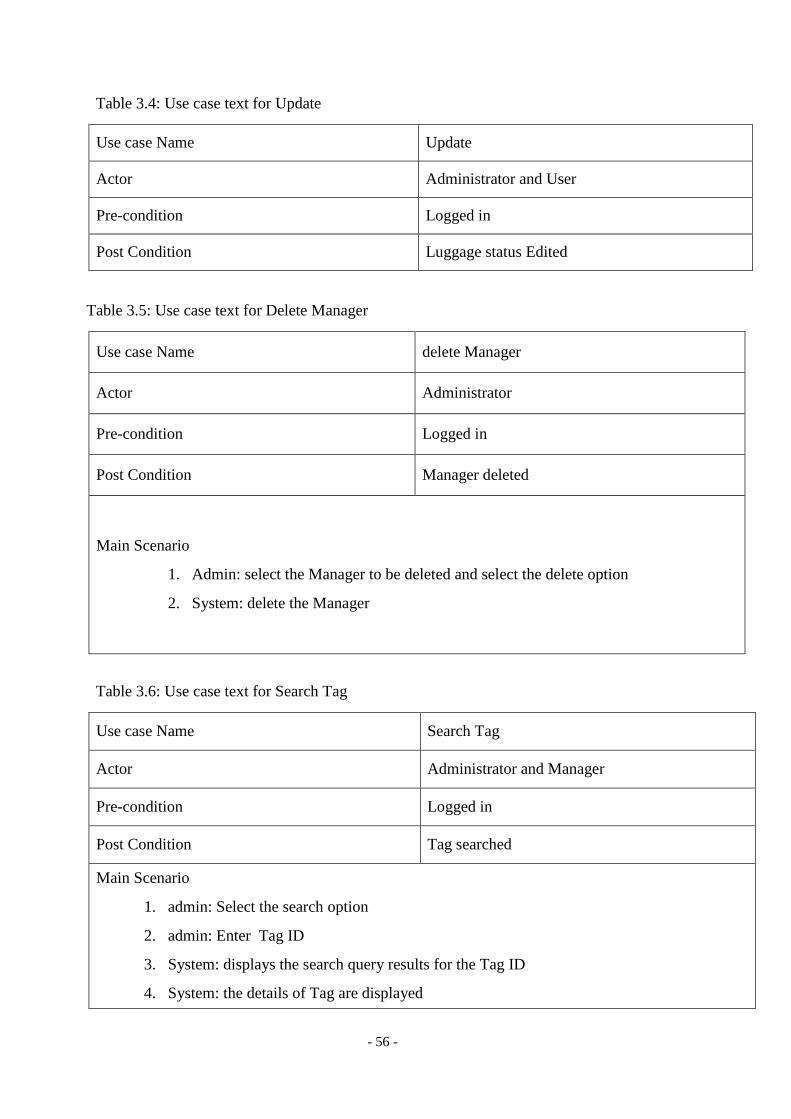
- 56 -
Table 3.4: Use case text for Update
Use case Name Update
Actor Administrator and User
Pre-condition Logged in
Post Condition Luggage status Edited
Table 3.5: Use case text for Delete Manager
Use case Name delete Manager
Actor Administrator
Pre-condition Logged in
Post Condition Manager deleted
Main Scenario
1. Admin: select the Manager to be deleted and select the delete option
2. System: delete the Manager
Table 3.6: Use case text for Search Tag
Use case Name Search Tag
Actor Administrator and Manager
Pre-condition Logged in
Post Condition Tag searched
Main Scenario
1. admin: Select the search option
2. admin: Enter Tag ID
3. System: displays the search query results for the Tag ID
4. System: the details of Tag are displayed

- 57 -
Table 3.7: Use case text for Add Office
Use case Name Add office
Actor Administrator
Pre-condition Logged in
Post Condition Office added
Main Scenario
1. Admin: Select the add office option
2. System: displays a form with fields
3. Admin: Enter name of Bus operator, address, contact person and details
4. System: System saves the record
Table 3.8: Use case text for View Managers
Use case Name View Managers
Actor Administrator
Pre-condition Logged in
Post Condition List Displayed
Main Scenario
1. Admin: Select view Managers option
2. System: displays names of all Managers enrolled.
Table 3.9: Use case text for View on Map
Use case Name View on Map
Actor Administrator, Manager, Passenger
Pre-condition Logged in
Post Condition View of real-time google maps location
Main Scenario
1. Admin: click of View map
2. System: displays the location of the bus
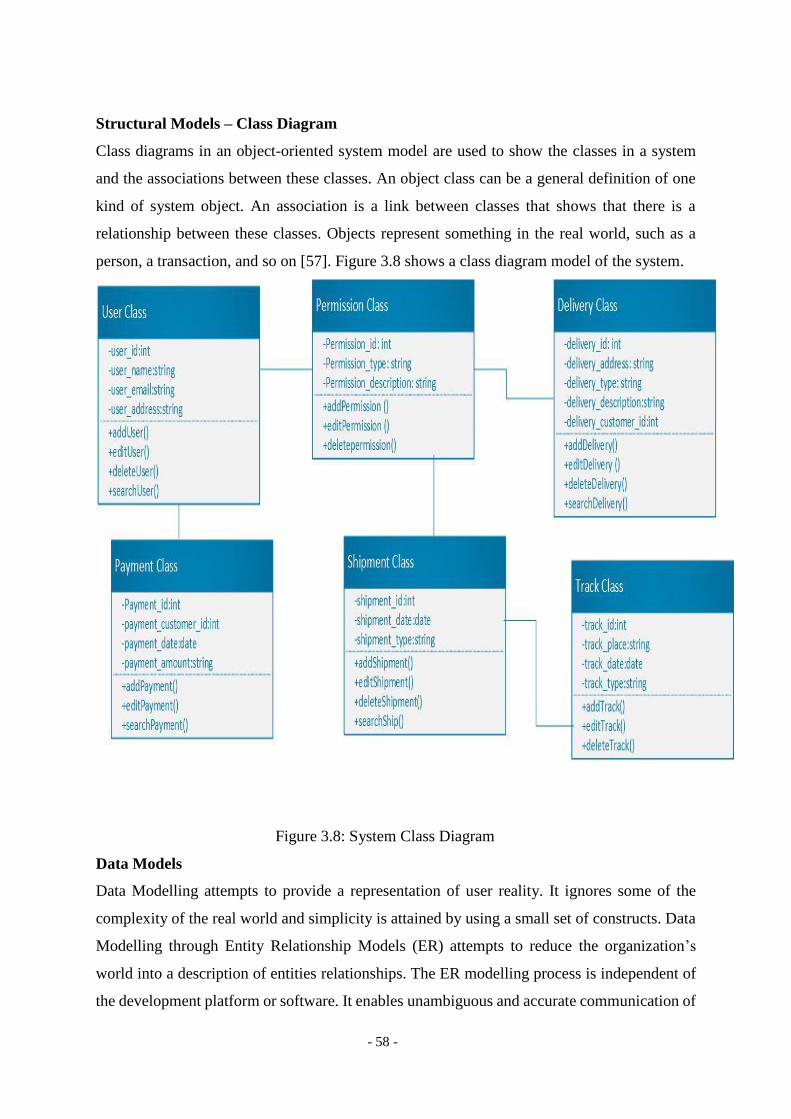
- 58 -
Structural Models – Class Diagram
Class diagrams in an object-oriented system model are used to show the classes in a system
and the associations between these classes. An object class can be a general definition of one
kind of system object. An association is a link between classes that shows that there is a
relationship between these classes. Objects represent something in the real world, such as a
person, a transaction, and so on [57]. Figure 3.8 shows a class diagram model of the system.
Figure 3.8: System Class Diagram
Data Models
Data Modelling attempts to provide a representation of user reality. It ignores some of the
complexity of the real world and simplicity is attained by using a small set of constructs. Data
Modelling through Entity Relationship Models (ER) attempts to reduce the organization’s
world into a description of entities relationships. The ER modelling process is independent of
the development platform or software. It enables unambiguous and accurate communication of
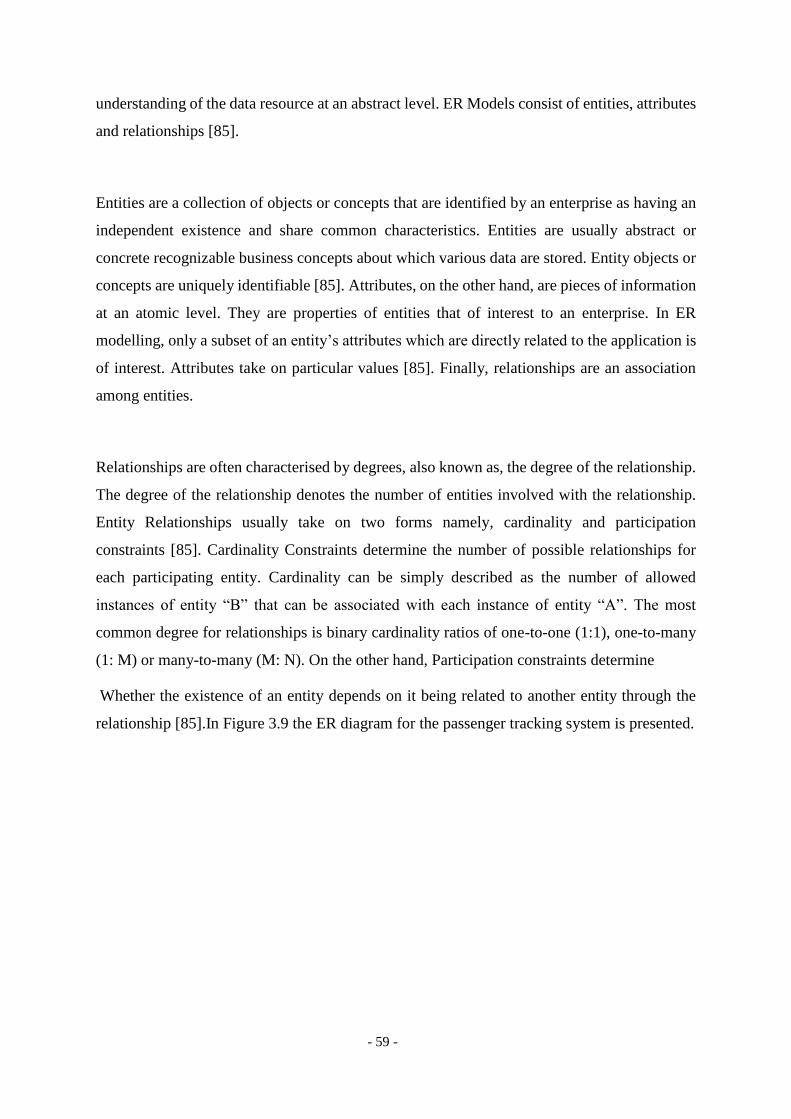
- 59 -
understanding of the data resource at an abstract level. ER Models consist of entities, attributes
and relationships [85].
Entities are a collection of objects or concepts that are identified by an enterprise as having an
independent existence and share common characteristics. Entities are usually abstract or
concrete recognizable business concepts about which various data are stored. Entity objects or
concepts are uniquely identifiable [85]. Attributes, on the other hand, are pieces of information
at an atomic level. They are properties of entities that of interest to an enterprise. In ER
modelling, only a subset of an entity’s attributes which are directly related to the application is
of interest. Attributes take on particular values [85]. Finally, relationships are an association
among entities.
Relationships are often characterised by degrees, also known as, the degree of the relationship.
The degree of the relationship denotes the number of entities involved with the relationship.
Entity Relationships usually take on two forms namely, cardinality and participation
constraints [85]. Cardinality Constraints determine the number of possible relationships for
each participating entity. Cardinality can be simply described as the number of allowed
instances of entity “B” that can be associated with each instance of entity “A”. The most
common degree for relationships is binary cardinality ratios of one-to-one (1:1), one-to-many
(1: M) or many-to-many (M: N). On the other hand, Participation constraints determine
Whether the existence of an entity depends on it being related to another entity through the
relationship [85].In Figure 3.9 the ER diagram for the passenger tracking system is presented.
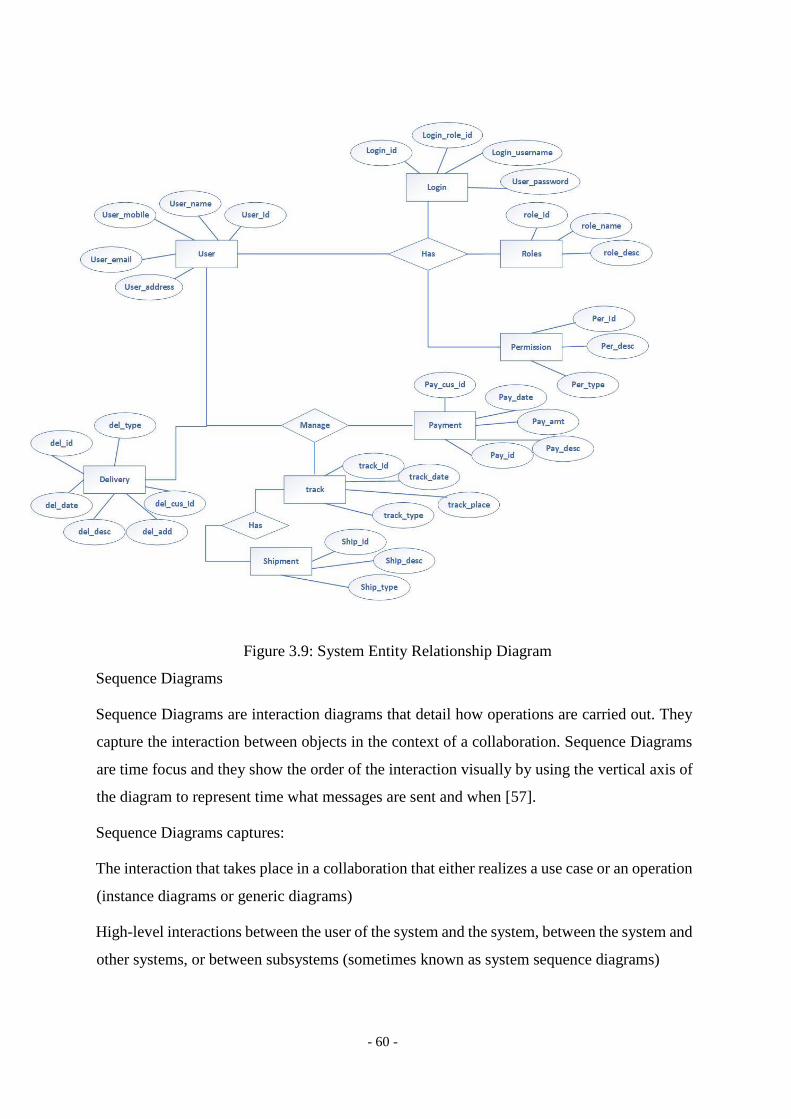
- 60 -
Figure 3.9: System Entity Relationship Diagram
Sequence Diagrams
Sequence Diagrams are interaction diagrams that detail how operations are carried out. They
capture the interaction between objects in the context of a collaboration. Sequence Diagrams
are time focus and they show the order of the interaction visually by using the vertical axis of
the diagram to represent time what messages are sent and when [57].
Sequence Diagrams captures:
The interaction that takes place in a collaboration that either realizes a use case or an operation
(instance diagrams or generic diagrams)
High-level interactions between the user of the system and the system, between the system and
other systems, or between subsystems (sometimes known as system sequence diagrams)
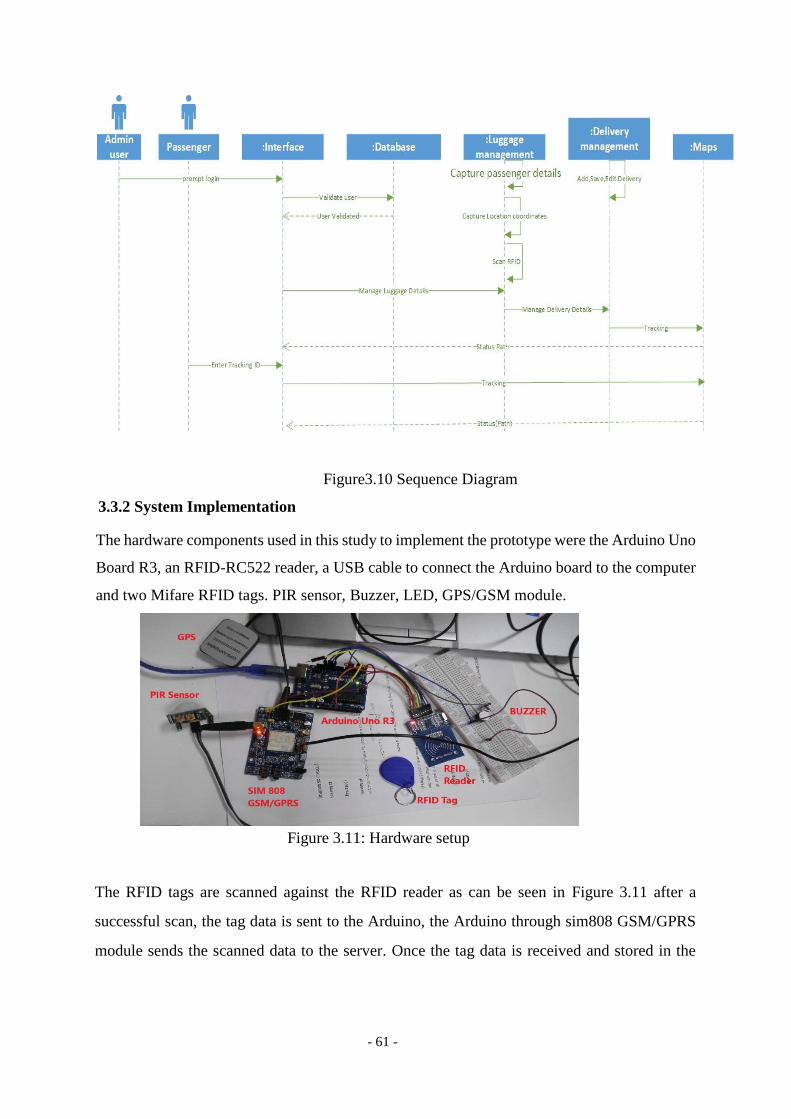
- 61 -
Figure3.10 Sequence Diagram
3.3.2 System Implementation
The hardware components used in this study to implement the prototype were the Arduino Uno
Board R3, an RFID-RC522 reader, a USB cable to connect the Arduino board to the computer
and two Mifare RFID tags. PIR sensor, Buzzer, LED, GPS/GSM module.
Figure 3.11: Hardware setup
The RFID tags are scanned against the RFID reader as can be seen in Figure 3.11 after a
successful scan, the tag data is sent to the Arduino, the Arduino through sim808 GSM/GPRS
module sends the scanned data to the server. Once the tag data is received and stored in the
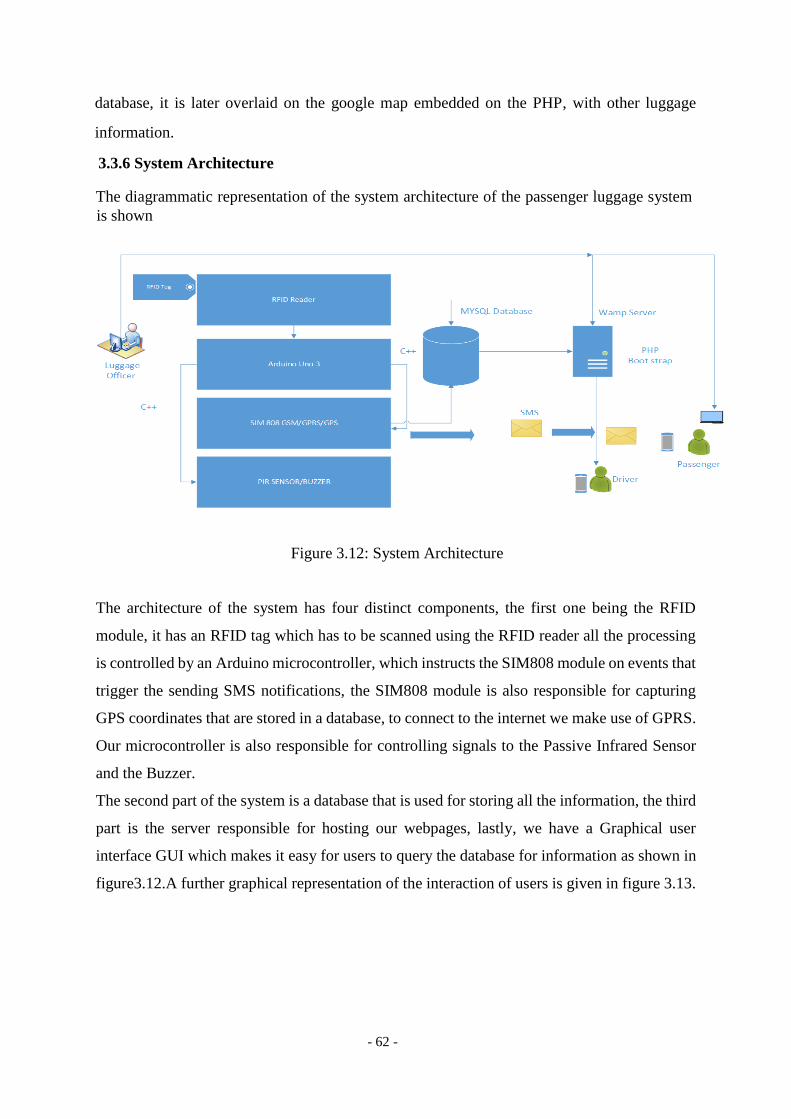
- 62 -
database, it is later overlaid on the google map embedded on the PHP, with other luggage
information.
3.3.6 System Architecture
The diagrammatic representation of the system architecture of the passenger luggage system
is shown
Figure 3.12: System Architecture
The architecture of the system has four distinct components, the first one being the RFID
module, it has an RFID tag which has to be scanned using the RFID reader all the processing
is controlled by an Arduino microcontroller, which instructs the SIM808 module on events that
trigger the sending SMS notifications, the SIM808 module is also responsible for capturing
GPS coordinates that are stored in a database, to connect to the internet we make use of GPRS.
Our microcontroller is also responsible for controlling signals to the Passive Infrared Sensor
and the Buzzer.
The second part of the system is a database that is used for storing all the information, the third
part is the server responsible for hosting our webpages, lastly, we have a Graphical user
interface GUI which makes it easy for users to query the database for information as shown in
figure3.12.A further graphical representation of the interaction of users is given in figure 3.13.
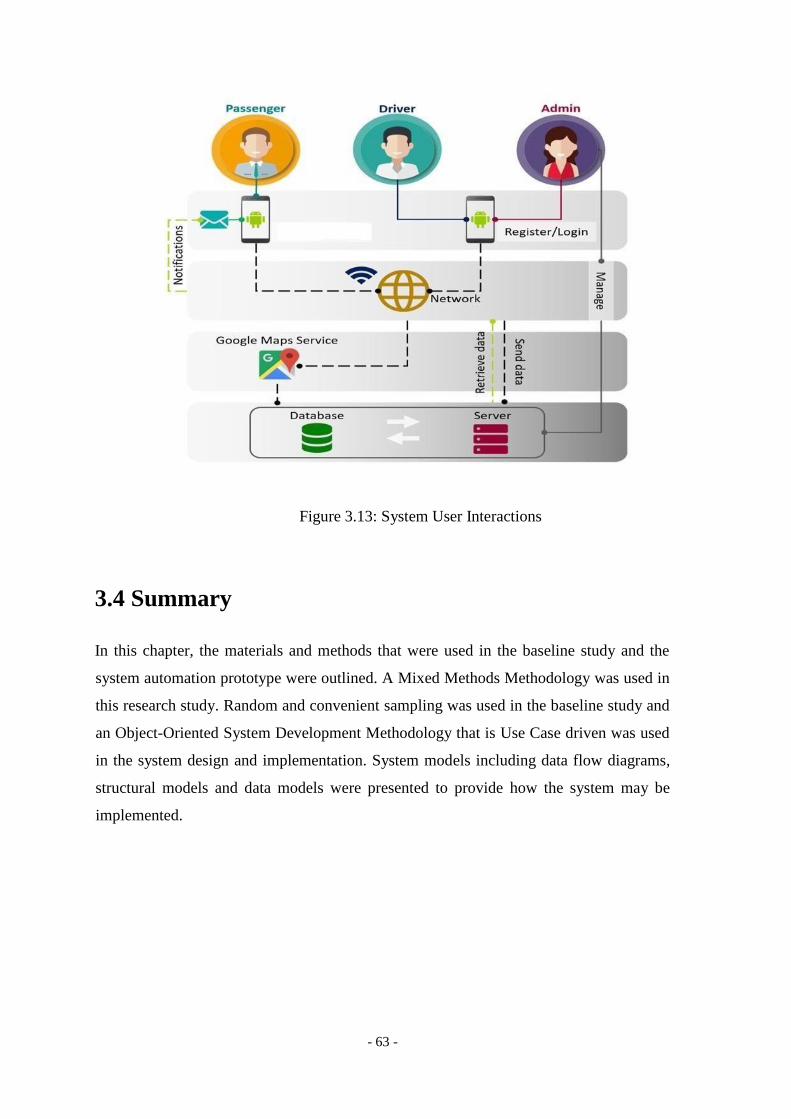
- 63 -
Figure 3.13: System User Interactions
3.4 Summary
In this chapter, the materials and methods that were used in the baseline study and the
system automation prototype were outlined. A Mixed Methods Methodology was used in
this research study. Random and convenient sampling was used in the baseline study and
an Object-Oriented System Development Methodology that is Use Case driven was used
in the system design and implementation. System models including data flow diagrams,
structural models and data models were presented to provide how the system may be
implemented.
- 64 -
CHAPTER FOUR
DATA COLLECTION ANALYSIS
4.1 Introduction
In this chapter, we present the results that were derived from the baseline study. We also
present results for the implementation of the system prototype using screenshots of the
system application and hardware.
4.2 Baseline Study Results In this section, the results from the baseline study derived from the analysis of each variable
through descriptive statistics are presented. The presentation of the results is in the form
of tables, bar charts and pie charts. The implementation and results that were outlined in
the previous chapter and how they relate to the objectives of this study.
The first objective sought to establish the level of technology adoption among the bus
operators and passengers and understand the operational challenges. The study revealed
that 99.5 per cent of the respondents have used public transportation to connect from one
end of the country to another. Respondents were asked if they had made online ticket
reservation before, 14.5 Percent of the respondents had made online ticket reservation 85.5
Percent had not, this was largely attributed to fear of making paperless payments and lack
of knowledge to making electronic payments. Further information to ascertain the
respondents’ level of computer skills was conducted, over 50 per cent of the respondents
stated that they had basic computer skills, which included sending an email, typing a
document, switching on a computer and browsing for information on the internet.
The survey also revealed that respondents that had encountered losing or misplacing
luggage on a journey were 28 per cent while 78 Percent had never encountered such an
occurrence. Once all the information from the questionnaires was collected, it was
organized into tables and charts.
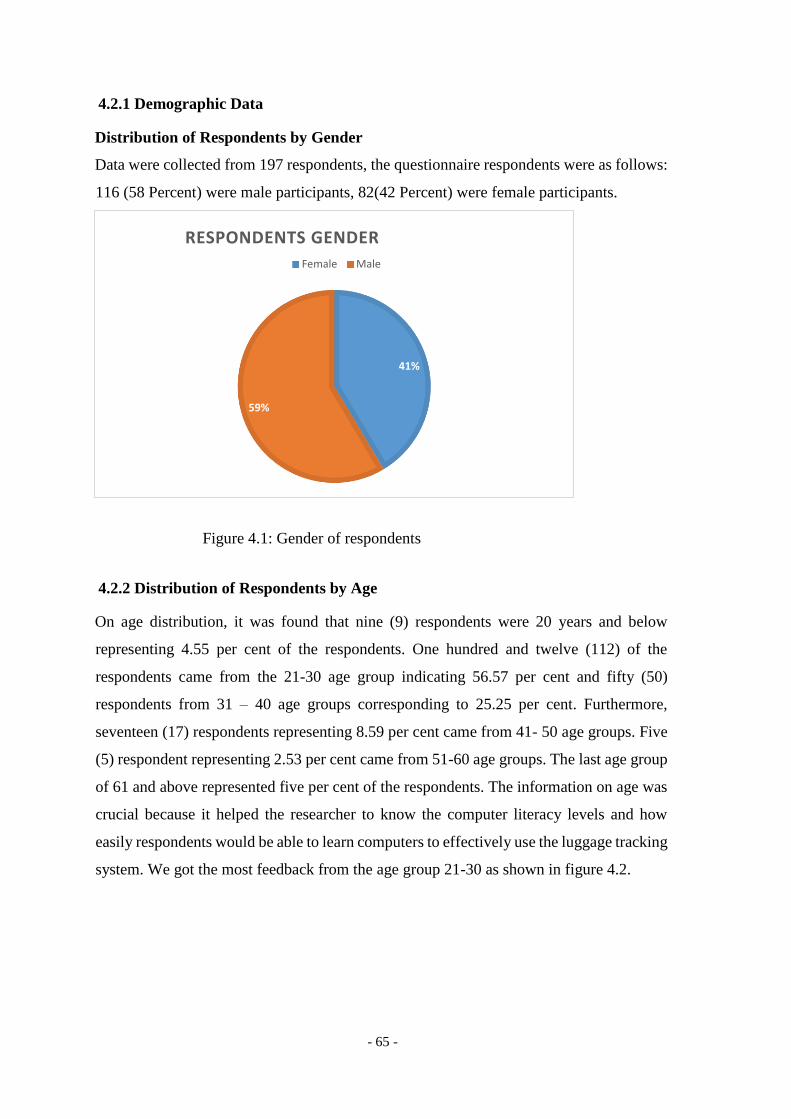
- 65 -
4.2.1 Demographic Data
Distribution of Respondents by Gender
Data were collected from 197 respondents, the questionnaire respondents were as follows:
116 (58 Percent) were male participants, 82(42 Percent) were female participants.
Figure 4.1: Gender of respondents
4.2.2 Distribution of Respondents by Age
On age distribution, it was found that nine (9) respondents were 20 years and below
representing 4.55 per cent of the respondents. One hundred and twelve (112) of the
respondents came from the 21-30 age group indicating 56.57 per cent and fifty (50)
respondents from 31 – 40 age groups corresponding to 25.25 per cent. Furthermore,
seventeen (17) respondents representing 8.59 per cent came from 41- 50 age groups. Five
(5) respondent representing 2.53 per cent came from 51-60 age groups. The last age group
of 61 and above represented five per cent of the respondents. The information on age was
crucial because it helped the researcher to know the computer literacy levels and how
easily respondents would be able to learn computers to effectively use the luggage tracking
system. We got the most feedback from the age group 21-30 as shown in figure 4.2.
41%
59%
RESPONDENTS GENDER
Female Male
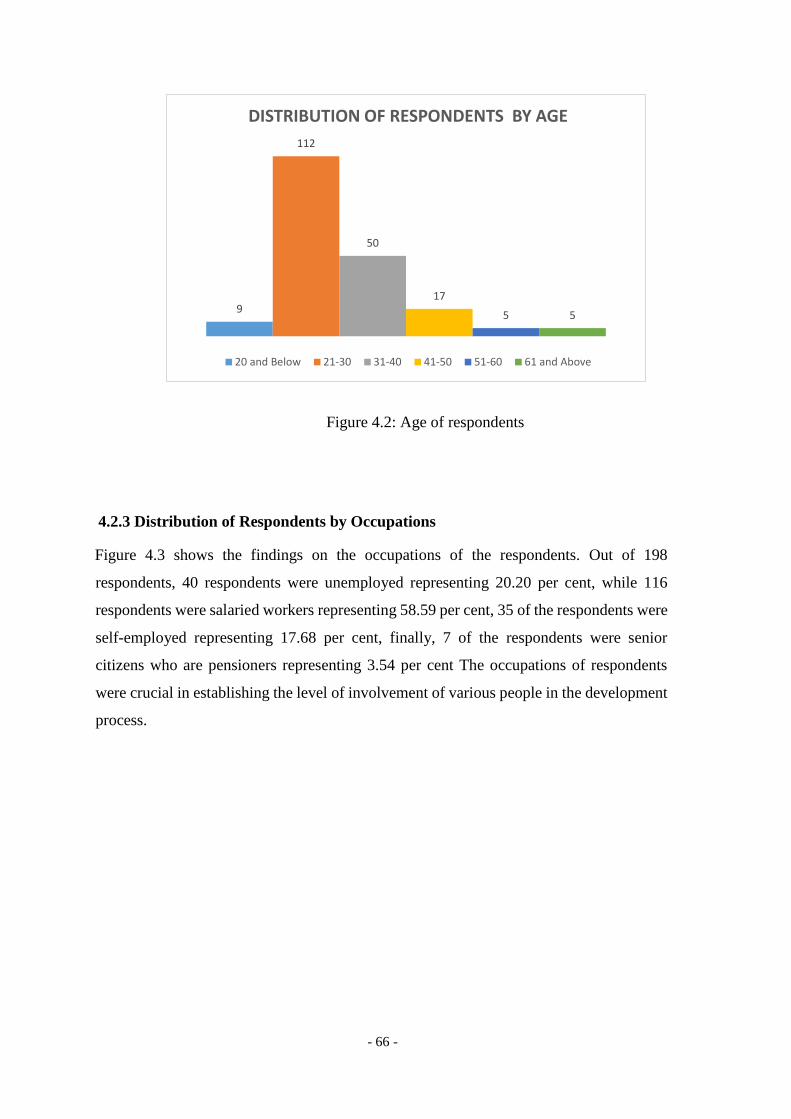
- 66 -
Figure 4.2: Age of respondents
4.2.3 Distribution of Respondents by Occupations
Figure 4.3 shows the findings on the occupations of the respondents. Out of 198
respondents, 40 respondents were unemployed representing 20.20 per cent, while 116
respondents were salaried workers representing 58.59 per cent, 35 of the respondents were
self-employed representing 17.68 per cent, finally, 7 of the respondents were senior
citizens who are pensioners representing 3.54 per cent The occupations of respondents
were crucial in establishing the level of involvement of various people in the development
process.
9
112
50
17
5 5
DISTRIBUTION OF RESPONDENTS BY AGE
20 and Below 21-30 31-40 41-50 51-60 61 and Above
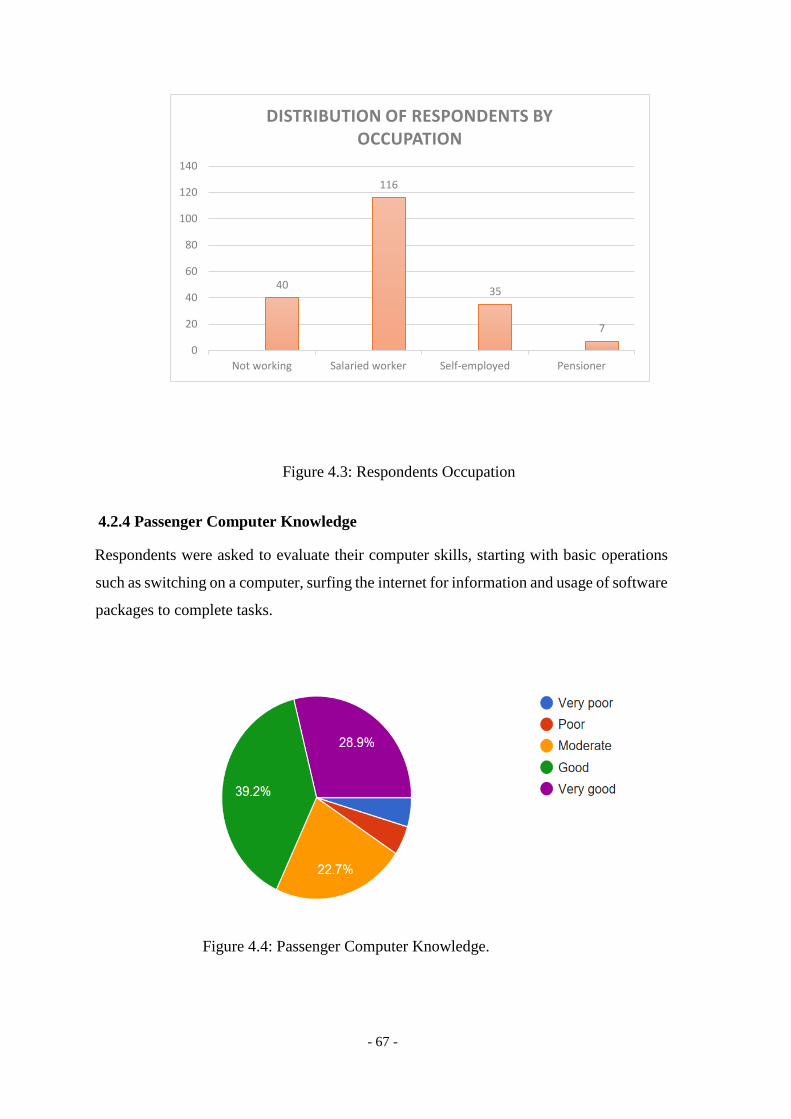
- 67 -
Figure 4.3: Respondents Occupation
4.2.4 Passenger Computer Knowledge
Respondents were asked to evaluate their computer skills, starting with basic operations
such as switching on a computer, surfing the internet for information and usage of software
packages to complete tasks.
Figure 4.4: Passenger Computer Knowledge.
40
116
35
7
0
20
40
60
80
100
120
140
Not working Salaried worker Self-employed Pensioner
DISTRIBUTION OF RESPONDENTS BY OCCUPATION
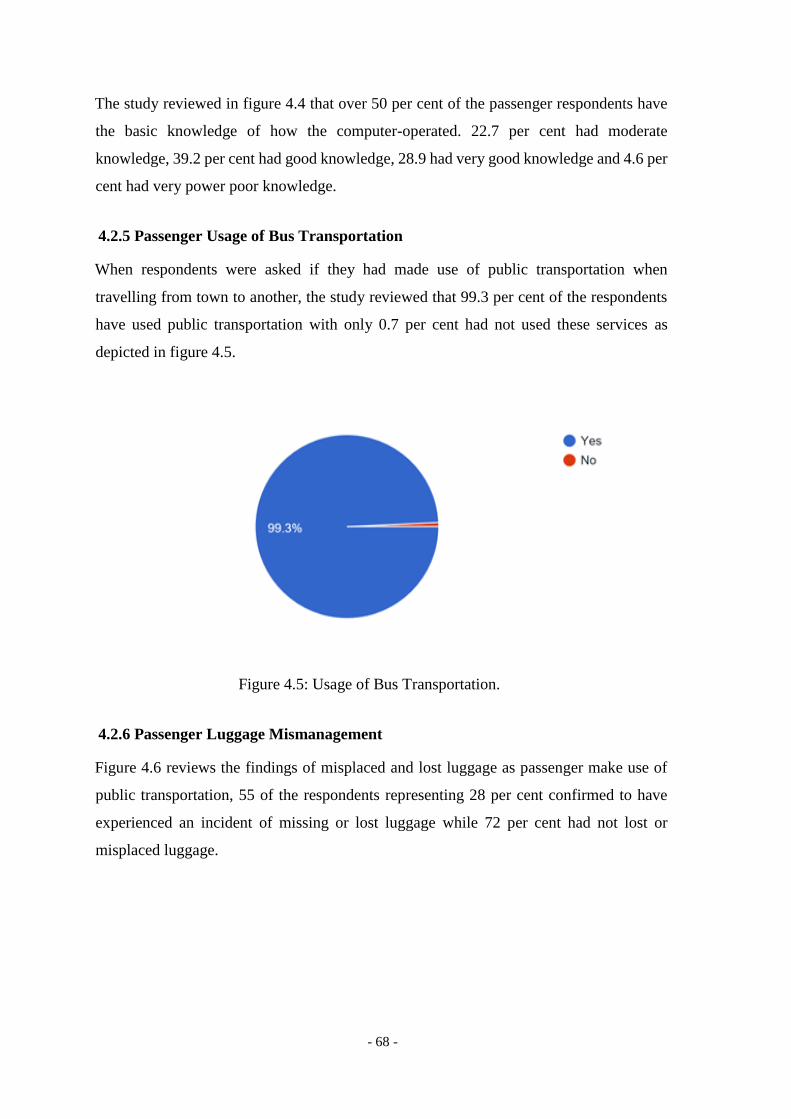
- 68 -
The study reviewed in figure 4.4 that over 50 per cent of the passenger respondents have
the basic knowledge of how the computer-operated. 22.7 per cent had moderate
knowledge, 39.2 per cent had good knowledge, 28.9 had very good knowledge and 4.6 per
cent had very power poor knowledge.
4.2.5 Passenger Usage of Bus Transportation
When respondents were asked if they had made use of public transportation when
travelling from town to another, the study reviewed that 99.3 per cent of the respondents
have used public transportation with only 0.7 per cent had not used these services as
depicted in figure 4.5.
Figure 4.5: Usage of Bus Transportation.
4.2.6 Passenger Luggage Mismanagement
Figure 4.6 reviews the findings of misplaced and lost luggage as passenger make use of
public transportation, 55 of the respondents representing 28 per cent confirmed to have
experienced an incident of missing or lost luggage while 72 per cent had not lost or
misplaced luggage.
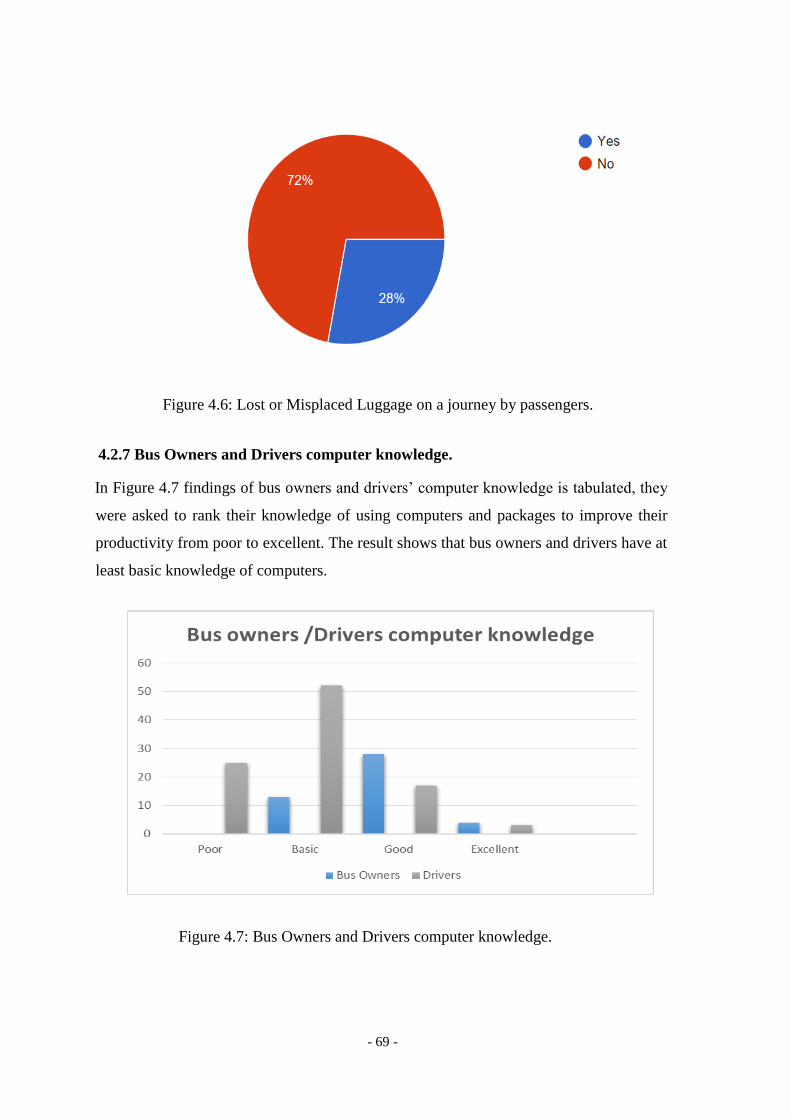
- 69 -
Figure 4.6: Lost or Misplaced Luggage on a journey by passengers.
4.2.7 Bus Owners and Drivers computer knowledge.
In Figure 4.7 findings of bus owners and drivers’ computer knowledge is tabulated, they
were asked to rank their knowledge of using computers and packages to improve their
productivity from poor to excellent. The result shows that bus owners and drivers have at
least basic knowledge of computers.
Figure 4.7: Bus Owners and Drivers computer knowledge.
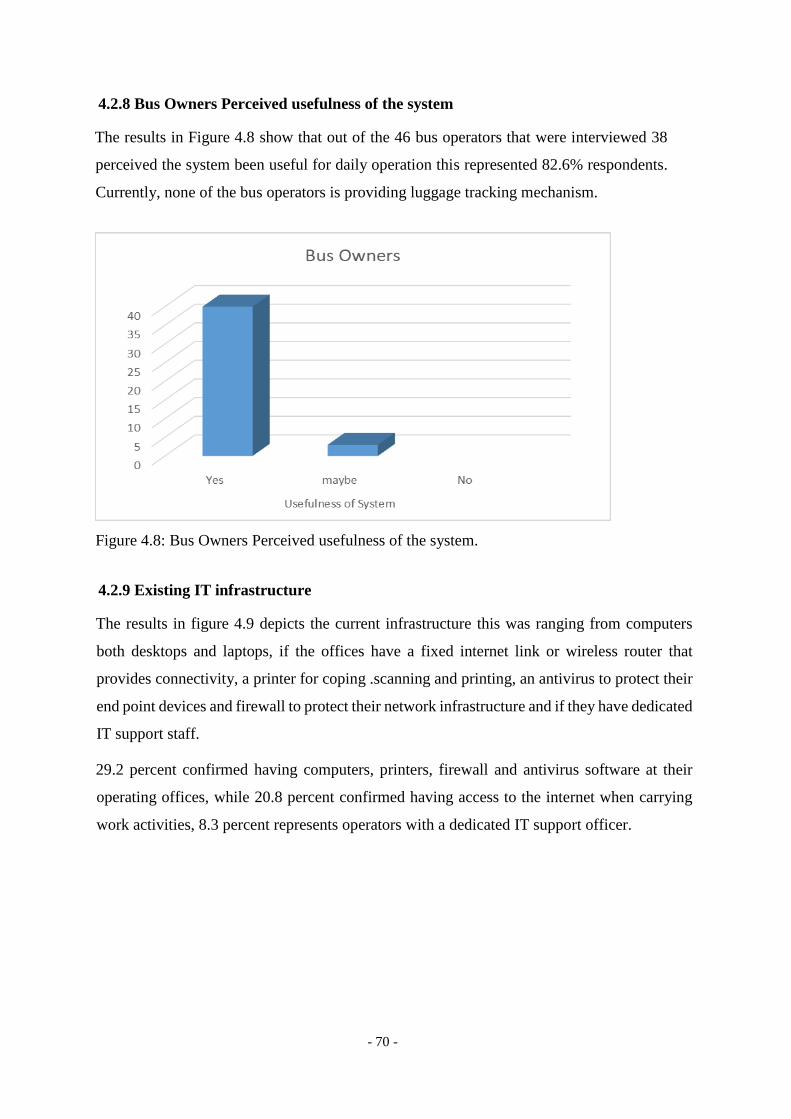
- 70 -
4.2.8 Bus Owners Perceived usefulness of the system
The results in Figure 4.8 show that out of the 46 bus operators that were interviewed 38
perceived the system been useful for daily operation this represented 82.6% respondents.
Currently, none of the bus operators is providing luggage tracking mechanism.
Figure 4.8: Bus Owners Perceived usefulness of the system.
4.2.9 Existing IT infrastructure
The results in figure 4.9 depicts the current infrastructure this was ranging from computers
both desktops and laptops, if the offices have a fixed internet link or wireless router that
provides connectivity, a printer for coping .scanning and printing, an antivirus to protect their
end point devices and firewall to protect their network infrastructure and if they have dedicated
IT support staff.
29.2 percent confirmed having computers, printers, firewall and antivirus software at their
operating offices, while 20.8 percent confirmed having access to the internet when carrying
work activities, 8.3 percent represents operators with a dedicated IT support officer.
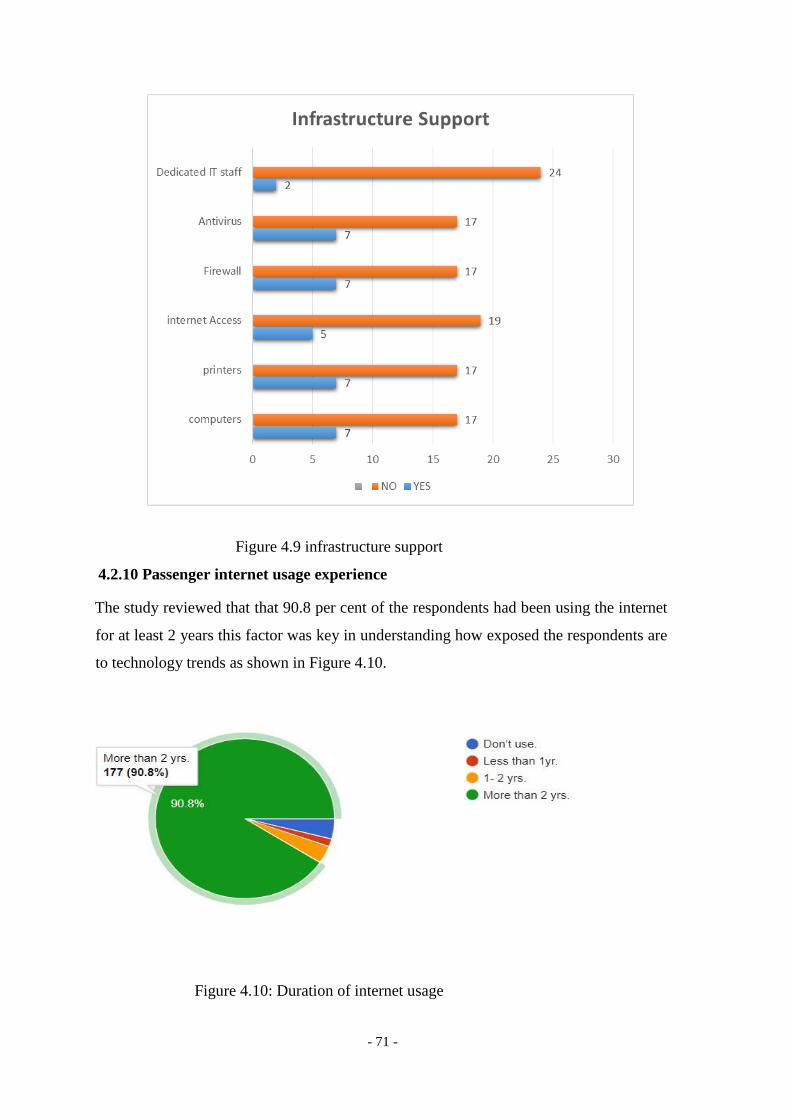
- 71 -
Figure 4.9 infrastructure support
4.2.10 Passenger internet usage experience
The study reviewed that that 90.8 per cent of the respondents had been using the internet
for at least 2 years this factor was key in understanding how exposed the respondents are
to technology trends as shown in Figure 4.10.
Figure 4.10: Duration of internet usage
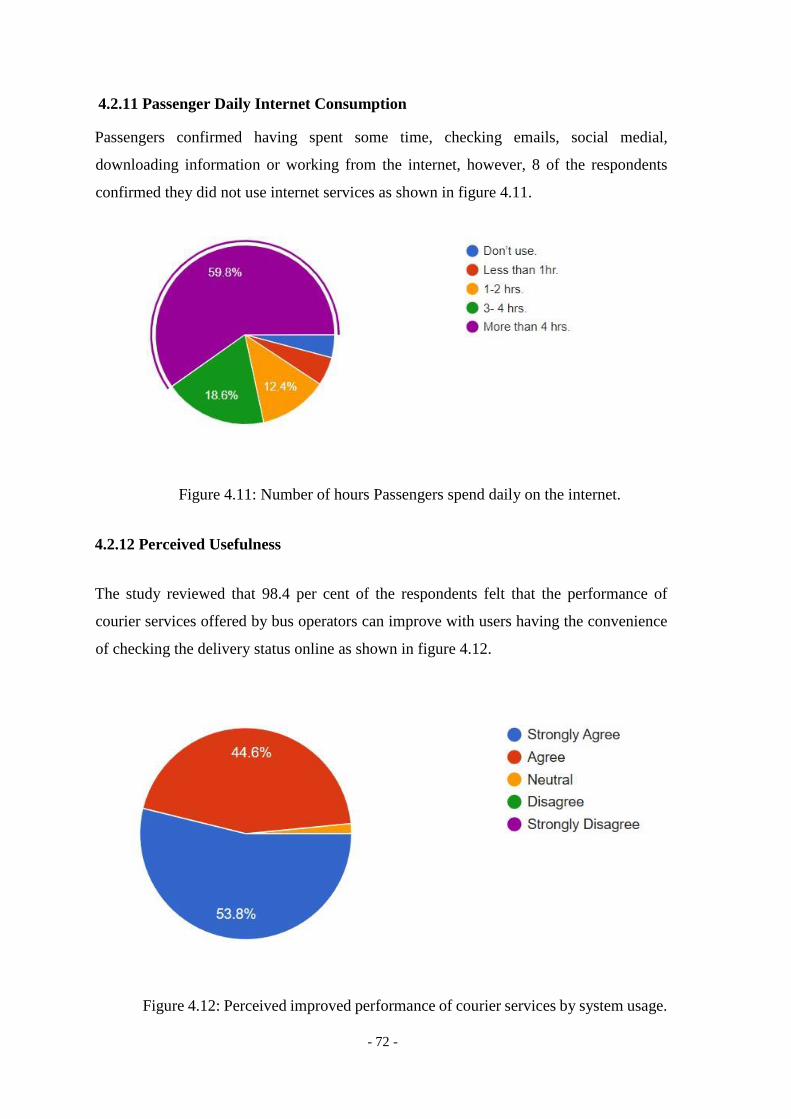
- 72 -
4.2.11 Passenger Daily Internet Consumption
Passengers confirmed having spent some time, checking emails, social medial,
downloading information or working from the internet, however, 8 of the respondents
confirmed they did not use internet services as shown in figure 4.11.
Figure 4.11: Number of hours Passengers spend daily on the internet.
4.2.12 Perceived Usefulness
The study reviewed that 98.4 per cent of the respondents felt that the performance of
courier services offered by bus operators can improve with users having the convenience
of checking the delivery status online as shown in figure 4.12.
Figure 4.12: Perceived improved performance of courier services by system usage.
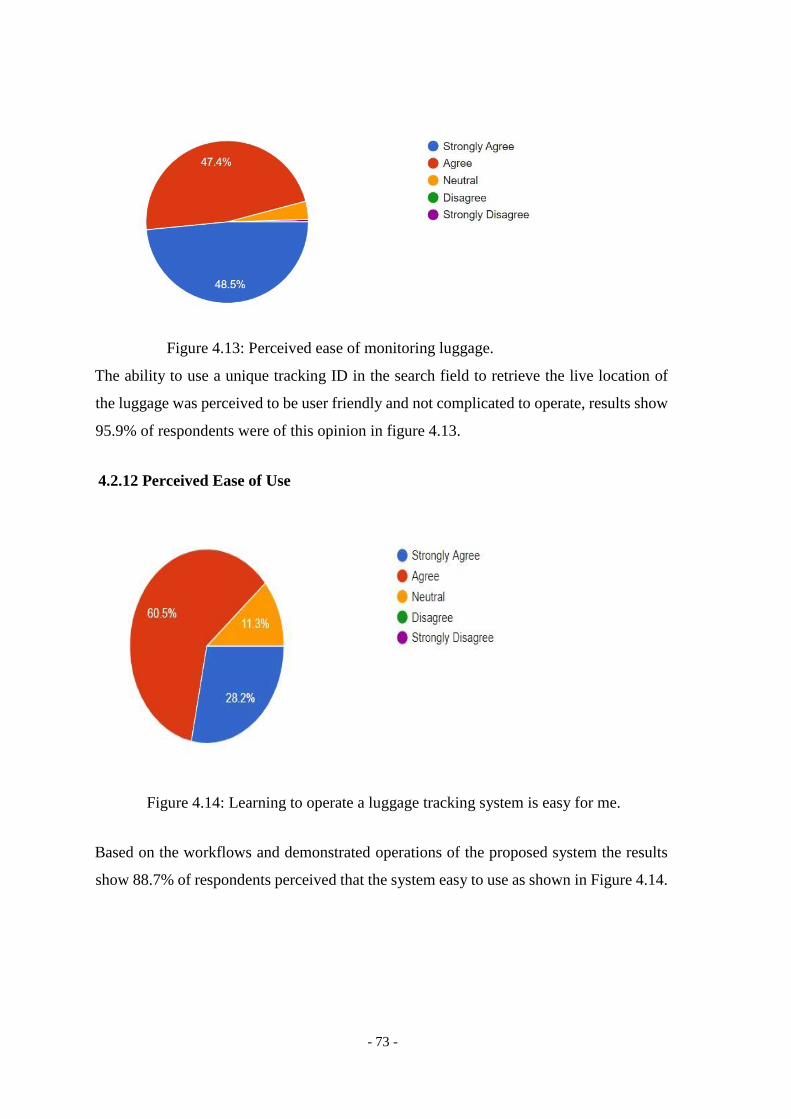
- 73 -
Figure 4.13: Perceived ease of monitoring luggage.
The ability to use a unique tracking ID in the search field to retrieve the live location of
the luggage was perceived to be user friendly and not complicated to operate, results show
95.9% of respondents were of this opinion in figure 4.13.
4.2.12 Perceived Ease of Use
Figure 4.14: Learning to operate a luggage tracking system is easy for me.
Based on the workflows and demonstrated operations of the proposed system the results
show 88.7% of respondents perceived that the system easy to use as shown in Figure 4.14.
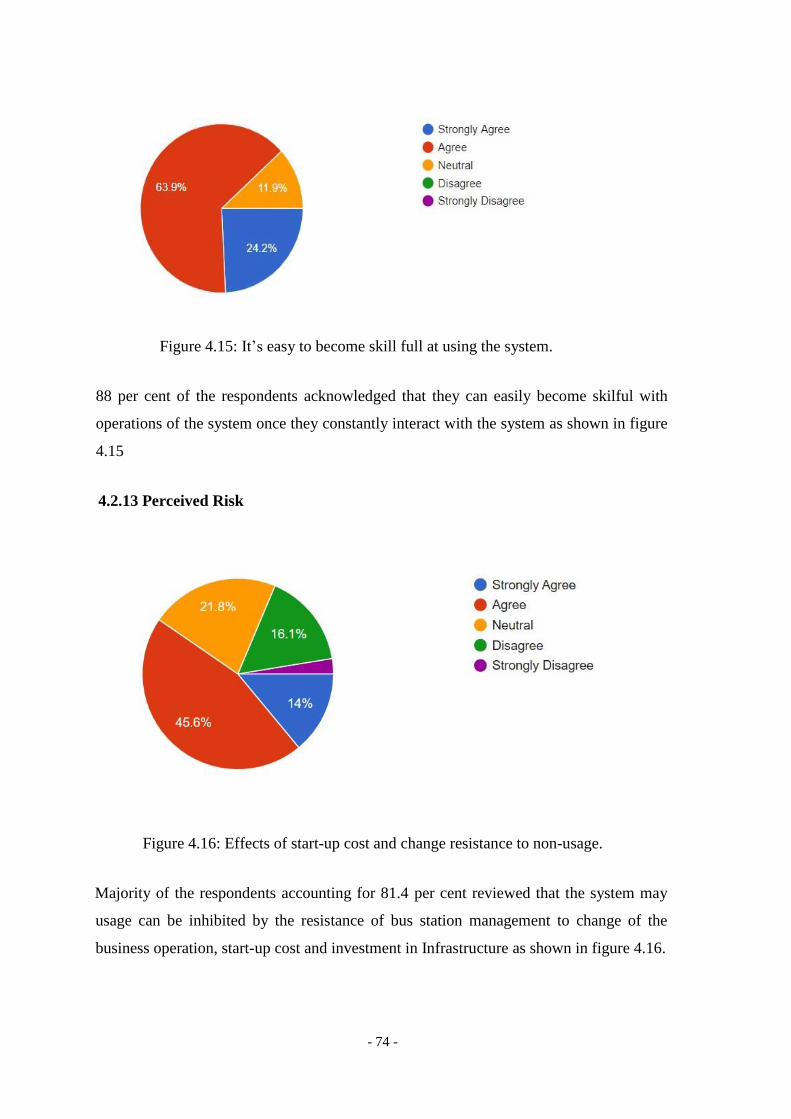
- 74 -
Figure 4.15: It’s easy to become skill full at using the system.
88 per cent of the respondents acknowledged that they can easily become skilful with
operations of the system once they constantly interact with the system as shown in figure
4.15
4.2.13 Perceived Risk
Figure 4.16: Effects of start-up cost and change resistance to non-usage.
Majority of the respondents accounting for 81.4 per cent reviewed that the system may
usage can be inhibited by the resistance of bus station management to change of the
business operation, start-up cost and investment in Infrastructure as shown in figure 4.16.
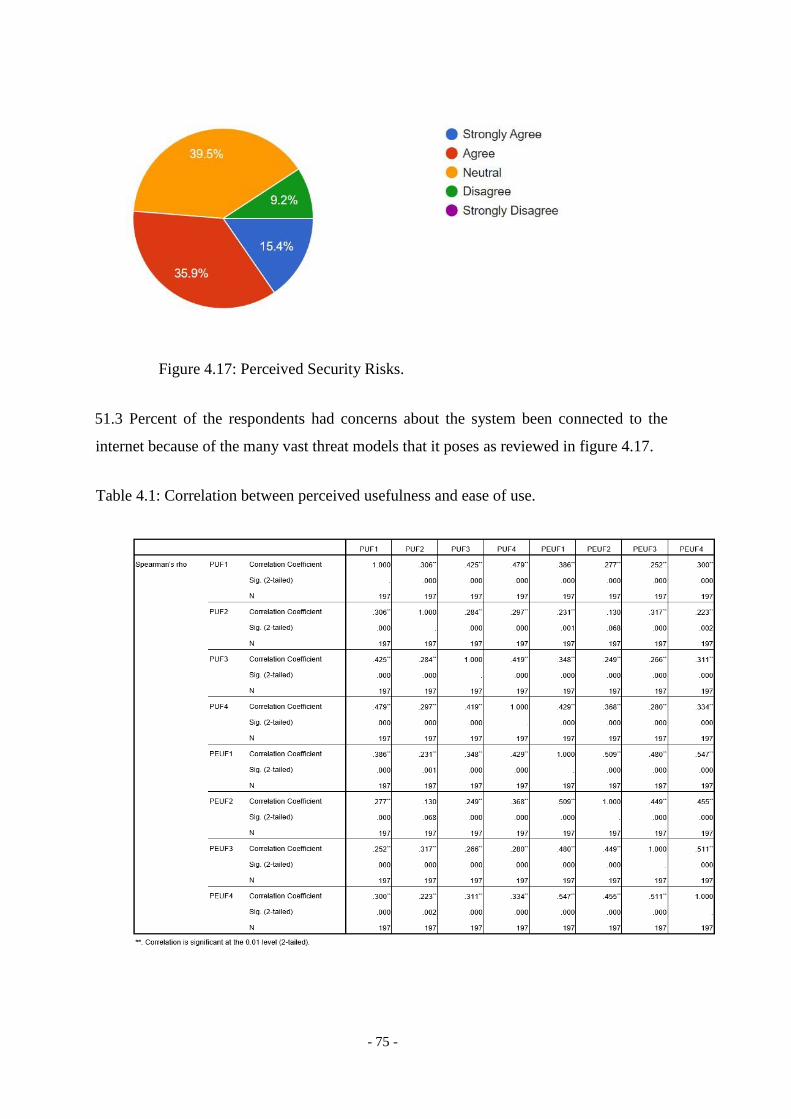
- 75 -
Figure 4.17: Perceived Security Risks.
51.3 Percent of the respondents had concerns about the system been connected to the
internet because of the many vast threat models that it poses as reviewed in figure 4.17.
Table 4.1: Correlation between perceived usefulness and ease of use.
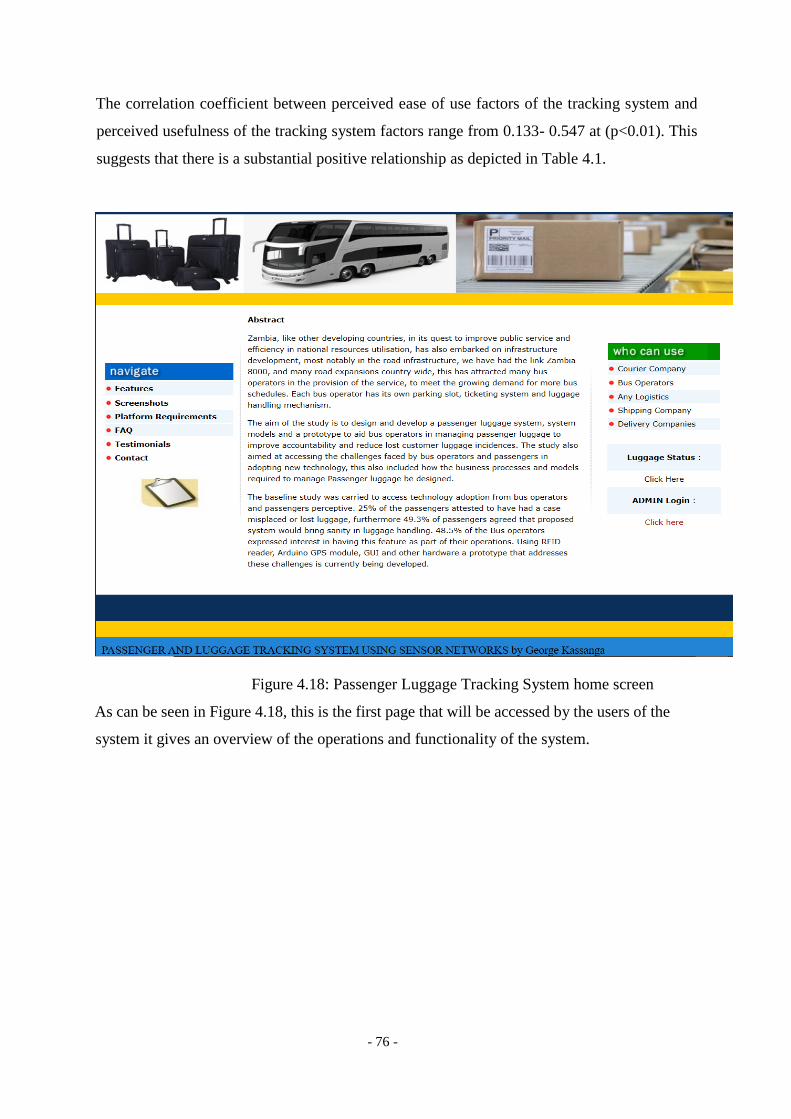
- 76 -
The correlation coefficient between perceived ease of use factors of the tracking system and
perceived usefulness of the tracking system factors range from 0.133- 0.547 at (p<0.01). This
suggests that there is a substantial positive relationship as depicted in Table 4.1.
Figure 4.18: Passenger Luggage Tracking System home screen
As can be seen in Figure 4.18, this is the first page that will be accessed by the users of the
system it gives an overview of the operations and functionality of the system.
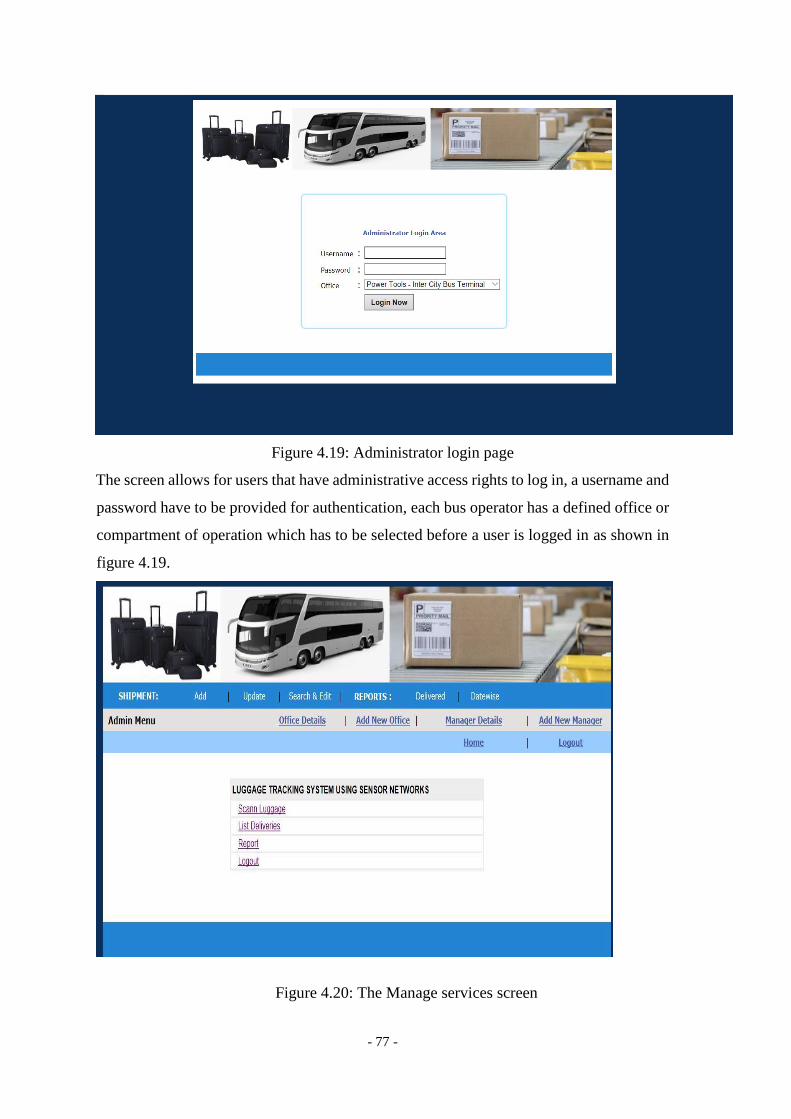
- 77 -
Figure 4.19: Administrator login page
The screen allows for users that have administrative access rights to log in, a username and
password have to be provided for authentication, each bus operator has a defined office or
compartment of operation which has to be selected before a user is logged in as shown in
figure 4.19.
Figure 4.20: The Manage services screen
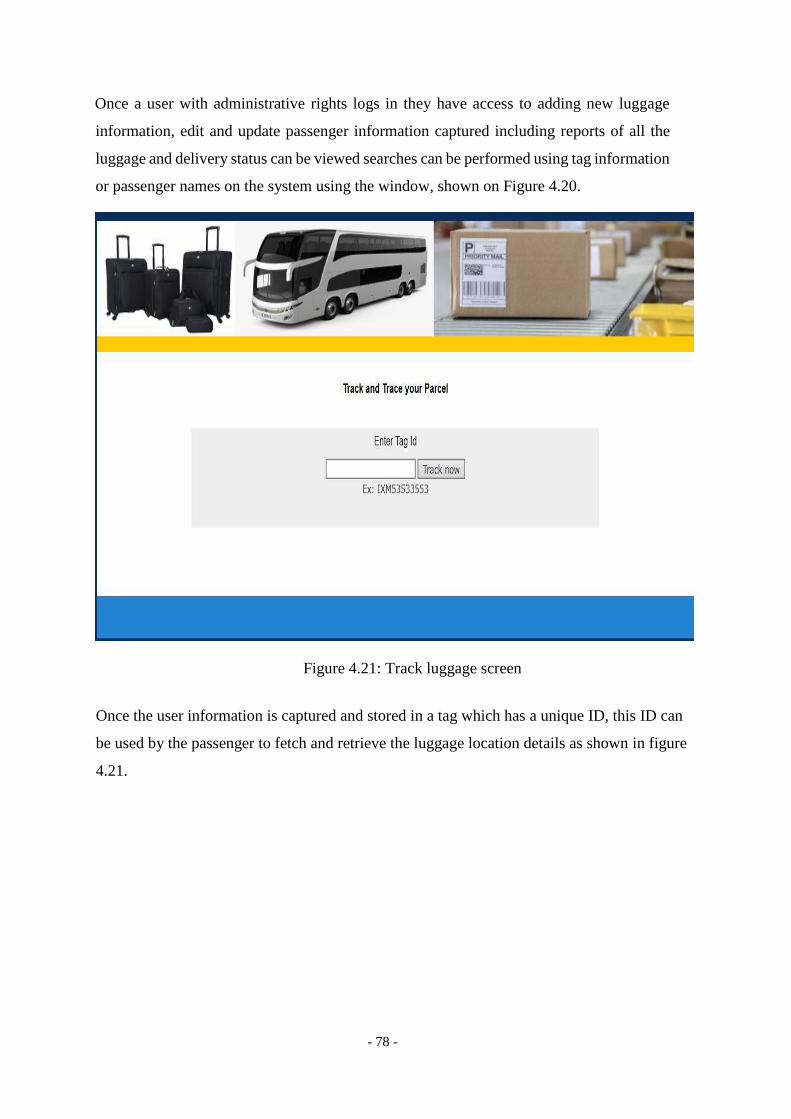
- 78 -
Once a user with administrative rights logs in they have access to adding new luggage
information, edit and update passenger information captured including reports of all the
luggage and delivery status can be viewed searches can be performed using tag information
or passenger names on the system using the window, shown on Figure 4.20.
Figure 4.21: Track luggage screen
Once the user information is captured and stored in a tag which has a unique ID, this ID can
be used by the passenger to fetch and retrieve the luggage location details as shown in figure
4.21.
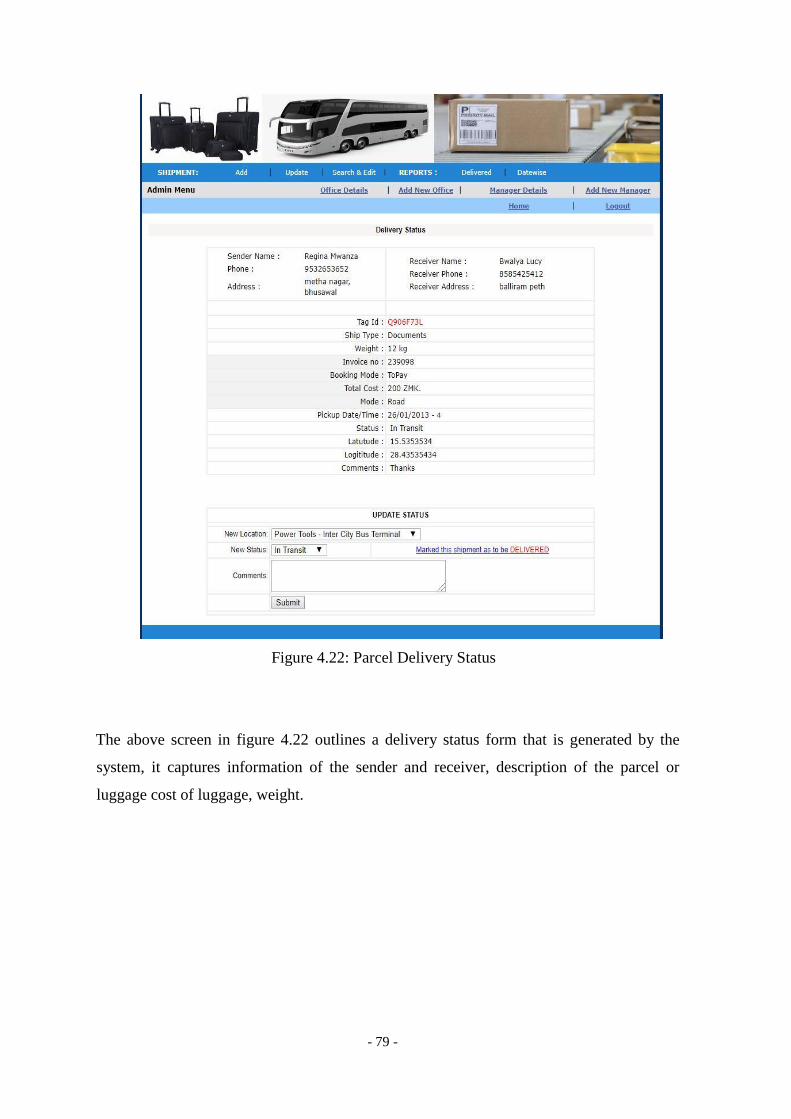
- 79 -
Figure 4.22: Parcel Delivery Status
The above screen in figure 4.22 outlines a delivery status form that is generated by the
system, it captures information of the sender and receiver, description of the parcel or
luggage cost of luggage, weight.
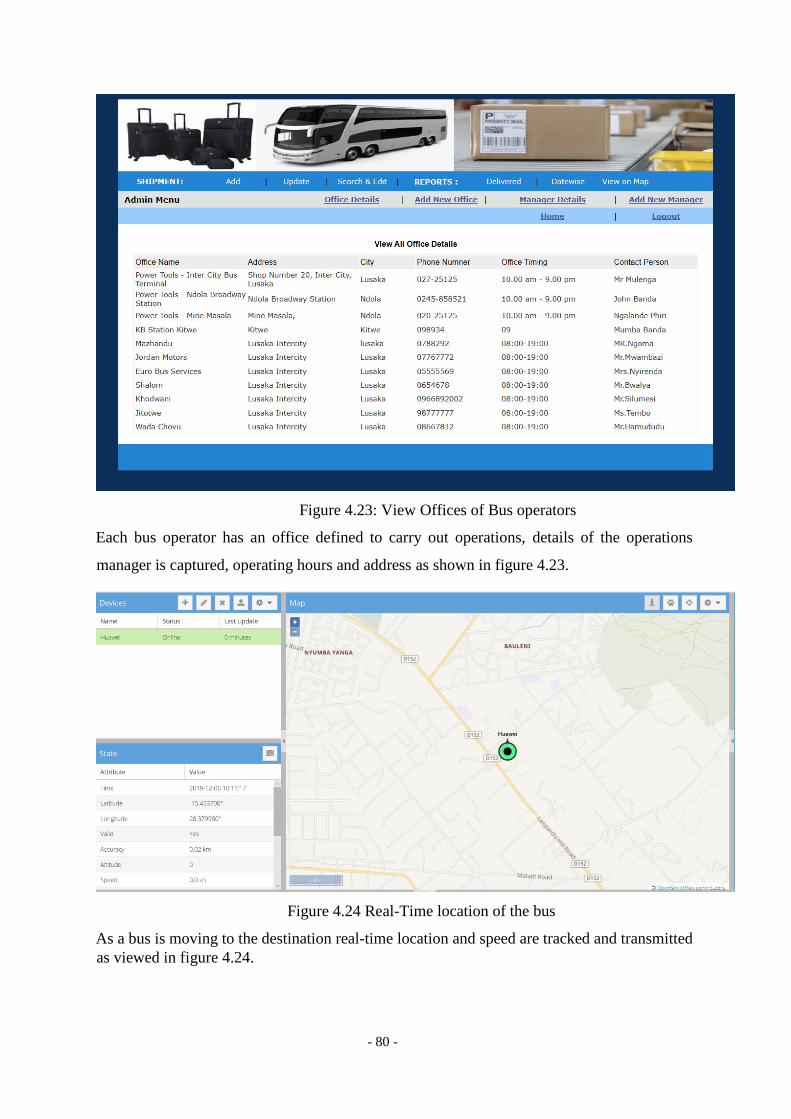
- 80 -
Figure 4.23: View Offices of Bus operators
Each bus operator has an office defined to carry out operations, details of the operations
manager is captured, operating hours and address as shown in figure 4.23.
Figure 4.24 Real-Time location of the bus
As a bus is moving to the destination real-time location and speed are tracked and transmitted
as viewed in figure 4.24.
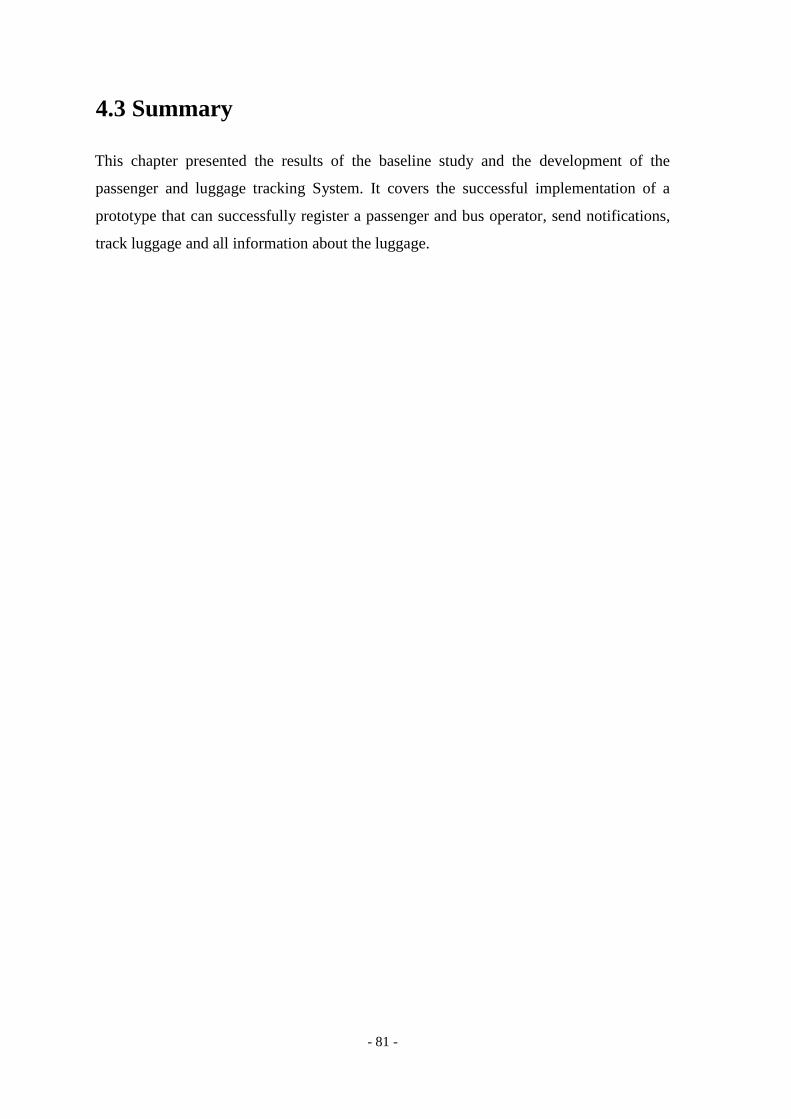
- 81 -
4.3 Summary
This chapter presented the results of the baseline study and the development of the
passenger and luggage tracking System. It covers the successful implementation of a
prototype that can successfully register a passenger and bus operator, send notifications,
track luggage and all information about the luggage.
- 82 -
CHAPTER FIVE
DISCUSSION AND CONCLUSIONS
5.1 Introduction
In this chapter, based on the empirical results and findings from this research project,
the researcher presents a prototype system for the luggage tracking to help the public
transportation sector, integrate operations with technology and the implementation
considerations.
5.2 Discussion
The research was guided by objectives and research questions as outlined in chapter one,
the Government of the Republic of Zambia has been making strides in improving service
provision to members of the public by embracing technology, this was set in motion by
the implementation of the National ICT policy in the year 2006 by the Ministry of
Communications and Transport [121] which identifies ICTs as enablers of social and
economic development. In the year 2016, the seventh national development plan was
developed, a multi-sectoral development blueprint for the country[7], with special
interest on the technology sector to improve the production of technology and innovation
through the use of research and development, putting in place appropriate laws, policies
and regulations to support the provision of electronic services, improve ICT
infrastructure, As part of achieving the National development plan, Zambia is currently
undergoing computerization of some of the key infrastructures (data centres, servers,
and computers)in health, judiciary, road tolling, defence and security, financial
institutions, education, utility services and more, the development plan runs from 2017-
2021[7]. The research attempted to assess the level of usage of technology among
members of the public, and understand the challenges that can affect the adoption of
technology among bus operators for daily operation.
From the findings of the research, it was established that 90.8 per cent of respondents
had at least two years’ experience with usage of a computer and mobile phones which
involves looking up information online, checking emails and sending SMS, with 59.8
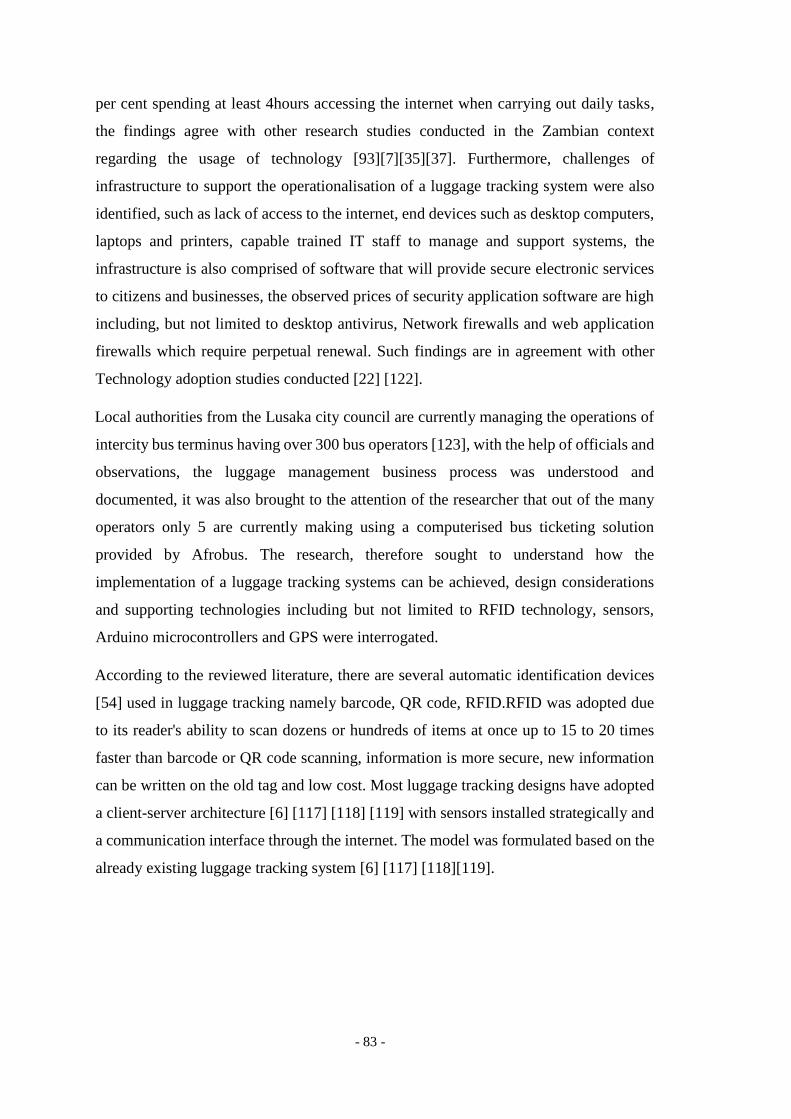
- 83 -
per cent spending at least 4hours accessing the internet when carrying out daily tasks,
the findings agree with other research studies conducted in the Zambian context
regarding the usage of technology [93][7][35][37]. Furthermore, challenges of
infrastructure to support the operationalisation of a luggage tracking system were also
identified, such as lack of access to the internet, end devices such as desktop computers,
laptops and printers, capable trained IT staff to manage and support systems, the
infrastructure is also comprised of software that will provide secure electronic services
to citizens and businesses, the observed prices of security application software are high
including, but not limited to desktop antivirus, Network firewalls and web application
firewalls which require perpetual renewal. Such findings are in agreement with other
Technology adoption studies conducted [22] [122].
Local authorities from the Lusaka city council are currently managing the operations of
intercity bus terminus having over 300 bus operators [123], with the help of officials and
observations, the luggage management business process was understood and
documented, it was also brought to the attention of the researcher that out of the many
operators only 5 are currently making using a computerised bus ticketing solution
provided by Afrobus. The research, therefore sought to understand how the
implementation of a luggage tracking systems can be achieved, design considerations
and supporting technologies including but not limited to RFID technology, sensors,
Arduino microcontrollers and GPS were interrogated.
According to the reviewed literature, there are several automatic identification devices
[54] used in luggage tracking namely barcode, QR code, RFID.RFID was adopted due
to its reader's ability to scan dozens or hundreds of items at once up to 15 to 20 times
faster than barcode or QR code scanning, information is more secure, new information
can be written on the old tag and low cost. Most luggage tracking designs have adopted
a client-server architecture [6] [117] [118] [119] with sensors installed strategically and
a communication interface through the internet. The model was formulated based on the
already existing luggage tracking system [6] [117] [118][119].
- 84 -
Figure 5.1: Proposed luggage tracking business model
The proposed luggage tracking business model in figure 5.1 was used to develop the
passenger luggage tracking prototype by making use of RFID tags, RFID readers, servers
GPRS\GSM and GPS technology.
5.2.1 How the Model Operates
At the starting point in figure 5.1, the passenger purchases the ticket at the ticket generation
booth information is captured such as names, seat number, the destination and phone
number are saved in the tag in step 1 every tag has a unique identifier, the luggage is then
moved to the loading bay in step 2 the tag is scanned as luggage is loaded on the bus,
changing the status of luggage to on-board also capturing the vehicle plat number. this
information is then relayed using GPRS [113] with the aid of our SIM808 board to the
STEP 4
- 85 -
server hosting the database in step 3 as the bus journeys the GPS tracking module updates
the location of the bus, in step 4 the passenger or receiver of a parcel can monitor the real-
time location of the also checking at which points the luggage was checked in.
In step 5 the luggage is scanned at the destination changing the status to arrive and send a
notification the phone number linked to the luggage.
5.2.3 Prototype development
Development of the prototype was the final phase of the research study, OOSDM [61]
development methodology was adopted based on literature, ease of development and
module testing, the methodology was followed from the Analysis phase through to the
Testing phase in the implementation.
Information gathered in the early stages of the study was analysed and formulated into
useful system requirements. The system requirements were derived from observation of
operations, interviews with local authorities from the Lusaka city council, members of the
public and operational managers for different bus operators that provided insight into their
preferences. According to the literature reviewed [62] [63] [65], system requirements
afford a way to understand the business needs of an entity, code was developed for each
module beginning with the user interface developed using PHP, the front end of the system
was tested for usability and readability.
A database was created using MySQL to house all system information and linked to the
frontend to also provide data validation and authentication, the information in the database
was not served in plaintext but was run through an encryption function to produce cipher
text [39]. Arduino IDE was used to programme the individual system components using
C++ and tested before integration, the Arduino UNO R3 boards been the heart of the
project are limited to the number analogue and digital pins hence a breadboard was
introduced. Once the Prototype was functional data was input to test system responses,
error handling and performance.
Appendix III provides code developed
- 86 -
5.4 Recommendations We put forward the following recommendations to improve the efficiency of luggage
tracking and parcel monitoring at intercity bus terminal:
i. Infrastructure support there is a need for increased investment in
telecommunication infrastructure with is the backbone for online services,
availability of affordable end devices such as computers and smartphones.
ii. Providing cheaper and faster internet broadband packages for bus operators to
encourage the provision of most services online, this also implies increased
access to internet service by the general public.
iii. An improved legal framework that protects data privacy, and upholds data
security standards to security breaches and intrusive behaviour.
iv. Marketing institutions need to highly market the advantages of having self-
service online-based platforms to change public perception towards online
services. This also entails improved availability, usability and customer
experience when using online platforms
ii) Automating the courier services and luggage management using automatic
identification such as RFID and sensor network technologies to effectively
monitor and track luggage inventory from source to destination.
iii) Computerising the record management and daily operations to significantly
reduce inefficiencies, time wastage, errors, brought about by the use of paper-
based systems.
iv) For the paradigm shift of manual to automate to take place there is a need to build
the capacity of computer skills among bus operators and supporting for them to
easily transfer these skills to others.
5.5 Future Works The research implemented several functionalities in the application but the following
was not considered due to time and financial limitations;
i) Using GPS enabled tags to provide real-time tracking of each bag, and in an event
that it gets misplaced or stolen the location can still be tracked.
ii) Development of a mobile Application would be a good advancement of the
solution.
- 87 -
iii) Installation of Perimeter sensors and alarms that can scan for tags leaving the
station without been deactivated.
iv) The ability to query the location of the luggage using an SMS and receiving the
location name and coordinates without internet.
v) Installation of a Camera in the luggage compartment that takes pictures once it
senses infrared emission can help capture faces of thieves.
Furthermore, the study was limited to Bus operators at Intercity in Lusaka, Zambia.
Hence, there is a need to study other bus stations in other parts of Zambia. The study
only focussed on Bus operators at Intercity Bus Terminal and did not consider other
areas outside Lusaka, future research can be done in other areas to compare the findings.
5.6 Summary
The study brought out important points on the fact that there were challenges in the
management of luggage by bus operators and also infrastructure challenges to
accommodate new technologies were common among various bus operators that operate
from intercity. All participants agreed to the need to find a solution to solve passenger
luggage mismanagement. Bus owners also expressed interest in providing the tracking
feature to help improve service delivery and gain a competitive advantage.
- 88 -
REFERENCES
[1]J. Vetelino and A. Reghu, Introduction to sensors.2011
[2] W. Fleming, "Overview of automotive sensors", IEEE Sensors Journal, vol. 1, no. 4,
pp. 296-308, 2001. Available: 10.1109/7361.983469 [Accessed 4 July 2020].
[3] J. Yun and S. Lee, "Human Movement Detection and Identification Using
Pyroelectric Infrared Sensors", Sensors, vol. 14, no. 5, pp. 8057-8081, 2014. Available:
10.3390/s140508057 [Accessed 4 July 2020].
[4] S. Hernandez, A. Tok and S. Ritchie, "Integration of Weigh-in-Motion (WIM) and
inductive signature data for truck body classification", Transportation Research Part C:
Emerging Technologies, vol. 68, pp. 1-21, 2016. Available: 10.1016/j.trc.2016.03.003
[Accessed 4 July 2020].
[5] J. Yun and S. Lee, "Human Movement Detection and Identification Using Pyroelectric
Infrared Sensors", Sensors, vol. 14, no. 5, pp. 8057-8081, 2014. Available:
10.3390/s140508057 [Accessed 4 July 2020].
[6] C.L. Muyunda and J. Phiri, "A Wireless Sensor Network Based Grain Inventory
Management System for Zambia’s Food Reserve Agency, Vol. 5, no.3, pp.1-6,2016
Available: DOI:10.15680/IJIRSET.2016.0503144
[7] "Seventh National Development Plan 2017-2021 | Embassy of the Republic of Zambia
inWashington,D.C.",Zambiaembassy.org,2019.[Online].Available:
http://www.zambiaembassy.org/document/seventh-national-development-plan-2017-
2021. [Accessed: 10- Aug- 2019].
[8]L. Ruiz-Garcia and L. Lunadei, "The role of RFID in agriculture: Applications,
limitations and challenges," Computers and Electronics in Agriculture, vol. 75, no. 1, pp.
42-50, January 2011
[9] G. Swagarya, L. Boaz, and M. Kisangiri, “International Journal of Scientific
Engineering and Research (IJSER) Designing of UHF-Radio Frequency Identification
(RFID) Antenna,” 2013
[10] M. Abid, b. Nsiri, y. Serhane and h. Aghari, "Tracking Items Through Rfid and
Solving Heterogeneity Problems During a Collaboration Between Port Companies",
International Journal of Advanced Computer Science and Applications, vol. 7, no. 2, 2016.
Available: 10.14569/ijacsa.2016.070230.
[11]W.SYSTEM,"WEIGHBRIDGE WITH RFID SYSTEM",
Virtualwarehousetks.blogspot.com, 2019. [Online]. Available:
http://virtualwarehousetks.blogspot.com/p/weighbridge-with-rfid-system.html.
[Accessed: 02- May- 2019].
[12] H. M.Quraishi, F.Farheen “Curtain Raiser on Gen-Next of RFID Technology”, IOSR
Journal of Electrical and Electronics Engineering, 2014.
[13] R. Yadav and S. Nainan, "Design of RFID Based Student Attendance System with
Notification to Parents Using GSM," International Journal of Engineering Research &
Technology (IJERT), vol. 3, no. 2, February 2014.
- 89 -
[14] U. Mamdapur and I. Rajgoli, "Implementing radio frequency identification technology
in libraries: Advantages and disadvantages," International Journal of Library and
Information Science, vol. 3, no. 3, pp. pp. 46-57, March 2011.
[15] K. N. Singh and P. Mahajan, "Application of RFID Technology in Libraries,"
International Journal of Library and Information Studies, vol. 4, no. 2, pp. 1-9, April-June
2014.
[16] O. T. Arulogun, A. Olatunbosun, O. A. Fakolujo and O. M. Olaniyi, "RFID-Based
Students Attendance Management System," International Journal of Scientific &
Engineering Research, vol. 4, no. 2, p. 1, February 2013.
[17] M. Bertrand and S. Bouchard, “The Technology Acceptance Model: A Potentially
Useful Tool to Understand Why Therapists Intend to Use or Not Virtual Reality,”
PsycEXTRA Dataset, 2006.
[18] L.Isaiah, O.Tonny and M.Tim,”Application of Technology Acceptance Model (TAM)
in M-Banking Adoption in Kenya,” International Journal of Computing and ICT Research,
Vol. 6, Issue 1, June 2012.
[19]R. Boateng, "Mobile phones and micro‐trading activities – conceptualizing the link",
info, vol. 13, no. 5, pp. 48-62, 2011. Available: 10.1108/14636691111160635.
[20] N.Sana , H.Nael and A.Musbah. “A secure mobile payment system using QR code."
111-114. 10.1109/CSIT.2013.6588767. 2013.
[21] QR Code: A New Opportunity for Effective Mobile Marketing
[22]P. Soneka and J. Phiri, "A Model for Improving E-Tax Systems Adoption in Rural
Zambia Based on the TAM Model", Open Journal of Business and Management, vol. 07,
no. 02, pp. 908-918, 2019. Available: 10.4236/ojbm.2019.72062.
23] H. Kuruva and G. S. P. R. S., "IoT-based anti-theft and remote controlling system for
automobiles,"
International Journal of Science, Engineering and Technology Research
(IJSETR), vol. 5, no. 12, pp. 3385-3389, 2016.
[24] H. Alshamisi and V. Këpuska, "Real Time GPS Vehicle Tracking System,"
International
Journal of Advanced Research in Electronics and Communication Engineering
(IJARECE),
vol. 6, no. 3, pp. 179-182, march 2017.
[25] Stewart, J., Tittel, E. and Chapple, M. (2008). CISSP. Hoboken: John Wiley & Sons,
Inc.
[26] M. U.Farooq, M. Waseem, A. Khairi and S. Mazhar, "A Critical Analysis on the
Security Concerns of Internet of Things (IoT)", International Journal of Computer
Applications, vol. 111, no. 7, pp. 1-6, 2015. Available: 10.5120/19547-1280
[27] "Connectivity of the Internet of Things - learn.sparkfun.com", Learn.sparkfun.com,
2019. [Online]. Available: https://learn.sparkfun.com/tutorials/connectivity-of-the-
internet-of-things/rfid-and-nfc. [Accessed: 15- Dec- 2019].
- 90 -
[28]"RFID BASED ATTENDANCE SYSTEM", International Journal of Recent Trends
in Engineering and Research, vol. 3, no. 4, pp. 94-97, 2017. Available:
10.23883/ijrter.2017.3114.wjkh4.
[29] C. Sun, "Application of RFID Technology for Logistics on Internet of Things",
AASRI Procedia, vol. 1, pp. 106-111, 2012. Available: 10.1016/j.aasri.2012.06.019.
[30] M. G. Evic, T. Cicak and T. Lovric, "RFID and Supply Chain Management for
Manufacturing Digital Enterprise," in Supply Chain Management- New Perspectives,
InTech, 2011.
[31] Prasad, Sanjana & Mahalakshmi, P & John, A & Sunder, Clement & Swathi, R.2019
‘Smart Surveillance Monitoring System Using Raspberry PI and PIR Sensor.”
International Journal on Future Revolution in Computer Science & Communication
Engineering ISSN: 2454-4248 Volume: 4 Issue: 4 April 2018.
[32]Michael Chui, Markus Löffler, and Roger Roberts, The Internet of Things;
http://tc.indymedia.org/files/bigbrother/internet-spy-all.pdf
[33]M. Burhan, R. Rehman, B. Khan and B. Kim, "IoT Elements, Layered Architectures
and Security Issues: A Comprehensive Survey", Sensors, vol. 18, no. 9, p. 2796, 2018.
Available: 10.3390/s18092796.
[34]"IoT: number of connected devices worldwide 2012-2025 | Statista",
Statista,2019.[Online].Available:https://www.statista.com/statistics/471264/iot-number-
of-connected-devices-worldwide/. [Accessed: 05- Nov- 2019].
[35] M. Chibuye and J. Phiri, "A Remote Sensor Network using Android Things and Cloud
Computing for the Food Reserve Agency in Zambia," (IJACSA) International Journal of
Advanced Computer Science and Applications, vol. 8, no. 11, pp. 411-418, 2017.
[36] R.Shanmugasundaram, S.Pavithra, V.Sangeetha, S.Tamilselvan, A.H.Thanveer
Ahmed.. (2017), “IOT BASED ANIMAL TRACKING AND MONITORING SYSTEM
IN ZOO ", South Asian Journal of Engineering and Technology Vol.3, No.2 (2017) 162–
168.
[37] S. Chihana, J. Phiri and D. Kunda, "An IoT based Warehouse Intrusion Detection (E-
Perimeter) and Grain Tracking Model for Food Reserve Agency", International Journal of
Advanced Computer Science and Applications, vol. 9, no. 9, 2018.
Available:https://doi.org 10.14569/ijacsa.2018.090929.
[38] M. G. Evic, T. Cicak and T. Lovric, "RFID and Supply Chain Management for
Manufacturing Digital Enterprise," in Supply Chain Management- New Perspectives,
InTech, 2011.
[39]J. Vacca, Computer and information security handbook. .
[40]Arduino, "Arduino," 2019. [Online]. Available:
http://www.arduino.cc/en/Guide/Introduction. [Accessed 19 May 2019].
[41]A. Dolgui and M. J. Proth, "RFID Technology in Supply Chain Management: State of
the Art and Perspectives," in Proceedings of the 17th World Congress The International
Federation of Automatic Control, Seoul, 2008.
- 91 -
[42] K. N. Singh and P. Mahajan, "Application of RFID Technology in Libraries,"
International Journal of Library and Information Studies, vol. 4, no. 2, pp. 1-9, April-June
2014.
[43] R. Yadav and S. Nainan, "Design of RFID Based Student Attendance System with
Notification to Parents Using GSM," International Journal of Engineering Research &
Technology (IJERT), vol. 3, no. 2, February 2014.
[44] P. Salunke, P. Malle, K. Datir and J. Dakule, "Automated Toll Collection System
Using RFID," IOSR Journal of Computer Engineering (IOSR-JCE), vol. 9, no. 2, pp. 61-
66, Jan-Feb 2013.
[45] S. K. Ravi, H. G. Varun, T. Vamsi and P. Pratyusha, "RFID Based Security
System," International Journal of Innovative Technology and Exploring Engineering
(IJITEE), vol. 2, no. 5, April 2013.
[46] U. Mamdapur and I. Rajgoli, "Implementing radio frequency identification
technology in libraries: Advantages and disadvantages," International Journal of Library
and Information Science, vol. 3
[47] M. MuzaffarIqbal and V. P. Singh, "Radio Frequency identification (RFID)
Technology in Libraries: An Introduction," Research Directions, vol. 2, no. 2, pp. 1-7,
August 2014, no. 3, pp. pp. 46-57, March 2011.
[48] S. Samadi, "Applications and Opportunities for Radio Frequency Identification
(RFID) Technology in Intelligent Transportation Systems: A Case Study," International
Journal of Information and Electronics Engineering, vol. 3, no. 3, pp. 341-345, May 2013.
[49] V. Sheridan, B. Tsegaye and M. Walter-Echols, "ZigBee-Enabled RFID Reader
Network," Worcester Polytechnic Institute, Worcester, 2005.
[50] P. Hamilton and S. Sankaranarayanan, "Intelligent Agent Based RFID System for
on Demand Bus Scheduling and Ticketing," International Journal of Future Computer and
Communication, vol. 2, no. 5, pp. 399-406, October 2013.
[51] J. Qian, Z. Liu and X. Xie, "Design and Application of RFID Technology in
Container Port," Scientific Journal of Information Engineering, vol. 4, no. 2, pp. 26-37,
April 2014.
[52] “RFID Applications, RFID Technology, Radio Frequency Identification",
Fibre2fashion.com, 2019. [Online]. Available: https://www.fibre2fashion.com/industry-
article/3271/rfid-applications. [Accessed: 1- Dec- 2019].
[53] "Application of RFID", U.arizona.edu, 2019. [Online]. Available:
http://www.u.arizona.edu/~obaca/rfid/uses.html. [Accessed: 15- Dec- 2019].
[54] L.Trupti, R. Kankapurkar, A.Parekar, and A.Mohite. "Comparative study of Barcode,
QR-code and RFID System." Int. J. Comput. Technol. Appl. 4, no. 5 (2013): 817-821.
[55] A. B. Hatem and H. Habib, "Bus Management System Using RFID In WSN," in
European and Mediterranean Conference on Information Systems, Abu Dhabi, 2009.
[56] S.P Wijetunge, Peiris, G.R.V.;Aluthgedara, C.S.; Samarasinghe, A.T.L.K.; , "Design
and Implementation of a Bluetooth based General Purpose Controlling Module,"
- 92 -
Information and Automation for Sustainability, 2008. 4th International Conference on,
Dec. 2008.
[57] A.Flammini,,D.Marioli,E. Sisinni,and A.Taroni,"Environmental Telemonitoring: A
Flexible GSM-DECT-Based Solution," Instrumentation and Measurement, IEEE
Transactions on, Oct. 2007
[58] I. Sommerville, Software Engineering, 9th ed., Boston: Addison-Wesley, 2011.
[59] R. Norman, Object-Oriented System Analysis and Design, Pentice Hall, 1996.
[60] A. Brahmi, Object-Oriented System Development.
[61]Z. Liu, Object-Oriented Software Development with UML, Macau: United Nations
University International Institue for Software Technology, 2002.
[62]A. Ojo and E. Estevez, Object-Oriented Analysis with UML, e-Marcao, 2005.
[63]S. Bennett, S. McRobb and R. Farmer, Object-Oriented Systems Analysis and Design
using UML, 3rd ed., McGraw Hill, 2006.
[64] I. Jacobson, G. Booch and J. Rumbaugh, The Unified Software Development
Process, Boston: Addison-Wesley, 1999.
[65] R. A. Mohammad, "Issues of Structured vs. Object-Oriented Methodology of
Systems Analysis and Design," Issues in Information Systems, vol. 5, no. 1, pp. 275-280,
2004.
[66] J. Gosling, B. Joy, G. Steele and G. Bracha, Java (TM) Language Specification,
Addison-Wesley, 2005.
[67] P. J. Deitel and H. M. Deitel, Java How to Program, 7th ed., New Jersey: Prentice
Hall, 2006.
[68] The Saylor Foundation, "Saylor," [Online]. Available:
http://www.saylor.org/courses/cs101/#2.1.2 . [Accessed 4 February 2019].
[69] F. Esker, "RFID in Vehicles LLC.," NetWorld Alliance, 2015.
[70] S. Yadav, "RFID Implemented Parking System," International Journal of
Information and Computation Technology, vol. 4, no. 4, pp. 369-372, 2014.
[71] X. Sui, Y. Teng, Y. Chen and X. Wang, "Design of Tool Automatic Identification
and Database Management System Based on RFID," International Journal of Database
Theory and Application, vol. 7, no. 5, pp. 133-144, 2014.
[72] E. Nasr, T. Shehab and A. Vlad, "Tracking Systems in Construction: Applications
and Comparisons," in 49th ASC Annual International Conference Proceedings, 2013.
[73] M. Schneider, "Radio Frequency Identification (RFID) Technology and its
Applications in the Commercial Construction Industry," 2003.
[74] F. Khursheed, H. S. Saeed, N. R. Kidwai and S. Rahman, "RFID: in the World of
Health Care," International Journal of Life Sciences and Review (IJLSR), vol. 1, no. 2, pp.
34-40, February 2015.
[75] S. S. Dhable, M. Jose, R. P. Kothawade, P. B. Nilkanth and R. A. Gaidhani, "A
Patient e-Health Care System Using Passive RFID," International Conference of Advance
Research and Innovation (ICARI), February 2014.
- 93 -
[76] R. Chandrashekar, J. Shinde and D. Mane, "Importance and Analysis of RFID in
Attendance System," International Journal of Emerging Science and Engineering (IJESE),
vol. 1, no. 9, July 2013.
[77] K. K. Murthy, B. Y. Dhanalakshmi, S. Pooja, K. M. Geetha and H. C. S. Kumar,
"Advanced College Surveillance System," International Journal of Scientific and Research
Publications, vol. 4, no. 6, June 2014.
[78] R.-G. L. and L. L., "The role of RFID in agriculture: Applications, limitations and
challenges," Computers and Electronics in Agriculture, vol. 75, no. 1, pp. 42-50, January
2011.
[79] R. Hornbaker, V. Kindratenko and D. Pointer, An RFID Agricultural Product and
Food Security Tracking System.
[80] R. H. Hornbaker, V. Kindratenko and D. Pointer, "Method and System for Tracking
Grain". United States of America Patent US 20060004484A1, 5 January 2006.
[81] C. M. Scherer and M. M. S. Gomes, "Information Technology Applied to the
Process of Traceability in the Wheat Supply Chain," African Journal of Agricultural
Research, vol. 9, no. 17, pp. 1318-1325, April 2014.
[82] A. Rodarte, U. Steinmeier, M. Deimel, D. von Hoersten, L. Theuvsen and W.
Luecke, "Uninterrupted traceability in bulk grain flow and trade: Possibilities and
limitations of Radio Frequency Identification," Goettingen.
[83] C. R. Kothari, Research Methodlogy: Methods and Techniques, 2nd ed., New
Delhi: New Age International (P) Ltd, 2004.
[84] J. W. Creswell, Research Design: Qualitative, Quantitative and Mixed Methods
Approaches, 3rd ed., California: SAGE Publications, 2009, p. 18.
[85] T. M. Connolly and C. E. Begg, Database Systems: A Practical Approach to
Design, Implementation, and Management, Addison-Wesley, 2005.
[86] Yunseop Kim, R. Evans and W. Iversen, "Remote Sensing and Control of an
Irrigation System Using a Distributed Wireless Sensor Network", IEEE Transactions on
Instrumentation and Measurement, vol. 57, no. 7, pp. 1379-1387, 2008. Available:
10.1109/tim.2008.917198.
[87] A. K. Singh, S. Ghosh, B. Roy, D. K. Tiwari and R. Baghel, "Application of Radio
Frequency Identification (RFID) Technology in Dairy Herd Management," International
Journal of Livestock Research, vol. 4, no. 1, pp. 10-18, 2014.
[88] H.Kanma, N.Wakabayashi, R.Kanazawa, "Home Appliance control system over
Bluetooth with a cellular phone,"Consumer Electronics, IEEE Transactions, Nov. 2003.
[89] Y.Sung-Nien ; J. Cheng; , "A Wireless Physiological Signal Monitoring System with
Integrated Bluetooth and WiFi Technologies," Engineering in Medicine and Biology
Society, 2005. IEEE-EMBS 2005. 27th Annual International Conference
[90] W. D. Brown, An Introduction to Object-Oriented Analysis: Objects and UML in
Plain English, Wiley, 2002.
- 94 -
[91] A. U. Khan, A. I. Al-Bidewi and K. Gupta, "Object-Oriented Software
Methodologies: Roadmap to the Future," IJCSI International Journal of Computer Science
Issues, vol. 8, no. 5, pp. 392-396, September 2011.
[92] Cleland-Huang and Jane, "Toward improved traceability of nonfunctional
requirements," in TEFSE '05 Proceedings of the 3rd international workshop on
Traceability in emerging forms of software engineering, California, 2005.
[93]
Zicta.zm,2019.[Online].Available:http://www.zicta.zm/Views/Publications/ZICTAPerce
nt20
ICTPercent20SurveyPercent202018Percent20Report.pdf. [Accessed: 10- Dec- 2019].
[94] R. L. Rivest, “The MD5 message-digest algorithm”, Internet Requests for Comments,
RFC Editor, RFC 1321, 1992. Available at: http://www.rfc-editor.org/rfc/rfc1321.txt
[95] Xiaoyun Wang, Hongbo Yu, “How to Break MD5 and Other Hash
Functions”,Advances in Cryptology – Lecture Notes in Computer Science, pp. 19–35,
2005.
[96] D. Eastlake and P. Jones, “US Secure Hash Algorithm 1 (SHA1)”, Internet Requests
for Comments, RFC Editor, RFC 3174, 2001. Available at: http://www.rfc-
editor.org/rfc/rfc3174.txt
[97] Microsoft, “Windows Enforcement of Authenticode Code Signing and
Timestamping”, 2015.
[98] Google, “Intent to Deprecate: SHA-1 certificates”, 2014.
[99] Apple Inc., “Safari and WebKit ending support for SHA-1 certificates – Apple
Support”, 2017.
[100] Mozilla, “CA:Problematic Practices – MozillaWiki”, 2014.
[101] B. Preneel, “The first 30 years of cryptographic hash functions and the NIST SHA-
3 competition”, in Cryptographers’ Track at the RSA Conference, pringer, pp. 1–14, 2010.
[102]CWI Amsterdam and Google Reseach, Marc Stevens, Elie Bursztein, Pierre
Karpman, Ange Albertini, Yarik Markov, “The first collision for full SHA-1”,2017.
[103]J. Sen, "Security in Wireless Sensor Networks", Arxiv.org, 2020. [Online]. Available:
https://arxiv.org/ftp/arxiv/papers/1301/1301.5065.pdf. [Accessed: 07- Jul- 2020].
[104] Bencini, L.; Chiti, F.; Collodi, G.; Di Palma, D.; Fantacci, R.; Manes, A.; Manes, G.;
, "Agricultural Monitoring Based on Wireless Sensor Network Technology: Real Long
Life Deployments for Physiology and Pathogens Control," Sensor Technologies and
Applications, 2009
[105] Harms, T.; Sedigh, S.; Bastianini, F., "Structural Health Monitoring of Bridges Using
Wireless Sensor Networks," Instrumentation & Measurement Magazine, IEEE, December
2010.
[106] ]R. Salas-Rueda, "Impact of the WampServer application in Blended learning
considering data science, machine learning, and neural networks", E-Learning and Digital
Media, vol. 17, no. 3, pp. 199-217, 2020. Available: 10.1177/2042753020901730 [Accessed
4 July 2020].
- 95 -
[107] Mulyadi, I.H., Supriyanto, E., Safri, N.M., & Satria, M.H. (2009). Wireless Medical
Interface Using ZigBee and Bluetooth Technology. 2009 Third Asia International
Conference on Modelling & Simulation, 276-281.
[108] Zeinaly, Y., De Schutter, B. and Hellendoorn, H., 2015. An Integrated Model
Predictive Scheme for Baggage-Handling Systems: Routing, Line Balancing, and Empty-
Cart Management. IEEE Transactions on Control Systems Technology, 23(4), pp.1536-
1545.
[109] Singh, Ashwini, Sakshi Meshram, Tanvi Gujar, and P. R. Wankhede. "Baggage
tracing and handling system using RFID and IoT for airports." In 2016 International
Conference on Computing, Analytics and Security Trends (CAST), pp. 466-470. IEEE,
2016.
[110] Ouyang, Yuanxin, Yao Hou, Ling Pang, Dongwei Wang, and Zhang Xiong. "An
intelligent RFID reader and its application in airport baggage handling system." In 2008
4th International Conference on Wireless Communications, Networking and Mobile
Computing, pp. 1-4. IEEE, 2008.
[111]http://thegadgetflow.com/portfolio/konas-theworlds-only-trackable-luggage-and-
backpacks/
[112]https://flipboard.com/@anyajones2014/top-10- best-smart-luggage-tracker-device-
reviews-2016-5khet719y
[113]"Mini GSM/GPRS + GPS Breakout - SIM808", Seeeddoc.github.io, 2020. [Online].
Available:https://seeeddoc.github.io/Mini_GSM-GPRS_Plus_GPS_Breakout-SIM808/.
[Accessed: 07- Jul- 2020].
[114] https://www.trakdot.com/en/how-it-works
[115]"How to Use a Breadboard", Science Buddies, 2020. [Online]. Available:
https://www.sciencebuddies.org/science-fair-projects/references/how-to-use-a-
breadboard#:~:text=A%20breadboard%20is%20a%20rectangular,
(light%2Demitting%20diode). [Accessed: 07- Jan- 2020]
[116] T. Ogawa, R. Sugisawa, Y. Sakurada, H. Aoshima, M. Hikida and H. Akaishi,
"Energy Harvesting Devices Utilizing Resonance Vibration of Piezoelectric Buzzer",
Japanese Journal of Applied Physics, vol. 52, no. 91, pp. 09KD14, 2013. Available:
10.7567/jjap.52.09kd14.
[117] N. Chadil, A. Russameesawang and P. Keeratiwintakorn, "Real-time tracking
management system using GPS, GPRS and Google earth", 2008 5th International
Conference on Electrical Engineering/Electronics, Computer, Telecommunications and
Information Technology, 2008. Available: 10.1109/ecticon.2008.4600454 [Accessed 7
July 2020].
[118]E. Yfantis, "An intelligent baggage-tracking system for airport security", Engineering
Applications of Artificial Intelligence, vol. 10, no. 6, pp. 603-606, 1997. Available:
10.1016/s0952-1976(97)00042-0 [Accessed 5 July 2020].
[119]Varun Gupta, Roushan Kumar, R. Mishra, Anirudha Semwal and Sweety Siwach,
"Design and Optimization of Luggage Tracking System on Airport", Proceeding of
International Conference on Intelligent Communication, Control and Devices, pp. 833-
838, 2016. Available: 10.1007/978-981-10-1708-7_97 [Accessed 5 July 2020].
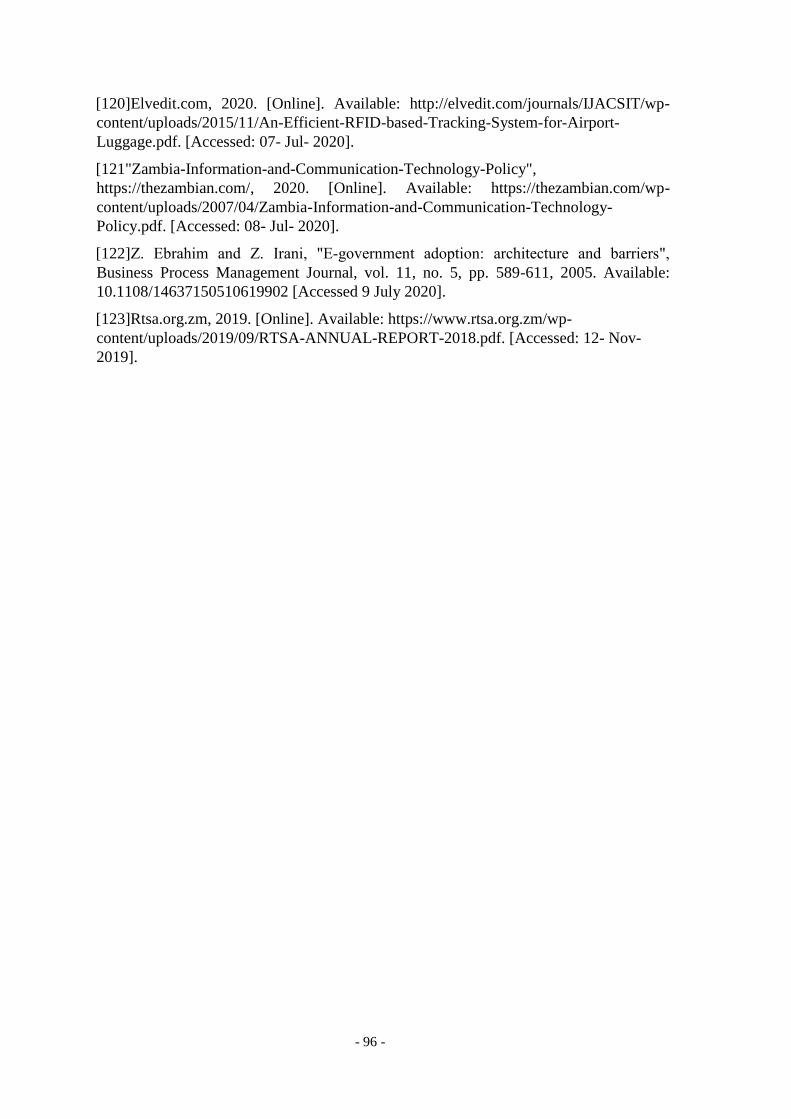
- 96 -
[120]Elvedit.com, 2020. [Online]. Available: http://elvedit.com/journals/IJACSIT/wp-
content/uploads/2015/11/An-Efficient-RFID-based-Tracking-System-for-Airport-
Luggage.pdf. [Accessed: 07- Jul- 2020].
[121"Zambia-Information-and-Communication-Technology-Policy",
https://thezambian.com/, 2020. [Online]. Available: https://thezambian.com/wp-
content/uploads/2007/04/Zambia-Information-and-Communication-Technology-
Policy.pdf. [Accessed: 08- Jul- 2020].
[122]Z. Ebrahim and Z. Irani, "E‐government adoption: architecture and barriers",
Business Process Management Journal, vol. 11, no. 5, pp. 589-611, 2005. Available:
10.1108/14637150510619902 [Accessed 9 July 2020].
[123]Rtsa.org.zm, 2019. [Online]. Available: https://www.rtsa.org.zm/wp-
content/uploads/2019/09/RTSA-ANNUAL-REPORT-2018.pdf. [Accessed: 12- Nov-
2019].
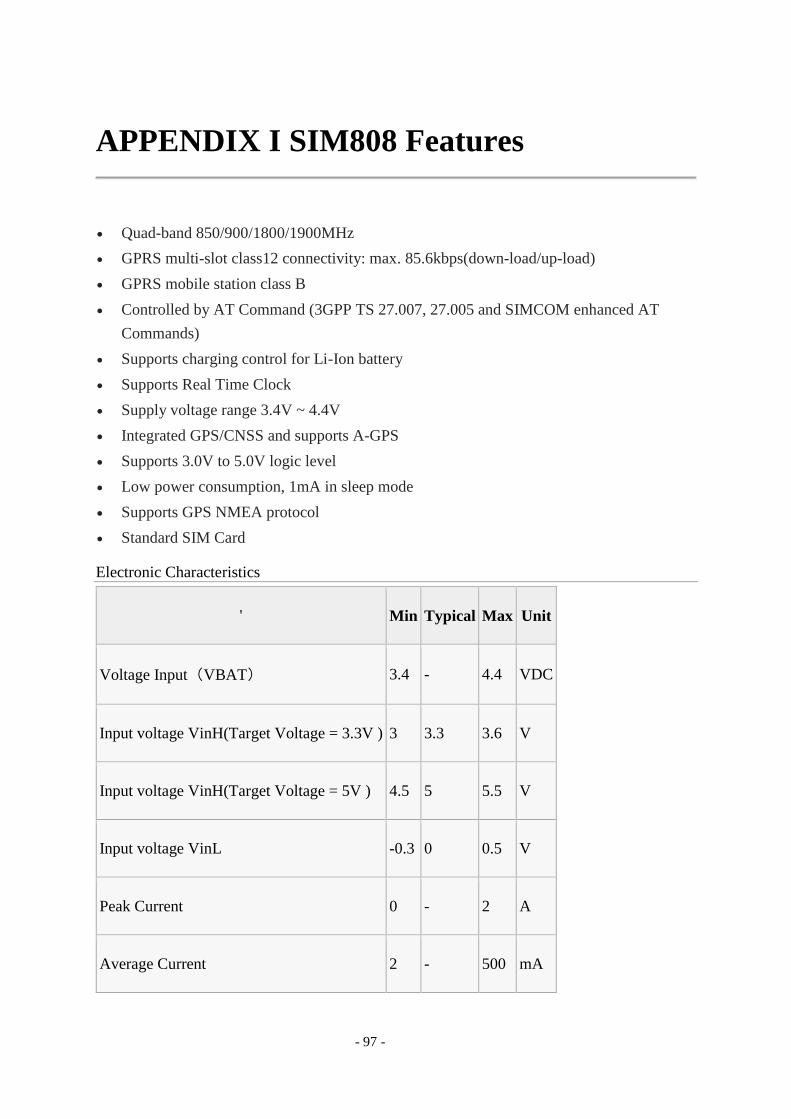
- 97 -
APPENDIX I SIM808 Features
Quad-band 850/900/1800/1900MHz
GPRS multi-slot class12 connectivity: max. 85.6kbps(down-load/up-load)
GPRS mobile station class B
Controlled by AT Command (3GPP TS 27.007, 27.005 and SIMCOM enhanced AT
Commands)
Supports charging control for Li-Ion battery
Supports Real Time Clock
Supply voltage range 3.4V ~ 4.4V
Integrated GPS/CNSS and supports A-GPS
Supports 3.0V to 5.0V logic level
Low power consumption, 1mA in sleep mode
Supports GPS NMEA protocol
Standard SIM Card
Electronic Characteristics
' Min Typical Max Unit
Voltage Input(VBAT) 3.4 - 4.4 VDC
Input voltage VinH(Target Voltage = 3.3V ) 3 3.3 3.6 V
Input voltage VinH(Target Voltage = 5V ) 4.5 5 5.5 V
Input voltage VinL -0.3 0 0.5 V
Peak Current 0 - 2 A
Average Current 2 - 500 mA
- 98 -
Hardware
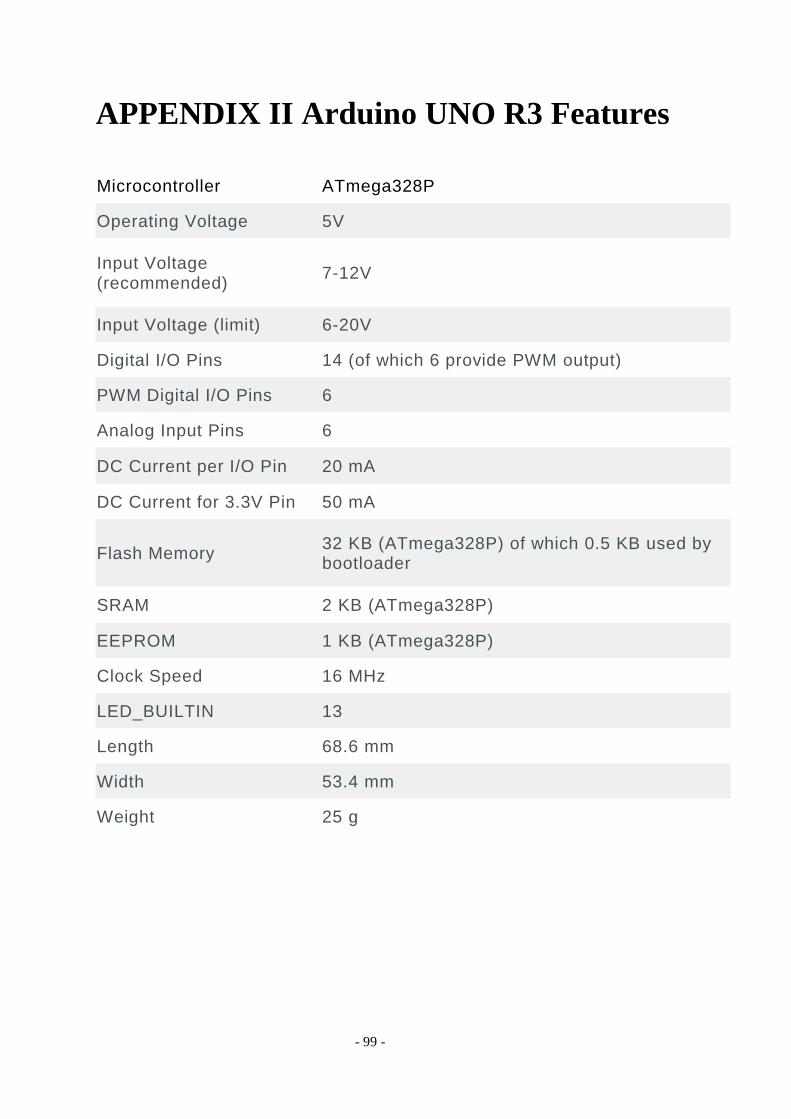
- 99 -
APPENDIX II Arduino UNO R3 Features
Microcontroller ATmega328P
Operating Voltage 5V
Input Voltage (recommended)
7-12V
Input Voltage (limit) 6-20V
Digital I/O Pins 14 (of which 6 provide PWM output)
PWM Digital I/O Pins 6
Analog Input Pins 6
DC Current per I/O Pin 20 mA
DC Current for 3.3V Pin 50 mA
Flash Memory 32 KB (ATmega328P) of which 0.5 KB used by bootloader
SRAM 2 KB (ATmega328P)
EEPROM 1 KB (ATmega328P)
Clock Speed 16 MHz
LED_BUILTIN 13
Length 68.6 mm
Width 53.4 mm
Weight 25 g
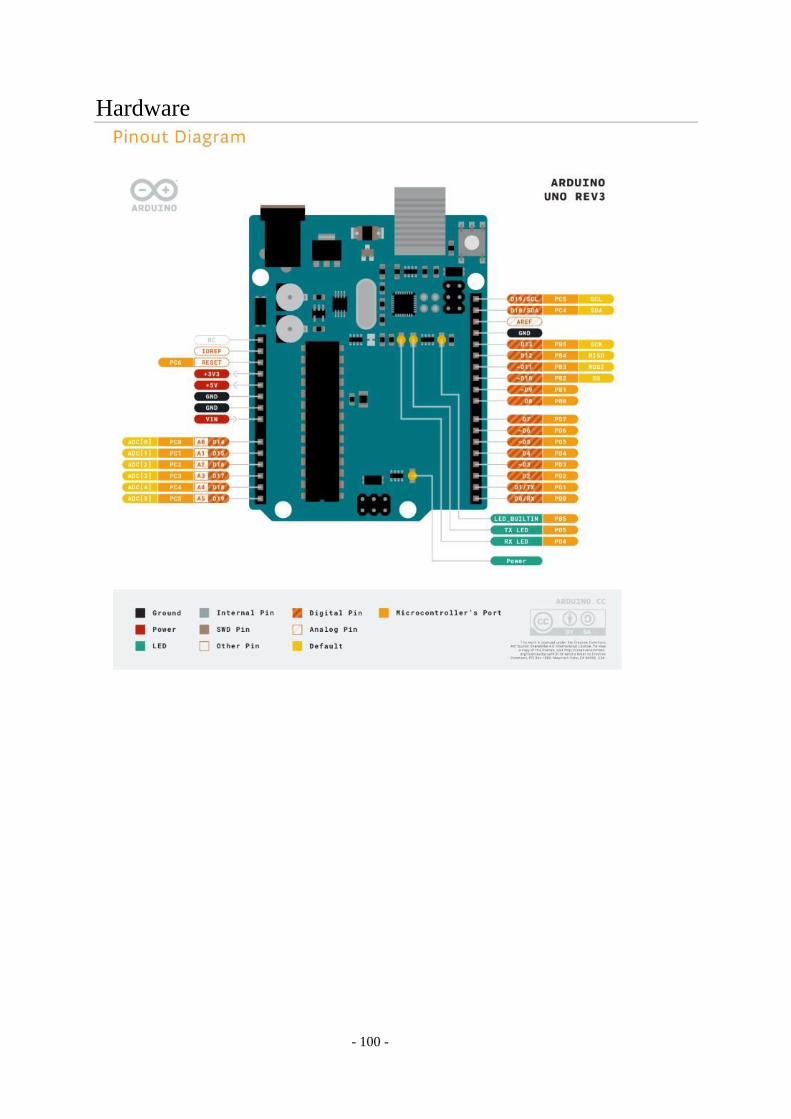
- 100 -
Hardware
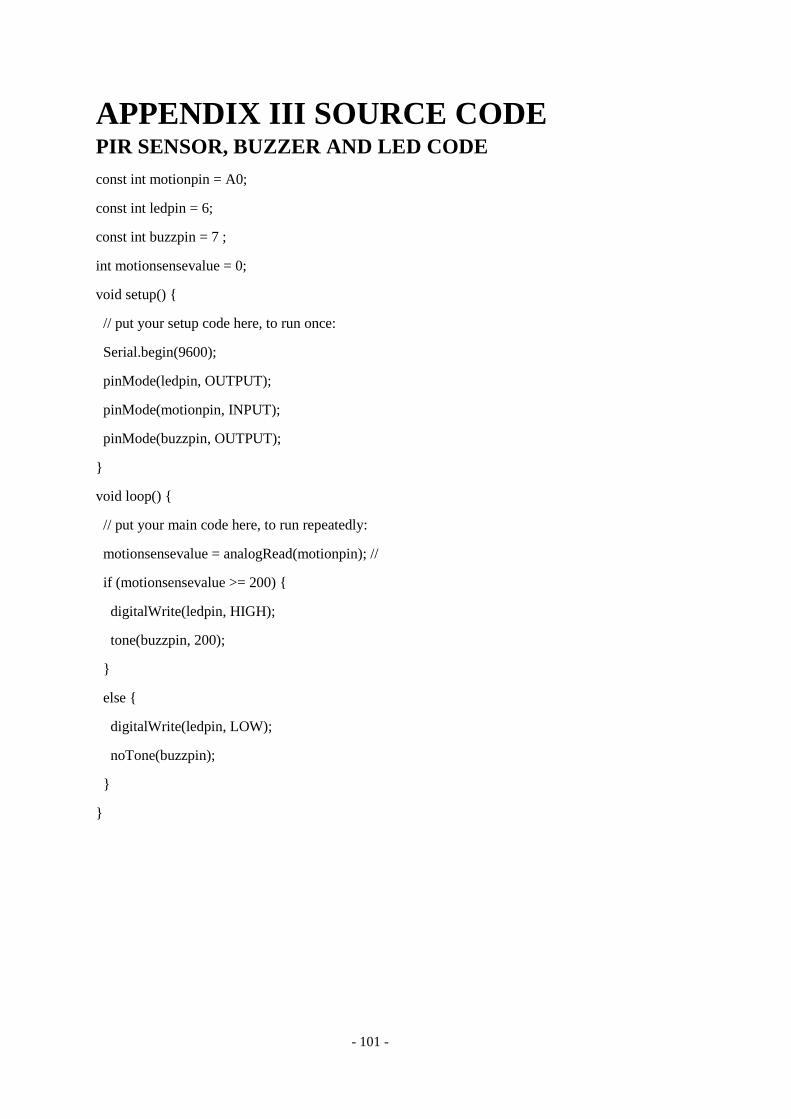
- 101 -
APPENDIX III SOURCE CODE PIR SENSOR, BUZZER AND LED CODE
const int motionpin = A0;
const int ledpin = 6;
const int buzzpin = 7 ;
int motionsensevalue = 0;
void setup() {
// put your setup code here, to run once:
Serial.begin(9600);
pinMode(ledpin, OUTPUT);
pinMode(motionpin, INPUT);
pinMode(buzzpin, OUTPUT);
}
void loop() {
// put your main code here, to run repeatedly:
motionsensevalue = analogRead(motionpin); //
if (motionsensevalue >= 200) {
digitalWrite(ledpin, HIGH);
tone(buzzpin, 200);
}
else {
digitalWrite(ledpin, LOW);
noTone(buzzpin);
}
}
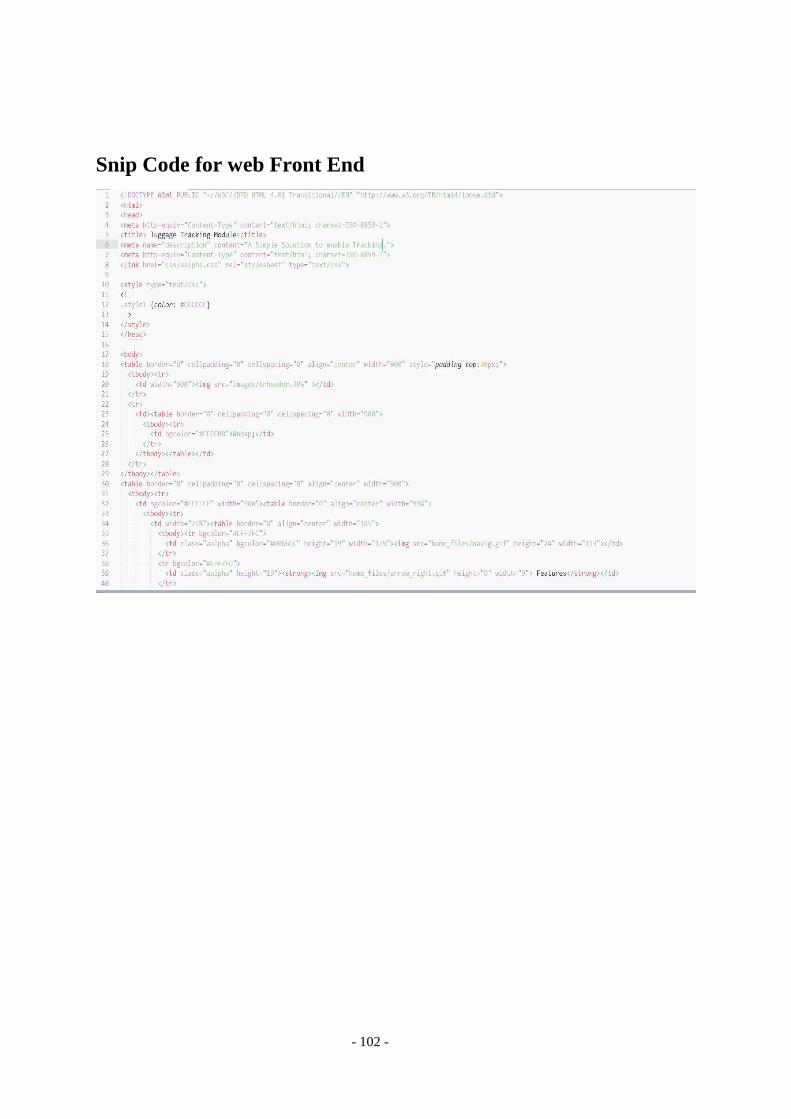
- 102 -
Snip Code for web Front End
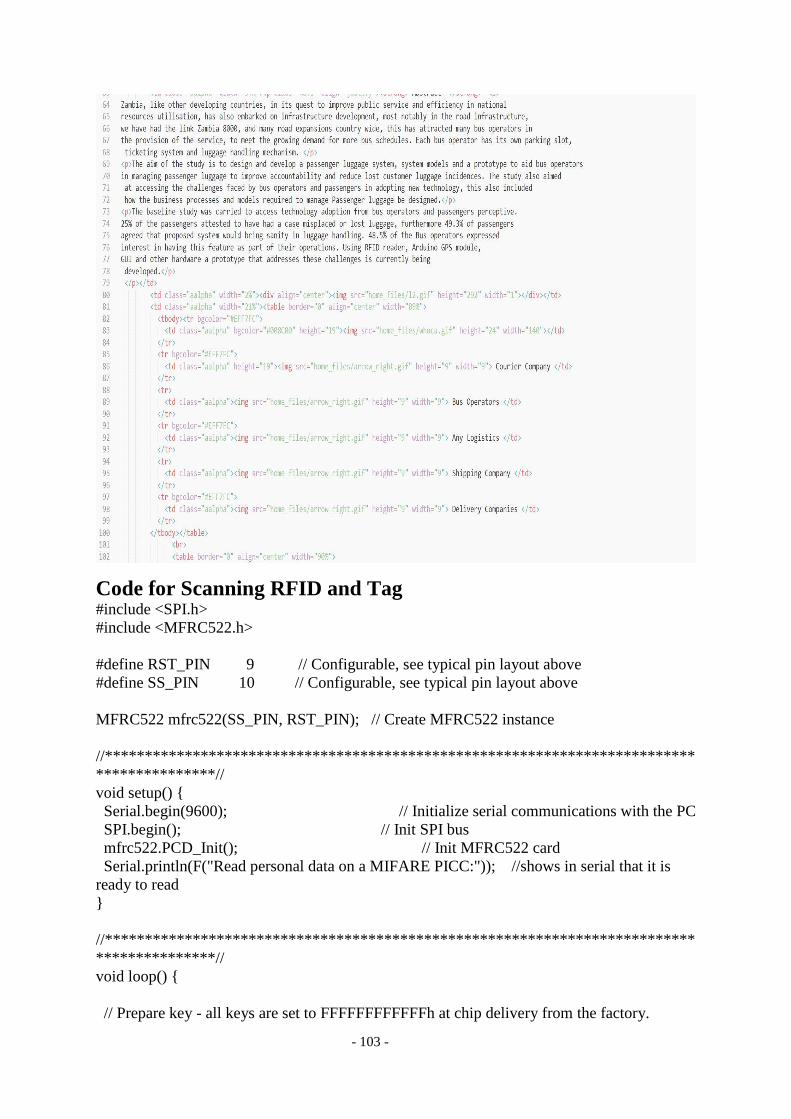
- 103 -
Code for Scanning RFID and Tag #include <SPI.h>
#include <MFRC522.h>
#define RST_PIN 9 // Configurable, see typical pin layout above
#define SS_PIN 10 // Configurable, see typical pin layout above
MFRC522 mfrc522(SS_PIN, RST_PIN); // Create MFRC522 instance
//**************************************************************************
***************//
void setup() {
Serial.begin(9600); // Initialize serial communications with the PC
SPI.begin(); // Init SPI bus
mfrc522.PCD_Init(); // Init MFRC522 card
Serial.println(F("Read personal data on a MIFARE PICC:")); //shows in serial that it is
ready to read
}
//**************************************************************************
***************//
void loop() {
// Prepare key - all keys are set to FFFFFFFFFFFFh at chip delivery from the factory.
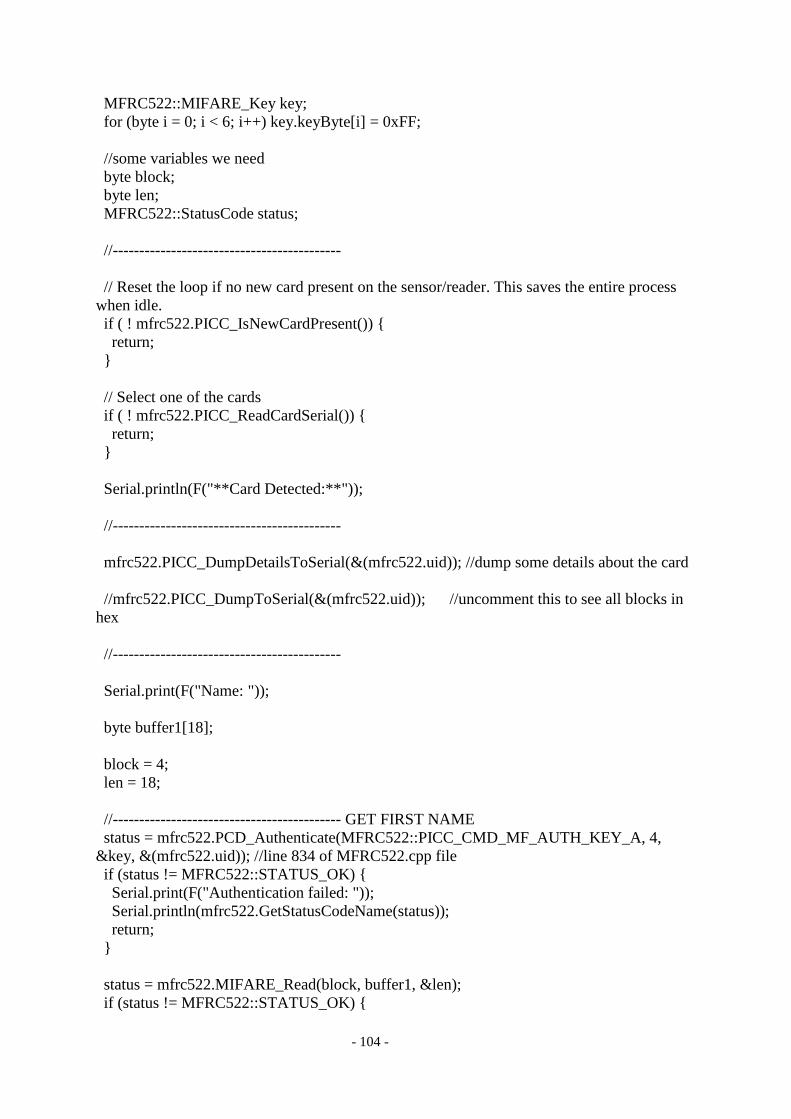
- 104 -
MFRC522::MIFARE_Key key;
for (byte i = 0; i < 6; i++) key.keyByte[i] = 0xFF;
//some variables we need
byte block;
byte len;
MFRC522::StatusCode status;
//-------------------------------------------
// Reset the loop if no new card present on the sensor/reader. This saves the entire process
when idle.
if ( ! mfrc522.PICC_IsNewCardPresent()) {
return;
}
// Select one of the cards
if ( ! mfrc522.PICC_ReadCardSerial()) {
return;
}
Serial.println(F("**Card Detected:**"));
//-------------------------------------------
mfrc522.PICC_DumpDetailsToSerial(&(mfrc522.uid)); //dump some details about the card
//mfrc522.PICC_DumpToSerial(&(mfrc522.uid)); //uncomment this to see all blocks in
hex
//-------------------------------------------
Serial.print(F("Name: "));
byte buffer1[18];
block = 4;
len = 18;
//------------------------------------------- GET FIRST NAME
status = mfrc522.PCD_Authenticate(MFRC522::PICC_CMD_MF_AUTH_KEY_A, 4,
&key, &(mfrc522.uid)); //line 834 of MFRC522.cpp file
if (status != MFRC522::STATUS_OK) {
Serial.print(F("Authentication failed: "));
Serial.println(mfrc522.GetStatusCodeName(status));
return;
}
status = mfrc522.MIFARE_Read(block, buffer1, &len);
if (status != MFRC522::STATUS_OK) {
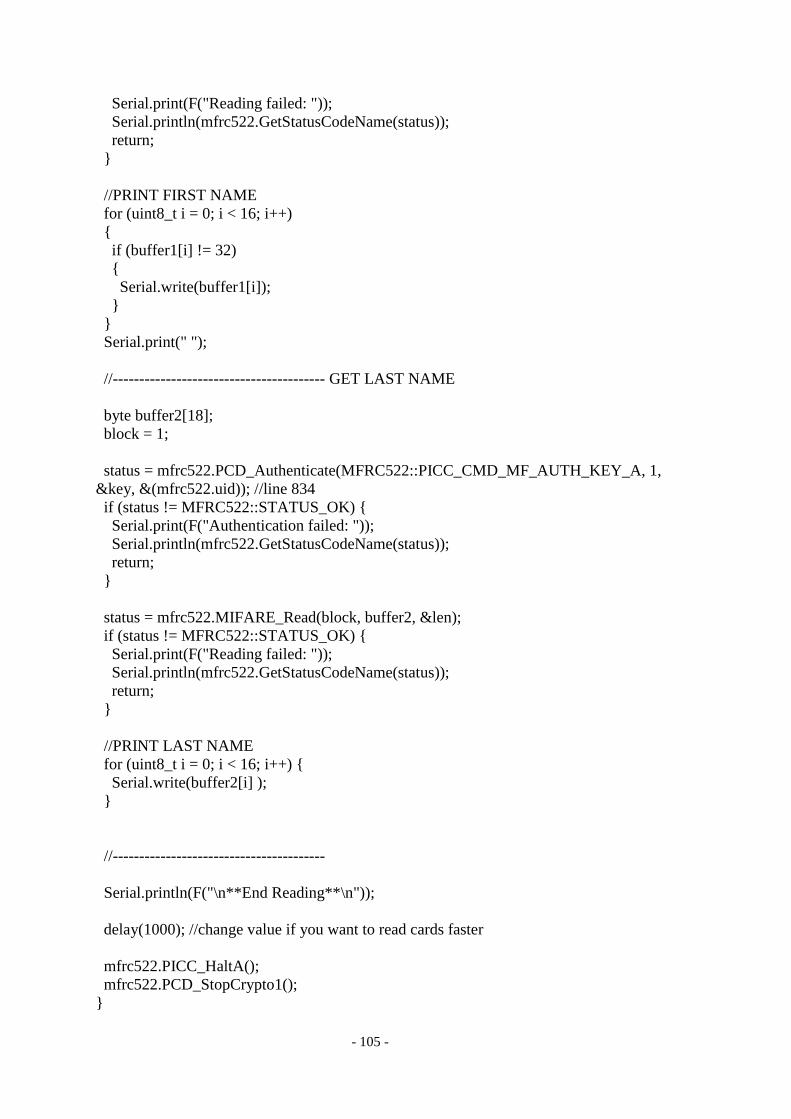
- 105 -
Serial.print(F("Reading failed: "));
Serial.println(mfrc522.GetStatusCodeName(status));
return;
}
//PRINT FIRST NAME
for (uint8_t i = 0; i < 16; i++)
{
if (buffer1[i] != 32)
{
Serial.write(buffer1[i]);
}
}
Serial.print(" ");
//---------------------------------------- GET LAST NAME
byte buffer2[18];
block = 1;
status = mfrc522.PCD_Authenticate(MFRC522::PICC_CMD_MF_AUTH_KEY_A, 1,
&key, &(mfrc522.uid)); //line 834
if (status != MFRC522::STATUS_OK) {
Serial.print(F("Authentication failed: "));
Serial.println(mfrc522.GetStatusCodeName(status));
return;
}
status = mfrc522.MIFARE_Read(block, buffer2, &len);
if (status != MFRC522::STATUS_OK) {
Serial.print(F("Reading failed: "));
Serial.println(mfrc522.GetStatusCodeName(status));
return;
}
//PRINT LAST NAME
for (uint8_t i = 0; i < 16; i++) {
Serial.write(buffer2[i] );
}
//----------------------------------------
Serial.println(F("\n**End Reading**\n"));
delay(1000); //change value if you want to read cards faster
mfrc522.PICC_HaltA();
mfrc522.PCD_StopCrypto1();
}
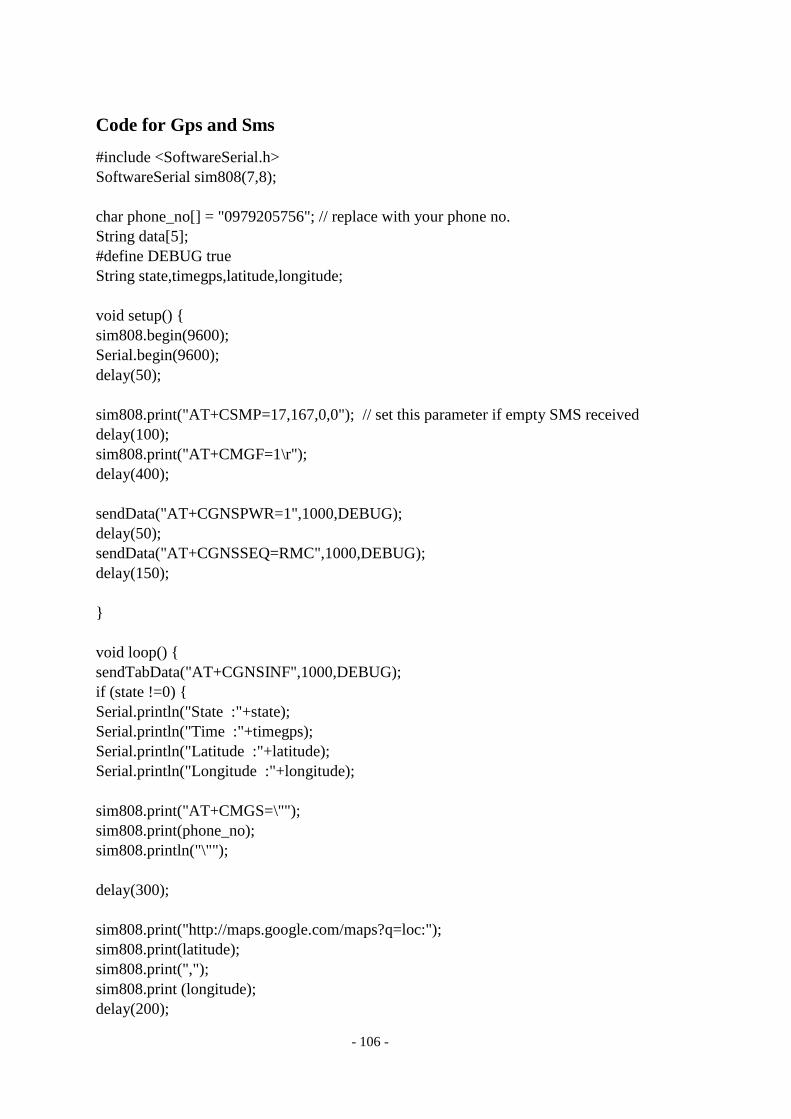
- 106 -
Code for Gps and Sms
#include <SoftwareSerial.h>
SoftwareSerial sim808(7,8);
char phone_no[] = "0979205756"; // replace with your phone no.
String data[5];
#define DEBUG true
String state,timegps,latitude,longitude;
void setup() {
sim808.begin(9600);
Serial.begin(9600);
delay(50);
sim808.print("AT+CSMP=17,167,0,0"); // set this parameter if empty SMS received
delay(100);
sim808.print("AT+CMGF=1\r");
delay(400);
sendData("AT+CGNSPWR=1",1000,DEBUG);
delay(50);
sendData("AT+CGNSSEQ=RMC",1000,DEBUG);
delay(150);
}
void loop() {
sendTabData("AT+CGNSINF",1000,DEBUG);
if (state !=0) {
Serial.println("State :"+state);
Serial.println("Time :"+timegps);
Serial.println("Latitude :"+latitude);
Serial.println("Longitude :"+longitude);
sim808.print("AT+CMGS=\"");
sim808.print(phone_no);
sim808.println("\"");
delay(300);
sim808.print("http://maps.google.com/maps?q=loc:");
sim808.print(latitude);
sim808.print(",");
sim808.print (longitude);
delay(200);
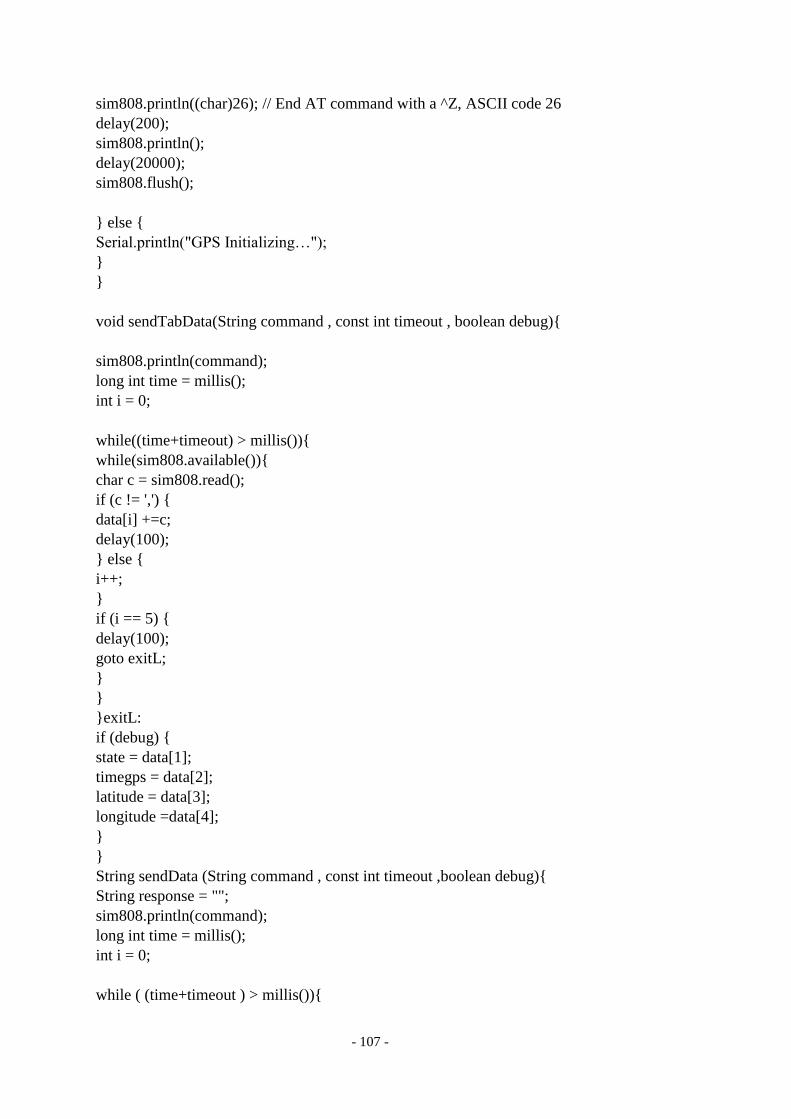
- 107 -
sim808.println((char)26); // End AT command with a ^Z, ASCII code 26
delay(200);
sim808.println();
delay(20000);
sim808.flush();
} else {
Serial.println("GPS Initializing…");
}
}
void sendTabData(String command , const int timeout , boolean debug){
sim808.println(command);
long int time = millis();
int i = 0;
while((time+timeout) > millis()){
while(sim808.available()){
char c = sim808.read();
if (c != ',') {
data[i] +=c;
delay(100);
} else {
i++;
}
if (i == 5) {
delay(100);
goto exitL;
}
}
}exitL:
if (debug) {
state = data[1];
timegps = data[2];
latitude = data[3];
longitude =data[4];
}
}
String sendData (String command , const int timeout ,boolean debug){
String response = "";
sim808.println(command);
long int time = millis();
int i = 0;
while ( (time+timeout ) > millis()){
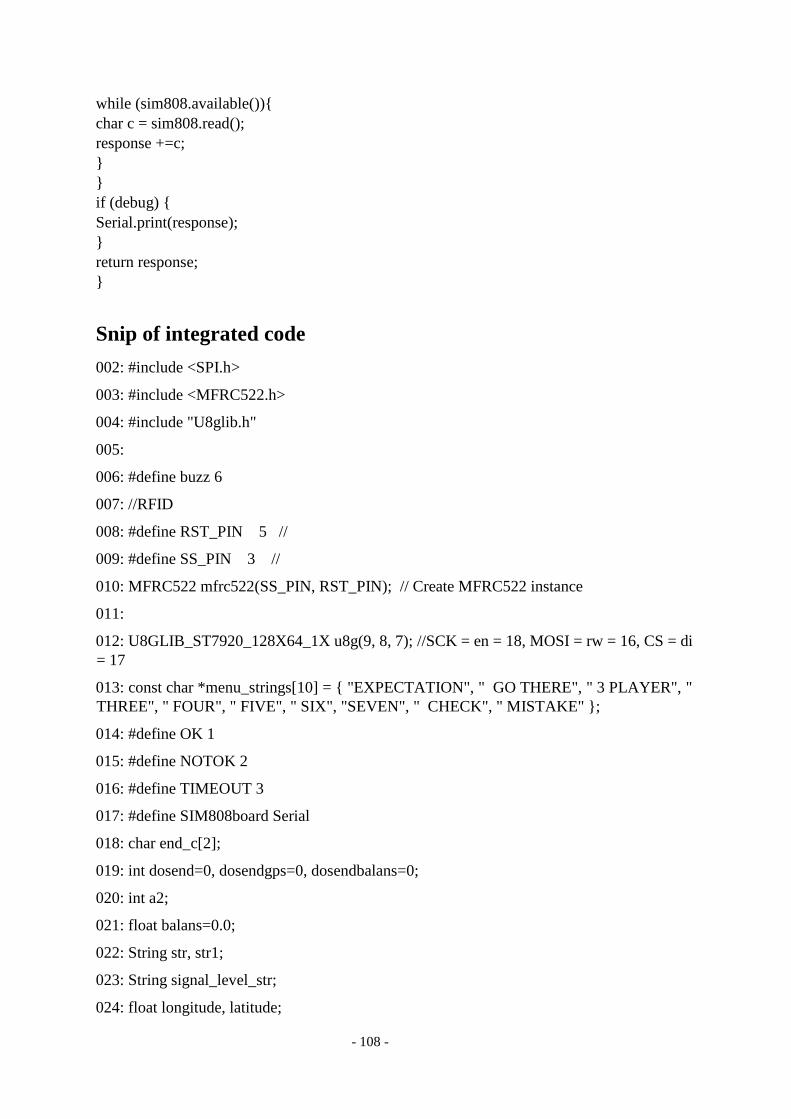
- 108 -
while (sim808.available()){
char c = sim808.read();
response +=c;
}
}
if (debug) {
Serial.print(response);
}
return response;
}
Snip of integrated code
002: #include <SPI.h>
003: #include <MFRC522.h>
004: #include "U8glib.h"
005:
006: #define buzz 6
007: //RFID
008: #define RST_PIN 5 //
009: #define SS_PIN 3 //
010: MFRC522 mfrc522(SS_PIN, RST_PIN); // Create MFRC522 instance
011:
012: U8GLIB_ST7920_128X64_1X u8g(9, 8, 7); //SCK = en = 18, MOSI = rw = 16, CS = di
= 17
013: const char *menu_strings[10] = { "EXPECTATION", " GO THERE", " 3 PLAYER", "
THREE", " FOUR", " FIVE", " SIX", "SEVEN", " CHECK", " MISTAKE" };
014: #define OK 1
015: #define NOTOK 2
016: #define TIMEOUT 3
017: #define SIM808board Serial
018: char end_c[2];
019: int dosend=0, dosendgps=0, dosendbalans=0;
020: int a2;
021: float balans=0.0;
022: String str, str1;
023: String signal_level_str;
024: float longitude, latitude;
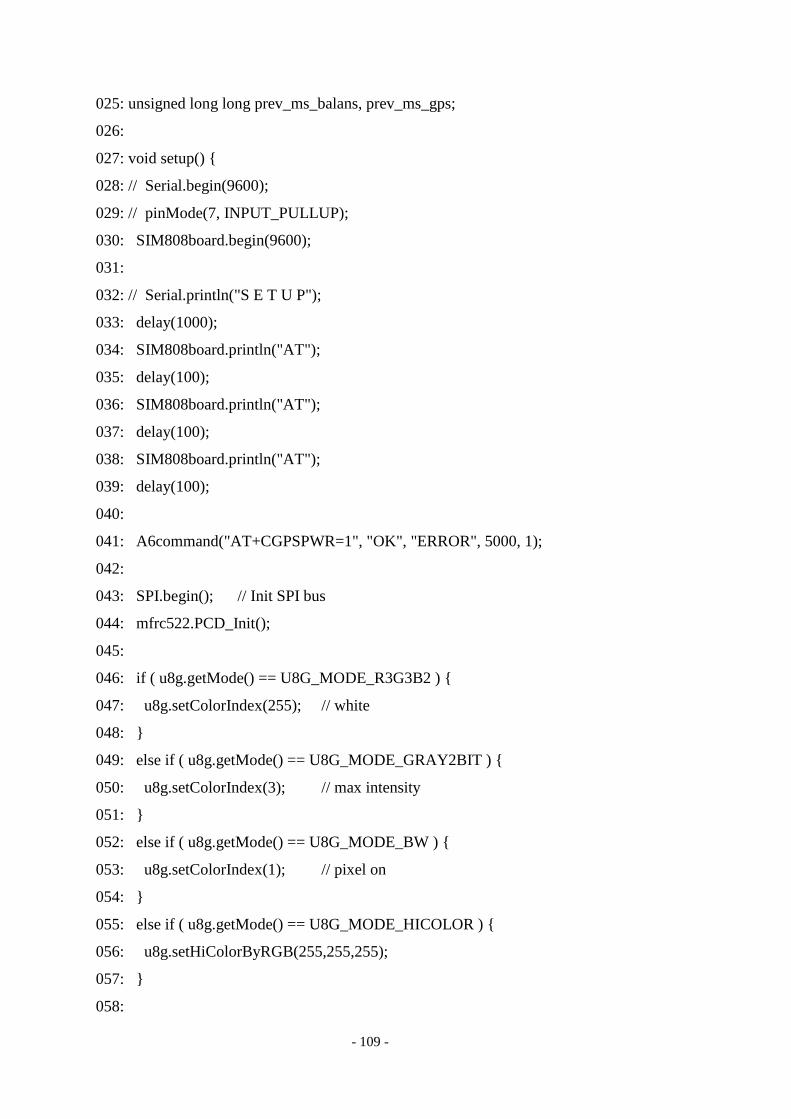
- 109 -
025: unsigned long long prev_ms_balans, prev_ms_gps;
026:
027: void setup() {
028: // Serial.begin(9600);
029: // pinMode(7, INPUT_PULLUP);
030: SIM808board.begin(9600);
031:
032: // Serial.println("S E T U P");
033: delay(1000);
034: SIM808board.println("AT");
035: delay(100);
036: SIM808board.println("AT");
037: delay(100);
038: SIM808board.println("AT");
039: delay(100);
040:
041: A6command("AT+CGPSPWR=1", "OK", "ERROR", 5000, 1);
042:
043: SPI.begin(); // Init SPI bus
044: mfrc522.PCD_Init();
045:
046: if ( u8g.getMode() == U8G_MODE_R3G3B2 ) {
047: u8g.setColorIndex(255); // white
048: }
049: else if ( u8g.getMode() == U8G_MODE_GRAY2BIT ) {
050: u8g.setColorIndex(3); // max intensity
051: }
052: else if ( u8g.getMode() == U8G_MODE_BW ) {
053: u8g.setColorIndex(1); // pixel on
054: }
055: else if ( u8g.getMode() == U8G_MODE_HICOLOR ) {
056: u8g.setHiColorByRGB(255,255,255);
057: }
058:
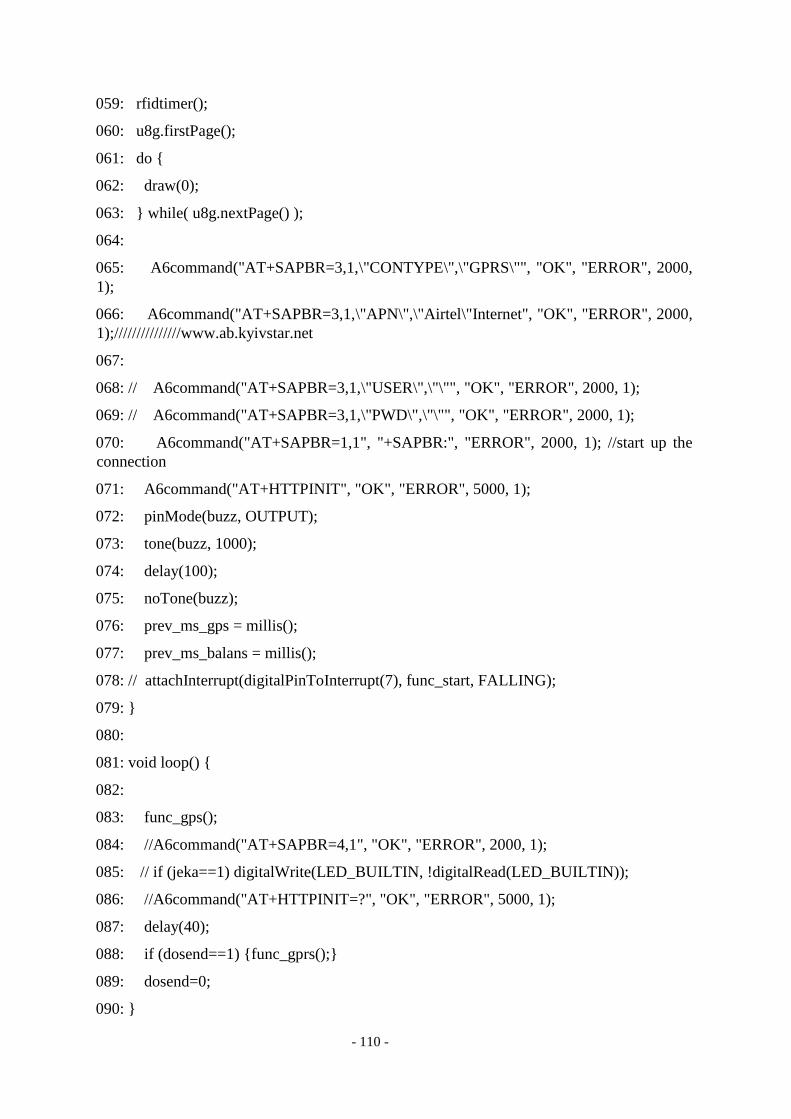
- 110 -
059: rfidtimer();
060: u8g.firstPage();
061: do {
062: draw(0);
063: } while( u8g.nextPage() );
064:
065: A6command("AT+SAPBR=3,1,\"CONTYPE\",\"GPRS\"", "OK", "ERROR", 2000,
1);
066: A6command("AT+SAPBR=3,1,\"APN\",\"Airtel\"Internet", "OK", "ERROR", 2000,
1);///////////////www.ab.kyivstar.net
067:
068: // A6command("AT+SAPBR=3,1,\"USER\",\"\"", "OK", "ERROR", 2000, 1);
069: // A6command("AT+SAPBR=3,1,\"PWD\",\"\"", "OK", "ERROR", 2000, 1);
070: A6command("AT+SAPBR=1,1", "+SAPBR:", "ERROR", 2000, 1); //start up the
connection
071: A6command("AT+HTTPINIT", "OK", "ERROR", 5000, 1);
072: pinMode(buzz, OUTPUT);
073: tone(buzz, 1000);
074: delay(100);
075: noTone(buzz);
076: prev_ms_gps = millis();
077: prev_ms_balans = millis();
078: // attachInterrupt(digitalPinToInterrupt(7), func_start, FALLING);
079: }
080:
081: void loop() {
082:
083: func_gps();
084: //A6command("AT+SAPBR=4,1", "OK", "ERROR", 2000, 1);
085: // if (jeka==1) digitalWrite(LED_BUILTIN, !digitalRead(LED_BUILTIN));
086: //A6command("AT+HTTPINIT=?", "OK", "ERROR", 5000, 1);
087: delay(40);
088: if (dosend==1) {func_gprs();}
089: dosend=0;
090: }
- 111 -
091: // funtion to execut Gps funstions
092: void func_gps() {
093:
094: if (millis() - prev_ms_gps >= 300000){ //chastota otpravki danih msec
095: prev_ms_gps = millis();
096: if (dosend==1) return;
097: A6command("AT+CGPSPWR=1", "OK", "ERROR", 5000, 1);
098: if (dosend==1) return;
099: A6command("AT+CGPSSTATUS?", "OK", "ERROR", 5000, 1);
100: if (dosend==1) return;
101:
102: if ((signal_level_str.indexOf("Location 3D Fix")>-
1)||(signal_level_str.indexOf("Location 2D Fix")>-1)){
103: A6command("AT+CGPSINF=2", "+CGPSINF:", "ERROR", 5000, 1);
104: if (dosend==1) return;
105: signal_level_str = signal_level_str.substring(signal_level_str.indexOf(",")+1,
signal_level_str.length());
106: signal_level_str = signal_level_str.substring(signal_level_str.indexOf(",")+1,
signal_level_str.length());
107: String part;
108: part = signal_level_str.substring(0, signal_level_str.indexOf(","));
109: latitude = part.toFloat();
110: Serial.print("latitude="); // de commented
111: Serial.print(latitude,4); // de commented
112: signal_level_str = signal_level_str.substring(signal_level_str.indexOf(",")+1,
signal_level_str.length());
113: signal_level_str = signal_level_str.substring(signal_level_str.indexOf(",")+1,
signal_level_str.length());
114: part = signal_level_str.substring(0, signal_level_str.indexOf(","));
115: longitude = part.toFloat();
116: dosendgps = 1;
117: //Serial.print(" longitude="); // de commented
118: // Serial.println(longitude,4); // de commented
119: }
120: }
- 112 -
121: }
122:
123:
124: void func_gprs() {
125:
126: tone(buzz, 1000);
127: delay(100);
128: noTone(buzz);
129:
130: str1 = "RFID.php?";
131: str1 += "a=";
132: str1 += str;
133: str1 += ";";
134: if (dosendgps==1){
135: str1 += "L1=";
136: str1 += String(longitude, 5);
137: str1 += ";L2=";
138: str1 += String(latitude, 5);
139: str1 += ";";
140: dosendgps = 0;
141: }
142: if (dosendbalans==1){
143: str1 += "B=";
144: str1 += String(balans, 2);
145: }
146:
147: A6command("AT+HTTPPARA=\"URL\",\"https://www.unilus.ac.zm/RFID/" + str1
+ "\"", "OK", "ERROR", 10000, 1);
148: A6command("AT+HTTPPARA=\"CID\",1", "OK", "ERROR", 10000, 1);
149:
150: A6command("AT+HTTPACTION=0", "+HTTPACTION:", "ERROR", 20000, 1);
151:
152: if (signal_level_str.indexOf("+HTTPACTION: 0,200,")==-1){
153: A6command("AT+HTTPTERM", "HTTPTERM", "ERROR", 20000, 1);
- 113 -
154: A6command("AT+SAPBR=0,1", "+SAPBR:", "ERROR", 2000, 1);
155:
156: A6command("AT+SAPBR=1,1", "+SAPBR:", "ERROR", 2000, 1); //start up the
connection
157: A6command("AT+HTTPINIT", "OK", "ERROR", 5000, 1);
158: A6command("AT+HTTPPARA=\"URL\",\"https://www.unilus.ac.zm/RFID/" + str1
+ "\"", "OK", "ERROR", 10000, 1);
159: A6command("AT+HTTPPARA=\"CID\",1", "OK", "ERROR", 10000, 1);
160: A6command("AT+HTTPACTION=0", "+HTTPACTION:", "ERROR", 20000, 1);
161: if (signal_level_str.indexOf("+HTTPACTION: 0,200,")==-1){
162: u8g.firstPage();
163: do {
164: draw(9);
165: } while( u8g.nextPage() );
166: tone(buzz, 200);
167: delay(600);
168: noTone(buzz);
169: delay(3000);
170: return;
171: }
172: }
173: signal_level_str = "";
174: A6command("AT+HTTPREAD", "HTTPREAD", "ERROR", 20000, 1);
175: parse_dani(signal_level_str);
176: }
177:
178: void parse_dani(String &outstr)
179: {
180: if (outstr.indexOf("a=")>-1){
181: outstr = outstr.substring(outstr.indexOf("a=")+2, outstr.length());
182:
183: a2 = outstr.toInt();
184: u8g.firstPage();
185: do {
- 114 -
186: draw(a2);
187: } while( u8g.nextPage() );
188: if (a2==1){
189: tone(buzz, 1000);
190: delay(500);
191: tone(buzz, 2000);
192: delay(400);
193: noTone(buzz);
194: }else{
195: tone(buzz, 200);
196: delay(600);
197: noTone(buzz);
198: delay(2000);
199: }
200: u8g.firstPage();
201: do {
202: draw(0);
203: } while( u8g.nextPage() );
204: // Serial.print("a2=");
205: // Serial.println(a2);
206: /* u8g.firstPage();
207: do {
208: draw(a2);
209: } while( u8g.nextPage() );*/
210: }
211: }
212:
213: byte A6waitFor(String response1, String response2, uint16_t timeOut) {
214: uint16_t entry = 0;
215: uint16_t count = 0;
216: String reply = A6read();
217: byte retVal = 99;
218: do {
219: reply = A6read();
- 115 -
220: delay(1);
221: entry ++;
222: } while ((reply.indexOf(response1) + reply.indexOf(response2) == -2) && entry <
timeOut );
223: if (entry >= timeOut) {
224: retVal = TIMEOUT;
225: } else {
226: if (reply.indexOf(response1) + reply.indexOf(response2) > -2) retVal = OK;
227: else retVal = NOTOK;
228: }
229: signal_level_str = reply;
230: return retVal;
231: }
232:
233: byte A6command(String command, String response1, String response2, uint16_t
timeOut, uint16_t repetitions) {
234: byte returnValue = NOTOK;
235: byte count = 0;
236:
237: while (count < repetitions && returnValue != OK) {
238: SIM808board.println(command);
239:
240: if (A6waitFor(response1, response2, timeOut) == OK) {
241: returnValue = OK;
242: } else {returnValue = NOTOK;}
243: count++;
244: }
245:
246: return returnValue;
247: }
248:
249: String A6read() {
250: char c;
251: String reply = "";
- 116 -
252: if (SIM808board.available()) {
253: reply = SIM808board.readString();
254: }
255:
256: /* if (reply!=""){
257: Serial.print("Reply: ");
258: Serial.println(reply);
259: }
260: */
261: //signal_level_str = reply;
262: return reply;
263: }
264:
266: void Decode7bit(String &instr, String &outstr)
267: {
268: String part1 = outstr.substring(outstr.indexOf("rahunku")+8, outstr.indexOf(" grn."));
//parsing balance from operator text
269: if (part1.indexOf(".")>-1) {balans = part1.toFloat(); dosendbalans = 1;}
270: }
271:
272: void func_balans() {
273: if (millis() - prev_ms_balans >= 600000){
274: prev_ms_balans = millis();
275: signal_level_str = "";
276: A6command("AT+CUSD=1,\"*114#\"", "grn", "ERROR", 10000, 1); //CSSD balance
check
277: String inputstr;
278: String decodestr="";
279:
280: inputstr = signal_level_str;
281: decodestr=inputstr;
282: Decode7bit(inputstr, decodestr);
283: }
284: }
- 117 -
288: void rfidtimer() {
289: //set timer1 interrupt at 1Hz
290: TCCR1A = 0;// set entire TCCR1A register to 0
291: TCCR1B = 0;// same for TCCR1B
292: TCNT1 = 0;//initialize counter value to 0
293: // set compare match register for 1hz increments
294: OCR1A = 15624;// = (16*10^6) / (1*1024) - 1 (must be <65536)
295: // turn on CTC mode
296: TCCR1B |= (1 << WGM12);
297: // Set CS12 and CS10 bits for 1024 prescaler
298: TCCR1B |= (1 << CS12) | (1 << CS10);
299: // enable timer compare interrupt
300: TIMSK1 |= (1 << OCIE1A);
301: }
302:
303: ISR(TIMER1_COMPA_vect){//timer1 interrupt 1Hz toggles pin 13 (LED)
304: //generates pulse wave of frequency 1Hz/2 = 0.5kHz (takes two cycles for full wave-
toggle high then toggle low)
305: if ( ! mfrc522.PICC_IsNewCardPresent()) {
306: return;
307: }
308:
309: // Select one of the cards
310: if ( ! mfrc522.PICC_ReadCardSerial()) {
311: return;
312: }
313:
314: // Dump debug info about the card; PICC_HaltA() is automatically called
315: // mfrc522.PICC_DumpToSerial(&(mfrc522.uid));
316: str="";
317: for (byte i = 0; i < mfrc522.uid.size; i++) {
318: if(mfrc522.uid.uidByte[i] < 0x10) str+="0";
319:
320: str+=String(mfrc522.uid.uidByte[i], HEX);
- 118 -
321: }
322: // Serial.println(str);
323:
324: u8g.firstPage();
325: do {
326: draw(8);
327: } while( u8g.nextPage() );
328: dosend=1;
329:
330: }
331:
332:
333: void draw(int i) {
334: //u8g.setFont(u8g_font_unifont_0_8);
335: u8g.setFont(u8g_font_unifont_72_73);
336: u8g.drawStr( 10, 35, menu_strings[i]);
337:
338: }
PHP Database Functions
01: <?php
02:
03:
04: // database connection config
05: $dbHost = 'localhost';
06: $dbUser = 'root';
07: $dbPass = '';
08: $dbName = 'traccardemo';
09:
10: $dbConn = mysqli_connect ($dbHost, $dbUser, $dbPass, $dbName);
11: mysqli_select_db($dbConn, $dbName) or die('Cannot select database. ' . mysqli_error());
12:
13: //$con = mysqli_connect($server_name, $mysql_username, $mysql_password,
$db_name);
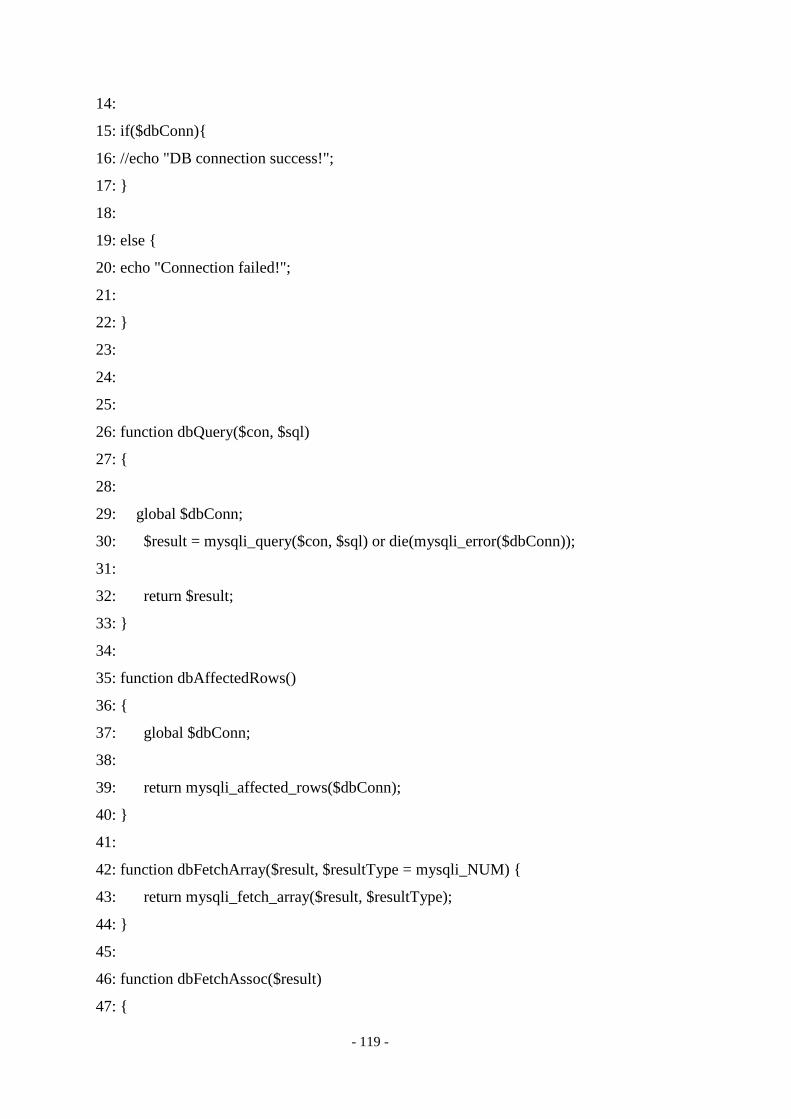
- 119 -
14:
15: if($dbConn){
16: //echo "DB connection success!";
17: }
18:
19: else {
20: echo "Connection failed!";
21:
22: }
23:
24:
25:
26: function dbQuery($con, $sql)
27: {
28:
29: global $dbConn;
30: $result = mysqli_query($con, $sql) or die(mysqli_error($dbConn));
31:
32: return $result;
33: }
34:
35: function dbAffectedRows()
36: {
37: global $dbConn;
38:
39: return mysqli_affected_rows($dbConn);
40: }
41:
42: function dbFetchArray($result, $resultType = mysqli_NUM) {
43: return mysqli_fetch_array($result, $resultType);
44: }
45:
46: function dbFetchAssoc($result)
47: {
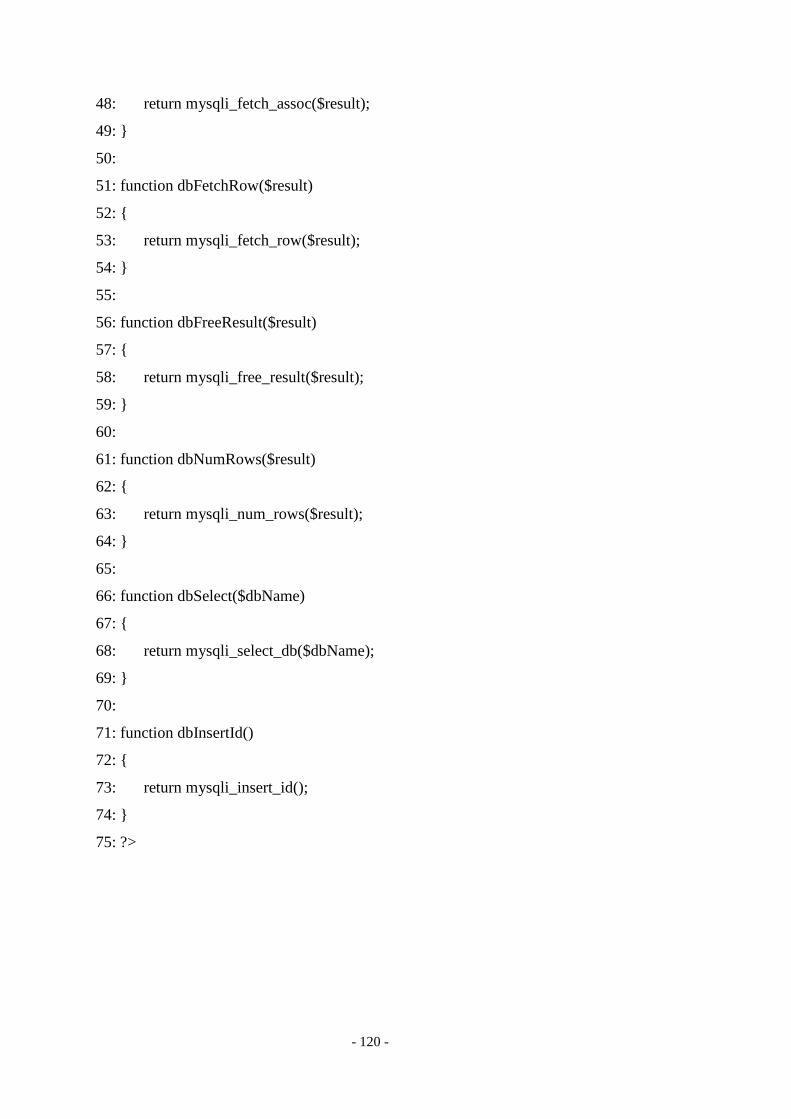
- 120 -
48: return mysqli_fetch_assoc($result);
49: }
50:
51: function dbFetchRow($result)
52: {
53: return mysqli_fetch_row($result);
54: }
55:
56: function dbFreeResult($result)
57: {
58: return mysqli_free_result($result);
59: }
60:
61: function dbNumRows($result)
62: {
63: return mysqli_num_rows($result);
64: }
65:
66: function dbSelect($dbName)
67: {
68: return mysqli_select_db($dbName);
69: }
70:
71: function dbInsertId()
72: {
73: return mysqli_insert_id();
74: }
75: ?>
- 121 -
APPENDIX IV QUESTIONNAIRE.
B.1: Respondent Questionnaire
The University of Zambia
School of Engineering
Passenger luggage tracking system using Sensor Networks
for Livingstone and Lusaka Intercity Bus Terminal
George Kasanga
MEng ICT Security
For more information or any queries, kindly get in touch on [email protected]
Dear Respondent,

- 122 -
I am a student at the University of Zambia in my final stage pursuing a MEng in ICT Security.
As partial fulfilment for the award of a Master’s degree, I am conducting a baseline study on:
“Passenger and luggage tracking system using Sensor Networks.”
Research Summary
There has been an increase in the number of bus operators, which has led to many options for
users when travelling however there has been no computerised mechanism to manage, monitor
and track luggage information by mapping it to the rightful owner at bus stations. This research
seeks to obtain factors that influence the use and non-use of technology in tracking passenger
luggage throughout the journey.
You have been purposefully sampled to provide information for the topic indicated above. The
information being collected is purely for academic purposes as such, it will be treated with
maximum confidentiality. Subsequently, you are not supposed to indicate your name or any
personal information that can lead to revealing of your identity.
Your co-operation will be greatly appreciated.
For more information or any queries, kindly get in touch with the following:
Project Supervisor: Dr. Jackson Phiri (0966 693 731) or
Assistant Dean Postgraduate: Dr. Charles Kahanji
Survey Questionnaires
Have you used Bus transportation when travelling to another town? Yes [ ] No [ ]
Name of Bus
Operator/s____________________________________________________________
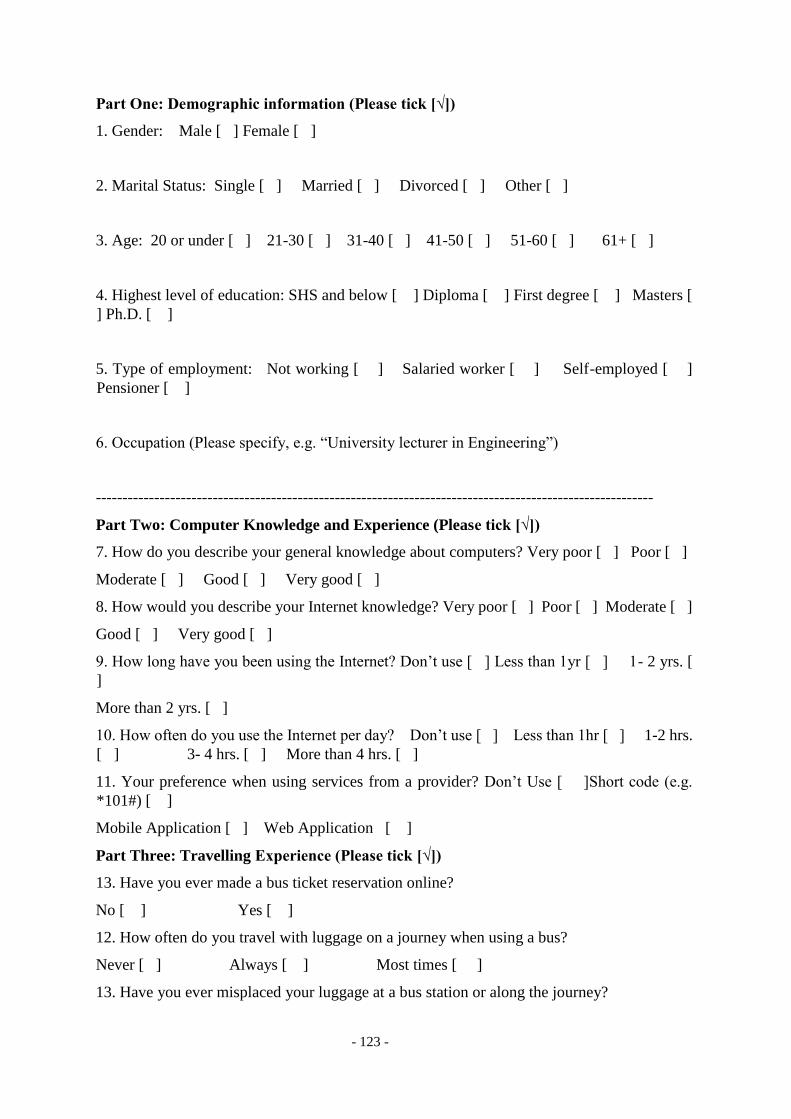
- 123 -
Part One: Demographic information (Please tick [√])
1. Gender: Male [ ] Female [ ]
2. Marital Status: Single [ ] Married [ ] Divorced [ ] Other [ ]
3. Age: 20 or under [ ] 21-30 [ ] 31-40 [ ] 41-50 [ ] 51-60 [ ] 61+ [ ]
4. Highest level of education: SHS and below [ ] Diploma [ ] First degree [ ] Masters [
] Ph.D. [ ]
5. Type of employment: Not working [ ] Salaried worker [ ] Self-employed [ ]
Pensioner [ ]
6. Occupation (Please specify, e.g. “University lecturer in Engineering”)
---------------------------------------------------------------------------------------------------------
Part Two: Computer Knowledge and Experience (Please tick [√])
7. How do you describe your general knowledge about computers? Very poor [ ] Poor [ ]
Moderate [ ] Good [ ] Very good [ ]
8. How would you describe your Internet knowledge? Very poor [ ] Poor [ ] Moderate [ ]
Good [ ] Very good [ ]
9. How long have you been using the Internet? Don’t use [ ] Less than 1yr [ ] 1- 2 yrs. [
]
More than 2 yrs. [ ]
10. How often do you use the Internet per day? Don’t use [ ] Less than 1hr [ ] 1-2 hrs.
[ ] 3- 4 hrs. [ ] More than 4 hrs. [ ]
11. Your preference when using services from a provider? Don’t Use [ ]Short code (e.g.
*101#) [ ]
Mobile Application [ ] Web Application [ ]
Part Three: Travelling Experience (Please tick [√])
13. Have you ever made a bus ticket reservation online?
No [ ] Yes [ ]
12. How often do you travel with luggage on a journey when using a bus?
Never [ ] Always [ ] Most times [ ]
13. Have you ever misplaced your luggage at a bus station or along the journey?
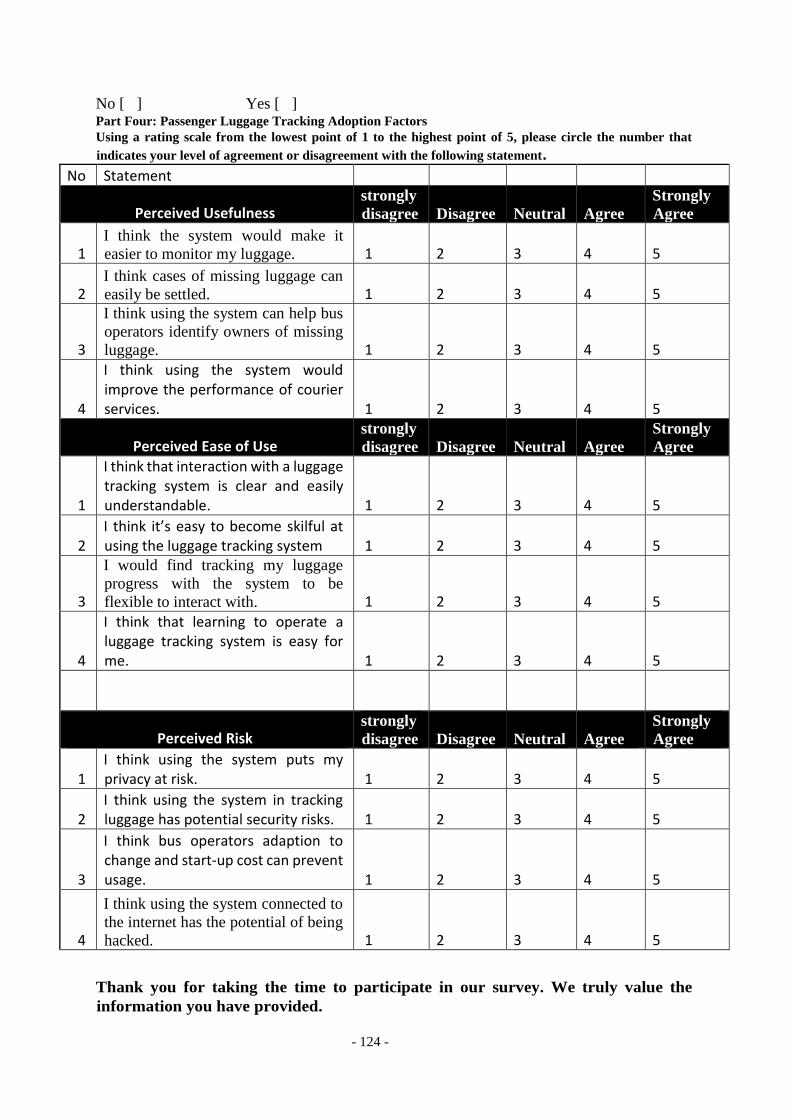
- 124 -
No [ ] Yes [ ] Part Four: Passenger Luggage Tracking Adoption Factors
Using a rating scale from the lowest point of 1 to the highest point of 5, please circle the number that
indicates your level of agreement or disagreement with the following statement.
No Statement
Perceived Usefulness strongly
disagree Disagree Neutral Agree Strongly
Agree
1 I think the system would make it
easier to monitor my luggage. 1 2 3 4 5
2 I think cases of missing luggage can
easily be settled. 1 2 3 4 5
3
I think using the system can help bus
operators identify owners of missing
luggage. 1 2 3 4 5
4
I think using the system would improve the performance of courier services. 1 2 3 4 5
Perceived Ease of Use strongly
disagree Disagree Neutral Agree Strongly
Agree
1
I think that interaction with a luggage tracking system is clear and easily understandable. 1 2 3 4 5
2 I think it’s easy to become skilful at using the luggage tracking system 1 2 3 4 5
3
I would find tracking my luggage
progress with the system to be
flexible to interact with. 1 2 3 4 5
4
I think that learning to operate a luggage tracking system is easy for me. 1 2 3 4 5
Perceived Risk strongly
disagree Disagree Neutral Agree Strongly
Agree
1 I think using the system puts my privacy at risk. 1 2 3 4 5
2 I think using the system in tracking luggage has potential security risks. 1 2 3 4 5
3
I think bus operators adaption to change and start-up cost can prevent usage. 1 2 3 4 5
4
I think using the system connected to
the internet has the potential of being
hacked. 1 2 3 4 5
Thank you for taking the time to participate in our survey. We truly value the
information you have provided.
- 125 -
B.2: Operator Respondent Questionnaire
The University of Zambia
School of Engineering
Passenger luggage tracking system using Sensor Networks
for Livingstone and Lusaka Intercity Bus Terminal
George Kasanga
MEng ICT Security
For more information or any queries, kindly get in touch on [email protected]
Dear Respondent,
I am a student at the University of Zambia in my final stage pursuing a MEng in ICT Security.
As partial fulfilment for the award of a Master’s degree, I am conducting a baseline study on:
“Passenger and luggage tracking system using Sensor Networks.”
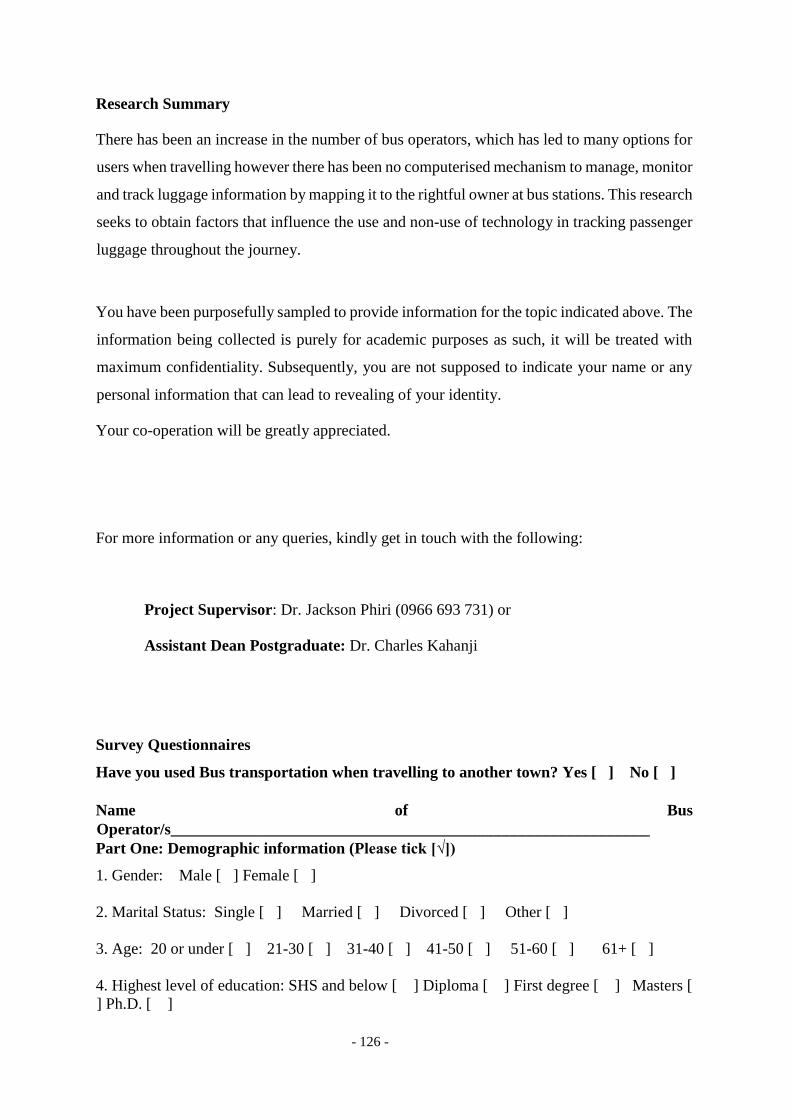
- 126 -
Research Summary
There has been an increase in the number of bus operators, which has led to many options for
users when travelling however there has been no computerised mechanism to manage, monitor
and track luggage information by mapping it to the rightful owner at bus stations. This research
seeks to obtain factors that influence the use and non-use of technology in tracking passenger
luggage throughout the journey.
You have been purposefully sampled to provide information for the topic indicated above. The
information being collected is purely for academic purposes as such, it will be treated with
maximum confidentiality. Subsequently, you are not supposed to indicate your name or any
personal information that can lead to revealing of your identity.
Your co-operation will be greatly appreciated.
For more information or any queries, kindly get in touch with the following:
Project Supervisor: Dr. Jackson Phiri (0966 693 731) or
Assistant Dean Postgraduate: Dr. Charles Kahanji
Survey Questionnaires
Have you used Bus transportation when travelling to another town? Yes [ ] No [ ]
Name of Bus
Operator/s____________________________________________________________
Part One: Demographic information (Please tick [√])
1. Gender: Male [ ] Female [ ]
2. Marital Status: Single [ ] Married [ ] Divorced [ ] Other [ ]
3. Age: 20 or under [ ] 21-30 [ ] 31-40 [ ] 41-50 [ ] 51-60 [ ] 61+ [ ]
4. Highest level of education: SHS and below [ ] Diploma [ ] First degree [ ] Masters [
] Ph.D. [ ]
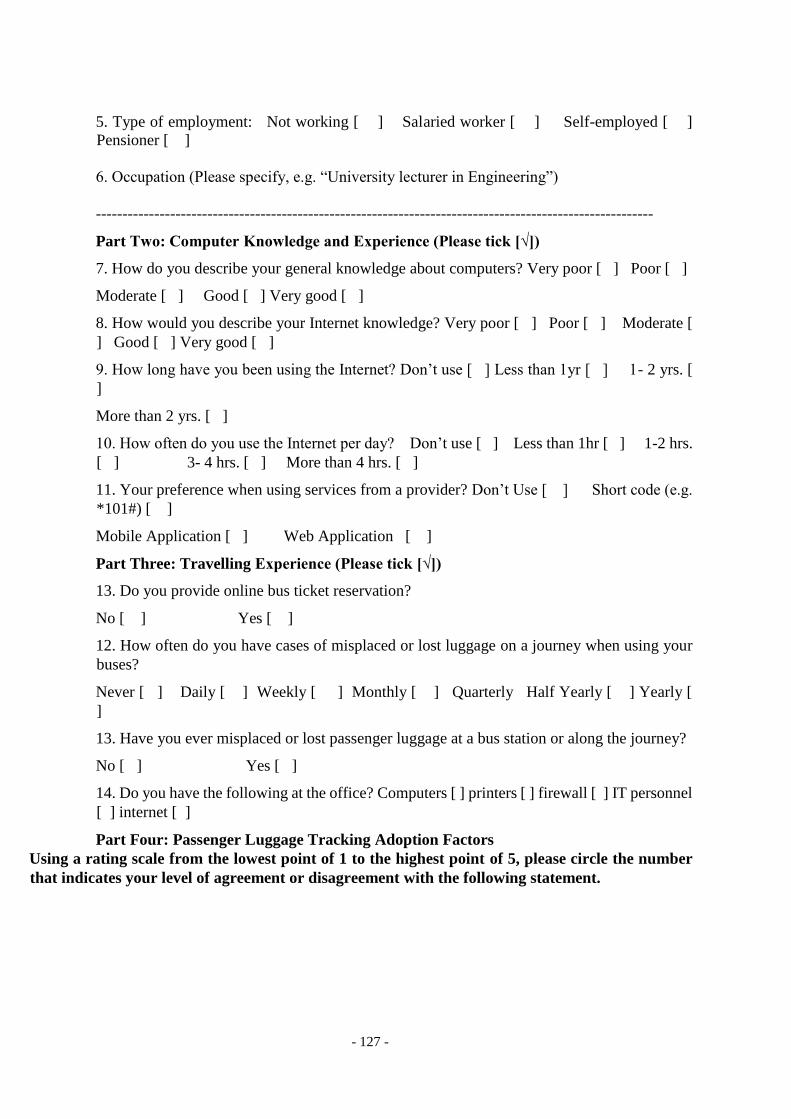
- 127 -
5. Type of employment: Not working [ ] Salaried worker [ ] Self-employed [ ]
Pensioner [ ]
6. Occupation (Please specify, e.g. “University lecturer in Engineering”)
---------------------------------------------------------------------------------------------------------
Part Two: Computer Knowledge and Experience (Please tick [√])
7. How do you describe your general knowledge about computers? Very poor [ ] Poor [ ]
Moderate [ ] Good [ ] Very good [ ]
8. How would you describe your Internet knowledge? Very poor [ ] Poor [ ] Moderate [
] Good [ ] Very good [ ]
9. How long have you been using the Internet? Don’t use [ ] Less than 1yr [ ] 1- 2 yrs. [
]
More than 2 yrs. [ ]
10. How often do you use the Internet per day? Don’t use [ ] Less than 1hr [ ] 1-2 hrs.
[ ] 3- 4 hrs. [ ] More than 4 hrs. [ ]
11. Your preference when using services from a provider? Don’t Use [ ] Short code (e.g.
*101#) [ ]
Mobile Application [ ] Web Application [ ]
Part Three: Travelling Experience (Please tick [√])
13. Do you provide online bus ticket reservation?
No [ ] Yes [ ]
12. How often do you have cases of misplaced or lost luggage on a journey when using your
buses?
Never [ ] Daily [ ] Weekly [ ] Monthly [ ] Quarterly Half Yearly [ ] Yearly [
]
13. Have you ever misplaced or lost passenger luggage at a bus station or along the journey?
No [ ] Yes [ ]
14. Do you have the following at the office? Computers [ ] printers [ ] firewall [ ] IT personnel
[ ] internet [ ]
Part Four: Passenger Luggage Tracking Adoption Factors
Using a rating scale from the lowest point of 1 to the highest point of 5, please circle the number
that indicates your level of agreement or disagreement with the following statement.
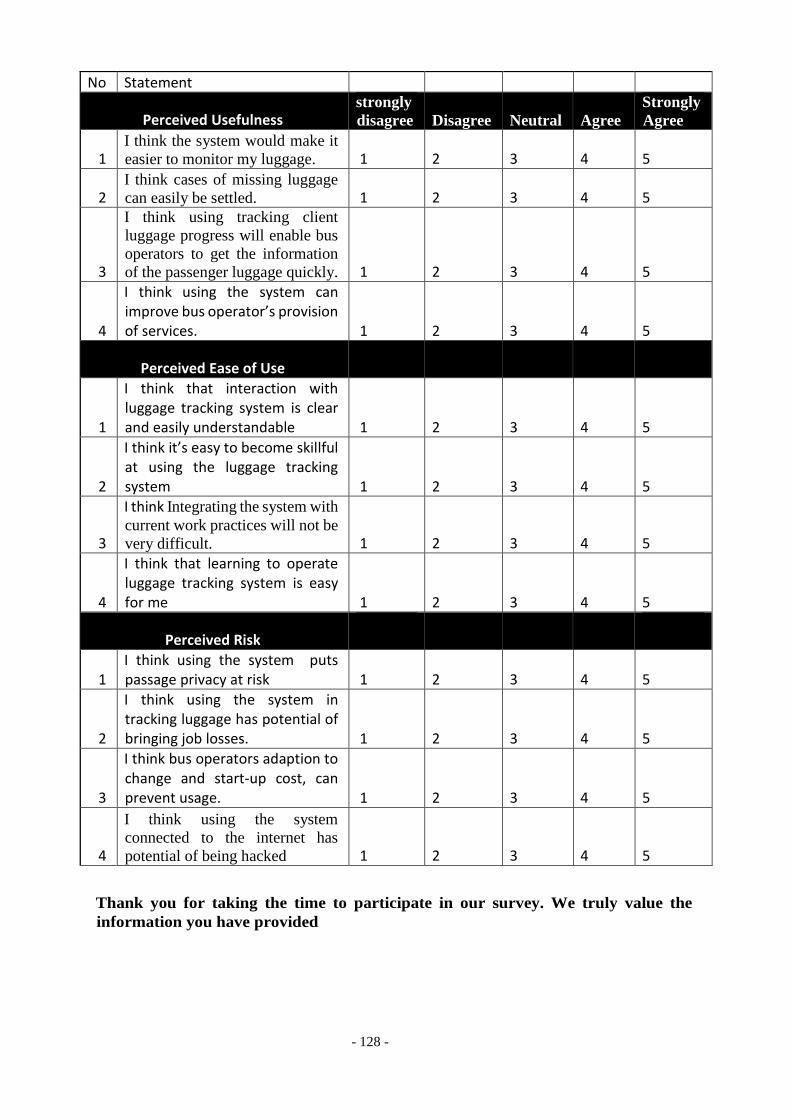
- 128 -
Thank you for taking the time to participate in our survey. We truly value the
information you have provided
No Statement
Perceived Usefulness strongly
disagree Disagree Neutral Agree Strongly
Agree
1 I think the system would make it
easier to monitor my luggage. 1 2 3 4 5
2 I think cases of missing luggage
can easily be settled. 1 2 3 4 5
3
I think using tracking client
luggage progress will enable bus
operators to get the information
of the passenger luggage quickly. 1 2 3 4 5
4
I think using the system can improve bus operator’s provision of services. 1 2 3 4 5
Perceived Ease of Use strongly
disagree Disagree Neutral Agree Strongly
Agree
1
I think that interaction with luggage tracking system is clear and easily understandable 1 2 3 4 5
2
I think it’s easy to become skillful at using the luggage tracking system 1 2 3 4 5
3
I think Integrating the system with
current work practices will not be
very difficult. 1 2 3 4 5
4
I think that learning to operate luggage tracking system is easy for me 1 2 3 4 5
Perceived Risk strongly
disagree Disagree Neutral Agree Strongly
Agree
1 I think using the system puts passage privacy at risk 1 2 3 4 5
2
I think using the system in tracking luggage has potential of bringing job losses. 1 2 3 4 5
3
I think bus operators adaption to change and start-up cost, can prevent usage. 1 2 3 4 5
4
I think using the system
connected to the internet has
potential of being hacked 1 2 3 4 5
- 129 -
LIST OF PUBLICATIONS
1. George Kasanga, Jackson Phiri, “Passenger and Luggage Tracking System Using Sensor
Networks for Public Transport”, Proceedings of the 3rdinternational conference in ICT
(ICICT2019).
2. Kasanga, G. and Phiri, J. (2020) Factors Affecting the Adoption and Usage of Luggage
Tracking System by Public Transporters Based on TAM Model. Open Journal of Business
and Management, 8, 855-865. Doi: 10.4236/ojbm.2020.82052.


