Embed Size (px)
Citation preview
1
Patterns of comorbidity and their impact on axial spondyloarthritis
Thesis submitted to the University of Liverpool
for the degree of Doctor of Philosophy
in the Faculty of Health and Life Sciences
2020
Sizheng Steven Zhao
Institute of Life Course and Medical Sciences

2
Declaration
This work has not been submitted in substance for any other degree or award at this or any
other university or place of learning, nor is being submitted concurrently in candidature for
any degree or other award. This thesis is being submitted in partial fulfilment of the
requirements for the degree of PhD. This thesis is the result of my own independent
work/investigation, except where otherwise stated. Other sources are acknowledged by
explicit references. The views expressed are my own. I hereby give consent for my thesis, if
accepted, to be available for photocopying and for interlibrary loan, and for the title and
summary to be made available to outside organisations.
Signed:
Sizheng Steven Zhao
10 November 2020

3
Acknowledgements
I started my journey on clinical research eight years ago with zero experience. My first
paper required so many revisions that it took over a year’s worth of tracked changes from
first draft to submission. I am grateful to Dr Nicola Goodson for seeing my potential and
patiently tutoring me over these years, and for her mentorship in writing this thesis. I thank
Dr Dierdre Lane, for being an indispensable source of encouragement and pastoral support,
and for her drive and commitment in supervising this PhD to completion. Academia can be
a dangerous beast, sucking life from things that actually matter. I have Professor Robert
Moots to thank for simultaneously providing me the opportunity to remain in it (through
funding this PhD) and reminding me that there is much more.
Many people can pick out a time in their lives when they found their identity or voice. For
me as a researcher, this was without doubt during my time under the mentorship of
Professor Daniel Solomon. Dan showed my family and I such a level of consideration and
kindness that I do not have the word count to convey, and showed me what it is to mentor
for no other reason than the prosperity of the next generation of researchers. I am also
indebted to Dr Gareth Jones and Professor Gary Macfarlane, for their guidance on using the
BSRBR-AS data and writing the thesis manuscripts, and for taking such a junior researcher
seriously (meeting up for dinner and finding opportunities for me to present my research);
to Dr Kazuki Yoshida, who patiently taught me causal inference – a new and better way to
think; to Drs Stephen Duffield, Houchen Lyu, Sara Tedeschi, Mrinalini Dey, and David
Hughes, for being my friends; to Dr Azri Nache, who allowed me to contribute to the
pandemic effort while minimising disruption to my research.
I started the clock on this PhD the day my first daughter – Liliana – was born. She is now a
vibrant, intelligent, and beautiful girl. She has been joined by her sister – Phoebe – who
directly contributed to this thesis by being a better sleeper. I thank my wonderful wife –
Naomi – for reminding me daily to make the most of enjoying them and keeping
perspective. I thank my parents for moving their lives to support me and my family.
My PhD journey has been a catalogue of blessings.

4
5
Abstract
Background and Aim: Axial spondyloarthritis (axSpA) patients have higher risk of co-
existing medical conditions – comorbidities – than the general population, yet management
guidelines are largely based on randomised controlled trials that often exclude those with
comorbidities. The overarching aim of this thesis was to describe the patterns of
comorbidity and their impact on treatment using three real-world axSpA populations.
Methods: Three datasets were used: one from a specialist axSpA service (Aintree cohort)
and one from tertiary hospitals in Boston, Massachusetts (Boston cohort), and a
longitudinal national axSpA register – the British Society for Rheumatology Biologics
Register for axSpA (BSRBR-AS). Chapter 4 compared the prevalence of 39 comorbidities
between two axSpA phenotypes – non-radiographic and radiographic axSpA – using the
Boston and Aintree cohorts. Cluster analysis was then used to examine how comorbidities
co-exist in the Aintree cohort, and how clusters relate to axSpA severity using multivariable
regression models. Chapter 5 applied multivariable regression models to baseline BSRBR-AS
data to examine whether axSpA disease assessment using various indices were
differentially influenced by 14 comorbidities. Chapter 6 applied conditional models to
longitudinal data from the BSRBR-AS to investigate the association between comorbidity
and treatment response. Chapter 7 focused on the potential causal association of baseline
mental health symptoms on treatment outcomes using marginal models.
Results: The Boston cohort included 775 patients (mean age 53 (SD 17) years, 74% male),
Aintree 421 patients (46 (SD 14) years, 69% male), and BSRBR-AS 2042 patients (49 (SD 15)
years, 67% male). Around half of each cohort had at least one comorbidity. Comorbidity
patterns and counts were similar between radiographic and non-radiographic axSpA in
Boston (mean 1.5 vs. 1.3, respectively) and Aintree cohorts (1.4 vs. 1.3). Mental health
conditions tended to co-exist and were associated with greater axSpA disease severity. In
the baseline BSRBR-AS data, each additional comorbidity was associated with higher
BASDAI (Bath AS Disease Activity Index) by 0.40 units (95% CI 0.27, 0.52) and ASDAS (AS
Disease Activity Score) by 0.09 units (95% CI 0.03, 0.15). Among 994 BSRBR-AS patients
starting TNF inhibitors (TNFi), those with multiple comorbidities had similar absolute
improvement in disease activity but reduced improvement in function (by 1.0 unit in BASFI
at 6 months) and health-related quality of life (2.3 ASQoL units). Compared to those with
less than mild depressive symptoms, patients with moderate-severe symptoms had
reduced response at 6 months, by approximately 2 BASDAI units and 0.9 ASDAS units.
Patients with moderate-severe anxiety symptoms had increased treatment discontinuation
(HR 1.59; 95% CI 1.12 to 2.26) than those with less than mild anxiety.
Conclusions: Comorbidities are highly prevalent in axSpA, in particular cardiovascular and
mental health disorders. Comorbidities are associated with axSpA disease activity at
baseline and adverse treatment outcomes, particularly depression and anxiety. These
results have important clinical and policy implications for the current approach to disease
assessment. Clinicians should record and refer comorbidities for optimal management,
particularly mental health disorders.
6
Table of contents
Declaration ............................................................................................................................... 2
Acknowledgements .................................................................................................................. 3
Abstract .................................................................................................................................... 5
Table of contents ...................................................................................................................... 6
List of Tables ........................................................................................................................... 12
List of Figures .......................................................................................................................... 17
Glossary .................................................................................................................................. 22
Publications ............................................................................................................................ 24
Chapter 1: Introduction .......................................................................................................... 27
1.1 What is axial spondyloarthritis? ................................................................................... 27
1.1.1 Clinical features ..................................................................................................... 28
1.1.2 Extra-articular manifestations (EAMs) .................................................................. 29
1.2 Epidemiology ................................................................................................................ 31
1.2.1 Prevalence and incidence ...................................................................................... 31
1.2.2 Non-environmental risk factors ............................................................................ 31
1.2.3 Environmental risk factors .................................................................................... 31
1.3 Pathophysiology ........................................................................................................... 32
1.4 Diagnosis and Classification ......................................................................................... 33
1.4.1 Diagnosis................................................................................................................ 33
1.4.2 Classification .......................................................................................................... 35
1.4.3 Differences between radiographic and non-radiographic axial spondyloarthritis 37
1.5 Management ................................................................................................................ 38
1.5.1 Assessment ............................................................................................................ 38
1.5.2 Non-steroidal anti-inflammatory drugs (NSAIDs) ................................................. 41
1.5.3 Disease-modifying antirheumatic drugs (DMARDs) .............................................. 42
1.6 Comorbidity .................................................................................................................. 44
1.6.1 Comorbidity or multimorbidity ............................................................................. 44
1.7 Summary ...................................................................................................................... 46
Chapter 2: Background Literature Review ............................................................................. 47
2.1 Introduction .................................................................................................................. 47
2.2 Aims .............................................................................................................................. 48
2.3 Methods ....................................................................................................................... 48
7
2.4 Results .......................................................................................................................... 50
2.4.1 Prevalence of comorbidities ................................................................................. 56
2.4.2 Comorbidity in axSpA vs. controls ........................................................................ 61
2.4.3 Comorbidity and disease outcomes ...................................................................... 66
2.5 Discussion ..................................................................................................................... 72
2.5.1 Prevalence of comorbidities ................................................................................. 72
2.5.2 Methods for studying comorbidity ....................................................................... 74
2.5.3 Association with axial spondyloarthritis outcomes .............................................. 78
2.5.4 Summary of literature review ............................................................................... 79
2.6 Thesis Aims and Objectives .......................................................................................... 80
Chapter 3: Methods ............................................................................................................... 81
3.1 Study populations ........................................................................................................ 81
3.2 Aintree axial spondyloarthritis registry ........................................................................ 81
3.2.1 Local population .................................................................................................... 81
3.2.2 Health provision and the Aintree University Hospital spondyloarthritis service.. 83
3.2.3 Electronic Health Records (EHRs) ......................................................................... 84
3.2.4 Study design .......................................................................................................... 84
3.3 Boston axial spondyloarthritis study (Massachusetts, USA) ........................................ 93
3.3.1 Local population .................................................................................................... 93
3.3.2 Health provision .................................................................................................... 94
3.3.3 Electronic Health Records (EHRs) and the Research Patient Data Registry (RPDR)
....................................................................................................................................... 95
3.3.4 Study design .......................................................................................................... 97
3.4 The British Society for Rheumatology Biologics Register for Ankylosing Spondylitis
(BSRBR-AS) ....................................................................................................................... 105
3.4.1 Background ......................................................................................................... 105
3.4.2 Study design ........................................................................................................ 106
3.4.3 Preparing data for analysis ................................................................................. 111
3.5 Statistics ..................................................................................................................... 116
3.5.1 Analysis approach ............................................................................................... 116
3.5.2 Exposure and outcome definitions ..................................................................... 117
3.5.3 Descriptive statistics ........................................................................................... 118
3.5.4 Generalised linear regression models ................................................................. 119
3.5.6 Mixed effects models and GEE (Generalised Estimating Equations) .................. 120
3.5.7 Survival analysis .................................................................................................. 124
8
3.5.8 Missing data and multiple imputation ................................................................ 125
3.6 Summary .................................................................................................................... 127
Chapter 4: Comorbidities in radiographic vs. non-radiographic axSpA and clustering of
comorbidities in axial spondyloarthritis ............................................................................... 129
4.1 Introduction ................................................................................................................ 129
4.2 Aims ............................................................................................................................ 130
4.3 Methods ..................................................................................................................... 130
4.3.1 Patient populations ............................................................................................. 130
4.3.2 Definition of AS and nr-axSpA ............................................................................. 131
4.3.3 Statistics............................................................................................................... 131
4.4 Results ........................................................................................................................ 138
4.4.1 Prevalence of comorbidities ................................................................................ 138
4.4.2 Comorbidities in AS vs. nr-axSpA ........................................................................ 149
4.4.3 Comorbidity clusters in the Aintree axSpA registry ............................................ 152
4.4.4 Associations between patient-clusters and disease indices in the Aintree study
...................................................................................................................................... 162
4.5 Discussion ................................................................................................................... 165
4.5.1 Prevalence of comorbidities ................................................................................ 165
4.5.2 Comorbidities in AS vs. nr-axSpA ........................................................................ 166
4.5.3 Comorbidity clusters and associations with disease severity ............................. 167
4.5.4 Strengths and limitations .................................................................................... 169
4.6 Summary .................................................................................................................... 170
Chapter 5: Comorbidities and disease assessment in axSpA ............................................... 171
5.1 Introduction ................................................................................................................ 171
5.2 Aims ............................................................................................................................ 172
5.3 Methods ..................................................................................................................... 172
5.3.1 Comorbidity ......................................................................................................... 172
5.3.2 Assessment of disease activity and severity ....................................................... 172
5.3.3 Covariates ............................................................................................................ 173
5.3.4 Statistics............................................................................................................... 174
5.4 Results ........................................................................................................................ 176
5.4.1 Comorbidities and disease activity ...................................................................... 179
5.4.2 Comorbidities and other measures of disease severity ...................................... 182
5.4.3 Independent influence of comorbidity on the patient global score ................... 184
5.4.4 Sensitivity analysis ............................................................................................... 185
9
5.5 Discussion ................................................................................................................... 186
5.5.1 Strengths and limitations .................................................................................... 187
5.6 Summary .................................................................................................................... 188
Chapter 6: Comorbidities and response to TNF inhibitors .................................................. 189
6.1 Introduction ............................................................................................................... 189
6.2 Aims............................................................................................................................ 190
6.3 Methods ..................................................................................................................... 190
6.3.1 Patient population .............................................................................................. 190
6.3.2 Comorbidity ........................................................................................................ 191
6.3.3 Outcomes ............................................................................................................ 191
6.3.4 Covariates ........................................................................................................... 193
6.3.5 Statistics .............................................................................................................. 193
6.4 Results ........................................................................................................................ 196
6.4.1 Binary response outcome ................................................................................... 201
6.4.2 Change in continuous outcome indices over time ............................................. 205
6.4.3 Time to treatment discontinuation..................................................................... 218
6.4.4 Sensitivity analyses ............................................................................................. 222
6.5 Discussion ................................................................................................................... 223
6.5.1 Strengths and limitations .................................................................................... 225
6.6 Summary .................................................................................................................... 226
Chapter 7: Depression and anxiety and response to TNF inhibitors ................................... 227
7.1 Introduction ............................................................................................................... 227
7.2 Aims............................................................................................................................ 228
7.3 Methods ..................................................................................................................... 228
7.3.1 Patient population .............................................................................................. 228
7.3.2 ‘Exposures’ – baseline depression and anxiety................................................... 228
7.3.3 Covariates ........................................................................................................... 229
7.3.4 Statistics .............................................................................................................. 230
7.4 Results ........................................................................................................................ 233
7.4.1 Comparison of depression diagnosis and symptoms ......................................... 235
7.4.2 History of depression vs. treatment outcomes (conditional models) ................ 239
7.4.3 Baseline symptoms of depression/anxiety vs. treatment outcomes (marginal
models) ........................................................................................................................ 242
7.4.4 Gender interactions between baseline depression or anxiety symptoms and each
outcome. ...................................................................................................................... 253
10
7.4.5 Sensitivity analysis ............................................................................................... 254
7.5 Discussion ................................................................................................................... 254
7.5.1 Strengths and limitations .................................................................................... 256
7.6 Summary .................................................................................................................... 259
Chapter 8: Discussion and conclusions ................................................................................ 261
8.1 Summary of findings ................................................................................................... 261
8.1.1 Comorbidities in radiographic vs non-radiographic axSpA ................................. 261
8.1.2 Clustering of comorbidities ................................................................................. 262
8.1.3 Comorbidities and disease assessment ............................................................... 262
8.1.4 Comorbidities and response to TNF inhibitors .................................................... 263
8.1.5 Depression and anxiety and response to TNF inhibitors..................................... 264
8.2 Strengths and limitations ........................................................................................... 264
8.2.1 Strengths ............................................................................................................. 264
8.2.2 Limitations ........................................................................................................... 266
8.3 Recommendations for clinical practice ...................................................................... 267
8.3.1 Recording and screening for comorbidities ........................................................ 267
8.3.2 Optimising and treating comorbidities ............................................................... 268
8.3.3 Adapting practice in the presence of comorbidities ........................................... 270
8.3.4 Taking part in pragmatic trials ............................................................................. 271
8.4 Recommendations for health policy .......................................................................... 273
8.4.1 AxSpA guidelines ................................................................................................. 273
8.4.2 Healthcare services ............................................................................................. 274
8.5 Recommendations for future research ...................................................................... 275
8.5.1 Clinical research................................................................................................... 275
8.5.2 Research methodology ........................................................................................ 278
8.6 Future research projects related to this thesis .......................................................... 279
8.7 Conclusions ................................................................................................................. 280
9. Bibliography ...................................................................................................................... 281
10. Appendices ..................................................................................................................... 305
10.1 Appendix for Chapter 2 ............................................................................................ 305
10.2 Appendix for Chapter 3 ............................................................................................ 307
10.2.1 Summary of data preparation for the BSRBR-AS .............................................. 310
10.2.2 Covariance/correlation structure for longitudinal analyses ............................. 314
10.3 Appendix for Chapter 4 ............................................................................................ 315

11
10.4 Appendix for Chapter 5 ............................................................................................ 322
10.5 Appendix for Chapter 6 ............................................................................................ 331
10.6 Appendix for Chapter 7 ............................................................................................ 337
10.6.1 Inverse-probability weights .............................................................................. 337
10.6.2 Results from marginal and conditional models may not coincide for binary and
time-to-event outcomes. ............................................................................................. 338
10.6.3 Equivalence between Cox and pooled logistic regression models ................... 339
12
List of Tables
Table 1. 1: Likelihood ratios to aid diagnosis of axial spondyloarthritis. ............................... 34
Table 2. 1: Summary of characteristics of studies included in the systematic review of
comorbidities in axial spondyloarthritis. ................................................................................ 52
Table 2. 2: Meta-analysis estimates for prevalence of individual comorbidities in the
included studies...................................................................................................................... 58
Table 2. 3: Comparison of comorbidity prevalence between axSpA and controls. ............... 62
Table 2. 4: Meta-analysis estimates for odds ratios of comorbidities compared between
axSpA and control groups. ..................................................................................................... 65
Table 2. 5: Cross-sectional studies examining the impact of comorbidity on disease indices
in axial spondyloarthritis. ....................................................................................................... 66
Table 2. 6: Longitudinal studies examining the impact of comorbidity on disease outcomes
in axial spondyloarthritis. ....................................................................................................... 69
Table 2. 7: Comparison of five common comorbidity tools in rheumatic diseases research. 76
Table 3. 1: Comorbidities assumed to be present if history and medications were suggestive
of the condition. ..................................................................................................................... 90
Table 3. 2: Relationship between sample size and precision for different prevalence
estimates. ............................................................................................................................... 92
Table 3. 3: Variables collected at baseline and follow-up in the BSRBR-AS that were
requested for this thesis. ...................................................................................................... 108
Table 3. 4: Simple descriptive statistical tests used in the thesis. ....................................... 119
Table 3. 5: Example output from mixed model with BASDAI as the outcome to explain the
interpretation of interaction terms. ..................................................................................... 123
Table 4. 1: Examples of statistical power for t-tests. ........................................................... 136
Table 4. 2: Relationship between prevalence and difference that can be detected with
sufficient power. .................................................................................................................. 136
Table 4. 3: Characteristics of 775 axSpA patients in the Boston axSpA study, overall and
compared according to diagnosis. ....................................................................................... 139
13
Table 4. 4: Medications used in 775 Boston axSpA patients compared according to
diagnosis. ............................................................................................................................. 140
Table 4. 5: Characteristics of Boston axSpA patients according to whether they have
isolated axial spondyloarthritis (axSpA) or axSpA with comorbidities. ............................... 143
Table 4. 6: Patient characteristics and patient reported outcome of the Aintree axial
spondyloarthritis registry. .................................................................................................... 145
Table 4. 7: Patient characteristics the Aintree axial spondyloarthritis registry according to
the presence of comorbidities. ............................................................................................ 148
Table 4. 8: Prevalence of comorbidities in each of the 11 patient clusters with more than
one patient. .......................................................................................................................... 154
Table 4. 9 Baseline characteristics compared between each comorbidity cluster and axial
spondyloarthritis patients with no comorbidity. ................................................................. 156
Table 4. 10: External validation of clusters by replicating the cluster analysis in the Boston
axSpA study. ......................................................................................................................... 159
Table 4. 11 Baseline characteristics compared between each comorbidity cluster and axial
spondyloarthritis patients with no comorbidity. ................................................................. 161
Table 4. 12: Disease indices compared between each comorbidity cluster and axial
spondyloarthritis patients with no comorbidity. ................................................................. 163
Table 5. 1: Baseline characteristics of 2043 participants from the BSRBR-AS registry. ....... 177
Table 6. 1: Baseline characteristics of 994 BSRBR-AS participants in the longitudinal analysis
cohort. .................................................................................................................................. 197
Table 6. 2: Association between comorbidity and binary response at 6 months. .............. 201
Table 6. 3: Coefficients from mixed effects models of baseline comorbidity status vs.
disease activity over time. ................................................................................................... 209
Table 6. 4: Coefficients from mixed effect models of baseline comorbidity status vs. disease
severity measures over time. ............................................................................................... 211
Table 6. 5: Coefficients from mixed effect models of baseline continuous comorbidity count
vs. disease severity measures over time. ............................................................................ 213
Table 6. 6: Coefficients from mixed effect models of baseline comorbidity count categories
vs. disease activity over time. .............................................................................................. 215
14
Table 6. 7: Coefficients from mixed effect models of baseline comorbidity count categories
vs. disease severity measures over time. ............................................................................. 217
Table 7. 1 Baseline characteristics of 994 participants compared according to history of
depression diagnosis. ........................................................................................................... 234
Table 7. 2: Proportion of patients in each HADS depression category according to history of
depression. ........................................................................................................................... 236
Table 7. 3: Association between HADS anxiety and depression sub-scale categories. ........ 236
Table 7. 4: Baseline characteristics compared according to baseline HADS depression
categories. ............................................................................................................................ 237
Table 7. 5: Baseline characteristics compared according to HADS anxiety categories. ....... 238
Table 7. 6: Association between history of depression and binary response at 6 months. 239
Table 7. 7: Coefficients from mixed effects models of history of depression vs. disease
activity over time. ................................................................................................................. 240
Table 7. 8: Model coefficients for change in disease activity vs. baseline HADS depression
symptom categories. ............................................................................................................ 247
Table 7. 9: Model coefficients for change in disease activity vs. baseline HADS anxiety
symptom categories. ............................................................................................................ 249
Table 8. 1 Examples of randomised controlled trials of TNF inhibitors for axSpA and their
exclusion criteria. ................................................................................................................. 272
Table 8. 2: Comparison of registries, registry-based RCTs, and RCTs. ................................. 278
Table S2. 1: Risk of bias assessment using a modified Newcastle-Ottawa Scale. ................ 305
Table S3. 1: ICD codes used in the Boston axial spondyloarthritis study. ............................ 307
Table S4. 1: Characteristics of 646 axSpA Boston patients meeting full classification criteria,
compared according to diagnosis. ....................................................................................... 315
Table S4. 2: Medications used among 646 axSpA patients meeting full classification criteria,
compared according to diagnosis. ....................................................................................... 316
15
Table S4. 3: Characteristics of Aintree axSpA patients according to presence or absence of
comorbidities, excluding obesity. ........................................................................................ 317
Table S4. 4: Prevalence of 39 comorbidities compared between AS and nr-axSpA patients in
the Boston study. Sensitivity analysis restricting to individuals meeting full classification
criteria. ................................................................................................................................. 318
Table S4. 5: The pseudo F and T-squared statics to determine the optimal number of
clusters in the main analysis using the Aintree axSpA study. .............................................. 319
Table S4. 6: Sensitivity analysis using 28 morbidities that were prevalent in at least two
patients. ............................................................................................................................... 320
Table S4. 7: The pseudo F and T-squared statics to determine the optimal number of
clusters in the main analysis using the Boston axSpA study. ............................................... 321
Table S5. 1: Baseline characteristics of BSRBR-AS participants included and excluded from
the analysis. ......................................................................................................................... 322
Table S5. 2: Full model coefficients for the association between comorbidity count
categories and disease activity. ........................................................................................... 323
Table S5. 3: Full model coefficients for the association between each comorbidity and
disease activity. .................................................................................................................... 324
Table S5. 4: Full model coefficients for the association between comorbidity count and
other measures of disease severity. .................................................................................... 325
Table S5. 5: Full model coefficients for the association between each comorbidity and other
measures of disease severity. .............................................................................................. 326
Table S5. 6: Baseline characteristics of participants according to recruitment arm. .......... 327
Table S6. 1: Baseline characteristics of 994 participants included in the longitudinal analysis
cohort and 141 who were excluded. ................................................................................... 331
Table S6. 2: Full model coefficients for associations between binary comorbidity status
(present vs. absent) and binary responses at 6 months. ..................................................... 332
Table S6. 3: Full model coefficients for associations between continuous comorbidity count
and binary responses at 6 months. ...................................................................................... 333
Table S6. 4: Full model coefficients for associations between comorbidity count categories
and binary responses at 6 months. ...................................................................................... 334
Table S6. 5: Cox model coefficients for risk of discontinuing TNF inhibitor according to the
number of baseline comorbidities ....................................................................................... 335
16
Table S6. 6: Sensitivity analysis for the association between comorbidity and binary
response at 6 months, with missing binary outcomes imputed as response if patients
remained on drug for longer than one year. ........................................................................ 335
Table S7. 1: Baseline characteristics of BSRBR-AS participants included and excluded from
the analysis using HADS. ...................................................................................................... 341
Table S7. 2: Full model coefficients for associations between depression diagnosis and
binary responses at 6 months. ............................................................................................. 342
Table S7. 3: Descriptive summary of all weights used in the analysis. ................................ 343
Table S7. 4: Model coefficients for associations between HADS sub-scale categories and
binary responses at 6 months. ............................................................................................. 344
17
List of Figures
Figure 1. 1: The spondyloarthritides. ..................................................................................... 27
Figure 1. 2: Diagnostic algorithm for axial spondyloarthritis by the Assessment of
SpondyloArthritis international Society (ASAS). .................................................................... 34
Figure 1. 3: Ankylosing spondylitis disease activity score (ASDAS) states. ............................ 40
Figure 1. 4. ASAS-EULAR recommendations for the management of axial spondyloarthritis41
Figure 1. 5 Biologic disease-modifying antirheumatic drugs licenced for axSpA. ................. 43
Figure 1. 6: The number of co-existing conditions increases with age. ................................. 45
Figure 2. 1: PRISMA flowchart of study selection for each of the study aims. ...................... 51
Figure 2. 2: Pooled prevalence of individual comorbidities reported by three or more
studies. ................................................................................................................................... 57
Figure 2. 3: Forest plot for meta-analysis of hypertension prevalence. ................................ 59
Figure 2. 4: Forest plot for meta-analysis of diabetes mellitus prevalence. .......................... 60
Figure 2. 5: Forest plot for meta-analysis of depression prevalence. .................................... 61
Figure 2. 6: Meta-analysis estimates for odds ratios comparing comorbidities between
axSpA and control groups. ..................................................................................................... 65
Figure 3. 1: Map showing relative deprivation in Liverpool, using the post-code-based Index
of Multiple Deprivation. ......................................................................................................... 82
Figure 3. 2: Self-reported level of general health in Liverpool from the 2011 UK census. .... 83
Figure 3. 3: Summary of data collection for the Aintree axial spondyloarthritis registry. .... 86
Figure 3. 4: Boston city within Greater Boston. ..................................................................... 93
Figure 3. 5: The Research Patient Data Registry (RPDR). ....................................................... 96
Figure 3. 6: Classification process for axSpA patients. ........................................................... 99
Figure 3. 7: Summary of data processing for the Boston axial spondyloarthritis study. ..... 101
Figure 3. 8: Time ranges from which data were obtained from electronic health records for
the Boston axSpA study. ...................................................................................................... 102
Figure 3. 9: Recruitment sites cross the UK for the BSRBR-AS. ........................................... 106
Figure 3. 10: Preparation of the analysis file from data files provided by the BSRBR-AS. ... 112
Figure 3. 11: Categorisation of follow-up assessments for the BSRBR-AS registry. ............ 113
Figure 3. 12: Summary of exclusions used for BSRBR-AS analyses. ..................................... 115
18
Figure 3. 13: Linear mixed models. ...................................................................................... 121
Figure 3. 14: Demonstration of how coefficients from a mixed model with interaction terms
are plotted as predicated values .......................................................................................... 123
Figure 4. 1: Principle of the Jaccard coefficient. .................................................................. 132
Figure 4. 2: Concepts behind common linkage algorithms. ................................................. 133
Figure 4. 3: Example of tree ‘dendrogram’ from hierarchical cluster analysis. ................... 134
Figure 4. 4: Histogram showing comorbidity count among 775 Boston axSpA patients. .... 141
Figure 4. 5: Prevalence of individual comorbidities in the Boston axSpA study. ................. 142
Figure 4. 6: Histogram showing comorbidity count among 419 Aintree axial
spondyloarthritis patients. ................................................................................................... 146
Figure 4. 7: Prevalence of individual comorbidities in the Aintree axial spondyloarthritis
registry. ................................................................................................................................. 147
Figure 4. 8: Prevalence of 39 comorbidities compared between AS and nr-axSpA patients in
the Boston study. ................................................................................................................. 150
Figure 4. 9: Prevalence of 39 comorbidities compared between AS and nr-axSpA patients in
the Aintree registry. ............................................................................................................. 151
Figure 4. 10: Diagram (‘dendrogram’) from cluster analysis of 419 Aintree patients and 34
comorbidities. ....................................................................................................................... 152
Figure 4. 11: Dendrogram from cluster analysis of 775 Boston patients and 39
comorbidities. ....................................................................................................................... 157
Figure 4. 12: Disease indices compared between each comorbidity cluster and axial
spondyloarthritis patients with no comorbidity, show graphically. .................................... 164
Figure 5. 1. Causal diagrams to justify covariate selection. ................................................. 173
Figure 5. 2: Histogram showing comorbidity count among 2043 participants of the BSRBR-
AS. ......................................................................................................................................... 178
Figure 5. 3: Prevalence of individual comorbidities among 2043 participants of the BSRBR-
AS. ......................................................................................................................................... 179
Figure 5. 4: Association between comorbidity count and disease activity. ......................... 180
Figure 5. 5: Association between each comorbid condition and disease activity. .............. 181
Figure 5. 6: Association between comorbidity count and other measures of disease severity
.............................................................................................................................................. 182
19
Figure 5. 7: Association between each comorbid condition and other measures of disease
severity. ................................................................................................................................ 183
Figure 5. 8: Association between comorbidities and the patient global score. .................. 184
Figure 6. 1: Comorbidity prevalence in the treatment response analysis cohort. .............. 198
Figure 6. 2: Histogram showing comorbidity count among 944 participants initiating TNF
inhibitors in the BSRBR-AS. .................................................................................................. 199
Figure 6. 3 Prevalence of individual comorbidities among those with only one comorbidity,
and in two other comorbidity count categories. ................................................................. 200
Figure 6. 4: Associations between comorbidity count categories and binary responses at 6
months. ............................................................................................................................... 203
Figure 6. 5: Associations between comorbidity count categories and binary responses at 6
months, additionally adjusting for baseline values of respective indices. .......................... 204
Figure 6. 6: Number of participants with follow-up at each per protocol assessment time,
according to comorbidity status. ......................................................................................... 205
Figure 6. 7: Change in average disease activity after starting TNF inhibitors in the analysis
sample. ................................................................................................................................. 206
Figure 6. 8: Change in average disease severity indices after starting TNF inhibitors in the
analysis sample. ................................................................................................................... 207
Figure 6. 9: Change in disease activity in response to TNF inhibitors, in participants with and
without comorbidities.......................................................................................................... 208
Figure 6. 10: Change in other measures of disease severity in response to TNF inhibitors, in
participants with and without comorbidities. ..................................................................... 210
Figure 6. 11: Change in disease activity according to comorbidity count categories. ......... 214
Figure 6. 12: Change in other measures of disease severity according to comorbidity count
categories. ............................................................................................................................ 216
Figure 6. 13: Kaplan-Meier curves comparing drug survival in participants according to
presence of comorbidities. .................................................................................................. 219
Figure 6. 14: TNF inhibitor discontinuation compared according to the number of baseline
comorbidities. ...................................................................................................................... 220
Figure 6. 15: Hazard rate of TNF inhibitor discontinuation according to the number of
baseline comorbidities, stratified by gender. ...................................................................... 221
20
Figure 7. 1: Change in HADS sub-scale scores after TNFi initiation, shown alongside change
in disease activity. ................................................................................................................ 235
Figure 7. 2 : Change in disease activity in response to TNF inhibitors according to history of
depression at baseline. ......................................................................................................... 240
Figure 7. 3: Kaplan-Meier curves comparing drug survival between participant with and
without a history of depression. .......................................................................................... 241
Figure 7. 4: Standardised mean differences in each variable before and after inverse
probability weighting. .......................................................................................................... 242
Figure 7. 5: Associations between HADS depression sub-scale categories and binary
responses at 6 months. ........................................................................................................ 243
Figure 7. 6: Associations between HADS anxiety sub-scale categories and binary responses
at 6 months. ......................................................................................................................... 244
Figure 7. 7: Change in disease activity in response to TNF inhibitors according baseline HADS
depression symptom categories. ......................................................................................... 246
Figure 7. 8: Change in disease activity in response to TNF inhibitors according baseline HADS
anxiety symptom categories. ............................................................................................... 248
Figure 7. 9: Kaplan-Meier curves comparing drug survival between participant-groups with
different categories of baseline depression and anxiety symptoms. .................................. 250
Figure 7. 10: Treatment discontinuation according to baseline depression or anxiety
symptom categories. ............................................................................................................ 251
Figure 7. 11: TNFi discontinuation modelled using proportional and non-proportional
hazards. ................................................................................................................................ 252
Figure 7. 12: Significant effect modification by gender in the longitudinal analysis of BASDAI
according to baseline HADS-depression categories. ............................................................ 253
Figure 7. 13: Causal associations between time-varying mental health symptoms and axSpA
disease activity, and implications for analytical approaches. .............................................. 258
Figure 8. 1: Proportion of patients optimally monitored for comorbidities as reported by the
ASAS-COMOSPA study.......................................................................................................... 269
Figure S2. 1: Distribution of bias scores using modified Newcastle Ottowa Scale. ............. 306
Figure S3. 1: Preparation of the analysis file from data files provided by the BSRBR-AS. ... 312
21
Figure S5. 1: Sensitivity analysis of comorbidity categories restricted to the non-biologic
cohort show comparable results for comorbidity count vs. disease severity. .................... 329
Figure S5. 2: Sensitivity analysis of individual comorbidities restricted to the non-biologic
cohort show comparable results for comorbidity count vs. disease severity. .................... 330
Figure S6. 1: Sensitivity analyses for binary outcomes with missing binary outcomes
imputed as response if patients remained on drug for longer than one year. ................... 336
Figure S7. 1: Dotted lines show individual/conditional estimates, which do not coincide with
population average/marginal estimates in the solid line. ................................................... 339
Figure S7. 2: Equivalence of Kaplan-Meier estimates derived using continuous (top) and
monthly-discrete time (bottom), for Cox and pooled logistic regression. .......................... 340
22
Glossary
AS Ankylosing spondylitis
ASDAS Ankylosing Spondylitis Disease Activity Score
ASDAS-MI Ankylosing Spondylitis Disease Activity Score major
improvement (reduction by 2 or more units)
ASQoL Ankylosing spondylitis quality of life questionnaire
axSpA Axial spondyloarthritis
BASDAI 50/2 50% or 2-unit reduction in BASDAI
BASFI Bath Ankylosing Spondylitis Functional Index
BASMI Bath Ankylosing Spondylitis Metrology Index
bDMARDs Biologic disease-modifying antirheumatic drugs
BMI Body mass index
BSRBR-AS British Society for Rheumatology Biologics Register for
Ankylosing Spondylitis
CCI Charlson Comorbidity Index
COPD Chronic obstructive pulmonary disease
CRP C-reactive protein
csDMARDs Conventional synthetic disease-modifying antirheumatic drugs
CVD Cardiovascular diseases
DAS28 Disease activity score – 28 joints
EAMs Extra-articular manifestations
EHRs Electronic health records
EQ5D EuroQol questionnaire - 5 dimensions
ESR Erythrocyte sedimentation rate
GEE Generalised estimating equations
HADS Hospital anxiety and depression scale
HLA-B27 Human leukocyte antigen B27
IBD Inflammatory bowel disease
IBS Irritable bowel syndrome
ICD International Classification of Diseases codes
IMD Index of Multiple Deprivation
IPCW Inverse probability of censoring weight
IPTW Inverse probability of treatment weight
MMI Multimorbidity index
MS Multiple sclerosis
NICE National Institute for Health and Care Excellence
Nr-axSpA
NSAIDs
Non-radiographic axial spondyloarthritis
Non-steroidal anti-inflammatory drugs
PsA Psoriatic arthritis
QoL Quality of life
RA Rheumatoid arthritis
RCTs Randomised controlled trials
RDCI Rheumatic Disease Comorbidity Index

23
SCQ Self-reported comorbidity questionnaire
SpA Spondyloarthritis
TB Tuberculosis
TIA Transient ischaemic attack
TNFi Tissue necrosis factor inhibitors
VAS Visual analogue scale
24
Publications
The work presented in this thesis formed the basis of the following publications:
1. Zhao S, Robertson S, Reich T, Harrison NL, Moots RJ, Goodson NJ. Prevalence and impact of comorbidities in axial spondyloarthritis: systematic review and meta-analysis. Rheumatology 2020;59(supplement 4): iv47–-57 [Chapter 2]
2. Zhao S, Hong C, Cai T, Chang X, Huang J, Ermann J, Goodson NJ, Solomon DH, Cai T, Liao KP. Incorporating natural language processing to improve classification of axial spondyloarthritis using electronic health records. Rheumatology 2020;59(5):1059-1065 [Chapter 3]
3. Zhao S, Ermann J, Xu C, Lyu H, Tedeschi SK, Liao KP, Yoshida K, Moots RJ, Goodson NJ, Solomon DH. Comparison of comorbidities and treatment between ankylosing spondylitis and non-radiographic axial spondyloarthritis in the United States. Rheumatology 2019;58(11):2025-2030 [Chapter 4]
4. Zhao S, Radner H, Siebert S, Duffield SJ, Thong D, Hughes DM, Moots RJ, Solomon DH, Goodson NJ. Comorbidity burden in axial spondyloarthritis: a cluster analysis. Rheumatology 2019;58(10): 1746-54 [Chapter 4]
5. Zhao S, Solomon DH, Goodson NJ. Comment on: Comorbidity burden in axial spondyloarthritis: Reply. Rheumatology 2019;59(3):692-3 [Chapter 4]
6. Zhao S, Jones GT, Macfarlane GJ, Hughes DM, Moots RJ, Goodson NJ. Association between comorbidities and disease activity in axial spondyloarthritis: results from the BSRBR-AS. Rheumatology 2020. [Online ahead of print] [Chapter 5]
7. Zhao S, Jones GT, Macfarlane GJ, Hughes DM, Moots RJ, Goodson NJ. Comorbidity and response to TNF inhibitors in axial spondyloarthritis: longitudinal analysis of the BSRBR-AS. Rheumatology 2020. [Online ahead of print] [Chapter 6]
8. Zhao S, Jones GT, Macfarlane GJ, Hughes DM, Moots RJ, Goodson NJ. Depression and anxiety symptoms at TNF inhibitor initiation are associated with impaired treatment response axial spondyloarthritis. [under review] [Chapter 7]
Related works on smoking and research methodology included:
9. Zhao S, Goodson NJ, Robertson S, Gaffney K. Smoking in spondyloarthritis: unravelling the complexities. Rheumatology 2020;59(7):1472-81
10. Zhao S, Yoshida K, Jones GT, Hughes DM, Duffield SJ, Tedeschi SK, Lyu H, Moots RJ, Solomon DH, Goodson NJ. Smoking status and cause-specific discontinuation of tumour necrosis factor inhibitors in axial spondyloarthritis. Arthritis Res Ther 2019;21:177
11. Zhao S, Macfarlane GJ, Jones GT, Gaffney K, Hughes DM, Moots RJ, Goodson NJ. Smoking does not protect axial spondyloarthritis patients from attacks of uveitis. Ann Rheum Dis 2019;78(9):1287-1288
12. Zhao S, Yoshida K, Jones GT, Hughes DM, Tedeschi SK, Lyu H, Moots RJ, Solomon DH, Goodson NJ. The impact of smoking on response to TNF inhibitors in axial spondyloarthritis: methodological considerations for longitudinal observational studies. Arthritis Care Res 2019; 72(4):591-599
13. Zhao S, Jones GT, Macfarlane GJ, Hughes DM, Dean LE, Moots RJ, Goodson NJ. Associations between smoking and extra-axial manifestations and disease severity in axial spondyloarthritis: results from the BSRBR-AS. Rheumatology 2018;58(5):811-819
25
Other publications during the PhD: 14. Zhao S, Lyu H, Solomon DH, Yoshida K. Improving rheumatoid arthritis comparative
effectiveness research through causal inference principles: systematic review using a target trial emulation framework. Ann Rheum Dis 2020;79:883-890
15. Zhao S, Pittam B, Harrison NL, Ahmed AE, Goodson NJ, Hughes DM. Diagnostic delay in axial spondyloarthritis: a systematic review and meta-analysis. Rheumatology 2020 [Online ahead of print]
16. Zhao S, Mackie SL, Zheng J. Why clinicians need to know about Mendelian randomization. Rheumatology 2020 [Online ahead of print]
17. Zhao S, Lyu H, Yoshida K. Versatility of the clone-censor-weight approach: response to ‘trial emulation in the presence of immortal-time bias’. International Journal of Epidemiology 2020 [Online ahead of print]
18. Zhao S, Moots RJ. Biomarkers for treatment response in rheumatoid arthritis: Where are they? Rheumatology and Immunology Research 2020; 1(1):1-2
19. Zhao S, Miller N, Harrison N, Duffield SJ, Dey M, Goodson N. Systematic review of mental health comorbidities in psoriatic arthritis. Clinical Rheumatology 2019; 39(1):217-225
20. Zhao S, Duffield SJ, Goodson NJ. The prevalence and impact of comorbid fibromyalgia in inflammatory arthritis. Best Practice & Research Clinical Rheumatology 2019; 33(3):101423
21. Zhao S, Duffield SJ, Hughes DM. Seasonal variations of Google searches for joint swelling: implications for patient-reported outcomes. Clinical Rheumatology 2019; 38(6):1791-1792
22. Zhao S, Thong D, Miller N, Duffield SJ, Hughes D, Chadwick L, Goodson NJ. The prevalence of depression in axial spondyloarthritis and its association with disease activity: a systematic review and meta-analysis. Arthritis Res Ther 2018;20(1):140.
As supervisor: 23. Pittam B, Gupta S, Harrison NL, Robertson S, Hughes DM, Zhao S. Prevalence of extra-
articular manifestations in psoriatic arthritis: a systematic review and meta-analysis. Rheumatology 2020; 59(9):2199-2206
24. Zhao S, Pittam B, Hughes DM. Comment: Prevalence of extra-articular manifestations in psoriatic arthritis: reply. Rheumatology 2020; 59(9):e51-e53.
25. Pittam B, Gupta S, Ahmed AE, Hughes DM, Zhao S. The prevalence and impact of depression in primary systemic vasculitis: a systematic review and meta-analysis. Rheumatology International 2020; 40(8): 1215–1221
26. Dey M, Zhao S. Google search data as a novel adjunct to patient and public involvement in rheumatology research. Rheumatology International 2020 Oct 19 : 1–9.
27. Gupta S, Syrimi Z, Hughes DM, Zhao S. Comorbidities in psoriatic arthritis: a systematic review and meta-analysis. Rheum int 2021. [Online ahead of print]
As co-author: 28. Lyu H, Yoshida K, Zhao S, Wei J, Zeng C, Tedeschi SK, Leder BZ, Lei G, Tang P, Solomon
DH. Delayed Denosumab Injections and Fracture Risk Among Subjects with Osteoporosis: A population-based cohort study. Annals of Internal Medicine 2020; 173(7):516-526 1.
29. Lyu H, Zhao S, Yoshida K, Tedeschi SK, Xu C, Nigwekar SU, Leder BZ, Solomon DH. Delayed Denosumab Injections and Bone Mineral Density Response: An Electronic Health Record-based Study. J Clin Endocrinol Metab 2020; 105(5):1435-1444
26
30. Lyu H, Zhao S, Yoshida K, Tedeschi SK, Xu C, Nigwekar SU, Leder BZ, Solomon DH. Comparison of Teriparatide and Denosumab in Patients Switching from Long-Term Bisphosphonate Use. J Clin Endocrinol Metab 2019; 104(11):5611-5620
31. Lyu H, Yoshida K, Tedeschi SK, Zhao S, Xu C, Nigwekar SU, Leder B, Solomon DH. Intervals between bone mineral density testing with dual-energy X-ray absorptiometry scans in clinical practice. Osteoporosis International 2019; 30(4):923-927
32. Lyu H, Jundi B, Xu C, Tedeschi SK, Yoshida K, Zhao S, Nigwekar SU, Leder BZ, Solomon DH. Comparison of denosumab vs. bisphosphonates in osteoporosis patients: A meta-analysis of randomized controlled trials. J Clin Endocrinol Metab 2018; 104(5):1753-1765
33. Dey M, Zhao S, Moots RJ. Anti-TNF biosimilars in rheumatology: the end of an era? Expert Opinion on Biological Therapy 2020; 12;1-7
34. Benson R, Zhao S, Goodson NJ, Abernethy R, Mewar D, Barnes T. Biologic monotherapy in the biologic naïve patient with rheumatoid arthritis: Results from an observational study. Rheumatology International 2020; 40:1045–1049
35. Duffield SJ, Miller N, Zhao S, Goodson NJ. Concomitant fibromyalgia complicating chronic inflammatory arthritis: a systematic review and meta-analysis. Rheumatology 2018; 57(8):1453-60
36. Hng M, Zhao S, Moots RJ. An update on the general management to common vaculitides. Clinical medicine 2020; 20(6): 572–579
37. DiIorio M, Sobiesczcyk P, Xu C, Huang W, Ford J, Zhao S, Solomon DH, Docken W, Tedeschi SK. Associations among temporal and large artery abnormalities on vascular ultrasound in giant cell arteritis. Scandinavian Journal of Rheumatology 2021. [Online ahead of print]
27
Chapter 1: Introduction
This chapter provides an overview of axial spondyloarthritis (axSpA). Aspects of the disease
that are necessary to provide a background for the thesis are described, including clinical
features, epidemiology, diagnosis and classification, pathophysiology, and management.
This chapter will also introduce the importance of comorbidities and related terminology.
1.1 What is axial spondyloarthritis?
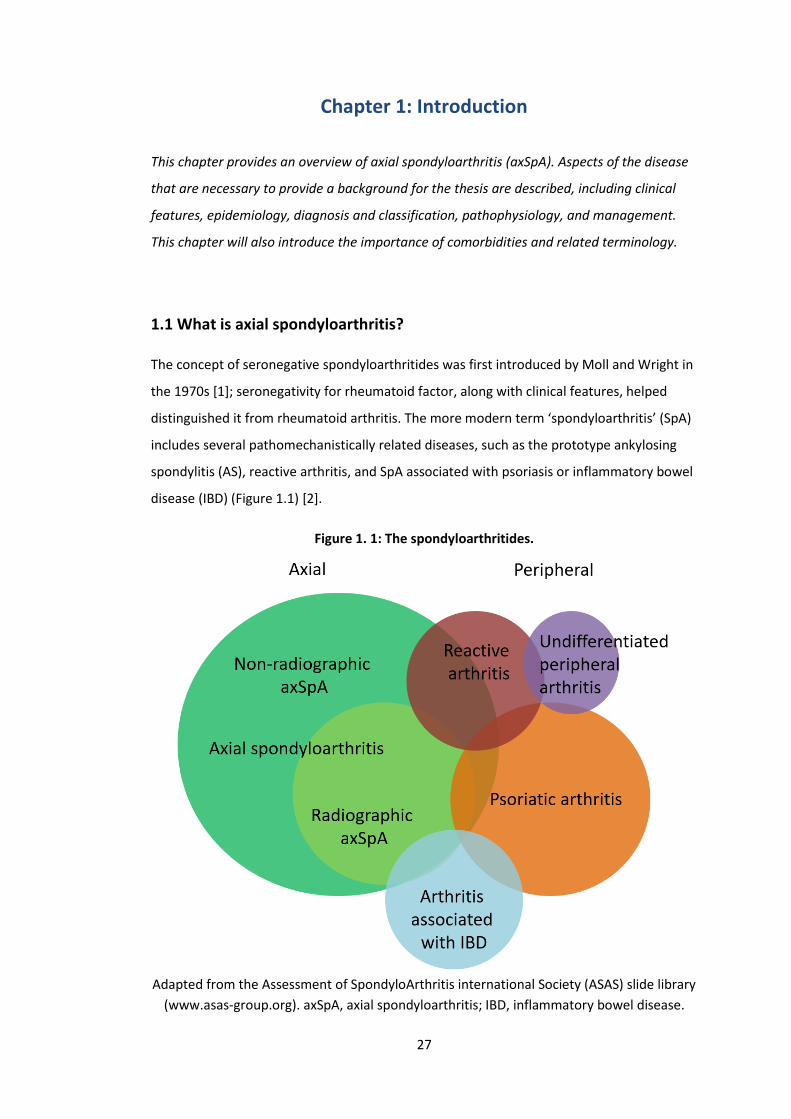
The concept of seronegative spondyloarthritides was first introduced by Moll and Wright in
the 1970s [1]; seronegativity for rheumatoid factor, along with clinical features, helped
distinguished it from rheumatoid arthritis. The more modern term ‘spondyloarthritis’ (SpA)
includes several pathomechanistically related diseases, such as the prototype ankylosing
spondylitis (AS), reactive arthritis, and SpA associated with psoriasis or inflammatory bowel
disease (IBD) (Figure 1.1) [2].
Figure 1. 1: The spondyloarthritides.
Adapted from the Assessment of SpondyloArthritis international Society (ASAS) slide library
(www.asas-group.org). axSpA, axial spondyloarthritis; IBD, inflammatory bowel disease.
28
These diseases share similar clinical features and a common association with the human
leukocyte antigen B27 (HLA-B27). From a practical viewpoint (e.g., for management), SpA
can be grouped into disease that has predilection for the axial or peripheral joints [3].
Patients can, and often do, have both patterns of joint involvement; those with purely axial
disease at presentation can develop peripheral arthritis over time and vice versa. This thesis
will focus entirely on axial SpA.
Axial spondyloarthritis (axSpA) is a relatively recent disease concept that includes AS, as
well as ‘non-radiographic axSpA’ (nr-axSpA). AS can be considered an advanced stage of the
disease spectrum, which is characterised by abnormal, excessive bone formation in the
axial skeleton. Nr-axSpA was introduced to recognise early disease without observable
damage on plain radiographs [2]. Some consider the two as difference conditions, as only a
minority of nr-axSpA progress to AS [4,5].
1.1.1 Clinical features
AxSpA patients can have a diverse combination of disease features that develop in varying
chronological order. The commonest presentation is chronic inflammatory back pain: lower
back and/or buttock pain that improves with activity and non-steroidal anti-inflammatory
drugs (NSAIDs), often causing nocturnal wakening and, upon waking, early morning
stiffness. Unlike other adult rheumatic diseases, symptoms of axSpA typically begin at a
relatively young age. The mean age of symptom onset in UK cohorts is the early 20s [6,7] - a
critical time for education, career, social networks and development of personal identity in
general. Consequently, axSpA significant impacts quality of life and work productivity over
the life course, at costs to both the individual and the economy [8]. Symptoms of poor
mental health are common [9], and this is at least partly due to uncertainty and frustration
through the often prolonged delay to diagnosis (mean of 6.7 years [10]).
Peripheral articular features – arthritis, enthesitis and dactylitis – are present in around half
of axSpA patients and contribute to additional symptom burden [11]. Arthritis, or synovitis,
affect around 29% of patients [12], causing pain, stiffness and functional limitation as in
rheumatoid arthritis (RA). Unlike RA, joint involvement is more often asymmetrical,
oligoarticular, and associated with a better prognosis (i.e., less structural damage). There is
evidence to suggest that synovitis in axSpA is preceded by, and may be a result of cytokine
spill over from, adjacent enthesitis [13].
29
Enthesitis involves localised inflammation at the point of ligament, tendon or capsule
insertion into the bone. Enthesitis is common, present in 29-35% of axSpA patients, and can
cause widespread pain and tenderness not only in the limbs, but also at spinous processes,
costochondral junctions, sternal articulations and iliac crests [12]. These symptoms can
present challenges to axSpA diagnosis and management, since widespread tenderness can
also be caused by fibromyalgia [14].
Another peripheral feature is dactylitis. It is present in around 6% of axSpA patients and is
characterised by inflammation and circumferential thickening of whole digits [12]. Dactylitis
may also be a manifestation of enthesitis: inflammation of multiple digital entheseal
insertions result in flexor tenosynovitis and extensive soft-tissue swelling outside the joint
capsule [13]. It is a cardinal feature of another member of the SpA family, psoriatic arthritis
(PsA), where it is present in a quarter of patients and may be associated with greater
radiographic damage [15].
1.1.2 Extra-articular manifestations (EAMs)
AxSpA is also strongly associated with extra-articular, or extra-skeletal, manifestations. The
prevalence of uveitis among axSpA patients is 26%, while 9% have psoriasis and 7% IBD
[16]. The hazard of uveitis was 16-fold higher (95% CI 11.6 to 20.7), psoriasis 50% higher
(95% CI 1.1 to 1.9) and IBD 3-fold higher (95% CI 2.3 to 4.8) in axSpA (n=4101) than age- and
sex-matched controls (n=28,591) in the UK primary care population [17]. Presence of one
EAM can influence the chances of having others [18]. Research into their pathophysiology
has improved understanding of the axSpA disease mechanism (Section 1.3). The presence
of EAMs also help diagnosis and classification of axSpA (Section 1.4). Patients with EAMs
often require collaborative cross-specialty management, which is relevant for healthcare
resource use [16]. Most importantly, EMAs impact quality of life and work outcomes, and
have also been associated with greater disease activity, functional impairment and
radiographic progression in axSpA [18].
1.1.2.1 Acute anterior uveitis (AAU)
Anterior uveitis is defined by inflammation of the anterior uvea (iris and ciliary body) and
can be acute (<3 months duration) or chronic (≥3 months). AAU is, by definition, self-
limiting and usually managed with topical corticosteroids. It is typically unilateral and
recurrent in around half of patients [19]. Symptoms include acute onset of eye redness,
30
pain, photophobia and miosis. Visual acuity is generally preserved but can be reduced in 8%
of cases [20].
AAU occurs in around a quarter of axSpA patients – higher in HLA-B27 positive individuals.
Its prevalence becomes higher with longer disease duration as reported in meta-regression
of published studies (17% among studies reporting with a mean disease duration of <10
years to 39% with a mean disease duration of >20 years) [20]. AAU and SpA likely share the
same underlying disease mechanism [21]. It may the first clinical manifestation of axSpA. In
the SENTINEL study of 798 patients with anterior uveitis, over half of patients were found
to have axSpA - 70% if HLA-B27 positive [22]. AAU also impacts treatment decisions;
monoclonal antibodies to TNF reduce incidence and relapse of AAU, whereas etanercept is
less efficacious (see Section 1.5.3.2).
1.1.2.2 Psoriasis
Psoriasis is characterised by keratinocyte proliferation, which results in erythematous, scaly
plaques on the body, as well as nail deformities. The disease is not limited to the skin –
there are significant associations with metabolic syndrome and depression [23]. Thirty
percent of psoriasis patients develop articular involvement, including SpA. Conversely,
around 9% of axSpA patients have psoriasis; these individuals are also more likely to have
peripheral joint involvement [24].
Due to shared inflammatory pathways, many treatments are approved for psoriasis, PsA
and axSpA. Some drugs, such as ustekinumab (IL12/23 inhibitor), guselkumab (IL23
inhibitor), and apremilast (phosphodiesterase 4 inhibitor) are effective for psoriasis but not
axial symptoms. Interestingly, around 1.5 to 5% of patients treated with TNFi develop
paradoxical psoriasis [25]; the mechanism of which is not yet fully understood.
1.1.2.3 Inflammatory bowel disease
Inflammatory bowel disease (IBD) includes ulcerative colitis (mostly affecting continuous
portions of the colon), Crohn’s disease (skip lesions anywhere from mouth to anus), and
indeterminate colitis. Approximately 10% of patients with IBD develop arthritis – the most
common extra-intestinal manifestation [26]. Conversely, around 7% of axSpA patients are
diagnosed with IBD [16] and over half have microscopic inflammatory gut lesions [27].
Microscopic bowel inflammation has been associated with more extensive inflammation of
the sacroiliac joints [28]. Co-existing IBD and axSpA impacts treatment decisions for both
treating specialties; for example, vedolizumab (integrin inhibitor) and ustekinumab are
31
effective treatments for IBD but not for concurrent axSpA, whereas etanercept for axSpA is
not effective for IBD.
1.2 Epidemiology
1.2.1 Prevalence and incidence
Estimates for the prevalence of axSpA vary according to geography (mostly due to
background HLA-B27 prevalence), sampling method and disease definition. Most
epidemiological studies have focused on AS, where the mean prevalence was estimated as
0.19% in Europe (95% CI calculated from reported data: 0.13 to 0.28%) and 0.32% in North
America (95% CI 0.19 to 0.53%) [29]. The incidence of AS was estimated to be 7 cases per
100,000 in both continents [30]. Similar studies of axSpA are scarce. Extrapolating from
chronic back pain populations, the prevalence of axSpA in the US and Netherlands were
both 0.7% [31,32]. There are no studies of axSpA incidence.
1.2.2 Non-environmental risk factors
AS has traditionally been described as a disease of young males. Earlier studies quoted
male:female ratios as high as 9:1, although males only outnumber females by 2-3:1 in more
recent studies [30]. This is more likely due to phenotypic differences between the sexes
rather than a true difference in prevalence, since sex ratios in early stages of the disease
process (i.e., before progression to ankylosis) are typically balanced [12].
Genetic factors are estimated to contribute >90% of the overall susceptibility to AS, half of
which due to HLA-B27 and other major histocompatibility complex (MHC) genes [33]. The
prevalence of HLA-B27 is around 80% in advanced AS cohorts, but lower in nr-axSpA. The
risk of AS was 63% in one monozygotic twin if the other was affected [34]. In one Icelandic
study, first degree relatives of AS patients had a 76-fold higher risk of having the condition
[35].
1.2.3 Environmental risk factors
Recent studies demonstrated distinctive microbial signature (e.g., abundance of
Ruminococcaceae) in gut biopsies and faeces of patients with AS/SpA compared with
controls [37,38]. This rekindled interest in dietary risk factors, originally ignited by the
hypothesis that Klebsiella infection is a trigger for axSpA. There is indeed evidence that diet
32
has a strong impact on the composition of the gut microbiota [39]. However, no specific
dietary components have been identified that can impact the risk or severity of AS. Studies
of the gut microbiome have not confirmed the Klebsiella hypothesis.
The most studied environmental risk factor is cigarette smoking. Smoking is a major risk
factor for the incidence and severity of RA, and it is also a causal contributor to numerous
comorbidities and mortality in all rheumatic diseases. However, its role in axSpA risk and
treatment response is less clear. A body of work was performed in parallel to this thesis,
since smoking is intimately related to comorbidities but not commonly included as one. In
brief, smoking is consistently associated with greater axSpA disease severity and risk of
psoriasis and uveitis flares [7,40]. However, evidence for an independent causal role of
smoking on axSpA incidence and treatment response had important methodological
limitations [9,41,42] (see list of Publications).
1.3 Pathophysiology
Around 80% of axSpA patients are positive for HLA-B27 [2]. This association remains the
strongest between any disease and an MHC antigen. However, the precise mechanism(s)
through which it causes disease is unclear. It may induce cellular stress and cytokine
production directly or through protein misfolding, present ‘arthrogenic’ microbial peptides
to cytotoxic T-cells, and/or cause disease through modulation of the skin and bowel
microbiome [2].
AxSpA differs from autoimmune diseases, such as RA, that are typically characterised by T
and B cell dysfunction, disease-specific autoantibodies, and female predominance. Instead,
it has more in common with auto-inflammatory diseases, where localised stress at specific
tissue sites lead to abnormal innate immune responses. AxSpA is clinically, genetically and
pathophysiologically related to barrier dysfunction diseases such as psoriasis and IBD; many
features of axSpA occur at sites of high mechanical stress, such as those of the sacroiliac
joints, spine and entheses [21].
The interplay between genetic predisposition and mechanical stress has become clearer in
recent decades. HLA-B27 misfolding and bowel inflammation both induce IL23 expression.
IL23 responsive resident T cells, thought responsible for abnormal innate immune response
to mechanical stress, have been found at the entheses and aortic root. Overexpressing IL23
in mice activates these T cells to produce peripheral and axial enthesitis, aortitis and uveitis.
33
IL23 also activates T helper (Th17) cells that produce IL17A/F and TNF [43]. There is
evidence to suggest they, and other related cytokines, contribute to the osteoproliferation
that characterises AS [2]. The role of these downstream cytokines has been confirmed by
clinical efficacy of their blockade [2].
1.4 Diagnosis and Classification
Diagnostic and classification criteria are seldom interchangeable. This distinction is
sometimes neglected, partly because the same clinical, laboratory and imaging features are
often used for both diagnostic and classification purposes in axSpA. Diagnostic criteria are
‘a set of signs, symptoms, and tests developed for use in routine clinical care to guide the
care of individual patients [44].’ In contrast, classification criteria are ‘standardised
definitions that are primarily intended to enable clinical studies to have uniform cohorts for
research [44].’ Diagnostic criteria need to account for disease heterogeneity and have high
sensitivity (as well as specificity), whereas classification criteria create homogeneous
patient groups and need to have high specificity (rather than sensitivity).
1.4.1 Diagnosis
There are no diagnostic criteria for axSpA (or any members of the SpA family), which is
unlikely to change [44]. There are many problems with applying diagnostic criteria, such as
their dependence on the disease prevalence and range of differential diagnoses (i.e., the
pre-test probability). Nevertheless, algorithms, such as the one shown in Table 1.1, can aid
diagnostic decisions by providing relative ‘importance’ of each disease feature [45]. The
Assessment of SpondyloArthritis international Society (ASAS) used this data to propose a
diagnostic algorithm shown in Figure 1.2.
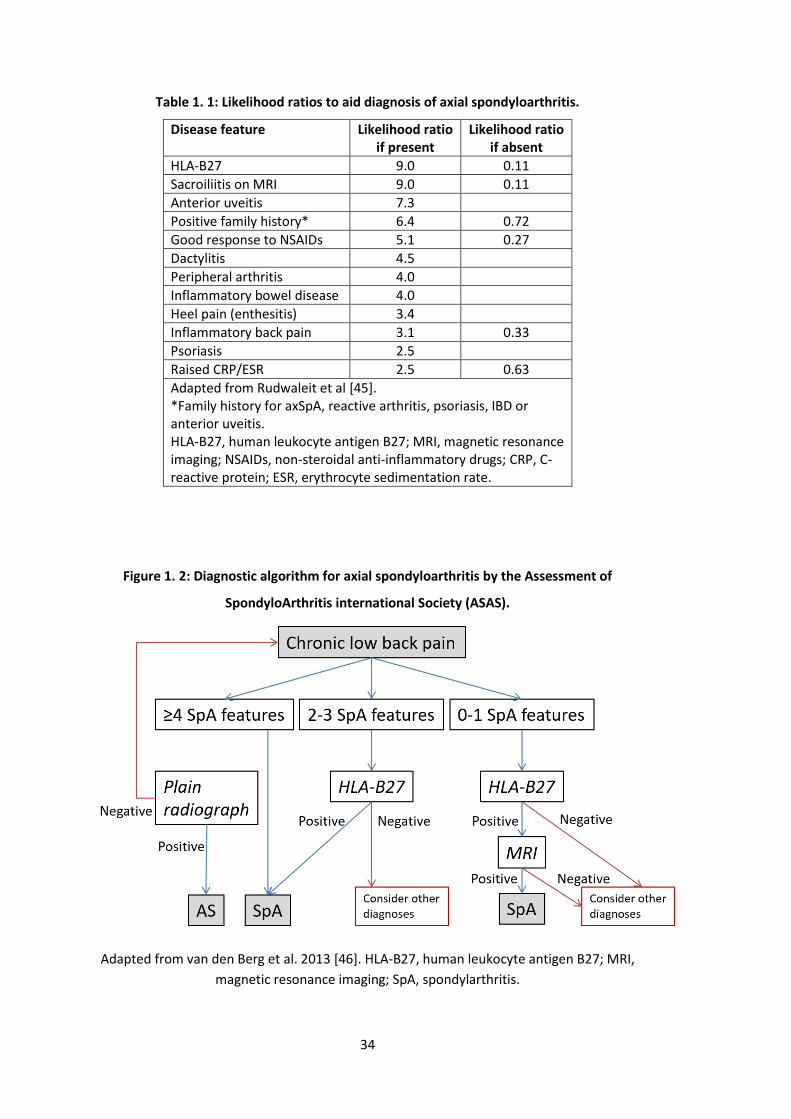
34
Table 1. 1: Likelihood ratios to aid diagnosis of axial spondyloarthritis.
Disease feature Likelihood ratio if present
Likelihood ratio if absent
HLA-B27 9.0 0.11
Sacroiliitis on MRI 9.0 0.11
Anterior uveitis 7.3
Positive family history* 6.4 0.72
Good response to NSAIDs 5.1 0.27
Dactylitis 4.5
Peripheral arthritis 4.0
Inflammatory bowel disease 4.0
Heel pain (enthesitis) 3.4
Inflammatory back pain 3.1 0.33
Psoriasis 2.5
Raised CRP/ESR 2.5 0.63
Adapted from Rudwaleit et al [45]. *Family history for axSpA, reactive arthritis, psoriasis, IBD or anterior uveitis. HLA-B27, human leukocyte antigen B27; MRI, magnetic resonance imaging; NSAIDs, non-steroidal anti-inflammatory drugs; CRP, C-reactive protein; ESR, erythrocyte sedimentation rate.
Figure 1. 2: Diagnostic algorithm for axial spondyloarthritis by the Assessment of
SpondyloArthritis international Society (ASAS).
Adapted from van den Berg et al. 2013 [46]. HLA-B27, human leukocyte antigen B27; MRI,
magnetic resonance imaging; SpA, spondylarthritis.
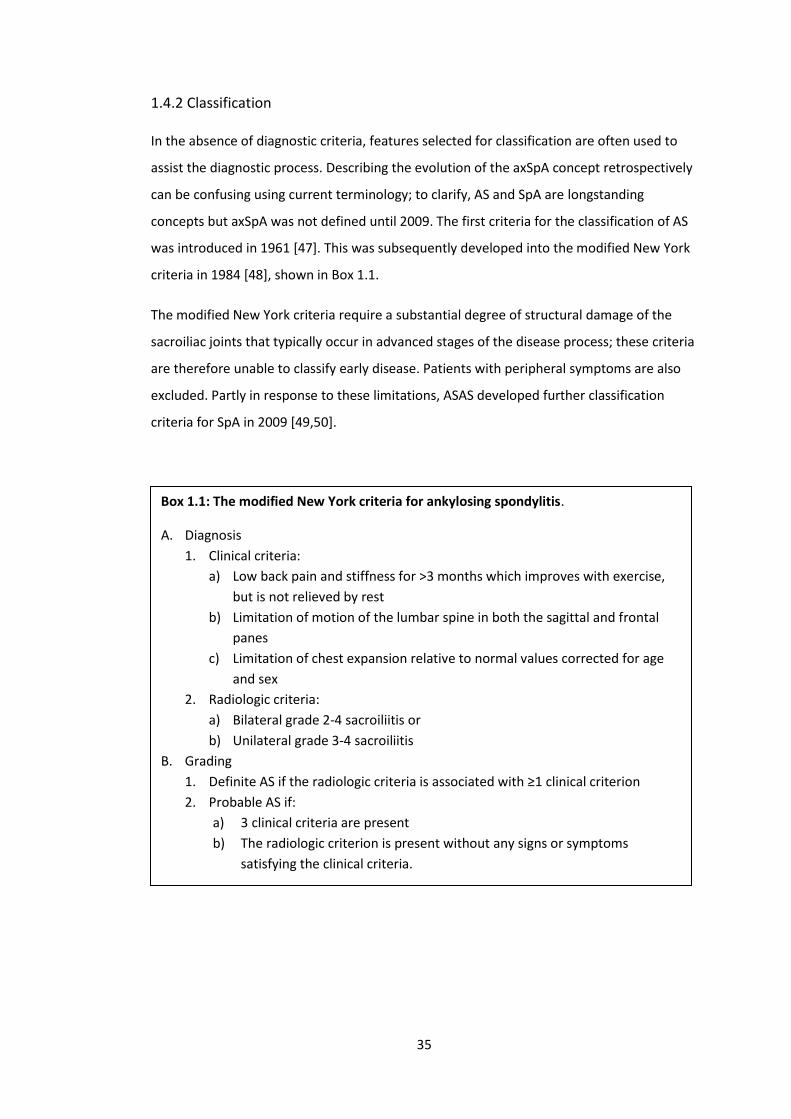
35
1.4.2 Classification
In the absence of diagnostic criteria, features selected for classification are often used to
assist the diagnostic process. Describing the evolution of the axSpA concept retrospectively
can be confusing using current terminology; to clarify, AS and SpA are longstanding
concepts but axSpA was not defined until 2009. The first criteria for the classification of AS
was introduced in 1961 [47]. This was subsequently developed into the modified New York
criteria in 1984 [48], shown in Box 1.1.
The modified New York criteria require a substantial degree of structural damage of the
sacroiliac joints that typically occur in advanced stages of the disease process; these criteria
are therefore unable to classify early disease. Patients with peripheral symptoms are also
excluded. Partly in response to these limitations, ASAS developed further classification
criteria for SpA in 2009 [49,50].
Box 1.1: The modified New York criteria for ankylosing spondylitis.
A. Diagnosis
1. Clinical criteria:
a) Low back pain and stiffness for >3 months which improves with exercise,
but is not relieved by rest
b) Limitation of motion of the lumbar spine in both the sagittal and frontal
panes
c) Limitation of chest expansion relative to normal values corrected for age
and sex
2. Radiologic criteria:
a) Bilateral grade 2-4 sacroiliitis or
b) Unilateral grade 3-4 sacroiliitis
B. Grading
1. Definite AS if the radiologic criteria is associated with ≥1 clinical criterion
2. Probable AS if:
a) 3 clinical criteria are present
b) The radiologic criterion is present without any signs or symptoms
satisfying the clinical criteria.
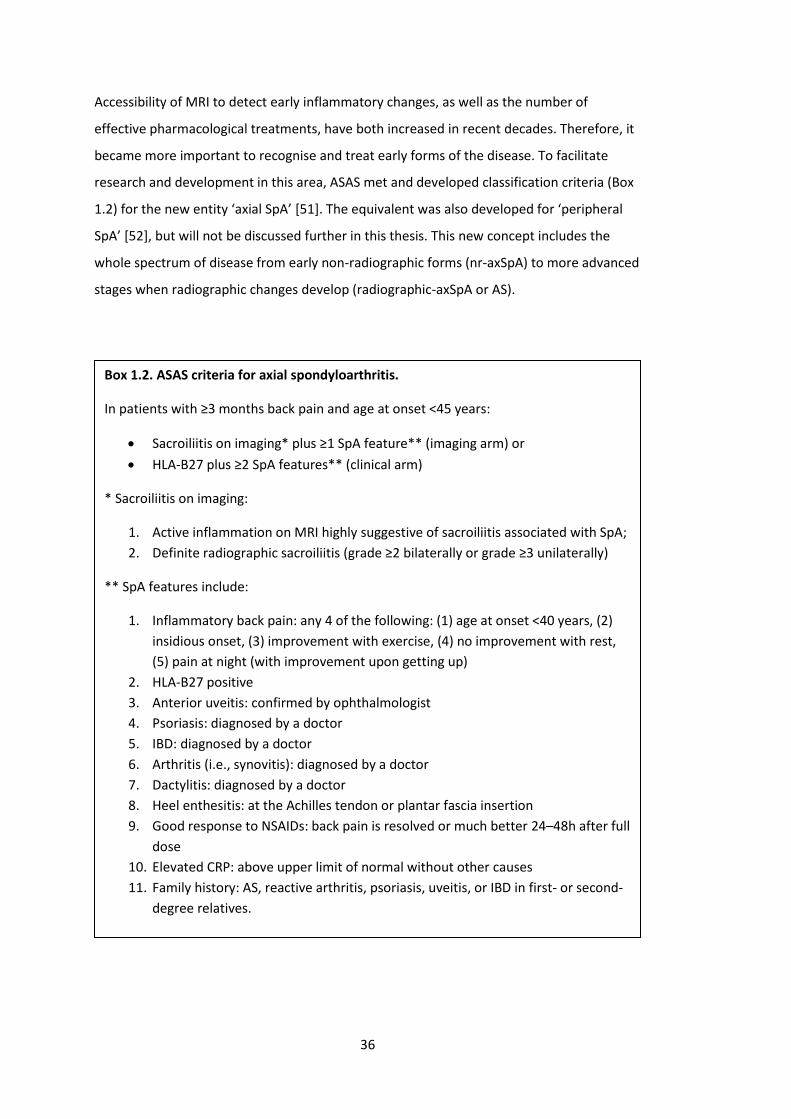
36
Accessibility of MRI to detect early inflammatory changes, as well as the number of
effective pharmacological treatments, have both increased in recent decades. Therefore, it
became more important to recognise and treat early forms of the disease. To facilitate
research and development in this area, ASAS met and developed classification criteria (Box
1.2) for the new entity ‘axial SpA’ [51]. The equivalent was also developed for ‘peripheral
SpA’ [52], but will not be discussed further in this thesis. This new concept includes the
whole spectrum of disease from early non-radiographic forms (nr-axSpA) to more advanced
stages when radiographic changes develop (radiographic-axSpA or AS).
Box 1.2. ASAS criteria for axial spondyloarthritis.
In patients with ≥3 months back pain and age at onset <45 years:
• Sacroiliitis on imaging* plus ≥1 SpA feature** (imaging arm) or
• HLA-B27 plus ≥2 SpA features** (clinical arm)
* Sacroiliitis on imaging:
1. Active inflammation on MRI highly suggestive of sacroiliitis associated with SpA;
2. Definite radiographic sacroiliitis (grade ≥2 bilaterally or grade ≥3 unilaterally)
** SpA features include:
1. Inflammatory back pain: any 4 of the following: (1) age at onset <40 years, (2)
insidious onset, (3) improvement with exercise, (4) no improvement with rest,
(5) pain at night (with improvement upon getting up)
2. HLA-B27 positive
3. Anterior uveitis: confirmed by ophthalmologist
4. Psoriasis: diagnosed by a doctor
5. IBD: diagnosed by a doctor
6. Arthritis (i.e., synovitis): diagnosed by a doctor
7. Dactylitis: diagnosed by a doctor
8. Heel enthesitis: at the Achilles tendon or plantar fascia insertion
9. Good response to NSAIDs: back pain is resolved or much better 24–48h after full
dose
10. Elevated CRP: above upper limit of normal without other causes
11. Family history: AS, reactive arthritis, psoriasis, uveitis, or IBD in first- or second-
degree relatives.
37
Meta-analysis of the ASAS criteria performance (from 9 studies, 5739 patients) found high
overall sensitivity (82%) and specificity (89%) [53]. The ASAS criteria for axSpA permitted
classification via the ‘imaging’ or the ‘clinical’ arm (Box 1.2). For the former, the specificity
of ‘positive MRI’ has been questioned, since 28% patients with non-specific back pain have
demonstrated similar MRI findings [54]. The definition of a positive MRI finding also has a
significant impact on its specificity [55]. The clinical arm has received even greater criticism
since it does not require imaging at all. For example, a young, obese, HLA-B27 positive
female with fibromyalgia could be misclassified as axSpA if she reports a good response to
NSAIDs and is found to have an elevated ESR.
When the United States (US) Food and Drug Administration (FDA) met to consider TNF
inhibitors (TNFi) for patients with nr-axSpA, they raised concerns that patients with highly
prevalent conditions such as fibromyalgia might be misdiagnosed as nr-axSpA and
inappropriately treated. This was one reason why biologic treatment remained unlicensed
for nr-axSpA in the USA until March 2019. Research are ongoing to validate the ASAS axSpA
criteria and, if needed, to strengthen the MRI imaging definition and weighting of the SpA
features.
1.4.3 Differences between radiographic and non-radiographic axial spondyloarthritis
Not all patients with nr-axSpA progress to AS [4]; therefore, there is some controversy over
whether or not nr-axSpA is an early form of the axSpA spectrum. There are important
differences between the two evident in observational cohorts: AS groups tend to be older,
more frequently male, and have higher inflammatory markers and a higher proportion of
HLA-B27 positivity than their nr-axSpA counterparts [56–58]. However, both have similar
disease features, symptom burden and, importantly, similar response to treatment [59,60].
ASAS-EULAR (the European League against Rheumatism) recommends a unified treatment
approach for all axSpA patients [61]. How management should be delivered for these two
conditions has not yet been fully elucidated; for example, whether comorbidities differ
between AS and nr-axSpA is not yet known.
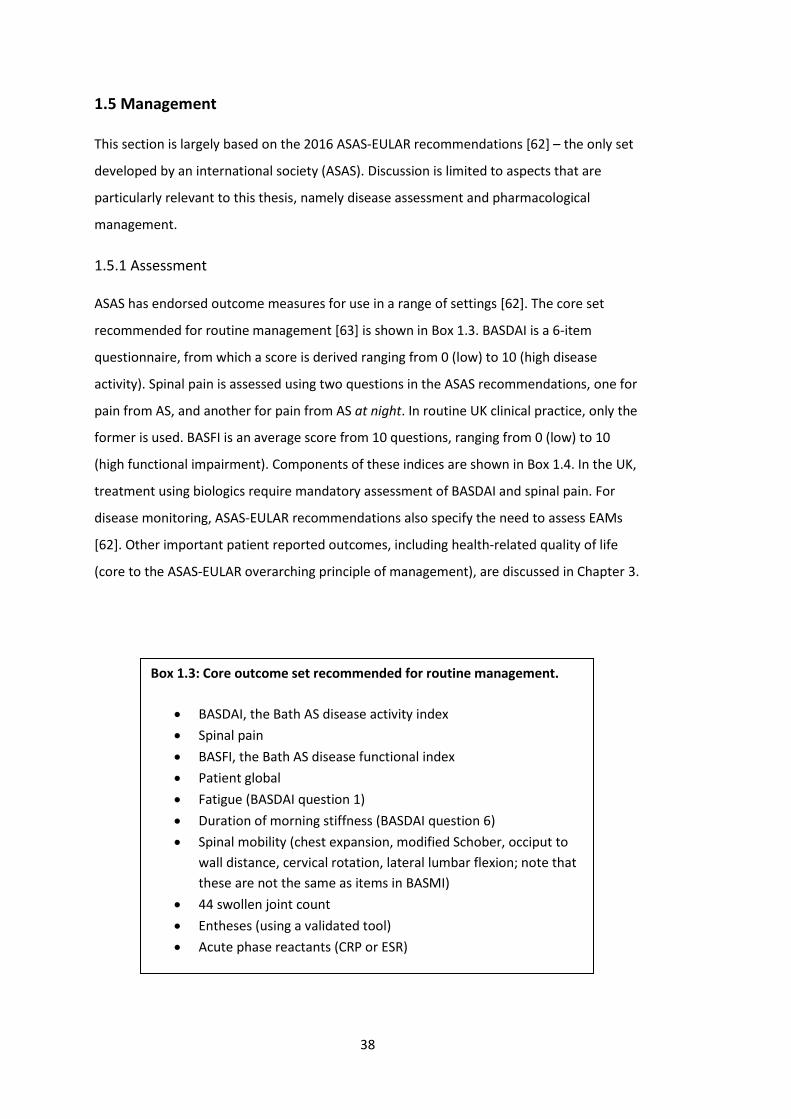
38
1.5 Management
This section is largely based on the 2016 ASAS-EULAR recommendations [62] – the only set
developed by an international society (ASAS). Discussion is limited to aspects that are
particularly relevant to this thesis, namely disease assessment and pharmacological
management.
1.5.1 Assessment
ASAS has endorsed outcome measures for use in a range of settings [62]. The core set
recommended for routine management [63] is shown in Box 1.3. BASDAI is a 6-item
questionnaire, from which a score is derived ranging from 0 (low) to 10 (high disease
activity). Spinal pain is assessed using two questions in the ASAS recommendations, one for
pain from AS, and another for pain from AS at night. In routine UK clinical practice, only the
former is used. BASFI is an average score from 10 questions, ranging from 0 (low) to 10
(high functional impairment). Components of these indices are shown in Box 1.4. In the UK,
treatment using biologics require mandatory assessment of BASDAI and spinal pain. For
disease monitoring, ASAS-EULAR recommendations also specify the need to assess EAMs
[62]. Other important patient reported outcomes, including health-related quality of life
(core to the ASAS-EULAR overarching principle of management), are discussed in Chapter 3.
Box 1.3: Core outcome set recommended for routine management.
• BASDAI, the Bath AS disease activity index
• Spinal pain
• BASFI, the Bath AS disease functional index
• Patient global
• Fatigue (BASDAI question 1)
• Duration of morning stiffness (BASDAI question 6)
• Spinal mobility (chest expansion, modified Schober, occiput to
wall distance, cervical rotation, lateral lumbar flexion; note that
these are not the same as items in BASMI)
• 44 swollen joint count
• Entheses (using a validated tool)
• Acute phase reactants (CRP or ESR)

39
Box 1.4: Components of key patient reported outcome measures used to monitor
axSpA patients.
BASDAI
1. How would you describe the overall level of fatigue/tiredness you have
experienced?
2. How would you describe the overall level of AS neck, back or hip pain you
have had?
3. How would you describe the overall level of pain/swelling in joints other
than the neck, back or hips you have had?
4. How would you describe the overall level of discomfort you have from any
areas tender to touch or pressure?
5. How would you describe the overall level of morning stiffness you have had
from the time you wake up?
6. How long does your morning stiffness last from the time you wake up?
Spinal pain
How would you describe the overall level of pain you have experienced in your
spine during the past week?
BASFI
Level of ability with each of the following activities during the past week:
1. Putting on your socks or tights without help or aids (e.g., sock aid).
2. Bending forward from the waist to pick up a pen from the floor without an
aid.
3. Reaching up to a high shelf without help or aids (e.g., helping hand).
4. Getting up out of an armless dining room chair without using your hands or
any other help.
5. Getting up off the floor without help from lying on your back.
6. Standing unsupported for 10 min without discomfort.
7. Climbing 12 to 15 steps without using a handrail or walking aid. One foot at
each step.
8. Looking over your shoulder without turning your body.
9. Doing physically demanding activities (e.g., physiotherapy, exercises,
gardening or sports).
10. Doing a full day’s activities, whether it be at home or at work.
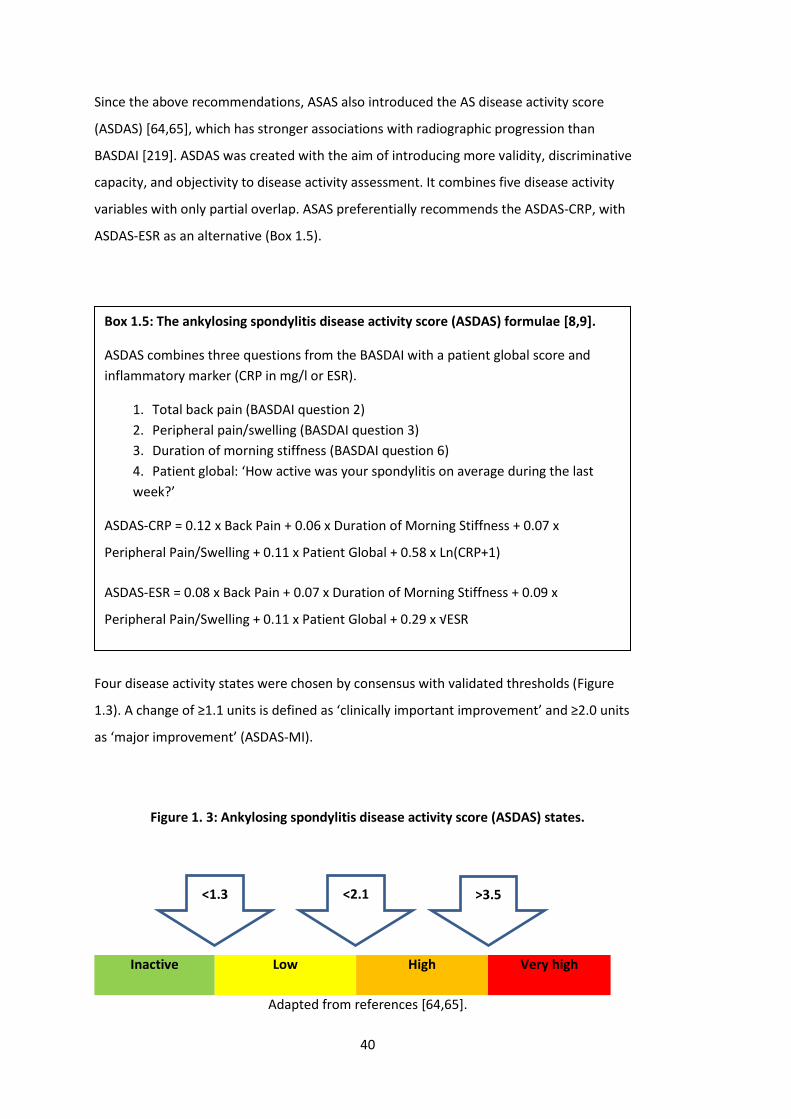
40
Since the above recommendations, ASAS also introduced the AS disease activity score
(ASDAS) [64,65], which has stronger associations with radiographic progression than
BASDAI [219]. ASDAS was created with the aim of introducing more validity, discriminative
capacity, and objectivity to disease activity assessment. It combines five disease activity
variables with only partial overlap. ASAS preferentially recommends the ASDAS-CRP, with
ASDAS-ESR as an alternative (Box 1.5).
Four disease activity states were chosen by consensus with validated thresholds (Figure
1.3). A change of ≥1.1 units is defined as ‘clinically important improvement’ and ≥2.0 units
as ‘major improvement’ (ASDAS-MI).
Figure 1. 3: Ankylosing spondylitis disease activity score (ASDAS) states.
Inactive Low High Very high
Adapted from references [64,65].
Box 1.5: The ankylosing spondylitis disease activity score (ASDAS) formulae [8,9].
ASDAS combines three questions from the BASDAI with a patient global score and
inflammatory marker (CRP in mg/l or ESR).
1. Total back pain (BASDAI question 2)
2. Peripheral pain/swelling (BASDAI question 3)
3. Duration of morning stiffness (BASDAI question 6)
4. Patient global: ‘How active was your spondylitis on average during the last
week?’
ASDAS-CRP = 0.12 x Back Pain + 0.06 x Duration of Morning Stiffness + 0.07 x
Peripheral Pain/Swelling + 0.11 x Patient Global + 0.58 x Ln(CRP+1)
ASDAS-ESR = 0.08 x Back Pain + 0.07 x Duration of Morning Stiffness + 0.09 x
Peripheral Pain/Swelling + 0.11 x Patient Global + 0.29 x √ESR
<1.3 >3.5 <2.1
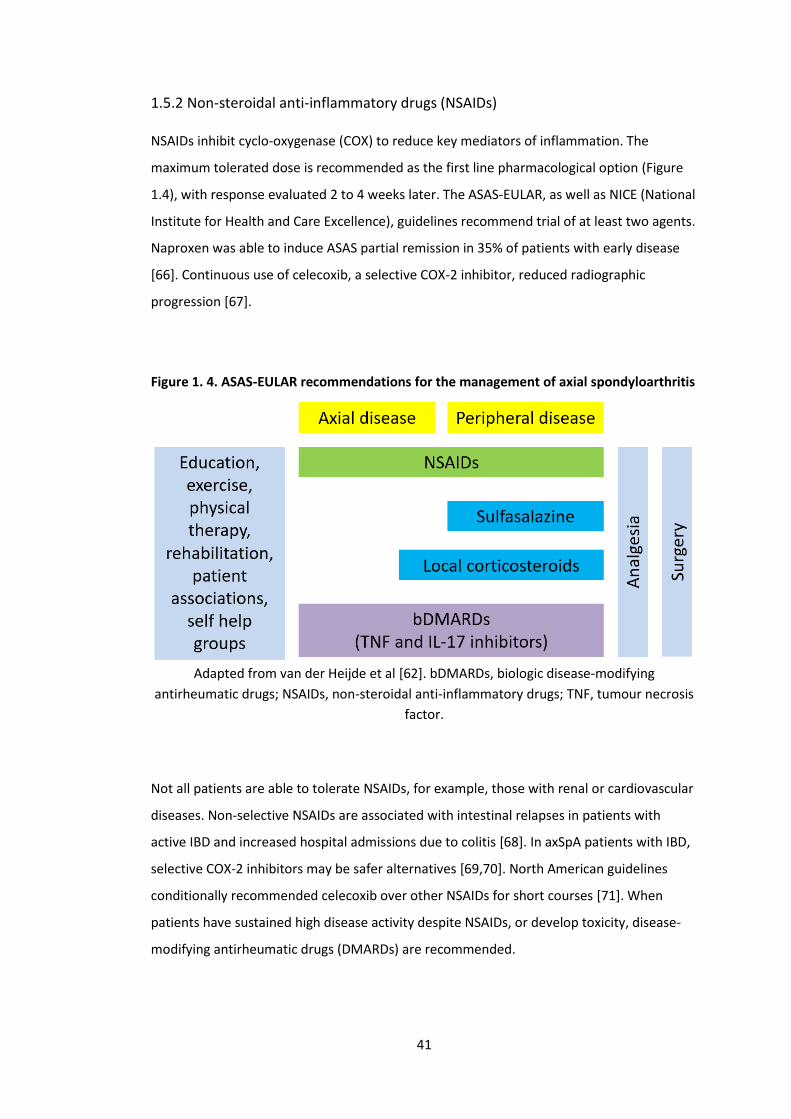
41
1.5.2 Non-steroidal anti-inflammatory drugs (NSAIDs)
NSAIDs inhibit cyclo-oxygenase (COX) to reduce key mediators of inflammation. The
maximum tolerated dose is recommended as the first line pharmacological option (Figure
1.4), with response evaluated 2 to 4 weeks later. The ASAS-EULAR, as well as NICE (National
Institute for Health and Care Excellence), guidelines recommend trial of at least two agents.
Naproxen was able to induce ASAS partial remission in 35% of patients with early disease
[66]. Continuous use of celecoxib, a selective COX-2 inhibitor, reduced radiographic
progression [67].
Figure 1. 4. ASAS-EULAR recommendations for the management of axial spondyloarthritis
Adapted from van der Heijde et al [62]. bDMARDs, biologic disease-modifying
antirheumatic drugs; NSAIDs, non-steroidal anti-inflammatory drugs; TNF, tumour necrosis
factor.
Not all patients are able to tolerate NSAIDs, for example, those with renal or cardiovascular
diseases. Non-selective NSAIDs are associated with intestinal relapses in patients with
active IBD and increased hospital admissions due to colitis [68]. In axSpA patients with IBD,
selective COX-2 inhibitors may be safer alternatives [69,70]. North American guidelines
conditionally recommended celecoxib over other NSAIDs for short courses [71]. When
patients have sustained high disease activity despite NSAIDs, or develop toxicity, disease-
modifying antirheumatic drugs (DMARDs) are recommended.
42
1.5.3 Disease-modifying antirheumatic drugs (DMARDs)
1.5.3.1 Conventional synthetic disease-modifying antirheumatic drugs (csDMARDs)
There is evidence that csDMARDs - sulfasalazine, methotrexate and leflunomide - are not
efficacious for axial symptoms. Patients with purely axial disease should not normally be
treated with csDMARDs [62], although sulfasalazine may be considered in patients with
peripheral joint involvement.
1.5.3.2 Biologic disease-modifying antirheumatic drugs (bDMARDs)
bDMARDs have revolutionised the treatment for those with sustained high disease activity
despite the above treatment options. These are large, complex protein molecules that
target specific cytokines, or their receptors, involved in the inflammatory pathway. Several
TNF inhibitors (TNFi) have been approved for axSpA (Figure 1.5). All except infliximab have
indications for both radiographic and nr-axSpA. TNFi for nr-axSpA was approved more
recently: 2016 in the UK, and 2019 in the US (only certolizumab pegol). In the UK, biosimilar
infliximab, adalimumab and etanercept are widely in use. In 2016, a new class of bDMARDs
became available for AS patients in the UK – secukinumab (IL17A inhibitor).
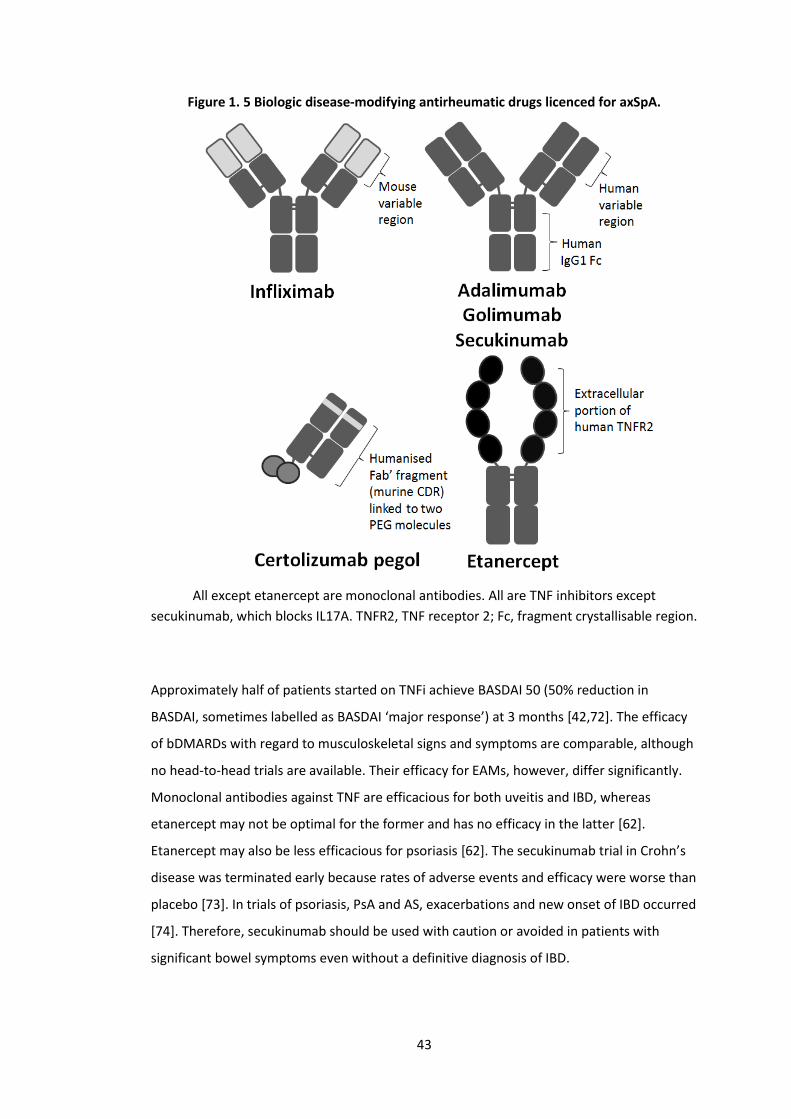
43
Figure 1. 5 Biologic disease-modifying antirheumatic drugs licenced for axSpA.
All except etanercept are monoclonal antibodies. All are TNF inhibitors except
secukinumab, which blocks IL17A. TNFR2, TNF receptor 2; Fc, fragment crystallisable region.
Approximately half of patients started on TNFi achieve BASDAI 50 (50% reduction in
BASDAI, sometimes labelled as BASDAI ‘major response’) at 3 months [42,72]. The efficacy
of bDMARDs with regard to musculoskeletal signs and symptoms are comparable, although
no head-to-head trials are available. Their efficacy for EAMs, however, differ significantly.
Monoclonal antibodies against TNF are efficacious for both uveitis and IBD, whereas
etanercept may not be optimal for the former and has no efficacy in the latter [62].
Etanercept may also be less efficacious for psoriasis [62]. The secukinumab trial in Crohn’s
disease was terminated early because rates of adverse events and efficacy were worse than
placebo [73]. In trials of psoriasis, PsA and AS, exacerbations and new onset of IBD occurred
[74]. Therefore, secukinumab should be used with caution or avoided in patients with
significant bowel symptoms even without a definitive diagnosis of IBD.
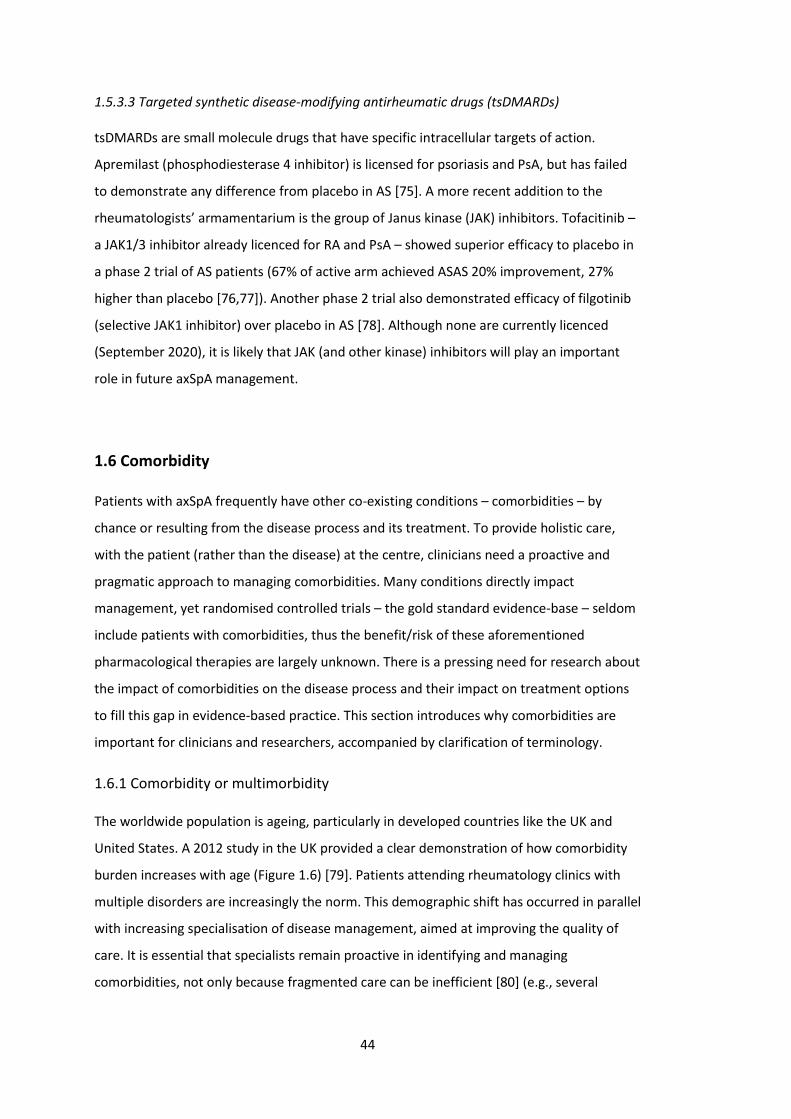
44
1.5.3.3 Targeted synthetic disease-modifying antirheumatic drugs (tsDMARDs)
tsDMARDs are small molecule drugs that have specific intracellular targets of action.
Apremilast (phosphodiesterase 4 inhibitor) is licensed for psoriasis and PsA, but has failed
to demonstrate any difference from placebo in AS [75]. A more recent addition to the
rheumatologists’ armamentarium is the group of Janus kinase (JAK) inhibitors. Tofacitinib –
a JAK1/3 inhibitor already licenced for RA and PsA – showed superior efficacy to placebo in
a phase 2 trial of AS patients (67% of active arm achieved ASAS 20% improvement, 27%
higher than placebo [76,77]). Another phase 2 trial also demonstrated efficacy of filgotinib
(selective JAK1 inhibitor) over placebo in AS [78]. Although none are currently licenced
(September 2020), it is likely that JAK (and other kinase) inhibitors will play an important
role in future axSpA management.
1.6 Comorbidity
Patients with axSpA frequently have other co-existing conditions – comorbidities – by
chance or resulting from the disease process and its treatment. To provide holistic care,
with the patient (rather than the disease) at the centre, clinicians need a proactive and
pragmatic approach to managing comorbidities. Many conditions directly impact
management, yet randomised controlled trials – the gold standard evidence-base – seldom
include patients with comorbidities, thus the benefit/risk of these aforementioned
pharmacological therapies are largely unknown. There is a pressing need for research about
the impact of comorbidities on the disease process and their impact on treatment options
to fill this gap in evidence-based practice. This section introduces why comorbidities are
important for clinicians and researchers, accompanied by clarification of terminology.
1.6.1 Comorbidity or multimorbidity
The worldwide population is ageing, particularly in developed countries like the UK and
United States. A 2012 study in the UK provided a clear demonstration of how comorbidity
burden increases with age (Figure 1.6) [79]. Patients attending rheumatology clinics with
multiple disorders are increasingly the norm. This demographic shift has occurred in parallel
with increasing specialisation of disease management, aimed at improving the quality of
care. It is essential that specialists remain proactive in identifying and managing
comorbidities, not only because fragmented care can be inefficient [80] (e.g., several
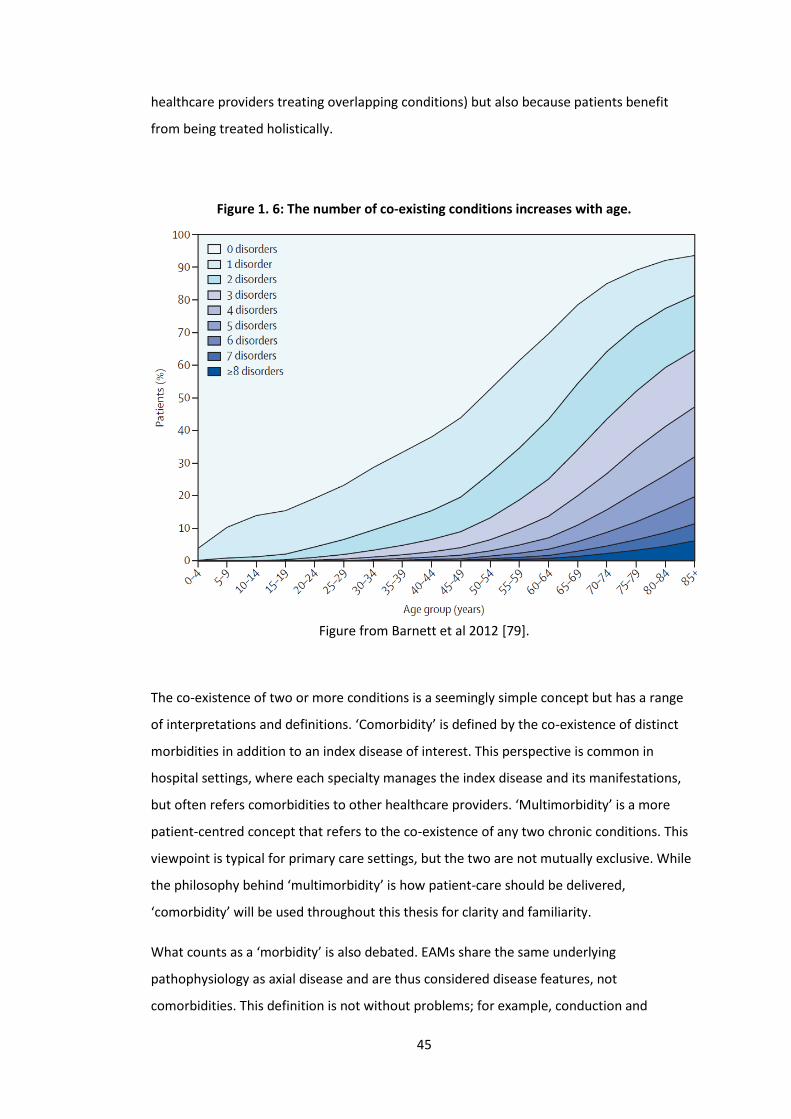
45
healthcare providers treating overlapping conditions) but also because patients benefit
from being treated holistically.
Figure 1. 6: The number of co-existing conditions increases with age.
Figure from Barnett et al 2012 [79].
The co-existence of two or more conditions is a seemingly simple concept but has a range
of interpretations and definitions. ‘Comorbidity’ is defined by the co-existence of distinct
morbidities in addition to an index disease of interest. This perspective is common in
hospital settings, where each specialty manages the index disease and its manifestations,
but often refers comorbidities to other healthcare providers. ‘Multimorbidity’ is a more
patient-centred concept that refers to the co-existence of any two chronic conditions. This
viewpoint is typical for primary care settings, but the two are not mutually exclusive. While
the philosophy behind ‘multimorbidity’ is how patient-care should be delivered,
‘comorbidity’ will be used throughout this thesis for clarity and familiarity.
What counts as a ‘morbidity’ is also debated. EAMs share the same underlying
pathophysiology as axial disease and are thus considered disease features, not
comorbidities. This definition is not without problems; for example, conduction and
46
valvular defects of the heart also share mechanisms with axial inflammation [43], but would
be more commonly considered as cardiovascular comorbidities. A helpful delineation is
observed from RCTs: EAMs are actively included, while comorbidities are generally
excluded. There is further ambiguity between comorbidity and complications, most notably
regarding osteoporosis and fractures: reduced bone mineral density of the spine is
considered a comorbidity but is related to effects of localised inflammation in the spine
(i.e., the disease process); fractures can be due to vertebral fusion (complication) or
osteoporosis (comorbidity). Chronic comorbidities are most commonly counted, but some
indices also include acute conditions (e.g., myocardial infarction), health-related risk factors
(e.g., obesity and hypertension) and/or symptoms (e.g., back pain and urinary
incontinence) [81–83]. For example, hypertension is a risk factor for coronary heart disease
and stroke, but also has a diagnostic definition and requires long-term management like
many chronic diseases.
The choice of which comorbidities to include depends somewhat on whether they are
studied as outcomes (e.g., do bDMARDs increase risk of infections?) or exposures (does
depression impact treatment response?). Rather than focusing on one definition, this thesis
will examine aspects related to comorbidity from a flexible standpoint, to identify and
contribute to areas of unmet research need.
1.7 Summary
AxSpA is a complex condition that presents with a range of disease features and unique
challenges for management. Its onset in early adulthood can be deleterious to education,
career, relationships, and mental health; improving care for axSpA patients is important as
the disease has potential to disrupt the entire life-course. Although effective targeted
treatments are increasingly available, most clinical trials have excluded patients with
comorbidities. Description of comorbidity burden and patterns are scarce. How
comorbidities impact axSpA outcomes, such as treatment response, are unclear. There is a
pressing need for research into comorbidities in axSpA to inform and support holistic,
evidence-based management.
47
Chapter 2: Background Literature Review
This chapter systematically reviews the literature on comorbidities in axSpA and discusses
areas in need of further research to support the aims and objectives of this thesis.
2.1 Introduction
Comorbidities are common in people with chronic rheumatic diseases. This may be due to
shared risk factors, consequences of inflammation or its treatment (e.g., long-term NSAIDs).
Comorbidities are associated with adverse health outcomes such as poorer physical
function, quality of life, work productivity, and mortality [84]. Some, such as renal,
cardiovascular and gastrointestinal diseases, influence treatment decisions [85]. A holistic,
patient-centred approach is therefore essential in rheumatology, yet randomised controlled
trials – the gold-standard on which management guidelines are largely based – often
exclude patients with comorbidities. Observational research using real-world data are
important in addressing this unmet need, but studies have historically been heterogeneous
in design and quality.
The majority of axSpA comorbidity research has focused on one or a few closely related
conditions within one organ system; for example, depression in axSpA [9], or cardiovascular
diseases (CVDs) in axSpA [86]. While this approach is valid for assessing the impact of one
comorbid disease on axSpA and vice versa, it does not reflect the real-world setting where
patients frequently have multiple inter-related comorbidities. Studying a broad range of
comorbidities helps quantify their collective ‘burden’ on health, which in turn provides
context for the relative importance of, and relationship between, individual conditions. For
example, what are the relative impacts of CVDs and depression on outcomes such as
quality of life? When commissioning interventions, which should be prioritised? Are there
‘clusters’ of commonly co-existing comorbidities, such that the presence of one should
trigger screening for others? These are some of many unmet research-needs in axSpA that
motivated this thesis. This chapter begins by reviewing descriptive epidemiological studies
of comorbidities in axSpA and then moves on to their impact on disease outcomes. A
detailed discussion follows, focusing on directions and methodological approaches for this
thesis.
48
2.2 Aims
1. To describe the prevalence of commonly reported comorbidities in patients with
axSpA and how they compare to control populations.
2. To summarise what is known about the impact of comorbidity burden on
longitudinal outcomes in patients with axSpA.
3. To discuss implications of the systematic review findings on the aims and
methodology of this thesis.
2.3 Methods
A systematic review was reported in accordance with the Preferred Reporting Items for
Systematic Reviews and Meta-Analyses (PRISMA) guidelines [11]. The protocol was pre-
registered with PROSPERO (CRD42019151105). Full details on methods and results for this
review are published in reference [84]. Medline, PubMed, Scopus and Web of Science were
searched for relevant literature on 27th of September 2019, using the following search
terms: (ankylosing spondylitis [MeSH] OR axial spondyloarth*) AND (multimorbidy [MeSH]
OR comorbidity [MesH] OR polymorbid* OR multi-morbid* OR co-morbid* OR poly-
morbid*). No additional date or language restrictions were used. Bibliographies of all
eligible studies were also manually searched to identify additional titles. The review was
updated on 30th of September 2020 to include articles published over the last 12 months.
‘PICO’ was defined as:
• Participants/population: Studies of axSpA, whether defined by classification criteria
or otherwise.
• Intervention/exposure: Not applicable for Aim 1. For Aim 2, ‘exposure’ was the
presence of any or individual comorbidities versus none.
• Comparator/control: For Aim 1, incidence and prevalence of comorbidities were
compared against controls. The definition of the control group could be healthy
(i.e., without rheumatic diseases) or general populations (i.e., including rheumatic
disease).
• Outcome: Aim 1 ‘outcomes’ of interest were incidence and prevalence of
comorbidities. Aim 2 examined axSpA-specific (e.g., treatment response or disease
severity indices) and general outcomes (e.g., mortality).
49
Published conference abstracts were considered, as some prevalence studies may not be
published as full articles but nevertheless have sufficiently detailed methodology and
results. Reviews, comments, and editorials were excluded.
Studies were excluded if they focused on only one comorbid condition (e.g., stroke only) or
a few closely related diseases in one organ system (e.g., cardiovascular diseases only). This
distinguished studies of comorbidity from, e.g., cardiovascular risk. Studies that used non-
representative sampling (highly selective recruitment or randomised controlled trials) or
had a samples size of less than 30 (to avoid unreliable prevalence estimates) were
excluded. Extra-articular manifestations (EAMs) were excluded from the list of
comorbidities, since they share pathogenesis with and aid diagnosis of axSpA (thereby
determining study inclusion) [87,88].
Two independent reviewers screened titles and abstracts, assessed full texts for eligibility
and extracted data from qualifying studies. Any discrepancy at each stage was resolved
through discussion moderated by a third reviewer. Information from included studies was
extracted into predefined tabulated summaries. Studies were assessed for risk of bias using
an adapted version of the Newcastle Ottawa Scale.
For Aims 1 and 2, meta-analysis was performed for comorbidities reported by at least three
studies. Pooled prevalence estimates were reported as percentages (95% confidence
interval, I2 statistic), using random-effects models (DerSimonian-Laird). Double arcsine
transformation was used, since traditional weighting methods are problematic when
proportions are close to the bound limits. Heterogeneity of meta-analysis estimates were
presented using the I2 statistic. Funnel plots were used to assess risk of publication bias.
Analyses were performed using MetaXL Version 5.3 (Sunrise Beach, Australia).
50
2.4 Results
A total of 1522 publications were found from the literature search. After excluding
duplicates, irrelevant and ineligible studies, 44 studies remained. Three used data from the
ASAS-COMOSPA study [89–91], from which the paper by Nikiphorou et al was selected
since it restricted to participants fulfilling ASAS criteria. Two articles used the OASIS registry
[92,93]; Stolwijk et al was selected as it reported a greater range of comorbidities. The
larger of 2 studies using United States’ claims data by Walsh et al was included [94,95].
Flowchart of the selection process is shown in Figure 2.1.
The 40 included studies are summarised in Table 2.1 [7,86,90,93,95–129]. Sample size
ranged from 74 to 21,872 [107,108]. Twenty-one studies used European cohorts
[7,96,98,100,102,106,108–110,112–114,116,118,119,121–123,128–130], 7 were from Asia
[101,104,111,115,117,124,125], 6 North America [86,95,97,103,126,127], 1 Argentina
[120], 1 Australia [99] and 4 were multinational [90,93,105,107]. Mean age of study
samples ranged from 29 (China [115]) to 59 (UK [109]). Mean BASDAI ranged from 3.4
(China [115]) to 7.6 (Australia, cohort initiating TNFi [99]).
AxSpA was defined using classification criteria in 20 studies (7 using the modified New York
criteria only, 13 using the ASAS and/or mNY criteria), diagnostic codes in 14, physician
diagnosis in 3 and self-report in 1. The number of comorbidities studied ranged from 3 to
43 (excluding EAMs). Most studies used non-validated lists, while 13 used a validated index
either directly or indirectly (to inform which comorbidities to include, e.g., Kang et al [101]):
3 used the Charlson Comorbidity Index (CCI), 2 Elixhauser Comorbidity Index (ECI), 3 self-
reported comorbidity questionnaire (SCQ), 2 Rheumatic Disease Comorbidity Index (RDCI),
2 multimorbidity index (MMI) and 1 Functional Comorbidity Index. EAMs were included as
comorbidity in a minority (5 out of 40 studies), while 2 considered valvular heart disease
and restrictive lung disease as EAMs. Two studies also included smoking as comorbidity.
Most studies did not justify their sample size since they were not dedicated studies of
comorbidities, thereby losing one point for bias. Taking this into account, most studies
scored 4 or 5 out of a possible 6 points indicating minimal bias (summary in Table 2.1,
detailed risk of bias assessment is presented in Appendix 10.1, Table S2.1 and Figure S2.1).
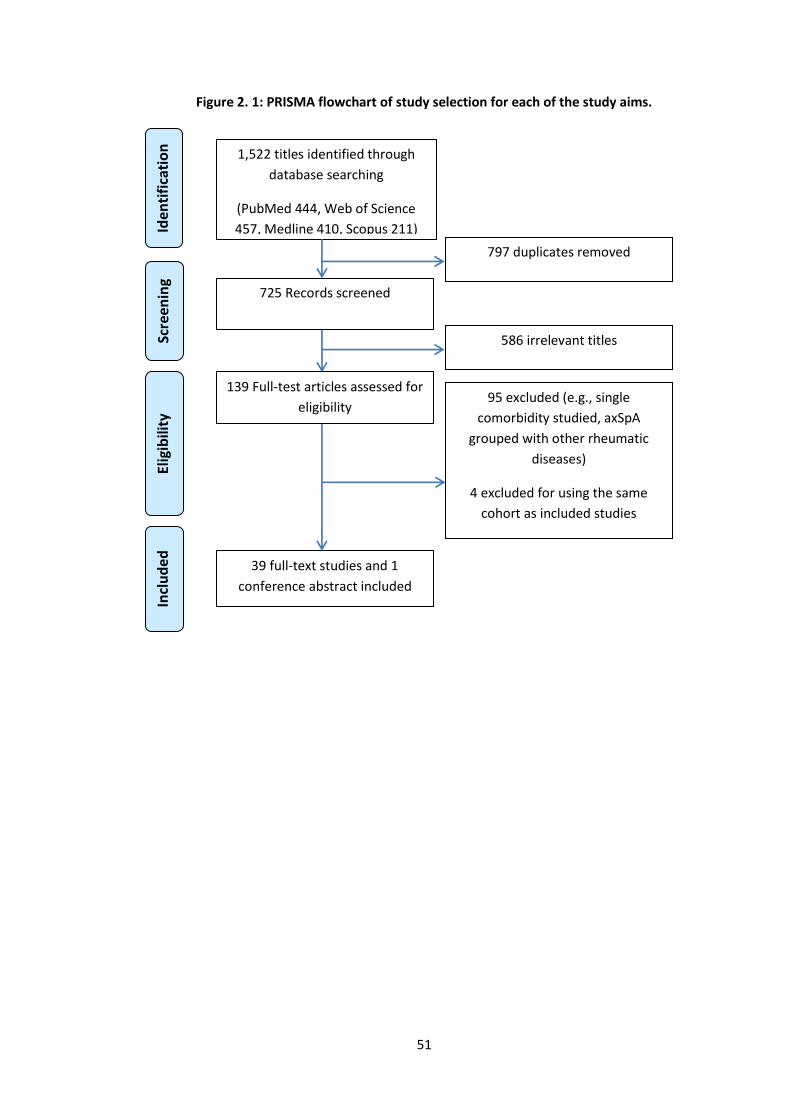
51
Figure 2. 1: PRISMA flowchart of study selection for each of the study aims.
1,522 titles identified through
database searching
(PubMed 444, Web of Science
457, Medline 410, Scopus 211)
797 duplicates removed
725 Records screened
586 irrelevant titles
139 Full-test articles assessed for
eligibility 95 excluded (e.g., single
comorbidity studied, axSpA
grouped with other rheumatic
diseases)
4 excluded for using the same
cohort as included studies
39 full-text studies and 1
conference abstract included
Scre
enin
g In
clu
ded
El
igib
ility
Id
enti
fica
tio
n
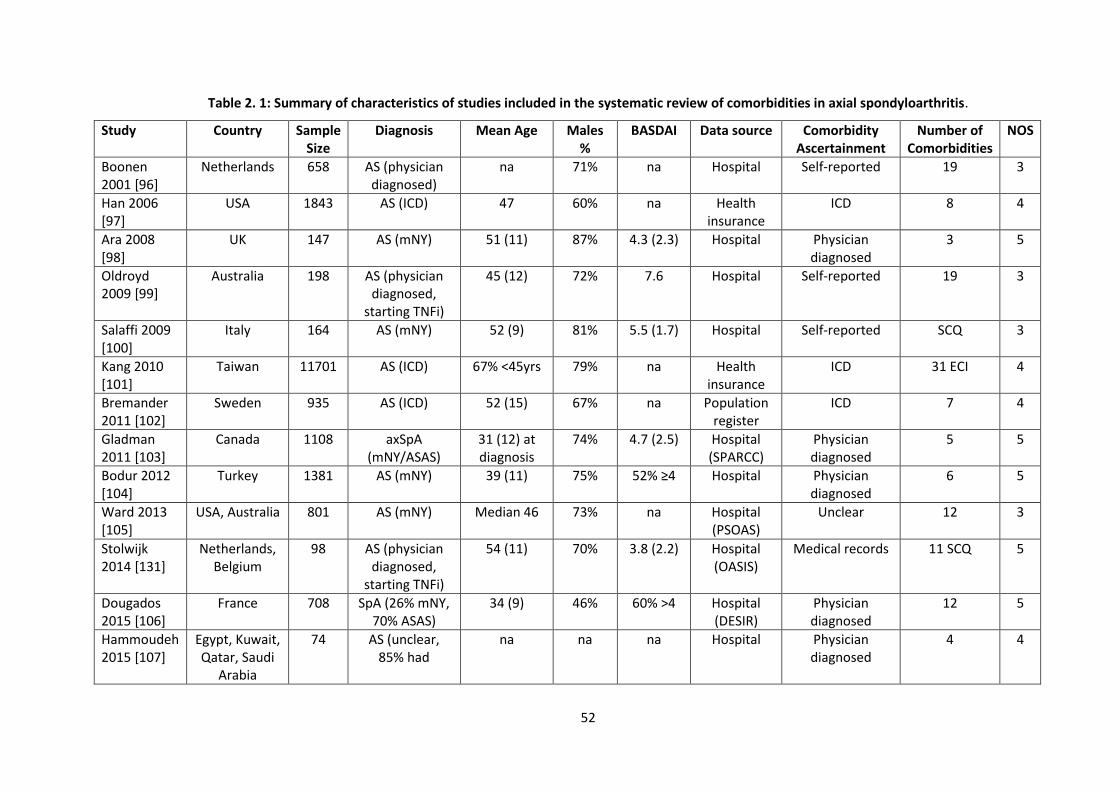
52
Table 2. 1: Summary of characteristics of studies included in the systematic review of comorbidities in axial spondyloarthritis.
Study Country Sample Size
Diagnosis Mean Age Males %
BASDAI Data source Comorbidity Ascertainment
Number of Comorbidities
NOS
Boonen 2001 [96]
Netherlands 658 AS (physician diagnosed)
na 71% na Hospital Self-reported 19 3
Han 2006 [97]
USA 1843 AS (ICD) 47 60% na Health insurance
ICD 8 4
Ara 2008 [98]
UK 147 AS (mNY) 51 (11) 87% 4.3 (2.3) Hospital Physician diagnosed
3 5
Oldroyd 2009 [99]
Australia 198 AS (physician diagnosed,
starting TNFi)
45 (12) 72% 7.6 Hospital Self-reported 19 3
Salaffi 2009 [100]
Italy 164 AS (mNY) 52 (9) 81% 5.5 (1.7) Hospital Self-reported SCQ 3
Kang 2010 [101]
Taiwan 11701 AS (ICD) 67% <45yrs 79% na Health insurance
ICD 31 ECI 4
Bremander 2011 [102]
Sweden 935 AS (ICD) 52 (15) 67% na Population register
ICD 7 4
Gladman 2011 [103]
Canada 1108 axSpA (mNY/ASAS)
31 (12) at diagnosis
74% 4.7 (2.5) Hospital (SPARCC)
Physician diagnosed
5 5
Bodur 2012 [104]
Turkey 1381 AS (mNY) 39 (11) 75% 52% ≥4 Hospital Physician diagnosed
6 5
Ward 2013 [105]
USA, Australia 801 AS (mNY) Median 46 73% na Hospital (PSOAS)
Unclear 12 3
Stolwijk 2014 [131]
Netherlands, Belgium
98 AS (physician diagnosed,
starting TNFi)
54 (11) 70% 3.8 (2.2) Hospital (OASIS)
Medical records 11 SCQ 5
Dougados 2015 [106]
France 708 SpA (26% mNY, 70% ASAS)
34 (9) 46% 60% >4 Hospital (DESIR)
Physician diagnosed
12 5
Hammoudeh 2015 [107]
Egypt, Kuwait, Qatar, Saudi
Arabia
74 AS (unclear, 85% had
na na na Hospital Physician diagnosed
4 4
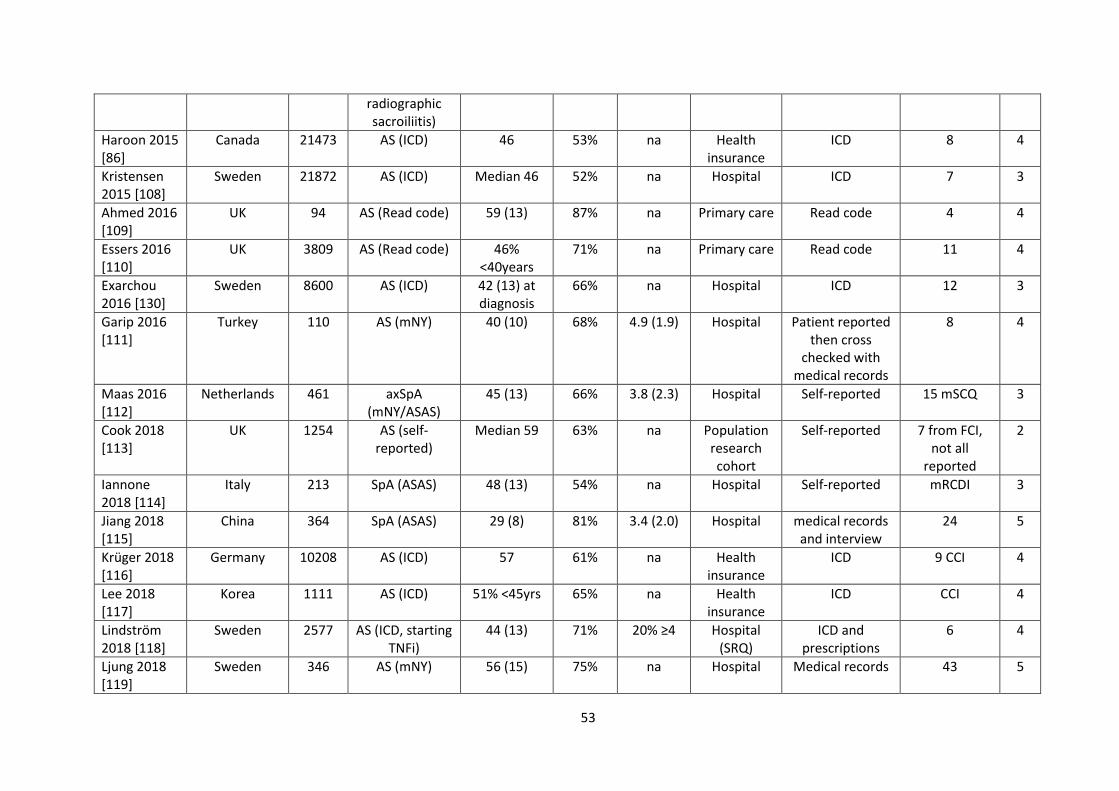
53
radiographic sacroiliitis)
Haroon 2015 [86]
Canada 21473 AS (ICD) 46 53% na Health insurance
ICD 8 4
Kristensen 2015 [108]
Sweden 21872 AS (ICD) Median 46 52% na Hospital ICD 7 3
Ahmed 2016 [109]
UK 94 AS (Read code) 59 (13) 87% na Primary care Read code 4 4
Essers 2016 [110]
UK 3809 AS (Read code) 46% <40years
71% na Primary care Read code 11 4
Exarchou 2016 [130]
Sweden 8600 AS (ICD) 42 (13) at diagnosis
66% na Hospital ICD 12 3
Garip 2016 [111]
Turkey 110 AS (mNY) 40 (10) 68% 4.9 (1.9) Hospital Patient reported then cross
checked with medical records
8 4
Maas 2016 [112]
Netherlands 461 axSpA (mNY/ASAS)
45 (13) 66% 3.8 (2.3) Hospital Self-reported 15 mSCQ 3
Cook 2018 [113]
UK 1254 AS (self-reported)
Median 59 63% na Population research cohort
Self-reported 7 from FCI, not all
reported
2
Iannone 2018 [114]
Italy 213 SpA (ASAS) 48 (13) 54% na Hospital Self-reported mRCDI 3
Jiang 2018 [115]
China 364 SpA (ASAS) 29 (8) 81% 3.4 (2.0) Hospital medical records and interview
24 5
Krüger 2018 [116]
Germany 10208 AS (ICD) 57 61% na Health insurance
ICD 9 CCI 4
Lee 2018 [117]
Korea 1111 AS (ICD) 51% <45yrs 65% na Health insurance
ICD CCI 4
Lindström 2018 [118]
Sweden 2577 AS (ICD, starting TNFi)
44 (13) 71% 20% ≥4 Hospital (SRQ)
ICD and prescriptions
6 4
Ljung 2018 [119]
Sweden 346 AS (mNY) 56 (15) 75% na Hospital Medical records 43 5
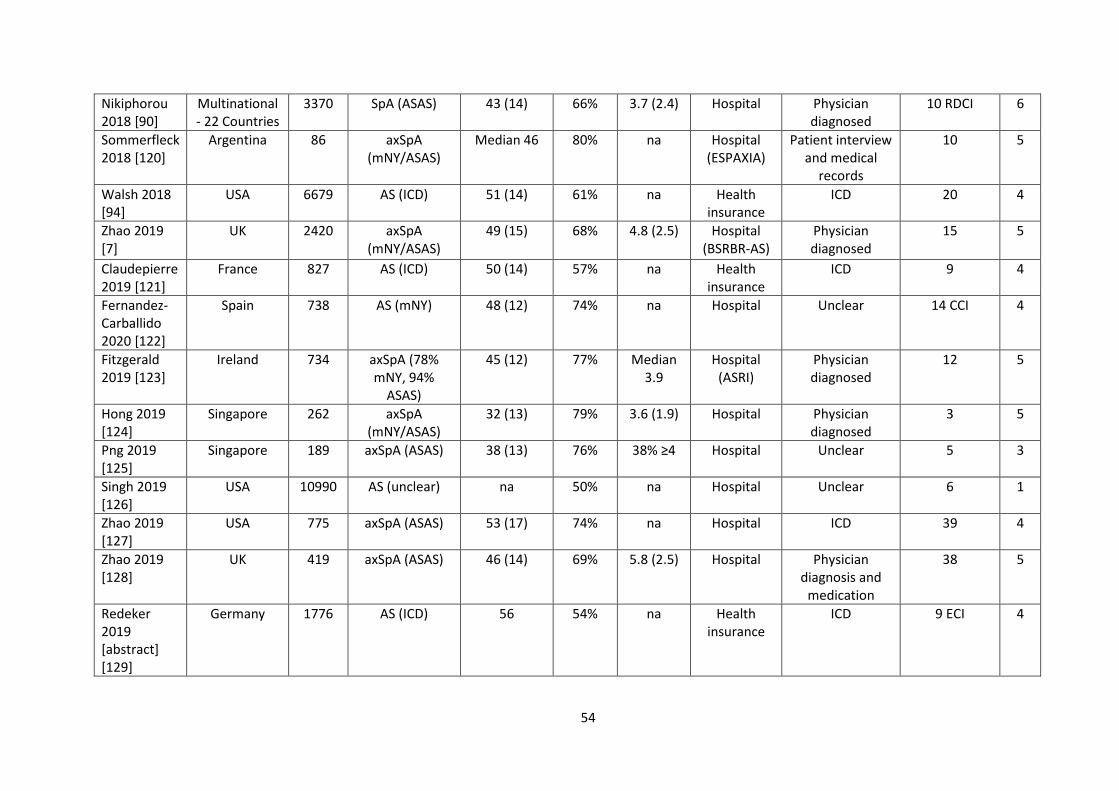
54
Nikiphorou 2018 [90]
Multinational - 22 Countries
3370 SpA (ASAS) 43 (14) 66% 3.7 (2.4) Hospital Physician diagnosed
10 RDCI 6
Sommerfleck 2018 [120]
Argentina 86 axSpA (mNY/ASAS)
Median 46 80% na Hospital (ESPAXIA)
Patient interview and medical
records
10 5
Walsh 2018 [94]
USA 6679 AS (ICD) 51 (14) 61% na Health insurance
ICD 20 4
Zhao 2019 [7]
UK 2420 axSpA (mNY/ASAS)
49 (15) 68% 4.8 (2.5) Hospital (BSRBR-AS)
Physician diagnosed
15 5
Claudepierre 2019 [121]
France 827 AS (ICD) 50 (14) 57% na Health insurance
ICD 9 4
Fernandez-Carballido 2020 [122]
Spain 738 AS (mNY) 48 (12) 74% na Hospital Unclear 14 CCI 4
Fitzgerald 2019 [123]
Ireland 734 axSpA (78% mNY, 94%
ASAS)
45 (12) 77% Median 3.9
Hospital (ASRI)
Physician diagnosed
12 5
Hong 2019 [124]
Singapore 262 axSpA (mNY/ASAS)
32 (13) 79% 3.6 (1.9) Hospital Physician diagnosed
3 5
Png 2019 [125]
Singapore 189 axSpA (ASAS) 38 (13) 76% 38% ≥4 Hospital Unclear 5 3
Singh 2019 [126]
USA 10990 AS (unclear) na 50% na Hospital Unclear 6 1
Zhao 2019 [127]
USA 775 axSpA (ASAS) 53 (17) 74% na Hospital ICD 39 4
Zhao 2019 [128]
UK 419 axSpA (ASAS) 46 (14) 69% 5.8 (2.5) Hospital Physician diagnosis and
medication
38 5
Redeker 2019 [abstract] [129]
Germany 1776 AS (ICD) 56 54% na Health insurance
ICD 9 ECI 4
55
na, not available; NOS, Newcastle-Ottawa Score for bias; mNY, modified New York criteria; ASAS, Assessment of SpondyloArthritis international Society criteria; axSpA, axial spondyloarthritis; AS, ankylosing spondylitis; ICD, International Statistical Classification of Diseases; CCI, Charlson Comorbidity Index;
SCQ, self-reported comorbidity questionnaire; RDCI, Rheumatic Disease Comorbidity Index; ECI, Elixhauser Comorbidity Index.
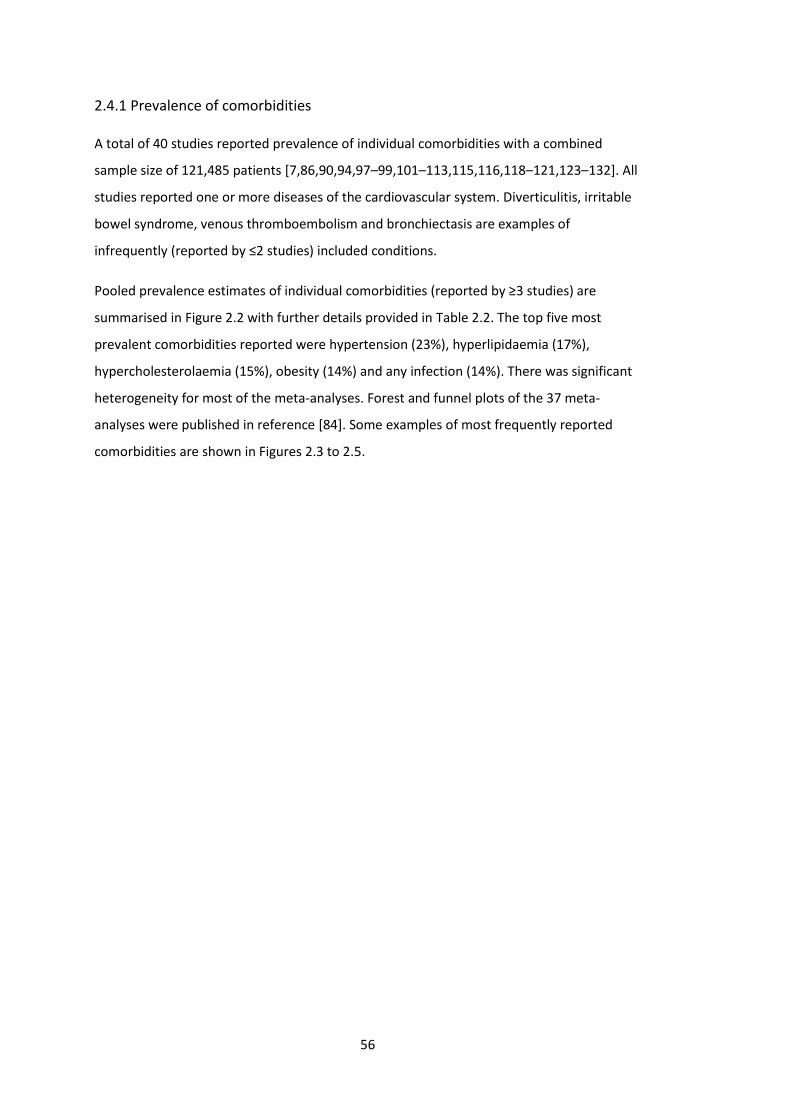
56
2.4.1 Prevalence of comorbidities
A total of 40 studies reported prevalence of individual comorbidities with a combined
sample size of 121,485 patients [7,86,90,94,97–99,101–113,115,116,118–121,123–132]. All
studies reported one or more diseases of the cardiovascular system. Diverticulitis, irritable
bowel syndrome, venous thromboembolism and bronchiectasis are examples of
infrequently (reported by ≤2 studies) included conditions.
Pooled prevalence estimates of individual comorbidities (reported by ≥3 studies) are
summarised in Figure 2.2 with further details provided in Table 2.2. The top five most
prevalent comorbidities reported were hypertension (23%), hyperlipidaemia (17%),
hypercholesterolaemia (15%), obesity (14%) and any infection (14%). There was significant
heterogeneity for most of the meta-analyses. Forest and funnel plots of the 37 meta-
analyses were published in reference [84]. Some examples of most frequently reported
comorbidities are shown in Figures 2.3 to 2.5.
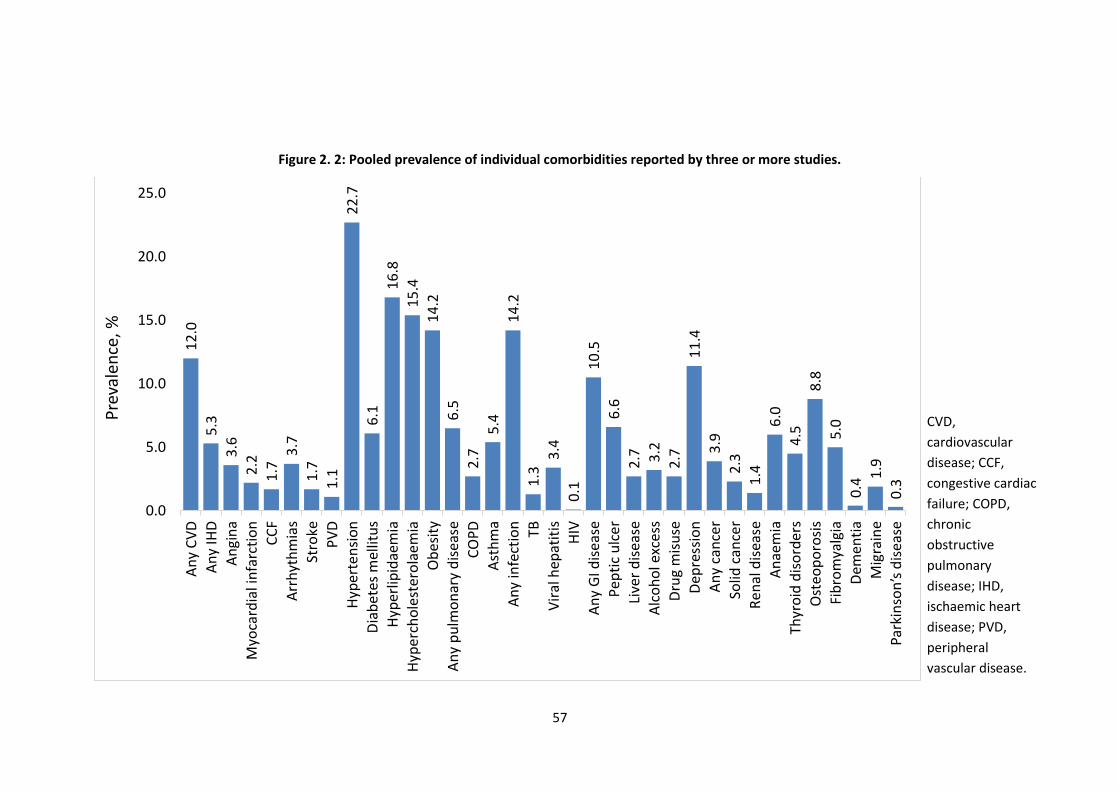
57
Figure 2. 2: Pooled prevalence of individual comorbidities reported by three or more studies.
12
.0
5.3
3.6
2.2
1.7
3.7
1.7
1.1
22
.7
6.1
16
.8
15
.4
14
.2
6.5
2.7
5.4
14
.2
1.3
3.4
0.1
10
.5
6.6
2.7 3.2
2.7
11
.4
3.9
2.3
1.4
6.0
4.5
8.8
5.0
0.4
1.9
0.3
0.0
5.0
10.0
15.0
20.0
25.0A
ny
CV
D
An
y IH
D
An
gin
a
Myo
card
ial i
nfa
rcti
on
CC
F
Arr
hyt
hm
ias
Stro
ke
PV
D
Hyp
erte
nsi
on
Dia
bet
es m
ellit
us
Hyp
erlip
idae
mia
Hyp
erch
ole
ster
ola
emia
Ob
esit
y
An
y p
ulm
on
ary
dis
ease
CO
PD
Ast
hm
a
An
y in
fect
ion
TB
Vir
al h
epat
itis
HIV
An
y G
I dis
ease
Pep
tic
ulc
er
Live
r d
isea
se
Alc
oh
ol e
xces
s
Dru
g m
isu
se
Dep
ress
ion
An
y ca
nce
r
Solid
can
cer
Ren
al d
isea
se
An
aem
ia
Thyr
oid
dis
ord
ers
Ost
eop
oro
sis
Fib
rom
yalg
ia
Dem
enti
a
Mig
rain
e
Park
inso
n’s
dis
ease
Pre
vale
nce
, %
CVD,
cardiovascular
disease; CCF,
congestive cardiac
failure; COPD,
chronic
obstructive
pulmonary
disease; IHD,
ischaemic heart
disease; PVD,
peripheral
vascular disease.
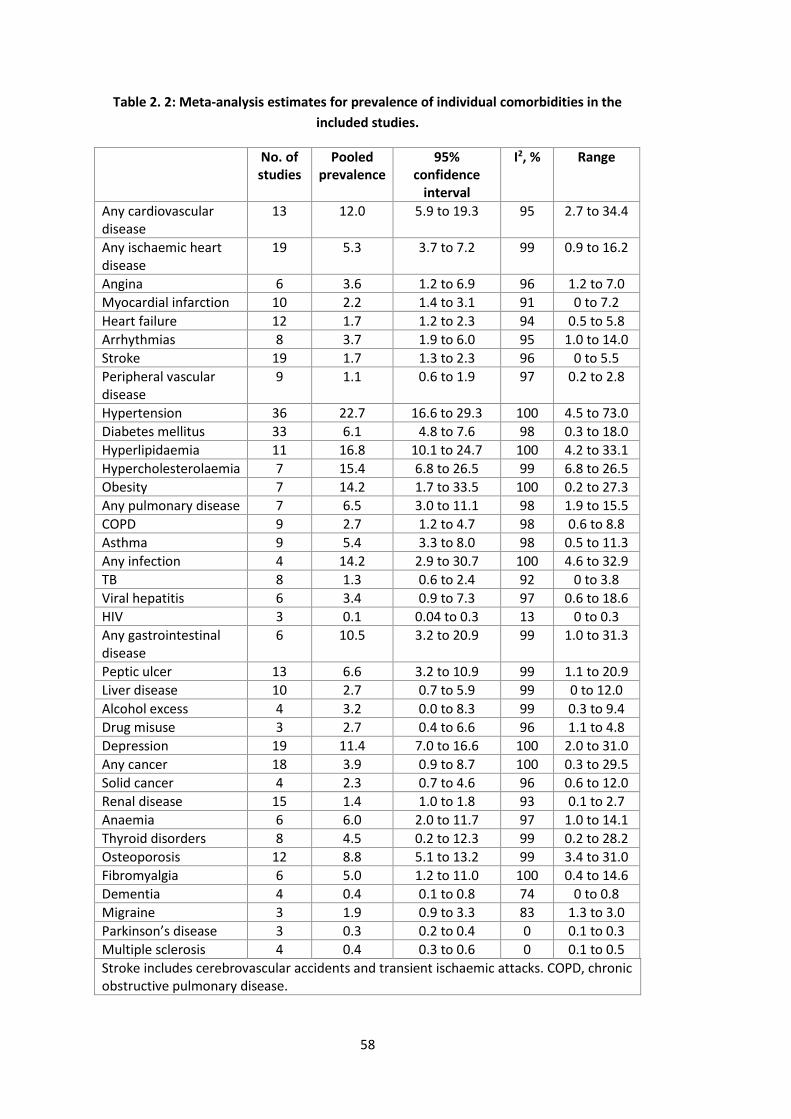
58
Table 2. 2: Meta-analysis estimates for prevalence of individual comorbidities in the
included studies.
No. of studies
Pooled prevalence
95% confidence
interval
I2, % Range
Any cardiovascular disease
13 12.0 5.9 to 19.3 95 2.7 to 34.4
Any ischaemic heart disease
19 5.3 3.7 to 7.2 99 0.9 to 16.2
Angina 6 3.6 1.2 to 6.9 96 1.2 to 7.0
Myocardial infarction 10 2.2 1.4 to 3.1 91 0 to 7.2
Heart failure 12 1.7 1.2 to 2.3 94 0.5 to 5.8
Arrhythmias 8 3.7 1.9 to 6.0 95 1.0 to 14.0
Stroke 19 1.7 1.3 to 2.3 96 0 to 5.5
Peripheral vascular disease
9 1.1 0.6 to 1.9 97 0.2 to 2.8
Hypertension 36 22.7 16.6 to 29.3 100 4.5 to 73.0
Diabetes mellitus 33 6.1 4.8 to 7.6 98 0.3 to 18.0
Hyperlipidaemia 11 16.8 10.1 to 24.7 100 4.2 to 33.1
Hypercholesterolaemia 7 15.4 6.8 to 26.5 99 6.8 to 26.5
Obesity 7 14.2 1.7 to 33.5 100 0.2 to 27.3
Any pulmonary disease 7 6.5 3.0 to 11.1 98 1.9 to 15.5
COPD 9 2.7 1.2 to 4.7 98 0.6 to 8.8
Asthma 9 5.4 3.3 to 8.0 98 0.5 to 11.3
Any infection 4 14.2 2.9 to 30.7 100 4.6 to 32.9
TB 8 1.3 0.6 to 2.4 92 0 to 3.8
Viral hepatitis 6 3.4 0.9 to 7.3 97 0.6 to 18.6
HIV 3 0.1 0.04 to 0.3 13 0 to 0.3
Any gastrointestinal disease
6 10.5 3.2 to 20.9 99 1.0 to 31.3
Peptic ulcer 13 6.6 3.2 to 10.9 99 1.1 to 20.9
Liver disease 10 2.7 0.7 to 5.9 99 0 to 12.0
Alcohol excess 4 3.2 0.0 to 8.3 99 0.3 to 9.4
Drug misuse 3 2.7 0.4 to 6.6 96 1.1 to 4.8
Depression 19 11.4 7.0 to 16.6 100 2.0 to 31.0
Any cancer 18 3.9 0.9 to 8.7 100 0.3 to 29.5
Solid cancer 4 2.3 0.7 to 4.6 96 0.6 to 12.0
Renal disease 15 1.4 1.0 to 1.8 93 0.1 to 2.7
Anaemia 6 6.0 2.0 to 11.7 97 1.0 to 14.1
Thyroid disorders 8 4.5 0.2 to 12.3 99 0.2 to 28.2
Osteoporosis 12 8.8 5.1 to 13.2 99 3.4 to 31.0
Fibromyalgia 6 5.0 1.2 to 11.0 100 0.4 to 14.6
Dementia 4 0.4 0.1 to 0.8 74 0 to 0.8
Migraine 3 1.9 0.9 to 3.3 83 1.3 to 3.0
Parkinson’s disease 3 0.3 0.2 to 0.4 0 0.1 to 0.3
Multiple sclerosis 4 0.4 0.3 to 0.6 0 0.1 to 0.5
Stroke includes cerebrovascular accidents and transient ischaemic attacks. COPD, chronic obstructive pulmonary disease.
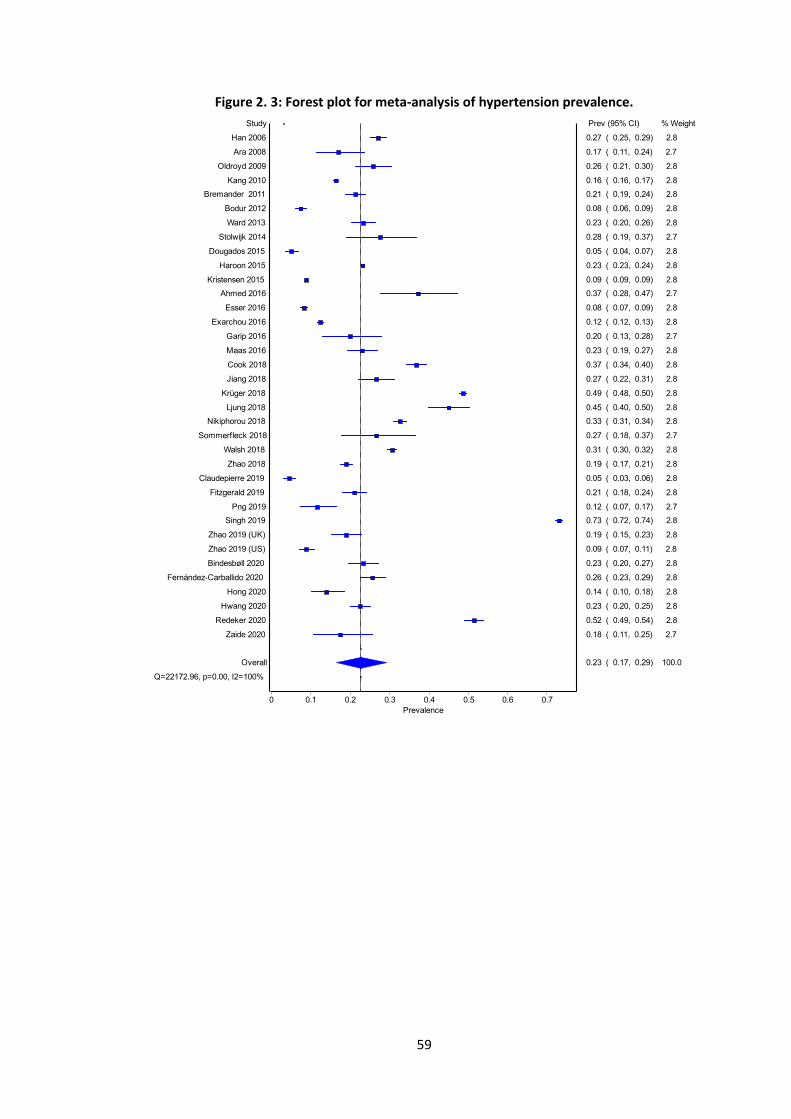
59
Figure 2. 3: Forest plot for meta-analysis of hypertension prevalence.
Random effects
Prevalence
0.70.60.50.40.30.20.10
Study
Claudepierre 2019
Dougados 2015
Bodur 2012
Esser 2016
Kristensen 2015
Zhao 2019 (US)
Png 2019
Exarchou 2016
Hong 2020
Kang 2010
Ara 2008
Zaide 2020
Zhao 2018
Zhao 2019 (UK)
Garip 2016
Fitzgerald 2019
Bremander 2011
Hwang 2020
Overall
Q=22172.96, p=0.00, I2=100%
Maas 2016
Haroon 2015
Bindesbøll 2020
Ward 2013
Fernández-Carballido 2020
Oldroyd 2009
Jiang 2018
Sommerfleck 2018
Han 2006
Stolwijk 2014
Walsh 2018
Nikiphorou 2018
Cook 2018
Ahmed 2016
Ljung 2018
Krüger 2018
Redeker 2020
Singh 2019
Prev (95% CI) % Weight
0.05 ( 0.03, 0.06) 2.8
0.05 ( 0.04, 0.07) 2.8
0.08 ( 0.06, 0.09) 2.8
0.08 ( 0.07, 0.09) 2.8
0.09 ( 0.09, 0.09) 2.8
0.09 ( 0.07, 0.11) 2.8
0.12 ( 0.07, 0.17) 2.7
0.12 ( 0.12, 0.13) 2.8
0.14 ( 0.10, 0.18) 2.8
0.16 ( 0.16, 0.17) 2.8
0.17 ( 0.11, 0.24) 2.7
0.18 ( 0.11, 0.25) 2.7
0.19 ( 0.17, 0.21) 2.8
0.19 ( 0.15, 0.23) 2.8
0.20 ( 0.13, 0.28) 2.7
0.21 ( 0.18, 0.24) 2.8
0.21 ( 0.19, 0.24) 2.8
0.23 ( 0.20, 0.25) 2.8
0.23 ( 0.17, 0.29) 100.0
0.23 ( 0.19, 0.27) 2.8
0.23 ( 0.23, 0.24) 2.8
0.23 ( 0.20, 0.27) 2.8
0.23 ( 0.20, 0.26) 2.8
0.26 ( 0.23, 0.29) 2.8
0.26 ( 0.21, 0.30) 2.8
0.27 ( 0.22, 0.31) 2.8
0.27 ( 0.18, 0.37) 2.7
0.27 ( 0.25, 0.29) 2.8
0.28 ( 0.19, 0.37) 2.7
0.31 ( 0.30, 0.32) 2.8
0.33 ( 0.31, 0.34) 2.8
0.37 ( 0.34, 0.40) 2.8
0.37 ( 0.28, 0.47) 2.7
0.45 ( 0.40, 0.50) 2.8
0.49 ( 0.48, 0.50) 2.8
0.52 ( 0.49, 0.54) 2.8
0.73 ( 0.72, 0.74) 2.8
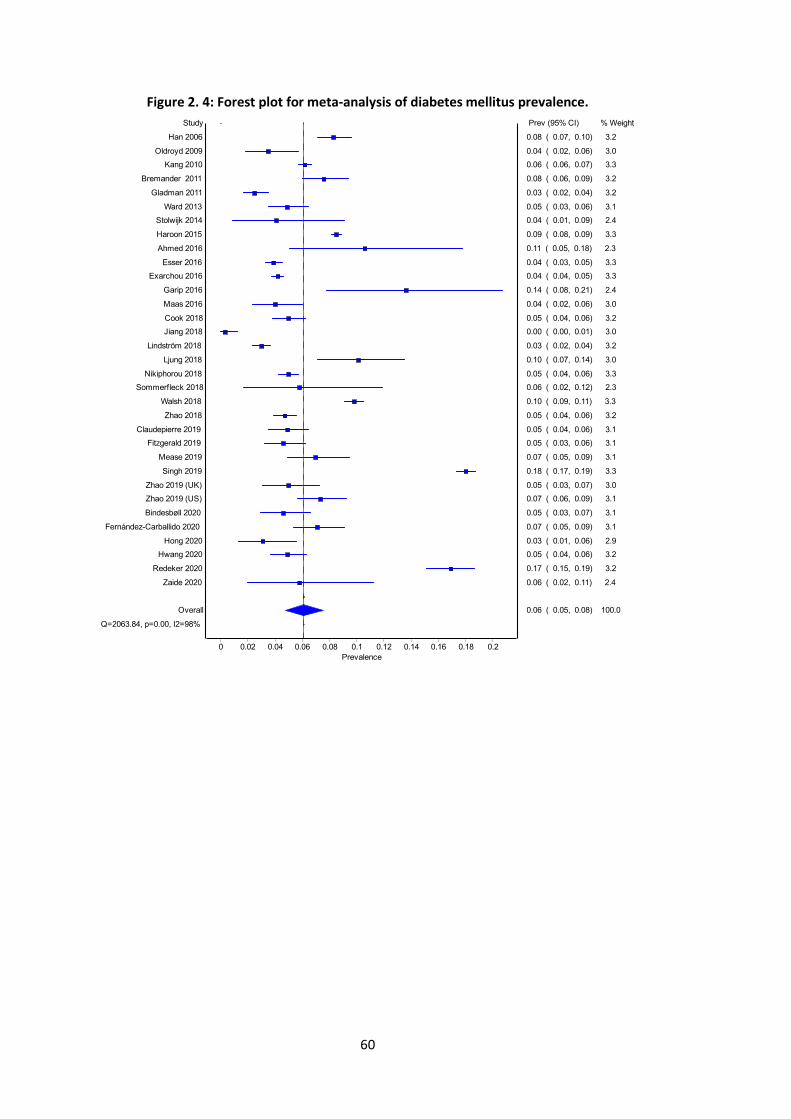
60
Figure 2. 4: Forest plot for meta-analysis of diabetes mellitus prevalence.
Random effects
Prevalence
0.20.180.160.140.120.10.080.060.040.020
Study
Jiang 2018
Gladman 2011
Lindström 2018
Hong 2020
Oldroyd 2009
Esser 2016
Maas 2016
Stolwijk 2014
Exarchou 2016
Bindesbøll 2020
Fitzgerald 2019
Zhao 2018
Ward 2013
Claudepierre 2019
Hwang 2020
Cook 2018
Nikiphorou 2018
Zhao 2019 (UK)
Sommerfleck 2018
Zaide 2020
Overall
Q=2063.84, p=0.00, I2=98%
Kang 2010
Mease 2019
Fernández-Carballido 2020
Zhao 2019 (US)
Bremander 2011
Han 2006
Haroon 2015
Walsh 2018
Ljung 2018
Ahmed 2016
Garip 2016
Redeker 2020
Singh 2019
Prev (95% CI) % Weight
0.00 ( 0.00, 0.01) 3.0
0.03 ( 0.02, 0.04) 3.2
0.03 ( 0.02, 0.04) 3.2
0.03 ( 0.01, 0.06) 2.9
0.04 ( 0.02, 0.06) 3.0
0.04 ( 0.03, 0.05) 3.3
0.04 ( 0.02, 0.06) 3.0
0.04 ( 0.01, 0.09) 2.4
0.04 ( 0.04, 0.05) 3.3
0.05 ( 0.03, 0.07) 3.1
0.05 ( 0.03, 0.06) 3.1
0.05 ( 0.04, 0.06) 3.2
0.05 ( 0.03, 0.06) 3.1
0.05 ( 0.04, 0.06) 3.1
0.05 ( 0.04, 0.06) 3.2
0.05 ( 0.04, 0.06) 3.2
0.05 ( 0.04, 0.06) 3.3
0.05 ( 0.03, 0.07) 3.0
0.06 ( 0.02, 0.12) 2.3
0.06 ( 0.02, 0.11) 2.4
0.06 ( 0.05, 0.08) 100.0
0.06 ( 0.06, 0.07) 3.3
0.07 ( 0.05, 0.09) 3.1
0.07 ( 0.05, 0.09) 3.1
0.07 ( 0.06, 0.09) 3.1
0.08 ( 0.06, 0.09) 3.2
0.08 ( 0.07, 0.10) 3.2
0.09 ( 0.08, 0.09) 3.3
0.10 ( 0.09, 0.11) 3.3
0.10 ( 0.07, 0.14) 3.0
0.11 ( 0.05, 0.18) 2.3
0.14 ( 0.08, 0.21) 2.4
0.17 ( 0.15, 0.19) 3.2
0.18 ( 0.17, 0.19) 3.3
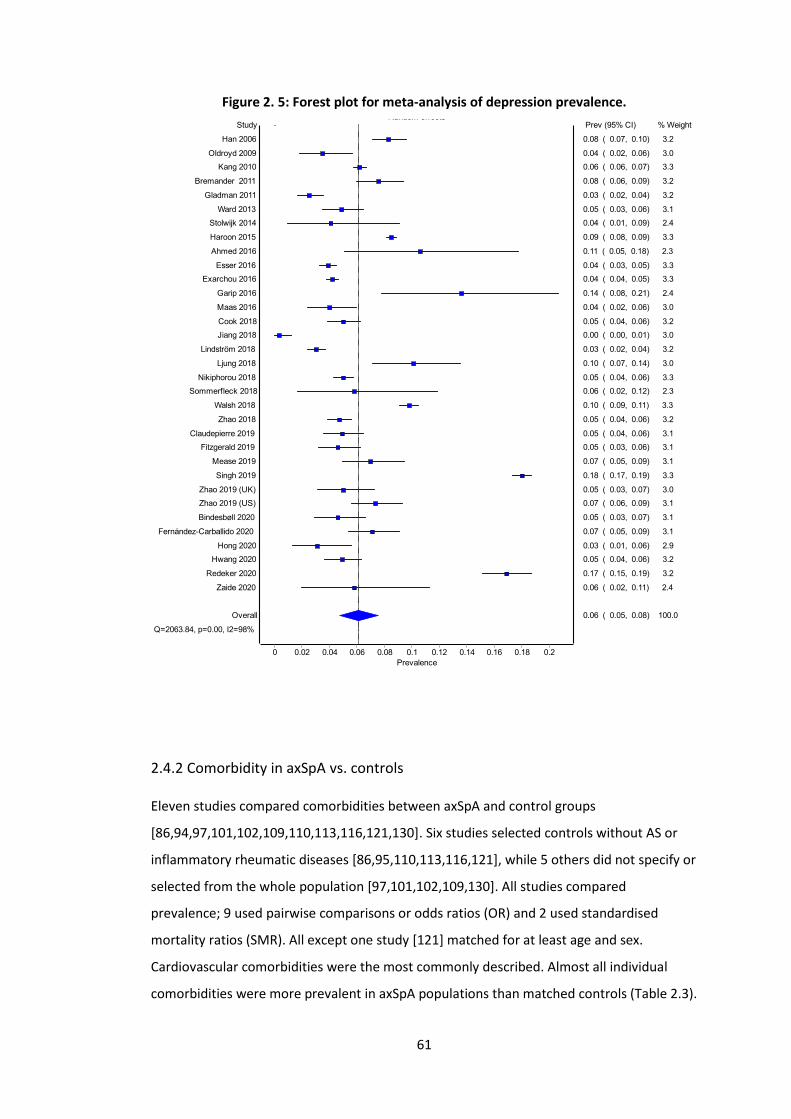
61
Figure 2. 5: Forest plot for meta-analysis of depression prevalence.
2.4.2 Comorbidity in axSpA vs. controls
Eleven studies compared comorbidities between axSpA and control groups
[86,94,97,101,102,109,110,113,116,121,130]. Six studies selected controls without AS or
inflammatory rheumatic diseases [86,95,110,113,116,121], while 5 others did not specify or
selected from the whole population [97,101,102,109,130]. All studies compared
prevalence; 9 used pairwise comparisons or odds ratios (OR) and 2 used standardised
mortality ratios (SMR). All except one study [121] matched for at least age and sex.
Cardiovascular comorbidities were the most commonly described. Almost all individual
comorbidities were more prevalent in axSpA populations than matched controls (Table 2.3).
Random effects
Prevalence
0.20.180.160.140.120.10.080.060.040.020
Study
Jiang 2018
Gladman 2011
Lindström 2018
Hong 2020
Oldroyd 2009
Esser 2016
Maas 2016
Stolwijk 2014
Exarchou 2016
Bindesbøll 2020
Fitzgerald 2019
Zhao 2018
Ward 2013
Claudepierre 2019
Hwang 2020
Cook 2018
Nikiphorou 2018
Zhao 2019 (UK)
Sommerfleck 2018
Zaide 2020
Overall
Q=2063.84, p=0.00, I2=98%
Kang 2010
Mease 2019
Fernández-Carballido 2020
Zhao 2019 (US)
Bremander 2011
Han 2006
Haroon 2015
Walsh 2018
Ljung 2018
Ahmed 2016
Garip 2016
Redeker 2020
Singh 2019
Prev (95% CI) % Weight
0.00 ( 0.00, 0.01) 3.0
0.03 ( 0.02, 0.04) 3.2
0.03 ( 0.02, 0.04) 3.2
0.03 ( 0.01, 0.06) 2.9
0.04 ( 0.02, 0.06) 3.0
0.04 ( 0.03, 0.05) 3.3
0.04 ( 0.02, 0.06) 3.0
0.04 ( 0.01, 0.09) 2.4
0.04 ( 0.04, 0.05) 3.3
0.05 ( 0.03, 0.07) 3.1
0.05 ( 0.03, 0.06) 3.1
0.05 ( 0.04, 0.06) 3.2
0.05 ( 0.03, 0.06) 3.1
0.05 ( 0.04, 0.06) 3.1
0.05 ( 0.04, 0.06) 3.2
0.05 ( 0.04, 0.06) 3.2
0.05 ( 0.04, 0.06) 3.3
0.05 ( 0.03, 0.07) 3.0
0.06 ( 0.02, 0.12) 2.3
0.06 ( 0.02, 0.11) 2.4
0.06 ( 0.05, 0.08) 100.0
0.06 ( 0.06, 0.07) 3.3
0.07 ( 0.05, 0.09) 3.1
0.07 ( 0.05, 0.09) 3.1
0.07 ( 0.06, 0.09) 3.1
0.08 ( 0.06, 0.09) 3.2
0.08 ( 0.07, 0.10) 3.2
0.09 ( 0.08, 0.09) 3.3
0.10 ( 0.09, 0.11) 3.3
0.10 ( 0.07, 0.14) 3.0
0.11 ( 0.05, 0.18) 2.3
0.14 ( 0.08, 0.21) 2.4
0.17 ( 0.15, 0.19) 3.2
0.18 ( 0.17, 0.19) 3.3
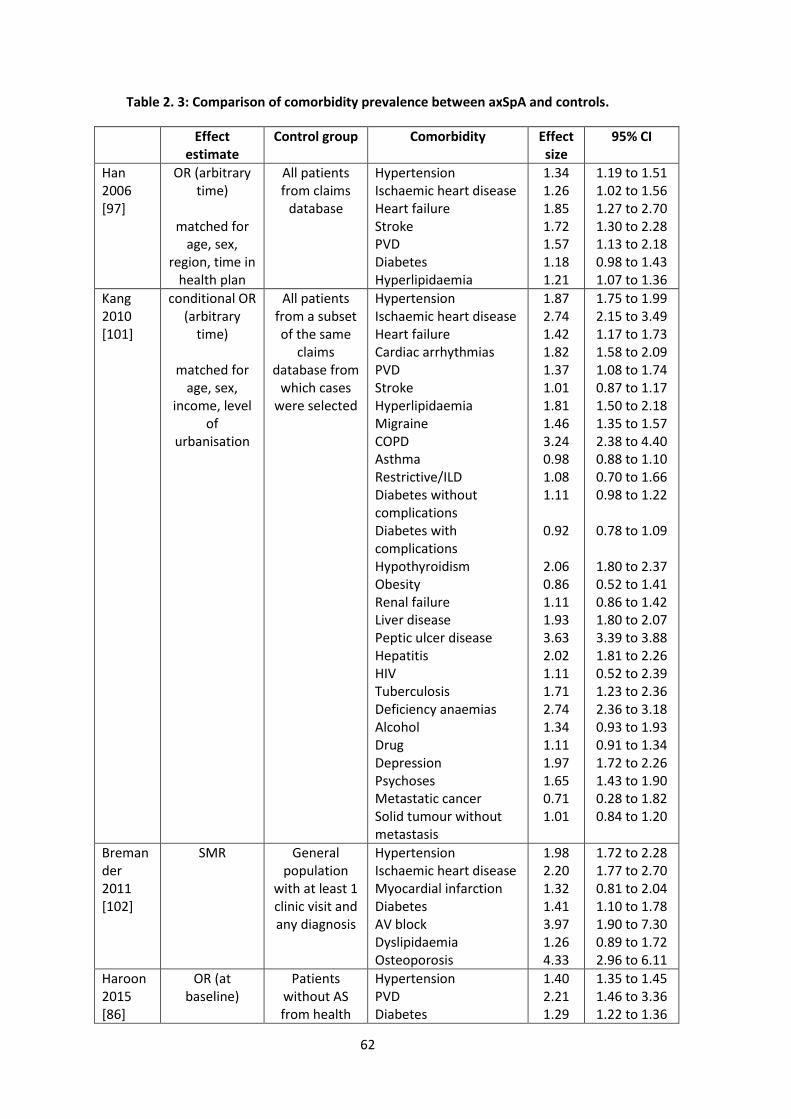
62
Table 2. 3: Comparison of comorbidity prevalence between axSpA and controls.
Effect estimate
Control group Comorbidity Effect size
95% CI
Han 2006 [97]
OR (arbitrary time)
matched for
age, sex, region, time in
health plan
All patients from claims
database
Hypertension Ischaemic heart disease Heart failure Stroke PVD Diabetes Hyperlipidaemia
1.34 1.26 1.85 1.72 1.57 1.18 1.21
1.19 to 1.51 1.02 to 1.56 1.27 to 2.70 1.30 to 2.28 1.13 to 2.18 0.98 to 1.43 1.07 to 1.36
Kang 2010 [101]
conditional OR (arbitrary
time)
matched for age, sex,
income, level of
urbanisation
All patients from a subset of the same
claims database from
which cases were selected
Hypertension Ischaemic heart disease Heart failure Cardiac arrhythmias PVD Stroke Hyperlipidaemia Migraine COPD Asthma Restrictive/ILD Diabetes without complications Diabetes with complications Hypothyroidism Obesity Renal failure Liver disease Peptic ulcer disease Hepatitis HIV Tuberculosis Deficiency anaemias Alcohol Drug Depression Psychoses Metastatic cancer Solid tumour without metastasis
1.87 2.74 1.42 1.82 1.37 1.01 1.81 1.46 3.24 0.98 1.08 1.11
0.92
2.06 0.86 1.11 1.93 3.63 2.02 1.11 1.71 2.74 1.34 1.11 1.97 1.65 0.71 1.01
1.75 to 1.99 2.15 to 3.49 1.17 to 1.73 1.58 to 2.09 1.08 to 1.74 0.87 to 1.17 1.50 to 2.18 1.35 to 1.57 2.38 to 4.40 0.88 to 1.10 0.70 to 1.66 0.98 to 1.22
0.78 to 1.09
1.80 to 2.37 0.52 to 1.41 0.86 to 1.42 1.80 to 2.07 3.39 to 3.88 1.81 to 2.26 0.52 to 2.39 1.23 to 2.36 2.36 to 3.18 0.93 to 1.93 0.91 to 1.34 1.72 to 2.26 1.43 to 1.90 0.28 to 1.82 0.84 to 1.20
Bremander 2011 [102]
SMR General population
with at least 1 clinic visit and any diagnosis
Hypertension Ischaemic heart disease Myocardial infarction Diabetes AV block Dyslipidaemia Osteoporosis
1.98 2.20 1.32 1.41 3.97 1.26 4.33
1.72 to 2.28 1.77 to 2.70 0.81 to 2.04 1.10 to 1.78 1.90 to 7.30 0.89 to 1.72 2.96 to 6.11
Haroon 2015 [86]
OR (at baseline)
Patients without AS from health
Hypertension PVD Diabetes
1.40 2.21 1.29
1.35 to 1.45 1.46 to 3.36 1.22 to 1.36
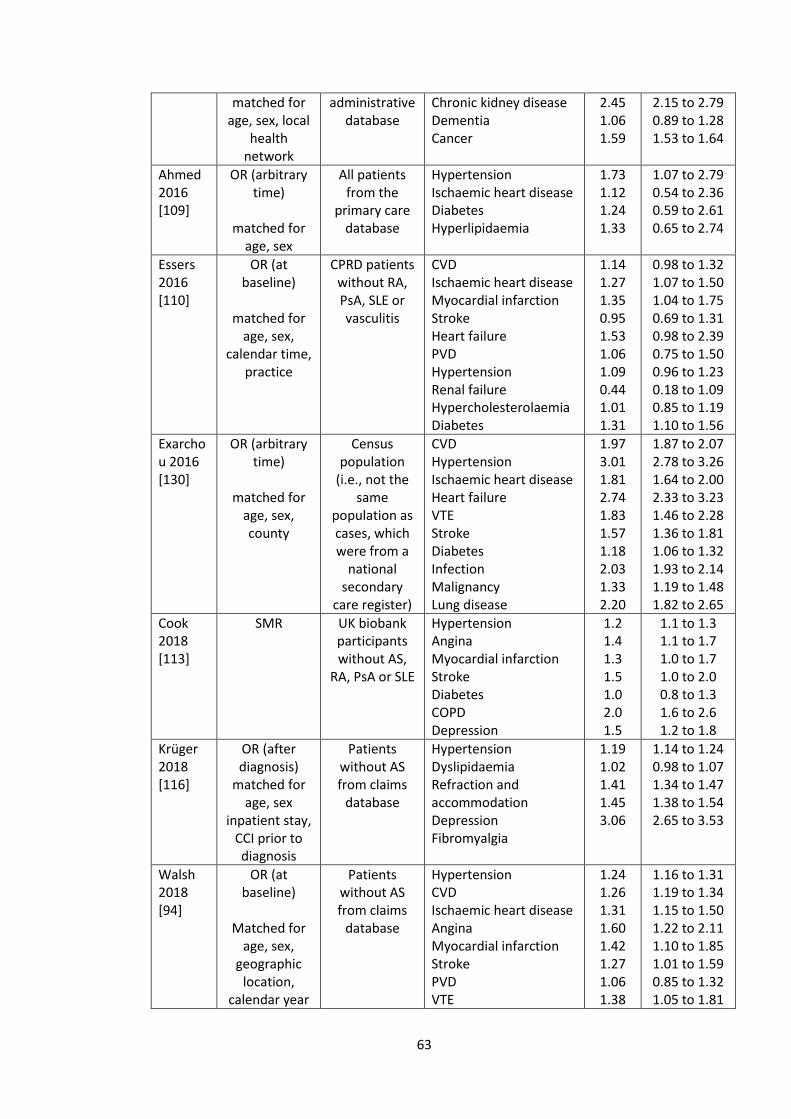
63
matched for age, sex, local
health network
administrative database
Chronic kidney disease Dementia Cancer
2.45 1.06 1.59
2.15 to 2.79 0.89 to 1.28 1.53 to 1.64
Ahmed 2016 [109]
OR (arbitrary time)
matched for
age, sex
All patients from the
primary care database
Hypertension Ischaemic heart disease Diabetes Hyperlipidaemia
1.73 1.12 1.24 1.33
1.07 to 2.79 0.54 to 2.36 0.59 to 2.61 0.65 to 2.74
Essers 2016 [110]
OR (at baseline)
matched for
age, sex, calendar time,
practice
CPRD patients without RA, PsA, SLE or vasculitis
CVD Ischaemic heart disease Myocardial infarction Stroke Heart failure PVD Hypertension Renal failure Hypercholesterolaemia Diabetes
1.14 1.27 1.35 0.95 1.53 1.06 1.09 0.44 1.01 1.31
0.98 to 1.32 1.07 to 1.50 1.04 to 1.75 0.69 to 1.31 0.98 to 2.39 0.75 to 1.50 0.96 to 1.23 0.18 to 1.09 0.85 to 1.19 1.10 to 1.56
Exarchou 2016 [130]
OR (arbitrary time)
matched for
age, sex, county
Census population
(i.e., not the same
population as cases, which were from a
national secondary
care register)
CVD Hypertension Ischaemic heart disease Heart failure VTE Stroke Diabetes Infection Malignancy Lung disease
1.97 3.01 1.81 2.74 1.83 1.57 1.18 2.03 1.33 2.20
1.87 to 2.07 2.78 to 3.26 1.64 to 2.00 2.33 to 3.23 1.46 to 2.28 1.36 to 1.81 1.06 to 1.32 1.93 to 2.14 1.19 to 1.48 1.82 to 2.65
Cook 2018 [113]
SMR UK biobank participants without AS,
RA, PsA or SLE
Hypertension Angina Myocardial infarction Stroke Diabetes COPD Depression
1.2 1.4 1.3 1.5 1.0 2.0 1.5
1.1 to 1.3 1.1 to 1.7 1.0 to 1.7 1.0 to 2.0 0.8 to 1.3 1.6 to 2.6 1.2 to 1.8
Krüger 2018 [116]
OR (after diagnosis)
matched for age, sex
inpatient stay, CCI prior to diagnosis
Patients without AS from claims
database
Hypertension Dyslipidaemia Refraction and accommodation Depression Fibromyalgia
1.19 1.02 1.41 1.45 3.06
1.14 to 1.24 0.98 to 1.07 1.34 to 1.47 1.38 to 1.54 2.65 to 3.53
Walsh 2018 [94]
OR (at baseline)
Matched for
age, sex, geographic
location, calendar year
Patients without AS from claims
database
Hypertension CVD Ischaemic heart disease Angina Myocardial infarction Stroke PVD VTE
1.24 1.26 1.31 1.60 1.42 1.27 1.06 1.38
1.16 to 1.31 1.19 to 1.34 1.15 to 1.50 1.22 to 2.11 1.10 to 1.85 1.01 to 1.59 0.85 to 1.32 1.05 to 1.81
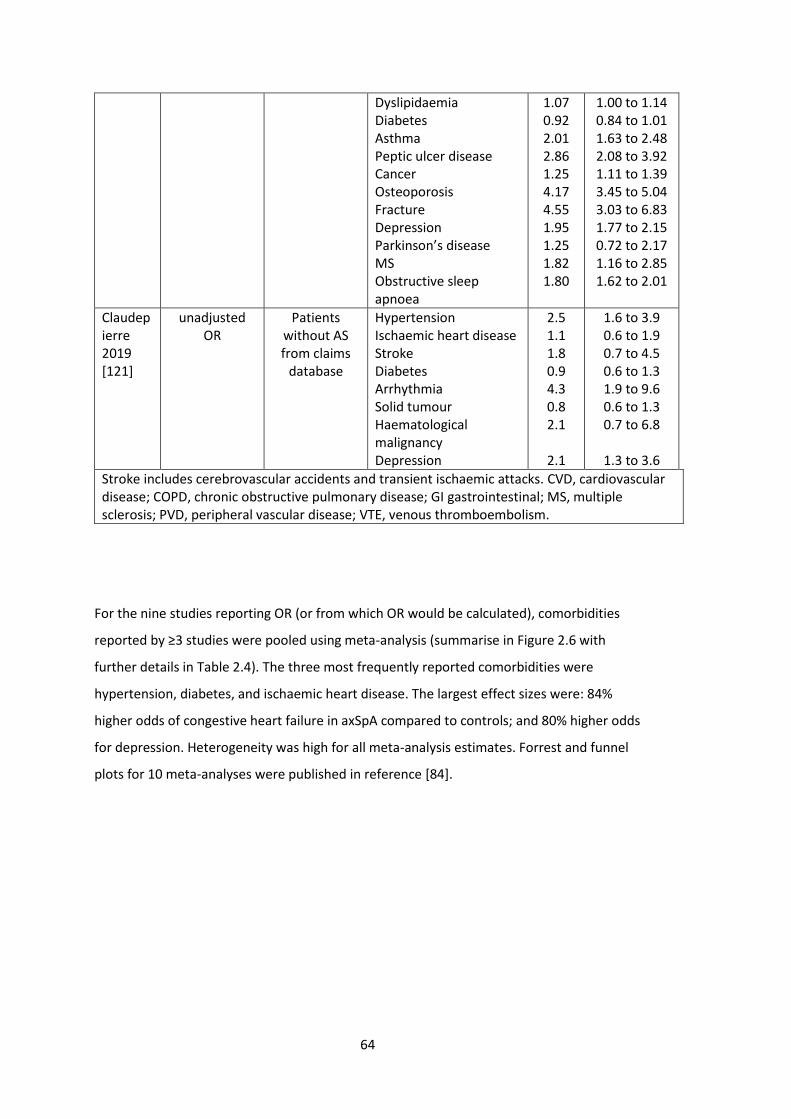
64
Dyslipidaemia Diabetes Asthma Peptic ulcer disease Cancer Osteoporosis Fracture Depression Parkinson’s disease MS Obstructive sleep apnoea
1.07 0.92 2.01 2.86 1.25 4.17 4.55 1.95 1.25 1.82 1.80
1.00 to 1.14 0.84 to 1.01 1.63 to 2.48 2.08 to 3.92 1.11 to 1.39 3.45 to 5.04 3.03 to 6.83 1.77 to 2.15 0.72 to 2.17 1.16 to 2.85 1.62 to 2.01
Claudepierre 2019 [121]
unadjusted OR
Patients without AS from claims
database
Hypertension Ischaemic heart disease Stroke Diabetes Arrhythmia Solid tumour Haematological malignancy Depression
2.5 1.1 1.8 0.9 4.3 0.8 2.1
2.1
1.6 to 3.9 0.6 to 1.9 0.7 to 4.5 0.6 to 1.3 1.9 to 9.6 0.6 to 1.3 0.7 to 6.8
1.3 to 3.6
Stroke includes cerebrovascular accidents and transient ischaemic attacks. CVD, cardiovascular disease; COPD, chronic obstructive pulmonary disease; GI gastrointestinal; MS, multiple sclerosis; PVD, peripheral vascular disease; VTE, venous thromboembolism.
For the nine studies reporting OR (or from which OR would be calculated), comorbidities
reported by ≥3 studies were pooled using meta-analysis (summarise in Figure 2.6 with
further details in Table 2.4). The three most frequently reported comorbidities were
hypertension, diabetes, and ischaemic heart disease. The largest effect sizes were: 84%
higher odds of congestive heart failure in axSpA compared to controls; and 80% higher odds
for depression. Heterogeneity was high for all meta-analysis estimates. Forrest and funnel
plots for 10 meta-analyses were published in reference [84].
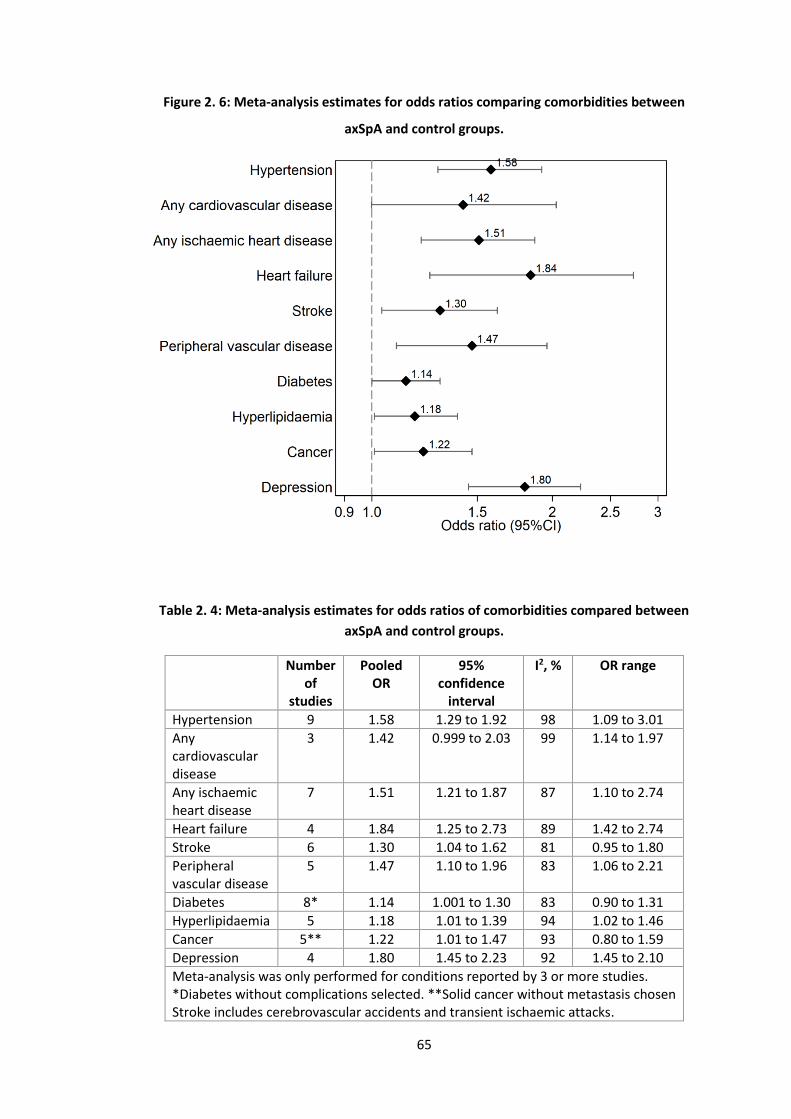
65
Figure 2. 6: Meta-analysis estimates for odds ratios comparing comorbidities between
axSpA and control groups.
Table 2. 4: Meta-analysis estimates for odds ratios of comorbidities compared between
axSpA and control groups.
Number of
studies
Pooled OR
95% confidence
interval
I2, % OR range
Hypertension 9 1.58 1.29 to 1.92 98 1.09 to 3.01
Any cardiovascular disease
3 1.42 0.999 to 2.03 99 1.14 to 1.97
Any ischaemic heart disease
7 1.51 1.21 to 1.87 87 1.10 to 2.74
Heart failure 4 1.84 1.25 to 2.73 89 1.42 to 2.74
Stroke 6 1.30 1.04 to 1.62 81 0.95 to 1.80
Peripheral vascular disease
5 1.47 1.10 to 1.96 83 1.06 to 2.21
Diabetes 8* 1.14 1.001 to 1.30 83 0.90 to 1.31
Hyperlipidaemia 5 1.18 1.01 to 1.39 94 1.02 to 1.46
Cancer 5** 1.22 1.01 to 1.47 93 0.80 to 1.59
Depression 4 1.80 1.45 to 2.23 92 1.45 to 2.10
Meta-analysis was only performed for conditions reported by 3 or more studies. *Diabetes without complications selected. **Solid cancer without metastasis chosen Stroke includes cerebrovascular accidents and transient ischaemic attacks.
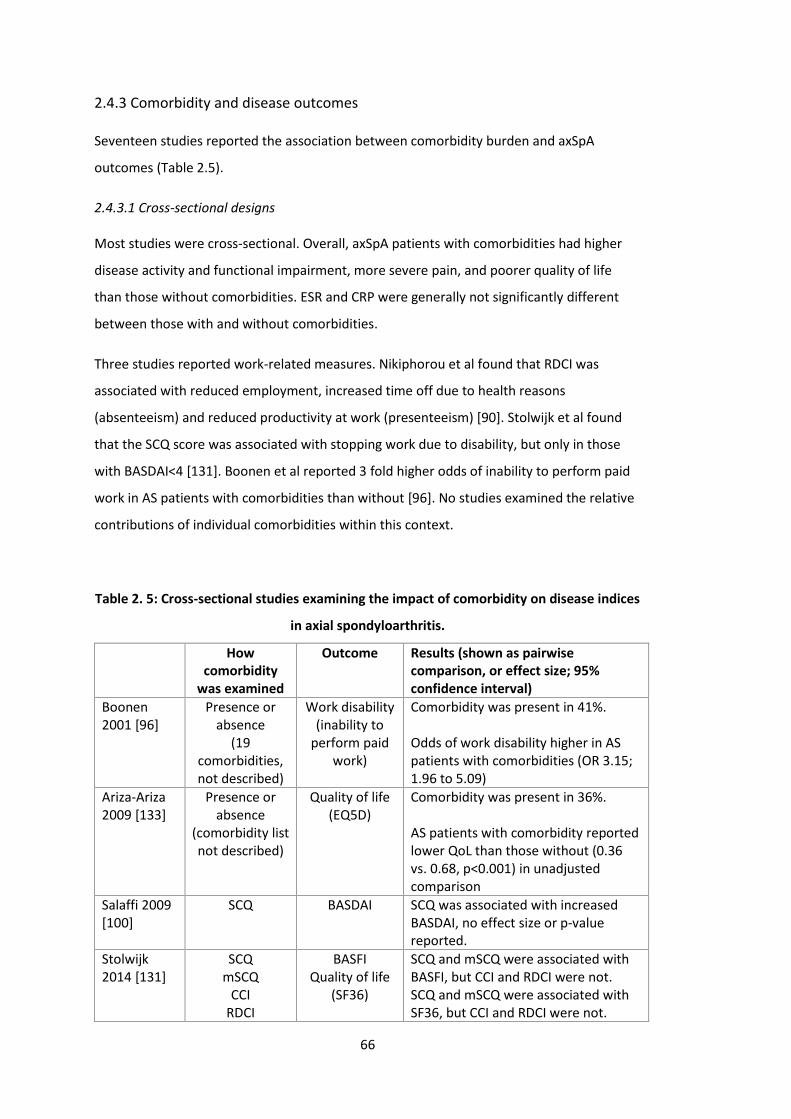
66
2.4.3 Comorbidity and disease outcomes
Seventeen studies reported the association between comorbidity burden and axSpA
outcomes (Table 2.5).
2.4.3.1 Cross-sectional designs
Most studies were cross-sectional. Overall, axSpA patients with comorbidities had higher
disease activity and functional impairment, more severe pain, and poorer quality of life
than those without comorbidities. ESR and CRP were generally not significantly different
between those with and without comorbidities.
Three studies reported work-related measures. Nikiphorou et al found that RDCI was
associated with reduced employment, increased time off due to health reasons
(absenteeism) and reduced productivity at work (presenteeism) [90]. Stolwijk et al found
that the SCQ score was associated with stopping work due to disability, but only in those
with BASDAI<4 [131]. Boonen et al reported 3 fold higher odds of inability to perform paid
work in AS patients with comorbidities than without [96]. No studies examined the relative
contributions of individual comorbidities within this context.
Table 2. 5: Cross-sectional studies examining the impact of comorbidity on disease indices
in axial spondyloarthritis.
How comorbidity
was examined
Outcome Results (shown as pairwise comparison, or effect size; 95% confidence interval)
Boonen 2001 [96]
Presence or absence
(19 comorbidities, not described)
Work disability (inability to
perform paid work)
Comorbidity was present in 41%. Odds of work disability higher in AS patients with comorbidities (OR 3.15; 1.96 to 5.09)
Ariza-Ariza 2009 [133]
Presence or absence
(comorbidity list not described)
Quality of life (EQ5D)
Comorbidity was present in 36%. AS patients with comorbidity reported lower QoL than those without (0.36 vs. 0.68, p<0.001) in unadjusted comparison
Salaffi 2009 [100]
SCQ BASDAI SCQ was associated with increased BASDAI, no effect size or p-value reported.
Stolwijk 2014 [131]
SCQ mSCQ
CCI RDCI
BASFI Quality of life
(SF36)
SCQ and mSCQ were associated with BASFI, but CCI and RDCI were not. SCQ and mSCQ were associated with SF36, but CCI and RDCI were not.
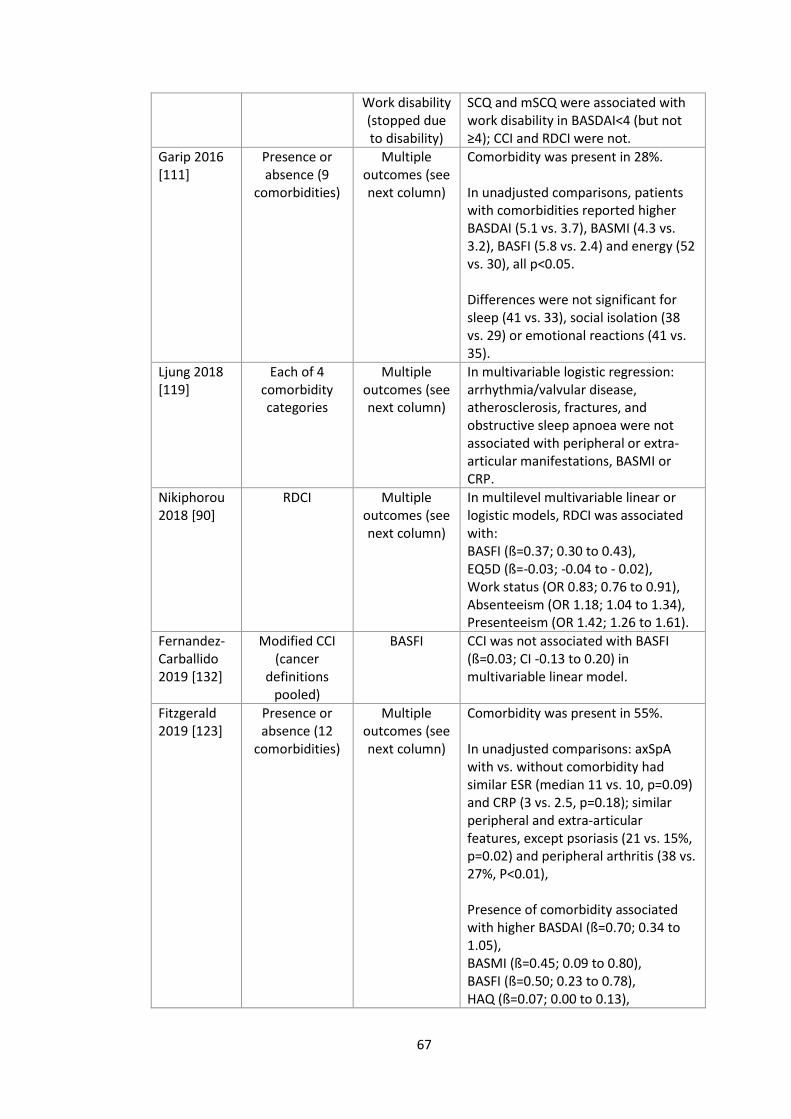
67
Work disability (stopped due to disability)
SCQ and mSCQ were associated with work disability in BASDAI<4 (but not ≥4); CCI and RDCI were not.
Garip 2016 [111]
Presence or absence (9
comorbidities)
Multiple outcomes (see next column)
Comorbidity was present in 28%. In unadjusted comparisons, patients with comorbidities reported higher BASDAI (5.1 vs. 3.7), BASMI (4.3 vs. 3.2), BASFI (5.8 vs. 2.4) and energy (52 vs. 30), all p<0.05. Differences were not significant for sleep (41 vs. 33), social isolation (38 vs. 29) or emotional reactions (41 vs. 35).
Ljung 2018 [119]
Each of 4 comorbidity categories
Multiple outcomes (see next column)
In multivariable logistic regression: arrhythmia/valvular disease, atherosclerosis, fractures, and obstructive sleep apnoea were not associated with peripheral or extra-articular manifestations, BASMI or CRP.
Nikiphorou 2018 [90]
RDCI Multiple outcomes (see next column)
In multilevel multivariable linear or logistic models, RDCI was associated with: BASFI (ß=0.37; 0.30 to 0.43), EQ5D (ß=-0.03; -0.04 to - 0.02), Work status (OR 0.83; 0.76 to 0.91), Absenteeism (OR 1.18; 1.04 to 1.34), Presenteeism (OR 1.42; 1.26 to 1.61).
Fernandez-Carballido 2019 [132]
Modified CCI (cancer
definitions pooled)
BASFI CCI was not associated with BASFI (ß=0.03; CI -0.13 to 0.20) in multivariable linear model.
Fitzgerald 2019 [123]
Presence or absence (12
comorbidities)
Multiple outcomes (see next column)
Comorbidity was present in 55%. In unadjusted comparisons: axSpA with vs. without comorbidity had similar ESR (median 11 vs. 10, p=0.09) and CRP (3 vs. 2.5, p=0.18); similar peripheral and extra-articular features, except psoriasis (21 vs. 15%, p=0.02) and peripheral arthritis (38 vs. 27%, P<0.01), Presence of comorbidity associated with higher BASDAI (ß=0.70; 0.34 to 1.05), BASMI (ß=0.45; 0.09 to 0.80), BASFI (ß=0.50; 0.23 to 0.78), HAQ (ß=0.07; 0.00 to 0.13),
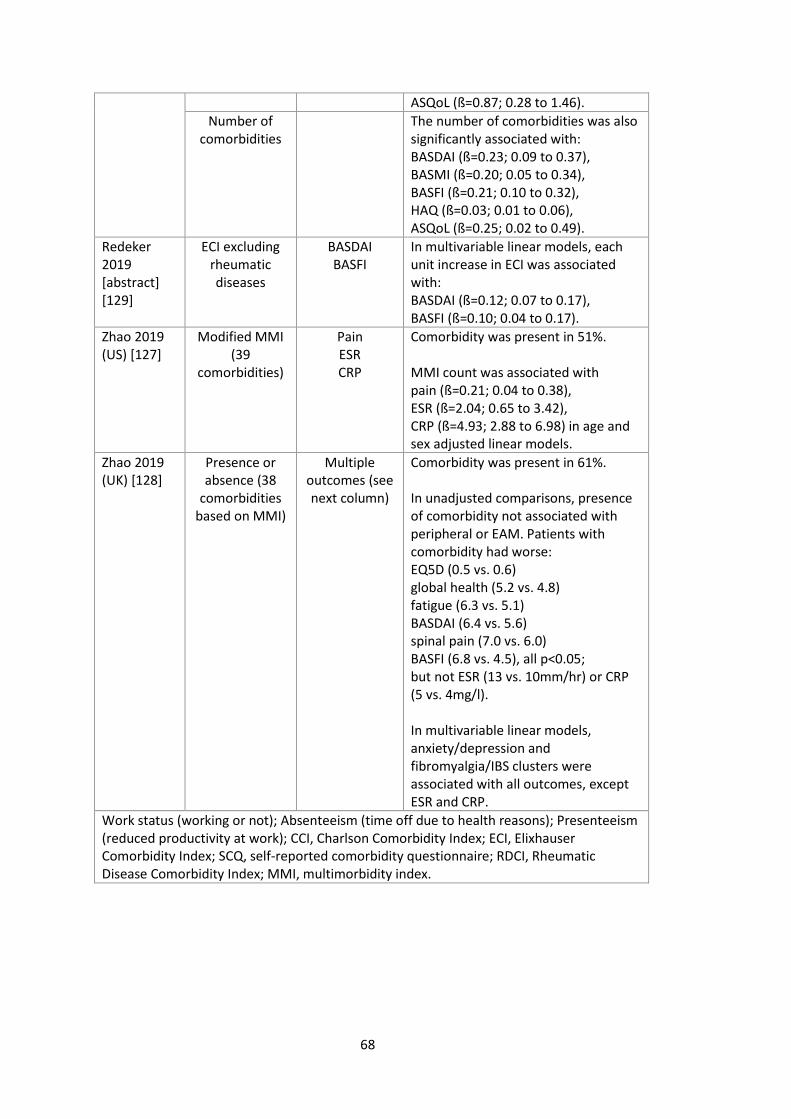
68
ASQoL (ß=0.87; 0.28 to 1.46).
Number of comorbidities
The number of comorbidities was also significantly associated with: BASDAI (ß=0.23; 0.09 to 0.37), BASMI (ß=0.20; 0.05 to 0.34), BASFI (ß=0.21; 0.10 to 0.32), HAQ (ß=0.03; 0.01 to 0.06), ASQoL (ß=0.25; 0.02 to 0.49).
Redeker 2019 [abstract] [129]
ECI excluding rheumatic diseases
BASDAI BASFI
In multivariable linear models, each unit increase in ECI was associated with: BASDAI (ß=0.12; 0.07 to 0.17), BASFI (ß=0.10; 0.04 to 0.17).
Zhao 2019 (US) [127]
Modified MMI (39
comorbidities)
Pain ESR CRP
Comorbidity was present in 51%. MMI count was associated with pain (ß=0.21; 0.04 to 0.38), ESR (ß=2.04; 0.65 to 3.42), CRP (ß=4.93; 2.88 to 6.98) in age and sex adjusted linear models.
Zhao 2019 (UK) [128]
Presence or absence (38
comorbidities based on MMI)
Multiple outcomes (see next column)
Comorbidity was present in 61%. In unadjusted comparisons, presence of comorbidity not associated with peripheral or EAM. Patients with comorbidity had worse: EQ5D (0.5 vs. 0.6) global health (5.2 vs. 4.8) fatigue (6.3 vs. 5.1) BASDAI (6.4 vs. 5.6) spinal pain (7.0 vs. 6.0) BASFI (6.8 vs. 4.5), all p<0.05; but not ESR (13 vs. 10mm/hr) or CRP (5 vs. 4mg/l). In multivariable linear models, anxiety/depression and fibromyalgia/IBS clusters were associated with all outcomes, except ESR and CRP.
Work status (working or not); Absenteeism (time off due to health reasons); Presenteeism (reduced productivity at work); CCI, Charlson Comorbidity Index; ECI, Elixhauser Comorbidity Index; SCQ, self-reported comorbidity questionnaire; RDCI, Rheumatic Disease Comorbidity Index; MMI, multimorbidity index.
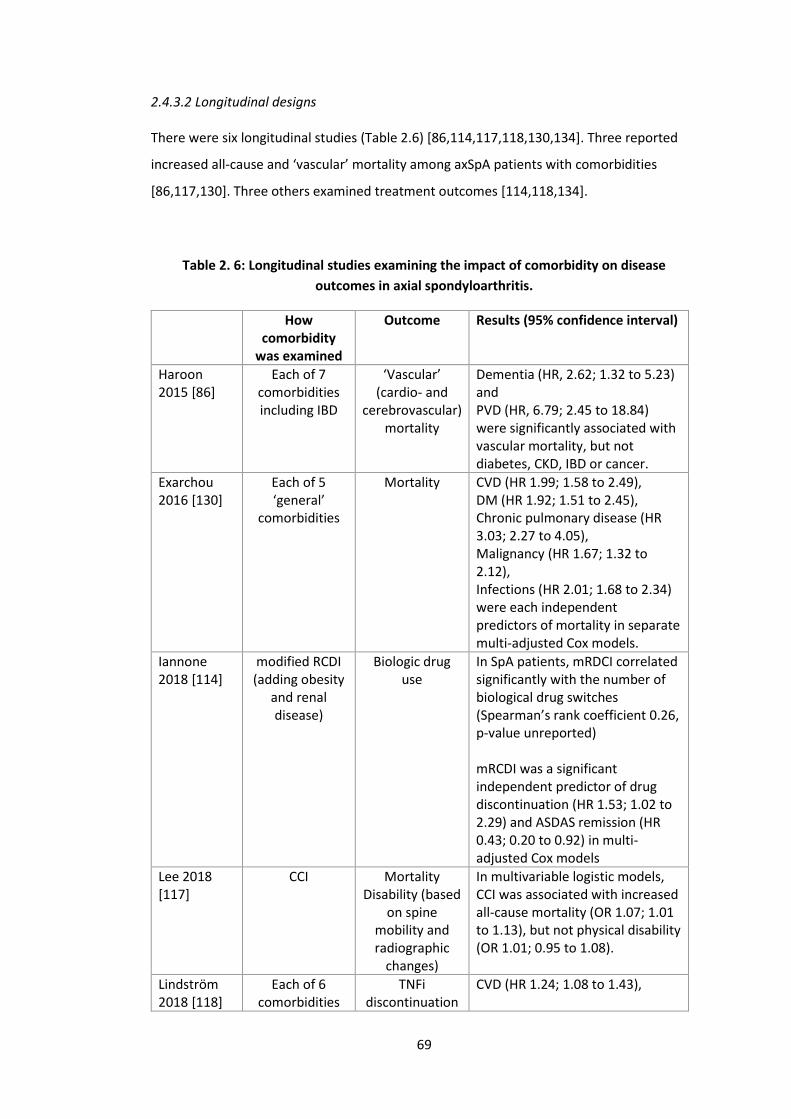
69
2.4.3.2 Longitudinal designs
There were six longitudinal studies (Table 2.6) [86,114,117,118,130,134]. Three reported
increased all-cause and ‘vascular’ mortality among axSpA patients with comorbidities
[86,117,130]. Three others examined treatment outcomes [114,118,134].
Table 2. 6: Longitudinal studies examining the impact of comorbidity on disease
outcomes in axial spondyloarthritis.
How comorbidity
was examined
Outcome Results (95% confidence interval)
Haroon 2015 [86]
Each of 7 comorbidities including IBD
‘Vascular’ (cardio- and
cerebrovascular) mortality
Dementia (HR, 2.62; 1.32 to 5.23) and PVD (HR, 6.79; 2.45 to 18.84) were significantly associated with vascular mortality, but not diabetes, CKD, IBD or cancer.
Exarchou 2016 [130]
Each of 5 ‘general’
comorbidities
Mortality CVD (HR 1.99; 1.58 to 2.49), DM (HR 1.92; 1.51 to 2.45), Chronic pulmonary disease (HR 3.03; 2.27 to 4.05), Malignancy (HR 1.67; 1.32 to 2.12), Infections (HR 2.01; 1.68 to 2.34) were each independent predictors of mortality in separate multi-adjusted Cox models.
Iannone 2018 [114]
modified RCDI (adding obesity
and renal disease)
Biologic drug use
In SpA patients, mRDCI correlated significantly with the number of biological drug switches (Spearman’s rank coefficient 0.26, p-value unreported) mRCDI was a significant independent predictor of drug discontinuation (HR 1.53; 1.02 to 2.29) and ASDAS remission (HR 0.43; 0.20 to 0.92) in multi-adjusted Cox models
Lee 2018 [117]
CCI Mortality Disability (based
on spine mobility and radiographic
changes)
In multivariable logistic models, CCI was associated with increased all-cause mortality (OR 1.07; 1.01 to 1.13), but not physical disability (OR 1.01; 0.95 to 1.08).
Lindström 2018 [118]
Each of 6 comorbidities
TNFi discontinuation
CVD (HR 1.24; 1.08 to 1.43),
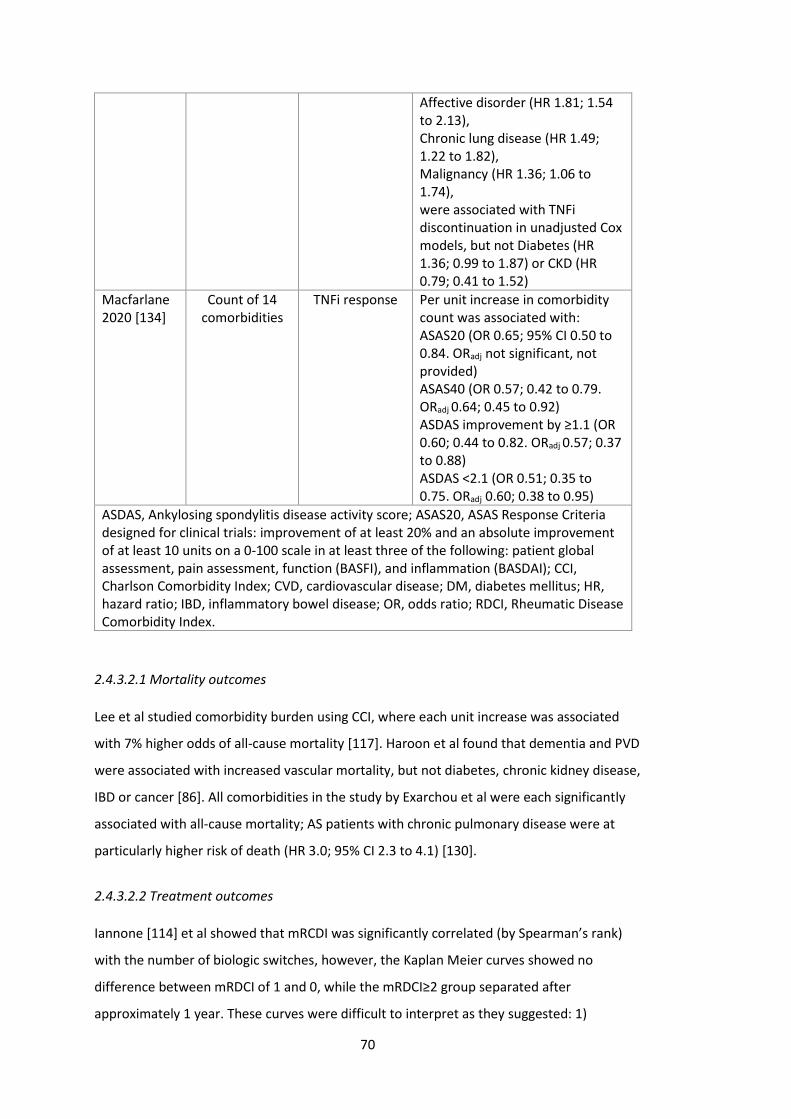
70
Affective disorder (HR 1.81; 1.54 to 2.13), Chronic lung disease (HR 1.49; 1.22 to 1.82), Malignancy (HR 1.36; 1.06 to 1.74), were associated with TNFi discontinuation in unadjusted Cox models, but not Diabetes (HR 1.36; 0.99 to 1.87) or CKD (HR 0.79; 0.41 to 1.52)
Macfarlane 2020 [134]
Count of 14 comorbidities
TNFi response Per unit increase in comorbidity count was associated with: ASAS20 (OR 0.65; 95% CI 0.50 to 0.84. ORadj not significant, not provided) ASAS40 (OR 0.57; 0.42 to 0.79. ORadj 0.64; 0.45 to 0.92) ASDAS improvement by ≥1.1 (OR 0.60; 0.44 to 0.82. ORadj 0.57; 0.37 to 0.88) ASDAS <2.1 (OR 0.51; 0.35 to 0.75. ORadj 0.60; 0.38 to 0.95)
ASDAS, Ankylosing spondylitis disease activity score; ASAS20, ASAS Response Criteria designed for clinical trials: improvement of at least 20% and an absolute improvement of at least 10 units on a 0-100 scale in at least three of the following: patient global assessment, pain assessment, function (BASFI), and inflammation (BASDAI); CCI, Charlson Comorbidity Index; CVD, cardiovascular disease; DM, diabetes mellitus; HR, hazard ratio; IBD, inflammatory bowel disease; OR, odds ratio; RDCI, Rheumatic Disease Comorbidity Index.
2.4.3.2.1 Mortality outcomes
Lee et al studied comorbidity burden using CCI, where each unit increase was associated
with 7% higher odds of all-cause mortality [117]. Haroon et al found that dementia and PVD
were associated with increased vascular mortality, but not diabetes, chronic kidney disease,
IBD or cancer [86]. All comorbidities in the study by Exarchou et al were each significantly
associated with all-cause mortality; AS patients with chronic pulmonary disease were at
particularly higher risk of death (HR 3.0; 95% CI 2.3 to 4.1) [130].
2.4.3.2.2 Treatment outcomes
Iannone [114] et al showed that mRCDI was significantly correlated (by Spearman’s rank)
with the number of biologic switches, however, the Kaplan Meier curves showed no
difference between mRDCI of 1 and 0, while the mRDCI≥2 group separated after
approximately 1 year. These curves were difficult to interpret as they suggested: 1)
71
discontinuation was assessed at (large intervals of) discrete times, and 2) >90% of those
with mRDCI 0 or 1, but 0% of those with mRDCI≥2, remained on treatment at end of follow-
up (approximately month 60). This clearly non-(log-)linear relationship with mRDCI was
then modelled adjusting for gender and disease duration, showing mRDCI to be a significant
predictor of drug discontinuation (HR 1.53; 95CI 1.02 to 2.29) for 635 patients with
rheumatic diseases overall; no results were reported for the 213 SpA patients. Cox models
were also used to assess (discrete-)time-to-remission (ASDAS<1.3) and reported HR 0.43
(95% CI 0.20 to 0.92) for the comorbid SpA subgroup.
The second study, by Lindström et al [118], examined risk of TNFi discontinuation in
unadjusted Cox models for each of: cardiovascular disease (HR 1.24; 1.08 to 1.43), affective
disorder (HR 1.81; 1.54 to 2.13), chronic lung disease (HR 1.49; 1.22 to 1.82), malignancy
(HR 1.36; 1.06 to 1.74), diabetes (HR 1.36; 0.99 to 1.87) and chronic kidney disease (HR
0.79; 0.41 to 1.52). These effect estimates did not account for confounding, thus are
difficult to interpret causally.
The third study used a sample of 335 BSRBR-AS participants to show continuous
comorbidity count as a predictor of binary response [134] . The investigators showed each
additional comorbidity to reduce odds of achieving clinically important improvement in
ASDAS (≥1.1) by 43% (95% CI 0.37 to 0.88) and ASDAS<2.1 by 40% (95% CI 0.38 to 0.95)
within 10 weeks to 9 months of treatment initiation.
72
2.5 Discussion
This systematic review aimed to summarise existing research on comorbidities in axSpA and
identify unmet needs to inform aims of this thesis. A large body of literature consistently
showed that comorbidities are common among axSpA patients, more so than age- and sex-
matched controls. Comorbidities were also consistently associated with greater disease
severity in mostly cross-sectional studies. However, research into the impact of comorbidity
burden on longitudinal outcomes in patients with axSpA were relatively scarce.
Methodological approaches were highly heterogenous, for example, in the type and
number of conditions included.
A strength of this review is the breadth of the literature search, allowing a hypothesis-free
(in terms of comorbidity selection) overview of the topic. It was not feasible to additionally
combine results from studies of individual comorbid conditions in axSpA, which may have
provided further insight. However, this thesis aimed to examine comorbidities overall
rather than a priori comorbid diseases of interest. Meta-analysis results should be
interpreted with limitations in mind. There was significant heterogeneity in the
measurement of comorbidities and relative lack of data on severity. These factors will
impact pooled prevalence estimates. Once patients develop symptoms of or are diagnosed
with axSpA, it is likely that increased healthcare interaction will result in improved
identification of comorbidities; therefore, prevalence may be higher than controls by this
explanation alone. Well-established comorbidities such as hypertension may undergo more
systematic screening and diagnosis than others.
2.5.1 Prevalence of comorbidities
Studies in this review consistently showed higher prevalence of comorbidities in axSpA
patients than controls. Yet, in clinical practice, management of comorbidities for patients
with chronic inflammatory rheumatic diseases are often poorer than in the general
population [135]. The 2016 EULAR points to consider for comorbidities recommend
rheumatology teams to detect and collect information on comorbidities, liaise with
appropriate healthcare providers to treat comorbidities, and repeat comorbidity reviews
[135]. They focused on six conditions – CVDs, depression, infections, malignancies, peptic
ulcer, and osteoporosis – that map almost exactly with high-prevalence comorbidities in
our meta-analysis. It may, however, be that under-recognised comorbidities have under-
estimated prevalence. Others have suggested including additional comorbidities [136], but
73
this may be limited by feasibility in daily practice - the six comorbidities alone require a 93-
item reporting form.
Almost all comorbidities examined were more prevalent in axSpA patients than age- and
sex-matched controls. AxSpA patients had markedly increased odds for depression and
CVDs. Symptoms of axSpA typically begin in early adulthood, which is a critical time for
careers, relationships, and general social and personal identity. Disruptive symptoms –
sometimes undiagnosed for many years – may impact life-long mental health trajectory and
contribute to depression rates. Unlike RA, axSpA is not typically associated with high levels
of systemic inflammation – a key driver of CVD risk. Higher CVD prevalence may be related
to treatment in addition to the disease process itself; incidence of myocardial infarction and
ischaemic heart disease were no different between axSpA and controls after adjusting for
NSAID-use [110]. Congestive heart failure is downstream of many CVDs, thus higher odds in
axSpA may reflect the overall burden and severity of CVDs. It may also be due to more
systematic identification when considering TNF inhibitors. These results are consistent with
prior studies showing reduced systolic and diastolic function in axSpA patients compared to
controls [137,138]. Heart failure can have significant impact on function and quality of life
[139], thus optimal symptom management is important for patients already burdened by
their rheumatic disease.
In all studies, comorbidities were studied individually or as a count. Future studies should
complement such analyses by interrogating the contribution of individual comorbidities in
the context of comorbidity clusters [128] and their combined impact. To address these
unmet needs, this thesis will examine individual conditions and total comorbidity burden in
parallel. How individual comorbidities co-exist will also be examined. Existing studies
described comorbidity epidemiology in AS or axSpA populations, but none have directly
compared comorbidity patterns between AS and non-radiographic axSpA. These diagnoses
of the axSpA spectrum have similar symptom burdens and clinical features, but AS cohorts
differ from their nr-axSpA counterparts in being more frequently male and having higher
levels of CRP [56,57]. Comorbidity patterns are different between the sexes (e.g., prostate
disorders or osteoporosis) [140], while systemic inflammation is a risk factor for many
comorbidities [141]. Characterising comorbidity burden in AS and nr-axSpA subgroups is
important since comorbidities influence treatment decisions and disease outcomes [142].
The type and number of conditions included were highly heterogenous. The number of
included comorbidities in this review ranged from 3 to 43. Most studies used investigator-
74
defined lists that were not validated, and selection of diseases was seldom justified. While
all studies consistently included CVDs, some important conditions were underrepresented,
such as fibromyalgia, alcohol or drug abuse [143], and neurological disorders. Validated
comorbidity indices can include rare comorbidities in axSpA (e.g., AIDS and dementia) but
not common and important conditions (e.g., depression [9]). Some studies used indices that
were weighted and validated for outcomes unrelated to their research question.
Methodological approaches for comorbidity research could benefit from similar
standardisation as suggested for clinical practice [144]. The following section will discuss
comorbidity indices in detail and justify the approach used in this thesis.
2.5.2 Methods for studying comorbidity
There is a plethora of tools and checklists for measuring comorbidity in the clinical
literature [145]. Conditions are typically selected based on some consensus of their
perceived importance, or on prognostic factors such as mortality. They can be patient-
reported or derived from routine healthcare data. Individual conditions can be added as a
count or weighted according to their impact on outcomes such as mortality or quality of
life. Severity may also be considered for some conditions (e.g., malignancies and diabetes).
Choice of which index to use should be based on the population and outcome of the
original validation studies; for example, using the Charlson Comorbidity Index (CCI) –
originally validated for inpatient mortality – may not be suitable for studying quality of life
in outpatient settings. This is particularly relevant for weighted indices, whereas a simple
count of the number of conditions will be less tied to specific outcomes. For example, CCI
poorly correlated with most axSpA outcomes (e.g., Spearman’s rho=-0.01 for BASDAI) while
both CCI and RDCI were poorly associated with BASFI and quality of life (Short Form 36)
[131]. Studies should avoid using weighted indices that have not been validated for their
main outcome of interest.
The CCI and ECI were both validated using hospital inpatients and may be less suitable for
primarily outpatient specialties such as rheumatology. The CCI has also been adapted into a
self-administered comorbidity questionnaire (SCQ) which asks about 13 comorbidities
[146]. Both indices were validated to predict mortality (ECI additionally for cost and length
of stay). RDCI was developed in patients with rheumatic and musculoskeletal diseases and
is better at predicting mortality and functional disability than the CCI [147].
Only the SCQ was validated against health-related quality of life – a priority outcome in
chronic disease management. One other index in the RA literature is an adapted version of

75
the list of 40 chronic conditions in the Barnett et al multimorbidity study of the Scottish
primary care population [79]. Barnett et al selected these diseases based on 1)
recommendations from systematic review, 2) the quality and outcomes framework of the
UK general practice contract, and 3) long-term disorders identified as important by NHS
Scotland [79]. Radner et al validated the index against the CCI and functional comorbidity
index in two large RA samples [148]. The authors created a count version of the index and
another weighted for health-related quality of life, but the latter was not meaningfully
superior. Key characteristics of some of these tools are compared in Table 2.7.
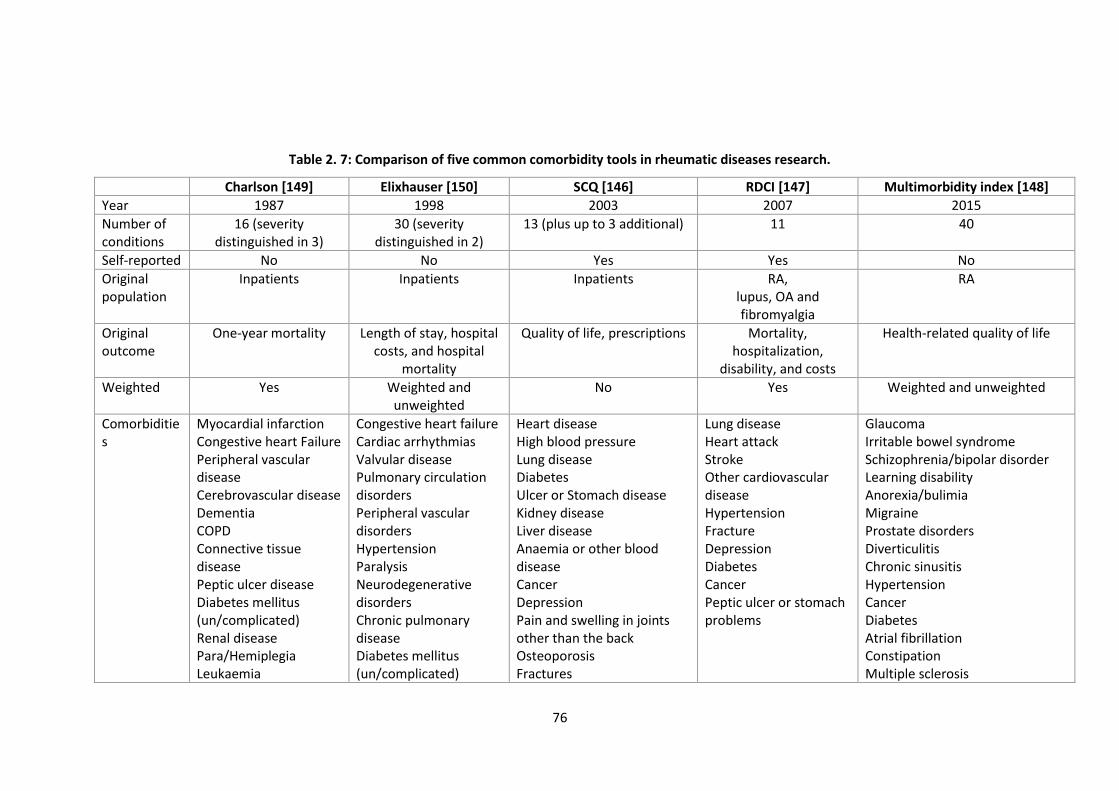
76
Table 2. 7: Comparison of five common comorbidity tools in rheumatic diseases research.
Charlson [149] Elixhauser [150] SCQ [146] RDCI [147] Multimorbidity index [148]
Year 1987 1998 2003 2007 2015
Number of conditions
16 (severity distinguished in 3)
30 (severity distinguished in 2)
13 (plus up to 3 additional) 11 40
Self-reported No No Yes Yes No
Original population
Inpatients
Inpatients Inpatients RA, lupus, OA and fibromyalgia
RA
Original outcome
One-year mortality Length of stay, hospital costs, and hospital
mortality
Quality of life, prescriptions Mortality, hospitalization,
disability, and costs
Health-related quality of life
Weighted Yes Weighted and unweighted
No Yes Weighted and unweighted
Comorbidities
Myocardial infarction Congestive heart Failure Peripheral vascular disease Cerebrovascular disease Dementia COPD Connective tissue disease Peptic ulcer disease Diabetes mellitus (un/complicated) Renal disease Para/Hemiplegia Leukaemia
Congestive heart failure Cardiac arrhythmias Valvular disease Pulmonary circulation disorders Peripheral vascular disorders Hypertension Paralysis Neurodegenerative disorders Chronic pulmonary disease Diabetes mellitus (un/complicated)
Heart disease High blood pressure Lung disease Diabetes Ulcer or Stomach disease Kidney disease Liver disease Anaemia or other blood disease Cancer Depression Pain and swelling in joints other than the back Osteoporosis Fractures
Lung disease Heart attack Stroke Other cardiovascular disease Hypertension Fracture Depression Diabetes Cancer Peptic ulcer or stomach problems
Glaucoma Irritable bowel syndrome Schizophrenia/bipolar disorder Learning disability Anorexia/bulimia Migraine Prostate disorders Diverticulitis Chronic sinusitis Hypertension Cancer Diabetes Atrial fibrillation Constipation Multiple sclerosis
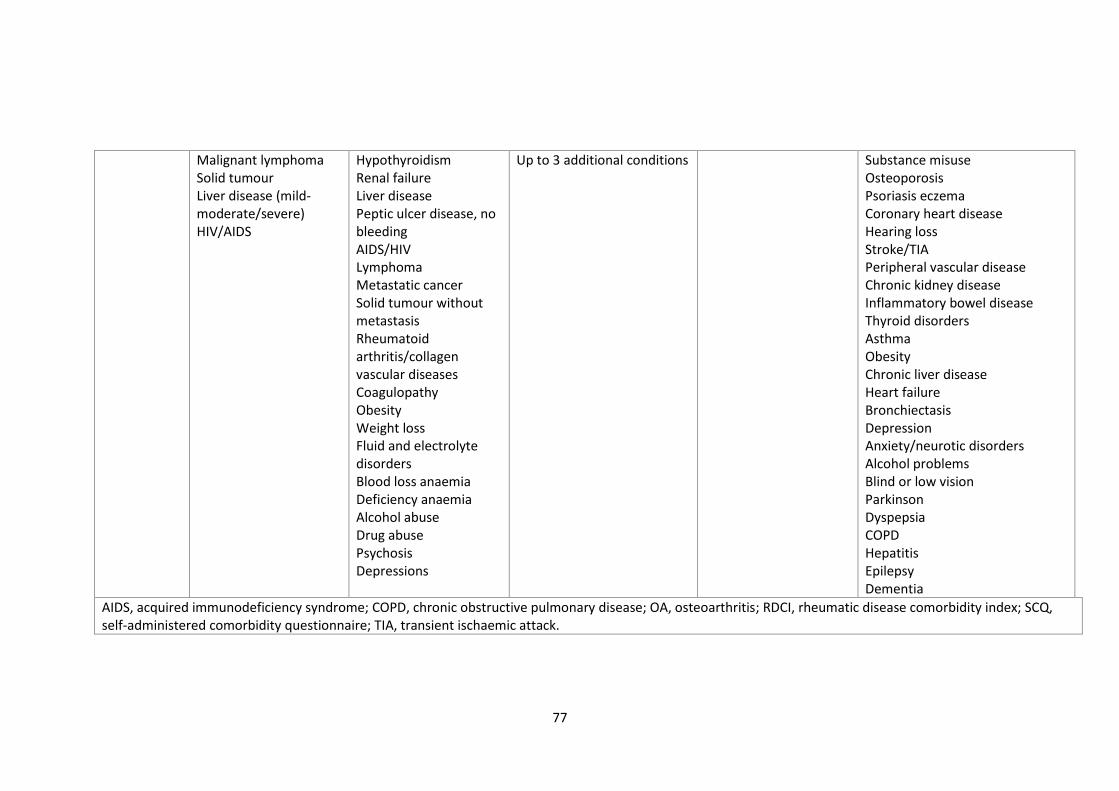
77
Malignant lymphoma Solid tumour Liver disease (mild-moderate/severe) HIV/AIDS
Hypothyroidism Renal failure Liver disease Peptic ulcer disease, no bleeding AIDS/HIV Lymphoma Metastatic cancer Solid tumour without metastasis Rheumatoid arthritis/collagen vascular diseases Coagulopathy Obesity Weight loss Fluid and electrolyte disorders Blood loss anaemia Deficiency anaemia Alcohol abuse Drug abuse Psychosis Depressions
Up to 3 additional conditions Substance misuse Osteoporosis Psoriasis eczema Coronary heart disease Hearing loss Stroke/TIA Peripheral vascular disease Chronic kidney disease Inflammatory bowel disease Thyroid disorders Asthma Obesity Chronic liver disease Heart failure Bronchiectasis Depression Anxiety/neurotic disorders Alcohol problems Blind or low vision Parkinson Dyspepsia COPD Hepatitis Epilepsy Dementia
AIDS, acquired immunodeficiency syndrome; COPD, chronic obstructive pulmonary disease; OA, osteoarthritis; RDCI, rheumatic disease comorbidity index; SCQ, self-administered comorbidity questionnaire; TIA, transient ischaemic attack.
78
AxSpA studies require additional considerations for which comorbidities should be
included. For example, the SCQ includes osteoarthritis, back pain and RA that may be
difficult for patients to distinguish from axSpA when self-reported [131]. The MMI includes
inflammatory bowel disease and psoriasis that are not considered comorbidities, since they
share pathogenesis with and aid diagnosis of axSpA [87,88]. EAMs are common, partly
because they are included in the disease definition; including uveitis (prevalence around
25% [151]) in comorbidity lists will dominate many less common conditions in analyses.
Furthermore, including EAMs in the modified SCQ did not improve its validity [152]. These
distinctions and their supportive evidence only emerged in more recent years. Two studies
in this review included cigarette smoking as a comorbidity. The distinction between
comorbidity and risk factor is not absolute (take for example hypertension).
2.5.3 Association with axial spondyloarthritis outcomes
In this literature review, the presence of comorbidities was consistently associated with
greater axSpA disease severity as assessed by a range of indices. Individuals with more
severe axSpA may be at higher risk of developing comorbidities directly (e.g., depression) or
indirectly through treatment (e.g., dyspepsia or renal disease from NSAIDs). Conversely,
many comorbidities (e.g., heart failure or COPD) will directly impact physical function and
fatigue, while others (e.g., depression) may indirectly influence the perception and
reporting of pain. In two individuals with identical underlying axSpA disease activity, the
one with multiple comorbidities will likely report higher subjective symptom burden. This is
highly relevant to axSpA management where most disease indices are completely patient
reported (e.g., BASDAI, spinal pain, BASFI). Whether more objective indices (e.g., ASDAS)
are less influenced by comorbidities has not been investigated. This is an important clinical
question since many treatment decisions rely on these indices. For example, eligibility for
bDMARDs in the UK is partly determined by BASDAI, which may be modified by the
presence of comorbidities that influence fatigue and pain. This thesis will address this
unmet need by investigating how robustly various outcomes (e.g., BASDAI vs. ASDAS) are
related to comorbidities such as depression.
Evidence beyond cross-sectional associations between comorbidities and axSpA severity
were comparatively scarce. Increased mortality in individuals with multiple comorbidities
has been repeatedly described in other populations [153] and replicated among axSpA
patients. Only three studies examined longitudinal associations with treatment outcomes,
each with important methodological limitations. Comorbid axSpA patients consistently had
79
more severe axSpA, which will influence how treatment response is defined. For example,
patients with higher disease activity will need to achieve greater absolute improvement to
reach a low disease activity or remission state, compared to those with less active disease.
Prior studies have only analysed these potentially problematic binary response definitions.
The choice of response definition has both statistical (power and bias) and philosophical
(which matters more to patients or health economics) implications. A better approach
would be to provide a range of complementary response definitions, and additionally
include absolute change in disease indices (rarely used in the general rheumatology
literature and not at all in the reviewed axSpA studies) and time to treatment
discontinuation. Outcome definitions and justification for selection will be discussed in
greater detail in the Methods chapter.
2.5.4 Summary of literature review
Comorbidities are common among axSpA patients and are associated with greater axSpA
severity. Several unmet research needs of clinical relevance were identified, namely
whether comorbidities differ between AS and nr-axSpA populations, whether comorbidities
co-exist, whether they are differentially associated with disease activity indices, and
whether they influence response to TNFi therapy. There is also need for improved
methodological approaches, namely the assessment of comorbidities and definitions of
treatment outcomes.

80
2.6 Thesis Aims and Objectives
The main aim of this thesis is to describe the patterns and impact of comorbidity in axial
spondyloarthritis using real-world patient populations. This body of work will approach
comorbidity as a count (‘comorbidity burden’) and individual conditions to understand how
they contribute to disease severity and treatment response. Three distinct populations –
each with unique strengths and limitations – will be used to answer specific objectives and
results from one data source will be validated in another where possible.
The objectives were to:
1. To describe the prevalence and patterns of comorbidities in axSpA and examine
whether they differ between AS and nr-axSpA.
2. To investigate whether and how comorbidities co-occur among people with axSpA
and whether these patient ‘clusters’ are associated with axSpA disease severity.
3. To determine whether comorbidities influence axSpA disease severity and compare
whether these indices are differentially affected.
4. To examine whether baseline comorbidity burden is associated with response to
TNF inhibitors.
As the thesis evolved, analyses addressing the above objectives repeatedly pointed to
mental health conditions as a prevalent and important comorbidity. Thus, an additional
objective was added:
5. To examine the impact of baseline depression and anxiety on response to TNF
inhibitors.
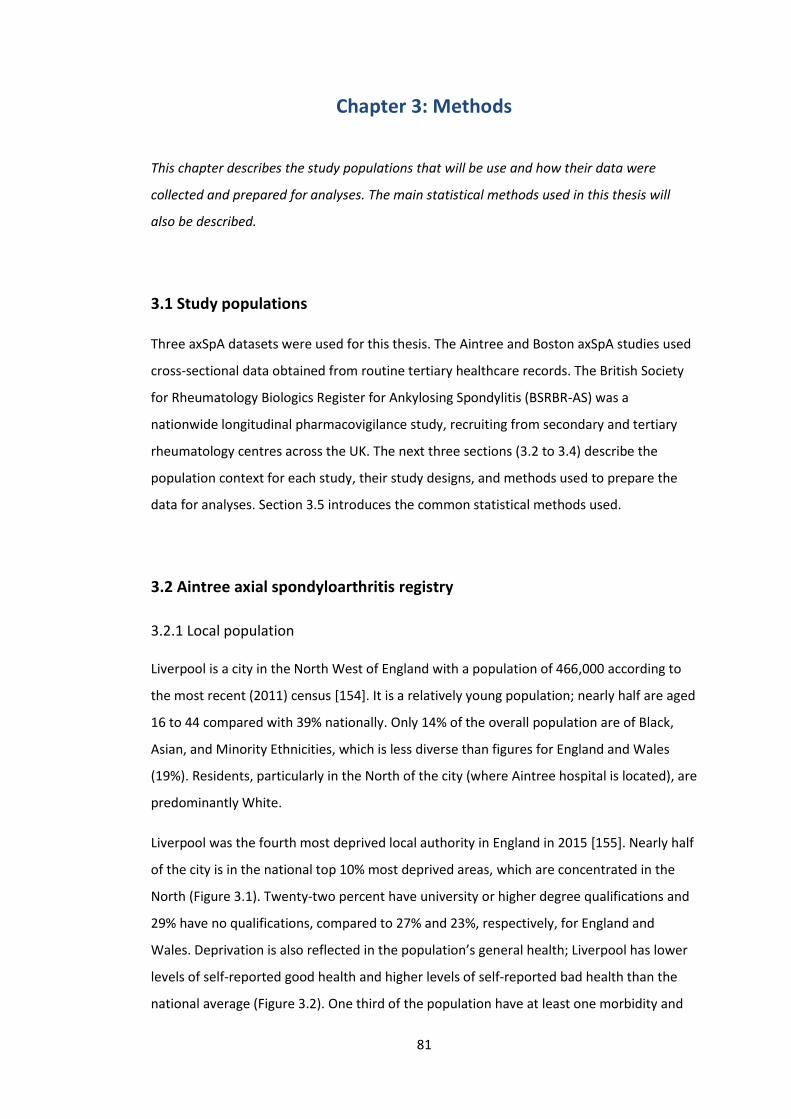
81
Chapter 3: Methods
This chapter describes the study populations that will be use and how their data were
collected and prepared for analyses. The main statistical methods used in this thesis will
also be described.
3.1 Study populations
Three axSpA datasets were used for this thesis. The Aintree and Boston axSpA studies used
cross-sectional data obtained from routine tertiary healthcare records. The British Society
for Rheumatology Biologics Register for Ankylosing Spondylitis (BSRBR-AS) was a
nationwide longitudinal pharmacovigilance study, recruiting from secondary and tertiary
rheumatology centres across the UK. The next three sections (3.2 to 3.4) describe the
population context for each study, their study designs, and methods used to prepare the
data for analyses. Section 3.5 introduces the common statistical methods used.
3.2 Aintree axial spondyloarthritis registry
3.2.1 Local population
Liverpool is a city in the North West of England with a population of 466,000 according to
the most recent (2011) census [154]. It is a relatively young population; nearly half are aged
16 to 44 compared with 39% nationally. Only 14% of the overall population are of Black,
Asian, and Minority Ethnicities, which is less diverse than figures for England and Wales
(19%). Residents, particularly in the North of the city (where Aintree hospital is located), are
predominantly White.
Liverpool was the fourth most deprived local authority in England in 2015 [155]. Nearly half
of the city is in the national top 10% most deprived areas, which are concentrated in the
North (Figure 3.1). Twenty-two percent have university or higher degree qualifications and
29% have no qualifications, compared to 27% and 23%, respectively, for England and
Wales. Deprivation is also reflected in the population’s general health; Liverpool has lower
levels of self-reported good health and higher levels of self-reported bad health than the
national average (Figure 3.2). One third of the population have at least one morbidity and
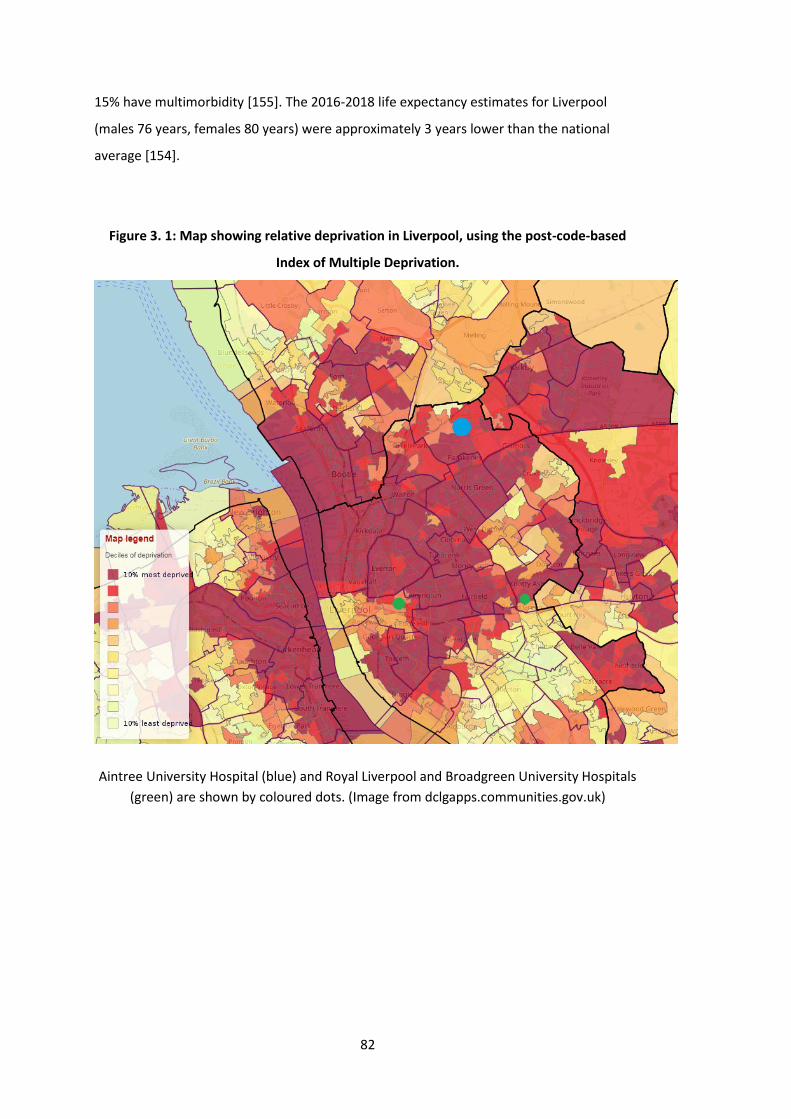
82
15% have multimorbidity [155]. The 2016-2018 life expectancy estimates for Liverpool
(males 76 years, females 80 years) were approximately 3 years lower than the national
average [154].
Figure 3. 1: Map showing relative deprivation in Liverpool, using the post-code-based
Index of Multiple Deprivation.
Aintree University Hospital (blue) and Royal Liverpool and Broadgreen University Hospitals
(green) are shown by coloured dots. (Image from dclgapps.communities.gov.uk)
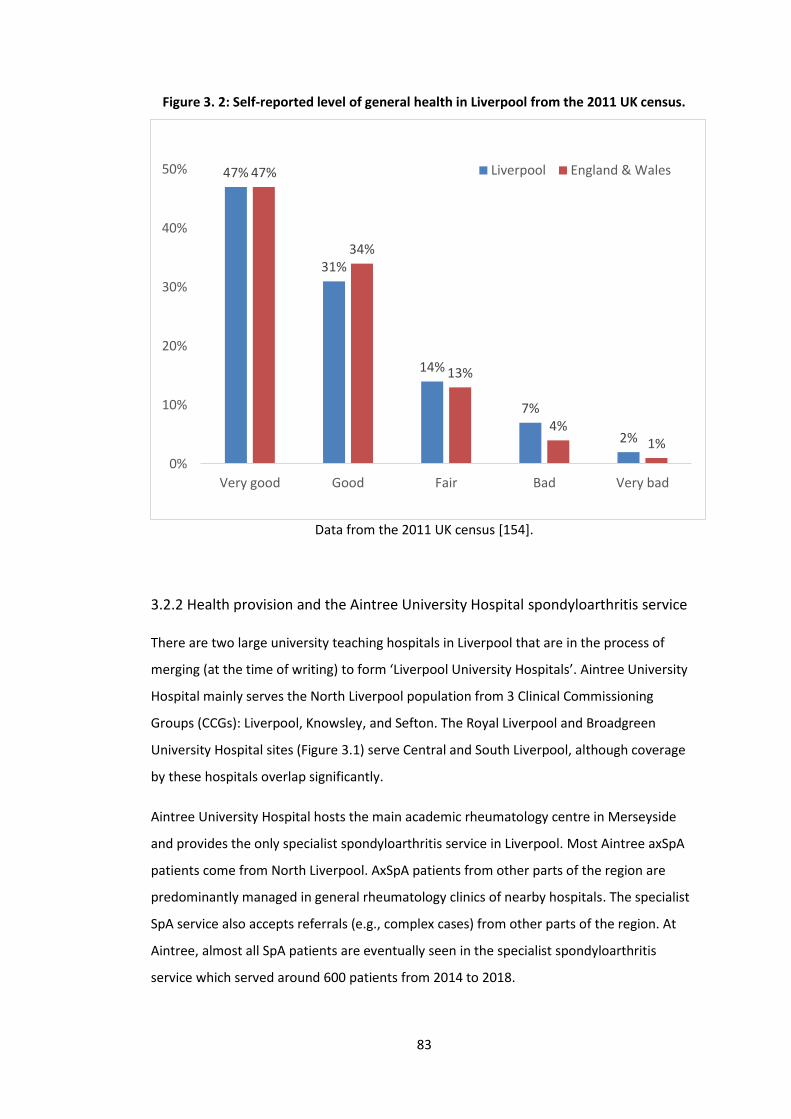
83
Figure 3. 2: Self-reported level of general health in Liverpool from the 2011 UK census.
Data from the 2011 UK census [154].
3.2.2 Health provision and the Aintree University Hospital spondyloarthritis service
There are two large university teaching hospitals in Liverpool that are in the process of
merging (at the time of writing) to form ‘Liverpool University Hospitals’. Aintree University
Hospital mainly serves the North Liverpool population from 3 Clinical Commissioning
Groups (CCGs): Liverpool, Knowsley, and Sefton. The Royal Liverpool and Broadgreen
University Hospital sites (Figure 3.1) serve Central and South Liverpool, although coverage
by these hospitals overlap significantly.
Aintree University Hospital hosts the main academic rheumatology centre in Merseyside
and provides the only specialist spondyloarthritis service in Liverpool. Most Aintree axSpA
patients come from North Liverpool. AxSpA patients from other parts of the region are
predominantly managed in general rheumatology clinics of nearby hospitals. The specialist
SpA service also accepts referrals (e.g., complex cases) from other parts of the region. At
Aintree, almost all SpA patients are eventually seen in the specialist spondyloarthritis
service which served around 600 patients from 2014 to 2018.
47%
31%
14%
7%
2%
47%
34%
13%
4%1%
0%
10%
20%
30%
40%
50%
Very good Good Fair Bad Very bad
Liverpool England & Wales
84
At the first clinic visit, new patients complete a set of questionnaires, undergo a detailed
clinical history and examination, followed by relevant investigations such as serum
inflammatory makers and imaging. Questionnaires used in the clinic are for routine care
purposes only, to assess disease activity and facilitate clinical assessment (e.g., BASDAI,
BASFI, health-related quality of life). Clinical assessment is semi-structured including, for
example, SpA features from classification criteria, past medical history, and social history
(smoking status, pack-years, and alcohol status). Once a diagnosis of SpA is made or
confirmed, patients are followed-up annually at a minimum. Axial SpA patients are
generally seen in the dedicated axSpA clinic, which includes parallel reviews by a
physiotherapist. Patients also have access to hydrotherapy as indicated.
3.2.3 Electronic Health Records (EHRs)
At the time of writing, the Aintree site uses a combined electronic health record (EHR)
system. Medway Sigma (System C Healthcare) was introduced in 2009 including 10 years of
backdated patient records. This system holds:
1) Patient identifiable information,
2) Text-documents of dictated clinic letters,
3) EDMS (Engineering Document Management System) of scanned hand-written (in-
and outpatient) clinical notes,
4) Results of investigation such as blood tests and imaging reports, and
5) Integrated PACS (Picture Archiving and Communication System) images.
There is a separate electronic prescription system (predominantly used for inpatient care),
which was not used for this study as outpatient medication were not consistently captured.
Medication data were instead extracted from clinical letters and notes.
3.2.4 Study design
The Aintree axSpA registry was created by the thesis author with ethical approval granted
by the National Research Ethics Committee in August 2015 (15/LO/1519). Individual patient
consent was not required for this study. Active data collection continued to April 2018, and
the study was formally ended in May 2020 to allow completion of analyses. It was a cross-
sectional observational study of consecutive axSpA patients at their first contact with the
specialist SpA service (i.e., retrospective inception population). The registry held pseudo-
anonymised data, but it was possible to trace patients via a secured key file if required.
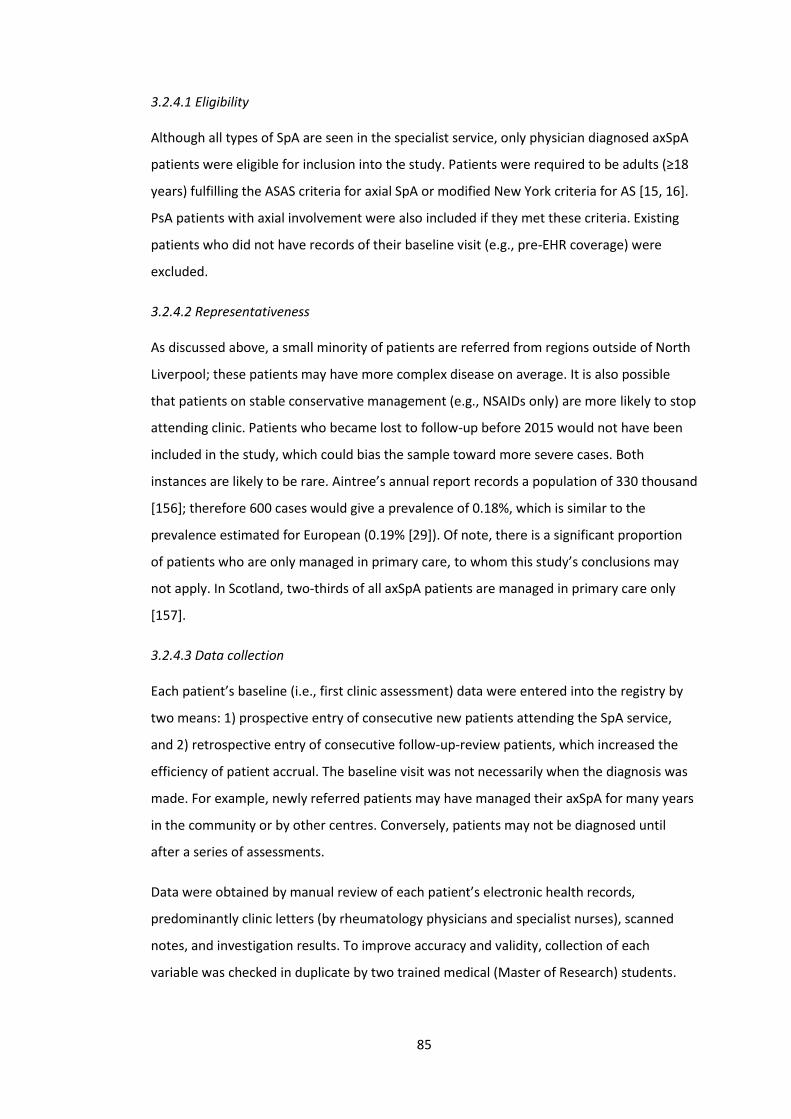
85
3.2.4.1 Eligibility
Although all types of SpA are seen in the specialist service, only physician diagnosed axSpA
patients were eligible for inclusion into the study. Patients were required to be adults (≥18
years) fulfilling the ASAS criteria for axial SpA or modified New York criteria for AS [15, 16].
PsA patients with axial involvement were also included if they met these criteria. Existing
patients who did not have records of their baseline visit (e.g., pre-EHR coverage) were
excluded.
3.2.4.2 Representativeness
As discussed above, a small minority of patients are referred from regions outside of North
Liverpool; these patients may have more complex disease on average. It is also possible
that patients on stable conservative management (e.g., NSAIDs only) are more likely to stop
attending clinic. Patients who became lost to follow-up before 2015 would not have been
included in the study, which could bias the sample toward more severe cases. Both
instances are likely to be rare. Aintree’s annual report records a population of 330 thousand
[156]; therefore 600 cases would give a prevalence of 0.18%, which is similar to the
prevalence estimated for European (0.19% [29]). Of note, there is a significant proportion
of patients who are only managed in primary care, to whom this study’s conclusions may
not apply. In Scotland, two-thirds of all axSpA patients are managed in primary care only
[157].
3.2.4.3 Data collection
Each patient’s baseline (i.e., first clinic assessment) data were entered into the registry by
two means: 1) prospective entry of consecutive new patients attending the SpA service,
and 2) retrospective entry of consecutive follow-up-review patients, which increased the
efficiency of patient accrual. The baseline visit was not necessarily when the diagnosis was
made. For example, newly referred patients may have managed their axSpA for many years
in the community or by other centres. Conversely, patients may not be diagnosed until
after a series of assessments.
Data were obtained by manual review of each patient’s electronic health records,
predominantly clinic letters (by rheumatology physicians and specialist nurses), scanned
notes, and investigation results. To improve accuracy and validity, collection of each
variable was checked in duplicate by two trained medical (Master of Research) students.
86
Any discrepancies were resolved through discussion. The data collection process is
summarised in Figure 3.3.
Figure 3. 3: Summary of data collection for the Aintree axial spondyloarthritis registry.
For each consecutive patient attending the Aintree SpA service, three components of
electronic health records were manually reviewed by the thesis author. All variables were
validated by a trained medical student (duplicated extraction). Only patients who had
records of their baseline assessment were eligible (e.g., follow-up patients whose baseline
assessment predated available electronic records would not be eligible). Two patients, who
had records missing all relevant components of clinical letters and notes, were excluded.
No record was kept of the number of individuals failing to meet eligibility criteria, but the
SpA service was estimated to have served 600 patients from 2014 to 2018, inclusive. BMI,
body mass index; CRP, C-reactive protein; ESR, erythrocyte sedimentation rate; Hx, history;
PROMs, patient reported outcome measures.
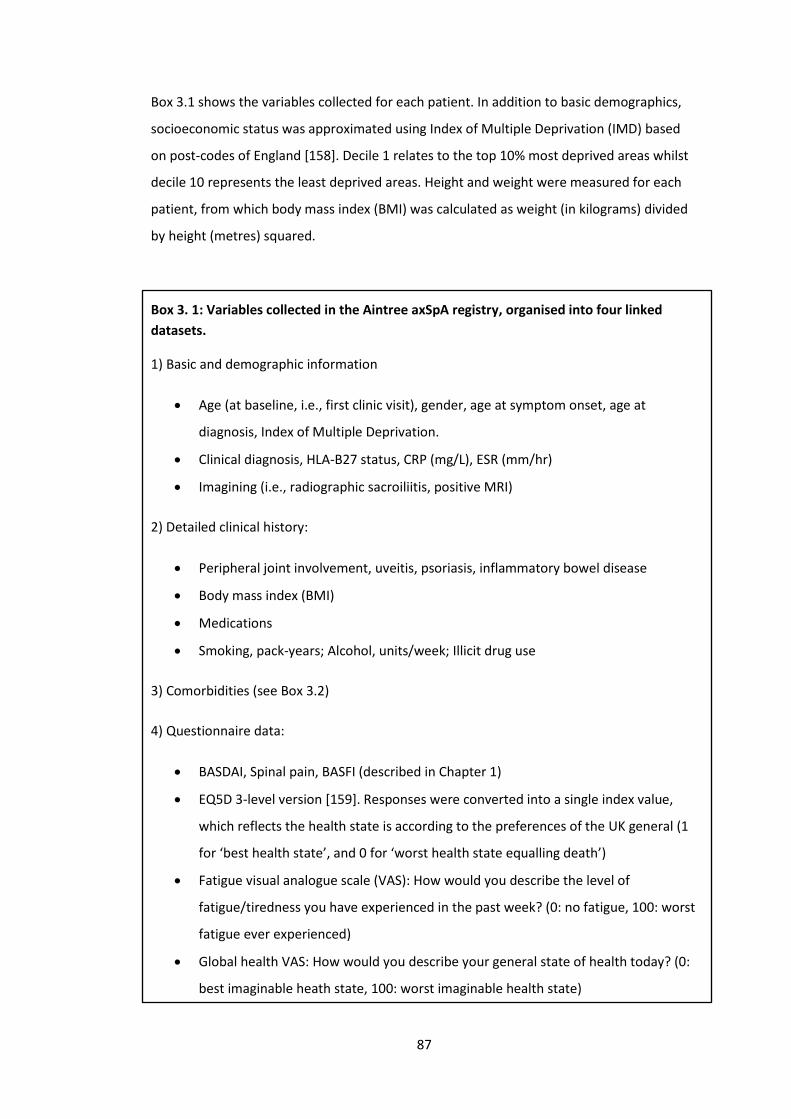
87
Box 3.1 shows the variables collected for each patient. In addition to basic demographics,
socioeconomic status was approximated using Index of Multiple Deprivation (IMD) based
on post-codes of England [158]. Decile 1 relates to the top 10% most deprived areas whilst
decile 10 represents the least deprived areas. Height and weight were measured for each
patient, from which body mass index (BMI) was calculated as weight (in kilograms) divided
by height (metres) squared.
Box 3. 1: Variables collected in the Aintree axSpA registry, organised into four linked
datasets.
1) Basic and demographic information
• Age (at baseline, i.e., first clinic visit), gender, age at symptom onset, age at
diagnosis, Index of Multiple Deprivation.
• Clinical diagnosis, HLA-B27 status, CRP (mg/L), ESR (mm/hr)
• Imagining (i.e., radiographic sacroiliitis, positive MRI)
2) Detailed clinical history:
• Peripheral joint involvement, uveitis, psoriasis, inflammatory bowel disease
• Body mass index (BMI)
• Medications
• Smoking, pack-years; Alcohol, units/week; Illicit drug use
3) Comorbidities (see Box 3.2)
4) Questionnaire data:
• BASDAI, Spinal pain, BASFI (described in Chapter 1)
• EQ5D 3-level version [159]. Responses were converted into a single index value,
which reflects the health state is according to the preferences of the UK general (1
for ‘best health state’, and 0 for ‘worst health state equalling death’)
• Fatigue visual analogue scale (VAS): How would you describe the level of
fatigue/tiredness you have experienced in the past week? (0: no fatigue, 100: worst
fatigue ever experienced)
• Global health VAS: How would you describe your general state of health today? (0:
best imaginable heath state, 100: worst imaginable health state)
88
The semi-structured clinical assessment routinely recorded age at symptom onset, CRP,
ESR, and SpA features (Chapter 1, Box 1.2, page 35) as they are pivotal for diagnosis and
classification. HLA-B27 was not always tested, for example, when the clinical picture was
highly indicative of a diagnosis. All medications were recorded from clinic letters and
confirmed against GP referral documents where available. Only summary-level results for
imaging investigations were collected for the study, i.e., presence of radiographic sacroiliitis
or bone marrow oedema without grading or further description.
Routine clinic questionnaires were scanned into EDMS. Numerical rating scale (i.e., integers
from 1 to 10) version of the BASDAI, spinal pain and BASFI were used. In addition, patients
completed the 3-level version of the descriptive EQ-5D (i.e., without the visual analogue
scale, EQ5D-VAS), and single questions on fatigue and general health. No additional
questionnaires were given to patients specifically for the study. Data were stored in a
Microsoft Access relational database, with the four datasets linked by a unique study
identification number.
3.2.4.4 Comorbidity ascertainment
There are several indices commonly used to measure comorbidity burden. Among them,
the multimorbidity index (MMI) by Radner et al [148] was selected for use in assessing
comorbidities in this study for the following reasons: 1) it assesses the largest number of
conditions, 2) it is unweighted and 3) it has been validated in patients with rheumatic
diseases against health-related quality of life [148]. Weighted indices such as the Charlson
[149] and Elixhauser [150] indices were validated for inpatients and mortality or inpatient-
related outcomes. They are less suitable for chronic diseases predominantly managed in
outpatient settings. The rheumatic disease comorbidity index (RDCI) - although validated in
rheumatic diseases - is also weighted and only includes 11 conditions [147].
Further adaptations to the original MMI were made for the Aintree axSpA registry, with
discussion involving senior academic rheumatologists. Extra-articular manifestations -
inflammatory bowel disease and psoriasis - were excluded. ‘Painful conditions’ was
changed to fibromyalgia. Osteoporosis was added because of its importance in chronic
rheumatic musculoskeletal diseases. The final list of 39 comorbidities is shown in Box 3.2.
Body mass index (BMI) was systematically measured in all patients. Given this differential
ascertainment of obesity (compared to other comorbidities) and the greater amount of
information held by BMI as a continuous variable (compared to obesity), obesity was not
included in analyses using the Aintree data.
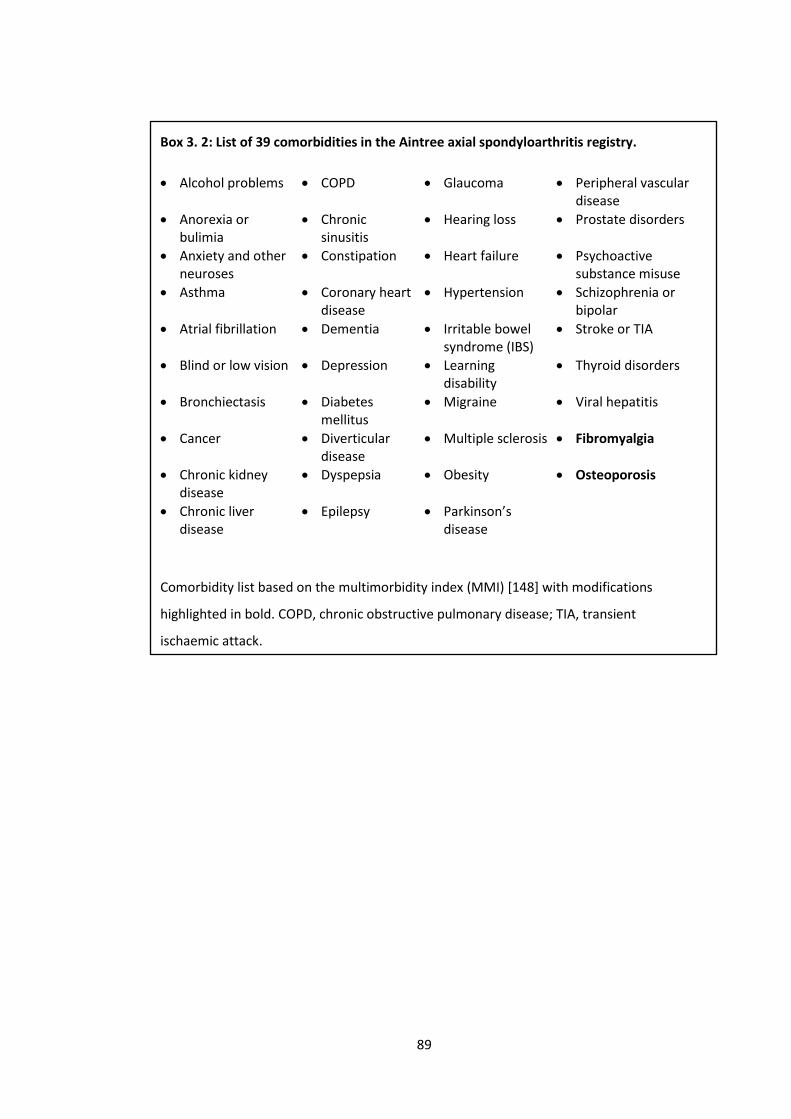
89
Box 3. 2: List of 39 comorbidities in the Aintree axial spondyloarthritis registry.
• Alcohol problems • COPD • Glaucoma • Peripheral vascular disease
• Anorexia or bulimia
• Chronic sinusitis
• Hearing loss • Prostate disorders
• Anxiety and other neuroses
• Constipation • Heart failure • Psychoactive substance misuse
• Asthma • Coronary heart disease
• Hypertension • Schizophrenia or bipolar
• Atrial fibrillation • Dementia • Irritable bowel syndrome (IBS)
• Stroke or TIA
• Blind or low vision • Depression • Learning disability
• Thyroid disorders
• Bronchiectasis • Diabetes mellitus
• Migraine • Viral hepatitis
• Cancer • Diverticular disease
• Multiple sclerosis • Fibromyalgia
• Chronic kidney disease
• Dyspepsia • Obesity • Osteoporosis
• Chronic liver disease
• Epilepsy • Parkinson’s disease
Comorbidity list based on the multimorbidity index (MMI) [148] with modifications
highlighted in bold. COPD, chronic obstructive pulmonary disease; TIA, transient
ischaemic attack.
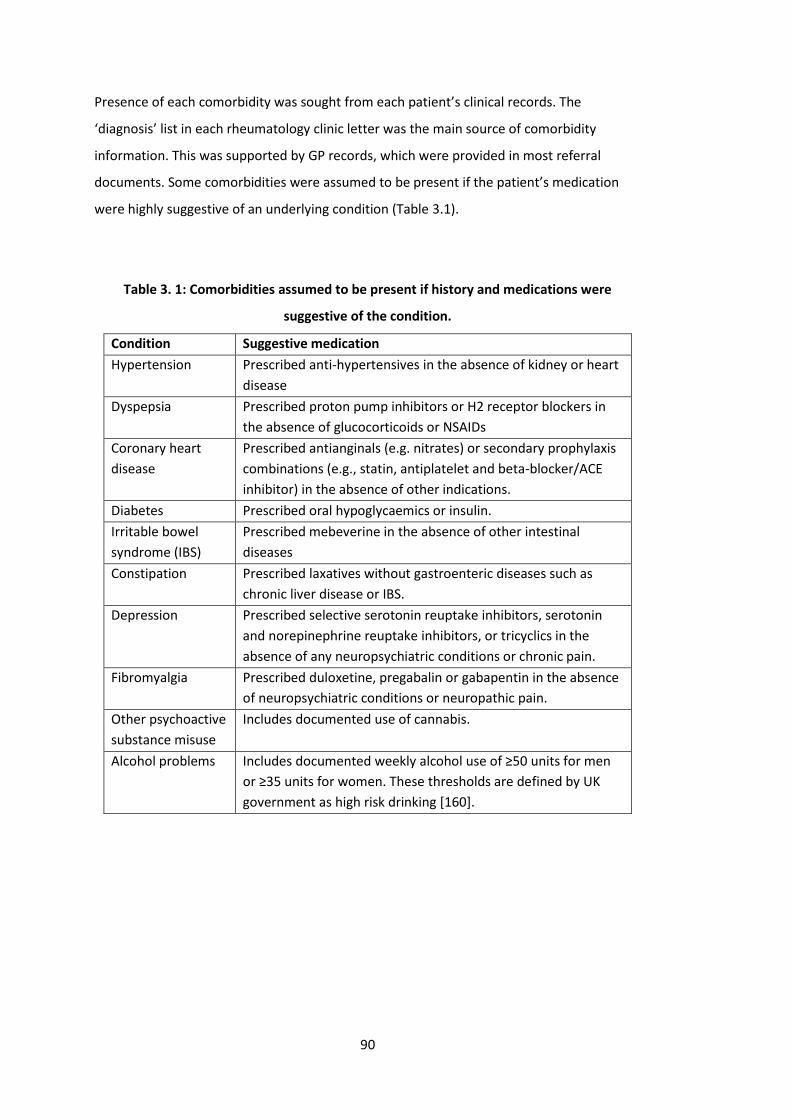
90
Presence of each comorbidity was sought from each patient’s clinical records. The
‘diagnosis’ list in each rheumatology clinic letter was the main source of comorbidity
information. This was supported by GP records, which were provided in most referral
documents. Some comorbidities were assumed to be present if the patient’s medication
were highly suggestive of an underlying condition (Table 3.1).
Table 3. 1: Comorbidities assumed to be present if history and medications were
suggestive of the condition.
Condition Suggestive medication
Hypertension Prescribed anti-hypertensives in the absence of kidney or heart
disease
Dyspepsia Prescribed proton pump inhibitors or H2 receptor blockers in
the absence of glucocorticoids or NSAIDs
Coronary heart
disease
Prescribed antianginals (e.g. nitrates) or secondary prophylaxis
combinations (e.g., statin, antiplatelet and beta-blocker/ACE
inhibitor) in the absence of other indications.
Diabetes Prescribed oral hypoglycaemics or insulin.
Irritable bowel
syndrome (IBS)
Prescribed mebeverine in the absence of other intestinal
diseases
Constipation Prescribed laxatives without gastroenteric diseases such as
chronic liver disease or IBS.
Depression Prescribed selective serotonin reuptake inhibitors, serotonin
and norepinephrine reuptake inhibitors, or tricyclics in the
absence of any neuropsychiatric conditions or chronic pain.
Fibromyalgia Prescribed duloxetine, pregabalin or gabapentin in the absence
of neuropsychiatric conditions or neuropathic pain.
Other psychoactive
substance misuse
Includes documented use of cannabis.
Alcohol problems Includes documented weekly alcohol use of ≥50 units for men
or ≥35 units for women. These thresholds are defined by UK
government as high risk drinking [160].
91
3.2.4.5 Sample size considerations
Sample size calculations are subtly different when describing data without invoking
hypothesis testing, but nevertheless relevant for precision (i.e., standard error). The
primary aim of the Aintree axSpA study was to describe the prevalence of comorbidities.
Standard error of a proportion is given by:
𝑆𝐸 = √𝑝(1 − 𝑝)
𝑁
Where p is the proportion (or prevalence), and N is the sample size. The 95% confidence
interval (i.e., alpha=0.05) is p±1.96*SE. A correction (±0.5/N) is made for using a normal
approximation for a discrete distribution, i.e., 95% CI = p±1.96*SE±0.5/N. The relationship
between prevalence, sample size and precision are illustrated in Table 3.2; sufficient
precision is where the ‘margin of error’ is smaller than the prevalence estimate. For
example, a sample size of >1000 is required to provide sufficient precision (i.e., margin of
error <0.5%) for a comorbidity with 0.5% prevalence.
However, sample size is often not a decision in many observational studies; examples
include secondary analysis of existing registries, or when the available patient population
imposes a ceiling of sample size. Instead, investigators are recommended to estimate
whether there is sufficient power (or in this case precision) to pursue their analysis, given
the sample size [161].
Using the above described method of case identification, a sample of 421 axSpA patients
was achieved at the time of analysis. This would allow conditions with >1.2% prevalence to
be estimated with sufficient precision. It was therefore anticipated that 1) confidence
intervals for the population prevalence estimate would include zero for rarer conditions,
and 2) rarer comorbidities are likely to have zero cases in this study. In a study of RA using
the same list of comorbidities, a sample size of 876 was able to capture at least one case of
all but one comorbidity [148].
A once popular practice is to calculate post hoc power of an analysis. This is simply an
alternative way of expressing the p-value and provides no additional information [162].
Instead, each chapter will begin by estimating whether there is sufficient power given the
sample size (using G*Power version 3.1.9). Precision of effect estimates will then form part
of discussions.
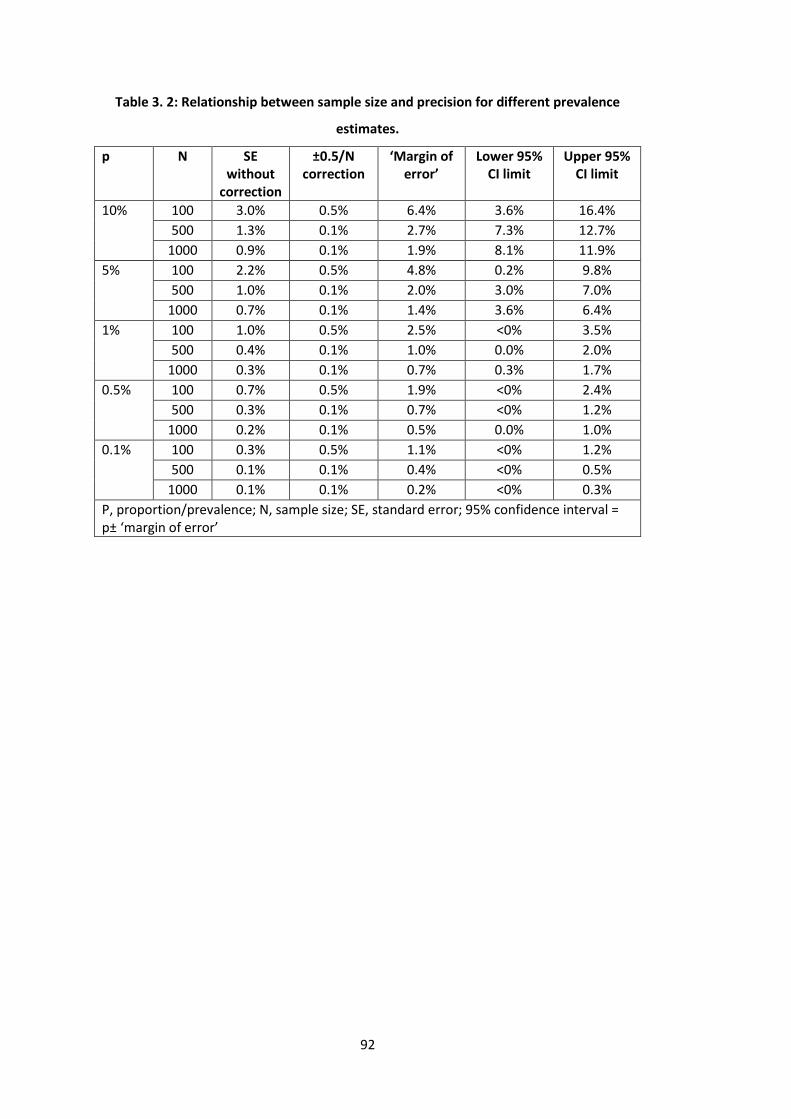
92
Table 3. 2: Relationship between sample size and precision for different prevalence
estimates.
p N SE without
correction
±0.5/N correction
‘Margin of error’
Lower 95% CI limit
Upper 95% CI limit
10% 100 3.0% 0.5% 6.4% 3.6% 16.4%
500 1.3% 0.1% 2.7% 7.3% 12.7%
1000 0.9% 0.1% 1.9% 8.1% 11.9%
5% 100 2.2% 0.5% 4.8% 0.2% 9.8%
500 1.0% 0.1% 2.0% 3.0% 7.0%
1000 0.7% 0.1% 1.4% 3.6% 6.4%
1% 100 1.0% 0.5% 2.5% <0% 3.5%
500 0.4% 0.1% 1.0% 0.0% 2.0%
1000 0.3% 0.1% 0.7% 0.3% 1.7%
0.5% 100 0.7% 0.5% 1.9% <0% 2.4%
500 0.3% 0.1% 0.7% <0% 1.2%
1000 0.2% 0.1% 0.5% 0.0% 1.0%
0.1% 100 0.3% 0.5% 1.1% <0% 1.2%
500 0.1% 0.1% 0.4% <0% 0.5%
1000 0.1% 0.1% 0.2% <0% 0.3%
P, proportion/prevalence; N, sample size; SE, standard error; 95% confidence interval = p± ‘margin of error’

93
3.3 Boston axial spondyloarthritis study (Massachusetts, USA)
3.3.1 Local population
Boston is the capital of the state of Massachusetts, United States (US), with a population of
695 thousand according to the 2018 census [163]. It is also the centre of the larger
metropolitan area known as Greater Boston which, depending on the geographic definition,
is home to 5 to 8 million people (Figure 3.4). Like Liverpool, the Boston population is
relatively young, with half the population between 20 and 49 years of age. However,
Boston has significantly greater ethnic diversity (44% white, 22% black, 20% Hispanic and
9% Asian) and higher educational attainment (51% with university or higher degrees).
Figure 3. 4: Boston city within Greater Boston.
The Brigham and Women’s Hospital (blue) and Massachusetts General Hospital (green)
shown in circles. (Reuse with permission from commons.wikimedia.org)
94
There are no metrics of socioeconomic status equivalent to the UK’s Index of Multiple
Deprivation. The Greater Boston area has the 6th largest economy in the US and 12th largest
in the world (by 2008 estimates [164]). But there is great disparity in wealth [165]; 18% of
Boston residents live below the poverty line (defined as minimum necessary to meet the
basic needs of a family unit), compared to 10% for the state of Massachusetts.
3.3.2 Health provision
3.3.2.1 Healthcare in the United States (US)
Unlike the UK’s NHS, healthcare facilities in the US are predominantly run by private sector
businesses. A single clinic visit can cost several hundred dollars and an average three-day
inpatient stay may cost tens of thousands of dollars depending on the type of care needed.
Most Americans access healthcare through insurance, paid either privately or by their
employer, to reduce such costs. The US government also provides state-managed, low-cost,
public insurance: Medicare is eligible to people over the age of 65, disabled adults and
those with end-stage renal disease. Medicaid provides health insurance to those who
cannot afford it, to children in lower-income families, and sometimes to the disabled.
The insurance premium is not the only cost; there are also deductibles (analogous to the
‘excess’ in UK insurance), co-insurance (a proportion that individuals have to pay alongside
the insurer), and/or ‘co-pays’ (co-payments; a fixed-amount payment each time care is
accessed), the amount of each varies with different insurance policies. Furthermore, not all
insurance plans cover all aspects of care; for example, until the Affordable Care Act
(‘Obamacare’) in 2010 that standardised essential care, some plans did not cover
prescriptions or non-emergency services. Not all plans provide access to all providers; that
is, insurers may give access to certain physicians, hospitals, pharmacies, networks, etc.,
while another may not. These factors mean that there is great disparity in who can, or
chooses to, access certain health services.
3.3.2.2 Healthcare in Boston
Partners HealthCare is a not-for-profit conglomerate of over 20 hospitals and primary care
centres in the Greater Boston area. Around 1.5 million patients are seen each year in
Partners hospitals [166]. It was founded in 1994 by two large tertiary care hospitals, the
Brigham and Women’s Hospital and Massachusetts General Hospital (Figure 3.4). Both are
academic tertiary hospitals affiliated with Harvard Medical School. Together, they run the
largest hospital-based research program in the world.
95
There are around 30 rheumatologists in the Brigham and Women’s hospital, among whom
SpA patients are dispersed. Although there is no dedicated SpA service, some
rheumatologists do have it as a sub-specialty interest.
The American College of Rheumatology guidance for axSpA management resembles those
from the UK and Europe, but there are differences in routine practice. First, uptake of the
term ‘axial spondyloarthritis’ (first defined by predominantly European researchers) came
much later. Until March 2019 (when the first biologic was licenced for non-radiographic
axSpA in the US), many continued to exclusively use ‘ankylosing spondylitis’. This is partly
because the billing code system (International Classification of Diseases, ICD) was not
updated to include axSpA until version 11 (to come into effect in 2022), and partly because
of concerns in distinguishing non-radiographic axSpA from other differentials (namely
fibromyalgia). Second, access to biologic drugs are at the discretion of the rheumatologist
and the patient’s insurer. Unlike the UK (and much of Europe), there are no criteria
required to commence or continue biologic therapy. Thus, many outcome measures, such
as BASDAI or ASDAS, are not recorded. in the Partners’ electronic health records, the only
consistently recorded patient-reported outcome is the pain visual analogue scale, which
patients complete in the waiting room.
3.3.3 Electronic Health Records (EHRs) and the Research Patient Data Registry
(RPDR)
Use of EHR started in 1996 for Brigham and Women’s Hospital and 1994 for Massachusetts
General Hospital. An internally developed Longitudinal Medical Record (LMR) system was
initially used. This was superseded by EHR from Epic Systems in 2015. This system provides
a single platform where all aspects of healthcare records (e.g., prescriptions, clinic letters,
investigation results) are entered and accessed. Together, LMR and Epic EHR have
facilitated care for approximately 7 million patients.
Partners HealthCare also has a Research Patient Data Registry (RPDR) – a centralised clinical
data registry that gathers information from EHR and other hospital systems, as well as
existing research data (Figure 3.5).
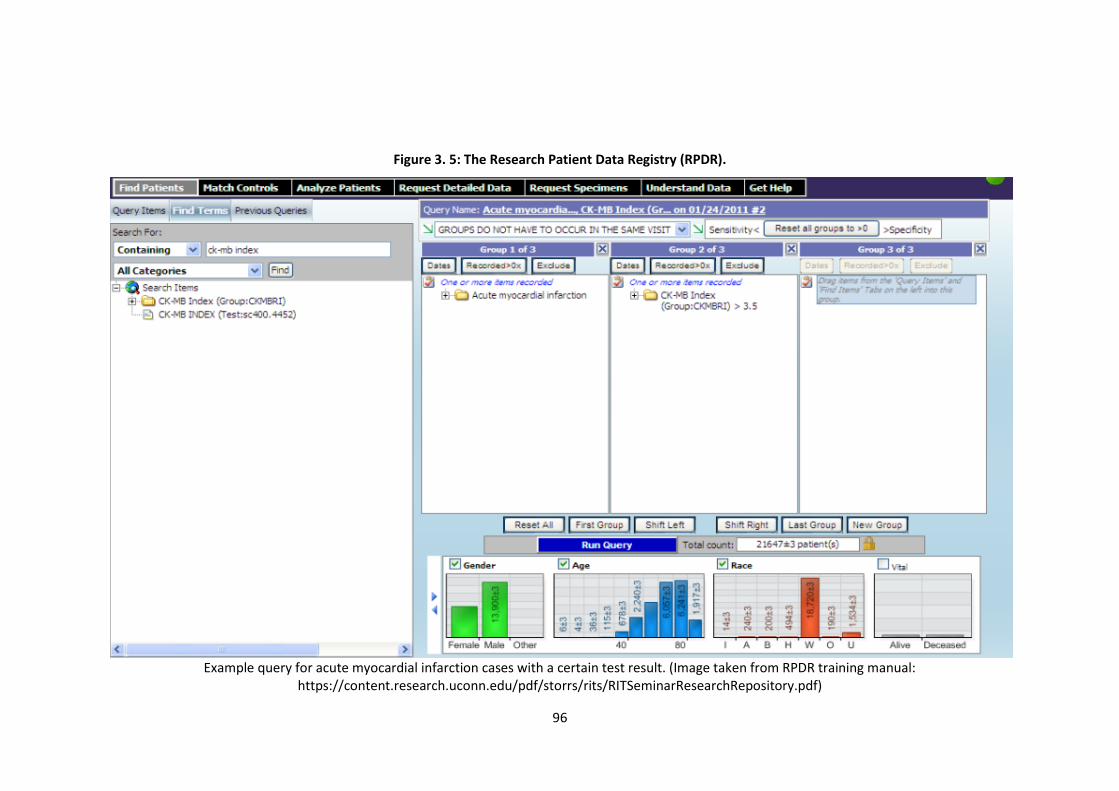
96
Figure 3. 5: The Research Patient Data Registry (RPDR).
Example query for acute myocardial infarction cases with a certain test result. (Image taken from RPDR training manual:
https://content.research.uconn.edu/pdf/storrs/rits/RITSeminarResearchRepository.pdf)
97
RPDR is not an inherent component of the Epic EHR. It is an online, self-service system that
allows registered users to, for example, identify patients for clinical trials or audit care
provision. It also controls and audits access to patient data for research, thereby ensuring
security of patient information. The RPDR can be used to: 1) obtain aggregate numbers (i.e.,
no individual-level data) of patients that meet user-defined criteria (e.g., diagnosis,
medication, investigations) to help assess study feasibility, without institute review board
(IRB) approval, and 2) request detailed identifiable patient records from the
aforementioned searches, but only with an IRB approved study protocol.
3.3.4 Study design
The Boston axSpA study was set up by the thesis author. The Partners HealthCare
Institutional Review Board approved all aspects of this study (2018P001840/PHS) in August
2018. Individual patient consent was not required. All data processing and analyses were
completed in November 2018 and IRB approval ended in August 2020. It was a cross-
sectional observational study of axSpA patients identified from Partners EHR. Requests for
data from all Partners sites were submitted to, and processed by, the RPDR. Patient data
were identifiable (via unique hospital number and date of birth) and were stored and
processed on secure drives held at the Division of Rheumatology, Immunology and Allergy,
Brigham and Women’s Hospital.
3.3.4.1 Eligibility
The Partners EHR contains over 7 million patient-records. A feasible approach of identifying
axSpA patients among this number was therefore necessary. There is no dedicated Partners
SpA service from which potentially eligible patients could be identified. It was also not
possible to restrict records to rheumatology departments. Potentially eligible patients were
identified from the entirety of Partners EHR using automated searches in RPDR.
Since the prevalence of axSpA was expected to be low (0.2 to 0.5% [167]), a search strategy
with high specificity (at costs to sensitivity) was necessary to make subsequent manual
review feasible. For example, using published criteria (at least 1 ICD code for AS [168])
returned tens of thousands of records with low prevalence of true axSpA. More stringent
search criteria were therefore developed. Aggregate data provided by RPDR facilitated an
iterative process to refine the search strategy. Ultimately, the search combined ICD codes
with a simple text-search of radiology reports: ≥3 ICD-9 or 10 codes for AS (720.x or M45.x)
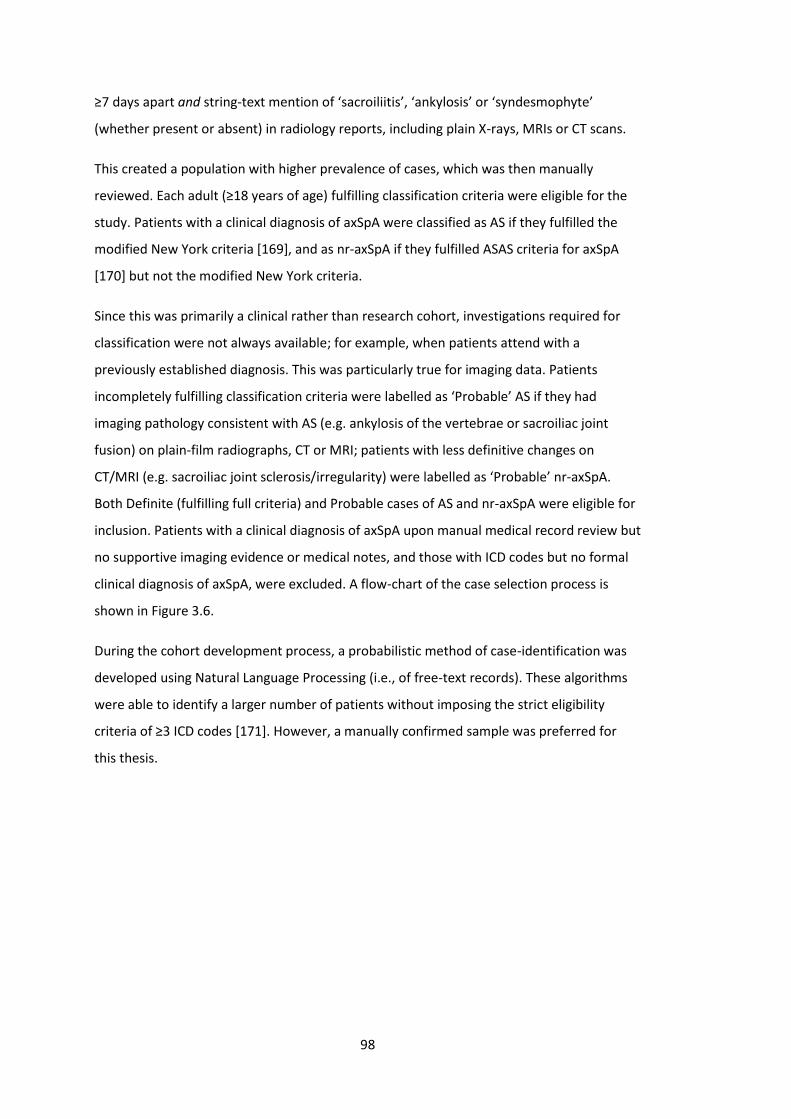
98
≥7 days apart and string-text mention of ‘sacroiliitis’, ‘ankylosis’ or ‘syndesmophyte’
(whether present or absent) in radiology reports, including plain X-rays, MRIs or CT scans.
This created a population with higher prevalence of cases, which was then manually
reviewed. Each adult (≥18 years of age) fulfilling classification criteria were eligible for the
study. Patients with a clinical diagnosis of axSpA were classified as AS if they fulfilled the
modified New York criteria [169], and as nr-axSpA if they fulfilled ASAS criteria for axSpA
[170] but not the modified New York criteria.
Since this was primarily a clinical rather than research cohort, investigations required for
classification were not always available; for example, when patients attend with a
previously established diagnosis. This was particularly true for imaging data. Patients
incompletely fulfilling classification criteria were labelled as ‘Probable’ AS if they had
imaging pathology consistent with AS (e.g. ankylosis of the vertebrae or sacroiliac joint
fusion) on plain-film radiographs, CT or MRI; patients with less definitive changes on
CT/MRI (e.g. sacroiliac joint sclerosis/irregularity) were labelled as ‘Probable’ nr-axSpA.
Both Definite (fulfilling full criteria) and Probable cases of AS and nr-axSpA were eligible for
inclusion. Patients with a clinical diagnosis of axSpA upon manual medical record review but
no supportive imaging evidence or medical notes, and those with ICD codes but no formal
clinical diagnosis of axSpA, were excluded. A flow-chart of the case selection process is
shown in Figure 3.6.
During the cohort development process, a probabilistic method of case-identification was
developed using Natural Language Processing (i.e., of free-text records). These algorithms
were able to identify a larger number of patients without imposing the strict eligibility
criteria of ≥3 ICD codes [171]. However, a manually confirmed sample was preferred for
this thesis.
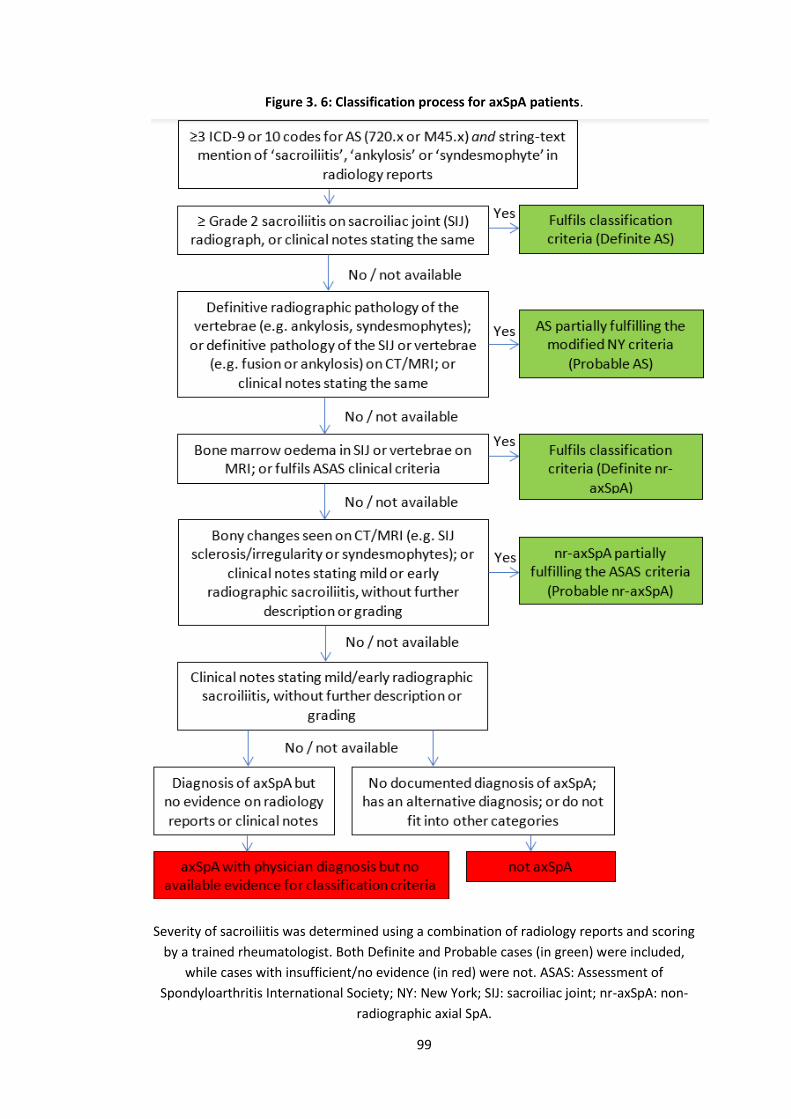
99
Figure 3. 6: Classification process for axSpA patients.
Severity of sacroiliitis was determined using a combination of radiology reports and scoring
by a trained rheumatologist. Both Definite and Probable cases (in green) were included,
while cases with insufficient/no evidence (in red) were not. ASAS: Assessment of
Spondyloarthritis International Society; NY: New York; SIJ: sacroiliac joint; nr-axSpA: non-
radiographic axial SpA.
100
3.3.4.2 Representativeness
The Boston cohort may differ in representability for several reasons. First, there is great
disparity in wealth and access to healthcare. Patients with underlying axSpA may not
present to healthcare services, or decline referral to rheumatology recommended by, for
example, physiotherapists or primary care clinicians. AxSpA patients without insurance or
those with plans that do not cover relevant tests, referrals, or treatments (i.e., those from
lower socioeconomic groups), are unlikely to be represented unless they are eligible for
Medicaid. In a similar Partners study of rheumatoid arthritis, 96% of the cohort were white
[148], which does not reflect the local diversity. Second, the Partners group includes two
large tertiary academic hospitals but also over 20 affiliated primary care centres. The latter
may provide better representation of the general axSpA population in theory. However, in
practice, most records came from rheumatology departments of the two academic
hospitals. Third, the way in which eligibility was defined will likely restrict the study to
patients with longer disease duration or more severe disease.
3.3.4.3 Data collection
Records of potentially eligible patient from all historical encounters with Partners
HealthCare were downloaded, including in- and outpatient records, medication/pharmacy
records, laboratory results (HLA-B27, ESR and CRP) and radiology reports. Records include
all free-text documents and coded data (e.g., ICD and prescription codes); scanned records
were not included. Patients’ unique identifiers were used to access their records on Epic
EHR where review of radiological images was required. A summary of the data processing is
shown in Figure 3.7.
101
Figure 3. 7: Summary of data processing for the Boston axial spondyloarthritis study.
An automated search was performed (using criteria adapted to balanced positive predictive
value and feasibility) to identify 965 individuals with high probability of having axSpA. Their
records were then manually reviewed by the thesis author (without validation) to assess
eligibility (defined by classification criteria). 190 individuals were excluded because they did
not have a clearly documented physician diagnosis of axSpA (thus classification criteria not
applicable) or did not meet classification criteria. Imaging definitions were adapted (e.g.,
accepting ankylosis on CT); these individuals were labelled as partial or ‘Probable’ cases.
ASAS, Assessment of SpondyloArthritis international Society; AS, ankylosing spondylitis;
axSpA, axial spondyloarthritis; EHR, electronic health records; ICD-9, International
Classification of Diseases codes version 9; RPDR, Research Patient Data Registry.
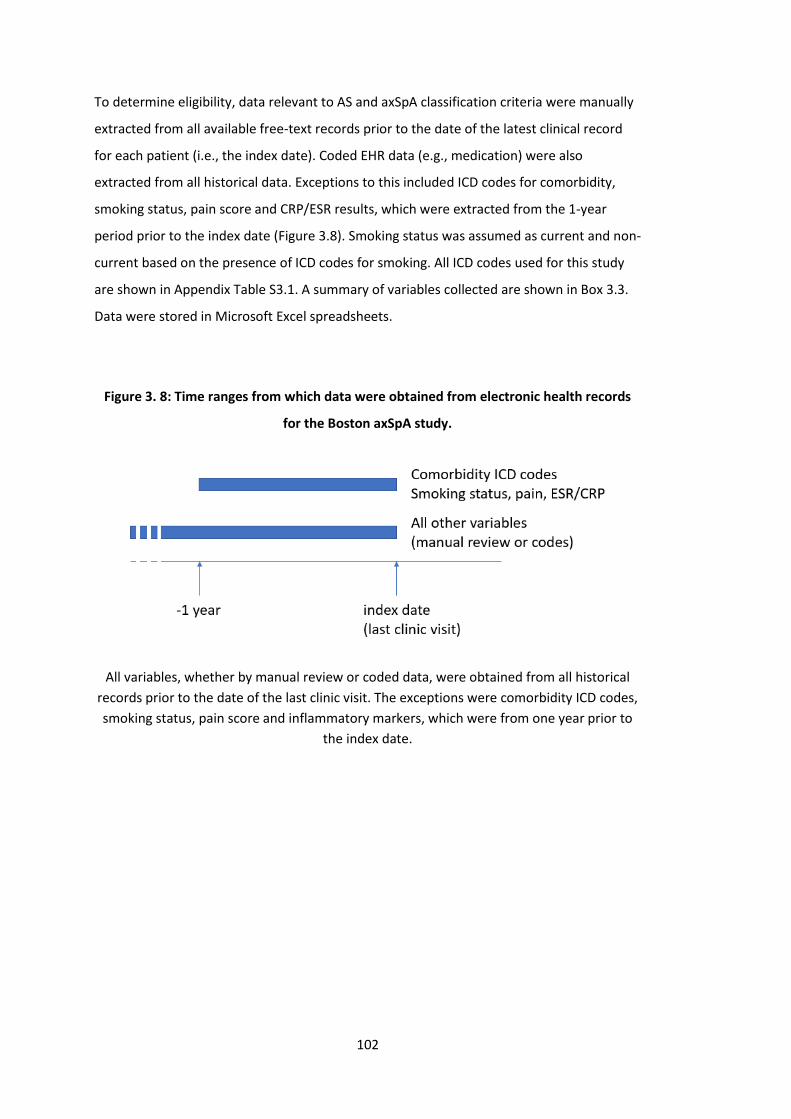
102
To determine eligibility, data relevant to AS and axSpA classification criteria were manually
extracted from all available free-text records prior to the date of the latest clinical record
for each patient (i.e., the index date). Coded EHR data (e.g., medication) were also
extracted from all historical data. Exceptions to this included ICD codes for comorbidity,
smoking status, pain score and CRP/ESR results, which were extracted from the 1-year
period prior to the index date (Figure 3.8). Smoking status was assumed as current and non-
current based on the presence of ICD codes for smoking. All ICD codes used for this study
are shown in Appendix Table S3.1. A summary of variables collected are shown in Box 3.3.
Data were stored in Microsoft Excel spreadsheets.
Figure 3. 8: Time ranges from which data were obtained from electronic health records
for the Boston axSpA study.
All variables, whether by manual review or coded data, were obtained from all historical
records prior to the date of the last clinic visit. The exceptions were comorbidity ICD codes,
smoking status, pain score and inflammatory markers, which were from one year prior to
the index date.
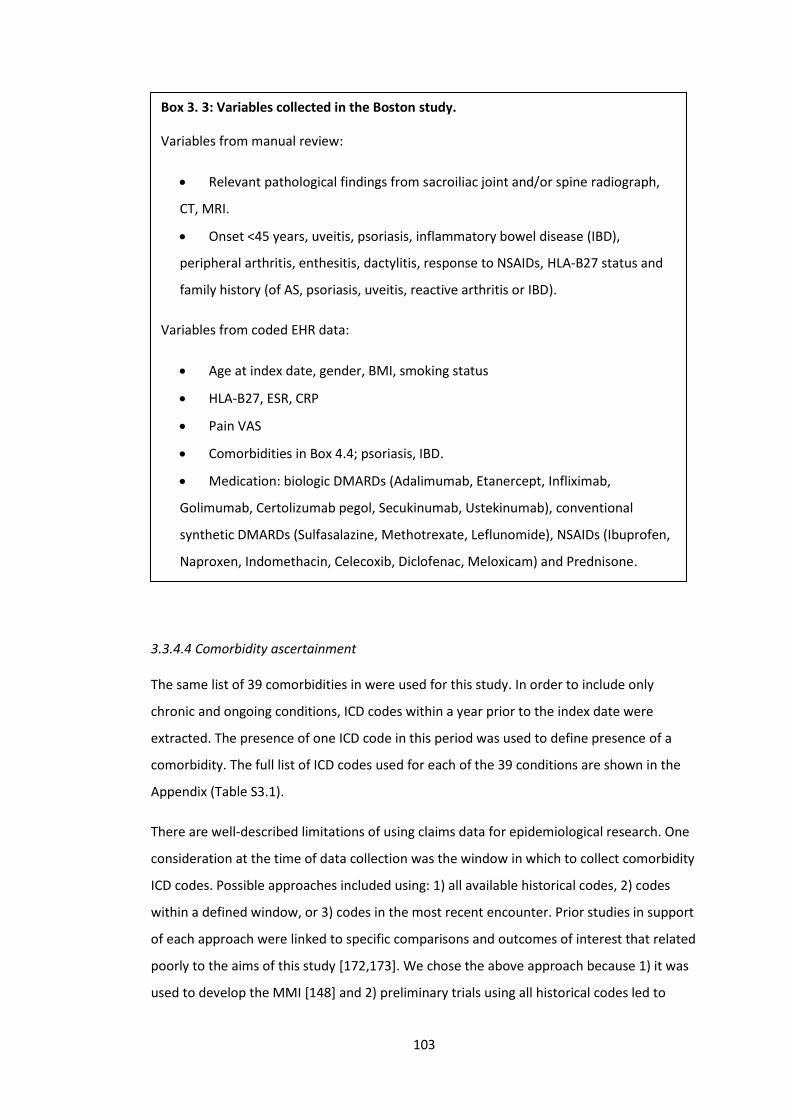
103
3.3.4.4 Comorbidity ascertainment
The same list of 39 comorbidities in were used for this study. In order to include only
chronic and ongoing conditions, ICD codes within a year prior to the index date were
extracted. The presence of one ICD code in this period was used to define presence of a
comorbidity. The full list of ICD codes used for each of the 39 conditions are shown in the
Appendix (Table S3.1).
There are well-described limitations of using claims data for epidemiological research. One
consideration at the time of data collection was the window in which to collect comorbidity
ICD codes. Possible approaches included using: 1) all available historical codes, 2) codes
within a defined window, or 3) codes in the most recent encounter. Prior studies in support
of each approach were linked to specific comparisons and outcomes of interest that related
poorly to the aims of this study [172,173]. We chose the above approach because 1) it was
used to develop the MMI [148] and 2) preliminary trials using all historical codes led to
Box 3. 3: Variables collected in the Boston study.
Variables from manual review:
• Relevant pathological findings from sacroiliac joint and/or spine radiograph,
CT, MRI.
• Onset <45 years, uveitis, psoriasis, inflammatory bowel disease (IBD),
peripheral arthritis, enthesitis, dactylitis, response to NSAIDs, HLA-B27 status and
family history (of AS, psoriasis, uveitis, reactive arthritis or IBD).
Variables from coded EHR data:
• Age at index date, gender, BMI, smoking status
• HLA-B27, ESR, CRP
• Pain VAS
• Comorbidities in Box 4.4; psoriasis, IBD.
• Medication: biologic DMARDs (Adalimumab, Etanercept, Infliximab,
Golimumab, Certolizumab pegol, Secukinumab, Ustekinumab), conventional
synthetic DMARDs (Sulfasalazine, Methotrexate, Leflunomide), NSAIDs (Ibuprofen,
Naproxen, Indomethacin, Celecoxib, Diclofenac, Meloxicam) and Prednisone.
104
unrealistic prevalence estimates. For example, one prior episode of self-limited reactive
depression, or irritable bowel syndrome that was included in a list of differential diagnoses
several years before the index date, should not be included as a chronic comorbidity. The
duration of available historical records would also vary between individuals and differ in a
manner that risks introducing bias.
3.3.4.5 Sample size considerations
Sample size considerations mirror those of the Aintree axSpA study (Section 3.2.4.5). The
required sample size to provide sufficiently precise prevalence estimates for most
comorbidities (i.e., those with prevalence >0.5%) was 1000. However, identifying cases
from such a large data source required an approach that had different limitations on
sample size. Less restrictive criteria for identifying potentially eligible patients returned
samples that were not feasible to manually review. For example, using one ICD code for AS
returned over 10,000 cases with less than 10% having AS. The maximum prevalence that
could be estimated with sufficient precision was 0.5%. It was again anticipated that rarer
comorbidities would have zero cases in this study population.
105
3.4 The British Society for Rheumatology Biologics Register for Ankylosing
Spondylitis (BSRBR-AS)
3.4.1 Background
The British Society for Rheumatology (BSR), along with pharmaceutical partners and the
University of Manchester, set up the first nationwide biologics register in 2001 when these
therapies became available for the management of rheumatoid arthritis (RA). This registry
provided a wealth of safety data for TNF inhibitors, which were subsequently licensed for
treatment of axSpA. Transferring observed safety data to the axSpA population is
problematic given the older age, higher comorbidity burden and concurrent csDMARD use
in RA patients. The BSRBR-AS was therefore created to test the hypothesis that biologic
therapy increases the risk of serious infections (i.e., those requiring hospitalisation or
death). Secondary objectives of the BSRBR-AS were to examine the relationship between
biologic therapy and incidence of malignancy, serious comorbidity, all-cause mortality, and
impact on quality of life.
The BSRBR-AS was set up by the University of Aberdeen as a five-year prospective
pharmacovigilance study across the UK (Figure 3.9). Recruitment began in December 2012.
Initially, the study recruited only patients who met classification criteria for AS. This was
amended to include those fulfilling classification criteria for axSpA (i.e., to include nr-axSpA)
in November 2014 [15,16]. The study population was recruited into two cohorts: 1) a
‘biologic’ groups: participants newly exposed to an eligible biologic drug, and 2) a ‘non-
biologic’ group: participants unexposed to these therapies. The sample size was updated
after the first year of study recruitment to reflect the number of serious adverse events
reported; the study set out to recruit approximately 2000 participants. The final dataset of
2687 participants (downloaded December 2018) was used for all BSRBR-AS analyses in this
thesis.
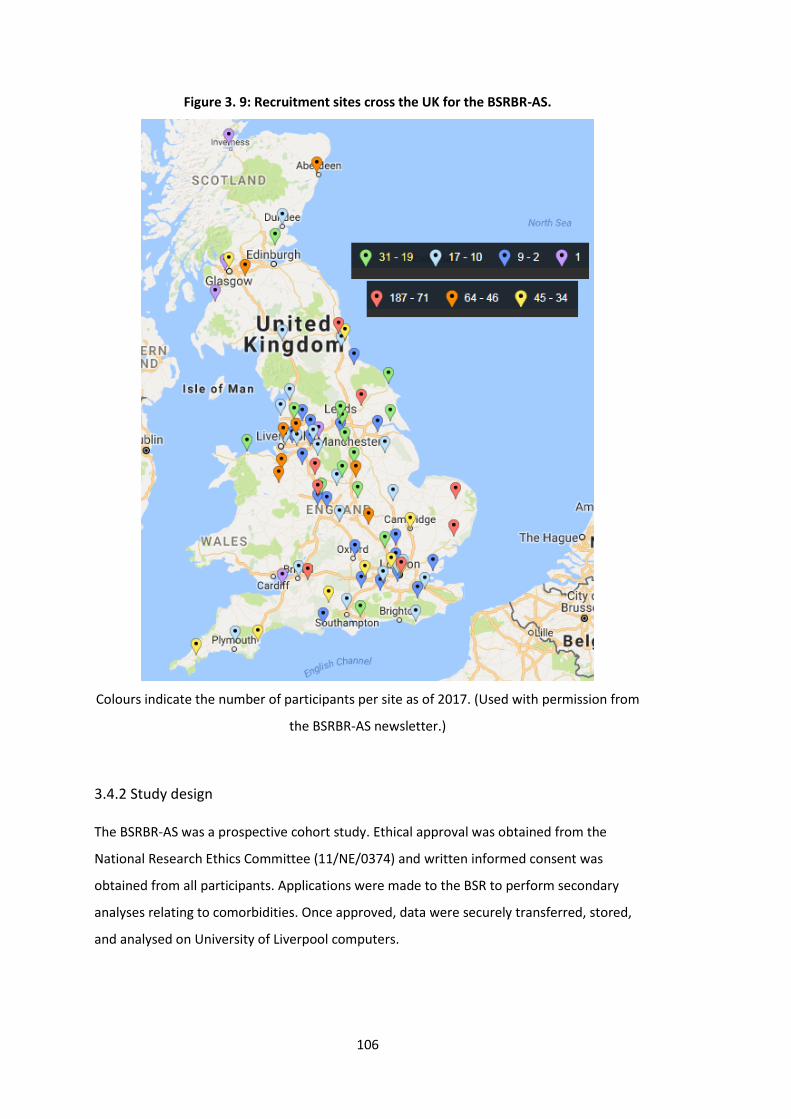
106
Figure 3. 9: Recruitment sites cross the UK for the BSRBR-AS.
Colours indicate the number of participants per site as of 2017. (Used with permission from
the BSRBR-AS newsletter.)
3.4.2 Study design
The BSRBR-AS was a prospective cohort study. Ethical approval was obtained from the
National Research Ethics Committee (11/NE/0374) and written informed consent was
obtained from all participants. Applications were made to the BSR to perform secondary
analyses relating to comorbidities. Once approved, data were securely transferred, stored,
and analysed on University of Liverpool computers.
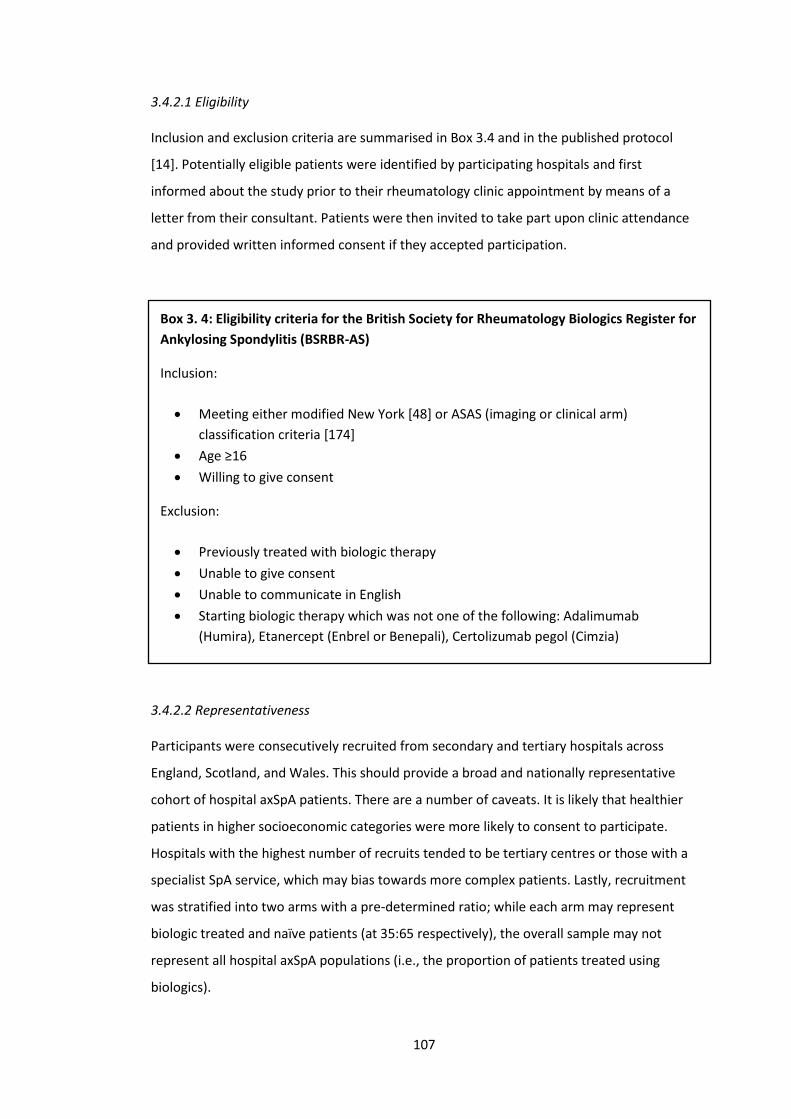
107
3.4.2.1 Eligibility
Inclusion and exclusion criteria are summarised in Box 3.4 and in the published protocol
[14]. Potentially eligible patients were identified by participating hospitals and first
informed about the study prior to their rheumatology clinic appointment by means of a
letter from their consultant. Patients were then invited to take part upon clinic attendance
and provided written informed consent if they accepted participation.
Box 3. 4: Eligibility criteria for the British Society for Rheumatology Biologics Register for
Ankylosing Spondylitis (BSRBR-AS)
Inclusion:
• Meeting either modified New York [48] or ASAS (imaging or clinical arm)
classification criteria [174]
• Age ≥16
• Willing to give consent
Exclusion:
• Previously treated with biologic therapy
• Unable to give consent
• Unable to communicate in English
• Starting biologic therapy which was not one of the following: Adalimumab
(Humira), Etanercept (Enbrel or Benepali), Certolizumab pegol (Cimzia)
3.4.2.2 Representativeness
Participants were consecutively recruited from secondary and tertiary hospitals across
England, Scotland, and Wales. This should provide a broad and nationally representative
cohort of hospital axSpA patients. There are a number of caveats. It is likely that healthier
patients in higher socioeconomic categories were more likely to consent to participate.
Hospitals with the highest number of recruits tended to be tertiary centres or those with a
specialist SpA service, which may bias towards more complex patients. Lastly, recruitment
was stratified into two arms with a pre-determined ratio; while each arm may represent
biologic treated and naïve patients (at 35:65 respectively), the overall sample may not
represent all hospital axSpA populations (i.e., the proportion of patients treated using
biologics).
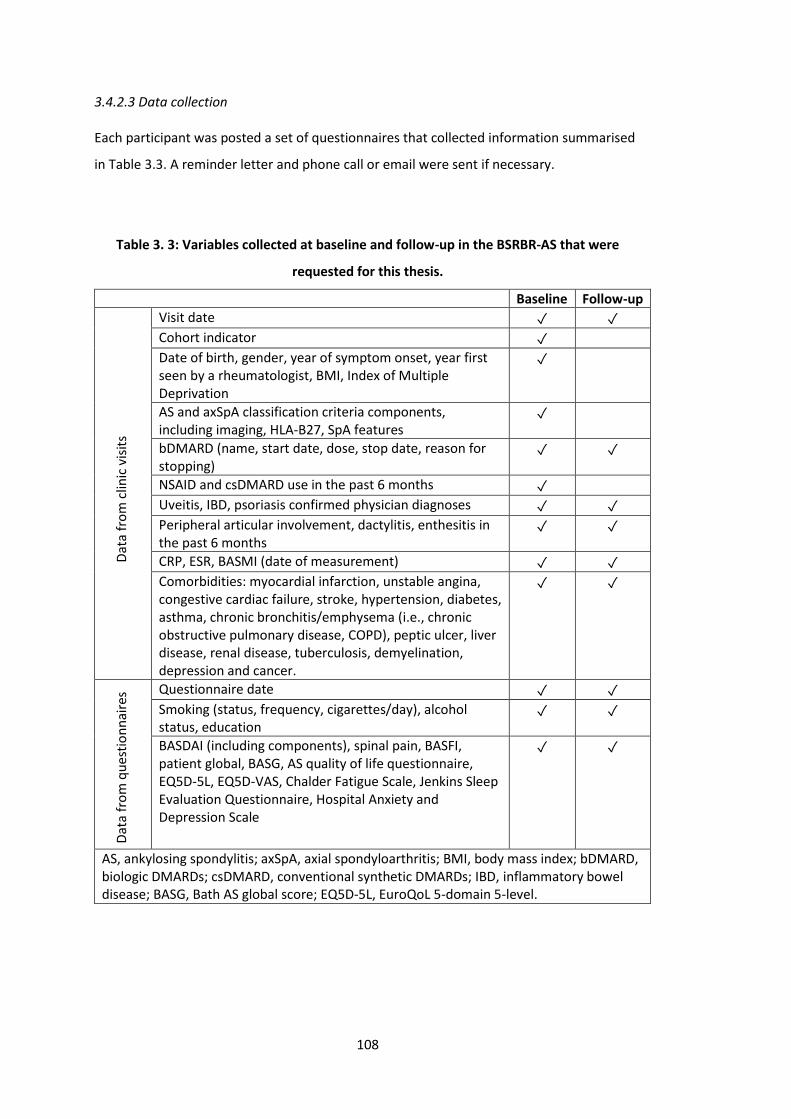
108
3.4.2.3 Data collection
Each participant was posted a set of questionnaires that collected information summarised
in Table 3.3. A reminder letter and phone call or email were sent if necessary.
Table 3. 3: Variables collected at baseline and follow-up in the BSRBR-AS that were
requested for this thesis.
Baseline Follow-up
Visit date ✓ ✓ Cohort indicator ✓
Date of birth, gender, year of symptom onset, year first seen by a rheumatologist, BMI, Index of Multiple Deprivation
✓
AS and axSpA classification criteria components, including imaging, HLA-B27, SpA features
✓
bDMARD (name, start date, dose, stop date, reason for stopping)
✓ ✓
NSAID and csDMARD use in the past 6 months ✓
Uveitis, IBD, psoriasis confirmed physician diagnoses ✓ ✓ Peripheral articular involvement, dactylitis, enthesitis in the past 6 months
✓ ✓
CRP, ESR, BASMI (date of measurement) ✓ ✓ Comorbidities: myocardial infarction, unstable angina, congestive cardiac failure, stroke, hypertension, diabetes, asthma, chronic bronchitis/emphysema (i.e., chronic obstructive pulmonary disease, COPD), peptic ulcer, liver disease, renal disease, tuberculosis, demyelination, depression and cancer.
✓ ✓
Questionnaire date ✓ ✓
Smoking (status, frequency, cigarettes/day), alcohol status, education
✓ ✓
BASDAI (including components), spinal pain, BASFI, patient global, BASG, AS quality of life questionnaire, EQ5D-5L, EQ5D-VAS, Chalder Fatigue Scale, Jenkins Sleep Evaluation Questionnaire, Hospital Anxiety and Depression Scale
✓ ✓
AS, ankylosing spondylitis; axSpA, axial spondyloarthritis; BMI, body mass index; bDMARD, biologic DMARDs; csDMARD, conventional synthetic DMARDs; IBD, inflammatory bowel disease; BASG, Bath AS global score; EQ5D-5L, EuroQoL 5-domain 5-level.
Dat
a fr
om
clin
ic v
isit
s D
ata
fro
m q
ues
tio
nn
aire
s
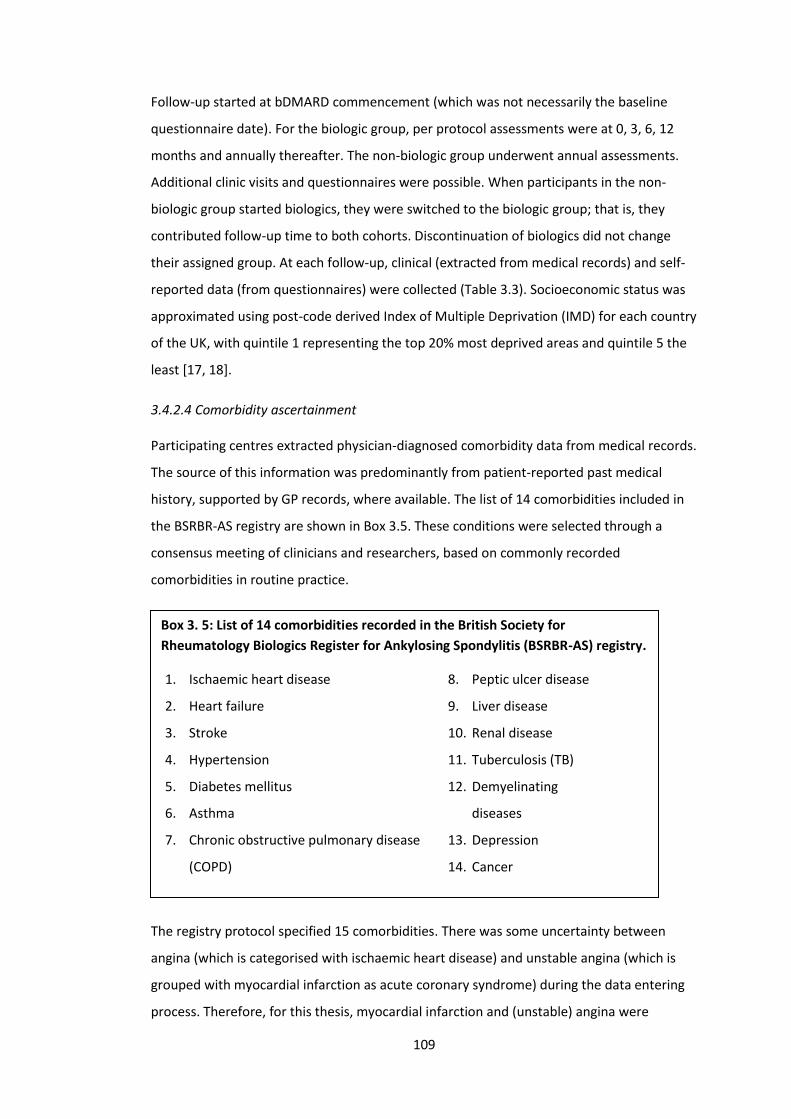
109
Follow-up started at bDMARD commencement (which was not necessarily the baseline
questionnaire date). For the biologic group, per protocol assessments were at 0, 3, 6, 12
months and annually thereafter. The non-biologic group underwent annual assessments.
Additional clinic visits and questionnaires were possible. When participants in the non-
biologic group started biologics, they were switched to the biologic group; that is, they
contributed follow-up time to both cohorts. Discontinuation of biologics did not change
their assigned group. At each follow-up, clinical (extracted from medical records) and self-
reported data (from questionnaires) were collected (Table 3.3). Socioeconomic status was
approximated using post-code derived Index of Multiple Deprivation (IMD) for each country
of the UK, with quintile 1 representing the top 20% most deprived areas and quintile 5 the
least [17, 18].
3.4.2.4 Comorbidity ascertainment
Participating centres extracted physician-diagnosed comorbidity data from medical records.
The source of this information was predominantly from patient-reported past medical
history, supported by GP records, where available. The list of 14 comorbidities included in
the BSRBR-AS registry are shown in Box 3.5. These conditions were selected through a
consensus meeting of clinicians and researchers, based on commonly recorded
comorbidities in routine practice.
The registry protocol specified 15 comorbidities. There was some uncertainty between
angina (which is categorised with ischaemic heart disease) and unstable angina (which is
grouped with myocardial infarction as acute coronary syndrome) during the data entering
process. Therefore, for this thesis, myocardial infarction and (unstable) angina were
Box 3. 5: List of 14 comorbidities recorded in the British Society for
Rheumatology Biologics Register for Ankylosing Spondylitis (BSRBR-AS) registry.
1. Ischaemic heart disease
2. Heart failure
3. Stroke
4. Hypertension
5. Diabetes mellitus
6. Asthma
7. Chronic obstructive pulmonary disease
(COPD)
8. Peptic ulcer disease
9. Liver disease
10. Renal disease
11. Tuberculosis (TB)
12. Demyelinating
diseases
13. Depression
14. Cancer
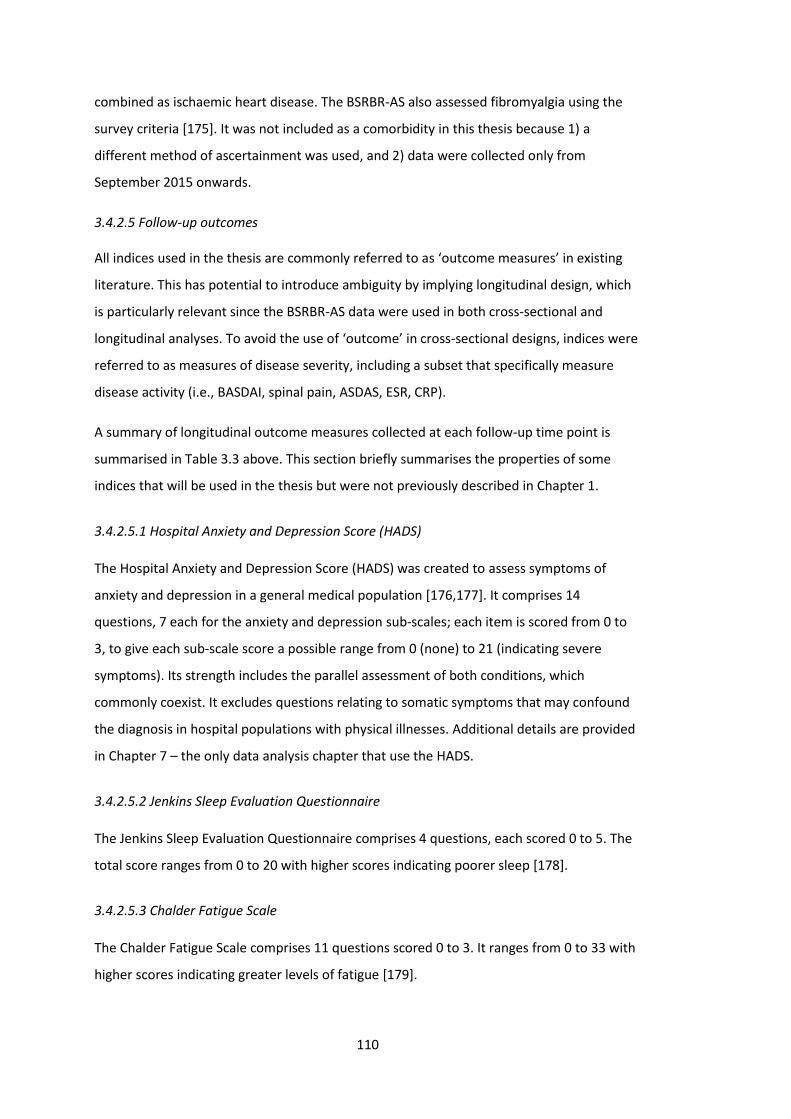
110
combined as ischaemic heart disease. The BSRBR-AS also assessed fibromyalgia using the
survey criteria [175]. It was not included as a comorbidity in this thesis because 1) a
different method of ascertainment was used, and 2) data were collected only from
September 2015 onwards.
3.4.2.5 Follow-up outcomes
All indices used in the thesis are commonly referred to as ‘outcome measures’ in existing
literature. This has potential to introduce ambiguity by implying longitudinal design, which
is particularly relevant since the BSRBR-AS data were used in both cross-sectional and
longitudinal analyses. To avoid the use of ‘outcome’ in cross-sectional designs, indices were
referred to as measures of disease severity, including a subset that specifically measure
disease activity (i.e., BASDAI, spinal pain, ASDAS, ESR, CRP).
A summary of longitudinal outcome measures collected at each follow-up time point is
summarised in Table 3.3 above. This section briefly summarises the properties of some
indices that will be used in the thesis but were not previously described in Chapter 1.
3.4.2.5.1 Hospital Anxiety and Depression Score (HADS)
The Hospital Anxiety and Depression Score (HADS) was created to assess symptoms of
anxiety and depression in a general medical population [176,177]. It comprises 14
questions, 7 each for the anxiety and depression sub-scales; each item is scored from 0 to
3, to give each sub-scale score a possible range from 0 (none) to 21 (indicating severe
symptoms). Its strength includes the parallel assessment of both conditions, which
commonly coexist. It excludes questions relating to somatic symptoms that may confound
the diagnosis in hospital populations with physical illnesses. Additional details are provided
in Chapter 7 – the only data analysis chapter that use the HADS.
3.4.2.5.2 Jenkins Sleep Evaluation Questionnaire
The Jenkins Sleep Evaluation Questionnaire comprises 4 questions, each scored 0 to 5. The
total score ranges from 0 to 20 with higher scores indicating poorer sleep [178].
3.4.2.5.3 Chalder Fatigue Scale
The Chalder Fatigue Scale comprises 11 questions scored 0 to 3. It ranges from 0 to 33 with
higher scores indicating greater levels of fatigue [179].
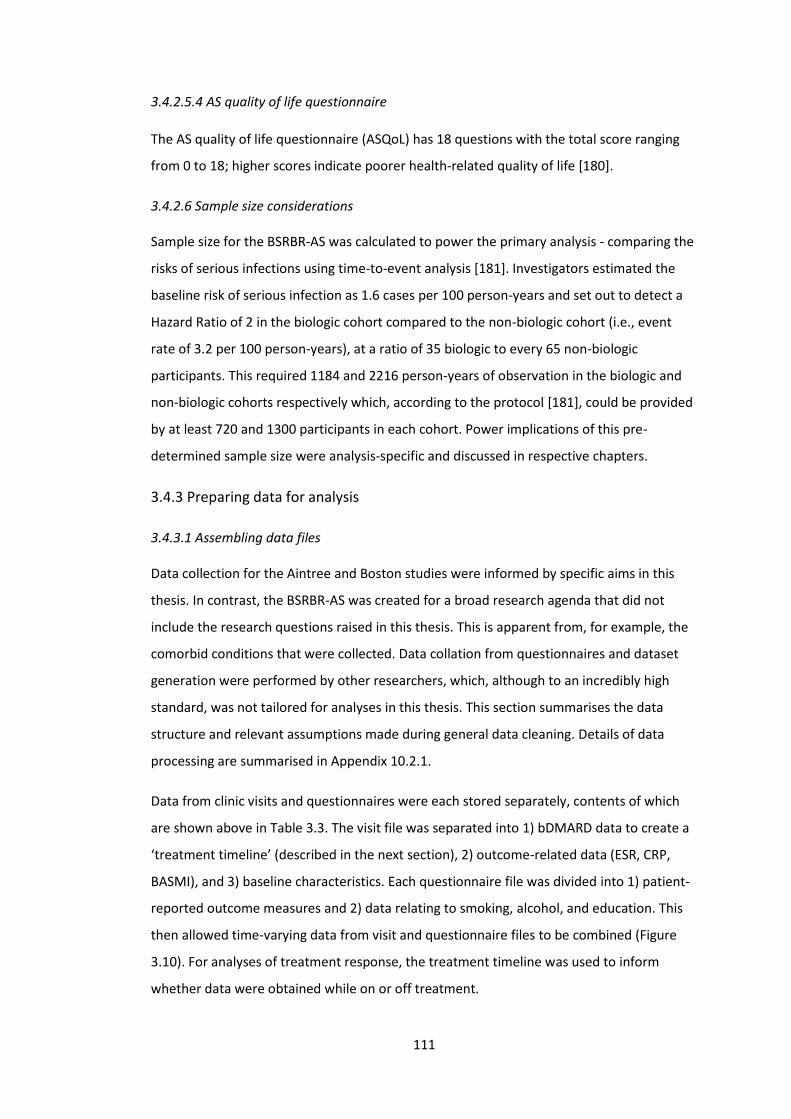
111
3.4.2.5.4 AS quality of life questionnaire
The AS quality of life questionnaire (ASQoL) has 18 questions with the total score ranging
from 0 to 18; higher scores indicate poorer health-related quality of life [180].
3.4.2.6 Sample size considerations
Sample size for the BSRBR-AS was calculated to power the primary analysis - comparing the
risks of serious infections using time-to-event analysis [181]. Investigators estimated the
baseline risk of serious infection as 1.6 cases per 100 person-years and set out to detect a
Hazard Ratio of 2 in the biologic cohort compared to the non-biologic cohort (i.e., event
rate of 3.2 per 100 person-years), at a ratio of 35 biologic to every 65 non-biologic
participants. This required 1184 and 2216 person-years of observation in the biologic and
non-biologic cohorts respectively which, according to the protocol [181], could be provided
by at least 720 and 1300 participants in each cohort. Power implications of this pre-
determined sample size were analysis-specific and discussed in respective chapters.
3.4.3 Preparing data for analysis
3.4.3.1 Assembling data files
Data collection for the Aintree and Boston studies were informed by specific aims in this
thesis. In contrast, the BSRBR-AS was created for a broad research agenda that did not
include the research questions raised in this thesis. This is apparent from, for example, the
comorbid conditions that were collected. Data collation from questionnaires and dataset
generation were performed by other researchers, which, although to an incredibly high
standard, was not tailored for analyses in this thesis. This section summarises the data
structure and relevant assumptions made during general data cleaning. Details of data
processing are summarised in Appendix 10.2.1.
Data from clinic visits and questionnaires were each stored separately, contents of which
are shown above in Table 3.3. The visit file was separated into 1) bDMARD data to create a
‘treatment timeline’ (described in the next section), 2) outcome-related data (ESR, CRP,
BASMI), and 3) baseline characteristics. Each questionnaire file was divided into 1) patient-
reported outcome measures and 2) data relating to smoking, alcohol, and education. This
then allowed time-varying data from visit and questionnaire files to be combined (Figure
3.10). For analyses of treatment response, the treatment timeline was used to inform
whether data were obtained while on or off treatment.
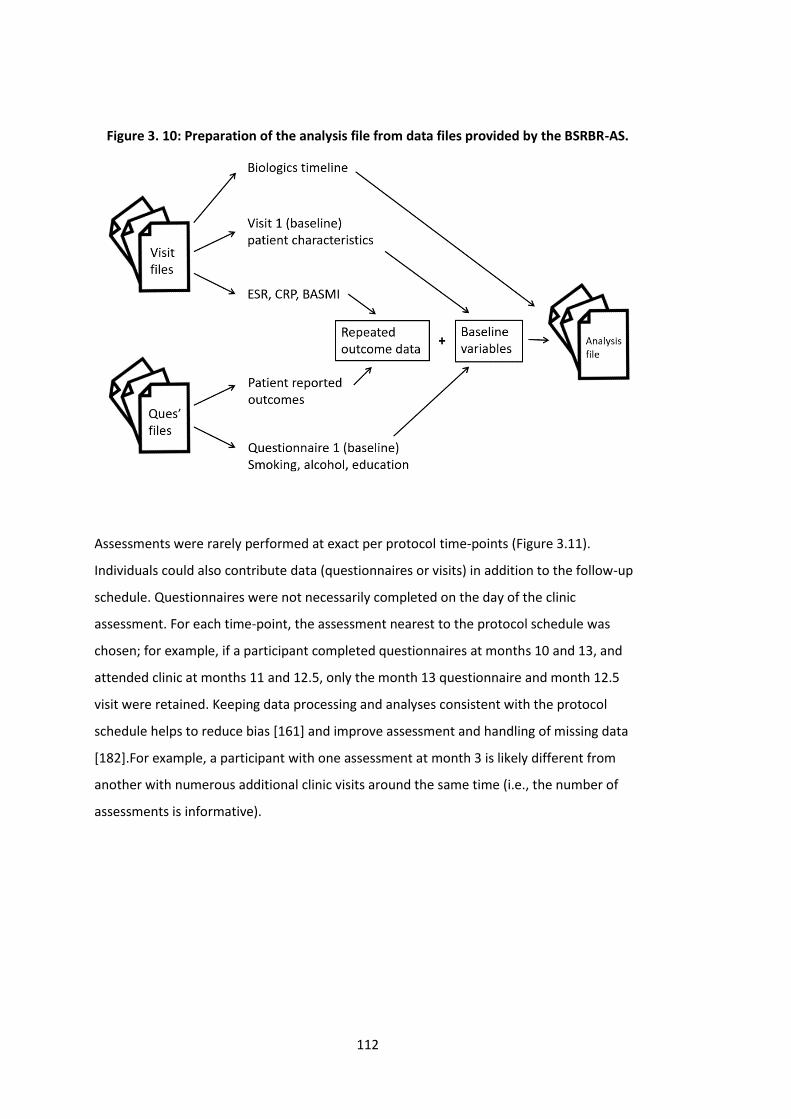
112
Figure 3. 10: Preparation of the analysis file from data files provided by the BSRBR-AS.
Assessments were rarely performed at exact per protocol time-points (Figure 3.11).
Individuals could also contribute data (questionnaires or visits) in addition to the follow-up
schedule. Questionnaires were not necessarily completed on the day of the clinic
assessment. For each time-point, the assessment nearest to the protocol schedule was
chosen; for example, if a participant completed questionnaires at months 10 and 13, and
attended clinic at months 11 and 12.5, only the month 13 questionnaire and month 12.5
visit were retained. Keeping data processing and analyses consistent with the protocol
schedule helps to reduce bias [161] and improve assessment and handling of missing data
[182].For example, a participant with one assessment at month 3 is likely different from
another with numerous additional clinic visits around the same time (i.e., the number of
assessments is informative).
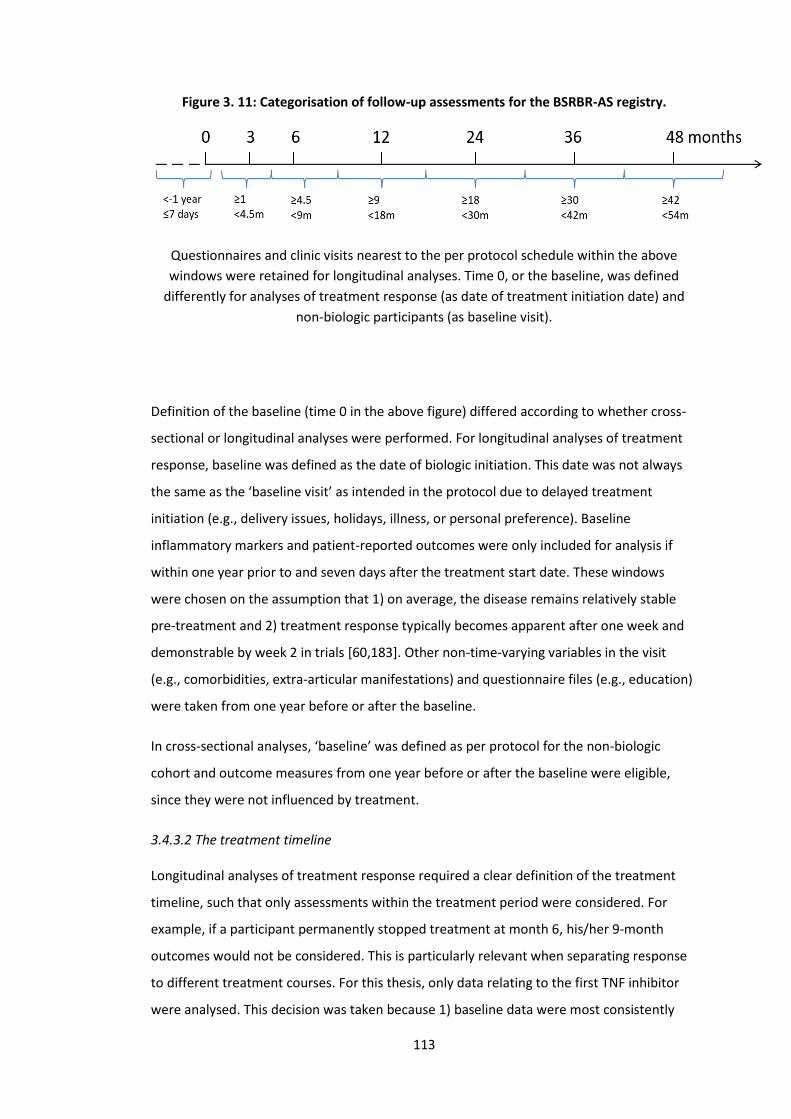
113
Figure 3. 11: Categorisation of follow-up assessments for the BSRBR-AS registry.
Questionnaires and clinic visits nearest to the per protocol schedule within the above
windows were retained for longitudinal analyses. Time 0, or the baseline, was defined
differently for analyses of treatment response (as date of treatment initiation date) and
non-biologic participants (as baseline visit).
Definition of the baseline (time 0 in the above figure) differed according to whether cross-
sectional or longitudinal analyses were performed. For longitudinal analyses of treatment
response, baseline was defined as the date of biologic initiation. This date was not always
the same as the ‘baseline visit’ as intended in the protocol due to delayed treatment
initiation (e.g., delivery issues, holidays, illness, or personal preference). Baseline
inflammatory markers and patient-reported outcomes were only included for analysis if
within one year prior to and seven days after the treatment start date. These windows
were chosen on the assumption that 1) on average, the disease remains relatively stable
pre-treatment and 2) treatment response typically becomes apparent after one week and
demonstrable by week 2 in trials [60,183]. Other non-time-varying variables in the visit
(e.g., comorbidities, extra-articular manifestations) and questionnaire files (e.g., education)
were taken from one year before or after the baseline.
In cross-sectional analyses, ‘baseline’ was defined as per protocol for the non-biologic
cohort and outcome measures from one year before or after the baseline were eligible,
since they were not influenced by treatment.
3.4.3.2 The treatment timeline
Longitudinal analyses of treatment response required a clear definition of the treatment
timeline, such that only assessments within the treatment period were considered. For
example, if a participant permanently stopped treatment at month 6, his/her 9-month
outcomes would not be considered. This is particularly relevant when separating response
to different treatment courses. For this thesis, only data relating to the first TNF inhibitor
were analysed. This decision was taken because 1) baseline data were most consistently
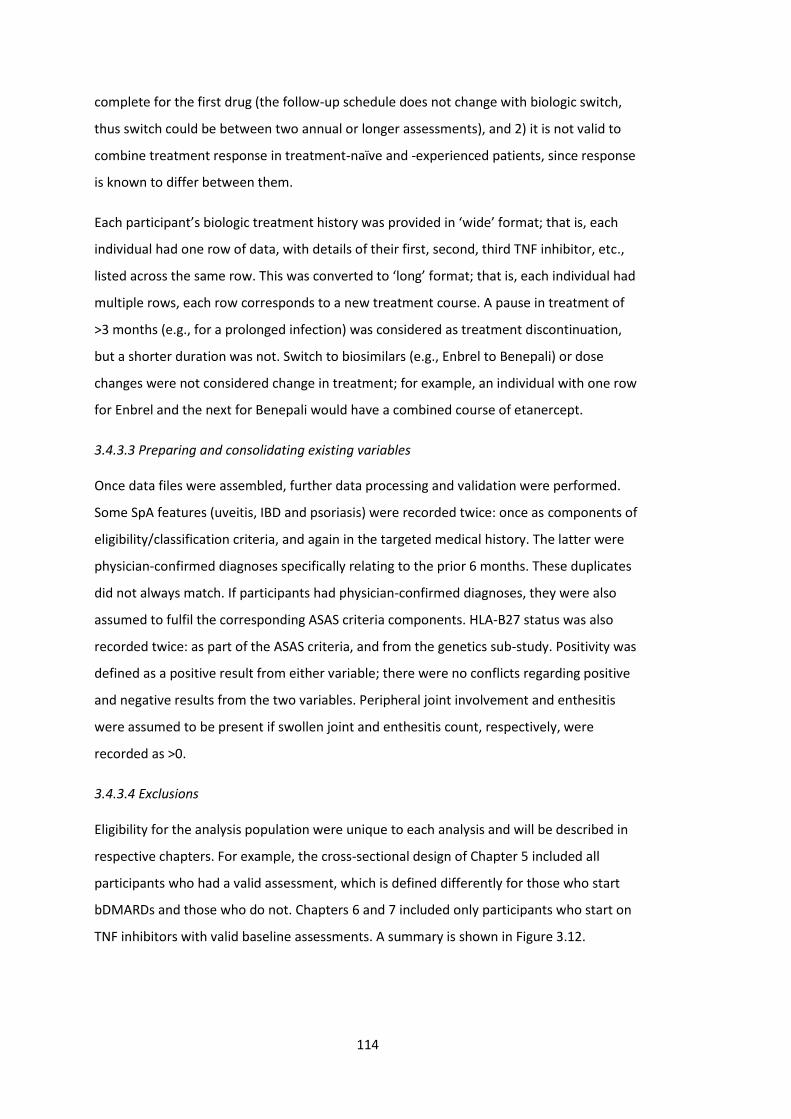
114
complete for the first drug (the follow-up schedule does not change with biologic switch,
thus switch could be between two annual or longer assessments), and 2) it is not valid to
combine treatment response in treatment-naïve and -experienced patients, since response
is known to differ between them.
Each participant’s biologic treatment history was provided in ‘wide’ format; that is, each
individual had one row of data, with details of their first, second, third TNF inhibitor, etc.,
listed across the same row. This was converted to ‘long’ format; that is, each individual had
multiple rows, each row corresponds to a new treatment course. A pause in treatment of
>3 months (e.g., for a prolonged infection) was considered as treatment discontinuation,
but a shorter duration was not. Switch to biosimilars (e.g., Enbrel to Benepali) or dose
changes were not considered change in treatment; for example, an individual with one row
for Enbrel and the next for Benepali would have a combined course of etanercept.
3.4.3.3 Preparing and consolidating existing variables
Once data files were assembled, further data processing and validation were performed.
Some SpA features (uveitis, IBD and psoriasis) were recorded twice: once as components of
eligibility/classification criteria, and again in the targeted medical history. The latter were
physician-confirmed diagnoses specifically relating to the prior 6 months. These duplicates
did not always match. If participants had physician-confirmed diagnoses, they were also
assumed to fulfil the corresponding ASAS criteria components. HLA-B27 status was also
recorded twice: as part of the ASAS criteria, and from the genetics sub-study. Positivity was
defined as a positive result from either variable; there were no conflicts regarding positive
and negative results from the two variables. Peripheral joint involvement and enthesitis
were assumed to be present if swollen joint and enthesitis count, respectively, were
recorded as >0.
3.4.3.4 Exclusions
Eligibility for the analysis population were unique to each analysis and will be described in
respective chapters. For example, the cross-sectional design of Chapter 5 included all
participants who had a valid assessment, which is defined differently for those who start
bDMARDs and those who do not. Chapters 6 and 7 included only participants who start on
TNF inhibitors with valid baseline assessments. A summary is shown in Figure 3.12.
115
Figure 3. 12: Summary of exclusions used for BSRBR-AS analyses.
bDMARD, biologic disease modifying antirheumatic drugs; PROMs, patient-reported
outcome measures; TNFi, TNF inhibitor.
116
3.5 Statistics
This section describes the common statistical methods used throughout the thesis,
including basic descriptive statistics, linear and generalise linear regression, and
longitudinal analyses (time-to-event and repeated measures). All datasets were imported
into Stata version 13 (College Station, TX).
3.5.1 Analysis approach
Statistical approaches can be broadly considered to serve one of three purposes:
description, prediction, or causal inference [184]. Description provides a quantitative
summary of the data, ranging in complexity from mean/median to cluster analysis.
Prediction links input to output, for example, correlation coefficients or ‘machine learning’
methods such as neural networks. Not all predictors are, or need to be, causative factors –
factors that change the outcome if modified. Distinguishing causation from association has
become an increasing focus for the data sciences [185]. Causal inference differs from
prediction in that it requires expert knowledge to specify the question, relevant data
sources and the underlying causal structure. The thesis follows the prevailing school of
thought that causation can only be claimed for exposures that can be manipulated under a
(hypothetical) experiment (‘no causation without manipulation’). Although analyses in this
thesis were carefully considered, comorbidity status generally cannot be manipulated;
therefore, conclusions should not be interpreted as strictly causal. Further discussions are
provided in respective chapters.
Regardless of the confidence with which causation can be claimed, this thesis focused on
inference between comorbidities and outcomes. Thus, coefficients for other variables in
multivariable models were not presented. This avoids the ‘Table 2 fallacy’ – derived from
the practice of presenting effect estimates for all independent variables in ‘Table 2’ [186].
Many journals actively forbid this approach [187], since observed associations between
these covariates and the outcome are not part of a priori aims, do not undergo
consideration for confounding, and are thus subject to bias. Throughout this thesis, results
– particularly from regression models – were presented primarily as graphs of effect
estimates or predicted values to facilitate interpretation. Raw model outputs, including
values of the confidence intervals, were included in the Appendices.
117
3.5.2 Exposure and outcome definitions
The main ‘exposure’ or independent variable of interest in this thesis was comorbidity. For
descriptive purposes, results for individual conditions and total count were presented.
Chapter 2 showed that comorbidity could be included in different forms in regression
modelling. Since each has strengths and limitations, all variable types were used where
possible:
1. Binary variable (i.e., presence or absence of comorbidity) provides results that are
the simplest to interpret but has limited amount of information;
2. Continuous variable captures more information, but assumes a linear relationship
with the outcome;
3. Categorical variable allows examination of the linear assumption. However, very
few patients have high comorbidity count, thus necessitating grouping of higher
counts (e.g., into 0, 1, 2 and ≥3 comorbidities);
4. Comorbidities can also be examined as individual conditions, which provides
granular information but at the cost of statistical power (e.g., due to the high
number of comparisons and the low prevalence of some comorbidities)
In longitudinal analyses, treatment response can be assessed using various definitions of
change from baseline. Methodology research (that was performed in parallel but not
included in the thesis) demonstrated the potential for very different conclusions to be
drawn using different definitions [41,42]. For chapters on treatment response, three
approaches were therefore used:
1. Binary response at a specified time point. This is the commonest response
definition used by existing studies and clinical trials. They fall into two categories
that are described in the next section: a fixed reduction (e.g., 50% reduction in
BASDAI) or a disease state (e.g., ASDAS inactive disease). There are many well-
described methodological issues with binary outcomes [188]. For example, binary
response thresholds are harder to achieve for individuals with higher baseline
disease activity. Adjustment for the baseline disease activity is necessary, but
introduces bias [41]. However, binary outcomes are favoured for their ease of
interpretation for clinicians and patients alike. Patients may also care more about
achieving a certain disease state (e.g., ‘inactive disease’) rather than other outcome
definitions. They are included in this thesis predominantly for consistency and
comparability with existing literature.
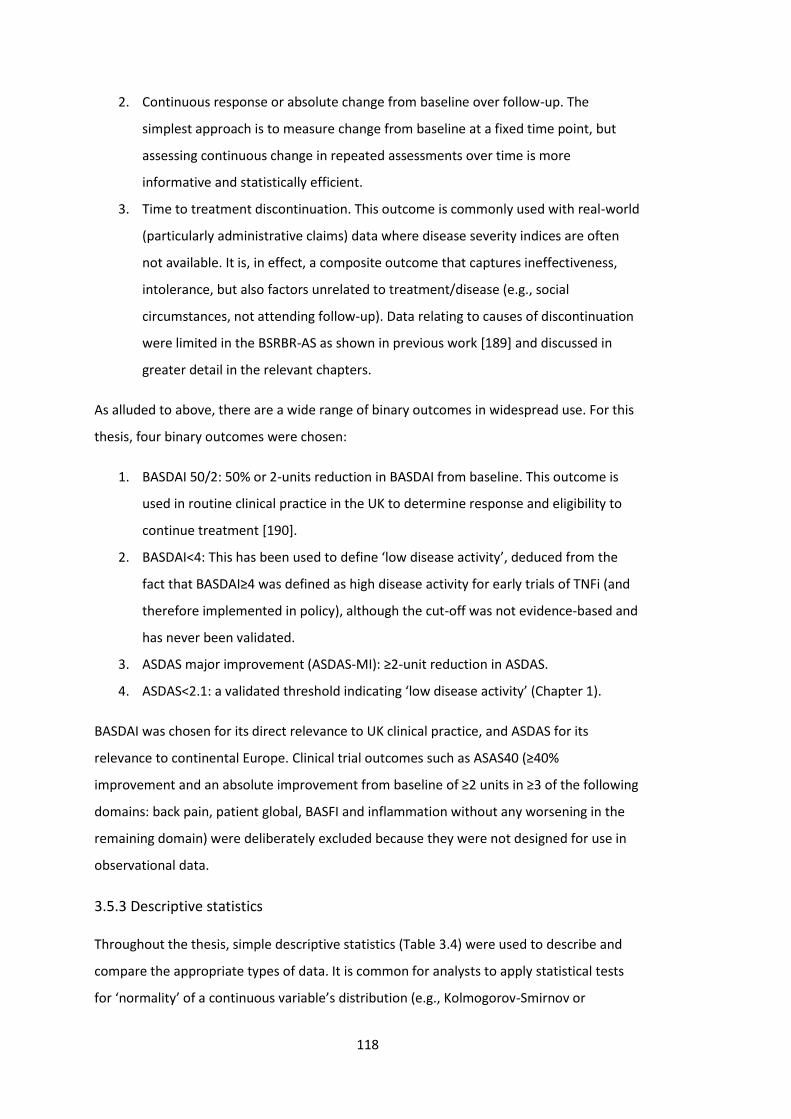
118
2. Continuous response or absolute change from baseline over follow-up. The
simplest approach is to measure change from baseline at a fixed time point, but
assessing continuous change in repeated assessments over time is more
informative and statistically efficient.
3. Time to treatment discontinuation. This outcome is commonly used with real-world
(particularly administrative claims) data where disease severity indices are often
not available. It is, in effect, a composite outcome that captures ineffectiveness,
intolerance, but also factors unrelated to treatment/disease (e.g., social
circumstances, not attending follow-up). Data relating to causes of discontinuation
were limited in the BSRBR-AS as shown in previous work [189] and discussed in
greater detail in the relevant chapters.
As alluded to above, there are a wide range of binary outcomes in widespread use. For this
thesis, four binary outcomes were chosen:
1. BASDAI 50/2: 50% or 2-units reduction in BASDAI from baseline. This outcome is
used in routine clinical practice in the UK to determine response and eligibility to
continue treatment [190].
2. BASDAI<4: This has been used to define ‘low disease activity’, deduced from the
fact that BASDAI≥4 was defined as high disease activity for early trials of TNFi (and
therefore implemented in policy), although the cut-off was not evidence-based and
has never been validated.
3. ASDAS major improvement (ASDAS-MI): ≥2-unit reduction in ASDAS.
4. ASDAS<2.1: a validated threshold indicating ‘low disease activity’ (Chapter 1).
BASDAI was chosen for its direct relevance to UK clinical practice, and ASDAS for its
relevance to continental Europe. Clinical trial outcomes such as ASAS40 (≥40%
improvement and an absolute improvement from baseline of ≥2 units in ≥3 of the following
domains: back pain, patient global, BASFI and inflammation without any worsening in the
remaining domain) were deliberately excluded because they were not designed for use in
observational data.
3.5.3 Descriptive statistics
Throughout the thesis, simple descriptive statistics (Table 3.4) were used to describe and
compare the appropriate types of data. It is common for analysts to apply statistical tests
for ‘normality’ of a continuous variable’s distribution (e.g., Kolmogorov-Smirnov or
119
skewness-kurtosis tests). These tests are over-sensitive, particularly when sample sizes are
large. Whether distributions were normally distributed - for the purposes of descriptive
statistics (as well as for linear model residuals, see later) - was decided using visual
inspection of kernel density plots juxtaposed against a normal distribution.
Table 3. 4: Simple descriptive statistical tests used in the thesis.
Data type Description Comparison between 2 groups
Comparison between ≥3 groups
Categorical Number (percentage)
Chi-squared. Fisher’s exact when expected value of any cell is ≤5. Non-parametric test for trend when ordered categorical (e.g., deprivation index)
Non-normally distributed
Median (interquartile range)
Wilcoxon rank-sum test Kruskal Wallis test
Normally distributed
Mean (standard deviation)
Independent samples t-test (two-sided)
One-way analysis of variance (ANOVA)
3.5.4 Generalised linear regression models
A simple regression model describes the relationship between a dependent variable, y, and
an independent variable, x. In its simplest form, the association between two continuous
variables are modelled. The regression line formula is yi = β0+ β1xi+Ɛi, where β1 gives the
slope of the regression line, i.e., the change in y for one-unit change in x. The intercept, β0,
is the value of y when x is zero. Due to potentially broad range of unmeasured
determinants, y varies for any given value of x, which is combined in an error term Ɛ or
‘residual’. The relationship between y and x are assumed to be linear, not unduly influenced
by outliers, and correctly specified (i.e., model adequate) [191]. The model residuals and
assumptions were tested for each linear model in this thesis, but not shown.
The above simple linear regression model can be extended to a linear combination of
multiple covariates – a multivariable model: yi = β0+ β1x1+ β2x2+…+ βpxp+Ɛi, where x
represents a collection of p variables (x1, x2, … xp). Coefficient β1 is the change in y for one-
unit increase in x1, holding all other variables in the model constant.
Linear models can be generalised to accommodate other outcome variable types; for
example, logistic models for binary outcomes. In the logistic model, the log-odds of the
120
outcome is linearly related to x: log [𝑃(𝑥)
1−𝑃(𝑥)] = β0+ β1x. Exponentiating β1 gives the odds
ratio associated with one-unit increase in x. Generalisation to multiple predictors is the
same as for linear models. Unlike ordinal least square in linear models, logistic models use
maximum likelihood to estimate parameters; that is, parameter are estimated to maximise
the likelihood (or joint probability) for the observed data under the chosen model. Models
were examined for adequacy (Hosmer-Lemeshow test), influential datapoints, and linearity
(between log-odds and x) [191].
3.5.6 Mixed effects models and GEE (Generalised Estimating Equations)
All tests and models discussed so far assume independent (i.e., non-clustered) data. When
comparing effects of treatment on BASDAI over repeated follow-ups, each participant’s
follow-up BASDAI would be related to values at the baseline and other time points.
Different methods are required for such analyses. A brief summary of their principles
relevant to this thesis are discussed here.
Linear mixed effects (also known as random effects or multilevel) models accommodate
non-independent data and, more importantly, examine effects between and within
individuals. They differ from simple linear models in the way which variance (error) is
partitioned. Each cluster, in this case each patient over time, can be given their own
intercept and/or slope (Figure 3.13).
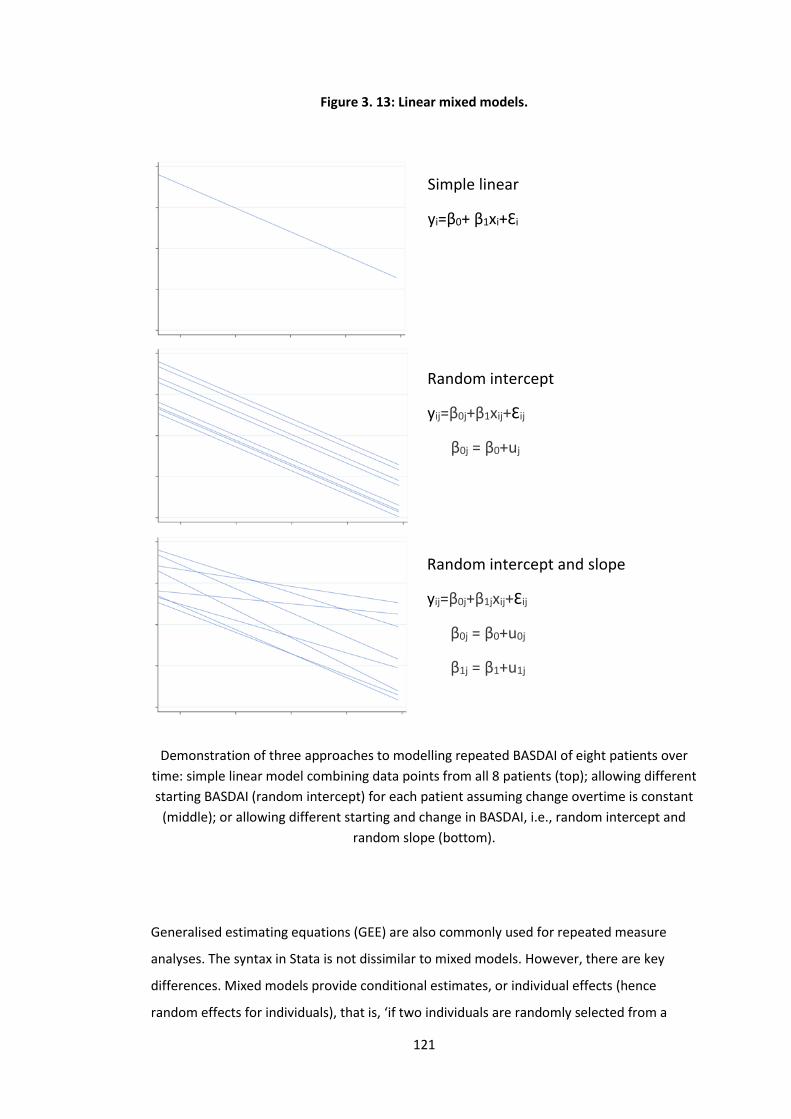
121
Figure 3. 13: Linear mixed models.
Demonstration of three approaches to modelling repeated BASDAI of eight patients over
time: simple linear model combining data points from all 8 patients (top); allowing different
starting BASDAI (random intercept) for each patient assuming change overtime is constant
(middle); or allowing different starting and change in BASDAI, i.e., random intercept and
random slope (bottom).
Generalised estimating equations (GEE) are also commonly used for repeated measure
analyses. The syntax in Stata is not dissimilar to mixed models. However, there are key
differences. Mixed models provide conditional estimates, or individual effects (hence
random effects for individuals), that is, ‘if two individuals are randomly selected from a
Simple linear
yi=β0+ β1xi+Ɛi
Random intercept
yij=β0j+β1xij+Ɛij
β0j = β0+uj
Random intercept and slope
yij=β0j+β1jxij+Ɛij
β0j = β0+u0j
β1j = β1+u1j
122
population and both have identical covariate values, the person with one comorbidity
would have an outcome value which is, on average, β units higher’. GEE assess marginal
effects, that is, population-level effects or ‘average change in outcome per unit change in
exposure’. Results from marginal and conditional models coincide for continuous
outcomes, but not necessarily for binary and time-to-event outcomes. Thus, marginal
estimates should not be used to make inferences about individuals under these
circumstances. For context, randomised controlled trials assess marginal effects (and so do
observational emulations thereof [161], e.g., using inverse-probability weighting).
GEE is robust against misspecification of the correlation structure (discussed in greater
detail in Appendix 10.2.2). However, GEE requires stronger assumptions about missing data
(Missing Completely At Random) than mixed models (Missing At Random) (Section 3.5.8)
[192]. Marginal structural models (discussed in Chapter 7) can only be used with GEE.
3.5.6.1 Interpretation of interaction terms
For both mixed models and GEE, difference over time between ‘exposure’ groups were
compared using interaction terms between the group and time. Clarifying the
interpretation for interaction terms is essential for understanding the results. There is a not
uncommon misconception that interaction terms are not required, and that the coefficient
for the ‘exposure’ (i.e., here the dependent variable comorbidity) represents the difference
in longitudinal change (e.g., as applied in reference [193]). The following explains why this is
incorrect. Take for example the output shown in Table 3.5 when modelling BASDAI
(repeated over time) against comorbidity (as binary) and follow-up time (as categorical).
(For simplicity covariates are omitted; when they are included later in the results,
interpretations remain analogous when all covariates take the value of 0 or the reference.)
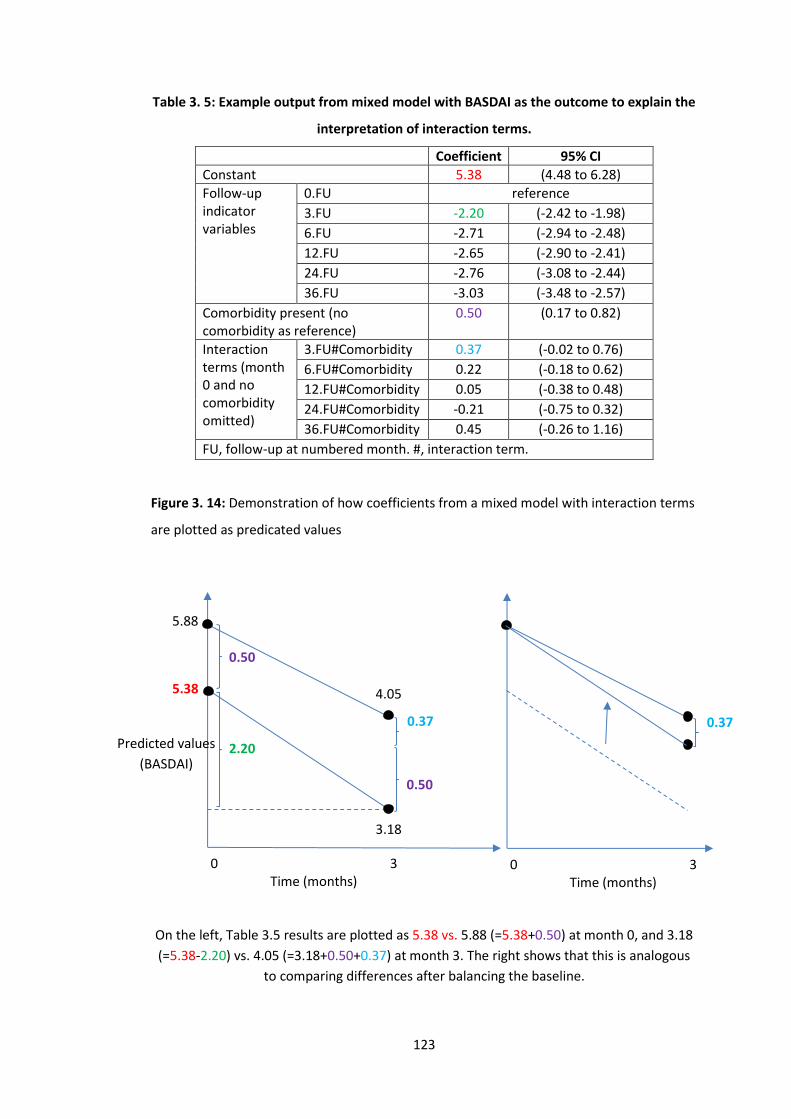
123
Table 3. 5: Example output from mixed model with BASDAI as the outcome to explain the
interpretation of interaction terms.
Coefficient 95% CI
Constant 5.38 (4.48 to 6.28)
Follow-up indicator variables
0.FU reference
3.FU -2.20 (-2.42 to -1.98)
6.FU -2.71 (-2.94 to -2.48)
12.FU -2.65 (-2.90 to -2.41)
24.FU -2.76 (-3.08 to -2.44)
36.FU -3.03 (-3.48 to -2.57)
Comorbidity present (no comorbidity as reference)
0.50 (0.17 to 0.82)
Interaction terms (month 0 and no comorbidity omitted)
3.FU#Comorbidity 0.37 (-0.02 to 0.76)
6.FU#Comorbidity 0.22 (-0.18 to 0.62)
12.FU#Comorbidity 0.05 (-0.38 to 0.48)
24.FU#Comorbidity -0.21 (-0.75 to 0.32)
36.FU#Comorbidity 0.45 (-0.26 to 1.16)
FU, follow-up at numbered month. #, interaction term.
Figure 3. 14: Demonstration of how coefficients from a mixed model with interaction terms
are plotted as predicated values
On the left, Table 3.5 results are plotted as 5.38 vs. 5.88 (=5.38+0.50) at month 0, and 3.18
(=5.38-2.20) vs. 4.05 (=3.18+0.50+0.37) at month 3. The right shows that this is analogous
to comparing differences after balancing the baseline.
0 3 Time (months)
0.37
0 3 Time (months)
4.05
3.18
Predicted values
(BASDAI)
5.88
5.38
0.50
0.50
0.37
2.20
124
The mean BASDAI at baseline is 5.38 (the constant) in those without comorbidities; that is,
when the follow-up time indicator and comorbidity both take the value of 0. Those with
comorbidities have 0.50-units higher BASDAI (coefficient for comorbidity) when the follow-
up takes the value of 0. For those without comorbidities, month 3 BASDAI falls by a mean of
2.20-units from baseline (month 3 coefficient). Those with comorbidities have 0.87
(=0.37+0.50)-unit higher BASDAI at month 3 (interaction coefficient plus baseline
difference). Note that the baseline difference in disease activity (0.50) is incorporated into
the difference at month 3, thus the interaction term coefficient indicates the difference in
change from baseline between groups at each follow-up; in this example, the difference
(0.37) was not statistically significant (see below). Additional ‘adjustment’ for the baseline
value is therefore not necessary. (This approach also avoids the causal conundrum of
baseline adjustment). Had the model not used interaction terms, the two groups’
trajectories would be parallel, with the coefficient for comorbidity simply representing the
baseline difference (carried over time).
To make interpretation easier, predicted values (using -marginsplot- command in Stata) are
shown graphically (Figure 3.14, left panel), with asterisks indicating statistical significance of
the interaction term at the p<0.05 level. Note that statistical significance here does not
relate to the difference between the two predicted values at month 3 (4.05 and 3.18),
rather it is the departure from the baseline difference, or ‘difference accounting for the
baseline’ (Figure 3.14, right panel).
3.5.7 Survival analysis
Survival analysis accounts for whether the event occurred as well as time to event (e.g.,
treatment discontinuation). Survival analysis allows ‘right-censored’ data (when follow-up is
stopped before the event occurs) to be included in analyses. The probability of remaining
event-free at time t (i.e., the survival function, S(t)) is estimated using the Kaplan-Meier
estimator. The Kaplan-Meier curve ‘drops’ at observed event times and is flat in the
intervening period. Curves can be compared using the log-rank test, that tests the
hypothesis that the survival distribution is equal at all times.
S(t) is related to the hazard function, h(t), which is the short-term event rate for individuals
who have not yet experienced the outcome event. The hazard ratio HR(t) is simply a ratio of
h(t) between two groups. In their simplest form, proportional hazards models assume that
the hazard ratio does not vary with time, i.e., HR(t)=HR. In these models, the linear
125
predictor is linked through log-transformation to the HR: log[HR(x)] = log [ℎ(𝑡|𝑥)
ℎ0(𝑡)] = βx,
where h(t|x) is the hazard at time t for an observation with predictor value x, and h0(t) is
the baseline hazard (hazard at time t with predictor at zero). This equation solves to:
log[h(t|x)] = log[h0(t)] + βx, where log[h0(t)] is analogous to the intercept in linear
models. This log-linear model implies that the log of the hazard changes linearly with each
unit change in x. The Cox proportional hazards model was used in this thesis. There are
many other approaches, including pooled logistic regression (used with marginal structural
models, described in Chapter 7).
Four main diagnostics were performed for each Cox model: model specification, outliers,
log-linearity, and proportional hazards [191]. For model specification, Cox-Snell residuals
(compared to the cumulative hazard) were used to examine model fit. For log-linearity,
higher-order forms of each variable (polynomials) were added to assess model
improvement. Proportional hazards were tested by inspecting the Kaplan-Meier estimator
and Schoenfeld residuals. Where covariates violated the proportional hazards assumption,
the variable was stratified (using the -strata()- option of the -stcox- command in Stata); i.e.,
allowing equal coefficients across strata but with a baseline hazard unique to each stratum.
3.5.8 Missing data and multiple imputation
Missing data are problematic because most statistical analyses require a value for each
variable. The simplest and commonest approach is to analyse only the cases with complete
data; individuals with data missing on any variable are excluded. This can reduce the
sample size, power, and introduce bias. Types of missing data can be considered according
to their relationship with the non-missing (Box 3.6).
126
Complete case analysis with MCAR data produces the same result had there been no
missing; this is true of cross-sectional or longitudinal data. MAR data can be imputed based
on, or weighted to be represented by, observed data to provide unbiased estimates. In
longitudinal data, complete case analysis with MAR data can introduce bias when using
with some approaches (GEE) but not others (mixed models). MNAR is particularly
problematic and requires sophisticated methods that are beyond the scope of this thesis.
Complete case analysis in GEE/mixed models – used throughout this thesis – do not ‘drop’
individuals who do not have complete follow-up at all time points. No imputation was
performed for longitudinal analyses. The only exception was when deriving inverse-
probability of censoring weights, where the derivation procedure creates a row of data for
each person-month (Chapter 7). Values of time-varying variables were carried forward until
the next available time point.
The proportion of missing for each relevant variable is described in respective chapters. All
primary analyses used complete case only. Sensitivity analysis using multiple imputation
was performed for each regression model that used cross-sectional data; only clinically
meaningful differences were reported. Models for inverse-probability weights used MICE
by default. Multiple imputation by chained equations (-mi- command in Stata) handles
MAR/MCAR data by creating multiple copies of the dataset (30 used in this thesis) and
using the distribution of the observed data and relationships with ‘auxiliary variables’ to
impute missing values (i.e., using them to predict the missing values) of each variable in
Box 3.6. Missing data mechanisms.
Missing Completely at Random (MCAR): the propensity for missingness is completely
random; i.e., there is no relationship between whether a data point is missing and any
values in the dataset (missing or observed).
Missing at Random (MAR): systematic relationship between the propensity for
missingness and the observed data (but not the missing data); i.e., missingness can be
made random by conditioning on certain observed variables.
Missing Not at Random (MNAR): missingness that is explained by the missing data. For
example, missing disease activity data after loss of treatment response because
treatment was discontinued due to loss of response.
127
turn. Outcome regression was performed on all 30 datasets and combined. Using multiple
imputed values reflect the uncertainty around the true value. All covariates in the model of
interest were used as auxiliary variables (i.e., variables that are correlated or believed to be
associated with missingness).
3.6 Summary
Data used in this thesis were derived from three sources:
• Aintree axSpA registry: cross-sectional data from routine clinical records and
questionnaires, from 2010 to 2018. This tertiary care dataset included rich and
validated comorbidities (39 diseases derived from multiple sources of data by
manual review).
• Boston axSpA study: cross-sectional data from electronic health records extracted
by manual review and using coded data, from 2001 to 2018. This was one of the
biggest axSpA cohorts in the US at the time of creation. The same list of 39
comorbidities were derived from ICD codes.
• BSRBR-AS: a longitudinal pharmacovigilance study from 2012 to 2017. It contained
a wealth of outcomes data for biologic treated and biologic naïve axSpA
participants, which allowed examination of treatment response. The list of 15
comorbidities were already collected by the study and provided for secondary
analysis for this thesis.
A brief summary of each Results chapter and the dataset used is shown below.
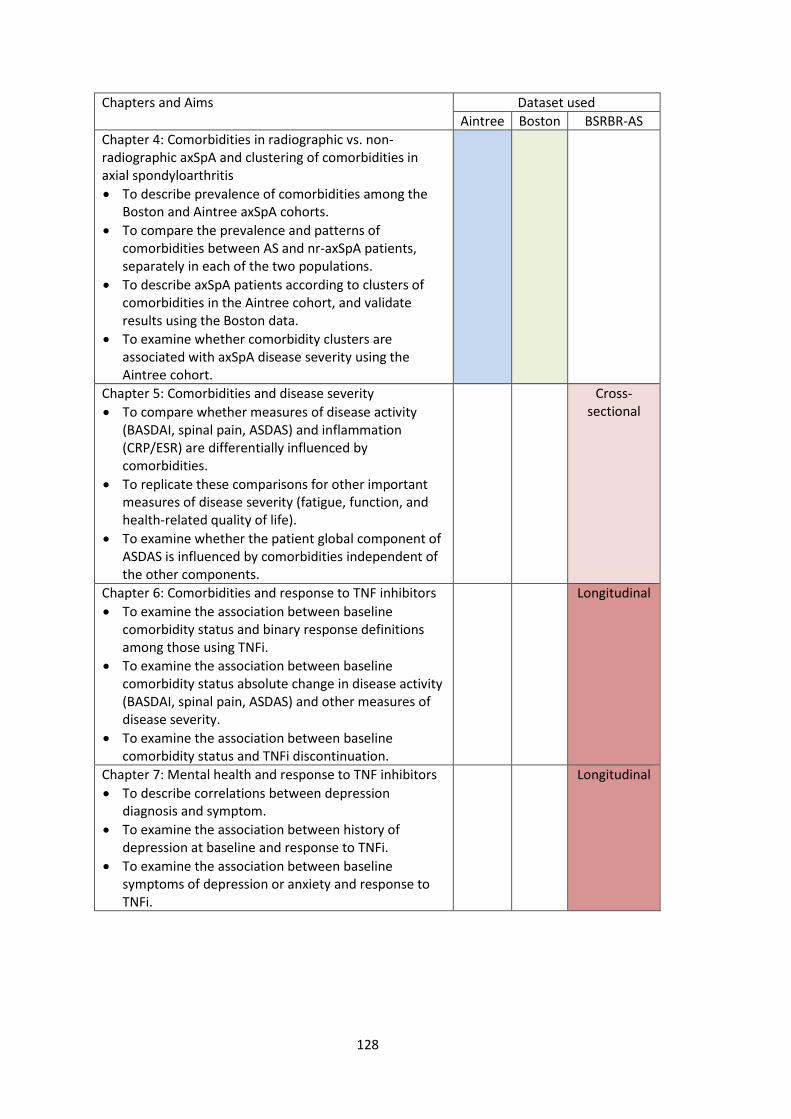
128
Chapters and Aims Dataset used
Aintree Boston BSRBR-AS
Chapter 4: Comorbidities in radiographic vs. non-radiographic axSpA and clustering of comorbidities in axial spondyloarthritis
• To describe prevalence of comorbidities among the Boston and Aintree axSpA cohorts.
• To compare the prevalence and patterns of comorbidities between AS and nr-axSpA patients, separately in each of the two populations.
• To describe axSpA patients according to clusters of comorbidities in the Aintree cohort, and validate results using the Boston data.
• To examine whether comorbidity clusters are associated with axSpA disease severity using the Aintree cohort.
Chapter 5: Comorbidities and disease severity
• To compare whether measures of disease activity (BASDAI, spinal pain, ASDAS) and inflammation (CRP/ESR) are differentially influenced by comorbidities.
• To replicate these comparisons for other important measures of disease severity (fatigue, function, and health-related quality of life).
• To examine whether the patient global component of ASDAS is influenced by comorbidities independent of the other components.
Cross-sectional
Chapter 6: Comorbidities and response to TNF inhibitors
• To examine the association between baseline comorbidity status and binary response definitions among those using TNFi.
• To examine the association between baseline comorbidity status absolute change in disease activity (BASDAI, spinal pain, ASDAS) and other measures of disease severity.
• To examine the association between baseline comorbidity status and TNFi discontinuation.
Longitudinal
Chapter 7: Mental health and response to TNF inhibitors
• To describe correlations between depression diagnosis and symptom.
• To examine the association between history of depression at baseline and response to TNFi.
• To examine the association between baseline symptoms of depression or anxiety and response to TNFi.
Longitudinal
129
Chapter 4: Comorbidities in radiographic vs. non-radiographic axSpA and clustering of comorbidities in axial
spondyloarthritis
This chapter describes the prevalence and pattern of comorbidities and compares them
between radiographic (i.e., ankylosing spondylitis) and non-radiographic axial
spondyloarthritis, using cross-sectional data from both the Aintree and Boston studies. The
same datasets were used to examine how comorbidities co-occur and whether axSpA
disease severity differs between these patient-clusters.
4.1 Introduction
AS and non-radiographic axSpA (nr-axSpA) have similar symptom burdens and clinical
features [56,57]. AS cohorts differ from their nr-axSpA counterparts in being older, more
frequently male and having higher levels of CRP [56,57]. Each of these factors can influence
the likelihood of developing comorbidities; for example, comorbidity burden generally
increases with age, while some conditions are unique to (e.g., prostate disorders), or are
much more prevalent in, one gender (osteoporosis in females) [140]. Systemic
inflammation is also a risk factor for many comorbidities, e.g., cardiovascular diseases
[141]. Whether comorbidities differ between AS and nr-axSpA groups has not been
examined. Characterising their respective comorbidity burden is important since it is
associated with several adverse disease outcomes [142].
Prior studies of comorbidities have either examined individual conditions or comorbidity
count, which does not account for relationships between diseases (e.g., between
hypertension and cardiovascular disease). This chapter addresses this gap in the literature
using cluster analysis. Cluster analysis is a set of exploratory statistical techniques that can
be used to describe which comorbidities commonly co-occur. It also helps identify patient-
groups with disease clusters most associated with disease activity and other outcome
measures, who may benefit from additional intervention.
Cross-sectional data from two tertiary centres in Boston (USA) and Aintree (UK), that differ
in both socioeconomic context and clinical approaches, will be used to complement each
other in all analyses. The Results section will begin with a description of comorbidity
prevalence in each patient population.
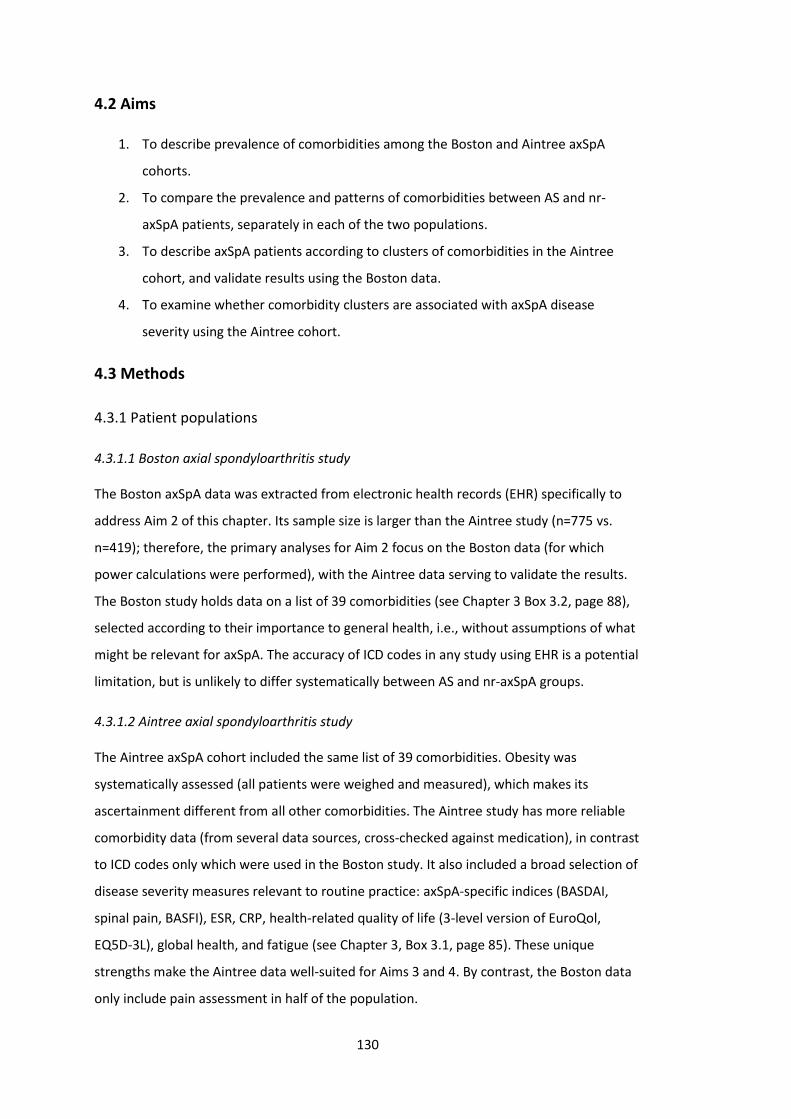
130
4.2 Aims
1. To describe prevalence of comorbidities among the Boston and Aintree axSpA
cohorts.
2. To compare the prevalence and patterns of comorbidities between AS and nr-
axSpA patients, separately in each of the two populations.
3. To describe axSpA patients according to clusters of comorbidities in the Aintree
cohort, and validate results using the Boston data.
4. To examine whether comorbidity clusters are associated with axSpA disease
severity using the Aintree cohort.
4.3 Methods
4.3.1 Patient populations
4.3.1.1 Boston axial spondyloarthritis study
The Boston axSpA data was extracted from electronic health records (EHR) specifically to
address Aim 2 of this chapter. Its sample size is larger than the Aintree study (n=775 vs.
n=419); therefore, the primary analyses for Aim 2 focus on the Boston data (for which
power calculations were performed), with the Aintree data serving to validate the results.
The Boston study holds data on a list of 39 comorbidities (see Chapter 3 Box 3.2, page 88),
selected according to their importance to general health, i.e., without assumptions of what
might be relevant for axSpA. The accuracy of ICD codes in any study using EHR is a potential
limitation, but is unlikely to differ systematically between AS and nr-axSpA groups.
4.3.1.2 Aintree axial spondyloarthritis study
The Aintree axSpA cohort included the same list of 39 comorbidities. Obesity was
systematically assessed (all patients were weighed and measured), which makes its
ascertainment different from all other comorbidities. The Aintree study has more reliable
comorbidity data (from several data sources, cross-checked against medication), in contrast
to ICD codes only which were used in the Boston study. It also included a broad selection of
disease severity measures relevant to routine practice: axSpA-specific indices (BASDAI,
spinal pain, BASFI), ESR, CRP, health-related quality of life (3-level version of EuroQol,
EQ5D-3L), global health, and fatigue (see Chapter 3, Box 3.1, page 85). These unique
strengths make the Aintree data well-suited for Aims 3 and 4. By contrast, the Boston data
only include pain assessment in half of the population.
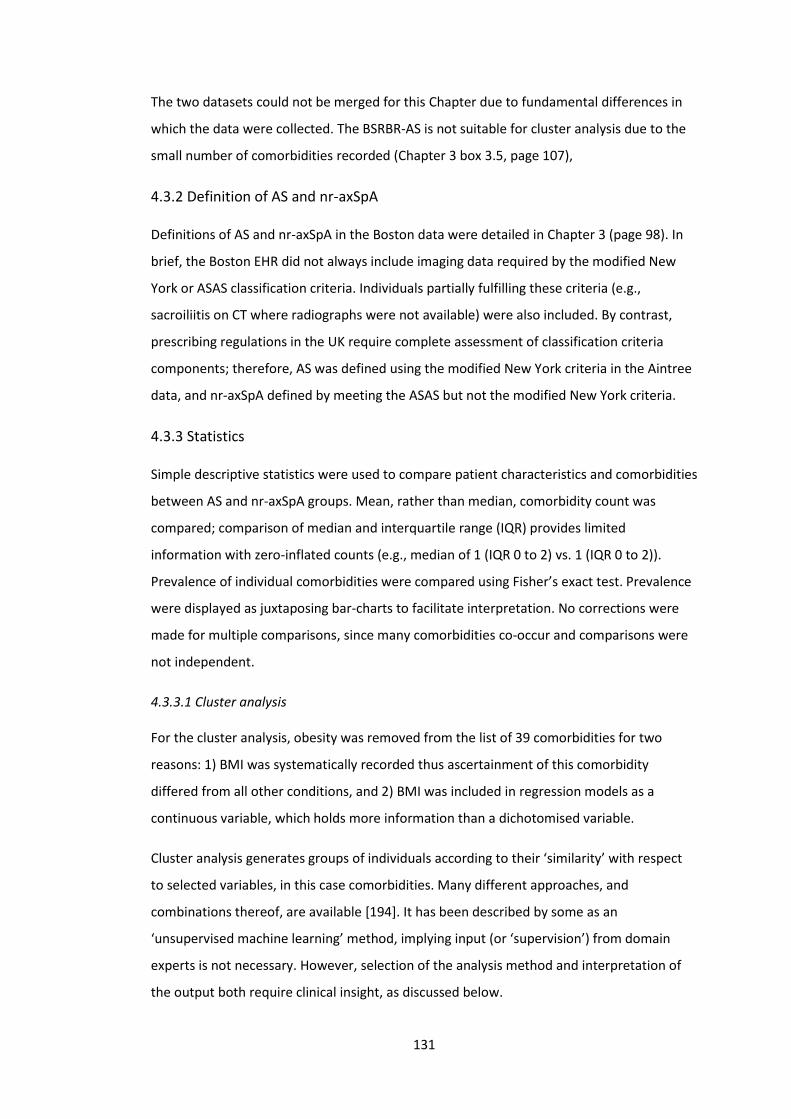
131
The two datasets could not be merged for this Chapter due to fundamental differences in
which the data were collected. The BSRBR-AS is not suitable for cluster analysis due to the
small number of comorbidities recorded (Chapter 3 box 3.5, page 107),
4.3.2 Definition of AS and nr-axSpA
Definitions of AS and nr-axSpA in the Boston data were detailed in Chapter 3 (page 98). In
brief, the Boston EHR did not always include imaging data required by the modified New
York or ASAS classification criteria. Individuals partially fulfilling these criteria (e.g.,
sacroiliitis on CT where radiographs were not available) were also included. By contrast,
prescribing regulations in the UK require complete assessment of classification criteria
components; therefore, AS was defined using the modified New York criteria in the Aintree
data, and nr-axSpA defined by meeting the ASAS but not the modified New York criteria.
4.3.3 Statistics
Simple descriptive statistics were used to compare patient characteristics and comorbidities
between AS and nr-axSpA groups. Mean, rather than median, comorbidity count was
compared; comparison of median and interquartile range (IQR) provides limited
information with zero-inflated counts (e.g., median of 1 (IQR 0 to 2) vs. 1 (IQR 0 to 2)).
Prevalence of individual comorbidities were compared using Fisher’s exact test. Prevalence
were displayed as juxtaposing bar-charts to facilitate interpretation. No corrections were
made for multiple comparisons, since many comorbidities co-occur and comparisons were
not independent.
4.3.3.1 Cluster analysis
For the cluster analysis, obesity was removed from the list of 39 comorbidities for two
reasons: 1) BMI was systematically recorded thus ascertainment of this comorbidity
differed from all other conditions, and 2) BMI was included in regression models as a
continuous variable, which holds more information than a dichotomised variable.
Cluster analysis generates groups of individuals according to their ‘similarity’ with respect
to selected variables, in this case comorbidities. Many different approaches, and
combinations thereof, are available [194]. It has been described by some as an
‘unsupervised machine learning’ method, implying input (or ‘supervision’) from domain
experts is not necessary. However, selection of the analysis method and interpretation of
the output both require clinical insight, as discussed below.
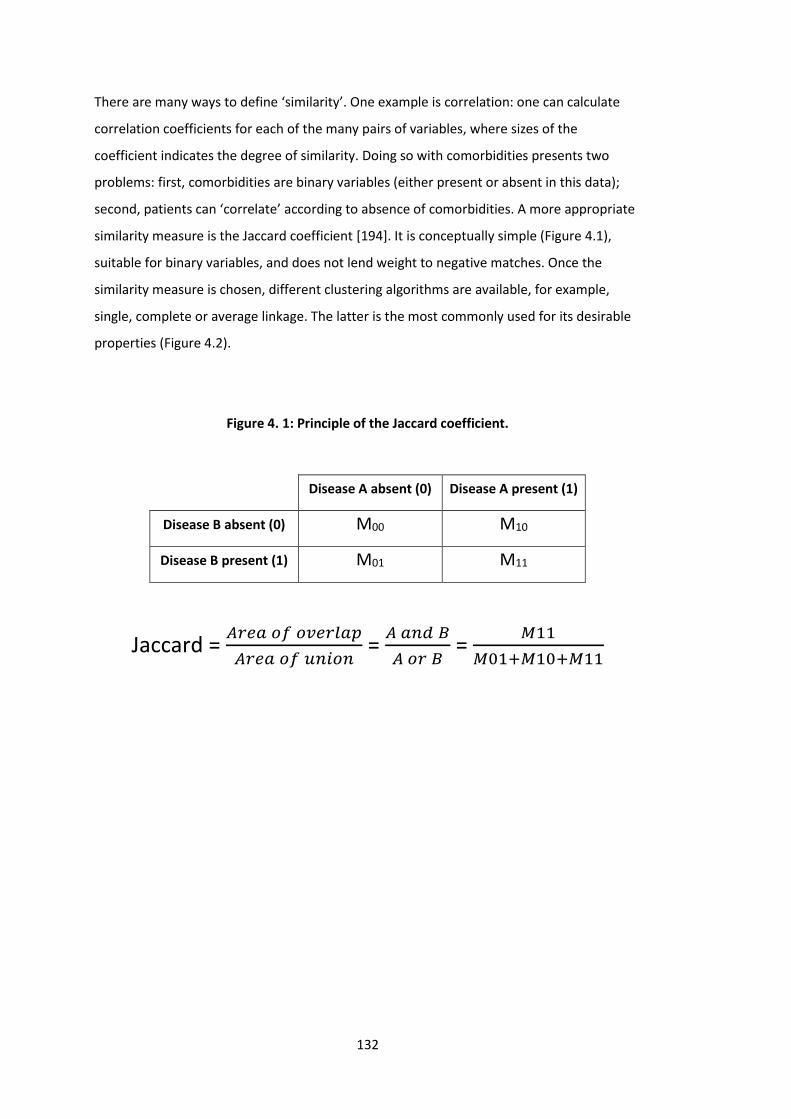
132
There are many ways to define ‘similarity’. One example is correlation: one can calculate
correlation coefficients for each of the many pairs of variables, where sizes of the
coefficient indicates the degree of similarity. Doing so with comorbidities presents two
problems: first, comorbidities are binary variables (either present or absent in this data);
second, patients can ‘correlate’ according to absence of comorbidities. A more appropriate
similarity measure is the Jaccard coefficient [194]. It is conceptually simple (Figure 4.1),
suitable for binary variables, and does not lend weight to negative matches. Once the
similarity measure is chosen, different clustering algorithms are available, for example,
single, complete or average linkage. The latter is the most commonly used for its desirable
properties (Figure 4.2).
Figure 4. 1: Principle of the Jaccard coefficient.
Disease A absent (0) Disease A present (1)
Disease B absent (0) M00 M10
Disease B present (1) M01 M11
Jaccard = 𝐴𝑟𝑒𝑎 𝑜𝑓 𝑜𝑣𝑒𝑟𝑙𝑎𝑝
𝐴𝑟𝑒𝑎 𝑜𝑓 𝑢𝑛𝑖𝑜𝑛 =
𝐴 𝑎𝑛𝑑 𝐵
𝐴 𝑜𝑟 𝐵 =
𝑀11
𝑀01+𝑀10+𝑀11
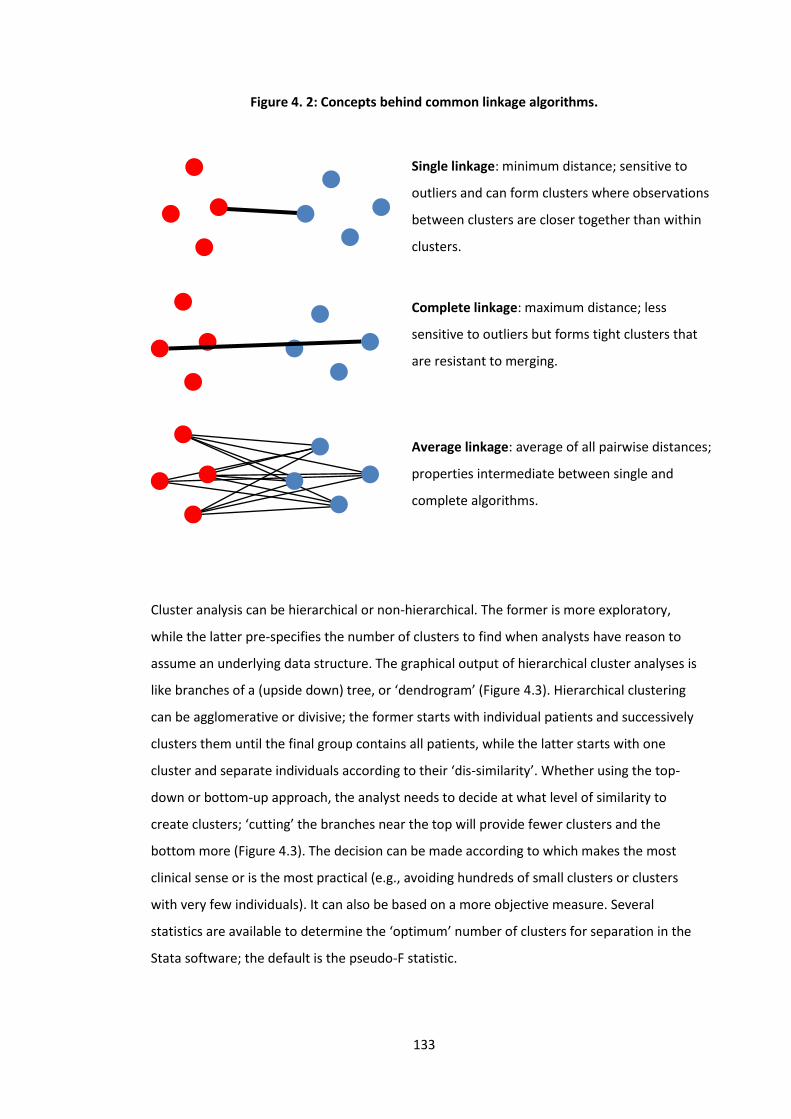
133
Figure 4. 2: Concepts behind common linkage algorithms.
Cluster analysis can be hierarchical or non-hierarchical. The former is more exploratory,
while the latter pre-specifies the number of clusters to find when analysts have reason to
assume an underlying data structure. The graphical output of hierarchical cluster analyses is
like branches of a (upside down) tree, or ‘dendrogram’ (Figure 4.3). Hierarchical clustering
can be agglomerative or divisive; the former starts with individual patients and successively
clusters them until the final group contains all patients, while the latter starts with one
cluster and separate individuals according to their ‘dis-similarity’. Whether using the top-
down or bottom-up approach, the analyst needs to decide at what level of similarity to
create clusters; ‘cutting’ the branches near the top will provide fewer clusters and the
bottom more (Figure 4.3). The decision can be made according to which makes the most
clinical sense or is the most practical (e.g., avoiding hundreds of small clusters or clusters
with very few individuals). It can also be based on a more objective measure. Several
statistics are available to determine the ‘optimum’ number of clusters for separation in the
Stata software; the default is the pseudo-F statistic.
Single linkage: minimum distance; sensitive to
outliers and can form clusters where observations
between clusters are closer together than within
clusters.
Complete linkage: maximum distance; less
sensitive to outliers but forms tight clusters that
are resistant to merging.
Average linkage: average of all pairwise distances;
properties intermediate between single and
complete algorithms.
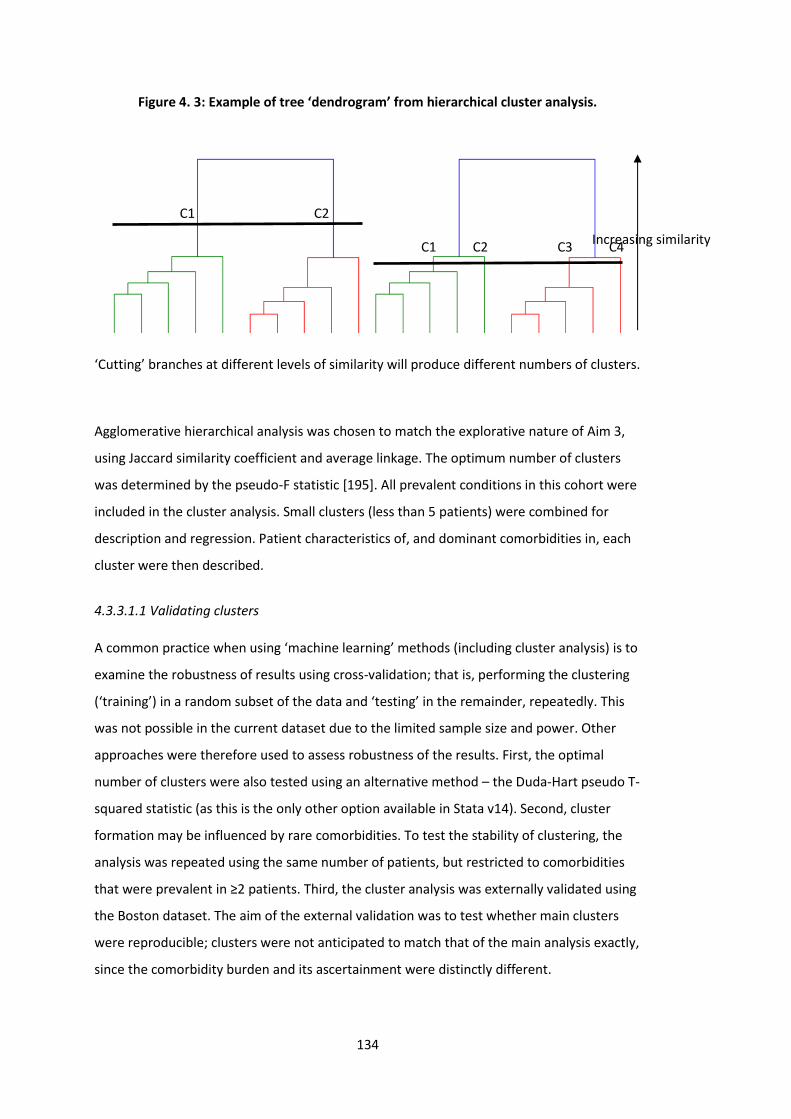
134
Figure 4. 3: Example of tree ‘dendrogram’ from hierarchical cluster analysis.
‘Cutting’ branches at different levels of similarity will produce different numbers of clusters.
Agglomerative hierarchical analysis was chosen to match the explorative nature of Aim 3,
using Jaccard similarity coefficient and average linkage. The optimum number of clusters
was determined by the pseudo-F statistic [195]. All prevalent conditions in this cohort were
included in the cluster analysis. Small clusters (less than 5 patients) were combined for
description and regression. Patient characteristics of, and dominant comorbidities in, each
cluster were then described.
4.3.3.1.1 Validating clusters
A common practice when using ‘machine learning’ methods (including cluster analysis) is to
examine the robustness of results using cross-validation; that is, performing the clustering
(‘training’) in a random subset of the data and ‘testing’ in the remainder, repeatedly. This
was not possible in the current dataset due to the limited sample size and power. Other
approaches were therefore used to assess robustness of the results. First, the optimal
number of clusters were also tested using an alternative method – the Duda-Hart pseudo T-
squared statistic (as this is the only other option available in Stata v14). Second, cluster
formation may be influenced by rare comorbidities. To test the stability of clustering, the
analysis was repeated using the same number of patients, but restricted to comorbidities
that were prevalent in ≥2 patients. Third, the cluster analysis was externally validated using
the Boston dataset. The aim of the external validation was to test whether main clusters
were reproducible; clusters were not anticipated to match that of the main analysis exactly,
since the comorbidity burden and its ascertainment were distinctly different.
C1 C2
Increasing similarity C1 C2 C3 C4
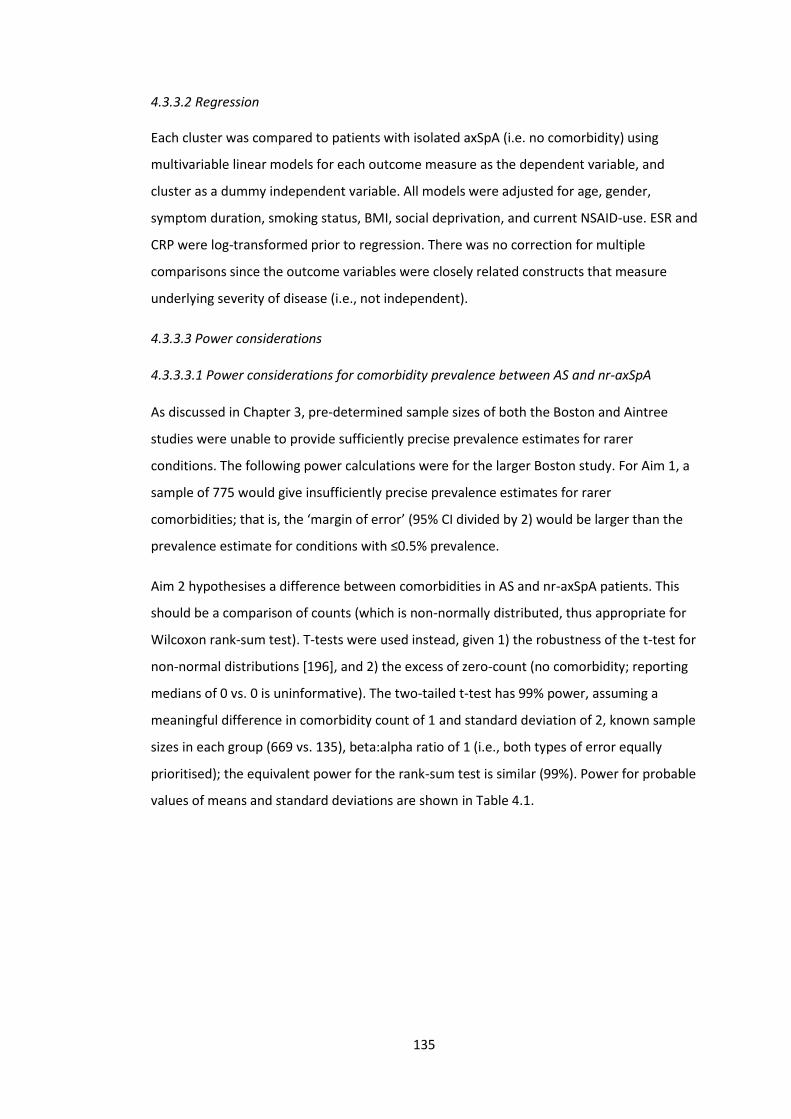
135
4.3.3.2 Regression
Each cluster was compared to patients with isolated axSpA (i.e. no comorbidity) using
multivariable linear models for each outcome measure as the dependent variable, and
cluster as a dummy independent variable. All models were adjusted for age, gender,
symptom duration, smoking status, BMI, social deprivation, and current NSAID-use. ESR and
CRP were log-transformed prior to regression. There was no correction for multiple
comparisons since the outcome variables were closely related constructs that measure
underlying severity of disease (i.e., not independent).
4.3.3.3 Power considerations
4.3.3.3.1 Power considerations for comorbidity prevalence between AS and nr-axSpA
As discussed in Chapter 3, pre-determined sample sizes of both the Boston and Aintree
studies were unable to provide sufficiently precise prevalence estimates for rarer
conditions. The following power calculations were for the larger Boston study. For Aim 1, a
sample of 775 would give insufficiently precise prevalence estimates for rarer
comorbidities; that is, the ‘margin of error’ (95% CI divided by 2) would be larger than the
prevalence estimate for conditions with ≤0.5% prevalence.
Aim 2 hypothesises a difference between comorbidities in AS and nr-axSpA patients. This
should be a comparison of counts (which is non-normally distributed, thus appropriate for
Wilcoxon rank-sum test). T-tests were used instead, given 1) the robustness of the t-test for
non-normal distributions [196], and 2) the excess of zero-count (no comorbidity; reporting
medians of 0 vs. 0 is uninformative). The two-tailed t-test has 99% power, assuming a
meaningful difference in comorbidity count of 1 and standard deviation of 2, known sample
sizes in each group (669 vs. 135), beta:alpha ratio of 1 (i.e., both types of error equally
prioritised); the equivalent power for the rank-sum test is similar (99%). Power for probable
values of means and standard deviations are shown in Table 4.1.
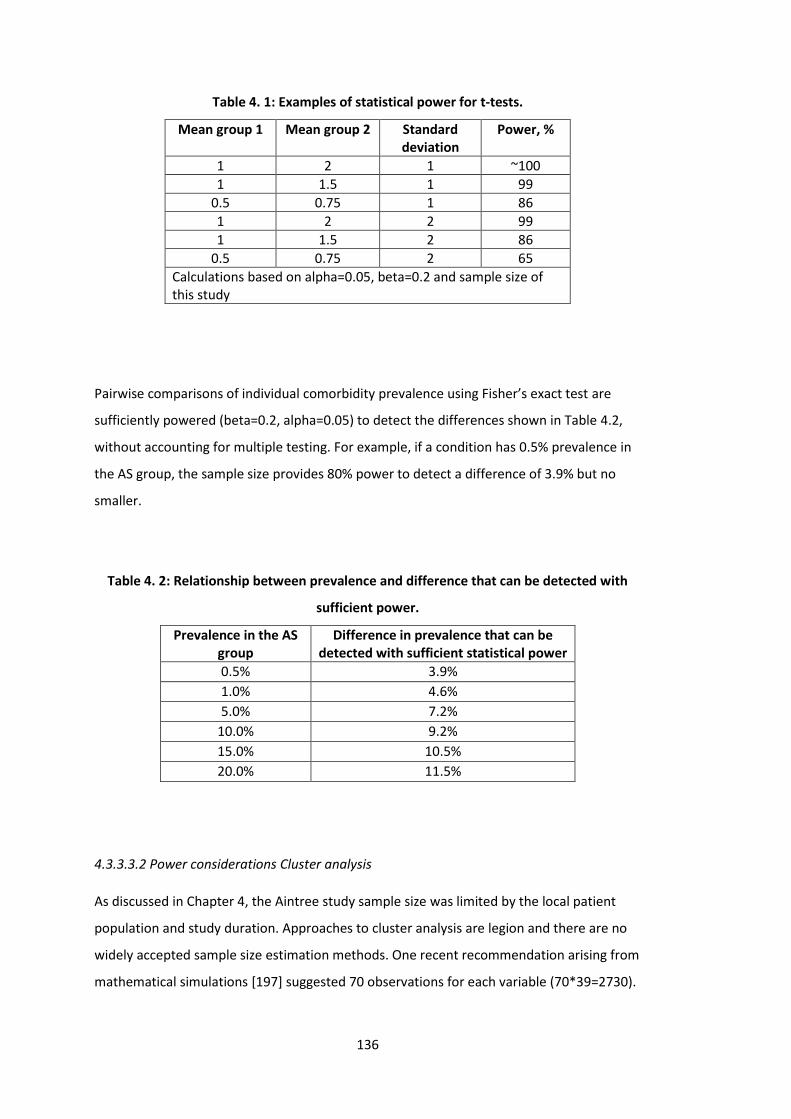
136
Table 4. 1: Examples of statistical power for t-tests.
Mean group 1 Mean group 2 Standard deviation
Power, %
1 2 1 ~100
1 1.5 1 99
0.5 0.75 1 86
1 2 2 99
1 1.5 2 86
0.5 0.75 2 65
Calculations based on alpha=0.05, beta=0.2 and sample size of this study
Pairwise comparisons of individual comorbidity prevalence using Fisher’s exact test are
sufficiently powered (beta=0.2, alpha=0.05) to detect the differences shown in Table 4.2,
without accounting for multiple testing. For example, if a condition has 0.5% prevalence in
the AS group, the sample size provides 80% power to detect a difference of 3.9% but no
smaller.
Table 4. 2: Relationship between prevalence and difference that can be detected with
sufficient power.
Prevalence in the AS group
Difference in prevalence that can be detected with sufficient statistical power
0.5% 3.9%
1.0% 4.6%
5.0% 7.2%
10.0% 9.2%
15.0% 10.5%
20.0% 11.5%
4.3.3.3.2 Power considerations Cluster analysis
As discussed in Chapter 4, the Aintree study sample size was limited by the local patient
population and study duration. Approaches to cluster analysis are legion and there are no
widely accepted sample size estimation methods. One recent recommendation arising from
mathematical simulations [197] suggested 70 observations for each variable (70*39=2730).
137
The main concern was that insufficient sample sizes could produce unstable clusters – this
was addressed using approaches described in Section 4.3.3.1.1.
For the regression model, patient-clusters were entered as dummy variables (i.e., each
cluster required one additional degree of freedom) resulting in 18 variables in total. Power
depends on the amount of variance explained by each variable. Using an alpha of 0.05, a
sample size of 419 provides 80% power (i.e., beta of 0.2) for a cluster explaining ≥2% of
total variance. This value is difficult to conceptualise; to illustrate, the proportion of
variance (i.e., R2) in BASDAI explained by age is 0.2%, depression 0.5%, and hypertension
0.02%. For a binary variable such as cluster-membership, a very low prevalence will
contribute to a small R2, although their relationship is not easily predictable.
4.3.3.4 Sensitivity analyses
For the AS vs. nr-axSpA comparison and bDMARD-prescription analysis using Boston data,
sensitivity analyses were conducted restricting to only individuals meeting full classification
criteria to increase robustness of eligibility. Sensitivity analysis was also performed for the
Aintree study by excluding obesity from the comorbidity count. Sensitivity analysis for
clustering was described in Section 4.3.3.1.1.
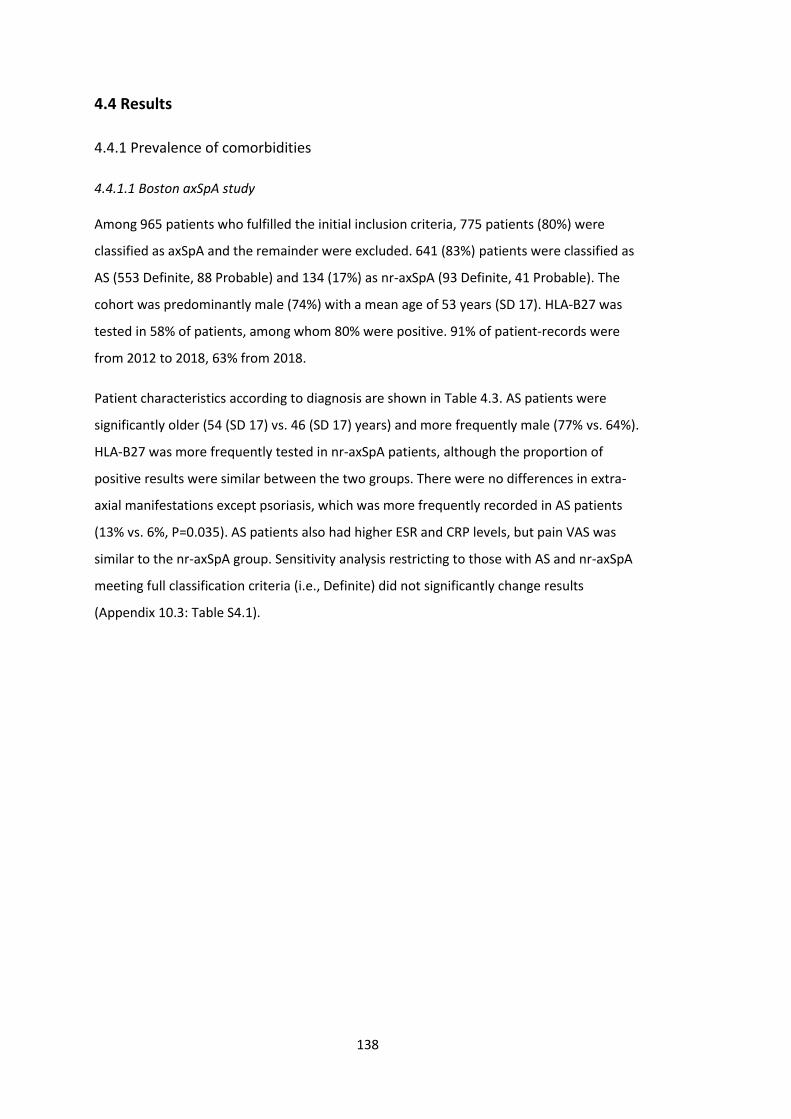
138
4.4 Results
4.4.1 Prevalence of comorbidities
4.4.1.1 Boston axSpA study
Among 965 patients who fulfilled the initial inclusion criteria, 775 patients (80%) were
classified as axSpA and the remainder were excluded. 641 (83%) patients were classified as
AS (553 Definite, 88 Probable) and 134 (17%) as nr-axSpA (93 Definite, 41 Probable). The
cohort was predominantly male (74%) with a mean age of 53 years (SD 17). HLA-B27 was
tested in 58% of patients, among whom 80% were positive. 91% of patient-records were
from 2012 to 2018, 63% from 2018.
Patient characteristics according to diagnosis are shown in Table 4.3. AS patients were
significantly older (54 (SD 17) vs. 46 (SD 17) years) and more frequently male (77% vs. 64%).
HLA-B27 was more frequently tested in nr-axSpA patients, although the proportion of
positive results were similar between the two groups. There were no differences in extra-
axial manifestations except psoriasis, which was more frequently recorded in AS patients
(13% vs. 6%, P=0.035). AS patients also had higher ESR and CRP levels, but pain VAS was
similar to the nr-axSpA group. Sensitivity analysis restricting to those with AS and nr-axSpA
meeting full classification criteria (i.e., Definite) did not significantly change results
(Appendix 10.3: Table S4.1).
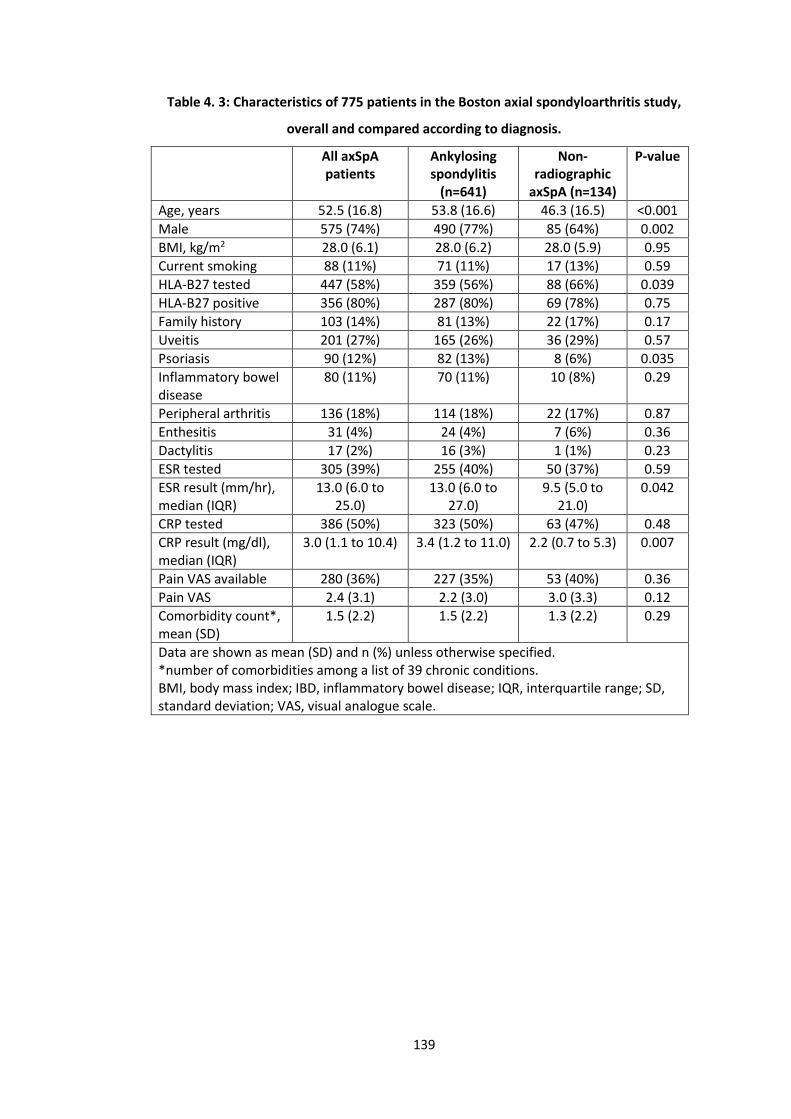
139
Table 4. 3: Characteristics of 775 patients in the Boston axial spondyloarthritis study,
overall and compared according to diagnosis.
All axSpA patients
Ankylosing spondylitis
(n=641)
Non-radiographic
axSpA (n=134)
P-value
Age, years 52.5 (16.8) 53.8 (16.6) 46.3 (16.5) <0.001
Male 575 (74%) 490 (77%) 85 (64%) 0.002
BMI, kg/m2 28.0 (6.1) 28.0 (6.2) 28.0 (5.9) 0.95
Current smoking 88 (11%) 71 (11%) 17 (13%) 0.59
HLA-B27 tested 447 (58%) 359 (56%) 88 (66%) 0.039
HLA-B27 positive 356 (80%) 287 (80%) 69 (78%) 0.75
Family history 103 (14%) 81 (13%) 22 (17%) 0.17
Uveitis 201 (27%) 165 (26%) 36 (29%) 0.57
Psoriasis 90 (12%) 82 (13%) 8 (6%) 0.035
Inflammatory bowel disease
80 (11%) 70 (11%) 10 (8%) 0.29
Peripheral arthritis 136 (18%) 114 (18%) 22 (17%) 0.87
Enthesitis 31 (4%) 24 (4%) 7 (6%) 0.36
Dactylitis 17 (2%) 16 (3%) 1 (1%) 0.23
ESR tested 305 (39%) 255 (40%) 50 (37%) 0.59
ESR result (mm/hr), median (IQR)
13.0 (6.0 to 25.0)
13.0 (6.0 to 27.0)
9.5 (5.0 to 21.0)
0.042
CRP tested 386 (50%) 323 (50%) 63 (47%) 0.48
CRP result (mg/dl), median (IQR)
3.0 (1.1 to 10.4) 3.4 (1.2 to 11.0) 2.2 (0.7 to 5.3) 0.007
Pain VAS available 280 (36%) 227 (35%) 53 (40%) 0.36
Pain VAS 2.4 (3.1) 2.2 (3.0) 3.0 (3.3) 0.12
Comorbidity count*, mean (SD)
1.5 (2.2) 1.5 (2.2) 1.3 (2.2) 0.29
Data are shown as mean (SD) and n (%) unless otherwise specified. *number of comorbidities among a list of 39 chronic conditions. BMI, body mass index; IBD, inflammatory bowel disease; IQR, interquartile range; SD, standard deviation; VAS, visual analogue scale.
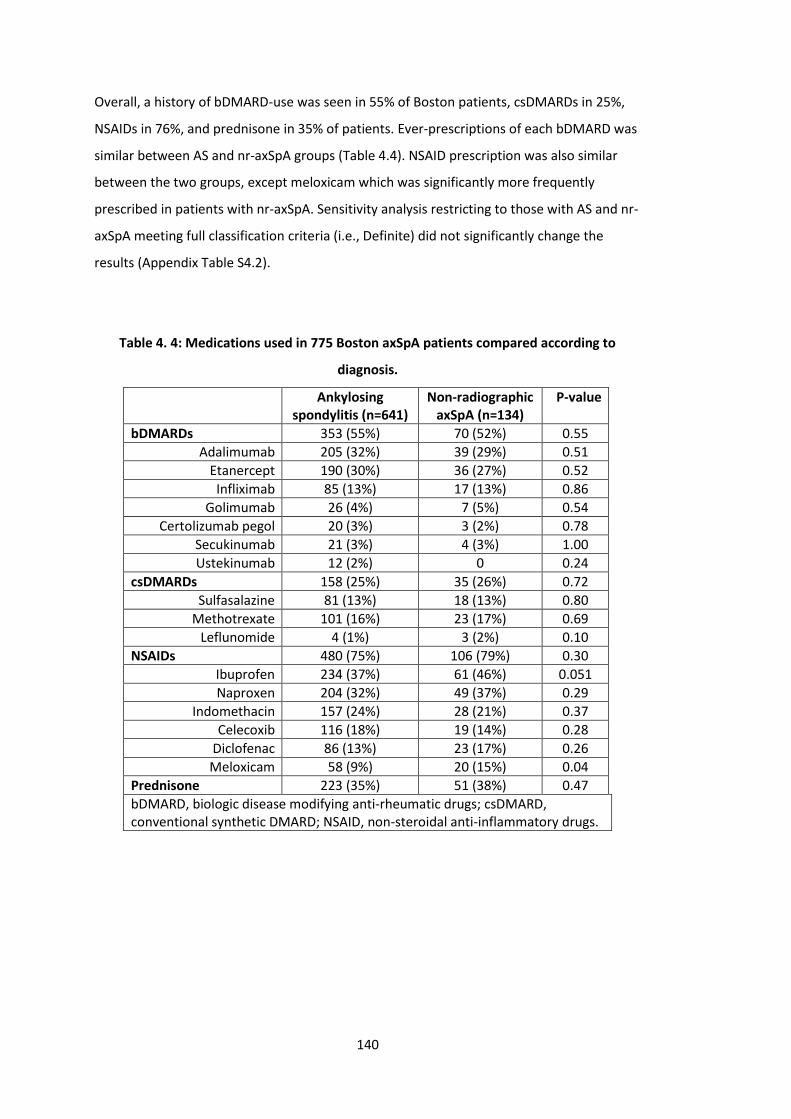
140
Overall, a history of bDMARD-use was seen in 55% of Boston patients, csDMARDs in 25%,
NSAIDs in 76%, and prednisone in 35% of patients. Ever-prescriptions of each bDMARD was
similar between AS and nr-axSpA groups (Table 4.4). NSAID prescription was also similar
between the two groups, except meloxicam which was significantly more frequently
prescribed in patients with nr-axSpA. Sensitivity analysis restricting to those with AS and nr-
axSpA meeting full classification criteria (i.e., Definite) did not significantly change the
results (Appendix Table S4.2).
Table 4. 4: Medications used in 775 Boston axSpA patients compared according to
diagnosis.
Ankylosing spondylitis (n=641)
Non-radiographic axSpA (n=134)
P-value
bDMARDs 353 (55%) 70 (52%) 0.55
Adalimumab 205 (32%) 39 (29%) 0.51
Etanercept 190 (30%) 36 (27%) 0.52
Infliximab 85 (13%) 17 (13%) 0.86
Golimumab 26 (4%) 7 (5%) 0.54
Certolizumab pegol 20 (3%) 3 (2%) 0.78
Secukinumab 21 (3%) 4 (3%) 1.00
Ustekinumab 12 (2%) 0 0.24
csDMARDs 158 (25%) 35 (26%) 0.72
Sulfasalazine 81 (13%) 18 (13%) 0.80
Methotrexate 101 (16%) 23 (17%) 0.69
Leflunomide 4 (1%) 3 (2%) 0.10
NSAIDs 480 (75%) 106 (79%) 0.30
Ibuprofen 234 (37%) 61 (46%) 0.051
Naproxen 204 (32%) 49 (37%) 0.29
Indomethacin 157 (24%) 28 (21%) 0.37
Celecoxib 116 (18%) 19 (14%) 0.28
Diclofenac 86 (13%) 23 (17%) 0.26
Meloxicam 58 (9%) 20 (15%) 0.04
Prednisone 223 (35%) 51 (38%) 0.47
bDMARD, biologic disease modifying anti-rheumatic drugs; csDMARD, conventional synthetic DMARD; NSAID, non-steroidal anti-inflammatory drugs.
141
The median number of comorbidities was 1 (IQR 0 to 2). The mean comorbidity count was
1.5 (SD 2.2) and not statistically different between AS and nr-axSpA groups. Half of all
patients had at least one comorbidity. Figure 4.4 shows the distribution of comorbidity
count. The prevalence of each comorbidity is shown in Figure 4.5 in order of prevalence.
The common comorbidities were anxiety (7.9%), coronary heart disease (7.7%), cancer
(7.2%), hypertension (6.1%) and depression (5.2%). Twelve of the 39 conditions had a
prevalence of 5% or higher, while 9 diseases had a prevalence of 1% or lower.
Figure 4. 4: Histogram showing comorbidity count among 775 Boston axSpA patients.
≥
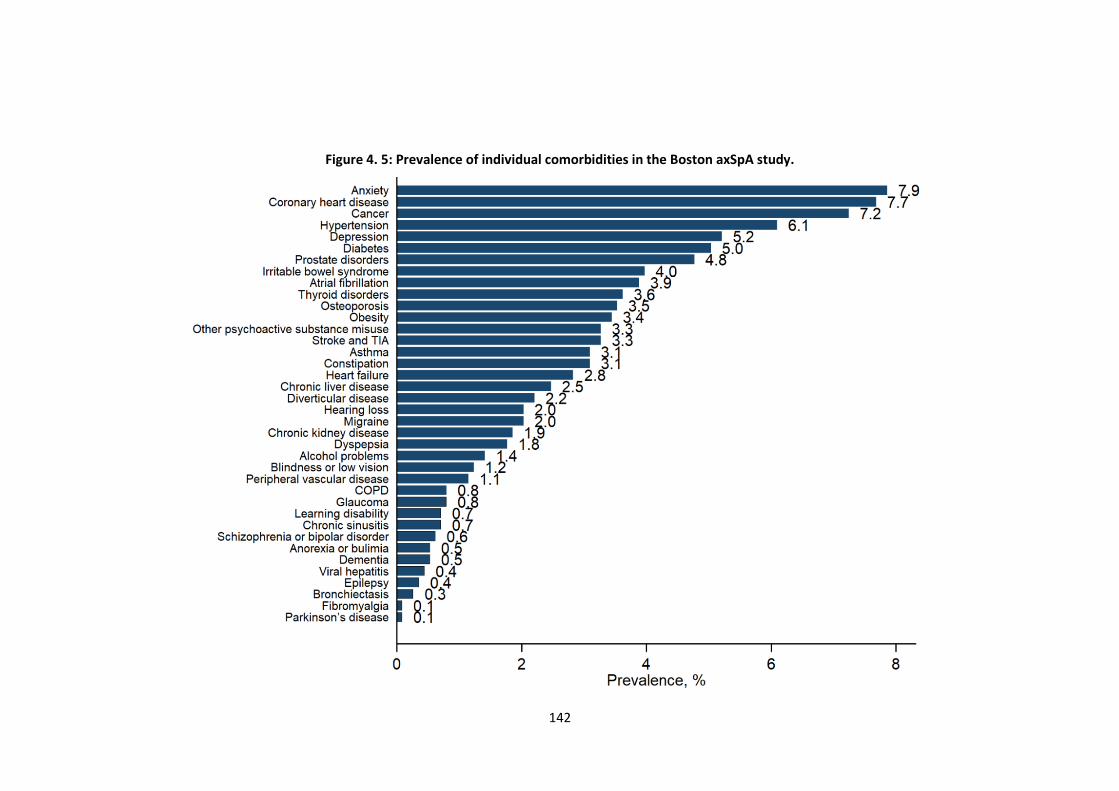
142
Figure 4. 5: Prevalence of individual comorbidities in the Boston axSpA study.
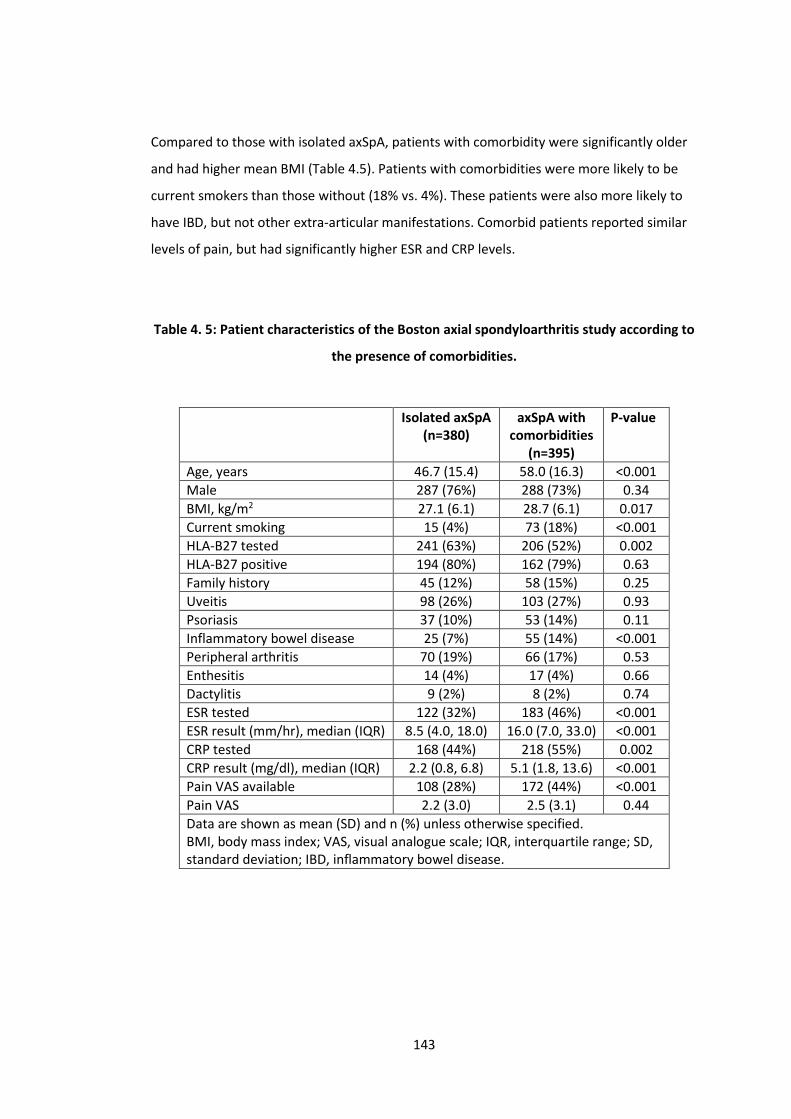
143
Compared to those with isolated axSpA, patients with comorbidity were significantly older
and had higher mean BMI (Table 4.5). Patients with comorbidities were more likely to be
current smokers than those without (18% vs. 4%). These patients were also more likely to
have IBD, but not other extra-articular manifestations. Comorbid patients reported similar
levels of pain, but had significantly higher ESR and CRP levels.
Table 4. 5: Patient characteristics of the Boston axial spondyloarthritis study according to
the presence of comorbidities.
Isolated axSpA
(n=380) axSpA with
comorbidities
(n=395)
P-value
Age, years 46.7 (15.4) 58.0 (16.3) <0.001
Male 287 (76%) 288 (73%) 0.34
BMI, kg/m2 27.1 (6.1) 28.7 (6.1) 0.017
Current smoking 15 (4%) 73 (18%) <0.001
HLA-B27 tested 241 (63%) 206 (52%) 0.002
HLA-B27 positive 194 (80%) 162 (79%) 0.63
Family history 45 (12%) 58 (15%) 0.25
Uveitis 98 (26%) 103 (27%) 0.93
Psoriasis 37 (10%) 53 (14%) 0.11
Inflammatory bowel disease 25 (7%) 55 (14%) <0.001
Peripheral arthritis 70 (19%) 66 (17%) 0.53
Enthesitis 14 (4%) 17 (4%) 0.66
Dactylitis 9 (2%) 8 (2%) 0.74
ESR tested 122 (32%) 183 (46%) <0.001
ESR result (mm/hr), median (IQR) 8.5 (4.0, 18.0) 16.0 (7.0, 33.0) <0.001
CRP tested 168 (44%) 218 (55%) 0.002
CRP result (mg/dl), median (IQR) 2.2 (0.8, 6.8) 5.1 (1.8, 13.6) <0.001
Pain VAS available 108 (28%) 172 (44%) <0.001
Pain VAS 2.2 (3.0) 2.5 (3.1) 0.44
Data are shown as mean (SD) and n (%) unless otherwise specified. BMI, body mass index; VAS, visual analogue scale; IQR, interquartile range; SD, standard deviation; IBD, inflammatory bowel disease.
144
4.4.1.2 Aintree axSpA registry
The Aintree axSpA registry included 421 patients with established axSpA. Sufficient clinical
data were available for 419 patients (2 patients had no accessible electronic health
records). The cohort was predominantly male (69%) with a mean age of 46 (SD 14) years.
82% fulfilled the modified New York criteria for AS. HLA-B27 was available in 269 and of
these 59% were positive. Two patients were prescribed TNF inhibitors and 17% were
currently using NSAIDs at baseline.
Patient characteristics according to diagnosis are shown in Table 4.6. AS patients were
significantly older (46 (SD 14) vs. 41 (SD 14) years) and more frequently male (73% vs. 53%).
HLA-B27 was more frequently positive among AS patients (66 vs. 30%). AS patients more
frequently had EAMs, which was significant for uveitis and psoriasis but not IBD. AS patients
had (numerically but not statistically) higher median ESR (12.0 vs. 10.0mm/hr) and CRP (5.0
vs. 3.0mg/dl) levels. All patient reported measures were similar in the AS and nr-axSpA
groups. The mean number of comorbidities was 1.3 (SD 1.3) and not statistically different
between the AS and nr-axSpA groups.
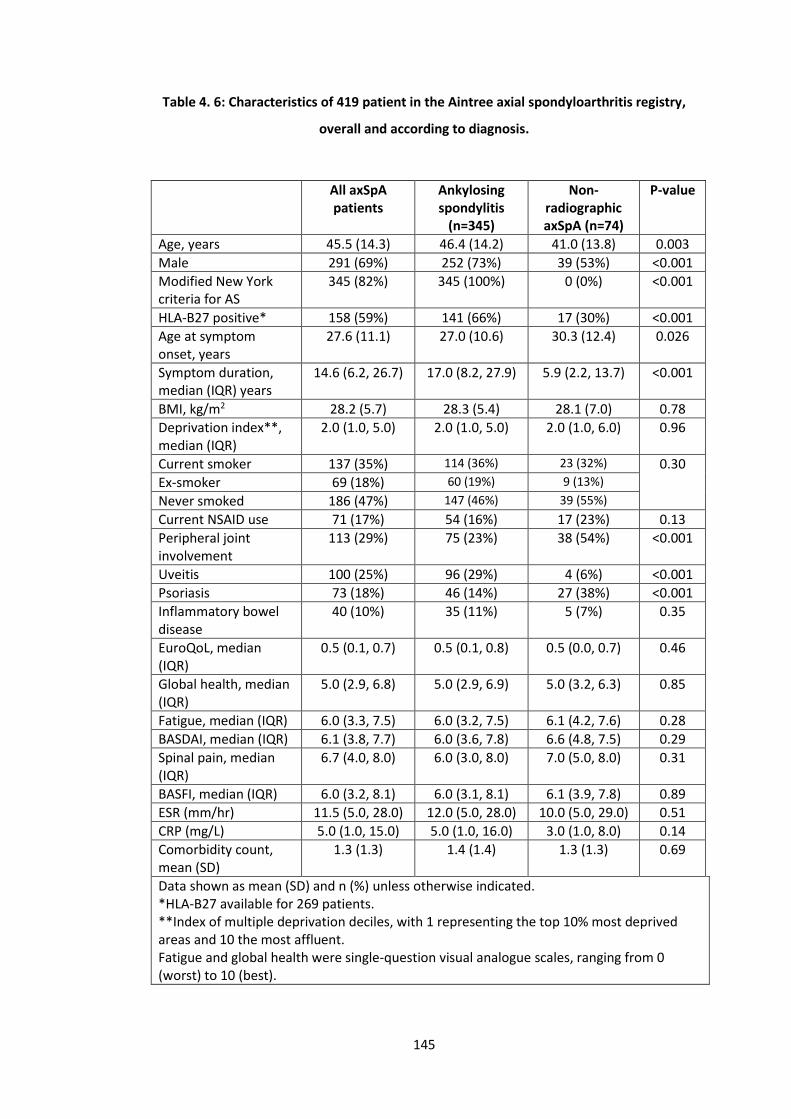
145
Table 4. 6: Characteristics of 419 patient in the Aintree axial spondyloarthritis registry,
overall and according to diagnosis.
All axSpA patients
Ankylosing spondylitis
(n=345)
Non-radiographic axSpA (n=74)
P-value
Age, years 45.5 (14.3) 46.4 (14.2) 41.0 (13.8) 0.003
Male 291 (69%) 252 (73%) 39 (53%) <0.001
Modified New York criteria for AS
345 (82%) 345 (100%) 0 (0%) <0.001
HLA-B27 positive* 158 (59%) 141 (66%) 17 (30%) <0.001
Age at symptom onset, years
27.6 (11.1) 27.0 (10.6) 30.3 (12.4) 0.026
Symptom duration, median (IQR) years
14.6 (6.2, 26.7) 17.0 (8.2, 27.9) 5.9 (2.2, 13.7) <0.001
BMI, kg/m2 28.2 (5.7) 28.3 (5.4) 28.1 (7.0) 0.78
Deprivation index**, median (IQR)
2.0 (1.0, 5.0) 2.0 (1.0, 5.0) 2.0 (1.0, 6.0) 0.96
Current smoker 137 (35%) 114 (36%) 23 (32%) 0.30
Ex-smoker 69 (18%) 60 (19%) 9 (13%)
Never smoked 186 (47%) 147 (46%) 39 (55%)
Current NSAID use 71 (17%) 54 (16%) 17 (23%) 0.13
Peripheral joint involvement
113 (29%) 75 (23%) 38 (54%) <0.001
Uveitis 100 (25%) 96 (29%) 4 (6%) <0.001
Psoriasis 73 (18%) 46 (14%) 27 (38%) <0.001
Inflammatory bowel disease
40 (10%) 35 (11%) 5 (7%) 0.35
EuroQoL, median (IQR)
0.5 (0.1, 0.7) 0.5 (0.1, 0.8) 0.5 (0.0, 0.7) 0.46
Global health, median (IQR)
5.0 (2.9, 6.8) 5.0 (2.9, 6.9) 5.0 (3.2, 6.3) 0.85
Fatigue, median (IQR) 6.0 (3.3, 7.5) 6.0 (3.2, 7.5) 6.1 (4.2, 7.6) 0.28
BASDAI, median (IQR) 6.1 (3.8, 7.7) 6.0 (3.6, 7.8) 6.6 (4.8, 7.5) 0.29
Spinal pain, median (IQR)
6.7 (4.0, 8.0) 6.0 (3.0, 8.0) 7.0 (5.0, 8.0) 0.31
BASFI, median (IQR) 6.0 (3.2, 8.1) 6.0 (3.1, 8.1) 6.1 (3.9, 7.8) 0.89
ESR (mm/hr) 11.5 (5.0, 28.0) 12.0 (5.0, 28.0) 10.0 (5.0, 29.0) 0.51
CRP (mg/L) 5.0 (1.0, 15.0) 5.0 (1.0, 16.0) 3.0 (1.0, 8.0) 0.14
Comorbidity count, mean (SD)
1.3 (1.3) 1.4 (1.4) 1.3 (1.3) 0.69
Data shown as mean (SD) and n (%) unless otherwise indicated. *HLA-B27 available for 269 patients. **Index of multiple deprivation deciles, with 1 representing the top 10% most deprived areas and 10 the most affluent. Fatigue and global health were single-question visual analogue scales, ranging from 0 (worst) to 10 (best).
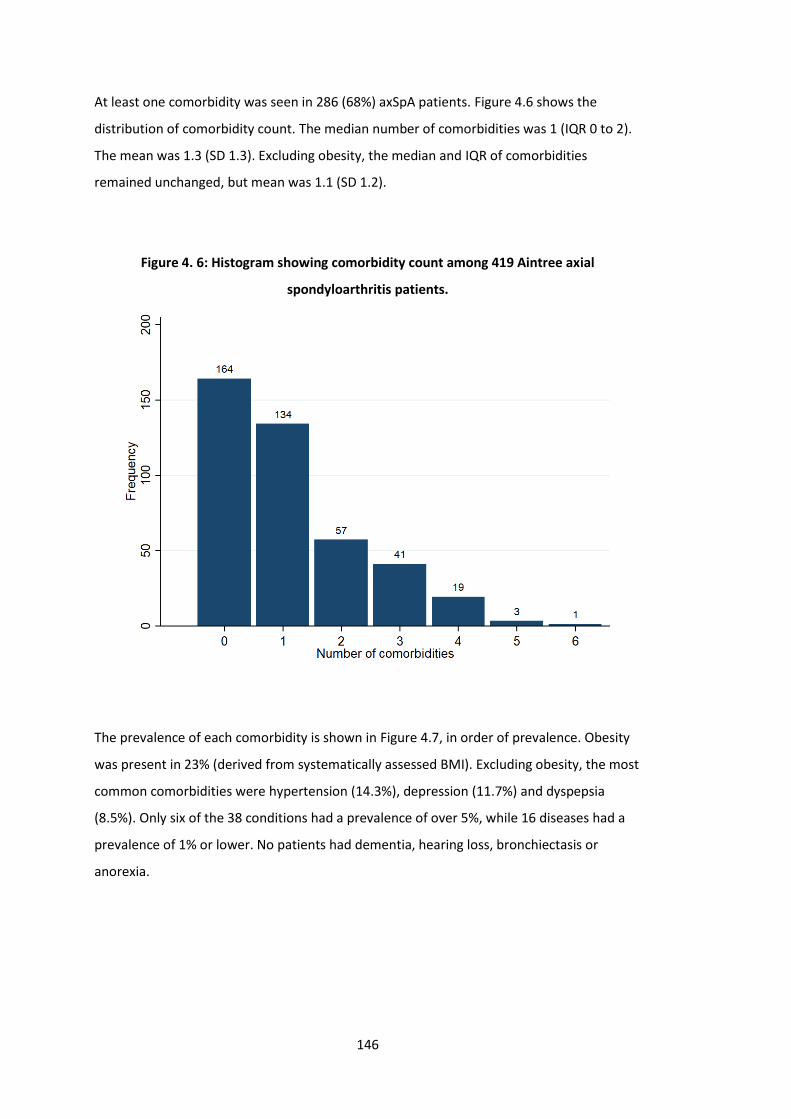
146
At least one comorbidity was seen in 286 (68%) axSpA patients. Figure 4.6 shows the
distribution of comorbidity count. The median number of comorbidities was 1 (IQR 0 to 2).
The mean was 1.3 (SD 1.3). Excluding obesity, the median and IQR of comorbidities
remained unchanged, but mean was 1.1 (SD 1.2).
Figure 4. 6: Histogram showing comorbidity count among 419 Aintree axial
spondyloarthritis patients.
The prevalence of each comorbidity is shown in Figure 4.7, in order of prevalence. Obesity
was present in 23% (derived from systematically assessed BMI). Excluding obesity, the most
common comorbidities were hypertension (14.3%), depression (11.7%) and dyspepsia
(8.5%). Only six of the 38 conditions had a prevalence of over 5%, while 16 diseases had a
prevalence of 1% or lower. No patients had dementia, hearing loss, bronchiectasis or
anorexia.
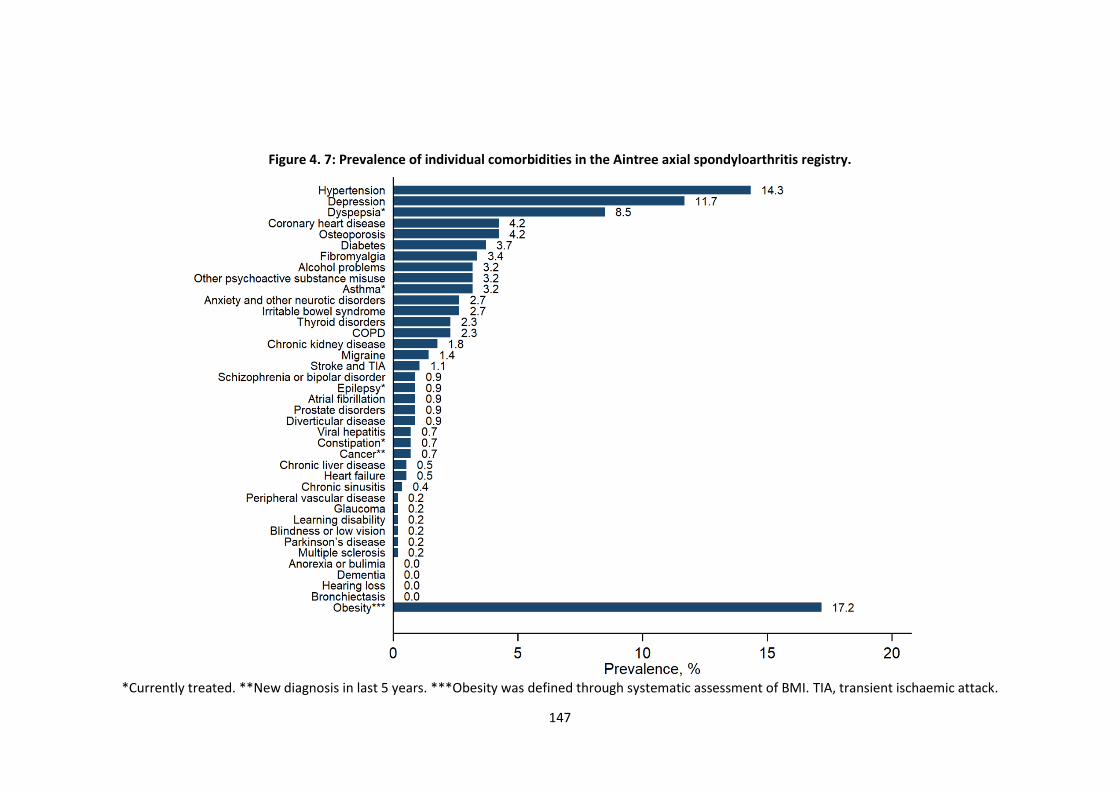
147
Figure 4. 7: Prevalence of individual comorbidities in the Aintree axial spondyloarthritis registry.
*Currently treated. **New diagnosis in last 5 years. ***Obesity was defined through systematic assessment of BMI. TIA, transient ischaemic attack.
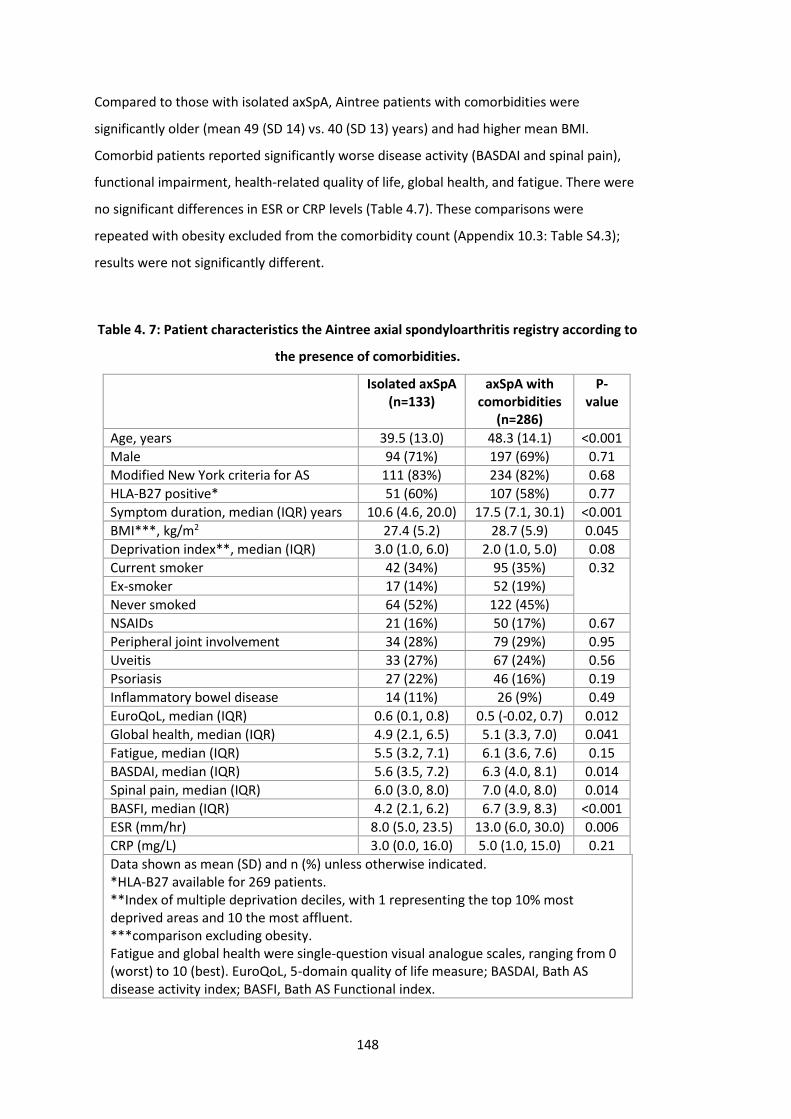
148
Compared to those with isolated axSpA, Aintree patients with comorbidities were
significantly older (mean 49 (SD 14) vs. 40 (SD 13) years) and had higher mean BMI.
Comorbid patients reported significantly worse disease activity (BASDAI and spinal pain),
functional impairment, health-related quality of life, global health, and fatigue. There were
no significant differences in ESR or CRP levels (Table 4.7). These comparisons were
repeated with obesity excluded from the comorbidity count (Appendix 10.3: Table S4.3);
results were not significantly different.
Table 4. 7: Patient characteristics the Aintree axial spondyloarthritis registry according to
the presence of comorbidities.
Isolated axSpA (n=133)
axSpA with comorbidities
(n=286)
P-value
Age, years 39.5 (13.0) 48.3 (14.1) <0.001
Male 94 (71%) 197 (69%) 0.71
Modified New York criteria for AS 111 (83%) 234 (82%) 0.68
HLA-B27 positive* 51 (60%) 107 (58%) 0.77
Symptom duration, median (IQR) years 10.6 (4.6, 20.0) 17.5 (7.1, 30.1) <0.001
BMI***, kg/m2 27.4 (5.2) 28.7 (5.9) 0.045
Deprivation index**, median (IQR) 3.0 (1.0, 6.0) 2.0 (1.0, 5.0) 0.08
Current smoker 42 (34%) 95 (35%) 0.32
Ex-smoker 17 (14%) 52 (19%)
Never smoked 64 (52%) 122 (45%)
NSAIDs 21 (16%) 50 (17%) 0.67
Peripheral joint involvement 34 (28%) 79 (29%) 0.95
Uveitis 33 (27%) 67 (24%) 0.56
Psoriasis 27 (22%) 46 (16%) 0.19
Inflammatory bowel disease 14 (11%) 26 (9%) 0.49
EuroQoL, median (IQR) 0.6 (0.1, 0.8) 0.5 (-0.02, 0.7) 0.012
Global health, median (IQR) 4.9 (2.1, 6.5) 5.1 (3.3, 7.0) 0.041
Fatigue, median (IQR) 5.5 (3.2, 7.1) 6.1 (3.6, 7.6) 0.15
BASDAI, median (IQR) 5.6 (3.5, 7.2) 6.3 (4.0, 8.1) 0.014
Spinal pain, median (IQR) 6.0 (3.0, 8.0) 7.0 (4.0, 8.0) 0.014
BASFI, median (IQR) 4.2 (2.1, 6.2) 6.7 (3.9, 8.3) <0.001
ESR (mm/hr) 8.0 (5.0, 23.5) 13.0 (6.0, 30.0) 0.006
CRP (mg/L) 3.0 (0.0, 16.0) 5.0 (1.0, 15.0) 0.21
Data shown as mean (SD) and n (%) unless otherwise indicated. *HLA-B27 available for 269 patients. **Index of multiple deprivation deciles, with 1 representing the top 10% most deprived areas and 10 the most affluent. ***comparison excluding obesity. Fatigue and global health were single-question visual analogue scales, ranging from 0 (worst) to 10 (best). EuroQoL, 5-domain quality of life measure; BASDAI, Bath AS disease activity index; BASFI, Bath AS Functional index.
149
4.4.2 Comorbidities in AS vs. nr-axSpA
4.4.2.1 Comparison of comorbidities in AS and nr-axSpA among Boston patients
There were no statistically significant differences in prevalence of the 39 chronic conditions
between AS and nr-axSpA groups, except chronic kidney disease which was higher in AS
patients (3% vs. 0%, p=0.035) (Figure 4.8). Sensitivity analysis restricting to those with AS
and nr-axSpA meeting full classification criteria did not significantly change results
(Appendix 10.3: Table S4.4).
4.4.2.2 Comparison of comorbidities in AS and nr-axSpA among Aintree patients
There were no statistically significant differences in prevalence of the 39 chronic conditions
between AS and nr-axSpA groups, except irritable bowel syndrome (2% in AS vs. 9% in nr-
axSpA, p=0.008) (Figure 4.9). The prevalence of hypertension was higher in AS patients with
borderline significance (21% vs. 11%, p=0.05). Depression and fibromyalgia prevalence
were numerically higher in nr-axSpA than AS patients, but the difference was not
statistically significant.
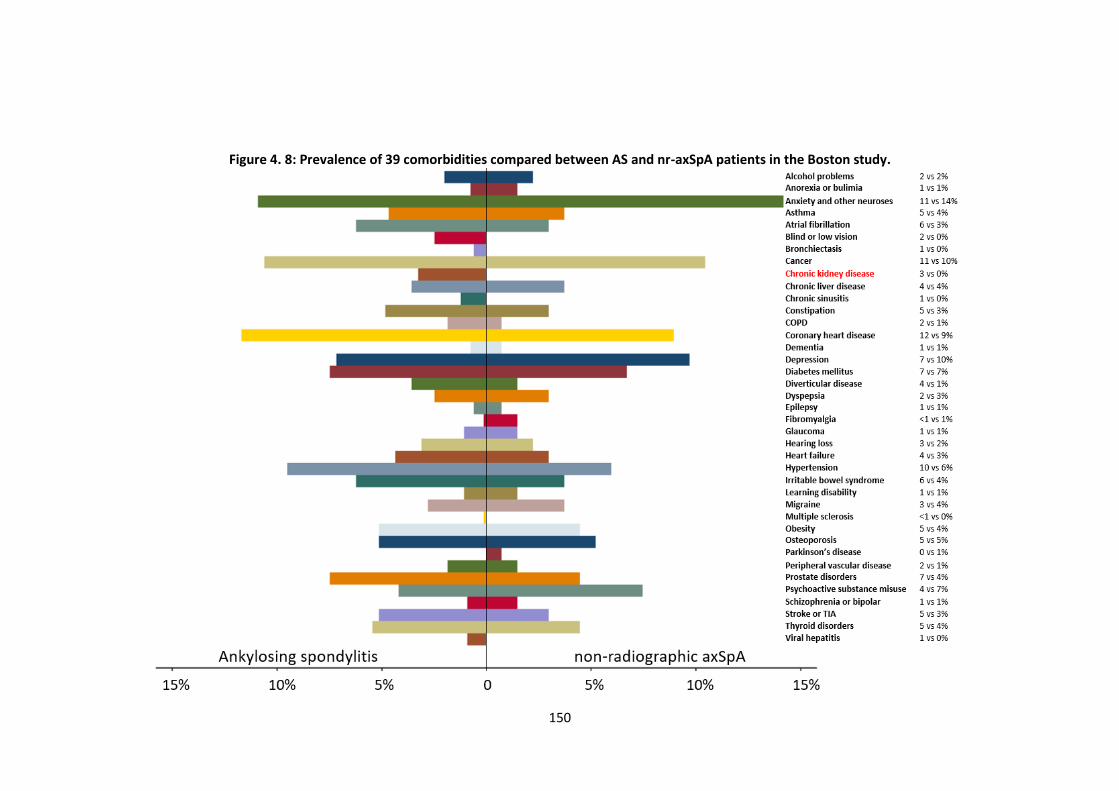
150
Figure 4. 8: Prevalence of 39 comorbidities compared between AS and nr-axSpA patients in the Boston study.
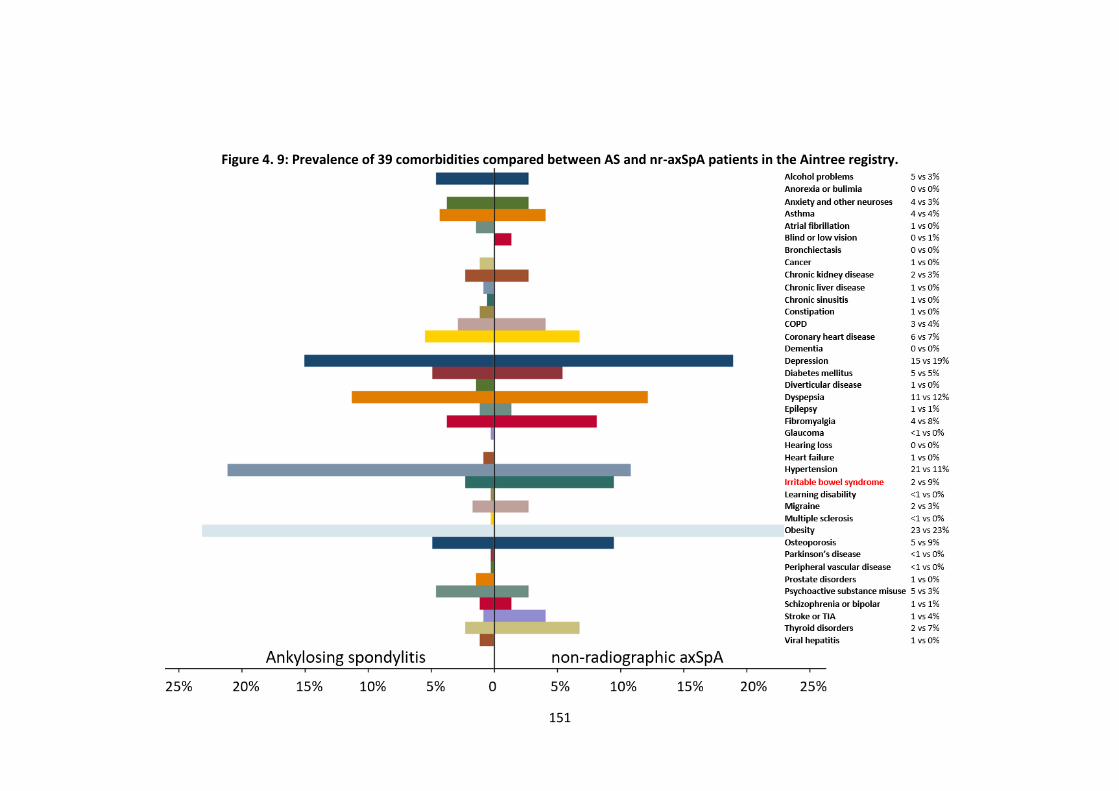
151
Figure 4. 9: Prevalence of 39 comorbidities compared between AS and nr-axSpA patients in the Aintree registry.
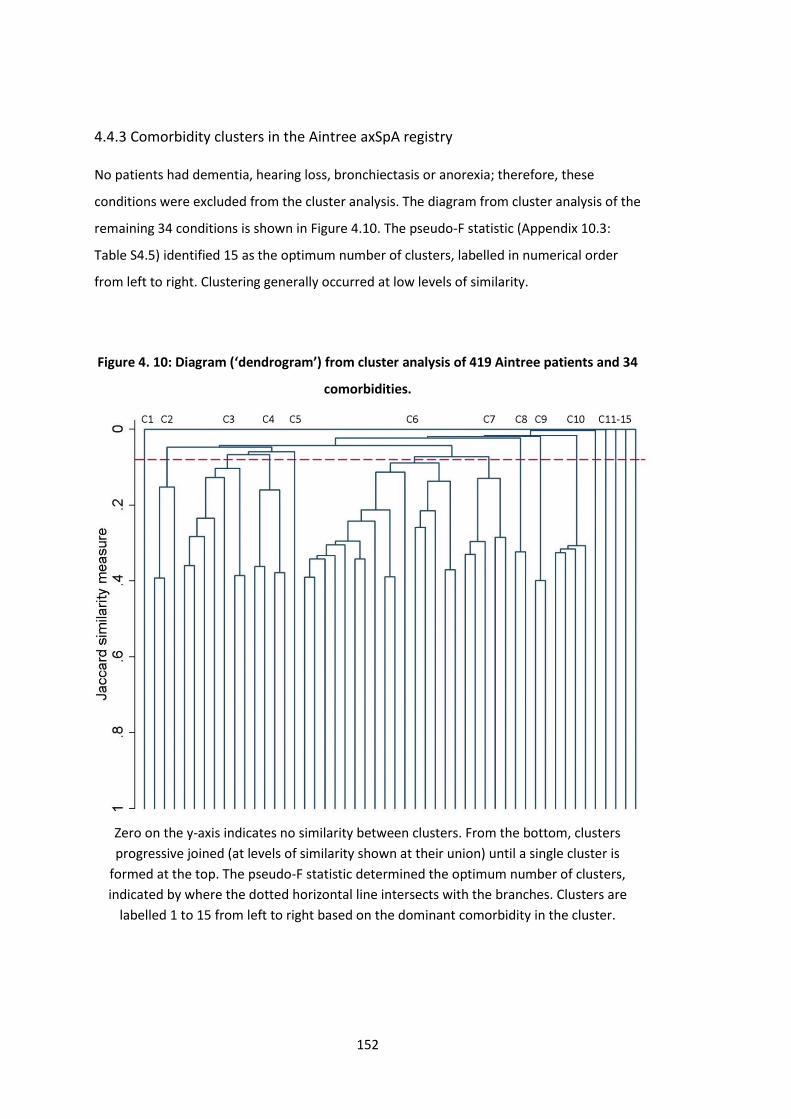
152
4.4.3 Comorbidity clusters in the Aintree axSpA registry
No patients had dementia, hearing loss, bronchiectasis or anorexia; therefore, these
conditions were excluded from the cluster analysis. The diagram from cluster analysis of the
remaining 34 conditions is shown in Figure 4.10. The pseudo-F statistic (Appendix 10.3:
Table S4.5) identified 15 as the optimum number of clusters, labelled in numerical order
from left to right. Clustering generally occurred at low levels of similarity.
Figure 4. 10: Diagram (‘dendrogram’) from cluster analysis of 419 Aintree patients and 34
comorbidities.
Zero on the y-axis indicates no similarity between clusters. From the bottom, clusters
progressive joined (at levels of similarity shown at their union) until a single cluster is
formed at the top. The pseudo-F statistic determined the optimum number of clusters,
indicated by where the dotted horizontal line intersects with the branches. Clusters are
labelled 1 to 15 from left to right based on the dominant comorbidity in the cluster.
153
Six clusters were formed at near-zero similarity, indicating relative distinctness. Cluster 1
(C1, n=164) consisted of patients with isolated axSpA with no comorbidities. C11 had two
patients with atrial fibrillation, one of whom also had Parkinson’s disease. C12 to C15
contained only one patient each with the following conditions: chronic sinusitis, blindness
or low vision, multiple sclerosis, and learning disability.
All other clusters were generally dominated by one to two comorbidities with varying
number of other less frequent conditions (Table 4.8). C2 (n=40) was predominantly
characterised by patients with concurrent dyspepsia (94%). Clusters 3, 4 and 5 were similar:
C3 (n=84) patients most commonly had depression (83%) and anxiety (14%); C4 (n=35)
patients frequently had fibromyalgia (72%) and irritable bowel syndrome (IBS, 56%); C5 had
only four patients, all with anxiety. Clusters 3 and 5 were combined for further analysis
since they both included anxiety and would merge in the next clustering (Figure 4.10).
C6, the largest comorbidity cluster (n=88), was predominantly characterised by
hypertension (82%) and coronary heart disease (CHD, 24%). C7 (n=38) commonly had
osteoporosis (74%) and alcohol problems (47%). CHD and other cardiovascular diseases
feature in both groups, explaining their proximity in Figure 4.10.
C8 (thyroid disease), C9 (other psychoactive substance misuse) and C10 (asthma) were
largely unrelated to other clusters and each was dominated by a single disease.
The fibromyalgia-IBS cluster and thyroid disorders cluster were predominantly female and
least frequently had positive HLA-B27 status or met classification criteria for AS (Table 4.9).
Patients in the hypertension-CHD cluster and alcohol problems-osteoporosis cluster were
the oldest and had a higher prevalence of uveitis. Current NSAID use was lowest among
those in the dyspepsia and other substance misuse clusters. Current smoking was highest
among those with other substance misuse and lowest among asthma clusters.
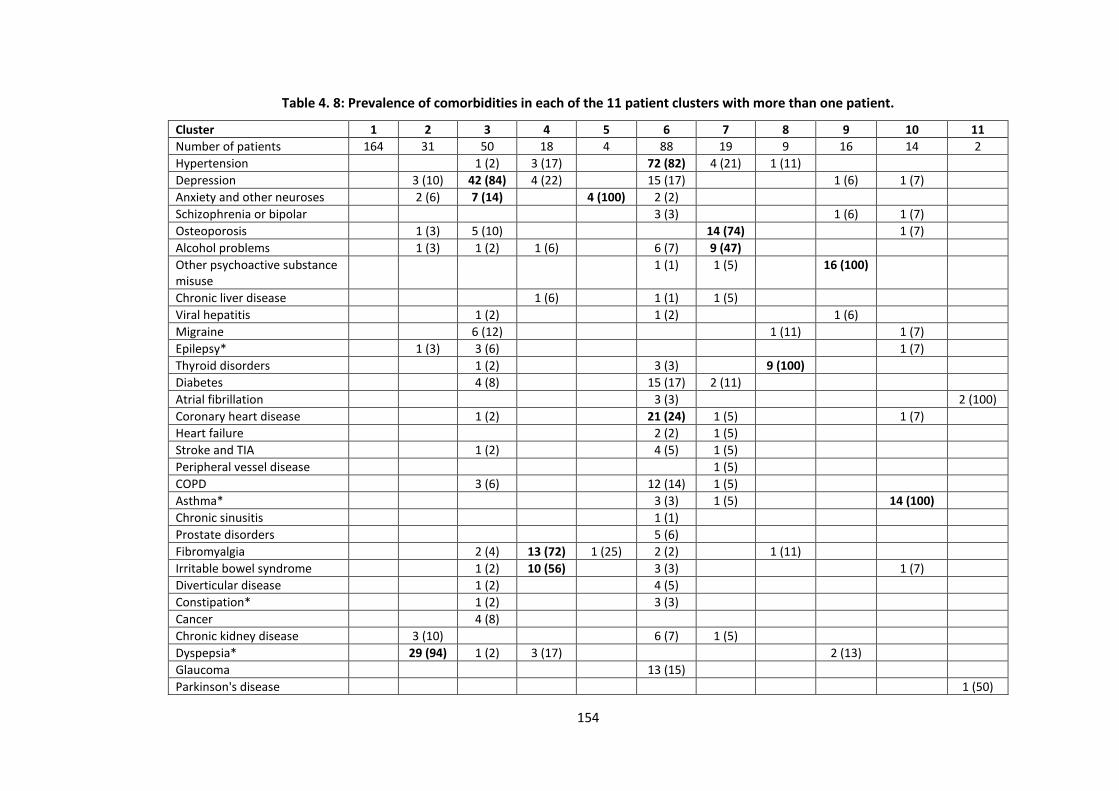
154
Table 4. 8: Prevalence of comorbidities in each of the 11 patient clusters with more than one patient.
Cluster 1 2 3 4 5 6 7 8 9 10 11
Number of patients 164 31 50 18 4 88 19 9 16 14 2
Hypertension 1 (2) 3 (17) 72 (82) 4 (21) 1 (11)
Depression 3 (10) 42 (84) 4 (22) 15 (17) 1 (6) 1 (7)
Anxiety and other neuroses 2 (6) 7 (14) 4 (100) 2 (2)
Schizophrenia or bipolar 3 (3) 1 (6) 1 (7)
Osteoporosis 1 (3) 5 (10) 14 (74) 1 (7)
Alcohol problems 1 (3) 1 (2) 1 (6) 6 (7) 9 (47)
Other psychoactive substance misuse
1 (1) 1 (5) 16 (100)
Chronic liver disease 1 (6) 1 (1) 1 (5)
Viral hepatitis 1 (2) 1 (2) 1 (6)
Migraine 6 (12) 1 (11) 1 (7)
Epilepsy* 1 (3) 3 (6) 1 (7)
Thyroid disorders 1 (2) 3 (3) 9 (100)
Diabetes 4 (8) 15 (17) 2 (11)
Atrial fibrillation 3 (3) 2 (100)
Coronary heart disease 1 (2) 21 (24) 1 (5) 1 (7)
Heart failure 2 (2) 1 (5)
Stroke and TIA 1 (2) 4 (5) 1 (5)
Peripheral vessel disease 1 (5)
COPD 3 (6) 12 (14) 1 (5)
Asthma* 3 (3) 1 (5) 14 (100)
Chronic sinusitis 1 (1)
Prostate disorders 5 (6)
Fibromyalgia 2 (4) 13 (72) 1 (25) 2 (2) 1 (11)
Irritable bowel syndrome 1 (2) 10 (56) 3 (3) 1 (7)
Diverticular disease 1 (2) 4 (5)
Constipation* 1 (2) 3 (3)
Cancer 4 (8)
Chronic kidney disease 3 (10) 6 (7) 1 (5)
Dyspepsia* 29 (94) 1 (2) 3 (17) 2 (13)
Glaucoma 13 (15)
Parkinson's disease 1 (50)
155
*Currently treated. **Cancer diagnoses in the past 5 years. Cells with zero prevalence were left empty for clarity. Bold text highlights dominant morbidities in each cluster. Clusters 12, 13, 14 and 15 were omitted: each had only 1 patient (chronic sinusitis, blind or low vision, multiple sclerosis, and learning disability). COPD, chronic obstructive pulmonary diseases; TIA, transient ischaemic attack.
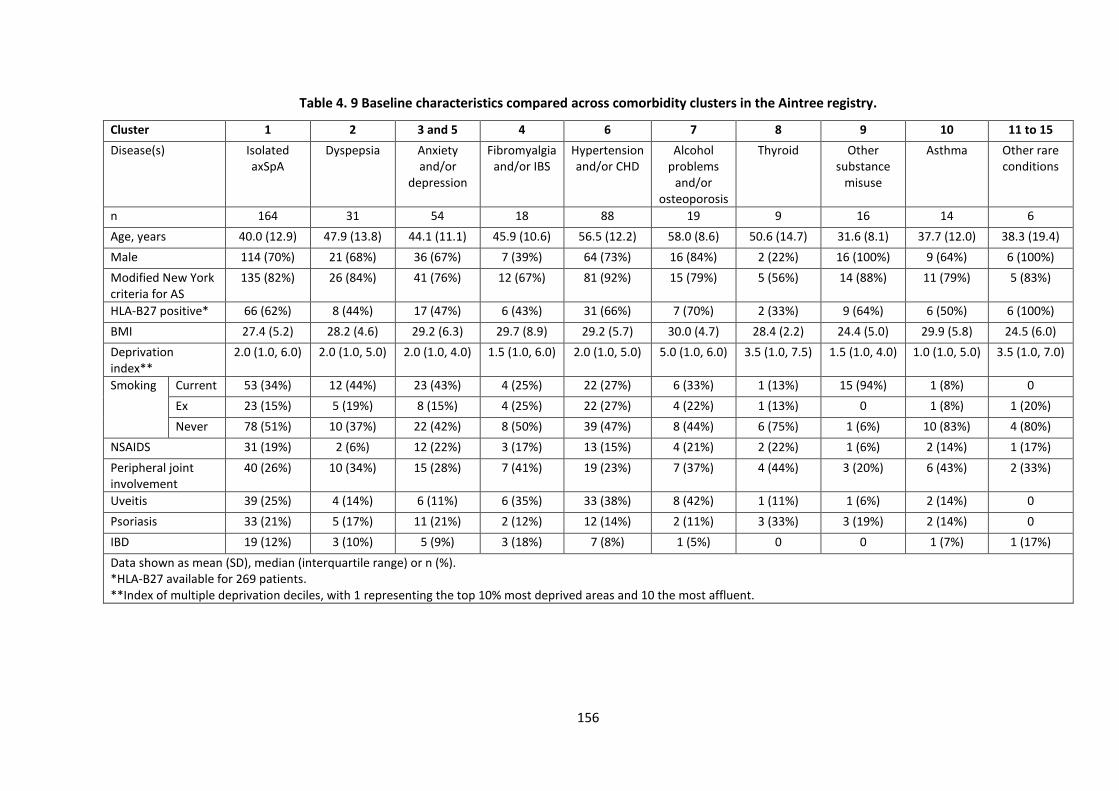
156
Table 4. 9 Baseline characteristics compared across comorbidity clusters in the Aintree registry.
Cluster 1 2 3 and 5 4 6 7 8 9 10 11 to 15
Disease(s) Isolated axSpA
Dyspepsia Anxiety and/or
depression
Fibromyalgia and/or IBS
Hypertension and/or CHD
Alcohol problems
and/or osteoporosis
Thyroid Other substance
misuse
Asthma Other rare conditions
n 164 31 54 18 88 19 9 16 14 6
Age, years 40.0 (12.9) 47.9 (13.8) 44.1 (11.1) 45.9 (10.6) 56.5 (12.2) 58.0 (8.6) 50.6 (14.7) 31.6 (8.1) 37.7 (12.0) 38.3 (19.4)
Male 114 (70%) 21 (68%) 36 (67%) 7 (39%) 64 (73%) 16 (84%) 2 (22%) 16 (100%) 9 (64%) 6 (100%)
Modified New York criteria for AS
135 (82%) 26 (84%) 41 (76%) 12 (67%) 81 (92%) 15 (79%) 5 (56%) 14 (88%) 11 (79%) 5 (83%)
HLA-B27 positive* 66 (62%) 8 (44%) 17 (47%) 6 (43%) 31 (66%) 7 (70%) 2 (33%) 9 (64%) 6 (50%) 6 (100%)
BMI 27.4 (5.2) 28.2 (4.6) 29.2 (6.3) 29.7 (8.9) 29.2 (5.7) 30.0 (4.7) 28.4 (2.2) 24.4 (5.0) 29.9 (5.8) 24.5 (6.0)
Deprivation index**
2.0 (1.0, 6.0) 2.0 (1.0, 5.0) 2.0 (1.0, 4.0) 1.5 (1.0, 6.0) 2.0 (1.0, 5.0) 5.0 (1.0, 6.0) 3.5 (1.0, 7.5) 1.5 (1.0, 4.0) 1.0 (1.0, 5.0) 3.5 (1.0, 7.0)
Smoking Current 53 (34%) 12 (44%) 23 (43%) 4 (25%) 22 (27%) 6 (33%) 1 (13%) 15 (94%) 1 (8%) 0
Ex 23 (15%) 5 (19%) 8 (15%) 4 (25%) 22 (27%) 4 (22%) 1 (13%) 0 1 (8%) 1 (20%)
Never 78 (51%) 10 (37%) 22 (42%) 8 (50%) 39 (47%) 8 (44%) 6 (75%) 1 (6%) 10 (83%) 4 (80%)
NSAIDS 31 (19%) 2 (6%) 12 (22%) 3 (17%) 13 (15%) 4 (21%) 2 (22%) 1 (6%) 2 (14%) 1 (17%)
Peripheral joint involvement
40 (26%) 10 (34%) 15 (28%) 7 (41%) 19 (23%) 7 (37%) 4 (44%) 3 (20%) 6 (43%) 2 (33%)
Uveitis 39 (25%) 4 (14%) 6 (11%) 6 (35%) 33 (38%) 8 (42%) 1 (11%) 1 (6%) 2 (14%) 0
Psoriasis 33 (21%) 5 (17%) 11 (21%) 2 (12%) 12 (14%) 2 (11%) 3 (33%) 3 (19%) 2 (14%) 0
IBD 19 (12%) 3 (10%) 5 (9%) 3 (18%) 7 (8%) 1 (5%) 0 0 1 (7%) 1 (17%)
Data shown as mean (SD), median (interquartile range) or n (%). *HLA-B27 available for 269 patients. **Index of multiple deprivation deciles, with 1 representing the top 10% most deprived areas and 10 the most affluent.
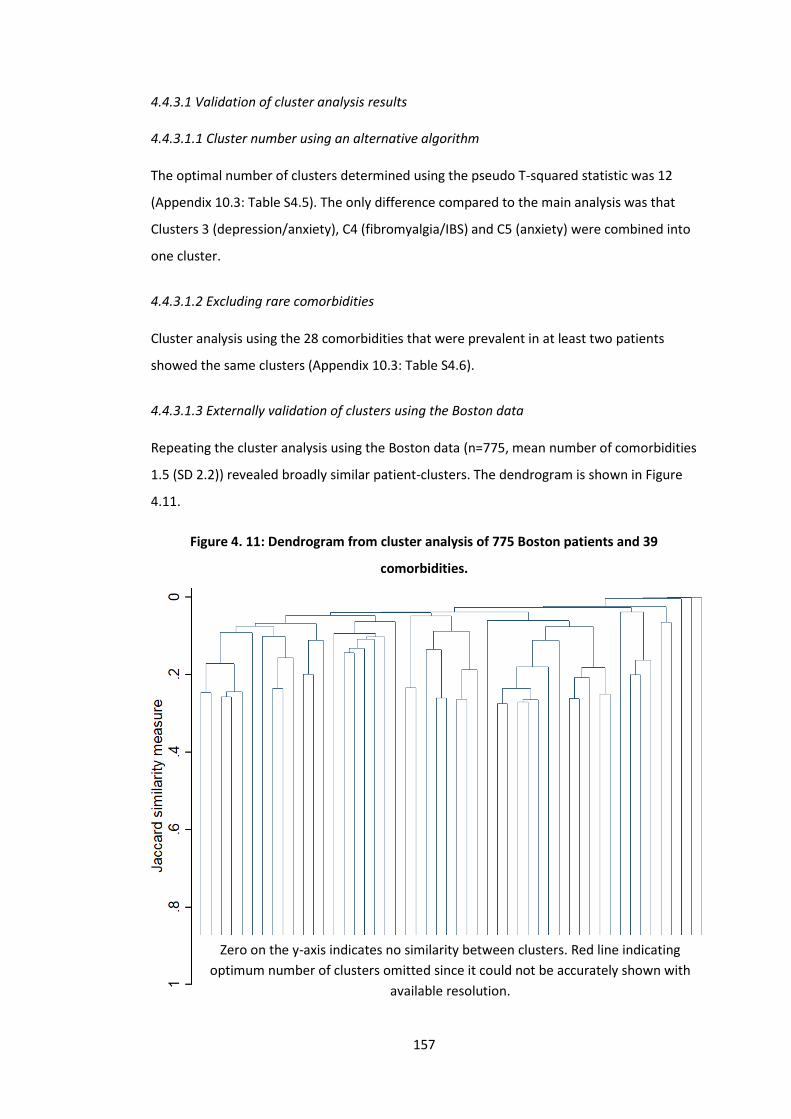
157
4.4.3.1 Validation of cluster analysis results
4.4.3.1.1 Cluster number using an alternative algorithm
The optimal number of clusters determined using the pseudo T-squared statistic was 12
(Appendix 10.3: Table S4.5). The only difference compared to the main analysis was that
Clusters 3 (depression/anxiety), C4 (fibromyalgia/IBS) and C5 (anxiety) were combined into
one cluster.
4.4.3.1.2 Excluding rare comorbidities
Cluster analysis using the 28 comorbidities that were prevalent in at least two patients
showed the same clusters (Appendix 10.3: Table S4.6).
4.4.3.1.3 Externally validation of clusters using the Boston data
Repeating the cluster analysis using the Boston data (n=775, mean number of comorbidities
1.5 (SD 2.2)) revealed broadly similar patient-clusters. The dendrogram is shown in Figure
4.11.
Figure 4. 11: Dendrogram from cluster analysis of 775 Boston patients and 39
comorbidities.
Zero on the y-axis indicates no similarity between clusters. Red line indicating
optimum number of clusters omitted since it could not be accurately shown with
available resolution.
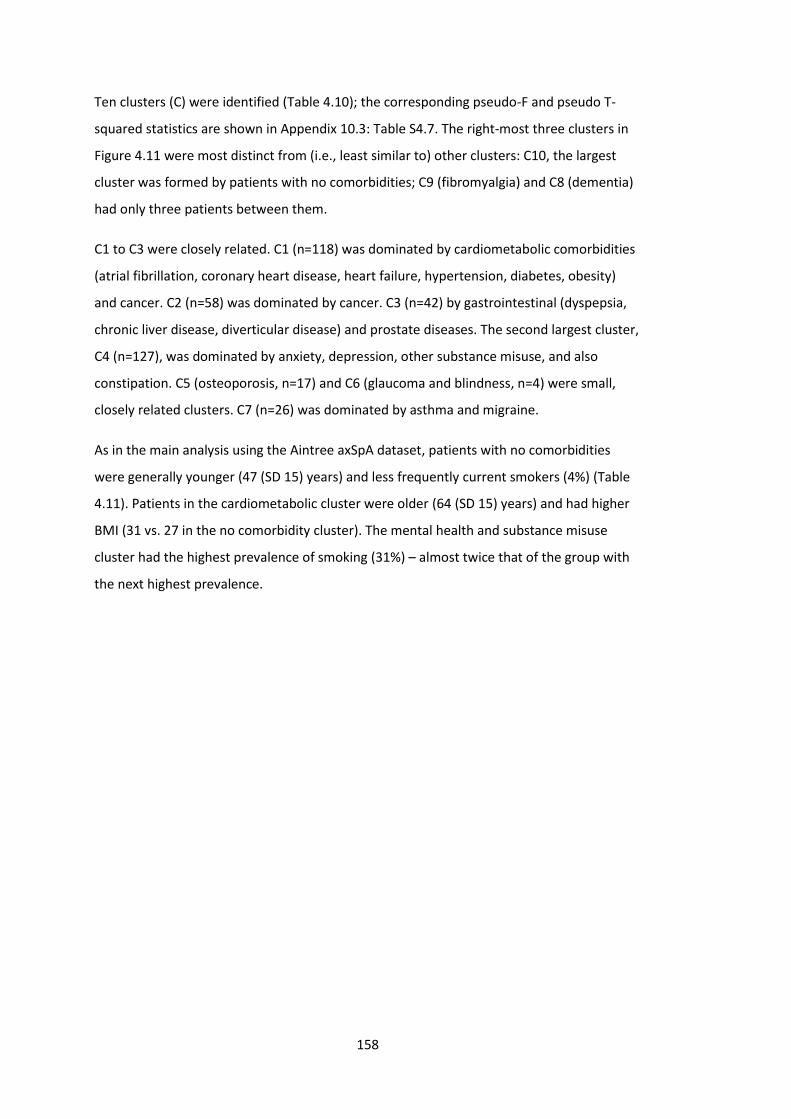
158
Ten clusters (C) were identified (Table 4.10); the corresponding pseudo-F and pseudo T-
squared statistics are shown in Appendix 10.3: Table S4.7. The right-most three clusters in
Figure 4.11 were most distinct from (i.e., least similar to) other clusters: C10, the largest
cluster was formed by patients with no comorbidities; C9 (fibromyalgia) and C8 (dementia)
had only three patients between them.
C1 to C3 were closely related. C1 (n=118) was dominated by cardiometabolic comorbidities
(atrial fibrillation, coronary heart disease, heart failure, hypertension, diabetes, obesity)
and cancer. C2 (n=58) was dominated by cancer. C3 (n=42) by gastrointestinal (dyspepsia,
chronic liver disease, diverticular disease) and prostate diseases. The second largest cluster,
C4 (n=127), was dominated by anxiety, depression, other substance misuse, and also
constipation. C5 (osteoporosis, n=17) and C6 (glaucoma and blindness, n=4) were small,
closely related clusters. C7 (n=26) was dominated by asthma and migraine.
As in the main analysis using the Aintree axSpA dataset, patients with no comorbidities
were generally younger (47 (SD 15) years) and less frequently current smokers (4%) (Table
4.11). Patients in the cardiometabolic cluster were older (64 (SD 15) years) and had higher
BMI (31 vs. 27 in the no comorbidity cluster). The mental health and substance misuse
cluster had the highest prevalence of smoking (31%) – almost twice that of the group with
the next highest prevalence.
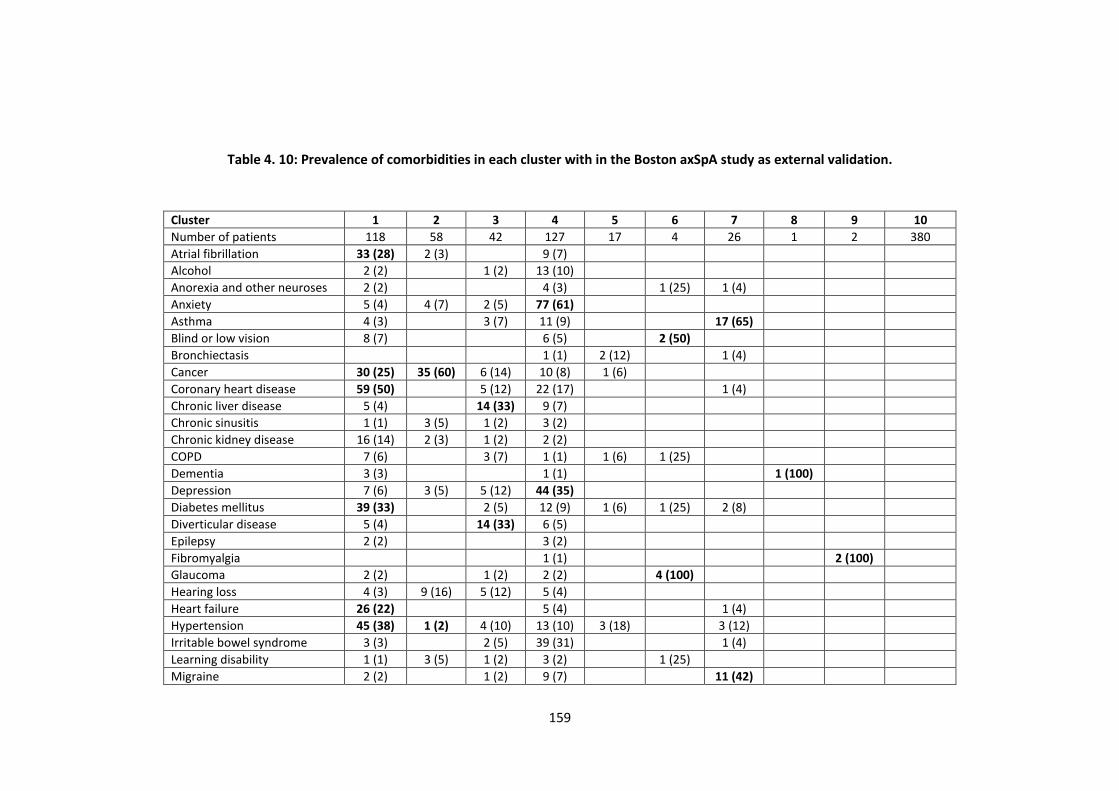
159
Table 4. 10: Prevalence of comorbidities in each cluster with in the Boston axSpA study as external validation.
Cluster 1 2 3 4 5 6 7 8 9 10
Number of patients 118 58 42 127 17 4 26 1 2 380
Atrial fibrillation 33 (28) 2 (3) 9 (7)
Alcohol 2 (2) 1 (2) 13 (10)
Anorexia and other neuroses 2 (2) 4 (3) 1 (25) 1 (4)
Anxiety 5 (4) 4 (7) 2 (5) 77 (61)
Asthma 4 (3) 3 (7) 11 (9) 17 (65)
Blind or low vision 8 (7) 6 (5) 2 (50)
Bronchiectasis 1 (1) 2 (12) 1 (4)
Cancer 30 (25) 35 (60) 6 (14) 10 (8) 1 (6)
Coronary heart disease 59 (50) 5 (12) 22 (17) 1 (4)
Chronic liver disease 5 (4) 14 (33) 9 (7)
Chronic sinusitis 1 (1) 3 (5) 1 (2) 3 (2)
Chronic kidney disease 16 (14) 2 (3) 1 (2) 2 (2)
COPD 7 (6) 3 (7) 1 (1) 1 (6) 1 (25)
Dementia 3 (3) 1 (1) 1 (100)
Depression 7 (6) 3 (5) 5 (12) 44 (35)
Diabetes mellitus 39 (33) 2 (5) 12 (9) 1 (6) 1 (25) 2 (8)
Diverticular disease 5 (4) 14 (33) 6 (5)
Epilepsy 2 (2) 3 (2)
Fibromyalgia 1 (1) 2 (100)
Glaucoma 2 (2) 1 (2) 2 (2) 4 (100)
Hearing loss 4 (3) 9 (16) 5 (12) 5 (4)
Heart failure 26 (22) 5 (4) 1 (4)
Hypertension 45 (38) 1 (2) 4 (10) 13 (10) 3 (18) 3 (12)
Irritable bowel syndrome 3 (3) 2 (5) 39 (31) 1 (4)
Learning disability 1 (1) 3 (5) 1 (2) 3 (2) 1 (25)
Migraine 2 (2) 1 (2) 9 (7) 11 (42)
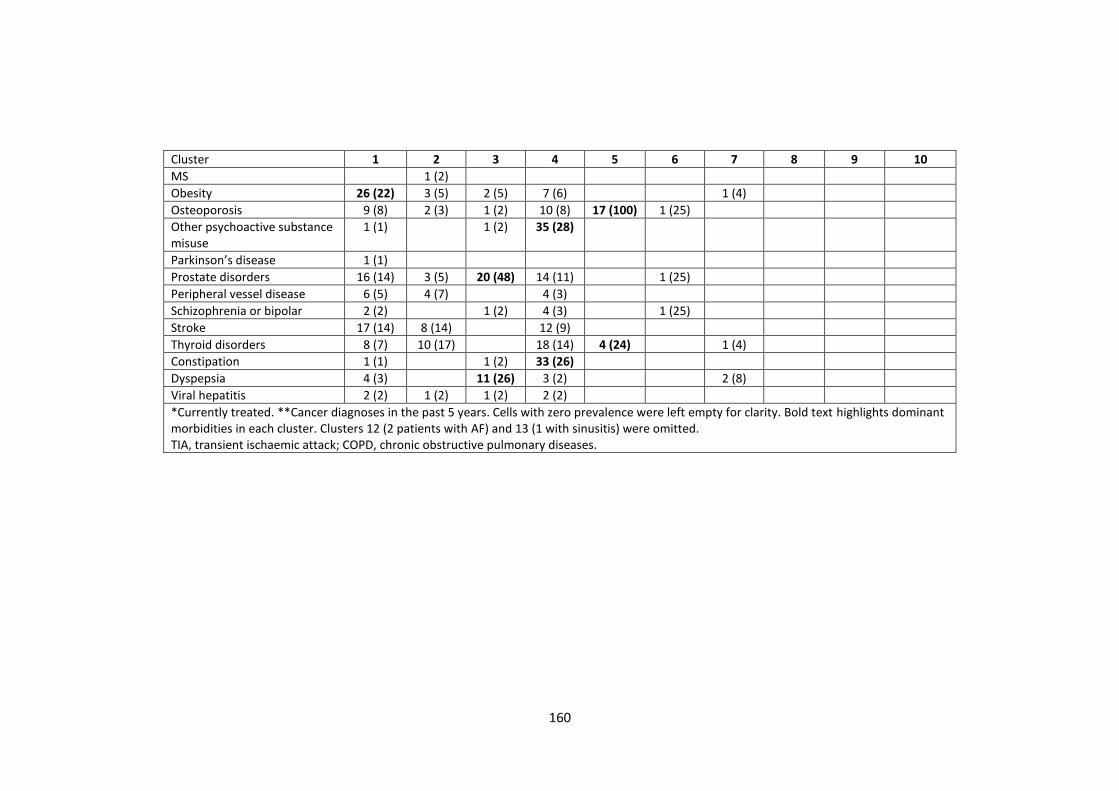
160
Cluster 1 2 3 4 5 6 7 8 9 10
MS 1 (2)
Obesity 26 (22) 3 (5) 2 (5) 7 (6) 1 (4)
Osteoporosis 9 (8) 2 (3) 1 (2) 10 (8) 17 (100) 1 (25)
Other psychoactive substance misuse
1 (1) 1 (2) 35 (28)
Parkinson’s disease 1 (1)
Prostate disorders 16 (14) 3 (5) 20 (48) 14 (11) 1 (25)
Peripheral vessel disease 6 (5) 4 (7) 4 (3)
Schizophrenia or bipolar 2 (2) 1 (2) 4 (3) 1 (25)
Stroke 17 (14) 8 (14) 12 (9)
Thyroid disorders 8 (7) 10 (17) 18 (14) 4 (24) 1 (4)
Constipation 1 (1) 1 (2) 33 (26)
Dyspepsia 4 (3) 11 (26) 3 (2) 2 (8)
Viral hepatitis 2 (2) 1 (2) 1 (2) 2 (2)
*Currently treated. **Cancer diagnoses in the past 5 years. Cells with zero prevalence were left empty for clarity. Bold text highlights dominant morbidities in each cluster. Clusters 12 (2 patients with AF) and 13 (1 with sinusitis) were omitted. TIA, transient ischaemic attack; COPD, chronic obstructive pulmonary diseases.
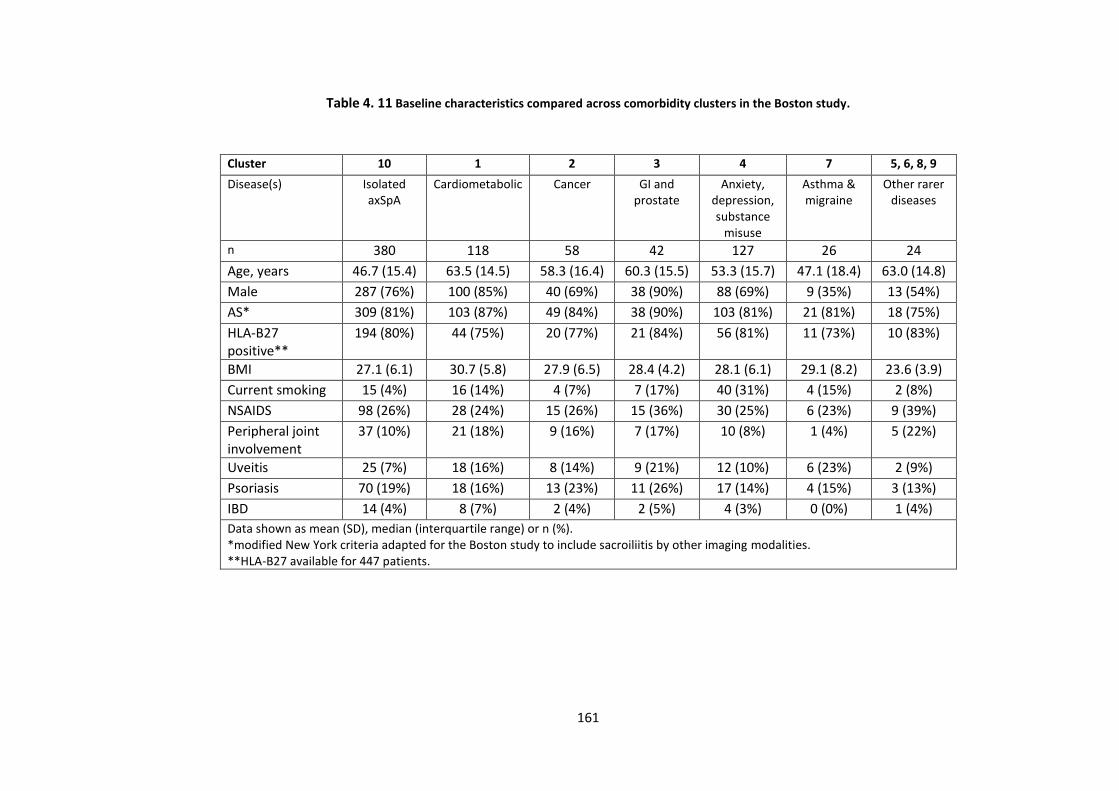
161
Table 4. 11 Baseline characteristics compared across comorbidity clusters in the Boston study.
Cluster 10 1 2 3 4 7 5, 6, 8, 9
Disease(s) Isolated axSpA
Cardiometabolic Cancer GI and prostate
Anxiety, depression, substance
misuse
Asthma & migraine
Other rarer diseases
n 380 118 58 42 127 26 24
Age, years 46.7 (15.4) 63.5 (14.5) 58.3 (16.4) 60.3 (15.5) 53.3 (15.7) 47.1 (18.4) 63.0 (14.8)
Male 287 (76%) 100 (85%) 40 (69%) 38 (90%) 88 (69%) 9 (35%) 13 (54%)
AS* 309 (81%) 103 (87%) 49 (84%) 38 (90%) 103 (81%) 21 (81%) 18 (75%)
HLA-B27 positive**
194 (80%) 44 (75%) 20 (77%) 21 (84%) 56 (81%) 11 (73%) 10 (83%)
BMI 27.1 (6.1) 30.7 (5.8) 27.9 (6.5) 28.4 (4.2) 28.1 (6.1) 29.1 (8.2) 23.6 (3.9)
Current smoking 15 (4%) 16 (14%) 4 (7%) 7 (17%) 40 (31%) 4 (15%) 2 (8%)
NSAIDS 98 (26%) 28 (24%) 15 (26%) 15 (36%) 30 (25%) 6 (23%) 9 (39%)
Peripheral joint involvement
37 (10%) 21 (18%) 9 (16%) 7 (17%) 10 (8%) 1 (4%) 5 (22%)
Uveitis 25 (7%) 18 (16%) 8 (14%) 9 (21%) 12 (10%) 6 (23%) 2 (9%)
Psoriasis 70 (19%) 18 (16%) 13 (23%) 11 (26%) 17 (14%) 4 (15%) 3 (13%)
IBD 14 (4%) 8 (7%) 2 (4%) 2 (5%) 4 (3%) 0 (0%) 1 (4%)
Data shown as mean (SD), median (interquartile range) or n (%). *modified New York criteria adapted for the Boston study to include sacroiliitis by other imaging modalities. **HLA-B27 available for 447 patients.
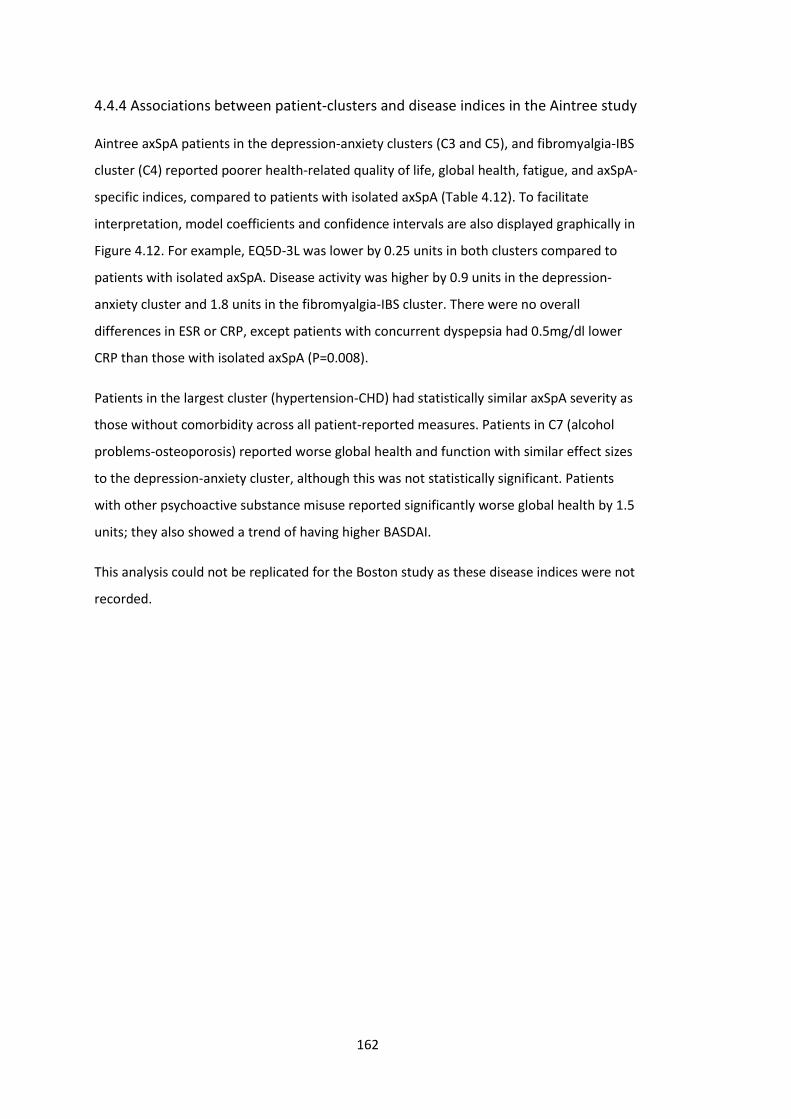
162
4.4.4 Associations between patient-clusters and disease indices in the Aintree study
Aintree axSpA patients in the depression-anxiety clusters (C3 and C5), and fibromyalgia-IBS
cluster (C4) reported poorer health-related quality of life, global health, fatigue, and axSpA-
specific indices, compared to patients with isolated axSpA (Table 4.12). To facilitate
interpretation, model coefficients and confidence intervals are also displayed graphically in
Figure 4.12. For example, EQ5D-3L was lower by 0.25 units in both clusters compared to
patients with isolated axSpA. Disease activity was higher by 0.9 units in the depression-
anxiety cluster and 1.8 units in the fibromyalgia-IBS cluster. There were no overall
differences in ESR or CRP, except patients with concurrent dyspepsia had 0.5mg/dl lower
CRP than those with isolated axSpA (P=0.008).
Patients in the largest cluster (hypertension-CHD) had statistically similar axSpA severity as
those without comorbidity across all patient-reported measures. Patients in C7 (alcohol
problems-osteoporosis) reported worse global health and function with similar effect sizes
to the depression-anxiety cluster, although this was not statistically significant. Patients
with other psychoactive substance misuse reported significantly worse global health by 1.5
units; they also showed a trend of having higher BASDAI.
This analysis could not be replicated for the Boston study as these disease indices were not
recorded.
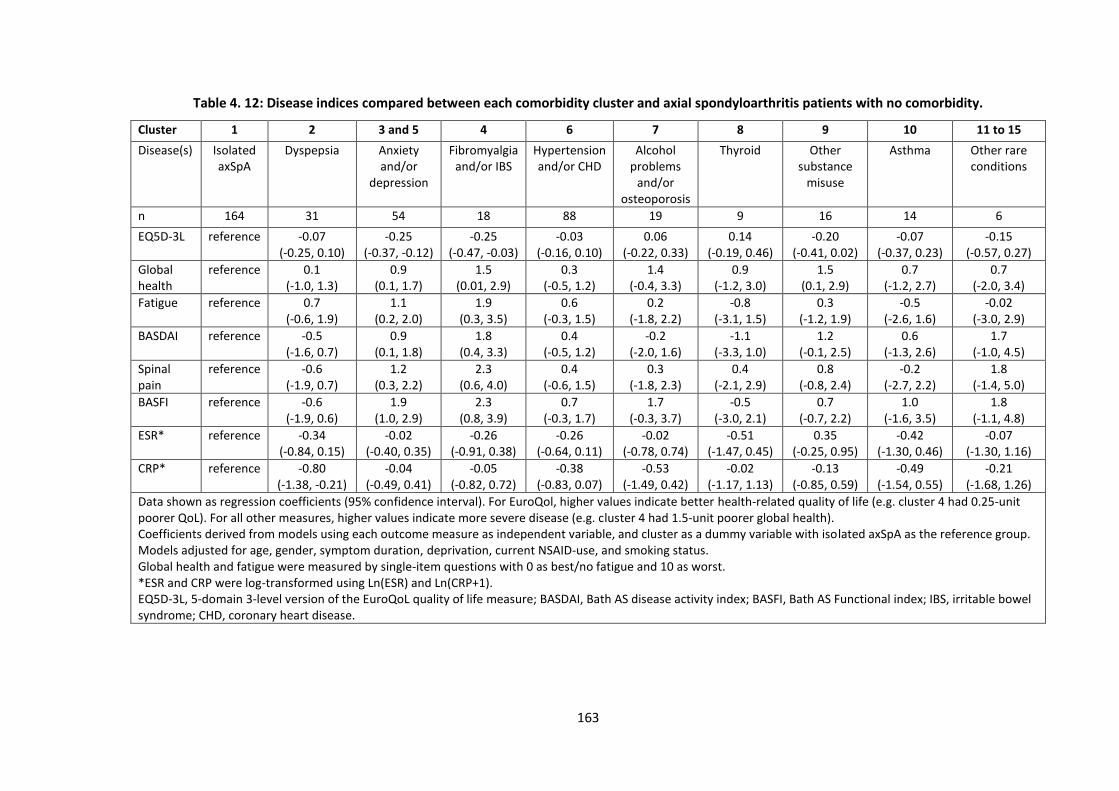
163
Table 4. 12: Disease indices compared between each comorbidity cluster and axial spondyloarthritis patients with no comorbidity.
Cluster 1 2 3 and 5 4 6 7 8 9 10 11 to 15
Disease(s) Isolated axSpA
Dyspepsia Anxiety and/or
depression
Fibromyalgia and/or IBS
Hypertension and/or CHD
Alcohol problems
and/or osteoporosis
Thyroid Other substance
misuse
Asthma Other rare conditions
n 164 31 54 18 88 19 9 16 14 6
EQ5D-3L reference -0.07 (-0.25, 0.10)
-0.25 (-0.37, -0.12)
-0.25 (-0.47, -0.03)
-0.03 (-0.16, 0.10)
0.06 (-0.22, 0.33)
0.14 (-0.19, 0.46)
-0.20 (-0.41, 0.02)
-0.07 (-0.37, 0.23)
-0.15 (-0.57, 0.27)
Global health
reference 0.1 (-1.0, 1.3)
0.9 (0.1, 1.7)
1.5 (0.01, 2.9)
0.3 (-0.5, 1.2)
1.4 (-0.4, 3.3)
0.9 (-1.2, 3.0)
1.5 (0.1, 2.9)
0.7 (-1.2, 2.7)
0.7 (-2.0, 3.4)
Fatigue reference 0.7 (-0.6, 1.9)
1.1 (0.2, 2.0)
1.9 (0.3, 3.5)
0.6 (-0.3, 1.5)
0.2 (-1.8, 2.2)
-0.8 (-3.1, 1.5)
0.3 (-1.2, 1.9)
-0.5 (-2.6, 1.6)
-0.02 (-3.0, 2.9)
BASDAI reference -0.5 (-1.6, 0.7)
0.9 (0.1, 1.8)
1.8 (0.4, 3.3)
0.4 (-0.5, 1.2)
-0.2 (-2.0, 1.6)
-1.1 (-3.3, 1.0)
1.2 (-0.1, 2.5)
0.6 (-1.3, 2.6)
1.7 (-1.0, 4.5)
Spinal pain
reference -0.6 (-1.9, 0.7)
1.2 (0.3, 2.2)
2.3 (0.6, 4.0)
0.4 (-0.6, 1.5)
0.3 (-1.8, 2.3)
0.4 (-2.1, 2.9)
0.8 (-0.8, 2.4)
-0.2 (-2.7, 2.2)
1.8 (-1.4, 5.0)
BASFI reference -0.6 (-1.9, 0.6)
1.9 (1.0, 2.9)
2.3 (0.8, 3.9)
0.7 (-0.3, 1.7)
1.7 (-0.3, 3.7)
-0.5 (-3.0, 2.1)
0.7 (-0.7, 2.2)
1.0 (-1.6, 3.5)
1.8 (-1.1, 4.8)
ESR* reference -0.34 (-0.84, 0.15)
-0.02 (-0.40, 0.35)
-0.26 (-0.91, 0.38)
-0.26 (-0.64, 0.11)
-0.02 (-0.78, 0.74)
-0.51 (-1.47, 0.45)
0.35 (-0.25, 0.95)
-0.42 (-1.30, 0.46)
-0.07 (-1.30, 1.16)
CRP* reference -0.80 (-1.38, -0.21)
-0.04 (-0.49, 0.41)
-0.05 (-0.82, 0.72)
-0.38 (-0.83, 0.07)
-0.53 (-1.49, 0.42)
-0.02 (-1.17, 1.13)
-0.13 (-0.85, 0.59)
-0.49 (-1.54, 0.55)
-0.21 (-1.68, 1.26)
Data shown as regression coefficients (95% confidence interval). For EuroQol, higher values indicate better health-related quality of life (e.g. cluster 4 had 0.25-unit poorer QoL). For all other measures, higher values indicate more severe disease (e.g. cluster 4 had 1.5-unit poorer global health). Coefficients derived from models using each outcome measure as independent variable, and cluster as a dummy variable with isolated axSpA as the reference group. Models adjusted for age, gender, symptom duration, deprivation, current NSAID-use, and smoking status. Global health and fatigue were measured by single-item questions with 0 as best/no fatigue and 10 as worst. *ESR and CRP were log-transformed using Ln(ESR) and Ln(CRP+1). EQ5D-3L, 5-domain 3-level version of the EuroQoL quality of life measure; BASDAI, Bath AS disease activity index; BASFI, Bath AS Functional index; IBS, irritable bowel syndrome; CHD, coronary heart disease.
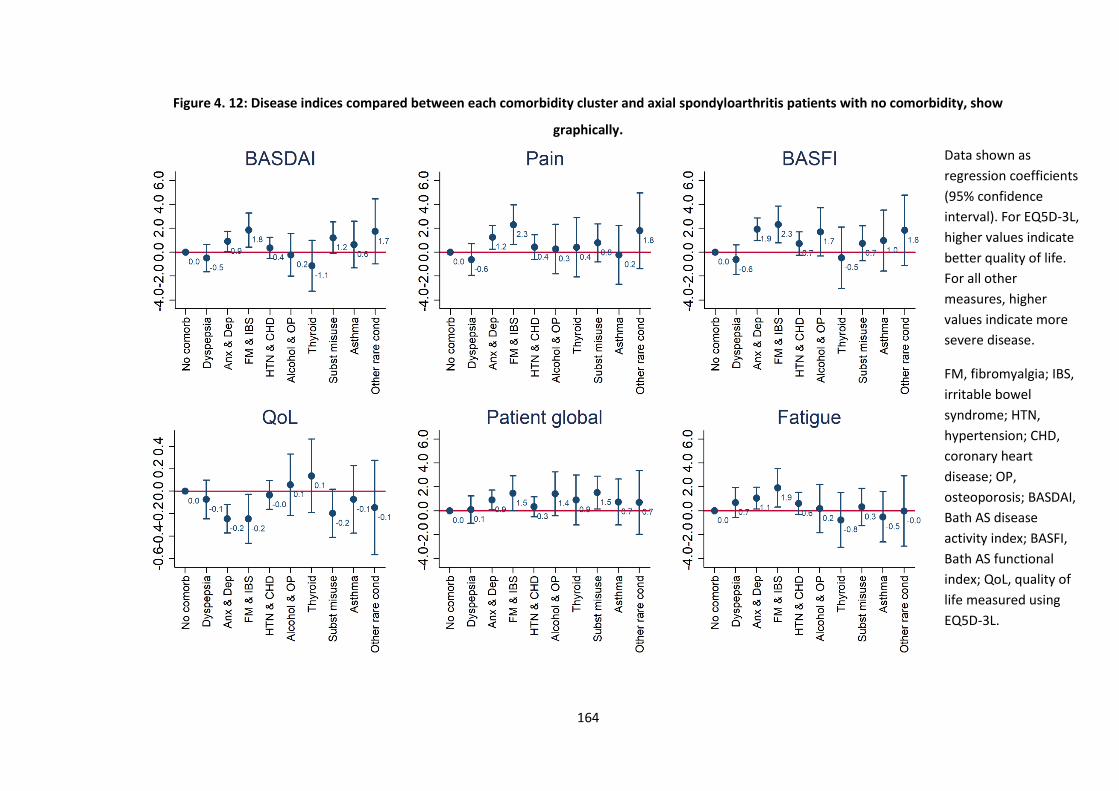
164
Figure 4. 12: Disease indices compared between each comorbidity cluster and axial spondyloarthritis patients with no comorbidity, show
graphically.
Data shown as
regression coefficients
(95% confidence
interval). For EQ5D-3L,
higher values indicate
better quality of life.
For all other
measures, higher
values indicate more
severe disease.
FM, fibromyalgia; IBS,
irritable bowel
syndrome; HTN,
hypertension; CHD,
coronary heart
disease; OP,
osteoporosis; BASDAI,
Bath AS disease
activity index; BASFI,
Bath AS functional
index; QoL, quality of
life measured using
EQ5D-3L.
165
4.5 Discussion
This chapter used two cross-sectional axSpA populations to describe comorbidity
prevalence and patterns. In both populations, over half of all patients had at least one
comorbid condition. Overall pattern and burden of comorbidity were similar between
patients with AS and nr-axSpA. Several comorbidity clusters were identified, each with only
a small number of predominant conditions. Depression-anxiety and hypertension-coronary
heart disease were the most common disease clusters in both axSpA cohorts. Patients in
the depression-anxiety clusters and fibromyalgia-IBS clusters had more severe disease
consistent across all patient-reported outcomes.
4.5.1 Prevalence of comorbidities
Differences in demography and socioeconomic context between Boston and Aintree
cohorts offer interesting comparisons. Boston patients were, on average, older (mean age
53 vs. 46 years) and less likely to be current smokers (11 vs. 35%) compared to Aintree
patients. BMI, extra-articular manifestations, and inflammatory makers between the two
cohorts were virtually identical. Patients with comorbidities had higher inflammatory
markers in both studies, but statistical significance was reached only in the Boston analysis;
this could be due to selective testing (comorbid patients were more likely to be tested) or
greater statistical power. Interestingly, the prevalence of IBD was higher in Boston patients
with comorbidities than without, which was not observed in the Aintree data. This
difference may be due to limitations of ICD codes used in the Boston data.
The mean (1.5 vs. 1.3) and range (0 up to 13 vs. 6) of comorbidity count differed between
the Boston and Aintree studies. Direct comparison of comorbidity prevalence has limited
meaning given differences in age and methods of data collection. Manual chart review
supported by GP and medication records (Aintree) is more likely to capture comorbidities
than diagnostic codes (Boston). Clinical practice may also explain some key discrepancies,
for example, systematic recording of BMI (obesity in 17% of Aintree vs. 3.4% of Boston
patients) and blood pressure (hypertension in 14% of Aintree vs. 6.1% of Boston patients).
Boston patients had higher prevalence of anxiety (7.9 vs. 2.7%), coronary heart disease (7.7
vs. 4.2%), and cancer (7.2 vs. 0.7%) than Aintree patients. These differences are more
challenging to explain without knowing the validity of ICD codes for these conditions, but
may partly be explained by the older age of the Boston cohort.
166
The mean number of comorbidities (1.5) in the Boston axSpA study was similar to the 1.6
conditions reported among rheumatoid arthritis patients, using the same index and ICD
codes in the Brigham and Women’s Hospital Rheumatoid Arthritis Sequential Study (BRASS)
[198]. The BRASS cohort was older (mean age 58 years) than this axSpA group (mean age 53
years). Notably, axSpA subjects had a higher prevalence of anxiety (11% vs. 4% of BRASS);
this adds to an increasing body of literature highlighting the importance of mental health in
these patients [199].
The prevalence of individual morbidities in the Aintree cohort were consistent with those
reported in the worldwide ASAS-COMOSPA cohort which had similar age and gender
distributions, although ASAS-COMOSPA included patients with both axial and peripheral
SpA [200]. The proportion with at least one comorbidity was higher in the Aintree cohort
(61% vs. 51%), but this is likely due to the larger number of conditions included. The Aintree
cohort had a greater proportion of current smokers (35% vs. 29% of ASAS-COMOSPA),
which is compatible with the relative deprivation in this area of Liverpool (see Chapter 3,
Section 3.2.1). This may also explain the higher prevalence of coronary heart disease (6%
vs. 1%) in the Aintree cohort. Interestingly, the prevalence of hypertension in the Aintree
data was lower (19% vs. 34% in ASAS-COMOSPA). The ASAS-COMOSPA study used single-
measurement blood pressure thresholds in their definition of hypertension, which may lead
to over-diagnosis [201]. Osteoporosis was also less common (6% vs. 13%), which may be
under-documented since a previous study [202] found a higher (9%) prevalence of
osteoporosis in a subgroup of this cohort (defined by T-score≤-2.5, as was in ASAS-
COMOSPA).
Some comorbidities are likely under-represented in both cohorts. For example,
fibromyalgia prevalence (0.1% in Boston and 3.4% in Aintree) were much lower than the
prevalence reported using meta-analysis (13%) and found by screening questionnaire in the
British Society for Rheumatology Biologics Register for AS (21%) [203,204].
4.5.2 Comorbidities in AS vs. nr-axSpA
There were no differences in the prevalence of HLA-B27 positivity between AS and nr-
axSpA groups in the Boston study, while the difference was marked in the Aintree data
(66% positive in AS and 30% positive in nr-axSpA). Similar discrepancies exist in existing
literature and may be explained by different approaches to the diagnostic work-up. AS
subgroups in both populations had higher inflammatory markers and greater proportion of
males [205,206]. These results support the hypothesis that both diagnoses belong to the
167
same disease spectrum, and that males and those with higher inflammatory markers are
more likely to progress to radiographic damage [207]. Although data on disease severity
measures were limited in the Boston data, subjective measures of pain were similar
between diagnoses. All patient-reported disease measures were similar between AS and nr-
axSpA in the Aintree data. This is consistent with more detailed outcome measures from
the Corrona SpA registry, where the two groups had similar disease activity, functional
impairment, and health-related quality of life [205]. These results are supportive of
guidelines that recommend a unified treatment approach for all axSpA patients [61].
The only statistically significant differences in prevalence of individual morbidities between
AS and nr-axSpA patients were chronic kidney disease (in Boston cohort) and IBS (in Aintree
cohort). Higher prevalence of chronic kidney disease in AS patients may be related to their
older age and longer exposure to NSAIDs. Higher IBS (along with fibromyalgia and
depression) prevalence in nr-axSpA may be due to higher psychosomatic burden due to
more challenging (and therefore likely delayed) diagnosis, or from misdiagnosis of
fibromyalgia as nr-axSpA. These differences should not be over-interpreted in the context
of multiple comparisons.
Results from the Boston study confirms those from the Corrona SpA registry that bDMARDs
are widely used for nr-axSpA in clinical practice [205]. This is consistent with the
ACR/SAA/SPARTAN treatment recommendations for AS and axSpA [208], although
bDMARDs were not licensed for this indication in the US when this study was conducted.
Clinicians were likely relying on a clinical diagnosis rather than classification criteria for
making treatment decisions. The proportions of patients prescribed bDMARDs and
csDMARDs (55% and 25%, respectively) were similar to those reported in Corrona SpA
registry (67% and 36%) [205]. A history of bDMARD-use was seen in 55% of Boston patients,
csDMARDs in 25%, NSAIDs in 76%, and prednisone in 35% of patients.
4.5.3 Comorbidity clusters and associations with disease severity
In the main analysis using the Aintree cohort, each comorbidity cluster had only a small
number of predominant conditions reflecting the low number of conditions among those
with comorbidity. All comorbidities within each cluster had shared patho-aetiological
mechanisms. Depression-anxiety and hypertension-coronary heart disease formed the
most common disease clusters, which were externally validated in the Boston axSpA study.
The higher comorbidity burden in the Boston cohort resulted in clusters dominated by a
higher number of conditions; for example, the cardiometabolic cluster additionally included
168
atrial fibrillation, heart failure and obesity, compared to results from the Aintree cohort.
Another notable difference was the clustering of mental health and other substance misuse
disorders. The latter was shown to be associated with disease severity indices with clinically
important (but statistically non-significant) effect sizes. It also highlights the intimate link
between mental and physical health.
Differences in patient characteristics across the Aintree comorbidity clusters were
consistent with the existing literature. Both fibromyalgia [209] and thyroid disorders [210]
are generally more prevalent among females, which explains the high proportion of female
patients in these clusters and also the higher prevalence of peripheral joint involvement
and lower prevalence of radiographic disease and HLA-B27 positivity [211]. The prevalence
of uveitis increases with age [16], which explains its higher prevalence in the older
hypertension-CHD and alcohol problems-osteoporosis clusters.
In the Aintree cohort, patients in the depression-anxiety clusters and fibromyalgia-IBS
clusters reported worse health-related quality of life, global health, fatigue, disease activity,
pain, and functional impairment. Associations between these two clusters and patient-
reported outcome measures were similar in magnitude to those reported in other studies
[199,203,204,142]. However, none of the comorbidity clusters were significantly associated
with ESR or CRP in the present study. In a previous meta-analysis, depression was
additionally associated with objective measures such as ESR and BASMI [199]. Severe axSpA
is likely to increase the risk of depression, and depression is known to impact the
experience and reporting of pain [199,212]. Direction of causation could not be determined
due to the cross-sectional design of this study. This is less relevant when the aim is to
identify patient-clusters that may benefit from additional management. Baseline
depression has been shown to reduce treatment response in longitudinal studies of RA
[213], but whether this is true for axSpA patients is not yet known.
Although consistent associations across several outcomes are reassuring, care should be
taken when interpreting isolated significant results (such as the association between global
health and other substance misuse). Several clusters (e.g., asthma, thyroid and other rare
diseases) had low prevalence, which partly contributed to the lack of precision in their
effect estimate. For example, the cluster for other rare conditions was associated with
clinically significant effect sizes in BASDAI, pain and BASFI, but these were not statistically
significant. Larger studies using standardised recording of comorbidities and disease indices
are needed to study them in greater detail.
169
4.5.4 Strengths and limitations
A key strength of this study was the range and number of comorbidities, selected based on
their importance in the general population rather than their relationship to the index
disease. The latter approach is common among studies of comorbidity, many of which
include diseases based on prevalence or availability of data and may overlook other
important conditions. Analyses of the two axSpA cohorts complemented and strengthened
each other. In the Aintree axSpA study, comorbidity data were extracted from diagnoses
documented in clinical notes, which are likely more accurate than those obtained from
patient-recall or administrative diagnostic codes alone. Several sources of clinical
information were reviewed to reduce the possibility of missing diagnoses.
There were several limitations. For the Boston study, identifying cases from historical EHR
data is challenging in the context of evolving terminology and classification criteria. There
are no ICD-9 or -10 codes for axSpA, and using ICD code alone to classify AS has limited
accuracy [168]. The high positive predictive value (80%) of the search strategy likely came
at the cost of reduced sensitivity, in particular the ability to identify nr-axSpA cases.
Requiring three or more ICD codes and radiological keywords may have selected individuals
with more advanced disease, which may explain the older age of the cohort. Nevertheless,
the proportion of AS cases (83%) was similar to that of the Corrona SpA registry (76%)
[205].
In the US, patients can, and do, change their hospitals and care-providers such that
diagnoses are often made at prior institutions and by different providers; therefore, data
may not be consistently available for variables such as disease or symptom duration.
Disease severity indices were not systematically collected. Treatment decisions in the US
are made by the provider together with the patient; insurance companies do not require
documentation of BASDAI to prescribe biologics. However, the available pain data was
consistent with analyses of other disease indices in the Aintree axSpA and Corrona SpA
registries [205].
Using ICD codes to derive comorbidities may have limited accuracy for certain diseases.
However, any inaccuracies with ICD codes are likely to be the same for both AS and nr-
axSpA groups and would not result in directional bias. Coded EHR medication data could
not be used to determine current use of individual drugs. Furthermore, NSAIDs might be
bought over the counter, and infliximab could be prescribed on infusion charts and not
coded. It is also possible for patients to consult and receive treatment from
170
rheumatologists outside of Partners HealthCare, which would not be coded. The proportion
of patients who had ever used prednisone was high. This could be explained by short
courses prescribed for symptom flares or for other co-existing conditions.
The main methodological limitation for the cluster analysis was the lack of internal (e.g.,
cross-) validation of the cluster analysis. Clustering results were, however, supported by a
range of sensitivity analyses, including the use of an independent, external dataset.
Results from these analyses may have limited generalisability to all axSpA cohorts, since
both studies were conducted at tertiary centres. Lastly, some important disease indices
were lacking in both studies, namely ASDAS and BASMI. This precluded comparison of
whether associations with subjective and more objective measures of disease activity.
4.6 Summary
Comorbidities were common in both axSpA populations and similar between AS and nr-
axSpA. These findings highlight the importance of identifying and managing comorbidities
in these patients and support a unified management approach for the full spectrum of
axSpA. Comorbidity co-existed in clusters, which consisted mostly of concurrent
cardiovascular or mental-health disorders. Patients with comorbid depression-anxiety and
fibromyalgia-IBS reported worse overall health-related quality of life, global health, fatigue
and axSpA disease activity. These results highlight the importance of identification and
optimisation of comorbidities, particularly mental health, and holistic patient-centred
management of axSpA.
171
Chapter 5: Comorbidities and disease assessment in axSpA
This chapter examines whether assessment of axSpA disease activity and other measures of
disease severity are influenced by the presence of comorbidities, using cross-sectional data
from the BSRBR-AS registry.
5.1 Introduction
The previous chapter showed that axSpA patients with comorbidities reported more severe
disease (including disease activity, functional impairment, fatigue, etc.) than those without.
This may be explained, at least in part, by the subjectivity of patient-reported outcome
measures. Prior studies have shown that patient perspectives of disease activity are more
associated with function and fatigue, whereas physician assessments are more related to
metrology and CRP [214]. Patients’ experience of axSpA symptom severity may be
influenced by coexisting conditions; for example, cardiorespiratory diseases can
significantly reduce physical function [90,215], while concurrent depression and
fibromyalgia influence fatigue [216]. Many treatment decisions depend on patient-reported
disease activity despite these limitations; for example, eligibility to commence and continue
biologics are defined using thresholds of BASDAI and spinal pain in the UK [190].
The AS disease activity score (ASDAS) was developed to address some of these concerns
around disease activity assessment [217,218]. ASDAS combines three questions from
BASDAI with CRP/ESR and the patient global score (see Chapter 1, Box 1.5, page 39),
analogous to the disease activity score – 28 joints (DAS28) for rheumatoid arthritis (RA).
Unlike BASDAI, it has been shown to associate with radiographic progression [219].
However, whether ASDAS is robust to the influence of comorbidities compared to patient-
reported disease activity has not been examined. In RA, comorbidity count inflates DAS28
through the patient global score, independently of swollen/tender joints and inflammatory
markers [220]. The patient global score is given more weight than all other patient-reported
components in the ESR-based ASDAS formula and surpassed only by the ‘back pain’
component in the CRP-based formula. It is unknown whether the same vulnerability exists
for ASDAS. Understanding whether and how comorbidities influence assessment of disease
activity is crucial given their high prevalent [84,221]. This chapter addresses these unmet
172
research needs, namely how comorbidities influence the assessment of disease activity and
other disease indices.
5.2 Aims
1. To compare whether measures of disease activity (BASDAI, spinal pain, ASDAS) and
inflammation (CRP/ESR) are differentially influenced by comorbidities.
2. To replicate these comparisons for other important measures of disease severity
(fatigue, function, and health-related quality of life).
3. To examine whether the patient global component of ASDAS is influenced by
comorbidities independent of the other components.
5.3 Methods
The BSRBR-AS was used to address these aims as it includes a wealth of axSpA disease
severity measures. Sufficient data was collected from which ASDAS could be derived, which
was not possible in the Aintree and Boston cohorts. Cross-sectional baseline data were
used from both biologic (i.e., pre-treatment data) and non-biologic groups.
5.3.1 Comorbidity
The count of 14 comorbidities was considered in three ways (as described in Chapter 3,
Section 3.5.2) as: binary (no comorbidity vs. at least one), continuous, categorical (0, 1, 2,
≥3) and individual conditions.
5.3.2 Assessment of disease activity and severity
Disease severity is a multifaceted concept. For this thesis, ‘severity’ included disease
activity and other indices such as functional impairment. Disease activity was assessed
using BASDAI, ASDAS, spinal pain, CRP (mg/dl) and ESR (mm/hr) [180]. ASDAS was
calculated using the following: ASDAS-CRP = 0.12 x Back Pain + 0.06 x Duration of Morning
Stiffness + 0.07 x Peripheral Pain/Swelling + 0.11 x Patient Global + 0.58 x Ln(CRP+1), or
ASDAS-ESR = 0.08 x Back Pain + 0.07 x Duration of Morning Stiffness + 0.09 x Peripheral
Pain/Swelling + 0.11 x Patient Global + 0.29 x √ESR [218].
Functional impairment was assessed using BASFI and BASMI [180]. Fatigue was measured
using the Chalder Fatigue Scale Likert scale (CFQ) and health-related quality of life using the
AS quality of life questionnaire (ASQoL) [179,222].
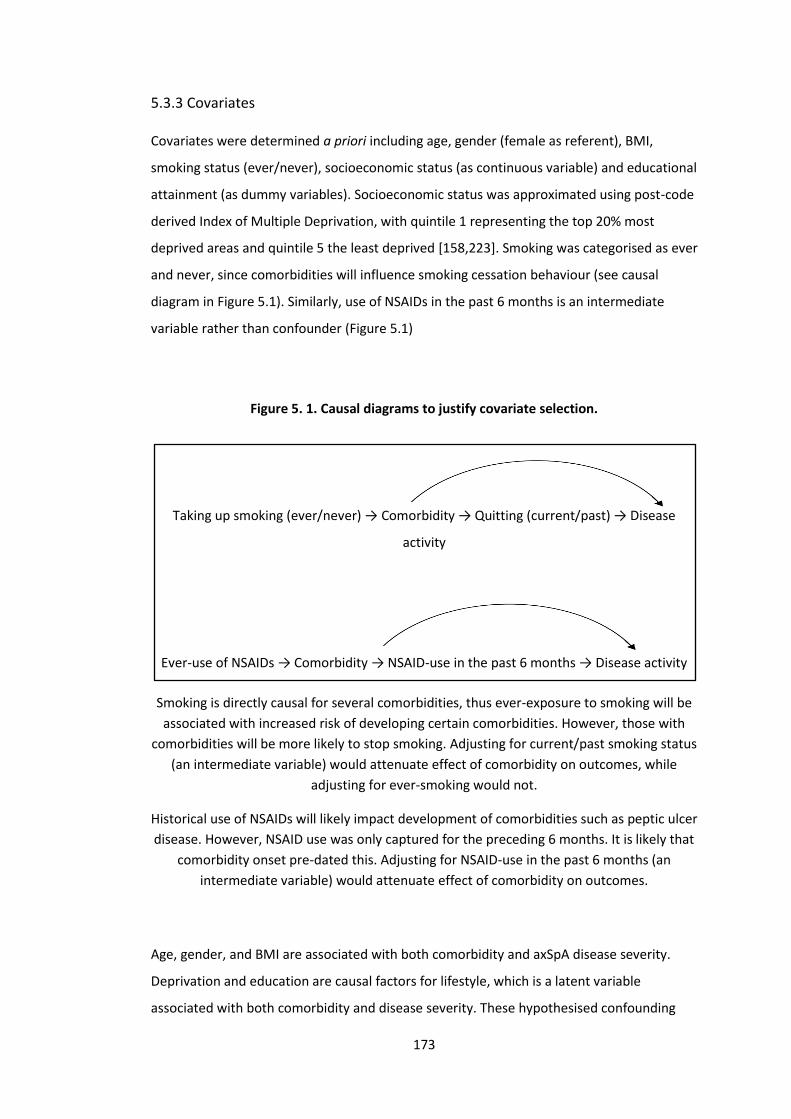
173
5.3.3 Covariates
Covariates were determined a priori including age, gender (female as referent), BMI,
smoking status (ever/never), socioeconomic status (as continuous variable) and educational
attainment (as dummy variables). Socioeconomic status was approximated using post-code
derived Index of Multiple Deprivation, with quintile 1 representing the top 20% most
deprived areas and quintile 5 the least deprived [158,223]. Smoking was categorised as ever
and never, since comorbidities will influence smoking cessation behaviour (see causal
diagram in Figure 5.1). Similarly, use of NSAIDs in the past 6 months is an intermediate
variable rather than confounder (Figure 5.1)
Figure 5. 1. Causal diagrams to justify covariate selection.
Taking up smoking (ever/never) → Comorbidity → Quitting (current/past) → Disease
activity
Ever-use of NSAIDs → Comorbidity → NSAID-use in the past 6 months → Disease activity
Smoking is directly causal for several comorbidities, thus ever-exposure to smoking will be
associated with increased risk of developing certain comorbidities. However, those with
comorbidities will be more likely to stop smoking. Adjusting for current/past smoking status
(an intermediate variable) would attenuate effect of comorbidity on outcomes, while
adjusting for ever-smoking would not.
Historical use of NSAIDs will likely impact development of comorbidities such as peptic ulcer
disease. However, NSAID use was only captured for the preceding 6 months. It is likely that
comorbidity onset pre-dated this. Adjusting for NSAID-use in the past 6 months (an
intermediate variable) would attenuate effect of comorbidity on outcomes.
Age, gender, and BMI are associated with both comorbidity and axSpA disease severity.
Deprivation and education are causal factors for lifestyle, which is a latent variable
associated with both comorbidity and disease severity. These hypothesised confounding
174
relationships were tested in the data: education was strongly associated with comorbidity
count and BASDAI; deprivation was strongly associated with BASDAI but not comorbidity
count. Potential confounders strongly associated with the outcome should be included,
even if only weakly associated with the ‘exposure’ [224]. These variables were therefore
included as covariates.
5.3.4 Statistics
Descriptive statistics were used to summarise comorbidity prevalence and compare
participants with and without comorbidities. CRP and ESR were transformed using
ln(CRP+1) and ln(ESR) in regression models.
In addition to three variable-types for comorbidity count, the independent contribution of
individual comorbidities to each disease activity and other disease severity measures was
also examined, by adding all 14 comorbidities into linear models, and adjusting for the
same covariates. Individual conditions may be closely related to others (e.g., hypertension
and ischaemic heart disease shown in Chapter 4); variance inflation factor [191] was used
to check for multicollinearity. Correction for multiple testing was not performed since
dependent variables measure a shared underlying construct of disease severity; that is,
tests were not independent [225].
To examine whether comorbidity count or individual comorbid conditions independently
inflated the patient global score, the above analyses were repeated for patient global and
comorbidity count or individual comorbidities, but additionally adjusting for other
components of the ASDAS (three BASDAI questions and CRP). Throughout, model
coefficients and 95% confidence intervals were displayed graphically with detailed results
provided in the Appendix 10.4.
5.3.4.1 Power considerations
The primary analysis examined the association between the number of comorbidities
against BASDAI using multivariable linear regression. Education was entered as a dummy
variable (i.e., as 5 variables), giving a total of 11 variables. Using alpha of 0.05, a sample size
of 2043 provides 80% power (i.e., beta of 0.2) if comorbidity count explains ≥0.4% of the
total variance. These power estimates remain practically unchanged for secondary analyses
that examine individual comorbidities (i.e., 14 additional variables, total 25 variables).
Statistical power was reduced for analyses of other disease severity outcomes where the
proportion missing was greater.
175
7.3.4.2 Sensitivity analyses
Some comorbidities, including heart failure, cancer, TB and demyelinating diseases, are
routinely sought for during the workup for TNF inhibitor therapy. These comorbidities may
therefore be more prevalent in the biologic cohort due to differential ascertainment alone.
Equally, presence of certain comorbidities may channel patients into (e.g., renal/peptic
ulcer disease and inability to use NSAIDs) or away from (e.g., cancer) the biologic group. All
analyses were repeated in the non-biologic cohort only.
For analyses of comorbidity and the patient global score, successful adjustment for other
components of ASDAS required adequate covariate overlap between comparison groups;
extrapolating beyond overlap can introduce bias. Patients were therefore matched on all
covariates (gender, ever-smoking, education, deprivation index, quintiles of age and BMI,
and tertiles of the three ASDAS questions and ln(CRP+1)) in sensitivity analyses, using
coarsened exact matching [226].
176
5.4 Results
Among a total of 2687 participants, 2043 (76%) were included for analysis; exclusions were
due to missing questionnaires (n=364, 14%), missing comorbidity data (n=6, 0.2%) and
questionnaires completed outside the eligible window (n=274, 10%). Included and excluded
participants were generally similar (Appendix 10.4: Table S5.1), except the latter were
younger (mean 44 (SD 13) vs. 49 (SD 15) years, p<0.001) and had younger age of symptom
onset (mean 28 (SD 13) vs. 29 (SD 14) years, p=0.015) and clinically non-significantly lower
ESR (median 9 vs. 13 mm/hr, p=0.035) and BASMI (median 3.2 vs. 3.8, p=0.022).
The population included in the analyses were predominantly male (67%) with mean age of
49 (SD 15) years (Table 5.1). Classification criteria for AS was fulfilled by 1316 (65%). HLA-
B27 status was available for 74% of participants and was positive in 79% of these cases.
Thirty one percent were in the biologic group but had not yet commenced treatment.
Those with comorbidities were significantly older (54 (SD 15) vs. 45 (SD 14) years), had
higher BMI (29 (SD 6) vs. 27 (SD 5) kg/m2) and lower educational attainment. Although
there were more ever-smokers in the group with comorbidities (63 vs. 50%), a larger
proportion had quit (43 vs. 32%). NSAID use in the preceding 6 months was less common
among those with comorbidities. Participants with comorbidity also had higher disease
activity, more fatigue, function impairment and lower health-related quality of life.
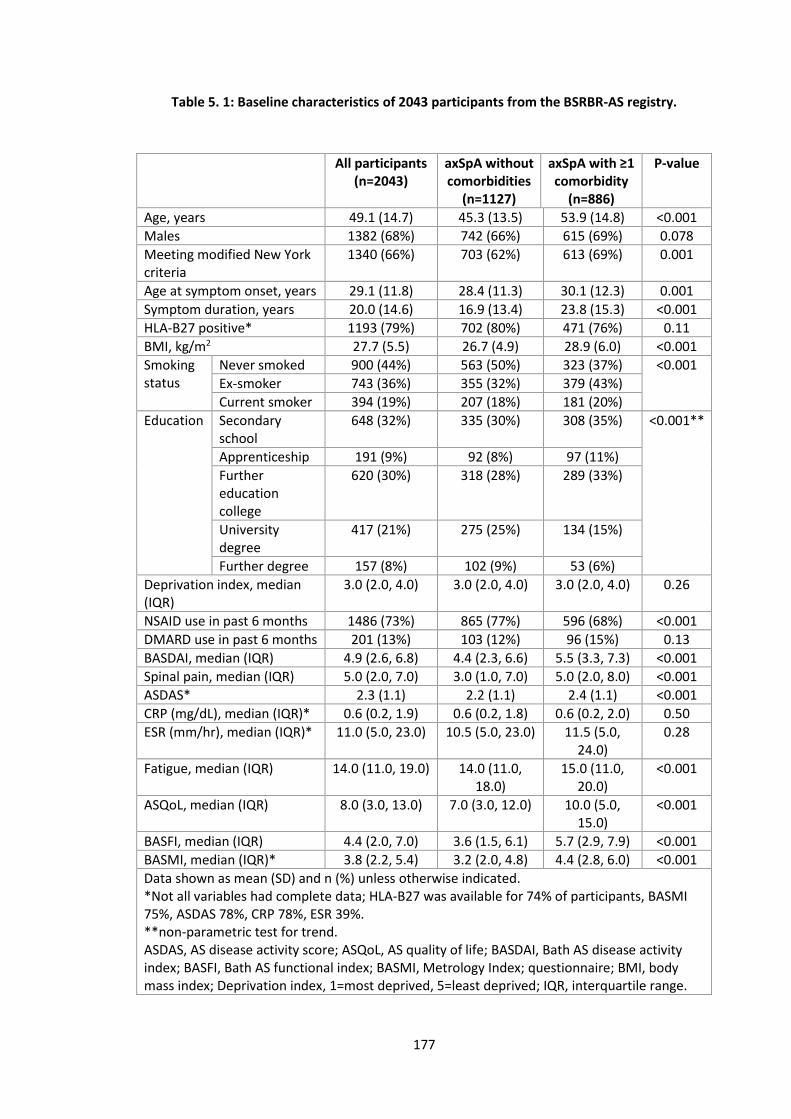
177
Table 5. 1: Baseline characteristics of 2043 participants from the BSRBR-AS registry.
All participants (n=2043)
axSpA without comorbidities
(n=1127)
axSpA with ≥1 comorbidity
(n=886)
P-value
Age, years 49.1 (14.7) 45.3 (13.5) 53.9 (14.8) <0.001
Males 1382 (68%) 742 (66%) 615 (69%) 0.078
Meeting modified New York criteria
1340 (66%) 703 (62%) 613 (69%) 0.001
Age at symptom onset, years 29.1 (11.8) 28.4 (11.3) 30.1 (12.3) 0.001
Symptom duration, years 20.0 (14.6) 16.9 (13.4) 23.8 (15.3) <0.001
HLA-B27 positive* 1193 (79%) 702 (80%) 471 (76%) 0.11
BMI, kg/m2 27.7 (5.5) 26.7 (4.9) 28.9 (6.0) <0.001
Smoking status
Never smoked 900 (44%) 563 (50%) 323 (37%) <0.001
Ex-smoker 743 (36%) 355 (32%) 379 (43%)
Current smoker 394 (19%) 207 (18%) 181 (20%)
Education Secondary school
648 (32%) 335 (30%) 308 (35%) <0.001**
Apprenticeship 191 (9%) 92 (8%) 97 (11%)
Further education college
620 (30%) 318 (28%) 289 (33%)
University degree
417 (21%) 275 (25%) 134 (15%)
Further degree 157 (8%) 102 (9%) 53 (6%)
Deprivation index, median (IQR)
3.0 (2.0, 4.0) 3.0 (2.0, 4.0) 3.0 (2.0, 4.0) 0.26
NSAID use in past 6 months 1486 (73%) 865 (77%) 596 (68%) <0.001
DMARD use in past 6 months 201 (13%) 103 (12%) 96 (15%) 0.13
BASDAI, median (IQR) 4.9 (2.6, 6.8) 4.4 (2.3, 6.6) 5.5 (3.3, 7.3) <0.001
Spinal pain, median (IQR) 5.0 (2.0, 7.0) 3.0 (1.0, 7.0) 5.0 (2.0, 8.0) <0.001
ASDAS* 2.3 (1.1) 2.2 (1.1) 2.4 (1.1) <0.001
CRP (mg/dL), median (IQR)* 0.6 (0.2, 1.9) 0.6 (0.2, 1.8) 0.6 (0.2, 2.0) 0.50
ESR (mm/hr), median (IQR)* 11.0 (5.0, 23.0) 10.5 (5.0, 23.0) 11.5 (5.0, 24.0)
0.28
Fatigue, median (IQR) 14.0 (11.0, 19.0) 14.0 (11.0, 18.0)
15.0 (11.0, 20.0)
<0.001
ASQoL, median (IQR) 8.0 (3.0, 13.0) 7.0 (3.0, 12.0) 10.0 (5.0, 15.0)
<0.001
BASFI, median (IQR) 4.4 (2.0, 7.0) 3.6 (1.5, 6.1) 5.7 (2.9, 7.9) <0.001
BASMI, median (IQR)* 3.8 (2.2, 5.4) 3.2 (2.0, 4.8) 4.4 (2.8, 6.0) <0.001
Data shown as mean (SD) and n (%) unless otherwise indicated. *Not all variables had complete data; HLA-B27 was available for 74% of participants, BASMI 75%, ASDAS 78%, CRP 78%, ESR 39%. **non-parametric test for trend. ASDAS, AS disease activity score; ASQoL, AS quality of life; BASDAI, Bath AS disease activity index; BASFI, Bath AS functional index; BASMI, Metrology Index; questionnaire; BMI, body mass index; Deprivation index, 1=most deprived, 5=least deprived; IQR, interquartile range.
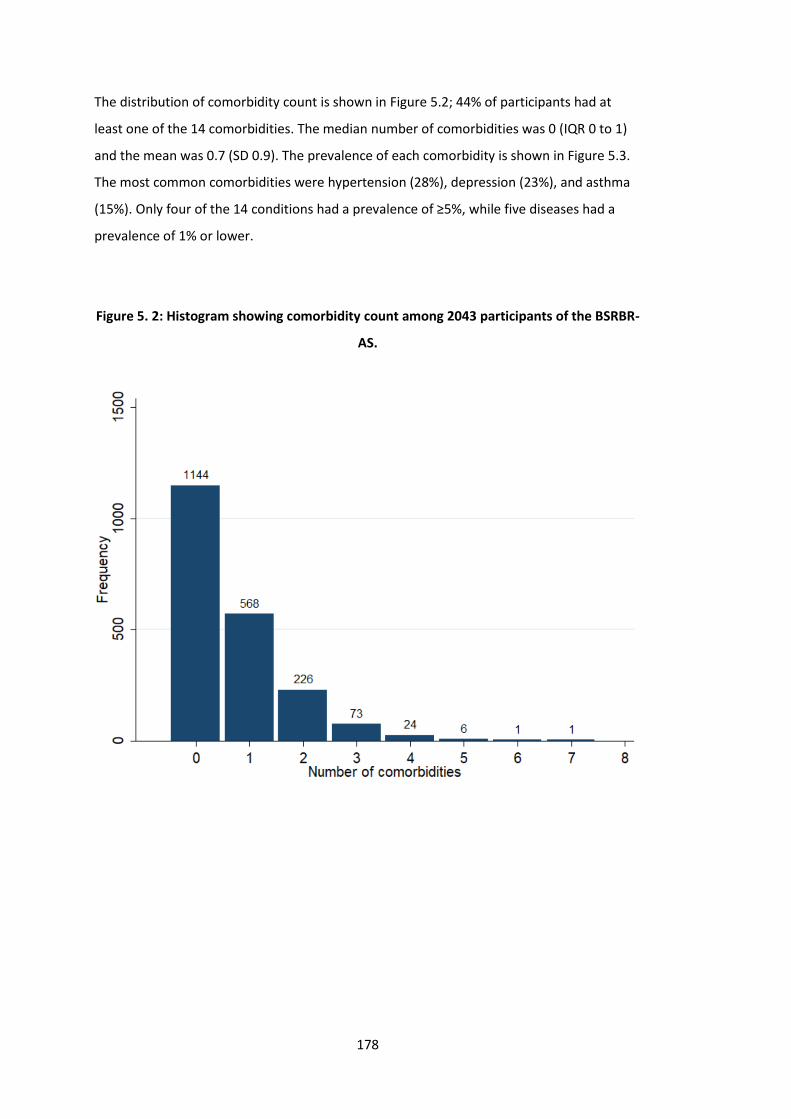
178
The distribution of comorbidity count is shown in Figure 5.2; 44% of participants had at
least one of the 14 comorbidities. The median number of comorbidities was 0 (IQR 0 to 1)
and the mean was 0.7 (SD 0.9). The prevalence of each comorbidity is shown in Figure 5.3.
The most common comorbidities were hypertension (28%), depression (23%), and asthma
(15%). Only four of the 14 conditions had a prevalence of ≥5%, while five diseases had a
prevalence of 1% or lower.
Figure 5. 2: Histogram showing comorbidity count among 2043 participants of the BSRBR-
AS.
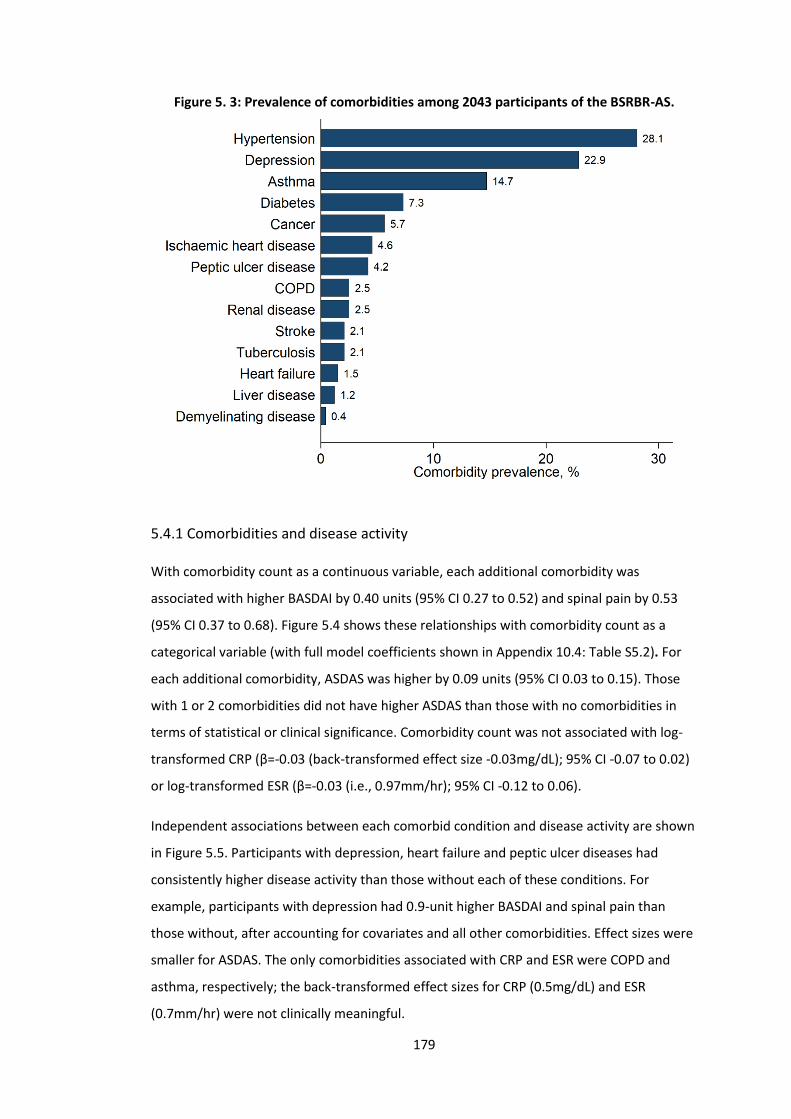
179
Figure 5. 3: Prevalence of comorbidities among 2043 participants of the BSRBR-AS.
5.4.1 Comorbidities and disease activity
With comorbidity count as a continuous variable, each additional comorbidity was
associated with higher BASDAI by 0.40 units (95% CI 0.27 to 0.52) and spinal pain by 0.53
(95% CI 0.37 to 0.68). Figure 5.4 shows these relationships with comorbidity count as a
categorical variable (with full model coefficients shown in Appendix 10.4: Table S5.2). For
each additional comorbidity, ASDAS was higher by 0.09 units (95% CI 0.03 to 0.15). Those
with 1 or 2 comorbidities did not have higher ASDAS than those with no comorbidities in
terms of statistical or clinical significance. Comorbidity count was not associated with log-
transformed CRP (β=-0.03 (back-transformed effect size -0.03mg/dL); 95% CI -0.07 to 0.02)
or log-transformed ESR (β=-0.03 (i.e., 0.97mm/hr); 95% CI -0.12 to 0.06).
Independent associations between each comorbid condition and disease activity are shown
in Figure 5.5. Participants with depression, heart failure and peptic ulcer diseases had
consistently higher disease activity than those without each of these conditions. For
example, participants with depression had 0.9-unit higher BASDAI and spinal pain than
those without, after accounting for covariates and all other comorbidities. Effect sizes were
smaller for ASDAS. The only comorbidities associated with CRP and ESR were COPD and
asthma, respectively; the back-transformed effect sizes for CRP (0.5mg/dL) and ESR
(0.7mm/hr) were not clinically meaningful.
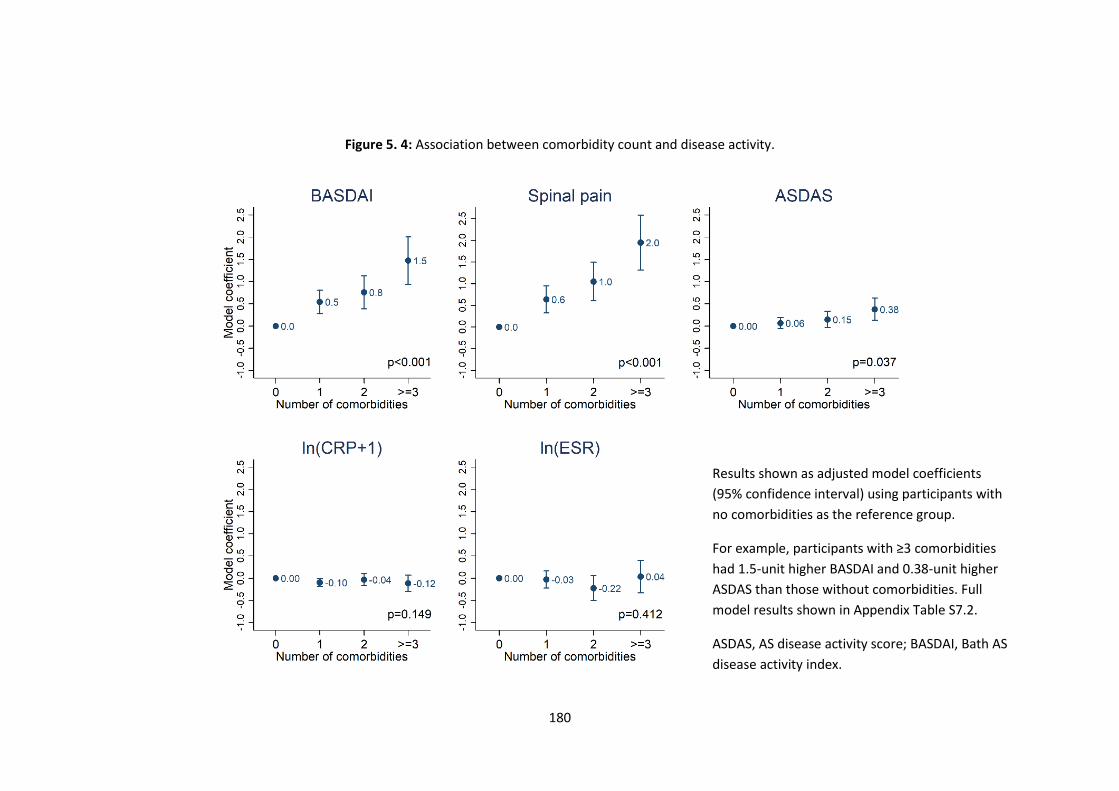
180
Figure 5. 4: Association between comorbidity count and disease activity.
Results shown as adjusted model coefficients
(95% confidence interval) using participants with
no comorbidities as the reference group.
For example, participants with ≥3 comorbidities
had 1.5-unit higher BASDAI and 0.38-unit higher
ASDAS than those without comorbidities. Full
model results shown in Appendix Table S7.2.
ASDAS, AS disease activity score; BASDAI, Bath AS
disease activity index.
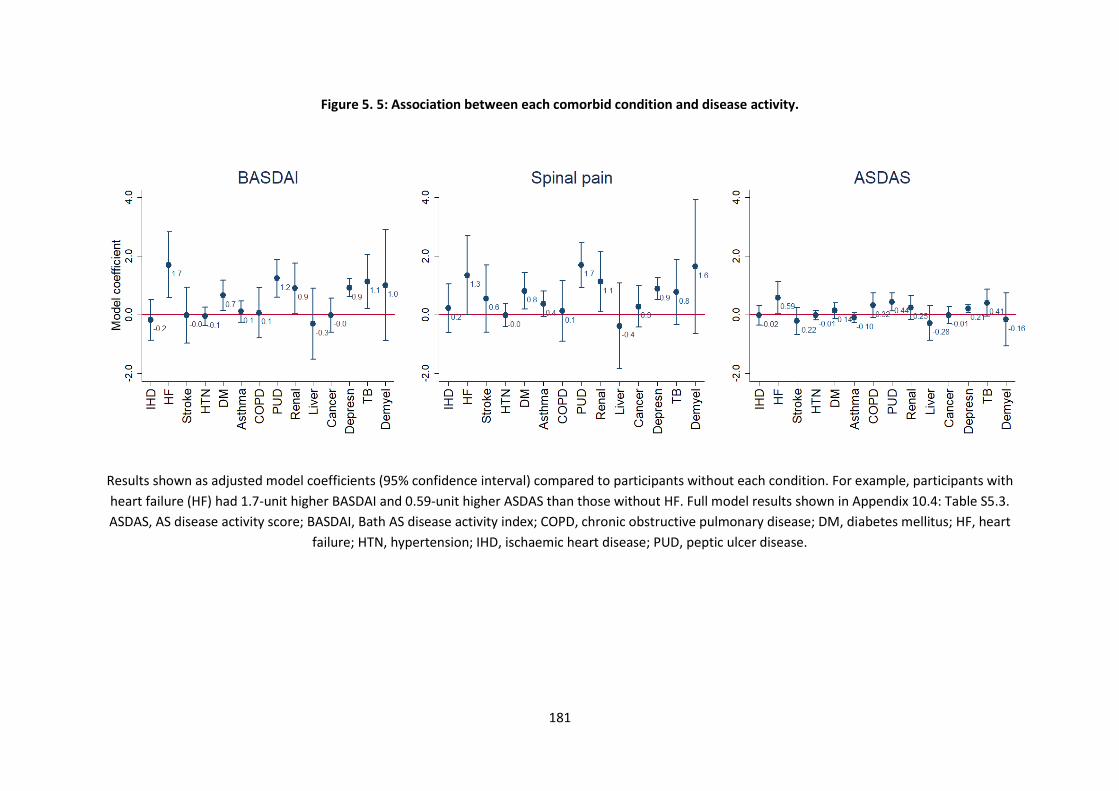
181
Figure 5. 5: Association between each comorbid condition and disease activity.
Results shown as adjusted model coefficients (95% confidence interval) compared to participants without each condition. For example, participants with
heart failure (HF) had 1.7-unit higher BASDAI and 0.59-unit higher ASDAS than those without HF. Full model results shown in Appendix 10.4: Table S5.3.
ASDAS, AS disease activity score; BASDAI, Bath AS disease activity index; COPD, chronic obstructive pulmonary disease; DM, diabetes mellitus; HF, heart
failure; HTN, hypertension; IHD, ischaemic heart disease; PUD, peptic ulcer disease.
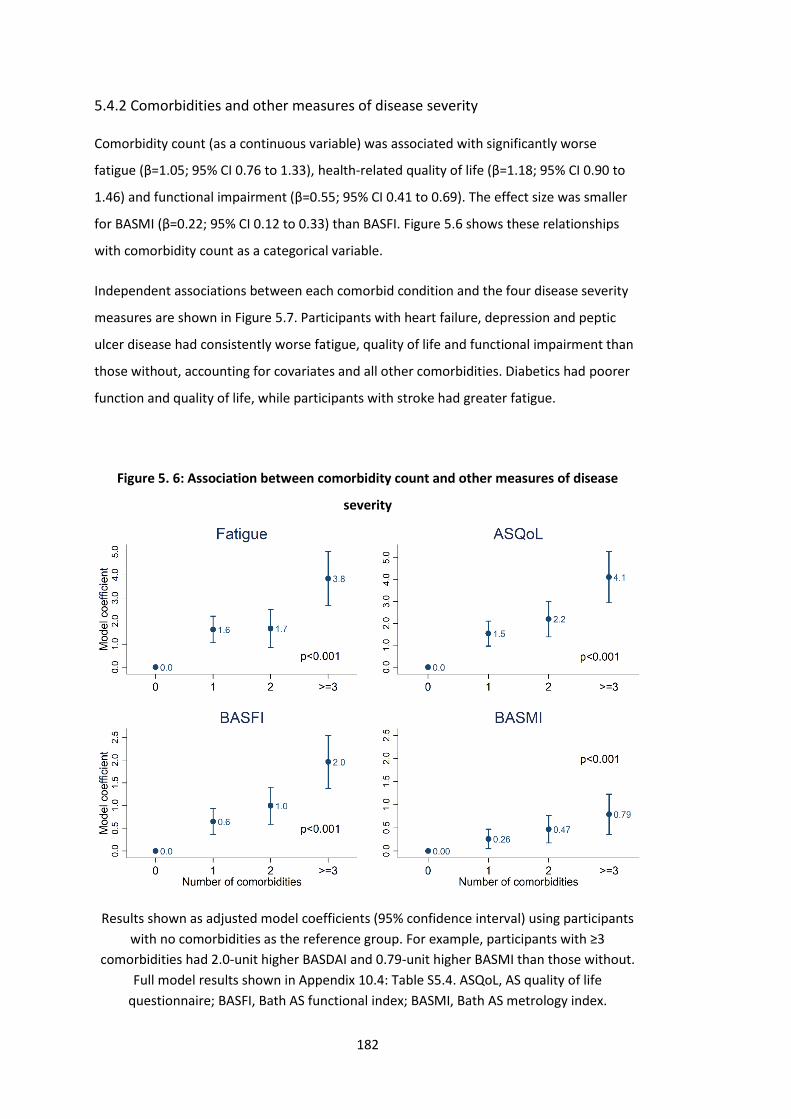
182
5.4.2 Comorbidities and other measures of disease severity
Comorbidity count (as a continuous variable) was associated with significantly worse
fatigue (β=1.05; 95% CI 0.76 to 1.33), health-related quality of life (β=1.18; 95% CI 0.90 to
1.46) and functional impairment (β=0.55; 95% CI 0.41 to 0.69). The effect size was smaller
for BASMI (β=0.22; 95% CI 0.12 to 0.33) than BASFI. Figure 5.6 shows these relationships
with comorbidity count as a categorical variable.
Independent associations between each comorbid condition and the four disease severity
measures are shown in Figure 5.7. Participants with heart failure, depression and peptic
ulcer disease had consistently worse fatigue, quality of life and functional impairment than
those without, accounting for covariates and all other comorbidities. Diabetics had poorer
function and quality of life, while participants with stroke had greater fatigue.
Figure 5. 6: Association between comorbidity count and other measures of disease
severity
Results shown as adjusted model coefficients (95% confidence interval) using participants
with no comorbidities as the reference group. For example, participants with ≥3
comorbidities had 2.0-unit higher BASDAI and 0.79-unit higher BASMI than those without.
Full model results shown in Appendix 10.4: Table S5.4. ASQoL, AS quality of life
questionnaire; BASFI, Bath AS functional index; BASMI, Bath AS metrology index.
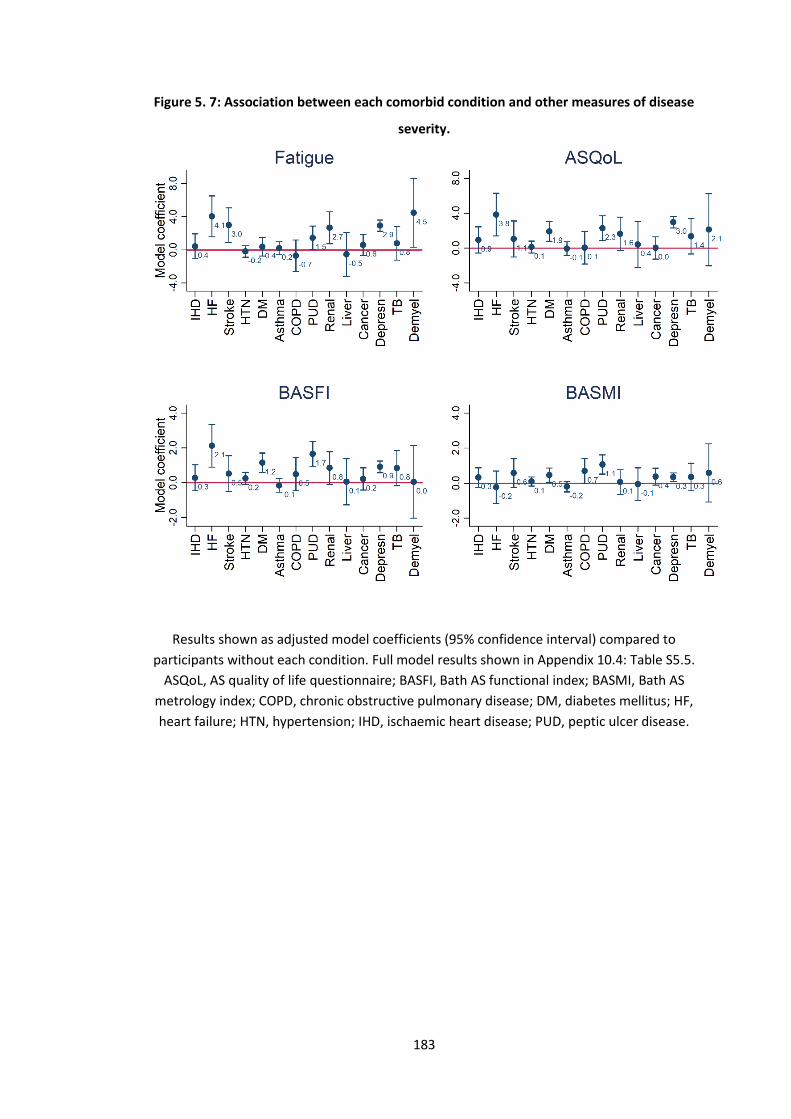
183
Figure 5. 7: Association between each comorbid condition and other measures of disease
severity.
Results shown as adjusted model coefficients (95% confidence interval) compared to
participants without each condition. Full model results shown in Appendix 10.4: Table S5.5.
ASQoL, AS quality of life questionnaire; BASFI, Bath AS functional index; BASMI, Bath AS
metrology index; COPD, chronic obstructive pulmonary disease; DM, diabetes mellitus; HF,
heart failure; HTN, hypertension; IHD, ischaemic heart disease; PUD, peptic ulcer disease.
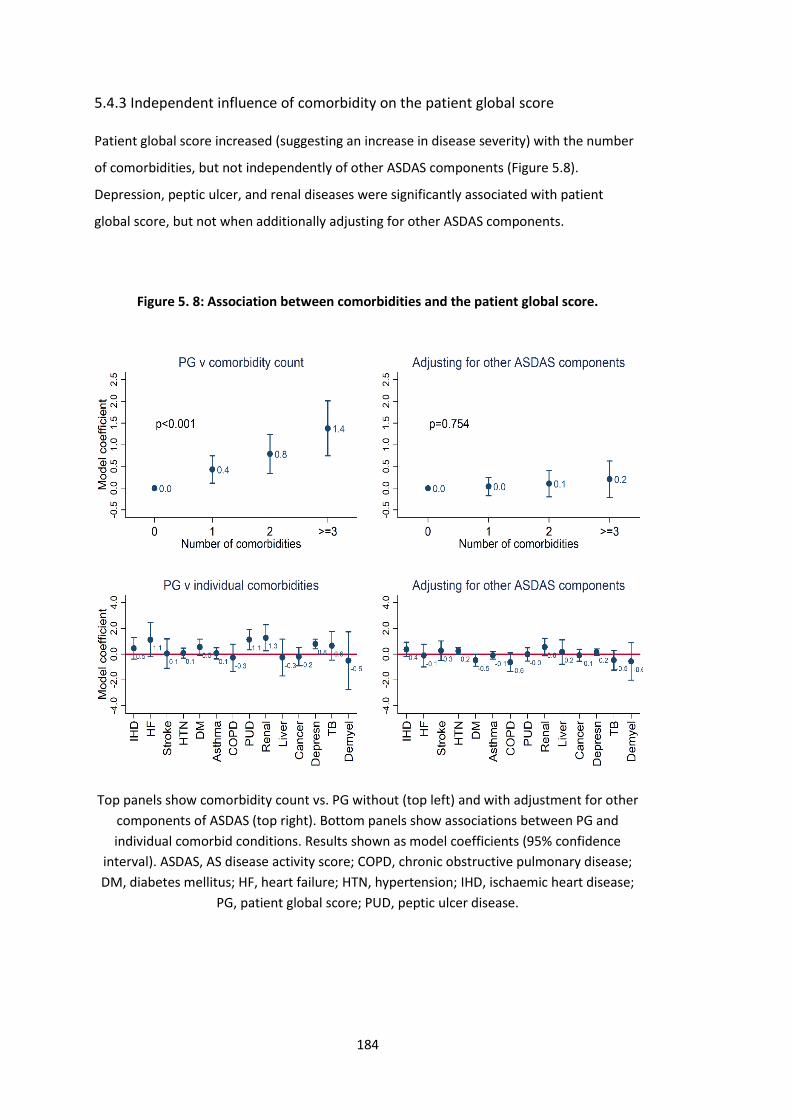
184
5.4.3 Independent influence of comorbidity on the patient global score
Patient global score increased (suggesting an increase in disease severity) with the number
of comorbidities, but not independently of other ASDAS components (Figure 5.8).
Depression, peptic ulcer, and renal diseases were significantly associated with patient
global score, but not when additionally adjusting for other ASDAS components.
Figure 5. 8: Association between comorbidities and the patient global score.
Top panels show comorbidity count vs. PG without (top left) and with adjustment for other
components of ASDAS (top right). Bottom panels show associations between PG and
individual comorbid conditions. Results shown as model coefficients (95% confidence
interval). ASDAS, AS disease activity score; COPD, chronic obstructive pulmonary disease;
DM, diabetes mellitus; HF, heart failure; HTN, hypertension; IHD, ischaemic heart disease;
PG, patient global score; PUD, peptic ulcer disease.
185
5.4.4 Sensitivity analysis
There were some differences when biologic and non-biologic cohorts were compared
(Appendix 10.4: Table S5.6). Participants in the biologic arm of the BSRBR-AS registry were
younger, less frequently HLA-B27 positive or met the classification criteria for AS, more
often current smokers, and resided in more deprived areas. They also had significantly
more severe disease across all indices. Participants in the biologic cohort had an overall
similar comorbidity burden (mean number 0.7 (SD 0.9) vs. 0.7 (SD 0.9)) to those in the non-
biologic cohort. However, they less frequently had stroke (1 vs. 2%, p=0.04), hypertension
(15 vs. 21%, p=0.003), cancer (2 vs. 5%, p<0.001), and more often had peptic ulcer (4 vs. 2%
p=0.006) and depression (21 vs. 13% p<0.001). Despite these differences, results from the
sensitivity analysis restricted to the non-biologic cohort did not meaningfully change effect
estimates, although precision was reduced (i.e., confidence intervals widened) with smaller
sample sizes (Appendix 10.4: Figure S5.1 and S5.2). Results using coarsened exact matching
to adjust for other components of ASDAS were not meaningfully different (data not shown).
186
5.5 Discussion
This chapter used cross-sectional, pre-treatment data from the BSRBR-AS to examine
associations between comorbidity and measures of disease severity. Unlike BASDAI and
spinal pain (subjective measures of disease activity), ASDAS was not associated with
comorbidity count or individual comorbidities at a clinically meaningful effect size. Although
the patient global component of ASDAS was influenced by coexisting morbidities, they did
not inflate ASDAS through the patient global score independently of other ASDAS
components. Other patient-reported measures of disease severity (function, fatigue, and
health-related quality of life) were significantly associated with comorbidity count and
individual comorbidities. When making treatment decisions, clinicians should be mindful of
the potential impact of comorbidities on patient reported measures of disease activity, and
consider additionally assessing disease activity using ASDAS when comorbidities are
present.
These results complement those from the ASAS-COMOSPA study, where comorbidity
burden (assessed using RDCI) was associated with poorer BASFI, health-related quality of
life (EuroQol) and work-related outcomes, despite using a slightly different list of comorbid
conditions [90]. The current analyses additionally demonstrated that BASMI – a physician
derived outcome often considered objective – is also significantly associated with
comorbidity count, albeit with smaller effect sizes than BASFI. Importantly, ASDAS was
found to be comparatively robust to the impact of coexisting morbidities. Unlike BASDAI
and spinal pain, the relationship between comorbidity count and ASDAS was not
completely linear, which may be explained by the weighting of ASDAS components. ASDAS
was not significantly different between participants without comorbidities and those with
one or two. There was a statistically significant difference in ASDAS between those with ≥3
and no comorbidities, but the mean difference of 0.38 is not clinically significant
(meaningful change = 1.1). Using an unweighted comorbidity count was preferable, since
RCDI was weighted for inpatient outcomes (mortality, hospitalization, disability, and costs)
that may not be appropriate to study axSpA-specific measures. It also allowed examination
of the relationship between comorbidity and outcomes in more detail: depression,
diabetes, heart failure, peptic ulcer, and renal diseases (and to a smaller and less consistent
extent stroke) were the most significant contributing conditions. Most of these conditions
are relative (or potentially absolute depending on severity) contra-indications for NSAIDs –
the first and only line of pharmacological therapy before bDMARDs. Patients with high
cardiovascular risk, renal or peptic ulcer diseases, who cannot use NSAIDs, are more likely
187
to experience more severe symptoms of axSpA and their impact on other aspects such as
fatigue. This channelling away from NSAIDs and towards bDMARDs was supported by the
higher prevalence of peptic ulcer disease in the biologic than non-biologic cohort of the
BSRBR-AS (Appendix 10.4: Table S5.6). Equally, cardiovascular, renal, and peptic ulcer
disease may also result from long-term exposure to NSAIDs due to severe symptoms. These
are limitations arising from the cross-sectional design and lack of historical NSAID data. The
data does, however, suggest that more objective measures such as ASDAS and BASMI are
influenced by comorbidities to a lesser extent than patient-reported indices.
In RA, patient global score increased with the number of comorbidities, independently of
tender/swollen joint count, CRP and physician global [220]. Among axSpA participants in
these analyses, patient global score was significantly associated with comorbidity count.
This is potentially concerning since it is given more weight than almost all patient-reported
components of the ASDAS. Reassuringly, the patient global score did not appear to inflate
ASDAS independent of its other components. These observations support the use of ASDAS
particularly when comorbidities are present and likely to influence other patient-reported
outcome measures. Further longitudinal studies are needed to assess whether
comorbidities influence treatment response as measured by different outcomes (e.g.,
BASDAI vs. ASDAS). Longitudinal studies on comorbidities as ‘exposure’ (rather than
outcome) in axSpA are scarce. Preliminary results from the BSRBR-AS suggests that
comorbidity may be one of very few potentially modifiable predictors of treatment
response [134].
5.5.1 Strengths and limitations
A key strength of this study is its large sample size representative of a national axSpA
population, for whom a wide range of disease measures were collected. Ascertainment of
comorbidities was robust, using physician diagnoses from medical records. There were also
some limitations. Cross-sectional data do not inform causal direction; however, it is more
plausible that comorbidity burden influences experience and reporting of disease activity,
rather than vice versa. First, baseline disease activity is less likely to influence past medical
history (albeit baseline may reflect disease activity history). Second, the difference between
subjective and more objective indices suggest subjectivity is relevant. Comorbidities were
selected through a consensus meeting of clinicians and researchers to support the primary
drug safety aims; therefore some (e.g., neurological) comorbidities were not compared.
However, included comorbidities were broadly representative of important diseases when
188
compared to prior axSpA research [84]. Low prevalence of some conditions (e.g., heart
failure, liver, and demyelinating diseases) meant that their effect estimates had significant
uncertainty. Severity (e.g., for heart failure) and more granular descriptions (e.g., cancer
type) for comorbidities were not available but would have provided useful information.
Some comorbidities (TB, heart failure, cancer, and demyelinating diseases) are of special
interest when considering TNF inhibition therapy; they may be recorded more
systematically in patients. However, restricting analyses to the non-biologic cohort did not
meaningful change results. Lastly, the wording of the patient global question can be highly
variable [227]. For example, the patient global question in DAS28 can be worded to assess
arthritis-related disease activity or global health (the recommended phrasing in RA is
‘Considering all the ways your arthritis has affected you, how do you feel your arthritis is
today?’). The patient global question in the BSRBR-AS was specific to spondyloarthritis
activity in the past week; therefore, other versions may not be equally robust in the
presence of comorbidities.
5.6 Summary
Patient-reported axSpA measures are influenced by comorbidities. This is important for
routine practice as around half of all patients have at least one comorbidity. ASDAS seems
to be less influenced by the presence of comorbidities. ASDAS was not disproportionately
inflated by the effect of comorbidities on the patient global score, as was shown for DAS28
in rheumatoid arthritis. In routine clinical practice, clinicians should consider additionally
collecting ASDAS to assess disease activity in patients with multiple comorbidities, including
but not limited to depression. Additional studies are needed to examine the impact of
comorbidity burden on longitudinal disease severity and response to treatment. This will be
addressed in the next Chapter.
189
Chapter 6: Comorbidities and response to TNF inhibitors
This chapter uses longitudinal data from the BSRBR-AS to examine whether the presence of
comorbidities at baseline is associated with response to TNF inhibition treatment. Analyses
will approach response using common binary definitions, change in continuous outcome
indices over time, and time to treatment discontinuation.
6.1 Introduction
Previous chapters showed that comorbidities are common and are associated with greater
axSpA severity. Comorbidities may also impact management (e.g., eligibility for treatment
escalation) through the way in which axSpA disease activity is assessed. Despite this,
research into the impact of comorbidities on treatment response are scarce. This is an
important unmet need for two reasons: First, up to half of patients do not respond to their
first TNF inhibitor (TNFi) [228], thus identifying potentially modifiable factors are important
for clinical practice. Second, if some axSpA disease indices are inflated in the presence of
comorbidities, comorbid patients may have persistently high scores – thereby at risk of
having treatment discontinued – despite successfully supressing axSpA inflammation.
Of the three existing studies [114,118,134], most rely on binary response definitions, such
as a certain degree of improvement (e.g., 50% improvement in BASDAI) or disease state
(e.g., ASDAS low disease activity, <2.1). These outcomes are problematic in observational
data where starting disease activity differ between groups under comparison: those with
higher baseline disease activity are simultaneously more able to achieve the former
(because there is more ‘room’ for improvement) and less able to achieve the latter
(because greater absolute improvement is required), compared to those with lower disease
activity. Consider a participant with ASDAS of 3.6 at baseline and another with ASDAS 2.2;
an identical reduction by 1 unit in both would achieve ‘inactive disease’ status for the latter
while the former would still have ‘high disease activity’. This is true regardless of the
‘exposure’ of interest; smokers, those from more deprived areas or with lower education
attainment, or any group with high disease activity at baseline, would all be less likely to
achieve binary response. Thus, absolute improvement in disease activity is likely to differ
from the binary response derived from the same index. (These limitations have been
examined in detail in publications related to the thesis project [41,42].) Adjustment for the
190
baseline disease activity is necessary, but controversial [41], since it is unlikely a confounder
(i.e., baseline disease activity will not cause comorbidities) and more likely a mediator (i.e.,
comorbidities influence baseline disease activity as a causal intermediate to response, as
shown in the previous chapter).
Untangling the role of comorbidities on the treatment response is important for clinical
practice, which requires more than one approach to defining response. This chapter
addresses this unmet research need using binary response definitions, change in
continuous outcome indices over time, and time to treatment discontinuation.
6.2 Aims
1. To examine the association between baseline comorbidity status and binary
response definitions among those using TNFi.
2. To examine the association between baseline comorbidity status absolute change
in disease activity (BASDAI, spinal pain, ASDAS) and other measures of disease
severity.
3. To examine the association between baseline comorbidity status and TNFi
discontinuation.
6.3 Methods
6.3.1 Patient population
Participants in the BSRBR-AS who started on their first TNFi (including those who switched
from the non-biologic group) were eligible for inclusion in this analysis. Eligible individuals
were required to have a clinic visit or questionnaire within 1 year before, or 7 days after,
the TNFi start date, from which the baseline value of time-varying data (i.e., measures of
disease activity and severity) was obtained. Time-invariant data could come from any
assessment time if missing at baseline; all variables except disease activity indices were
considered time-invariant in this analysis.
191
6.3.2 Comorbidity
The count of 14 comorbidities was analysed as three variable types: binary (comorbidity vs.
none), continuous, and categorical (0, 1, ≥2; or 0, 1, 2 ≥3 where possible) (see Chapter 3,
Section 3.5.2). Many existing studies select one approach often without justification;
performing analyses using all three can reveal comparative merits or deficiencies of each.
This subpopulation of TNFi initiators in the BSRBR-AS was not sufficient in size to explore
individual comorbidities as was performed in the previous chapter.
6.3.3 Outcomes
6.3.3.1 Binary response definitions
The first aim used the following common binary response definitions at 6 months: BASDAI
50/2 (50% or 2-unit reduction), ASDAS major improvement (ASDAS-MI, ≥2-unit reduction),
low disease activity defined as BASDAI<4 or ASDAS<2.1 (see Chapter 3, Section 3.5.2).
Participants with missing baseline BASDAI or ASDAS were excluded. Where the 6-month
assessment was missing but participants remained on the drug, they were considered as
having responded if they demonstrated response at 3 or 12 months. Both assumptions are
justifiable since participants were unlikely to remain on the drug if they lost or did not have
a response, as per prescribing guidelines in the UK [190]. Participants who discontinued
treatment within 6 months for any reason were considered as non-responders.
Using the above definitions for the binary response, individuals who stayed on treatment
(i.e., no stop date) but did not have assessments recorded at 3, 6 or 12 months would have
missing response values. In sensitivity analyses, these individuals were assumed to have
responded at 6 months if they remained on treatment beyond 12 months. This was not
included in the main analysis because patients without a documented stop date could be
on treatment or lost to follow-up.
The first two response definitions are derivatives (in part for BASDAI 50/2) of absolute
reductions. They should be less effected by baseline disease activity except through a ‘floor
effect’ of the index (e.g., someone starting with BASDAI of 2 cannot possibly decrease by
more than 2). The low disease activity definitions would be affected by issues relating to
differing baseline values, as discussed above.
192
6.3.3.2 Change in continuous outcome indices over time
The second aim examines the absolute change in disease activity (BASDAI, spinal pain,
ASDAS); that is, change from baseline over follow-up time. Assessing continuous change in
repeated assessments made over time is more efficient and informative than imposing one
time point.
These analyses were repeated for other disease outcomes including functional impairment,
health-related quality of life, fatigue, and sleep (see Chapter 3 for descriptions of these
indices). Response was assessed only in the first 3 years (up to 36 months + 6 months’
window = 42 months) because the number at each sequential follow-up dropped
dramatically (see Results below).
For continuous change in disease indices, mixed effects models are able to handle data
Missing At Random (i.e., systematic relationship between the propensity for missingness
and the observed data, but not the missing data [192]). No imputation for baseline or
longitudinal values were required.
6.3.3.3 Time to treatment discontinuation
The final aim examines time to any-cause discontinuation. Treatment duration was
analysed as continuous time from start to discontinuation of treatment was derived from
respective dates. Censoring was defined by the last visit for those who did not discontinue
treatment.
A small number of participants were commenced on TNFi but did not have any subsequent
assessments by visit or questionnaire, thus their time on-drug were unknown. These
individuals with zero follow-up time would, by definition, be excluded from all time-to-
event analyses. They can contribute (their baseline characteristics) to the analysis by having
an arbitrarily small time assigned. In the primary analysis, each were assigned 0.001 days’
follow-up (approximately 1.5 minutes) which does not affect the overall person-time.
Cause-specific discontinuation was not assessed as part of the primary aims because
previous work using the BSRBR-AS showed limitations in this data [189]. There is often
overlap between how inefficacy and adverse events are defined and reported. For example,
therapy is more likely to continue in the face of mild adverse events if they are highly
effective for symptom control; inflammation in previously unaffected peripheral joints may
be reported as an adverse event, when it would more appropriately reflect lack of disease
193
control and efficacy. Before 2016 – that is, most of the study period (2012-2017) – NICE
stipulated that patients who did not demonstrate initial or maintained response to
treatment would not be funded to use a second TNFi [17, 18]. However, switching to a
second TNFi was allowed if discontinuation was due to the development of a treatment-
related adverse event. This may have influenced labelling of discontinuation as adverse
events or other reasons. These errors would not affect the analysis of all-cause
discontinuation.
6.3.4 Covariates
The following covariates were determined a priori: age, gender (female as reference), BMI,
Index of Multiple Deprivation (IMD, as a continuous variable) and educational attainment
(as dummy variables). Smoking was not included since analyses performed in parallel to this
thesis did not demonstrate a convincing causal role with treatment-related outcomes
[42,189].
Baseline disease activity is a controversial covariate. Existing literature have both justifiably
included and excluded it as a covariate. Debate on this topic necessitates the distinction
and definition of causation, as discussed in Chapter 3; a summary is given in this section.
Part of the definition for a confounder is that it is a cause for the exposure (here
comorbidity) and outcome. High disease activity at baseline does not cause comorbidity. It
is more likely that comorbidities influence baseline assessment, in which case adjusting for
a causal intermediate (a mediator) would be inappropriate. However, not accounting for
baseline disease activity is problematic for some binary definitions of response (see above)
and does not give the effect of the exposure independent of baseline disease activity.
6.3.5 Statistics
Descriptive statistics were used to describe comorbidity prevalence in this analysis cohort
and compare participant with and without comorbidities.
6.3.5.1 Logistic regression
Each of the four binary response variables were used in turn as the dependent variable.
Comorbidity count was modelled as the independent variable, adjusting for covariates.
Odds ratios were reported without, then with, adjustment for baseline values of the
disease index of interest; the latter were displayed graphically to aid interpretation.

194
Interactions between the comorbidity variable and each covariate (i.e., effect modification
age, gender, etc.) were tested.
6.3.5.2 Mixed effect model
The principles of mixed effect models and interaction terms were discussed in Chapter 3. In
summary, differences in baseline values of each index is accounted for by the intercept and
does not require additional adjustment. Comparison instead focuses on the interaction-
term coefficients, which represents the additional difference in change from baseline. To
facilitate interpretation, predicted values are shown graphically, with an asterisk indicating
statistical significance of the interaction term at the p<0.05 level. Note that statistical
significance refers to the departure from the baseline difference, or ‘difference accounting
for the baseline’ (see Chapter 3, Figure 3.14).
6.3.5.3 Time-to-event analyses
TNFi discontinuation is equivalent to drug ‘survival’. Kaplan-Meier curves were used to
show the shape of the survival function for each group (comorbidity was used as binary and
categorical). The log-rank test was used to test whether their survival distributions are
equal. The relationship between comorbidity history at baseline (binary and categorical)
and discontinuation was then modelled using Cox models, adjusting for covariates.
Interaction between comorbidity and all covariates were tested. Where covariates violated
the proportional hazards assumption, non-proportional variables were stratified (see
Chapter 3, Section 3.5.7).
6.3.5.4 Power considerations
Power calculation for logistic regression remains an active area of research. The
commonest ‘rule-of-thumb’ is to have at least 10 ‘events’ (i.e., responders) per
independent variable. The number of events would therefore need to be 90 for models of
binary comorbidity and 100 for categorical (assuming 3 categories). Adjusting for baseline
disease activity would require 10 additional events. Assuming a 50% response, a sample of
994 would provide sufficient events per variable. There are two caveats. First, this rule-of-
thumb is not based on robust mathematics nor does it perform well in simulations [229].
Alternatives were developed mainly for prediction models (using metrics related to out-of-
sample prediction performance) that are difficult to apply here [229]. Second, the number
of events will be very small when categorising comorbidity count; for example, around 150
195
participants have just one comorbidity (thus 75 events) and 60 have two or more (thus 30
events). These analyses will be underpowered.
Power calculations for mixed models are extremely complex, many of which are simulation-
based, and are not available in software such as Stata and G*Power. They also require a
range of assumptions that, if taken from the output of an already performed model,
essentially become a transformation of its p-value (i.e., post-hoc power).
For a Cox model with none:≥1 comorbidities ratio of 2:1, alpha 0.05 and power 0.8, the
number of events (TNFI discontinuation) needed is 3198 for a 10% reduction in hazard (i.e.,
HR 0.9), 713 for 20%, and 279 for 30% [230]. There were approximately 300
discontinuations in the analysis population. Therefore, the present analyses will be
underpowered to detect an effect size smaller than 30% risk of discontinuation in those
with compared to without comorbidities. As above, power will be further reduced when
comorbidity count is categorised.
6.3.5.5 Sensitivity analyses
The UK prescribing guidelines should mean that all participants have BASDAI ≥4 at TNFi
initiation. Some participants had lower values; the commonest example is a participant who
had BASDAI<4 within a year before TNFi initiation but did not have any other assessments
recorded prior to (or within 7 days of) starting treatment. It is also possible that the
initiation date was recalled with error. In the first set of sensitivity analyses, these
individuals were excluded from the analysis set.
Second, missing binary outcomes were imputed as response if patients remained on drug
for longer than one year (see Section 6.3.3.1).
The third set of sensitivity analyses additionally adjusted for smoking status (ever/never)
and alcohol status (ever/never) in turn. These are potential confounders, although evidence
of their causal link with the outcome (required for confounder definition) are equivocal.
Baseline employment status was reported as a predictor in a subsequent BSRBR-AS
publication [134], but this data was not available for this thesis. Note that employment
status – a time-varying covariate – is unlikely to serve as a confounder.
The final sensitivity analysis, other variance-covariance structures were tested for one
outcome, BASDAI, in linear mixed models. Three are available in Stata: ‘independent’, one
variance parameter per random effect and all covariances 0; ‘exchangeable’, equal
196
variances for random effects and one common pairwise covariance; and ‘unstructured’, all
variances and covariances to be distinctly estimated (Appendix 10.2.2).
6.4 Results
Among 2687 participants in the BSRBR-AS, 1145 (43%) started on biologics. Of this group,
17 (1.5%) were excluded for using non-TNFi bDMARD, and 134 (12%) for having no valid
baseline assessment within the accepted time window. Thus 994 (87%) were eligible for the
current analysis. TNFi initiators included and excluded from the analysis set were similar in
all baseline characteristics except the former were more often male (68 vs. 60%) (Appendix
10.5:Table S6.1). Sample sizes for individual analyses in the subsections below vary
according to the amount of missing data for each variable. The analysis cohort was
predominantly (68%) male with a mean age of 45 (SD 13) years (Table 6.1). Participants
with comorbidities were significantly older, had higher BMI, and less frequently had
university education than those without; they also used NSAIDs less frequently in the past 6
months and had more severe disease across all indices.
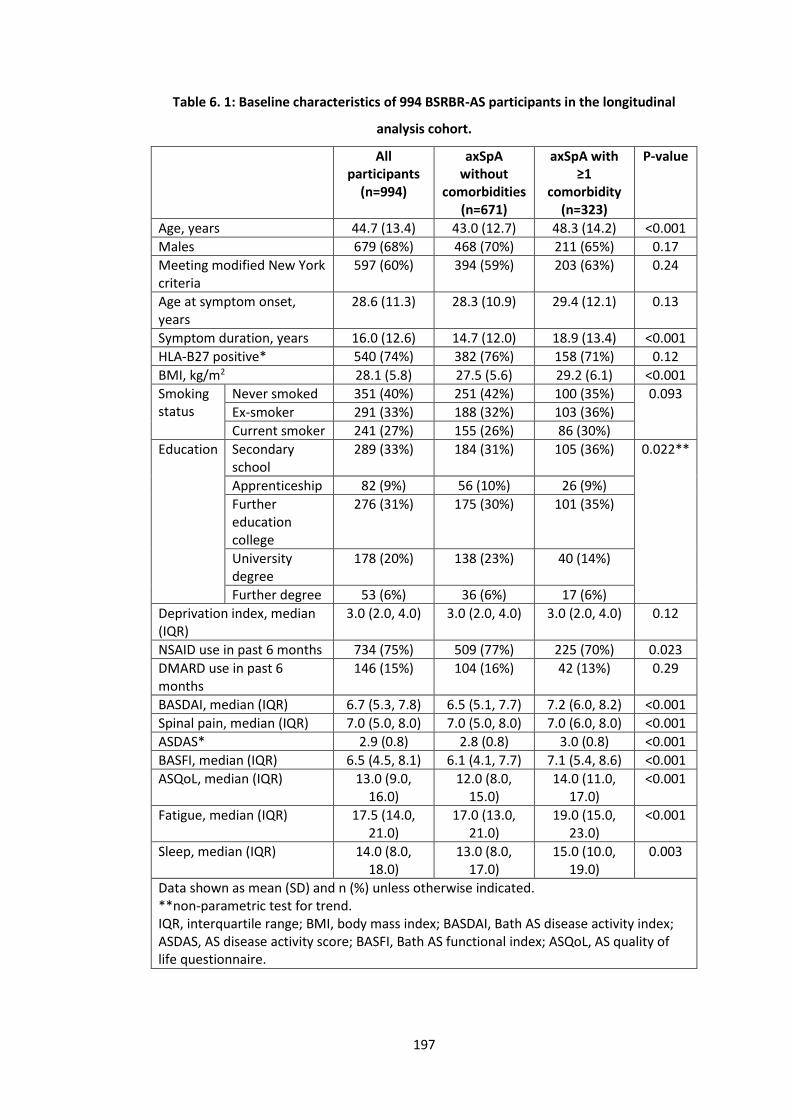
197
Table 6. 1: Baseline characteristics of 994 BSRBR-AS participants in the longitudinal
analysis cohort.
All participants
(n=994)
axSpA without
comorbidities (n=671)
axSpA with ≥1
comorbidity (n=323)
P-value
Age, years 44.7 (13.4) 43.0 (12.7) 48.3 (14.2) <0.001
Males 679 (68%) 468 (70%) 211 (65%) 0.17
Meeting modified New York criteria
597 (60%) 394 (59%) 203 (63%) 0.24
Age at symptom onset, years
28.6 (11.3) 28.3 (10.9) 29.4 (12.1) 0.13
Symptom duration, years 16.0 (12.6) 14.7 (12.0) 18.9 (13.4) <0.001
HLA-B27 positive* 540 (74%) 382 (76%) 158 (71%) 0.12
BMI, kg/m2 28.1 (5.8) 27.5 (5.6) 29.2 (6.1) <0.001
Smoking status
Never smoked 351 (40%) 251 (42%) 100 (35%) 0.093
Ex-smoker 291 (33%) 188 (32%) 103 (36%)
Current smoker 241 (27%) 155 (26%) 86 (30%)
Education Secondary school
289 (33%) 184 (31%) 105 (36%) 0.022**
Apprenticeship 82 (9%) 56 (10%) 26 (9%)
Further education college
276 (31%) 175 (30%) 101 (35%)
University degree
178 (20%) 138 (23%) 40 (14%)
Further degree 53 (6%) 36 (6%) 17 (6%)
Deprivation index, median (IQR)
3.0 (2.0, 4.0) 3.0 (2.0, 4.0) 3.0 (2.0, 4.0) 0.12
NSAID use in past 6 months 734 (75%) 509 (77%) 225 (70%) 0.023
DMARD use in past 6 months
146 (15%) 104 (16%) 42 (13%) 0.29
BASDAI, median (IQR) 6.7 (5.3, 7.8) 6.5 (5.1, 7.7) 7.2 (6.0, 8.2) <0.001
Spinal pain, median (IQR) 7.0 (5.0, 8.0) 7.0 (5.0, 8.0) 7.0 (6.0, 8.0) <0.001
ASDAS* 2.9 (0.8) 2.8 (0.8) 3.0 (0.8) <0.001
BASFI, median (IQR) 6.5 (4.5, 8.1) 6.1 (4.1, 7.7) 7.1 (5.4, 8.6) <0.001
ASQoL, median (IQR) 13.0 (9.0, 16.0)
12.0 (8.0, 15.0)
14.0 (11.0, 17.0)
<0.001
Fatigue, median (IQR) 17.5 (14.0, 21.0)
17.0 (13.0, 21.0)
19.0 (15.0, 23.0)
<0.001
Sleep, median (IQR) 14.0 (8.0, 18.0)
13.0 (8.0, 17.0)
15.0 (10.0, 19.0)
0.003
Data shown as mean (SD) and n (%) unless otherwise indicated. **non-parametric test for trend. IQR, interquartile range; BMI, body mass index; BASDAI, Bath AS disease activity index; ASDAS, AS disease activity score; BASFI, Bath AS functional index; ASQoL, AS quality of life questionnaire.
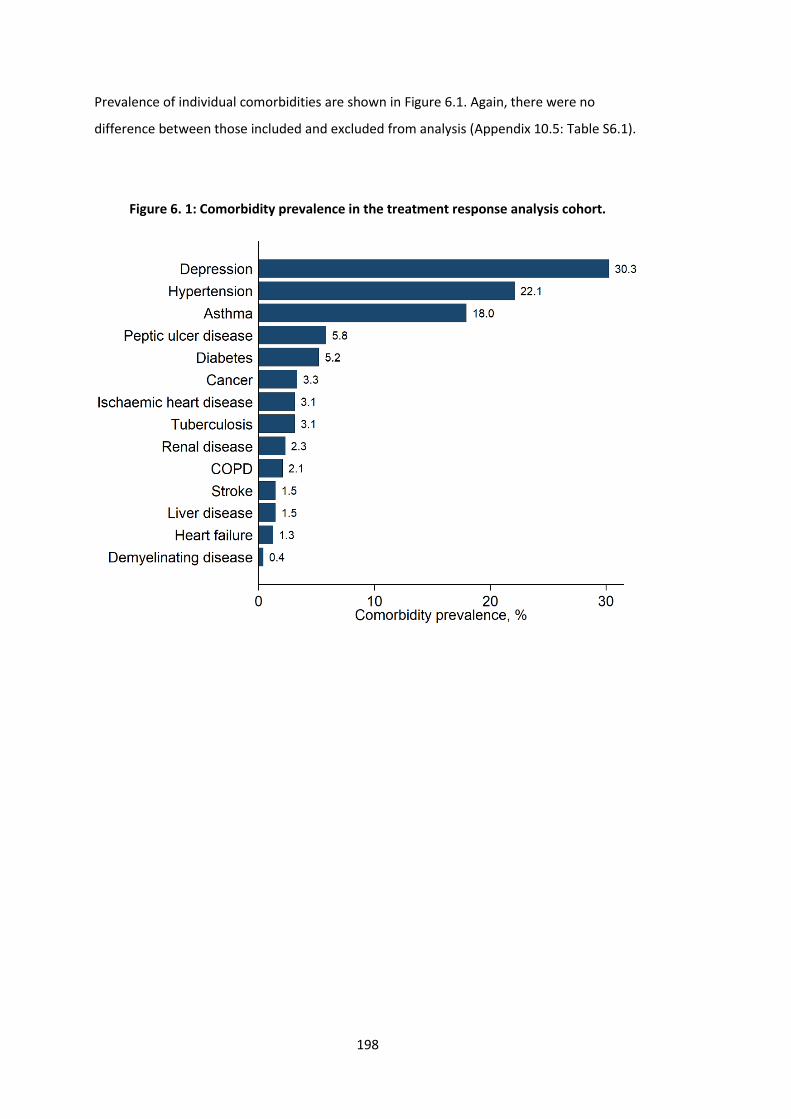
198
Prevalence of individual comorbidities are shown in Figure 6.1. Again, there were no
difference between those included and excluded from analysis (Appendix 10.5: Table S6.1).
Figure 6. 1: Comorbidity prevalence in the treatment response analysis cohort.
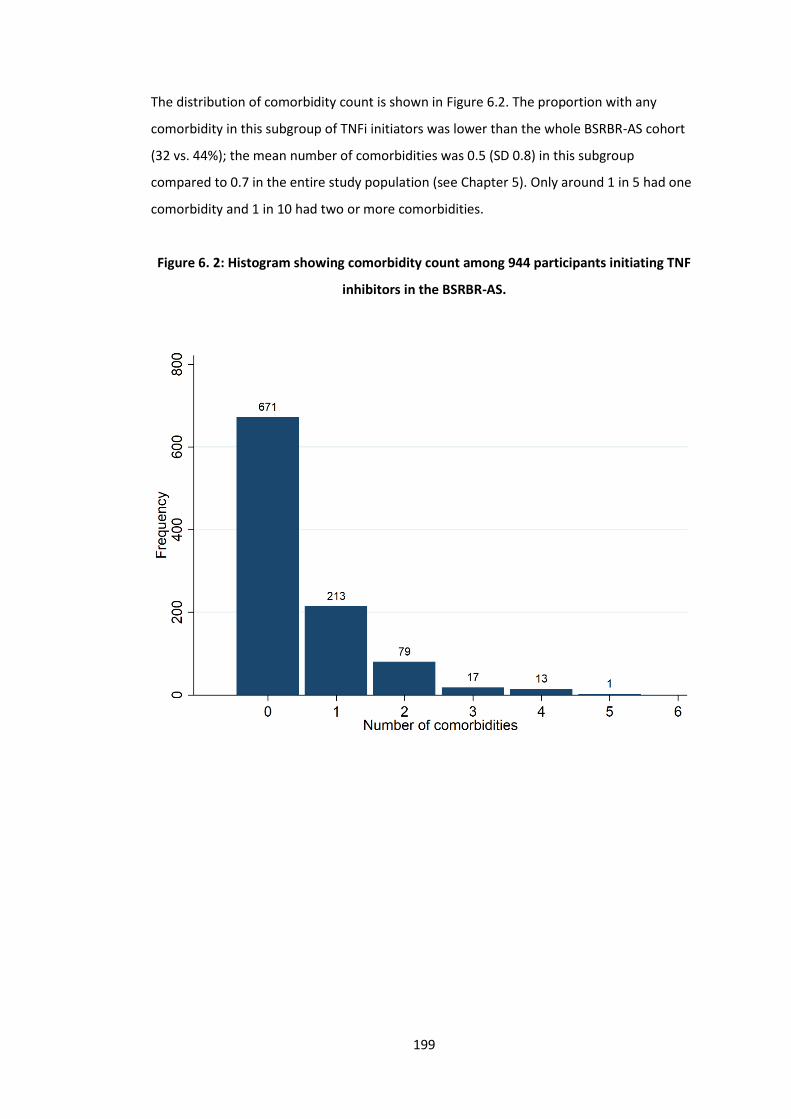
199
The distribution of comorbidity count is shown in Figure 6.2. The proportion with any
comorbidity in this subgroup of TNFi initiators was lower than the whole BSRBR-AS cohort
(32 vs. 44%); the mean number of comorbidities was 0.5 (SD 0.8) in this subgroup
compared to 0.7 in the entire study population (see Chapter 5). Only around 1 in 5 had one
comorbidity and 1 in 10 had two or more comorbidities.
Figure 6. 2: Histogram showing comorbidity count among 944 participants initiating TNF
inhibitors in the BSRBR-AS.
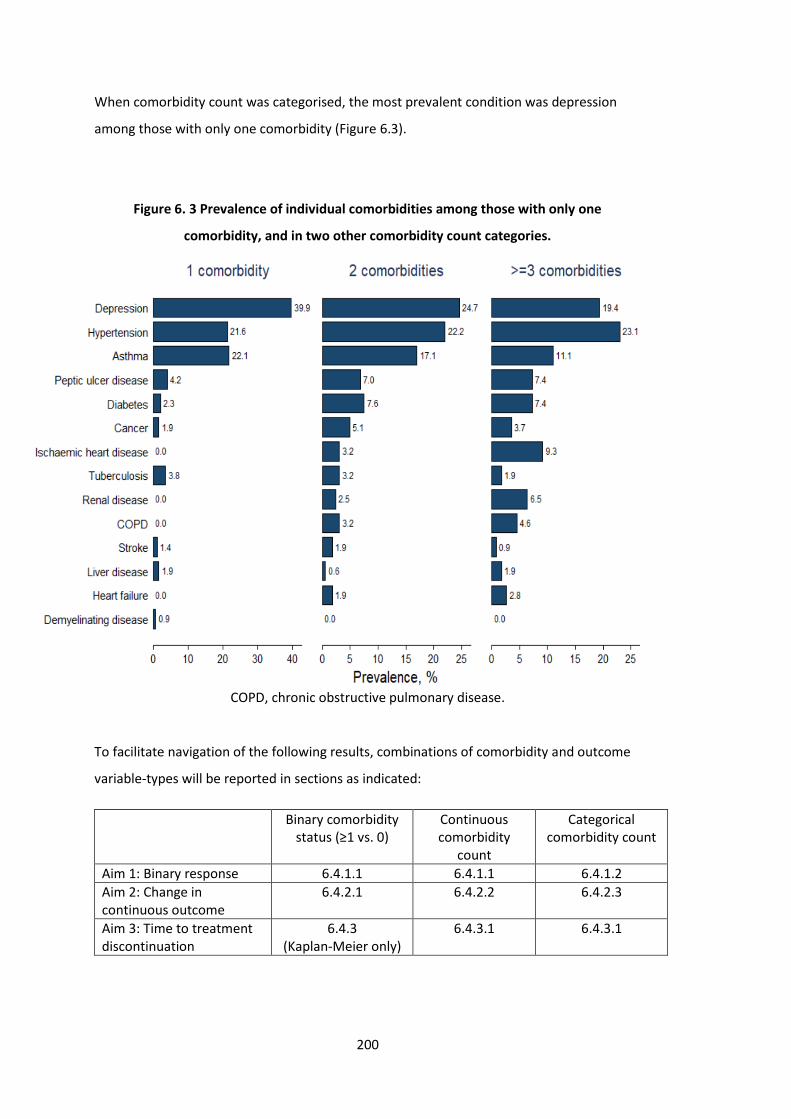
200
When comorbidity count was categorised, the most prevalent condition was depression
among those with only one comorbidity (Figure 6.3).
Figure 6. 3 Prevalence of individual comorbidities among those with only one
comorbidity, and in two other comorbidity count categories.
COPD, chronic obstructive pulmonary disease.
To facilitate navigation of the following results, combinations of comorbidity and outcome
variable-types will be reported in sections as indicated:
Binary comorbidity status (≥1 vs. 0)
Continuous comorbidity
count
Categorical comorbidity count
Aim 1: Binary response 6.4.1.1 6.4.1.1 6.4.1.2
Aim 2: Change in continuous outcome
6.4.2.1 6.4.2.2 6.4.2.3
Aim 3: Time to treatment discontinuation
6.4.3 (Kaplan-Meier only)
6.4.3.1 6.4.3.1
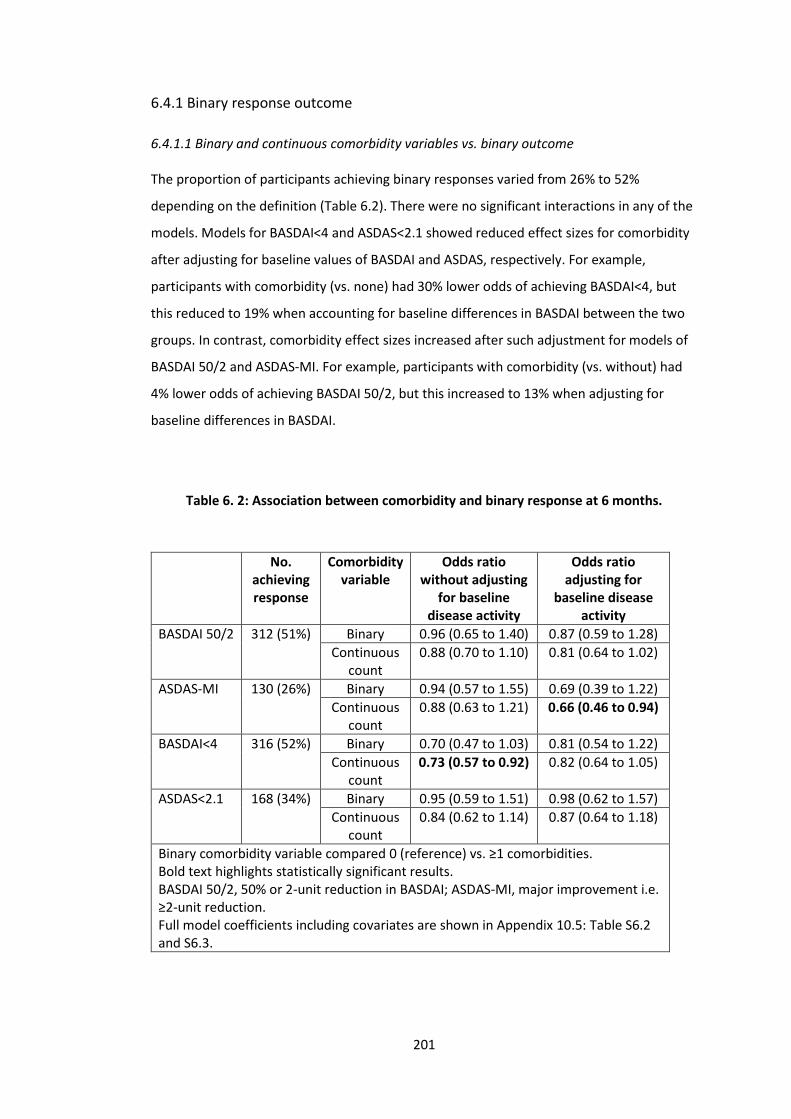
201
6.4.1 Binary response outcome
6.4.1.1 Binary and continuous comorbidity variables vs. binary outcome
The proportion of participants achieving binary responses varied from 26% to 52%
depending on the definition (Table 6.2). There were no significant interactions in any of the
models. Models for BASDAI<4 and ASDAS<2.1 showed reduced effect sizes for comorbidity
after adjusting for baseline values of BASDAI and ASDAS, respectively. For example,
participants with comorbidity (vs. none) had 30% lower odds of achieving BASDAI<4, but
this reduced to 19% when accounting for baseline differences in BASDAI between the two
groups. In contrast, comorbidity effect sizes increased after such adjustment for models of
BASDAI 50/2 and ASDAS-MI. For example, participants with comorbidity (vs. without) had
4% lower odds of achieving BASDAI 50/2, but this increased to 13% when adjusting for
baseline differences in BASDAI.
Table 6. 2: Association between comorbidity and binary response at 6 months.
No. achieving response
Comorbidity variable
Odds ratio without adjusting
for baseline disease activity
Odds ratio adjusting for
baseline disease activity
BASDAI 50/2 312 (51%) Binary 0.96 (0.65 to 1.40) 0.87 (0.59 to 1.28)
Continuous count
0.88 (0.70 to 1.10) 0.81 (0.64 to 1.02)
ASDAS-MI 130 (26%) Binary 0.94 (0.57 to 1.55) 0.69 (0.39 to 1.22)
Continuous count
0.88 (0.63 to 1.21) 0.66 (0.46 to 0.94)
BASDAI<4 316 (52%) Binary 0.70 (0.47 to 1.03) 0.81 (0.54 to 1.22)
Continuous count
0.73 (0.57 to 0.92) 0.82 (0.64 to 1.05)
ASDAS<2.1 168 (34%) Binary 0.95 (0.59 to 1.51) 0.98 (0.62 to 1.57)
Continuous count
0.84 (0.62 to 1.14) 0.87 (0.64 to 1.18)
Binary comorbidity variable compared 0 (reference) vs. ≥1 comorbidities. Bold text highlights statistically significant results. BASDAI 50/2, 50% or 2-unit reduction in BASDAI; ASDAS-MI, major improvement i.e. ≥2-unit reduction. Full model coefficients including covariates are shown in Appendix 10.5: Table S6.2 and S6.3.
202
The following results refer to models adjusted for baseline disease activity. Participants
with comorbidity (vs. none) had a 2% to 31% reduced odds of achieving a binary response
at 6 months (Table 6.2), but none were statistically significant. Using comorbidity count as a
continuous variable showed a 13% to 34% reduced odds of achieving a binary response at 6
months for each additional comorbidity.
Effect sizes were not dissimilar when using binary and continuous comorbidity in Table 6.2,
suggesting that the relationships between comorbidity count and outcome were not linear.
For example, odds of BASDAI 50/2 were reduced by 19% per additional comorbidity yet the
presence of any comorbidity reduced it by 13%.
6.4.1.2 Categorical comorbidity count vs. binary outcome
No participants with ≥3 comorbidities achieved ASDAS-MI or ASDAS<2.1 and very few
achieved BASDAI 50/2 or BASDAI<4; therefore, the top category was replaced as ≥2
comorbidities. Figure 6.4 shows that the odds of achieving each binary response was not
statistically significantly different with increasing number of comorbidities, without
adjusting for baseline values of each index. Effect sizes for BASDAI<4 (43% reduction) and
ASDAS<2.1 (30% reduction) were, however, clinically significant when comparing ≥2 vs. no
comorbidities.
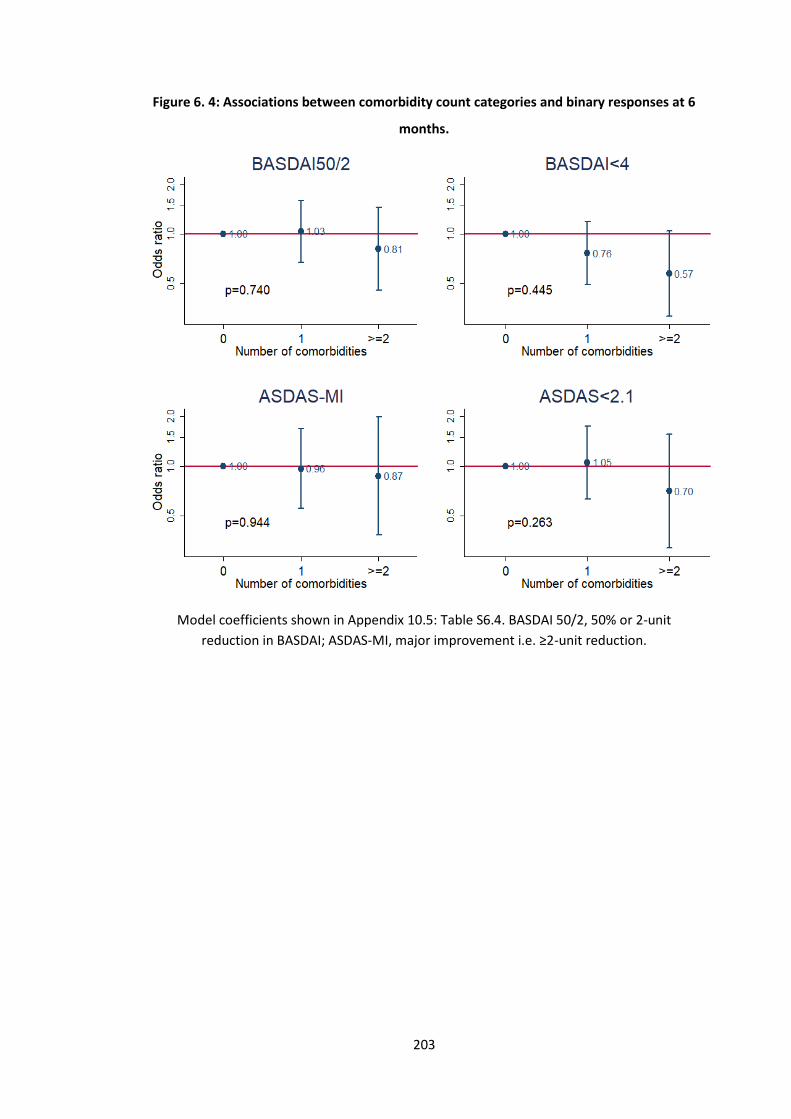
203
Figure 6. 4: Associations between comorbidity count categories and binary responses at 6
months.
Model coefficients shown in Appendix 10.5: Table S6.4. BASDAI 50/2, 50% or 2-unit
reduction in BASDAI; ASDAS-MI, major improvement i.e. ≥2-unit reduction.
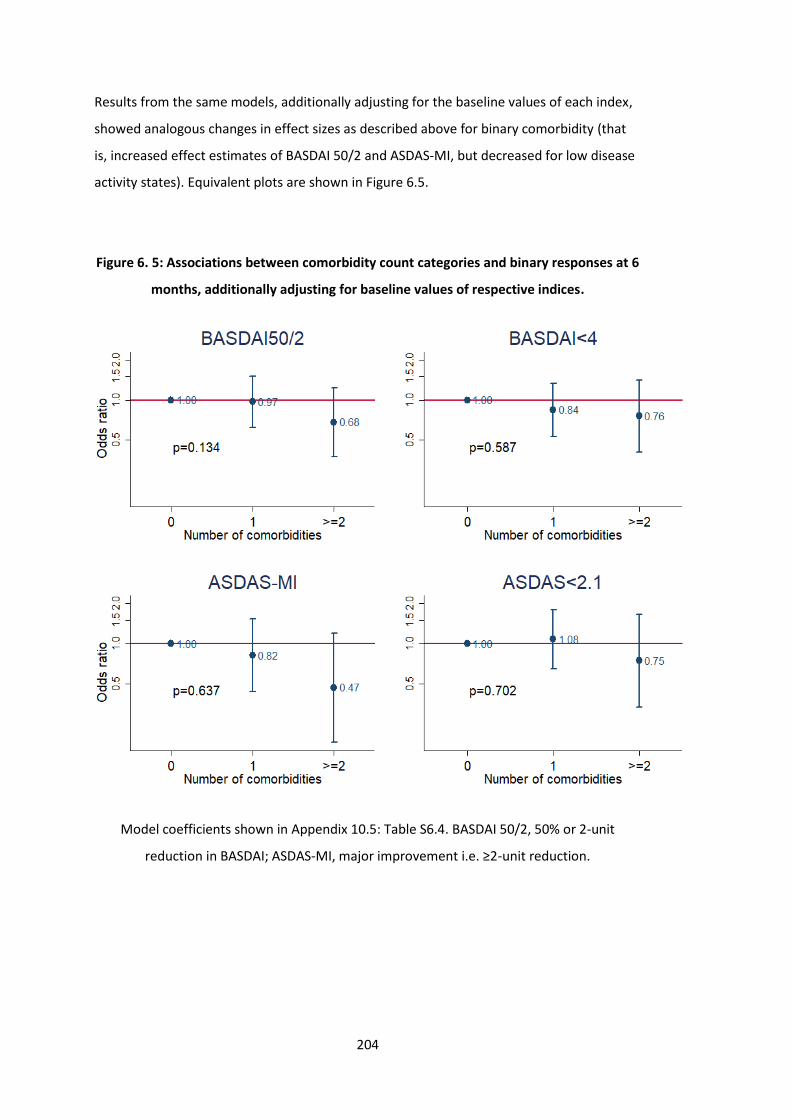
204
Results from the same models, additionally adjusting for the baseline values of each index,
showed analogous changes in effect sizes as described above for binary comorbidity (that
is, increased effect estimates of BASDAI 50/2 and ASDAS-MI, but decreased for low disease
activity states). Equivalent plots are shown in Figure 6.5.
Figure 6. 5: Associations between comorbidity count categories and binary responses at 6
months, additionally adjusting for baseline values of respective indices.
Model coefficients shown in Appendix 10.5: Table S6.4. BASDAI 50/2, 50% or 2-unit
reduction in BASDAI; ASDAS-MI, major improvement i.e. ≥2-unit reduction.
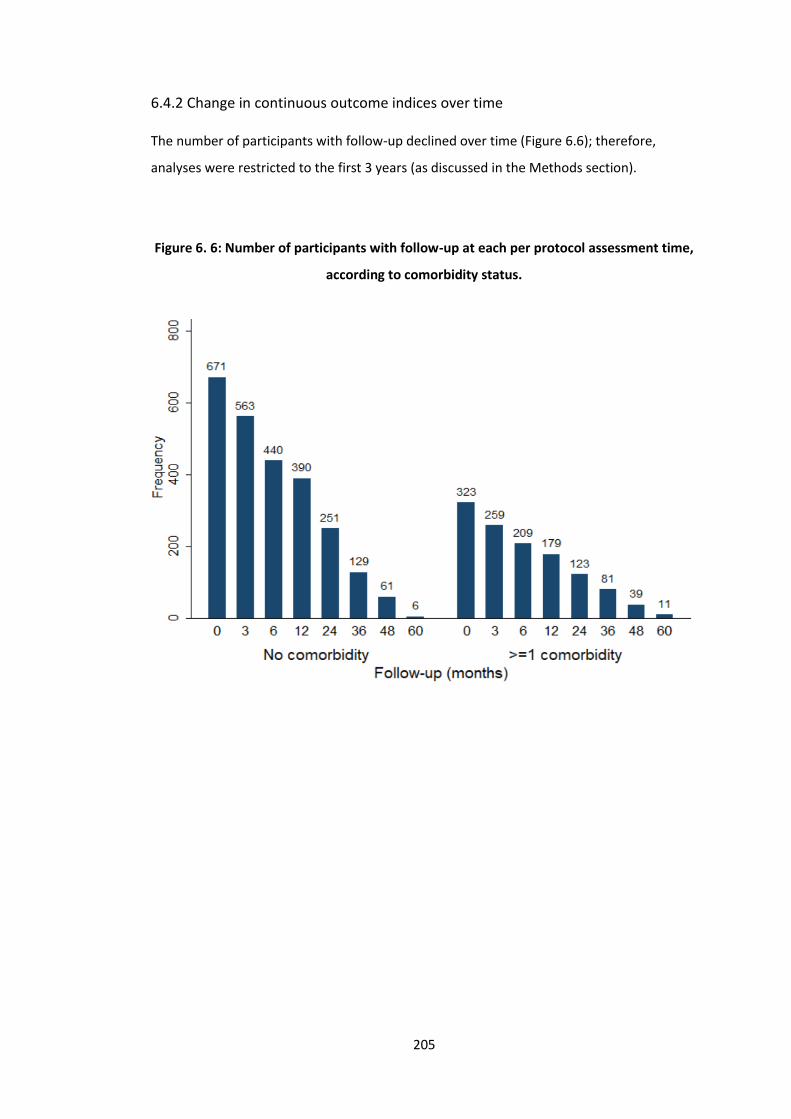
205
6.4.2 Change in continuous outcome indices over time
The number of participants with follow-up declined over time (Figure 6.6); therefore,
analyses were restricted to the first 3 years (as discussed in the Methods section).
Figure 6. 6: Number of participants with follow-up at each per protocol assessment time,
according to comorbidity status.
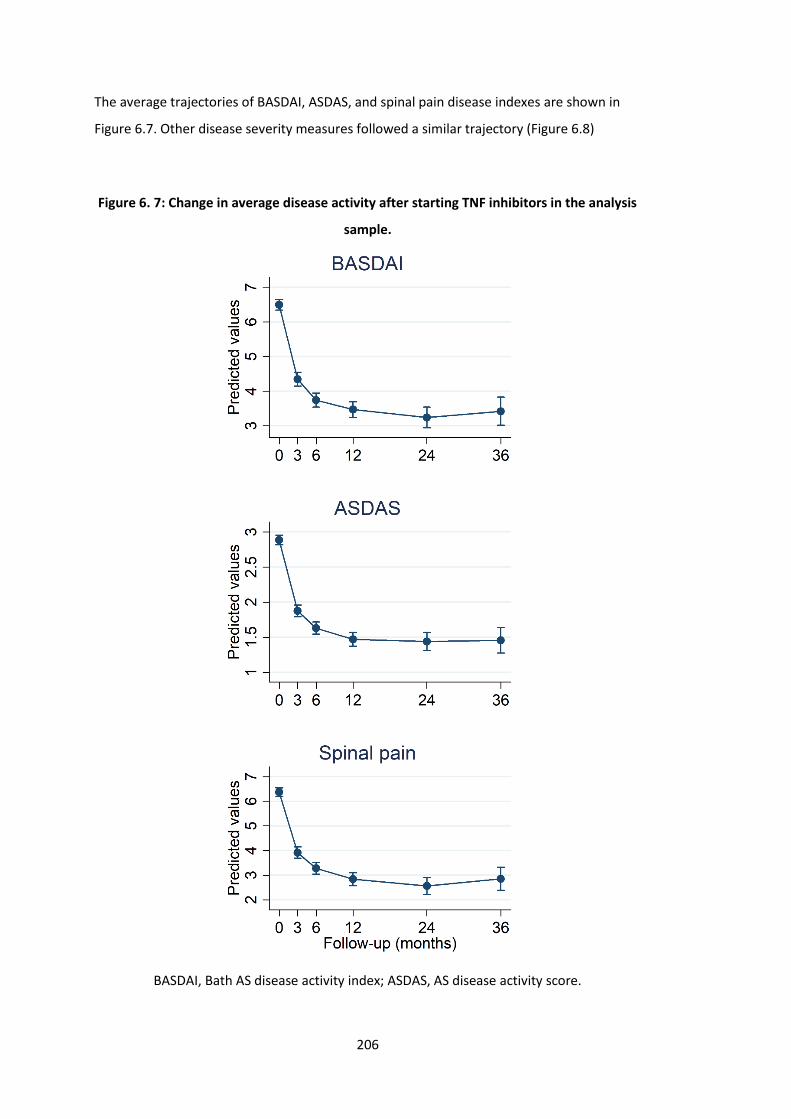
206
The average trajectories of BASDAI, ASDAS, and spinal pain disease indexes are shown in
Figure 6.7. Other disease severity measures followed a similar trajectory (Figure 6.8)
Figure 6. 7: Change in average disease activity after starting TNF inhibitors in the analysis
sample.
BASDAI, Bath AS disease activity index; ASDAS, AS disease activity score.
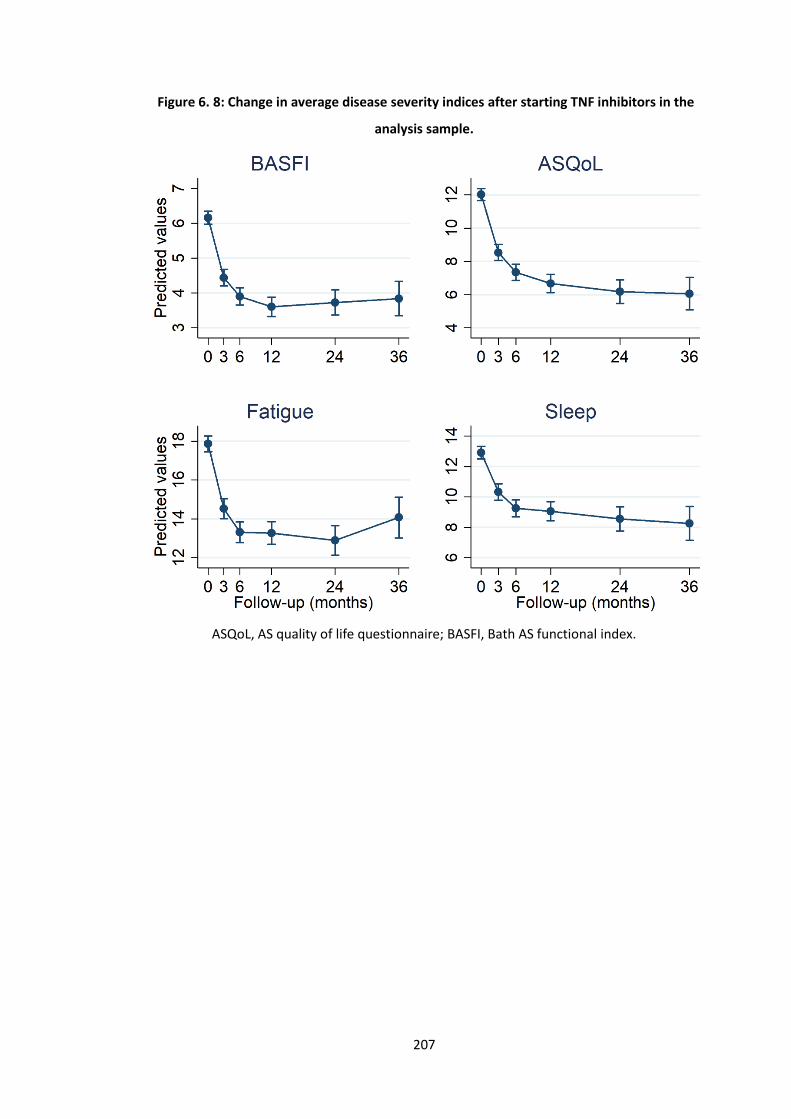
207
Figure 6. 8: Change in average disease severity indices after starting TNF inhibitors in the
analysis sample.
ASQoL, AS quality of life questionnaire; BASFI, Bath AS functional index.
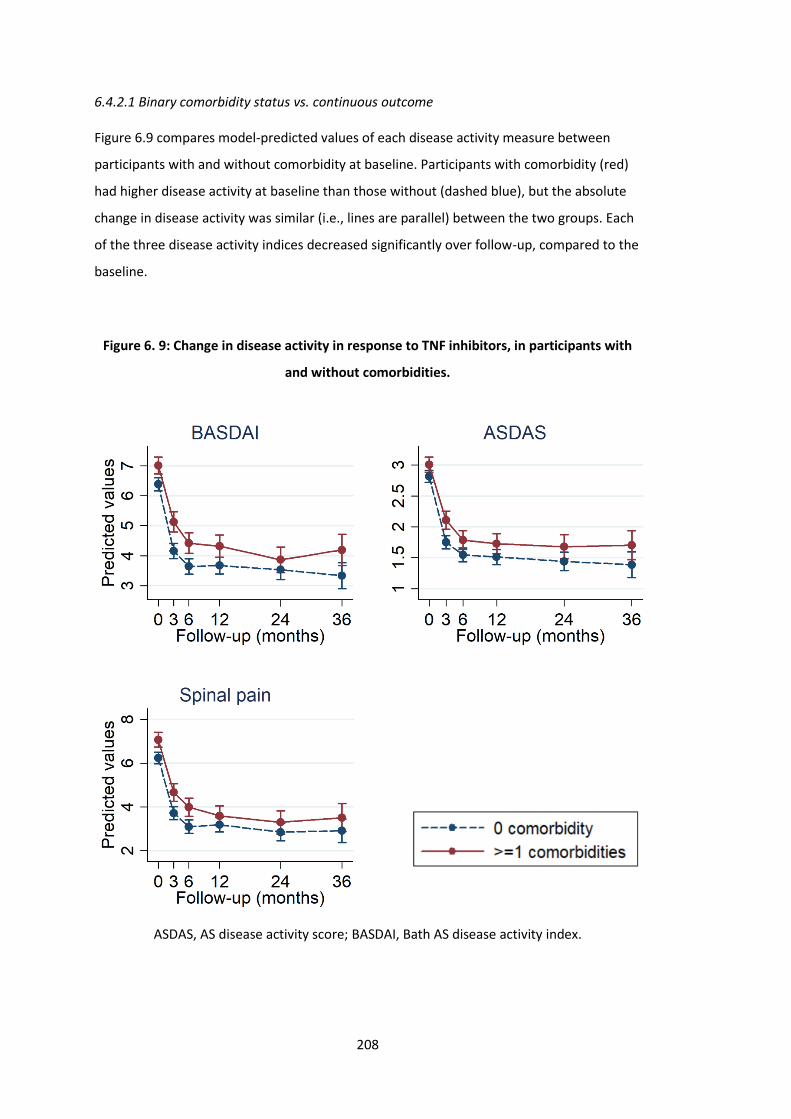
208
6.4.2.1 Binary comorbidity status vs. continuous outcome
Figure 6.9 compares model-predicted values of each disease activity measure between
participants with and without comorbidity at baseline. Participants with comorbidity (red)
had higher disease activity at baseline than those without (dashed blue), but the absolute
change in disease activity was similar (i.e., lines are parallel) between the two groups. Each
of the three disease activity indices decreased significantly over follow-up, compared to the
baseline.
Figure 6. 9: Change in disease activity in response to TNF inhibitors, in participants with
and without comorbidities.
ASDAS, AS disease activity score; BASDAI, Bath AS disease activity index.
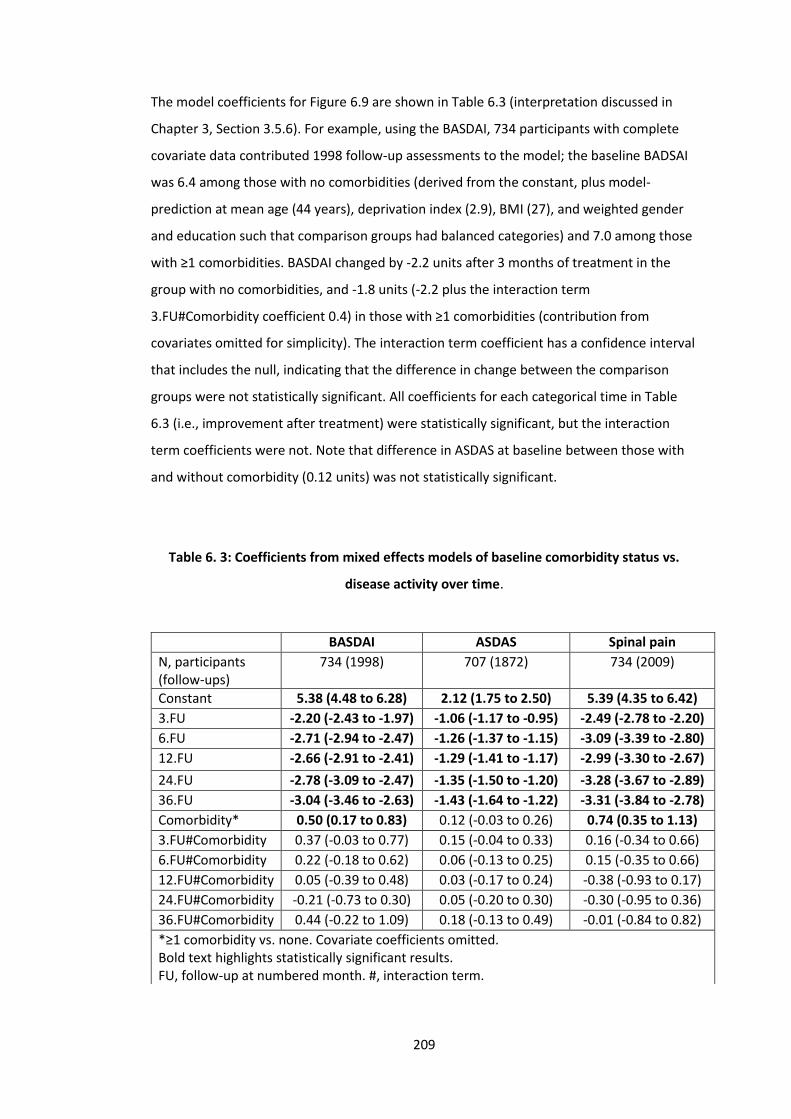
209
The model coefficients for Figure 6.9 are shown in Table 6.3 (interpretation discussed in
Chapter 3, Section 3.5.6). For example, using the BASDAI, 734 participants with complete
covariate data contributed 1998 follow-up assessments to the model; the baseline BADSAI
was 6.4 among those with no comorbidities (derived from the constant, plus model-
prediction at mean age (44 years), deprivation index (2.9), BMI (27), and weighted gender
and education such that comparison groups had balanced categories) and 7.0 among those
with ≥1 comorbidities. BASDAI changed by -2.2 units after 3 months of treatment in the
group with no comorbidities, and -1.8 units (-2.2 plus the interaction term
3.FU#Comorbidity coefficient 0.4) in those with ≥1 comorbidities (contribution from
covariates omitted for simplicity). The interaction term coefficient has a confidence interval
that includes the null, indicating that the difference in change between the comparison
groups were not statistically significant. All coefficients for each categorical time in Table
6.3 (i.e., improvement after treatment) were statistically significant, but the interaction
term coefficients were not. Note that difference in ASDAS at baseline between those with
and without comorbidity (0.12 units) was not statistically significant.
Table 6. 3: Coefficients from mixed effects models of baseline comorbidity status vs.
disease activity over time.
BASDAI ASDAS Spinal pain
N, participants (follow-ups)
734 (1998) 707 (1872) 734 (2009)
Constant 5.38 (4.48 to 6.28) 2.12 (1.75 to 2.50) 5.39 (4.35 to 6.42)
3.FU -2.20 (-2.43 to -1.97) -1.06 (-1.17 to -0.95) -2.49 (-2.78 to -2.20)
6.FU -2.71 (-2.94 to -2.47) -1.26 (-1.37 to -1.15) -3.09 (-3.39 to -2.80)
12.FU -2.66 (-2.91 to -2.41) -1.29 (-1.41 to -1.17) -2.99 (-3.30 to -2.67)
24.FU -2.78 (-3.09 to -2.47) -1.35 (-1.50 to -1.20) -3.28 (-3.67 to -2.89)
36.FU -3.04 (-3.46 to -2.63) -1.43 (-1.64 to -1.22) -3.31 (-3.84 to -2.78)
Comorbidity* 0.50 (0.17 to 0.83) 0.12 (-0.03 to 0.26) 0.74 (0.35 to 1.13)
3.FU#Comorbidity 0.37 (-0.03 to 0.77) 0.15 (-0.04 to 0.33) 0.16 (-0.34 to 0.66)
6.FU#Comorbidity 0.22 (-0.18 to 0.62) 0.06 (-0.13 to 0.25) 0.15 (-0.35 to 0.66)
12.FU#Comorbidity 0.05 (-0.39 to 0.48) 0.03 (-0.17 to 0.24) -0.38 (-0.93 to 0.17)
24.FU#Comorbidity -0.21 (-0.73 to 0.30) 0.05 (-0.20 to 0.30) -0.30 (-0.95 to 0.36)
36.FU#Comorbidity 0.44 (-0.22 to 1.09) 0.18 (-0.13 to 0.49) -0.01 (-0.84 to 0.82)
*≥1 comorbidity vs. none. Covariate coefficients omitted. Bold text highlights statistically significant results. FU, follow-up at numbered month. #, interaction term.
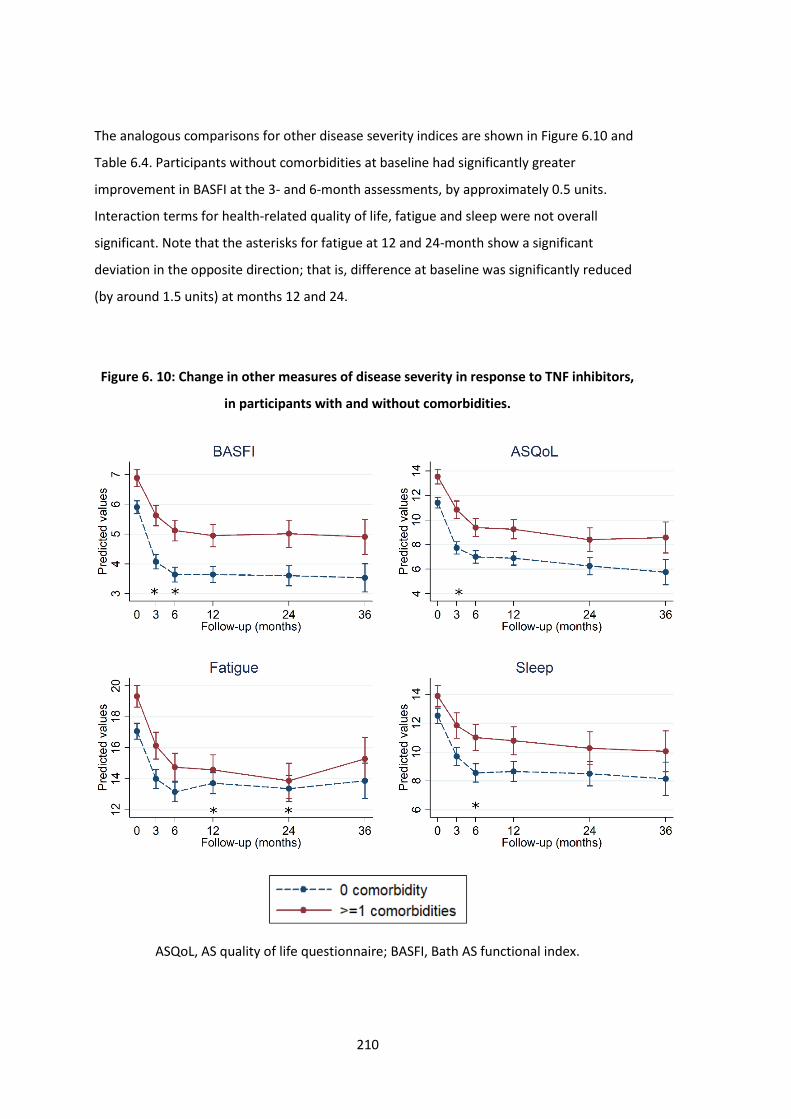
210
The analogous comparisons for other disease severity indices are shown in Figure 6.10 and
Table 6.4. Participants without comorbidities at baseline had significantly greater
improvement in BASFI at the 3- and 6-month assessments, by approximately 0.5 units.
Interaction terms for health-related quality of life, fatigue and sleep were not overall
significant. Note that the asterisks for fatigue at 12 and 24-month show a significant
deviation in the opposite direction; that is, difference at baseline was significantly reduced
(by around 1.5 units) at months 12 and 24.
Figure 6. 10: Change in other measures of disease severity in response to TNF inhibitors,
in participants with and without comorbidities.
ASQoL, AS quality of life questionnaire; BASFI, Bath AS functional index.
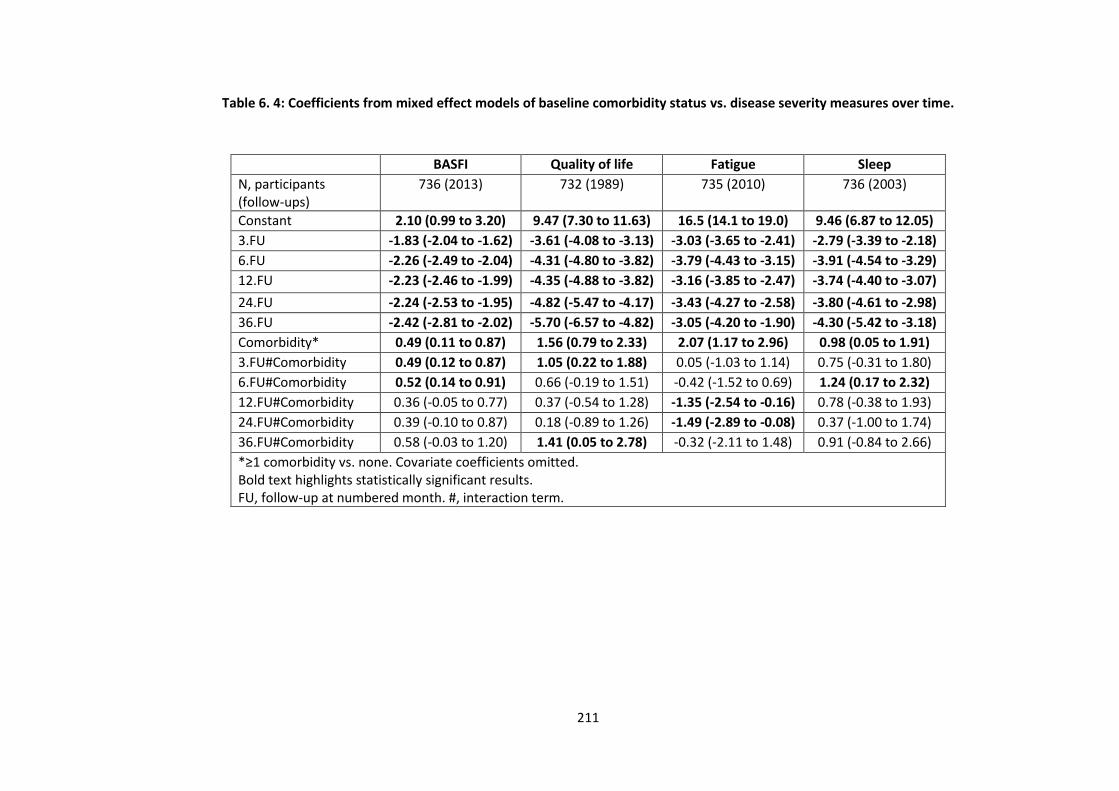
211
Table 6. 4: Coefficients from mixed effect models of baseline comorbidity status vs. disease severity measures over time.
BASFI Quality of life Fatigue Sleep
N, participants (follow-ups)
736 (2013) 732 (1989) 735 (2010) 736 (2003)
Constant 2.10 (0.99 to 3.20) 9.47 (7.30 to 11.63) 16.5 (14.1 to 19.0) 9.46 (6.87 to 12.05)
3.FU -1.83 (-2.04 to -1.62) -3.61 (-4.08 to -3.13) -3.03 (-3.65 to -2.41) -2.79 (-3.39 to -2.18)
6.FU -2.26 (-2.49 to -2.04) -4.31 (-4.80 to -3.82) -3.79 (-4.43 to -3.15) -3.91 (-4.54 to -3.29)
12.FU -2.23 (-2.46 to -1.99) -4.35 (-4.88 to -3.82) -3.16 (-3.85 to -2.47) -3.74 (-4.40 to -3.07)
24.FU -2.24 (-2.53 to -1.95) -4.82 (-5.47 to -4.17) -3.43 (-4.27 to -2.58) -3.80 (-4.61 to -2.98)
36.FU -2.42 (-2.81 to -2.02) -5.70 (-6.57 to -4.82) -3.05 (-4.20 to -1.90) -4.30 (-5.42 to -3.18)
Comorbidity* 0.49 (0.11 to 0.87) 1.56 (0.79 to 2.33) 2.07 (1.17 to 2.96) 0.98 (0.05 to 1.91)
3.FU#Comorbidity 0.49 (0.12 to 0.87) 1.05 (0.22 to 1.88) 0.05 (-1.03 to 1.14) 0.75 (-0.31 to 1.80)
6.FU#Comorbidity 0.52 (0.14 to 0.91) 0.66 (-0.19 to 1.51) -0.42 (-1.52 to 0.69) 1.24 (0.17 to 2.32)
12.FU#Comorbidity 0.36 (-0.05 to 0.77) 0.37 (-0.54 to 1.28) -1.35 (-2.54 to -0.16) 0.78 (-0.38 to 1.93)
24.FU#Comorbidity 0.39 (-0.10 to 0.87) 0.18 (-0.89 to 1.26) -1.49 (-2.89 to -0.08) 0.37 (-1.00 to 1.74)
36.FU#Comorbidity 0.58 (-0.03 to 1.20) 1.41 (0.05 to 2.78) -0.32 (-2.11 to 1.48) 0.91 (-0.84 to 2.66)
*≥1 comorbidity vs. none. Covariate coefficients omitted. Bold text highlights statistically significant results. FU, follow-up at numbered month. #, interaction term.

212
6.4.2.2 Continuous comorbidity count vs. continuous outcome
Comorbidity count was also modelled as a continuous variable, but results could not be
shown graphically. Coefficients are shown in Table 6.5. Using BASDAI as the example:
model-predictions show that for each additional comorbidity, the BASDAI response was
approximately (since covariate contributions unaccounted) 0.2 units smaller at 3 and 6
months, although these interaction coefficients were not statistically significant. The same
model for BASFI showed 0.3 units reduced response at 3 months for each additional
comorbidity, and 0.4 units at 6 months, which were both statistically significant.
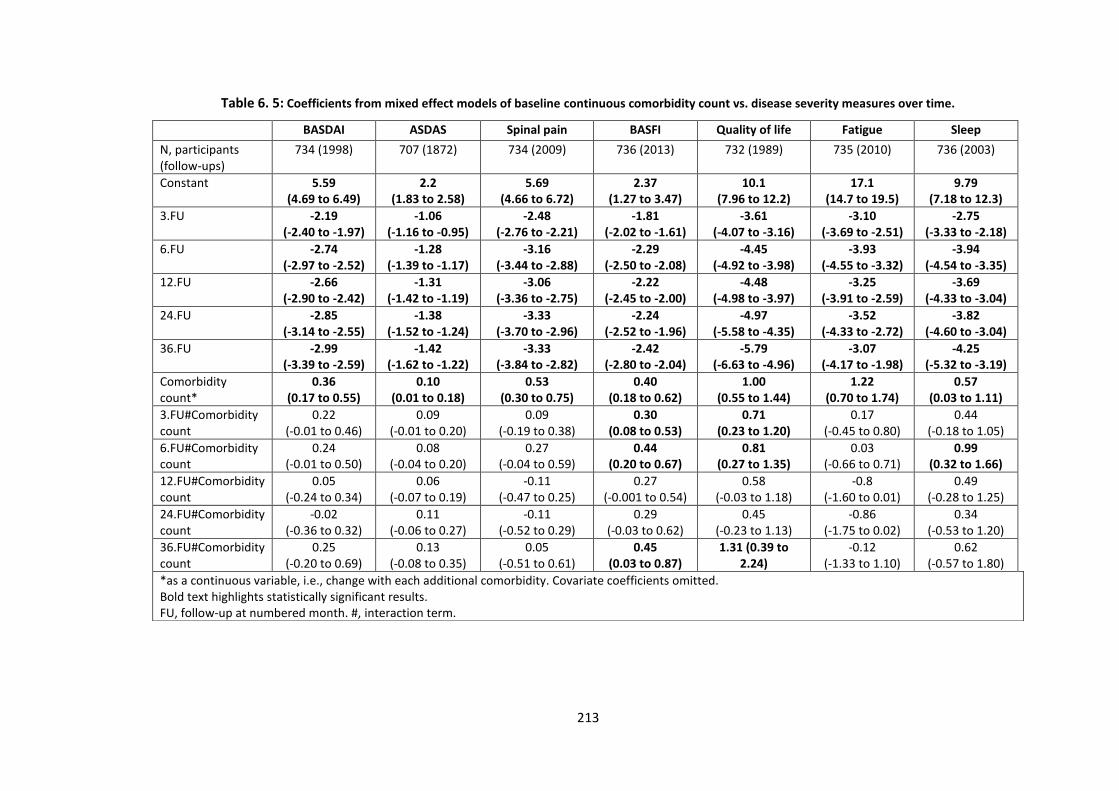
213
Table 6. 5: Coefficients from mixed effect models of baseline continuous comorbidity count vs. disease severity measures over time.
BASDAI ASDAS Spinal pain BASFI Quality of life Fatigue Sleep
N, participants (follow-ups)
734 (1998) 707 (1872) 734 (2009) 736 (2013) 732 (1989) 735 (2010) 736 (2003)
Constant 5.59 (4.69 to 6.49)
2.2 (1.83 to 2.58)
5.69 (4.66 to 6.72)
2.37 (1.27 to 3.47)
10.1 (7.96 to 12.2)
17.1 (14.7 to 19.5)
9.79 (7.18 to 12.3)
3.FU -2.19 (-2.40 to -1.97)
-1.06 (-1.16 to -0.95)
-2.48 (-2.76 to -2.21)
-1.81 (-2.02 to -1.61)
-3.61 (-4.07 to -3.16)
-3.10 (-3.69 to -2.51)
-2.75 (-3.33 to -2.18)
6.FU -2.74 (-2.97 to -2.52)
-1.28 (-1.39 to -1.17)
-3.16 (-3.44 to -2.88)
-2.29 (-2.50 to -2.08)
-4.45 (-4.92 to -3.98)
-3.93 (-4.55 to -3.32)
-3.94 (-4.54 to -3.35)
12.FU -2.66 (-2.90 to -2.42)
-1.31 (-1.42 to -1.19)
-3.06 (-3.36 to -2.75)
-2.22 (-2.45 to -2.00)
-4.48 (-4.98 to -3.97)
-3.25 (-3.91 to -2.59)
-3.69 (-4.33 to -3.04)
24.FU -2.85 (-3.14 to -2.55)
-1.38 (-1.52 to -1.24)
-3.33 (-3.70 to -2.96)
-2.24 (-2.52 to -1.96)
-4.97 (-5.58 to -4.35)
-3.52 (-4.33 to -2.72)
-3.82 (-4.60 to -3.04)
36.FU -2.99 (-3.39 to -2.59)
-1.42 (-1.62 to -1.22)
-3.33 (-3.84 to -2.82)
-2.42 (-2.80 to -2.04)
-5.79 (-6.63 to -4.96)
-3.07 (-4.17 to -1.98)
-4.25 (-5.32 to -3.19)
Comorbidity count*
0.36 (0.17 to 0.55)
0.10 (0.01 to 0.18)
0.53 (0.30 to 0.75)
0.40 (0.18 to 0.62)
1.00 (0.55 to 1.44)
1.22 (0.70 to 1.74)
0.57 (0.03 to 1.11)
3.FU#Comorbidity count
0.22 (-0.01 to 0.46)
0.09 (-0.01 to 0.20)
0.09 (-0.19 to 0.38)
0.30 (0.08 to 0.53)
0.71 (0.23 to 1.20)
0.17 (-0.45 to 0.80)
0.44 (-0.18 to 1.05)
6.FU#Comorbidity count
0.24 (-0.01 to 0.50)
0.08 (-0.04 to 0.20)
0.27 (-0.04 to 0.59)
0.44 (0.20 to 0.67)
0.81 (0.27 to 1.35)
0.03 (-0.66 to 0.71)
0.99 (0.32 to 1.66)
12.FU#Comorbidity count
0.05 (-0.24 to 0.34)
0.06 (-0.07 to 0.19)
-0.11 (-0.47 to 0.25)
0.27 (-0.001 to 0.54)
0.58 (-0.03 to 1.18)
-0.8 (-1.60 to 0.01)
0.49 (-0.28 to 1.25)
24.FU#Comorbidity count
-0.02 (-0.36 to 0.32)
0.11 (-0.06 to 0.27)
-0.11 (-0.52 to 0.29)
0.29 (-0.03 to 0.62)
0.45 (-0.23 to 1.13)
-0.86 (-1.75 to 0.02)
0.34 (-0.53 to 1.20)
36.FU#Comorbidity count
0.25 (-0.20 to 0.69)
0.13 (-0.08 to 0.35)
0.05 (-0.51 to 0.61)
0.45 (0.03 to 0.87)
1.31 (0.39 to 2.24)
-0.12 (-1.33 to 1.10)
0.62 (-0.57 to 1.80)
*as a continuous variable, i.e., change with each additional comorbidity. Covariate coefficients omitted. Bold text highlights statistically significant results. FU, follow-up at numbered month. #, interaction term.
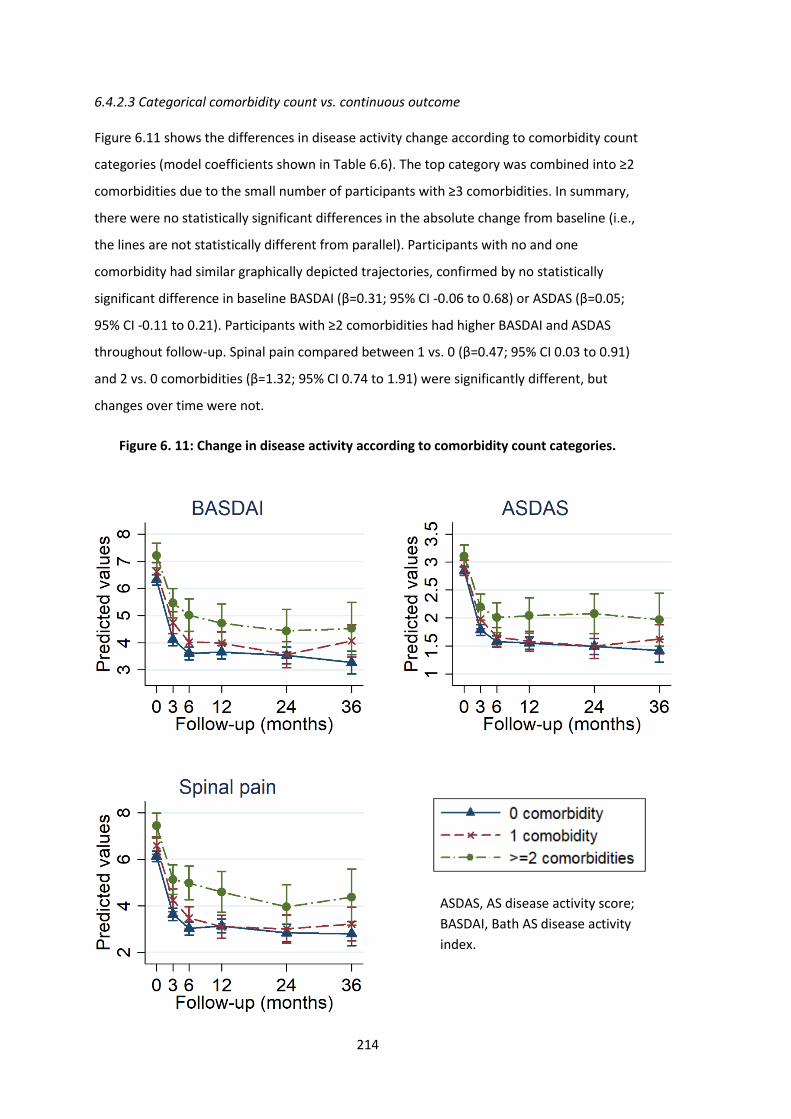
214
6.4.2.3 Categorical comorbidity count vs. continuous outcome
Figure 6.11 shows the differences in disease activity change according to comorbidity count
categories (model coefficients shown in Table 6.6). The top category was combined into ≥2
comorbidities due to the small number of participants with ≥3 comorbidities. In summary,
there were no statistically significant differences in the absolute change from baseline (i.e.,
the lines are not statistically different from parallel). Participants with no and one
comorbidity had similar graphically depicted trajectories, confirmed by no statistically
significant difference in baseline BASDAI (β=0.31; 95% CI -0.06 to 0.68) or ASDAS (β=0.05;
95% CI -0.11 to 0.21). Participants with ≥2 comorbidities had higher BASDAI and ASDAS
throughout follow-up. Spinal pain compared between 1 vs. 0 (β=0.47; 95% CI 0.03 to 0.91)
and 2 vs. 0 comorbidities (β=1.32; 95% CI 0.74 to 1.91) were significantly different, but
changes over time were not.
Figure 6. 11: Change in disease activity according to comorbidity count categories.
ASDAS, AS disease activity score;
BASDAI, Bath AS disease activity
index.
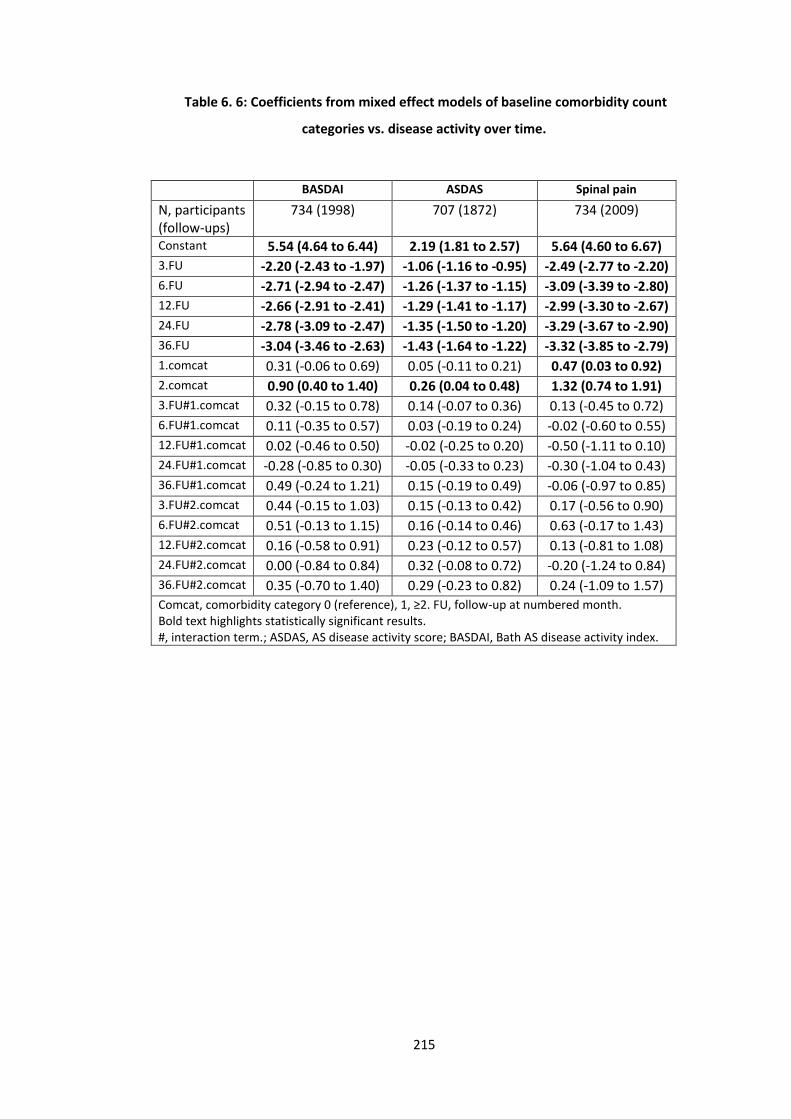
215
Table 6. 6: Coefficients from mixed effect models of baseline comorbidity count
categories vs. disease activity over time.
BASDAI ASDAS Spinal pain
N, participants (follow-ups)
734 (1998) 707 (1872) 734 (2009)
Constant 5.54 (4.64 to 6.44) 2.19 (1.81 to 2.57) 5.64 (4.60 to 6.67)
3.FU -2.20 (-2.43 to -1.97) -1.06 (-1.16 to -0.95) -2.49 (-2.77 to -2.20)
6.FU -2.71 (-2.94 to -2.47) -1.26 (-1.37 to -1.15) -3.09 (-3.39 to -2.80)
12.FU -2.66 (-2.91 to -2.41) -1.29 (-1.41 to -1.17) -2.99 (-3.30 to -2.67)
24.FU -2.78 (-3.09 to -2.47) -1.35 (-1.50 to -1.20) -3.29 (-3.67 to -2.90)
36.FU -3.04 (-3.46 to -2.63) -1.43 (-1.64 to -1.22) -3.32 (-3.85 to -2.79)
1.comcat 0.31 (-0.06 to 0.69) 0.05 (-0.11 to 0.21) 0.47 (0.03 to 0.92)
2.comcat 0.90 (0.40 to 1.40) 0.26 (0.04 to 0.48) 1.32 (0.74 to 1.91)
3.FU#1.comcat 0.32 (-0.15 to 0.78) 0.14 (-0.07 to 0.36) 0.13 (-0.45 to 0.72)
6.FU#1.comcat 0.11 (-0.35 to 0.57) 0.03 (-0.19 to 0.24) -0.02 (-0.60 to 0.55)
12.FU#1.comcat 0.02 (-0.46 to 0.50) -0.02 (-0.25 to 0.20) -0.50 (-1.11 to 0.10)
24.FU#1.comcat -0.28 (-0.85 to 0.30) -0.05 (-0.33 to 0.23) -0.30 (-1.04 to 0.43)
36.FU#1.comcat 0.49 (-0.24 to 1.21) 0.15 (-0.19 to 0.49) -0.06 (-0.97 to 0.85)
3.FU#2.comcat 0.44 (-0.15 to 1.03) 0.15 (-0.13 to 0.42) 0.17 (-0.56 to 0.90)
6.FU#2.comcat 0.51 (-0.13 to 1.15) 0.16 (-0.14 to 0.46) 0.63 (-0.17 to 1.43)
12.FU#2.comcat 0.16 (-0.58 to 0.91) 0.23 (-0.12 to 0.57) 0.13 (-0.81 to 1.08)
24.FU#2.comcat 0.00 (-0.84 to 0.84) 0.32 (-0.08 to 0.72) -0.20 (-1.24 to 0.84)
36.FU#2.comcat 0.35 (-0.70 to 1.40) 0.29 (-0.23 to 0.82) 0.24 (-1.09 to 1.57)
Comcat, comorbidity category 0 (reference), 1, ≥2. FU, follow-up at numbered month. Bold text highlights statistically significant results. #, interaction term.; ASDAS, AS disease activity score; BASDAI, Bath AS disease activity index.
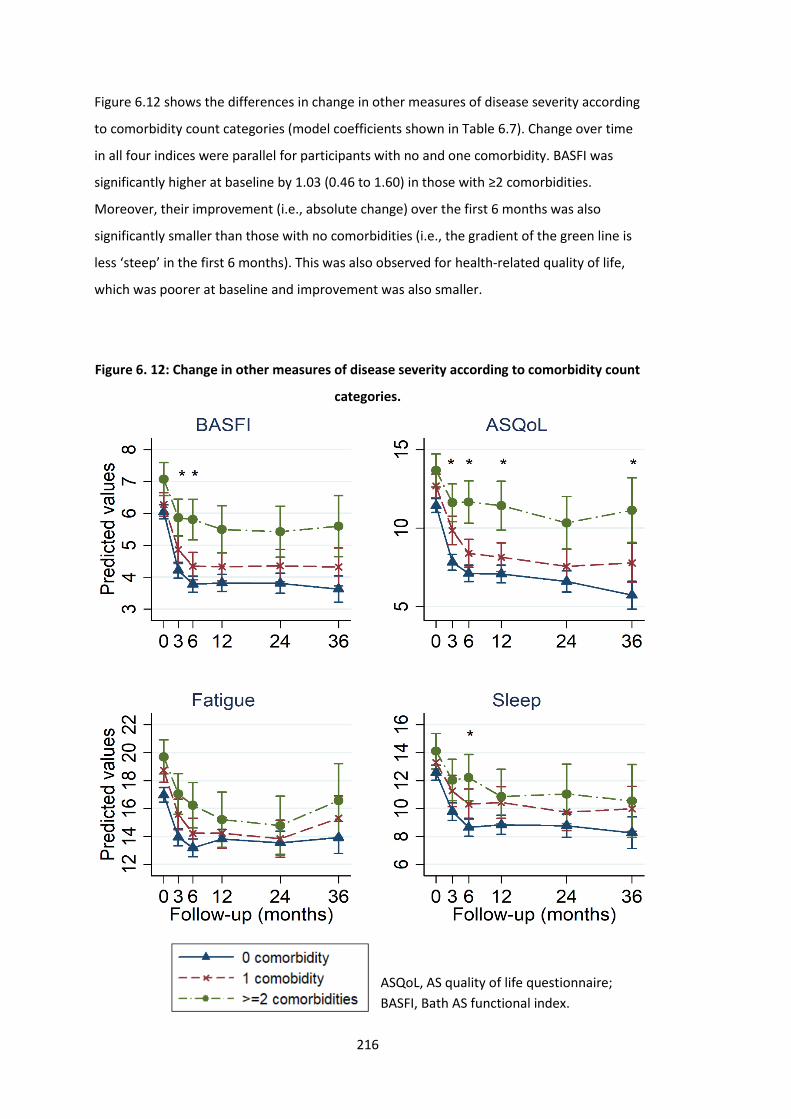
216
Figure 6.12 shows the differences in change in other measures of disease severity according
to comorbidity count categories (model coefficients shown in Table 6.7). Change over time
in all four indices were parallel for participants with no and one comorbidity. BASFI was
significantly higher at baseline by 1.03 (0.46 to 1.60) in those with ≥2 comorbidities.
Moreover, their improvement (i.e., absolute change) over the first 6 months was also
significantly smaller than those with no comorbidities (i.e., the gradient of the green line is
less ‘steep’ in the first 6 months). This was also observed for health-related quality of life,
which was poorer at baseline and improvement was also smaller.
Figure 6. 12: Change in other measures of disease severity according to comorbidity count
categories.
ASQoL, AS quality of life questionnaire;
BASFI, Bath AS functional index.
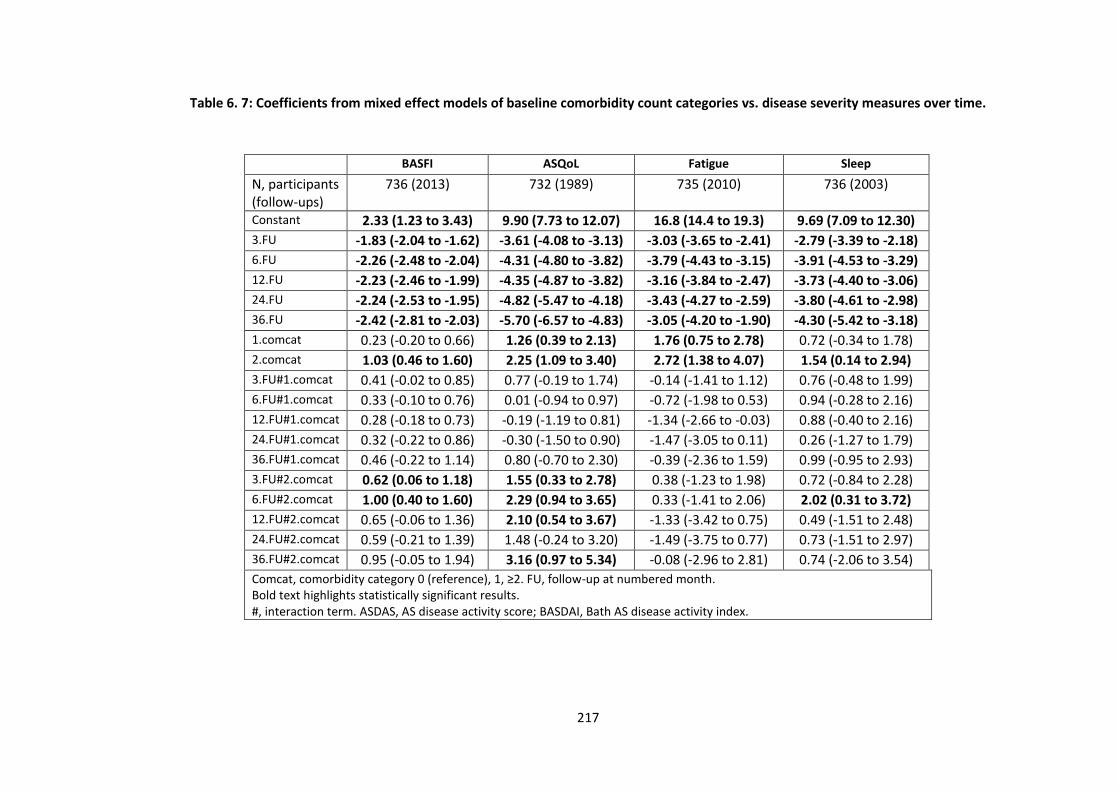
217
Table 6. 7: Coefficients from mixed effect models of baseline comorbidity count categories vs. disease severity measures over time.
BASFI ASQoL Fatigue Sleep
N, participants (follow-ups)
736 (2013) 732 (1989) 735 (2010) 736 (2003)
Constant 2.33 (1.23 to 3.43) 9.90 (7.73 to 12.07) 16.8 (14.4 to 19.3) 9.69 (7.09 to 12.30)
3.FU -1.83 (-2.04 to -1.62) -3.61 (-4.08 to -3.13) -3.03 (-3.65 to -2.41) -2.79 (-3.39 to -2.18)
6.FU -2.26 (-2.48 to -2.04) -4.31 (-4.80 to -3.82) -3.79 (-4.43 to -3.15) -3.91 (-4.53 to -3.29)
12.FU -2.23 (-2.46 to -1.99) -4.35 (-4.87 to -3.82) -3.16 (-3.84 to -2.47) -3.73 (-4.40 to -3.06)
24.FU -2.24 (-2.53 to -1.95) -4.82 (-5.47 to -4.18) -3.43 (-4.27 to -2.59) -3.80 (-4.61 to -2.98)
36.FU -2.42 (-2.81 to -2.03) -5.70 (-6.57 to -4.83) -3.05 (-4.20 to -1.90) -4.30 (-5.42 to -3.18)
1.comcat 0.23 (-0.20 to 0.66) 1.26 (0.39 to 2.13) 1.76 (0.75 to 2.78) 0.72 (-0.34 to 1.78)
2.comcat 1.03 (0.46 to 1.60) 2.25 (1.09 to 3.40) 2.72 (1.38 to 4.07) 1.54 (0.14 to 2.94)
3.FU#1.comcat 0.41 (-0.02 to 0.85) 0.77 (-0.19 to 1.74) -0.14 (-1.41 to 1.12) 0.76 (-0.48 to 1.99)
6.FU#1.comcat 0.33 (-0.10 to 0.76) 0.01 (-0.94 to 0.97) -0.72 (-1.98 to 0.53) 0.94 (-0.28 to 2.16)
12.FU#1.comcat 0.28 (-0.18 to 0.73) -0.19 (-1.19 to 0.81) -1.34 (-2.66 to -0.03) 0.88 (-0.40 to 2.16)
24.FU#1.comcat 0.32 (-0.22 to 0.86) -0.30 (-1.50 to 0.90) -1.47 (-3.05 to 0.11) 0.26 (-1.27 to 1.79)
36.FU#1.comcat 0.46 (-0.22 to 1.14) 0.80 (-0.70 to 2.30) -0.39 (-2.36 to 1.59) 0.99 (-0.95 to 2.93)
3.FU#2.comcat 0.62 (0.06 to 1.18) 1.55 (0.33 to 2.78) 0.38 (-1.23 to 1.98) 0.72 (-0.84 to 2.28)
6.FU#2.comcat 1.00 (0.40 to 1.60) 2.29 (0.94 to 3.65) 0.33 (-1.41 to 2.06) 2.02 (0.31 to 3.72)
12.FU#2.comcat 0.65 (-0.06 to 1.36) 2.10 (0.54 to 3.67) -1.33 (-3.42 to 0.75) 0.49 (-1.51 to 2.48)
24.FU#2.comcat 0.59 (-0.21 to 1.39) 1.48 (-0.24 to 3.20) -1.49 (-3.75 to 0.77) 0.73 (-1.51 to 2.97)
36.FU#2.comcat 0.95 (-0.05 to 1.94) 3.16 (0.97 to 5.34) -0.08 (-2.96 to 2.81) 0.74 (-2.06 to 3.54)
Comcat, comorbidity category 0 (reference), 1, ≥2. FU, follow-up at numbered month. Bold text highlights statistically significant results. #, interaction term. ASDAS, AS disease activity score; BASDAI, Bath AS disease activity index.
218
6.4.3 Time to treatment discontinuation
Of the 994 participants that started TNFi, 18 (1.8%) did not have any post-baseline data and
were each assigned one minute of follow-up time. The remaining 976 subjects had 1441
person-years of follow-up, with a mean of 17 (SD 15) months and median of 12 (IQR 6 to
27) months. Thirty one percent of the cohort stopped treatment over the whole study
follow-up: 29% of those with no comorbidities, 30% of those with one, 42% two and 68%
with ≥3 comorbidities.
The top panel of Figure 6.13 shows overall poorer drug survival in those with comorbidity at
baseline than without. The lines are approximately parallel except at around 3 years,
suggesting violation of the proportional hazards assumption required for further modelling.
(Kaplan-Meier curves were not possible for continuous comorbidity count.) The right panel
compares drug survival according to categories of comorbidity count. Log-rank test
confirms a statistically significant difference, particularly notable for those with 2 and ≥3
comorbidities.
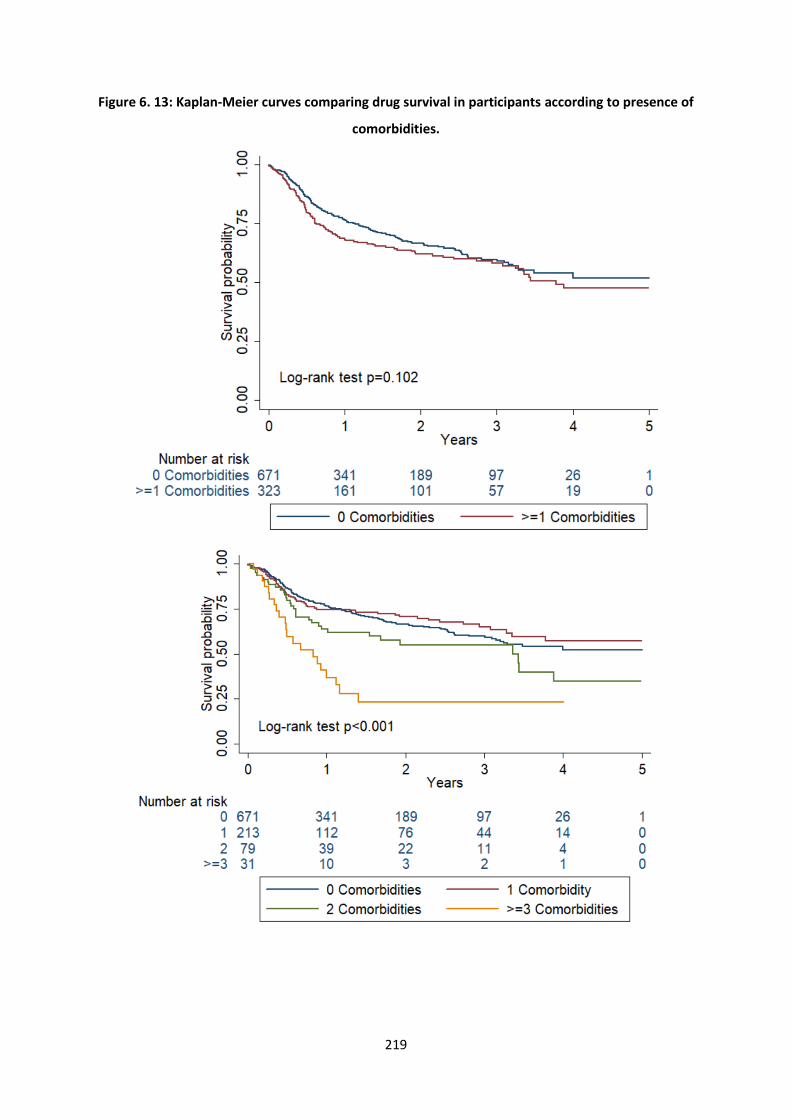
219
Figure 6. 13: Kaplan-Meier curves comparing drug survival in participants according to presence of
comorbidities.
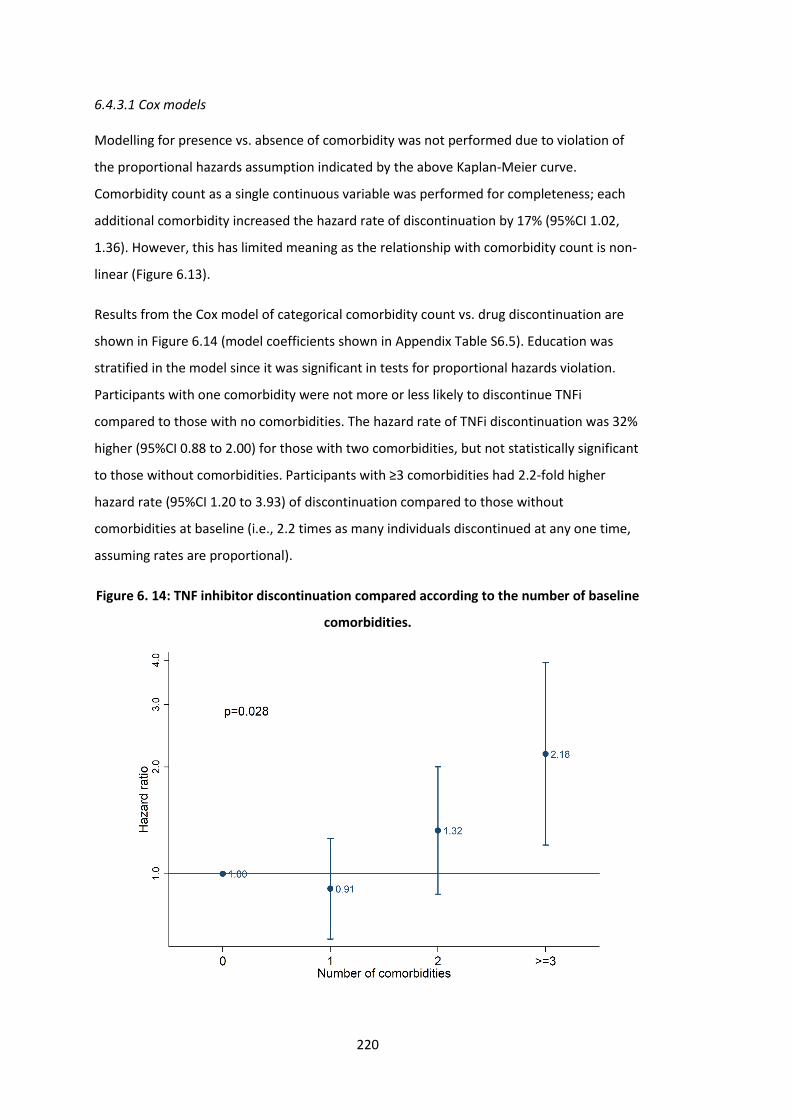
220
6.4.3.1 Cox models
Modelling for presence vs. absence of comorbidity was not performed due to violation of
the proportional hazards assumption indicated by the above Kaplan-Meier curve.
Comorbidity count as a single continuous variable was performed for completeness; each
additional comorbidity increased the hazard rate of discontinuation by 17% (95%CI 1.02,
1.36). However, this has limited meaning as the relationship with comorbidity count is non-
linear (Figure 6.13).
Results from the Cox model of categorical comorbidity count vs. drug discontinuation are
shown in Figure 6.14 (model coefficients shown in Appendix Table S6.5). Education was
stratified in the model since it was significant in tests for proportional hazards violation.
Participants with one comorbidity were not more or less likely to discontinue TNFi
compared to those with no comorbidities. The hazard rate of TNFi discontinuation was 32%
higher (95%CI 0.88 to 2.00) for those with two comorbidities, but not statistically significant
to those without comorbidities. Participants with ≥3 comorbidities had 2.2-fold higher
hazard rate (95%CI 1.20 to 3.93) of discontinuation compared to those without
comorbidities at baseline (i.e., 2.2 times as many individuals discontinued at any one time,
assuming rates are proportional).
Figure 6. 14: TNF inhibitor discontinuation compared according to the number of baseline
comorbidities.
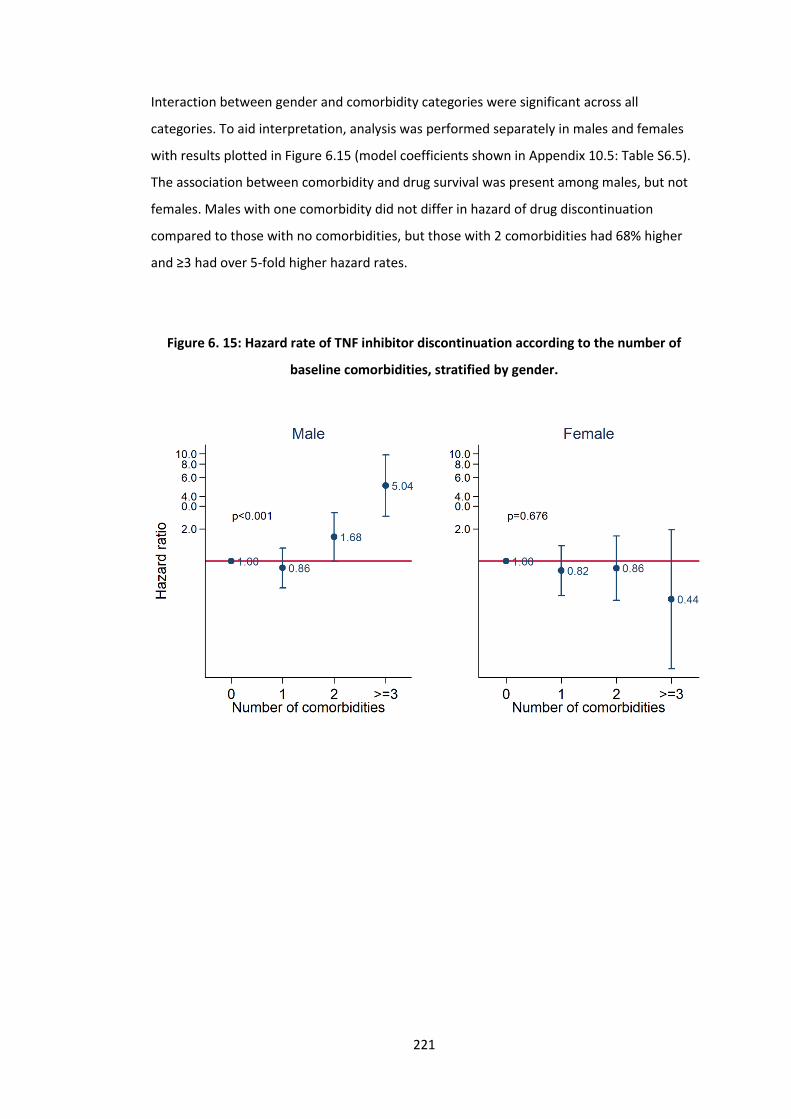
221
Interaction between gender and comorbidity categories were significant across all
categories. To aid interpretation, analysis was performed separately in males and females
with results plotted in Figure 6.15 (model coefficients shown in Appendix 10.5: Table S6.5).
The association between comorbidity and drug survival was present among males, but not
females. Males with one comorbidity did not differ in hazard of drug discontinuation
compared to those with no comorbidities, but those with 2 comorbidities had 68% higher
and ≥3 had over 5-fold higher hazard rates.
Figure 6. 15: Hazard rate of TNF inhibitor discontinuation according to the number of
baseline comorbidities, stratified by gender.
222
6.4.4 Sensitivity analyses
6.4.4.1 Excluding individuals with baseline BASDAI<4
Participants with baseline BASDAI<4 would not ordinarily be eligible for TNFi according to
NICE guidance. One explanation is imputation of missing baseline BASDAI from up to a year
before TNFi initiation. After excluding these patients, results for the binary outcome,
absolute response, and treatment discontinuation analyses were not meaningfully different
from the primary analysis (data not shown).
6.4.4.2 Missing binary outcome imputation
Analyses of binary outcomes with imputation significantly changed the proportion of
responders, particularly for ASDAS-based variables (due to more missing data with ASDAS).
However, analyses of binary, continuous or categorical comorbidity count definitions
showed no meaningful differences in results (Appendix 10.5: Table S6.6 and Figure S6.1).
6.4.4.3 Adjusting for additional potential confounders
Results from all models additionally adjusting for ever/never smoking and ever/never use of
alcohol were not meaningfully different (data not shown).
6.4.4.4 Testing other variance-covariance structures
Mixed effects models of comorbidity vs. BASDAI using three other variance-covariance
structures resulted in no meaningfully difference (data not shown).
223
6.5 Discussion
In this longitudinal study of response to the first TNF inhibitor, participants with greater
comorbidity burden had higher disease activity at baseline that persisted throughout
follow-up. Participants with multiple (≥2) comorbidities had significantly poorer absolute
improvements in function and health-related quality of life. These individuals also had
significantly increased TNFi discontinuation compared to those without comorbidities.
Three studies have previously examined the same topic. Iannone et al showed that mRCDI
was significantly correlated (by Spearman’s rank) with the number of biologic switches
[114]. Kaplan Meier curves showed no difference between mRDCI of 1 and 0, while the
mRDCI≥2 group separated after approximately 1 year. These curves were difficult to
interpret as they suggested: 1) discontinuation was assessed at large intervals of discrete
time, and 2) >90% of those with mRDCI 0 or 1, but 0% of those with mRDCI≥2, remained on
treatment at end of follow-up (approximately 60 months). The second study, by Lindström
et al [118], examined risk of TNFi discontinuation in unadjusted Cox models for each of:
cardiovascular disease (HR 1.24; 1.08 to 1.43), affective disorder (HR 1.81; 1.54 to 2.13),
chronic lung disease (HR 1.49; 1.22 to 1.82), malignancy (HR 1.36; 1.06 to 1.74), diabetes
(HR 1.36; 0.99 to 1.87) and chronic kidney disease (HR 0.79; 0.41 to 1.52). The third study
used an earlier sample of 335 BSRBR-AS participants to show continuous comorbidity count
as a predictor of binary response [134]. The investigators showed each additional
comorbidity to reduce odds of achieving clinically important improvement in ASDAS (≥1.1)
by 43% (95%CI 0.37 to 0.88) and ASDAS<2.1 by 40% (95%CI 0.38 to 0.95) within 10 weeks to
9 months of treatment initiation. These prediction models assumed a log-linear relationship
between outcomes and each additional comorbidity, which was shown not to be the case in
this study.
Another limitation of these prior studies is that they used only binary definitions of
response. To summarise, the decision to adjust for baseline disease activity or not are both
fraught with potential bias. By analysing three types of outcomes, this chapter highlights
the importance of interpreting each result in the context of the others. For example, it is
reasonable to tell patients with comorbidities that they may have lower odds of achieving
‘low disease activity’ states, but the absolute degree of improvement from pre-treatment
disease activity is comparable to those with no comorbidities. Communicating the influence
of comorbidities to patients should be more nuanced, depending on whether degree of
improvement or a fixed low level of disease activity is more important to the individual.
224
Existing definitions of response as used for prescribing guidelines, for example in the UK,
may need to be reconsidered: a patient starting TNFi with BASDAI of 7 will have higher odds
(by 25% in this data) of achieving BASDAI 50/2, while simultaneously having lower odds of
BASDAI<4 (by 32%), than an identical individual with starting BASDAI of 6. Which definition
of response is more relevant for health-economics remains to be determined. Lastly, many
comorbid patients would have been ineligible for randomised controlled trials; this study
provided unique insights into how therapeutic effects on function and quality of life
differed in comorbid patients – highlighting the need to optimise comorbidities not just
axSpA.
The most clinically significant effect sizes came from time-to-event analyses. Interestingly,
the association between comorbidity count and TNFi discontinuation was limited to males.
Male participants with 1 comorbid condition had similar hazard rate of treatment
discontinuation as those with no comorbidities, which concurs with analyses of binary and
absolute responses. Male participants with 2 comorbidities had 68% higher hazard rates
and ≥3 comorbidities over 5-fold higher. The same was not observed among the female
population. Note that the large effect size showing reduced risk of TNFi discontinuation in
females with ≥3 comorbidities had a wide confidence interval, arising from just 10
individuals; therefore, it should not be interpreted as being protective. The reasons for
these findings are unclear. Data on causes of discontinuation in the BSRBR-AS had
limitations (see Methods above) that precluded inclusion into primary analyses; causes did
not differ according to gender or the presence of comorbidities (data not shown).
Males had higher prevalence of diabetes but lower prevalence of depression. The high
prevalence of depression among female participants and the lack of association between
comorbidity count and TNFi discontinuation are not consistent with existing evidence that:
1) depression was negatively associated with disease severity (as shown in prior chapters)
and 2) mental health symptoms was a negative predictor of binary treatment response in
MacFarlane and colleagues’ analysis of the BSRBR-AS [134]. It is also notable that having
only one comorbidity was not associated with treatment response or discontinuation, when
the commonest condition among those with one single comorbidity was depression (40%,
see Figure 6.3). More research is needed to further dissect the role of depression as an
independent comorbidity, particularly gender differences in prevalence and symptom
reporting.
225
6.5.1 Strengths and limitations
The strengths of the BSRBR-AS dataset have been discussed in detail in the previous
chapter. The systematic approach of the current analysis – using different approaches for
comorbidity and outcome variables – provided a contextual overview that prior studies
lacked [114,118,134]. Results were also robust to a battery of sensitivity analyses testing
several assumptions. There were, however, limitations. Most importantly is the causal
interpretation of the role of comorbidity: Did the presence of comorbidities cause blunted
improvement in function and quality of life and increased treatment discontinuation among
males? It would be inappropriate to confidently attribute a causal relationship with
treatment response, since many comorbidities are not ‘manipulatable’ (i.e., one cannot
‘assign’ individuals to having a history of a certain comorbidity in an RCT). Using
comorbidity history collected at baseline meant that the complex time-varying relationship
between comorbidities and disease activity, before and after TNFi initiation, could not be
captured.
Results from analyses of binary response definitions suggested clinically meaningful effect
sizes but lacked precision. Results from analysis of change over time should be interpreted
with one important caveat: participants who did not respond by the first assessment
(usually after 3 months) or those who lost response would have had their treatment
stopped under NICE guidance [190]; therefore, record of such high disease activity would
be censored. However, such informative censoring should not affect data within the first 3
months [42]. This may help explain the dramatic difference between the relatively
unimpressive effect sizes of the response analyses compared to treatment discontinuation.
Lastly, analyses of comorbidity count assume that individual comorbidities affect the
outcomes equally. This is unlikely to be true and larger studies are required to examine
relative contributions of individual conditions in the context of overall comorbidity burden.
226
6.6 Summary
Participants with multiple (≥2) comorbidities had reduced absolute improvement in
function and health-related quality of life compared to those without. Overall, participants
with comorbidities generally had reduced odds of achieving binary response definitions
compared to those with none, although most effect estimates were small and with
uncertainty. They also had significantly higher rate of TNFi discontinuation. Taken together,
results can be used to better inform clinicians and educate patients about the likelihood of
response to the first TNFi given baseline comorbidity status. Further research is needed to
identify potentially modifiable comorbidities that may improve response. This will be the
topic of the next Chapter.
227
Chapter 7: Depression and anxiety and response to TNF inhibitors
This chapter uses longitudinal data from the BSRBR-AS to examine the impact of baseline
depression and anxiety on response to TNF inhibitors. This thesis set out to study
comorbidities in general, without a priori aims to focus on a single disease group. However,
previous chapters have each pointed towards mental health as an important factor in axSpA
management.
7.1 Introduction
Symptoms of axSpA commonly begin in early adulthood, which can be a critical time for
education, career, and relationships. The consequence of these disruptive symptoms on
mental health is compounded by the often-significant delays to diagnosis and treatment
[10]. Depression is well-known to influence the experience and reporting of symptoms
[231]. This is particularly relevant for assessment of axSpA disease activity, since indices are
mostly (e.g., ASDAS) or entirely subjective (BASDAI and spinal pain). Though a recent
systematic review identified numerous studies that consistently showed depression to be
associated with disease activity [9], none have examined whether they influence
longitudinal treatment outcomes.
This chapter includes an in-depth assessment of depression and anxiety and their
associations with treatment response. These two mental health comorbidities were chosen
because they are the most prevalent and were available in the BSRBR-AS. Studying
depression presents unique challenges – namely under-diagnosis and documentation – that
can be addressed using the BSRBR-AS data. Diagnosis of depression and depressive
symptoms (according to the Hospital Anxiety and Depression Score, HADS) were both
recorded to allow comparison.
Unlike other chronic comorbidities, symptoms of depression and anxiety are potentially
modifiable, for example, by pharmacological or talking therapies [232]. Estimating the
impact of potential mental health interventions on TNFi response could help inform future
clinical trials or guidelines. Finding modifiable factors to improve TNFi response is important
since up to half do not respond adequately [228] and the number of therapeutic options
remains relatively limited compared to rheumatoid arthritis.
228
7.2 Aims
1. To describe correlations between symptoms and diagnosis of depression.
2. To examine the association between history of depression at baseline and response
to TNFi.
3. To examine the association between baseline symptoms of depression or anxiety
and response to TNFi.
7.3 Methods
7.3.1 Patient population
Participants in the BSRBR-AS who started on their first TNFi (including those who switched
from the non-biologic group) were eligible for inclusion in this analysis. Eligible individuals
were required to have a clinic visit or questionnaire within 1 year before, or 7 days after,
the TNFi start date, from which the baseline values of time-varying data (i.e., measures of
disease activity and severity) were obtained. For aims relating to baseline symptoms of
depression or anxiety, only those who completed the baseline HADS questionnaire were
eligible.
7.3.2 ‘Exposures’ – baseline depression and anxiety
7.3.2.1 History of depression
The BSRBR-AS recorded physician-confirmed diagnosis (or ‘past medical history’) of
depression as a binary variable. In clinical practice, depression typically remains on a
patient’s list of diagnoses only when it is currently relevant (i.e., ongoing symptoms or
treatment), whereas a resolved depressive episode from many years ago should not. This
assumption is difficult to test since the time of diagnosis was not recorded, and reflects the
challenges of studying a condition with dynamic symptoms over time. Therefore, mental
health symptoms at TNFi initiation were also examined.
7.3.2.2 Symptoms of depression and anxiety
Symptoms of depression and anxiety were measured using the HADS. The original
description of the HADS use each sub-scale to describe ‘case-ness’ (i.e., presence) of
depression or anxiety using the following thresholds: 0-7 indicating ‘non-cases’, 8-10
‘doubtful cases’, 11-21 ‘cases’ [176,177]. These thresholds were not validated for diagnosis
229
or classification purposes. For example, the HADS depression sub-scale (HADS-D) does not
include all components relevant for diagnostic criteria of depression according to Diagnostic
and Statistical Manual of Mental Disorders (e.g., appetite, sleep, and self-harm). HADS-D≥8
was reported to have a sensitivity of 82% and specificity of 74% for major depressive
disorder; the corresponding performance for ≥11 was 56% and 92%, respectively [233]. For
HADS-A≥8, sensitivity was reported as 90% and specificity 78% [234].
Since HADS reflects symptom severity, commonly used thresholds were labelled as the
following: mild (8-10), moderate (11-14) and severe (≥15). Snaith described the 0-7
category as ‘being in the normal range’ [176]. For convenience, this category was referred
to as ‘none’ (though this includes less than ‘mild’ symptoms). For models, the moderate
and severe groups (i.e., scores ≥11) were combined due to their small numbers.
7.3.3 Outcomes
Outcomes included: 1) binary response (BASDAI 50/2, ASDAS-MI, BASDAI<4, ASDAS<2.1) at
6 months, 2) absolute improvement in disease activity over the first 3 years, and 3) time to
treatment discontinuation. In this chapter, only absolute improvement in disease activity
(i.e., BASDAI, ASDAS, spinal pain) were considered. This is because causal pathways
involving ‘downstream’ outcomes (e.g., sleep or quality of life that may be mediated by
improvement in both disease activity and mental health symptoms) invoke greater
complexity and number of assumptions.
7.3.3 Covariates
The following covariates were included: age, gender (female as reference), BMI, Index of
Multiple Deprivation (IMD, as a continuous variable) and educational attainment (as
dummy variables). Additional covariates included: elevated CRP (defined as per ASAS
classification criteria; low as reference), comorbidity count (continuous variable), and
baseline values of each outcome measure. Inflammation, measured here using CRP, is a
potential confounder since 1) it is suggested to have a causal role in depression [235], 2)
‘high CRP’ has been shown to be associated with response [236], and 3) depression is less
likely to cause elevated CRP, unlike many other comorbidities. The dichotomous variable
‘elevated CRP’ (recorded for eligibility purposes) was used instead of CRP levels because the
latter had higher proportion of missing values at baseline. The presence of other
comorbidities may also be a confounder since they will influence mental health and
230
response. Baseline disease activity was additionally included as a covariate in the marginal
models (see below).
Sensitivity analyses additionally included baseline smoking/alcohol status and HLA-B27
status as covariates. Prevalence of HLA-B27 positivity differed between those with and
without depression, and has been shown to predict response [236].
7.3.4 Statistics
7.3.4.1 History of depression (Aim 2)
For analyses using history of depression as the independent variable, logistic regression was
used for binary response definitions, mixed effects model for change in continuous
outcome indices over time (using interaction terms between depression diagnosis and
time), and Cox models for time to treatment discontinuation; that is, the same conditional
approaches as used in the previous chapter, replacing comorbidity with depression
diagnosis. All analyses were adjusted for the above covariates.
These approaches describe association between history of depression and diagnosis, which
is inherent in conditional models and when using an exposure that cannot be modified (it is
not possible to modify a past medical history of depression) [237]. By contrast, symptoms
of depression can be modified, thus a marginal approach was used to estimate the
potential impact of mental health interventions on TNFi response. Further discussion on
conditional vs. marginal approaches are given in Appendix 10.6.
7.3.4.2 Symptoms of depression or anxiety (Aim 3)
For symptoms of depression and anxiety, marginal approaches were used: inverse-
probability (IP) weighted logistic regression for binary outcomes, IP weighted GEE for
absolute response, and marginal structural Cox models (i.e., IP weighted pooled logistic
regression) for time to treatment discontinuation. IP weights aim to balance all covariates
in the weighted model, thus the outcome models were not additionally adjusted for
(‘conditioned on’) any additional variables.
Marginal approaches estimate the potential change in TNFi response at the group level
(akin to randomised controlled trials) if mental health symptoms were modified. Studying
the causal effect of baseline mental health status has some conceptual challenges. For
example, a hypothetical intervention would need to successfully improve baseline mental
health symptoms and also their prior history (of unknown duration); this is not equivalent
231
to a mental health intervention administered at TNFi initiation, but can be considered as
one delivered (at an unknown time) before. Nevertheless, IPTW methods are still useful for
‘unconfounded descriptive comparisons’ [238].
7.3.4.3 Inverse-probability weights
IPTWs were originally devised to compare treatments (hence ‘treatment’ weights).
Although the exposure here is prevalent mental health symptoms, the term ‘IPTW’ is
retained to distinguish it from inverse probability of censoring weights (IPCW, discussed
later). IPTWs, in effect, create a hypothetical (‘pseudo’-)population where some individuals
are upweighted (represented more than once) and others are down-weighted, such that
the weighted populations have comparable values of all covariates.
Detailed descriptions of IPTW are given in Appendix 10.6.1. In brief, the numerator was the
predicted probability from multinomial logistic model with three-level HADS-categories as
the only variable, and the denominator was the same model conditioned on all covariates.
This approach to confounding has an important advantage over inclusion of the baseline
covariates in the outcome model. IPTW accounts for baseline disease activity without
adjusting for it [42]. Baseline covariate balance was checked in the weighted population;
one example (balancing between HADS-D groups) is provided in the Results for
demonstration.
The marginal risk of treatment discontinuation can be estimated using a marginal approach
to Cox models (e.g., standardisation or IPTW). However, an important assumption is that
censoring is random; that is, censoring should not differ between exposure groups
conditioning on covariates. This can be remediated using IPCWs. Its numerator is the
probability of being uncensored at month t, given the individual was uncensored at month
t-1, the exposure history (unchanged baseline mental health symptoms) and baseline
covariates. The denominator is the same but additionally adjusting for the history of time-
varying disease activity.
The product of two weights – baseline time-invariant IPTW and time-varying IPCW – was
used in a pooled logistic regression model. Pooled logistic regression is equivalent to a Cox
model since the event hazard is small at each time point [239]. (For demonstration, the
equivalence of Kaplan-Meier and Cox proportional hazard models using this data is shown
in the Appendix 10.6.3). All weights were examined for means close to 1 and extreme
values (summary statistics on weights provided in Appendix 10.6: Table S7.3).
232
To generate the above weights, multinomial logistic models required complete data for all
covariates. Multiple imputation was therefore performed (see Chapter 3, Section 3.5.8).
7.3.4.4 Gender interaction
Since treatment discontinuation differed by gender in the previous chapter, and that
depression and anxiety are more prevalent among females [240], all analyses took gender
into consideration. For descriptive statistics (Aim 1), results were stratified by gender where
relevant. For models (Aims 2 and 3), interaction terms were used (e.g., gender-by-
depression interaction in the logistic and survival analyses, or gender-by-depression-by-
time interaction in the repeated measure analyses). Adding interaction terms into marginal
structural models does not require their inclusion into the weights [237].
7.3.4.5 Power considerations
Power considerations were analogous to the previous chapter for analyses using history of
depression. Conducting a priori power calculations for analyses using IPTW is difficult since
such a calculation is dependent on the weights, which are only known after the analysis has
been conducted. In general, IPTW reduces the statistical power [241] through the need for
robust standard errors.
7.3.5.6 Sensitivity analyses
First, all analyses were repeated with IP weights including baseline smoking, HLA-B27, and
alcohol status. Since HADS sub-scales are correlated with disease activity, HADS categories
may have poor overlap in distribution of disease activity (and other covariates). Models that
extrapolate to non-overlap areas have limited causal interpretation. In the second
sensitivity analysis, overlap was ensured using matching weights, which replaced the
numerator with the smallest value weight of the other comparator groups and in doing so
emulates a (multi-group propensity score) matched population [242]. Lastly, missing binary
outcomes were imputed as response if patients remained on drug for longer than one year
(see Section 6.3.3.1).
233
7.4 Results
Participants with a history of depression at baseline were more often female than those
without history of depression at baseline; they were also more frequently current smokers
and resided in more deprived areas (Table 7.1). Participants with comorbid depression also
had higher disease activity across all three indices. The mean age and proportion of those
meeting the modified New York criteria for AS were similar between those with and
without a history of depression, but HLA-B27 positivity was significantly more common
among those without depression. Those with depression more frequently had other
comorbidities, including hypertension, asthma, peptic ulcer, diabetes, and ischaemic heart
disease.
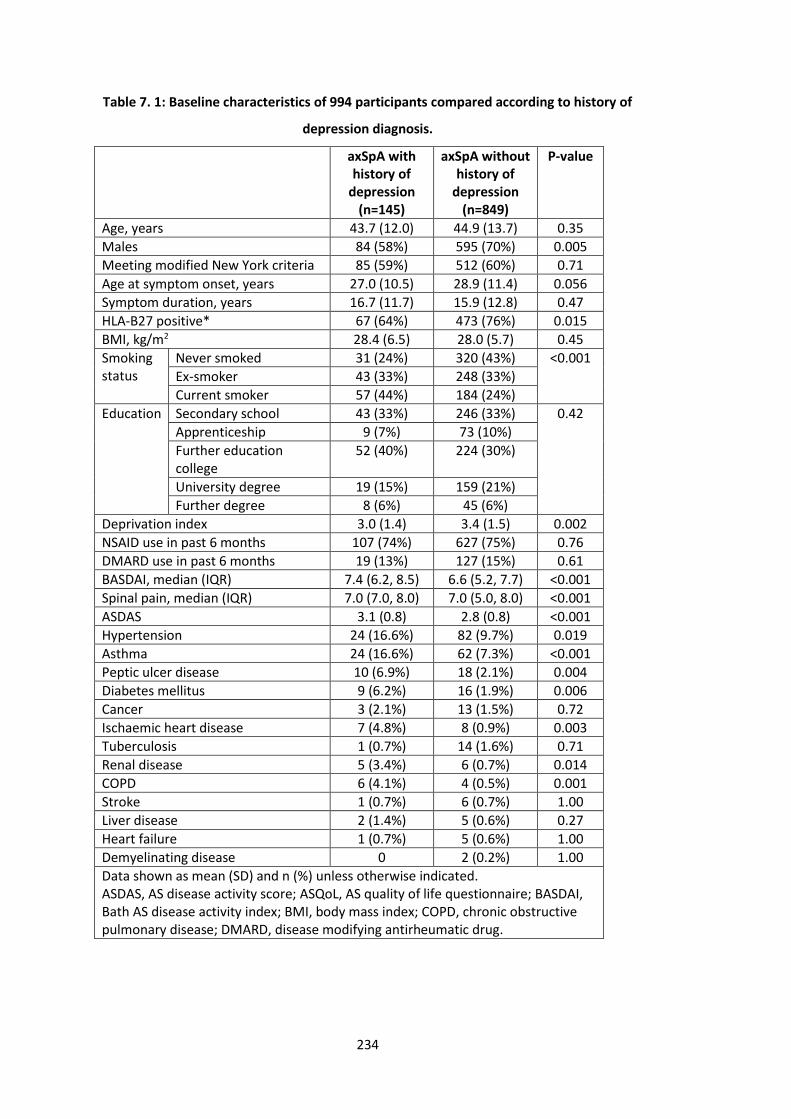
234
Table 7. 1: Baseline characteristics of 994 participants compared according to history of
depression diagnosis.
axSpA with history of
depression (n=145)
axSpA without history of
depression (n=849)
P-value
Age, years 43.7 (12.0) 44.9 (13.7) 0.35
Males 84 (58%) 595 (70%) 0.005
Meeting modified New York criteria 85 (59%) 512 (60%) 0.71
Age at symptom onset, years 27.0 (10.5) 28.9 (11.4) 0.056
Symptom duration, years 16.7 (11.7) 15.9 (12.8) 0.47
HLA-B27 positive* 67 (64%) 473 (76%) 0.015
BMI, kg/m2 28.4 (6.5) 28.0 (5.7) 0.45
Smoking status
Never smoked 31 (24%) 320 (43%) <0.001
Ex-smoker 43 (33%) 248 (33%)
Current smoker 57 (44%) 184 (24%)
Education Secondary school 43 (33%) 246 (33%) 0.42
Apprenticeship 9 (7%) 73 (10%)
Further education college
52 (40%) 224 (30%)
University degree 19 (15%) 159 (21%)
Further degree 8 (6%) 45 (6%)
Deprivation index 3.0 (1.4) 3.4 (1.5) 0.002
NSAID use in past 6 months 107 (74%) 627 (75%) 0.76
DMARD use in past 6 months 19 (13%) 127 (15%) 0.61
BASDAI, median (IQR) 7.4 (6.2, 8.5) 6.6 (5.2, 7.7) <0.001
Spinal pain, median (IQR) 7.0 (7.0, 8.0) 7.0 (5.0, 8.0) <0.001
ASDAS 3.1 (0.8) 2.8 (0.8) <0.001
Hypertension 24 (16.6%) 82 (9.7%) 0.019
Asthma 24 (16.6%) 62 (7.3%) <0.001
Peptic ulcer disease 10 (6.9%) 18 (2.1%) 0.004
Diabetes mellitus 9 (6.2%) 16 (1.9%) 0.006
Cancer 3 (2.1%) 13 (1.5%) 0.72
Ischaemic heart disease 7 (4.8%) 8 (0.9%) 0.003
Tuberculosis 1 (0.7%) 14 (1.6%) 0.71
Renal disease 5 (3.4%) 6 (0.7%) 0.014
COPD 6 (4.1%) 4 (0.5%) 0.001
Stroke 1 (0.7%) 6 (0.7%) 1.00
Liver disease 2 (1.4%) 5 (0.6%) 0.27
Heart failure 1 (0.7%) 5 (0.6%) 1.00
Demyelinating disease 0 2 (0.2%) 1.00
Data shown as mean (SD) and n (%) unless otherwise indicated. ASDAS, AS disease activity score; ASQoL, AS quality of life questionnaire; BASDAI, Bath AS disease activity index; BMI, body mass index; COPD, chronic obstructive pulmonary disease; DMARD, disease modifying antirheumatic drug.
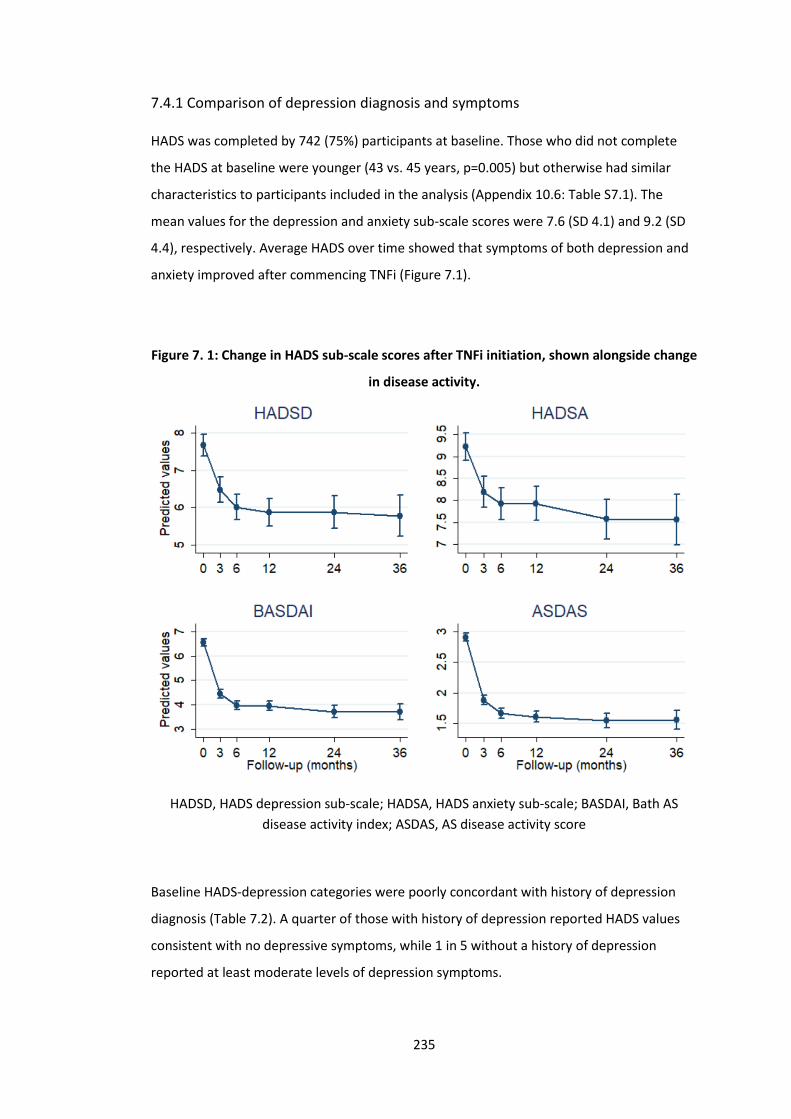
235
7.4.1 Comparison of depression diagnosis and symptoms
HADS was completed by 742 (75%) participants at baseline. Those who did not complete
the HADS at baseline were younger (43 vs. 45 years, p=0.005) but otherwise had similar
characteristics to participants included in the analysis (Appendix 10.6: Table S7.1). The
mean values for the depression and anxiety sub-scale scores were 7.6 (SD 4.1) and 9.2 (SD
4.4), respectively. Average HADS over time showed that symptoms of both depression and
anxiety improved after commencing TNFi (Figure 7.1).
Figure 7. 1: Change in HADS sub-scale scores after TNFi initiation, shown alongside change
in disease activity.
HADSD, HADS depression sub-scale; HADSA, HADS anxiety sub-scale; BASDAI, Bath AS
disease activity index; ASDAS, AS disease activity score
Baseline HADS-depression categories were poorly concordant with history of depression
diagnosis (Table 7.2). A quarter of those with history of depression reported HADS values
consistent with no depressive symptoms, while 1 in 5 without a history of depression
reported at least moderate levels of depression symptoms.
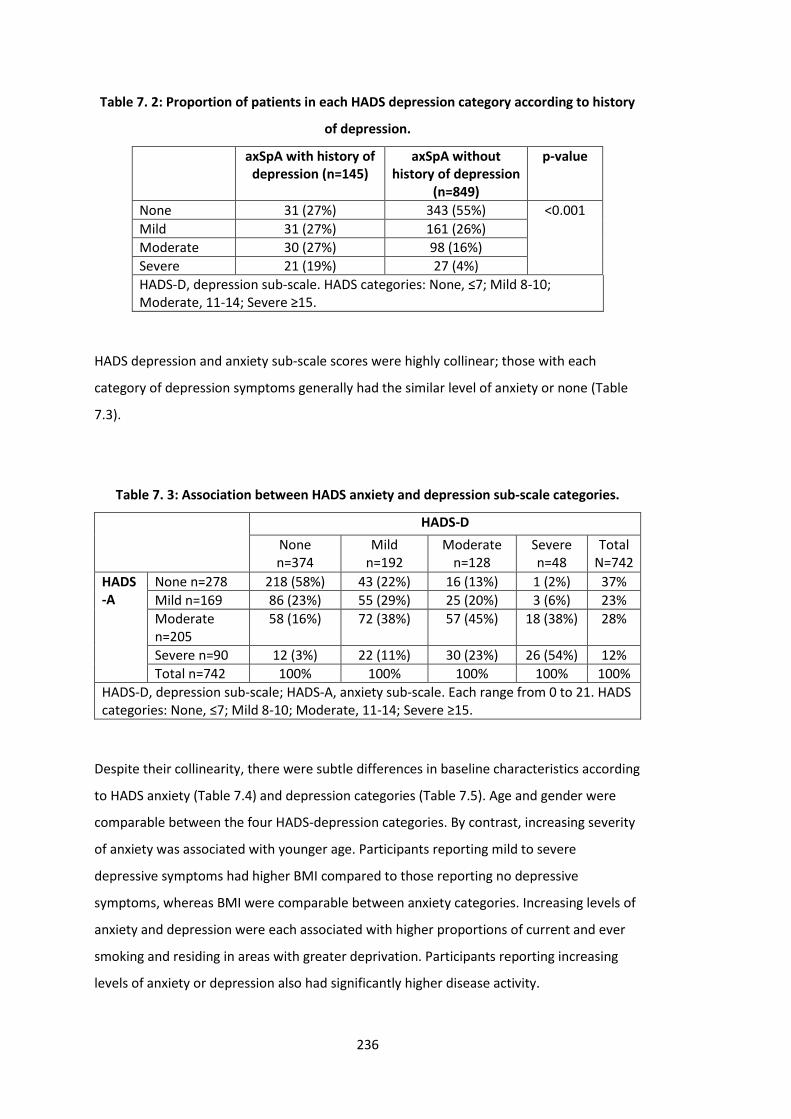
236
Table 7. 2: Proportion of patients in each HADS depression category according to history
of depression.
axSpA with history of depression (n=145)
axSpA without history of depression
(n=849)
p-value
None 31 (27%) 343 (55%) <0.001
Mild 31 (27%) 161 (26%)
Moderate 30 (27%) 98 (16%)
Severe 21 (19%) 27 (4%)
HADS-D, depression sub-scale. HADS categories: None, ≤7; Mild 8-10; Moderate, 11-14; Severe ≥15.
HADS depression and anxiety sub-scale scores were highly collinear; those with each
category of depression symptoms generally had the similar level of anxiety or none (Table
7.3).
Table 7. 3: Association between HADS anxiety and depression sub-scale categories.
HADS-D
None n=374
Mild n=192
Moderate n=128
Severe n=48
Total N=742
HADS-A
None n=278 218 (58%) 43 (22%) 16 (13%) 1 (2%) 37%
Mild n=169 86 (23%) 55 (29%) 25 (20%) 3 (6%) 23%
Moderate n=205
58 (16%) 72 (38%) 57 (45%) 18 (38%) 28%
Severe n=90 12 (3%) 22 (11%) 30 (23%) 26 (54%) 12%
Total n=742 100% 100% 100% 100% 100%
HADS-D, depression sub-scale; HADS-A, anxiety sub-scale. Each range from 0 to 21. HADS categories: None, ≤7; Mild 8-10; Moderate, 11-14; Severe ≥15.
Despite their collinearity, there were subtle differences in baseline characteristics according
to HADS anxiety (Table 7.4) and depression categories (Table 7.5). Age and gender were
comparable between the four HADS-depression categories. By contrast, increasing severity
of anxiety was associated with younger age. Participants reporting mild to severe
depressive symptoms had higher BMI compared to those reporting no depressive
symptoms, whereas BMI were comparable between anxiety categories. Increasing levels of
anxiety and depression were each associated with higher proportions of current and ever
smoking and residing in areas with greater deprivation. Participants reporting increasing
levels of anxiety or depression also had significantly higher disease activity.
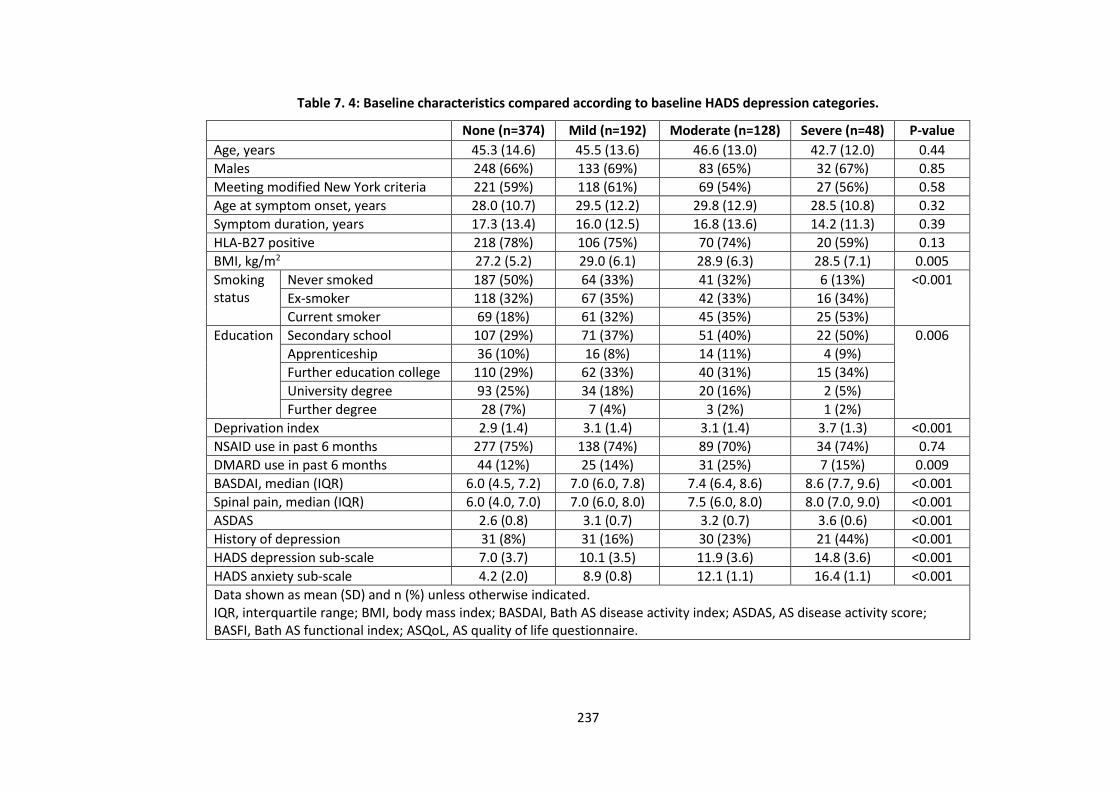
237
Table 7. 4: Baseline characteristics compared according to baseline HADS depression categories.
None (n=374) Mild (n=192) Moderate (n=128) Severe (n=48) P-value
Age, years 45.3 (14.6) 45.5 (13.6) 46.6 (13.0) 42.7 (12.0) 0.44
Males 248 (66%) 133 (69%) 83 (65%) 32 (67%) 0.85
Meeting modified New York criteria 221 (59%) 118 (61%) 69 (54%) 27 (56%) 0.58
Age at symptom onset, years 28.0 (10.7) 29.5 (12.2) 29.8 (12.9) 28.5 (10.8) 0.32
Symptom duration, years 17.3 (13.4) 16.0 (12.5) 16.8 (13.6) 14.2 (11.3) 0.39
HLA-B27 positive 218 (78%) 106 (75%) 70 (74%) 20 (59%) 0.13
BMI, kg/m2 27.2 (5.2) 29.0 (6.1) 28.9 (6.3) 28.5 (7.1) 0.005
Smoking status
Never smoked 187 (50%) 64 (33%) 41 (32%) 6 (13%) <0.001
Ex-smoker 118 (32%) 67 (35%) 42 (33%) 16 (34%)
Current smoker 69 (18%) 61 (32%) 45 (35%) 25 (53%)
Education Secondary school 107 (29%) 71 (37%) 51 (40%) 22 (50%) 0.006
Apprenticeship 36 (10%) 16 (8%) 14 (11%) 4 (9%)
Further education college 110 (29%) 62 (33%) 40 (31%) 15 (34%)
University degree 93 (25%) 34 (18%) 20 (16%) 2 (5%)
Further degree 28 (7%) 7 (4%) 3 (2%) 1 (2%)
Deprivation index 2.9 (1.4) 3.1 (1.4) 3.1 (1.4) 3.7 (1.3) <0.001
NSAID use in past 6 months 277 (75%) 138 (74%) 89 (70%) 34 (74%) 0.74
DMARD use in past 6 months 44 (12%) 25 (14%) 31 (25%) 7 (15%) 0.009
BASDAI, median (IQR) 6.0 (4.5, 7.2) 7.0 (6.0, 7.8) 7.4 (6.4, 8.6) 8.6 (7.7, 9.6) <0.001
Spinal pain, median (IQR) 6.0 (4.0, 7.0) 7.0 (6.0, 8.0) 7.5 (6.0, 8.0) 8.0 (7.0, 9.0) <0.001
ASDAS 2.6 (0.8) 3.1 (0.7) 3.2 (0.7) 3.6 (0.6) <0.001
History of depression 31 (8%) 31 (16%) 30 (23%) 21 (44%) <0.001
HADS depression sub-scale 7.0 (3.7) 10.1 (3.5) 11.9 (3.6) 14.8 (3.6) <0.001
HADS anxiety sub-scale 4.2 (2.0) 8.9 (0.8) 12.1 (1.1) 16.4 (1.1) <0.001
Data shown as mean (SD) and n (%) unless otherwise indicated. IQR, interquartile range; BMI, body mass index; BASDAI, Bath AS disease activity index; ASDAS, AS disease activity score; BASFI, Bath AS functional index; ASQoL, AS quality of life questionnaire.
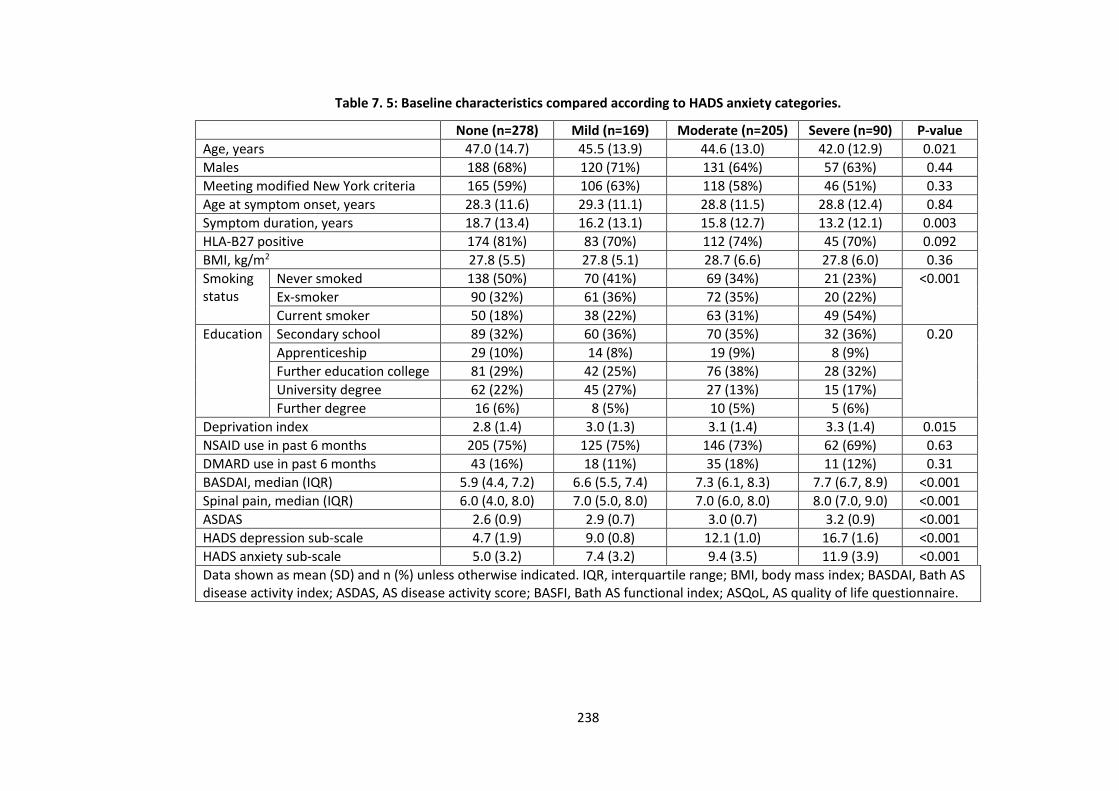
238
Table 7. 5: Baseline characteristics compared according to HADS anxiety categories.
None (n=278) Mild (n=169) Moderate (n=205) Severe (n=90) P-value
Age, years 47.0 (14.7) 45.5 (13.9) 44.6 (13.0) 42.0 (12.9) 0.021
Males 188 (68%) 120 (71%) 131 (64%) 57 (63%) 0.44
Meeting modified New York criteria 165 (59%) 106 (63%) 118 (58%) 46 (51%) 0.33
Age at symptom onset, years 28.3 (11.6) 29.3 (11.1) 28.8 (11.5) 28.8 (12.4) 0.84
Symptom duration, years 18.7 (13.4) 16.2 (13.1) 15.8 (12.7) 13.2 (12.1) 0.003
HLA-B27 positive 174 (81%) 83 (70%) 112 (74%) 45 (70%) 0.092
BMI, kg/m2 27.8 (5.5) 27.8 (5.1) 28.7 (6.6) 27.8 (6.0) 0.36
Smoking status
Never smoked 138 (50%) 70 (41%) 69 (34%) 21 (23%) <0.001
Ex-smoker 90 (32%) 61 (36%) 72 (35%) 20 (22%)
Current smoker 50 (18%) 38 (22%) 63 (31%) 49 (54%)
Education Secondary school 89 (32%) 60 (36%) 70 (35%) 32 (36%) 0.20
Apprenticeship 29 (10%) 14 (8%) 19 (9%) 8 (9%)
Further education college 81 (29%) 42 (25%) 76 (38%) 28 (32%)
University degree 62 (22%) 45 (27%) 27 (13%) 15 (17%)
Further degree 16 (6%) 8 (5%) 10 (5%) 5 (6%)
Deprivation index 2.8 (1.4) 3.0 (1.3) 3.1 (1.4) 3.3 (1.4) 0.015
NSAID use in past 6 months 205 (75%) 125 (75%) 146 (73%) 62 (69%) 0.63
DMARD use in past 6 months 43 (16%) 18 (11%) 35 (18%) 11 (12%) 0.31
BASDAI, median (IQR) 5.9 (4.4, 7.2) 6.6 (5.5, 7.4) 7.3 (6.1, 8.3) 7.7 (6.7, 8.9) <0.001
Spinal pain, median (IQR) 6.0 (4.0, 8.0) 7.0 (5.0, 8.0) 7.0 (6.0, 8.0) 8.0 (7.0, 9.0) <0.001
ASDAS 2.6 (0.9) 2.9 (0.7) 3.0 (0.7) 3.2 (0.9) <0.001
HADS depression sub-scale 4.7 (1.9) 9.0 (0.8) 12.1 (1.0) 16.7 (1.6) <0.001
HADS anxiety sub-scale 5.0 (3.2) 7.4 (3.2) 9.4 (3.5) 11.9 (3.9) <0.001
Data shown as mean (SD) and n (%) unless otherwise indicated. IQR, interquartile range; BMI, body mass index; BASDAI, Bath AS disease activity index; ASDAS, AS disease activity score; BASFI, Bath AS functional index; ASQoL, AS quality of life questionnaire.
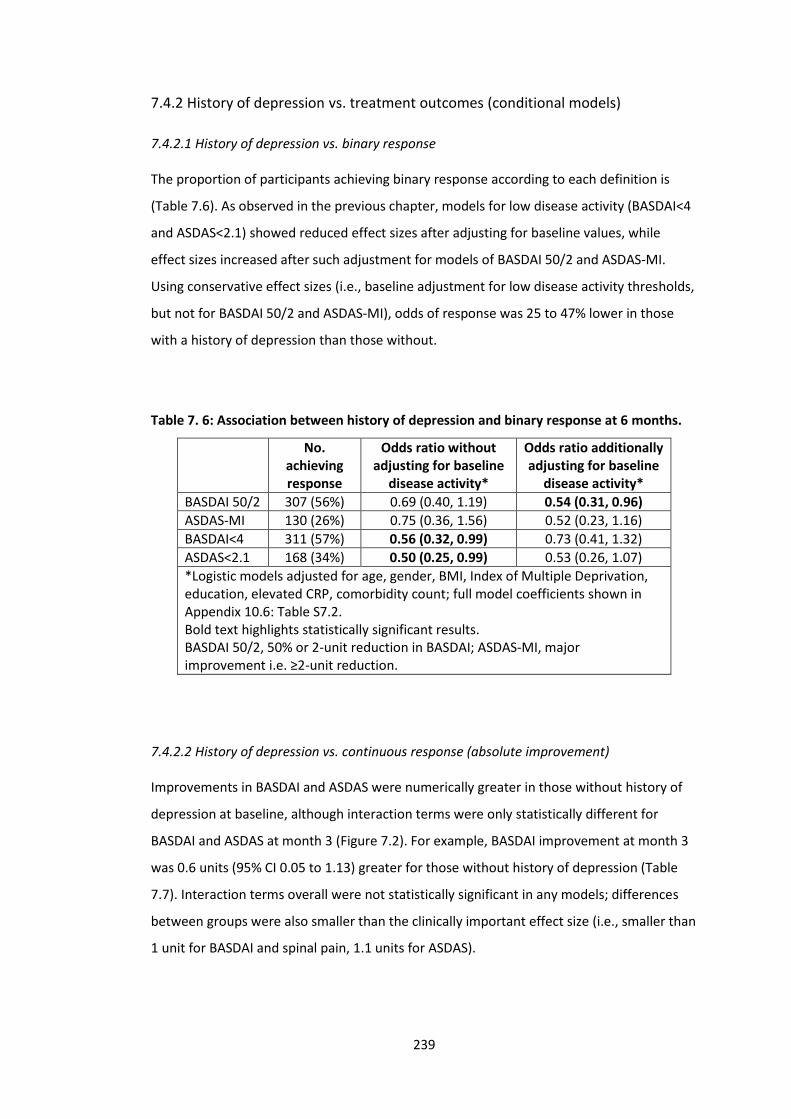
239
7.4.2 History of depression vs. treatment outcomes (conditional models)
7.4.2.1 History of depression vs. binary response
The proportion of participants achieving binary response according to each definition is
(Table 7.6). As observed in the previous chapter, models for low disease activity (BASDAI<4
and ASDAS<2.1) showed reduced effect sizes after adjusting for baseline values, while
effect sizes increased after such adjustment for models of BASDAI 50/2 and ASDAS-MI.
Using conservative effect sizes (i.e., baseline adjustment for low disease activity thresholds,
but not for BASDAI 50/2 and ASDAS-MI), odds of response was 25 to 47% lower in those
with a history of depression than those without.
Table 7. 6: Association between history of depression and binary response at 6 months.
No. achieving response
Odds ratio without adjusting for baseline
disease activity*
Odds ratio additionally adjusting for baseline
disease activity*
BASDAI 50/2 307 (56%) 0.69 (0.40, 1.19) 0.54 (0.31, 0.96)
ASDAS-MI 130 (26%) 0.75 (0.36, 1.56) 0.52 (0.23, 1.16)
BASDAI<4 311 (57%) 0.56 (0.32, 0.99) 0.73 (0.41, 1.32)
ASDAS<2.1 168 (34%) 0.50 (0.25, 0.99) 0.53 (0.26, 1.07)
*Logistic models adjusted for age, gender, BMI, Index of Multiple Deprivation, education, elevated CRP, comorbidity count; full model coefficients shown in Appendix 10.6: Table S7.2. Bold text highlights statistically significant results. BASDAI 50/2, 50% or 2-unit reduction in BASDAI; ASDAS-MI, major improvement i.e. ≥2-unit reduction.
7.4.2.2 History of depression vs. continuous response (absolute improvement)
Improvements in BASDAI and ASDAS were numerically greater in those without history of
depression at baseline, although interaction terms were only statistically different for
BASDAI and ASDAS at month 3 (Figure 7.2). For example, BASDAI improvement at month 3
was 0.6 units (95% CI 0.05 to 1.13) greater for those without history of depression (Table
7.7). Interaction terms overall were not statistically significant in any models; differences
between groups were also smaller than the clinically important effect size (i.e., smaller than
1 unit for BASDAI and spinal pain, 1.1 units for ASDAS).
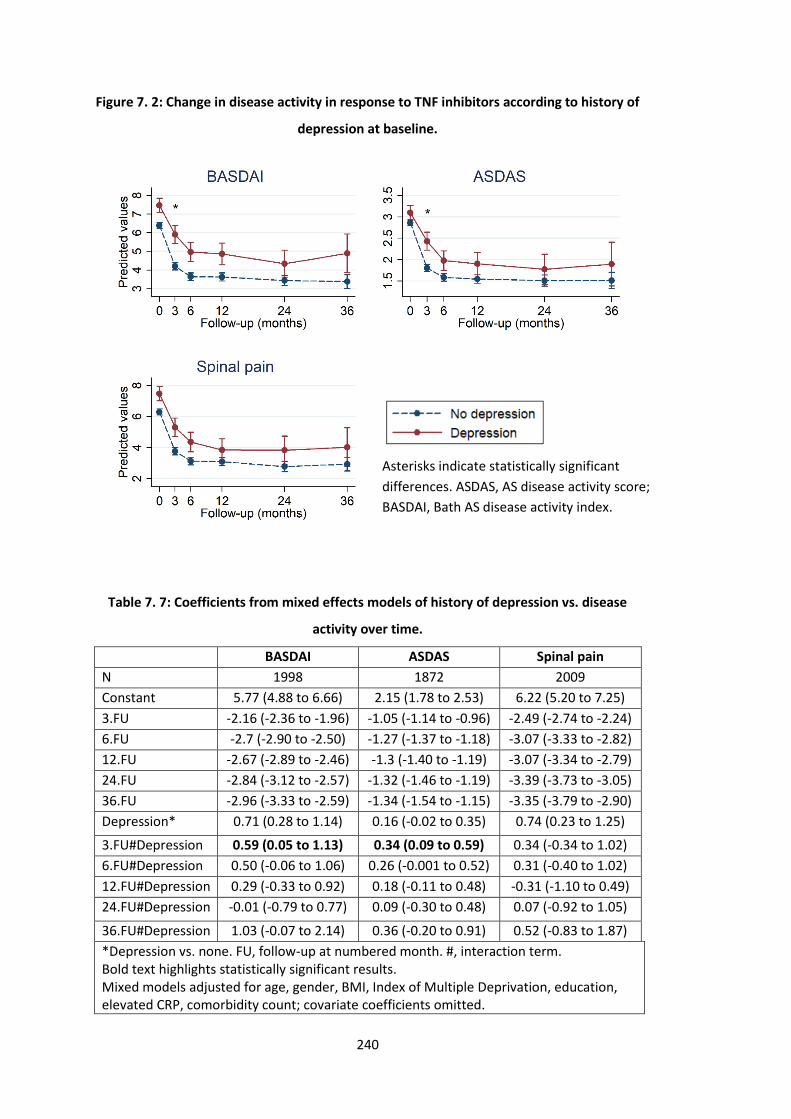
240
Figure 7. 2: Change in disease activity in response to TNF inhibitors according to history of
depression at baseline.
Table 7. 7: Coefficients from mixed effects models of history of depression vs. disease
activity over time.
BASDAI ASDAS Spinal pain
N 1998 1872 2009
Constant 5.77 (4.88 to 6.66) 2.15 (1.78 to 2.53) 6.22 (5.20 to 7.25)
3.FU -2.16 (-2.36 to -1.96) -1.05 (-1.14 to -0.96) -2.49 (-2.74 to -2.24)
6.FU -2.7 (-2.90 to -2.50) -1.27 (-1.37 to -1.18) -3.07 (-3.33 to -2.82)
12.FU -2.67 (-2.89 to -2.46) -1.3 (-1.40 to -1.19) -3.07 (-3.34 to -2.79)
24.FU -2.84 (-3.12 to -2.57) -1.32 (-1.46 to -1.19) -3.39 (-3.73 to -3.05)
36.FU -2.96 (-3.33 to -2.59) -1.34 (-1.54 to -1.15) -3.35 (-3.79 to -2.90)
Depression* 0.71 (0.28 to 1.14) 0.16 (-0.02 to 0.35) 0.74 (0.23 to 1.25)
3.FU#Depression 0.59 (0.05 to 1.13) 0.34 (0.09 to 0.59) 0.34 (-0.34 to 1.02)
6.FU#Depression 0.50 (-0.06 to 1.06) 0.26 (-0.001 to 0.52) 0.31 (-0.40 to 1.02)
12.FU#Depression 0.29 (-0.33 to 0.92) 0.18 (-0.11 to 0.48) -0.31 (-1.10 to 0.49)
24.FU#Depression -0.01 (-0.79 to 0.77) 0.09 (-0.30 to 0.48) 0.07 (-0.92 to 1.05)
36.FU#Depression 1.03 (-0.07 to 2.14) 0.36 (-0.20 to 0.91) 0.52 (-0.83 to 1.87)
*Depression vs. none. FU, follow-up at numbered month. #, interaction term. Bold text highlights statistically significant results. Mixed models adjusted for age, gender, BMI, Index of Multiple Deprivation, education, elevated CRP, comorbidity count; covariate coefficients omitted.
Asterisks indicate statistically significant
differences. ASDAS, AS disease activity score;
BASDAI, Bath AS disease activity index.
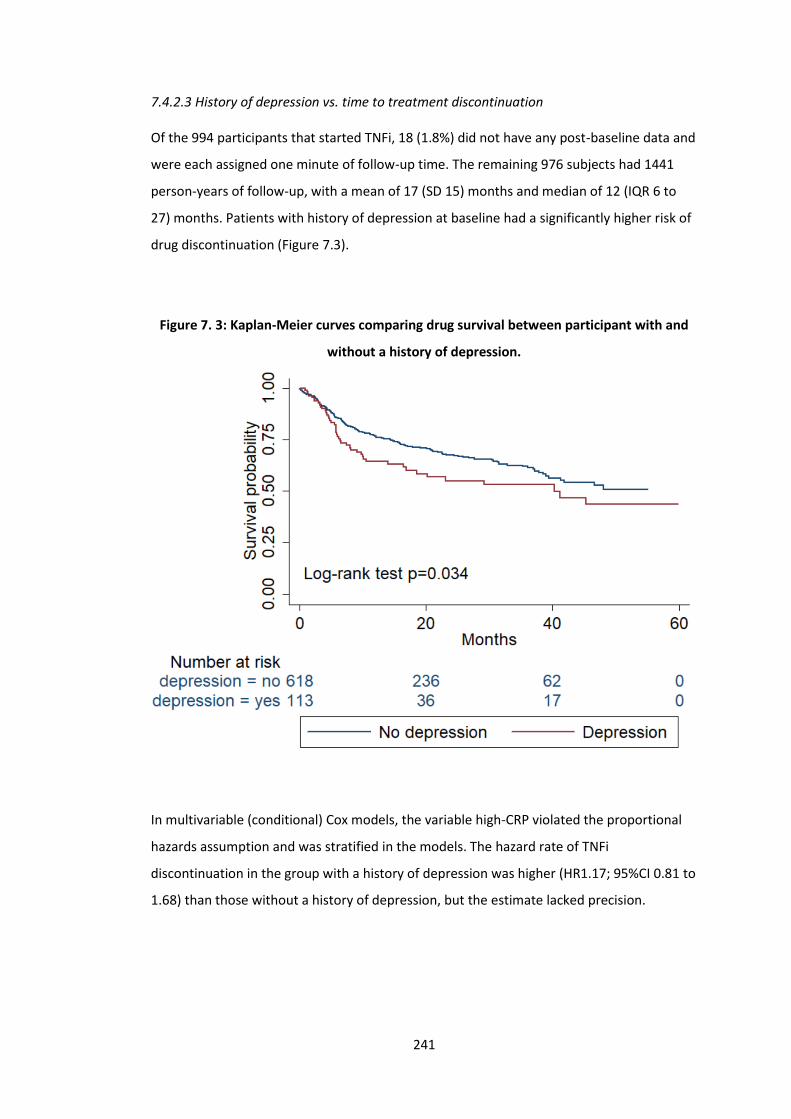
241
7.4.2.3 History of depression vs. time to treatment discontinuation
Of the 994 participants that started TNFi, 18 (1.8%) did not have any post-baseline data and
were each assigned one minute of follow-up time. The remaining 976 subjects had 1441
person-years of follow-up, with a mean of 17 (SD 15) months and median of 12 (IQR 6 to
27) months. Patients with history of depression at baseline had a significantly higher risk of
drug discontinuation (Figure 7.3).
Figure 7. 3: Kaplan-Meier curves comparing drug survival between participant with and
without a history of depression.
In multivariable (conditional) Cox models, the variable high-CRP violated the proportional
hazards assumption and was stratified in the models. The hazard rate of TNFi
discontinuation in the group with a history of depression was higher (HR1.17; 95%CI 0.81 to
1.68) than those without a history of depression, but the estimate lacked precision.
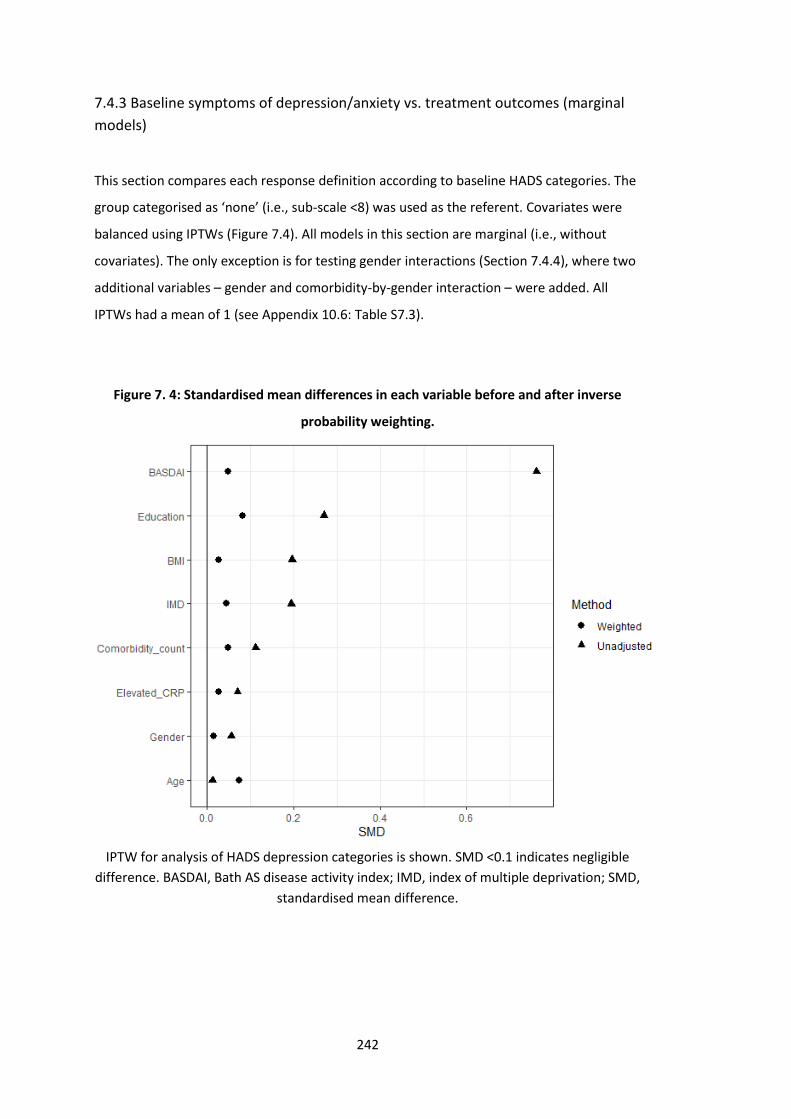
242
7.4.3 Baseline symptoms of depression/anxiety vs. treatment outcomes (marginal
models)
This section compares each response definition according to baseline HADS categories. The
group categorised as ‘none’ (i.e., sub-scale <8) was used as the referent. Covariates were
balanced using IPTWs (Figure 7.4). All models in this section are marginal (i.e., without
covariates). The only exception is for testing gender interactions (Section 7.4.4), where two
additional variables – gender and comorbidity-by-gender interaction – were added. All
IPTWs had a mean of 1 (see Appendix 10.6: Table S7.3).
Figure 7. 4: Standardised mean differences in each variable before and after inverse
probability weighting.
IPTW for analysis of HADS depression categories is shown. SMD <0.1 indicates negligible
difference. BASDAI, Bath AS disease activity index; IMD, index of multiple deprivation; SMD,
standardised mean difference.
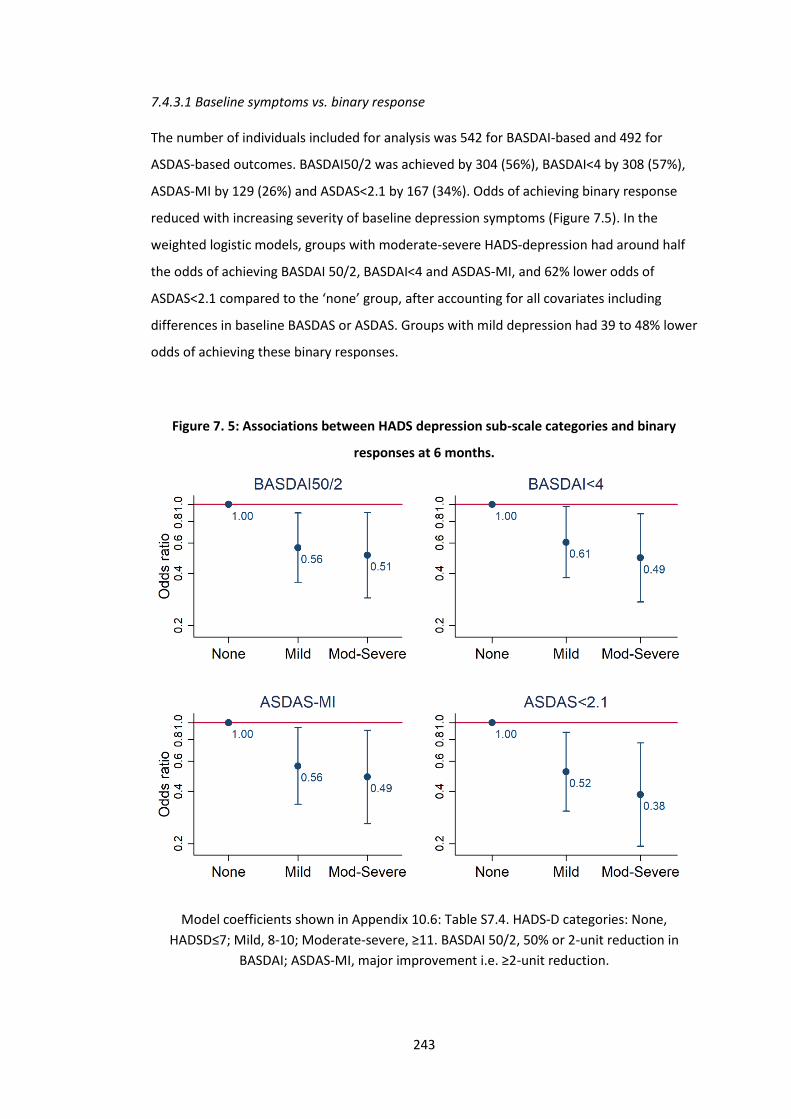
243
7.4.3.1 Baseline symptoms vs. binary response
The number of individuals included for analysis was 542 for BASDAI-based and 492 for
ASDAS-based outcomes. BASDAI50/2 was achieved by 304 (56%), BASDAI<4 by 308 (57%),
ASDAS-MI by 129 (26%) and ASDAS<2.1 by 167 (34%). Odds of achieving binary response
reduced with increasing severity of baseline depression symptoms (Figure 7.5). In the
weighted logistic models, groups with moderate-severe HADS-depression had around half
the odds of achieving BASDAI 50/2, BASDAI<4 and ASDAS-MI, and 62% lower odds of
ASDAS<2.1 compared to the ‘none’ group, after accounting for all covariates including
differences in baseline BASDAS or ASDAS. Groups with mild depression had 39 to 48% lower
odds of achieving these binary responses.
Figure 7. 5: Associations between HADS depression sub-scale categories and binary
responses at 6 months.
Model coefficients shown in Appendix 10.6: Table S7.4. HADS-D categories: None,
HADSD≤7; Mild, 8-10; Moderate-severe, ≥11. BASDAI 50/2, 50% or 2-unit reduction in
BASDAI; ASDAS-MI, major improvement i.e. ≥2-unit reduction.
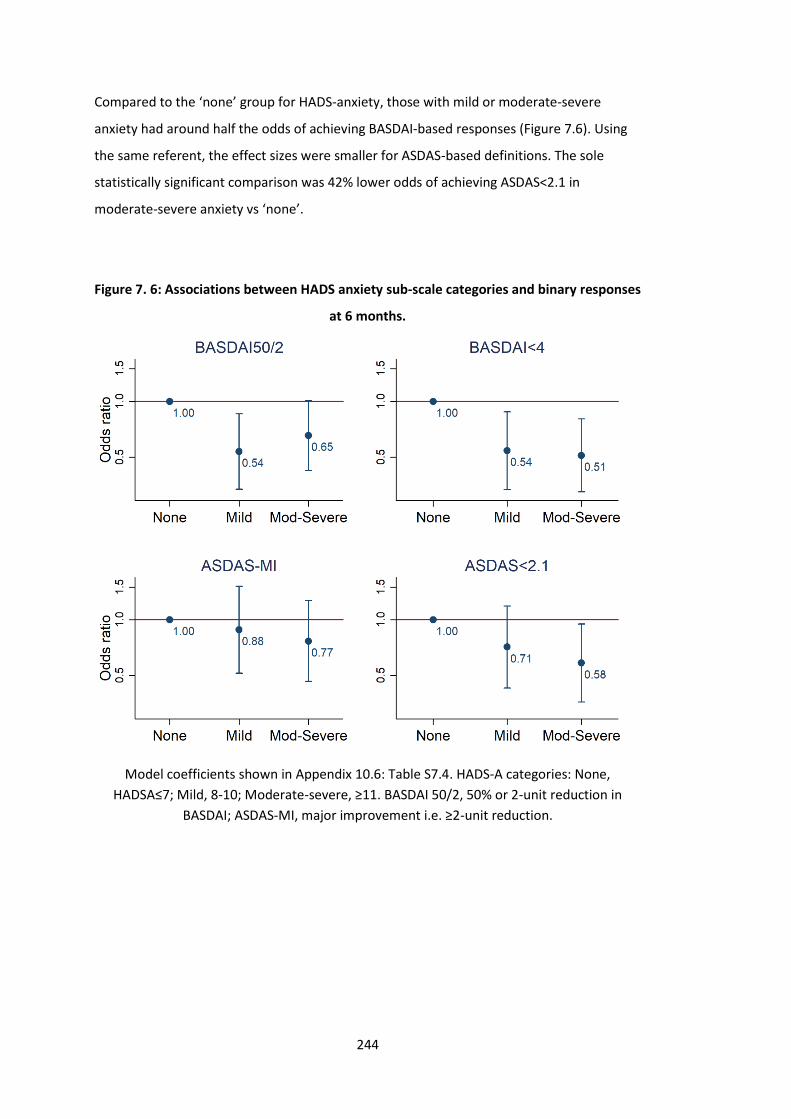
244
Compared to the ‘none’ group for HADS-anxiety, those with mild or moderate-severe
anxiety had around half the odds of achieving BASDAI-based responses (Figure 7.6). Using
the same referent, the effect sizes were smaller for ASDAS-based definitions. The sole
statistically significant comparison was 42% lower odds of achieving ASDAS<2.1 in
moderate-severe anxiety vs ‘none’.
Figure 7. 6: Associations between HADS anxiety sub-scale categories and binary responses
at 6 months.
Model coefficients shown in Appendix 10.6: Table S7.4. HADS-A categories: None,
HADSA≤7; Mild, 8-10; Moderate-severe, ≥11. BASDAI 50/2, 50% or 2-unit reduction in
BASDAI; ASDAS-MI, major improvement i.e. ≥2-unit reduction.
245
7.4.3.2 Baseline symptoms vs. continuous response (absolute improvement)
Groups reporting mild or moderate-severe baseline depressive symptoms had smaller
improvement in all three disease activity indices (Figure 7.7). All data points were
statistically significantly different between none vs. moderate-severe depressive symptom
groups. For example, the group with no depression at 3-months had approximately 2.1
units greater response in BASDAI, 0.9 units greater response in ASDAS and 2.3 units greater
response in spinal pain than the group with moderate-severe depression (Table 7.8). This
blunted response persisted throughout the first three years of follow-up. Effect sizes
comparing mild vs. ‘none’ groups were smaller but nevertheless statistically and clinically
significant at approximately 1.1- to 1.6-unit greater response in BASDAI, 0.4 to 0.7 units in
ASDAS and 0.6 to 2.5 units in spinal pain over 3 years of follow-up.
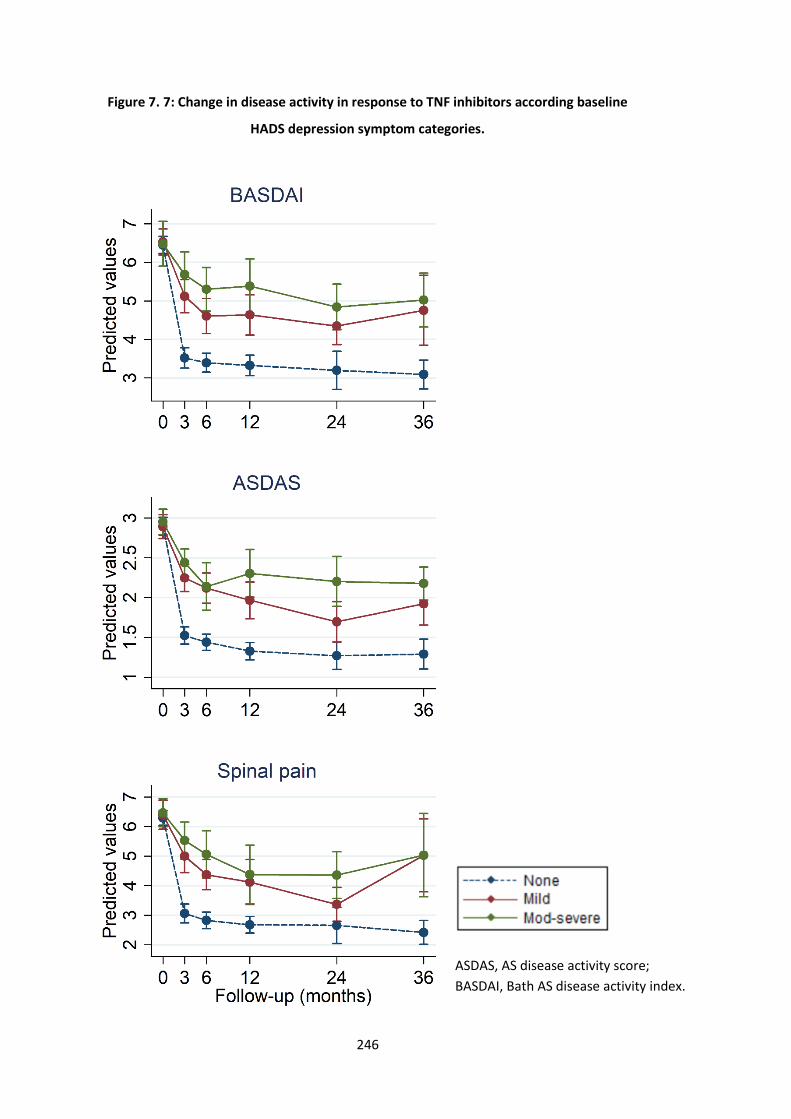
246
Figure 7. 7: Change in disease activity in response to TNF inhibitors according baseline
HADS depression symptom categories.
ASDAS, AS disease activity score;
BASDAI, Bath AS disease activity index.
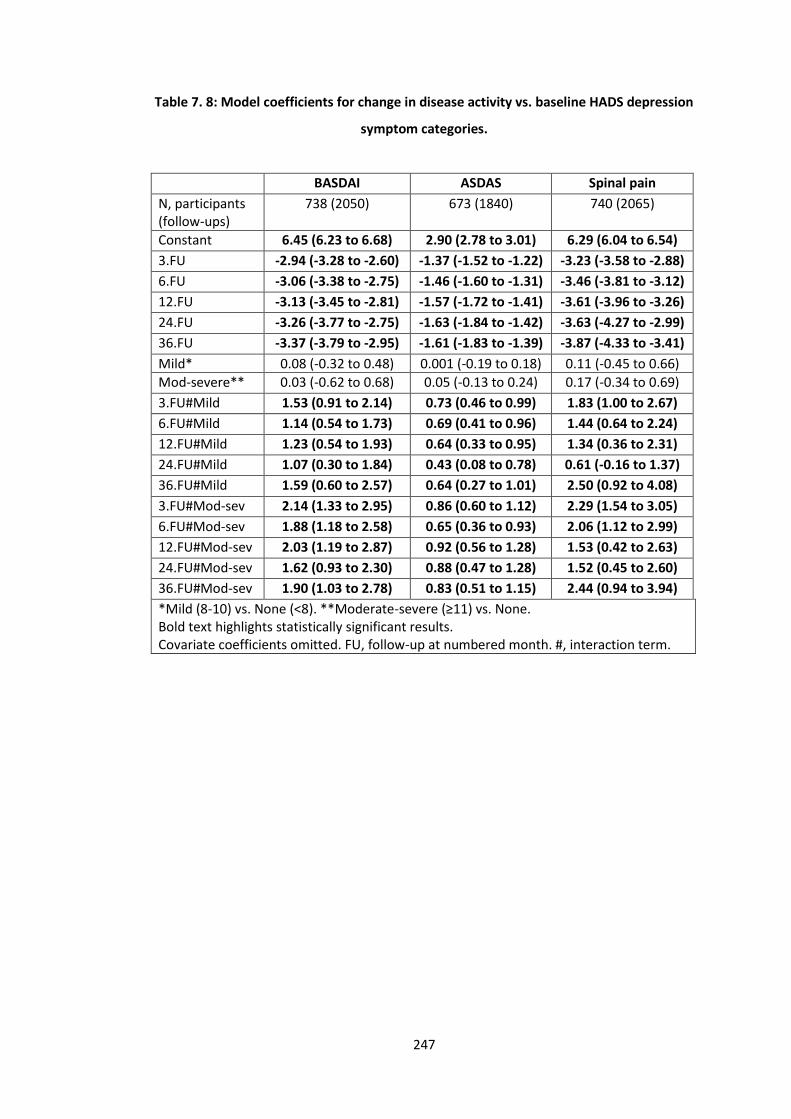
247
Table 7. 8: Model coefficients for change in disease activity vs. baseline HADS depression
symptom categories.
BASDAI ASDAS Spinal pain
N, participants (follow-ups)
738 (2050) 673 (1840) 740 (2065)
Constant 6.45 (6.23 to 6.68) 2.90 (2.78 to 3.01) 6.29 (6.04 to 6.54)
3.FU -2.94 (-3.28 to -2.60) -1.37 (-1.52 to -1.22) -3.23 (-3.58 to -2.88)
6.FU -3.06 (-3.38 to -2.75) -1.46 (-1.60 to -1.31) -3.46 (-3.81 to -3.12)
12.FU -3.13 (-3.45 to -2.81) -1.57 (-1.72 to -1.41) -3.61 (-3.96 to -3.26)
24.FU -3.26 (-3.77 to -2.75) -1.63 (-1.84 to -1.42) -3.63 (-4.27 to -2.99)
36.FU -3.37 (-3.79 to -2.95) -1.61 (-1.83 to -1.39) -3.87 (-4.33 to -3.41)
Mild* 0.08 (-0.32 to 0.48) 0.001 (-0.19 to 0.18) 0.11 (-0.45 to 0.66)
Mod-severe** 0.03 (-0.62 to 0.68) 0.05 (-0.13 to 0.24) 0.17 (-0.34 to 0.69)
3.FU#Mild 1.53 (0.91 to 2.14) 0.73 (0.46 to 0.99) 1.83 (1.00 to 2.67)
6.FU#Mild 1.14 (0.54 to 1.73) 0.69 (0.41 to 0.96) 1.44 (0.64 to 2.24)
12.FU#Mild 1.23 (0.54 to 1.93) 0.64 (0.33 to 0.95) 1.34 (0.36 to 2.31)
24.FU#Mild 1.07 (0.30 to 1.84) 0.43 (0.08 to 0.78) 0.61 (-0.16 to 1.37)
36.FU#Mild 1.59 (0.60 to 2.57) 0.64 (0.27 to 1.01) 2.50 (0.92 to 4.08)
3.FU#Mod-sev 2.14 (1.33 to 2.95) 0.86 (0.60 to 1.12) 2.29 (1.54 to 3.05)
6.FU#Mod-sev 1.88 (1.18 to 2.58) 0.65 (0.36 to 0.93) 2.06 (1.12 to 2.99)
12.FU#Mod-sev 2.03 (1.19 to 2.87) 0.92 (0.56 to 1.28) 1.53 (0.42 to 2.63)
24.FU#Mod-sev 1.62 (0.93 to 2.30) 0.88 (0.47 to 1.28) 1.52 (0.45 to 2.60)
36.FU#Mod-sev 1.90 (1.03 to 2.78) 0.83 (0.51 to 1.15) 2.44 (0.94 to 3.94)
*Mild (8-10) vs. None (<8). **Moderate-severe (≥11) vs. None. Bold text highlights statistically significant results. Covariate coefficients omitted. FU, follow-up at numbered month. #, interaction term.
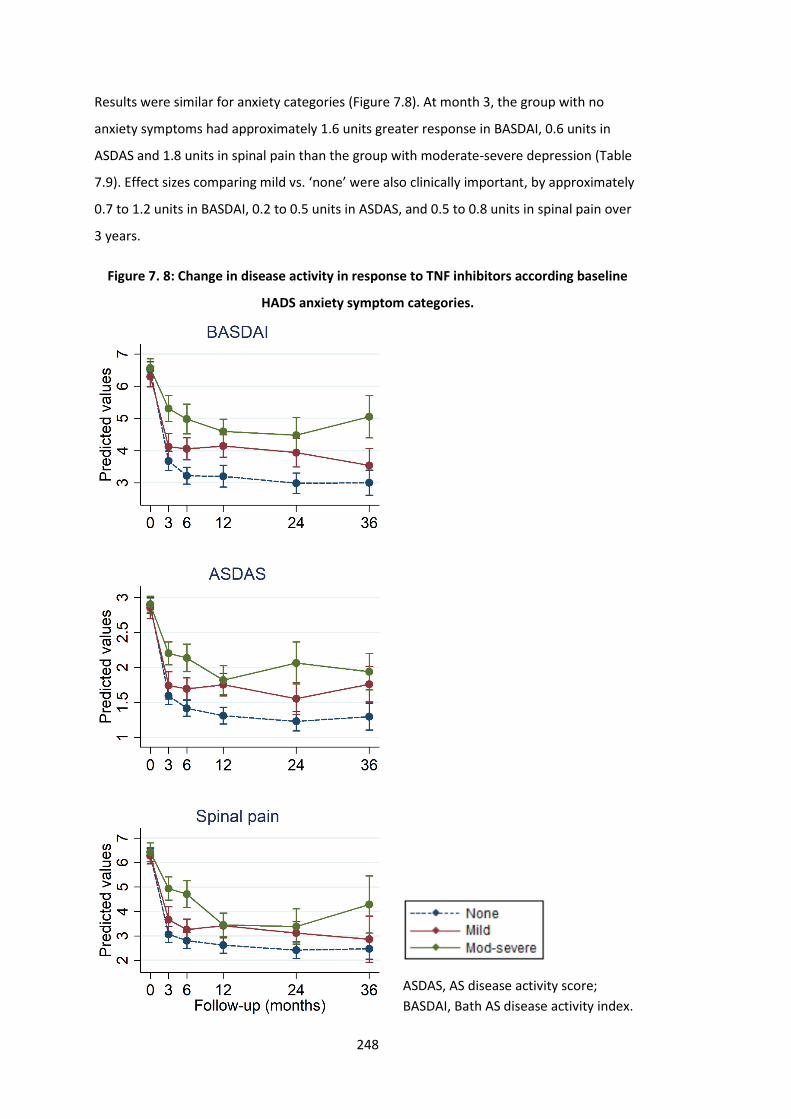
248
Results were similar for anxiety categories (Figure 7.8). At month 3, the group with no
anxiety symptoms had approximately 1.6 units greater response in BASDAI, 0.6 units in
ASDAS and 1.8 units in spinal pain than the group with moderate-severe depression (Table
7.9). Effect sizes comparing mild vs. ‘none’ were also clinically important, by approximately
0.7 to 1.2 units in BASDAI, 0.2 to 0.5 units in ASDAS, and 0.5 to 0.8 units in spinal pain over
3 years.
Figure 7. 8: Change in disease activity in response to TNF inhibitors according baseline
HADS anxiety symptom categories.
ASDAS, AS disease activity score;
BASDAI, Bath AS disease activity index.
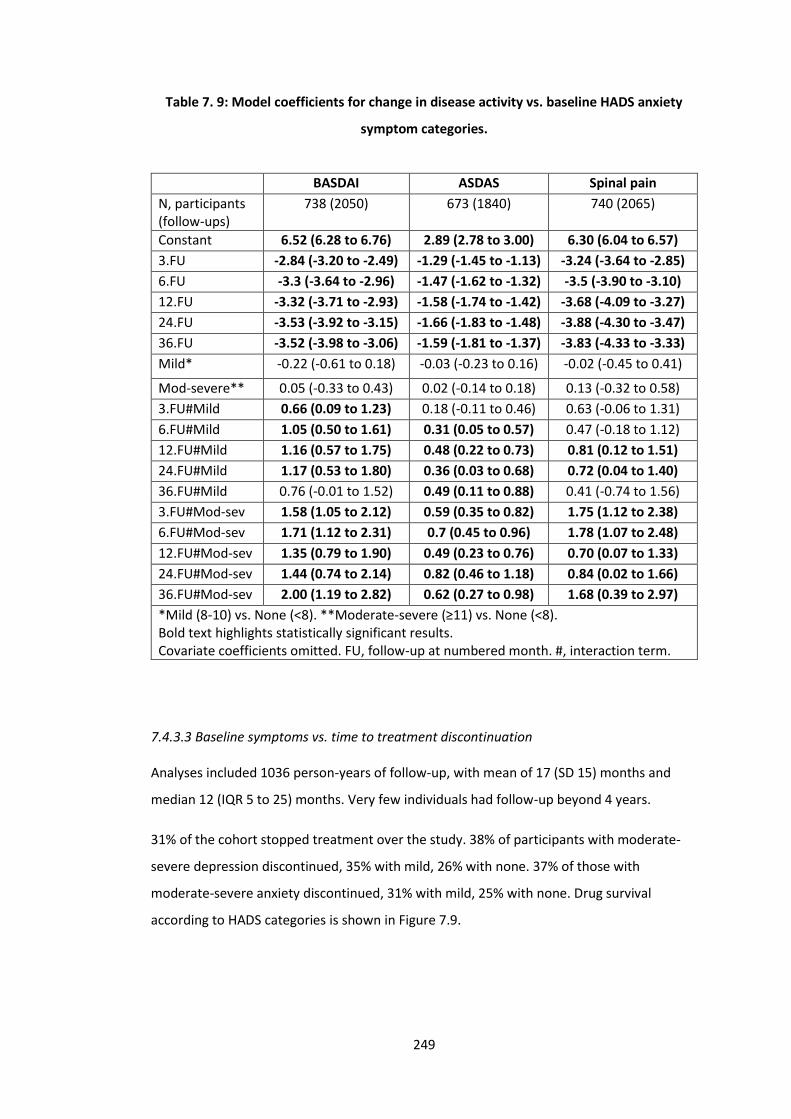
249
Table 7. 9: Model coefficients for change in disease activity vs. baseline HADS anxiety
symptom categories.
BASDAI ASDAS Spinal pain
N, participants (follow-ups)
738 (2050) 673 (1840) 740 (2065)
Constant 6.52 (6.28 to 6.76) 2.89 (2.78 to 3.00) 6.30 (6.04 to 6.57)
3.FU -2.84 (-3.20 to -2.49) -1.29 (-1.45 to -1.13) -3.24 (-3.64 to -2.85)
6.FU -3.3 (-3.64 to -2.96) -1.47 (-1.62 to -1.32) -3.5 (-3.90 to -3.10)
12.FU -3.32 (-3.71 to -2.93) -1.58 (-1.74 to -1.42) -3.68 (-4.09 to -3.27)
24.FU -3.53 (-3.92 to -3.15) -1.66 (-1.83 to -1.48) -3.88 (-4.30 to -3.47)
36.FU -3.52 (-3.98 to -3.06) -1.59 (-1.81 to -1.37) -3.83 (-4.33 to -3.33)
Mild* -0.22 (-0.61 to 0.18) -0.03 (-0.23 to 0.16) -0.02 (-0.45 to 0.41)
Mod-severe** 0.05 (-0.33 to 0.43) 0.02 (-0.14 to 0.18) 0.13 (-0.32 to 0.58)
3.FU#Mild 0.66 (0.09 to 1.23) 0.18 (-0.11 to 0.46) 0.63 (-0.06 to 1.31)
6.FU#Mild 1.05 (0.50 to 1.61) 0.31 (0.05 to 0.57) 0.47 (-0.18 to 1.12)
12.FU#Mild 1.16 (0.57 to 1.75) 0.48 (0.22 to 0.73) 0.81 (0.12 to 1.51)
24.FU#Mild 1.17 (0.53 to 1.80) 0.36 (0.03 to 0.68) 0.72 (0.04 to 1.40)
36.FU#Mild 0.76 (-0.01 to 1.52) 0.49 (0.11 to 0.88) 0.41 (-0.74 to 1.56)
3.FU#Mod-sev 1.58 (1.05 to 2.12) 0.59 (0.35 to 0.82) 1.75 (1.12 to 2.38)
6.FU#Mod-sev 1.71 (1.12 to 2.31) 0.7 (0.45 to 0.96) 1.78 (1.07 to 2.48)
12.FU#Mod-sev 1.35 (0.79 to 1.90) 0.49 (0.23 to 0.76) 0.70 (0.07 to 1.33)
24.FU#Mod-sev 1.44 (0.74 to 2.14) 0.82 (0.46 to 1.18) 0.84 (0.02 to 1.66)
36.FU#Mod-sev 2.00 (1.19 to 2.82) 0.62 (0.27 to 0.98) 1.68 (0.39 to 2.97)
*Mild (8-10) vs. None (<8). **Moderate-severe (≥11) vs. None (<8). Bold text highlights statistically significant results. Covariate coefficients omitted. FU, follow-up at numbered month. #, interaction term.
7.4.3.3 Baseline symptoms vs. time to treatment discontinuation
Analyses included 1036 person-years of follow-up, with mean of 17 (SD 15) months and
median 12 (IQR 5 to 25) months. Very few individuals had follow-up beyond 4 years.
31% of the cohort stopped treatment over the study. 38% of participants with moderate-
severe depression discontinued, 35% with mild, 26% with none. 37% of those with
moderate-severe anxiety discontinued, 31% with mild, 25% with none. Drug survival
according to HADS categories is shown in Figure 7.9.
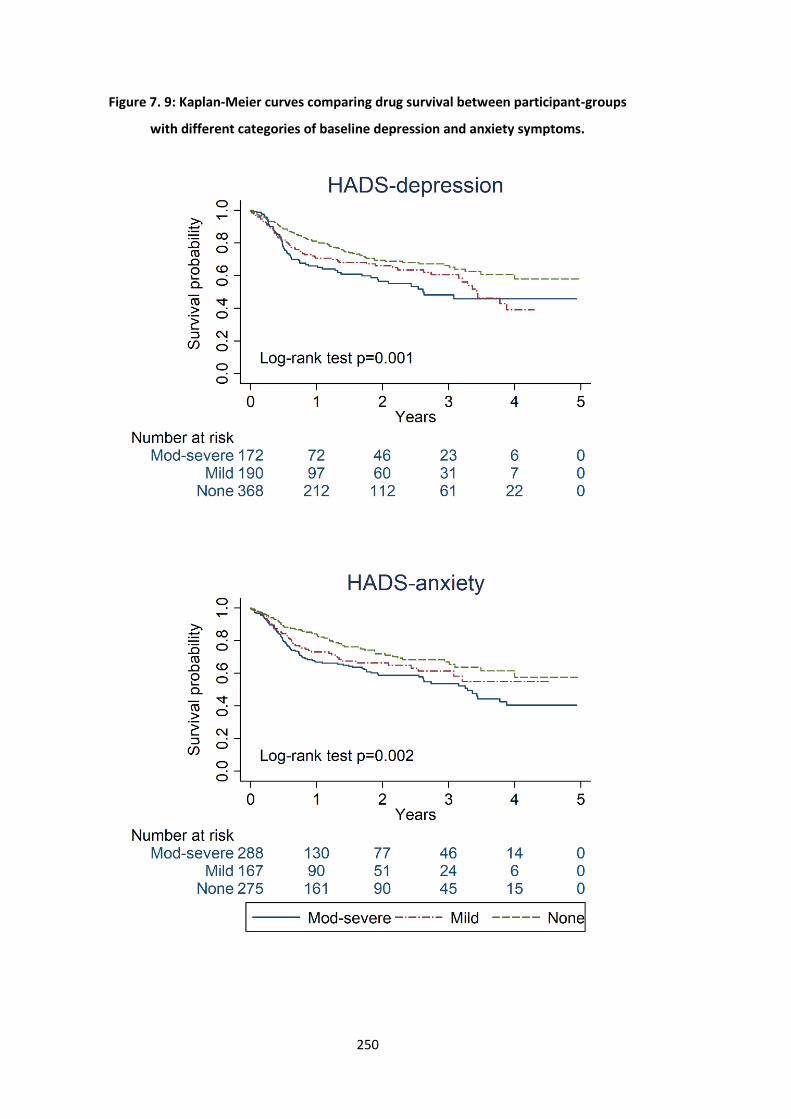
250
Figure 7. 9: Kaplan-Meier curves comparing drug survival between participant-groups
with different categories of baseline depression and anxiety symptoms.
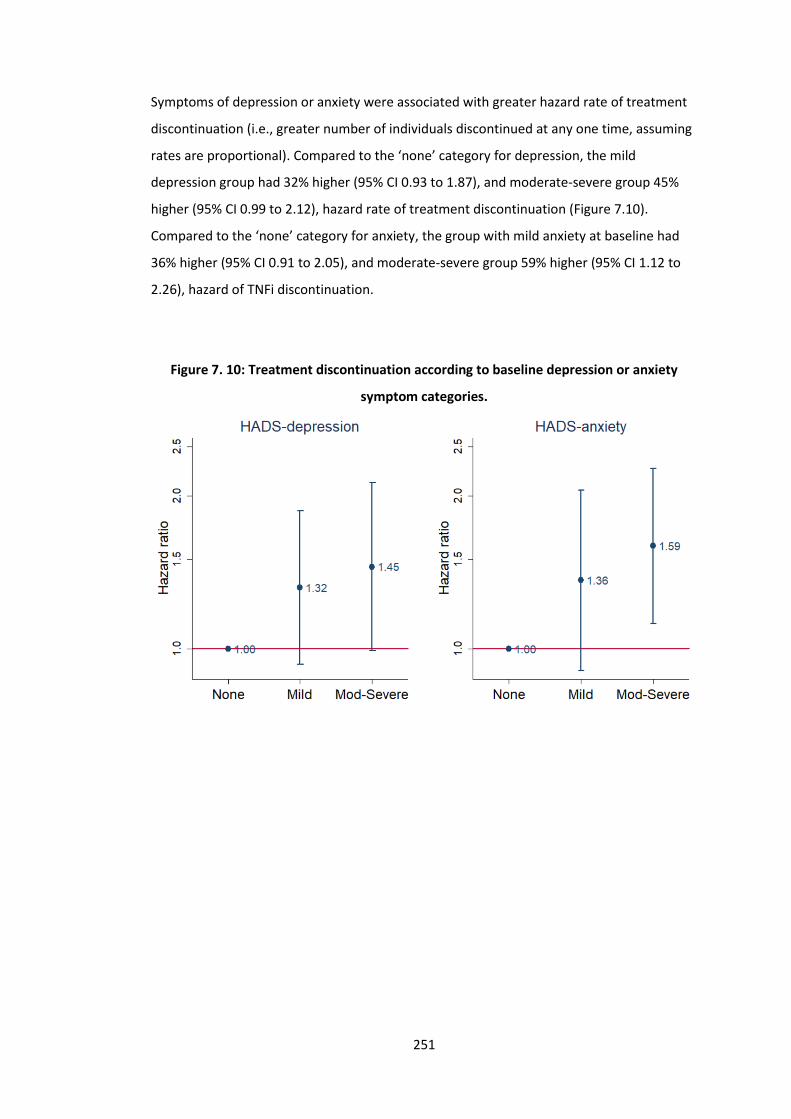
251
Symptoms of depression or anxiety were associated with greater hazard rate of treatment
discontinuation (i.e., greater number of individuals discontinued at any one time, assuming
rates are proportional). Compared to the ‘none’ category for depression, the mild
depression group had 32% higher (95% CI 0.93 to 1.87), and moderate-severe group 45%
higher (95% CI 0.99 to 2.12), hazard rate of treatment discontinuation (Figure 7.10).
Compared to the ‘none’ category for anxiety, the group with mild anxiety at baseline had
36% higher (95% CI 0.91 to 2.05), and moderate-severe group 59% higher (95% CI 1.12 to
2.26), hazard of TNFi discontinuation.
Figure 7. 10: Treatment discontinuation according to baseline depression or anxiety
symptom categories.
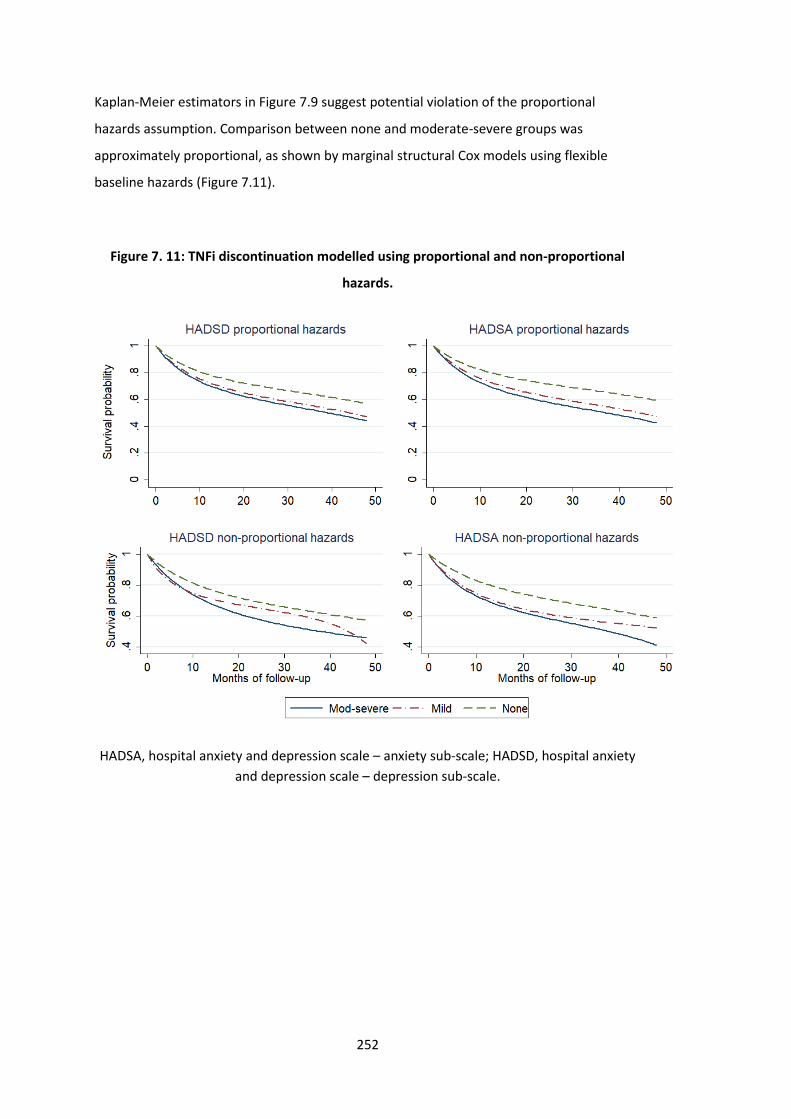
252
Kaplan-Meier estimators in Figure 7.9 suggest potential violation of the proportional
hazards assumption. Comparison between none and moderate-severe groups was
approximately proportional, as shown by marginal structural Cox models using flexible
baseline hazards (Figure 7.11).
Figure 7. 11: TNFi discontinuation modelled using proportional and non-proportional
hazards.
HADSA, hospital anxiety and depression scale – anxiety sub-scale; HADSD, hospital anxiety
and depression scale – depression sub-scale.
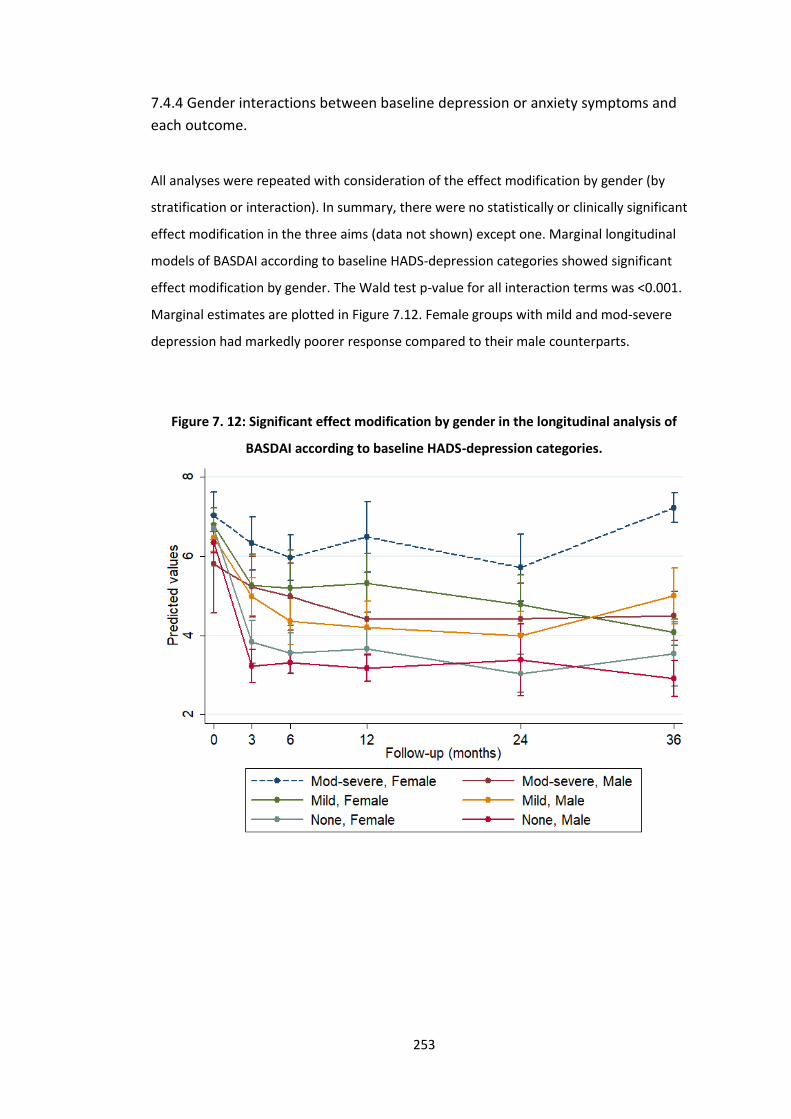
253
7.4.4 Gender interactions between baseline depression or anxiety symptoms and
each outcome.
All analyses were repeated with consideration of the effect modification by gender (by
stratification or interaction). In summary, there were no statistically or clinically significant
effect modification in the three aims (data not shown) except one. Marginal longitudinal
models of BASDAI according to baseline HADS-depression categories showed significant
effect modification by gender. The Wald test p-value for all interaction terms was <0.001.
Marginal estimates are plotted in Figure 7.12. Female groups with mild and mod-severe
depression had markedly poorer response compared to their male counterparts.
Figure 7. 12: Significant effect modification by gender in the longitudinal analysis of
BASDAI according to baseline HADS-depression categories.
254
7.4.5 Sensitivity analysis
Models using weights that additionally included baseline smoking status, HLA-B27, and
alcohol status did not produce significantly different results (data not shown). Analyses
repeated using matching weights also did not produce meaningfully different results (data
not shown).
7.5 Discussion
In this longitudinal analysis of the BSRBR-AS, history of depression was poorly concordant
with depressive symptoms; 1 in 5 of those with no documented depression reported at
least moderate symptoms. AxSpA patients with mild to severe symptoms of depression or
anxiety had markedly poorer response to their first TNFi compared to those with less than
mild symptoms. Interventions to optimise mental health at or before TNFi initiation may
dramatically improve treatment response.
In a recent meta-analysis, numerous cross-sectional studies have shown higher disease
activity in axSpA patients with depression [9]. Only one prior study – that used an early
version of the same BSRBR-AS dataset – examined mental health in the context of
treatment response in axSpA [6]. Macfarlane et al used stepwise selection of predictors to
show that, for each unit increase in the mental component summary of the SF12 (higher
score indicating higher level of health), odds of ASDAS clinically important response
(reduction by ≥1.1) and ASDAS low disease activity (<2.1) were significantly increased by
5%. Similarly, ASAS20 response was reduced by 6% for each unit increase in the HADS
anxiety subscore. However, predictors do not necessarily have a causal interpretation [20];
for example, stepwise variable selection provides final models that may omit important
confounders [21,22]. The current analysis was designed to best approximate a causal
interpretation, and extended outcome measures beyond binary response definitions. Such
definitions have inherent limitations when using observational data [23]; for example, high
baseline DAS28 is a predictor that simultaneously increases odds of ACR70 response and
decreases odds of DAS remission in RA [24].
Results of the current analysis are consistent with studies in rheumatoid arthritis using the
BSRBR-RA, where history of depression and symptoms of depression were associated with
reduced response [243]. The authors used mixed models to examined linear improvement
through months 6 and 12, showing an adjusted difference in DAS28 of 0.01 units between
255
those with and without depression symptoms. This and other effect sizes were an order of
magnitude smaller than that deemed clinically meaningful. Contrast this to a difference of
proximately 2 BASDAI units and 0.9 ASDAS units between axSpA patients in the moderate-
severe and ‘none’ group for depression, where clinically meaningful differences are around
1 unit for BASDAI and ASDAS [180]. This may be explained by forcing linearity onto a clearly
non-linear response trajectory, or the use of the Short-Form 36-item questionnaire which
was designed to measure quality of life not to assess depression. The main reason is likely
the unique way in which axSpA disease activity is assessed: BASDAI and spinal pain are
completely patient-reported. Depression is known to influence the experience and
reporting of symptoms [199,231], which is supported by larger effect sizes for BASDAI than
(the more objective) ASDAS. Optimising mental health may offer substantial improvements
in axSpA treatment response. Conversely, neglecting mental health may lead those with
severe mental health symptoms to ‘double jeopardy’, where apparent inadequate response
in disease indices means their TNFi are withdrawn in healthcare systems like the UK.
This study is the first to assess the impact of anxiety on treatment outcomes. Anxiety is
often assumed to exist in parallel with depression and thus overlooked in clinical practice
and research. Symptoms of both depression and anxiety were associated with treatment
discontinuation, but the effect sizes were larger for anxiety: moderate-severe depression
(vs. ‘none’) was associated with 45% higher hazard rate compared to 59% for anxiety.
Although correlated, the depression and anxiety are not equivalent. Of those without
depressive symptoms, nearly half had at least mild symptoms of anxiety and 1 in 5 had at
least moderate. Conversely, 22% of those without anxiety had at least mild symptoms of
depression.
Mental health disorders are under-recognised and -diagnosed in axSpA, despite their high
prevalence [9] and association with many other important health factors such as
alcohol/drug abuse and suicide [143]. Under-diagnosis of depression was clearly
demonstrated by the data: 20% of those without a recorded diagnosis of depression
reported HADS-D≥11, which has 92% specificity for major depressive disorder [233].
Conversely, diagnosed depression may be treated with variable success; 27% of those with
a history of depression reported HADS-D<8. Mental health symptoms are dynamic and
should be assessed as such. This likely explains why differences in absolute disease activity
improvement were more prominent when using symptoms than history of depression.
256
These results suggest that symptoms of both depression and anxiety should be
systematically screened in routine practice. This allows clinicians to better predict
treatment response, but more importantly to highlight individuals who may benefit from
interventions to reduce depression and anxiety (medication and/or psychological therapy).
Up to half of axSpA patients do not respond to their first TNFi. This study suggests potential
for substantial improvements in treatment response (e.g., approximately 2 units in BASDAI)
and treatment persistence if severe depression symptoms can be successfully treated. The
number of pharmacological options is increasing but as yet not reliably effective in routine
practice, while talking therapies can be difficult to access. Improving access to the latter, for
example using internet or telephone delivered cognitive behavioural therapy for those with
mild to moderate symptoms, may be one solution. Individuals with more severe symptoms
will still require one-to-one therapy. RCTs of non-pharmacological mental health
interventions in chronic rheumatic disease are needed to find optimal approaches for these
prevalent and impactful comorbidities.
7.5.1 Strengths and limitations
Strengths of the data were discussed in previous chapters; for example, the large sample
size recruited from a broad range of rheumatology centres, and use of three response
definitions that each lends strength to the overall conclusion. Diagnoses correlate poorly
with dynamic and often under-recognised symptoms. Therefore, symptoms of
depression/anxiety, rather than documented diagnosis, provide effect estimates that have
greater relevance to clinical practice and potential interventions. Results were robust
against several sensitivity analyses.
There were also important limitations. Studying the causal effect of baseline mental health
symptoms (a ‘prevalent exposure’) has conceptual difficulty; the implied hypothetical
intervention would need to successfully improve baseline symptoms, but also symptoms
pre-baseline of unknown duration. This might be considered as an intervention
administered before (rather than at) TNFi initiation, but true causal effect sizes are likely to
be smaller. Even if more realistic effect estimates were half the size, they still remain larger
and more amenable to intervention that other ‘modifiable risk factors’: Smoking cessation
did not convincingly impact treatment outcomes and is difficult to achieve [42,189]; BMI is
associated with treatment outcomes [244] but causal effects are conceptually problematic
to estimate and interventions practically difficult to implement [245].
257
Categorising HADS sub-scales will have reduced statistical power and effect sizes. Using IP
weights for continuous HADS requires strong assumptions of its distribution; it would also
assume a linear relationship between HADS and treatment outcomes, which the above
results showed not to hold. Results from weighted GEE models should be interpreted with
the limitation that participants who did not respond by the first assessment (usually after 3
months) or those who lost response would have had their treatment stopped under NICE
guidance; therefore, record of such high disease activity would be censored. This
informative censoring should not affect data within the first 3 months [42]. IP weighting
methods are known to inflate variance (reduce precision), for example, through use of
robust standard error. A key limitation is that mental health symptoms improve after TNFi
initiation; the time-varying interplay between them and axSpA disease activity may be of
interest for future analyses. This requires consideration of both time-varying ‘exposure’ and
covariates (Figure 7.13), and is beyond the scope of this thesis [246].
The singular significant result for effect modification by gender should not be over-
interpreted. First, binary BASDAI responses were not significantly different according to
gender. Second, significant effect modification by gender was not observed for any other
indices or treatment discontinuation. Third, the number of females were small leading to
uncertainty in the point estimate. Nevertheless, it may be of interest for future studies to
examine whether depression differentially affects BASDAI and ASDAS in males and females.
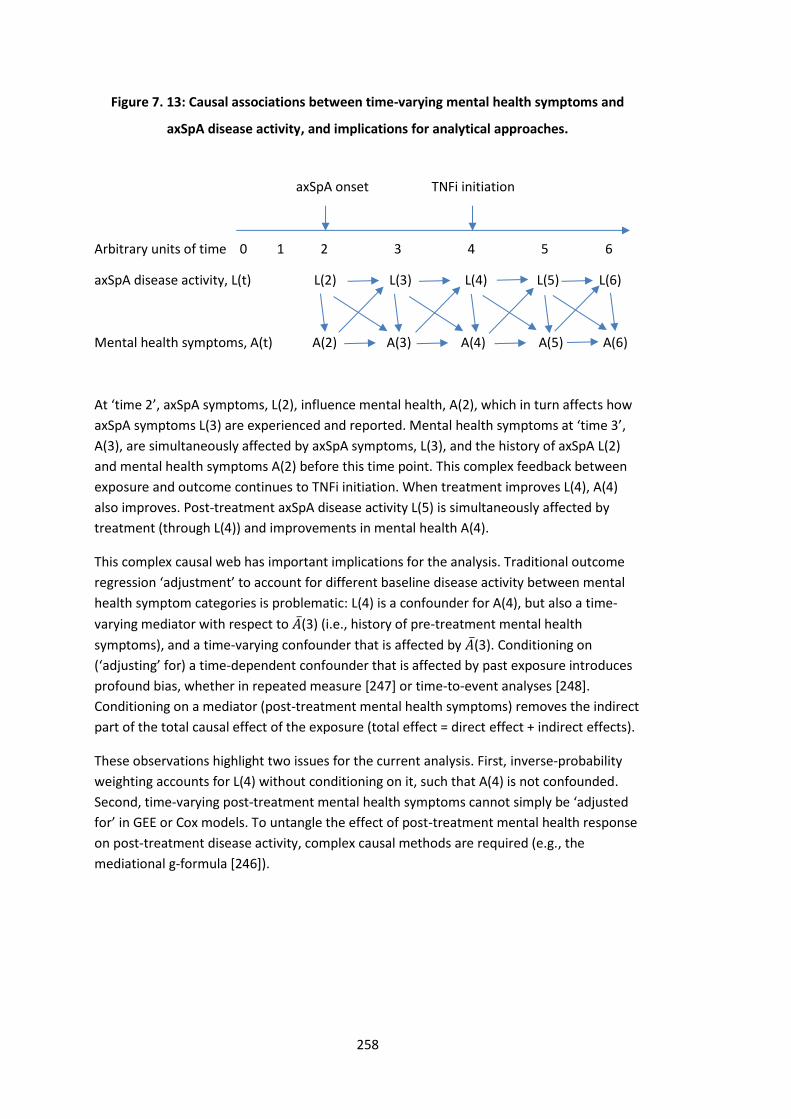
258
Figure 7. 13: Causal associations between time-varying mental health symptoms and
axSpA disease activity, and implications for analytical approaches.
axSpA onset TNFi initiation
Arbitrary units of time 0 1 2 3 4 5 6
axSpA disease activity, L(t) L(2) L(3) L(4) L(5) L(6)
Mental health symptoms, A(t) A(2) A(3) A(4) A(5) A(6)
At ‘time 2’, axSpA symptoms, L(2), influence mental health, A(2), which in turn affects how
axSpA symptoms L(3) are experienced and reported. Mental health symptoms at ‘time 3’,
A(3), are simultaneously affected by axSpA symptoms, L(3), and the history of axSpA L(2)
and mental health symptoms A(2) before this time point. This complex feedback between
exposure and outcome continues to TNFi initiation. When treatment improves L(4), A(4)
also improves. Post-treatment axSpA disease activity L(5) is simultaneously affected by
treatment (through L(4)) and improvements in mental health A(4).
This complex causal web has important implications for the analysis. Traditional outcome
regression ‘adjustment’ to account for different baseline disease activity between mental
health symptom categories is problematic: L(4) is a confounder for A(4), but also a time-
varying mediator with respect to �̅�(3) (i.e., history of pre-treatment mental health
symptoms), and a time-varying confounder that is affected by �̅�(3). Conditioning on
(‘adjusting’ for) a time-dependent confounder that is affected by past exposure introduces
profound bias, whether in repeated measure [247] or time-to-event analyses [248].
Conditioning on a mediator (post-treatment mental health symptoms) removes the indirect
part of the total causal effect of the exposure (total effect = direct effect + indirect effects).
These observations highlight two issues for the current analysis. First, inverse-probability
weighting accounts for L(4) without conditioning on it, such that A(4) is not confounded.
Second, time-varying post-treatment mental health symptoms cannot simply be ‘adjusted
for’ in GEE or Cox models. To untangle the effect of post-treatment mental health response
on post-treatment disease activity, complex causal methods are required (e.g., the
mediational g-formula [246]).
259
7.6 Summary
Baseline history of depression is poorly representative of mental health symptom burden.
Symptoms of depression and anxiety at TNFi initiation were each associated with adverse
treatment outcomes. Assuming these marginal models provide an adequate approximation
of real causal effects, reducing depression symptoms (from moderate-severe to less than
mild) at TNFi initiation may improve binary response at 6 months by up to 2-fold, absolute
response by as much as 2 BASDAI and 0.9 ASDAS units. Similarly improving anxiety
symptoms may reduce treatment discontinuation by up to a third. Taken together, these
findings highlight the importance of routinely screening and optimising depression and
anxiety. Randomised controlled trials are needed to identify efficacious mental health
interventions for axSpA patients.

260
261
Chapter 8: Discussion and conclusions
This chapter summarises the major research findings across the thesis and discusses their
significance for future research, clinical practice, and wider health policy. Strengths and
limitations are outlined, and gaps are identified for further research.
8.1 Summary of findings
The thesis began with a review of the comorbidity literature, which showed axSpA patients
to have higher comorbidity burden than control populations [84]. These descriptive studies
predominantly approached comorbidities as the outcome (e.g., incidence of cardiovascular
disease or cancer), with few examining its impact on and relevance to axSpA management.
Of the latter, the majority were studies of individual or related conditions, which lacked
context for the relative significance of individual conditions [84]. This context is essential to
help identify areas most in need of future research or intervention. Several research needs
were identified; for example, the need for a comprehensive description of comorbidity
burden and differences between axSpA subgroups, how comorbidities co-occur, their
impact on various aspects of axSpA management, and improved study methods. This
section summarises findings from this thesis and how they addressed unmet research
needs.
8.1.1 Comorbidities in radiographic vs non-radiographic axSpA
Comorbidity burden was measured in two axSpA populations from academic centres in the
UK and USA using an adapted version of the multimorbidity index (MMI) [198], which was
validated in rheumatic diseases and includes 39 chronic conditions deemed important by
multimorbidity researchers and the UK’s National Health Service [140]. Comorbidity was
common in both study populations; over half of all axSpA patients had at least one
additional condition, most frequently belonging to the mental health or cardiometabolic
groups [127,128,143]. Mean comorbidity count was higher in the older Boston than Aintree
population, in part due to its older age.
The novel contribution to the literature was that comorbidity burden was remarkably
similar between AS and non-radiographic axSpA in both Boston and Aintree populations, in
terms of individual conditions and the total number of comorbidities. These results were
262
unexpected given these subgroups differed in age, gender, and inflammatory burden; they
support the need for a unified clinical approach to management of the whole axSpA
spectrum.
8.1.2 Clustering of comorbidities
Several comorbidity clusters were identified in the Aintree axSpA data. Due to the relatively
low comorbidity burden (most patients in this study had only one or two comorbid
conditions), clusters were dominated by relatively few diseases. The largest clusters were
respectively dominated by mental health and cardiovascular diseases. For external
validation, clustering was reproduced in the older Boston axSpA population with higher
comorbidity burden. These disease clusters largely confirmed clinical experience: anxiety
co-occurs with depression and hypertension with coronary heart disease [249]. Chapter 7
later showed the importance of screening for anxiety when depression is present. An
equally important finding was the consistently higher disease severity in groups with
anxiety/depression and fibromyalgia/IBS. These patient groups are clearly in need of
prioritisation in clinical practice – a conclusion shared by subsequent chapters (namely
anxiety/depression; see limitations section for fibromyalgia).
In the validation analysis using the Boston study, substance misuse was clustered with
mental health disorders. Substance misuse disorders also showed consistent associations
with disease severity, with potentially important but underpowered effect sizes.
Subsequent publications using the Boston data confirmed the close relationship between
depression and this comorbidity group in greater detail [143].
Describing comorbidity clusters bridges existing study designs that either focus on total
counts or individual conditions. This approach could inform screening of other diseases
within a cluster when one is present, or identification of patient groups in need of greater
prioritisation for research or clinical care.
8.1.3 Comorbidities and disease assessment
Since axSpA symptoms are more severe with increasing comorbidity burden, how should
clinicians assess axSpA disease activity in the presence of comorbidities? Chapter 5
addressed this question by comparing whether disease activity measures were differentially
influenced by comorbidities in the baseline BSRBR-AS data. Results showed that patient-
reported disease activity indices – BASDAI and spinal pain – increased with the number of
comorbidities. By contrast, ASDAS was not associated with comorbidity count or individual
263
comorbidities by a clinically meaningful effect size. The patient global score, although
influenced by comorbidities, did not inflate ASDAS independently of other ASDAS
components. These results are clinically relevant since many treatment decisions are based
on assessments using these indices. Healthcare providers should be mindful of the potential
impact of comorbidities on patient reported measures, and consider additionally collecting
ASDAS to assess disease activity in patients with multiple comorbidities.
Although the BSRBR-AS comorbidity data differed from the preceding chapters (14
conditions compared to 39 in Boston and Aintree data), depression was again highlighted as
highly prevalent (23%) and associated with greater disease severity. When each of the 14
comorbidities were modelled against a range of indices (disease activity plus fatigue,
health-related quality of life, and function), depression was consistently and significantly
associated with them all.
8.1.4 Comorbidities and response to TNF inhibitors
Patients with comorbidities were significantly more likely to discontinue their treatment.
These individuals generally had reduced odds of achieving binary response definitions but
had comparable absolute improvement in disease activity, demonstrating that greater
absolute improvement is needed to achieve a binary response in those starting with higher
disease activity. These subtly different but complementary results highlight the importance
of analysing a range of response definitions.
Many comorbid patients would have been ineligible for randomised controlled trials; these
results provide unique insights into how therapeutic effects on function and quality of life
differed in comorbid patients – highlighting the need to optimise comorbidities as part of
axSpA management. Interpreting results of each outcome type in the context of others is
important. For example, patients with comorbidities may have comparable absolute
improvement yet lower odds of achieving ‘low disease activity’ states than those with no
comorbidities. Communication to patients should be more nuanced. Existing definitions of
response as used for prescribing guidelines, for example in the UK, may need to be
reconsidered: a patient starting treatment with high BASDAI will have higher odds of
achieving BASDAI 50/2, while simultaneously having lower odds of BASDAI<4, than an
identical individual with lower starting BASDAI. Which definition of response is more
relevant for health-economics remains to be determined.
264
This chapter’s longitudinal design shed further light on causal directions. But is the
association between comorbidity and treatment outcome causal? Since comorbidity count
cannot be ‘modified’, it remains difficult to claim causality under this robust definition.
Causal interpretation of results should therefore be limited. Comorbidities such as
depression can, however, be modified.
8.1.5 Depression and anxiety and response to TNF inhibitors
Baseline history of depression was poorly representative of depressive symptom burden in
the BSRBR-AS. Symptoms of depression and anxiety at TNFi initiation were each associated
with adverse treatment outcomes. Assuming these marginal models provide an adequate
approximation of causal effects, reducing depression symptoms (from moderate-severe to
less than mild) at TNFi initiation may improve binary response at 6 months by up to 2-fold,
and absolute response by as much as 2 BASDAI and 0.9 ASDAS units. Similarly improving
anxiety symptoms may reduce treatment discontinuation by up to a third. These are novel
findings in the axSpA literature. By contrast, effect sizes from analyses of other ‘modifiable
risk factors’ such as smoking [41,42] and BMI [250] have been much more modest (or null).
These results suggest that symptoms of both depression and anxiety should be
systematically screened in routine practice. This allows clinicians to better predict
treatment response, but more importantly to highlight individuals who may benefit from
interventions to reduce depression and anxiety (e.g., medication and/or psychological
therapy).
8.2 Strengths and limitations
8.2.1 Strengths
There are several strengths of this thesis regarding the data, design, analysis, and
generalisability. Data for comorbidities and outcomes were robust with little missing data.
For example, comorbidity data in the Aintree study were complete for almost all (>99%)
patients and validated by multiple researchers and data sources. Comorbidity
ascertainment in the BSRBR-AS, though different, was again robustly defined using
physician confirmed diagnoses. This is a key advantage over many existing studies that use
patient reported diagnoses [93]. Inherent weaknesses of one study was supported by
strengths in the other. For example, the potentially limited accuracy of comorbidity ICD
codes in the Boston study were supported by more robust Aintree data; limited number of
265
comorbidities in the BSRBR-AS were supported by comprehensive and standardised
comorbidity collection in the Aintree and Boston data.
The design of the two cross-sectional studies were specific to the aims of the thesis,
allowing clear axSpA definitions, relevant covariates, and disease indices to be captured
where possible. Notably, this allowed a comprehensive list of comorbidities to be
standardised across two study populations. The multimorbidity index is also unique in that
it is not weighted for a specific outcome and has been validated in rheumatic diseases,
which is an advantage over many other commonly used indices. The BSRBR-AS, although
not designed to study comorbidities, nevertheless captured most important conditions. Its
main strength lies in the large and nationally representative secondary care axSpA
population, for whom a wide range of disease measures were collected at regular time
points. All three datasets are broadly representative of axSpA populations in
secondary/tertiary care. However, they do not represent all axSpA patients in the general
population since many are managed in primary care only [157].
Another key strength of this thesis is its methodology. For example, confounder selection
has historically relied on suboptimal practices such as stepwise, univariate or other
statistical selection [251]. In this thesis, covariate selection was carefully considered with
transparent justification (supported by causal graphs) and numerous sensitivity analyses
examining additional potential confounders. This more robust approach to confounding is
essential for reducing bias and increasing the validity of results. Another weakness of
previous research is the heterogenous definition of comorbidity and outcome. Chapter 6
(summarised in Section 8.1.4 above), demonstrated the potential for very different
conclusions to be drawn using different outcome definitions (supported by methodology
work that was performed in parallel but not included in the thesis [41,42]). Thus, analysis
approaches in this thesis included a diverse set of definitions, for example, using a range of
approaches for comorbidity (binary, count, individual) and longitudinal outcomes (binary,
continuous, time-to-event). Different results highlight the underlying assumptions and
limitations of each approach.
In the final results chapter, marginal approaches were chosen to provide results that have a
clearer causal interpretation and would be more clinically informative (i.e., emulating
output from RCTs), whereas popular conditional approaches may theoretically be less likely
concordant with future RCT results.
266
8.2.2 Limitations
There were three main limitations in this thesis. First, several (mostly sub-)analyses lacked
statistical power; for example, regression models of rarer comorbidities (such as peripheral
vascular disease) or severe mental health symptom categories. However, most primary
analyses were adequately powered. Increasing the sample size of the cohorts employed
was not possible: the Aintree and Boston studies sampled from all patients at these
centres, while the BSRBR-AS had a predetermined sample size and had completed
recruiting. Some statistical methods (weighted GEE) further inflated variance.
Second, the main dataset used in this thesis – the BSRBR-AS – collected a list of conditions
tailored for pharmacovigilance rather than comprehensive study of comorbidity. This is an
inherent limitation of using pre-collected data. For example, some important conditions
were not included (e.g., anxiety or other neuropsychiatric conditions) while conditions
seldom included in comorbidity studies were, for example demyelinating diseases and TB.
Fibromyalgia was identified as an important comorbidity (Chapter 4) but could not be
examined in the BSRBR-AS since it was ascertained differently. However, included
comorbidities were broadly representative of important diseases when compared to prior
axSpA research [84]. None of the comorbidity data included severity; for example, end-
stage renal/liver/heart disease will have very different impact on patients and treatment
choices than milder forms. Loss of granularity is somewhat inherent when studying
comorbidity burden rather than individual conditions. Chapters 6 and 7 showed that
summarising comorbidities into a count may provide limited information for treatment
outcomes and may hide the effect of certain comorbidities. Another limitation common to
almost all published research is the lack of data on the chronology of comorbidities pre-
baseline, which has implications for causal interpretation of some results.
Third, association is not necessarily causation. This is an intrinsic limitation for the cross-
sectional designs, which cannot distinguish whether high disease severity (directly or
indirectly through its treatment) cause comorbidities or vice versa. For the longitudinal
designs, claims of causality depend on the extent of unmeasured confounding (and other
modelling assumptions) and the ability to modify the ‘exposure’, i.e., comorbidities. The
latter remains debated [252]. Some relevant confounders such as physical activity and
time-varying use of co-medication (e.g., NSAIDs) were not available. Sensitivity analysis
methods such as the E-value are available (i.e., size of potential confounder required to
explain away the observed results [253]) but not universally accepted [254]. For illustration,
267
the odds ratio of 0.51 (95%CI 0.29 to 0.90) observed when comparing low disease activity
(BASDAI 50/2) at 6 months between moderate-severe vs less than mild depression (Chapter
7) could be explained away by an unmeasured confounder that was associated with both
the exposure and outcome by odds ratio of 2.2-fold each, above and beyond measured
confounders; weaker confounding could not do so. A single unmeasured confounder of this
effect size is highly unlikely.
Additional limitations include the fact that adaptations to the multimorbidity index have
not been validated in axSpA. The main adaptation – excluding extra-articular manifestations
– has been shown to make no meaningful difference to performance of another
comorbidity index [152]. This validation is ongoing as part of research arising from this
thesis. Comorbidities were considered as a fixed baseline ‘exposure’, whereas additional
comorbidities are likely to accumulate with time and increasing age in practice. The mean
follow-up duration was relatively short for the treatment response analyses, during which
accumulation of comorbidities should have been negligible. Accounting for the time-varying
nature of comorbidity burden is important for longer-term studies; for example,
accumulation of comorbidities substantially accounted for excess mortality among women
with RA [255].
8.3 Recommendations for clinical practice
8.3.1 Recording and screening for comorbidities
Comorbidities are more prevalent in axSpA than control populations and are present in the
majority of axSpA patients [84]. They influence treatment decisions (e.g., for NSAIDs and
bDMARDs [85]), while treatments can cause or contribute to many comorbidities (e.g.,
cardiovascular and peptic ulcer diseases). Comorbidities are associated with poorer
outcomes including disease severity, work productivity and mortality [84]. Rheumatologists,
who often follow patients over many years through which comorbidities may accrue, are
uniquely positioned to facilitate the optimisation of these co-existing diseases.
Systematic and repeated assessments should be integrated into routine clinical practice to
ensure holistic patient-centred management. The 2016 EULAR ‘points to consider for
comorbidities’ recommended rheumatology teams to detect and collect information on
comorbidities, liaise with appropriate healthcare providers to treat comorbidities, and
268
repeat comorbidity reviews [135]. They focused on six conditions: CVD, malignancies,
infections, peptic ulcer, osteoporosis, and depression. Others have suggested including
additional comorbidities [136], but this may be limited by feasibility in daily practice – the
six conditions alone require a 93-item reporting form.
Recording comorbidities may not be enough. This thesis has shown that depression is the
most prevalent comorbidity, yet the real burden of mental health in axSpA patients is likely
much higher [9] given under-diagnosis is common. Data herein confirmed that diagnosis
and symptoms correlate poorly. Mental health has direct relevance to rheumatologists
because it significantly impacts treatment response [9,213,243], which may in turn affect
long-term outcomes such as disability and quality of life. Suboptimal response to the first
TNFi is common in axSpA and may be improved by optimising mental health symptoms.
Additional assessment or screening should become part of routine clinical practice. One
potential barrier to implementation is not knowing the optimal care pathway when mental
health disorders (or indeed other comorbidities) are found.
8.3.2 Optimising and treating comorbidities
Despite the prevalence and impact of comorbidities, their management among patients
with chronic inflammatory rheumatic diseases are often suboptimal [135]. The ASAS-
COMOSPA study reviewed nearly 4000 SpA patients, and found suboptimal monitoring of
comorbidities, particularly relating to vaccinations and some cancers (Figure 8.1) [89]. This
highlights the need for holistic patient-centred, rather than single-disease focused, care
provision.
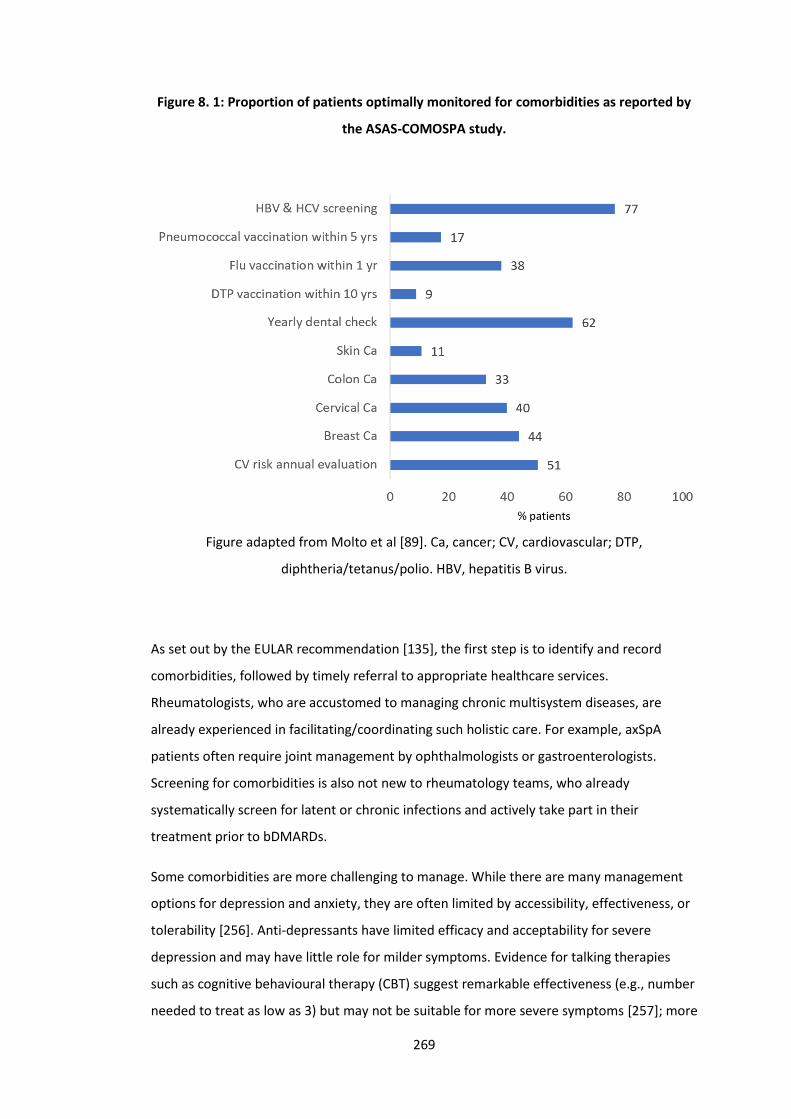
269
Figure 8. 1: Proportion of patients optimally monitored for comorbidities as reported by
the ASAS-COMOSPA study.
Figure adapted from Molto et al [89]. Ca, cancer; CV, cardiovascular; DTP,
diphtheria/tetanus/polio. HBV, hepatitis B virus.
As set out by the EULAR recommendation [135], the first step is to identify and record
comorbidities, followed by timely referral to appropriate healthcare services.
Rheumatologists, who are accustomed to managing chronic multisystem diseases, are
already experienced in facilitating/coordinating such holistic care. For example, axSpA
patients often require joint management by ophthalmologists or gastroenterologists.
Screening for comorbidities is also not new to rheumatology teams, who already
systematically screen for latent or chronic infections and actively take part in their
treatment prior to bDMARDs.
Some comorbidities are more challenging to manage. While there are many management
options for depression and anxiety, they are often limited by accessibility, effectiveness, or
tolerability [256]. Anti-depressants have limited efficacy and acceptability for severe
depression and may have little role for milder symptoms. Evidence for talking therapies
such as cognitive behavioural therapy (CBT) suggest remarkable effectiveness (e.g., number
needed to treat as low as 3) but may not be suitable for more severe symptoms [257]; more
270
importantly, access to these therapies are often limited and/or accompanied by
unacceptably prolonged delays [258].
Unlike many comorbidities, there is often no dedicated healthcare ‘department’ that takes
ownership of mental health management in people with chronic physical conditions.
Depression remains underdiagnosed and under-treated in patients with rheumatic
conditions [259]. There has been growing integration of psychology into multidisciplinary
rheumatology services in recognition of this [260], but currently only 39% of rheumatology
departments have access to clinical psychology according to the recent British Society for
Rheumatology national audit [261]. Management of rheumatic diseases has evolved
significantly with development of protocolised, target-driven management pathways. As a
result, patient-encounters have become more pressured with less time to take an
exhaustive history or perform a holistic assessment. Assessment aids designed to promptly
highlight psychological aspects of rheumatic illness in a busy clinical environment should be
considered; for example, the HADS or the 4-question version of the Patient Health
Questionnaire (PHQ-4).
8.3.3 Adapting practice in the presence of comorbidities
Chapter 5 showed that ASDAS was less associated with individual comorbidities and
comorbidity burden than other indices. For example, individuals with and without
comorbidity may have similar ASDAS but markedly different BASDAI. This suggests that
routine assessment and monitoring of axSpA patients with multiple comorbidities should
additionally include ASDAS. ASDAS is associated with radiographic progression (the axSpA
disease process) whereas BASDAI is not [219]. This could mean that escalating to bDMARD
based on BASDAI alone may not treat axSpA-specific pathology. However, until prescribing
guidelines include ASDAS in healthcare systems such as in the UK, treatment decisions
based on this index will be difficult to implement.
Chapter 6 showed that patients with or without comorbidity were able to achieve similar
degrees of absolute disease activity reduction irrespective of the index used. This provides
reassurance against the potential for ‘double jeopardy’ in comorbid axSpA patients; that is,
having TNFi withdrawn after demonstrating inadequate response due to impact of
comorbidities on disease activity assessment, even if axSpA-specific disease activity was
improved. Both ASDAS and BASDAI are equally suitable for monitoring treatment response.
271
Patients and clinicians often benefit from being able to anticipate or predict future
response. Results from this thesis should reassure both patients and clinicians that the
ability to respond to TNFi, in terms of absolute disease activity reduction, does not appear
to be significantly predicted by baseline comorbidity burden. Since comorbid patients start
with higher disease activity, they will need greater absolute improvement and thus have
lower odds of achieving ‘low disease activity’ states. Education and communication to
patients should include these subtleties. Binary response definitions are used to determine
ongoing treatment eligibility in the UK [190] which, along with future research
methodology, may need to be reviewed in light of these results (see below). Patients with
comorbidities may also find it helpful to know that, on average, it takes slightly longer to
experience improvement in disease activity, function, health-related quality of life and
sleep. Equally, clinicians may make allowances when assessing response; for example,
delaying review by a few weeks, or allowing further reviews if initial response is not
demonstrated. It helps both patients and clinicians to know that individuals who have high
comorbidity burden, particularly males, are much more likely to discontinue their
treatment. More detailed examination of causes of discontinuation, and why they should
differ according to gender, are warranted in future studies.
8.3.4 Taking part in pragmatic trials
All three datasets used in this thesis have shown that comorbidities are highly prevalent in
real-world patient populations. Despite this, RCTs – the gold-standard in evidence-based
medicine – often exclude patients with many of these conditions; Table 8.1 provides some
examples of exclusion criteria of TNFi trials in axSpA. This has important implications for
routine practice, where guidelines and protocols are mostly derived from RCTs. Evidence-
based practice is lacking for patients with certain comorbidities and is dependent on
extrapolation.
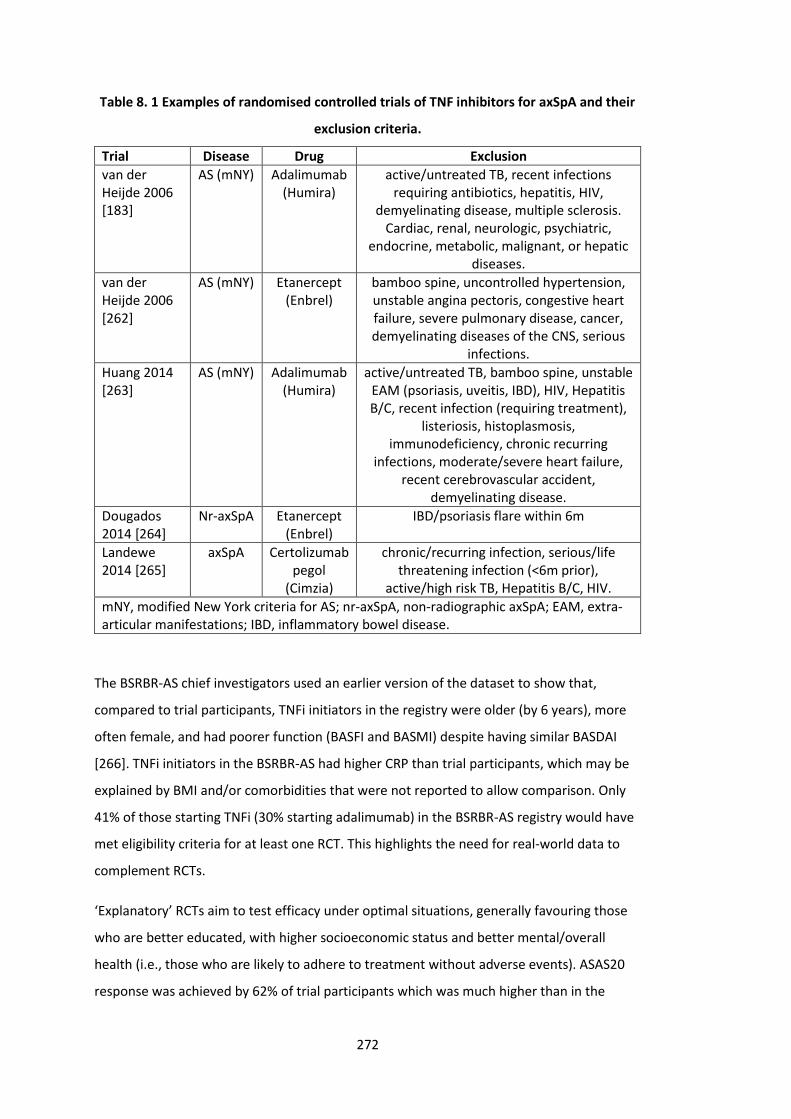
272
Table 8. 1 Examples of randomised controlled trials of TNF inhibitors for axSpA and their
exclusion criteria.
Trial Disease Drug Exclusion
van der Heijde 2006 [183]
AS (mNY) Adalimumab (Humira)
active/untreated TB, recent infections requiring antibiotics, hepatitis, HIV,
demyelinating disease, multiple sclerosis. Cardiac, renal, neurologic, psychiatric,
endocrine, metabolic, malignant, or hepatic diseases.
van der Heijde 2006 [262]
AS (mNY) Etanercept (Enbrel)
bamboo spine, uncontrolled hypertension, unstable angina pectoris, congestive heart failure, severe pulmonary disease, cancer, demyelinating diseases of the CNS, serious
infections.
Huang 2014 [263]
AS (mNY) Adalimumab (Humira)
active/untreated TB, bamboo spine, unstable EAM (psoriasis, uveitis, IBD), HIV, Hepatitis B/C, recent infection (requiring treatment),
listeriosis, histoplasmosis, immunodeficiency, chronic recurring
infections, moderate/severe heart failure, recent cerebrovascular accident,
demyelinating disease.
Dougados 2014 [264]
Nr-axSpA Etanercept (Enbrel)
IBD/psoriasis flare within 6m
Landewe 2014 [265]
axSpA Certolizumab pegol
(Cimzia)
chronic/recurring infection, serious/life threatening infection (<6m prior),
active/high risk TB, Hepatitis B/C, HIV.
mNY, modified New York criteria for AS; nr-axSpA, non-radiographic axSpA; EAM, extra-articular manifestations; IBD, inflammatory bowel disease.
The BSRBR-AS chief investigators used an earlier version of the dataset to show that,
compared to trial participants, TNFi initiators in the registry were older (by 6 years), more
often female, and had poorer function (BASFI and BASMI) despite having similar BASDAI
[266]. TNFi initiators in the BSRBR-AS had higher CRP than trial participants, which may be
explained by BMI and/or comorbidities that were not reported to allow comparison. Only
41% of those starting TNFi (30% starting adalimumab) in the BSRBR-AS registry would have
met eligibility criteria for at least one RCT. This highlights the need for real-world data to
complement RCTs.
‘Explanatory’ RCTs aim to test efficacy under optimal situations, generally favouring those
who are better educated, with higher socioeconomic status and better mental/overall
health (i.e., those who are likely to adhere to treatment without adverse events). ASAS20
response was achieved by 62% of trial participants which was much higher than in the
273
BSRBR-AS, where 51% achieved ASAS20 (between 10 weeks and 9 months) among the 39%
with available follow-up data [266]. Since those with unavailable data may have
discontinued treatment, the true response rate is likely much lower. Differences between
trial and real-world populations, between efficacy and effectiveness, are evident [266]; the
same is also likely to apply to safety.
There is a ‘middle ground’ that bridges real-world observational data and explanatory RCTs:
pragmatic trials [267]. Pragmatic trials are designed to measure effectiveness under real-
world conditions, and (unlike explanatory RCTs that are often set up with regulatory
approval in mind) to guide routine clinical practice. Pragmatic trials recruit and randomise
representative patients, use clinically relevant comparators (i.e., not placebo), and follow
participants over longer periods of time to study safety and other ‘hard’ (i.e., not surrogate)
outcomes (e.g., radiographic progression). Clinicians should be aware of pragmatic trials,
take part in them, and promote/demand their use to inform real-world guidelines. Current
NICE protocols for guideline development and health technology assessment consider all
types of randomised trials and observational studies, but they are nevertheless dominated
by explanatory RCTs [268].
8.4 Recommendations for health policy
8.4.1 AxSpA guidelines
The current UK management guidelines from NICE recommend escalating to bDMARDs
when high disease activity (typically BASDAI>4) persists despite NSAIDs. Results from this
thesis suggest that the BASDAI definition of ‘high disease activity’ may need to be
reconsidered for individuals with high comorbidity burden. ASDAS may be a superior index
in preventing escalation to these potentially toxic drugs for symptoms that are not specific
to the axSpA disease process.
Once started, NICE recommends that response to TNFi should be assessed at 12 weeks (16
weeks for secukinumab). Treatment should only be continued if there is clear evidence of
response (i.e., BASDAI 50/2 response and spinal pain reduction of ≥2 units). NICE includes
the following caveat: ‘healthcare professionals should take into account any physical,
sensory or learning disabilities, or communication difficulties that could affect the
responses to the questionnaires, and make any adjustments they consider appropriate.
274
[190]’ Results from this thesis support additional allowances for response to treatment in
the presence of comorbidities, for example, allowing longer for response assessment.
The current response definition (based on BASDAI and spinal pain) is a compromise
between 1) absolute response and 2) a fixed threshold for low disease activity/remission.
This may be problematic for any patient group with high starting disease activity – for they
are simultaneously more able to achieve the former and less able to achieve the latter,
compared to those with lower starting disease activity. There are good arguments for both
definitions; some patients may only be interested in being ‘in remission’ or having ‘low
disease activity’, while others would be satisfied with any improvement to their current
symptoms. One way for policy makers to decide is to look at the personal and societal
benefits from each; for example, if quality of life or work productivity are only improved
when remission is achieved, or if they improve proportionately with the degree of absolute
disease activity change. Until these studies are available, clinicians should be aware that
binary response definitions are highly dependent on starting disease activity and should be
interpreted with caution outside of clinical trials.
8.4.2 Healthcare services
The main public health message relates to the need to provide holistic care that addresses
comorbidities, particularly co-existing mental health conditions. In 2012, over half of the UK
general population over the age of 65 had two or more co-existing chronic conditions [79];
this will continue to increase as the population ages. Patients attending rheumatology
clinics with multiple disorders are increasingly the norm. This demographic shift has
occurred in parallel with increasingly sub-specialised and protocol-driven disease
management; therefore, it is essential that specialists remain proactive in treating patients
holistically. Multidisciplinary services may be part of the answer. Some rare conditions,
such as Behcet’s disease, already benefit from multidisciplinary clinics involving other
medical specialties, psychology and social support [260,269]. Similar services have been
successful and well-received by patients for SpA [270].
Musculoskeletal and mental health disorders represent some of the biggest disease
burdens in the developed world and thus the most likely to co-exist; when they do, there is
evidence that they are synergistically detrimental on outcomes such as work [271].
Screening for depression and anxiety in rheumatology services have been discussed above;
this should be part of the wider societal effort to improve awareness and provisions for
mental health disorders. The World Health Organisation set out its comprehensive Mental
275
Health Action Plan in 2013 [272]; this was recently echoed by Public Health England’s ‘Every
Mind Matters’ campaign [273]. They acknowledge the essential role of mental health in
achieving overall health for all people – a fact that rheumatology is increasingly recognising
in both clinical practice and research.
Finally, lifestyle factors are directly relevant to rheumatic diseases (e.g., smoking in RA) and
indirectly through comorbidities (e.g., SpA patients have higher risk of cardiovascular
diseases that can be further increased by poor lifestyle). Education and interventions to
promote behavioural change toward healthier lifestyles – e.g., relating to diet, smoking,
weight, alcohol, physical activity – should be emphasised to prevent, or improve
management of, comorbidities.
8.5 Recommendations for future research
8.5.1 Clinical research
8.5.1.1 Evidence for patient-centred care model
The importance of proactively managing comorbidities in rheumatology was highlighted by
EULAR and this thesis, but evidence for its benefit on individual or health economic
outcomes are lacking. Such evidence will be needed to support changes in policy, practice,
or funding.
A fully patient-centred approach to care is more compatible within the primary, than
secondary, care setting. A large pragmatic cluster RCT of 1546 patients in UK primary care
compared the effectiveness of patient-centred multimorbidity management to usual care
[274]. The ‘3D intervention’ replaced disease-focused reviews with whole-person reviews
that included several components thought to be important by this thesis and other
research, for example, depression screening, social support, and health promotion. The
intervention significantly improved ‘patient-centred care’ as defined by patient satisfaction,
physician/nurse empathy, and compatibility with the ‘Chronic Care Model’ (organization of
health care, clinical information systems, delivery system design, decision support, self-
management support, and community resources). However, the primary outcome – quality
of life at 15 months – was no different between the intervention and control arms. This
finding was consistent with meta-analysis of several previous small trials [275]. There were
also no differences in a series of secondary outcomes including HADS, self-rated health,
276
effect of illness on life, patient-reported treatment burden, medication adherence, or
hospital admissions. Cost-effectiveness, in terms of cost per quality-adjusted life year
gained, was also equivocal [276].
It is unlikely that similar interventions in secondary care will show superior outcomes given
the 3D trial findings. But, as the authors pointed out, improving patient experience is one of
the triple aims of health care, thus providing care that is demonstrably more patient-
centred is arguably sufficient justification for implementation in itself [274]. Future
research, preferably pragmatic trials, should examine the individual and health economic
benefits of holistic approaches to comorbidity management in rheumatology services.
Successful optimisation of comorbidities, particularly depression, may have direct benefits
on axSpA outcomes such as treatment response and, in turn, quality of life and work
productivity.
8.5.1.2 Mental health interventions
Preliminary observational data show that clinical psychology interventions integrated into
routine rheumatology services can halve psychological distress and reduced need for
rheumatology outpatient follow-up by a third [270]. Direct comparison against usual care in
pragmatic trials are required to support wide adoption of these integrated interventions.
The following examples can inform the design of such trials.
Compared to rheumatologist-led care of RA, nurse-led management (that, among other
things, included a 3.3-fold greater provision of psychosocial support and 1.8-fold more
education) led to no difference in satisfaction, and no clinically meaningful difference in
HADS or quality of life improvement. Nurse-led care also resulted in smaller improvements
in perceived self-efficacy, but superior improvements in pain and physical function.
Analogous results have been reported for nurse-led (vs GP-led) care of gout that included 1)
holistic assessment, education, shared decision making and discussion of illness
perceptions, and 2) treat-to-target urate-lowering therapy. Nurse-led care was superior for
reducing urate levels and flares; this group also reported superior improvement in the
physical component of SF-36 (a quality of life instrument) but not mental health [277]. In
both examples, many other clinical parameters (e.g., treatment changes) differed between
the trial arms; therefore, it is difficult to attribute results to holistic management.
Future trials should separate direct axSpA interventions from those for optimising mental
health. They will also likely need well-defined mental health interventions, rather than non-
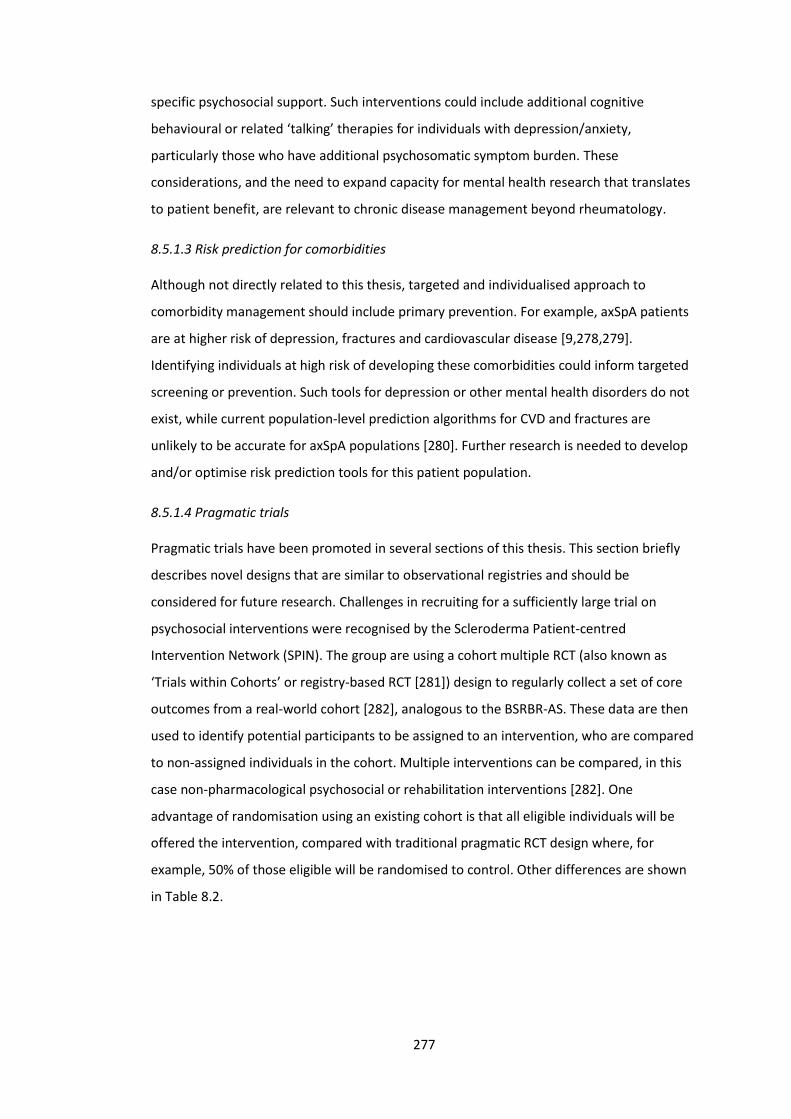
277
specific psychosocial support. Such interventions could include additional cognitive
behavioural or related ‘talking’ therapies for individuals with depression/anxiety,
particularly those who have additional psychosomatic symptom burden. These
considerations, and the need to expand capacity for mental health research that translates
to patient benefit, are relevant to chronic disease management beyond rheumatology.
8.5.1.3 Risk prediction for comorbidities
Although not directly related to this thesis, targeted and individualised approach to
comorbidity management should include primary prevention. For example, axSpA patients
are at higher risk of depression, fractures and cardiovascular disease [9,278,279].
Identifying individuals at high risk of developing these comorbidities could inform targeted
screening or prevention. Such tools for depression or other mental health disorders do not
exist, while current population-level prediction algorithms for CVD and fractures are
unlikely to be accurate for axSpA populations [280]. Further research is needed to develop
and/or optimise risk prediction tools for this patient population.
8.5.1.4 Pragmatic trials
Pragmatic trials have been promoted in several sections of this thesis. This section briefly
describes novel designs that are similar to observational registries and should be
considered for future research. Challenges in recruiting for a sufficiently large trial on
psychosocial interventions were recognised by the Scleroderma Patient-centred
Intervention Network (SPIN). The group are using a cohort multiple RCT (also known as
‘Trials within Cohorts’ or registry-based RCT [281]) design to regularly collect a set of core
outcomes from a real-world cohort [282], analogous to the BSRBR-AS. These data are then
used to identify potential participants to be assigned to an intervention, who are compared
to non-assigned individuals in the cohort. Multiple interventions can be compared, in this
case non-pharmacological psychosocial or rehabilitation interventions [282]. One
advantage of randomisation using an existing cohort is that all eligible individuals will be
offered the intervention, compared with traditional pragmatic RCT design where, for
example, 50% of those eligible will be randomised to control. Other differences are shown
in Table 8.2.
278
Table 8. 2: Comparison of registries, registry-based RCTs, and RCTs.
Design Advantages Disadvantages
Registries and observational studies
• Ideal for description of standards
• Real-world, generalisable cohorts
• Large numbers allow for the study of rare events
• Relatively inexpensive
• Data quality is variable
• Limited use for comparative outcomes research
• Confounding
Randomised clinical trials
• Well-designed studies with adequate power
• Removes confounding factors
• Highly selected populations
• Recruitment often at specialised centres
• Often uses surrogate end points
• Expensive
• Rarely compares interventions that have no economic benefit
Registry-based randomised clinical trials
• Removes confounding
• Less-selected patient populations
• Large numbers allow for the study of rare events
• Data quality may be variable
• Dropout will be higher
• Limited outcomes
Adapted from James et al [283].
8.5.2 Research methodology
This thesis demonstrated the importance of using and reporting a range of different
methodological approaches. Future research on comorbidities should consider adopting a
combined approach by examining individual conditions in the context of overall
comorbidity burden or comorbidity clusters. When using comorbidity count in analyses,
weighted scores should not be used for outcomes for which it was not validated.
Comorbidity count should not only be dichotomised (present vs absent), since there may be
valuable insights offered by continuous or categorical variable types. For example, results
from this thesis suggested non-linear relationships between comorbidity count and some
treatment outcomes.
This thesis also demonstrated markedly different results when using each of the three
definitions of treatment (binary, absolute change, and time-to-discontinuation). Limitations
of binary outcome measures on statistical power and causal inference are well-described in
the literature [284], yet they remain the preferred and often the only outcome used. Their
limitations should be fully acknowledged in future studies, which should preferably be
accompanied by analyses using continuous indices. Any patient group with high disease
activity at baseline will simultaneously be more able to achieve a fixed or proportional
279
reduction (because there is more capacity for improvement) and less able to achieve a
threshold for low disease activity (because a greater absolute improvement is required). In
support of results in this thesis, studies in RA showed that high baseline DAS28
simultaneously increased odds of ACR70 response and decreased odds of DAS remission
[285]. Using outcomes from RCTs (e.g., ASAS20 or ACR70), where baseline disease activity is
balanced, is inappropriate for observational comparisons when it is not. Adjusting for
baseline disease activity may not be a robust solution when using binary outcomes [41].
Future studies should adopt a more considered approach to confounder selection – one
that differs according to whether the aim is for prediction or causation [187,251]. For
causation, confounder selection should be based on existing knowledge and/or literature
review, preferably supported by transparently declared assumptions in the form of causal
diagrams. Variable selection methods that are popular for prediction (e.g., univariate
screening or stepwise variable selection) should not be used for questions of causation.
Researchers should declare the aim of their analysis and highlight limitations in the ability
to infer causation. For manipulatable exposures, the gold-standard methodological
approach is to use observational data to emulate the design of a hypothetical RCT [161].
8.6 Future research projects related to this thesis
Results from this thesis (and parallel projects on smoking in the BSRBR-AS [7]) have
suggested subtle differences between male and female participants, which may be due to
the different ways in which they respond to questionnaires generally, and in the context of
some comorbidities, such as depression. The axSpA disease process itself is also well-known
to differ between sexes, for example, phenotype, prognosis and treatment response [286].
Therefore, future research following on from this thesis will include more detailed
examination of gender differences; for example, why treatment discontinuation differs.
Having identified depression and anxiety as a major unmet need within rheumatology,
future research should explore – with input from patients and allied health professionals
throughout – feasible and acceptable solutions for treatment and strategies for
implementation. Clinical psychology input would be ideal but is limited, for example, by
funding. A small pilot study of 35 axSpA patients is underway to assess the feasibility and
acceptability of internet-delivered CBT for those with depression or anxiety (REC reference
19/NI/0066). This may be promising given its low cost, availability, and acceptability by the
280
comparatively younger axSpA patients. Lastly, work is ongoing to validate the
multimorbidity index (MMI [148]) against other comorbidity indices in an axSpA population.
The MMI is comprehensive but labour-intensive to collect. Other, simpler indices (e.g., the
self-reported comorbidity index [93]) may be more practical for routine practice.
8.7 Conclusions
Comorbidities are present in the majority of real-world axSpA populations, regardless of the
disease stage (i.e., nr-axSpA vs AS). Mental health and cardiovascular comorbidities are by
far the most prevalent comorbidities, with mental health having the largest and most
consistent impact on axSpA disease assessment and treatment response. These results
have important clinical and policy implications for the current approach to disease
assessment, including eligibility for initiating (using ASDAS rather than BASDAI) and
continuing bDMARDs (using both binary and continuous response definitions). Evidence-
based practice is underpinned by RCTs that often exclude comorbid patients. Results of this
thesis also highlighted the potential impact of comorbidities on treatment response (e.g.,
function and health-related quality of life) and discontinuation, that may explain
differences between real-world effectiveness and RCT efficacy. Future research will benefit
from a broader and more methodologically robust approach to studying comorbidities and
treatment outcomes (e.g., comorbidity clusters and outcome-types). Having described the
problem of poor response rates to bDMARD treatment, the thesis concluded with a search
for a solution: optimising mental health symptoms before or at treatment initiation may
provide substantial improvements to treatment response – with effect sizes that are
magnitudes larger than seen in RA or with other ‘modifiable’ risk factors of poor-response
(e.g., smoking) in axSpA. Healthcare providers should routinely record and refer
comorbidities for optimal management. The importance of multimorbidity – particularly
mental health disorders that are often under-recognised – and methodological approaches
adopted in this thesis have wider applicability to chronic disease management beyond
rheumatology.
281
9. Bibliography
1. Moll JM, Haslock I, Macrae IF, Wright V. Associations between ankylosing spondylitis, psoriatic arthritis, Reiter’s disease, the intestinal arthropathies, and Behcet’s syndrome. Medicine (Baltimore). 1974 Sep;53(5):343–64.
2. Sieper J, Braun J, Dougados M, Baeten D. Axial spondyloarthritis. Nat Rev Dis Primers. 2015 09;1:15013.
3. McAllister K, Goodson N, Warburton L, Rogers G. Spondyloarthritis: diagnosis and management: summary of NICE guidance. Bmj. 2017 Mar 1;356:j839.
4. Wang R, Gabriel SE, Ward MM. Progression of Nonradiographic Axial Spondyloarthritis to Ankylosing Spondylitis: A Population-Based Cohort Study: Prognosis of Nonradiographic Axial Spa. Arthritis & Rheumatology. 2016 Jun;68(6):1415–21.
5. Poddubnyy D, Rudwaleit M, Haibel H, Listing J, Märker-Hermann E, Zeidler H, et al. Rates and predictors of radiographic sacroiliitis progression over 2 years in patients with axial spondyloarthritis. Ann Rheum Dis. 2011 Aug;70(8):1369–74.
6. Zhao S, Challoner B, Khattak M, Moots RJ, Goodson NJ. Increasing smoking intensity is associated with increased disease activity in axial spondyloarthritis. Rheumatology international. 2017 Feb;37(2):239–44.
7. Zhao S, Jones GT, Macfarlane GJ, Hughes DM, Dean LE, Moots RJ, et al. Associations between smoking and extra-axial manifestations and disease severity in axial spondyloarthritis: results from the BSR Biologics Register for Ankylosing Spondylitis (BSRBR-AS). Rheumatology (Oxford, England). 2019;58(5):811–9.
8. Martindale J, Shukla R, Goodacre J. The impact of ankylosing spondylitis/axial spondyloarthritis on work productivity. Best Practice & Research Clinical Rheumatology. 2015 Jun 1;29(3):512–23.
9. Zhao S, Thong D, Miller N, Duffield SJ, Hughes DM, Chadwick L, et al. The prevalence of depression in axial spondyloarthritis and its association with disease activity: a systematic review and meta-analysis. Arthritis Research & Therapy. 2018 Dec;20(1).
10. Zhao SS, Pittam B, Harrison N, Ahmed AE, Goodson N, Hughes D. Diagnostic delay in axial spondyloarthritis: a systematic review and meta-analysis. Rheumatology (Oxford). 2020;
11. Winter JJ de, Paramarta JE, Jong HM de, Sande MG van de, Baeten DL. Peripheral disease contributes significantly to the level of disease activity in axial spondyloarthritis. RMD Open. 2019 Jan 1;5(1):e000802.
12. de Winter JJ, van Mens LJ, van der Heijde D, Landewé R, Baeten DL. Prevalence of peripheral and extra-articular disease in ankylosing spondylitis versus non-radiographic axial spondyloarthritis: a meta-analysis. Arthritis Res Ther. 2016 [cited 2019 May 30];18(1).
282
13. McGonagle D, Gibbon W, Emery P. Classification of inflammatory arthritis by enthesitis. Lancet. 1998 Oct 3;352(9134):1137–40.
14. Zhao SS, Duffield SJ, Goodson NJ. The prevalence and impact of comorbid fibromyalgia in inflammatory arthritis. Best Pract Res Clin Rheumatol. 2019;33(3):101423.
15. Pittam B, Gupta S, Harrison N, Robertson S, Hughes D, Zhao S. Prevalence of extra-articular manifestations in psoriatic arthritis: a systematic review and meta-analysis. Rheumatology (Oxford). [epub ahead of print].
16. Stolwijk C, van Tubergen A, Castillo-Ortiz JD, Boonen A. Prevalence of extra-articular manifestations in patients with ankylosing spondylitis: a systematic review and meta-analysis. Annals of the rheumatic diseases. 2015 Jan;74(1):65–73.
17. Stolwijk C, Essers I, van Tubergen A, Boonen A, Bazelier MT, De Bruin ML, et al. The epidemiology of extra-articular manifestations in ankylosing spondylitis: a population-based matched cohort study. Ann Rheum Dis. 2015 Jul;74(7):1373–8.
18. Brophy S, Pavy S, Lewis P, Taylor G, Bradbury L, Robertson D, et al. Inflammatory eye, skin, and bowel disease in spondyloarthritis: genetic, phenotypic, and environmental factors. The Journal of Rheumatology. 2001 Dec 1;28(12):2667–73.
19. Bañares A, Hernández-García C, Fernández-Gutiérrez B, Jover JA. Eye involvement in the spondyloarthropathies. Rheumatic Diseases Clinics of North America. 1998 Nov;24(4):771–84, ix.
20. Zeboulon N, Dougados M, Gossec L. Prevalence and characteristics of uveitis in the spondyloarthropathies: a systematic literature review. Annals of the Rheumatic Diseases. 2008 Jul 1;67(7):955–9.
21. McGonagle D, Aydin SZ, Gül A, Mahr A, Direskeneli H. ’MHC-I-opathy’-unified concept for spondyloarthritis and Behçet disease. Nat Rev Rheumatol. 2015;11(12):731–40.
22. Juanola X, Loza Santamaría E, Cordero-Coma M, SENTINEL Working Group. Description and Prevalence of Spondyloarthritis in Patients with Anterior Uveitis: The SENTINEL Interdisciplinary Collaborative Project. Ophthalmology. 2016;123(8):1632–6.
23. Zhao SS, Miller N, Harrison N, Duffield SJ, Dey M, Goodson NJ. Systematic review of mental health comorbidities in psoriatic arthritis. Clin Rheumatol. 2020 Jan;39(1):217–25.
24. Jadon DR, Sengupta R, Nightingale A, Lindsay M, Korendowych E, Robinson G, et al. Axial Disease in Psoriatic Arthritis study: defining the clinical and radiographic phenotype of psoriatic spondyloarthritis. Annals of the Rheumatic Diseases. 2017 Apr 1;76(4):701–7.
25. Wendling D, Balblanc J-C, Briançon D, Brousse A, Lohse A, Deprez P, et al. Onset or exacerbation of cutaneous psoriasis during TNFalpha antagonist therapy. Joint Bone Spine. 2008 May;75(3):315–8.
283
26. De Vos M, Mielants H, Cuvelier C, Elewaut A, Veys E. Long-term evolution of gut inflammation in patients with spondyloarthropathy. Gastroenterology. 1996 Jun 1;110(6):1696–703.
27. Praet LV, Bosch FEV den, Jacques P, Carron P, Jans L, Colman R, et al. Microscopic gut inflammation in axial spondyloarthritis: a multiparametric predictive model. Annals of the Rheumatic Diseases. 2013 Mar 1;72(3):414–7.
28. Praet LV, Jans L, Carron P, Jacques P, Glorieus E, Colman R, et al. Degree of bone marrow oedema in sacroiliac joints of patients with axial spondyloarthritis is linked to gut inflammation and male sex: results from the GIANT cohort. Annals of the Rheumatic Diseases. 2014 Jun 1;73(6):1186–9.
29. Dean LE, Jones GT, MacDonald AG, Downham C, Sturrock RD, Macfarlane GJ. Global prevalence of ankylosing spondylitis. Rheumatology (Oxford). 2014 Apr 1;53(4):650–7.
30. Akkoç N, Khan MA. Epidemiology of Axial Spondyloarthritis. In: Axial Spondyloarthritis. Elsevier; 2019 [cited 2019 May 30]. p. 31–56.
31. Strand V, Rao SA, Shillington AC, Cifaldi MA, McGuire M, Ruderman EM. Prevalence of axial spondyloarthritis in United States rheumatology practices: Assessment of SpondyloArthritis International Society criteria versus rheumatology expert clinical diagnosis. Arthritis Care Res (Hoboken). 2013 Aug;65(8):1299–306.
32. van Hoeven L, Luime J, Han H, Vergouwe Y, Weel A. Identifying axial spondyloarthritis in Dutch primary care patients, ages 20-45 years, with chronic low back pain. Arthritis Care Res (Hoboken). 2014 Mar;66(3):446–53.
33. Reveille JD. The genetic basis of ankylosing spondylitis. Curr Opin Rheumatol. 2006 Jul;18(4):332–41.
34. Brown MA, Laval SH, Brophy S, Calin A. Recurrence risk modelling of the genetic susceptibility to ankylosing spondylitis. Ann Rheum Dis. 2000 Nov;59(11):883–6.
35. Geirsson AJ, Kristjansson K, Gudbjornsson B. A strong familiality of ankylosing spondylitis through several generations. Annals of the Rheumatic Diseases. 2010 Jul 1;69(7):1346–8.
36. Calin A, Brophy S, Blake D. Impact of sex on inheritance of ankylosing spondylitis: a cohort study. Lancet. 1999 Nov 13;354(9191):1687–90.
37. Costello M-E, Ciccia F, Willner D, Warrington N, Robinson PC, Gardiner B, et al. Brief Report: Intestinal Dysbiosis in Ankylosing Spondylitis. Arthritis & Rheumatology (Hoboken, NJ). 2015 Mar;67(3):686–91.
38. Breban M, Tap J, Leboime A, Said-Nahal R, Langella P, Chiocchia G, et al. Faecal microbiota study reveals specific dysbiosis in spondyloarthritis. Ann Rheum Dis. 2017 Sep;76(9):1614–22.
39. David LA, Maurice CF, Carmody RN, Gootenberg DB, Button JE, Wolfe BE, et al. Diet rapidly and reproducibly alters the human gut microbiome. Nature. 2014 Jan;505(7484):559–63.
284
40. Zhao SS, Macfarlane GJ, Jones GT, Gaffney K, Hughes DM, Moots RJ, et al. Smoking does not protect patients with axial spondyloarthritis from attacks of uveitis. Annals of the Rheumatic Diseases. 2019 Apr 19;annrheumdis-2019-215348.
41. Zhao SS, Goodson NJ, Robertson S, Gaffney K. Smoking in spondyloarthritis: unravelling the complexities. Rheumatology (Oxford). 2020 Apr 1;
42. Zhao S, Yoshida K, Jones GT, Hughes DM, Tedeschi SK, Lyu H, et al. The impact of smoking on response to TNF inhibitors in axial spondyloarthritis: methodological considerations for longitudinal observational studies. Arthritis Care & Research. 2020;72(4):591-599.
43. Sherlock JP, Joyce-Shaikh B, Turner SP, Chao C-C, Sathe M, Grein J, et al. IL-23 induces spondyloarthropathy by acting on ROR-γt+ CD3+CD4-CD8- entheseal resident T cells. Nat Med. 2012 Jul 1;18(7):1069–76.
44. Aggarwal R, Ringold S, Khanna D, Neogi T, Johnson SR, Miller A, et al. Distinctions Between Diagnostic and Classification Criteria? Arthritis Care & Research. 2015;67(7):891–7.
45. Rudwaleit M, Feldtkeller E, Sieper J. Easy assessment of axial spondyloarthritis (early ankylosing spondylitis) at the bedside. Ann Rheum Dis. 2006 Sep;65(9):1251–2.
46. van den Berg R, de Hooge M, Rudwaleit M, Sieper J, van Gaalen F, Reijnierse M, et al. ASAS modification of the Berlin algorithm for diagnosing axial spondyloarthritis: results from the SPondyloArthritis Caught Early (SPACE)-cohort and from the Assessment of SpondyloArthritis international Society (ASAS)-cohort. Ann Rheum Dis. 2013 Oct;72(10):1646–53.
47. Taurog JD, Chhabra A, Colbert RA. Ankylosing Spondylitis and Axial Spondyloarthritis. N Engl J Med. 2016 Jun 30;374(26):2563–74.
48. van der Linden S, Valkenburg HA, Cats A. Evaluation of diagnostic criteria for ankylosing spondylitis. A proposal for modification of the New York criteria. Arthritis Rheum. 1984 Apr;27(4):361–8.
49. Amor B, Dougados M, Listrat V, Menkes CJ, Dubost JJ, Roux H, et al. [Evaluation of the Amor criteria for spondylarthropathies and European Spondylarthropathy Study Group (ESSG). A cross-sectional analysis of 2,228 patients]. Ann Med Interne (Paris). 1991;142(2):85–9.
50. Dougados M, van der Linden S, Juhlin R, Huitfeldt B, Amor B, Calin A, et al. The European Spondylarthropathy Study Group preliminary criteria for the classification of spondylarthropathy. Arthritis Rheum. 1991 Oct;34(10):1218–27.
51. Rudwaleit M, van der Heijde D, Landewé R, Listing J, Akkoc N, Brandt J, et al. The development of Assessment of SpondyloArthritis international Society classification criteria for axial spondyloarthritis (part II): validation and final selection. Ann Rheum Dis. 2009 Jun;68(6):777–83.
52. Rudwaleit M, van der Heijde D, Landewé R, Akkoc N, Brandt J, Chou CT, et al. The Assessment of SpondyloArthritis International Society classification criteria for
285
peripheral spondyloarthritis and for spondyloarthritis in general. Ann Rheum Dis. 2011 Jan;70(1):25–31.
53. Sepriano A, Rubio R, Ramiro S, Landewé R, van der Heijde D. Performance of the ASAS classification criteria for axial and peripheral spondyloarthritis: a systematic literature review and meta-analysis. Ann Rheum Dis. 2017 May;76(5):886–90.
54. Arnbak B, Jensen TS, Egund N, Zejden A, Hørslev-Petersen K, Manniche C, et al. Prevalence of degenerative and spondyloarthritis-related magnetic resonance imaging findings in the spine and sacroiliac joints in patients with persistent low back pain. European Radiology. 2016 Apr;26(4):1191–203.
55. Molto A, Gossec L, Lefèvre-Colau M-M, Foltz V, Beaufort R, Laredo J-D, et al. Evaluation of the performances of ‘typical’ imaging abnormalities of axial spondyloarthritis: results of the cross-sectional ILOS-DESIR study. RMD Open. 2019 May;5(1):e000918.
56. Rudwaleit M, Haibel H, Baraliakos X, Listing J, Märker-Hermann E, Zeidler H, et al. The early disease stage in axial spondylarthritis: results from the German Spondyloarthritis Inception Cohort. Arthritis Rheum. 2009 Mar;60(3):717–27.
57. Kiltz U, Baraliakos X, Karakostas P, Igelmann M, Kalthoff L, Klink C, et al. Do patients with non-radiographic axial spondylarthritis differ from patients with ankylosing spondylitis? Arthritis Care Res (Hoboken). 2012 Sep;64(9):1415–22.
58. Mease PJ, Heijde DVD, Karki C, Palmer JB, Liu M, Pandurengan R, et al. Characterization of Patients With Ankylosing Spondylitis and Nonradiographic Axial Spondyloarthritis in the US-Based Corrona Registry. Arthritis Care & Research. 2018 Nov;70(11):1661–70.
59. Song I-H, Weiß A, Hermann K-GA, Haibel H, Althoff CE, Poddubnyy D, et al. Similar response rates in patients with ankylosing spondylitis and non-radiographic axial spondyloarthritis after 1 year of treatment with etanercept: results from the ESTHER trial. Ann Rheum Dis. 2013 Jun;72(6):823–5.
60. Landewé R, Braun J, Deodhar A, Dougados M, Maksymowych WP, Mease PJ, et al. Efficacy of certolizumab pegol on signs and symptoms of axial spondyloarthritis including ankylosing spondylitis: 24-week results of a double-blind randomised placebo-controlled Phase 3 study. Annals of the Rheumatic Diseases. 2014 Jan 1;73(1):39–47.
61. Heijde D van der, Ramiro S, Landewé R, Baraliakos X, Bosch FV den, Sepriano A, et al. 2016 update of the ASAS-EULAR management recommendations for axial spondyloarthritis. Annals of the Rheumatic Diseases. 2017 Jun 1;76(6):978–91.
62. van der Heijde D, Ramiro S, Landewé R, Baraliakos X, Van den Bosch F, Sepriano A, et al. 2016 update of the ASAS-EULAR management recommendations for axial spondyloarthritis. Annals of the Rheumatic Diseases. 2017 Jun;76(6):978–91.
63. van der Heijde D, Calin A, Dougados M, Khan MA, van der Linden S, Bellamy N. Selection of instruments in the core set for DC-ART, SMARD, physical therapy, and clinical record keeping in ankylosing spondylitis. Progress report of the ASAS
286
Working Group. Assessments in Ankylosing Spondylitis. J Rheumatol. 1999 Apr;26(4):951–4.
64. Machado P, Landewé R, Lie E, Kvien TK, Braun J, Baker D, et al. Ankylosing Spondylitis Disease Activity Score (ASDAS): defining cut-off values for disease activity states and improvement scores. Annals of the Rheumatic Diseases. 2011 Jan 1;70(1):47–53.
65. Machado PM, Landewé R, Heijde D van der. Ankylosing Spondylitis Disease Activity Score (ASDAS): 2018 update of the nomenclature for disease activity states. Annals of the Rheumatic Diseases. 2018 Oct 1;77(10):1539–40.
66. Sieper J, Lenaerts J, Wollenhaupt J, Rudwaleit M, Mazurov VI, Myasoutova L, et al. Efficacy and safety of infliximab plus naproxen versus naproxen alone in patients with early, active axial spondyloarthritis: results from the double-blind, placebo-controlled INFAST study, Part 1. Ann Rheum Dis. 2014 Jan;73(1):101–7.
67. Wanders A, Heijde D van der, Landewé R, Béhier J-M, Calin A, Olivieri I, et al. Nonsteroidal antiinflammatory drugs reduce radiographic progression in patients with ankylosing spondylitis: a randomized clinical trial. Arthritis Rheum. 2005 Jun;52(6):1756–65.
68. Evans JM, McMahon AD, Murray FE, McDevitt DG, MacDonald TM. Non-steroidal anti-inflammatory drugs are associated with emergency admission to hospital for colitis due to inflammatory bowel disease. Gut. 1997 May;40(5):619–22.
69. Sandborn WJ, Stenson WF, Brynskov J, Lorenz RG, Steidle GM, Robbins JL, et al. Safety of celecoxib in patients with ulcerative colitis in remission: a randomized, placebo-controlled, pilot study. Clin Gastroenterol Hepatol. 2006 Feb;4(2):203–11.
70. El Miedany Y, Youssef S, Ahmed I, El Gaafary M. The gastrointestinal safety and effect on disease activity of etoricoxib, a selective cox-2 inhibitor in inflammatory bowel diseases. Am J Gastroenterol. 2006 Feb;101(2):311–7.
71. Ward MM, Deodhar A, Akl EA, Lui A, Ermann J, Gensler LS, et al. American College of Rheumatology/Spondylitis Association of America/Spondyloarthritis Research and Treatment Network 2015 Recommendations for the Treatment of Ankylosing Spondylitis and Nonradiographic Axial Spondyloarthritis: ACR/SAA/Spartan Treatment Recommendations in as. Arthritis & Rheumatology. 2016 Feb;68(2):282–98.
72. Rudwaleit M, Listing J, Brandt J, Braun J, Sieper J. Prediction of a major clinical response (BASDAI 50) to tumour necrosis factor alpha blockers in ankylosing spondylitis. Annals of the rheumatic diseases. 2004 Jun;63(6):665–70.
73. Hueber W, Sands BE, Lewitzky S, Vandemeulebroecke M, Reinisch W, Higgins PDR, et al. Secukinumab, a human anti-IL-17A monoclonal antibody, for moderate to severe Crohn’s disease: unexpected results of a randomised, double-blind placebo-controlled trial. Gut. 2012 Dec;61(12):1693–700.
74. Schreiber S, Colombel J-F, Feagan BG, Reich K, Deodhar AA, McInnes IB, et al. Incidence rates of inflammatory bowel disease in patients with psoriasis, psoriatic arthritis and ankylosing spondylitis treated with secukinumab: a retrospective
287
analysis of pooled data from 21 clinical trials. Annals of the Rheumatic Diseases. 2019 Apr 1;78(4):473–9.
75. Study of Apremilast to Treat Subjects With Active Ankylosing Spondylitis - Study Results - ClinicalTrials.gov. [cited 2019 Jun 18]. Available from: https://clinicaltrials.gov/ct2/show/results/NCT01583374
76. Heijde D van der, Deodhar A, Wei JC, Drescher E, Fleishaker D, Hendrikx T, et al. Tofacitinib in patients with ankylosing spondylitis: a phase II, 16-week, randomised, placebo-controlled, dose-ranging study. Annals of the Rheumatic Diseases. 2017 Aug 1;76(8):1340–7.
77. Maksymowych WP, van der Heijde D, Baraliakos X, Deodhar A, Sherlock SP, Li D, et al. Tofacitinib is associated with attainment of the minimally important reduction in axial magnetic resonance imaging inflammation in ankylosing spondylitis patients. Rheumatology (Oxford). 2018 01;57(8):1390–9.
78. Heijde D van der, Baraliakos X, Gensler LS, Maksymowych WP, Tseluyko V, Nadashkevich O, et al. Efficacy and safety of filgotinib, a selective Janus kinase 1 inhibitor, in patients with active ankylosing spondylitis (TORTUGA): results from a randomised, placebo-controlled, phase 2 trial. The Lancet. 2018 Dec 1;392(10162):2378–87.
79. Barnett K, Mercer SW, Norbury M, Watt G, Wyke S, Guthrie B. Epidemiology of multimorbidity and implications for health care, research, and medical education: a cross-sectional study. The Lancet. 2012 Jul;380(9836):37–43.
80. Garrison GM, Keuseman R, Bania B, Robelia P, Pecina J. Visit Entropy Associated with Hospital Readmission Rates. J Am Board Fam Med. 2017 Jan 1;30(1):63–70.
81. Le Reste JY, Nabbe P, Manceau B, Lygidakis C, Doerr C, Lingner H, et al. The European General Practice Research Network presents a comprehensive definition of multimorbidity in family medicine and long term care, following a systematic review of relevant literature. J Am Med Dir Assoc. 2013 May;14(5):319–25.
82. Willadsen TG, Bebe A, Køster-Rasmussen R, Jarbøl DE, Guassora AD, Waldorff FB, et al. The role of diseases, risk factors and symptoms in the definition of multimorbidity – a systematic review. Scandinavian Journal of Primary Health Care. 2016 Apr 2;34(2):112–21.
83. Johnston MC, Crilly M, Black C, Prescott GJ, Mercer SW. Defining and measuring multimorbidity: a systematic review of systematic reviews. European Journal of Public Health. 2019 Feb 1;29(1):182–9.
84. Zhao SS, Robertson S, Reich T, Harrison N, Moots RJ, Goodson NJ. Prevalence and impact of comorbidities in axial spondyloarthritis: systematic review and meta-analysis. Rheumatology. 2020;59(Supplement_4):iv47–iv57.
85. González C, Curbelo Rodríguez R, Torre-Alonso JC, Collantes E, Castañeda S, Hernández MV, et al. Recommendations for the Management of Comorbidity in Patients With Axial Spondyloarthritis in Clinical Practice. Reumatología Clínica (English Edition). 2018 Nov;14(6):346–59.
288
86. Haroon NN, Paterson JM, Li P, Inman RD, Haroon N. Patients With Ankylosing Spondylitis Have Increased Cardiovascular and Cerebrovascular Mortality: A Population-Based Study. Ann Intern Med. 2015 Sep 15;163(6):409.
87. Stolwijk C. Extra articular manifestations and comorbidities in spondyloarthritis: epidemiological and clinical aspects. 2015.
88. Mielants H, Van den Bosch F. Extra-articular manifestations. Clin Exp Rheumatol. 2009 Aug;27(4 Suppl 55):S56-61.
89. Moltó A, Etcheto A, van der Heijde D, Landewé R, van den Bosch F, Bautista Molano W, et al. Prevalence of comorbidities and evaluation of their screening in spondyloarthritis: results of the international cross-sectional ASAS-COMOSPA study. Ann Rheum Dis. 2016 Jun;75(6):1016–23.
90. Nikiphorou E, Ramiro S, van der Heijde D, Norton S, Moltó A, Dougados M, et al. Association of Comorbidities in Spondyloarthritis With Poor Function, Work Disability, and Quality of Life: Results From the Assessment of SpondyloArthritis International Society Comorbidities in Spondyloarthritis Study. Arthritis Care & Research. 2018 Aug;70(8):1257–62.
91. Bautista-Molano W, Landewé R, Burgos-Vargas R, Maldonado-Cocco J, Moltó A, van den Bosch F, et al. Prevalence of Comorbidities and Risk Factors for Comorbidities in Patients with Spondyloarthritis in Latin America: A Comparative Study with the General Population and Data from the ASAS-COMOSPA Study. J Rheumatol. 2018 Feb;45(2):206–12.
92. Webers C, Ramiro S, Landewé R, van der Heijde D, van den Bosch F, Dougados M, et al. Sick leave and its predictors in ankylosing spondylitis: long-term results from the Outcome in Ankylosing Spondylitis International Study. RMD Open. 2018 Nov;4(2):e000766.
93. Stolwijk C, van Tubergen A, Ramiro S, Essers I, Blaauw M, van der Heijde D, et al. Aspects of validity of the self-administered comorbidity questionnaire in patients with ankylosing spondylitis. Rheumatology. 2014 Jun 1;53(6):1054–64.
94. Walsh JA, Song X, Kim G, Park Y. Evaluation of the comorbidity burden in patients with ankylosing spondylitis using a large US administrative claims data set. Clin Rheumatol. 2018 Jul;37(7):1869–78.
95. Walsh JA, Song X, Kim G, Park Y. Evaluation of the comorbidity burden in patients with ankylosing spondylitis treated with tumour necrosis factor inhibitors using a large administrative claims data set. J Pharm Health Serv Res. 2018 Jun;9(2):115–21.
96. Boonen A. Withdrawal from labour force due to work disability in patients with ankylosing spondylitis. Annals of the Rheumatic Diseases. 2001 Nov 1;60(11):1033–9.
97. Han C, Robinson DW, Hackett MV, Paramore LC, Fraeman KH, Bala MV. Cardiovascular disease and risk factors in patients with rheumatoid arthritis, psoriatic arthritis, and ankylosing spondylitis. The Journal of rheumatology. 2006 Nov;33(11):2167–72.
289
98. Ara RM, Packham JC, Haywood KL. The direct healthcare costs associated with ankylosing spondylitis patients attending a UK secondary care rheumatology unit. Rheumatology. 2008 Jan 1;47(1):68–71.
99. Oldroyd J, Schachna L, Buchbinder R, Staples M, Murphy B, Bond M, et al. Ankylosing Spondylitis Patients Commencing Biologic Therapy Have High Baseline Levels of Comorbidity: A Report from the Australian Rheumatology Association Database. International Journal of Rheumatology. 2009;2009:1–10.
100. Salaffi F, Carotti M, Gasparini S, Intorcia M, Grassi W. The health-related quality of life in rheumatoid arthritis, ankylosing spondylitis, and psoriatic arthritis: a comparison with a selected sample of healthy people. Health and Quality of Life Outcomes. 2009 Dec [cited 2019 Oct 17];7(1).
101. Kang J-H, Chen Y-H, Lin H-C. Comorbidity profiles among patients with ankylosing spondylitis: a nationwide population-based study. Annals of the Rheumatic Diseases. 2010 Jun 1;69(6):1165–8.
102. Bremander A, Petersson IF, Bergman S, Englund M. Population-based estimates of common comorbidities and cardiovascular disease in ankylosing spondylitis. Arthritis Care Res. 2011 Apr;63(4):550–6.
103. Gladman DD, Rahman P, Cook RJ, Shen H, Zummer M, Thomson G, et al. The Spondyloarthritis Research Consortium of Canada Registry for Spondyloarthritis. J Rheumatol. 2011 Jul;38(7):1343–8.
104. Bodur H, Ataman Ş, Buğdaycı DS, Rezvani A, Nas K, Uzunca K, et al. Description of the registry of patients with ankylosing spondylitis in Turkey: TRASD-IP. Rheumatol Int. 2012 Jan;32(1):169–76.
105. Ward MM, Learch TJ, Gensler LS, Davis JC, Reveille JD, Weisman MH. Regional radiographic damage and functional limitations in patients with ankylosing spondylitis: Differences in early and late disease. Arthritis Care Res. 2013 Feb;65(2):257–65.
106. Dougados M, Etcheto A, Molto A, Alonso S, Bouvet S, Daurès J-P, et al. Clinical presentation of patients suffering from recent onset chronic inflammatory back pain suggestive of spondyloarthritis: The DESIR cohort. Joint Bone Spine. 2015 Oct;82(5):345–51.
107. Hammoudeh M, Al Rayes H, Alawadhi A, Gado K, Shirazy K, Deodhar A. Clinical Assessment and Management of Spondyloarthritides in the Middle East: A Multinational Investigation. International Journal of Rheumatology. 2015;2015:1–6.
108. Kristensen LE, Jakobsen AK, Askling J, Nilsson F, Jacobsson LTH. Safety of Etoricoxib, Celecoxib, and Nonselective Nonsteroidal Antiinflammatory Drugs in Ankylosing Spondylitis and Other Spondyloarthritis Patients: A Swedish National Population-Based Cohort Study: Spondyloarthritis and Safety of COX Inhibitors. Arthritis Care & Research. 2015 Aug;67(8):1137–49.
109. Ahmed N, Prior JA, Chen Y, Hayward R, Mallen CD, Hider SL. Prevalence of cardiovascular-related comorbidity in ankylosing spondylitis, psoriatic arthritis and
290
psoriasis in primary care: a matched retrospective cohort study. Clin Rheumatol. 2016 Dec;35(12):3069–73.
110. Essers I, Stolwijk C, Boonen A, De Bruin ML, Bazelier MT, de Vries F, et al. Ankylosing spondylitis and risk of ischaemic heart disease: a population-based cohort study. Annals of the Rheumatic Diseases. 2016 Jan;75(1):203–9.
111. Garip Y, Eser F, Guler T, Dortbas F, Kilicarslan A, Bodur H. Comorbidity profiles among patients with ankylosing spondylitis. MMJ. 2016 Mar 4;29(1):23.
112. Maas F, Arends S, van der Veer E, Wink F, Efde M, Bootsma H, et al. Obesity Is Common in Axial Spondyloarthritis and Is Associated with Poor Clinical Outcome. J Rheumatol. 2016 Feb;43(2):383–7.
113. Cook MJ, Bellou E, Bowes J, Sergeant JC, O’Neill TW, Barton A, et al. The prevalence of co-morbidities and their impact on physical activity in people with inflammatory rheumatic diseases compared with the general population: results from the UK Biobank. Rheumatology. 2018 Dec 1;57(12):2172–82.
114. Iannone F, Salaffi F, Fornaro M, Di Carlo M, Gentileschi S, Cantarini L, et al. Influence of baseline modified Rheumatic Disease Comorbidity Index (mRDCI) on drug survival and effectiveness of biological treatment in patients affected with Rheumatoid arthritis, Spondyloarthritis and Psoriatic arthritis in real-world settings. Eur J Clin Invest. 2018 Nov;48(11):e13013.
115. Jiang Y, Zhang P, Tu L, Lv Q, Qi J, Lin Z, et al. Prevalence of comorbidities and evaluation of screening in Chinese patients with spondyloarthritis. Clin Rheumatol. 2018 Feb;37(2):423–8.
116. Krüger K, von Hinüber U, Meier F, Tian H, Böhm K, Jugl SM, et al. Ankylosing spondylitis causes high burden to patients and the healthcare system: results from a German claims database analysis. Rheumatol Int. 2018 Nov;38(11):2121–31.
117. Lee JS, Oh B-L, Lee HY, Song YW, Lee EY. Comorbidity, disability, and healthcare expenditure of ankylosing spondylitis in Korea: A population-based study. Ramagopalan SV, editor. PLoS ONE. 2018 Feb 8;13(2):e0192524.
118. Lindström U, Olofsson T, Wedrén S, Qirjazo I, Askling J. Impact of extra-articular spondyloarthritis manifestations and comorbidities on drug retention of a first TNF-inhibitor in ankylosing spondylitis: a population-based nationwide study. RMD Open. 2018 Oct;4(2):e000762.
119. Ljung L, Sundström B, Smeds J, Ketonen M, Forsblad-d’Elia H. Patterns of comorbidity and disease characteristics among patients with ankylosing spondylitis-a cross-sectional study. Clin Rheumatol. 2018 Mar;37(3):647–53.
120. Sommerfleck F, Schneeberger E, Department of Rheumatology, Instituto de Rehabilitación Psicofísica, Buenos Aires, Argentina, Citera G, Department of Rheumatology, Instituto de Rehabilitación Psicofísica, Buenos Aires, Argentina, Department of Rheumatology, Instituto de Rehabilitación Psicofísica, Buenos Aires, Argentina. Comorbidities in Argentine patients with axial spondyloarthritis: Is nephrolithiasis associated with this disease? Eur J Rheumatol. 2018 Aug 27;5(3):169–72.
291
121. Claudepierre P, Fagnani F, Cukierman G, de Chalus T, Joubert J-M, Laurendeau C, et al. Burden of severe spondyloarthritis in France: A nationwide assessment of prevalence, associated comorbidities and cost. Joint Bone Spine. 2019 Jan;86(1):69–75.
122. Fernández‐Carballido C, Martín‐Martínez MA, García‐Gómez C, Castañeda S, González‐Juanatey C, Sánchez‐Alonso F, et al. Impact of Comorbidity on Physical Function in Patients With Ankylosing Spondylitis and Psoriatic Arthritis Attending Rheumatology Clinics: Results From a Cross‐Sectional Study. Arthritis Care Res. 2020 Jun;72(6):822–8.
123. Fitzgerald G, Gallagher P, O’Shea F. Multimorbidity is Common in Axial Spondyloarthropathy and is Associated with Worse Disease Outcomes: Results from the ASRI cohort. J Rheumatol. 2019 May 15;jrheum.181415.
124. Hong C, Kwan YH, Leung Y, Lui NL, Fong W. Comparison of ankylosing spondylitis and non‐radiographic axial spondyloarthritis in a multi‐ethnic Asian population of Singapore. Int J Rheum Dis. 2019 May 14;1756-185X.13603.
125. Png WY, Kwan YH, Lee YX, Lim KK, Chew EH, Lui NL, et al. Factors Associated With Initiation of Biologics in Patients With Axial Spondyloarthritis in an Urban Asian City: A PRESPOND Study. Journal of Clinical Rheumatology. 2019 Mar;25(2):59–64.
126. Singh DK, Magrey M. Racial Differences in Clinical Features and Co-morbidities In Ankylosing Spondylitis in the United States. J Rheumatol. 2019 Sep 1;jrheum.181019.
127. Zhao SS, Ermann J, Xu C, Lyu H, Tedeschi SK, Liao KP, et al. Comparison of comorbidities and treatment between ankylosing spondylitis and non-radiographic axial spondyloarthritis in the United States. Rheumatology. 2019 May 12;kez171.
128. Zhao SS, Radner H, Siebert S, Duffield SJ, Thong D, Hughes DM, et al. Comorbidity burden in axial spondyloarthritis: a cluster analysis. Rheumatology. 2019 Oct 1;58(10):1746–54.
129. Redeker I, Callhoff J, Hoffmann F, Haibel H, Sieper J, Zink A, et al. Comorbid conditions are associated with higher disease activity and worse functional status in axial spondyloarthritis: a population-based analysis of insurance claims linked to patient survey data. Annals of the Rheumatic Diseases 2019;78:1253-1254.
130. Exarchou S, Lie E, Lindström U, Askling J, Forsblad-d’Elia H, Turesson C, et al. Mortality in ankylosing spondylitis: results from a nationwide population-based study. Ann Rheum Dis. 2016 Aug;75(8):1466–72.
131. Stolwijk C, van Tubergen A, Ramiro S, Essers I, Blaauw M, van der Heijde D, et al. Aspects of validity of the self-administered comorbidity questionnaire in patients with ankylosing spondylitis. Rheumatology. 2014 Jun 1;53(6):1054–64.
132. Fernández‐Carballido C, Martín‐Martínez MA, García‐Gómez C, Castañeda S, González‐Juanatey C, Sánchez‐Alonso F, et al. Impact of Comorbidity on Physical Function in Patients with Ankylosing Spondylitis and Psoriatic Arthritis Attending Rheumatology Clinics. Results from the CAR diovascular in rheu MA tology ( CARMA ) study. Arthritis Care & Research. 2019 Apr 29
292
133. Ariza-Ariza R, Hernández-Cruz B, López-Antequera G, Navarro-Sarabia F. Variables related to utility in patients with ankylosing spondylitis. Clin Rheumatol. 2009 Feb;28(2):207–11.
134. Macfarlane GJ, Pathan E, Jones GT, Dean LE. Predicting response to anti-TNFα therapy among patients with axial spondyloarthritis (axSpA): results from BSRBR-AS. Rheumatology (Oxford). 2020;59(9):2481–90.
135. Baillet A, Gossec L, Carmona L, Wit M de, van Eijk-Hustings Y, Bertheussen H, et al. Points to consider for reporting, screening for and preventing selected comorbidities in chronic inflammatory rheumatic diseases in daily practice: a EULAR initiative. Annals of the Rheumatic Diseases. 2016 Jun;75(6):965–73.
136. Castañeda S, Vicente EF, González-Gay MA. Additional proposals to reduce comorbidity in patients with chronic inflammatory rheumatic diseases: comment on ‘Points to consider for reporting, screening for and preventing selected comorbidities in chronic inflammatory rheumatic diseases in daily practice: a EULAR initiative’ by Baillet et al. Annals of the Rheumatic Diseases. 2016 Aug 1;75(8):e55–e55.
137. Midtbø H, Semb AG, Matre K, Rollefstad S, Berg IJ, Gerdts E. Left Ventricular Systolic Myocardial Function in Ankylosing Spondylitis. Arthritis Care & Research. 2019;71(9):1276–83.
138. Chen Y, Chung H-Y, Zhao C-T, Wong A, Zhen Z, Tsang HH-L, et al. Left ventricular myocardial dysfunction and premature atherosclerosis in patients with axial spondyloarthritis. Rheumatology (Oxford). 2015 Feb 1;54(2):292–301.
139. Juenger J. Health related quality of life in patients with congestive heart failure: comparison with other chronic diseases and relation to functional variables. Heart. 2002 Mar 1;87(3):235–41.
140. Barnett K, Mercer SW, Norbury M, Watt G, Wyke S, Guthrie B. Epidemiology of multimorbidity and implications for health care, research, and medical education: a cross-sectional study. The Lancet. 2012 Jul;380(9836):37–43.
141. Willerson James T., Ridker Paul M. Inflammation as a Cardiovascular Risk Factor. Circulation. 2004 Jun 1;109(21_suppl_1):II–2.
142. Nikiphorou E, Ramiro S, van der Heijde D, Norton S, Moltó A, Dougados M, et al. Association of Comorbidities in Spondyloarthritis With Poor Function, Work Disability, and Quality of Life: Results From the Assessment of SpondyloArthritis International Society Comorbidities in Spondyloarthritis Study. Arthritis Care & Research. 2018 Aug;70(8):1257–62.
143. Zhao SS, Solomon DH, Goodson NJ. Comment on: Comorbidity burden in axial spondyloarthritis: a cluster analysis: reply. Rheumatology (Oxford). 2020 Mar 1;59(3):692–3.
144. Radner H, Chatzidionysiou K, Nikiphorou E, Gossec L, Hyrich KL, Zabalan C, et al. 2017 EULAR recommendations for a core data set to support observational research and clinical care in rheumatoid arthritis. Annals of the Rheumatic Diseases. 2018 Apr 1;77(4):476–9.
293
145. Aslam F, Khan NA. Tools for the Assessment of Comorbidity Burden in Rheumatoid Arthritis. Front Med (Lausanne). 2018 Feb 16 [cited 2019 Oct 17];5. Available from: https://www.ncbi.nlm.nih.gov/pmc/articles/PMC5820312/
146. Sangha O, Stucki G, Liang MH, Fossel AH, Katz JN. The Self-Administered Comorbidity Questionnaire: a new method to assess comorbidity for clinical and health services research. Arthritis Rheum. 2003 Apr 15;49(2):156–63.
147. England BR, Sayles H, Mikuls TR, Johnson DS, Michaud K. Validation of the Rheumatic Disease Comorbidity Index. Arthritis Care & Research. 2015;67(6):865–72.
148. Radner H, Yoshida K, Mjaavatten MD, Aletaha D, Frits M, Lu B, et al. Development of a multimorbidity index: Impact on quality of life using a rheumatoid arthritis cohort. Seminars in Arthritis and Rheumatism. 2015 Oct;45(2):167–73.
149. Charlson ME, Pompei P, Ales KL, MacKenzie CR. A new method of classifying prognostic comorbidity in longitudinal studies: development and validation. J Chronic Dis. 1987;40(5):373–83.
150. Elixhauser A, Steiner C, Harris DR, Coffey RM. Comorbidity measures for use with administrative data. Med Care. 1998 Jan;36(1):8–27.
151. Stolwijk C, van Tubergen A, Castillo-Ortiz JD, Boonen A. Prevalence of extra-articular manifestations in patients with ankylosing spondylitis: a systematic review and meta-analysis. Ann Rheum Dis. 2015 Jan;74(1):65–73.
152. Stolwijk C, Essers I, van den Bosch F, Dougados M, Etcheto A, van der Heijde D, et al. Validation of the self-administered comorbidity questionnaire adjusted for spondyloarthritis: results from the ASAS-COMOSPA study. Rheumatology (Oxford). 2019 Oct 26;
153. Marengoni A, Angleman S, Melis R, Mangialasche F, Karp A, Garmen A, et al. Aging with multimorbidity: a systematic review of the literature. Ageing Research Reviews. 2011 Sep;10(4):430–9.
154. Office for National Statistics. 2011 Census data. [cited 2020 Oct 8]. Available from: https://www.ons.gov.uk/census/2011census/2011censusdata
155. Council LC. Indices of Deprivation. Liverpool City Council. [cited 2020 Feb 20]. Available from: https://liverpool.gov.uk:443/council/key-statistics-and-data/indices-of-deprivation/
156. Aintree University Hospital. ANNUAL REPORT & ACCOUNTS 2017/18. [cited 2020 Mar 5]. Available from: https://www.aintreehospital.nhs.uk/media/7607/full-annual-report-and-accounts-2017-18.pdf
157. Dean LE, Macfarlane GJ, Jones GT. Differences in the prevalence of ankylosing spondylitis in primary and secondary care: only one-third of patients are managed in rheumatology. Rheumatology (Oxford). 2016;55(10):1820–5.
294
158. English indices of deprivation 2015. GOV.UK. 2018 [cited 2018 Oct 17]. Available from: https://www.gov.uk/government/statistics/english-indices-of-deprivation-2015
159. Devlin NJ, Brooks R. EQ-5D and the EuroQol Group: Past, Present and Future. Appl Health Econ Health Policy. 2017;15(2):127–37.
160. Statistics on Alcohol, England 2015. GOV.UK. [cited 2018 Nov 5]. Available from: https://www.gov.uk/government/statistics/statistics-on-alcohol-england-2015
161. Zhao SS, Lyu H, Solomon DH, Yoshida K. Improving rheumatoid arthritis comparative effectiveness research through causal inference principles: systematic review using a target trial emulation framework. Annals of the Rheumatic Diseases. 2020 epub ahead of print;
162. Levine M, Ensom MHH. Post Hoc Power Analysis: An Idea Whose Time Has Passed? Pharmacotherapy: The Journal of Human Pharmacology and Drug Therapy. 2001;21(4):405–9.
163. Census profile: Boston, MA. Census Reporter. [cited 2020 Mar 10]. Available from: http://censusreporter.org/profiles/16000US2507000-boston-ma/
164. PricewaterhouseCoopers. UK Economic Outlook: III – Which are the largest city economies in the world and how might this change by 2025? 2009 Nov; Available from: https://pwc.blogs.com/files/pwc-uk-economic-outlook-nov-09.pdf
165. Lima A, Melnik M, Dowd K, Kang K, Borella N. Poverty in Boston. Boston Redevelopment Authority Research Division. 2014 Mar;
166. 2018 Annual Report | Partners HealthCare. [cited 2020 Mar 11]. Available from: https://www.partners.org/About/Annual-Report-2018.aspx
167. Reveille JD. Epidemiology of Spondyloarthritis in North America. Am J Med Sci. 2011 Apr;341(4):284–6.
168. Lindström U, Exarchou S, Sigurdardottir V, Sundström B, Askling J, Eriksson J, et al. Validity of ankylosing spondylitis and undifferentiated spondyloarthritis diagnoses in the Swedish National Patient Register. Scandinavian Journal of Rheumatology. 2015 Sep 3;44(5):369–76.
169. van der Linden S, Valkenburg HA, Cats A. Evaluation of diagnostic criteria for ankylosing spondylitis. A proposal for modification of the New York criteria. Arthritis Rheum. 1984 Apr;27(4):361–8.
170. Rudwaleit M, van der Heijde D, Landewé R, Listing J, Akkoc N, Brandt J, et al. The development of Assessment of SpondyloArthritis international Society classification criteria for axial spondyloarthritis (part II): validation and final selection. Ann Rheum Dis. 2009 Jun;68(6):777–83.
171. Zhao SS, Hong C, Cai T, Xu C, Huang J, Ermann J, et al. Incorporating natural language processing to improve classification of axial spondyloarthritis using electronic health records. Rheumatology (Oxford). [cited 2019 Oct 10];
295
172. Brunelli SM, Gagne JJ, Huybrechts KF, Wang SV, Patrick AR, Rothman KJ, et al. Estimation using all available covariate information versus a fixed look-back window for dichotomous covariates: COVARIATE LOOK-BACK WINDOWS. Pharmacoepidemiol Drug Saf. 2013 May;22(5):542–50.
173. Gilbertson DT, Bradbury BD, Wetmore JB, Weinhandl ED, Monda KL, Liu J, et al. Controlling confounding of treatment effects in administrative data in the presence of time-varying baseline confounders: Estimating Confounded Treatment Effects. Pharmacoepidemiol Drug Saf. 2016 Mar;25(3):269–77.
174. Sieper J, Rudwaleit M, Baraliakos X, Brandt J, Braun J, Burgos-Vargas R, et al. The Assessment of SpondyloArthritis international Society (ASAS) handbook: a guide to assess spondyloarthritis. Annals of the Rheumatic Diseases. 2009 Jun 1;68(Suppl 2):ii1–44.
175. Wolfe F, Clauw DJ, Fitzcharles M-A, Goldenberg DL, Häuser W, Katz RS, et al. Fibromyalgia criteria and severity scales for clinical and epidemiological studies: a modification of the ACR Preliminary Diagnostic Criteria for Fibromyalgia. J Rheumatol. 2011 Jun;38(6):1113–22.
176. Snaith RP. The Hospital Anxiety And Depression Scale. Health and quality of life outcomes. 2003 Aug 1;1:29.
177. Zigmond AS, Snaith RP. The hospital anxiety and depression scale. Acta Psychiatr Scand. 1983 Jun;67(6):361–70.
178. Jenkins CD, Stanton BA, Niemcryk SJ, Rose RM. A scale for the estimation of sleep problems in clinical research. J Clin Epidemiol. 1988;41(4):313–21.
179. Jackson C. The Chalder Fatigue Scale (CFQ 11). Occup Med (Lond). 2015 Jan;65(1):86.
180. Zochling J. Measures of symptoms and disease status in ankylosing spondylitis: Ankylosing Spondylitis Disease Activity Score (ASDAS), Ankylosing Spondylitis Quality of Life Scale (ASQoL), Bath Ankylosing Spondylitis Disease Activity Index (BASDAI), Bath Ankylosing Spondylitis Functional Index (BASFI), Bath Ankylosing Spondylitis Global Score (BAS-G), Bath Ankylosing Spondylitis Metrology Index (BASMI), Dougados Functional Index (DFI), and Health Assessment Questionnaire for the Spondylarthropathies (HAQ-S). Arthritis care & research. 2011 Nov;63 Suppl 11:S47-58.
181. Macfarlane GJ, Barnish MS, Jones EA, Kay L, Keat A, Meldrum KT, et al. The British Society for Rheumatology Biologics Registers in Ankylosing Spondylitis (BSRBR-AS) study: Protocol for a prospective cohort study of the long-term safety and quality of life outcomes of biologic treatment. BMC musculoskeletal disorders. 2015 Nov 11;16:347.
182. Haneuse S, Daniels M. A General Framework for Considering Selection Bias in EHR-Based Studies: What Data Are Observed and Why? EGEMS (Wash DC). 2016;4(1):1203.
183. van der Heijde D, Kivitz A, Schiff MH, Sieper J, Dijkmans BAC, Braun J, et al. Efficacy and safety of adalimumab in patients with ankylosing spondylitis: results of a
296
multicenter, randomized, double-blind, placebo-controlled trial. Arthritis Rheum. 2006 Jul;54(7):2136–46.
184. Pearl J, Mackenzie D. The Book of Why: The New Science of Causa and Effect. Penguin; 2019.
185. Hernán MA, Hsu J, Healy B. A Second Chance to Get Causal Inference Right: A Classification of Data Science Tasks. CHANCE. 2019 Jan 2;32(1):42–9.
186. Westreich D, Greenland S. The table 2 fallacy: presenting and interpreting confounder and modifier coefficients. Am J Epidemiol. 2013 Feb 15;177(4):292–8.
187. Lederer DJ, Bell SC, Branson RD, Chalmers JD, Marshall R, Maslove DM, et al. Control of Confounding and Reporting of Results in Causal Inference Studies. Guidance for Authors from Editors of Respiratory, Sleep, and Critical Care Journals. Annals ATS. 2018 Sep 19;16(1):22–8.
188. Harrell F. Regression Modeling Strategies: With Applications to Linear Models, Logistic Regression, and Survival Analysis. New York: Springer-Verlag; 2001 [cited 2020 Jun 12]. (Springer Series in Statistics).
189. Zhao S, Yoshida K, Jones GT, Hughes DM, Duffield SJ, Tedeschi SK, et al. Smoking status and cause-specific discontinuation of tumour necrosis factor inhibitors in axial spondyloarthritis. Arthritis Research & Therapy. 2019;22(21(1)):177.
190. National Insititute for Health and Care Excellence (NICE). TNF-alpha inhibitors for ankylosing spondylitis and non-radiographic axial spondyloarthritis. NICE; [cited 2020 May 5]. Available from: https://www.nice.org.uk/guidance/ta383
191. Vittinghoff E, Glidden DV, Shiboski SC, McCulloch CE. Regression Methods in Biostatistics: Linear, Logistic, Survival, and Repeated Measures Models. 2nd ed. New York: Springer-Verlag; 2012 [cited 2020 Feb 27]. (Statistics for Biology and Health). Available from: https://www.springer.com/gp/book/9781461413523
192. Little RJ, D’Agostino R, Cohen ML, Dickersin K, Emerson SS, Farrar JT, et al. The Prevention and Treatment of Missing Data in Clinical Trials. New England Journal of Medicine. 2012 Oct 4;367(14):1355–60.
193. Kydd AS, Chen JS, Makovey J, Chand V, Henderson L, Buchbinder R, et al. Smoking did not modify the effects of anti-TNF treatment on health-related quality of life among Australian ankylosing spondylitis patients. Rheumatology. 2015 Feb;54(2):310–7.
194. Everitt BS, Landau S, Leese M, Stahl D. Cluster Analysis, 5th Edition. Wiley.com. [cited 2018 Nov 25]. Available from: https://www.wiley.com/en-us/Cluster+Analysis%2C+5th+Edition-p-9780470749913
195. Calinski T, Harabasz J. A dendrite method for cluster analysis. Communications in Statistics. 1974;3:1–27.
196. Fagerland MW. t-tests, non-parametric tests, and large studies--a paradox of statistical practice? BMC medical research methodology. 2012 Jun 14;12:78.
297
197. Dolnicar S, Grün B, Leisch F, Schmidt K. Required Sample Sizes for Data-Driven Market Segmentation Analyses in Tourism. Journal of Travel Research. 2014 May 1;53(3):296–306.
198. Radner H, Yoshida K, Mjaavatten MD, Aletaha D, Frits M, Lu B, et al. Development of a multimorbidity index: Impact on quality of life using a rheumatoid arthritis cohort. Seminars in Arthritis and Rheumatism. 2015 Oct;45(2):167–73.
199. Zhao S, Thong D, Miller N, Duffield SJ, Hughes DM, Chadwick L, et al. The prevalence of depression in axial spondyloarthritis and its association with disease activity: a systematic review and meta-analysis. Arthritis Research & Therapy. 2018 Dec;20(1).
200. Moltó A, Etcheto A, van der Heijde D, Landewé R, van den Bosch F, Bautista Molano W, et al. Prevalence of comorbidities and evaluation of their screening in spondyloarthritis: results of the international cross-sectional ASAS-COMOSPA study. Annals of the Rheumatic Diseases. 2016 Jun;75(6):1016–23.
201. Hypertension in adults: diagnosis and management | Guidance and guidelines | NICE. [cited 2018 Nov 5]. Available from: https://www.nice.org.uk/guidance/cg127/chapter/1-guidance#measuring-blood-pressure
202. Hauser B, Zhao S, Visconti MR, Riches PL, Fraser WD, Piec I, et al. Autoantibodies to Osteoprotegerin are Associated with Low Hip Bone Mineral Density and History of Fractures in Axial Spondyloarthritis: A Cross-Sectional Observational Study. Calcified Tissue International. 2017 Oct;101(4):375–83.
203. Duffield SJ, Miller N, Zhao S, Goodson NJ. Concomitant fibromyalgia complicating chronic inflammatory arthritis: a systematic review and meta-analysis. Rheumatology. 2018 May 16 [cited 2019 Feb 7];
204. Macfarlane GJ, Barnish MS, Pathan E, Martin KR, Haywood KL, Siebert S, et al. Co-Occurrence and Characteristics of Patients With Axial Spondyloarthritis Who Meet Criteria for Fibromyalgia: Results From a UK National Register. Arthritis & Rheumatology (Hoboken, NJ). 2017;69(11):2144–50.
205. Mease PJ, Heijde DVD, Karki C, Palmer JB, Liu M, Pandurengan R, et al. Characterization of Patients With Ankylosing Spondylitis and Nonradiographic Axial Spondyloarthritis in the US-Based Corrona Registry. Arthritis Care & Research. 2018 Nov;70(11):1661–70.
206. Poddubnyy D, Sieper J. Similarities and differences between nonradiographic and radiographic axial spondyloarthritis: a clinical, epidemiological and therapeutic assessment. Curr Opin Rheumatol. 2014 Jul;26(4):377–83.
207. Baraliakos X, Braun J. Non-radiographic axial spondyloarthritis and ankylosing spondylitis: what are the similarities and differences? RMD Open. 2015 Aug 15;1(Suppl 1).
208. Ward MM, Deodhar A, Akl EA, Lui A, Ermann J, Gensler LS, et al. American College of Rheumatology/Spondylitis Association of America/Spondyloarthritis Research and Treatment Network 2015 Recommendations for the Treatment of Ankylosing Spondylitis and Nonradiographic Axial Spondyloarthritis: ACR/SAA/Spartan
298
Treatment Recommendations in as. Arthritis & Rheumatology. 2016 Feb;68(2):282–98.
209. Häuser W, Ablin J, Fitzcharles M-A, Littlejohn G, Luciano JV, Usui C, et al. Fibromyalgia. Nature Reviews Disease Primers. 2015 Aug 13;15022.
210. Wang C, Crapo LM. The epidemiology of thyroid disease and implications for screening. Endocrinol Metab Clin North Am. 1997 Mar;26(1):189–218.
211. Lee W, Reveille JD, Weisman MH. Women with ankylosing spondylitis: A review. Arthritis Care & Research. 2008;59(3):449–54.
212. Woo AK. Depression and Anxiety in Pain. Rev Pain. 2010 Mar;4(1):8–12.
213. Matcham F, Norton S, Scott DL, Steer S, Hotopf M. Symptoms of depression and anxiety predict treatment response and long-term physical health outcomes in rheumatoid arthritis: secondary analysis of a randomized controlled trial. Rheumatology (Oxford). 2016 Feb;55(2):268–78.
214. Spoorenberg A, van Tubergen A, Landewé R, Dougados M, van der Linden S, Mielants H, et al. Measuring disease activity in ankylosing spondylitis: patient and physician have different perspectives. Rheumatology. 2005 Jun 1;44(6):789–95.
215. Cook MJ, Bellou E, Bowes J, Sergeant JC, O’Neill TW, Barton A, et al. The prevalence of co-morbidities and their impact on physical activity in people with inflammatory rheumatic diseases compared with the general population: results from the UK Biobank. Rheumatology. 2018 Dec 1;57(12):2172–82.
216. Macfarlane GJ, Barnish MS, Pathan E, Martin KR, Haywood KL, Siebert S, et al. Co-Occurrence and Characteristics of Patients With Axial Spondyloarthritis Who Meet Criteria for Fibromyalgia: Results From a UK National Register. Arthritis & Rheumatology (Hoboken, NJ). 2017;69(11):2144–50.
217. Lukas C, Landewe R, Sieper J, Dougados M, Davis J, Braun J, et al. Development of an ASAS-endorsed disease activity score (ASDAS) in patients with ankylosing spondylitis. Annals of the rheumatic diseases. 2009 Jan;68(1):18–24.
218. van der Heijde D, Lie E, Kvien TK, Sieper J, Van den Bosch F, Listing J, et al. ASDAS, a highly discriminatory ASAS-endorsed disease activity score in patients with ankylosing spondylitis. Annals of the Rheumatic Diseases. 2009 Dec 1;68(12):1811–8.
219. Ramiro S, van der Heijde D, van Tubergen A, Stolwijk C, Dougados M, van den Bosch F, et al. Higher disease activity leads to more structural damage in the spine in ankylosing spondylitis: 12-year longitudinal data from the OASIS cohort. Ann Rheum Dis. 2014 Aug;73(8):1455–61.
220. Radner H, Yoshida K, Tedeschi S, Studenic P, Frits M, Iannaccone C, et al. Different Rating of Global Rheumatoid Arthritis Disease Activity in Rheumatoid Arthritis Patients With Multiple Morbidities. Arthritis & Rheumatology (Hoboken, NJ). 2017;69(4):720–7.
221. Moltó A, Etcheto A, van der Heijde D, Landewé R, van den Bosch F, Bautista Molano W, et al. Prevalence of comorbidities and evaluation of their screening in
299
spondyloarthritis: results of the international cross-sectional ASAS-COMOSPA study. Annals of the Rheumatic Diseases. 2016 Jun;75(6):1016–23.
222. Doward L, Spoorenberg A, Cook S, Whalley D, Helliwell P, Kay L, et al. Development of the ASQoL: a quality of life instrument specific to ankylosing spondylitis. Ann Rheum Dis. 2003 Jan;62(1):20–6.
223. The Scottish Government. Scottish Index of Multiple Deprivation.
224. Brookhart MA, Schneeweiss S, Rothman KJ, Glynn RJ, Avorn J, Stürmer T. Variable selection for propensity score models. Am J Epidemiol. 2006 Jun 15;163(12):1149–56.
225. McDonald J. Multiple comparisons. In: Handbook of Biological Statistics. 3rd ed. SPARKY HOUSE PUBLISHING; Available from: http://www.biostathandbook.com/HandbookBioStatThird.pdf
226. Blackwell M, Iacus S, King G, Porro G. Cem: Coarsened Exact Matching in Stata: The Stata Journal. 2009 Dec 1 [cited 2020 Apr 3]; Available from: https://journals.sagepub.com/doi/10.1177/1536867X0900900402
227. Nikiphorou E, Radner H, Chatzidionysiou K, Desthieux C, Zabalan C, van Eijk-Hustings Y, et al. Patient global assessment in measuring disease activity in rheumatoid arthritis: a review of the literature. Arthritis Research & Therapy. 2016 Oct 28;18(1):251.
228. Lord PA, Farragher TM, Lunt M, Watson KD, Symmons DP, Hyrich KL, et al. Predictors of response to anti-TNF therapy in ankylosing spondylitis: results from the British Society for Rheumatology Biologics Register. Rheumatology. 2010 Mar;49(3):563–70.
229. van Smeden M, Moons KG, de Groot JA, Collins GS, Altman DG, Eijkemans MJ, et al. Sample size for binary logistic prediction models: Beyond events per variable criteria. Stat Methods Med Res. 2019 Aug 1;28(8):2455–74.
230. Schoenfeld DA. Sample-Size Formula for the Proportional-Hazards Regression Model. Biometrics. 1983;39(2):499–503.
231. Strigo IA, Simmons AN, Matthews SC, Craig ADB, Paulus MP. Association of major depressive disorder with altered functional brain response during anticipation and processing of heat pain. Arch Gen Psychiatry. 2008 Nov;65(11):1275–84.
232. Pilling S, Anderson I, Goldberg D, Meader N, Taylor C. Depression in adults, including those with a chronic physical health problem: summary of NICE guidance. BMJ. 2009 Oct 27 [cited 2020 Sep 28];339.
233. Brennan C, Worrall-Davies A, McMillan D, Gilbody S, House A. The Hospital Anxiety and Depression Scale: A diagnostic meta-analysis of case-finding ability. Journal of Psychosomatic Research. 2010 Oct;69(4):371–8.
234. Bjelland I, Dahl AA, Haug TT, Neckelmann D. The validity of the Hospital Anxiety and Depression Scale: An updated literature review. Journal of Psychosomatic Research. 2002 Feb 1;52(2):69–77.
300
235. Dantzer R, O’Connor JC, Freund GG, Johnson RW, Kelley KW. From inflammation to sickness and depression: when the immune system subjugates the brain. Nature reviews Neuroscience. 2008 Jan;9(1):46–56.
236. Maneiro JR, Souto A, Salgado E, Mera A, Gomez-Reino JJ. Predictors of response to TNF antagonists in patients with ankylosing spondylitis and psoriatic arthritis: systematic review and meta-analysis. RMD Open. 2015 Jan 1;1(1):e000017.
237. Hernán M, Robins J. Causal Inference: What If. Boca Raton: Chapman & Hall/CRC; 2020 [cited 2020 Jan 13]. Available from: https://www.hsph.harvard.edu/miguel-hernan/causal-inference-book/
238. Li F, Morgan KL, Zaslavsky AM. Balancing Covariates via Propensity Score Weighting. Journal of the American Statistical Association. 2018 Jan 2;113(521):390–400.
239. Fewell A, Hernan MA, Wolfe F, Tilling K, Choi HK, Sterne JAC. Controlling for time-dependent confounding using marginal structural models. The Stata Journal. 2004;4(4):402–20.
240. Albert PR. Why is depression more prevalent in women? J Psychiatry Neurosci. 2015 Jul;40(4):219–21.
241. Austin PC, Schuster T, Platt RW. Statistical power in parallel group point exposure studies with time-to-event outcomes: an empirical comparison of the performance of randomized controlled trials and the inverse probability of treatment weighting (IPTW) approach. BMC Med Res Methodol. 2015 Oct 15 [cited 2020 Jun 19];15.
242. Yoshida K, Hernández-Díaz S, Solomon DH, Jackson JW, Gagne JJ, Glynn RJ, et al. Matching Weights to Simultaneously Compare Three Treatment Groups: Comparison to Three-way Matching. Epidemiology. 2017;28(3):387–95.
243. Matcham F, Davies R, Hotopf M, Hyrich KL, Norton S, Steer S, et al. The relationship between depression and biologic treatment response in rheumatoid arthritis: An analysis of the British Society for Rheumatology Biologics Register. Rheumatology (Oxford). 2018 01;57(5):835–43.
244. Liew JW, Huang IJ, Louden DN, Singh N, Gensler LS. Association of body mass index on disease activity in axial spondyloarthritis: systematic review and meta-analysis. RMD Open. 2020 May 21 [cited 2020 Jun 26];6(1).
245. Hernán MA, Taubman SL. Does obesity shorten life? The importance of well-defined interventions to answer causal questions. Int J Obes (Lond). 2008 Aug;32 Suppl 3:S8-14.
246. VanderWeele TJ, Tchetgen Tchetgen EJ. Mediation analysis with time varying exposures and mediators. J R Stat Soc Series B Stat Methodol. 2017 Jun;79(3):917–38.
247. Hernan MA, Brumback BA, Robins JM. Estimating the causal effect of zidovudine on CD4 count with a marginal structural model for repeated measures. Statistics in medicine. 2002 Jun 30;21(12):1689–709.
301
248. Hernán MA, Brumback B, Robins JM. Marginal structural models to estimate the causal effect of zidovudine on the survival of HIV-positive men. Epidemiology. 2000 Sep;11(5):561–70.
249. British Medical Journal. Clustering of comorbidities and other stories . . . BMJ. 2015 Aug 12 [cited 2020 Nov 5];351.
250. Vargas RR, Berg R van den, Lunteren M van, Ez-Zaitouni Z, Bakker PAC, Dagfinrud H, et al. Does body mass index (BMI) influence the Ankylosing Spondylitis Disease Activity Score in axial spondyloarthritis?: Data from the SPACE cohort. RMD Open. 2016 Jun 1;2(1):e000283.
251. VanderWeele TJ. Principles of confounder selection. European Journal of Epidemiology. 2019 Mar;34(3):211–9.
252. Pearl J. Does Obesity Shorten Life? Or is it the Soda? On Non-manipulable Causes. 2018;
253. VanderWeele TJ, Ding P. Sensitivity Analysis in Observational Research: Introducing the E-Value. Ann Intern Med. 2017 Aug 15;167(4):268.
254. Ioannidis JPA, Tan YJ, Blum MR. Limitations and Misinterpretations of E-Values for Sensitivity Analyses of Observational Studies. Ann Intern Med. 2019 15;170(2):108–11.
255. Yoshida K, Lin T-C, Wei M, Malspeis S, Chu SH, Camargo CA, et al. The roles of post-diagnosis accumulation of morbidities and lifestyle changes on excess total and cause-specific mortality risk in rheumatoid arthritis. Arthritis Care & Research. [cited 2020 Jul 13]
256. Cipriani A, Furukawa TA, Salanti G, Chaimani A, Atkinson LZ, Ogawa Y, et al. Comparative efficacy and acceptability of 21 antidepressant drugs for the acute treatment of adults with major depressive disorder: a systematic review and network meta-analysis. The Lancet. 2018 Apr 7;391(10128):1357–66.
257. Driessen E, Hollon SD. Cognitive Behavioral Therapy for Mood Disorders: Efficacy, Moderators and Mediators. Psychiatr Clin North Am. 2010 Sep;33(3):537–55.
258. Mental Health Taskforce to the NHS in England. The Five Year Forward View for Mental Health. 2016. Available from: https://www.england.nhs.uk/wp-content/uploads/2016/02/Mental-Health-Taskforce-FYFV-final.pdf
259. Anyfanti P, Gavriilaki E, Pyrpasopoulou A, Triantafyllou G, Triantafyllou A, Chatzimichailidou S, et al. Depression, anxiety, and quality of life in a large cohort of patients with rheumatic diseases: common, yet undertreated. Clin Rheumatol. 2016 Mar;35(3):733–9.
260. Moots R, Campbell S. Is Psychological Status Related to Symptom Experience in Behçet’s Syndrome? ACR Meeting Abstracts. 2014 [cited 2020 Apr 18]; Available from: https://acrabstracts.org/abstract/is-psychological-status-related-to-symptom-experience-in-behcets-syndrome/
302
261. British Society for Rheumatology. National Early Inflammatory Arthritis Audit: 1st Annual Report. 2019 [cited 2019 Oct 10]. Available from: https://www.rheumatology.org.uk/practice-quality/audits/neia-audit
262. van der Heijde D, Da Silva JC, Dougados M, Geher P, van der Horst-Bruinsma I, Juanola X, et al. Etanercept 50 mg once weekly is as effective as 25 mg twice weekly in patients with ankylosing spondylitis. Ann Rheum Dis. 2006 Dec;65(12):1572–7.
263. Huang F, Gu J, Zhu P, Bao C, Xu J, Xu H, et al. Efficacy and safety of adalimumab in Chinese adults with active ankylosing spondylitis: results of a randomised, controlled trial. Ann Rheum Dis. 2014 Mar;73(3):587–94.
264. Dougados M, van der Heijde D, Sieper J, Braun J, Maksymowych WP, Citera G, et al. Symptomatic efficacy of etanercept and its effects on objective signs of inflammation in early nonradiographic axial spondyloarthritis: a multicenter, randomized, double-blind, placebo-controlled trial. Arthritis & Rheumatology (Hoboken, NJ). 2014 Aug;66(8):2091–102.
265. Landewé R, Braun J, Deodhar A, Dougados M, Maksymowych WP, Mease PJ, et al. Efficacy of certolizumab pegol on signs and symptoms of axial spondyloarthritis including ankylosing spondylitis: 24-week results of a double-blind randomised placebo-controlled Phase 3 study. Annals of the Rheumatic Diseases. 2014 Jan 1;73(1):39–47.
266. Jones GT, Dean LE, Pathan E, Hollick RJ, Macfarlane GJ. Real-world evidence of TNF inhibition in axial spondyloarthritis: can we generalise the results from clinical trials? Ann Rheum Dis. 2020 Jul;79(7):914–9.
267. Roland M, Torgerson DJ. Understanding controlled trials: What are pragmatic trials? BMJ. 1998 Jan 24;316(7127):285.
268. NICE technology appraisal guidance | NICE guidance | Our programmes | What we do | About. NICE. NICE; [cited 2020 Aug 7]. Available from: https://www.nice.org.uk/about/what-we-do/our-programmes/nice-guidance/nice-technology-appraisal-guidance
269. Ahmed AE, Lowe D, Kirton JA, O’Brien MR, Mediana A, Frankland H, et al. Development of a Rheumatology-specific Patient Concerns Inventory and Its Use in the Rheumatology Outpatient Clinic Setting. J Rheumatol. 2016 Apr;43(4):779–87.
270. Vandevelde CY, Mandela R, Aaron D, Davis C, Barr A, Freeston J, et al. Comment on: Comorbidity burden in axial spondyloarthritis: a cluster analysis. Rheumatology (Oxford).
271. Duffield SJ. The contribution of musculoskeletal disorders and multimorbidity to health-related job loss among older working-age adults: a population-based study. PhD Thesis University of Liverpool. 2020;
272. World Health Organization. Mental health action plan 2013 - 2020.. 2013. Available from: https://www.who.int/mental_health/publications/action_plan/en/
273. Public Health England. Every Mind Matters. [cited 2019 Oct 10]. Available from: https://www.nhs.uk/oneyou/every-mind-matters/
303
274. Salisbury C, Man M-S, Bower P, Guthrie B, Chaplin K, Gaunt DM, et al. Management of multimorbidity using a patient-centred care model: a pragmatic cluster-randomised trial of the 3D approach. The Lancet. 2018 Jul 7;392(10141):41–50.
275. Smith SM, Wallace E, O’Dowd T, Fortin M. Interventions for improving outcomes in patients with multimorbidity in primary care and community settings. Cochrane Database of Systematic Reviews. 2016 [cited 2020 Jul 15];(3).
276. Thorn J, Man M-S, Chaplin K, Bower P, Brookes S, Gaunt D, et al. Cost-effectiveness of a patient-centred approach to managing multimorbidity in primary care: a pragmatic cluster randomised controlled trial. BMJ Open. 2020 Jan 1;10(1):e030110.
277. Doherty M, Jenkins W, Richardson H, Sarmanova A, Abhishek A, Ashton D, et al. Efficacy and cost-effectiveness of nurse-led care involving education and engagement of patients and a treat-to-target urate-lowering strategy versus usual care for gout: a randomised controlled trial. The Lancet. 2018 Oct;392(10156):1403–12.
278. Liew JW, Ramiro S, Gensler LS. Cardiovascular morbidity and mortality in ankylosing spondylitis and psoriatic arthritis. Best Pract Res Clin Rheumatol. 2018;32(3):369–89.
279. Zhang M, Li X-M, Wang G-S, Tao J-H, Chen Z, Ma Y, et al. The association between ankylosing spondylitis and the risk of any, hip, or vertebral fracture: A meta-analysis. Medicine. 2017 Dec;96(50):e8458.
280. Colaco K, Ocampo V, Ayala AP, Harvey P, Gladman DD, Piguet V, et al. Predictive Utility of Cardiovascular Risk Prediction Algorithms in Inflammatory Rheumatic Diseases: A Systematic Review. J Rheumatol. 2020 Jun 1;47(6):928–38.
281. Relton C, Torgerson D, O’Cathain A, Nicholl J. Rethinking pragmatic randomised controlled trials: introducing the ‘cohort multiple randomised controlled trial’ design. BMJ. 2010 Mar 19;340:c1066.
282. Kwakkenbos L, Jewett LR, Baron M, Bartlett SJ, Furst D, Gottesman K, et al. The Scleroderma Patient-centered Intervention Network (SPIN) Cohort: protocol for a cohort multiple randomised controlled trial (cmRCT) design to support trials of psychosocial and rehabilitation interventions in a rare disease context. BMJ Open. 2013 Aug 1;3(8):e003563.
283. James S, Rao SV, Granger CB. Registry-based randomized clinical trials—a new clinical trial paradigm. Nature Reviews Cardiology. 2015 May;12(5):312–6.
284. Altman DG, Royston P. The cost of dichotomising continuous variables. Bmj. 2006 May 6;332(7549):1080.
285. Kristensen LE, Kapetanovic MC, Gülfe A, Söderlin M, Saxne T, Geborek P. Predictors of response to anti-TNF therapy according to ACR and EULAR criteria in patients with established RA: results from the South Swedish Arthritis Treatment Group Register. Rheumatology (Oxford). 2008 Apr;47(4):495–9.
286. Ciurea A, Scherer A, Weber U, Neuenschwander R, Tamborrini G, Exer P, et al. Age at symptom onset in ankylosing spondylitis: is there a gender difference? Annals of the Rheumatic Diseases. 2014 Oct 1;73(10):1908–10.

304
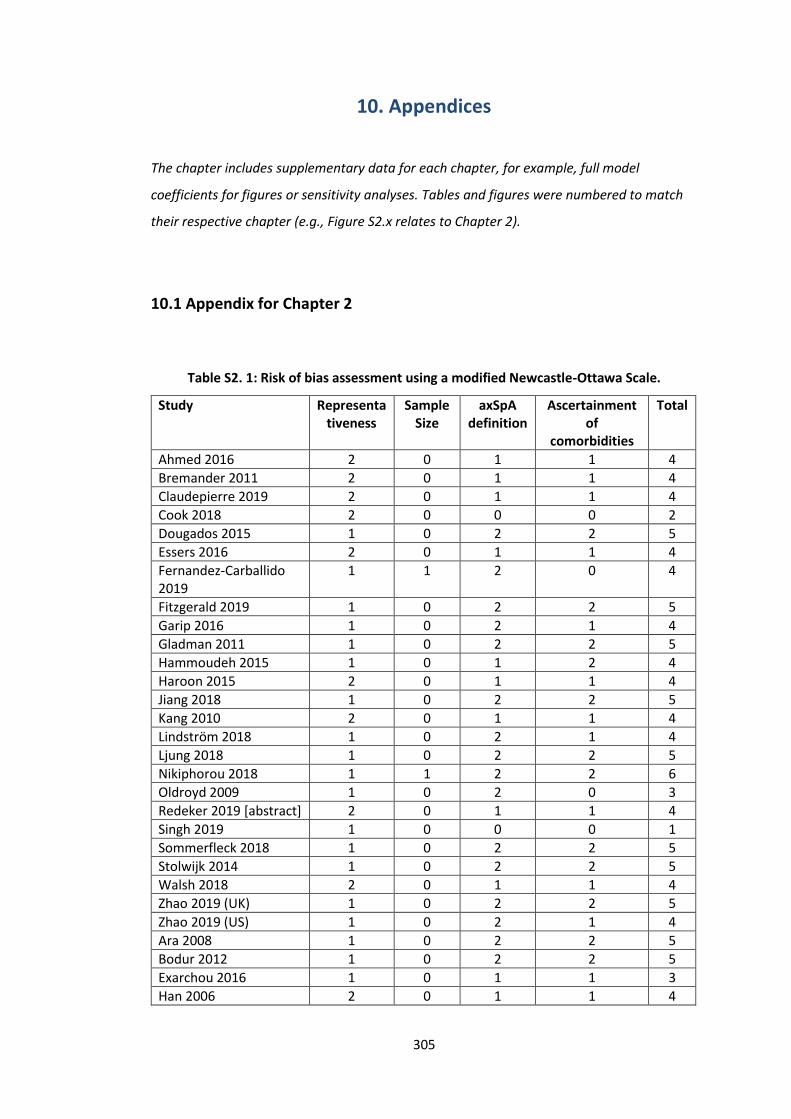
305
10. Appendices
The chapter includes supplementary data for each chapter, for example, full model
coefficients for figures or sensitivity analyses. Tables and figures were numbered to match
their respective chapter (e.g., Figure S2.x relates to Chapter 2).
10.1 Appendix for Chapter 2
Table S2. 1: Risk of bias assessment using a modified Newcastle-Ottawa Scale.
Study Representativeness
Sample Size
axSpA definition
Ascertainment of
comorbidities
Total
Ahmed 2016 2 0 1 1 4
Bremander 2011 2 0 1 1 4
Claudepierre 2019 2 0 1 1 4
Cook 2018 2 0 0 0 2
Dougados 2015 1 0 2 2 5
Essers 2016 2 0 1 1 4
Fernandez-Carballido 2019
1 1 2 0 4
Fitzgerald 2019 1 0 2 2 5
Garip 2016 1 0 2 1 4
Gladman 2011 1 0 2 2 5
Hammoudeh 2015 1 0 1 2 4
Haroon 2015 2 0 1 1 4
Jiang 2018 1 0 2 2 5
Kang 2010 2 0 1 1 4
Lindström 2018 1 0 2 1 4
Ljung 2018 1 0 2 2 5
Nikiphorou 2018 1 1 2 2 6
Oldroyd 2009 1 0 2 0 3
Redeker 2019 [abstract] 2 0 1 1 4
Singh 2019 1 0 0 0 1
Sommerfleck 2018 1 0 2 2 5
Stolwijk 2014 1 0 2 2 5
Walsh 2018 2 0 1 1 4
Zhao 2019 (UK) 1 0 2 2 5
Zhao 2019 (US) 1 0 2 1 4
Ara 2008 1 0 2 2 5
Bodur 2012 1 0 2 2 5
Exarchou 2016 1 0 1 1 3
Han 2006 2 0 1 1 4
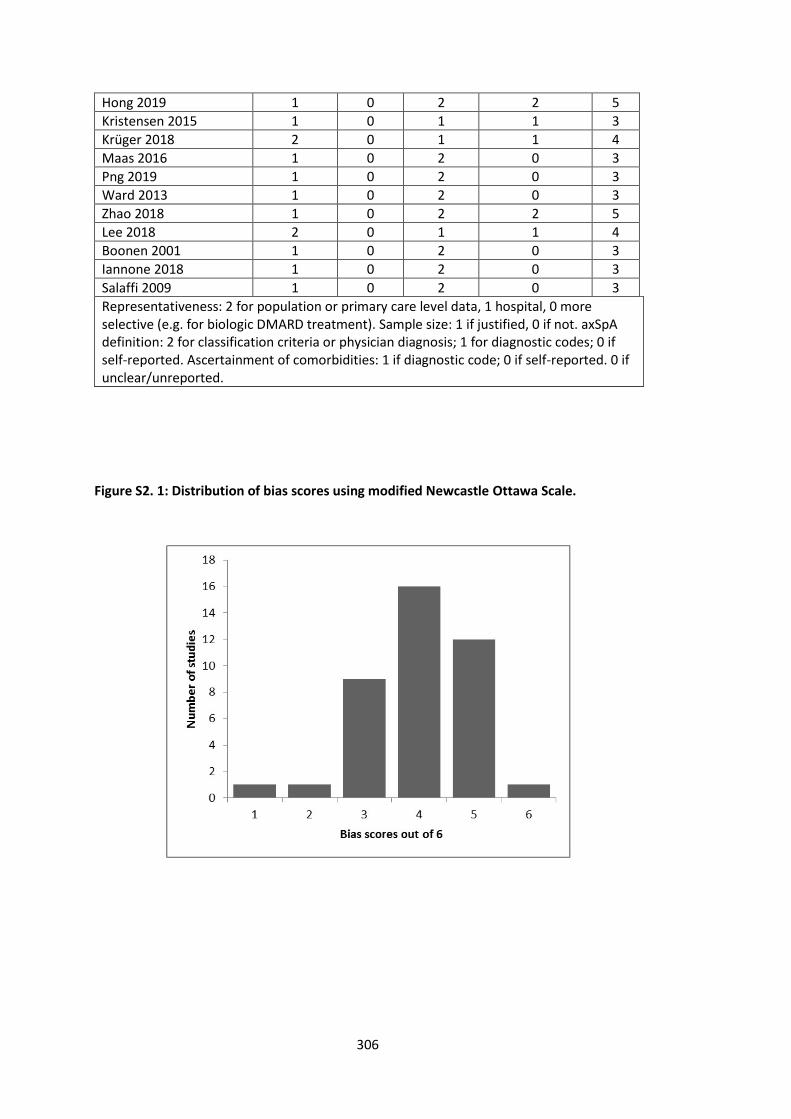
306
Hong 2019 1 0 2 2 5
Kristensen 2015 1 0 1 1 3
Krüger 2018 2 0 1 1 4
Maas 2016 1 0 2 0 3
Png 2019 1 0 2 0 3
Ward 2013 1 0 2 0 3
Zhao 2018 1 0 2 2 5
Lee 2018 2 0 1 1 4
Boonen 2001 1 0 2 0 3
Iannone 2018 1 0 2 0 3
Salaffi 2009 1 0 2 0 3
Representativeness: 2 for population or primary care level data, 1 hospital, 0 more selective (e.g. for biologic DMARD treatment). Sample size: 1 if justified, 0 if not. axSpA definition: 2 for classification criteria or physician diagnosis; 1 for diagnostic codes; 0 if self-reported. Ascertainment of comorbidities: 1 if diagnostic code; 0 if self-reported. 0 if unclear/unreported.
Figure S2. 1: Distribution of bias scores using modified Newcastle Ottawa Scale.
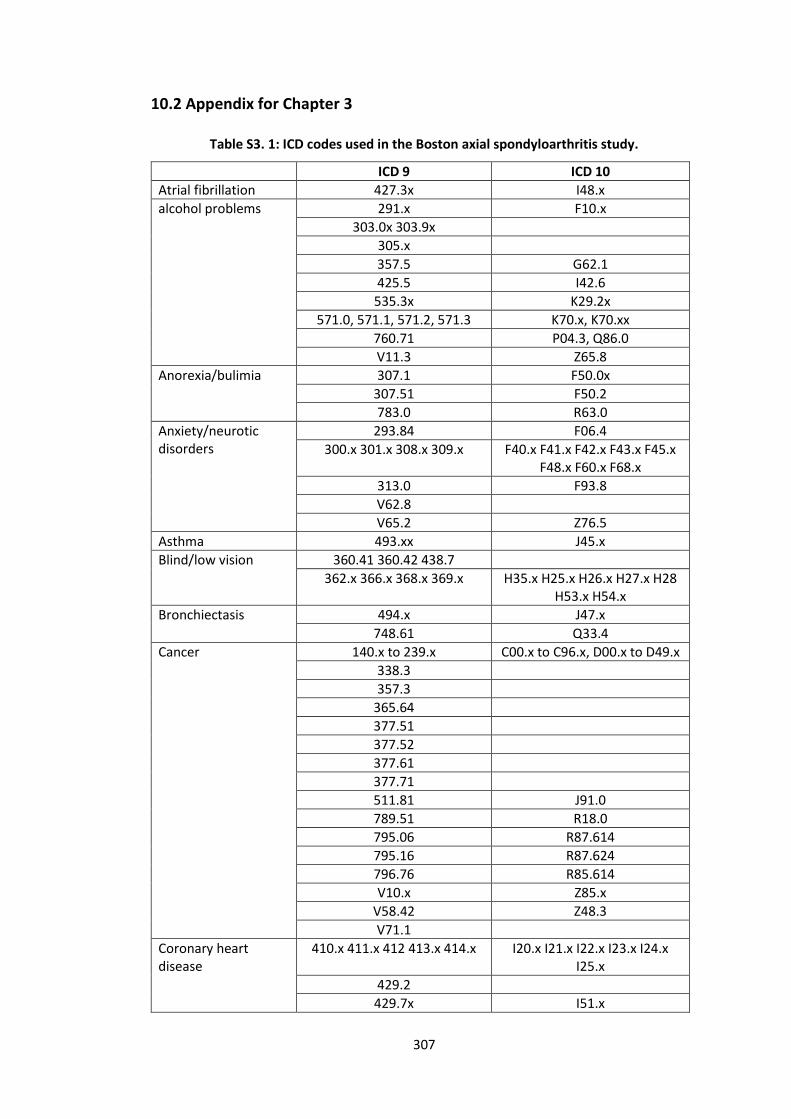
307
10.2 Appendix for Chapter 3
Table S3. 1: ICD codes used in the Boston axial spondyloarthritis study.
ICD 9 ICD 10
Atrial fibrillation 427.3x I48.x
alcohol problems 291.x F10.x
303.0x 303.9x
305.x
357.5 G62.1
425.5 I42.6
535.3x K29.2x
571.0, 571.1, 571.2, 571.3 K70.x, K70.xx
760.71 P04.3, Q86.0
V11.3 Z65.8
Anorexia/bulimia 307.1 F50.0x
307.51 F50.2
783.0 R63.0
Anxiety/neurotic disorders
293.84 F06.4
300.x 301.x 308.x 309.x F40.x F41.x F42.x F43.x F45.x F48.x F60.x F68.x
313.0 F93.8
V62.8
V65.2 Z76.5
Asthma 493.xx J45.x
Blind/low vision 360.41 360.42 438.7
362.x 366.x 368.x 369.x H35.x H25.x H26.x H27.x H28 H53.x H54.x
Bronchiectasis 494.x J47.x
748.61 Q33.4
Cancer 140.x to 239.x C00.x to C96.x, D00.x to D49.x
338.3
357.3
365.64
377.51
377.52
377.61
377.71
511.81 J91.0
789.51 R18.0
795.06 R87.614
795.16 R87.624
796.76 R85.614
V10.x Z85.x
V58.42 Z48.3
V71.1
Coronary heart disease
410.x 411.x 412 413.x 414.x I20.x I21.x I22.x I23.x I24.x I25.x
429.2
429.7x I51.x
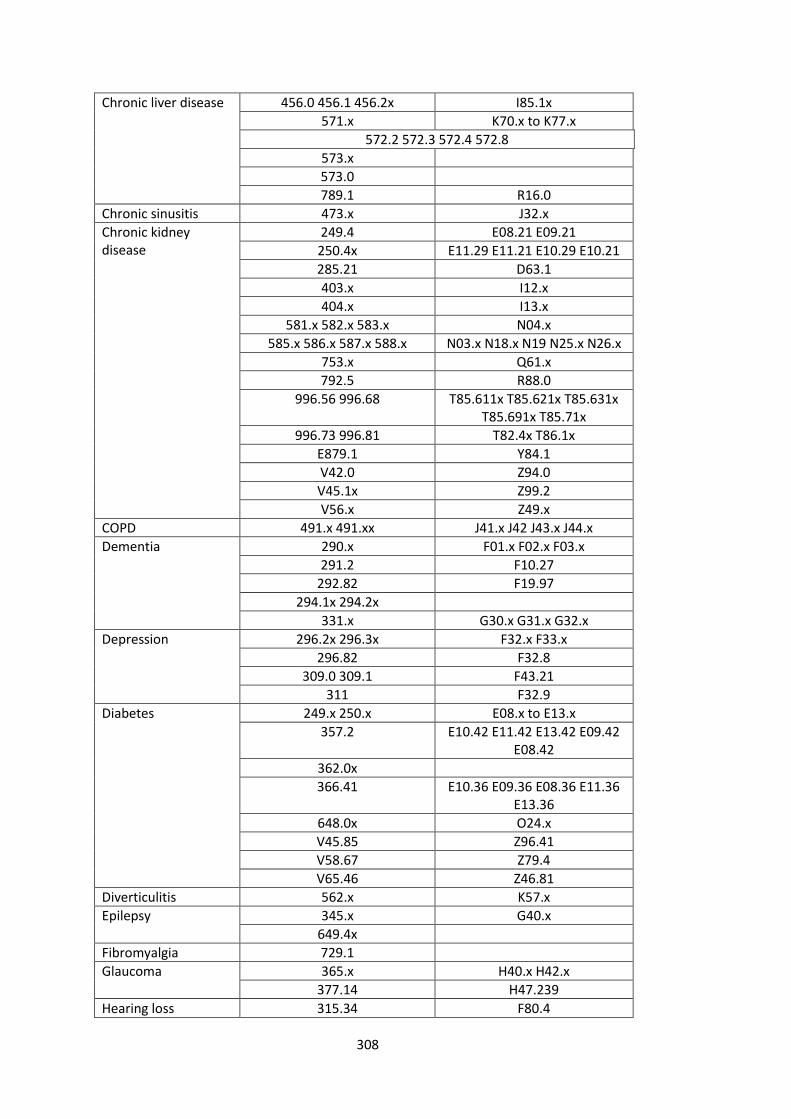
308
Chronic liver disease 456.0 456.1 456.2x I85.1x
571.x K70.x to K77.x
572.2 572.3 572.4 572.8
573.x
573.0
789.1 R16.0
Chronic sinusitis 473.x J32.x
Chronic kidney disease
249.4 E08.21 E09.21
250.4x E11.29 E11.21 E10.29 E10.21
285.21 D63.1
403.x I12.x
404.x I13.x
581.x 582.x 583.x N04.x
585.x 586.x 587.x 588.x N03.x N18.x N19 N25.x N26.x
753.x Q61.x
792.5 R88.0
996.56 996.68 T85.611x T85.621x T85.631x T85.691x T85.71x
996.73 996.81 T82.4x T86.1x
E879.1 Y84.1
V42.0 Z94.0
V45.1x Z99.2
V56.x Z49.x
COPD 491.x 491.xx J41.x J42 J43.x J44.x
Dementia 290.x F01.x F02.x F03.x
291.2 F10.27
292.82 F19.97
294.1x 294.2x
331.x G30.x G31.x G32.x
Depression 296.2x 296.3x F32.x F33.x
296.82 F32.8
309.0 309.1 F43.21
311 F32.9
Diabetes 249.x 250.x E08.x to E13.x
357.2 E10.42 E11.42 E13.42 E09.42 E08.42
362.0x
366.41 E10.36 E09.36 E08.36 E11.36 E13.36
648.0x O24.x
V45.85 Z96.41
V58.67 Z79.4
V65.46 Z46.81
Diverticulitis 562.x K57.x
Epilepsy 345.x G40.x
649.4x
Fibromyalgia 729.1
Glaucoma 365.x H40.x H42.x
377.14 H47.239
Hearing loss 315.34 F80.4
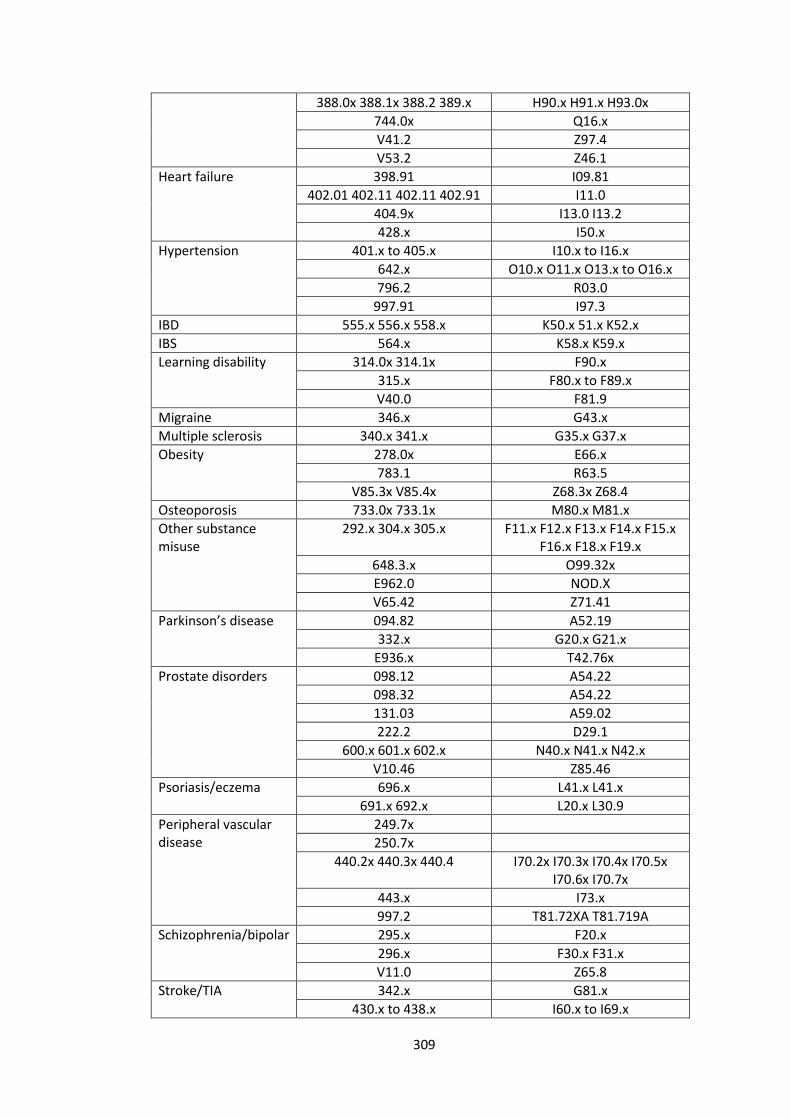
309
388.0x 388.1x 388.2 389.x H90.x H91.x H93.0x
744.0x Q16.x
V41.2 Z97.4
V53.2 Z46.1
Heart failure 398.91 I09.81
402.01 402.11 402.11 402.91 I11.0
404.9x I13.0 I13.2
428.x I50.x
Hypertension 401.x to 405.x I10.x to I16.x
642.x O10.x O11.x O13.x to O16.x
796.2 R03.0
997.91 I97.3
IBD 555.x 556.x 558.x K50.x 51.x K52.x
IBS 564.x K58.x K59.x
Learning disability 314.0x 314.1x F90.x
315.x F80.x to F89.x
V40.0 F81.9
Migraine 346.x G43.x
Multiple sclerosis 340.x 341.x G35.x G37.x
Obesity 278.0x E66.x
783.1 R63.5
V85.3x V85.4x Z68.3x Z68.4
Osteoporosis 733.0x 733.1x M80.x M81.x
Other substance misuse
292.x 304.x 305.x F11.x F12.x F13.x F14.x F15.x F16.x F18.x F19.x
648.3.x O99.32x
E962.0 NOD.X
V65.42 Z71.41
Parkinson’s disease 094.82 A52.19
332.x G20.x G21.x
E936.x T42.76x
Prostate disorders 098.12 A54.22
098.32 A54.22
131.03 A59.02
222.2 D29.1
600.x 601.x 602.x N40.x N41.x N42.x
V10.46 Z85.46
Psoriasis/eczema 696.x L41.x L41.x
691.x 692.x L20.x L30.9
Peripheral vascular disease
249.7x
250.7x
440.2x 440.3x 440.4 I70.2x I70.3x I70.4x I70.5x I70.6x I70.7x
443.x I73.x
997.2 T81.72XA T81.719A
Schizophrenia/bipolar 295.x F20.x
296.x F30.x F31.x
V11.0 Z65.8
Stroke/TIA 342.x G81.x
430.x to 438.x I60.x to I69.x
310
674.00 O99.419
V12.54 Z86.73
Thyroid disorders 226 D34
240.x to 246.x E00.x to E07.x
376.21 H05.89
648.1x
E932.7 E932.8
Constipation 564.0x K59.0x
Dyspepsia 535.x K29.x K30.x
787.1 R12
Viral hepatitis 070.x B15.x to B19.x
V02.6x
Fibromyalgia 729.1 Z79.7
Uveitis 364.x H20.x
Smoking 305.1x F17.2xx
649.0x O99.33
989.84 T65.2x
10.2.1 Summary of data preparation for the BSRBR-AS
For the initial analyses of the BSRBR-AS, individual data files were provided by the
investigators (e.g., 14 visit files, 9 questionnaire files, one file for deprivation indices, etc.).
The following section describes the process with which they were prepared for analysis.
Some of the following methods was used by the BSRBR-AS investigators to process final
versions of the data. The final version of the BSRBR-AS data was used for analyses shown in
the thesis. This version was provided as only 4 files: recruitment data, visits, questionnaires,
and TNFi timeline.
Early downloads of the BSRBR-AS dataset included individuals in the non-biologics arm with
prior biologic exposure records (could be data entry error or inappropriately recruited). This
was checked in the latest download.
Some SpA features (uveitis, IBD, psoriasis) were recorded twice: once as components of
ASAS criteria, and again in the targeted medical history that 1) specifically enquires about
the past 6 months and 2) are physician confirmed diagnoses. If patients had physician-
confirmed records of these features, they should also fulfil the corresponding ASAS
components. Inconsistencies were corrected. For descriptions of participant characteristics,
physician-confirmed diagnoses were used. A participant with known history of dactylitis,
arthritis or enthesitis may not report an episode in the past 6 months; therefore, the SpA
criteria were used instead of the targeted medical history for prevalence description. HLA-
311
B27 status was recorded twice: as component of ASAS criteria and again as its own variable.
Overall, positivity was defined as a positive result from either variable. There were no
conflicts regarding positive and negative results from the two variables; each helped
populate unknown variables in the other.
Classification using the modified New York and ASAS criteria were performed. All patients
met classification criteria for AS or axSpA: 1757 (65%) met criteria for AS, whilst 2508 (93%)
met ASAS criteria for axSpA (imaging criteria met by 2395 and clinical by 1406).
All variables were then renamed and relabelled. The following variables were generated:
• Age (date of first visit – DOB)/365.25
• Year of visit
• Age at symptom onset (year of onset – year of birth)
o Those with age at symptom onset younger than 5 were replaced as missing
o Age at symptom onset that were older than age at recruitment were
replaced with age at recruitment (i.e., they could be diagnosed at
recruitment, but not after recruitment).
• Symptom duration (age – age at symptom onset)
o Due to discrepancies in the accuracy (decimal places) of above variables,
those with negative symptom duration were set to 0.
• Number of comorbidities (sum of 13 comorbidities: hypertension, angina, MI, heart
failure, stroke, diabetes, asthma, ‘bronchitis’, depression, cancer, kidney disease,
peptic ulcer, and liver disease)
The first visit file was saved as baseline ‘time-independent’ characteristics (File A) (Figure
S3.1). Visit files (14 in total) were then combined and split into B) biologic information (each
visit can have up to 3 entries for biologics information; these were converted from wide
into long format), and C) ESR/CRP/BASMI labelled by visit and result dates.
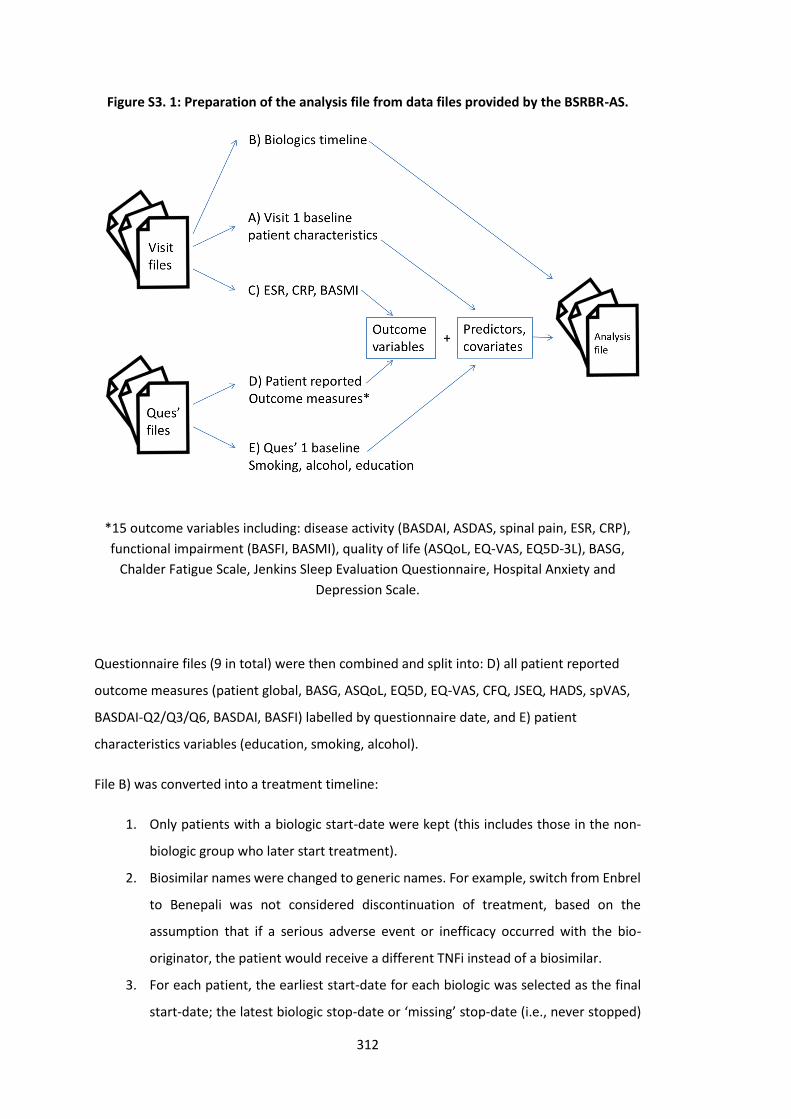
312
Figure S3. 1: Preparation of the analysis file from data files provided by the BSRBR-AS.
*15 outcome variables including: disease activity (BASDAI, ASDAS, spinal pain, ESR, CRP),
functional impairment (BASFI, BASMI), quality of life (ASQoL, EQ-VAS, EQ5D-3L), BASG,
Chalder Fatigue Scale, Jenkins Sleep Evaluation Questionnaire, Hospital Anxiety and
Depression Scale.
Questionnaire files (9 in total) were then combined and split into: D) all patient reported
outcome measures (patient global, BASG, ASQoL, EQ5D, EQ-VAS, CFQ, JSEQ, HADS, spVAS,
BASDAI-Q2/Q3/Q6, BASDAI, BASFI) labelled by questionnaire date, and E) patient
characteristics variables (education, smoking, alcohol).
File B) was converted into a treatment timeline:
1. Only patients with a biologic start-date were kept (this includes those in the non-
biologic group who later start treatment).
2. Biosimilar names were changed to generic names. For example, switch from Enbrel
to Benepali was not considered discontinuation of treatment, based on the
assumption that if a serious adverse event or inefficacy occurred with the bio-
originator, the patient would receive a different TNFi instead of a biosimilar.
3. For each patient, the earliest start-date for each biologic was selected as the final
start-date; the latest biologic stop-date or ‘missing’ stop-date (i.e., never stopped)
313
was set as the final stop-date for that biologic. This accounted for those who stop
and start the same treatment – which can be assumed to be temporary stops, since
inefficacy or serious AE would necessitate permanent cessation. This process also
accounted for biosimilar switches.
4. Pauses in treatment of longer than 3 months was considered discontinuation.
5. The last visit or questionnaire date to help create a ‘censor’ date (relevant for Cox
models) for those who do not have a stop-date. (Note many patients do not have
further visits but still return questionnaires, for these patients their last
questionnaire date was used as censor date instead.)
6. All entries were de-duplicated leaving one entry for each biologic for each patient.
Files C) and D) were merged according to ID and categorised time. At this stage, no
imputation was performed. Note carrying forward/backwards is difficult to justify,
particularly for baseline values, since treatment is likely to improve all measures. Note also
that a patient can have ≤1 questionnaire but still have >1 CRP/ESR/BASMI. This file (C+D)
was then merged with the timeline for first biologic (file B) to establish whether the patient
was on treatment on that assessment date.
For file E), missing smoking, education and alcohol data at baseline were carried backwards
from when they first became available. For example, in the early download of the data,
smoking data was missing for 85 patients before this process and 24 after; education 43 to
33; alcohol 98 to 43. File E) was then de-duplicated by patient to give baseline values that
was then merged with other baseline characteristics derived from baseline visit file (File A).
For survival analyses, time was defined by duration in days between TNFi start date and: 1)
TNFi stop date (main even of interest), 2) last visit date or last questionnaire date if no visit
date (censoring). Individuals with zero follow-up time (i.e., started TNFi but did not have
further contact with the study) were assigned 0.001 days.
For longitudinal analyses, date of starting first TNFi was used to define the baseline, that is,
as the reference point with which the window of acceptable assessments was defined.
Baseline data from visits or questionnaires had to come from within 1 year before or 7 days
after the TNFi start date. Only assessments made between TNFi start and stop dates (i.e.,
while on treatment) were included. For any missing disease indices, the last value was
carried forward provided it was from within 30 days.
314
10.2.2 Covariance/correlation structure for longitudinal analyses
Measurements take through time on the same individual are correlated. The correlation (or
covariance) between data points can be assumed, for example, to be equal (exchangeable),
more closely correlated if closer together in time (auto regressive), different for all pairs of
observations (unstructured). Specifying the ‘correct’ correlation/covariance structure is
difficult. For GEE, a temporary assumption can be made before estimating coefficients, with
subsequent adjustment to the standard errors to give valid inferences (i.e., Huber-White or
‘robust’ standard errors). Estimates and standard errors tend to be similar regardless of
correlation structure [191].
Covariance structure is analogous for mixed effects models. The random part of the model
separates within- and between-individual changes (which is further separated into variance
for intercept and slope and their covariance). This has two implications: 1) effects are
conditional (i.e., individual, rather than marginal/population-level) and 2) the random
effects are of direct interest (c.f. GEE where they are not). A detailed discussion of the
variance-covariance structure is beyond the scope of this section, and derived inference not
of primary interest in this analysis. In this thesis, the default covariance structure was used
(‘independent’, i.e., equal variances for random effects, all covariances 0). This may or may
not be appropriate; therefore, each of the other structures were tested for a single,
illustrative model to see whether conclusions were meaningfully changed.
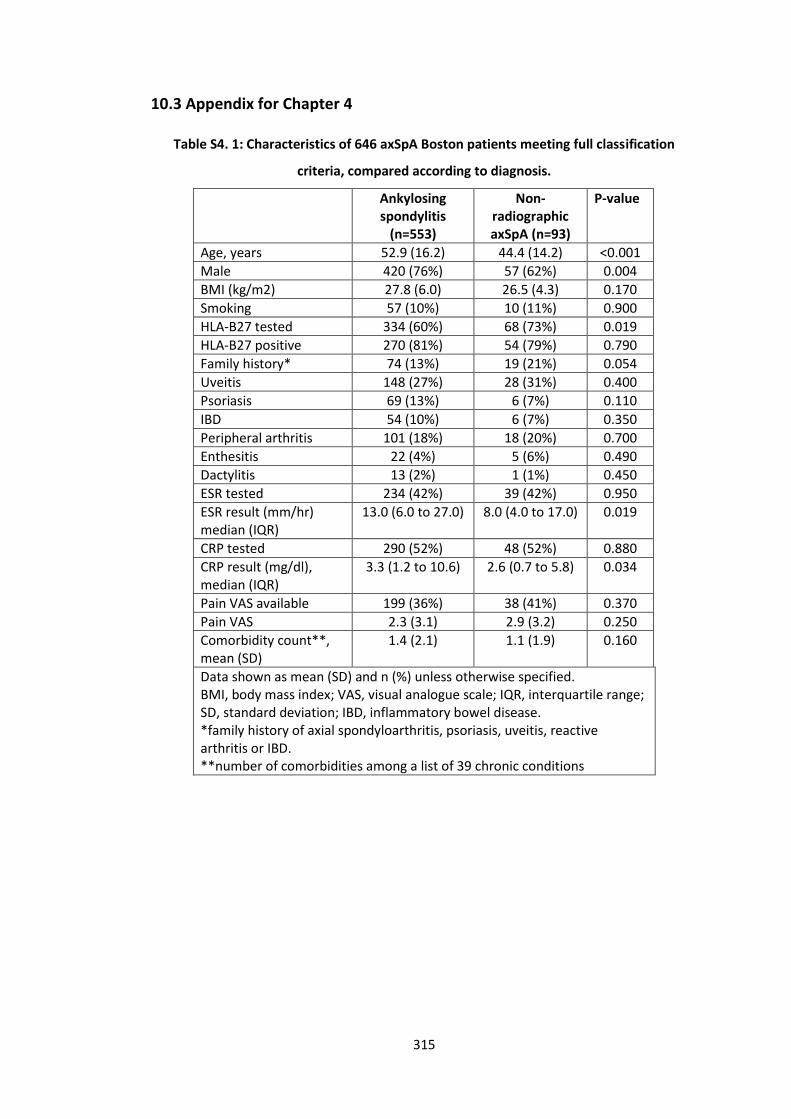
315
10.3 Appendix for Chapter 4
Table S4. 1: Characteristics of 646 axSpA Boston patients meeting full classification
criteria, compared according to diagnosis.
Ankylosing spondylitis
(n=553)
Non-radiographic axSpA (n=93)
P-value
Age, years 52.9 (16.2) 44.4 (14.2) <0.001
Male 420 (76%) 57 (62%) 0.004
BMI (kg/m2) 27.8 (6.0) 26.5 (4.3) 0.170
Smoking 57 (10%) 10 (11%) 0.900
HLA-B27 tested 334 (60%) 68 (73%) 0.019
HLA-B27 positive 270 (81%) 54 (79%) 0.790
Family history* 74 (13%) 19 (21%) 0.054
Uveitis 148 (27%) 28 (31%) 0.400
Psoriasis 69 (13%) 6 (7%) 0.110
IBD 54 (10%) 6 (7%) 0.350
Peripheral arthritis 101 (18%) 18 (20%) 0.700
Enthesitis 22 (4%) 5 (6%) 0.490
Dactylitis 13 (2%) 1 (1%) 0.450
ESR tested 234 (42%) 39 (42%) 0.950
ESR result (mm/hr) median (IQR)
13.0 (6.0 to 27.0) 8.0 (4.0 to 17.0) 0.019
CRP tested 290 (52%) 48 (52%) 0.880
CRP result (mg/dl), median (IQR)
3.3 (1.2 to 10.6) 2.6 (0.7 to 5.8) 0.034
Pain VAS available 199 (36%) 38 (41%) 0.370
Pain VAS 2.3 (3.1) 2.9 (3.2) 0.250
Comorbidity count**, mean (SD)
1.4 (2.1) 1.1 (1.9) 0.160
Data shown as mean (SD) and n (%) unless otherwise specified. BMI, body mass index; VAS, visual analogue scale; IQR, interquartile range; SD, standard deviation; IBD, inflammatory bowel disease. *family history of axial spondyloarthritis, psoriasis, uveitis, reactive arthritis or IBD. **number of comorbidities among a list of 39 chronic conditions
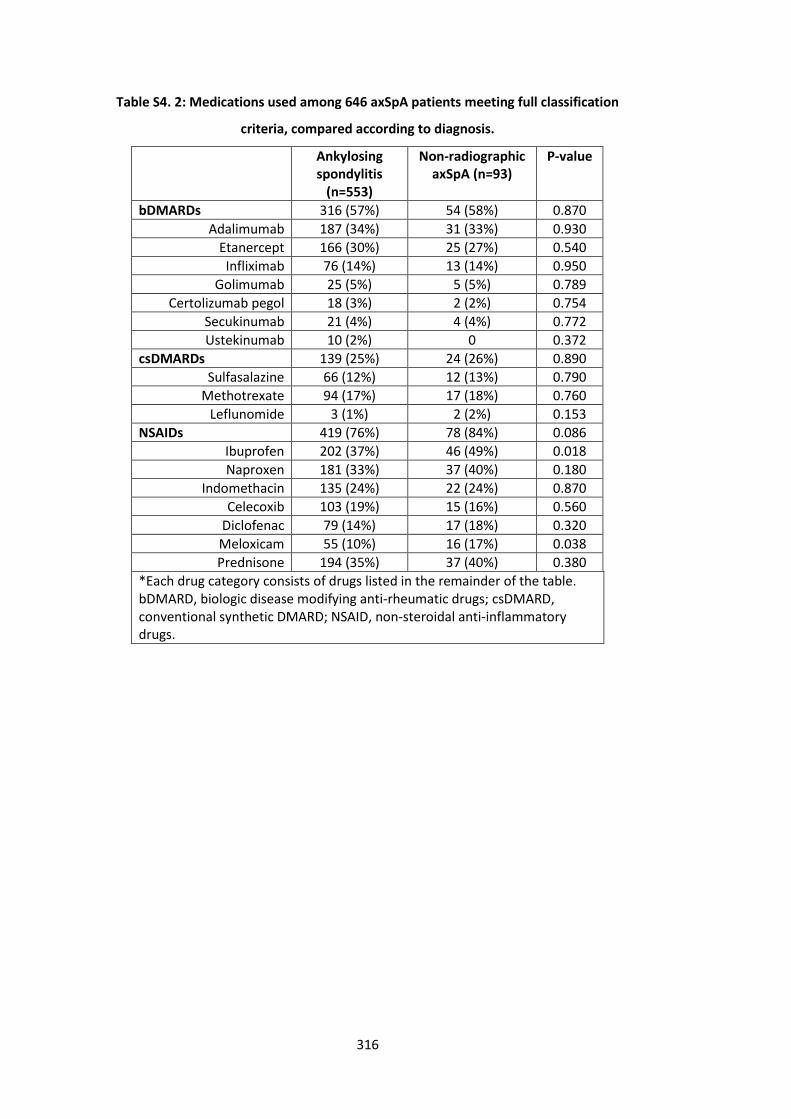
316
Table S4. 2: Medications used among 646 axSpA patients meeting full classification
criteria, compared according to diagnosis.
Ankylosing spondylitis
(n=553)
Non-radiographic axSpA (n=93)
P-value
bDMARDs 316 (57%) 54 (58%) 0.870
Adalimumab 187 (34%) 31 (33%) 0.930
Etanercept 166 (30%) 25 (27%) 0.540
Infliximab 76 (14%) 13 (14%) 0.950
Golimumab 25 (5%) 5 (5%) 0.789
Certolizumab pegol 18 (3%) 2 (2%) 0.754
Secukinumab 21 (4%) 4 (4%) 0.772
Ustekinumab 10 (2%) 0 0.372
csDMARDs 139 (25%) 24 (26%) 0.890
Sulfasalazine 66 (12%) 12 (13%) 0.790
Methotrexate 94 (17%) 17 (18%) 0.760
Leflunomide 3 (1%) 2 (2%) 0.153
NSAIDs 419 (76%) 78 (84%) 0.086
Ibuprofen 202 (37%) 46 (49%) 0.018
Naproxen 181 (33%) 37 (40%) 0.180
Indomethacin 135 (24%) 22 (24%) 0.870
Celecoxib 103 (19%) 15 (16%) 0.560
Diclofenac 79 (14%) 17 (18%) 0.320
Meloxicam 55 (10%) 16 (17%) 0.038
Prednisone 194 (35%) 37 (40%) 0.380
*Each drug category consists of drugs listed in the remainder of the table. bDMARD, biologic disease modifying anti-rheumatic drugs; csDMARD, conventional synthetic DMARD; NSAID, non-steroidal anti-inflammatory drugs.
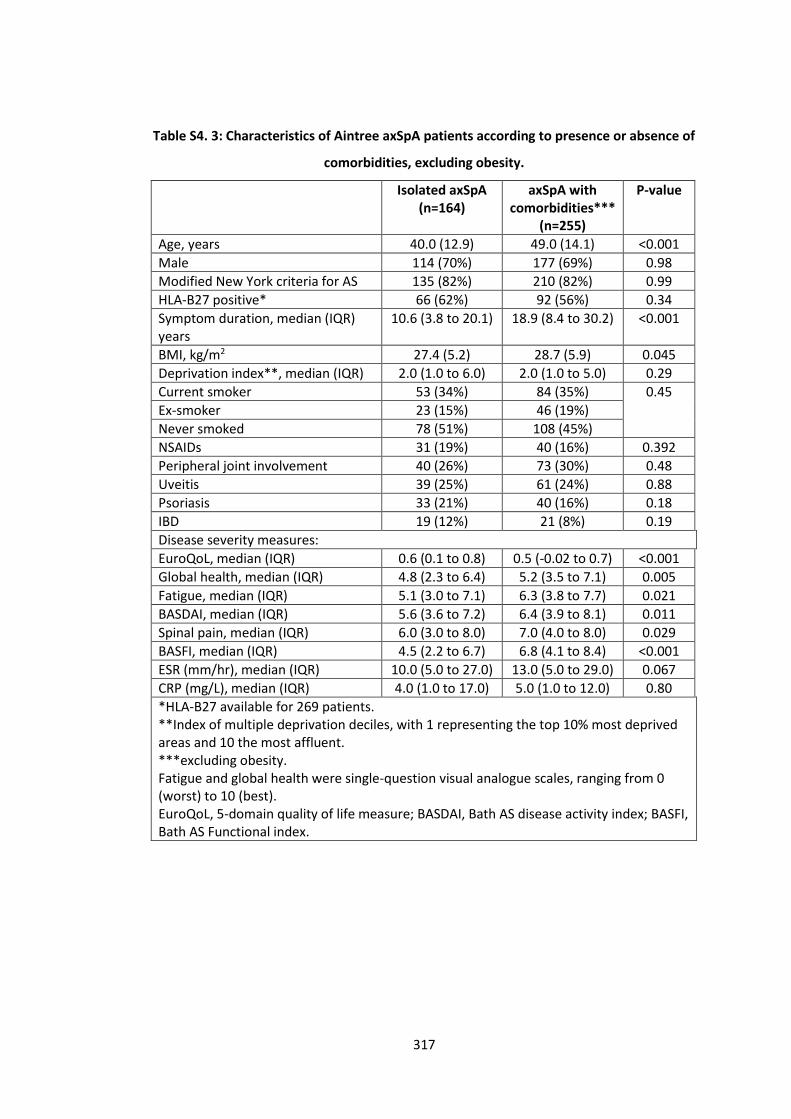
317
Table S4. 3: Characteristics of Aintree axSpA patients according to presence or absence of
comorbidities, excluding obesity.
Isolated axSpA (n=164)
axSpA with comorbidities***
(n=255)
P-value
Age, years 40.0 (12.9) 49.0 (14.1) <0.001
Male 114 (70%) 177 (69%) 0.98
Modified New York criteria for AS 135 (82%) 210 (82%) 0.99
HLA-B27 positive* 66 (62%) 92 (56%) 0.34
Symptom duration, median (IQR) years
10.6 (3.8 to 20.1) 18.9 (8.4 to 30.2) <0.001
BMI, kg/m2 27.4 (5.2) 28.7 (5.9) 0.045
Deprivation index**, median (IQR) 2.0 (1.0 to 6.0) 2.0 (1.0 to 5.0) 0.29
Current smoker 53 (34%) 84 (35%) 0.45
Ex-smoker 23 (15%) 46 (19%)
Never smoked 78 (51%) 108 (45%)
NSAIDs 31 (19%) 40 (16%) 0.392
Peripheral joint involvement 40 (26%) 73 (30%) 0.48
Uveitis 39 (25%) 61 (24%) 0.88
Psoriasis 33 (21%) 40 (16%) 0.18
IBD 19 (12%) 21 (8%) 0.19
Disease severity measures:
EuroQoL, median (IQR) 0.6 (0.1 to 0.8) 0.5 (-0.02 to 0.7) <0.001
Global health, median (IQR) 4.8 (2.3 to 6.4) 5.2 (3.5 to 7.1) 0.005
Fatigue, median (IQR) 5.1 (3.0 to 7.1) 6.3 (3.8 to 7.7) 0.021
BASDAI, median (IQR) 5.6 (3.6 to 7.2) 6.4 (3.9 to 8.1) 0.011
Spinal pain, median (IQR) 6.0 (3.0 to 8.0) 7.0 (4.0 to 8.0) 0.029
BASFI, median (IQR) 4.5 (2.2 to 6.7) 6.8 (4.1 to 8.4) <0.001
ESR (mm/hr), median (IQR) 10.0 (5.0 to 27.0) 13.0 (5.0 to 29.0) 0.067
CRP (mg/L), median (IQR) 4.0 (1.0 to 17.0) 5.0 (1.0 to 12.0) 0.80
*HLA-B27 available for 269 patients. **Index of multiple deprivation deciles, with 1 representing the top 10% most deprived areas and 10 the most affluent. ***excluding obesity. Fatigue and global health were single-question visual analogue scales, ranging from 0 (worst) to 10 (best). EuroQoL, 5-domain quality of life measure; BASDAI, Bath AS disease activity index; BASFI, Bath AS Functional index.
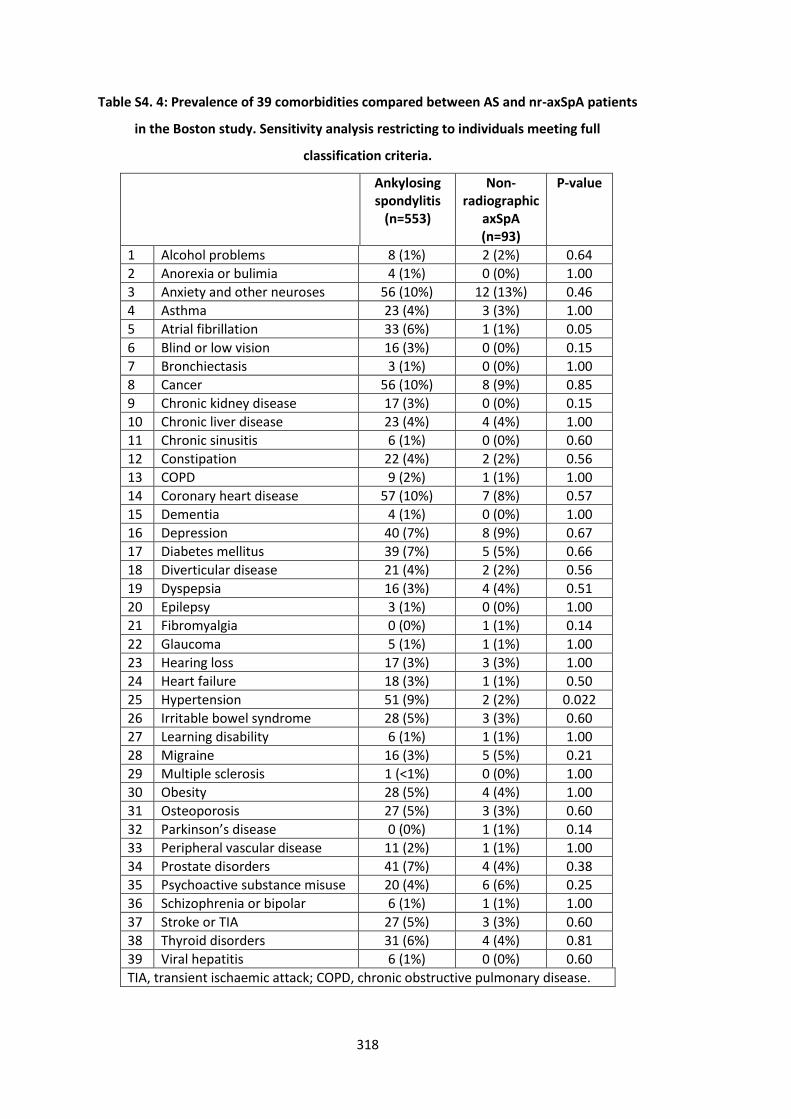
318
Table S4. 4: Prevalence of 39 comorbidities compared between AS and nr-axSpA patients
in the Boston study. Sensitivity analysis restricting to individuals meeting full
classification criteria.
Ankylosing spondylitis
(n=553)
Non-radiographic
axSpA (n=93)
P-value
1 Alcohol problems 8 (1%) 2 (2%) 0.64
2 Anorexia or bulimia 4 (1%) 0 (0%) 1.00
3 Anxiety and other neuroses 56 (10%) 12 (13%) 0.46
4 Asthma 23 (4%) 3 (3%) 1.00
5 Atrial fibrillation 33 (6%) 1 (1%) 0.05
6 Blind or low vision 16 (3%) 0 (0%) 0.15
7 Bronchiectasis 3 (1%) 0 (0%) 1.00
8 Cancer 56 (10%) 8 (9%) 0.85
9 Chronic kidney disease 17 (3%) 0 (0%) 0.15
10 Chronic liver disease 23 (4%) 4 (4%) 1.00
11 Chronic sinusitis 6 (1%) 0 (0%) 0.60
12 Constipation 22 (4%) 2 (2%) 0.56
13 COPD 9 (2%) 1 (1%) 1.00
14 Coronary heart disease 57 (10%) 7 (8%) 0.57
15 Dementia 4 (1%) 0 (0%) 1.00
16 Depression 40 (7%) 8 (9%) 0.67
17 Diabetes mellitus 39 (7%) 5 (5%) 0.66
18 Diverticular disease 21 (4%) 2 (2%) 0.56
19 Dyspepsia 16 (3%) 4 (4%) 0.51
20 Epilepsy 3 (1%) 0 (0%) 1.00
21 Fibromyalgia 0 (0%) 1 (1%) 0.14
22 Glaucoma 5 (1%) 1 (1%) 1.00
23 Hearing loss 17 (3%) 3 (3%) 1.00
24 Heart failure 18 (3%) 1 (1%) 0.50
25 Hypertension 51 (9%) 2 (2%) 0.022
26 Irritable bowel syndrome 28 (5%) 3 (3%) 0.60
27 Learning disability 6 (1%) 1 (1%) 1.00
28 Migraine 16 (3%) 5 (5%) 0.21
29 Multiple sclerosis 1 (<1%) 0 (0%) 1.00
30 Obesity 28 (5%) 4 (4%) 1.00
31 Osteoporosis 27 (5%) 3 (3%) 0.60
32 Parkinson’s disease 0 (0%) 1 (1%) 0.14
33 Peripheral vascular disease 11 (2%) 1 (1%) 1.00
34 Prostate disorders 41 (7%) 4 (4%) 0.38
35 Psychoactive substance misuse 20 (4%) 6 (6%) 0.25
36 Schizophrenia or bipolar 6 (1%) 1 (1%) 1.00
37 Stroke or TIA 27 (5%) 3 (3%) 0.60
38 Thyroid disorders 31 (6%) 4 (4%) 0.81
39 Viral hepatitis 6 (1%) 0 (0%) 0.60
TIA, transient ischaemic attack; COPD, chronic obstructive pulmonary disease.
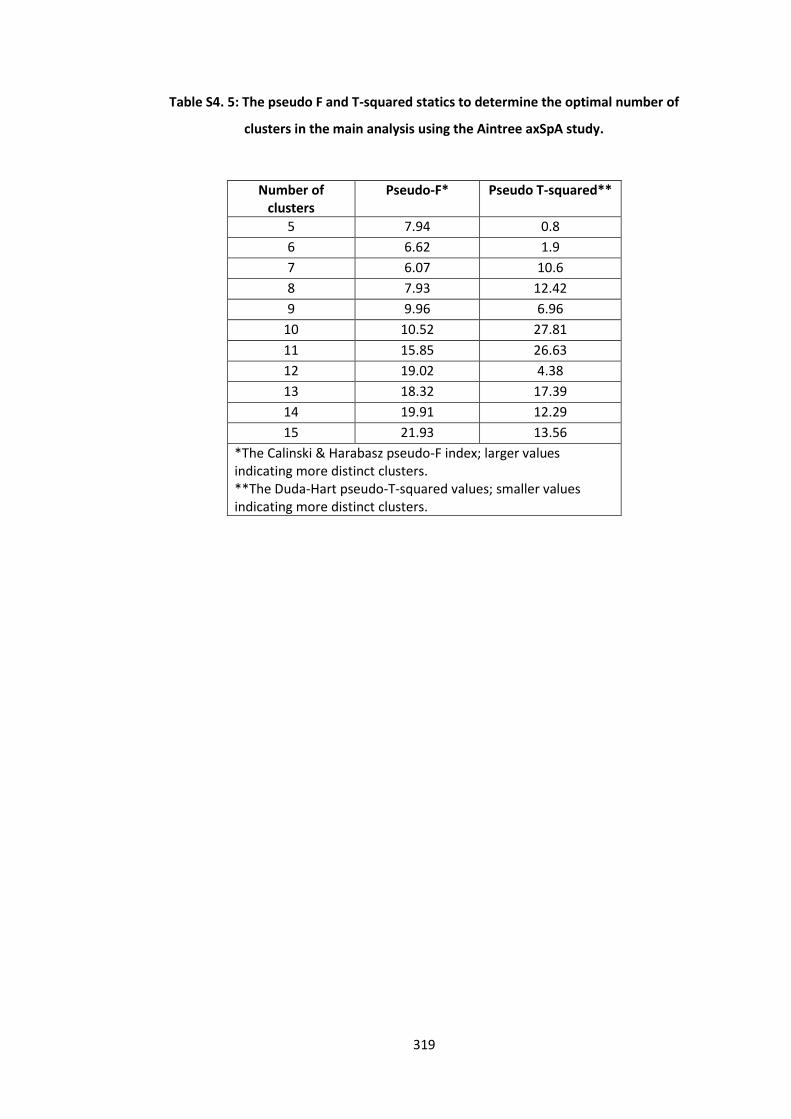
319
Table S4. 5: The pseudo F and T-squared statics to determine the optimal number of
clusters in the main analysis using the Aintree axSpA study.
Number of clusters
Pseudo-F* Pseudo T-squared**
5 7.94 0.8
6 6.62 1.9
7 6.07 10.6
8 7.93 12.42
9 9.96 6.96
10 10.52 27.81
11 15.85 26.63
12 19.02 4.38
13 18.32 17.39
14 19.91 12.29
15 21.93 13.56
*The Calinski & Harabasz pseudo-F index; larger values indicating more distinct clusters. **The Duda-Hart pseudo-T-squared values; smaller values indicating more distinct clusters.
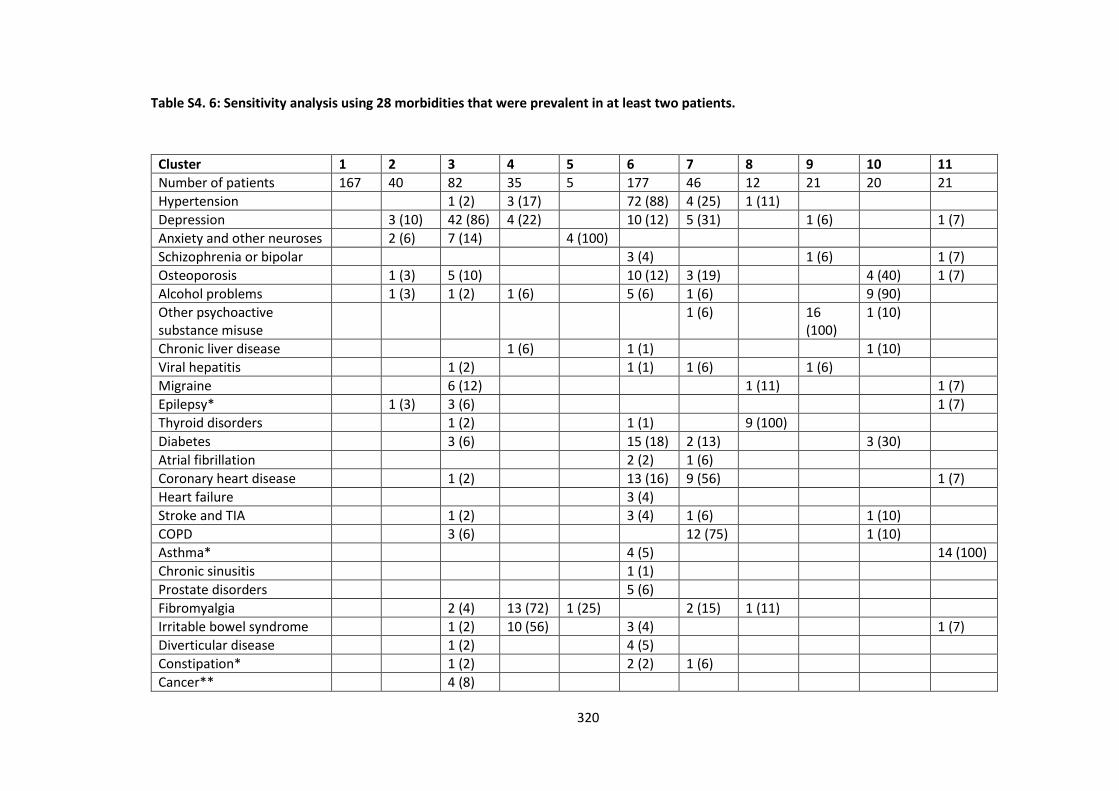
320
Table S4. 6: Sensitivity analysis using 28 morbidities that were prevalent in at least two patients.
Cluster 1 2 3 4 5 6 7 8 9 10 11
Number of patients 167 40 82 35 5 177 46 12 21 20 21
Hypertension 1 (2) 3 (17) 72 (88) 4 (25) 1 (11)
Depression 3 (10) 42 (86) 4 (22) 10 (12) 5 (31) 1 (6) 1 (7)
Anxiety and other neuroses 2 (6) 7 (14) 4 (100)
Schizophrenia or bipolar 3 (4) 1 (6) 1 (7)
Osteoporosis 1 (3) 5 (10) 10 (12) 3 (19) 4 (40) 1 (7)
Alcohol problems 1 (3) 1 (2) 1 (6) 5 (6) 1 (6) 9 (90)
Other psychoactive substance misuse
1 (6) 16 (100)
1 (10)
Chronic liver disease 1 (6) 1 (1) 1 (10)
Viral hepatitis 1 (2) 1 (1) 1 (6) 1 (6)
Migraine 6 (12) 1 (11) 1 (7)
Epilepsy* 1 (3) 3 (6) 1 (7)
Thyroid disorders 1 (2) 1 (1) 9 (100)
Diabetes 3 (6) 15 (18) 2 (13) 3 (30)
Atrial fibrillation 2 (2) 1 (6)
Coronary heart disease 1 (2) 13 (16) 9 (56) 1 (7)
Heart failure 3 (4)
Stroke and TIA 1 (2) 3 (4) 1 (6) 1 (10)
COPD 3 (6) 12 (75) 1 (10)
Asthma* 4 (5) 14 (100)
Chronic sinusitis 1 (1)
Prostate disorders 5 (6)
Fibromyalgia 2 (4) 13 (72) 1 (25) 2 (15) 1 (11)
Irritable bowel syndrome 1 (2) 10 (56) 3 (4) 1 (7)
Diverticular disease 1 (2) 4 (5)
Constipation* 1 (2) 2 (2) 1 (6)
Cancer** 4 (8)
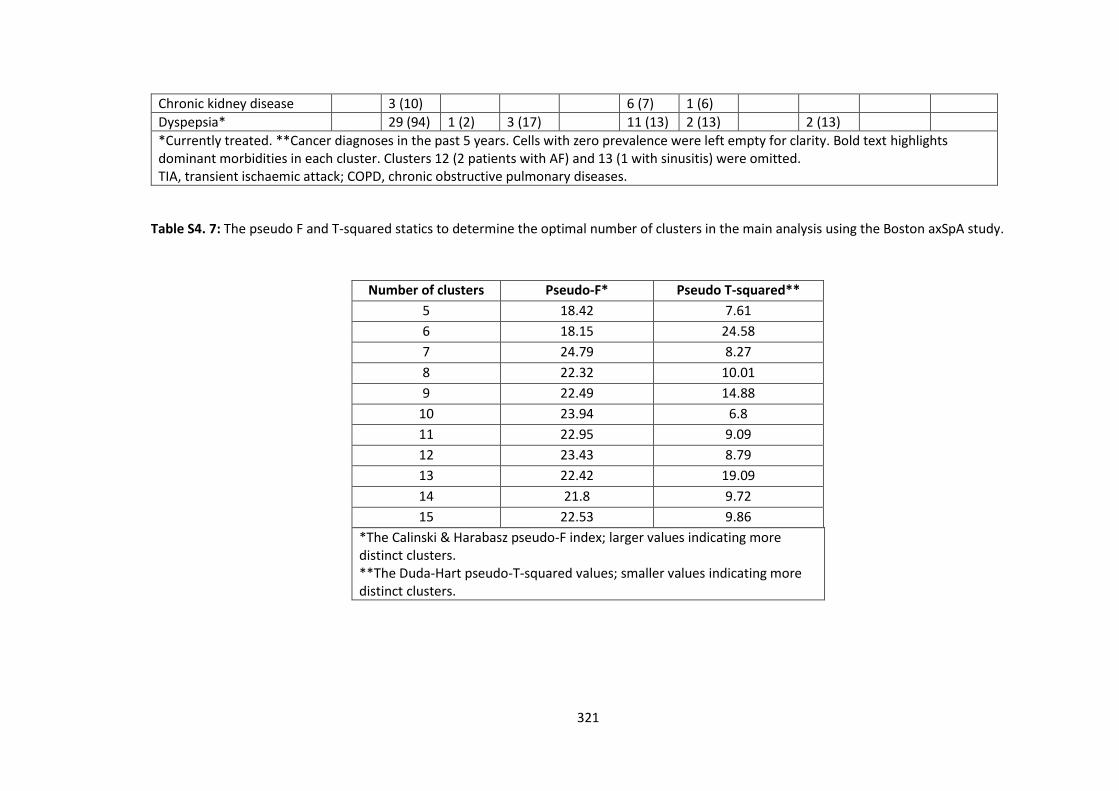
321
Chronic kidney disease 3 (10) 6 (7) 1 (6)
Dyspepsia* 29 (94) 1 (2) 3 (17) 11 (13) 2 (13) 2 (13)
*Currently treated. **Cancer diagnoses in the past 5 years. Cells with zero prevalence were left empty for clarity. Bold text highlights dominant morbidities in each cluster. Clusters 12 (2 patients with AF) and 13 (1 with sinusitis) were omitted. TIA, transient ischaemic attack; COPD, chronic obstructive pulmonary diseases.
Table S4. 7: The pseudo F and T-squared statics to determine the optimal number of clusters in the main analysis using the Boston axSpA study.
Number of clusters Pseudo-F* Pseudo T-squared**
5 18.42 7.61
6 18.15 24.58
7 24.79 8.27
8 22.32 10.01
9 22.49 14.88
10 23.94 6.8
11 22.95 9.09
12 23.43 8.79
13 22.42 19.09
14 21.8 9.72
15 22.53 9.86
*The Calinski & Harabasz pseudo-F index; larger values indicating more distinct clusters. **The Duda-Hart pseudo-T-squared values; smaller values indicating more distinct clusters.
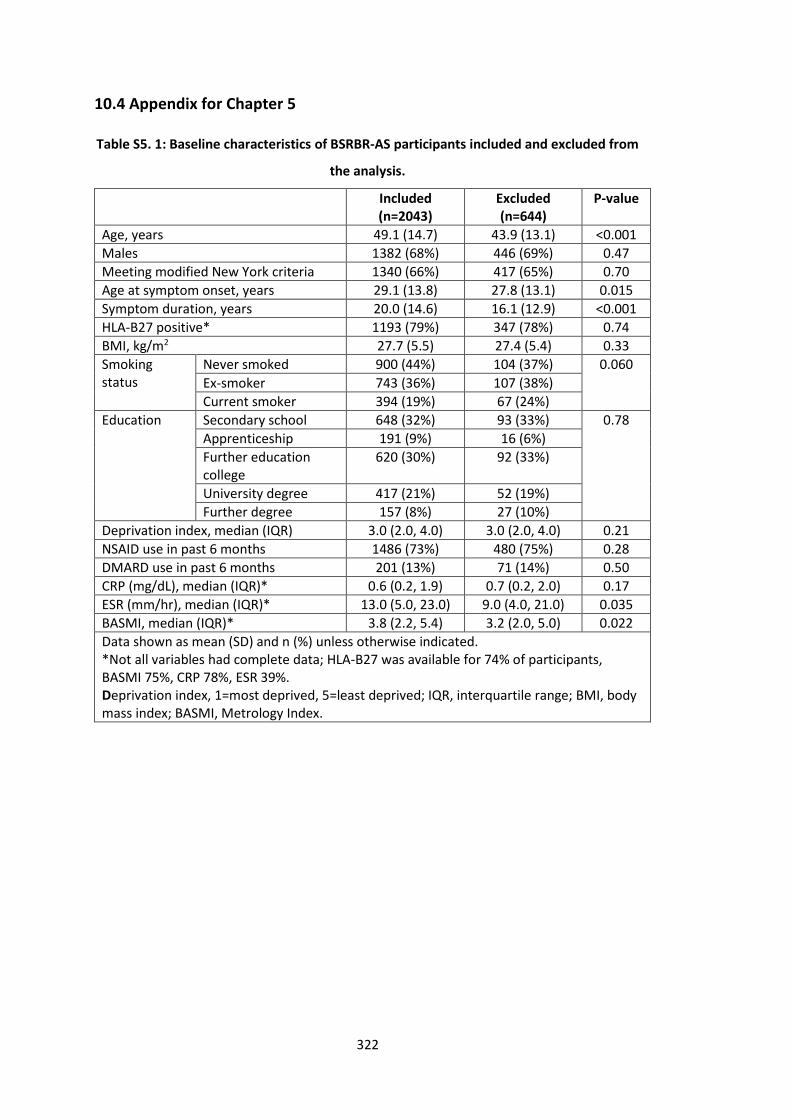
322
10.4 Appendix for Chapter 5
Table S5. 1: Baseline characteristics of BSRBR-AS participants included and excluded from
the analysis.
Included (n=2043)
Excluded (n=644)
P-value
Age, years 49.1 (14.7) 43.9 (13.1) <0.001
Males 1382 (68%) 446 (69%) 0.47
Meeting modified New York criteria 1340 (66%) 417 (65%) 0.70
Age at symptom onset, years 29.1 (13.8) 27.8 (13.1) 0.015
Symptom duration, years 20.0 (14.6) 16.1 (12.9) <0.001
HLA-B27 positive* 1193 (79%) 347 (78%) 0.74
BMI, kg/m2 27.7 (5.5) 27.4 (5.4) 0.33
Smoking status
Never smoked 900 (44%) 104 (37%) 0.060
Ex-smoker 743 (36%) 107 (38%)
Current smoker 394 (19%) 67 (24%)
Education Secondary school 648 (32%) 93 (33%) 0.78
Apprenticeship 191 (9%) 16 (6%)
Further education college
620 (30%) 92 (33%)
University degree 417 (21%) 52 (19%)
Further degree 157 (8%) 27 (10%)
Deprivation index, median (IQR) 3.0 (2.0, 4.0) 3.0 (2.0, 4.0) 0.21
NSAID use in past 6 months 1486 (73%) 480 (75%) 0.28
DMARD use in past 6 months 201 (13%) 71 (14%) 0.50
CRP (mg/dL), median (IQR)* 0.6 (0.2, 1.9) 0.7 (0.2, 2.0) 0.17
ESR (mm/hr), median (IQR)* 13.0 (5.0, 23.0) 9.0 (4.0, 21.0) 0.035
BASMI, median (IQR)* 3.8 (2.2, 5.4) 3.2 (2.0, 5.0) 0.022
Data shown as mean (SD) and n (%) unless otherwise indicated. *Not all variables had complete data; HLA-B27 was available for 74% of participants, BASMI 75%, CRP 78%, ESR 39%. Deprivation index, 1=most deprived, 5=least deprived; IQR, interquartile range; BMI, body mass index; BASMI, Metrology Index.
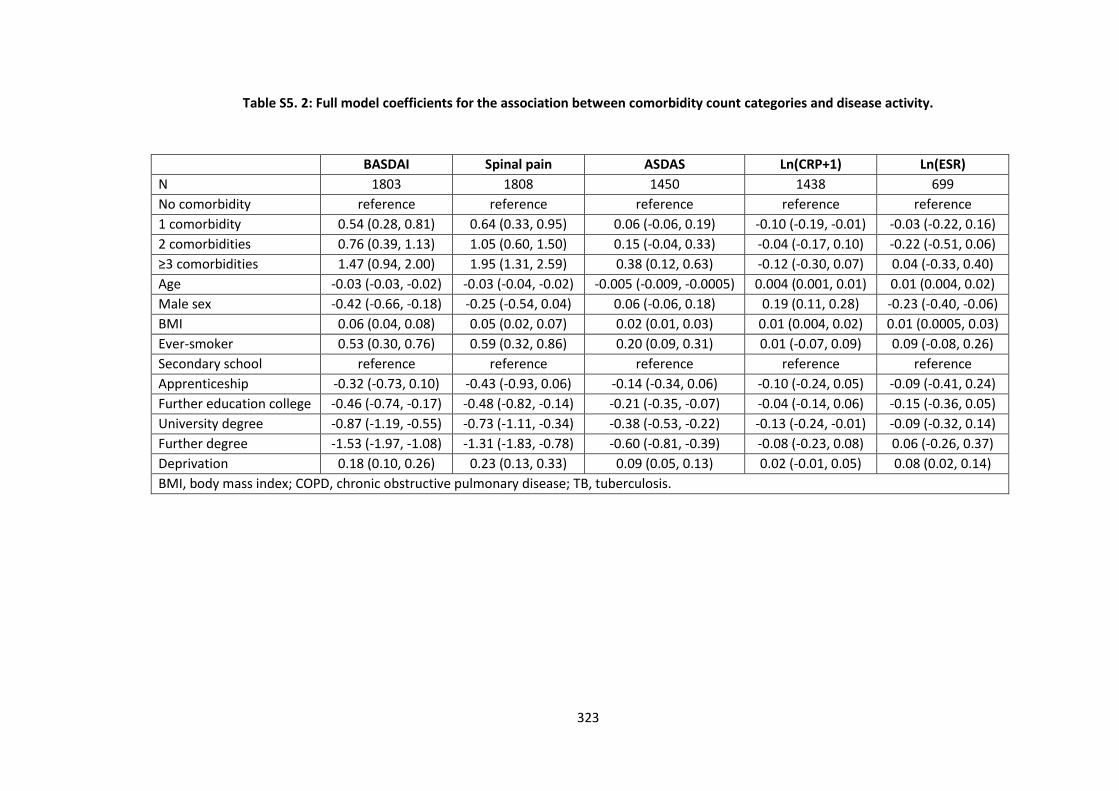
323
Table S5. 2: Full model coefficients for the association between comorbidity count categories and disease activity.
BASDAI Spinal pain ASDAS Ln(CRP+1) Ln(ESR)
N 1803 1808 1450 1438 699
No comorbidity reference reference reference reference reference
1 comorbidity 0.54 (0.28, 0.81) 0.64 (0.33, 0.95) 0.06 (-0.06, 0.19) -0.10 (-0.19, -0.01) -0.03 (-0.22, 0.16)
2 comorbidities 0.76 (0.39, 1.13) 1.05 (0.60, 1.50) 0.15 (-0.04, 0.33) -0.04 (-0.17, 0.10) -0.22 (-0.51, 0.06)
≥3 comorbidities 1.47 (0.94, 2.00) 1.95 (1.31, 2.59) 0.38 (0.12, 0.63) -0.12 (-0.30, 0.07) 0.04 (-0.33, 0.40)
Age -0.03 (-0.03, -0.02) -0.03 (-0.04, -0.02) -0.005 (-0.009, -0.0005) 0.004 (0.001, 0.01) 0.01 (0.004, 0.02)
Male sex -0.42 (-0.66, -0.18) -0.25 (-0.54, 0.04) 0.06 (-0.06, 0.18) 0.19 (0.11, 0.28) -0.23 (-0.40, -0.06)
BMI 0.06 (0.04, 0.08) 0.05 (0.02, 0.07) 0.02 (0.01, 0.03) 0.01 (0.004, 0.02) 0.01 (0.0005, 0.03)
Ever-smoker 0.53 (0.30, 0.76) 0.59 (0.32, 0.86) 0.20 (0.09, 0.31) 0.01 (-0.07, 0.09) 0.09 (-0.08, 0.26)
Secondary school reference reference reference reference reference
Apprenticeship -0.32 (-0.73, 0.10) -0.43 (-0.93, 0.06) -0.14 (-0.34, 0.06) -0.10 (-0.24, 0.05) -0.09 (-0.41, 0.24)
Further education college -0.46 (-0.74, -0.17) -0.48 (-0.82, -0.14) -0.21 (-0.35, -0.07) -0.04 (-0.14, 0.06) -0.15 (-0.36, 0.05)
University degree -0.87 (-1.19, -0.55) -0.73 (-1.11, -0.34) -0.38 (-0.53, -0.22) -0.13 (-0.24, -0.01) -0.09 (-0.32, 0.14)
Further degree -1.53 (-1.97, -1.08) -1.31 (-1.83, -0.78) -0.60 (-0.81, -0.39) -0.08 (-0.23, 0.08) 0.06 (-0.26, 0.37)
Deprivation 0.18 (0.10, 0.26) 0.23 (0.13, 0.33) 0.09 (0.05, 0.13) 0.02 (-0.01, 0.05) 0.08 (0.02, 0.14)
BMI, body mass index; COPD, chronic obstructive pulmonary disease; TB, tuberculosis.
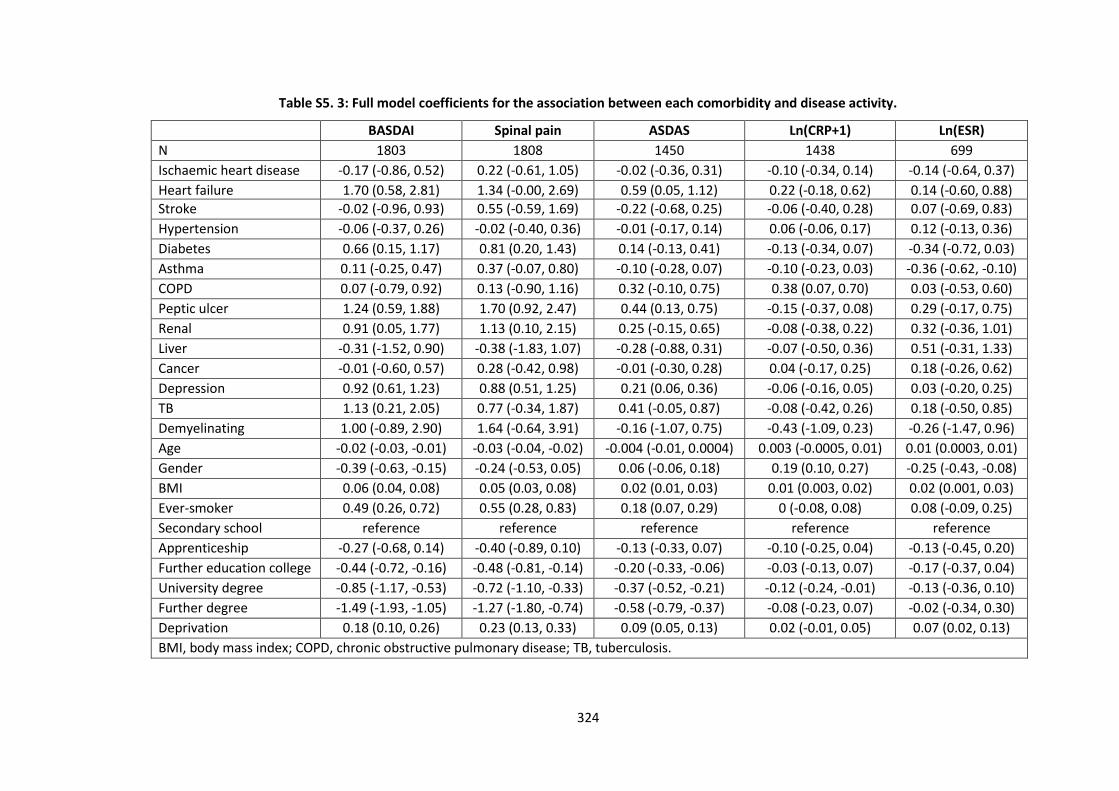
324
Table S5. 3: Full model coefficients for the association between each comorbidity and disease activity.
BASDAI Spinal pain ASDAS Ln(CRP+1) Ln(ESR)
N 1803 1808 1450 1438 699
Ischaemic heart disease -0.17 (-0.86, 0.52) 0.22 (-0.61, 1.05) -0.02 (-0.36, 0.31) -0.10 (-0.34, 0.14) -0.14 (-0.64, 0.37)
Heart failure 1.70 (0.58, 2.81) 1.34 (-0.00, 2.69) 0.59 (0.05, 1.12) 0.22 (-0.18, 0.62) 0.14 (-0.60, 0.88)
Stroke -0.02 (-0.96, 0.93) 0.55 (-0.59, 1.69) -0.22 (-0.68, 0.25) -0.06 (-0.40, 0.28) 0.07 (-0.69, 0.83)
Hypertension -0.06 (-0.37, 0.26) -0.02 (-0.40, 0.36) -0.01 (-0.17, 0.14) 0.06 (-0.06, 0.17) 0.12 (-0.13, 0.36)
Diabetes 0.66 (0.15, 1.17) 0.81 (0.20, 1.43) 0.14 (-0.13, 0.41) -0.13 (-0.34, 0.07) -0.34 (-0.72, 0.03)
Asthma 0.11 (-0.25, 0.47) 0.37 (-0.07, 0.80) -0.10 (-0.28, 0.07) -0.10 (-0.23, 0.03) -0.36 (-0.62, -0.10)
COPD 0.07 (-0.79, 0.92) 0.13 (-0.90, 1.16) 0.32 (-0.10, 0.75) 0.38 (0.07, 0.70) 0.03 (-0.53, 0.60)
Peptic ulcer 1.24 (0.59, 1.88) 1.70 (0.92, 2.47) 0.44 (0.13, 0.75) -0.15 (-0.37, 0.08) 0.29 (-0.17, 0.75)
Renal 0.91 (0.05, 1.77) 1.13 (0.10, 2.15) 0.25 (-0.15, 0.65) -0.08 (-0.38, 0.22) 0.32 (-0.36, 1.01)
Liver -0.31 (-1.52, 0.90) -0.38 (-1.83, 1.07) -0.28 (-0.88, 0.31) -0.07 (-0.50, 0.36) 0.51 (-0.31, 1.33)
Cancer -0.01 (-0.60, 0.57) 0.28 (-0.42, 0.98) -0.01 (-0.30, 0.28) 0.04 (-0.17, 0.25) 0.18 (-0.26, 0.62)
Depression 0.92 (0.61, 1.23) 0.88 (0.51, 1.25) 0.21 (0.06, 0.36) -0.06 (-0.16, 0.05) 0.03 (-0.20, 0.25)
TB 1.13 (0.21, 2.05) 0.77 (-0.34, 1.87) 0.41 (-0.05, 0.87) -0.08 (-0.42, 0.26) 0.18 (-0.50, 0.85)
Demyelinating 1.00 (-0.89, 2.90) 1.64 (-0.64, 3.91) -0.16 (-1.07, 0.75) -0.43 (-1.09, 0.23) -0.26 (-1.47, 0.96)
Age -0.02 (-0.03, -0.01) -0.03 (-0.04, -0.02) -0.004 (-0.01, 0.0004) 0.003 (-0.0005, 0.01) 0.01 (0.0003, 0.01)
Gender -0.39 (-0.63, -0.15) -0.24 (-0.53, 0.05) 0.06 (-0.06, 0.18) 0.19 (0.10, 0.27) -0.25 (-0.43, -0.08)
BMI 0.06 (0.04, 0.08) 0.05 (0.03, 0.08) 0.02 (0.01, 0.03) 0.01 (0.003, 0.02) 0.02 (0.001, 0.03)
Ever-smoker 0.49 (0.26, 0.72) 0.55 (0.28, 0.83) 0.18 (0.07, 0.29) 0 (-0.08, 0.08) 0.08 (-0.09, 0.25)
Secondary school reference reference reference reference reference
Apprenticeship -0.27 (-0.68, 0.14) -0.40 (-0.89, 0.10) -0.13 (-0.33, 0.07) -0.10 (-0.25, 0.04) -0.13 (-0.45, 0.20)
Further education college -0.44 (-0.72, -0.16) -0.48 (-0.81, -0.14) -0.20 (-0.33, -0.06) -0.03 (-0.13, 0.07) -0.17 (-0.37, 0.04)
University degree -0.85 (-1.17, -0.53) -0.72 (-1.10, -0.33) -0.37 (-0.52, -0.21) -0.12 (-0.24, -0.01) -0.13 (-0.36, 0.10)
Further degree -1.49 (-1.93, -1.05) -1.27 (-1.80, -0.74) -0.58 (-0.79, -0.37) -0.08 (-0.23, 0.07) -0.02 (-0.34, 0.30)
Deprivation 0.18 (0.10, 0.26) 0.23 (0.13, 0.33) 0.09 (0.05, 0.13) 0.02 (-0.01, 0.05) 0.07 (0.02, 0.13)
BMI, body mass index; COPD, chronic obstructive pulmonary disease; TB, tuberculosis.
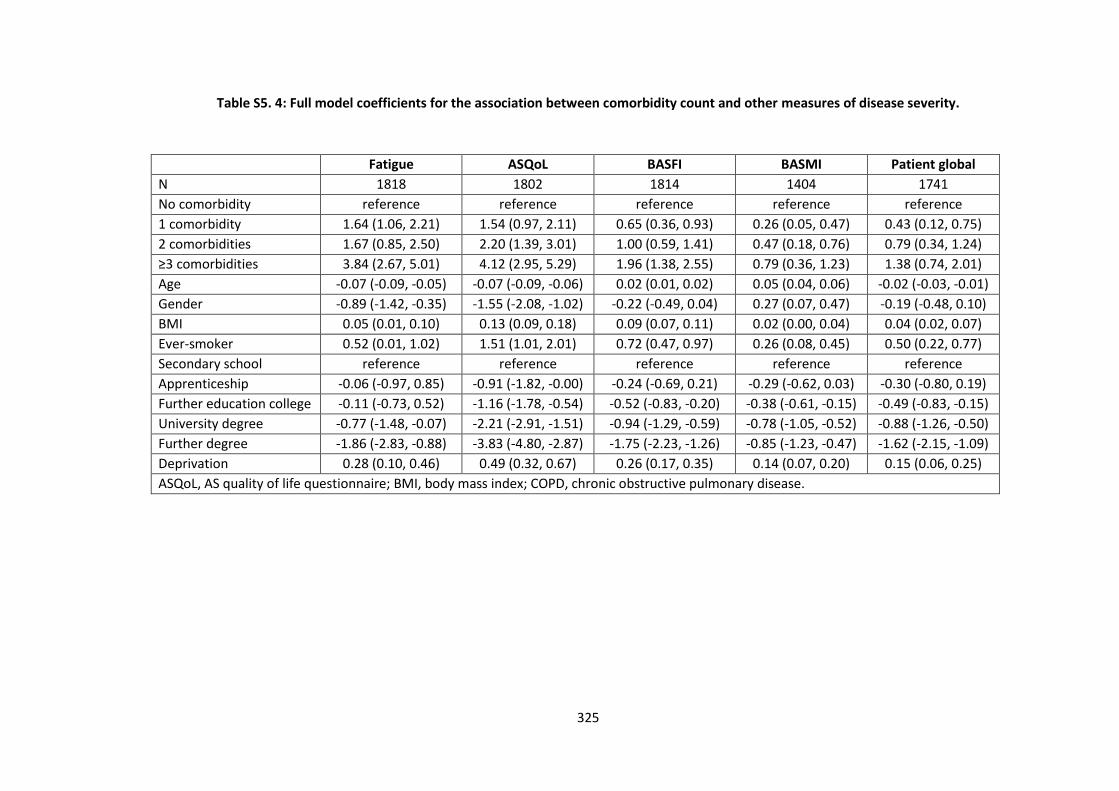
325
Table S5. 4: Full model coefficients for the association between comorbidity count and other measures of disease severity.
Fatigue ASQoL BASFI BASMI Patient global
N 1818 1802 1814 1404 1741
No comorbidity reference reference reference reference reference
1 comorbidity 1.64 (1.06, 2.21) 1.54 (0.97, 2.11) 0.65 (0.36, 0.93) 0.26 (0.05, 0.47) 0.43 (0.12, 0.75)
2 comorbidities 1.67 (0.85, 2.50) 2.20 (1.39, 3.01) 1.00 (0.59, 1.41) 0.47 (0.18, 0.76) 0.79 (0.34, 1.24)
≥3 comorbidities 3.84 (2.67, 5.01) 4.12 (2.95, 5.29) 1.96 (1.38, 2.55) 0.79 (0.36, 1.23) 1.38 (0.74, 2.01)
Age -0.07 (-0.09, -0.05) -0.07 (-0.09, -0.06) 0.02 (0.01, 0.02) 0.05 (0.04, 0.06) -0.02 (-0.03, -0.01)
Gender -0.89 (-1.42, -0.35) -1.55 (-2.08, -1.02) -0.22 (-0.49, 0.04) 0.27 (0.07, 0.47) -0.19 (-0.48, 0.10)
BMI 0.05 (0.01, 0.10) 0.13 (0.09, 0.18) 0.09 (0.07, 0.11) 0.02 (0.00, 0.04) 0.04 (0.02, 0.07)
Ever-smoker 0.52 (0.01, 1.02) 1.51 (1.01, 2.01) 0.72 (0.47, 0.97) 0.26 (0.08, 0.45) 0.50 (0.22, 0.77)
Secondary school reference reference reference reference reference
Apprenticeship -0.06 (-0.97, 0.85) -0.91 (-1.82, -0.00) -0.24 (-0.69, 0.21) -0.29 (-0.62, 0.03) -0.30 (-0.80, 0.19)
Further education college -0.11 (-0.73, 0.52) -1.16 (-1.78, -0.54) -0.52 (-0.83, -0.20) -0.38 (-0.61, -0.15) -0.49 (-0.83, -0.15)
University degree -0.77 (-1.48, -0.07) -2.21 (-2.91, -1.51) -0.94 (-1.29, -0.59) -0.78 (-1.05, -0.52) -0.88 (-1.26, -0.50)
Further degree -1.86 (-2.83, -0.88) -3.83 (-4.80, -2.87) -1.75 (-2.23, -1.26) -0.85 (-1.23, -0.47) -1.62 (-2.15, -1.09)
Deprivation 0.28 (0.10, 0.46) 0.49 (0.32, 0.67) 0.26 (0.17, 0.35) 0.14 (0.07, 0.20) 0.15 (0.06, 0.25)
ASQoL, AS quality of life questionnaire; BMI, body mass index; COPD, chronic obstructive pulmonary disease.
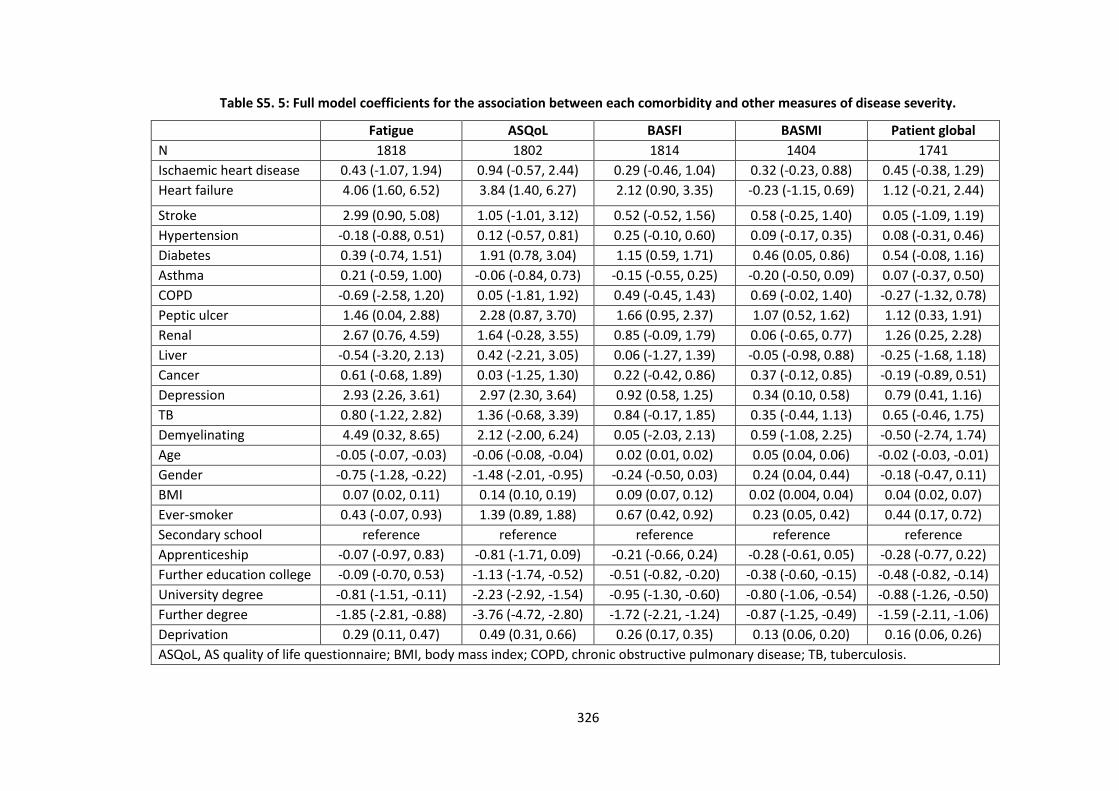
326
Table S5. 5: Full model coefficients for the association between each comorbidity and other measures of disease severity.
Fatigue ASQoL BASFI BASMI Patient global
N 1818 1802 1814 1404 1741
Ischaemic heart disease 0.43 (-1.07, 1.94) 0.94 (-0.57, 2.44) 0.29 (-0.46, 1.04) 0.32 (-0.23, 0.88) 0.45 (-0.38, 1.29)
Heart failure 4.06 (1.60, 6.52) 3.84 (1.40, 6.27) 2.12 (0.90, 3.35) -0.23 (-1.15, 0.69) 1.12 (-0.21, 2.44)
Stroke 2.99 (0.90, 5.08) 1.05 (-1.01, 3.12) 0.52 (-0.52, 1.56) 0.58 (-0.25, 1.40) 0.05 (-1.09, 1.19)
Hypertension -0.18 (-0.88, 0.51) 0.12 (-0.57, 0.81) 0.25 (-0.10, 0.60) 0.09 (-0.17, 0.35) 0.08 (-0.31, 0.46)
Diabetes 0.39 (-0.74, 1.51) 1.91 (0.78, 3.04) 1.15 (0.59, 1.71) 0.46 (0.05, 0.86) 0.54 (-0.08, 1.16)
Asthma 0.21 (-0.59, 1.00) -0.06 (-0.84, 0.73) -0.15 (-0.55, 0.25) -0.20 (-0.50, 0.09) 0.07 (-0.37, 0.50)
COPD -0.69 (-2.58, 1.20) 0.05 (-1.81, 1.92) 0.49 (-0.45, 1.43) 0.69 (-0.02, 1.40) -0.27 (-1.32, 0.78)
Peptic ulcer 1.46 (0.04, 2.88) 2.28 (0.87, 3.70) 1.66 (0.95, 2.37) 1.07 (0.52, 1.62) 1.12 (0.33, 1.91)
Renal 2.67 (0.76, 4.59) 1.64 (-0.28, 3.55) 0.85 (-0.09, 1.79) 0.06 (-0.65, 0.77) 1.26 (0.25, 2.28)
Liver -0.54 (-3.20, 2.13) 0.42 (-2.21, 3.05) 0.06 (-1.27, 1.39) -0.05 (-0.98, 0.88) -0.25 (-1.68, 1.18)
Cancer 0.61 (-0.68, 1.89) 0.03 (-1.25, 1.30) 0.22 (-0.42, 0.86) 0.37 (-0.12, 0.85) -0.19 (-0.89, 0.51)
Depression 2.93 (2.26, 3.61) 2.97 (2.30, 3.64) 0.92 (0.58, 1.25) 0.34 (0.10, 0.58) 0.79 (0.41, 1.16)
TB 0.80 (-1.22, 2.82) 1.36 (-0.68, 3.39) 0.84 (-0.17, 1.85) 0.35 (-0.44, 1.13) 0.65 (-0.46, 1.75)
Demyelinating 4.49 (0.32, 8.65) 2.12 (-2.00, 6.24) 0.05 (-2.03, 2.13) 0.59 (-1.08, 2.25) -0.50 (-2.74, 1.74)
Age -0.05 (-0.07, -0.03) -0.06 (-0.08, -0.04) 0.02 (0.01, 0.02) 0.05 (0.04, 0.06) -0.02 (-0.03, -0.01)
Gender -0.75 (-1.28, -0.22) -1.48 (-2.01, -0.95) -0.24 (-0.50, 0.03) 0.24 (0.04, 0.44) -0.18 (-0.47, 0.11)
BMI 0.07 (0.02, 0.11) 0.14 (0.10, 0.19) 0.09 (0.07, 0.12) 0.02 (0.004, 0.04) 0.04 (0.02, 0.07)
Ever-smoker 0.43 (-0.07, 0.93) 1.39 (0.89, 1.88) 0.67 (0.42, 0.92) 0.23 (0.05, 0.42) 0.44 (0.17, 0.72)
Secondary school reference reference reference reference reference
Apprenticeship -0.07 (-0.97, 0.83) -0.81 (-1.71, 0.09) -0.21 (-0.66, 0.24) -0.28 (-0.61, 0.05) -0.28 (-0.77, 0.22)
Further education college -0.09 (-0.70, 0.53) -1.13 (-1.74, -0.52) -0.51 (-0.82, -0.20) -0.38 (-0.60, -0.15) -0.48 (-0.82, -0.14)
University degree -0.81 (-1.51, -0.11) -2.23 (-2.92, -1.54) -0.95 (-1.30, -0.60) -0.80 (-1.06, -0.54) -0.88 (-1.26, -0.50)
Further degree -1.85 (-2.81, -0.88) -3.76 (-4.72, -2.80) -1.72 (-2.21, -1.24) -0.87 (-1.25, -0.49) -1.59 (-2.11, -1.06)
Deprivation 0.29 (0.11, 0.47) 0.49 (0.31, 0.66) 0.26 (0.17, 0.35) 0.13 (0.06, 0.20) 0.16 (0.06, 0.26)
ASQoL, AS quality of life questionnaire; BMI, body mass index; COPD, chronic obstructive pulmonary disease; TB, tuberculosis.
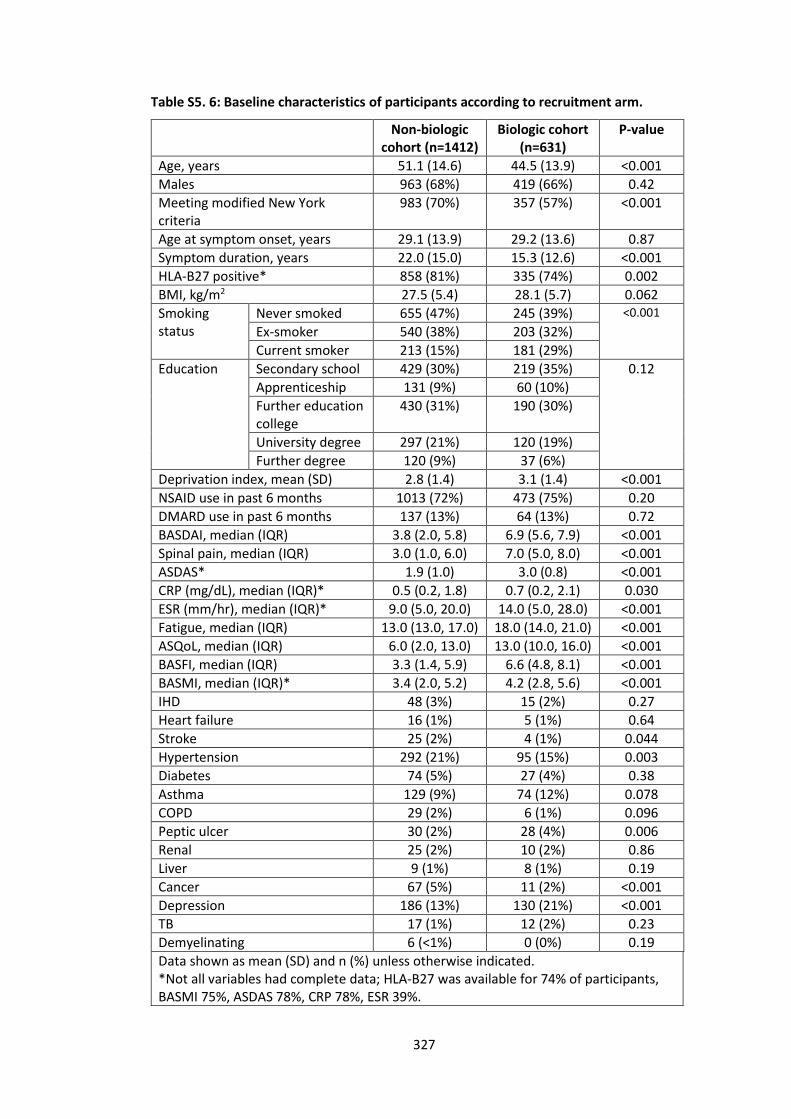
327
Table S5. 6: Baseline characteristics of participants according to recruitment arm.
Non-biologic cohort (n=1412)
Biologic cohort (n=631)
P-value
Age, years 51.1 (14.6) 44.5 (13.9) <0.001
Males 963 (68%) 419 (66%) 0.42
Meeting modified New York criteria
983 (70%) 357 (57%) <0.001
Age at symptom onset, years 29.1 (13.9) 29.2 (13.6) 0.87
Symptom duration, years 22.0 (15.0) 15.3 (12.6) <0.001
HLA-B27 positive* 858 (81%) 335 (74%) 0.002
BMI, kg/m2 27.5 (5.4) 28.1 (5.7) 0.062
Smoking status
Never smoked 655 (47%) 245 (39%) <0.001
Ex-smoker 540 (38%) 203 (32%)
Current smoker 213 (15%) 181 (29%)
Education Secondary school 429 (30%) 219 (35%) 0.12
Apprenticeship 131 (9%) 60 (10%)
Further education college
430 (31%) 190 (30%)
University degree 297 (21%) 120 (19%)
Further degree 120 (9%) 37 (6%)
Deprivation index, mean (SD) 2.8 (1.4) 3.1 (1.4) <0.001
NSAID use in past 6 months 1013 (72%) 473 (75%) 0.20
DMARD use in past 6 months 137 (13%) 64 (13%) 0.72
BASDAI, median (IQR) 3.8 (2.0, 5.8) 6.9 (5.6, 7.9) <0.001
Spinal pain, median (IQR) 3.0 (1.0, 6.0) 7.0 (5.0, 8.0) <0.001
ASDAS* 1.9 (1.0) 3.0 (0.8) <0.001
CRP (mg/dL), median (IQR)* 0.5 (0.2, 1.8) 0.7 (0.2, 2.1) 0.030
ESR (mm/hr), median (IQR)* 9.0 (5.0, 20.0) 14.0 (5.0, 28.0) <0.001
Fatigue, median (IQR) 13.0 (13.0, 17.0) 18.0 (14.0, 21.0) <0.001
ASQoL, median (IQR) 6.0 (2.0, 13.0) 13.0 (10.0, 16.0) <0.001
BASFI, median (IQR) 3.3 (1.4, 5.9) 6.6 (4.8, 8.1) <0.001
BASMI, median (IQR)* 3.4 (2.0, 5.2) 4.2 (2.8, 5.6) <0.001
IHD 48 (3%) 15 (2%) 0.27
Heart failure 16 (1%) 5 (1%) 0.64
Stroke 25 (2%) 4 (1%) 0.044
Hypertension 292 (21%) 95 (15%) 0.003
Diabetes 74 (5%) 27 (4%) 0.38
Asthma 129 (9%) 74 (12%) 0.078
COPD 29 (2%) 6 (1%) 0.096
Peptic ulcer 30 (2%) 28 (4%) 0.006
Renal 25 (2%) 10 (2%) 0.86
Liver 9 (1%) 8 (1%) 0.19
Cancer 67 (5%) 11 (2%) <0.001
Depression 186 (13%) 130 (21%) <0.001
TB 17 (1%) 12 (2%) 0.23
Demyelinating 6 (<1%) 0 (0%) 0.19
Data shown as mean (SD) and n (%) unless otherwise indicated. *Not all variables had complete data; HLA-B27 was available for 74% of participants, BASMI 75%, ASDAS 78%, CRP 78%, ESR 39%.

328
**non-parametric test for trend. Deprivation index, 1=most deprived, 5=least deprived; IQR, interquartile range; BMI, body mass index; BASDAI, Bath AS disease activity index; BASFI, Bath AS functional index; BASMI, Metrology Index; ASQoL, AS quality of life questionnaire; ASDAS, AS disease activity score; IHD, ischaemic heart disease.
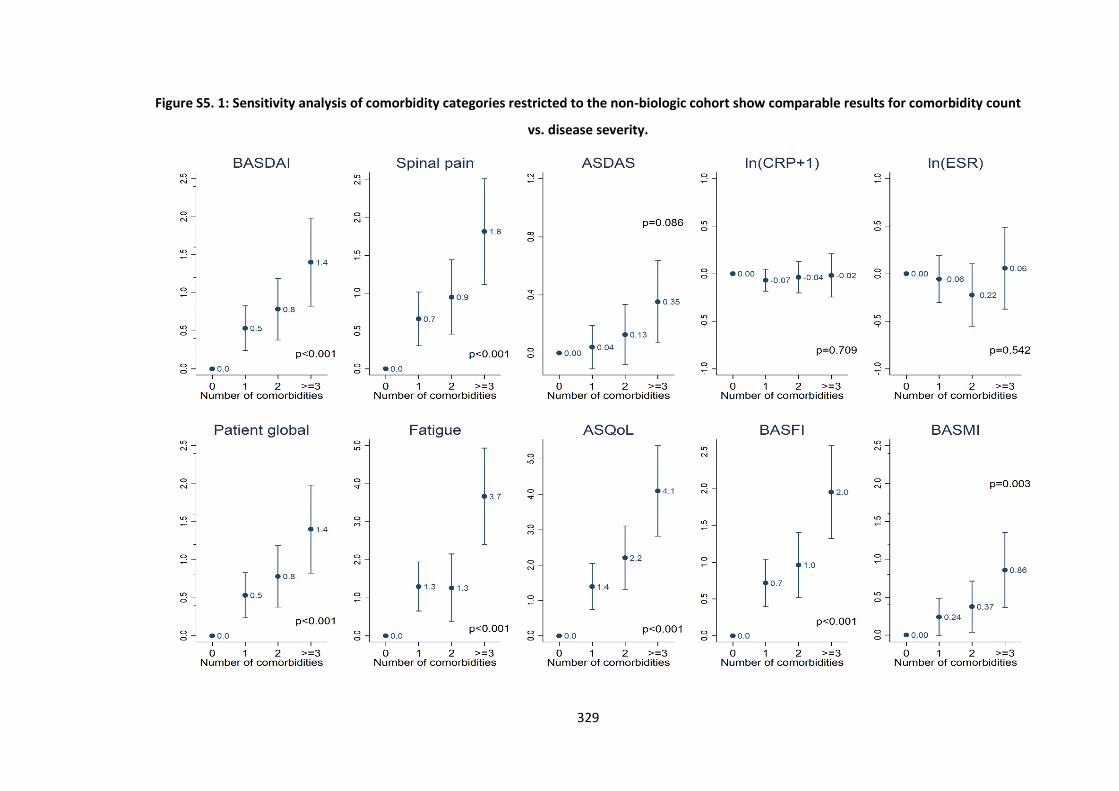
329
Figure S5. 1: Sensitivity analysis of comorbidity categories restricted to the non-biologic cohort show comparable results for comorbidity count
vs. disease severity.
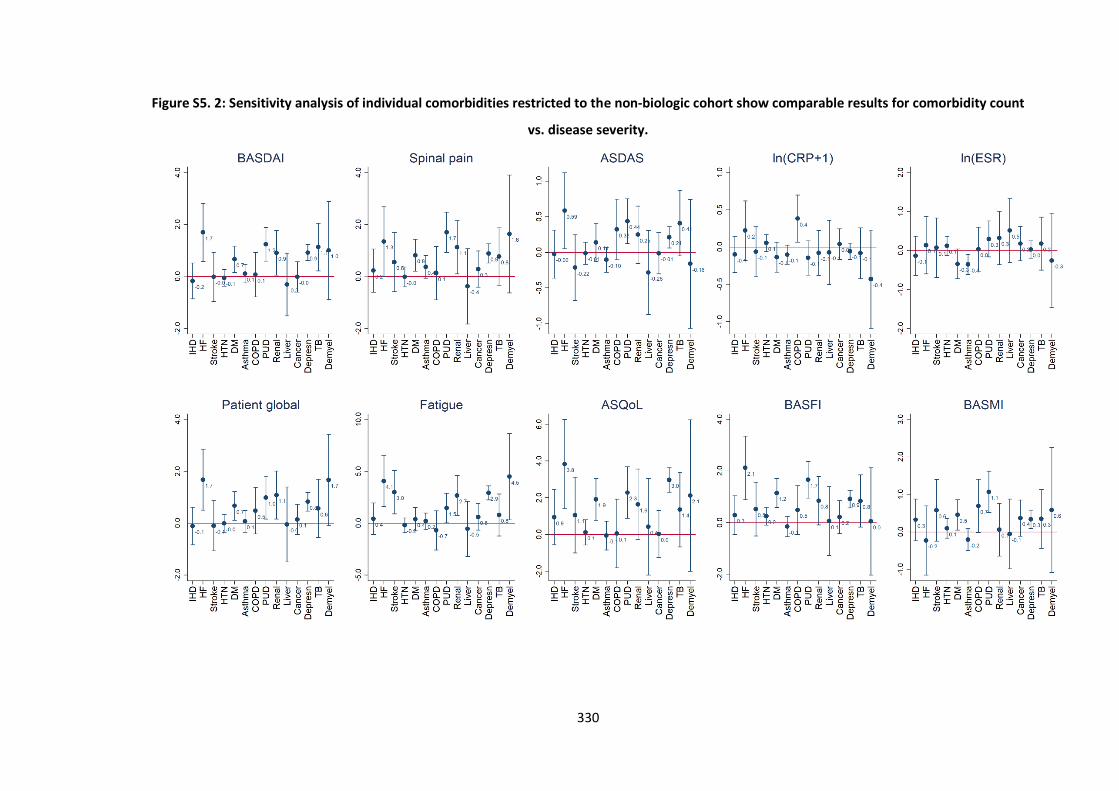
330
Figure S5. 2: Sensitivity analysis of individual comorbidities restricted to the non-biologic cohort show comparable results for comorbidity count
vs. disease severity.
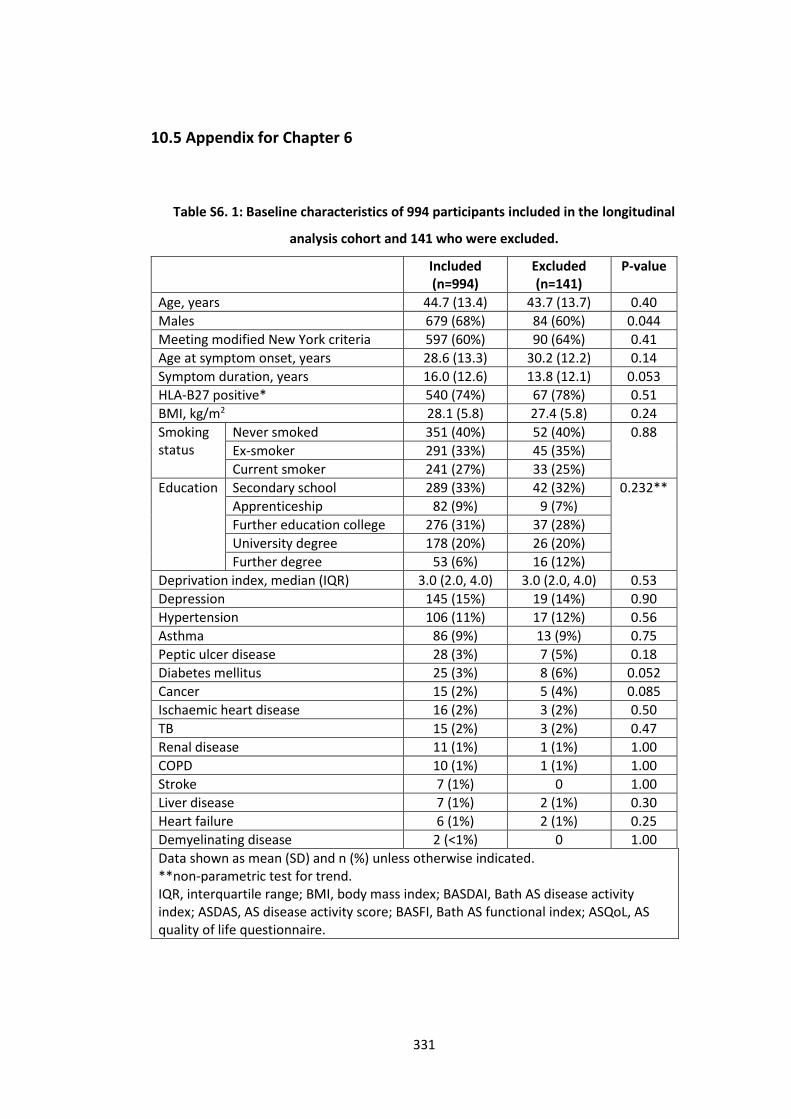
331
10.5 Appendix for Chapter 6
Table S6. 1: Baseline characteristics of 994 participants included in the longitudinal
analysis cohort and 141 who were excluded.
Included (n=994)
Excluded (n=141)
P-value
Age, years 44.7 (13.4) 43.7 (13.7) 0.40
Males 679 (68%) 84 (60%) 0.044
Meeting modified New York criteria 597 (60%) 90 (64%) 0.41
Age at symptom onset, years 28.6 (13.3) 30.2 (12.2) 0.14
Symptom duration, years 16.0 (12.6) 13.8 (12.1) 0.053
HLA-B27 positive* 540 (74%) 67 (78%) 0.51
BMI, kg/m2 28.1 (5.8) 27.4 (5.8) 0.24
Smoking status
Never smoked 351 (40%) 52 (40%) 0.88
Ex-smoker 291 (33%) 45 (35%)
Current smoker 241 (27%) 33 (25%)
Education Secondary school 289 (33%) 42 (32%) 0.232**
Apprenticeship 82 (9%) 9 (7%)
Further education college 276 (31%) 37 (28%)
University degree 178 (20%) 26 (20%)
Further degree 53 (6%) 16 (12%)
Deprivation index, median (IQR) 3.0 (2.0, 4.0) 3.0 (2.0, 4.0) 0.53
Depression 145 (15%) 19 (14%) 0.90
Hypertension 106 (11%) 17 (12%) 0.56
Asthma 86 (9%) 13 (9%) 0.75
Peptic ulcer disease 28 (3%) 7 (5%) 0.18
Diabetes mellitus 25 (3%) 8 (6%) 0.052
Cancer 15 (2%) 5 (4%) 0.085
Ischaemic heart disease 16 (2%) 3 (2%) 0.50
TB 15 (2%) 3 (2%) 0.47
Renal disease 11 (1%) 1 (1%) 1.00
COPD 10 (1%) 1 (1%) 1.00
Stroke 7 (1%) 0 1.00
Liver disease 7 (1%) 2 (1%) 0.30
Heart failure 6 (1%) 2 (1%) 0.25
Demyelinating disease 2 (<1%) 0 1.00
Data shown as mean (SD) and n (%) unless otherwise indicated. **non-parametric test for trend. IQR, interquartile range; BMI, body mass index; BASDAI, Bath AS disease activity index; ASDAS, AS disease activity score; BASFI, Bath AS functional index; ASQoL, AS quality of life questionnaire.
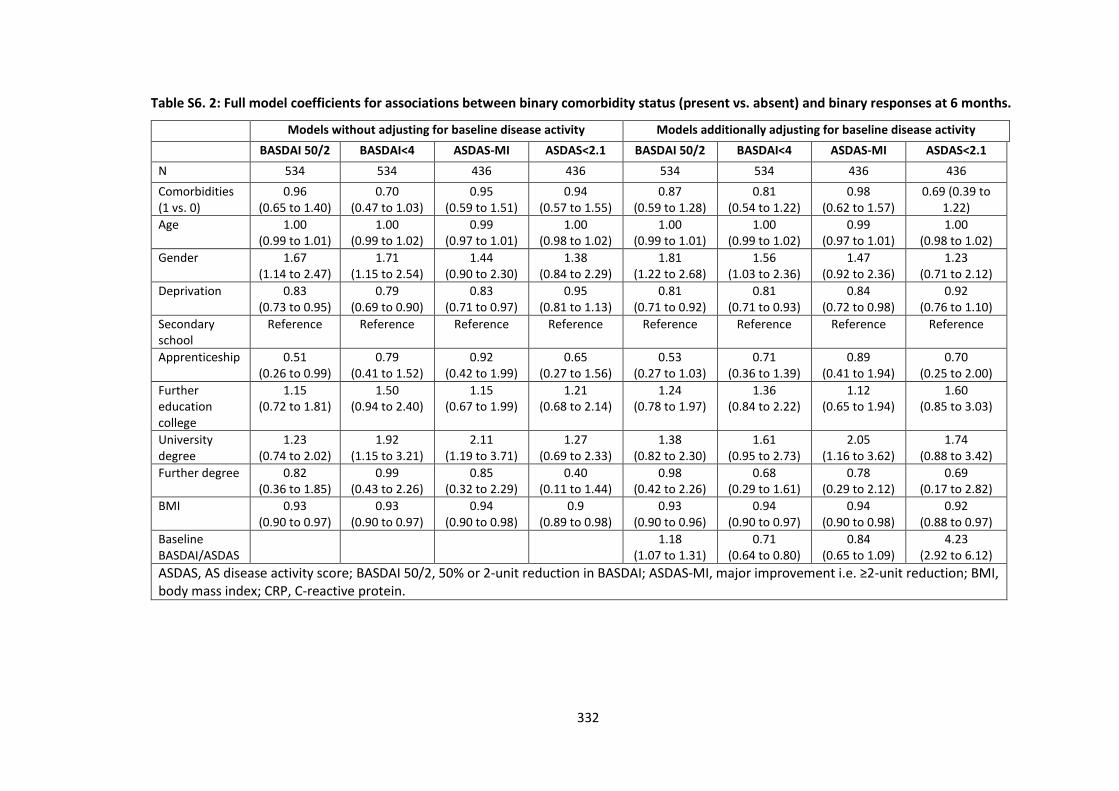
332
Table S6. 2: Full model coefficients for associations between binary comorbidity status (present vs. absent) and binary responses at 6 months.
Models without adjusting for baseline disease activity Models additionally adjusting for baseline disease activity
BASDAI 50/2 BASDAI<4 ASDAS-MI ASDAS<2.1 BASDAI 50/2 BASDAI<4 ASDAS-MI ASDAS<2.1
N 534 534 436 436 534 534 436 436
Comorbidities (1 vs. 0)
0.96 (0.65 to 1.40)
0.70 (0.47 to 1.03)
0.95 (0.59 to 1.51)
0.94 (0.57 to 1.55)
0.87 (0.59 to 1.28)
0.81 (0.54 to 1.22)
0.98 (0.62 to 1.57)
0.69 (0.39 to 1.22)
Age 1.00 (0.99 to 1.01)
1.00 (0.99 to 1.02)
0.99 (0.97 to 1.01)
1.00 (0.98 to 1.02)
1.00 (0.99 to 1.01)
1.00 (0.99 to 1.02)
0.99 (0.97 to 1.01)
1.00 (0.98 to 1.02)
Gender 1.67 (1.14 to 2.47)
1.71 (1.15 to 2.54)
1.44 (0.90 to 2.30)
1.38 (0.84 to 2.29)
1.81 (1.22 to 2.68)
1.56 (1.03 to 2.36)
1.47 (0.92 to 2.36)
1.23 (0.71 to 2.12)
Deprivation 0.83 (0.73 to 0.95)
0.79 (0.69 to 0.90)
0.83 (0.71 to 0.97)
0.95 (0.81 to 1.13)
0.81 (0.71 to 0.92)
0.81 (0.71 to 0.93)
0.84 (0.72 to 0.98)
0.92 (0.76 to 1.10)
Secondary school
Reference Reference Reference Reference Reference Reference Reference Reference
Apprenticeship 0.51 (0.26 to 0.99)
0.79 (0.41 to 1.52)
0.92 (0.42 to 1.99)
0.65 (0.27 to 1.56)
0.53 (0.27 to 1.03)
0.71 (0.36 to 1.39)
0.89 (0.41 to 1.94)
0.70 (0.25 to 2.00)
Further education college
1.15 (0.72 to 1.81)
1.50 (0.94 to 2.40)
1.15 (0.67 to 1.99)
1.21 (0.68 to 2.14)
1.24 (0.78 to 1.97)
1.36 (0.84 to 2.22)
1.12 (0.65 to 1.94)
1.60 (0.85 to 3.03)
University degree
1.23 (0.74 to 2.02)
1.92 (1.15 to 3.21)
2.11 (1.19 to 3.71)
1.27 (0.69 to 2.33)
1.38 (0.82 to 2.30)
1.61 (0.95 to 2.73)
2.05 (1.16 to 3.62)
1.74 (0.88 to 3.42)
Further degree 0.82 (0.36 to 1.85)
0.99 (0.43 to 2.26)
0.85 (0.32 to 2.29)
0.40 (0.11 to 1.44)
0.98 (0.42 to 2.26)
0.68 (0.29 to 1.61)
0.78 (0.29 to 2.12)
0.69 (0.17 to 2.82)
BMI 0.93 (0.90 to 0.97)
0.93 (0.90 to 0.97)
0.94 (0.90 to 0.98)
0.9 (0.89 to 0.98)
0.93 (0.90 to 0.96)
0.94 (0.90 to 0.97)
0.94 (0.90 to 0.98)
0.92 (0.88 to 0.97)
Baseline BASDAI/ASDAS
1.18 (1.07 to 1.31)
0.71 (0.64 to 0.80)
0.84 (0.65 to 1.09)
4.23 (2.92 to 6.12)
ASDAS, AS disease activity score; BASDAI 50/2, 50% or 2-unit reduction in BASDAI; ASDAS-MI, major improvement i.e. ≥2-unit reduction; BMI, body mass index; CRP, C-reactive protein.
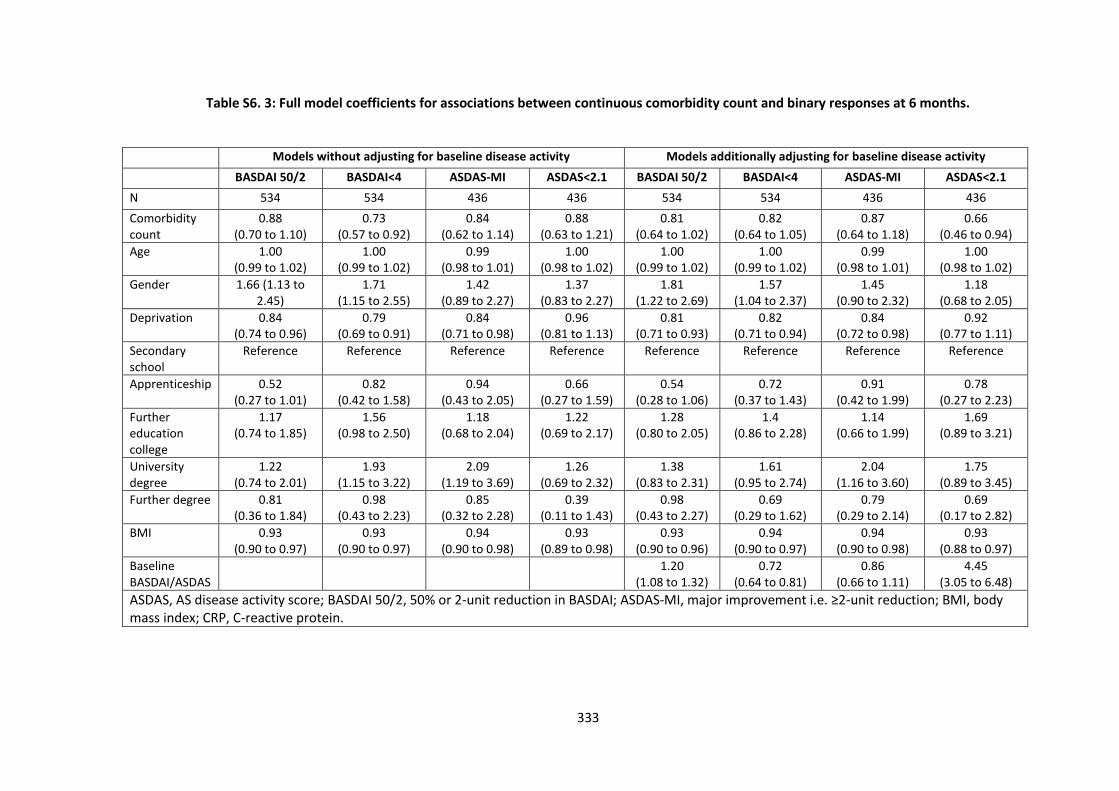
333
Table S6. 3: Full model coefficients for associations between continuous comorbidity count and binary responses at 6 months.
Models without adjusting for baseline disease activity Models additionally adjusting for baseline disease activity
BASDAI 50/2 BASDAI<4 ASDAS-MI ASDAS<2.1 BASDAI 50/2 BASDAI<4 ASDAS-MI ASDAS<2.1
N 534 534 436 436 534 534 436 436
Comorbidity count
0.88 (0.70 to 1.10)
0.73 (0.57 to 0.92)
0.84 (0.62 to 1.14)
0.88 (0.63 to 1.21)
0.81 (0.64 to 1.02)
0.82 (0.64 to 1.05)
0.87 (0.64 to 1.18)
0.66 (0.46 to 0.94)
Age 1.00 (0.99 to 1.02)
1.00 (0.99 to 1.02)
0.99 (0.98 to 1.01)
1.00 (0.98 to 1.02)
1.00 (0.99 to 1.02)
1.00 (0.99 to 1.02)
0.99 (0.98 to 1.01)
1.00 (0.98 to 1.02)
Gender 1.66 (1.13 to 2.45)
1.71 (1.15 to 2.55)
1.42 (0.89 to 2.27)
1.37 (0.83 to 2.27)
1.81 (1.22 to 2.69)
1.57 (1.04 to 2.37)
1.45 (0.90 to 2.32)
1.18 (0.68 to 2.05)
Deprivation 0.84 (0.74 to 0.96)
0.79 (0.69 to 0.91)
0.84 (0.71 to 0.98)
0.96 (0.81 to 1.13)
0.81 (0.71 to 0.93)
0.82 (0.71 to 0.94)
0.84 (0.72 to 0.98)
0.92 (0.77 to 1.11)
Secondary school
Reference Reference Reference Reference Reference Reference Reference Reference
Apprenticeship 0.52 (0.27 to 1.01)
0.82 (0.42 to 1.58)
0.94 (0.43 to 2.05)
0.66 (0.27 to 1.59)
0.54 (0.28 to 1.06)
0.72 (0.37 to 1.43)
0.91 (0.42 to 1.99)
0.78 (0.27 to 2.23)
Further education college
1.17 (0.74 to 1.85)
1.56 (0.98 to 2.50)
1.18 (0.68 to 2.04)
1.22 (0.69 to 2.17)
1.28 (0.80 to 2.05)
1.4 (0.86 to 2.28)
1.14 (0.66 to 1.99)
1.69 (0.89 to 3.21)
University degree
1.22 (0.74 to 2.01)
1.93 (1.15 to 3.22)
2.09 (1.19 to 3.69)
1.26 (0.69 to 2.32)
1.38 (0.83 to 2.31)
1.61 (0.95 to 2.74)
2.04 (1.16 to 3.60)
1.75 (0.89 to 3.45)
Further degree 0.81 (0.36 to 1.84)
0.98 (0.43 to 2.23)
0.85 (0.32 to 2.28)
0.39 (0.11 to 1.43)
0.98 (0.43 to 2.27)
0.69 (0.29 to 1.62)
0.79 (0.29 to 2.14)
0.69 (0.17 to 2.82)
BMI 0.93 (0.90 to 0.97)
0.93 (0.90 to 0.97)
0.94 (0.90 to 0.98)
0.93 (0.89 to 0.98)
0.93 (0.90 to 0.96)
0.94 (0.90 to 0.97)
0.94 (0.90 to 0.98)
0.93 (0.88 to 0.97)
Baseline BASDAI/ASDAS
1.20 (1.08 to 1.32)
0.72 (0.64 to 0.81)
0.86 (0.66 to 1.11)
4.45 (3.05 to 6.48)
ASDAS, AS disease activity score; BASDAI 50/2, 50% or 2-unit reduction in BASDAI; ASDAS-MI, major improvement i.e. ≥2-unit reduction; BMI, body mass index; CRP, C-reactive protein.
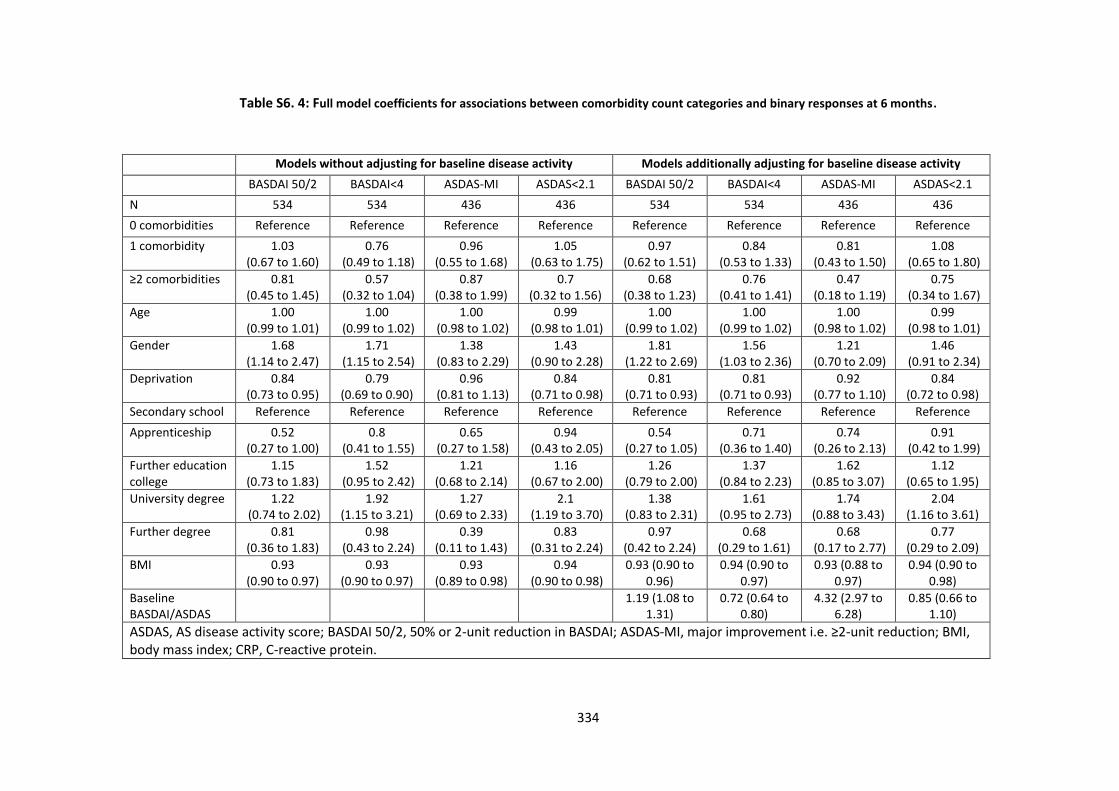
334
Table S6. 4: Full model coefficients for associations between comorbidity count categories and binary responses at 6 months.
Models without adjusting for baseline disease activity Models additionally adjusting for baseline disease activity
BASDAI 50/2 BASDAI<4 ASDAS-MI ASDAS<2.1 BASDAI 50/2 BASDAI<4 ASDAS-MI ASDAS<2.1
N 534 534 436 436 534 534 436 436
0 comorbidities Reference Reference Reference Reference Reference Reference Reference Reference
1 comorbidity 1.03 (0.67 to 1.60)
0.76 (0.49 to 1.18)
0.96 (0.55 to 1.68)
1.05 (0.63 to 1.75)
0.97 (0.62 to 1.51)
0.84 (0.53 to 1.33)
0.81 (0.43 to 1.50)
1.08 (0.65 to 1.80)
≥2 comorbidities 0.81 (0.45 to 1.45)
0.57 (0.32 to 1.04)
0.87 (0.38 to 1.99)
0.7 (0.32 to 1.56)
0.68 (0.38 to 1.23)
0.76 (0.41 to 1.41)
0.47 (0.18 to 1.19)
0.75 (0.34 to 1.67)
Age 1.00 (0.99 to 1.01)
1.00 (0.99 to 1.02)
1.00 (0.98 to 1.02)
0.99 (0.98 to 1.01)
1.00 (0.99 to 1.02)
1.00 (0.99 to 1.02)
1.00 (0.98 to 1.02)
0.99 (0.98 to 1.01)
Gender 1.68 (1.14 to 2.47)
1.71 (1.15 to 2.54)
1.38 (0.83 to 2.29)
1.43 (0.90 to 2.28)
1.81 (1.22 to 2.69)
1.56 (1.03 to 2.36)
1.21 (0.70 to 2.09)
1.46 (0.91 to 2.34)
Deprivation 0.84 (0.73 to 0.95)
0.79 (0.69 to 0.90)
0.96 (0.81 to 1.13)
0.84 (0.71 to 0.98)
0.81 (0.71 to 0.93)
0.81 (0.71 to 0.93)
0.92 (0.77 to 1.10)
0.84 (0.72 to 0.98)
Secondary school Reference Reference Reference Reference Reference Reference Reference Reference
Apprenticeship 0.52 (0.27 to 1.00)
0.8 (0.41 to 1.55)
0.65 (0.27 to 1.58)
0.94 (0.43 to 2.05)
0.54 (0.27 to 1.05)
0.71 (0.36 to 1.40)
0.74 (0.26 to 2.13)
0.91 (0.42 to 1.99)
Further education college
1.15 (0.73 to 1.83)
1.52 (0.95 to 2.42)
1.21 (0.68 to 2.14)
1.16 (0.67 to 2.00)
1.26 (0.79 to 2.00)
1.37 (0.84 to 2.23)
1.62 (0.85 to 3.07)
1.12 (0.65 to 1.95)
University degree 1.22 (0.74 to 2.02)
1.92 (1.15 to 3.21)
1.27 (0.69 to 2.33)
2.1 (1.19 to 3.70)
1.38 (0.83 to 2.31)
1.61 (0.95 to 2.73)
1.74 (0.88 to 3.43)
2.04 (1.16 to 3.61)
Further degree 0.81 (0.36 to 1.83)
0.98 (0.43 to 2.24)
0.39 (0.11 to 1.43)
0.83 (0.31 to 2.24)
0.97 (0.42 to 2.24)
0.68 (0.29 to 1.61)
0.68 (0.17 to 2.77)
0.77 (0.29 to 2.09)
BMI 0.93 (0.90 to 0.97)
0.93 (0.90 to 0.97)
0.93 (0.89 to 0.98)
0.94 (0.90 to 0.98)
0.93 (0.90 to 0.96)
0.94 (0.90 to 0.97)
0.93 (0.88 to 0.97)
0.94 (0.90 to 0.98)
Baseline BASDAI/ASDAS
1.19 (1.08 to 1.31)
0.72 (0.64 to 0.80)
4.32 (2.97 to 6.28)
0.85 (0.66 to 1.10)
ASDAS, AS disease activity score; BASDAI 50/2, 50% or 2-unit reduction in BASDAI; ASDAS-MI, major improvement i.e. ≥2-unit reduction; BMI, body mass index; CRP, C-reactive protein.
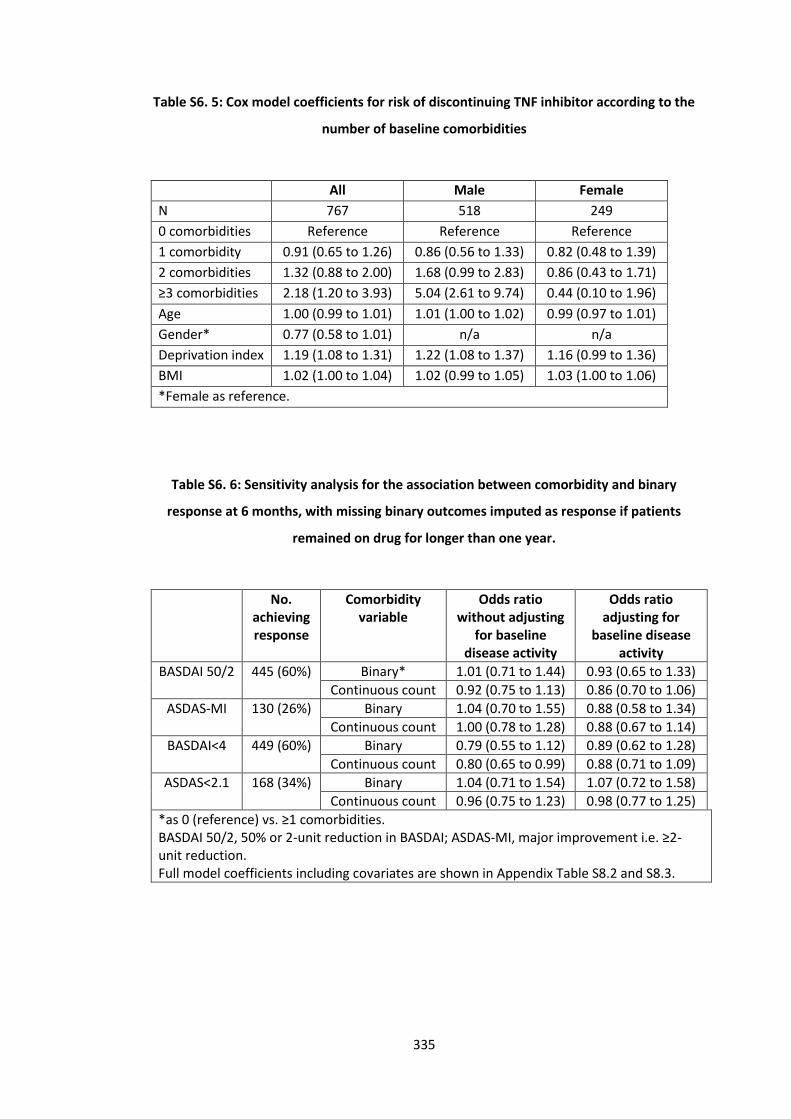
335
Table S6. 5: Cox model coefficients for risk of discontinuing TNF inhibitor according to the
number of baseline comorbidities
All Male Female
N 767 518 249
0 comorbidities Reference Reference Reference
1 comorbidity 0.91 (0.65 to 1.26) 0.86 (0.56 to 1.33) 0.82 (0.48 to 1.39)
2 comorbidities 1.32 (0.88 to 2.00) 1.68 (0.99 to 2.83) 0.86 (0.43 to 1.71)
≥3 comorbidities 2.18 (1.20 to 3.93) 5.04 (2.61 to 9.74) 0.44 (0.10 to 1.96)
Age 1.00 (0.99 to 1.01) 1.01 (1.00 to 1.02) 0.99 (0.97 to 1.01)
Gender* 0.77 (0.58 to 1.01) n/a n/a
Deprivation index 1.19 (1.08 to 1.31) 1.22 (1.08 to 1.37) 1.16 (0.99 to 1.36)
BMI 1.02 (1.00 to 1.04) 1.02 (0.99 to 1.05) 1.03 (1.00 to 1.06)
*Female as reference.
Table S6. 6: Sensitivity analysis for the association between comorbidity and binary
response at 6 months, with missing binary outcomes imputed as response if patients
remained on drug for longer than one year.
No. achieving response
Comorbidity variable
Odds ratio without adjusting
for baseline disease activity
Odds ratio adjusting for
baseline disease activity
BASDAI 50/2 445 (60%) Binary* 1.01 (0.71 to 1.44) 0.93 (0.65 to 1.33)
Continuous count 0.92 (0.75 to 1.13) 0.86 (0.70 to 1.06)
ASDAS-MI 130 (26%) Binary 1.04 (0.70 to 1.55) 0.88 (0.58 to 1.34)
Continuous count 1.00 (0.78 to 1.28) 0.88 (0.67 to 1.14)
BASDAI<4 449 (60%) Binary 0.79 (0.55 to 1.12) 0.89 (0.62 to 1.28)
Continuous count 0.80 (0.65 to 0.99) 0.88 (0.71 to 1.09)
ASDAS<2.1 168 (34%) Binary 1.04 (0.71 to 1.54) 1.07 (0.72 to 1.58)
Continuous count 0.96 (0.75 to 1.23) 0.98 (0.77 to 1.25)
*as 0 (reference) vs. ≥1 comorbidities. BASDAI 50/2, 50% or 2-unit reduction in BASDAI; ASDAS-MI, major improvement i.e. ≥2-unit reduction. Full model coefficients including covariates are shown in Appendix Table S8.2 and S8.3.
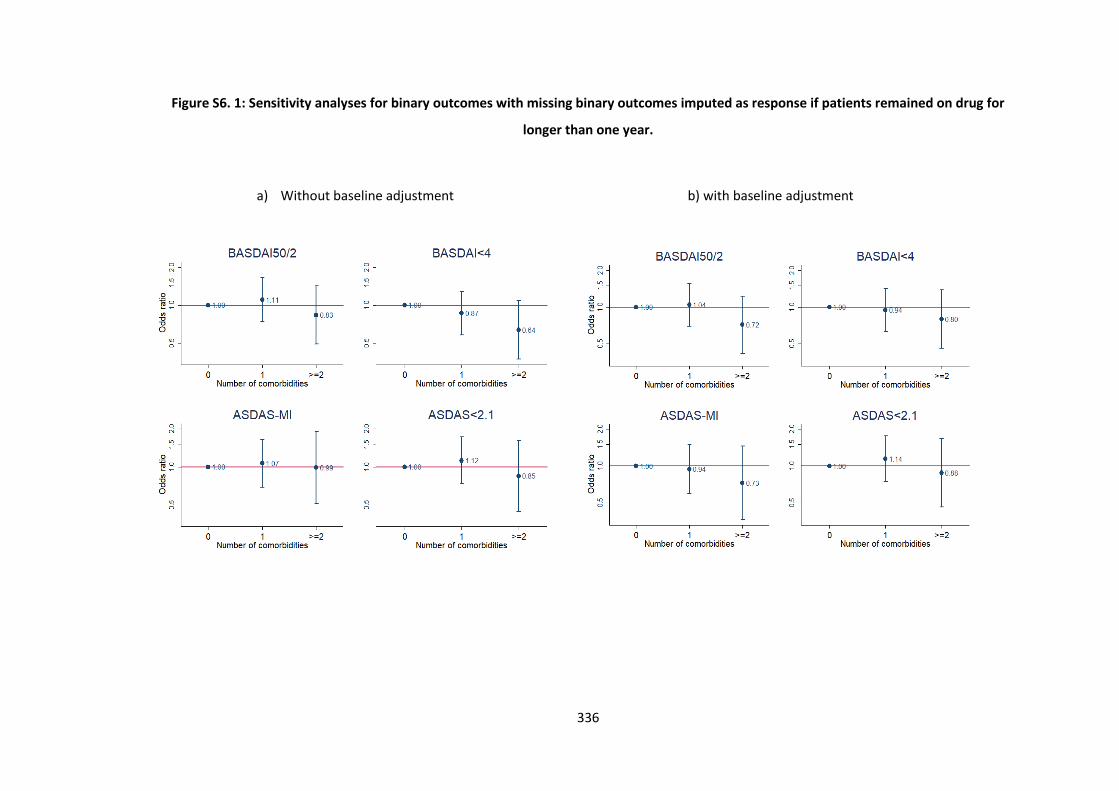
336
Figure S6. 1: Sensitivity analyses for binary outcomes with missing binary outcomes imputed as response if patients remained on drug for
longer than one year.
a) Without baseline adjustment b) with baseline adjustment
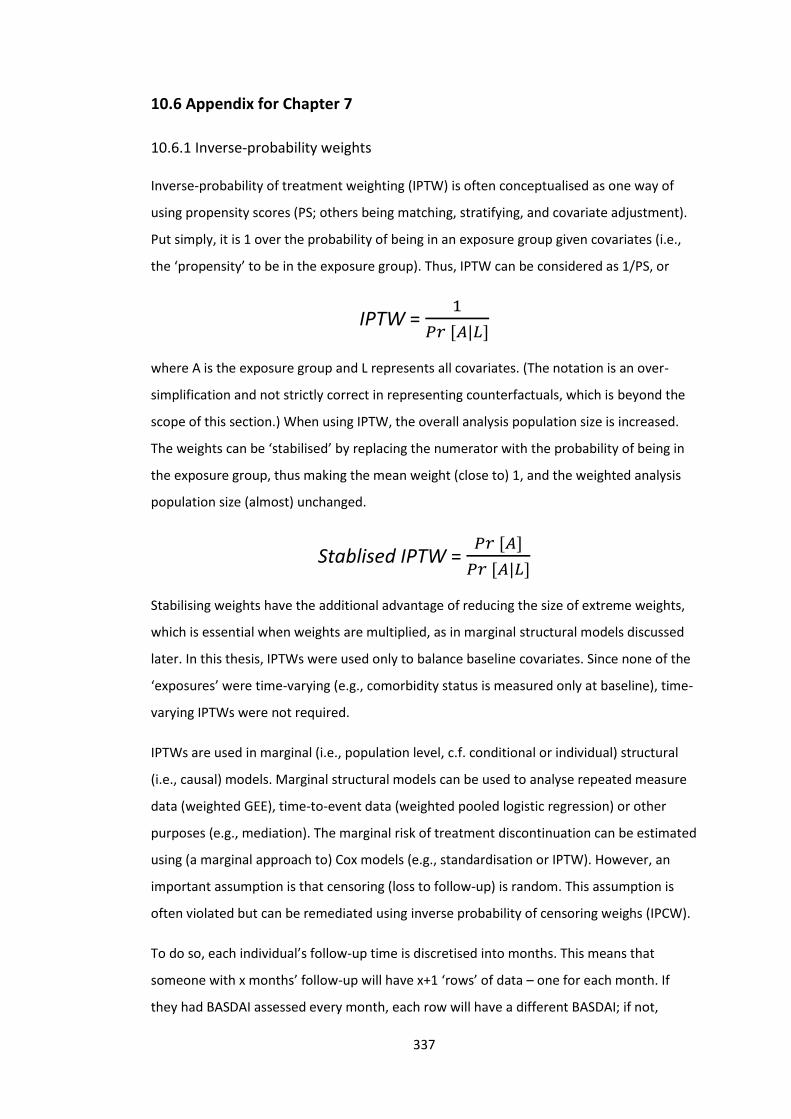
337
10.6 Appendix for Chapter 7
10.6.1 Inverse-probability weights
Inverse-probability of treatment weighting (IPTW) is often conceptualised as one way of
using propensity scores (PS; others being matching, stratifying, and covariate adjustment).
Put simply, it is 1 over the probability of being in an exposure group given covariates (i.e.,
the ‘propensity’ to be in the exposure group). Thus, IPTW can be considered as 1/PS, or
IPTW = 1
𝑃𝑟 [𝐴|𝐿]
where A is the exposure group and L represents all covariates. (The notation is an over-
simplification and not strictly correct in representing counterfactuals, which is beyond the
scope of this section.) When using IPTW, the overall analysis population size is increased.
The weights can be ‘stabilised’ by replacing the numerator with the probability of being in
the exposure group, thus making the mean weight (close to) 1, and the weighted analysis
population size (almost) unchanged.
Stablised IPTW = 𝑃𝑟 [𝐴]
𝑃𝑟 [𝐴|𝐿]
Stabilising weights have the additional advantage of reducing the size of extreme weights,
which is essential when weights are multiplied, as in marginal structural models discussed
later. In this thesis, IPTWs were used only to balance baseline covariates. Since none of the
‘exposures’ were time-varying (e.g., comorbidity status is measured only at baseline), time-
varying IPTWs were not required.
IPTWs are used in marginal (i.e., population level, c.f. conditional or individual) structural
(i.e., causal) models. Marginal structural models can be used to analyse repeated measure
data (weighted GEE), time-to-event data (weighted pooled logistic regression) or other
purposes (e.g., mediation). The marginal risk of treatment discontinuation can be estimated
using (a marginal approach to) Cox models (e.g., standardisation or IPTW). However, an
important assumption is that censoring (loss to follow-up) is random. This assumption is
often violated but can be remediated using inverse probability of censoring weighs (IPCW).
To do so, each individual’s follow-up time is discretised into months. This means that
someone with x months’ follow-up will have x+1 ‘rows’ of data – one for each month. If
they had BASDAI assessed every month, each row will have a different BASDAI; if not,
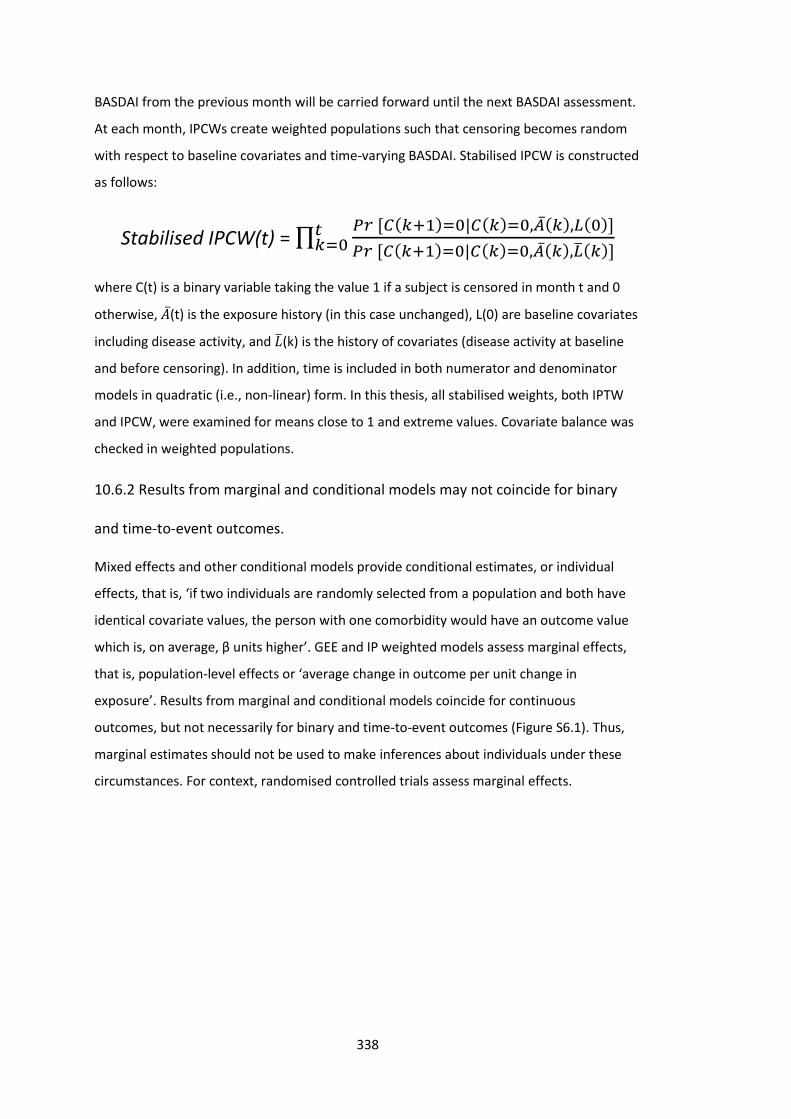
338
BASDAI from the previous month will be carried forward until the next BASDAI assessment.
At each month, IPCWs create weighted populations such that censoring becomes random
with respect to baseline covariates and time-varying BASDAI. Stabilised IPCW is constructed
as follows:
Stabilised IPCW(t) = ∏𝑃𝑟 [𝐶(𝑘+1)=0|𝐶(𝑘)=0,�̅�(𝑘),𝐿(0)]
𝑃𝑟 [𝐶(𝑘+1)=0|𝐶(𝑘)=0,�̅�(𝑘),�̅�(𝑘)]𝑡𝑘=0
where C(t) is a binary variable taking the value 1 if a subject is censored in month t and 0
otherwise, �̅�(t) is the exposure history (in this case unchanged), L(0) are baseline covariates
including disease activity, and �̅�(k) is the history of covariates (disease activity at baseline
and before censoring). In addition, time is included in both numerator and denominator
models in quadratic (i.e., non-linear) form. In this thesis, all stabilised weights, both IPTW
and IPCW, were examined for means close to 1 and extreme values. Covariate balance was
checked in weighted populations.
10.6.2 Results from marginal and conditional models may not coincide for binary
and time-to-event outcomes.
Mixed effects and other conditional models provide conditional estimates, or individual
effects, that is, ‘if two individuals are randomly selected from a population and both have
identical covariate values, the person with one comorbidity would have an outcome value
which is, on average, β units higher’. GEE and IP weighted models assess marginal effects,
that is, population-level effects or ‘average change in outcome per unit change in
exposure’. Results from marginal and conditional models coincide for continuous
outcomes, but not necessarily for binary and time-to-event outcomes (Figure S6.1). Thus,
marginal estimates should not be used to make inferences about individuals under these
circumstances. For context, randomised controlled trials assess marginal effects.
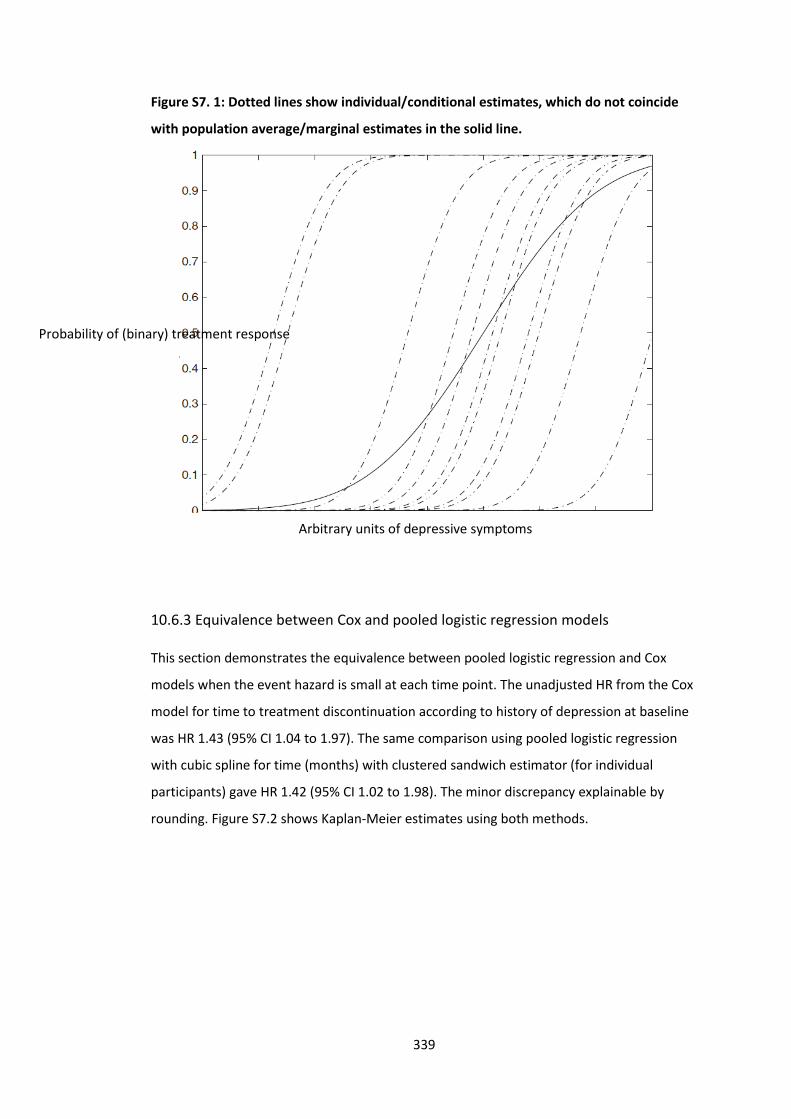
339
Figure S7. 1: Dotted lines show individual/conditional estimates, which do not coincide
with population average/marginal estimates in the solid line.
10.6.3 Equivalence between Cox and pooled logistic regression models
This section demonstrates the equivalence between pooled logistic regression and Cox
models when the event hazard is small at each time point. The unadjusted HR from the Cox
model for time to treatment discontinuation according to history of depression at baseline
was HR 1.43 (95% CI 1.04 to 1.97). The same comparison using pooled logistic regression
with cubic spline for time (months) with clustered sandwich estimator (for individual
participants) gave HR 1.42 (95% CI 1.02 to 1.98). The minor discrepancy explainable by
rounding. Figure S7.2 shows Kaplan-Meier estimates using both methods.
Arbitrary units of depressive symptoms
Probability of (binary) treatment response
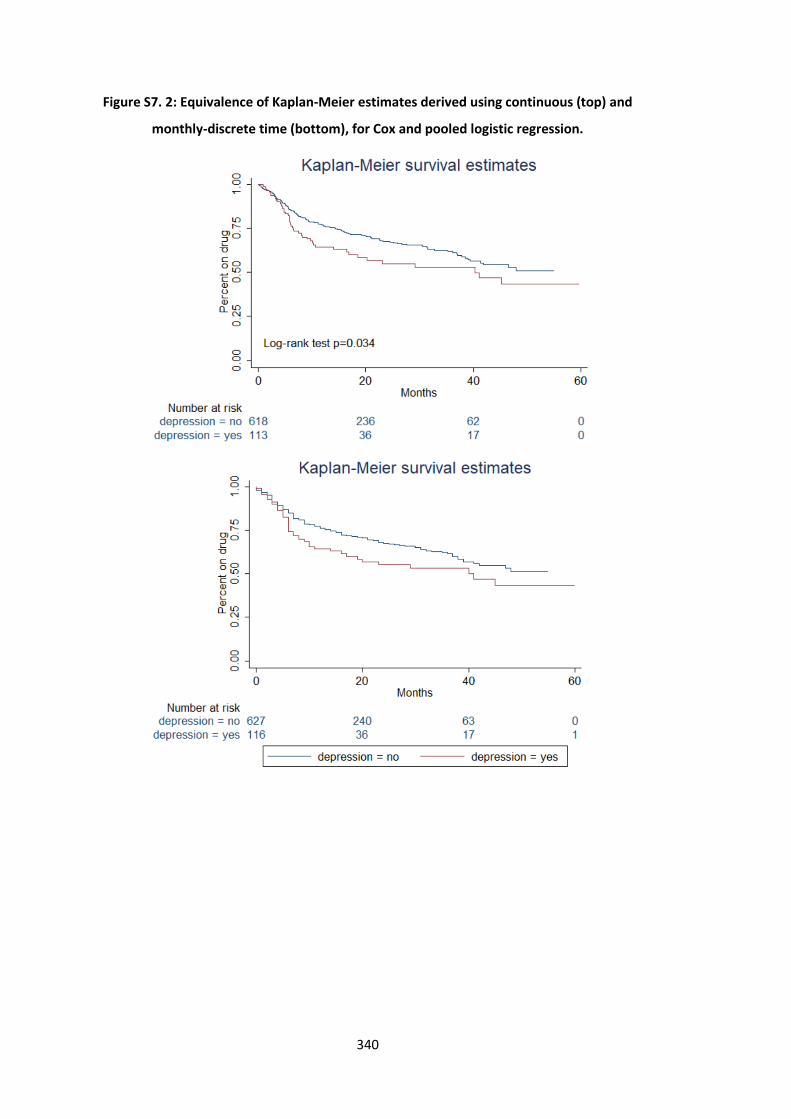
340
Figure S7. 2: Equivalence of Kaplan-Meier estimates derived using continuous (top) and
monthly-discrete time (bottom), for Cox and pooled logistic regression.
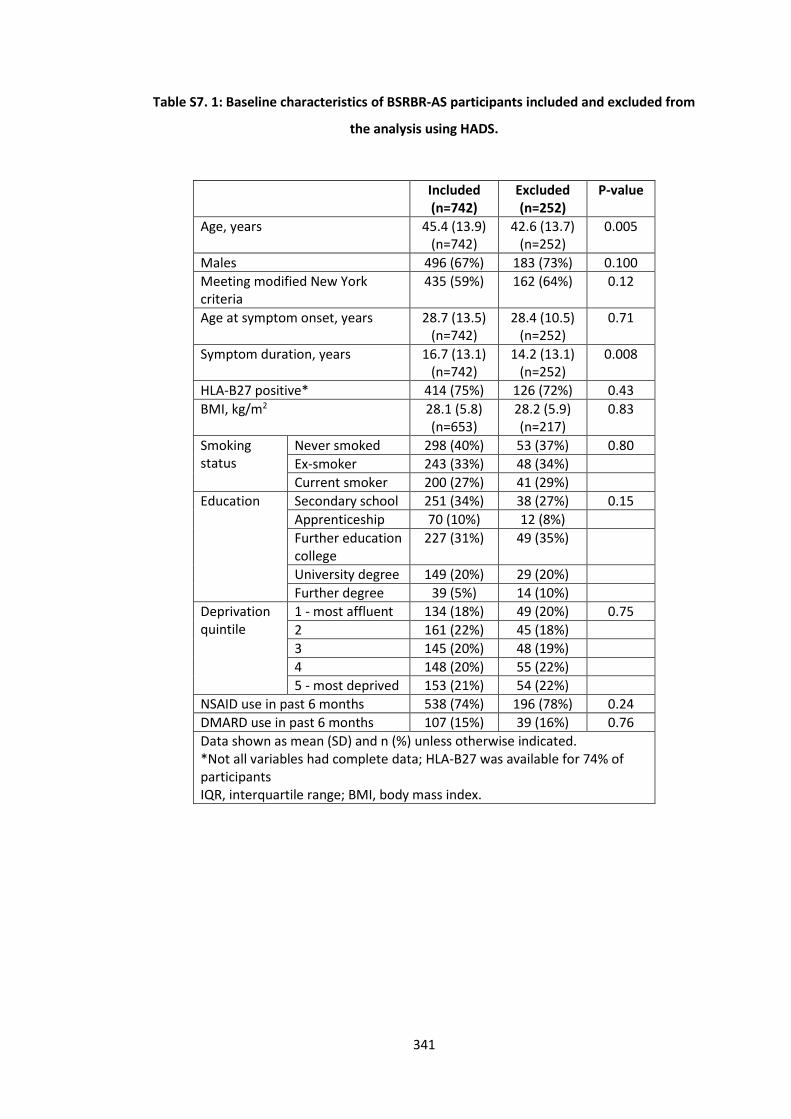
341
Table S7. 1: Baseline characteristics of BSRBR-AS participants included and excluded from
the analysis using HADS.
Included (n=742)
Excluded (n=252)
P-value
Age, years 45.4 (13.9) (n=742)
42.6 (13.7) (n=252)
0.005
Males 496 (67%) 183 (73%) 0.100
Meeting modified New York criteria
435 (59%) 162 (64%) 0.12
Age at symptom onset, years 28.7 (13.5) (n=742)
28.4 (10.5) (n=252)
0.71
Symptom duration, years 16.7 (13.1) (n=742)
14.2 (13.1) (n=252)
0.008
HLA-B27 positive* 414 (75%) 126 (72%) 0.43
BMI, kg/m2 28.1 (5.8) (n=653)
28.2 (5.9) (n=217)
0.83
Smoking status
Never smoked 298 (40%) 53 (37%) 0.80
Ex-smoker 243 (33%) 48 (34%)
Current smoker 200 (27%) 41 (29%)
Education Secondary school 251 (34%) 38 (27%) 0.15
Apprenticeship 70 (10%) 12 (8%)
Further education college
227 (31%) 49 (35%)
University degree 149 (20%) 29 (20%)
Further degree 39 (5%) 14 (10%)
Deprivation quintile
1 - most affluent 134 (18%) 49 (20%) 0.75
2 161 (22%) 45 (18%)
3 145 (20%) 48 (19%)
4 148 (20%) 55 (22%)
5 - most deprived 153 (21%) 54 (22%)
NSAID use in past 6 months 538 (74%) 196 (78%) 0.24
DMARD use in past 6 months 107 (15%) 39 (16%) 0.76
Data shown as mean (SD) and n (%) unless otherwise indicated. *Not all variables had complete data; HLA-B27 was available for 74% of participants IQR, interquartile range; BMI, body mass index.
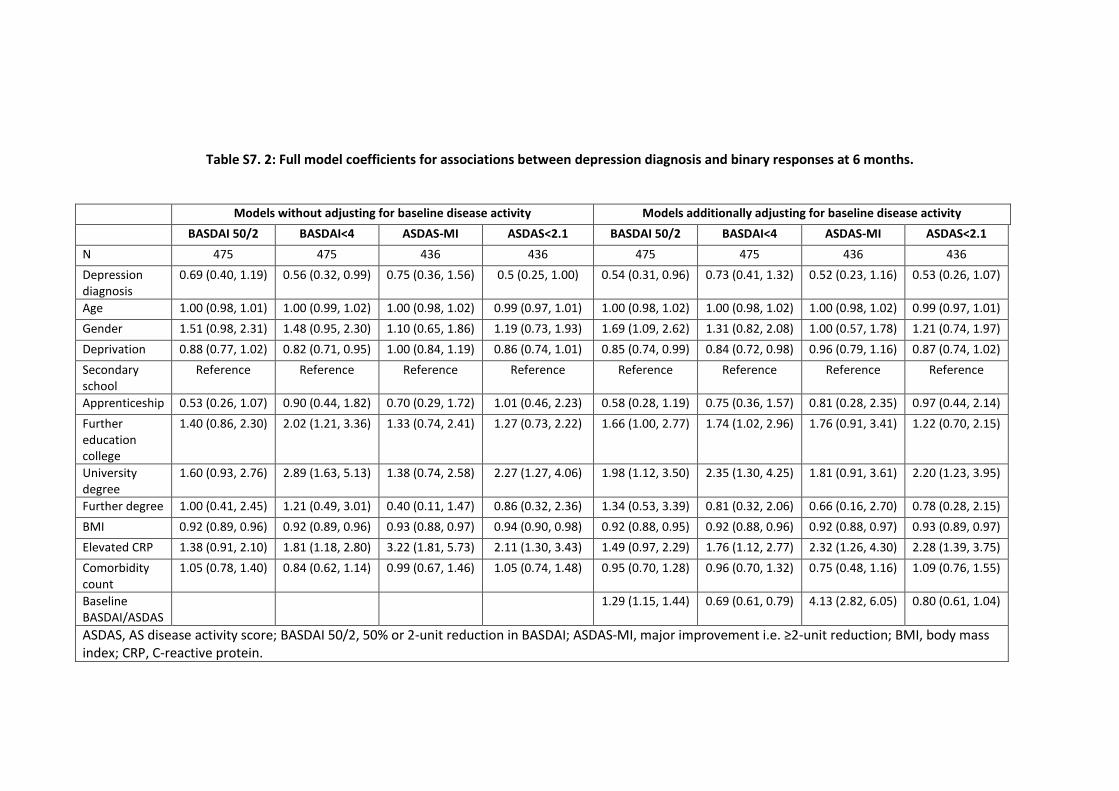
342
Table S7. 2: Full model coefficients for associations between depression diagnosis and binary responses at 6 months.
Models without adjusting for baseline disease activity Models additionally adjusting for baseline disease activity
BASDAI 50/2 BASDAI<4 ASDAS-MI ASDAS<2.1 BASDAI 50/2 BASDAI<4 ASDAS-MI ASDAS<2.1
N 475 475 436 436 475 475 436 436
Depression diagnosis
0.69 (0.40, 1.19) 0.56 (0.32, 0.99) 0.75 (0.36, 1.56) 0.5 (0.25, 1.00) 0.54 (0.31, 0.96) 0.73 (0.41, 1.32) 0.52 (0.23, 1.16) 0.53 (0.26, 1.07)
Age 1.00 (0.98, 1.01) 1.00 (0.99, 1.02) 1.00 (0.98, 1.02) 0.99 (0.97, 1.01) 1.00 (0.98, 1.02) 1.00 (0.98, 1.02) 1.00 (0.98, 1.02) 0.99 (0.97, 1.01)
Gender 1.51 (0.98, 2.31) 1.48 (0.95, 2.30) 1.10 (0.65, 1.86) 1.19 (0.73, 1.93) 1.69 (1.09, 2.62) 1.31 (0.82, 2.08) 1.00 (0.57, 1.78) 1.21 (0.74, 1.97)
Deprivation 0.88 (0.77, 1.02) 0.82 (0.71, 0.95) 1.00 (0.84, 1.19) 0.86 (0.74, 1.01) 0.85 (0.74, 0.99) 0.84 (0.72, 0.98) 0.96 (0.79, 1.16) 0.87 (0.74, 1.02)
Secondary school
Reference Reference Reference Reference Reference Reference Reference Reference
Apprenticeship 0.53 (0.26, 1.07) 0.90 (0.44, 1.82) 0.70 (0.29, 1.72) 1.01 (0.46, 2.23) 0.58 (0.28, 1.19) 0.75 (0.36, 1.57) 0.81 (0.28, 2.35) 0.97 (0.44, 2.14)
Further education college
1.40 (0.86, 2.30) 2.02 (1.21, 3.36) 1.33 (0.74, 2.41) 1.27 (0.73, 2.22) 1.66 (1.00, 2.77) 1.74 (1.02, 2.96) 1.76 (0.91, 3.41) 1.22 (0.70, 2.15)
University degree
1.60 (0.93, 2.76) 2.89 (1.63, 5.13) 1.38 (0.74, 2.58) 2.27 (1.27, 4.06) 1.98 (1.12, 3.50) 2.35 (1.30, 4.25) 1.81 (0.91, 3.61) 2.20 (1.23, 3.95)
Further degree 1.00 (0.41, 2.45) 1.21 (0.49, 3.01) 0.40 (0.11, 1.47) 0.86 (0.32, 2.36) 1.34 (0.53, 3.39) 0.81 (0.32, 2.06) 0.66 (0.16, 2.70) 0.78 (0.28, 2.15)
BMI 0.92 (0.89, 0.96) 0.92 (0.89, 0.96) 0.93 (0.88, 0.97) 0.94 (0.90, 0.98) 0.92 (0.88, 0.95) 0.92 (0.88, 0.96) 0.92 (0.88, 0.97) 0.93 (0.89, 0.97)
Elevated CRP 1.38 (0.91, 2.10) 1.81 (1.18, 2.80) 3.22 (1.81, 5.73) 2.11 (1.30, 3.43) 1.49 (0.97, 2.29) 1.76 (1.12, 2.77) 2.32 (1.26, 4.30) 2.28 (1.39, 3.75)
Comorbidity count
1.05 (0.78, 1.40) 0.84 (0.62, 1.14) 0.99 (0.67, 1.46) 1.05 (0.74, 1.48) 0.95 (0.70, 1.28) 0.96 (0.70, 1.32) 0.75 (0.48, 1.16) 1.09 (0.76, 1.55)
Baseline BASDAI/ASDAS
1.29 (1.15, 1.44) 0.69 (0.61, 0.79) 4.13 (2.82, 6.05) 0.80 (0.61, 1.04)
ASDAS, AS disease activity score; BASDAI 50/2, 50% or 2-unit reduction in BASDAI; ASDAS-MI, major improvement i.e. ≥2-unit reduction; BMI, body mass index; CRP, C-reactive protein.
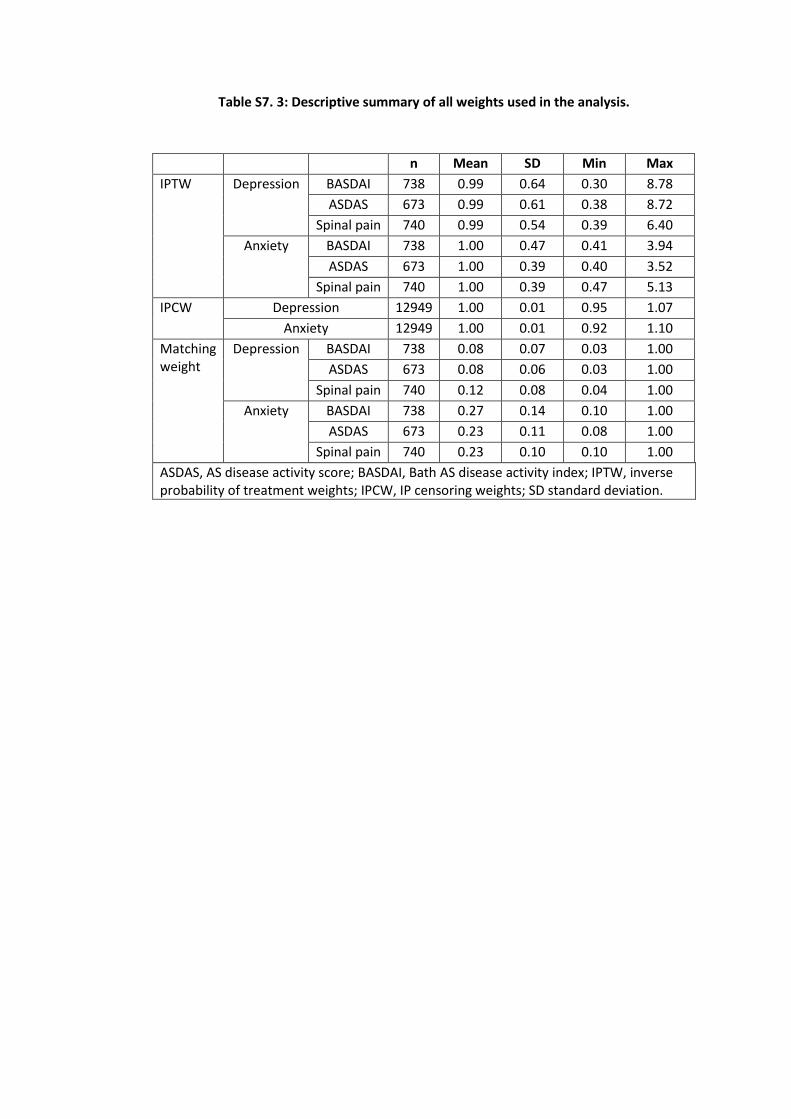
343
Table S7. 3: Descriptive summary of all weights used in the analysis.
n Mean SD Min Max
IPTW Depression BASDAI 738 0.99 0.64 0.30 8.78
ASDAS 673 0.99 0.61 0.38 8.72
Spinal pain 740 0.99 0.54 0.39 6.40
Anxiety BASDAI 738 1.00 0.47 0.41 3.94
ASDAS 673 1.00 0.39 0.40 3.52
Spinal pain 740 1.00 0.39 0.47 5.13
IPCW Depression 12949 1.00 0.01 0.95 1.07
Anxiety 12949 1.00 0.01 0.92 1.10
Matching weight
Depression BASDAI 738 0.08 0.07 0.03 1.00
ASDAS 673 0.08 0.06 0.03 1.00
Spinal pain 740 0.12 0.08 0.04 1.00
Anxiety BASDAI 738 0.27 0.14 0.10 1.00
ASDAS 673 0.23 0.11 0.08 1.00
Spinal pain 740 0.23 0.10 0.10 1.00
ASDAS, AS disease activity score; BASDAI, Bath AS disease activity index; IPTW, inverse probability of treatment weights; IPCW, IP censoring weights; SD standard deviation.
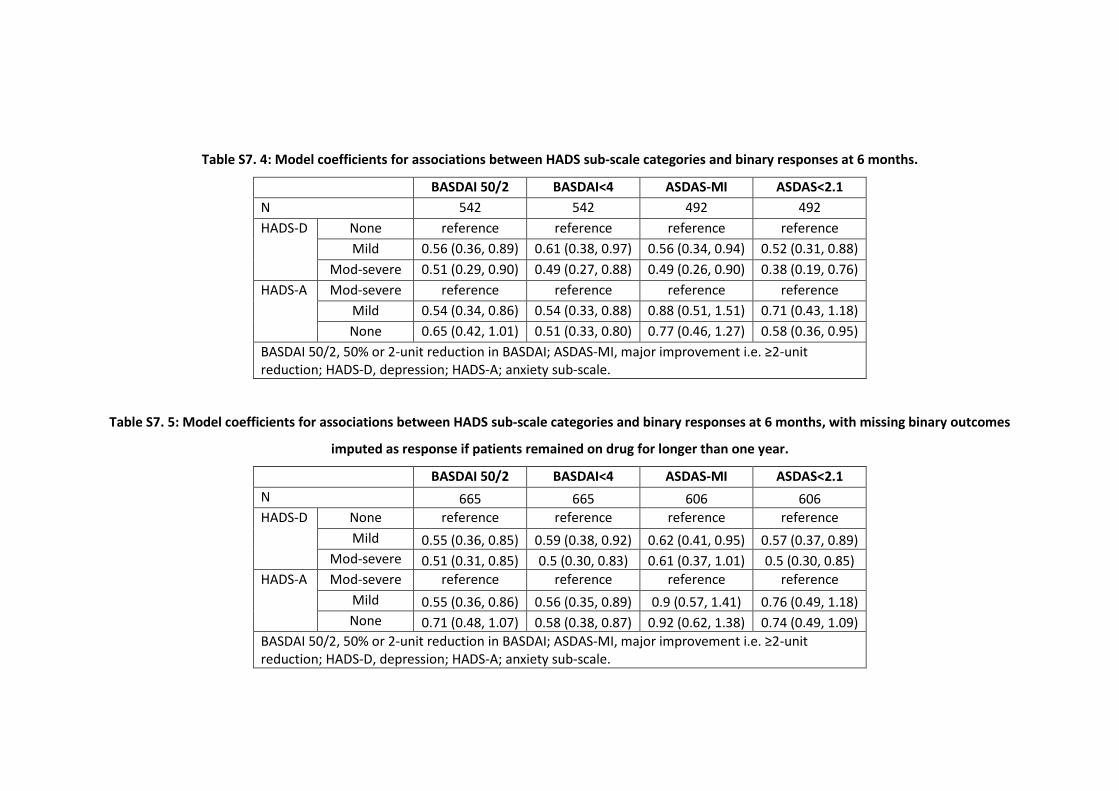
344
Table S7. 4: Model coefficients for associations between HADS sub-scale categories and binary responses at 6 months.
BASDAI 50/2 BASDAI<4 ASDAS-MI ASDAS<2.1
N 542 542 492 492
HADS-D None reference reference reference reference
Mild 0.56 (0.36, 0.89) 0.61 (0.38, 0.97) 0.56 (0.34, 0.94) 0.52 (0.31, 0.88)
Mod-severe 0.51 (0.29, 0.90) 0.49 (0.27, 0.88) 0.49 (0.26, 0.90) 0.38 (0.19, 0.76)
HADS-A Mod-severe reference reference reference reference
Mild 0.54 (0.34, 0.86) 0.54 (0.33, 0.88) 0.88 (0.51, 1.51) 0.71 (0.43, 1.18)
None 0.65 (0.42, 1.01) 0.51 (0.33, 0.80) 0.77 (0.46, 1.27) 0.58 (0.36, 0.95)
BASDAI 50/2, 50% or 2-unit reduction in BASDAI; ASDAS-MI, major improvement i.e. ≥2-unit reduction; HADS-D, depression; HADS-A; anxiety sub-scale.
Table S7. 5: Model coefficients for associations between HADS sub-scale categories and binary responses at 6 months, with missing binary outcomes
imputed as response if patients remained on drug for longer than one year.
BASDAI 50/2 BASDAI<4 ASDAS-MI ASDAS<2.1
N 665 665 606 606
HADS-D None reference reference reference reference
Mild 0.55 (0.36, 0.85) 0.59 (0.38, 0.92) 0.62 (0.41, 0.95) 0.57 (0.37, 0.89)
Mod-severe 0.51 (0.31, 0.85) 0.5 (0.30, 0.83) 0.61 (0.37, 1.01) 0.5 (0.30, 0.85)
HADS-A Mod-severe reference reference reference reference
Mild 0.55 (0.36, 0.86) 0.56 (0.35, 0.89) 0.9 (0.57, 1.41) 0.76 (0.49, 1.18)
None 0.71 (0.48, 1.07) 0.58 (0.38, 0.87) 0.92 (0.62, 1.38) 0.74 (0.49, 1.09)
BASDAI 50/2, 50% or 2-unit reduction in BASDAI; ASDAS-MI, major improvement i.e. ≥2-unit reduction; HADS-D, depression; HADS-A; anxiety sub-scale.