Embed Size (px)
Citation preview
Journal of Vegetation Science && (2014)
Patterns of tree diversity and composition inAmazonian floodplain paleo-v�arzea forest
Rafael L. Assis, Torbjørn Haugaasen, Jochen Sch€ongart, Juan C. Montero, Maria T.F. Piedade& FlorianWittmann
Keywords
Alluvial dynamism; Amazonia; Floodplain
forest; Neotropics; Paleo-v�arzea; Similarity
analysis; Substrate fertility; Tree diversity
Abbreviations
GNMDS = Global non-metric multidimensional
scaling; ANOSIM = Analysis of similarity
ISA = Indicator species analysis.
Nomenclature
The International Plant Names Index (2012),
http://www.ipni.org (accessed June 2013)
Received 11 December 2013
Accepted 4 August 2014
Co-ordinating Editor: Kerry Woods
Assis, R.L. (Corresponding author,
[email protected]) & Haugaasen, T.
([email protected]): Department
of Ecology and Natural Resource Management,
Norwegian University of Life Sciences, P.O. Box
5003,�As 1432, Norway
Assis, R.L. , Sch€ongart, J.
Piedade, M.T.F ([email protected]):
Instituto Nacional de Pesquisas da Amazonia,
Av. Andr�e Ara�ujo 2.936, Manaus-AM, CEP
69.067-375, Brazil
Montero, J.C.
([email protected]): Faculty of
Environment and Natural Resources, University
of Freiburg, Tennenbacherstrasse 4, Freiburg
79106, Germany
Wittmann, F. ([email protected]):
Biogeochemistry Dep., Max Planck Institute for
Chemistry, Hahn-Meitner Weg 1, Mainz 55128,
Germany
Abstract
Question: In a recent re-classification of Amazonian floodplain types, a new
category was established for paleo-v�arzea. Although the geological basis for this
classification is sound, a key question is whether it can be supported by botanical
criteria, where floodplain paleo-v�arzea forests contain distinct tree assemblages
compared to other major floodplain types.
Location: Central Amazonian floodplains, Brazil.
Methods: We used 41 tree inventories from floodplain paleo-v�arzea, v�arzea
and igap�o forests to perform a meta-analysis. Diversity and richness estimators
were applied at the level of genus and the examination of floristic composition
was performed at family and generic levels. Generic composition across the
three floodplain types was investigated using GNMDS and cluster analysis. Simi-
larity coefficients and ANOSIM were applied to quantify floristic resemblance at
the generic level between forest types. Indicator species analysis (ISA) was used
to identify any indicator genera for the forest types evaluated.
Results: Alpha diversity and generic richness in paleo-v�arzea forest was similar
to v�arzea. Igap�o forest was clearly the least diverse. Family compositionwas sim-
ilar across the three forest types; Fabaceae was the dominant family on all three
floodplains. Pouteria, Licania and Eschweilera presented the highest importance
values in paleo-v�arzea, but these genera were also important in v�arzea and
igap�o. Nevertheless, ANOSIM analyses show that generic composition differed
significantly between the three forest types, and a GNMDS ordination and clus-
ter analysis portrays paleo-v�arzea tree composition as intermediate between
v�arzea and igap�o. ISA revealed that Euterpe, Dipteryx and Goupia were the most
important indicator genera of paleo-v�arzea.
Conclusions: We conclude that paleo-v�arzea floodplain tree assemblages are
dissimilar to those of v�arzea and igap�o, but contain components typical of both
these floodplain types, explaining their intermediate positioning in our analyses.
This floral mix probably allows paleo-v�arzea alpha diversity to be similar to that
of v�arzea.
Introduction
Amazonian floodplains subjected to predictable, long-last-
ing, monomodal flood pulses extend to an area of ca.
600 000 km2 (Melack & Hess 2010), most of which is cov-
ered by forest. Trees are subjected to alternating terrestrial
and aquatic phases (flood pulse, sensu Junk et al. 1989)
with seasonal inundations of up to 230 days�yr�1. Many
physical and ecological processes, such as mineral cycling,
decomposition and forest succession, are influenced by the
flood pulse, and species inhabiting these environments
have developed morpho-anatomical and physiological
adaptations to deal with the seasonal flooding (Parolin
et al. 2004).
1Journal of Vegetation ScienceDoi: 10.1111/jvs.12229© 2014 International Association for Vegetation Science
Several different forest types are recognized within
Amazonian floodplains. An initial classification was based
on hydrochemical (Sioli 1956) and floristic (Prance 1979)
differences. Floodplain forests along white-water rivers,
such as the Amazon mainstem, Purus and Madeira, are
known as v�arzea forests and cover an area of ca.
275 000 km2 (Irion et al. 2010; Melack & Hess 2010).
These rivers carry large amounts of nutrient-rich Tertiary/
Quaternary sediments originating from the Andes or pre-
Andean regions. Due to the seasonal influx of nutrients,
white-water floodplains remain exceptionally productive
(Junk & Piedade 1993). The high content of suspended
sediments induces a highly dynamic system, characterized
by intense sedimentation and erosion processes (Witt-
mann et al. 2004; Peixoto et al. 2009). This alluvial dyna-
mism creates a patchwork of habitats, which together with
highly fertile substrates, are thought to be the underlying
reasons for v�arzea forest having the highest tree species
richness of any floodplain forest worldwide (Wittmann
et al. 2006).
Forests inundated on a seasonal basis by either black- or
clear-water rivers are collectively known as igap�o and
cover ca. 180 000 km2 of the Amazon Basin (Melack &
Hess 2010). These rivers (e.g. Negro, Tapaj�os and Tocan-
tins) originate in Precambrian formations, such as the Gui-
ana Shield and Central Brazilian Shields for black-water
and clear-water, respectively (Irion et al. 2010). They carry
a reduced load of suspended inorganic elements compared
to white-water rivers, and floodplain fertility is therefore
much lower than that of the v�arzea. Furthermore, river-
beds and associated floodplains have low geomorphic
dynamics, being relatively stable over several thousands of
years (Irion et al. 2010).
In addition to v�arzea and igap�o, another floodplain type
was later recognized – floodplain paleo-v�arzea. Floodplain
paleo-v�arzeas were first described by Irion (1976) and have
been referred to as Pleistocene v�arzeas (Irion 1976, 1978;
Klammer 1984), abandoned floodplains (Salo et al. 1986)
or ancient v�arzea (Ayres 1993). They are dated to the
Mid-/Late Pleistocene when, during periods of higher sea
levels, the Amazonian floodplains were much more exten-
sive than today (Irion 1976, 1984; Klammer 1984). During
periods of high sea levels, water from the Amazon river
systemwas effectively dammed. Due to the low inclination
of the basin, lowlands up to 2500 km from the coast were
affected and large areas of the basin were flooded and
dominated by freshwater systems rich in Andean sedi-
ments (Irion et al. 1995). Paleo-v�arzea forest is located on
alluvial Andean deposits abandoned bywhite-water rivers.
They are flooded by small to intermediate black-water
rivers, which transport these once-deposited Andean
paleo-sediments (Irion et al. 2010). The surface substrates
of paleo-v�arzea are therefore less fertile than v�arzea, but
remain more fertile than igap�o (Irion 1978; Schubart
1983). Recent estimates indicate that paleo-v�arzeas cover
at least 125 000 km2, with the largest expanses found in
the states of Amazonas and Par�a in the Brazilian part of the
Amazon (Melack & Hess 2010). Until recently paleo-
v�arzea was not recognized as a distinct floodplain type.
However, applying the above information to a re-classifi-
cation of floodplain types in the Amazon, Junk et al.
(2011) proposed that floodplain paleo-v�arzeas should be
classed as a distinct floodplain category.
The literature on quantitative floristic inventories of
Amazonian floodplain forests is considerable, with several
studies available for v�arzea (e.g. Ayres 1993; Wittmann
et al. 2002; Haugaasen & Peres 2006; Assis & Wittmann
2011), but fewer for igap�o (e.g. Ferreira 1997; Ferreira &
Prance 1998; Parolin et al. 2004; Montero et al. 2014).
Comparative studies in central Amazonian floodplains
show that v�arzea generally support a higher number of
tree species than igap�o (Prance 1979; Kubitzki 1989; Witt-
mann et al. 2010). However, paleo-v�arzea tree assem-
blages are yet to be examined following the new
classification. Junk et al. (2011) suggest species composi-
tion is intermediate between v�arzea and igap�o, containing
floral components from both floodplain types. However,
although the geological basis for a new paleo-v�arzea cate-
gory is sound, no study to date has evaluated the botanical
criteria for this floodplain category.
In this paper, we examine the tree composition of
paleo-v�arzea forest to evaluate the botanical characteristics
of this category of floodplain forest in the Central Amazon.
Our main objective is to investigate patterns of community
assembly across three floodplain forest types: igap�o, v�arzea
and paleo-v�arzea. We used 41 Amazonian floodplain tree
inventories from igap�o, v�arzea and paleo-v�arzea and use
these data to address the following questions: (1) does tree
alpha diversity in paleo-v�arzea differ from v�arzea and
igap�o; (2) which are the most important taxa in each forest
type; (3) what is the degree of floristic similarity between
forest types; and (4) are there any tree genera characteristic
of the different forest types?
Methods
Data preparation
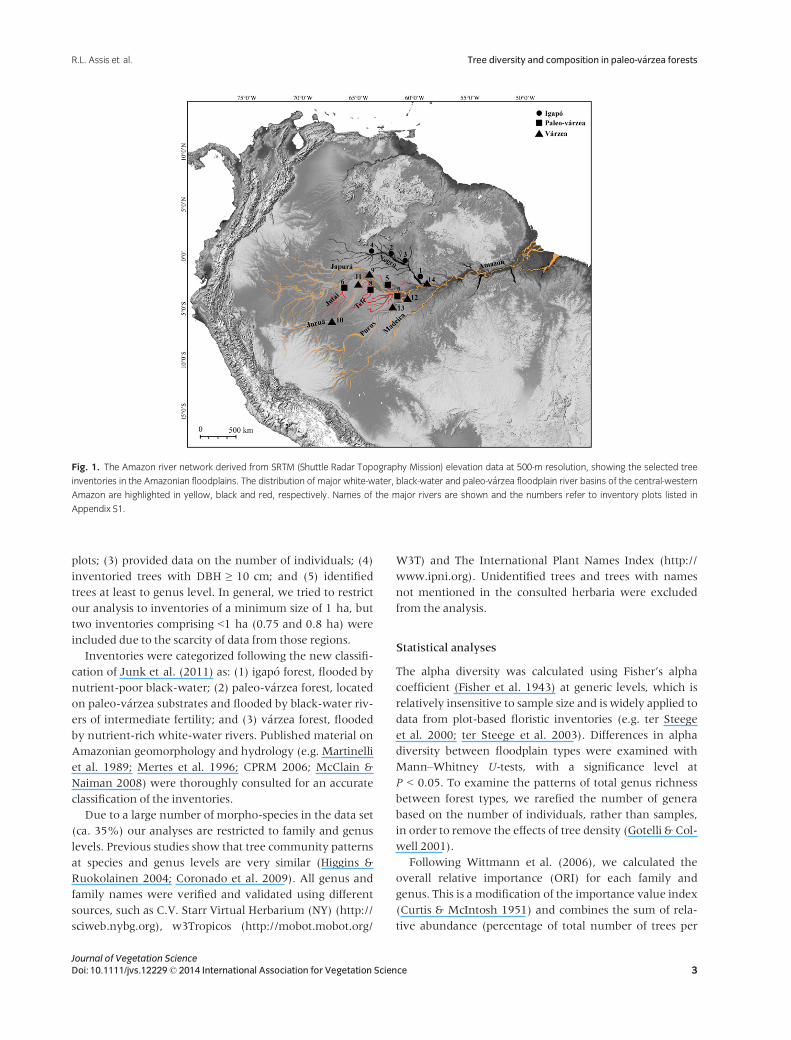
Our database consists of 41 published and unpublished flo-
ristic inventories (App. S1) in floodplain forests from seven
central Amazonian river basins (Fig. 1). We considered
only inventories that met the following criteria: (1) sur-
veyed floodplain forests subjected to predictable, long-last-
ing, monomodal flood pulses; (2) surveyed late
successional stages of floodplain forests (according to
Wittmann et al. 2010), in order to decrease the influence
of different flooding regimes on floristic similarity between
Journal of Vegetation Science2 Doi: 10.1111/jvs.12229© 2014 International Association for Vegetation Science
Tree diversity and composition in paleo-v�arzea forests R.L. Assis et al.
plots; (3) provided data on the number of individuals; (4)
inventoried trees with DBH ≥ 10 cm; and (5) identified
trees at least to genus level. In general, we tried to restrict
our analysis to inventories of a minimum size of 1 ha, but
two inventories comprising <1 ha (0.75 and 0.8 ha) were
included due to the scarcity of data from those regions.
Inventories were categorized following the new classifi-
cation of Junk et al. (2011) as: (1) igap�o forest, flooded by
nutrient-poor black-water; (2) paleo-v�arzea forest, located
on paleo-v�arzea substrates and flooded by black-water riv-
ers of intermediate fertility; and (3) v�arzea forest, flooded
by nutrient-rich white-water rivers. Published material on
Amazonian geomorphology and hydrology (e.g. Martinelli
et al. 1989; Mertes et al. 1996; CPRM 2006; McClain &
Naiman 2008) were thoroughly consulted for an accurate
classification of the inventories.
Due to a large number of morpho-species in the data set
(ca. 35%) our analyses are restricted to family and genus
levels. Previous studies show that tree community patterns
at species and genus levels are very similar (Higgins &
Ruokolainen 2004; Coronado et al. 2009). All genus and
family names were verified and validated using different
sources, such as C.V. Starr Virtual Herbarium (NY) (http://
sciweb.nybg.org), w3Tropicos (http://mobot.mobot.org/
W3T) and The International Plant Names Index (http://
www.ipni.org). Unidentified trees and trees with names
not mentioned in the consulted herbaria were excluded
from the analysis.
Statistical analyses
The alpha diversity was calculated using Fisher’s alpha
coefficient (Fisher et al. 1943) at generic levels, which is
relatively insensitive to sample size and is widely applied to
data from plot-based floristic inventories (e.g. ter Steege
et al. 2000; ter Steege et al. 2003). Differences in alpha
diversity between floodplain types were examined with
Mann–Whitney U-tests, with a significance level at
P < 0.05. To examine the patterns of total genus richness
between forest types, we rarefied the number of genera
based on the number of individuals, rather than samples,
in order to remove the effects of tree density (Gotelli & Col-
well 2001).
Following Wittmann et al. (2006), we calculated the
overall relative importance (ORI) for each family and
genus. This is a modification of the importance value index
(Curtis & McIntosh 1951) and combines the sum of rela-
tive abundance (percentage of total number of trees per
Fig. 1. The Amazon river network derived from SRTM (Shuttle Radar Topography Mission) elevation data at 500-m resolution, showing the selected tree
inventories in the Amazonian floodplains. The distribution of major white-water, black-water and paleo-v�arzea floodplain river basins of the central-western
Amazon are highlighted in yellow, black and red, respectively. Names of the major rivers are shown and the numbers refer to inventory plots listed in
Appendix S1.
3Journal of Vegetation ScienceDoi: 10.1111/jvs.12229© 2014 International Association for Vegetation Science
R.L. Assis et al. Tree diversity and composition in paleo-v�arzea forests
plot) and relative frequency of a genus (number of plots in
which a given genus or family was recorded).
To evaluate patterns of floristic similarity between the
three forest types, we performed global non-metric mul-
tidimensional scaling (GNMDS; Minchin 1987) and hier-
archical clustering analysis with group-average linking
(UPGMA). Both analyses were performed using the Len-
non dissimilarity index (Lennon et al. 2001). Based on a
goodness of fit between the ordination distances and the
original dissimilarity distances (Sheppard plot) and
GNMDS stress values, the Lennon index performed bet-
ter than other indices tested (Bray-Curtis, Jaccard, Simp-
son). The Lennon index is an adjusted form of the
Simpson’s index, and appears to perform better for data
containing species with few occurrences (Chao et al.
2006). All plots were truncated to a standard of 241 ran-
domly chosen trees (the number of trees contained in
the plot with lowest tree density) in order to weight plots
equally.
Two similarity coefficients were calculated for each
forest type: Chao shared estimator (Chen et al. 1995) and
Chao–Sørensen abundance-based estimator (Chao et al.
2005). In the Chao shared estimator coefficient, the
observed number of shared species is augmented by a cor-
rection term based on the relative abundance of the rare
species shared. The Chao–Sørensen abundance-based esti-
mator coefficient is based on the probability that two ran-
domly chosen individuals (one from each of two forest
types) belong to a genus shared by both forest types. In
addition, it estimates the probability of such a genus being
present in both forest types but not detected in one or both
of these. These approaches substantially reduce the nega-
tive bias of traditional similarity indices when working
with incomplete sampling of rich communities (Chao et al.
2005).
An analysis of similarity (ANOSIM) was performed to
examine significant differences in genus composition
between the three forest types. This analysis includes a
nonparametric permutation test equivalent to an ANOVA
for similarity matrices (Clarke 1993), and we used the Len-
non similarity index for the analysis. The ANOSIM was
calculated based on 5928 randomly chosen tree individuals
– the total number of trees from the igap�o inventories,
which was the lowest across the three floodplain forest
types examined.
Indicator species analysis (ISA) was used to determine
whether a specific genus was a good indicator for one of
the three forest types evaluated. For each genus, the analy-
sis provides an indicator value (IndVal; Dufrene & Legen-
dre 1997), which is highest when a genus is present in all
plots of one forest type and absent in all plots of the other
forest types. Statistical significance was tested using a per-
mutation test with 1000 iterations.
Similarity coefficients were computed using EstimateS
(v. 7.5; http://purl.oclc.org/estimates). All other analyses
were performed in R (v 2.14.1; R Foundation for Statistical
Computing, Vienna, AT), using the packages ‘MASS’
(Venables & Ripley 2002) for GNMDS, ‘indicspecies’ (De
C�aceres & Legendre 2009) for ISA and ‘vegan’ (Oksanen
2005) for the other analyses.
Results
Patterns of tree diversity
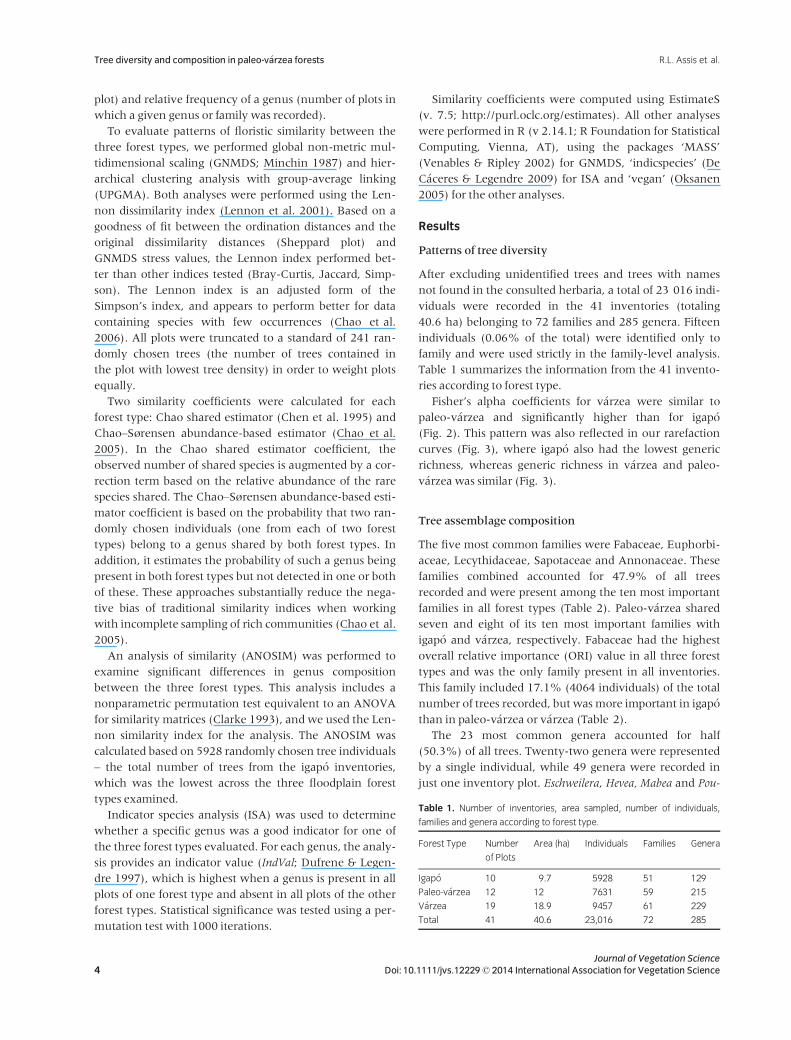
After excluding unidentified trees and trees with names
not found in the consulted herbaria, a total of 23 016 indi-
viduals were recorded in the 41 inventories (totaling
40.6 ha) belonging to 72 families and 285 genera. Fifteen
individuals (0.06% of the total) were identified only to
family and were used strictly in the family-level analysis.
Table 1 summarizes the information from the 41 invento-
ries according to forest type.
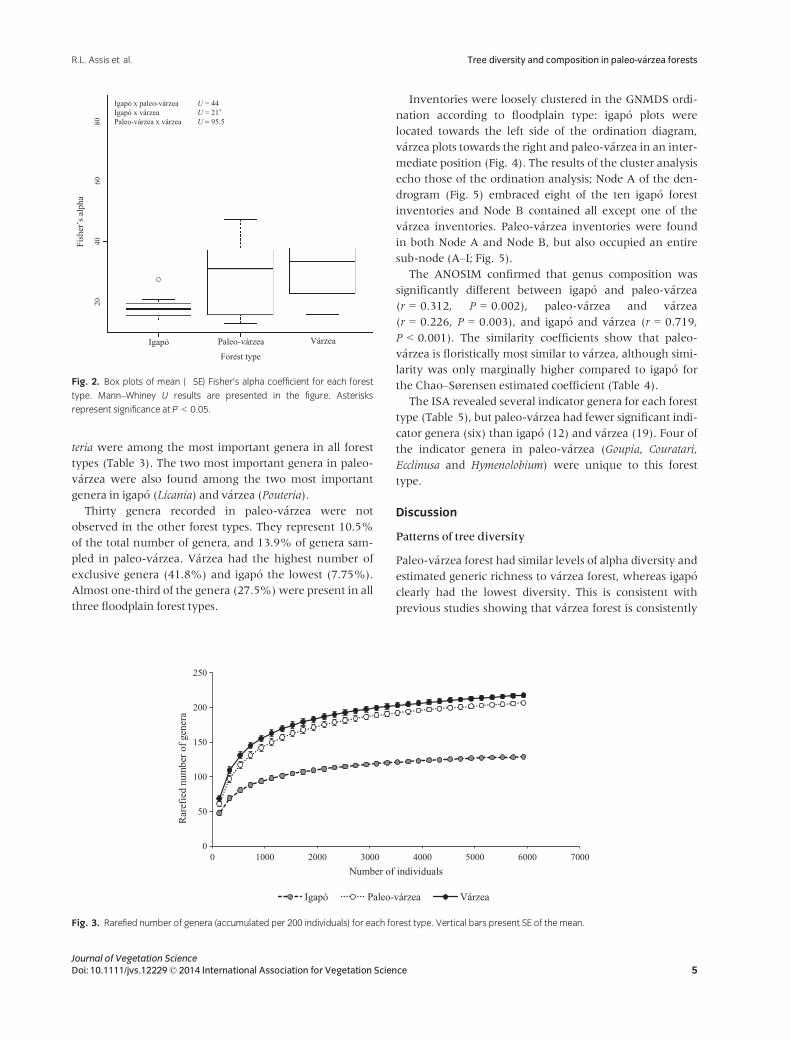
Fisher’s alpha coefficients for v�arzea were similar to
paleo-v�arzea and significantly higher than for igap�o
(Fig. 2). This pattern was also reflected in our rarefaction
curves (Fig. 3), where igap�o also had the lowest generic
richness, whereas generic richness in v�arzea and paleo-
v�arzea was similar (Fig. 3).
Tree assemblage composition
The five most common families were Fabaceae, Euphorbi-
aceae, Lecythidaceae, Sapotaceae and Annonaceae. These
families combined accounted for 47.9% of all trees
recorded and were present among the ten most important
families in all forest types (Table 2). Paleo-v�arzea shared
seven and eight of its ten most important families with
igap�o and v�arzea, respectively. Fabaceae had the highest
overall relative importance (ORI) value in all three forest
types and was the only family present in all inventories.
This family included 17.1% (4064 individuals) of the total
number of trees recorded, but wasmore important in igap�o
than in paleo-v�arzea or v�arzea (Table 2).
The 23 most common genera accounted for half
(50.3%) of all trees. Twenty-two genera were represented
by a single individual, while 49 genera were recorded in
just one inventory plot. Eschweilera, Hevea, Mabea and Pou-
Table 1. Number of inventories, area sampled, number of individuals,
families and genera according to forest type.
Forest Type Number
of Plots
Area (ha) Individuals Families Genera
Igap�o 10 9.7 5928 51 129
Paleo-v�arzea 12 12 7631 59 215
V�arzea 19 18.9 9457 61 229
Total 41 40.6 23,016 72 285
Journal of Vegetation Science4 Doi: 10.1111/jvs.12229© 2014 International Association for Vegetation Science
Tree diversity and composition in paleo-v�arzea forests R.L. Assis et al.
teria were among the most important genera in all forest
types (Table 3). The two most important genera in paleo-
v�arzea were also found among the two most important
genera in igap�o (Licania) and v�arzea (Pouteria).
Thirty genera recorded in paleo-v�arzea were not
observed in the other forest types. They represent 10.5%
of the total number of genera, and 13.9% of genera sam-
pled in paleo-v�arzea. V�arzea had the highest number of
exclusive genera (41.8%) and igap�o the lowest (7.75%).
Almost one-third of the genera (27.5%)were present in all
three floodplain forest types.
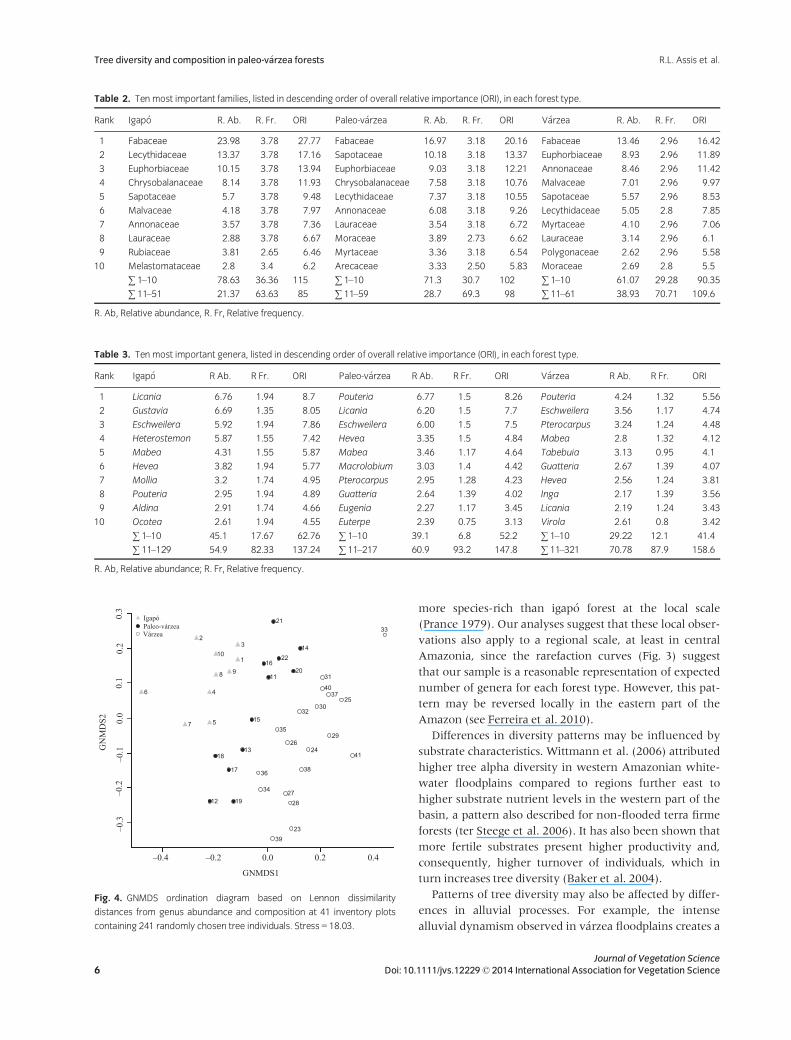
Inventories were loosely clustered in the GNMDS ordi-
nation according to floodplain type: igap�o plots were
located towards the left side of the ordination diagram,
v�arzea plots towards the right and paleo-v�arzea in an inter-
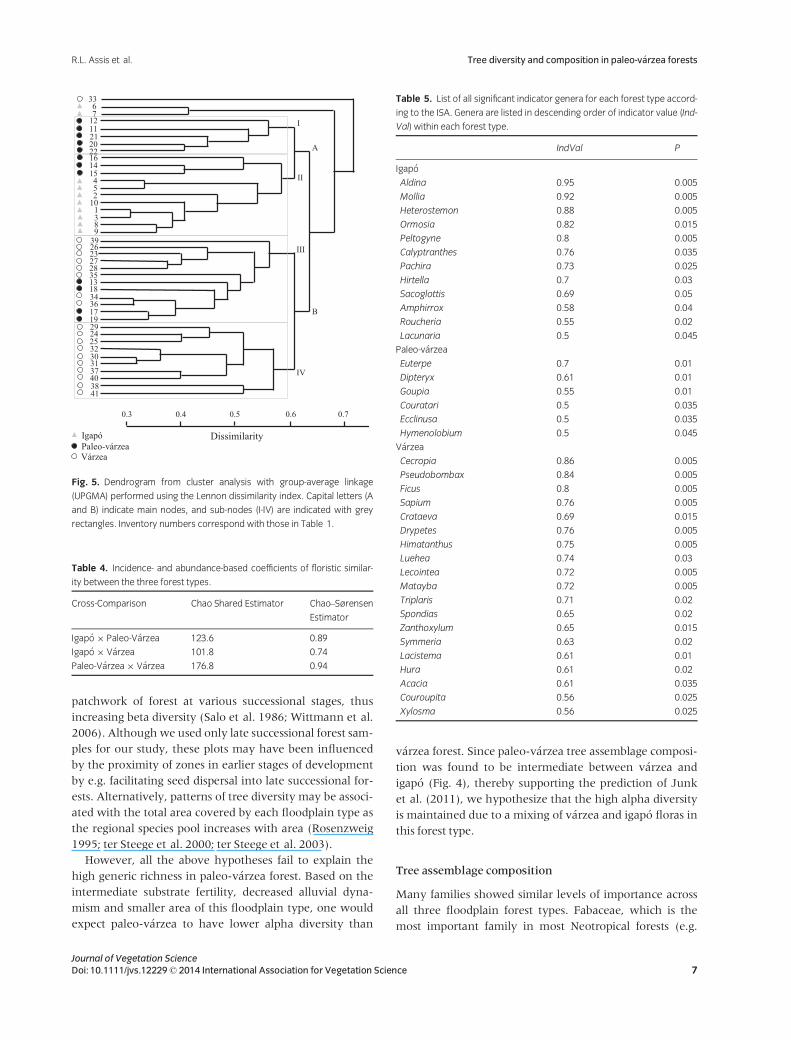
mediate position (Fig. 4). The results of the cluster analysis
echo those of the ordination analysis; Node A of the den-
drogram (Fig. 5) embraced eight of the ten igap�o forest
inventories and Node B contained all except one of the
v�arzea inventories. Paleo-v�arzea inventories were found
in both Node A and Node B, but also occupied an entire
sub-node (A–I; Fig. 5).
The ANOSIM confirmed that genus composition was
significantly different between igap�o and paleo-v�arzea
(r = 0.312, P = 0.002), paleo-v�arzea and v�arzea
(r = 0.226, P = 0.003), and igap�o and v�arzea (r = 0.719,
P < 0.001). The similarity coefficients show that paleo-
v�arzea is floristically most similar to v�arzea, although simi-
larity was only marginally higher compared to igap�o for
the Chao–Sørensen estimated coefficient (Table 4).
The ISA revealed several indicator genera for each forest
type (Table 5), but paleo-v�arzea had fewer significant indi-
cator genera (six) than igap�o (12) and v�arzea (19). Four of
the indicator genera in paleo-v�arzea (Goupia, Couratari,
Ecclinusa and Hymenolobium) were unique to this forest
type.
Discussion
Patterns of tree diversity
Paleo-v�arzea forest had similar levels of alpha diversity and
estimated generic richness to v�arzea forest, whereas igap�o
clearly had the lowest diversity. This is consistent with
previous studies showing that v�arzea forest is consistently
0
50
100
150
200
250
0 1000 2000 3000 4000 5000 6000 7000
Rar
efie
d nu
mbe
r of g
ener
a
Number of individuals
Igapó Paleo-várzea Várzea
Fig. 3. Rarefied number of genera (accumulated per 200 individuals) for each forest type. Vertical bars present SE of the mean.
Forest typeIgapó Paleo-várzea Várzea
Fish
er’s
alp
ha
Igapó x paleo-várzeaIgapó x várzeaPaleo-várzea x várzea
U = 44U = 21*
U = 95.58060
4020
Fig. 2. Box plots of mean (�SE) Fisher’s alpha coefficient for each forest
type. Mann–Whiney U results are presented in the figure. Asterisks
represent significance at P < 0.05.
5Journal of Vegetation ScienceDoi: 10.1111/jvs.12229© 2014 International Association for Vegetation Science
R.L. Assis et al. Tree diversity and composition in paleo-v�arzea forests
more species-rich than igap�o forest at the local scale
(Prance 1979). Our analyses suggest that these local obser-
vations also apply to a regional scale, at least in central
Amazonia, since the rarefaction curves (Fig. 3) suggest
that our sample is a reasonable representation of expected
number of genera for each forest type. However, this pat-
tern may be reversed locally in the eastern part of the
Amazon (see Ferreira et al. 2010).
Differences in diversity patterns may be influenced by
substrate characteristics. Wittmann et al. (2006) attributed
higher tree alpha diversity in western Amazonian white-
water floodplains compared to regions further east to
higher substrate nutrient levels in the western part of the
basin, a pattern also described for non-flooded terra firme
forests (ter Steege et al. 2006). It has also been shown that
more fertile substrates present higher productivity and,
consequently, higher turnover of individuals, which in
turn increases tree diversity (Baker et al. 2004).
Patterns of tree diversity may also be affected by differ-
ences in alluvial processes. For example, the intense
alluvial dynamism observed in v�arzea floodplains creates a
Table 2. Ten most important families, listed in descending order of overall relative importance (ORI), in each forest type.
Rank Igap�o R. Ab. R. Fr. ORI Paleo-v�arzea R. Ab. R. Fr. ORI V�arzea R. Ab. R. Fr. ORI
1 Fabaceae 23.98 3.78 27.77 Fabaceae 16.97 3.18 20.16 Fabaceae 13.46 2.96 16.42
2 Lecythidaceae 13.37 3.78 17.16 Sapotaceae 10.18 3.18 13.37 Euphorbiaceae 8.93 2.96 11.89
3 Euphorbiaceae 10.15 3.78 13.94 Euphorbiaceae 9.03 3.18 12.21 Annonaceae 8.46 2.96 11.42
4 Chrysobalanaceae 8.14 3.78 11.93 Chrysobalanaceae 7.58 3.18 10.76 Malvaceae 7.01 2.96 9.97
5 Sapotaceae 5.7 3.78 9.48 Lecythidaceae 7.37 3.18 10.55 Sapotaceae 5.57 2.96 8.53
6 Malvaceae 4.18 3.78 7.97 Annonaceae 6.08 3.18 9.26 Lecythidaceae 5.05 2.8 7.85
7 Annonaceae 3.57 3.78 7.36 Lauraceae 3.54 3.18 6.72 Myrtaceae 4.10 2.96 7.06
8 Lauraceae 2.88 3.78 6.67 Moraceae 3.89 2.73 6.62 Lauraceae 3.14 2.96 6.1
9 Rubiaceae 3.81 2.65 6.46 Myrtaceae 3.36 3.18 6.54 Polygonaceae 2.62 2.96 5.58
10 Melastomataceae 2.8 3.4 6.2 Arecaceae 3.33 2.50 5.83 Moraceae 2.69 2.8 5.5
∑ 1–10 78.63 36.36 115 ∑ 1–10 71.3 30.7 102 ∑ 1–10 61.07 29.28 90.35
∑ 11–51 21.37 63.63 85 ∑ 11–59 28.7 69.3 98 ∑ 11–61 38.93 70.71 109.6
R. Ab, Relative abundance, R. Fr, Relative frequency.
Table 3. Ten most important genera, listed in descending order of overall relative importance (ORI), in each forest type.
Rank Igap�o R Ab. R Fr. ORI Paleo-v�arzea R Ab. R Fr. ORI V�arzea R Ab. R Fr. ORI
1 Licania 6.76 1.94 8.7 Pouteria 6.77 1.5 8.26 Pouteria 4.24 1.32 5.56
2 Gustavia 6.69 1.35 8.05 Licania 6.20 1.5 7.7 Eschweilera 3.56 1.17 4.74
3 Eschweilera 5.92 1.94 7.86 Eschweilera 6.00 1.5 7.5 Pterocarpus 3.24 1.24 4.48
4 Heterostemon 5.87 1.55 7.42 Hevea 3.35 1.5 4.84 Mabea 2.8 1.32 4.12
5 Mabea 4.31 1.55 5.87 Mabea 3.46 1.17 4.64 Tabebuia 3.13 0.95 4.1
6 Hevea 3.82 1.94 5.77 Macrolobium 3.03 1.4 4.42 Guatteria 2.67 1.39 4.07
7 Mollia 3.2 1.74 4.95 Pterocarpus 2.95 1.28 4.23 Hevea 2.56 1.24 3.81
8 Pouteria 2.95 1.94 4.89 Guatteria 2.64 1.39 4.02 Inga 2.17 1.39 3.56
9 Aldina 2.91 1.74 4.66 Eugenia 2.27 1.17 3.45 Licania 2.19 1.24 3.43
10 Ocotea 2.61 1.94 4.55 Euterpe 2.39 0.75 3.13 Virola 2.61 0.8 3.42
∑ 1–10 45.1 17.67 62.76 ∑ 1–10 39.1 6.8 52.2 ∑ 1–10 29.22 12.1 41.4
∑ 11–129 54.9 82.33 137.24 ∑ 11–217 60.9 93.2 147.8 ∑ 11–321 70.78 87.9 158.6
R. Ab, Relative abundance; R. Fr, Relative frequency.
1
23
4
5
6
7
8 9
10
11
12
13
14
15
16
17
18
19
20
21
22
23
24
25
26
2728
29
30
31
32
33
34
35
36
37
38
39
40
41
IgapóPaleo-várzeaVárzea
0.3
0.2
0.1
0.0
–0.1
–0.2
–0.3
GN
MD
S2
GNMDS1
–0.4 –0.2 0.0 0.2 0.4
Fig. 4. GNMDS ordination diagram based on Lennon dissimilarity
distances from genus abundance and composition at 41 inventory plots
containing 241 randomly chosen tree individuals. Stress = 18.03.
Journal of Vegetation Science6 Doi: 10.1111/jvs.12229© 2014 International Association for Vegetation Science
Tree diversity and composition in paleo-v�arzea forests R.L. Assis et al.
patchwork of forest at various successional stages, thus
increasing beta diversity (Salo et al. 1986; Wittmann et al.
2006). Although we used only late successional forest sam-
ples for our study, these plots may have been influenced
by the proximity of zones in earlier stages of development
by e.g. facilitating seed dispersal into late successional for-
ests. Alternatively, patterns of tree diversity may be associ-
ated with the total area covered by each floodplain type as
the regional species pool increases with area (Rosenzweig
1995; ter Steege et al. 2000; ter Steege et al. 2003).
However, all the above hypotheses fail to explain the
high generic richness in paleo-v�arzea forest. Based on the
intermediate substrate fertility, decreased alluvial dyna-
mism and smaller area of this floodplain type, one would
expect paleo-v�arzea to have lower alpha diversity than
v�arzea forest. Since paleo-v�arzea tree assemblage composi-
tion was found to be intermediate between v�arzea and
igap�o (Fig. 4), thereby supporting the prediction of Junk
et al. (2011), we hypothesize that the high alpha diversity
is maintained due to a mixing of v�arzea and igap�o floras in
this forest type.
Tree assemblage composition
Many families showed similar levels of importance across
all three floodplain forest types. Fabaceae, which is the
most important family in most Neotropical forests (e.g.
3367
1211212022161415452
101389
39262327283513183436171929242532303137403841
A
B
I
II
III
IV
0.3 0.4 0.5 0.6 0.7
DissimilarityIgapóPaleo-várzeaVárzea
Fig. 5. Dendrogram from cluster analysis with group-average linkage
(UPGMA) performed using the Lennon dissimilarity index. Capital letters (A
and B) indicate main nodes, and sub-nodes (I-IV) are indicated with grey
rectangles. Inventory numbers correspond with those in Table 1.
Table 4. Incidence- and abundance-based coefficients of floristic similar-
ity between the three forest types.
Cross-Comparison Chao Shared Estimator Chao–Sørensen
Estimator
Igap�o9 Paleo-V�arzea 123.6 0.89
Igap�o9 V�arzea 101.8 0.74
Paleo-V�arzea9 V�arzea 176.8 0.94
Table 5. List of all significant indicator genera for each forest type accord-
ing to the ISA. Genera are listed in descending order of indicator value (Ind-
Val) within each forest type.
IndVal P
Igap�o
Aldina 0.95 0.005
Mollia 0.92 0.005
Heterostemon 0.88 0.005
Ormosia 0.82 0.015
Peltogyne 0.8 0.005
Calyptranthes 0.76 0.035
Pachira 0.73 0.025
Hirtella 0.7 0.03
Sacoglottis 0.69 0.05
Amphirrox 0.58 0.04
Roucheria 0.55 0.02
Lacunaria 0.5 0.045
Paleo-v�arzea
Euterpe 0.7 0.01
Dipteryx 0.61 0.01
Goupia 0.55 0.01
Couratari 0.5 0.035
Ecclinusa 0.5 0.035
Hymenolobium 0.5 0.045
V�arzea
Cecropia 0.86 0.005
Pseudobombax 0.84 0.005
Ficus 0.8 0.005
Sapium 0.76 0.005
Crataeva 0.69 0.015
Drypetes 0.76 0.005
Himatanthus 0.75 0.005
Luehea 0.74 0.03
Lecointea 0.72 0.005
Matayba 0.72 0.005
Triplaris 0.71 0.02
Spondias 0.65 0.02
Zanthoxylum 0.65 0.015
Symmeria 0.63 0.02
Lacistema 0.61 0.01
Hura 0.61 0.02
Acacia 0.61 0.035
Couroupita 0.56 0.025
Xylosma 0.56 0.025
7Journal of Vegetation ScienceDoi: 10.1111/jvs.12229© 2014 International Association for Vegetation Science
R.L. Assis et al. Tree diversity and composition in paleo-v�arzea forests
Gentry 1988; Terborgh & Andresen 1998; ter Steege et al.
2013), was also the dominant family in igap�o, paleo-v�arzea
and v�arzea. However, Fabaceae was much more important
in igap�o than in the other two forest types. This may partly
reflect the lower number of families recorded in this forest
type, allowing each family to gain higher dominance. It
has also been suggested that legumes are particularly suc-
cessful on nutrient-poor substrates (e.g. igap�o) due to their
high seed mass, providing them with an advantage over
trees from other families with smaller seeds (Janzen 1974;
ter Steege et al. 2006). Other differences at the family level
may also reflect edaphic properties. Lecythidaceae has
been considered amore characteristic family of poorer sub-
strates such as terra firme (Coronado et al. 2009) and igap�o
(Mori et al. 2001). This agrees with our data, where Lecyt-
hidaceae attained its highest ORI value in igap�o.
The results at the generic level reflect those at the fam-
ily level, where many of the most important genera were
shared among the three forest types. However, six genera
were identified as indicators of paleo-v�arzea forest
(Table 5), and four of these were exclusive to this forest
type. We also observe that many genera containing spe-
cies known to occupy early successional stages of flood-
plain forest (e.g. Cecropia, Luehea, Pseudobombax, Symmeria
and Triplaris; Wittmann et al. 2002, 2004) were among
the indicator genera for v�arzea (Table 5). The presence of
these typical pioneer taxa in late successional v�arzea forest
is probably a result of an elevated number of disturbance
events, such as fluvial erosion and gap formation, since
the alluvial dynamism in v�arzea floodplains is much
higher compared to the more stable (less sedimentation
and erosion) paleo-v�arzea and igap�o (Junk et al. 1989;
Wittmann et al. 2004).
Another interesting pattern that emerges from our data
is that some genera important in v�arzea have decreased
importance (lower ORI value) in paleo-v�arzea (e.g. Guat-
teria, Pterocarpus and Virola), whereas some genera impor-
tant in igap�o (e.g. Hevea, Licania and Mabea) were of
similar importance in paleo-v�arzea (Table 3). While the
combination of the above results accounts for the inter-
mediate positioning of paleo-v�arzea forest in the ordina-
tion diagram (Fig. 4), the latter observations may suggest
that paleo-v�arzea is gradually gaining species typical of
igap�o and losing species typical of the more nutrient-rich
and dynamic v�arzea floodplains. This appears consistent
with the interpretation that paleo-v�arzea floodplains are
in a transitional phase between v�arzea and igap�o (Salo
et al. 1986).
However, floristic composition of paleo-v�arzea forest
differed substantially across this ‘transitional’ gradient, and
the degree of similarity between paleo-v�arzea and either
igap�o or v�arzea may depend on several factors. First, more
recent paleo-v�arzea may contain higher abundance of
common v�arzea tree species due to higher substrate fertil-
ity, while older and less fertile paleo-v�arzea contain floral
elements of igap�o. This could explain why some paleo-
v�arzea sites of the present study were clustered close to
igap�o sites, while others were more similar to v�arzea
(Fig. 5) – even though floristic composition of paleo-
v�arzea forest was significantly different to v�arzea and igap�o
according to our ANOSIM. Second, paleo-v�arzea forest
may be more similar to igap�o or v�arzea forest located
nearby due to seed and propagule dispersion. However, an
effect of geographic location remains unclear since paleo-
v�arzea and v�arzea plots in the Japur�a basin can be found in
different nodes of the cluster analysis. Third, previous stud-
ies have shown that flood height and duration influence
patterns of floristic composition (e.g. Worbes et al. 1992;
Ayres 1993; Wittmann et al. 2002, 2004), and small-scale
topographic variation between plots could thus have
affected plot distribution in our ordination and cluster
analyses despite our focus on late successional forest.
In summary, we show that paleo-v�arzea floodplain tree
assemblages are dissimilar to those of v�arzea and igap�o, but
clearly contain many components typical of both these
floodplain types. We also show that diversity in paleo-
v�arzea is equal to that of more nutrient-rich v�arzea, and
this is perhaps due to the coexisting floral components typ-
ical of v�arzea and igap�o. In addition, we hypothesize that
paleo-v�arzea is in a transitional phase between v�arzea and
igap�o, and that this transition from an active to a paleo
floodplain (which includes a reduction in sediment and
nutrient input by rivers, and successional dynamics) pro-
motes significant changes in floristic composition. We sug-
gest that the current paleo-v�arzea assemblages may
progressively becomemore similar to those of igap�o, where
tree species typical of v�arzea forests will gradually be
substituted by species common to igap�o. We do, however,
recognize that our genus-level analysis is coarse and that a
species-level study is necessary to further examine the
trends observed in the current study. Until species-level
identifications can be significantly improved throughout
the basin, such a studywill remain difficult.
Acknowledgements
This research was supported by the INPA/Max Planck
ProjectManaus, the Brazilian Council of Science and Tech-
nology (Universal 479599/2008-4) and PRONEX CNPq-
FAPEAM, �Areas �Umidas, MAUA. RLA is supported by a
doctoral scholarship from the Norwegian State Educational
Loan Fund. We are grateful to Sr. Jos�e Ramos at the
National Institute for Amazonian Research (INPA) Herbar-
ium for assisting with species identifications. Special
thanks to Nat�alia Castro, Celso Rabelo Costa, Jos�e Lima,
Thiago Ilnicki, Jackson de Castro and all the field assistants
Journal of Vegetation Science8 Doi: 10.1111/jvs.12229© 2014 International Association for Vegetation Science
Tree diversity and composition in paleo-v�arzea forests R.L. Assis et al.
who contributed to the present study. We thank Ethan
Householder, James Gilroy, Mark Bush and two anony-
mous reviewers for constructive comments on an earlier
version of this manuscript.
References
Assis, R.L. &Wittmann, F. 2011. Forest structure and tree species
composition of the understory of two central Amazonian
v�arzea forests of contrasting flood heights. Flora 206: 251–
260.
Ayres, J.M. 1993. As matas de v�arzea do Mamirau�a. CNPq: Socied-
ade Civil Mamirau�a, Bras�ılia, DF, BR.
Baker, T.R., Phillips, O.L., Malhi, Y., Almeida, S., Arroyo, L.,
Di Fiore, A., Erwin, T., Higuchi, N., Killeen, T.J., (. . .) &
V�asquez Mart�ınez, R. 2004. Increasing biomass in Amazo-
nian forest plots. Philosophical Transactions of the Royal Society
London B: Biological Sciences 359: 353–365.
Chao, A., Chazdon, R.L., Colwell, R.K. & Shen, T.-J. 2005. A
new statistical approach for assessing compositional similar-
ity based on incidence and abundance data. Ecology Letters 8:
148–159.
Chao, A., Chazdon, R.L., Colwell, R.K. & Shen, T.-J. 2006.
Abundance-based similarity indices and their estimation
when there are unseen species in samples. Biometrics 62:
361–371.
Chen, Y.-C., Hwang, W.-H., Chao, A. & Kuo, C.-Y. 1995.
Estimating the number of common species. Analysis of the
number of common bird species in Ke-Yar Stream and
Chung-Kang Stream. Journal of the Chinese Statistical Associa-
tion 33: 373–393 [In Chinese with English abstract].
Clarke, K.R. 1993. Non-parametric multivariate analysis of
changes in community structure. Australian Journal of Ecology
18: 117–143.
Coronado, E.N.H., Baker, T.R., Phillips, O.L., Pitman, N.C.A.,
Pennington, R.T., V�asquez Mart�ınez, R., Monteagudo, A.,
Mogoll�on, H., D�avila Cardozo, N., (. . .) & Freitas Alvarado, L.
2009. Multi-scale comparisons of tree composition in Ama-
zonian terra firme forests. Biogeosciences 6: 2719–2731.
CPRM. 2006. Mapa Geol�ogico do Estado do Amazonas. Geolo-
gia e Recursos Minerais do Estado do Amazonas. Sistemas
de Informac�~ao Geogr�afica (SIG), Programa Geologia do
Brasil do Minist�erio de Minas e Energia, Rio de Janeiro,
BR.
Curtis, J.T. & McIntosh, R.P. 1951. An upland forest continuum
in the prairie forest border region of Wisconsin. Ecology 32:
476–496.
De C�aceres, M. & Legendre, P. 2009. Associations between spe-
cies and groups of sites: indices and statistical inference. Ecol-
ogy 90: 3566–3574.
Dufrene, M. & Legendre, P. 1997. Species assemblages and indi-
cator species: the need for a flexible asymmetrical approach.
Ecological Monographs 67: 345–366.
Ferreira, L.V. 1997. Effects of flooding duration on species rich-
ness and floristic composition in three hectares in the Ja�u
National Park in floodplain forests in Central Amazonia. Bio-
diversity and Conservation 6: 1353–1363.
Ferreira, L.V. & Prance, G.T. 1998. Structure and species richness
of low-diversity floodplain forest on the Rio Tapaj�os,
Eastern Amazonia, Brazil. Biodiversity and Conservation 7:
585–596.
Ferreira, L.V., Almeida, S.S. & Parolin, P. 2010. Amazonian
white- and blackwater floodplain forests in Brazil: large dif-
ferences on a small scale. Ecotropica 16: 31–41.
Fisher, R.A., Corbert, A.S. & Williams, C.B. 1943. The relation-
ship between the number of individuals in a random sample
and an animal population. Journal of Animal Ecology 12: 42–
58.
Gentry, A.H. 1988. Changes in plant community diversity and
floristic composition on environmental and geographical
gradients. Annals of the Missouri Botanical Garden 75: 1–34.
Gotelli, N. & Colwell, R.K. 2001. Quantifying biodiversity: proce-
dures and pitfalls in the measurement and comparison of
species richness. Ecology Letters 4: 379–391.
Haugaasen, T. & Peres, C. 2006. Floristic, edaphic and structural
characteristics of flooded and unflooded forests in the lower
Rio Pur�us region of central Amazonia, Brazil. Acta Amazonica
36: 25–36.
Higgins, M. & Ruokolainen, K. 2004. Rapid tropical forest
inventory: a comparison of techniques based on inventory
data from Western Amazonia. Conservation Biology 18:
799–811.
Irion, G. 1976. Quaternary sediments of the upper Amazon low-
lands of Brasil. Biogeographica 7: 163–167.
Irion, G. 1978. Soil infertility in the Amazonian rain forest. Na-
turwissenschaften 65: 515–519.
Irion, G. 1984. Sedimentation and sediments of Amazon rivers
and evolution of the Amazon landscape since Pliocene time.
In: Sioli, H. (ed.) The Amazon, pp. 201–214. Dr. W Junk,
Dordrecht, NL.
Irion, G., M€uller, J., Nunes deMello, J. & Junk, W.J. 1995. Qua-
ternary geology of the Amazonian lowland. Geo-Marine Let-
ters 15: 172–178.
Irion, G., de Mello, J.A.S.N., Morais, J., Piedade, M.T.F., Junk,
W.J. & Garming, L. 2010. Development of the Amazon
valley during the Middle to Late Quaternary: sedimento-
logical and climatological observations. In: Junk, W.J.,
Piedade, M.T.F., Wittmann, F., Sch€ongart, J. & Parolin, P.
(eds.) Central Amazonian floodplain forests: ecophysiology, bio-
diversity and sustainable management, pp. 27–42. Springer,
Berlin, DE.
Janzen, D.H. 1974. Tropical blackwater rivers, animals, and mast
fruiting by the Dipterocarpaceae. Biotropica 6: 69–103.
Junk, W.J. & Piedade, M.T.F. 1993. Herbaceous plants of the
flood plain nearManaus: species diversity and adaptations to
the flood pulse. Amazoniana 12: 467–484.
9Journal of Vegetation ScienceDoi: 10.1111/jvs.12229© 2014 International Association for Vegetation Science
R.L. Assis et al. Tree diversity and composition in paleo-v�arzea forests
Junk, W.J., Bayley, P.B. & Sparks, R.E. 1989. The flood pulse
concept in river-floodplain systems. Canadian Special Publica-
tion of Fisheries and Aquatic Sciences 106: 110–127.
Junk, W.J., Piedade, M.T.F., Sch€ongart, J., Cohn-haft, M., Ade-
ney, J.M. &Wittmann, F. 2011. A classification ofmajor nat-
urally occurring Amazonian lowland wetlands. Wetlands 31:
623–640.
Klammer, G. 1984. The relief of the extra-Andean Amazon
basin. In: Sioli, H. (ed.) The Amazon: limnology and landscape
ecology of a mighty tropical river and its basin, pp. 47–84. Dr. W.
Junk, Dordrecht, NL.
Kubitzki, K. 1989. The ecogeographical differentiation of Ama-
zonian inundation forests. Plant Systematics and Evolution 162:
285–304.
Lennon, J.J., Koleff, P., Greenwood, J.J.D. & Gaston, K.J. 2001.
The geographical structure of British bird distributions:
diversity, spatial turnover and scale. Journal of Animal Ecology
70: 966–979.
Martinelli, L.A., Victoria, R.L., Devol, A.H. & Forsberg, B. 1989.
Suspended sediment load in the Amazon basin: an overview.
GeoJournal 19: 381–389.
McClain, M.E. & Naiman, R.J. 2008. Andean Influences on the
Biogeochemistry and Ecology of the Amazon River. BioSci-
ence 58: 325–338.
Melack, J.M. & Hess, L.L. 2010. Remote sensing of the distribu-
tion and extent of wetlands in the Amazon basin. In: Junk,
W.J., Piedade, M.T.F., Wittmann, F., Sch€ongart, J. & Parolin,
P. (eds.) Central Amazonian floodplain forests: ecophysiology, bio-
diversity and sustainable management, pp. 43–59. Springer, Ber-
lin, DE.
Mertes, L.A.K., Dunne, T. & Martinelli, L.A. 1996. Channel-
floodplain geomorphology along the Solim~oes-Amazon
River, Brazil. Geological Society of America Bulletin 108: 1089–
1107.
Minchin, P.R. 1987. Simulation ofmultidimensional community
patterns: towards a comprehensive model. Vegetatio 71: 145–
156.
Montero, J.C., Piedade, M.T.F. & Wittmann, F. 2014. Floristic
variation across 600 km of inundation forests (igap�o) along
the Negro River, Central Amazonia. Hydrobiologia 729: 229–
246.
Mori, S.A., Becker, P. & Kincaid, D. 2001. Lecythidaceae of a
central Amazonian lowland forest: implications for conser-
vation. In: Bierregaard, R.O.J., Gascon, C., Lovejoy, T.E. &
Mesquita, R.C.G. (eds.) Lessons from Amazonia: the ecology and
conservation of a fragmented, pp. 54–67. Yale University Press,
NewHaven, CT, US.
Oksanen, J. 2005. Multivariate analysis of ecological communities in
R: vegan tutorial. University of Oulu, Oulu, HI, US.
Parolin, P., De Simone, O., Haase, K., Waldhoff, D., Rottenber-
ger, S., Kuhn, U., Kesselmeier, J., Schmidt, W., Piedade,
M.T.F. & Junk, W.J. 2004. Central Amazon floodplain
forests: tree survival in a pulsing system. The Botanical Review
70: 357–380.
Peixoto, J.M.A., Nelson, B.W. & Wittmann, F. 2009. Spatial and
temporal dynamics of alluvial geomorphology and vegeta-
tion in central Amazonian white-water floodplains by
remote-sensing techniques. Remote Sensing of Environment
113: 2258–2266.
Prance, G.T. 1979. Notes on the vegetation of Amazonia III. The
terminology of Amazonian forest types subject to inunda-
tion. Brittonia 31: 26–38.
Rosenzweig, M.L. 1995. Species diversity in space and time. Cam-
bridge University Press, New York, NY, US.
Salo, J., Kalliola, R., H€akkinen, I., M€akinen, Y., Niemel€a, P.,
Puhakka, M. & Coley, P.D. 1986. River dynamics and diver-
sity of the Amazon lowland forest.Nature 322: 254–258.
Schubart, H.O.R. 1983. Ecologia e utilizac�~ao das florestas. In:
Prance, G.T. & Lovejoy, T.E. (eds.) Amazonia, pp. 101–143.
Editora Brasiliense, S~ao Paulo, BR.
Sioli, H. 1956. €Uber Natur undMensch im brasilianischen Amaz-
onasgebiet. Erdkunde 10: 89–109.
ter Steege, H., Pitman, N., Sabatier, D., Castellanos, H., Van der
Hout, P., Daly, D.C., Silveira, M., Phillips, O., Vasquez, R.,
(. . .) & Morawetz, W. 2003. A spatial model of tree a-diver-
sity and tree density for the Amazon. Biodiversity and Conser-
vation 12: 2255–2277.
ter Steege, H., Sabatier, S., Castellanos, H., van Andel, T., Dui-
venvoorden, J., de Oliveira, A.A., Ek, R.C., Lilwah, R., Maas,
P.J.M. & Mori, S.A. 2000. An analysis of Amazonian floristic
composition, including those of the Guiana Shield. Journal of
Tropical Ecology 16: 801–828.
ter Steege, H., Pitman, N.C.A., Phillips, O.L., Chave, J.,
Sabatier, D., Duque, A., Molino, J.F., Pr�evost, M.F., Spi-
chiger, R., (. . .) & V�asquez, R. 2006. Continental-scale
patterns of canopy tree composition and function across
Amazonia. Nature 443: 444–447.
ter Steege, H., Pitman, N.C., Sabatier, D., Baraloto, C., Salom~ao,
R.P., Guevara, J.E., Phillips, O.L., Castilho, C.V., Magnusson,
W.E. (. . .) & Silman, M.R. 2013. Hyperdominance in the
Amazonian tree flora. Science 342: 325–334.
Terborgh, J. & Andresen, E. 1998. The composition of Amazo-
nian forests: patterns at local and regional scales. Journal of
Tropical Ecology 14: 645–664.
Venables, W.N. & Ripley, B.D. 2002. Modern applied statistics with
S. Springer, Berlin, DE.
Wittmann, F., Anhuf, D. & Junk, W.J. 2002. Tree species distri-
bution and community structure of Central Amazonian
v�arzea forests by remote sensing techniques. Journal of Tropi-
cal Ecology 18: 805–820.
Wittmann, F., Junk, W.J. & Piedade, M.T.F. 2004. The v�arzea
forests in Amazonia: flooding and the highly dynamic geo-
morphology interact with natural forest succession. Forest
Ecology andManagement 196: 199–212.
Wittmann, F., Sch€ongart, J., Montero, J.C., Motzer, T., Junk,
W.J., Piedade, M.T.F., Queiroz, H.L.D. & Worbes, M. 2006.
Tree species composition and diversity gradients in white-
Journal of Vegetation Science10 Doi: 10.1111/jvs.12229© 2014 International Association for Vegetation Science
Tree diversity and composition in paleo-v�arzea forests R.L. Assis et al.
water forests across the Amazon Basin. Journal of Biogeogra-
phy 33: 1334–1347.
Wittmann, F., Sch€ongart, J. & Junk, W.J. 2010. Phytogeogra-
phy, species diversity, community structure and dynamics
of Amazonian floodplain forests. In: Junk, W.J., Piedade,
M.T.F., Wittmann, F., Sch€ongart, J. & Parolin, P. (eds.)
Central Amazonian floodplain forests: ecophysiology, biodiversity
and sustainable management, pp. 61–102. Springer, Berlin,
DE.
Worbes, M., Klinge, H., Revilla, J.D. & Martius, C. 1992. On the
dynamics, floristic subdivision and geographical distribution
of v�arzea forests in Central Amazonia. Journal of Vegetation
Science 3: 553–564.
Supporting Information
Additional Supporting Information may be found in the
online version of this article:
Appendix S1. Tree inventory locations with their
forest type, latitude/longitude, area inventoried, number
of trees, number of species, alpha diversity and data
source.
11Journal of Vegetation ScienceDoi: 10.1111/jvs.12229© 2014 International Association for Vegetation Science
R.L. Assis et al. Tree diversity and composition in paleo-v�arzea forests


