Embed Size (px)
Citation preview
INSTRUMENT ANALYSISSEPTEMBER 2021
PEACE RENEWABLEENERGY CREDIT (P-REC)AGGREGATION FUND
Peace Renewable Energy Credits (P-REC) Aggregation Fund
LAB INSTRUMENT ANALYSIS September 2021
DESCRIPTION & GOAL — A unique financing facility monetizing unbundled environmental attributes of renewable energy to provide project developers in fragile countries with an additional revenue stream which they can use to unlock further finance. SECTOR — Renewable Energy
FINANCE TARGET — Renewable energy project developers International corporations with voluntary sustainability, social, and climate commitments
GEOGRAPHY — Stage 1: Chad, Democratic Republic of the Congo (DRC), Somalia, South Sudan, Uganda, and Ethiopia Stage 2: Central African Republic (CAR), Liberia, Mali, Nigeria, and Sudan
2
The Lab identifies, develops, and launches sustainable finance instruments that can drive billions to a low-carbon economy. The 2021 Lab cycle targets three specific sectors: sustainable food systems, sustainable energy access, and sustainable cities, in addition to two regions: Brazil and Southern Africa. AUTHORS AND ACKNOWLEDGEMENTS The authors of this brief are Daniela Chiriac, Megan Sager, and David Hazell. The authors would like to acknowledge the following professionals for their cooperation and valued contributions including the proponents: Sherwin Das, Dave Mozersky, Katie Retz, David Williams, Orrin Cook, Linda Wamune, Bessma Mourad (EPP); the working group members: Haley Shewfelt, Erin Horleman, Rick Freeman (3Degrees), Ntumba Katabua (AFD), Joāo Cunha, Rahul Barua (AfDB-SEFA), Joan Chahenza (Africa Minigrid Developers Association), Nicole Grunewald (Zukunft Umwelt and Gesellschaft (ZUG)/German Government), Jonathan First (GFA Consulting), Sophia Sunderji (GIIN), Jack Radmore (GreenCape), Max Klotz (IFC), Emmanuel Beau (Minexx), Julien Jeannet (J Cube Lab), Baraka Kasali (Nuru DRC), Olivia Coldrey (SEforALL), Mark Correnti (Shine Campaign), David Krzywda (U.S. Department of State), Scott Zimmerman (Wilson Sonsini Goodrich Rosati), Ashish Kumar (Shell Foundation). The authors would like to acknowledge the contribution of the experts: Jessica Stephens (AMDA), Geoff Sinclair (REPP/ Camco Clean Energy), Carmen de Castro, Deogratius Adriko (Facility for Energy Inclusion / Lion’s Head GP), Edwin Chui, Kyle Hamilton (Nuru), Jaco Swart (DBSA), Humphrey Wireko, Annette Mumbi (CrossBoundary Energy Access), Joslin Lydall (Catalyst Solutions), Mike Hayes (KPMG), Zach Crowley (Clean Energy Counsel). The authors would also like to thank Ben Broché, Barbara Buchner, Vikram Widge, Amanda Lonsdale, Federico Mazza, Rob Kahn, Júlio Lubianco, and Josh Wheeling for their continuous advice, support, comments, design, and internal review.
The Lab’s 2021 programs have been funded by the Dutch, German, Swedish, and UK governments, as well as the Rockefeller Foundation. Climate Policy Initiative (CPI) serves as Secretariat and analytical provider.
3
SUMMARY Only 46% of the population in Sub-Saharan Africa (SSA) has access to reliable energy, half of the 90% global average (IEA et al., 2021). The situation is even worse in fragile states in the region, which are incapable of providing public services and show a weakened authority for collective decisions (Fragile States Index, 2018). Their volatile political and economic environments severely constrain renewable energy (RE) project developers' access to finance (SEforALL, 2020), particularly problematic as RE is one of the most cost-effective ways of scaling energy access in low-income countries (IRENA, 2019; IEA, 2020). The COVID-19 crisis is expected to exacerbate existing levels of energy poverty. Dedicated national and international recovery support estimated at over USD 20 billion is needed annually for SSA’s energy generation. At the same time, the demand for electricity is projected to quadruple between 2019 and 2040. To address some of these challenges, the Peace Renewable Energy Credit (P-REC) Aggregation Fund (“the Fund”), proposed by Energy Peace Partners, monetizes unbundled environmental and socio-economic attributes of renewable energy to provide project developers with an additional revenue stream that they can use to unlock further finance. P-RECs are a high-quality type of I-REC (International Renewable Energy Certificate) thanks to the economic and social impacts that the RE projects deliver to communities in fragile contexts, in addition to their environmental benefits. The Fund will tap into the growing voluntary market for energy attribute certificates, especially popular among international corporations, including the 300+ corporate members of the RE100 initiative. This instrument meets all four of the Lab endorsement criteria:
• Innovative: By aggregating unbundled energy attribute certificates, the Fund is unique in monetizing environmental attributes to improve the financial viability of marginal distributed renewable energy projects. This unlocks access to infrastructure finance for project developers. For investors, fund domicile in a stable jurisdiction, commodity dollar pricing, and the ability to tap large international markets reduces risk.
• Financially Sustainable: At the commercial stage, the Fund’s track record and longer-
term offtake contracts with P-REC buyers will allow a reduction of the grant portion and entrance of commercial equity.
• Catalytic: The Fund can unlock nine times more capital from other sources. Thanks to
its catalytic potential, USD 16 invested in the Fund can help abate one tCO2e and USD 31.5 invested in the Fund can help provide energy access to one household.
• Actionable: Energy Peace Partners, the authorized issuer of P-RECs, has already
facilitated two P-REC sale transactions, to Microsoft and Google, and will continue to generate a project pipeline for the Fund through its accreditation process. The Fund, a stand-alone entity, will execute a contract for services with a qualified fund manager as well as EPP Advisory Services (a new division within EPP), both of whom will lead timely fundraising and implementation.
Next Steps: Following Lab endorsement, EPP will prioritize setting up EPP Advisory Services, selecting a qualified fund manager, and fundraising for the proof-of-concept phase.
4
TABLE OF CONTENTS SUMMARY .......................................................................................................................................... 3
ACRONYMS ....................................................................................................................................... 6
CONTEXT ............................................................................................................................................ 7
CONCEPT .......................................................................................................................................... 8
1. Instrument Mechanics ........................................................................................................... 8
Peace Renewable Energy Credits ....................................................................................... 8
P-REC Aggregation Fund ...................................................................................................... 9
2. Innovation ............................................................................................................................ 11
Barriers Addressed: Supporting projects in fragile economies ......................................... 11
Innovation: Early-stage capital for small renewable energy projects in fragile economies ...................................................................................................................................... 13
Challenges to Instrument Success ...................................................................................... 13
MARKET TEST AND BEYOND ............................................................................................................ 16
3. Implementation Pathway and Replication ....................................................................... 16
Target Markets ..................................................................................................................... 16
Implementing Entities .......................................................................................................... 18
Implementation Timeline ..................................................................................................... 18
4. Financial Impact and Sustainability ................................................................................... 19
Quantitative Modeling ........................................................................................................ 19
Private Finance Mobilization and Replication Potential ................................................... 22
5. Environmental and Socio-economic Impact .................................................................... 23
Environmental Impact ......................................................................................................... 23
Social and Economic impact ............................................................................................. 23
NEXT STEPS ....................................................................................................................................... 25
REFERENCES .................................................................................................................................... 26
Annex 1 - Modelling Methodology and Detailed Results ........................................................... 29
1. Fund Economics Cash Flow model .................................................................................... 30
2. Environmental and Socio-economic Impact Assessment ................................................ 31
Annex 2 – Market Analysis Methodology ..................................................................................... 35
Annex 3 – RE100 Market for I-RECS in Sub-Saharan Africa .......................................................... 38
1. Renewable Energy Strategies ............................................................................................. 38
2. Market Boundaries ............................................................................................................... 38
3. RE100 Member Footprint in Africa ...................................................................................... 39
Annex 4 – Carbon Footprint Reduction Potential ........................................................................ 40
1. RECS & Emissions Reduction................................................................................................ 40
5
2. GHG Protocol Guidance .................................................................................................... 40
Annex 5 – Project Developer Case Study (Nuru) ......................................................................... 42
Annex 6 – Comparable Funds and Instruments ........................................................................... 43
Annex 7 – Competitors to P-RECs .................................................................................................. 48
1. Within the Renewable Energy Market................................................................................ 48
2. Within the Sphere of Corporate Sustainability ................................................................... 49
6
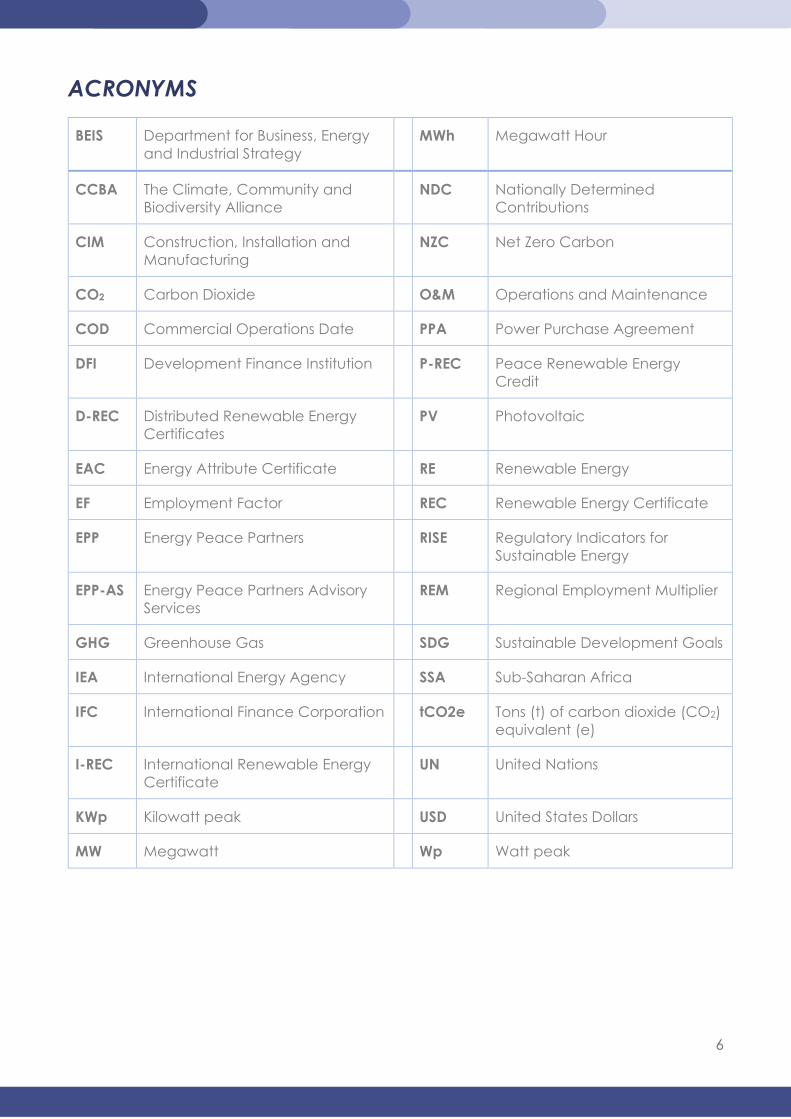
ACRONYMS
BEIS Department for Business, Energy and Industrial Strategy
MWh Megawatt Hour
CCBA The Climate, Community and Biodiversity Alliance
NDC Nationally Determined Contributions
CIM Construction, Installation and Manufacturing
NZC Net Zero Carbon
CO2 Carbon Dioxide O&M Operations and Maintenance
COD Commercial Operations Date PPA Power Purchase Agreement
DFI Development Finance Institution P-REC Peace Renewable Energy Credit
D-REC Distributed Renewable Energy Certificates
PV Photovoltaic
EAC Energy Attribute Certificate RE Renewable Energy
EF Employment Factor REC Renewable Energy Certificate
EPP Energy Peace Partners RISE Regulatory Indicators for Sustainable Energy
EPP-AS Energy Peace Partners Advisory Services
REM Regional Employment Multiplier
GHG Greenhouse Gas SDG Sustainable Development Goals
IEA International Energy Agency SSA Sub-Saharan Africa
IFC International Finance Corporation tCO2e Tons (t) of carbon dioxide (CO2) equivalent (e)
I-REC International Renewable Energy Certificate
UN United Nations
KWp Kilowatt peak USD United States Dollars
MW Megawatt Wp Watt peak
7
CONTEXT
Fragile countries in Sub-Saharan Africa suffer from energy poverty and low investments in the sector. The P-REC Aggregation Fund can help raise the finance needed for
renewable energy, a low-cost solution capable to bridge this gap.
Worldwide, average access to electricity has reached a record high. However, progress is not consistent across geographies, with Sub-Saharan Africa having only a 46% access rate, (IEA et al., 2021). Despite progress at the continent level, where the number of people without access to electricity fell by 30 million between 2013 and 2019, much of this trend is driven by a handful of countries: Kenya, Senegal, Rwanda, Ghana, and Ethiopia (IEA, 2020).
Fragile states in Africa continue to suffer from persistent energy poverty and low investments in the sector (SEforALL, 2020). They are characterized by erosion of legitimate authority for collective decisions and inability to provide reasonable public services (Fragile States Index, 2018)1. While not equivalent to fragility, violence and armed conflict are concentrated in fragile contexts (OECD, 2020). These volatile political and economic environments deter investments, constraining access to finance for renewable energy project developers.
In addition, the COVID-19 crisis is expected to exacerbate existing levels of energy poverty. Without dedicated national and international recovery support, the number of people without energy access could reach 630 million, equivalent to more than 80% of the world’s total (IEA, 2020). This overlaps with an unparalleled increase in global poverty of 97 million people in 2020 due to the pandemic. Poverty rates will likely further increase in SSA in 2021 (World Bank, 2021).
To achieve universal electricity access by 2030, SSA needs an estimated USD 20.5 billion per year (SEforALL, 2020). Between 2019 and 2040, electricity demand is projected to quadruple in the region2 driven by rising incomes in urban areas and increasing demand for productive uses. Therefore, major investments are required.
However, most investments in the African energy sector come from public sources, with international development finance compensating for the limited financial capacity of national governments. It is thus essential to strategically use these public resources to catalyze additional private funding (IEA, 2019).
Energy Peace Partners (EPP) initiated the P-REC Aggregation Fund, aiming to increase public and private investments for the renewable energy sector in fragile states in Africa. Renewable energy appears to be the most price-efficient way to achieve universal electricity access (IEA, 2020). Peace Renewable Energy Credits (P-RECs) are a unique commodity. P-RECs monetize the environmental and socio-economic attributes of renewable energy, thus providing project developers with an additional revenue stream that can help unlock the remaining finance needed for construction. Demand for renewable energy attributes is increasing among corporates worldwide thanks to voluntary commitments, such as those of the 300+ corporate members of the RE100 initiative3.
1 The twelve CAST indicators, upon which the Fragile States Index is based, cover a wide range of state failure risk elements such as extensive corruption and criminal behavior, inability to collect taxes or otherwise draw on citizen support, large-scale involuntary dislocation of the population, sharp economic decline, group-based inequality, institutionalized persecution or discrimination, severe demographic pressures, brain drain, and environmental decay. 2 Excluding South Africa 3 RE100 is a global initiative bringing together the world’s most influential businesses driving the transition to 100% renewable electricity. RE100 corporates commit to sourcing 100% renewable energy covering their Scope 1 and 2 activities.
8
CONCEPT
1. INSTRUMENT MECHANICS
The P-REC Aggregation Fund will help unlock capital by monetizing the future yield of environmental attributes from renewable energy in fragile states
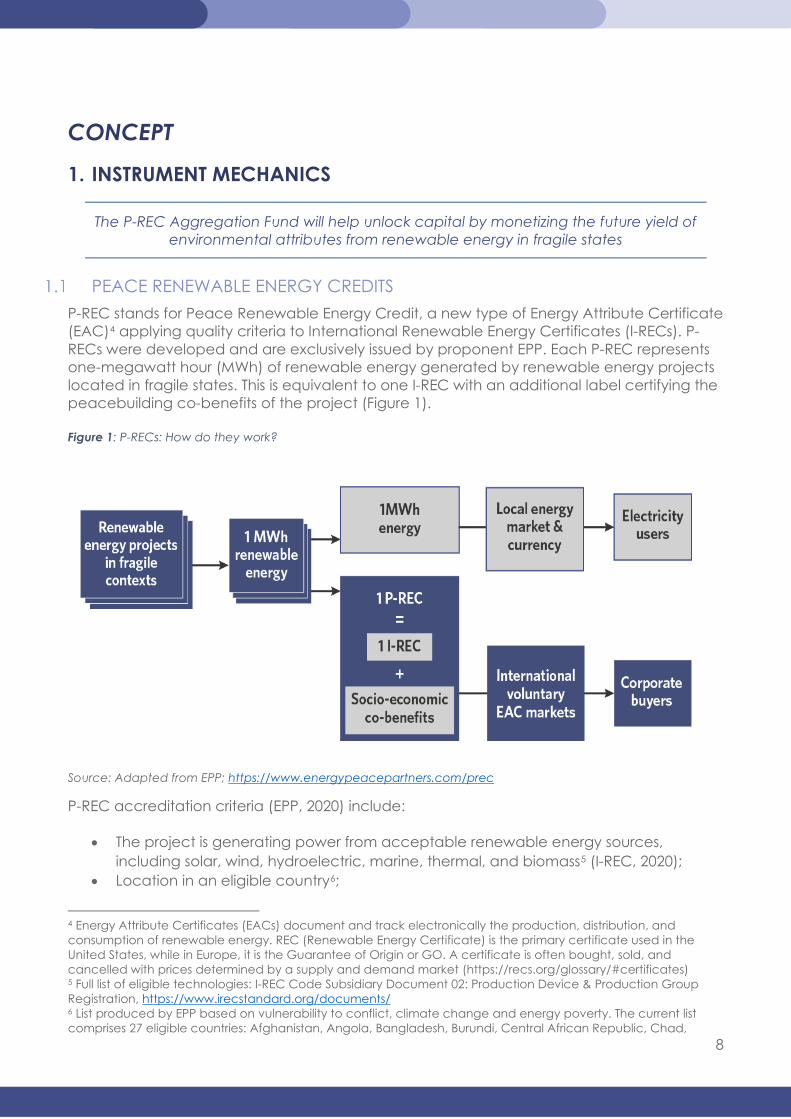
PEACE RENEWABLE ENERGY CREDITS P-REC stands for Peace Renewable Energy Credit, a new type of Energy Attribute Certificate (EAC)4 applying quality criteria to International Renewable Energy Certificates (I-RECs). P-RECs were developed and are exclusively issued by proponent EPP. Each P-REC represents one-megawatt hour (MWh) of renewable energy generated by renewable energy projects located in fragile states. This is equivalent to one I-REC with an additional label certifying the peacebuilding co-benefits of the project (Figure 1). Figure 1: P-RECs: How do they work?
Source: Adapted from EPP; https://www.energypeacepartners.com/prec
P-REC accreditation criteria (EPP, 2020) include:
• The project is generating power from acceptable renewable energy sources, including solar, wind, hydroelectric, marine, thermal, and biomass5 (I-REC, 2020);
• Location in an eligible country6;
4 Energy Attribute Certificates (EACs) document and track electronically the production, distribution, and consumption of renewable energy. REC (Renewable Energy Certificate) is the primary certificate used in the United States, while in Europe, it is the Guarantee of Origin or GO. A certificate is often bought, sold, and cancelled with prices determined by a supply and demand market (https://recs.org/glossary/#certificates) 5 Full list of eligible technologies: I-REC Code Subsidiary Document 02: Production Device & Production Group Registration, https://www.irecstandard.org/documents/ 6 List produced by EPP based on vulnerability to conflict, climate change and energy poverty. The current list comprises 27 eligible countries: Afghanistan, Angola, Bangladesh, Burundi, Central African Republic, Chad,
9
• Demonstrable improvement of access to energy for consumers by being a new project or project expansion;
• Permitting and compliance at local and national level; • Demonstration that the revenue from P-REC sales will serve as catalytic capital to
underwrite financing for the upfront cost of the project; • Demonstration that the project contributes to peacebuilding; • Risk mitigation steps undertaken or planned.
P-RECs can be traded unbundled from the underlying energy, providing additional revenue to renewable energy project developers. The commodities can be used by P-REC buyers towards corporate environmental and other sustainability commitments, in many cases satisfying RE100 criteria.
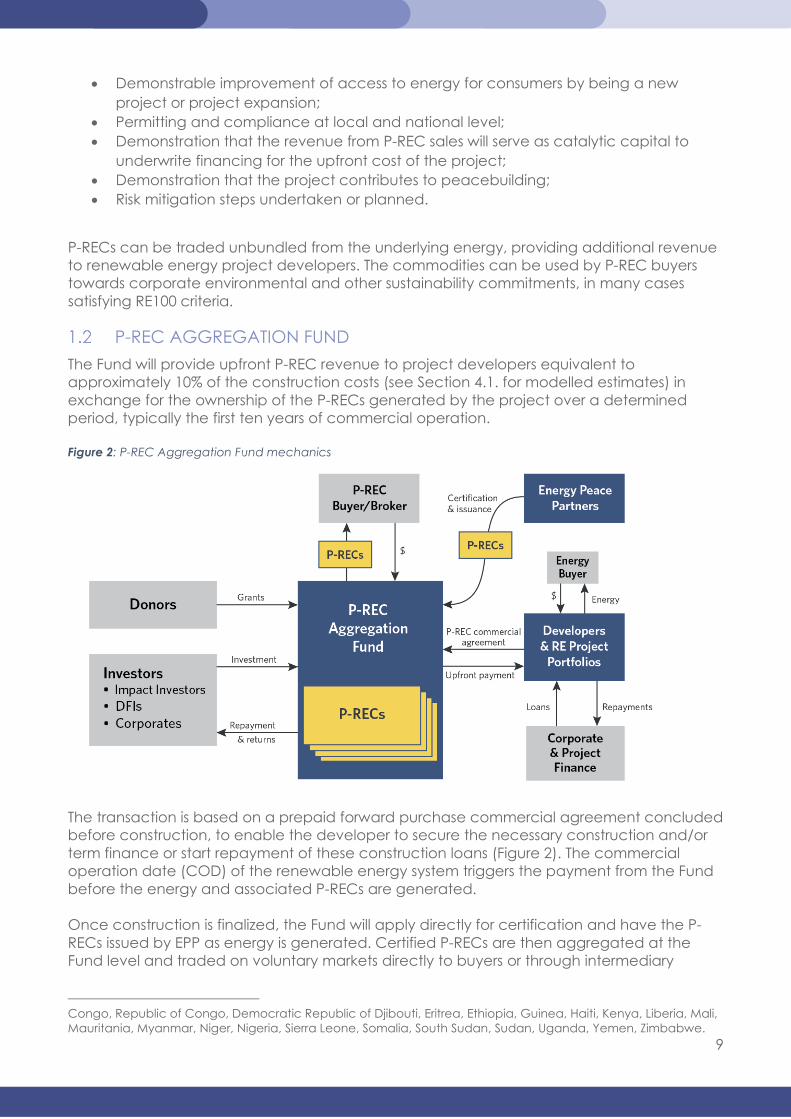
P-REC AGGREGATION FUND The Fund will provide upfront P-REC revenue to project developers equivalent to approximately 10% of the construction costs (see Section 4.1. for modelled estimates) in exchange for the ownership of the P-RECs generated by the project over a determined period, typically the first ten years of commercial operation. Figure 2: P-REC Aggregation Fund mechanics
The transaction is based on a prepaid forward purchase commercial agreement concluded before construction, to enable the developer to secure the necessary construction and/or term finance or start repayment of these construction loans (Figure 2). The commercial operation date (COD) of the renewable energy system triggers the payment from the Fund before the energy and associated P-RECs are generated. Once construction is finalized, the Fund will apply directly for certification and have the P-RECs issued by EPP as energy is generated. Certified P-RECs are then aggregated at the Fund level and traded on voluntary markets directly to buyers or through intermediary
Congo, Republic of Congo, Democratic Republic of Djibouti, Eritrea, Ethiopia, Guinea, Haiti, Kenya, Liberia, Mali, Mauritania, Myanmar, Niger, Nigeria, Sierra Leone, Somalia, South Sudan, Sudan, Uganda, Yemen, Zimbabwe.
10
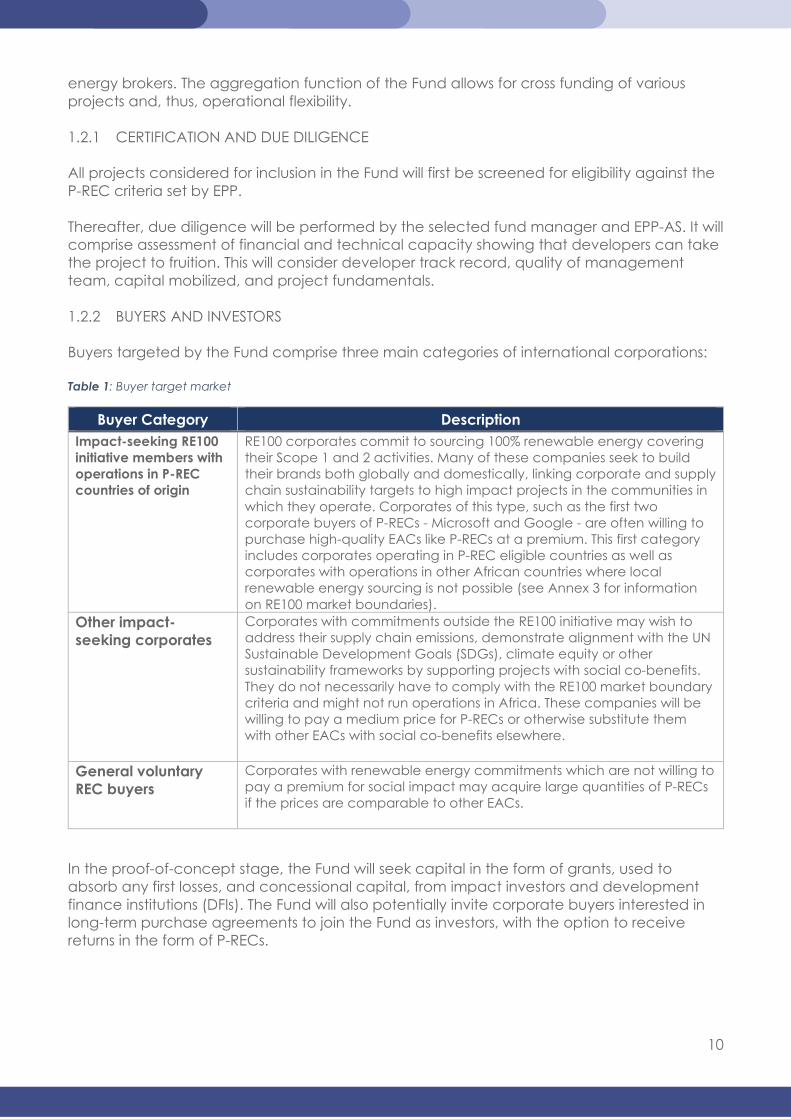
energy brokers. The aggregation function of the Fund allows for cross funding of various projects and, thus, operational flexibility. 1.2.1 CERTIFICATION AND DUE DILIGENCE All projects considered for inclusion in the Fund will first be screened for eligibility against the P-REC criteria set by EPP. Thereafter, due diligence will be performed by the selected fund manager and EPP-AS. It will comprise assessment of financial and technical capacity showing that developers can take the project to fruition. This will consider developer track record, quality of management team, capital mobilized, and project fundamentals. 1.2.2 BUYERS AND INVESTORS Buyers targeted by the Fund comprise three main categories of international corporations: Table 1: Buyer target market
Buyer Category Description Impact-seeking RE100 initiative members with operations in P-REC countries of origin
RE100 corporates commit to sourcing 100% renewable energy covering their Scope 1 and 2 activities. Many of these companies seek to build their brands both globally and domestically, linking corporate and supply chain sustainability targets to high impact projects in the communities in which they operate. Corporates of this type, such as the first two corporate buyers of P-RECs - Microsoft and Google - are often willing to purchase high-quality EACs like P-RECs at a premium. This first category includes corporates operating in P-REC eligible countries as well as corporates with operations in other African countries where local renewable energy sourcing is not possible (see Annex 3 for information on RE100 market boundaries).
Other impact-seeking corporates
Corporates with commitments outside the RE100 initiative may wish to address their supply chain emissions, demonstrate alignment with the UN Sustainable Development Goals (SDGs), climate equity or other sustainability frameworks by supporting projects with social co-benefits. They do not necessarily have to comply with the RE100 market boundary criteria and might not run operations in Africa. These companies will be willing to pay a medium price for P-RECs or otherwise substitute them with other EACs with social co-benefits elsewhere.
General voluntary REC buyers
Corporates with renewable energy commitments which are not willing to pay a premium for social impact may acquire large quantities of P-RECs if the prices are comparable to other EACs.
In the proof-of-concept stage, the Fund will seek capital in the form of grants, used to absorb any first losses, and concessional capital, from impact investors and development finance institutions (DFIs). The Fund will also potentially invite corporate buyers interested in long-term purchase agreements to join the Fund as investors, with the option to receive returns in the form of P-RECs.
11
2. INNOVATION
The P-REC Aggregation Fund aims to boost roll-out of distributed renewable energy in fragile states through enhancing developer access to capital early in the project
lifecycle
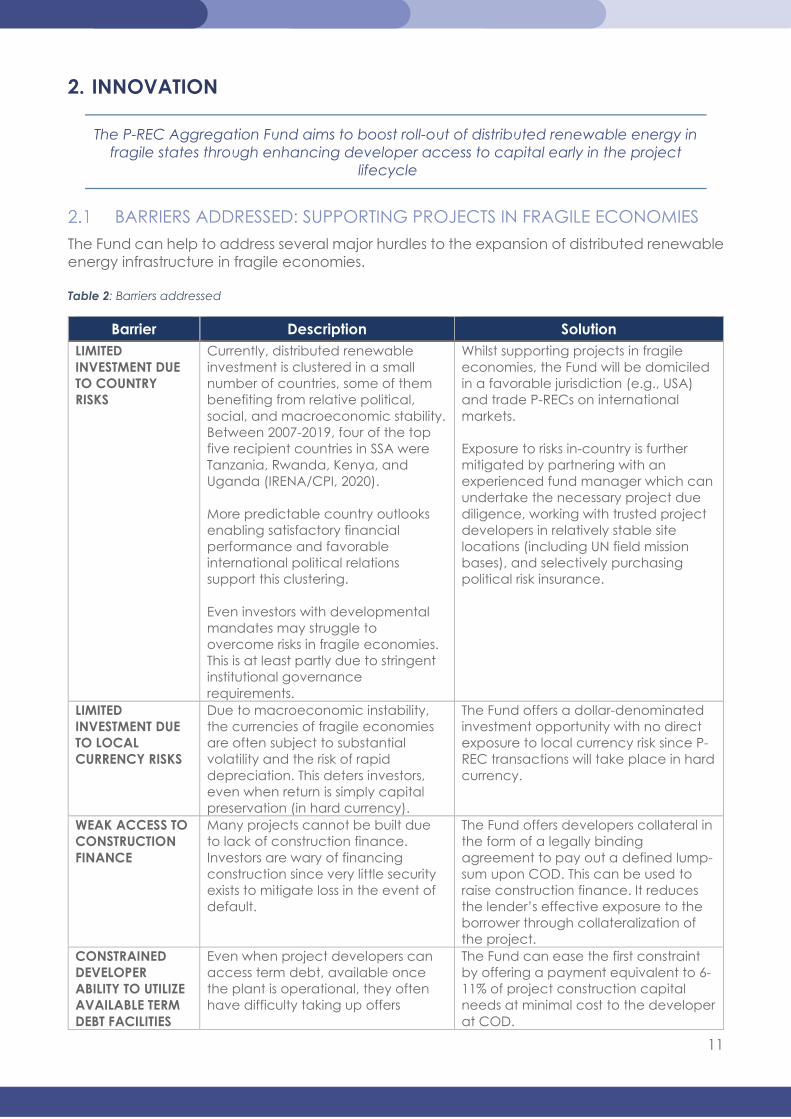
BARRIERS ADDRESSED: SUPPORTING PROJECTS IN FRAGILE ECONOMIES The Fund can help to address several major hurdles to the expansion of distributed renewable energy infrastructure in fragile economies. Table 2: Barriers addressed
Barrier Description Solution LIMITED INVESTMENT DUE TO COUNTRY RISKS
Currently, distributed renewable investment is clustered in a small number of countries, some of them benefiting from relative political, social, and macroeconomic stability. Between 2007-2019, four of the top five recipient countries in SSA were Tanzania, Rwanda, Kenya, and Uganda (IRENA/CPI, 2020). More predictable country outlooks enabling satisfactory financial performance and favorable international political relations support this clustering. Even investors with developmental mandates may struggle to overcome risks in fragile economies. This is at least partly due to stringent institutional governance requirements.
Whilst supporting projects in fragile economies, the Fund will be domiciled in a favorable jurisdiction (e.g., USA) and trade P-RECs on international markets. Exposure to risks in-country is further mitigated by partnering with an experienced fund manager which can undertake the necessary project due diligence, working with trusted project developers in relatively stable site locations (including UN field mission bases), and selectively purchasing political risk insurance.
LIMITED INVESTMENT DUE TO LOCAL CURRENCY RISKS
Due to macroeconomic instability, the currencies of fragile economies are often subject to substantial volatility and the risk of rapid depreciation. This deters investors, even when return is simply capital preservation (in hard currency).
The Fund offers a dollar-denominated investment opportunity with no direct exposure to local currency risk since P-REC transactions will take place in hard currency.
WEAK ACCESS TO CONSTRUCTION FINANCE
Many projects cannot be built due to lack of construction finance. Investors are wary of financing construction since very little security exists to mitigate loss in the event of default.
The Fund offers developers collateral in the form of a legally binding agreement to pay out a defined lump-sum upon COD. This can be used to raise construction finance. It reduces the lender’s effective exposure to the borrower through collateralization of the project.
CONSTRAINED DEVELOPER ABILITY TO UTILIZE AVAILABLE TERM DEBT FACILITIES
Even when project developers can access term debt, available once the plant is operational, they often have difficulty taking up offers
The Fund can ease the first constraint by offering a payment equivalent to 6-11% of project construction capital needs at minimal cost to the developer at COD.
12
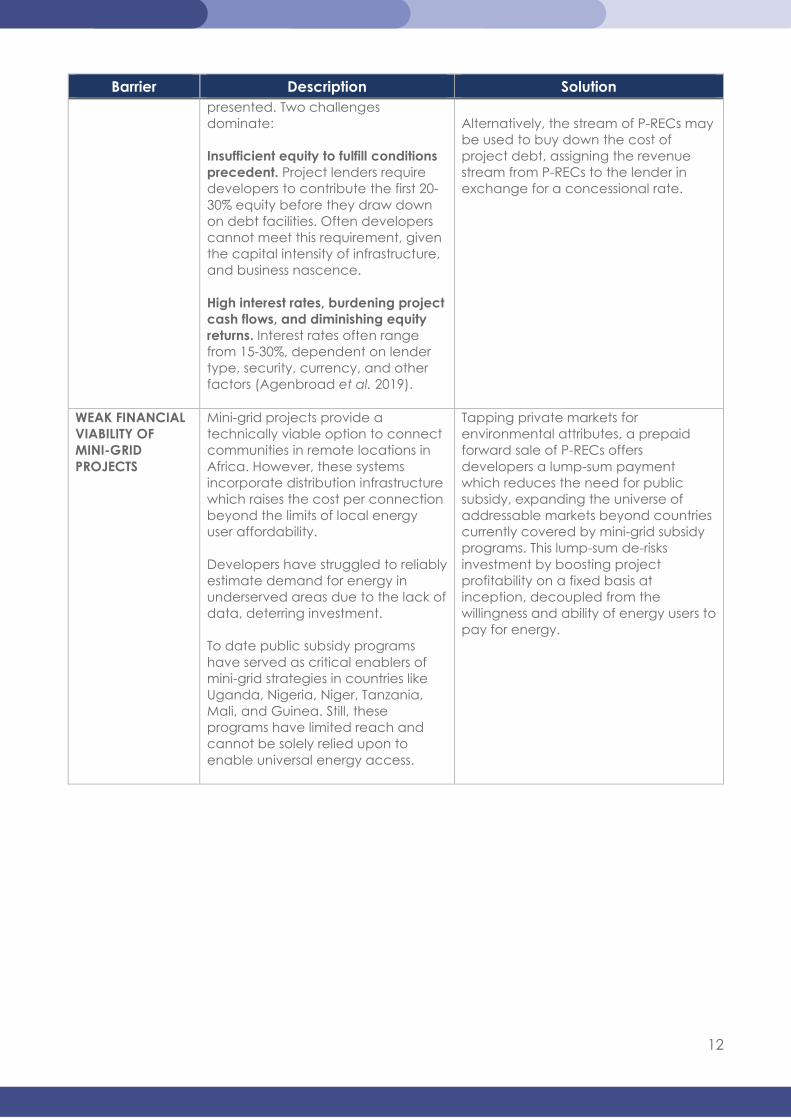
Barrier Description Solution presented. Two challenges dominate: Insufficient equity to fulfill conditions precedent. Project lenders require developers to contribute the first 20-30% equity before they draw down on debt facilities. Often developers cannot meet this requirement, given the capital intensity of infrastructure, and business nascence. High interest rates, burdening project cash flows, and diminishing equity returns. Interest rates often range from 15-30%, dependent on lender type, security, currency, and other factors (Agenbroad et al. 2019).
Alternatively, the stream of P-RECs may be used to buy down the cost of project debt, assigning the revenue stream from P-RECs to the lender in exchange for a concessional rate.
WEAK FINANCIAL VIABILITY OF MINI-GRID PROJECTS
Mini-grid projects provide a technically viable option to connect communities in remote locations in Africa. However, these systems incorporate distribution infrastructure which raises the cost per connection beyond the limits of local energy user affordability. Developers have struggled to reliably estimate demand for energy in underserved areas due to the lack of data, deterring investment. To date public subsidy programs have served as critical enablers of mini-grid strategies in countries like Uganda, Nigeria, Niger, Tanzania, Mali, and Guinea. Still, these programs have limited reach and cannot be solely relied upon to enable universal energy access.
Tapping private markets for environmental attributes, a prepaid forward sale of P-RECs offers developers a lump-sum payment which reduces the need for public subsidy, expanding the universe of addressable markets beyond countries currently covered by mini-grid subsidy programs. This lump-sum de-risks investment by boosting project profitability on a fixed basis at inception, decoupled from the willingness and ability of energy users to pay for energy.
13
INNOVATION: EARLY-STAGE CAPITAL FOR SMALL RENEWABLE ENERGY PROJECTS IN FRAGILE ECONOMIES Extensive screening of financial instruments focused on distributed renewable energy infrastructure7 (for more details see Annex 6)) revealed no overlap with the P-REC Aggregation Fund. Instead, a high degree of complementarity has been noted. The Fund can potentially boost utilization of existing financial instruments through various applications to projects, i.e., enabling uptake of debt offers, de-risking lending, or enhancing returns to other investors. The main differentiators with the four funds8 which are most similar in mission to the P-REC Aggregation Fund (Table 19 – Annex 6) are: Geographic coverage. The Fund prioritizes fragile economies in SSA in which very few distributed renewable investors are currently active. Provision of early-stage capital to developers at minimal9 cost. Existing debt and equity instruments are repayable and often carry significant costs for developers, putting pressure on cash flows, profitability, and the developer’s economic interests in the project. Inclusion of small energy projects. Generally, small infrastructure projects (< 5 MW capacity) struggle to access investors due to associated transaction costs10. The Fund expands investor participation by aggregation of small investments. Supporting equity and inclusion. The Fund provides an entry point for large corporates in affluent economies (e.g., technology companies in the USA) to support climate-smart infrastructure projects that increase resilience and improve the quality of life of communities in impoverished areas – often in the same region or countries in which these corporates operate.
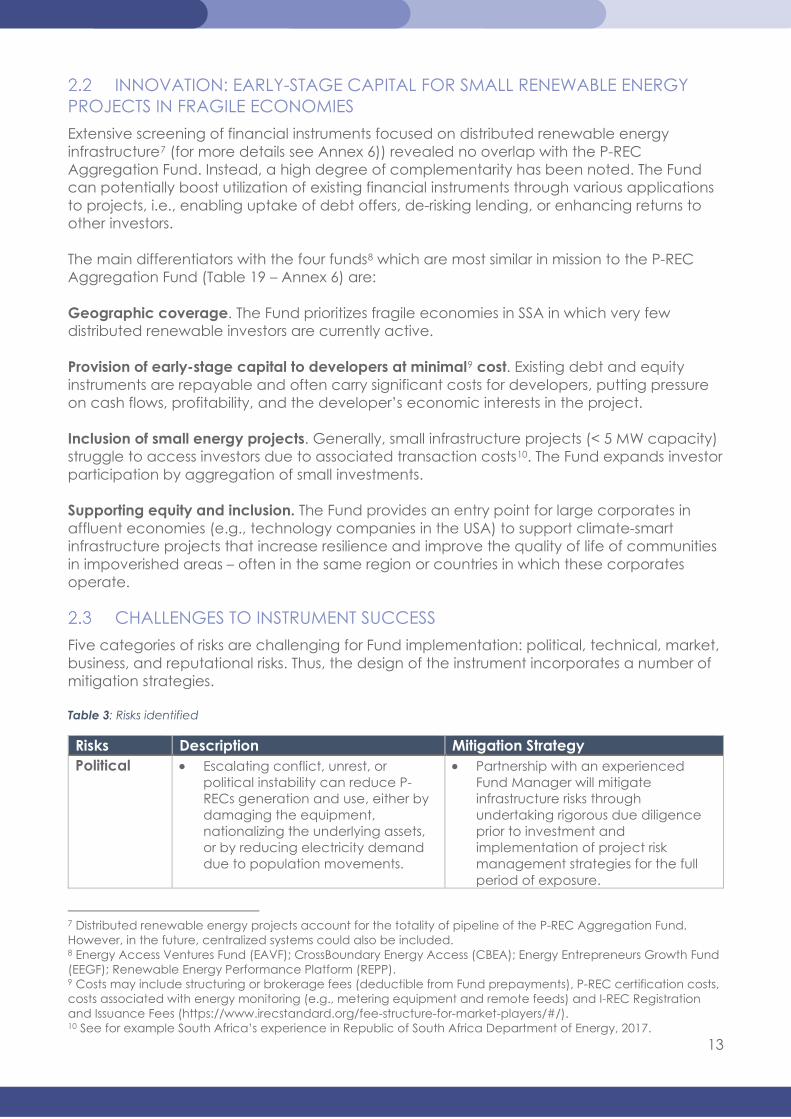
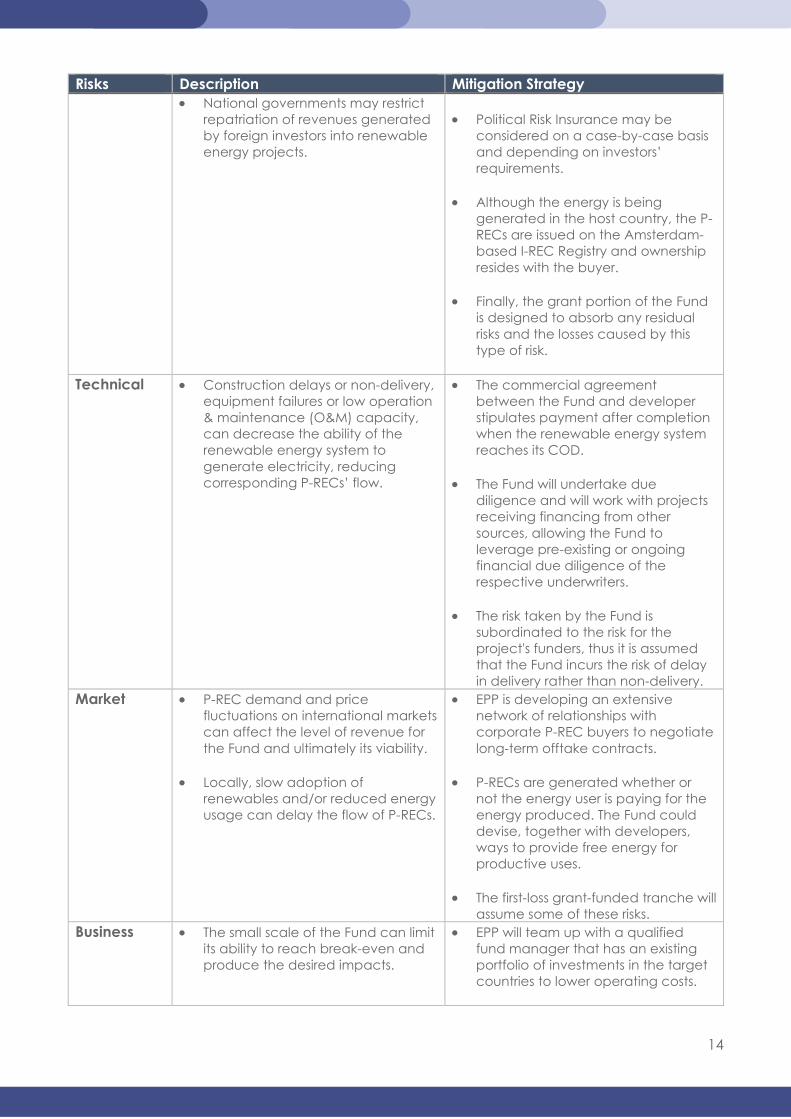
CHALLENGES TO INSTRUMENT SUCCESS Five categories of risks are challenging for Fund implementation: political, technical, market, business, and reputational risks. Thus, the design of the instrument incorporates a number of mitigation strategies. Table 3: Risks identified
Risks Description Mitigation Strategy Political • Escalating conflict, unrest, or
political instability can reduce P-RECs generation and use, either by damaging the equipment, nationalizing the underlying assets, or by reducing electricity demand due to population movements.
• Partnership with an experienced Fund Manager will mitigate infrastructure risks through undertaking rigorous due diligence prior to investment and implementation of project risk management strategies for the full period of exposure.
7 Distributed renewable energy projects account for the totality of pipeline of the P-REC Aggregation Fund. However, in the future, centralized systems could also be included. 8 Energy Access Ventures Fund (EAVF); CrossBoundary Energy Access (CBEA); Energy Entrepreneurs Growth Fund (EEGF); Renewable Energy Performance Platform (REPP). 9 Costs may include structuring or brokerage fees (deductible from Fund prepayments), P-REC certification costs, costs associated with energy monitoring (e.g., metering equipment and remote feeds) and I-REC Registration and Issuance Fees (https://www.irecstandard.org/fee-structure-for-market-players/#/). 10 See for example South Africa’s experience in Republic of South Africa Department of Energy, 2017.
14
Risks Description Mitigation Strategy • National governments may restrict
repatriation of revenues generated by foreign investors into renewable energy projects.
• Political Risk Insurance may be
considered on a case-by-case basis and depending on investors’ requirements.
• Although the energy is being
generated in the host country, the P-RECs are issued on the Amsterdam-based I-REC Registry and ownership resides with the buyer.
• Finally, the grant portion of the Fund
is designed to absorb any residual risks and the losses caused by this type of risk.
Technical • Construction delays or non-delivery,
equipment failures or low operation & maintenance (O&M) capacity, can decrease the ability of the renewable energy system to generate electricity, reducing corresponding P-RECs’ flow.
• The commercial agreement between the Fund and developer stipulates payment after completion when the renewable energy system reaches its COD.
• The Fund will undertake due
diligence and will work with projects receiving financing from other sources, allowing the Fund to leverage pre-existing or ongoing financial due diligence of the respective underwriters.
• The risk taken by the Fund is
subordinated to the risk for the project's funders, thus it is assumed that the Fund incurs the risk of delay in delivery rather than non-delivery.
Market • P-REC demand and price fluctuations on international markets can affect the level of revenue for the Fund and ultimately its viability.
• Locally, slow adoption of renewables and/or reduced energy usage can delay the flow of P-RECs.
• EPP is developing an extensive network of relationships with corporate P-REC buyers to negotiate long-term offtake contracts.
• P-RECs are generated whether or
not the energy user is paying for the energy produced. The Fund could devise, together with developers, ways to provide free energy for productive uses.
• The first-loss grant-funded tranche will
assume some of these risks. Business • The small scale of the Fund can limit
its ability to reach break-even and produce the desired impacts.
• EPP will team up with a qualified fund manager that has an existing portfolio of investments in the target countries to lower operating costs.
15
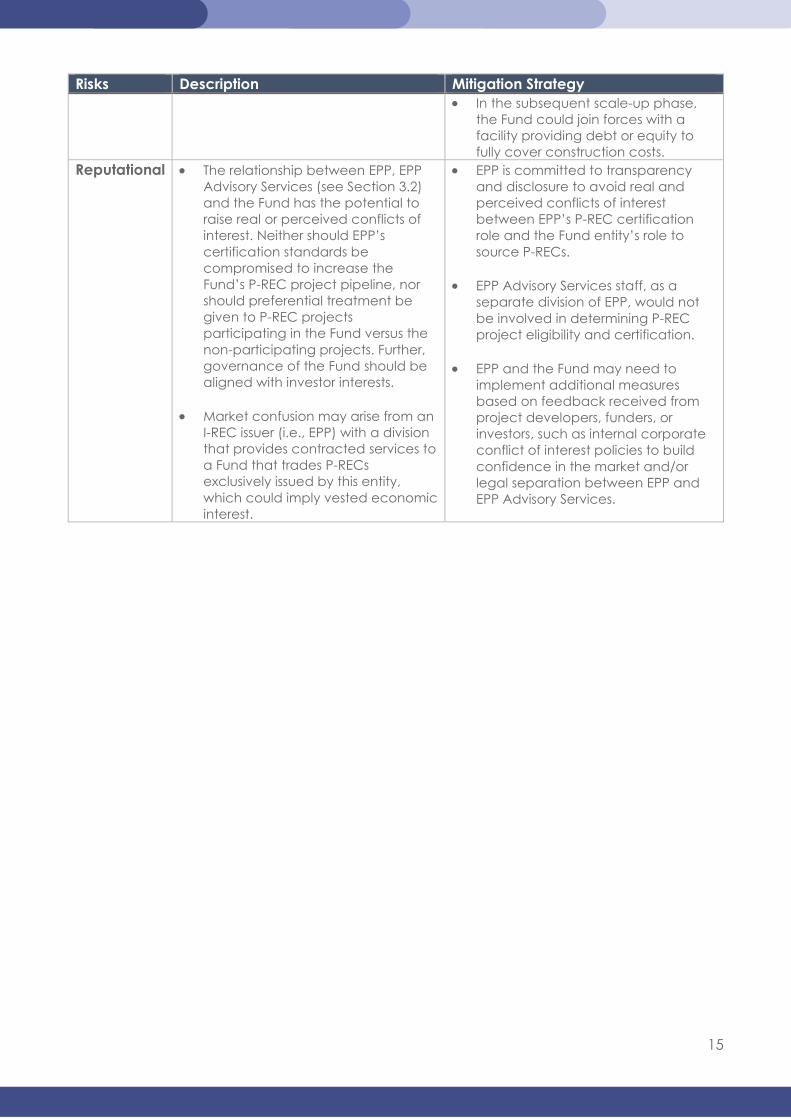
Risks Description Mitigation Strategy • In the subsequent scale-up phase,
the Fund could join forces with a facility providing debt or equity to fully cover construction costs.
Reputational • The relationship between EPP, EPP Advisory Services (see Section 3.2) and the Fund has the potential to raise real or perceived conflicts of interest. Neither should EPP’s certification standards be compromised to increase the Fund’s P-REC project pipeline, nor should preferential treatment be given to P-REC projects participating in the Fund versus the non-participating projects. Further, governance of the Fund should be aligned with investor interests.
• Market confusion may arise from an I-REC issuer (i.e., EPP) with a division that provides contracted services to a Fund that trades P-RECs exclusively issued by this entity, which could imply vested economic interest.
• EPP is committed to transparency and disclosure to avoid real and perceived conflicts of interest between EPP’s P-REC certification role and the Fund entity’s role to source P-RECs.
• EPP Advisory Services staff, as a separate division of EPP, would not be involved in determining P-REC project eligibility and certification.
• EPP and the Fund may need to
implement additional measures based on feedback received from project developers, funders, or investors, such as internal corporate conflict of interest policies to build confidence in the market and/or legal separation between EPP and EPP Advisory Services.
16
MARKET TEST AND BEYOND
3. IMPLEMENTATION PATHWAY AND REPLICATION
The instrument benefits from an existing pipeline of project opportunities covering nine of the eleven Sub-Saharan countries targeted during the proof-of-concept phase
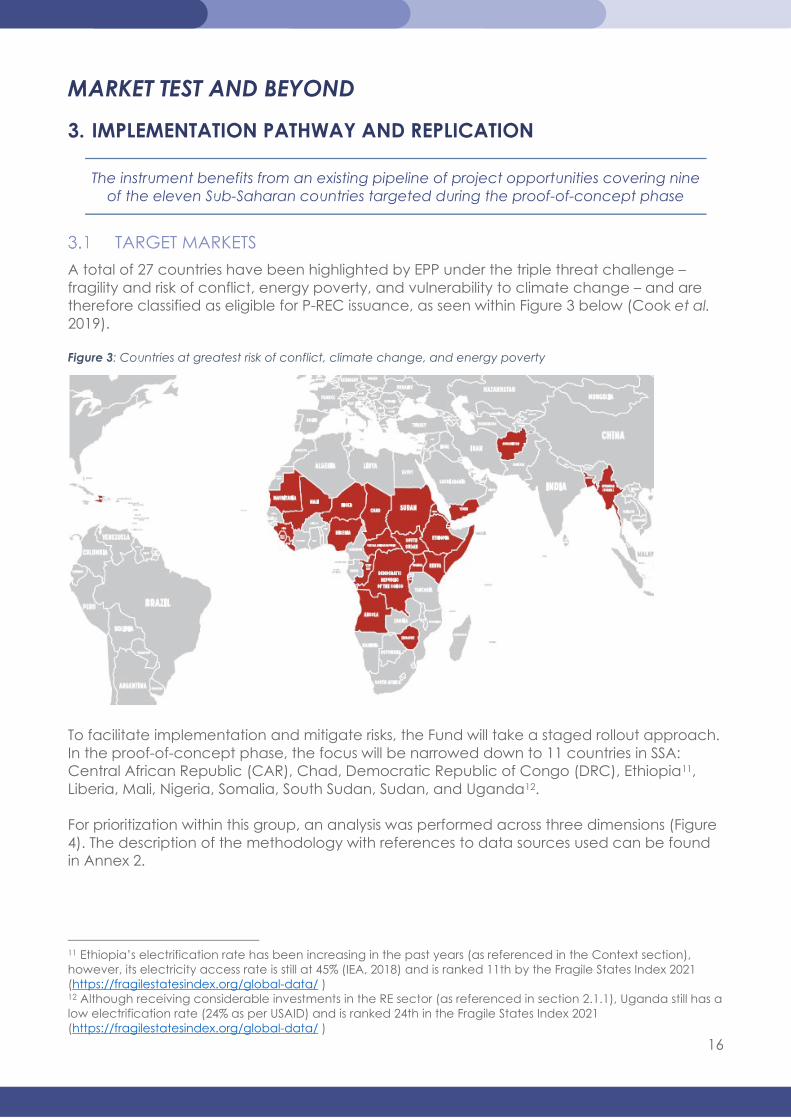
TARGET MARKETS A total of 27 countries have been highlighted by EPP under the triple threat challenge –fragility and risk of conflict, energy poverty, and vulnerability to climate change – and are therefore classified as eligible for P-REC issuance, as seen within Figure 3 below (Cook et al. 2019). Figure 3: Countries at greatest risk of conflict, climate change, and energy poverty
To facilitate implementation and mitigate risks, the Fund will take a staged rollout approach. In the proof-of-concept phase, the focus will be narrowed down to 11 countries in SSA: Central African Republic (CAR), Chad, Democratic Republic of Congo (DRC), Ethiopia11, Liberia, Mali, Nigeria, Somalia, South Sudan, Sudan, and Uganda12. For prioritization within this group, an analysis was performed across three dimensions (Figure 4). The description of the methodology with references to data sources used can be found in Annex 2.
11 Ethiopia’s electrification rate has been increasing in the past years (as referenced in the Context section), however, its electricity access rate is still at 45% (IEA, 2018) and is ranked 11th by the Fragile States Index 2021 (https://fragilestatesindex.org/global-data/ ) 12 Although receiving considerable investments in the RE sector (as referenced in section 2.1.1), Uganda still has a low electrification rate (24% as per USAID) and is ranked 24th in the Fragile States Index 2021 (https://fragilestatesindex.org/global-data/ )
17
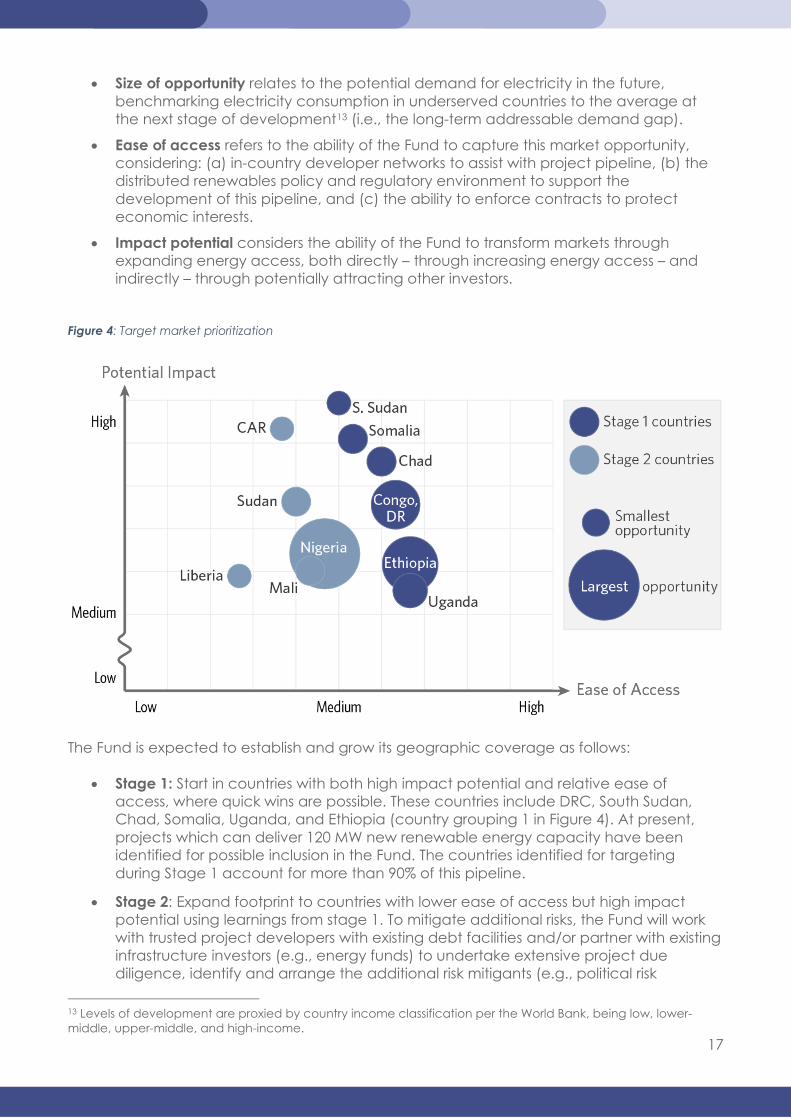
• Size of opportunity relates to the potential demand for electricity in the future, benchmarking electricity consumption in underserved countries to the average at the next stage of development13 (i.e., the long-term addressable demand gap).
• Ease of access refers to the ability of the Fund to capture this market opportunity, considering: (a) in-country developer networks to assist with project pipeline, (b) the distributed renewables policy and regulatory environment to support the development of this pipeline, and (c) the ability to enforce contracts to protect economic interests.
• Impact potential considers the ability of the Fund to transform markets through expanding energy access, both directly – through increasing energy access – and indirectly – through potentially attracting other investors.
Figure 4: Target market prioritization
The Fund is expected to establish and grow its geographic coverage as follows:
• Stage 1: Start in countries with both high impact potential and relative ease of access, where quick wins are possible. These countries include DRC, South Sudan, Chad, Somalia, Uganda, and Ethiopia (country grouping 1 in Figure 4). At present, projects which can deliver 120 MW new renewable energy capacity have been identified for possible inclusion in the Fund. The countries identified for targeting during Stage 1 account for more than 90% of this pipeline.
• Stage 2: Expand footprint to countries with lower ease of access but high impact potential using learnings from stage 1. To mitigate additional risks, the Fund will work with trusted project developers with existing debt facilities and/or partner with existing infrastructure investors (e.g., energy funds) to undertake extensive project due diligence, identify and arrange the additional risk mitigants (e.g., political risk
13 Levels of development are proxied by country income classification per the World Bank, being low, lower-middle, upper-middle, and high-income.
18
insurance, credit guarantees), and adapt legal agreements. Examples include Sudan, Nigeria, CAR, Liberia, and Mali (country grouping 2 in Figure 4).
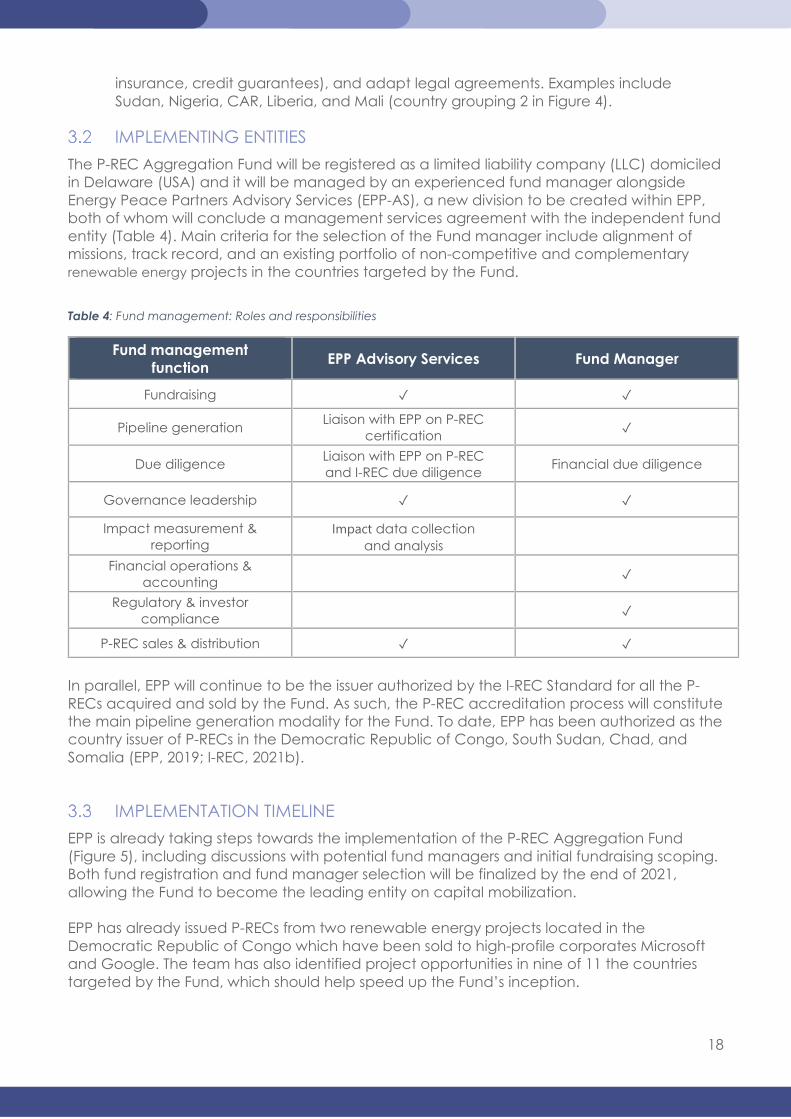
IMPLEMENTING ENTITIES The P-REC Aggregation Fund will be registered as a limited liability company (LLC) domiciled in Delaware (USA) and it will be managed by an experienced fund manager alongside Energy Peace Partners Advisory Services (EPP-AS), a new division to be created within EPP, both of whom will conclude a management services agreement with the independent fund entity (Table 4). Main criteria for the selection of the Fund manager include alignment of missions, track record, and an existing portfolio of non-competitive and complementary renewable energy projects in the countries targeted by the Fund.
Table 4: Fund management: Roles and responsibilities
Fund management function EPP Advisory Services Fund Manager
Fundraising ✓ ✓
Pipeline generation Liaison with EPP on P-REC certification ✓
Due diligence Liaison with EPP on P-REC and I-REC due diligence Financial due diligence
Governance leadership ✓ ✓
Impact measurement & reporting
Impact data collection and analysis
Financial operations & accounting ✓
Regulatory & investor compliance ✓
P-REC sales & distribution ✓ ✓
In parallel, EPP will continue to be the issuer authorized by the I-REC Standard for all the P-RECs acquired and sold by the Fund. As such, the P-REC accreditation process will constitute the main pipeline generation modality for the Fund. To date, EPP has been authorized as the country issuer of P-RECs in the Democratic Republic of Congo, South Sudan, Chad, and Somalia (EPP, 2019; I-REC, 2021b).
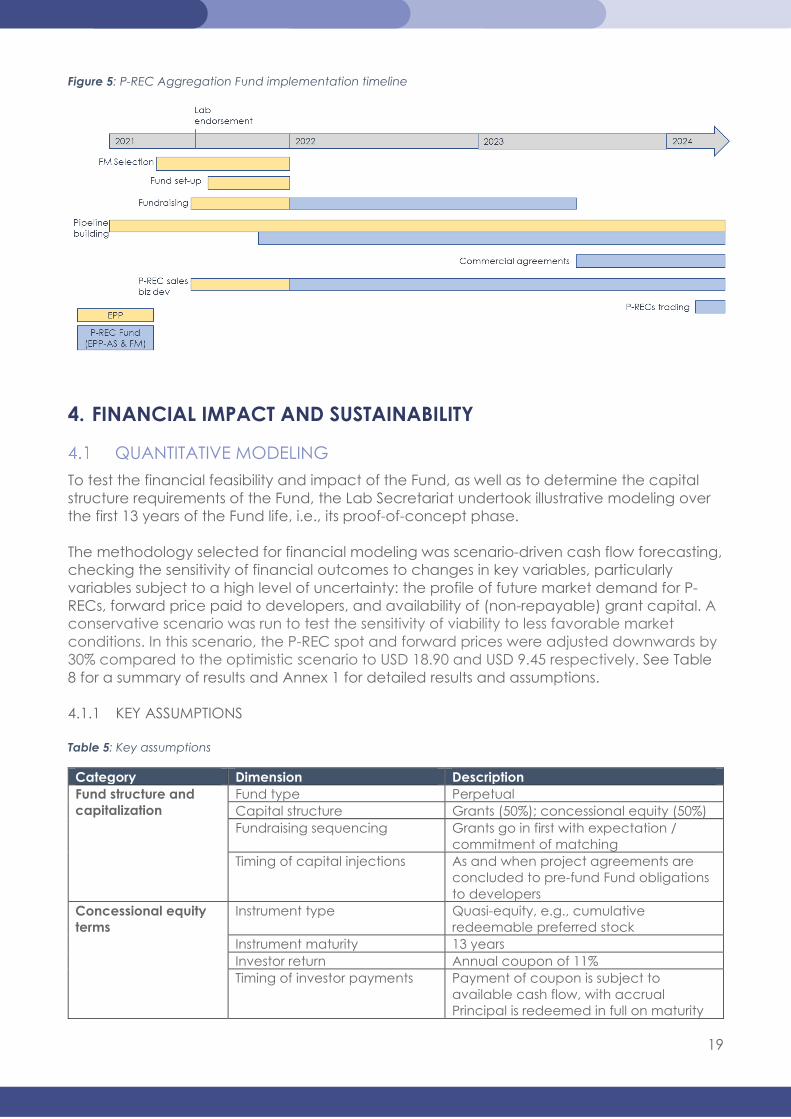
IMPLEMENTATION TIMELINE EPP is already taking steps towards the implementation of the P-REC Aggregation Fund (Figure 5), including discussions with potential fund managers and initial fundraising scoping. Both fund registration and fund manager selection will be finalized by the end of 2021, allowing the Fund to become the leading entity on capital mobilization. EPP has already issued P-RECs from two renewable energy projects located in the Democratic Republic of Congo which have been sold to high-profile corporates Microsoft and Google. The team has also identified project opportunities in nine of 11 the countries targeted by the Fund, which should help speed up the Fund’s inception.
19
Figure 5: P-REC Aggregation Fund implementation timeline
4. FINANCIAL IMPACT AND SUSTAINABILITY
QUANTITATIVE MODELING To test the financial feasibility and impact of the Fund, as well as to determine the capital structure requirements of the Fund, the Lab Secretariat undertook illustrative modeling over the first 13 years of the Fund life, i.e., its proof-of-concept phase. The methodology selected for financial modeling was scenario-driven cash flow forecasting, checking the sensitivity of financial outcomes to changes in key variables, particularly variables subject to a high level of uncertainty: the profile of future market demand for P-RECs, forward price paid to developers, and availability of (non-repayable) grant capital. A conservative scenario was run to test the sensitivity of viability to less favorable market conditions. In this scenario, the P-REC spot and forward prices were adjusted downwards by 30% compared to the optimistic scenario to USD 18.90 and USD 9.45 respectively. See Table 8 for a summary of results and Annex 1 for detailed results and assumptions. 4.1.1 KEY ASSUMPTIONS Table 5: Key assumptions
Category Dimension Description Fund structure and capitalization
Fund type Perpetual Capital structure Grants (50%); concessional equity (50%) Fundraising sequencing Grants go in first with expectation /
commitment of matching Timing of capital injections As and when project agreements are
concluded to pre-fund Fund obligations to developers
Concessional equity terms
Instrument type Quasi-equity, e.g., cumulative redeemable preferred stock
Instrument maturity 13 years Investor return Annual coupon of 11% Timing of investor payments Payment of coupon is subject to
available cash flow, with accrual Principal is redeemed in full on maturity
20
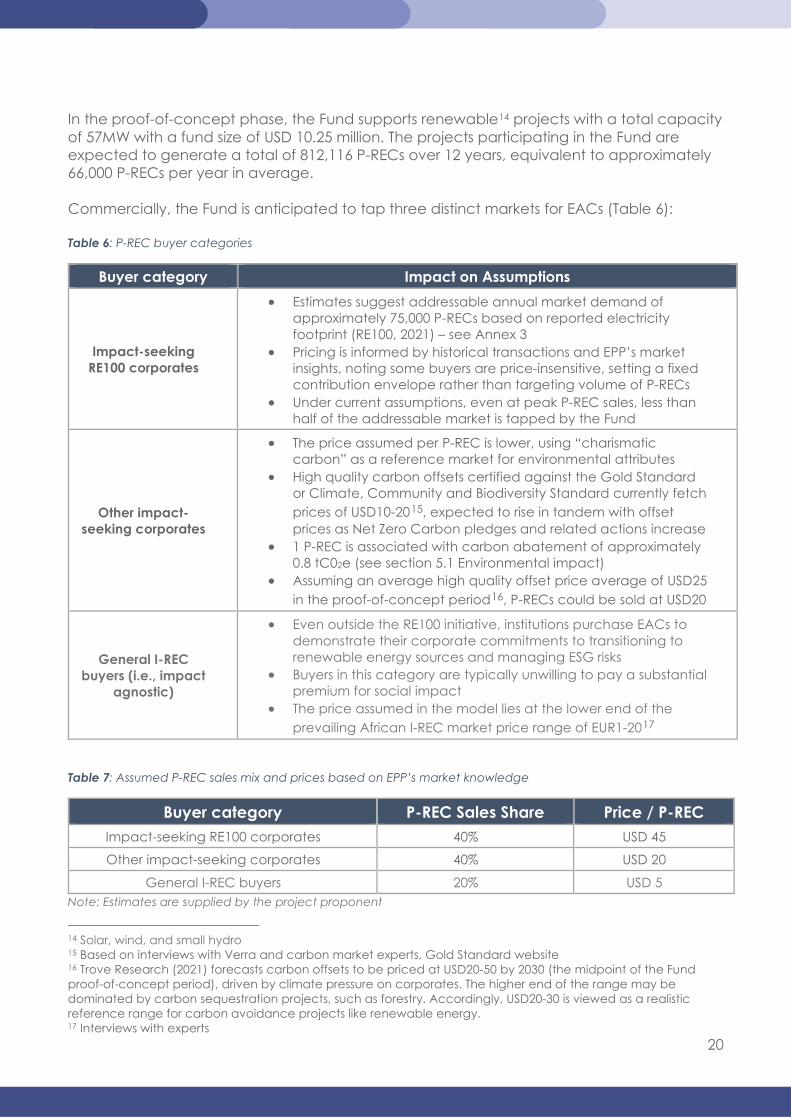
In the proof-of-concept phase, the Fund supports renewable14 projects with a total capacity of 57MW with a fund size of USD 10.25 million. The projects participating in the Fund are expected to generate a total of 812,116 P-RECs over 12 years, equivalent to approximately 66,000 P-RECs per year in average. Commercially, the Fund is anticipated to tap three distinct markets for EACs (Table 6): Table 6: P-REC buyer categories
Buyer category Impact on Assumptions
Impact-seeking RE100 corporates
• Estimates suggest addressable annual market demand of approximately 75,000 P-RECs based on reported electricity footprint (RE100, 2021) – see Annex 3
• Pricing is informed by historical transactions and EPP’s market insights, noting some buyers are price-insensitive, setting a fixed contribution envelope rather than targeting volume of P-RECs
• Under current assumptions, even at peak P-REC sales, less than half of the addressable market is tapped by the Fund
Other impact-seeking corporates
• The price assumed per P-REC is lower, using “charismatic carbon” as a reference market for environmental attributes
• High quality carbon offsets certified against the Gold Standard or Climate, Community and Biodiversity Standard currently fetch prices of USD10-2015, expected to rise in tandem with offset prices as Net Zero Carbon pledges and related actions increase
• 1 P-REC is associated with carbon abatement of approximately 0.8 tC02e (see section 5.1 Environmental impact)
• Assuming an average high quality offset price average of USD25 in the proof-of-concept period16, P-RECs could be sold at USD20
General I-REC buyers (i.e., impact
agnostic)
• Even outside the RE100 initiative, institutions purchase EACs to demonstrate their corporate commitments to transitioning to renewable energy sources and managing ESG risks
• Buyers in this category are typically unwilling to pay a substantial premium for social impact
• The price assumed in the model lies at the lower end of the prevailing African I-REC market price range of EUR1-2017
Table 7: Assumed P-REC sales mix and prices based on EPP’s market knowledge
Buyer category P-REC Sales Share Price / P-REC Impact-seeking RE100 corporates 40% USD 45
Other impact-seeking corporates 40% USD 20
General I-REC buyers 20% USD 5 Note: Estimates are supplied by the project proponent
14 Solar, wind, and small hydro 15 Based on interviews with Verra and carbon market experts, Gold Standard website 16 Trove Research (2021) forecasts carbon offsets to be priced at USD20-50 by 2030 (the midpoint of the Fund proof-of-concept period), driven by climate pressure on corporates. The higher end of the range may be dominated by carbon sequestration projects, such as forestry. Accordingly, USD20-30 is viewed as a realistic reference range for carbon avoidance projects like renewable energy. 17 Interviews with experts
21
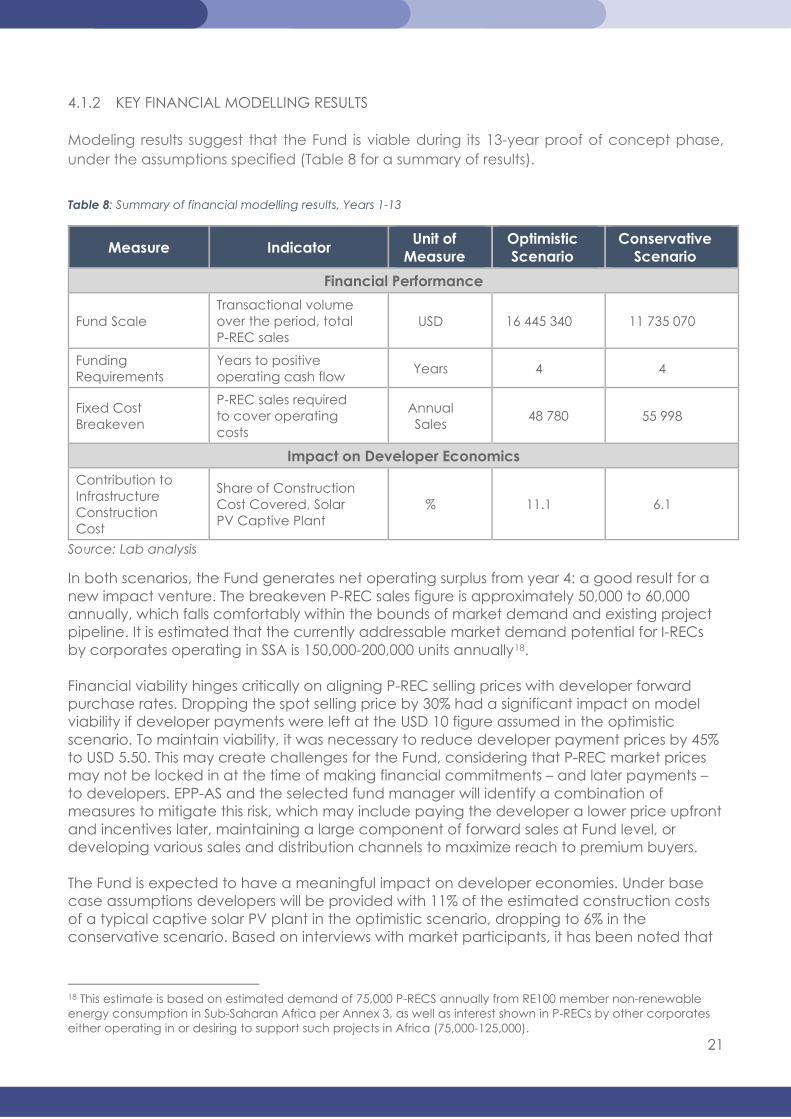
4.1.2 KEY FINANCIAL MODELLING RESULTS Modeling results suggest that the Fund is viable during its 13-year proof of concept phase, under the assumptions specified (Table 8 for a summary of results).
Table 8: Summary of financial modelling results, Years 1-13
Measure Indicator Unit of Measure
Optimistic Scenario
Conservative Scenario
Financial Performance
Fund Scale Transactional volume over the period, total P-REC sales
USD 16 445 340 11 735 070
Funding Requirements
Years to positive operating cash flow Years 4 4
Fixed Cost Breakeven
P-REC sales required to cover operating costs
Annual Sales 48 780 55 998
Impact on Developer Economics Contribution to Infrastructure Construction Cost
Share of Construction Cost Covered, Solar PV Captive Plant
% 11.1 6.1
Source: Lab analysis
In both scenarios, the Fund generates net operating surplus from year 4: a good result for a new impact venture. The breakeven P-REC sales figure is approximately 50,000 to 60,000 annually, which falls comfortably within the bounds of market demand and existing project pipeline. It is estimated that the currently addressable market demand potential for I-RECs by corporates operating in SSA is 150,000-200,000 units annually18. Financial viability hinges critically on aligning P-REC selling prices with developer forward purchase rates. Dropping the spot selling price by 30% had a significant impact on model viability if developer payments were left at the USD 10 figure assumed in the optimistic scenario. To maintain viability, it was necessary to reduce developer payment prices by 45% to USD 5.50. This may create challenges for the Fund, considering that P-REC market prices may not be locked in at the time of making financial commitments – and later payments – to developers. EPP-AS and the selected fund manager will identify a combination of measures to mitigate this risk, which may include paying the developer a lower price upfront and incentives later, maintaining a large component of forward sales at Fund level, or developing various sales and distribution channels to maximize reach to premium buyers. The Fund is expected to have a meaningful impact on developer economies. Under base case assumptions developers will be provided with 11% of the estimated construction costs of a typical captive solar PV plant in the optimistic scenario, dropping to 6% in the conservative scenario. Based on interviews with market participants, it has been noted that
18 This estimate is based on estimated demand of 75,000 P-RECS annually from RE100 member non-renewable energy consumption in Sub-Saharan Africa per Annex 3, as well as interest shown in P-RECs by other corporates either operating in or desiring to support such projects in Africa (75,000-125,000).
22
even at the lower end of the range, the additional equity injection is expected to have a significant impact on developers in the applicable regions. See Annex I for further discussion around assumptions and the sensitivity analysis performed.
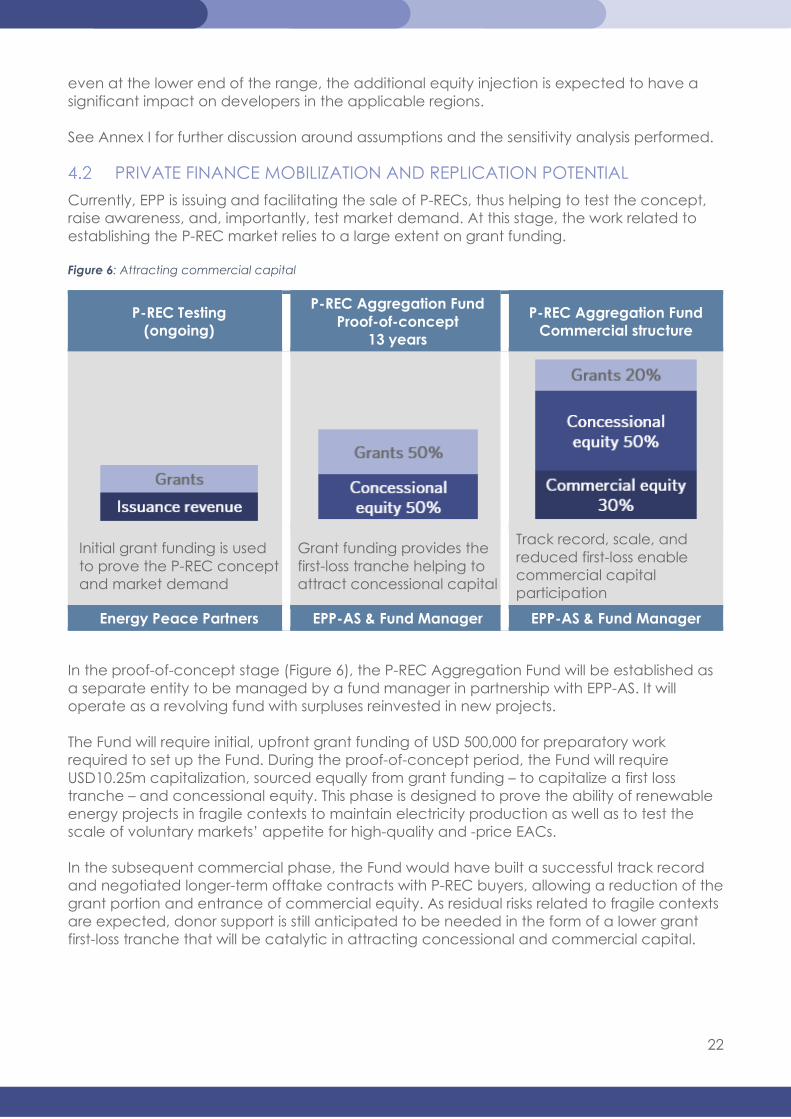
PRIVATE FINANCE MOBILIZATION AND REPLICATION POTENTIAL Currently, EPP is issuing and facilitating the sale of P-RECs, thus helping to test the concept, raise awareness, and, importantly, test market demand. At this stage, the work related to establishing the P-REC market relies to a large extent on grant funding. Figure 6: Attracting commercial capital
P-REC Testing (ongoing)
P-REC Aggregation Fund Proof-of-concept
13 years
P-REC Aggregation Fund Commercial structure
Initial grant funding is used to prove the P-REC concept and market demand
Grant funding provides the first-loss tranche helping to attract concessional capital
Track record, scale, and reduced first-loss enable commercial capital participation
Energy Peace Partners EPP-AS & Fund Manager EPP-AS & Fund Manager
In the proof-of-concept stage (Figure 6), the P-REC Aggregation Fund will be established as a separate entity to be managed by a fund manager in partnership with EPP-AS. It will operate as a revolving fund with surpluses reinvested in new projects. The Fund will require initial, upfront grant funding of USD 500,000 for preparatory work required to set up the Fund. During the proof-of-concept period, the Fund will require USD10.25m capitalization, sourced equally from grant funding – to capitalize a first loss tranche – and concessional equity. This phase is designed to prove the ability of renewable energy projects in fragile contexts to maintain electricity production as well as to test the scale of voluntary markets’ appetite for high-quality and -price EACs. In the subsequent commercial phase, the Fund would have built a successful track record and negotiated longer-term offtake contracts with P-REC buyers, allowing a reduction of the grant portion and entrance of commercial equity. As residual risks related to fragile contexts are expected, donor support is still anticipated to be needed in the form of a lower grant first-loss tranche that will be catalytic in attracting concessional and commercial capital.
23
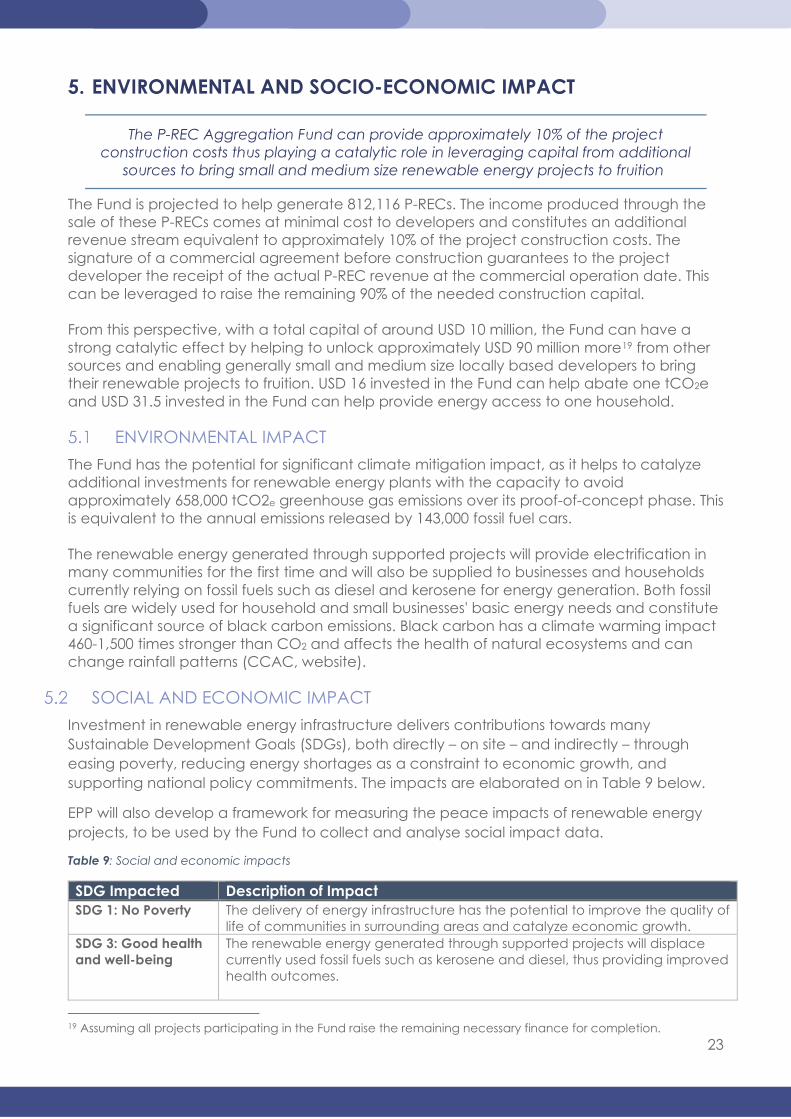
5. ENVIRONMENTAL AND SOCIO-ECONOMIC IMPACT
The P-REC Aggregation Fund can provide approximately 10% of the project construction costs thus playing a catalytic role in leveraging capital from additional
sources to bring small and medium size renewable energy projects to fruition
The Fund is projected to help generate 812,116 P-RECs. The income produced through the sale of these P-RECs comes at minimal cost to developers and constitutes an additional revenue stream equivalent to approximately 10% of the project construction costs. The signature of a commercial agreement before construction guarantees to the project developer the receipt of the actual P-REC revenue at the commercial operation date. This can be leveraged to raise the remaining 90% of the needed construction capital. From this perspective, with a total capital of around USD 10 million, the Fund can have a strong catalytic effect by helping to unlock approximately USD 90 million more19 from other sources and enabling generally small and medium size locally based developers to bring their renewable projects to fruition. USD 16 invested in the Fund can help abate one tCO2e and USD 31.5 invested in the Fund can help provide energy access to one household.
ENVIRONMENTAL IMPACT The Fund has the potential for significant climate mitigation impact, as it helps to catalyze additional investments for renewable energy plants with the capacity to avoid approximately 658,000 tCO2e greenhouse gas emissions over its proof-of-concept phase. This is equivalent to the annual emissions released by 143,000 fossil fuel cars. The renewable energy generated through supported projects will provide electrification in many communities for the first time and will also be supplied to businesses and households currently relying on fossil fuels such as diesel and kerosene for energy generation. Both fossil fuels are widely used for household and small businesses' basic energy needs and constitute a significant source of black carbon emissions. Black carbon has a climate warming impact 460-1,500 times stronger than CO2 and affects the health of natural ecosystems and can change rainfall patterns (CCAC, website).
SOCIAL AND ECONOMIC IMPACT Investment in renewable energy infrastructure delivers contributions towards many Sustainable Development Goals (SDGs), both directly – on site – and indirectly – through easing poverty, reducing energy shortages as a constraint to economic growth, and supporting national policy commitments. The impacts are elaborated on in Table 9 below.
EPP will also develop a framework for measuring the peace impacts of renewable energy projects, to be used by the Fund to collect and analyse social impact data.
Table 9: Social and economic impacts
SDG Impacted Description of Impact SDG 1: No Poverty The delivery of energy infrastructure has the potential to improve the quality of
life of communities in surrounding areas and catalyze economic growth. SDG 3: Good health and well-being
The renewable energy generated through supported projects will displace currently used fossil fuels such as kerosene and diesel, thus providing improved health outcomes.
19 Assuming all projects participating in the Fund raise the remaining necessary finance for completion.
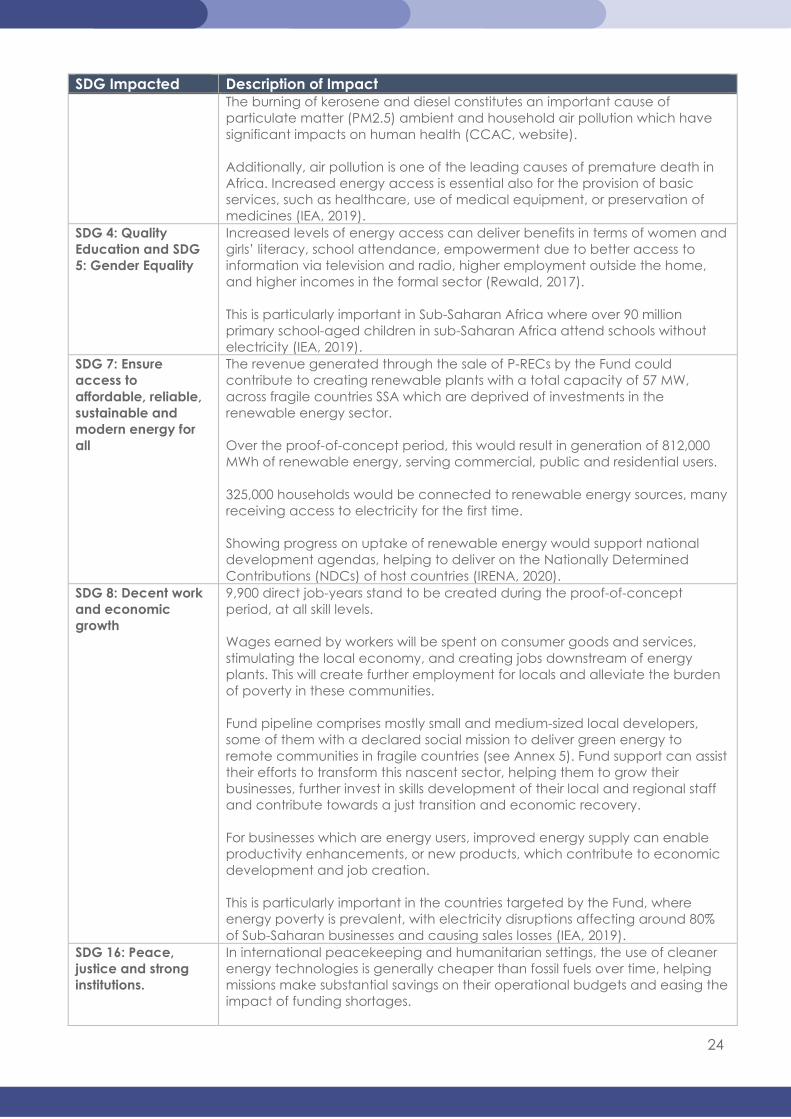
24
SDG Impacted Description of Impact The burning of kerosene and diesel constitutes an important cause of particulate matter (PM2.5) ambient and household air pollution which have significant impacts on human health (CCAC, website). Additionally, air pollution is one of the leading causes of premature death in Africa. Increased energy access is essential also for the provision of basic services, such as healthcare, use of medical equipment, or preservation of medicines (IEA, 2019).
SDG 4: Quality Education and SDG 5: Gender Equality
Increased levels of energy access can deliver benefits in terms of women and girls’ literacy, school attendance, empowerment due to better access to information via television and radio, higher employment outside the home, and higher incomes in the formal sector (Rewald, 2017). This is particularly important in Sub-Saharan Africa where over 90 million primary school-aged children in sub-Saharan Africa attend schools without electricity (IEA, 2019).
SDG 7: Ensure access to affordable, reliable, sustainable and modern energy for all
The revenue generated through the sale of P-RECs by the Fund could contribute to creating renewable plants with a total capacity of 57 MW, across fragile countries SSA which are deprived of investments in the renewable energy sector. Over the proof-of-concept period, this would result in generation of 812,000 MWh of renewable energy, serving commercial, public and residential users. 325,000 households would be connected to renewable energy sources, many receiving access to electricity for the first time. Showing progress on uptake of renewable energy would support national development agendas, helping to deliver on the Nationally Determined Contributions (NDCs) of host countries (IRENA, 2020).
SDG 8: Decent work and economic growth
9,900 direct job-years stand to be created during the proof-of-concept period, at all skill levels. Wages earned by workers will be spent on consumer goods and services, stimulating the local economy, and creating jobs downstream of energy plants. This will create further employment for locals and alleviate the burden of poverty in these communities. Fund pipeline comprises mostly small and medium-sized local developers, some of them with a declared social mission to deliver green energy to remote communities in fragile countries (see Annex 5). Fund support can assist their efforts to transform this nascent sector, helping them to grow their businesses, further invest in skills development of their local and regional staff and contribute towards a just transition and economic recovery. For businesses which are energy users, improved energy supply can enable productivity enhancements, or new products, which contribute to economic development and job creation. This is particularly important in the countries targeted by the Fund, where energy poverty is prevalent, with electricity disruptions affecting around 80% of Sub-Saharan businesses and causing sales losses (IEA, 2019).
SDG 16: Peace, justice and strong institutions.
In international peacekeeping and humanitarian settings, the use of cleaner energy technologies is generally cheaper than fossil fuels over time, helping missions make substantial savings on their operational budgets and easing the impact of funding shortages.
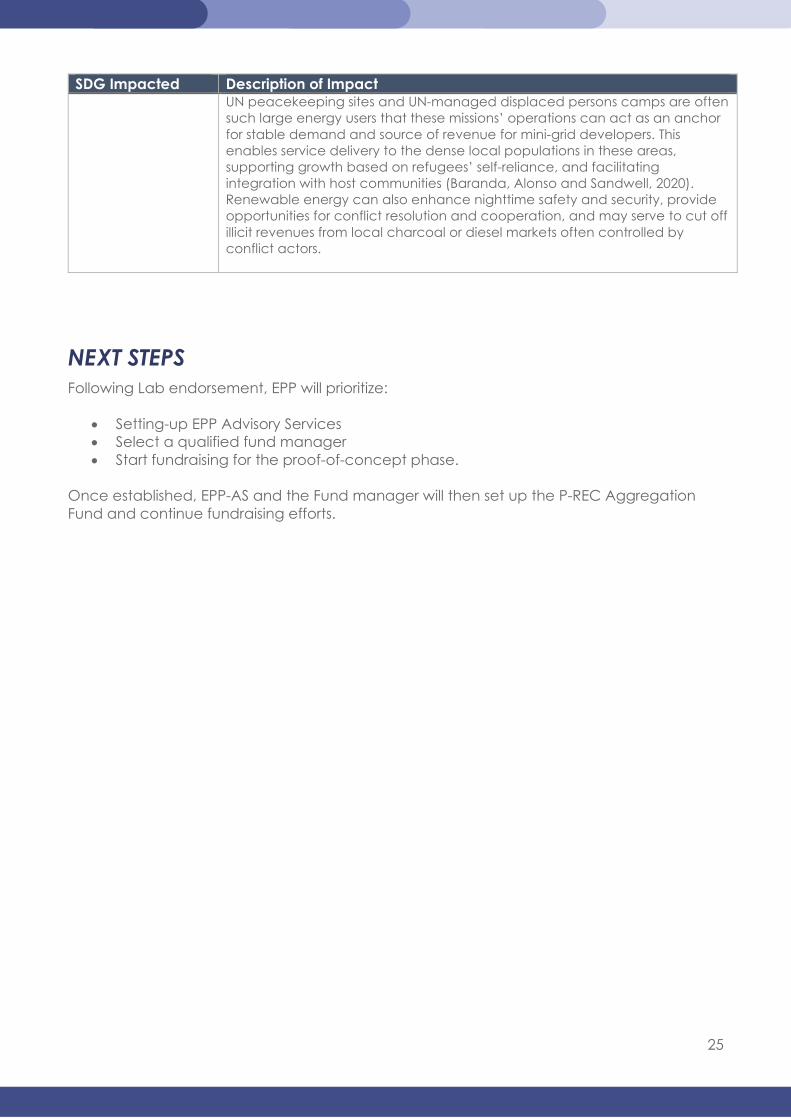
25
SDG Impacted Description of Impact UN peacekeeping sites and UN-managed displaced persons camps are often such large energy users that these missions’ operations can act as an anchor for stable demand and source of revenue for mini-grid developers. This enables service delivery to the dense local populations in these areas, supporting growth based on refugees’ self-reliance, and facilitating integration with host communities (Baranda, Alonso and Sandwell, 2020). Renewable energy can also enhance nighttime safety and security, provide opportunities for conflict resolution and cooperation, and may serve to cut off illicit revenues from local charcoal or diesel markets often controlled by conflict actors.
NEXT STEPS Following Lab endorsement, EPP will prioritize:
• Setting-up EPP Advisory Services • Select a qualified fund manager • Start fundraising for the proof-of-concept phase.
Once established, EPP-AS and the Fund manager will then set up the P-REC Aggregation Fund and continue fundraising efforts.
26
REFERENCES Agenbroad J, Carlin K, Ernst , Doig S. 2018. “Minigrids in the Money: Six Ways to Reduce Minigrid Costs by 60% for Rural Electrification.” Rocky Mountain Institute. www.rmi.org/insight/minigrids2018.
Ashden. 2017. “Does Energy Access Help Women? Beyond Anecdotes: A Review Of The Evidence.” https://www.ashden.org/sustainable-energy/reports/does-energy-access-help-women-beyond-anecdotes-a-review-of-the-evidence
Baranda Alonso, J., Sandwell, P. 2020. “Sustainable mini-grid systems in refugee camps: A case study of Rwanda.” Grantham Institute, Imperial College London. https://spiral.imperial.ac.uk:8443/bitstream/10044/1/77296/6/Sustainable%20mini-grid%20systems%20in%20refugee%20gamps%20-%20Rwanda%20-%20web.pdf.
BNEF. 2019. “Solar for Businesses in Sub-Saharan Africa.” Bloomberg. https://data.bloomberglp.com/professional/sites/24/BNEF_responsAbility-report-Solar-for-Businesses-in-Sub-Saharan-Africa.pdf.
BP. 2020. “BP Statistical Review of World Energy.” BP Plc. https://www.bp.com/en/global/corporate/energy-economics/statistical-review-of-world-energy.html. Climate & Clean Air Coalition (CCAC). . "Black Carbon." https://www.ccacoalition.org/en/slcps/black-carbon.
Cook O, Forte J, Mozersky D, Terada R. 2019. “Peace Renewable Energy Credits: Facilitating High- Impact Projects in Fragile Regions.” CRS & EPP. www.resource-solutions.org/document/012419/.
Dave Jones. 2021. “Global Electricity Review: 2021.” EMBER Coal to Clean Energy Policy. https://ember-climate.org/wp-content/uploads/2021/03/Global-Electricity-Review-2021.pdf.
Energy Peace Partners. 2019. “Peace Renewable Energy Credit." https://www.energypeacepartners.com/prec#.
Energy Peace Partners. 2020. “Seller Package."
Forest Trends Association. 2020. "Forest Trends’ Ecosystem Marketplace, Voluntary Carbon and the Post-Pandemic Recovery. State of Voluntary Carbon Markets Report." Forest Trends Association. https://www.forest-trends.org/publications/state-of-the-voluntary-carbon-markets-2020-2/.
Fragile States Index, The Fund for Peace. 2018. “What Does State Fragility Mean?.” https://fragilestatesindex.org/frequently-asked-questions/what-does-state-fragility-mean/.
Gold Standard. 2021. "2020 Market Report." Gold Standard. https://www.goldstandard.org/blog-item/gold-standard-market-report-2020.
IEA (International Energy Agency). 2017. “Energy Access Outlook 2017: From Poverty to Prosperity..” IEA. https://www.oecd.org/publications/energy-access-outlook-2017-9789264285569-en.htm
IEA (International Energy Agency). 2019. “Africa Energy Outlook 2019.” IEA. https://www.iea.org/reports/africa-energy-outlook-2019.
IEA (International Energy Agency). 2020a. “Defining energy access: 2020 methodology.” IEA. https://www.iea.org/articles/defining-energy-access-2020-methodology.
IEA, IRENA, UNSD, World Bank, WHO. 2021. “Tracking SDG 7: The Energy Progress Report.” World Bank. https://trackingsdg7.esmap.org/data/files/download-documents/2021_tracking_sdg7_report.pdf.
27
International Energy Agency (IEA). 2020b. “SDG7: Data and Projections.” https://www.iea.org/reports/sdg7-data-and-projections.
International Energy Agency (IEA). 2019. “Africa Energy Outlook 2019.” https://www.iea.org/reports/africa-energy-outlook-2019.
International Renewable Energy Agency (IRENA). 2020. “Scaling up Renewable Energy Deployment in Africa.” https://www.irena.org/-/media/Files/IRENA/Agency/Publication/2020/Feb/IRENA_Africa_Impact_Report_2020.pdf?la=en&hash=B1AD828DFD77D6430B93185EC90A0D1B72D452CC
International Renewable Energy Agency (IRENA). 2020. “Renewable Power Generation Costs in 2019.” IRENA. https://www.irena.org/-/media/Files/IRENA/Agency/Publication/2020/Jun/IRENA_Power_Generation_Costs_2019.pdf
International Renewable Energy Agency (IRENA). 2018. “Corporate Sourcing of Renewables: Market and Industry Trends”. https://www.irena.org/publications/2018/May/Corporate-Sourcing-of-Renewable-Energy
IRENA and CPI (2020), 2020. “Global Landscape of Renewable Energy Finance.” IRENA & CPI. https://data.bloomberglp.com/professional/sites/24/BNEF_responsAbility-report-Solar-for-Businesses-in-Sub-Saharan-Africa.pdf.
Lehmann I. . 2019. “When cultural political economy meets ‘charismatic carbon’ marketing: A gender-sensitive view on the limitations of Gold Standard cookstove offset projects." Energy Research & Social Science, Volume 55, Pp. 146-154. https://doi.org/10.1016/j.erss.2019.05.001.
Mahler D.G., Yonzan N, Lakner C, Castaneda Aguilar R.A., Wu H.. 2021. “Updated estimates of the impact of COVID-19 on global poverty: Turning the corner on the pandemic in 2021?.” World Bank. https://blogs.worldbank.org/opendata/updated-estimates-impact-covid-19-global-poverty-turning-corner-pandemic-2021.
OECD. 2020. “States of Fragility 2020.” OECD Publishing. https://www.oecd-ilibrary.org/sites/ba7c22e7 -en/index.html?itemId=/content/publication/ba7c22e7-en.
Ram M., Aghahosseini A., Breyer C. 2019. “Job creation during the global energy transition towards 100% renewable power system by 2050.” Technological Forecasting and Social Change. https://www.researchgate.net/publication/334359425_Job_creation_during_the_global_energy_transition_towards_100_renewable_power_system_by_2050.
REN21, 2021, “Renewables 2021. Global Status Report”, https://www.ren21.net/wp- content/uploads/2019/05/GSR2021_Full_Report.pdf
RE100, Climate Group, CDP. 2020. “Growing renewable power: companies seizing leadership opportunities. RE100 Annual Progress and Insights Report 2020.” https://www.there100.org/growing-renewable-power-companies-seizing-leadership-opportunities.
RE100, Climate Group, CDP. 2019. “Market boundary for making corporate renewable electricity uses claims.” https://www.there100.org/sites/re100/files/2020-10/Note%20on%20Market%20Boundaries.pdf.
RE100, Climate Group, CDP. 2021. “Website.” https://www.there100.org/.
Republic of South Africa Department of Energy. 2017. “Small Projects IPP Procurement Programme.” www.ipp-projects.co.za.
Rewald R. 2017. “Energy and Women and Girls: Analyzing the Needs, Uses, and Impacts of Energy on Women and Girls in the Developing World.” Oxfam. https://s3.amazonaws.com/oxfam-us/www/static/media/files/energy-women-girls.pdf.
28
Rutovitz J, Dominish E, Downes J. 2015. “CALCULATING GLOBAL ENERGY SECTOR JOBS: 2015 METHODOLOGY UPDATE.” Institute for Sustainable Futures, UTS . https://opus.lib.uts.edu.au/bitstream/10453/43718/1/Rutovitzetal2015Calculatingglobalenergysectorjobsmethodology.pdf.
Sustainable Energy for All (SEforALL). 2020. “Energizing Finance: Understanding the Landscape 2020.” https://www.climatepolicyinitiative.org/publication/energizing-finance-understanding-the-landscape-2020/.
Taskforce on Scaling Voluntary Carbon Markets. 2021. "Final Report: Taskforce on Scaling Voluntary Carbon Markets." Taskforce on Scaling Voluntary Carbon Markets. https://www.iif.com/tsvcm.
The Green certificate Company (GCC). 2019. “Annual Review 2019”, http://review.gcc.re/2019
The International REC Standard (I-REC Standard). 2021a. “Renewable Energy Certificate (REC) schemes explained.” https://www.irecstandard.org/what-are-recs/.
The International REC Standard (I-REC Standard). 2021b. “Chad, Mauritius, and Somalia approved as I-REC issuing countries.” https://www.irecstandard.org/news/chad-mauritius-and-somalia-approved-as-i-rec-issuing-countries/.
The International REC Standard (I-REC Standard). 2020. “I-REC Code Subsidiary Document 02: Production Device & Production Group Registration.” https://www.irecstandard.org/documents/.
The International REC Standard. 2020. "Market Statistics June 2019 – May 2020." The International REC Standard. https://www.irecstandard.org/download/market-statistics-june-2019-may-2020/#/. Trove Research. 2021. "Future Demand, Supply and Prices for Voluntary Carbon Credits - Keeping the
Balance." Trove Research and University College London. https://trove-research.com/wp-content/uploads/2021/06/Trove-Research-Carbon-Credit-Demand-Supply-and-Prices-1-June-2021.pdf.
United Nations. “Small-scale Methodology: Renewable electricity generation for captive use and
mini-grid, version 03.0.” UN. https://cdm.unfccc.int/filestorage/Y/P/1/YP1U4E0H976Z3WDMV2NGSTBLQIRCK5/EB81_repan26_AMS-I.F_ver03.0.pdf?t=QzN8cXd3a3kwfDBinKeNZ78f5ehGl7X8-4cp
Verra. 2021. "Verified Carbon Standard." Verra. https://verra.org/project/vcs-program/.
World Bank. 2021. “Electric Power Consumption.” World Bank.
https://data.worldbank.org/indicator/EG.USE.ELEC.KH.PC.
29
ANNEX 1 - MODELLING METHODOLOGY AND DETAILED RESULTS The Lab’s financial modeling outputs relied on discounted cash flow modeling of the Fund economics. The model tested how underlying P-REC prices, outcomes, and costs affect unit returns and how different financing scenarios and sensitivities impact returns and cash flow positions. The unit (P-REC) economics assumptions were provided by the proponents and further enhanced through market research. The assumptions on Fund costs were collected via interviews and additional literature. For the proof-of-concept Fund scenario, the analysis considered a USD 10.25 million fund with an annual management cost of USD 500,000. The capital structure is made up of a 50% grant funding tranche and a 50% concessional equity tranche. The concessional equity tranche receives a cumulative dividend on equity provided, with an average return targeted at 11%. The analysis undertaken by the Lab Secretariat focused on the impact that the following three variables have on fund viability and cash flows. The profile of future market demand for P-RECs. Being new environmental attributes pitched at premium prices, the mix of P-RECs sold onto spot and forward markets, as well as the prices obtained in these respective commercial arrangements, will be critical to funding financial outcomes. A conservative scenario was run to test the sensitivity of viability to less favorable market conditions. In this scenario, the P-REC spot and forward prices were adjusted downwards by 30% to USD 18.90 and USD 9.45 respectively. The prepaid forward price paid to developers. After it makes payment, the Fund essentially takes all risk on the renewable energy production profile, which determines the timing and volume of P-REC issuance, and the market for P-RECs. The ability to correctly price for this risk, whilst still sharing P-REC sale proceeds in a way that has a material impact on project economics, will be central to the Fund manager’s role. Availability of (non-repayable) grant capital with which to capitalize the proof-of-concept stage. Due to the early-stage nature of this Fund, the degree of market risk taken, and country risk in host project countries, significant reliance upon grants is anticipated. Therefore, the financial modeling scenarios in the proof-of-concept phase assumed that a 50:50 ratio of grants and concessional equity. This assumption is supported by the capital structures of similar instruments such as REPP: 100% grant-funded (GBP 148 million funding from the UK’s International Climate Finance commitment through the Department for Business, Energy, and Industrial Strategy (BEIS) during its 8-year first phase of operation. SENSITIVITY ANALYSIS: REVENUE/PRICING Optimistic scenario operating assumptions are as follows:
• Plant pipeline converts at a factor of 50%, i.e., 50% of prospects are realized • Revenue is earned exclusively from the sale of P-RECs on spot and forward markets, in
an estimated ratio of 50:50 • P-REC’s are sold at a spot price of USD 27.00 (being the weighted average from the
table above) and at a forward price of USD 13.50 (i.e., forward price is 50% of prevailing spot price)
30
• The Fund pays developers USD 10 per P-REC generated over the first 10 years of project life
• The Fund pays a P-REC issuance fee of USD 2 per P-REC to EPP • The Fund pays a fund manager a flat fee of USD 500,000 annually
The rationale behind the reduced pricing scenario has been discussed further below. The first P-REC sales have been concluded with initial spot prices at 10-20 times the average price of standard Africa I-RECs20, albeit at modest volumes. It is anticipated that premium price ranges such as this could be obtained through entering into transactions with big corporations. However, as noted above there is uncertainty around both demand and price due to the unique product and niche market the P-REC is operating in. The price range for African I-RECs is large, varying from EUR1-20 according to interviews with market participants. While the market average appears to lie at the lower end of the range, around EUR2, it is possible for high quality I-RECs with socio-economic co-benefits to achieve an order of magnitude more. In general, factors impacting EAC prices include local supply and demand, technology, locational attributes, and contract length (IRENA, 2018).
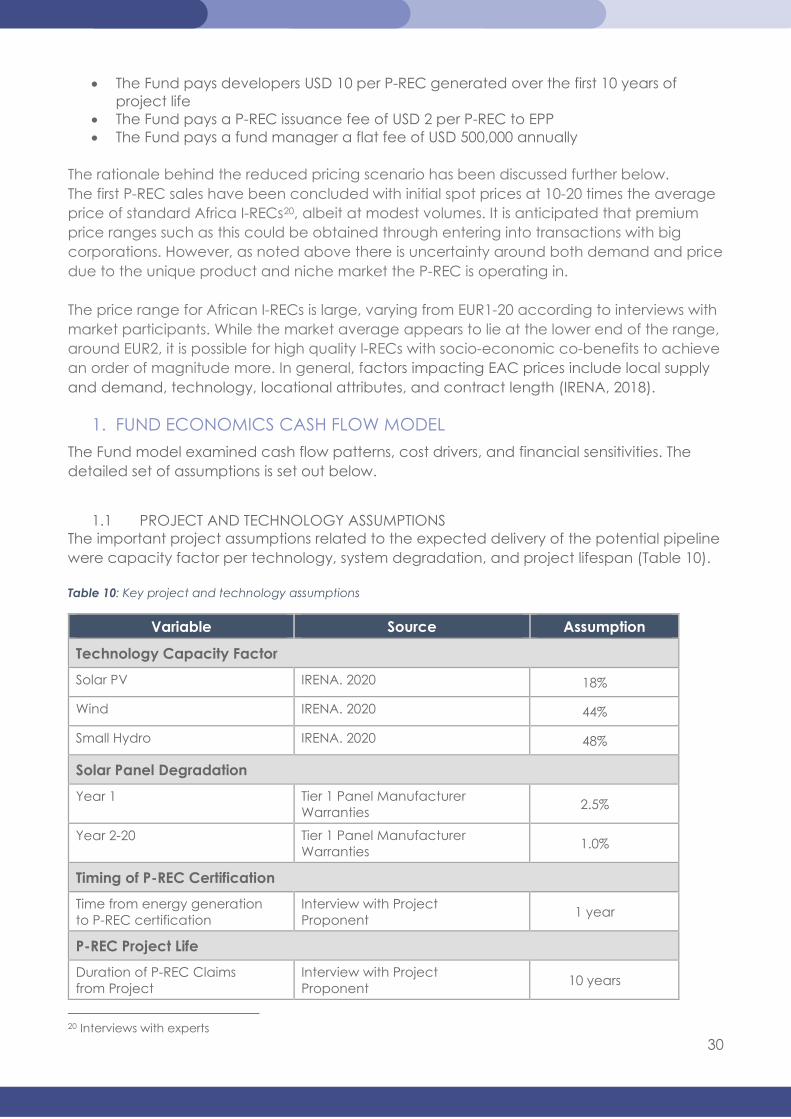
1. FUND ECONOMICS CASH FLOW MODEL The Fund model examined cash flow patterns, cost drivers, and financial sensitivities. The detailed set of assumptions is set out below.
1.1 PROJECT AND TECHNOLOGY ASSUMPTIONS
The important project assumptions related to the expected delivery of the potential pipeline were capacity factor per technology, system degradation, and project lifespan (Table 10). Table 10: Key project and technology assumptions
Variable Source Assumption
Technology Capacity Factor Solar PV IRENA. 2020 18%
Wind IRENA. 2020 44%
Small Hydro IRENA. 2020 48%
Solar Panel Degradation
Year 1 Tier 1 Panel Manufacturer Warranties 2.5%
Year 2-20 Tier 1 Panel Manufacturer Warranties 1.0%
Timing of P-REC Certification
Time from energy generation to P-REC certification
Interview with Project Proponent 1 year
P-REC Project Life
Duration of P-REC Claims from Project
Interview with Project Proponent 10 years
20 Interviews with experts
31
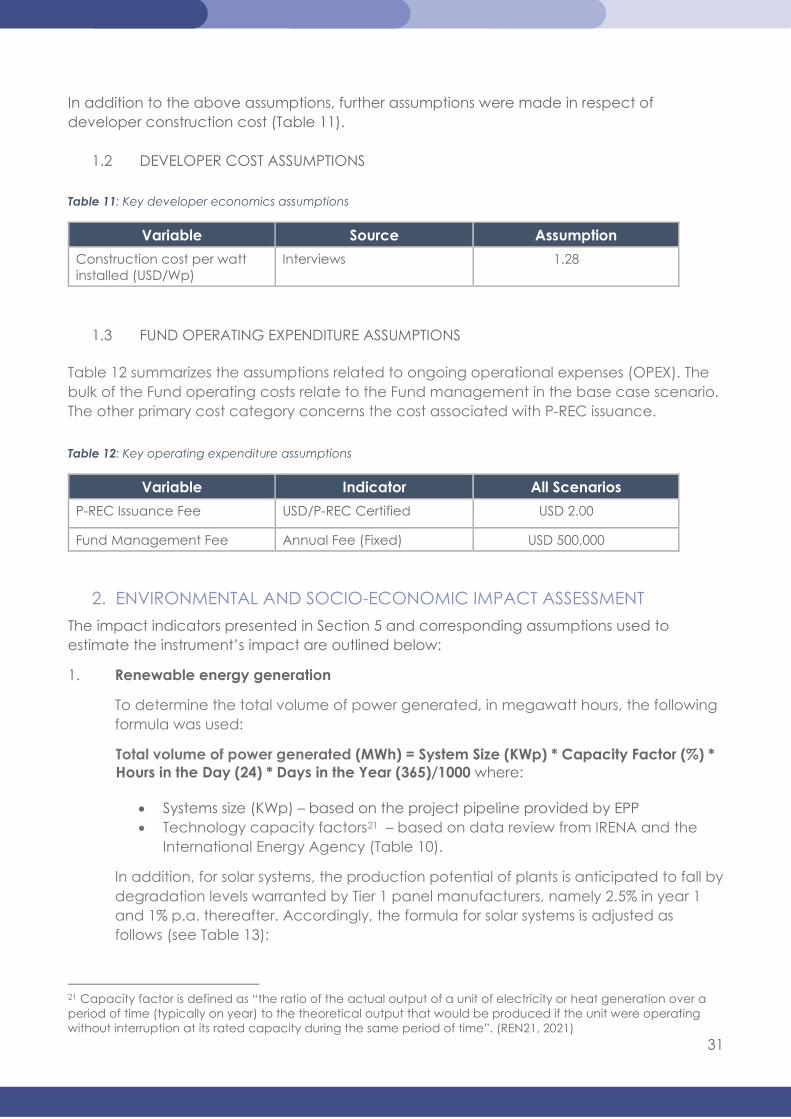
In addition to the above assumptions, further assumptions were made in respect of developer construction cost (Table 11).
1.2 DEVELOPER COST ASSUMPTIONS Table 11: Key developer economics assumptions
Variable Source Assumption Construction cost per watt installed (USD/Wp)
Interviews 1.28
1.3 FUND OPERATING EXPENDITURE ASSUMPTIONS Table 12 summarizes the assumptions related to ongoing operational expenses (OPEX). The bulk of the Fund operating costs relate to the Fund management in the base case scenario. The other primary cost category concerns the cost associated with P-REC issuance. Table 12: Key operating expenditure assumptions
Variable Indicator All Scenarios P-REC Issuance Fee USD/P-REC Certified USD 2.00
Fund Management Fee Annual Fee (Fixed) USD 500,000
2. ENVIRONMENTAL AND SOCIO-ECONOMIC IMPACT ASSESSMENT The impact indicators presented in Section 5 and corresponding assumptions used to estimate the instrument’s impact are outlined below:
1. Renewable energy generation
To determine the total volume of power generated, in megawatt hours, the following formula was used:
Total volume of power generated (MWh) = System Size (KWp) * Capacity Factor (%) * Hours in the Day (24) * Days in the Year (365)/1000 where:
• Systems size (KWp) – based on the project pipeline provided by EPP • Technology capacity factors21 – based on data review from IRENA and the
International Energy Agency (Table 10).
In addition, for solar systems, the production potential of plants is anticipated to fall by degradation levels warranted by Tier 1 panel manufacturers, namely 2.5% in year 1 and 1% p.a. thereafter. Accordingly, the formula for solar systems is adjusted as follows (see Table 13):
21 Capacity factor is defined as “the ratio of the actual output of a unit of electricity or heat generation over a period of time (typically on year) to the theoretical output that would be produced if the unit were operating without interruption at its rated capacity during the same period of time”. (REN21, 2021)
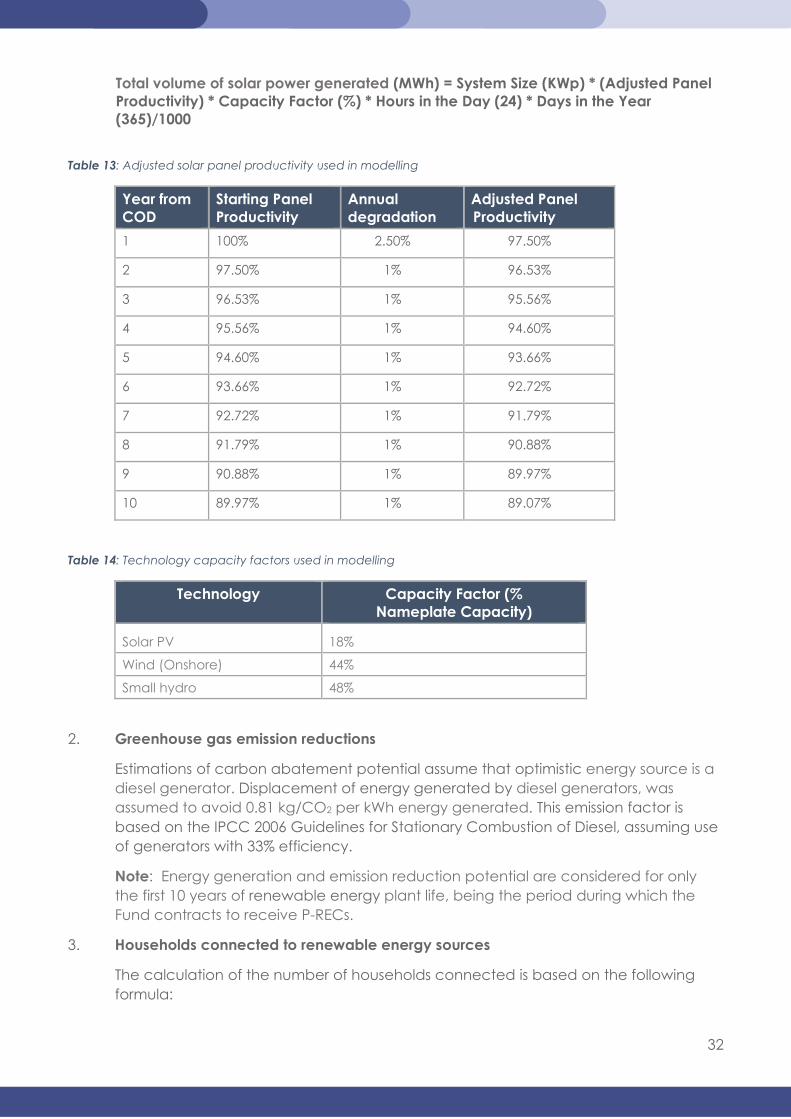
32
Total volume of solar power generated (MWh) = System Size (KWp) * (Adjusted Panel Productivity) * Capacity Factor (%) * Hours in the Day (24) * Days in the Year (365)/1000
Table 13: Adjusted solar panel productivity used in modelling
Year from COD
Starting Panel Productivity
Annual degradation
Adjusted Panel Productivity
1 100% 2.50% 97.50%
2 97.50% 1% 96.53%
3 96.53% 1% 95.56%
4 95.56% 1% 94.60%
5 94.60% 1% 93.66%
6 93.66% 1% 92.72%
7 92.72% 1% 91.79%
8 91.79% 1% 90.88%
9 90.88% 1% 89.97%
10 89.97% 1% 89.07%
Table 14: Technology capacity factors used in modelling
Technology Capacity Factor (% Nameplate Capacity)
Solar PV 18%
Wind (Onshore) 44%
Small hydro 48%
2. Greenhouse gas emission reductions
Estimations of carbon abatement potential assume that optimistic energy source is a diesel generator. Displacement of energy generated by diesel generators, was assumed to avoid 0.81 kg/CO2 per kWh energy generated. This emission factor is based on the IPCC 2006 Guidelines for Stationary Combustion of Diesel, assuming use of generators with 33% efficiency.
Note: Energy generation and emission reduction potential are considered for only the first 10 years of renewable energy plant life, being the period during which the Fund contracts to receive P-RECs.
3. Households connected to renewable energy sources
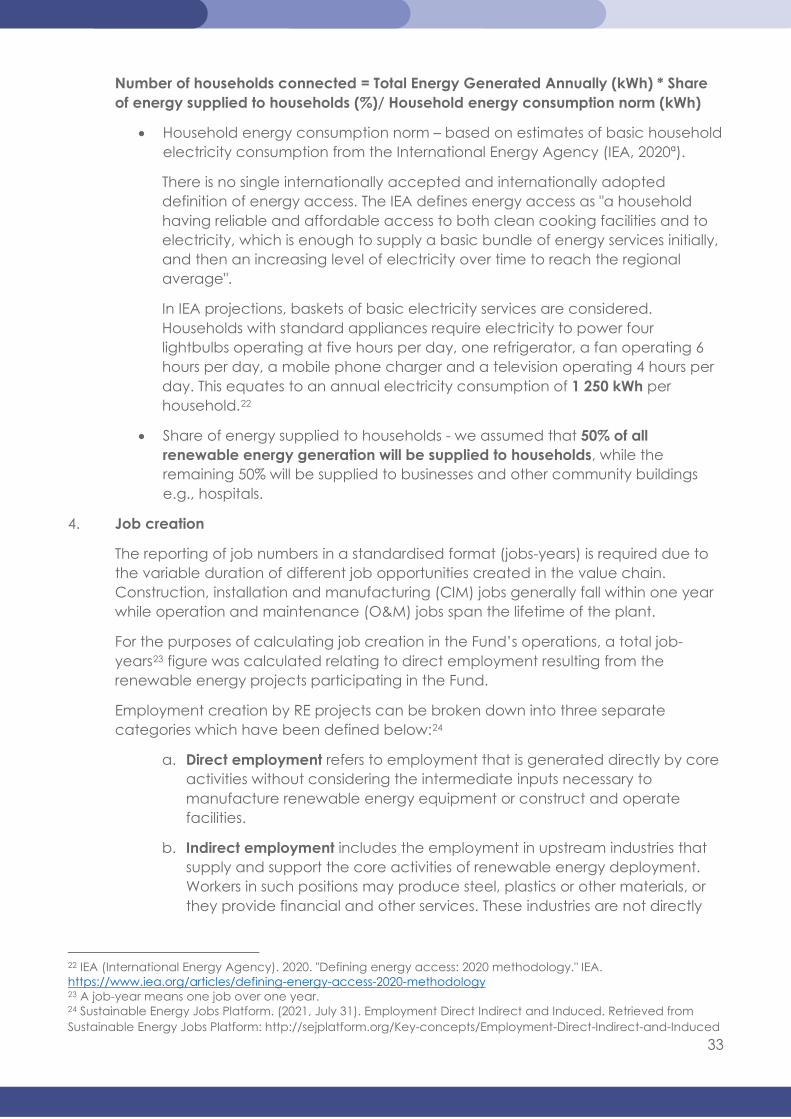
The calculation of the number of households connected is based on the following formula:
33
Number of households connected = Total Energy Generated Annually (kWh) * Share of energy supplied to households (%)/ Household energy consumption norm (kWh)
• Household energy consumption norm – based on estimates of basic household electricity consumption from the International Energy Agency (IEA, 2020ª).
There is no single internationally accepted and internationally adopted definition of energy access. The IEA defines energy access as "a household having reliable and affordable access to both clean cooking facilities and to electricity, which is enough to supply a basic bundle of energy services initially, and then an increasing level of electricity over time to reach the regional average".
In IEA projections, baskets of basic electricity services are considered. Households with standard appliances require electricity to power four lightbulbs operating at five hours per day, one refrigerator, a fan operating 6 hours per day, a mobile phone charger and a television operating 4 hours per day. This equates to an annual electricity consumption of 1 250 kWh per household.22
• Share of energy supplied to households - we assumed that 50% of all renewable energy generation will be supplied to households, while the remaining 50% will be supplied to businesses and other community buildings e.g., hospitals.
4. Job creation
The reporting of job numbers in a standardised format (jobs-years) is required due to the variable duration of different job opportunities created in the value chain. Construction, installation and manufacturing (CIM) jobs generally fall within one year while operation and maintenance (O&M) jobs span the lifetime of the plant.
For the purposes of calculating job creation in the Fund’s operations, a total job-years23 figure was calculated relating to direct employment resulting from the renewable energy projects participating in the Fund.
Employment creation by RE projects can be broken down into three separate categories which have been defined below:24
a. Direct employment refers to employment that is generated directly by core activities without considering the intermediate inputs necessary to manufacture renewable energy equipment or construct and operate facilities.
b. Indirect employment includes the employment in upstream industries that supply and support the core activities of renewable energy deployment. Workers in such positions may produce steel, plastics or other materials, or they provide financial and other services. These industries are not directly
22 IEA (International Energy Agency). 2020. "Defining energy access: 2020 methodology." IEA. https://www.iea.org/articles/defining-energy-access-2020-methodology 23 A job-year means one job over one year. 24 Sustainable Energy Jobs Platform. (2021, July 31). Employment Direct Indirect and Induced. Retrieved from Sustainable Energy Jobs Platform: http://sejplatform.org/Key-concepts/Employment-Direct-Indirect-and-Induced
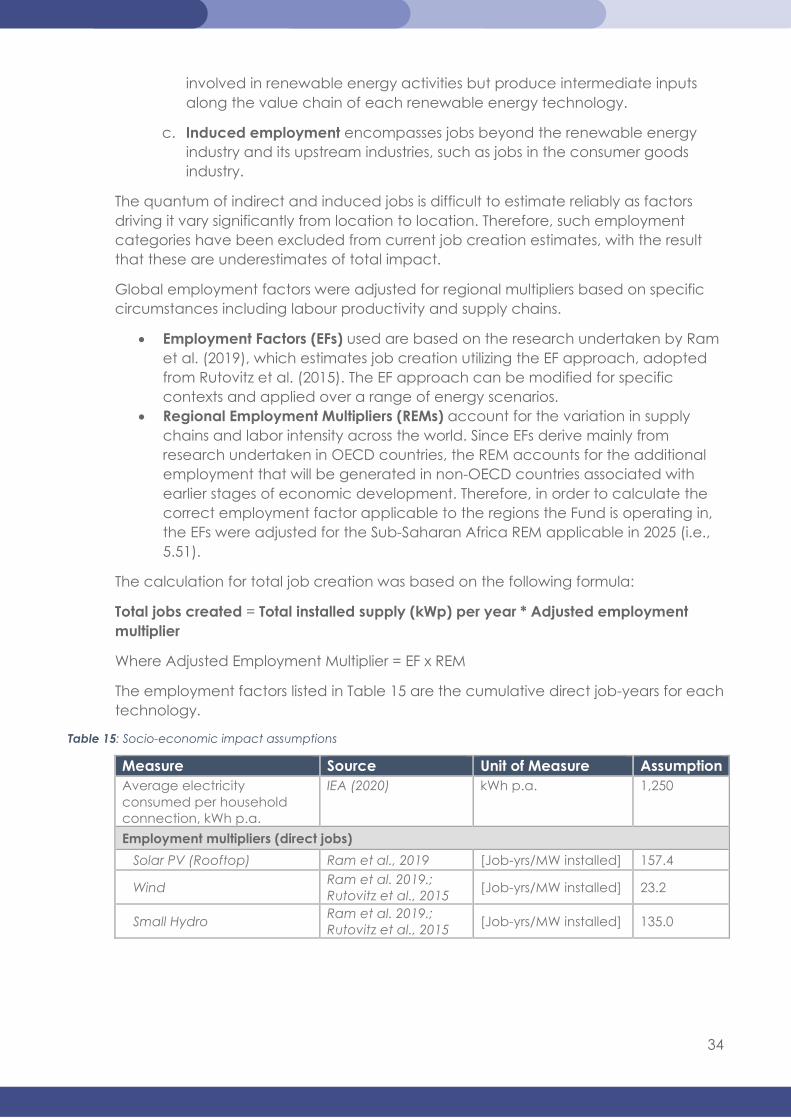
34
involved in renewable energy activities but produce intermediate inputs along the value chain of each renewable energy technology.
c. Induced employment encompasses jobs beyond the renewable energy industry and its upstream industries, such as jobs in the consumer goods industry.
The quantum of indirect and induced jobs is difficult to estimate reliably as factors driving it vary significantly from location to location. Therefore, such employment categories have been excluded from current job creation estimates, with the result that these are underestimates of total impact.
Global employment factors were adjusted for regional multipliers based on specific circumstances including labour productivity and supply chains.
• Employment Factors (EFs) used are based on the research undertaken by Ram et al. (2019), which estimates job creation utilizing the EF approach, adopted from Rutovitz et al. (2015). The EF approach can be modified for specific contexts and applied over a range of energy scenarios.
• Regional Employment Multipliers (REMs) account for the variation in supply chains and labor intensity across the world. Since EFs derive mainly from research undertaken in OECD countries, the REM accounts for the additional employment that will be generated in non-OECD countries associated with earlier stages of economic development. Therefore, in order to calculate the correct employment factor applicable to the regions the Fund is operating in, the EFs were adjusted for the Sub-Saharan Africa REM applicable in 2025 (i.e., 5.51).
The calculation for total job creation was based on the following formula:
Total jobs created = Total installed supply (kWp) per year * Adjusted employment multiplier
Where Adjusted Employment Multiplier = EF x REM
The employment factors listed in Table 15 are the cumulative direct job-years for each technology.
Table 15: Socio-economic impact assumptions
Measure Source Unit of Measure Assumption Average electricity consumed per household connection, kWh p.a.
IEA (2020) kWh p.a. 1,250
Employment multipliers (direct jobs) Solar PV (Rooftop) Ram et al., 2019 [Job-yrs/MW installed] 157.4
Wind Ram et al. 2019.; Rutovitz et al., 2015 [Job-yrs/MW installed] 23.2
Small Hydro Ram et al. 2019.; Rutovitz et al., 2015 [Job-yrs/MW installed] 135.0
35
ANNEX 2 – MARKET ANALYSIS METHODOLOGY The following methodologies were applied to each of the three dimensions identified in performing the target market analysis:
I. Size of opportunity relates to the potential demand for electricity in the future, benchmarking electricity consumption in underserved countries to the average at the next stage of development (i.e., the long-term addressable demand gap).
To determine this, a supply-side gap analysis was performed to estimate the size of the potential opportunity within each of the target countries, as follows:
a) The per capita energy consumption was obtained for each of the countries (BP, 2020).
b) The average per capita energy consumption was obtained for country income categories from the World Bank Database i.e., low, low-middle, middle (World Bank, 2021).
c) Country income classification was applied (as per the World Bank Classifications).
d) It was assumed that countries would grow over time due to infrastructure investment, moving up an income category classification, so for each country the income category one step above current level was used for long-term demand estimation.
e) The per capita consumption data for existing country income level (c) was compared against the per capita consumption norm data at the next income level (d) to estimate a per capita energy gap per country.
For example, Chad is classified as low income. The per capita data for Chad would be compared against the average per capita data for the low-middle income category (one up) to assess the gap.
f) The total energy gap for the country is calculated by multiplying the per capita gap by the total population within the country.
For this analysis, it is assumed that renewable energy technology will be able to meet the entire supply gap.
II. Ease of access refers to the ability of the Fund to capture the market opportunity to close the energy gap. This is a function of (a) in-country developer networks - to assist with project pipeline, (b) the distributed renewables policy and regulatory environment – to support development of this pipeline, and (c) the ability to enforce contracts and so protect economic interests.
To describe ease of access, an index was created from three sub-indices – each of which is described below.
a) Regulatory and Policy Frameworks
The regulatory framework and policies were scored by looking at the RISE tool scores as provided by research undertaken by the World Bank. RISE is a tool for policymakers to compare national policy frameworks for sustainable energy and identify opportunities to attract investment.
36
An adjusted RISE scoring was developed which was specifically relevant to distributed renewables and mini-grids in particular. The scoring focused on the detailed elements and scores underpinning two categories: Access to Electricity, and Renewable Energy extracted from the RISE country profiles.
b) Ease of Doing Business
The World Bank category concerning Enforcing Contracts was used to score countries. This category was identified as the most important as it was noted that even with a strong regulatory framework there needs to be an environment that allows private companies and funders to contract effectively.
c) Strength of Relationships with Project Developers (with track record)
Developer relationships were noted as a key element of expanding into any of the applicable countries. Feedback was obtained from the project proponent on the strength of relationships, previous contracts concluded, etc., and each country assigned a developer relationship/presence scoring based on this information.
Each of the above dimensions was assigned a score, tallied to give combined ease of access score.
III. Impact potential considers the ability of the Fund to transform markets through expanding energy access, both directly – through increasing energy access - and indirectly – through potentially attracting other investors currently not present/active.
a) Lender presence in the target regions
As previously noted, one of the major barriers to growth and uptake in small-scale renewable energy in these regions is this lack of private funding, in particular debt finance. It is anticipated that the Fund will target and have the most impact in those countries where there is currently greatest deficit in financing for small-scale renewable energy projects since the envisioned Fund prepaid forward purchase transactions aim primarily to unlock additional debt capital in these countries.
As a result, an exercise was undertaken to determine the presence of distributed renewable lenders within each of these markets, primarily focused on the mini-grid sector. Many mini-grid lenders are also active in distributed renewables more generally (i.e., all non-utility-scale renewables).
A desktop search was used as the primary research method. The list of lenders identified through this method is by no means exhaustive but prioritizes larger well-known funds operating in SSA.
To determine whether a lender was present, evidence of investment in-country was required. It was noted that many lenders state they are active or willing to invest throughout SSA yet do not participate in business in certain (risky) countries. Therefore, simply stating country eligibility was not considered evidence of willingness to invest in-country for present purposes. To corroborate lender claims, specific project information and evidence of project implementation were sought, e.g., through media reports.
37
10 lenders formed part of the final analysis. For the presence of a lender in a country, 1 point was allocated, to a maximum of 10 points where all lenders were present. Countries with the “highest” lender presence scored lowest in terms of overall potential impact. The following lenders were considered: 1. EcoBank 2. FEI Off-Grid Energy Facility – Lions
Head Global Partners 3. Solar Energy Transformation Fund –
Sunfunder 4. CrossBoundary Energy Access 5. Beyond the Grid Solar Fund –
Sunfunder
6. SIMA Off-grid Solar Fund I 7. DI FRONTIER: Frontier Energy II 8. Energy Access Venture Fund 9. Catalyst Venture Builder 10. Renewable Energy Performance
Platform
b) Electrification levels in the target regions
Electrification levels were determined for each of the countries through looking at Electricity Access data obtained from the IEA’s “World Energy Outlook 2020”.
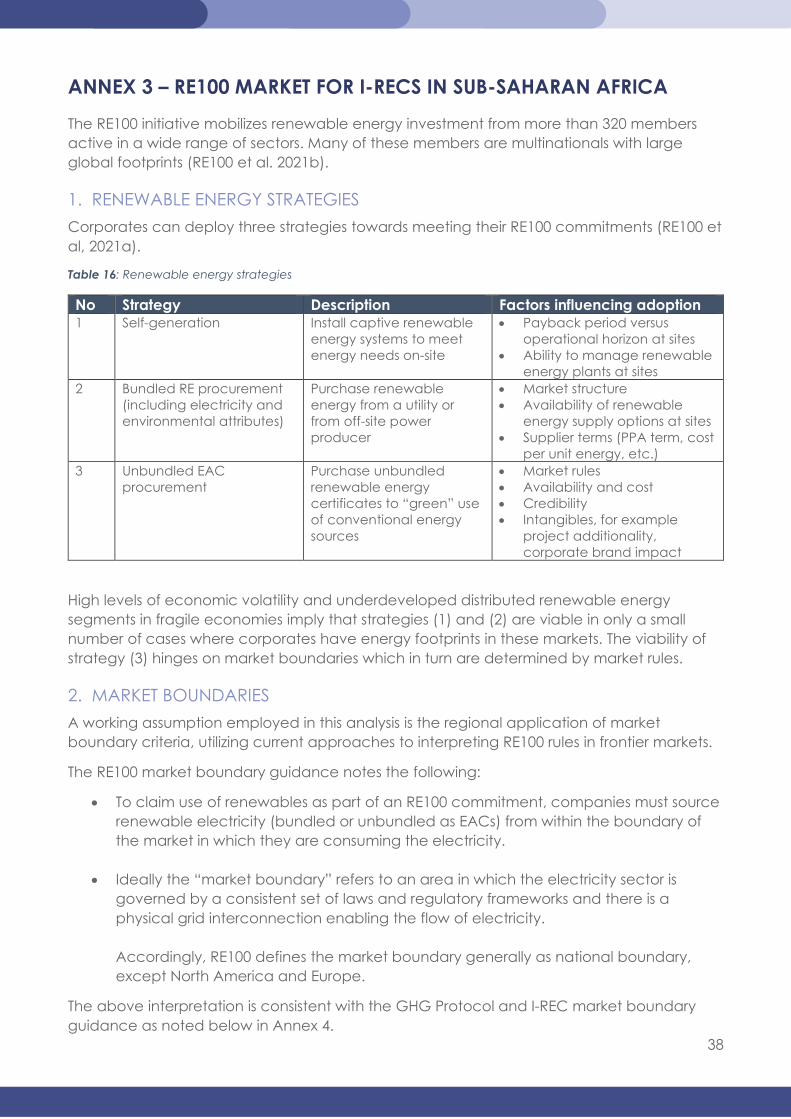
38
ANNEX 3 – RE100 MARKET FOR I-RECS IN SUB-SAHARAN AFRICA The RE100 initiative mobilizes renewable energy investment from more than 320 members active in a wide range of sectors. Many of these members are multinationals with large global footprints (RE100 et al. 2021b).
1. RENEWABLE ENERGY STRATEGIES Corporates can deploy three strategies towards meeting their RE100 commitments (RE100 et al, 2021a).
Table 16: Renewable energy strategies
No Strategy Description Factors influencing adoption 1 Self-generation Install captive renewable
energy systems to meet energy needs on-site
• Payback period versus operational horizon at sites
• Ability to manage renewable energy plants at sites
2 Bundled RE procurement (including electricity and environmental attributes)
Purchase renewable energy from a utility or from off-site power producer
• Market structure • Availability of renewable
energy supply options at sites • Supplier terms (PPA term, cost
per unit energy, etc.) 3 Unbundled EAC
procurement Purchase unbundled renewable energy certificates to “green” use of conventional energy sources
• Market rules • Availability and cost • Credibility • Intangibles, for example
project additionality, corporate brand impact
High levels of economic volatility and underdeveloped distributed renewable energy segments in fragile economies imply that strategies (1) and (2) are viable in only a small number of cases where corporates have energy footprints in these markets. The viability of strategy (3) hinges on market boundaries which in turn are determined by market rules.
2. MARKET BOUNDARIES A working assumption employed in this analysis is the regional application of market boundary criteria, utilizing current approaches to interpreting RE100 rules in frontier markets.
The RE100 market boundary guidance notes the following:
• To claim use of renewables as part of an RE100 commitment, companies must source renewable electricity (bundled or unbundled as EACs) from within the boundary of the market in which they are consuming the electricity.
• Ideally the “market boundary” refers to an area in which the electricity sector is governed by a consistent set of laws and regulatory frameworks and there is a physical grid interconnection enabling the flow of electricity. Accordingly, RE100 defines the market boundary generally as national boundary, except North America and Europe.
The above interpretation is consistent with the GHG Protocol and I-REC market boundary guidance as noted below in Annex 4.
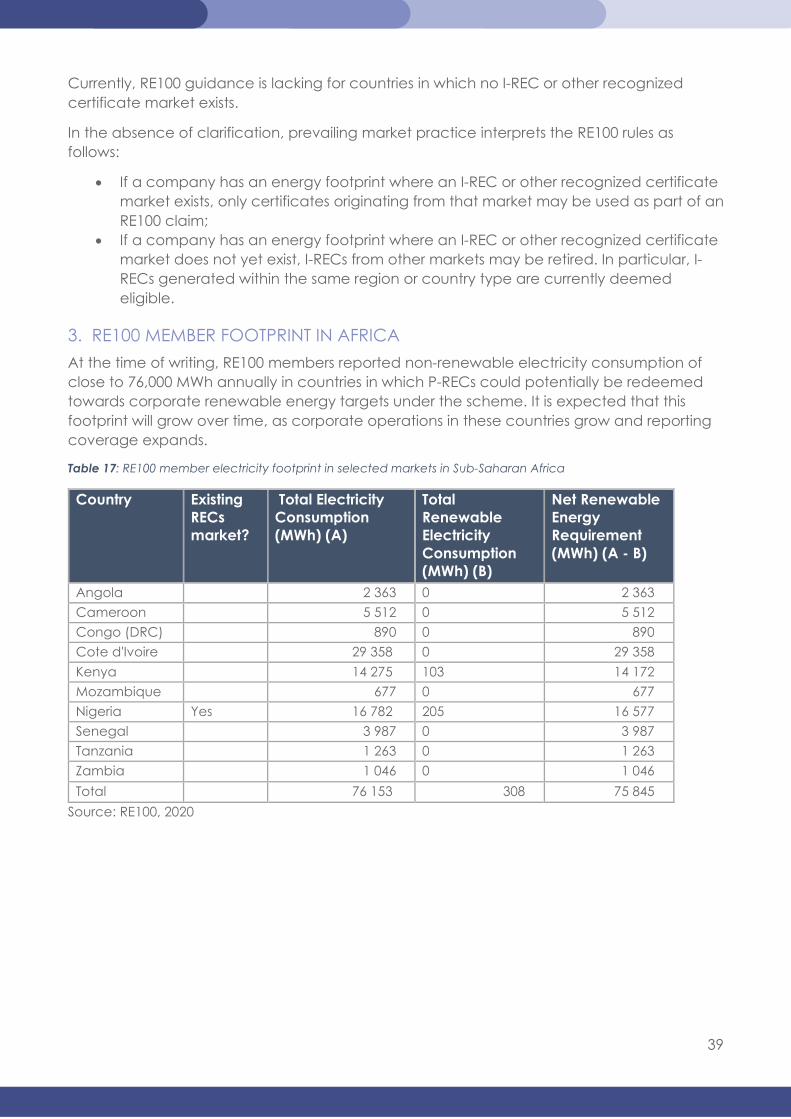
39
Currently, RE100 guidance is lacking for countries in which no I-REC or other recognized certificate market exists.
In the absence of clarification, prevailing market practice interprets the RE100 rules as follows:
• If a company has an energy footprint where an I-REC or other recognized certificate market exists, only certificates originating from that market may be used as part of an RE100 claim;
• If a company has an energy footprint where an I-REC or other recognized certificate market does not yet exist, I-RECs from other markets may be retired. In particular, I-RECs generated within the same region or country type are currently deemed eligible.
3. RE100 MEMBER FOOTPRINT IN AFRICA At the time of writing, RE100 members reported non-renewable electricity consumption of close to 76,000 MWh annually in countries in which P-RECs could potentially be redeemed towards corporate renewable energy targets under the scheme. It is expected that this footprint will grow over time, as corporate operations in these countries grow and reporting coverage expands.
Table 17: RE100 member electricity footprint in selected markets in Sub-Saharan Africa
Country Existing RECs market?
Total Electricity Consumption (MWh) (A)
Total Renewable Electricity Consumption (MWh) (B)
Net Renewable Energy Requirement (MWh) (A - B)
Angola 2 363 0 2 363 Cameroon 5 512 0 5 512 Congo (DRC) 890 0 890 Cote d'Ivoire 29 358 0 29 358 Kenya 14 275 103 14 172 Mozambique 677 0 677 Nigeria Yes 16 782 205 16 577 Senegal 3 987 0 3 987 Tanzania 1 263 0 1 263 Zambia 1 046 0 1 046 Total 76 153 308 75 845
Source: RE100, 2020
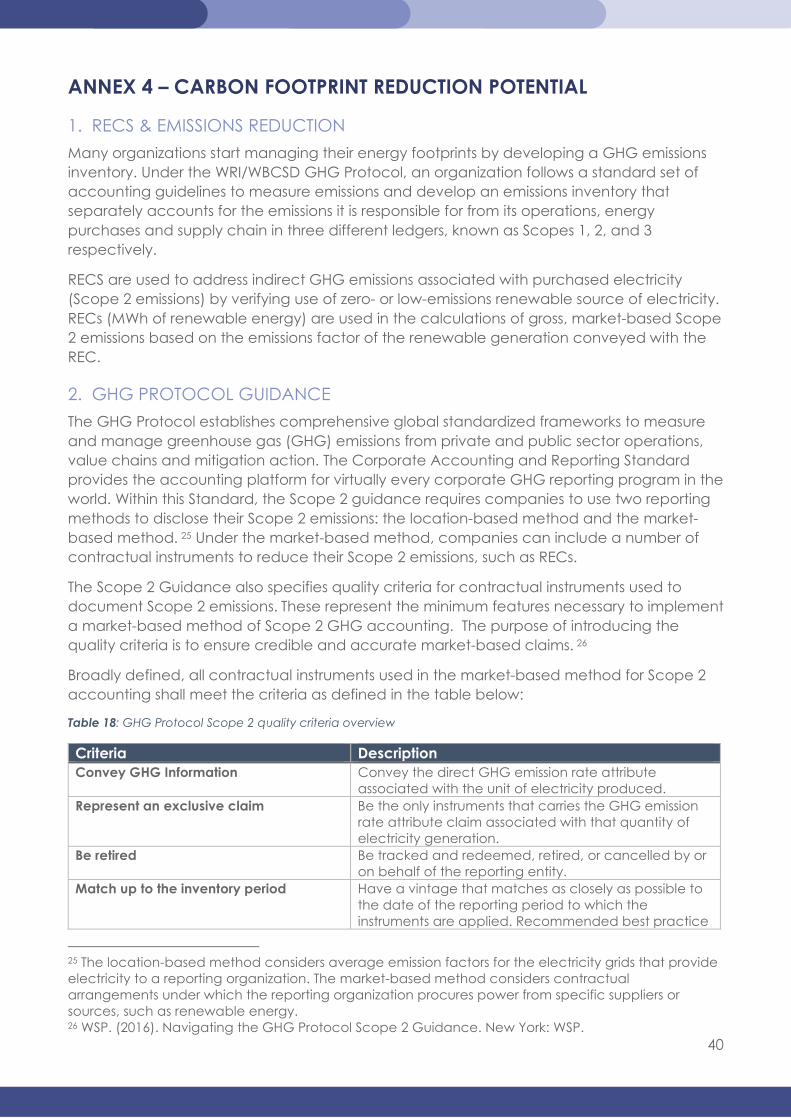
40
ANNEX 4 – CARBON FOOTPRINT REDUCTION POTENTIAL
1. RECS & EMISSIONS REDUCTION Many organizations start managing their energy footprints by developing a GHG emissions inventory. Under the WRI/WBCSD GHG Protocol, an organization follows a standard set of accounting guidelines to measure emissions and develop an emissions inventory that separately accounts for the emissions it is responsible for from its operations, energy purchases and supply chain in three different ledgers, known as Scopes 1, 2, and 3 respectively.
RECS are used to address indirect GHG emissions associated with purchased electricity (Scope 2 emissions) by verifying use of zero- or low-emissions renewable source of electricity. RECs (MWh of renewable energy) are used in the calculations of gross, market-based Scope 2 emissions based on the emissions factor of the renewable generation conveyed with the REC.
2. GHG PROTOCOL GUIDANCE The GHG Protocol establishes comprehensive global standardized frameworks to measure and manage greenhouse gas (GHG) emissions from private and public sector operations, value chains and mitigation action. The Corporate Accounting and Reporting Standard provides the accounting platform for virtually every corporate GHG reporting program in the world. Within this Standard, the Scope 2 guidance requires companies to use two reporting methods to disclose their Scope 2 emissions: the location-based method and the market-based method. 25 Under the market-based method, companies can include a number of contractual instruments to reduce their Scope 2 emissions, such as RECs.
The Scope 2 Guidance also specifies quality criteria for contractual instruments used to document Scope 2 emissions. These represent the minimum features necessary to implement a market-based method of Scope 2 GHG accounting. The purpose of introducing the quality criteria is to ensure credible and accurate market-based claims. 26
Broadly defined, all contractual instruments used in the market-based method for Scope 2 accounting shall meet the criteria as defined in the table below:
Table 18: GHG Protocol Scope 2 quality criteria overview
Criteria Description Convey GHG Information Convey the direct GHG emission rate attribute
associated with the unit of electricity produced. Represent an exclusive claim Be the only instruments that carries the GHG emission
rate attribute claim associated with that quantity of electricity generation.
Be retired Be tracked and redeemed, retired, or cancelled by or on behalf of the reporting entity.
Match up to the inventory period Have a vintage that matches as closely as possible to the date of the reporting period to which the instruments are applied. Recommended best practice
25 The location-based method considers average emission factors for the electricity grids that provide electricity to a reporting organization. The market-based method considers contractual arrangements under which the reporting organization procures power from specific suppliers or sources, such as renewable energy. 26 WSP. (2016). Navigating the GHG Protocol Scope 2 Guidance. New York: WSP.
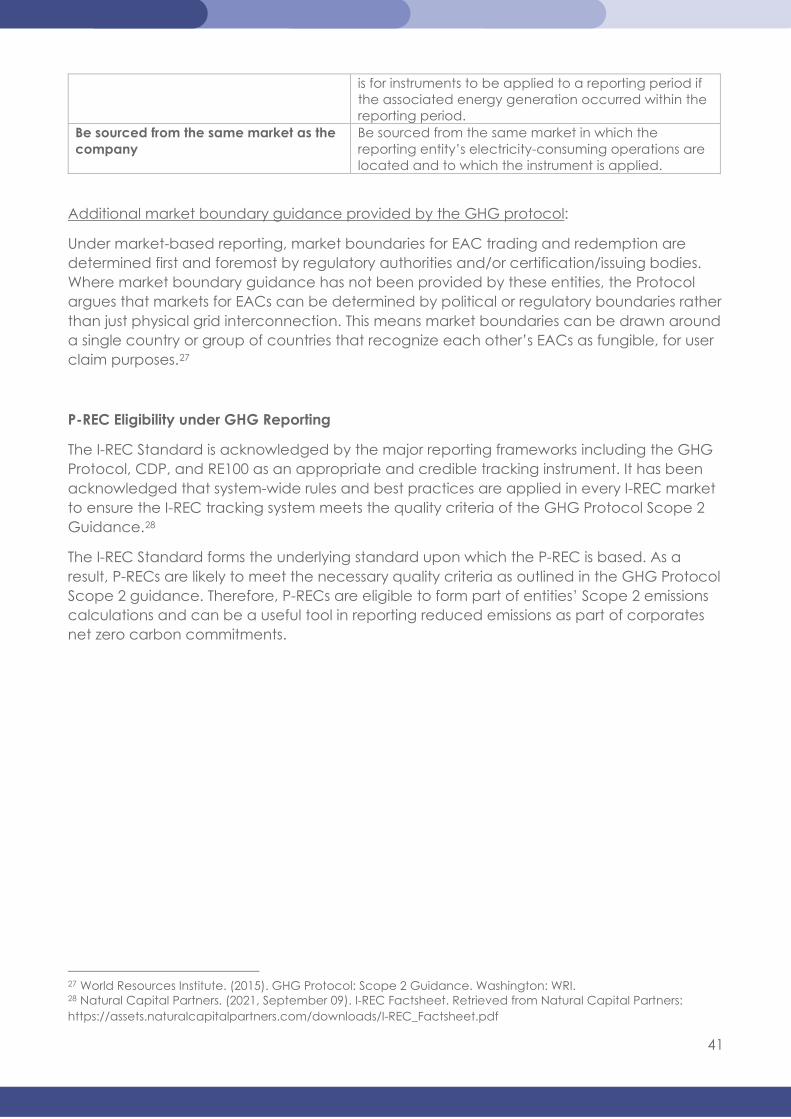
41
is for instruments to be applied to a reporting period if the associated energy generation occurred within the reporting period.
Be sourced from the same market as the company
Be sourced from the same market in which the reporting entity’s electricity-consuming operations are located and to which the instrument is applied.
Additional market boundary guidance provided by the GHG protocol:
Under market-based reporting, market boundaries for EAC trading and redemption are determined first and foremost by regulatory authorities and/or certification/issuing bodies. Where market boundary guidance has not been provided by these entities, the Protocol argues that markets for EACs can be determined by political or regulatory boundaries rather than just physical grid interconnection. This means market boundaries can be drawn around a single country or group of countries that recognize each other’s EACs as fungible, for user claim purposes.27
P-REC Eligibility under GHG Reporting
The I-REC Standard is acknowledged by the major reporting frameworks including the GHG Protocol, CDP, and RE100 as an appropriate and credible tracking instrument. It has been acknowledged that system-wide rules and best practices are applied in every I-REC market to ensure the I-REC tracking system meets the quality criteria of the GHG Protocol Scope 2 Guidance.28
The I-REC Standard forms the underlying standard upon which the P-REC is based. As a result, P-RECs are likely to meet the necessary quality criteria as outlined in the GHG Protocol Scope 2 guidance. Therefore, P-RECs are eligible to form part of entities’ Scope 2 emissions calculations and can be a useful tool in reporting reduced emissions as part of corporates net zero carbon commitments.
27 World Resources Institute. (2015). GHG Protocol: Scope 2 Guidance. Washington: WRI. 28 Natural Capital Partners. (2021, September 09). I-REC Factsheet. Retrieved from Natural Capital Partners: https://assets.naturalcapitalpartners.com/downloads/I-REC_Factsheet.pdf
42
ANNEX 5 – PROJECT DEVELOPER CASE STUDY (NURU) Mini-grid operator Nuru (DR Congo) funded and installed community streetlights through P-REC sales to Microsoft and partially financed and constructed two mini-grids through P-REC sales to Google. Goma Streetlights (DR Congo): P-REC Buyer: Microsoft (2020) P-REC Project: Funding/installation of community streetlights Project Impact: Increased renewable energy access in community where average
electricity access rate is 3%. Increased livelihood opportunities and improved safety and security for 28,000 residents.
Market impact: Launched P-REC market, first I-RECs issued from DRC, among first off-grid I-RECs
Garamba National Park Rural Mini-grids (DR Congo): P-REC Buyer: Google (2021) P-REC Project: Funding for distributed rural solar mini-grids Project Impact: Provided first-time electrification to underserved rural communities,
offering alternatives to poaching and artisanal mining. Market Impact: P-REC multi-year forward sale key component of project finance
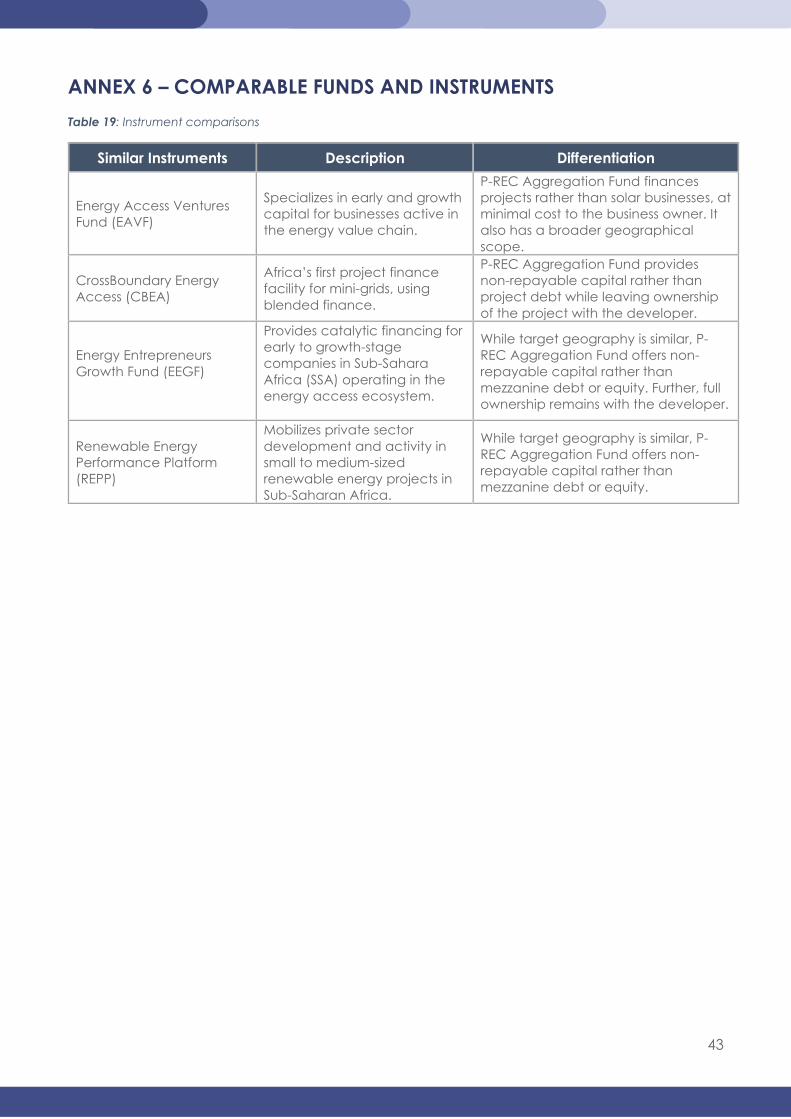
43
ANNEX 6 – COMPARABLE FUNDS AND INSTRUMENTS Table 19: Instrument comparisons
Similar Instruments Description Differentiation
Energy Access Ventures Fund (EAVF)
Specializes in early and growth capital for businesses active in the energy value chain.
P-REC Aggregation Fund finances projects rather than solar businesses, at minimal cost to the business owner. It also has a broader geographical scope.
CrossBoundary Energy Access (CBEA)
Africa’s first project finance facility for mini-grids, using blended finance.
P-REC Aggregation Fund provides non-repayable capital rather than project debt while leaving ownership of the project with the developer.
Energy Entrepreneurs Growth Fund (EEGF)
Provides catalytic financing for early to growth-stage companies in Sub-Sahara Africa (SSA) operating in the energy access ecosystem.
While target geography is similar, P-REC Aggregation Fund offers non-repayable capital rather than mezzanine debt or equity. Further, full ownership remains with the developer.
Renewable Energy Performance Platform (REPP)
Mobilizes private sector development and activity in small to medium-sized renewable energy projects in Sub-Saharan Africa.
While target geography is similar, P-REC Aggregation Fund offers non-repayable capital rather than mezzanine debt or equity.
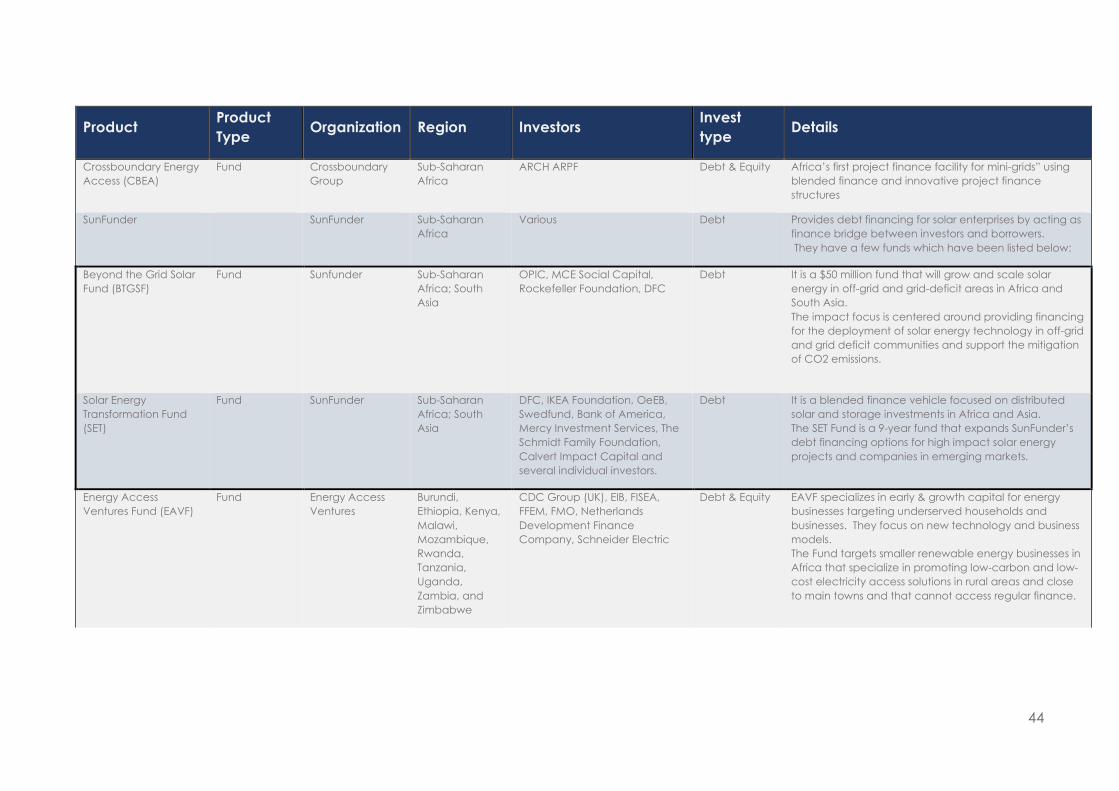
44
Product Product Type Organization Region Investors Invest
type Details
Crossboundary Energy Access (CBEA)
Fund Crossboundary Group
Sub-Saharan Africa
ARCH ARPF Debt & Equity Africa’s first project finance facility for mini-grids” using blended finance and innovative project finance structures
SunFunder SunFunder Sub-Saharan Africa
Various Debt Provides debt financing for solar enterprises by acting as finance bridge between investors and borrowers. They have a few funds which have been listed below:
Beyond the Grid Solar Fund (BTGSF)
Fund Sunfunder Sub-Saharan Africa; South Asia
OPIC, MCE Social Capital, Rockefeller Foundation, DFC
Debt It is a $50 million fund that will grow and scale solar energy in off-grid and grid-deficit areas in Africa and South Asia. The impact focus is centered around providing financing for the deployment of solar energy technology in off-grid and grid deficit communities and support the mitigation of CO2 emissions.
Solar Energy Transformation Fund (SET)
Fund SunFunder Sub-Saharan Africa; South Asia
DFC, IKEA Foundation, OeEB, Swedfund, Bank of America, Mercy Investment Services, The Schmidt Family Foundation, Calvert Impact Capital and several individual investors.
Debt It is a blended finance vehicle focused on distributed solar and storage investments in Africa and Asia. The SET Fund is a 9-year fund that expands SunFunder’s debt financing options for high impact solar energy projects and companies in emerging markets.
Energy Access Ventures Fund (EAVF)
Fund Energy Access Ventures
Burundi, Ethiopia, Kenya, Malawi, Mozambique, Rwanda, Tanzania, Uganda, Zambia, and Zimbabwe
CDC Group (UK), EIB, FISEA, FFEM, FMO, Netherlands Development Finance Company, Schneider Electric
Debt & Equity EAVF specializes in early & growth capital for energy businesses targeting underserved households and businesses. They focus on new technology and business models. The Fund targets smaller renewable energy businesses in Africa that specialize in promoting low-carbon and low-cost electricity access solutions in rural areas and close to main towns and that cannot access regular finance.
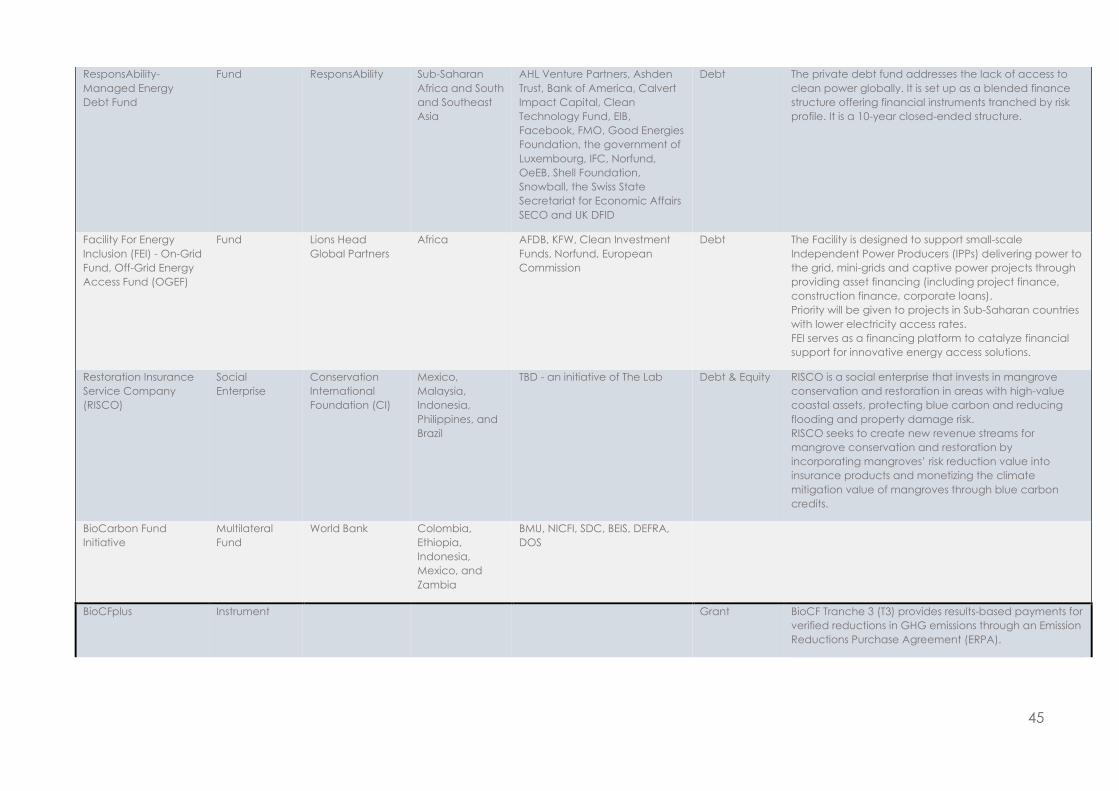
45
ResponsAbility-Managed Energy Debt Fund
Fund ResponsAbility Sub-Saharan Africa and South and Southeast Asia
AHL Venture Partners, Ashden Trust, Bank of America, Calvert Impact Capital, Clean Technology Fund, EIB, Facebook, FMO, Good Energies Foundation, the government of Luxembourg, IFC, Norfund, OeEB, Shell Foundation, Snowball, the Swiss State Secretariat for Economic Affairs SECO and UK DFID
Debt The private debt fund addresses the lack of access to clean power globally. It is set up as a blended finance structure offering financial instruments tranched by risk profile. It is a 10-year closed-ended structure.
Facility For Energy Inclusion (FEI) - On-Grid Fund, Off-Grid Energy Access Fund (OGEF)
Fund Lions Head Global Partners
Africa AFDB, KFW, Clean Investment Funds, Norfund, European Commission
Debt The Facility is designed to support small-scale Independent Power Producers (IPPs) delivering power to the grid, mini-grids and captive power projects through providing asset financing (including project finance, construction finance, corporate loans). Priority will be given to projects in Sub-Saharan countries with lower electricity access rates. FEI serves as a financing platform to catalyze financial support for innovative energy access solutions.
Restoration Insurance Service Company (RISCO)
Social Enterprise
Conservation International Foundation (CI)
Mexico, Malaysia, Indonesia, Philippines, and Brazil
TBD - an initiative of The Lab Debt & Equity RISCO is a social enterprise that invests in mangrove conservation and restoration in areas with high-value coastal assets, protecting blue carbon and reducing flooding and property damage risk. RISCO seeks to create new revenue streams for mangrove conservation and restoration by incorporating mangroves’ risk reduction value into insurance products and monetizing the climate mitigation value of mangroves through blue carbon credits.
BioCarbon Fund Initiative
Multilateral Fund
World Bank Colombia, Ethiopia, Indonesia, Mexico, and Zambia
BMU, NICFI, SDC, BEIS, DEFRA, DOS
BioCFplus Instrument Grant BioCF Tranche 3 (T3) provides results-based payments for verified reductions in GHG emissions through an Emission Reductions Purchase Agreement (ERPA).
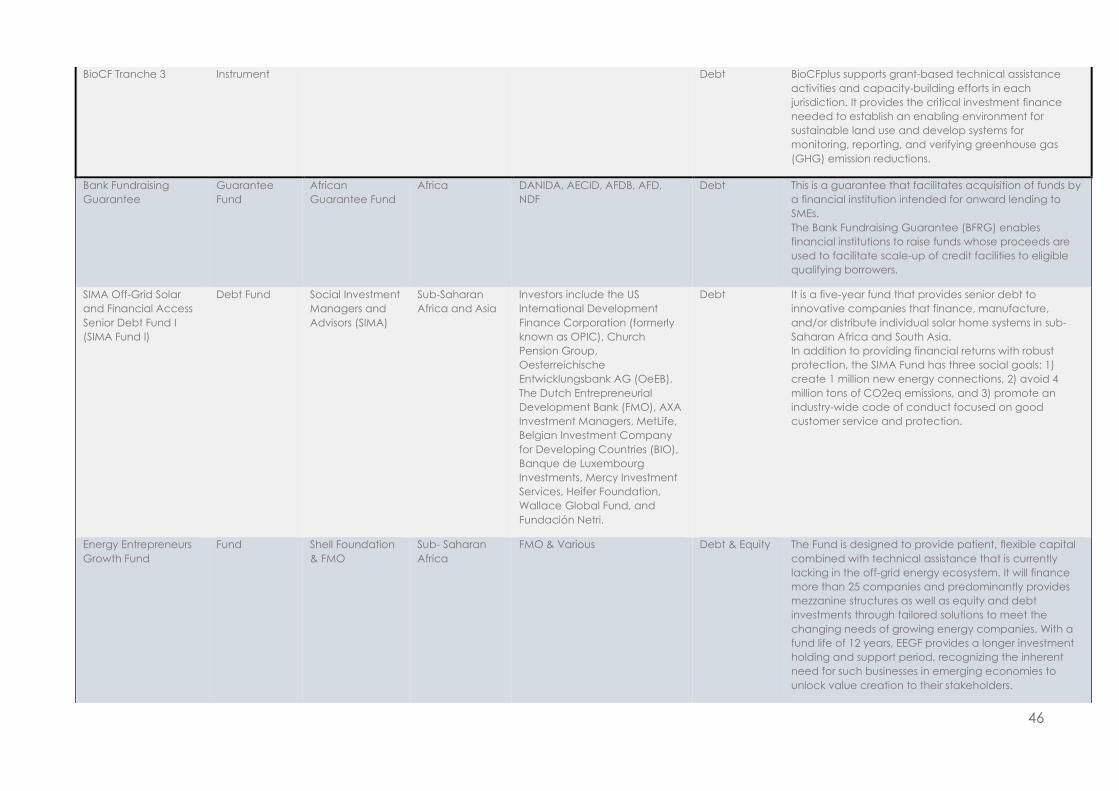
46
BioCF Tranche 3 Instrument Debt BioCFplus supports grant-based technical assistance activities and capacity-building efforts in each jurisdiction. It provides the critical investment finance needed to establish an enabling environment for sustainable land use and develop systems for monitoring, reporting, and verifying greenhouse gas (GHG) emission reductions.
Bank Fundraising Guarantee
Guarantee Fund
African Guarantee Fund
Africa DANIDA, AECID, AFDB, AFD, NDF
Debt This is a guarantee that facilitates acquisition of funds by a financial institution intended for onward lending to SMEs. The Bank Fundraising Guarantee (BFRG) enables financial institutions to raise funds whose proceeds are used to facilitate scale-up of credit facilities to eligible qualifying borrowers.
SIMA Off-Grid Solar and Financial Access Senior Debt Fund I (SIMA Fund I)
Debt Fund Social Investment Managers and Advisors (SIMA)
Sub-Saharan Africa and Asia
Investors include the US International Development Finance Corporation (formerly known as OPIC), Church Pension Group, Oesterreichische Entwicklungsbank AG (OeEB), The Dutch Entrepreneurial Development Bank (FMO), AXA Investment Managers, MetLife, Belgian Investment Company for Developing Countries (BIO), Banque de Luxembourg Investments, Mercy Investment Services, Heifer Foundation, Wallace Global Fund, and Fundación Netri.
Debt It is a five-year fund that provides senior debt to innovative companies that finance, manufacture, and/or distribute individual solar home systems in sub-Saharan Africa and South Asia. In addition to providing financial returns with robust protection, the SIMA Fund has three social goals: 1) create 1 million new energy connections, 2) avoid 4 million tons of CO2eq emissions, and 3) promote an industry-wide code of conduct focused on good customer service and protection.
Energy Entrepreneurs Growth Fund
Fund Shell Foundation & FMO
Sub- Saharan Africa
FMO & Various Debt & Equity The Fund is designed to provide patient, flexible capital combined with technical assistance that is currently lacking in the off-grid energy ecosystem. It will finance more than 25 companies and predominantly provides mezzanine structures as well as equity and debt investments through tailored solutions to meet the changing needs of growing energy companies. With a fund life of 12 years, EEGF provides a longer investment holding and support period, recognizing the inherent need for such businesses in emerging economies to unlock value creation to their stakeholders.
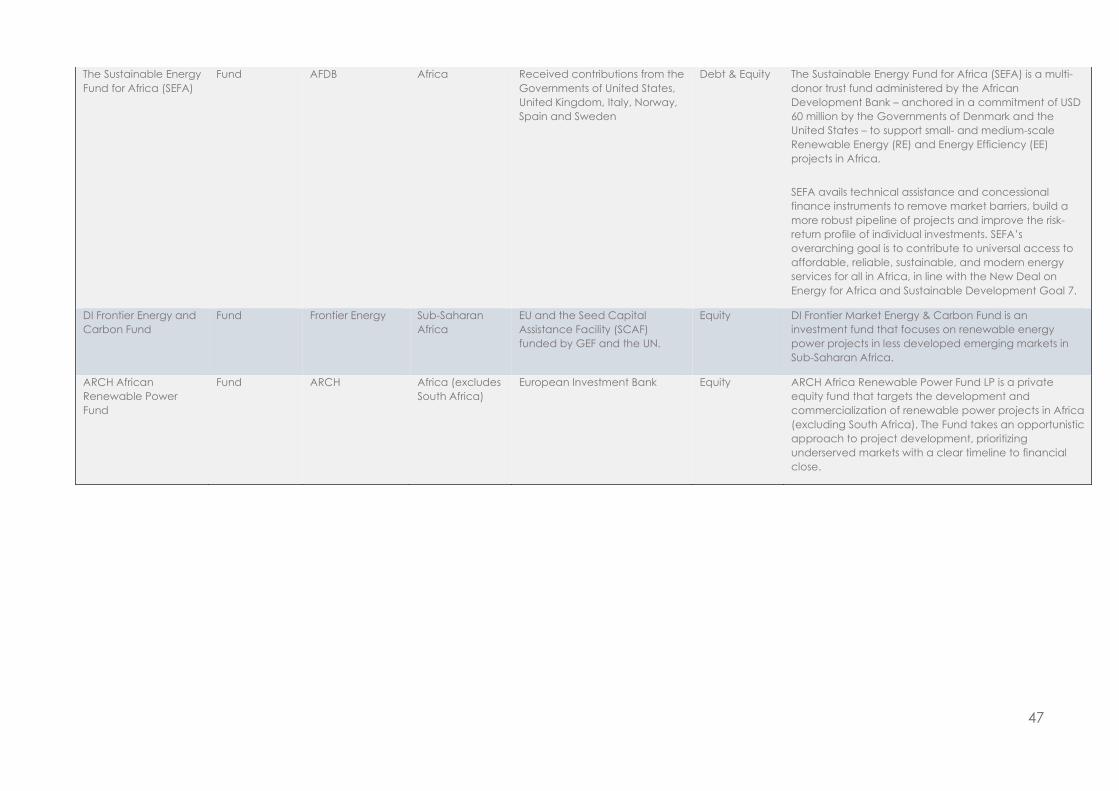
47
The Sustainable Energy Fund for Africa (SEFA)
Fund AFDB Africa Received contributions from the Governments of United States, United Kingdom, Italy, Norway, Spain and Sweden
Debt & Equity The Sustainable Energy Fund for Africa (SEFA) is a multi-donor trust fund administered by the African Development Bank – anchored in a commitment of USD 60 million by the Governments of Denmark and the United States – to support small- and medium-scale Renewable Energy (RE) and Energy Efficiency (EE) projects in Africa. SEFA avails technical assistance and concessional finance instruments to remove market barriers, build a more robust pipeline of projects and improve the risk-return profile of individual investments. SEFA’s overarching goal is to contribute to universal access to affordable, reliable, sustainable, and modern energy services for all in Africa, in line with the New Deal on Energy for Africa and Sustainable Development Goal 7.
DI Frontier Energy and Carbon Fund
Fund Frontier Energy Sub-Saharan Africa
EU and the Seed Capital Assistance Facility (SCAF) funded by GEF and the UN.
Equity DI Frontier Market Energy & Carbon Fund is an investment fund that focuses on renewable energy power projects in less developed emerging markets in Sub-Saharan Africa.
ARCH African Renewable Power Fund
Fund ARCH Africa (excludes South Africa)
European Investment Bank Equity ARCH Africa Renewable Power Fund LP is a private equity fund that targets the development and commercialization of renewable power projects in Africa (excluding South Africa). The Fund takes an opportunistic approach to project development, prioritizing underserved markets with a clear timeline to financial close.
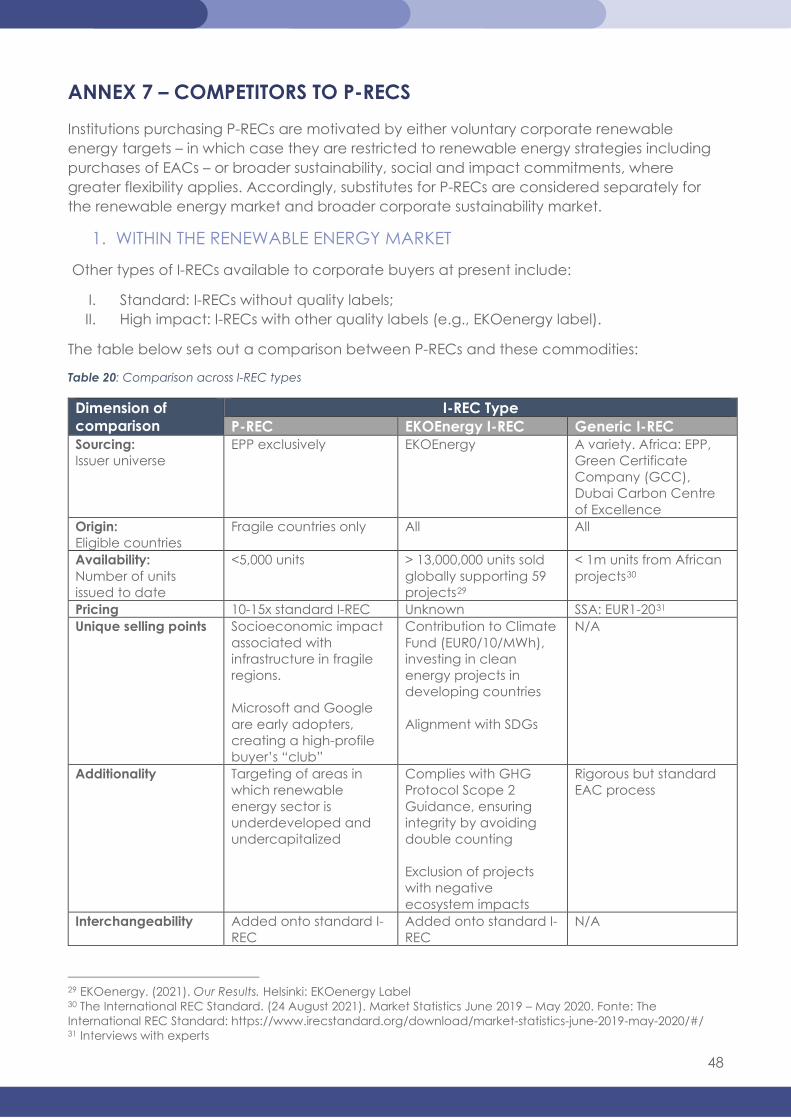
48
ANNEX 7 – COMPETITORS TO P-RECS Institutions purchasing P-RECs are motivated by either voluntary corporate renewable energy targets – in which case they are restricted to renewable energy strategies including purchases of EACs – or broader sustainability, social and impact commitments, where greater flexibility applies. Accordingly, substitutes for P-RECs are considered separately for the renewable energy market and broader corporate sustainability market.
1. WITHIN THE RENEWABLE ENERGY MARKET
Other types of I-RECs available to corporate buyers at present include:
I. Standard: I-RECs without quality labels; II. High impact: I-RECs with other quality labels (e.g., EKOenergy label).
The table below sets out a comparison between P-RECs and these commodities:
Table 20: Comparison across I-REC types
Dimension of comparison
I-REC Type P-REC EKOEnergy I-REC Generic I-REC
Sourcing: Issuer universe
EPP exclusively EKOEnergy A variety. Africa: EPP, Green Certificate Company (GCC), Dubai Carbon Centre of Excellence
Origin: Eligible countries
Fragile countries only All All
Availability: Number of units issued to date
<5,000 units
> 13,000,000 units sold globally supporting 59 projects29
< 1m units from African projects30
Pricing 10-15x standard I-REC Unknown SSA: EUR1-2031 Unique selling points Socioeconomic impact
associated with infrastructure in fragile regions. Microsoft and Google are early adopters, creating a high-profile buyer’s “club”
Contribution to Climate Fund (EUR0/10/MWh), investing in clean energy projects in developing countries Alignment with SDGs
N/A
Additionality Targeting of areas in which renewable energy sector is underdeveloped and undercapitalized
Complies with GHG Protocol Scope 2 Guidance, ensuring integrity by avoiding double counting Exclusion of projects with negative ecosystem impacts
Rigorous but standard EAC process
Interchangeability Added onto standard I-REC
Added onto standard I-REC
N/A
29 EKOenergy. (2021). Our Results. Helsinki: EKOenergy Label 30 The International REC Standard. (24 August 2021). Market Statistics June 2019 – May 2020. Fonte: The International REC Standard: https://www.irecstandard.org/download/market-statistics-june-2019-may-2020/#/ 31 Interviews with experts
49
P-RECs enjoy distinct market advantages over generic I-RECs and EKOEnergy certified I-RECs due to the socioeconomic impact associated with investing in renewable energy in vulnerable areas. Engaging in P-REC purchases can be a powerful brand enhancement tool for corporates, displaying commitment not only to renewable energy but to equity and social inclusion in the communities proximate to their operations.
It is noted that the premium pricing of P-RECs may come under pressure at larger trading volumes, given substantially lower generic I-REC price levels. However, the initial transactions and subsequent market interest indicate that for some companies with strong environmental and social commitments, impact considerations outweigh pricing considerations.
Further, additional competitor I-REC labels may emerge, targeting the spending power of high-profile P-REC buyers, e.g., Microsoft and Google. In this regard, EPP’s standing and experience as an I-REC issuer support the credibility of P-RECs over newer instruments without proven market track records.
For instance, South Pole and Positive Capital Partners are developing a D-REC (Distributed RECs) platform to facilitate access to various climate finance instruments (e.g., climate bonds) for distributed renewable energy developers in emerging markets. Demand for D-RECs and the extent of their alignment with the I-REC standard are not yet known. However, since D-RECs are denominated in kWh (1 D-REC = 1kWh), the platform may provide a technological solution for facilitating the aggregation and I-REC registration of small-scale distributed renewable energy projects – particularly solar home systems which are excluded from EAC markets – as no such solution currently exists. Theoretically, the P-REC label could be added to I-RECs issued from aggregated underlying D-RECs, suggesting complementarity.
Finally, as renewable energy markets develop, renewable energy will become more widely available to corporates, potentially reducing their demand for I-RECs. However, this is a long-term consideration.
2. WITHIN THE SPHERE OF CORPORATE SUSTAINABILITY Currently, the main competitors within the sphere of corporate sustainability are:
2.1 High quality carbon offsets with socioeconomic co-benefits. A carbon credit represents a unit (1 ton) of carbon dioxide equivalent, and
2.2 Philanthropic contributions to projects or activities undertaken for sustainable development purposes (being a donation based on an expectation of specific outputs and/or outcomes).
Like RECs, carbon offsets are issued after the delivery of promised environmental performance. Through purchasing these commodities, corporates are engaging in outcomes-based investing, which is attractive for those hesitant to fund projects through donations due to uncertainty about the ability of project developers to deliver promised outputs / outcomes.
Philanthropic contributions are not directly comparable because they do not directly link to the delivery of specified environmental attributes or outcomes.
The table below outlines the key differences between P-RECs and high-quality carbon offsets.
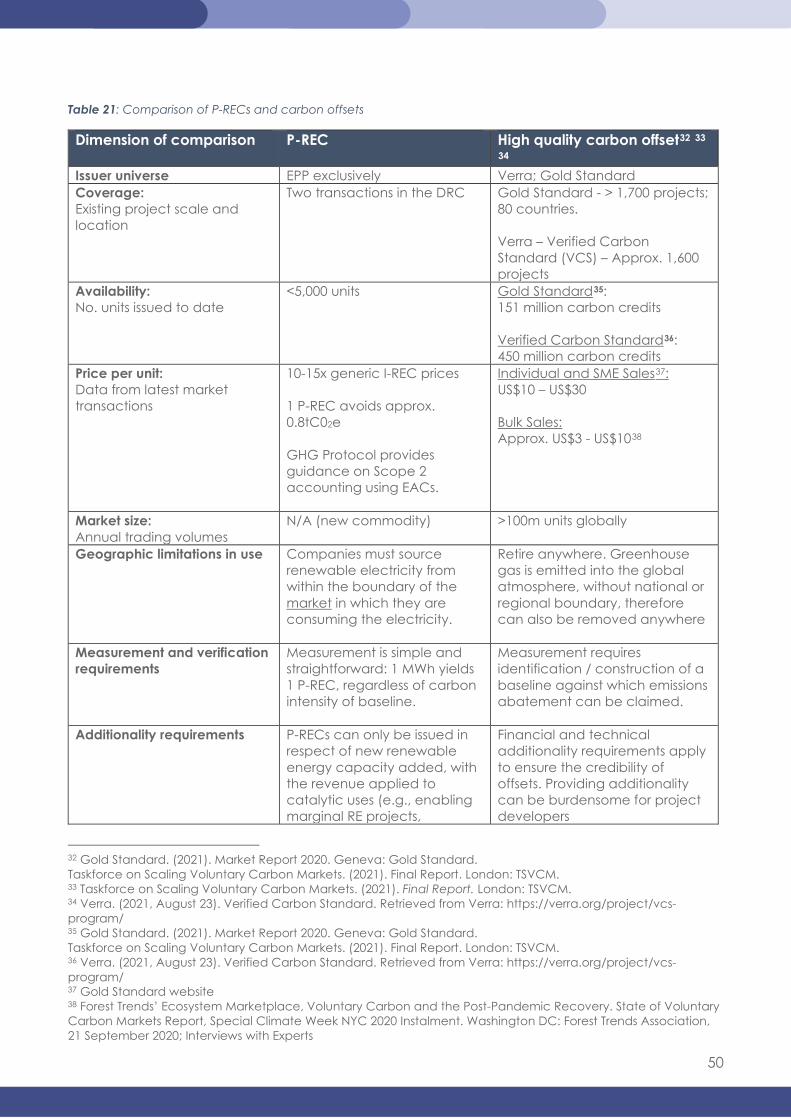
50
Table 21: Comparison of P-RECs and carbon offsets
Dimension of comparison P-REC High quality carbon offset32 33 34
Issuer universe EPP exclusively Verra; Gold Standard Coverage: Existing project scale and location
Two transactions in the DRC Gold Standard - > 1,700 projects; 80 countries. Verra – Verified Carbon Standard (VCS) – Approx. 1,600 projects
Availability: No. units issued to date
<5,000 units
Gold Standard35: 151 million carbon credits Verified Carbon Standard36: 450 million carbon credits
Price per unit: Data from latest market transactions
10-15x generic I-REC prices 1 P-REC avoids approx. 0.8tC02e GHG Protocol provides guidance on Scope 2 accounting using EACs.
Individual and SME Sales37: US$10 – US$30 Bulk Sales: Approx. US$3 - US$1038
Market size: Annual trading volumes
N/A (new commodity) >100m units globally
Geographic limitations in use
Companies must source renewable electricity from within the boundary of the market in which they are consuming the electricity.
Retire anywhere. Greenhouse gas is emitted into the global atmosphere, without national or regional boundary, therefore can also be removed anywhere
Measurement and verification requirements
Measurement is simple and straightforward: 1 MWh yields 1 P-REC, regardless of carbon intensity of baseline.
Measurement requires identification / construction of a baseline against which emissions abatement can be claimed.
Additionality requirements P-RECs can only be issued in respect of new renewable energy capacity added, with the revenue applied to catalytic uses (e.g., enabling marginal RE projects,
Financial and technical additionality requirements apply to ensure the credibility of offsets. Providing additionality can be burdensome for project developers
32 Gold Standard. (2021). Market Report 2020. Geneva: Gold Standard. Taskforce on Scaling Voluntary Carbon Markets. (2021). Final Report. London: TSVCM. 33 Taskforce on Scaling Voluntary Carbon Markets. (2021). Final Report. London: TSVCM. 34 Verra. (2021, August 23). Verified Carbon Standard. Retrieved from Verra: https://verra.org/project/vcs-program/ 35 Gold Standard. (2021). Market Report 2020. Geneva: Gold Standard. Taskforce on Scaling Voluntary Carbon Markets. (2021). Final Report. London: TSVCM. 36 Verra. (2021, August 23). Verified Carbon Standard. Retrieved from Verra: https://verra.org/project/vcs-program/ 37 Gold Standard website 38 Forest Trends’ Ecosystem Marketplace, Voluntary Carbon and the Post-Pandemic Recovery. State of Voluntary Carbon Markets Report, Special Climate Week NYC 2020 Instalment. Washington DC: Forest Trends Association, 21 September 2020; Interviews with Experts
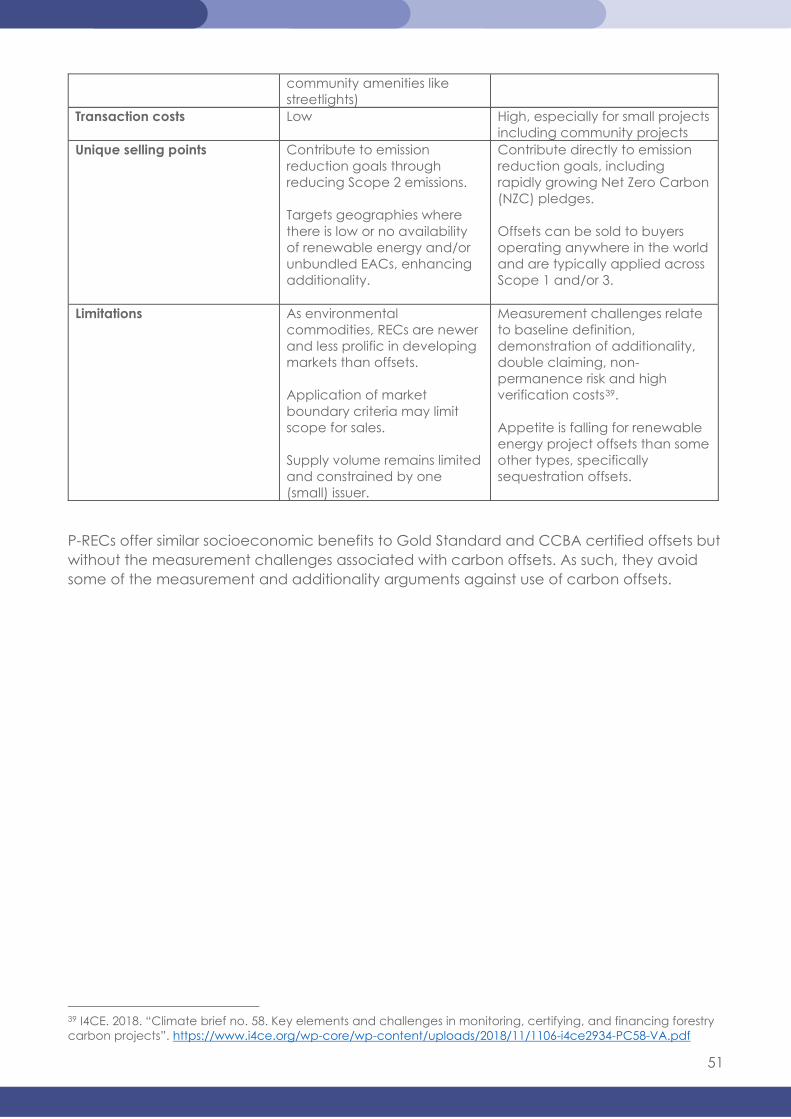
51
community amenities like streetlights)
Transaction costs Low High, especially for small projects including community projects
Unique selling points Contribute to emission reduction goals through reducing Scope 2 emissions. Targets geographies where there is low or no availability of renewable energy and/or unbundled EACs, enhancing additionality.
Contribute directly to emission reduction goals, including rapidly growing Net Zero Carbon (NZC) pledges. Offsets can be sold to buyers operating anywhere in the world and are typically applied across Scope 1 and/or 3.
Limitations As environmental commodities, RECs are newer and less prolific in developing markets than offsets. Application of market boundary criteria may limit scope for sales. Supply volume remains limited and constrained by one (small) issuer.
Measurement challenges relate to baseline definition, demonstration of additionality, double claiming, non-permanence risk and high verification costs39. Appetite is falling for renewable energy project offsets than some other types, specifically sequestration offsets.
P-RECs offer similar socioeconomic benefits to Gold Standard and CCBA certified offsets but without the measurement challenges associated with carbon offsets. As such, they avoid some of the measurement and additionality arguments against use of carbon offsets.
39 I4CE. 2018. “Climate brief no. 58. Key elements and challenges in monitoring, certifying, and financing forestry carbon projects”. https://www.i4ce.org/wp-core/wp-content/uploads/2018/11/1106-i4ce2934-PC58-VA.pdf