Embed Size (px)
Citation preview

RESEARCH ARTICLE
Peak Torque and Rate of TorqueDevelopment Influence on RepeatedMaximal Exercise Performance: Contractileand Neural ContributionsBaptiste Morel1*, David M. Rouffet2, Damien Saboul1,3, Samuel Rota1, Michel Clémençon1,Christophe A. Hautier1
1 Center of Research and Innovation on Sport, University of Lyon 1, Villeurbanne, France, 2 Institute ofSport, Exercise and Active Living, Victoria University, Melbourne, Australia, 3 Almerys, Clermont-Ferrand,France
AbstractRapid force production is critical to improve performance and prevent injuries. However,
changes in rate of force/torque development caused by the repetition of maximal contrac-
tions have received little attention. The aim of this study was to determine the relative
influence of rate of torque development (RTD) and peak torque (Tpeak) on the overall perfor-
mance (i.e. mean torque, Tmean) decrease during repeated maximal contractions and to in-
vestigate the contribution of contractile and neural mechanisms to the alteration of the
various mechanical variables. Eleven well-trained men performed 20 sets of 6-s isokinetic
maximal knee extensions at 240°�s-1, beginning every 30 seconds. RTD, Tpeak and Tmean
as well as the Rate of EMG Rise (RER), peak EMG (EMGpeak) and mean EMG (EMGmean)
of the vastus lateralis were monitored for each contraction. A wavelet transform was also
performed on raw EMG signal for instant mean frequency (ifmean) calculation. A neuromus-
cular testing procedure was carried out before and immediately after the fatiguing protocol
including evoked RTD (eRTD) and maximal evoked torque (eTpeak) induced by high fre-
quency doublet (100 Hz). Tmean decrease was correlated to RTD and Tpeak decrease
(R²=0.62; p<0.001; respectively β=0.62 and β=0.19). RER, eRTD and initial ifmean (0-225
ms) decreased after 20 sets (respectively -21.1±14.1, -25±13%, and ~20%). RTD decrease
was correlated to RER decrease (R²=0.36; p<0.05). The eTpeak decreased significantly
after 20 sets (24±5%; p<0.05) contrary to EMGpeak (-3.2±19.5 %; p=0.71). Our results show
that reductions of RTD explained part of the alterations of the overall performance during re-
peated moderate velocity maximal exercise. The reductions of RTD were associated to an
impairment of the ability of the central nervous system to maximally activate the muscle in
the first milliseconds of the contraction.
PLOS ONE | DOI:10.1371/journal.pone.0119719 April 22, 2015 1 / 16
OPEN ACCESS
Citation: Morel B, Rouffet DM, Saboul D, Rota S,Clémençon M, Hautier CA (2015) Peak Torque andRate of Torque Development Influence on RepeatedMaximal Exercise Performance: Contractile andNeural Contributions. PLoS ONE 10(4): e0119719.doi:10.1371/journal.pone.0119719
Academic Editor: Jonathan Peterson, EastTennessee State University, UNITED STATES
Received: August 10, 2014
Accepted: January 16, 2015
Published: April 22, 2015
Copyright: © 2015 Morel et al. This is an openaccess article distributed under the terms of theCreative Commons Attribution License, which permitsunrestricted use, distribution, and reproduction in anymedium, provided the original author and source arecredited.
Data Availability Statement: All relevant data arewithin the paper and its Supporting Information files.
Funding: The authors received no specific fundingfor this work.
Competing Interests: One of the authors is affiliatedto a commercial company (Almerys). This companyworks on telecommunication and D. Saboul isemployed in the research department. Nevertheless,the authors declare no conflict of interest sinceD. Saboul worked on the present study formethodological supply concerning the EMG signal

IntroductionFatigue can be defined as a reduction in the force generating capacity of the neuromuscular sys-tem, regardless of the level of force required [1]. During exercises of maximal intensity, fatiguecan result into declines of force [2, 3], contraction velocity [4, 5] or power [4, 6, 7]. In recentyears, numerous studies have investigated the mechanisms at the origin of fatigue during inter-mittent maximal isokinetic contractions interspersed by short recovery periods. Most studieshave investigated fatigue-induced impairments of human performances by focusing on reduc-tions of the average levels and/or peak levels of force, diminutions of peak movement velocity,or changes in the curvature of the force-velocity relationships. However, the effect of fatigue onthe ability to produce force rapidly has received less attention despite its importance for theproduction of many movements. Indeed, rate of force development (RFD) is a key factor ofperformance during movements characterized by reduced contractions times (<250ms) suchas sprinting, jumping or kicking [8]. Furthermore, maintaining the ability of producing highRFD values is important to limit the risks of injury following mechanical perturbation [9]. Theunderstanding of how rate of force development (RFD) is impaired during intermittent maxi-mal exercise is decisive for a better comprehension of athletic performance and injury risk.
The origin of fatigue following repeated maximal isokinetic contractions has been previouslyinvestigated. Following a series of contractions performed at moderate velocity, it has beenshown that evoked peak twitch responses are substantially reduced (by 25 to 75%) [2, 5, 10].Conversely, investigation of changes in voluntary activation using the twitch interpolation tech-nique only revealed slight reductions (by 3 to 5%) [2, 5, 10] of the ability of the central nervoussystem to maximally activate the muscles following repeated maximal contractions. Because ofthe relatively long duration of maximal isometric contractions, one can wonder if the twitch in-terpolation technique can be used to identify manifestations of central fatigue causing reductionsof rapid force production. Recent studies showed that, during simulated team sport matches, theRFD decrease was associated with a decrease in EMG signal during the early phase of the con-traction (0–100 ms). Therefore, fatigue induced by repeated maximal contractions manifests bya reduction of RFD that might be due to an alteration of the ability to maximally and rapidly ac-tivate the muscles [11, 12]. The contractile component of the RFD, estimated during evokedtwitch, has also been evidenced to be altered following a fatiguing protocol of repeated maximalcontractions [13]. However, no study has investigated the link between fatigue-induced reduc-tions of RFD and changes in the EMG signals during the early part of the contraction after repe-tition of a series of maximal contractions performed at moderate velocities.
The first aim of this study was to evaluate the relative contribution of reductions in the rateof torque development and diminutions of the peak torque on the decrease of the average tor-que measured during repeated maximal contractions performed at a moderate velocity (240degrees/s). The second aim was to investigate the link between fatigue-induced reductions ofRTD and changes in the contractile (twitch) and neural (EMG) responses. It was hypothesizedthat i) reductions of RTD have a substantial impact on the decrease of overall performance pro-duced during repeated maximal contractions performed at moderate velocities and ii) diminu-tions of RTD would be associated to alterations of the characteristics of the evoked torque andthe EMG signal during the initial phase of the contraction.
Materials and Methods
SubjectsEleven males volunteered to participate in this study (mean ± SD; age: 22.7 ± 1.9 year; mass:87.6 ± 8.6 kg; height: 1.82 ± 0.06 m; training volume: 11.1 ± 3.1 h.wk-1). All participants
Peak Torque and Rate of Torque Development Fatigue Etiology
PLOS ONE | DOI:10.1371/journal.pone.0119719 April 22, 2015 2 / 16
analysis which is not related to Almerys commercial’sactivity. Furthermore, this does not alter the authors’adherence to PLOS ONE policies on sharing dataand materials.

regularly performed maximal efforts involving their lower limb muscles. Written informedconsent was obtained from the subjects, and the study was conducted according to the declara-tion of Helsinki. Approval for the project was obtained from the Lyon 1 University ethics com-mittee on human experimentation.
Experimental designFirst, the subjects participated in a familiarization session to become accustomed to the testingprocedures. At the start of the experimental session, participants completed a standardizedwarm-up protocol that consisted of a 10-min cycling exercise completed at 1 W�kg-1 of bodymass immediately followed by a series of knee extensions (standardized order, perceived inten-sity from 70% at the beginning to 100% at the end of the warm-up, recovery between sets = 45s: 8 × 240°�s-1; 6 × 180°�s-1; 4 × 90°�s-1; 2 × 30°�s-1; 2 × 0°�s-1). Following a 5-min recovery peri-od, participants completed a pre-exercise neuromuscular testing before completing the exerciseprotocol (i.e. repeated maximal knee extensions). Immediately after completion of the exerciseprotocol, participants performed a post-exercise neuromuscular testing (see Fig 1).
The exercise protocol consisted of total of 160 isokinetic maximal knee extensions that wereperformed at 240°�s-1, with the knee joint angle changing from 105° to 15° (0° corresponding tofull knee extension) so that each contraction lasted ~375ms. The 160 contractions were per-formed in the following manner: participants completed 20 sets of eight repetitions each(work/rest ratio = 1 during each set) and were given 24s recovery between each set (see Fig 1).At the end of each maximal knee extension, an experimenter manually pushed the arm to itsinitial position while the participants were instructed to relax their knee flexors during thisphase. Participants were instructed to “push as hard and as fast as possible” during each con-traction and were provided with a real-time visual feedback allowing them to monitor the tor-que produced during each maximal knee extension. Researchers provide participants withstrong verbal encouragements during the whole duration of the exercise. Immediately aftercompletion of the 160 maximal knee extensions, participants completed the same the neuro-muscular testing (i.e. post-exercise neuromuscular testing).
For the neuromuscular testing (organized pre- and post-exercise) participant were instructedto perform three isometric maximal voluntary contractions (IMVC) of 4-s duration each inter-spersed by 60-s rest with the knee positioned at 90°. During each IMVC, the femoral nerve waselectrically stimulated. First a high-frequency doublet stimulus (100 Hz) was delivered on thetorque plateau (identified using a real-time visual display of the torque signal) while the subjectswere instructed to prolong their IMVC for about 2 s after the stimulation. After each IMVC,participants were instructed to relax their muscles. During this period, one high frequency dou-blet stimulation (100 Hz) was applied 2 s after the end of the IMVC followed by low frequency(10 Hz) doublet stimulation 5 s after the first stimulation and a single twitch was applied 5 slater. The ratio between Db10 and eTpeak (Db10:100) was also calculated to investigate if there wasany predominance of low or high frequency fatigue, respectively associated to Ca2+ release-reup-take or sarcolemmal disruption [14]. For both pre- and post-exercise neuromuscular testing, av-erage values of eTpeak, Db10:100 and eRTD were calculated over the three measurementsobtained as no changes were observed between measurements during the post-exercise testing.Peripheral nerve stimulations were delivered using an electrical stimulator (Digitimer DS7AH,Hertfordshire, UK) and consisted of a square wave stimuli (200 μs duration and 400 V) deliv-ered by at supra-maximal intensity (i.e. 150% of the stimulation intensity inducing maximal me-chanical and electrical response). All electrical stimulations were delivered by percutaneouslystimulating the femoral nerve using a self-adhesive cathode (10-mm diameter, Ag-AgCl,Contrôle Graphique Medical, Brie-Comte-Robert, France) that was pressed manually over the
Peak Torque and Rate of Torque Development Fatigue Etiology
PLOS ONE | DOI:10.1371/journal.pone.0119719 April 22, 2015 3 / 16

femoral triangle while the anode (a 10 × 5 cm self-adhesive stimulation electrode, MedicompexSA, Ecublens, Switzerland) was positioned in the gluteal fold.
Measurements and data analysisTorque. The torque was measured by the isokinetic dynamometer (Biodex 3, Biodex, Shir-
ley, NY) during the neuromuscular testing (pre and post-exercise) and the exercise protocol(maximal repeated knee extensions). The subjects were seated with their hip joint angles set at80° (0° is full extension) and their chest and working leg tightly fixed against the chair in orderto limit lateral and frontal displacement. They were also asked to cross their arms over thechest during the voluntary contractions to limit the involvement of peripheral muscles. Foreach contraction, both torque and angular velocity signals were recorded (sampling rate: 100Hz). The isokinetic dynamometer used an automated gravity correction. During the exerciseprotocol, the following variables were extracted for each contraction (n = 160): time requiredby the subjects to reach the target angular velocity (240°.s-1), average torque (Tmean), peak
Fig 1. Experimental design (A) and neuromuscular testing procedure (B). Arrows indicate the timing of(A) blood micro sampling for lactate analysis (Lapre and Lapost) and (B) motor nerve stimulation. Three typesof stimulation were performed: doublet stimulation at 100 Hz, doublet stimulation at 10 Hz and single twitch(Tw). Stimulations were delivered during the isometric maximal voluntary contraction (IMVC) and on therelaxed potentiated muscle (baseline).
doi:10.1371/journal.pone.0119719.g001
Peak Torque and Rate of Torque Development Fatigue Etiology
PLOS ONE | DOI:10.1371/journal.pone.0119719 April 22, 2015 4 / 16

torque (Tpeak), and rate of torque development (RTD). RTD values represent the average slopeof the torque vs. time curve between 0 and 75ms relative to the contraction onset (Fig 2A).
During the neuromuscular testing (both pre- and post-exercise), IMVC was calculated asthe maximal torque value obtained over a 500-ms period preceding the superimposed twitch.The following equation was used to calculate voluntary activation during neuromuscular test-ing organized pre- and post-exercise (Eq 1):
VA %ð Þ ¼ 1� superimposed twitchpotentiated resting twitch
� �� 100 ð1Þ
For the pre-exercise neuromuscular testing, voluntary activation (VA) was calculated from thesuperimposed twitch obtained during the highest IMVC (i.e. maximal value obtained from the
Fig 2. Torque and EMG signals recorded at the start and end of the exercise protocol. A- Illustration oftypical changes in average torque traces recorded during set 1 (black line) and set 20 (grey line) andassociated changes in the torque variables extracted: Tmean (dash-dotted lines), Tpeak (triangles) and RTD(dotted lines). B—Illustration of the typical changes in average EMGRMS signal of VL muscle recordedduring set 1 (black line) and set 20 (grey line) and associated changes in the EMG variables extracted:EMGmean (dash-dotted lines), EMGpeak (triangles) and RER (dotted lines).
doi:10.1371/journal.pone.0119719.g002
Peak Torque and Rate of Torque Development Fatigue Etiology
PLOS ONE | DOI:10.1371/journal.pone.0119719 April 22, 2015 5 / 16

three contractions). For the post-neuromuscular testing, VA was calculated from the superim-posed twitch obtained during the first IMVC in order to avoid any recovery between contrac-tions 1 and 3. Then the torque signal was processed to extract the maximal evoked torque(eTpeak) and the maximal evoked rate of twitch tension development (eRTD) induced by thehigh frequency doublet stimulation (100 Hz); as well as the maximal evoked torque (Db10) in-duced by low the frequency doublet stimulation (10 Hz). The ratio between Db10 and eTpeak
(Db10:100) was also calculated to investigate if there was any predominance of low or high fre-quency fatigue, respectively associated to Ca2+ release-reuptake or sarcolemmal disruption[14]. For both pre- and post-exercise neuromuscular testing, average values of eTpeak, Db10:100and eRTD were calculated over the three measurements obtained as no changes were observedbetween measurements during the post-exercise testing.
During each contraction performed during the repeated knee extension protocol, thefollowing variables were extracted: average torque (Tmean), peak torque (Tpeak) rate of torquedevelopment (RTD) that was calculated as the average slope of the torque—time curvebetween 0 and 75 ms relative to the contraction onset. Then, the values obtained for eachvariable were expressed as a percentage of the maximal values obtained and averaged over 4set (Fig 2A).
Electromyography. EMG activity of the vastus lateralis (VL) muscle of the dominant legwas recorded using surface electrodes (EMG Triode, nickel-plated brass, electrode diameter = 1cm, inter-electrode distance = 2 cm, Thought Technology, Montreal, Canada). EMG signalswere sampled at 2,048Hz using the Flexcomp Infiniti system (Thought Technology, Montreal,Canada). The Flexcomp Infiniti system had an input impedance and common mode rejectionratio of 2 MO and>110 dB, respectively. The EMG electrodes were positioned according toSENIAM recommendations [15]. The skin was shaved and cleaned with alcohol before placingelectrodes to improve the contact between skin and electrode and to reduce skin impedance(<2 kO). The electrodes were placed on the muscle belly and positioned longitudinally to themuscle fibers.
Raw EMGs were filtered (Butterworth order 2, bandpass 10–500 Hz) and amplified(gain = 500) before calculating root mean squared values (RMS) with a 50-ms moving rectan-gular window (Origin Pro 8.1, OriginLab, Northampton, USA). M-wave peak to peak ampli-tude (Mmax) was calculated as the voltage difference between the two extreme points of theelectromyographic response to optimal electrical stimulation (i.e. M-wave). For each contrac-tion, the following EMG variables were extracted: average EMG (EMGmean), peak EMG(EMGpeak) and rate of EMG increase (RER). RER values represent the average slope of theEMG—time curve between 0 and 75ms relative to the activation onset, since a decrease inEMG signal amplitude typically occurred after 80–100ms [8] (Fig 2B). Average values of thedifferent EMG variables were then calculated for five 20% intervals (i.e. including 32 contrac-tions each) of the exercise protocol (see Fig 1A) and were normalized to the maximal valuesmeasured during one of the 160 maximal knee contractions. Additionally, average values werecalculated for all EMG variables over the 8 first and last contractions performed and the valueswere normalized to Mmax values obtained pre- and post-fatigue, respectively (i.e. nEMGmean,nEMGpeak and nRER).
A wavelet transform (WT) was made on raw EMG signals for each contraction of the firstand the twentieth set. The computation of the WT was made with MATLAB software (R2010a,The MathWorks Inc., Natick, MA, USA) based on the algorithm of Torrence and Compo [16]available at http://paos.colorado.edu/research/wavelets, and modified by Frère, Göpfert, Sla-winski and Tourny-Chollet [17] to obtain a set of wavelets similar to the one defined by vonTscharner [18]. The EMG signal was transformed by a wavelet bank following a second-degree
Peak Torque and Rate of Torque Development Fatigue Etiology
PLOS ONE | DOI:10.1371/journal.pone.0119719 April 22, 2015 6 / 16

polynomial scale function, according to Eq 2:
Faj ¼ 1
scale
� �� jþ qð Þr ð2Þ
where Faj is the center frequency of wavelet j (Hz). For this study, the factor scale = 0.3 in orderto define a range of frequencies provided by different wavelets, while factors q (1.45) andr (1.959) optimized the spacing between the wavelets [18]. The mother wavelet used for WTwas a ‘Morlet’ wavelet. The instantaneous mean frequency (ifmean) was computed by the rela-tion (Eq 3):
ifmean ¼S10
j¼0Faj � Spj� �� �
S10j¼0 Spj
� �� � ð3Þ
The intensity (Spj) for each wavelet j was calculated and corresponded to the power of thesignal within the center frequencies of these two wavelet sets [19]. The mean ifmean was con-sidered for each 75 ms interval of the contraction (i.e., 0–75, 75–150, 150–225, 225–300 and300–375 ms).
Gas exchange. During the exercise protocol (maximal knee extensions), oxygen consump-tion (VO2) was measured using a mobile gas analyzer (MetaMax 3b; Cortex Biophysik, Leipzig,Germany). The analyzer was warmed up and calibrated according to the manufacturer’s in-structions before each measurement. Average VO2 values were calculated over 30 s intervals(i.e. 8 contractions + resting period duration). Non-linear regression techniques were used tomodel changes in VO2 over the whole duration of the exercise protocol. The data were well fit-ted by a mono-exponential function allowing us to use the asymptote of the function to calcu-late O2 consumption at a steady state.
Blood lactate. A micro blood sample was taken from the fingertip and analyzed for bloodlactate concentration [La-] using a Lactate Pro (LT-1710, Arkray, Japan) portable analyzer.[La-] was measured just after completion of the neuromuscular testing organized immediatelyprior and after the repeated knee extension exercise (i.e. 3 min after the end of the exercise fa-tiguing protocol). Blood lactate accumulation was obtained by calculating the variation be-tween [La-] values measured pre- and post-exercise [20].
Statistical analysisAll data were analyzed with Statistica 8.0 Software (StatSoft Inc., Tulsa, OK, USA) and were ex-pressed as means ± SD. The normality of the error distribution was examined with the Lillie-fors test. Homogeneity of variance was verified using Levene's test. With the assumption ofnormality and homogeneity of variance confirmed, a one-way analysis of variance (ANOVA)with repeated measures (set) was employed on ifmean, Tmean, Tpeak, RTD, EMGmean, EMGpeak,and RER. A one-way analysis of variance (ANOVA) with repeated measures (pre- vs. post-fa-tigue or 1st vs 20th set) was also employed on each pre- vs. post- variable (i.e. IMVC torque,VA, eTpeak Db10:100, eRTD, Mmax, blood lactate accumulation) and 1st vs 20th set (i.e. Tmean,Tpeak, RTD, nEMGmean, nEMGpeak, nRER). When a significant interaction was revealed,Tukey’s post hoc test was used to specify where the difference occurred. Forward stepwise mul-tiple linear regression analyses were performed to verify the influence of RTD and Tpeak onTmean as well as RER and EMGpeak on EMGmean. If one of the predictor variable did not im-proved the R2, was not significant or correlated to the other one, a simple linear regression wasperformed. A simple linear regression was used to verify the influence of RER on RTD. Thealpha level for statistical significance was set at p<0.05.
Peak Torque and Rate of Torque Development Fatigue Etiology
PLOS ONE | DOI:10.1371/journal.pone.0119719 April 22, 2015 7 / 16

Results
Torque and EMG changes during the exercise protocolThe time to reach the target velocity (57 ± 8 ms vs. 58 ± 10 ms; p>0.05) as well as the time toreach Tpeak (161 ± 32 ms vs. 156 ± 12 ms, p>0.05) did not vary between the first and last setof contractions. Compared to the sets 1–4, Tmean, Tpeak and RTD consistently decreased fromthe set 5–8 (p<0.05). Larger reductions were observed for RTD variable compared to Tmean
(p<0.05) and Tpeak decrease (p<0.001) (Fig 3A). The multiple regression analysis showed that
Fig 3. Variations of the torque variables during the exercise protocol.Mean torque (Tmean), peak torque(Tpeak) and rate of torque development (RTD) decrease over the 20 sets (A) as well as the multiple linearregression of Tmean predicted by Tpeak and RTD (B) is presented. Data are mean ± SD for four sets.Significant difference from set 1–4: * <0.05. Significant difference between Tmean and RTD from the samesets: a; Significant difference between Tmean and Tpeak from the same sets: b; Significant difference betweenRTD and Tpeak from the same sets: c.
doi:10.1371/journal.pone.0119719.g003
Peak Torque and Rate of Torque Development Fatigue Etiology
PLOS ONE | DOI:10.1371/journal.pone.0119719 April 22, 2015 8 / 16
Tmean decrease was explained by RTD decrease and Tpeak decrease (R2 = 0.62; p<0.001). Fur-
thermore, the Tmean decrease was more influenced (p<0.01) by the RTD decrease (β = 0.64)than Tpeak decrease (β = 0.19) (Fig 3B).
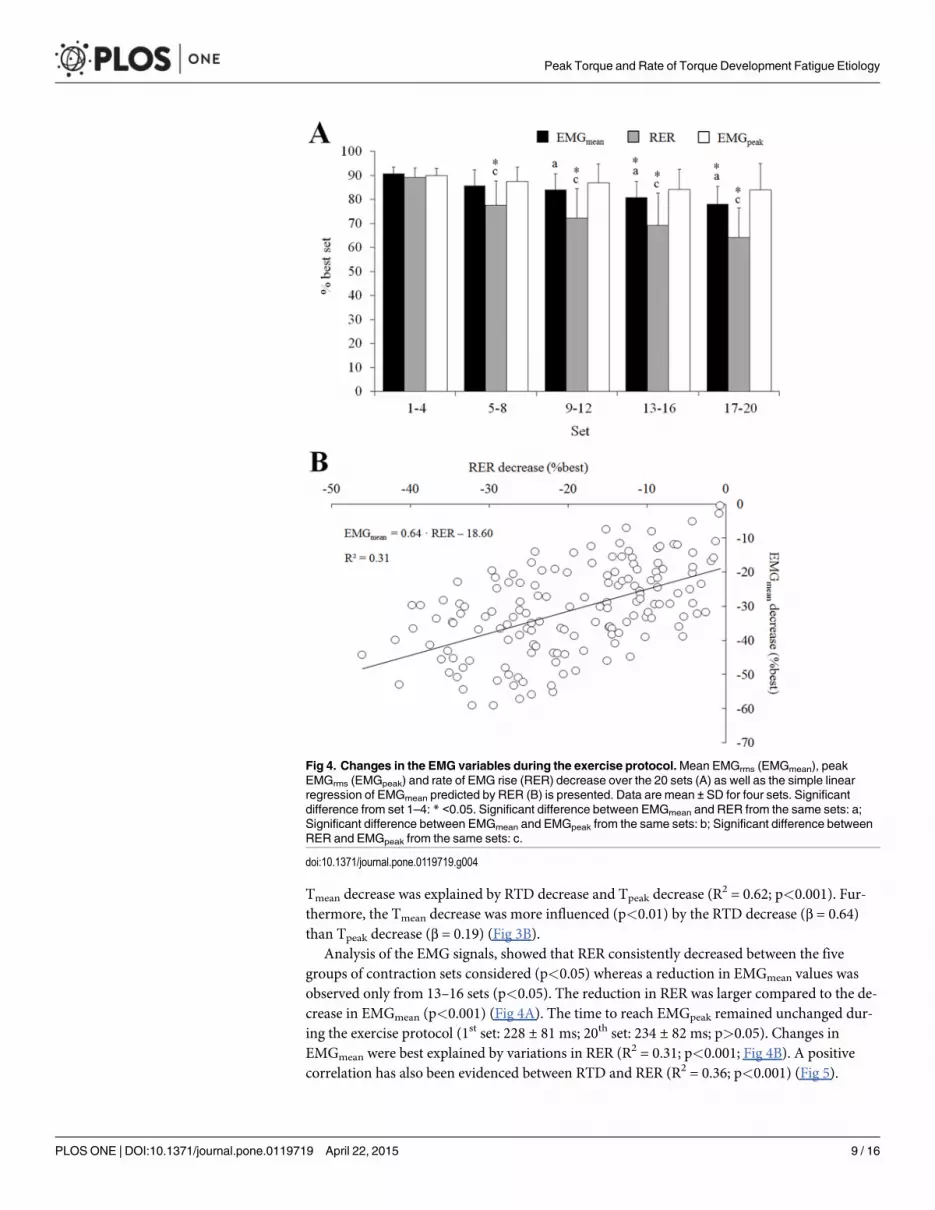
Analysis of the EMG signals, showed that RER consistently decreased between the fivegroups of contraction sets considered (p<0.05) whereas a reduction in EMGmean values wasobserved only from 13–16 sets (p<0.05). The reduction in RER was larger compared to the de-crease in EMGmean (p<0.001) (Fig 4A). The time to reach EMGpeak remained unchanged dur-ing the exercise protocol (1st set: 228 ± 81 ms; 20th set: 234 ± 82 ms; p>0.05). Changes inEMGmean were best explained by variations in RER (R2 = 0.31; p<0.001; Fig 4B). A positivecorrelation has also been evidenced between RTD and RER (R2 = 0.36; p<0.001) (Fig 5).
Fig 4. Changes in the EMG variables during the exercise protocol.Mean EMGrms (EMGmean), peakEMGrms (EMGpeak) and rate of EMG rise (RER) decrease over the 20 sets (A) as well as the simple linearregression of EMGmean predicted by RER (B) is presented. Data are mean ± SD for four sets. Significantdifference from set 1–4: * <0.05. Significant difference between EMGmean and RER from the same sets: a;Significant difference between EMGmean and EMGpeak from the same sets: b; Significant difference betweenRER and EMGpeak from the same sets: c.
doi:10.1371/journal.pone.0119719.g004
Peak Torque and Rate of Torque Development Fatigue Etiology
PLOS ONE | DOI:10.1371/journal.pone.0119719 April 22, 2015 9 / 16

Torque and EMG differences between the first and 20th set ofcontractionsAs shown in Fig 6, reductions in all torque variables were observed during the last set of the ex-ercise protocol: Tmean = 94.0 ± 18.5 vs 59.8 ± 9.5 N.m (p<0.001), Tpeak = 172.8 ± 27.5 vs.134.8 ± 31.7 N.m (p<0.001) and RTD = 1069 ± 352 vs. 561 ± 174 N.m.s-1 (p<0.001).
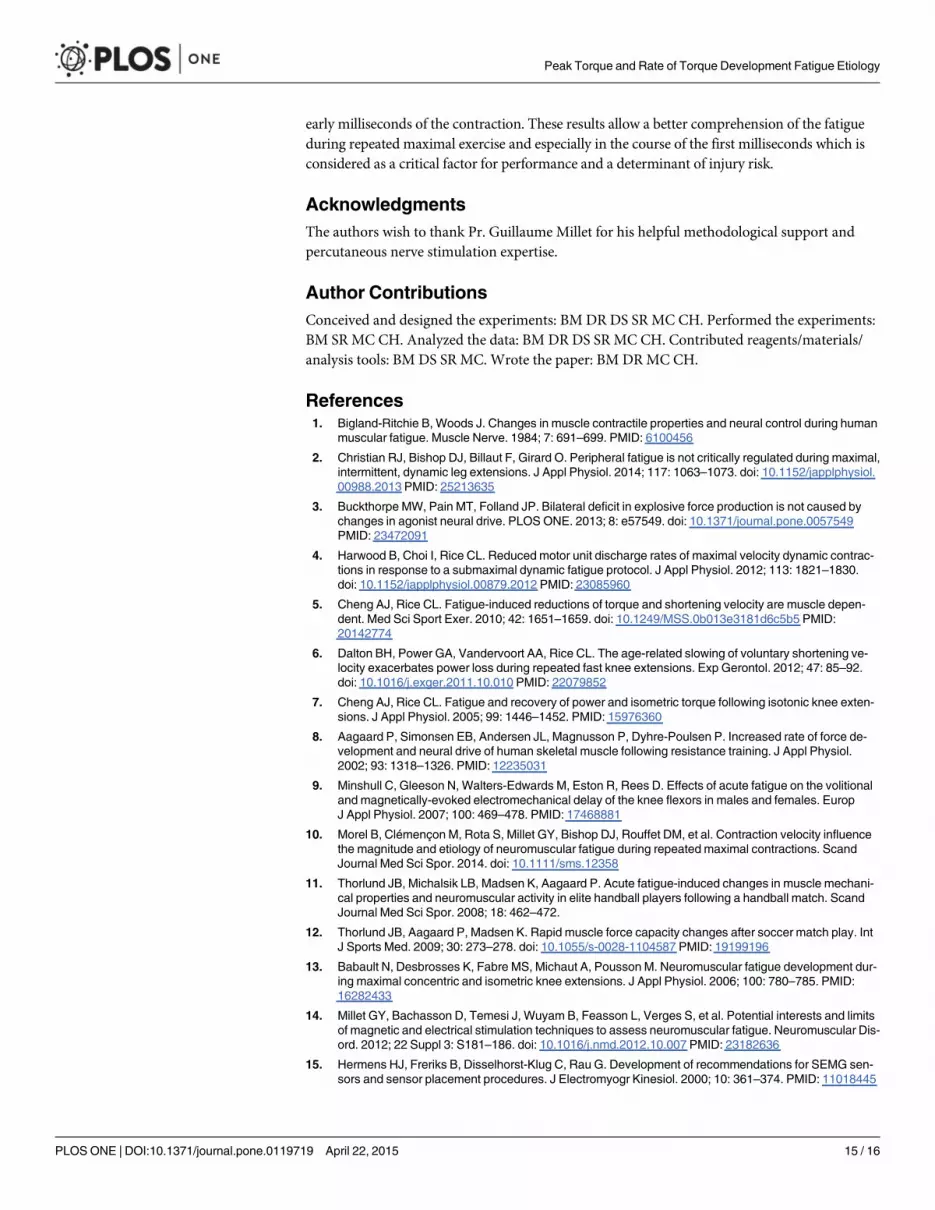
Analysis of the EMG signals revealed that changes in most EMG variables were observedduring the last set of the exercise protocol: nEMGmean = 0.110 ± 0.051 vs. 0.089 ± 0.029 a.u.(p = 0.04); nRER = 1.42 ± 0.63 vs. 1.09 ± 0.40 a.u. (p<0.001). The ifmean was significantly lowerat the end compared to the beginning of the fatiguing exercise, only in the first milliseconds ofthe contraction, before EMGpeak was reached, i.e. 0–75, 75–150 and 150–225 ms (p<0.001)(Fig 7A). However, no changes in the nEMGpeak were observed at the end of the exercise proto-col (0.177 ± 0.082 a.u. vs. 0.169 ± 0.048 a.u.; p = 0.71; Fig 6).
Neuromuscular parameters changes between pre- and post-fatiguetestsIMVC was reduced after the exercise (-32.6 ± 6.3%) (Table 1) and the high frequency doublet(100 Hz) induced both a lower peak torque (eTpeak: 120.6 ± 19.7 N�m vs. 90.4 ± 12.7 N�m;p<0.001) and a lower rate of torque development (eRTD: 3463 ± 962 N�m�s-1 vs. 2559 ± 702N�m�s-1; p = 0.002) (Fig 6). Db10:100 was also reduced (-26.8 ± 10.8%) (Table 1). The M-wavepeak to peak amplitude (Mmax) did not change from pre- to post-fatigue (-4.9 ± 20.5%;p = 0.62) as well as the VA (-4.3 ±1.6%, p = 0.08) (Table 1).
Metabolic dataThe mean plateau of O2 consumption estimated from the asymptote was 23.7 ± 6.4 mL�min-1�kg-1.and the blood lactate accumulation attained 5.7 ± 4.0 mmol�L-1 (p<0.001).
Fig 5. Relationship between changes in rate of EMG rise and variations of rate of torque developmentduring the exercise protocol. The simple linear regression of the rate of torque development (RTD)predicted by the rate of rate of EMG rise (RER) is presented.
doi:10.1371/journal.pone.0119719.g005
Peak Torque and Rate of Torque Development Fatigue Etiology
PLOS ONE | DOI:10.1371/journal.pone.0119719 April 22, 2015 10 / 16

Fig 6. Changes in time-frequency EMG parameters during the exercise protocol. Instant mean powerfrequency (ifmean) during the first (black) and the twentieth (grey) set within each portion (75 ms) of thecontraction is presented on panel A (A). Significant differences first vs. twentieth set: *: p<0.05, **: p<0.01,***: p<0.001. Wavelet transform representation of the vastus lateralis EMG signal of one contraction ispresented for the first (B) and the twentieth (C) set. The intensity patterns are indicated on a colour scale
Peak Torque and Rate of Torque Development Fatigue Etiology
PLOS ONE | DOI:10.1371/journal.pone.0119719 April 22, 2015 11 / 16
DiscussionThe results of this study indicate that the large reductions of average torque measured duringmaximal intermittent contractions performed at 240 degrees/s were strongly associated withdecreases of RTD values. Reductions of both EMG and evoked torque characteristics were ob-served during the first milliseconds of the contraction, indicating that central and peripheralmechanisms could explain the fatigue-induced reductions of RTD resulting from the repetitionof maximal contractions at moderate velocity. Maximal intermittent contractions performed at
(0–100% of the first set), with red corresponding to higher intensities. The frequency content is expressed inpseudo-frequencies (Hz) calculated from wavelet transform. Data are mean of the eight contractions of theeleven subjects for the first and the twentieth set.
doi:10.1371/journal.pone.0119719.g006
Fig 7. Changes pre- vs. post-fatigue for peak and ‘rate of’ data. Tpeak: voluntary peak torque; eTpeak:evoked peak torque; nEMGpeak: peak EMGrms normalized with Mmax; RTD: voluntary rate of torquedevelopment; eRTD: evoked rate of torque development; nRER: rate of EMGRise normalized with Mmax.Data are mean ±SD. Significant changes post- vs pre-fatigue: *: p<0.05, **: p<0.01, ***: p<0.001.
doi:10.1371/journal.pone.0119719.g007
Table 1. Neuromuscular testing data obtained pre- and immediately post-exercise.
Pre-fatigue Post-fatigue
IMVC (N�m) 320 ± 101 215 ± 62 ***
VA (%) 96.4 ± 4.0 92.3 ± 4.9
eTpeak (N�m) 121 ± 21 92 ± 13 ***
Db10:100 (a.u.) 0.89 ± 0.11 0.64 ± 0.08 ***
Mmax (mV) 6.34 ± 2.87 6.13 ± 3.36
Values are mean ± SD; IMVC: isometric maximal voluntary torque; VA: voluntary activation; eTpeak: Peak
torque during 100 Hz doublet stimulation; Db10:100: ratio between peak torque at 10 Hz and 100 Hz doublet
stimulation; Mmax: M-wave peak to peak amplitude.
***: Significant difference with pre-fatigue (p<0.001).
doi:10.1371/journal.pone.0119719.t001
Peak Torque and Rate of Torque Development Fatigue Etiology
PLOS ONE | DOI:10.1371/journal.pone.0119719 April 22, 2015 12 / 16

moderate velocity also led to some reductions of peak torque values that had a smaller impacton the overall performance and were mainly associated to manifestations of peripheral fatigue.
Manifestation of neuromuscular fatigue during the repeated kneeextensionsThe relative reductions of mean torque (-31.4 ± 9.6%) and peak torque (-22.3 ± 12.4%) ob-served in the present study (Fig 3A) are slightly higher than those previously reported for exer-cise protocols that used comparable contraction velocity, contraction number and duty cycle[2, 21]. One can assume that the participants of our study may have been able to reach higherlevels fatigue because they were accustomed to the repetition of maximal exercises [22]. Amajor finding of this study was the large reduction of RTD observed after 160 maximal con-tractions (-45.1 ± 14.5%, p<0.05; Fig 3A). This result demonstrates that an important manifes-tation of fatigue during repeated maximal contractions performed at moderate velocityconsists into a substantial alteration of rapid force production. This result is in line with the re-ductions of RTD previously reported following the repetition of multi-joint movements per-formed at maximal intensity, such as sprint running and sprint cycling [11, 12, 23]. Our resultsindicate that it is very important that researchers investigate the effect of fatigue on human per-formance by carefully selecting the mechanical variable(s); e.g. average force, peak force, RTD[24]. Importantly, our results show that the reduction in rate of torque development had agreater effect on mean torque decrease (β = 0.62) compared to the diminution of peak torque(β = 0.19) during maximal repeated contractions completed at a moderate velocity (Fig 3B). Inlight of this finding, more studies are warranted to investigate the reductions of RTD during re-peated contractions of maximal intensity and its link with changes in the overall performance.
A reduction of the nEMGmean (-19.1 ± 15.4%; p<0.05) was observed between the first andlast bouts in accordance with previous findings [25] whereas no changes in nEMGpeak were ob-served (-3.2 ± 19.5%; p = 0.71). A decrease of nRER (-21.1 ± 14.1%; p<0.001) was observed, in-dicating that fatigue was associated to changes in the EMG signal measured during the earlypart of the contraction (Fig 4A). Moreover, our results show that the decrease in nRER partlyexplain the reduction of EMGmean values (R
2 = 0.31; p<0.001; Fig 4B) whereas no associationswere observed between changes in EMGpeak and nEMGmean values (p = 0.43). These resultssuggest that the capacity of the central nervous system to maximally activate the muscle duringthe first milliseconds of the contraction was altered, whereas similar levels of maximal activa-tion were reached later during the contraction. Because we could not record the EMG signalsfrom the antagonist muscles (knee flexors), our results do not allow us to report changes in theco-activation levels between the agonist and antagonist muscles. It is possible that the reduc-tion of the maximum and/or rapid knee torque production could be partly caused by an in-crease in the activation and force produced by the knee flexor muscles [26]. However, thecontribution of this factor is probably limited as trained athletes usually display low levels ofco-activation [27] and co-activation is usually reinforced to prevent hyper-extensions [28].
Manifestation of peripheral fatigue after the repeated knee extensionsThe reductions of resting potentiated twitch (eTpeak: -24.3 ± 5.3%, Fig 6) observed followingthe 160 maximal contractions completed by the subjects were comparable to those previouslyreported by Christian, Bishop, Billaut and Girard [2]. Similar levels of diminutions were ob-served for the evoked rate of torque development (eRTD: -24.7 ± 13.5%; Fig 6), suggesting asimilar effect of alterations of the excitation-contraction coupling process on maximum forceproduction and rapid-force production. No changes in Mmax were observed at the end of theexercise protocol (Table 1), confirming the results from previous studies [6, 29] and suggesting
Peak Torque and Rate of Torque Development Fatigue Etiology
PLOS ONE | DOI:10.1371/journal.pone.0119719 April 22, 2015 13 / 16

that alterations of the excitation-contraction coupling were not due to changes in the sarcolem-ma excitability. Based on the reduction of Db10:100 observed following completion of the exer-cise protocol (-26.8 ± 6.2%, Table 1), impairments of the excitation-contraction coupling arelikely to result from perturbations taking place beyond the muscle membrane [14]. Consider-ing the blood lactate concentrations measured after the exercise (5.7 ± 4.0 mmol�L-1; p<0.001)and the plateau in O2 consumption (23.7 ± 6.4 mL�min-1�kg-1), repetition of maximal contrac-tions performed at moderate velocity probably led a large accumulation of intracellular metab-olites (ADP, Pi and H
+). Large accumulation of these metabolites have been associated toimpairments of the Ca2+ excitation-contraction coupling process [30] and alterations of the cy-clical interaction of actin and myosin [31]. In light of the findings reported by Debold [31], re-ductions of RTD values could be due to an accumulation of H+ while decrease in peak torqueproduction could be explained by an accumulation of Pi.
Manifestation of central fatigue after the repeated knee extensionsIn line with previous findings [25], no changes in the voluntary activation (-4.3 ±1.6%,p = 0.08; Table 1) were observed after completion of the exercise protocol. The lack of changesin voluntary activation does not seem to be due to methodological points [32] since we usedpaired stimuli and there was no recovery period between the fatiguing protocol and the neuro-muscular testing. The discrepancy between the results obtained for voluntary activation andnEMGmean might be due to the fact that changes in nEMGmean reflect both changes in rapid-ac-tivation (see reduction of nRER previously discussed) and maximal activation.
Results of the time-frequency analysis of the EMG signals revealed a substantial reductionof the mean power frequency (ifmean) during the first 225ms of the contraction (Fig 7). In linewith previous findings, this result shows that repeated maximal contractions at moderate in-tensity may result into alterations of the recruitment and firing frequency of the motor units(MU) during the early part of the contraction [4, 8, 33, 34]. Indeed, supra-maximal firing rates,above the firing frequency needed to achieve maximum tetanic tension, are necessary to en-hance RTD [8]. Moreover, the rapid force production has been recently strongly related to cen-tral parameters under fresh condition [35]. Especially, Johnson, Kipp, Norcross and Hoffman[35] showed that both the supraspinal drive and presynaptic inhibition can affect RTD. A num-ber of spinal and supraspinal mechanisms have been suggested to influence the supraspinaldrive and/or MU firing rate (for review see Gandevia [36]). Considering the high metabolic ac-tivity associated to the exercise protocol used in this study, it is likely that signals originated bythe III/IV metabo-sensitive muscle afferents may have caused some inhibitions at the spinaland/or supraspinal levels [37, 38]. However, central fatigue can also come from more complexphenomenon like a loss of motivation [36] which is difficult to estimate. Finally, our resultssuggest that central fatigue might play an important role in the reduction of the firing frequen-cy of the MUs during the first milliseconds of the contraction when subjects are repeating max-imal contractions at moderate velocity.
ConclusionIn summary, the performance decrease observed during repeated moderate velocity maximalexercise was critically associated to RTD decrease and to lesser extent to peak torque decrease.Moreover the fatigue etiology was different for each torque characteristic. Indeed, the maximum-torque capacity alteration seems to be strongly related to peripheral perturbations whereas rapid-torque capacity losses were associated to both central and peripheral fatigue. More particularly,the present study showed that repetition of maximal contractions at moderate velocity led to analteration of the capacity of the central nervous system to maximally activate the muscle in the
Peak Torque and Rate of Torque Development Fatigue Etiology
PLOS ONE | DOI:10.1371/journal.pone.0119719 April 22, 2015 14 / 16
early milliseconds of the contraction. These results allow a better comprehension of the fatigueduring repeated maximal exercise and especially in the course of the first milliseconds which isconsidered as a critical factor for performance and a determinant of injury risk.
AcknowledgmentsThe authors wish to thank Pr. Guillaume Millet for his helpful methodological support andpercutaneous nerve stimulation expertise.
Author ContributionsConceived and designed the experiments: BM DR DS SR MC CH. Performed the experiments:BM SR MC CH. Analyzed the data: BM DR DS SR MC CH. Contributed reagents/materials/analysis tools: BM DS SR MC. Wrote the paper: BM DRMC CH.
References1. Bigland-Ritchie B, Woods J. Changes in muscle contractile properties and neural control during human
muscular fatigue. Muscle Nerve. 1984; 7: 691–699. PMID: 6100456
2. Christian RJ, Bishop DJ, Billaut F, Girard O. Peripheral fatigue is not critically regulated during maximal,intermittent, dynamic leg extensions. J Appl Physiol. 2014; 117: 1063–1073. doi: 10.1152/japplphysiol.00988.2013 PMID: 25213635
3. Buckthorpe MW, Pain MT, Folland JP. Bilateral deficit in explosive force production is not caused bychanges in agonist neural drive. PLOS ONE. 2013; 8: e57549. doi: 10.1371/journal.pone.0057549PMID: 23472091
4. Harwood B, Choi I, Rice CL. Reducedmotor unit discharge rates of maximal velocity dynamic contrac-tions in response to a submaximal dynamic fatigue protocol. J Appl Physiol. 2012; 113: 1821–1830.doi: 10.1152/japplphysiol.00879.2012 PMID: 23085960
5. Cheng AJ, Rice CL. Fatigue-induced reductions of torque and shortening velocity are muscle depen-dent. Med Sci Sport Exer. 2010; 42: 1651–1659. doi: 10.1249/MSS.0b013e3181d6c5b5 PMID:20142774
6. Dalton BH, Power GA, Vandervoort AA, Rice CL. The age-related slowing of voluntary shortening ve-locity exacerbates power loss during repeated fast knee extensions. Exp Gerontol. 2012; 47: 85–92.doi: 10.1016/j.exger.2011.10.010 PMID: 22079852
7. Cheng AJ, Rice CL. Fatigue and recovery of power and isometric torque following isotonic knee exten-sions. J Appl Physiol. 2005; 99: 1446–1452. PMID: 15976360
8. Aagaard P, Simonsen EB, Andersen JL, Magnusson P, Dyhre-Poulsen P. Increased rate of force de-velopment and neural drive of human skeletal muscle following resistance training. J Appl Physiol.2002; 93: 1318–1326. PMID: 12235031
9. Minshull C, Gleeson N, Walters-Edwards M, Eston R, Rees D. Effects of acute fatigue on the volitionaland magnetically-evoked electromechanical delay of the knee flexors in males and females. EuropJ Appl Physiol. 2007; 100: 469–478. PMID: 17468881
10. Morel B, Clémençon M, Rota S, Millet GY, Bishop DJ, Rouffet DM, et al. Contraction velocity influencethe magnitude and etiology of neuromuscular fatigue during repeated maximal contractions. ScandJournal Med Sci Spor. 2014. doi: 10.1111/sms.12358
11. Thorlund JB, Michalsik LB, Madsen K, Aagaard P. Acute fatigue-induced changes in muscle mechani-cal properties and neuromuscular activity in elite handball players following a handball match. ScandJournal Med Sci Spor. 2008; 18: 462–472.
12. Thorlund JB, Aagaard P, Madsen K. Rapid muscle force capacity changes after soccer match play. IntJ Sports Med. 2009; 30: 273–278. doi: 10.1055/s-0028-1104587 PMID: 19199196
13. Babault N, Desbrosses K, Fabre MS, Michaut A, Pousson M. Neuromuscular fatigue development dur-ing maximal concentric and isometric knee extensions. J Appl Physiol. 2006; 100: 780–785. PMID:16282433
14. Millet GY, Bachasson D, Temesi J, Wuyam B, Feasson L, Verges S, et al. Potential interests and limitsof magnetic and electrical stimulation techniques to assess neuromuscular fatigue. Neuromuscular Dis-ord. 2012; 22 Suppl 3: S181–186. doi: 10.1016/j.nmd.2012.10.007 PMID: 23182636
15. Hermens HJ, Freriks B, Disselhorst-Klug C, Rau G. Development of recommendations for SEMG sen-sors and sensor placement procedures. J Electromyogr Kinesiol. 2000; 10: 361–374. PMID: 11018445
Peak Torque and Rate of Torque Development Fatigue Etiology
PLOS ONE | DOI:10.1371/journal.pone.0119719 April 22, 2015 15 / 16

16. Torrence C, Compo GP. A practical guide to wavelet analysis. Bulletin of the American Meteorologicalsociety. 1998; 79: 61–78.
17. Frère J, Göpfert B, Slawinski J, Tourny-Chollet C. Influence of the scale function on wavelet transforma-tion of the surface electromyographic signal. Comput Methods Biomech Biomed Engin. 2012; 15:111–120. doi: 10.1080/10255842.2010.517199 PMID: 21476155
18. von Tscharner V. Intensity analysis in time-frequency space of surface myoelectric signals by waveletsof specified resolution. J Electromyogr Kinesiol. 2000; 10: 433–445. PMID: 11102846
19. Wakeling JM. Patterns of motor recruitment can be determined using surface EMG. J ElectromyogrKinesiol. 2009; 19: 199–207. PMID: 18029198
20. Maciejewski H, Bourdin M, Lacour JR, Denis C, Moyen B, Messonnier L. Lactate accumulation in re-sponse to supramaximal exercise in rowers. Scand Journal Med Sci Spor. 2012; 23: 585–592.
21. Mathiassen SE. Influence of angular velocity and movement frequency on development of fatigue in re-peated isokinetic knee extensions. Europ J Appl Physiol. 1989; 59: 80–88. PMID: 2583154
22. Girard O, Mendez-Villanueva A, Bishop D. Repeated-sprint ability—part I: factors contributing to fa-tigue. Sports Med. 2011; 41: 673–694. doi: 10.2165/11590550-000000000-00000 PMID: 21780851
23. Girard O, Bishop D, Racinais S. Hot conditions improve power output during repeated cycling sprintswithout modifying neuromuscular fatigue characteristics. Europ J Appl Physiol. 2013; 113: 359–369.doi: 10.1007/s00421-012-2444-3 PMID: 22743981
24. Cairns SP, Knicker AJ, Thompson MW, Sjøgaard G. Evaluation of models used to study neuromuscularfatigue. Exerc Sport Sci Rev. 2005; 33: 9–16. PMID: 15640715
25. Racinais S, Bishop D, Denis R, Lattier G, Mendez-Villaneuva A, Perrey S. Muscle deoxygenation andneural drive to the muscle during repeated sprint cycling. Med Sci Sports Exerc. 2007; 39: 268–274.PMID: 17277590
26. Weir JP, Keefe DA, Eaton JF, Augustine RT, Tobin DM. Effect of fatigue on hamstring coactivation dur-ing isokinetic knee extensions. Europ J Appl Physiol. 1998; 78: 555–559. PMID: 9840412
27. Psek J-A, Cafarelli E. The behaviour of coactive muscles during fatigue. Am Physiological Soc. 1993;74(1): 170–175.
28. Draganich L, Jaeger R, Kralj A. Coactivation of the hamstrings and quadriceps during extension of theknee. J Bone Joint Surg Am. 1989; 71: 1075–1081. PMID: 2760083
29. Lanza IR, Russ DW, Kent-Braun JA. Age-related enhancement of fatigue resistance is evident in menduring both isometric and dynamic tasks. J Appl Physiol. 2004; 97: 967–975. PMID: 15145914
30. Glaister M. Multiple sprint work. Sports Med. 2005; 35: 757–777. PMID: 16138786
31. Debold EP. Recent insights into muscle fatigue at the cross-bridge level. Front Physiol. 2012; 3: 151.doi: 10.3389/fphys.2012.00151 PMID: 22675303
32. Miller M, DownhamD, Lexell J. Superimposed single impulse and pulse train electrical stimulation:A quantitative assessment during submaximal isometric knee extension in young, healthy men. MuscleNerve. 1999; 22: 1038–1046. PMID: 10417784
33. Van CutsemM, Duchateau J, Hainaut K. Changes in single motor unit behaviour contribute to the in-crease in contraction speed after dynamic training in humans. J Physiol. 1998; 513: 295–305. PMID:9782179
34. Aagaard P. Training-induced changes in neural function. Exerc Sport Sci Rev. 2003; 31: 61–67. PMID:12715968
35. Johnson ST, Kipp K, Norcross MF, Hoffman MA. Spinal and supraspinal motor control predictors ofrate of torque development. Scand Journal Med Sci Spor. 2014. doi: 10.1111/sms.12283
36. Gandevia SC. Spinal and supraspinal factors in human muscle fatigue. Physiol Rev. 2001; 81:1725–1789. PMID: 11581501
37. Amann M, Venturelli M, Ives SJ, McDaniel J, Layec G, Rossman MJ, et al. Peripheral fatigue limits en-durance exercise via a sensory feedback-mediated reduction in spinal motoneuronal output. J ApplPhysiol. 2013; 115: 355–364. doi: 10.1152/japplphysiol.00049.2013 PMID: 23722705
38. Taylor JL, Allen GM, Butler JE, Gandevia S. Supraspinal fatigue during intermittent maximal voluntarycontractions of the human elbow flexors. J Appl Physiol. 2000; 89: 305–313. PMID: 10904066
Peak Torque and Rate of Torque Development Fatigue Etiology
PLOS ONE | DOI:10.1371/journal.pone.0119719 April 22, 2015 16 / 16


