Embed Size (px)
Citation preview

Pension Projections Exercise 2021
Country Fiche
Germany
Peer review process on national pension systems and pension projection results
For the attention of the Economic Policy Committees’ Working Group on Ageing Populations and Sustainability
November, 2020
Page ii of 2
Index of Contents 1. Overview of the pension system……………………………………………………………… 1
1.1 Description…………………………………………………………...………….………… 1
1.2 Recent reforms of the pension system included in the projections………………….. 7
1.3 Description of the actual “constant policy” assumptions used in the projection……. 9
2. Overview of the demographic and labour forces projections……………..……………….. 10
2.1 Demographic development………………………………………………………………. 10
2.2 Labour forces……………….……………………………………………………..………. 12
3. Pension projection results………………….…………………...…………………………….. 14
3.1 Extent of the coverage of pension schemes in the projections…………….………… 14
3.2 Overview of projection results…………………………………………..………………. 15
3.3 Description of main driving forces behind the projection results and their implication for main items from a pension questionnaire………….………………….. 18
3.4 Financing of the pension system………………………………………………..………. 28
3.5 Sensitivity analysis………………………………………………………………...……… 29
3.6 Description of the changes in comparison with the 2006, 2009 and 2012 projections………………………………………………………………………………….. 32
4. Description of the pension model and its base data………………………………………… 34
4.1 Institutional context…………………………………………………………..……………. 34
4.2 Assumptions and methodologies applied…………………………….…….…………… 34
4.3 Data used to run the models……………………………………………………………… 34
4.4 Reforms incorporated in the models……………………………………..………………. 35
4.5 General description of the models……………………………………………………….. 35
4.5.1 The demographic cohort pension model……………………………..…………….. 35
4.5.2 The financial pension model…………………………..………………...…..……….. 36
Annex – The indexation formula………………………………………..……………..…….………. 38
Annex – Further detailed assumptions regarding the projection exercise………..…….………. 40
Page 1 of 42
1. Overview of the pension system 1.1 Description The pension system in Germany is in general based on three pillars, where the first pillar
with the statutory and the civil servant pension system is mandatory for all employees
and civil servants. The occupational (2nd pillar) and the private pension system (3rd pillar)
are non-mandatory, but certain elements are of growing importance since future
declining public pension benefits shall be compensated by capital formation of the 2nd
and 3rd pillar components. Both systems are tax-promoted and subsidised by the
government.1
The German projections exercise of future pension expenditures comprises the
statutory and the civil servants pension schemes. These schemes provided old-age
pension as well as survivors and disability pension claims to (more than) 90 % of the
employed population in 2019. Currently, the general pay-as-you-go (PAYG) earnings-
related first pillar statutory pension scheme covers about 85 % of the employed German
population whereas the public civil servants scheme protects 5 %. Both systems
accounted for pension expenditures of about 10.3 % of GDP in 2019. Not covered by this
pension projection exercise are specific pension schemes for miners and farmers with
pension expenditures of less than 0.5 % of GDP (in 2019).2
Means-tested social assistance expenditures for pensioners are projected with a
separate model due to the social assistance schemes’ substantially different design
compared to the public pension systems. Within the concept of minimum income
provision, individuals - as of the age of the statutory retirement age - can claim means-
tested benefits from social assistance if old-age provision from all income sources is not
sufficient.3 The system of social assistance is completely tax-financed. The respective
expenditures amounted to 0.2 % of GDP in 2019.
The statutory pension system is operated and administrated by the German
Federal Insurance Fund (Deutsche Rentenversicherung). The civil servants pension
scheme is operated by the Federal Ministry of the Interior. If not stated otherwise,
following statements refer to the statutory pension scheme.
1 Governmental subsidies for the 3rd pillar Riester pensions - excluding tax savings - amounted e.g. to 2.7 billion Euro in 2017. Tax allowances for a Riester pension are of EET concept, which means that contributions are tax-free while pensions are taxed. 2 For further information concerning the farmers and miners systems see box 3. 3 Those benefits refer to the individual primary needs. Means-tested provision results from the difference between the individual need and the weighted household equivalence income (including pension benefits). The average of these individual needs amounted to 9,756 EUR per capita in 2019 for all, who received means-tested old-age provision. At the end of the year 2019 roughly 0.56 million persons of statutory retirement age or older received such a provision, which are about 3.2 % of the total population within that age interval. For further details see annex.
Page 2 of 42
Statutory Pension System
The statutory pension insurance scheme - as a point system - comprises pensions for
old-age, survivors and disability, provides rehabilitation benefits, but no minimum
pensions.
The annual budget volume of the statutory pension system is based on two major
sources: the contributions by insured persons and the government subsidies. The latter
contribute an amount of about 23 % of total receipts. In 2019, insured employees and
their employers each contributed 9.3 % of the employees’ gross wages to the statutory
pension system. In 2019, total revenues amounted to 321.0 billion EUR while total
expenditures aggregated to 319.1 billion EUR.
Old-age pension
The German statutory pension system is oriented towards contribution equivalence,
which basically translates the amount of individual pension-related contributions into
similar pension entitlements. A minimum of five years of contributions entitles to benefits.
For the calculation of old-age pension benefit, see formula 1 to 3.
Since 1992 numerous pension reforms have reacted on the growing budgetary
pressures on the statutory pension schemes due to the demographic development of
steadily rising life expectancy and relatively constant fertility rates far below the
replacement level. In 2007, a major reform legislated the gradual increase of the
statutory retirement age from age 65 to age 67 by the year 2029 (see, table 1). Other
pension schemes, like the civil servants pension scheme, are also affected by that raise
of the retirement age. Simultaneously, several pension types within the statutory pension
scheme with retirement ages that were originally lower, such as pensions for women or
for unemployed, have expired - fully affecting birth cohorts from 1952 onwards. Hence,
since 2011 there is in principle no possibility to retire for an old-age pension before the
age of 63.4
Under current legislation, the statutory retirement age for men and women has
been age 65 and 8 months in 2019. Nevertheless, as seen in table 1, early retirement is
possible under certain conditions, but in any case of using such an option, individual
benefits will be reduced permanently by 0.3 % for each retired month pensioners fall
short of the statutory retirement age. On the other hand, postponement of retirement will
yield a higher pension accrual of 0.5 % for each month worked after the statutory
retirement age, this to be seen as an incentive to work longer.
As stated in table 1, early retirement is possible at the age of 63 for persons with an
insurance record of at least 35 years. However, the pension benefit will be reduced by a
permanent deduction of 0.3 % for each retired month pensioners fall short of the
statutory retirement age. Because the latter is gradually increasing to the age of 67 by
2030, the maximum permanent deduction will increase to 14.4 %.
4 Specific exceptions still exist for severely handicapped people.
Page 3 of 42
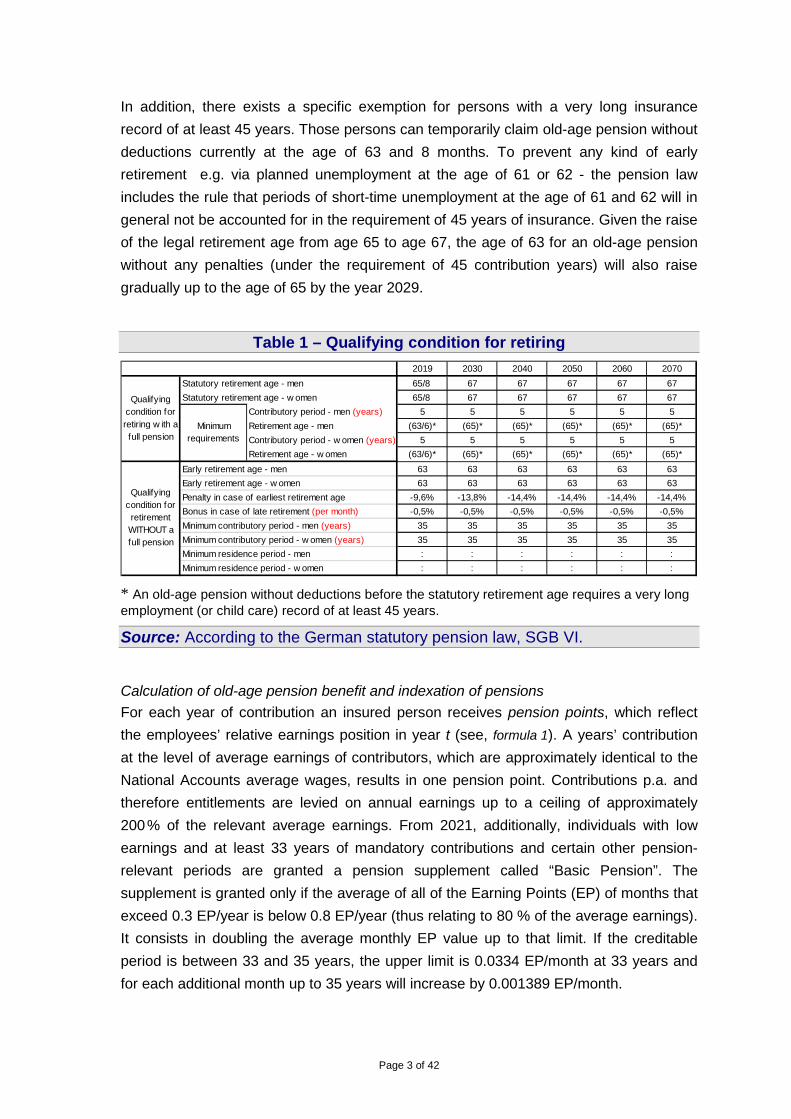
In addition, there exists a specific exemption for persons with a very long insurance
record of at least 45 years. Those persons can temporarily claim old-age pension without
deductions currently at the age of 63 and 8 months. To prevent any kind of early
retirement e.g. via planned unemployment at the age of 61 or 62 - the pension law
includes the rule that periods of short-time unemployment at the age of 61 and 62 will in
general not be accounted for in the requirement of 45 years of insurance. Given the raise
of the legal retirement age from age 65 to age 67, the age of 63 for an old-age pension
without any penalties (under the requirement of 45 contribution years) will also raise
gradually up to the age of 65 by the year 2029.
Table 1 – Qualifying condition for retiring
2019 2030 2040 2050 2060 2070
65/8 67 67 67 67 67
65/8 67 67 67 67 67
Contributory period - men (years) 5 5 5 5 5 5
Retirement age - men (63/6)* (65)* (65)* (65)* (65)* (65)*
Contributory period - w omen (years) 5 5 5 5 5 5
Retirement age - w omen (63/6)* (65)* (65)* (65)* (65)* (65)*
63 63 63 63 63 63
63 63 63 63 63 63
-9,6% -13,8% -14,4% -14,4% -14,4% -14,4%
-0,5% -0,5% -0,5% -0,5% -0,5% -0,5%
35 35 35 35 35 35
35 35 35 35 35 35
: : : : : :
: : : : : :
Minimum contributory period - men (years)
Minimum contributory period - w omen (years)
Minimum residence period - men
Minimum residence period - w omen
Qualifying condition for retiring w ith a full pension
Statutory retirement age - men
Statutory retirement age - w omen
Minimum requirements
Qualifying condition for
retirement WITHOUT a full pension
Early retirement age - men
Early retirement age - w omen
Penalty in case of earliest retirement age
Bonus in case of late retirement (per month)
* An old-age pension without deductions before the statutory retirement age requires a very long employment (or child care) record of at least 45 years.
Source: According to the German statutory pension law, SGB VI.
Calculation of old-age pension benefit and indexation of pensions
For each year of contribution an insured person receives pension points, which reflect
the employees’ relative earnings position in year t (see, formula 1). A years’ contribution
at the level of average earnings of contributors, which are approximately identical to the
National Accounts average wages, results in one pension point. Contributions p.a. and
therefore entitlements are levied on annual earnings up to a ceiling of approximately
200 % of the relevant average earnings. From 2021, additionally, individuals with low
earnings and at least 33 years of mandatory contributions and certain other pension-
relevant periods are granted a pension supplement called “Basic Pension”. The
supplement is granted only if the average of all of the Earning Points (EP) of months that
exceed 0.3 EP/year is below 0.8 EP/year (thus relating to 80 % of the average earnings).
It consists in doubling the average monthly EP value up to that limit. If the creditable
period is between 33 and 35 years, the upper limit is 0.0334 EP/month at 33 years and
for each additional month up to 35 years will increase by 0.001389 EP/month.
Page 4 of 42
In the German pure point system where contributory periods make for only a part of the
accrued claims for pension benefits, the individual pension benefit in year T+n (as seen
in formula 2) results from the sum of individual pension points multiplied by the specific
pension type factor (e. g., 1.0 for old-age pension, 0.55 for a widower’s pension) and the
‘pension point value’ (measured in EUR) in year T+n. The pension point value is valid for
new and stock pensioners. Irrespective of the year of retirement all pensions are
adjusted annually with the current pension point value at mid year. Hence, the pension
point value is set to be fix for the period July 1st in year t to June 30th in year t + 1.
Formula 1: ˘= ttt e/epp , where
tpp = individual pension points in year t,
te = individual earning in year t,
˘te = average of nation-wide earnings related to contributors in year t.
Formula 2: nT
T
1t
tnT ppvptfppP +
=
+ ··= , where
nTP + = individual pension benefit in year T+n,
=
T
1t
tpp = sum of individual pension points,
ptf = pension type factor,
nTppv + = pension point value in year T+n.
Formula 3: 1nT1nT1nT1nTnT sfcfwfppvppv -+-+-+-++ ···= , where
1nTppv -+ = pension point value in year T+n-1,
1nTwf -+ = wage factor in year T+n-1,
1nTcf -+ = contribution rate factor in year T+n-1,
1nTsf -+ = sustainability factor in year T+n-1.
The pension point value (see, formula 3) is adjusted in relation to the gross wage growth
(‘wage factor, wf’) as a starting point. In addition, the ‘contribution factor, cf’ accounts for
changes of the contribution rate to the statutory pension scheme and to the subsidised
(voluntary) private pension schemes. An increase of contribution rates will reduce the
adjustment of the pension point value and respectively vice versa. The ‘sustainability
factor, sf’, that measures the change of the number of standardized contributors in
relation to the number of standardized pensioners, links the adjustment of the pension
point value to the changes in the statutory pension scheme’s dependency ratio, the ratio
of pensioners to contributors5. The last two factors in the indexation formula 3 can alter
the size of adjustment, resulting in lower growth of the pension point value in relation to
gross wages per capita in the long run. Temporary, until 2025 a so-called “double
boundary” is applicable that sets a pension value, so that a lower limit of 48% for the net
5 Changes of the ratio are reduced by an allocation factor, which is set at 0.25. For more details refer to annex.
Page 5 of 42
pension level before taxation6 is guaranteed while ensuring an upper limit of 20 % for the
contribution rate.7 Thus, when the adjustment of the pension point value (see formula 3)
results in a net pension level before taxation below 48 %, the pension point value is
further increased to guarantee the limit of 48 %.
Additionally, formula 3 is linked to specific pension assurance laws, which
guarantee that none of the three incorporated factors (wf, cf, sf) translate the indexation
of the pension point value in year T+n into a lower value compared to the previous year
T+n-1. When the “double boundary” expires in 2025, a theoretically possible decrease of
the nominal pension point value e. g., due to a declining wage development (observed in
2009 for Germany), is kept virtually and is counterbalanced with future increases of the
pension point. Respectively, future increases of the pension point value (based on
formula 3) will be reduced by 50 % until the original trajectory of the pension point value is
reached.
Due to existing differences in per capita income between the Western and the
Eastern part of Germany, the pension-related contributory average income levels differ.
E.g., the (preliminary) average income in 2020 amounts to 40,551 EUR for Germany
(west) and 35,977 EUR for Germany (east). Hence, the calculation of the pension point
value distinguishes between both German regions by considering the respective average
wages.8 Consequently, the pension point values are currently9 set at 34.19 EUR (west)
and at 33.23 EUR (east) - regarding pension benefits per month. In 2017 a stepwise
harmonization of pension point values was legislated so that there will be a uniform
pension legislation for Germany in 2025. From 1 January 2025 onwards there will not be
different calculation parameters for calculating pensions.
6 Ratio of the standard pension (with 45 earnings points) to the average earnings of employees insured in the SPI, both reduced by the average of social contributions for health and long-term care insurance. 7 However, it is enacted in law, that up to the year 2030 the pre-tax replacement rate must not fall below 43 %. This level is not to be understood as target figure, but as the lowest limit for the replacement rate. Whenever there is a risk that this limit cannot be upheld, the legislator is required to act. 8 This transitional treatment of eastern German pension entitlements is based in regulations legislated during the reunification negotiations. It was implemented to ensure that lower income levels in Germany (east) will not result in permanently lower pension entitlements. The system has been adjusted so that converging income levels will automatically result into converging pension point values. Thus, both - stock and new - pensioners in Germany (east) profit from a declining income gap. 9 Period from 1st July 2020 to 30th June 2021.
Box 2: Example for Calculation of Old-age Pension Benefit
In December 2020 a man/woman wishes to retire exactly two years before the current
statutory retirement age of 65 years and 9 month. He/she has a contribution record of 40 years
just based on average income p.a., which results into 40 pension points. This sum of pension
points is multiplied by the pension-type factor of 1.0 for old-age pensions and the current
pension point value. Because of the two years’ earlier retirement, a permanent deduction of
7.2 % results into a gross pension amount of 1,269.13 € per month (40 · 1.0 · 34.19 € ·
0.928) at least until the next pension indexation on 1th July 2021.
Page 6 of 42
Disability pension
Persons with more than five years’ pension contributions are entitled to receive a
disability pension. Disability pensions are a replacement income for people below the
statutory retirement age, who are partially or completely, temporarily or permanently
unable to work. Work capability of less than three hours a day qualifies for a full disability
pension with a pension type factor of 1.0, whereas work capability of three to six hours
per day results in a partial disability pension with a pension type factor of 0.5.
The disability pension benefit is based on the assumption that the respective
person would have worked virtually up to the statutory retirement age with an earned
income p.a. which relates to the individual average wage p.a. based on the working
period prior to disability status. Additionally, an examination takes place whether the last
four years of earned income p.a. before the disability status will decrease the virtually
assumed earned income for the period from the occurrence of disability up to the
statutory retirement age. In case of negative influence these respective years will be
discounted. In total, disability pension entitlements are an aggregate of already accrued
pension points before disability and additional pension points based on a virtual record of
contribution.
Individuals will be faced with a maximum deduction of 10.8 % in case of applying
for a disability pension before the age of 64 and 6 months (in 2021), rising up to age 65
in 2024. (After that age, pension penalty is reduced by 0.3 % per month.). In general, the
disability pension will be converted into an old-age pension (just for statistical reasons)
once the respective person has reached the statutory retirement age.
Survivor’s pension
Spouses are entitled to a survivor’s pension if the deceased fulfilled the minimum
condition of five years of contributions to the statutory pension system. A valid
entitlement to a ”high-rate” widow’s pension exists if the surviving spouse is unable to
work or is raising an underage child or is at least 45 years old10. Otherwise, a “small”
widow’s pension is paid. While the “high-rate“ widow’s pension amounts to 55 % of the
full pension benefit of the deceased, the “small” widow’s pension is only 25 % of that
pension and is additionally restricted to two years. In both cases own income over a
certain level is taken into account.
Orphan’s pension is generally paid until the age of 18. Exemptions exist up to the
age of 27. The amount of an orphan’s pension is also related to the full pension benefit of
the deceased, with one-tenth for half-orphans and one-fifth for double orphans.
Receiving an old-age or disability pension plus a survivor’s pension results in a
reduction of the latter by a specific relative value which is related to the difference
between the amount of the old-age or disability pension and an individualized (income-
related) exemption.
10 This age is increasing to age 47 in line with the increasing statutory retirement age.
Page 7 of 42
1.2 Recent reforms of the pension system included in the projections Pension reforms since the last AWG projection exercise are incorporated into the 2020
exercise. Please find below a detailed description of all components of the latest pension
reforms in year 2020.
• Pension benefits and contributions:
For the net pension level before taxation11 a lower limit of 48% and for the
contribution rate an upper limit of 20% was introduced. This so-called “double
boundary” is applicable until 2025. Additionally, until 2025 the lower limit for the
contribution rate is set at 18.6%.
The earnings points (EPs) for children born before 1992 are raised from 2.0 to
2.5, which means further convergence towards the 3.0 EPs that mothers or fathers
receive for children born after 1992.
• Old-age pension
Entering into force on 1 January 2021, a pension supplement called “Basic
Pension” for individuals with at least 33 years of mandatory contributions
(stemming in particular from working periods, initial child-care periods and periods
of providing nonpaid care to a close or related person), depending on their
contributions and a proof of income is granted. The supplement is granted only if
the average of all of the Earning Points (EP) of months that exceed 0.3 EP/year is
below 0.8 EP/year (thus relating to 80 % of the average earnings). It consists in
doubling the average monthly EP value up to that limit. Different upper limits for the
calculated average monthly EP value apply to creditable careers of 35 years or
more, and to careers of 33 to (just before) 35 years. If the creditable period is at
least 35 years, the upper limit is 0.0667 EP/month. If the creditable period is
between 33 and 35 years, the upper limit is 0.0334 EP/month at 33 years and for
each additional month up to 35 years will increase by 0.001389 EP/month. In order
to correspond to the principle of equivalence of benefits and contributions, the
value of the EP is then multiplied by 0.875 and by the number of monthly periods
for a basic SPI pension, up to but not exceeding 420 months (35 years).
The basic pension will be income-tested. For people who are married or living in
a registered partnership, the income of the partner will also be taken into account.
If the couple’s monthly taxable income is above €2,300, the basic SPI pension
supplement will partly be reduced. For a single person the relevant threshold
income is €1,600/month. An allowance for people with a high number of creditable
periods and in receipt of a benefit under the ‘basic social assistance in old age and
in the event of reduced earning capacity’ scheme is being introduced. For people
11 Ratio of the standard pension (with 45 earnings points) to the average earnings of employees insured in the SPI, both reduced by the average of social contributions for health and long-term care insurance.
Page 8 of 42
with a minimum of 33 years of mandatory contributions (or other compulsory old
age pension) the allowance is €100/month and additionally 30% of the statutory
pension. The allowance is subject to a cap of 50% of the minimum subsistence
level 1 (Regelbedarfsstufe 1), which is currently €216/month.
• Disability pension:
In total, disability pension entitlements are an aggregate of already accrued
pension points before and additional pension points after the occurrence of
disability. Latter pension points are based on a virtual record of contribution. Before
the latest pension reform the virtual employment record (please see section 1.1)
was gradually increasing from age 63 to age 65. Under the new legislation, this
period is further extended to statutory retirement age, reaching age 67 in 2031.
1.3 Description of the “constant policy” assumptions used in the
projection As commonly agreed, all recently enacted pension reforms have been taken into account
in the German 2020 pension projection exercise. In addition, all AWG assumptions
regarding the demographic and macro-economic context have been completely
considered.
It is worthwhile to note that alternative assumptions for the demographic and
labour market scenarios influence the projection results on pension expenditures.
Page 9 of 42
2. Overview of the demographic and labour forces projections 2.1 Demographic development
Eurostat’s latest population projection (2019) shows a temporary increasing population in
Germany over the coming decades. In the long run population growth will nevertheless
remain negative. Migration assumptions for Germany are the main driver for the
observed increase in population numbers. However, for Germany the natural population
growth has been negative for almost 40 years. Since the mid-1970s, the total fertility rate
of 1.4 has been relatively stable over time and increased only lately to 1.5 which is still
well below the replacement level of approx. 2.1. Hence, the quantity of every new birth
cohort is just around two-thirds of its parental cohort. Due to the population momentum
and the future assumption of fertility being below replacement level, fertility is the main
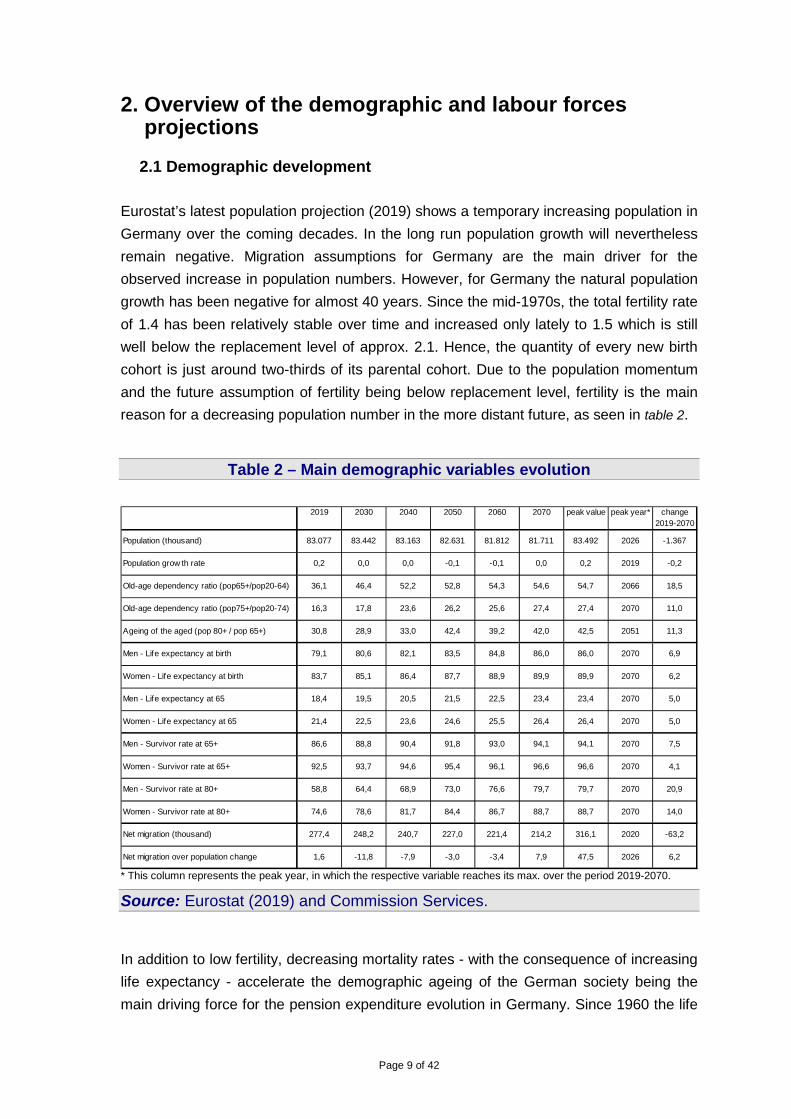
reason for a decreasing population number in the more distant future, as seen in table 2.
Table 2 – Main demographic variables evolution
2019 2030 2040 2050 2060 2070 peak value peak year* change
2019-2070
Population (thousand) 83.077 83.442 83.163 82.631 81.812 81.711 83.492 2026 -1.367
Population grow th rate 0,2 0,0 0,0 -0,1 -0,1 0,0 0,2 2019 -0,2
Old-age dependency ratio (pop65+/pop20-64) 36,1 46,4 52,2 52,8 54,3 54,6 54,7 2066 18,5
Old-age dependency ratio (pop75+/pop20-74) 16,3 17,8 23,6 26,2 25,6 27,4 27,4 2070 11,0
Ageing of the aged (pop 80+ / pop 65+) 30,8 28,9 33,0 42,4 39,2 42,0 42,5 2051 11,3
Men - Life expectancy at birth 79,1 80,6 82,1 83,5 84,8 86,0 86,0 2070 6,9
Women - Life expectancy at birth 83,7 85,1 86,4 87,7 88,9 89,9 89,9 2070 6,2
Men - Life expectancy at 65 18,4 19,5 20,5 21,5 22,5 23,4 23,4 2070 5,0
Women - Life expectancy at 65 21,4 22,5 23,6 24,6 25,5 26,4 26,4 2070 5,0
Men - Survivor rate at 65+ 86,6 88,8 90,4 91,8 93,0 94,1 94,1 2070 7,5
Women - Survivor rate at 65+ 92,5 93,7 94,6 95,4 96,1 96,6 96,6 2070 4,1
Men - Survivor rate at 80+ 58,8 64,4 68,9 73,0 76,6 79,7 79,7 2070 20,9
Women - Survivor rate at 80+ 74,6 78,6 81,7 84,4 86,7 88,7 88,7 2070 14,0
Net migration (thousand) 277,4 248,2 240,7 227,0 221,4 214,2 316,1 2020 -63,2
Net migration over population change 1,6 -11,8 -7,9 -3,0 -3,4 7,9 47,5 2026 6,2
* This column represents the peak year, in which the respective variable reaches its max. over the period 2019-2070.
Source: Eurostat (2019) and Commission Services.
In addition to low fertility, decreasing mortality rates - with the consequence of increasing
life expectancy - accelerate the demographic ageing of the German society being the
main driving force for the pension expenditure evolution in Germany. Since 1960 the life
Page 10 of 42
expectancy at birth has increased from 66.5 to 79.1 years for males and from 71.7 to
83.7 years for females according to Eurostat. That implies an increase of more than
12 years within 60 years for both sexes. Even the remaining life expectancy at age 65
has been increasing during that period to 18.4 years for males and 21.4 years for
females. Table 2 displays a further - almost steady - increase for both indicators in future.
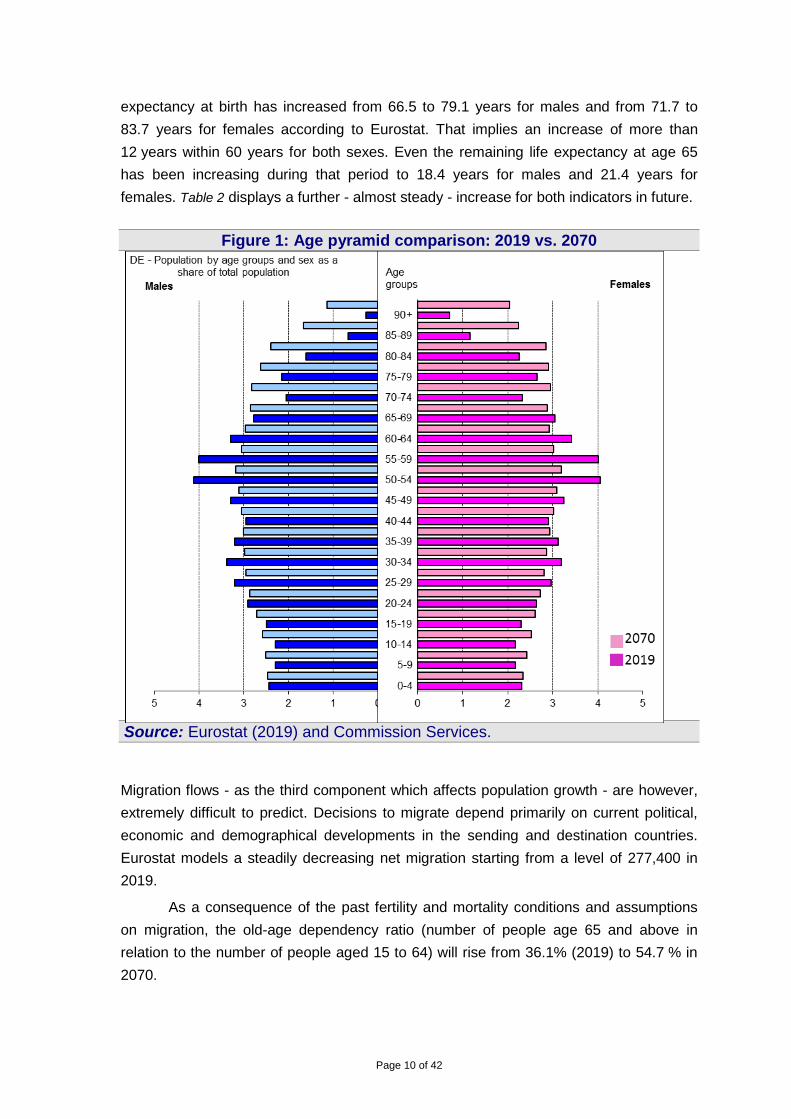
Figure 1: Age pyramid comparison: 2019 vs. 2070
Source: Eurostat (2019) and Commission Services.
Migration flows - as the third component which affects population growth - are however,
extremely difficult to predict. Decisions to migrate depend primarily on current political,
economic and demographical developments in the sending and destination countries.
Eurostat models a steadily decreasing net migration starting from a level of 277,400 in
2019.
As a consequence of the past fertility and mortality conditions and assumptions
on migration, the old-age dependency ratio (number of people age 65 and above in
relation to the number of people aged 15 to 64) will rise from 36.1% (2019) to 54.7 % in
2070.
Page 11 of 42
2.2 Labour forces In the near future Germany will be faced with a radical societal change based on
demographic development. There will be a strong increase in the absolute number of
people at age 65 or older and simultaneously the overall population number is
decreasing in the long run. In the future, the working age population is shrinking. That will
result in a situation where the so called baby-boomers will leave the labour market and
will become pension-beneficiaries (in technical terms) whereas the number of
contributors will decrease accordingly.
To counterbalance this development partially, the statutory retirement age is
increasing from age 65 (in year 2011) to age 67 by the year 2029. The relatively long
transition period ensures the adjustment of working conditions to an older work-force in
demographical terms. This task has to be accomplished by companies, social partners
and policymakers together.
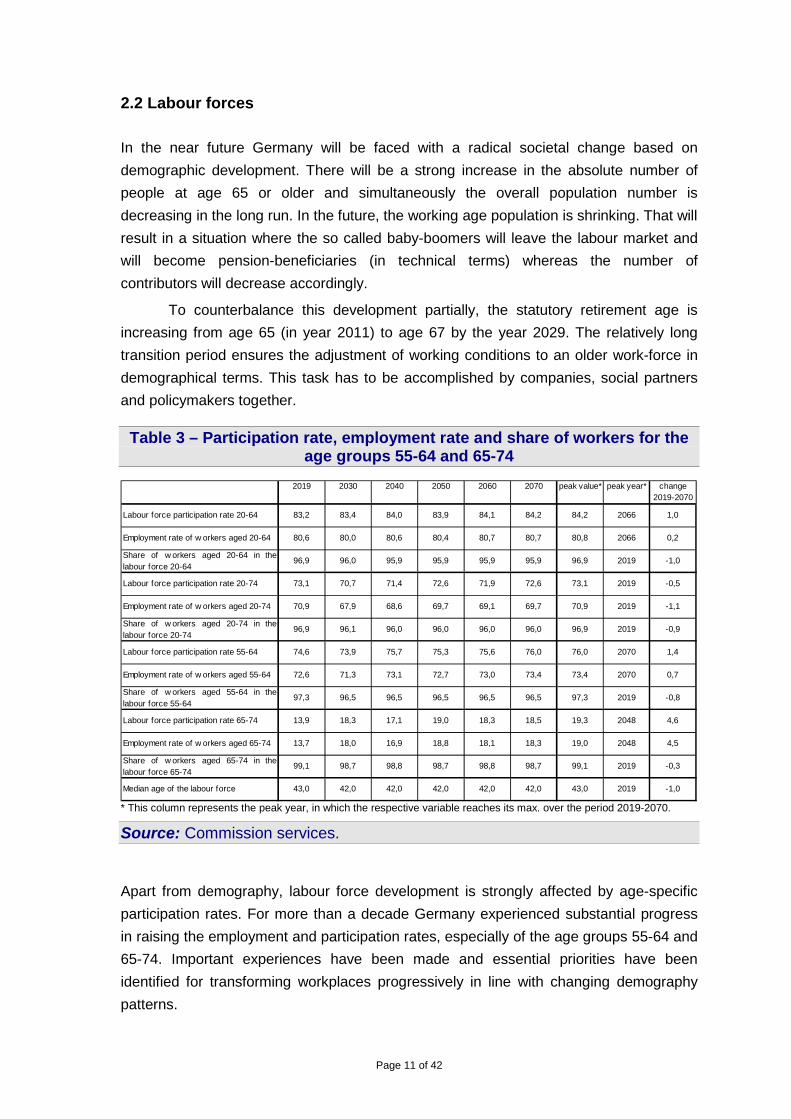
Table 3 – Participation rate, employment rate and share of workers for the age groups 55-64 and 65-74
2019 2030 2040 2050 2060 2070 peak value* peak year* change
2019-2070
Labour force participation rate 20-64 83,2 83,4 84,0 83,9 84,1 84,2 84,2 2066 1,0
Employment rate of w orkers aged 20-64 80,6 80,0 80,6 80,4 80,7 80,7 80,8 2066 0,2
Share of w orkers aged 20-64 in thelabour force 20-64
96,9 96,0 95,9 95,9 95,9 95,9 96,9 2019 -1,0
Labour force participation rate 20-74 73,1 70,7 71,4 72,6 71,9 72,6 73,1 2019 -0,5
Employment rate of w orkers aged 20-74 70,9 67,9 68,6 69,7 69,1 69,7 70,9 2019 -1,1
Share of w orkers aged 20-74 in thelabour force 20-74
96,9 96,1 96,0 96,0 96,0 96,0 96,9 2019 -0,9
Labour force participation rate 55-64 74,6 73,9 75,7 75,3 75,6 76,0 76,0 2070 1,4
Employment rate of w orkers aged 55-64 72,6 71,3 73,1 72,7 73,0 73,4 73,4 2070 0,7
Share of w orkers aged 55-64 in thelabour force 55-64
97,3 96,5 96,5 96,5 96,5 96,5 97,3 2019 -0,8
Labour force participation rate 65-74 13,9 18,3 17,1 19,0 18,3 18,5 19,3 2048 4,6
Employment rate of w orkers aged 65-74 13,7 18,0 16,9 18,8 18,1 18,3 19,0 2048 4,5
Share of w orkers aged 65-74 in thelabour force 65-74
99,1 98,7 98,8 98,7 98,8 98,7 99,1 2019 -0,3
Median age of the labour force 43,0 42,0 42,0 42,0 42,0 42,0 43,0 2019 -1,0
* This column represents the peak year, in which the respective variable reaches its max. over the period 2019-2070.
Source: Commission services.
Apart from demography, labour force development is strongly affected by age-specific
participation rates. For more than a decade Germany experienced substantial progress
in raising the employment and participation rates, especially of the age groups 55-64 and
65-74. Important experiences have been made and essential priorities have been
identified for transforming workplaces progressively in line with changing demography
patterns.
Page 12 of 42
Since 2000, the employment rate for age group 55-64 almost doubled from
37.4 % to 70.2 %. While the employment rate for the age group 60-64 was at just 19.6 %
in the year 2000 the value tripled to 58.6 % in 2017. Hence, more and more older
employees experience the fact that there is an increasing demand by employers for the
practical, technical and theoretical expertise of older people.
Table 3 displays the participation and employment rates projected by the
European Commission Service. The future results from the underlying cohort simulation
model depend crucially on the used assumptions on the effects of legislated policy
reforms - e.g. the increase of statutory retirement ages. Overall, the employment rate for
workers aged 55-64 is projected to increase from 72.6 % in 2019 to 73.4 % in 2070.
Given the observed labour market trends this seems to be rather conservative expected
development.
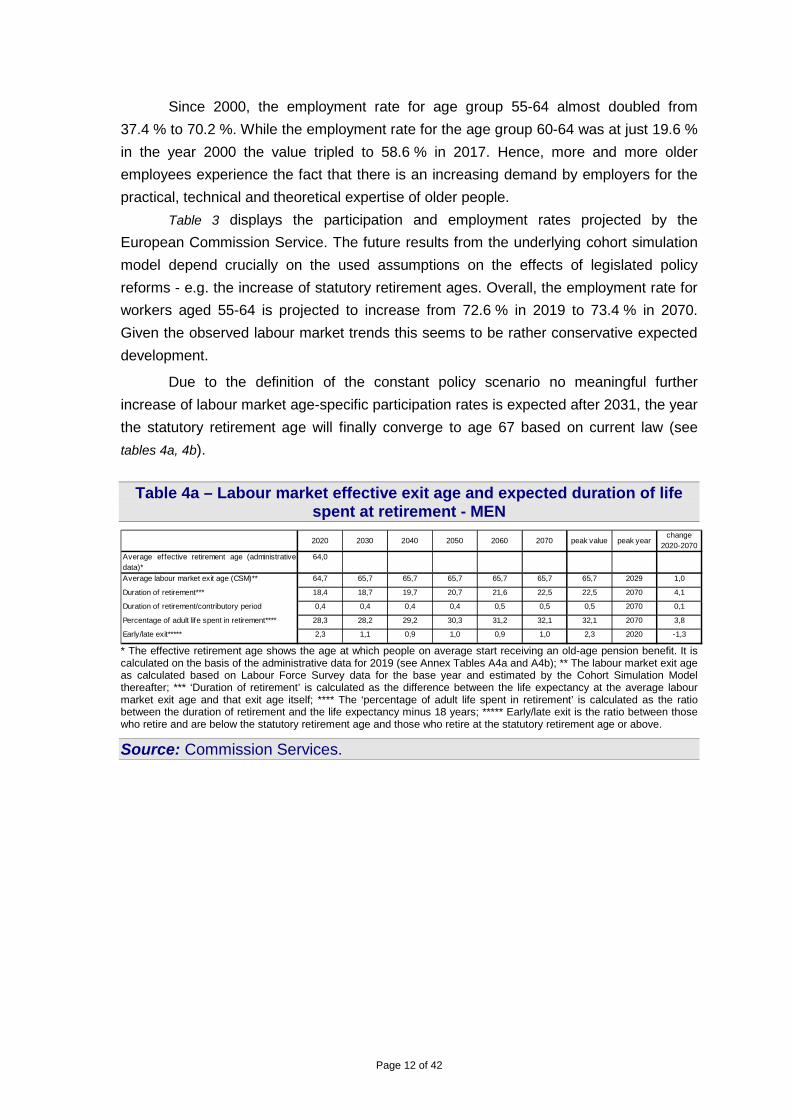
Due to the definition of the constant policy scenario no meaningful further
increase of labour market age-specific participation rates is expected after 2031, the year
the statutory retirement age will finally converge to age 67 based on current law (see
tables 4a, 4b).
Table 4a – Labour market effective exit age and expected duration of life
spent at retirement - MEN
* The effective retirement age shows the age at which people on average start receiving an old-age pension benefit. It is calculated on the basis of the administrative data for 2019 (see Annex Tables A4a and A4b); ** The labour market exit age as calculated based on Labour Force Survey data for the base year and estimated by the Cohort Simulation Model thereafter; *** ‘Duration of retirement’ is calculated as the difference between the life expectancy at the average labour market exit age and that exit age itself; **** The ‘percentage of adult life spent in retirement’ is calculated as the ratio between the duration of retirement and the life expectancy minus 18 years; ***** Early/late exit is the ratio between those who retire and are below the statutory retirement age and those who retire at the statutory retirement age or above.
Source: Commission Services.
2020 2030 2040 2050 2060 2070 peak value peak yearchange
2020-2070
Average effective retirement age (administrativedata)*
64,0
Average labour market exit age (CSM)** 64,7 65,7 65,7 65,7 65,7 65,7 65,7 2029 1,0
Duration of retirement*** 18,4 18,7 19,7 20,7 21,6 22,5 22,5 2070 4,1
Duration of retirement/contributory period 0,4 0,4 0,4 0,4 0,5 0,5 0,5 2070 0,1
Percentage of adult life spent in retirement**** 28,3 28,2 29,2 30,3 31,2 32,1 32,1 2070 3,8
Early/late exit***** 2,3 1,1 0,9 1,0 0,9 1,0 2,3 2020 -1,3
Page 13 of 42
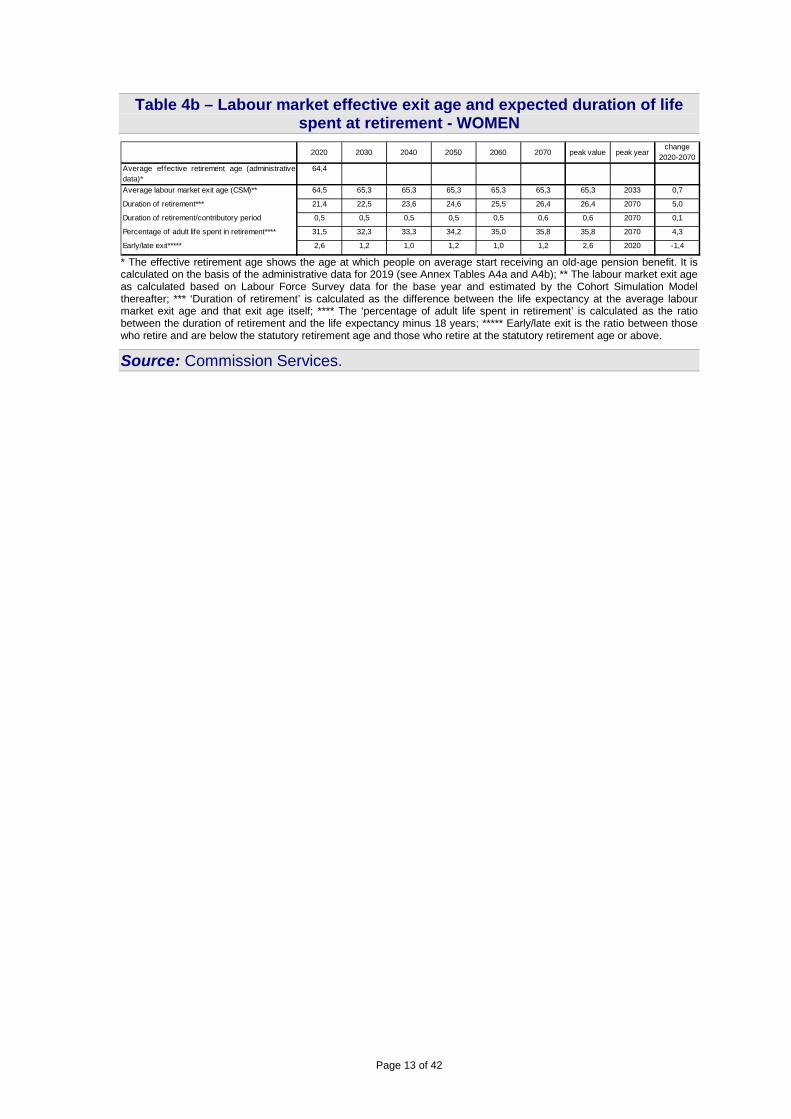
Table 4b – Labour market effective exit age and expected duration of life spent at retirement - WOMEN
2020 2030 2040 2050 2060 2070 peak value peak yearchange
2020-2070
Average effective retirement age (administrativedata)*
64,4
Average labour market exit age (CSM)** 64,5 65,3 65,3 65,3 65,3 65,3 65,3 2033 0,7
Duration of retirement*** 21,4 22,5 23,6 24,6 25,5 26,4 26,4 2070 5,0
Duration of retirement/contributory period 0,5 0,5 0,5 0,5 0,5 0,6 0,6 2070 0,1
Percentage of adult life spent in retirement**** 31,5 32,3 33,3 34,2 35,0 35,8 35,8 2070 4,3
Early/late exit***** 2,6 1,2 1,0 1,2 1,0 1,2 2,6 2020 -1,4 * The effective retirement age shows the age at which people on average start receiving an old-age pension benefit. It is calculated on the basis of the administrative data for 2019 (see Annex Tables A4a and A4b); ** The labour market exit age as calculated based on Labour Force Survey data for the base year and estimated by the Cohort Simulation Model thereafter; *** ‘Duration of retirement’ is calculated as the difference between the life expectancy at the average labour market exit age and that exit age itself; **** The ‘percentage of adult life spent in retirement’ is calculated as the ratio between the duration of retirement and the life expectancy minus 18 years; ***** Early/late exit is the ratio between those who retire and are below the statutory retirement age and those who retire at the statutory retirement age or above.
Source: Commission Services.
Page 14 of 42
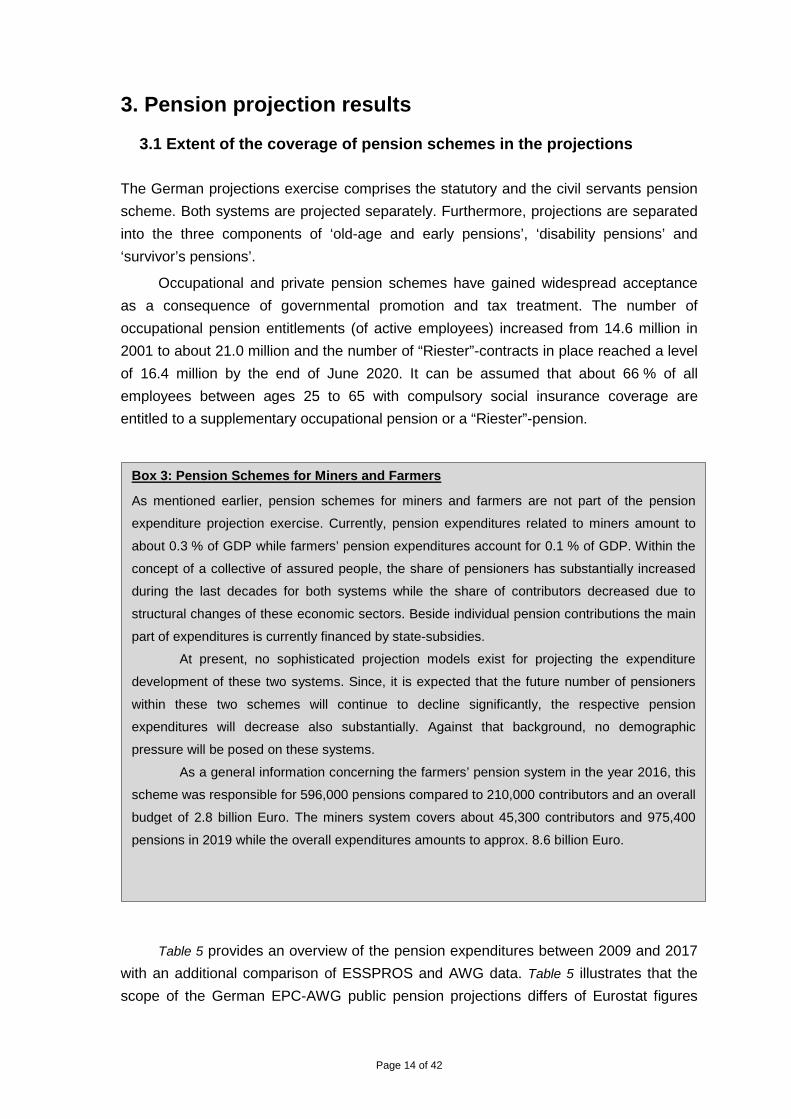
3. Pension projection results 3.1 Extent of the coverage of pension schemes in the projections
The German projections exercise comprises the statutory and the civil servants pension
scheme. Both systems are projected separately. Furthermore, projections are separated
into the three components of ‘old-age and early pensions’, ‘disability pensions’ and
‘survivor’s pensions’.
Occupational and private pension schemes have gained widespread acceptance
as a consequence of governmental promotion and tax treatment. The number of
occupational pension entitlements (of active employees) increased from 14.6 million in
2001 to about 21.0 million and the number of “Riester”-contracts in place reached a level
of 16.4 million by the end of June 2020. It can be assumed that about 66 % of all
employees between ages 25 to 65 with compulsory social insurance coverage are
entitled to a supplementary occupational pension or a “Riester”-pension.
Table 5 provides an overview of the pension expenditures between 2009 and 2017
with an additional comparison of ESSPROS and AWG data. Table 5 illustrates that the
scope of the German EPC-AWG public pension projections differs of Eurostat figures
Box 3: Pension Schemes for Miners and Farmers
As mentioned earlier, pension schemes for miners and farmers are not part of the pension
expenditure projection exercise. Currently, pension expenditures related to miners amount to
about 0.3 % of GDP while farmers’ pension expenditures account for 0.1 % of GDP. Within the
concept of a collective of assured people, the share of pensioners has substantially increased
during the last decades for both systems while the share of contributors decreased due to
structural changes of these economic sectors. Beside individual pension contributions the main
part of expenditures is currently financed by state-subsidies.
At present, no sophisticated projection models exist for projecting the expenditure
development of these two systems. Since, it is expected that the future number of pensioners
within these two schemes will continue to decline significantly, the respective pension
expenditures will decrease also substantially. Against that background, no demographic
pressure will be posed on these systems.
As a general information concerning the farmers’ pension system in the year 2016, this
scheme was responsible for 596,000 pensions compared to 210,000 contributors and an overall
budget of 2.8 billion Euro. The miners system covers about 45,300 contributors and 975,400
pensions in 2019 while the overall expenditures amounts to approx. 8.6 billion Euro.
Page 15 of 42
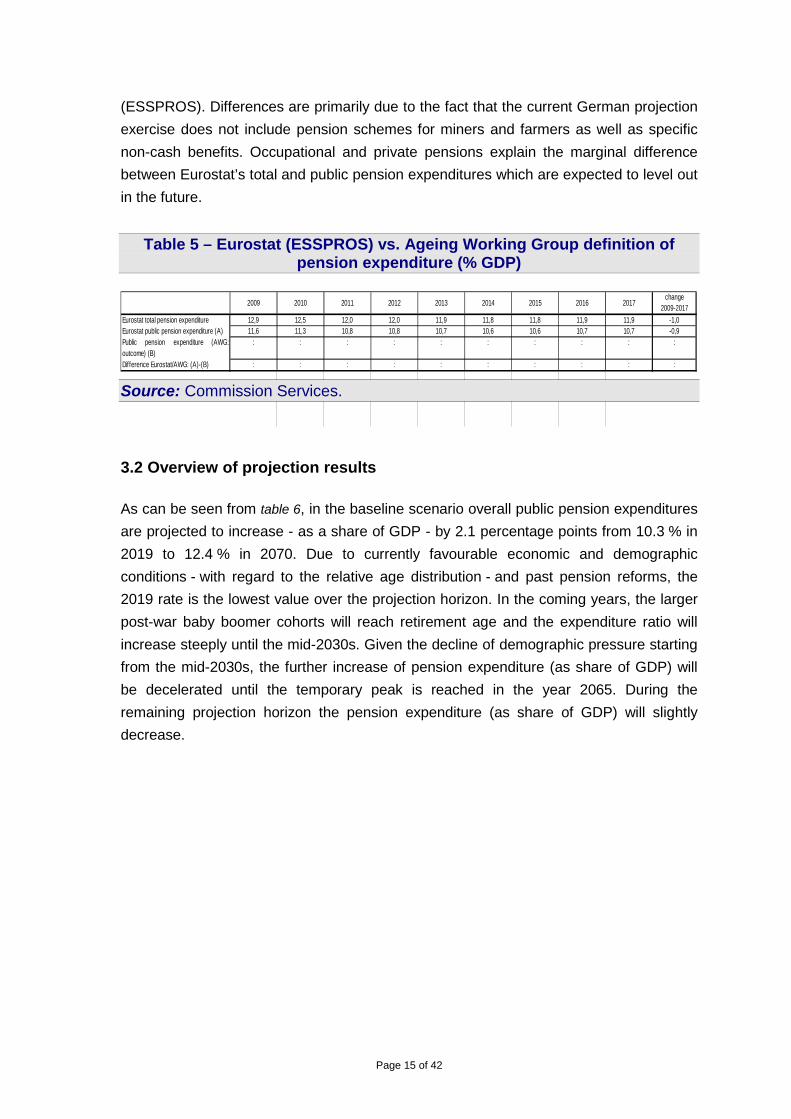
(ESSPROS). Differences are primarily due to the fact that the current German projection
exercise does not include pension schemes for miners and farmers as well as specific
non-cash benefits. Occupational and private pensions explain the marginal difference
between Eurostat’s total and public pension expenditures which are expected to level out
in the future.
Table 5 – Eurostat (ESSPROS) vs. Ageing Working Group definition of
pension expenditure (% GDP)
2009 2010 2011 2012 2013 2014 2015 2016 2017change
2009-2017
Eurostat total pension expenditure 12,9 12,5 12,0 12,0 11,9 11,8 11,8 11,9 11,9 -1,0Eurostat public pension expenditure (A) 11,6 11,3 10,8 10,8 10,7 10,6 10,6 10,7 10,7 -0,9Public pension expenditure (AWG:outcome) (B)
: : : : : : : : : :
Difference Eurostat/AWG: (A)-(B) : : : : : : : : : :
Expenditure categories not considered : : : : : : : : : :
Source: Commission Services.
3.2 Overview of projection results As can be seen from table 6, in the baseline scenario overall public pension expenditures
are projected to increase - as a share of GDP - by 2.1 percentage points from 10.3 % in
2019 to 12.4 % in 2070. Due to currently favourable economic and demographic
conditions - with regard to the relative age distribution - and past pension reforms, the
2019 rate is the lowest value over the projection horizon. In the coming years, the larger
post-war baby boomer cohorts will reach retirement age and the expenditure ratio will
increase steeply until the mid-2030s. Given the decline of demographic pressure starting
from the mid-2030s, the further increase of pension expenditure (as share of GDP) will
be decelerated until the temporary peak is reached in the year 2065. During the
remaining projection horizon the pension expenditure (as share of GDP) will slightly
decrease.
Page 16 of 42
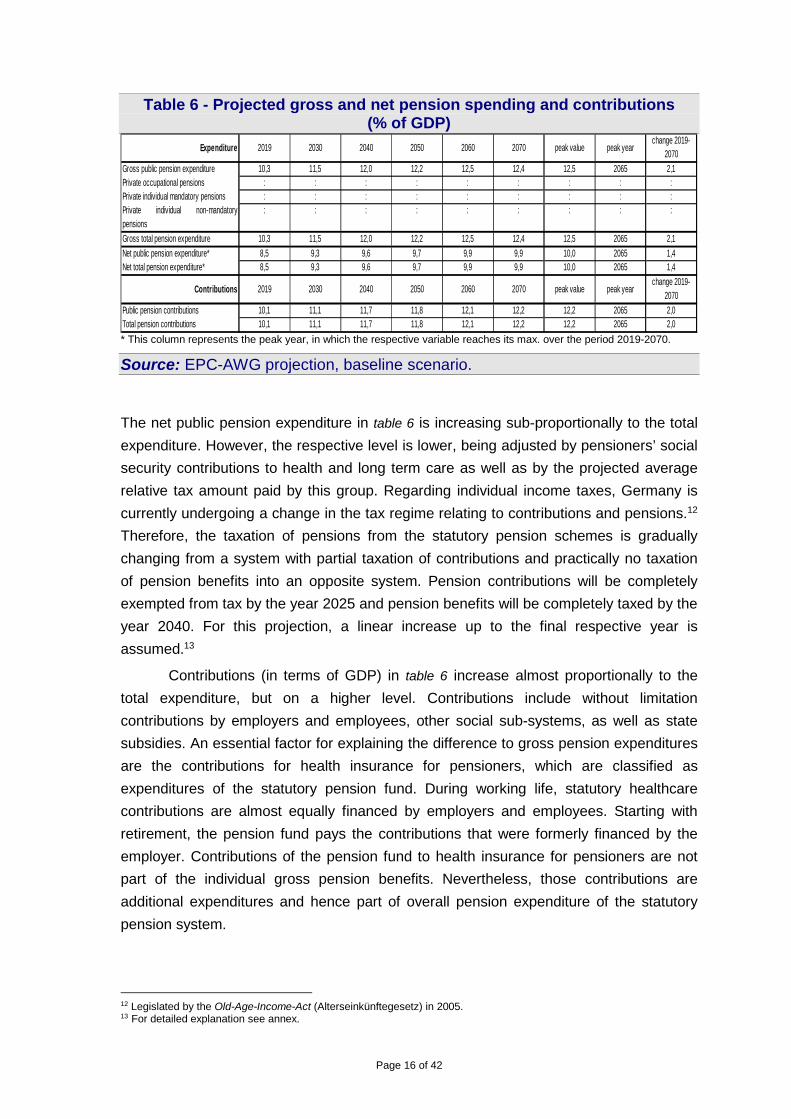
Table 6 - Projected gross and net pension spending and contributions (% of GDP)
Expenditure 2019 2030 2040 2050 2060 2070 peak value peak yearchange 2019-
2070
Gross public pension expenditure 10,3 11,5 12,0 12,2 12,5 12,4 12,5 2065 2,1Private occupational pensions : : : : : : : : :Private individual mandatory pensions : : : : : : : : :Private individual non-mandatorypensions
: : : : : : : : :
Gross total pension expenditure 10,3 11,5 12,0 12,2 12,5 12,4 12,5 2065 2,1
Net public pension expenditure* 8,5 9,3 9,6 9,7 9,9 9,9 10,0 2065 1,4Net total pension expenditure* 8,5 9,3 9,6 9,7 9,9 9,9 10,0 2065 1,4
Contributions 2019 2030 2040 2050 2060 2070 peak value peak yearchange 2019-
2070
Public pension contributions 10,1 11,1 11,7 11,8 12,1 12,2 12,2 2065 2,0Total pension contributions 10,1 11,1 11,7 11,8 12,1 12,2 12,2 2065 2,0
* This column represents the peak year, in which the respective variable reaches its max. over the period 2019-2070.
Source: EPC-AWG projection, baseline scenario.
The net public pension expenditure in table 6 is increasing sub-proportionally to the total
expenditure. However, the respective level is lower, being adjusted by pensioners’ social
security contributions to health and long term care as well as by the projected average
relative tax amount paid by this group. Regarding individual income taxes, Germany is
currently undergoing a change in the tax regime relating to contributions and pensions.12
Therefore, the taxation of pensions from the statutory pension schemes is gradually
changing from a system with partial taxation of contributions and practically no taxation
of pension benefits into an opposite system. Pension contributions will be completely
exempted from tax by the year 2025 and pension benefits will be completely taxed by the
year 2040. For this projection, a linear increase up to the final respective year is
assumed.13
Contributions (in terms of GDP) in table 6 increase almost proportionally to the
total expenditure, but on a higher level. Contributions include without limitation
contributions by employers and employees, other social sub-systems, as well as state
subsidies. An essential factor for explaining the difference to gross pension expenditures
are the contributions for health insurance for pensioners, which are classified as
expenditures of the statutory pension fund. During working life, statutory healthcare
contributions are almost equally financed by employers and employees. Starting with
retirement, the pension fund pays the contributions that were formerly financed by the
employer. Contributions of the pension fund to health insurance for pensioners are not
part of the individual gross pension benefits. Nevertheless, those contributions are
additional expenditures and hence part of overall pension expenditure of the statutory
pension system.
12 Legislated by the Old-Age-Income-Act (Alterseinkünftegesetz) in 2005. 13 For detailed explanation see annex.
Page 17 of 42
Contributions of the pension fund to the statutory healthcare system account for
about 0.6 % of GDP in 2019 and rise to 0.8 % of GDP in 2070. That is slightly more than
the difference between the relative amount of contributions and total expenditures in table
6, but since parts of pension benefits for civil servants are financed from appropriate
reserve funds, contributions and expenditures are not necessarily identical, especially in
the long run. Nevertheless, the parallel development of contributions and expenditures
results from interaction of the contribution rate and the annual pension indexation. Both
components ensure automatically the financial sustainability of the public pension
systems, as seen in the ratio of public pension expenditure and contributions to GDP in
table 6.
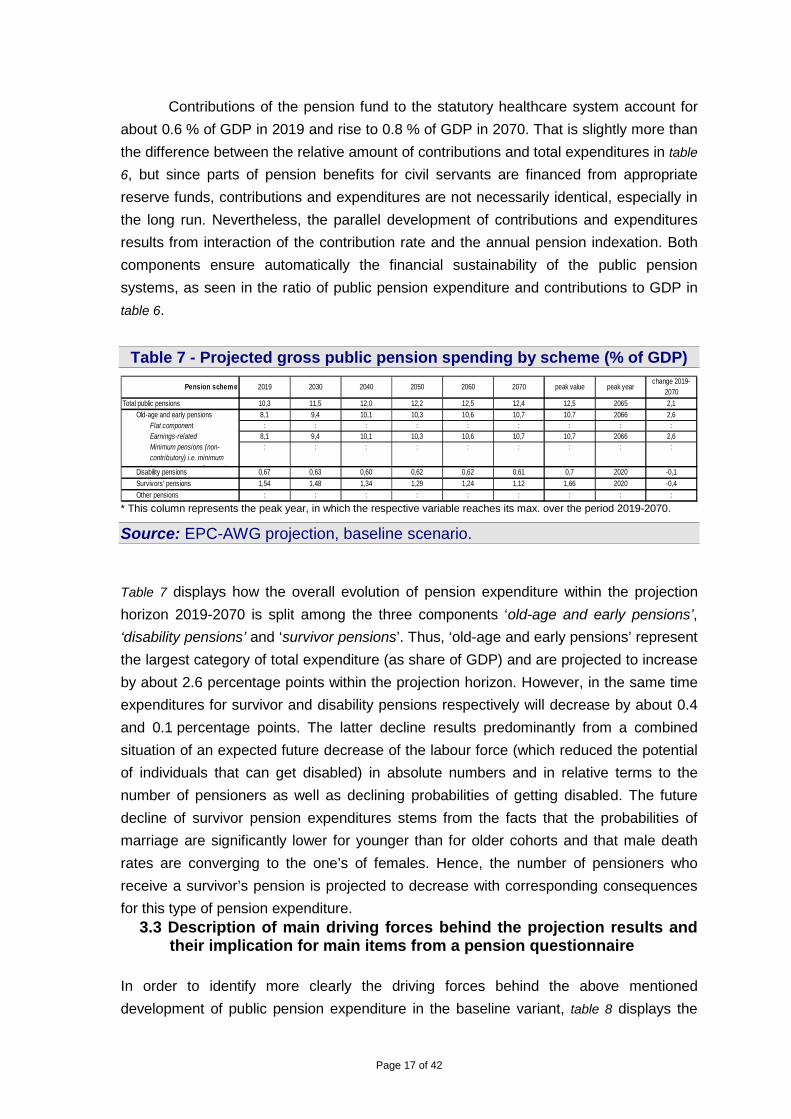
Table 7 - Projected gross public pension spending by scheme (% of GDP)
Pension scheme 2019 2030 2040 2050 2060 2070 peak value peak yearchange 2019-
2070
Total public pensions 10,3 11,5 12,0 12,2 12,5 12,4 12,5 2065 2,1Old-age and early pensions 8,1 9,4 10,1 10,3 10,6 10,7 10,7 2066 2,6
Flat component : : : : : : : : :Earnings-related 8,1 9,4 10,1 10,3 10,6 10,7 10,7 2066 2,6Minimum pensions (non-contributory) i.e. minimum income guarantee for people
: : : : : : : : :
Disability pensions 0,67 0,63 0,60 0,62 0,62 0,61 0,7 2020 -0,1
Survivors' pensions 1,54 1,48 1,34 1,29 1,24 1,12 1,66 2020 -0,4
Other pensions : : : : : : : : : * This column represents the peak year, in which the respective variable reaches its max. over the period 2019-2070.
Source: EPC-AWG projection, baseline scenario.
Table 7 displays how the overall evolution of pension expenditure within the projection
horizon 2019-2070 is split among the three components ‘old-age and early pensions’,
‘disability pensions’ and ‘survivor pensions’. Thus, ‘old-age and early pensions’ represent
the largest category of total expenditure (as share of GDP) and are projected to increase
by about 2.6 percentage points within the projection horizon. However, in the same time
expenditures for survivor and disability pensions respectively will decrease by about 0.4
and 0.1 percentage points. The latter decline results predominantly from a combined
situation of an expected future decrease of the labour force (which reduced the potential
of individuals that can get disabled) in absolute numbers and in relative terms to the
number of pensioners as well as declining probabilities of getting disabled. The future
decline of survivor pension expenditures stems from the facts that the probabilities of
marriage are significantly lower for younger than for older cohorts and that male death
rates are converging to the one’s of females. Hence, the number of pensioners who
receive a survivor’s pension is projected to decrease with corresponding consequences
for this type of pension expenditure. 3.3 Description of main driving forces behind the projection results and
their implication for main items from a pension questionnaire In order to identify more clearly the driving forces behind the above mentioned
development of public pension expenditure in the baseline variant, table 8 displays the
Page 18 of 42
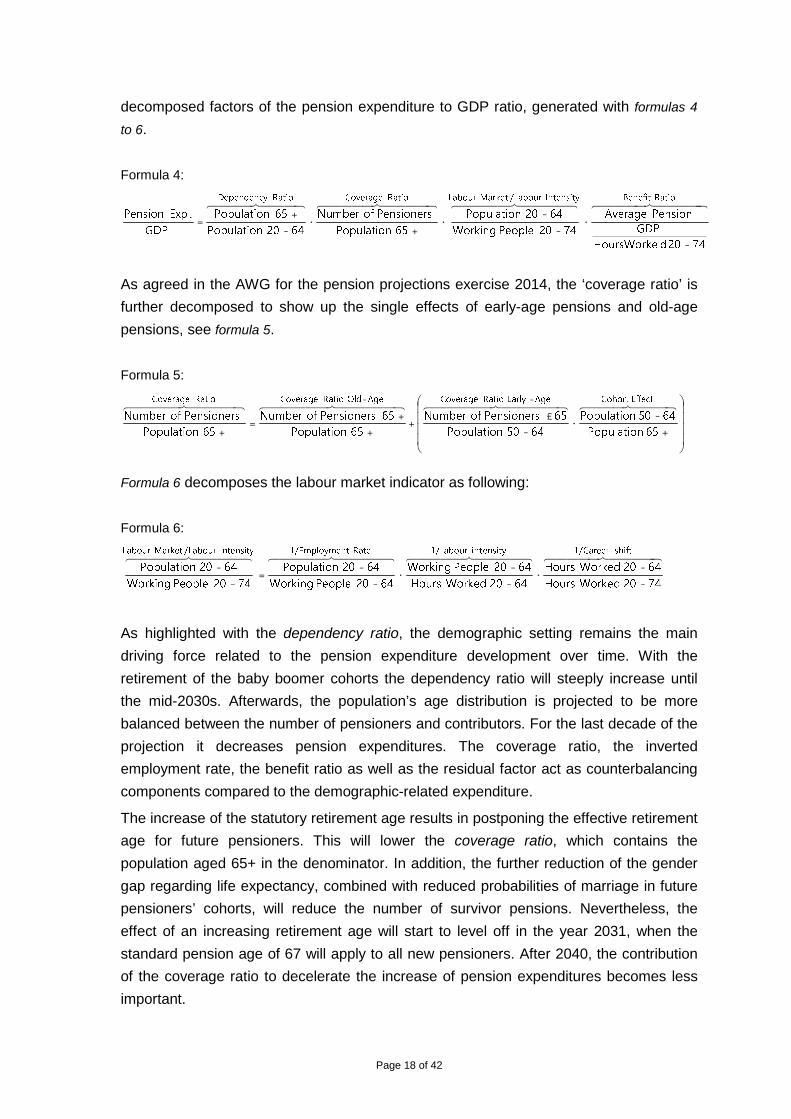
decomposed factors of the pension expenditure to GDP ratio, generated with formulas 4
to 6.
Formula 4:
4444 84444 764444 84444 764444 84444 76444 8444 76RatioBenefitIntensityLabour/MarketLabourRatioCoverageRatioDependency
7420dHoursWorke
GDP
PensionAverage
7420PeopleWorking
6420Population
65Population
PensionersofNumber
6420Population
65Population
GDP
.ExpPension
-
·-
-·
+·
-
+=
As agreed in the AWG for the pension projections exercise 2014, the ‘coverage ratio’ is
further decomposed to show up the single effects of early-age pensions and old-age
pensions, see formula 5.
Formula 5:
+
-·
-
£+
+
+=
+
--444 8444 7644444 844444 7644444 844444 764444 84444 76
EffectCohortAgeEarlyRatioCoverageAgeOldRatioCoverageRatioCoverage
65Population
6450Population
6450Population
65PensionersofNumber
65Population
65PensionersofNumber
65Population
PensionersofNumber
Formula 6 decomposes the labour market indicator as following:
Formula 6:
4444 84444 764444 84444 764444 84444 764444 84444 76shiftCareer/1ensityintLabour/1RateEmployment/1IntensityLabour/MarketLabour
7420WorkedHours
6420WorkedHours
6420WorkedHours
6420PeopleWorking
6420PeopleWorking
6420Population
7420PeopleWorking
6420Population
-
-·
-
-·
-
-=
-
-
As highlighted with the dependency ratio, the demographic setting remains the main
driving force related to the pension expenditure development over time. With the
retirement of the baby boomer cohorts the dependency ratio will steeply increase until
the mid-2030s. Afterwards, the population’s age distribution is projected to be more
balanced between the number of pensioners and contributors. For the last decade of the
projection it decreases pension expenditures. The coverage ratio, the inverted
employment rate, the benefit ratio as well as the residual factor act as counterbalancing
components compared to the demographic-related expenditure.
The increase of the statutory retirement age results in postponing the effective retirement
age for future pensioners. This will lower the coverage ratio, which contains the
population aged 65+ in the denominator. In addition, the further reduction of the gender
gap regarding life expectancy, combined with reduced probabilities of marriage in future
pensioners’ cohorts, will reduce the number of survivor pensions. Nevertheless, the
effect of an increasing retirement age will start to level off in the year 2031, when the
standard pension age of 67 will apply to all new pensioners. After 2040, the contribution
of the coverage ratio to decelerate the increase of pension expenditures becomes less
important.
Page 19 of 42
In the given decomposition, the employment ratio reduces its positive impact on
decelerating pension expenditure increase until the mid-2030s as the assumed increase
of older workers’ labour participation will enlarge the workforce over age 64 as can be
seen by the career shift effect. Although the increase of the statutory retirement age will
start in the year 2012, it is assumed that the working population will adjust to longer
working careers substantially earlier. For the remaining projection horizon the influence
of the inverse employment rate is marginal.
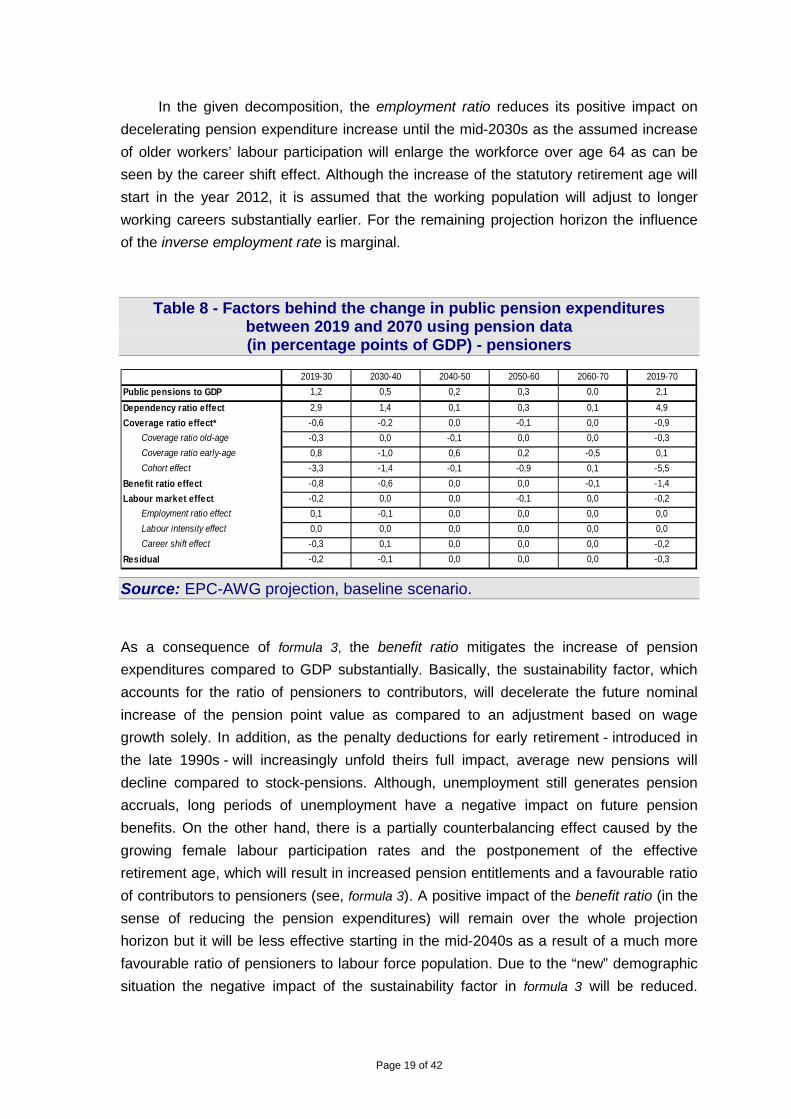
Table 8 - Factors behind the change in public pension expenditures
between 2019 and 2070 using pension data (in percentage points of GDP) - pensioners
2019-30 2030-40 2040-50 2050-60 2060-70 2019-70
Public pensions to GDP 1,2 0,5 0,2 0,3 0,0 2,1
Dependency ratio effect 2,9 1,4 0,1 0,3 0,1 4,9
Coverage ratio effect* -0,6 -0,2 0,0 -0,1 0,0 -0,9
Coverage ratio old-age -0,3 0,0 -0,1 0,0 0,0 -0,3
Coverage ratio early-age 0,8 -1,0 0,6 0,2 -0,5 0,1
Cohort effect -3,3 -1,4 -0,1 -0,9 0,1 -5,5
Benefit ratio effect -0,8 -0,6 0,0 0,0 -0,1 -1,4
Labour market effect -0,2 0,0 0,0 -0,1 0,0 -0,2
Employment ratio effect 0,1 -0,1 0,0 0,0 0,0 0,0
Labour intensity effect 0,0 0,0 0,0 0,0 0,0 0,0
Career shift effect -0,3 0,1 0,0 0,0 0,0 -0,2
Residual -0,2 -0,1 0,0 0,0 0,0 -0,3
Source: EPC-AWG projection, baseline scenario.
As a consequence of formula 3, the benefit ratio mitigates the increase of pension
expenditures compared to GDP substantially. Basically, the sustainability factor, which
accounts for the ratio of pensioners to contributors, will decelerate the future nominal
increase of the pension point value as compared to an adjustment based on wage
growth solely. In addition, as the penalty deductions for early retirement - introduced in
the late 1990s - will increasingly unfold theirs full impact, average new pensions will
decline compared to stock-pensions. Although, unemployment still generates pension
accruals, long periods of unemployment have a negative impact on future pension
benefits. On the other hand, there is a partially counterbalancing effect caused by the
growing female labour participation rates and the postponement of the effective
retirement age, which will result in increased pension entitlements and a favourable ratio
of contributors to pensioners (see, formula 3). A positive impact of the benefit ratio (in the
sense of reducing the pension expenditures) will remain over the whole projection
horizon but it will be less effective starting in the mid-2040s as a result of a much more
favourable ratio of pensioners to labour force population. Due to the “new” demographic
situation the negative impact of the sustainability factor in formula 3 will be reduced.

Page 20 of 42
Additionally, the effect of longer contribution records will also have an impact on the
reverse impact of the benefit ratio.
As expected, the incorporated labour intensity effect has no impact on the pension
expenditure/GDP ratio.
Table 9 - Replacement rate at retirement (RR), benefit ratio (BR) and
coverage by pension scheme (in %)
2019 2030 2040 2050 2060 2070change 2019-
2070 (pps)
Public scheme (BR) 42% 40% 39% 39% 39% 39% -3%
Coverage 100,0 100,0 100,0 100,0 100,0 100,0 0,0
Public scheme: old-age earnings related (BR)
39% 39% 38% 38% 38% 38% -1%
Public scheme: old-age earnings related (RR)
40% 38% 37% 37% 37% 37% -3%
Coverage 83,6 85,5 87,0 87,1 87,7 88,2 4,5
Private occupational scheme (BR) : : : : : : :
Private occupational scheme (RR) : : : : : : :
Coverage : : : : : : :
Private individual schemes (BR) : : : : : : :
Private individual schemes (RR) : : : : : : :
Coverage : : : : : : :
Total benefit ratio 42% 40% 39% 39% 39% 39% -3%
Total replacement rate 40% 38% 37% 37% 37% 37% -3%
Source: EPC-AWG projection, baseline scenario.
Regarding the replacement rate at retirement in the public pension scheme, this value is
calculated with the assumption that the average wage at retirement is five percentage
points above the nationwide average wage (over all ages) for the entire projection period.
For further clarification, please see annex.
As stated in table 9, the replacement rate at retirement is expected to decrease
from 40 % to 37 % over the projection horizon.14 This development is a consequence of
the sustainability factor performance in the pension indexation formula 3. This specific
component of the pension indexation formula reflects the strong increase in the absolute
number of people at age 65 or older while simultaneously the overall population number
is decreasing in the transition period. The latter fact relates primarily to the shrinking
working age population in the future. This results into a situation where the so called
baby-boomers will leave the labour market and will become pension-beneficiaries (in
technical terms) whereas the number of contributors will decrease accordingly.
Furthermore, this development is intensified by the fact, that - in absolute numbers - the
very old post-war cohorts are much smaller than the baby-boomer cohorts.15
14 The calculation of benefit ratio and replacement rate includes pensions abroad. When ascribing total pension costs to the number of national pensioners only, the calculated ratios are higher. 15 See page 24 for further details on the impact of the different factors of the indexation formula.
Page 21 of 42
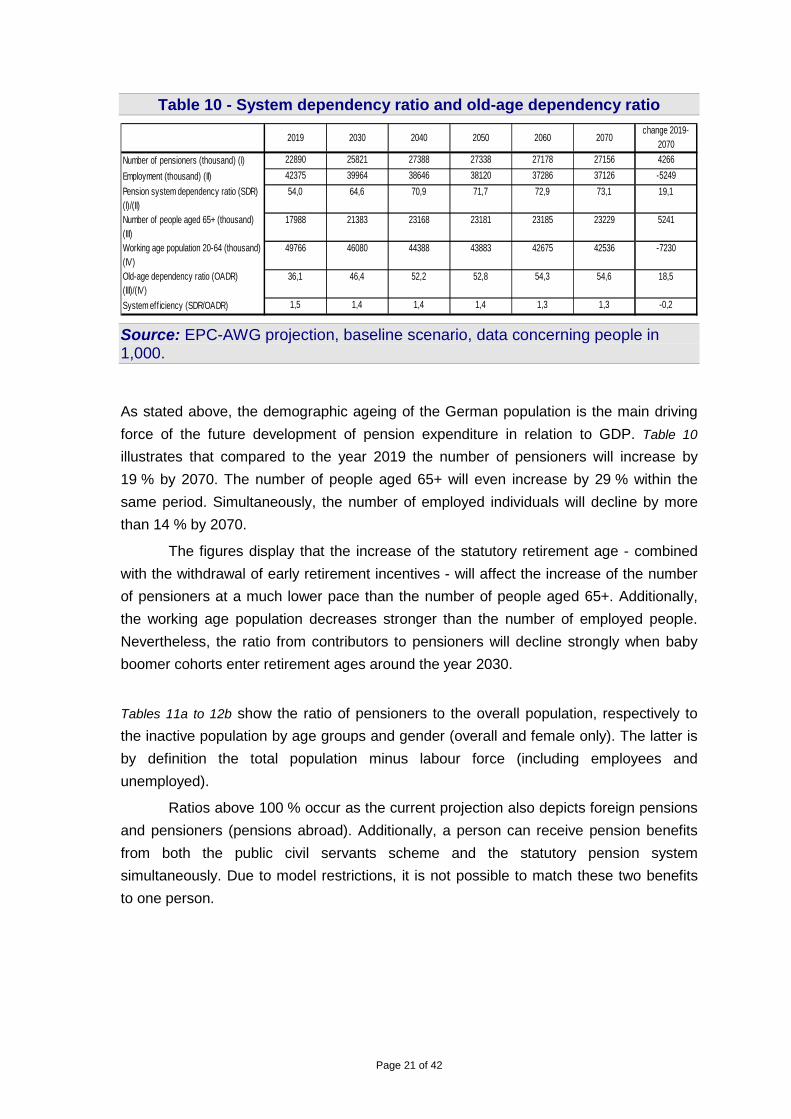
Table 10 - System dependency ratio and old-age dependency ratio
2019 2030 2040 2050 2060 2070change 2019-
2070
Number of pensioners (thousand) (I) 22890 25821 27388 27338 27178 27156 4266
Employment (thousand) (II) 42375 39964 38646 38120 37286 37126 -5249
Pension system dependency ratio (SDR) (I)/(II)
54,0 64,6 70,9 71,7 72,9 73,1 19,1
Number of people aged 65+ (thousand) (III)
17988 21383 23168 23181 23185 23229 5241
Working age population 20-64 (thousand) (IV)
49766 46080 44388 43883 42675 42536 -7230
Old-age dependency ratio (OADR) (III)/(IV)
36,1 46,4 52,2 52,8 54,3 54,6 18,5
System eff iciency (SDR/OADR) 1,5 1,4 1,4 1,4 1,3 1,3 -0,2
Source: EPC-AWG projection, baseline scenario, data concerning people in 1,000.
As stated above, the demographic ageing of the German population is the main driving
force of the future development of pension expenditure in relation to GDP. Table 10
illustrates that compared to the year 2019 the number of pensioners will increase by
19 % by 2070. The number of people aged 65+ will even increase by 29 % within the
same period. Simultaneously, the number of employed individuals will decline by more
than 14 % by 2070.
The figures display that the increase of the statutory retirement age - combined
with the withdrawal of early retirement incentives - will affect the increase of the number
of pensioners at a much lower pace than the number of people aged 65+. Additionally,
the working age population decreases stronger than the number of employed people.
Nevertheless, the ratio from contributors to pensioners will decline strongly when baby
boomer cohorts enter retirement ages around the year 2030.
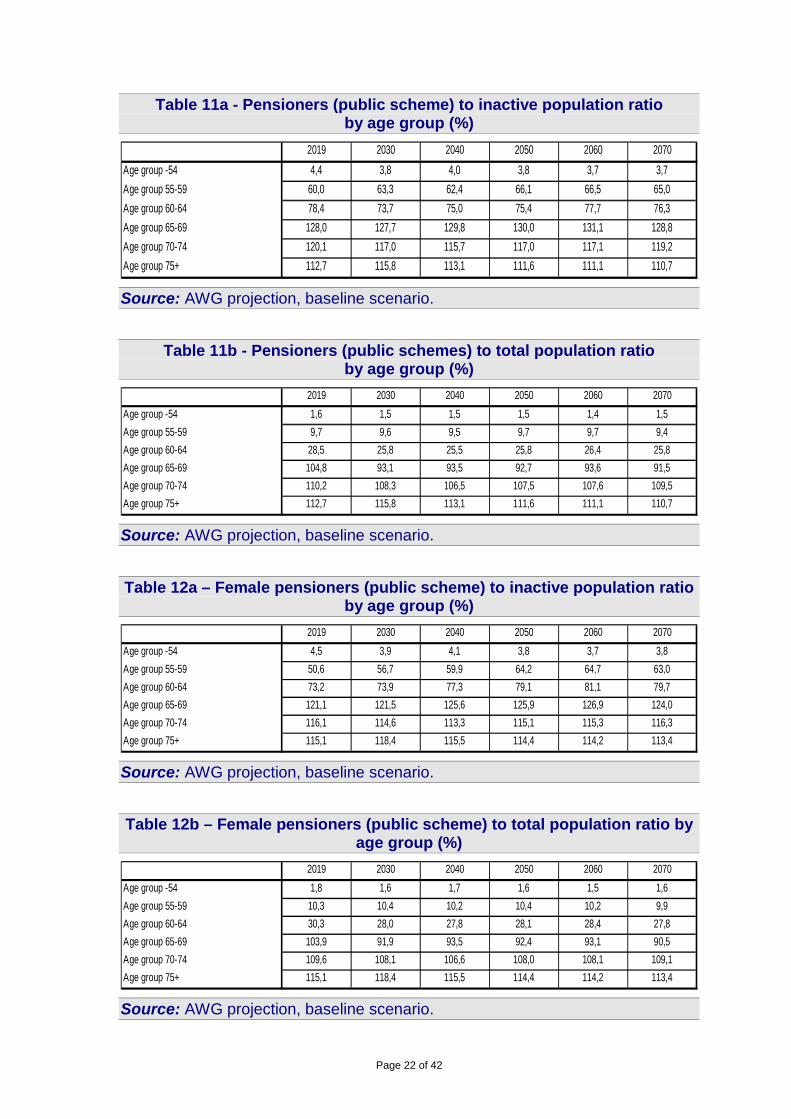
Tables 11a to 12b show the ratio of pensioners to the overall population, respectively to
the inactive population by age groups and gender (overall and female only). The latter is
by definition the total population minus labour force (including employees and
unemployed).
Ratios above 100 % occur as the current projection also depicts foreign pensions
and pensioners (pensions abroad). Additionally, a person can receive pension benefits
from both the public civil servants scheme and the statutory pension system
simultaneously. Due to model restrictions, it is not possible to match these two benefits
to one person.
Page 22 of 42
Table 11a - Pensioners (public scheme) to inactive population ratio by age group (%)
2019 2030 2040 2050 2060 2070
Age group -54 4,4 3,8 4,0 3,8 3,7 3,7
Age group 55-59 60,0 63,3 62,4 66,1 66,5 65,0
Age group 60-64 78,4 73,7 75,0 75,4 77,7 76,3
Age group 65-69 128,0 127,7 129,8 130,0 131,1 128,8
Age group 70-74 120,1 117,0 115,7 117,0 117,1 119,2
Age group 75+ 112,7 115,8 113,1 111,6 111,1 110,7
Source: AWG projection, baseline scenario.
Table 11b - Pensioners (public schemes) to total population ratio
by age group (%)
2019 2030 2040 2050 2060 2070
Age group -54 1,6 1,5 1,5 1,5 1,4 1,5
Age group 55-59 9,7 9,6 9,5 9,7 9,7 9,4
Age group 60-64 28,5 25,8 25,5 25,8 26,4 25,8
Age group 65-69 104,8 93,1 93,5 92,7 93,6 91,5
Age group 70-74 110,2 108,3 106,5 107,5 107,6 109,5
Age group 75+ 112,7 115,8 113,1 111,6 111,1 110,7
Source: AWG projection, baseline scenario.
Table 12a – Female pensioners (public scheme) to inactive population ratio
by age group (%)
2019 2030 2040 2050 2060 2070
Age group -54 4,5 3,9 4,1 3,8 3,7 3,8
Age group 55-59 50,6 56,7 59,9 64,2 64,7 63,0
Age group 60-64 73,2 73,9 77,3 79,1 81,1 79,7
Age group 65-69 121,1 121,5 125,6 125,9 126,9 124,0
Age group 70-74 116,1 114,6 113,3 115,1 115,3 116,3
Age group 75+ 115,1 118,4 115,5 114,4 114,2 113,4
Source: AWG projection, baseline scenario.
Table 12b – Female pensioners (public scheme) to total population ratio by
age group (%)
2019 2030 2040 2050 2060 2070
Age group -54 1,8 1,6 1,7 1,6 1,5 1,6
Age group 55-59 10,3 10,4 10,2 10,4 10,2 9,9
Age group 60-64 30,3 28,0 27,8 28,1 28,4 27,8
Age group 65-69 103,9 91,9 93,5 92,4 93,1 90,5
Age group 70-74 109,6 108,1 106,6 108,0 108,1 109,1
Age group 75+ 115,1 118,4 115,5 114,4 114,2 113,4
Source: AWG projection, baseline scenario.
Page 23 of 42
Overall, the ratios in table 11a and table 12a are strongly influenced by labour market
dynamics. A proper description of the ratios’ development over time should be able to
extract these effects, what is rather complicated. Therefore, a ratio of pensioners to
population for the same age groups, as shown in table 11b and table 12b is calculated.
Especially for the age groups 60-64 and 65-69 the declining ratios in the next 20 years
reflect quite clearly the effect of postponing the retirement age due to the increase of the
statutory retirement until 2029.
The individual pension benefit accrued in the German statutory pension scheme - as a
point system - is in principle based on the number of individual pension points accrued
during working life. The quantity of pension points p.a. depends in general on the
proportion of individual gross wage to economy-wide average wage. Furthermore, credits
for specific periods raise the individual pension entitlements. Hence, the number of
pension points is not necessarily comparable to the length of the working career. In
addition, there is no direct link between the cost of pension points and the number of
pension points. The absolute costs of a pension point p.a. depend on the level of the
contribution rate and the individual gross wage in that specific year as limited by the
corresponding earnings ceiling.
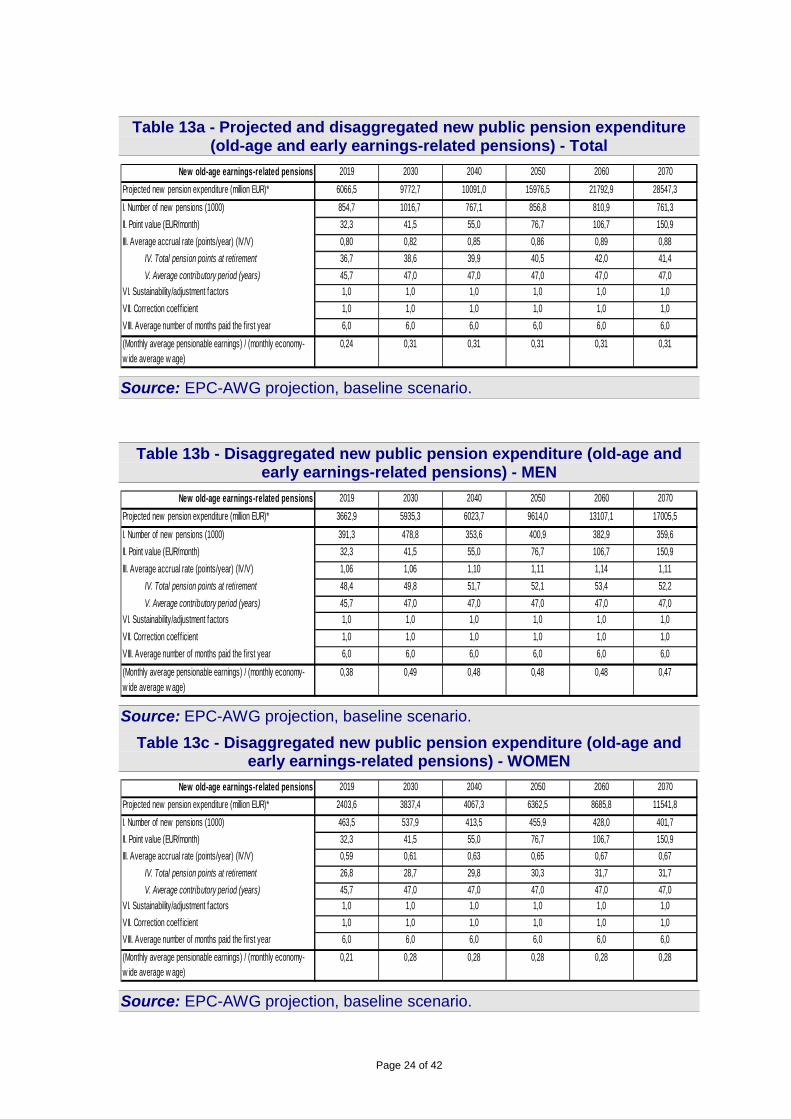
Tables 13a to 13c show the main driving forces behind the future development of
expenditure for new pensions by gender. Despite the increase of the statutory retirement
age, the number of new old-age and early pensions will increase within the next two
decades, as the baby-boomers will reach retirement ages. After baby-boomers have
retired in the mid-2030s, the number of new pensions will decrease and reach a lower
level in 2070 comparable to that in 2019. The pension point value will increase -
according to the pension indexation formula - on a lower level than the wages will
increase (see also formula 7 et seqq.). A future increase of the average number of
individual pension points can mainly be explained by an extended working lifetime and
the projected higher labour market participation, especially of women and older people.
However, differences between cohorts emerge due to varying pension claims already
accrued in the base year.
In tables 13a to 13c, the value for the category “sustainability/adjustment factors” is
constantly declared to be 1.0. That declaration is necessary to obtain a transparent and
consistent correlation between the projected new pension expenditures and the
categories “number of new pensions”, “total pension points at retirement” and “point
value”. That definition does not mean that the German statutory pension system has no
sustainability elements implemented. It just clarifies, that the pension point value in year t
for new pensioners in year t contains already all previous adjustments by the
sustainability factor before the year t. Furthermore, the pension point value is equal for
stock and new pensions. Hence, the current pension point value in year t reflects the
adjustment by the sustainability factor for stock and new pensions.
Page 24 of 42
Table 13a - Projected and disaggregated new public pension expenditure
(old-age and early earnings-related pensions) - Total
New old-age earnings-related pensions 2019 2030 2040 2050 2060 2070
Projected new pension expenditure (million EUR)* 6066,5 9772,7 10091,0 15976,5 21792,9 28547,3
I. Number of new pensions (1000) 854,7 1016,7 767,1 856,8 810,9 761,3
II. Point value (EUR/month) 32,3 41,5 55,0 76,7 106,7 150,9
III. Average accrual rate (points/year) (IV/V) 0,80 0,82 0,85 0,86 0,89 0,88
IV. Total pension points at retirement 36,7 38,6 39,9 40,5 42,0 41,4
V. Average contributory period (years) 45,7 47,0 47,0 47,0 47,0 47,0
VI. Sustainability/adjustment factors 1,0 1,0 1,0 1,0 1,0 1,0
VII. Correction coefficient 1,0 1,0 1,0 1,0 1,0 1,0
VIII. Average number of months paid the first year 6,0 6,0 6,0 6,0 6,0 6,0
(Monthly average pensionable earnings) / (monthly economy-w ide average w age)
0,24 0,31 0,31 0,31 0,31 0,31
Source: EPC-AWG projection, baseline scenario.
Table 13b - Disaggregated new public pension expenditure (old-age and early earnings-related pensions) - MEN
New old-age earnings-related pensions 2019 2030 2040 2050 2060 2070
Projected new pension expenditure (million EUR)* 3662,9 5935,3 6023,7 9614,0 13107,1 17005,5
I. Number of new pensions (1000) 391,3 478,8 353,6 400,9 382,9 359,6
II. Point value (EUR/month) 32,3 41,5 55,0 76,7 106,7 150,9
III. Average accrual rate (points/year) (IV/V) 1,06 1,06 1,10 1,11 1,14 1,11
IV. Total pension points at retirement 48,4 49,8 51,7 52,1 53,4 52,2
V. Average contributory period (years) 45,7 47,0 47,0 47,0 47,0 47,0
VI. Sustainability/adjustment factors 1,0 1,0 1,0 1,0 1,0 1,0
VII. Correction coefficient 1,0 1,0 1,0 1,0 1,0 1,0
VIII. Average number of months paid the first year 6,0 6,0 6,0 6,0 6,0 6,0
(Monthly average pensionable earnings) / (monthly economy-w ide average w age)
0,38 0,49 0,48 0,48 0,48 0,47
Source: EPC-AWG projection, baseline scenario.
Table 13c - Disaggregated new public pension expenditure (old-age and early earnings-related pensions) - WOMEN
New old-age earnings-related pensions 2019 2030 2040 2050 2060 2070
Projected new pension expenditure (million EUR)* 2403,6 3837,4 4067,3 6362,5 8685,8 11541,8
I. Number of new pensions (1000) 463,5 537,9 413,5 455,9 428,0 401,7
II. Point value (EUR/month) 32,3 41,5 55,0 76,7 106,7 150,9
III. Average accrual rate (points/year) (IV/V) 0,59 0,61 0,63 0,65 0,67 0,67
IV. Total pension points at retirement 26,8 28,7 29,8 30,3 31,7 31,7
V. Average contributory period (years) 45,7 47,0 47,0 47,0 47,0 47,0
VI. Sustainability/adjustment factors 1,0 1,0 1,0 1,0 1,0 1,0
VII. Correction coefficient 1,0 1,0 1,0 1,0 1,0 1,0
VIII. Average number of months paid the first year 6,0 6,0 6,0 6,0 6,0 6,0
(Monthly average pensionable earnings) / (monthly economy-w ide average w age)
0,21 0,28 0,28 0,28 0,28 0,28
Source: EPC-AWG projection, baseline scenario.
Page 25 of 42
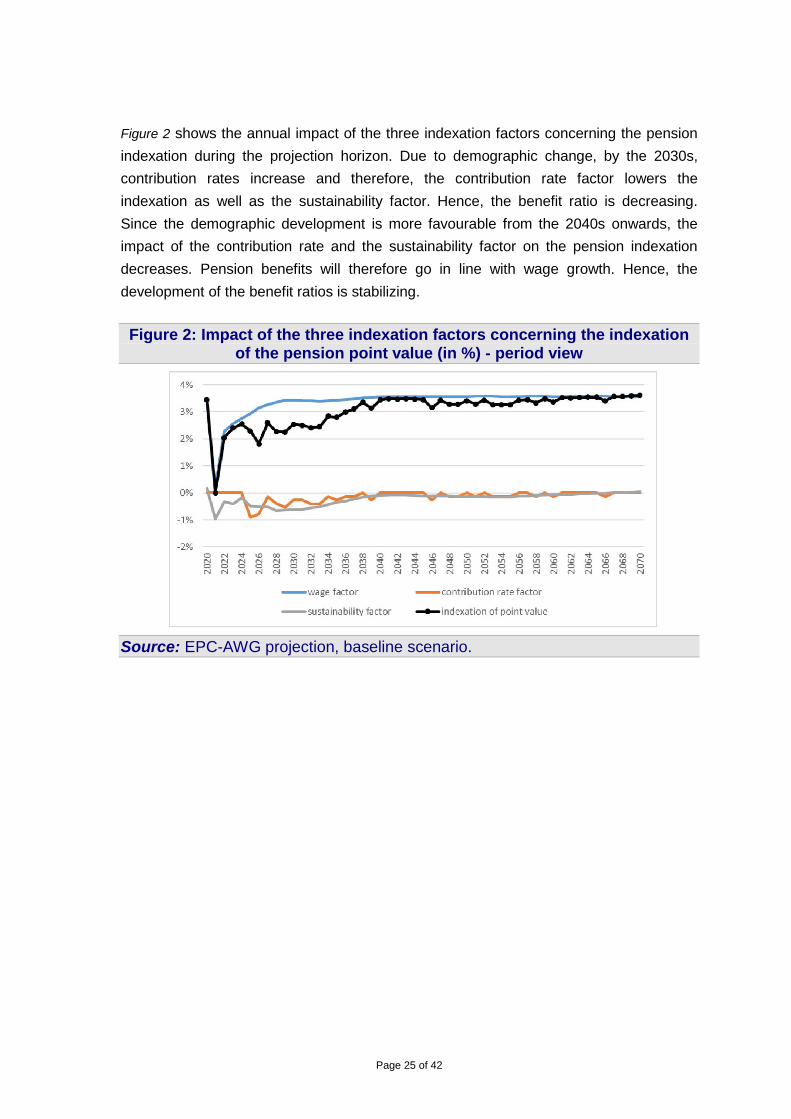
Figure 2 shows the annual impact of the three indexation factors concerning the pension
indexation during the projection horizon. Due to demographic change, by the 2030s,
contribution rates increase and therefore, the contribution rate factor lowers the
indexation as well as the sustainability factor. Hence, the benefit ratio is decreasing.
Since the demographic development is more favourable from the 2040s onwards, the
impact of the contribution rate and the sustainability factor on the pension indexation
decreases. Pension benefits will therefore go in line with wage growth. Hence, the
development of the benefit ratios is stabilizing.
Figure 2: Impact of the three indexation factors concerning the indexation
of the pension point value (in %) - period view
Source: EPC-AWG projection, baseline scenario.
Page 26 of 42
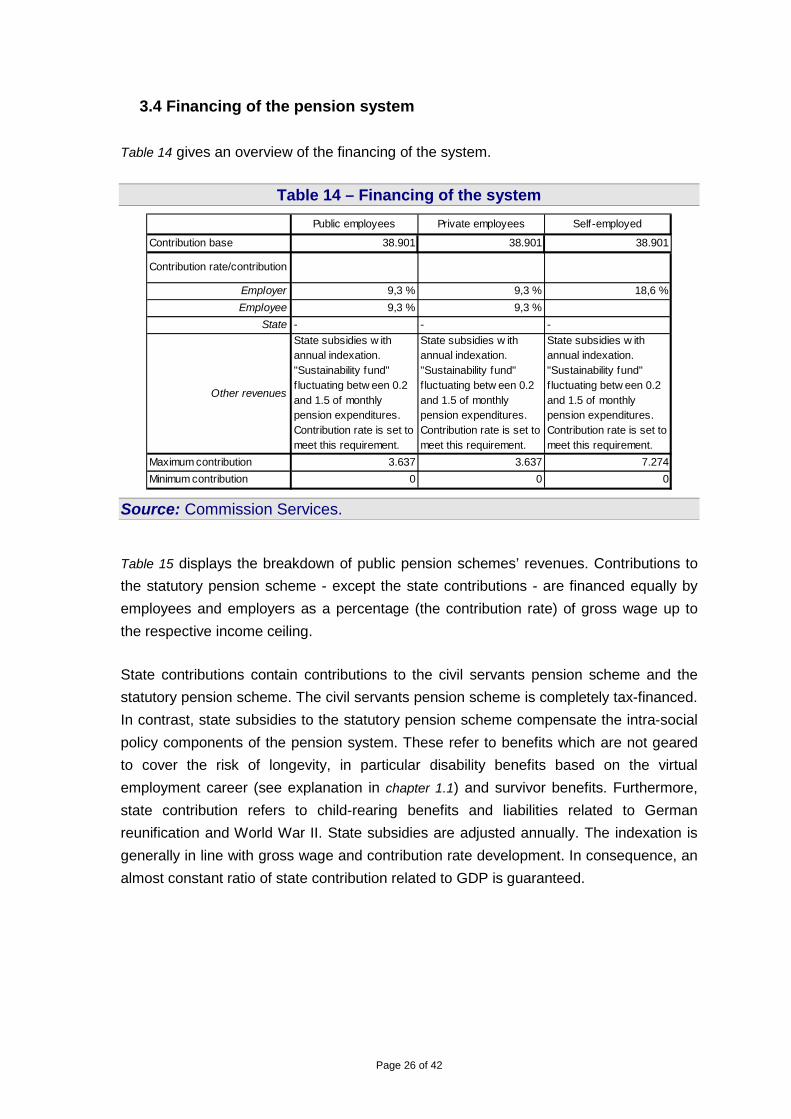
3.4 Financing of the pension system
Table 14 gives an overview of the financing of the system.
Table 14 – Financing of the system
Public employees Private employees Self-employed
Contribution base 38.901 38.901 38.901
Contribution rate/contribution
Employer 9,3 % 9,3 % 18,6 %
Employee 9,3 % 9,3 %
State - - -
Other revenues
State subsidies w ith annual indexation. "Sustainability fund" f luctuating betw een 0.2 and 1.5 of monthly pension expenditures. Contribution rate is set to meet this requirement.
State subsidies w ith annual indexation. "Sustainability fund" f luctuating betw een 0.2 and 1.5 of monthly pension expenditures. Contribution rate is set to meet this requirement.
State subsidies w ith annual indexation. "Sustainability fund" f luctuating betw een 0.2 and 1.5 of monthly pension expenditures. Contribution rate is set to meet this requirement.
Maximum contribution 3.637 3.637 7.274
Minimum contribution 0 0 0
Source: Commission Services.
Table 15 displays the breakdown of public pension schemes’ revenues. Contributions to
the statutory pension scheme - except the state contributions - are financed equally by
employees and employers as a percentage (the contribution rate) of gross wage up to
the respective income ceiling.
State contributions contain contributions to the civil servants pension scheme and the
statutory pension scheme. The civil servants pension scheme is completely tax-financed.
In contrast, state subsidies to the statutory pension scheme compensate the intra-social
policy components of the pension system. These refer to benefits which are not geared
to cover the risk of longevity, in particular disability benefits based on the virtual
employment career (see explanation in chapter 1.1) and survivor benefits. Furthermore,
state contribution refers to child-rearing benefits and liabilities related to German
reunification and World War II. State subsidies are adjusted annually. The indexation is
generally in line with gross wage and contribution rate development. In consequence, an
almost constant ratio of state contribution related to GDP is guaranteed.
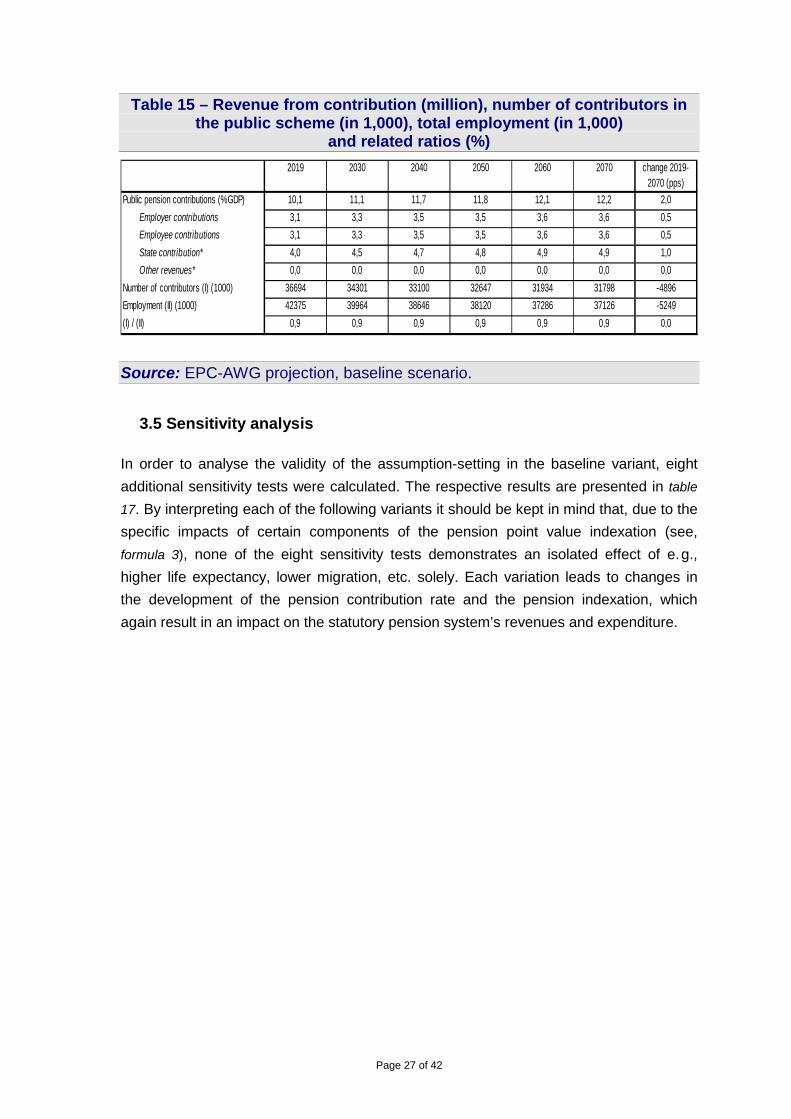
Page 27 of 42
Table 15 – Revenue from contribution (million), number of contributors in the public scheme (in 1,000), total employment (in 1,000)
and related ratios (%)
2019 2030 2040 2050 2060 2070 change 2019-2070 (pps)
Public pension contributions (%GDP) 10,1 11,1 11,7 11,8 12,1 12,2 2,0
Employer contributions 3,1 3,3 3,5 3,5 3,6 3,6 0,5
Employee contributions 3,1 3,3 3,5 3,5 3,6 3,6 0,5
State contribution* 4,0 4,5 4,7 4,8 4,9 4,9 1,0
Other revenues* 0,0 0,0 0,0 0,0 0,0 0,0 0,0
Number of contributors (I) (1000) 36694 34301 33100 32647 31934 31798 -4896
Employment (II) (1000) 42375 39964 38646 38120 37286 37126 -5249
(I) / (II) 0,9 0,9 0,9 0,9 0,9 0,9 0,0
Source: EPC-AWG projection, baseline scenario.
3.5 Sensitivity analysis In order to analyse the validity of the assumption-setting in the baseline variant, eight
additional sensitivity tests were calculated. The respective results are presented in table
17. By interpreting each of the following variants it should be kept in mind that, due to the
specific impacts of certain components of the pension point value indexation (see,
formula 3), none of the eight sensitivity tests demonstrates an isolated effect of e. g.,
higher life expectancy, lower migration, etc. solely. Each variation leads to changes in
the development of the pension contribution rate and the pension indexation, which
again result in an impact on the statutory pension system’s revenues and expenditure.
Page 28 of 42
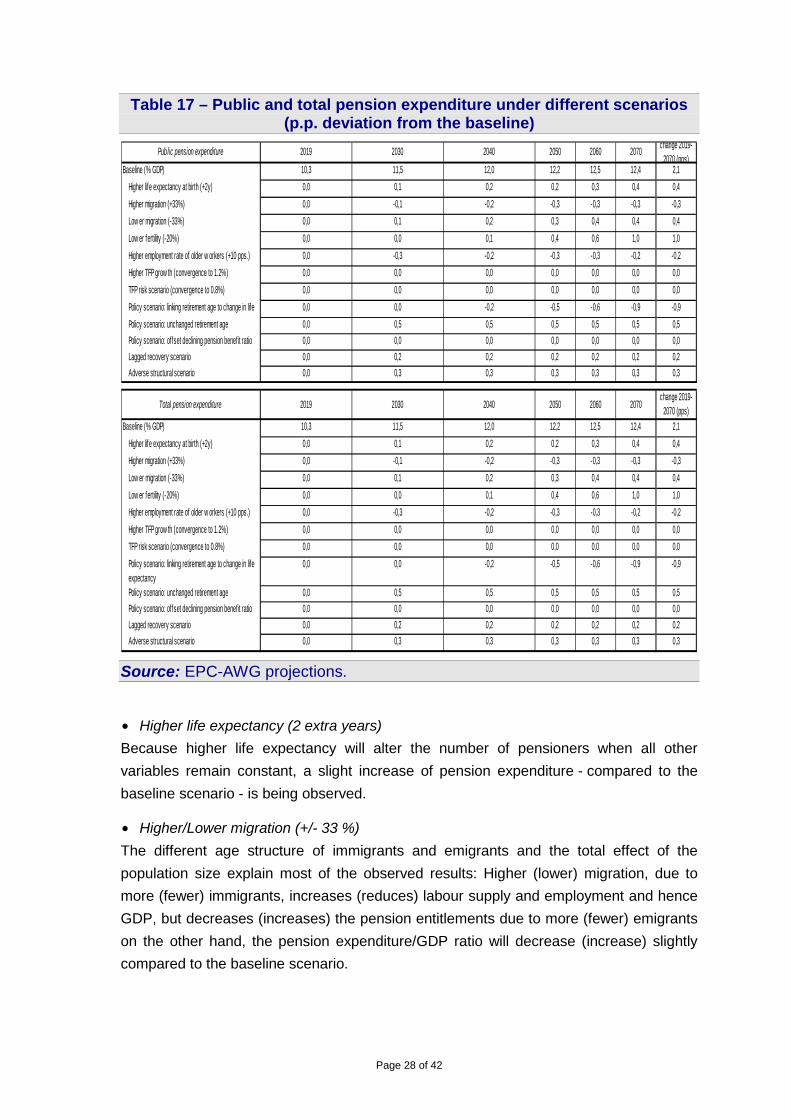
Table 17 – Public and total pension expenditure under different scenarios (p.p. deviation from the baseline)
Public pension expenditure 2019 2030 2040 2050 2060 2070change 2019-
2070 (pps)Baseline (% GDP) 10,3 11,5 12,0 12,2 12,5 12,4 2,1
Higher life expectancy at birth (+2y) 0,0 0,1 0,2 0,2 0,3 0,4 0,4
Higher migration (+33%) 0,0 -0,1 -0,2 -0,3 -0,3 -0,3 -0,3
Low er migration (-33%) 0,0 0,1 0,2 0,3 0,4 0,4 0,4
Low er fertility (-20%) 0,0 0,0 0,1 0,4 0,6 1,0 1,0
Higher employment rate of older w orkers (+10 pps.) 0,0 -0,3 -0,2 -0,3 -0,3 -0,2 -0,2
Higher TFP grow th (convergence to 1.2%) 0,0 0,0 0,0 0,0 0,0 0,0 0,0
TFP risk scenario (convergence to 0.8%) 0,0 0,0 0,0 0,0 0,0 0,0 0,0
Policy scenario: linking retirement age to change in life expectancy
0,0 0,0 -0,2 -0,5 -0,6 -0,9 -0,9
Policy scenario: unchanged retirement age 0,0 0,5 0,5 0,5 0,5 0,5 0,5
Policy scenario: offset declining pension benefit ratio 0,0 0,0 0,0 0,0 0,0 0,0 0,0
Lagged recovery scenario 0,0 0,2 0,2 0,2 0,2 0,2 0,2
Adverse structural scenario 0,0 0,3 0,3 0,3 0,3 0,3 0,3
Total pension expenditure 2019 2030 2040 2050 2060 2070change 2019-
2070 (pps)
Baseline (% GDP) 10,3 11,5 12,0 12,2 12,5 12,4 2,1
Higher life expectancy at birth (+2y) 0,0 0,1 0,2 0,2 0,3 0,4 0,4
Higher migration (+33%) 0,0 -0,1 -0,2 -0,3 -0,3 -0,3 -0,3
Low er migration (-33%) 0,0 0,1 0,2 0,3 0,4 0,4 0,4
Low er fertility (-20%) 0,0 0,0 0,1 0,4 0,6 1,0 1,0
Higher employment rate of older w orkers (+10 pps.) 0,0 -0,3 -0,2 -0,3 -0,3 -0,2 -0,2
Higher TFP grow th (convergence to 1.2%) 0,0 0,0 0,0 0,0 0,0 0,0 0,0
TFP risk scenario (convergence to 0.8%) 0,0 0,0 0,0 0,0 0,0 0,0 0,0
Policy scenario: linking retirement age to change in life expectancy
0,0 0,0 -0,2 -0,5 -0,6 -0,9 -0,9
Policy scenario: unchanged retirement age 0,0 0,5 0,5 0,5 0,5 0,5 0,5
Policy scenario: offset declining pension benefit ratio 0,0 0,0 0,0 0,0 0,0 0,0 0,0
Lagged recovery scenario 0,0 0,2 0,2 0,2 0,2 0,2 0,2
Adverse structural scenario 0,0 0,3 0,3 0,3 0,3 0,3 0,3
Source: EPC-AWG projections.
• Higher life expectancy (2 extra years)
Because higher life expectancy will alter the number of pensioners when all other
variables remain constant, a slight increase of pension expenditure - compared to the
baseline scenario - is being observed.
• Higher/Lower migration (+/- 33 %)
The different age structure of immigrants and emigrants and the total effect of the
population size explain most of the observed results: Higher (lower) migration, due to
more (fewer) immigrants, increases (reduces) labour supply and employment and hence
GDP, but decreases (increases) the pension entitlements due to more (fewer) emigrants
on the other hand, the pension expenditure/GDP ratio will decrease (increase) slightly
compared to the baseline scenario.
Page 29 of 42
• Lower fertility
In comparison to the baseline scenario a lower fertility will reduce the number of
contributors while wages are not affected. Together with a lower GDP the pension
expenditures in relation to GDP increase over the projection horizon.
• Higher employment of older workers (+10pp.)
Because higher (lower) employment rates will not only result in a higher (lower) GDP, but
also increase the pension entitlements, only a minor reduction in expenditures is
observed. The fact, that the increase of additional pension entitlements is weighted by
the sustainability factor, promotes that minor effect.
• Higher TFP growth (convergence to 1.2%)
Because pension benefits basically are indexed in line with nominal wages (as a starting
point), a change in labour productivity has minor effects on the results of these scenarios
compared to the baseline variant.
• TFP risk scenario (convergence to 0.8%)
This scenario with its effects on pension expenditures is almost similar to the lower
productivity scenario. Changes of TFP from 1 to 0.8 do not have a clearly recognizable
effect on the results of this scenario compared to the baseline variant.
• Linking statutory retirement age to increase in life expectancy
This scenario was incorporated into the sensitivity test to discuss the question whether a
further increase of the statutory retirement age is needed to guarantee financial
sustainability of public pension systems. The present approach keeps the current
pension payment period constant. A review of the question whether the coming gains in
life expectancy will be one to one gains of life in good health and therefore working time -
as the assumptions implicate - has been not considered. Furthermore, there is
abstraction from adequate reaction of the labour market. Assumptions regarding future
employability of older people are not considered. In addition, probabilities for entering
into a disability pension are kept as constant. Hence, results of this artificial scenario
calculation should be interpreted carefully.
• Unchanged retirement age
This scenario assumes that the main eligibility requirements (early and statutory
retirement age, career requirement) are unchanged over the projection horizon from the
starting point. As a consequence, there is an increase in pension expenditures.
• Offset declining pension benefit ratio
This scenario assumes policy measures are taken when the (earnings-related) public
pension benefit ratio would decrease by 10% relative to the base year. Since this is not
the case, there is no difference with respect to the baseline scenario.
Page 30 of 42
• Lagged recovery scenario
The temporary shock leads to less pension entitlements, but also induces a stronger
increase in pension values relative to wages. This is due to a particularity of the
German pension formula, where pension values are guaranteed in a crisis.
Supplementary, the so-called “double boundary” is applicable until 2025 and defines
lower limits to the pension level. Therefore the recovery after the shock induces
larger increases in pension values than in the baseline scenario. As a consequences,
we see an increase in pension expenditures.
• Adverse structural scenario
The permanent shock leads to less pension entitlements and, therefore, in absolute
terms less pension expenditures. However, relative to the lower GDP we observe an
increase in expenditures.
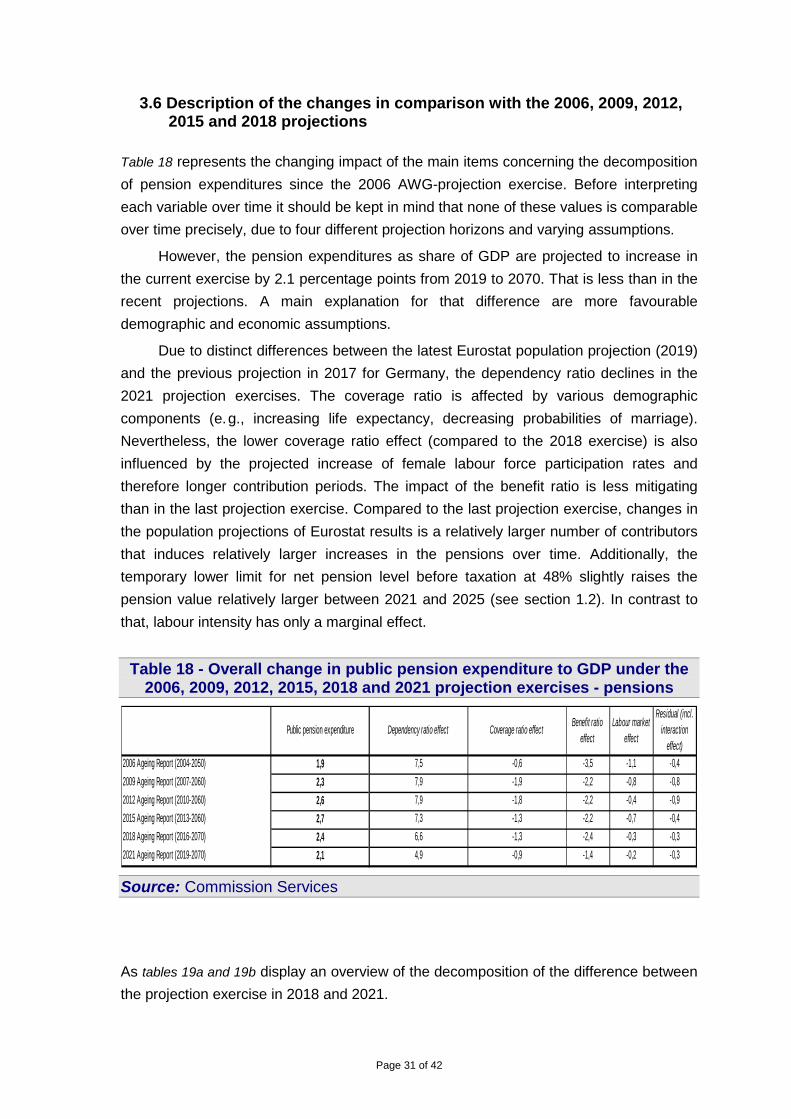
Page 31 of 42
3.6 Description of the changes in comparison with the 2006, 2009, 2012, 2015 and 2018 projections Table 18 represents the changing impact of the main items concerning the decomposition
of pension expenditures since the 2006 AWG-projection exercise. Before interpreting
each variable over time it should be kept in mind that none of these values is comparable
over time precisely, due to four different projection horizons and varying assumptions.
However, the pension expenditures as share of GDP are projected to increase in
the current exercise by 2.1 percentage points from 2019 to 2070. That is less than in the
recent projections. A main explanation for that difference are more favourable
demographic and economic assumptions.
Due to distinct differences between the latest Eurostat population projection (2019)
and the previous projection in 2017 for Germany, the dependency ratio declines in the
2021 projection exercises. The coverage ratio is affected by various demographic
components (e. g., increasing life expectancy, decreasing probabilities of marriage).
Nevertheless, the lower coverage ratio effect (compared to the 2018 exercise) is also
influenced by the projected increase of female labour force participation rates and
therefore longer contribution periods. The impact of the benefit ratio is less mitigating
than in the last projection exercise. Compared to the last projection exercise, changes in
the population projections of Eurostat results is a relatively larger number of contributors
that induces relatively larger increases in the pensions over time. Additionally, the
temporary lower limit for net pension level before taxation at 48% slightly raises the
pension value relatively larger between 2021 and 2025 (see section 1.2). In contrast to
that, labour intensity has only a marginal effect.
Table 18 - Overall change in public pension expenditure to GDP under the
2006, 2009, 2012, 2015, 2018 and 2021 projection exercises - pensions
Public pension expenditure Dependency ratio effect Coverage ratio effectBenefit ratio
effectLabour market
effect
Residual (incl. interaction
effect)
2006 Ageing Report (2004-2050) 1,9 7,5 -0,6 -3,5 -1,1 -0,4
2009 Ageing Report (2007-2060) 2,3 7,9 -1,9 -2,2 -0,8 -0,8
2012 Ageing Report (2010-2060) 2,6 7,9 -1,8 -2,2 -0,4 -0,9
2015 Ageing Report (2013-2060) 2,7 7,3 -1,3 -2,2 -0,7 -0,4
2018 Ageing Report (2016-2070) 2,4 6,6 -1,3 -2,4 -0,3 -0,3
2021 Ageing Report (2019-2070) 2,1 4,9 -0,9 -1,4 -0,2 -0,3
Source: Commission Services
As tables 19a and 19b display an overview of the decomposition of the difference between
the projection exercise in 2018 and 2021.
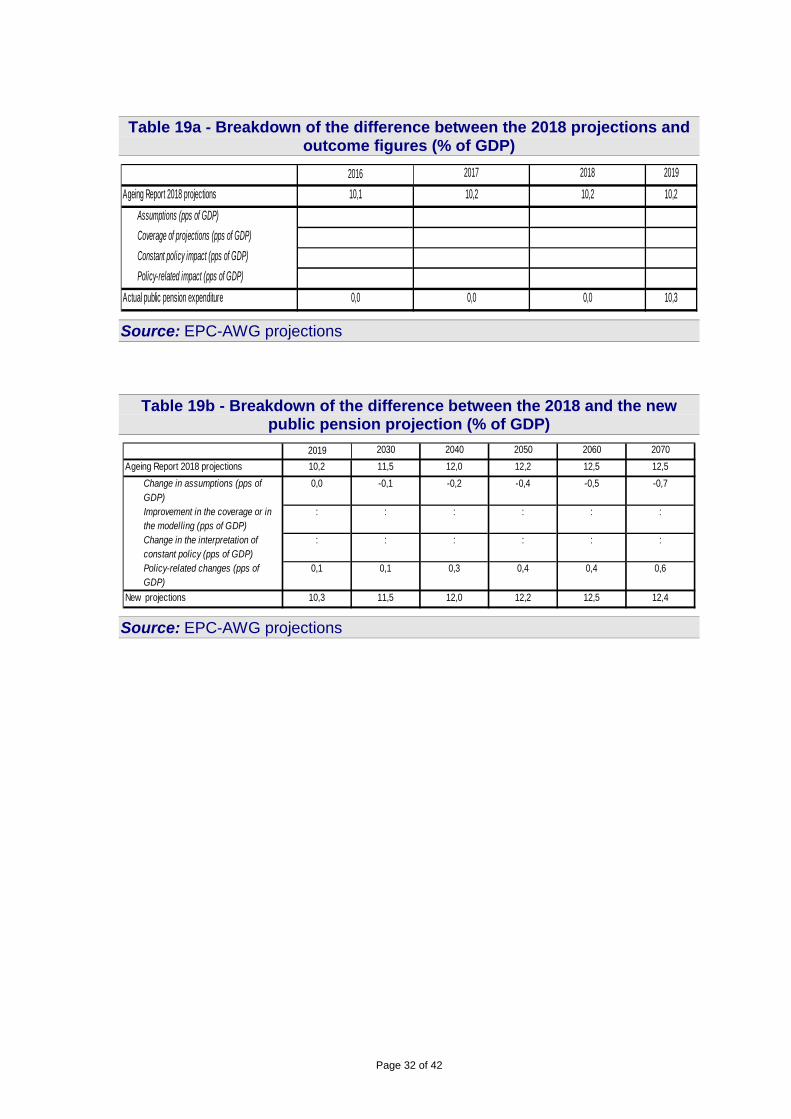
Page 32 of 42
Table 19a - Breakdown of the difference between the 2018 projections and
outcome figures (% of GDP)
2016 2017 2018 2019
Ageing Report 2018 projections 10,1 10,2 10,2 10,2
Assumptions (pps of GDP)
Coverage of projections (pps of GDP)
Constant policy impact (pps of GDP)
Policy-related impact (pps of GDP)
Actual public pension expenditure 0,0 0,0 0,0 10,3
Source: EPC-AWG projections
Table 19b - Breakdown of the difference between the 2018 and the new
public pension projection (% of GDP)
2019 2030 2040 2050 2060 2070
Ageing Report 2018 projections 10,2 11,5 12,0 12,2 12,5 12,5
Change in assumptions (pps of GDP)
0,0 -0,1 -0,2 -0,4 -0,5 -0,7
Improvement in the coverage or in the modelling (pps of GDP)
: : : : : :
Change in the interpretation of constant policy (pps of GDP)
: : : : : :
Policy-related changes (pps of GDP)
0,1 0,1 0,3 0,4 0,4 0,6
New projections 10,3 11,5 12,0 12,2 12,5 12,4
Source: EPC-AWG projections
Page 33 of 42
4. Description of the pension model and data
4.1 Institutional context The pension model for the statutory pension scheme is operated jointly by the Federal
Ministry of Labour and Social Affairs and the German Federal Insurance Fund (Deutsche
Rentenversicherung). A joint working group with experts of both institutions project the
financial development of the statutory pension scheme. Meetings are scheduled at least
four times a year. The projected results are used for indexation of the pension point
value, the fixation of the contribution rate and the assessment of pension reforms and
long-term planning.
4.2 Assumptions and methodologies applied All originally model components with national focus are calibrated in order to fully comply
with the Ageing Working Group (AWG) assumptions.
4.3 Data used to run the models The models incorporate data from numerous sources. Most data relating to pensions is
provided by the official statistics of the German statutory pension insurance scheme.
Population data is provided by the Federal Statistical Office (Statistisches Bundesamt).
The set of long-term demographic and macroeconomic assumptions is set by the
governmental committee on "Achieving financial sustainability for the social security
system" and supplemented by short and medium term economic forecasts of the
government. However, this projection exercise is based on the commonly agreed (AWG)
assumptions. Fertility rates, mortality rates and migration assumptions are in line with the
assumptions of the latest population projection of Eurostat (2019). For future
employment growth as well as for the future participation rates the AWG pre-settings are
used. AWG labour productivity assumptions are applied to model real wage growth. The
following data sets are included:
• number of pensions (DRV),
• average pension benefit of the persons already retired (DRV),
• new pensions (DRV),
• average pension benefit of new pensions (DRV),
• population projection, mortality and fertility rates (Eurostat scenarios),
• labour market (AWG scenarios),
• gross wages (AWG scenario).
Page 34 of 42
4.4 Reforms incorporated in the models All legislated pension reforms have been taken into account. In particular, the gradual
increase in statutory retirement age - to age 67 by the year 2029 - has been considered. 4.5 General description of the models Basically, the pension model consists of two sub-models: a cohort model for the
projection of the demographic components on pension expenditures (demographic
cohort pension model) and a model for the calculation of the dynamic financial
development regarding the pension adjustment and the contribution rate (financial
pension model). Supplementary, two major sub-modules, which capture the future
occupational career developments and the interactions between different pension types,
affected by individual performances due to early retirement and the rising statutory
retirement age, have been incorporated. As already noticed, the model distinguishes
between the Western and Eastern part of Germany. 4.5.1 The demographic cohort pension model The demographic pension model is based on a cohort approach. In general, the number
of stock pensions in year t+1 for a specific cohort y results from the number of pensions
in year t,y plus new pensions minus pensions expiring due to death. Because of the
possibility to receive pensions from more than one pension scheme simultaneously (e. g.
old age pension and a survivor's pension), the original model runs with the number of
pensions and not with the number of pensioners. The number of expired pensions in
each projection year is equal to the number of pensions in year t multiplied by the
mortality rates given the AWG population scenario. Conditional on age and gender-
specific marriage probabilities, spouses of the deceased retirees will be granted survivor
pensions. Newly granted old-age and disability pensions are calculated with probabilities
of pension entry, estimated on the basis of past trends, while also taking into account the
legislated increase of the statutory retirement age. Figure 3 illustrates the main
interdependencies of this model for Western Germany.
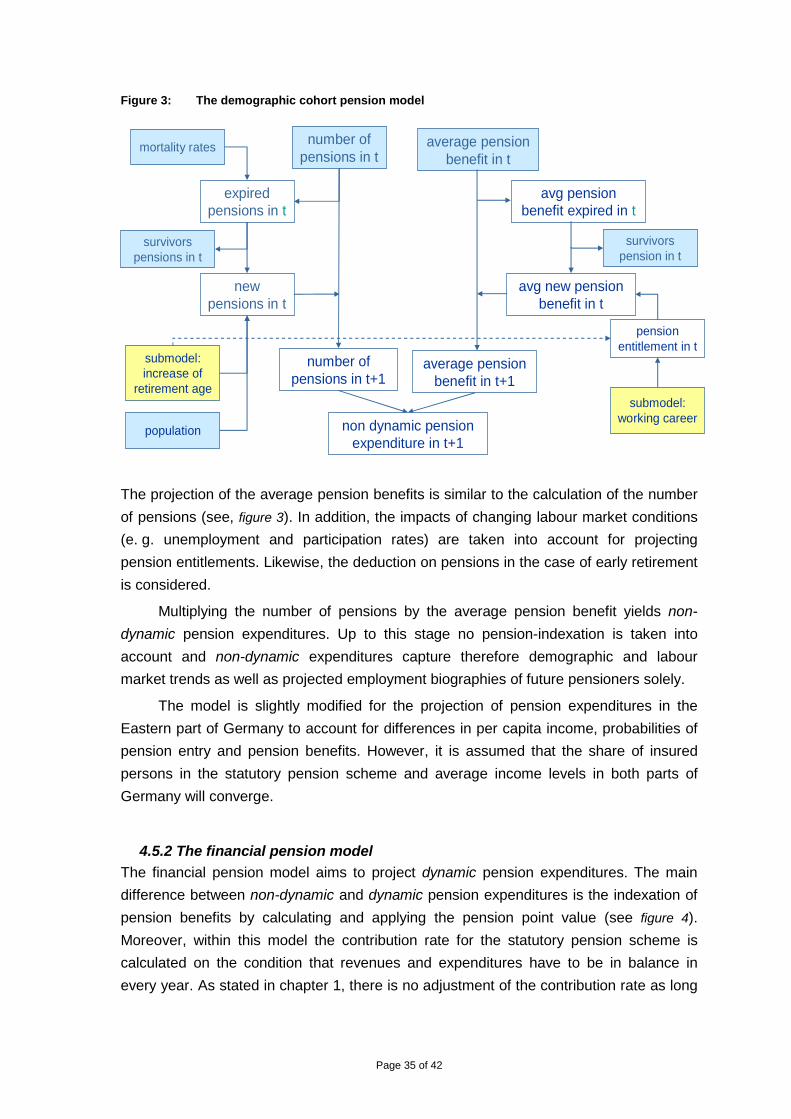
Page 35 of 42
Figure 3: The demographic cohort pension model
number of pensions in t+1
mortality rates
expired pensions in t
new pensions in t
survivors pensions in t
avg new pension benefit in t
number of pensions in t
submodel: increase of
retirement age
population
average pension benefit in t
average pension benefit in t+1
avg pension benefit expired in t
submodel: working career
pension entitlement in t
non dynamic pension expenditure in t+1
survivors pension in t
The projection of the average pension benefits is similar to the calculation of the number
of pensions (see, figure 3). In addition, the impacts of changing labour market conditions
(e. g. unemployment and participation rates) are taken into account for projecting
pension entitlements. Likewise, the deduction on pensions in the case of early retirement
is considered.
Multiplying the number of pensions by the average pension benefit yields non-
dynamic pension expenditures. Up to this stage no pension-indexation is taken into
account and non-dynamic expenditures capture therefore demographic and labour
market trends as well as projected employment biographies of future pensioners solely.
The model is slightly modified for the projection of pension expenditures in the
Eastern part of Germany to account for differences in per capita income, probabilities of
pension entry and pension benefits. However, it is assumed that the share of insured
persons in the statutory pension scheme and average income levels in both parts of
Germany will converge. 4.5.2 The financial pension model The financial pension model aims to project dynamic pension expenditures. The main
difference between non-dynamic and dynamic pension expenditures is the indexation of
pension benefits by calculating and applying the pension point value (see figure 4).
Moreover, within this model the contribution rate for the statutory pension scheme is
calculated on the condition that revenues and expenditures have to be in balance in
every year. As stated in chapter 1, there is no adjustment of the contribution rate as long
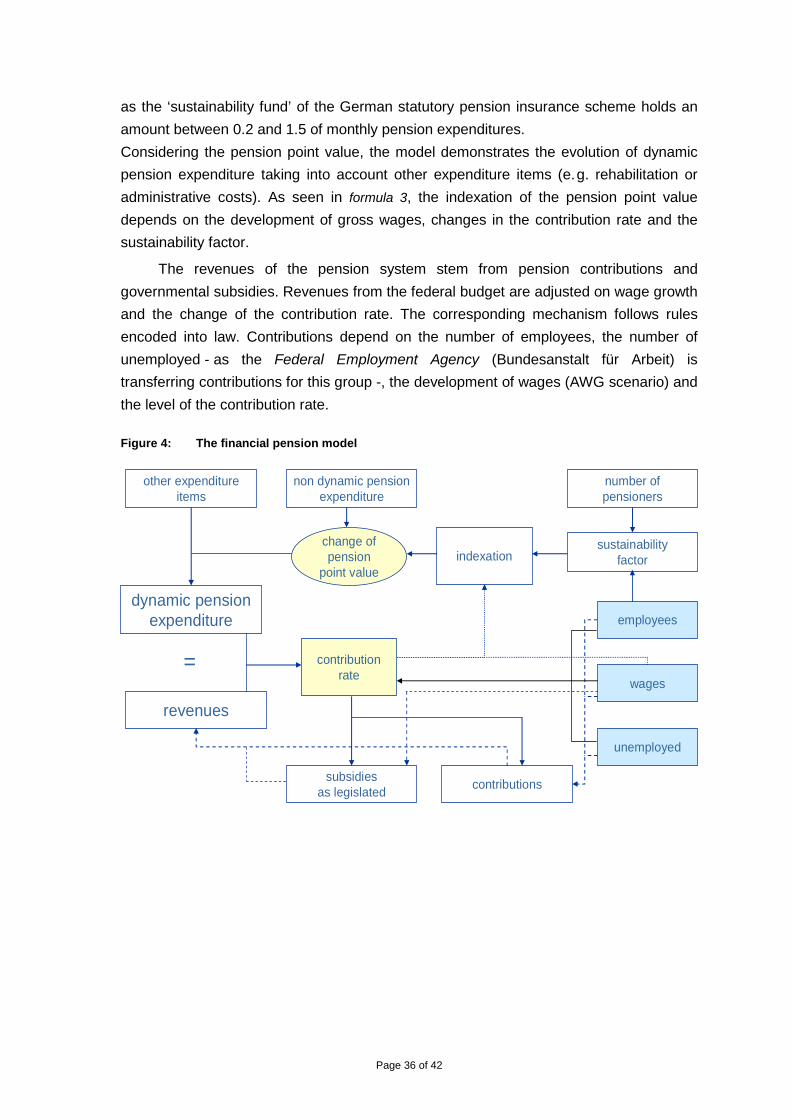
Page 36 of 42
as the ‘sustainability fund’ of the German statutory pension insurance scheme holds an
amount between 0.2 and 1.5 of monthly pension expenditures.
Considering the pension point value, the model demonstrates the evolution of dynamic
pension expenditure taking into account other expenditure items (e. g. rehabilitation or
administrative costs). As seen in formula 3, the indexation of the pension point value
depends on the development of gross wages, changes in the contribution rate and the
sustainability factor.
The revenues of the pension system stem from pension contributions and
governmental subsidies. Revenues from the federal budget are adjusted on wage growth
and the change of the contribution rate. The corresponding mechanism follows rules
encoded into law. Contributions depend on the number of employees, the number of
unemployed - as the Federal Employment Agency (Bundesanstalt für Arbeit) is
transferring contributions for this group -, the development of wages (AWG scenario) and
the level of the contribution rate. Figure 4: The financial pension model
dynamic pension expenditure
change of pension
point value
non dynamic pension expenditure
=
indexation
contributionssubsidies
as legislated
other expenditure items
contribution rate
number of pensioners
employees
sustainability factor
wages
revenues
unemployed
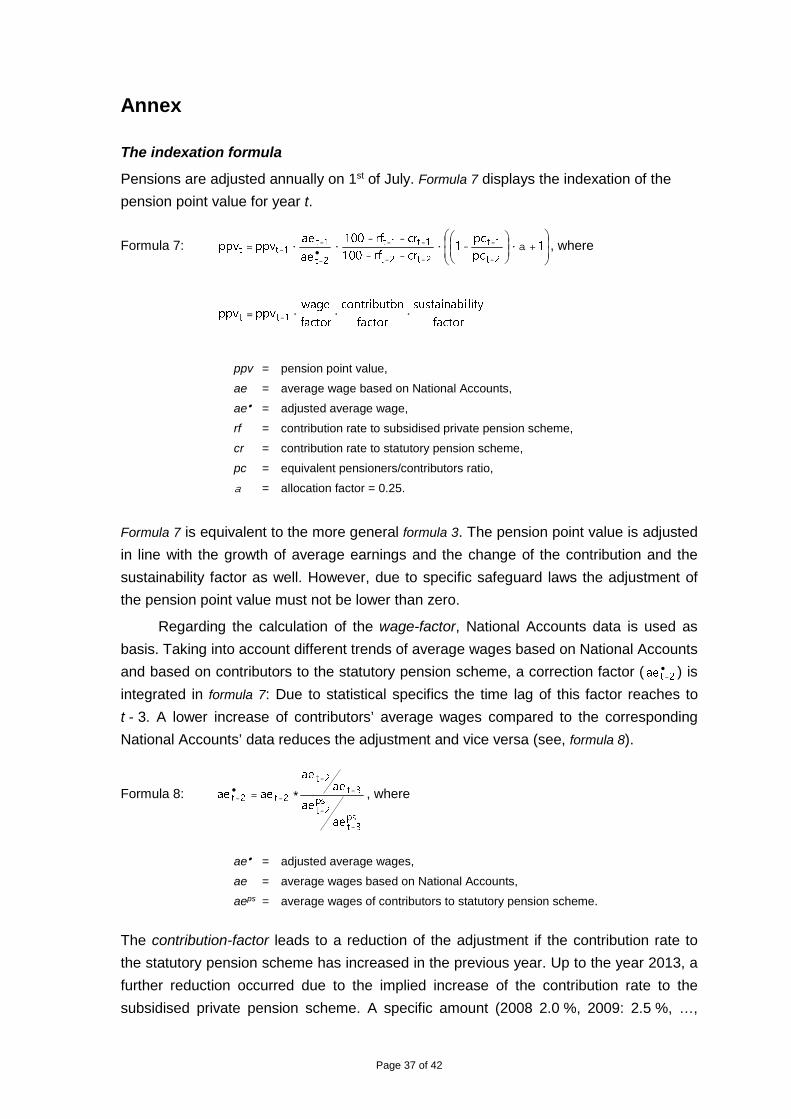
Page 37 of 42
Annex
The indexation formula
Pensions are adjusted annually on 1st of July. Formula 7 displays the indexation of the
pension point value for year t.
Formula 7:
+a·
-·
--
--··=
-
-
--
--•-
-- 1
pc
pc1
crrf100
crrf100
ae
aeppvppv
2t
1t
2t2t
1t1t
2t
1t1tt , where
factor
litysustainabi
factor
oncontributi
factor
wageppvppv 1tt ···= -
ppv = pension point value,
ae = average wage based on National Accounts,
ae• = adjusted average wage,
rf = contribution rate to subsidised private pension scheme,
cr = contribution rate to statutory pension scheme,
pc = equivalent pensioners/contributors ratio,
a = allocation factor = 0.25.
Formula 7 is equivalent to the more general formula 3. The pension point value is adjusted
in line with the growth of average earnings and the change of the contribution and the
sustainability factor as well. However, due to specific safeguard laws the adjustment of
the pension point value must not be lower than zero.
Regarding the calculation of the wage-factor, National Accounts data is used as
basis. Taking into account different trends of average wages based on National Accounts
and based on contributors to the statutory pension scheme, a correction factor ( •-2tae ) is
integrated in formula 7: Due to statistical specifics the time lag of this factor reaches to
t - 3. A lower increase of contributors’ average wages compared to the corresponding
National Accounts’ data reduces the adjustment and vice versa (see, formula 8).
Formula 8:
ps3t
ps2t
3t
2t
2t2t
ae
ae
aeae
aeae
-
-
--
-•- *= , where
ae• = adjusted average wages,
ae = average wages based on National Accounts,
aeps = average wages of contributors to statutory pension scheme.
The contribution-factor leads to a reduction of the adjustment if the contribution rate to
the statutory pension scheme has increased in the previous year. Up to the year 2013, a
further reduction occurred due to the implied increase of the contribution rate to the
subsidised private pension scheme. A specific amount (2008 2.0 %, 2009: 2.5 %, …,
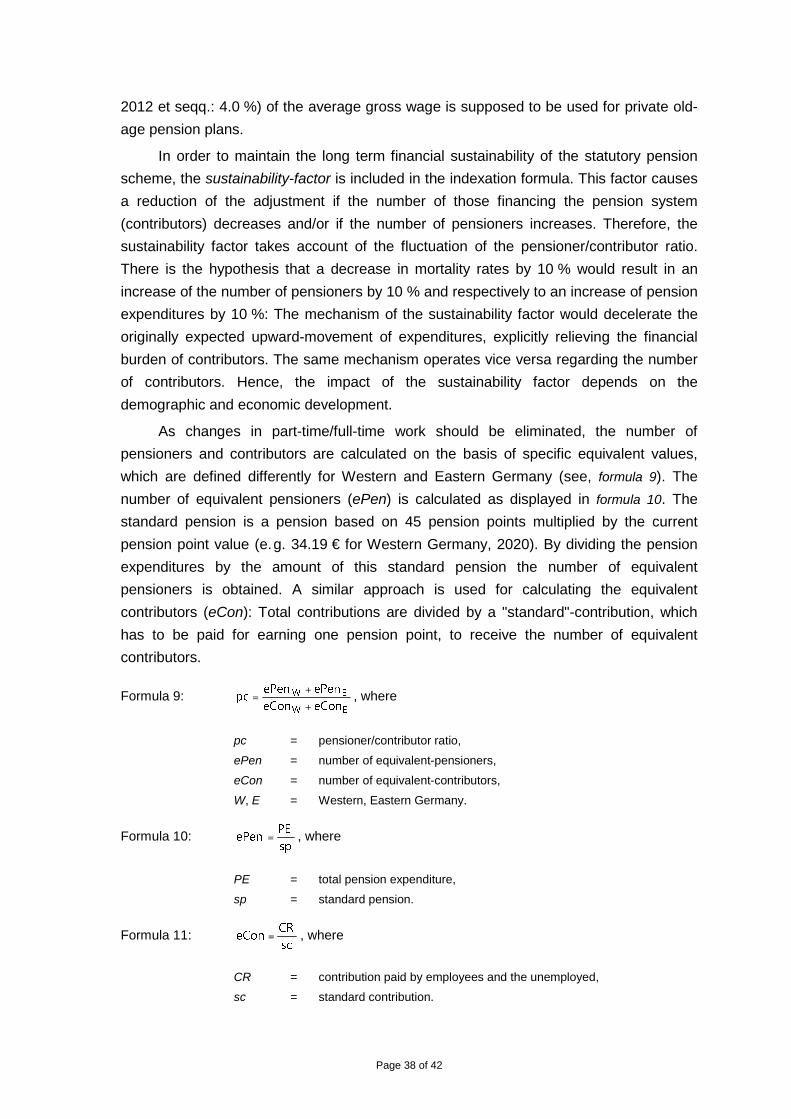
Page 38 of 42
2012 et seqq.: 4.0 %) of the average gross wage is supposed to be used for private old-
age pension plans.
In order to maintain the long term financial sustainability of the statutory pension
scheme, the sustainability-factor is included in the indexation formula. This factor causes
a reduction of the adjustment if the number of those financing the pension system
(contributors) decreases and/or if the number of pensioners increases. Therefore, the
sustainability factor takes account of the fluctuation of the pensioner/contributor ratio.
There is the hypothesis that a decrease in mortality rates by 10 % would result in an
increase of the number of pensioners by 10 % and respectively to an increase of pension
expenditures by 10 %: The mechanism of the sustainability factor would decelerate the
originally expected upward-movement of expenditures, explicitly relieving the financial
burden of contributors. The same mechanism operates vice versa regarding the number
of contributors. Hence, the impact of the sustainability factor depends on the
demographic and economic development.
As changes in part-time/full-time work should be eliminated, the number of
pensioners and contributors are calculated on the basis of specific equivalent values,
which are defined differently for Western and Eastern Germany (see, formula 9). The
number of equivalent pensioners (ePen) is calculated as displayed in formula 10. The
standard pension is a pension based on 45 pension points multiplied by the current
pension point value (e. g. 34.19 € for Western Germany, 2020). By dividing the pension
expenditures by the amount of this standard pension the number of equivalent
pensioners is obtained. A similar approach is used for calculating the equivalent
contributors (eCon): Total contributions are divided by a "standard"-contribution, which
has to be paid for earning one pension point, to receive the number of equivalent
contributors.
Formula 9: EW
EW
eConeCon
ePenePenpc
+
+= , where
pc = pensioner/contributor ratio,
ePen = number of equivalent-pensioners,
eCon = number of equivalent-contributors,
W, E = Western, Eastern Germany.
Formula 10: sp
PEePen = , where
PE = total pension expenditure,
sp = standard pension.
Formula 11: sc
CReCon = , where
CR = contribution paid by employees and the unemployed,
sc = standard contribution.
Page 39 of 42
Economy-wide average wage at retirement
A reasonable approach about future age-specific wage development is currently not
feasible. At this time, there exist no valid empirical findings about:
a) the development of productivity at older ages compared to the average,
b) if the shortage of skilled labour forces leads e. g. to a large upgrading of workplace
health management or to a higher payment for older workers to commit those
skilled worker to companies.
Hence, for this exercise we focus on the current weak empirical evidence, which
documents 5 % higher wages on average for workers at age 60-64 compared to the
economy-wide average wage.
Pensioners vs. Pension
As stated in section 1.3, all AWG assumptions regarding the demographic and macro-
economic context have been considered in the national pension projection model. In
general, a pensioner in the statutory pension scheme is entitled to just one pension type.
Differences between the numbers of pensions and pensioners result by drawing
additional retirement benefits on survivor’s pensions solely. In addition, it is not possible
to isolate pensioners who receive pension benefits from both, the statutory pension
scheme and the civil servant scheme. Hence, double counting for this case is observed.
Pension taxation
Regarding individual income taxes, Germany is currently undergoing a change in the tax
regime relating to contributions and pensions.16 Therefore, the taxation of pensions from
the statutory pension schemes is gradually changing from a system with partial taxations
of contributions and practically no taxation of pension benefits into an opposite system.
Pension contributions will be completely exempted from tax by the year 2025 and
pension benefits will be completely taxed by the year 2040.
Beside this, it should be noted that the effective tax rate depends on household income,
which includes more than the income source of old-age pensions. Due to the ongoing
rearrangement of taxation of public pension benefits, we assumed a linear increase of
the tax burden from 7 % in 2013 to 10 % in 2070 for this projection round.
Survivors pension
The projection considers single age-sex specific probabilities to marriage within the age-
cohort model in combination with single age-sex specific mortality rates. Furthermore,
16 Legislated by the Old-Age-Income-Act (Alterseinkünftegesetz) in year 2005.
Page 40 of 42
the model adopt the current age gap between spouses with the assumption of no future
change for the projection horizon.
Non-earnings related “minimum pension” (means-tested basic social assistance in
old age)
The eligibility criteria for means-tested benefits from basic social assistance for older
people (not a “minimum pension” in terms of the Statutory pension insurance scheme) is
just the fact of reaching the statutory retirement age. There exists no other request e. g.,
for specific minimum years of contributions.
The amount of means-tested benefit consists of two parts:
a) social assistance benefits, and
b) housing allowances.
Social assistance benefits secure the recipients' livelihood (covers e. g., the
demand for food, personal care, household goods, etc.). It includes a lump-sum for non-
recurring and recurring needs. Regarding the social assistance benefit amount, there
exist different social assistance categories. Social assistance benefits are indexed by an
aggregate of 70 % CPI for low income group and 30 % of economy-wide average net
wage.
Housing allowances depend on the local rental market. Reasonable housing costs
are determined according to the circumstances of each individual, particularly family size,
age, sex and state of health of the family members. Based on these individual
information concerning the beneficiary and his/her relatives, the number of living rooms,
the local rent level and the conditions of the local housing market is to be evaluated.
Hence, the individual maximum gross amount of means-tested benefits depends
on the household structure and the condition of the local rental market. However,
individual net-benefits and therefore the gross expenditures for the means-tested
benefits from the social assistance system are calculated as the difference between
gross individual needs and individual income from all sources.
For this projection round the means-tested social benefit model is based on an
age-cohort approach with configurations for the development of demography, wage and
inflation. Furthermore, the change p.a. of past stock information is considered.
Information regarding in- and outflows are not available and the projection is, thus, based
on stock information with a distinction of relevant sex-specific expenditure items and
state of housing.
The results - as presented in table 8a - are mainly influenced by demographic
development, and the specific underlining assumptions regarding the commonly agreed
wage and price development, where CPI is assumed to increase at a lower level over the
projection horizon than wage. Additionally, gross needs are primarily indexed by CPI
whereas pensions - as the main individual income source of older people - are indexed (-
due to the sustainability factor -) to a somewhat lower level than wage development. This

Page 41 of 42
specific setting results into a more or less parallel development of gross needs and
means-tested incomes (mainly pensions), with an almost constant ratio of expenditures
related to GDP.
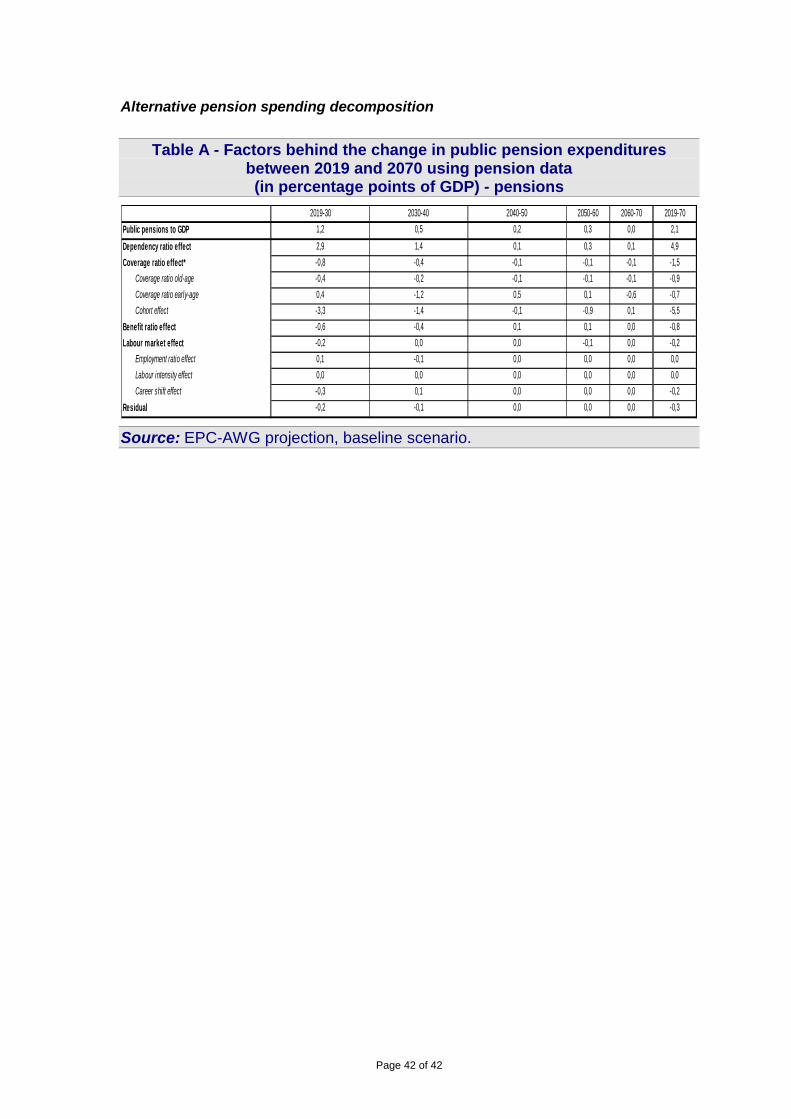
Page 42 of 42
Alternative pension spending decomposition
Table A - Factors behind the change in public pension expenditures
between 2019 and 2070 using pension data (in percentage points of GDP) - pensions
2019-30 2030-40 2040-50 2050-60 2060-70 2019-70
Public pensions to GDP 1,2 0,5 0,2 0,3 0,0 2,1
Dependency ratio effect 2,9 1,4 0,1 0,3 0,1 4,9
Coverage ratio effect* -0,8 -0,4 -0,1 -0,1 -0,1 -1,5
Coverage ratio old-age -0,4 -0,2 -0,1 -0,1 -0,1 -0,9
Coverage ratio early-age 0,4 -1,2 0,5 0,1 -0,6 -0,7
Cohort effect -3,3 -1,4 -0,1 -0,9 0,1 -5,5
Benefit ratio effect -0,6 -0,4 0,1 0,1 0,0 -0,8
Labour market effect -0,2 0,0 0,0 -0,1 0,0 -0,2
Employment ratio effect 0,1 -0,1 0,0 0,0 0,0 0,0
Labour intensity effect 0,0 0,0 0,0 0,0 0,0 0,0
Career shift effect -0,3 0,1 0,0 0,0 0,0 -0,2
Residual -0,2 -0,1 0,0 0,0 0,0 -0,3
Source: EPC-AWG projection, baseline scenario.


