Embed Size (px)
Citation preview

Dewi Budhiartini Juli ISNAINI, Yuris DANILWAN, Daduk Merdika MANSUR, Gunawan Bata ILYAS, Sri MURTINI, Muhammad Ybnu TAUFAN 1
/ Journal of Distribution Science 19-12 (2021) 1-14
Print ISSN: 1738-3110 / Online ISSN 2093-7717 JDS website: http://www.jds.or.kr/ http://dx.doi.org/10.15722/jds.19.12.202112.1
Perceived Distribution Quality Awareness, Organizational Culture,
TQM on Quality Output
Dewi Budhiartini Juli ISNAINI1, Yuris DANILWAN2, Daduk Merdika MANSUR3, Gunawan Bata ILYAS4,
Sri MURTINI5, Muhammad Ybnu TAUFAN6
Received: August 11, 2021. Revised: October 08, 2021. Accepted: December 05, 2021.
Abstract
Purpose: For the last few decades, TQM has become a hot topic in the inner-disciplinary field in the production management line. Still,
unfortunately, the study of TQM and Quality Output management is partially only attached to the tangible side in the production
management line. Whereas theoretically, the implications of TQM require incremental improvement in all management lines (e.g.,
HRM, Marketing, Operations, and Distribution Management). Therefore, starting from the main problem, this study aims to analyze the
effect of total quality management, Organizational Culture, Perceived Distribution of Quality Awareness, and quality output through a
more in-depth analysis. Research design, data and methodology: We conducted a survey of 170 respondents from managers, staff,
and employees from 48 companies in Indonesia. We used a quantitative approach with the SEM method to answer this study's problem
formulation and hypotheses. Results: The results of our research stated that based on the demonstration of statistical test results, all
hypotheses were positive and significant, both direct and indirect relationship demonstrations. Conclusions: Universally, the findings
in this study illustrate that the supporting factor for creating value-added in TQM and Quality output lies in the optimal and positive
organizational culture and Perceived Distribution Quality Awareness factors in the organization.
Keywords : Perceived Distribution Quality Awareness, Organizational Culture, Total Quality Management, Quality Output
JEL Classification Code: M0, M20, L11, L7
1. Introduction12
Globalization will provide benefits as well as challenges
for manufacturing companies globally. One of the benefits of
globalization in supporting the development of the
manufacturing industry is to provide more significant market
opportunities. However, globalization also presents quite a
1 First Author & Corresponding Author. Associate Professor,
Department of Management, Universitas Amir Hamzah, Medan, Indonesia. Email: [email protected]
2 Second Author, Associate Professor, Politeknik Adiguna Maritim Indonesia, Medan, Indonesia.
3 Assistant Professor, Department of Management, Faculty of Economic & Business, Universitas Muhammadiyah Bandung, Indonesia. Email: [email protected]
4 Associate Professor, Department of Management, STIE AMKOP, Indonesia. Email: [email protected]
challenge, especially in the competition to produce high-
quality products. Globalization has become an unstoppable
force in recent decades, with global trade continuing to
expand through the ups and downs of the world economy.
The future quality movement presents a different scenario.
Market dynamics change continuously. The global market
presents new, constantly evolving challenges, leading to a
5 Assistant Professor, Department of Management, Faculty of Economic & Business, Universitas Muhammadiyah Semarang, Indonesia. Email: [email protected]
6 Assistant Professor, Faculty of Teacher Training and Education, Universitas Tomakaka, Makassar, Indonesia
ⓒ Copyright: The Author(s) This is an Open Access article distributed under the terms of the Creative Commons Attribution Non-Commercial License (http://Creativecommons.org/licenses/by-nc/4.0/) which permits unrestricted noncommercial use, distribution, and reproduction in any medium, provided the original work is properly cited.

2 Perceived Distribution Quality Awareness, Organizational Culture, TQM on Quality Output
stressful competitive environment (Ireland & Webb, 2007;
Moore & Manring, 2009).
Indonesia is not yet the most accessible country to set up
a new company or play an active role in the business sector.
This situation is reflected in the 2018 Doing Business index
ranking report published by the World Bank. In the report,
Indonesia is currently in position 72. One of the biggest
problems in establishing a new company in Indonesia is
obtaining all the necessary permits. The licensing process
can take a long time and be expensive for new companies and
companies currently operating. To develop business in
Indonesia to be successful, it is essential to build a good
network with industry and government. Entrepreneurs
should be aware of the importance of these networks and
seek to develop them. Indonesia is a promising country from
a macroeconomic perspective. But Indonesia also has more
risks than investing in developed countries. Political, social,
and cultural dynamics cause this (Sorokin & Richard, 2017).
Of course, the various problems that occur are among the
many factors that cause the actualization of TQM and
business activities in Indonesia to be so complicated.
Prior studies on TQM are primarily based on
observations of the implementation of TQM and are
supported based on the results of interviews with company
executives (e.g., Amar & Zain, 2002). No previous
researchers have offered concepts and tools that can be used
to assess potential obstacles to implementing TQM. Ngai and
Cheng (1999), and Bugdol (2020) have researched
professional managers to identify potential challenges to
implementing TQM. Georgiev and Georgiev (2017), Sahney,
Banwet and Karunes (2008) stated the importance of quality
as a dimension to realize the company's competitiveness. In
addition, the quality can be used to achieve higher
productivity and competitive advantage. Côrte-Real, Ruivo
and Oliveira (2020) and Othman, Khatab, Esmaeel, Mustafa
and Sadq (2020), That quality is considered a competitive
strategic tool and can increase the value of an organization.
Then, Al‐khalifa and Aspinwall (2000) revealed that
increasing competition has forced many organizations to
participate in the quality movement. Bader, Shugars and
Bonito (2001) state that organizations must realize the
importance of a quality system with growing competition.
The average manufacturing company in Indonesia shows that
product quality is still considered low. According to Gaspersz
(2002), the average industry in Indonesia is still at the level
of achieving six-sigma with a defect per million
opportunities value. Over the last few decades, businesses
have adopted quality management approaches such as TQM,
Lean Six Sigma, efficiency-driven production management,
and ISO 9001. Some of these studies focused on the
relationship between Quality Management practices, the
results of which explain the strong relationship between
organizational performance (Prajogo & Sohal, 2006; Kaynak,
2003; Nair, 2006). Other studies examine Quality
Management as the single factor supporting company
performance (Barata & Cunha, 2017; López-Gamero, Yunez,
Bandeira, Herrero, & Pinochet 2016; Pereira-Moliner,
Pertusa-Ortega, Tari, López-Gamero, & Molina-Azorin,
2016; Sadikoglu & Zehir, 2010; Sadikoglu & Zehir, 2010).
However, previous studies investigated the effect of Quality
Management on organizational performance.
Furthermore, previous literature has revealed
inconsistent results in the relationship between Quality
Management practices and organizational performance.
Quality Management practices affect organizational
performance dynamically by different antecedent variables
(Nair, 2006). For example, (Das, Handfield, Calantone, &
Ghosh, 2000) and (Bouranta, Psomas, Suárez-Barraza, &
Jaca, 2019); found that competition moderated the
relationship between Quality Management practices and
customer satisfaction and the relationship between high job
involvement and organizational performance. Akgün, Ince,
Imamoglu, Keskin, and Kocoglu (2014) suggested that firms'
business innovation and organizational learning capabilities
mediate the relationship between TQM and financial
performance. Baird, Hu, and Reeve (2011) In his previous
study, he emphasized that work culture in the organization is
the most essential factor in improving and realizing TQM
practices. Therefore, Baird, Hu, and Reeve (2011) suggested
that the urgency of a conducive organizational culture is a
crucial factor contributing to achieving the company's
desired operational results. Quality management can
establish a suitable environment that affects operational and
business performance (Cadden, Marshall, & Cao, 2013;
Baird, Hu, & Reeve, 2011; Zailani, Iranmanesh, Aziz, &
Kanapathy, 2017; Kanapathy, Bin, Zailani, & Aghapour,
2017). These differences lead to the question of the impact of
organizational culture on relationships between TQM and
performance. This view is supported by Kanapathy, Bin,
Zailani and Aghapour (2017), who suggested examining the
role of organizational culture on the relationship between
TQM and performance. In particular, there is a deep inherent
need to investigate the associations between TQM, culture,
and performance (Hilman, Ali, & Gorondutse, 2019;
Ebrahimi & Sadeghi, 2013; Abusa & Gibson, 2013).
However, a dearth of experimental studies examines the
relationship between TQM, performance, and Perceived
Distribution Quality Awareness implementation, particularly
in developing countries (Imran, Hamid, Shabbir, Salman, &
Jian, 2018; Talapatra & Uddin, 2019; Abusa & Gibson, 2013).
Therefore, objectively, this study discusses the association
between total quality management, Organizational Culture,
Perceived Distribution of Quality Awareness, and quality
output through a more in-depth analysis.
Dewi Budhiartini Juli ISNAINI, Yuris DANILWAN, Daduk Merdika MANSUR, Gunawan Bata ILYAS, Sri MURTINI, Muhammad Ybnu TAUFAN 3
/ Journal of Distribution Science 19-12 (2021) 1-14
2. Literature Review
2.1. Quality Output
Quality has several meanings put forward by several
experts. Aristotle gives two purposes to the word quality:
showing how an object is distinguished from other things and
perceiving excellent or not. On the other hand, quality is
defined as a product's perceived superiority compared to
alternative competitors from a market perspective (Anttila &
Jussila, 2017; Lopes, Yunes, Freire, Herrero, & Pinochet,
2020). Quality is the ability to meet customer expectations
and standards (Donnelly, Kerr, Rimmer, & Shiu, 2006).
Quality is the totality of appearance and characteristics of a
product or service related to its ability to meet needs (Waluya,
Iqbal, & Indradewa, 2019). In the modern era, The
Committee of International Organization for Standardization,
ISO-9000, defines quality as the totality of features and
characteristics of a product or service related to its ability to
satisfy stated or implied needs (Delleman & Dul, 2007).
Then the concept of quality was refined again in the form of
certificate ISO-9001 to a level where an object's inherent
characteristics meet the requirements (Anttila & Jussila,
2017). Ojasalo (2010) defines quality in general and in
particular. The definition of quality generally describes the
natural characteristics of a product, such as performance,
reliability, ease of use, esthetics, and so on.
Concerning the marketing aspect, well-known
researchers in Marketing, Heizer, and Render (2006) state
that product quality is the ability of a product to carry out its
functions, including durability, reliability, accuracy, and ease
of operation repair, and other valuable attributes. In
concession marketing, quality provides a benchmark for
something expected to satisfy and exceed customer wants
and needs. Therefore, quality control demands several
fundamental aspects, including Compliance with
requirements/demands; Suitability for use; Continuous
improvement or refinement; Free from damage; Fulfillment
of customer needs from the beginning and every time;
Quality control means carrying out various stages correctly
from the start of production to the distribution process to
make customers happy. In the study developed by Deming
and Edward (1982), quality control is divided into 3 (three)
categories: User-based quality, i.e., quality is seen as
depending on the audience. User-based quality means having
better product quality, better features, and other
improvements in real-time. Second, manufacturing-based
quality, where quality as a control center is carried out from
the start by complying with applicable standard operating
procedures. Activity, the product-based quality that views
quality as a variable that is precise and can be calculated. The
philosophical experts of the quality movement, especially
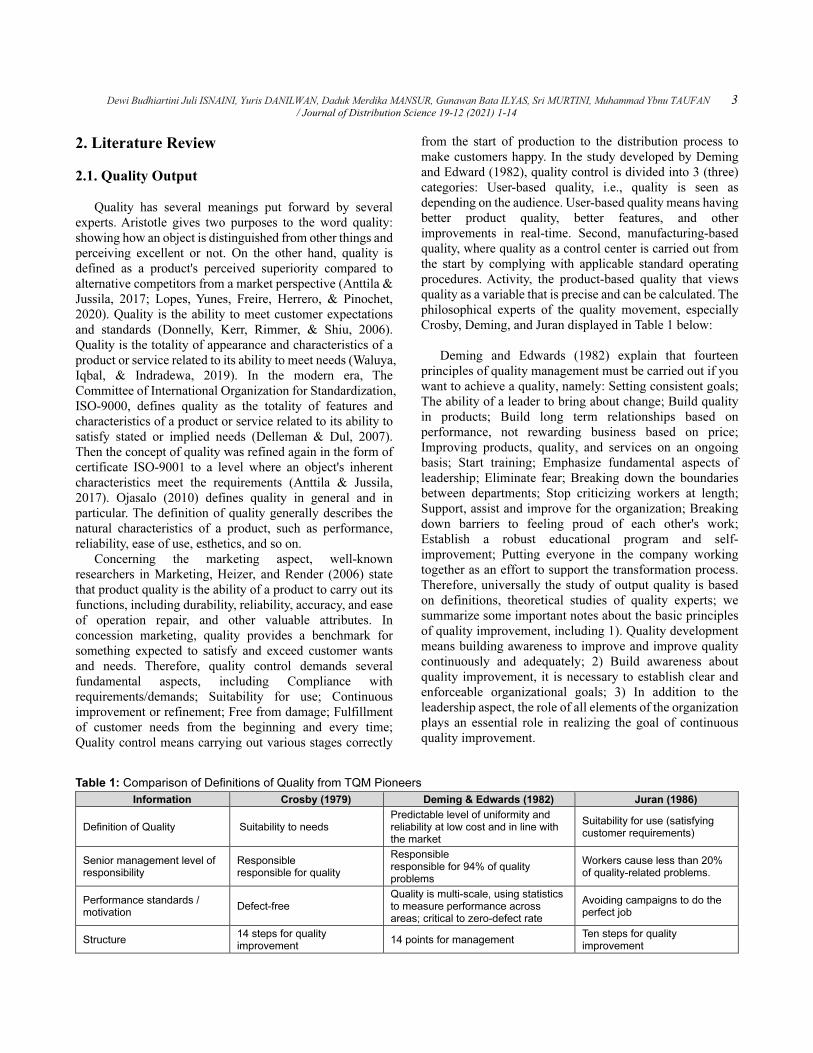
Crosby, Deming, and Juran displayed in Table 1 below:
Deming and Edwards (1982) explain that fourteen
principles of quality management must be carried out if you
want to achieve a quality, namely: Setting consistent goals;
The ability of a leader to bring about change; Build quality
in products; Build long term relationships based on
performance, not rewarding business based on price;
Improving products, quality, and services on an ongoing
basis; Start training; Emphasize fundamental aspects of
leadership; Eliminate fear; Breaking down the boundaries
between departments; Stop criticizing workers at length;
Support, assist and improve for the organization; Breaking
down barriers to feeling proud of each other's work;
Establish a robust educational program and self-
improvement; Putting everyone in the company working
together as an effort to support the transformation process.
Therefore, universally the study of output quality is based
on definitions, theoretical studies of quality experts; we
summarize some important notes about the basic principles
of quality improvement, including 1). Quality development
means building awareness to improve and improve quality
continuously and adequately; 2) Build awareness about
quality improvement, it is necessary to establish clear and
enforceable organizational goals; 3) In addition to the
leadership aspect, the role of all elements of the organization
plays an essential role in realizing the goal of continuous
quality improvement.
Table 1: Comparison of Definitions of Quality from TQM Pioneers
Information Crosby (1979) Deming & Edwards (1982) Juran (1986)
Definition of Quality Suitability to needs Predictable level of uniformity and reliability at low cost and in line with the market
Suitability for use (satisfying customer requirements)
Senior management level of responsibility
Responsible responsible for quality
Responsible responsible for 94% of quality problems
Workers cause less than 20% of quality-related problems.
Performance standards / motivation
Defect-free Quality is multi-scale, using statistics to measure performance across areas; critical to zero-defect rate
Avoiding campaigns to do the perfect job
Structure 14 steps for quality improvement
14 points for management Ten steps for quality improvement
4 Perceived Distribution Quality Awareness, Organizational Culture, TQM on Quality Output
The concept of quality is limited to matters relating to
the dimensions of performance (performance benchmarks)
that are increasingly effective and efficient (Heizer &
Render, 2006). or the features of a product through the
addition of features, level of product reliability,
conformance to specifications, durability, and the ability to
provide superior service. However, the concept of quality
must also represent conformity between aesthetics, ethics,
and norms (Mappamiring & Putra, 2021). Understanding the
distribution of output quality in the prospect of operational
management put forward several relevant theories and
contribute to overcoming the company's problems. These
theories include quality mission theory and quality
assurance theory. This theory becomes the basic theory to
understand the importance of improving the output quality
of a manufacturing company. The quality mission theory put
forward by Ventegodt (2003) states that the quality mission
determines a company's success to progress and develop and
how well the distribution of management knowledge and the
organization's internal readiness to realize an optimal quality
control mission is. These missions include a quality
leadership mission, a customer orientation mission, a
supplier relationship mission, and a product design mission.
Operational performance indicators include market share,
new product launches, product/service quality, marketing
effectiveness, and customer satisfaction (Hasrat &
Rosyadah, 2021; Marpaung, Dwwi, Grace, Sudirman, &
Sugiat,2021; Simanjuntak & Putra, 2021).
2.2. Perceived Distribution Quality Awareness
In understanding the concept of awareness of
distribution quality, excellent and optimal quality is needed.
All members of the organization can carry that out.
Awareness is a person's attitude who voluntarily obeys all
regulations and knows his duties and responsibilities. By Chitcharoen, Kanthawongs, Wathanasuksiri, and
Kanthawongs (2013) is 1) Awareness of feelings, thoughts,
and surroundings. 2) Complete activity and involvement of
the senses. 3) Individual and group ideas and feelings. Berti-
Equille (2007) states that awareness is the process of
internalizing the information obtained and becomes the
values adopted to be realized every day. The definition of
awareness has three components, e.g., Recall of personal
knowledge; Recall of general information, and Memory of
the collective wisdom of the individual concerned. Self-
Knowledge is the understanding of a person's personally
identifiable information. This knowledge is called self-
awareness. Self-knowledge consists of self-awareness and
other information about oneself. Second, World-knowledge,
the ability to remember several facts from long-term
memory. Third, activation of knowledge, someone is aware
of the actions of others or can understand what other people
think. Emotional or affective components are associated
with consciousness. According to Murray and Raffaele
(1997); Brauner, Philipsen, Fels, Guhrmann, Ngo, Stiller,
Schmitt and Ziefle (2016) stated that quality awareness is a
way of thinking that includes all quality system elements.
The concept of quality awareness emphasizes the dynamic
interaction between people within the internal and external
scope of the organization to realize organizational efficiency
and aspects of sound and optimal communication. In his
previous study, Khatoon, Zhengliang and Hussain (2020)
stated that quality awareness includes, i.e., Good
communication; Trust in the system, and Encouraging
contributions from all parties.
2.3. Perceived Distribution Quality Awareness
Total Quality Management (TQM) is an operational
management concept that focuses on the quality of
production results and is based on the participation of all
human resources and continuous improvement-oriented to
long-term success through quality outputs that impact
customer satisfaction and provide benefits to members;
organization (human resources) and society. The
widespread of TQM reflects the recent changes in the
competitive environment that force organizations in many
industries to formulate new strategic responses to increase
internal efficiency and external effectiveness (Aquilani,
Silvestri, Ruggieri & Gatti, 2017; Chong & Rundus, 2004).
TQM has three main principles, customer orientation, total
participation of all employees, and constant improvement
(Bouranta, Psomas, Suárez-Barraza, & Jaca, 2019).
Corredor and Goñi (2011) asserts that TQM is a unified
management philosophy and set of practices emphasizing,
among other things, continuous improvement, meeting
customer needs, reducing rework, thinking long term,
increasing employee engagement and teamwork, process
redesign, benchmarking, competitive, team-based problem
solving, continuously measuring results, and closer
relationships with suppliers. The theory of global challenges
put forward by Firman, Mustapa, Ilyas and Putra (2020) that
the challenge of globalization for companies is quality. This
means that to be a winner in competition in the era of
globalization, companies must implement quality-based
TQM. The company's implementation of TQM needs to
require a guided control to determine customer-oriented
quality. The theory of quality control group leaders (quality
circle leader theory) from Corredor and Goñi (2011) states
that to realize the implementation of competitive and high-
performance TQM cannot be separated from quality
leadership, customer involvement, supplier relations, and
product design as a control group. Quality. This theory
becomes a quality life cycle in a company. The theories
above are in line with the views put forward by Bouranta,
Dewi Budhiartini Juli ISNAINI, Yuris DANILWAN, Daduk Merdika MANSUR, Gunawan Bata ILYAS, Sri MURTINI, Muhammad Ybnu TAUFAN 5
/ Journal of Distribution Science 19-12 (2021) 1-14
Psomas, Suárez-Barraza, and Jaca (2019). He introduced
Deming's theory that total and integrated quality
management determines the success of competitiveness and
improvement of company performance.
2.4. Hypothesis Development
In the quality management literature, attention to the
importance of organizational culture is primarily driven by
many companies' failure to achieve the expected benefits
from their TQM implementation. This is due to the
company's cultural factors that are not optimally
implemented by the internal organizations (Prajogo &
McDermott, 2005). Both TQM and Six Sigma require
radical changes in organizations when carrying out their
business processes. Employees' Attitudes and Behaviors are
very Important To implement the necessary adjustments in
implementing a quality management program.
Organizational culture is recognized to have a limiting effect
on the effectiveness of the implementation of quality
management. Underlying Values and Beliefs Organizational
culture can shape the philosophy and policies of managing
a business, influencing quality management practices
(Waldman, 1993). It has been widely agreed that to realize
the value of implementing TQM practices, all internal
organizations must have a culture that can support
organizational goals effectively and efficiently fully (Sousa‐
Poza, Nystrom, & Wiebe, 2001).
The importance of organizational culture is also
explicitly discussed in the Six Sigma literature. Culture is
seen as a very effective tool to bring about the necessary
changes for disseminating Six Sigma and distributing
knowledge about quality within an organization. For
example, Antony and Banuelas (2002) identify
organizational culture as critical to implementing Six Sigma
and reasonable corporate quality control. Breyfogle and
Meadows (2001) suggests that organizations should assess
their current culture and identify strengths, weaknesses, and
factors that become opportunities for the company as an
organization's efforts to push the organization towards Six
Sigma implementation and reasonable quality control.
Therefore, Managers must then create a strategic plan to
increase the drivers and overcome the restraining forces.
Previous studies have tried to identify cultural
characteristics conducive to quality management
implementation, e.g., (Buch & Rivers, 2001; Zeitz,
Johannesson, & Ritchie, 1997). Most previous studies
treated quality management as a unidimensional construct
and usually focused on the cultural characteristics associated
with people with high flexibility. However, the quality
management literature has shown that quality management
is a multi-dimensional construct that includes many
practices. In particular, some practices are softer
infrastructure practices, such as stop management support
and workforce management, which emphasize quality
management of organizational culture and society and use
various organizational development techniques to facilitate
change. Given the significant differences between the
multiple practices covered by TQM and Six Sigma, it is
highly likely that the characteristics of cultures that support
certain practices differ from the characteristics of cultures
that support other methods. They need to recognize the
multi-dimensional relationship between organizational
culture and quality management has been identified by
several researchers (Prajogo & McDermott, 2005). Prajogo
and McDermott (2005) stated that TQM initiatives fail in
many companies for two main reasons: partial deployment
of TQM practices and failure to integrate TQM and cultural
change. It is thus recommended to use the CVF model to
highlight the comprehensive nature of the TQM Factors and
ensure they are integrated into the TQM implementation for
success. Prajogo and McDermott (2005) compared the unit
research model that treated TQM as a single construct and
the pluralist model that considered TQM multi-dimensional
elements. The pluralist model better described the
relationship between cultural types and TQM practices with
different cultures. They were associated with other groups
of TQM practices. This study builds on previous research by
Prajogo and McDermott (2005) by extending practice with
consideration to include Six Sigma Practices. Next, we
develop and propose a set of hypotheses between individual
message cultures TQM/Six Sigma Practices. The results will
provide a detailed description of the culture-quality
management relationship. Based on the description of the
narrative literature background and prior research, the
hypotheses proposed in this study are:
H1: An excellent organizational culture will encourage
efforts to increase the company's quality output to be
optimal. Therefore, organizational culture plays a
significant role in quality output. Furthermore,
organizational culture also urges measures to increase
TQM by organizations to be significant so that the
optimal organizational culture has a positive and
significant impact on TQM.
H2: Perceived Distribution Quality Awareness will form a
positive and significant direct relationship and
influence organizational culture, quality output, and
TQM.
H3: Total Quality Management (TQM) will have a positive
and significant effect on quality output.
H4: Indirectly, Perceived Distribution Quality Awareness
will encourage increased quality output if it is
intervened by positive organizational culture and TQM.
H5: TQM and organizational culture further strengthen the
indirect effect on the dependent variable
6 Perceived Distribution Quality Awareness, Organizational Culture, TQM on Quality Output
asymmetrically and symmetrically. Therefore,
Organizational culture and TQM play an essential role
in realizing optimal quality output.
3. Research Methods and Materials
3.1. Sample of the study
The Selection sample in this study came from 170
respondents who are internal members of the organization
(i.e., managers, staff, employees, production workers, back-
office staff) spread from 48 companies from various sectors
such as the industrial sector, property sector, transportation
sector, and industrial sector. In determining the sample, we
adopted the results of research on TQM in Indonesia by
Ramlawati and Putra (2018) which uses a sample of 129
managers in 43 companies in Indonesia. In addition, Sample
Size Recommendations when using PLS-SEM by Hair,
Sarstedt, Hopkins, and Kuppelwieser (2014) provides a
minimum sample statement referring to the number of the
arrow pointing at a construct. In our study, we demonstrated
a 4-way arrow pointing at a construct. Therefore, in his
research, Hair, Sarstedt, Hopkins, and Kuppelwieser (2014)
gave a statement using a minimum sample of 137 with a sig
value criterion of 0.05. Based on these two foundations, our
study using a selection of 170 samples was declared eligible
for testing using SEM-PLS. The criteria for the informants
are based on the length of work of at least three years. The
sampling method uses the quota sampling method. The
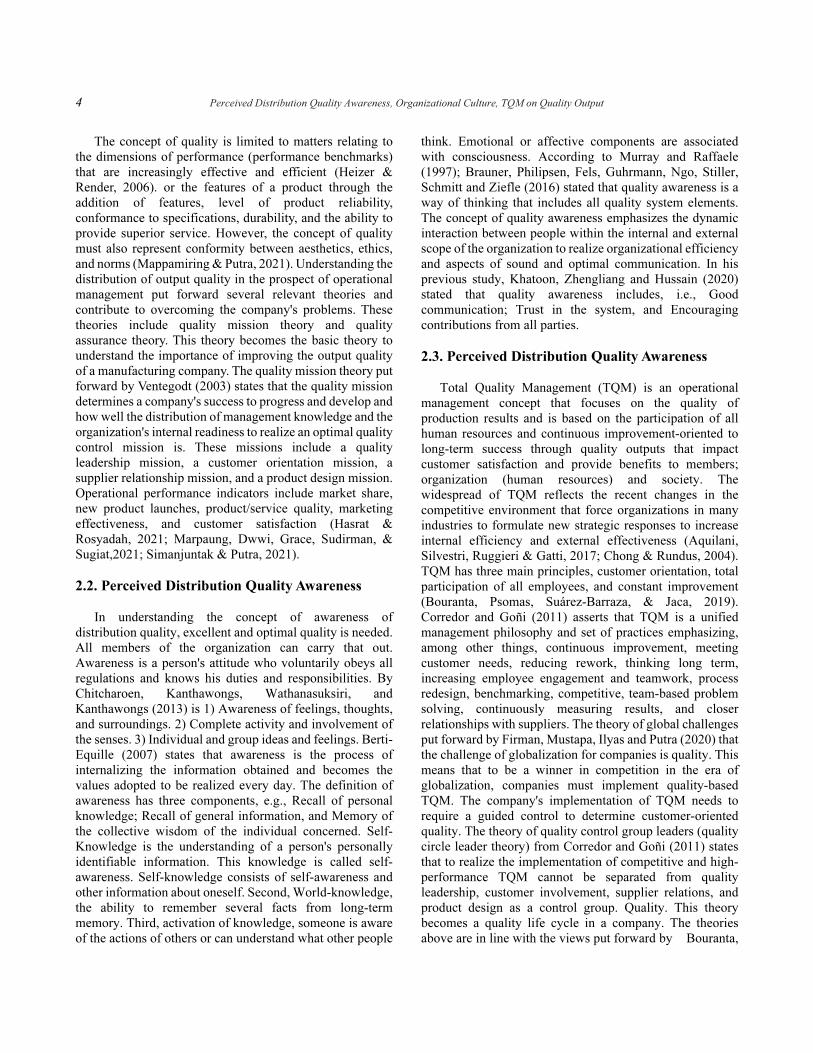
demographic description of the respondents is illustrated
explicitly in Table 2.
Table 2: Sample Criteria (N = 170)
Measurement N %
Gender
- Man 138 81.2
- Female 32 18.8
Age (years old)
- 30 – 35 79 46.4
- 36 – 40 41 24.1
- 41 – 45 34 20
- > 45 16 9.4
Status
- Manager Operational 48 28.2
- Manager Human Resource Development
40 23.5
- Production Staff 27 15.8
- Back office staff 21 12.3
- Employee 34 20
Length of Work (years)
- 3 – 5 28 16.6
- 5 – 8 71 41.7
- > 8 71 41.7
Education Level
- Senior High School 44 25.8
- Bachelor 93 54.7
- Magister 33 19.4
3.2. Measures for study variables
Measurement and data collection in this study used a
questionnaire that was distributed to the respondents. The
survey contains 52 questions; each question is grouped
based on the variable; for example, the question regarding
Perceived Distribution Quality Awareness consists of 10
question items. Variable Organizational Culture consists of
12 question items. Variable Total Quality Management
consists of 18 question items. The quality output variable
consists of 11 questions. Measuring the frequency
distribution of respondents' answers, we measure it using a
Likert scale with scale details as follows: 1 = strongly
disagree, 2 = disagree; 3 = disagree; 4 = neutral; 5 =
somewhat agree; 6 = agree; and 7 = strongly agree. The
measurement of the distribution of respondents' answers is
then calculated using Smart-PLS to determine the standard
deviation value, the average value of the distribution of
respondents' answers, loading factor > 0.60 (Fornell &
Larcker, 1981; Hair, Sarstedt, Hopkins, and Kuppelwieser
(2014); Inner-model testing with assessment criteria > 0.60
(i.e., Cronbach alpha, composite reliability, and AVE) (Chin,
1998). Demonstration of the measurement of item-variable
data is shown in Table 3.
Furthermore, suppose the measurement data has been
declared feasible as with the measurement criteria described
above. In that case, the next step is to measure the goodness
of fit model by assessing the data testing standards, i.e.,
Standardized Root Mean Square Residual and Normed Fit
Index (SRMR < 0.80, NFI > 0.90) (Henseler, Hubona, &
Ray (2016); Bentler & Bonett, 1980). d_ULS and d_G
With the original value criteria (saturated model > estimated
model). The results of the demonstration of the Goodness fit
model are illustrated in table 4. Further, the subsequent
testing stage tests the coefficient of determination and the F-
test (R-Square and F-test), presented in Table 6. The last
step of research testing is testing the hypothesis using the
constant bootstrapping method with chi-square (n = 170),
determining the T-statistic value and P-Value value with the
measurement criteria sig < 0.05 as demonstrated in Table 7.

Dewi Budhiartini Juli ISNAINI, Yuris DANILWAN, Daduk Merdika MANSUR, Gunawan Bata ILYAS, Sri MURTINI, Muhammad Ybnu TAUFAN 7
/ Journal of Distribution Science 19-12 (2021) 1-14
Table 3: Data Measurement
Variable Item Std. Dev
Mean Loading Factor
Cronbach Alpha
CR AVE
Perceived Distribution Quality Awareness
• Attitude of responsibility 1.238 5.500 0,845
0.936 0.946 0.635
• Self-awareness 1.040 5.794 0,778
• Alignment 0,654 6.112 0,797
• Attentive attitude. 1.253 5.647 0,792
• Increased contribution from everyone 0,589 6.094 0,772
• Good communication 0,563 6.206 0,774
• Organizational Readiness 1.001 5.876 0,859
• Supporting facilities 0,661 5.988 0,798
• Clear standard operating procedures 1.123 5.718 0,773
• Based on customer needs 1.017 5.865 0,778
Organizational Culture
• Participation, open discussion 1.543 4.653 0,692
0.940 0.949 0.654
• Empowerment of employees to act 1.443 5.106 0,760
• Assessing employee concerns and ideas 1.538 4.559 0,821
• Human relations, teamwork, cohesion 1.577 4.888 0,764
• Flexibility and decentralization 1.184 5.512 0,802
• Expansion, growth, and development 1.242 5.529 0,766
• Innovation and change 1.036 5.741 0,876
• Creative problem-solving processes 0,689 5.776 0,846
• Accomplishment and goal achievement 0,660 5.882 0,865
• Direction, objective setting, goal clarity 0,686 5.847 0,873
• Control, centralization 1.059 5.947 Delete
• Stability, continuity, order 1.390 5.494 Delete
Total Quality Management
• Leadership 1.129 5.918 Delete
0.947 0.953 0.611
• Organizational culture 1.193 5.865 Delete
• Top management support 1.679 4.424 0,683
• Continuous improvement 1.567 4.224 0,708
• Benchmarking 1.564 4.247 0,833
• Quality objectives and policy 1.439 4.771 0,726
• Employee empowerment 1.381 5.382 Delete
• Employee engagement 1.265 5.665 Delete
• Employee training 1.620 4.535 0,791
• Use of information technology 1.429 5.006 0,701
• Supplier quality 1.656 4.518 0,764
• Supplier relations 1.513 4.994 Delete
• Supplier performance appraisal 1.233 5.535 0,742
• Product and service design 0,679 6.176 0,842
• Process approach 1.005 6.118 0,834
• Customer orientation 1.125 5.900 0,784
• Realistic TQM implementation schedule 1.051 5.865 0,873
• Inspection and checking of work 1.145 5.841 0,848
Quality Output
• Guarantees or non-defective products 1.052 5.924 0,855
0.942 0.950 0.654
• Compliance with design specifications 1.038 5.800 0,801
• Reliability 1.093 5.735 0,838
• Durability 1.051 5.700 0,860
• Ease of use of the product 1.086 5.259 Delete
• Aesthetics 1.072 5.418 0,761
• Product Pricing Flexibility 1.102 5.488 0,761
• After-sales service 1.163 4.965 0,779
• Image product and Image organization 1.159 4.947 0,776
• Product safety 1.125 5.006 0,784
• Service quality 1.384 5.118 0,860

8 Perceived Distribution Quality Awareness, Organizational Culture, TQM on Quality Output
4. Results and Discussion
4.1. Statistical Analysis
In this section, we discuss the results we have obtained
in the demonstration of statistical tests. For example, as
shown in Table 3, the mean coefficient value in the
frequency distribution for each question item is on a scale of
5~6. This indicates that the frequency distribution of
respondents' answers is between the categories somewhat
agree - agree with all statements on the questionnaire sheet.
Then the outer-loading coefficient of all item variables
shows a value > 0.60, so it can be concluded that based on
the outer-loading value. It is declared valid to be continued
at the next statistical testing stage, as for some items that
were deleted due to the measurement of the outer-loading
value < 0.60. based on the assumption of using the SEM
method, these items were excluded from the test.
Furthermore, the Cronbach Alpha, AVE, and Composite
reliability values also show a valid value > 0.60. Moreover,
the measurement of the Model Fit coefficient is illustrated
in Table 4. It also states that the Saturated Model and
Estimated Model values have been declared fit based on the
Assessment criteria benchmarks. Table 5, which explains
the measurement of Discriminant validity, shows that
testing the validity of the variable crosswise against other
variables also shows the coefficient value > 0.60. Therefore,
this illustrates that the validity test obtained a validity value
with a very high category. Table 6 describes the
measurement of the R-Square value, which means how
closely the relationship between the independent variable
and the dependent variable is, for example, on the
organizational culture variable with the coefficient of
determination R-Square = 0.935. this means that the close
relationship of the independent variable to the
organizational culture variable is 93.5%. Then the
dependent variable on the quality output variable is 0.738 or
73.8%, and the TQM variable is 0.872 or 87.2%. The
residual value from the measurement of the R-Square
coefficient explains that the difference to 100% of the close
relationship is influenced by other factors not examined in
this study. Then the F-Square coefficient test also shows that
all independent variables on the dependent variable are
significant < 0.05.
Table 4: Model Fit
Assessment criteria Saturated Model Estimated Model Result
SOME < 0.80 0,086 0,089 Fit
d_ULS saturated model > estimated model 7,011 7,416 Fit
d_G saturated model > estimated model 4,561 4,709 Fit
Chi-Square - 3279,774 3315,951 Fit
NFI >0.90 0,942 0,938 Fit
Table 5: Discriminant Validity
OC PDQA QU TQM
OC 0,809
PDQA 0,967 0,797
QU 0,880 0,894 0,809
TQM 0,917 0,932 0,859 0,782
Table 6: R-Square dan F-Square
R Square R Square Adjusted
Organizational Culture
0,935 0,935
Quality Output 0,738 0,736
TQM 0,872 0,870
F-Square OC PDQA QU TQM
Organizational Culture
0,030
Perceived Distribution Quality Awareness
14,379 0,247
Quality Output
TQM 2,811

Dewi Budhiartini Juli ISNAINI, Yuris DANILWAN, Daduk Merdika MANSUR, Gunawan Bata ILYAS, Sri MURTINI, Muhammad Ybnu TAUFAN 9
/ Journal of Distribution Science 19-12 (2021) 1-14
Figure 1: SEM-PLS Result
In the next stage, namely hypothesis testing, as shown in
table 7, it is explained that all test demonstrations, either
directly or indirectly using the intervening variable,
obtained a significance coefficient value (p-value) < 0.05.
The demonstration that illustrates the direct relationship of
the most dominant variables is shown in the relationship
between the Perceived Distribution Quality Awareness on
Organizational Culture variable with a T-statistic value =
142,964 with a significance value < 0.01. Furthermore, the
indirect relationship is the most dominant relationship
between Perceived Distribution Quality Awareness on
Quality Output, bridged by the TQM variable as an
intervening variable with a T-statistic coefficient = 6.008
with a P-value < 0.01. In detail, the Structural Equation
Model using the PLS method is also demonstrated, as shown
in Figure 1.
The results of hypothesis testing (H1) indicate that
organizational culture has a positive and significant effect
on quality output (t-statistic = 2.044; with a significance
coefficient of 0.042 < 0.05), as well as the relationship that
explains organizational culture on TQM, which also has a
positive and significant effect (t-statistic = 2.062,
significance coefficient 0.040 < 0.05). So it can be
concluded that an excellent organizational culture will
encourage efforts to increase quality output to be optimal.
Therefore, based on the demonstration of statistical testing
described in table 7, it is stated that the hypothesis (H1) is
accepted. Furthermore, the idea (H2) also says that
Perceived Distribution Quality Awareness has a positive and
significant direct effect on quality output (t-statistic =
142,964; significance coefficient < 0.01) as well as on TQM,
which also has a positive and significant impact (t-statistic
= 76.743, significant coefficient < 0.01). This means that
positive implementation of Perceived Distribution Quality
Awareness will encourage a more positive organizational
culture related to TQM implementation and quality output;
based on the test results, it can be concluded that the
hypothesis (H2) is also accepted. Apart from that, the results
of hypothesis testing (H3), which demonstrate the effect of
TQM on quality output, also show a positive and significant
impact. Implementing TQM that is both optimal and applied
in an integrated manner in the organization will encourage a
positive increase in quality output. Then, hypothesis testing
(H4) shows that the intervention of TQM and organizational
culture variables has a positive and significant effect on
quality output. The positive coefficient of TQM and
organizational culture further strengthens the role of
perceived distribution quality awareness on quality output.
Likewise, the hypothesis (H5) is also accepted to
demonstrate an indirect relationship. TQM and
organizational culture further strengthen the indirect effect
on the dependent variable asymmetrically and
symmetrically. Therefore, organizational culture and TQM
play an essential role in realizing optimal quality output.

10 Perceived Distribution Quality Awareness, Organizational Culture, TQM on Quality Output
Table 7: Hypothesis Result
Direct Effect Original Sample
Sample Mean
Standard Deviation
T-Statistics P-Values Result
Organizational Culture Quality Output 0,208 0,219 0,102 2,044 0,042 Support
Organizational Culture TQM 0,242 0,254 0,117 2,062 0,040 Support
Perceived Distribution Quality Awareness Organizational Culture
0,967 0,967 0,007 142,964 0,000 Support
Perceived Distribution Quality Awareness Quality Output
0,800 0,803 0,028 28,100 0,000 Support
Perceived Distribution Quality Awareness TQM 0,932 0,933 0,012 76,743 0,000 Support
TQM Quality Output 0,859 0,861 0,023 37,369 0,000 Support
Indirect Effect Original Sample
Sample Mean
Standard Deviation
T-Statistics P-Values Result
Perceived Distribution Quality Awareness Organizational Culture TQM Quality Output
0,201 0,212 0,099 2,029 0,043 Support
Perceived Distribution Quality Awareness TQM Quality Output
0,599 0,592 0,100 6,008 0,000 Support
Perceived Distribution Quality Awareness Organizational Culture TQM
0,234 0,246 0,114 2,049 0,041 Support
Organizational Culture TQM Quality Output 0,208 0,219 0,102 2,044 0,042 Support
4.2. Discussion
Discussion about Perceived Distribution Quality
Awareness for a company is essential to face global
competition. Perceived Distribution Quality Awareness in
question is the attitude of a person consciously, responsible,
and attentive to work together with others in terms of quality
to make continuous improvements and quality
improvements to fulfill user desires. The results of this
analysis indicate that all indicators of quality awareness
have a positive influence on the implementation of TQM in
the company. Quality awareness indicators in the form of
increased contribution from everyone, harmony, good
communication, the attitude of responsibility, awareness,
and caring must be appropriately considered. These
indicators can form employee quality awareness that can
have a positive and significant impact on the
implementation of TQM.
This study also confirms that every element of the
organization must contribute in the form of participation and
involvement of people (employees and managers) both in
thought and action in continuous quality improvement. In
implementing TQM, a fundamental aspect of sustaining
perceived distribution quality awareness is involving people
in the implementation process and empowering them to
participate actively. Managers need to be aware of the
various possibilities for involving people in quality
awareness activities as a strategic issue, contributing to
organizational goals. Furthermore, the Alignment Indicator
on perceived distribution quality awareness is the second
aspect that can form quality awareness in carrying out the
company's operational activities. Alignment referred to in
quality awareness is that every employee can harmonize
between self-awareness and organizational awareness. If the
alignment of self-awareness and organizational awareness
goes well, then the implementation of TQM will also run
well. Comprehensive management involvement is required
to ensure those job descriptions are genuinely aligned with
the organization's needs or in line with the company's
quality manual. To support this, a good communication
network is a necessary indicator in forming perceived
distribution quality awareness. Communication aims to
promote shared values and understanding of the business
through ongoing dialogue. Effective communication
between workers and managers helps create efficient work
processes to follow standard operating procedures.
Management should take the time to discuss quality with
different team members to get all elements of the operation
involved. The information flows from top to bottom, and
vice versa from bottom to top and flows between fellow
employees horizontally. The fourth-order indicator needed
in forming quality awareness is an attitude of responsibility.
Responsibility is an essential moral value in social life that
also needs to be instilled in every employee. Employees who
are responsible always show perseverance, diligence, and
seriousness in handling the work given.
The fifth-order indicator that makes up the Perceived
Distribution Quality Awareness is awareness. Awareness is
a state of understanding, knowing, and alertness in
continuous improvement and quality improvement activities.
Consciousness is considered as an individual's ability to
control behavior over what is happening around him. In
addition, what also forms the Perceived Distribution Quality
Awareness is the attitude of concern. Attitude is a reaction
or response that is still closed from a person to a stimulus or
object. Attention is closely related to the soul's awareness of

Dewi Budhiartini Juli ISNAINI, Yuris DANILWAN, Daduk Merdika MANSUR, Gunawan Bata ILYAS, Sri MURTINI, Muhammad Ybnu TAUFAN 11
/ Journal of Distribution Science 19-12 (2021) 1-14
a thing that is reacted at a time. Attitudes and engagement
must be instilled properly in every internal member of the
organization to support the successful implementation of
TQM.
They understood the quality awareness indicators that
have a positive and significant impact is expected to
improve the implementation of Total Quality Management
in a better direction. This aligns with Chitcharoen,
Kanthawongs, Wathanasuksiri, and Kanthawongs (2013)
that quality awareness among people is essential for
achieving TQM goals. Similarly, Brauner, Philipsen, Fels,
Guhrmann, Ngo, Stiller, Schmitt, and Ziefle (2016), the
successful implementation of TQM will be achieved with
the involvement of employees. A high level of quality
awareness during the development of TQM produces the
essential prerequisites for success and the primary goal of
TQM (Prajogo & McDermott, 2005). The primary purpose
of quality awareness is to collect team experiences and
communicate them to management for current and future
improvement (Baker, Phelan, Woods, Boyd, Rowland, &
Ng, 2021); quality awareness can be summed up by "3A"
Awareness, Alignment, and Attention. Awareness, harmony,
and mindfulness imply awareness of oneself and one's
surroundings; This also shows that awareness must be in
alignment with organizational awareness, which will help
the activities and full involvement of the senses so that the
actions of implementing Total Quality Management can run
well. The above description is supported by several theories,
including the idea put forward by Dwivedi, Ismagilova,
Hughes, Carlson, Filieri, Jacobson, Jain, Karjaluoto, Kefi,
Krishen, Kumar, Rahman, Raman, Rauschnabel, Rowley,
Salo, Tran, & Wang (2020) regarding self-awareness.
The importance of human resources to the organization
lies in human self-awareness to react positively to goals of
work or activities undertaken. Previous research relevant to
this research is that conducted by Sousa‐Poza, Nystrom, &
Wiebe (2001). The results of his study include showing that
employee behavior in the form of (quality awareness,
quality competence, and quality motivation) has a
significant impact on the practice of Total Quality
Management. Likewise, Amar and Zain (2002) results of his
research stated that quality awareness, staff capabilities,
quality attitudes, and staff interests had a positive and
significant impact on TQM practice. This study indicates
that quality awareness has a positive and significant effect
on Total Quality Management in manufacturing companies.
The two previous researchers used quality awareness as an
indicator in their research, while quality awareness was used
as a research variable in this study. Quality awareness plays
an essential role for companies to improve the quality of
output. The contribution of quality awareness for a company
dramatically determines the production quality compete
globally. Perfect quality (quality excellence) in an
organization can be achieved if all members contribute to
quality improvement. However, efforts to contribute to
quality will not be practical if employees' awareness of
quality lacks. Based on this, it shows that quality awareness
is an important variable to improve the quality of the
company's output.
5. Conclusions
Total Quality Management applied in manufacturing
companies is essential to face global competition that
prioritizes the quality of output following the wishes of users
or consumers. Total Quality Management is meant to be
integrated and integrated quality management practices that
involve all company components to realize the quality of
output following the user's wishes. Supplier performance
assessment indicators are essential indicators in Total
Quality Management. Supplier performance assessment is
critical to a company. Companies that implement TQM
know the performance of each supplier to be used as
material for good supplier recommendations in meeting
company needs. Performance appraisal is essential as an
evaluation material that can later be used to improve
supplier performance or consider whether or not to find
another supplier. In addition to efforts to implement TQM
in an integrated manner, the leadership factor plays a vital
role because top management support provides a critical role
to direct the organization to make continuous improvements.
Apart from that, the organizational culture factor is also an
aspect of the implementation of TQM and the Perceived
Distribution of Quality Awareness.
Participation factors and open discussions involving all
elements of the organization can provide opportunities for
the performance of TQM and Quality Output to be accurate.
The organizational culture that leads to integrated human
relationships, flexible teamwork, and innovation orientation
is essential for realizing sustainable organizational goals.
Therefore, some critical notes in creating organizational
culture, perceived quality awareness, and quality output
require concrete steps, including creative problem-solving
processes. The effectiveness of achieving clearly defined
goals includes direction, goal setting, and efforts to describe
the organization's strengths, weaknesses, strengths, and
opportunities so that the quality output of production and
company operations becomes effective and efficient. Apart
from that, efforts to create an organizational culture to
maximize Perceived Distribution, Quality Awareness, and
quality output can provide organizational opportunities for
benchmarking because competitiveness and comparison are
tools within the company to position itself in the business
world. When making decisions, it is necessary to look for
techniques to improve quality and competitiveness in terms

12 Perceived Distribution Quality Awareness, Organizational Culture, TQM on Quality Output
of strategic management and operations and sustainable
product competitiveness (Krishnamoorthy & D'Lima, 2014).
References
Abusa, F. M., & Gibson, P. (2013). TQM implementation in developing countries: a case study of the Libyan industrial sector. Benchmarking: An International Journal. 20(5), 693-711. http://dx.doi.org/10.1108/BIJ-01-2012-0003
Akgün, A. E., Ince, H., Imamoglu, S. Z., Keskin, H., & Kocoglu, İ. (2014). The mediator role of learning capability and business innovativeness between total quality management and financial performance. International Journal of Production
Research, 52(3), 888-901. https://doi.org/10.1080/00207543.2013.843796
Al‐khalifa, K. N., & Aspinwall, E. M. (2000). The development of total quality management in Qatar. The TQM Magazine, 12(3), 194-204. http://dx.doi.org/10.1108/09544780010320250
Amar, K., & Zain, Z. (2002). Barriers to implementing TQM in Indonesian manufacturing organizations. The TQM Magazine, 14(6), 367-372. https://doi.org/10.1108/09544780210447474
Antony, J., & Banuelas, R. (2002). Key ingredients for the effective implementation of the Six Sigma program. Measuring
Business Excellence, 6(4), 20-27. http://dx.doi.org/10.1108/13683040210451679
Anttila, J., & Jussila, K. (2017). Understanding quality–conceptualization of the fundamental concepts of quality. International Journal of Quality and Service Sciences, 9(3-4). 251-268. https://doi.org/10.1108/IJQSS-03-2017-0020
Aquilani, B., Silvestri, C., Ruggieri, A., & Gatti, C. (2017). A systematic literature review on total quality management critical success factors and the identification of new avenues of research. The TQM Journal, 29(1), 184-213. http://dx.doi.org/10.1108/TQM-01-2016-0003
Bader, J. D., Shugars, D. A., & Bonito, A. J. (2001). A systematic review of selected caries prevention and management methods. Community Dentistry and Oral Epidemiology: Systematic
Review, 29(6), 399-411. https://doi.org/10.1034/j.1600-0528.2001.290601.x
Baird, K., Jia Hu, K., & Reeve, R. (2011). The relationships between organizational culture, total quality management practices and operational performance. International Journal
of Operations & Production Management, 31(7), 789-814. https://doi.org/10.1108/01443571111144850
Baker, L. R., Phelan, S., Woods, N. N., Boyd, V. A., Rowland, P., & Ng, S. L. (2021). Re-envisioning paradigms of education: towards awareness, alignment, and pluralism. Advances in
Health Sciences Education, 26(3) 1045-1058. https://doi.org/10.1007/s10459-021-10036-z
Barata, J., & Cunha, P. R. (2017). Synergies between quality management and information systems: a literature review and map for further research. Total Quality Management &
Business Excellence, 28(3-4), 282-295. http://dx.doi.org/10.1080/14783363.2015.1080117
Bentler, P. M., & Bonett, D. G. (1980). Significance tests and goodness of fit in the analysis of covariance structures. Psychological Bulletin, 88(3), 588-606. https://psycnet.apa.org/doi/10.1037/0033-2909.88.3.588
Berti-Equille, L. (2007). Measuring and modelling data quality for quality-awareness in data mining. Quality measures in data
mining, pp. 101-126. Springer. https://doi.org/10.1007/978-3-540-44918-8_5
Bouranta, N., Psomas, E., Suárez-Barraza, M. F., & Jaca, C. (2019). The key factors of total quality management in the service sector: a cross-cultural study. Benchmarking: An International
Journal, 26(3), 893-921. https://doi.org/10.1108/BIJ-09-2017-0240
Brauner, P., Philipsen, R., Fels, A., Fuhrmann, M., Ngo, Q. H., Stiller, S., Schmitt, R., & Ziefle, M. (2016). A game-based approach to raise quality awareness in ramp-up processes. Quality Management Journal, 23(1), 55-69. https://doi.org/10.1080/10686967.2016.11918462
Breyfogle, F. W., & Meadows, B. (2001). Bottom-line success with Six Sigma. Quality Progress, 34(5), 101-104. http://dx.doi.org/10.1504/IJSSCA.2006.010111
Buch, K., & Rivers, D. (2001). TQM: The Role of Leadership and Culture. Leadership & Organization Development Journal,
22(8), 365-371. http://dx.doi.org/10.1108/01437730110410080
Bugdol, M. (2020). The problem of fear in TQM–causes, consequences and reduction methods–a literature review. The
TQM Journal, 32(6), 1217-1239. https://doi.org/10.1108/TQM-02-2019-0047
Cadden, T., Marshall, D., & Cao, G. (2013). Opposites attract: organisational culture and supply chain performance. Supply
Chain Management: An International Journal, 18(1). 86-103. https://doi.org/10.1108/13598541311293203
Chin, W. (1998). The partial least squares approach to structural equation modeling. Modern Methods for Business Research, 295(2), 295–336. https://doi.org/10.1016/j.aap.2008.12.010
Chitcharoen, C., Kanthawongs, P., Wathanasuksiri, K., & Kanthawongs, P. (2013). A Model to Investigate the Influence of Channel, Perceived Web Quality, Brand Awareness, Perceived Quality on After-sales Service of the All-in-one Office Products. Procedia - Social and Behavioral Sciences, 88(October), 8-12. https://doi.org/10.1016/j.sbspro.2013.08.475
Chong, V. K., & Rundus, M. J. (2004). Total quality management, market competition, and organizational performance. The
British Accounting Review, 36(2), 155-172. https://doi.org/https://doi.org/10.1016/j.bar.2003.10.006
Corredor, P., & Goñi, S. (2011). TQM and performance: is the relationship so obvious? Journal of Business Research, 64(8), 830-838. https://doi.org/https://doi.org/10.1016/j.jbusres.2010.10.002
Côrte-Real, N., Ruivo, P., & Oliveira, T. (2020). Leveraging internet of things and big data analytics initiatives in European and American firms: Is data quality a way to extract business value? Information & Management, 57(1), 103-141. https://doi.org/10.1016/j.im.2019.01.003
Das, A., Handfield, R. B., Calantone, R. J., & Ghosh, S. (2000). A contingent view of quality management‐the impact of international competition on quality. Decision Sciences, 31(3), 649-690. https://doi.org/10.1111/j.1540-5915.2000.tb00938.x
Delleman, N. J., & Dul, J. (2007). International standards on working postures and movements ISO 11226 and EN 1005-4. Ergonomics, 50(11), 1809-1819. https://doi.org/10.1080/00140130701674430

Dewi Budhiartini Juli ISNAINI, Yuris DANILWAN, Daduk Merdika MANSUR, Gunawan Bata ILYAS, Sri MURTINI, Muhammad Ybnu TAUFAN 13
/ Journal of Distribution Science 19-12 (2021) 1-14
Deming, W. E., & Edwards, D. W. (1982). Quality, productivity,
and competitive position (Vol. 183). Massachusetts Institute of Technology, Center for advanced engineering study, pp. 1-373.
Donnelly, M., Kerr, N. J., Rimmer, R., & Shiu, E. M. (2006). Assessing the quality of police services using SERVQUAL. Policing: An International Journal of Police Strategies &
Management, 2(6), 92-105. https://doi.org/10.12691/jbms-2-6-1
Dwivedi, Y. K., Ismagilova, E., Hughes, D. L., Carlson, J., Filieri, R., Jacobson, J., Jain, V., Karjaluoto, H., Kefi, H., Krishen, A. S., Kumar, V., Rahman, M. M., Raman, R., Rauschnabel, P. A., Rowley, J., Salo, J., Tran, G. A., & Wang, Y. (2020). Setting the future of digital and social media marketing research: Perspectives and research propositions. International Journal
of Information Management, 59(August), 102168. https://doi.org/https://doi.org/10.1016/j.ijinfomgt.2020.102168
Ebrahimi, M., & Sadeghi, M. (2013). Quality management and performance: An annotated review. International Journal of
Production Research, 51(18), 5625-5643. https://doi.org/10.1080/00207543.2013.793426
F. Hair Jr, J., Sarstedt, M., Hopkins, L., & G. Kuppelwieser, V. (2014). Partial least squares structural equation modeling (PLS-SEM). European Business Review, 26(2), 106-121. https://doi.org/10.1108/EBR-10-2013-0128
Firman, A., Mustapa, Z., Ilyas, G. B., & Putra, A. H. P. K. (2020). Relationship of TQM on managerial performance: Evidence from property sector in Indonesia. Journal of Distribution
Science, 18(1), 47-57. https://doi.org/10.15722/jds.18.01.20201.47
Fornell, C., & Larcker, D. F. (1981). Structural equation models with unobservable variables and measurement error: Algebra and statistics. Journal of Marketing Research, 18(3), 382-388. https://doi.org/10.2307/3150980
Gaspersz, V. (2002). Pedoman implementasi program six sigma
terintegrasi dengan ISO 9001: 2000, MBNQA, dan HACCP. pp. 1-543.
Georgiev, S., & Georgiev, E. (2017). Evolution of top management’s understanding of product quality in Eastern Europe since the end of communism: The case of Bulgaria. The
TQM Journal, 29(1), 82-100. http://dx.doi.org/10.1108/TQM-09-2015-0115
Hair, J. F., Henseler, J., Dijkstra, T. K., & Sarstedt, M. (2014). Common beliefs and reality about partial least squares: comments on Rönkkö and Evermann (2013), 17(2), 182-209. https://doi.org/10.1177%2F1094428114526928
Henseler, J., Hubona, G., & Ray, P. A. (2016). Using PLS path modeling in new technology research: updated guidelines. Industrial Management & Data Systems, 116(1), 2-20. https://doi.org/10.1108/IMDS-09-2015-0382
Hilman, H., Ali, G. A., & Gorondutse, A. H. (2019). The relationship between TQM and SMEs’ performance: The mediating role of organizational culture. International Journal
of Productivity and Performance Management, 69(1), 61-84. https://doi.org/10.1108/IJPPM-02-2019-0059
Imran, M., Aziz, A., Hamid, S., Shabbir, M., Salman, R., & Jian, Z. (2018). Retracted: The mediating role of total quality management between entrepreneurial orientation and SMEs export performance. Management Science Letters, 8(6), 519-
532. http://dx.doi.org/10.5267/j.msl.2018.5.003 Ireland, R. D., & Webb, J. W. (2007). Strategic entrepreneurship:
Creating competitive advantage through streams of innovation. Business Horizons, 50(1), 49-59. http://dx.doi.org/10.1016/j.bushor.2006.06.002
Juran, J. M. (1986). The quality trilogy. Quality Progress, 19(8), 19-24.
Kanapathy, K., Bin, C. S., Zailani, S., & Aghapour, A. H. (2017). The impact of soft TQM and hard TQM on innovation performance: the moderating effect of organisational culture. International Journal of Productivity and Quality
Management, 20(4), 429–461. https://doi.org/10.1504/IJPQM.2017.082831
Kaynak, H. (2003). The relationship between total quality management practices and their effects on firm performance. Journal of Operations Management, 21(4), 405–435. https://doi.org/10.12691/jbms-2-6-1
Khatoon, S., Zhengliang, X., & Hussain, H. (2020). The Mediating Effect of customer satisfaction on the relationship between Electronic banking service quality and customer Purchase intention: Evidence from the Qatar banking sector. SAGE Open, 10(2), 1-12. https://doi.org/10.1177/2158244020935887
Lopes, E. L., Yunes, L. Z., Bandeira de Lamônica Freire, O., Herrero, E., & Contreras Pinochet, L. H. (2020). The role of ethical problems related to a brand in the purchasing decision process: An analysis of the moderating effect of complexity of purchase and mediation of perceived social risk. Journal of
Retailing and Consumer Services, 53(March), 101970 https://doi.org/10.1016/j.jretconser.2019.101970
López-Gamero, M. D., Pertusa-Ortega, E. M., Molina-Azorín, J. F., Tari-Guillo, J. J., & Pereira-Moliner, J. (2016). Organizational antecedents and competitive consequences of environmental proactivity in the hotel industry. Journal of Sustainable
Tourism, 24(7), 949–970. https://doi.org/10.1080/09669582.2015.1101124
Mappamiring, M., & Putra, A. H. P. K. (2021). Understanding Career Optimism on Employee Engagement: Broaden-Built and Organizational Theory Perspective. Journal of Asian
Finance, Economics and Business, 8(2), 0605–0616. https://doi.org/10.13106/jafeb.2021.vol8.no2.0605
Marpaung, F. K., Dewi, R. S., Grace, E., Sudirman, A., & Sugiat, M. (2021). Behavioral Stimulus for Using Bank Mestika Mobile Banking Services: UTAUT2 Model Perspective. Golden Ratio of Marketing and Applied Psychology of
Business, 1(2), 61-72. https://doi.org/10.52970/grmapb.v1i2.68
McKinlay, C. J. D., Alsweiler, J. M., Ansell, J. M., Anstice, N. S., Chase, J. G., Gamble, G. D., Harris, D. L., Jacobs, R. J., Jiang, Y., & Paudel, N. (2015). Neonatal glycemia and neurodevelopmental outcomes at 2 years. New England
Journal of Medicine, 373(16), 1507-1518. https://doi.org/10.1056/nejmoa1504909
Moore, S. B., & Manring, S. L. (2009). Strategy development in small and medium sized enterprises for sustainability and increased value creation. Journal of Cleaner Production, 17(2), 276-282. http://dx.doi.org/10.1016/j.jclepro.2008.06.004
Murray, B., & Raffaele, G. C. (1997). Single‐site, results‐level evaluation of quality awareness training. Human Resource
Development Quarterly, 8(3), 229-245.

14 Perceived Distribution Quality Awareness, Organizational Culture, TQM on Quality Output
https://doi.org/10.1002/hrdq.3920080306 Nair, A. (2006). Meta-analysis of the relationship between quality
management practices and firm performance—implications for quality management theory development. Journal of
Operations Management, 24(6), 948-975. http://dx.doi.org/10.1016/j.jom.2005.11.005
Ngai, E. W. T., & Cheng, T. C. E. (1999). MSS4TQM-a management support system for total quality management. IEEE Transactions on Systems, Man, and Cybernetics, Part C (Applications and Reviews), 29(3), 371-386. https://doi.org/10.1109/5326.777073
Ojasalo, J. (2010). E-service quality: A conceptual model. International Journal of Arts and Sciences, 3(7), 127-143.
Othman, B., Khatab, J. J., Esmaeel, E. S., Mustafa, H. A., & Sadq, Z. M. (2020). The Influence of Total Quality Management on Competitive Advantage towards Bank Organizations: Evidence from Erbil/Iraq. International Journal of
Psychosocial Rehabilitation, 24(5), 3427-3439. Pereira-Moliner, J., Pertusa-Ortega, E. M., Tarí, J. J., López-
Gamero, M. D., & Molina-Azorin, J. F. (2016). Organizational design, quality management and competitive advantage in hotels. International Journal of Contemporary Hospitality
Management, 28(4), 762-784 http://dx.doi.org/10.1108/IJCHM-10-2014-0545
Prajogo, D. I., & McDermott, C. M. (2005). The relationship between total quality management practices and organizational culture. International Journal of Operations & Production
Management, 25(11), 1101-1122. https://doi.org/10.1108/01443570510626916
Prajogo, D. I., & Sohal, A. S. (2006). The relationship between organization strategy, total quality management (TQM), and organization performance––the mediating role of TQM. European Journal of Operational Research, 168(1), 35-50. http://dx.doi.org/10.1016/j.ejor.2004.03.033
Ramlawati, R., & Putra, A. H. P. K. (2018). Total Quality Management as the Key of the Company to Gain the Competitiveness, Performance Achievement and Consumer Satisfaction. International Review of Management and
Marketing, 8(5), 60-69. https://doi.org/10.32479/irmm.6932 Razak, M., Hidayat, M., Launtu, A., Perdana, A. H., Putra, K., &
Bahasoan, S. (n.d.). Antecedents and Consequence of Brand Management: Empirical Study of Apple’s Brand Product. Journal of Asia Business Studies, 14(3). 307-322. http://dx.doi.org/10.1108/JABS-01-2019-0030
Sadikoglu, E., & Zehir, C. (2010). Investigating the effects of innovation and employee performance on the relationship between total quality management practices and firm performance: An empirical study of Turkish firms.
International Journal of Production Economics, 127(1), 13-26. https://doi.org/10.1016/j.ijpe.2010.02.013
Sahney, S., Banwet, D.-K., & Karunes, S. (2008). An integrated framework of indices for quality management in education: A faculty perspective. The TQM Journal, 20(5), 502-519. http://dx.doi.org/10.1108/17542730810898467
Sorokin, P., & Richard, M. P. (2017). Social and cultural dynamics:
a study of change in major systems of art, truth, ethics, law,
and social relationships. Routledge. pp.1-750 Simanjuntak, M., & Putra, A. H. P. K. (2021). Theoretical
Implications of Theory Planned Behavior on Purchasing Decisions: A Bibliometric Review. Golden Ratio of Mapping
Idea and Literature Format, 1(2), 1-7. https://doi.org/10.52970/grmilf.v1i1.18
Sousa‐Poza, A., Nystrom, H., & Wiebe, H. (2001). A cross‐cultural study of the differing effects of corporate culture on TQM in three countries. International Journal of Quality & Reliability
Management, 18(7), 744-761. https://doi.org/10.1108/EUM0000000005778
Hasrat, T., & Rosyadah, K. (2021). Usability Factors as Antecedent and Consequence on Business Strategy and SERVQUAL: Nielsen & Mack Approach. Golden Ratio of Marketing and
Applied Psychology of Business, 1(2), 81-92. https://doi.org/10.52970/grmapb.v1i2.68
Talapatra, S., & Uddin, M. K. (2019). Prioritizing the barriers of TQM implementation from the perspective of the garment sector in developing countries. Benchmarking: An
International Journal, 26(7), 2205-2224. https://doi.org/10.1108/bij-01-2019-0023
Ventegodt, S. (2003). The life mission theory: A theory for a consciousness-based medicine. International Journal of
Adolescent Medicine and Health, 15(1), 89-92. https://doi.org/10.1515/IJAMH.2003.15.1.89
Waluya, A. I., Iqbal, M. A., & Indradewa, R. (2019). How product quality, brand image, and customer satisfaction affect the purchase decisions of Indonesian automotive customers. International Journal of Services, Economics and
Management, 10(2), 177-193. http://dx.doi.org/10.1504/IJSEM.2019.100944
Zailani, S., Iranmanesh, M., Aziz, A. A., & Kanapathy, K. (2017). Halal logistics opportunities and challenges. Journal of Islamic
Marketing. 18(1), 127-139. https://doi.org/10.1108/JIMA-04-2015-0028
Zeitz, G., Johannesson, R., & Ritchie Jr, J. E. (1997). An employee survey measuring total quality management practices and culture: Development and validation. Group & Organization
Management, 22(4), 414-444. https://psycnet.apa.org/doi/10.1177/1059601197224002


