Embed Size (px)
Citation preview

PLEASE SCROLL DOWN FOR ARTICLE
This article was downloaded by: [Lawson, Lartey G.]On: 4 February 2010Access details: Access Details: [subscription number 919057726]Publisher Taylor & FrancisInforma Ltd Registered in England and Wales Registered Number: 1072954 Registered office: Mortimer House, 37-41 Mortimer Street, London W1T 3JH, UK
Food Economics - Acta Agriculturae Scandinavica, Section CPublication details, including instructions for authors and subscription information:http://www.informaworld.com/smpp/title~content=t713710315
Perceptions of genetically modified crops among Danish farmersLartey G. Lawson a; Anders S. Larsen b; Søren Marcus Pedersen a; Morten Gylling a
a Institute of Food and Resource Economics, University of Copenhagen, Frederiksberg C, Denmark b
Food Industry Agency, Copenhagen K, Denmark
Online publication date: 03 February 2010
To cite this Article Lawson, Lartey G., Larsen, Anders S., Pedersen, Søren Marcus and Gylling, Morten(2009) 'Perceptionsof genetically modified crops among Danish farmers', Food Economics - Acta Agriculturae Scandinavica, Section C, 6: 2,99 — 118To link to this Article: DOI: 10.1080/16507540903474699URL: http://dx.doi.org/10.1080/16507540903474699
Full terms and conditions of use: http://www.informaworld.com/terms-and-conditions-of-access.pdf
This article may be used for research, teaching and private study purposes. Any substantial orsystematic reproduction, re-distribution, re-selling, loan or sub-licensing, systematic supply ordistribution in any form to anyone is expressly forbidden.
The publisher does not give any warranty express or implied or make any representation that the contentswill be complete or accurate or up to date. The accuracy of any instructions, formulae and drug dosesshould be independently verified with primary sources. The publisher shall not be liable for any loss,actions, claims, proceedings, demand or costs or damages whatsoever or howsoever caused arising directlyor indirectly in connection with or arising out of the use of this material.

ORIGINAL ARTICLE
Perceptions of genetically modified crops among Danish farmers
LARTEY G. LAWSON1, ANDERS S. LARSEN2, SØREN MARCUS PEDERSEN1 &
MORTEN GYLLING1
1Institute of Food and Resource Economics, University of Copenhagen, Rolighedsvej 25, 1958 Frederiksberg C, Denmark, and2Food Industry Agency, Nyropsgade 30, 1780 Copenhagen K, Denmark
AbstractThe objective of this paper is to investigate what factors have an impact on farmers’ attitude toward accepting geneticallymodified (GM) crops. For this purpose, a farm survey was conducted and data were subjected to a multinomial logitregression analysis. The main results indicate that approximately 45%, 28%, and 27% of the farmers are positive, negative,and neutral, respectively, toward GM technology. Farm income is the main driver for adoption of the technology. More than25% of neutral as well as negative farmers will adopt GM crops if farm income improves. Farmers expect improved yieldsand reduction in the use of herbicides, insecticides, fungicides, and growth regulators. Neutral farmers are additionallyconcerned about the general risks and resistances that may be attributed to adopting GM crops. While positive farmers areadditionally concerned about environment, health hazards, and the limitations on biological diversity within the vicinity oftheir farms. A significant number of negative farmers would revise their choice if the chemical plant protection inputs arereduced. The age of the farmer has a less clear impact on the attitude toward GM technology.
Keywords: Pesticide-resistance, gene-technology, biological-diversity, farm income, survey.
1. Introduction
The first generations of genetically modified (GM)
crops (Killicoat, 2004) were designed to resist a
specific herbicide or specific insects and are as such
beneficial for farmers to reduce inputs to farm
management. On a global scale farmers have rapidly
adapted to the use of GM crops. In 2007, the total
area under tillage with GM crops increased by
12�114 million hectares (GMO Compass, 2008).
The first commercial GM crops were grown in
China in 1992 and large-scale adoption in the USA
began in 1996 (Enriquez, 2001). In 1995, there were
no commercial plantings of GM crops in the USA
(Hillyer, 1999). In a recent update on US agricul-
ture, the data were 87% for cotton, 73% for corn,
and 91% for soybean (USDA, 2007). Within USA,
the speed of GM adoption has been rather signifi-
cant. In 1999, Carpenter and Gianessi (1999) stated
that the adoption rate of Roundup resistant soybean
was limited only by the availability of seeds. Today
the world’s leading producers of GM crops are the
USA, Argentina, Brazil, Canada, India, and China.
Whereas the US farmers have been very keen to
adopt this new technology, adoption has been very
slow in Europe due to a strong polarization between
opponents and supporters of this new technology.
The public opposition has been so severe, that only
about 107,000 ha of arable land, primarily GM
maize grown in Spain, is currently cultivated in the
EU (GMO Compass, 2009).
So far, the debate and studies concerning the
perception of GM crops and GM food have mainly
been among consumers and public stakeholders.
A significant number of these studies have been
carried out to determine the consumers’ attitude
toward GM crops in Europe. They find that there is
a general concern among consumers with regard to
GM food. A significant number of studies in Europe
dealing with these issues are represented in Jonas
and Beckmann (1998), Bredahl (2001), and Saher
et al. (2006). Most of these studies conclude that the
Correspondence: L. G. Lawson, Institute of Food and Resource Economics, University of Copenhagen, Rolighedsvej 25, 1958 Frederiksberg C, Denmark.
E-mail: [email protected]
Food Economics � Acta Agricult Scand C, 2009; 6: 99�118
ISSN 1650-7541 print/ISSN 1651-288X online # 2009 Taylor & Francis
DOI: 10.1080/16507540903474699
Downloaded By: [Lawson, Lartey G.] At: 08:15 4 February 2010

majority of consumers have reservations about GM
food � and there appears to be a downward trend
over time (Frewer et al., 2004).
In accepting GM crops, focus has mainly been on
risks to health and the environment (Wagner et al.,
1997). The public concern, which goes much
deeper, involves perceived risks, benefits, and moral
concerns. Wagner et al. (1997) in the Eurobarometer
survey from 1996, indicated that in the first
place, usefulness is a precondition for support of
biotechnology; second, people seem prepared to
accept some risks as long as there is a perception
of usefulness and no moral concern; but third and
crucially, moral doubts act as a veto irrespective of
people’s views on use and risk.
Lassen and Jamison (2006) in a Danish study using
focus group interviews found that social, economic,
and cultural issues were relevant for public acceptance
of genetic technologies. Hence, focusing only on
economic costs and benefits of these technologies
and the short-term health and environmental risks is
considered insufficient to accept the technology.
In Denmark, the government initiated a strategy
work on co-existence between GM and Non-GM
crops back in 2002. Based on the recommendations
a co-existence act was passed through the Danish
Parliament (act. No. 436 of June 9, 2004). On the
one hand, it supports the opportunity to grow GM
crops and on the other hand it fulfills the demand for
a continued non-GM crop production. A number of
farmers have been educated to handle GM crops in
their crop rotation but so far no commercial scale
GM crop production has been initiated for the
growing season 2007, 2008, and 2009 in Denmark.
The farmers are largely not present in the debate
and yet their decisions about whether or not to
cultivate GM crops will be crucial for the future of
this technology in Europe (Hall, 2008). The aim of
this paper is to investigate what factors have an
impact on farmers’ decision to cultivate GM crops
and hence to understand farmers’ perception of the
new technology.
The rest of the paper is organized as follows:
Section 2 gives a short literature review of farmers’
attitude toward GM crops. Section 3 presents the
methodology and data collection, while Section 4
provides the results of this study. Discussion and
concluding remarks are presented in Sections 5 and
6, respectively.
2. Review on farmers’ attitude toward
genetically modified (GM) crops
What determines whether or not a farmer adopts a
new technology and what are the key drivers in
making farmers choose to grow a GM variety?
According to Hillyer (1999), this question can
mainly be related to two issues. Firstly, does it
work? Secondly, will it make money? (i.e. increase
net income) From a farmer’s perspective, technology
is successful only if it is profitable (Hillyer, 1999).
When GM crops were first marketed in the USA,
some surveys examined the motives for GM adop-
tion. In a 1997 survey conducted by the Agricul-
tural Resource Management Study, the majority
(54�76%) of farmers stated ‘‘increase yields through
improved pest control’’ as the main reason for
adopting GM crops. A second reason, ‘‘decreased
pesticide cost’’ was given by ‘‘19�42%,’’ and only
1.8�6.4% stated ‘‘increased planting flexibility’’
(e.g. ease crop rotation, reduced tillage systems, or
no-tillage systems) as their main reason for favoring
a GM crop, and 0�2% stated that they adopted the
technology for environmental reasons (Fernandez-
Cornejo & McBride, 2000).
In a 1998 Iowa crop survey, interviews were
conducted with 800 farmers. To the question, why
the farmers planted GM soybean; 53% stated
increased yields through improved pest control,
27% stated decreasing pesticide cost, 12% stated
increased flexibility in planting, and 3% listed a more
environmentally friendly practice (Duffy, 1999). For
the Bt corn, an overwhelmingly majority of the
farmers stated increased yields as the reason for
planting. Only 7% stated decreasing cost to pesticides
(Duffy, 1999).
In USDA’s Agricultural and Resource Manage-
ment Surveys (ARMS) conducted from 2001 to
2003, the majority of farmers adopting GM crops
did so because of expected profitability increases
through higher yields and/or lower costs, e.g. from
operator labor and pesticides use (Fernandez-
Cornejo & Caswell, 2006).
Kondoh and Jussaume (2006) investigated how
farmers’ expressed willingness to use a controversial
technology on their farms can be influenced by
a mixture of their personal characteristics, social
networks, and political�economic structures. Their
results show that farmers’ production practices and
market strategies may be at least as important as
their socio-economic characteristics in explaining
their potential attitude toward using GM technology.
They found that farmers’ interest in trying GM
crops are a result of complex thought processes
wherein they weigh their personal assessments of the
technology against the assessment of other actors in
their networks. Farmers with a formal academic
training and who are innovators in terms of direct
marketing or organic production are less enamored
with the idea of using GM technology than other
highly educated farmers. This suggests that farmers
may build their attitudes toward technologies and
100 L. G. Lawson et al.
Downloaded By: [Lawson, Lartey G.] At: 08:15 4 February 2010

farm management practices as a result of shared
experiences through the interactions with other
social actors.
Studies of GM farmers’ attitude toward GM crops
are less abundant in the EU than in the USA.
Breustedt et al. (2008) analyzed German farmers’
willingness to adopt GM oilseed rape prior to its
commercial release by using choice experiments.
Breustedt et al. (2008) found that farmers’ GM
adoption decisions are driven by profit expectations,
neighbors, and the public’s opinion along with
personal as well as farm characteristics. Monetary
determinants, such as lower gross margin for farms
using GM seeds, expected liability costs from cross
pollination, and restricted flexibility in returning to
conventional rape seed growing, all reduced the
propensity to grow the GM variety. They also find
that the seed price has a large influence on farmers’
demand for the new technology, and that a farmer’s
attitude toward growing GM is reduced if their
neighbors are negative toward the technology. They
further conclude that female farmers, older farmers,
farmers with children aged 16 years and below, as
well as farmers living close to a city are significantly
less likely to adopt the GM crops. Larger farm size
and a college degree or university degree is found to
have the opposite effect, with farmers being more
positive toward the GM variety.
The Swedish farmers’ attitude toward GM insect
resistant crops was investigated by Lehrman and
Johnson (2008). The reports showed that the
majority of the farmers were negative (56.7%),
although almost one-third claimed to be neutral to
GM crops. Benefits from GM crops were recognized
in terms of agricultural production and for the
environment, but farmers were highly concerned
about the consumers’ willingness to buy GM pro-
ducts. Dividing the farmers into positive, negative,
and neutral groups revealed differences in their
wishes and concerns. Farmers negative to GM crops
were more concerned than positive farmers about
the crops being dangerous for humans and livestock
consumption and mainly perceived no benefits from
growing the GM crop. The positive farmers (12.7%)
were concerned about potential problems with
growing a marketable crop and expensive seeds,
but saw a potential benefit in the reduced health risk
to the grower due to less use of pesticides. The
neutral farmers (30.6%) were mostly related to the
positive farmers’ attitudes, implying that they recog-
nize the advantages of the GM crop, but also fear
potential drawbacks which may prevent them from
accepting the technology. The study also revealed
that farmers who had a degree in agronomy or
agriculture and rural management were significantly
more positive toward GM crops. These farmers also
owned larger farms, and there was also a significant
correlation between increasing farm size and a more
positive attitude.
In a questionnaire study by Gomez-Barbero and
Rodrıguez-Cerezo (2007) with a focus on GM Bt
maize among Spanish farmers, it was found the three
main reasons for adopting GM crops were ‘‘reduc-
tion of risk of losses due to Maize Borer,’’ ‘‘higher
yields,’’ and that the GM crops (seeds) ‘‘ensure better
quality of the harvest.’’ The Corn Borer that the Bt
maize is resistant to is particularly difficult to control
with chemicals because the insecticide is only effec-
tive in a very narrow time span between egg hatch
and larvae stage (Gomez-Barbero & Rodrıguez-
Cerezo, 2007). Hence, it is suggested that the main
reason for adopting GM crops is risk aversion as is
the case for Spanish farmers. Farmers see GM maize
as an insurance against loss from pests, and farmers
who face more severe pests are likely to adopt the
GM technology (Alexander, 2006).
To sum up, it appears that farmers are likely to
adopt new practices and technologies if they expect
to benefit from them in monetary terms. From the
surveys, as mentioned above, expected profitability
from improved yields, reduced use of pesticides, and
reduced risk have been the main motivators for the
initial adoption of GM technology. This appears to
be so for the US farmers, though under a different
agricultural policy context, as well as for the EU
farmers although the data material are limited for the
EU.
3. Methodology, data, and analyses
3.1. Economic framework
The discussion in the previous section suggests that
farmers’ willingness to adopt the GM technology is
derived from their considerations of farm income,
biodiversity, and risks, as well as their perceptions of
consumers attitudes toward GM crops (Lehrman &
Johnson, 2008). The model for farmers’ decision to
adopt GM technology is proposed to depend on the
weight given to the various considerations such that
a farmer may select among three mutually exclusive
alternatives, such as adoption (yes), unsure (neu-
tral), and non-adoption (no). Generally technology
adoption decisions are modeled as an outcome of a
utility maximization problem (Hill, 1983; Breustedt
et al., 2008), which is derived from constrained
maximization of the indirect profit function (Basant,
1997). This implies that the farmer compares the
maximum utility attainable given each alternative
decision and selects the one which yields the max-
imum utility. Let Uyes, Uneutral, and Uno denote the
ith farmer’s expected utility from adoption, unsure,
Farmers’ perceptions of genetically modified crops 101
Downloaded By: [Lawson, Lartey G.] At: 08:15 4 February 2010

and non-adoption. The technological choice deci-
sion Yi is given as:
Yi�Yes if Ui yes �U i neutral and Ui yes �Ui no
Neutral if Ui neutral �Ui yes and Ui neutral �Ui no
No if Ui no �Ui yes and Ui no �Ui neutral
8<:
9=;:
(1)
The maximum utility, Uij of the farmer i, from his or
her choice decision j for yes, neutral, or no, can be
decomposed into non-stochastic (S) and stochastic
(o) parts such that these represent the function of
observable and unobservable variables, respectively,
hence,
Uij �Sij �oij : (2)
Modeling a choice decision following the discussion
in Maddala (1983), a multinomial logit specification
for the non-stochastic part Sij may be approximated
in linear form such that the econometric estimation
of the model is effected by taking the natural log
odds of the ratio of two probabilities. Given that
probability is the chance for an event to occur, the
odds is the ratio of two probabilities and the odds
ratio is the ratio of two odds when comparing two
groups, which measures the impact of a predictor
variable. Hence, with pno as the base, the two natural
log odds ratios estimated simultaneously are given
by:
ln
�pyes
pno
��b0 yes�b1yesxi1� � � ��bk yesxik; (3)
ln
�pneutral
pno
�
�b0 neutral�b1 neutralxi1� � � ��bk neutralxik: (4)
The bs are the estimated coefficients and reflect the
effects of the independent variables xk on the logit,
which expresses the likelihood of farmers responding
yes or being neutral, relative to the base response no.
The resulting three probabilities are estimated as:
Prob(Yi � j)
�exp(b
0
jXik)
exp(b0
yesXik) � exp(b0
neutralXik) � exp(b0
noXik);
j�yes; neutral; or no; (5)
where bj is a vector of parameters estimated from
Equations (3) and (4) for the vector of independent
variables Xk describing the choice probabilities.
Since the probabilities sum to one, the normal-
ization rule suggests that one of the parameter
vectors, say bno equals to zero. Following Green
(2002), the probabilities for the three alternative
choices become:
Pj �Prob(Yi � j)
�exp(b
0
jXik)
1 � [exp(b0
yesXik) � exp(b0
neutralXik)];
j�yes or neutral; (6)
Pno�Prob(Yi�no)
�1
1 � [exp(b0
yesXik) � exp(b0
neutralXik)]: (7)
The magnitude of the relative effects can be eval-
uated by the odds ratios (relative risk), which for a
unit change is exp(bjk). Following Green (2002), the
marginal effects di on the probabilities of choice with
respect to the Xkth vector of independent variables
can be estimated as:
dj �@Pj
@Xk
�Pj
bjk�
XJ
k�0
Pkb jk
�;
where j�yes; neutral; or no: (8)
Note that the sum of the product term, Pkbk
in Equation (8) is given by (Pyes�byes)�(Pneutral�bneutral)�(Pno�bno). However, due to the normal-
ization, which requires the sum of the probabilities
to be zero (Pno�bno) is set to zero, and dno is derived
as the negative of the sum of dyes and dneutral, i.e. �(dyes�dneutral). The sign or the magnitude of the
marginal effects need not bear any relationship to the
sign of the coefficients (Green, 2002).
3.2. Survey
A questionnaire survey was designed and forwarded
to 400 Danish farmers (respondents) by mail. The
selection of respondents was taken from an existing
farm database administrated by the Danish Institute
of Agricultural Sciences (DIAS, Aarhus University).
The sample collection was random but stratified on
farms with more than 100 ha and less than 100 ha
and represented both part-time and full-time farm-
ers to ensure the criteria for selection with equal
representation.
Mainly closed questions were used in the ques-
tionnaire to ensure that farmers’ answers were as clear
as possible and hence capture the knowledge of what
influences their perceptions of cultivating GM crops.
In the survey, farmers were asked to answer a number
of questions concerning expected costs and benefits
of GM crops, environmental considerations, and
their personal expectations about growing GM crops.
To determine the characteristics and the percep-
tions that influence the decision to cultivate GM
crops in the future (response variable), farmers were
requested to express their views on 30-item ques-
tions or statements, expressing expectations and
concerns about GM crops and provide information
102 L. G. Lawson et al.
Downloaded By: [Lawson, Lartey G.] At: 08:15 4 February 2010

on farm characteristics. The farm characteristics
include questions about their age group, farm type,
and farm size defined by the area of hectares
cultivated. Farmers were also asked to state whether
or not they expect an improvement in future profit,
defined by change in gross margins by a certain
amount. The expected change in gross margin, was
chosen to reflect a measure of farm size in terms of
the economy of size which might be a predictor for
adopting a new technology (Kondoh & Jussaume,
2006).
The 30-item questions are generally related to
farmers’ perceptions and pertain to:
(1) Whether they expected changes in the use of
various inputs (i.e. whether or not the use of
insecticides, herbicides, fungicides, growth
regulators, seeds, and fertilizer will be re-
duced) as well as risks and other matters that
potentially discourage them from cultivating
GM crops. These are referred to as the 12
items in the texts and reflect farmers’ own
direct expectations.
(2) Their general expectations concern environ-
mental and health hazards (i.e. risks to envir-
onmental and human health) and the
economic benefits of cultivating GM crops.
These are referred to as the 18 items (general
expectations) in the texts.
The 12-item questions pertaining to plant protection
and seed inputs as well as the risks and other issues
leading to the discouragement from adopting GM
are coded as dummy variables (zeros and ones). The
18-item question statements, which reflect farmers’
general expectations to the environment, resistance,
and risks associated with GM crops as well as
economic benefits, are scored using Likert scales
coded 1�5 for responses corresponding to ‘‘strongly
disagree,’’ ‘‘disagree,’’ ‘‘either or,’’ ‘‘agree,’’ or
‘‘strongly agree,’’ respectively. No replies contribute
zero to the responses.
Generally, these questions were formulated to
reflect income benefits and risk issues of relevance
for the discussion as to cultivating GM crops in
Denmark as well as suggested by the literature
(Duffy, 1999; Hillyer, 1999; Kondoh & Jussaume,
2006; Breustedt et al., 2008; Lehrman & Johnson,
2008).
3.3. Data
Out of the 400 questionnaires that were mailed to
farmers, 175 respondents returned a completed
questionnaire (44%). Among these respondents,
50% were above 50 years of age. The main farming
practices were well represented among the respon-
dents such that 31% had only crops, 63% had either
pigs or milk production along with crop production,
and only 6% did not grow crops on their farms. The
most frequent crops in rotation were wheat, rape-
seed, and barley. Seventy-eight farmers (45%) felt
that they would like to grow GM crops and 49
farmers (28%) stated that they would not. The
remaining group of 48 farmers (27%) was not clear
on the issue (neutral).
The questions and the distribution of respondents
by farm characteristics, as well as by the replies to
the 12-item and 18-item statements, are given in
Tables I and II.
3.4. Statistical analysis
To investigate the factors that have an impact on the
willingness or not to adopt GM crops in the future, a
four-step procedure was used. Firstly, a chi-square
test of independence between response variable and
the independent variables, as well as between in-
dependent variables were conducted to generate
information on the level of dependence and the
association between variables. Secondly, the 30-
item, i.e. the 12-item dummy variables, plus the
18-item Likert scale statements, were subjected to a
joint principal component analysis (PCA) using ones
as prior communality estimates (Hatcher, 1994).
The principal axis method was used to extract the
components and was followed by a varimax (ortho-
gonal) rotation. The first eight components (factors)
for the PCA analysis were retained for rotation.
Items with factor loadings of 0.60 or greater are
those of main relevance for a particular factor
component. Hence, information from the original
30-item responses was reduced to eight uncorrelated
variables. Thirdly, the weighted factor scores were
calculated.
Finally, farm characteristics as well as the eight
weighted factor scores were subjected to a multi-
nomial logit regression analysis to identify the
variables that significantly impact on the willingness
or not to adopt GM crops in the future. Following
the economic framework in Section 3.1, the multi-
nomial logit regression model (Green, 2002) was
specified as:
Logit(pj ½no)� log
�pj
pno
�
�a0�a1jkage�a2jlfarm type
�a3jmhasize�a4jnprofit
�bqj f scores�oj : (9)
From the model specification in Equation (9), pj are
the probabilities of responding ‘‘yes’’ or ‘‘neutral’’ to
Farmers’ perceptions of genetically modified crops 103
Downloaded By: [Lawson, Lartey G.] At: 08:15 4 February 2010

Table I. Frequency count and percent distribution of farm characteristics and 12-item responses.
Respondents Attitude
Characteristics and statements Count Count (%) Yes (%) Neutral (%) No (%)
Farm types
Only crops 54 31 37 28 35
Pig and crop production 60 34 50 30 20
Cattle and crop production 50 29 40 30 30
Other type 11 6 73 0 27
Farmer age group, years
20�40 39 22 54 31 15
�40�50 45 26 58 11 31
�50�60 47 27 36 36 28
�60 44 25 32 32 36
Farm size (ha)
580 74 42 24 31 45
�80�120 26 15 35 38 27
�120 75 43 68 20 12
Expected increase in gross margin (EUR/ha)
0 94 54 24 29 47
�0�27 18 10 50 44 6
�27�81 63 36 73 21 6
Statement: what would make you not grow GM crops (six of the 12-item statements)?
Risk of gene dispersal to other fields
No 53 30 53 25 23
Yes 122 70 41 29 30
Health hazards
No 53 30 42 25 34
Yes 122 70 46 29 25
Risk of deteriorated biological diversity
No 84 48 50 25 25
Yes 91 52 40 30 31
Relations to neighboring farms
No 115 66 48 25 27
Yes 60 34 38 32 30
High cost of seeds
No 136 78 41 27 32
Yes 39 22 56 28 15
Low selling price of crops
No 116 66 36 24 40
Yes 59 34 61 34 5
Statements: about the decrease in inputs if GM crops are cultivated (six of the 12-item statements)
Use of fungicides
No 70 40 24 27 49
Yes 105 60 58 28 14
Use of herbicides
No 60 34 18 28 53
Yes 115 66 58 27 15
Use of insecticides
No 62 35 21 29 50
Yes 113 65 58 27 16
Use of growth regulators
No 89 51 33 28 39
Yes 86 49 57 27 16
Use of fertilizer
No 152 87 42 28 30
Yes 23 13 61 22 17
Use of seeds
No 156 89 44 28 28
Yes 19 11 53 21 26
104 L. G. Lawson et al.
Downloaded By: [Lawson, Lartey G.] At: 08:15 4 February 2010

Table II. Frequency count percent distribution of 18-item statements and percent attitude toward GM.
Respondents Attitude
Statements/responses Count Count (%) Yes (%) Neutral (%) No (%)
It is important that GM crops improves the gross margin
No answer 17 10 0 35 65
Strongly disagree 7 4 14 14 71
Disagree 5 3 20 0 80
Either or 25 14 16 20 64
Agree 52 30 48 38 13
Strongly agree 69 39 68 23 9
It is important that GM crops improves the yield
No answer 17 10 6 29 65
Strongly disagree 8 5 13 13 75
Disagree 5 3 20 0 80
Either or 29 17 24 28 48
Agree 69 39 51 35 14
Strongly agree 47 27 70 21 9
It is important that quality of the crops is improved
No answer 18 10 0 33 67
Strongly disagree 2 1 0 0 100
Disagree 7 4 43 0 57
Either or 22 13 41 27 32
Agree 69 39 46 32 22
Strongly agree 57 33 60 25 16
It is important that the risk of gene dispersal from GM crops to neighboring fields is minimal
No answer 15 9 0 27 73
Strongly disagree 1 1 0 0 100
Disagree 2 1 50 0 50
Either or 11 6 73 27 0
Agree 43 25 63 23 14
Strongly agree 103 59 41 30 29
It is important to distinctly label GM products
No answer 19 11 5 32 63
Strongly disagree 1 1 100 0 0
Disagree 12 7 100 0 0
Either or 33 19 61 33 6
Agree 46 26 50 35 15
Strongly agree 64 37 33 23 44
It is important that there is no health risk associated with the GM crops
No answer 13 7 0 31 69
Strongly disagree 0 0 0 0 0
Disagree 0 0 10 6 0
Either or 3 2 33 33 33
Agree 47 27 55 30 15
Strongly agree 112 64 46 26 29
It is important that GM crops do not have an effect on the surrounding environment
No answer 12 7 0 25 75
Strongly disagree 0 0 0 0 0
Disagree 1 1 100 0 0
Either or 7 4 71 14 14
Agree 47 27 57 30 13
Strongly agree 108 62 42 28 31
It is important that GM crops are resistant to insects
No answer 13 7 8 23 69
Strongly disagree 2 1 0 0 100
Disagree 4 2 50 25 25
Either or 35 20 40 31 29
Agree 68 39 50 29 21
Strongly agree 53 30 51 25 25
It is important that GM crops are resistant to fungi
No answer 13 7 8 23 69
Strongly disagree 2 1 0 0 100
Disagree 4 2 50 0 50
Either or 19 11 16 47 37
Farmers’ perceptions of genetically modified crops 105
Downloaded By: [Lawson, Lartey G.] At: 08:15 4 February 2010

Table II. (Continued).
Respondents Attitude
Statements/responses Count Count (%) Yes (%) Neutral (%) No (%)
Agree 75 43 51 27 23
Strongly agree 62 35 55 26 19
It is important the GM crops are Roundup resistant
No answer 15 9 0 33 67
Strongly disagree 9 5 0 22 78
Disagree 17 10 47 24 29
Either or 49 28 39 35 27
Agree 49 28 53 29 18
Strongly agree 36 21 69 17 14
It is important to maintain/improve the biological diversity
No answer 15 9 0 27 73
Strongly disagree 1 1 0 0 100
Disagree 2 1 50 0 50
Either or 29 17 55 28 17
Agree 65 37 54 31 15
Strongly agree 63 36 41 25 33
GM crops will be useful in the future
No answer 14 8 0 36 64
Strongly disagree 10 6 0 0 100
Disagree 7 4 0 14 86
Either or 47 27 28 40 32
Agree 55 31 64 24 13
Strongly agree 42 24 71 24 5
The GM technology is itself exciting
No answer 14 8 7 21 71
Strongly disagree 12 7 0 25 75
Disagree 9 5 11 0 89
Either or 33 19 39 27 33
Agree 74 42 54 32 14
Strongly agree 33 19 70 27 3
GM technology holds the potential for an improved gross margin
No answer 14 8 7 29 64
Strongly disagree 7 4 0 0 100
Disagree 8 5 25 13 63
Either or 50 29 28 34 38
Agree 62 35 58 31 11
Strongly agree 34 19 74 21 6
GM crops give potential of simpler farm management
No answer 14 8 0 29 71
Strongly disagree 7 4 0 0 100
Disagree 10 6 50 0 50
Either or 59 34 39 36 25
Agree 60 34 53 32 15
Strongly agree 25 14 72 16 12
The environment will benefit from the GM crops
No answer 16 9 13 25 63
Strongly disagree 14 8 0 14 86
Disagree 19 11 21 11 68
Either or 55 31 40 40 20
Agree 44 25 66 30 5
Strongly agree 27 15 78 19 4
The selling price of the GM crop will increase
No answer 14 8 0 29 71
Strongly disagree 14 8 7 29 64
Disagree 35 20 57 14 29
Either or 90 51 50 32 18
Agree 18 10 56 28 17
Strongly agree 4 2 50 25 25
106 L. G. Lawson et al.
Downloaded By: [Lawson, Lartey G.] At: 08:15 4 February 2010

cultivating GM crops against ‘‘no’’ for not cultivat-
ing GM crops. The ajs, and the bjs are the parameters
to be estimated simultaneously for the two (yes and
neutral) regression equations represented by Equa-
tion (9) and oj are the corresponding residual terms.
The variable age classified into 4 k levels in the
questionnaire are divided into groups of 20�40, 40�50, 50�60, and �60 years. The variable age repre-
sents the joint effect of the levels of farming education
and experience. It is expected that young farmers with
modern formal education in farming might be
inclined to respond yes to adopt the cultivation of
GM crops. However, being less experienced they may
be inclined to wait by responding neutral to the
cultivation of GM crops. At the other end of the age
scale, farmers with substantial farming experience
might be inclined to respond no or neutral if the
benefits associated with GM crops are less than the
perceived risks that might be incurred by themselves
or society. The farmers in the middle of the age
groups might respond positive to the cultivation of
GM crops given the combined effect of their level of
education and moderate experience.
Farm type is categorized into four (l) levels; only
crops, pig and crops, cattle and crops, as well as
‘‘other type’’ (pig, cattle, crops, and other) farms.
The variable is of interest because some poultry
farmers are, for example, paid a premium for not
using GM feedstuff by their slaughterhouse. Addi-
tionally, crops meant for human consumption, e.g.
for bred-making are expected to be labeled (EU,
2003). Hence, crop farmers might not be willing to
adopt GM crop cultivation if their market situation
is threatened.
Farm size, ‘‘hasize,’’ which is measured as total
hectare of farm area has three (m) levels divided into
groups of less than 80, 80�120, and larger than 120
ha. Although the sample selection was stratified by
less and more than 100 ha farm area, the question was
constructed with three levels to account for a better
variation in the variable. It is expected that the
benefits from the reduction in the use of plant
protection inputs herbicide, insecticides, fungicides,
and growth regulators will accrue to owners of large
farms. Therefore, these farmers will be more inclined
to adopt GM crops than those with small farms.
The expected amount by which the gross margin,
i.e. the short-term profit (sales�variable costs), is
expected to increase per ha, has three (n) levels: 0, 0�27, and 27�81 EUR. The expected change repre-
sents the improvement in the economy of size. But it
also corresponds to a monetary threshold at which
farmers will be willing to adopt GM crops. A higher
profit level is expected to be a strong motivation for
adopting GM crops.
The ‘‘fscores’’ represent the eight q, weighted
factor scores estimated from the PCA analysis for
the responses of the 30-item statements. The eight
weighted factor scores, of which two cover the
18-item Likert responses, represent issues related
to and are referred to in short as ‘‘improved farm
income’’ (F1) as well as ‘‘risk and resistance’’ (F2).
The next six weighted factor scores covering the
12-item dummy responses are ‘‘reduced chemical
plant protection inputs’’ (F3), ‘‘high seed cost and
low crop price’’ (F4), ‘‘deteriorating biodiversity’’
(F5), ‘‘health hazard’’ (F6), ‘‘reduced demand for
fertilizer’’ (F7), and ‘‘reduced demand for seed’’
(F8).
4. Results
4.1. Descriptive analyses
4.1.1. Chi-square tests. Table III shows the pairwise
chi-square tests of independence. The tests of
independence between GM cultivation in the future
and each of the independent variables suggest that
the cultivation of GM crop depends on all farm
characteristics except for farm type (Row 1 under
column titles). However, because farm type is
correlated with farm size and chemical plant protec-
tion inputs, the variable is dropped from the
statistical analysis.
Table III further shows that among the 12-item
variables, future adoption of GM crops depends on
Table II. (Continued).
Respondents Attitude
Statements/responses Count Count (%) Yes (%) Neutral (%) No (%)
GM crops will reduce the use of input factors
No answer 17 10 12 24 65
Strongly disagree 4 2 0 0 100
Disagree 6 3 50 0 50
Either or 75 43 43 29 28
Agree 54 31 52 31 17
Strongly agree 19 11 68 26 5
Note: The 18-item statements are related to general environmental consequences, health risks, and economic benefits.
Farmers’ perceptions of genetically modified crops 107
Downloaded By: [Lawson, Lartey G.] At: 08:15 4 February 2010

Table III. Chi-square test results of association between the dependent and independent variables as well as between independent variables.
Farm characteristics and plant protection inputs Refrain from GM cultivation due to:
/
Farm
ers
age
/
Typ
eof
farm
/
Farm
size
(ha)
/
Gro
ssm
arg
in
/
Fer
tilize
r
/
Her
bic
ide
/
Inse
ctic
ide
/
Fu
ngic
ide
/
See
ds
/
Gro
wth
regu
lato
rs
/
Ris
kof
gen
ed
isper
sals
/
Hea
lth
haza
rds
/
Ris
kof
det
erio
rate
dbio
logic
al
div
ersi
ty /
Rel
ati
on
sto
nei
ghbori
ng
farm
s
/
Hig
her
pri
ceon
seed
s
/
The
sellin
gpri
ceof
the
crops
/
Farm
chara
cter
isti
csan
dpla
nt
pro
tect
ion
inpu
ts
Cultivate GM a x ns xxx xxx ns xxx xxx xxx ns xxx ns ns ns ns ns xxx
Farmers age � xxx ns ns x x xx ns xx xxx xxx � � ns xx
Type of farm xx ns ns � x x x ns ns ns ns ns ns ns
Farm size (ha) � ns xx xxx xxx ns xx ns ns ns ns ns ns
Gross margin ns xxx xxx xxx ns xx ns � ns ns ns ns
Fertilizer xxx xxx xx xx xxx ns ns � ns x x
Herbicide xxx xxx � xxx x xx � ns ns x
Insecticide xxx � xxx xx xx � ns ns xx
Fungicide � xxx � xx x ns ns xxx
Seeds � x ns ns ns x ns
Growth regulators xxx x ns ns ns xx
/
Ref
rain
from
GM
cult
ivati
on
du
eto
:
Risk of gene dispersals xxx xxx xxx x ns
Health hazards xx x ns �Risk of deteriorated
biological diversity
xx ns ns
Relations to neighboring farms xx ns
Higher price on seeds xxx
The selling price of the crops
aIs the dependent variable;��pB0.10; x�pB0.05; xx�pB0.01; xxx�pB0.001; ns�non-significant.
108
L.
G.
Law
sonet
al.
Downloaded By: [Lawson, Lartey G.] At: 08:15 4 February 2010

perceptions pertaining to the use of chemical plant
protection inputs of herbicides, insecticides, fungi-
cides, and growth regulators, as well as on ‘‘high seed
cost’’ and ‘‘low crop price.’’ Furthermore, among
the 12-item variables there is a strong pairwise
association between variables (see the diagonals).
This, in summary, calls for a PCA (factor analysis) to
reduce the number of variables to be included in the
multinomial logit model.
4.1.2. Factor analysis. The eight-factor components
identified and retained from the PCA for the 30-item
variables are presented with their respective loadings
in Table IV.
For farmers’ opinion about the 30-item variables,
the eight factor components account for 76% of the
total variation with an alpha coefficient of 0.95 for
the internal consistency reliability index. The index
measures how the individual items correlated with
one another. A value close to one is most preferred
and above 0.70 is conventionally accepted (Hatcher,
1994). The measure suggests that the extracted
factors, and hence their weighted factor scores,
reasonably account for the variations in the data
and are useful for inclusion as independent variables
in the multinomial logit model.
4.2. Statistical results
4.2.1. Multinomial logit model. The multinomial logit
estimation based on Equations (3) and (4), and made
operational in Equation (9) examines the simulta-
neous impact of the independent variables on the
future adoption decision on cultivating GM crops.
The model is estimated using the statistical software
SAS (2008); and the LIMDEP logit software (Green,
2002) is used to estimate the marginal changes using
Equation (8). The fitted model was evaluated by the
Log likelihood ratio. The test where all independent
variables are simultaneously zero was rejected (x2�171; df�30; pB0.0001). The analysis of the effects
suggests that all independent variables except for the
age of farmers, farm size, and the use of fertilizer
impact significantly on the adoption decision (at
pB0.10 or pB0.05).
Table IV. Summary results of the 30-items principal components analysis.
Eigenvalue/variance (%) Factor name Set of items with ordered factor loadings of 0.60 or greater Loadings
18-items group
F1:6.7/30 Improved farm income (F1) GM technology holds the potential for an improved gross margin 0.84
GM crops will benefit the environment 0.78
GM crops will be useful in the future 0.77
GM crops provide potentials for simpler farm management 0.74
GM technology is itself exciting 0.71
GM crops will benefit from increase sales price 0.69
Important that GM crops improves the gross margin 0.65
Important that GM crops improves the yield 0.65
GM crops will reduce the use of input factors 0.64
F2:5.8/25 Risk and resistance (F2) It is important that GM crops do not have an effect on the
environment
0.83
It is important that there is no health risk associated with the
GM crops
0.81
It is important that GM crops are resistant to insects 0.74
It is important that GM crops are resistant to fungi 0.74
It is important to minimize the risk of gene dispersal of GM
crops to other fields
0.73
It is important to distinctly label GM products 0.73
It is important to maintain/improve the biological diversity 0.63
12-items group
F3:3.6/16 Reduced chemical plant
protection inputs (F3)
Decreased demand for insecticides 0.91
Decreased demand for fungicides 0.87
Decreased demand for herbicides 0.83
Decreased demand for growth regulator 0.63
F4:1.6/7.0 High seed cost and low crop
price (F4)
High cost for GM-seed 0.83
Low price for GM-crop 0.71
F5:1.5/6.5 Deteriorating biodiversity (F5) Biodiversity risk 0.82
F6:1.1/5.2 Health hazards (F6) Health risk 0.78
F7:1.1/5.2 Reduced demand for
fertilizer (F7)
Less demand for fertilizer 0.81
F8:1.1/5.1 Reduced demand for seed (F8) Less demand for seed 0.90
Farmers’ perceptions of genetically modified crops 109
Downloaded By: [Lawson, Lartey G.] At: 08:15 4 February 2010

The goodness-of-fit-test was also conducted to
evaluate the model’s ability to predict farmers’
response to the future cultivation of GM crops, i.e.
the classification accuracy rate. The calculated
accuracy rate of 71% suggests that the responses to
the decision to cultivate GM crops in the future were
highly predicted. The comparable accuracy rate is
44.1%. The 44.1% is referred to as the proportional
by chance accuracy criteria. The proportional by
chance accuracy rate is calculated as the sum of the
square of the proportions in each GM response
group multiplied by 1.25 (i.e. (0.44572�0.28002�0.27432)�1.25), where 0.4457, 0.2800, and 0.2743
are the proportions of the respondents replying
‘‘yes,’’ ‘‘no,’’ or ‘‘neutral’’ to the cultivation of GM
crops. Operationally, this suggests that the classifica-
tion accuracy rate should be at least 25% (i.e. 1.25)
higher than the proportional by chance accuracy rate
(Schwab, 2003). The two tests described confirm
the reasonability of the estimated model.
Table V shows the estimated coefficients and the
corresponding t-statistic as well as the odds ratios of
the two regression equations for the likelihood of
farmers responding yes or being neutral relative to
responding no to the cultivation of GM crops.
Hence, the no response to the cultivation of GM
crops is the base to which the yes and the neutral
responses are compared. However, Table VI presents
the marginal effects of the independent variables on
the probability of responding yes, neutral, or no to
the cultivation of GM crops.
4.2.2. Farm characteristics and stated preferences. Table
V shows that farmers responding ‘‘yes’’ relative to
‘‘no’’ respondents and anticipating an increased
short-term profit (gross margin) of above 27 EUR
per hectare have a higher preference for adopting
GM technology. Their odds ratio of 15.6 suggests a
15.6 times increased likelihood of adopting GM
crops in the future compared to farmers stating that
there will be no change in profit.
4.2.3. Improved farm income. From the survey, the
potential increase in farm income for growing GM
crop is a major argument for accepting the technol-
ogy when farmers respond positive compared to
negative respondents. The same is the case for
farmers responding neutral to cultivation of GM
crops compared to negative respondents. As shown
in Table V, those GM positive and neutral farmers
are expressing their expectations for improved farm
income (F1) by affirming to: ‘‘GM technology holds
the potential for an improved gross margin,’’ ‘‘GM
crops will improve the environment,’’ ‘‘GM crops
will be useful in the future,’’ ‘‘GM crops provide the
potentials for simpler farm management,’’ ‘‘the GM
technology is itself exciting,’’ ‘‘it will increase product
sales price,’’ ‘‘it is important that GM crops improve
the yield,’’ ‘‘it is important that GM crops improve
the gross margin,’’ and ‘‘it will lead to reduction in
the use of input factors, i.e. herbicides, insecticides,
fungicides, and growth regulators.’’ Hence, these
farmers have 22.9 and 3.9 times higher likelihood
to adopt or remain neutral to GM crops compared to
farmers who declined to adopt GM crops in the
future. Examples of the expectations for improved
farm income are also illustrated in Figure 1.
In Figure 1, the upper half, farmers who are positive
toward the cultivation of GM crops suggested that
improvement in yield and gross margin, respectively,
are important for adopting GM crops account for
87% and 92%, respectively. The similar distributions
for the 48 farmers responding neutral to the cultiva-
tion of GM crops are 71% and 75%, respectively.
Even among the 49 farmers responding negative to
adoption, more than 25% agreed that it is important
with an improvement in yield and gross margin as a
source of motivation for adopting GM crops.
From the survey data, yes and neutral respondents
agreed that the cultivation of GM crops holds
potential for improvement in profits and simpler
farm management. The distribution of responses
suggested that 78% and 64% of ‘‘yes,’’ and 54% and
48% of ‘‘neutral’’ farmers pointed to the importance
of profits and simpler farm management, respec-
tively. The corresponding percentages for farmers
responding ‘‘no’’ are 18 and 24%. However, as
shown in Figure 1 (lower half), the responses are
less optimistic for price increases for GM crops.
Figure 1 (lower half, first bars) shows that only 15%
of the ‘‘yes’’ farmers responded affirmatively to the
increase in sales price of GM crops, but 53% of these
farmers responded affirmatively to the reduction in
the use of inputs. Similar percentages for ‘‘neutral’’
farmers are 13% and 46%, respectively. Hence, it is
suggested that the improvement in profit should
originate from the reduction in the use of inputs.
4.2.4. GM crop risk and resistance. Table V shows that
the likelihood of farmers cultivating GM crops does
not depend on the risk and resistance perceptions
(i.e. F2) when positive as well as neutral farmers
are compared to farmers responding negative to
the cultivation of GM crops. This suggests that the
relative distribution of farmers replying to the
statements comprising F2 in Table IV ‘‘It is im-
portant that the risk of gene dispersal from GM
crops to neighboring fields is minimal,’’ ‘‘It is
important to distinctly label GM products,’’ ‘‘It is
important that there is no health risk associated with
110 L. G. Lawson et al.
Downloaded By: [Lawson, Lartey G.] At: 08:15 4 February 2010

Table V. Results of the multinomial logit regression analysis with no respondents as base.
Estimates of yes relative to no Estimates of neutral relative to no
Independent variables df Estimate SE
Chi-
square P-wald OR LCI UCI Estimate SE
Chi-
square P-wald OR LCI UCI
Farmer age groups (years)
20�40 � � � � 1.00 � � � � � � 1.00 � ��40�50 1 1.3156 1.14 1.34 0.247 3.73 0.40 34.5 �0.2374 1.05 0.05 0.821 0.79 0.10 6.1
�50�60 1 0.4421 0.96 0.21 0.644 1.56 0.24 10.1 0.4551 0.85 0.29 0.591 1.58 0.30 8.3
�60 1 �1.1574 1.01 1.32 0.250 0.31 0.04 2.3 �0.1656 0.87 0.04 0.850 0.85 0.15 4.7
Farm size (ha)
580 � � � � 1.00 � � � � 1.00 � ��80�120 1 0.9475 1.00 0.90 0.342 2.58 0.37 18.2 0.0714 0.81 0.01 0.930 1.07 0.22 5.2
�120 1 1.7202 0.88 3.84 0.050 5.59 1.00 31.2 0.1339 0.76 0.03 0.860 1.14 0.26 5.1
Expected increase in gross margin (EUR/ha)
0 � � � � 1.00 � � � � 1.00 � ��0�27 1 1.0161 1.42 0.51 0.475 2.76 0.17 44.9 1.8611 1.33 1.96 0.162 6.43 0.47 87.3
�27�81 1 2.7507 0.91 9.21 0.002 15.65 2.65 92.5 1.1734 0.81 2.08 0.150 3.23 0.66 16.0
Factor from the 30-item statements
Of which from the 18-item Likert responses
Improved farm income
(F1)
1 3.1317 0.62 25.36 0.000 22.91 6.77 77.5 1.3614 0.37 13.27 0.000 3.90 1.88 8.1
Risk and resistance (F2) 1 0.3443 0.53 0.42 0.515 1.41 0.50 4.0 �0.4448 0.24 3.31 0.069 0.64 0.40 1.0
Of which from the 12-item dummy responses
Chemical plant protection
inputs (F3)
1 1.0487 0.39 7.09 0.008 2.85 1.32 6.2 0.5325 0.31 3.02 0.082 1.70 0.93 3.1
High seed cost and low
crop price (F4)
1 0.9972 0.40 6.11 0.013 2.71 1.23 6.0 0.8173 0.37 4.89 0.027 2.26 1.10 4.7
Deteriorating biodiversity
(F5)
1 �0.9952 0.39 6.40 0.011 0.37 0.17 0.8 �0.3478 0.33 1.10 0.294 0.71 0.37 1.4
Health hazard (F6) 1 �0.7539 0.35 4.60 0.032 0.47 0.24 0.9 �0.0537 0.27 0.04 0.840 0.95 0.56 1.6
Reduced demand for
fertilizer (F7)
1 0.5435 0.38 2.10 0.148 1.72 0.83 3.6 0.2818 0.34 0.70 0.404 1.33 0.68 2.6
Reduced demand for seed
(F8)
1 �0.8429 0.36 5.50 0.019 0.43 0.21 0.9 �0.6383 0.31 4.32 0.038 0.53 0.29 1.0
Constant 1 �1.3876 0.98 1.99 0.158 � � � 0.4776 0.82 0.34 0.558 � � �
Note: df, degrees of freedom; SE, standard error; OR, odds ratio; LCI, lower confidence interval; UCI, upper confidence interval.
Farm
ers’percep
tions
ofgen
etically
mod
ifiedcrop
s111
Downloaded By: [Lawson, Lartey G.] At: 08:15 4 February 2010

Table VI. Multinomial logit marginal effect estimates of the attitude toward future cultivation of GM crops.
Partial derivative of probability of responding
Yes Neutral No
With respect to: Estimate SE T-stats p-Value Estimate SE T-stats p-Value Estimate SE T-stats p-Value Mean
Farmer age group (years)
20�40 � � � � � � � � � � � � ��40�50 0.3324 0.18 1.87 0.061 �0.2827 0.17 �1.62 0.105 �0.0497 0.13 �0.38 0.706 0.26
�50�60 0.0209 0.14 0.15 0.884 0.0387 0.14 0.27 0.787 �0.0595 0.11 �0.54 0.591 0.27
�60 �0.2288 0.15 �1.51 0.132 0.1551 0.15 1.02 0.307 0.0737 0.12 0.64 0.523 0.25
Farm size (ha)
580 � � � � � � � � � � � � ��80�120 0.1983 0.17 1.15 0.249 �0.1430 0.16 �0.87 0.383 �0.0552 0.11 �0.52 0.606 0.15
�120 0.3592 0.14 2.64 0.008 �0.2586 0.13 �1.92 0.055 �0.1006 0.10 �0.99 0.321 0.43
Expected increase in gross margin (EUR/ha)
0 � � � � � � � � � � � � ��0�27 �0.0904 0.16 �0.56 0.578 0.2926 0.17 1.70 0.089 �0.2022 0.17 �1.17 0.242 0.10
�27�81 0.4115 0.14 2.97 0.003 �0.1738 0.14 �1.23 0.219 �0.2377 0.10 �2.38 0.017 0.36
Factors from the 30-item statements
Of which from the 18-item Likert responses
Improved farm income (F1) 0.4641 0.09 5.19 0.000 �0.1915 0.09 �2.10 0.036 �0.2726 0.08 �3.38 0.001 0.00
Risk and resistance (F2) 0.1520 0.10 1.50 0.134 �0.1696 0.09 �1.98 0.048 0.0176 0.04 0.49 0.624 0.00
Of which from the 12-item dummy responses
Chemical plant protection inputs (F3) 0.1424 0.06 2.25 0.025 �0.0450 0.06 �0.74 0.457 �0.0974 0.04 �2.24 0.025 0.00
High seed cost and low crop price (F4) 0.0826 0.05 1.63 0.103 0.0349 0.05 0.65 0.517 �0.1175 0.05 �2.41 0.016 0.00
Deteriorating biodiversity (F5) �0.1619 0.06 �2.57 0.010 0.0821 0.06 1.35 0.177 0.0798 0.04 1.85 0.065 0.00
Health hazard (F6) �0.1583 0.06 �2.45 0.014 0.1146 0.06 1.87 0.062 0.0437 0.04 1.21 0.225 0.00
Reduced demand for fertilizer (F7) 0.0728 0.05 1.36 0.175 �0.0219 0.05 �0.40 0.687 �0.0510 0.04 �1.17 0.243 0.00
Reduced demand for seed (F8) �0.0788 0.06 �1.40 0.162 �0.0164 0.06 �0.29 0.772 0.0952 0.04 2.26 0.024 0.00
Constant �0.3892 0.15 �2.59 0.010 0.3549 0.15 2.30 0.021 0.0342 0.11 0.31 0.753 �
Note: df, degrees of freedom; SE, standard error; OR, odds ratio; LCI, lower confidence interval; UCI, upper confidence interval.
112
L.
G.
Law
sonet
al.
Downloaded By: [Lawson, Lartey G.] At: 08:15 4 February 2010

the GM,’’ ‘‘It is important that GM crops do not
have an effect on the surrounding environment,’’ ‘‘It
is important that GM crops are resistant to insects,’’
‘‘It is important that GM crops are resistant to
fungi,’’ and ‘‘It is important to maintain/improve the
biological diversity’’ turn out to be equal with regard
to the attitude toward the future cultivation of GM
crops. The survey data suggested that over 90%
of GM positive and neutral farmers, as well as 80%
of GM negative farmers, expressed the need that
no health risks as well as no environmental effects
should be associated with the cultivation of GM
crop. Similar percentages for insect and fungi
resistances are over 65% and 55%, respectively.
These characteristics are typical for first generation
GM crops and underline that the prime benefits
perceived by the farmers are reduced crop inputs.
A clearer picture of the impact of the replies to these
statements on the attitude toward future cultivation
of GM crops is provided in Table VI (see later).
4.2.5. Reduced demand for chemical plant protection
inputs. Farmers who respond affirmatively to culti-
vate GM crops and anticipate a reduction in the use
of insecticides, fungicides, herbicides, and growth
regulators (F3, four items of the 12-item dummy
responses) are 2.85 times more likely to adopt GM
crops compared to farmers responding no (see odds
ratio column, Table V). However, there is no
difference when farmers who responded neutral
are compared to the no respondents. It is noted
that most farmers tend to believe that the cultiva-
tion of GM crops will reduce the chemical plant
protection inputs although the number is fewer for
farmers responding negative to the cultivation of
GM crops.
4.2.6. High seed cost and low crop price. The weighted
factor scores representing the high cost of GM seed
and the low price for GM crops (i.e. F4, 2-items of
the 12-item dummy responses) increase with the logs
of the ratio of probabilities of both positive and
neutral to no respondents by 2.7 and 2.3, respec-
tively (odds ratio column, Table V). This suggests
that the impact of the factor is higher for affirmative
and neutral farmers compared to the no respon-
dents.
4.2.7. Risk of deteriorating biological diversity and
health hazards. As shown in Table V, if the risk of
deteriorating biological diversity (i.e. F5) increases
the odds for adopting GM crops will decrease by 63%
(1�0.37) for yes farmers compared to no respondents.
Similarly, a unit increase in the factor weighted scores
for health hazard (F6) decreases the odds for cultivat-
ing GM crops by 53% (1�0.47) for positive com-
pared to no respondent farmers. However, for the
two factors, there are no differences when farmers
It is important that GM improves the yield
0
20
40
60
80
100
Attitude towards GM
It is important that GM improves the gross margin
0
20
40
60
80
100
Attitude towards GM
The price of GM crops will increase
0
20
40
60
80
100
Attitude towards GM
Agree Either or Disagree No answer
GM crops will reduce input factors
0
20
40
60
80
100
Yes Neutral No Yes Neutral No
Yes Neutral No Yes Neutral No
Attitude towards GM
Agree Either or Disagree No answer
Figure 1. Attitude toward GM crops by 78, 49, and 48 farmers responding yes, no, or neutral, respectively.
Farmers’ perceptions of genetically modified crops 113
Downloaded By: [Lawson, Lartey G.] At: 08:15 4 February 2010

respond neutral compared to those farmers who
respond negative to future adoption of the GM crops.
4.2.8. Reduced demand for fertilizer and seed. Table V
shows that the weighted factor scores for the
anticipated reduction in the demand for fertilizer
(F7, 1-item of the 12-item dummy responses) do not
have a significant effect on the likelihood to cultivate
GM crops in the future. Hence, the survey data
showed 18, 10, and 8% of yes, neutral, and no
respondents suggesting that the use of fertilizer
will decrease. However, Table V shows that the
weighted factor scores for the anticipated reduction
in the demand for GM seed (F8) suggest that
the odds for cultivating GM crops decrease by
57% (1�0.43) when comparing positive to negative
respondent. For neutral respondents compared to
farmers responding no the decrease in odds for
cultivating GM crops is 47% (1�0.53).
4.3. Marginal effects
The relative interpretations of results, as above,
reflect the impact of changes in the independent
variables on the logit. Hence, the estimates do not
imply anything about the magnitude and direction of
effects on the attitude toward the cultivation of GM
crops caused by changes in the explanatory variables.
From Equation (8), the estimated marginal effects
for an apparent effect, i.e. the partial derivatives of
the probability of responding yes, neutral, or no with
respect to the independent variables estimated from
the average values, are reported in Table VI.
4.3.1. Farm characteristics and stated preferences. Table
VI shows that the age of the farmer does not have a
significant impact on the attitude toward the cultiva-
tion of GM crops (at 5% significance level). How-
ever, at a moderate level of significance (pB0.10),
the marginal effect of being a farmer within the ages
of 40�50 increases the probability of cultivating GM
crops in the future by approximately 33% compared
to those younger than 40 years. For similar groups of
farmers (40�50 years) the probabilities of responding
neutral or no decreases by 28% and 5%, respectively,
although these marginal effects are not significantly
different from zero.
The marginal effect of farm size suggests that
being a farmer with more than 120 ha of farmland
compared to having less than 80 ha of farmland
increases the probability of responding yes to culti-
vating GM crops significantly by 36% (pB0.01).
While the probability of responding neutral or no
decreases by 26% (pB0.10) and 10% (pB0.32),
respectively.
For the marginal effect of the stated expected
profit, being a farmer with anticipated increased
profit of more than 27 EUR per ha compared to
zero expected profit increases the probability of
responding yes to the cultivation of GM crops by
41% (pB0.01). While the probability of responding
no or neutral decreases by 24% (pB0.05) and 17%
(pB0.22), respectively.
4.3.2. Weighted factor scores. For the eight weighted
factor scores estimated from the 30-item statements,
marginal effects of the use of fertilizer on the attitude
toward the cultivation of GM crops are not signifi-
cantly different from zero (Table VI, F7).
Specifically, Table VI shows that a unit increase in
the weighted factor score for improved farm income
(F1) increases the probability of responding yes to
the cultivation of GM crops by 46% (pB0.0001).
While the probability of responding no or being
neutral decreases by 27% (pB0.001) and 19%
(pB0.05), respectively. This suggests that state-
ments reflecting improved farm income are strong
motivations for the choice farmers make relative to
adopting GM crops. For the marginal effects of the
statements reflecting increased risks and resistance
issues (F2), a unit increase in the weighted factor
score of these statements reduces the probability of
responding neutral to the cultivation of GM crops by
17% (pB0.05). The marginal effects of these state-
ments on responding yes or no are not significantly
different from zero.
For the marginal effects of farmers’ responses
reflecting anticipated reduction in the use of chemi-
cal plant protection inputs (F3), a unit increase in
their weighted factor score increases the probability
of responding yes by 14% (pB0.05) or decreases the
probability of responding no to cultivating GM crops
by 10% (pB0.05). Negative farmers indicating that
low crop price and high seed cost (F4) will make
them refrain from the cultivation of GM crops will
only do so 88% (100�12%) of the time (pB0.05).
This suggests that the factor is of less importance to
respondents replying ‘‘no’’ to the cultivation of GM
crops. The marginal effect of the risk of deteriorated
biological diversity for the yes group will decrease
the probability of adopting GM crops by 16%
(pB0.05). But the probability of non-adoption is
increased by 8% (pB0.10). Similarly, the marginal
effect of health hazard is to decrease the probability
of adopting the cultivation of GM crops by 16%
(pB0.05) and increase the probability of being
neutral to the cultivation of GM crops by 11%
(pB0.10). Furthermore, Table VI shows that the
marginal effect of an anticipated reduction in the use
of GM seeds is the increase in probability of
responding ‘‘no’’ to the cultivation GM crops by
114 L. G. Lawson et al.
Downloaded By: [Lawson, Lartey G.] At: 08:15 4 February 2010

10% (pB0.05). This is contrary to our expectation
and is discussed in the discussion.
5. Discussion
The purpose of this study was to investigate what
factors underline farmers’ attitude toward accepting
GM crops. Based on the DIAS database, a ques-
tionnaire was forwarded to 400 farmers. The
response rate was 44%, which is approximately
12% less than reported in a Swedish case study,
which used a sample of 564 out of 1000 (Lehrman &
Johnson, 2008) but similar to the 44% (255/575)
reported by Breustedt et al. (2008) in the German
case study.
The distribution of the respondents by farm
characteristics reflected the representativeness of
the sample well. Of the 175 farms used in the
analysis, pig and cattle farms accounted for 63% of
the farms, crop farms for 31%, and the remaining
6% represent other farms. This distribution is
similar to the national distribution of farms in
2004 where the total number of farms was 45,525
of which pigs and cattle accounted for 61%, crop
farms for 32% with the remaining 7% representing
other farms (DST, 2008). With regards to the farm
size, the 175 farms were distributed such that 42, 15,
and 43% accounted for farms with less than 80 ha,
80�120 ha, and above 120 ha of farmland, respec-
tively. However, according to DST (2008), the
corresponding distribution for Denmark was 73%,
13%, and 14%, respectively, in 2004. Hence, our
distribution is biased toward large farms but this was
due to the desired stratification, i.e. to have an equal
number of farms below and above 100 ha of farm-
land. The decision to stratify as has been done was
based on the knowledge and expectation that farms
are getting larger in the future. Therefore, we believe
the data used in the analysis reasonably reflects the
farm structure in Denmark. Factor analysis was
applied to reduce the 30-item response statements
to eight-factor variables, which were utilized to
conduct the multinomial logit estimation and the
results used to estimate the marginal change effects.
5.1. Farm characteristics
In the present study, farm characteristics such as
farmers’ age and hectares under cultivation did not
reveal a clear significant relationship to the propen-
sity of growing GM crops when the relative compar-
ison with a base (‘‘no’’ responds) was evaluated
(Table V). However, the estimated marginal effects
reported in Table VI suggest otherwise. For the
variable ‘‘age,’’ the middle age farmers between the
ages of 40 and 50 years turn out to be moderately
more inclined toward adopting GM crops compared
to farmers of less than 40 years. The 40�50-year-old
farmers might benefit from their combined experi-
ence and formal agricultural education (Breustedt
et al., 2008; Lehrman & Johnson, 2008). The
German study by Breustedt et al. (2008), from a
choice set of 4731 responses, reported that older
farmers were less keen to adapt to the GM technol-
ogy. While the Swedish study by Lehrman and
Johnson (2008), with data from year 2005, reported
that age has no effect on the attitude toward the
cultivation of a GM insect resistant crop. In our
study, evaluating the direction of estimate for farm-
ers above 60 years, they are less likely to adopt GM
crops compared to those less than 40 years (although
the estimate is not significant). It is, however, noted
that due to the high investment cost of establishing a
farm business the younger generation of farmers in
Denmark, who are less than 30 years old, were not
well represented in the present study. The attitude of
the future farm owners among students at farm
colleges may provide useful insights. In the case of
the variable ‘‘farm size’’ in hectares, the estimated
marginal effects in Table VI suggest that large farms
are more inclined to adopt the cultivation of GM
crops in the future compared to small farms. This
finding is consistent with those reported by Breus-
tedt et al. (2008) and Lehrman and Johnson (2008).
5.2. Improving farm income
It is clear from the survey that the potential increase
in farm income from GM crops is a major argument
for accepting the technology. Farmers who expect an
improvement in gross margin by more than 27 EUR
per ha is by far more likely to adopt GM crops on
their farms. This is in line with the studies conducted
when the GM technology was first introduced in the
USA, although under different agricultural policy
contexts than in Europe (Duffy, 1999; Fernandez-
Cornejo & McBride, 2000; Fernandez-Cornejo &
Caswell, 2006). Similarly, our results are consistent
with the studies conducted in Europe (Breustedt
et al., 2008; Lehrman & Johnson, 2008). Most of the
USA studies were conducted after the GM crops
have been introduced on farms while this study and
the other European studies are based on farmers’
expectations. The improved profitability of the
farming business expressed by the Likert responses
(9-items from the 18-items) is thought of in terms of:
Simpler management for higher yields, less demand for
chemical inputs, which benefits the environment and
should lead to improved gross margin, hence an exciting
technology that may be useful for the future. It is noted,
following Lassen et al. (2007), that possible environ-
mental benefits from GM crops are recognized
Farmers’ perceptions of genetically modified crops 115
Downloaded By: [Lawson, Lartey G.] At: 08:15 4 February 2010

although benefits for the farmers are mainly thought
of in monetary terms. Farmers, although they may
wish for it, mainly have little faith in higher prices for
GM crops. Hence, it is suggested that economic
benefits to the farmers is perceived to come from
reduced use of inputs.
The economic benefits from GM crops may,
however, not be as straight forward as farmers tend
to believe. In an overview of the literature reflecting
the post-cultivation experiences regarding farmers
decision-making toward GM crops, Alexander
(2006) concludes that adopters of GM crops in
the USA do not significantly earn more profit than
non-GM adopters. According to Fernandez-Cornejo
and Caswell (2006), the use of herbicide tolerant
cotton and herbicide tolerant corn have been asso-
ciated with increased net return, but the corn area
has been limited and grown on areas of special
advantage for the trait. Fernandez-Cornejo and
Caswell (2006) also suggested that the positive
return from the GM corn may be caused by lower
prices for the seeds as part of a marketing strategy for
the crop.
Of further interest, the rapid adoption of the GM
soybean in the USA may not be explained by
increased gross margins. In the first years (1997�1998) of adoption of GM crops among the US
farmers there were no increased net return reported
for GM soybeans (Fernandez-Cornejo & Caswell,
2006). It appears that other factors have driven this
development. Carpenter and Gianessi (1999) state
that by most accounts, the popularity of Roundup
ready soybeans is primarily due to the simplicity and
flexibility of a weed control program that provides
broad spectrum weed control (Carpenter & Gianessi,
1999).
Fernandez-Cornejo (2005) stated in his study that
the adoption of herbicide tolerant soybeans did not
have a significant economic impact on farm earnings.
It did however have an impact on the household
economy because of the simplicity and flexibility of
the technology. Farmers were now able to make
money from off-farm activities. This is presented as
a plausible explanation for the impressive growth
rates in the area cultivated with GM soybean.
5.3. GM crop risks and resistance
The GM crop labeling, which reflects farmers con-
cern for the risk associated with the consumers,
especially in the European population, could suggest
that some farmers would be less in favor of GM crops.
Products of animals fed with GM crops do not have to
be labeled whereas crops for human consumption by
law have to be labeled (EU, 2003). The latter could
prevent some producers from accepting a GM variety.
Likewise processing units could request suppliers to
refrain from using GM feed in their animal produc-
tion. In contrast, animal farmers could consider GM
crops as a necessity in order to obtain cheap feed for
the livestock and compete on the international
markets. In the present study the relative comparisons
of ‘‘yes to no’’ and ‘‘neutral to no’’ for risks and
resistance did not show any difference in the attitude
of farmers. However, the estimated marginal effect
suggests that if risk and resistance issues are mini-
mized, quite a number of indecisive farmers would be
positive toward adoption. Hence, for non-decisive
Danish farmers, a risk of unintended gene dispersal
and health risks reduced the propensity to grow GM
crops. In the German case study by Breustedt et al.
(2008), the willingness to grow GM rapeseed was
reduced out of fear of possible liability from GM gene
dispersal. Denmark has in contrary to other Eur-
opean countries a mandatory insurance scheme
compensating the non-GM grower in case of con-
tamination. The hesitance related to cultivating GM
crops because of gene spreading is thus hardly related
strictly to concerns of economic liability.
5.4. Reduced chemical plant protection inputs
From the survey it is clear that GM positive farmers
expect reduction in the use of herbicides, insecti-
cides, as well as growth regulators which underlines
the fact that farmers are focusing on first generation
GM crops (Killicoat, 2004) and further underlines
the fact that economic benefits are thought of as
reduced inputs. The fact that 10% of the negative
farmers (Table VI) also agreed that a reduction in
the use of chemical inputs will encourage them to
refrain from being negative suggests that this group
have deeper reservations about the technology,
which may have to receive more attention.
5.5. Risk of deteriorating biological diversity and health
hazard
The issues of deteriorating biological diversity and
health risk of direct concern to the farmers may
strongly influence their adoption decision. Farmers
responding affirmatively to the cultivation of GM
crops will refrain from adopting it. This is consistent
with Lehrman and Johnson (2008) who reported
that the risk of potential harm to other organism and
the potential of genes spreading to non-GM crop
varieties or wildlife relatives were frequently named
as negative consequences. They further reported
that positive farmers were more likely to see the
benefits of reduced health risks for themselves
compared to neutral or negative farmers.
116 L. G. Lawson et al.
Downloaded By: [Lawson, Lartey G.] At: 08:15 4 February 2010
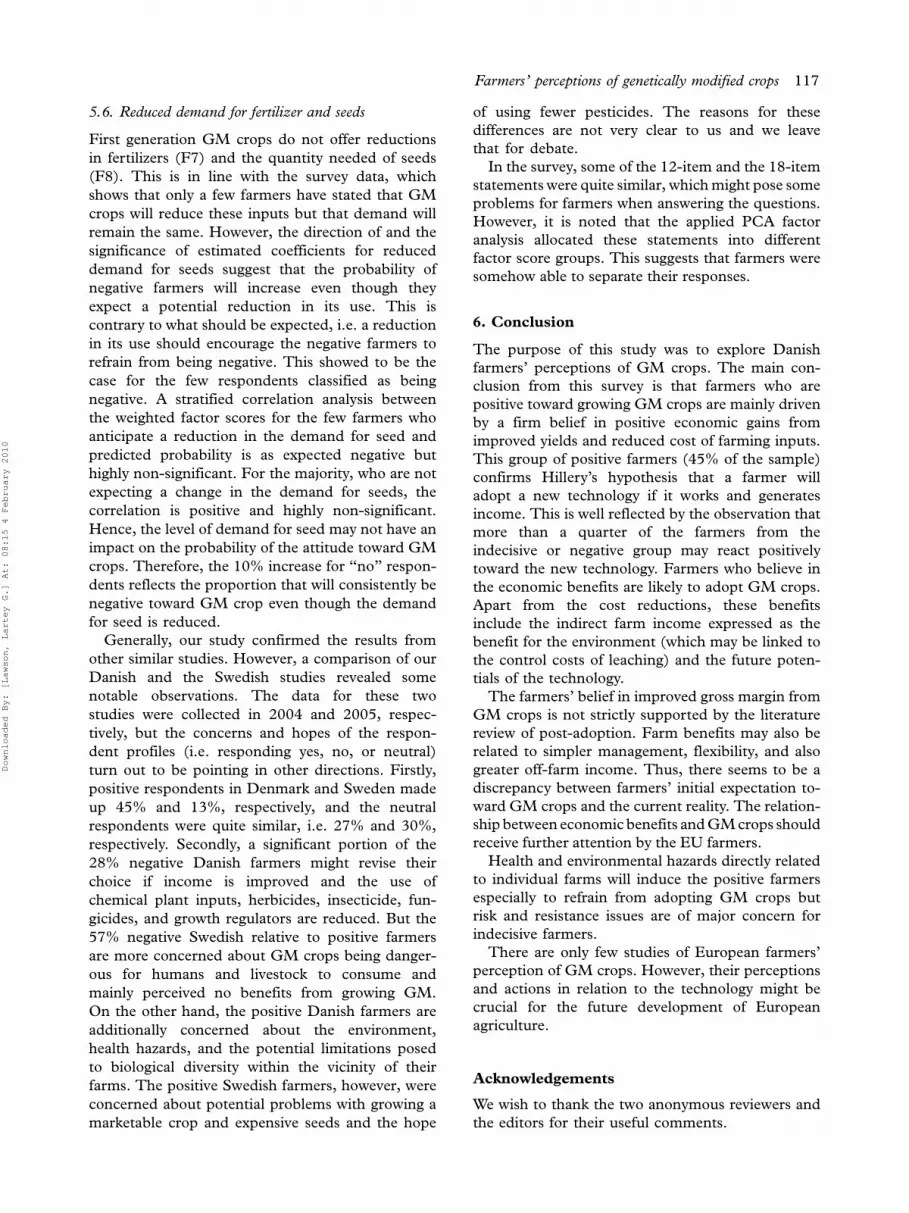
5.6. Reduced demand for fertilizer and seeds
First generation GM crops do not offer reductions
in fertilizers (F7) and the quantity needed of seeds
(F8). This is in line with the survey data, which
shows that only a few farmers have stated that GM
crops will reduce these inputs but that demand will
remain the same. However, the direction of and the
significance of estimated coefficients for reduced
demand for seeds suggest that the probability of
negative farmers will increase even though they
expect a potential reduction in its use. This is
contrary to what should be expected, i.e. a reduction
in its use should encourage the negative farmers to
refrain from being negative. This showed to be the
case for the few respondents classified as being
negative. A stratified correlation analysis between
the weighted factor scores for the few farmers who
anticipate a reduction in the demand for seed and
predicted probability is as expected negative but
highly non-significant. For the majority, who are not
expecting a change in the demand for seeds, the
correlation is positive and highly non-significant.
Hence, the level of demand for seed may not have an
impact on the probability of the attitude toward GM
crops. Therefore, the 10% increase for ‘‘no’’ respon-
dents reflects the proportion that will consistently be
negative toward GM crop even though the demand
for seed is reduced.
Generally, our study confirmed the results from
other similar studies. However, a comparison of our
Danish and the Swedish studies revealed some
notable observations. The data for these two
studies were collected in 2004 and 2005, respec-
tively, but the concerns and hopes of the respon-
dent profiles (i.e. responding yes, no, or neutral)
turn out to be pointing in other directions. Firstly,
positive respondents in Denmark and Sweden made
up 45% and 13%, respectively, and the neutral
respondents were quite similar, i.e. 27% and 30%,
respectively. Secondly, a significant portion of the
28% negative Danish farmers might revise their
choice if income is improved and the use of
chemical plant inputs, herbicides, insecticide, fun-
gicides, and growth regulators are reduced. But the
57% negative Swedish relative to positive farmers
are more concerned about GM crops being danger-
ous for humans and livestock to consume and
mainly perceived no benefits from growing GM.
On the other hand, the positive Danish farmers are
additionally concerned about the environment,
health hazards, and the potential limitations posed
to biological diversity within the vicinity of their
farms. The positive Swedish farmers, however, were
concerned about potential problems with growing a
marketable crop and expensive seeds and the hope
of using fewer pesticides. The reasons for these
differences are not very clear to us and we leave
that for debate.
In the survey, some of the 12-item and the 18-item
statements were quite similar, which might pose some
problems for farmers when answering the questions.
However, it is noted that the applied PCA factor
analysis allocated these statements into different
factor score groups. This suggests that farmers were
somehow able to separate their responses.
6. Conclusion
The purpose of this study was to explore Danish
farmers’ perceptions of GM crops. The main con-
clusion from this survey is that farmers who are
positive toward growing GM crops are mainly driven
by a firm belief in positive economic gains from
improved yields and reduced cost of farming inputs.
This group of positive farmers (45% of the sample)
confirms Hillery’s hypothesis that a farmer will
adopt a new technology if it works and generates
income. This is well reflected by the observation that
more than a quarter of the farmers from the
indecisive or negative group may react positively
toward the new technology. Farmers who believe in
the economic benefits are likely to adopt GM crops.
Apart from the cost reductions, these benefits
include the indirect farm income expressed as the
benefit for the environment (which may be linked to
the control costs of leaching) and the future poten-
tials of the technology.
The farmers’ belief in improved gross margin from
GM crops is not strictly supported by the literature
review of post-adoption. Farm benefits may also be
related to simpler management, flexibility, and also
greater off-farm income. Thus, there seems to be a
discrepancy between farmers’ initial expectation to-
ward GM crops and the current reality. The relation-
ship between economic benefits and GM crops should
receive further attention by the EU farmers.
Health and environmental hazards directly related
to individual farms will induce the positive farmers
especially to refrain from adopting GM crops but
risk and resistance issues are of major concern for
indecisive farmers.
There are only few studies of European farmers’
perception of GM crops. However, their perceptions
and actions in relation to the technology might be
crucial for the future development of European
agriculture.
Acknowledgements
We wish to thank the two anonymous reviewers and
the editors for their useful comments.
Farmers’ perceptions of genetically modified crops 117
Downloaded By: [Lawson, Lartey G.] At: 08:15 4 February 2010

References
Alexander, C. (2006). Farmer decisions to adopt genetically
modified crops. CAB Reviews: Perspectives in Agriculture,
Veterinary Science, Nutrition and Natural Resources, 1 (45).
DOI: 10.1079/PAVSNNR20061045, http://www.cabstracts
plus.org/cabreviews. (Accessed 26 November 2009).
Basant, R. (1997). Technology strategies of large enterprises in
Indian industry: Some explorations. World Development, 25
(10), 1683�1700.
Bredahl, L. (2001). Determinants of consumer attitudes and
purchase intentions with regards to genetically modified
foods: Results of cross-national survey. Journal of Consumer
Policy, 24, 23�61.
Breustedt, G., Sheessel, J. M., & Latacz-Lohmann, U. (2008).
Forecasting the adoption of GM oilseed rape: Evidence from
a discrete choice experiment in Germany. Journal of Agri-
cultural Economics, 59 (2), 237�256.
Carpenter, J., & Gianessi, L. (1999). Herbicide tolerant soybeans:
Why growers are adopting roundup ready varieties. AgBio-
Forum, 2 (2), 65�72.
DST. (2008). Danmarks Statistik. Statistikbanken. Bedrifter type,
areal og ar [Satistics of Denmark. Statistics Database. Farms
by type, area and year]. Available at: http://www.statistuik
banken.dk/statbank5a/default.asp?w�1680, (Accessed 26
November 2009).
Duffy, M. (1999). Does planting GMO seed boost farmers’
profits? Leopold Letter, 11 (3), 1�5.
Enriquez, J. (2001). Green biotechnology and European competi-
tiveness. Trends in Biotechnology, 19 (4), 135�139.
EU. (2003). EU Regulation (EC) No 1829/2003 of the European
Parliament and of the Council of 22 September 2003 on
genetically modified food and feed. Official Journal L 268, 18/
10/2003 P. 0001�0023. http://eur-lex.europa.eu/LexUriServ/
LexUriServ.do?uri�CELEX:32003R1829:EN:HTML, (Ac-
cessed 26 November 2009).
Fernandez-Cornejo, J., & Caswell, M. (2006). The first decade of
genetically engineered crops in the United States, United
States Department of Agriculture. Economic Information
Bulletin, 11 April, http://www.ers.usda.gov/publications/
eib11/eib11.pdf (Accessed 26 November 2009)
Fernandez-Cornejo, J., & McBride, W. D. (2000). Genetically
Engineered Crops for Pest Management in U.S. Agriculture:
Farm-Level Effects, USDA. Agricultural Economic Report No.
786, http://purl.umn.edu/33931, (Accessed 26 November
2009).
Fernandez-Cornejo, J. H. C. M. A. (2005). Technology adoption
and off-farm household income: The case of herbicide-
tolerant soybeans. Journal of Agricultural and Applied Econom-
ics, 37 (3), 549�563.
Frewer, L., Lassen, J., Kettlitz, B., Scholderer, J., Beekman, V., &
Berdal, K. G. (2004). Societal aspects of genetically modified
foods. Food and Chemical Toxicology, 42 (7), 1181�1193.
GMO Compass. (2008). Global cultivation areas 2007. Available
at: http://www.gmo-compass.org/eng/agri_biotechnology/gmo_
planting/411.gmo_planting_2007.html, (Accessed 4 Febru-
ary 2008).
GMO Compass. (2009). Commercial GM crops in the EU
in 2008. Available at: http://www.gmo-compass.org/eng/agri_
biotechnology/gmo_planting/>392.gm_maize_cultivation_euro-
pe_2008.html, (Accessed 4 February 2009).
Gomez-Barbero, M., & Rodrıguez-Cerezo, E. (2007). GM crops in
EU agriculture � Case Study for the BIO4EU Project. EUR-
OPEAN COMMISSION, DG JRC, Institute for Prospective
Technological Studies-Sustainability in Agriculture, Food
and Health Unit, http://bio4eu.jrc.ec.europa.eu/documents/
FINALGMcropsintheEUBIO4EU.pdf, (Accessed 26 No-
vember 2009).
Green, W. H. (2002). LIMDEP Econometric Modeling Guide (vol.
2) (Plainview, NY: Econometric Software).
Hall, C. (2008). Identifying farmer attitudes towards genetically
modified (GM) crops in Scotland: Are they pro- or anti-GM.
Geoforum, 39 (1), 204�212.
Hatcher, L. (1994). A Step-by-Step Approach to Using SAS, for
Factor Analysis and Structural Equation Modeling (Cary, NC:
SAS Institute).
Hill, M. A. (1983). Female labour force participation in develop-
ing and developed countries: Consideration of the informal
sector. Review of Economics and Statistics, 63 (3), 459�468.
Hillyer, G. (1999). Biotechnology offers US farmers promises and
problems. AgBioForum, 2 (2), 1�4.
Jonas, M. S., & Beckmann, S. C. (1998). Functional foods:
Consumer perceptions in Denmark and England. MAPP
Working Paper No. 55, Aarhus School of Business, Aarhus.
Killicoat, P. (2004). Food Phobias behind the fuss over GM crops.
Policy, 20 (1), 17�21.
Kondoh, K., & Jussaume, Jr., R. A. (2006). Contextualizing
farmers’ attitudes towards genetically modified crops. Agri-
culture and Human Values, 23, 341�352.
Lassen, J., & Jamison, A. (2006). Genetic technologies meet the
public: The discourses of concern. Science. Technology and
Human Values, 31 (1), 8�28.
Lassen, J., Nielsen, D. E., Vestergaard, L., & Sandoe, P. (2007).
Miljøvenlige genmodificerede afgrøder? Vil landmænd have
dem, og vil de blive brugt til gavn for naturen? [Environ-
mental friendly gene modifiedcrops? Will farmers pay for
them and will it be used for the benefit of nature?].
Environmental Council Research Report number 112.
Lehrman, A., & Johnson, K. (2008). Swedish farmers’ attitudes,
expectations and fears in relation to growing genetically
modified crops. Environmental Biosafety Research, 7, 153�162.
Maddala, G. S. (1983). Limited Dependent and Qualitative Variables
in Econometrics. (Cambridge: Cambridge University Press).
Saher, M., Lindeman, M., & Koivisto, U-K. (2006). Attitudes
towards genetically modified and organic foods. Appetite, 46
(3), 324�331.
SAS. (2008). SAS/ETS 9.2, User’s Guide (Cary, NC: SAS
Institute).
Schwab, J. (2003). Data Analysis and computers II, Course
Number: SWN388R7, Unique Number: 96270, Multion-
mial logistic Regression Basic Relationships.ppt, available
http://www.otexas.edu/courses/schwab/SN 388r7/solving pro-
blems, (Accessed 26 November 2009).
USDA. (2007). National Agricultural Statistics Service (NASS).
Agricultural Statistics Board, US Department of Agriculture
Acreage.
Wagner, W., Torgerson, H., Einsiedel, E., Jelsoe, E., Fredrickson,
H., Lassen, J., Rusanen, T., Boy, D., deCheveigne, S.,
Hampel, J., Stathopoulou, A., Allansdottir, A., Midden,
C., Nielsen, T., Przestalski, A., Twardowski, T., Fjaestad, B.,
Olsson, S., Olofsson, A., Gaskell, G., Durant, J., Bauer, M.,
& Liakopoulos, M. (1997). Europe ambivalent on biotech-
nology. Nature, 387 (6636), 845�847.
118 L. G. Lawson et al.
Downloaded By: [Lawson, Lartey G.] At: 08:15 4 February 2010


