Embed Size (px)
Citation preview


International Federation of Library Associations and Institutions
Fédération Internationale des Associations de Bibliothécaires et des Bibliothèques
Internationaler Verband der bibliothekarischen Vereine und Institutionen
Международная Федерация Библиотечных Ассоциаций и Учреждений
Federación Internacional de Asociaciones de Bibliotecarios y Bibliotecas
About IFLA www.ifla.org
IFLA (The International Federation of Library Associations and Institutions) is the lead-
ing international body representing the interests of library and information services and
their users. It is the global voice of the library and information profession.
IFLA provides information specialists throughout the world with a forum for exchanging
ideas and promoting international cooperation, research, and development in all fields
of library activity and information service. IFLA is one of the means through which
libraries, information centres, and information professionals worldwide can formulate
their goals, exert their influence as a group, protect their interests, and find solutions to
global problems.
IFLA’s aims, objectives, and professional programme can only be fulfilled with the co-
operation and active involvement of its members and affiliates. Currently, over 1,700
associations, institutions and individuals, from widely divergent cultural backgrounds,
are working together to further the goals of the Federation and to promote librarianship
on a global level. Through its formal membership, IFLA directly or indirectly represents
some 500,000 library and information professionals worldwide.
IFLA pursues its aims through a variety of channels, including the publication of a major
journal, as well as guidelines, reports and monographs on a wide range of topics. IFLA
organizes workshops and seminars around the world to enhance professional practice
and increase awareness of the growing importance of libraries in the digital age. All this
is done in collaboration with a number of other non-governmental organizations, funding
bodies and international agencies such as UNESCO and WIPO. IFLANET, the Federa-
tion’s website, is a prime source of information about IFLA, its policies and activities:
www.ifla.org
Library and information professionals gather annually at the IFLA World Library and
Information Congress, held in August each year in cities around the world.
IFLA was founded in Edinburgh, Scotland, in 1927 at an international conference of
national library directors. IFLA was registered in the Netherlands in 1971. The Konink-
lijke Bibliotheek (Royal Library), the national library of the Netherlands, in The Hague,
generously provides the facilities for our headquarters. Regional offices are located in
Rio de Janeiro, Brazil; Dakar, Senegal; and Singapore.

IFLA Publications 127
Measuring Quality
Performance Measurement
in Libraries
2nd revised edition
Roswitha Poll
Peter te Boekhorst
K · G ·Saur München 2007

IFLA Publications
edited by Sjoerd Koopman
Bibliographic information published by the Deutsche Nationalibliothek
The Deutsche Nationalbibliothek lists this publication in the Deutsche Nationalbibliografie;
detailed bibliographic data is available in the Internet at http://dnb.d-nb.de.
U
Printed on permanent paper
The paper used in this publication meets the minimum requirements of
American National Standard – Permanence of Paper
for Publications and Documents in Libraries and Archives
ANSI/NISO Z39.48-1992 (R1997)
© 2007 by International Federation of Library Associations
and Institutions, The Hague, The Netherlands
Alle Rechte vorbehalten / All Rights Strictly Reserved
K.G.Saur Verlag, München
An Imprint of Walter de Gruyter GmbH & Co. KG
All rights reserved. No part of this publication may be reproduced, stored in a retrieval
system of any nature, or transmitted, in any form or by any means, electronic, mechanical,
photocopying, recording or otherwise, without the prior written permission of the publisher.
Printed in the Federal Republic of Germany by Strauss GmbH, Mörlenbach
ISBN 978-3-598-22033-3
ISSN 0344-6891 (IFLA Publications)

5
CONTENTS
Preface .................................................................................................................. 7
1. The role of performance indicators in quality management .................... 13
2. Indicators of impact or outcome .................................................................. 31
3. Overview of the indicators............................................................................ 39
4. Description of the indicators ........................................................................ 41
5. List of indicators ............................................................................................ 43
A. Resources, infrastructure
A.1 User area per capita................................................................................... 46
A.2 Seats per capita.......................................................................................... 51
A.3 Opening hours compared to demand ........................................................ 54
A.4 Expenditure on information provision per capita ..................................... 60
A.5 Availability of required titles .................................................................... 64
A.6 Percentage of rejected sessions................................................................. 71
A.7 Ratio of requests received to requests sent out in interlibrary lending..... 74
A.8 Immediate availability .............................................................................. 78
A.9 Staff per capita .......................................................................................... 82
A.10 Direct access from the homepage ........................................................... 88
B. Use
B.1 Market penetration .................................................................................. 100
B.2 User satisfaction ...................................................................................... 105
B.3 Library visits per capita........................................................................... 112
B.4 Seat occupancy rate................................................................................. 120
B.5 Number of content units downloaded per capita .................................... 124
B.6 Collection use (turnover)......................................................................... 128
B.7 Percentage of stock not used ................................................................... 132
B.8 Loans per capita ...................................................................................... 137
B.9 Percentage of loans to external users ...................................................... 141
B.10 Attendances at training lessons per capita ............................................ 145
B.11 Reference questions per capita.............................................................. 150
B.12 Attendances at events per capita ........................................................... 154
C. Efficiency
C.1 Cost per user............................................................................................ 158
C.2 Cost per visit............................................................................................ 164
C.3 Cost per use ............................................................................................. 169

6
C.4 Ratio of acquisitions costs to staff costs ................................................. 175
C.5 Cost per document processed.................................................................. 180
C.6 Cost per download................................................................................... 184
C.7 Acquisition speed .................................................................................... 189
C.8 Media processing speed .......................................................................... 193
C.9 Employee productivity in media processing........................................... 199
C.10 Lending speed ....................................................................................... 202
C.11 Interlibrary loan speed........................................................................... 206
C.12 Reference fill rate .................................................................................. 213
C.13 Shelving accuracy ................................................................................. 226
D. Potentials and development
D.1 Percentage of acquisitions expenditure spent on the electronic collection........................................................................................................ 233
D.2 Percentage of library staff providing and developing electronic services........................................................................................................... 238
D.3 Attendances at training lessons per staff member .................................. 242
D.4 Percentage of library means received by special grants or income generation....................................................................................................... 246
D.5 Percentage of institutional means allocated to the library ...................... 250
Annex 1: Calculating costs ............................................................................. 255
Annex 2: Main sources of the indicators....................................................... 259
Selective bibliography ..................................................................................... 263
Index to the Indicators .................................................................................... 269
7
PREFACE
It is now more than ten years since “Measuring Quality” was first published. We
have been gratified indeed to see that the book has not only been translated into
five other languages, but has also been widely used, as frequent citations and
lists of performance indicators in different countries show.
In the ten years since this handbook appeared, there have been rapid and ex-
tensive changes as well in scholarly communication as in the services of librar-
ies. Libraries are increasingly offering their services in electronic and web-based
form. Therefore performance measurement must include indicators for elec-
tronic resources and services and should – if possible – combine traditional and
new forms of service in the assessment. The first edition contained only two
very simple indicators for electronic library services. The new edition offers
seven indicators especially intended for electronic services; a great part of the
other indicators combine the quality assessment of both traditional and elec-
tronic services.
There are other issues beside electronic services that gained in relevance
since the first edition:
• The demand for cost-effectiveness: Libraries today are experiencing
growing problems when organising their work and offering their services
within the given budget and resources. In addition, there is a general de-
mand for transparency as to costs and quality in all areas, especially in the
public sector. The new edition offers six indicators dealing with costs or
expenditure ratios and seven indicators for measuring the effectiveness of
processes.
• The library as working place and meeting point: Contrary to all expec-
tations, the importance of the library as physical place has in most cases
not decreased. The possibility of “hybrid” use, combining print and elec-
tronic media, and a growing tendency to work in groups are reasons for
attracting users to the library. Libraries have taken up these issues by of-
fering group working areas and information commons. The library’s ac-
tivities in cultural life (exhibitions and other events with a literary, cul-
tural or educational intent) add to the relevance of the library as physical
place.
The topic “library as a physical place” is represented by six indicators in
the new edition.
• The library’s teaching role: The dramatic change in information re-
sources entails problems in information seeking. “Information overload”

Preface
8
has become a serious problem in research, and academic teachers are
complaining about the “Google mentality” of students who do not proceed
beyond a quick search on the web. The difficulty today is how to find and
select relevant information. Libraries have taken up the new task of teach-
ing information literacy, often in cooperation with faculties.
The new edition presents three indicators for the library’s information and
teaching services.
• The library’s functions for external users: Most libraries offer services
to external users, users not belonging to the population the library has
been set up to serve. But the services delivered to external users have sel-
dom been included in quality assessment, though they may add up to a
considerable part of a library’s expenses and activities.
The new edition shows one indicator for the topic.
• The importance of staff: In times of ongoing changes in the information
world, the quality of library services is more than ever dependant on em-
ployees whose professional qualification and engagement can cope with
the change.
The new edition includes two indicators for this topic.
Of the 17 indicators in the first edition, 6 have been deleted, either because they
proved too difficult in practice and therefore were not often used (e.g. expert
checklists for collection assessment, success rate of subject searches) or because
they have been replaced by more up-to-date indicators including electronic ser-
vices.
This handbook is intended as practical instrument for the evaluation of library
services. While the first edition aimed only at academic libraries, the perspective
has now been widened to include public libraries. That does not mean that the
book will not be of use for other types of libraries. Special libraries serving re-
search will be able to use most of the indicators. General research libraries with-
out a specified clientele cannot use the “per capita” indicators that compare
resources and usage to the population to be served. National libraries could ap-
ply part of the handbook, but they will need an additional set of indicators that
reflect their special tasks of collecting, cataloguing and preserving the national
documentary heritage.
Libraries vary as to mission and goals, collections and services, size and type of
population. Therefore not all performance indicators in this book will be appli-

Preface
9
cable in every library. The collection is not meant to be prescriptive. Libraries
should choose the indicators best adapted to their needs, and local circumstances
might make it necessary to modify the methods of data collection. In most cases,
it will be necessary to repeat the measuring process after some time in order to
note changes and to monitor the effect of organisational steps taken after the
first measuring.
The handbook shows a set of 40 indicators that were selected according to the
following criteria:
• To cover the full range of resources and services generally offered in aca-
demic and public libraries
• To consider traditional services as well as new electronic services and, if
possible, to combine them in “merged” indicators
• To select indicators that have been tested and documented, at least in a
similar form to what is described here
• To cover the different aspects of service quality as described in the Bal-
anced Scorecard, including indicators for the aspect of development and
potentials
The Balanced Scorecard is a management strategy developed for the commercial
sector1, with the four perspectives: users, finances, processes, learning and de-
velopment. It was adapted to libraries in several projects.2
As in the first edition, the authors have tried to limit the number of indicators.
But evaluation in libraries can serve different purposes and can aim at different
target groups. “It is difficult to produce a core set for all stakeholders, for all
purposes, and for all frequencies. An annual core set for accountants looks dif-
ferent from a core set for the library manager to check productivity or for a Li-
1 Kaplan, R. S. and Norton, D. P. (1996), The Balanced Scorecard: translating strategy into action, Harvard Business School Press, Boston, Mass. 2 see e.g. Ceynowa, K. and Coners, A. (2002), Balanced Scorecard für wissenschaftliche Bibliotheken, Zeitschrift für Bibliothekswesen und Bibliographie, Sonderheft 82, Kloster-mann, Frankfurt a.M.; Krarup, K. (2004), Balanced scorecard at the Royal Library, Copenha-gen, LIBER Quarterly 14,1, pp.37-57, available at: http://liber.library.uu.nl/ ; Pienaar, H. and Penzhorn, C. (2000), Using the balanced scorecard to facilitate strategic management at an academic information service, Libri 50,3, pp.202-209, available at: http://www.librijournal.org/pdf/2000-3pp202-209.pdf; Poll, R. (2001), Performance, proc-esses and costs: managing service quality with the balanced scorecard, Library Trends 49,4, pp.709-718; University of Virginia Library, Balanced scorecard at UVa Library, available at: http://www.lib.virginia.edu/bsc/index.html

Preface
10
brary Committee to see how use and users have changed over the last five years.
Reasonably large bundles of indicators seem unavoidable…”3
Another reason for a large set of indicators is that there may be several well-
tested indicators for the same service that answer different aspects of the same
question.
Example: How intensively is the collection used? Indicators:
• collection turnover • loans per capita • percentage of stock not used
Each indicator gives a somewhat different picture and might serve different purposes of the evaluating library.
Trying to consider all stakeholder groups, all purposes of measuring and all
aspects of the Balanced Scorecard, it did not seem possible to restrict the hand-
book to only 15 or 20 indicators.
For the selection of indicators, the following sources have been consulted:
• The existing literature on performance measurement, especially reports on
practical use of certain indicators
• The benchmarking projects, where groups of libraries join in using a
specified set of performance indicators
• The International Standard for library performance indicators that is being
revised at the moment4
It proved especially helpful that the authors cooperated in the national and inter-
national groups for benchmarking and standardization.
Experience of libraries when using the first edition showed, that in spite of de-
tailed descriptions libraries had problems using the different methods and calcu-
lating and interpreting the results of the measuring process. The new edition
tries to give more help as to the calculation of costs and as to possible actions
based on the results of measuring.
3 Sumsion, J. (1999), Popularity ratings, core sets and classification of performance indica-tors, Proceedings of the 3
rd Northumbria International Conference on Performance Meas-
urement in Libraries and Information Service, University of Northumbria, Newcastle upon Tyne, p. 249. 4 ISO DIS 11620 (2006), Information and documentation – Library performance indicators, International Organization for Standardization, Geneva

Preface
11
In many cases it will be difficult to know whether the results of an indicator are
“good” or “bad”. Where results of libraries using the same indicator were avail-
able, they have been added to the individual indicators in order to give help in
rating the own score. For example, if a library reaches a shelving accuracy of
85%, seeing that between 92 to 99% are the usual score will allow to rank the
own results.
The detailed description of measuring techniques (sampling, surveying) in the
first edition has been omitted as there is now a sufficient number of handbooks
available for these methods.
The first edition of the handbook offered a comprehensive bibliography of the
literature dealing with performance measurement. As performance measures are
now established and standardized, the new edition presents only a short bibliog-
raphy of the most important literature, but more sources and additional reading
have been added to the individual indicators.
Measures for the outcome or impact of library services on users and on society
have not yet been included in this handbook, as methods and possible “indica-
tors” are still being tested in projects. But because of the growing importance of
this issue a chapter has been added showing an overview of possible methods
for assessing impact and outcome.
Acknowledgements
The authors are grateful for the manifold information gained in contacts with
experts in the German and international groups concerned with library assess-
ment and benchmarking. The working groups of ISO TC 46 SC 8 “Quality –
statistics and performance evaluation” have been especially helpful in discussing
the indicators.
All links cited in this book have been checked in June 2007.


13
1. The role of performance indicators in quality management
1.1 Quality in library and information services
To achieve high quality in their products and services is essential not only for
commercial firms, but also for all non-commercial institutions. Quality will have
a different aspect in every institution, but there is a broad consensus in manage-
ment literature about a general definition of quality. The most frequently cited
definition is:
Quality is fitness for purpose
In the ISO 9000 standard quality is described as “the consistent conformance of
a product or service to a given set of standards or expectations”.5
In most definitions quality is defined in relation to the customer or user:
“…the key issue is that quality becomes a meaningful concept only when it is
indissolubly linked to the aim of total customer satisfaction”.6
Quality of a product or service defined in relation to the customer must not
necessarily mean the highest grade possible. A product of a simpler grade may
have high quality because it meets the needs and expectations of its target cus-
tomer group. Quality for one customer or customer group does not always mean
quality for another customer or group
Example: Bicycles For the normal cyclist, a bicycle should be:
• Solidly built • Easy to use • Cheap
For the racing cyclist, it should have: • Highest possible durability • Minimum weight • High-end components
The price will not be as important as for the normal cyclist.
Quality in library and information services can have many aspects. Peter Bro-
phy, starting from the general management literature, has adapted a set of qual-
5 ISO 9000 (2005), Quality management systems, fundamentals and vocabulary, International Organization for Standardization, Geneva 6 Brophy, P. and Coulling, K. (1996), Quality management for information and library man-agers, Aslib Gower, Aldershot, p. 6

1. The role of performance indicators in quality management
14
ity attributes to libraries.7 The following table relies for the most part on Bro-
phy’s set and shows the quality criteria with typical examples of their appliance
to library services.
Criteria of library quality
Example
Performance A service meets its most basic purpose
Making key informa-tion resources avail-able on demand
Features Secondary characteristics which add to the service but are beyond the essential core
Alerting services
Reliability Consistency of the service’s performance in use
No broken Web links
Conformance The service meets the agreed standard
Dublin Core
Durability Sustainability of the service over a period of time
Document delivery within 2 days
Currency Up-to-dateness of information Online catalogue
Serviceability Level of help available to users Complaint service
Aesthetics Visual attractiveness Physical library, website
Usability/Accessability Ease of access and use Opening hours, web-site structure
Assurance/Competence/Credibility Good experience with staff’s knowledgability
Correct reference answers
Courtesy/Responsiveness/Empathy Accessibility, flexibility and friendliness of staff
Reference service
Communication Clear explanation of services and options in language free of jar-gon
Website, signposting in the library
Speed Quick delivery of services Interlibrary lending
Variety of services offered May clash with quality, if the resources are not sufficient for maintaining quality in all ser-vices
Comprehensive collec-tion, reference service in walk-in, mail and chat form
Perceived quality The user’s view of the service User satisfaction
7 Brophy, P. (2004), The quality of libraries, in Die effektive Bibliothek, Roswitha Poll zum 65. Geburtstag, Saur, München, pp. 30-46.

1.2 The stakeholders’ view
15
1.2 The stakeholders’ view
Stakeholders are all groups that have an interest in the functioning of an institu-
tion. For a library, this will normally be:
• The users (actual and potential users)
• The funding institutions (a university, a community, a commercial firm,
etc.)
• Library staff
• Library managers
Additional stakeholders may be staff representatives and a library board or con-
trolling committee.
The perception of library quality will differ in the stakeholder groups. Users
see library quality according to their experience with the services they use. They
will not care for the efficiency of background processes, but for the effective
delivery of services. The funding or parent institution will be interested in the
library’s benefit to the institution and in the library’s cost-effectiveness. Staff,
on the other hand, will rate the library’s quality by their working conditions, by
adequate offers for further education, and by an efficient organisation.
Users • Access to information worldwide • Delivery of information to the desktop • Speed and accuracy of delivery • Good in-library working conditions • Responsiveness of staff • Reliability of services
Financing authorities • Cost-effectiveness • Clear planning, effective organisation • Positive outcome on users • Benefits for the institution’s goals • Effective cooperation with other institutions • High reputation of the library
Staff • Good working conditions • Clear planning, straight processes • Systematic staff development • High reputation of the library
Not all of the issues named here are indeed criteria of library quality. A good
reputation for instance is rather an effect of quality services, but it is important
for maintaining quality.
Two studies are especially informative when assessing stakeholder percep-
tions of library quality: The New Zealand University Libraries Effectiveness

1. The role of performance indicators in quality management
16
Study8 and a project at Glasgow Caledonian University9. Both studies offered an
extensive list of possible performance indicators to different stakeholder groups
and asked respondents to rate the usefulness of the indicators for judging the
effectiveness of a university library. The stakeholder groups in New Zealand
were
• resource allocators,
• senior library staff,
• other library staff,
• academic staff,
• graduate students,
• undergraduates,
with a subdivision of academics and students into seven subjects like chemistry
or law. The Glasgow project replaced “resource allocators” by “university senior
management team” and subdivided graduate and undergraduate students in part-
time and full-time and academics into research and teaching.
Both projects found that the university management was mostly interested in
issues concerning staff performance and user satisfaction like “competence of
library management”, “helpfulness, courtesy of staff” and “match of open hours
to user needs”, but also in financial issues like the amount and flexibility of the
library budget and the cost-efficiency of the library.
Library staff also showed a strong focus on management issues and on help-
fulness and courtesy of staff. “Other library staff”, being directly involved in
user services, showed a higher identification with user needs than senior staff.
The user groups showed differing priorities. Academics ranked indicators of
expert assistance and document delivery very high, but showed also an interest
in library management and library financing. Student groups placed the empha-
sis on their immediate needs. The availability of seats or of multiple copies of
titles in high demand, longer opening hours and adequate equipment, but also
helpfulness of staff, especially at the reference desk, ranged high.
The existing performance indicators have been devised, tested, and selected
by librarians. That means that they reflect the librarian’s picture of the ideal
library. “In other words, the measures we use tell us, presumably, what it is we
8 Cullen, R. and Calvert, P. J. (1995), Stakeholder perceptions of university library effective-ness, The Journal of Academic Librarianship 21,6, pp. 438-448 9 Crawford, J., Pickering, H. and McLelland, D. (1998), The stakeholder approach to the construction of performance measures, Journal of Librarianship and Information Science
30,2, pp. 87-112

1.3 The model of quality management
17
value in libraries.”10 The view of the funding institutions, of the users or the
general public might not be the same.
The best way for combining the different views will be for libraries to
• assess what their users (or non-users) expect from the services they use
(or do not use because of bad experience),
• ask the funding institution’s opinion about what the library should do and
how it should perform in order to support the institution’s goals,
• try to find measures that assess quality in the sense of stakeholder groups.
1.3 The model of quality management
Managing a library’s quality requires that the special tasks of the library in ques-
tion are clearly defined. A definition of the library’s mission – in consensus with
the authorities – should precede all other steps.
The International Standard ISO 11620 defines “mission” as:
“Statement approved by the authorities formulating the organisation's
goals and its choices in services and products development”
Stating a library’s mission means formally describing the framework within
which the library is to move. The mission statement should specify the primary
user group whom the library intends to serve and what kind of fundamental
services the library intends to offer. It should consider the mission and goals of
the parent institution or community and – as far as possible – not only the pre-
sent needs of its population, but also predictable future demand.
The mission of a library could be summarized as follows:
To select, organize and provide access to information for users, in the first
place for the primary user group, and to further information literacy by
help and training services.
The German benchmarking project BIX11 developed a mission statement for
academic libraries that defined the following tasks (shortened version):
• Mediating information use by
- building a collection that supports learning, teaching and research,
- guiding to the existing literature and information worldwide via portals
10 Cullen, R. (1998), Measure for measure: a post modern critique of performance measure-ment in libraries and information services, IATUL Proceedings 8, available at: http://iatul.org/ conferences/pastconferences/1998proceedings.asp 11 BIX. Der Bibliotheksindex, available at: http://www.bix-bibliotheksindex.de/
1. The role of performance indicators in quality management
18
and bibliographic databases,
- organizing quick delivery or online access for documents not available
locally.
• Producing and preserving information by
- offering an infrastructure for electronic publishing,
- archiving and preserving print and electronic information in the library’s
parent institution,
- indexing, digitizing and promoting its collections for local, national and
international use.
• Supporting teaching and learning by
- offering a place for individual and group work with adequate technical
facilities,
- supporting online and multimedia teaching and learning and remote ac-
cess,
- furthering information literacy via teaching modules and help services.
• Managing the services effectively by
- developing and maintaining innovative technology,
- using adequate management methods for effectiveness and efficiency,
- furthering staff competences by staff training and development,
- cooperating locally, nationally and internationally.
The mission of public libraries is summarized in the IFLA/UNESO public li-
brary manifesto of 199412 that defines as “key missions”:
1. creating and strengthening reading habits in children from an early age;
2. supporting both individual and self conducted education as well as formal
education at all levels;
3. providing opportunities for personal creative development;
4. stimulating the imagination and creativity of children and young people;
5. promoting awareness of cultural heritage, appreciation of the arts, scien-
tific achievements and innovations;
6. providing access to cultural expressions of all performing arts;
7. fostering inter-cultural dialogue and favouring cultural diversity;
8. supporting the oral tradition;
9. ensuring access for citizens to all sorts of community information;
12 IFLA/UNESCO Public Library Manifesto 1994, available at http://www.ifla.org/VII/s8/ unesco/eng.htm

1.3 The model of quality management
19
10. providing adequate information services to local enterprises, associations
and interest groups;
11. facilitating the development of information and computer literacy skills;
12. supporting and participating in literacy activities and programmes for all
age groups, and initiating such activities if necessary.
For each individual library’s mission statement it will be necessary to add the
special tasks of that library, e.g. legal deposit right, archiving functions, tasks in
cooperative programs, or services for special user groups.
Based on the definition of the mission and the general tasks, long- and short-
time goals can be fixed and resources (funds, space, staff time) can be allocated
to the activities that are necessary for attaining the goals. This includes defining
the quality that should be reached in the delivery of services. The goals should
be realistic, achievable within a given time, and the results should be measurable
and comparable over time.
If the general goal is for instance to inform users by comprehensive and cur-
rent online catalogues, the short-time objectives might be
• to eliminate backlogs within a certain period,
• to include separate catalogues for special collections in the online cata-
logue.
After some time, it will be necessary to control whether the goals and the de-
sired quality have been attained. This will probably lead to re-planning and to
redefining goals for the next period.
A simple model of quality management could show like this:

1. The role of performance indicators in quality management
20
Quality management is a recurrent process, a continual revision of goals, proc-
esses, and evaluation. “Effective planning is impossible without an evaluation
component, and evaluation has little practical utility unless the findings are inte-
grated into the planning process.”13
1.4 Performance measurement in the context of quality management
There is today a general demand for transparency, accountability, and quality
assurance in non-commercial institutions. For libraries, it will generally be the
funding institution that wants to see “value for money” and asks not only for
data of input and output, but also for evidence of effective and cost-efficient
delivery of services and products. The library must be able to show how well it
is performing, but also what resources are needed for maintaining or raising its
level of quality. Quality assessment is “…a political weapon in acquiring re-
sources and securing the library’s place in the organisation.”14 It can help to
make libraries “visible” to the financing authorities and to the public.
13 Hernon, P. and Altman, E. (1996), Service quality in academic libraries, Ablex Publ., Nor-wood, NJ, p. 16 14 Brophy, P. and Coulling, K. (1996), Quality management for information and library man-agers, Aslib Gower, Aldershot, p. 157
1.4 Performance measurement in the context of quality management
21
Quality planning needs a measuring instrument to assess whether a library
comes up to its goals. Such an instrument is performance measurement.
Measuring performance means collecting statistical and other data that de-
scribe the performance of the library and analysing these data in order to evalu-
ate the performance. Or, in other words: Comparing what a library is doing (per-
formance) with what it is meant to do (mission) and what it wants to achieve
(goals).
Performance or quality indicators (also called performance measures) have
been developed and applied by libraries since several decades and have been
published in handbooks and standards. The International Standard ISO 11620
defines a performance indicator as “numerical, symbolic or verbal expression,
derived from library statistics and data used to characterize the performance of a
library”. Performance indicators include both simple counts and ratios between
counts.
The criteria for performance indicators are established in the International
Standard 11620. Performance indicators should be
• informative = helpful for identifying problems and possible actions to be
taken,
• reliable = producing the same results when used under the same circum-
stances,
• valid = measuring what they are intended to measure,
• appropriate = compatible with the library's procedures and working envi-
ronment,
• practical = easy to use and understand, applicable with a reasonable
amount of effort in terms of staff time, staff qualifications, operational
costs and users’ time and patience,
• comparable = allowing comparison of results between libraries of similar
mission, structure and clientele.
It could be added that indicators should address only factors that can be con-
trolled or at least influenced by the library.
Performance indicators measure on the one side the effectiveness in deliver-
ing services to users and on the other side the cost-effectiveness, the efficient
use of existing resources. Quality would then mean that a service is “good” as
well as “cheap”.
The reasons for measuring performance are manifold. For library manage-
ment, quality assessment will support the improvement of services and products
and will help to demonstrate the library’s effectiveness to funding institutions
and the public. An additional “outcome” of the measurement process will be that

1. The role of performance indicators in quality management
22
staff will get a better overview of the different aspects of services, of the goals to
be achieved and the ways to reach them. There will be awareness of the way the
library functions. “The key purpose of performance measurement, sometimes
forgotten, is to influence people – their behaviour and their decision-making”.15
1.5 The choice of indicators
The first step for a library will be to choose a set of performance indicators that
corresponds to its mission and goals. The indicators should also refer to the
mission and goals of the library’s parent institution and show the library’s sup-
port for the institution’s goals.
Not all libraries will be allowed to choose those performance indicators that
they think most appropriate. If there is an evaluation program for libraries or-
ganized by government or other authorities, or if the library’s parent institution
engages in a specified evaluation program, the evaluation processes and meas-
ures will be prescriptive. It may therefore be expedient for libraries to take the
initiative and present methods by which they want to demonstrate their effec-
tiveness. If groups of libraries use a joint evaluation system, e.g. a benchmarking
system on a national scale, this might help to avoid measures imposed on them
by external institutions.
Different libraries will have different missions. Even in libraries in higher
education that apparently have the same goals, there will be differences as to
• the structure of the clientele,
• the research subjects of the institution,
• the level of research and teaching,
• special tasks like a collection of rare material.
There is no objective standard for library “goodness”, though standards have
been developed for different types of libraries. The concept of quality may be
different for each library, and measures must be selected according to that con-
cept and the special tasks. In addition, the library’s mission and tasks may
change over time, e.g. by
• certain subjects being deleted from or added to the curriculum,
• new tasks like teaching information literacy being added,
• other libraries taking over tasks of the library.
15 Winkworth, I. (1998), Making performance measurement influential, Proceedings of the 2
nd
Northumbria International Conference on Performance Measurement in Libraries and Infor-
mation Services, Information North, Newcastle upon Tyne, p. 93

1.6 Staff involvement
23
Generally, a set of indicators should be chosen that allow an overall view of the
library, including traditional and electronic services, and that show the interac-
tion of the different services.
Normally, libraries will not start measuring performance by systematically
using all indicators described in a handbook or standard. Rather, the library will
first be interested in using only a few indicators for specified services, because
• users complain about specific services,
• staff suggests that a particular service might be improved,
• library statistics point to decreasing use of certain services,
• the introduction of new technology or budget restraints imply organisa-
tional changes.
In such cases, the choice of indicators will be determined by the results that the
library wants to obtain from the evaluation. But isolated evaluation of only one
service or aspect might lead to wrong perceptions.
Example: • The processing speed of media is measured and proved to be high. • But: Both the availability of required media and the overall collection use are low.
Apparently the wrong titles are purchased – but processed efficiently.
Performance indicators evaluate different services or activities of a library, but
there may be interdependencies. Trying to achieve a higher score for one indica-
tor may affect the score of another indicator.
Example: A high percentage of library funds spent on acquisitions can mean lower expenditure for staff and therewith a lower rate of “staff per capita”.
The library will have to decide on priorities, but the results of indicators can
support such decisions.
1.6 Staff involvement
After choosing the appropriate indicators for the individual library, it is impor-
tant to involve staff in the measurement project, especially those persons that are
actually responsible for the service that is evaluated. Staff members could sug-
gest possible problems bound up with the measurement process or could help to
adapt the method to the specific circumstances of the library.
It should be made quite clear that performance indicators measure the quality
of the library’s services, not the performance of individual persons. Data about

1. The role of performance indicators in quality management
24
staff performance like in indicator C.9 “Employee productivity in media pro-
cessing” in this handbook should be summarized.
Yet, staff may be concerned about the implications of the measuring process.
They feel that the efficiency of their department may be questioned, and that
there might be organisational changes starting from the results that can affect
their individual area of responsibility.
It is necessary, therefore, to
• reach consensus with staff about the mission and goals of the library,
• inform staff representatives at an early stage of the planning,
• give constant feedback to all staff members affected by a measuring proc-
ess or the results,
• discuss and analyze results with staff,
• develop strategies for improvement together with staff,
• ensure data protection,
• establish transparency about the reasons for measuring and the expected
gains.
1.7 Using the results
It is crucial that the results of the measuring process find their way into the or-
ganisation and procedures of the library. Too often, performance measurement
seems to be an end in itself, the results being stored without practical effects.
Above all, the staff members must be informed about the results of the often
tedious measuring procedures. A short summary illustrated with diagrams and
stating the conclusions drawn from the project and the actions to be taken will
be interesting to all staff, even if they are not directly affected by the measures.
This will also help to overcome possible reservations in regard to performance
measurement.
If the indicator has been used before by the library, it will be informative to
compare with former results in order to evaluate the effect of activities taken
after the first measuring. It will also be useful to identify changes in the library’s
working environment that occurred in the meantime and that might have af-
fected the results of the second measuring.
The interpretation of the results should – if possible – include comparison
with scores of the same indicator obtained in other libraries of similar structure
and clientele. “In using performance measures for planning and evaluation one
needs to know how one library compares with another in order to determine
what the figures ‘should be’, and whether particular figures are ‘high’ or ‘low’.

1.7 Using the results
25
This is particularly important when dealing with the library’s public and provid-
ers of finance.”16 Such comparisons should consider special goals and conditions
of a library that may make it impossible to obtain the same results as other li-
braries. For example, a library whose mission includes archival functions cannot
have the same results in the indicator “Collection use” as a library that can weed
its collection regularly. The rating whether a score is “good enough” for the
library will depend on the library’s mission and goals, that is on what services
the library has to offer, and what range of services is adequate to its clientele.
But comparison with other libraries will help to get a broader view of the li-
brary’s own results.
Using a performance indicator will not directly show what activities could be
taken in order to achieve higher effectiveness or efficiency for the service that
was evaluated. There is not always a clear-cut correlation between cause and
effect. “…the reason that the term ‘performance indicator’ is generally preferred
to ‘performance measure’ is that interpretation is always necessary. The figures
produced are indicative of a situation which may need to be investigated or
monitored.”17
Insufficient scores of indicators can be due to manifold issues:
• Inadequate knowledge of the population’s needs
• Lack of staff skills
• Insufficient staffing for a service
• Insufficient promotion of the services
• Users’ lack of competences or of knowledge about the library’s services
and procedures
• Other libraries nearby supplying services to the library’s clientele
• Inefficient workflows
• Insufficient degree of automation
• Inadequate buildings
• Legal regulations that do not allow flexible use of resources
• Low priority of the service that was evaluated in the library’s policy
Not all of these issues can be influenced by the library.
Libraries would probably see insufficient resources as first reason for poor
performance. But additional resources will not lead to higher quality, if man-
agement issues are not considered at the same time, and in many cases better
performance can be reached without additional resources.
16 Revill, D. (1990), Performance measures for academic libraries, in Kent, E. (Ed.), Encyclo-pedia of Library and Information Science, Vol.45, Suppl.10, Dekker, New York, Basel, p. 322 17 Brophy, P. (2005), The academic library, 2nd edition, Facet, London, p. 189

1. The role of performance indicators in quality management
26
Actions to be taken in case of bad results relate in the first place to organisa-
tional changes. In close collaboration with the staff directly involved in the ser-
vices that were evaluated, workflows and procedures should be reconsidered.
Staff will probably be able to name training issues, additional equipment, or
changes in the organisational structure that would help them to perform better.
The experience of performance measurement will awake sensibility for possible
improvements in the library’s services.
In most cases, organisational changes should not be addressed after the first
use of an indicator. It will be useful to repeat the measurement after some time
in order to make sure that the time of measurement or special conditions during
the measuring process have not influenced the score.
While the results of performance measurement will in the first place be used
for management decisions in the library, they will also be extremely useful when
reporting to authorities or applying for funding. If a library uses standardized
indicators or joins in a benchmarking project, this will make the results more
convincing for the funding institutions.
The results should also be presented to the library’s population or clientele.
Especially the users who have actively taken part in a study, e.g. via question-
naires, have a right to know the outcome of the study. Results should be pub-
lished even if they are worse than expected. In that case special emphasis should
be placed on the initiatives to improve the situation. If the scores are good, the
presentation of the results will be an effective public relations tool for the li-
brary.
All stakeholder groups – library staff, the library’s parent organisation or
funding authority, the library’s clientele – should be acquainted not only with
the results of performance measurement, but also with the actions taken in con-
sequence of the results and with the improvements achieved by such actions.
“Measurement is a political activity.”18
1.8 The present state of performance measurement
In the literature about quality assessment in libraries, there have been frequent
complaints about a lack of reports on practical use of performance indicators
opposed to a broad theoretical discussion on the merits or problems of perform-
ance measurement. Though this situation has become somewhat better in the last
18 Cullen, R. (1998), Measure for measure: a post modern critique of performance measure-ment in libraries and information services, IATUL Proceedings 8, available at: http://iatul.org/ conferences/pastconferences/1998proceedings.asp

1.8 The present state of performance measurement
27
ten years, there is still a majority of articles concerned with the theory of quality
assessment, asking for better and more qualitative measures or for new topics to
be addressed in measuring. But while there is already a demand for a “new gen-
eration” of performance indicators19, including indicators of impact and out-
come, there seems to be still a lack of knowledge about how to choose and use
indicators for the evaluation of library services.
Yet evidently the usefulness of performance measurement has by now been
recognized worldwide. Though there are few reports about the use of special
indicators, this could mean that some indicators (e.g. availability or collection
use) are so well established that libraries do not publish the results every time
they use them.
That quality measures have been accepted as an important management in-
strument is probably not least due to the Northumbria International Conference
on Performance Measurement in Libraries and Information Services, which
since 1995 every two years assembles experts of quality management world-
wide. This conference and its journal20 have certainly acted as communication
centre for projects on development and use of performance indicators and have
supported the promotion of quality measurement in theory and practice.
The proceedings of the Northumbria conference clearly show the develop-
ment of quality assessment in the last ten years and the growing interest for
topics like
• user-orientation as focal point,
• assessment of stakeholder views,
• qualitative measures as a necessary complement to quantitative measures
(though qualitative measures must be made quantifiable in order to be
convincing),
• impact and outcome measures as a step beyond input and output meas-
ures.
Use of performance indicators has proceeded from individual libraries using
certain indicators for their specific problems to joint benchmarking projects of
library groups on a regional or even national scale.21 There are quite a number of
19 see e.g. Brophy, P. (2002), Performance measures for 21st century libraries, Proceedings of
the 4th
Northumbria International Conference on Performance Measurement in Libraries and
Information Services, Association of Research Libraries, Washington DC, pp. 1-7 20 Performance Measurement and Metrics, Vol.1 (2000) ff. 21 Poll, R. (2007), Benchmarking with quality indicators: national projects, Performance
Measurement and Metrics 8,1, pp. 41-53

1. The role of performance indicators in quality management
28
projects now where groups of libraries have found consensus on a set of indica-
tors that they use regularly, some already since several years. Examples are:
BIX –Library Index22
German public and academic libraries (two separate sets of indicators) Public libraries 1999 ff., academic libraries 2002 ff.
CASL (Council of Australian State Libraries) 23
Public libraries 1998 ff.
Swedish Quality Handbook24
All types of libraries 3-years project 2001-2004; continuation not decided
HELMS (UK Higher Education Library Management Statistics) 25
Academic libraries 1997/98 ff.
Benchmarking of the Netherlands University Libraries26
University libraries 1999 ff.
Norwegian indicators27
Academic and public libraries New project starting 2007
The problem for such joint projects is to reach consensus on a list of perform-
ance indicators that consider the goals and special tasks of each participating
library. Libraries often restrict themselves to “measuring the measurable”. When
discussing a possible set of indicators in a group of libraries, the main question
22 BIX. Der Bibliotheksindex, available at: http://www.bix-bibliotheksindex.de/ 23 Australian Public Libraries Comparative Report 1998-2004, available at: http://www.nsla. org.au/publications/statistics/2004/pdf/NSLA.Statistics-20040701-Australian.Public.Library. Comparative.Report.1998.2004.pdf 24 Edgren, J. et.al. (2005), Quality handbook, performance indicators for library activities, The Swedish Library Association’s Special Interest Group for Quality Management and Statistics, available at: http://www.biblioteksforeningen.org/sg/kvalitet/handbook_eng.html 25 UK Higher Education Library Management Statistics 2003-2004 (2005), Sconul, London 26 http://www.ukb.nl/benchmark.htm; see also Laeven, H. and Smit, A. (2003), A project to benchmark university libraries in The Netherlands, Library Management 24, 6/7, pp. 291-304 27 Forslag til indikatorer for fag- og folkebibliotek (2007), version 4.0, ABM-utvikling, Oslo, available at: http://www.abm-utvikling.no/bibliotek/statistikk-for-bibliotek/indikatorer-for-fag-og-folkebibliotek

1.8 The present state of performance measurement
29
is always whether the data could be taken from existing (national) library statis-
tics, and what time would be needed for the measuring process. But some im-
portant questions cannot be addressed by taking only data from the automated
system, a turnstile, or the institutional member statistics and nearly all joint li-
brary projects mentioned before have also used indicators that require additional
data collection.
It is interesting to see that though the projects differ in the sets of indicators
they deem most important, yet they address the same topics, and most indicators
are taken form existing handbooks or the ISO standard 11620, so that results
become comparable between library groups and countries. Using such standard-
ized methods does not only allow benchmarking, but will give the individual
library more confidence in its measuring process and will add reliability to the
data when reporting to funding institutions.


31
2. Indicators of impact or outcome
2.1 Impact/outcome of libraries
Libraries have always been able to calculate the input into their services (fund-
ing, staff, collections, space, equipment) and the output of those services (loans,
visits, downloads, reference transactions, etc). Measures have also been devel-
oped for assessing the quality of library services and the cost-efficiency of the
library’s performance. Performance measurement evaluates whether a library is
effective and efficient in delivering its services.
But quantity of use and quality of performance do not yet prove that users
benefited from their interaction with a library. Measuring impact or outcome
means going a step further and trying to assess the effect of services on users
and on society. “Impact” and “outcome” are often used synonymously in the
professional literature, but “outcome” is also used for the output/usage of library
services (e.g. a user reading a book), while “impact” is also seen as the broader
term, denoting changes in users (e.g. the user gaining knowledge).28
Outcome or impact means that there is a change in a user’s skills, knowledge, or
behaviour.
“Outcomes are the results of library use as affecting the individual
user.”29
“Outcomes are the ways in which library users are changed as a result of
their contact with the library’s resources and programs.”30
What changes can a library effect in users? Using library services can further
28 Brophy, P. (2005), The academic library, 2nd edition, Facet, London, p. 189 29 Revill, D. (1990), Performance measures for academic libraries, in Kent, E. (Ed.), Encyclo-pedia of Library and Information Science, Dekker, New York, Basel, Vol.45, Suppl.10, p.316 30 ACRL. Association of College and Research Libraries. Task Force on Academic Library Outcomes Assessment Report. June 27 1998, available at: http://www.ala.org/ala/acrl/ acrlpubs/whitepapers/taskforceacademic.htm

2. Indicators of impact or outcome
32
• knowledge,
• information literacy,
• democracy (access to information for all),
• higher academic or professional success,
• social inclusion (e.g. of elderly people or immigrants),
• lifelong learning,
• individual well-being.
Short-term effects even of a single library visit may be that users find relevant
information, can solve a problem, save time in their work, gain searching skills
and self-reliance in using information.
Long-term effects of using library services could be permanently higher in-
formation literacy, higher academic or professional success, changes in attitudes
and motivation (e.g. motivation to read), and changes in information behaviour
(e.g. using a broader variety of information resources).
The changes could be seen as a pyramid, going from cognitive impacts
(knowledge acquisition) to changes in attitudes and opinions and lastly to
changes in behaviour.
2.2 Methods for assessing impact/outcome
For several years, projects worldwide have tried to find methods for proving an
outcome of library services.31 The main problem for such methods is that influ-
ences on an individual are manifold and that therefore it is difficult to trace
changes and improvements in users back to the library. Nevertheless, there are
quite a number of possible methods that have already yielded interesting results.
They can be roughly differentiated into quantitative and qualitative methods.32
Qualitative (“soft”) measures, developed in social science, try to assess out-
comes by evaluating users’ experiences and opinions. Methods used are:
• Surveys (print, telephone, or online)
• Interviews
• Focus groups, discussion groups
• Users’ self-assessment of skills and competences gained
31 An overview of ongoing research is given in: Poll, R., Bibliography “Impact and outcome of libraries”, available at: http://www.ulb.uni-muenster.de/outcome 32 Poll, R. and Payne, P. (2006), Impact measures for libraries and information services, Li-
brary High Tech 24,2, pp. 547-562, available at: http://conference.ub.uni-bielefeld.de/2006/ proceedings/payne_poll_final_web.pdf

2.2 Methods for assessing impact/outcome
33
The methods have not only been used with actual library users, but also with
non-users and the general public in order to gain estimates of potential outcomes
of libraries.
In surveys, interviews or discussion groups, users and non-users are asked for
• direct benefit from using library services,
• potential benefits from using libraries or a specified library,
• indirect (potential) benefit of a library’s existence, (e.g. free access to in-
formation, cultural life in the community, children’s literacy, social inclu-
sion),
• potential value of libraries for future users (e.g. preservation of the na-
tional documentary heritage).
Users’ self-assessment of their benefits has proved less reliable, as users tend to
over-estimate the competences gained.
Qualitative methods have been frequently used in public libraries in order to
show their social impact and local importance.33 Such qualitative methods will
deliver a rich fund of “stories” that show what users think about actual or poten-
tial benefits of libraries. This “anecdotal evidence” helps to elucidate and cor-
roborate the results of quantitative measuring, but it should be organized and
made quantifiable to be convincing. The Museums, Libraries and Archives
Council, London, cites such quantified results in a conspicuous place on its web-
site, e.g.:
“70% of children believe that a library is one of the best places to learn,
outside school.” 34
It should always be kept in mind that results gained by qualitative methods will
have a subjective bias. They show the “perceived benefit”, but do not prove
benefit. They should therefore be compared with results of quantitative methods
or with statistics of library usage in order to validate the results.
Quantitative methods try to obtain tangible data for a change in user compe-
tences or behaviour or to find correlations between library use and a person’s
academic or professional success. The following methods have been used:
33 Bohme, S. and Spiller, D. (Ed.) (1999), Perspectives of public library use 2. A compendium of survey information, Library & Information Statistics Unit (LISU), Loughborough; Debono, B. (2002), Assessing the social impact of public libraries : what the literature is saying, Aus-
tralasian Public Libraries and Information Services 15,2, pp. 80-95; Linley, R. and Usher-wood, B. (1998), New measures for the new library: a social audit of public libraries, British
Library Research and Innovation Centre Report 89, British Library Board, London 34MLA. Museums, Libraries and Archives Council, available at: http://www.mla.gov.uk/

2. Indicators of impact or outcome
34
• Tests that assess user skills before and after a library training lesson or the
use of library services
• Performance monitoring/data mining
• Unobtrusive observation of users
• Analysis of citations in course work or research publications over years
• Comparison of success data with data of library use
Tests for assessing changes in users’ skills and competences are today widely
applied in libraries, especially for evaluating the learning outcome of a library’s
information literacy training. Such tests can be used before and after a training
session or a series of training sessions in order to show differences in the compe-
tence of finding and evaluating relevant information. Tests for measuring train-
ing impact will be compulsory when a library’s information literacy modules are
included in the curriculum of its institution.35
Performance monitoring, data mining and unobtrusive observation have been
used for tracing users’ searching procedures, their search terms, and their use of
help functions. These methods can show successes, failures and problems. When
the study is repeated regularly, results may trace quantifiable changes in the
searching skills of users.
Analysis of bibliographies in users’ papers, especially in doctoral disserta-
tions, has been used for two different purposes:
1. To assess the importance of the local library for research and study: The
citations in research papers are compared with the local collection (includ-
ing electronic resources licensed by the library). The results show how far
the materials cited in the papers have been (or could have been) accessed
via the local library and thus whether the local library offers sufficient
material for research.36
35 For literature on the outcome of information literacy training see: Poll, R., Bibliography “Impact and outcome of libraries”, Part 3, available at: http://www.ulb.uni-muenster.de/out come 36 Ahtola, A. A. (2002), How to evaluate and measure the impact of the library’s collection on the learning outcome? 68th IFLA Council and General Conference, available at: http://www.ifla.org/VII/s2/conf/ahtola.pdf; Kayß, M. and Poll, R. (2006), Unterstützen Bib-liotheksbestände die Forschung? Zitatanalyse in Dissertationen, B.I.T. online 2006,2, avail-able at: http://www.b-i-t-online.de/archiv/2006-02-idx.html; Smith, E. T. (2003), Assessing collection usefulness: an investigation of library ownership of the resources graduate students use, College & Research Libraries 64, pp. 344-355

2.3 Assessing the financial value of libraries
35
2. To show whether there are changes over time or after library training ses-
sions as to the accuracy of citations, the currency of cited titles, the type
of resources used or the number of electronic resources cited.37
It would of course be most interesting to funding institutions to know whether
library services positively influence the academic or professional success of
users. For assessing such influence, data as to the frequency of library use and
the type of services used are set in relation to data about the same persons’ suc-
cess. This method has especially been used for students’ success, described by
data like
• duration of studies,
• grades in exams,
• student persistence (retention),
• employment rates after exams.
A number of projects worldwide have tried to find a correlation between the use
of library services and the success of users.38 Problems occur when data protec-
tion rules forbid the use of personal data, but even comparing groups of users
has yielded valid results in some cases.39
2.3 Assessing the financial value of libraries
In the frame of outcome assessment, libraries have also tried to “measure” their
economic value. The funding that is necessary for libraries (collections, build-
ings, equipment, and especially staff) constitutes a considerable factor in the
budget of universities or communities, and funding institutions and the taxpay-
ers will want to see whether investment in libraries yields “value for money”.
Libraries have tried to answer this question, including the actual and the po-
tential economic benefit as well for single users as for the general public. As
most library services have no equivalent on the common market and therefore
37 Emmons, M. and Martin, W. (2002), Engaging conversation: evaluating the contribution of library instruction to the quality of student research, College and Research Libraries 63, pp. 545-560; Tunón, J. and Brydges, B. (2006), Improving the quality of university libraries through citation mining and analysis using two new dissertation bibliometric assessment tools, World Library and Information Congress: 71th IFLA General Conference and Council, available at: http://www.ifla.org/IV/ifla71/papers/078e-Tunon_Brydges.pdf 38 see: Poll, R., Bibliography “Impact and outcome of libraries”, Part 4, available at: http:// www.ulb.uni-muenster.de/outcome 39 de Jager, K. (2002), Impacts and outcomes: searching for the most elusive indicators of academic library performance, Proceedings of the 4th Northumbria International Conference
on Performance Measurement in Libraries and Information Services, Washington DC, Asso-ciation of Research Libraries , pp. 291-297

2. Indicators of impact or outcome
36
no "market prices“ for services can be determined, two other ways have been
tried for assessing the economic value of libraries:
• Assessing time costs ("replacement value of a client's time")
• Using the contingent valuation method
Measuring time costs starts from the assumption: When users invest time and
effort in order to use library services the financial value that they - or their insti-
tution - place on that use must be at least as high as their "sacrifice“ of time. The
time costs of library usage are calculated by multiplying the time users spend on
library services with the average salary costs of the population served by that
library. The problems of this method are that in many cases it will not be possi-
ble to calculate average salaries, e. g. for students, and that the time costs of
library usage might as well be seen as just another cost factor, not as a financial
value achieved by the library.
More promising is the contingent valuation method that has been developed
for assessing the financial value of non-profit organisations and services, espe-
cially for projects in health care, environmental protection, education or cul-
ture.40 Persons that would be directly or potentially interested in a specified
organisation or its services are asked to rate the value of the organisation or
service in financial terms, expressed by their “willingness-to-pay” or “willing-
ness-to-accept”. For assessing the financial value of libraries, the questions
could be:
• Willingness-to-pay: What would you pay for maintaining this library/this
particular library service?
• Willingness-to-accept: Which sum would you accept as an equivalent if
this library/this particular library service were given up?
Usually, the interviewees are given options between sums they would pay (e.g.
in higher taxes) or accept (e.g. in lower taxes). The problem of this method is
that people are asked to financially rate services or institutions that they never
thought of in terms of money. The contingent valuation method has already been
frequently applied for public libraries.41 The British Library used this method
40 see e. g. Mitchell, R. C. and Carson, R. T. (1993), Using surveys to value public goods, the contingent valuation method, Resources for the Future, Washington 41 Aabø, S. (2005), The value of public libraries in Norway, Bibliotekforum 6, pp. 38-40; Holt, G. E., Elliott, D. and Moore, A. (1999), Placing a value on public library services, Public
Libraries 38, pp. 89-108; Morris, A., Hawkins, M. and Sumsion, J. (2001), The economic analysis of public libraries, Library and Information Commission Research Report 89, British Library, London
2.4 Impact/outcome assessment and performance measurement
37
with the impressive result that for every £1 of public funding that the British
Library receives each year, £4.4 are generated for the national economy.42
2.4 Impact/outcome assessment and performance measurement
Performance measures assess the quality of library services, either by quantita-
tive data or by users’ perception of the quality. Assessing impact or outcome
tries to find out whether library services have an identifiable effect on users.
It might be assumed that services with good quality (speed, reliability, user-
orientation) will have more positive impact on users than services with poor
performance. If outcome assessment shows that the outcomes that the library
intends to achieve are not reached, performance measurement can help to iden-
tify problems or failures in the service delivery that may lead to minimally posi-
tive or even negative outcome on users.
Information literacy training is a good example for showing relations be-
tween impact and performance assessment. If attendants of training sessions do
not show higher skills in tests after the training, the library could use satisfaction
surveys in order to find reasons for poor impact. It could also use indicator B.10
“Attendances at training lessons per capita” to see whether the lessons attract a
sufficient part of the population.
Another example is the relation between library use and academic success of
users. If the results of such comparison show that students with high success
have not used library services frequently, again satisfaction surveys will help to
detect reasons for non-use of certain services. The library might then apply
specified indicators for measuring the quality of those services in order to see
whether insufficient service delivery has influenced the use of services and thus
impeded possible positive outcomes on users.
2.5 Projects of outcome assessment
A number of projects worldwide are trying to find methods, measures, and tools
for assessing impact/outcome of libraries and information services.
• The eVALUEd Project, based within the evidence base at the University
of Central England, was set up to develop a transferable model for e-
42 Pung, C., Clarke, A. and Patten, L. (2004), Measuring the economic impact of the British Library, New Review of Academic Librarianship 10,1, pp. 79-102

2. Indicators of impact or outcome
38
library evaluation in higher education. The project produced a toolkit for
evaluating electronic information services43.
• IMLS (Institute of Museum and Library Services) fosters outcome-based
evaluation of projects.44
• The New Measures Initiative of ARL (Association of Research Libraries)
includes several outcome-related programs45:
- Learning Outcomes
- Higher Education Outcomes Research Review
- MINES (Measuring the Impact of Networked Electronic Services)
• IBEC, a joint research initiative of the Information School of the Univer-
sity of Washington and the University of Michigan School of Information
has developed a toolkit for assessing the impact of information in com-
munities.46
• SCONUL (Society of College, National and University Libraries) and
LIRG (Library and Information Research Group) have started an impact
initiative. 47
43 available at: http://www.evalued.uce.ac.uk/index.htm 44available at: http://www.imls.gov/index.shtm 45available at: http://www.arl.org/stats/initiatives/index.shtml 46 available at: http://ibec.ischool.washington.edu/default1024.aspx?cat=Home&b=y 47 available at: http://www.sconul.ac.uk/groups/performance_improvement/impact2.html

39
3. Overview of the indicators
The set of indicators used in this handbook has many sources and has developed
over time. The 17 indicators in the first edition, considering only academic li-
braries, were based on the existing literature, on the results of IFLA sessions in
1989 and 1990, and on practical tests undertaken by the authors. These indica-
tors were partly adopted by the project EQLIPSE (1995-1998), a European
Commission funded research project for quality management and performance
measurement in libraries,48 and also by the ISO group that edited the first inter-
national standard on performance measurement in libraries.49 The authors of this
handbook cooperated in both projects.
Up to 1998, performance measurement had mainly considered the traditional
library services. The next step was again initiated by a project of the European
Commission: EQUINOX (1998-2000)50, where nearly the same partners as in
EQLIPSE tested performance indicators for electronic library resources and
services. The result was a list of 14 indicators that greatly influenced interna-
tional quality measurement in libraries, especially the ISO Technical Report for
performance measures in electronic library services.51
In 1999, a German project for controlling in academic libraries was funded
by the German Research Foundation and chaired by the University Library
Münster. This project adapted the Balanced Scorecard, developed for the com-
mercial sector by Kaplan and Norton, for the use in libraries. The performance
indicators used in the project relied only partly on the work done before, as new
indicators had to be developed in order to cover all perspectives of the Balanced
Scorecard, especially the perspective “potentials and development”. The project
resulted in a handbook in 2002.52
48 EQLIPSE. Evaluation and quality in library performance: system for Europe, 1995-1997, available at: http://www.cerlim.ac.uk/projects/eqlipse/ 49 ISO 11620 (1998), Information and documentation – Library performance indicators 50 EQUINOX. Library performance measurement and quality management system, 1998-2000, available at: http://equinox.dcu.ie/ 51 ISO TR 20983 (2003), Information and documentation – Performance indicators for elec-tronic library services 52 Ceynowa, K. and Coners, A. (2002), Balanced Scorecard für wissenschaftliche Bibliothe-ken, Zeitschrift für Bibliohekswesen und Bibliographie, Sonderheft 82, Klostermann, Frank-furt a.M.

3. Overview of the indicators
40
Many ideas and indicators of this controlling handbook were then taken over
by the German benchmarking project BIX.53 BIX had been started for public
libraries in 1999 by the Bertelsmann Foundation in cooperation with the German
Library Association. Data are collected and published annually. In 2002, the
project was widened to academic libraries. The 17 indicators used for academic
libraries are grouped in the perspectives of the Balanced Scorecard.
In 2004, work started on the revision of the International Standard ISO
11620. The goal was to combine performance indicators for traditional and elec-
tronic library services, if possible in “merged” indicators. The German example
led to the adoption of the Balanced Scorecard and of the newly developed indi-
cators for potentials and development. The ISO standard will probably be pub-
lished later in 2007.
Thus, influences on this handbook have been manifold, going to and fro from
the national to the international level, and there was a broad selection of indica-
tors to choose from. And yet, the authors decided to develop and test two new
indicators, as some crucial aspects seemed to be missing: One indicator for the
quality of the library website, another for the overall cost per case of usage,
including traditional forms of use (loans, in-house use) as well as downloads.
In order to avoid naming the general sources at each indicator, a list of the
indicators with the main sources was added as Annex 2.
53 BIX. Der Bibliotheksindex, available at: http://www.bix-bibliotheksindex.de/

41
4. Description of the indicators
Each indicator is presented in the standard format described below.
4.1 Name
Each indicator has a unique, descriptive name.
4.2 Background
The background statement describes the present state and importance of the
service, activity or aspect the indicator is meant to measure.
The statement shows what is regarded as quality in the service, activity or as-
pect in libraries and what measures/indicators have as yet been used for assess-
ing quality.
4.3 Definition
The definition describes the data that are necessary for the indicator and their
relation.
Definitions of the data elements used rely for the most part on ISO 2789.54 If
terms are used in a specified sense in the frame of an indicator, the special defi-
nition is given.
Unambiguous terms used in the customary sense are not defined.
4.4 Aims of the indicator
Explains what the indicator is meant to measure in relation to the library’s goals.
Describes what types of services or activities would benefit most from using
the indicator and limitations in the application of the indicator.
Explains under what circumstances comparison of results with other libraries
may be possible.
54 ISO 2789 (2006) Information and documentation – International library statistics, Interna-tional Organisation for Standardization, Geneva

4. Description of the indicators
42
4.5 Method(s)
The method statement describes the way of collecting the data and of calculating
the results.
If more than one method has proved effective for the same purpose, several
methods are described.
If possible, the descriptions of methods indicate the effort necessary for
preparation, data collection and analysis of results.
4.6 Interpretation and use of results
The interpretation statement discusses what the results may point to, especially
reasons for low effectiveness. It points to difficulties and to circumstances that
could affect the results.
The statement names possible reactions to the results in order to achieve bet-
ter results and explains what other indicators might be useful in the same con-
text.
The interpretation statement may include information about the variability to
be expected, such as seasonal variations or variations in time of day.
4.7 Examples and further reading
References are supplied to document the source of the indicator or of similar
indicators.
If possible, examples are given of results when using this or a similar indica-
tor, in order to show the range of scores that may be possible and to help librar-
ies in interpreting their own results.

43
5. List of indicators
The definitions in the indicators follow for the most part the International Stan-
dard ISO 2789 (2006) Information and documentation – International library
statistics.
The description of methods in the indicators relies partly on the newest draft
of the International Standard ISO DIS 11620 (2006) Information and documen-
tation – Library performance indicators.
The indicators are presented in the perspectives of the Balanced Scorecard
and within those along the service areas. The Balanced Scorecard as defined for
commercial institutions had originally four perspectives: users, finances, proc-
esses, and learning and development. Here, as in the standard 11620 and the
German project BIX, these perspectives are adapted to libraries as follows:
• Resources, infrastructure
• Use
• Efficiency
• Potentials and development
Using the structure of the Balanced Scorecard helps to consider all relevant
management issues and to establish a “balance” between user-orientation and
cost-effectiveness, effective organisation and the ability to cope with future
developments
A. Resources, infrastructure: What services does the library offer?
The aspect “Resources/infrastructure” is represented by 10 indicators. The li-
brary’s attractiveness as place for learning and research is defined by the size of
the user area, the availability of user workplaces and by the opening hours. The
quality of the collection is measured by the acquisitions expenditure per capita,
by a comparison of giving and taking in interlibrary lending and by the avail-
ability of requested media (Indicators A.5, A.6, and A.8). Staff resources and
website quality are each represented by one indicator.
Library as place for learning and re-search
A.1. User area per capita
A.2. Seats per capita A.3. Opening hours compared to demand Collections A.4. Expenditure on information provision per capita
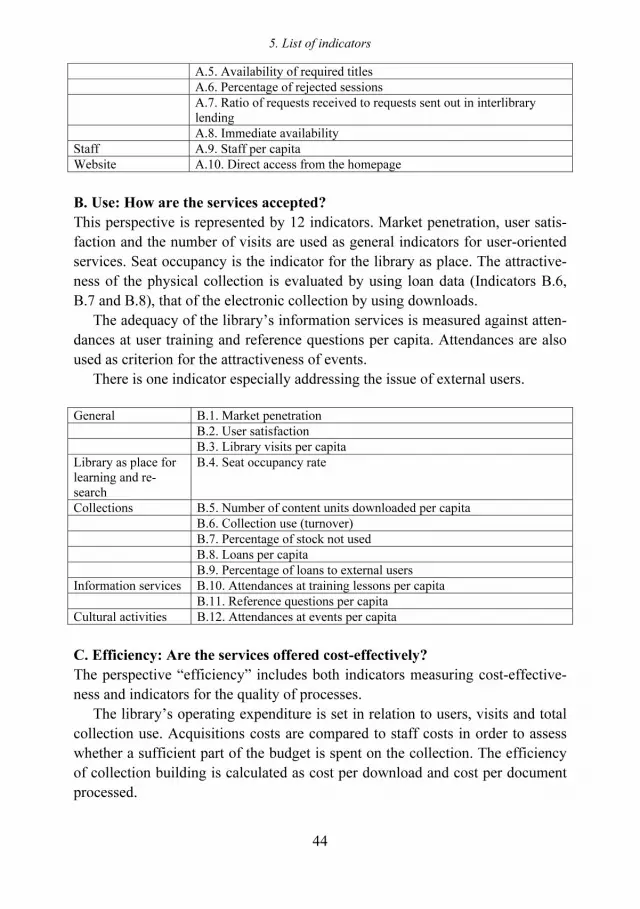
5. List of indicators
44
A.5. Availability of required titles A.6. Percentage of rejected sessions A.7. Ratio of requests received to requests sent out in interlibrary
lending A.8. Immediate availability Staff A.9. Staff per capita Website A.10. Direct access from the homepage
B. Use: How are the services accepted?
This perspective is represented by 12 indicators. Market penetration, user satis-
faction and the number of visits are used as general indicators for user-oriented
services. Seat occupancy is the indicator for the library as place. The attractive-
ness of the physical collection is evaluated by using loan data (Indicators B.6,
B.7 and B.8), that of the electronic collection by using downloads.
The adequacy of the library’s information services is measured against atten-
dances at user training and reference questions per capita. Attendances are also
used as criterion for the attractiveness of events.
There is one indicator especially addressing the issue of external users.
General B.1. Market penetration B.2. User satisfaction B.3. Library visits per capita Library as place for learning and re-search
B.4. Seat occupancy rate
Collections B.5. Number of content units downloaded per capita B.6. Collection use (turnover) B.7. Percentage of stock not used B.8. Loans per capita B.9. Percentage of loans to external users Information services B.10. Attendances at training lessons per capita B.11. Reference questions per capita Cultural activities B.12. Attendances at events per capita
C. Efficiency: Are the services offered cost-effectively?
The perspective “efficiency” includes both indicators measuring cost-effective-
ness and indicators for the quality of processes.
The library’s operating expenditure is set in relation to users, visits and total
collection use. Acquisitions costs are compared to staff costs in order to assess
whether a sufficient part of the budget is spent on the collection. The efficiency
of collection building is calculated as cost per download and cost per document
processed.
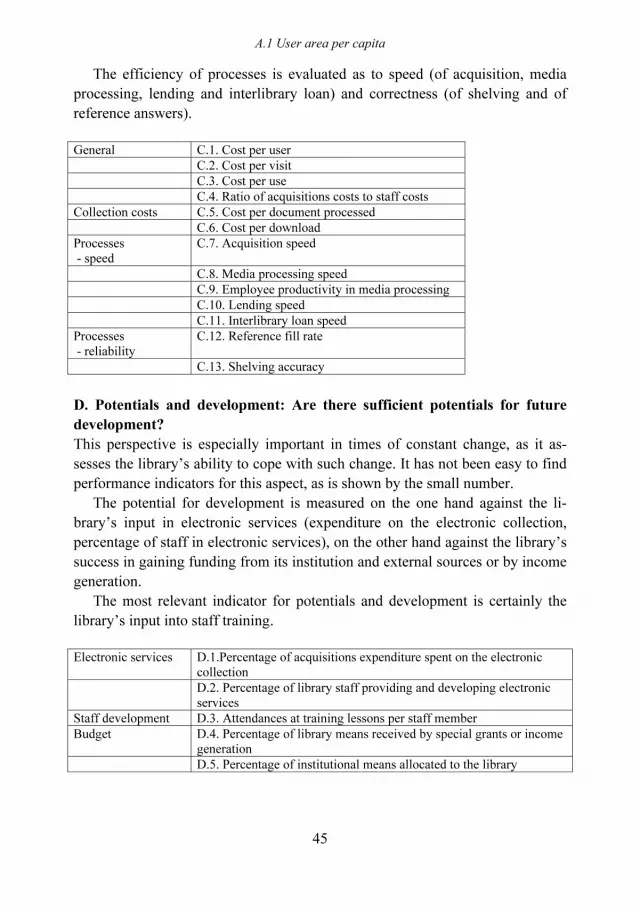
A.1 User area per capita
45
The efficiency of processes is evaluated as to speed (of acquisition, media
processing, lending and interlibrary loan) and correctness (of shelving and of
reference answers).
General C.1. Cost per user C.2. Cost per visit C.3. Cost per use C.4. Ratio of acquisitions costs to staff costs Collection costs C.5. Cost per document processed C.6. Cost per download Processes - speed
C.7. Acquisition speed
C.8. Media processing speed C.9. Employee productivity in media processing C.10. Lending speed C.11. Interlibrary loan speed Processes - reliability
C.12. Reference fill rate
C.13. Shelving accuracy
D. Potentials and development: Are there sufficient potentials for future
development?
This perspective is especially important in times of constant change, as it as-
sesses the library’s ability to cope with such change. It has not been easy to find
performance indicators for this aspect, as is shown by the small number.
The potential for development is measured on the one hand against the li-
brary’s input in electronic services (expenditure on the electronic collection,
percentage of staff in electronic services), on the other hand against the library’s
success in gaining funding from its institution and external sources or by income
generation.
The most relevant indicator for potentials and development is certainly the
library’s input into staff training.
Electronic services D.1.Percentage of acquisitions expenditure spent on the electronic
collection D.2. Percentage of library staff providing and developing electronic
services Staff development D.3. Attendances at training lessons per staff member Budget D.4. Percentage of library means received by special grants or income
generation D.5. Percentage of institutional means allocated to the library

5. List of indicators
46
A. Resources, infrastructure
A.1 User area per capita
Background
“Institutions today are asking for and retrieving much greater accountability for
the use of their library space. They need to know how it enhances the institu-
tion’s educational mission and at what cost.” (Library as place, 2005, p.8)
With more and more information being accessible from the desktop, funding
institutions tend to economize on library buildings; libraries seem to need less
space in future. In spite of such predictions, libraries remain important as places
for research, learning, reading, or attending cultural events. “The variety and
combination of resources, services, spaces, and activities renders the library a
destination of academic adventure and serendipitous discovery.” (Demas, 2005,
p.28)
While formerly the planning of library buildings focussed on the space for
collections and the library’s technical services, today planning involves the
knowledge of user activities in a library. Space for user activities, including
areas for meeting and recreation, has become an important issue for the library’s
success in performing its tasks.
Technological changes and users’ growing familiarity with electronic ser-
vices will affect the planning of user areas in libraries. A Delphi study for health
sciences libraries in 2005 sees the following developments for user areas in
libraries: “Our experts believe that by 2010, most users will primarily come to a
health sciences library not for access to information, but for time-saving or
value-added information services and for places to collaborate and study….To
attract users, it will be common for health sciences libraries to provide access to
food services, within or adjacent to the library. Learning commons will become
commonplace as well, as users need help with both the use of information and
the tools to access it. Libraries will continue to include both enclosed group
study areas and open areas designed for quiet study to satisfy user needs for both
group work and privacy.” (Logan and Starr, 2005, p.321)

A.1 User area per capita
47
Definition of the indicator
The library’s net user area per 1.000 members of the library’s population to be served.
User area in the sense of this indicator includes reading and working areas
for users, special study places, space for lending, reference and user training
services, open-access storage areas, space for exhibitions and events, and all
other space designed for user services, including halls, stairways, lobbies and
functional rooms.
Areas not usually available to users are excluded.
The population to be served is the number of persons to whom the library is
commissioned to provide its services. For public libraries, this will normally be
the population of the community (or part of the community); for academic li-
braries, this will normally be the total of students and academic staff in the insti-
tution.
Aims of the indicator
The indicator assesses the adequacy of user space to the library’s population and
therewith the priority given to user services by the library and the funding insti-
tution. It is relevant for all libraries with a defined population to be served.
Comparison between libraries of similar mission, structure and clientele is
possible, if special conditions (e.g. a new building, special tasks of the library)
are considered.
Method
The user area is calculated in square meters.
The members of the population to be served are counted as persons, not as
FTE (full time equivalent). Thus, part-time students or staff in academic institu-
tions will be counted each as one person.
The user area in square meters is set in relation to the number of persons in
the population to be served, divided by 1.000.
Interpretation and use of results
A higher score will normally be considered as better. The indicator can be influ-
enced by studying, reading, and meeting facilities that are offered by the li-
brary’s parent institution outside the library premises, or by another institution
near the library.

5. List of indicators
48
If the user area per capita seems insufficient compared with other libraries,
the library could of course apply for building funds. It might be useful for such
appliances to show results of user satisfaction surveys, if users complain of in-
adequate space for learning, lack of quiet areas or group learning areas.
But building projects take a long time. A shorter way could be to look into
the space for the background services and see whether some of that space might
be dispensed with and converted into user area. For example, libraries conver-
ting their catalogues have used the space of the former card catalogues for user
workplaces.
Another solution could be to merge a service with that of other institutions,
e.g. the institution’s IT centre, in order to find space for new user services like
information commons.
Libraries have also cooperated with commercial firms to find funding for a
building annex combining e.g. a bookshop and a reading room.
Examples and further reading
The indicator as described above is used in the German benchmarking project
BIX (BIX. Der Bibliotheksindex). In 2005, BIX showed the following results
(BIX, 2006):
User area in sqm per 1.000 capita mean maximum minimum
Public Librar-
ies
Communities under 15.000 inhabitants 50,5 121.7 20,3
Communities from 15.000 to 30.000 inhabitants
35,0 85,3 7,9
Communities from 30.000 to 50.000 inhabitants
27,5 58,4 6,9
Communities from 50.000 to 100.000 inhabitants
26,3 44,6 9,2
Communities over 100.000 inhabitants 23,6 52,3 5,9
Academic
Libraries
Universities of applied sciences 359,3 676,3 97,1
Universities: One-tier systems 832,7 2490,8 286,7
Universities: Two-tier systems (only the central library considered)
322,1 807,5 37,8
The results demonstrate that comparison is only meaningful between libraries
with a similar mission and population. Public libraries offer significantly less
user space, as their users usually do not work in the library. Public libraries in

A.1 User area per capita
49
smaller communities reach better scores with this indicator, as there will be a
certain basic user space (e.g. for the lending area), which will not be much less
in a small community.
Academic libraries have to offer large areas for learning and working. In
two-tier systems with separate institute libraries, it will be nearly impossible to
separate user space in the institute libraries from other functions. Therefore in
BIX only the space in the central library of two-tier systems is considered.
It is easier to compare the library’s total space to the population. This is for
instance done in the SCONUL statistics (Creaser, 2006). SCONUL, Society of
College, National and University Libraries, UK measures “traditional floor
space per FTE student” in square meters. Space for “non-traditional” library
services, such as binderies or reprographics, is excluded. Results did not vary
much between 1994-95 and 2004-05, but showed an average between 0,82 and
0,90 m2 floor space per full-time equivalent student.
The statistics of CAUL (Council of Australian University Libraries) count
the library’s total floor space in m2 and total persons in the population, including
students, academic and non-academic staff. Comparing these data in the online
statistics shows a mean value of 0.67 m2 per person (CAUL online statistics).
A study in Polish academic libraries calculated total library space per mem-
ber of the population and found for 2003 a median score of 0,27 m2 for univer-
sity libraries and 0,15 m2 for technical university libraries (Derfert-Wolf, Górski
and Marcinek, 2005).
Comparing the total library space to the population could be misleading, as
the space for special tasks of the library (storage space for rare collections or
legal deposit, rooms for training students in librarianship etc.) might influence
the score. And if funding institutions doubt the library’s need for space, a per-
formance indicator especially considering the user area may be more convinc-
ing.
________________________________________________________________
BIX. Der Bibliotheksindex, available at: http://www.bix-bibliotheksindex.de/
BIX. Der Bibliotheksindex (2006), B.I.T. online, Sonderheft 2006
CAUL online statistics, Council of Australian University Libraries, available at:
http://www.anu.edu.au/caul/stats/
Creaser, C. (2006), SCONUL library statistics: trends 1994-95 to 2004-05, LISU,
Loughborough University

5. List of indicators
50
Demas, S. (2005), From the ashes of Alexandria: what’s happening in the college library?, in
Library as place: rethinking roles, rethinking space, Council on Library and Information
Resources, Washington D.C., pp. 25-40, available at:
http://www.clir.org/pubs/reports/pub129/pub129.pdf
Derfert-Wolf, L., Górski, M. and Marcinek, M. (2005), Quality of academic libraries –
funding bodies, librarians and users, World Library and Information Congress, 71th IFLA
General Conference and Council, available at: http://www.ifla.org/IV/ifla71/papers/080e-
Derfert-Wolf.pdf#search=%22Derfert-Wolf%22
Library as place: rethinking roles, rethinking space (2005), Council on Library and
Information Resources, Washington D.C., available at:
http://www.clir.org/pubs/reports/pub129/pub129.pdf
Logan, L. and Starr, S. (2005), Library as place: results of a Delphi study, Journal of the
Medical Library Association 93,3, pp. 315-326, available at:
http://www.pubmedcentral.nih.gov/articlerender.fcgi?artid=1175798

A.2 Seats per capita
51
A.2 Seats per capita
Background
Libraries are highly esteemed places for reading, learning and working. Though
in some libraries physical library visits are decreasing, due to a high number of
the library’s services and resources being available for remote use, the growing
tendency of group work in libraries or of users working with their own material
in libraries and the advantage of using both print and electronic resources to-
gether with help and training services make the library attractive as a place to
meet and study.
Especially in institutions of higher education, the library is the physical place
where students meet for studying singly or in groups. Therefore a sufficient
number of working places with adequate equipment will be one of the most
important issues for user satisfaction.
In public libraries, where users primarily need seats for a shorter time of
reading and browsing, the number of seats for the population to be served will
be significantly lower than in academic libraries, where users might need a seat
for the whole day.
In order to know whether the number of seats provided is adequate to the
population to be served, libraries can calculate the ratio of seats per member of
the population and benchmark the result with other libraries of similar structure
and mission.
Definition of the indicator
The number of user seats provided for reading or working in the library per
1.000 members of the library’s population to be served
The definition includes seats with or without equipment, seats in carrels, in
seminar and study rooms and in the audiovisual and children's departments of
the library.
Seats in halls, lecture and auditory theatres intended for audiences of special
events are excluded. The definition also excludes informal seating, e.g. floor
space on which users may sit.
The population to be served is the number of persons to whom the library is
commissioned to provide its services. For public libraries, this will normally be
the population of the community (or part of the community); for academic li-

5. List of indicators
52
braries, this will normally be the total of students and academic staff in the insti-
tution.
Aims of the indicator
The indicator assesses the adequacy of seats in the library provided to the li-
brary’s population and therewith the priority given to the library’s role as physi-
cal place for reading, learning and working.
The indicator is relevant for all libraries to be served that offer reading and
working facilities to a defined population to be served. It will be most relevant
for libraries in institutions of higher education.
Comparison between libraries of similar mission, structure and clientele is
possible.
The indicator does not measure the usage of the provided seats (see Indicator
B. 4 “Seat occupancy rate”).
Method
Count the number of seats provided for reading and working in the library.
In a library system with branch, departmental or institute libraries, seats in
those libraries should be included.
The members of the population to be served are counted as persons, not as
FTE (full time equivalent). Thus, part-time students or staff in academic institu-
tions will be counted each as one person.
The number of seats provided for reading and working in the library is set in
relation to the number of persons in the population to be served, divided by
1.000.
Interpretation and use of results
A higher score will normally be considered as better.
The indicator can be influenced by studying, reading, and meeting facilities
that are offered by the library’s institution outside the library premises, or by
another institution near the library.
If the number of seats seems inadequate compared to other libraries, or if the
occupancy rate of seats demonstrates such inadequacy, the library should try to
find space for offering more seats. Longer opening hours may contribute to a
better distribution of users needing seats over the day/week, so that even with
the same number of seats there will be lower seat occupancy.

A.2 Seats per capita
53
Examples and further reading
Many national library statistics count the number of user seats provided by the
library, some count also the number of persons in the population to be served,
some only the number of registered users.
The statistics of CAUL, Council of Australian University Libraries, show for
2005 the following result (CAUL online statistics):
• Total seats per total population, including students, academic and non-
academic staff (persons) = median value 0.1007
For higher education libraries in the UK the statistics show the “seat hours per
week per FTE student” (Creaser, 2005):
• Seat hours per week per FTE student = 8.4
If average opening hours per week are calculated as 70, seats per student would
be 0.12, which corresponds to the CAUL data.
The statistics of the Finnish research libraries (Finnish research library statis-
tics database) count:
• Seats per capita (population to be served) x 1.000
The result for 2006 is 203,6 per 1.000 capita = 0,20 seats per member of the
population.
A survey in five Bavarian university libraries counted seats per 1.000 mem-
bers of the population to be served (similar to the Finnish statistics); the result
was 137.6 = 0.1376 per member of the population (Kennzahlen für Hochschul-
bibliotheken, 2003).
________________________________________________________________
CAUL online statistics, Council of Australian University Libraries, available at:
http://www.anu.edu.au/caul/stats/
Creaser, C., Maynard, S. and White, S. (2005), LISU annual library statistics 2005, featuring
trend analysis of UK public and academic libraries 1994 – 2004, LISU, Loughborough
University, available at:
http://www.lboro.ac.uk/departments/dils/lisu/downloads/als05.pdf
Finnish research library statistics database, Helsinki University Library, available at:
https://yhteistilasto.lib.helsinki.fi/language.do?action=change&choose_language=3
Kennzahlen für Hochschulbibliotheken in Bayern (2003), Unpublished document

5. List of indicators
54
A.3 Opening hours compared to demand
Background
The hours the library is open to users have always been regarded as the main
criterion for the accessibility of library services. Though many services and
resources are today offered for remote access, the physical library with its user
space and collections remains important as place for meeting, studying and
learning. “Match of opening hours with user needs” was the library effectiveness
measure that ranked highest or second highest in the New Zealand university
libraries effectiveness study (Cullen and Calvert, 1995). Opening hours are
counted in most national library statistics and are also used as performance indi-
cator in quality assessment and benchmarking projects.
Longer opening hours are generally seen as better service, and in most cases
this will be true. But if a library wants to assess the adequacy of its opening
times, it will be most informative to compare them with users’ wishes and
needs. “Never accept an assertion that more hours will increase use – or even
that they will make lots of users happy. Check first, with user conversations or
focus groups … to find out which users are using a particular library when.”
(Holt, 2005, p.89) The ACRL Standards do not ask for the longest opening
hours possible, but for user-friendly opening times: “Hours of access to the li-
brary should be reasonable and convenient for its users.” (ACRL, 2004) Longer
opening times, e.g. after 10 p.m. in the evening, might be unnecessary from the
users’ point of view, if most users have left the campus by then.
An important issue is to have the same opening hours on all weekdays and –
if possible – in all library departments. It is confusing for users if they have to
remember different hours for different days and services.
There is always a discrepancy between users’ wishes and the library’s ability
to fulfil these wishes because of restrictions in finances and staff time. The point
is to find the right balance between wishes and financial capabilities. Assessing
demand in regard to opening hours will help to find such balance within given
resources.
Definition of the indicator
The present number and time of a library’s opening hours compared to the num-
ber and time of opening hours as desired by users.

A.3 Opening hours compared to demand
55
Opening hours are the hours in a normal week when the main services of the
library (e.g. reference and loan services, reading rooms) are available to users.
Aims of the indicator
To assess the correspondence of a library’s present opening hours with users’
demand.
The indicator is applicable to all libraries.
Comparison between libraries will only be possible as to the general satisfac-
tion with present opening times.
The indicator will be especially informative if it is applied separately for user
groups (e.g. undergraduates, graduates, and academic staff).
Methods
1. A survey is handed out to a random sample of users when entering or
leaving the library. Data collection should be spread equally over the day
and throughout the week to make sure that users preferring morning or
evening time or certain days for their visits are not over-represented. The
advantage of this method is that there will be in most cases a quick and
ready response and that users can make comments when returning the
survey. The disadvantage is that potential users that cannot visit the li-
brary because of the existing opening times will not be represented.
2. An online survey is put on the library’s website at certain times, again
with an equal spread over times of the day and week. The advantage is
that potential users are considered. The disadvantage is that actual heavy
users might be under-represented.
Both surveys should ask for satisfaction with the present opening times and
should give the option to name additional times the library should be open. The
survey could be added to a comprehensive survey of user satisfaction with the
library’s services.
Example of a survey:
How would you rate your satisfaction with the present opening times of the library? very unsatisfactory unsatisfactory moderately satisfactory satisfactory very satisfactory

5. List of indicators
56
Please specify the hours other than the present opening hours you would like the library to be open, by placing an “O” in the appropriate box. The present opening hours are already repre-sented by an “X”.
Mon Tue Wed Thu Fri Sat Sun0 - 7
7 - 8
8 - 9 X X X X X
9 - 10 X X X X X
10 - 11 X X X X X X
11 - 12 X X X X X X
12 - 13 X X X X X X
13 -14 X X X X X X
14 - 15 X X X X X X
15 - 16 X X X X X X
16 - 17 X X X X X X
17 - 18 X X X X X X
18 - 19 X X X X X X
19 - 20 X X X X X
20 - 21 X X X X X
21 - 22 X X X X X
22 - 23
23 - 24
In case the library can only offer further opening hours (e.g. Sunday opening) in
exchange for opening hours on other days, users could be asked what present
opening hours they would be willing to sacrifice in exchange for hours they
prefer.
Many libraries have different opening hours during academic term or vaca-
tion. In these cases it would be advisable to have separate surveys during term
and vacation time.
Branch libraries or departments such as the loan department or the children’s
library may have opening hours that differ from the general opening hours. If the
library wants to assess the adequacy of such special opening times, it would be
best to hand out special surveys to visitors of the individual branch library or
department.
Interpretation and use of results
The library should react, if a high percentage of respondents is dissatisfied with
present opening hours and asks for extended hours or a different distribution of
opening hours over the day/week. This may be difficult, especially if users ask
for extended times on weekends or during the night. A possible solution might

A.3 Opening hours compared to demand
57
be to open the library without offering full service, so that non-professional staff
could run the library during these times. What services should be offered during
additional opening hours should depend on users’ needs. The easiest solution
would be to offer only study space, if studying is the main reason for users’
visits, e.g. during late hours (Engel, Womack and Ellis, 2002). Many libraries
when enlarging their opening hours offer only study space, the open access col-
lections, and lending service; reference service might not be available during
such times
The survey results should be compared to actual usage data (number of li-
brary visits, loans, or reference questions over the day/week). This would help to
assess – what the indicator does not measure - whether existing opening times
are too liberal and the supply exceeds demand.
Evaluating usage statistics might also help to draw the line between “reason-
able” and “unreasonable” demand. In order to know what is “reasonable”, the
library could offer extended opening hours on trial, e.g. for a test period of two
or three months. For a decision on permanent longer opening times it will be
useful to assess the number of visits during the test opening and the status of the
users visiting the library in that time. It might be that the additional hours attract
new user groups or users not belonging to the library’s population to be served.
It could also be helpful to make use of other libraries’ experience with longer
opening hours, if the libraries are in a similar situation (e.g. central campus or
spread over town).
In addition to the questions referring to satisfaction and demand, users could
also be asked to estimate how frequently they visit the library at certain times of
the day or certain days of the week. This might help to judge the urgency of the
demand for extended hours.
Examples and further reading
An example for the indicator as described above is the joint user survey of 15 German university libraries in 2001 that applied the same survey methodology and collected the data under comparable conditions (Follmer, Guschker and Mundt, 2002; Mundt, 2003). Users were asked to rate their satisfaction with a service and also the importance of the service to them. Opening hours were one of the survey topics. A regression analysis was applied in order to determine the contribution of each factor to the overall satisfaction of each user. Opening hours had a high influence on general satisfaction with the library (14 %). Most libraries had opening times from 8.00 to 22.00 on weekdays, and users seemed content with this; there was not much demand for a 24-hours service. But in

5. List of indicators
58
libraries with only morning opening on Saturday, there was a clear demand for afternoon opening. Sunday opening was generally not much in demand. Long opening hours on weekday evenings had a higher influence on satisfaction than extended opening hours on weekends. Libraries offering different opening hours for individual departments or services faced lower satisfaction than those offer-ing the same opening hours for all services.
In the project EQLIPSE (EQLIPSE, 1995-1997) that tested data collection
for a large set of performance indicators, “opening hours compared to demand”
was assessed in two ways:
• Using a survey in short interviews with users and recording their answers
• Offering four options for possible extended opening times:
- Sunday opening
- later Saturday opening
- later weekday opening
- satisfied with present opening hours
The Swedish Quality Handbook project used the indicator as described above,
but added a formula for calculating the relation between the present opening
hours and those desired by the respondents (Edgren et. al., 2005):
A/B
A = the number of present opening hours
B = the number of hours which the users state that they need (present hours +
additional hours)
If a library is open 60 hours per week and users ask for 10 hours more, the score
would be 60:70 = 0.86.
Users could also be asked for the reasons of preferring certain hours, e.g. late
hours, for their visits (Curry, 2003, p.12). This can show the importance of addi-
tional opening times for certain user groups, e.g. users with a full timetable who
would prefer to visit the library in late evening.
Don Revill describes a method for assessing not the additional demand, but
the effectiveness of the present opening hours (Revill, 1983). The indicator,
named “effective user hours”, assesses the total number of hours spent by users
in the library during a sampling period and divides them by the number of hours
open during the same period. This method would serve for evaluating whether
the existing opening times are sufficiently used, but does not measure whether
additional times are needed.

A.3 Opening hours compared to demand
59
________________________________________________________________
ACRL, Association of College & Research Libraries (2004), Standards for libraries of higher
education, available at: http://www.ala.org/ala/acrl/acrlstandards/standardslibraries.htm
Cullen, R. J. and Calvert, P.J. (1995), Stakeholder perceptions of university library
effectiveness, Journal of Academic Librarianship 21,6, pp. 438-448
Curry, A. (2003), Opening hours: the contest between diminishing resources and a 24/7
world, Journal of Academic Librarianship 27,6, pp. 375-385
Edgren, J. et.al. (2005), Quality handbook, performance indicators for library activities, The
Swedish Library Association’s Special Interest Group for Quality Management and
Statistics, available at:
http://www.biblioteksforeningen.org/sg/kvalitet/handbook_eng.html
Engel, D., Womack, K. and Ellis, U. (2002), Opening a library 24 hours, Journal of Library
Administration 36,4, pp.95-108
EQLIPSE. Evaluation and quality in library performance: system for Europe (1995-1997),
available at: http://www.cerlim.ac.uk/projects/eqlipse/
Follmer, R., Guschker, S. and Mundt, S. (2002), Gemeinsame Nutzerbefragung der
nordrhein-westfälischen Universitätsbibliotheken – methodisches Vorgehen und
Erfahrungen, Bibliotheksdienst 36,1, pp. 20-33, available at:
http://bibliotheksdienst.zlb.de/2002/02_01_02.pdf
Holt, G. (2005), “Library myths”, The Bottom Line 18,2 , pp. 87-91
Mundt, S. (2003), Benchmarking user satisfaction in academic libraries – a case study,
Library and Information Research 27 (87), pp. 29-37, available at:
http://www.lirg.org.uk/lir/pdf/article87_mundt.pdf
Revill, D H. (1983), Some examples and types of performance measures, in Blagden, J. (ed.),
Do we really need libraries: Proceedings of the first joint Library Association Cranfield
Institute of Technology conference on performance assessment, Cranfield Press,
Cranfield, pp. 59-66

5. List of indicators
60
A.4 Expenditure on information provision per capita
Background
Libraries provide a wide range of services, but “the provision of materials for
readers' use is the single most important role” (Scientific publications, 2004).
Against the background of stagnant library budgets and rising prices, the amount
of money spent on information provision per member of the population is a
crucial indicator when assessing a library’s effort to cope with one of its main
tasks.
The indicator is helpful in benchmarking procedures, but the calculation of
the expenditure may differ between libraries. It is indisputable to include expen-
diture on books, periodicals, and electronic resources of various kinds as well as
binding costs, but the money spent on document delivery is arguable. Some
libraries meet document delivery costs for their users instead of buying books
and periodicals, either as a deliberate shift from holdings to access or for saving
costs.
Definition of the indicator
The expenditure on information provision per member of the library’s popula-
tion to be served during a year.
Expenditure on information provision in the sense of this indicator means the
total expenditure for traditional and electronic media, including licenses, pay-
per-view costs and expenditure on binding.
Electronic document delivery costs are included if the library covers the
document delivery costs for its users.
Expenditure on infrastructure, such as hardware, software or networking, and
on digitisation of documents is excluded.
The population to be served is the number of persons to whom the library is
commissioned to provide its services. For public libraries, this will normally be
the population of the community (or part of the community); for academic li-
braries, this will normally be the total of students and academic staff in the insti-
tution.

A.4 Expenditure on information provision per capita
61
Aims of the indicator
The indicator assesses the adequacy of the expenditure on information provision
per member of the population and describes in monetary terms the benefit of
collection building for the individual user.
The indicator is relevant for all libraries with a defined population to be
served.
Comparison of results between libraries with similar mission, structure and
clientele is possible, if differences in collection policies are taken into account
and if the expenditure is calculated in the same way.
Method
For a clearly defined budget period (usually a year) the library’s expenditure on
acquisition and licensing (including binding and pay-per-view) is determined. In
the context of electronic resources the library’s involvement in consortia and
other over-all contracts should be taken into account: only the library’s own
share in the contractual expenses should be counted.
Libraries paying the document delivery charges for their users should add the
amount to the expenditure on information provision.
The members of the population to be served are counted as persons, not as
FTE (full time equivalent). Thus, part-time students or staff in academic institu-
tions will be counted each as one person.
The total expenditure on information provision during a year is divided by
the number of persons in the population to be served.
Interpretation and use of results
A higher score will be considered as good, but the indicator should be seen in
the context of the library’s goals. It will be especially useful to compare results
over time.
Budget cuts and changes in the size of the population will affect the indica-
tor.
Benchmarking effort on the basis of this indicator should consider that spe-
cial funding, e.g. for special collections supporting information provision on a
national scale or for library consortia purchasing databases and other electronic
resources will influence the scores.

5. List of indicators
62
Examples and further reading
In Great Britain the university libraries’ expenditure on information provision
per capita has increased considerably in the period between 1994-95 and 2004-
05. The new universities recorded a rise from 60.33 £ to 71.23 £, whereas the
old universities saw a rise from 97.98 £ to 131.72 £ – an increase by almost 26%
(Creaser, 2006, pp.123-127).
In 2005 academic libraries taking part in the German benchmarking project
BIX (BIX. Der Bibliotheksindex) recorded an average expenditure on informa-
tion provision per capita of 123.96 €. Separated according to categories the fig-
ures were as follows (BIX, 2006):
mean minimum maximum
University libraries (one-tier systems): 195.30 € 69.15 € 662.05 € University libraries (two-tier systems): 106.67 € 31.22 € 260.60 € Universities of applied sciences: 50.81 € 16.93 € 124.59 €
In two-tier systems with many departmental libraries, only the expenditure of
the central library was considered in BIX.
The statistics of CAUL, Council of Australian University Libraries, report for
2005 a mean “acquisitions expenditure per population member” of 268.60 AUD
which would be about 169.69 € (CAUL online statistics). The figure is higher
than the German mean for academic libraries and lower than what old universi-
ties in Great Britain spent in the same period (ca. 196,14 €).
For public libraries the score will be lower. In 2006 the Finnish public libra-
ries spent 7.01 € for “library materials per inhabitant” (Finnish public library
statistics).
The public libraries in British Columbia, Canada, spent 4,9 CAD = ca. 3,4 €
for library materials per “population of the service area” in 2003 (British Co-
lumbia public library statistics, 2004).
________________________________________________________________
BIX. Der Bibliotheksindex, available at: http://www.bix-bibliotheksindex.de/
BIX. Der Bibliotheksindex (2006), B.I.T. online Sonderheft 2006
British Columbia public library statistics (2004), Ministry of Education, Victoria, British
Columbia, available at: http://www.bced.gov.bc.ca/pls/bcplstats_2004.pdf
CAUL online statistics, Council of Australian University Libraries, available at:
http://www.anu.edu.au/caul/stats/

A.4 Expenditure on information provision per capita
63
Creaser, C., Maynard, S. and White, S. (2006), LISU annual library statistics 2006, featuring
trend analysis of UK public and academic libraries 1995 – 2005, LISU, Loughborough
University, available at:
http://www.lboro.ac.uk/departments/dils/lisu/downloads/als06.pdf
Finnish public library statistics, Culture and Media Division of the Ministry of Education,
available at: http://tilastot.kirjastot.fi/Default.aspx?&langId=en
Scientific publications: free for all? (2004), House of Commons, Science and Technology,
10th report, Vol.2, Appendix 135, available at:
http://www.publications.parliament.uk/pa/cm200304/cmselect/cmsctech/399/399we160.ht
m

5. List of indicators
64
A.5 Availability of required titles
Background
“Availability” is a classic among performance indicators in both public and
academic libraries. As such it has been often described in the wake of Buck-
land’s landmark Book Availability and the Library User (1975) and Kantor’s
groundbreaking study (Kantor, 1984) and – even more important – has been
practically applied in different library settings all over the world (Nisonger,
2007). Despite the librarians’ best efforts the complaints can still be heard: “But
the good books are still never available when I need them.” (Gregory, 2003, p.
283)
The two main aspects of availability are mirrored in the two questions users ask
when looking for information in the library’s collection:
• Is the document (book, journal article, E-book) I am looking for in the
collection?
• If yes, is it available for me?
While the former deals with the quality of the library collection in terms of its fit
to users’ information needs the latter examines the extent to which titles in the
collection are actually available and is therefore a primary measure of demand
satisfaction.
Consequently, the ISO standard 11620 distinguishes two indicators to meas-
ure the two aspects of availability. This is understandable from a theoretical
point of view. However, for practical reasons in most cases where the indicator
is used the two aspects are combined in the data collection procedure.
In this sense the availability of required titles as described here is the more
comprehensive indicator. It checks both how far the collection fits the require-
ments of the users and to what degree the titles in demand are actually available.
The indicator also sheds a light on the reasons why the library’s collection
does not match the requirements of the user. It is multidimensional in that it not
only monitors whether the users get what they ask for but also carefully records
the various stages of the process in which the user tries to align his short-term
information needs with the momentary state of the collection. Ignoring any inci-
dent of user failure like inaccurate bibliographic references or inability to locate
books in the OPAC or on the shelf, the indicator brings to light where the library
is to blame, because it produced incorrect catalogue information, misshelved the

A.5 Availability of required titles
65
book, or failed to buy a sufficient number of spare copies. In the context of elec-
tronically available documents the range of reasons for failures widens consi-
derably, from a dead link to an outdated browser version.
In the run of the data collection procedure the indicator pinpoints a variety of
reasons preventing the user from receiving the information asked for. Therefore,
the indicator is extremely helpful in identifying weaknesses in a core aspect of
the library’s service provision.
Definition of the indicator
The percentage of titles requested by users that are directly available to the
users.
Available in the sense of this indicator means both that the title is included in
the library’s collection and that it is actually available at the time of the request
for consultation in the form of loan, in-library use, or downloading. Non-
availability because of user failures is excluded.
“Titles” in the sense of this indicator covers not only books, but also individ-
ual articles and all kinds of electronic documents.
The indicator measures the success of known-item searches and does not
consider subject searches.
Aims of the indicator
The indicator quantifies the degree of congruence between supply and demand
at the core of library services. Firstly, the indicator assesses to what extent the
library collection contains what is demanded by the users. Secondly, the indica-
tor assesses to what extent the titles demanded by the users are actually available
to them. A third aim is a by-product of the data collection procedure: the de-
tailed analysis of reasons why user and requested title do not come together.
The indicator is relevant for all libraries.
Comparison between libraries of similar mission, structure and clientele is
possible.

5. List of indicators
66
Method
A sample of users looking for specific items in the collection is asked to fill out
a form with the title(s) they were seeking. Users should also note whether their
search was successful, as this will help the librarian’s follow-up of the title.
Duplicate titles are removed from the sample. The titles are then checked on the
catalogue and the automated system to see
• whether the title is included in the collection,
• whether, if it is included, it is available at the moment.
In addition to the catalogue and system check, the titles are then checked on the
shelves. This is important to see whether items have been misshelved.
If titles are not found by users because of user failure - e.g. wrong search in
the catalogue, item not found on the shelves - but are identified as available in
the follow-up, these titles are counted as available. The indicator is meant to
measure the library’s, not the user’s failure.
Titles ordered by the library but not yet received are counted as not included
in the collection.
Non-availability of titles owned by the library can be due to many reasons:
• The documents are momentarily involved in processing procedures such
as cataloguing, binding, reshelving etc.
• The documents are on loan, momentarily used by others in the library etc.
• The documents have been stolen, misshelved etc.
• Electronic documents cannot be accessed because the computer system is
down, the number of simultaneous users is exceeded, or the link is dead.
The different reasons for non-availability should be noted separately.
Example:
In a sample of 400 titles requested by users • 50 have not (yet) been acquired by the library, • 120 are on loan, • 45 are not in their right position on the shelves, • 15 are in processing procedures (accounted for in the library’s system), • 10 electronic documents were not accessible at the moment of request (this informa-
tion can only be obtained from the user who was doing the search). Thus, 240 titles all in all were not available. Availability for the sample would then be 40%.
The size of the sample as well as the sample period should be carefully chosen.
Because of the time-consuming nature of the data collection process it is not
possible to repeat it at small intervals. A comparison over time is, however, very

A.5 Availability of required titles
67
useful to determine the ups and downs in one of the key areas of library service
provision.
Interpretation and use of results
High availability will of course be seen as good.
If the percentage of available titles falls below a certain value - which will
vary considerably between public and academic libraries - the library could take
various measures:
• Adjust its collection policy to user needs by closely analysing loan statis-
tics and interlibrary loans (see indicators B.6 “Collection use”, B.7 “Per-
centage of stock not used”, A.7 “Ratio of requests received to requests
sent out in interlibrary lending”).
• Order multiple copies of titles in heavy demand
• Review the workflow of the processing department if required titles are in
the library but not yet on the shelf
• Reduce loan periods to accelerate turnaround time for a copy
• Reduce the number of misshelved items by systematic shelf reading (see
indicator C.13 “Shelving accuracy”)
• Restrict the number of renewals by the same person.
All activities that support the users in their effort to locate an item in the collec-
tion – e.g. explaining the shelf-location system in user training, improved sign-
posting – will help to avoid non-availability by failures on the part of the users.
Examples and further reading
An overview of availability studies in the last 20 to 25 years is given by Nison-
ger (2007).
Nisonger found that the mean availability rates for known-item searches by
actual users range between 61.3 and 63.1 percent, depending on the calculation
method. But several studies have found higher availability scores.
The following table differentiates between the availability of requested items
in the collection and the direct availability of requested items to the user. The
examples show that while usually ca. 90% or even more of the requested items
could be found in the collection, the direct availability to the user ranged only
between 42 to 81 percent. In the examples shown here, user failure was included
in the percentage of non-availability.

5. List of indicators
68
Library Year Availability in
the collection
%
Direct availability
%
Universitäts- und Landesbibliothek Münster (te Boekhorst, 1992)
1991 81 42
King Fahd University of Petrol & Minerals Library (Chaudry and Ashoor, 1994)
1993 93 63
University of Southern Queensland (Watson, 1998)
1996 88 54
University of New South Wales (UNSW, 2004)
2004 97 63
University of Wollongong Library (James, 2005)
2005 96 77
La Trobe University Library (2005)
2005 98 81
Griffith University Library (2005)
2005 92 69
CAUL, Council of Australian University Libraries, uses the indicator “availabil-
ity” with a clear differentiation of reasons for non-availability (CAUL perform-
ance indicators):
• Not owned
• User error - not found in catalogue
• Owned at other location
• User error - failure to identify location
• On loan
• User error - failure to identify status
• Missing
• User error - on shelf
• Other
One of the libraries using the CAUL indicator noted also the staff time needed
for assessing availability (La Trobe University Library, 2005). For three cam-
puses, staff time needed was
• 82,7 hours for local planning,
• 70,25 hours for form distribution,
• 47,25 hours for checking and coding.
The example shows that an availability study must not be extremely time-
consuming.

A.5 Availability of required titles
69
All examples named before are from academic libraries. For public libraries,
goals for the availability of requested items are sometimes included in standards.
The best value guidance for library authorities in England names as goal for
“Percentage of library users reporting success in obtaining a specific book” a
percentage of 65% (Watson, 2001).
________________________________________________________________
Buckland, M. K. (1975), Book availability and the library user, New York, Pergamon
CAUL performance indicators, materials availability, available at:
http://www.anu.edu.au/caul/best-practice/PerfInd.html
Chaudhry, A. S. and Ashoor, S. (1994), Comprehensive materials availability studies in
academic libraries, Journal of Academic Librarianship 20,5/6, pp. 300-305
Gregory, D. J. and Pedersen, W. A. (2003), Book availability revisited: turnaround time for
recalls versus interlibrary loans, College & Research Libraries 64/4, pp. 283-299.
Griffith University Library (2005), Materials availability survey 2005, available at: http://
www.griffith.edu.au/ins/publications/reports/availability_survey2005/content01.html
James, K. (2005), University of Wollongong Library - materials availability - CAUL survey
results 2005 - Did they find it? available at:
http://www.library.uow.edu.au/about/news/survey/pdfs/matavail2005.pdf
Kantor, P. B. (1984), Objective performance measures for academic and research libraries,
Association of Research Libraries, Washington, D.C.
La Trobe University Library (2005), Materials availability survey 2005, available at:
http://www.lib.latrobe.edu.au/about/surveys/materialavailability2005.pdf
Nisonger, T. E. (2007), A review and analysis of library availability studies, Library
Resources & Technical Services 51,1, pp. 30-49
te Boekhorst, P. (1992), Methoden der Leistungsmessung in Bibliotheken, Bibliothek,
Forschung und Praxis 16,2, pp. 153-161
UNSW, University of New South Wales (2004), Materials availability performance, available
at: http://info.library.unsw.edu.au/libadmin/about/materials.html
Watson, A. et al. (2001), Best returns. Best value guidance for library authorities in England,
2nd ed., Exhibit 6, available at: http://www.la-
hq.org.uk/directory/prof_issues/exhibit6.html

5. List of indicators
70
Watson, T. K. (1998), How to plan and manage library performance measurement projects
through continuous improvement practice: USQ library experience, Proceedings of the 2nd
Northumbria International Conference on Performance Measurement in Libraries and
Information Services, Information North, Newcastle upon Tyne, pp.239-259

A.6 Percentage of rejected sessions
71
A.6 Percentage of rejected sessions
Background
The availability of documents they want to read or consult is an important issue
for library users. This indicator covers a special aspect of availability in the
electronic environment. Over the years more and more information suppliers
have based their pricing models for expensive databases on the number of con-
current users. This leaves the library with the problem to even out the discre-
pancy between its budgetary restrictions and the demand for unhindered access
to information on the part of the user. In this regard the indicator is an indispen-
sable tool to fine tune the users’ needs and the library’s financial resources in
regard to the number of access licences for databases.
Turnaways (rejected sessions) have been firmly established in various stan-
dards of network library services such as the international standard ISO 2789,
the International Coalition of Library Consortia (ICOLC, 2006) and Release 2 of
the COUNTER code of practice for journals and databases (COUNTER, 2005).
Unfortunately, not all information suppliers are able to provide usage statistics
according to the COUNTER standard.
Definition of the indicator
The percentage of rejected sessions of the total attempted sessions for each li-
censed database during a specified time period.
A session is defined as successful request of a database, a rejected session as
unsuccessful request of a database by exceeding the simultaneous user limit.
Sessions by library staff and for user training should be included in the counts.
Sessions rejected because of incorrect passwords or user ID’s are not included.
Aims of the indicator
The indicator assesses whether the number of licenses for a database is sufficient
for user demand. The indicator could be compared to the number of copies
available for print documents in high demand.
Since especially the expensive databases have prices graduated according to
the number of simultaneous users, the ratio of attempted sessions to rejected

5. List of indicators
72
sessions helps to balance the users’ demand for unlimited access to information
and the restrictions of the library budget.
The indicator is relevant for libraries with licensed databases in high demand.
Comparisons for individual databases may be possible between libraries with
a similar clientele.
Method
Starting point for the data collection is a list of all electronic resources where the
number of simultaneous accesses is limited. For each item on the list the number
of total attempted sessions and the number of unsuccessful requests are re-
corded. The information will basically be gained from two sources:
• The usage statistics for online databases as provided by the database sup-
plier
• Data drawn from the statistics packages which are integral part of most
servers that control the access to local databases
For each electronic service the percentage of rejected sessions must be calcu-
lated and interpreted separately.
It is necessary to bear in mind that the data recorded by library suppliers are
not always comparable, since not all vendors adhere closely to the recommended
standards such as COUNTER.
Interpretation and use of results
A high figure is a clear indication that the present number of concurrent users
allowed to access the database simultaneously is too low. Depending on the
price and the level of gradation additional licences should be bought. An ex-
tremely low figure or the total absence of rejected accesses points to a surplus of
licences for concurrent usage. Depending on the gradation level the number of
licences could be reduced.
Examples and further reading
The indicator was introduced in the project EQUINOX: Library performance
measurement and quality management system (EQUINOX, 2000).
A detailed description of the data collection procedure and its pitfalls is to be
found on the E-metrics instructional system of the Information Use Management
and Policy Institute (2005).

A.6 Percentage of rejected sessions
73
A particular kind of turnaways is counted in usage statistics for e-journal
packages. In this context a turnaway is an unsuccessful attempt to access an e-
journal title offered by the publisher but not subscribed to by the institution the
user belongs to. For huge aggregator databases containing journals with and
without full text the count of unsuccessful attempts at accessing certain re-
stricted titles provides valuable information about what titles are requested by
the users and should be subscribed to in the future. To extend the definition of
the indicator in this direction might be useful.
________________________________________________________________
Counter (2005), Release 2 of the COUNTER code of practice for journals and databases
(Published April 2005), available at:
http://www.projectcounter.org/r2/Appendix_A_Glossary.pdf
Equinox. Library performance measurement and quality management system (2000),
available at: http://equinox.dcu.ie/index.html
Information Use Management and Policy Institute (2005), E-metrics instructional system:
librarian education in network statistics, Florida State University, available at:
http://www.ii.fsu.edu/emis/
ICOLC, International Coalition of Library Consortia (2006), Revised guidelines for statistical
measures of usage of web-based information resources, available at:
http://www.library.yale.edu/consortia/webstats06.htm

5. List of indicators
74
A.7 Ratio of requests received to requests sent out in interlibrary
lending
Background
Resource sharing is more important than ever if libraries want to maintain a high
service level in spite of stagnating budgets. Rising costs for journal subscriptions
and additional resources needed for information technology have seriously af-
fected the budget of libraries worldwide. At the same time, there are an ever
increasing number of new publications, and with easy access to online biblio-
graphies users tend to consult more publications than ever. It is impossible for
any library to satisfy all user needs via its own collection. Interlibrary lending or
document delivery is a matter of give and take in the library community, where
every library has to play its role according to its capacities. The balance between
giving and taking can be seen as an indicator for the comprehensiveness and
adequacy of the library’s collection for its population, but also for the library’s
role in resource sharing and for the relevance of its collection to the scientific
community.
Definition of the indicator
The number of requests received in interlibrary lending (ILL) divided by the
number of requests sent out.
Requests received: The number of requests for materials received from other
libraries or directly from their users during a specified period of time (usually a
year).
Requests sent out: The number of requests for materials sent by a library to
other libraries on behalf of its users within a specified period of time (usually a
year). Requests made by the library’s users directly to other libraries are in-
cluded if the number can be obtained from the cooperative automated system.
Aims of the indicator
The indicator assesses whether the library’s collection is adequate and sufficient
for the needs of the library’s population. A large number of titles requested from
other libraries are a clear indication that either the acquisitions budget is insuffi-
cient or the collection policy is not based on the needs of the local users.

A.7 Ratio of requests received to requests sent out in interlibrary lending
75
On the other side, the number of requests received shows the importance of
the library’s collection for the scientific community and the library’s role in
resource sharing.
The indicator is relevant for all libraries participating in interlibrary lending
and document delivery services. It will be most useful for academic libraries.
Comparison between libraries of similar size, structure and mission will be
possible, if the request allocation procedures of cooperative systems are taken
into account.
Method
Establish the number of requests received and requests sent out in interlibrary
lending during a year.
Requests made by users directly to other libraries should be included if the
cooperative automated system for the interlending procedures can deliver these
data.
The number of requests received is divided by the number of requests sent
out to obtain the ratio for the indicator.
It might be useful to count requests for books and articles separately to get
more detailed information about possible shortcomings in the collection.
Interpretation and use of results
A higher score will generally be considered as good, as it shows the relevance
and comprehensiveness of the library’s collection. The results of the indicator
can also be used for promoting the library’s importance and role.
But a high score also indicates high workload for the library and might lead
to the library’s trying to be less frequented by requests in a cooperative system.
A low score points to the collection not being adequate to the population to
be served, as many items have to be borrowed from other libraries. The follow-
ing measures could be taken:
• Check outgoing requests for recent publications and buy them
• Analyse outgoing requests to see what subjects are in highest demand and
reallocate the budget accordingly
• Revise existing collection building policies
• Ask users to suggest new titles for the collection
The indicator should be seen in relation to the library’s mission and goals. Li-
braries commissioned to collect and preserve the national or regional documen-
tary heritage or libraries with large special collections may see it as their goal to

5. List of indicators
76
serve as last resort for materials in their collections. Libraries primarily serving
the actual needs of a specified population may consider it sufficient if they can
serve such needs to some extent by quick delivery from other libraries.
Today, interlibrary lending and document delivery are increasingly organized
in cooperative automated systems, where self-initiated user requests may go
directly to a supplying library. The location of the requested item has either been
verified in the online catalogues, or link resolvers lead from a citation in a data-
base to a catalogue search and an interlibrary lending or document delivery re-
quest. If such systems have automated procedures for the allocation of requests
to libraries, this will greatly influence the amount of requests received by a li-
brary.
Examples and further reading
The indicator as described here is used in the benchmarking project of the uni-
versity libraries in the Netherlands, but with a differentiation between book and
article requests (Laeven and Smit, 2003). In 2004, the ratio of ILL book requests
received to ILL book requests made by each library ranged between 0,52 and
10,83, with an average of 3,28 in 12 libraries (UKB, 2004). The ratio of ILL
article requests received to ILL article requests made by each library ranged
between 0,52 and 9,54, with an average of 2,72.
The online statistics of the Australian university libraries allow comparing
“total documents delivered” to “total documents received” (CAUL online statis-
tics). The mean value for 2005 was 1,885, the median was 0,647.
The Finnish university library statistics allow comparing “given distance
loans and copies” to “received distance loans and copies” (Finnish research
library statistics database). In 2005, the value was 0,9.
The statistics of the Association of Research Libraries compare total interli-
brary lending to total interlibrary borrowing (ARL statistics). The median score
for 2005 was 1,37.
An Australian benchmarking study surveyed all types of libraries as to inter-
library lending (National Resource Sharing Working Group, 2001). There was
an overall ratio of 1,22 for supplying to requesting, but the results showed con-
siderable differences between library types:
• University libraries did the most requesting, but supplied a similar num-
ber.
• Public libraries requested only little more than they supplied.
• National/state libraries supplied significantly more than they requested.

77
• Special libraries, on average, requested more than they supplied.
The Finnish public library statistics show for 2005 a total of 357.996 given inter-
library loans and 354.317 received interlibrary loans, which is a ratio of 1,01
(Finnish public library statistics).
________________________________________________________________
ARL statistics interactive edition, available at: http://fisher.lib.virginia.edu/arl/index.html
CAUL online statistics, Council of Australian University Libraries, available at:
http://www.anu.edu.au/caul/stats/
Finnish public library statistics, Culture and Media Division of the Ministry of Education,
available at: http://tilastot.kirjastot.fi/Default.aspx?&langId=en
Finnish research library statistics database, Helsinki University Library, available at:
https://yhteistilasto.lib.helsinki.fi/language.do?action=change&choose_language=3
Laeven, H. and Smit, A. (2003), A project to benchmark university libraries in the
Netherlands, Library Management 24, 6/7, pp. 291-304.
National Resource Sharing Working Group (2001), Interlibrary loan and document delivery
benchmarking study, National Library of Australia, available at:
http://www.nla.gov.au/initiatives/nrswg/illdd_rpt.pdf (last visit 16/09/06)
UKB (2004), Benchmarking, Samenwerkingsverband van de Nederlandse universiteitsbiblio-
theken en de Koninklijke Bibliotheek, results only available to participants

5. List of indicators
78
A.8 Immediate availability
Background
Measuring the availability of required titles in the collection as described in
indicator A.5 is both complicated and time-consuming, as it means following up
users’ actual requests. It will be easier to use data out of the regular library sta-
tistics to assess whether a user’s loan request can be met immediately. For the
evaluation of the Copenhagen Business School Library in 1992, a simple indica-
tor was used comparing the data of “loans made directly from the shelves” with
loans made in connection with reservations or interlibrary loans (Cotta-
Schønberg and Line, 1994, p.60). This indicator was adopted in the German
benchmarking initiative for academic libraries in 2002 and called “immediate
availability” (BIX. Der Bibliotheksindex). The idea behind the indicator is to
simplify the data collection procedure considerably while determining as closely
as possible the users’ chance of immediately receiving requested items.
Definition of the indicator
The percentage of immediate loans of total loans during a specified period, usu-
ally a year.
Loans in the sense of this indicator are lending transactions of physical items
to one user. This includes on-site loans (loans within the library) and copies
supplied in place of original documents.
Immediate loans in the sense of this indicator are loans where users receive
the requested item directly, either by the user fetching the item from open access
shelves or the library delivering the item from closed shelves. Renewals are
excluded.
Total loans in the sense of this indicator include all loans, whether immediate
or via reservations, and interlibrary loans. Renewals are excluded.
Aims of the indicator
The indicator assesses the probability that a user’s loan request will be fulfilled
immediately.

A.8 Immediate availability
79
It can be seen as a stopgap for all libraries that shrink from conducting the
availability study as described in indicator A.5 but are looking for a figure indi-
cating the library’s potential to satisfy the loan requests of its users.
The indicator is relevant for all libraries with a loan collection.
The indicator is ideal for benchmarking purposes, since the data elements it
is made up of are usually part of the annual library statistics. Comparison be-
tween libraries should consider the libraries’ mission and clientele.
Method
The data elements involved, namely number of loans, number of reservations,
number of interlibrary loans received by the library, are easily obtained from the
annual library statistics.
For the number of immediate loans, calculate the number of all loans during
a specified time, usually a year, and deduct the number of reservations in the
same time period.
For the number of total loans, the interlibrary loans received by the library
are added to the number of all loans during a specified time, usually a year.
It is essential that for both immediate and total loans the number of renewals
is not counted. Interlibrary lending requests sent to other libraries as well as
document delivery transactions are not considered.
The immediate availability is then calculated as the percentage of immediate
loans of total loans.
Interpretation and use of results
A high score will be considered as good. It shows the probability of the user’s
obtaining the requested items directly.
Values between 80 and 90% are to be expected regardless of the type of li-
brary (see table below). This is considerably higher than the results for direct
availability in availability studies following up samples of titles required by
users. The indicator “immediate availability” disregards cases when users trying
to borrow an item do not transact a reservation if the item is on loan. The disap-
pointed user just walking away is not considered.
In case that immediate availability seems too low, the library might take the
following measures:
• Adjust its collection policy to user needs by closely analysing loan statis-
tics and interlibrary loans (see indicators B.6 “Collection use”, B.7 “Per-

5. List of indicators
80
centage of stock not used”, A.7 “Ratio of requests received to requests
sent out in interlibrary lending”).
• Invest in multiple copies of titles in heavy demand
• Review the workflow of the processing department if required titles are in
the library but not yet on the shelf
• Reduce loan periods to accelerate turnaround time for a copy
• Reduce the number of misshelved items by systematic shelf reading (see
indicator C.13 “Shelving accuracy”)
• Restrict the number of renewals by the same person.
The indicator should be seen in relation to the library’s goals. “On the other
hand, it is not the aim of the library to ensure that needed books should be avail-
able to all users immediately, and a direct availability rate of 80 per cent is not
considered unacceptable” (Cotta-Schønberg and Line, 1994, p.60).
Examples and further reading
When the indicator was first used in the evaluation of the Copenhagen Business
School Library, “direct loans” were compared to “delayed loans” (loans via
reservation or interlibrary lending). The results for 3 years were (Cotta-
Schønberg and Line, 1994, p.60):
1991
%
1992
%
1993
%
Direct loans 84 79 78 Delayed loans 16 21 22
From the beginning of the BIX benchmarking project ”immediate availability”
was used as main indicator for the quality of the collection.
BIX-results 2006-2007 for indicator "immediate availability"
Immediate availability 2006 2007
mean 85,1 84,34 standard deviation 6,9 7,47 min 72,8 70,67 max 99,2 99,01 Polytechnics
mean 89,2 87,88 standard deviation 5,5 5,97 min 77,5 75,33 max 98,8 97,76 University libraries (one-tier)

A.8 Immediate availability
81
mean 83,2 84,62 standard deviation 7,0 7,88 min 73,5 70,94 max 99,2 99,01 University libraries (two-tier)
mean 82,7 79,10 standard deviation 6,3 5,55 min 72,8 70,67 max 94,6 90,99
The possibility to obtain requested items quickly ranks high in users’ wishes. In
the New Zealand university libraries effectiveness study “proportion of items
wanted by user finally obtained” was ranked in the top 10 indicators by aca-
demic staff, and “provision of multiple copies of items in high use” was seen as
number one indicator by undergraduate students (Cullen and Calvert, 1995, pp.
443-44).
________________________________________________________________
BIX. Der Bibliotheksindex, available at: http://www.bix-bibliotheksindex.de/
BIX. Der Bibliotheksindex (2006), B.I.T. online Sonderheft 2006
Cotta-Schønberg, M. and Line, M. B. (1994), Evaluation of academic libraries: with special
reference to the Copenhagen Business School Library, Journal of Librarianship and
Information Science 26,2, pp. 55-69
Cullen, R. J. and Calvert, P.J. (1995), Stakeholder perceptions of university library
effectiveness, Journal of Academic Librarianship 21,6, pp. 438-448

5. List of indicators
82
A.9 Staff per capita
Background
What number and qualification of staff is adequate for a specific library’s tasks?
This question has always been debated between funding institutions and li-
braries. Library associations as well as funding institutions have tried to find
models for calculating “necessary” staff.
Such models start in most cases from statistics describing a library’s regular
and special tasks:
• Number of acquired media per year
• Number of current journal subscriptions
• Number of loans
• Number of users (active, registered or potential users)
• Opening hours
• Number of service points (control desks, reference points, issue desks
etc.)
• Number of rare materials in the collection
A certain percentage is then added for administrative tasks, the information
technology department etc.
Recently, such a model has been published by the German Higher Education
Information System HIS (Vogel and Cordes, 2005, pp.77-82). The model starts
from average production times for a product or service where such products and
services can be quantified, e.g. 20 minutes for one acquired medium or 3 min-
utes for one loan. Staff for control or reference desks is calculated by the num-
ber of such points. Percentages are then added for other activities, e.g. 6-10% for
administration.
The problem in such models is always to find reliable data for production
times, as production times will be influenced by the kind of material acquired or
the specific services the library offers. The best way would be to use time-
logging in a number of libraries of similar structure and clientele in order to get
reliable data (Ceynowa and Coners, 2003, pp.78-84).
Other projects have tried to answer the question the other way round: How
much can one FTE staff achieve on average in one year (how many loans, how
many media processed)? This is easier, as the number of processed media or of
loans is counted anyway in the library’s statistics, but it is necessary to estimate

A.9 Staff per capita
83
the number of persons and the percentage of their working time involved in the
specified activities like lending or media processing (see Indicator C.9 “Em-
ployee productivity in media processing”). Again, time-logging might be neces-
sary to assess what percentage of an employee’s time is spent on the different
activities.
The calculation of “necessary” staff based on production times or products
per FTE person takes a long time, and the results might soon be outdated by
changes in library services and workflows. Therefore, other models simply
compare the number of employees to the population to be served in order to get
an estimate of whether the number of employees seems to be adequate. This
method is used in the indicator described here.
Definition of the indicator
The number of library staff members in FTE per 1.000 members of the library’s
population to be served.
Library staff for this indicator means total staff, including project staff, tem-
porary staff, voluntaries, student assistants etc.
The population to be served is the number of persons to whom the library is
commissioned to provide its services. For public libraries, this will normally be
the population of the community (or part of the community); for academic li-
braries, this will normally be the total of students and academic staff in the insti-
tution.
Aims of the indicator
The indicator assesses the adequacy of the number of library employees to the
library’s population. It is relevant for all libraries with a defined population to be
served.
Comparison between libraries of similar structure, mission and clientele is
possible.
Method
Staff members are calculated in FTE (full time equivalent).
The members of the population to be served are counted as persons, not as
FTE (full time equivalent). Thus, part-time students or staff in academic institu-
tions will be counted each as one person.

5. List of indicators
84
The number of staff members in FTE is set in relation to the number of per-
sons in the population to be served, divided by 1.000.
Interpretation and use of results
A higher score will normally be considered as better. But the results should be
seen in relation to the library’s mission and goals. Special tasks like preserving a
rare collection may make more staff necessary than in other libraries with a
similar population size.
If the results of the indicator seem too low compared to other libraries, it will
not always be possible for the library to provide more staff. A special budget for
staff expenditure or a fixed position chart for staff minimizes the library’s ability
to recruit more staff. The library could apply for extra funding, e.g. for student
assistants, or recruit volunteers for certain tasks. If the library has a global
budget (lump sum), it will be possible to spend more resources on staff.
If the library has a high percentage of professional librarians in all services, it
may also be possible to test producing some services with a higher percentage of
non-professionals. In the long range, staff costs might be saved and used for
hiring additional staff, e.g. for new services.
If the indicator is used together with indicators of staff efficiency and service
quality, it will be easier to decide whether the number of staff is sufficient for
the needs of the population.
Examples and further reading
The indicator as described above is used in the German benchmarking project
BIX (BIX. Der Bibliotheksindex). In 2005, BIX showed the following results
(BIX, 2006):
Staff in FTE per
1.000 capita
mean maximum minimum
Public Libraries Communities under 15.000 inhabi-tants
0,26 0,43 0,14
Communities from 15.000 to 30.000 inhabitants
0,20 0,47 0,09
Communities from 30.000 to 50.000 inhabitants
0,20 0,38 0,08
Communities from 50.000 to 100.000 inhabitants
0,21 0,50 0,10
Communities over 100.000 inhabi-tants
0,24 0,40 0,10

A.9 Staff per capita
85
Academic Librar-
ies
Universities of applied sciences 2,7 4,7 1,3
Universities: One-tier systems 7,2 15,3 2,2
Universities: Two-tier systems (only the central library considered)
5,1 11,0 2,1
The BIX results show that comparison is only meaningful between libraries with
a similar mission and population. Public libraries offer significantly less staff
compared to their population than academic libraries, but the BIX results for
public libraries in small and large communities are similar, ranging from 0,20 to
0,26. For public libraries in British Columbia, Canada, the average number of
FTE staff per 1.000 members of the population was somewhat higher (Ministry
of education, British Columbia):
• 2003 = 0,50
• 2004 = 0,51
Academic libraries have to provide staff for information in specialized areas, for
electronic services, teaching, interlibrary lending and partly also for activities
like preservation and digitizing. In two-tier systems with separate institute li-
braries, many persons involved in library services of institutes will also have
other functions. Therefore in BIX only the staff in the central library is consid-
ered.
The annual library statistics compiled by LISU at Loughborough University
(Creaser, Maynard and White, 2005) show the following data for academic li-
braries 2003/04:
• Old universities:
Total library staff (FTE) = 5.870
Total population (FTE, students and academic staff) = 932.700
That would mean 6.29 staff per 1.000 capita.
• New universities:
Total library staff (FTE) = 3.409
Total population (FTE, students and academic staff) = 711.800
That would mean 4.79 staff per 1.000 capita.
• Higher education colleges:
Total library staff (FTE) = 960
Total population (FTE, students and academic staff) = 185.900
That would mean 5.16 staff per 1.000 capita.
The statistics of the Council of Australian University Libraries count total posi-
tions of library staff and total persons in the population (CAUL online statistics).

5. List of indicators
86
Comparing these data shows a mean value of 6.7 staff positions per 1.000 per-
sons in the population.
The data taken from BIX, LISU and CAUL suggest that “staff per 1.000 cap-
ita” ranges somewhere between 5 and 7 in academic libraries.
Other projects have compared the number of users to the number of staff
members in order to assess the workload of staff. The statistics of SCONUL,
Society of College, National and University Libraries, UK measure “FTE stu-
dents per FTE professional staff” (Creaser, 2006). Data from 1994-95 to 2004-
05 show an increase from 372 to 451 students per professional staff member.
A study in Polish academic libraries calculated users per library staff member
and found for 2003 a median score of 339,33 users per staff member in univer-
sity libraries and 403,89 in technical university libraries (Derfert-Wolf, Górski
and Marcinek, 2005).
A study in the United States evaluated data of 1.380 academic institutions as
to library staffing (Applegate, 2007). The ratio of FTE students to librarians
(professional librarians) was:
• For libraries in public institutions an average between 466 and 574 stu-
dents per librarian
• For libraries in private institutions an average between 223 and 423 stu-
dents per librarian
Librarians in large libraries served fewer students than those in medium or small
libraries.
________________________________________________________________
Applegate, R. (2007), Charting academic library staffing: Data from national surveys, College
& Research Libraries 68,1, pp. 59 - 68
BIX. Der Bibliotheksindex available at: http://www.bix-bibliotheksindex.de/
BIX. Der Bibliotheksindex (2006), B.I.T. online Sonderheft 2006
CAUL online statistics, Council of Australian University Libraries, available at:
http://www.anu.edu.au/caul/stats/
Ceynowa, K. and Coners, A. (2003), Cost management for university libraries, Saur,
München
Creaser, C. (2006), SCONUL library statistics: trends 1994-95 to 2004-05, LISU,
Loughborough University

A.9 Staff per capita
87
Creaser, C., Maynard, S. and White, S. (2005), LISU annual library statistics 2005, featuring
trend analysis of UK public and academic libraries 1994 – 2004, LISU, Loughborough
University, available at:
http://www.lboro.ac.uk/departments/dils/lisu/downloads/als05.pdf
Derfert-Wolf, L., Górski, M. and Marcinek, M. (2005), Quality of academic libraries –
funding bodies, librarians and users, World Library and Information Congress, 71th IFLA
General Conference and Council, available at: http://www.ifla.org/IV/ifla71/papers/080e-
Derfert-Wolf.pdf#search=%22Derfert-Wolf%22
British Columbia public library statistics (2004), Ministry of education, Victoria, British
Columbia, available at: http://www.bced.gov.bc.ca/pls/bcplstats_2004.pdf
Vogel, B. and Cordes, S. (2005), Bibliotheken an Universitäten und Fachhochschulen,
Organisation und Ressourcenplanung, HIS, Hannover, pp. 77-82

5. List of indicators
88
A.10 Direct access from the homepage
Background
Most libraries today make their services accessible via a website. The library
website may be the library’s own domain, or it may be within the institu-
tion’s/community’s domain.
The quality of a library website can have different aspects:
• Contents
• Language
• Structure
• Design
• Navigation
• Accessibility
Taken together these aspects describe the usability of the website. Usability is
generally defined as “the extent to which a product can be used by specified
users to achieve specified goals with effectiveness, efficiency and satisfaction in
a specified context of use” (ISO 9241-11, 1998). Extensive information about
how to evaluate websites can be found on the websites of Jacob Nielsen, an
authority on website design (useit.com), and Ursula Schulz (Schulz, 2006).
The usability of a website can be assessed with different methods:
1. Evaluation without user participation:
- Heuristic evaluation: A small group of experts evaluates the website,
based on the principles of usability. Nielsen provides a list of 10 “heu-
ristics” (Nielsen, 1994).
- Cognitive walk-through: Experts construct a "user scenario" and per-
form tasks of an imaginary user.
2. Evaluation with user participation:
- Web surveys: Surveys ask for user satisfaction with the website, pur-
poses of a search, problems in searching, etc.
- Focus groups: The website is discussed with a small group of website
users who talk about their experiences and problems.
- Group tests: Groups work on specified tasks, moderated by an expert.
- Thinking aloud: A test user's verbalizing his or her thoughts when
searching is recorded on tape.

A.10 Direct access from the homepage
89
- Observation: Users perform a set of tasks and are observed either by
video or by an observing person.
- Transaction logs: Evaluation of data as to frequency of use, most-used
pages, ways of searching, etc.
There is a broad range of literature about the usability of library websites, espe-
cially about usability tests that concentrate on the three issues effectiveness,
efficiency, and satisfaction. In most cases, evaluation of the website starts with
an expert review, followed by usability testing involving website users. A bibli-
ography of usability testing for library websites has been published by Letnik-
ova (2003). Another bibliography can be found on the website of North Carolina
State University Libraries (Library usability bibliography).
When designing a library website, the most important issue is to consider the
special needs, competences and behaviour of the library’s population to be
served. What users generally want when accessing a website is either to find a
specific information (the opening times of the library, the way to get a user card)
or to perform a specific activity (a catalogue search, a renewal). The library
should identify what kind of information is most often needed and which are the
most-used services and collections in order to give direct and quick access to
those topics. “One of the most successful design strategies … is the placement
of direct links on the homepage to a very small number of high-priority opera-
tions” (Nielsen and Loranger, 2006, p.210).
The homepage is the most important part of the website. “A company's
homepage is its face to the world and the starting point for most user visits”
(Nielsen, 2002). Normal users spend only about 35 seconds looking at the
homepage, expert users about 25 seconds (Nielsen and Loranger, 2006, p.30).
During this time, they should be able to recognize whether the site is interesting
for them and how they can get to the information they are seeking. Users gene-
rally scan the page instead of reading consecutively. They will scan the headings
until they suppose they find what they are seeking, and they will follow the line
of minimum effort. “After all, the main goal of a homepage is to guide users
somewhere else …” (Nielsen and Loranger, 2006, p.32).
If the homepage does not correspond to users’ needs and terminology, they
will either leave quickly, or they may spend much time by “clicking the wrong
link and being lost forever in the wrong part of the site” or “scouring a site for a
term that the site doesn't use and doesn't cross-reference” (Nielsen, 2006). The
need to keep information on the homepage short and concise can lead to misun-
derstandings. “The brevity of some home pages places a semantic burden on the
chosen vocabulary” (Spivey, 2000, p.151). An overview of library terminology

5. List of indicators
90
and its problems in usability tests is given by Kupersmith (2006). A study about
students’ recognition of the terms librarians use in teaching was conducted in
California State University in 2000/2001 (Hutcherson, 2004).
The design and contents of the homepage will be decisive for the success of
the website visit. “Minimize the number of clicks users must make…Most users
come to a library site wanting to do research, and the shorter their paths, the
happier they are” (Jasek, 2004). Therefore, speed of information access via the
homepage was chosen as indicator for website quality. It is an indicator that is
applicable for every library homepage, easy to use, and with an informative
content that enables the library to directly take steps for improving access via
the homepage
Definition of the indicator
The availability of the most frequently used resources and services via the
homepage of the library’s website, measured by the number of clicks (key
strokes) necessary to find the topics and the comprehensibility of the terms used.
The homepage is the page which serves as the visual unit that is displayed
when accessing the library’s website. It may appear after the redirection through
an entry page.
Aims of the indicator
To assess whether the homepage leads directly or very quickly, with adequate
terminology, to the most frequently needed information and the most-used ser-
vices and thus serves as an efficient sign-posting.
The indicator is applicable to all libraries with a library-owned website.
Comparison will be possible between libraries of similar mission and clien-
tele, if a standardized set of topics is used.
The indicator does not evaluate the design or navigation options of the web-
site or the overall contents of the website.
Method
The method used is a kind of cognitive walk-through. A small group of experts
simulates user behaviour when seeking for specified information via the home-
page.
The first step is to define the services and information that are most impor-
tant for the library’s clientele. This includes the decision what terms would be
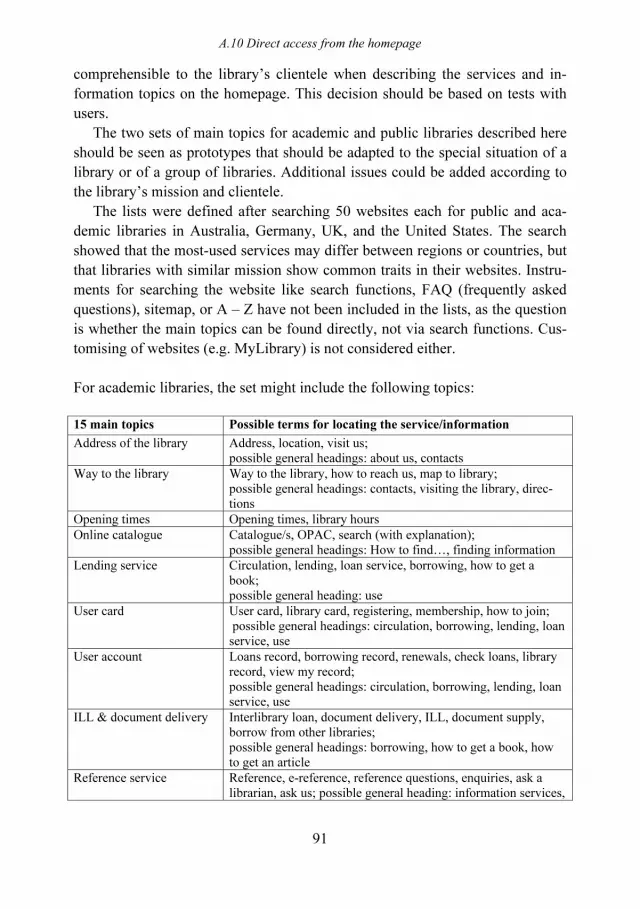
A.10 Direct access from the homepage
91
comprehensible to the library’s clientele when describing the services and in-
formation topics on the homepage. This decision should be based on tests with
users.
The two sets of main topics for academic and public libraries described here
should be seen as prototypes that should be adapted to the special situation of a
library or of a group of libraries. Additional issues could be added according to
the library’s mission and clientele.
The lists were defined after searching 50 websites each for public and aca-
demic libraries in Australia, Germany, UK, and the United States. The search
showed that the most-used services may differ between regions or countries, but
that libraries with similar mission show common traits in their websites. Instru-
ments for searching the website like search functions, FAQ (frequently asked
questions), sitemap, or A – Z have not been included in the lists, as the question
is whether the main topics can be found directly, not via search functions. Cus-
tomising of websites (e.g. MyLibrary) is not considered either.
For academic libraries, the set might include the following topics:
15 main topics Possible terms for locating the service/information
Address of the library Address, location, visit us; possible general headings: about us, contacts
Way to the library Way to the library, how to reach us, map to library; possible general headings: contacts, visiting the library, direc-tions
Opening times Opening times, library hours Online catalogue Catalogue/s, OPAC, search (with explanation);
possible general headings: How to find…, finding information Lending service Circulation, lending, loan service, borrowing, how to get a
book; possible general heading: use
User card User card, library card, registering, membership, how to join; possible general headings: circulation, borrowing, lending, loan service, use
User account Loans record, borrowing record, renewals, check loans, library record, view my record; possible general headings: circulation, borrowing, lending, loan service, use
ILL & document delivery Interlibrary loan, document delivery, ILL, document supply, borrow from other libraries; possible general headings: borrowing, how to get a book, how to get an article
Reference service Reference, e-reference, reference questions, enquiries, ask a librarian, ask us; possible general heading: information services,
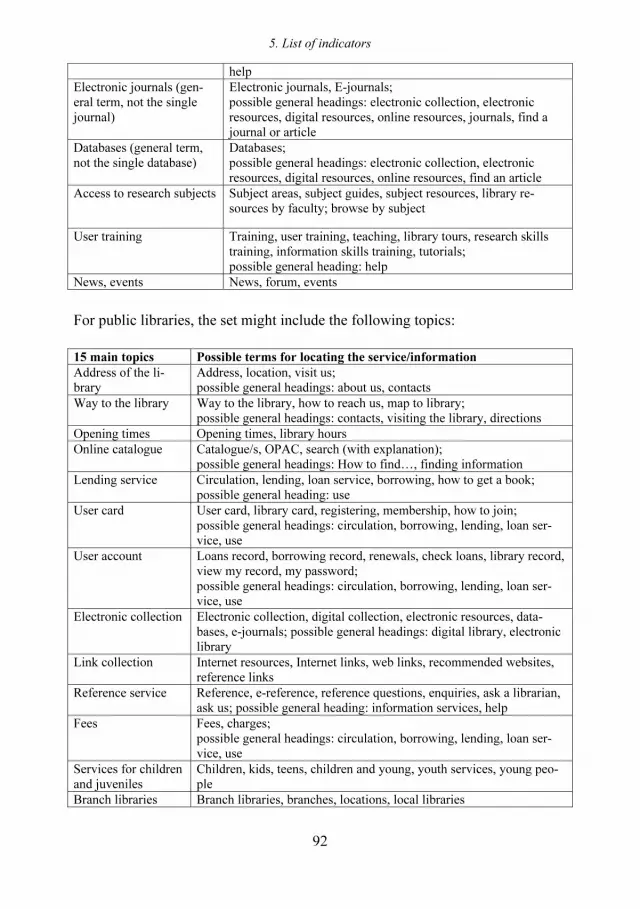
5. List of indicators
92
help Electronic journals (gen-eral term, not the single journal)
Electronic journals, E-journals; possible general headings: electronic collection, electronic resources, digital resources, online resources, journals, find a journal or article
Databases (general term, not the single database)
Databases; possible general headings: electronic collection, electronic resources, digital resources, online resources, find an article
Access to research subjects Subject areas, subject guides, subject resources, library re-sources by faculty; browse by subject
User training Training, user training, teaching, library tours, research skills training, information skills training, tutorials; possible general heading: help
News, events News, forum, events
For public libraries, the set might include the following topics:
15 main topics Possible terms for locating the service/information
Address of the li-brary
Address, location, visit us; possible general headings: about us, contacts
Way to the library Way to the library, how to reach us, map to library; possible general headings: contacts, visiting the library, directions
Opening times Opening times, library hours Online catalogue Catalogue/s, OPAC, search (with explanation);
possible general headings: How to find…, finding information Lending service Circulation, lending, loan service, borrowing, how to get a book;
possible general heading: use User card User card, library card, registering, membership, how to join;
possible general headings: circulation, borrowing, lending, loan ser-vice, use
User account Loans record, borrowing record, renewals, check loans, library record, view my record, my password; possible general headings: circulation, borrowing, lending, loan ser-vice, use
Electronic collection Electronic collection, digital collection, electronic resources, data-bases, e-journals; possible general headings: digital library, electronic library
Link collection Internet resources, Internet links, web links, recommended websites, reference links
Reference service Reference, e-reference, reference questions, enquiries, ask a librarian, ask us; possible general heading: information services, help
Fees Fees, charges; possible general headings: circulation, borrowing, lending, loan ser-vice, use
Services for children and juveniles
Children, kids, teens, children and young, youth services, young peo-ple
Branch libraries Branch libraries, branches, locations, local libraries
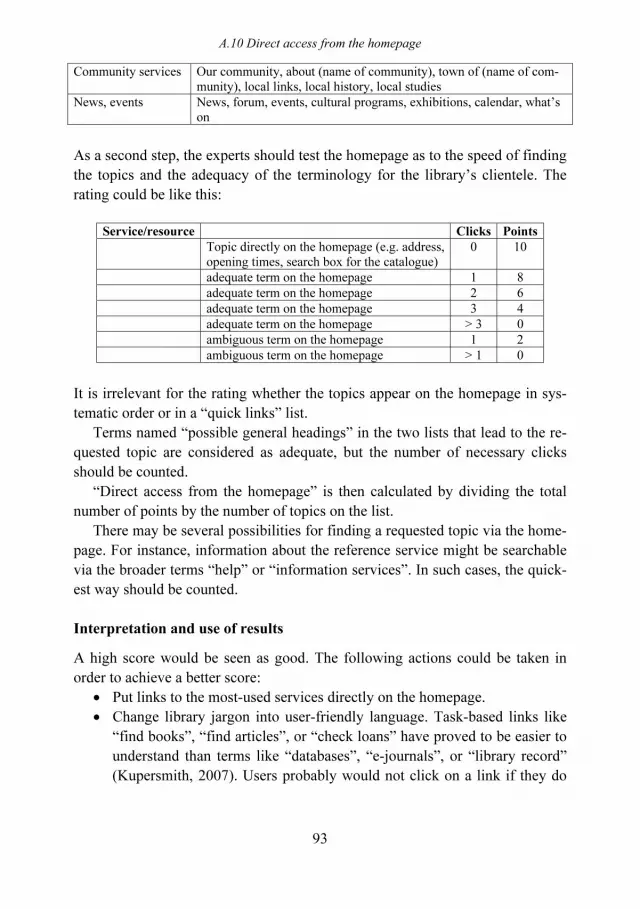
A.10 Direct access from the homepage
93
Community services Our community, about (name of community), town of (name of com-munity), local links, local history, local studies
News, events News, forum, events, cultural programs, exhibitions, calendar, what’s on
As a second step, the experts should test the homepage as to the speed of finding
the topics and the adequacy of the terminology for the library’s clientele. The
rating could be like this:
Service/resource Clicks Points
Topic directly on the homepage (e.g. address, opening times, search box for the catalogue)
0 10
adequate term on the homepage 1 8 adequate term on the homepage 2 6 adequate term on the homepage 3 4 adequate term on the homepage > 3 0 ambiguous term on the homepage 1 2 ambiguous term on the homepage > 1 0
It is irrelevant for the rating whether the topics appear on the homepage in sys-
tematic order or in a “quick links” list.
Terms named “possible general headings” in the two lists that lead to the re-
quested topic are considered as adequate, but the number of necessary clicks
should be counted.
“Direct access from the homepage” is then calculated by dividing the total
number of points by the number of topics on the list.
There may be several possibilities for finding a requested topic via the home-
page. For instance, information about the reference service might be searchable
via the broader terms “help” or “information services”. In such cases, the quick-
est way should be counted.
Interpretation and use of results
A high score would be seen as good. The following actions could be taken in
order to achieve a better score:
• Put links to the most-used services directly on the homepage.
• Change library jargon into user-friendly language. Task-based links like
“find books”, “find articles”, or “check loans” have proved to be easier to
understand than terms like “databases”, “e-journals”, or “library record”
(Kupersmith, 2007). Users probably would not click on a link if they do

5. List of indicators
94
not know what the term means. But extremely “popular” language should
also be avoided, as it may irritate users.
• Avoid abbreviations the users are not familiar with. “ILL” was misunder-
stood as meaning “Illinois” in a survey (VandeCreek, 2005).
• Use a consistent set of terms, e.g. not “periodicals” beside “e-journals”.
• Evaluate frequently asked questions and place the topics on the home-
page. If a question occurs frequently (e.g. “How to look into my account”
or “Where can I find articles”), it is more useful to have a link on the
homepage than to refer the user to “FAQ”.
If the library sees that it takes too many clicks to find its main services, or that
the services are not clearly labelled, the indicator could be followed up by a user
survey or a usability test in order to find more details about the usability of the
homepage.
Users’ searching ways are not predictable. There may be differences between
the searching ways and the terminology of new users and advanced users. Some
users may prefer access to resources by format (books, journals), others may
prefer a subject-oriented search (medicine, linguistics). The terminology and the
links on the homepage should always consider several search options and differ-
ences in the needs and experience of user groups. “A library website requires an
interface that can accommodate the different needs, scholarly disciplines and
capabilities of the many and varied users within its institution” (Raward, 2001).
A good solution would be to offer options for different user groups on the
homepage, for instance:
• first-time visitors
• external users
• children, juveniles
• seniors
• first-year students
• graduates
• faculty
• disabled persons
The problem in offering quick access to the main services via the homepage for
all user groups will be that on the one side the homepage should offer all rele-
vant information, on the other side it must not be overloaded and confusing.
This can be a tightrope walk between conflicting wishes. If, based on the results
of this indicator, the library wants to place additional topics on the homepage,
the existing topics should be examined and possibly weeded. Surveys show that
there is often too much general information about the library, e.g. its history,

A.10 Direct access from the homepage
95
organisation, and mission, placed prominently on the homepage, information
that would not matter to users performing a quick search. Information on the
homepage should be limited to the necessary.
Examples and further reading
The number of clicks necessary to find an information, starting from the home-
page, was counted in a project of the School of Communication, Information,
and Library Studies, Rutgers, The State University of New Jersey, US (Jeng,
2005, p.104). Students were given specified tasks, and the study measured as
well the time needed as the keystrokes, clicks, or movements necessary for
completing the task. As the tasks included finding certain journal or encyclope-
dia articles, students on average needed between 2 to 4 minutes and between 7
to 13 clicks.
The “minimum number of moves” to complete a task was also counted in a
usability study at Louisiana State University Libraries, US (Robins and Kelsey,
2002). The study differentiated between “correct” and “incorrect” moves, where
65% were rated as correct moves. An interesting result was that for most of the
assigned tasks the project staff identified more than one way to navigate to the
desired information. “In some cases, it was possible to navigate various paths
from the libraries' home page to the desired page and still complete the task in
the minimum number of moves.”
A usability study at the e-library at Iowa State University, US, with 14 par-
ticipants and “think out loud” method differentiated between participants fol-
lowing “expected paths” (paths anticipated by the research team) and partici-
pants finding information in their own way (Report on the 2004 usability study,
2005). The success rate of the participants following expected paths was 42%,
while the average overall success rate was 81%. The average number of clicks
by participants following expected paths was 2.75 – 3, while the average number
of clicks by participants following their own paths was 5.5. Users evidently were
more successful with their own ways, but needed more clicks.
A usability test in the University of Hull, UK, graded the test results by the
number of attempts made to find a specific resource or information (Holland,
2005). The categories were:
• Grade 1 – Found the information or resource straight away (the volunteer
performed a correct series of clicks to locate the answer).
• Grade 2 – Found the link after two or three false starts.

5. List of indicators
96
• Grade 3 – Found the information or resource they needed after more than
three attempts.
• Grade 4 – The volunteer was unable to find the information.
49% of the participants found the information at the first attempt. Library jargon
was found to be the main barrier.
A study at the University of Wollongong, Australia, tried to find the most
commonly used services in order to give them prominent placement on the
homepage (Norris and Freeman, 2005). They found that the most frequent
searches concerned:
• database search (more topic than article searches)
• catalogue search (more item than topic searches)
• journal search
• circulation record
A study evaluating 41 websites of academic health sciences libraries offers a list
of “obligatory” homepage links for health library websites (Brower, 2004):
• bibliographic databases, listed by title
• e-books
• e-journals
• hours of operation
• instruction or tutorials
• news, events
• descriptions of services
A study of university library websites in four English speaking countries (Aus-
tralia, Canada, the UK and the US) found that the visual display of information
was similar across all countries, but that there were differences in the content
supplied (Still, 2001). “These are no doubt tied to the educational environment,
such as the prevalence of exam papers in some countries, the interaction be-
tween universities and the for-profit sector, such as the presence of links to
bookstores, and the financial and technical concerns…”
A study at the University of Calgary Library, Canada, using the “think aloud”
method with 10 test questions, asked for users’ comments on the usability of the
website (Hayden et al., 2004). One of the results was that the participants
wanted “the most important and most commonly used resources accessible with
one click from the first page, ideally from a page that is tailored to their subject
needs”.
The difficulty of adequate terminology was one of the main results in a focus
group study at Texas A&M University, US (Crowley et al., 2002). Participants

A.10 Direct access from the homepage
97
complained not only about technical terms, but also about misleading everyday
words. “When I see the link for information I get excited because I think that is
what I am looking for: research articles. But I’m not looking for any of this kind
of information (hours, telephone numbers, and directions).”
The indicator described here assesses the direct access to information and
services from the library’s homepage. Another important issue for the visibility
and effective use of the library’s website is the access to the library’s website
via its parent institution’s website:
• How many clicks away is the library?
• Can the library be identified directly on the institution’s website? As the
library is always one of the most-used links, it should not be hidden in
general terms like “central institutions”, “services” or “organisation”
(Bao, 2000, p.194; King, 1998, p.462).
Literature on library website design and usability tests is so extensive that only a
few studies can be named that have addressed special topics related to this indi-
cator or that can be seen as typical examples.
________________________________________________________________
Bao, X. (2000), Academic library home pages: link location and database provision, Journal
of Academic Librarianship 26,3, pp. 191-195
Brower, S. M. (2004), Academic health sciences library Website navigation: an analysis of
forty-one Websites and their navigation tools, Journal of the Medical Library Association
92,4, pp. 412 – 420, available at:
http://www.pubmedcentral.nih.gov/articlerender.fcgi?artid=521512
Crowley, G. et al. (2002), User perceptions of the library’s web pages: a focus group study at
Texas A&M University, Journal of Academic Librarianship 28,4, pp. 205-211
Hayden, A. et al. (2004), University library website usability study report, University of
Calgary Library website usability study team, available at:
http://hdl.handle.net/1880/43524
Holland, D. (2005), Practical experiences of using formal usability testing as a tool to support
website redesign, SCONUL Focus 36 Winter, pp. 31-35
Hutcherson, N. B. (2004), Library jargon: student recognition of terms and concepts
commonly used by librarians in the classroom, College & Research Libraries 65,4, pp.
349 - 354

5. List of indicators
98
ISO 9241 (1998), Ergonomic requirements for office work with visual display terminals
(VDTs) -- Part 11: Guidance on usability, International Organization for Standardization,
Geneva
Jasek, C. (2004), How to design library web sites to maximize usability, Library Connect,
pamphlet 5, available at:
http://www.elsevier.com/framework_librarians/LibraryConnect/lcpamphlet5.pdf
Jeng, J. (2005), Usability assessment of academic digital libraries: effectiveness, satisfaction,
and learnability, Libri 55, pp. 96 – 121
King, D. L. (1998), Library home page design: a comparison of page layout for front ends to
ARL library web sites, College & Research Libraries 59,5, pp. 457-464, available at:
http://www.ala.org/ala/acrl/acrlpubs/crljournal/backissues1998b/september98/king.pdf
Kupersmith, J. (2007), Library terms that users understand, available at:
http://www.jkup.net/terms.html
Kupersmith, J. (2006), Library terms evaluated in usability tests and other studies, available
at: http://www.jkup.net/terms-studies.html
Letnikova, G. (2003), Usability testing on academic library websites: a selective bibliography,
Internet Reference Services Quarterly 8,4, pp. 53 - 68
Library usability bibliography, NCSU Libraries, North Carolina State University, available at:
http://www.lib.ncsu.edu/usability/library-usability.html
Nielsen, J. (1994), 10 usability heuristics, available at:
http://www.useit.com/papers/heuristic/heuristic_list.html
Nielsen, J. (2002), Top 10 guidelines for homepage usability, Alertbox, May 12 2002,
available at: http://www.useit.com/alertbox/20020512.html
Nielsen, J. (2006), Outliers and luck in user performance, Alertbox, March 6 2006, available
at: http://www.useit.com/alertbox/outlier_performance.html
Nielsen, J. and Loranger, H. (2006), Prioritizing web usability, Berkeley, Cal., New Riders
Norris, A. and M. Freeman (2005), Improving library website usability: a user focus, Paper
presented at ALIA National Library & Information Technicians Conference, available at:
http://e-prints.alia.org.au/archive/00000062/
Raward, R. (2001), Academic library website design principles: development of a checklist,
Australian Academic & Research Libraries 32,2, pp. 123-136, available at:
http://alia.org.au/publishing/aarl/32.2/full.text/raward.html

A.10 Direct access from the homepage
99
Report on the 2004 usability study of the e-library at Iowa State University (2005), available
at: http://www.lib.iastate.edu/cfora/pdf/3000000.pdf
Robins, D, and Kelsey, S. (2002), Analysis of web-based information architecture in a
university library: navigating for known items, Information Technology and Libraries
21,4, pp. 159-170, available at:
http://www.ala.org/ala/lita/litapublications/ital/2104robins.htm
Schulz, U. (2006), Web usability, available at: http://www.bui.fh-
hamburg.de/pers/ursula.schulz/webusability/webusability.html
Spivey, M. E. (2000), The vocabulary of library home pages: an influence on diverse and
remote end-users, Information Technology and Libraries 19,3, pp. 151-156
Still, J. M. (2001), A content analysis of university library Web sites in English speaking
countries, Online Information Review 25,3, pp. 160-165
Useit.com: Jacob Nielsen’s website, available at: http://www.useit.com/
VandeCreek, L. M. (2005), Usability analysis of Northern Illinois University Libraries’
website: a case study, OCLC Systems & Services 21,3, pp. 181 - 192

5. List of indicators
100
B. Use
B.1 Market penetration
Background
Libraries are usually founded and funded with the intent that they shall serve a
defined population, e.g. the members of a university or the inhabitants of a
community. Therefore the question to what extent a library reaches its popula-
tion to be served with its services is an important issue for assessing whether the
library fulfils its mission by offering services that meet the interests and needs of
its population.
When measuring the market penetration or percentage of the population
reached, libraries have generally concentrated on borrowing: They count the
number of persons in the population that have borrowed an item from the library
during a specified time. But library use can include many other activities besides
borrowing:
• Working in the library with user-owned materials
• In-house use of the library collection, including copying
• Use of interlibrary lending and document delivery services
• Use of help services (reference service)
• Attending user training lessons
• Attending library events
• Using the library’s electronic services and resources, inside or outside the
library
Assessing the library’s market penetration should therefore, if possible, include
all user activities concerned with library services and resources.
Definition of the indicator
The percentage of the population to be served that are active users of the library.
The population to be served is the number of persons to whom the library is
commissioned to provide its services. For public libraries, this will normally be
the population of the community (or part of the community); for academic li-
braries, this will normally be the total of students and academic staff in the insti-
tution..

B.1 Market penetration
101
An active user is defined as a registered user who has visited the library or
made use of library facilities or services during a specified period. This may
include the use of electronic library services within or outside the library.
Aims of the indicator
The indicator assesses the library’s success in reaching its population.
The indicator is relevant for all libraries with a defined population to be
served.
Comparison of results between libraries with similar mission, structure and
clientele is possible.
Methods
1. A representative sample of the population to be served is questioned by
survey whether they have visited the library or made use of library ser-
vices in any form during the last year. Surveys can be sent by mail or e-
mail, or an online survey can be made available on the library’s website.
Questions in the survey could be:
- Have you visited the library during the last year?
- Have you visited the library’s website during the last year?
- Have you used the library’s electronic services from outside the library
during the last year?
The market penetration of the library is calculated by the percentage of re-
spondents answering “yes” at least once of the total number of respon-
dents.
2. As an estimate for market penetration, the number of active borrowers can
be used.
Active borrowers are registered users who have borrowed at least one
item during the last year. The data should be available via the records of
the library’s loan system.
The market penetration of the library is calculated by the percentage of
active borrowers of the total population to be served.
As members of the population may have visited the library or used elec-
tronic library services without borrowing, the market penetration calcu-
lated by this method can be lower than in reality, especially if borrowing
is not a main user activity. This can be the case in libraries of medicine or
sciences, where electronic collections are more heavily used than the loan
collection. In such cases, methods 1 or 3 should be preferred.

5. List of indicators
102
3. If the library’s authentication procedures for the use of its electronic ser-
vices make it possible to identify which users out of its population have
used the electronic services, these data can be compared with those of ac-
tive borrowers.
The market penetration of the library is then calculated as the percentage
of persons in the population to be served that have either borrowed at least
one item and/or have used electronic library services during the last year.
When measuring market penetration, some libraries have also used the number
of “registered users” (persons having registered for using library services). But
this number may be too high, if users are registered automatically when enroll-
ing in the institution, or if the library does not “weed” its user data regularly.
In order to get a more detailed view of market penetration, in all three meth-
ods the population to be served could be split into groups. For a university li-
brary this could be:
• Undergraduate students
• Graduate students
• Academic staff
• Students and academic staff of a faculty (e.g. medicine)
For a public library, this could be:
• Children (up to and including age 14)
• Adults
• Adults over 65 years
Market penetration could also be measured for special target groups differenti-
ated as to gender or ethnic origin.
Interpretation and use of results
High market penetration will be considered as good. “A library that appeals to
only a small proportion of prospective clients could not be seen as being effec-
tive in comparison with one which attracted 100% of prospective users” (Revill,
1990, p.303). But the degree of market penetration that can be achieved will
depend on the library’s mission and clientele. While libraries in institutions of
higher education may reach nearly the whole population, especially if there is no
other library nearby that could deliver similar services, public libraries will
probably reach only part of the total population in the community.
The indicator can be influenced by several issues:
• Other libraries nearby supplying services to the library’s clientele

B.1 Market penetration
103
• The distance of potential users to the library
• The level of education in the population
If the market penetration seems too low compared with other libraries of similar
mission and population, the library could
• try to improve its services,
• introduce new attractive services (e.g. group working areas, wireless ac-
cess, e-books),
• promote its services via its website or public media,
• tailor services to special target groups in the population.
Examples and further reading
When assessing market penetration, libraries as yet have used either active bor-
rowers or registered users for the calculation. No example was found of a library
including all types of usage as described in this indicator.
The German benchmarking project BIX (BIX. Der Bibliotheksindex) used
the indicator “market penetration” in 2004 for academic libraries, calculated by
the number of active borrowers in the population (BIX, 2004). The results were:
Percentage of active borrowers in the population mean maximum minimum
Universities of applied sciences 87.9% 99.6% 68.4%
Universities: One-tier systems 85.8% 98.1% 67.2%
Universities: Two-tier systems (only the central library considered)
69.3% 98.5% 49.5%
Market penetration seemed to be lower in the traditional two-tier systems, but in
their first terms many students use mainly the departmental or institute libraries,
that may not yet participate in the central computerized loan system.
A study in Polish academic libraries used the indicator “registered users as %
of potential users” (Derfert-Wolf, Górski and Marcinek, 2005). The results for
2003 were:
Registered users as percentage of potential users average median
University libraries 70,56% 75,76%
Technical university libraries 65,88% 70,17%
All academic libraries 69,93% 74,52%

5. List of indicators
104
Market penetration is of course lower in public libraries. The Finnish public
library statistics show a percentage of 44.77% active borrowers of the popula-
tion for 2005 and 43.33% for 2006 (Finnish public library statistics).
The statistics of public libraries in British Columbia compare the number of
“resident borrowers” to the population to be served (British Columbia public
library statistics, 2004). Resident borrowers are persons residing in the library’s
service area with borrower cards that have been used during the last three years.
In 2004, 55.48% of the population to be served were resident borrowers.
The Council of Australian State Libraries published a report with accumu-
lated data for the states or territories, using among others the indicator “percent
of population who are library members” (Australian public libraries comparative
report, 2005). This indicator calculates market penetration with the number of
registered users. The percentage will therefore be higher than when active bor-
rowers are compared to the population. The results for 2003/04 showed a maxi-
mum of 60% for South Australia and a minimum of 38% for the Northern Terri-
tory.
________________________________________________________________
Australian public libraries comparative report 1998 – 2004 (2005), presented to CASL
meeting Sydney, NSW, July 2005, available at:
http://www.nsla.org.au/publications/statistics/2004/pdf/NSLA.Statistics-20040701-
Australian.Public.Library.Comparative.Report.1998.2004.pdf
BIX. Der Bibliotheksindex, available at: http://www.bix-bibliotheksindex.de/
BIX. Der Bibliotheksindex (2004), Bertelsmann Stiftung, Gütersloh
British Columbia public library statistics (2004), Ministry of Education, Victoria, British
Columbia, available at: http://www.bced.gov.bc.ca/pls/bcplstats_2004.pdf
Derfert-Wolf, L., Górski, M. and Marcinek, M. (2005), Quality of academic libraries –
funding bodies, librarians and users, World Library and Information Congress, 71th IFLA
General Conference and Council, available at: http://www.ifla.org/IV/ifla71/papers/080e-
Derfert-Wolf.pdf#search=%22Derfert-Wolf%22
Finnish public library statistics, Culture and Media Division of the Ministry of Education,
available at: http://tilastot.kirjastot.fi/Default.aspx?&langId=en
Revill, D. (1990), Performance measures for academic libraries, in Kent, E. (Ed.),
Encyclopedia of Library and Information Science, Vol.45, Suppl.10, Dekker, New York,
Basel, pp. 294 - 333

B.2 User satisfaction
105
B.2 User satisfaction
Background
“In a service environment, how users perceive and value what is available is
central to effective service design and delivery.” (Creaser, 2006, p.1)
Most libraries are trying to assess their users’ opinion on the services they
supply. This is usually done by surveys handed out or mailed to a random sam-
ple of users or by a web-based survey on the library’s website. Other methods
used are focus groups or personal interviews with users.
User surveys can ask for different levels of experience with library services:
• The particular experience and satisfaction with the last library visit or
the last use of a library service
• The long-time experience and satisfaction with all or individual library
services
• The experience and satisfaction compared with the expected quality
level
Surveying users is today very common in libraries. A questionnaire by the
Association of Research Libraries to its members in 2004 showed, that only one
library did not survey its users (Diamond, 2004, p.9). For a long time most li-
braries designed their own surveys according to their tasks and clientele. The
advantage of such individual surveys is that each library can address its special
problems and specified user groups. More recently, libraries tend to make use of
standard surveys, designed for a group or type of libraries. The advantage is that
benchmarking of the results will become possible, especially if the survey is
applied regularly over years. A standardized survey will also give the individual
library more confidence in its surveying process and will add reliability to the
data when reporting to funding institutions. If libraries join in a user survey
project, it will be possible to evaluate the data centrally and to save workload in
the individual library.
User surveys will assist in tailoring library services to the needs and interests
of the population. They show areas of dissatisfaction and thus help to detect
problems and shortcomings in the service delivery.

5. List of indicators
106
Definition of the indicator
The average rating given by users on a numeric scale ranging from very unsatis-
factory to very satisfactory expressing their perception of the library services as
a whole and of individual services offered by the library.
The numeric scale can have different numbers of points; scales with four,
five, seven, nine or ten points have been used. For the description of this indica-
tor, a five-point- scale is used with 1 as the lowest value.
Aims of the indicator
To assess the degree to which users are satisfied with the library services as a
whole and with individual services offered by the library.
The indicator is relevant for all libraries.
Comparison with other libraries, as well of the overall satisfaction with the
library as of the satisfaction with individual services, will be possible, if the
same kind of survey is used and if differences in the libraries’ tasks and clientele
are taken into consideration.
The indicator can be used separately for different target groups in the li-
brary’s population, e.g. for undergraduates, the faculty of medicine, external
users, or elderly people.
Methods
The library designs a questionnaire that lists the specific services and/or aspects
of services which it wants to evaluate. A numeric scale, usually a five-point
scale, is provided for answering the questions. Space should be given for addi-
tional comments.
The questionnaire should be tested by a small sample of users to see whether the
questions are clear and understandable.
If the library decides to use a standard survey, if possible in a joint project to-
gether with other libraries, it should ensure that relevant local questions can be
added to that survey.
Questions about user status should be included in the questionnaire in order to
allow differentiating between the needs of the different user groups.
The contents of the questionnaire could be as follows
• Questions as to user status:
Questions in an academic library could ask for age group, status (under-
graduate, postgraduate, academic staff, others), faculty.

B.2 User satisfaction
107
Questions in a public library could ask for age group, gender, ethnic ori-
gin, employment status.
• Questions as to the frequency of library use
e.g. frequency of library visits, preferred branch or departmental library,
frequency of using specified services (lending, reference, online cata-
logue, etc.)
• Questions as to the last time use of library services and the satisfac-
tion
What did you do when you last visited the library and how satisfied were
you? (Options for activities and for a satisfaction rating on a five-point
scale)
What did you do when you last accessed library services from a computer
and how satisfied were you? (Options for activities and for a satisfaction
rating on a five-point scale)
• Questions as to satisfaction with an individual library service and its
importance for the respondent (Satisfaction and importance are each
rated on a numeric scale.)
The services named could be:
- collection (differentiated as to books, e-books, print and electronic
journals, databases, audiovisual materials, children’s books, etc.)
- studying and reading facilities (differentiated as to seats, computer
workstations, copying, etc.)
- opening hours
- library environment (differentiated as to noise, climate, security, etc.)
- lending service
- interlibrary lending
- online catalogue
- library website
- reference service
- user training
- Internet access
- staff (helpfulness, competence)
The survey could also ask for the overall satisfaction with the library’s services,
again on a five-point scale.
Method 1:
A random sample of users is asked to fill out the questionnaire. The question-
naires could be handed out directly to users visiting the library or sent by post or

5. List of indicators
108
e-mail to active users. If the questionnaire is handed out in the library, “normal”
weeks should be chosen and an equal spread over times of the day and week in
order to include different types of users.
Non-users should generally not be included, as they would have no experience
with library services.
Method 2:
An online survey is put on the library’s website at certain times, with an equal
spread over times of the day and week. With this method, non-users might be
included if they choose to answer the questions. The advantage is that the
evaluation of the data will be much easier.
In both methods, user satisfaction is then calculated for the overall satisfaction
with the library and for each service separately. The satisfaction scores given by
respondents for each service are summed up and divided by the number of re-
spondents.
Example:
In a sample of 371 users rating their satisfaction with the electronic journal collection on a five- point scale, 8 consider the collection as very unsatisfactory, 24 as unsatisfactory, 120 as moderately satisfactory, 164 as satisfactory, and 55 as very satisfactory. 8 x 1 = 8 24 x 2 = 48 120 x 3 = 360 164 x 4 = 656 55 x 5 = 275 __________________________________ 1.347 : 371 = 3.63 The satisfaction rate with the electronic journal collection would be 3.63, between moderately satisfactory and satisfactory. The statements of the respondents about the frequency of use and the importance of individual services could then be compared to the results in order to decide whether more resources should be spent on this service.
Interpretation and use of results
High satisfaction rates will of course be seen as good and can be used as an
efficient marketing tool of the library. The results, even if worse than expected,
should in any case be publicised as well to library staff as to the user community
and the parent institution.
Low satisfaction with a service points to shortcomings in the service deliv-
ery. The open comments of users in the questionnaire can give more information

B.2 User satisfaction
109
about the reasons for dissatisfaction. The library could follow up the problem by
conducting focus groups or interviews for the specified service. The comments
might also have addressed issues that were not considered in the questionnaire.
For the interpretation of the scores it will be of vital importance to bear in
mind that the results are based on the subjective opinion of a random sample of
users. The problems are:
• Individual circumstances at the time of the survey can influence the an-
swers. For example, a user who had to queue at the reference desk may
rate the whole reference service as unsatisfactory.
• The previous experience of users will influence their expectations and
therewith the satisfaction with a library service. If users have no experi-
ence of high quality services they may be satisfied with lower quality.
• Loyalty may influence the answers. Library staff often gets good scores
for friendliness and helpfulness, because users know staff members per-
sonally.
The indicator “user satisfaction” should always be used together with other indi-
cators for service quality and with usage statistics for the services that are evalu-
ated.
Examples and further reading
Over years, many libraries have developed and used individual satisfaction sur-
veys. But the trend is going to standard surveys and to joint projects for reasons
of benchmarking and practicality of data evaluation.
There are a number of options available for standard surveys. For public li-
braries, surveys are sometimes mandatory, if a quality assessment program is
prescribed for them by a central institution. This is for instance the case in UK
public libraries (Creaser, 2006, p.1).
In academic libraries, the LibQUAL+ survey developed by the Association
of Research Libraries has found wide acceptance. The survey asks library users
to rate the library services on a nine-point scale as to
• the minimum acceptable service level,
• the desired level,
• the perceived service performance.
An overview of studies about LibQUAL+ and it’s applications is given in the
LibQual+TM bibliography and the LibQUAL+(R) study bibliography.
In the UK, a standard survey has been developed by SCONUL, Society of
College, National and University Libraries. The survey asks not only for the

5. List of indicators
110
“last time experience”, but also for the satisfaction with individual services
along with how important each individual service is to the user. This supports
management decisions, where important services with low satisfaction rates
would be tackled first.
In Australia, the Rodski survey, now Insync survey is used in many libraries.
As in the SCONUL survey, it measures satisfaction with performance against
importance of the service to the user (Saw and Clark, 2004).
A survey similar to SCONUL and Rodski, again asking for satisfaction and
importance, was used in the joint user survey of 15 German university libraries
in 2001 (Follmer, Guschker and Mundt, 2002; Mundt, 2003).
A joint project of 10 Austrian university libraries in 2003 concentrated on
user satisfaction with electronic library services, with an online questionnaire on
the library websites (Bauer, 2004).
________________________________________________________________
Bauer, B. (2004), Die elektronische Bibliothek auf dem Prüfstand ihrer Kunden: Konzeption
und Methodik der gemeinsamen Online-Befragung 2003 an zehn österreichischen
Universitäts- und Zentralbibliotheken, Bibliotheksdienst 38,5, pp. 595-610
Creaser, C. (2006), User surveys in academic libraries, New Review of Academic
Librarianship 12,1, pp. 1-15
Diamond, T. (2004), Library user surveys, SPEC Kit 280, Association of Research Libraries,
Washington D.C.
Follmer, R., Guschker, S. and Mundt, S. (2002), Gemeinsame Nutzerbefragung der
nordrhein-westfälischen Universitätsbibliotheken – methodisches Vorgehen und
Erfahrungen, Bibliotheksdienst 36,1, pp. 20-33, available at:
http://bibliotheksdienst.zlb.de/2002/02_01_02.pdf
LibQUAL+TM , available at: http://www.libqual.org/
LibQUAL+TM bibliography (2004), available at:
http://www.libqual.org/documents/admin/LibQUALBibliography3.1.pdf
LibQUAL+(R) study bibliography, available at:
http://www.coe.tamu.edu/~bthompson/servqbib
Mundt, S. (2003), Benchmarking user satisfaction in academic libraries – a case study,
Library and Information Research 27 (87), pp. 29-37, available at:
http://www.lirg.org.uk/lir/pdf/article87_mundt.pdf

B.2 User satisfaction
111
Saw, G. and Clark, N. (2004), Reading Rodski: user surveys revisited, IATUL Proceedings
14, available at:
http://www.iatul.org/doclibrary/public/Conf_Proceedings/2004/Grace20Saw20and20Nico
le20Clark.pdf
SCONUL service templates, available at:
http://www.sconul.ac.uk/groups/performance_improvement/surveys/templates.html
5. List of indicators
112
B.3 Library visits per capita
Background
Traditionally, libraries offer the use of their collections and services via a user’s
visit to the library as physical place. As users’ visits can be seen as a measure
for the library’s attractiveness, national library statistics have in most cases in-
cluded the number of library visits in their counts.
With the development of electronic collections and services libraries have
started to offer a new virtual “entrance” to their services: the library website.
Users can “visit” the library and use many of its services from remote places,
e.g. from their workplace or from home. Such visits, in analogy to the traditional
physical visits, are called “virtual visits”.
Both forms of “visits” are used side by side, often by the same users. In some
libraries physical library visits have decreased, due to a high number of the li-
brary’s services and resources being available for remote use. In other cases,
physical visits have remained stable or have even increased. This may be due to
a growing tendency for group work in libraries, to the trend of users working
with their own material in libraries, and to the advantage of using both print and
electronic resources together with help and training services.
The library has remained attractive as a place to meet and study. Therefore,
physical library visits are still a relevant measure of a library’s attractiveness.
But in order to additionally assess the attractiveness of the library’s web ser-
vices, the indicator proposed here tries to combine physical and website visits in
order to show the growing use of library services via the library’s website.
Definition of the indicator
The total number of visits to the library per year, either physical or virtual, by
members of the population to be served, divided by the number of persons in the
population.
A physical visit is defined as the act of a person’s entering the library prem-
ises. Visits are counted independently of the purpose of the visit (borrowing,
working in the library, or taking part in events and guided tours).

B.3 Library visits per capita
113
A virtual visit is defined as a user’s request on the library’s website from out-
side the library premises in order to use one of the services provided by the li-
brary.
The population to be served is the number of persons to whom the library is
commissioned to provide its services. For public libraries, this will normally be
the population of the community (or part of the community); for academic li-
braries, this will normally be the total of students and academic staff in the insti-
tution.
Aims of the indicator
The indicator assesses the library’s success in attracting users either to the li-
brary as place or to its web services and the adequacy of the library’s traditional
and new web-based services to its population.
The indicator is relevant for all libraries with a defined population to be
served and with both traditional and web-based services.
Comparison between libraries of similar mission, structure and clientele is
possible, if special conditions (e.g. a new building) are considered.
The indicator does not consider users’ activities during physical or virtual
visits.
Methods
a) Physical visits: Count the number of visits made by persons (individuals) to
the library premises annually. This is usually done by using a turnstile or similar
device to automatically count the number of people leaving or entering the li-
brary. Count either entries or exits, not both.
If manual counts have to be used, samples of “normal” times could be taken
and grossed up to give an annual estimate. Times with normal activity could be
identified by using circulation data.
The method used (turnstile or manual count) should be reported.
Entrances and exits of library staff should be estimated and deducted.
Visits by external users (users not belonging to the population to be served)
will be included in the counts. If external users’ activities constitute a high pro-
portion of library use, the library could try to estimate the number of external
users’ visits by calculating the percentage of loans to external users (see Indica-
tor B.9 “Percentage of loans to external users”).

5. List of indicators
114
b) Virtual visits: Counting virtual visits is not as straightforward as counting
physical visits. Following the international standard ISO 2789, the following
rules apply for this indicator:
• A virtual visit is a series of requests for data files from one and the same
website visitor.
• A website visitor is either a unique and identified web browser program or
an identified IP address that has accessed pages from the library’s web-
site.
• Only requests coming from outside the library premises are defined as vir-
tual visits. Website visits from inside the library premises and page views
by changing over from another page of the website are excluded. This can
be difficult if the server cannot extract such visits.
• The interval between two consecutive requests must not be longer than a
time-out period of 30 minutes if they are to be counted as part of the same
virtual visit. A longer interval initiates a new visit.
• Website visits from robot or spider crawls and from page reloads may in-
crease the numbers and should be excluded from the counts.
• If a request results in opening a HTML page that consists of several
frames, the HTML document should be counted that comprises the most
essential contents of the frameset.
• If a website exists in several languages, counting has to be done sepa-
rately for every language and the partial results have to be added.
Ideally, the indicator should only consider virtual visits made by members of the
population. Visits from outside the population should be excluded. IP-addresses
inside an institution might be used for this purpose, but this would exclude the
virtual visits from home addresses by members of the population.
Separating the virtual visits made by members of the population from other
virtual visits would be possible if each website visitor were asked to register.
But as most libraries want to offer information about their services to every
interested person, registration is only used for services restricted to the popula-
tion like licensed databases. Visitors from outside the population will therefore
in most cases be included in the count of virtual visits. But as that will probably
also be the case for physical visits, and as certainly the highest number of both
physical and virtual visitors are members of the population, data of physical and
virtual visits will still be comparable and can be summed up for this indicator
“Library visits per capita”.

B.3 Library visits per capita
115
Another problem for counting virtual visits is caching. Caching means that
the user’s browser has stored the page the user visited and at the next visit will
pull the page from the cache, so that the visit will not be recorded in the server’s
log files. “The number of requests does not translate into number of unique visi-
tors, and the numbers may not reflect all usage because of caching” (Bauer,
2000).
Libraries measuring website visits have used different counts:
• All page views, but excluding page accesses via another page of the web-
site
• Only accesses to the homepage and the most-used pages
• Only accesses to the homepage
The home page is the page which serves as the visual unit that is displayed when
accessing the library’s website. The home page may appear after the redirection
through an entry page.
A method for joint use by a group of libraries was developed by the German
benchmarking project BIX (BIX. Der Bibliotheksindex) and will be used from
2007 following. The counts include only the library’s homepage and the start
page for the online catalogue. A “pixel” with a short text is inserted on each of
the pages for counting purposes. The number of deliveries of the pixel is identi-
cal to the number of page deliveries. The advantage of this method is that it is
easy to use; the disadvantage is that access to other pages is not counted.
The method chosen and the pages included in the count of virtual visits should
be specified in the statistics, especially if the data are aggregated on a national
basis and if the results are used for comparison and benchmarking.
For calculating “Library visits per capita”, the total number of physical + vir-
tual visits is divided by the number of persons in the population.
Interpretation and use of results
A high number of visits per member of the population show the library’s attrac-
tiveness and the adequacy of its services to the population to be served.
The results for the number of physical visits per member of the population
may be too high if visits by external users cannot be excluded from the counts.
The number may also be influenced by users frequently leaving and re-entering
the library, e.g. if the cafeteria is located outside the library premises.
If physical visits seem too low or are decreasing, the library could

5. List of indicators
116
• introduce new attractive services (e.g. group working areas, wireless ac-
cess, a cafeteria and recreation areas),
• address problems of in-house library use by a user satisfaction survey,
• offer longer opening hours (see Indicator A.3 “Opening hours compared
to demand”)
• try to enlarge the space offered to users for reading and working (see In-
dicator A.1 “User area per capita”).
If virtual visits per member of the population seem too low compared with other
libraries, the library could
• align the homepage and other relevant pages to the main needs of its
population (see Indicator A.10 “Direct access from the homepage”),
• change to a more user-friendly and consistent terminology,
• offer various instruments for orientation like a search function, a sitemap,
or an “A – Z” register.
Another issue might be to offer special homepage entrances for special target
groups. For academic libraries this could be:
• first-time visitors
• first-year students
• postgraduates
• faculty
• senior students
• disabled persons
• external visitors
For public libraries this could be:
• first-time visitors
• children, juveniles
• seniors
• disabled persons
Examples and further reading
The only example found where both physical and virtual visits are counted and compared to the population is that of the Finnish public libraries (Finnish public library statistics). The data of the last 4 years show a slight decrease in physical visits, a considerable increase in virtual visits, and an increase in total library visits.

B.3 Library visits per capita
117
physical visits
per inhabitant
virtual visits
per inhabitant
total visits
per inhabitant
2003 12,72 6,76 19,48 2004 12,84 7,90 20,74 2005 11,98 9,04 21,02 2006 11,38 10,15 21,53
As yet, most libraries count only the physical visits to the library.
The German benchmarking project BIX (BIX. Der Bibliotheksindex) uses for
academic libraries the indicator „visits per capita“, that aims at counting the total
number of visits, including both physical and virtual visits, per member of the
population. The count of virtual visits will start in 2007. The results for only
physical visits in 2005 were (BIX, 2006):
Visits per capita mean maximum minimum
Universities of applied sciences 32,0 51,4 7,0
Universities: One-tier systems 63,8 166,1 5,7 Universities: Two-tier systems (only the central library considered)
36,4 70,9 13,8
Visits seem to be lower in the traditional two-tier systems, but in their first terms
many students use mainly the institute libraries.
The statistics of the Australian university libraries (CAUL online statistics)
show for 2005 a mean score of 22,18 visits per member of the total population
(students and staff). Visits increased during the last years.
In UK academic libraries the statistics of 2004/05 show an average of 57 vi-
sits per full time equivalent member of the population, including academic staff
and students (Creaser, 2006, p.15). Visits decreased from 1994/95 to 2001/02,
but remain stable since 2002/03.
The Finnish research libraries had in 2005 a score of 39,2 visits per member
of the population, including students and staff ( Finnish research libraries statis-
tics database).
There are of course fewer visits per member of the population in public li-
braries. The German project BIX uses for public libraries the indicator “visits
per capita”, which is defined as the number of all physical visits to the library,

5. List of indicators
118
including attendances at events, compared to the population to be served. The
results in 2005 were (BIX, 2006):
Visits per capita mean maximum minimum
Libraries in communities under 15.000 inhabitants 4,3 7,0 1,7
Libraries in communities from 15.000 to 30.000 inhabitants 3,5 6,3 0,6
Libraries in communities from 30.000 to 50.000 inhabitants 3,1 6,2 1,1
Libraries in communities from 50.000 to 100.000 inhabi-tants
2,7 5,0 0,9
Libraries in communities over 100.000 inhabitants 3,0 5,3 0,7
The mean score of visits per capita seems to be somewhat higher in smaller
communities.
Public library statistics in British Columbia show 30.531.306 visits per
4.071.176 members of the population = 7,5 visits per member in 2003 (British
Columbia public library statistics, 2004).
In UK public libraries, the 10-years statistics show a slight decrease in visits,
but an increase again from 2002/03 to 2003/04 (Creaser, Maynard and White,
2005):
• 1993/94 = 8,0 visits per capita
• 2002/03 = 6,9 visits per capita
• 2003/04 = 7,1 visits per capita
The US public library statistics for 2004 count 4,67 visits per capita (Public
libraries in the United States, 2006).
Virtual visits are a new issue in library statistics. Only a few national or re-
gional statistics have started counting virtual visits in addition to physical visits.
In the German library statistics of 2005, data from 28 university libraries for
both kinds of visits show the following results (DBS, 2005):
• total physical visits: 21.151.999
• total virtual visits: 43.323.411
• total visits: 64.475.410 (physical visits = 32,81 %)
Virtual visits were about double the physical visits, but in 9 libraries the number
of virtual visits was lower than that of physical visits. The statistics count only
accesses to a page from outside the library website, not changing to another page
inside the website.

B.3 Library visits per capita
119
The Finnish university libraries counted in 2005 a total of 38.143.761
“downloads” from the library website and in 2006 a total of 49.629.268
“downloads” (Finnish research library statistics database).
The Association of Research Libraries has started counting virtual visits in its
supplementary statistics, but the data are not yet published, as there is no stan-
dard method used in the libraries.
Measuring not only physical, but also virtual library visits will certainly be
an important issue for library statistics in the next years in order to show on the
one side the gradual shift from traditional to virtual library use, on the other side
the continuing appreciation of the library as physical place.
________________________________________________________________
Bauer, K. (2000), Who goes where? Measuring library web site usage, ONLINE January
2000, available at: http://www.infotoday.com/Online/OL2000/bauer1.html
BIX. Der Bibliotheksindex, available at: http://www.bix-bibliotheksindex.de/
BIX. Der Bibliotheksindex (2006), B.I.T. online Sonderheft 2006
British Columbia public library statistics (2004), Ministry of Education, Victoria, British
Columbia, available at: http://www.bced.gov.bc.ca/pls/bcplstats_2004.pdf
CAUL online statistics, Council of Australian University Libraries, available at:
http://www.anu.edu.au/caul/stats/
Creaser, C. (2006), SCONUL library statistics: trends 1994-95 to 2004-05, LISU,
Loughborough University
Creaser, C., Maynard, S. and White, S. (2005), LISU annual library statistics 2005, featuring
trend analysis of UK public and academic libraries 1994 – 2004, LISU, Loughborough
University, available at:
http://www.lboro.ac.uk/departments/dils/lisu/downloads/als05.pdf
DBS. Deutsche Bibliotheksstatistik (2005), available at: http://www.hbz-
nrw.de/angebote/dbs/auswertung/
Finnish public library statistics, Culture and Media Division of the Ministry of Education,
available at: http://tilastot.kirjastot.fi/Default.aspx?&langId=en
Finnish research library statistics database, Helsinki University Library, available at:
https://yhteistilasto.lib.helsinki.fi/language.do?action=change&choose_language=3
Public libraries in the United States: fiscal year 2004 (2006), National Center for Education
Statistics, available at: http://nces.ed.gov/pubs2006/2006349.pdf

5. List of indicators
120
B.4 Seat occupancy rate
Background
Libraries are highly-valued places for reading, learning and working. In some
libraries physical library visits are decreasing, due to a high number of the li-
brary’s services and resources being available for remote use. In others physical
visits remain stagnant or are even increasing. Users appreciate the possibility of
using both print and electronic resources together with help and training services
inside the library. Other aspects add to a new attractiveness of the library: There
is a growing tendency for group work in libraries and for users working with
their own material in libraries. Therefore a sufficient number of working places
with adequate equipment will be one of the most important issues for user satis-
faction
Especially in institutions of higher education, the library is the physical place
where students meet for studying singly or in groups. In public libraries, where
users primarily need seats for a shorter time of reading and browsing, the num-
ber of seats for the population to be served will be significantly lower than in
academic libraries, where users might need a seat for the whole day.
If a library wants to know whether the number of seats provided is adequate
to the library’s visitors, measuring the occupancy rate of the seats will give
valuable information.
Definition of the indicator
The mean occupancy rate of user seats in the library over the year.
The definition includes seats with or without equipment, seats in carrels, in
seminar and study rooms and in the audiovisual and children's departments of
the library.
Seats in halls, lecture and auditory theatres intended for audiences of special
events are excluded. The definition also excludes informal seating, e.g. floor
space on which users may sit.
Aims of the indicator
The indicator assesses the adequacy of seats provided in the library to users’
needs and therewith the priority given to the library’s role as physical place for

B.4 Seat occupancy rate
121
reading, learning and working.
The indicator is relevant for all libraries that offer reading and working facili-
ties. It will be most relevant for libraries in institutions of higher education.
Comparison between libraries of similar mission, structure and clientele is
possible.
The indicator does not measure the ratio of seats provided to the population
to be served (see Indicator A.2).
Method
Count the number of seats available to users and the number of those occupied
at random intervals over the year, including peak times and times of lower use,
e.g. inside and outside term. By cumulating the results, the mean occupancy rate
over the year can be calculated. Seats where users have placed their working
material, notebooks etc. are defined as occupied, even if the user is absent at the
time of counting.
It might also be useful to measure the seat occupancy rate in peak times sepa-
rately, as the results show whether the library can also provide for high demand.
If there are different forms of reading and working areas, e.g. group working
areas or laptop areas, the seat occupancy could be measured separately for such
areas in order to find out what kind of reading and working facilities users pre-
fer.
Interpretation and use of results
A low mean occupancy rate shows that there is sufficient seating available. This
would be user-friendly, but it might also point to a decrease in user visits and an
under-use of the facilities offered.
A high occupancy rate shows that the library is efficiently used, but over a
certain level of occupancy users may feel uncomfortable. There is no standard to
say what occupancy rate is appropriate for comfortable space and quiet working.
This may depend on the space allowed for one user working place. In the Ger-
man Technical Report for academic library buildings, the following space is
defined as adequate for a workplace (Bau- und Nutzungsplanung, 1998).
• normal workplace = 3 m2
• computer workplace = 3,50 m2
• multimedia workplace or carrel = 4 m2
All three types of workplaces would need an additional space of 0,90 m2 for
access to the place.

5. List of indicators
122
To assess whether the number and equipment of seats correspond to users’
wishes, the issue could be addressed in a user satisfaction survey.
Examples and further reading
In a survey in Glasgow Caledonian University Library, UK, the highest occu-
pancy rate was 43%, at a point of time just prior to examinations (Crawford and
MacNicol, 2001).
La Trobe University Library, Australia, used an interesting categorization of
workplaces in its 2-weeks seating usage survey in three campuses (King, Sheri-
dan and Beranek, 2004). The survey also differentiated between times of the
day/week. The highest occupancy rates occurred from Monday to Wednesday,
chiefly between 11.30 am and 2.30 pm. Computer workstations had the highest
occupancy, sometimes more than 100% (waiting queues). Group study places
were often used in preference to single study places that generally had a low use.
The average occupancy rates on one campus (Bendigo) were:
• Single study places or carrels 25%
• Group study seating 24%
• Casual seating 12%
• Computer workstations (seated) 74%
• Computer workstations (standing) 46%
The statistics of SCONUL, Society of College, National and University Libra-
ries, UK count the average percentage of seats occupied. For 2004/05 the mean
value was 36% (SCONUL, 2006).
As occupancy rates may not give a definite view of whether users feel com-
fortable with the number of seats, many libraries have assessed user opinion on
this topic by satisfaction surveys.
In a joint user satisfaction survey of the university libraries in North Rhine-
Westphalia, Germany, only 56% of respondents were satisfied with the number
of user workplaces in the libraries, 65% with the working atmosphere, and 60%
with quietness in the reading rooms (Follmer, Guschker and Mundt, 2002).
In the satisfaction survey of Glasgow Caledonian University Library men-
tioned above, only two respondents mentioned a need for additional study
places, and general satisfaction with the study environment got the note 3.5 on a
5-point scale, with 5 the best note. This corresponds with the low occupancy rate
in that library.

B.4 Seat occupancy rate
123
________________________________________________________________
Bau- und Nutzungsplanung von wissenschaftlichen Bibliotheken (1998), DIN-Fachbericht
13, DIN – Deutsches Institut für Normung e.V., Berlin
Crawford, J. C. and MacNicol, C. (2001), Report on the general satisfaction survey conducted
at Glasgow Caledonian University Library, February/March 2001, available at:
http://www.learningservices.gcal.ac.uk/library/research/gss01.pdf#search=%22Glasgow%
20Caledonian%20University%20Library%202001%22
Follmer, R., Guschker, S. and Mundt, S. (2002), Alles was man zum Lernen braucht...,
Übergreifende Ergebnisse der Benutzerbefragung in den nordrhein-westfälischen
Universitätsbibliotheken 2001, ProLibris 2002,1, pp. 20-25
King, H., Sheridan, L. and Beranek, L. (2004), Seating usage survey 2004, La Trobe
University Library, available at:
www.lib.latrobe.edu.au/about/surveys/seatingsurvey2004.pdf
SCONUL annual library statistics 2004-2005 (2006), SCONUL, Society of College, National
& University Libraries, London

5. List of indicators
124
B.5 Number of content units downloaded per capita
Background
In both public and academic libraries the number of electronic resources in-
creases continually. Consequently, the question arises in how far this collection
is adjusted to the needs of the population to be served.
In the international standard ISO 2789, the electronic library collection is
subdivided as to databases, electronic serials, and digital documents. What
makes it difficult to apply performance measures is the heterogeneous nature of
these electronic resources. Databases for instance may contain only descriptive
records such as bibliographic descriptions of books and articles, or they may be
pure full-content databases with large quantities of digital documents or non-
textual material, where the user is actually provided with the complete content
and not only with meta-information that has to be followed up. Another type of
electronic resources is a mixture of both descriptive records and full-content
units.
Measures for the use of the electronic collection have been defined in ISO
2789 as follows:
• Search: specific intellectual query
• Session: successful request of a database
• Rejected session (turnaway): unsuccessful request of a database by ex-
ceeding the simultaneous user limit
• Session time: the period of time between a log-in to and an implicit or ex-
plicit log-off from a database
• Contents downloaded: a content unit being successfully requested from a
database, electronic serial or digital document
• Records downloaded: a descriptive record being successfully requested
from a database
Downloads of content units indicate that users have found items that seem to be
relevant for their interests. The measure could be seen in analogy to loans of
print materials, while sessions could be seen in analogy to browsing the shelves.
Therefore, downloads can be regarded as the most expressive measure for the
relevance of the electronic collection to users.

B.5 Number of content units downloaded per capita
125
Definition of the indicator
The number of content units downloaded from electronic resources - databases,
electronic serials or digital documents - in the library’s collection per member of
the population to be served during a specified time, usually a year.
A content unit is defined as a computer-processed uniquely identifiable tex-
tual or audiovisual piece of published work that may be original or a digest of
other published work.
A content download is defined as a content unit being successfully requested
from a database, electronic serial or digital document
The population to be served is the number of persons to whom the library is
commissioned to provide its services. For public libraries, this will normally be
the population of the community (or part of the community); for academic li-
braries, this will normally be the total of students and academic staff in the insti-
tution.
Downloads from free Internet resources (Internet resources with unrestricted
access) are excluded, even if they have been catalogued by the library in its
online catalogue or a database.
Aims of the indicator
The indicator assesses the use of the library’s electronic collection by the popu-
lation to be served and therewith the adequacy of the collection for the popula-
tion. The number of requests for content units indicates the relevance attributed
to the electronic collection by the users.
The indicator is especially useful for comparison over time.
Comparison between libraries, even of similar structure and clientele, will be
difficult. It might be possible between libraries with the same subject collections
(e.g. medicine), if a similar number and type of electronic resources is offered.
The indicator is relevant for all libraries with an electronic collection and a
defined population to be served.
Method
Count the number of content units downloaded from all electronic resources
during a year.
In case there are various manifestations of the same unit (HTML, PDF for
text files and JPEG or WAV for non-textual material) all requests are counted.

5. List of indicators
126
Usually, the vendors of online resources provide detailed statistics separating
the number of retrieved database entries or hits from the number of documents
viewed or downloaded. Such a distinction should also be made for electronic
resources hosted by the library itself.
For each electronic resource the total number of views or downloads over a
certain time period – usually correlating to the subscription period of one year –
is recorded. The numbers are summed up for all electronic resources and divided
by the number of members of the population to be served, counted as persons
(not full-time equivalent).
Downloads by library staff and for user training are included in the calcula-
tion.
With the population to be served as a data element all electronic resources
freely available on the Internet should be left out of consideration. They can be
accessed by anyone and give an incomplete picture of how relevant the elec-
tronic collection is for the primary users.
It is necessary to bear in mind that the data recorded by library suppliers are
not always comparable, since not all vendors adhere closely to the recommended
standards such as COUNTER (2005) or ICOLC (2006).
Interpretation and use of results
A high score will be seen as good as it shows high acceptance of the library’s
electronic collection by the members of the population to be served.
A low score points to inadequacy of the electronic collection to the needs of
the population or to users’ not being familiar with the collection. The library
could try to promote its electronic resources by drawing attention to them in user
training lessons.
As downloads are counted for each electronic resource separately, the library
will know what resources have a low degree of acceptance. For such resources
subscriptions might be cancelled and other resources might be licensed instead.
But in such decisions the library should consider the special interests of small
user groups.
The indicator may be affected by factors outside the control of the library, for
example the level of network access and fees charged for access or download-
ing.
The number of content units downloaded could also be affected by the qual-
ity and efficiency of users' search strategies.

B.5 Number of content units downloaded per capita
127
Examples and further reading
The project EQUINOX (2000) used the indicator “Number of documents and
entries (records) viewed per session for each electronic library service”. EQUI-
NOX as well as the international standard 11620 for library performance indica-
tors do not compare total downloads to the population.
Not many library statistics have already dared to count downloads on a na-
tional scale. The German national library statistics try to count downloads from
databases and electronic journals, but in 2006 only 9 percent of the reporting
libraries were able to deliver data for databases and 13 percent for electronic
journals (DBS, 2006).
It will be easier to count only the downloads from licensed resources on ex-
ternal servers. The Danish research libraries count in their statistics downloads
from electronic resources on external servers. In 2005, there were 7.014.143
such downloads. Compared to active borrowers of the same year (the total popu-
lation is not counted) this would be 64,48 downloads per borrower.
________________________________________________________________
Counter (2005), Release 2 of the COUNTER code of practice for journals and databases
(Published April 2005), available at:
http://www.projectcounter.org/r2/Appendix_A_Glossary.pdf
DBS – Deutsche Bibliotheksstatistik (2006), Hochschulbibliothekszentrum, Köln, available
at: http://www.hbz-nrw.de/angebote/dbs/
Equinox. Library performance measurement and quality management system (2000),
available at: http://equinox.dcu.ie/index.html
Folke- og Forskningsbiblioteksstatistik (2005), Biblioteksstyrelsen, København, available at:
http://www.bs.dk/content.aspx?itemguid={D9A1DF3D-6DE9-42F1-B13E-
D04CEF1941E0}
ICOLC, International Coalition of Library Consortia (2006), Revised guidelines for statistical
measures of usage of web-based information resources, available at:
http://www.library.yale.edu/consortia/webstats06.htm

5. List of indicators
128
B.6 Collection use (turnover)
Background
If storing books on shelves is not an end in itself – as may be the case in libraries
with an archival function - the degree to which the library collection is used is
an essential measure to determine in how far the library meets the needs and
interests of its users. Public libraries in particular have made this measure an
integral part of the evaluation process for their collection development policy.
Each item that was never issued within a certain period of time is seen as failure
in providing what users want (see indicator B.7 “Percentage of stock not used”).
The aim is to reach as high a collection turnover as possible.
The indicator is restricted to the loan collection and to loans, not including
in-house use. It also leaves out of consideration the growing number of elec-
tronic resources, especially e-books, even though some providers follow the
example of the printed book and restrict the use of an e-book to certain loan
periods.
Definition of the indicator
The total number of loans in a certain period of time (usually one year) is di-
vided by the total number of documents in the loan collection.
Loans in the sense of this indicator are lending transactions of physical items
to one user. This includes user-initiated renewals, on-site loans (loans within the
library) and copies supplied in place of original documents.
Automatic renewals by the system without user initiation and interlibrary
loans are excluded.
Aims of the indicator
The indicator assesses the use rate of the loan collection and therewith quantifies
the library’s effort to match the loan collection and the information needs of its
users. It is relevant for all libraries with a loan collection.
The indicator can be used separately for specified collections, subject areas,
or branch and departmental libraries. For academic libraries that have to store
and preserve collections for a longer time it might be useful to measure collec-
tion turnover only for materials acquired in the last 2 or 3 years.

B.6 Collection use (turnover)
129
Comparison between libraries of similar mission, structure and clientele will
be possible, if differences in the collection subjects are considered.
Method
Define the number of documents in the loan collection and the number of loans
during a specified period, usually a year. Most automated library systems con-
tain data of a document’s location as well as lending status. This makes it easy
to determine the exact size of the loan collection, respectively parts of it, at any
given moment. The library system also provides the number of loans that can be
attributed to the loan collection as a whole or a particular part of it within a cer-
tain period of time.
Sometimes it may be useful to apply the indicator not to the loan collection
as a whole but to special parts of it such as the junior library or the short-loan
collection. New insights can be gained from distinguishing between various
subject collections, since the lifespan of a book in the humanities differs consid-
erably from that of a book in the natural sciences.
Since users are mostly interested in that part of the loan collection that has
been acquired recently, it could also be useful to restrict the indicator to those
documents added to the loan collection within the last two years, based on the
date of acquisition as recorded by the automated library system.
The collection turnover is calculated by dividing the number of loans during
a year by the number of documents in the loan collection.
Interpretation and use of results
A higher score will be seen as good. There are a number of factors influencing
the indicator:
• The adequacy of the collection to current research topics or interests
• The weeding policies of the library
• The accessibility of the collection in regard to opening hours or physical
arrangements
• The number of multiple copies for titles in high demand
• The lending regulations (loan periods, number of documents that may be
borrowed simultaneously by a user, number of renewals that are possible)
• The proportion of in-library use to loans
If collection turnover seems too low, the library should above all try to assess
the needs and wishes of its population and to adapt its collection policies accord-
ingly. User satisfaction surveys can help to identify what users are missing in the

5. List of indicators
130
collection. The library could also evaluate interlibrary lending or document sup-
ply requests in order to tailor its acquisitions policy to user needs.
Adapting the collection policy to user demand can only succeed as long-term
strategy. It asks for a regular repetition of the indicator and a constant effort to
keep pace with new trends and topics as well as with the sometimes quick
changes in the users’ research topics and interests.
Examples and further reading
Many public libraries use the indicator regularly. Texas public libraries have
even developed a standard, distinguishing between three levels of performance
(essential, enhanced, excellent) for various categories of public libraries based
on the size of the population to be served (Texas public library standards, 2005).
For libraries serving a population of more than 200,000 a collection turnover
rate of 1.0 is considered essential, 2.5 is rated as enhanced, and 3.5 as excellent.
In 2006 Finnish public library statistics reached an overall collection turnover
of 2.51 (Finnish public library statistics). In addition, they recorded the turnover
for document types such as books and printed music (2.02 in 2006), other than
books and printed music (7.54), music recordings (4.50) and video cassettes
(7.60).
British Columbia public libraries use a slightly altered version of the indica-
tor (British Columbia public library statistics, 2006). They divide the number of
loans by the total number of volumes held. For 2005 they recorded the average
score of 4.29.
The German project BIX (BIX. Der Bibliotheksindex) uses the indicator for
public libraries. Loans include renewals; stock in closed access is excluded. The
results for 2005 were (BIX, 2006):
Collection turnover mean maximum minimum
Communities under 15.000 inhabitants 4,3 7,4 2,1
Communities from 15.000 to 30.000 inhabitants 4,8 7,8 1,2
Communities from 30.000 to 50.000 inhabitants 4,8 9,2 1,8
Communities from 50.000 to 100.000 inhabitants 4,5 6,5 2,2
Communities over 100.000 inhabitants 5,0 7,1 2,6

B.6 Collection use (turnover)
131
Academic libraries using this indicator restrict it to loans of recently acquired
documents. The benchmarking project of the Netherlands university libraries
measures “loans in the past year to acquisitions over the past five years”
(Laeven and Smit, 2003, p.297). The results for 2004 for 13 libraries ranged
between 1,02 and 4,89, with an average of 1,92 (UKB, 2004).
________________________________________________________________
BIX. Der Bibliotheksindex, available at: http://www.bix-bibliotheksindex.de/
BIX. Der Bibliotheksindex (2006), B.I.T. online Sonderheft 2006
British Columbia public library statistics (2006), British Columbia Ministry of Education,
Victoria, British Columbia, available at:
http://www.bced.gov.bc.ca/pls/bcplstats_2005.pdf
Finnish public library statistics database, Culture and Media Division of the Ministry of
Education, available at: http://tilastot.kirjastot.fi/?langId=en
Laeven, H. and Smit, A. (2003), A project to benchmark university libraries in the
Netherlands, Library Management 24, 6/7, pp. 291-304
Texas Public Library Standards [draft document] (2005), Joint TSLAC/TLA Task Force on
Public Library Standards and Accreditation, available at: http://www.tsl.state.tx.us/cgi-
bin/ld/plstandards/plstandards.php
UKB (2004), Benchmarking, Samenwerkingsverband van de Nederlandse
universiteitsbibliotheken en de Koninklijke Bibliotheek, results only available to
participants

5. List of indicators
132
B.7 Percentage of stock not used
Background
In the context of collection development and collection use the question of non-
use and its reasons has always been discussed, in the case of the Pittsburgh
Study (Kent, 1979) in much detail. The study found that 48,37% of the collec-
tion had never circulated during the seven years of the study period and fol-
lowed the results up by differentiations as to the acquisition year, the language
and subject of a non-used document and the frequency of circulation of each
document.
Ten years earlier Fussler and Simon (1969) had already tried to determine the
probability of a book in the collection being used by analysing circulation statis-
tics.
Many studies found results that correspond to the famous 80/20 rule, namely
that 80% of the circulations in a library come from a relatively small proportion
of the collection, often from about 20%. This small proportion usually coincides
with the more recently acquired titles in the collection. “…it is important to
recognize that the longer a book goes without being used the less probable it
becomes that it will ever be used” (Lancaster, 1993, p.56).
Circulation analysis is usually the main method for libraries evaluating their
collection. Non-use is seen as violation of the first of Ranganathan’s five laws of
library science, namely that “books are for use” (Ranganathan, 1931). Each
library has to decide on its own to what extent it is willing to accept that docu-
ments in its collection are not used. For libraries with an archival function (e.g.
legal deposit) non-use during a certain time period will be tolerable. But espe-
cially for public libraries use will be the main issue for collection quality, and
non-use will be the criterion for weeding decisions. “Non-use is the kiss of
death” was an answer in a survey on weeding practices in public libraries
(Dilevko and Gottlieb, 2003).
Definition of the indicator
The percentage of documents in the loan collection that have not been used dur-
ing a certain period of time, usually a year.
A longer time period, e.g. 2 or 3 years, would be used if the library has a col-
lection with highly specified materials that would probably not be used every

B.7 Percentage of stock not used
133
year, but will yet remain important for research. “Use” in the sense of this indi-
cator means borrowing. Registered loans within the library (on-site loans) are
included.
Browsing and other forms of in-house use are not considered. Interlibrary
lending is excluded.
Documents in the collection that are not available for loan are excluded.
Aims of the indicator
The indicator identifies parts of the collection that are not used and is thus a
valuable instrument for fine-tuning the collection profile to users’ needs. It will
support weeding decisions as well as changes in selection policies and resource
allocation to subjects.
The indicator has often been used together with the indicator B.6 “Collection
use”. “Collection use” compares the number of documents in the collection to
the number of loans, irrespective of the fact that some documents have been
used frequently while others have not been used at all. This indicator deals with
the single document and its use, as there may be “dead areas” in the collection
though the collection as a whole is heavily used.
The indicator is relevant for all libraries with a loan collection. It will be es-
pecially interesting for public libraries. For academic libraries that have to store
and preserve collections for a longer time it might be useful to measure non-use
only for materials acquired in the last 2 or 3 years.
Comparison between libraries of similar mission, structure and clientele will
be possible, if differences in the collection subjects are considered.
Methods
1. For a random sample of books in the collection all loans over a certain pe-
riod of time (usually one year) are recorded. Documents not available for
loan should be excluded from the sample. If the indicator is used to moni-
tor the collection development policy the sample chosen should relate to a
particular subject collection, since the interpretation of the results depends
on the subject. The time-point of obsolescence (the time when documents
“age” and will be less used) varies considerably between subjects.
Sampling should be used with caution, as there may be clusters of unused
documents in different parts of the collection.
2. With the help of an automated library system it will be possible to identify
the overall number of items in the collection that are available for loan

5. List of indicators
134
and the number of those items which were on loan at least once during the
period in question. The rest consists of unused material, so-called “zero
loans”.
In the context of this indicator it is irrelevant whether an item was used once or
several times. What matters is that it has been used at all. But a library may want
to raise its standards and decide to count those cases when an item has been used
only once or twice as “zero loans”. This will of course result in a much higher
score for “stock not used”.
The “stock not used” is calculated as the percentage of documents not used
of all documents in the loan collection.
Interpretation and use of results
A low percentage of stock not used will be seen as good. What percentage
would be tolerated will depend on the library’s goals.
The indicator will be influenced by high in-house use that may reduce circu-
lation. It will also be affected by storage conditions: Documents in closed stacks
will probably be used less than documents in open access areas. Documents
placed in small collections that are easy to survey might have a higher chance of
being used than documents “lost” in large collections. Use may also be influ-
enced by a complicated shelf classification, and even by the shelf level the
document is placed on. A study in the Southeast Missouri State University found
that “books sitting on the bottom shelf circulate the least, followed by those
sitting on the top shelf” (Banks, 2002. p.115).
There are basically two ways of dealing with a large percentage of books not
used:
• If loans are the essential criterion for collection development, any docu-
ment that has not been used could be removed from the collection in order
to improve the turnover rate. The period for “not used” may vary in librar-
ies according to their goals.
• The collection development policies should be revised and adapted to user
needs. When applied to different subjects the indicator may influence re-
source allocation so that subjects with a low percentage of non-use will
receive more funds than others.
The non-used documents should be further examined as to language, publication
date, type and subject of the document in order to identify the reasons for non-
use.

B.7 Percentage of stock not used
135
Some libraries deliver so-called “flop-lists” to staff in charge of collection
development in order to give them a feel of what did not meet the demands of
the users.
Examples and further reading
The results of circulation analysis have often been disappointing for librarians
who have taken great care with the collection building. Only a few examples are
given her:
Institution Year Collection Titles
examined
% not used
4 libraries participating in the project EQLIPSE (EQLIPSE, 1995-97)
1995/6 Monographs of one acquisition year
3, 29, 30, 39
Southeast Missouri State University (Banks, 2002)
2002 Political science 531 43
Duke University Libraries (Littman and Connaway, 2004)
2002 Titles available both as print and e-book
7.880 print: 64 e-books: 60
Rowan University’s Campbell Library (Brush, 2006)
2004/05 Engineering 227 77
Results in public libraries will show a much lower percentage of stock not used,
due to the continuous weeding of the collection. A project in the Huntington
Beach Public Library in 1984/85 showed that only 4,4% of 290.000 volumes did
not circulate at least once in three years (Hayden, 1987).
The weakness of this indicator is that it does not consider in-house use of a
document. In-house use can come up to a considerable amount and may be even
higher than circulation. The University Library Münster, Germany, found a
relation of 0,6 to 1 between in-house use and circulation (te Boekhorst, 1997,
p.209).
At the moment most libraries have a routine to monitor the use and non-use
of their material. Electronic resources, especially e-books, will make the moni-
toring process both easier and more complicated. For an electronic document

5. List of indicators
136
every single form of usage can be recorded, on the other hand usage statistics
have to be collected from different sources.
An interesting project in the Duke University Libraries, Durham, NC com-
pared the usage of 7.880 titles that were available both in print and e-book for-
mat (Littman and Connaway, 2004). For e-books, the measure of usage was
“access”, including both a short browsing and a “checkout”, where an e-book is
in circulation to a user for a specified period. E-books received 11% more usage
than comparable print books, but in either format 3.597 titles remained unused.
Non-use for e-books was 60%, for print books 64%.
________________________________________________________________
Banks, J. (2003), Weeding book collections in the age of the Internet, Collection Building
21,3, pp. 113-119
Dilevko, J. and Gottlieb, L (2003), Weed to achieve: a fundamental part of the public library
mission? Library Collections, Acquisitions & Technical Services 27,1, pp. 73-96,
available at: http://www.ugr.es/~alozano/Translations/Weeding.pdf
EQLIPSE. Evaluation and Quality in Library Performance: System for Europe (1995-1997),
available at: http://www.cerlim.ac.uk/projects/eqlipse/ (The low score of 3% was reached
in a special library.)
Fussler, H. and Simon, J. (1969), Patterns in the use of books in large research libraries,
Chicago University Press, Chicago
Hayden, R. (1987), If it circulates, keep it, Library Journal 112,10, pp. 80-82
Kent, A. (1979), Use of library materials: the University of Pittsburgh study, Books in library
and information science 26, New York, Dekker
Lancaster, F. W. (1993), If you want to evaluate your library…, 2nd ed., University of
Illinois, Graduate School for Library and Information Science, Champaign, Ill.
Littman, J. and Connaway, L. S. (2004), A circulation analysis of print books and e-books in
an academic library, Library Resources & Technical Services 48,4, pp. 256-262
Ranganathan, Shiyali Ramamrita (1931), The five laws of library science, Madras Library
Association, Madras, Madras Library Association Publication Series 2, available at:
http://dlist.sir.arizona.edu/1220/
te Boekhorst, P. (1997), Zum Verhältnis von Präsenznutzung und Ausleihe, eine Stichprobe
der ULB Münster, Bibliotheksdienst 31,2, pp. 208-210, available at:
http://bibliotheksdienst.zlb.de/1997/1997_02_Benutzung01.pdf

B.8 Loans per capita
137
B.8 Loans per capita
Background
In spite of growing electronic library collections, the loan collection is still one
of the most-used library services. Borrowing books for reading and studying at
home or inside the library ranks high in users’ priorities. In a joint user satisfac-
tion survey of the university libraries in North Rhine-Westphalia, Germany, nine
from 10 respondents said that they visited the library for borrowing books
(Follmer, Guschker and Mundt, 2002). Though in some libraries the number of
loans is decreasing, due to resources, especially journals, being offered in elec-
tronic form, this is not generally the case even in academic libraries. “Overall,
the number of loans per FTE student has increased by 11.5 % over the ten year
period covered” (Creaser, 2006).
Therefore, the number of loans per member of the library’s population to be
served is still an important indicator for the acceptance of the library’s services.
Definition of the indicator
The total number of loans per year by members of the population to be served
divided by the number of persons in the population.
The population to be served is the number of persons to whom the library is
commissioned to provide its services. For public libraries, this will normally be
the population of the community (or part of the community); for academic li-
braries, this will normally be the total of students and academic staff in the insti-
tution.
Loans in the sense of this indicator are lending transactions of physical items
to one user. This includes user-initiated renewals, on-site loans (loans within the
library) and copies supplied in place of original documents.
Automatic renewals by the system without user initiation and interlibrary
loans are excluded.

5. List of indicators
138
Aims of the indicator
The indicator assesses the use of the library’s non-electronic collection by the
population to be served and therewith the adequacy of the collection to the
population.
The indicator is relevant for all libraries with a defined population to be
served and with a loan collection.
Comparison of results between libraries with similar mission, structure and
clientele is possible.
Method
The number of loans by members of the population to be served during a year is
set in relation to the number of persons in the population to be served. The loan
data should be available via the automated lending system.
The members of the population to be served are counted as persons, not as
FTE (full time equivalent). Thus, part-time students or staff in academic institu-
tions will be counted each as one person.
Interpretation and use of results
A high score will be seen as good.
The indicator can be affected by the library’s loan periods and the number of
books that users can borrow simultaneously. Cutting down loan periods will
probably result in a higher number of loans and user-initiated renewals.
Other libraries nearby supplying services to the library’s clientele can also in-
fluence the score.
A low score points to inadequacy of the collection for the population’s inter-
ests. In order to find more details about collection use, the library could try the
indicators B.6 “Collection use” or B. 7 “Percentage of stock not used”. User
satisfaction surveys can help to identify what users are missing in the collection.
The library could also evaluate interlibrary lending or document supply requests
in order to tailor its acquisitions policy to user needs.
The indicator will be less relevant in libraries where borrowing is not a main
user activity. This can be the case in libraries of medicine or sciences, where
electronic collections are more heavily used than the loan collection. In such
cases, the indicator should be used together with indicator B.5 “Number of con-
tent units downloaded per capita”.
B.8 Loans per capita
139
Examples and further reading
The German benchmarking project BIX (BIX. Der Bibliotheksindex) uses for
public libraries the indicator „loans per capita“, which is defined as the number
of all materials borrowed, including renewals, compared to the population to be
served. The results in 2005 were (BIX, 2006):
Loans per capita mean maximum minimum
Libraries in communities under 15.000 inhabitants 9,8 14,9 4,8
Libraries in communities from 15.000 to 30.000 inhabitants 8,7 20,0 0,9
Libraries in communities from 30.000 to 50.000 inhabitants 7,6 16,0 1,6
Libraries in communities from 50.000 to 100.000 inhabi-tants
6,9 12,5 2,5
Libraries in communities over 100.000 inhabitants 6,8 13,4 1,4
The number of loans per capita seems to be higher in small communities, com-
parable to the number of visits per capita (see the table in Indicator B.3 “Library
visits per capita”).
In public libraries in British Columbia, Canada, “circulation per capita” had
in 2003 an average value of 12,33 (British Columbia public library statistics,
2004).
The Council of Australian State Libraries published a report with accumu-
lated data for the states or territories, using among others the indicator “circula-
tion per capita” (Australian public libraries comparative report, 2005). The re-
sults of 2003/04 showed a maximum of 11,2 for South Australia and a minimum
of 4,8 for the Northern Territory.
The US public libraries had in 2004 a score of 7,1 loans per capita, including
renewals (Public libraries in the United States, 2006).
In academic libraries, the results of the indicator will be much higher, as stu-
dents and researchers rely for their work on the library collection. The statistics
of UK academic libraries in 2004/05 show an average of 56 loans per full time
equivalent student (Creaser, 2006, p.17).
The statistics of the Australian university libraries (CAUL online statistics)
show for 2004 a mean score of 19,64 loans per student and 24,11 loans per
member of the total population (students and staff).
The libraries in the Association of Research Libraries had in 2005 a mean
value of 16.82 initial loans per FTE (full-time equivalent) student and 29,01
loans including renewals (ARL statistics interactive edition).

5. List of indicators
140
The Finnish university libraries had in 2005 a score of 63,6 loans per member
of the target population ( Finnish research library statistics database).
When comparing the results of this indicator, it will be important to state the
individual definition of “circulation” or “loans” (possibly including renewals or
interlibrary loans) and the definition of “population” or “capita”.
________________________________________________________________
ARL statistics interactive edition, available at: http://fisher.lib.virginia.edu/arl/index.html
Australian public libraries comparative report 1998 – 2004 (2005), presented to CASL
meeting Sydney, NSW, July 2005, available at:
http://www.nsla.org.au/publications/statistics/2004/pdf/NSLA.Statistics-20040701-
Australian.Public.Library.Comparative.Report.1998.2004.pdf
BIX. Der Bibliotheksindex, available at: http://www.bix-bibliotheksindex.de/
BIX. Der Bibliotheksindex (2006), B.I.T. online Sonderheft 2006
British Columbia public library statistics (2004), Ministry of Education, Victoria, British
Columbia, available at: http://www.bced.gov.bc.ca/pls/bcplstats_2004.pdf
CAUL online statistics, Council of Australian University Libraries, available at:
http://www.anu.edu.au/caul/stats/
Creaser, C. (2006), SCONUL library statistics: trends 1994-95 to 2004-05, LISU,
Loughborough University
Finnish research library statistics database, Helsinki University Library, available at:
https://yhteistilasto.lib.helsinki.fi/language.do?action=change&choose_language=3
Follmer, R., Guschker, S. and Mundt, S. (2002), “Alles was man zum Lernen braucht...”,
Übergreifende Ergebnisse der Benutzerbefragung in den nordrhein-westfälischen
Universitätsbibliotheken 2001“, ProLibris 2002,1, pp. 20-25
Public libraries in the United States: fiscal year 2004 (2006), National Center for Education
Statistics, available at: http://nces.ed.gov/pubs2006/2006349.pdf
B.9 Percentage of loans to external users
141
B.9 Percentage of loans to external users
Background
Many libraries extend the use of their collections and services to users outside
their primary clientele, called “external” or “unaffiliated” users. For a university
library, this could be for instance the inhabitants of the community or students of
other universities. For public libraries, this would be persons from outside their
legal community.
Services to external users are offered free or with specified fees; policies dif-
fer considerably between countries and types of libraries. In many cases, the
libraries offer only a certain range of services to external users. Onsite use of
materials and borrowing rights are in most cases included, but may be restricted
to the general collection, excluding e.g. undergraduate libraries, or to a limited
number of simultaneous loans. Access to licensed electronic collections will
generally be allowed only as in-house use because of licensing agreements.
Temporary login may be provided for external users.
External users can come up to a high percentage of a library’s users and can
create considerable workload for library staff and therewith costs. Serving the
needs of the general public is not often accounted for in the budgets. Therefore,
external users will not always be welcome, as the services delivered to them
may interfere with the main tasks of the library. One of the most-cited articles
on external users is entitled “Barbarians at the gate” (Courtney, 2001).
Though external users are an important factor in many libraries, there is not
much literature about this topic, and few national statistics count external users.
Probably the libraries did not consider it advisable to point to this issue, as the
funding institutions might deem this a possible source for income generation.
”The point of view of the unaffiliated user is not often represented in the library
literature; the arguments for and against opening academic libraries to the use of
the public are generally made by librarians who find themselves caught between
a professional instinct to provide access to all and the realities of budgets, space,
and the needs of their own clientele” (Courtney, 2001, p.473).
But on the other side, a high number of external users can prove the attrac-
tiveness of the library’s services and the importance of the library in the regional
environment. Academic libraries often see services to external users “as means
to maintain good public relations in their communities” (Courtney, 2003, p.3).

5. List of indicators
142
Whether the indicator described here should be used as quality measure for a
library will depend on that library’s mission and on the priority given to its edu-
cational and cultural role outside its institution or community.
Definition of the indicator
The percentage of loans to external users of the total loans during one year.
An external user of a library is a person who does not belong to that library’s
population to be served.
The population to be served is the number of persons to whom the library is
commissioned to provide its services. For public libraries, this will normally be
the population of the community (or part of the community); for academic li-
braries, this will normally be the total of students and academic staff in the insti-
tution.
Loans in the sense of this indicator are lending transactions of physical items
to one user. This includes user-initiated renewals, on-site loans (loans within the
library) and copies supplied in place of original documents.
Automatic renewals by the system without user initiation and interlibrary
loans are excluded.
Aims of the indicator
The indicator assesses the extent to which the library’s loan services are used by
users outside the library’s population to be served and therewith the attractive-
ness of the library to external users. Loans are taken exemplarily for the services
delivered to external users as in most libraries borrowing represents the main
activity of external users.
The indicator can also be used to determine the workload connected with
services to users outside the population.
The indicator is relevant for all libraries with a defined population to be
served that offer borrowing rights to external users. It will be especially interest-
ing for libraries with cooperation policies in a region.
Comparison of results between libraries is possible, if the mission and poli-
cies of the library in regard to external users are taken into consideration.

B.9 Percentage of loans to external users
143
Method
Count the number of total loans and the number of loans to external users during
one year. The data should be accessible via the library’s circulation system.
Then calculate the percentage of all loans that are delivered to external users.
Interpretation and use of results
Whether a higher score would be considered as good will depend on the li-
brary’s mission and goals and its institution’s or community’s conception of the
library’s role outside the institution and in the region.
A higher score could be reached by promoting library services outside the in-
stitution or community and by offering usage privileges to external users.
The results of the indicator can be used for promoting the library’s impor-
tance and role. They could also be used for requesting support for services to
external users from the institutions or communities the external users belong to.
Examples and further reading
The indicator is used in the Norwegian set of performance indicators (Forslag til
indikatorer, 2007, p.17). It includes loans + interlibrary loans to external users.
The German national library statistics count the number of external users that
are active users (persons who have borrowed at least one item during the report-
ing year). The statistics of 2006 for academic libraries show a total of 2.633.128
active users, of those 782.386 external users = 29,7 % (DBS, 2006).
The percentage of loans to external users of all loans must not necessarily be
the same as the percentage of external users of all users. External users’ utiliza-
tion of a library service may be disproportionately higher or lower than the abso-
lute number of external users would suggest. For example, surveys showed that
the reference service in university libraries was used more frequently by an ex-
ternal user than by a user out of the library’s population (Verhoeven, Cooksey
and Hand, 1996). In Münster University and Regional Library, Germany, data
over years showed that external users borrowed fewer items than the members
of the university.
A survey of academic libraries in the US asked for the privileges accorded to
external users and for different privileges accorded to certain groups (Courtney,
2003). 88,9 % of the responding libraries allowed unrestricted access to the
building to all external users, but borrowing privileges varied considerably be-
tween user groups. Groups with higher borrowing privileges were alumni, fac-

5. List of indicators
144
ulty and students of consortia institutions, and persons in the local or regional
area. Libraries of publicly funded institutions were more liable to grant unre-
stricted borrowing to all external users than libraries of private institutions.
________________________________________________________________
Courtney, N. (2001), Barbarians at the gates: a half-century of unaffiliated users in academic
libraries, The Journal of Academic Librarianship 27,6, pp. 473-480
Courtney, N. (2003), Unaffiliated users’ access to academic libraries: a survey, The Journal of
Academic Librarianship 29,1, pp. 3-7
DBS – Deutsche Bibliotheksstatistik (2006), Hochschulbibliothekszentrum, Köln, available
at: http://www.hbz-nrw.de/angebote/dbs/
Forslag til indikatorer for fag- og folkebibliotek (2007), ABM-utvikling, Oslo, available at:
http://www.abm-utvikling.no/bibliotek/statistikk-for-bibliotek/indikatorer-for-fag-og-
folkebibliotek
Verhoeven, S., Cooksey, E. and Hand, C. (1996), The disproportionate use of reference desk
service by external users at an urban university library, RQ 35,3, pp. 392-397

B.10 Attendances at training lessons per capita
145
B.10 Attendances at training lessons per capita
Background
Most libraries have always offered training in the use of their services, either as
guided library tours or as general introductory lessons about the library services
or a specified service.
Today, information resources and ways of information seeking have changed
dramatically. “Information overload” has become a main problem in research,
and academic teachers are complaining about the “Google mentality” of students
who do not proceed beyond a quick search on the web. The difficulty today is
how to find and select relevant information.
Libraries have taken up the new task of teaching information literacy, as well
in public as in academic libraries. In universities, libraries often join with facul-
ties in offering training courses within the curriculum, whether as face-to-face
training or as online training modules. There is abundant literature about libra-
ries and information literacy teaching. An international overview is given by
Lau (2007).
Developing and offering training courses will involve considerable effort and
input of resources. Therefore, libraries should be able to show at least basic data
about input and output of their training activities. But judging from national
library statistics it seems that libraries are only recently starting to collect data
about the number, duration, and costs of training lessons and the number of
attendants. If possible, libraries should also try to assess the effect and impact of
user training activities by satisfaction surveys or interviews and by tests of the
attendants’ skills and competences before and after training.
The indicator described here concentrates on the acceptance of library train-
ing by the population. It was chosen because of its practicality and its suitability
for benchmarking purposes.
Definition of the indicator
The number of attendances at formal user training lessons per 1.000 members of
the population to be served during one year.
User training is defined as a programme with a specified lesson plan, which
aims at specific learning outcomes for the use of library and other information
services. This definition includes guided tours of the library. Online tutorials
5. List of indicators
146
offered as web-based services and personal one to one instructions (point-of-use
training) are excluded. The duration of lessons is irrelevant.
The population to be served is the number of persons to whom the library is
commissioned to provide its services. For public libraries, this will normally be
the population of the community (or part of the community); for academic li-
braries, this will normally be the total of students and academic staff in the insti-
tution.
Aims of the indicator
The indicator assesses the library’s success in reaching its population by user
training services.
The indicator is relevant for all libraries with a defined population to be
served and with user training services. It will probably be more interesting for
academic than for public libraries.
Comparison of results between libraries with similar mission, structure and
clientele is possible.
The indicator does not measure the quality or the impact of the training.
Method
Count the number of attendants at each training lesson, including guided tours.
If training lessons are not aiming at the library’s population, but at external user
groups, the attendants of these lessons should be excluded. The numbers are
accumulated at the end of the year.
The number of attendances is set in relation to the number of persons in the
population to be served, divided by 1.000.
As a subset, the number of attendances at training lessons on electronic ser-
vices and information technology could be counted.
In order to get a more detailed view of training lessons attendance, the popu-
lation to be served could be split into groups. For a university library this could
be:
• Undergraduate students
• Graduate students
• Academic staff
• Students and academic staff of a faculty (e.g. medicine)
For a public library, this could be:
• Children (up to and including age 14)
• Adults

B.10 Attendances at training lessons per capita
147
• Adults over 65 years
Interpretation and use of results
A high score will be generally seen as good.
The indicator will be affected by the number of training lessons offered and
by the quality of the training. Libraries should therefore also count the number
of lessons. The quality of the lessons should be monitored by satisfaction ques-
tionnaires and/or by tests that assess the learning outcome.
The indicator will also depend on the library’s mission and clientele. In aca-
demic libraries, teaching information literacy is now more or less acknowledged
by the parent institutions as a library task, and students are more apt to recognize
the need of training in this sector than users of public libraries.
In case of low attendance at training lessons, the library could
• promote its user training services via its website or other media,
• tailor the services to special target groups in the population,
• try to improve the quality of training,
• offer information literacy training within the curriculum in collaboration
with faculties.
Examples and further reading
The statistics of the Australian university libraries (CAUL online statistics)
show for 2005 a mean score of 0,34 training attendances per member of the total
institutional population (students, academic and non-academic staff) and 0,49
attendances per student. The number of training lessons show a mean value of
0,0244 per member of the population and 0,0349 per student.
The Swedish research libraries statistics show in 2005 a total number of
115.546 attendants at training lessons and 325.800 members of the population
(students and academic staff), which would be 0,35 attendances per member of
the population (Forskningsbiblioteken, 2005). The results are similar to CAUL.
The Netherlands university libraries counted 47.443 attendances at training
lessons per 226.669 members of the population, which would come out 0,21
attendances per member (UKB, 2004).
The Finnish university libraries had in 2005 a total of 177.756 students and
47.371 participants in user training = 0,27 attendances per student (Finnish re-
search libraries statistics database).
The Canadian Association of Research Libraries compared attendances in
group presentations with the number of students, counted as FTE (full-time

5. List of indicators
148
equivalent). In 2003/04, participation in group presentations in university librar-
ies ranged from the equivalent of 14 % to 99 % of the students, with a median of
50 % equivalent participation (Hoffmann, 2005).
The German benchmarking project (BIX. Der Bibliotheksindex) uses the in-
dicator “User training hours per 1.000 members of the population” for academic
libraries. The hours of duration are counted for each training session and added
up. The results in 2005 were (BIX, 2006):
User training hours per 1.000 members of the population mean maximum minimum
Universities of applied sciences 23,5 84,1 2,9
Universities: One-tier systems 32,0 159,8 5,1
Universities: Two-tier systems (only the central library considered)
17,6 64,0 4,5
No examples were found for public libraries, probably because many public
libraries include the count of training sessions in the count of “library events”
(see Indicator B.12 “Attendances at events per capita”).
________________________________________________________________
BIX. Der Bibliotheksindex, available at: http://www.bix-bibliotheksindex.de/
BIX. Der Bibliotheksindex (2006), B.I.T. online Sonderheft 2006
CAUL online statistics, Council of Australian University Libraries, available at:
http://www.anu.edu.au/caul/stats/
Finnish research library statistics database, Helsinki University Library, available at:
https://yhteistilasto.lib.helsinki.fi/language.do?action=change&choose_language=3
Forskningsbiblioteken 2005 (2005), KB/Bibsam och SCB, Sveriges officiella statistik,
available at:
http://www.scb.se/statistik/_publikationer/KU0102_2005A01_BR_KUFT0601.pdf
Hoffmann, E. (2005), CARL statistics 2003 – 2004, trends and observations, Canadian
Association of Research Libraries, available at: http://www.carl-
abrc.ca/projects/statistics/statistics-e.html
Lau, J. et al. (2007), Information literacy, an international state-of-the-art report, second draft,
available at: http://www.infolitglobal.info/

B.10 Attendances at training lessons per capita
149
UKB (2004), Benchmarking, Samenwerkingsverband van de Nederlandse
universiteitsbibliotheken en de Koninklijke Bibliotheek, results only available to
participants

5. List of indicators
150
B.11 Reference questions per capita
Background
Offering help in information seeking and library use by answering reference
questions has always been an important library service as well in public as in
academic libraries. This is still more the case in times of electronic information
sources and the Internet.
Reference service has traditionally been offered as face-to-face reference, us-
ers coming to the help-desk with point-of-use questions. Today it is comple-
mented by e-mail or online (chat) reference and cooperative online reference.
In some countries, reference questions per year seem to decrease. The statis-
tics of the Association of Research Libraries show a decrease by 48% in refer-
ence questions from 1991 to 2005 (Kyrillidou, and Young, 2006, p.9). This may
be due to users relying most on the Internet, especially for factual or subject
questions. But the number of reference transactions is still high overall, and the
workload may even be higher than before, as users confronted with multiple
information resources may need more differentiated assistance than before.
Statistics of reference questions are not yet common in national library statis-
tics, but the number of such statistics is growing, and probably there are more
data available in individual libraries. “Reference statistics constitute a poorly
developed area of library statistics. … The only recognized indicator that has
been established so far is he number of reference questions per inhabitant per
year” (Høivik, 2003, p.30/31).
Definition of the indicator
The total number of reference questions per year by members of the population
to be served divided by the number of persons in the population.
Reference questions can regard facts, documents, or advice on sources for the
user’s subject.
The definition excludes directional and administrative inquiries, e.g. for lo-
cating staff or facilities, regarding opening times, about handling equipment
such as reader printers or computer terminals, using self-service functions, or
locating items of stock that have already been identified bibliographically.
The population to be served is the number of persons to whom the library is
commissioned to provide its services. For public libraries, this will normally be

B.11 Reference questions per capita
151
the population of the community (or part of the community); for academic li-
braries, this will normally be the total of students and academic staff in the insti-
tution.
Aims of the indicator
The indicator assesses the use of the library’s reference service by the popula-
tion to be served and therewith the importance of the service to the population. It
can also be used to assess the workload for the reference service per member of
the population. The indicator does not measure the quality of the reference ser-
vice.
The indicator is relevant for all libraries with a defined population to be
served and with a reference service.
Comparison of results between libraries with similar mission, structure and
clientele is possible.
Method
For a sample period, count all incoming reference questions, whether face-to-
face at the reference desk, by mail, e-mail or online (chat) reference, that come
from the population to be served.
The members of the population to be served are counted as persons, not as
FTE (full time equivalent). Thus, part-time students or staff in academic institu-
tions will be counted each as one person.
The number of reference questions is set in relation to the number of persons
in the population to be served.
As single counts can be misleading, sample counts should be conducted at
random intervals over the year, including peak times and times of lower use, e.g.
inside and outside term. By cumulating the results, the mean reference questions
per capita over the year can be calculated.
In order to get a more detailed view of the use of reference service, the popu-
lation to be served could be split into groups. For a university library this could
be:
• Undergraduate students
• Graduate students
• Academic staff
• Students and academic staff of a faculty (e.g. medicine)
For a public library, this could be:
• Children (up to and including age 14)

5. List of indicators
152
• Adults
• Adults over 65 years
If reference questions submitted in electronic form are counted separately, the
results can also be used for calculating the percentage of reference questions in
electronic format in order to show to what extent users are switching to elec-
tronic media for asking questions.
Interpretation and use of results
A high score will be generally seen as good.
The indicator will be affected by the quality of the reference service. Quick
and correct answers, friendly and helpful staff will induce users to repeatedly
using the service. Waiting times, unsatisfying answers, or an unfriendly atmos-
phere will reduce the number of questions.
The indicator will also be influenced by the structure and contents of the li-
brary’s website. If the website offers effective guidance and explanations for the
library’s services, there may be less need for questions pertaining to how to use
the services.
The indicator will also be affected by socio-economic factors, e.g. the level
of information literacy in the population.
If the score seems too low, the library should assess user satisfaction with the
reference service. Waiting times should be considered, and staffing might be
increased in peak times.
The quality of reference answers could be evaluated by using the indicator
C.12 “Reference fill rate”.
Examples and further reading
In UK public libraries, the 10-years statistics show a slight decrease in “enquir-
ies per capita” (Creaser, Maynard and White, 2005):
• 1993/94 = 1,05 enquiries per capita
• 2003/04 = 0,98 enquiries per capita
In public libraries in British Columbia, Canada, “reference transactions per cap-
ita” had an average of 1,04 in 2003 (British Columbia public library statistics,
2004). This corresponds to the British data.
The Australian public library statistics report for 2003/04 a number of 525
“information enquiries per 1.000 persons” = 0,52 enquiries per capita, but add
that the data have not been uniformly reported across all States and Territories,

B.11 Reference questions per capita
153
and that the reported annual figure can vary markedly according to the States
and Territories that supply the data.
In Norwegian public libraries there was a rate of 0,8 enquiries per capita in
2000 (Høivik, 2003, p.31).
In academic libraries, the results of the indicator will be much higher, as stu-
dents and researchers working in the library will have many point-of-use ques-
tions.
For UK academic libraries the statistics of 2004/05 show an average of 7,1
“enquiries per FTE student” (Creaser, 2006, p.20). Directional questions are
included. Statistics of the last years show a slight decrease in questions.
The statistics of the Australian university libraries (CAUL online statistics)
show for 2005 a mean score of 3,52 reference transactions per person in the
population to be served and 5,09 per student. Simple directional questions are
excluded.
When comparing results of this indicator, it will be important to state what
kind of reference questions have been included in the count.
________________________________________________________________
Australian public libraries statistical report 2003 – 2004 (2006), Public Library Services, State
Library of Queensland, available at:
http://www.nsla.org.au/publications/statistics/2004/pdf/NSLA.Statistics-20040701-
Australian.Public.Library.Comparative.Report.1998.2004.pdf
British Columbia public library statistics (2004), Ministry of Education, Victoria, British
Columbia, available at: http://www.bced.gov.bc.ca/pls/bcplstats_2004.pdf
CAUL online statistics, Council of Australian University Libraries, available at:
http://www.anu.edu.au/caul/stats/
Creaser, C. (2006), SCONUL library statistics: trends 1994-95 to 2004-05, LISU,
Loughborough University
Creaser, C., Maynard, S. and White, S. (2005), LISU annual library statistics 2005, featuring
trend analysis of UK public and academic libraries 1994 – 2004, LISU, Loughborough
University, available at:
http://www.lboro.ac.uk/departments/dils/lisu/downloads/als05.pdf
Høivik, T. (2003), Why do you ask? Reference statistics for library planning, Performance
Measurement and Metrics 4,1, pp. 28-37
Kyrillidou, M. and Young, M. (2006), ARL statistics 2004-05, Association of Research
Libraries, available at: http://www.arl.org/bm~doc/arlstat05.pdf

5. List of indicators
154
B.12 Attendances at events per capita
Background
Libraries, beside their regular services, offer various kinds of “events” to their
population and the general public. Such events can have a cultural or literary
intent, e.g. promoting the cultural heritage by exhibitions, author visits and liter-
ary discussions, or an educational intent, e.g. organizing reading groups or story-
telling sessions. In most cases, such events are offered free of charge to all inter-
ested persons.
Events are more popular and various in public libraries. In academic librar-
ies, events are often restricted to exhibitions, lectures and workshops.
Organizing library events will involve considerable effort and input of re-
sources, especially staff resources. The funding institutions might not always be
convinced of the importance of library events. Therefore, libraries should be
able to show at least basic data about input and output of such activities. But
judging from national library statistics it seems that libraries are only recently
starting to collect data about the number of events offered and the number of
attendants.
It would of course be most interesting to the funding institutions if the librar-
ies could show the impact of events on the attendants, e.g. a better understanding
of the local cultural heritage, or a higher knowledge of literature. Libraries could
try to assess the effect and impact of their events by satisfaction surveys or in-
terviews of attendants.
But such methods would be time-consuming, and the results would only
yield an “anecdotal evidence” of an event’s impact. Therefore the indicator de-
scribed here uses the number of attendances at library events as a measure for
assessing the attractiveness of the events to the population. It was chosen be-
cause of its practicality and its suitability for benchmarking purposes.
Definition of the indicator
The number of attendances at library events per 1.000 members of the popula-
tion to be served during one year.
Library events in the sense of this indicator include events organized by the
library with literary, cultural or educational intent, e.g. author visits, reading
groups, literary discussions, workshops, etc.
Events inside the library premises organized by institutions outside the li-
brary and user training sessions are excluded. The definition also excludes exhi-

B.12 Attendances at events per capita
155
bitions, as they are often accessible inside the library premises and entrance
counts are not possible.
The population to be served is the number of persons to whom the library is
commissioned to provide its services. For public libraries, this will normally be
the population of the community (or part of the community); for academic li-
braries, this will normally be the total of students and academic staff in the insti-
tution.
Aims of the indicator
The indicator assesses the library’s success in attracting its population by library
events. It may also be used for demonstrating the library’s cultural role in the
community or institution.
The indicator is relevant for all libraries with a defined population to be
served that organize events. It will be of special interest for public libraries.
Comparison of results between libraries with similar mission, structure and
clientele is possible.
Method
Count the number of attendants at each event. The numbers are accumulated at
the end of the year.
The total number of attendances is set in relation to the population to be
served, divided by 1.000.
If events aim at a specified target group inside the population, e.g. children,
only attendances by that target group should be counted (if possible) and set in
relation to the number of members in that target group, divided by 1.000.
Attendants not belonging to the population to be served will probably be in-
cluded in the counts, as it will not be possible to count them separately.
Interpretation and use of results
A high score will be generally seen as good. It shows that the events the library
organized were suited to the interests of its population.
The indicator will be affected by the number of events offered and by the at-
tractiveness of the events to a broad population. Specialized events, though pos-
sibly with high impact on attendants, may attract fewer visits than popular top-
ics. The indicator will also be influenced by socio-demographic variables in the

5. List of indicators
156
population, e.g. the level of education, by the distance of the library to parts of
the population, and by the timing and opening times of events.
In addition to the results of this indicator, the quality of the events could also
be monitored by satisfaction questionnaires.
In case of low attendance at events, the library could try to
• intensify the promotion of events via the media,
• assess the attendants’ satisfaction with events by exit questionnaires or in-
terviews,
• tailor events to special target groups in the population.
Libraries might also ask their population for preferences of events, e.g. by an
online survey. They could ask for the kind of events and activities in libraries
that people would like to attend, e.g. author talks, history themed events, work-
shops for writers, or events for children.
In order to get more insight into the attractiveness of special events, the at-
tendances to each event could be calculated separately.
Examples and further reading
The statistics of public libraries in British Columbia, Canada, count the number
of program attendances and the members of the population in the service area
(Ministry of education, British Columbia). The average data are:
• 2003 = 0,19 attendances per member of the population
For public libraries in Ontario, Canada, the average data for the same statistics
are (Ministry of culture, Ontario):
• 2003 = 0,21 attendances per member of the population
• 2004 = 0,22 attendances per member of the population
No example was found for this indicator in the statistics of academic libraries.
But several national statistics count the number of exhibitions and/or other
events for academic libraries. The German and Finnish statistics count exhibi-
tions and other events (DBS. Deutsche Bibliotheksstatistik; Finnish research
library statistics database).
________________________________________________________________
DBS. Deutsche Bibliotheksstatistik,, available at: http://www.hbz-nrw.de/angebote/dbs/
Finnish research library statistics database, Helsinki University Library, available at:
https://yhteistilasto.lib.helsinki.fi/language.do?action=change&choose_language=3

B.12 Attendances at events per capita
157
Ministry of culture, Ontario (2004), Ontario public library statistics, available at:
http://www.culture.gov.on.ca/english/culdiv/library/statistics2004/2004stats.htm
British Columbia public library statistics (2004), Ministry of education, British Columbia,,
available at: http://www.bced.gov.bc.ca/pls/bcplstats_2004.pdf

5. List of indicators
158
C. Efficiency
C.1 Cost per user
Background
Libraries today are confronted with a general demand for transparency as to
costs and quality. Funding institutions as well as the general public want to see
how resources are spent and what values are achieved. In addition, libraries are
experiencing growing problems when organising their work and offering their
services within their given budget and resources. Therefore, measures of cost-
effectiveness are becoming important in library evaluation.
For measuring cost-effectiveness, a library’s expenditure can be set in rela-
tion to its output, e.g. loans or library visits. It can also be compared with the
number of registered or active users in order to assess the totals costs per user.
When calculating the cost per user, the total operating expenditure is set in
relation to the number of active users in the library’s population, users that have
made use of library services during the reporting year. Active users are preferred
to the number of registered users. The statistics of “registered users” may be
misleading, if users are registered automatically when enrolling in the institu-
tion, or if the library does not “weed” its user data regularly. Another advantage
for comparing with active users is that the library can actively influence the
number of active users by attractive and effective services.
Definition of the indicator
The total operating or recurrent expenditure of the library during the reporting
year divided by the number of active users in the population to be served.
The total operating expenditure includes expenditure for
• acquisitions (including binding, licenses, and pay-per-view costs),
• staff (including project staff, student assistants, etc.),
• operations and maintenance of computers and network, software licenses
and telecommunication,
• repair or replacement of existing equipment,
• other items like cataloguing records, copying, postage, promotion of ser-
vices, insurance, transport, consulting, etc.

C.1 Cost per user
159
Utility costs (heating, electricity, water, sewage, cleaning, security) and calcula-
tory depreciations of assets (buildings, IT- and other equipment) are excluded.
Capital expenditure (expenditure on building sites, new buildings and exten-
sions, furnishings and equipment for new and expanded buildings, new com-
puter systems) is also excluded.
The population to be served is the number of persons to whom the library is
commissioned to provide its services. For public libraries, this will normally be
the population of the community (or part of the community); for academic li-
braries, this will normally be the total of students and academic staff in the insti-
tution.
An active user is defined as a registered user who has visited or made use of
library facilities or services during the year. This may include the use of elec-
tronic library services within or outside the library. For libraries in which loans
are the principal activity, the number of active borrowers (users who have bor-
rowed at least one item during the year) could be used as an estimate of the
number of active users.
Aims of the indicator
The indicator assesses the library costs per active user in the population and
therewith the cost-efficiency of library services.
The indicator is relevant for all libraries with a defined population to be
served.
Comparison of results between libraries with similar mission, structure and
clientele is possible, if the operating expenditure is calculated in the same way.
Methods
1. A random sample of the population to be served is asked by survey
whether they have visited the library, borrowed a book, or made use of li-
brary services in any form during the last year. Surveys can be sent by
mail or e-mail, or an online survey can be made available on the library’s
website.
Questions could be:
- Have you visited the library during the last year?
- Have you borrowed a book or other material during the last year?
- Have you visited the library’s website during the last year?
- Have you used the library’s electronic services from outside the library
during the last year?

5. List of indicators
160
Calculate the percentage of respondents answering “yes” at least once of
total respondents in the sample. Then calculate the number of total active
library users by applying the same percentage to the population to be
served.
Assess the total operating expenditure of the library during the reporting
year.
The “cost per user” is then calculated by dividing the total operating ex-
penditure by the number of active users in the population.
2. As an estimate for the cost per user, the number of active borrowers in the
population could be used.
Active borrowers are registered users who have borrowed at least one
item during the last year. The data should be available via the records of
the library’s loan system.
The “cost per user” is calculated by dividing the total operating expendi-
ture by the number of active borrowers of the population to be served.
As members of the population may have visited the library or used elec-
tronic library services without borrowing, the “cost per user” calculated
by this method can be higher than in reality.
3. If the library’s authentication procedures for the use of its electronic ser-
vices make it possible to identify what users out of its population have
used the library’s services, these data can be compared with those of ac-
tive borrowers.
The “cost per user” is then calculated by dividing the total operating ex-
penditure by the number of persons in the population to be served that
have either borrowed at least one item and/or have accessed electronic li-
brary services during the last year.
Most libraries will probably prefer method 2 as the easiest method. But using the
number of “active borrowers” may result in higher cost per user than in reality,
if borrowing is not a main user activity. This can be the case in libraries of
medicine or sciences, where electronic collections are more heavily used than
the loan collection. In such cases, methods 1 or 3 should be preferred.
Interpretation and use of results
Low cost per user would generally be considered as showing high cost-
effectiveness of the library. But a higher score may be justified by special tasks
of the library and special needs of the clientele. For libraries in institutions of
higher education that have to offer specialized and labour-intensive services to

C.1 Cost per user
161
their users the cost per user will be higher than in public libraries. Therefore, this
indicator should not be used by itself, but together with indicators of service
quality.
The indicator will be useful for evaluating the cost-effectiveness of a library
in different periods or compared with other libraries of a similar type. It can be
used for justifying the library’s expenditure and for budget appliances.
The indicator can be influenced by several issues:
• Other libraries nearby supplying services to the library’s clientele
• Special library services like rare or specialized collections, electronic pub-
lishing, or special teaching modules
• Specialized needs of the population to be served
• A high percentage of external active users (not belonging to the popula-
tion) that may increase the costs
• Fees for library use
If the cost per user seems too high compared with other libraries of similar mis-
sion and population, the library might try to reduce costs, e.g. by streamlining
processes, cutting down less-used services, or replacing professional staff in
certain services by non-professionals.
As this will not often be possible without lower service quality, it may be
more effective to attract a higher number of active users in order to reduce the
cost per user. This might be done by
• introducing new attractive services,
• promoting services via the library website or public media,
• tailoring the services to special target groups in the population.
Examples and further reading
Not many library statistics compare the library’s expenditure to active users. The
indicator as described here was introduced in a German project using the Bal-
anced Scorecard for academic libraries (Ceynowa and Coners, 2002, pp.73-76).
The German benchmarking project BIX (BIX. Der Bibliotheksindex) uses
the indicator “library expenditure per user” for academic libraries, calculated by
the operating expenditure as described above and the number of active borrow-
ers in the population (BIX, 2006). The results in 2005 were:
Library expenditure per user mean maximum minimum
Universities of applied sciences 179,38 € 279,64 € 95,27 €

5. List of indicators
162
Universities: One-tier systems 526,01 € 1224,34 € 217,98 €
Universities: Two-tier systems (only the central library considered)
426,78 € 798,13 € 206,55 €
The cost per user was lower in the universities of applied sciences, probably
because they offer fewer specialized services.
The Finnish research library statistics allow comparing the total operating
expenditure to active borrowers (Finnish research library statistics database). In
2005, the expenditure of all research libraries was 135.039.700 €. Divided by
397.811 active borrowers this is 339,46 € per active borrower. For university
libraries only, total operating expenditure = 96.671.900 € divided by 207.440
active borrowers came up to 466,02 € per active borrower.
Other statistics compare the library expenditure to the number of persons in
the population to be served.
The statistics of the UK academic libraries compare expenditure to students.
The statistics of 2004/05 show an average of 307 £ per full time equivalent stu-
dent (Creaser, 2006, p.23). Since 1994/95, expenditure per student increased by
24,3 %.
The statistics of SCONUL, Society of College, National and University Li-
braries, UK count the total expenditure per full-time equivalent user, meaning
potential users (students and academic staff). For 2004/05 the mean value was
243 £ (SCONUL, 2006).
The statistics of the Australian university libraries (CAUL online statistics)
show for 2005 a mean expenditure of 399 AUD per member of the population
which would be about 233 €. Expenditure excludes capital expenditure
The cost per member of the population will be lower in public libraries. In
UK public libraries, the 10-years statistics show a continuous increase of expen-
diture per capita, expenditure including capital expenditure (Creaser, Maynard
and White, 2005):
• 1993/94 = 12,85 £
• 2003/04 = 17,64 £
The US public library statistics for 2004 count 32,21 $ of operating expenditure
per capita = population of the legal service area (Public libraries in the United
States, 2006).
The Finnish public library statistics show an operating expenditure of 47,69 €
per inhabitant in 2005 and 48,71 € in 2006 (Finnish public library statistics).

C.1 Cost per user
163
The examples show that for comparing results it is extremely important to
know whether active users, registered users, or members of the population are
compared to expenditure, and what is included in the calculation of expenditure.
________________________________________________________________
BIX. Der Bibliotheksindex Available at: http://www.bix-bibliotheksindex.de/
BIX. Der Bibliotheksindex (2006), B.I.T. online Sonderheft 2006
CAUL online statistics, Council of Australian University Libraries, available at:
http://www.anu.edu.au/caul/stats/
Ceynowa, K. and Coners, A. (2002), Balanced Scorecard für wissenschaftliche Bibliotheken,
Zeitschrift für Bibliohekswesen und Bibliographie, Sonderheft 82, Klostermann, Frankfurt
a.M.
Creaser, C. (2006), SCONUL library statistics: trends 1994-95 to 2004-05, LISU,
Loughborough University
Creaser, C., Maynard, S. and White, S. (2005), LISU annual library statistics 2005, featuring
trend analysis of UK public and academic libraries 1994 – 2004, LISU, Loughborough
University, available at:
http://www.lboro.ac.uk/departments/dils/lisu/downloads/als05.pdf
Finnish public library statistics, Culture and Media Division of the Ministry of Education,
available at: http://tilastot.kirjastot.fi/Default.aspx?&langId=en
Finnish research library statistics database, Helsinki University Library, available at:
https://yhteistilasto.lib.helsinki.fi/language.do?action=change&choose_language=3
Public libraries in the United States: fiscal year 2004 (2006), National Center for Education
Statistics, available at: http://nces.ed.gov/pubs2006/2006349.pdf
SCONUL annual library statistics 2004-2005 (2006), SCONUL, Society of College, National
& University Libraries, London

5. List of indicators
164
C.2 Cost per visit
Background
Libraries today are confronted with a general demand for transparency as to
costs and quality. Funding institutions as well as the general public want to see
how resources are spent and what values are achieved. In addition, libraries are
experiencing growing problems when organising their work and offering their
services within their given budget and resources. Therefore, measures of cost-
effectiveness are becoming important in library evaluation.
For measuring cost-effectiveness, a library’s expenditure can be set in rela-
tion to its output.
While indicator C.1 compares expenditure to users, this indicator sets the li-
brary’s expenditure in relation to library visits.
Traditionally, libraries offer the use of their collections and services via a
user’s visit to the library as physical place. With the development of electronic
collections and services libraries have started to offer a new virtual “entrance” to
their services: the library website. Users can “visit” the library and use many of
its services from remote places, e.g. from their workplace or from home. Such
visits, in analogy to the traditional physical visits, are called “virtual visits”.
Both forms of “visits” together can be seen as a measure for the use of library
services and therewith as a cost driver for the library’s expenditure. During a
physical visit, visitors make use of the library’s building, equipment, collection,
or loan and help services. During a virtual visit, they use the electronic collec-
tions and services of the library. Therefore, this indicator calculates the total
number of physical + virtual visits in order to assess the cost of a user’s “enter-
ing the library”.
Definition of the indicator
The total operating or recurrent expenditure of the library during the reporting
year divided by the number of physical + virtual library visits.
The total operating expenditure in the sense of this indicator includes expen-
diture for
• acquisitions (including binding, licenses, and pay-per-view costs),
• staff (including project staff, student assistants, etc.),
C.2 Cost per visit
165
• operations and maintenance of computers and network, software licenses
and telecommunication,
• repair or replacement of existing equipment,
• other items like cataloguing records, copying, postage, promotion of ser-
vices, insurance, transport, consulting, etc.
Utility costs (heating, electricity, water, sewage, cleaning, security) and calcula-
tory depreciations of assets (buildings, IT- and other equipment) are excluded.
Capital expenditure (expenditure on building sites, new buildings and exten-
sions, furnishings and equipment for new and expanded buildings, new com-
puter systems) is also excluded.
A physical visit is defined as the act of a person’s entering the library prem-
ises. Visits are counted independently of the purpose of the visit (borrowing,
working in the library, or taking part in events and guided tours).
A virtual visit is defined as a user’s request on the library’s website from out-
side the library premises in order to use one of the services provided by the li-
brary.
For this indicator, both physical and virtual visits include visits made by ex-
ternal users (users not belonging to the population to be served), as it would be
difficult to identify such visits.
Aims of the indicator
The indicator assesses the library costs per library visit and therewith the cost-
efficiency of library services.
The indicator is relevant for all libraries with both traditional and web-based
services.
Comparison between libraries of similar mission, structure and clientele is
possible, if special conditions (e.g. a new building) are considered and if the
operating expenditure is calculated in the same way.
The indicator does not consider users’ activities during physical or virtual
visits.
Method
Calculate the total operating expenditure of the library during the reporting year.
Count the number of physical and virtual visits during the same time. For the
methods of counting, compare Indicator B.3 “Library visits per capita”.
For calculating the cost per visit the total operating expenditure is divided by
the number of physical + virtual visits.

5. List of indicators
166
Interpretation and use of results
Low cost per visit would generally be considered as showing high cost-
effectiveness of the library. But a higher score may be justified by the special
tasks of the library and special needs of its clientele. For libraries in institutions
of higher education that have to offer specialized and labour-intensive services
to their users the cost per visit will be higher than in public libraries. Therefore,
this indicator should not be used by itself, but together with indicators of service
quality.
The indicator will be useful for evaluating the cost-effectiveness of a library
in different periods or compared with other libraries of a similar type. It can be
used for justifying the library’s expenditure and for budget appliances.
The indicator can be influenced by several issues:
• Other libraries nearby supplying services to the library’s clientele
• Special library services like rare or specialized collections, electronic pub-
lishing, or special teaching modules
• Specialized needs of the population to be served
• A high percentage of external users (not belonging to the population) that
may increase the costs
If the cost per visit seems too high compared with other libraries of similar mis-
sion and population, the library might try to reduce costs, e.g. by streamlining
processes, cutting down less-used services, or replacing professional staff in
certain services by non-professionals.
As this will not often be possible without lower service quality, it may be
more effective to attract a higher number of visits, e.g. by
• introducing new attractive services,
• offering more space or seats for user (see Indicators A.1 “User area per
capita” and A.2 “Seats per capita”),
• offering longer opening hours,
• promoting services via the library website or public media,
• tailoring the services to special target groups in the population,
• improving the usability of the library website.
Satisfaction surveys including non-users can help to identify issues that detain
members of the population from visiting the library.

C.2 Cost per visit
167
Examples and further reading
As yet, there is no example of practical appliance of the indicator as described
here. Libraries using cost measures have compared their expenditure only to the
number of physical visits.
The German benchmarking project BIX (BIX. Der Bibliotheksindex) uses
the indicator “library expenditure per visit” for public libraries, calculated by the
operating expenditure + capital expenditure and the number of physical visits
(BIX, 2006). The results in 2005 were:
Total expenditure per visit mean maxi-
mum
mini-
mum
Libraries in communities under 15.000 inhabitants 3,87 € 8,30 € 1,58 €
Libraries in communities from 15.000 to 30.000 inhabitants 4,90 € 35,34 € 2,45 €
Libraries in communities from 30.000 to 50.000 inhabitants 4,08 € 6,19 € 2,41 €
Libraries in communities from 50.000 to 100.000 inhabi-tants
5,06 € 7,86 € 3,07 €
Libraries in communities over 100.000 inhabitants 5,38 € 11,82 € 2,36 €
The cost per visit seems to be higher in libraries of large communities, possibly
due to more specialized services.
The Finnish public library statistics show an operating expenditure of 3,89 €
per library visit in 2005 and 4,28 € in 2006 (Finnish Public Library Statistics).
The Swiss public libraries had in 2005 a total expenditure of 110.746.930
CHF and 5.762.836 visits, that is 19,22 CHF or 13,09 € per visit (Schweize-
rische Bibliothekenstatistik, 2005). The higher score is explained by expenditure
including calculatory costs.
The cost per visit is generally somewhat higher in academic libraries because
of the specialized services offered and the special activities of users in the li-
brary.
The Finnish research library statistics allow comparing the total operating
expenditure to physical visits (Finnish research library statistics database). In
2005, the expenditure of all research libraries was 135.039.700 €. Divided by
16.284.641 visits, this is 8,29 € per visit. For university libraries only, the total
operating expenditure = 96.671.900 € divided by 9.675.617 visits came up to
9,99 € per visit.
The statistics of the Australian university libraries (CAUL online statistics)
show for 2005 a mean expenditure per visit of 10,82 AUD which would be

5. List of indicators
168
about 6,30 €. Expenditure excludes capital expenditure; visits are measured by
turnstile count.
The Swiss university libraries had in 2005 a total expenditure of 180.095.610
CHF and 5.088.574 visits, that is 35,39 CHF or 24,10 € per visit (Schweize-
rische Bibliothekenstatistik, 2005). Expenditure here includes calculatory costs.
The examples show that for comparing results it is extremely important to
know how the expenditure was calculated and what is included in the calcula-
tion.
________________________________________________________________
BIX. Der Bibliotheksindex, available at: http://www.bix-bibliotheksindex.de/
BIX. Der Bibliotheksindex (2006), B.I.T. online Sonderheft 2006
CAUL online statistics, Council of Australian University Libraries, available at:
http://www.anu.edu.au/caul/stats/
Finnish public library statistics, Culture and Media Division of the Ministry of Education,
available at: http://tilastot.kirjastot.fi/Default.aspx?&langId=en
Finnish research library statistics database, Helsinki University Library, available at:
https://yhteistilasto.lib.helsinki.fi/language.do?action=change&choose_language=3
Schweizerische Bibliothekenstatistik (2005), Bundesamt für Statistik, available at:
http://www.bfs.admin.ch/bfs/portal/de/index/themen/kultur__medien__zeitverwendung/ku
ltur/blank/analysen__berichte/bibliotheken.html

C.3 Cost per use
169
C.3 Cost per use
Background
Libraries today are confronted with a general demand for transparency as to
costs and quality. Funding institutions as well as the general public want to see
how resources are spent and what values are achieved. In addition, libraries are
experiencing growing problems when organizing their work and offering their
services within their given budget and resources. Therefore, measures of cost-
effectiveness are becoming important in library evaluation.
For measuring cost-effectiveness, a library’s expenditure can be set in rela-
tion to its output.
While indicators C.1 and C.2 compare expenditure to users and library visits,
this indicator sets the library’s expenditure in relation to all forms of collection
use.
The traditional measure for collection use is the number of loans. But this
measure ignores the extent of non-lending (in-house) use of library materials
and thus underrates the usage of the physical collection. The amount of in-house
usage should therefore be counted additionally.
Since libraries offer electronic resources beside their physical collection, the
use of the electronic collection should also be considered when comparing col-
lection use to the library costs. Electronic usage could be counted as
• sessions (requests of electronic material),
• or downloads (successful requests of a content unit or descriptive record
out of the electronic collection).
A session on a database shows the user’s interest in a topic, while the download
of a content unit or descriptive record out of the database would show that users
have found items they deem relevant. The relation of downloads to sessions is
somewhat similar to that of loans to browsing. Downloads are therefore pre-
ferred as measures for the electronic use of the collection.
The indicator described here tries to count all forms of collection use and sets
them in relation to the library’s expenditure.

5. List of indicators
170
Definition of the indicator
The total operating or recurrent expenditure of the library during the reporting
year divided by the number of loans + in-house uses + downloads from the elec-
tronic collection.
The total operating expenditure in the sense of this indicator includes expen-
diture for
• acquisitions (including binding, licenses, and pay-per-view costs),
• staff (including project staff, student assistants, etc.),
• operations and maintenance of computers and network, software licenses
and telecommunication,
• repair or replacement of existing equipment,
• other items like cataloguing records, copying, postage, promotion of ser-
vices, insurance, transport, consulting, etc.
Utility costs (heating, electricity, water, sewage, cleaning, security) and calcula-
tory depreciations of assets (buildings, IT- and other equipment) are excluded.
Capital expenditure (expenditure on building sites, new buildings and exten-
sions, furnishings and equipment for new and expanded buildings, new com-
puter systems) is also excluded.
Loans in the sense of this indicator are lending transactions of physical items
to one user. This includes user-initiated renewals, on-site loans (loans within the
library) and copies supplied in place of original documents. Automatic renewals
by the system without user initiation and interlibrary loans are excluded.
In-house use in the sense of this indicator means that a user takes a docu-
ment from the open access collections for using it inside the library. This in-
cludes browsing the contents of a document while standing at the shelves.
A download is the successful request of a content unit or descriptive record
from a database, electronic serial or digital document. In the sense of this indica-
tor, a content unit means a published document or a part of a document, either
textual or audiovisual. A descriptive record is a bibliographic or other record
that describes a document or a content unit with elements such as title, author,
subject, date of origin etc.
Aims of the indicator
The indicator assesses the library costs per case of collection use and therewith
the cost-efficiency of library services.
The indicator is relevant for all libraries with both a physical and an elec-
tronic collection.

C.3 Cost per use
171
Comparison between libraries of similar mission, structure and clientele is
possible, if differences in the collections are considered and if the operating
expenditure is calculated in the same way.
Method
Calculate the total operating expenditure of the library during the reporting year.
Count the numbers of the different forms of collection use during the same
time.
The loan data should be available via the automated lending system.
In-house use is measured by sampling. The samples should be taken in one
or more normal weeks and grossed up for the year. During the sampling period
the users are asked not to reshelve documents used in the library. The documents
are counted before reshelving. On-site loans (items lent for use inside the li-
brary) should, if possible, be excluded or deducted, as they are counted as loans.
The number of downloads must be collected from different sources. For
electronic documents on a supplier’s server, the statistics should be delivered by
the supplier. For electronic documents on the library’s own server, the server
statistics should be used.
Only downloads from the library’s electronic collection are counted. This
comprises all documents acquired or licensed by the library, but excludes free
Internet resources, even if the library has included them in its online catalogue.
For calculating the cost per use, the total operating expenditure is divided by
the number of loans + in-house uses + downloads.
If a library does not see its way to gather the data for in-house use and for
downloads, and if lending is one of the main services, the cost per loan only
might be used as an estimate for the cost per use. For public libraries that do not
yet offer a large electronic collection this might afford an insight into cost-
effectiveness. In academic libraries, in-house use will probably represent a high
percentage of usage of the physical collection and should be counted in addition
to loans. For all libraries offering a growing electronic collection, ignoring elec-
tronic use in an indicator of cost-effectiveness would be misleading, as the use
of the physical collection might decrease and be replaced by electronic usage.
Interpretation and use of results
Low cost per use would generally be considered as showing high cost-
effectiveness of the library. But a higher score may be justified by the special

5. List of indicators
172
tasks of the library and special needs of its clientele. Therefore, this indicator
should not be used by itself, but together with indicators of service quality.
The indicator will be useful for evaluating the cost-effectiveness of a library
in different periods or compared with other libraries of a similar type. It can be
used for justifying the library’s expenditure and for budget appliances.
The indicator can be influenced by several issues:
• Ease of access to the physical and the electronic collection
• Studying and reading facilities in the library
• Other libraries nearby supplying services to the library’s clientele
• The level of user skills
• Fees for library use
The number of downloads could also be influenced by users' search strategies.
If the cost per use seems too high compared with other libraries of similar
mission and population, the library might try to reduce costs, e.g. by streamlin-
ing processes, cutting down less-used services, or replacing professional staff in
certain services by non-professionals.
As this will not often be possible without lower service quality, it may be
more effective to try attracting higher collection use, e.g. by
• promoting the collection via the library website or public media,
• adapting the collection policy to the needs of the population,
• opening closed magazines for open access.
In order to find more details about collection use, the library could use the Indi-
cators B.6 “Collection use”, B.7 “Percentage of stock not used” or B.5 “Number
of content units downloaded per capita”.
User surveys can help to identify issues of dissatisfaction with the collection
or with the options for collection use.
Examples and further reading
As yet, there is no example of practical appliance of this indicator. Libraries
using cost measures have compared their expenditure only to the number of
loans.
The German public libraries had in 2006 an expenditure of 795.333.000 €
and 348.982.000 loans which is about 2,28 € per loan (DBS - Deutsche Biblio-
theksstatistik).
The Finnish public libraries counted in 2006 2,48 € per loan, similar to the
German score (Finnish public library statistics).

C.3 Cost per use
173
The Swiss public library statistics had in 2005 a total expenditure of
110.746.930 CHF and 17.426.571 loans, that is 6,35 CHF or 4,32 € per loan
(Schweizerische Bibliothekenstatistik, 2005). Expenditure here includes calcula-
tory costs.
The cost per loan is generally higher in academic libraries because of the
specialized services and collections offered.
The Swedish university libraries had in 2005 an expenditure of 1.265.863 (in
1.000 SEK) and 10.694.594 loans which is 118.36 SEK or 13,02 € per loan
(Forskningsbiblioteken, 2005).
The Finnish research library statistics allow comparing the total operating
expenditure to loans (Finnish research library statistics database). In 2005, the
expenditure of all research libraries was 135.039.700 €. Divided by 4.508.633
loans, this is 29,95 € per loan. For university libraries only, total operating ex-
penditure = 96.671.900 € divided by 2.619.610 loans came up to 36,90 € per
loan. The score is higher because renewals are excluded.
The statistics of the Australian university libraries (CAUL online statistics)
show for 2005 a mean expenditure per loan of 23,94 AUD which would be
about 13,95 €. Expenditure excludes capital expenditure; loans include all re-
newals which would make the cost lower.
The Swiss university libraries had in 2005 a total expenditure of 180.095.610
CHF and 3.439.162 loans, that is 52,37 CHF or 35,66 € per loan (Schweize-
rische Bibliothekenstatistik, 2005). Expenditure here includes calculatory costs.
The examples show that for comparing results it is extremely important to
know how the loans and the expenditure are calculated and what is included in
the calculation.
________________________________________________________________
CAUL online statistics, Council of Australian University Libraries, available at:
http://www.anu.edu.au/caul/stats/
DBS. Deutsche Bibliotheksstatistik, Hochschulbibliothekszentrum des Landes Nordrhein-
Westfalen, available at: http://www.hbz-nrw.de/angebote/dbs/
Finnish public library statistics, Culture and Media Division of the Ministry of Education,
available at: http://tilastot.kirjastot.fi/Default.aspx?&langId=en
Finnish research library statistics database, Helsinki University Library, available at:
https://yhteistilasto.lib.helsinki.fi/language.do?action=change&choose_language=3

5. List of indicators
174
Forskningsbiblioteken 2005 (2005), KB/Bibsam och SCB, Sveriges officiella statistik,
available at:
http://www.scb.se/statistik/_publikationer/KU0102_2005A01_BR_KUFT0601.pdf
Schweizerische Bibliothekenstatistik (2005), Bundesamt für Statistik, available at:
http://www.bfs.admin.ch/bfs/portal/de/index/themen/kultur__medien__zeitverwendung/ku
ltur/blank/analysen__berichte/bibliotheken.html

C.4 Ratio of acquisitions costs to staff costs
175
C.4 Ratio of acquisitions costs to staff costs
Background
Staff costs are in most libraries the highest factor in the budget. Libraries offer
services that in many cases need experienced professional staff. During the last
decades libraries have tried to cut down staff costs by resource sharing, e.g. in
cataloguing or portal building, and by streamlining processes, e.g. in book proc-
essing. But new tasks like online services and teaching activities have raised
staff costs on the other side.
As one of the main tasks of a library is to offer print and electronic collec-
tions that are adequate to its population, the problem arises whether staff costs
are becoming so high that they narrow the library’s funds for collection build-
ing. This can be the case in libraries that have flexible or global budgets and that
can shift resources between staff and collection expenditure.
Therefore, the relation between acquisitions and staff costs can be seen as an
indicator for the library’s cost-effectiveness and its ability to keep a good bal-
ance between the collection and other library services. This issue will be inter-
esting as well to the funding institution as to users and to the general public.
Definition of the indicator
The acquisitions expenditure divided by the expenditure on regular staff.
Acquisitions expenditure in the sense of this indicator includes binding, li-
censes and pay-per-view costs. If the library joins in consortia or other over-all
contracts, only the library’s own share in the contractual expenses should be
counted.
Staff expenditure in the sense of this indicator includes the expenditure for
regular staff (staff in the position chart). Staff members paid by special grants
and student helps are excluded. If the actual expenditure cannot be calculated,
average rates can be used. Lists of average rates for each level of the position
chart, published by governmental departments, are available in many countries.

5. List of indicators
176
Aims of the indicator
The indicator assesses whether the library has organized its processes so effi-
ciently that staff costs do not prevent the library from investing a relevant part of
its income in the collection.
The indicator is relevant for all libraries. The indicator is most informative
for libraries that have flexible or global budgets and that can shift resources
between staff and acquisitions expenditure.
Comparison of results between libraries with similar mission, structure and
clientele is possible, if differences in collection policies are taken into account
and if the acquisitions and staff expenditure is calculated in the same way.
Method
Calculate the total acquisitions expenditure and the total staff expenditure of the
library during the reporting year. Staff expenditure includes only the expenditure
for regular staff.
For calculating the ratio of acquisitions costs to staff costs, the total acquisi-
tions expenditure is divided by the total staff expenditure.
Interpretation and use of results
A higher score is usually considered as good. It shows that by efficient organisa-
tion staff costs are kept within reasonable bounds that allow the library to invest
a relevant part of its income in the collection. But a lower score may be justified
by labour-intensive special tasks of the library. Therefore, this indicator should
not be used by itself, but together with indicators of service quality.
The indicator can be influenced by
• the library’s collection policies,
• labour-intensive services,
• specialized needs of the population to be served,
• external means (e.g. special grants) for consortia,
• cuts in collection building funds,
• raises in staff salaries.
If staff costs seem too high, the library should try to reduce staff costs, espe-
cially in background services like media processing and administration. This
might be done by
• streamlining processes,
• using as much automation of procedures as possible,

C.4 Ratio of acquisitions costs to staff costs
177
• intensifying cooperative services between libraries,
• replacing professional staff in certain services by non-professionals.
It should be kept in mind that such actions must not result in lower service qual-
ity.
Examples and further reading
The German benchmarking project BIX (BIX. Der Bibliotheksindex) uses the
indicator “ratio of acquisitions expenditure to staff expenditure” for academic
libraries as described above. The results in 2005 were (BIX, 2006):
Ratio of acquisitions expenditure to staff expenditure mean maximum minimum
Universities of applied sciences 0.52 1.24 0.28
Universities: One-tier systems 0.77 2.13 0.39
Universities: Two-tier systems (only the central library considered)
0.55 0.83 0.31
The statistics of the UK academic libraries allow comparing total expenditure on
information provision to total staff expenditure. The statistics of 2004/05 count
11.800.000 £ expenditure on information provision and 21.200.000 £ expendi-
ture on staff, which is a score of 0.56 for the indicator and comparable to the
BIX results (Creaser, 2006, p.123).
The Finnish research library statistics for 2005 show for all research libraries
“library materials costs” of 28.877.200 € and “staff salaries and social costs” of
63.236.500 €, which is a ratio of 0.46 (Finnish research library statistics data-
base). For university libraries only, “library materials costs” are 20.908.800 €
and “staff salaries and social costs” are 41.901.800 €, which is a ratio of 0.50.
The ratio is somewhat lower in the Finnish libraries, because social costs are
included in staff costs.
The statistics of the Association of Research Libraries show in 2004
8.286.431 $ expenditure for library materials and 9.088.732 $ total salary ex-
penditure, which is a ratio of 0.91 (Kyrillidou and Young, 2005). 10 years ear-
lier, in 1994, the ratio was 0.75. From 1986 to 2004, materials expenditure had
risen by 206 %, salary expenditure only by 122 %.
In public libraries staff expenditure comes up to a higher percentage and ac-
quisition costs are lower.

5. List of indicators
178
The US public library statistics for 2004 count a total operating expenditure
of 8.643.028.000 $, of which 65.8 % are staff costs and 13.2 % collection costs
(Public libraries in the United States, 2006). This results in a ratio of 0.20.
The Finnish public library statistics show for 2005 an “expenditure on library
materials” of 35.944.205 € and “expenditure on staff” of 142.604.435 €, which
is a ratio of 0.25, comparable to the US libraries (Finnish public library statis-
tics).
The cost structure of public libraries differs from that of academic libraries.
In Finnish public libraries 2005, distribution of expenditure was as follows
(Finnish public library statistics):
• staff = 57.39 %
• library materials = 14.47 %
• other = 28.14 %
The university libraries in the Association of Research Libraries had in 2003/04
the following distribution of expenditure (Kyrillidou and Young, 2005):
• staff = 46 %
• library materials = 40 %
• other = 13.88 %
CARL, the Canadian Association of Research Libraries, had in 2004/05 the
following distribution of expenses (Holmes, 2006):
• staff = 51.6 %
• library materials = 39.7 %
• other = 8.7 %
A survey of library spending in 29 countries found the following resource allo-
cation pattern over all types of libraries (OCLC, 2001):
• staff = 53 %
• collection = 30 %
• other = 17 %
When comparing results of this indicator, it will be extremely important to com-
pare only with libraries of similar type and clientele and to define clearly what
has been included in the calculation.
________________________________________________________________
BIX. Der Bibliotheksindex, available at: http://www.bix-bibliotheksindex.de/
BIX. Der Bibliotheksindex (2006), B.I.T. online Sonderheft 2006

C.4 Ratio of acquisitions costs to staff costs
179
Creaser, C., Maynard, S. and White, S. (2005), LISU annual library statistics 2005, featuring
trend analysis of UK public and academic libraries 1994 – 2004, LISU, Loughborough
University, available at:
http://www.lboro.ac.uk/departments/dils/lisu/downloads/als05.pdf
Finnish public library statistics, Culture and Media Division of the Ministry of Education,
available at: http://tilastot.kirjastot.fi/Default.aspx?&langId=en
Finnish research library statistics database, Helsinki University Library, available at:
https://yhteistilasto.lib.helsinki.fi/language.do?action=change&choose_language=3
Holmes, D. (2006), CARL statistics 2004-05, trends and observations, Canadian Association
of Research Libraries, available at: http://www.carl-abrc.ca/projects/statistics/statistics-
e.html
Kyrillidou, M. and Young, M. (2005), ARL statistics 2003-04, Association of Research
Libraries, available at: http://www.arl.org/bm~doc/arlstat04.pdf
OCLC (2003), Worldwide education and library spending, in 2003 environmental scan: a
report to the OCLC membership, available at:
http://www.oclc.org/reports/escan/economic/educationlibraryspending.htm
Public libraries in the United States: fiscal year 2004 (2006), National Center for Education
Statistics, available at: http://nces.ed.gov/pubs2006/2006349.pdf

5. List of indicators
180
C.5 Cost per document processed
Background
Libraries need data about the costs of their individual products and services, on
the one side for resource management, on the other side for reporting, for budget
appliances and for justifying the library’s expenditure. Especially financing
authorities often ask for the cost of one loan, document delivery, or catalogue
entry.
If the costs per unit of individual products and services are known, bench-
marking with other libraries will be possible. Additionally, staff will gain a bet-
ter understanding of the cost implications of practices and policies. The data will
also be extremely helpful for decisions on outsourcing processes.
Media processing is taken as example for unit costs, as the processing activi-
ties are necessary in all libraries, and the results can therefore be compared be-
tween libraries.
The first edition of the International Standard ISO 11620 included the indica-
tor “Cost per title catalogued”. But in many libraries acquisition and cataloguing
processes are now combined in a media processing department and will be car-
ried out in one. Therefore “cost of document processed”, including both acquisi-
tion and cataloguing, will be more adequate to the present situation in libraries.
Definition of the indicator
The staff costs of processing acquired media (print and electronic documents)
divided by the number of documents processed.
Media processing includes acquisition and descriptive cataloguing.
For the purpose of this indicator, acquisition is defined as all processes after
documents have arrived at the library and it has been decided to add them to the
collections (e.g. accession list, accounting procedures).
Classification and/or subject cataloguing are excluded, as the rules and pro-
cedures in libraries are too different to render comparison possible.
Media acquired by gift, exchange or legal deposit are included.

C.5 Cost per document processed
181
Aims of the indicator
The indicator assesses the staff costs of a library’s procedures for processing
acquired documents and therewith the efficiency of processes.
The indicator is relevant for all libraries.
Comparison between libraries is possible, if the type and language of ac-
quired media, the percentage of copy and/or minimal cataloguing and differ-
ences in salaries are taken into account.
The indicator is not applicable if the processing or some part of the process-
ing has been outsourced.
Method
The library chooses a sampling period with normal workload.
To obtain the number of hours spent on processing acquired media, time cost
analysis is necessary. Because staff members are often involved in several tasks,
the time they spend on processing should be logged during the sampling period.
If time logging is not possible, the proportion of time spent on processing can,
instead, be estimated.
The time spent on processing by all staff during the sampling period is
summed up to hours. The hours are then multiplied with the cost per hour of
labour (wages divided by the regular working time of the relevant staff) to ob-
tain the staff costs of processing.
The number of documents processed during the sampling period is recorded.
The cost per document processed is calculated by dividing the staff costs of
processing during the sampling period by the number of documents processed
during the same period.
It should be stated clearly what part of the processing is included in the cal-
culation
Interpretation and use of results
A low score for “cost per document processed” will be seen as good.
The indicator will be greatly influenced by the type and language of the proc-
essed documents. Processing of non-commercial publications will probably take
longer, as copy cataloguing data might not be available. Cataloguing of publica-
tions in foreign languages may offer more problems than cataloguing of publica-
tions in the national language.

5. List of indicators
182
The indicator will also be influenced by the procedures of media processing,
the level of bibliographic description, the degree of automation, and the qualifi-
cation and expertise of staff.
If the cost per document processed seems too high compared to other librar-
ies, the library might
• revise workflows,
• use more automated procedures,
• try to increase the percentage of copy cataloguing,
• replace highly paid professional staff by support staff.
Examples and further reading
The indicator is adapted from a method described by Deriez and Giappiconi
(1994) that calculated “cost per title catalogued”.
One of the most comprehensive time and cost studies was conducted by the
Technical Services of the Iowa State University Library between 1987 and 2001
(Morris, 1992; Morris and Osmus, 1992; Morris et al., 2000). The study focus-
sed on aspects of staff time and costs for cataloguing. The average cost of cata-
loguing per title decreased from $20.83 to $ 16.25 between 1990-91 and 1997-
98, and at the end of 1999 the cost was about $6.13 per title. The decrease of
costs was due to shared cataloguing, process automation and more cataloguing
done by support staff.
The National Library of Australia calculates the cost per collection item ac-
quired and/or processed or digitised. Over the last three years the costs increased
from AUD 38.43 to AUD 42.10.
A study of the Library at Curtin University of Technology and the three other
publicly funded universities in Western Australia (known collectively as WA-
GUL) compared cost savings to be achieved by re-engineering cataloguing and
related operations with savings to be expected from outsourcing (Wade and
Williamson, 2007). In Curtin, the cost of one title catalogued before re-
engineering was 21,13 AUD. The expectation was to reach a cataloguing cost
per title of 10,11 AUD by organisational measures.
When comparing results of this indicator it will be especially important to
state which activities have been included in “cataloguing” or “processing”.
________________________________________________________________
Deriez, R. and Giappiconi, T. (1994), Analyser et comparer les coûts de catalogage, Bulletin
des Bibliothèques de France 39,6, pp. 28-33

C.5 Cost per document processed
183
Morris, D. E. (1992), Staff time and costs for cataloguing, Library Resources & Technical
services 36,1, pp. 79-92
Morris, D. E. and Osmus, L. (1992). Serials cataloguing time and costs: results of an ongoing
study at Iowa State University, The Serials Librarian 22, 1/ 2, pp. 235-248
Morris, D. E. et al. (2000), Cataloguing staff costs revisited, Library Resources & Technical
Services, 44,2, pp. 70-83, available at:
http://www.ala.org/ala/alcts/alctspubs/librestechsvc/LRTSarchive/44n2.pdf
National Library of Australia (2006), 46th Annual Report 2005/06, available at:
http://www.nla.gov.au/policy/annrep06/index.html
Wade, R. and Williamson, V. (2007), Cataloguing costed and restructured at Curtin
University of Technology, available at:
http://www.unilinc.edu.au/services/consult_curtin.html
5. List of indicators
184
C.6 Cost per download
Background
Over the last two decades the electronic collections of libraries have been grow-
ing steadily. Bibliographic databases were the first to replace their printed ver-
sion, followed by journals that nowadays often appear in two formats – both in
print and electronically. Compared to the printed books the proportion of e-
books is still rather small but growing continuously.
Since an ever increasing part of the library budget is spent on electronic re-
sources, the library will have to justify the expenditure for each resource by
showing that the cost per use does not exceed limits the library itself is willing
to accept as reasonable in the context of its information provision.
Downloads indicate that users have found items that seem to be relevant to
their interests. The measure could be seen in analogy to loans of print materials,
while sessions could be seen in analogy to browsing the shelves. Therefore,
downloads can be regarded as the most expressive measure for the relevance of
the electronic collection to users.
If the number of downloads from an electronic resource is compared with the
costs of that resource, the cost per use will show whether the expenditure is
justified.
Definition of the indicator
The costs of each electronic resource – a database, an electronic serial or an e-
book – are divided by the number of downloads from that resource during a
specified period, usually a year.
The costs of an electronic resource consist of its subscription or licensing
costs. One-time purchases of electronic resources are excluded, since usage
period and cost period do not correspond. Regular payments for server mainte-
nance fees if the resource is not hosted on the library’s server are included.
Maintenance of computers and network and software licences for the provision
of electronic resources on the library’s own servers as well as other operational
costs are excluded.
Pay-per-view arrangements are excluded since costs per download for such a
service are determined in advance.

C.6 Cost per download
185
If the costs of an individual electronic resource cannot be clearly established,
because it has been acquired by bulk purchase or in a package with a print ver-
sion, this indicator will not be applicable for that resource.
A download is the successful request of a content unit or descriptive record
from a database, electronic serial or digital document. In the sense of this indica-
tor, a content unit means a published document or a part of a document, either
textual or audiovisual. A descriptive record is a bibliographic or other record
that describes a document or a content unit with elements such as title, author,
subject, date of origin etc.
Downloads by library staff and in user training are included in the number of
downloads.
Aims of the indicator
The indicator assesses the cost-efficiency of the library’s electronic collection on
a titles basis so that the library can decide at regular intervals if it is still willing
to accept the cost per use or if it decides to cancel a resource.
The number of downloads is also an indication of the relevance attributed to
the electronic resource by the users.
The indicator is relevant for all libraries with an electronic collection. It will
be especially useful for comparison over time.
Comparison of the same or similar resources between libraries may be possi-
ble, if differences in the libraries’ clientele are considered.
Method
To begin with the electronic collection has to be checked through for those re-
sources for which access fees are paid at regular intervals.
For each electronic resource for which payments are made on a regular basis
the costs per year are calculated and divided by the number of downloads re-
corded for that resource during the same period. In case there are various mani-
festations of the same unit (HTML, PDF for text files and JPEG or WAV for
non-textual material) all requests are counted.
In an automated library system it will be easy to identify the costs of an indi-
vidual resource. Bibliographic as well as full text databases are usually paid
annually. The cost structure of electronic journals is simple in the case of e-only
subscriptions. It becomes complicated when there is an extra fee for electronic
access that has to be added to the price of the print subscription. When a consor-
tium agreement or other contractual arrangements with a journal publisher exist

5. List of indicators
186
it is often difficult to determine the access fee for the individual journal. In that
case the total access fee (including cross access) has to be divided by the number
of journals in the package (including the journals to be accessed because of
cross access within the consortium). As long as e-books are mainly sold in pack-
ages it seems reasonable to apply the indicator on the basis of the package as a
whole.
If the costs of an individual electronic resource cannot be clearly established,
because it has been acquired by bulk purchase or in a package with a print ver-
sion, this indicator will not be applicable for that resource.
The collection of usage statistics may be time-consuming because publishers
and database suppliers provide separate statistics of downloads for each product.
For the usability of the data COUNTER compliancy is a necessity.
With more and more libraries making use of Electronic Resource Manage-
ment Systems, where both cost and usage data are integrated, the data collection
process will become easier in the future.
Interpretation and use of results
In general low cost per download is considered a good cost-benefit relation for
an electronic resource. It is for the library to decide what it regards as a good
cost-benefit relation – there are no generally applicable standards. For a full text
database of medieval manuscripts a price of 2,45 € per download may be ac-
ceptable while 1,95 € per download may be deemed high for downloads from a
widely used bibliographic database in the STM sector.
The indicator will be affected by the users’ browser cache configurations and
use of proxy servers. The real number of downloads could be higher than the
numbers shown by server statistics.
If the cost per session seems too high, the library could either promote the
use of the electronic resource, e.g. in user training, or cancel it. Especially in the
case of electronic journals, a subscription could be replaced by document deliv-
ery, with the library covering the delivery costs.
Before cancelling a database or journal with high cost per session, the library
should assess whether the resource is of crucial importance for a comparatively
small user group. User surveys or interviews could help to determine the impor-
tance of an electronic resource beyond the confines of pure usage statistics.

C.6 Cost per download
187
The indicator will be useful for improving the library’s cost-efficiency in re-
gard to its electronic collection. It can be used for justifying the library’s expen-
diture and for budget appliances.
Examples and further reading
The indicator was introduced in the project EQUINOX in the form “Cost per
document or entry (record) viewed for each electronic library service” (EQUI-
NOX, 2000).
Being confined to single resources it is not surprising that the indicator is not
used in the framework of national library statistics. Many libraries use it, how-
ever, to prove the cost-efficiency of their electronic resources. In the context of
the transition from print to electronic journal collections cost per use data have
been analysed and found to “hold tremendous potential for libraries and library
consortia to increasingly employ reliable cost and use data to support collection
development and management decisions.” (Franklin, 2004)
At Drexel University Library in Philadelphia detailed usage statistics of both
print and electronic journal use were collected (Montgomery and King, 2002).
For electronic journals subscriptions the average cost per download amounted to
1,40 $ with considerable differences between individual subscriptions (3,20 $),
publisher’s packages (2,25 $), aggregator journals (1,35 $) and full text database
journals (0,40 $). A similar result of 1,64 $ per download was given for the Uni-
versity of Virginia (Franklin, 2004).
The medical branch library of the University Library in Münster conducted a
similar study (Obst, 2003). The cost per download for electronic journals turned
out to be 3,47 €, producing evidence for great difference between various pub-
lishers between 15,10 € (Academic Press) and 0,31 € (HighWire).
At the University of Connecticut as at many libraries of other universities the
indicator is used – on an annul basis - as decision-making tool in collection de-
velopment (Franklin, 2004). Expensive databases are compared in regard to their
cost-efficiency. In 2003 the cost per download ranged from 0,37 $ for WorldCat
to 2,17 $ for Web of Science with FirstSearch (0,47 $) and JStor (0,62 $) in
between.
________________________________________________________________
Equinox. Library performance measurement and quality management system (2000),
available at: http://equinox.dcu.ie/index.html

5. List of indicators
188
Franklin, B. (2004), Managing the electronic collection with cost per use data, World Library
and Information Congress: 70th IFLA General Conference and Council, 22-27 August
2004, Buenos Aires, available at: http://www.ifla.org/IV/ifla70/papers/098e-Franklin.pdf
Montgomery, C. H. and King, D.W. (2002) Comparing library and user related costs of print
and electronic journal collections: a first step towards a comprehensive analysis, D-Lib
Magazine 8,10, available at:
http://www.dlib.org/dlib/october02/montgomery/10montgomery.html
Obst, O., (2003), Patterns and cost of printed and online journal usage, Health information
and libraries journal, 20, pp. 22 - 32

C.7 Acquisition speed
189
C.7 Acquisition speed
Background
New publications – in whatever format – are of high interest for users, especially
for researchers who want to be up-to-date in their subject. It will therefore be
important for them that newly published documents are acquired by the library
as quickly as possible.
The speed of acquisition has two aspects:
• The library’s promptness to react on the publication of a document
• The vendor’s quickness in delivering the item
The library can influence the speed of ordering a document by quick reaction on
publication announcements, but is at the mercy of the vendors in respect to the
timely delivery of a document as soon as it is published. This indicator is re-
stricted to the second aspect, the delivery speed of vendors. Besides pricing
conditions and the correct fulfilment of orders, delivery speed is one of the most
important criteria in the dealings between libraries and their suppliers. In a ques-
tionnaire to community colleges in 1990 that asked for top criteria for choosing
vendors, speed of delivery ranked fourth, after accuracy of order fulfilment,
discounts and customer service (Alessi, 1992).
Definition of the indicator
The median number of days between the date the library orders a document and
the date the document is received in the library.
Documents ordered before publication are excluded, as the time elapsed be-
tween ordering and actual publication of the document cannot be seen as short-
coming of the vendor.
Days are counted in working days, not calendar days.
Aims of the indicator
The indicator assesses whether the library has chosen vendors with efficient
workflows and whether users can expect speedy availability of new titles.
The indicator is relevant for all libraries. It will be especially useful for measur-
ing the acquisition speed of monographs, but can be applied to different types of

5. List of indicators
190
documents. Useful results can be expected from a comparison of vendors among
different libraries.
Methods
1. The library chooses a sample period. For each document that is received
by the library within this period the day of ordering, the day of receipt and
the supplier’s name are recorded, either from the computerized acquisition
system or from the order forms and similar records. It should be made cer-
tain that there is no delay between documents arriving in the library’s mail
room and in the acquisitions or processing department.
Documents acquired by gift, exchange or legal deposit are excluded.
Documents ordered before publication should also be excluded, but this
may prove difficult. If the source for the ordered title was a pre-
announcement or a CIP (cataloguing in publication) bibliography, such ti-
tles can be excluded from the sample. Another way would be to mark
documents not yet published with a code when ordering. This would also
be useful for differentiating within overdue orders when claiming. In
many cases it will be necessary to identify titles not yet published indi-
vidually by consulting online vendors or national catalogue databases.
For each vendor the titles are ranked according to the number of working
days that elapsed between ordering and delivery. The median acquisition
speed is the number of days that is in the middle of the ranking list.
In order to facilitate comparisons between different vendors or an individ-
ual vendor’s speed over time it is useful to separate domestic from foreign
orders. It is also necessary to keep normal acquisition procedures apart
from special procedures such as rush orders for documents already re-
quested by users or orders for antiquarian titles that might take a longer
delivery time.
2. A simpler method uses the claiming procedures of the automated library
system. When the library orders a title, it will usually fix the time period
until a claim is sent out. Such periods are for instance: 20 days for rush
orders, 60 days for domestic orders, 90 days for foreign orders.
For a sample time, the library fixes for all orders a shorter claiming pe-
riod, e.g. 15 days. The claims produced by the system after that period
will show what percentage of orders was not delivered within that period.
C.7 Acquisition speed
191
Interpretation and use of results
According to the type of acquired material (domestic/foreign/antiquarian) and
the acquisition procedure (express/normal delivery) the performance of each
vendor is quantified. The lower the number of days between order and receipt
the better.
If the acquisition speed seems inadequate, the library could make up time by
using online ordering. The time between order and receipt of an already pub-
lished book can also be reduced by an approval plan, since it saves the time for
ordering procedures.
The library may also consider changing vendors. Orders that have taken an
especially long completion time should be discussed with the vendor in search
of reasons for the delay. This may help the vendor to become aware of ineffi-
cient handling or shipment procedures.
The library may have to revise its procedures for claiming overdue books. In
the case of already published documents a change to shorter claiming intervals
may reduce the days it takes to deliver a document.
Comparisons on the basis of the median acquisition speed facilitate the
choice of vendors delivering similar material, although speed is but one criterion
for vendor quality.
Examples and further reading
Acquisition speed has increased visibly during the last years because of faster
ordering procedures and improved handling procedures between suppliers and
publishers.
In the project EQLIPSE (EQLIPSE, 1995-1997) that tested data collection
for a large set of performance indicators, acquisition speed in three participating
libraries varied from 24 days to 97 days.
In an evaluation of the Copenhagen Business School Library “supply times
for receipt of new materials” were measured (Report on the 1992 evaluation
study, 1993, p.89). The median supply time for all books in 1992 was 56 days,
for Danish books 21 days and for foreign books 65 days.
The Swedish benchmarking project 2001 – 2004 (Edgren et al., 2005, pp.34-
35) used a combined indicator for acquisition and processing speed, but measur-
ing each issue separately. The median acquisition speed in 2004 for academic
libraries varied from 7 days to 23 days, with an average of 12,1 days. For public
libraries the time varied from 6 to 53 days, with an average of 28,8 days.

5. List of indicators
192
In 2005 the Appalachian State University conducted a study comparing Ama-
zon.com with other library suppliers (Orkiszewski, 2005). While the main crite-
ria were availability and pricing, speed of delivery was also analysed, ranging
from two weeks for Amazon to an average of three weeks for all vendors and
four weeks for the library’s primary book vendor.
An overview of the literature on vendor assessment is given by Vargas
(2006).
________________________________________________________________
Alessi, D. (1992), Vendor selection, vendor collection, or vendor defection, Journal of
Library Administration 16,3, pp. 117-130
Edgren, J. et.al. (2005), Quality handbook, performance indicators for library activities, The
Swedish Library Association’s Special Interest Group for Quality Management and
Statistics , available at:
http://www.biblioteksforeningen.org/sg/kvalitet/handbook_eng.html
EQLIPSE. Evaluation and quality in library performance: system for Europe, 1995-1997,
available at: http://www.cerlim.ac.uk/projects/eqlipse/
Orkiszewski, P. (2005), A comparative study of Amazon.com as a library book and media
vendor, Library Resources & Technical Services 49,3, pp. 204-209.
Report on the 1992 evaluation study of the Copenhagen Business School Library (1993),
Copenhagen Business School Library
Vargas, S. C. (2006), Library vendor assessment literature review, BiblioTech, the online
magazine of the Library Student Organisation (LSO) of the University of Arizona, Tucson,
USA 4/1, available at:
http://www.sir.arizona.edu/lso/bibliotech/2006sep_vol4_no1/Vargas.html

C.8 Media processing speed
193
C.8 Media processing speed
Background
The activities needed for processing (acquiring and cataloguing) new media for
the collection constitute one of the main background services of the library.
Media processing involves several steps:
• Accession: all processes after the item has arrived at the library and it has
been decided to add it to the collections (accession list, accounting proce-
dures)
• Cataloguing (bibliographic description)
• Classification and/or subject indexing
• Jacketing or binding (if applicable)
• Physical processing (stamping, labelling, bar-coding, applying a magnetic
strip)
• Shelving
In a French survey in university libraries in 1989-1991, cataloguing (including
classification and/or subject cataloguing) amounted to 51 % of the total time for
processing; acquisition and physical processing each amounted to about 25 %
(Deriez and Le Barbanchon, 1993).
In many libraries acquisition and cataloguing processes are now combined in
a media processing department and will be carried out in one.
As media processing is a regular process occurring in all libraries, it can be
easily used as example for the efficiency of processes in the library.
Definition of the indicator
The median number of days between the date a document arrives at the library
and the date it is available for use, usually on the shelves or on the server.
Days are counted in working days, not calendar days.
Processing procedures include acquisition, descriptive cataloguing, subject
indexing, if applicable binding, physical processing, and shelving.
Aims of the indicator
The indicator assesses whether the processing procedures are efficiently organ-
ized, and what priority the library gives to the speed of services.

5. List of indicators
194
The indicator is relevant for all libraries. It will be especially useful for
measuring the processing speed of monographs, but can be applied to different
types of documents.
Comparisons between libraries are possible, if differences in the level of
automation, in descriptive cataloguing and subject indexing, in the percentage of
copy cataloguing, in binding policies etc. are taken into account.
Method
The library chooses a sampling time with normal activity. For all incoming
items the date of the following processes - if applicable - is noted on a manual
recording sheet that accompanies the item through the processing:
• Arrival
• End of accession
• End of cataloguing/adding metadata
• End of classification and/or subject indexing
• End of binding
• End of physical processing (stamping, labelling, bar-coding, applying a
magnetic strip)
• Shelving or installation on the server
For items received as gift or in exchange, it must be decided that the item will be
added to the collection before processing starts.
For electronic documents, the end of processing will either coincide with
cataloguing, when the URL for a document on an external server has been
added, or with the installation of the document on the library’s server and the
URL being added in the catalogue.
Each staff member processing the item is asked to write down the exact date
after handling the document. If all data are available via the automated system,
no manual recording sheet will be needed.
In libraries with online cataloguing procedures, the document will be earlier
in the catalogue than on the shelf. But as shelving is necessary for the availabi-
lity of the document, the date of shelving determines the end of processing.
For each item, calculate the number of working days between arrival and
availability for use. Rank the items according to the number of days elapsed.
The median processing speed is the number of days that is in the middle of the
ranking list.
A more detailed view of the processing speed is possible, if processing times
are shown in cumulative distribution, e.g.:

C.8 Media processing speed
195
Media processing speed %
< 1 day 5 1 – 2 days 102 – 5 days 305 - 10 days 3010 – 20 days 20> 20 days 5
If processing speed is evaluated in cumulative distribution, transactions with
especially long completion time could be followed up in order to find reasons
for the delay, e.g. backlogs or inefficient procedures.
Apart from the usual way a document is processed, there may be special pro-
cedures for special document types that should be analyzed separately:
• Rush processing for items already requested by users
• Electronic media
• Legal deposit
• Special collections
It might also be interesting to assess media processing speed for each subject
collection.
Items sent to a bindery before the physical processing should also be evalu-
ated separately, as outside binding may considerably lengthen the processing
time.
Interpretation and use of results
Processing speed will be influenced by the type of materials processed. Process-
ing of rare material will take longer as special procedures have to be followed.
If there is a division of labour for certain types of documents, documents in
foreign languages or in a special format may have to wait for the staff person
with good knowledge of that language or that format.
The speed will also be influenced by peak times for incoming documents,
e.g. end of the year, or by absence times of staff.
When a manual recording sheet is used, this may influence the processing
speed, as staff might try to keep processing time for these items low.
In most libraries, priorities will be given to certain groups of documents, e.g.
patron requested items or items for which high use is expected. Gift or exchange
documents are often given lower priority. Another issue for priorities is that
“human nature may succumb to the temptation to do the easier items first” (Hol-
ley, 1984, p.346).

5. List of indicators
196
If the processing speed is too low, the following measures could be taken:
• Streamlining workflows
• Quick forwarding of items from one department involved in the process-
ing to the next
• Using as much automation of procedures as possible
• Using more copy cataloguing
• Integrating acquisition and cataloguing activities
• Adding more staff in peak times
Staff motivation will be important for speedy procedures, and backlogs can be
demotivating. It has proved efficient to eliminate backlogs by assigning addi-
tional staff for a short period and then trying to keep up short processing times.
Examples and further reading
Processing speed has increased visibly during the last years due to higher auto-
mation of processes and higher availability of bibliographical data for copy cata-
loguing.
In the project EQLIPSE (EQLIPSE, 1995-1997) that tested data collection
for a large set of performance indicators, document processing in three partici-
pating libraries varied from 17 days to 28 days.
The public library in Münster, Germany, measured processing time before
and after reorganizing its processes (Rosenberger, 2001). In 1999, before the
reorganisation, the average processing time was 43 days; in 2000, after the reor-
ganisation, it was 26 days.
A study in Polish academic libraries used the indicator “time of document
acquisition and processing in days” (Derfert-Wolf, Górski and Marcinek, 2005).
The median result for all academic libraries in 2002 and 2003 was 14 days.
The Netherlands university libraries’ benchmarking project counted in 2003
(UKB, 2003):
Books available for use days
50 % within … from 3 to 32 80 % within… from 5 to 67 90 % within… from 14 to 109
The Swedish benchmarking project (Edgren et al., 2005) used a combined indi-
cator for acquisition and processing speed, but measuring each issue separately.
The median processing speed for 2004 varied from 1 day to 28 days,

C.8 Media processing speed
197
The service standards of Headingley & Civic Quarter Libraries at Leeds Met-
ropolitan University promise that “85 % of material requiring catalogu-
ing/processing will be sent for shelving within 8 weeks of being unpacked” and
that “we will make all new electronic information sources available to users
within 1 working week of the subscription being activated” (Headingley & Civic
Quarter Libraries, 2006)
In an evaluation of the Copenhagen Business School Library, the goal was
that the maximal processing time for new books should be 2 weeks, and that
external binding of books and periodicals should not take more than one month
(Report on the 1992 evaluation study, 1993, p.89). Processing time showed a
mean of 6 days, while binding time came up to 6 weeks.
Columbus Metropolitan Library, Ohio, had an average processing time (from
receipt to the distribution to branch libraries) of 17 days when they started estab-
lishing productivity standards and looking at their workflow in 2003 (Hatcher,
2006). In 2004, they reached a “turnaround time” of 1.5 days, and since 2005, of
48 hours. Weekends and closed days are ignored in the calculation.
A survey in Carnegie Mellon University Libraries in 2001 monitored “the
amount of time required to catalog materials from receipt in the Acquisitions
Department to shelf-ready status” (Hurlbert and Dujmic, 2004). 75 % of all
materials and 72 % of monographs were catalogued within 7 weeks. As acquisi-
tions and cataloguing departments were still separate, the critical time was the
period between receipt and cataloguing, as cataloguing staff tended to leave
items with difficult cataloguing issues in the backlog. Gifts proved to have less
priority in cataloguing and thus had a longer processing time.
Apart from the processing speed, libraries may also look at the efficiency of
the processing staff (see Indicator C.9 “Employee productivity in media process-
ing”).
________________________________________________________________
Derfert-Wolf, L., Górski, M. and Marcinek, M. (2005), Quality of academic libraries –
funding bodies, librarians and users, World Library and Information Congress, 71th IFLA
General Conference and Council, available at: http://www.ifla.org/IV/ifla71/papers/080e-
Derfert-Wolf.pdf#search=%22Derfert-Wolf%22
Deriez, R. and Le Barbanchon, E. (1993), Le circuit du livre dans les bibliothèques
universitaires: évaluation des tâches, Bulletin des Bibliothèques de France 38,2, pp. 50 –
55

5. List of indicators
198
Edgren, J. et.al. (2005), Quality handbook, performance indicators for library activities, The
Swedish Library Association’s Special Interest Group for Quality Management and
Statistics , available at:
http://www.biblioteksforeningen.org/sg/kvalitet/handbook_eng.html
EQLIPSE. Evaluation and quality in library performance: system for Europe (1995-1997),
available at: http://www.cerlim.ac.uk/projects/eqlipse/
Hatcher, M. (2006), On the shelf in 24 hours, Library Journal September 15, pp. 30 - 31
Headingley & Civic Quarter Libraries (2006), Service standards 2005-06, available at:
http://www.lmu.ac.uk/lis/lss/commitment/service_stds_cq-hy_2006-07.pdf
Holley, R. P. (1984), Priority as a factor in technical processing, Journal of Academic
Librarianship 9,6, pp. 345-348
Hurlbert, T. and Dujmic, L.L. (2004), Factors affecting cataloging time: an in-house survey,
Technical Services Quarterly 22,2, pp. 1 - 14
Report on the 1992 evaluation study of the Copenhagen Business School Library (1993),
Copenhagen Business School Library
Rosenberger, B. (2001), “Der Kunde kommt schneller an neue Medien!”, Ermittlung der
Mediendurchlaufzeiten an der Stadtbücherei Münster, BuB, Forum Bibliothek und
Information 53,8, pp. 471 - 477
UKB (2003), Benchmarking, Samenwerkingsverband van de Nederlandse
universiteitsbibliotheken en de Koninklijke Bibliotheek, results only available to
participants

C.9 Employee productivity in media processing
199
C.9 Employee productivity in media processing
Background
Assessing employee productivity is an important issue when evaluating the effi-
ciency of a library’s organisation. Media processing is taken as example for
employee productivity, as the processing activities are necessary in all libraries,
and the results can therefore be compared between libraries.
The quality criteria for media processing are the speed and accuracy of proc-
essing. The efficiency of media processing can be measured by comparing the
output of one FTE (full-time equivalent) staff over time and with results in other
libraries. The results will be especially interesting for the funding institution, as
the question of how much staff is necessary for the library’s tasks is one that is
always debated between libraries and their authorities.
Libraries have always been reluctant to assess staff performance, and they are
still more reluctant to communicate such data. But staff productivity is a crucial
issue for cost-effectiveness of libraries, as staff costs will often represent the
main part of all costs. When assessing staff productivity it will be advisable to
include staff representatives and to ensure that the evaluation does not consider
the individual person, but the overall productivity in specified services.
Definition of the indicator
The average number of acquired media (print and electronic documents) pro-
cessed per employee in a certain period (usually one year).
Media acquired by gift, exchange or legal deposit are included.
Staff is calculated as FTE (full-time equivalent). Figures for part-time em-
ployees are converted to the equivalent number of full-time workers.
Example: If out of three persons employed as librarians, one works quarter-time, one works half-time, and one works full-time, then the FTE of these three persons would be 0,25+0,5+1,0=1,75 librarians (FTE).
Processing in the sense of this indicator includes both acquisition and cata-
loguing. Classification and/or subject cataloguing are excluded, as the rules and
procedures in libraries are too different to render comparison possible.

5. List of indicators
200
The number of acquired media is divided by the number of employees (FTE)
involved in media processing (acquisition and descriptive cataloguing, no retro-
spective cataloguing).
Aims of the indicator
The indicator demonstrates overall employee productivity by the example of
media processing.
The indicator is useful for comparisons over time. Comparison to other li-
braries is possible, if differences in the type and language of acquired media and
in the procedures of media processing are taken into account.
The indicator is not applicable if the processing or some part of the process-
ing has been outsourced.
Method
Count the number of processed media during a specified period, usually a year,
including all formats. For electronic periodicals and newspapers, an annual sub-
scription is counted as one document acquired.
Calculate the number of staff in FTE that are involved in the acquisition and
descriptive cataloguing of acquired media. Retrospective cataloguing and classi-
fication/subject cataloguing are excluded. The count includes all staff, whether
permanent or temporary. Because staff members are often involved in several
tasks, the time they spend on acquisition and cataloguing should be logged dur-
ing a representative period. If time logging is not possible, the proportion of
time spent on acquisition and cataloguing can, instead, be estimated.
The number of processed media is divided by the number of FTE staff in-
volved in acquisition and cataloguing.
Interpretation and use of results
A high number of processed media per FTE person will be considered as good.
The indicator will be greatly influenced by the type and language of the ac-
quired media. Processing of non-commercial publications will probably take
longer, as copy cataloguing data might not be available. Cataloguing of publica-
tions in foreign languages may offer more problems than cataloguing of publica-
tions in the national language.
The indicator will also be influenced by the procedures of media processing,
the degree of automation, and the qualification and expertise of staff.

C.9 Employee productivity in media processing
201
If the employee productivity seems too low compared to other libraries, the
library might
• revise workflows,
• use more automated procedures,
• intensify staff training,
• try to increase the percentage of copy cataloguing.
Examples and further reading
The indicator was introduced in a German controlling project for academic li-
braries (Ceynowa and Coners, 2002) and adopted by the German benchmarking
project BIX for academic libraries (BIX. Der Bibliotheksindex). In 2005, BIX
showed the following results (BIX, 2006):
Employee productivity in media processing mean maximum minimum
Universities of applied sciences 1.996 4.425 934
Universities: One-tier systems 2.497 4.913 1.219
Universities: Two-tier systems (only the central library considered)
2.972 5.759 797
The indicator is also used in the benchmarking project of the Netherlands uni-
versity libraries, but restricted to books (Laeven and Smit, 2003). The results for
2004 showed an average of 1.017 titles of books processed per FTE staff (UKB,
2004).
________________________________________________________________
BIX. Der Bibliotheksindex, available at: http://www.bix-bibliotheksindex.de/
BIX. Der Bibliotheksindex (2006), B.I.T. online Sonderheft 2006
Ceynowa, K. and Coners, A. (2002), Balanced Scorecard für wissenschaftliche Bibliotheken,
Zeitschrift für Bibliohekswesen und Bibliographie, Sonderheft 82, Klostermann, Frankfurt
a.M.
Laeven, H. and Smit, A. (2003), A project to benchmark university libraries in the
Netherlands, Library Management 24, 6/7, pp. 291-304
UKB (2004), Benchmarking, Samenwerkingsverband van de Nederlandse
universiteitsbibliotheken en de Koninklijke Bibliotheek, results only available to
participants

5. List of indicators
202
C.10 Lending speed
Background
Libraries store their collections either in open access, where users can browse
and collect items for reading or borrowing, or in closed stacks, where users have
no access. For materials in closed stacks users must consult the catalogue to find
items of interest and must fill out a lending request. The kind of storage is influ-
enced by building conditions and by the materials in the collection. Rare and old
materials will in most cases be stored in closed magazines. Generally, open
access storage is preferable not only for users, but also for the library, as users
can deliberately select items, and the library will save the workload of retrieving
the items. Open access, even if the documents are not shelved in systematic
order, but in accession order, will need more space for users’ browsing activi-
ties.
But even if a library has the possibility of offering large parts of its collection
– preferably the most-used parts – in open access, in most cases certain parts of
the collection have to be stored in closed stacks, due to lack of space or to the
kind of materials stored.
Therefore, quick access to items in closed stacks is still an important issue for
many libraries. Delivery speed will be even more important, if collections are
housed in off-site storage.
Definition of the indicator
The median time between the moment a user requests an item out of closed
stacks and the moment the item is available at the issue desk. The time is
counted in hours and minutes, considering only the working hours of the re-
trieval services and the lending department.
Aims of the indicator
The indicator assesses whether the library’s retrieval and lending services are
efficiently organized.
The indicator is relevant for all libraries with at least part of their collection
in closed stacks.

C.10 Lending speed
203
Comparison between libraries is possible if local differences in regard to
means of transportation, construction of the library building, and especially
remote storage are taken into account.
Method
The library chooses a sampling time with normal activity. For a random sample
of documents stored in closed stacks and requested by a user note the date and
time of the request and the date and time of the item being available at the issue
desk. Requests for items in off-site storage should be evaluated separately.
In most cases these data will be available via the library’s circulation system. If
the system does not deliver the information, the following data are noted on a
manual recording sheet:
• Date and time a request is received (in any format)
• Date and time the requested item is available at the issue desk
Failed requests because of incorrect shelving or other reasons are left out of the
calculation.
The time needed for each delivery is calculated by counting only the business
hours of the retrieval services and the lending department on the sampling days.
The lending delivery time is then calculated by ranking the requests in as-
cending order by the retrieval time. The median time is the value of the request
in the middle of the ranking list.
A more detailed view of the delivery speed is possible, if delivery times are
shown in cumulative distribution, e.g.:
Delivery time %
0 – 30 minutes 2030 minutes – 1 hour 351 – 2 hours 30> 2 hours 15
If delivery times are evaluated in cumulative distribution, transactions with es-
pecially long completion time could be followed up in order to find reasons for
the delay. In some cases, this may be due to wrong citations, e.g. when a re-
quested article cannot be found in the journal issue cited and the library has to
verify the citation.

5. List of indicators
204
Interpretation and use of results
A short delivery time will be considered as good.
Delivery speed will be influenced by the number of orders at peak times and
by the storage conditions. If the requested item has to be fetched from remote
storage, transportation time will be added to the total delivery time.
The indicator is also influenced by incorrect shelving, by an insufficient
number of stack attendants, especially in peak times, and by staff competences,
e.g. stack attendants’ knowledge about the shelving system, locations of special
collections etc.
If the delivery speed is too slow, the following measures could be taken:
• Examining workflows
• Using as much automation of procedures as possible
• Training staff in issues of the shelving system, storage problems etc.
• A higher number of stack attendants during peak times
• A more transparent shelf-location system
• Regular shelf-reading procedures (see Indicator C.13 “Shelving accu-
racy”)
• Quick reshelving of returned items
Examples and further reading
The indicator was described early (Dougherty, 1973; Orr and Schless, 1972).
Though probably many libraries actually measure the speed of their retrieval
services, results are rarely published.
In the project EQLIPSE (EQLIPSE, 1995-1997) that tested data collection
for a large set of performance indicators, “median time of document retrieval
from closed stacks” was assessed by two participating libraries. The results dif-
fered considerably: 64 minutes and 3 days.
Some libraries have defined goals for delivery speed in their strategy. The
National Library of Australia promises “that 60% of items requested from onsite
storage areas will be delivered within 25 minutes, material stored in more distant
locations onsite may take up to 45 minutes to deliver” (National Library of Aus-
tralia, 2004).
The National Library of New Zealand reports for the period 2003-2004 that
90% of author/title requests for collection items were “completed within 20
minutes of request or advertised batch times for onsite use and within 48 hour
for off-site use” (National Library of New Zealand, 2004, p.50).

C.10 Lending speed
205
Many libraries name a time when the requested item should normally be avail-
able to users.
The public library in Vienna, Austria, states that requests within opening
times will be available after 45 minutes, while requests outside opening times
will be available from 9.00 in the morning on the following day (Wienbibliothek
im Rathaus, FAQ).
There are several libraries that name a time limit for retrieving requested
items from remote storage. The University of Birmingham Library uses a per-
formance indicator “Recovery from store/another site: time to recover” with the
goal “90 % within 1 working day” (Key performance indicators, 2006).
________________________________________________________________
Dougherty, R.M. (1973), The evaluation of campus library document delivery service,
College and Research Libraries 34, pp. 29 – 32
EQLIPSE. Evaluation and quality in library performance: system for Europe (1995-1997),
available at: http://www.cerlim.ac.uk/projects/eqlipse/
Key performance indicators (2006), University of Birmingham Information Services,
available at: http://www.isquality.bham.ac.uk/kpi.htm
National Library of Australia (2004), Reader services policy, available at:
http://www.nla.gov.au/policy/readerservices.html
National Library of New Zealand (2004), Statement of intent 2003/04, available at:
http://www.natlib.govt.nz/en/about/2pubsoi03.html
Orr, R.H. and Schless, A. P. (1972), Document delivery capabilities of major biomedical
libraries in 1968: results of a national survey employing standardized tests, Bulletin of the
Medical Library Association 60, pp. 382 – 422, available at:
http://www.pubmedcentral.nih.gov/picrender.fcgi?artid=197715&blobtype=pdf
Wienbibliothek im Rathaus, FAQ, available at: www.wienbibliothek.at

5. List of indicators
206
C.11 Interlibrary loan speed
Background
Interlibrary loan (ILL) and document delivery by libraries have not become less
important in times of growing electronic resources. Some surveys show that ILL
and document delivery transactions have decreased during the last years (Good-
ier and Dean, 2004; Brine, 2006). This may be due to a higher number of elec-
tronic resources being available free on the web, but also to – temporarily - in-
creasing numbers of electronic journal subscriptions in libraries. On the other
side, decreasing or stagnating library budgets cause journal cancellations. Li-
braries evaluating their journal subscriptions on a cost per use basis have partly
replaced subscriptions by covering the ILL and document delivery costs for their
users. This may again result in a higher number of ILL and document delivery
requests for materials not available via the local library.
Data about the quantity and quality of ILL and document delivery have al-
ways been collected widely. ILL data have frequently been used for managing
the collection:
• Identifying gaps in the collection
• Cancelling or ordering journals
• Finding a balance between giving and taking in library cooperation
Evaluating the quality of ILL and document delivery services can focus on
different issues. “There is a general agreement that fill rate, turnaround time,
cost and user satisfaction are the four primary criteria for evaluating ILL and
document supply” (Stein, 2001, p.11).
The difficulty for measuring the performance of ILL and document delivery
services is that only part of the performance can be influenced by the individual
library. If a requesting library measures either the fill rate of requests (the num-
ber of successfully completed requests) or the “turnaround time” (the time be-
tween the initiation and the completion of a request), it will for the most part be
measuring the performance of other institutions, namely the supplying libraries
and – if applicable – the transport system (postal service or library courier ser-
vices).
When evaluating the speed of delivery, a number of projects have assessed
the total supply time (“turnaround time”) for an ILL or document delivery re-
quest, starting from the requesting library. This would include (Line, 1991):

C.11 Interlibrary loan speed
207
1. Request processing by the borrowing library
2. Request transmission
3. Processing by the supplying library (retrieval from shelves, copying etc.)
4. Supply transmission
5. Handling of supplied item in the requesting library
Today, self-initiated user requests may go directly to a supplying library. The
location of the requested item has either been verified in the online catalogues,
or link resolvers lead from a citation in a database to a catalogue search and to
an ILL or document delivery request. Request transmission will not be a time
factor in online ILL or document delivery. The most important issue for the
delivery speed will be the time taken in the delivering library. Therefore, this
indicator measures the speed and quality of processes in the delivering library.
Definition of the indicator
The average time needed for completing an interlibrary loan or document deliv-
ery transaction in the lending/delivering library. The time is counted in hours,
considering only the working hours of the interlibrary loan department.
The transaction starts when the library receives a request and ends when ei-
ther the item is despatched to the requesting library/user, or when the li-
brary/user is notified about delivery not being possible (item unavailable for
loan, missing, at the bindery, etc.), if the system did not notify this. The end is
not the time when the requesting party receives the item.
Transactions include returnable items as well as non-returnable items (cop-
ies) and all methods of transmission (e.g. postal delivery, fax, electronic deliv-
ery).
The indicator includes mediated and end-user initiated interlibrary loan and
document delivery, delivery from libraries to other libraries and delivery directly
to individual users.
Document delivery from commercial suppliers is excluded.
Aims of the indicator
The indicator assesses whether the delivering services are efficiently organized,
and what priority the library gives to its role in interlibrary cooperation.
The indicator does not intend to measure the success or fill rate of requests.
The indicator is relevant for all libraries participating in interlibrary loan and
document delivery services.

5. List of indicators
208
Comparison between delivering libraries is possible, if the different methods
of transmission are taken into account.
Method
The library chooses a sampling time with normal activity. All incoming requests
are noted on a manual recording sheet as to:
• Date and time a request is received (in any format)
• Date and time the requested item is forwarded to the requesting li-
brary/user
• Or: Date and time the library/user is notified of the non-availability
If the library’s system is able to record all that information, no manual re-
cording will be needed.
Requests for material that is not included in the library’s collection should be
deleted from the sample.
The hours needed for completing each transaction are calculated by counting
only the business hours of the ILL department on the specific day/s.
The hours for completing all transactions in the sample are summed up and
divided by the number of transactions in the sample.
A more detailed view of the delivery speed is possible, if delivery times are
shown in cumulative distribution, e.g.:
Completion time %
0 – 2 hours 10
2 – 4 hours 12
4 – 6 hours 30
6 – 10 hours 25
10 – 15 hours 12
> 15 hours 11
Transactions with especially long completion time should be followed up in
order to find reasons for the delay. In many cases, this may be due to wrong
citations, e.g. when a requested article cannot be found in the journal issue cited
and the library has to verify the citation.
Special rush services for urgent requests should be evaluated separately.
Non-availability of a requested item can be due to the item being on loan,
misshelved, in in-house use, at the bindery, or not available for external loan.

C.11 Interlibrary loan speed
209
Interpretation and use of results
Delivery speed will be influenced by the type of material requested. Delivery of
an article from an electronic journal will be quickest, if copyright laws and the
library’s treaty with the publisher permit electronic delivery. Copyright issues
hindering electronic delivery from electronic resources in the library and de-
manding instead copy and fax delivery will considerably influence the delivery
speed.
All activities like fetching materials from the shelves, copying and sending
by fax or normal mail will naturally prolong the transaction. Requests for copies
out of rare material will probably take longer, as special procedures have to be
followed. The speed will also be influenced by storage conditions. If the re-
quested item has to be fetched from remote storage, transportation time will be
added to the total delivery time.
If the library wants to find more details about possible delays in the delivery,
the transaction could be split up into several processes (Measuring the perform-
ance of document supply systems, 1987):
• Time between receipt of a request and the handling of it
• Time spent searching the catalogue (if no shelf mark was given in the re-
quest)
• Time involved in actual retrieval of the item
• Time spent copying, microfilming or digitizing in cases where the original
is not sent
• Time spent packing the item
• Time between packing the item and its dispatch
Thus, possible backlogs or lengthy procedures in different departments can
be identified.
The indicator is influenced by insufficient staffing for the lending activities,
especially in peak times, and by staff competences, e.g. stack attendants’ knowl-
edge about the shelf-location system, locations of special collections etc.
Speed must not be the main criterion for user satisfaction with ILL and
document delivery services, at least not for all researchers. While users in natu-
ral sciences and engineering generally want their material very quickly, users in
human and social sciences might deem the reliability of delivery and the quality
of the copies more important. Therefore, delivery speed could also be split up as
to subjects.
For all users, costs will be a very important issue, and they may be content to
wait for some days, if the fees they have to pay are low. Maurice Line proposes

5. List of indicators
210
that “timeliness”, a reasonable average speed of supply, might be the best qual-
ity issue (Line, 1991, p.7).
In order to decide whether the delivery speed coincides with users’ wishes,
user satisfaction with ILL and document delivery could be assessed by a survey
in the requesting library.
If the delivery times are too long, the following measures could be taken:
• Updating records in the online catalogue (union catalogue) to make sure
that for items that are missing or not available for loan this information
appears in the catalogue
• Streamlining workflows
• Using as much automation of procedures as possible
• Training staff in issues of the shelf-location system, storage problems etc.
Examples and further reading
A survey of the literature on performance measurement for ILL and document
delivery from 1986 to 1998 is given by Stein (2001).
Most libraries assessing the ILL and document delivery speed have measured
the total turnaround time, from the time the user makes the request to the time
the user is notified that either the requested item has arrived or is not available.
Only a few projects show a breakdown of the delivery time into stages so that
the supplying library’s delivery time can be identified.
Turnaround time has been measured as well in working days as in calendar
days.
An Australian benchmarking study in 2001 in 97 libraries of all types found
an average turnaround time of 11.5 calendar days (National Resource Sharing
Working Group, 2001), of which 6.3 days were the average time from the date
the request was sent by the requesting library to the date the material or a nega-
tive response was received.
A study in the Nordic countries in 2001 found a turnaround time of 10.4 cal-
endar days, of which 8.1 days were the average time from the date the request
was sent by the requesting library to the date the material or a negative response
was received (Vattulainen, 2001). Turnaround time was longer for returnables
(books) = 13.0 days than for non-returnables (copies) = 9.8 days.
Several studies of the Association of Research Libraries show the difference
made by the introduction of online procedures in ILL services (Jackson, 2003).
Turnaround time for mediated borrowing dropped by about 50% since the 1996
study.

C.11 Interlibrary loan speed
211
Borrowing turnaround time
1996 2002
Turnaround time
mediated 16.9 days (loans)
14.9 days (copies)
9.29 days (loans)
6.23 days (copies) Turnaround time
user-initiated (loans) -- 2.30 – 8.23 days
In the ARL study of 2001/2002, “turnabout time for lending” was measured, the
time between a library receiving and shipping a request (Assessing ILL/DD
services, 2004). This corresponds to the indicator described above.
Lending turnaround time
Calendar days
User-initiated requests 0.1 – 1.5 days Mediated requests 1.5 days
A study in publicly-funded Tennessee colleges and universities in 1995 with 25
libraries cooperating looked at the different steps in ILL. “Lending turnaround
time” (from the lending library receiving the order to shipping the item) was
about one day (Phillips et al., 1999).
Delivery times were also evaluated for “Impala”, the Belgian electronic
document ordering system for research libraries (van Borm, Corthouts and Phil-
ips, 2000). Turnaround time was split into several segments, of which the seg-
ment “busy to success” includes the time from the moment the delivering library
first looks at the request to the time when the requested item has been set ready
for supply. The results show a growing speed of delivery time.
Busy to success
=< 2 days
%
1994 411995 451996 561997 571998 63
Most studies have not assessed the speed of ILL and document delivery sepa-
rately, but together with other quality measures like fill rate, cost per transaction,
or user satisfaction.

5. List of indicators
212
________________________________________________________________
Assessing ILL/DD services: new cost-effective alternatives, ARL Bimonthly Report 236,
available at: http://www.arl.org/bm~doc/illstudy.pdf
Brine, J. (2006), The history of interlending and document supply in the UK, in Bradford, J.
and Brine, J. (eds.), Interlending and document supply in Britain today, Chandos
Publishing, Oxford
Goodier, R. and Dean, E. (2004), Changing patterns in interlibrary loan and document supply,
Interlending & Document Supply 32, 4, pp. 206-214
Jackson, M. E. (2003), Assessing ILL/DD services study: initial observations, ARL Bimonthly
Report 230/231, available at: http://www.arl.org/bm~doc/illdd.pdf
Line, M. B. (1991), Performance measurement with interlending and document supply
systems, in Gallico, A. (Ed.), Interlending and document supply, proceedings of the
second international conference, held in London, November 1990, British Library,
London, pp. 5-13
Measuring the performance of document supply systems (1987), Prepared by the IFLA
International Office for UAP, Unesco, Paris
National Resource Sharing Working Group (2001), Interlibrary loan and document delivery
benchmarking study, National Library of Australia, available at:
http://www.nla.gov.au/initiatives/nrswg/illdd_rpt.pdf
Phillips, L.L. et al. (1999), Interlibrary loan turnaround time: measuring the component parts,
Journal of Interlibrary Loan, Document Delivery & Information Supply. 9,2, pp. 97-121
Stein, J. (2001), Measuring the performance of ILL and document supply: 1986 to 1998,
Performance Measurement and Metrics 2,1, pp. 11-72
Van Borm, J., Corthouts, J. and Philips, R. (2000), Performance measurement in the Belgian
document ordering and delivery system Impala, Scientometrics 47,2, pp. 207-225
Vattulainen, P. (2001), Nordic study of performance measurement of interlibrary loan and
document delivery services, Nordic University and Research Libraries, available at:
http://www.nrl.fi/nvbf/nordicpm.htm

C.12 Reference fill rate
213
C.12 Reference fill rate
Background
“Reference work is not the most important library service, but it ranks near the
top.”(Høivik 2003, p.2). The importance and the responsibilities of reference
services differ between countries and sometimes between types of libraries.
Libraries in Anglo-American countries have been more liable to consider the
reference desk as a focal point than those in Europe, and while public libraries
generally see it as their duty to directly deliver the information the user asks for,
academic libraries tend to content themselves with showing the way to find that
information.
Though reference service is seen as important, statistics of reference activi-
ties are still scarce. Looking into ten national library statistics (Europe, Australia
and the ARL statistics), only half of them try to count reference transactions;
and if the national statistics prescribe counting reference transactions, only part
of the libraries deliver the data, even if sampling is allowed.
Example: In the German library statistics for academic libraries 2006, only 68 of 224 participating libraries delivered data for reference transactions in their library (DBS. Deutsche Biblio-theksstatistik).
While already the quantity of reference transactions is often unknown, this is
even more the case for the quality of reference answers. Yet the issue of refer-
ence quality has been discussed for decades, and there is a multitude of publica-
tions about reference service in general (Saxton and Richardson, 2002b) or digi-
tal reference (Smith, 2002; Wasik, 2005).
Quality of reference services has different aspects:
• Accuracy (of the information given)
• Utility, usefulness or relevance of the information in the user’s view
• Satisfaction of the user (as well with the answer as with the reference
transaction)
Accuracy, rated by experts, will in most cases be lower than usefulness (rated by
users) and user satisfaction. Users tend to be satisfied if they have learned or
found something they think relevant, not knowing that they may have missed
more important information, or that the information they got was incorrect. User
5. List of indicators
214
satisfaction also depends very much on staff behaviour (empathy, friendliness,
apparent competence).
Reference questions address different topics. They can be subdivided into the
following:
• Factual questions: Users ask for facts or data, e.g.
- the etymological origin of a name,
- the longest river in a country,
- the year of an event.
• Subject (topical) questions: Users ask for advice on sources or reading
about a subject, e.g.
- a sociological method,
- a political question,
- an author.
• Document questions: Users ask for specific documents or their use, e.g.
- a specific article or book,
- the contents of a specific database,
- search options in the online catalogue.
A study of 500 digital questions in Oslo Public Library showed the following
differentiation (Høivik, 2003, p.4):
• subject = 71%
• document = 19%
• factual = 11%
The percentage of factual questions seems to be higher in public libraries than in
academic libraries. “Public libraries offer more direct, fact-based answers, unen-
cumbered by the need to teach the methodology of searching as a primary moti-
vation.” (Meserve, 2006, p.32) A study in a German university library in 1999
showed only 5.8% of factual questions (Scholle, 2000). Users apparently did not
expect to get direct facts, but help in their search procedures. In the future, fac-
tual questions might even decrease, as users search for facts directly in the Inter-
net. Tests of reference accuracy should therefore not focus on factual questions.
Today, traditional face-to-face reference is complemented by e-mail or online
(chat) reference and cooperative online reference. The different forms of digital
reference show varying advantages and disadvantages (Roesch, 2006). Guide-
lines for digital reference have been edited by several library associations (ALA,
2004 and 2006; IFLA, 2005). Publications on performance indicators for digital
reference focus on staff skills and user satisfaction (Booth, Dawes and Kigbo,
2004; UNISON, 2006).

C.12 Reference fill rate
215
For reference transactions in electronic form, it is much easier to check what
has been done in the transaction and whether the user got the right answer or
was directed to the relevant resource for finding information. Questions and
answers can be stored, and a sample of reference transactions can be evaluated
without disturbing the reference interview or conducting time-consuming sur-
veys. But it might be more difficult than in face-to-face interviews to get a defi-
nite notion of the specific user’s needs.
Definition of the indicator
The percentage of reference questions that is answered correctly
Reference questions can regard facts, documents, or advice on sources for the
user’s subject.
The definition excludes directional and administrative inquiries, e.g. for lo-
cating staff or facilities, regarding opening times, about handling equipment
such as reader printers or computer terminals, using self-service functions, or
locating items of stock that have already been identified bibliographically.
Aims of the indicator
The indicator assesses the quality of the reference service in terms of accuracy
and completeness of the supplied information. It does not measure:
• The usefulness of the supplied information to the user
• The user’s satisfaction with the reference interview
• The speed of the reference transaction
• The quality of staff behaviour
The indicator is relevant for all libraries offering reference and information ser-
vices. Comparison of results between libraries with similar clientele is possible,
if the same method of data collection has been used.
Methods
This handbook recommends two methods for assessing reference fill rate (accu-
racy). In both methods, directional and administrative questions are excluded.
Typical such questions are:
• Where is the next copying machine?
• How can I get a user card?
• What time is the library open?
• Who can help me to use the scanner?

5. List of indicators
216
If a reference interview addresses several questions, each question should be
evaluated separately.
Method 1: Set of questions with predefined answers
Library experts choose a set of questions that mirror typical questions in aca-
demic or public libraries. The set should contain factual, subject and document
questions in the distribution that seems appropriate to the library. If libraries
have collected specified statistics as to the kind of questions asked in their refer-
ence service, this will be easier. The number of questions depends on the differ-
entiation of user groups the library has to serve and therewith the variety of
questions usually asked at the library’s reference desk.
The correct answers to the questions must be added to the set. It should be
checked that the library owns or has access to resources that would enable staff
to answer correctly.
The questions should be pre-tested in order to avoid ambiguities and to de-
cide on the different options of categorizing answers as correct or incorrect.
The method used for testing the set is unobtrusive observation (Hernon and
McClure, 1986a). Proxy users (surrogate users) put the questions to the refer-
ence staff, either in face-to-face interviews or by phone, e-mail, or in an online
reference service. In most cases, students have been used as proxies. They
should be trained in order to guarantee the unobtrusiveness and uniformity of the
reference interview. The interaction between reference staff and proxy should be
as normal as possible, therefore proxy users must be convincing. The question-
ing should be spread over the day/week to include peak times and times with
low use.
After finishing the interview, proxies should record carefully the procedure
and outcome of the reference transaction. For questions put in electronic form it
will be easy to keep a record of the reference interview for evaluation.
To avoid moral objections of staff members, the test should be strictly
anonymous. The proxies should not note the name of the staff member. The
reference staff as a whole is tested, not the individual staff member. Collabora-
tion with staff representatives will be useful. If the library management decides
that the study should be pre-announced, this should be done somewhat earlier
and without defining the point of time of the study, so that staff behaviour will
not be influenced.
After the interviews, the answers are rated by library experts. Whether an an-
swer is rated as correct depends on what the library’s reference policy aims at.
Basically, there are two ways of answering questions:

C.12 Reference fill rate
217
• Telling the users directly the facts, bibliographical records etc. they are
seeking for
• Telling the users the best way to find the answers themselves
In academic libraries, naming and/or showing the source where the user can find
the information will in most cases be seen as correct answer.
As the correct answers have been predefined, evaluation of answers could be
simple:
• Correct answer = fully correct; all aspects covered; user referred to the
right sources
• Incorrect answer = simply wrong; only partially correct; not all aspects
covered; user referred to wrong sources
The answer “don’t know” without referral to other persons/sources would be
counted as incorrect. If the user gets no answer at all (librarian too busy, user
asked to return later), this should not be counted in the sample; the question
should be put again at a later time.
The reference fill rate is the percentage of correct answers of all answers.
If more complicated questions have been used in the set, or if the library
wants to know more details about failures and success, a more differentiated
scoring could be used (Elzy et al., 1991).
• Fully correct; all aspects covered; users referred to sources that provided
the right answer
• Partly correct; not all aspects covered; users sent to resources that pro-
vided only part of the answer
• Partly incorrect; users sent to inappropriate sources
• Simply wrong; question not answered without referral to other
sources/persons
In order to calculate the reference fill rate, answers scoring 1 or 2 should be
rated as correct, 3 or 4 as incorrect.
Method 1 is easy to use and not too time-consuming, but it does not consider
ambiguous or open-ended questions occurring in actual reference service nor the
often lengthy procedures where user and librarian join in seeking relevant
sources. But if the choice of questions is adequate to the library’s population, the
results will suffice to get an insight into reference accuracy.
Method 2: A sample of actual questions in electronic form
This method uses a random sample of actual questions. There are no predefined
answers as in the first method; therefore questions in electronic form should be

5. List of indicators
218
preferred, as the answer and/or the whole reference interview can be stored and
evaluated.
A team of experts rates the procedures and answers. In many cases, addi-
tional searches in sources will be needed to find the “right” answer/s. The time
needed for evaluation will be higher than in the first method. When rating an-
swers as “correct” or “incorrect”, it should be kept in mind that an answer need
not always cover all information possible for the topic, but that answers should
be adequate to the specific user’s need. An undergraduate writing a paper on
“evidence-based medicine” will need some general sources to start from, while
for a doctoral dissertation a graduate student will be glad to find specialized
articles about that subject. If the protocol of the reference transaction shows that
the referral to one source was what the user needed, that should be counted as
correct.
The advantage of the method is that the questions are representative of the
real situation, and that a high number of reference interviews can be evaluated.
Reference questions put to staff members outside reference staff (e.g. subject
specialists) could be included. But it should be kept in mind that answering
questions in written form will make staff take more pains. Experience shows
that answers in written form tend to be more correct, probably because the an-
swering person feels that the answer might be controlled.
The problem of the method is that questions in electronic form, issued from
home or the workplace, might be of a more complicated nature than point-of-use
questions occurring when users work in the library. Questions could be ambigu-
ous; several answers might be possible. There will be “escalator questions”
(Christenson et al., 1989), requiring several steps to clarify the user’s questions,
as users tend to start with broader topics than they really seek. Therefore a sim-
ple rating of answers as “correct” or “incorrect” will not be possible; scoring
should be more differentiated as shown above in method 1.
Method 2 will give a better insight into the causes of failure and success in ref-
erence service, e.g. what procedures staff followed in order to clarify the ques-
tion, whether the user was referred to another person or library, and what the
attitude of the staff was.

C.12 Reference fill rate
219
Interpretation and use of results
A high accuracy rate will be considered as good. But when interpreting the re-
sults, it must be kept in mind that the decision whether an answer is counted as
correct or incorrect may be subjective, especially if actual questions are used.
The outcome of the reference interview can be influenced by
• staff skills (including communication skills),
• the users’ skills (familiarity with the library, experience in information
seeking; especially the ability to explain what they want to know),
• the point of time of the interview (especially busy times, long queues
waiting),
• the variety and accessibility of reference sources,
• and – of course – the difficulty of the questions.
A low reference fill rate points to
• an inadequate reference collection,
• insufficient equipment of the reference desk,
• lack of staff skills,
• insufficient staffing at the reference desk, especially at peak times,
• low priority of the reference service in the library’s policy.
More detailed information about reasons for failure could be gained from fol-
lowing the procedure of the reference interview (e.g. which sources were
checked, or whether the user was asked to explain the question).
Expertise in conducting reference interviews can lead to higher accuracy. A
study in Maryland in 1983 found that closing the reference transaction with
“Does this answer your question?” increased the accuracy of answers from 52 to
76 percent (Gers and Seward, 1985).
It should always be borne in mind that this indicator measures only one as-
pect of reference service quality, namely accuracy. It is advisable to compare the
results with users’ rating of reference quality by conducting user satisfaction
surveys. But accuracy is certainly the most important aspect of reference quality,
though a well-conducted reference interview and empathy of reference staff can
help to reach accuracy. Incorrect answers given by reference staff can have
negative outcome on users’ work, as users tend to believe in the competence of
this service. Even if a user has got an incorrect or incomplete answer, he “may
believe that because the service is providing the answer, that this, in some way,
ensures correctness, definitiveness, or comprehensiveness.” (McClure et al.,
2002, p.41)

5. List of indicators
220
Examples and further reading
An overview of studies on reference accuracy till 1995 is given by Lorene Roy
(Roy, 1995).
Using the indicator “reference fill rate” with a set of predefined questions
and answers and unobtrusive observation has a long tradition. In 1986, a
paper of Hernon and McClure (1986b) announced the startling result that refer-
ence staff generally answered only 50 to 60% of questions correctly – the fa-
mous “55% rule”. This of course caused a vehement debate, especially as user
surveys showed high satisfaction with reference service, and the 55%-rule was
contradicted by studies that, by using other methods, found much higher accu-
racy rates. Even Thomas Childers, one of the two graduate students conducting
the first unobtrusive reference studies in 1967 (Crowley and Childers, 1971),
twenty years later cautioned against “oversimplification” when judging refer-
ence service quality (Childers, 1987). Still, as the method proved simple and –
for its purpose – reliable, it has been used regularly. A study in 104 public and
academic libraries in Canada in 1997/98, using questions related to government
documents, resulted in only 29.3% of correct (complete) answers, 42.4% if
partly complete answers were included (Dilevko, 2000).
A pilot study for assessing the quality of chat reference with unobtrusive ob-
servation was conducted in the University of Maryland (White, Abels and
Kaske, 2003). A set of predefined questions, including “escalator” questions,
was tested both in a public and an academic library. Answers were rated as ac-
curate, if the proxies (experienced searchers) were able to locate the right an-
swer in the sources the reference staff named. With this definition, accuracy
reached 75%.
Other projects have used actual reference questions for assessing accuracy.
Saxton and Richardson asked: “How can half-right reference service be found to
have high utility and give great satisfaction to users?” (Richardson, 2002;
Saxton and Richardson, 2002b). They evaluated 3500 actual questions in 12
public libraries with an expert panel that rated 90% of answers as correct (accu-
rate source or accurate strategy). Comparing accuracy with other variables of the
reference transaction, the only variable that was found to predict accuracy was
the difficulty of the query.
Asking reference staff to rate the accuracy of their own answers resulted in
high accuracy rates, as staff would naturally be convinced of working effectively
(Rothstein, 1964).

C.12 Reference fill rate
221
An evaluation program asking both staff and users to rate reference quality is
the Wisconsin-Ohio Reference Evaluation Program (WOREP) that uses actual
reference interviews and survey forms for staff and users for detailed assessment
of the success. WOREP has even set up quality criteria for success (Stalker and
Murfin, 1996):
• poor 0 – 50.99 % successful
• fair 51 – 54.99 % successful
• adequate 55 – 59.99 % successful
• good 60 – 64.99 % successful
• very good 65 – 69.99 % successful
• excellent 70% plus successful
When WOREP was used in 110 academic libraries (Havener and Murfin, 1998),
“satisfaction with what was found” reached 70.95%, but “success in finding
exactly what was wanted” only 57.99%, which is not higher than the accuracy
rate found in unobtrusive observation studies.
A great part of reference quality studies have focussed not on accuracy of the
answers, but on user satisfaction and on the usefulness of answers as seen by
users. In some cases, proxy users have been employed for putting questions out
of their own study subjects and rating friendliness and competence of staff, the
usefulness of the answer, their own satisfaction with the reference interview and
their “willingness to return” to the same staff member with another question.
Two examples are cited here (Dewdney and Ross, 1994; Spribille, 1998).
Though “usefulness of the answer” scored only between 38.2 and 47 %, between
59.7 and 64 % of users were willing to return to the same staff person another
time. Satisfaction is apparently highly influenced by staff behaviour. In another
study with unobtrusive testing (but without accuracy rating), satisfaction with
the answer received reached 48 % (Gatten and Radcliff, 2001). In most studies
trying to assess user satisfaction, user surveys or interviews have been applied,
especially exit surveys when the user leaves the reference desk or the library.
Other studies have measured the duration of the reference interview in or-
der to assess whether length of time has an influence on the accuracy of an-
swers. Results differed. While in the Canadian study mentioned above the num-
ber of complete or partially complete answers increased with the amount of time
spent on the interview (Dilevko, 2001, p.54), Hernon and McClure found no
statistically significant relation (Hernon and McClure, 1986b, p.39), but experi-
enced a sort of “internal clock” that seemed to impede staff to spend more than a
certain time on a reference interview (Hernon and McClure, 1987).

5. List of indicators
222
Waiting time for access to reference staff has also been evaluated in the con-
text of reference service quality, as it will certainly influence user satisfaction. A
study in a Canadian university library recorded on average about two minutes of
waiting time (Tillotson, Adlington and Holt, 1997). A study in Northampton
(Martin, 1998) collected more differentiated data:
• 0 – 2 min = 98%
• 2 – 5 min = 7%
• 5 – 10 min = 1%
All in all, literature on reference quality is by now so extensive, that only a few
studies can be named that have initiated new methods in assessing quality or that
can be seen as typical examples.
________________________________________________________________
ALA. American Library Association. Reference and User Services Association (2004),
Guidelines for implementing and maintaining virtual reference services, available at:
http://www.ala.org/ala/rusa/rusaprotools/referenceguide/virtrefguidelines.htm
ALA. American Library Association. Reference and User Services Association (2006),
Guidelines for cooperative reference services, available at:
http://www.ala.org/ala/rusa/rusaprotools/referenceguide/guidelinescooperative.htm
Benham, F. et al. (1995), The Reference assessment manual, American Library Association,
Evaluation of Reference and Adult Services Committee, Pierian Press, Ann Arbor,
Michigan
Booth, D., Dawes, E. and Kigbo, F. (2004), Performance indicators for digital research and
information services, University of Newcastle, Australia, available at:
http://www.caul.edu.au/best-practice/PerfInd.html
Childers, T. (1987), The quality of reference: still moot after 20 years, Journal of Academic
Librarianship 13,2 , pp. 73-74
Christenson, J. O. et al. (1989), An evaluation of reference desk service, College & Research
Libraries 50,4, pp. 468-483
Crowley, T. and Childers, T. (1971), Information service in public libraries: two studies,
Scarecrow, Metuchen.
DBS. Deutsche Bibliotheksstatistik, Hochschulbibliothekszentrum, Köln, available at:
http://www.hbz-nrw.de/angebote/dbs/

C.12 Reference fill rate
223
Dewdney, P. and Sheldrick Ross, C. (1994), Flying a light aircraft: reference service
evaluation from a user’s viewpoint, Reference Quarterly 34, pp. 217-230, available at:
http://www.ala.org/ala/rusa/rusapubs/rusq/specialfeatures/rspawardwinning/1996/1996.ht
m
Dilevko, J. (2000), Unobtrusive evaluation of reference service and individual responsibility,
Ablex, Westport, Conn.
Elzy, C. et al. (1991), Evaluating reference service in a large academic library, College &
Research Libraries 52, pp. 454-464
Gatten, J. N. and J. Radcliff, C. J. (2001), Assessing reference behaviours with unobtrusive
testing, in Wallace, D. P. and Van Fleet, C., Library evaluation, a casebook and can-do
guide, Libraries Unlimited , Englewood, Colo., pp. 105-115
Gers, R. and Seward, L. J. (1985), Improving reference performance: results of a statewide
study, Library Journal 110, Nov.1, pp. 32-35
Havener, W. M. and Murfin, M. E. (1998), Cronbach revisited: a powerful enemy to validity
in library services, Proceedings of the 2nd
Northumbria International Conference on
Performance Measurement in Libraries and Information Services, Newcastle upon Tyne,
pp. 139-155
Hernon, P. and McClure, C.R. (1986a), Unobtrusive testing and library reference services,
Ablex, Westport, Conn.
Hernon, P. and McClure, C.R. (1986b), Unobtrusive reference testing: the 55% rule, Library
Journal 111,7 , pp. 37-41
Hernon, P. and McClure, C.R. (1987), Library reference service: an unrecognized crisis – a
symposium, Journal of Academic Librarianship 13,2, pp. 69-71
Høivik, T. (2003), Why is quality control so hard? Reference studies and reference quality in
public libraries: the case of Norway, World Library and Information Congress: 69th
IFLA
General Conference and Council, available at: http://www.ifla.org/IV/ifla69/papers/131e-
Hoivik.pdf
IFLA (2005), Digital reference guidelines, available at:
http://www.ifla.org/VII/s36/pubs/drg03.htm
Martin, A. (1998), Setting standards for enquiry desk operations: a case study, Proceedings of
the 2nd
Northumbria International Conference on Performance Measurement in Libraries
and Information Services, Newcastle upon Tyne, pp. 165-171

5. List of indicators
224
McClure, C. R. et al. (2002), Statistics, measures, and quality standards for assessing digital
reference library services, guidelines and procedures, School of Information Studies,
Syracuse N.Y.
Meserve, H. (2006), Evolving reference, changing culture: the Dr. Martin Luther King, Jr.
Library and reference challenges ahead, in Anderson, B. and Webb, P.T. (eds.), New
directions in reference, Haworth Press, Binghamton, N.Y., pp. 23-40
Richardson, J. V. (2002), Reference is better than we thought, Library Journal, 127,7 , pp. 41-
42, available at: http://www.libraryjournal.com/article/CA206407.html
Roesch, H. (2006), Digital reference services: state of the art in the focus on quality, World
Library and Information Congress: 72tnd
IFLA General Conference and Council, available
at: http://www.ifla.org/IV/ifla72/papers/098-Roesch-en.pdf
Rothstein, S. (1964), The measurement and evaluation of reference service, Library Trends
12, pp. 456-472
Roy, L. (1995), Reference accuracy, The Reference Librarian 49/50, pp. 217-227
Saxton, M. and Richardson, J.J. (2002a), Understanding reference transactions: transforming
an art into science, Academic Press, Amsterdam
Saxton, M. and Richardson, J. J. (2002b), Understanding reference transactions: transforming
an art into science. Suppl. (1.000 citations), available at:
http://polaris.gseis.ucla.edu/jrichardson/dis220/urt.htm
Scholle, U. (2000), Kann ich Ihnen behilflich sein? Erhebung am zentralen Auskunftsplatz
der ULB Münster, Bibliotheksdienst 34,1, pp. 39-48
Smith, J. (2002), The Reference Interview: connecting in-person and in cyberspace, a
selective bibliography from the 2002 President's Program, available at:
http://www.ala.org/ala/rusa/rusapubs/pastpresidentpro/20023/selectivebibliography.htm
Spribille, I. (1998), Die Wahrscheinlichkeit, in einer Bibliothek eine nützliche bzw.
zufriedenstellende Antwort zu bekommen, ist „fifty-fifty“, Bibliothek 22,1, pp. 106-110.
Stalker, J. C. and Murfin, M.E. (1996), Quality reference service: a preliminary case study,
Journal of Academic Librarianship 22,6 , pp. 423-429
Tillotson, J., Adlington, J. and Holt, C. (1997), Benchmarking waiting time, College &
Research Libraries News 58,10, pp. 693-694, 700
UNISON (2006), Digital reference key performance indicators, project report, available at:
http://www.caul.edu.au/best-practice/reference.html

C.12 Reference fill rate
225
Wasik, J. M. (2005), Digital reference bibliography, available at:
http://www.webjunction.org/do/DisplayContent?id=11878
White, M. D., Abels, E.G. and Kaske, N. (2003), Evaluation of chat reference service quality:
pilot study, D-Lib Magazine 9,2, available at:
http://www.dlib.org/dlib/february03/white/02white.html
WOREP. Wisconsin Ohio Reference Evaluation Program, available at:
http://worep.library.kent.edu/

5. List of indicators
226
C.13 Shelving accuracy
Background
Though “shelving accuracy” may not be a fashionable performance indicator in
times of growing electronic services, correct shelving remains essential for the
availability of the library’s physical collection. User satisfaction surveys show
that the issue “materials in their proper place” ranks high in users’ wishes (Har-
wood and Bydder, 1998).
Incorrect shelving will not only affect user satisfaction, but will also be the
cause of much unnecessary effort in the library. “While a shelf-reading program
requires an investment of work hours and funds that must compete with other
needs for dollars and time, not shelf-reading costs the patrons access and costs
the library time and money in conducting missing book searches, processing
interlibrary loans, and purchasing duplicate copies …” (Anderson, 1998, p.2).
Definition of the indicator
The percentage of documents that are in their correct place on the shelves at the
time of investigation
Aims of the indicator
The indicator assesses the accuracy of the library’s shelving and shelf monitor-
ing procedures and therewith the availability of documents for the user. It does
not measure the speed of shelving.
The indicator is applicable for all libraries with physical collections. It can be
used for collections in free or closed access, for special parts of the collection or
for branch libraries.
Comparisons between libraries are possible, if differences in storing (free or
closed access) and in the frequency of use are taken into consideration.
Method
Check a sample of shelves with the help of a shelf-list. Usually, libraries will not
check their whole collection, but will choose a certain part of the collection, e.g.
the children’s library, the collection of rare material, a subject collection like
medicine or history.

C.13 Shelving accuracy
227
Documents waiting for shelving should be reshelved before counting.
Record for each document in the list whether it is shelved correctly. It is ad-
visable to search also behind the documents to detect items that have been
pushed back. Documents found near their correct place are also counted as mis-
placed. For serials or monographs with several volumes, each physical unit
counts as one document.
For missing documents, check in the library system whether the absence is
accounted for (the document is on loan, sent to the bookbinder, noted as lost
etc.). Missing documents accounted for are excluded from the sample. Missing
documents not accounted for are counted as misplaced. The count thus includes
the documents that have been misplaced as well as those that are lost (e.g. sto-
len), but not yet noted as lost. Thus, the indicator measures not only the accu-
racy of the shelving procedures, but also the effectiveness of shelf monitoring.
Shelves in free access areas should be checked outside opening times in order
to include documents that have been used inside the library.
If all items in a collection are equipped with barcodes, scanning tools and
wireless technology might be used instead of shelf-lists. This makes the check-
ing process easier for staff. While the barcodes of the items on the shelves are
scanned, a direct connection to the library’s integrated system shows
• whether items are in the correct order,
• whether missing items are accounted for by the system.
The shelving accuracy is affected by open access for users and by the frequency
of use. In free access collections or during peak times of use (e.g. end of the
term in universities), more items may be misshelved. Collection parts in high
use and/or in free access should therefore be checked separately from collection
parts with low use and/or in closed magazines.
Journal collections should also be checked separately, as the volumes are less
likely to be misshelved.
The time required for using the indicator will depend on
• the library’s shelf-location system,
• the kind of collection surveyed,
• the expertise of the staff in the project,
• the number of missing documents that have to be followed up,
• the accuracy of the catalogue (shelf-list).
The shelving accuracy is the percentage of all documents in the sample that are
in their correct place at the time of investigation.
5. List of indicators
228
Interpretation and use of results
High shelving accuracy will be considered as good.
Low shelving accuracy can be caused by
• careless or hasty shelving,
• a complicated shelf-location system,
• infrequent shelf-reading.
Actions taken in order to achieve higher accuracy could be
• better instruction of shelving staff (often part-time staff or student assis-
tants),
• a higher number of shelving staff during peak times,
• a more transparent shelf-location system,
• regular shelf-reading procedures.
The results of the indicator do not only point to errors in shelving and failures in
shelf-reading, but in following up missing items can also help to improve cata-
logue accuracy.
As shelving or shelf reading is tedious work, motivating shelving staff is im-
portant. It should be demonstrated that correct shelving is crucial for the acces-
sibility of the collection, and that shelving errors can cause considerable addi-
tional workload.
Examples and further reading
Though probably most libraries use procedures for checking shelving accuracy,
literature about practical experiences in this sector is not abundant. “Shelving is
mundane, lacking the high-wire excitement of … technical topics en vogue.”
(Kendrick, 1991, p.16). Apart from the indicator described above, the following
methods have been used:
• Checking a sample of titles that have been actually ordered by users. This
is usually done in the frame of an availability study.
• Checking only the sequence of documents on the shelves, without the help
of a shelf-list. With this method, missing documents are not considered.
• Choosing a sample of documents waiting to be shelved and checking the
shelving accuracy after shelving. This method measures only the accuracy
of the shelving staff and disregards documents misshelved by users.
• Taking a random sample of titles out of a specified collection and check-
ing them on the shelves.
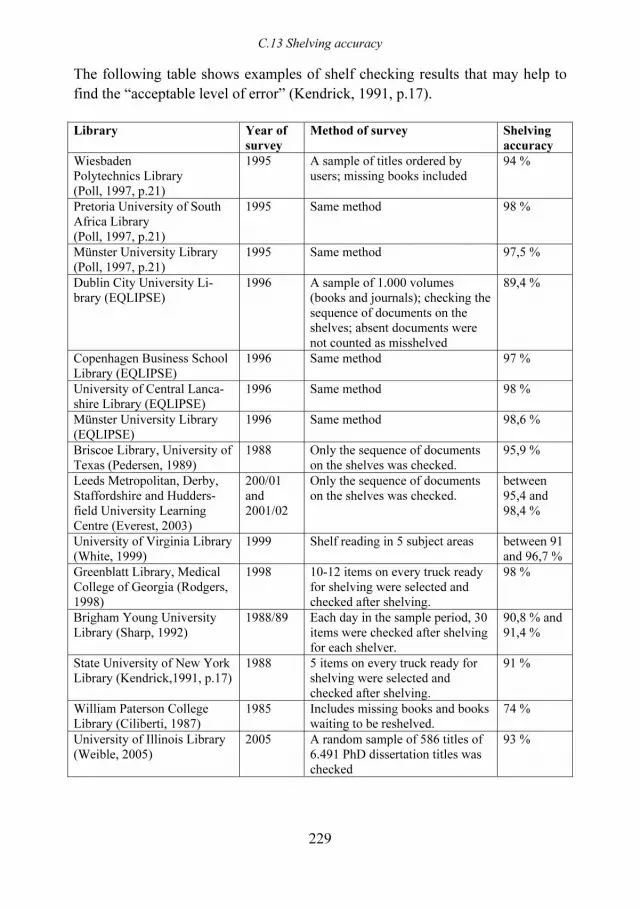
C.13 Shelving accuracy
229
The following table shows examples of shelf checking results that may help to
find the “acceptable level of error” (Kendrick, 1991, p.17).
Library Year of
survey
Method of survey Shelving
accuracy
Wiesbaden Polytechnics Library (Poll, 1997, p.21)
1995 A sample of titles ordered by users; missing books included
94 %
Pretoria University of South Africa Library (Poll, 1997, p.21)
1995 Same method 98 %
Münster University Library (Poll, 1997, p.21)
1995 Same method 97,5 %
Dublin City University Li-brary (EQLIPSE)
1996 A sample of 1.000 volumes (books and journals); checking the sequence of documents on the shelves; absent documents were not counted as misshelved
89,4 %
Copenhagen Business School Library (EQLIPSE)
1996 Same method 97 %
University of Central Lanca-shire Library (EQLIPSE)
1996 Same method 98 %
Münster University Library (EQLIPSE)
1996 Same method 98,6 %
Briscoe Library, University of Texas (Pedersen, 1989)
1988 Only the sequence of documents on the shelves was checked.
95,9 %
Leeds Metropolitan, Derby, Staffordshire and Hudders-field University Learning Centre (Everest, 2003)
200/01 and 2001/02
Only the sequence of documents on the shelves was checked.
between 95,4 and 98,4 %
University of Virginia Library (White, 1999)
1999 Shelf reading in 5 subject areas between 91 and 96,7 %
Greenblatt Library, Medical College of Georgia (Rodgers, 1998)
1998 10-12 items on every truck ready for shelving were selected and checked after shelving.
98 %
Brigham Young University Library (Sharp, 1992)
1988/89 Each day in the sample period, 30 items were checked after shelving for each shelver.
90,8 % and 91,4 %
State University of New York Library (Kendrick,1991, p.17)
1988 5 items on every truck ready for shelving were selected and checked after shelving.
91 %
William Paterson College Library (Ciliberti, 1987)
1985 Includes missing books and books waiting to be reshelved.
74 %
University of Illinois Library (Weible, 2005)
2005 A random sample of 586 titles of 6.491 PhD dissertation titles was checked
93 %
5. List of indicators
230
Shelving accuracy will probably be higher if only the sequence on the shelves is
checked and absent documents are not considered. If documents waiting to be
shelved are included in the “misshelving” counts, shelving accuracy will appear
much lower. Though of course backlogs in shelving can frustrate users, it would
not be logical to count the waiting documents as misshelved.
Shelving errors could be differentiated as to:
• Minor errors (books out of place, but still on the correct shelf or the shelf
immediately before or after)
• Major errors (all others)
Especially in collections with free access, the number of minor errors will be
much higher than that of major errors. A study at the University of Illinois
showed a ratio of 18.15 minor errors to one major error (Anderson, 1998, p.12).
Minor errors would probably cause less trouble, as the documents could be
found in a short search.
A recent study in the University of Illinois differentiated again between
“slightly misshelved” and “not found” (Weible, 2005), but was conducted in a
collection of PhD dissertations. 2.05 % were slightly misshelved, 4.95 % were
not found at all. This study also reports about the time needed for checking shelf
availability. One student spent 35 hours for the three phases: looking titles up in
the OPAC, physically searching for materials, and entering the results into a
spreadsheet. The example shows that checking correct shelving must not be
time-consuming.
Eastern Illinois University Library uses a “Library Stacks Management Sys-
tem” that automatically generates and stores a shelf-list and a status-list for the
collection part that is checked (Sung, Lanham and Sung, 2006). Staff members
scan the barcodes using a scanner attached to a laptop that is wirelessly con-
nected to the server. During the scanning process, the system alerts the operator
if the items are out of order or not found and not accounted for in the system.
The system also calculates the distance of misplacement. Scanning of 102.000
books showed a misshelving rate of 6.6%; over 72% of the misplaced books
were found within a range of 1 to 10 books.
Speed of reshelving is a different issue and should be assessed separately. In
a survey of 19 university libraries in 1999, University of Virginia Library found
that the fastest “turnaround time” of documents from return desk to shelf was 4
hours (White, 1999). In a benchmarking project of four UK university learning
centres, the site with the quickest reshelving times had reshelved 95 % within 14
hours (Everest, 2003, p. 44).
C.13 Shelving accuracy
231
Some projects have also measured the average books shelved per hour per
person. Brigham Young University Library had a shelving average of 230 to 253
books per hour; there was no relation between shelving average and level of
accuracy (Sharp, 1992, p.187).
Generally, a shelving accuracy of 95% upwards seems to be attainable, de-
pending on the storing and usage conditions of the collection part that is
checked. The Copenhagen Business School Library reported a maximum rate of
misshelved books fixed by the Library Board: 1-2 % in an UDC-based shelf
arrangement system (Cotta-Schonberg and Line, 1994, p.61). This corresponds
with the target value of 97% accuracy in the Hale Library, Kansas State Univer-
sity (Edwardy and Pontius, 2001).
________________________________________________________________
Anderson, D. R. (1998), Method without madness: shelf-reading methods and project
management, College & Undergraduate Libraries 5,1, pp .1-13
Ciliberti, A. C. et al. (1987), Material availability: a study of academic library performance,
College & Research Libraries 48,6, pp. 513-527
Cotta-Schønberg, M. and Line, M. B. (1994), Evaluation of academic libraries: with special
reference to the Copenhagen Business School Library, Journal of Librarianship and
Information Science 26,2, p.55-69
Edwardy, J. M. and Pontius, J. S. (2001), Monitoring book reshelving in libraries using
statistical sampling and control charts, Library Resources & Technical Services 45,2, pp.
90-94
EQLIPSE, Unpublished data collected within the Project EQLIPSE, project available at:
http://www.cerlim.ac.uk/projects/eqlipse/
Everest, K. (2003), Benchmarking shelving processes 2000/01 and 2001/02, in Creaser, C.
(Ed.), As others see us: benchmarking in practice, LISU, Loughborough University, LISU
Occasional Paper 33, pp. 37-48, available at:
http://www.lboro.ac.uk/departments/ls/lisu/downloads/OP33.pdf
Harwood, N. and Bydder, J. (1998), Student expectations of, and satisfaction with, the
university library, The Journal of Academic Librarianship 24,2, pp. 161-171.
Kendrick, C. L (1991), Performance measures of shelving accuracy, The Journal of Academic
Librarianship 17,1, pp. 16-18.
Pedersen, W. A. (1989), Statistical measures for shelf reading in an academic health science
center library, Bulletin of the Medical Library Association 77,2, pp. 219-222.
5. List of indicators
232
Poll, R. (1997), Leistungsindikatoren für wissenschaftliche Bibliotheken, in Ressourcen
nutzen für neue Aufgaben, Zeitschrift für Bibliothekswesen und Bibliographie. Sonderheft
66, Klostermann, Frankfurt a.M., pp. 15-22
Rodgers, J. (1998), The evaluation of correct shelving quality in the Robert B. Greenblatt,
M.D. Library, available at: http://www.mcg.edu/Library/MLA/title.html
Sharp, S. C. (1992), A library shelver’s performance evaluation as it relates to shelving
accuracy, Collection Management 17, 1/2, pp. 177-192
Sung, J., Lanham, A. and Sung, N. (2006), Transforming data to build knowledge for healthy
libraries, World Library and Information Congress; 72nd
IFLA General Conference and
Council Seoul, available at: http://www.ifla.org/IV/ifla72/papers/141-
Sung_%20Lanham_Sung-en.pdf
Weible, C. L. (2005), Where have all the dissertations gone? Assessing the state of a unique
collection’s shelf (un)availability, Collection Management 30,1, pp. 55-62
White, L.S. (1999), Report on shelving process, University of Virginia Library Benchmarking
Team, available at: http://www.lib.virginia.edu/mis/benchmarking/bench-shortrpt.html

D.1 Percentage of acquisitions expenditure spent on the electronic collection
233
D. Potentials and development
D.1 Percentage of acquisitions expenditure spent on the electronic
collection
Background
Users today expect to have access to information resources from their workplace
or home. They want not only to search for information in electronic sources, but
to get the full view of a document that they think relevant on the screen.
Libraries worldwide are therefore offering a growing number of electronic
resources in their collections, either by purchase or licensing agreements. This
means that a considerable amount of funds is shifted from the traditional to the
electronic collection. The hope of the funding institutions is generally that offer-
ing information resources in electronic form will save costs. Experience shows
that acquisitions costs for electronic instead of print media will not be lower, and
that possible savings in shelving and space will be made up by high IT equip-
ment costs. But as electronic resources in most cases are more frequently used
than traditional ones, higher usage can reduce the cost per use and thus improve
the efficiency of the services.
The library’s investment into its electronic collection is therefore seen as in-
dicator not only for user-orientation, but also for efficiency and future-
orientation.
Definition of the indicator
The percentage of acquisitions expenditure that is spent on the electronic collec-
tion.
Acquisitions expenditure in the sense of this indicator means the total expen-
diture for traditional and electronic media, including licenses and pay-per-view
costs. Binding expenditure is excluded.
Expenditure on the electronic collection in the sense of this indicator com-
prises the library's acquisition, subscription and licensing costs for databases,
electronic journals and digital documents, including pay-per-view costs.
Electronic document delivery costs are excluded.

5. List of indicators
234
Expenditure on infrastructure, such as hardware, software or networking, and
on digitisation of documents is excluded.
Aims of the indicator
The indicator assesses the library’s investment into electronic media and
therewith the priority that the library gives to developing its electronic collec-
tion.
The indicator is relevant for all libraries with both print and electronic collec-
tions.
Comparison of results between libraries with similar mission, structure and
clientele is possible, if differences in subjects and collection policies are taken
into account and if the acquisitions expenditure is calculated in the same way.
Method
Determine the total acquisitions expenditure and as a subtotal the expenditure on
the electronic collection during a year.
Where electronic versions of documents, especially journals, are acquired in
a package with print versions, only the surplus payment for the electronic ver-
sion should be counted.
If the library joins in consortia or other over-all contracts, only the library’s
own share in the contractual expenses should be counted.
Interpretation and use of results
A higher score will normally be considered as better, as it indicates high invest-
ment into new services. But what percentage of the library’s acquisitions budget
would be seen as appropriate for the electronic collection will be influenced by
the library’s collection subjects and clientele. In a medical library the percentage
will be much higher than in a library of human sciences. In public libraries the
percentage will generally be lower.
The indicator is influenced by
• the library’s collection policies,
• the range of electronic publications available in the library’s collection
subjects,
• specialized needs of the population to be served,
• external means (e.g. special grants) for consortia.

D.1 Percentage of acquisitions expenditure spent on the electronic collection
235
If the percentage of acquisitions expenditure spent on the electronic collection
seems too low, libraries could use the following methods to decide whether to
invest more into electronic resources:
• Evaluate usage data for both print and electronic collections
• Evaluate interlibrary lending or document supply requests in order to
adapt the acquisition policy to user needs
• Perform a user survey for assessing the market penetration of electronic
services and the satisfaction with electronic resources
The indicator will be especially useful if applied consequently over years.
Examples and further reading
The German benchmarking project BIX (BIX. Der Bibliotheksindex) uses the
indicator as described here for academic libraries. The results in 2005 were
(BIX, 2006):
Percentage of expenditure for information
provision spent on the electronic collection
mean maximum minimum
Universities of applied sciences 10,9 25,4 0,9
Universities: One-tier systems 19,3 43,8 8,8
Universities: Two-tier systems (only the central library considered)
26,9 72,7 4,5
The results show that the percentage can vary considerably, according to a li-
brary’s subject collections and clientele.
The Finnish research library statistics for 2005 show for all research libraries
“library material costs” of 28.964.900 €, of those for electronic resources
12.312.700 €, which is 42,5 %. For university libraries only, “library materials
costs” are 20.996.500 €, of those for electronic material 10.790.200 €, which
comes up to even 51,4 % (Finnish research libraries statistics database). Nearly
the same percentage (50,64 %) was reported by the Netherlands university li-
braries in 2004 (UKB, 2004).
The statistics of the Association of Research Libraries show for 2003/04 the
following percentages of expenditure for electronic materials of total library
materials expenditure (Kyrillidou and Young, 2005):
• median = 37,53 %
• high = 76,89 %
• low = 9,71 %
5. List of indicators
236
In the Swiss university libraries 23,23 % of the acquisitions expenditure in 2005
were spent on electronic documents (Schweizerische Bibliothekenstatistik,
2005).
The Swedish research libraries show an extremely high percentage: In 2005,
58,4 % of acquisitions expenditure were spent on the electronic collection
(Forskningsbiblioteken, 2005).
In public libraries the percentage is generally lower.
The UK public libraries had in 2003/04 a total acquisitions expenditure of
121.719.000 £ and 4.261.000 £ for electronic resources, which is 3,5 % for elec-
tronic resources (Creaser, 2006, p.37). Expenditure for electronic resources dou-
bled since 1997/98 and increased by 63 % since 5 years.
The Swiss public library statistics show that in 2005 4,35 % of acquisitions
expenditure were spent on electronic documents (Schweizerische Bibliotheken-
statistik, 2005).
Public libraries in British Columbia, Canada, spent in 2003 6,72 % of acqui-
sitions expenditure for “electronic information”, that is for licensed online data-
bases and subscriptions (British Columbia public library statistics, 2004).
When comparing the results of this indicator, it will be extremely important
to compare only with libraries with similar collections and clientele and to cal-
culate acquisitions expenditure in the same way.
________________________________________________________________
BIX. Der Bibliotheksindex, available at: http://www.bix-bibliotheksindex.de/
BIX. Der Bibliotheksindex (2006), B.I.T. online Sonderheft 2006
British Columbia public library statistics (2004), Ministry of Education, Victoria, British
Columbia, available at: http://www.bced.gov.bc.ca/pls/bcplstats_2004.pdf
Creaser, C., Maynard, S. and White, S. (2005), LISU annual library statistics 2005, featuring
trend analysis of UK public and academic libraries 1994 – 2004, LISU, Loughborough
University, available at:
http://www.lboro.ac.uk/departments/dils/lisu/downloads/als05.pdf
Finnish research library statistics database, Helsinki University Library, available at:
https://yhteistilasto.lib.helsinki.fi/language.do?action=change&choose_language=3
Forskningsbiblioteken 2005 (2005), KB/Bibsam och SCB, Sveriges officiella statistik,
available at:
http://www.scb.se/statistik/_publikationer/KU0102_2005A01_BR_KUFT0601.pdf

D.1 Percentage of acquisitions expenditure spent on the electronic collection
237
Schweizerische Bibliothekenstatistik (2005), Bundesamt für Statistik, available at:
http://www.bfs.admin.ch/bfs/portal/de/index/themen/kultur__medien__zeitverwendung/ku
ltur/blank/analysen__berichte/bibliotheken.html
UKB (2004), Benchmarking, Samenwerkingsverband van de Nederlandse
universiteitsbibliotheken en de Koninklijke Bibliotheek, results only available to
participants

5. List of indicators
238
D.2 Percentage of library staff providing and developing
electronic services
Background
Libraries have to keep pace with the developments in information technology
and information resources. They have to invest into new web-based services and
products. The necessary investment will include equipment, hard- and software,
space, and above all human resources.
There are no existing standards to tell what number or percentage of staff
would be adequate for the task of providing end developing electronic services.
It may be possible to calculate the “necessary” staff for regular tasks like media
processing or lending services, based on the library’s acquisitions and loan sta-
tistics and on average production times. The activities in providing end develop-
ing electronic services differ so widely between libraries and in each library over
years, depending on projects and on the introduction of new services, that stan-
dards would be outdated as soon as formulated. But comparing the percentage of
staff invested into electronic services over years and with other libraries can
indicate whether the library’s organisation and staff allocation consider the
needs of continuous development.
Therefore, the allocation of staff resources to electronic services can be seen
as an indicator of the library’s ability to cope with future.
Definition of the indicator
The percentage of all library staff members in FTE (full-time equivalent) that
are planning, maintaining, providing and developing IT services and technically
developing and improving the library’s electronic services.
Library staff for this indicator includes project staff, temporary staff, volun-
taries, student assistants etc.
Staff is calculated as FTE (full-time equivalent). Figures for part-time em-
ployees are converted to the equivalent number of full-time workers.
Example:
If out of three persons employed as librarians, one works quarter-time, one works half-time, and one works full-time, then the FTE of these three persons would be 0,25+0,5+1,0=1,75 librarians (FTE).

D.2 Percentage of library staff providing and developing electronic services
239
In the sense of this indicator, providing electronic services means maintaining
and developing the automated library system, the library’s web server(s), a de-
pository for electronic publications, the electronic reference system and all other
software applications provided for users, and staff taking care of computer
hardware (servers, computers, printers and scanners).
Staff in reference services, in acquisition/processing of electronic resources,
in digitisation of material for the electronic collection, in user training dealing
with electronic library services and in content-related work on the library's
internet services (e.g. adding texts or data) is excluded.
Aims of the indicator
The indicator assesses the amount of staff time dedicated to the library’s elec-
tronic services and therewith the priority that the library gives to developing and
maintaining electronic services.
The indicator is relevant for all libraries providing electronic services with
their own staff. It will be especially interesting for following the development in
a library over years.
Comparison between libraries with similar mission and clientele is possible,
if the same method of calculating staff has been used.
Method
Calculate the total library staff in FTE (full-time equivalent), including project
staff, temporary staff, voluntaries, student assistants etc.
Calculate the number of library staff providing and developing electronic li-
brary services in FTE (full-time equivalent). Generally, staff in the library’s IT
department can be simply counted, as it may be assumed that their work time is
spent on maintaining and developing electronic services. The time spent by
other staff members on electronic services in the sense of this indicator will be
best assessed by sampling. Staff members are asked to keep work diaries for
several representative days, and the amount of time spent on electronic services
can then be calculated in FTE for the year.
The indicator is calculated as percentage of FTE staff providing and develop-
ing electronic services of total FTE staff.
If the tasks of maintaining and developing the library’s electronic services
have been partly out-sourced to an IT department or other external institutions
(in return for payment or not), this indicator should only be applied if the exter-
nal workload can be quantified accordingly in FTE. This number should be

5. List of indicators
240
added to both the total library staff and to the library staff providing and devel-
oping electronic services.
Interpretation and use of results
A higher score will normally be considered as better, as it indicates high invest-
ment into new services. But what percentage of staff would be seen as sufficient
for the library’s electronic services will depend on the library’s mission and
goals, that is on the definition of what services the library has to offer, and what
range of electronic services is adequate to its clientele.
The indicator will be influenced by a high amount of staff being involved in
special tasks of the library, e.g. preservation tasks.
The indicator should be compared with indicators measuring the use of elec-
tronic services (see Indicator B.3 “Library visits per capita” or B.5 “Number of
content units downloaded per capita”).
Examples and further reading
The indicator was developed in the project EQUINOX: Library performance
measurement and quality management system (EQUINOX, 2000), where it
included user training on electronic services.
The indicator as described here is used in the German benchmarking project
BIX (BIX. Der Bibliotheksindex). In 2005, BIX showed the following results
(BIX, 2006):
Percentage of staff developing and
maintaining electronic services
mean maximum minimum
Universities of applied sciences 7.5 12.5 0.0
Universities: One-tier systems 7.5 17.8 3.1
Universities: Two-tier systems (only the central library considered)
7.9 12.4 1.1
The university libraries in North-Rhine Westphalia, Germany, assessed over
years the allocation of staff resources to specified service areas (Poll, 2000). One
of the background service areas was “central tasks”, including electronic ser-
vices, staff training, central services for branch libraries, and public relations.
Percentage of staff allocated to tasks 1995 1997 2001
Management/subject specialists 8.03 8.14 6.98 Administration 7.27 7.24 6.74

D.2 Percentage of library staff providing and developing electronic services
241
Central tasks 4.69 7.02 10.08 Media processing 31.49 28.92 23.05 Collection maintenance 5.24 5.80 5.41 User services 40.96 42.68 43.52 Special tasks 2.32 0.19 4.23
The results showed a continuous decrease of staff in management, administra-
tion and media processing, due to reorganisation of processes, and an increase in
staff allocation to user services and especially to “central tasks”, due to the
growing importance of electronic services.
________________________________________________________________
BIX. Der Bibliotheksindex, available at: http://www.bix-bibliotheksindex.de/
BIX. Der Bibliotheksindex (2006), B.I.T. online Sonderheft 2006
Equinox. Library performance measurement and quality management system (2000),
available at: http://equinox.dcu.ie/index.html
Poll, R. (2000), Three years of operating ratios for university libraries, Performance
Measurement & Metrics 1,1, pp. 3 - 8

5. List of indicators
242
D.3 Attendances at training lessons per staff member
Background
Library staff with high competences as well in traditional as in new web-based
library services is the most important criterion for a library’s ability to cope with
rising user expectations and rapid developments in the information sector. Fur-
ther education of staff has become a continuous task.
But developing and offering training courses for library staff will involve
considerable effort and input of resources. Therefore, libraries should be able to
show at least basic data about input and output of their training activities. Judg-
ing from national library statistics it seems that libraries are only recently start-
ing to collect data about the number, duration, and costs of staff training lessons
and the number of attendants. If possible, they should also try to assess the effect
and impact of staff training activities by satisfaction surveys and by tests of the
attendants’ skills and competences before and after training.
The indicator described here concentrates on the amount of library training
per staff member. It was chosen because of its practicality and its suitability for
benchmarking purposes.
Definition of the indicator
The number of attendance hours of staff members at formal training lessons
during one year divided by the total number of library staff at the end of the
year.
Formal training lessons in the sense of this indicator are pre-planned lessons
which can be held in-house or externally and can be hosted by library staff or
external experts.
Online lessons by an expert from outside the library are included. Conference
visits are excluded. Informal training, e.g. point-of-use training, is excluded.
Library staff includes all persons working in return for payment in the li-
brary. Volunteers are excluded. For this indicator, the number of library staff
members is counted in persons, not in FTE (full-time equivalent).
As a subset, the indicator counts the number of attendances at training les-
sons per staff member.
The indicator does not measure the quality or the impact of the training.

D.3 Attendances at training lessons per staff member
243
Aims of the indicator
The indicator assesses the improvement of library staff skills by attending train-
ing lessons and the priority that the library gives to staff training and therewith
to the library’s ability to cope with new developments.
The indicator is relevant for all libraries.
Comparison of results between libraries with similar mission and structure is
possible.
Method
Count the number of attendants at each training lesson and the duration of each
training lesson. A training lesson of 3 hours with 12 staff attendants would be 36
attendance hours. The numbers are accumulated at the end of the year.
The total number of attendance hours is divided by the total number of li-
brary staff (persons). The total number of library staff includes part-time staff
and project staff, temporary staff, student assistants etc., but excludes volun-
teers. The number of persons, not FTE (full-time equivalent), is chosen for this
indicator, as training attendance will be important for all persons in the library,
and as it is important to know how many persons attended training lessons. A
high number of attendances at formal training lessons may, however, involve the
same staff members.
As a subset, the number of attendance hours at training lessons on electronic
services and information technology could be counted.
Interpretation and use of results
A high score will be generally seen as good; only an extremely high score might
also be seen as affecting the time available for the library’s services. A low
score, especially in comparison with libraries of similar mission and structure,
points to the need of intensifying staff training.
The indicator will be affected by the number of training lessons offered and
by the quality of the training. The quality of the lessons should be monitored by
satisfaction questionnaires and/or by tests that assess the learning outcome.
The indicator will also be influenced by the library’s introducing new ser-
vices during the reporting year, e.g. a new cataloguing system that requires more
training.
In case of low attendance at training lessons, the library could
• promote the training lessons via its intranet or personal invitation,

5. List of indicators
244
• survey staff as to their need and preference of certain topics for training
lessons,
• adapt the training to special target groups of staff members,
• improve the quality of training.
A high number of attendance hours at training lessons per staff member do not
mean that every staff member attended the training to the same degree. The
same persons may have attended many training lessons.
As the indicator does not include informal training, it may undervalue the
amount of training attendance per staff member.
Examples and further reading
Libraries assess the amount of staff training in different ways:
• Hours of training per staff member
• Days of training per staff member (hours calculated in days)
• Percentage of staff members who received training during the year
• Number of training lessons per staff member
The German benchmarking project (BIX. Der Bibliotheksindex) uses the indica-
tor “training days per staff member” for academic libraries, summing up the
attendance hours to working days. The number of training days is divided by the
number of regular staff (staff in the position chart) in FTE (full-time equivalent).
The results in 2005 were (BIX, 2006):
Training days per staff member mean maximum minimum
Universities of applied sciences 3,5 13,8 1,0
Universities: One-tier systems 2,7 9,5 0,9
Universities: Two-tier systems (only the central library considered)
2,8 5,4 1,1
The Finnish university libraries had in 2005 a total of 1.350 staff members (in-
cluding all staff), of which 1.154 = 85.5 % received training during the year
(Finnish research library statistics database). The libraries counted 5.889 “days
of staff training”, which would be 4,36 days per staff member.
The Bavarian libraries in universities of applied sciences use the indicator
“number of training attendances per staff member” (Indikatoren für Fach-
hochschulbibliotheken, 2000). The number of training attendances is divided by
the number of regular staff (staff in the position chart) in FTE (full-time equiva-
lent). The mean result in 2000 was 6,6 attendances per staff member.

D.3 Attendances at training lessons per staff member
245
The number of training attendance hours might also be compared to the total
staff working hours during the year in order to assess the percentage of work
time devoted to staff training.
The German benchmarking project BIX has an indicator “ratio of staff train-
ing” for public libraries that calculates the percentage of training attendance
hours of the total staff working hours during a year, including work hours of
project staff and volunteers. Staff training in this indicator includes conference
visits. The results in 2005 were (BIX, 2006):
Ratio of staff training
(Percentage of training hours of the total working hours)
mean maximum minimum
Libraries in communities under 15.000 inhabitants 1,6 5,8 0,1
Libraries in communities from 15.000 to 30.000 inhabitants 0,9 2,3 0,0
Libraries in communities from 30.000 to 50.000 inhabitants 1,2 3,0 0,1
Libraries in communities from 50.000 to 100.000 inhabi-tants
1,0 2,7 0,2
Libraries in communities over 100.000 inhabitants 1,3 3,6 0,2
There seems to be no difference between libraries in smaller or larger communi-
ties.
The benchmarking project of the Netherlands university libraries does not
measure attendances at training lessons, but the expenditure for staff training,
excluding conference visits. In 2004 there was an average of 36.400 € of such
expenditure for 12 reporting libraries (UKB, 2004).
________________________________________________________________
BIX. Der Bibliotheksindex, available at: http://www.bix-bibliotheksindex.de/
BIX. Der Bibliotheksindex (2006), B.I.T. online Sonderheft 2006
Finnish research library statistics database, Helsinki University Library, available at:
https://yhteistilasto.lib.helsinki.fi/language.do?action=change&choose_language=3
Indikatoren für Fachhochschulbibliotheken – Beispiel Bayern (2000), available at:
http://www.fh-bibliotheken-bayern.de/projekte/indikatoren.shtml
UKB (2004), Benchmarking, Samenwerkingsverband van de Nederlandse
universiteitsbibliotheken en de Koninklijke Bibliotheek, results only available to
participants

5. List of indicators
246
D.4 Percentage of library means received by special grants or
income generation
Background
In the last years, most library budgets have been stagnant and have not been
adapted to rising prices and new tasks of the libraries. In addition, there is often
no longer a fixed budget that the library can rely on in its planning. It will there-
fore be crucial for libraries to try for additional financial resources from institu-
tions or private persons outside its financing authority. Such resources could be
obtained via project grants, sponsoring, or income generated by the library.
The library’s success in gaining additional funds can be seen as an indicator
for the library’s ability to cope with financial restraints and for enlarging its
scope for development.
Definition of the indicator
The percentage of all library means in the reporting year received by special
grants or income generated.
The overall library means include means from the funding institution and ex-
ternal means, also means for capital expenditure.
The means received by special grants or income generated include means for
capital expenditure if they were not paid by the funding institution.
Special grants in the sense of this indicator are grants of a non-recurrent na-
ture to fund major projects, e.g. a cost analysis project or the test of a chat refer-
ence service. Continuous funding by external bodies for special tasks of the
library (e. g. maintaining a centre for library education) is not considered as
special grant, but included in the overall library means.
Income generated by the library includes income from fees, charges, dona-
tions, and income generated by special activities like a library shop or adver-
tisements.
Aims of the indicator
The indicator assesses the library’s success in obtaining additional funding via
projects or income generation and therewith its ability to gain scope for neces-
sary developments.

D.4 Percentage of library means received by special grants or income generation
247
The indicator is relevant for all libraries.
Comparison of results between libraries with similar mission and structure is
possible, if differences in the funding institutions are taken into account, and if
the income is calculated in the same way.
Method
Determine the overall means of the library, including means for capital expendi-
ture. As a subtotal, determine the means obtained by income generation and
special grants, including those means for capital expenditure that were not paid
by the funding institutions.
Calculate the percentage of the total means obtained by special grants and in-
come generation.
In order to get a more detailed view, the different groups of income could be
assessed separately:
• Percentage of library means received by special grants
• Percentage of library means received by fees and charges
• Percentage of library means received by donations
• Percentage of library means received by income generated by special li-
brary activities
Interpretation and use of results
A higher score is usually considered as good, as it shows that the library is suc-
cessful in obtaining additional means on its own initiative. The indicator can
also show the extent to which the library is involved in tasks that go beyond its
main mission and therefore qualify for extra means. But this interpretation is
doubtful if the largest part of the additional income results from fixed fees and
charges that do not indicate additional effort of the library.
The score will be greatly influenced by the financing conditions for libraries
in the country or region, e. g.
• whether there are central institutions where libraries can apply for special
grants,
• whether libraries can or must take fees for all services or for special ser-
vices,
• whether libraries can use the total income from fees and charges for them-
selves or must deliver it to the funding institutions.
The indicator may also be influenced by the national tax laws concerning dona-
tions that make it more or less advantageous for sponsors to support a library.

5. List of indicators
248
If the library’s normal budget decreases and the library’s income from spe-
cial grants and income generated keeps constant, this will lead to a higher score
without additional initiatives of the library.
Because of the differing legal and political conditions, it will be problematic
to compare the results of this indicator between libraries in different countries.
Examples and further reading
The German benchmarking project BIX (BIX. Der Bibliotheksindex) uses the
indicator “percentage of library means received by external funding, special
grants and income generation” for academic libraries. This includes continuous
external funding for special tasks of the libraries. The results in 2005 were (BIX,
2006):
Percentage of library means received by
external funding, special grants and in-
come generation
mean maximum minimum
Universities of applied sciences 4,8 24,6 0,0
Universities: One-tier systems 5,8 17,2 0,8
Universities: Two-tier systems (only the central library considered)
8,8 36,9 0,8
The statistics of the UK academic libraries count the total library expenditure
and the income generated, which includes special grants. The statistics of
2004/05 show for all academic libraries an expenditure of 500.005.000 £ and an
income generated of 70.442.000 £, which is 14,09 % (Creaser, 2006, p.129).
The Swedish libraries in institutions of higher education had in 2005 a total
income of 1.555.261 (in 1.000 SEK) and 78.414 (in 1.000 SEK) by special
grants and income generated, which is 5,04 % (Forskningsbiblioteken, 2005,
p.38).
The Netherlands university libraries use the indicator “percentage of own
revenues of the total library expenditure” (UKB, 2004). The own revenues in-
clude fees and charges, special grants, donations, and income generated by spe-
cial activities like document delivery. In 2004, the libraries had an average own
revenue of 14,85 %.
The public libraries of British Columbia, Canada, had in 2003 a total revenue
of 153.553.679 CAD, of which 7,42 % were project grants, donations, and in-
come generated (Ministry of Education, British Columbia, 2004).

D.4 Percentage of library means received by special grants or income generation
249
A report by OCLC showed the situation of public libraries’ income in 2001
for 29 countries (Wilson, 2004): “For all countries covered, public funding is the
primary source of library funding, comprising 87 percent of funding on aver-
age... User fees and charges represent 4 percent of library funding on average,
with the remainder of resources coming from the miscellaneous ‘other’
sources.”
The examples show that the calculation varies considerably in the library sta-
tistics and that it is difficult to compare results between countries or library
types.
________________________________________________________________
BIX. Der Bibliotheksindex, available at: http://www.bix-bibliotheksindex.de/
BIX. Der Bibliotheksindex (2006), B.I.T. online Sonderheft 2006
Creaser, C., Maynard, S. and White, S. (2005), LISU annual library statistics 2005, featuring
trend analysis of UK public and academic libraries 1994 – 2004, LISU, Loughborough
University, available at:
http://www.lboro.ac.uk/departments/dils/lisu/downloads/als05.pdf
Finnish research library statistics database, Helsinki University Library, available at:
https://yhteistilasto.lib.helsinki.fi/language.do?action=change&choose_language=3
Forskningsbiblioteken 2005 (2005), KB/Bibsam och SCB, Sveriges officiella statistik,
available at:
http://www.scb.se/statistik/_publikationer/KU0102_2005A01_BR_KUFT0601.pdf
Ministry of education, British Columbia, Public Library Services Branch (2004), British
Columbia public library statistics 2003, available at:
http://www.bced.gov.bc.ca/pls/bcplstats_2004.pdf
UKB (2004), Benchmarking, Samenwerkingsverband van de Nederlandse
universiteitsbibliotheken en de Koninklijke Bibliotheek, results only available to
participants
Wilson, A. ed. (2004), The OCLC 2003 environmental scan: pattern recognition, A report to
the OCLC membership, available at: http://www.oclc.org/reports/escan/toc.htm

5. List of indicators
250
D.5 Percentage of institutional means allocated to the library
Background
For offering high quality services to their users, libraries need financial re-
sources that are adequate to their mission, tasks and clientele. Without adequate
funding, the quality of service delivery may diminish, and even if the library
finds ways of coping with budget cuts and keeping up its service quality, it will
not be able to invest into necessary developments. In a time of rapidly changing
information channels and information types, it is especially important for librar-
ies that their budgets allow introducing new web-based services and investing
into electronic collections.
In the last years, most library budgets have been stagnant and have not been
adapted to rising prices and new tasks of the libraries. In addition, there is often
no longer a fixed budget that the library can rely on in its planning. The library
must compete for resources with other claimants in its funding institution, e.g. in
universities with the faculties or the computer centre, in communities with other
cultural institutions like museums or theatres.
Therefore the library’s success in gaining sufficient funding from its parent
institution can be seen as an indicator for the importance of the library in the
institution and for the library’s ability to cope with emerging new services and
future development.
Definition of the indicator
The percentage of institutional means allocated to the library.
The institutional means, in the sense of this indicator, include the total budget
of the parent institution in the reporting year, but exclude third-party funds (ex-
ternal funds for special purposes) and possible rests of the previous year.
The means of the library, in the sense of this indicator, are all funds received
from the institution during the reporting year, including funding for capital ex-
penditure and one-time funding. External funding, e.g. from other public
sources, or from corporate or private sources (including donations) is excluded.
Income generated by the library, e.g. from fees, charges, or by a library shop, is
excluded.
The indicator does not consider external funding and income generated, as its
object is to set the library’s budget in relation to the institution’s budget.

D.5 Percentage of institutional means allocated to the library
251
Aims of the indicator
The indicator assesses what part of its budget the institution allocates to its li-
brary and therewith the priority the institution gives to the library.
The indicator is most valuable for libraries of an institution of higher educa-
tion. Comparison between integrated library systems and two-tier systems with
many departmental libraries may be difficult.
Public libraries may adapt this indicator to obtain the percentage of public
means allocated to the library from the total budget of their funding authority.
Comparison of results between libraries with similar mission and structure is
possible, if the institutional and library means are calculated in the same way.
Method
Define the total means of the library (including capital expenditure and one-time
funds received from the institution, excluding external funding and income gen-
erated by the library) in the reporting year.
Define the total means of the institution (excluding third-party funds and
rests of the previous year) for the same period.
Calculate the library means as percentage of the institutional means.
Interpretation and use of results
A higher percentage will be considered as good. It indicates that the funding
institution acknowledges the library’s value for the institution and its financial
needs and may allow the library to offer better services to its users.
This indicator will be influenced by the existence of external funding bodies
and structures (e.g. governmental means). It will also be influenced by special
tasks of the library with a high amount of funding, e.g. special collections
funded by an external institution..
Examples and further reading
The German benchmarking project BIX (BIX. Der Bibliotheksindex) uses the
indicator in the sense described here for academic libraries. The results in 2005
were (BIX, 2006):
Library means as percentage of institutional
means
mean maximum minimum
Universities of applied sciences 4.8 19.0 1.9

5. List of indicators
252
Universities: One-tier systems 6.0 10.9 1.2
Universities: Two-tier systems (only the central library considered)
4.2 7.3 1.7
The percentage seems to be lower for libraries in two-tier systems, but there the
means of faculty and institute libraries are not considered.
The statistics of the UK academic libraries show the proportion of total insti-
tutional expenditure spent on the library (Creaser, Maynard and White, 2005,
p.119). The results for 1993/94 and 2003/04 were:
1993/94 2003/04
Old universities 2.9 % 2.8 % New universities 3.8 % 3.5 % Higher education colleges 3.3 3.2
In all UK academic libraries, the percentage decreased slightly during the 10
years.
The benchmarking project of the Netherlands university libraries calculates
library expenditure as percentage of the university’s expenditure (UKB, 2004).
In 2004, 11 libraries delivered data for this indicator. The average was 3.09 %.
No example was found for public libraries. A report by OCLC showed the
situation of public libraries’ income in 2001 for 29 countries (Wilson, 2004):
“For all countries covered, public funding is the primary source of library fund-
ing, comprising 87 percent of funding on average.”
The examples show that the percentage differs between types of libraries and
between methods of calculation (budget or expenditure).
________________________________________________________________
BIX. Der Bibliotheksindex, available at: http://www.bix-bibliotheksindex.de/
BIX. Der Bibliotheksindex (2006), B.I.T. online Sonderheft 2006
Creaser, C., Maynard, S. and White, S. (2005), LISU annual library statistics 2005, featuring
trend analysis of UK public and academic libraries 1994 – 2004, LISU, Loughborough
University, available at:
http://www.lboro.ac.uk/departments/dils/lisu/downloads/als05.pdf
UKB (2004), Benchmarking, Samenwerkingsverband van de Nederlandse
universiteitsbibliotheken en de Koninklijke Bibliotheek, results only available to
participants

D.5 Percentage of institutional means allocated to the library
253
Wilson, A. ed. (2004), The OCLC 2003 environmental scan: pattern recognition, A report to
the OCLC membership, available at: http://www.oclc.org/reports/escan/toc.htm


255
Annex 1: Calculating costs
This handbook includes several indicators that compare the use of library ser-
vices to costs in order to show the cost-effectiveness or efficiency of the library.
“Costs” in the indicators can have different meanings: costs of an electronic
resource, total cost of the library or unit costs (cost of a single product or ser-
vice).
Costs of electronic resources
The indicator
• C.6 Cost per download
calculates the costs of the individual electronic resource (a database, an elec-
tronic journal, a digital document) and compares them to the number of
downloads. These costs include the subscription or licensing costs paid by the
library for that resource during a specified time, usually a year. Pay-per-view
costs are excluded.
The calculation of such costs is comparably easy, but there may be some
problems:
• Electronic versions of a document could be acquired in a package with the
print version of the document. If the costs for each version cannot be
clearly separated, such documents should be excluded in this indicator.
• Electronic documents are sometimes acquired in bundles (e.g. all serials
of one publisher, subject bundles of e-books), especially in consortia
agreements. In that case, the bundle price could be divided by the number
of documents in the bundle
Total costs of the library
The following indicators compare the total costs of the library to the number of
library users or the quantity of library use:
• C.1 Cost per user
• C.2 Cost per visit
• C.3 Cost per use
“Total costs” in the sense of these indicators means the total operating or recur-
rent expenditure of the library.
This includes expenditure on
• staff,
• collection building and maintenance,

Annex 1: Calculating costs
256
• operations and maintenance of the computer network,
• library administration (e.g. maintenance and repair of equipment, materi-
als, communication).
It is irrelevant for the calculation whether the expenditure was transacted out of
means received from the parent institution or out of external funding or income
generated by the library.
Capital expenditure - expenditure for new buildings, new computer systems,
etc. - is not included in the calculation as such expenditure varies greatly over
years. The intention of the indicators is to compare the yearly costs of running
the library to the use of library services.
In reality, the total operating expenditure of a library would also include:
• utility costs like heating, electricity, water, sewage, cleaning, security,
• calculatory depreciations of assets (buildings, IT- and other equipment).
These costs are usually "hidden" costs, as they do not appear on the library's
bills or payrolls. Utility costs are often paid by the library’s parent institution,
not by the library itself. They must be split up in order to define the library's
part, and this might prove difficult.
Calculatory depreciation means that a minimum useful life-time is defined
for groups of assets, e.g. 4 years for a computer or 20 years for a library build-
ing. The purchase price is then divided by the number of years of useful life-
time, and for each of these years the annual depreciation can thus be calculated.
But depreciation costs are calculated differently in countries and even in many
institutions, so that comparison of the indicator scores would be difficult.
Therefore, when “total costs” are used as dataset for the indicators in this
handbook, only the operating or recurrent expenditure of the library is calcu-
lated, excluding utility costs and depreciations. This will in many cases be
equivalent to the library’s yearly budget and will be most interesting to the fund-
ing institution.
Unit costs of a product or service
For many reasons, libraries need data about the costs of their products. Espe-
cially financing authorities often ask for the cost of one loan, document delivery,
or catalogue entry. This handbook offers one indicator for “unit costs”:
• C.5 Cost per document processed
Calculating all costs associated with the production of a single product or ser-
vice requires time cost analysis for the activities connected with the product or
service.

Annex 1: Calculating costs
257
The unit costs could be calculated in two different ways, both including time
cost analysis.
1. Only the staff costs are considered.
To obtain the number of hours spent on producing specified services or
products (e.g. bibliographic records, loans, reference answers) staff in-
volved in these services (cataloguing, lending, reference) note the time
they spend on this task during a sample period. Thus, the proportion of
time that every employee dedicates to this special service (cataloguing,
lending, and reference) can be calculated in hours. If time logging is not
possible, this proportion could, instead, be estimated.
The hours are then multiplied with the cost per hour of labour (wages di-
vided by the regular working time of the relevant staff), and the result is
divided by the number of “units” produced (titles catalogued, loans trans-
acted, reference questions answered) during the sampling period. Thus,
the unit costs for one title catalogued, one loan or one reference answer
can be calculated.
2. If the library wants to assess not only staff costs, but all costs directly as-
sociated with a product or service, all operating cost as shown before must
be included.
The total operating costs of the library are assigned to “cost centres” or
working areas of the library, in these examples to the cataloguing or proc-
essing department, the lending department or the reference service. Some
costs can be assigned directly to each cost centre, for instance the staff
costs in media processing. Other indirect costs like the costs of informa-
tion technology must be assigned by using keys. Information technology
costs could be calculated according to the number of computers in the cost
centre.
As in method 1, the proportion of time that every employee spends on the
specified service (cataloguing, lending, reference) is calculated by time-
logging. The total operating costs of the cost centre are then allocated to
cataloguing, lending, or reference according to the percentage of staff
time spent on these services. The result is divided by the number of
“units” produced (titles catalogued, loans transacted, reference questions
answered) to obtain the unit costs.

Annex 1: Calculating costs
258
Example
Costs of the cost centre "media processing" 188.000,00 € Costs of the activity "cataloguing" 67.716,00 € Number of titles catalogued 5.232 Total costs of one title catalogued 12,94 €
Further information as to cost analysis in libraries is given in:
Ceynowa, K., Coners, A. (2003), Cost management for university libraries, IFLA Publications
104, Saur, München
Heaney, M. (2004), Do users get what they pay for? A resource allocation model for Oxford
University library services, World Library and Information Congress: 70th IFLA General
Conference and Council, available at: http://www.ifla.org/IV/ifla70/papers/179e-
Heaney.pdf
Poll, R. (2000), The costs of quality: cost analysis and cost management as counterpart to
performance measurement, Proceedings of the 3rd
Northumbria International Conference
on Performance Measurement in Libraries and Information Services, Newcastle upon
Tyne, Information North, pp. 43-52
Roberts, S. A. (1998), Financial and cost management for libraries and information services,
2nd ed., Bowker-Saur, London.
Snyder, H. and Davenport, E. (1997), Costing and pricing in the digital age, a practical guide
for information services, Library Association, London
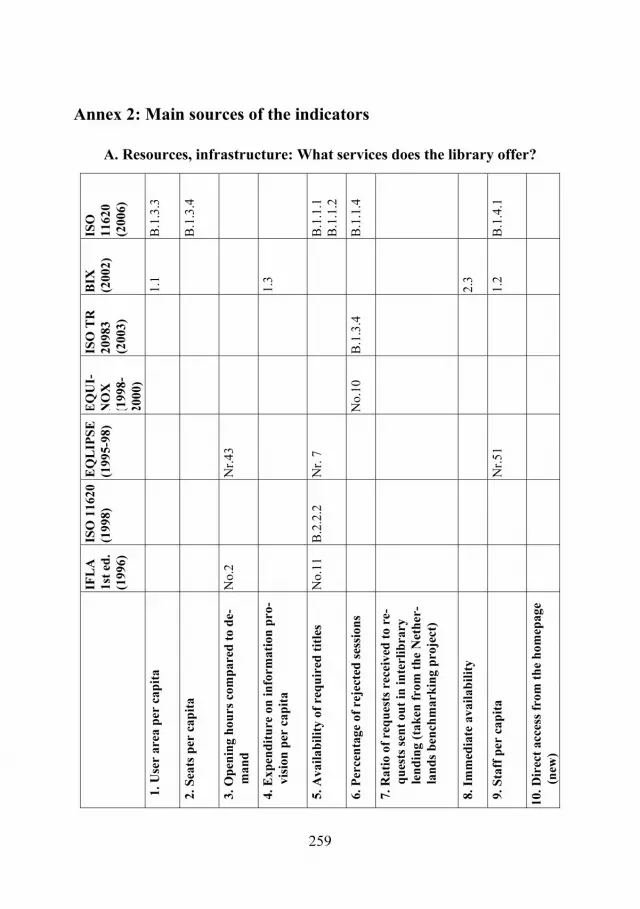
259
Annex 2: Main sources of the indicators
A. Resources, infrastructure: What services does the library offer?
ISO
11620
(2006)
B.1
.3.3
B.1
.3.4
B.1
.1.1
B.1
.1.2
B.1
.1.4
B.1
.4.1
BIX
(2002)
1.1
1.3
2.3
1.2
ISO
TR
20983
(2003)
B.1
.3.4
EQ
UI-
NO
X
( 1998-
2000)
No.1
0
EQ
LIP
SE
(1995-9
8)
Nr.
43
Nr.
7
Nr.
51
ISO
11620
(1998)
B.2
.2.2
IFL
A
1st
ed
.
(1996)
No.2
No.1
1
1
. U
ser
are
a p
er c
ap
ita
2. S
eats
per
cap
ita
3. O
pen
ing h
ou
rs c
om
pare
d t
o d
e-
man
d
4. E
xp
end
itu
re o
n i
nfo
rmati
on
pro
-
vis
ion
per
cap
ita
5. A
vail
ab
ilit
y o
f re
qu
ired
tit
les
6. P
erce
nta
ge
of
reje
cted
ses
sion
s
7. R
ati
o o
f re
qu
ests
rec
eived
to r
e-
qu
ests
sen
t ou
t in
in
terl
ibra
ry
len
din
g (
tak
en f
rom
th
e N
eth
er-
lan
ds
ben
chm
ark
ing p
roje
ct)
8. Im
med
iate
avail
ab
ilit
y
9. S
taff
per
cap
ita
10. D
irec
t acc
ess
from
th
e h
om
epage
(new
)

Annex 2: Main sources of the indicators
260
B. Use: How are the services accepted? IS
O
11620
(2006)
B.2
.4.1
B.2
.4.2
B.2
.2.1
B.2
.3.1
B.2
.1.4
B.2
.1.1
B.2
.1.3
B.2
.1.2
B.2
.2.4
B.2
.2.6
B.2
.2.5
BIX
(2002)
in t
est
2.1
Pu
bli
c
libra
ries
2.2
ISO
TR
20983
(2003)
B.1
.5.1
EQ
UI-
NO
X
(1998-
2000)
No.4
No.1
2
EQ
LIP
SE
(1995-9
8)
Nr.
2
Nr.
1
Nr.
4
Nr.
42
Nr.
24
Nr.
29
Nr.
25
Nr.
36
Nr.
50
ISO
11620
(1998)
B.2
.1.1
B.1
.1.1
B.2
.1.3
B.2
.9.3
B.2
.4.1
B.2
.4.2
IFL
A
1st
ed
.
(1996)
No.1
No.1
6
No.4
No.6
1. M
ark
et p
enet
rati
on
2. U
ser
sati
sfact
ion
3. L
ibra
ry v
isit
s p
er c
ap
ita
4. S
eat
occ
up
an
cy r
ate
5. N
um
ber
of
con
ten
t u
nit
s d
ow
nlo
ad
ed p
er c
ap
ita
6. C
oll
ecti
on
use
(tu
rnover
)
7. P
erce
nta
ge
of
stock
not
use
d
8
. L
oa
ns
per
ca
pit
a
9. P
erce
nta
ge
of
loan
s to
exte
rnal
use
rs
10. A
tten
dan
ces
at
train
ing l
esso
ns
per
cap
ita
11.R
efer
ence
qu
esti
on
s p
er c
ap
ita
12. A
tten
dan
ces
at
even
ts p
er c
ap
ita

Annex 2: Main sources of the indicators
261
C. Efficiency: Are the services offered cost-effectively? IS
O
11620
(2006)
B.3
.4.1
B.3
.1.4
B.3
.3.3
B.3
.1.3
B.3
.2.1
B.3
.2.2
B.3
.3.4
B.1
.2.2
B.1
.2.3
B.3
.3.2
B.1
.2.1
BIX
(2002)
3.1
3.2
3.3
ISO
TR
20983
(2003)
B.1
.3.3
EQ
UI-
NO
X
(1998-
2000)
No.6
EQ
LIP
SE
(1995-9
8)
Nr.
3
Nr.
5
Nr.
47
Nr.
48
Nr.
21
Nr.
34
Nr.
37
Nr.
23
ISO
11620
(1998)
B.2
.1.2
B.2
.1.4
B.3
.3.1
B.3
.1.1
B.3
.2.1
B.2
.3.1
B.2
.5.1
B.2
.6.1
IFL
A
1st
ed
.
(1996)
No.9
No.1
0
No.1
2
No.1
3
No.1
4
1. C
ost
per
use
r
2. C
ost
per
vis
it
3. C
ost
per
use
(n
ew)
4. R
ati
o o
f acq
uis
itio
ns
cost
s to
sta
ff c
ost
s
5. C
ost
per
docu
men
t p
roce
ssed
6. C
ost
per
dow
nlo
ad
7. A
cqu
isit
ion
sp
eed
8. M
edia
pro
cess
ing s
pee
d
9. E
mp
loyee
pro
du
ctiv
ity i
n m
edia
pro
cess
ing
10. L
end
ing s
pee
d
11. In
terl
ibra
ry l
oan
sp
eed
12. R
efer
ence
fil
l ra
te
13. S
hel
vin
g a
ccu
racy

Annex 2: Main sources of the indicators
262
D. Potentials and development: Are there sufficient potentials for future
development?
No indicators in IFLA (1996), ISO 11620 (1998) and EQLIPSE
Com
men
ts
ISO
TR
= a
tten
dan
ces
at I
T t
rain
ing
BIX
= d
ays
of
trai
nin
g
per
sta
ff m
ember
ISO
11620
(2006)
B.4
.1.1
B.4
.2.1
B.4
.2.2
B.4
.3.1
B.4
.3.2
BIX
(2002)
1.4
4.4
.
4.1
4.3
4.2
ISO
TR
20983
(2003)
B.1
.2.1
B.2
.2.1
B.2
.1.1
EQ
UIN
OX
(1998-2
000)
No.1
1
No.1
3
1. P
erce
nta
ge
of
acq
uis
itio
ns
exp
end
itu
re sp
ent
on
th
e el
ectr
on
ic c
oll
ecti
on
2. P
erce
nta
ge
of
lib
rary
sta
ff p
rovid
ing a
nd
dev
elop
ing e
lect
ron
ic s
ervic
es
3. A
tten
dan
ces
at
train
ing l
esso
ns
per
sta
ff
mem
ber
4. P
erce
nta
ge
of
lib
rary
mea
ns
rece
ived
by
spec
ial
gra
nts
or
inco
me
gen
erati
on
5. P
erce
nta
ge
of
inst
itu
tion
al
mea
ns
all
oca
ted
to
the
lib
rary
263
Selective bibliography
Handbooks and standards
Barton, J. and Blagden, J. (1998), Academic library effectiveness: a comparative approach,
British Library Research and Innovation Report 120, British Library Research and
Innovation Centre, Boston Spa
Bertot, J. C., McClure, C. R. and Ryan, J. (2001), Statistics and performance measures for
public library networked services, American Library Association, Chicago
Bertot, J. C., Ed. (2004), Planning and evaluating library networked services and resources,
Libraries Unlimited, Westport, Conn.
Bloor, I. G. (1991), Performance indicators and decision support systems for libraries: a
practical application of “Keys to success”, Library Research Paper 93, British Library
Research and Development Department, London
Brophy, P. (2006), Measuring library performance, Facet, London
Brophy, P. and Coulling, K. (1996), Quality management for information and library
managers, Aslib Gower,
Aldershot
Ceynowa, K. and Coners, A. (2002), Balanced Scorecard für wissenschaftliche Bibliotheken,
Zeitschrift für Bibliothekswesen und Bibliographie, Sonderheft 82, Klostermann, Frankfurt
a.M.
Edgren, J. et al. (2005), Quality handbook, performance indicators for library activities, The
Swedish Library Association’s Special Interest Group for Quality Management and
Statistics, available at:
http://www.biblioteksforeningen.org/sg/kvalitet/handbook_eng.html
Hernon, P. and Altman, E. (1996), Service quality in academic libraries, Ablex Publ.,
Norwood, NJ
Hernon, P. and Whitman, J. R. (2001), Delivering satisfaction and service quality: a customer
based approach for libraries, American Library Association, Chicago
ISO 2789 (2006), Information and documentation – International library statistics, 4th ed.,
International Organization for Standardization, Geneva
ISO DIS 11620 (2006), Information and documentation – Library performance indicators, 2nd
ed., International Organization for Standardization, Geneva
Selective bibliography
264
Kantor, P. B. (1984), Objective performance measures for academic and research libraries,
Association of Research Libraries, Washington, DC
Keys to success: performance indicators for public libraries; a manual of performance
measures and indicators developed by King Research Ltd. (1990), Library Information
Series 18, HMSO, London
Lancaster, F. W. (1993), If you want to evaluate your library…, 2nd ed., University of Illinois,
Graduate School for Library and Information Science, Champaign, Ill.
The effective academic library: a framework for evaluating the performance of UK academic
libraries; a consultative report to the HEFCE, SHEFC, HEFCW and DENI (1995),
HEFCE, Bristol
VanHouse, N. A. et al. (1987), Output measures for public libraries: a manual of standardized
procedures, 2nd ed., American Library Association, Chicago
VanHouse, N. A., Weil, B. T. and McClure, C. R. (1990), Measuring academic library
performance: a practical approach, American Library Association, Chicago
VanHouse, N. A. and Childers, T. (1993), The public library effectiveness study, the complete
report, American Library Association, Chicago
Ward, S. et al. (1995), Library performance indicators and library management tools, Office
for Official Publications of the European Communities, Luxemburg
Projects and conferences
Australian public libraries comparative report 1998 – 2004, available at:
http://www.nsla.org.au/publications/statistics/2004/pdf/NSLA.Statistics-20040701-
Australian.Public.Library.Comparative.Report.1998.2004.pdf
BIX. Der Bibliotheksindex, available at: http://www.bix-bibliotheksindex.de/
EQLIPSE. Evaluation and Quality in Library Performance: System for Europe (1995-1997),
available at: http://www.cerlim.ac.uk/projects/eqlipse/
EQUINOX. Library performance measurement and quality management system (1998-2000),
available at: http://equinox.dcu.ie/index.html
Forslag til indikatorer for fag- og folkebibliotek (2007), ABM-utvikling, Oslo, available at:
http://www.abm-utvikling.no/bibliotek/statistikk-for-bibliotek/indikatorer-for-fag-og-
folkebibliotek
Indikatoren für Fachhochschulbibliotheken – Beispiel Bayern (2000), available at:
http://www.fh-bibliotheken-bayern.de/projekte/indikatoren.shtml

Selective bibliography
265
Proceedings of the Northumbria International Conference on Performance Measurement in
Libraries and Information Services, 1 (1995) ff.
Report on the 1992 evaluation study of the Copenhagen Business School Library (1993),
Copenhagen Business School Library
UK higher education library management statistics 2003-2004 (2005), Sconul, London
UKB, Benchmarking, Samenwerkingsverband van de Nederlandse universiteitsbibliotheken
en de Koninklijke Bibliotheek, available at: http://www.ukb.nl/benchmark.htm
Articles
Brophy, P. (2002), Performance measures for 21st century libraries, Proceedings of the 4th
Northumbria International Conference on Performance Measurement in Libraries and
Information Services, Association of Research Libraries, Washington DC, pp. 1-7
Calvert, P. (2000), Integrated performance measures in New Zealand, Proceedings of the 3rd
Northumbria International Conference on Performance Measurement in Libraries and
Information Services, University of Northumbria, Newcastle upon Tyne, pp. 11-17
Cram, J. (2000), “Six impossible things before breakfast”: a multidimensional approach to
measuring the value of libraries, Proceedings of the 3rd
Northumbria International
Conference on Performance Measurement in Libraries and Information Services,
University of Northumbria, Newcastle upon Tyne, pp. 19-29
Crawford, J., Pickering, H. and McLelland, D. (1998), The stakeholder approach to the
construction of performance measures, Journal of Librarianship and Information Science
30,2, pp. 87-112
Cullen, R. J. (1998), Measure for measure: a post modern critique of performance
measurement in libraries and information services, IATUL Proceedings 8, available at:
http://iatul.org/conferences/pastconferences/1998proceedings.asp
Cullen, R. J., Calvert, P. J. (1995), Stakeholder perceptions of university library effectiveness,
Journal of Academic Librarianship 21,6, pp. 438-448
Derfert-Wolf, L., Górski, M. and Marcinek, M. (2005), Quality of academic libraries –
funding bodies, librarians and users, World Library and Information Congress, 71st IFLA
General Conference and Council, available at: http://www.ifla.org/IV/ifla71/papers/080e-
Derfert-Wolf.pdf#search=%22Derfert-Wolf%22
Ford, G. (2002), Strategic uses of evaluation and performance measurement, Proceedings of
the 4th
Northumbria International Conference on Performance Measurement in Libraries
and Information Services, Association of Research Libraries, Washington DC, pp. 19-30
Selective bibliography
266
Harer, J. B. and Cole, B. R. (2005), The importance of the stakeholder in performance
measurement: critical processes and performance measures for assessing and improving
academic library services and programs, College & Research Libraries 66, 2, pp. 149-170
Hernon, P. and Dugan, R. E. (2004), Different perspectives on assessment and evaluation: the
need to refine and link them, Proceedings of the 5th
Northumbria International
Conference on Performance Measurement in Libraries and Information Services,
Emerald, Bradford, England, pp. 23-30
Laeven, H. and Smit, A. (2003), A project to benchmark university libraries in the
Netherlands, Library Management 24, 6/7, pp. 291-304
Lambert, S., Willson, J. and Oulton, T. (1998), Use and interest in performance measures:
differences between library sectors, Proceedings of the 2nd
Northumbria International
Conference on Performance Measurement in Libraries and Information Services,
Information North, Newcastle upon Tyne, pp. 67-76
Pienaar, H. and Penzhorn, C. (2000), Using the balanced scorecard to facilitate strategic
management at an academic information service, Libri 50,3, pp. 202-209, available at:
http://www.librijournal.org/pdf/2000-3pp202-209.pdf
Poll, R. (1998), The house that Jack built: the consequences of measuring, Proceedings of the
2nd
Northumbria International Conference on Performance Measurement in Libraries and
Information Services, Information North, Newcastle upon Tyne, pp. 39-45
Poll, R. (2001), Performance, processes and costs: managing service quality with the balanced
scorecard, Library Trends 49,4, pp. 709-718
Poll, R. (2007), Benchmarking with quality indicators: national projects, Performance
Measurement and Metrics 8,1, pp. 41-53
Pors, N. O., Dixon, P. and Robson, H. (2004), The employment of quality measures in
libraries: cultural differences, institutional imperatives and managerial profiles,
Performance Measurement and Metrics 5,1, pp. 20-27
Poustie, K. (1995), A climate of change: performance measurement in Australian public
libraries, Proceedings of the1st Northumbria International Conference on Performance
Measurement in Libraries and Information Services, Information North, Newcastle upon
Tyne, pp. 43-49
Revill, D. (1983), Some examples and types of performance measures, in Blagden, J. (ed.),
Do we really need libraries: Proceedings of the first joint Library Association Cranfield
Institute of Technology conference on performance assessment, Cranfield Press,
Cranfield, pp. 59-66

Selective bibliography
267
Revill, D. (1990), Performance measures for academic libraries, in Kent, E. (ed.),
Encyclopedia of Library and Information Science, Vol.45, Suppl.10, Dekker, New York,
Basel, pp. 294 – 333
Revill, D. (2000), A polemic: what we still don’t know about performance, Performance
Measurement and Metrics 1,1, pp. 9-14
Self, J. (2003), From values to metrics: implementation of the balanced scorecard at a
university library, Performance Measurement and Metrics 4,2, pp. 57-63
Sumsion, J. (1999), Popularity ratings, core sets and classification of performance indicators,
Proceedings of the 3rd
Northumbria International Conference on Performance
Measurement in Libraries and Information Services, University of Northumbria,
Newcastle upon Tyne, pp. 247-252
Town, S. (1998), Performance or measurement? Performance Measurement and Metrics 1,1,
pp. 43-54
Willemse, J. (1995), The impact of performance measurement on library and information
services, Proceedings of the1st Northumbria International Conference on Performance
Measurement in Libraries and Information Services, Information North, Newcastle upon
Tyne, pp. 11-32
Winkworth, I. (1998), Making performance measurement influential, Proceedings of the 2nd
Northumbria International Conference on Performance Measurement in Libraries and
Information Services, Information North, Newcastle upon Tyne, pp. 93-97
Winkworth, I. and Gannon-Leary, P. (2000), Library performance measures: government
perspectives, Proceedings of the 3rd
Northumbria International Conference on
Performance Measurement in Libraries and Information Services, University of
Northumbria, Newcastle upon Tyne, pp. 61-65
Young, P. R. (2002), Electronic services and library performance: a definitional challenge,
Proceedings of the 4th
Northumbria International Conference on Performance
Measurement in Libraries and Information Services, Association of Research Libraries,
Washington DC, pp. 51-66


269
Index to the Indicators
As the structure of the Balanced Scorecard for the indicators might be confusing
to readers not familiar with it and as the names of indicators do not always
clearly explain what services are concerned, a short index was added, consider-
ing only the main contents of the indicators. It should be seen as possible help
for a quick search.
acquisition C. 7, C. 9
acquisitions expenditure A .4, C. 4, D. 1
active users B. 1
attendances at events B. 12
attendances at training
lessons
B. 10, D. 3
availability A. 5, A. 8
budget D. 4, D. 5
cataloguing C.5, C. 8, C. 9
closed stacks C. 10
collection use B. 6, B. 7, B. 8,
C. 3
content units B. 5, C. 3, C. 6
costs C. 1, C. 2, C. 3,
C. 4, C. 5, C. 6
downloads B. 5, C. 3, C. 6
electronic collection A. 6, D. 1
electronic services D. 2
events B. 12
expenditure (acquisi-
tions)
A. 4, C. 4, D. 1
expenditure (electronic
collection)
D. 1
external users B. 9
income D. 4, D. 5
information requests B. 11, C. 12
in-house use C. 3
interlibrary lending A. 7, C. 11
lending service C. 10
library building A. 1
library means D. 4, D. 5
library visits B. 3, C. 2
loans B. 1, B. 6, B. 7,
B. 8, B. 9, C. 3
opening hours A.3
processing C. 5, C. 8, C. 9
reference service B. 11, C. 12
seats A.2, B.4
sessions A. 6
shelving C. 13
speed C. 7, C. 8, C.
10, C, 11
staff A. 9, C. 9, D. 2
staff costs C. 4, C. 5
staff training D. 3
training lessons B. 10, D. 3
turnaways A. 6
turnover B.6
user area A.1
user satisfaction B. 2
user training B. 10
user workplaces A.2, B.4
visits B. 3, C. 2
website A. 10

K . G . s a u r
www.saur.de
Barbara B. Tillett / Jaesun Lee / Ana Lupe Cristán (Ed.)
n IFLa Cataloguing Principles: steps towards an International Cataloguing Code, 4Reports from the 4th IFLA Meeting of Experts on an International Cataloguing Code, Seoul, Korea, 2006
2007. Approx. 676 pp. Hc.€ 128.00 / *US$ 179.00IFLA members: € 98.00 / *US$ 137.00ISBN 978-3-598-24281-6(IFLA Series on Bibliographic Control, Vol. 32)
n IsBD: International standard Bibliographic DescriptionRecommended by the ISBD Review Group. Approved by the Standing Committee of the IFLA Cataloguing Section2007. 322 pp. Loose-leaf with ring binder.€ 84.00 / *US$ 118.00IFLA members: € 64.00 / *US$ 90.00ISBN 978-3-598-24280-9(IFLA Series on Bibliographic Control, Vol. 31)
Marie-France Plassard (Ed.)
n uNIMarC & Friends: Charting the New Landscape of Library standardsProceedings of the International Conference Held in Lisbon, 20–21 March 20062007. 133 pp. Hc. € 68.00 / *US$ 95.00IFLA members: € 48.00 / *US$ 67.00ISBN 978-3-598-24279-3(IFLA Series on Bibliographic Control, Vol. 30)
*For orders placed in North AmericaPrices are subject to change
IFLA Series on Bibliographic Control

K . G . s a u r
www.saur.de*For orders placed in North America
Prices are subject to change
Essentials for Library and Information Professionals
n IFLa Library Building Guidelines: Developments & reflectionsEdited on behalf of IFLA by Karen Latimer and Hellen Niegaard 2007. xxxii, 266 pp. Hc.€ 58.00 / *US$ 81.00ISBN 978-3-598-11768-8The information society and the information age are changing library services as well as library premises. This raises questions about what needs to be considered when planning and designing new library buildings in order to achieve attractive, efficient and future-oriented new library spaces.
n Marketing Library and Information services: International PerspectivesEdited on behalf of IFLA by Dinesh K. Gupta, Christie Koontz, Ángels Massísimo and Réjean Savard2006. xvi, 419 pp. Hc.€ 68.00 / *US$ 95.00ISBN 978-3-598-11753-4This book offers a userful tool for both working librarians and future librarians to under-stand vital issues relating to marketing of library and information services at the local, national, and international level.
n Handbook on the International Exchange of PublicationsEdited on behalf of IFLA by Kirsti Ekonen, Päivi Papoloski and Pentti Vattulainen5th completely revised edition2006. 158 pp. Hc.€ 54.00 / *US$ 76.00ISBN 978-3-598-11752-7The international exchange of publications continues to be an important mode of collec-tion building. This handbook addresses the changes which have taken place and provides practices, history, current examples, as well as a directory.

K . G . s a u r
www.saur.de
n LIBEr QuarTErLYThe Journal of European research LibrariesEdited by Trix Bakker on behalf of the Ligue des Bibliothèques Européennes de Recherche (LIBER)1 print volume p. a. Online quarterly. ISSN 1435-5205LIBER Quarterly offers in-depth reports on the practical aspects of library management and expert analysis of current developments within the information world. It helps li-brary managers to improve services, to understand new developments and to keep their professional skills right up to date.
n LibriInternational Journal of Libraries and Information servicesEdited by Nancy R. John, Ian M. Johnson and Svend Larsen4 issues p. a. Print and Online. ISSN 0024-2667Libri examines the many functions of libraries and information services from a histori-cal, cultural and political angle and looks at the role of information in cultural, organi-zational, national and international developments. For information specialists who want to see the larger picture, Libri opens up a wealth of new perspectives.
n Microform & Imaging reviewEdited by Ken Middleton4 issues p. a. Print and Online. ISSN 0949-5770This quarterly publication deals with practical and theoretical aspects of microform and digital imaging. Each issue also contains critical reviews of new microform and imaging projects, valuable resources when making acquisition decisions.
n restauratorInternational Journal for the Preservation of Library and archival MaterialEdited by Helmut Bansa4 print issues p. a. ISSN 0034-5806Restaurator reports on the latest advances in restoration technique from around the world. The journal keeps its focus firmly on specifics, favouring articles which give a clear and detailed presentation of technical procedures.
Please ask for our current journals pricelist.
Journals for Library and Information Professionals