Embed Size (px)
Citation preview

中華水土保持學報, 46(1): 61-69 (2015) 61 Journal of Chinese Soil and Water Conservation, 46 (1): 61-69 (2015)
Performance of Pitcher Irrigation with Saline Water under High Evapotranspiration Rates
Altaf Ali SIYAL* Shoukat Ali SOOMRO Abdul Ghafoor SIYAL
ABSTRACT Bottle gourd was cultivated with saline water, using pitcher irrigation at experimental field of
Sindh Agriculture University Tandojam, Pakistan. Ten unglazed baked clay pitchers with a water-holding capacity of
approximately 10 L were installed in soil. Two types of irrigation water—fresh water and saline water with salinities
of 1.2 dS m−1 (treatment T1) and 10 dS m−1 (treatment T2), respectively—were used to fill the pitchers. The choice of
pitchers and water type were randomized, and each treatment was repeated six times. The experimental results
showed that, compared with conventional surface irrigation methods, pitcher irrigation reduces water consumption by
approximately 82%–84%. In addition, water seepage in pitchers containing saline water was approximately 13.7%
lower than in those containing fresh water. The measured and simulated results showed that the maximum salt con-
centration was near the soil surface. Use of saline water resulted in a slight loss (approximately 22.2%) in the crop
yield. Although the plants were under dry stress when the surface evaporation rate reached 9 cm d−1, high crop
productivities of 13.12 kg m−3 and 11.81 kg m−3 were obtained with fresh and saline water, respectively. Pitcher irri-
gation is thus a novel irrigation method that can be effectively employed in arid regions where only saline water is
available.
Key Words : Bottle gourd, crop water productivity, salinity, subsurface, yield.
Introduction The rapidly growing human population has put a lot of pres-
sure on the available fresh water resources especially in the arid
and semi-arid regions of the world (Yensen, 2006). On one hand
the demand for food, fodder and fiber is increasing at an alarming
rate while on the other hand availably of fresh water resources,
needed for sustainable agriculture, is decreasing which has com-
pelled the farmers to explore the possibilities of using saline wa-
ter for irrigation purpose and use simple, easy to install and oper-
ate, low cost and efficient irrigation methods. The available
groundwater in most of the desert areas of Pakistan is brackish
(Geyh and Ploethner, 1995) which is not considered fit for irriga-
tion with conventional irrigation methods. Also the soils in these
areas are sandy to sandy loam having high infiltration rate, thus
generally require huge amounts of water for cultivation of any
crop. For those conditions, pitcher irrigation is considered an
efficient irrigation method for small scale irrigation for arid agri-
culture (Bainbridge, 2001) where fresh water is either scarce or
not enough for irrigated agriculture and where infiltration is rapid
and salinity is a problem (Bainbridge, 2002). The pitchers are
round earthen pots having capacity of 10 to 20 liters which are
commonly used for water storage and cooling in rural areas espe-
cially in South Asia.
Several studies were conducted (Mondal, 1978; Mondal, et
al., 1992; Okalebo et al., 1995; Gupta, 2002) on use of saline
water for irrigation using pitchers and good crop yields were re-
ported. It is said (Mondal, 1987; Vasudaven, et al., 2011) that
under pitcher irrigation, salt accumulates at the soil surface which
results in the salt concentration in the root zone water less than
that of water used in the pitcher for irrigation purpose. Thus, the
salt distribution in the plant root zone is considered more favora-
ble with pitcher irrigation than with any surface method of irriga-
tion. However, most of the studies were conducted during winter
or at moderate temperatures when the surface evaporation rates
were low. Hence, it needs to be tested that pitchers are capable of
meeting crop water requirements during high evaporation rates.
Therefore, it is of great interest to evaluate the performance of
pitcher irrigation in arid regions of the world having warm cli-
mate with high evaporation rates (such as desert areas of Pakistan)
and where plenty of saline groundwater is easily available for
irrigation purpose. Thus, the objective of the study was to assess
performance of pitcher irrigation with fresh and saline water un-
der high evaporation rates.
Materials and Methods
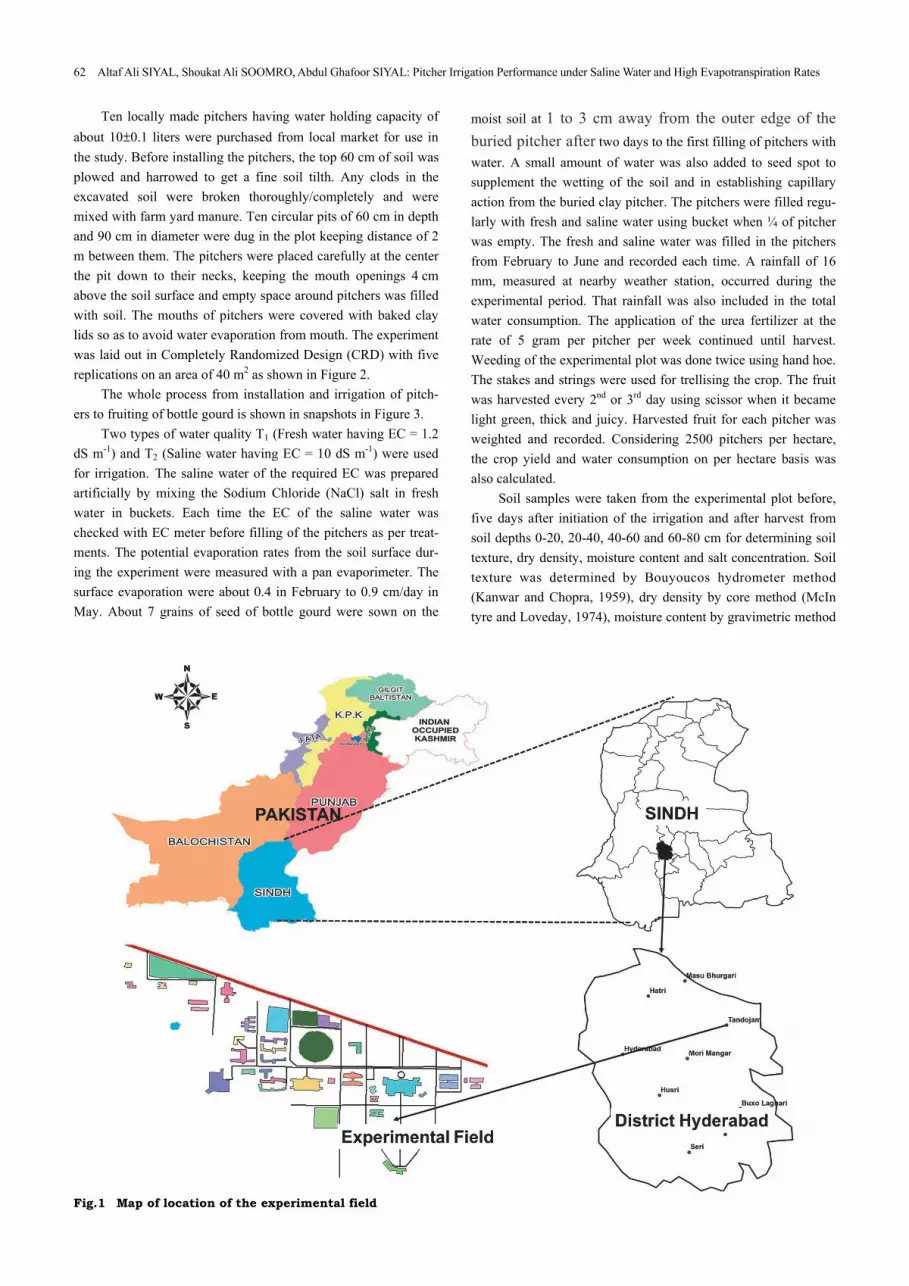
1. Field Experiment A field experiment was conducted at the experimental site of
Faculty of Agriculture Engineering, Sindh Agriculture University
Tandojam, Sindh, Pakistan during 2012. It is in arid region of the
world situated at a Latitude of 25o 25’ 28’’ N and Longitude of
68o 32’ 24’ E and at an elevation of about 26 m above Mean Sea
Level (MSL). The location of the experimental field is shown in
Figure 1.
Department of Land and Water Management, Sindh Agriculture University Tandojam, Pakistan. * Corresponding Author. E-mail : [email protected]
62 Altaf Ali SIYAL, Shoukat Ali SOOMRO, Abdul Ghafoor SIYAL: Pitcher Irrigation Performance under Saline Water and High Evapotranspiration Rates
Ten locally made pitchers having water holding capacity of
about 100.1 liters were purchased from local market for use in
the study. Before installing the pitchers, the top 60 cm of soil was
plowed and harrowed to get a fine soil tilth. Any clods in the
excavated soil were broken thoroughly/completely and were
mixed with farm yard manure. Ten circular pits of 60 cm in depth
and 90 cm in diameter were dug in the plot keeping distance of 2
m between them. The pitchers were placed carefully at the center
the pit down to their necks, keeping the mouth openings 4 cm
above the soil surface and empty space around pitchers was filled
with soil. The mouths of pitchers were covered with baked clay
lids so as to avoid water evaporation from mouth. The experiment
was laid out in Completely Randomized Design (CRD) with five
replications on an area of 40 m2 as shown in Figure 2.
The whole process from installation and irrigation of pitch-
ers to fruiting of bottle gourd is shown in snapshots in Figure 3.
Two types of water quality T1 (Fresh water having EC = 1.2
dS m-1) and T2 (Saline water having EC = 10 dS m-1) were used
for irrigation. The saline water of the required EC was prepared
artificially by mixing the Sodium Chloride (NaCl) salt in fresh
water in buckets. Each time the EC of the saline water was
checked with EC meter before filling of the pitchers as per treat-
ments. The potential evaporation rates from the soil surface dur-
ing the experiment were measured with a pan evaporimeter. The
surface evaporation were about 0.4 in February to 0.9 cm/day in
May. About 7 grains of seed of bottle gourd were sown on the
moist soil at 1 to 3 cm away from the outer edge of the
buried pitcher after two days to the first filling of pitchers with
water. A small amount of water was also added to seed spot to
supplement the wetting of the soil and in establishing capillary
action from the buried clay pitcher. The pitchers were filled regu-
larly with fresh and saline water using bucket when ¼ of pitcher
was empty. The fresh and saline water was filled in the pitchers
from February to June and recorded each time. A rainfall of 16
mm, measured at nearby weather station, occurred during the
experimental period. That rainfall was also included in the total
water consumption. The application of the urea fertilizer at the
rate of 5 gram per pitcher per week continued until harvest.
Weeding of the experimental plot was done twice using hand hoe.
The stakes and strings were used for trellising the crop. The fruit
was harvested every 2nd or 3rd day using scissor when it became
light green, thick and juicy. Harvested fruit for each pitcher was
weighted and recorded. Considering 2500 pitchers per hectare,
the crop yield and water consumption on per hectare basis was
also calculated.
Soil samples were taken from the experimental plot before,
five days after initiation of the irrigation and after harvest from
soil depths 0-20, 20-40, 40-60 and 60-80 cm for determining soil
texture, dry density, moisture content and salt concentration. Soil
texture was determined by Bouyoucos hydrometer method (Kanwar and Chopra, 1959), dry density by core method (McIn
tyre and Loveday, 1974), moisture content by gravimetric method
Fig.1 Map of location of the experimental field

中華水土保持學報,46(1), 2015 63
and ECe of soil saturation extract method using digital EC meter.
Due to the assumed symmetry of the wetted zone, two samples
for each depth on opposite sides of the pitcher at equal distance
were taken and were composite for data analysis. Water con-
sumption with respect to flood irrigation was determined by di-
viding difference in depth of water used by flood and pitcher
irrigation methods to that used under conventional flood irrigation
method. Crop Water Productivity (CWP) was calculated by di-
viding the crop yield with total water consumed by the pitcher.
2. Simulations with HYDRUS model Water flow and solute transport from the pitchers into soil
were also simulated using HYDRUS-2D model (Simunek et al.,
1999). The water flow and solute transport in HYDRUS-2D is
based on Richard’s equation given by:
( )= ht
K K
(1a)
for a two-dimensional isotropic medium like in our study
reduces to
( )( ) ( )
h h K h= K h K h
t x x y y y
(1b)
where x and y are the horizontal and the vertical coordinates
(L), t is time (T), θ is the soil water content on volumetric basis
(L3L-3), h is the pressure head (L), and K(h) is the soil unsaturated
hydraulic conductivity function (LT-1). The soil hydraulic proper-
ties i.e. water retention, θ(h), and hydraulic conductivity, K(h),
functions in Eq. (1b) can be designated using the equation (van
Genuchten, 1980):
01
0
rr n m
s
hhh
h
(2)
2
1/1 1ml m
s e eK h K S S (3)
where θr and θs are the residual and saturated soil water con-
tents (L3 L–3) respectively; Ks is the saturated hydraulic conduc-
tivity (L T–1); α is an empirical constant (L–1); n is an empirical
parameter which is related to the distribution of the pore-size (-);
is an empirical shape parameter; m = 1–1/n (-); and Se is the
effective saturation which can be determined using relation:
rs
reS
(4)
Solute transport can be described using the general advec-
tion-dispersion equation:
( )c
= c ct
D q
(5)
where c is the solution concentration (ML-3), q is the Dar-
cy-Buckingham soil water flux vector (LT-1), and D is the disper-
sion tensor (L2T-1).
Water and solute transport from the pitcher in a vertical
cross-section was simulated using a rectangular computational
flow domain. Because of symmetry, simply the right side of the
vertical cross section of the flow domain was simulated. The
computational flow domain was of size 80 cm x 80 cm, with a
pitcher like curved shape at the upper left corner where the pitch-
er was situated. A finite element mesh was generated with the
axis of symmetry along the left side of the flow domain as shown
in Fig 4.
There were two materials in the flow domain, i.e. a 1 cm
thick layer (pitcher material) along the curved boundary, and soil
material considered homogenous throughout profile. The nodes
representing the pitcher wall were given a constant pressure head,
with the pressure head equal to zero at the water surface in the
pitcher while it increased linearly with increasing depth such that
it was maximum at the bottom of the pitcher (equal to the depth
of the water in pitcher). A constant potential surface evaporation
rate of 0.4 cm d-1 and 0.9 cm d-1, for winter and summer respec-
tively (Ansari et al., 2013), was assigned to the soil surface
boundary, while the free drainage was set at the bottom boundary.
Hydraulic parameters (θr, θs, α, n and ) for nodes repre-
senting soil material were determined with the Rosetta pedo-
transfer function model (Schaap et al., 2001) that is associated in
HYDRUS model. Based on measured data of soil dry density and
percentages of sand, silt and clay, parameters for the sandy loam
soil were estimated to be: θr = 0.065, θs = 0.415, Ks = 104.5 cm
d-1, α = 0.074 cm-1, n = 1.88 and = 0.5. For pitcher, the Ks val-
ue of 0.076 cm d-1 was used in the simulations (for determination
of Ks of pitcher, please read Siyal et al. (2009)). While the re-
maining hydraulic parameters for the clay pitcher were taken as:
Fig.2 Experimental layout

64 Altaf Ali SIYAL, Shoukat Ali SOOMRO, Abdul Ghafoor SIYAL: Pitcher Irrigation Performance under Saline Water and High Evapotranspiration Rates
θs = 0.35, θr = 0.042, α = 0.000001 cm-1, n = 1.3 and = 0.5.
The small value of α was chosen assuming that the pitcher wall
will remain saturated throughout the simulations, and thus other
parameters of the pitcher wall material were not important.
The initial soil profile condition was quantified based on the
measured electrical conductivity (ECe) and water content of soil
samples taken before the experiment. Initial soil ECe at the bot-
tom of flow domain (z = 80 cm) was quantified as 1.3 dS m-1
which linearly increased to 1.34 dS m-1 at the surface (z = 0). The
field measured water contents were transformed into pressure
head values using the soil water retention characteristic given by
equation (2). The initial conditions were specified as per observed
values such that the pressure head increased linearly with soil
depth in the profile, from -1000 cm at the top (z = 0) to -500 cm at
the bottom (z = 80 cm).
Results and Discussions
1. Soil texture and dry density The results of soil analysis revealed that the texture of the
soil profile was sandy loam throughout the profile (0-80 cm)
which did not changed after the experiment (Table 1).
However, the relative percentage of clay soil separates
slightly decreased with increasing depth. After experiment, a
negligible variation in the relative percentage of the soil separates
Table 1 Soil texture and dry density of the profile before and after experiment
Soil Depth (cm) Before Experiment After Experiment
Sand % Silt % Clay % Textural Class Dry density (g cm-3) Sand % Silt % Clay % Textural Class Dry density (g cm-3)
0-20 58 23 19 Sandy Loam 1.42 60 22 18 Sandy Loam 1.44
20-40 55 27 18 Sandy Loam 1.39 56 24 20 Sandy Loam 1.41
40-60 60 25 15 Sandy Loam 1.41 58 26 16 Sandy Loam 1.41
60-80 62 26 12 Sandy Loam 1.40 59 26 15 Sandy Loam 1.38
Fig.3 Snapshots of the process of installation and irrigation of pitchers to fruiting of bottle gourd
中華水土保持學報,46(1), 2015 65
with depth was observed. It might be due to the effect of mixing
of soil during digging holes for pitchers’ installation. Soil dry
density before experiment was 1.42 g cm-3 which slightly de-
creased to 1.40 g cm-3. Similarly the dry density at other soil
depths also marginally decreased such that the average soil dry
density of the profile before experiment was 1.400.01 g cm-3
which decreased to 1.410.01 g cm-3. This may be due the effect
of human trafficking during filling of pitchers.
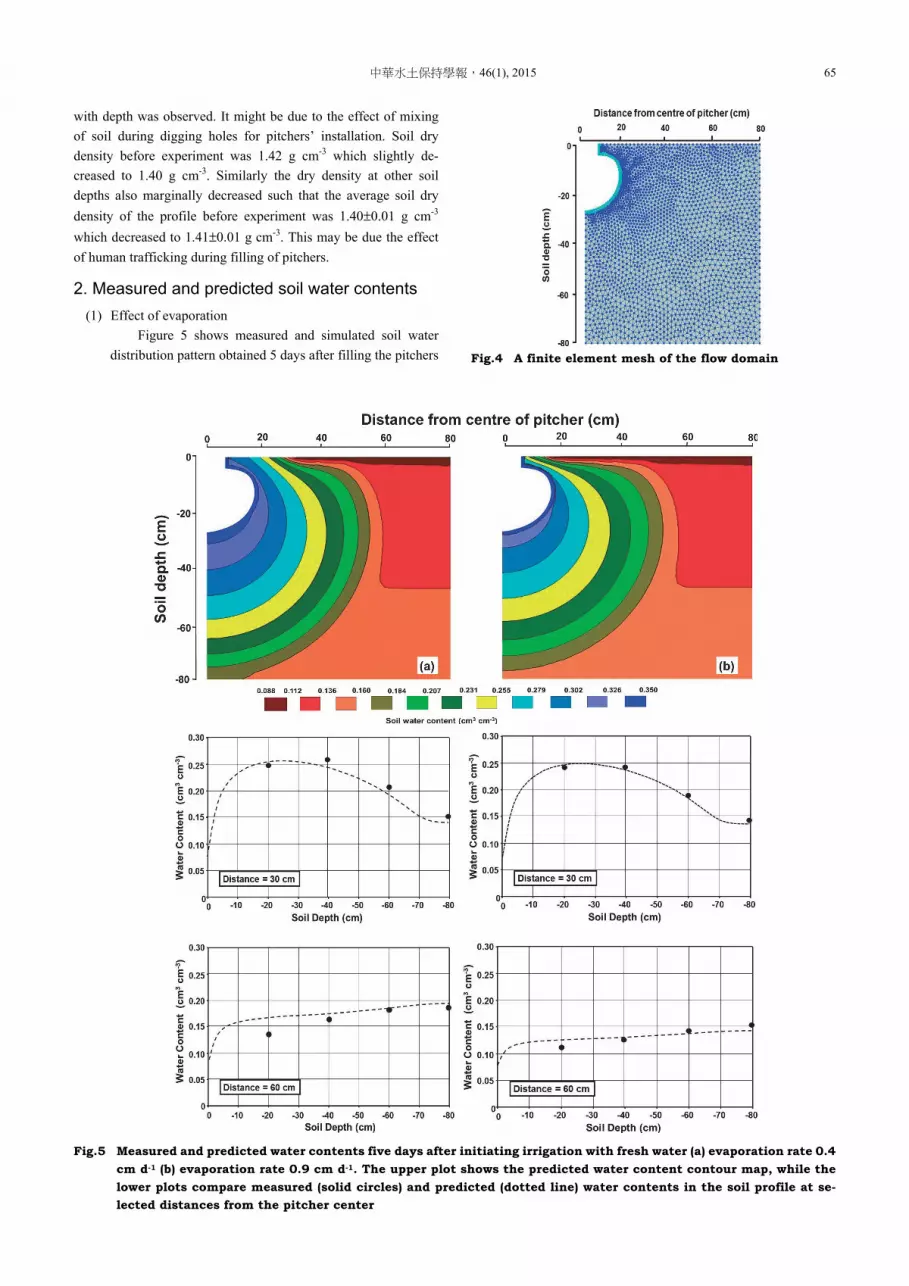
2. Measured and predicted soil water contents (1) Effect of evaporation
Figure 5 shows measured and simulated soil water
distribution pattern obtained 5 days after filling the pitchers
Fig.4 A finite element mesh of the flow domain
Fig.5 Measured and predicted water contents five days after initiating irrigation with fresh water (a) evaporation rate 0.4
cm d-1 (b) evaporation rate 0.9 cm d-1. The upper plot shows the predicted water content contour map, while the
lower plots compare measured (solid circles) and predicted (dotted line) water contents in the soil profile at se-
lected distances from the pitcher center

66 Altaf Ali SIYAL, Shoukat Ali SOOMRO, Abdul Ghafoor SIYAL: Pitcher Irrigation Performance under Saline Water and High Evapotranspiration Rates
with fresh water when evaporation rate was 0.4 cm d-1 (a)
and 0.9 cm d-1 (b).
In each figure, measured and predicted soil water
content at selected profile transects as well as simulated
water content profiles are shown. These plots clearly show
that water seeped from pitchers and wetted soil vertically
and horizontally more when surface evaporation rate was
less i.e. 0.4 cm d-1 compared to that of when evaporation
rate was high i.e. 0.9 cm d-1. It may be due to more water
losses from the soil surface as a result of evaporation when
evaporation rate was 0.9 cm d-1 compared to that of 0.4 cm
d-1 as depicted in the Figure 6. When potential surface
evaporation rate is 0.9 cm d-1, the simulated actual evapo
Fig. 6 Simulated actual surface evaporation for the po-
tential evaporation rate of 0.9 cm/day (Solid line)
and 0.4 cm d-1 (broken line)
Fig.7 Measured and predicted water contents five days after initiating irrigation with fresh (a) and saline water (b) at
evaporation rate of 0.4 cm d-1. The upper plot shows the predicted water content contour map, while the lower
plots compare measured (solid circles) and predicted (dotted line) water contents in the /soil profile at selected
distances from the pitcher center for irrigation with fresh and saline waters

中華水土保持學報,46(1), 2015 67
ration is about 0.1 cm d-1. Simulated actual evaporation
rate is 0.05 cm d-1 for potential surface evaporation rate of
0.4 cm d-1.
Under such condition, pitchers were incapable of to
meet plant water requirements. A dry stress was thus ob-
served from the physical appearance of bottle gourd plants
when the surface evaporation rate increased from 0.4 cm
d-1 to 0.9 cm d-1.
(2) Effect of saline water
To compare the effect of saline water on soil wetting
pattern, measured and simulated soil water distribution
patterns obtained 5 days after filling the pitchers with fresh
(a) and saline water (b) are plotted in Figure 7.
It shows that at the same evaporation rate (0.4 cm d-1) more
vertical and horizontal movement of seeped water occurred
when fresh water was used for irrigation in pitchers com-
pared to that of when saline water was used. Thus, the size
of wetting front in the soil decreased with increase salt
concentration (ECw) of the water. Naik et al. (2008) also
reported that with increase in salinity level of water used in
pitchers, the advancement of soil wetting front decreased.
Small size of soil wetting front occurred because of less
seepage of saline water from the pitcher wall might be due
to blockage of some of water conducting microspores of
the pitcher due to partial retaining of salt in the saline water.
Similar results were reported by Vasudaven et al. (2011)
who found 14% of reduction in water seepage from pitch-
ers due to use of saline water. 3. Measured and predicted salt concentration
Before initiation of the experiment, the electrical conductiv-
ity of soil saturation extract (ECe) was 1.34 dS m-1 at 0-20 cm,
1.32 dS m-1 at 20-40 cm, 1.30 dS m-1 at 40-60 cm and 1.30 dS m-1
at 60-80 cm soil depth as shown in Figure 8.
Figure 9 shows the measured and simulated ECe in the soil
profile down to 80 cm at distance of 30 cm from the center of the
pitcher.
After experiment, for pitchers using fresh water having ECw
of 1.2 dS m-1, the average ECe of the soil profile increased about
0.2 dS m-1 with minimum and maximum salt concentrations near
the periphery of pitcher wall and the soil surface respectively.
Whereas, when saline water having ECw of 10 dS m-1 was used
for irrigation with pitchers, the average ECe of the soil profile
increased 0.5 dS m-1. The maximum salt concentration was ob-
served near the soil surface and at the periphery of the soil wet-
ting front. Thus, salt moves away from the root zone and accu-
mulates at the outer fringes of the soil mass wetted by pitcher
making salt concentration in the root zone more favorable than
the salinity of water used for irrigation in the pitcher as also re-
ported by Alemi (1980). Long term use of pitcher irrigation may
create large irregular patches of salt accumulation in the field
which can be avoided by applying extra water using surface irri-
gation method after harvest of crop.
4. Crop yield and productivity The results of crop yield with fresh and saline irrigation wa-
ter given in Table 2 revealed that the crop yield of 4.77±0.150 kg
pitcher-1 was obtained with fresh irrigation (T1) whereas it was
3.71±0.115 kg pitcher-1 with saline water irrigation (T2). Thus,
crop yield with treatment T2 (under saline environment) was
about 22.2% less compared to that of with treatment T1.
Fig.8 Salt distribution in the soil profile before experi-
ment
Fig.9 Salt distribution (ECe) after experiment in the soil
profile at a distance of 30 cm from the center of
pitcher. Solid and broken lines in the plot repre-
sent the simulated ECe in the profile for fresh and
saline water respectively. While symbols show
measured data
Table 2 Crop water productivity (kg m-3) and water saving
Water Treatment Crop Yield
(kg pitcher-1) Crop Yield
(kg ha-1)
Irrigation Water Con-sumption Precipitation
(mm)
Total Irrigation Water Consumption CWP
(kg m-3) Water Saving
(%)# (litre pitcher-1) mm mm m3 ha-1
T1 4.77±0.15 11940* 300 75.0 16 91.0 910 13.12 81.80
T2 3.71±0.11 9275* 250 62.5 16 78.5 785 11.81 84.30
*Assuming 2500 pitchers per hectare # Compared with traditional irrigation method (500 mm)

68 Altaf Ali SIYAL, Shoukat Ali SOOMRO, Abdul Ghafoor SIYAL: Pitcher Irrigation Performance under Saline Water and High Evapotranspiration Rates
The consumption from sowing to harvest of bottle gourd
under T1 was 91 mm (910 m3 ha-1) while it was 78.5 mm (785 m3
ha-1). Thus, under saline water condition 12.5 mm or 13.7% less
water seeped from the pitcher walls compared to irrigation with
fresh water (T1). The crop water requirements of the bottle gourd
in Sindh, Pakistan with conventional irrigation methods (border
and furrow irrigation) is reported as about 500 mm (MINFAL,
2005). Thus, when compared to the conventional flood irrigation
methods, irrigation water savings with pitcher irrigation were
81.8% and 84.3% under treatments T1 and T2 respectively. Crop
water productivity (CWP) was 13.12 kg m-3 under T1 while it was
11.81 kg m-3 under T2. Thus, CWP was high when fresh and sa-
line water were used in pitcher irrigation method as also reported
by Whitmore (2000) and Memon et al. (2010).
Conclusions The results of growing bottle gourd using fresh and saline
water showed that with pitcher irrigation 82-84% of the water can
be saved compared to the conventional irrigation methods. How-
ever, under high surface evaporation rate (0.9 cm d-1) pitchers
were incapable of meeting crop water requirements both with
fresh and saline irrigation water. About 13.7% more water seeped
from the pitcher walls when fresh water was used for irrigation
purpose compared to saline water. A 22.2% less crop yield was
obtained when saline irrigation water was used. Thus, saline wa-
ter can be used with pitcher irrigation method for growing bottle
gourd with slight decrease in crop yield. Though, plants were
under dry stress when surface evaporation rate was 9 cm d-1, yet
high crop productivity i.e. 13.12 kg m-3 and 11.81 kg m-3 was
obtained under both fresh and saline water irrigation respectively.
Thus, pitcher irrigation is an efficient and novel irrigation method
which can be successfully used at places with fresh water scarcity
or where the poor quality water is available. Thus, there is a scope
to develop and propagate indigenous efficient irrigation methods
for use of saline water for crop production.
References [1] Alemi, M.H. (1980). “Distribution of water and salt in soil
under trickle and pitcher irrigation regimes.” Agricultural
Water Management, 3, 195–20.
[2] Ansari, K., Memon, N.A., Pathan, A.F.H., and Memon, A.
(2013). “Analysis of the Runoff Generated due to the 2011
Monsoon Rainfall in Sindh using HEC-HMS.” Sindh Univ.
Res. Jour., 45 (1), 159-162.
[3] Bainbridge, D.A. (2001). “Buried clay pot irrigation: A little
known but very efficient traditional method of irrigation.”
Agricultural Water Management, 48(2), 79-88.
[4] Bainbridge, D.A. (2002). “Alternate irrigation systems for
Arid Land Restoration.” Ecological Restoration, 20(1),
23-29.
[5] Geyh, M.A., and Ploethner, D. (1995). “An applied paleo
hydrological study in Cholistan, Thar Desert, Pakistan.” In:
Adar, E.M. & Leibundgut, Ch. (eds.). Application of Tracers
in Arid Zone Hydrology. IAHS Press, Wallingford, 119-127.
[6] Gupta, S.K. (2002). “Meeting challenge of the water short-
age: Rainwater conservation in land reclamation programs.”
12th ISCO Conference, Beijing, China, 446-451.
[7] Kanwar, J.S., and Chopra, S.L. (1959). Practical Agriculture
Chemistry. Chand and Co. New Delhi. pp. 130-131.
[8] McIntyre, D.S., and Loveday, J. (1974). “Bulk density. In:
Methods of Analysis for Irrigated Soils.” (Ed. Loveday, J.)
Technical Communication No. 54. Commonwealth Agricul-
tural Bureau: Farnham Royal, England.
[9] Memon, A.H., Soomro, A.G., and Gadehi, M.A. (2010).
“Water use efficiency and saving through pitcher and poly-
ethylene bag irrigation.” Pak. J. Agri., Agril. Engg. Vet. Sci.,
26 (1), 16-29.
[10] MINFAL. (2005). “Irrigation Agronomy VI.” On Farm Wa-
ter Management Field Manual. Ministry of Food, Agricul-
ture and Livestock, Islamabad, 164-165.
[11] Mondal, R.C. (1978). “Pitcher farming is economical.”
World Crops, 303, 124-127.
[12] Mondal, R.C. (1987). Pitcher Irrigation. Central Soil Salini-
ty Research Institute Karnal, India.
[13] Mondal, R.C., Dubey, S.K., and Gupta, S. K. (1992). “Use
pitchers when water for irrigation is saline.” Indian Agric.,
36, 13-15.
[14] Naik, B.S., Panda, R.K., Nayak, S.C., et al. (2008). “Hy-
draulics and salinity profile of pitcher irrigation in saline
water condition.” Agriculture Water Management, 95(10),
1129-1134.
[15] Okalebo, J.A., Home, P.G., and Lenga, F.K. (1995). “Pitcher irriga-
tion, a new technique to curb the effect of salinization.” Engineering
the Economy Proceedings 7th Annual Conference Kenya society of
Agriculture Engineers, Jomo Kenyatta University of Agriculture and
Technology, Kenya, 15-21. [16] Schaap, M.G., Leiji, F.J., and van Genuchten, M.Th. (2001).
“ROSETTA: a computer program for estimating soil hy-
draulic properties with hierarchical pedotransfer functions.”
J. Hydrol, 251, 163-176.
[17] Simunek, J., Sejna, M., van Genuchten, M.Th. (1999). The
HYDRUS-2D software package for simulating the
two-dimensional movement of water, heat, and multiple so-
lutes in variably-saturated media. IGWMC-TPS 53, Version
2.0, International Ground Water Modeling Center, Colorado
School of Mines, Golden, CO.
[18] Siyal, A.A., van Genuchten M. Th., and Skaggs, T.H. (2009).
“Performance of pitcher irrigation systems.” Soil Science,
174(6), 312-320.
[19] van Genuchten, M.Th. (1980). “A closed-form equation for
predicting the hydraulic conductivity of unsaturated soils.”
Soil Science Society of America Journal, 44, 892–898.
[20] Vasudaven, P., Bhumija, K., Srivastava, R.K., et al. (2011).
“Buried clay pot irrigation using saline water.” Journal of
Scientific and Industrial Research, 70, 653-655.
[21] Yensen, N.P. (2006). “Halophyte uses for the twenty-first
century.” In: M.A. Khan, & D.J. Weber (eds), Eco-

中華水土保持學報,46(1), 2015 69
physiology of High Salinity Tolerant Plants. Springer, Neth-
erlands, 367-396.
[22] Whitmore, J.S. (2000). Drought Management on Farmland.
Kluwer Academic Publishers. The Netherlands, 221.
2014年 09月 28日 收稿 2014年 11月 05日 修正 2014年 11月 07日 接受
(本文開放討論至 2015 年 9 月 30 日)


