Embed Size (px)
Citation preview

DESIGNED FOR PERPETUITYHAPPIEST MINDS
INTEGRATED ANNUAL REPORT 2022
DESIGNED FOR PERPETUITYHAPPIEST MINDS

About the Report
Basis of Reporting Happiest Minds has started its Integrated Reporting journey from FY 2021-22 following the principles of the International Integrated Reporting Council’s (IIRC) Integrated Reporting <IR> Framework. Through such reporting, we intend to progress on our transparency and disclosure practices by providing a holistic picture of how we create value using six capitals – Financial, Manufactured, Human, Intellectual, Social & Relationship, and Natural Capital. We also detail the operating environment in which we operate, the material matters that may impact our ability to create value, our governance practices, and our strategy to maximize value creation in the future. Additionally, we have an Environment, Social, and Governance report which encompasses our sustainability practices. This Report provides detailed and relevant information about our performance and prospects to the stakeholder, and will help them make an informed decision regarding their engagement with us.
Reporting PrincipleThis Report has been prepared in accordance with the Companies Act, 2013 (and the Rules made thereunder), the Indian Accounting Standards, the SEBI (Listing Obligations and Disclosure Requirements) Regulations, 2015, and the Secretarial Standards. The non-financial in the Report have been prepared following the guiding principles and content elements as stated in the <IR> framework as well as the GRI standards.
Boundary and Scope of ReportingThe Report covers financial and non-financial information and activities of Happiest Minds Technologies Limited (Happiest Minds) and its subsidiary Happiest Minds Inc., USA, for the period of April 1, 2021 to March 31, 2022.
UN Sustainable Development Goals (SDGs)
Many of our activities are aligned with the UN Sustainable Development Goals (SDGs). Across the Report, we have mapped the UN SDGs that we contribute to with the activities undertaken.
Forward-looking StatementsCertain statements in this Report regarding our business operations may constitute forward-looking statements. These include all statements other than statements of historical fact, including those regarding the financial position, business strategy, management plans, and objectives for future operations. Forward-looking statements can be identified by words such as 'believes', 'estimates', 'anticipates', 'expects', 'intends', 'may', 'will', 'plans', 'outlook', and other words of similar meaning in connection with a discussion of future operating or financial performance.
Forward-looking statements are necessarily dependent on assumptions, data, or methods that may be incorrect or imprecise and that may be incapable of being realized and, as such, are not intended to be a guarantee of future results but constitute our current expectations based on reasonable assumptions. Actual results could differ materially from those projected in any forward-looking statements due to various events, risks, uncertainties, and other factors. We neither assume any obligation nor intention to update or revise any forward-looking statements, whether as a result of new information, future events, or otherwise.
Get this report online at: https://www.happiestminds.com/investors/

Corporate Overview02 Chairman’s Letter04 Executive Board’s Letter 08 Born Digital and Agile
Powering a Better World10 Built on a Solid Foundation to Deliver
and Create Value15 Delivering Solutions across the Globe16 Awards and Recognition20 The Year as it Was22 Value Created across Six Capitals26 Our Business Model 28 Strategy for Maximizing Value Creation30 Maintaining Effective Dialogue with Stakeholders32 Addressing Material Matters35 Risk Management 38 Digital Business Services (DBS)42 Infrastructure Management & Security
Services (IMSS)46 Product Engineering Services (PES)49 Building Competitive Edge with Our
Intellectual Capital52 Glimpses of FY2268 Environmental, Social and Governance
Statutory Reports117 Board’s Report140 Management Discussion and Analysis of
Financial Condition and Results of Operations157 Corporate Governance Report174 Business Responsibility & Sustainability Reporting
Financial StatementsStandalone Financial Statements
206 Independent Auditor’s Report216 Standalone Balance Sheet218 Standalone Statement of Profit and Loss220 Standalone Statement of Changes in Equity222 Standalone Statement of Cash Flows224 Notes to the Standalone Financial Statements
Consolidated Financial Statements
283 Independent Auditor’s Report290 Consolidated Balance Sheet292 Consolidated Statement of Profit and Loss294 Consolidated Statement of Changes in Equity296 Consolidated Statement of Cash Flows298 Notes to the Consolidated Financial Statements
Contents
DESIGNED FOR PERPETUITYHAPPIEST MINDS
INTEGRATED ANNUAL REPORT 2022
DESIGNED FOR PERPETUITYHAPPIEST MINDS
Happiest Minds...Designed for Perpetuity � endless stream of successes � symbol of an unending cycle � steps towards perfection � security for all time
Symbolizes a Happy Person, centered around our Being, our
Belonging & our Becoming
Logical extension of our happiness brand positioning and is indicative
of our endeavor to being and doing mindful in our approach to our people,
our customers & the community
Indicates our commitment to be agile and digital to transform organizational
& business practices

Dear Stakeholders.The completion of Happiest Minds’ first decade happily coincided with an outstanding year both in terms of financial results and organizational excellence. I am delighted to inform you that:
� Happiest Minds delivered industry standard leading growth with a superior profit profile. Our growth was 40.9% in constant currency while we achieved 26.1% in EBITDA
� The growth was broad-based with all our business units, operating geos and centers of excellence delivering excellent results. These results were enabled by the contributions of our delivery teams, technology and domain groups and the support of all our corporate functions under the leadership of our Executive Board
� We are proud to be recognized by the Great Place to Work® Institute (GPTW) to be amongst India’s Top 15 Best Workplaces in Health and Wellness. We continued to receive other recognitions from GPTW such as India’s Top 25 Best Workplaces in IT & IT-BPM and India’s Top 50 Best Workplaces for Women for the 3rd consecutive year
� The Institute of Directors (IoD) recognized us as winners of the Golden Peacock Business Excellence Award for the IT industry
� We were also recognized by Asiamoney as the Best Company for the Most Outstanding IPO in India
� Customer Satisfaction, as measured by our internal survey showed a Net Promoter Score (NPS) of 53 and overall satisfaction level of 7.7 on a scale of 9.0. We believe these numbers to be in the top tier along with comparable companies
The rapid adoption of digital technologies is forcing companies cutting across industries to innovate rapidly and take advantage of newer technologies and paradigms to significantly enhance customer experience. Our deep expertise in the building blocks of Digital such as IoT, AI, Cloud and RPA,
26.1%
53
EBITDA
NPS
The Happiest Minds’ model for creating an institution which will survive in perpetuity is unique.
Chairman’s Letter
02
Annual Report 2021-22

along with next-gen technologies such as Blockchain, AR/VR and Robotics has made us a strategic partner of choice to many of these companies, leading to robust demand and deep long-lasting relationships.
During the first decade, we set our goals through two 5-year cycles of our Vision statements, each with well-defined measurement criteria.
I am now happy to share our Vision statements – that form the acronym DELiGHT – for the next 10 years and beyond:
Design Happiest Minds for Perpetuity
Accelerate Profitable Growth
Build & Sustain a World-Class Team
Be the Ambassador of Happiness
Be Recognized for Thought Leadership in our focus areas of Technology & Solutions
Be known for our ESG standards
The Happiest Minds’ model for creating an institution which will survive in perpetuity is unique. The tamper-proof legal framework, the Executive Board structure, being on the leading edge of technology, and the enduring belief and commitment of the leadership will enable its success. Our Executive Board has continued to function very successfully as the CEO of the company individually and collectively.
Our target is to grow at 20% CAGR over the next five years and after that at one and a half times the industry growth. Acquisitions will be a key part of our growth trajectory. Building and sustaining a world-class team would involve succession planning for every leader, career development plan for the entire team and a strong technology learning program. The plan is to have 60% of senior positions to be filled
internally. Diversity will be key. We will increase the percentage of women in the company to 35% in ten years. We will also have women in 30% of leadership positions by then.
To be recognized for thought leadership in the company’s focus areas, requires creating and delivering value. We will continue to build consultative skills, look at technology aggressively and continue to build on our IP’s and solution accelerators.
We have placed sustainability at the heart of our business approach. Our goal is to be carbon neutral by 2030, establish Happiest Minds Foundation this year and be recognized for corporate governance by leading industry bodies.
Our members in primary locations of Bengaluru, Noida and Pune have returned to office on a hybrid model of three days’ work-from-office in our transition Back2SMILES. This has led to an increase in attrition which is now an industry wide phenomenon. However, to mitigate this, we are increasing our delivery capacity much higher by an order of magnitude than the previous years. Our campus hiring is expected to be 300 joinees by August 2022 and will double to 600 for the next year. We are also expanding capacity in each of our locations – Bengaluru, Noida, and Pune, and adding Bhubaneswar as a major new delivery center.
Our culture of giving defines our social responsibility programs. We have till date donated towards 4.04 Mn meals to The Akshaya Patra Foundation. We have also contributed to Sri Jayadeva Institute of Cardiovascular Sciences and Research where a molecular testing lab has been set up along with ICU beds at their Bengaluru facility.
During this past year, we focused on the wellbeing of our 4,000+ team of Happiest Minds across locations. Our Internal First Responder Teams swung into action to support Happiest Minds and their families. Our virtual engagement included wellness initiatives, mindfulness programs and counseling. Our effort in COVID Care was recognized by Great Place to Work® Institute when we received special recognition for supporting our members and their families during the COVID crisis.
As we look ahead to the future, we are optimistic and excited about the tremendous opportunity that awaits us.
I would like to express my gratitude to our customers for their continued faith and trust in Happiest Minds. I am also grateful to all Happiest Minds for their commitment and dedication to enable the happiness of our customers. I am grateful to our Board of Directors, our shareholders and all other stakeholders for their wishes, guidance and support that help us accelerate our digital and agile journeys.
Let me close by wishing all of you good health and happiness.
With warm regards.
Ashok SootaExecutive Chairman
We were recognized by Asiamoney as the Best Company for the Most Outstanding IPO in India.
20% CAGRtarget over the next 5 years
Corporate Overview1 Financial Statements3Statutory Reports2
03
Annual Report 2021-22
Dear Stakeholders:We hope you are doing well and keeping safe.
It’s been a little over two years since the outbreak of COVID and through this time each one of us has been directly or indirectly affected. But, with vaccines and a better understanding of how to handle it, we have emerged stronger and resilient. It is our hope that the ensuing times bring in good health and prosperity to all.
Executive Board’s Letter
Joseph AnantharajuExecutive Vice Chairman & CEOProduct Engineering Services (PES)
Rajiv ShahPresident & CEODigital Business Services (DBS)
Ram Mohan C President & CEOInfrastructure Management and Security Services
Venkatraman Narayanan Managing Director & CFO
04
Annual Report 2021-22

Businesses, companies and enterprises focused on delivering services around digital technologies were able to adapt successfully. The industrialization-of-digital theme that had gathered steam earlier was accentuated by the pandemic. Adapting to digital realities became an imperative. Technology was no longer just a cost of doing business; it became a source of advantage. Happiest Minds as a Born Digital . Born Agile Company was fortuitous to be at the intersection of technology + digital and favorably positioned to serve our customers making the migration. Demand for our services was robust which is reflected in growth, revenues and profits. Therefore, we continue to see a healthy demand for our services.
As mentioned in our letter in the Annual Report 2020-21, during the pandemic, three technology themes had evolved: People Centricity, Location Independence, and Resilient Delivery. These three continue to be at the core of discussion for business users, decision makers and CXOs. While certain aspects of these themes have been mastered, enterprises continue to try, evaluate, test, and deploy technology solutions that can meet and enhance the needs of their teams, customers and stakeholders. This provides a long runway for Happiest Minds to partner with its customers in their strategic digital roadmap. Today, Internet of behavior, Distributed Cloud & AI Engineering continue to evolve and are still work-in-progress for many enterprises.
We foresee that enterprises will have three strategic imperatives to focus on – Growth, Digitization and Efficiency
1. Growth Leveraging technology trends to
maximize value and create IT force multipliers to win business and market share by
a. Enhanced People Engagement: The world in the foreseeable future will
be hybrid and remote working must be enabled for more use cases like real-time collaboration, AR / VR and metaverse. Delivery model must be reconfigured to embrace distributed services
b. Enhanced Customer Engagement: Combining Customer Experience (CX), Employee Experience (EX), User Experience (UX) and Multi-experience (MX) to drive greater customer and team confidence, satisfaction, loyalty, and advocacy
c. Implementing self-managing physical or software systems that learn from their environments and can dynamically modify their own algorithms to adapt to new conditions in the field like humans
d. Developing systems and applications that learn about objects or content by analyzing their data and using it for creating realistic, original, and brand-new artefacts
2. Digitization
IT and business staff as a team-in-fusion collaborate and drive innovation to rapidly digitize business by
a. Composable Application architecture which allows implementing new features up to 80% faster which reduces risk of losing market momentum and customer loyalty significantly
b. Implementing Decision Intelligence architecture to understand and engineer how decisions are made
c. Rapidly identifying, vetting, and automating as many processes as possible
d. An integrated approach for operationalizing AI models to generate three times more value from AI efforts
We foresee that enterprises will have three strategic imperatives to focus on – Growth, Digitization and Efficiency
Corporate Overview1 Financial Statements3Statutory Reports2
05
Annual Report 2021-22

3. Efficiency
Digital business requires a resilient and efficient IT foundation as its core to scale cost-efficiently & to engineer trust
a. Resilient and flexible integration of data across business users and platforms to simplify the data integration infrastructure and minimize technical debt
b. Assets and users can be anywhere, meaning the traditional security perimeter is gone making a strong case for ring fencing security around data, privacy, and safety
Your Company is leading the digital efforts for its customers as they experiment and rapidly deploy systems and processes that pivot them to their next level of growth, adopt to changing times and increase the trust factor amongst stakeholders.
Your Company delivered an excellent performance in the fiscal gone by. Your Company delivered industry leading growth both for the fourth quarter and the full year with a superior margin profile. Operating revenues for the year was at US$147 Mn , a growth of 40.2% over the prior fiscal. Total income for the year was ` 1,131 Crores, displaying a solid growth of 41.8%. Since FY18, your Company has delivered a consistent Compounded Annual Growth Rate (CAGR) of 23.3%.
The Executive Board expresses its deep appreciation to our Happiest Minds who gave their best and acted in resonance resulting in those excellent numbers. The revenue growth was broad-based, and all the three Business Units (BU) have shown growth, profitability driven by demand and growth across all our geographies and chosen verticals.
Digital Business Services (DBS) led the growth with 53.3% followed by Infrastructure Management and Security Services (IMSS) at 45.4% and Product Engineering Services (PES) at 31%. The three Centers of Excellence (CoE) delivered excellent performance with all of them contributing to revenues of more than 50%. We will continue to focus on strengthening our technology offerings by carving out new centers of excellence as and when they achieve a critical mass. Next-Generation Cyber security services and low code/no code application development services are two areas where we have seen increased traction and demand.
During the year, your Company added 33 new logos and increased the average revenue per customer by 22% to US$774,000. The success of our land-and-expand strategy resulted in an increased count of large customers. Our $5-$10 Mn clients increased by 1 to a total count of 4, $3-$4 Mn clients increased by 2 to a total count of 8, $1-$3 Mn clients increased by 9 to a total count of 25 .
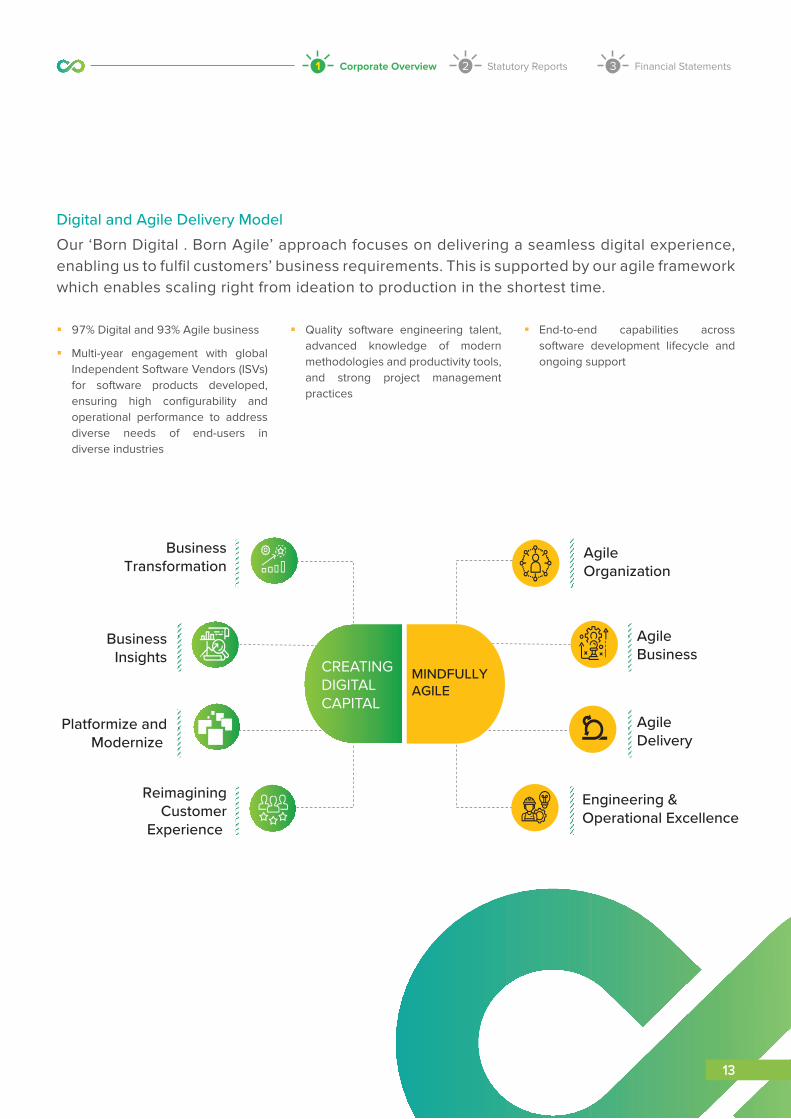
Our EBITDA for the year was `295 Crores at 26.1% of total revenues showed a superior growth of 26.9%. 99% of EBITDA was converted to cash with a free cash flow of `291 Crores. Net Profit increased by 11.5% to `181 Crores. Our capital return ratios continue to industry leading standards with Return on Capital Employed (RoCE) at 39.8% and Return on Equity at 27.3%.
The Board of Directors, based on your Company’s good performance, strong cash generation and review of capital allocation strategy has recommended a final dividend of ` 2.0 per equity share subject to approval of shareholders. The total dividend for the year including the interim dividend (of ` 1.75) is ` 3.75.
Your Company delivered industry leading growth both for the fourth quarter and the full year with a superior margin profile
40.2%
41.8%
22%
Operating Revenues for the Year
Total Income for the Year
Average Revenue per Customer
06
Annual Report 2021-22

We made good progress on our diversity metrics which increased by 2% to 26.4%.
Your Company received multiple accolades from the Great Place to Work® Institute which includes:
� India's Best Companies to Work for 2021
� India’s Top 25 Best Workplaces in IT & IT-BPM 2021
� Asia’s Best Workplaces 2021
� India’s Top 50 Best Workplaces for Women 2021
� India’s Top 15 Best Workplaces in Health & Wellness 2021 and a special recognition for our Care programs for Happiest Minds and their families during the COVID-19 crisis
Your Company’s Glassdoor® ratings increased to 4.4 from 4.3 in the previous fiscal. These recognitions are a validation of our efforts over many years of fostering an open culture and putting our people first in everything we do and focusing on their learning and development. During the year, on an average every Happiest Mind spent 30 hrs on learning. Also, we had 1,885 Happiest Minds who were covered as part of various upskilling & multiskilling initiatives. We ended the year with 4,168 Happiest Minds which is a strong net addition of 22%.
In the fiscal, Happiest Minds entered into a strategic partnership with Tech4TH Inc, an early-stage start-up which provides consulting-led digital solutions to the travel and hospitality industry. We intend to join forces and combine their consulting and domain expertise with the strengths of digital technology and software engineering of Happiest Minds to deliver innovative solutions.
As we look at FY23 and beyond, the demand remains buoyant despite multiple shocks to the world economy – cross-border conflicts, high inflationary scenario, rising interest rates, broken supply chains and slow growth. With our ear to the ground, we continue our focus to shape the digital journey of enterprises. Cloud adoption is still underpenetrated with about only 30% of workload on the cloud and core transformation that is a multi-year journey has still a long way to go. Our aim is to grow consistently at 20% and continue to deliver superior margin profile. To address the heightened demand, we will strengthen our existing delivery centers in Bengaluru, Noida & Pune and open a new delivery center in Bhubaneswar. During FY22, we started onboarding fresh campus graduates and we will continue this journey with greater vigor in this new fiscal and beyond. We have enhanced our hiring channels both onsite and offshore which will help us attract quality talent across the digital spectrum. We are making ahead-of-time investments in emerging technologies such as Metaverse, Web3.0, Advanced Analytics etc. to ensure we are ready when our customers adopt these technologies.
Our organic growth has been very healthy. However, in the case of inorganic growth, despite coming tantalizingly close to some strategic opportunities, we were not able to close any during the year. We will however continue to focus on this aspect with increased vigor and focus in FY23. Our approach to inorganic growth opportunities will continue to be focused on strengthening our offerings, entry into a new geography or strengthening an existing geography for us, getting us in-depth focus in a vertical. Our emphasis will be to build on the strength of Happiest Minds or fill gaps in our capabilities while acting as a springboard for our growth aspirations.
With COVID abating, one question which has been topmost in the minds of people has been on ‘return to office’. The IT industry was the first to move to remote working/work-from-home when the pandemic hit. However, now with most of the industries returning to work in a physical mode, the technology industry has been in a wait-and-watch mode.
We believe very strongly that working in the office with and amongst colleagues strengthens and sustains culture. Our Back2SMILES initiative was conceptualized to welcome our colleagues back to office in a planned, staggered manner. All our offices are now open, working, and ready. To meet our growth objectives, we have also decided to expand in our existing locations while also opening a presence in Bhubaneswar in FY23.
We express our gratitude to you as a stakeholder of the Company for providing us support, encouragement and timely advise which acts as guiding light to the next level of growth.
Thank you.
Happiest Minds’ Executive Board
Corporate Overview1 Financial Statements3Statutory Reports2
07
Annual Report 2021-22

ABOUT HAPPIEST MINDS
Born Digital and Agile Powering a Better World.Happiest Minds is a next-generation digital transformation, infrastructure, security and product engineering services company.
We have a solid team of some of the most talented people and partnerships with leading global companies. Together with this combined expertise, we are delivering end-to-end futuristic and transformative digital solutions to some of the world’s biggest corporates, enabling them to build a competitive edge and win.
Our solutions have also been at the forefront of transitioning to a digital and sustainable economy, thereby powering a progressive and better world. We are increasingly leveraging our competencies and innovating to solve for our clients as well as tackle many of the world’s pressing issues.
Our Mission
Happiest People . Happiest Customers
Social Responsibility
Sharing
Mindful
Integrity
Learning
Excellence
Design for Perpetuity
ESG Excellence
Thought Leadership
Profitable Growth
Ambassador for Happiness
World-Class Team
Our 2021-31 Vision - Our Values
Mission, Vision & Values
08
Annual Report 2021-22

Shareholding Pattern (%)
Promoters and Promoter Group Public Clearing Members Mutual Funds/Banks/FI’s/QIB FIIs/NRIs/FPI’s Body Corporates
53.26
34.81
0.161.48
8.05
2.24
(as on March 31, 2022)
Diversified Business Offering Spanning Digital Lifecycle
Great Place To Work®
Global Certifications
Awards
� Ranked #21 - India's Best Companies to Work for 2021
� Ranked #63 - Asia’s Best Workplaces 2021
� India’s Top 50 Best Workplaces for Women 2021
� India’s Top 15 Best Workplaces in Health & Wellness 2021
� India's Top 10 for COVID Care 2021
� India's Top 25 Best Workplaces in IT & IT- BPM 2021
� ISO 9001:2015: Quality Management System
� ISO 27001:2013: Information Security Management System
� Golden Peacock Business Excellence Award 2021
� IBM Geography Excellence Award for APAC
� Intel® Network Builders Winners' Circle Gold
� ISG Digital Case Study Awards™ 2021
`1,094 Crores 206Total Revenues (in `) Active clients
4,168 Happiest Minds across 7 countries
Product Engineering Services (PES) Engineering digital products that are smart, secure and connected.
Digital Business Services (DBS)Helps organizations develop a digital roadmap to create digital capital and a seamless customer experience.
Infrastructure Management & Security Services (IMSS)Offers end-to-end monitoring and management and secure ring-fencing of customers' infrastructure and applications.
Corporate Overview1 Financial Statements3Statutory Reports2
09
Annual Report 2021-22

OUR STRENGTHS
� Capabilities to develop solutions as per the new technological breakthroughs
� Expertise on the Internet of Things (IoT), DevOps and Robotic Process Automation (RPA), Software Defined Networking/Network Function Virtualization (SDN/NFV), Big Data and Advanced Analytics, Blockchain, Cloud, Business Process Management (BPM) & Security
� Expertise in technological capabilities developed to support mobile connectivity with other devices, social media, big data analytics and cloud delivery, among others
� Enterprise digital transformation, next-generation product and platform engineering and secure infrastructure delivery capabilities
� Three Centers of Excellence (CoEs) for IoT, Analytics/Artificial Intelligence and Digital Process Automation
Strong R&D Capabilities and Technology Expertise
Built on a Solid Foundation to Deliver and Create Value
Happiest Minds is a Born Digital . Born Agile Company. With our end-to-end capabilities across the digital lifecycle, innovation prowess and strong team, we are positioned to rapidly deliver strategically viable, futuristic and transformative digital solutions. This is complemented by our diversified business model which provides scalability across verticals, technologies, customers and geographies.
Visionary Leadership & World-Class Team � Promoted by Ashok Soota, a veteran
in IT industry
� Led by a professional management team with extensive experience in the IT Services industry, in-depth understanding of managing complex projects and a proven performance track record
Diversified Geographic Footprint � Presence across seven countries including the US and the UK which are the
largest IT markets
� Deep offshoring capabilities which provide scalability as India has availability of large pool of trained engineers
� Diversified operations across geographies ensuring lower market concentration risks
Top-Rated Clientele and Diversified Revenue Concentration
54 85% Fortune 2000 / Forbes 200 Billion $ Corporation
Repeat Business
Broad range of offerings and multiple business units facilitating upsell and cross-sell opportunities
10
Annual Report 2021-22

Diverse Industry Expertise � Expertise across sectors with proven delivery model and in-depth experience
� Ability to deliver solutions tailored to local market and business-specific requirements
Edutech Travel, Media & Entertainment
(TME)
ManufacturingRetailBanking and Financial Services
(BFSI)
Industrial Hitech
Corporate Overview1 Financial Statements3Statutory Reports2
11
Annual Report 2021-22

Leading Ahead With Culture & TechnologyHappiest Minds is a Mindful IT Company, that enables digital transformation for enterprises and technology providers.
Happiest Minds is the First Indian IT firm to be‘The Mindful IT Company’
Perceive Immersively
Process Non-judgementally
Perform Empathetically
In The Moment
The happiness and prosperity of all stakeholders is the key to success. We have institutionalized this simple thought into our mindful approach which enables our success and drives us towards excellence.
We help our customers win by delivering the right solutions to them.
Happiest People . Happiest Customers
7C Framework
Happiest People
Happiest Customers
CULTURE
CONSIDERATE CREDIBILITY
COMMUNICATION
CONSULTATIVE
CULTURE
COMMUNITY
CO-CREATION
CREDIBILITY
COLLABORATION COMMUNICATION
COMMUNITY
CHOICE
CONTRIBUTION
12
Annual Report 2021-22
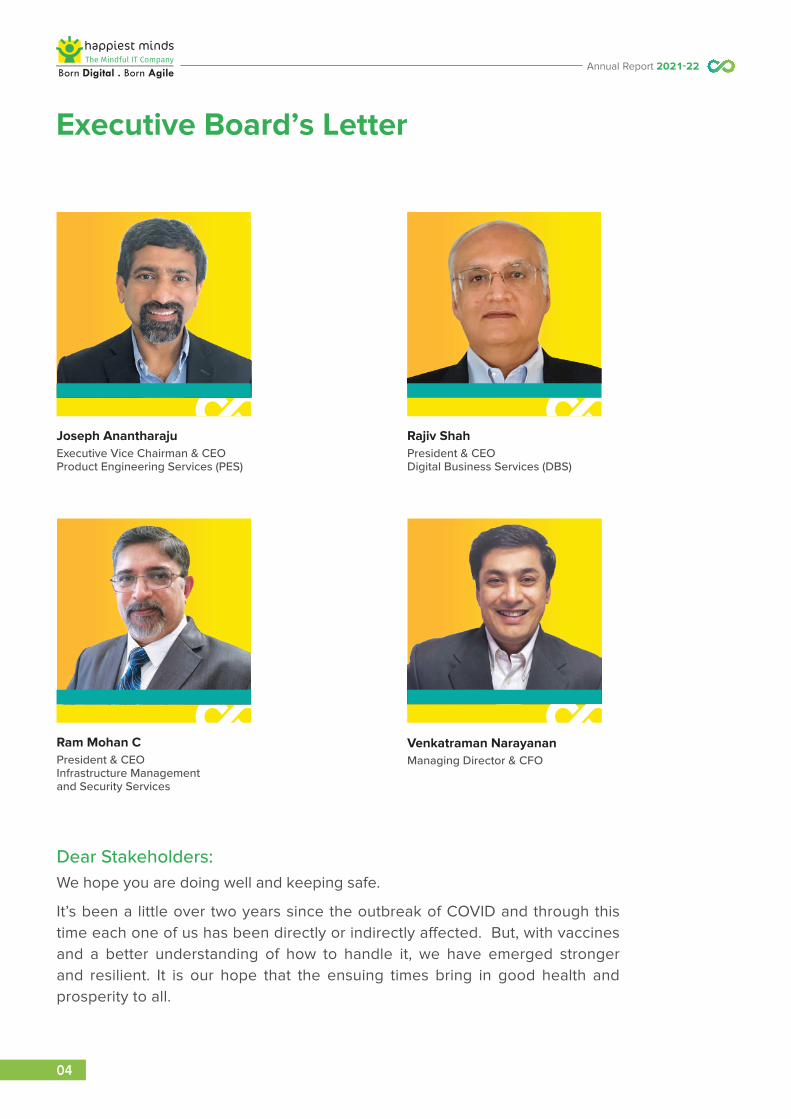
Digital and Agile Delivery ModelOur ‘Born Digital . Born Agile’ approach focuses on delivering a seamless digital experience, enabling us to fulfil customers’ business requirements. This is supported by our agile framework which enables scaling right from ideation to production in the shortest time.
� 97% Digital and 93% Agile business
� Multi-year engagement with global Independent Software Vendors (ISVs) for software products developed, ensuring high configurability and operational performance to address diverse needs of end-users in diverse industries
� Quality software engineering talent, advanced knowledge of modern methodologies and productivity tools, and strong project management practices
� End-to-end capabilities across software development lifecycle and ongoing support
ReimaginingCustomer
Experience
BusinessTransformation
AgileOrganization
AgileBusiness
AgileDelivery
Engineering &Operational Excellence
MINDFULLYAGILE
Platformize andModernize
BusinessInsights
CREATINGDIGITALCAPITAL
Corporate Overview1 Financial Statements3Statutory Reports2
13
Annual Report 2021-22

4.1%Onsite
25.1%
66.5% 43.6%
23.2%
15.8%
13.2%
12.1% 10.3%
6.9%
8.6%
8.8%
20.3%13.2%
9.0% 8.6%3.5%
14.1%
10.4%
11.9%
USA Digital Infra/Cloud
Security
SaaS
IoT
Analytics / AI
Others
Europe IndiaRest of World
Fixed Price Time and Material
Scalable Business Model � Diversified business model which is scalable across verticals, technologies, customers and geography
� High proportion of revenue from offshore which ensures high margins and scalability as India has a large talent pool of trained engineers with experience in delivering IT services
Revenue by Geography
Onsite/Offshore (by number of members)
Digital Revenue Revenue by Vertical
Currently, a large portion of revenue comes from the US market. Increasing demand from other locations and our growing implementation capabilities provide scope to grow business there.
Edutech Hitech Travel, Media and Entertainment Banking and Financial Services Retail / CPG Industrial Manufacturing Others
Competencies in multiple technologies especially in emerging ones that are witnessing growing demand provide scope for growth.
A significant portion of our revenues is concentrated in a few industry verticals. Our growing expertise in various other industries provide scope to participate in opportunities arising from them.
12.6%
30.7%
44.1%
60.6%
Top 1 Top 5 Top 10 Top 20
Client Revenue Concentration
206 clients as of March 31, 2022. Healthy mix of customers across chosen verticals, offerings and geographies.
25 26
38
FY20 FY21 FY22
Million $ Customers
Consistent increase in million dollar customers across the years through focused land and expand strategy.
95.9% 74.9%Offshore
14
Annual Report 2021-22

Europe & UK UK and Netherlands
UAE Dubai
Americas US and Canada
Delivering Solutions across the Globe
Bengaluru (2)
San Jose
Houston
Westford
Atlanta
Omaha
Austin
Sydney
Reading
Amsterdam
Dubai
TorontoSeattle
Pune
Noida
We have built a presence and established our competencies in strategic locations. We will continue to leverage our technology expertise and offshoring capabilities to position ourselves as an attractive digital transformation partner.
2 1 820 15 66Offices Office Offices/PresenceHappiest Minds Happiest Minds Happiest Minds
Australia
1 3Office Happiest Minds
India
4 4,0643 HeadquartersOffices Happiest MindsStates Bengaluru
Corporate Overview1 Financial Statements3Statutory Reports2
15
Annual Report 2021-22

Awards and Recognition
People Practice
Great Place to Work® Institute
Ranked #21 - India's Best Companies to Work for 2021
India’s Top 50 Best Workplaces for Women 2021
Ranked #63 - Asia’s Best Workplaces 2021
*All logos are properties of their respective owners.
People Practice
Great Place to Work® Institute
India's Top 25 Best Workplaces in IT & IT-BPM 2021
India’s Top 10 forCOVID Care 2021
India’s Top 15 Best Workplaces in Health and Wellness 2021
*All logos are properties of their respective owners.16
Annual Report 2021-22

People Practice
Great Place to Work® Institute
Ranked #21 - India's Best Companies to Work for 2021
India’s Top 50 Best Workplaces for Women 2021
Ranked #63 - Asia’s Best Workplaces 2021
*All logos are properties of their respective owners.
People Practice
Great Place to Work® Institute
India's Top 25 Best Workplaces in IT & IT-BPM 2021
India’s Top 10 forCOVID Care 2021
India’s Top 15 Best Workplaces in Health and Wellness 2021
*All logos are properties of their respective owners.
Corporate Overview1 Financial Statements3Statutory Reports2
17
Annual Report 2021-22

People Practice
2021 ISG Digital Case Study Awards™
Golden Peacock Award for Business Excellence 2021
Global HR Excellence Award 2021 for Learning & Development and Innovation in Recruitment
Corporate
Talent Acquisition and Learning & Development
*All logos are properties of their respective owners.
Corporate
Asiamoney - Asia's Outstanding Companies Poll 2021Most Outstanding Company in India under Small / Mid-caps SectorMost Outstanding IPO in India
2021 IBM GeographyExcellence Award for APAC
Intel® Network Builders - Gold Partner
League of American Communication Professionals (LACP) - Platinum and Gold Awards for 2021 Annual Report
Ranked #24 globally and #1 in India
*All logos are properties of their respective owners.18
Annual Report 2021-22

People Practice
2021 ISG Digital Case Study Awards™
Golden Peacock Award for Business Excellence 2021
Global HR Excellence Award 2021 for Learning & Development and Innovation in Recruitment
Corporate
Talent Acquisition and Learning & Development
*All logos are properties of their respective owners.
Corporate
Asiamoney - Asia's Outstanding Companies Poll 2021Most Outstanding Company in India under Small / Mid-caps SectorMost Outstanding IPO in India
2021 IBM GeographyExcellence Award for APAC
Intel® Network Builders - Gold Partner
League of American Communication Professionals (LACP) - Platinum and Gold Awards for 2021 Annual Report
Ranked #24 globally and #1 in India
*All logos are properties of their respective owners.
Corporate Overview1 Financial Statements3Statutory Reports2
19
Annual Report 2021-22

The Year as it Was
Industry-leading Growth with a Superior Margin Profile
Gaining Recognition Among the Analyst Community
Delivering Returns to Shareholders
41.8% 95.7%
26.1%` 3.75 per share
In total income to ` 1,13,075 Lacs In market capitalization to ` 15,51,834 Lacs as on March 31, 2022 (` 7,93,137 Lacs in FY 2020-21)
EBITDA margin to ` 29,477 Lacs
Interim dividend of ` 1.75/- per share & recommend a final dividend of ` 2/- per equity share (` 3/- per share in FY 2020-21)
For the complete list of Analyst Mentions, refer to: https://www.happiestminds.com/about-us/analyst-mentions/
� Recognized as a ‘Major Contender’ in Everest Group PEAK Matrix for Digital Engineering
� Featured in NASSCOM’s report on India Cybersecurity Industry Services & Product Growth Story for a case study on major civil aviation infrastructure. We are also recognized as managed security service providers and integrators under emerging cyber security services hubs.
� Featured in NASSCOM Cloud Case study Compendium on Digital Content Monetization (DCM) solution
� Recognized in Zinnov Zones as a:
� Leader for Enterprise Software
� Leader for ER&D (Small & Medium Service Providers)
� Niche-Established for AI Engineering
� Niche-Established for IoT Services
� Recognized by Information Services Group (ISG), with two 2021 ISG Digital Case Study Awards™
� Included in Forrester Now Tech: Robotic Process Automation Services Analyst Report
20

Robust Business Wins
Enabling Customer Happiness
StrengthenedTalent Capabilities
33
53
940
54New Customers
Net Promoter Score (57 in FY 2020-21)
Net Happiest Minds Additions (562 in FY 2020-21)
Fortune 2000 / Forbes 200 Billion $ Corporations
Customer Satisfaction
7.7/9.0Customer Happiness Score (7.8/9.0 in FY 2020-21)
21

Value Created across Six Capitals
Financial Capital
It represents the funds that are available to us, including debt and equity, which we deploy in the business and in other capitals to support our operations and business strategy. Our endeavor is to deploy funds efficiently to optimize returns for our stakeholders.
1,13,075 29,47726.1%
FY22 FY22
79,765 21,525
27.0%
FY21 FY21
71,423
11,312
15.8%
FY20 FY20
60,181
6,628
11.0%
FY19 FY19
48,912
762 1.6%
FY18 FY18
CAGR CAGR 23.3% 149.4%
Total Income (` Lacs) EBITDA (` Lacs) and EBITDA Margin (%)
EBITDA MarginEBITDA
18,120
FY22
16,246
FY21
7,17110%
FY20
1,4212.4%
FY19
(4.6%)
FY18
CAGR (3-year) 133.7%
PAT (` Lacs) and PAT Margin (%)
PAT MarginPAT
(2,247)
16.0%
20.4%
22
Annual Report 2021-22
39.8%
27.3%
FY22 FY22
31.2%
29.8%
FY21 FY21
28.9%
27.1%
FY20 FY20
12.55 66,580
FY22 FY22
11.4554,599
FY21 FY21
5.36 26,531
FY20 FY20
1.16
(6,605)FY19
FY19
(3.13)(10,888)
FY18 FY18
Earnings Per Share (EPS) ` Diluted Net Worth (` Lacs)
Return of Capital Employed (RoCE) (%) Return on Equity (RoE) (%)
29,064
FY22
21,428
FY21
11,266
FY20
6,549
FY19
649
FY18
CAGR 158.7%
Free Cash Flow to EBITDA (` Lacs)
Conversion (%)Free Cash Flow
98.6%99.5%99.6%98.8%
85%
Corporate Overview1 Financial Statements3Statutory Reports2
23
Annual Report 2021-22

Intellectual Capital
Human Capital
It represents the collective knowledge of the organization which helps us in delivering innovative solutions to clients as well as provides us a competitive edge in the industry. It includes the knowledge of our people and the strategic alliance partners through which we have developed several platforms and intellectual properties which helps in driving business opportunities. We are continually investing in nurturing our people skills and entering new partnerships to reinforce our capabilities and drive the success of our clients.
It represents the competencies, experience, engagement, and motivation of our people to work passionately towards serving our clients and achieving organizational goals. They are critical to our long-term growth, and we are continually investing in their wellbeing, engagement, skill development and diversity and inclusion to create a workplace with which they can be proud to be associated.
R&D Investments
`1,383 Lacs` 1,450 Lacs in FY21
Digital Revenues
97%Agile Revenues
93%
Centers of Excellence
3(IoT, Analytics/Artificial Intelligence and Digital Process Automation)
People Satisfaction Score
93% (GPTW)94% in FY21
Person with Disabilities
47 in FY21
Utilization
80.5%79.5% in FY21
Nationalities in the Workforce
1010 in FY21
Attrition
22.7%12.4% in FY21
Diversity
26.4%24.5% in FY21
24
Annual Report 2021-22

Social and Relationship Capital
Natural Capital
Manufactured Capital
It represents the quality of relationship that we have with our stakeholders, the shared values we create for them as well as the intangibles associated with our brand that drive their willingness to associate with us. It encompasses our customers, supply chain, alliances and the community at large all of whom are integral to our business decisions. We continually engage with them and take action to address their needs.
It represents the renewable and non-renewable environmental resources that we use in conducting our operations. It also includes the intended and unintended impact of our operations on the environment. We are continually investing in minimizing our environmental footprint towards a sustainable world and building business resilience.
It represents the state-of-the-art tangible infrastructure like office space, IT hardware and telecommunication equipment, and other infrastructure which helps us in carrying out activities efficiently and driving the wellbeing of employees. We prudently invest in upgrading these to ensure seamless operations as well as drive shareholder value creation.
Active Customers
206173 in FY21
Net Promoter Score
5357 in FY21
Million Dollar Customers
3826 in FY21
Akshaya Patra Meals
12,76,62213,31,154 in FY21
CSR Spend
`215 Lacs`75 Lacs in FY21
Repeat Revenues
85%87% in FY21
Average Annual Revenue/Active Customer
US$774,000US$634,000 in FY21
tCO2e Carbon Emissions (Scope 1 + 2)
907.03837.54 in FY21
Water Recycled
87.38%66.20% in FY21
Offices/Presence
1611 in FY21
Corporate Overview1 Financial Statements3Statutory Reports2
25
Annual Report 2021-22

Our Business Model
Input Value Creation
Cap
itals
� Net Worth: ` 66,580 Lacs � Cash and Cash Equivalents: ` 63,200 Lacs � Plant, Property and Equipment: ` 78 Lacs
� Sales Intelligence Tool � Partner Connect � Deal Database � Customer Referrals � Lead Generation and Nurturing � Proactive Proposals � Skills, Competencies, and
Capabilities of Happiest Minds
� Deal Qualification � Clarity on value proposition � Stakeholder mapping � Interlocks with other
enterprise applications � Collaboration on CRM � Management review of pipeline � Controlled access to
proposal repository � Customer testimonials � Deal-based marketing � Innovative pricing technique � Win/Loss analysis
� Matching skills and aspirations of Happiest Minds to customer requirements
� Use of accelerators/new solutions, tools
� Collaborations, unmatched personal experience
� Continuous project monitoring, defect tracking
� Implementation of LEAN initiative � Robust Quality Control processes
� Capturing feedback
� Evaluation and assessment of project execution and delivery
� Identification of improvement areas
� Obtaining dual level customer feedback on four broad parameters: satisfaction, advocacy, loyalty and value for money
� 3 Centers of Excellence (CoEs) for IoT, Analytics / Artificial Intelligence and Digital Process Automation
� Delivery Centers: 3 � 16 offices/presence in 7 countries
� R&D Expenditure: ` 1,383 Lacs � IPs/Solution Accelerators: 7
� Happiest Minds: 4,168 � Employee Benefits Expense: ` 62,000 Lacs � Diverse and Inclusive Workforce: 26.4% women,
10 Nationalities � Total Training Hours: 1,18,325
(Excluding Mandatory Training hours) � Average training hours per Happiest Mind: 32
� CSR Spend: ` 215 Lacs � 175 interactions with analysts, investors and shareholders
through periodic earnings calls, conferences, etc. � Active Customers: 206
� Vision to be Carbon Neutral by 2030 � Energy-saving initiatives and optimization � Promoting responsible use of water in-house and through
community initiatives � Optimizing Business Travel � Water Consumption: 984.22 KL � Energy Consumption: 4,375.89 GJ
Opportunity Tracking
Capitalizing on Projects
Delivery Excellence
Client Retention
Financial
Manufactured
Intellectual
Human
Social & Relationship
Natural
26
Annual Report 2021-22

Cap
itals
Output � Operating Revenue: US$146.6 Million;
Growth of 40.2% y-o-y � Total Income of ` 1,13,075 Lacs;
Growth 41.8% y-o-y � EBITDA of ` 29,477 Lacs, 26.1% of Total
Income (Growth of 36.9% y-o-y)
� Recognized as a ‘Major Contender’ in Everest Group’s PEAK Matrix for Digital Engineering
� Featured in NASSCOM’s report on India Cybersecurity Industry Services & Product Growth Story for a case study on major civil aviation infrastructure. We are also recognized as managed security service providers and integrators under emerging cyber security services hubs
� Featured in NASSCOM Cloud Case study Compendium on Digital Content Monetization (DCM) solution
� Best-in-class ecosystem benefiting Happiest Minds and Customers � Achieving greater efficiency with reduced cycle time � Local presence in 7 countries to facilitate prompt business turnaround
� Women Happiest Minds as a % of total workforce increased from 24.5% in FY21 to 26.4%
� Recognized as one of the Top 15 of India’s Best Workplaces in Health and Wellness by Great Place To Work® Institute (GPTW)
� Learning Hours in FY22 increased by 46% compared to FY21
� Net Promoter Score: 53 � Million Dollar Customers: 38 � Repeat Revenues: 85% � Akshaya Patra Foundation Meals: 12,76,622
� Total water recycled – 87.38% (FY22), 66.2% (FY21) � Total Emissions (Scope 1 + Scope 2) = 907.03 tCO2e (FY22), 837.54 tCO2e (FY21)
Financial
Manufactured
Intellectual
Human
Social & Relationship
Natural
� PAT of ` 18,120 Lacs (Growth of 11.5% y-o-y) � Free Cash Flows of ` 29,064 Lacs � RoCE & RoE of 39.8% and 27.3% respectively � Increase in Market Capitalization by 95.65% as
compared to FY21 � Earnings Per Share of ` 12.55 � Dividend Per Share ` 3.75
� Recognized in Zinnov Zones as a Leader for Enterprise Software, Leader for ER&D (Small & Medium Service Providers), Niche-Established for AI Engineering, Niche-Established for IoT Services
� Expertise in Internet of Things (IoT), DevOps and Robotic Process Automation (RPA), Software Defined Networking / Network Function Virtualization (SDN/NFV), Big Data and Advanced Analytics, Blockchain, Cloud, Business Process Management (BPM) and Integration, Security
Corporate Overview1 Financial Statements3Statutory Reports2
27
Annual Report 2021-22

Strategy for Maximizing Value Creation
We endeavor to deliver business excellence through digital transformation for enterprises and technology providers. We do this with our comprehensive technology offerings anchored in our unique philosophy of ‘Born Digital . Born Agile’, a Mindful IT Company. We continue to nurture this approach alongside augmenting capabilities to establish new product and services' roadmaps and strengthen our reputation to meet evolving needs.
We believe that understanding the customers and making them central to our decision-making is key to our long-term growth. We carefully segment our customers and deliver differentiated experiences. We mindfully understand their perceptions, share our brand’s vision and value, and provide excellent services. This drives word-of-mouth brand building and helps us tap into and grow new accounts. This strategy has been driving our brand desirability, visibility and credibility as well as enhancing our chances of success and increasing customer lifetime value.
We will continue to adopt a consumer-centric strategy through research, actionable insights and realizable blueprints to position ourselves as a relentless, agile player in the pursuit of innovation and digital transformation.
Mergers and Acquisitions (M&A) have been a key driver in augmenting our capabilities in core, niche and emerging technology areas. It has enabled us to position ourselves as an attractive digital partner of choice.
We will continue to pursue many more opportunities such as these to strengthen our market position as well as open new possibilities to drive business growth. It will help us to combine the assets and skills, reduce risks, create value, improve capacity utilization, and gain economies of scale. Our focus is on targeting companies that can bring speciality and complementary skills so that we can provide a better value proposition to our clients.
Land and Expand Strategy
Pursue Inorganic Opportunities
2828
Annual Report 2021-22

Domain-expertise-led business expansion provides more scalability and reliability to our business. Starting with technology, we have built expertise across banking and financial services, edutech, retail, manufacturing, media, entertainment, travel & hospitality, and HiTech by recruiting IT professionals with dedicated industry experience. This specialization provides the efficiency and flexibility to deliver quicker turnaround and high quality.
We have also focused on enhancing our expertise in emerging disruptive technologies by continually investing in our members and increasing our R&D capabilities. Our current identified areas are AI, Blockchain, RPA, Virtual Reality, Robotics, Drones, Low-code No-code Platforms, Metaverse, Web 3.0 and Privacy Enhanced Computing. We have already created use-cases and demos to show their potential and fitment to customers in their solutions.
We will continue to explore and build competence in new verticals and technology areas in Media & Entertainment and Health & Life Sciences to diversify and grow our customer base as well as build a competitive edge to remain at the forefront.
Geographical expansion is a strategic move to attract new customers, generate new and lucrative streams of revenue, manage competition, and leverage new market opportunities. We have already established our presence in key geographical areas including UK, US, Canada, Australia, UAE and The Netherlands, in addition to our existing office locations in India at Bengaluru, Noida and Pune.
We have further plans to set up a new office in eastern India at Bhubaneswar, Odisha to strengthen our offshoring capabilities and attract local talent. We will also pursue opportunities to deepen our presence in existing locations as well as enter new global locations.
IPs are an integral part of our offerings to generate additional revenues. With niche IPs that can complement our existing services, our ability to deliver value to our clients are elevated. So, while innovation continues to drive growth, we create and monetize a successful IP strategy to ramp-up revenue.
Our strategy is to develop software platforms & components having high configurability and operational performance, so that it can address the needs of diverse end-users across multiple industries and environments. Our advantage of high quality and speed of delivery supported by engineering talent, proprietary software development lifecycle processes, applications and tools, and strong project management practices position us as an attractive partner and solution provider.
Widen Domain and Technology Expertise
Scale Geographical Presence
Intensify IP-led Growth
Corporate Overview1 Financial Statements3Statutory Reports2
29
Annual Report 2021-22

Maintaining Effective Dialogue with Stakeholders
Stakeholders are key to implementing our business strategy and driving business growth in the long run. We ensure sustained engagements with them to understand and address their concerns as well as ensure alignment of interests. This helps us to build long-term relationships and ensure sustained value creation for all.
At Happiest Minds, our stakeholder engagement process is focused on stakeholder identification, consultation, prioritization, collaboration, engagement, and reporting. While we deal with multiple stakeholders, it is only those who add value to our business and are critical to our value creation that are key. We identify them through an exercise undertaken in consultation with our leaders. We understand their expectations & concerns and address them accordingly. This helps in the prioritization of strategy, policies and action plans in the environment, economy, and society.
Key Stakeholders and their Concerns
Key Stakeholders Channels of Engagements Key Topics and Concerns Raised during such Engagement
How We are Addressing
Customers
People
Project-related calls, reviews and meetings; relationship meetings and reviews; executive meetings and briefings; customer visits; responses to RFIs/RFPs; sponsored events; mailers; newsletters; brochures; company website; social media (LinkedIn, Twitter, Facebook, Instagram); Customer Happiness Surveys; sponsored community events
Town halls; project or operations reviews; video/audio conferences; performance evaluation/wellness/ member engagement programmes; Yammer (intranet platform); one-to-one counselling; iAppreciate (appreciation portal); Committees; Circle of Happiness Champions; Annual Reviews
� Achieve an NPS of 55 by 2026
� 95% or more of customers score 7 on a 9-point scale in the Customer Happiness survey
� Increase repeat business from 90%+ to 95%+ by 2031
� Track value adds with 30% customer coverage every year
� Effort towards personal wellbeing and happiness
� Happiest Minds score 7 on a 9-point scale in the Happiness Index
� Create an atmosphere to be recognized as amongst the top 3 places to work in the Indian IT services industry
� Improved implementation capabilities and skills of people to deliver projects on time
� Strong cyber security solutions implemented to protect data
� Instituted a dedicated wellness program and council to address 7 aspects of wellness i.e. physical, spiritual, intellectual, professional, social, emotional and environmental wellness
� 90+ wellness programs in FY 2021-22
� Multiple learning programs including 36 for niche skills
� Multiple programs to support gender, cultural, generational and ethnic diversity
30

Shareholders & Investors
Press releases; email advisories; in-person meetings; press/investor conferences; disclosure; social and environmental sustainability financial statements; earnings call; exchange notifications; press conferences; website; Annual General Meeting; Annual Report
� Long-term growth
� Highest standards of corporate governance
� Transparency and disclosure
� Establish leadership in Environment, Social and Governance (ESG) standards
� Maintained industry-leading performance with superior margins
� Devised strategy for long-term growth
� Established ESG policy to drive business resilience
Key Stakeholders Channels of Engagements Key Topics and Concerns Raised during such Engagement
How We are Addressing
Alliance Partners
Community
Vendors
Government and Regulatory Bodies
Meetings/calls; visits; partner events; conference calls; business reviews
Presentations; reviews, field visits and surveys; calls and meetings; consultative sessions; due diligence; conferences and seminars; press releases & conferences; sponsored events
Project management reviews; relationship meetings and reviews; contracts
Representations on consultative papers by regulatory authorities; interactions with statutory bodies like SEBI, the Labor Authorities, CPCB, etc.; policy advocacy; interactions/representations with Government through industry associations like NASSCOM, FICCI, ASSOCHAM, CII
� Fair business practices
� Governance
� Sustained demand and business opportunities
� Creditworthiness
� Promote small businesses
� Participate in national economic development
� Timely payment to the exchequer
� Contribute to community development and sustainability
� Ensured fair and transparent onboarding and payment terms
� Supporting suppliers with training and skill-building
� Transparent reporting of financial and non-financial performance as per GRI standards
� ESG action plan created
� Enhance and actively engage in innovation
� Be a partner for digital technologies
� Being a responsible corporate citizen
� Contribute time and financial resources to social and environmental causes
� Associate with organizations working towards this goal
� Premier vendor relationships with dedicated support
� Provide ready availability of skilled resources and privileged access to IPs, labs and infrastructure
� Supported Akshaya Patra Foundation in their meal distribution program
� CSR spending for COVID-19 support, supporting treatment of blindness and enhancing education
� Provided resources for Sri Jayadeva Institute of Cardiovascular Sciences and Research for a molecular testing lab and ICU beds
31
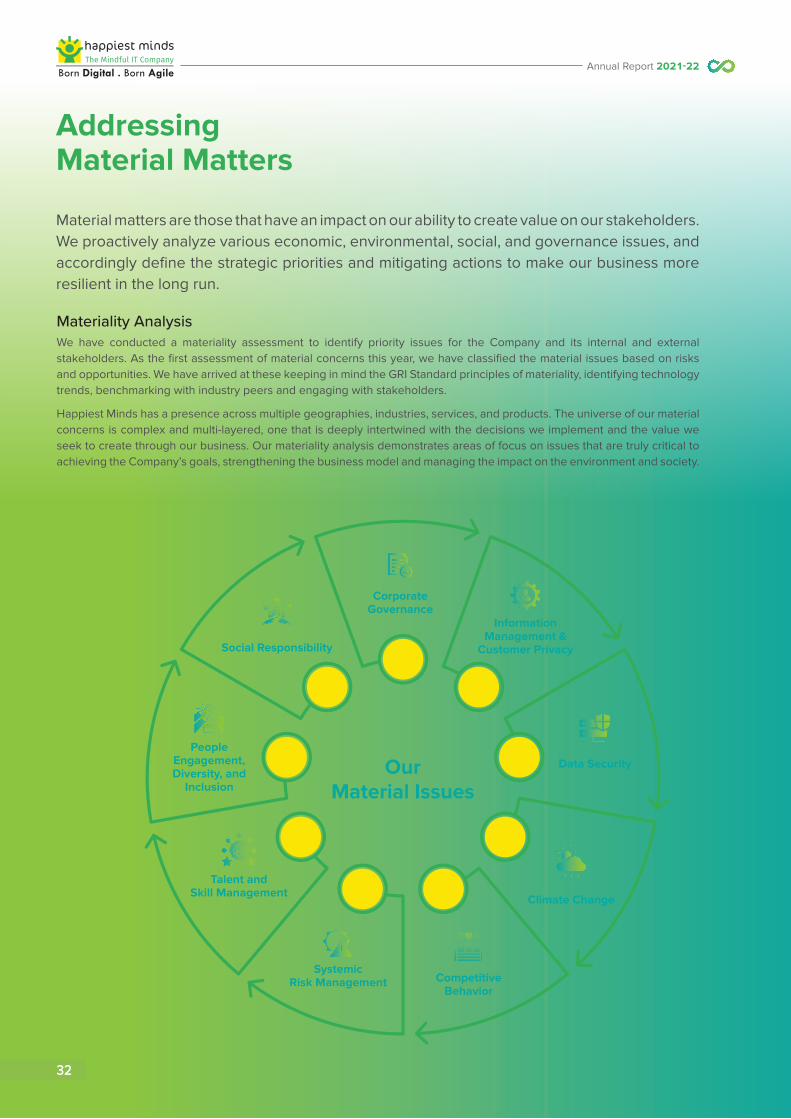
Addressing Material Matters
Material matters are those that have an impact on our ability to create value on our stakeholders. We proactively analyze various economic, environmental, social, and governance issues, and accordingly define the strategic priorities and mitigating actions to make our business more resilient in the long run.
Our Material Issues
Corporate Governance
Information Management &
Customer Privacy
Data Security
Materiality Analysis We have conducted a materiality assessment to identify priority issues for the Company and its internal and external stakeholders. As the first assessment of material concerns this year, we have classified the material issues based on risks and opportunities. We have arrived at these keeping in mind the GRI Standard principles of materiality, identifying technology trends, benchmarking with industry peers and engaging with stakeholders.
Happiest Minds has a presence across multiple geographies, industries, services, and products. The universe of our material concerns is complex and multi-layered, one that is deeply intertwined with the decisions we implement and the value we seek to create through our business. Our materiality analysis demonstrates areas of focus on issues that are truly critical to achieving the Company’s goals, strengthening the business model and managing the impact on the environment and society.
Climate Change
Competitive Behavior
Systemic Risk Management
Talent and Skill Management
People Engagement, Diversity, and
Inclusion
Social Responsibility
32
Annual Report 2021-22

Key Stakeholders and their Concerns
Material Issue Matter of Risk or Opportunity and the Context Approach to Adapt or Mitigate
Corporate Governance
Risk
Risk
Risk
Information Management & Customer Privacy
Data Security
Strong corporate governance that considers stakeholder concerns, engenders trust, oversees business strategies, and ensures fiscal accountability, ethical corporate behavior, and fairness to all stakeholders is core to achieving our longer-term mission.
We work with a wide range of customer data which is leading to increased regulatory scrutiny globally. Cloud-based software and IT services also raise concerns about potential access to user data by governments.
Effective management in this area is important to reduce regulatory and reputational risks which can impact revenues, and market share, and lead to regulatory actions involving potential fines and other legal costs.
Rising instances of cyber-attacks and social engineering puts our data and that of our customers at risk.
Inadequate prevention, detection, and remediation of data security threats can damage our reputation and thus influence customer acquisition and retention, resulting in decreased market share and lower demand for our products.
It can also result in increased expenses, due to remediation efforts such as identity protection offerings and employee training on data protection. New and emerging data security standards and regulations further lead to increased costs of compliance.
� Implemented Data privacy policies and controls as per the GDPR requirement to protect personal data
� In process of implementing the Privacy Information Management System as per the ISO 27701 standard
� Undertaking annual security awareness sessions
� Implemented multiple controls to ensure data security and privacy including user awareness and training programs, end point and N/W security controls
� Proactive monitoring and analysis of any new vulnerabilities and threats
� Ensuring all third parties have adequate data protection measures and procedures
� Robust corporate governance mechanism which ensures responsible business conduct and regulatory compliance
� Adequate Independent Director representation to protect stakeholder interest
� Robust enterprise risk management framework and consideration for ESG risks
� Promoters to hold 40% stake to ensure perpetuity in the Company’s vision and culture
� Strong checks in place to prevent corruption and non-compliance
Climate Change
Risk & Opportunity
Climate change poses significant physical and transition risks to our business. It can also impact the wellbeing of Happiest Minds and customers as well as our strategy and financial resources. It also offers opportunities arising from innovations in energy efficiency and renewable energy.
� Actively integrating ESG in our business decisions and designing our operations and business activities aligned with climate neutrality by leveraging innovative technologies, renewable energy, and upgrading existing systems for higher efficiency
� Board-approved ESG policy aimed at enabling a low-carbon and resource-wise economy
� Climate change risks and opportunities reviewed by a Board-approved management level ESG committee
� Helping our customers to transform their business into lean, energy-efficient, and agile cloud-based digital solutions, and embrace technology-led green solutions
� Encouraging vendors to adhere to safe and environmentally responsible practices
Corporate Overview1 Financial Statements3Statutory Reports2
33
Annual Report 2021-22

Addressing Material Matters
Material Issue Matter of Risk or Opportunity and the Context Approach to Adapt or Mitigate
Talent and Skill Management
People Engagement, Diversity and Inclusion
Social & Relationship
Opportunity
Opportunity
Opportunity
Our people are the key contributors to value creation. Recruiting qualified employees to fill the relevant positions and training them adequately in including niche skills is key to servicing our clients and driving future growth. It also enables us to provide a quality differentiator.
The health and safety of our teams as well as their physical, emotional, and mental wellbeing is critical to keeping them motivated, driving their productivity, and influencing their retention.
Diversity and Inclusion is essential as it helps in bringing diverse talent within the organization and thus drives a thriving and innovative culture. It also helps us understand the needs of our diverse and global customer base.
Business must be rooted in community and be aligned with its larger interests. Any adversarial relationship can hurt our ability to create long-term value.
� Multiple learning and development programs to upskill and reskill people
� Robust system for acquiring and retaining the right talent
� Significant monetary and non-monetary benefits given to improve people engagement and therefore retention
� Regular surveys conducted to gauge People Pulse
� Consistently scored high on all Great Place To Work® parameters
� In terms of diversity, 26.4% of Happiest Minds are women and we intend to increase this to 35% in 10 years
� Striving to be a good corporate citizen with a special emphasis on environmental responsibility and driving inclusivity
� Maintaining harmonious relationships with the community by undertaking various support and developmental efforts
Competitive Behavior
Systemic Risk Management
Opportunity
Risk
IT companies spend a significant proportion of their revenues on IP protection. While IP protection is inherent to the business model of some companies, it is also an important driver of innovation, and restricting competition from accessing its benefits can be a contentious societal issue.
Programming errors or server downtime have the potential to generate systemic risks, such as computing and data storage functions to the cloud. The risks are heightened for sensitive sectors, such as financial institutions or utilities, which are critical to national infrastructure.
Investments in improving the reliability and quality of IT infrastructure and services are therefore critical.
� Balancing the protection of our IPs and their use to spur innovation so as to not unfairly restrict competition
� Adopted a Secure Software development process to ensure any security vulnerabilities are identified and fixed prior to release
� Perform detailed security testing on the developed application/system
34
Annual Report 2021-22

Risk Management
Our business faces several risks which may be internal or external. We have a robust framework and process in place to effectively manage them and deliver long-term value to our shareholders.
Risk Management Framework We have established a well-defined framework and procedures for enterprise risk management, prepared under the supervision of the Executive Board. It encompasses significant risk in areas of information security, operations, delivery, and key support functions along with detailed risk management guidelines including risk identification, analysis, response, tracking, and management discussion and mitigation. Risk registries are maintained by respective functions and project teams. These are centrally reviewed and periodically monitored by compliance and governance teams identified as the owner for the specific area of risk.
The Chief Information Security Officer (CISO), Chief Information Officer (CIO) and Engineering and Business Excellence Team (EBE) work together with the Executive Board in achieving the above. The process followed by them in identifying areas of risk includes:
� Identification of key risk areas
� Assessment of key risks for probability and impact
� Prioritization
� Formulation of response
� Identification of owners
� Participation by owners in outlining mitigation plans
� Reporting on adequacy and effectiveness
� Acceptance of residual risk
Our risk appetite reflects the broader level of risk that we can assume and successfully manage and is factored into our strategy at the time of drawing up the long-term and the annual business plan.
Key Risks and Mitigation Actions
Risks Mitigating Actions
Foreign currency fluctuation
A large part of the revenues come from international operations. Any unfavourable movement in foreign currency may adversely impact profitability.
Customer credit
Inability to obtain payments owed by our customers will impact on our working capital cycle and lead to loss.
Availability of credit and liquidity management
Inability to maintain optimum liquidity level may put us at risk of meeting future cash and collateral obligations.
� We manage FX risk in 2 ways. 1. Natural Hedge – Matching of payable and receivables in foreign currency such that the swings are neutralized. 2. Simple Derivatives - in the form of plain vanilla forward exchange contracts with a residual life of a maximum of one year and structured in the form of a ladder for covering probable transaction/inflows
� We maintain short bill and collect cycles, with a strong focus on collection as evident in our debtor days of 90 as on March 31, 2022
� We undertake assessing the creditworthiness of customer
� We ensure adherence to contractual terms to ensure timely collections
� We maintain our focus on monitoring our positions and maintaining adequate sources of financing through various banks under multiple banking arrangements.
� We have access to undrawn borrowing facilities of ` 87 Crores as on March 31, 2022
Financial Risks
Corporate Overview1 Financial Statements3Statutory Reports2
35
Annual Report 2021-22

Risks Mitigating Actions
Risks Mitigating Actions
Concentration of revenues
We are dependent on a few customers and geography for a large part of the revenues. Inability to attract new or retain existing customers, or any unfavorable macro scenario in our key target market may impact revenues.
Talent availability
Our business is people-driven and we are dependent on their talent to deliver solutions to clients. The unavailability of talented individuals may impact business opportunities.
Optimal resource utilization
Inability to maintain high resource utilization and productivity will impact profitability.
Contractual commitments and project delivery challenges
Inability to maintain contractual commitments may lead to termination of agreements and future business opportunities .
New and emerging technology disruption
Ours is a rapidly evolving industry, and the inability to build capabilities to deliver on new technological developments may impact new business opportunities.
Profitability and sustenance of the business
Increase in wages and inability to arrive at the right contract pricing through various cost estimation may impact profitability.
Business expansion
The inability to bag new orders and enhance people's bandwidth will result in stagnancy. We are also faced with the challenge of contractual clauses which may restrict our ability to offer services to different customers.
� The majority of our revenues come from the US. However, over the years we have grown business in other regions resulting in a consistent decline in the share of revenue from the US
� We maintain close relationships with customers and maintain constant engagements to understand their needs
� Continuous focus on adding new clients which in FY 2021-22 stood at 33
� We leverage our extensive portfolio of offerings to cross-sell and upsell to existing customers
� Being headquartered in India, we have significant access to talented engineers
� We have a robust talent management program which includes hiring freshers and skilling them as well as enhancing skills in our existing employees and providing them enhanced career opportunities
� We undertake multiple wellness programs and pay our employees in line with the industry standards to ensure high retention
� We have consistently ensured high utilization of our people resources which as on March 31, 2022, stood at 80.5%
� We are currently operating in times when the demand for IT products and services is significantly high. This will result in sustained business opportunities and high utilization
� We ensure the prompt transition of employees from completed projects, accurate demand forecasting and deploying the right people to right projects
� We maintain a focus on high-quality control and process execution standards, planning resource utilization rates, maintaining sustained engagements with clients and ensuring high productivity level to deliver projects
� A solid team of engineers and partnerships with leading global vendors enables us to deliver high-quality products and services as per terms and on a timely basis
� We have experience in several next-generation technologies like blockchain, AI, drones & robotics, and EDGE computing among others
� We constantly run upskilling and reskilling programs to gear our employees with the future of work
� With most of our IT professionals being from India, we have the advantage of lower wage costs
� Our team has extensive experience and applies adequate assessment in cost estimations and contract pricing
� Our ability to deliver high quality solutions ensure better pricing power
� We are continually enhancing our people assets (by continually attracting talent and containing retention) to execute growing operations
� Our solutions have enabled clients to achieve tangible outcomes, leading to sustained repeat orders as well as new orders
� Our diverse technology capabilities across diverse segments enable participation in several new orderings
Business Risks
Operational Risks
36
Annual Report 2021-22

Risks Mitigating Actions
Compliance with local legislation
Inability to comply with the local laws of the region in which we operate may lead to litigation or cancellation of licenses.
Restriction on immigration or work permits
We are dependent on our Indian people resources to deliver onsite support to clients. Any geopolitical tension or unfavorable change in immigration laws may impact project delivery.
Data privacy and information security risks
Inability to ensure the privacy of customer data and protect systems or clouds from cyberattacks may put us at risk of litigation.
IP risks
Inability to protect own IPs may lead to opportunity losses. We also face the risk of failure to comply with the terms of third-party open-source software that we use in providing solutions, or any IP infringement claims against the solutions that we have provided which may lead to the inability to continue providing services to our client.
� We have stringent policies and checks in place to ensure compliance with local laws
� We are also integrated with a compliance tool which provides timely reminders, alerts and helps in ensuring good governance and compliance with all applicable local legislation
� We also consult and seek guidance from professional experts on having interpretation issues with the local laws of the region
� While the present immigration scenario is mostly conducive, it is difficult to predict the future regulatory changes/events due to geo-political reasons. We closely keep track of the local immigration laws countries we operate and plan our activities
� We monitor the time & effort spent by our employees onsite to avoid tax incidences
� We have well-defined information security and data protection policies and procedures conforming to ISO 27001 standards
� Our data privacy policies and controls comply with Privacy regulations like GDPR
� We have stringent regulations relating to the handling of customers' data and employees are required to follow them, including a written agreement for confidentiality
� We use licensed third-party commercial software in all cases to avoid issues of infringement and no warranties or other contractual protections from licensors. They are monitored and managed in-house.
� We maintain strong focus on developing novel solutions to avoid issues of IP infringement
� We protect our technical know-how by registering intellectual property when required and by undertaking confidentiality obligations from all stakeholders involved in projects
� We do not recommend the use of any open-source tools unless it is verified and approved by IT/legal team.
� We also take necessary insurance to mitigate any eventualities related to IP risk.
Legal and Regulatory Risks
Corporate Overview1 Financial Statements3Statutory Reports2
37
Annual Report 2021-22

BUSINESS SEGMENT REVIEW
Digital Business Services (DBS)Enhancing business outcomes with digital modernization and transformation
`32,887 Lacs
30.1%
Revenue in FY 2021-22
Revenue contribution in FY 2021-22
External EnvironmentWe are operating in a digital era where rapid technology changes are disrupting and transforming enterprises, societies, and everything in between. In the past decade, digital adoption and transformation have significantly increased as companies strive to enhance efficiency through automation and build competitiveness by integrating data to better understand customer needs and make data-driven decisions. This has accelerated post pandemic with enterprises increasingly using digital for customer interactions and data to improve efficiency and predict business outcomes.
Business Overview We help companies enable and catalyze their innovation and digital transformation journey to drive growth,
performance, and revenue. We enable your digital transformation - by creating Digital Capital and elevate your business with Mindful 4E framework that stands for Explore, Envision, Engineer, and Enhance. We believe in helping customers meet their BUSINESS GOALS by ‘DELIVERING DIGITAL CAPITAL’ at each step of their DIGITAL TRANSFORMATION JOURNEY through outcomes and insights. Using API economy, next-gen tech, and insights, we enable our customers to provide a better customer experience, empower employees, optimize operations, and help transform their business model via path-breaking innovations.
Our process is meticulous, efficient and result-driven. 'Born Digital . Born Agile', we believe in delivering business goals by leveraging technologies that create a digitally resilient ecosystem.
38
Annual Report 2021-22

Mindful Framework-led Strategy
� Digital maturity assessment
� Value creation opportunities and target state blueprinting
� Operation digitization
� Immersive experience
� Cloud migration
� Agile delivery transformation
� Product and application innovation and modernization
Digital Products, Platforms, and Applications
� Product design and development (physical and digital)
� Digital platforms
� Intelligent edge
� Innovative applications
� Application modernization and migration
Digital Factory-led Organizations
� Quality engineering
� DevSecOps
� Enterprise applications
� Agility with reusability
� Insights-based dashboards
Digital Experience-led Transformations
� Immersive and phygital experiences
� Omni-channel experiences
� Converzational interfaces
� Gamification
� Connected workforce
Cognitive Intelligence and Hyper-automation
� Process discovery and optimization
� Connected assets
� Smart and connected spaces
� Data modernization and visualization
� Data quality, governance, operations and commercialization
� Cognitive insights, testing and automation
Mindful and Advanced Technologies to Build the Digital Future
� Blockchain
� AI and computer vision
� Virtual and augmented reality
� Edge computing
� Digital twin
� Data science as service
Our End-to-End Digital Offerings We provide end-to-end solutions right from innovating, building, maintaining, re-engineering and migrating in the following areas:
While building this solution along with Happiest Minds, we resurrected high-value strategic projects that we couldn’t tackle before because of the constraints of legacy apps. We feel empowered to take advantage of any future opportunities that the business provides us.
- Bob Means Director of Business Solutions Coca-Cola Bottling Company United
The innovative tech that Happiest Minds implemented at Coca-Cola Bottling Company United garnered attention at Microsoft Inspire on 14th July 2021 and was highlighted during the Keynote by Satya Nadella, CEO, Microsoft.
Watch at 20:10 mins: https://www.youtube.com/watch?v=t1PAGcP9lhc
Corporate Overview1 Financial Statements3Statutory Reports2
39
Annual Report 2021-22
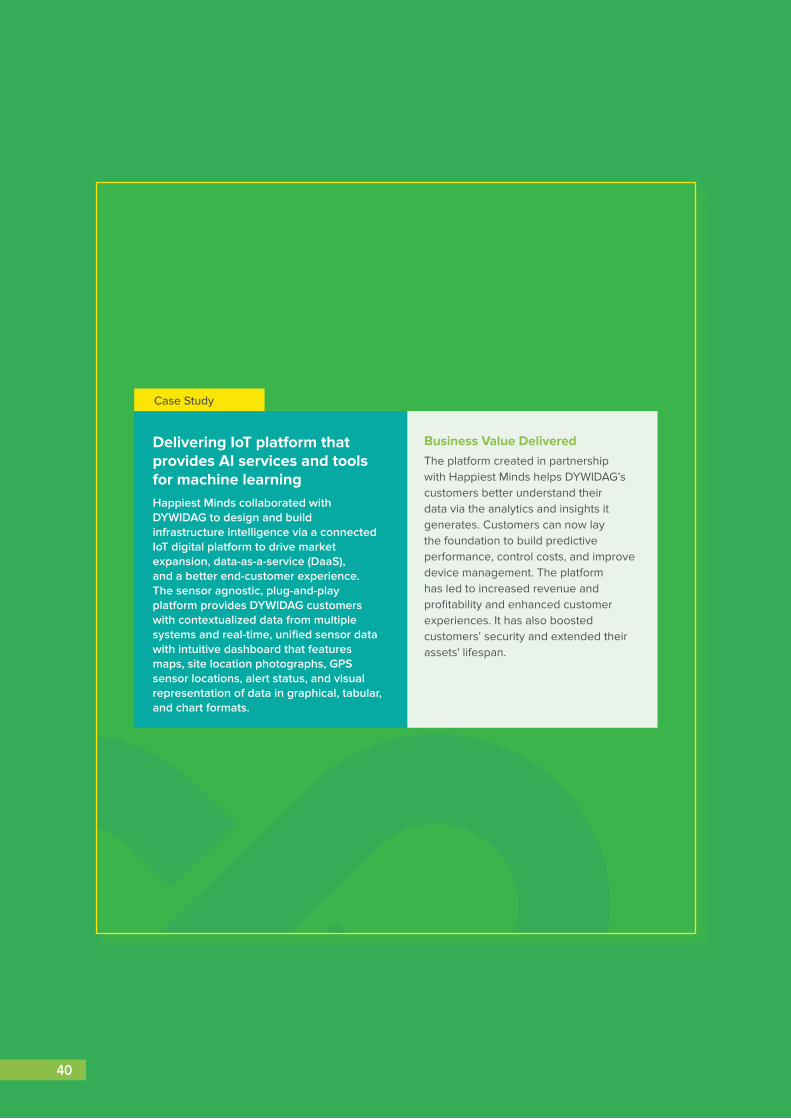
Delivering IoT platform that provides AI services and tools for machine learningHappiest Minds collaborated with DYWIDAG to design and build infrastructure intelligence via a connected IoT digital platform to drive market expansion, data-as-a-service (DaaS), and a better end-customer experience. The sensor agnostic, plug-and-play platform provides DYWIDAG customers with contextualized data from multiple systems and real-time, unified sensor data with intuitive dashboard that features maps, site location photographs, GPS sensor locations, alert status, and visual representation of data in graphical, tabular, and chart formats.
Business Value Delivered
Case Study
The platform created in partnership with Happiest Minds helps DYWIDAG’s customers better understand their data via the analytics and insights it generates. Customers can now lay the foundation to build predictive performance, control costs, and improve device management. The platform has led to increased revenue and profitability and enhanced customer experiences. It has also boosted customers’ security and extended their assets' lifespan.
40

Digital transformation project for streamlining order management We have been working with the Coca-Cola Bottling Company United on multiple areas of digital initiatives. The most recent engagement was when Happiest Minds successfully executed a digital transformation project for Coca-Cola Bottling Company United for streamlining its order management with Technology Transformation in Microsoft Power Automate.
We leveraged Microsoft Automate (UI flow) for the robotics process automation and AI features to extract invoice information from PDF files, Auto email reader on order confirmation, shipment & invoicing, Admin dashboard to manage exception.
Business Value Delivered
Case Study
The digital initiative was closely tied with the business goals of the company, and the solution was able to deliver on multiple aspects. The implementation led to a more efficient order processing - a faster way to process on-demand shipment requests (forced shipments) from customers and better supplier integration. It reduced labor costs, minimized the various points of error in the solution, and rapidly expanded the local Freestyle campaign to better support our customers.
This implementation led to:
� Immediate realization of 1 plus FTE hours freed up for more strategic activities
� Cost avoidance of up to 10 FTEs/ bottler as the Freestyle Campaign was scaled to include North America
� Enabling all other Coke Bottlers (11 in US, 100+ global)
41

`24,168 Lacs
22.1%
Revenue in FY 2021-22
Revenue contribution in FY 2021-22
External EnvironmentIn the digital world, all corporate goals, strategies, and operations need a close alignment with IT infrastructure management and security services to build a smart, protected, and robust organizational framework. An efficient and secure technology infrastructure minimizes downtime, increases business value through tangible and intangible elements.
Business Overview We offer end-to-end, 24x7 monitoring and management and secure ring-fencing of customers' (enterprises and technology companies) infrastructure and applications. We have expertise in automating business and IT operations with the DevSecOps model and providing world-class NOC/SOC (network and security operating center) services.
Infrastructure Management & Security Services (IMSS)Ensuring safe, secure and efficient data center, cloud infrastructure and applications
BUSINESS SEGMENT REVIEW
42
Annual Report 2021-22

1. Infrastructure Consulting � Infrastructure Discovery &
Maturity Assessments
� Migration and Modernization Strategies, and Roadmaps
� Consolidation & Optimization Strategies
� DR/BCP Strategies
2. Hybrid/Multi-Cloud � Hybrid/Multi-Cloud Cloud Design,
Build & Migration
� Datacenter Design, Build & Migration
� Database Migration & Modernization
� DevSecOps Integration
� Infrastructure as Code
� Cloud Platform Engineering Services
3. Digital Workplace � End-user Device Refresh
� OS Upgrades & Migrations
� Directory Services Migrations
� Unified Communication & Collaboration Services Migration
� Desktop Engineering Services
4. Network � Detailed Network Designing
� Network Deployment Planning
� Network Deployment, Migration and Validation
� Network Engineering Services
5. ITSM & ITOM Tools & Platforms � Tools Consolidation
� Tools Implementation & Migration
� Tools Integration Services
� Workflow Automation
� Tools Customization and Engineering Services
6. Managed Services � Service Desk, NOC &
Cross-functional Services
� Cloud & DC Infrastructure Management
� DevOps & DataOps
� Application Support
� End-user Support
� Network Management
� Tools Platform Maintenance
Infrastructure Lifecycle ServicesWe provide comprehensive and integrated services for managing distribution and hybrid IT/Cloud environments as a single entity with a single point of accountability. Our ELLIPSE platform automates standard operations and provides an integrated CxO dashboard for monitoring applications and infrastructure. We ensure a smooth start and operationalization of systems support services with minimal time and impact. During steady-state operations, service improvement plans, and initiatives are implemented along with the support for technology transformation.
Our Service Offerings
Security Services We offer the latest cyber security solutions through expert security professionals with a holistic risk-driven approach that ensures end-to-end security solutions. We aim to improve the agility, flexibility, and cost-effectiveness of the next- generation's needs for information security and compliance programs.
Our Service Offerings1. Governance, Risk & Compliance � IS policy Review/Remediation
� Compliance Consulting - ISO 27001, ISMS, PCI-DSS, SOXITGC, SWIFT
� Risk assessment consulting - Cyber Risk, TPR, ASD, NESA, NIST
� Professional Services – Archer, Metric Stream, Galvanize, SNOW
� BCP/DR Consulting, Security Awareness Programs
2. Advanced Threat Management � Application Security Services
� Security Code Review
� Mobile Security Testing
� Network Security Assessment / VAPT
� Vulnerability Management
� IOT Security Testing
� Device Configuration Review
� Phishing Simulation
Corporate Overview1 Financial Statements3Statutory Reports2
43
Annual Report 2021-22

3. Digital Risk & Data Security � Data Classification
� Data Leak Prevention
� Data Security Audit / DPIA
� Data Masking Encryption Services
� GDPR Remediation Services
� Data Privacy Assessment
� Cyber Resiliency Assessment
� Security Assessment
4. Identity & Access Management � IDAM Consulting,
Implementation, Ops Support
� Privilege Access - Implementation & Support
� Identity of Things (IoT)
� Cloud Access Security
� Multi-factor Authentication
� Identity Vigil (IDaaS) platform
� IDAM Managed Services (L1, L2)
5. SOC/MDR � Managed Detection
and Response (MDR)
� Managed Endpoint Detection and Response
� Cyber/Risk Analytics (UBA, NBA)
� End Point Threat Detection
� TI & Brand Monitoring as a service
� SOC Operations & Incident Management – 24x7, 8x5, dedicated/hybrid/shared
6. Infra & Cloud Security � DevSecOps
(microservices, containers)
� Cloud Security assessment / baseline
� Technical implementation – CASB, Firewall, IDAM, IDS/ IPS, WAF, Email sec
� Advanced Gateway Security (Layer 7)
� Azure Sentinel as-a-service
� Network Security audits/config review
� Select the appropriate RPA operating & governance model, change management plan, and deployment strategy
� Assess and prioritize automation opportunities and channel efforts according to current automation rates, transactional volume, and ease of implementation
1. Consult � Opportunity Sizing
� Solution design & implementation roadmap
� Governance & Change Management
� Build a business case and verify its value during the first RPA pilot to secure management buy-in and align key stakeholders
� Implement and develop services to create simple screen automation and cognitive robots
2. Build � Platform / Tool setup
� Process Automate / BoT Builds
� BoT Monitor / Orchestrator
3. Manage � BoT Factory setup & running
� RPA Service Desk setup & monitoring
� RPA Support setup & operations
Robotic Process Automation-as-a-Service
Our Service Offerings
Our Robotic Process Automation as a Service is designed to help organizations integrate RPA with technologies like artificial intelligence, machine learning, and knowledge-based systems to drive enterprise-wide transformation. Our end-to-end RPA services enable our clients to understand current automation levels and discover opportunities for reducing operational costs. We empower organizations to:
� Our highly skilled RPA experts will work with your business and IT teams to continuously identify processes ripe for automation, select RPA technology suitable for your processes, develop automation workflows and help sustain the robot workforce
44
Annual Report 2021-22

Migrating VMware to AWS cloud for CAN CapitalCAN Capital is a financial services firm that provides access to working capital to small and medium-sized businesses in the United States. Happiest Minds helped them to migrate from the existing complex data center to AWS with zero disruption, incorporate Redshift Cluster for data sampling, and update existing relay servers with SES deployment for SMTP communications.
Leveraging Alyne platform to automate GRC for Cutover, UK Cutover is a leader in work orchestration and observability. They wanted to enhance stakeholder trust and marketing edge by assuring SSAE-18/SOC2 requirements. They also wanted to reduce expenses related to information security incidents and enhance governance.
In partnership with Alyne, we understood their business ecosystems and service level agreements, and identified appropriate controls based on trust principles. Further, effectiveness of Confidentiality, Integrity, Availability, Security, and Privacy controls were tested, and continuous control monitoring and management was established through GRC Automation.
Happiest Minds quickly jumped in and learned our environment’s complexities and provided guidance and support throughout the whole process. The team was one of the best we’ve ever assisted with for a major initiative. We will be continuing the partnership on all major IT initiatives.
Managing governance, risk and compliance is more important than ever and working with Alyne-Happiest Minds alliance helped put controls in place to achieve SOC2 compliance. This is significant not just for our own internal controls but also assures our customers of effective governance.
- Andy Troiano VP-Technology, CAN Capital
- Craig Gregory CISO and Co-Founder, Cutover
Case Study
Case Study
45

BUSINESS SEGMENT REVIEW
Product Engineering Services (PES)Engineering excellence to build the next-generation of smart, secure, and connected products and platforms
`52,310 Lacs
47.8%
Revenue in FY 2021-22
Revenue contribution in FY 2021-22
External EnvironmentThe global PES market is expected to grow steadily at a CAGR of 11.3% between 2019 and 2025. The offshore delivery of software products is on the rise and with the increase in service providers that deliver the necessary requirements on this front; market growth is expected to be aggressive in the coming years.
Business Overview We engineer next-generation products and platforms across software and hardware that power digital evolution and provide end-to-end engineering services for developing high-quality, scalable, and secure products. We have
expertise in core technologies (cloud, mobile UI/UX, hardware & embedded, DevOps) and emerging technologies (blockchain, AI, edge computing, drones and computer vision) across edutech, hi-tech, media and entertainment, healthcare & life sciences, industry, and manufacturing sectors. These provide us with a competitive advantage and have enabled us to build smart and connected product solutions and services.
While the market landscape is expected to be competitive, our expertise in digital technologies, engineering innovation and customer centricity make us a preferred partner in the segment.
46
Annual Report 2021-22

Our Service OfferingsWe offer a host of highly tailored and carefully curated services that are attuned to the unique requirements of the following industries:
1. EduTech � Digital Learning
� Learning Platform
� Big Data for Education
� AI-enabled Learning
� Learning Credentials & Integrity
� Digital Campus
2. Hi-Tech � Software Products & Platforms
� AdTech
� Consumer Electronics
� Networking & Telecom
3. Media & Entertainment � Digital Video Solutions
� Quality of Experience
� Media Services & Solutions
4. Healthcare & Life Sciences � Digital Health
� Device Engineering
� Health Analytics
� Digital Enterprise
5. Industrial � Digital Strategy Assessment
� Embedded Product Engineering
� Edge & Communication Engineering
� Platform Engineering
� DevOps & Test Automation
� Solution Engineering
� Customer Experience Engineering
6. Manufacturing � Digital Strategy Assessment
� Product Design Optimizations
� Connected Manufacturing Operations
� Supply Chain Optimizations
� IoT enablement of Products
� IT Modernization & Automation
� Secure Managed Services
Corporate Overview1 Financial Statements3Statutory Reports2
47
Annual Report 2021-22

Digital Transformation for a Chemical MajorA global specialty chemical company needed to ably compete with larger players by meeting aggressive growth and profitability goals. This required creating a digital platform for enriching their chemistry solutions with differentiators for amplifying the value delivered to customers and minimizing customer bids and possible attrition.
We undertook a massive consultation exercise covering over 200 interviews to obtain a 360 degree view. Based on this, an innovative platform was delivered which extended across all business segments, facilitated visual mapping of rich contextual data and supported automated inventory management. Multiple assets and technologies including IoT Hub, Azure Active Directory, Azure SQL Server, Blob Storage, CosmosDB, BLE/Bluetooth, Android/iOS and React JS/React Native were used in it.
Business Value Delivered � 90% reduction of rush freight and reduction in order time by 15 minutes
� Efficient management of SLOB inventory
� Predictive and statistical analytics and high-quality service reports
Case Study
Delivering Smart Building SolutionsA Fortune 100 company that invents and manufactures technologies around global macro trends of safety, security, and energy, looked to create next-generation building solutions. This would be an overarching platform that stitched together their various building solutions and leveraged the resulting data to provide enhanced experiences to occupants and facility managers.
Starting off with a proof of concept within a controlled environment, we captured feedback from over 100 relevant stakeholders and end consumers. Accordingly, a smart buildings platform was developed. Its R&D-driven integrated ecosystem ensured all the varied technology components worked seamlessly across several building areas. It had Indoor Positioning to capture location-specific data and facilitate real-time actions such as booking conference rooms, adjusting temperature, etc. It used data generated by the building and its occupants intelligently to facilitate predictive maintenance.
Business Value Delivered � Direct revenue impact of US$15 Mn and pull-through of over US$100 Mn in 3 years
� Improved safety, security and compliance, and increased visibility on building usage, and energy consumption to improve space utilization and facility planning
� Data analytics-enabled decision-making that is faster and results in reduced maintenance costs
Case Study
48

Building Competitive Edge with Our Intellectual Capital
Digital transformation and digital adoption are finding increasing acceptance among global companies to build a competitive edge and enhance the way they engage with customers. We are leveraging and further strengthening our digital lifecycle of offerings through investing in R&D, emerging technologies and strategic alliances to solve for our clients.
We have the capabilities to deliver effective, quality and best-suited software. We do this by leveraging our diverse technologies and tool competence as well as an agile scaling framework for quality and speed.
This model provides a flexible approach to running software projects more efficiently. It enables experimentation
with the latest proprietary tools and techniques and selecting the right technology which balances innovation and predictability from our wide-ranging technology expertise including web technologies, cloud, data, mobile, testing, hardware and embedded, integration and APIs, IoT, AI, analytics and DevOps. The agile framework enables scaling across the spectrum
from ideation to production and delivers tangible outcomes to customers.
Our proprietary applications and tools are effective in reducing risks (security breaches and cost overruns), and provide better control and visibility across the project lifecycle.
Agile Engineering and Delivery
Corporate Overview1 Financial Statements3Statutory Reports2
49

Partnership rationaleHelp customers (both industrial and consumer segments) to unlock the potential of the AWS platform and achieve transformational outcomes.
Our specialized service offerings � Developing smarter products and systems
using the AWS IoT stack
� Enterprise Modernization (applications, DB, infrastructure), using AWS PaaS
Partnership rationaleDevelop simplified and robust security solutions by leveraging next-gen technologies with strong domain expertise.
Our specialized service offerings � Privileged Access Management (PAM)
� Critical credential management
Partnership rationaleWorking closely with them in all our focus geographies. Our deep capability within Microsoft technologies has helped us achieve Gold competencies within Application Development, Azure Cloud, Collaboration, Data Analytics, and DevOps areas.
Our specialized service offerings � Connected products development
� Power Platform COE setup and achieving rapid automation using LCAP
Partnership rationalePimcore is a 100% open-source and fully customizable digital experience platform spanning product information/master data/digital asset/content management, UI/ UX and eCommerce.
We offer end-to-end service capability in Pimcore. Our proven capabilities in architecting data solutions, designing experience, managing/consolidating applications, and engineering products bring a truly integrated approach to solving our client's critical challenges.
More on our alliances can be read on https://www.happiestminds.com/about-us/alliances/Disclaimer: All logos are the property of the respective owners.
Our specialized service offerings � Open-source PIM/MDM integrations
� Digital media asset management, transformation, and deployment
� Automate Open-source CMS/UX
� Open-source and customized e-commerce framework
Key highlight of the partnership As a strategic partner to Pimcore, we have delivered ~300 projects over 7 years through 150+ consultants.
� Cloud transformation and hybrid cloud management services
� Data Platform Modernization
� Cloud Security Services
Key highlight of the partnershipWe have built specialized industry solutions such as Think Center IoT Platform that enables appliance manufacturers to realize smart and connected products, that capture consumer insights and enhances service efficiency.
� DevOps Cycle, Bots, Embedded Credentials
� Implementation, integration and managed services
� Designing robust and trusted security solutions
� PAM-as-a-Service for a comprehensive cybersecurity strategy
� Enterprise and Data Platform Modernization
� Microsoft Azure Sentinel based security operations centers
� Identity and Access Management and Microsoft 365(R) transformation services
Key highlight of the partnershipWe have built specialized industry solutions that accelerate the adoption of Microsoft stack within enterprises, such as Managed Content as a Service (MCaaS) and Tahoe (Data Lake and Inventory Optimization)
Key Alliances Collaboration and partnerships are critical for business relevance, growth, and sustainability.
At Happiest Minds, we have partnered with some of the globally leading technology providers. We work with them jointly, share our technical know-how, services, and extended support towards creating a substantial impact in the tech ecosystem, and mutually gain a wider reach and competitive edge.
With the combined competencies across technologies and domains, we build industry-leading solutions and accelerators as well as unique solutions for complex challenges. This helps in meeting dynamic expectations and positions us uniquely to enable digital reinvention.
Here are a few examples of our key strategic partnerships with leading technology providers.
50
Annual Report 2021-22

Driving Niche Skills with Centers of Excellence (CoEs)
Our Platforms
We have formed three CoEs and increasingly investing in them to build excellence in niche skills. These include:
Internet of Things (IoT) � Digital strategy creation
� Device/edge/platform engineering
� End-to-end system integration on IoT platforms
� IoT security
� IoT-enabled managed services
� IoT roadmap
� IoT-led business transformation and new business models
EllipseA modular platform with multiple ITSM/ITOM tools integration, supported by powerful analytics backend with machine learning capabilities. Enables agile infrastructure operations and helps enterprises accelerate their journey toward IT-as-a-service. The platform also integrates with IT service management and automation tools, facilitating artificial-intelligence-enabled IT operations (AIOps).
Digital Content Monetization (DCM) SaaSAn AI-powered engine, it enables deriving relevant information from enterprise content and digital assets and monetize it efficiently. It ensures personalized and contextualized knowledge delivery, low TCO and time to market advantages.
UniVu A big data-based university analytics solution that enables course delivery and administrative insights along with student success analytics. It binds siloed data of universities in an integrated data platform to ensure critical, actionable, and predictive insights that are derived by using predefined or customizable KPIs.
Pro-RiTE A test automation framework to decipher and interpret industry-standard specification models and auto-generate test artifacts with optimized data feeds using model-based system engineering. Test types include UI, API and performance security testing. Pro-RiTE facilitates more accurately predictable quality from systematic test analysis, elimination of mundane test scripting and shorter feedback cycles.
ThingCenterA cloud agnostic consumer device IoT platform supporting connected device management with analytics.
CourseMapAn online AI-powered degree tool for students to plan the most optimal path towards reaching their academic goals.
Computer VisionA Computer Vision framework to support detection and tracking from real-time video feeds.
Among its many use-cases, it can be used for parking space monitoring and management including license plate recognition, monitoring of payment kiosks & boom barriers, and tracking of available parking slots.
Analytics/Artificial Intelligence (AI) � Advanced analytics using AI, ML and
statistical models
� Engineering big data platforms
� Data warehousing
� Modernization of data infrastructure and process automation through AI
Digital Process Automation (DPA) � Digital transformation through
process automation of core business applications, products and infrastructure leveraging intelligent process automation tools and technologies including RPA, intelligent business process management (iBPMS) and cognitive automation using AI & ML based models
Corporate Overview1 Financial Statements3Statutory Reports2
51
Annual Report 2021-22
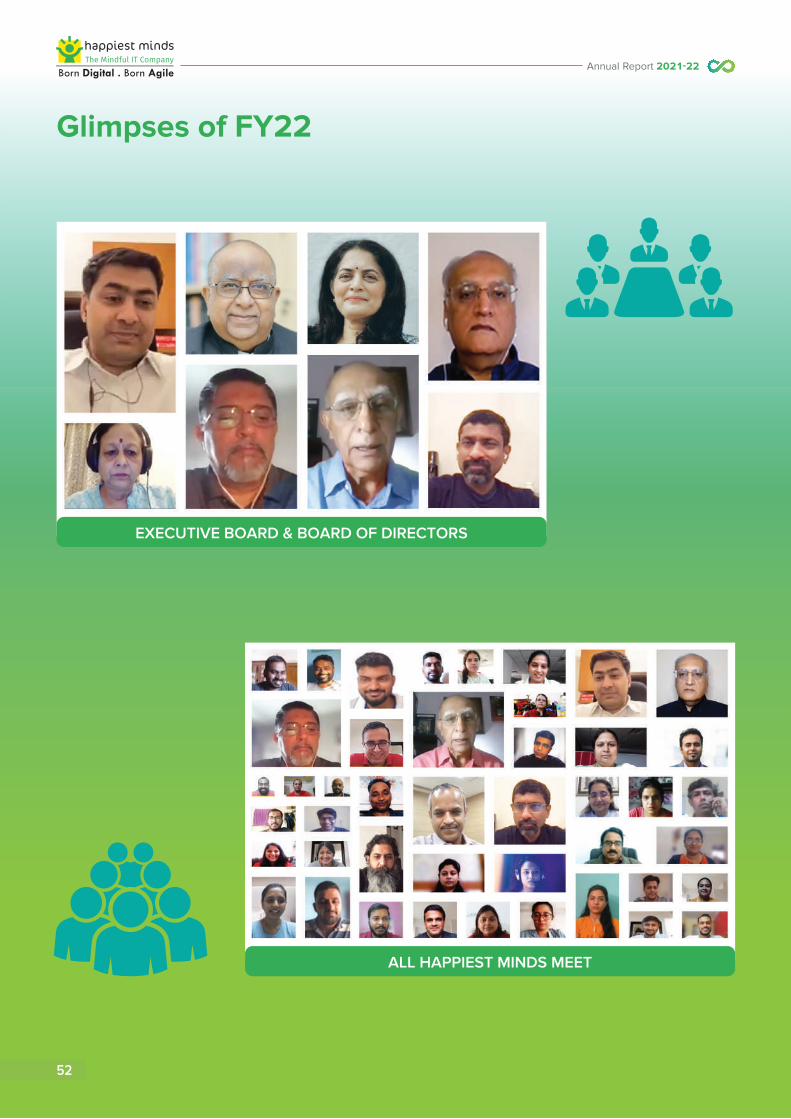
Glimpses of FY22
EXECUTIVE BOARD & BOARD OF DIRECTORS
ALL HAPPIEST MINDS MEET
52
Annual Report 2021-22

DBS CONNECT
DBS PRACTICE MEET
Corporate Overview1 Financial Statements3Statutory Reports2
53
Annual Report 2021-22

PES SUPERSTARS' GALA
PES LEADERSHIP CONNECT
54
Annual Report 2021-22

PES ROADMAP TO US$100 MN
IMSS CONNECT
Corporate Overview1 Financial Statements3Statutory Reports2
55
Annual Report 2021-22

COE - ANALYTICS CONNECT
ART OF COMMUNICATION TRAINING
56
Annual Report 2021-22

ASSIMILATION & MVV TRAINING
FUN WITH MJ RAKESH
Corporate Overview1 Financial Statements3Statutory Reports2
57
Annual Report 2021-22

SELF-CARE THROUGH MINDFULNESS
WOMEN IN EXCELLENCE
58
Annual Report 2021-22

BACK2SMILES
NARI SHAKTI - BREAK THE BIAS
Corporate Overview1 Financial Statements3Statutory Reports2
59
Annual Report 2021-22

I FOR INCLUSION TRAINING
INCLUSION - SIGNS OF JOY
60
Annual Report 2021-22

PRIDE @ WORK - RAINBOW ALLY
D&I SUMMIT - ABILITY IS BIGGER THAN DISABILITY
Corporate Overview1 Financial Statements3Statutory Reports2
61
Annual Report 2021-22

HAPPIZEST - WELLNESS WEBINARS
MITHRA - THE GOOD SAMARITAN TEAM
62
Annual Report 2021-22

WOMEN CLIENT LEADERS MEET
FATHER'S DAY
Corporate Overview1 Financial Statements3Statutory Reports2
63
Annual Report 2021-22

VACCINATION DRIVE
64
Annual Report 2021-22

ANNUAL REPORT TEAM
Corporate Overview1 Financial Statements3Statutory Reports2
65
Annual Report 2021-22


ESG68-11568 Message from the President
72 Sustainability Framework,Governance, and Approach
73 Climate Risk Management
74 ESG Goals & Objectives
75 Environmental
77 Social
107 Governance

Dear Stakeholders,The disruption caused by the COVID-19 pandemic in FY 2020-21 augmented multiple challenges across the world. Happiest Minds’ mission of making our people and customers happiest, enabled us to not only limit the extent of disruption in our operations, but also support the communities we operate in. We quickly adapted to newer ways of working and pioneered innovative solutions for our customers, employees, and communities. Our resolve to emerge stronger by improving our market, operational and financial performance made us realize a remarkable IPO in September 2020. We have demonstrated continuous and industry-leading Y-o-Y sequential revenue growth over each quarter in FY 2021-22.
This report elaborates our approach, and the value Happiest Minds has delivered across the continents, even during these unprecedented disruptive times.
Message from the President
We quickly adapted to newer ways of working and pioneered innovative solutions for our customers, our teams, and our communities.
68
Annual Report 2021-22

In these extremely challenging times due to the pandemic, I would like to share our heartfelt support and solidarity with you and your families. As governments around the globe are implementing measures to contain this public health crisis, we have been taking strict precautions to protect our colleagues and their families, while ensuring uninterrupted customer service and deliverables. Happiest Minds across 7 countries are fully operational with a hybrid work model to establish a robust deliverable system for all our clients.
Continuing its efforts, this year too, Happiest Minds demonstrated relentless commitment to its strategic priorities of achieving customer satisfaction while ensuring the wellbeing of all our stakeholders. This report elaborates our approach, and the value Happiest Minds has delivered across the continents, even during these unprecedented disruptive times.
Extending our efforts towards business continuity, we have implemented business agility to enable the growth and protect the interests of our key stakeholders. We used the pandemic to accelerate our value creation agenda for enhancing the Company’s agility and resilience to avail and realize forthcoming opportunities.
Last year, Happiest Minds embarked on a shared vision and published its first edition of the sustainability report with an extensive report on the operational footprint and impact on our operations due to COVID-19 and the measures we have taken to minimize its effect through various initiatives aimed at overall stakeholder wellbeing.
Leading the sustainable journey ahead, I am pleased to place this year’s Integrated Annual Report. Our focus is to build and Design for Perpetuity. In line with the core ESG objectives and sustainability spirit,
this year’s theme is strongly justified in fulfilling and delivering long-term business sustainability.
Our actions and approach to achieve environmental stewardship include energy and water efficiency, waste management, green services and technologies. Happiest Minds is driven by the spirit of innovation and is continuously focusing on sustainable processes & services.
Building sustainability in the value chain presents an urgent imperative today while sharing our commitment to responsible business practices beyond immediate boundaries.
Happiest Minds strives to actively engage with all key value chain partners on ESG issues through dedicated policies, guidelines, and code of conduct. The engagement aims to enhance sustainability performance through capability building, knowledge sharing and reporting on the six capitals - Financial, Manufactured, Intellectual, Human, Social & Relationship and Natural.
With various ESG initiatives and programmes, we are well positioned for the times ahead. Our emphasis remains on enhancing sales momentum, growing market share, maintaining leadership in sustainable solutions and delivering accretive growth.
I take this opportunity to express my sincere appreciation to all my colleagues and their families for their inspiring contribution amidst this challenging time. I also thank you for your continuing trust, support, and commitment to Happiest Minds.
With warm regards,
Aurobinda NandaPresident - Operations & Deputy Chief Executive Officer, PES
In line with the core ESG objectives and sustainability spirit, this year’s theme is strongly justified in fulfilling and delivering long-term business sustainability.
Corporate Overview1 Financial Statements3Statutory Reports2
69
Annual Report 2021-22

70
Annual Report 2021-22

Happiest Minds is built on sustainable practices and aligns with our vision of designing the company for perpetuity.
We designed and established a sustainability framework that guides us, focuses on investments and drives performance, while engaging with internal and external stakeholders.
Our priorities were identified through a sustainability materiality assessment process. It also helped us identify, calibrate, and define topics for focus. This helped us realign our ESG framework and categorize topics according to their environmental, social, or governance aspects.
Our ESG Policy is the foundation for our journey in Sustainability.
Addressing the impact of our operations across the geographies forms the core of our ESG strategy while transitioning to a low-carbon and judicious resource consumption enterprise. Corporate Governance is an integral part of our vision and therefore,
all our processes and systems are governed by this.
In pursuit of our goals on sustainability, we are in the process of establishing ESG actions based on the Task Force on Climate-related Financial Disclosures (TCFD) and Science Based Targets (SBTi). We believe these outcomes will help us take actions which tackle practices that adversely affect our climate. Our ESG programs and initiatives are designed to incorporate target-based actions assigned to three core pillars of sustainability: economic development, social development, and environmental protection. With proactive collaboration and partnership, these will help drive sustainable transformation.
Our KPIs on environmental, social and governance, guided by our values help us in this journey of transformation while building relationships based on genuine trust with our stakeholders.
Sustainability
Parika MahajanGlobal ESG Lead
Our KPIs on ESG, guided by our values help us in this journey of transformation.
FY 22 was dedicated to strengthen our governance, integrate sustainability into our corporate strategy, and intensify our efforts towards social responsibility. It is our commitment and endeavor to incorporate sustainability into our core business decision-making processes.
Corporate Overview1 Financial Statements3Statutory Reports2
71
Annual Report 2021-22

Sustainability Framework, Governance and Approach
Happiest Minds’ Sustainability framework is derived from Global Reporting Initiative (GRI), Sustainability Accounting Standards Board (SASB) and Task Force on Climate-related Financial Disclosures (TCFD).
Sustainability is embedded into the DNA of our everyday decision-making as a business, not as a separate goal or intention. We share a sense of purpose to grow digitally while being agile that motivates the actions of our workforce. Our teams and partners across seven countries are embedded in our organization worldwide to help and support our businesses embrace sustainable practices, outcomes and reporting.
As a testament to our commitment to the environment, we have constituted a Board-governed ESG policy in 2022, which serves as a framework to understand and manage our environmental risks, impacts and opportunities. To further strengthen our vision and focus on ESG, we have established an Environmental, Social
& Governance (ESG) committee, which is a management level committee comprising senior members across major functions at the Company, chaired by a member of the senior management team. The ESG Committee reports to the Executive Board and the Board of Directors on the Company’s ESG strategy and the roadmap to achieve set targets. The ESG Committee also works on improving the Company’s ESG disclosures in order to effectively demonstrate our ESG commitment to our stakeholders. The ESG Committee comprises members across different functions and businesses that will help in identifying ESG-related risks and related financial impacts for the Company. ESG Committee meets every quarter to review progress and performance.
Sustainability Snapshot - Stakeholders and UN Sustainable Development Goals (SDGs)
Economic Value Created and Distributed
Customers
Investors
Community & NGOs
Clients
People
Alliance Partners
Vendors
` Lacs
Particulars Fiscal 2021 Fiscal 2022
Revenues (a) 77,341 1,09,365
Other Income (b) 1,999 2,463
Direct Economic Value Generated (c) = (a)+(b)
79,340 1,11,828
Operating Costs 11,858 21,194
Employee Wages & Benefits 45,238 62,000
Payments to Providers of Capital 341 343
Payments to Governments (Total Taxes Paid)
3,527 6,310
Community Investments 75 215
Economic Value Distributed (d) 61,039 90,062
Economic Value Retained (e) = (c) - (d)
18,301 21,766
72
Annual Report 2021-22

Climate Risk Management
The climate change risks and opportunities are reviewed at a Board-approved ESG committee level. The climate change risks and opportunities are covered under the ‘operational risks’ for the Company and are reviewed on a quarterly basis.
The CSR committee of the Board is responsible for overseeing the execution of the Company's CSR policy, including the areas of Environmental Sustainability leading to Climate Action. The committee meets quarterly to track the progress of identified CSR focus areas and the required budgets for all CSR activities including mitigating and building resilience against climate change.
The ESG committee and the CSR committee assess and oversee the activities of climate action as a part of their quarterly meetings. At an operational level, this has been assigned as the responsibility of the Executive Board (EB). Under the guidance of our EB, the President - Operations and Chief Sustainability Officer drives projects to meet the goals related to climate action. These goals are cascaded to various business functions, who look after the identification, implementation, and monitoring of the ESG projects. Different business functions work in
collaboration with the Corporate and Facilities teams. The requirements of projects and progress are provided by the location-specific teams, which is then reported to the Facility Head and the President – Operations / CFO for allocation of funds.
The ESG Committee reports to the Executive Board and Board of Directors on the Company’s ESG strategy and the roadmap to achieve set targets to address climate-related issues.
The climate change risks can also cause potential disruptions to our business operations due to natural calamities like floods, cyclones, droughts, epidemics and pandemics, etc. in various geographies where we operate. The ESG Committee is therefore very actively involved in monitoring and managing these climate change related risks and opportunities.
Corporate Overview1 Financial Statements3Statutory Reports2
73
Annual Report 2021-22

ESG Goals & Objectives
Environmental � Achieve carbon neutrality in
our operations by 2030
� Establish and drive sustainable power usage & water conservation techniques
Social � Establish volunteering and
community involvement programs to cover 20% of our teams
� Launch Happiest Minds Foundation by March 2023
� Celebrate our smilestone – acts of giving – reach 10 million Akshaya Patra meals by 2028
Governance � Disclosure levels to be in the
top 10% of comparable listed companies in India
� Establish and drive industry best practices on data governance, privacy and integrity
� Drive openness and transparency in disseminating information to all stakeholders
Know more about our ESG Policy on https://www.happiestminds.com/investors/policy-documents/ESG%20Policy_May%2005,%202022.pdf
ESG KPIs
� Total Diesel Consumption (DG Set & People Commute)
� Total Petrol Consumption (Employee Commute)
� Energy Consumption (Grid)
� Energy Consumption (Solar)
� Total Scope 1 Emissions
� Total Scope 2 Emissions
� Total Scope 3 Emissions
� Total Water Consumption
� Total Wastewater Generated
� Total Wastewater Recycled
� Total Waste Generation vs Disposed (All Categories)
� Air Quality Parameters (SOx, NOx, PPM, etc.)
� Health & Safety Trainings (Fire Safety, First Aid, Emergency Response Plan)
� No. of Mock Drills
� No. of Trained Fire Fighters, First Aiders, Rescuers (ERT Members)
� Wellness initiatives/trainings
� CSR Budget vs Spend
� Women Empowerment Initiatives
� Voluntary hours spent by Happiest Minds on CSR
� Training on Ethics, Integrity, Bribery Corruption
� Training on POSH
� Value of fines/penalties imposed on Happiest Minds by regulatory and judicial institutions
� Number of meetings/dialogues with minority stakeholders
� Cyber security KPIs such as unapproved host ping scans, admin policy violation, security service downtime
Environmental Social Governance
74
Annual Report 2021-22

Environmental
As a responsible corporate citizen, Happiest Minds strives to respect, protect, and make efforts to restore the environment by utilizing natural and manmade resources in an optimal and responsible manner and ensure the sustainability of resources by reducing, reusing, recycling, and managing waste. We continuously seek to improve environmental performance by adopting and promoting use of energy-efficient and environment-friendly technologies and use of renewable energy in our operations. We shifted most of our IT infrastructure to the cloud to enable all Happiest Minds across geographies working in a hybrid model. We also extended this further to support our customers seamlessly from a remote work environment. This resulted again in considerable savings in terms of power usage at our offices. We adopt measures to conserve energy by using energy-efficient computers and equipment with latest technologies, which would help in conservation of energy.
Some of the steps and practices followed by our Company are:
India is endowed with vast solar energy potential. About 5,000 trillion kWh per year energy is incident over India's land area with most parts receiving 4-7 kWh per sq.m per day. Solar photovoltaics power can effectively be harnessed providing huge scalability in India. Solar also provides the ability to generate power on a distributed basis and enables rapid capacity addition with short lead times. From an energy security perspective, solar is the most secure of all sources since it is abundantly available. Theoretically, a small fraction of the total incident solar energy (if captured effectively) can meet the entire country's power requirements.
In line with India’s Intended Nationally Determined Contributions (INDCs) target to achieve about 40% cumulative electric power installed capacity from non-fossil fuel-based energy resources and to reduce the emission intensity of its GDP by 33% to 35% from 2005 level by 2030, Happiest Minds aims to lead the way in contributing to the country’s solar energy target.
A solar power plant of 183 kWp capacity is being installed at our Madivala Campus, Bengaluru to cater to our needs and reduce carbon footprint.
Other Energy Conservation Initiatives include:
� Optimum usage of Air Conditioners throughout our premises by ensuring that there is no cool air leakage
� Usage of LCD monitors (energy efficient) in place of normal CRT monitors
� Turning off lights on all floors when our teams are not working
� Turning off the air conditioners during non-peak hours and on weekends
� Installation of sun film to dissipate heat
� Usage of LED lights for our lighting solution
During the year, we made good progress in harvesting water at all our workspaces in India. We are happy to share with you that all our India centers generate zero effluents. Black water / grey water is treated and reused for gardening and various other purposes within the campuses. We also use treated water to recharge the groundwater thereby contributing to elevating the water table.
Rooftop-based Solar Energy Project
Corporate Overview1 Financial Statements3Statutory Reports2
75
Annual Report 2021-22

A simple way to have a huge impact on the environment is through reducing paper consumption, by turning paper documents into electronic ones and eliminating paper from workflows. A tree can only produce, on an average, 17 reams of paper, and takes a long time to grow. By reducing paper usage, we create a direct impact on reducing the carbon footprint.
Going paperless helps to reduce CO2 (carbon dioxide) emissions. Turning a single tree into 17 reams of paper results in around 50 tonnes of CO2 being released into the atmosphere. Additionally, trees also act as huge
carbon sinks and every tree that is not cut down for paper usage is able to absorb CO2.
We, at Happiest Minds, consciously choose to print only the important documents and avoid unnecessary paper consumption to further reduce the carbon footprint.
At Happiest Minds, we have adopted the 'Born Digital . Born Agile' approach focused on delivering seamless digital experience and solutions to our customers with end-to-end capabilities spanning the digital lifecycle.
We have also cut down on work-related travel promptly and effectively. In addition to securing the wellbeing of our people, reduced work-related travel also contributes to lesser carbon footprint for Happiest Minds.
Digital Approach – Reduced Paper Consumption and Work-related Travels
76
Annual Report 2021-22

Social
Happiness is the meaning and the purpose of life, the whole aim and end of human existence, said Aristotle many centuries ago. It all begins with the choice to lead a happier life. For homes, organizations and countries, happiness is prime - especially in these unprecedented times, wellbeing and happiness are significant.
While the pandemic has been tremendously challenging, there have been remarkable stories on human resilience and strength.
At Happiest Minds, we adapted to the new normal seamlessly. We celebrated our 10th smilestone from the launch of the Company. As we look back at the last decade and look ahead to the next, there are so many things that we are grateful for – personally and professionally, individually, and collectively. We are grateful to the team, our customers, our investors and shareholders. We have stayed true to our mission of ‘Happiest People . Happiest Customers’. We have reflected the ethos of our logo: “The Happy Person” depicting our Being, our Belonging and our Becoming. We have lived by our SMILES values (Sharing, Mindful, Integrity, Learning, Excellence, Social Responsibility). These have contributed to our vibrant culture. We have led strategically as a
‘Born Digital . Born Agile’ Company and truly lived up to our positioning of being a Mindful IT Company.
‘Happiness Evangelism’ and ‘Mindfulness’ are two sides of the same coin that need investment of time and talent. Your Company provides the enabling functions to internalize and institutionalize these as actionable activities to enable the happiness of our people.
It is believed that happiness influences health. Happy people choose to eat healthy, exercise wisely, sleep adequately and are mindful of their wellbeing. Happiness also benefits our cardiovascular and immune systems; researchers see a direct correlation between psychological wellbeing to ageing and health at the cellular level. Good health also leads to happiness. So, this is a happy cycle. Real happiness is learning to enjoy one’s work, being more grateful and having really positive relationships.
At Happiest Minds, we engage with our team on their wellbeing. Customized programs and initiatives for physical, mental, emotional and financial health were rolled out for our teams, such as the Emotional Intelligence program, Mindful Thinking program,
Digital Wellbeing program, extending online learning platforms to support continual learning, Financial wellness for women, Emotional and mental fitness, online curated learning paths to upskill on various technologies and professional development and much more. With a Happometer internally, every Happiest Mind is open to express their feelings, and we are happy to answer them.
It is a matter of pride for us at Happiest Minds to see the impact we have made on the lives of our people by fostering a sense of purpose, by forming collaborative communities and by fashioning the capacity to make choices.
Programs such as Mindfulness Training, SMILES Shorts, HappiZest – our Wellness initiative, along with a culture of listening through the annual Happiest People Pulse Survey & Customer Happiness Survey, the real-time Happometer, the external Great Place to Work® Survey and Mithra – the Good Samaritan Counselling Program, helps gather feedback and derive action items, to achieve the overarching principle of creating and sustaining a great place to work. Our CSR program, Circle of Happiness, executes a process for leveraging our capabilities, building a social engagement program and contributing to socially relevant causes; d’CARBON (Clean, Assured and Responsible Building of Outcomes towards Neutrality) makes a difference to the environment and aligns corporate values with actions.
People are one of the most important aspects in an organization. Our people are integral to our business and their happiness is of utmost importance. Our systems, policies, and practices are crafted to nurture an open culture, enabling our people to discover their potential and participate in shaping their own work-life experience. This is how we make a difference.
Enabling the happiness of our people….one person at a time.
Culture of Happiness Evangelism
Sharon S. Rajkumar, PhDHappiness Evangelist
At Happiest Minds, we enable the happiness of our people….one person at a time.
Corporate Overview1 Financial Statements3Statutory Reports2
77
Annual Report 2021-22

The individual, an environment to live in the moment and perform with purpose;
The customer, a trustworthy partnership, by living our core values; and
The community, contributions as an empathetic corporate citizen.
MindfulnessHappiest Minds is the Mindful IT Company that offers:
Being Mindful to the needs of our members by establishing people-centric Practices & Policies has resulted in higher people satisfaction. We have been consistently ranked high in Great Place to Work® Institute and Glassdoor® ratings.
Being Mindful which involves living in the moment; and
Doing Mindful which involves perceiving immersively, processing non-judgmentally & performing empathetically.
The focus is on:
78
Annual Report 2021-22

PeopleOur mission is Happiest People . Happiest Customers. We have frameworks around the same and run annual surveys with our people and our customers.
GPTW Survey
In the Great Place to Work® survey, we have been placed in India's & Asia's Top 100 Best Workplaces List.
GPTW 2022 GPTW 2021 GPTW 2020
Great Place to Work® 93 92 86
Credibility 90 88 80
Respect 88 86 79
Fairness 87 83 76
Pride 91 89 83
Camaraderie 89 88 85
Trust Index Score 89 87 80
Culture Audit Not announced yet
Best Cultures 13 Practices
Best Cultures 15 Practices
Glassdoor® Highlights
4.4
79%
3.8
93%
4.4
4.4
89%
4.3
Overall Rating
Interview Experience
Benefits
Recommend to a Friend
Culture & Values
Diversity & Inclusion
Business Outlook
Work-Life Balance
Corporate Overview1 Financial Statements3Statutory Reports2
79
Annual Report 2021-22
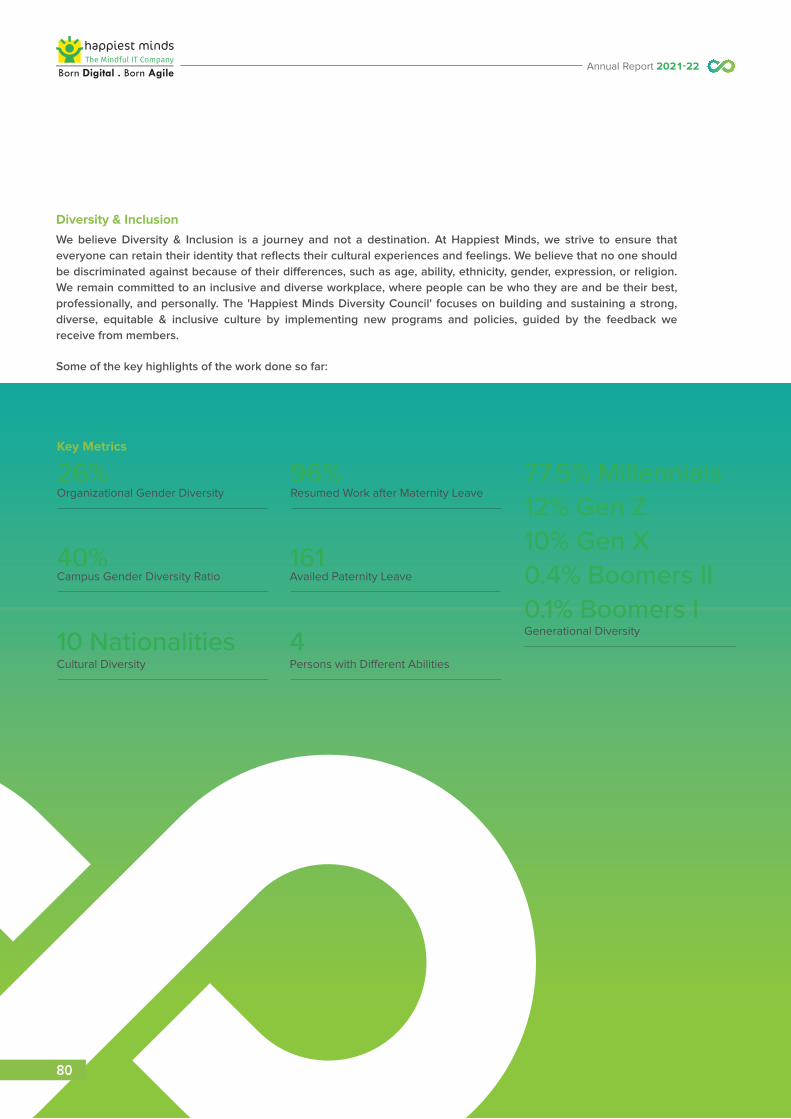
Diversity & InclusionWe believe Diversity & Inclusion is a journey and not a destination. At Happiest Minds, we strive to ensure that everyone can retain their identity that reflects their cultural experiences and feelings. We believe that no one should be discriminated against because of their differences, such as age, ability, ethnicity, gender, expression, or religion. We remain committed to an inclusive and diverse workplace, where people can be who they are and be their best, professionally, and personally. The 'Happiest Minds Diversity Council' focuses on building and sustaining a strong, diverse, equitable & inclusive culture by implementing new programs and policies, guided by the feedback we receive from members.
Some of the key highlights of the work done so far:
Key Metrics
26% 96%Organizational Gender Diversity Resumed Work after Maternity Leave
40% 161 Campus Gender Diversity Ratio Availed Paternity Leave
10 Nationalities 4Cultural Diversity Persons with Different Abilities
Generational Diversity
77.5% Millennials12% Gen Z10% Gen X0.4% Boomers II0.1% Boomers I
80
Annual Report 2021-22

Highlights
Title of Initiative Description
Inclusive Policies To make our policies more inclusive, we use gender neutral language
Inclusive JD To make our job descriptions more inclusive, we use gender neutral language so that we can attract diverse talents
Vaccination Drive To support the differently abled community, we have collaborated with Samarthanam for COVID Vaccination drives for people with different abilities
Wellness of Women Collaboration with HappiZest - the wellness team, for a month-long campaign on specific wellness needs of women
Career Fair for Women Hiring
Special Hiring Drive, to increase our Gender Diversity ratio
Aura Learning Circles A learning platform for the Aura community through webinars, book clubs & interesting articles
Women in Excellence Program
Exclusive Women Leadership Development for Mid Managers covering various elements of Holistic development for leadership roles
Women In Tech Inspiring Series of Panel Discussions to motivate our Aura members with stories of women leaders:
� Choose to Challenge with Nidhi Gupta (Product Manager, Google)
� Panel Discussion with Ram Mohan C, Member of Executive Board, President & CEO - IMSS
� Panel Discussion with Happiest Minds Client Women Leaders across geographies
Workshops & Sensitization Sessions on Diversity & Inclusion
� We conduct sensitization programs on Diversity and Inclusion which focuses on building skills to enable Happiest Minds leverage the strengths of diverse teams and customers.
� I for Inclusion is a theater-based Fun learning workshop
Let’s Celebrate Diversity
We celebrate diverse cultures through multiple celebrations: � Independence Day with D&I Team (Diversity Show by Jr. Happiest Minds)
� Save the Girl Child Day
� International Mother Language Day
� Cultural Celebration - Christmas, Eid & Sankranthi
� International Men’s Day, International Women’s Day
Aura Engagements Welcome mail to all women members with list of women benefits
Corporate Overview1 Financial Statements3Statutory Reports2
81
Annual Report 2021-22

Title of Initiative Description
Supply-side Branding � Glassdoor® Page on Diversity
� Happiest Minds Career Page
Thought Leadership by Leaders
Women leaders bagged multiple recognitions � Priya Kanduri, VP & CTO - IMSS, Women in Tech Award from Asia Pacific HRM Congress
� Preeti Menon, SVP & Global Delivery Head - PES, Top 20 Female Cloud Leader in 2021 on Sociable
Recognition in Diversity & Inclusion
Top 50 Best Workplaces for Women (3 consecutive years)Women Leadership Forum of Asia - Best D&I Company of the year Jobs for Her - Top 20 Innovative Diversity Practices for Women Initiatives
Diversity & Inclusion Communication Series
We did a series of communication on:#Diversity & Inclusion as a Business accelerator
#Share Load #Share Love
#Correct Unequal Homes
#Support to Empower
#Cultural Diversity #Being different is being powerful!!
#More Culture #More Power
#Valentine – Appreciate your family
Diversity & Inclusion Summit
� Day 1 - Inauguration by Sachin Khurana, Chief People Officer, focusing on our goals and vision for the long-term and sharing the glimpse of work done so far
� Day 2 - Panel Talk by Executive Board (Rajiv Shah, Venkatraman Narayanan, Ram Mohan C, Joseph Anantharaju) on the theme #breakthebias in which they shared some inspiring stories of women leaders in their lives
� Day 3 - Fun & Engaging Sign language workshop
� Day 4 - Mr. Jayasankar Oorjja, specialist in hiring differently-abled persons shared his perspective and inspiring stories around employment
� Day 5 - Session on LGBTQ awareness - Pride@Work: Rainbow Ally by Mr. Rajiv Sharma, Senior Director - People & Culture, Aristocrat India moderated by Sharon Rajkumar, Happiness Evangelist
82
Annual Report 2021-22

Women Hiring Drive
ARE YOU A PASSIONATETECHNO DIVA?
THENJOIN US!!
www.happiestminds.com
Respect to flexibility,career development and
an enriched personal life.
Corporate Overview1 Financial Statements3Statutory Reports2
83
Annual Report 2021-22

Thought Leadership by Women Leaders
84
Annual Report 2021-22

Corporate Overview1 Financial Statements3Statutory Reports2
85
Annual Report 2021-22

Diversity & Inclusion Training
BE INCLUSIVE... BE MINDFUL
Have you ever feltUnincluded?
Join us for a theatre-based fun-learning workshop where we understand Inclusion & Diversity and learn tools toManage Unconscious Bias to Build a more inclusive workplace at Happiest Minds.
This workshop is for Happiest Minds in competencies C5 to C8
Have you ever been calledBiased?
Have you ever felt Sidelined on notbeing asked for your opinion?
Do you want to know more about how to manage the above situations?
Themes covered
1Diversity, Equity,Inclusin, Bias
2Unconscious Bias
3Managing UnconsciousBias
4Enabling an Inclusiveand RespectfulWorkplace
© Happiest Minds Technologies, 2021 #IforInclusion #DandI
86
Annual Report 2021-22

Corporate Overview1 Financial Statements3Statutory Reports2
87
Annual Report 2021-22

Rewards & RecognitionsService Smilestones
Our work anniversaries are called as SMILESTONES; these are celebrated with the Happiest Mind by sharing a video testimonial from their colleagues. To make the event memorable, we also gift them customized experience boxes.
Gratitude Story
To cultivate a culture of gratitude in Happiest Minds, we have encouraged our members to share their personal gratitude stories. One gratitude story is published every month covering members from all BU’s.
RnR Awards
Our Rewards & Recognition (RnR) Council designs Award categories that have a positive impact on our members - Quarterly Awards, Annual Awards, Chairman Awards & Monthly Insta Awards.
HappiZest Advantage
Tie-up with Vantage Circle for rewards redemption across all geos. Intended to create an experience for all members with multiple options on perks & redemption. Awarding members with points that they can redeem for a reward of their choice by using an employee recognition platform that supports points-based recognition.
iAppreciate
i-Appreciate is a portal where Happiest Minds can appreciate or show expressions of gratitude to colleagues. In FY22, 11,500 appreciations were sent and received.
Culture of Gratitude
Gratitude is a ritual at your Company. Leadership or Team meetings start with an expression of gratitude. We believe that being grateful for the many things we have received increases our set point for happiness. Research has also validated this. At Happiest Minds, all
meetings commence with spending some time, expressing gratitude or silently being grateful.
Gratitude Week
1. Let’s App (Let us Appreciate)
Happiest Minds showcased their experiences of grateful moments in different forms (video, photo, art, craft, drawing & painting etc.).
2. Reflections of Gratitude (#amgratefulfor #gratitudeshowcase)
First ever gamified gratitude leaderboard to encourage participation & to spread the culture of appreciation & gratitude. In the history of Happiest Minds, Gratitude Week has embarked upon a smilestone by achieving:
� 943 appreciations sent to 3,000+ people over 7 days
� 5,500+ iAppreciate messages sent by 880+ people
88
Annual Report 2021-22

Benefits
Leave Donation: The Leave Donation Program is a voluntary program where Happiest Minds donate their leaves to help their colleagues who need them the most. It also provides a provision to avail additional paid leave, from the leave pool, to people undergoing critical illness.
COVID Leave: Provisioning of paid leave for people testing COVID positive and under treatment/quarantine. Option to avail paid leave for hospitalization, home quarantine and family care.
Salary Advance Policy: Salary advance is given to help members to cover their immediate financial requirement.
Compassionate Loan: A loan amount is provided to all Happiest Minds to support them during financial needs. Members will have the option to repay this amount up to 10 installments.
Sabbatical Leave: Members have an option to avail long leave or take a temporary break from work up to one year at a stretch for higher studies or for medical reason.
Medical Leave: All Happiest Minds are eligible for paid leaves for medical situations that need hospitalization. The entire medical leave is credited at the time of joining or beginning of the year.
Crèche Facility: Tie-ups at discounted rates with Klay, Feather Touch and Jumbo kids to provide crèche facility for the members with young children. Additionally, we will also offer a company co-paid amount.
Hospitals Tie-up: Tie-ups with well-known hospitals like (Narayana Hrudayalaya, Fortis, Apollo Spectra, Apollo Fertility, Cradle & Motherhood)for emergencies.
Flexi Working: Members have the option to work only during the core working hours at office and the rest at home. We have also introduced the hybrid work model, members may avail the same and work from office for 3 days & rest from home.
Childbirth Gift: A gift set to welcome a new born into the Happiest Minds family.
� Plant a Tree on behalf of the newborn: With the support of an NGO, we will plant a tree as a small step towards creating a greener, sustainable & happier tomorrow for our future generation
� 12 leaflets with different seeds in the calendar for creating and cherishing a living kitchen garden and make every month of the first memorable
� Best wishes certificate from Happiest Minds Leadership
� In addition, a Gift Voucher is sent to the parents
24x7 Doctor Consultation: Free online Doctor Consultation for members and families.
Referral Bonus: Referral Bonus when the referred candidate completes 3 months post joining.
Business Referral Bonus: Contribution to the growth of the Company by bringing in more business prospects will be eligible for bonus.
Care & Compassionate Contribution Scheme: We have launched the Care & Compassionate Contribution Scheme, which provides benefits to the beneficiaries of Happiest Minds during the difficult time of loss of life or a medical condition which requires extended treatment & goes beyond insurance coverage.
Care & Compassionate Contribution Scheme Benefits
� Continuity of salary upto two years or more
� Support extended to dependent parents
� Employment opportunity with the Company or employability training support
� Children Education Support upto graduation
� Continuation of Medical Insurance Coverage
� Continuation of Parent Medical Insurance Cover for next five years
� Immediate Cash assistance and loan/advances waiver
� Discretionary support for persons who have ongoing medical treatment not covered by medical insurance
Cult.fit Live Corporate Subscription: We have a tie-up with Cult to offer our members highly discounted live fitness session.
Exclusive Voluntary COVID Insurance Policy: Voluntary and exclusive COVID insurance plan for Happiest Minds and their family. Inclusion of partners, onsite, & support staff.
Group Accident Insurance Coverage: Enhancement in coverage limits for certain groups to align as per market standards.
Group Life Insurance Coverage: Enhancement in coverage limits for certain groups to align as per market standards.
Voluntary Life Insurance Coverage: A program to top-up GTL voluntarily for self during the policy period. This gives the flexibility to the members to go for higher life insurance coverage to their family.
Corporate Overview1 Financial Statements3Statutory Reports2
89
Annual Report 2021-22

GratitudeExpressing Gratitude is ingrained in our culture. Leadership or Team meetings start with an expression of gratitude. We believe that being grateful for the many things we have received increases our set point for happiness. Research has also validated this. At Happiest Minds, all meetings commence with spending some time expressing gratitude or silently being grateful. We institutionalize gratitude as a ritual by encouraging our people to freely use SMILES Cards which are placed at the reception in all our three facilities. We encourage Happiest Minds to use these for colleagues, family, and friends so that this ritual will cascade and have far-reaching benefits for a kind, compassionate and happy society. We also encourage our people to use the iAPPRECIATE Portal to appreciate or thank a colleague.
� Go Gratitude: A note of gratitude is sent to the family of the Happiest Mind to say how happy we are that they are one of our valued Happiest Mind and that we are very proud of and grateful to their contribution to the Company
� Say It With SMILES: The SMILES Card is used to reach out to fellow Happiest Minds, family, and friends. It is used to express gratitude, to acknowledge, appreciate, recognize, heal, forgive… The Way to Be Happy is to make others Happy, for happiness is itself a kind of gratitude
90

Work-from-Home Support during the Pandemic The Internal First Responder team, BU People Practice, respective managers and team members support the affected members in many ways, including financial support, insurance, logistics, hospital admission procedures, counseling, and medical leaves for the recovery period.
COVID Support
� Internal First Responder Team providing real-time support
� COVID Microsite for real-time information related to new guidelines by Govt, Precautions, Internal Responder team contacts, Organization communication
� Effective work-from-home guidelines and Back to office plans
� Medical Tele-consultation for Happiest Minds and family members who are infected with SARS-COV2
� COVID Task Force, Internal First Responder Teams supporting members in need
� Support given to travelers returning from other Geos
� Higher team connect, Leadership touchpoints
� COVID Tracker
� Back-up team members / managers
Policies and Benefits
� COVID leaves for Happiest Minds
� Voluntary COVID Policy with minimal premium, to cover the member and family
� 1,000 members touched by Mithra – The Good Samaritan Program
� Financial support with loans/salary advances for the pandemic
� VSafe – Vaccination Tracking System
Corporate Overview1 Financial Statements3Statutory Reports2
91

Succession PlanningWe have a systematic approach to ensuring leadership continuity within an organization by recruiting and/or encouraging individual Happiest Minds to grow and take up key leadership roles. It is important to ensure that succession planning is closely tied to our long-term business strategy and goals. As a process, we engage with our executive and senior leaders and clearly define the development of key talent and ensure that the successor understands his/her role in the process and knows what is expected of them. We do a Talent Risk assessment at regular intervals and make required interventions in time.
92
Annual Report 2021-22

Wellness Programs (HappiZest)Wellness Programs (HappiZest)Wellness Programs (HappiZest)W
Happiest Minds’ philosophy is simple. Happiest People lead to Happiest Customers. We see people as an integral part of our business and their happiness is of utmost importance. Aligned with the philosophy of Happiest Minds, the wellbeing of our teams has been an important element of the culture of Happiest Minds. The Happiest Minds’ Wellness Program constitutes the 7Ws of Physical Wellness, Spiritual Wellness, Intellectual Wellness, Professional Wellness, Social Wellness, Emotional Wellness and Environmental Wellness. These are nurtured by aligning activities, logistics, facilities, and the expertise of the organization through an array of Wellness schemes and initiatives.
Our systems, policies, and practices are crafted to foster an open culture, enabling our people to discover their potential and participate in shaping their own work-life experience. This is how we make a difference.
Though happiness is a very personal emotion, we believe that it is the organization’s responsibility to create enabling conditions for a person to be happy.
It is important for Happiest Minds to focus on the wellbeing of people to live up to our mission. Happiest Minds believes that the key factor of our successful wellness programs is to incorporate health & wellbeing into our culture. There are a varied range of initiatives launched under wellness which are conceptualized and designed to create awareness, enabling people to act and ultimately taking ownership of their own transformation.
There has been a wholehearted commitment from Happiest Minds, the Company to enable its members to take care of their wellbeing. This reflects in
leadership involvement and participation in adoption of key initiatives, enhanced budget year-on-year, maturity in wellness schemes, better scores and ranking in external and internal people surveys, overwhelming testimonials from our teams on the impact in their professional and personal lives.
Happiest Minds Wellness program is branded as – HappiZest. Our motto is “Experience the joy of living”. The name has been derived based on the internal naming contest for all members. We further created a HappiZest Council who are responsible for driving the wellness program at Happiest Minds.
The HappiZest Council comprises members across all levels, location, age groups and business who are actively engaged in conceptualizing and driving the key wellness charter for Happiest Minds. The Council defines the annual wellness objectives and agenda based on the feedback received from people through various sources/surveys, organization’s focus on people’s wellbeing, analytics of assessments and evolving wellness market practices and benchmarks. Periodic dashboard on wellness initiatives and its impact, participation and feedback is also shared with the leadership.
All the HappiZest initiatives have an in-built feedback loop which is a very strong source for us to reflect and redesign any element of wellness which needs attention or improvement. We also conduct periodic and varied health assessments of our people, which helps in determining overall interest and needs of our people and develop wellness initiatives to cater that.
Corporate Overview1 Financial Statements3Statutory Reports2
93
Annual Report 2021-22

Participation
We have organized 90+ wellness events/activities in FY22, where 4,000+ Happiest Minds have participated and provided an average feedback rating of 4.7 (out of 5)
Theme-Based Wellness Events
To set the rhythm & expectation for members, we have planned & implemented the theme-based wellness interventions on a monthly basis – the examples include parenting, Digital detox, self-care, wellness for women, hobbifying, oral health & sleep.
Exclusive Expert Driven Webinars/Talk Shows
Experienced subject matter experts provided their insights on various wellness topics to our members. Initiatives under this includes programs like Laughter Yoga by Dr Madan Kataria (Laughter Yoga Guru), Tai Chi by Seefar, Parenting sessions by Parvarish, Cardiac Health session by Dr Srinivas B V from Fortis Hospitals, Ergonomics Awareness Session by Dr. Sitaraman Sundaresan & Dr. Gayathri Mahalingam.
Sponsored Wellness Programs
These are key interventions which have high potential to change people’s lifestyle and enhance productivity of people. The key critical programs under this includes 24x7 Doctor Tele Consultation, Ergonomics Consultation, Virtual / Gamified Fitness challenges.
Emotional / Mental Wellbeing -
a. Good Samaritan - Mithra – our Good Samaritan program facilitates a culture of listening along with the various surveys that we run - measures happiness and our annual Dipstick of the Support Functions. The Good Samaritan Program consists of a team of volunteers who are committed to counsel Happiest Minds and be
available to listen to them, in safety, acceptance and confidentiality. During the fiscal, FY22, Team Mithra has been able to provide emotional and counselling support to over 1,000 Happiest Minds.
MITHRA is a team of Happiest Minds’ Volunteers who have committed to be available to listen, to help deal with whatever it is that one is going through. They are available to take calls or respond to mails 24x7, to help one process whatever it is that they are going through, in safety, acceptance and confidentiality.
b. Mindfulness Training - Our tagline ‘The Mindful IT Company’ differentiates us. To us Mindfulness is not just Being Mindful – being in the moment but also Doing Mindful - perceiving situations immersively, processing it non-judgmentally without biases or filters and performing empathetically. Nearly 81% of Happiest Minds have undergone Mindfulness Training.
c. SilverOak - We have joined hands with SilverOak EWAP services & launched one of the key initiatives of this year – 'Mithra for Wellbeing' program, which is an extension to our in-house counselling program. This is a unique program which provides a holistic approach to the emotional wellbeing of all Happiest Minds. Using this, all our members have free access to 24x7 counselling, Online Cognitive Behavioral Therapy, 8-week Online Resilience program – SCO (Stress Control Online), Mindfulness Application & self-help tools.
d. Hobbifying Workshops - To bring the hidden passion and talents of our members & to tap those talents, we have created this hobbifying
series. Mutual interests can be a great way to get the members to spend time together outside of work. Hobbies give them time to decompress and rejuvenate by doing something they enjoy. We have identified some common hobbies & interests and created intranet hobby communities, where few interested members have volunteered to be the admin of the communities and ran some engaging contests on a monthly basis. A collaborated session where our members or their family including children, with expertise in any arts/crafts/hobby conducted workshops on arts and crafts, ranging from Origami, Painting, Doodling, Mandala Art.
Physical Wellbeing
HappiZest believes that physical health is very important for our members and it is positively correlated with higher levels of concentration, increased mental stamina, reduced levels of stress, improved learning, sharper memory, and improved levels of focus and creativity. We have brought this habit into practice by introducing annual subscription plan to fitness application at a heavily discounted rate & also by creating fun engaging fitness challenges.
Doctor 24x7 - A tele consultation application that allows patients to connect with doctors from the convenience of their physical location over a phone call for 11 free categories.
Cure.fit - A curation of interactive online classes brought to all members from the best of trainers and celebrities. We have joined hands with Cure.Fit and provided our members a corporate annual plan with a heavy discount.
94
Annual Report 2021-22

Family Wellbeing
Family is an integral part of existence and journey of an individual. Family plays a crucial role in achieving holistic well being of individual. Hence, we have a dedicated focus on parenting and extension of programs to family and children to make the programs inclusive and cater to extended Happiest Minds family. Key initiatives involves parenting related workshops, collaboration by parents within Happiest Minds on parenting during lockdown focused workshop for kids around hobbies, learning and technical awareness, awareness session for kids on cyber security. Panel discussion with parents, medical insurance coverage for family members, voluntary life insurance coverage for spouse, exclusive COVID insurance policy for self and family.
Wellness for Women
HappiZest noticed that women Happiest Minds have unique physical and psychological concerns & needs as compared to men. We have prioritized Health and Wellness related programs and focused on the needs of women which helped us to retain the best female talent for long and drive business growth. We have taken the approach to establish gender-specific corporate wellness programs to widen the understanding of what is required to help women Happiest Minds.
As part of Wellness for Women, the HappiZest team has organized many wellness activities for Aura members of Happiest Minds such as Dress up for yourself, Webinar on PCOD, PCOS, Awareness on Sustainable menstruation, Breastfeeding awareness week.
Thursday Techies
During these unprecedent times, kids are locked inside homes without any engagement. During the summer holidays, to keep them engaged & to teach them something useful, HappiZest has planned technology related workshop for kids. Under this series, we have organized HTML & CSS workshops for kids & also cyber security webinars. The Thursday Techies series was launched with a simple philosophy – “For Jr. Happiest Minds, by Jr. Happiest Minds” where a few Jr. Happiest Minds have volunteered to take basic coding workshops.
We have encouraged participation, by keeping these webinars during summer holidays & also we have ensured these workshops are engaging & entertaining for the kids.
Ergonomic Care
a. Ergonomic Consultations - Considering the pandemic, virtual free one-on-one video Ergonomic doctor consultations were organized on a monthly basis.
b. Ergonomic Chairs at discounted rates to eliminate the most common physical issues related to Ergo, we have facilitated the members in buying Ergonomic chairs at a discounted price.
Hospital Tie-ups
Exclusive discounts for Happiest Minds & their families with hospitals pan India like Fortis, Narayana Health, Apollo Spectra, Apollo Fertility, Apollo Cradle, Motherhood hospitals.
Sharing Transformation Stories to inspire others
On a monthly basis, we would encourage our members to share their transformational stories (on weight loss, disease management, emotional wellbeing, financial management etc.) to motivate other members.
Corporate Overview1 Financial Statements3Statutory Reports2
95
Annual Report 2021-22

��������������������������MITHRA
�������������������
MITHRA - The Good Samaritan ProgramWe truly live in uncertain, complex, and ambiguous times, and the recent changes in the environment are a perfect example of this. There are times in our personal and professional lives when the pressures and the anxieties of life and living, uncertainties & constant changes and need to adapt to those changes, place enormous stress on us, and takes its toll. During these times, it is important to find someone trustworthy to talk to, someone with a sympathetic, listening ear. MITHRA – The Good Samaritan Program is precisely for that purpose.
MITHRA – The Good Samaritan Program
MITHRA is a team of Happiest Minds’ Volunteers who have committed to be available to listen, to help you deal with whatever it is that one is going through.
They are available to take calls or respond to mails 24/7, to help one process whatever it is that they are going through, in safety, acceptance and confidentiality.
In FY22, Team Mithra has connected with over 1,000 Happiest Minds
96
Annual Report 2021-22

Happiest Minds is the First Indian IT firm to be‘The Mindful IT Company’
Perceive Immersively
Process Non-judgementally
Perform Empathetically
In The Moment
Mindfulness Training in FY22
Total
5,262Happiest Minds till date
Sessions for * Students who have been given an offer
to join the Company* Happiest Minds' Customers* BIM Alumni Association
81%Coverage
14 sessions
1,613 covered in FY22
Corporate Overview1 Financial Statements3Statutory Reports2
97
Annual Report 2021-22

Circle of HappinessHappiness comes from giving, not getting. If we try to bring happiness to others, we cannot stop it from coming to us also. To get joy, we must give it, and to keep joy, we must scatter it. - John Templeton
Social Responsibility is a core value of Happiest Minds. It is also one of our vision statements where we have set out to “be a leader in integrating social responsibility initiatives with core business operations”.
Our CSR initiative, called the Circle of Happiness: � Establishes volunteering &
community involvement
� Celebrates our important milestones with acts of giving
� Executes a process for leveraging our capabilities and contribute to socially relevant causes. and builds a social engagement program that enables us to engage with clients & partners and make a difference to society and the environment
� A core team anchors this program, defines its charter at a granular level, interfaces with social organizations and coordinates volunteer activities
International Day of Happiness was celebrated in March with the theme:
Be Kind. Be Calm. Be Wise.
98
Annual Report 2021-22

Contribution towards meals to Akshaya Patra Foundation in FY22 - 1.28 million meals totaling ̀ 1,22,89,576; total meals till date 4.04 million (` 2,55,73,374)
Participation in Daan Utsav program, where 775 wishes were fulfilled through contributions of ` 7,69,390 by Team Happiest Minds. The NGO beneficiaries were: Baale Mane, Balajothi Centre for the Disabled, One Billion Literates Foundation & Jeevarathni Foundation
`1 Crore to Sri Jayadeva Institute of Cardiovascular Sciences and Research for a molecular testing lab and 3 ICU Ventilator Beds
` 5 Lacs to Bangalore West Lions Super Specialty Eye Hospital, (a Non-Profit unit of the Lions Club of Bangalore West Trust) towards their program for early detection & treatment of blindness due to diabetes & its complications
Some of our CSR initiatives in FY22 were:
In FY22, the total contribution for CSR initiatives was ` 2,35,58,966, of which
Company contribution was ` 2,15,00,000 and the team’s contribution was ` 20,58,966.
Corporate Overview1 Financial Statements3Statutory Reports2
99
Annual Report 2021-22

Learning and Development
Learning and Development at Happiest Minds is a continuous process of creating value through a learning culture which is agile, creative, collaborative and technologically advanced in alignment with business and organizational goals
Key Highlights
Multiskilling Initiative
1,885 Happiest Minds covered as part of cross-skilling/multiskilling initiative across the BUs. 338 Happiest Minds deployed in the projects across BUs based on training of new skills. The additional skill base is enabling BUs to identify new opportunities, enhance current project work and increase efficiency.
Dotnet Full Stack
AWS ELB, Cognito, Microservices
DDR4 Basics
Cloud Boot Camp, AWS DevOps, Azure DevOps, Networking
Cyber Security related trainings – Thycotic, CyberArk, QRADAR,
Advance SOC Analyst
ITIL Foundation
JS Full Stack
AI Fundamentals & Deep Learning
Azure DW, Modernization,
Programming experts
DataBricks
Kafka
DevOps
Angular 10
Cloud related trainings – AWS IoT, Azure IoT, Azure API
Management etc.
SAP Hybris
100
Annual Report 2021-22

Niche Skills Program
A learning initiative to identify and create an internal pool for niche skills that is currently in demand or is going to be the future skills. 36 Programs conducted for skills which are not readily available in the market and 448 Happiest Minds covered as part of the various programs.
Top Skills
� ServiceNow
� SAP HYBRIS
� AI@ Scale
� Reinforcement learning
� AWS & Azure DevOps
� Vue.js & Golang
� Labware LIMS
Happiest Minds Architect Academy Program
As part of our Talent strategy, a customized industry standard Architect program rolled out in FY22. 26 Happiest Minds aspiring to become future Architects completed the structured learning path and are being groomed for future projects opportunities.
D-Hub @Happiest Minds
D-Hub is a Domain learning initiative providing a framework to gain insights and expertise into various Business domains. Program curriculum design and roll out completed for two domains Retail and CPG.
Campus Programs
Collaboration with internal stakeholders for curriculum design, content creation and program launch planning. Also, as part of pre-joining engagement programs Tech Mind series, Quiz and fun events rolled out to the participants.
Role Transition Programs
IMPACT @Happiest Minds is a customized program for our new Managers who are taking the first step into managerial positions. The program focuses on building key skills on planning, delegating, managing, decision-making. Also, the program covers aspects of emotional intelligence, awareness of personality styles and communication skills empowering them to become confident managers. 60 first-time managers have completed the program in FY22.
Professional Development Programs
Competency based professional development programs focuses on people skills & personality attributes to enhance an individual’s self-awareness, interpersonal skills, communication skills, social skills, job performance skills, character traits, managerial skills and leadership skills.
Soft Skills/Behavioral Programs
� Business Communication Skills
� Presentation Skills
� Customer Centricity
� Collaborating Across Cultures
Manager and Leadership Development Programs
� IMPACT Program for First Time Managers
� Ananta Values Leadership Program
� Building Leadership Muscle Program
� Interviewing Skills Program
Corporate Overview1 Financial Statements3Statutory Reports2
101
Annual Report 2021-22

Key Metrics
326 1,18,325Total Programs completed Total Training Hours
(excluding mandatory programs)
8,512Campus training hours
24Trainings & Certifications
32Training hours per Happiest Mind (excluding mandatory programs)
117 trainers facilitated 209 coursesInternal trainer pool
Mandatory ProgramsProfessional
Development ProgramsTech Talks Technical
6,004 1,252 2,158 5,070
BUFY21 FY22
Online Learning Hours (Udemy)
Training Person Hours (VILT)
Online Learning Hours (Udemy)
Training Person Hours (VILT)
Total 37,625 35,081 58,699 59,625
Training Hours Overview
Happiest Minds Covered in Training (VILT)
102
Annual Report 2021-22
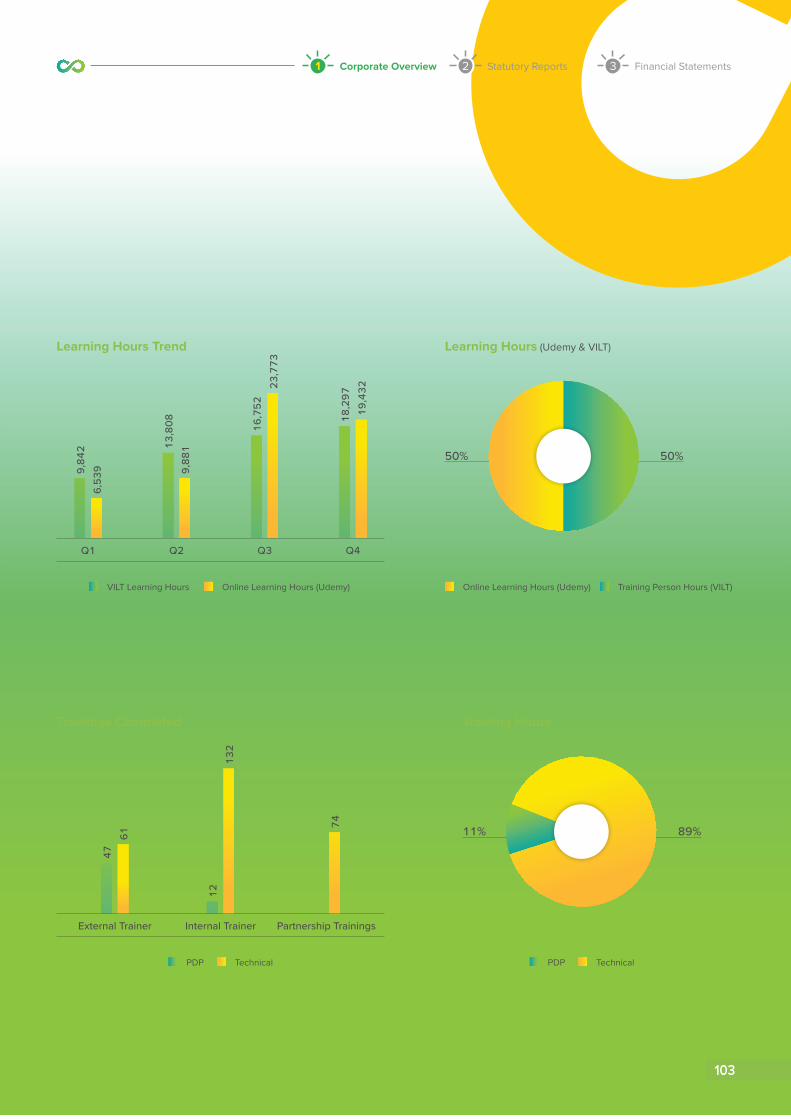
Q4Q2 Q3Q1
9,84
26,
539
External Trainer
4761
13,8
089,
881
16,7
5223
,773
Internal Trainer
1213
2
18,2
9719
,432
Partnership Trainings
74Learning Hours Trend
Trainings Completed
VILT Learning Hours Online Learning Hours (Udemy)
PDP Technical PDP Technical
Learning Hours (Udemy & VILT)
Online Learning Hours (Udemy) Training Person Hours (VILT)
50% 50%
Training Hours
11% 89%
Corporate Overview1 Financial Statements3Statutory Reports2
103
Annual Report 2021-22

Talent Acquisition
Talent Acquisition (TA) is an AI-enabled, analytics-driven function with agility in decision-making. The core theme that makes Happiest Minds an employer of choice is a differentiated hiring process focused on a superior candidate experience and future skills.
Over the last 4 years, the overall Turnaround Time (TAT) has been consistently maintained at 51 days.
Recognition:
Happiest Minds was awarded the Times Ascent – Global HR Award – 2021 for Innovation in Recruitment.
Differentiated hiring processes through various modes have ensured that scalability is always the prime focus:
� Majority of the interviews are conducted virtually which have helped reduce the TAT
� Engaging external interview panels to cater to volume-based hiring
� Limiting interviews to only 2 levels for certain skills/function with a focus on hiring based on potential and not just performance
� Routine meetings with respective stakeholders within the business to address any calibrations required on either toning down on expectations (skills) or mapping of relevant salary stack as per market trends
� Active involvement of project & client panels in engaging with short-listed candidates as part of post-offer engagement
� Panels being more diligent on interview etiquettes to ensure better candidate experience
� Market mapping of target companies & cross-mapping of interviewed candidates for relevant customer accounts
� Working with local vendors in specific geographies for global engagement hiring initiatives
TA has consistently delivered exceeding results in alignment with business goals.
104
Annual Report 2021-22
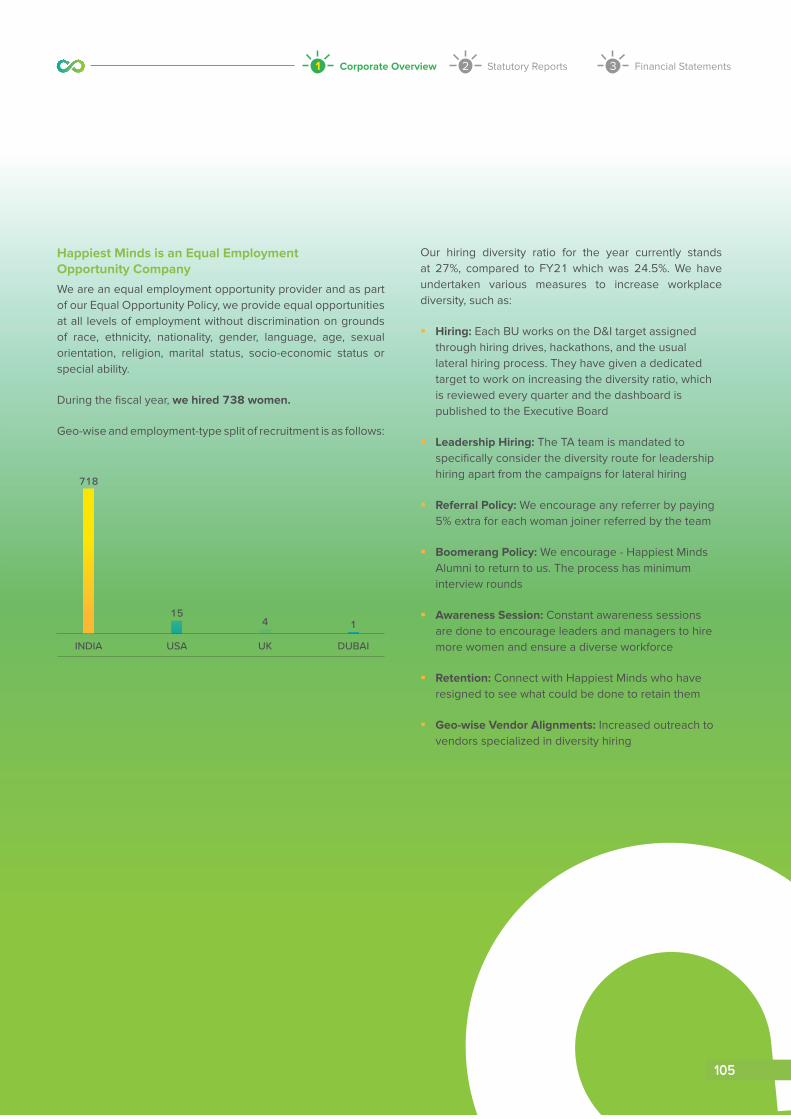
Our hiring diversity ratio for the year currently stands at 27%, compared to FY21 which was 24.5%. We have undertaken various measures to increase workplace diversity, such as:
� Hiring: Each BU works on the D&I target assigned through hiring drives, hackathons, and the usual lateral hiring process. They have given a dedicated target to work on increasing the diversity ratio, which is reviewed every quarter and the dashboard is published to the Executive Board
� Leadership Hiring: The TA team is mandated to specifically consider the diversity route for leadership hiring apart from the campaigns for lateral hiring
� Referral Policy: We encourage any referrer by paying 5% extra for each woman joiner referred by the team
� Boomerang Policy: We encourage - Happiest Minds Alumni to return to us. The process has minimum interview rounds
� Awareness Session: Constant awareness sessions are done to encourage leaders and managers to hire more women and ensure a diverse workforce
� Retention: Connect with Happiest Minds who have resigned to see what could be done to retain them
� Geo-wise Vendor Alignments: Increased outreach to vendors specialized in diversity hiring
Happiest Minds is an Equal Employment Opportunity CompanyWe are an equal employment opportunity provider and as part of our Equal Opportunity Policy, we provide equal opportunities at all levels of employment without discrimination on grounds of race, ethnicity, nationality, gender, language, age, sexual orientation, religion, marital status, socio-economic status or special ability.
During the fiscal year, we hired 738 women.
Geo-wise and employment-type split of recruitment is as follows:
DUBAIUSA UKINDIA
718
154 1
Corporate Overview1 Financial Statements3Statutory Reports2
105
Annual Report 2021-22

In order to compete effectively and survive in the global market, we must maintain and build relationships with a capable and competent network of suppliers and extract maximum value through such relationships. To create and maintain such a network and to improve capabilities that are necessary to meet its increasing competitive challenges, we engage in Supplier Development Initiatives to improve the performance of supply base both pro-reactively and strategically.
Value Chain ManagementWe believe that a holistic approach as well as responsible and informed choices can lead to solutions that are sustainable. Our actions and approach to achieve environmental stewardship include energy and water efficiency, waste management, and green services. Happiest Minds is driven by the spirit of innovation and is continuously focusing upon sustainable processes & services.
Building sustainability in the value-chain chain presents an urgent imperative today. Leading corporations across the world are extending their commitment to responsible business practices beyond their immediate boundaries.
Our Supplier Development initiatives focuses on following areas:
� Continuous Improvement of Strategic Supply Base
� Materials Management Competency
� Supplier Risk Management
� On-Site Supplier Assessment
Key initiatives undertaken for the suppliers in FY21-22 are:
� Engaging with suppliers to cut down the lead time.
� Negotiating with suppliers for AMC on Product warranty.
� Liasioning with Government Bodies for smooth functioning of all Happiest Minds Office Spaces
Key Initiatives Undertaken for Suppliers
Happiest Minds is actively engaging with their value chain partners on ESG issues through dedicated policies, guidelines, and code of conduct. The engagement aims to go beyond audits and assessments and focuses on supporting value chain partners in enhancing their sustainability performance through capability building and knowledge sharing. In addition to working with vendors, we are also focusing on sourcing materials and engaging the services that are sustainable and conflict-free in nature.
Local ProcurementWe have established procurement processes based on the principles of sustainability. Sustainable procurement is a process through which we meet our needs for goods, services, works and utilities in a way that achieves value for money on a whole life basis in terms of generating benefits not only to the Company, but also to society and the local economy, whilst minimizing damage to the environment.
Embedding sustainability into procurement supports our objectives as set out in relevant policies and strategies and is adapted to reflect the nature of the contract.
Many sustainability benefits can be achieved through supplier engagement before the procurement process begins which is essential to allow the market to understand and prepare their RFP response.
One of the key ESG objectives is to mobilize procurement to deliver local priorities. This highlights the delivery of social value and sustainable procurement, including economic, social, and environmental outcomes, such as:
� Creating new businesses, new jobs, and new skills in the local boundaries
� Improving supplier diversity, innovation, and resilience
� Tackling climate change and reducing waste
106
Annual Report 2021-22

Governance
Happiest Minds is committed to conducting its business in accordance with the applicable laws, rules, and regulations with highest standards of business ethics, integrity, environmental responsibility, and social responsibility.
To implement the Value Chain Sustainability Framework, Vendor’s Code of Conduct has been established and communicated to all the vendors. This Code is intended to define non-negotiable minimum standards of business conduct that Happiest Minds expect its Vendors to respect and adhere to. This includes compliance
with the laws of land and adherence to well-established ESG principles and standards such as National Guidelines on Responsible Business Conduct (NGRBC), the UN's Universal Declaration of Human Rights and the conventions of the International Labor Organization (ILO) Declaration on Fundamental Principles and Rights at Work and ILO’s Basic Terms and Conditions of Employment.
While Vendors are expected to self-monitor and demonstrate their compliance with this Code, Happiest Minds reserve its right to audit Vendors
or inspect Vendors’ facilities to confirm compliance. This Code is an integral part of Happiest Minds' contract or agreement with its Vendors.
The requirements under the Happiest Minds’ Vendor’s Code of Conduct focuses on Freedom of employment and association, The eradication of child labor, safe and hygienic working conditions, appropriate pay and working hours, humane and non-discriminatory treatment, anti-bribery and corruption, and environmental awareness.
Ethical Practices
Corporate Overview1 Financial Statements3Statutory Reports2
107
Annual Report 2021-22

Data Security and Privacy PoliciesInformation Security and Privacy Policies and Procedures: We have well-defined and implemented information security and data protection policies and procedures (as per ISO 27001 and ISO 27701 framework). Policies and practice related to Data Security includes:
Data Privacy and Freedom of Expression
Vendor Risk Management Policy
1
5
2
6
3
7
4
8Information Classification Policy
Policy on use of Encryption
Removal of Information Assets
Policy on Back-up and Restoration
Access Control Policy
Information Security Policy
Clear Desk and Clear Screen Policy
1. Happiest Minds has conducted detailed assessment of our internal processes to comply with Privacy regulation like GDPR. Data flow maps are developed and evaluated for each function/business process to identify the overall lifecycle of the collected data, privacy risk is assessed and mitigation measure and controls are deployed accordingly. Some of the key policies/practices implemented include:
1a. Awareness (Article 39): Annual information security awareness sessions
1b. Review and Update Privacy Notices (Article 19): The current privacy policy is updated as per the GDPR requirement. The same has been published in the Happiest Minds website.
1c. Appoint or Hire a Data Protection Officer (Article 37): In-house Full-time DPO has been appointed.
1d. Evaluate Data Retention Procedures (Article 12): Data retention policy is in place and timeline of data retention is mentioned by different process owners.
1e. Conduct a Privacy Impact Assessment (PIA) or DPIA (Article 35): DPIA was conducted when the GDPR was implemented identifying various PII data and its respective controls and owners. Annual audit is conducted to verify the DPIA.
1f. Establish Contracts with Third-Party Processors (Article 28, 46): Happiest Minds has modified the contracts to ensure that all third parties have adequate data protection measures and procedures in place. Annual privacy risk reviews are conducted for the identified critical vendors.
1g. Implement Procedures for Prompt Mandatory Notification (Article 33, 34): We have procedure in place to ensure that breaches are reported to regulators within 72 hours of the Company becoming aware of the breach. If notification occurs later than 72 hours after we become aware of a breach, eventual notice is accompanied by an explanation for the delay. DPO manages and oversees the activities.
108
Annual Report 2021-22

Total amount of monetary losses as a result of legal proceedings associated with user privacy None
Number of law enforcement requests for user information, number of users whose information was requested, Percentage resulting in disclosure
None
List of countries where core products or services are subject to government-required monitoring, blocking, content filtering, or censoring
None
The entity shall disclose the number of unique users whose information is used for secondary purposes None
Number of data breaches None
Percentage involving personally identifiable information (PII) 0%
Number of users affected None
Accounting Metrics for the Fiscal - 1
Accounting Metrics for the Fiscal - 2
1
1
2
2
3
3
4
2. As part of our Information Security Management System, ongoing risk assessment is conducted (both internal and third parties) to assess the risk and mitigation/controls. We undergo annual ISO 27001 certification and SOC 2 Type 2 attestation by third parties. The following Data security controls are in place:
2a. Encryption - Both at end points and at Network level
2b. Strong Access Control - Including Multi-factor and Risk-based Authentication and access control
2c. Malware protection - At end point and network layers (to protect web and email traffic)
2d. Device control - Restriction on usage of USBs, Mobile devices
109

Management & Leadership
Ashok SootaExecutive Chairman
Ashok Soota, Executive Chairman of Happiest Minds Technologies Limited (NSE:HAPPSTMNDS), is widely recognized as one of the pioneering leaders of the Indian IT industry.
Ashok was earlier founding Chairman & MD of Mindtree, a company he also led to a very successful IPO. Prior to Mindtree, he led Wipro’s IT business for fifteen years, making it the second largest IT company in India. He also led the turnaround of Shriram Refrigeration into a highly profitable company after four straight years of losses.
Ashok has been the President of leading industry association, Confederation of Indian Industry (CII), a member of the Prime Minister’s Task Force for IT and was on the Advisory Council for the World Intellectual Property Organization, Geneva. He is a Fellow of INAE and CSI and on the Board of Governors of Asian Institute Management (AIM), Philippines. He is a recipient of multiple IT Person of the Year (Dataquest and Elcina) and Lifetime Achievements Awards including Financial Express (2016), Dataquest (2017) and Chiratae Ventures, earlier IDG Ventures (2018).
On April 5, 2021, Ashok launched SKAN (Scientific Knowledge for Ageing and Neurological Ailments), India’s first private sector, non-profit organization, exclusively dedicated to carry out medical research on ageing and neurological disorders. SKAN seeks to be a global leader in gut microbiome research, specifically the gut-brain axis. Ashok has committed US$ 50 million (`375 Crores) for SKAN and the goals are to find kinder and gentler remedies; to delay the onset and slow the progression of the diseases; and to enrich the lives of people afflicted with such ailments. Ashok is not new to philanthropic work. He is the Founding Trustee of Ashirvadam, an NGO committed to caring for the environment and providing support to the needy including vocational training, education and medical assistance.
Ashok holds a Bachelor’s Degree in Electrical Engineering from University of Roorkee (now called Indian Institute of Technology, Roorkee) and a Master of Business Management degree from the Asian Institute of Management, Philippines.
Ashok is co-author of the national bestseller – “Entrepreneurship Simplified: From Idea to IPO”.
110
Annual Report 2021-22

Joseph AnantharajuExecutive Vice Chairman & CEOProduct Engineering Services (PES)
Rajiv ShahPresident & CEODigital Business Services (DBS)
Joseph has over 25 years of professional experience, primarily focused on helping technology and digital engineering companies unlock new levers of growth. In 2011, he became one of the co-founders of Happiest Minds and currently serves as its Executive Vice Chairman and a member of its Executive Board. Joseph’s instrumental role in establishing the Company’s Product Engineering Business Unit helped in substantiating its digital credentials and contributed towards a highly successful IPO.
Previously, Joseph owned the P&L responsibility at Mindtree for the Microsoft Strategic Business Unit. In this role, he devised and implemented a strategic program that helped the Company become one of the largest vendors and engineering partner of choice for Microsoft. In his stint
Rajiv Shah is the President and Chief Executive Officer of the Digital Business Services and member of the Executive Board of our Company. He is a global executive with more than 30 years of experience across the healthcare, financial services, technology, travel/transportation, and software industries.
Rajiv has held leadership and Board level positions at technology-driven organizations including Electronic Data Systems (EDS), Wipro Technologies, IBS Software Services, and Mu Sigma. Prior to Happiest Minds, he was an advisor to Founder CEOs and various companies and worked with PE firms during their investment evaluation process.
As a CEO and Executive Director of IBS, he turned around the company with proprietary software by engineering the change in business model from on-premise to SaaS which improved revenue and profitability visibility. He drove their global expansion, initiated acquisitions and integration of
niche product companies, and facilitated a major transaction to provide profitable exit to shareholders.
Rajiv led Financial and Healthcare Business Units at Wipro. He also oversaw the establishment of international operations of an IT major, EDS, a JV between the largest US BPO TeleTech and Bharti group and a new entity for an Australian Conglomerate – Kerry Packer Group. He then ran these businesses as a CEO and Executive Director.
Rajiv holds an MS in Mechanical Engineering from the University of Missouri. He has completed Executive Management courses at multiple business schools and has also participated in Global Leadership Alliance Training in St. Petersburg, Russia, and Stanford University. He speaks at various forums and has published leadership articles.
with Aztecsoft (later acquired by Mindtree), he was first responsible for making inroads into Microsoft and rapidly scaling it into a multi million-dollar account. During his combined association with both companies, he was instrumental in winning several large deals while contributing in strategy formulation, customer engagement and strategic marketing. He started his career in banking and manufacturing before foraying into the world of IT.
Joseph holds a Bachelor of Engineering degree from BITS Pilani and a PGDM from IIM Ahmedabad.
Corporate Overview1 Financial Statements3Statutory Reports2
111
Annual Report 2021-22

Ram Mohan C President and CEOInfrastructure Management and Security Services
Venkatraman Narayanan Managing Director and CFO
Ram Mohan is President and CEO of Infrastructure Management and Security Services Business Division and a member of the Executive Board in Happiest Minds Technologies.
Previously, Ram was EVP and Global Head of IMS, Enterprise Integration, Mainframe services and APAC business in Mindtree. He was also CISO for Mindtree, responsible for organizational automation. Prior to that, he was EVP - Operations of e4e.
He was Founder and COO of Vinciti Networks, a specialized service provider in Infrastructure Management and Tech Support (IMTS) which he ran successfully for five years and built a 1,200 strong team, before rolling up to the holding company.
Ram has worked in the Support Division at Wipro for 11 years in various capacities from customer support to business development, and helped the formation of its Global Support division, now Global Infrastructure Services division.
Venkat is the Managing Director, Chief Financial Officer and member of the Executive Board of our Company. He is a fellow member of the Institute of Chartered Accountants of India and holds a Bachelor’s Degree in Commerce and in Law. He has been associated with our Company since April 2015 and has over 25 years of experience in general management, operations, finance and law.
Ram worked as a Systems Manager in MPACT Immedia, Michigan, USA, thus acquiring the multifaceted experience in IT management and business, technology, operations and managing multiple business.
He has 30+ years of experience in IMTS, including last 20 years in senior management positions. He has the experience of working both in service organizations and product companies and has played key role in M&A activities.
Ram holds a Bachelor of Electronics Engineering degree with distinction from Bangalore University. He is a distinguished speaker in many Infrastructure and Support forums and seminars. He has also taught MBA (IT) to students of Symbiosis. He is the winner of the coveted Chairman’s Award at Mindtree and at Happiest Minds and the CSO Award.
Previously, he was CFO, Sonata Software, TeamLease Services, Perot Systems TSI (India), Transworks Information Services, and Mindtree. He was Director - Operations Oracle and Consultant at Arthur Andersen. He has been on the Board of Directors of Sonata’s subsidiaries and Perot Systems.
112
Annual Report 2021-22

Anita Ramachandran Independent Director
Anita is a well-known HR expert in the country and has over 40 years’ experience as a management consultant. She is one of the first generation of women professionals to become an entrepreneur and run a highly successful HR consulting and services organization.
Anita began her career in the Management Consultancy division of AF Ferguson & Co (AFF), a KPMG network company in India then, as its first woman consultant. In her 19 years stint with AFF, she worked in Finance, Industrial Market Research, Strategy and Human Resources Consulting roles across India and finally became its Director.
Anita founded Cerebrus Consultants in 1995 for HR advisory services, including organization transformation. With her innovative approach, she grew it to international scale, having worked with over 700 companies in South Asia (Bangladesh, Sri Lanka and India) on a wide variety of HR projects.
Known as an authority in Reward Management in India, Anita’s work in the compenzation and rewards area is well-recognized. Recently, she was involved in several large organization transformation assignments. She regularly facilitates senior and top management workshops and assesses senior positions. She is a strategic advisor to many family groups. She also works with several PE firms, mentors start-ups and supports organizations in the social sector.
Anita has been an Independent Director on Boards of companies across diverse industries for the last 20 years. She is currently on the Board of Grasim, Metropolis Healthcare, Kotak Life, Happiest Minds and several other companies.
She was the Chairperson of TiE Women and was on the Executive Committee of TiE Mumbai and Advertising Standards Council of India.
Anita is an MBA from the Jamnalal Bajaj Institute, Mumbai and has won several academic honors.
Independent Directors
Corporate Overview1 Financial Statements3Statutory Reports2
113
Annual Report 2021-22
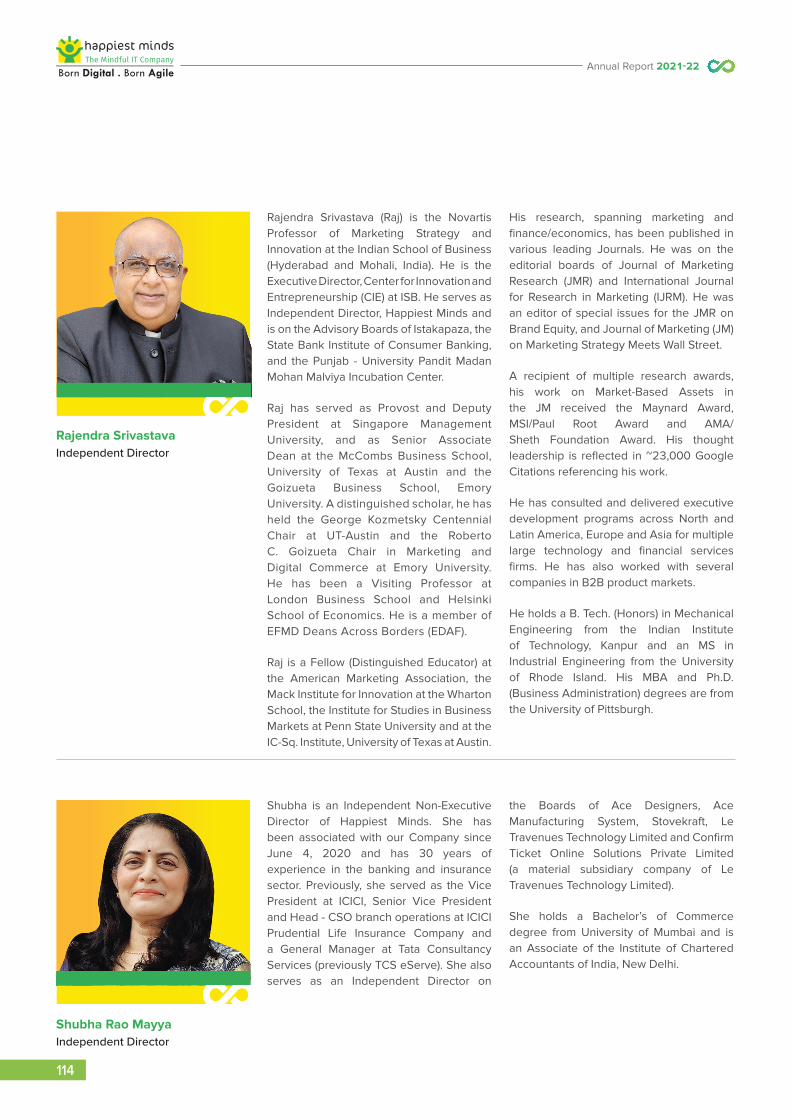
Rajendra Srivastava Independent Director
Rajendra Srivastava (Raj) is the Novartis Professor of Marketing Strategy and Innovation at the Indian School of Business (Hyderabad and Mohali, India). He is the Executive Director, Center for Innovation and Entrepreneurship (CIE) at ISB. He serves as Independent Director, Happiest Minds and is on the Advisory Boards of Istakapaza, the State Bank Institute of Consumer Banking, and the Punjab - University Pandit Madan Mohan Malviya Incubation Center.
Raj has served as Provost and Deputy President at Singapore Management University, and as Senior Associate Dean at the McCombs Business School, University of Texas at Austin and the Goizueta Business School, Emory University. A distinguished scholar, he has held the George Kozmetsky Centennial Chair at UT-Austin and the Roberto C. Goizueta Chair in Marketing and Digital Commerce at Emory University. He has been a Visiting Professor at London Business School and Helsinki School of Economics. He is a member of EFMD Deans Across Borders (EDAF).
Raj is a Fellow (Distinguished Educator) at the American Marketing Association, the Mack Institute for Innovation at the Wharton School, the Institute for Studies in Business Markets at Penn State University and at the IC-Sq. Institute, University of Texas at Austin.
His research, spanning marketing and finance/economics, has been published in various leading Journals. He was on the editorial boards of Journal of Marketing Research (JMR) and International Journal for Research in Marketing (IJRM). He was an editor of special issues for the JMR on Brand Equity, and Journal of Marketing (JM) on Marketing Strategy Meets Wall Street.
A recipient of multiple research awards, his work on Market-Based Assets in the JM received the Maynard Award, MSI/Paul Root Award and AMA/Sheth Foundation Award. His thought leadership is reflected in ~23,000 Google Citations referencing his work.
He has consulted and delivered executive development programs across North and Latin America, Europe and Asia for multiple large technology and financial services firms. He has also worked with several companies in B2B product markets.
He holds a B. Tech. (Honors) in Mechanical Engineering from the Indian Institute of Technology, Kanpur and an MS in Industrial Engineering from the University of Rhode Island. His MBA and Ph.D. (Business Administration) degrees are from the University of Pittsburgh.
Shubha Rao Mayya Independent Director
Shubha is an Independent Non-Executive Director of Happiest Minds. She has been associated with our Company since June 4, 2020 and has 30 years of experience in the banking and insurance sector. Previously, she served as the Vice President at ICICI, Senior Vice President and Head - CSO branch operations at ICICI Prudential Life Insurance Company and a General Manager at Tata Consultancy Services (previously TCS eServe). She also serves as an Independent Director on
the Boards of Ace Designers, Ace Manufacturing System, Stovekraft, Le Travenues Technology Limited and Confirm Ticket Online Solutions Private Limited (a material subsidiary company of Le Travenues Technology Limited).
She holds a Bachelor’s of Commerce degree from University of Mumbai and is an Associate of the Institute of Chartered Accountants of India, New Delhi.
114
Annual Report 2021-22
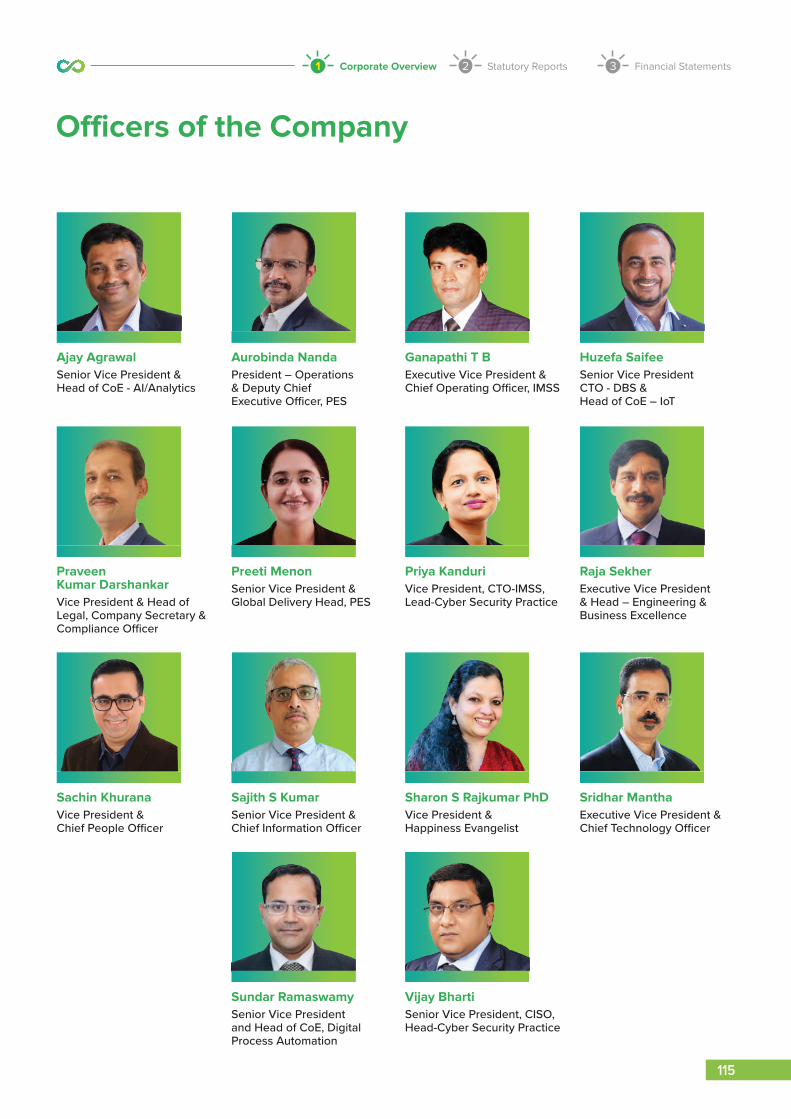
Officers of the Company
Ajay AgrawalSenior Vice President & Head of CoE - AI/Analytics
Aurobinda NandaPresident – Operations & Deputy Chief Executive Officer, PES
Ganapathi T BExecutive Vice President & Chief Operating Officer, IMSS
Huzefa SaifeeSenior Vice PresidentCTO - DBS & Head of CoE – IoT
Praveen Kumar DarshankarVice President & Head of Legal, Company Secretary & Compliance Officer
Preeti MenonSenior Vice President & Global Delivery Head, PES
Priya KanduriVice President, CTO-IMSS, Lead-Cyber Security Practice
Raja SekherExecutive Vice President & Head – Engineering & Business Excellence
Sachin KhuranaVice President & Chief People Officer
Sajith S KumarSenior Vice President & Chief Information Officer
Sharon S Rajkumar PhDVice President & Happiness Evangelist
Sridhar ManthaExecutive Vice President & Chief Technology Officer
Sundar RamaswamySenior Vice President and Head of CoE, Digital Process Automation
Vijay BhartiSenior Vice President, CISO, Head-Cyber Security Practice
Corporate Overview1 Financial Statements3Statutory Reports2
115
Annual Report 2021-22

116
Annual Report 2021-22
117 to 204
Statutory Reports
117 Board’s Report140 Management Discussion and Analysis of
Financial Condition and Results of Operations157 Corporate Governance Report174 Business Responsibility & Sustainability Reporting

Corporate Overview1 Statutory Reports2 Financial Statements3
117
Annual Report 2021-22
Board’s ReportDear Members,Your Directors take pleasure in presenting the Eleventh Annual Report covering the highlights of the finances, business, and operations of your Company. Also included herein are the Audited Financial Statements of the Company (standalone and consolidated) prepared in compliance with Ind AS accounting standards, for the financial year ended March 31, 2022.
Highlights of Financial PerformanceAmount in ` Lacs
Description Standalone Consolidated
March 31, 2022 March 31, 2021 March 31, 2022 March 31, 2021
Revenue from Operations 103,354 76,096 109,365 77,341
Other Income 3,771 2,342 3,710 2,424
Total Income 107,125 78,438 113,075 79,765
Employee benefits expense 61,210 45,012 62,000 45,238
Depreciation and amortization 2,423 2,063 3,288 2,274
Finance cost 830 645 995 649
Other expenses 17,577 12,116 21,598 13,002
Total expenses 82,040 59,836 87,881 61,163
Profit / (Loss) before Exceptional Items and Tax 25,085 18,602 25,194 18,602
Exceptional (Income) / Expense - - 609 -
Profit / (Loss) before Tax 25,085 18,602 24,585 18,602
Tax expense 6,437 2,409 6,465 2,356
Profit / (Loss) after Tax 18,648 16,193 18,120 16,246
Earnings per share (Basic) 13.21 11.71 12.84 11.75
Earnings per share (Diluted) 12.91 11.41 12.55 11.45
Attributable to:
Shareholders of the Company 18,648 16,193 18,120 16,246
Opening balance of retained earnings 10,637 (5,457) 10,550 (5,597)
Dividend on equity shares (6,830) - (6,830) -
Other comprehensive income recognised directly in retained earnings
(73) (108) (73) (108)
Transferred from share option outstanding reserve for options forfeited
6 9 6 9
Closing balance of retained earnings 22,388 10,637 21,773 10,550
Note: Previous year’s figures have been regrouped/reclassified wherever necessary to correspond with the current year’s classification/disclosure.
A detailed analysis of the financials and business performance of the Company during the year under review including the impact of the COVID 19 pandemic had on your Company’s business is detailed below.
Management Discussion and AnalysisManagement Discussion and Analysis as required under Schedule V of the Securities and Exchange Board of India (Listing Obligations and Disclosure Requirements) Regulations, 2015 (“Listing Regulations”) is provided separately in the Annual Report.
Dividend & Transfer to ReservesYour Company’s policy on Dividend Distribution is available at https://www.happiestminds.com/investors/policy-documents/.
In accordance with the said policy, your Directors declared an interim dividend of ` 1.75/- per equity share in the Board meeting held on 27th October 2021 and are pleased to recommend a final dividend of ` 2/- per equity share for the financial year ended

118
Annual Report 2021-22
March 31, 2022 i.e., the total dividend for the current financial year under review being ` 3.75/- per equity share (previous financial year - ` 3/- per equity share). If the above recommendation is accepted by the Members of the Company at the ensuing Annual General Meeting, the total outflow on this account will be ` 5507.38 Lacs.
Your Directors do not propose to transfer any amounts to the general reserves of the Company, instead have recommended to retain the entire profits for the financial year ended March 31, 2022 in the profit and loss account.
Your Company did not have any amounts due or outstanding as of the Balance Sheet date to be credited to the Investor Education and Protection Fund.
Mergers & AcquisitionsYour Company has an active investment committee represented by two executive members of the Board who continuously evaluate M&A opportunities that can complement or augment capabilities in strategic focus areas, and also help the Company increase its geographic outreach in the chosen markets. Emphasis is given to capabilities that can help the Company further its digital vision for its customers. Your Company is selective about the type of opportunities that are pursued and innovative in modes of engagement with them.
During the year under review, your Company made a strategic investment into Tech4TH, a consulting led technology services company that exclusively focuses on the travel and hospitality segment. Tech4TH’s vision is to empower travel and hospitality (T&H) enterprises with next generation of products, services, and drive superior customer experiences. The investment aligns with your Company’s ten-year vision to be a thought leader in its focus areas of technology and solutions.
Subsidiary CompanyAs of March 31, 2022, your Company had one wholly-owned subsidiary company viz., Happiest Minds Inc., USA (formerly PGS Inc.). The statement under Section 129(3) of the Companies Act, 2013 in respect of the subsidiary in Form AOC-1 is attached as Annexure I. The Consolidated Accounts of your Company duly audited by the Statutory Auditors are presented as part of this Report.
The financial statements together with related information and other reports of the subsidiary are available on the website at https://www.happiestminds.com/investors/
Your Company’s policy on material subsidiary is also available on the website at https://www.happiestminds.com/investors/policy-documents/
RecognitionsWe are happy to inform that your Company and its executives have received the following recognitions during the year:
• Happiest Minds is ranked among India’s Top 15 Best Workplaces in Health and Wellness 2021 by Great Place to Work® Institute. Happiest Minds also received a special recognition for supporting employees and their families during COVID-19 crisis.
• Happiest Minds is ranked among India’s Top 50 Best Workplaces for Women 2021 by Great Place to Work® Institute for the third consecutive year.
• Happiest Minds is recognized as a GOLD partner of the Intel Network Builders Winners’ Circle.
• Ashok Soota, Executive Chairman is among India’s 100 Great People Managers 2021 by Great Manager Institute®.
• Priya Kanduri, Vice President & CTO - IMSS received the Women in Tech award at the 19th Edition of Asia Pacific HRM Congress & Awards.
• Preeti Menon, Senior Vice President & Global Delivery Head – PES is recognized among the Top 20 Female Cloud Leaders in 2021 by The Sociable.
• Kiran Veigas, General Manager – Corporate Marketing & Communications was awarded DMA Trailblazer Rising Star CMO 2021 award at the BrandMaster Award Nite.
• Happiest Minds’ Digital Content Monetization (DCM) solution was featured in the NASSCOM Cloud Case study Compendium.
• Happiest Minds is featured in NASSCOM’s report on India Cybersecurity Industry Services & Product Growth Story.
• Happiest Minds is recognized in Zinnov Zones as a Leader for Enterprise Software; Leader for ER&D (Small & Medium Service Providers) and Niche-Established for AI Engineering o Niche-Established for IoT Services.
• Happiest Minds is recognized as a ‘Major Contender’ in Everest Group PEAK Matrix for Digital Engineering.

Corporate Overview1 Statutory Reports2 Financial Statements3
119
Annual Report 2021-22
Share CapitalDuring the year under review, your Company did not issue any shares. The paid-up equity share capital as on March 31, 2022 was ` 293,727,112/- consisting of 146,863,556 equity shares of ` 2/- each.
Your Company has not issued shares with differential voting rights and sweat equity shares during the year under review.
Directors and Key Managerial PersonnelAs on March 31, 2022, the Board of Directors of your Company comprised of six Directors, viz., three Executive Directors and three Independent Directors including two women Directors. As per the Articles of Association of the Company, one third of the Directors (other than Independent Directors) are liable to retire by rotation at the Annual General Meeting (“AGM”) of the Company, every year. Mr. Ashok Soota (DIN 00145962) retires by rotation at the ensuing 11th AGM and being eligible, offers himself for re-appointment.
Mr. Ashok Soota (having DIN 00145962-Executive Chairman), Mr. Venkatraman Narayanan (having DIN 01856347-Managing Director & CFO) and Mr. Joseph Anantharaju (having DIN 08859640- Executive Vice Chairman) are Executive Directors on the Board.
Ms. Anita Ramachandran (DIN 00118188), Mr. Rajendra Kumar Srivastava (DIN 07500741) and Ms. Shubha Rao Mayya (DIN No. 08193276) are the Independent Directors on the Board. Pursuant to the provisions of Section 149 of the Companies Act, 2013 the Independent Directors have submitted declarations that each of them meets the criteria of independence as provided in Section 149(6) of the Companies Act, 2013 along with the Rules framed thereunder and Regulation 16(1)(b) of the Listing Regulations. There has been no change in the circumstances affecting their status as Independent Directors of the Company. In the opinion of the Board, the Independent Directors possess the requisite integrity, experience, expertise and proficiency required under all applicable laws and the policies of the Company.
Policy on Nomination and Remuneration of DirectorsThis policy on the nomination and remuneration of Directors, Key Managerial Personnel and Senior Management Personnel have been formulated by the Nomination and Remuneration Committee and approved by the Board of Directors of the Company. The Policy is guided by the principles and objectives as enumerated under the provisions of the Companies Act, 2013 and the Listing Regulations, to ensure reasonableness and sufficiency of remuneration to attract, retain and motivate competent resources, a clear relationship of remuneration to performance and a balance between rewarding short and long-term performance of the Company. A Copy of the policy is uploaded on the Company’s website at https://www.happiestminds.com/investors/policy-documents/.
We confirm that the remuneration paid to Directors, Key Managerial Personnel and Senior Management Personnel is in accordance with the said policy of the Company. The statement of Disclosure of Remuneration under Section 197 of Companies Act, 2013 and Rule 5(1) of Companies (Appointment and Remuneration of Managerial Personnel) Rules, 2014 is attached to this report as Annexure II.
None of the Executive Directors of the Company were in receipt of any commission from the Company or any remuneration from the subsidiaries of the Company.
Familiarization Program for Independent DirectorsThe Company has in place a familiarization program for its Independent Directors. The objective of the program is to familiarize Independent Directors on our Board with the business of the Company, industry in which the Company operates, business model, challenges etc. through various programs which includes interaction with subject matter experts within the Company, meetings with our business leads and functional heads on a regular basis.
The familiarization program and other disclosures as specified under the Listing Regulations is available on the Company’s website at https://www.happiestminds.com/investors/disclosures/HappiestMinds-Details-of-Familiarization-Programme.pdf
Board EvaluationDuring the year under review, the Nomination, Remuneration and Governance Committee of the Company has reviewed and approved the evaluation criteria for the Board Evaluation. The criteria for the evaluation were broadly based on the SEBI’s Guidance Note on Board Evaluation. The evaluation criteria covered the Board as a whole, the Committees of the Board, each individual Director and the Chairman of the Company and were focused on the Board’s composition and accountability, their role in setting strategies, the effectiveness of the Board committees and the performance of each individual Director and Chairman.

120
Annual Report 2021-22
The questionnaire was circulated to all the Board members of the Company in a transparent and confidential manner and based on their responses, a detailed report was presented to the Board on an anonymous basis to give an understanding of its working dynamics, highlight areas of strength/improvement and proposed the suggested action plan to improve the Board’s overall performance and effectiveness.
Some of the suggested action plans that are being implemented during FY 2022-23 are as below:
1. To expand the Board/Committees with the induction of one Independent Director and one Executive Director.
2. To send a report to Board on material aspects as and when they occur.
3. To review Sustainability risk (ESG) and Strategic risk (Acquisitions).
4. To organize professional development programs for the Directors.
Committees of the BoardThe details of the powers, functions, composition and meetings of the Committees of the Board held during the year are given in the Report on Corporate Governance section forming part of the Annual Report.
Board MeetingsThe Board of Directors of the Company met five times during the year under review. The details of these Board Meetings are provided in the Report on Corporate Governance section forming part of the Annual Report. The necessary quorum was present for all the meetings. The maximum interval between any two meetings did not exceed 120 days.
Corporate GovernanceYour Company has taken adequate steps to adhere to all the stipulations laid down in the Listing Regulations. A report on Corporate Governance is disclosed separately in the Annual Report.
A Certificate from M/s. V Sreedharan & Associates, a firm of Company Secretaries in practice, confirming the compliance with the conditions of Corporate Governance as stipulated under the said Regulations is attached as Annexure VII to this Report.
Employees Stock Option Plan (ESOP)During the year under review, no fresh grants were made under the Happiest Minds Employee Stock Option Scheme 2020, however, your Company facilitated the transfer of 8,25,563 Equity Shares of ` 2/- each by the Happiest Minds Technologies Share Ownership Plans Trust to the employees who exercised their options under the old schemes.
The additional details of stock options are provided under Notes to Financial Statements (Standalone).
Pursuant to the requirements of the SEBI (Share Based Employee Benefits) Regulations, 2014, a certificate has been issued by the Secretarial Auditors of the Company confirming that the Plan has been implemented in accordance with the said Regulations and in accordance with the resolution passed by the Company in the General Meeting.
As required under the SEBI (Share Based Employee Benefits) Regulations, 2014, the applicable disclosures as on March 31, 2022 are uploaded on the website of the Company at https://www.happiestminds.com/investors/disclosures/
Code for Prevention of Insider TradingYour Company has adopted a Code of Conduct to regulate, monitor and report trading by designated persons and their immediate relatives as per the requirements under the Securities and Exchange Board of India (Prohibition of Insider Trading) Regulations, 2015. This Code of Conduct also includes the code for practices and procedures for fair disclosure of unpublished price sensitive information which has been made available at https://www.happiestminds.com/investors/policy-documents/
Vigil MechanismThe Vigil Mechanism as envisaged in the Companies Act, 2013, the Rules prescribed thereunder and the Listing Regulations is implemented through the Company’s Whistle Blower Policy to enable all its employees, consultants (part-time, full-time and temporary employees) of the Company and its subsidiary companies and its associate companies to report genuine concerns, to provide for adequate safeguards against victimization of persons who use such mechanism and make provision for direct access to the Chairman of the Audit Committee. Your Directors affirm that no employee/consultant has been denied access to the Audit Committee.

Corporate Overview1 Statutory Reports2 Financial Statements3
121
Annual Report 2021-22
The Whistle Blower Policy is available at https://www.happiestminds.com/investors/policy-documents/
During the year under review, your Company did not receive any complaints under the said policy.
Annual ReturnPursuant to Section 92(3) of the Companies Act, 2013 read with Rule 12 of the Companies (Management and Administration) Rules, 2014, copies of the Annual Returns of the Company for previous financial years prepared in accordance with Section 92(1) of the Act have been placed on the website and is available at https://www.happiestminds.com/investors/disclosures/.
Software Technology ParkThe entire Indian operations of the Company have been registered under the Software Technology Parks of India (STPI) Scheme.
Fixed DepositsYour Company has not accepted any fixed deposits during the year under review and as such, no amount of principal or interest was outstanding on the date of the Balance Sheet.
Significant & Material Orders passed by the Regulators or Courts or TribunalsDuring the year under review, your Directors confirm that there were no significant and material orders passed by the Regulators or Courts or Tribunals impacting the going concern status of your Company and its future operations.
Loans, Guarantees and InvestmentsPursuant to Section 186 of the Companies Act, 2013 and Schedule V of the Listing Regulations, disclosure on particulars relating to Loans, Advances, Guarantees and Investments are provided as part of the financial statements.
Related Party TransactionsThe policy on related party transactions is available at https://www.happiestminds.com/investors/policy-documents/
Particulars of the Contracts or Arrangements with related parties referred to in Section 188(1) in the format specified as Form AOC-2 forms part of this Report as Annexure III. Further details of related party transaction are provided in Notes to Financial Statements (both Standalone and Consolidated).
All the Related Party Transactions entered by your Company with the Related Parties are in the ordinary course of business and are carried out at arm’s length pricing.
Details of the transaction(s) of your Company with the entity(ies) belonging to the promoter/promoter group which hold(s) more than 10% shareholding in the Company as required under para A of Schedule V of the Listing Regulations are provided as part of the financial statements.
Auditors & Auditors' ReportThe current Statutory Auditors of the Company are M/s. Deloitte Haskins & Sells (ICAI registration number 008072S) who have been appointed at the 10th AGM of the Company held on 7th July 2021 to hold office for a term of 5 years i.e., till the conclusion of the 15th AGM.
The Auditors’ Report does not contain any qualification, reservation, or adverse remark on the financial statements for the financial year ended March 31, 2022. The Notes on financial statements referred to in the Auditors’ Report are self-explanatory and do not call for any further comments.
Pursuant to the provisions of Section 204 of the Companies Act, 2013 and the Companies (Appointment and Remuneration of Managerial Personnel) Rules 2014, the Company has appointed M/s. V Sreedharan & Associates, a firm of Company Secretaries in practice to undertake the Secretarial Audit of the Company. The Secretarial Audit Report issued by them for the financial year ended March 31, 2022 is attached as Annexure VIII to this Report. The Secretarial Audit Report does not contain any qualifications, reservations, or adverse remarks.
During the year under review, the Statutory Auditors and Secretarial Auditors have not reported any instances of frauds committed in the Company by its officers or employees, to the Audit Committee under Section 143(12) of the Companies Act, 2013, details of which needs to be mentioned in this Report.

122
Annual Report 2021-22
Sustainability and Corporate Social Responsibility (CSR)Company’s Sustainability, Environment, Social and Governance Reporting is provided separately as part of the Annual Report.
The annual report on CSR including a brief outline of the CSR Policy and the activities undertaken during the year under review is enclosed as Annexure IV to this Report. The CSR policy is available at https://www.happiestminds.com/investors/policy-documents/.
Risk ManagementYour Company under the supervision of the Executive Board has established a well-defined framework and procedures on organization wide risk and its management. The framework encompasses significant risk in areas of Information security, operations, delivery, and key support functions. Under the framework and procedures, detailed risk management guidelines have been prescribed and implemented covering Risk Identification, Analysis, Response, Tracking, and Management Discussion and Mitigation. Risk registers are maintained by respective functions and project teams. These are centrally reviewed and periodically monitored by compliance and governance teams identified as the owner for the area of risk. The Chief Information Security Officer (CISO), Chief Information Officer (CIO), and Engineering and Business Excellence (EBE) Team work together with the Executive Board in achieving the above.
The Executive Board with the assistance of the CISO, CIO and EBE follows a process covering the steps below in identifying areas of risk in the Company. The process covers:
• Identification of key risk areas
• Assessment of key risks for probability and impact
• Prioritization
• Formulation of response
• Identification of Owners
• Participation by Owners in outlining mitigation plans
• Reporting on adequacy and effectiveness
• Acceptance of residual risk
Your Company while designing its strategy in drawing up of its long term business plan, it makes provision to accommodate broader/ higher level of risk than it expects/envisages so that Company is prepared to sustain in the eventuality of unforeseen level of risk.
Significant risks areas which have been identified and are constantly monitored are:
1. Financial Risks: a. Foreign currency fluctuation
b. Customer credit
c. Profitability and sustenance of the business
d. Availability of credit and liquidity management
2. Business Risks: a. Concentration of revenues
b. New, emerging disruptive technologies and their impact on business, and delivery
c. Shrinking product development cycles
d. Customers insourcing
3. Operational Risks: a. Data privacy, social media
b. Talent availability and timely staffing of projects
c. Optimal resource utilization
d. Contractual commitments and project delivery challenges
e. Business continuity
f. COVID 19 Pandemic

Corporate Overview1 Statutory Reports2 Financial Statements3
123
Annual Report 2021-22
4. Legal and Regulatory: a. Compliance with local legislation in the geographies we operate in
b. Dynamic and ever changing immigration and travel laws
5. Projects Delivery related risk
a. Related to change meeting timelines, estimated effort
b. Quality of deliverables
6. Information Security Risks
a. Loss of Customer Artifacts, Digital Assets (Code, database etc.,) or IP
b. Privacy breach, sharing of sensitive data without requisite approvals
c. Phishing, Malware and Ransomware attacks
Oversight of the framework is provided by the Risk Management Committee of the Board of Directors A Risk Management Policy has also been adopted based on this framework, copy of the policy is available at https://www.happiestminds.com/investors/ policy-documents/.
People PracticesBuilding a culture of innovation, collaboration, and being mindful of our members’ needs are the key objectives of people practice. Induced by COVID-led disruptions, we saw the rapid adoption of digital technologies across industries leading to increased demand for tech talent. This led to a fiercely competitive global talent market, especially for experienced software engineers. Our work culture and people practices continued to be our key differentiators helping us attract and retain people in the highly challenging talent landscape. We continued to have an industry-leading Glassdoor rating of 4.4, a reflection of the perception of our members and alumni. In this competitive market, we added 950 members this financial year, leading to a headcount increase of 29% over last year. We continued to operate virtually for FY 2021-22, in order to protect our people from the different waves of coronavirus that emerged.
Open communication and a sense of belongingness were critical to creating a productive and conducive workplace. The People Practice team conducted multiple connect & team bonding programs, including the virtual town hall, leadership connects, benefits communication series, awareness programs and team building events.
Under the Care program, your Company launched many initiatives to support Happiest Minds and their families, including tele-doctor consultation, Mithra – for counselling support, COVID Leaves, leave donation program, ergonomics consultation, financial wellness, and multiple webinars on emotional, physical and mental wellbeing. To support the families of Happiest Minds who lost their lives in the past two years, your Company launched one of the unique benefits under the Compassionate & Caring Contribution Scheme, where the Company supported the grieving family in many ways, including support for the child's education, employment for the spouse, continuity of salary, an extension of medical insurance, etc.
Under the Agile program, your Company has diversified its hiring and has expanded its efforts into newer areas. We have undertaken our most extensive campus hiring plan, expanded hiring from newer locations, explored building campuses in new cities, increased women hiring, etc. Your Company has invested immensely in upskilling and cross-skilling initiatives. We are also building a comprehensive leadership succession development plan. People Practice has a representative present in each significant geography to support Happiest Minds. We conducted regular surveys and dipstick to take our members’ input and create a detailed action plan based on survey outcomes.
Further, during the year under review, your Company received multiple industry accolades, including Rank 21 – Best Companies to Work for in India, Rank 63 - Best Companies to work for in Asia, all of these by the Great Place to Work(R) Institute. Top 15 India’s Best Workplaces in Health and Wellness 2021 & Top 10 for supporting the team & their families during COVID-19. Furthermore, two women leaders received industry recognition, Priya Kanduri got the Women in Tech Award by Asia Pacific HRM Congress & Preeti Menon, was recognised as the Top 20 Female Cloud Leaders in The Sociable. In addition, your Company received a few more people and culture awards, which speak volumes about the people’s practices of your Company.
Your Company continually strives to provide people with competitive and innovative compensation packages. We have recently restructured our compensation stack to offer a higher fixed payout and upside potential on the Company and individual performance. In addition, we work with leading industry partners and consultants to benchmark our compensation and benefits programs with the best organizations in the industry. Our compensation packages include a combination of fixed salary, variable pay, stock options, health insurance, and unique benefits like leave donation, flexi work, etc.

124
Annual Report 2021-22
Quality Management System (QMS)1. Quality Policy “Happiest Minds will consistently strive for customer happiness. We are committed to deliver excellence in our services by
continually improving processes and systems, aiding in creating value to all our stake holders”.
2. QMS Framework Our strategy for continual quality improvement journey is derived on our Vision, business needs, technology changes,
customer feedback, suggestions, and process performance. Our quality processes are derived from industry best practices and are continually improved based on our experience, and our processes have been assessed by external accredited agencies. Your Company has received accreditation on international quality and process models, including ISO 9001:2015. In December 2021, your Company was recertified for ISO 9001:2015 with the external auditors applauding our focus towards digitization of internal processes. In addition, your Company is certified to Information Security standards like ISO 27001:2013, which guides our policies and procedures for protecting information security, our own software enablers and as well customers’ software enablers.
3. Engineering Practices Engineering practices form the crux of successful delivery. Our engineering practices help your Company deliver high-quality
software to its customers as per the planned timelines and consistently earn their trust and enable customer happiness. We measure the satisfaction levels of our customers every year and have been consistent/improving on the scores, year on year since inception. Our digital driven engineering practices have been well accepted by our customers with some of them adopting these practices in their internal processes. We have adopted Agile practices to support our Mission of “Born Digital . Born Agile”
4. Systems Driven Our projects are managed using systems to track project management practices and engineering practices for projects
managed within your Company. This is line with our digital focus towards process and practices. Our Integrated Project Management system helps the delivery to have an end-to-end view of the project at all levels of the management to provide enhanced delivery value to our customers. There are regular updates done to the system. Our projects that are adopting Agile methodologies are using JIRA Plan, Track and manage the projects to decrease the turnaround of the shippable products to our customers. The usage of JIRA in extensive to Plan epics, Plan sprints, manage sprints and to manage releases. We also have built Business Intelligence (BI) reports and Metrics Dashboard’s which help’s in taking proactive actions.
5. Code Quality Apart from regular code reviews process our projects extensively use Code Quality tools to check the code on various
parameters. We have defined Code Quality Index based on the Code Quality metrics and this help us to deliver high quality outputs to our customers.
6. Rapid Iteration and Experimentation Fail fast and learn quickly - Agile teams develop solutions through fast cycles of field testing and learning from mistakes.
Products and solutions are developed iteratively using minimum viable products i.e., minimum set of features needed to test and learn. This also helps our customers to get early feel on the products/solutions that they would be using and also help reducing the time for production release.
7. DevOps and automation Your Company has deployed DevOps practices which include building pipelines for continuous integration, code analysis,
testing and deployment of software solutions developed. Some of the practices like continuous deployment, pushing a new release into production based on passing of all the tests, checking code and software quality in the build pipeline and leverage the build pipeline to get feedback on the health of their software, etc help your Company to decrease the turnaround to the customers and build a better quality products.
8. Information Transparency The accessibility, accuracy, and availability of quality, unfiltered data which is critical for organizational agility is deployed
across the organization. Various data pipelines and reports are built to enable team members to easily share their ideas and results of their work with those who might benefit from the information.
9. Continuous Learning At your Company, continuous learning happens on both the individual and organizational level. At the organizational level,
structured processes and tools have been enabled to share the tribal knowledge. This helps the information learned through experimentation and experience is available across the organization.

Corporate Overview1 Statutory Reports2 Financial Statements3
125
Annual Report 2021-22
10. Delivery Methodologies Our suite of delivery methodologies in the below mentioned areas demonstrates our thought leadership and execution
capabilities viz., Agile methodologies, Service delivery lifecycle, Application Support and Maintenance life cycle, Embedded system software, Waterfall model for Software development and Hardware development life cycle. These methodologies along with our best practices help in providing value added services to our customers.
11. Involve to Evolve We drive the continual improvement programs by actively engaging the team members across the organization. Focused groups
will be formed to make the resources part of the continual improvement journey to bring in Agile community of practice, technical experts from Practice, estimation work group and internal audit community. The continuous measurement of benefits accrued from your Company’s process improvement initiatives has brought to light a significant reduction in rework, increase in productivity, adherence to schedules and budget, and significant added value, culminating in customer delight.
12. Rewards and Recognitions The team members/teams are rewarded for their exemplary work towards process improvements and customer delight with
awards such as Code excellence award, Service Delivery excellence award, etc.
13. Customer Connect Your Company has customer experience framework to understand the behaviors, needs and expectations of individual
customers which helps in developing a roadmap for continuous engagement and enriching the customer relationship. As part of this framework, we conduct Customer happiness Survey, Customer Pulse, bringing Value adds, etc.
Whenever there is a customer escalation related delivery or staffing, the concerned manager will raise the escalation in project management system. An action item for the same is created and assigned to the respective team member to track, monitor the status of the escalation. The closure of the escalation of the communicated back to the customer.
Internal Control SystemYour Company has deployed adequate Internal Control Systems in place to ensure a smooth functioning of its business. The processes and the systems are reviewed constantly and changed to address the changing regulatory and business environment. The Control Systems provide a reasonable assurance of recording the transactions of its operations in all material aspects and of providing protection against misuse or loss of Company’s assets. The ERP system which the Company had implemented has helped in further strengthening the internal control systems that are in place.
The existing internal control systems and their adequacy are frequently reviewed and improved upon to meet the changing business environment. The Statutory Auditors as well as the internal auditors periodically review the internal control systems, policies and procedures for their adequacy, effectiveness and continuous operation for addressing risk management and mitigation strategies.
Conservation of Energy, Research and Development, Foreign Exchange Earnings and OutgoYour Company has made the necessary disclosures in Annexure V to this Report in terms of Section 134(3) of the Companies Act, 2013 (earlier Section 217(1)(e) of the Companies Act, 1956), read with the Companies (Disclosure of Particulars in the Report of the Board of Directors) Rules, 1988.
Employees’ RemunerationAs per the proviso to Rule 5(2) of the Companies (Appointment and Remuneration of Managerial Personnel) Rules, 2014, the statement containing the names and other details of employees drawing more than `10.2 Mn per financial year or `0.85 Mn per month, as the case may be, are set out in the Annexure VI to the Board’s Report. Further, as per the proviso to Rule 5(3) of the said Rules, the particulars of employees posted and working outside India not being directors or their relatives, need not be included in the statement but, such particulars shall be furnished to the Registrar of Companies. Accordingly, the statement included in this Report does not contain the particulars of employees who are posted and working outside India. If any Member is interested in obtaining a copy thereof, such Member may write to the Company in this regard.
Directors’ Responsibility StatementPursuant to the requirement under Section 134 (5) of the Companies Act, 2013, with respect to Directors Responsibility Statement, it is hereby confirmed that:
(i) In the preparation of the Annual Accounts, the applicable accounting standards have been followed along with proper explanation relating to material departures, if any;

126
Annual Report 2021-22
(ii) Accounting policies have been selected and applied them consistently and made judgments and estimates that are reasonable and prudent to give a true and fair view of the state of affairs of the Company at the end of the financial year 2021-22 and of the profit or loss of the Company for that financial year;
(iii) Proper and sufficient care have been taken for the maintenance of adequate accounting records in accordance with the provisions of the Companies Act, 2013 for safeguarding the assets of the Company and for preventing and detecting fraud and other irregularities;
(iv) The Annual Accounts have been prepared on a going concern basis.
(v) Proper systems have been devised to ensure compliance with the provisions of all applicable laws and that such systems were adequate and operating efficiently.
Your Directors have laid down internal financial controls to be followed by the Company and that such internal financial controls are adequate and were operating effectively.
Secretarial StandardsDuring the year under review, your Company has duly complied with all applicable Secretarial standards issued by the Institute of Company Secretaries of India.
Cost AuditThe provisions of Companies (Cost Records and Audit) Rules, 2014 are not applicable to your Company.
Disclosure under the Sexual Harassment of Women at Workplace (Prevention, Prohibition and Redressal) Act, 2013Your Company is committed to promote a safe and professional work environment, that fosters teamwork, diversity and trust across. Your Company has a gender neutral Anti-Sexual Harassment Policy at workplace which is also in line with the requirements of the Sexual Harassment of Women at Workplace (Prevention, Prohibition and Redressal) Act, 2013 and the applicable rules. Internal Committee has been set up to redress complaints received regarding sexual harassment. We have also appointed a lawyer as an external Internal Committee member, who specializes in Prevention of Sexual Harassment (“POSH”) and Protection of Children against Sexual Offences Acts.
All employees regardless of position or contractual status, i.e., permanent, short-term contract, visitors and casual employees are covered under this Policy. The POSH awareness program is mandated to all Happiest Minds and every member going through the training will be provided with completion certificate. During the year under review, most of our employees were working remotely, communications and awareness mailers were sent on the applicability of the POSH during remote working times along with do’s and don’ts under POSH.
During the year under review, there were no complaint with allegation of sexual harassment filed with Internal Committee.
Events Subsequent to the date of Financial StatementsAs on the date of this Report, your Directors are not aware of any circumstances not otherwise dealt with in this Report or in the financial statements of your Company, which would render any amount stated in the Accounts of the Company misleading.
In the opinion of the Directors, no item, transaction or event of a material and unusual nature has arisen in the interval between the end of the financial year and the date of this report, which would affect substantially the results, or the operations of your Company for the financial year in respect of which this report is made.
AcknowledgementsYour Directors have pleasure in recording their appreciation for all the guidance and co-operation received from all its customers, Members, investors, vendors, partners, bankers, government authorities and other stakeholders for their consistent support to your Company in its operations. Your Directors take this opportunity to place on record their sincere appreciation of the dedication, contribution and commitment of all Happiest Minds in Company’s growth.
For and on Behalf of Board
Venkatraman N Ashok SootaManaging Director & CFO Executive ChairmanDIN: 01856347 DIN: 00145962BengaluruDated: May 30, 2022

Corporate Overview1 Statutory Reports2 Financial Statements3
127
Annual Report 2021-22
Annexure I to Board’s Report
Form AOC-1(Pursuant to Section 129(3) of the Companies Act, 2013 read with Rule 5 of Companies (Accounts) Rules, 2014) Statement
containing salient features of the financial statement of subsidiaries or associate companies or joint ventures
Part A Subsidiaries(Information in respect of each subsidiary to be presented with amounts in `)
1 Name of the subsidiary Happiest Minds Inc
2 The date since when subsidiary was acquired January 1, 2021
3 Reporting period for the subsidiary concerned, if different from the holding company’s reporting period
April 1, 2021 till March 31, 2022
4 Reporting currency and Exchange rate as on the last date of the relevant Financial year in the case of foreign subsidiaries
Reporting Currency – USD Exchange Rate - 75.7875
Financial Details as on March 31, 2022 Amount in ` Lacs
5 Share capital 76
6 Reserves and surplus (3,328)
7 Total assets 4,827
8 Total Liabilities 8,080
9 Investments 762
10 Turnover 9,645
11 Profit before taxation 385
12 Provision for taxation 244
13 Profit after taxation 141
14 Proposed Dividend -
15 Extent of shareholding (in percentage) 100%
Notes:
1. Names of subsidiaries which are yet to commence operations- Nil
2. Names of subsidiaries which have been liquidated or sold during the year- Nil
3. Part B of the Annexure is not applicable as there are no Associate Companies / Joint ventures of the Company as on March 31, 2022
For and on behalf of Board
Venkatraman NManaging Director & CFODIN: 01856347
Ashok SootaExecutive ChairmanDIN: 00145962
Praveen Kumar DarshankarCompany Secretary & Compliance OfficerMembership No. F6706
BengaluruDated: May 30, 2022

128
Annual Report 2021-22
Annexure II to Board’s Report
Statement of Disclosure of Remuneration under Section 197 of Companies Act, 2013 and Rule 5(1) of Companies (Appointment and Remuneration of Managerial Personnel) Rules, 2014
1. The ratio of the remuneration of each Director and Key Managerial Personnel to the median remuneration of the employees of the Company for the financial year ended March 31, 2022 and percentage increase in remuneration compared to last financial year:
Director/ KMP Designation % increase in remuneration compared to last FY
Ratio to median remuneration of employees
Mr. Ashok Soota Executive Chairman 10%* 10.03
Mr. Venkatraman Narayanan Managing Director & CFO 9%* 10.44
Mr. Joseph Vinod Anantharaju Executive Vice Chairman 5%* 27.96
Mr. Rajendra Kumar Srivastava Independent Director NA 2.56
Mrs. Shubha Rao Mayya Independent Director NA 2.13
Mrs. Anita Ramachandran Independent Director NA 2.13
Mr. Praveen Kumar Darshankar Company Secretary & Compliance Officer
25% 4.26
*The CTC increment was approved in the Board Meeting held on July 28, 2021
Note:
(a) For the purpose of calculation of median, salary at global level with conversion rate as of March 31, 2022 has been considered. The median salary at global level of employment is ̀ 11,73,300 and at India level of employment is ̀ 1,144,100.
2. Percentage increase in the median remuneration of employees in the financial year ended March 31, 2022:
There was an increase in the median by 6.5%. This has been arrived by comparing the median remuneration of the cost-to-the Company as on March 31, 2022 as compared to previous year as on March 31, 2021.
3. No. of permanent employees on the rolls of Company as on March 31, 2022 was 3744.
4. Average percentile increase already made in the salaries of employees other than the managerial personnel in the last financial year and its comparison with the percentile increase in the managerial remuneration and justification thereof and point out if there are any exceptional circumstances for increase in the managerial remuneration:
There was an increase of 21.2% in remuneration of employees other than managerial personnel against 12.3% increase in remuneration of managerial personnel. There has been no exceptional remuneration increase for managerial personnel.
5. Affirmation that the remuneration is as per the remuneration policy of the Company:
Your Company affirms that the remuneration of Directors and Key Managerial Personnel was as per the Remuneration Policy of the Company.
For and on Behalf of Board
Venkatraman N Ashok SootaManaging Director & CFO Executive ChairmanDIN: 01856347 DIN: 00145962
BengaluruDated: May 30, 2022

Corporate Overview1 Statutory Reports2 Financial Statements3
129
Annual Report 2021-22
Annexure III to Board’s Report
FORM NO. AOC.2Details of Related Party Transaction
(Pursuant to Section 134(3)(h) of the Companies Act, 2013 and Rule 8(2) of the Companies (Accounts) Rules, 2014)
Form for disclosure of particulars of contracts/arrangements entered into by the company with related parties referred to in sub-section (1) of section 188 of the Companies Act, 2013 including certain arm’s length transactions under third proviso thereto
1. Details of contracts or arrangements or transactions not at arm’s length basis:
(a) Name(s) of the related party and nature of relationship Not Applicable.
(b) Nature of contracts/arrangements/transactions There were no transactions or arrangements which were not at arm’s length and which were not in the ordinary course of business during financial year 2021-22.
(c) Duration of the contracts/arrangements/transactions
(d) Salient terms of the contracts or arrangements or transactions including the value, if any
(e) Justification for entering into such contracts or arrangements or transactions
(f) Date of approval by the Board
(g) Amount paid as advances, if any:
(h) Date on which the special resolution was passed in general meeting as required under first proviso to section 188
2. Details of material contracts or arrangement or transactions at arm’s length basis:
(a) Name(s) of the related party and nature of relationship Not Applicable.
(b) Nature of contracts/arrangements/transactions There were no material contracts or arrangements with related parties during financial year 2021-22.
(c) Duration of the contracts/arrangements/transactions
(d) Salient terms of the contracts or arrangements or transactions including the value, if any
(f) Date of approval by the Board
(g) Amount paid as advances, if any:
For and on Behalf of Board
Venkatraman N Ashok SootaManaging Director & CFO Executive ChairmanDIN: 01856347 DIN: 00145962
BengaluruDated: May 30, 2022

130
Annual Report 2021-22
Annexure IV to Board’s Report
Annual Report on CSR[Pursuant to Section 134(3)(o) of the Act and Rule 8 of the Companies (Corporate Social Responsibility) Rules, 2014]
1. Brief outline on CSR Policy of the Company: The CSR policy has been instituted based on the Corporate Social Responsibility (CSR) philosophy of your Company and
is committed to undertake CSR activities in accordance with the CSR Regulations. Your Company conducts its business in a sustainable and socially responsible manner. This principle has been an integral part of the Company’s corporate values and believes that corporate growth and development should be inclusive, and every Company must be responsible and shall contribute towards betterment of the society. Your Company is committed to the safety and health of the employees, protecting the environment and the quality of life in all regions in which your Company operates. Further, with respect to the Company’s CSR philosophy, the Board has constituted the “CSR Committee” as its core CSR team, as a means of fulfilling this commitment.
The CSR activities of the Company are as per the provisions of Schedule VII of the Companies Act, 2013 and CSR Policy gives an overview of the projects and programmes which are proposed to be undertaken by the Company in the coming years.
2. The Composition of the CSR Committee:
Sl. No.
Name of the Director Nature of Directorship Designation Number of meetings of CSR Committee held during the year
Number of meetings of CSR
Committee attended during the year
1 Joseph Vinod Anantharaju Executive Director Chairperson 2 2
2 Ashok Soota Executive Director Member 2 2
3 Shubha Rao Mayya Independent Director Member 2 2
3. Web-link where Composition of CSR committee, CSR Policy and CSR projects approved by the board are disclosed on the website of the Company:
a) CSR Committee: https://www.happiestminds.com/investors/disclosures/Board-and-Board-Committees.pdf
b) CSR Policy: https://www.happiestminds.com/investors/policy-documents/Corporate%20Social%20Responsibility%20Policy.pdf
c) CSR projects approved by the Board: https://www.happiestminds.com/investors/disclosures/CSR-projects-approved-by-the-Board-for-FY2021-22.pdf
4. Details of Impact assessment of CSR projects carried out in pursuance of sub-rule (3) of rule 8 of the Companies (Corporate Social responsibility Policy) Rules, 2014, if applicable (attach the report):
Not Applicable
5. Details of the amount available for set off in pursuance of sub-rule (3) of rule 7 of the Companies (Corporate Social responsibility Policy) Rules, 2014 and amount required for set off for the financial year, if any
Sl. No.
Financial Year Amount available for set-off from preceding financial years (in lacs)
Amount required to be set-off for the financial year, if any (in lacs)
1 2020-21 0 0
2 2021-22 11 11

Corporate Overview1 Statutory Reports2 Financial Statements3
131
Annual Report 2021-22
6. Average net profit of the Company for last three financial year as per section 135(5):
Particulars Amount in lacs
FY 2020-21 16,321
FY 2019-20 9,415
FY 2018-19 5,051
Average Net Profit of the Company for last three financial year 10,262
7. Prescribed CSR Expenditure (two per cent of the amount as in item 3 above):
Particulars Amount in lacs
Prescribed CSR Expenditure (2% Average net profit of the Company for last three financial year as per section 135(5))
205
Surplus arising out of the CSR projects or programmes or activities of the previous financial years 0
Amount required to be set off for the financial year, if any 11
Total CSR obligation for the financial year (7a+7b-7c) 194
8. Details of CSR spent during the financial year:(a) CSR amount spent or unspent for the financial year:
Total Amount Spent
Amount Unspent (in `Lacs)
Total Amount transferred to Unspent CSR Account as per section 135(6).
Amount transferred to any fund specified under Schedule VII as per second proviso to section 135(5).
Amount Date of Transfer Name of the Fund Amount Date of Transfer
215 NIL NIL NIL NIL NIL
(b) Details of CSR amount spent against ongoing projects for the financial year: Nil
(c) Details of CSR amount spent against other than ongoing projects for the financial year:
1 2 3 4 5 6 7 8Sl.No.
Name of the Project
Item from the list of
activities in schedule VII to the
Act.
Local area (Yes/ No).
Location of the
project.
Amount spent for the project
(in ` Lacs)
Mode of implementation
Direct (Yes/No).
Mode of implementation
Through implementing
agencyState District Name CSR
Registration Number
1 The Akshaya Patra Foundation
Education Yes Karnataka Bengaluru 110 Yes
2 Lions Club of Bangalore West
Trust
Healthcare Yes Karnataka Bengaluru 5 Yes
3 Sri Jayadeva Institute of
Cardiovascular Sciences and
Research
Healthcare Yes Karnataka Bengaluru 100 Yes
(d) Amount spent in Administrative Overheads: Nil
(e) Amount spent on Impact Assessment, if applicable : Not Applicable
(f) Total amount spent for the Financial Year (8b+8c+8d+8e): `215 lacs

132
Annual Report 2021-22
(g) Excess amount for set off, if any:
Sl. No.
Particulars Amount (in ` Lacs)
i) Two percent of average net profit of the Company as per section 135(5) 205
ii) Total amount spent for the Financial Year (including 11 lacs excess spent for last financial year) 226
iii) Excess amount spent for the financial year [(ii)-(i)] 21
iv)Surplus arising out of the CSR projects or programmes or activities of the previous financial years, if any 0
v) Amount available for set off in succeeding financial years [(iii)-(iv)] 21
9. (a) Details of Unspent CSR amount for the preceding three financial years: Nil
(b) Details of CSR amount spent in the financial year for ongoing projects of the preceding financial year: Nil
10. In case of creation or acquisition of capital asset, furnish the details relating to the asset so created or acquired through CSR spent in the financial year: Nil
11. Specify the reason(s), if the Company has failed to spend two per cent of the average net profit as per section 135(5):
The Company has spent more than what is prescribed under the CSR regulation. Hence not applicable.
For and on Behalf of Board
Venkatraman N Ashok SootaManaging Director & CFO Executive ChairmanDIN: 01856347 DIN: 00145962
BengaluruDated: May 30, 2022

Corporate Overview1 Statutory Reports2 Financial Statements3
133
Annual Report 2021-22
Annexure V to Board’s Report
A. Conservation of Energy Your Company is in a knowledge intensive industry, and does not operate industrial machinery, production facilities, or other
such energy intensive operations. However, as a responsible corporate citizen, it continues to pursue and adopt appropriate energy conservation measures.
During the year under review, due to pandemic, since most of your employees/consultants were working from home, there was minimal or nil usage of energy at the office premises.
To affirm with commitment to Company’s ESG Vision and to proactively reduce the carbon footprint, Company has invested in renewable energy project, specifically rooftop based solar energy for office spaces. Furthermore, your Company is in the process to set up electric vehicle charging infrastructure to promote the use of alternate use of fuel and energy.
B. Technology Absorption Your Company continues to track trends and latest developments in various technology areas, including those related to
mobility, big data analytics, security, cloud computing, IoT, unified communications. Your Company has taken major initiatives and upped its leadership in Low-Code Application Platforms and Analytics Space. Your company developed solutions in Digital Process Automation leveraging intelligent process automation tools and technologies. It has also deepened in partnership with Microsoft for the Azure Implementations, Power Platform, Business Applications and with Amazon AWS as consulting partner. Your Company has also entered in Health & Life Sciences, Manufacturing/Automotive space, which helps increase the knowledge base within your Company, and enhances the ability of your Company to undertake larger and more complex projects which are of higher value. Your Company started to invest in emerging technologies like Metaverse, Web3.0, Low Code Platforms, OT Security, Marketing Analytics and strengthening capabilities in Deep Neural Networks (Computer Vision), Blockchain, Drones, Edge computing etc. Your Company also undertakes continuous quality improvement programs, training programs, deployment and use of tools and technologies for monitoring projects, etc., to help increase efficiencies and productivity.
Research and Development (i) Specific Areas of Research and Development
During the year under review, your Company continued building technology in IoT, Mobility, Big Data & Analytics, Security and Cloud Technologies that will have a major impact on the global technology landscape with the objective of increasing the sales volumes and improving delivery capability. Your Company continued developing capabilities and creating solutions in newer technologies like Metaverse, Web3.0, Low Code Platform, Digital Process Automation, AI, Blockchain, Robotics & Drones leveraging Computer Vision, Edge computing etc. Your Company has created additional solutions like Cognitive QA to help customers with efficient testing. Your Company has developed IP & Solutions and new services through R&D investment and has built and added new capabilities in the existing solutions - Compliance Vigil, Ellipse – Infrastructure Management, Digital Content Monetization, Pro-RiTE Test Automation solution, UniVu-University Insights Solution and Thing Center – Consumer IoT platform, Connected Product solution, Power Platform CoE, Conversational chatbot, accelerators around PIMCore etc.
(ii) Benefits derived as a result of the above R&D
Your Company has gained considerable mind share in the industry by venturing into IP led state of the art solutions as mentioned above. These concerted efforts also helped your Company in acquiring new customers in the focus geographies and increased the share of IP-led revenues for the Company.
(iii) Future Plan of action
Your Company is continuing to leverage its efforts on digital technologies including increased efforts on IoT, Data Engineering and Analytics, Digital process automation, Security and Customer Experience. Your Company continues to develop solutions in new disruptive technologies of Metaverse, Web3.0, Marketing Analytics, OT Security and reusable components on Low Code Platform.
(iv) Expenditure on R&D
R&D is carried on by the Company as a part of the ongoing software development activity and expenditure thereof is considered as part of operating expenditure. Total expenses on R&D during FY 2021-22 was `1,383 Lacs as against ` 1,450.20 Lacs during FY 2020-21.

134
Annual Report 2021-22
C. Foreign Exchange Earnings and Outgo: i. Activities relating to exports, initiatives taken to increase exports, development of new export market for
services and export plans During the year under review, your Company has taken various initiatives to expand its presence into new geographies
by engaging consultants and business partners and been successful in building visibility about our services and offering to key clients. Your Company is also continuing to invest in online media and social networking to build its brand visibility.
ii. Foreign exchange used and earned
March 31, 2022 March 31, 2021
Foreign exchange earnings 86,666 66,758
Foreign exchange outgo 21,485 16,627
For and on Behalf of Board
Venkatraman N Ashok SootaManaging Director & CFO Executive ChairmanDIN: 01856347 DIN: 00145962
BengaluruDated: May 30, 2022

Corporate Overview1 Statutory Reports2 Financial Statements3
135
Annual Report 2021-22
Annexure VI to Board’s Report
Particulars of employees pursuant to Section 134 of the Companies Act, 2013 read with Rule 5(2) of the Companies (Appointment and Remuneration of Managerial Personnel), 2014 and forming part of the Board’s Report for the financial year ended March 31, 2022.
Name Designation in the Company
Qualification Remuneration for Fiscal 2022 (in `)
Percentage of equity shares on fully diluted basis
Experience (Years)
Age Date of Joining
Last Employment
Ashok Soota Executive Chairman & Director
Electrical Engineer & Master in Business Management
11,475,753 53.12%(includingshares heldthru LLP)
55 79 April 1, 2011 (re-appointed from August 1, 2019)
Mindtree Limited
Aurobinda Nanda
President – PES
Post Graduate in Computer Applications
11,379,188 0.58% 29 53 Aug 1, 2011 Mindtree Limited
Venkatraman Narayanan
Managing Director & CFO
Chartered Accountant & Law graduate
12,515,933 0.44% 27 51 April 23,
2015Sonata Software Limited
Note:
1. All the employees included in the table above are permanent employees of the Company and their appointments are non-contractual.
2. None of the above employees are relative of any Directors.
For and on Behalf of Board
Venkatraman N Ashok SootaManaging Director & CFO Executive ChairmanDIN: 01856347 DIN: 00145962
BengaluruDated: May 30, 2022
136
Annual Report 2021-22
Annexure VII to Board’s Report
CORPORATE GOVERNANCE COMPLIANCE CERTIFICATE
Corporate Identity No : L72900KA2011PLC057931
Nominal Capital : `58,90,00,000/-
To
The Members of Happiest Minds Technologies Limited,
We have examined all the relevant records of Happiest Minds Technologies Limited for the purpose of certifying compliance of the conditions of the Corporate Governance under the SEBI (Listing Obligations and Disclosure Requirements) Regulations, 2015 for the financial year ended March 31, 2022. We have obtained all the information and explanations which to the best of our knowledge and belief were necessary for the purposes of certification.
The compliance of conditions of corporate governance is the responsibility of the Management. Our examination was limited to the procedure and implementation process adopted by the Company for ensuring the compliance of the conditions of the corporate governance.
This certificate neither an assurance as to the future viability of the Company nor of the efficacy or effectiveness with which the management has conducted the affairs of the Company.
In our opinion and to the best of our information and according to the explanations and information furnished to us, we certify that the Company has complied with all the mandatory conditions of Corporate Governance as stipulated in the said Regulations. As regards Discretionary Requirements specified in Part E of Schedule II of the SEBI (Listing Obligations and Disclosure Requirements) Regulations, 2015 the Company has complied with items C and E.
For V. Sreedharan & AssociatesCompany Secretaries
Devika Sathyanarayana PartnerPlace: Bengaluru F.C.S. 11323; C.P.No. 17024Date: May 05, 2022 UDIN:F011323D000271121

Corporate Overview1 Statutory Reports2 Financial Statements3
137
Annual Report 2021-22
Annexure VIII to Board’s Report
Form No. MR-3
SECRETARIAL AUDIT REPORT[Pursuant to Sub Section (1) of Section 204 of the Companies Act, 2013 and Rule 9 of the Companies (Appointment and
Remuneration of Managerial Personnel) Rules, 2014]
For the Financial Year Ended March 31, 2022
To,The Members,Happiest Minds Technologies Limited,# 53/1-4, Hosur Main Road, Madivala,(Next to Madivala Police Station),Bengaluru – 560068
We have conducted the secretarial audit of the compliance of applicable statutory provisions and the adherence to good corporate practices by Happiest Minds Technologies Limited (the Company). Secretarial Audit was conducted in a manner that provided us a reasonable basis for evaluating the corporate conducts/statutory compliances and expressing our opinion thereon.
Based on our verification of the Company’s books, papers, minute books, forms and returns filed and other records maintained by the Company and also the information provided by the Company, its officers, agents and authorized representatives during the conduct of secretarial audit, we hereby report that in our opinion, the Company has, during the audit period covering the financial year ended on March 31, 2022 (the audit period) complied with the statutory provisions listed hereunder and also that the Company has proper Board-processes and compliance-mechanism in place to the extent, in the manner and subject to the reporting made hereinafter:
We have examined the books, papers, minute books, forms and returns filed, and other records maintained by the Company for the financial year ended on March 31, 2022 according to the provisions of:
i. The Companies Act, 2013 (the Act) and the rules made thereunder;
ii. The Securities Contracts (Regulation) Act, 1956 (‘SCRA’) and the rules made thereunder;
iii. The Depositories Act, 1996 and the Regulations and Bye-laws framed thereunder;
iv. Foreign Exchange Management Act, 1999 and the rules and regulations made thereunder to the extent of Foreign Direct Investment and Overseas Direct Investment. There was no External Commercial Borrowing by the Company during the period under review;
v. The following Regulations and Guidelines prescribed under the Securities and Exchange Board of India Act, 1992 (‘SEBI Act’): -
a. The Securities and Exchange Board of India (Substantial Acquisition of Shares and Takeovers) Regulations, 2011;
b. The Securities and Exchange Board of India (Prohibition of Insider Trading) Regulations, 2015;
c. The Securities and Exchange Board of India (Issue of Capital and Disclosure Requirements) Regulations, 2018;
d. The Securities and Exchange Board of India (Share Based Employee Benefits and Sweat Equity) Regulations, 2021;
e. The Securities and Exchange Board of India (Issue and Listing of Non-Convertible Securities) Regulations, 2021 (Not Applicable to the Company during the Audit Period);
f. The Securities and Exchange Board of India (Registrars to an Issue and Share Transfer Agents) Regulations, 1993 regarding the Companies Act and dealing with client;
g. The Securities and Exchange Board of India (Delisting of Equity Shares) Regulations, 2009 (Not Applicable to the Company during the Audit Period);
h. The Securities and Exchange Board of India (Buy-back of Securities) Regulations, 2018; (Not Applicable to the Company during the Audit Period) and
i. Securities and Exchange Board of India (Listing Obligations and Disclosure Requirements) Regulations, 2015.

138
Annual Report 2021-22
vi. Other laws applicable specifically to the Company namely:
a. Information Technology Act, 2000 and the rules made thereunder
b. Software Technology Parks of India rules and regulations
We have also examined compliance with the applicable clauses of the following:
i. Secretarial Standards issued by The Institute of Company Secretaries of India on Meetings of the Board of Directors and General Meetings.
ii. Listing Agreements entered into by the Company with BSE Limited and National Stock Exchange of India Limited.
We have not examined compliance by the Company with applicable financial laws, like direct and indirect tax laws, since the same have been subject to review by statutory financial audit and other designated professionals.
During the period under review, the Company has complied with the provisions of the Act, Rules, Regulations, Guidelines, etc. mentioned above.
We further report that:
The Board of Directors of the Company is duly constituted with proper balance of Executive Directors, Non-Executive Directors and Independent Directors. There was no change in the composition of the Board of Directors during the period under review.
Adequate notice is given to all directors to schedule the Board Meetings, agenda and detailed notes on agenda were sent at least seven days in advance and a system exists for seeking and obtaining further information and clarifications on the agenda items before the meeting and for meaningful participation at the meeting.
As per the minutes of the meetings duly recorded and signed by the Chairman, the decisions of the Board were unanimous and no dissenting views have been recorded.
We further report that Based on the review of systems and processes adopted by the Company and the Statutory Compliance self-certification by the Managing Director of the Company which was taken on record by the Board of Directors, there are adequate systems and processes in the Company commensurate with the size and operations of the Company to monitor and ensure compliance with applicable laws, rules, regulations and guidelines as per the list of such laws as mentioned above in Point No. vi of para 3 of this report.
We further report that during the year under review, there were no events/actions having a major bearing on the Company’s affairs in pursuance of the above referred laws, rules, etc.,
For V. Sreedharan & AssociatesCompany Secretaries
Devika Sathyanarayana Partner F.C.S. 11323; C.P.No. 17024Place: Bengaluru UDIN:F011323D000270912Date: May 05, 2022 Peer Review Certificate No.: 589/2019
This report (i.e., Form No. MR-3) is to be read with our letter of even date which is annexed as Annexure and forms an integral part of this report.

Corporate Overview1 Statutory Reports2 Financial Statements3
139
Annual Report 2021-22
‘Annexure’
To,The Members,Happiest Minds Technologies Limited,# 53/1-4, Hosur Main Road, Madivala,(Next to Madivala Police Station),Bengaluru – 560068
Our report of even date is to be read along with this letter:
1. Maintenance of secretarial record is the responsibility of the management of the Company. Our responsibility is to express an opinion on these secretarial records based on our audit.
2. We have followed the audit practices and processes as were appropriate to obtain reasonable assurance about the correctness of the contents of the Secretarial records. The verification was done on test basis to ensure that correct facts are reflected in secretarial records. We believe that the processes and practices, we followed provide a reasonable basis for our opinion.
3. We have not verified the correctness and appropriateness of financial records and Books of Accounts of the Company.
4. Wherever required, we have obtained the Management representation about the compliance of laws, rules and regulations and happening of events etc.
5. The compliance of the provisions of Corporate and other applicable laws, rules, regulations, standards is the responsibility of management. Our examination was limited to the verification of procedures on test basis.
6. The Secretarial Audit report is neither an assurance as to the future viability of the Company nor of the efficacy or effectiveness with which the management has conducted the affairs of the Company.
7. Due to Covid-19 pandemic situation, we have conducted online verification and examination of records, as facilitated by the Company for the purpose of issuing Secretarial Audit Report (Form No. MR-3).
For V. Sreedharan & AssociatesCompany Secretaries
Devika Sathyanarayana Partner F.C.S. 11323; C.P.No. 17024Place: Bengaluru UDIN:F011323D000270912Date: May 05, 2022 Peer Review Certificate No.: 589/2019

140
Annual Report 2021-22
OverviewPositioned as a “Born Digital . Born Agile” Company, we deliver services around next-generation technologies which help our customers deliver a seamless digital experience to their own customers and clients. Our service offerings can be categorized as being in the areas of Analytics, Artificial Intelligence, Automation, Cloud, Digital Infrastructure Management, Internet of Things, Security, Software product engineering etc. Our capabilities in the above and adjacent areas help us cover the entire spectrum of technology services referred to as "Digital Services". During this past year, almost 97% of revenues that we generated were from delivering the above digital services and almost 93% of them were by adopting the agile methodology of software development. Our mission of having "Happiest Customers" has made sure that we inculcate practices that are robust, customer-centric and aims to fulfil their tactical and strategic business needs through futuristic and transformative digital solutions.
To retain our edge in our technology capabilities, we are committed to remaining at the forefront of emerging technology trends, including areas such as Blockchain, AR/VR, Drones & Robotics, etc.
As of March 31, 2022, we had 206 its active customers and our volume of repeat business (revenue during the year from existing customers) has steadily grown and contributed a significant portion of our revenue from contracts with customers over the years indicating a high degree of customer stickiness.
Over the years and currently during the ongoing outbreak of Novel Coronavirus, we have successfully implemented our business continuity plans including to achieve efficient work-from home practices to ensure seamless delivery of services to our customers.
Our mission is “Happiest People . Happiest Customers” and we seek to enable our customers’ happiness through our people’s happiness. Our culture rests on the foundation of our SMILES Values (Sharing, Mindful, Integrity, Learning, Excellence, Social Responsibility). We believe that the recognitions and awards received by our Company are on outcome of our mindful approach. In the Great Place to Work® 2021 survey, we were ranked among Asia’s Top 100 Best Workplaces, India’s Top 25 best Companies to work, Top 50 best Companies to work for Women, India’s Top 15 best Workplaces in Health and Wellness and India’s Top 25 best workplaces in IT & IT- BPM 2021. We have also received the Great Place to Work® Certification. As of March 31, 2022, we had a Glassdoor rating of 4.4 on a scale of ‘1- 5’, 2nd amongst Indian IT services companies.
During the year, the Company won many prestigious awards a few of them being:
• The “Golden Peacock Business Excellence Award” instituted by the Institute of Directors for best management practices for accelerating organizational improvement.
• The “Most Outstanding Company in India under Small / Mid-Caps” and “Most Outstanding IPO in India” by Asiamoney which was done through a poll from amongst the financial community to identify Asia’s Outstanding Companies of 2021
• Platinum and Gold awards for the Company’s Annual Report of 2021 instituted by the League of American Communication Professionals. The award aims to facilitate discussion on best-in-class practices observed in the communications domain and recognizing those who demonstrate exemplary communications capabilities. Happiest Minds' Annual reports won top scores across the evaluation parameters of overall narrative, visual design, creativity, message clarity and perceived relevance; scoring 99 out of 100. The company's win is among an elite group of the who's who of global Fortune companies.
Our business is divided into three Business Units (BUs):• Digital Business Services (DBS): Our DBS offerings are aimed at (i) driving digital modernization and transformation for our
customers through digital application development and application modernization for an improved customer experience, enhanced productivity and better business outcomes; (ii) implementation of solutions, development and implementation of solution, capabilities for improving data quality of the customer’s platform, assistance in designing and testing of operations and management of platform and modernization of digital practices; and (iii) consulting and domain led offerings such as digital roadmap, mindful design thinking, and migration of on-premise applications to cloud.
• Product Engineering Services (PES): Our PES BU aims to help our customers capitalize on the transformative potential of ‘digital’ by building products and platforms that are smart, secure and connected. We provide our customers a blend of hardware and embedded software knowledge which combines with our software platform engineering skills to help create
Management Discussion and Analysis of Financial Condition and Results of Operations

Corporate Overview1 Statutory Reports2 Financial Statements3
141
Annual Report 2021-22
high quality, scalable and secure solutions. Our offerings extend across the development lifecycle from strategy to final roll out while ensuring quality. We get our clients started on this journey with our digital foundry that allows us to build rapid prototypes for our customers and provide a scalable Minimum Viable Product (MVP). We embrace a cloud and a mobile friendly approach along with an agile model that is supported by test automation to help our clients accelerate their time to market and build a competitive advantage.
• Infrastructure Management & Security Services (IMSS): Our IMSS offerings provide an end-to-end monitoring and management capability with secure ring fencing of our customers' IT applications and infrastructure. We provide continuous support and managed security services for mid-sized enterprises and technology companies. We specialize in automation of IT operations using the DevSecOps model. We also run Network & Security Operations centers to manage our client’s infrastructure and data centers. We make sure that our customers infrastructure is safe, secure, efficient, and productive. Our security offerings include cyber and infrastructure security, governance, risk & compliance, data privacy & security, Identity and Access Management, threat and venerability management.
Our business units are supported by the following Centers of Excellence (CoEs):• Internet of Things (IoT): Our IoT offering includes consulting led digital strategy creation, device/edge/platform engineering,
end-to-end system integration on industry standard IoT platforms, IoT security, and IoT enabled managed services, implementing IoT roadmap, deriving insights from connecting assets, connecting manufacturing, supply chain, products and services to deliver IoT led business transformation and new business models aimed at enhancing our customers’ operations and customer experience. In Fiscal 2022, revenues from IoT offerings were 8.6%.
• Analytics / Artificial Intelligence (AI): Our analytics/AI offering includes implementation of advanced analytics using artificial intelligence, machine learning and statistical models, engineering big data platforms to deal with large volume of data, creating actionable insights with data warehousing, modernization of data infrastructure and process automation through AI. In Fiscal 2022 revenues from analytics/AI were 12.1%.
• Digital Process Automation (DPA): Our DPA offering includes consulting led digital transformation through process automation of core business applications, products and infrastructure landscape of our customers, leveraging various intelligent process automation tools and technologies including Robotic Process Automation (RPA), intelligent Business Process Management (iBPMS) and cognitive automation using AI & machine learning based models. In Fiscals 2021 and Fiscals 2022 revenues from DPA were 25.2% and 25.4%, respectively.
In Fiscals 2021 and 2022, our total income was ̀ 79,765 lacs and ̀ 1,13,075 lacs, respectively, our EBITDA was ̀ 21,525 lacs and ` 29,477 lacs, respectively and our profit for the Fiscal 2021 and 2022 was ` 16,246 lacs and ` 18,120 lacs, respectively. This represents a CAGR for total income of 41.4% and a CAGR for EBITDA of 36.6% between Fiscal 2021 and Fiscal 2022.
Significant Factors Affecting our Results of OperationsThe following is a discussion of certain factors that had, and will continue to have, a significant effect on our financial condition and results of operations:
Expansion of Customer Base and new Sales to Existing CustomersCustomer relationships are the core of our business. We had an average count of active customers 173 and 206 as of March 31, 2021 and 2022, respectively. Our ability to grow our customer base and drive market adoption of our software is affected by the pace at which organizations digitally transform. We expect that our revenue growth will be primarily driven by the pace of adoption of our offerings. We believe the degree to which prospective customers recognize the need for our offerings to maximize their business process, would lead to a higher budget allocation by such prospective customers for engaging our services. This will drive our ability to acquire new customers and increase sales to existing customers, which in turn, will affect our future financial performance.
We believe that we have benefited from growth in the global software development services industry. Growth in the industry is driven by the needs of major corporations to maintain and upgrade the technology and services required to operate in a cost-efficient manner. Software companies are also increasingly outsourcing work to IT services providers in order to streamline and reduce the cost of the software development process. The Indian software development services market is growing rapidly due to its large pool of skilled IT professionals, robust infrastructure and strong government support and incentives.
We believe we have a substantial opportunity to grow our customer base. We have invested, and intend to continue to invest, in order to drive sales to new customers. We have made, and plan to continue to make, investments to enhance the expertise of our sales and marketing organization within our business verticals of focus namely Edutech, HiTech, BFSI, Industrial/Manufacturing, and Retail.

142
Annual Report 2021-22
We go deeper into our customers through our cross-selling and upselling of services. Our wide spectrum of service offerings, philosophy of account growth through a ‘land and expand strategy’ makes this possible. Our ability to increase sales to existing customers depend on a number of factors, including the size of our sales force. professional services teams, customers’ satisfaction with our services, economic conditions and our customers spend budgets. We believe that our ability to establish and strengthen customer relationships and expand the scope of our services remain an important factor growth and ability to generate profits.
Our Ability to Develop new Products and Enhance Existing Products in accordance with evolving customer needsThe requirements of our customers vary across a range of industries, geographies and service or technical requirements. To service and grow our relationships with our existing customers and to win new customers, we must be able to provide them with products that address their requirements, to anticipate and understand trends in their relevant markets and to continually address their requirements as those requirements change and evolve. In this regard, we believe that our strong culture of innovation, our workforce, our research and testing facilities have enabled us to expand the range of our offerings to customers and improve the delivery of our software platform and services.
If we can anticipate and respond to our customers’ requirements on a timely and cost-efficient manner, we could expect to receive repeat business from existing customers. Further, leveraging on our present portfolio of customers and gathering expertise in the verticals they operate in, we aim to acquire new customers. This ability to acquire, retain and deploy knowledge basis existing customer relationships is critical to our business growth and expansion. Any weakness in this process can adversely affect our business and consequently the financial statement.
Our continued growth in the United States marketThe US market has historically been our largest market. In Fiscals 2021 and 2022, our external customers located in the United States contributed 73.4% and 66.4% of our revenue from operations, respectively.
Though we have managed to reduce the dependence in the Fiscal 2022, the United States continues to be the geo which has shown the most robust demand for digital services and will continue to be the geography of focus for us. Our continued business growth and financial performance will depend on our ability to continue to grow our customer base in the United States. Concentration of our revenues from operations from this geography heightens our exposure to any adverse developments which amongst others may be economic, political, regulatory and/or other changes. Any such adverse development could have a material adverse effect on our business, financial condition and results of operations.
Pricing of and Margin on our Services and Revenue MixFor time-and-materials contracts, the hourly rates we charge for our IT professionals are a key factor impacting our gross margins and profitability. Hourly rates vary by complexity of the project and the mix of staffing deployed on the project. Margins on our services are impacted by the increase in our costs in providing those services, which is influenced by wage inflation and other factors. As a client relationship matures and deepens, we seek to maximize our revenues and profitability by expanding the scope of services offered to that client and winning higher margin assignments. The ability to price our offerings competitively while balancing the cost elements so as to maximize profit margins while delivering tangible value to our customers is critical to the continued success of the Company.
Continued Relationships with alliance partnersOver the years, we have developed strong relationships with several independent software companies which are ‘Alliances”. We intend to deepen these relationships by building deep capabilities on products and solutions of these partners. Our ability to continue offer services around such products is dependent on our continued relationships with such partners. We believe that our long-standing relationship with such companies has led to knowledge transfer thereby enabling us to improve and develop our in-house service capabilities around these products. Good relationships with our alliance partners are key as they not only refer customers to us, they also help us build capabilities and stay abreast of advancements made by them on their products. Thus any disruption in these business and alliance relationships can have an adverse effect on our business.
Recruitment, Retention and Management of IT ProfessionalsOur ability to recruit, train, retain and deploy our workforce of IT professionals influences our profit margins and results of our operations. We ended March 31, 2022 with a headcount of 3,823 IT professionals. This number was 2,948 as at March 31, 2021. Attrition of IT Professionals showed an increasing trend during the year. Business growth requires us to ramp our head count at the same time. Balancing these factors of recruitment and attritions requires quite a bit of fine balancing and planning. If we recruit too many, utilization will drop leading to margin erosion and if we recruit too late, we lose revenues. Attrition and its costs to business

Corporate Overview1 Statutory Reports2 Financial Statements3
143
Annual Report 2021-22
are very clear. Thus, our success largely depends on our ability to attract, train and retain our Happiest Minds, in particular our highly skilled engineering and IT professionals.
Our employee costs consist of salaries, wages and bonus, contribution to provident fund and other funds, employee stock compensation expense, compensated absences, gratuity and staff welfare. Salaries and wages in India, including in the services industry, have historically been lower those in the United States, Europe and other developed economies. However, if these costs in India continue to increase at a rate faster than in the United States, Europe and other developed economies due to competitive pressures, we may experience a greater increase in our employee costs, thereby eroding one of our principal cost advantages over competitors in the United States, Europe and other developed economies. In addition, our ability to manage our employee costs will also be heavily impacted by our international and domestic resource mix. For example, any increases in visa fees or healthcare insurance costs for employees located in developed countries such as USA and Canada, would increase our employee costs.
Training is an imperative and a key cost element. Ability to train our people on the right technology, invest in them ahead of time is very important element to manage their deployment into projects and also motivate them to stay engaged.
All the above aspects of people and its correct management is critical to the continues success of the Company.
Significant Accounting PoliciesRevenue RecognitionThe Group derives revenue primarily from rendering engineering services and sale of licenses. Revenue is recognized upon transfer of control of promised products or services to customers in an amount that reflects the consideration the Group expects to receive in exchange for those products or services. The Group is a principal in rendering engineering services and agent in relation to sale of licenses. Amounts disclosed as revenue are net of trade allowances, rebates and GST (Goods and Services Tax), amounts collected on behalf of third parties and includes reimbursement of out-of-pocket expenses, with corresponding expenses included in cost of revenues.
Revenue from the rendering of services and sale of license is recognized when the Group satisfies its performance obligations to its customers as below:
Rendering of engineering servicesRevenues from engineering services comprise primarily income from time-and-material and fixed price contracts. Revenue with respect to time and-material contracts is recognized over the period of time as the related services are performed. Revenue with respect to fixed price contracts where performance obligation is transferred over time and where there is no uncertainty as to measurability or collection of consideration is recognized in accordance with the proportionate performance method. The input (efforts expended) method has been used to measure progress towards completion, as there is a direct relationship between input and productivity. Provisions for estimated losses on contracts-in-progress are recorded in the period in which such losses become probable based on the current contract estimates. In determining the transaction price for rendering of engineering services, the Group considers the effect of variable consideration, existence of a significant financing component, non-cash consideration, and consideration payable to the customers if any. Revenue is recognized net of trade and cash discounts.
Trade receivablesA receivable is recognized if an amount of consideration that is unconditional (i.e., only the passage of time is required before payment of the consideration is due). Refer to accounting policies of financial assets.
Variable considerationIf the consideration in a contract includes a variable amount, the Group estimates the amount of consideration to which it will be entitled in exchange for transferring the goods to the customer. The variable consideration is estimated at contract inception and constrained until it is highly probable that a significant revenue reversal in the amount of cumulative revenue recognized will not occur when the associated uncertainty with the variable consideration is subsequently resolved.
Sale of licensesThe Group is a reseller for sale of right to use licenses and acting as agent in the arrangement. The revenue for sale of right to use license is recognized at point in time when control on use of license is transferred to the customer.
Contract balancesContract assets: The Group classifies its right to consideration in exchange for deliverables as either a receivable or as unbilled revenue. A receivable is a right to consideration that is unconditional upon passage of time. Revenues in excess of billings is recorded as unbilled revenue and is classified as a financial asset where the right to consideration is unconditional upon passage of
144
Annual Report 2021-22
time. Unbilled revenue which is conditional is classified as other current asset. Trade receivables and unbilled revenue is presented net of impairment.
Contract liabilities: A contract liability (which we referred to as Unearned Revenue) is the obligation to transfer goods or services to a customer for which the Group has received consideration (or an amount of consideration is due) from the customer. If a customer pays consideration before the Group transfers goods or services to the customer, a contract liability is recognized when the payment is received.
Interest incomeInterest income is recognized when it is probable that the economic benefits will flow to the Group and the amount of income can be measured reliably. Interest income is accrued on a time basis, by reference to the principal outstanding and at the effective interest rate applicable, which is the rate that discounts estimated future cash receipts through the expected life of the financial asset to that asset’s net carrying amount on initial recognition. Interest income is included under the head ‘other income’ in the statement of profit and loss.
For all financial instruments measured at amortized cost, interest income is recorded using the effective interest rate, which is the rate that exactly discounts the estimated future cash payments or receipts over the expected life of the financial instrument or a shorter period, where appropriate, to the net carrying amount of the financial asset. Interest income is included in other income in the statement of profit and loss.
Dividend incomeDividend income on investments is accounted when the right to receive the dividend is established, which is generally when shareholders approve the dividend. Dividend income is included under the head “Other income” in the statement of profit and loss account.
Business CombinationBusiness combinations are accounted for using the acquisition method. The cost of an acquisition is measured as the aggregate of the consideration transferred, which is measured at acquisition date fair value, and the amount of any non-controlling interests in the acquiree. For each business combination, the Group elects whether to measure the non-controlling interests in the acquiree at fair value or at the proportionate share of the acquiree’s identifiable net assets. Acquisition-related costs are expensed as incurred and included in other expenses.
At the acquisition date, the identifiable assets acquired and the liabilities assumed are recognized at their acquisition date fair values. For this purpose, the liabilities assumed include contingent liabilities representing present obligation and they are measured at their acquisition fair values irrespective of the fact that outflow of resources embodying economic benefits is not probable. However, the following assets and liabilities acquired in a business combination are measured at the basis indicated below:
• Deferred tax assets or liabilities, and the assets or liabilities related to employee benefit arrangements are recognized and measured in accordance with Ind AS 12 Income Tax and Ind AS 19 Employee Benefits respectively.
• Liabilities or equity instruments related to share based payment arrangements of the acquiree or share – based payments arrangements of the Group entered into to replace share-based payment arrangements of the acquiree are measured in accordance with Ind AS 102 Share-based Payments at the acquisition date.
• Assets (or disposal Groups) that are classified as held for sale in accordance with Ind AS 105 Non-current Assets Held for Sale and Discontinued Operations are measured in accordance with that standard.
• Reacquired rights are measured at a value determined on the basis of the remaining contractual term of the related contract. Such valuation does not consider potential renewal of the reacquired right.
When the Group acquires a business, it assesses the financial assets and liabilities assumed for appropriate classification and designation in accordance with the contractual terms, economic circumstances and pertinent conditions as at the acquisition date. This includes the separation of embedded derivatives in host contracts by the acquiree.
Any contingent consideration to be transferred by the acquirer is recognized at fair value at the acquisition date. Contingent consideration classified as an asset or liability that is a financial instrument and within the scope of Ind AS 109 Financial Instruments, is measured at fair value with changes in fair value recognized in statement of profit and loss in accordance with Ind AS 109. If the contingent consideration is not within the scope of Ind AS 109, it is measured in accordance with the appropriate Ind AS and shall be recognized in profit or loss. Contingent consideration that is classified as equity is not re-measured at subsequent reporting dates and subsequent its settlement is accounted for within equity.

Corporate Overview1 Statutory Reports2 Financial Statements3
145
Annual Report 2021-22
Goodwill is initially measured at cost, being the excess of the aggregate of the consideration transferred and any previous interest held, over the net identifiable assets acquired and liabilities assumed. If the fair value of the net assets acquired is in excess of the aggregate consideration transferred, the Group re-assesses whether it has correctly identified all of the assets acquired and all of the liabilities assumed and reviews the procedures used to measure the amounts to be recognized at the acquisition date. If the reassessment still results in an excess of the fair value of net assets acquired over the aggregate consideration transferred, then the gain is recognized in OCI and accumulated in equity as capital reserve. However, if there is no clear evidence of bargain purchase, the entity recognizes the gain directly in equity as capital reserve, without routing the same through OCI.
After initial recognition, goodwill is measured at cost less any accumulated impairment losses. For the purpose of impairment testing, goodwill acquired in a business combination is, from the acquisition date, allocated to each of the Group’s cash-generating units that are expected to benefit from the combination, irrespective of whether other assets or liabilities of the acquiree are assigned to those units.
Property, Plant and EquipmentCapital work in progress is stated at cost, net of accumulated impairment loss if any.
Property, plant and equipment are stated at historical cost less accumulated depreciation, and accumulated impairment loss, if any. Historical cost comprises of the purchase price including duties and non-refundable taxes, borrowing cost if capitalization criteria’s are met, directly attributable expenses incurred to bring the asset to the location and condition necessary for it to be capable of being operated in the manner intended by management and initial estimate of decommissioning, restoring and similar liabilities.
Subsequent costs related to an item of property, plant and equipment are recognized as a separate asset, as appropriate, only when it is probable that future economic benefits associated with the item will flow to the Group and the cost of the item can be measured reliably. The carrying amount of any component accounted for as a separate asset is derecognized when replaced. All other repairs and maintenance are recognized in statement of profit and loss during the reporting period when they are incurred.
An item of property, plant and equipment is derecognized on disposal or when no future economic benefits are expected from its use or disposal. The gains or losses arising from derecognition are measured as the difference between the net disposal proceeds and the carrying amount of the asset and are recognized in the statement of profit and loss when the asset is derecognized.
Property, plant and equipment individually costing ` 5,000 or less are depreciated at 100% in the year in which such assets are ready to use.
Depreciation is calculated using the straight-line method over their estimated useful lives as follows:
The estimates of useful lives of tangible assets are as follows:
Class of asset Useful life as per Schedule II Useful life as per group
Furniture and fixtures 10 years 5 years
Office equipment 5 years 4 years
Computer systems 6 years for server3 years for other than server
2.5-3 years
Leasehold improvements are amortized over the period of the lease or life of the asset whichever is less.
The useful lives have been determined based on technical evaluation done by the management’s expert which in certain instances are different from those specified by Schedule II to the Companies Act, 2013, in order to reflect the actual usage of the assets. The assets residual values and useful life are reviewed, and adjusted if appropriate, at the end of each reporting period. An asset’s carrying amount is written down immediately to its recoverable amount if the asset’s carrying amount is greater than its estimated recoverable amount.
Intangible AssetsIntangible assets acquired separately are measured on initial recognition at cost. The cost of intangible assets acquired in a business combination is their fair value at the date of acquisition. Following initial recognition, intangible assets are carried at cost less any accumulated amortization and accumulated impairment losses.

146
Annual Report 2021-22
An item of intangible asset is derecognized on disposal or when no future economic benefits are expected from its use or disposal. The gains or losses arising from derecognition are measured as the difference between the net disposal proceeds and the carrying amount of the asset and are recognized in the statement of profit and loss when the asset is derecognized.
GoodwillGoodwill on acquisitions of business is included in intangible assets. Goodwill is not amortized but it is tested for impairment annually, or more frequently if events or changes in circumstances indicate that it might be impaired, and is carried at cost less accumulated impairment losses. Gains and losses on the disposal of a business include the carrying amount of goodwill relating to the business sold.
Goodwill is allocated to cash-generating units for the purpose of impairment testing. The allocation is made to those cash-generating units or Group of cash-generating units that are expected to benefit from the business combination in which the goodwill arose. The units or Group of units are identified at the lowest level at which goodwill is monitored for internal management purposes.
Other Intangible AssetsIntangible assets acquired separately are measured on initial recognition at cost. The cost of intangible assets acquired in a business combination is their fair value at the date of acquisition. Following initial recognition, intangible assets are carried at cost less any accumulated amortization and accumulated impairment losses.
An item of intangible asset is derecognized on disposal or when no future economic benefits are expected from its use or disposal. The gains or losses arising from derecognition are measured as the difference between the net disposal proceeds and the carrying amount of the asset and are recognized in the statement of profit and loss when the asset is derecognized.
Amortization methods and periodsThe Group amortises intangible assets with a finite useful life using the straight-line method over the following periods:
Asset Life in years
Computer software 2.5-3 years
Non compete fees 3 years
Customer relations 3-4 years
Trade mark 2-3 years
Exclusive license 2 years
The estimated useful life of the intangible assets and the amortization period are reviewed at the end of the each financial year and the amortization period is revised to reflect the changed pattern, if any.
Research costs are expensed as incurred. Development expenditures on an individual project are recognized as an intangible asset when the Group can demonstrate:
• The technical feasibility of completing the intangible asset so that the asset will be available for use or sale
• Its intention to complete and its ability and intention to use or sell the asset
• How the asset will generate future economic benefits
• The availability of resources to complete the asset
• The ability to measure reliably the expenditure during development
Subsequent costs related to Intangible assets are recognized as a separate asset, as appropriate, only when it is probable that future economic benefits associated with the item will flow to the Group and the cost of the item can be measured reliably.
Impairment of Non-financial AssetsThe Group assesses, at each reporting date, whether there is an indication that an asset may be impaired. If any indication exists, or when annual impairment testing for an asset is required, the Group estimates the asset’s recoverable amount. An asset’s recoverable amount is the higher of an asset’s or cash-generating unit’s (CGU) fair value less costs of disposal and its value in use. The recoverable amount is determined for an individual asset, unless the asset does not generate cash inflows that are largely independent of those from other assets or groups of assets. When the carrying amount of an asset or CGU exceeds its recoverable amount, the asset is considered impaired and is written down to its recoverable amount.

Corporate Overview1 Statutory Reports2 Financial Statements3
147
Annual Report 2021-22
In assessing value in use, the estimated future cash flows are discounted to their present value using a pre-tax discount rate that reflects current market assessments of the time value of money and the risks specific to the asset. In determining fair value less costs of disposal, recent market transactions are taken into account. If no such transactions can be identified, an appropriate valuation model is used. These calculations are corroborated by valuation multiples, quoted share prices for publicly traded companies or other available fair value indicators.
The Group bases its impairment calculation on detailed budgets and forecast calculations, which are prepared separately for each of the Group’s CGUs to which the individual assets are allocated. These budgets and forecast calculations generally cover a period of five years. For longer periods, a long-term growth rate is calculated and applied to project future cash flows after the fifth year. To estimate cash flow projections beyond periods covered by the most recent budgets/forecasts, the Group extrapolates cash flow projections in the budget using a steady or declining growth rate for subsequent years, unless an increasing rate can be justified. In any case, this growth rate does not exceed the long-term average growth rate for the products, industries, or country or countries in which the Group operates, or for the market in which the asset is used.
Impairment losses of continuing operations, including impairment on inventories, are recognized in the statement of profit and loss, except for properties previously revalued with the revaluation surplus taken to OCI. For such properties, the impairment is recognized in OCI up to the amount of any previous revaluation surplus.
For assets excluding goodwill, an assessment is made at each reporting date to determine whether there is an indication that previously recognized impairment losses no longer exist or have decreased. If such indication exists, the Group estimates the asset’s or CGU’s recoverable amount. A previously recognized impairment loss is reversed only if there has been a change in the assumptions used to determine the asset’s recoverable amount since the last impairment loss was recognized. The reversal is limited so that the carrying amount of the asset does not exceed its recoverable amount, nor exceed the carrying amount that would have been determined, net of depreciation, had no impairment loss been recognized for the asset in prior years. Such reversal is recognized in the statement of profit and loss unless the asset is carried at a revalued amount, in which case, the reversal is treated as a revaluation increase.
Goodwill is tested for impairment annually and when circumstances indicate that the carrying value may be impaired. Impairment is determined for goodwill by assessing the recoverable amount of each CGU (or group of CGUs) to which the goodwill relates. When the recoverable amount of the CGU is less than its carrying amount, an impairment loss is recognized. Impairment losses relating to goodwill cannot be reversed in future periods.
Borrowing CostBorrowing costs directly attributable to the acquisition, construction or production of an asset that necessarily takes a substantial period of time to get ready for its intended use or sale are capitalised as part of the cost of the asset. All other borrowing costs are expensed in the period in which they occur. Borrowing costs consist of interest and other costs that an entity incurs in connection with the borrowing of funds. Borrowing cost also includes exchange differences to the extent regarded as an adjustment to the borrowing costs.
LeasesThe Group has lease contracts for various items of computers, vehicles and buildings used in its operations. Lease terms generally ranges between 3 and 10 years.
The Group assesses at contract inception whether a contract is, or contains, a lease. That is, if the contract conveys the right to control the use of an identified asset for a period of time in exchange for consideration.
Group as LesseeThe Group applies a single recognition and measurement approach for all leases, except for short-term leases and leases of low-value assets. The Group recognizes lease liabilities to make lease payments and right-of-use assets representing the right to use the underlying assets.
Right-of-use AssetsThe Group recognizes right-of-use assets at the commencement date of the lease (i.e., the date the underlying asset is available for use). Right- of-use assets are measured at cost, less any accumulated depreciation and impairment losses, and adjusted for any remeasurement of lease liabilities. The cost of right-of-use assets includes the amount of lease liabilities recognized, initial direct costs incurred, and lease payments made at or before the commencement date less any lease incentives received. Right-of-use assets are depreciated on a straight-line basis over the shorter of the lease term and the estimated useful lives of the assets.

148
Annual Report 2021-22
If ownership of the leased asset transfers to the Group at the end of the lease term or the cost reflects the exercise of a purchase option, depreciation is calculated using the estimated useful life of the asset.
The right-of-use assets are also subject to impairment. Refer to the accounting policies in section 2 (e) for policy on impairment of non- financial assets.
Lease LiabilitiesAt the commencement date of the lease, the Group recognizes lease liabilities measured at the present value of lease payments to be made over the lease term. The lease payments include fixed payments (including in-substance fixed payments) less any lease incentives receivable, variable lease payments that depend on an index or a rate, and amounts expected to be paid under residual value guarantees. The lease payments also include the exercise price of a purchase option reasonably certain to be exercised by the Group and payments of penalties for terminating the lease, if the lease term reflects the Group exercising the option to terminate. Variable lease payments that do not depend on an index or a rate are recognized as expenses (unless they are incurred to produce inventories) in the period in which the event or condition that triggers the payment occurs.
In calculating the present value of lease payments, the Group uses its incremental borrowing rate at the lease commencement date because the interest rate implicit in the lease is not readily determinable. After the commencement date, the amount of lease liabilities is increased to reflect the accretion of interest and reduced for the lease payments made. In addition, the carrying amount of lease liabilities is remeasured if there is a modification, a change in the lease term, a change in the lease payments (e.g., changes to future payments resulting from a change in an index or rate used to determine such lease payments) or a change in the assessment of an option to purchase the underlying asset.
Short-term Leases and Leases of low-value AssetsThe Group applies the short-term lease recognition exemption to its short-term leases of machinery and equipment (i.e., those leases that have a lease term of 12 months or less from the commencement date and do not contain a purchase option). It also applies the lease of low-value assets recognition exemption to leases of office equipment that are considered to be low value. Lease payments on short-term leases and leases of low-value assets are recognized as expense on a straight-line basis over the lease term.
Lease and Non-lease ComponentAs per Ind AS 116, “As a practical expedient, a lessee may elect, by class of underlying asset, not to separate non-lease components from lease components, and instead account for each lease component and any associated non-lease components as a single lease component.
The Group have not opted for this practical expedient and have accounted for Lease component only.
Extension and Termination optionThe Group has several lease contracts that include extension and termination options. These options are negotiated by management to provide flexibility in managing the leased-asset portfolio and align with the Group’s business needs. Management exercises significant judgement in determining whether these extension and termination options are reasonably certain to be exercised. Management have not considered any future cash outflow for which they are potentially exposed arising due to extension and termination options.
Provisions and Contingent LiabilitiesProvisionsProvisions are recognized when there is a present obligation (legal or constructive) as a result of a past event, it is probable that an outflow of resources embodying economic benefits will be required to settle the obligation, in respect of which a reliable estimate can be made of the amount of the obligation.
If the effect of the time value of money is material, provisions are discounted using a current pre-tax rate that reflects, when appropriate, the risks specific to the liability. When discounting is used, the increase in the provision due to the passage of time is recognized as a finance cost.
Provision for warrantyAs per the terms of the contracts, the Group provides post-contract services / warranty support to some of its customers. The Group accounts for the post-contract support / provision for warranty on the basis of the information available with the management duly taking into account the current and past technical estimates. The estimate of such warranty-related costs is revised annually.

Corporate Overview1 Statutory Reports2 Financial Statements3
149
Annual Report 2021-22
Contingent LiabilitiesA contingent liability is a possible obligation that arises from past events and whose existence will be confirmed only by the occurrence or non-occurrence of one or more uncertain future events not wholly within the control of the Group or a present obligation that is not recognized because it is not probable that an outflow of resources will be required to settle the obligation. A contingent liability also arises in extremely rare cases where there is a liability that cannot be recognized because it cannot be measured reliably. The Group does not recognize a contingent liability but discloses it in the Restated Consolidated Summary Statements, unless the possibility of an outflow of resources embodying economic benefits is remote.
Principal Components of our Statement of Profit and LossIncomeOur total income comprises of revenue from contract with customers and other income.
Revenue from contract with customers: Our revenue from contract with customers comprises of revenue from (i) sale of services and (ii) sale of licenses.
The following table sets forth a breakdown of our revenue from contract with our customers for the periods indicated:
(in ` lacs)March 31, 2022 March 31, 2021
Sale of services 1,09,314 77,306Sale of licenses 51 35Revenue from contracts with customers 1,09,365 77,341
Our revenue from contract with our customers are generated from three business units, namely Infrastructure Management & Security Services, Digital Business Services and Product Engineering Services
Infrastructure Management and Security Services (IMSS) business unit delivers integrated end-to-end infrastructure and security solutions with specialization in cloud, virtualization and mobility across a multitude of industry verticals and geographies. This group provides advisory, transformation, managed and hosted services, and secure intelligence solutions to our customers. This group has unique productized solution platforms for smart infrastructure and security solutions provides quick to deploy, mature service delivery over Global SOC/NOC. This improves efficiency and serviceability, reduces cost and drives innovation.
Digital Business Services (DBS) business unit delivers high value, cost-effective enterprise applications and customized solutions that enable organizations to be smarter and accelerate business transformations. This group provides advisory, design and architecture, custom-app development, package implementation, testing and on-going support services to IT initiatives. The business drivers for these applications are increasing market share, enhancing customer engagement, improving agility and efficiency of internal operations, reducing cost, driving differentiation and standardizing business processes.
Product Engineering Services (PES) business unit assists software product companies in building robust products and services that integrate mobile, cloud and social technologies. This group helps our customers understand the impact of new technologies and incorporate these technologies into their product roadmap. This group focuses on technology depth, innovation and solution accelerators which allow us to deliver time-to-market, growth and cost benefits to our customers
The following table sets forth our revenue from contracts with customers on the basis of business unit for the period indicated.
(in ` lacs)Business Unit March 31, 2022 March 31, 2021Infrastructure Management & Security Services 24,168 16,421Digital Business Services 32,887 21,288Product Engineering Services 52,310 39,632Total revenue from contract with customers 1,09,365 77,341
Other incomeOur other income primarily consists of (i) interest income on deposit with banks, financial instrument measured at amortized cost and others, (ii) fair value gain on investment measured at FVTPL, (iii) gain on sale of investments measured at FVTPL and (iv) exchange gain (v) Rent concession (vi) Insurance claim.
ExpensesOur expenses comprise of (i) employee benefits expense, (ii) depreciation and amortization, (iii) finance cost and (iv) other expenses.

150
Annual Report 2021-22
Employee benefits expenseOur employee benefits expense comprises of (i) salaries, wages and bonus, (ii) contribution to provident fund, (iii) employee stock compensation expense, (iv) gratuity expense, (v) compensated absences and (vi) staff welfare expenses.
The following table sets forth a breakdown of our employee benefits expense for the periods indicated:
(in ` lacs)
March 31, 2022 March 31, 2021
Salaries, wages and bonus 57,598 41,522
Contribution to provident fund 2,839 2,087
Employee stock compensation expense 300 297
Gratuity expense 518 409
Compensated absences 607 689
Staff welfare expenses 138 234
Total employee benefits expense 62,000 45,238
Depreciation and amortizationOur tangible and intangible assets are depreciated and amortized over periods corresponding to their estimated useful lives. Please see “Significant Accounting Policies” above. Our depreciation and amortization expense comprises of (i) depreciation of property, plant and equipment, (ii) amortization of intangible assets and (iii) depreciation of right-of-use assets.
Finance costOur finance cost comprises of (i) interest expense on borrowings and lease liability and (ii) other borrowing costs
Other expensesOur other expenses primarily comprise of (i) subcontractor charges, (ii) software license cost, (iii) Impairment loss allowance on trade receivables, (iv) travelling and conveyance and (v) Recruitment charges
The following table sets forth a breakdown of our other expenses for the periods indicated:
(in ` lacs)March 31, 2022 March 31, 2021
Power and fuel 204 184Subcontractor charges 14,056 7,455Repairs and maintenance- Buildings 107 101- Equipment 24 27- Others 246 209Rent expenses 284 166Advertising and business promotion expenses 282 101Commission 99 174Communication costs 278 257Insurance 48 46Legal and professional fees 540 273Software license cost 2,429 1,788Rates and taxes 96 69Recruitment charges 916 360Impairment loss allowance on trade receivables 101 980Impairment loss allowance on unbilled revenue 88 41Sitting fees to non-executive directors 54 56Commission to non-executive directors 26 24Corporate social responsibility ('CSR') expenditure 215 75Travelling and conveyance 893 427Postage and Courier 94 25Training Expense 248 120Miscellaneous expenses 270 54
21,598 13,002

Corporate Overview1 Statutory Reports2 Financial Statements3
151
Annual Report 2021-22
Income tax expenseOur income tax expense comprises of current tax, adjustment of tax relating to earlier periods and deferred tax credit.
Exceptional itemsOur exceptional items comprise of Fair valuation loss on contingent consideration. Contingent consideration was valued during quarter one of fiscal 2022. As a result of which there was increase in liability and it was accounted as fair valuation loss in profit and loss account and shown under exceptional items.
Results of OperationsThe following table sets forth our consolidated statement of profit and loss for the periods indicated.
March 31, 2022 March 31, 2021
(` lacs) (%) (` lacs) (%)
Income
Revenue from contract with customers 1,09,365 97% 77,341 97%
Other income 3,710 3% 2,424 3%
Total income 1,13,075 100% 79,765 100%
Expenses
Employee benefits expense 62,000 55% 45,238 57%
Depreciation and amortization 3,288 3% 2,274 3%
Finance cost 995 1% 649 1%
Other expenses 21,598 19% 13,002 16%
Total expenses 87,881 78% 61,163 77%
Profit/(loss) before exceptional items and tax 25,194 22% 18,602 23%
Exceptional items – Fair valuation loss on contingent consideration
609 1% - -
Profit/(loss) before tax 24,585 22% 18,602 23%
Current tax 6,266 5% 3,527 4%
Adjustment of tax relating to earlier periods 44 0.5% -
Deferred tax change/(credit) 155 0.5% (1,171) (1)%
Profit/(loss) for the year 18,120 16% 16,246 20%
Other comprehensive income
Other comprehensive income to be reclassified to profit or loss in subsequent period
Exchange differences on translating the financial statements of a foreign operation
202 0.2% 22 0.03%
Net movement on effective portion of cash flow hedges (316) (0.3%) 1,236 2%
Income tax effect 80 0.1% (127) (0.16)%
Net other comprehensive income / (loss) to be reclassified to profit or loss in subsequent periods
(34) (0.1%) 1,131 1%
Other comprehensive income not to be reclassified to profit or loss in subsequent period
Re-measurement gains/(losses) on defined benefit plans (97) (0.1%) (144) (0.18)%
Income tax effect 24 0.0% 36 0.05%
Net other comprehensive income / (loss) not to be reclassified to profit or loss in subsequent periods
(73) (0.1%) (108) (0.14)%
Other comprehensive income / (loss) for the year, net of tax
(107) (0.1%) 1,023 1%
Profit for the year 18,013 16% 17,269 22%
Attributable to:
Owners of the Company 18,120 16% 16,246 20%
Non-controlling interest - - -

152
Annual Report 2021-22
March 31, 2022 March 31, 2021
(` lacs) (%) (` lacs) (%)
Total comprehensive income / (loss) for the year
Attributable to:
Owners of the Company 18,013 16% 17,269 22%
Non-controlling interest - - - -
Earnings per equity share
Basic, computed on the basis of profit for the year attributable to equity holders of the parent
12.84 11.75
Diluted, computed on the basis of profit for the year attributable to equity holders of the parent
12.55 11.45
Fiscal 2022 Compared to Fiscal 2021IncomeOur total income increased by 41.8% to ` 1,13,075 lacs in Fiscal 2022 from ` 79,765 lacs in Fiscal 2021, due to increases in both revenues from contracts with customers and other income.
Revenue from contracts with customers
Our revenue from contracts with customers increased by 41.4% to ` 1,09,365 lacs in Fiscal 2022 from ` 77,341 lacs in Fiscal 2021, primarily due to an increase in the volume of projects executed by us on account of higher utilization of our increased workforce and due to billing at higher rates.
Infrastructure Management & Security Services: Our revenue from Infrastructure Management & Security Services increased by 47.2% to ` 24,168 lacs in Fiscal 2022 from ` 16,421 lacs in Fiscal 2021, primarily due to an increase in the number of projects executed by us.
Digital Business Services: Our revenue from Digital Business Services increased by 54.5% to ` 32,887 lacs in Fiscal 2022 from ` 21,288 lacs in Fiscal 2021. Our growth in Digital Business Services business unit was due to increase in the number of projects and acquisition of PGS Inc.
Product Engineering Services: Our revenue from Product Engineering Services increased by 32.0% to ` 52,310 lacs in Fiscal 2022 from ` 39,631 lacs in Fiscal 2021, primarily due to an increase in the number of projects executed by us.
Other income
Our other income increased by 53.1% to ` 3,710 lacs in Fiscal 2022 from ` 2,424 lacs in Fiscal 2021, primarily due to increases in (i) Exchange gain, (ii) gain on sale of investment measured at fair value through profit and loss (iii) Rent concession availed from lessor and (iv) Insurance claim from settlement of legal case with ex-employee.
ExpensesOur total expenses increased by 43.7% to ` 87,881 lacs in Fiscal 2022 from ` 61,163 lacs in Fiscal 2021, primarily due increase in employee benefit expenses, sub-contractors cost, software license cost and recruitment charges.
Employee benefits expense
Our employee benefits expense increased by 37.1% to ` 62,000 lacs in Fiscal 2022 from ` 45,238 lacs in Fiscal 2021, primarily due to increase in overall headcount and pay hikes given to employees during the year.
Depreciation and amortization
Our depreciation and amortization increased by 44.6% to ` 3,288 lacs in Fiscal 2022 from ` 2,274 lacs in Fiscal 2021. Increase is mainly on account of amortization of intangible assets arising out of acquisition of subsidiary Happiest Minds Inc (formerly PGS Inc).
Finance cost
Our finance cost increased by 53.3% to ̀ 995 lacs in Fiscal 2022 from ̀ 649 lacs in Fiscal 2021, primarily due to increase in interest expense on lease liabilities.

Corporate Overview1 Statutory Reports2 Financial Statements3
153
Annual Report 2021-22
Other expensesOur other expenses increased by 66.1% to ` 21,598 lacs in Fiscal 2022 from ` 13,002 lacs in Fiscal 2021, primarily due to increase in (i) Sub-contractors cost (ii) software license cost (iii) recruitment charges (iv) travelling expenses.
Profit before exceptional items and taxAs a result of the foregoing, our profit before exceptional items and tax increased by 35.4% to ` 25,194 lacs in Fiscal 2022 from ` 18,602 lacs in Fiscal 2021.
Exceptional ItemThe Group had acquired 100% voting interest in Happiest Minds Inc. (erstwhile PGS Inc.) vide definitive agreements signed on January 27, 2021, for a total recorded consideration of US $ 13.31 Mn (` 9,720 Lacs), comprising cash consideration of US $ 8.25 Mn (` 6,025 Lacs) and fair-valued contingent consideration in the form of warrants of US $ 5.06 Mn (` 3,696 Lacs) payable over the next 3 years. The contingent consideration was classified as a financial liability within the scope of Ind AS 109 ‘Financial Instruments’ and was measured at fair value. Ind AS 109 mandates that any subsequent changes in such fair value will have to be recognized in the statement of profit and loss. The Group carried out a fair valuation during the year ended March 31,2022 and there was increase in the liability basis increasing expectation of payout. The said increase amounting to ` 609 Lacs has been recognised in the statement of profit and loss and disclosed as ‘Exceptional Item’.
Profit before taxAs a result of the foregoing, our profit before tax increased 32.2% to ` 24,585 lacs in Fiscal 2022 from ` 18,602 lacs in Fiscal 2021.
Tax expensesOur total tax expense increased by 174.4% to ` 6,465 lacs in Fiscal 2022 from ` 2,356 lacs in Fiscal 2021 primarily due to increase in taxable income.
Profit for the yearDue to the factors discussed above, our profit / (loss) for the year increased by 11.5% to ` 18,120 lacs in Fiscal 2022 from ` 16,246 lacs in Fiscal 2021.
Liquidity and Capital ResourcesOur primary sources of liquidity have historically been cash generated from operations and short term borrowings from banks. We expect that cash generated from operations and short term borrowings from banks will continue to be our primary sources of liquidity. We believe that after taking into account cash generated from our business operations, we will have sufficient working capital for both our present and anticipated future requirements for capital expenditures and other cash requirements for 12 months following end of Fiscal 2022.
Cash flowsThe following table sets out a condensed summary of our cash flows for the periods indicated.
(in ` lacs)
March 31, 2022 March 31, 2021Net cash flows from operating activities 16,812 14,317
Net cash flows used in investing activities (9,608) (28,363)
Net cash flows from/(used) in financing activities (9,078) 16,984
Cash and cash equivalents at the beginning of the year 8,583 4,353
Cash and cash equivalents at the end of the year 6,729 8,583
Operating ActivitiesFiscal 2022Our net cash flows from operating activities was ` 16,812 lacs in Fiscal 2022. Our operating cash flow before working capital changes was ` 27,656 lacs in Fiscal 2022, which was primarily adjusted by depreciation/amortisation of property, plant and equipment, intangibles and right-of-use assets of ` 3,288 lacs, Fair value loss on contingent consideration of `609 lacs and finance cost of ` 995 lacs, partially offset by Gain on sale of investment carried at fair value through profit and loss ` 1,377 lacs, interest income of ` 636 lacs and rent concession of ` 323 lacs. Our movements in working capital primarily consisted of an decrease in trade receivables of ` 4,526 lacs, increase in trade payables of ` 1,489 lacs, decrease in contract liabilities of ` 660 lacs and an increase in non-financial liabilities of ` 496.
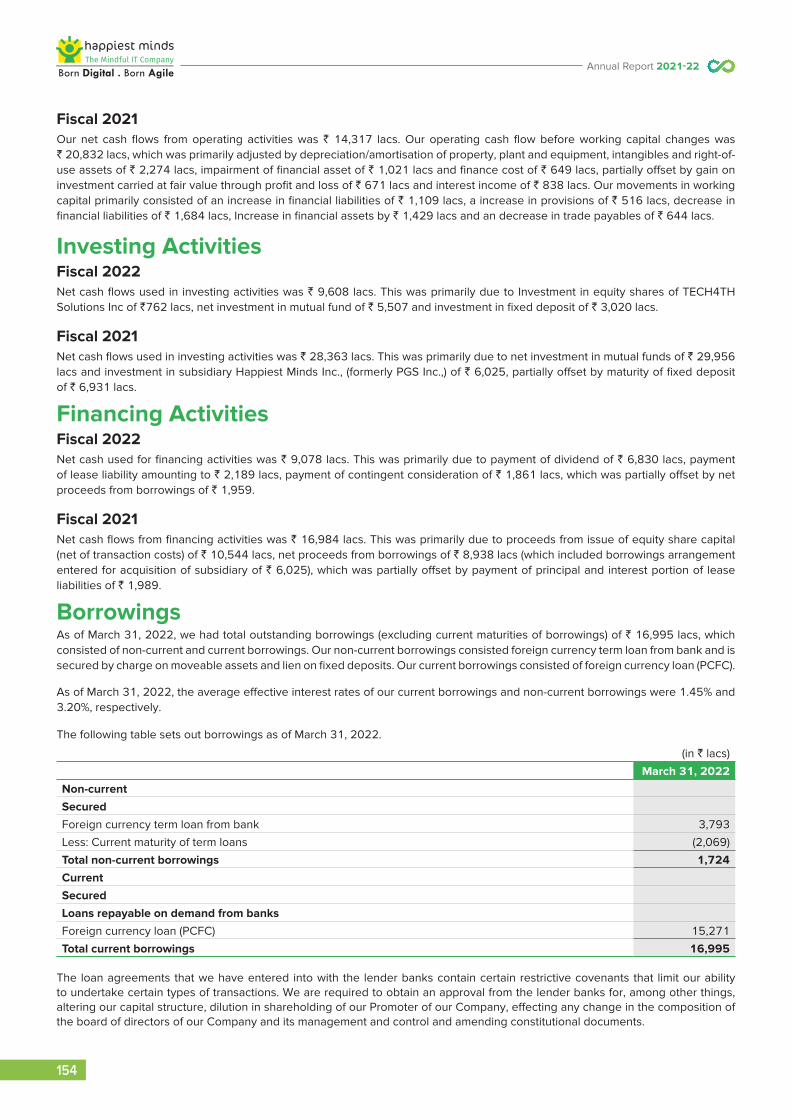
154
Annual Report 2021-22
Fiscal 2021Our net cash flows from operating activities was ` 14,317 lacs. Our operating cash flow before working capital changes was ` 20,832 lacs, which was primarily adjusted by depreciation/amortisation of property, plant and equipment, intangibles and right-of-use assets of ` 2,274 lacs, impairment of financial asset of ` 1,021 lacs and finance cost of ` 649 lacs, partially offset by gain on investment carried at fair value through profit and loss of ` 671 lacs and interest income of ` 838 lacs. Our movements in working capital primarily consisted of an increase in financial liabilities of ` 1,109 lacs, a increase in provisions of ` 516 lacs, decrease in financial liabilities of ` 1,684 lacs, Increase in financial assets by ` 1,429 lacs and an decrease in trade payables of ` 644 lacs.
Investing ActivitiesFiscal 2022Net cash flows used in investing activities was ` 9,608 lacs. This was primarily due to Investment in equity shares of TECH4TH Solutions Inc of `762 lacs, net investment in mutual fund of ` 5,507 and investment in fixed deposit of ` 3,020 lacs.
Fiscal 2021Net cash flows used in investing activities was ` 28,363 lacs. This was primarily due to net investment in mutual funds of ` 29,956 lacs and investment in subsidiary Happiest Minds Inc., (formerly PGS Inc.,) of ` 6,025, partially offset by maturity of fixed deposit of ` 6,931 lacs.
Financing ActivitiesFiscal 2022Net cash used for financing activities was ` 9,078 lacs. This was primarily due to payment of dividend of ` 6,830 lacs, payment of lease liability amounting to ` 2,189 lacs, payment of contingent consideration of ` 1,861 lacs, which was partially offset by net proceeds from borrowings of ` 1,959.
Fiscal 2021Net cash flows from financing activities was ` 16,984 lacs. This was primarily due to proceeds from issue of equity share capital (net of transaction costs) of ` 10,544 lacs, net proceeds from borrowings of ` 8,938 lacs (which included borrowings arrangement entered for acquisition of subsidiary of ` 6,025), which was partially offset by payment of principal and interest portion of lease liabilities of ` 1,989.
BorrowingsAs of March 31, 2022, we had total outstanding borrowings (excluding current maturities of borrowings) of ` 16,995 lacs, which consisted of non-current and current borrowings. Our non-current borrowings consisted foreign currency term loan from bank and is secured by charge on moveable assets and lien on fixed deposits. Our current borrowings consisted of foreign currency loan (PCFC).
As of March 31, 2022, the average effective interest rates of our current borrowings and non-current borrowings were 1.45% and 3.20%, respectively.
The following table sets out borrowings as of March 31, 2022.
(in ` lacs)
March 31, 2022Non-currentSecuredForeign currency term loan from bank 3,793
Less: Current maturity of term loans (2,069)
Total non-current borrowings 1,724CurrentSecuredLoans repayable on demand from banksForeign currency loan (PCFC) 15,271
Total current borrowings 16,995
The loan agreements that we have entered into with the lender banks contain certain restrictive covenants that limit our ability to undertake certain types of transactions. We are required to obtain an approval from the lender banks for, among other things, altering our capital structure, dilution in shareholding of our Promoter of our Company, effecting any change in the composition of the board of directors of our Company and its management and control and amending constitutional documents.

Corporate Overview1 Statutory Reports2 Financial Statements3
155
Annual Report 2021-22
Contractual Obligations and CommitmentsThe following table sets forth information regarding our contractual obligations and commitments as of March 31, 2022.
(in ` lacs)Payment due by period
Total Less than one year
Between one and five years
Later then five years
(in ` lacs)Lease liabilities (carried at amortized cost) 7,033 2,264 4,769Trade Payables (carried at amortized cost)Total outstanding dues of micro enterprises and small enterprises 79 79 - -Total outstanding dues of creditors other than micro enterprises and small enterprises
5,993 5,959 34 -
Capital commitments towards purchase of capital assets 638 638 - -
Related Party TransactionsRelated party transactions primarily relate to contribution made to post employee benefit plan, directors’ sitting fees and managerial remunerations.
Off-balance Sheet Arrangements and Contingent LiabilitiesAs of March 31, 2022 we did not have any off-balance sheet arrangements.
Other claims against the Group not provided for in booksa) Compounding and Settlement Applications filed by the Parent Company:
A compounding application had been filed by the Company before the National Company Law Tribunal (NCLT) and Registrar of Companies, Bombay (“RoC”), in relation to allotments of Equity Shares made by the Company during year ended March 31, 2013 and 2014 under ESOP Scheme 2011 and ESOP Scheme 2011 USA, where certain allotments were made in contravention of Section 67(3) of the Companies Act, 1956.
The Board, vide a resolution passed at its meeting held on August 4, 2020 voluntarily decided to provide an exit offer to the shareholders. Upon completion of the exit offer, the Company had filed a compounding application with the RoC (which will be forwarded to the National Company Law Tribunal, Bengaluru bench upon approval) and a settlement application with SEBI.
The matter has been closed by ROC bangalore vide letter dated February 1, 2022 citing no contravention of Section 67(3).
b) With respect to the License Agreement entered in June 2018 between the Company and a customer, for providing software services, the customer terminated the agreement claiming non-satisfactory delivery of services and damages of ` 623 Lacs. The customer has also initiated arbitration proceedings which the Parent Company is currently contesting and is of the view that the claim is not tenable and accordingly no adjustments are made in the financial statements.
c) There are numerous interpretative issues relating to the Supreme Court (SC) judgement on PF dated February 28, 2019. As a matter of caution, the Group has taken cognizance of the matter on a prospective basis from the date of the SC order. The Group will update its provision, if any, required, on receiving further clarity on the subject.
d) The Group is also subject to certain other claims and suits that arise from time to time in the ordinary conduct of its business. While the Group currently believes that such claims, individually or in aggregate, will not have a material adverse impact on its financial position, cash flows, or results of operations, the litigation and other claims are subject to inherent uncertainties, and management’s view of these matters may change in the future. Were an unfavourable final outcome to occur in any one or more of these matters, there exists the possibility of a material adverse impact on the Group’s business, reputation, financial condition, cash flows, and results of operations for the period in which the effect becomes reasonably estimable.
Capital ExpendituresOur capital expenditures include expenditures on property, plant and equipment, intangible assets and right-of-use assets. Property, plant and equipment include computer systems, office equipment, furniture and fixtures and leasehold improvements. Intangible assets include goodwill, trademark, customer relationships, non-compete and computer software. Right-of-use assets include computer systems, buildings and motor vehicles. The following table sets out the capital expenditures (addition to property, plant and equipment, intangible assets and right-of-use assets) including those arising from acquisition of business of subsidiary for the periods indicated:

156
Annual Report 2021-22
(in ` lacs)March 31, 2022 March 31, 2021
Property, plant and equipmentComputer systems 45 44Office equipment 11 18Furniture and fixtures - 2Leasehold improvements 11 -Intangible assetsGoodwill - 7020Trademark - 88Non-compete - 51Customer relationships - 2,612Exclusive license - 94Computer software 311 263Right-of-use assetsComputer systems 1,495 609Buildings 3,992 466
Motor vehicles - -
We expect to meet our working capital, capital expenditures and investment requirements for the next 12 months primarily from revenues from operating activities, bank borrowings, as well as the proceeds from this Offer.
Our actual capital expenditures may differ from the amount set out above due to various factors, including our future cash flows, results of operations and financial condition, changes in the local economy in India, defects or cost overrun, delays in obtaining or receipt of governmental approval, changes in the legislative and regulatory environment and other factors that are beyond our control.
Qualitative Disclosure about Market RisksMarket risk is attributable to all market-sensitive financial instruments, including foreign currency receivables and payables. The value of a financing instrument may change as a result of changes in interest rates, foreign currency exchange rates, commodity, prices, equity prices and other market changes that affect market risk sensitive instruments. Our exposure to market risk is a function of our revenue generating activities and any future borrowing activities in foreign currencies. The objective of market risk management is to avoid excessive exposure of our earnings and equity to loss.
Credit riskWe are exposed to credit risk related to monies owned to us by our customers. If our customers do not pay us promptly, or at all, we may have to make provisions for, or write-off, such amounts. As of March 31, 2022 and March 31, 2021, our net trade receivables (carried at amortized cost) were ` 16,738 lacs and ` 12,192 lacs, respectively. As of March 31, 2022 and March 31, 2021, our net unbilled receivables/ Contract assets were ` 10,664 lacs and ` 5,841 lacs respectively. Our average debtor cycle was 90 days (billed receivables-55 days & unbilled receivables-35 days) and 85 days (billed receivables-57 days & unbilled receivables-28 days) Fiscals 2022 and 2021, respectively.
Interest rate riskAs at March 31, 2022, we are not exposed to market risk with respect to changes in interest rates since all our financial assets or liabilities are either non-interest bearing or are at fixed interest rate.
Exchange rate riskAlthough our Company’s reporting currency is in `, we transact a significant portion of our business in other currencies, primarily USD. A significant portion of our revenue from contracts with customers in Fiscals 2022 and 2021, respectively, were derived from sales outside India. Substantially, all of our non-Indian sales income is denominated in foreign currencies, primarily in USD. Most of our foreign currency exposure is mitigated by maintaining balances in the EEFC account in USD / Euro/ GBP which is used for making foreign payments without currency conversion and by executing foreign exchange forward contracts.
Therefore, our exchange rate risk primarily arises from our foreign currency revenues, cost and other foreign currency assets and liabilities to the extent that there is no natural hedge.
Reservations, Qualifications and Adverse RemarksThere are no reservations, qualifications and adverse remarks by our statutory auditor for the previous three Fiscals.

Corporate Overview1 Statutory Reports2 Financial Statements3
157
Annual Report 2021-22
I. Brief Statement on Company’s Philosophy on Code of Corporate Governance
Happiest Minds’ philosophy on Corporate Governance is to create and conduct sustainable growing business with highest standards of integrity, transparency and accountability to maximize stakeholders’ value while duly complying with all applicable laws and regulations.
Happiest Minds firmly believes that Corporate Governance is critical to success of its business and its governance practices are reflected in its strategy, plan, culture, policies and relationship with stakeholders.
II. Board of Directors The Board of Directors of Happiest Minds as on March 31, 2022, comprised of six (6) Directors with optimum combination of
Executive and Non-Executive Directors i.e., three Executive Directors and three Non-Executive Independent Directors including two-woman Directors and each of them are professionals in their respective areas of specialization and have held eminent positions. The Board Members are not related to each other, and the number of Directorships/Committee memberships held by Executive and Non-Executive Independent Directors are within the permissible limits under SEBI(LODR), Regulations, 2015 and Companies Act, 2013.
(a) Composition of Board of Directors The composition and category of Directors as on March 31, 2022:
Sl.No.
Name of the Director
Category Number of other Director-ships held in other public Companies
Number of Committee membership held in other public companies (limited to only Audit and Stakeholders’ Relationship
Committees)
No. and % of Equity Shares
held in the Company (%)
As Chairperson As Member
1 Ashok Soota Promoter & Executive Director
Nil Nil Nil 78,017,452 (53.12%)1
2 Joseph Anantharaju Executive Director Nil Nil Nil 425,000 (0.29%)
3 Venkatraman Narayanan
Executive Director Nil Nil Nil 650,000 (0.44%)
4 Anita Ramachandran Non-Executive Independent Director
8 1 6 Nil
5 Rajendra Kumar Srivastava
Non-Executive Independent Director
Nil Nil Nil Nil
6 Shubha Rao Mayya Non-Executive Independent Director
4 2 6 Nil
1. Including shares held in the name of Ashok Soota Medical Research LLP
Directorship in other listed entities as on March 31, 2022:
Sl.No.
Name of the Director Directorship in other listed entities Category of Directorship
1 Ashok Soota Nil NA2 Joseph Anantharaju Nil NA3 Venkatraman Narayanan Nil NA
4 Anita Ramachandran
1. Grasim Industries Limited2. Rane (Madras) Limited3. Metropolis Healthcare Limited4. FSN E-Commerce Ventures Limited
Independent DirectorIndependent DirectorIndependent DirectorIndependent Director
5 Rajendra Kumar Srivastava Nil NA
6 Shubha Rao Mayya 1. Stove Kraft Limited Independent Director
Corporate Governance Report

158
Annual Report 2021-22
During the financial year 2021-22, five (5) meetings of the Board were held and the gap between two meetings did not exceed one hundred and twenty days. The Board Meetings are prescheduled, and adequate notice is given to the Board members. Board Meetings are generally held at the registered office of the Company either through video conference or through physical presence.
These Board Meetings were held on May 12, 2021; July 28, 2021; October 27, 2021; January 28, 2022 and March 30, 2022. The necessary quorum was present for all the meetings.
(b) Core Skills/Expertise/Competencies of the Board of Directors The Directors of the Company bring with them a wide range of skills and experience to the Board, which enhances the quality
of the Board’s decision-making process. The following are the core skills, expertise and competencies identified for effective functioning of the Board and the names of directors who have such skills/expertise/competence:
Name of the Director Interpersonal skills and personal
qualities/values
Information Technology
business & Industry knowledge
Legal, regulatory and financial
knowhow
Strategic and analytical mindset
Leadership, Management & Governance
Ashok Soota Venkatraman Narayanan Joseph Anantharaju Anita Ramachandran Rajendra Kumar Srivastava Shubha Rao Mayya
(c) Attendance of Directors at the Board Meetings and Annual General Meeting (AGM) held during the financial year 2021-22:Name of the Director Board Meetings
entitled to attendBoard Meetings
attendedWhether present at AGM
held on July 7, 2021*
Ashok Soota 5 5 YesJoseph Anantharaju 5 5 YesVenkatraman Narayanan 5 5 YesAnita Ramachandran 5 5 YesRajendra Kumar Srivastava 5 5 YesShubha Rao Mayya 5 5 Yes
*Note: The AGM was held through video conferencing and other audio-visual means (“VC”) because of COVID restrictions.
(d) Independent Directors The Board is of the opinion that the Independent Directors fulfil the conditions specified in the Companies Act, 2013 and
SEBI(LODR), Regulations, 2015 and that they are independent of the management.
During the financial year 2021-22, three (3) meetings of the Independent Directors were held on October 25, 2021, January 25, 2022 and March 24, 2022, interalia to review the following and the meeting was attended by all the Independent Directors:
(i) Review performance of non-independent directors and the Board of Directors as a whole;
(ii) Review performance of the Chairperson of the Company;
(iii) Assess the quality, quantity and timeliness of flow of information between the management of the Company and the Board of Directors that is necessary for the Board to effectively and reasonably perform their duties.
The familiarization program and other disclosures as specified under SEBI (Listing Obligations and Disclosure Requirements) Regulations, 2015 is available on the Company’s website at https://www.happiestminds.com/investors/disclosures/HappiestMinds-Details-of-Familiarization-Programme.pdf
No Independent Director had resigned during the financial year 2021-22.
(e) CEO/CFO Certification As required under Regulation 17 (8) of SEBI (LODR) Regulations, CEO/CFO have certified to the Board that the Financial
Statements for the financial year ended March 31, 2022 do not contain any untrue statement and that these statements

Corporate Overview1 Statutory Reports2 Financial Statements3
159
Annual Report 2021-22
represent a true and fair view of the Company’s affairs and other matters as specified thereunder. Copy of the Certificate is attached as Annexure I to this Report.
(f) Code of Conduct for Directors and Senior Management The Company has adopted a Code of Conduct for the Board of Directors and Senior Management Personnel to ensure that
the business of the Company is conducted with the highest standards of ethics and values in accordance with the applicable laws, regulations and rules and is critical to the success of the Company. The Code is available on the Company’s website at https://www.happiestminds.com/investors/policy-documents/
All the Board Members and Senior Management Personnel have affirmed compliance with the Code. A declaration signed by the CEO/CFO to this effect is enclosed as part of Annexure I to this Report.
III. Audit Committee (a) Terms of Reference The Audit Committee has interalia the following mandate:
1. Oversight of the Company’s financial reporting process, examination of the financial statement and the auditors’ report thereon and the disclosure of its financial information to ensure that the financial statement is correct, sufficient and credible;
2. Recommendation for appointment, re-appointment and replacement, remuneration and terms of appointment of auditors, including the internal auditor, cost auditor and statutory auditor, of the Company and the fixation of audit fee;
3. Approval of payments to Statutory Auditors for any other services rendered by the Statutory Auditors of the Company;
4. Reviewing, with the management, the annual financial statements and auditor’s report thereon before submission to the Board for approval, with particular reference to:
i. Matters required to be included in the Director’s Responsibility Statement to be included in the Board’s report in terms of clause (c) of sub-section 3 of section 134 of the Companies Act;
ii. Changes, if any, in accounting policies and practices and reasons for the same;
iii. Major accounting entries involving estimates based on the exercise of judgment by the management of the Company;
iv. Significant adjustments made in the financial statements arising out of audit findings;
v. Compliance with listing and other legal requirements relating to financial statements;
vi. Disclosure of any related party transactions; and
vii. Qualifications / modified opinion(s) in the draft audit report.
5. Reviewing, with the management, the quarterly, half-yearly and annual financial statements before submission to the Board for approval;
6. Reviewing, with the management, the statement of uses/application of funds raised through an issue (public issue, rights issue, preferential issue, etc.), the statement of funds utilised for purposes other than those stated in the offer document/prospectus/notice and the report submitted by the monitoring agency monitoring the utilisation of proceeds of a public or rights issue, and making appropriate recommendations to the Board to take up steps in this matter;
7. Reviewing and monitoring the auditor’s independence and performance, and effectiveness of audit process;
8. Formulating a policy on related party transactions, which shall include materiality of related party transactions;
9. Approval or any subsequent modification of transactions of the Company with related parties and omnibus approval for related party transactions proposed to be entered into by the Company subject to such conditions as may be prescribed;
10. Review, at least on a quarterly basis, the details of related party transactions entered into by the Company pursuant to each of the omnibus approvals given;
11. Scrutiny of inter-corporate loans and investments;
12. Valuation of undertakings or assets of the company, wherever it is necessary;

160
Annual Report 2021-22
13. Evaluation of internal financial controls and risk management systems;
14. Reviewing, with the management, performance of statutory and internal auditors, adequacy of the internal control systems;
15. Reviewing the adequacy of internal audit function, if any, including the structure of the internal audit department, staffing and seniority of the official heading the department, reporting structure coverage and frequency of internal audit;
16. Discussion with internal auditors of any significant findings and follow up there on;
17. Reviewing the findings of any internal investigations by the internal auditors into matters where there is suspected fraud or irregularity or a failure of internal control systems of a material nature and reporting the matter to the Board;
18. Discussion with Statutory Auditors before the audit commences, about the nature and scope of audit as well as post-audit discussion to ascertain any area of concern;
19. Looking into the reasons for substantial defaults in the payment to the depositors, debenture holders, shareholders (in case of non-payment of declared dividends) and creditors;
20. Recommending to the board of directors the appointment and removal of the external auditor, fixation of audit fees and approval for payment for any other services;
21. Reviewing the functioning of the whistle blower mechanism;
22. Approval of the appointment of the Chief Financial Officer of the Company (“CFO”) (i.e., the whole-time finance director or any other person heading the finance function or discharging that function) after assessing the qualifications, experience and background, etc., of the candidate;
23. Carrying out any other functions as provided under the Companies Act, the SEBI Listing Regulations and other applicable laws;
24. To formulate, review and make recommendations to the Board to amend the Audit Committee charter from time to time;
25. Establishing a vigil mechanism for directors and employees to report their genuine concerns or grievances; and
26. Carrying out any other function as is mentioned in the terms of reference of the Audit Committee.
27. Reviewing the utilization of loans and/or advances from/investment by the holding company in the subsidiary exceeding rupees 100 crore or 10% of the asset size of the subsidiary, whichever is lower.
28. Such roles as may be prescribed under the Companies Act and SEBI Listing Regulations.
(b) Number of Meetings: During the financial year 2021-22, six (6) meetings were held i.e., on May 12, 2021; June 28, 2021; July 28, 2021; October 27, 2021; January 28, 2022 and March 24, 2022.
(c) Composition of the Committee and Meetings attended by each member:
Name of the Member Category Position Meetings
Held Attended
Shubha Rao Mayya Independent Director Chairperson 6 6
Anita Ramachandran Independent Director Member 6 6
Venkatraman Narayanan Executive Director Member 6 6
IV. Nomination, Remuneration and Board Governance Committee (a) Terms of Reference
The Nomination, Remuneration and Board Governance Committee has interalia the following mandate:
1. Formulation of the criteria for determining qualifications, positive attributes and independence of a director and recommend to the Board a policy, relating to the remuneration of the directors, key managerial personnel and other employees;
2. Formulation of criteria for evaluation of performance of Independent Directors and the Board;
3. Devising a policy on Board diversity;
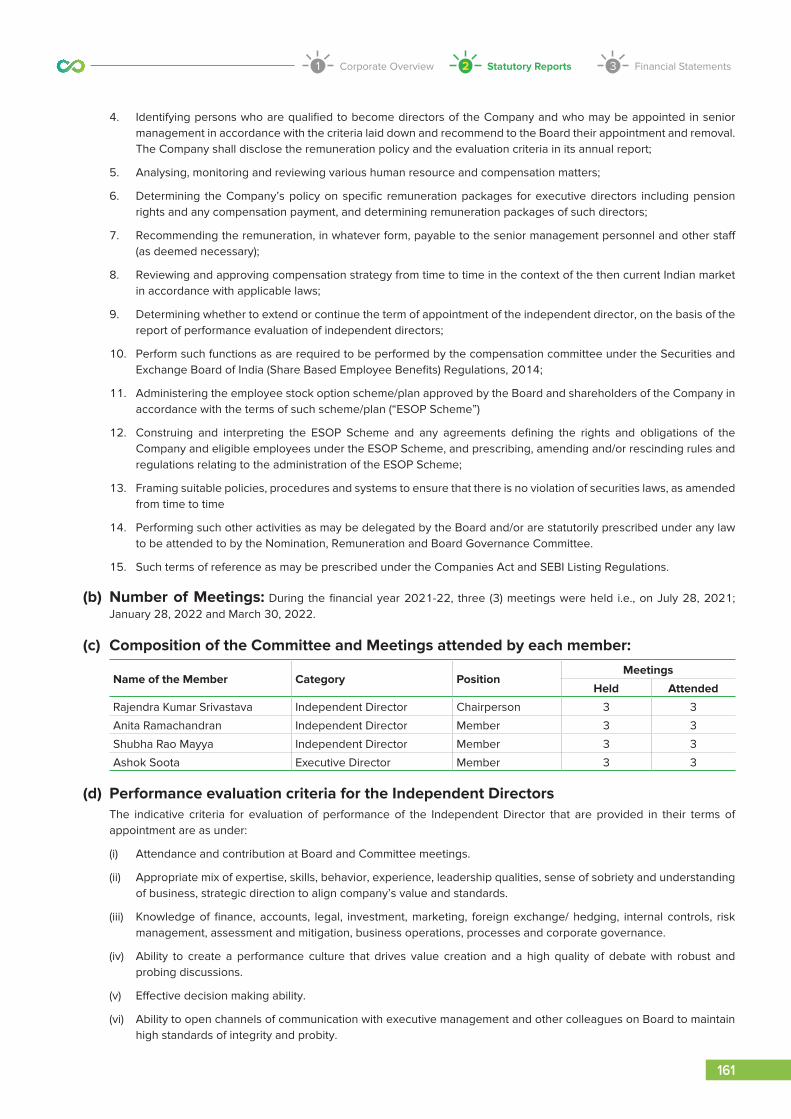
Corporate Overview1 Statutory Reports2 Financial Statements3
161
Annual Report 2021-22
4. Identifying persons who are qualified to become directors of the Company and who may be appointed in senior management in accordance with the criteria laid down and recommend to the Board their appointment and removal. The Company shall disclose the remuneration policy and the evaluation criteria in its annual report;
5. Analysing, monitoring and reviewing various human resource and compensation matters;
6. Determining the Company’s policy on specific remuneration packages for executive directors including pension rights and any compensation payment, and determining remuneration packages of such directors;
7. Recommending the remuneration, in whatever form, payable to the senior management personnel and other staff (as deemed necessary);
8. Reviewing and approving compensation strategy from time to time in the context of the then current Indian market in accordance with applicable laws;
9. Determining whether to extend or continue the term of appointment of the independent director, on the basis of the report of performance evaluation of independent directors;
10. Perform such functions as are required to be performed by the compensation committee under the Securities and Exchange Board of India (Share Based Employee Benefits) Regulations, 2014;
11. Administering the employee stock option scheme/plan approved by the Board and shareholders of the Company in accordance with the terms of such scheme/plan (“ESOP Scheme”)
12. Construing and interpreting the ESOP Scheme and any agreements defining the rights and obligations of the Company and eligible employees under the ESOP Scheme, and prescribing, amending and/or rescinding rules and regulations relating to the administration of the ESOP Scheme;
13. Framing suitable policies, procedures and systems to ensure that there is no violation of securities laws, as amended from time to time
14. Performing such other activities as may be delegated by the Board and/or are statutorily prescribed under any law to be attended to by the Nomination, Remuneration and Board Governance Committee.
15. Such terms of reference as may be prescribed under the Companies Act and SEBI Listing Regulations.
(b) Number of Meetings: During the financial year 2021-22, three (3) meetings were held i.e., on July 28, 2021; January 28, 2022 and March 30, 2022.
(c) Composition of the Committee and Meetings attended by each member:
Name of the Member Category PositionMeetings
Held Attended
Rajendra Kumar Srivastava Independent Director Chairperson 3 3
Anita Ramachandran Independent Director Member 3 3
Shubha Rao Mayya Independent Director Member 3 3
Ashok Soota Executive Director Member 3 3
(d) Performance evaluation criteria for the Independent Directors The indicative criteria for evaluation of performance of the Independent Director that are provided in their terms of
appointment are as under:
(i) Attendance and contribution at Board and Committee meetings.
(ii) Appropriate mix of expertise, skills, behavior, experience, leadership qualities, sense of sobriety and understanding of business, strategic direction to align company’s value and standards.
(iii) Knowledge of finance, accounts, legal, investment, marketing, foreign exchange/ hedging, internal controls, risk management, assessment and mitigation, business operations, processes and corporate governance.
(iv) Ability to create a performance culture that drives value creation and a high quality of debate with robust and probing discussions.
(v) Effective decision making ability.
(vi) Ability to open channels of communication with executive management and other colleagues on Board to maintain high standards of integrity and probity.

162
Annual Report 2021-22
(vii) His/her global presence, rational, physical and mental fitness, broader thinking, vision on corporate social responsibility etc.
(viii) His/her ability to monitor the performance of management and satisfy himself/herself with integrity of the financial controls and systems in place by ensuring right level of contact with external stakeholders.
(ix) His/her contribution to enhance overall brand image of the Company.
V. Remuneration to Directors: (a) Criteria of making payments to Non-Executive Directors Non-Executive Directors are paid sitting fees for attending the Meetings of the Board and of Committees of which they
are members at the rate of ̀ 1,00,000/- (Rupees One Lacs Only) per meeting and commission based on their performance provided however that the aggregate remuneration including commission, so paid to such Directors in a financial year shall not exceed 1% of the net profits of the Company.
(b) Criteria of making payments to Executive Directors The Executive Directors are paid as per the remuneration approved by the Shareholders at the time of their appointment
which are in line with the statutory requirements and Company’s policies. The revision in remuneration, if any is recommended by the Nomination Remuneration and Board Governance Committee to the Board for its consideration by taking into account their individual performance and as well performance of the Company in a given year. Perquisites, performance linked incentives and retirement benefits are paid in accordance with the Company’s compensation policies, as applicable to all employees, which also details criteria for such payments. As per the current terms of their appointment, none of the Executive Directors are entitled to commission on the net profits of the Company.
(c) Details of Remuneration paid to Directors for the financial year 2021-2022Name of the
DirectorSalary
(In ` Lacs)Perquisites(In ` Lacs)
Sitting Fees &
Commission(In ` Lacs)
Shares Issued under ESOPs
Total Remuneration
paid(In ` Lacs)
Details of Service Contracts, Notice Period & Severance fees
Fixed VariableAshok Soota 83 28 4 Nil Nil 115 Appointed as Executive Chairman
and Director for a period of 5 years from 01st April 2019 till 31st March, 2024. All other terms as per employment agreement. Three months’ notice period and no severance fees.
Joseph Anantharaju
239 80 19 Nil Nil 338 Appointed as a Whole-time Director of the Company designated as Executive Vice Chairman, for a period of five years from November 4, 2020 to November 3, 2025. All other terms as per employment agreement. Three months’ notice period and no severance fees.
Venkatraman Narayanan
85 30 10 Nil Nil 125 Appointed as the Managing Director and Chief Financial Officer of the Company, for a period of five years from November 4, 2020 to November 3, 2025. All other terms as per employment agreement. Three months’ notice period and no severance fees.
Anita Ramachandran
Nil Nil Nil 25 Nil 25 NA
Rajendra Kumar Srivastava
Nil Nil Nil 30 Nil 30 NA
Shubha Rao Mayya
Nil Nil Nil 25 Nil 25 NA

Corporate Overview1 Statutory Reports2 Financial Statements3
163
Annual Report 2021-22
VI. Administrative and Stakeholders Relationship Committee (a) Terms of Reference The Administrative and Stakeholders Relationship Committee has interalia the following mandate:
1. Redressal of all security holders’ and investors’ grievances such as complaints related to transfer of shares, including non-receipt of share certificates and review of cases for refusal of transfer/transmission of shares and debentures, non-receipt of balance sheet, non-receipt of declared dividends, non-receipt of annual reports, etc., and assisting with quarterly reporting of such complaints.
2. Reviewing of measures taken for effective exercise of voting rights by shareholders.
3. Investigating complaints relating to allotment of shares, approval of transfer or transmission of shares, debentures or any other securities.
4. Giving effect to all transfer/transmission of shares and debentures, dematerialisation of shares and re-materialisation of shares, split and issue of duplicate/consolidated share certificates, compliance with all the requirements related to shares, debentures and other securities from time to time;
5. Reviewing the measures and initiatives taken by the Company for reducing the quantum of unclaimed dividends and ensuring timely receipt of dividend warrants/annual reports/statutory notices by the shareholders of the Company;
6. Reviewing the adherence to the service standards by the Company with respect to various services rendered by the registrar and transfer agent of the Company and to recommend measures for overall improvement in the quality of investor services;
7. Carrying out such other functions as may be specified by the Board from time to time or specified/provided under the Companies Act or SEBI Listing Regulations, or by any other regulatory authority.
(b) Number of Meetings: During the financial year 2021-2022, three (3) meetings were held i.e., on May 12, 2021; July 28, 2021 and October 27,2021.
(c) Composition of the Committee and Meetings attended by each member:
Name of the Member Category PositionMeetings
Held AttendedAnita Ramachandran Independent Director Chairperson 3 3
Shubha Rao Mayya Independent Director Member 3 3
Venkatraman Narayanan Executive Director Member 3 3
(d) Name and designation of compliance officer : Mr. Praveen Kumar Darshankar, Company Secretary & Compliance Officer.
(e) Details of shareholders’ complaints: (i) Number of shareholders complaints received upto March 31, 2022: 232
(ii) Number of shareholders complaints resolved upto March 31, 2022: 232
(iii) Number of pending complaints as on March 31, 2022: Nil
VII. Corporate Social Responsibility Committee (a) Terms of Reference The Corporate Social Responsibility Committee has interalia the following mandate:
1. To formulate and recommend to the board, a corporate social responsibility policy which shall indicate the activities to be undertaken by the Company as specified in Schedule VII of the Companies Act and the rules made thereunder and make any revisions therein as and when decided by the Board;
2. To Identify corporate social responsibility policy partners and corporate social responsibility policy programmes;
3. To recommend the amount of expenditure to be incurred for the corporate social responsibility activities and the distribution of the same to various corporate social responsibility programmes undertaken by the Company;
4. To delegate responsibilities to the corporate social responsibility team and supervise proper execution of all delegated responsibilities;

164
Annual Report 2021-22
5. To review and monitor the implementation of corporate social responsibility programmes and issuing necessary directions as required for proper implementation and timely completion of corporate social responsibility programmes; and
6. To perform such other duties and functions as the Board may require the corporate social responsibility committee to undertake to promote the corporate social responsibility activities of the Company and exercise such other powers as may be conferred upon the CSR Committee in terms of the provisions of Section 135 of the Companies Act.
(b) Number of Meetings: During the financial year 2021-22, two (2) meetings were held i.e., on May 12, 2021, and January 28, 2022.
(c) Composition of the Committee and Meetings attended by each member:
Name of the Member Category PositionMeetings
Held Attended
Joseph Anantharaju Executive Director Chairperson 2 2
Ashok Soota Executive Director Member 2 2
Shubha Rao Mayya Independent Director Member 2 2
VIII.Risk Management Committee (a) Terms of Reference The Risk Management Committee has interalia the following mandate:
1. To assist the Board in fulfilling its responsibilities with regard to the identification, evaluation and mitigation of strategic, operational, and external environment risks.
2. Formulating, monitoring and overseeing the risk management plan and policy of the Company
3. Review the Cyber Security Functions of the Company on regular intervals.
4. Approve / recommend to the Board for its approval / review the policies, risk assessment models, strategies and associated frameworks for the management of risk.
5. To perform such other duties and functions as the Board may require or as may be prescribed by applicable law, from time to time.
(b) Number of Meetings: During the financial year 2021-2022, Two (2) meetings were held on July 28, 2021 and January 28, 2022.
(c) Composition of the Committee and Meetings attended by each member:
Name of the Member Category PositionMeetings
Held AttendedJoseph Anantharaju Executive Director Chairperson 2 2
Anita Ramachandran Independent Director Member 2 2
Shubha Rao Mayya Independent Director Member 2 2
Venkatraman Narayanan Executive Director Member 2 2
IX. Strategic Initiatives Committee (a) Terms of Reference The Strategic Initiatives Committee has interalia the following mandate:
1. Strategic planning;
2. New strategic projects and initiatives;
3. Mergers, acquisitions and joint ventures;
4. Asset management (including physical infrastructure and information technology);
5. Strategic human resources and other matters;
6. To perform such other duties and functions as the Board may require from time to time.

Corporate Overview1 Statutory Reports2 Financial Statements3
165
Annual Report 2021-22
(b) Number of Meetings: During the financial year 2021-22, three (3) meetings were held i.e., on September 24, 2021, October 27, 2021 and December 17, 2021.
(c) Composition of the Committee and Meetings attended by each member:
Name of the Member Category PositionMeetings
Held AttendedRajendra Kumar Srivastava Independent Director Chairperson 3 3Anita Ramachandran Independent Director Member 3 3Ashok Soota Executive Director Member 3 3Venkatraman Narayanan Executive Director Member 3 3Joseph Anantharaju Executive Director Member 3 3
X. General Body Meetings The Annual General Meetings of the Company were held at the registered office of the Company either through video
conference or through physical presence. Details of last three AGMs held are as below:
Financial Year Date Time (IST) Mode of Meeting
2018-2019 August 1, 2019 5:00 p.m Physical
2019-2020 August 6, 2020 5:00 p.m. Physical2020-2021 July 7, 2021 4:00 p.m. Video Conference
All resolutions moved at the Annual General Meetings were passed through remote e-voting or by show of hands by the requisite majority of members attending the meeting. The following are the special resolutions passed at the previous three AGMs:
AGM held on Summary of Special Resolutions
August 1, 2019 1. Re-appointment of Mr. Ashok Soota as Executive Chairman and Director
August 6, 2020 1. Appointment of Mr. Rajendra Kumar Srivastava as Non-Executive Independent Director of the Company;
2. Appointment of Ms. Anita Ramachandran as Non-Executive Independent Director of the Company;
3. Appointment of Ms. Shubha Rao Mayya as Non-Executive Independent Director of the Company;
4. Approval of payment of commission to Non-Executive Directors of the Company.
July 7, 2021 1. Appointment of Mr. Joseph Vinod Anantharaju as Whole-time Director of the Company designated as Executive Vice Chairman, for a period of five years from November 4, 2020 to November 3, 2025
2. Appointment of Mr. Venkatraman Narayanan as Managing Director and Chief Financial Officer of the Company, for a period of five years from November 4, 2020 to November 3, 2025.
3. Ratification and approval of the ‘Happiest Minds Employee Stock Option Scheme 2020’, formulated and approved prior to the Initial Public Offering of the Company.
No special resolution was passed through postal ballot in the last year. Accordingly, details relating to postal ballot are not applicable.
XI. Means of Communication (a) Financial Results and Newspaper Publication Quarterly and annual financial results are filed with stock exchanges and displayed on stock exchanges websites.
The results are also made available on Company’s website. The results are also normally published in Financial Express (English newspaper – all India edition) and Vishwavani (Regional Newspaper).
(b) Website The Company maintains an active website at https://www.happiestminds.com/investors/ wherein all the information
relevant for the Shareholders are displayed.
(c) Press Releases and Analysts/Investors Presentations The official news releases, meetings scheduled with analysts and detailed presentations made to analysts are
disseminated to stock exchanges and as well displayed on the Company’s website at https://www.happiestminds.com/investors/. The management participates in the analyst/earnings call every quarter, after the announcement of results. The audio recording of analyst calls and transcripts are posted on the Company’s website.

166
Annual Report 2021-22
(d) Annual report Annual Report containing audited standalone and consolidated financial statements together with Board’s Report,
Auditors’ Report and other reports/information are circulated to members entitled thereto and is also made available on the Company Website at https://www.happiestminds.com/investors/.
XII.General Shareholders Information General shareholder information is provided under “Shareholders Information” section attached as Annexure II to this Report.
XIII.Other Disclosures (a) Disclosures on materially significant related party transactions that may have potential
conflict with the interests of listed entity at large During the financial year ended March 31, 2022, there were no materially significant related party transactions that had
potential conflict with the interest of the Company at large.
(b) Details of non-compliance by the Company, penalties, strictures imposed on the Company by the Stock Exchange(s) or SEBI or any statutory authority, on any matter related to capital markets, during the last three years
The Company became listed company from September 17, 2020. No penalty or stricture was imposed by the Stock Exchanges or SEBI or any other authority, from the date of listing. All applicable requirements were fully complied with.
(c) Vigil Mechanism/Whistle-Blower Policy The Company has adopted a Whistle Blower Policy and has established necessary Vigil Mechanism as required under
Regulation 22 of the SEBI (LODR) Regulations, the details of which have been provided in the Board’s Report. The Company affirms that no personnel has been denied access to the Audit Committee.
(d) Details of compliance with mandatory requirements and adoption of the non-mandatory requirements
The Company has complied with all the applicable mandatory requirements of SEBI (LODR) Regulations. Details of adoption of non-mandatory requirements are provide in clause XV below.
(e) Weblink for Policy on determination of Material Subsidiary and Policy on Related Party Transactions
Both the policies can be accessed at https://www.happiestminds.com/investors/policy-documents/
(f) Disclosure of Commodity price risks and commodity hedging activities The Company does not deal in commodities and hence the disclosure pursuant to SEBI (LODR) Regulations are
not applicable.
(g) Details of utilization of funds raised through preferential allotment or qualified institutions placement as specified under Regulation 32 (7A)
During the financial year ended March 31, 2022, there were no funds raised through preferential allotment or qualified institutions placement.
(h) Certificate from Practicing Company Secretary on Non-Disqualification of Directors The Company has obtained a certificate from a Practicing Company Secretary that none of the Directors on the Board of
the Company have been debarred or disqualified from being appointed or continuing as Directors of companies by the SEBI/Ministry of Corporate Affairs or any such statutory authority in accordance with SEBI (LODR) Regulations. Copy of the Certificate is attached as Annexure III.
(i) Recommendation of Committees During the financial year ended March 31, 2022, the Board of Directors of the Company had accepted recommendation
of all the committees of the Board, which were mandatorily required.

Corporate Overview1 Statutory Reports2 Financial Statements3
167
Annual Report 2021-22
( j) Auditors’ Remuneration The details of total fees for all services paid by the Company during FY 2021-22, to the Statutory Auditors are as follows:
Particulars Amount(in ` Lacs )
Payment to Statutory Audit fees (including out of pocket expenses) 62
Certification fees 5
Total 67
(k) Disclosures as required under the Sexual Harassment of Women at Workplace (Prevention, Prohibition and Redressal) Act, 2013
The Company has in place a gender neutral Anti-Sexual Harassment Policy at workplace which is in line with the requirements of the Sexual Harassment of Women at Workplace (Prevention, Prohibition and Redressal) Act, 2013 and the applicable rules, the details of which have been provided in the Boards’ Report.
Details of sexual harassment complaints received: (i) No. of complaints received during financial year 2021-22: Nil
(ii) No. of complaints disposed of during financial year 2021-22: NA
(iii) No. of complaints pending as on end of the financial year 2021-22: NA
(l) Disclosure of Loans and advances in the nature of loans to firms/companies in which directors are interested:
During the Financial Year ended March 31, 2022, there are no loans or advances provided by the Company and its subsidiaries to firms/companies in which directors are interested.
XIV. Non-compliance of Regulations relating to Corporate Governance under SEBI (Listing Obligations and Disclosure Requirements) Regulations, 2015, if any
The Company is fully compliant with SEBI (LODR) Regulations and there are no such non-compliances to report.
XV.Discretionary Requirements The Company has adopted the following discretionary requirements as provided in the SEBI (LODR) Regulations:
(a) Modified opinion(s) in Audit Report The Company is in the regime of unmodified opinions on financial statements and that the Auditors of the Company have
issued Audit Reports with unmodified opinion on the standalone and consolidated financial statements for the financial year ended March 31, 2022.
(b) Reporting of Internal Auditor The Internal Auditors of the Company report directly to the Audit Committee and are invited to be present as invitees at
the Audit Committee meetings held every quarter.
XVI. Disclosures with respect to Demat Suspense Account/Unclaimed Suspense Account
The Company does not have any unclaimed shares and hence the disclosure pursuant to SEBI (LODR) Regulations are not applicable.
XVII.Compliance The Company is in compliance with all the mandatory requirements stipulated under Regulations 17 to 27 read with
Schedule V and clauses (b) to (i) of sub-regulation (2) of Regulation 46 of SEBI (LODR), Regulations, 2015 as applicable with regards to Corporate Governance.
The Company has obtained a certificate from a Practicing Company Secretary on compliance of conditions of Corporate Governance as stipulated in SEBI (LODR) Regulations. Copy of the Certificate is attached to the Boards’ Report.

168
Annual Report 2021-22
ANNEXURE I TO CG REPORT
CEO / CFO CERTIFICATIONMay 05, 2022The Board of DirectorsHappiest Minds Technologies LimitedBengaluru
We, Joseph Anantharaju, Executive Vice Chairman & CEO-PES, Rajiv Shah, President & CEO-DBS, Ram Mohan C, President & CEO-IMSS and Venkatraman Narayanan, Managing Director & CFO of Happiest Minds Technologies Limited to the best of our knowledge and belief, certify that:
(a) We have reviewed the financial statements and the cash flow statement for the quarter and financial year ended March 31, 2022 and confirm that:
(i) these financial statements do not contain any materially untrue statement or omit any material fact or contain statements that might be misleading;
(ii) these financial statements together present a true and fair view of the Company’s affairs and are in compliance with existing Accounting Standards, applicable laws and regulations;
(b) There is, to the best of our knowledge and belief, no transaction entered into by the Company during the quarter and financial year ended March 31, 2022, which is fraudulent, illegal or violative of the Company’s code of conduct.
(c) We accept responsibility for establishing and maintaining Internal Controls for financial reporting and that we have evaluated the effectiveness of Internal Control Systems of the Company pertaining to financial reporting and we have disclosed to the Auditors and the Audit Committee, deficiencies in the design or operation of such Internal Controls, if any, of which we are aware and the steps we have taken or propose to take to rectify these deficiencies.
We have indicated to the Auditors and the Audit committee that for the quarter and financial year ended March 31, 2022, that there were:
(i) no significant changes in Internal Control over financial reporting;
(ii) no significant changes in accounting policies and that the same have been disclosed in the notes to the financial statement; and
(iii) no instances of significant fraud of which we have become aware and there has been no involvement therein of the management or an employee having a significant role in the Company’s Internal Control System over financial reporting.
We further declare that all the Board Members and Senior Management Personnel have affirmed compliance with Code of Conduct in respect of the financial year ended March 31, 2022.
Executive Vice Chairman & CEO-PESSeattle, USA
President & CEO-DBSBoston, USA
President & CEO-IMSSSeattle, USA
MD & CFOBengaluru, India

Corporate Overview1 Statutory Reports2 Financial Statements3
169
Annual Report 2021-22
ANNEXURE II TO CG REPORT
SHAREHOLDERS INFORMATION
1. Annual General Meeting (AGM) of the Company Date: Thursday, the June 30, 2022
Time: 4.00 pm (IST)
Venue: Through Video Conference. For details, please refer to Notice of this AGM.
2. Financial Year The financial year of the Company was from April 1, 2021 to March 31, 2022. The quarterly results for the financial year were
announced as follows:
For the quarter ended June 30, 2021 : July 28, 2021
For the quarter ended September 30, 2021 : October 27, 2021
For the quarter ended December 31, 2021 : January 28, 2022
For the quarter and Financial Year ended March 31, 2022 : May 05, 2022
Company’s tentative calendar (subject to change) for the announcement of quarterly results & AGM during the financial year 2022-23 would be as below:
For the quarter ended June 30, 2022 : July, 2022
For the quarter ended September 30, 2022 : October, 2022
For the quarter ended December 31, 2022 : January, 2023
For the quarter and financial year ended March 31, 2023 : May, 2023
For Annual General Meeting of the Company : June, 2023
3. Dividend PaymentThe Board of Directors of the Company have recommended a final dividend of ` 2/- per equity share of face value of `2/- each, for the financial year ended March 31, 2022, subject to the approval of the shareholders at the ensuing AGM.
The Register of Members of the Company will be closed from Saturday, June 25, 2022 to Thursday, June 30, 2022 (both days inclusive) for the purpose of AGM, annual closing and for determining entitlement of members for the final dividend for FY 2021-22. The record date for payment of final dividend would be June 24, 2022.
The final dividend, if approved, will be paid on or after July 5, 2022.
4. Stock ExchangesThe Company’s equity shares are listed on following Stock Exchanges as on March 31, 2022:
Name of the Exchange and Stock Code Address & Contact details
BSE Limited (“BSE”)Stock Code : 543227
Phiroze Jeejeebhoy Towers, Dalal Street, Mumbai – 400 001, Maharashtra, IndiaTel: +91 22 22721233/34; Fax: +91 22 22721919
National Stock Exchange of India Limited (“NSE”)Stock Code : HAPPSTMNDS
Exchange Plaza, C-1, Block G, Bandra Kurla Complex, Bandra (E), Mumbai – 400 051, Maharashtra, IndiaTel: +91 22 26598100-14; Fax: +91 22 26598120
The Company hereby confirms it has duly paid the listing fees for the financial year 2022-23 to both BSE and NSE. It further confirms that the equity shares of the Company have never been suspended from trading either by BSE or NSE from the time it has been listed.

170
Annual Report 2021-22
5. Stock Market Price Data High and Low (based on daily closing prices) and volume (total number of equity shares traded) during each month in the last
financial year ended March 31, 2022, is as follows:
Month BSE NSEHigh
(Amt in `)Low
(Amt in `)Total Volume
(in Lacs)High
(Amt in `)Low
(Amt in `)Total Volume
(in Lacs)April, 2021 810.00 541.00 51.59 744.00 543.05 745.63May, 2021 910.00 718.20 76.25 910.00 718.80 960.76June, 2021 1,021.60 840.55 50.14 1,020.00 840.20 583.89July, 2021 1,580.80 1,027.00 82.85 1,580.00 1,032.30 1,123.66August, 2021 1,475.05 1,293.55 18.90 1,475.00 1,296.05 202.50September, 2021 1,568.00 1,350.00 18.82 1,568.00 1,362.00 181.70October, 2021 1,438.80 1,215.00 8.02 1,439.00 1,217.00 41.72November, 2021 1,370.00 1,157.90 4.68 1,370.00 1,177.70 27.93December, 2021 1,350.00 1,191.75 6.14 1,355.00 1,194.00 39.81January, 2022 1,360.20 1,100.00 9.31 1,360.00 1,071.65 44.79February, 2022 1,205.00 945.55 12.74 1,205.00 944.50 52.41March, 2022 1,220.00 918.85 13.51 1,224.45 917.95 85.60
6. Stock Performance Performance of the Company’s equity shares (closing share price on last trading day of each month) on NSE in comparison to
BSE Sensex and must be NSE Nifty IT during the financial year ended March 31, 2022 is as follows:
Month Happiest Minds BSE Sensex NSE Nifty ITApril, 2021 724.45 48,782.36 25,664.45May, 2021 867.55 51,937.44 27,115.05June, 2021 1,004.10 52,482.71 29,168.00July, 2021 1,361.60 52,586.84 30,480.05August, 2021 1,427.70 57,552.39 34,570.20September, 2021 1,379.95 59,126.36 35,028.00October, 2021 1,274.40 59,306.93 34,408.75November, 2021 1,205.55 57,064.87 35,043.75December, 2021 1,296.60 58,253.82 38,701.00January, 2022 1,150.90 58,014.17 34,824.55February, 2022 977.90 56,247.28 33,847.85March, 2022 1,056.65 58,568.51 36,317.20
90 .00Apr
2021May
2021Jun
2021Jul
2021Aug
2021Sept2021
Oct2021
Nov2021
Dec2021
Jan2022
Feb2022
Mar2022
110 .00
130 .00
150 .00
170 .00
190 .00
210.00
145.86
141.51
120.06
Note: For the purpose of graph, base value is taken as 100 as of April, 2021 and then projected accordingly
Baseline Happiest Minds BSE Sensex NSE Nifty IT

Corporate Overview1 Statutory Reports2 Financial Statements3
171
Annual Report 2021-22
7. Registrars and Transfer Agents (RTA) All work related to Share Registry, both in physical and electronic form, are handled by the Company’s Registrar and Share
Transfer Agent, whose name and contact details are as given below:
M/s. KFin Technologies Limited
Unit: Happiest Minds Technologies Limited
“Selenium” Tower B, Plot No. 31 & 32, Financial District, Nanakramguda,
Serilingampally Mandal, Hyderabad - 500 032, Telangana, India
Tel. No. + 91 - 1- 800-309-4001; E-mail: [email protected]
Website : https://www.kfintech.com/
8. Share Transfer System Pursuant to Regulation 40 (1) of SEBI (LODR) Regulations, effective from April 1, 2019, transfer of shares in physical mode has
been discontinued and accordingly the Company has not processed transfer of shares in physical mode (except in case of request received for transmission or transposition of shares) from the time the said Regulation was applicable and all the transfer of shares would be carried out only in dematerialized form by the respective Depository Participants of the shareholders.
Accordingly, shareholders holding shares in physical form are urged to have their shares dematerialized at the earliest so that they can transfer them in dematerialized form and participate in various corporate actions.
9. Distribution of Shareholding (a). Distribution of equity shareholding as on March 31, 2022:
Category (No. of Shares) No. of Shareholders
% of Shareholders
No. of Shares
% of Total No. of Shares
1 – 5,000 691,099 99.79 31,358,586 21.35
5,001 – 10,000 736 0.11 2,659,182 1.81
10,001 – 20,000 360 0.05 2,563,143 1.75
20,001 – 30,000 125 0.02 1,537,197 1.05
30,001 – 40,000 69 0.01 1,216,062 0.83
40,001 – 50,000 32 0.00 722,529 0.49
50,001 – 100,000 62 0.01 2,297,049 1.56
100,001 & Above 97 0.01 104,509,808 71.16
Total 692,580 100.00 146,863,556 100.00
(b). Shareholding pattern:
Category of Shareholders
As on March 31, 2022* As on March 31,2021
No. of Share-
holders
% of total Share-
holders
Total Shares
% of total
shares
No. of Share-
holders
% of total Share-
holders
Total Shares
% of total
Shares
Promoters and Promoter group
6 0.00 78,214,420 53.26 6 0.00 78,211,953 53.25
Body corporates 826 0.12 3,293,558 2.24 453 0.22 3,885,334 2.65
FIIs/NRIs/FPI’s 4,857 0.72 11,819,453 8.05 2,637 1.28 13,652,521 9.30
Mutual funds/ Banks/ FI’s/ QIB
15 0.00 2,173,041 1.48 19 0.01 10,841,489 7.38
Clearing Members 127 0.02 238,872 0.16 246 0.12 606,828 0.41
Trust 5 0.00 2,800 0.00 4 0.00 8,204 0.01
Public 669,286 99.14 51,121,412 34.81 203,483 98.37 39,657,227 27.00
Total 675,122 100.00 146,863,556 100.00 206,848 100.00 146,863,556 100.00
*Post consolidation of multiple folios/client IDs

172
Annual Report 2021-22
10. Dematerialization of shares and liquidity 97.94% of the Company's shares are in dematerialized form as on March 31, 2022, held with both the Depositories viz.,
the National Securities Depository Limited (‘NSDL’) and the Central Depository Services (India) Limited (‘CDSL’) and the break-up is as follows:
Description March 31, 2022 March 31, 2021
No. of Holders
No. of Shares
% to Total Shares
No. of Holders
No. of Shares
% to Total Shares
NSDL 1,67,972 11,98,75,867 81.62 73,226 1,276,87,668 86.94
CDSL 5,24,240 2,39,60,285 16.32 1,36,398 1,34,70,629 9.17
Physical 368 30,27,404 2.06 463 57,05,259 3.89
Total 6,92,580 146,863,556 100.00 2,10,087 14,68,63,556 100.00
Under the Depository System, the International Securities Identification Number (ISIN) allotted to the Company’s equity shares is INE419U01012.
11. Outstanding Global Depository Receipts (GDR) or American Depository Receipts (ADR) or warrants or any convertible instruments, conversion date and likely impact on equity
The Company has no outstanding GDR / ADR / warrants or any convertible Instruments as of March 31, 2022.
12. Commodity price risk or foreign exchange risk and hedging activities The Company does not deal in commodities and hence the disclosure pursuant to SEBI (LODR) Regulations are not applicable.
For a detailed discussion on foreign exchange risk and hedging activities with regard to Company’s revenue in foreign currency, please refer to Management Discussion and Analysis Report forming part of the Annual Report.
13. Locations The registered office address and the branch locations along with the contact details has been provided separately in the
Annual Report and the details are also available at https://www.happiestminds.com/location/
14. Address for Correspondence Shareholders can send their correspondence with respect to their shares, dividend, request for annual reports and grievances,
if any to the Company’s RTA as per contact details provided in Sl.No.7 above. They can also correspond with the Company as per below contact details:
Mr. Praveen Kumar DarshankarCompany Secretary & Compliance OfficerHappiest Minds Technologies Limited#53/1-4, Hosur Main Road, Madivala, Bengaluru-560068,Karnataka, India; Tel No.: +91 80 61960300Email : [email protected]
The Company has also designated person for addressing queries relating to results/analyst calls viz., Mr. Sunil Gujjar, Head of Investor Relations and he can be contacted at the above address and through email at [email protected].
15. Credit Ratings India Ratings and Research (Ind-Ra), a credit rating agency, has upgraded the Company’s Long-Term Issuer Rating to ‘IND A+’
from ‘IND A-’. The Outlook is Stable. The instrument-wise ratings outlook and action are as follows:
Instrument type Maturity Date Size of Issue (` Mn) Rating Outlook Rating action
Term Loans January 2024 498.44 INDA+/Stable Upgraded
Fund Based Limit NA 2,150 INDA+/Stable/IND A1+ Upgraded

Corporate Overview1 Statutory Reports2 Financial Statements3
173
Annual Report 2021-22
ANNEXURE III TO CG REPORT
CERTIFICATE OF NON-DISQUALIFICATION OF DIRECTORS(pursuant to Regulation 34(3) and Schedule V Para C clause (10)(i) of the SEBI
(Listing Obligations and Disclosure Requirements) Regulations, 2015)
To,The Members ofHAPPIEST MINDS TECHNOLOGIES LIMITED# 53/1-4, Hosur Main Road, Madivala(Next to Madivala Police Station)Bengaluru - 560068
We have examined the relevant registers, records, forms, returns and disclosures received from the Directors of HAPPIEST MINDS TECHNOLOGIES LIMITED, having CIN - L72900KA2011PLC057931 and having registered office at # 53/1-4, Hosur Main Road, Madivala (Next to Madivala Police Station), Bengaluru - 560068 (hereinafter referred to as ‘the Company’), produced before us by the Company for the purpose of issuing this Certificate, in accordance with Regulation 34(3) read with Schedule V Para-C Sub clause 10(i) of the Securities and Exchange Board of India (Listing Obligations and Disclosure Requirements) Regulations, 2015.
In our opinion and to the best of our information and according to the verifications (including Directors Identification Number (DIN) status at the portal www.mca.gov.in) as considered necessary and explanations furnished to us by the Company & its officers, we hereby certify that none of the Directors on the Board of the Company as stated below for the Financial Year ending on March 31, 2022 have been debarred or disqualified from being appointed or continuing as Directors of companies by the Securities and Exchange Board of India (SEBI) and Ministry of Corporate Affairs (MCA).
Details of Directors:
Sl. No. Name of Director DIN Date of appointment in Company
1. ANITA RAMACHANDRAN 00118188 04/06/2020
2. ASHOK SOOTA 00145962 01/04/2011
3. VENKATRAMAN NARAYANAN 01856347 16/01/2018
4. RAJENDRA KUMAR SRIVASTAVA 07500741 04/06/2020
5. SHUBHA RAO MAYYA 08193276 04/06/2020
6. JOSEPH VINOD ANANTHARAJU 08859640 04/11/2020
Ensuring the eligibility for the appointment / continuity of every Director on the Board is the responsibility of the management of the Company. Our responsibility is to express an opinion based on our verification. This certificate is neither an assurance as to the future viability of the Company nor of the efficiency or effectiveness with which the management has conducted the affairs of the Company.
For V SREEDHARAN & ASSOCIATESCompany Secretaries
Devika SathyanarayanaPartnerFCS: 11323; CP No. 17024
Place: BengaluruDate: May 5, 2022
UDIN: F011323D000271211

174
Annual Report 2021-22
SECTION A: GENERAL DISCLOSURESI. Details of the listed entity
1. Corporate Identity Number (CIN) of the Listed Entity - L72900KA2011PLC057931
2. Name of the Listed Entity - Happiest Minds Technologies Limited
3. Year of Incorporation – 30.03.2011
4. Registered office address – 53/1-4, Hosur Main Road, Madivala, Bengaluru-560068, Karnataka
5. Corporate address - 53/1-4, Hosur Main Road, Madivala, Bengaluru-560068, Karnataka
6. E-Mail – [email protected]
7. Telephone - 08061960300
8. Website - www.happiestminds.com
9. Financial year for which reporting is being done – FY 2021-22
10. Name of the Stock Exchange(s) where shares are listed – NSE/BSE
11. Paid-up Capital - `29,37,27,112
12. Name and contact details (telephone, email address) of the person who may be contacted in case of any queries on the BRSR Report – Aurobinda Nanda, President – Operations (Email: [email protected], Telephone-08061960300)
13. Reporting boundary - Are the disclosures under this report made on a standalone basis (i.e., only for the entity) or on a consolidated basis (for the entity and all the entities which form a part of its consolidated financial statements, taken together) - Disclosures made in this report are on a standalone basis and pertain only to Happiest Minds Technologies Ltd.
II. Products/services14. Details of business activities (accounting for 90% of the turnover):
S. No. Description of Main Activity Description of Business Activity % of Turnover of the Entity
1. Information and communication Computer Programming, Consultancy and related activities
100%
15. Products/Services sold by the entity (accounting for 90% of the entity’s turnover):
S. No. Product/Service NIC Code % of Total Turnover Contributed
1. Computer programming and related activities
6201 100%
III. Operations16. Number of locations where plants and/or operations/offices of the entity are situated:
Location Number of Plants Number of Offices/Presence TotalNational Not Applicable 4 4International Not Applicable 12 12
17. Markets served by the entity:
a. Number of Locations
Locations NumberNational (No. of States) 3International (No. of Countries) 6
Business Responsibility & Sustainability Reporting

Corporate Overview1 Statutory Reports2 Financial Statements3
175
Annual Report 2021-22
b. What is the contribution of exports as a percentage of the total turnover of the entity? 85.23%
c. A brief on types of customers Happiest Minds positions itself as a thought leader who partners with clients to deliver digital transformation,
leveraging disruptive technologies. Led by this vision, the Company focuses on vertical/industry segments, which shows a high propensity to innovate and transform. Based on market analysis, the Company expands into more verticals – e.g., The Company has put additional focus on healthcare since this fiscal. The Company also has specific GTM strategies for different Geos and Domains. Hence, the Market and Customers are also segmented by Geography, and the expansion in new geographies like ANZ and the Middle East is based on this. The Company also believes in forging long-term partnerships with clients & hence additional criteria such as client turnover and IT budget are used as lead indicators of potential to scale and deliver value in multiple areas.
o Verticals:
EduTech
HiTech
Retail
TME (Travel, Media, Entertainment)
BFSI (Banking, Financial Services & Insurance)
Industrial, Manufacturing
Public Service Organizations
Others
o Geographies:
Americas
Europe
India
Middle East
Australia
IV. Employees 18. Details as at the end of Financial Year i.e.
a. Employees and workers (including differently abled):
S. No. Particulars Total (A) Male FemaleNo. (B) % (B / A) No. (C) % (C / A)
EMPLOYEES1. Permanent (D) 3,744 2,777 74.17% 967 25.83%2. Other than Permanent (E) 424 292 68.86% 132 31.21%3. Total employees (D + E) 4,168 3,069 73.63% 1,099 26.37%
* Note: The Company does not have any workers as defined in the guidance note on BRSR.
b. Differently abled employees
S. No Particulars Total (A) Male FemaleNo. (B) % (B / A) No. (C) % (C / A)
DIFFERENTLY ABLED EMPLOYEES1. Permanent (D) 7 5 71% 2 29%2. Other than Permanent (E) 0 0 0% 0 0%3. Total differently abled
employees (D + E)7 5 71% 2 29%
*Note: The Company does not have any workers as defined in the guidance note on BRSR.

176
Annual Report 2021-22
19. Participation/inclusion/representation of women
Total (A) No. and Percentage of Females
No. (B) % (B/A)
Board of Directors 6 2 33%
Key Management Personnel 1 0 0%
20. Turnover rate for permanent employees and workers
FY 2021-22 (YTD; Mar’22)(Turnover rate in current FY)
FY 2020-21 (Turnover rate in previous FY)
FY 2019-20 (Turnover rate in the year prior to the previous FY)
Male Female Total Male Female Total Male Female TotalPermanentEmployees
23.42% 20.60% 22.71% 12.70% 11.56% 12.43% 19.08% 17.53% 18.72%
V. Holding, subsidiary and associate companies (including joint venture)
21. a. Name of the holding/subsidiary/associate companies / joint ventures (A) –
S. No.
Name of the holding/subsidiary / associate companies / joint ventures (A)
Indicate Whether Holding/ Subsidiary/ Associate/ Joint Venture
% Of shares held by
the listed entity
Do the entities indicated in column A participate in the Business
Responsibility initiatives of the listed entity? (Yes/No)
1. Happiest Minds Inc Wholly Owned Subsidiary 100% Yes
VI. CSR details22.
i. Whether CSR is applicable as per Section 135 of Companies Act, 2013: Yes
ii. Turnover: `1,03,354 Lacs
iii. Net worth: `66,974 Lacs
iv. Total amount spent on CSR for FY 2021-22: `215 Lacs
VII. Transparency and Disclosures Compliances 23. Complaints/grievances on any of the principles (Principles 1 to 9) under the National Guidelines on Responsible
Business Conduct (NGRBC)
Stakeholder group from whom the complaint is received
Grievance Redressal
Mechanism(s) in Place (Yes/No)
(If yes, then provide a web
link for Grievance Redressal Policy)
FY 2021-22 FY 2020-21
Current Financial Year Previous Financial Year
Number of complaint(s) filed during
the year
Number of complaint(s)
pending resolution at the close of
the year
Remarks Number of complaint(s) filed during
the yearthe year
Number of complaint(s)
pending resolution
at the close of the year
Remarks
Communities N/A NIL N/A - NIL N/A -Investors (other than shareholders)
N/A NIL N/A - NIL N/A -
Shareholders YES 232 NIL - 5,559 NIL -EmployeesAnd workers
N/A NIL N/A - NIL N/A -
Customers YES 13 NIL - 6 NIL -Value Chain Partners
N/A NIL N/A - NIL N/A -
Others N/A NIL N/A - NIL N/A --
Weblink for Grievance Redressal Policy: Grievance Resolution Policy is shared on Company's intranet platform.

Corporate Overview1 Statutory Reports2 Financial Statements3
177
Annual Report 2021-22
24. Overview of the entity’s material responsible business conduct issues: Please indicate material responsible business conduct and sustainability issues pertaining to environmental and social matters that present a risk or an opportunity to your business, rationale for identifying the same, approach to adapt or mitigate the risk, as per the following format:
S. No.
Material Issue Identified
Indicate Whether risk or opportunity
Rationale for identifying the risk/opportunity
Approach to adapt or mitigate
Positive/Negative Implications
1 Corporate Governance
Risk Strong corporate governance that considers stakeholder concerns, engenders trust, oversees business strategies, and ensures fiscal accountability, ethical corporate behaviour, and fairness to all stakeholders is core to achieving the Company's longer-term mission.
• Robust corporate governance mechanism which ensures responsible business conduct and regulatory compliance• Adequate Independent
Director representation to protect stakeholder interest• Robust enterprise risk
management framework and consideration for ESG risks• Promoters to hold
40% stake to ensure perpetuity in the Company’s vision and culture• Strong checks in place
to prevent corruption and non-compliance
Incorporating various policies and practices to ensuring effective corporate governance ensuring long term sustainability.
2 Information Management & Customer Privacy
Risk Happiest Minds works with a wide range of customer data which leads to increased regulatory scrutiny globally. Cloud-based software and IT services also raise concerns about potential access to user data by governments. Effective management in this area is important to reduce regulatory and reputational risks which can impact revenues, and market share, and lead to punitive actions involving potential fines and other legal costs.
• Implemented Data privacy policies and controls as per the GDPR requirement to protect personal data• In process of
implementing the Privacy Information Management System as per the ISO 27701 standard• Undertaking annual
security awareness sessions
Provides adequate assurance and confidence to the customer for the Protection of their Information Security and Privacy.
3 Data Security Risk Rising instances of cyber-attacks and social engineering puts the Company's as well as the customer's data at risk. Inadequate prevention, detection, and remediation of data security threats can damage the Company's reputation and thus influence customer acquisition and retention, resulting in decreased market share and lower demand for the Company's products.
• Implemented multiple controls to ensure data security and privacy including user awareness and training programs, end point and N/W security controls• Proactive monitoring
and analysis of any new vulnerabilities and threats• Ensuring all third parties
have adequate data protection measures and procedures
Provides adequate assurance and confidence to the customer for the Protection of their Intellectual Property.
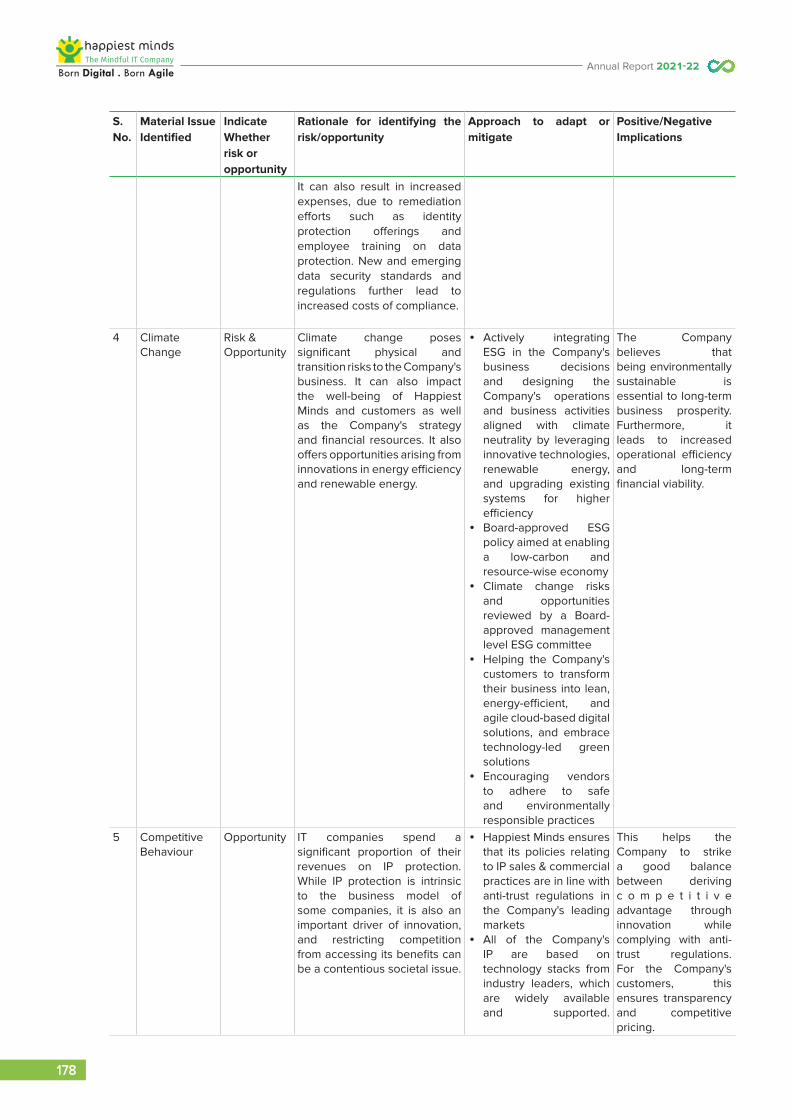
178
Annual Report 2021-22
S. No.
Material Issue Identified
Indicate Whether risk or opportunity
Rationale for identifying the risk/opportunity
Approach to adapt or mitigate
Positive/Negative Implications
It can also result in increased expenses, due to remediation efforts such as identity protection offerings and employee training on data protection. New and emerging data security standards and regulations further lead to increased costs of compliance.
4 Climate Change
Risk & Opportunity
Climate change poses significant physical and transition risks to the Company's business. It can also impact the well-being of Happiest Minds and customers as well as the Company's strategy and financial resources. It also offers opportunities arising from innovations in energy efficiency and renewable energy.
• Actively integrating ESG in the Company's business decisions and designing the Company's operations and business activities aligned with climate neutrality by leveraging innovative technologies, renewable energy, and upgrading existing systems for higher efficiency• Board-approved ESG
policy aimed at enabling a low-carbon and resource-wise economy• Climate change risks
and opportunities reviewed by a Board-approved management level ESG committee• Helping the Company's
customers to transform their business into lean, energy-efficient, and agile cloud-based digital solutions, and embrace technology-led green solutions• Encouraging vendors
to adhere to safe and environmentally responsible practices
The Company believes that being environmentally sustainable is essential to long-term business prosperity. Furthermore, it leads to increased operational efficiency and long-term financial viability.
5 Competitive Behaviour
Opportunity IT companies spend a significant proportion of their revenues on IP protection. While IP protection is intrinsic to the business model of some companies, it is also an important driver of innovation, and restricting competition from accessing its benefits can be a contentious societal issue.
• Happiest Minds ensures that its policies relating to IP sales & commercial practices are in line with anti-trust regulations in the Company's leading markets• All of the Company's
IP are based on technology stacks from industry leaders, which are widely available and supported.
This helps the Company to strike a good balance between deriving c o m p e t i t i v e advantage through innovation while complying with anti-trust regulations. For the Company's customers, this ensures transparency and competitive pricing.

Corporate Overview1 Statutory Reports2 Financial Statements3
179
Annual Report 2021-22
S. No.
Material Issue Identified
Indicate Whether risk or opportunity
Rationale for identifying the risk/opportunity
Approach to adapt or mitigate
Positive/Negative Implications
The Company also ensures that none of its IP infringe third-party patents etc. are based on restrictive proprietary technologies.
For Company's customers, this ensures that their IT landscape is based on future technologies and open standards & they have multiple options for support should the need arise.
6 Systemic Risk Management
Risk Programming errors or server downtime have the potential to generate systemic risks, such as computing and data storage functions to the cloud. The risks are heightened for sensitive sectors, such as financial institutions or utilities, which are critical to national infrastructure. Investments in improving the reliability and quality of IT infrastructure and services are therefore critical.
• Adopted a Secure Software development process to ensure that security vulnerabilities are identified and fixed prior to release• Perform detailed
security testing on the developed application/system
Ensures reduced failure rate, better security controls on the software applications that the Company develops and a better culture that ensures security is by design.
7 Talent and Skill Management
Opportunity The Company's people are the key contributors to value creation. Recruiting qualified members to fill the relevant positions and training them adequately in including niche skills is key to servicing our clients and driving future growth. It also enables the Company to provide a quality differentiator.
• Multiple learning and development programs to upskill and reskill people• Robust system for
acquiring and retaining the right talent
Improves people experience that has a direct impact on the Company's members and customer satisfaction. It prepares them to achieve the Company's strategic goals, which increases customer satisfaction and business performance.
8 People Engagement, Diversity, and Inclusion
Opportunity The health and safety of the Company's teams as well as their physical, emotional, and mental well-being is critical to keeping them motivated, driving their productivity, and influencing their retention. Diversity and Inclusion is essential as it helps in bringing diverse talent within the organization and thus drives a thriving and innovative culture. It also helps the Company understand the needs of its diverse and global customer base.
Happiest Minds believes that Diversity & Inclusion is a journey and not a destination. The Company strives to ensure that everyone can retain their identity that reflects their cultural experiences and feelings. The 'Happiest Minds Diversity Council' focuses on building and sustaining a strong, diverse, equitable & inclusive culture by implementing new programs and policies, guided by the feedback the Company receives from the members.Diverse Talent - Tapping Talent across
Tier 1 & Tier 2 Cities within India to get diverse mix across
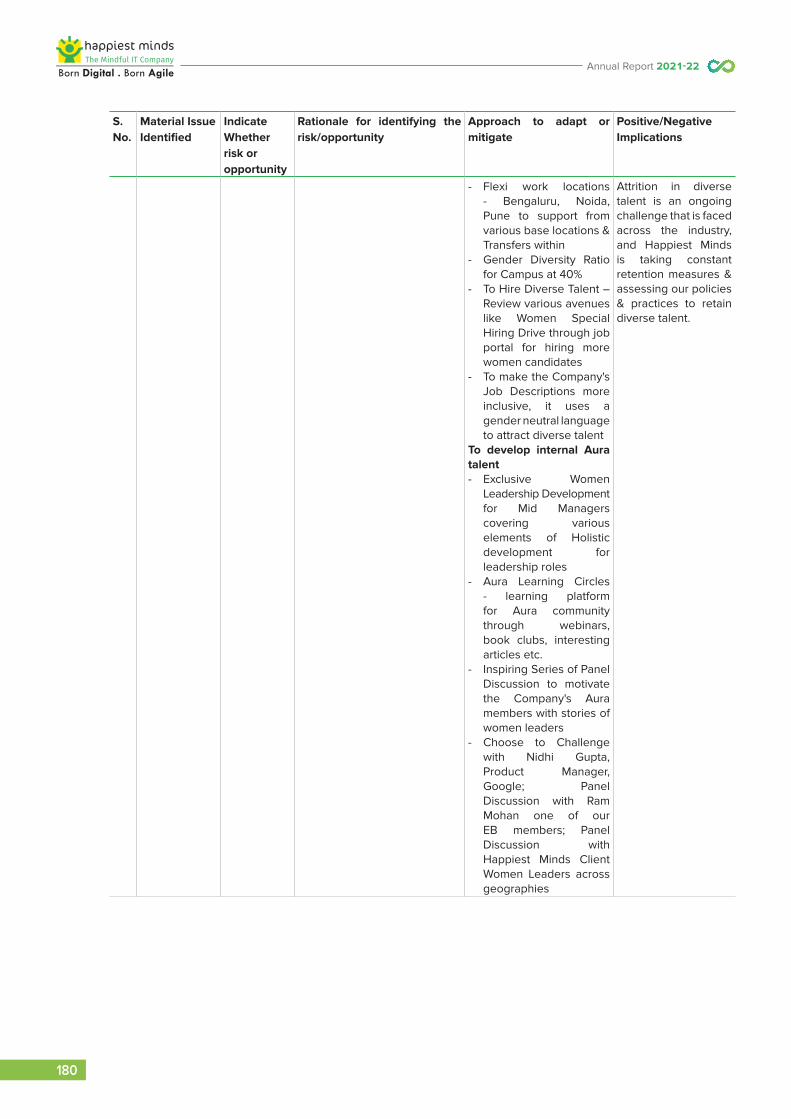
180
Annual Report 2021-22
S. No.
Material Issue Identified
Indicate Whether risk or opportunity
Rationale for identifying the risk/opportunity
Approach to adapt or mitigate
Positive/Negative Implications
- Flexi work locations - Bengaluru, Noida, Pune to support from various base locations & Transfers within
- Gender Diversity Ratio for Campus at 40%
- To Hire Diverse Talent – Review various avenues like Women Special Hiring Drive through job portal for hiring more women candidates
- To make the Company's Job Descriptions more inclusive, it uses a gender neutral language to attract diverse talent
To develop internal Aura talent - Exclusive Women
Leadership Development for Mid Managers covering various elements of Holistic development for leadership roles
- Aura Learning Circles - learning platform for Aura community through webinars, book clubs, interesting articles etc.
- Inspiring Series of Panel Discussion to motivate the Company's Aura members with stories of women leaders
- Choose to Challenge with Nidhi Gupta, Product Manager, Google; Panel Discussion with Ram Mohan one of our EB members; Panel Discussion with Happiest Minds Client Women Leaders across geographies
Attrition in diverse talent is an ongoing challenge that is faced across the industry, and Happiest Minds is taking constant retention measures & assessing our policies & practices to retain diverse talent.

Corporate Overview1 Statutory Reports2 Financial Statements3
181
Annual Report 2021-22
S. No.
Material Issue Identified
Indicate Whether risk or opportunity
Rationale for identifying the risk/opportunity
Approach to adapt or mitigate
Positive/Negative Implications
Engagement & AwarenessThe Company conducts sensitization programs on Diversity and Inclusion which focuses on building skills to enable 2,865 Happiest Minds to leverage the strengths of diverse teams and customers. The Company also has training programs around inclusion which help in mitigating unconscious bias. The annual Diversity Summit, which had over 3,000 participants had a range of experiences, including sign language, LGBTQiA+ awareness among other diversity themes.A series of communication on various aspects of diversity and inclusion is sent through the year.Thought Leadership Women leaders bagged
multiple recognitions - Priya Kanduri - Women
in Tech Award from Asia Pacific HRM Congress
- Preeti Menon - Top 20 Female Cloud Leader in 2021 in Sociable
Recognition Top 25 Best Workplaces for Women (3 consecutive years
9 Social Responsibility
Opportunity Business must be rooted in community and be aligned with its larger interests. Any adversarial relationship can hurt the Company's ability to create long-term value.
Happiest Minds strives to be a good corporate citizen with special emphasis on environmental responsibility and driving inclusivity.
Creating harmonious relationships with the community provides a secure, social license to operate. Also, being socially responsible, Happiest Minds believes in the holistic improvement of the ecosystem.

182
Annual Report 2021-22
SECTION B: MANAGEMENT AND PROCESS DISCLOSURESThe National Guidelines for Responsible Business Conduct (NGRBC) as prescribed by the Ministry of Corporate Affairs advocates nine principles referred to as P1-P9 as given below:
P1 Businesses should conduct and govern themselves with integrity in a manner that is ethical, transparent and accountable
P2 Businesses should provide goods and services in a manner that is sustainable and safe
P3 Businesses should respect and promote the well-being of all employees, including those in their value chains
P4 Businesses should respect the interests of and be responsive towards all its stakeholders
P5 Businesses should respect and promote human rights
P6 Businesses should respect, protect and make efforts to restore the environment
P7 Businesses when engaging in influencing public and regulatory policy should do so in a manner that isresponsible and transparent
P8 Businesses should promote inclusive growth and equitable development
P9 Businesses should engage with and provide value to their consumers in a responsible manner
Disclosure questions P 1 P 2 P3 P4 P5 P6 P7 P8 P9
P1 Ethics & Transpar-
ency
P2 Product Responsi-
bility
P3 Human Resources
P4 Respon-siveness to
Stakeholders
P5 Respect for Human
Rights
P6 Re-sponsible Lending
P7 Public Policy
Advocacy
P8 Inclusive Growth
P9 Customer Engagement
Policy and management processes1. a. Whether your
entity’s policy/ policies cover each principle and its core elements of the NGRBCs. (Yes/No) ^
Yes Yes Yes Yes Yes Yes Yes Yes Yes
b. Has the policy been approved by the Board? (Yes/No){Refer Note 1}
Yes Yes Yes Yes Yes Yes Yes Yes Yes
c. Web link of the policies, if available
https://www.happiestminds.com/investors/policy-documents/Business%20Responsibility%20Policy.pdf
2. Whether the entity has translated the policy into procedures. (Yes / No)
Yes Yes Yes Yes Yes Yes Yes Yes Yes
3. Do the enlisted policies extend to your value chain partners? (Yes/ No)
NO
4. Name the national and international codes/ certifications/ labels/standards
ISO 9001:2015ISO 27001:2013
5. Specific commitments, goals, and targets set by the entity with defined timelines, if any.
1. Achieve carbon neutrality in the Company's operation by 20302. Establish and drive sustainable power usage & water conservation techniques3. Establish volunteering and community involvement programs to cover at least 20% of the Company's teams4. Launch Happiest Minds Foundation with a clear charter by March 20235. Attain the target of 10 Mn meals through Akshaya Patra6. Disclosure levels to be in the top 10% of comparable and best-listed entities in India7. To win IoD or ICSI Awards for Excellence in Corporate Governance
6. Performance of the entity against specific commitments, goals and targets along with reasons in case the same are not met.
At each Board Meeting, the following are presented and reviewed:1. Performance against annual financial and strategy plan2. Review of the inorganic growth plans of the Company3. Objective set for the Management vs. Achievement4. Performance against priorities for the Management for the quarter5. Review of CSR, Environmental Compliances, sustainability framework, and Corporate Governance reports

Corporate Overview1 Statutory Reports2 Financial Statements3
183
Annual Report 2021-22
Governance, Leadership and Oversight7. Statement by the director responsible for the business responsibility report, highlighting ESG-related challenges, targets and achievements
(listed entity has flexibility regarding the placement of this disclosure) Message from President, Operations - Aurobinda Nanda (Reference Page No. 68 of the Annual Report)8. Details of the highest authority responsible for implementation and oversight of the Business Responsibility policy(ies). Venkatraman Narayanan Managing Director & CFO (DIN: 01856347)9. Does the entity have
a specified Committee of the Board/Director responsible for decision-making on sustainability-related issues? (Yes / No). If yes, provide details.
Yes.
Happiest Minds has formulated an ESG Committee approved by the Board responsible for decision-making and incorporating sustainability in core business decisions and internal operations.
This is a management level committee comprising of senior members across major functions at the Company, chaired by a member of the senior management team.
ESG Committee focuses on the Company’s ESG strategy and road map to achieve set targets. The ESG Committee also works on improving the Company’s ESG disclosures to effectively demonstrate the Company's ESG commitment to its stakeholders. The ESG Committee comprises of members across different functions and businesses that help in identifying ESG-related risks and related financial impacts for the Company.
The ESG team meets once every quarter to review the ESG progress and performance.
10. Details of Review of NGRBCs by the Company:
Subject for Review Indicate whether a review was undertaken by the Director / Committee of the Board / Any
other Committee
Frequency (Annually / Half Yearly / Quarterly / Any other – please specify)
P1 P2 P3 P4 P5 P6 P7 P8 P9 P1 P2 P3 P4 P5 P6 P7 P8 P9Performance against the above policies and follow-up action
Y Y Y Y Y Y Y Y Y Q Q Q Q Q Q Q Q Q
Compliance with statutory requirements of relevance to the principles, and rectification of any non-compliances
Y Y Y Y Y Y Y Y Y Q Q Q Q Q Q Q Q Q
Y - Yes, Q - Quarterly
11. Has the entity carried out an independent assessment/evaluation of the working of its policies by an external agency? (Yes/No). If yes, provide the name of the agency.
No. The processes and compliances, however, may be subject to scrutiny by internal auditors and regulatory compliances, as applicable. From a best practices perspective as well as from a risk perspective, policies are periodically evaluated and updated by various department heads and business heads and approved by the management or board. An internal assessment of the workings of the Business Responsibility (BR) policies has been done.
12. If the answer to question (1) above is “No” i.e., not all Principles are covered by a policy, reasons to be stated:
Not Applicable.

184
Annual Report 2021-22
SECTION C: PRINCIPLE-WISE PERFORMANCE DISCLOSUREPRINCIPLE 1 Businesses should conduct and govern themselves with integrity, and in a manner that is Ethical, Transparent and Accountable.
ESSENTIAL INDICATOR
1. Percentage coverage by training and awareness programmes on any of the principles during the financial year.
Segment Total number of Trainings and Awareness Programs Held
Topics/Principles coveredunder the training and its impact
% Of persons in their Respective Categories Covered by the Awareness Programs
Board of Directors /Key Managerial Personnel (KMP)
Program was conducted online, one was done on VILT platform,o Understand the many hidden negative results of conventional
business in terms of both energy and materials processingo Re-imagine a system of profitable businesses delivering the goods
and that the company needs with none of the hidden negatives that it does not want.
o Understand the essential requirements for profitable, durable, and healthy businesses that consistently support their entire community thru time
o Draw insight from the most successful design consultant available and use that insight during the redesign of the business process
o Develop effective and accurate systems that measure sustainable business progress within organizations over time
o Identify deceptive marketing techniques of impostor organizations that pose as legitimate practitioners of sustainable business
0 (0%) members of Board of Director have gone through the awareness program in the last year
1 (100%) member of KMP have gone through the awareness program in the last year
Employees other than the Board of Directors or KMPs
1,428 (34%) members have gone through the awareness program in the last year
2. Details of fines/penalties/punishment/award/compounding fees/settlement amount paid in proceedings (by the entity or by directors/KMPs) with regulators/law enforcement agencies/judicial institutions, in the financial year, in the following format (Note: The entity shall make disclosures on the basis of materiality as specified in Regulation 30 of SEBI (Listing Obligations and Disclosure Obligations) Regulations, 2015 and as disclosed on the entity’s website):
Nil
3. Of the instances disclosed in Question 2 above, details of the Appeal/Revision preferred in cases where monetary or non-monetary action has been appealed.
Not Applicable
4. Does the entity have an anti-corruption or anti-bribery policy? If yes, provide details in brief and if available, provide a web link to the policy.
The Company does not have a separate Anti-bribery policy; however, clause 5.1 of the Integrity Policy of the Company covers the requisites of an Anti-bribery policy. Happiest Minds’ values are Sharing, Mindful, Integrity, Learning, Excellence, and Social Responsibility (SMILES). Values guide behaviour. Integrity, one of the core values, involves respecting commitments not just in letter, but in spirit, by being reliable, trustworthy & dependable, exhibiting professional, intellectual and financial integrity by being truthful, transparent & honest, and sticking up for the right, not just the convenient.
Happiest Minds Technologies Ltd. has articulated this Integrity Policy to build a shared understanding in a diverse, multi-cultural, multi-locational environment. Happiest Minds places a very high value on integrity. Each of its stakeholders – Directors, Members of the Board, Members of the Advisory Board, Happiest Minds (team), Partners, Suppliers, and Consultants (“Stakeholders”)– are responsible for complying with all applicable laws and regulations in each country in which the Company does business and for knowing and complying with the Integrity Policy. The Policy expects that no one at the Company practices any illegal or unfair means to do business and should not accept or give bribes, kickbacks, loans, inducements, gifts, favours, or any other improper payments, direct or indirect, to any government officials, current or prospective customers, suppliers or competitors to win a contract or for some commercial gain.
The policy is shared on the Company’s website: https://www.happiestminds.com/investors/policy-documents

Corporate Overview1 Statutory Reports2 Financial Statements3
185
Annual Report 2021-22
5. Number of Directors/KMPs/employees/workers against whom disciplinary action was taken by any law enforcement agency for the charges of bribery/corruption:
FY 2021-22 FY 2020-21Directors
NIL NILKMPsEmployees
6. Details of complaints with regard to conflict of interest
FY 2021-22 FY 2020-21 FY 2021-22 FY 2020-21Number Remarks Number Remarks
Number of complaints received in relation to issues of conflict of interest of directors
NIL NIL NIL NIL
Number of complaints received in relation to issues of conflict of interest of KMPs
NIL NIL NIL NIL
7. Provide details of any corrective action taken or under way on issues related to fines/penalties/action taken by regulators/law enforcement agencies/judicial institutions, on cases of corruption and conflicts of interest.
Not Applicable
LEADERSHIP INDICATORS
1. Awareness programmes conducted for value chain partners on any of the principles during the financial year.
Total number of awareness programmes held
Topics/Principles covered under the training
% of value chain partners covered (by the value of business done with such partners) under the awareness programmes
21. Prevention Of Sexual
Harassment (POSH) training2. ISMS Training
100%
2. Does the entity have processes in place to avoid/manage conflict of interests involving members of the board? (Yes/No) If yes, provide details of the same.
Yes, the Code of Conduct for Directors and Senior Management covers the definition of ‘conflict of interest’. Clause 5 (5.1) (D) explains the requirement of not involving in any subject matter which could cause a conflict of interest. Managerial Excellence and Development of Agile Leaders (MEDAL) covers the training program on avoiding conflicts to employee categories C7 and above (around 120 employees). The ‘WE HEAR’ tool is the mechanism followed by the Company where the matter of conflict can be raised and sent by email to the CPO directly. Later, a team is formed to resolve the conflict.
PRINCIPLE 2 Businesses should provide goods and services in a manner that is sustainable and safe
1. Percentage of R&D and capital expenditure (capex) investments in specific technologies to improve the environmental and social impacts of product and processes to total R&D and capex investments made by the entity, respectively.
FY 2021-22 FY 2020-21 Details of improvement in Environmental and Social impacts
R&D NA NA NACapex NA NA NA
2. Does the entity have procedures in place for sustainable sourcing? (Yes/No)
a. Yes, Happiest Minds is working proactively with vendors and suppliers to drive social and environmental standards in the supply chain. To implement the ESG standards across the supply chain, a value chain sustainability framework is in place, along with a sustainable sourcing policy and vendor’s code of conduct.
b. If yes, what percentage of inputs were sourced sustainably?”
60% of all inputs were sourced sustainably as per the sustainable sourcing policy.

186
Annual Report 2021-22
3. Describe the processes in place to safely reclaim your products for reusing, recycling, and disposing at the end of life, for (a) Plastics (including packaging), (b) E-waste, (c) Hazardous waste, and (d) other waste.
Being an IT company, there is limited scope for using recycled material as processed inputs. Nonetheless, the Company is constantly seeking out opportunities to recycle waste.
The Company follows the below-mentioned processes to dispose waste safely:
a) Disposing off the plastic waste with Bruhat Bengaluru Mahanagara Palike (BBMP) & non usage of plastic garbage covers and plastic products in the cafeteria
b) IT team sends E-Waste to Karnataka State Pollution Control Board (KSPCB) licensed vendors & receive the certificate of disposal
c) Disposal of hazardous waste like DG filters to KSPCB licensed vendors
d) Disposal of other paper wastes to BBMP
e) Food waste & dry waste is recycled into manure & used for in-house garden
4. Whether Extended Producer Responsibility (EPR) is applicable to the entity’s activities (Yes / No). If yes, whether the waste collection plan is in line with the Extended Producer Responsibility (EPR) plan submitted to Pollution Control Boards? If not, provide steps taken to address the same.
Not Applicable
LEADERSHIP INDICATORS
1. Has the entity conducted Life Cycle Perspective/Assessments (LCA) for any of its products (for manufacturing industry) or for its services (for service industry)? If yes, provide details in the following format?
Not applicable
2. If there are any significant social or environmental concerns and/or risks arising from production or disposal of your products / services, as identified in the Life Cycle Perspective/Assessments (LCA) or through any other means, briefly describe the same along with action taken to mitigate the same.
Not applicable
3. Percentage of recycled or reused input material to total material (by value) used in production (for manufacturing industry) or providing services (for service industry).
Not Applicable
4. Of the products and packaging reclaimed at end of life of products, amount (in metric tonnes) reused, recycled, and safely disposed, as per the following format:
Not Applicable
5. Reclaimed products and their packaging materials (as percentage of products sold) for each product category.
Not Applicable
PRINCIPLE 3 Businesses should respect and promote the well-being of all employees, including those in their value chains
1. a. Details of measures for the well-being of employees
Category % Of employees covered byTotal (A) Health insurance Accident insurance Maternity
benefitsPaternitybenefits
Day care facilities
No. (B) % (B/A) No. (C) % (C/A) No. (D) % (D/A) No. (E) % (E/A) No. (F) % (F/A)PERMANENT EMPLOYEESMale 2,777 2,777 100% 2,777 100% 0 0% 160 6% 0 0Female 967 967 100% 967 100% 76 8% 0 0% 0 0Total 3,744 3,744 100% 3,744 100% 76 2% 160 4% 0 0

Corporate Overview1 Statutory Reports2 Financial Statements3
187
Annual Report 2021-22
Category % Of employees covered byTotal (A) Health insurance Accident insurance Maternity
benefitsPaternitybenefits
Day care facilities
No. (B) % (B/A) No. (C) % (C/A) No. (D) % (D/A) No. (E) % (E/A) No. (F) % (F/A)OTHER THAN PERMANENT EMPLOYEESMale 292 71 24% 71 24% 292 100% - - 292 100%Female 132 46 35% 46 35% 132 100% - - 132 100%Total 424 117 28% 117 28% 424 100% - - 424 100%
* Benefits provided during the reporting time period.
* All partners are provided Health & Accident Insurance - Happiest Minds provides to Team Lease-partners & those deployed from other third party vendors are covered by the respective vendor
b Details of measures for the well-being of workers
Not Applicable
2. Details of retirement benefits for the current and previous financial year
Benefits FY 2021-22 FY2020-21No. of
employees covered as a % of total employees
No. of workers
covered as a % of total
workers
Deducted and deposited with the authority
(Y/N/N.A.)
No. of employees covered as a % of total employees
No. of workers
covered as a % of total
workers
Deducted and deposited with the authority
(Y/N/N.A.)
PF 100% NA Y 100% NA YGratuity 100% NA Y 100% NA YESI 0.4% NA Y 1.7% NA YOthers – please specify - - - - - -
3. Accessibility of workplaces Are the premises/offices accessible to differently-abled employees as per the requirements of the Rights of Persons with
Disabilities Act, 2016? If not, whether any steps are being taken by the entity in this regard.
Happiest Minds has a diverse and inclusive culture that prides itself on gender diversity, generational diversity, persons with different abilities, and so on. All the Company's facilities are wheelchair accessible, making it convenient for a person to move around. For those in need, the Company also provides motorized wheelchairs that one can use in the office premises. Every single Happiest Mind is accepted, valued, and celebrated.
4. Does the entity have an equal opportunity policy as per the Rights of Persons with Disabilities Act, 2016? If so, provide a web link to the policy.
Yes, the Company has an ‘Equal Opportunity Statement’, which is shared on the Company's intranet platform.
5. Return to work and retention rates of permanent employees that took parental leave.
Gender Permanent employeesReturn to work rate Retention rate
Male 100% 100%
Female 100% 100%
Total 100% 100%
6. Is there a mechanism available to receive and redress grievances for the Permanent and Non-permanent employees’ categories of employees? If yes, give details of the mechanism in brief.
Permanent Employees Yes
Other than Permanent Employees Yes
'We Hear' is the Company's application where anyone who is a victim of or witness to sexual harassment or discrimination can raise a complaint with their name or anonymously. This complaint is directed to the Chief People Officer and further action taken to have it addressed and resolved with the help of the Internal Committee (IC).

188
Annual Report 2021-22
The IC members consist of more than 50% of the female members and one external member trained in handling any case without any bias.
1. The Audit Committee has been mandated to establish a vigil mechanism for reporting genuine concerns or grievances.
2. The Administrative and Stakeholders Relationship Committee has been formed for the redressal of all security holders’ and investors’ grievances, such as complaints related to transfer of shares, including non-receipt of share certificates and review of cases for refusal of transfer/transmission of shares and debentures, non-receipt of the balance sheet, non-receipt of declared dividends, non-receipt of annual reports, etc., and assisting with quarterly reporting of such complaints.
3. Internal Committee, as mandated by the Sexual Harassment of Women at Workplace (Prevention, Prohibition and Redressal) Act, 2013, has been set up to redress complaints received regarding sexual harassment. The company has also appointed a lawyer as an external member of the Internal Committee, who specializes in Prevention of Sexual Harassment (“POSH”) and Protection of Children against Sexual Offences Acts.
7. Membership of employees and worker in association(s) or Unions recognized by the listed entity: There is no Union/Association in Happiest Minds that members are affiliated to.
8. Details of training given to employees and workers
Category
FY 2021-22 FY2020-21
Total (A)
On Health and Safety Measures
On Skill Upgradation Total (A)
On Health and Safety Measures
On Skill Upgradation
No. (B) % (B/A) No. (C) % (C/A) No. (B) % (B/A) No. (C) % (C/A)EMPLOYEESMale 2,777 2,777 100% 1,186 49% 2,136 2,136 100% 1,235 58%Female 967 967 100% 494 58% 682 682 100% 426 62%Total 3,744 3,744 100% 1,680 51% 2,818 2,818 100% 1,661 59%
9. Details of performance and career development reviews of employees and workers
Category FY 2021-22 FY2020-21Total (A) No. (B) % (B/A) Total (C) No. (D) % (D/C)
EMPLOYEESMale 2,777 2,777 100% 2,136 2,136 100%Female 967 967 100% 682 682 100%Total 3,744 3,744 100% 2,818 2,818 100%
10. Health and Safety management system:
a. Whether an occupational health and safety management system has been implemented by the entity? (Yes/No). If yes, the coverage of such a system?
Yes, the ‘Health and Safety Policy’ covers all Happiest Minds including Trainees, Consultants and Partners.
b. What are the processes used to identify work-related hazards and assess risks on a routine and non-routine basis by the entity?
• The Company has created and maintained a safe working environment by identifying hazards and assessing and minimizing risks.
• The Company monitors the internal health and safety performance, including work-related accidents, incidents, and significant ill-health occurrences such as epidemic threats and investigates those that do occur and helps reduce their number and severity.
• The Company works closely with appropriate external agencies and within its industry to ensure the continued adoption of appropriate best-practice in health and safety management.
• The Company communicates, involves, and actively engages in training all employees on health and safety issues.
• The Company ensures periodic review of Health and Safety reports to comply with health and safety legislation.
• The Company encourages its suppliers, contractors, and business partners to adopt best practices in health and safety.

Corporate Overview1 Statutory Reports2 Financial Statements3
189
Annual Report 2021-22
c. Whether you have processes for workers to report the work-related hazards and to remove themselves from such risks.
Given the nature of the business, this is not directly applicable.
d. Do the employees/workers of the entity have access to non-occupational medical and healthcare services?
Yes, the Company has tie-ups with hospitals for consulting and has provided access to Doctor 24x7, a tele-consulting free application to all the members. It has also provided the following facilities
• COVID-19 insurance
• Salary Advances & Compassionate Loans are provided for Happiest Minds who test COVID positive.
• Medical Tele-consultation for members and their families.
11. Details of safety-related incidents
Safety Incident/Number Category FY 2021-22 FY 2020-21
Lost Time Injury Frequency Rate (LTIFR) (per one Mn-person hours worked)
Employees NIL NIL
Total recordable work-related injuries Employees NIL NIL
No. of fatalities (safety incident) Employees NIL NIL
High consequence work-related injury or ill-health (excluding fatalities)
Employees NIL NIL
12. Describe the measures taken by the entity to ensure a safe and healthy workplace The organisation emphasises the importance of maintaining a safe and healthy workplace for all its members and third-party
teams who work on its premises. The Company has Health and Safety Policy which includes measures such as:
1. Monitoring the internal health and safety performance, including work-related accidents, incidents, and significant ill-health occurrences such as epidemic threats, shall investigate those that occur and work to help reduce their number and severity.
2. Working closely with appropriate external agencies and within its industry to ensure the continued adoption of appropriate best-practice in health and safety management.
3. Emergency Team dealing with severe incidents involving safety threats to the Company’s locations with potential health and safety implications for team members, clients, or visitors at the Company locations. The Facilities & Administration Team acts in case of fire alarms, medical situations, and partial or total evacuations of the Company location in question. The members of these teams receive relevant training on an annual basis.
13. Number of complaints on the following made by employees:
FY 2021-22 FY 2020-21
Filed during the year
Pending resolution at
the end of year
Remarks Filed during the year
Pending resolution at
the end of year
Remarks
Working conditions NIL NIL - NIL NIL -
Health and safety NIL NIL - NIL NIL -
14. Assessments for the year:
% of your plants and offices that were assessed (by entity or statutory authorities or third parties)
Health and safety practices There have been no assessments done so far. However, the company does cover health issues like COVID-19 and safety precautions in its Risk register with a Moderate risk impactWorking Conditions
15. Provide details of any corrective action taken or underway to address safety-related incidents (if any) and on significant risks / concerns arising from assessments of health and safety practices and working conditions.
Not Applicable.

190
Annual Report 2021-22
LEADERSHIP INDICATORS
1. Does the entity extend any life insurance or any compensatory package in the event of death of? (A) Employees (Y/N) (B) Workers (Y/N).
(A) Yes, Life Insurance is provided as part of the Group Term Life Policy, which provides compensation to the insured person’s family in case of a Happiest Minds’ death.
(B) Not applicable as Happiest Minds Technologies Limited is an IT Company.
2. Provide the measures undertaken by the entity to ensure that statutory dues have been deducted and deposited by the value chain partners.
The Company ensures that statutory dues as applicable to the transactions within the remit of the Company are deducted and deposited in accordance with extant regulations. This activity is also reviewed as part of the internal and statutory audit. The Company expects its value chain partners to uphold business responsibility principles and values of transparency and accountability.
3. Provide the number of employees having suffered high consequence work-related injury / ill-health / fatalities (as reported in Q11 of Essential Indicators above), who have been rehabilitated and placed in suitable employment or whose family members have been placed in suitable employment:
Total no. of affected employees
No. of employees that are rehabilitated and placed in suitable employment or whose family members have been placed in
suitable employment
FY 2021-22 FY 2020-21 FY 2021-22 FY 2020-21
Employees NIL NIL NIL NIL
4. Does the entity provide transition assistance programmes to facilitate continued employability and the management of career endings resulting from retirement or termination of employment? (Yes/No)
Happiest Minds does not have a retirement age; hence this is not applicable.
5. Details on assessment of value chain partners
% Of value chain partners (by the value of business done with such partners) that were assessedHealth and safety practices
As part of the Company’s Value Chain Sustainability Framework, the Company expects all of its value chain partners to follow extant regulations, including health and safety practices and working conditions. Policy on Sustainable Sourcing and ESG are in place to ensure fair working conditions. These parameters are not explicitly captured or measured, but the Company has conducted a Vendors Feedback survey to ascertain the impact of health and safety practices.
Working conditions
6. Provide details of any corrective actions taken or underway to address significant risks/concerns arising from assessments of health and safety practices and working conditions of value chain partners
No corrective action plan has been necessitated regarding the above-mentioned parameters in FY 2021-22. Still, the Company
conducted a Vendors Feedback survey to ensure the health and safety practices to improve the process, which helps build a
good relationship with value chain partners.
PRINCIPLE 4 Businesses should respect the interests of and be responsive to all its stakeholders
ESSENTIAL INDICATOR
1. Describe the processes for identifying key stakeholder groups of the entity.
The stakeholders that could be identified can be employees, shareholders and investors, customers, channel partners, and key partners, regulators, lenders, vendors, credit rating agencies, communities, and non-governmental organizations. Key stakeholders are identified in consultation with the Company’s management to prioritize. The Company understands that a broad and inclusive materiality process, including stakeholder engagement with individual or group of individuals or institutions that adds value to the business chain, is identified as a key stakeholder. The expectations and concerns of identified stakeholders help in the prioritization of strategy, policies, and action plans for the environment, economy, and society. The key stakeholder groups that will be the recipient of the Company's CSR contribution are decided by the Board of Directors’ CSR Committee.
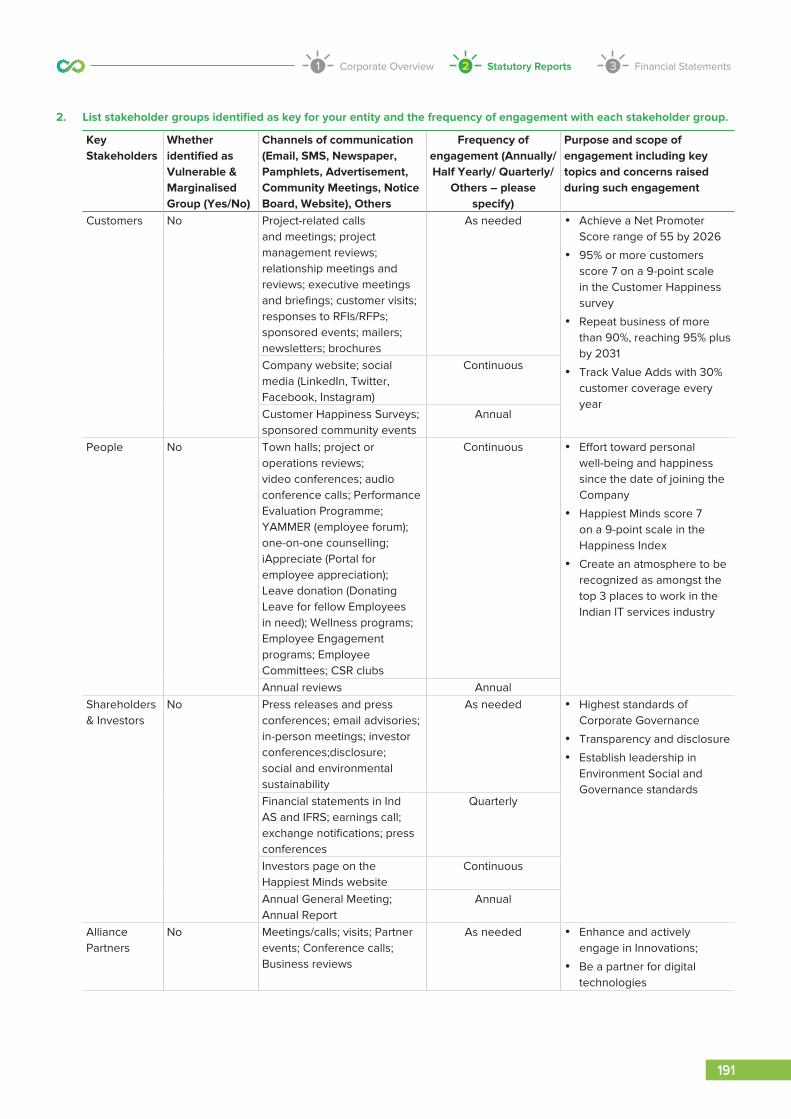
Corporate Overview1 Statutory Reports2 Financial Statements3
191
Annual Report 2021-22
2. List stakeholder groups identified as key for your entity and the frequency of engagement with each stakeholder group.
Key Stakeholders
Whether identified as Vulnerable & Marginalised Group (Yes/No)
Channels of communication (Email, SMS, Newspaper, Pamphlets, Advertisement, Community Meetings, Notice Board, Website), Others
Frequency of engagement (Annually/Half Yearly/ Quarterly/
Others – please specify)
Purpose and scope of engagement including key topics and concerns raised during such engagement
Customers No Project-related calls and meetings; project management reviews; relationship meetings and reviews; executive meetings and briefings; customer visits; responses to RFIs/RFPs; sponsored events; mailers; newsletters; brochures
As needed • Achieve a Net Promoter Score range of 55 by 2026
• 95% or more customers score 7 on a 9-point scale in the Customer Happiness survey
• Repeat business of more than 90%, reaching 95% plus by 2031
• Track Value Adds with 30% customer coverage every year
Company website; social media (LinkedIn, Twitter, Facebook, Instagram)
Continuous
Customer Happiness Surveys; sponsored community events
Annual
People No Town halls; project or operations reviews; video conferences; audio conference calls; Performance Evaluation Programme; YAMMER (employee forum); one-on-one counselling; iAppreciate (Portal for employee appreciation); Leave donation (Donating Leave for fellow Employees in need); Wellness programs; Employee Engagement programs; Employee Committees; CSR clubs
Continuous • Effort toward personal well-being and happiness since the date of joining the Company
• Happiest Minds score 7 on a 9-point scale in the Happiness Index
• Create an atmosphere to be recognized as amongst the top 3 places to work in the Indian IT services industry
Annual reviews AnnualShareholders & Investors
No Press releases and press conferences; email advisories; in-person meetings; investor conferences;disclosure; social and environmental sustainability
As needed • Highest standards of Corporate Governance
• Transparency and disclosure
• Establish leadership in Environment Social and Governance standards
Financial statements in Ind AS and IFRS; earnings call; exchange notifications; press conferences
Quarterly
Investors page on the Happiest Minds website
Continuous
Annual General Meeting; Annual Report
Annual
Alliance Partners
No Meetings/calls; visits; Partner events; Conference calls; Business reviews
As needed • Enhance and actively engage in Innovations;
• Be a partner for digital technologies

192
Annual Report 2021-22
Key Stakeholders
Whether identified as Vulnerable & Marginalised Group (Yes/No)
Channels of communication (Email, SMS, Newspaper, Pamphlets, Advertisement, Community Meetings, Notice Board, Website), Others
Frequency of engagement (Annually/Half Yearly/ Quarterly/
Others – please specify)
Purpose and scope of engagement including key topics and concerns raised during such engagement
Community No Presentations; Reviews;
calls and meetings; surveys; consultative sessions;
field visits; due diligence; conferences and seminars;
surveys; press releases; press conferences; sponsored events Contribute time and financial resources to a social cause. Actively engage, participate and support social and environmental causes and associate with organizations working towards this goal
As needed • Being a responsible Corporate Citizen;
• Promote Sustainable Development and Socially Responsible Culture
Vendors No Project management reviews; relationship meetings and reviews; contracts
As needed • Fair business practices
• Governance
• Sustainability of Demand
• Creditworthiness
• Promote small businessesGovernment and Regulatory Bodies
No • Representations on consultative papers by regulatory authorities
• Interactions with statutory bodies like SEBI, Labour Authorities, CPCB, etc.
• Policy Advocacy
• Interactions / Representations with government through industry associations like
NASSCOM, FICCI, ASSOCHAM, CII
As needed Participate in National economic development

Corporate Overview1 Statutory Reports2 Financial Statements3
193
Annual Report 2021-22
LEADERSHIP INDICATORS
1. Provide the processes for consultation between stakeholders and the Board on economic, environmental, and social topics or if consultation is delegated, how is feedback from such consultations provided to the Board.
Happiest Minds undertakes materiality as one of the critical processes in identifying and prioritizing the most pertinent issues. Key stakeholders are identified through an exercise undertaken in consultation with the Company's management. The prioritized list includes everyone from customers, employees, shareholders, investors, government and regulatory bodies, communities and NGOs, staffing agencies, alliance partners, and other vendors. A stakeholder interaction exercise with both internal and external stakeholders is then undertaken as part of the development of this report.
Consultation medium between stakeholders, Company Management, and Board takes place through various channels as listed below.
S. No. Identified Stakeholder Group
Stakeholder Consultation Process
1 Customers Project-related calls and meetings; project management reviews; relationship meetings and reviews; executive meetings and briefings; customer visits; responses to RFIs/RFPs; sponsored events; mailers; newsletters; brochures, Company website; social media (LinkedIn, Twitter, Facebook, Instagram); Customer Happiness Surveys; sponsored community events
2 People Town halls; project or operations reviews; video conferences; audio conference calls; PEP; YAMMER (employee forum); one-on-one counselling; iAppreciate (Portal for employee appreciation); Leave donation scheme (Donating Leave for fellow Employees in need); Wellness programs; Employee Engagement programs; Annual reviews; Employee Committees
3 Shareholders & Investors
Press releases and press conferences; email advisories; in-person meetings; investor conferences; disclosure; social and environmental sustainability, financial statements in Ind AS and IFRS; earnings call; exchange notifications; press conferences; Investors page, on Happiest Minds website Annual General Meeting; Annual Report
4 Alliance Partners Meetings/calls; visits; Partner events; Conference calls; Business reviews5 Community Presentations; Project meetings; Reviews; calls and meetings; surveys; consultative sessions;
field visits; due diligence; conferences and seminars; surveys; press releases; press conferences; sponsored events; Contribute time and financial resources in a social cause, actively engage, participate and support social and environmental causes and associate with organizations working towards this goal
6 Vendors The Company has conducted a vendor satisfaction survey during the year and are in the process of implementing the Vendor Audit and the Self-assessment questionnaire on ESG
7 Government & Regulatory Bodies
Inputs towards drafting new policies, rules & regulations
2. Whether stakeholder consultation is used to support the identification and management of environmental, and social topics (Yes / No). If so, provide details of instances as to how the inputs received from stakeholders on these topics were incorporated into the policies and activities of the entity.
Yes. ESG requirements in RfP from customers demand information and commitment on carbon neutrality, science-based targets, diversity, inclusion, equity, etc. Such requirements have been taken into account and have internalized the ESG requirements with the existing ESG framework in consultation with Happiest Minds' Executive Board.
3. Provide details of instances of engagement with, and actions are taken to, address the concerns of vulnerable/marginalised stakeholder groups.
Not Applicable

194
Annual Report 2021-22
PRINCIPLE 5 Businesses should respect and promote human rights
1. Employees who have been provided training on human rights issues and policy(ies)
Category FY 2021-22 FY 2020-21Total (A) No. of employees
covered (B)% (B/A) Total (C) No. of employees
covered (D)% (D/C)
EMPLOYEESPermanent 3,744 3,744 100% 2,136 2,136 100%Other than Permanent 424 424 100% 682 682 100%Total employees 4,168 4,168 100% 2,818 2,818 100%
*Note: The Company does not have any workers as defined in the guidance note on BRSR.
2. Details of minimum wages paid to employees and workers, in the following format
Category FY 2021-22 FY 2020-21
Total (A)
Equal to Minimum Wage
More than Minimum Wage
Total (D)
Equal to Minimum Wage
More than Minimum Wage
No. (B) % (B/A) No. (C) % (C/A) No. (E) % (E/D) No. (F) % (F/D)
EMPLOYEES
Permanent 3,744 40 1% 3,704 99% 2,730 43 2% 2,687 98%
Male 2,775 31 1% 2,744 99% 2,053 27 1% 2,026 99%
Female 969 9 1% 960 99% 677 16 2% 661 98%
Other than Permanent 424
All Other Than Permanent employees are under the payroll of third-party vendorsMale 292
Female 132
*Note: The Company does not have any workers as defined in the guidance note on BRSR.
3. Details of remuneration/salary
Male Female
Number Median remuneration/ salary/wages of
respective category in `
Number Median remuneration/ salary/wages of
respective category in `
Board of Directors (BoD) (Whole-time directors)
3 1,22,45,900 NA NA
Key Managerial Personnel (other than BoD) 1 50,00,800 NA NA
Employees other than BoD and KMP* 2,771 13,03,700 969 9,00,000
Workers N/A N/A N/A N/A
4. Do you have a focal point (Individual/ Committee) responsible for addressing human rights impacts or issues caused or contributed to by the business? (Yes/No)
Yes, Happiest Minds has an Internal committee that handles all human rights impacts or issues.
5. Describe the internal mechanisms in place to redress grievances related to human rights issues
Internal Committee (IC) has been set up to redress complaints received regarding sexual harassment. The company has also appointed a lawyer as an external Internal Committee member who specializes in the Prevention of Sexual Harassment (“POSH”) and Protection of Children against Sexual Offences Acts.
With respect to other human rights issues, the below mechanism is in place:
• Raising a complaint in the “We Hear” application in Smiles Central. The request shall be assigned to Chief People Officer. If the complaint is against the Chief People Officer, the Happiest Mind can directly submit the complaint to the Executive Board and the Executive Chairman. This complaint shall then be referred to the Internal Committee.
• Sending the complaint or contacting any member of the IC.

Corporate Overview1 Statutory Reports2 Financial Statements3
195
Annual Report 2021-22
6. Number of Complaints on the following made by employees and workers:
FY 2021-22 FY 2020-21
Filed during
the year
Pending resolution at the end of the year
Remarks Filed during
the year
Pending resolution at the end of the year
Remarks
Sexual Harassment NIL NIL - NIL NIL -Discrimination at workplace NIL NIL - NIL NIL -Child labour NIL NIL - NIL NIL -Forced labour / Involuntary labour NIL NIL - NIL NIL -Wages NIL NIL - NIL NIL -Other human rights related issues NIL NIL - NIL NIL -
7. Mechanisms to prevent adverse consequences to the complainant in discrimination and harassment cases
The Company is an equal employment opportunity provider. As part of its Equal Opportunity Policy, it provides equal opportunities at all levels of employment without discrimination on the grounds of race, ethnicity, nationality, gender, language, age, sexual orientation, religion, marital status, socio-economic status, or special ability. During the fiscal year, it has hired 1,736 people, out of which 469 were women.
• An awareness program is conducted for all new hires on discrimination and harassment.
• The policy is drafted and shared across the organization for quick reference.
• Posters are put up in all common areas on Do’s and Don’ts with contact details in the case, employees wish to raise a complaint.
• Employees can raise concerns or complaints with the Company's internal tool “We Hear”.
The Company has a policy against sexual harassment and a formal process for dealing with complaints of harassment or discrimination. The Company has strict guidelines for preventing sexual harassment. POSH training is conducted regularly; this is mandatory for all new joiners. The Company encourages participation of women & building representation through focused initiatives and interventions. Regarding the same, Happiest Minds has policies implemented to build a conducive workplace for women.
To prevent any adverse impact, the Company has undertaken initiatives to make the workplace safe for women, which include building employee awareness and stringent guidelines on Prevention of Sexual Harassment.
As a responsible organization, Happiest Minds has always believed in providing its members with a supportive work environment.
8. Do human rights requirements form part of your business agreements and contracts? (Yes/No)
Yes. All business agreements and contracts with Happiest Minds are bound by the Code of Conduct, and abiding by the fundamentals of Human Rights is a pre-requisite to conducting the business.
9. Assessments for the year
% Of offices that were assessed (by the entity or statutory authorities or third parties)
Child labour The Company follows the laws, as applicable. Although no assessment was done by the Company, no complaints were received.Forced/involuntary labour
Sexual harassment
Discrimination at workplace
Wages
Others – please specify
10. Provide details of any corrective actions taken or underway to address significant risks/concerns arising from the assessments at Question 9 above.
With a detailed assessment of topics mentioned above related to Human Rights, the Company has followed the applicable laws. Hence, it does not foresee any significant risks/concerns.
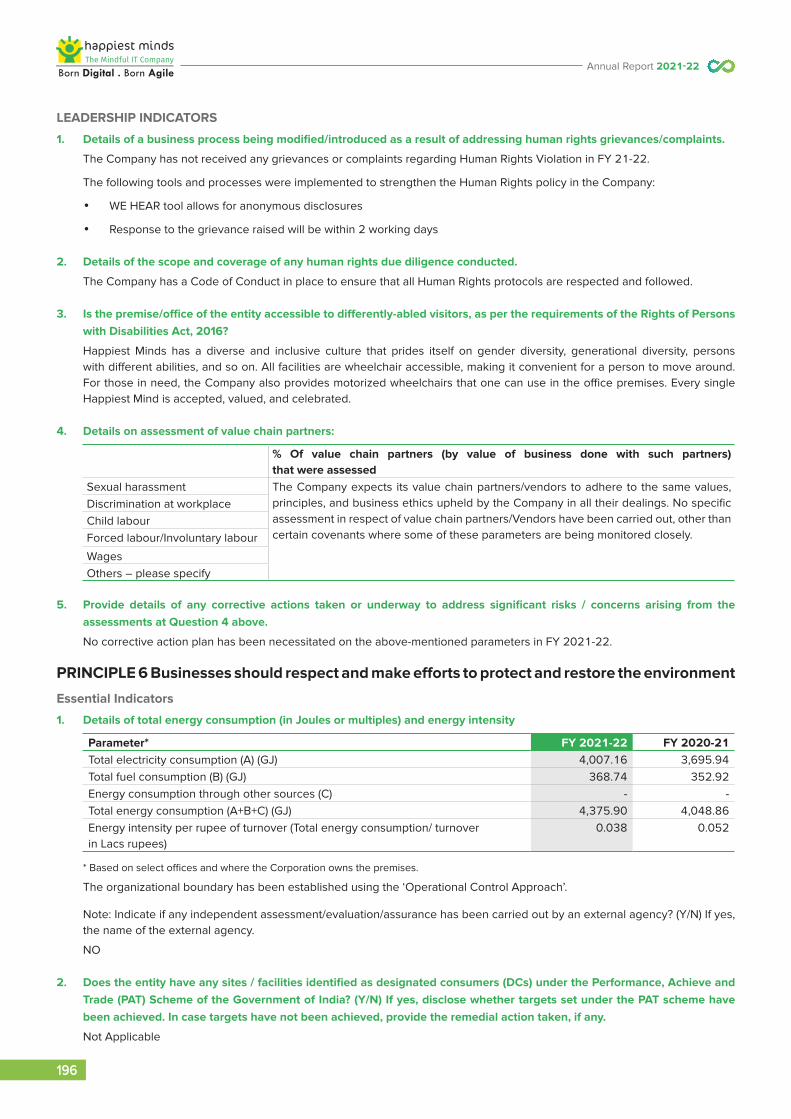
196
Annual Report 2021-22
LEADERSHIP INDICATORS
1. Details of a business process being modified/introduced as a result of addressing human rights grievances/complaints.
The Company has not received any grievances or complaints regarding Human Rights Violation in FY 21-22.
The following tools and processes were implemented to strengthen the Human Rights policy in the Company:
• WE HEAR tool allows for anonymous disclosures
• Response to the grievance raised will be within 2 working days
2. Details of the scope and coverage of any human rights due diligence conducted.
The Company has a Code of Conduct in place to ensure that all Human Rights protocols are respected and followed.
3. Is the premise/office of the entity accessible to differently-abled visitors, as per the requirements of the Rights of Persons with Disabilities Act, 2016?
Happiest Minds has a diverse and inclusive culture that prides itself on gender diversity, generational diversity, persons with different abilities, and so on. All facilities are wheelchair accessible, making it convenient for a person to move around. For those in need, the Company also provides motorized wheelchairs that one can use in the office premises. Every single Happiest Mind is accepted, valued, and celebrated.
4. Details on assessment of value chain partners:
% Of value chain partners (by value of business done with such partners) that were assessed
Sexual harassment The Company expects its value chain partners/vendors to adhere to the same values, principles, and business ethics upheld by the Company in all their dealings. No specific assessment in respect of value chain partners/Vendors have been carried out, other than certain covenants where some of these parameters are being monitored closely.
Discrimination at workplaceChild labourForced labour/Involuntary labour
WagesOthers – please specify
5. Provide details of any corrective actions taken or underway to address significant risks / concerns arising from the assessments at Question 4 above.
No corrective action plan has been necessitated on the above-mentioned parameters in FY 2021-22.
PRINCIPLE 6 Businesses should respect and make efforts to protect and restore the environment
Essential Indicators
1. Details of total energy consumption (in Joules or multiples) and energy intensity
Parameter* FY 2021-22 FY 2020-21Total electricity consumption (A) (GJ) 4,007.16 3,695.94Total fuel consumption (B) (GJ) 368.74 352.92Energy consumption through other sources (C) - -Total energy consumption (A+B+C) (GJ) 4,375.90 4,048.86Energy intensity per rupee of turnover (Total energy consumption/ turnover in Lacs rupees)
0.038 0.052
* Based on select offices and where the Corporation owns the premises.
The organizational boundary has been established using the ‘Operational Control Approach’.
Note: Indicate if any independent assessment/evaluation/assurance has been carried out by an external agency? (Y/N) If yes, the name of the external agency.
NO
2. Does the entity have any sites / facilities identified as designated consumers (DCs) under the Performance, Achieve and Trade (PAT) Scheme of the Government of India? (Y/N) If yes, disclose whether targets set under the PAT scheme have been achieved. In case targets have not been achieved, provide the remedial action taken, if any.
Not Applicable
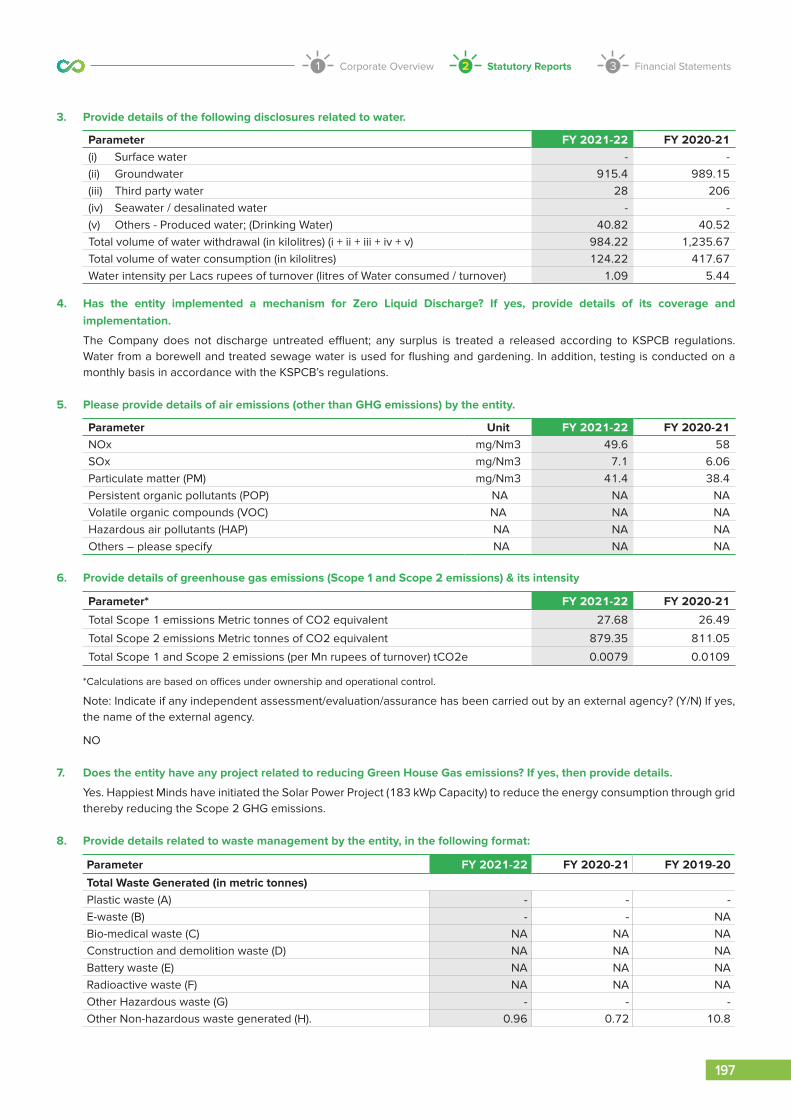
Corporate Overview1 Statutory Reports2 Financial Statements3
197
Annual Report 2021-22
3. Provide details of the following disclosures related to water.
Parameter FY 2021-22 FY 2020-21(i) Surface water - -(ii) Groundwater 915.4 989.15(iii) Third party water 28 206(iv) Seawater / desalinated water - -(v) Others - Produced water; (Drinking Water) 40.82 40.52Total volume of water withdrawal (in kilolitres) (i + ii + iii + iv + v) 984.22 1,235.67Total volume of water consumption (in kilolitres) 124.22 417.67Water intensity per Lacs rupees of turnover (litres of Water consumed / turnover) 1.09 5.44
4. Has the entity implemented a mechanism for Zero Liquid Discharge? If yes, provide details of its coverage and implementation.
The Company does not discharge untreated effluent; any surplus is treated a released according to KSPCB regulations. Water from a borewell and treated sewage water is used for flushing and gardening. In addition, testing is conducted on a monthly basis in accordance with the KSPCB’s regulations.
5. Please provide details of air emissions (other than GHG emissions) by the entity.
Parameter Unit FY 2021-22 FY 2020-21NOx mg/Nm3 49.6 58 SOx mg/Nm3 7.1 6.06Particulate matter (PM) mg/Nm3 41.4 38.4Persistent organic pollutants (POP) NA NA NAVolatile organic compounds (VOC) NA NA NA Hazardous air pollutants (HAP) NA NA NAOthers – please specify NA NA NA
6. Provide details of greenhouse gas emissions (Scope 1 and Scope 2 emissions) & its intensity
Parameter* FY 2021-22 FY 2020-21
Total Scope 1 emissions Metric tonnes of CO2 equivalent 27.68 26.49
Total Scope 2 emissions Metric tonnes of CO2 equivalent 879.35 811.05
Total Scope 1 and Scope 2 emissions (per Mn rupees of turnover) tCO2e 0.0079 0.0109
*Calculations are based on offices under ownership and operational control.
Note: Indicate if any independent assessment/evaluation/assurance has been carried out by an external agency? (Y/N) If yes, the name of the external agency.
NO
7. Does the entity have any project related to reducing Green House Gas emissions? If yes, then provide details.
Yes. Happiest Minds have initiated the Solar Power Project (183 kWp Capacity) to reduce the energy consumption through grid thereby reducing the Scope 2 GHG emissions.
8. Provide details related to waste management by the entity, in the following format:
Parameter FY 2021-22 FY 2020-21 FY 2019-20
Total Waste Generated (in metric tonnes)Plastic waste (A) - - -E-waste (B) - - NABio-medical waste (C) NA NA NAConstruction and demolition waste (D) NA NA NABattery waste (E) NA NA NARadioactive waste (F) NA NA NAOther Hazardous waste (G) - - -Other Non-hazardous waste generated (H). 0.96 0.72 10.8

198
Annual Report 2021-22
Parameter FY 2021-22 FY 2020-21 FY 2019-20
Other Non-hazardous waste generated (H). H-1: Wet Waste (Food Waste)
0 0 8.4
H-2: Dry wastepaper waste 0.96 0.72 2.4
Total (A+B + C + D + E + F + G + H) 0.96 0.72 10.8
For each category of waste generated, total waste recovered through recycling, re-using, or other recovery operations (in metric tonnes)Category of waste(i) Recycled - - -
(ii) Re-used - - -
(iii) Other recovery operations NA NA NA
Category 1 (Wet waste food waste) 0 0 0.5
Category 2 (Dry wastepaper waste) 0 0 0
Total 0 0 0.5For each category of waste generated, total waste disposed of by nature of disposal method (in metric tonnes)
NA NA NA
Category of waste NA NA NA
(i) Incineration NA NA NA
(ii) Landfilling NA NA NA
(iii) Other disposal operations NA NA NA
Category 1 (Wet waste food waste) 0 0 7.9
Category 2 (Dry wastepaper waste) 0.96 0.72 2.4
Total 0.96 0.72 10.3
Note: Indicate if any independent assessment/evaluation/assurance has been carried out by an external agency? (Y/N) If yes, the name of the external agency.
NO
9. Briefly describe the waste management practices adopted in your establishments. Describe the strategy adopted by your company to reduce the usage of hazardous and toxic chemicals in your products and processes and the practices adopted to manage such wastes.
Given the nature of the business, there is no usage of hazardous and toxic chemicals by the organisation.
10. If the entity has operations/offices in/around ecologically sensitive areas (such as national parks, wildlife sanctuaries, biosphere reserves, wetlands, biodiversity hotspots, forests, coastal regulation zones etc.) where environmental approvals/clearances are required, please specify details in the following format:
S no.Location of
operations/officesType of
operations
Whether the conditions of environmental approval / clearance are being complied with? (Y/N) If no, the reasons thereof and corrective
action taken, if any
NA NA NA NA
11. Details of environmental impact assessments of projects undertaken by the entity based on applicable laws, in the current financial year:
Name and brief details of project
EIA Notification No.
Date Whether conducted by independent external
agency (Yes / No)
Results communicated in public domain (Yes / No)
Relevant Web link
NA NA NA NA NA NA
12. Is the entity compliant with the applicable environmental law/regulations/guidelines in India; such as the Water (Prevention and Control of Pollution) Act, Air (Prevention and Control of Pollution) Act, and Environment Protection Act and Rules thereunder (Y/N). If not, provide details of all such non-compliances.
Yes, Happiest Minds is compliant with all the applicable environmental laws and regulations based on its nature of business.

Corporate Overview1 Statutory Reports2 Financial Statements3
199
Annual Report 2021-22
S. No. Specify the law / regulation / guidelines which was
not complied with
Provide details of the noncompliance
Any fines / penalties / action taken by regulatory agencies
such as pollution control boards or by courts
Corrective action taken, if any
NA NA NA NA NA
LEADERSHIP INDICATOR
1. Provide break-up of the total energy consumed (in Joules or multiples) from renewable and non-renewable sources, in the following format:
Parameter FY 2021-22 FY 2020-21
From renewable sources
Total electricity consumption (A) - -
Total fuel consumption (B) - -
Energy consumption through other sources (C) - -
Total energy consumed from renewable sources (A+B+C) - -
From non-renewable sources
Total electricity consumption (D) 4,007.16 3,695.94
Total fuel consumption (E) 368.74 352.92
Energy consumption through other sources (F) NA NA
Total energy consumed from non-renewable sources (D+E+F) 4,375.90 4,048.86
Note: Indicate if any independent assessment/evaluation/assurance has been carried out by an external agency? (Y/N) If yes, the name of the external agency.
NO
2. Provide the following details related to water discharged:
Parameter FY 2021-22 FY 2020-21
Water discharge by destination and level of treatment (in kilolitres)
(i) To Surface water - -
No treatment - -
With treatment – STP 860 818
(ii) To Groundwater - -
No treatment NA NA
With treatment – please specify level of treatment NA NA
(iii) To Seawater NA NA
No treatment NA NA
With treatment – please specify level of treatment NA NA
(iv) Sent to third-parties NA NA
No treatment NA NA
With treatment – please specify level of treatment NA NA
(v) Others NA NA
No treatment NA NA
With treatment – please specify level of treatment NA NA
Total water discharged (in kilolitres) 860 818
Note: Indicate if any independent assessment/evaluation/assurance has been carried out by an external agency? (Y/N) If yes, the name of the external agency.
NO
3. Water withdrawal, consumption and discharge in areas of water stress (in kilolitres):
Not Applicable.

200
Annual Report 2021-22
4. Please provide details of total Scope 3 emissions & its intensity, in the following format:
The Company is presently not tracking Scope 3 emissions.
Note: Indicate if any independent assessment/evaluation/assurance has been carried out by an external agency? (Y/N) If yes, name of the external agency.
NO
5. With respect to the ecologically sensitive areas reported at Question 10 of Essential Indicators above, provide details of significant direct & indirect impact of the entity on biodiversity in such areas along with prevention and remediation activities.
N/A
6. If the entity has undertaken any specific initiatives or used innovative technology or solutions to improve resource efficiency, or reduce impact due to emissions / effluent discharge / waste generated, please provide details of the same as well as outcome of such initiatives, as per the following format:
N/A
7. Does the entity have a business continuity and disaster management plan? Give details in 100 words/web-link
Happiest Minds follows a well-defined Business Continuity Plan (BCP) that guides the Company's response to natural or human-made calamities and disasters, which could disrupt or severely contain the Company's operations. The BCP program addresses all aspects of business continuity – Governance, Situation Monitoring, Risk Assessment, Mitigation Planning & Tracking, Stakeholder Communication, Liaison with external entities, and Scenario Planning. The Company has a specific task force to drive the transition to work-from-home and ensure business continuity. Over the years and currently during the pandemic, the Company has successfully implemented its business continuity plans including achieving efficient work-from-home practices to ensure connectivity across the enterprise.
8. Disclose any significant adverse impact to the environment, arising from the value chain of the entity. What mitigation or adaptation measures have been taken by the entity in this regard?
N/A
9. Percentage of value chain partners (by value of business done with such partners) that were assessed for environmental impacts.
N/A
PRINCIPLE 7 Businesses, when engaging in influencing public and regulatory policy, should do so in a manner that is responsible and transparent
ESSENTIAL INDICATORS
1. a. Number of affiliations with trade and industry chambers/associations.
Nil
b. List the top 10 trade and industry chambers/associations (determined based on the total members of such a body) the entity is a member of/affiliated to.
Not Applicable
2. Provide details of corrective action taken or underway on any issues related to anti-competitive conduct by the entity, based on adverse orders from regulatory authorities.
Not Applicable
LEADERSHIP INDICATORS
1. Details of public policy positions advocated by the entity:
Not Applicable

Corporate Overview1 Statutory Reports2 Financial Statements3
201
Annual Report 2021-22
PRINCIPLE 8 Businesses should promote inclusive growth and equitable development
1. Details of Social Impact Assessments (SIA) of projects undertaken by the entity based on applicable laws, in the current financial year.
The Company has not undertaken any SIAs in the current financial year.
2. Provide information on project(s) for which ongoing Rehabilitation and Resettlement (R&R) is being undertaken by your entity.
Not Applicable.
3. Describe the mechanisms to receive and redress grievances of the community.
Not Applicable
4. Percentage of input material (inputs to total inputs by value) sourced from suppliers.
FY 2021-22 FY 2020-21
Directly sourced from MSMEs/ small producers NA 25%
Sourced directly from within the district and neighbouring districts NA As per requirement,
efforts are made to
procure locally.
LEADERSHIP INDICATORS
1. Provide details of actions taken to mitigate any negative social impacts identified in the Social Impact Assessments (Reference: Question 1 of Essential Indicators above):
Not Applicable
2. Provide the following information on CSR projects undertaken by your entity in designated aspirational districts as identified by government bodies:
Not Applicable
3. (a) Do you have a preferential procurement policy where you give preference to purchase from suppliers comprising marginalised / vulnerable groups? (Yes/No)
No. However, the Company has a Procurement Manual in place, the process is followed according to the Manual.
(b) From which marginalised / vulnerable groups do you procure?
NA
(c) What percentage of total procurement (by value) does it constitute?
NA
4. Details of the benefits derived and shared from the intellectual properties owned or acquired by your entity (in the current financial year), based on traditional knowledge.
Not applicable
5. Details of corrective actions taken or underway, based on any adverse order in intellectual property related disputes wherein usage of traditional knowledge is involved.
Not applicable

202
Annual Report 2021-22
6. Details of beneficiaries of CSR Projects
S. No. CSR Project No. of Persons Benefited from CSR Projects
% of Beneficiaries from Vulnerable and Marginalised Groups
1. Akshayapatra Foundation 65,651 meals – COVID-19 Relief material by Team Happiest Minds
The Company’s objective is to pro-actively support meaningful socio-economic development in India and enable a significant number of people to participate in and benefit from India’s economic progress. This is based on the belief that growth and development are effective only when they result in wider access to opportunities and benefit a broader section of society. All our CSR initiatives, called Circle of Happiness, are for the support of the underprivileged, those who belong to the vulnerable/marginalized section of the society.
2. Sri Jayadeva Institute of Cardiovascular Sciences and Research
Molecular Testing Lab & 3 ICU Beds with Ventilator
3. Akshayapatra Foundation Happiness Kits for 4,167 children in Bengaluru location totalling 10,00,000 meals
4. Lions Eye Hospital Early detection & treatment of blindness due to diabetes & its complications
5. Akshayapatra Foundation – 10th Smilestone
2,10,970 meals for children
6. Daan Utsav 775 wishes fulfilled (Baale Mane 307; Balajothi 359; OBLF 41; Jeevarathni 68)
PRINCIPLE 9 Businesses should engage with and provide value to their consumers in a responsible manner
ESSENTIAL INDICATORS
1. Describe the mechanisms in place to receive and respond to consumer complaints and feedback.
The Company has a holistic customer experience framework to understand the behaviours, needs, and expectations of individual customers, which helps in developing a roadmap for continuous engagement and enriching the customer relationship. These programs are successful in providing early alerts, and appropriate course corrections are planned by Business and Delivery Leaders to provide high-quality products/services to the customers.
Customer perceptions are periodically reviewed through the below instruments:
• Structured, multi-layered governance processes
o Weekly governance between the project teams to track the progress of various engagement streams, review weekly plans to ensure the Company is aligned
o Monthly governance involving the sales/delivery leadership and client executives – to capture customer feedback and perceptions, assess key risks & mitigation strategies, if any
o Quarterly governance meetings involving BU heads and customer leadership to review relationship progress, update customers on new initiatives and projects at Happiest Minds & discuss additional areas for value add.
• Customer Happiness Survey: This is an annual survey rolled to multiple customer touchpoints (Ex: CXOs and Line managers). The CHS targets to cover 90% of the customers by Revenue base. NPS for FY 2022 is 53.
NPSPromoter %Detractor %
Promoter Passive DetractorCount 153 98 13
% 58 37 5
NPS SCORE 53
Project Feedback: Apart from the Customer Happiness survey, the pulse of the customers is also tracked throughout the year through two programs: “Project End Feedback” for small engagements and “Ongoing Engagement Feedback” for long-running engagements. These programs provides the Company a 360-degree feedback on the Quality of deliverables, Technical and Domain knowledge that the team exhibits, and finally, the Value-adds provided during the engagement. These programs are successful in providing early alerts, and course corrections are planned by leaders to provide high-quality products/services to the customers.

Corporate Overview1 Statutory Reports2 Financial Statements3
203
Annual Report 2021-22
(a) Number of total customer complaints/feedback received during the last two financial years.
Fiscal Year 2022 2021
No. of complaints 13 6
(b) Total outstanding at the end of each year for the last two financial years.
All customer escalations are resolved within the stipulated time and there are none open.
(c) Total cases raised in consumer forums year-wise, during the last two financial years.
None
(d) What is the customer complaint resolution time?
The first response time for any customer complaint is 2 - 4 hrs.
2. Turnover of products and/services as a percentage of turnover from all products/service that carry information about:
Not Applicable
3. Number of consumer complaints in respect of the following:
FY 2021-22 FY 2020-21Received
during the year
Pending resolution
at end of year
Remark Received during
the year
Pending resolution at end of year
Remarks
Data privacy 0 0 Nil 0 0 NilAdvertising Nil Nil Nil NilCyber-security 0 0 Nil 0 0 NilRestrictive Trade Practices
Nil Nil Nil Nil Nil Nil
Unfair Trade Practices Nil Nil Nil Nil Nil NilOthers
13 0All customer
complaints were resolved successfully
6 0All customer
complaints were resolved successfully
4. Details of instances of product recalls on account of safety issues:
Not applicable
5. Does the entity have a framework/policy on cyber security and risks related to data privacy? (Yes/No) If available, provide a web-link of the policy.
Yes, the Company has Information Security Policies based on the ISO 27001 Standard and a Data privacy policy as per GDPR and ISO 27701 Standards.
These policies are shared on the intranet platform of the Company.
6. Provide details of any corrective actions taken or underway on issues relating to advertising, and delivery of essential services; cyber security and data privacy of customers; re-occurrence of instances of product recalls; penalty / action taken by regulatory authorities on safety of products / services.
During the financial year 2021-22, Company did not have such events. Nonetheless, the Company has been instrumental in coming up with the below actions:
• EnhancingtheoverallCyberSecurityandDataprivacybyimplementingstrongtechnicalcontrols,includingtherolloutofdata classification and labelling,
• Userawareness,
• Networksegmentationand
• Proactivescanningofdeepanddarkwebtolookforanyleakedcredentials/data.
• IPprotectionclausesandundertakingismademandatoryforallpeoplejoiningandleavingtheorganization.

204
Annual Report 2021-22
The organization is also putting in place a detailed Privacy Information Management System (PIMS), which will act as a foundation for addressing multiple privacy regulations and safeguarding employee and customer privacy.
Leadership Indicators
1. Channels / platforms where information on products and services of the entity can be accessed (provide web link, if available).
Information relating to all the products and services provided by the Company is available on the Company’s website, https://www.happiestminds.com/
2. Steps taken to inform and educate consumers about safe and responsible usage of products and/or services.
A set of programs and activities are designed under the ‘Circle of Happiness’ to ensure the Company is socially and environmentally responsible when conducting its business. The activities of the CSR team under the ‘Circle of Happiness’ is approved and monitored by the CSR Committee of the Board.
3. Mechanisms in place to inform consumers of any risk of disruption/discontinuation of essential services.
All such communications to the customer are authorized by Executive Board / respective Sales Representative.
4. Does the entity display product information on the product over and above what is mandated as per local laws? (Yes/No/Not Applicable) If yes, provide details in brief. Did your entity carry out any survey with regard to consumer satisfaction relating to the major products / services of the entity, significant locations of operation of the entity or the entity as a whole? (Yes/No)
Customer satisfaction is measured through annual surveys. CSAT and Net Promoter Score (NPS) are part of the KRA goals for the senior leadership as well as all sales & delivery professionals for the clients managed by them, and this is measured within the Performance Management System.
• Customer Happiness Survey (CHS): This is an annual survey rolled to multiple customer touchpoints (Ex: CXOs and Line managers). The CHS targets to cover 90% of the customers by Revenue base.
• Project Feedback: Apart from the Customer Happiness survey, the pulse of the customers is also tracked throughout the year through two programs: “Project End Feedback” for small engagements and “Ongoing Engagement Feedback” for long-running engagements.
5. Provide the following information relating to data breaches:
a. Number of instances of data breaches along with impact –
NIL
b. Percentage of data breaches involving personally identifiable information of customers -
No

206 to 366
FinancialStatements
Financial StatementsStandalone Financial Statements206 Independent Auditor’s Report216 Standalone Balance Sheet218 Standalone Statement of Profit and Loss220 Standalone Statement of Changes in Equity222 Standalone Statement of Cash Flows224 Notes to the Standalone Financial Statements
Consolidated Financial Statements283 Independent Auditor’s Report290 Consolidated Balance Sheet292 Consolidated Statement of Profit and Loss294 Consolidated Statement of Changes in Equity296 Consolidated Statement of Cash Flows298 Notes to the Consolidated Financial Statements

206
Annual Report 2021-22
OpinionWe have audited the accompanying standalone financial statements of Happiest Minds Technologies Limited (“the Company”), which comprise the Balance Sheet as at March 31, 2022, and the Statement of Profit and Loss (including Other Comprehensive Income), the Statement of Cash Flows and the Statement of Changes in Equity for the year then ended, and a summary of significant accounting policies and other explanatory information in which are incorporated the financial statements of Happiest Minds Technologies Share Ownership Plans Trust (the “ESOP trust”) for the year ended on that date audited by other auditors (‘trust auditor’).
In our opinion and to the best of our information and according to the explanations given to us, and based on the consideration of reports of the trust auditor on separate financial statements of the ESOP trust, the aforesaid standalone financial statements give the information required by the Companies Act, 2013 (“the Act”) in the manner so required and give a true and fair view in conformity with the Indian Accounting Standards prescribed under section 133 of the Act read with the Companies (Indian Accounting Standards) Rules, 2015, as amended, (“Ind AS”) and other accounting principles generally accepted in India, of the state of affairs of the Company as at March 31, 2022, and its profit/loss, total comprehensive income, its cash flows and the changes in equity for the year ended on that date.
Basis for OpinionWe conducted our audit of the standalone financial statements in accordance with the Standards on Auditing specified under section 143(10) of the Act (SAs). Our responsibilities under those Standards are further described in the Auditor’s Responsibility for the Audit of the Standalone Financial Statements section of our report. We are independent of the Company in accordance with the Code of Ethics issued by the Institute of Chartered Accountants of India (ICAI) together with the ethical requirements that are relevant to our audit of the standalone financial statements under the provisions of the Act and the Rules made thereunder, and we have fulfilled our other ethical responsibilities in accordance with these requirements and the ICAI’s Code of Ethics. We believe that the audit evidence obtained by us and the audit evidence obtained by the trust auditors in terms of their report referred to in the Other Matters section below, is sufficient and appropriate to provide a basis for our audit opinion on the standalone financial statements.
Key Audit MattersKey audit matters are those matters that, in our professional judgment, were of most significance in our audit of the standalone financial statements of the current period. These matters were addressed in the context of our audit of the standalone financial statements as a whole, and in forming our opinion thereon, and we do not provide a separate opinion on these matters. We have determined the matters described below to be the key audit matters to be communicated in our report.
INDEPENDENT AUDITOR’S REPORTTo The Members of Happiest Minds Technologies Limited
Report on the Audit of the Standalone Financial Statements

Corporate Overview1 Statutory Reports2 Financial Statements3
207
Annual Report 2021-22
Sr. No. Key Audit Matter Auditor’s Response
1 Fixed price contracts using the percentage of completion method
(refer note 2(a) and note 27 of the standalone Ind AS financial statement)
Revenue from fixed-price contracts, where the performance obligations are satisfied over time, is recognized using the percentage-of-completion method. Use of the percentage-of-completion method requires the Company to determine the project costs incurred to date as a percentage of total estimated project costs required to complete the project. The estimation of total project costs involves significant judgement and is assessed throughout the period of the contract to reflect any changes based on the latest available information.
We identified the revenue recognition for fixed price contracts where the percentage-of-completion method is used as a key audit matter because of the significant judgement involved in estimating the efforts to complete such contracts. This estimate has a high inherent uncertainty and requires consideration of progress of the contract, efforts incurred to-date and estimates of efforts to complete the contract.
This required a high degree of auditor judgement in evaluating the audit evidence supporting the estimated efforts to complete and a higher extent of audit effort to evaluate the reasonableness of the total estimated efforts used to recognise revenue on fixed-price contracts.
Principal audit procedures performed:
Our audit procedures related to estimates of efforts to complete for fixed-price contracts accounted using the percentage-of-completion method included the following, among others:
• We tested the effectiveness of controls relating to (1) recording of efforts incurred and estimation of efforts to complete the remaining contract performance obligations, and (2) access and application controls pertaining to time recording and allocation systems, which prevents unauthorized changes to recording of efforts incurred.
• We evaluated management’s ability to reasonably estimate the progress towards satisfying the performance obligation by comparing actual information to estimates for performance obligations that have been fulfilled.
• We selected a sample of fixed price contracts with customers accounted using percentage-of-completion method and performed the following:
• Read the contract and based on the terms and conditions evaluated whether recognizing revenue over time was appropriate, and the contract was included in management’s calculation of revenue over time.
• Evaluated other information that supported the estimates of the progress towards satisfying the performance obligation.
• Evaluated the appropriateness of and consistency in the application of management’s policies and methodologies to estimate progress towards satisfying the performance obligation.
• Compared efforts incurred with data from the timesheet application system.
• Tested the estimate for consistency with the status of delivery of milestones and customer acceptances to identify possible delays in achieving milestones, which require changes in estimated efforts to complete the remaining performance obligations.
• We assessed the adequacy of disclosures made in the financial statements with respect to revenue recognized during the year as required by applicable Indian Accounting Standards.
Information Other than the Financial Statements and Auditor’s Report Thereon• The Company’s Board of Directors is responsible for the other information. The other information comprises the information
included in the Company’s annual report 2021-22, but does not include the consolidated financial statements, standalone financial statements and our auditor’s report thereon. The report is expected to be made available to us after the date of this auditor’s report.
• Our opinion on the standalone financial statements does not cover the other information and we do not express any form of assurance conclusion thereon.
• In connection with our audit of the standalone financial statements, our responsibility is to read the other information identified above when it becomes available and, in doing so, consider whether the other information is materially inconsistent with

208
Annual Report 2021-22
the standalone financial statements or our knowledge obtained during the course of our audit or otherwise appears to be materially misstated. Other information so far as it relates to the ESOP trust is traced from their financial statements audited by the trust auditors.
• When we read the Annual Report, if we conclude that there is a material misstatement therein, we are required to communicate the matter to those charged with governance as required under SA 720 ‘The Auditor’s responsibilities Relating to Other Information’.
Management’s Responsibility for the Standalone Financial StatementsThe Company’s Board of Directors is responsible for the matters stated in section 134(5) of the Act with respect to the preparation of these standalone financial statements that give a true and fair view of the financial position, financial performance including other comprehensive income, cash flows and changes in equity of the Company in accordance with the Ind AS and other accounting principles generally accepted in India. This responsibility also includes maintenance of adequate accounting records in accordance with the provisions of the Act for safeguarding the assets of the Company and for preventing and detecting frauds and other irregularities; selection and application of appropriate accounting policies; making judgments and estimates that are reasonable and prudent; and design, implementation and maintenance of adequate internal financial controls, that were operating effectively for ensuring the accuracy and completeness of the accounting records, relevant to the preparation and presentation of the standalone financial statement that give a true and fair view and are free from material misstatement, whether due to fraud or error.
In preparing the standalone financial statements, management is responsible for assessing the Company’s ability to continue as a going concern, disclosing, as applicable, matters related to going concern and using the going concern basis of accounting unless management either intends to liquidate the Company or to cease operations, or has no realistic alternative but to do so.
The Board of Directors are also responsible for overseeing the Company’s financial reporting process.
Auditor’s Responsibility for the Audit of the Standalone Financial StatementsOur objectives are to obtain reasonable assurance about whether the standalone financial statements as a whole are free from material misstatement, whether due to fraud or error, and to issue an auditor’s report that includes our opinion. Reasonable assurance is a high level of assurance, but is not a guarantee that an audit conducted in accordance with SAs will always detect a material misstatement when it exists. Misstatements can arise from fraud or error and are considered material if, individually or in the aggregate, they could reasonably be expected to influence the economic decisions of users taken on the basis of these standalone financial statements.
As part of an audit in accordance with SAs, we exercise professional judgment and maintain professional skepticism throughout the audit. We also:
• Identify and assess the risks of material misstatement of the standalone financial statements, whether due to fraud or error, design and perform audit procedures responsive to those risks, and obtain audit evidence that is sufficient and appropriate to provide a basis for our opinion. The risk of not detecting a material misstatement resulting from fraud is higher than for one resulting from error, as fraud may involve collusion, forgery, intentional omissions, misrepresentations, or the override of internal control.
• Obtain an understanding of internal financial control relevant to the audit in order to design audit procedures that are appropriate in the circumstances. Under section 143(3)(i) of the Act, we are also responsible for expressing our opinion on whether the Company has adequate internal financial controls system in place and the operating effectiveness of such controls.
• Evaluate the appropriateness of accounting policies used and the reasonableness of accounting estimates and related disclosures made by the management.
• Conclude on the appropriateness of management’s use of the going concern basis of accounting and, based on the audit evidence obtained, whether a material uncertainty exists related to events or conditions that may cast significant doubt on the Company’s ability to continue as a going concern. If we conclude that a material uncertainty exists, we are required to draw attention in our auditor’s report to the related disclosures in the standalone financial statements or, if such disclosures are inadequate, to modify our opinion. Our conclusions are based on the audit evidence obtained up to the date of our auditor’s report. However, future events or conditions may cause the Company to cease to continue as a going concern.
• Evaluate the overall presentation, structure and content of the standalone financial statements, including the disclosures, and whether the standalone financial statements represent the underlying transactions and events in a manner that achieves fair presentation.

Corporate Overview1 Statutory Reports2 Financial Statements3
209
Annual Report 2021-22
• Obtain sufficient appropriate audit evidence regarding the financial information of the Company and the ESOP Trust to express an opinion on the standalone financial statements. We are responsible for the direction, supervision and performance of the audit of the financial statements of such entities or business activities included in the standalone financial statements of which we are the independent auditors. For the other entities or business activities included in the standalone financial statements, which have been audited by the trust auditors, such trust auditors remain responsible for the direction, supervision and performance of the audits carried out by them. We remain solely responsible for our audit opinion.
Materiality is the magnitude of misstatements in the standalone financial statements that, individually or in aggregate, makes it probable that the economic decisions of a reasonably knowledgeable user of the standalone financial statements may be influenced. We consider quantitative materiality and qualitative factors in (i) planning the scope of our audit work and in evaluating the results of our work; and (ii) to evaluate the effect of any identified misstatements in the standalone financial statements.
We communicate with those charged with governance regarding, among other matters, the planned scope and timing of the audit and significant audit findings, including any significant deficiencies in internal control that we identify during our audit.
We also provide those charged with governance with a statement that we have complied with relevant ethical requirements regarding independence, and to communicate with them all relationships and other matters that may reasonably be thought to bear on our independence, and where applicable, related safeguards.
From the matters communicated with those charged with governance, we determine those matters that were of most significance in the audit of the standalone financial statements of the current period and are therefore the key audit matters. We describe these matters in our auditor’s report unless law or regulation precludes public disclosure about the matter or when, in extremely rare circumstances, we determine that a matter should not be communicated in our report because the adverse consequences of doing so would reasonably be expected to outweigh the public interest benefits of such communication.
Other MattersWe did not audit the financial statements/ financial information of the ESOP Trust included in the standalone financial statements of the Company whose financial statements reflect total assets of ` 46,284 Lacs as at March 31, 2022 and total revenue of ` NIL for the year ended on that date, as considered in the standalone financial statements. The financial statements of the ESOP trust have been audited by the trust auditors whose report has been furnished to us, and our opinion in so far as it relates to the amounts and disclosures included in respect of the ESOP trust and our report in terms of subsection (3) of Section 143 of the Act, in so far as it relates to the aforesaid ESOP trust is based solely on the report of such trust auditors.
Our opinion on the standalone financial statements and our report on Other Legal and Regulatory Requirements below is not modified in respect of these matters.
Report on Other Legal and Regulatory Requirements1. As required by Section 143(3) of the Act, based on our audit and on the consideration of the reports of the trust auditors on
the separate financial statements of the ESOP trust, referred to in the Other Matters section above we report, to the extent applicable that:
a) We have sought and obtained all the information and explanations which to the best of our knowledge and belief were necessary for the purposes of our audit.
b) In our opinion, proper books of account as required by law have been kept by the Company so far as it appears from our examination of those books and the reports of the trust auditors.
c) The Balance Sheet, the Statement of Profit and Loss including Other Comprehensive Income, the Statement of Cash Flows and Statement of Changes in Equity dealt with by this Report are in agreement with the relevant books of account and with the financial statements received from the trust auditors.
d) In our opinion, the aforesaid standalone financial statements comply with the Ind AS specified under Section 133 of the Act.
e) On the basis of the written representations received from the directors as on March 31, 2022 taken on record by the Board of Directors, none of the directors is disqualified as on March 31, 2022 from being appointed as a director in terms of Section 164(2) of the Act.
f) With respect to the adequacy of the internal financial controls over financial reporting of the Company and the operating effectiveness of such controls, refer to our separate Report in “Annexure A”. Our report expresses an unmodified opinion on the adequacy and operating effectiveness of the Company’s internal financial controls over financial reporting.

210
Annual Report 2021-22
g) With respect to the other matters to be included in the Auditor’s Report in accordance with the requirements of section 197(16) of the Act, as amended, in our opinion and to the best of our information and according to the explanations given to us, the remuneration paid by the Company to its directors during the year is in accordance with the provisions of section 197 of the Act.
h) With respect to the other matters to be included in the Auditor’s Report in accordance with Rule 11 of the Companies (Audit and Auditors) Rules, 2014, as amended in our opinion and to the best of our information and according to the explanations given to us:
i. The Company has disclosed the impact of pending litigations on its financial position in its standalone financial statements
ii. The Company did not have any long-term contracts including derivative contracts for which there were any material foreseeable losses.
iii. There were no amounts which were required to be transferred to the Investor Education and Protection Fund by the Company.
iv. (a) The Management has represented that, to the best of it’s knowledge and belief, other than as disclosed in the notes to the accounts no funds (which are material either individually or in the aggregate) have been advanced or loaned or invested (either from borrowed funds or share premium or any other sources or kind of funds) by the Company to or in any other person(s) or entity(ies), including foreign entities (“Intermediaries”), with the understanding, whether recorded in writing or otherwise, that the Intermediary shall, directly or indirectly lend or invest in other persons or entities identified in any manner whatsoever by or on behalf of the Company (“Ultimate Beneficiaries”) or provide any guarantee, security or the like on behalf of the Ultimate Beneficiaries.
(b) The management has represented that, to the best of their knowledge and belief, no funds (which are maintained either individually or in aggregate) have been received by the Company from any person or entity, including foreign entities (“Funding Parties”), with the understanding whether recorded in writing or otherwise, that the Company, shall, directly or indirectly, lend or invest in other persons or entities identified in any manner whatsoever by or on behalf of the Funding Party (“Ultimate Beneficiaries”) or provide any guarantee, security or the like on behalf of the Ultimate Beneficiaries.
(c) Based on the audit procedures that has been considered reasonable and appropriate in the circumstances, nothing has come to our notice that has caused us to believe that the representations under sub-clause (i) and (ii) of Rule 11(e), as provided under (a) and (b) above, contain any material misstatement.
v. The final dividend proposed in the previous year, declared and paid by the Company during the year is in accordance with section 123 of the Act, as applicable.
As stated in note 45 to the financial statements, the Board of Directors of the Company have proposed final dividend for the year which is subject to the approval of the members at the ensuing Annual General Meeting. The amount of dividend proposed is in accordance with section 123 of the Act, as applicable.
2. As required by the Companies (Auditor’s Report) Order, 2020 (“the Order”) issued by the Central Government in terms of Section 143(11) of the Act, we give in “Annexure B” a statement on the matters specified in paragraphs 3 and 4 of the Order.
For Deloitte Haskins & SellsChartered Accountants(Firm’s Registration No. 008072S)
______________________(Vikas Bagaria)(Partner)(Membership No. 060408)(UDIN: 22060408AJRNBF6347)Place: BengaluruDate: May 05, 2022

Corporate Overview1 Statutory Reports2 Financial Statements3
211
Annual Report 2021-22
Report on the Internal Financial Controls Over Financial Reporting under Clause (i) of Sub-section 3 of Section 143 of the Companies Act, 2013 (“the Act”)
We have audited the internal financial controls over financial reporting of Happiest Minds Technologies Limited (“the Company”) as of March 31, 2022 in conjunction with our audit of the standalone Ind AS financial statements of the Company for the year ended on that date.
Management’s Responsibility for Internal Financial ControlsThe Company’s management is responsible for establishing and maintaining internal financial controls based on the internal control over financial reporting criteria established by the Company considering the essential components of internal control stated in the Guidance Note on Audit of Internal Financial Controls Over Financial Reporting issued by the Institute of Chartered Accountants of India. These responsibilities include the design, implementation and maintenance of adequate internal financial controls that were operating effectively for ensuring the orderly and efficient conduct of its business, including adherence to company’s policies, the safeguarding of its assets, the prevention and detection of frauds and errors, the accuracy and completeness of the accounting records, and the timely preparation of reliable financial information, as required under the Companies Act, 2013.
Auditor’s ResponsibilityOur responsibility is to express an opinion on the Company’s internal financial controls over financial reporting of the Company based on our audit. We conducted our audit in accordance with the Guidance Note on Audit of Internal Financial Controls Over Financial Reporting (the “Guidance Note”) issued by the Institute of Chartered Accountants of India and the Standards on Auditing prescribed under Section 143(10) of the Companies Act, 2013, to the extent applicable to an audit of internal financial controls. Those Standards and the Guidance Note require that we comply with ethical requirements and plan and perform the audit to obtain reasonable assurance about whether adequate internal financial controls over financial reporting was established and maintained and if such controls operated effectively in all material respects.
Our audit involves performing procedures to obtain audit evidence about the adequacy of the internal financial controls system over financial reporting and their operating effectiveness. Our audit of internal financial controls over financial reporting included obtaining an understanding of internal financial controls over financial reporting, assessing the risk that a material weakness exists, and testing and evaluating the design and operating effectiveness of internal control based on the assessed risk. The procedures selected depend on the auditor’s judgement, including the assessment of the risks of material misstatement of the financial statements, whether due to fraud or error.
We believe that the audit evidence we have obtained is sufficient and appropriate to provide a basis for our audit opinion on the Company’s internal financial controls system over financial reporting.
Meaning of Internal Financial Controls Over Financial ReportingA company’s internal financial control over financial reporting is a process designed to provide reasonable assurance regarding the reliability of financial reporting and the preparation of financial statements for external purposes in accordance with generally accepted accounting principles. A company’s internal financial control over financial reporting includes those policies and procedures that (1) pertain to the maintenance of records that, in reasonable detail, accurately and fairly reflect the transactions and dispositions of the assets of the company; (2) provide reasonable assurance that transactions are recorded as necessary to permit preparation of financial statements in accordance with generally accepted accounting principles, and that receipts and expenditures of the company are being made only in accordance with authorisations of management and directors of the company; and (3) provide reasonable assurance regarding prevention or timely detection of unauthorised acquisition, use, or disposition of the company’s assets that could have a material effect on the financial statements.
ANNEXURE “A” TO THE INDEPENDENT AUDITOR’S REPORT (Referred to in paragraph (f) under ‘Report on Other Legal and Regulatory Requirements’ section of our report to the Members of Happiest Minds Technologies Limited of even date)

212
Annual Report 2021-22
Inherent Limitations of Internal Financial Controls Over Financial ReportingBecause of the inherent limitations of internal financial controls over financial reporting, including the possibility of collusion or improper management override of controls, material misstatements due to error or fraud may occur and not be detected. Also, projections of any evaluation of the internal financial controls over financial reporting to future periods are subject to the risk that the internal financial control over financial reporting may become inadequate because of changes in conditions, or that the degree of compliance with the policies or procedures may deteriorate.
OpinionIn our opinion, to the best of our information and according to the explanations given to us, the Company has, in all material respects, an adequate internal financial controls system over financial reporting and such internal financial controls over financial reporting were operating effectively as at March 31, 2022, based on the criteria for internal financial control over financial reporting established by the Company considering the essential components of internal control stated in the Guidance Note on Audit of Internal Financial Controls Over Financial Reporting issued by the Institute of Chartered Accountants of India.
For Deloitte Haskins & SellsChartered Accountants(Firm’s Registration No. 008072S)
______________________(Vikas Bagaria)(Partner)(Membership No. 060408)(UDIN: 22060408AJRNBF6347)Place: BengaluruDate: May 05, 2022
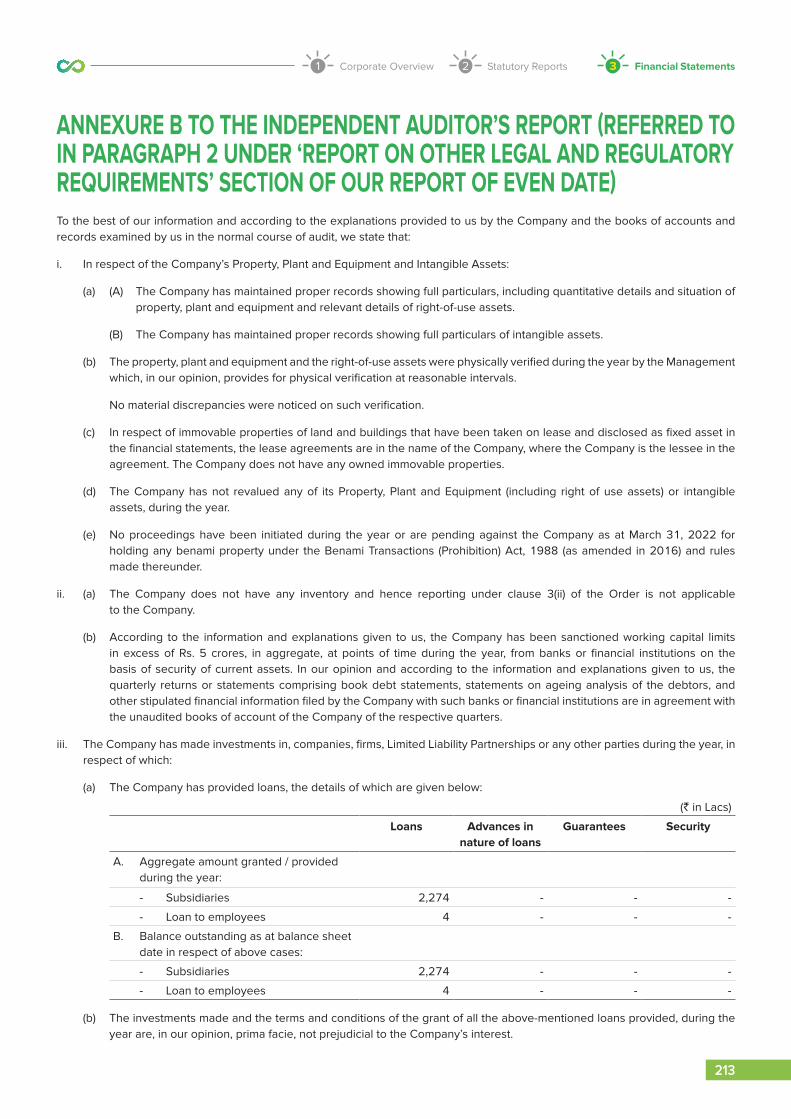
Corporate Overview1 Statutory Reports2 Financial Statements3
213
Annual Report 2021-22
To the best of our information and according to the explanations provided to us by the Company and the books of accounts and records examined by us in the normal course of audit, we state that:
i. In respect of the Company’s Property, Plant and Equipment and Intangible Assets:
(a) (A) The Company has maintained proper records showing full particulars, including quantitative details and situation of property, plant and equipment and relevant details of right-of-use assets.
(B) The Company has maintained proper records showing full particulars of intangible assets.
(b) The property, plant and equipment and the right-of-use assets were physically verified during the year by the Management which, in our opinion, provides for physical verification at reasonable intervals.
No material discrepancies were noticed on such verification.
(c) In respect of immovable properties of land and buildings that have been taken on lease and disclosed as fixed asset in the financial statements, the lease agreements are in the name of the Company, where the Company is the lessee in the agreement. The Company does not have any owned immovable properties.
(d) The Company has not revalued any of its Property, Plant and Equipment (including right of use assets) or intangible assets, during the year.
(e) No proceedings have been initiated during the year or are pending against the Company as at March 31, 2022 for holding any benami property under the Benami Transactions (Prohibition) Act, 1988 (as amended in 2016) and rules made thereunder.
ii. (a) The Company does not have any inventory and hence reporting under clause 3(ii) of the Order is not applicable to the Company.
(b) According to the information and explanations given to us, the Company has been sanctioned working capital limits in excess of Rs. 5 crores, in aggregate, at points of time during the year, from banks or financial institutions on the basis of security of current assets. In our opinion and according to the information and explanations given to us, the quarterly returns or statements comprising book debt statements, statements on ageing analysis of the debtors, and other stipulated financial information filed by the Company with such banks or financial institutions are in agreement with the unaudited books of account of the Company of the respective quarters.
iii. The Company has made investments in, companies, firms, Limited Liability Partnerships or any other parties during the year, in respect of which:
(a) The Company has provided loans, the details of which are given below:
(` in Lacs)
Loans Advances in nature of loans
Guarantees Security
A. Aggregate amount granted / provided during the year:
- Subsidiaries 2,274 - - -
- Loan to employees 4 - - -
B. Balance outstanding as at balance sheet date in respect of above cases:
- Subsidiaries 2,274 - - -
- Loan to employees 4 - - -
(b) The investments made and the terms and conditions of the grant of all the above-mentioned loans provided, during the year are, in our opinion, prima facie, not prejudicial to the Company’s interest.
ANNEXURE B TO THE INDEPENDENT AUDITOR’S REPORT (REFERRED TO IN PARAGRAPH 2 UNDER ‘REPORT ON OTHER LEGAL AND REGULATORy REqUIREMENTS’ SECTION OF OUR REPORT OF EVEN DATE)

214
Annual Report 2021-22
(c) In respect of loans, the schedule of repayment of principal and payment of interest has been stipulated. No repayments of principal or interest was due in the current year.
(d) In respect of loans granted by the Company, there is no amount overdue for more than 90 days at the balance sheet date.
(e) None of the loans or advances in the nature of loans granted by the Company have fallen due during the year.
(f) According to information and explanations given to us and based on the audit procedures performed, the Company has not granted any loans or advances in the nature of loans either repayable on demand or without specifying any terms or period of repayment during the year. Hence, reporting under clause (iii)(f) is not applicable.
(g) The Company has not provided any guarantees or provided security or granted any advances in the nature of loan, secured or unsecured, to any companies, firms, limited liability partnerships, or any other parties during the year.
iv. The Company has complied with the provisions of Sections 185 and 186 of the Companies Act, 2013 in respect of loans granted, investments made and guarantees and securities provided, as applicable.
v. The Company has not accepted any deposit or amounts which are deemed to be deposits. Hence, reporting under clause (v) of the Order is not applicable.
vi. The maintenance of cost records has not been specified for the activities of the Company by the Central Government under section 148(1) of the Companies Act, 2013 for the business carried out by the Company. Hence, reporting under clause (vi) of the Order is not applicable.
vii. In our opinion, in respect of statutory dues:
(a) Undisputed statutory dues, including Goods and Service tax, Provident Fund, Employees’ State Insurance, Income-tax, duty of Custom, duty of Excise, Value Added Tax, cess and other material statutory dues applicable to the Company have generally been regularly deposited by it with the appropriate authorities.
There were no undisputed amounts payable in respect of Goods and Service tax, Provident Fund, Employees’ State Insurance, Income-tax, duty of Custom, duty of Excise, Value Added Tax, cess and other material statutory dues in arrears as at March 31, 2022 for a period of more than six months from the date they became payable.
(b) There were no cases where statutory dues referred to in sub-clause (a) have not been deposited on account of any dispute, hence, the clause is not applicable.
viii. There were no transactions relating to previously unrecorded income that were surrendered or disclosed as income in the tax assessments under the Income Tax Act, 1961 (43 of 1961) during the year.
ix. (a) In our opinion, the company has not defaulted in the repayment of loans or other borrowings or in the payment of interest thereon to any lender during the year.
(b) The Company has not been declared wilful defaulter by any bank or financial institution or government or any government authority.
(c) The Company not taken any term loans during the year and there are no unutilised term loans at the beginning of the year and hence, reporting under Clause (ix)(c) of the Order is not applicable.
(d) On an overall examination of the Financial Statements of the Company, funds raised on short term basis, have, prima facie, not been used during the year, for long term purposes by the Company.
(e) On an overall examination of the Financial Statements of the Company, the company has not taken any funds from any entity or person on account of or to meet the obligations of its subsidiaries.
(f) The company has not raised loans during the year on the pledge of securities held in its subsidiaries.
x. (a) The Company has not raised moneys by way of initial public offer or further public offer (including debt instruments) during the year and hence reporting under clause 3(x)(a) of the Order is not applicable.
(b) The Company has not made any preferential allotment or private placement of shares or convertible debentures (fully, partially or optionally convertible) during the year and hence reporting under clause 3(x)(b) of the Order is not applicable.
xi. (a) To the best of our knowledge, no fraud by the Company and no material fraud on the Company has been noticed or reported during the year.

Corporate Overview1 Statutory Reports2 Financial Statements3
215
Annual Report 2021-22
(b) No report under sub-section (12) of section 143 of the Companies Act has been filed in Form ADT-4 as prescribed under rule 13 of Companies (Audit and Auditors) Rules, 2014 with the Central Government, during the year and upto the date of this report.
(c) As represented to us by the Management, there were no whistle blower complaints received by the Company during the year (and up to the date of this report).
xii. The Company is not a Nidhi Company and hence reporting under clause (xii) of the Order is not applicable.
xiii. In our opinion, the Company is in compliance with Section 177 and 188 of the Companies Act, where applicable, for all transactions with the related parties and the details of related party transactions have been disclosed in the financial statements as required by the applicable accounting standards.
xiv. (a) In our opinion the Company has an adequate internal audit system commensurate with the size and the nature of its business.
(b) We have considered, the internal audit reports issued to the Company during the year and covering the period upto March 31, 2022, in determining the nature, timing and extent of our audit procedures.
xv. In our opinion during the year the Company has not entered into any non-cash transactions with its directors or persons connected with its directors and hence provisions of section 192 of the Companies Act, 2013 are not applicable to the Company.
xvi. (a) The Company is not required to be registered under section 45-IA of the Reserve Bank of India Act, 1934. Hence, reporting under clause (xvi)(a), (b) and (c) of the Order is not applicable.
(b) In our opinion, there is no core investment Company with the Group (as identified in the Core Investment Companies (Reserve Bank) Directions, 2016) and accordingly reporting under clause 3(xvi)(d) of the Order is not applicable.
xvii. The Company has not incurred cash losses during the financial year covered by our audit and the immediately preceding financial year.
xviii. There has been no resignation of the statutory auditors of the Company during the year.
xix. On the basis of the financial ratios, ageing and expected dates of realization of financial assets and payment of financial liabilities, other information accompanying the financial statements and our knowledge of the Board of Directors and Management plans and based on our examination of the evidence supporting the assumptions, nothing has come to our attention, which causes us to believe that any material uncertainty exists as on the date of the audit report indicating that Company is not capable of meeting its liabilities existing at the date of balance sheet as and when they fall due within a period of one year from the balance sheet date.
We, however, state that this is not an assurance as to the future viability of the Company. We further state that our reporting is based on the facts up to the date of the audit report and we neither give any guarantee nor any assurance that all liabilities falling due within a period of one year from the balance sheet date, will get discharged by the Company as and when they fall due.
xx. The Company has fully spent the required amount towards Corporate Social Responsibility (CSR) and there are no unspent CSR amount for the year requiring a transfer to a Fund specified in Schedule VII to the Companies Act or special account in compliance with the provision of sub-section (6) of section 135 of the said Act. Accordingly, reporting under clause 3(xx) of the Order is not applicable for the year.
For Deloitte Haskins & SellsChartered Accountants(Firm’s Registration No. 008072S)
______________________(Vikas Bagaria)(Partner)(Membership No. 060408)(UDIN: 22060408AJRNBF6347)Place: BengaluruDate: May 05, 2022

216
Annual Report 2021-22
Notes As atMarch 31, 2022
As atMarch 31, 2021
AssetsNon-current assetsProperty, plant and equipment 3 77 67Capital work-in-progress 3 - 14Goodwill 4 611 611Other intangible assets 4 271 65Intangible assets under development 4 35 -Right-of-use assets 5 5,389 2,149Financial assetsi. Investments 6 6,025 9,720ii. Loans 7 2,274 -iii. Other financial assets 8 1,827 2,458Income tax assets (net) 9 679 1,408Other assets 10 1 7Deferred tax assets (net) 11 697 1,026Total non-current assets 17,886 17,525
Current assetsFinancial assetsi. Investments 12 46,400 39,148ii. Trade receivables 13 16,127 11,610iii. Cash and cash equivalents 14 5,601 7,952iv. Bank balance other than cash and cash equivalents 15 10,071 5,935v. Loans 7 4 14vi. Other financial assets 8 8,955 6,740Other assets 10 3,235 1,771Total current assets 90,393 73,170Total assets 108,279 90,695
Equity and liabilitiesEquityEquity share capital 16 2,854 2,837Instruments entirely in the nature of equity 17 - -Other equity 18 64,120 51,830Total equity 66,974 54,667
LiabilitiesNon-current liabilitiesFinancial liabilitiesi. Borrowings 20 1,724 3,661ii. Lease liabilities 21 4,119 1,223iii. Other financial liabilities 22 - 2,455Provisions 23 1,618 1,653Total non-current liabilities 7,461 8,992
Standalone Balance Sheet as at March 31, 2022(All amounts in ` Lacs, unless otherwise stated)

Corporate Overview1 Statutory Reports2 Financial Statements3
217
Annual Report 2021-22
Standalone Balance Sheet (Contd.)(All amounts in ` Lacs, unless otherwise stated)
Notes As atMarch 31, 2022
As atMarch 31, 2021
Current liabilitiesContract liabilities 24 972 365Financial liabilitiesi. Borrowings 20 17,340 12,969ii. Lease liabilities 21 1,792 1,422iii. Trade payables 25 (A) Total outstanding due of Micro enterprises and Small enterprises 79 95 (B) Total outstanding due of creditors other than Micro enterprises and
Small enterprises. 5,215 3,876
iv. Other financial liabilities 22 4,321 4,877Other current liabilities 26 2,427 1,924 Provisions 23 1,698 1,508 Total current liabilities 33,844 27,036Total liabilities 41,305 36,028Total equity and liabilities 108,279 90,695Summary of significant accounting policies 2
The notes referred to above form an integral part of the Standalone Financial Statements.
As per our report of even datefor Deloitte Haskins and SellsChartered AccountantsICAI Firm's Registration Number: 008072S
for and on behalf of the Board of Directors:Happiest Minds Technologies LimitedCIN : L72900KA2011PLC057931
Vikas BagariaPartnerMembership no.: 060408Place: Bengaluru, IndiaDate: May 5, 2022
Ashok SootaExecutive ChairmanDIN : 00145962 Place: Bengaluru, IndiaDate: May 5, 2022
Venkatraman NarayananManaging Director & Chief Financial OfficerDIN : 01856347 Place: Bengaluru, IndiaDate: May 5, 2022
Praveen DarshankarCompany Secretary & Compliance OfficerFCS No.: F6706Place: Bengaluru, IndiaDate: May 5, 2022

218
Annual Report 2021-22
Notes For the year endedMarch 31, 2022
For the year endedMarch 31, 2021
Income
Revenue from contract with customers 27 103,354 76,096
Other income 28 3,771 2,342
Total income 107,125 78,438
Expenses
Employee benefits expense 29 61,210 45,012
Depreciation and amortisation 30 2,423 2,063
Finance costs 31 830 645
Other expenses 32 17,577 12,116
Total expenses 82,040 59,836
Profit before exceptional items and tax 25,085 18,602
Exceptional items - -
Profit before tax 25,085 18,602
Tax expense 33
Current tax 6,004 3,527
Adjustment of tax relating to earlier periods - -
Deferred tax charge/ (credit) 433 (1,118)
6,437 2,409
Profit for the year 18,648 16,193
Other comprehensive income
Other comprehensive income to be reclassified to profit or loss in subsequent periods
Net movement on effective portion of cash flow hedges 37 (316) 1,236
Income tax effect 33 80 (128)
Net other comprehensive income to be reclassified to profit or loss in subsequent periods
(236) 1,108
Standalone Statement of Profit and Loss for the year ended March 31, 2022(All amounts in ` Lacs, unless otherwise stated)
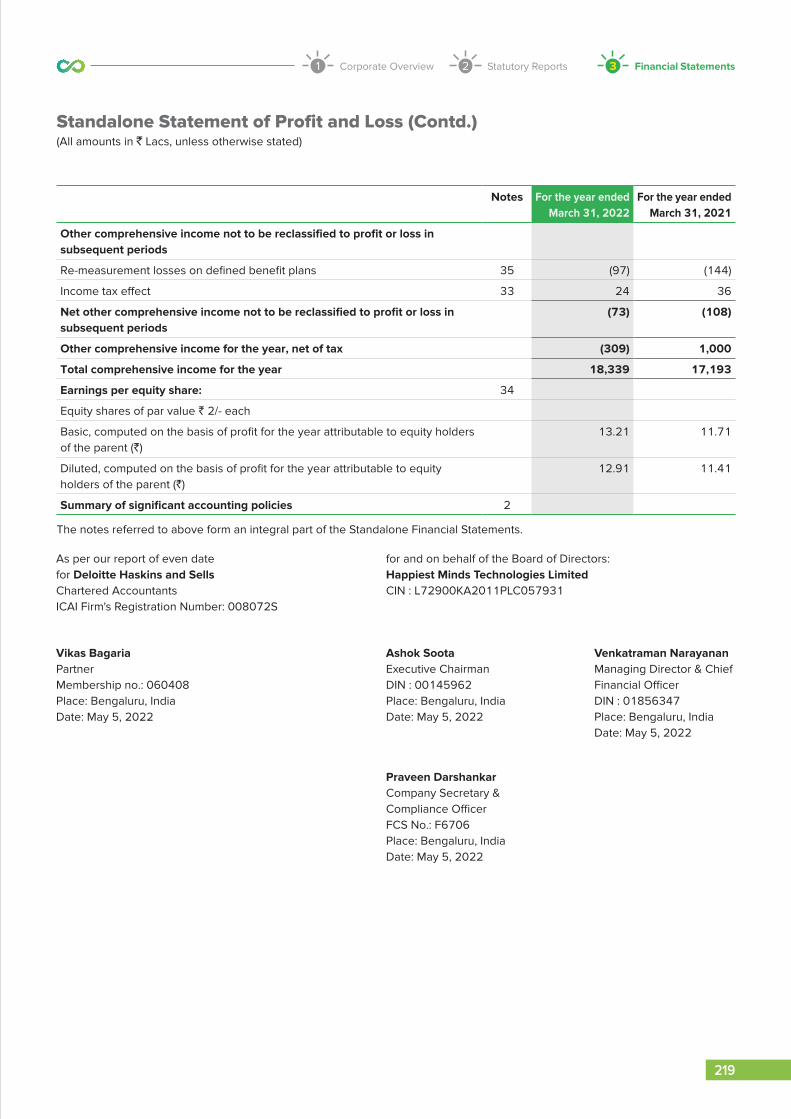
Corporate Overview1 Statutory Reports2 Financial Statements3
219
Annual Report 2021-22
Standalone Statement of Profit and Loss (Contd.)(All amounts in ` Lacs, unless otherwise stated)
Notes For the year endedMarch 31, 2022
For the year endedMarch 31, 2021
Other comprehensive income not to be reclassified to profit or loss in subsequent periods
Re-measurement losses on defined benefit plans 35 (97) (144)
Income tax effect 33 24 36
Net other comprehensive income not to be reclassified to profit or loss in subsequent periods
(73) (108)
Other comprehensive income for the year, net of tax (309) 1,000
Total comprehensive income for the year 18,339 17,193
Earnings per equity share: 34
Equity shares of par value ` 2/- each
Basic, computed on the basis of profit for the year attributable to equity holders of the parent (`)
13.21 11.71
Diluted, computed on the basis of profit for the year attributable to equity holders of the parent (`)
12.91 11.41
Summary of significant accounting policies 2
The notes referred to above form an integral part of the Standalone Financial Statements.
As per our report of even datefor Deloitte Haskins and SellsChartered AccountantsICAI Firm's Registration Number: 008072S
for and on behalf of the Board of Directors:Happiest Minds Technologies LimitedCIN : L72900KA2011PLC057931
Vikas BagariaPartnerMembership no.: 060408Place: Bengaluru, IndiaDate: May 5, 2022
Ashok SootaExecutive ChairmanDIN : 00145962 Place: Bengaluru, IndiaDate: May 5, 2022
Venkatraman NarayananManaging Director & Chief Financial OfficerDIN : 01856347 Place: Bengaluru, IndiaDate: May 5, 2022
Praveen DarshankarCompany Secretary & Compliance OfficerFCS No.: F6706Place: Bengaluru, IndiaDate: May 5, 2022

220
Annual Report 2021-22
a) Equity share capitalFor the year ended March 31, 2022 No. of Shares AmountEquity shares of ` 2 each issued, subscribed and fully paidAt April 1, 2021 14,17,83,304 2,837 Changes in Equity Share Capital due to prior period errors - - Restated balance 14,17,83,304 2,837 Exercise of share options - refer note 16 (ii) (2) 8,25,563 17 As at March 31, 2022 14,26,08,867 2,854
For the year ended March 31, 2021 No. of Shares AmountEquity shares of ` 2 each issued, subscribed and fully paid At April 1, 2020 4,38,99,177 879 Changes in Equity Share Capital due to prior period errors - - Restated balance 4,38,99,177 879 Conversion of preference shares during the year - refer note 16 (ii) (1) 9,08,47,235 1,817 Exercise of share options - refer note 16 (ii) (2) 4,10,386 8 Issued during the year - refer note 16 (ii) (3) 66,26,506 133 As at March 31, 2021 14,17,83,304 2,837
b) Instruments entirely in the nature of equityFor the year ended March 31, 2022 No. of Shares AmountSeries A 14% Non Cumulative Compulsorily Convertible Preference Shares (CCPS) of ` 652 each issued, subscribed and fully paid.At April 1, 2021 - - Changes due to prior period errors - - Restated balance - - Change during the year - - As at March 31, 2022 - -
For the year ended March 31, 2021 No. of Shares AmountSeries A 14% Non Cumulative Compulsorily Convertible Preference Shares (CCPS) of ` 652 each issued, subscribed and fully paid.At April 1, 2020 5,57,345 3,634 Changes due to prior period errors - - Restated balance 5,57,345 3,634 Conversion into equity shares during the year - refer note (16) (ii) (1) (5,57,345) (3,634)At March 31, 2021 - -
c) Other equityFor the year ended March 31, 2022 Reserves and Surplus Cash flow
hedge reserve
(Note 18)
Total equitySecurities premium (Note 18)
Share options outstanding
reserve (Note 18)
Retained earnings(Note 18)
As at April 1, 2021 40,454 361 10,637 378 51,830 Restated balance as at April 1, 2021 40,454 361 10,637 378 51,830 Profit for the year - - 18,648 - 18,648 Other comprehensive income - - (73) (236) (309)Total comprehensive income - - 18,575 (236) 18,339 Exercise of share option by employees 154 - - - 154
Standalone Statement of Changes in Equity for the year ended March 31, 2022(All amounts in ` Lacs, unless otherwise stated)

Corporate Overview1 Statutory Reports2 Financial Statements3
221
Annual Report 2021-22
Standalone Statement of Changes in Equity (Contd.)(All amounts in ` Lacs, unless otherwise stated)
For the year ended March 31, 2022 Reserves and Surplus Cash flow hedge reserve
(Note 18)
Total equitySecurities premium (Note 18)
Share options outstanding
reserve (Note 18)
Retained earnings(Note 18)
Transaction costs, net of recovery or reimbursement of expense on issue of shares - refer note 16 (ii) (3)
327 - - - 327
Transferred to retained earnings for options forfeited - (6) 6 - - Transferred to securities premium for options exercised 270 (270) - - - Dividend - refer note 19 - - (6,830) - (6,830)Share-based payments expense - refer note 42 - 300 - - 300 As at March 31, 2022 41,205 385 22,388 142 64,120
For the year ended March 31, 2021 Reserves and Surplus Cash flow hedge reserve
(Note 18)
Total equitySecurities premium (Note 18)
Share options outstanding
reserve (Note 18)
Retained earnings(Note 18)
As at April 1, 2020 27,781 454 (5,457) (730) 22,048 Restated balance as at April 1, 2020 27,781 454 (5,457) (730) 22,048 Profit for the year - - 16,193 - 16,193 Other comprehensive income - - (108) 1,108 1,000 Total comprehensive income - - 16,085 1,108 17,193 Conversion of preference shares during the year - refer note 16 (ii) (1)
1,817 - - - 1,817
Increase during the year - refer note 16 (ii) (3) 10,867 - - - 10,867 Exercise of share option by employees 64 - - - 64 Transaction costs, net of recovery or reimbursement of expense on issue of shares - refer note 16 (ii) (3)
(456) - - - (456)
Transferred to retained earnings for options forfeited - (9) 9 - - Transferred to securities premium for options exercised 381 (381) - - - Share-based payments expense - refer note 42 - 297 - - 297 As at March 31, 2021 40,454 361 10,637 378 51,830
Summary of significant accounting policies The notes referred to above form an integral part of the Standalone Financial Statements.
As per our report of even datefor Deloitte Haskins and SellsChartered AccountantsICAI Firm's Registration Number: 008072S
for and on behalf of the Board of Directors:Happiest Minds Technologies LimitedCIN : L72900KA2011PLC057931
Vikas BagariaPartnerMembership no.: 060408Place: Bengaluru, IndiaDate: May 5, 2022
Ashok SootaExecutive ChairmanDIN : 00145962 Place: Bengaluru, IndiaDate: May 5, 2022
Venkatraman NarayananManaging Director & Chief Financial OfficerDIN : 01856347 Place: Bengaluru, IndiaDate: May 5, 2022
Praveen DarshankarCompany Secretary & Compliance OfficerFCS No.: F6706Place: Bengaluru, IndiaDate: May 5, 2022

222
Annual Report 2021-22
Notes For the year endedMarch 31, 2022
For the year endedMarch 31, 2021
Operating activitiesProfit before tax 25,085 18,602Adjustments to reconcile profit before tax to net cash flows:Depreciation/ amortisation of property, plant and equipment, intangibles and right-of-use assets
30 2,423 2,063
(Gain)/ loss on disposal of property, plant and equipment, net 28 (10) -Share-based payment expense 29 300 297Gain on investment carried at fair value through profit and loss 28 (1,377) (184)Gain on sale of investment carried at fair value through profit and loss 28 (368) (671)Interest income 28 (667) (838)Unrealised foreign exchange (gain)/ loss 28 354 73Rent concession 28 (323) (302)Impairment loss on financial assets 32 33 945Finance costs 31 830 645Operating cash flow before working capital changes 26,280 20,630
Movements in working capital:Increase in trade receivables (4,415) (1,247)Decrease in loans 10 50Increase in non-financial assets (1,484) (213)Increase in financial assets (2,635) (1,445)Increase in trade payables 1,303 176Increase/ (decrease) in financial liabilities 648 (1,269)Increase in provisions 58 516Increase/ (decrease) in contract liabilities 607 (18)Increase in other non-financial liabilities 830 1,407
21,202 18,587Income tax paid, net of refunds (5,275) (3,600)Net cash flows from operating activities (A) 15,927 14,987
Investing activitiesPurchase of property, plant and equipment 3 (67) (78)Purchase of intangible assets 4 (346) (19)Proceeds from sale of property, plant and equipment 10 -Maturities of / (Investment in) bank deposit, net (3,020) 6,931Acquisition of subsidiary - (6,025)Loan to subsidiary (2,231) -Proceeds from sale of mutual funds 34,542 39,313Investment in mutual funds (40,049) (69,269)Interest received 84 777Net cash flows used in investing activities (B) (11,077) (28,370)
Standalone Statement of Cash Flows for the year ended March 31, 2022(All amounts in ` Lacs, unless otherwise stated)

Corporate Overview1 Statutory Reports2 Financial Statements3
223
Annual Report 2021-22
Standalone Statement of Cash Flows (Contd.)(All amounts in ` Lacs, unless otherwise stated)
Notes For the year endedMarch 31, 2022
For the year endedMarch 31, 2021
Financing activitiesRepayment of long-term borrowings (2,053) (1,257)Proceeds from long-term borrowings - 5,982Net repayment of short-term borrowings 4,012 4,213Security deposits given - (300)Payment of principal portion of lease liabilities (1,702) (1,657)Payment of interest portion of lease liabilities (487) (328)Proceeds from issue of Equity share capital (net of transaction costs) - 10,544Dividend paid (6,830) -Proceeds from exercise of share options 171 72Interest paid (328) (278)Net cash flows from/ (used) in financing activities (C) (7,217) 16,991
Net increase in cash and cash equivalents [(A)+(B)+(C)] (2,367) 3,608Net foreign exchange difference 16 (6)Cash and cash equivalents at the beginning of the year 7,952 4,350Cash and cash equivalents at the end of the year 5,601 7,952
Components of cash and cash equivalents 14Balance with banks- on current account 4,521 3,548- in EEFC accounts 1,080 2,029Deposits with original maturity of less than three months - 2,375Total cash and cash equivalents 5,601 7,952Non-cash investing activities:Acquisition of subsidiary - 3,695Acquisition of Right-of-use assets 5 5,487 1,075Refer note 20 and 21 for changes in liabilities arising from financing activities and for non-cash financing activities.Summary of significant accounting policies 2
The notes referred to above form an integral part of the Standalone Financial Statements.
As per our report of even datefor Deloitte Haskins and SellsChartered AccountantsICAI Firm's Registration Number: 008072S
for and on behalf of the Board of Directors:Happiest Minds Technologies LimitedCIN : L72900KA2011PLC057931
Vikas BagariaPartnerMembership no.: 060408Place: Bengaluru, IndiaDate: May 5, 2022
Ashok SootaExecutive ChairmanDIN : 00145962 Place: Bengaluru, IndiaDate: May 5, 2022
Venkatraman NarayananManaging Director & Chief Financial OfficerDIN : 01856347 Place: Bengaluru, IndiaDate: May 5, 2022
Praveen DarshankarCompany Secretary & Compliance OfficerFCS No.: F6706Place: Bengaluru, IndiaDate: May 5, 2022

224
Annual Report 2021-22
Corporate InformationHappiest Minds Technologies Limited ("the Company") is engaged in next generation IT solutions & services Company, enabling organizations to capture the business benefits of emerging technologies of cloud computing, social media, mobility solutions, business intelligence, analytics, unified communications and internet of things. The Company offers high degree of skills, IPs and domain expertise across a set of focused areas that include Digital Transformation & Enterprise Solutions, Product Engineering, Infrastructure Management, Security, Testing and Consulting. The Company focuses on industries in the Retail/CPG, BFSI, Travel & Transportation, Manufacturing and Media space. Happiest Minds Provide a Smart, Secure and Connected Experience to its Customers. In the Solution space, focus areas are Security, M2M and Mobility solutions.
The Company is a limited company, incorporated and domiciled in India and has a branch office at United States of America, United Kingdom, Australia, Canada, Netherland, Singapore, Malaysia and Dubai. The registered office of the Company is situated at #53/1-4, Hosur Main Road, Madivala (next to Madivala Police Station) Bangalore 560068.
The Company's Standalone Financial Statements for the year ended March 31, 2022 were approved by Board of Directors on May 5, 2022.
1 Basis of preparation of Standalone Financial Statementsa Statement of Compliance The Standalone Financial Statements (SFS) of the Company have been prepared in accordance with Indian Accounting
Standards (Ind AS) notified under the Companies (Indian Accounting Standards) Rules, 2015 (as amended from time to time) and presentation requirements of Division II of Schedule III to the Companies Act, 2013, (Ind AS compliant Schedule III), as applicable to the SFS.
This note provides a list of the significant accounting policies adopted in the preparation of the Standalone Financial Statements. These policies have been consistently applied to all the years presented, unless otherwise stated.
These Standalone Financial Statements have been prepared for the Company as a going concern on the basis of relevant Ind AS that are effective at the Company’s annual reporting date, March 31, 2022.
The Standalone Financial Statements have been prepared on an accrual basis under the historical cost convention except for the following that are measured at fair value as required by relevant Ind AS:
a) Defined benefit plan - plan assets measured at fair value
b) Certain financial assets and liabilities measured at fair value (refer accounting policy regarding financial instruments)
c) Derivative financial instruments
b Functional currency and presentation currency These Standalone Financial Statements are presented in India Rupee (`), which is also functional currency of the Company.
All the values are rounded off to the nearest Lacs (` 00,000) unless otherwise indicated.
c Use of estimates and judgements In preparing these Standalone Financial Statements, management has made judgements, estimates and assumptions that
affect the application of accounting policies and the reported amounts of assets, liabilities, the disclosures of contingent assets and liabilities at the date of the financial Statements and reported amounts of income and expenses during the period. Actual results may differ from these estimates.
Appropriate changes in estimates are made as management becomes aware of changes in circumstances surrounding estimate. Changes in estimate are reflected in the financial statements in the period in which changes are made and, if material, their effects are disclosed in the notes to the Standalone Financial Statements.
Judgements: Information about judgements made in applying accounting policies that have the most significant effects on the amounts
recognised in the Standalone Financial Statements is included in the following notes:
Notes to the Standalone Financial Statements for the year ended March 31, 2022(All amounts in ` Lacs, unless otherwise stated)

Corporate Overview1 Statutory Reports2 Financial Statements3
225
Annual Report 2021-22
Notes to the Standalone Financial Statements for the year ended March 31, 2022(All amounts in ` Lacs, unless otherwise stated)
- Note 2 (c) and Note 2 (d)- Useful life of property, plant and equipment and intangible assets;
- Note 2 (g) - Lease classification;
- Note 2(i) - Financial instrument; and
- Note 2 (m) - Measurement of defined benefit obligations: key actuarial assumptions.
Assumption and estimation uncertainties
Information about assumptions and estimation uncertainties that have a significant risk of resulting in a material adjustment in the year ended March 31, 2022 is included in the following notes:
- Note 2 (e) - Impairment test of non-financial assets; key assumptions underlying recoverable amounts including the recoverability of expenditure on internally-generated intangible assets;
- Note 2 (o) - Recognition of deferred tax assets: availability of future taxable profit against which tax losses carried forward can be used;
- Note 2 (i) - Impairment of financial assets
- Note 2 (q) - Recognition and measurement of provisions and contingencies: key assumptions about the likelihood and magnitude of an outflow of resources;
d Current and non-current classification The Company presents assets and liabilities in the balance sheet based on current/ non-current classification.
An asset is treated as current when it is:
• Expected to be realized or intended to be sold or consumed in normal operating cycle
• Held primarily for the purpose of trading
• Expected to be realized within twelve months after the reporting period, or
• Cash or cash equivalent unless restricted from being exchanged or used to settle a liability for at least twelve months after the reporting period.
All other assets are classified as non-current.
A liability is treated as current when:
• It is expected to be settled in normal operating cycle,
• It is held primarily for the purpose of trading,
• It is due to be settled within twelve months after the reporting period, or
• There is no unconditional right to defer the settlement of the liability for at least twelve months after the reporting period.
All other liabilities are classified as non-current.
Deferred tax assets and liabilities are classified as non-current assets and liabilities.
The operating cycle is the time between the acquisition of assets for processing and their realisation in cash and cash equivalents. The Company has identified twelve months as its operating cycle.
2 Significant accounting policies The accounting policies set out below have been applied consistently to the periods presented in these Standalone
Financial Statements.
a Revenue recognition The Company derives revenue primarily from rendering of services and sale of licenses. Revenue is recognised upon transfer
of control of promised products or services to customers in an amount that reflects the consideration the Company expects to receive in exchange for those products or services. The Company is a principal in rendering of services and agent in relation to sale of licenses. Amounts disclosed as revenue are net of trade allowances, rebates and Goods and Services tax (GST),
226
Annual Report 2021-22
Notes to the Standalone Financial Statements for the year ended March 31, 2022(All amounts in ` Lacs, unless otherwise stated)
amounts collected on behalf of third parties and includes reimbursement of out-of-pocket expenses, with corresponding expenses included in cost of revenues.
Revenue from the rendering of services and sale of license is recognised when the Company satisfies its performance obligations to its customers as below:
Rendering of services
Revenues from services comprise primarily income from time-and-material and fixed price contracts. Revenue with respect to time-and-material contracts is recognised over the period of time as the related services are performed. Revenue with respect to fixed price contracts where performance obligation is transferred over time. The input (efforts expended) method has been used to measure progress towards completion, as there is a direct relationship between input and productivity. Provisions for estimated losses on contracts-in-progress are recorded in the period in which such losses become probable based on the current contract estimates. In determining the transaction price for rendering of services, the Company considers the effect of variable consideration, existence of a significant financing component, non-cash consideration, and consideration payable to the customers if any. Revenue is recognised net of trade and cash discounts.
Trade receivables
A receivable is recognised if an amount of consideration that is unconditional (i.e., only the passage of time is required before payment of the consideration is due). Refer to accounting policies of financial assets.
Variable consideration
If the consideration in a contract includes a variable amount, the Company estimates the amount of consideration to which it will be entitled in exchange for transferring the goods to the customer. The variable consideration is estimated at contract inception and constrained until it is highly probable that a significant revenue reversal in the amount of cumulative revenue recognised will not occur when the associated uncertainty with the variable consideration is subsequently resolved.
Sale of licenses
The Company is a reseller for sale of right to use licenses and acting as agent in the arrangement. The revenue for sale of right to use license is recognised at point in time when control on use of license is transferred to the customer.
Contract balances
Contract assets: The Company classifies its right to consideration in exchange for deliverables as either a receivable or as unbilled revenue. A receivable is a right to consideration that is unconditional upon passage of time. Revenues in excess of billings is recorded as unbilled revenue and is classified as a financial asset where the right to consideration is unconditional upon passage of time. Unbilled revenue which is conditional is classified as other current asset. Trade receivables and unbilled revenue is presented net of impairment.
Contract liabilities: A contract liability (which we referred to as Unearned Revenue) is the obligation to transfer goods or services to a customer for which the Company has received consideration (or an amount of consideration is due) from the customer. If a customer pays consideration before the Company transfers goods or services to the customer, a contract liability is recognised when the payment is received.
Interest income
Interest income is recognised when it is probable that the economic benefits will flow to the Company and the amount of income can be measured reliably. Interest income is accrued on a time basis, by reference to the principle outstanding and at the effective interest rate applicable, which is the rate that discounts estimated future cash receipts through the expected life of the financial asset to that asset's net carrying amount on initial recognition. Interest income is included under the head ‘other income’ in the Statements of profit and loss.
For all financial instruments measured at amortised cost, interest income is recorded using the effective interest rate, which is the rate that exactly discounts the estimated future cash payments or receipts over the expected life of the financial instrument or a shorter period, where appropriate, to the net carrying amount of the financial asset. Interest income is included in other income in the Statements of profit and loss.

Corporate Overview1 Statutory Reports2 Financial Statements3
227
Annual Report 2021-22
Notes to the Standalone Financial Statements for the year ended March 31, 2022(All amounts in ` Lacs, unless otherwise stated)
Dividend income
Dividend income on investments is accounted when the right to receive the dividend is established, which is generally when shareholders approve the dividend. Dividend income is included under the head “Other income” in the Statements of profit and loss account.
b Business Combination Business combinations are accounted for using the acquisition method. The cost of an acquisition is measured as the aggregate
of the consideration transferred measured at acquisition date fair value. Acquisition-related costs are expensed as incurred and included in other expenses.
At the acquisition date, the identifiable assets acquired and the liabilities assumed are recognised at their acquisition date fair values. For this purpose, the liabilities assumed include contingent liabilities representing present obligation and they are measured at their acquisition fair values irrespective of the fact that outflow of resources embodying economic benefits is not probable. However, the following assets and liabilities acquired in a business combination are measured at the basis indicated below:
• Deferred tax assets or liabilities, and the assets or liabilities related to employee benefit arrangements are recognised and measured in accordance with Ind AS 12 Income Tax and Ind AS 19 Employee Benefits respectively.
• Liabilities or equity instruments related to share based payment arrangements of the acquiree or share – based payments arrangements of the Company entered into to replace share-based payment arrangements of the acquiree are measured in accordance with Ind AS 102 Share-based Payments at the acquisition date.
• Assets (or disposal Company's) that are classified as held for sale in accordance with Ind AS 105 Non-current Assets Held for Sale and Discontinued Operations are measured in accordance with that standard.
• Reacquired rights are measured at a value determined on the basis of the remaining contractual term of the related contract. Such valuation does not consider potential renewal of the reacquired right.
When the Company acquires a business, it assesses the financial assets and liabilities assumed for appropriate classification and designation in accordance with the contractual terms, economic circumstances and pertinent conditions as at the acquisition date. This includes the separation of embedded derivatives in host contracts by the acquiree.
Any contingent consideration to be transferred by the acquirer is recognised at fair value at the acquisition date. Contingent consideration classified as an asset or liability that is a financial instrument and within the scope of Ind AS - 109 Financial Instruments, is measured at fair value with changes in fair value recognised in profit and loss in accordance with Ind AS - 109. If the contingent consideration is not within the scope of Ind AS - 109, it is measured in accordance with the appropriate Ind AS and shall be recognised in the Statement of Profit and Loss. Contingent consideration that is classified as equity is not re-measured at subsequent reporting dates and subsequent its settlement is accounted for within equity.
Goodwill is initially measured at cost, being the excess of the aggregate of the consideration transferred and any previous interest held, over the net identifiable assets acquired and liabilities assumed. If the fair value of the net assets acquired is in excess of the aggregate consideration transferred, the Company re-assesses whether it has correctly identified all of the assets acquired and all of the liabilities assumed and reviews the procedures used to measure the amounts to be recognised at the acquisition date. If the reassessment still results in an excess of the fair value of net assets acquired over the aggregate consideration transferred, then the gain is recognised in other comprehensive income (OCI) and accumulated in equity as capital reserve. However, if there is no clear evidence of bargain purchase, the entity recognises the gain directly in equity as capital reserve, without routing the same through OCI.
After initial recognition, goodwill is measured at cost less any accumulated impairment losses. For the purpose of impairment testing, goodwill acquired in a business combination is, from the acquisition date, allocated to each of the Company’s cash-generating units that are expected to benefit from the combination, irrespective of whether other assets or liabilities of the acquiree are assigned to those units.
c Property, plant and equipment Capital work in progress is stated at cost, net of accumulated impairment loss if any.
Property, plant and equipment are stated at historical cost less accumulated depreciation, and accumulated impairment loss, if any. Historical cost comprises of the purchase price including duties and non-refundable taxes, borrowing cost if capitalisation criteria's are met, directly attributable expenses incurred to bring the asset to the location and condition necessary for it to

228
Annual Report 2021-22
Notes to the Standalone Financial Statements for the year ended March 31, 2022(All amounts in ` Lacs, unless otherwise stated)
be capable of being operated in the manner intended by management and initial estimate of decommissioning, restoring and similar liabilities.
Subsequent costs related to an item of property, plant and equipment are recognised as a separate asset, as appropriate, only when it is probable that future economic benefits associated with the item will flow to the Company and the cost of the item can be measured reliably. The carrying amount of any component accounted for as a separate asset is derecognised when replaced. All other repairs and maintenance are recognised in Statement of Profit and Loss during the reporting period when they are incurred.
An item of property, plant and equipment is derecognised on disposal or when no future economic benefits are expected from its use or disposal. The gains or losses arising from derecognition are measured as the difference between the net disposal proceeds and the carrying amount of the asset and are recognised in the Statement of Profit and Loss when the asset is derecognised.
Property, plant and equipment individually costing ` 5,000 or less are depreciated at 100% in the year in which such assets are ready to use.
Depreciation is calculated using the straight-line method over their estimated useful lives as follows:
The estimates of useful lives of tangible assets are as follows:
Class of asset Useful life as per schedule II Useful life as per CompanyFurniture and fixtures 10 years 5 yearsOffice equipment 5 years 4 yearsComputer systems 6 years for servers
3 years for other than servers2.5-3 years
Leasehold improvements are amortised over the period of the lease or life of the asset whichever is less.
The useful lives have been determined based on technical evaluation done by the management's expert which in certain instances are different from those specified by Schedule II to the Companies Act, 2013, in order to reflect the actual usage of the assets. The assets residual values and useful life are reviewed, and adjusted if appropriate, at the end of each reporting period. An asset's carrying amount is written down immediately to its recoverable amount if the asset's carrying amount is greater than its estimated recoverable amount.
d Intangible assets Goodwill Goodwill on acquisitions of business is included in intangible assets. Goodwill is not amortised but it is tested for impairment
annually, or more frequently if events or changes in circumstances indicate that it might be impaired, and is carried at cost less accumulated impairment losses. Gains and losses on the disposal of a business include the carrying amount of goodwill relating to the business sold.
Goodwill is allocated to cash-generating units for the purpose of impairment testing. The allocation is made to those cash-generating units or Company of cash-generating units that are expected to benefit from the business combination in which the goodwill arose. The units or Company of units are identified at the lowest level at which goodwill is monitored for internal management purposes.
Other intangible assets Intangible assets acquired separately are measured on initial recognition at cost. The cost of intangible assets acquired in a
business combination is their fair value at the date of acquisition. Following initial recognition, intangible assets are carried at cost less any accumulated amortisation and accumulated impairment losses.
An item of intangible asset is derecognised on disposal or when no future economic benefits are expected from its use or disposal. The gains or losses arising from derecognition are measured as the difference between the net disposal proceeds and the carrying amount of the asset and are recognised in the Statement of Profit and Loss when the asset is derecognised.
Amortisation methods and periods
The Company amortises intangible assets with a finite useful life using the straight-line method over the following periods:
Asset Life in yearsComputer software 2.5-3 yearsNon compete fees 3 yearsCustomer relations 3 years

Corporate Overview1 Statutory Reports2 Financial Statements3
229
Annual Report 2021-22
Notes to the Standalone Financial Statements for the year ended March 31, 2022(All amounts in ` Lacs, unless otherwise stated)
The estimated useful life of the intangible assets and the amortisation period are reviewed at the end of the each financial year and the amortisation period is revised to reflect the changed pattern, if any.
Research costs are expensed as incurred. Development expenditures on an individual project are recognised as an intangible asset when the company can demonstrate:
- The technical feasibility of completing the intangible asset so that the asset will be available for use or sale
- Its intention to complete and its ability and intention to use or sell the asset
- How the asset will generate future economic benefits
- The availability of resources to complete the asset
- The ability to measure reliably the expenditure during development
Subsequent costs related to intangible assets are recognised as a separate asset, as appropriate, only when it is probable that future economic benefits associated with the item will flow to the Company and the cost of the item can be measured reliably.
e Impairment of non-financial assets The Company assesses, at each reporting date, whether there is an indication that an asset may be impaired. If any indication
exists, or when annual impairment testing for an asset is required, the Company estimates the asset’s recoverable amount. An asset’s recoverable amount is the higher of an asset’s or cash-generating unit’s (CGU) fair value less costs of disposal and its value in use. The recoverable amount is determined for an individual asset, unless the asset does not generate cash inflows that are largely independent of those from other assets or groups of assets. When the carrying amount of an asset or CGU exceeds its recoverable amount, the asset is considered impaired and is written down to its recoverable amount.
In assessing value in use, the estimated future cash flows are discounted to their present value using a pre-tax discount rate that reflects current market assessments of the time value of money and the risks specific to the asset. In determining fair value less costs of disposal, recent market transactions are taken into account. If no such transactions can be identified, an appropriate valuation model is used. These calculations are corroborated by valuation multiples, quoted share prices for publicly traded companies or other available fair value indicators.
The Company bases its impairment calculation on detailed budgets and forecast calculations, which are prepared separately for each of the Company’s cash generating unit's (CGU's) to which the individual assets are allocated. These budgets and forecast calculations generally cover a period of five years. For longer periods, a long-term growth rate is calculated and applied to project future cash flows after the fifth year. To estimate cash flow projections beyond periods covered by the most recent budgets/forecasts, the Company extrapolates cash flow projections in the budget using a steady or declining growth rate for subsequent years, unless an increasing rate can be justified. In any case, this growth rate does not exceed the long-term average growth rate for the products, industries, or country or countries in which the Company operates, or for the market in which the asset is used.
Impairment losses of continuing operations, including impairment on inventories, are recognised in the Statement of Profit and Loss, except for properties previously revalued with the revaluation surplus taken to other comprehensive income (OCI). For such properties, the impairment is recognised in OCI up to the amount of any previous revaluation surplus.
For assets excluding goodwill, an assessment is made at each reporting date to determine whether there is an indication that previously recognised impairment losses no longer exist or have decreased. If such indication exists, the Company estimates the asset’s or cash generating unit's (CGU’s) recoverable amount. A previously recognised impairment loss is reversed only if there has been a change in the assumptions used to determine the asset’s recoverable amount since the last impairment loss was recognised. The reversal is limited so that the carrying amount of the asset does not exceed its recoverable amount, nor exceed the carrying amount that would have been determined, net of depreciation, had no impairment loss been recognised for the asset in prior years. Such reversal is recognised in the Statement of Profit and Loss unless the asset is carried at a revalued amount, in which case, the reversal is treated as a revaluation increase.
Goodwill is tested for impairment annually and when circumstances indicate that the carrying value may be impaired.
Impairment is determined for goodwill by assessing the recoverable amount of each cash generating unit (CGU) (or group of CGUs) to which the goodwill relates. When the recoverable amount of the CGU is less than its carrying amount, an impairment loss is recognised. Impairment losses relating to goodwill cannot be reversed in future periods.

230
Annual Report 2021-22
Notes to the Standalone Financial Statements for the year ended March 31, 2022(All amounts in ` Lacs, unless otherwise stated)
f Borrowing cost Borrowing costs directly attributable to the acquisition, construction or production of an asset that necessarily takes a substantial
period of time to get ready for its intended use or sale are capitalised as part of the cost of the asset. All other borrowing costs are expensed in the period in which they occur. Borrowing costs consist of interest and other costs that an entity incurs in connection with the borrowing of funds. Borrowing cost also includes exchange differences to the extent regarded as an adjustment to the borrowing costs.
g Leases The Company has lease contracts for various items of computers, vehicles and buildings used in its operations. Lease terms
generally ranges between 1 and 5 years.
The Company assesses at contract inception whether a contract is, or contains, a lease. That is, if the contract conveys the right to control the use of an identified asset for a period of time in exchange for consideration.
Company as lessee
The Company applies a single recognition and measurement approach for all leases, except for short-term leases and leases of low-value assets. The Company recognises lease liabilities to make lease payments and right-of-use assets representing the right to use the underlying assets.
Right-of-use assets
The Company recognises right-of-use assets at the commencement date of the lease (i.e., the date the underlying asset is available for use). Right-of-use assets are measured at cost, less any accumulated depreciation and impairment losses, and adjusted for any remeasurement of lease liabilities. The cost of right-of-use assets includes the amount of lease liabilities recognised, initial direct costs incurred, and lease payments made at or before the commencement date less any lease incentives received. Right-of-use assets are depreciated on a straight-line basis over the shorter of the lease term and the estimated useful lives of the assets.
If ownership of the leased asset transfers to the Company at the end of the lease term or the cost reflects the exercise of a purchase option, depreciation is calculated using the estimated useful life of the asset.
The right-of-use assets are also subject to impairment. Refer to the accounting policies in note 2(e) for policy on impairment of non-financial assets.
Lease liabilities
At the commencement date of the lease, the Company recognises lease liabilities measured at the present value of lease payments to be made over the lease term. The lease payments include fixed payments (including in-substance fixed payments) less any lease incentives receivable, variable lease payments that depend on an index or a rate, and amounts expected to be paid under residual value guarantees. The lease payments also include the exercise price of a purchase option reasonably certain to be exercised by the Company and payments of penalties for terminating the lease, if the lease term reflects the Company exercising the option to terminate. Variable lease payments that do not depend on an index or a rate are recognised as expenses (unless they are incurred to produce inventories) in the period in which the event or condition that triggers the payment occurs.
In calculating the present value of lease payments, the Company uses its incremental borrowing rate at the lease commencement date because the interest rate implicit in the lease is not readily determinable. After the commencement date, the amount of lease liabilities is increased to reflect the accretion of interest and reduced for the lease payments made. In addition, the carrying amount of lease liabilities is remeasured if there is a modification, a change in the lease term, a change in the lease payments (e.g., changes to future payments resulting from a change in an index or rate used to determine such lease payments) or a change in the assessment of an option to purchase the underlying asset.
Short-term leases and leases of low-value assets
The Company applies the short-term lease recognition exemption to its short-term leases of machinery and equipment (i.e., those leases that have a lease term of 12 months or less from the commencement date and do not contain a purchase option). It also applies the lease of low-value assets recognition exemption to leases of office equipment that are considered to be low value. Lease payments on short-term leases and leases of low-value assets are recognised as expense on a straight-line basis over the lease term.

Corporate Overview1 Statutory Reports2 Financial Statements3
231
Annual Report 2021-22
Notes to the Standalone Financial Statements for the year ended March 31, 2022(All amounts in ` Lacs, unless otherwise stated)
Lease and non-lease component
As per Ind AS - 116, “As a practical expedient, a lessee may elect, by class of underlying asset, not to separate non-lease components from lease components, and instead account for each lease component and any associated non-lease components as a single lease component.
The company have not opted for this practical expedient and have accounted for Lease component only.
Extension and termination option
The Company has several lease contracts that include extension and termination options. These options are negotiated by management to provide flexibility in managing the leased-asset portfolio and align with the Company's business needs. Management exercises significant judgement in determining whether these extension and termination options are reasonably certain to be exercised. Management have not considered any future cash outflow for which they are potentially exposed arising due to extension and termination options.
h Investment in subsidiary The Company recognizes its investments in subsidiary and associate companies at cost less accumulated impairment loss,
if any. Cost represents amount paid for acquisition of the said investments. The details of such investment is given in note 6. Refer to the accounting policies in note 2(e) for policy on impairment of non-financial asset.
On disposal of an investment, the difference between the net disposal proceeds and the carrying amount is charged or credited to the Statement of Profit and Loss.
i Financial Instruments Financial instrument is any contract that gives rise to a financial asset of one entity and a financial liability or equity instrument
of another entity.
Non-derivative financial instruments :
a) Financial assets
Initial recognition and measurement
Financial assets are classified, at initial recognition, as subsequently measured at amortised cost, fair value through other comprehensive income (OCI), and fair value through profit or loss.
The classification of financial assets at initial recognition depends on the financial asset’s contractual cash flow characteristics and the Company’s business model for managing them. With the exception of trade receivables that do not contain a significant financing component or for which the Company has applied the practical expedient, the Company initially measures a financial asset at its fair value plus, in the case of a financial asset not at fair value through profit or loss, transaction costs. Trade receivables that do not contain a significant financing component or for which the Company has applied the practical expedient are measured at the transaction price determined under Ind AS - 115.
In order for a financial asset to be classified and measured at amortised cost or fair value through other comprehensive income (OCI), it needs to give rise to cash flows that are ‘solely payments of principle and interest (SPPI)’ on the principle amount outstanding. This assessment is referred to as the SPPI test and is performed at an instrument level. Financial assets with cash flows that are not SPPI are classified and measured at fair value through profit or loss, irrespective of the business model.
The Company’s business model for managing financial assets refers to how it manages its financial assets in order to generate cash flows. The business model determines whether cash flows will result from collecting contractual cash flows, selling the financial assets, or both. Financial assets classified and measured at amortised cost are held within a business model with the objective to hold financial assets in order to collect contractual cash flows while financial assets classified and measured at fair value through other comprehensive income are held within a business model with the objective of both holding to collect contractual cash flows and selling.
Purchases or sales of financial assets that require delivery of assets within a time frame established by regulation or convention in the market place (regular way trades) are recognised on the trade date, i.e., the date that the Company commits to purchase or sell the asset.

232
Annual Report 2021-22
Notes to the Standalone Financial Statements for the year ended March 31, 2022(All amounts in ` Lacs, unless otherwise stated)
Subsequent measurement
For purposes of subsequent measurement, financial assets are classified in four categories:
• Debt instruments at amortised cost
• Debt instruments at Fair Value Through Other Comprehensive income (FVTOCI)
• Debt instruments, derivatives and equity instruments at Fair Value Through Profit and Loss (FVTPL)
• Equity instruments measured at Fair Value Through Other Comprehensive Income (FVTOCI)
Debt instruments at amortised cost
A ‘Debt instrument’ is measured at the amortised cost if both the following conditions are met:
a) The asset is held within a business model whose objective is to hold assets for collecting contractual cash flows, and
b) Contractual terms of the asset give rise on specified dates to cash flows that are solely payments of principle and interest (SPPI) on the principle amount outstanding.
After initial measurement, such financial assets are subsequently measured at amortised cost using the Effective Interest Rate (EIR) method. Amortised cost is calculated by taking into account any discount or premium on acquisition and fees or costs that are an integral part of the EIR. The EIR amortisation is included in other income in the Statement of Profit and Loss. The losses arising from impairment are recognised in the Statement of Profit and Loss. This category generally applies to trade and other receivables. For more information on receivables, refer to Note 13.
Debt instrument at Fair Value Through Other Comprehensive income (FVTOCI)
A ‘Debt instrument’ is classified as at the Fair Value Through Other Comprehensive income (FVTOCI) if both of the following criteria are met:
a) The objective of the business model is achieved both by collecting contractual cash flows and selling the financial assets, and
b) The asset’s contractual cash flows represent ‘solely payments of principle and interest (SPPI)’.
Debt instruments included within the FVTOCI category are measured initially as well as at each reporting date at fair value. Fair value movements are recognised in the other comprehensive income (OCI). However, the Company recognizes interest income, impairment losses & reversals and foreign exchange gain or loss in the Statement of Profit and Loss. On derecognition of the asset, cumulative gain or loss previously recognised in OCI is reclassified from the equity to Statement of Profit and Loss. Interest earned whilst holding FVTOCI debt instrument is reported as interest income using the Effective Interest Rate (EIR) method.
Debt instrument at Fair Value Through Profit and Loss (FVTPL)
Fair Value Through Profit and Loss (FVTPL) is a residual category for debt instruments. Any debt instrument, which does not meet the criteria for categorization as at amortized cost or as Fair Value Through Other Comprehensive income (FVTOCI), is classified as at FVTPL.
In addition, the Company may elect to designate a debt instrument, which otherwise meets amortized cost or FVTOCI criteria, as at FVTPL. However, such election is allowed only if doing so reduces or eliminates a measurement or recognition inconsistency (referred to as ‘accounting mismatch’). The Company has not designated any debt instrument as at FVTPL.
Debt instruments included within the FVTPL category are measured at fair value with all changes recognised in the Statement of Profit and Loss.
Equity investments
All equity investments in scope of Ind AS - 109 are measured at fair value. Equity instruments which are held for trading and contingent consideration recognised by an acquirer in a business combination to which Ind AS - 103 applies are classified as at Fair Value Through Profit and Loss (FVTPL). For all other equity instruments, the Company may make an irrevocable election to present in other comprehensive income subsequent changes in the fair value. The Company makes such election on an instrument-by-instrument basis. The classification is made on initial recognition and is irrevocable.

Corporate Overview1 Statutory Reports2 Financial Statements3
233
Annual Report 2021-22
Notes to the Standalone Financial Statements for the year ended March 31, 2022(All amounts in ` Lacs, unless otherwise stated)
If the Company decides to classify an equity instrument as at Fair Value Through Other Comprehensive income (FVTOCI), then all fair value changes on the instrument, excluding dividends, are recognised in the Other Comprehensive income (OCI). There is no recycling of the amounts from OCI to Statement of Profit and Loss, even on sale of investment. However, the Company may transfer the cumulative gain or loss within equity.
Equity instruments included within the FVTPL category are measured at fair value with all changes recognised in the Statement of Profit and Loss.
Derecognition
A financial asset (or, where applicable, a part of a financial asset or part of a Company of similar financial assets) is primarily derecognised (i.e. removed from the Company’s balance sheet) when:
• The rights to receive cash flows from the asset have expired, or
• The Company has transferred its rights to receive cash flows from the asset or has assumed an obligation to pay the received cash flows in full without material delay to a third party under a ‘pass-through’ arrangement and either (a) the Company has transferred substantially all the risks and rewards of the asset, or (b) the Company has neither transferred nor retained substantially all the risks and rewards of the asset, but has transferred control of the asset.
When the Company has transferred its rights to receive cash flows from an asset or has entered into a pass-through arrangement, it evaluates if and to what extent it has retained the risks and rewards of ownership. When it has neither transferred nor retained substantially all of the risks and rewards of the asset, nor transferred control of the asset, the Company continues to recognise the transferred asset to the extent of the Company’s continuing involvement. In that case, the Company also recognises an associated liability. The transferred asset and the associated liability are measured on a basis that reflects the rights and obligations that the Company has retained.
Reclassification of financial assets
The Company determines classification of financial assets on initial recognition. After initial recognition, no reclassification is made for financial assets which are equity instruments and financial liabilities. For financial assets which are debt instruments, a reclassification is made only if there is a change in the business model for managing those assets. Changes to the business model are expected to be infrequent. The Company’s senior management determines change in the business model as a result of external or internal changes which are significant to the Company’s operations. Such changes are evident to external parties. A change in the business model occurs when the Company either begins or ceases to perform an activity that is significant to its operations. If the Company reclassifies financial assets, it applies the reclassification prospectively from the reclassification date which is the first day of the immediately next reporting period following the change in business model. The Company does not restate any previously recognised gains, losses (including impairment gains or losses) or interest.
Impairment of financial assets
In accordance with Ind AS - 109, the Company applies expected credit loss (ECL) model for measurement and recognition of impairment loss on the following financial assets and credit risk exposure:
a) Financial assets that are debt instruments, and are measured at amortised cost e.g., loans, deposits, trade receivables, unbilled revenue and bank balance
b) Trade receivables or any contractual right to receive cash or another financial asset that result from transactions that are within the scope of Ind AS - 115.
The Company follows ‘simplified approach’ for recognition of impairment loss allowance on:
• Trade receivables, unbilled revenue and contract assets
The application of simplified approach does not require the Company to track changes in credit risk. Rather, it recognises impairment loss allowance based on lifetime ECLs at each reporting date, right from its initial recognition.
The Company recognises an allowance for expected credit losses (ECLs) for all debt instruments not held at fair value through profit or loss. ECLs are based on the difference between the contractual cash flows due in accordance with the contract and all the cash flows that the company expects to receive, discounted at an approximation of the original effective interest rate. The expected cash flows will include cash flows from the sale of collateral held or other credit enhancements that are integral to the contractual terms.

234
Annual Report 2021-22
Notes to the Standalone Financial Statements for the year ended March 31, 2022(All amounts in ` Lacs, unless otherwise stated)
For recognition of impairment loss on other financial assets and risk exposure, the Company determines that whether there has been a significant increase in the credit risk since initial recognition. If credit risk has not increased significantly, 12-month ECL is used to provide for impairment loss. However, if credit risk has increased significantly, lifetime ECL is used. If, in a subsequent period, credit quality of the instrument improves such that there is no longer a significant increase in credit risk since initial recognition, then the entity reverts to recognising impairment loss allowance based on 12-month ECL.
b) Financial Liabilities :
Initial recognition and measurement
Financial liabilities are classified, at initial recognition, as financial liabilities at fair value through profit or loss, loans and borrowings, or as payables, as appropriate.
All financial liabilities are recognised initially at fair value and, in the case of loans and borrowings and payables, net of directly attributable transaction costs.
The Company’s financial liabilities include trade and other payables, loans and borrowings including bank overdrafts. The subsequent measurement of financial liabilities depends on their classification, which is described below.
Subsequent measurement
The measurement of financial liabilities depends on their classification, as described below:
Financial liabilities at fair value through profit and loss (FVTPL)
Financial liabilities at fair value through profit and loss include financial liabilities held for trading and financial liabilities designated upon initial recognition as at Fair Value Through Profit or Loss (FVTPL). Financial liabilities are classified as held for trading if they are incurred for the purpose of repurchasing in the near term. This category also includes derivative financial instruments entered into by the Company that are not designated as hedging instruments in hedge relationships as defined by Ind AS - 109. Separated embedded derivatives are also classified as held for trading unless they are designated as effective hedging instruments.
Gains or losses on liabilities held for trading are recognised in the Statement of Profit and Loss.
Financial liabilities designated upon initial recognition at fair value through profit and loss are designated as such at the initial date of recognition, and only if the criteria in Ind AS 109 are satisfied. For liabilities designated as FVTPL, fair value gains or losses attributable to changes in own credit risk are recognised in other comprehensive income (OCI). These gains/ loss are not subsequently transferred to profit and loss. However, the Company may transfer the cumulative gain or loss within equity. All other changes in fair value of such liability are recognised in the Statement of Profit and Loss. The Company has not designated any financial liability as at fair value through profit or loss."
c) Loans and Borrowings
After initial recognition, interest-bearing loans and borrowings are subsequently measured at amortised cost using the effective interest rate (EIR) method. Gains or losses are recognised in the Statement of Profit and Loss when the liabilities are derecognised as well as through the EIR amortisation process.
Amortised cost is calculated by taking into account any discount or premium on acquisition and fees or costs that are an integral part of the EIR. The EIR amortisation is included as finance costs in the Statement of Profit and Loss.
This category generally applies to borrowings. For more information refer note 20."
Derecognition
A financial liability is derecognised when the obligation under the liability is discharged or cancelled or expires. When an existing financial liability is replaced by another from the same lender on substantially different terms, or the terms of an existing liability are substantially modified, such an exchange or modification is treated as the derecognition of the original liability and the recognition of a new liability. The difference in the respective carrying amounts is recognised in the Statement of Profit and Loss.

Corporate Overview1 Statutory Reports2 Financial Statements3
235
Annual Report 2021-22
Notes to the Standalone Financial Statements for the year ended March 31, 2022(All amounts in ` Lacs, unless otherwise stated)
d) Offsetting of financial instruments
Financial assets and financial liabilities are offset and the net amount presented in the balance sheet when, and only when, the Company current has a legally enforceable right to set off the amounts and it intends either to settle them on a net basis or to realize the asset and settle the liability simultaneously.
Derivative financial instruments and hedge accounting:
Initial recognition and subsequent measurement :
The Company uses derivative financial instruments, such as forward currency contracts and interest rate swaps to hedge its foreign currency risks and interest rate risks, respectively. Such derivative financial instruments are initially recognised at fair value on the date on which a derivative contract is entered into and are subsequently re-measured at fair value. Derivatives are carried as financial assets when the fair value is positive and as financial liabilities when the fair value is negative.
Any gains or losses arising from changes in the fair value of derivatives are taken directly to profit or loss, except for the effective portion of cash flow hedges, which is recognised in other comprehensive income (OCI) and later reclassified to Statement of Profit and Loss when the hedge item affects profit or loss or treated as basis adjustment if a hedged forecast transaction subsequently results in the recognition of a non-financial asset or non-financial liability.
For the purpose of hedge accounting, hedges are classified as:
• Fair value hedges when hedging the exposure to changes in the fair value of a recognised asset or liability or an unrecognised firm commitment
• Cash flow hedges when hedging the exposure to variability in cash flows that is either attributable to a particular risk associated with a recognised asset or liability or a highly probable forecast transaction or the foreign currency risk in an unrecognised firm commitment
• Hedges of a net investment in a foreign operation .
At the inception of a hedge relationship, the Company formally designates and documents the hedge relationship to which it wishes to apply hedge accounting and the risk management objective and strategy for undertaking the hedge.
The documentation includes identification of the hedging instrument, the hedged item, the nature of the risk being hedged and how the Company will assess whether the hedging relationship meets the hedge effectiveness requirements (including the analysis of sources of hedge ineffectiveness and how the hedge ratio is determined). A hedging relationship qualifies for hedge accounting if it meets all of the following effectiveness requirements:
• There is ‘an economic relationship’ between the hedged item and the hedging instrument.
• The effect of credit risk does not ‘dominate the value changes’ that result from that economic relationship.
• The hedge ratio of the hedging relationship is the same as that resulting from the quantity of the hedged item that the Company actually hedges and the quantity of the hedging instrument that the Company actually uses to hedge that quantity of hedged item.
Hedges that meet all the qualifying criteria for hedge accounting are accounted for, as described below:
Cash flow hedges
The Company designates certain foreign exchange forward and interest rate swaps as cash flow hedges with an intention to hedge its existing liabilities and highly probable transaction in foreign currency. When a derivative is designated as a cash flow hedge instrument, the effective portion of changes in the fair value of the derivative is recognised in other comprehensive income and accumulated in the cash flow hedge reserve. Any ineffective portion of changes in the fair value of the derivative is recognised immediately in the Statement of Profit and Loss. If the hedging instrument no longer meets the criteria for hedge accounting, then hedge accounting is discontinued prospectively. If the hedging instrument expires or is sold, terminated or exercised, the cumulative gain or loss on the hedging instrument recognised in cash flow hedge reserve till the period the hedge was effective remains in cash flow hedge reserve until the forecasted transaction occurs. The cumulative gain or loss previously recognised in the cash flow hedge reserve is transferred to the net profit in the Statement of Profit and Loss upon the occurrence of the related forecasted transaction. If the forecasted transaction is no longer expected to occur, then the amount accumulated in cash flow hedge reserve is reclassified to the Statement of Profit and Loss.

236
Annual Report 2021-22
Notes to the Standalone Financial Statements for the year ended March 31, 2022(All amounts in ` Lacs, unless otherwise stated)
Compulsory convertible preference shares
Compulsory convertible preference shares (CCPS) are classified as a liability or equity components based on the terms of the contract and in accordance with Ind AS - 32 (Financial instruments: Presentation). CCPS issued by the Company classified as equity is carried at its transaction value and shown within "other equity". CCPS issued by the Company classified as liability is initially recognised at fair value (issue price). Subsequent to initial recognition, such CCPS is fair valued through the Statement of Profit and Loss. On modification of CCPS from liability to equity, the CCPS is recorded at the fair value of CCPS classified as equity and the difference in fair value is recorded as a gain or loss on modification in the Statement of Profit and Loss.
j Fair value measurement ‘Fair value’ is the price that would be received to sell an asset or paid to transfer a liability in an orderly transaction between
market participants at the measurement date in the principle or, in its absence, the most advantageous market to which the Company has access at that date. The fair value of a liability reflects its non-performance risk. All assets and liabilities for which fair value is measured or disclosed in the Standalone Financial Statement are categorised within the fair value hierarchy, described as follows, based on the lowest level input that is significant to the fair value measurement as a whole:
- Level 1 - Quoted (unadjusted) market prices in active markets for identical assets or liabilities
- Level 2 - Valuation techniques for which the lowest level input that is significant to the fair value measurement is directly or indirectly observable
- Level 3 - Valuation techniques for which the lowest level input that is significant to the fair value measurement is unobservable
For assets and liabilities that are recognised in the financial statements on a recurring basis, the Company determines whether transfers have occurred between levels in the hierarchy by re-assessing categorisation (based on the lowest level input that is significant to the fair value measurement as a whole) at the end of each reporting period."
k Cash and cash equivalents Cash and cash equivalents in the balance sheet and cash flow statement comprise cash at banks and on hand and short-term
deposits with an original maturity of three months or less, which are subject to an insignificant risk of changes in value.
For the purpose of the Standalone Statement of Cash Flows , cash and cash equivalents consist of cash and short-term deposits, as defined above, net of outstanding bank overdrafts as they are considered an integral part of the Company’s cash management.
l Foreign currency translation (i) Functional and presentation currency:
Items included in the Standalone Financial Statements of the company are measured using the currency of the primary economic environment in which the entity operates (the functional currency). The financial statements are presented in Indian rupee (`), which is functional and presentation currency of the Company.
ii) Transactions and balances:
Foreign currency transactions are translated into the functional currency using the exchange rates at the dates of the transactions. Foreign exchange gains and losses resulting from the settlement of such transactions and from the translation of monetary assets and liabilities denominated in foreign currencies at year end exchange rates are recognised in Statement of Profit and Loss.
m Employee Benefits Short-term obligations
Liabilities for wages and salaries, including non-monetary benefits that are expected to be settled wholly within 12 months after the end of the period in which the employees render the related service are recognised in respect of employee's services up to the end of the reporting period and are measured at the amounts expected to be paid when the liabilities are settled. The liabilities are presented as current financial liabilities in the balance sheet.
Accumulated leave, which is expected to be utilized within the next 12 months, is treated as short-term employee benefit. The Company measures the expected cost of such absences as the additional amount that it expects to pay as a result of the unused entitlement that has accumulated at the reporting date.

Corporate Overview1 Statutory Reports2 Financial Statements3
237
Annual Report 2021-22
Notes to the Standalone Financial Statements for the year ended March 31, 2022(All amounts in ` Lacs, unless otherwise stated)
Other long-term employee benefit obligations
The liabilities for leave balance are not expected to be settled wholly within 12 months after the end of the period in which the employees render the related service. They are therefore measured as the present value of expected future payments to be made in respect of services provided by employees up to the end of the reporting period using the projected unit credit method. The benefits are discounted using the market yields on government bonds at the end of the reporting period that have terms approximating to the terms of the related obligation. Remeasurements as a result of experience adjustments and changes in actuarial assumptions are recognised in Statement of Profit and Loss.
The obligations are presented as current liabilities in the balance sheet if the entity does not have an unconditional right to defer settlement for at least twelve months after the reporting period, regardless of when the actual settlement is expected to occur.
Post-employment obligations
The company operates the following post-employment schemes:
(a) defined benefit plans - gratuity, and
(b) defined contribution plans such as provident fund.
Gratuity obligations
The liability or asset recognised in the balance sheet in respect of defined benefit gratuity plan is the present value of the defined benefit obligation at the end of the reporting period less the fair value of plan assets. The defined benefit obligation is calculated annually by an independent actuary using the projected unit credit method.
The present value of the defined benefit obligation is determined by discounting the estimated future cash outflows by reference to market yields at the end of the reporting period on government bonds that have term approximating the term of the related obligation. The net interest cost is calculated by applying the discount rate to the net balance of the defined benefit obligation and the fair value of plan assets.
Remeasurement gains and losses arising from experience adjustments and changes in actuarial assumptions are recognised in the period in which they occur, directly in other comprehensive income. They are included in retained earnings in the Statement of Changes in Equity and in the balance sheet. Such accumulated re-measurement balances are never reclassified into the Statement of Profit and Loss subsequently.
Changes in the present value of the defined benefit obligation resulting from plan amendments or curtailments are recognised immediately in profit and loss as past service costs.
Defined contribution plan
Retirement benefit in the form of provident fund scheme, Social security, National Insurance, Superannuation, Medicare schemes are the defined contribution plans. The Company has no obligation, other than the contribution payable. The Company recognizes contribution payable to these schemes as an expenditure, when an employee renders the related service.
n Employee share based payments Certain employees of the Company receive remuneration in the form of share-based payments, whereby employees render
services as consideration for equity instruments.
Equity-settled transactions:
The cost of equity-settled transactions is determined by the fair value at the date when the grant is made using a black Scholes model except for the option on date of modification of plan from cash settled to equity settled transaction (refer modification of plan).
That cost is recognised, together with a corresponding increase in employees stock option reserves in equity, over the period in which the performance and/or service conditions are fulfilled in employee benefits expense. The cumulative expense recognised for equity-settled transactions at each reporting date until the vesting date reflects the extent to which the vesting period has expired and the Company’s best estimate of the number of equity instruments that will ultimately vest. The expense or credit in the Statement of Profit and Loss for a period represents the movement in cumulative expense recognised as at the beginning and end of that period and is recognised in employee benefits expense.
238
Annual Report 2021-22
Notes to the Standalone Financial Statements for the year ended March 31, 2022(All amounts in ` Lacs, unless otherwise stated)
Service and non-market performance conditions are not taken into account when determining the grant date fair value of awards, but the likelihood of the conditions being met is assessed as part of the Company’s best estimate of the number of equity instruments that will ultimately vest. Market performance conditions are reflected within the grant date fair value. Any other conditions attached to an award, but without an associated service requirement, are considered to be non-vesting conditions. Non-vesting conditions are reflected in the fair value of an award and lead to an immediate expensing of an award unless there are also service and/or performance conditions.
No expense is recognised for awards that do not ultimately vest because non-market performance and/or service conditions have not been met. Where awards include a market or non-vesting condition, the transactions are treated as vested irrespective of whether the market or non-vesting condition is satisfied, provided that all other performance and/or service conditions are satisfied.
The dilutive effect of outstanding options is reflected as additional share dilution in the computation of diluted earnings per share.
o Taxation Income tax comprises of current tax and deferred tax. It is recognised in the Statement of Profit and Loss except to the extent
that it relates to an item recognised directly in the other comprehensive income.
Current income tax
Current income tax assets and liabilities are measured at the amount expected to be recovered from or paid to the taxation authorities. The tax rates and tax laws used to compute the amount are those that are enacted or substantively enacted, at the reporting date in the countries where the Company operates and generates taxable income.
Current income tax relating to items recognised outside the Statement of Profit and Loss is recognised outside profit and loss (either in other comprehensive income or in equity). Current tax items are recognised in correlation to the underlying transaction either in other comprehensive income (OCI) or directly in equity. Management periodically evaluates positions taken in the tax returns with respect to situations in which applicable tax regulations are subject to interpretation and establishes provisions where appropriate.
In the situations where Company is entitled to a tax holiday under the Income-tax Act, 1961 enacted in India or tax laws prevailing in the respective tax jurisdictions where they operate, no deferred tax (asset or liability) is recognised in respect of temporary differences which reverse during the tax holiday period, to the extent the concerned entity’s gross total income is subject to the deduction during the tax holiday period. Deferred tax in respect of temporary differences which reverse after the tax holiday period is recognised in the year in which the temporary differences originate. However, the Company restricts recognition of deferred tax assets to the extent it is probable that sufficient future taxable income will be available against which such deferred tax assets can be realized. For recognition of deferred taxes, the temporary differences which originate first are considered to reverse first.
Current tax assets and current tax liabilities are offset when there is a legally enforceable right to set off the recognised amounts, and there is an intention to settle the asset and the liability on a net basis.
Deferred tax
Deferred tax is provided using the liability method on temporary differences between the tax bases of assets and liabilities and their carrying amounts for financial reporting purposes at the reporting date.
Deferred tax liabilities are recognised for all taxable temporary differences, except:
• When the deferred tax liability arises from the initial recognition of goodwill or an asset or liability in a transaction that is not a business combination and, at the time of the transaction, affects neither the accounting profit nor taxable profit or loss.
• In respect of taxable temporary differences associated with investments in subsidiaries, associates and interests in joint ventures, when the timing of the reversal of the temporary differences can be controlled and it is probable that the temporary differences will not reverse in the foreseeable future.
Deferred tax assets are recognised for all deductible temporary differences, the carry forward of unused tax credits and any unused tax losses. Deferred tax assets are recognised to the extent that it is probable that taxable profit will be available against which the deductible temporary differences, and the carry forward of unused tax credits and unused tax losses can be utilised, except:

Corporate Overview1 Statutory Reports2 Financial Statements3
239
Annual Report 2021-22
Notes to the Standalone Financial Statements for the year ended March 31, 2022(All amounts in ` Lacs, unless otherwise stated)
• When the deferred tax asset relating to the deductible temporary difference arises from the initial recognition of an asset or liability in a transaction that is not a business combination and, at the time of the transaction, affects neither the accounting profit nor taxable profit or loss
• In respect of deductible temporary differences associated with investments in subsidiaries, associates and interests in joint ventures, deferred tax assets are recognised only to the extent that it is probable that the temporary differences will reverse in the foreseeable future and taxable profit will be available against which the temporary differences can be utilised
The carrying amount of deferred tax assets is reviewed at each reporting date and reduced to the extent that it is no longer probable that sufficient taxable profit will be available to allow all or part of the deferred tax asset to be utilised. Unrecognised deferred tax assets are re-assessed at each reporting date and are recognised to the extent that it has become probable that future taxable profits will allow the deferred tax asset to be recovered.
Deferred tax assets and liabilities are measured at the tax rates that are expected to apply in the year when the asset is realised, or the liability is settled, based on tax rates (and tax laws) that have been enacted or substantively enacted at the reporting date.
Deferred tax relating to items recognised outside profit or loss is recognised outside profit or loss (either in other comprehensive income or in equity). Deferred tax items are recognised in correlation to the underlying transaction either in OCI or directly in equity.
Tax benefits acquired as part of a business combination, but not satisfying the criteria for separate recognition at that date, are recognised subsequently if new information about facts and circumstances change. Acquired deferred tax benefits recognised within the measurement period reduce goodwill related to that acquisition if they result from new information obtained about facts and circumstances existing at the acquisition date. If the carrying amount of goodwill is zero, any remaining deferred tax benefits are recognised in OCI/ capital reserve depending on the principle explained for bargain purchase gains. All other acquired tax benefits realised are recognised in Statement of Profit and Loss.
The Company offsets deferred tax assets and deferred tax liabilities if and only if it has a legally enforceable right to set off current tax assets and current tax liabilities and the deferred tax assets and deferred tax liabilities relate to income taxes levied by the same taxation authority on either the same taxable entity or different taxable entities which intend either to settle current tax liabilities and assets on a net basis, or to realise the assets and settle the liabilities simultaneously, in each future period in which significant amounts of deferred tax liabilities or assets are expected to be settled or recovered.
Minimum Alternate Tax (MAT)
Minimum alternate tax (MAT) paid in a year is charged to the Statement of Profit and Loss as current tax for the year. The deferred tax asset is recognised for MAT credit available only to the extent that it is probable that the concerned company will pay normal income tax during the specified period, i.e., the period for which MAT credit is allowed to be carried forward. In the year in which the company recognizes MAT credit as an asset, it is created by way of credit to the Statement of Profit and Loss and shown as part of deferred tax asset. The company reviews the “MAT credit entitlement” asset at each reporting date and writes down the asset to the extent that it is no longer probable that it will pay normal tax during the specified period.
p Treasury shares The Company has created an Employee Benefit Trust (EBT) for providing share-based payment to its employees. The Company
uses EBT as a vehicle for distributing shares to employees under the employee remuneration schemes. The EBT buys shares from the Company, for giving shares to employees. The Company treats EBT as its extension and shares held by EBT are treated as treasury shares. Refer note 17.
No gain or loss is recognised in Statement of Profit and Loss on the issue or cancellation of the Company's own equity instruments.
On consolidation of EBT with the Company, the value of shares held by trust is shown as a deduction from equity (i.e. reduction from share capital to the extent of face value and remaining from securities premium). Gains/ losses recognized by the trust on issue of shares are shown as a part of securities premium.
Share options exercised during the reporting period are issued from treasury shares.

240
Annual Report 2021-22
Notes to the Standalone Financial Statements for the year ended March 31, 2022(All amounts in ` Lacs, unless otherwise stated)
q Provisions and Contingent Liabilities Provisions
Provisions are recognised when there is a present obligation (legal or constructive) as a result of a past event, it is probable that an outflow of resources embodying economic benefits will be required to settle the obligation, in respect of which a reliable estimate can be made of the amount of the obligation.
If the effect of the time value of money is material, provisions are discounted using a current pre-tax rate that reflects, when appropriate, the risks specific to the liability. When discounting is used, the increase in the provision due to the passage of time is recognised as a finance cost.
Provision for warranty
As per the terms of the contracts, the Company provides post-contract services / warranty support to some of its customers. The Company accounts for the post-contract support / provision for warranty on the basis of the information available with the management duly taking into account the current and past technical estimates. The estimate of such warranty-related costs is revised annually.
Contingent Liabilities
A contingent liability is a possible obligation that arises from past events and whose existence will be confirmed only by the occurrence or non-occurrence of one or more uncertain future events not wholly within the control of the Company or a present obligation that is not recognised because it is not probable that an outflow of resources will be required to settle the obligation. A contingent liability also arises in extremely rare cases where there is a liability that cannot be recognised because it cannot be measured reliably. The Company does not recognize a contingent liability but discloses it in the Standalone Financial Statements, unless the possibility of an outflow of resources embodying economic benefits is remote.
r Segment reporting Operating segments are reported in a manner consistent with the internal reporting provided to the chief operating decision
maker (CODM). The Company has identified three reportable segment based on the dominant source, nature of risks and return and the internal organisation and management structure and for which discrete financial information is available. The Executive Management Committee monitors the operating results of its business units separately for the purpose of making decisions about resource allocation and performance assessment.
The Company publishes standalone financial statements along with the consolidated financial statements. In accordance with Ind AS 108, Operating segments, the Company has disclosed the segment information in the consolidated financial statements. Accordingly, the segment information is given in the consolidated financial results of Happiest Minds Technologies Limited and its subsidiary for the year ended March 31, 2022.
s Earnings/(Loss) per share Basic earnings per share is calculated by dividing the net profit or loss attributable to equity holders of the Company (after
deducting preference dividends and attributable taxes) by the weighted average number of equity shares outstanding during the period (including treasury share).
The weighted average number of equity shares outstanding during the period is adjusted for events such as bonus issue, bonus element in a rights issue, share split, and reverse share split (consolidation of shares) that have changed the number of equity shares outstanding, without a corresponding change in resources.
For the purpose of calculating diluted earnings per share, the net profit or loss for the period attributable to equity shareholders of the company and the weighted average number of shares outstanding during the period are adjusted for the effects of all dilutive potential equity shares. The weighted average number of shares takes into account the weighted average effect of changes in treasury share transactions and CCPS during the year.
Ordinary shares that will be issued upon the conversion of a mandatorily convertible instrument are included in the calculation of basic earnings per share from the date the contract is entered into.
t Change in accounting policies and disclosure (i) Amendment to Ind AS 116 : Covid-19- Related Rent Concessions.
MCA issued an amendment to Ind AS 116 Covid-19-Related Rent Concessions beyond 30 June 2021 to update the condition for lessees to apply the relief to a reduction in lease payments originally due on or before 30 June 2022 from 30 June 2021. The amendment applies to annual reporting periods beginning on or after April 1, 2021. In case a lessee

Corporate Overview1 Statutory Reports2 Financial Statements3
241
Annual Report 2021-22
Notes to the Standalone Financial Statements for the year ended March 31, 2022(All amounts in ` Lacs, unless otherwise stated)
has not yet approved the financial statements for issue before the issuance of this amendment, then the same may be applied for annual reporting periods beginning on or after April 1, 2020.
The Company has continued to apply the practical expedient for the extended period. Refer note 28
(ii) Amendment to Ind AS 103 Business Combination:
The amendment states that to qualify for recognition as part of applying the acquisition method, the identifiable assets acquired and liabilities assumed must meet the definitions of assets and liabilities in the Framework for the Preparation and Presentation of Financial Statements in accordance with Indian Accounting Standards* issued by the Institute of Chartered Accountants of India at the acquisition date. Therefore, the acquirer does not recognise those costs as part of applying the acquisition method. Instead, the acquirer recognises those costs in its post-combination financial statements in accordance with other Ind AS.
These amendments had no impact on the financial statements of the Company.
(iii) Interest Rate Benchmark Reform – Phase 2: Amendments to Ind AS 109, Ind AS 107, Ind AS 104 and Ind AS 116
The amendments provide temporary reliefs which address the financial reporting effects when an interbank offered rate (IBOR) is replaced with an alternative nearly risk-free interest rate (RFR).
These amendments had no impact on the financial statements of the Company.
(iv) Amendment to Ind AS 105, Ind AS 16 and Ind AS 28
The definition of “Recoverable amount” is amended such that the words “the higher of an asset’s fair value less costs to sell and its value in use” are replaced with “higher of an asset’s fair value less costs of disposal and its value in use”. The consequential amendments are made in Ind AS 105, Ind AS 16 and Ind AS 28.
These amendments had no impact on the financial statements of the Company.
(v) Amendments to Schedule III to the Companies Act, 2013 (“Schedule III”)
The MCA had notified the amendments to Schedule III to the Companies Act, 2013 on 24 March 2021. The amendment contained significant additional disclosures requirement in the financial statements. The Company has adopted such changes in preparing these Standalone Financial Statements.
u Standards notified but not yet effective: (i) Amendments to Ind AS 37– Provisions, Contingent Liabilities and Contingent Assets-
The amendment specifies that the ‘cost of fulfilling’ a contract comprises the ‘costs that relate directly to the contract’. Costs that relate directly to a contract can either be incremental costs of fulfilling that contract (examples would be direct labour, materials) or an allocation of other costs that relate directly to fulfilling contracts (an example would be the allocation of the depreciation charge for an item of property, plant and equipment used in fulfilling the contract). The effective date for adoption of this amendment is annual periods beginning on or after April1,2022, although early adoption is permitted. The Company has evaluated the amendment and there is no impact on its financial statements.
There were no other standard notified but not yet effective upto the date of issuance of the Company's financial statements.
v Critical estimates and judgements The preparation of the Standalone Financial Statements requires management to make judgements, estimates and assumptions
that affect the reported amounts of revenues, expenses, assets and liabilities, and the accompanying disclosures, and the disclosure of contingent liabilities. Uncertainty about these assumptions and estimates could result in outcomes that require a material adjustment to the carrying amount of asset or liability affected in future periods. The areas involving significant estimates or critical judgements are:
Significant estimates
(a) Defined benefit plans
The cost of the defined benefit gratuity plan and other post-employment benefit and the present value of the gratuity obligation are determined using actuarial valuations. An actuarial valuation involves making various assumptions that may differ from actual developments in the future. These include the determination of the discount rate and future salary

242
Annual Report 2021-22
Notes to the Standalone Financial Statements for the year ended March 31, 2022(All amounts in ` Lacs, unless otherwise stated)
increases. Due to complexities involved in the valuation and its long term nature, a defined benefit obligation is highly sensitive to changes in these assumptions. All assumptions are reviewed at each reporting date.
The parameter most subject to change is the discount rate. The mortality rate is based on publicly available mortality table in India. The mortality tables tend to change only at interval in response to demographic changes. Further salary increases and gratuity increases are based on expected future inflation rates. Further details about the gratuity obligations are given in Note 35.
(b) Impairment of Investment in subsidiary
The Company has investment in subsidiary which have been tested for impairment as at the year end. Estimates involved in this assessment are continually evaluated. They are based on historical experience and other factors, including expectations of future events that may have a financial impact on these subsidiaries that are believed to be reasonable under the circumstances.
(c) Revenue recognition
The Company uses the percentage-of-completion method in accounting for its fixed-price contracts. Use of the percentage-of-completion method requires the Company to estimate the efforts or costs expended to date as a proportion of the total efforts or costs to be expended. Efforts or costs expended have been used to measure progress towards completion as there is a direct relationship between input and productivity.
Provisions for estimated losses, if any, on uncompleted contracts are recorded in the period in which such losses become probable based on the expected contract estimates at the reporting date.
(d) Uncertainty relating to the global health pandemic on COVID-19
In assessing the recoverability of receivables including unbilled receivables, contract assets and contract costs, goodwill, intangible assets, and certain investments, the Company has considered internal and external information up to the date of approval of these consolidated financial statements including credit reports and economic forecasts. Based on the current indicators of future economic conditions, the Company expects to recover the carrying amount of these assets.
The Company bases its assessment on the belief that the probability of occurrence of forecasted transactions is not impacted by COVID-19. The Company has considered the effect of changes, if any, in both counterparty credit risk and its own credit risk while assessing hedge effectiveness and measuring hedge ineffectiveness and continues to believe that COVID-19 has no impact on effectiveness of its hedges. The impact of COVID-19 may be different from what we have estimated as of the date of approval of these consolidated financial statements and the Company will continue to closely monitor any material changes to future economic conditions.
Critical judgements
Deferred taxes
Deferred tax liabilities are recognised for all taxable temporary differences. Deferred tax assets are recognised for all the deductible temporary differences, carry forward of unused tax credits and unused tax losses, however the same is restricted to the extent of the deferred tax liabilities unless it is probable that sufficient taxable profit will be available against which the deductible temporary differences, and the carry forward of unused tax credits and unused tax losses can be utilised. Refer note 11.

Corporate Overview1 Statutory Reports2 Financial Statements3
243
Annual Report 2021-22
Notes to the Standalone Financial Statements for the year ended March 31, 2022(All amounts in ` Lacs, unless otherwise stated)
3 Property, plant and equipmentComputerSystems
Officeequipments
Furnitureand fixtures
Leasehold improvements
Total Capital work-in-progress
Cost or valuationAs at April 1, 2020 216 116 23 46 401 -Additions 44 18 2 - 64 14Disposals (13) - - - (13) -As at March 31, 2021 247 134 25 46 452 14Additions 45 11 - 11 67Transfers from CWIP - - - 14 14 (14)Disposals (27) (1) - - (28)As at March 31, 2022 265 144 25 71 505 -Accumulated depreciationAs at April 1, 2020 188 78 16 28 310 -Charge for the year 44 20 9 15 88 -Disposals (13) - - - (13) -As at March 31, 2021 219 98 25 43 385 -Charge for the year 37 18 - 16 71Disposals (27) (1) - - (28)As at March 31, 2022 229 115 25 59 428 -Net book valueAs at March 31, 2021 28 36 - 3 67 14As at March 31, 2022 36 29 - 12 77 -
Note:
(ii) Refer note 20 for details of charge created on the Property, plant and equipment.
Capital work-in-progress (CWIP) Ageing There are no CWIP as at March 31, 2022.
As at March 31, 2021 Amount in CWIP for a period Total Less than
1 years 1-2 years 2-3 years More than
3 years Projects in progress 14 - - - 14 Projects temporarily suspended - - - - - Total 14 - - - 14
4 Goodwill and other intangible assets i) Goodwill
March 31, 2022 March 31, 2021Cost or valuationDeemed cost As at April 01 2,498 2,498 As at March 31 2,498 2,498 Accumulated impairmentAs at April 01 1,887 1,887 As at March 31 1,887 1,887 Net book value as at March 31 611 611

244
Annual Report 2021-22
Notes to the Standalone Financial Statements for the year ended March 31, 2022(All amounts in ` Lacs, unless otherwise stated)
ii) Other intangible assets
Other intangible assets Intangibleassets underdevelopment
Customerrelationships
Non-compete
Computersoftware
Total
Cost or valuation
As at April 1, 2020 204 11 254 469 17
Additions - - 19 19 -
Transfer from intangible assets under development
- - 17 17 (17)
As at March 31, 2021 204 11 290 505 -
Additions - - 311 311 35
Transfer from intangible assets under development
- - - -
As at March 31, 2022 204 11 601 816 35
Accumulated amortisation
As at April 1, 2020 200 10 186 396 -
Charge for the year 4 1 39 44 -
As at March 31, 2021 204 11 225 440 -
Charge for the year - - 105 105 -
As at March 31, 2022 204 11 330 545 -
Net book value
As at March 31, 2021 - - 65 65 -
As at March 31, 2022 - - 271 271 35
Intangible Assets under Development (IAUD) Ageing
As at March 31, 2022 Amount in IAUD for a period Total
Less than 1 years
1-2 years 2-3 years More than 3 years
Projects in progress 35 - - - 35
Projects temporarily suspended - - - - -
Total 35 - - - 35
There were no IAUD as at March 31, 2021.
Impairment of goodwill The Goodwill of ` 1,887 Lacs relates to business acquisition of OSS Cube Solutions Limited and ` 611 Lacs relates to the
business acquisition of Cupola Technology Private Limited which has been allocated to OSS Cube and Internet of things (IoT) cash generating units (CGUs) respectively. Goodwill related to OSS cube is fully impaired.
Goodwill is tested for impairment on an annual basis by the Company. The recoverable value of the CGU is determined based on value-in-use calculation using the cash flow projections based on the financial budgets approved by the management covering a five year period.

Corporate Overview1 Statutory Reports2 Financial Statements3
245
Annual Report 2021-22
Notes to the Standalone Financial Statements for the year ended March 31, 2022(All amounts in ` Lacs, unless otherwise stated)
The following table sets out the key assumptions for calculation of value-in-use for these CGUs:
IoT March 31, 2022 March 31, 2021
Discount rate 22.32% 20.01%Long term growth rate 4.00% 4.00%Sales growth 20.00% 10.00%Carrying value of goodwill 611 611
The discount rate is based on the Weighted Average Cost of Capital (WACC) which represents the weighted average return attributable to all the assets of the CGU.
There is no impairment noted in the IoT CGU based on the assessment performed by the management. Management has performed sensitivity analysis around the base assumption and have concluded that no reasonable possible change in key assumptions would cause the recoverable amount of the IoT CGU lower than the carrying amount of CGU.
5 Right-of-use assets Computer Systems Office Buildings Motor Vehicles Total
As at April 1, 2020 672 2,303 30 3,005 Additions 609 466 1,075 Depreciation (448) (1,464) (19) (1,931)As at March 31, 2021 833 1,305 11 2,149 Additions 1,495 3,992 - 5,487 Depreciation (750) (1,492) (5) (2,247)As at March 31, 2022 1,578 3,805 6 5,389
The average lease period of the leased assets is 4.7 years.
The Company recognized the following income and expense in the statement of profit and loss pertaining to leased assets:
March 31, 2022 March 31, 2021Rent concession income 323 302
323 302 Interest expense on lease liabilities 487 328 Depreciation of Right-of-use assets 2,247 1,931 Rent expense pertaining to short- term leases 237 151
2,971 2,410
6 Investments Unquoted, carried at cost less impairment
March 31, 2022 March 31, 2021Investment in Subsidiary:Investment in Equity shares of Happiest Minds Inc. (formerly known as PGS Inc.) - refer note 47
6,025 9,720
1,00,000 (March 31, 2021 : 1,00,000 ) equity shares of face value of $1 each, fully paid
6,025 9,720
Less: Impairment in value of investment - - 6,025 9,720
Aggregate amount of quoted investment and market value thereof - -Aggregate amount of unquoted investment 6,025 9,720Aggregate amount of impairment in the value of investments - -

246
Annual Report 2021-22
Notes to the Standalone Financial Statements for the year ended March 31, 2022(All amounts in ` Lacs, unless otherwise stated)
Note : Investment in subsidiaries includes principal place of business and proportion of ownership interest:
Name of entity Nature Country of incorporation
Ownership interest held by Company in %
March 31, 2022 March 31, 2021 Happiest Minds Inc. (formerly known as PGS Inc.) Subsidiary USA 100 100
7 Loans Carried at amortised cost
March 31, 2022 March 31, 2021Non-current Loans considered good - Unsecured Loans to Subsidiary - Refer note 39 2,274 -
2,274 -Current Loans considered good - Unsecured Loans to employees 4 14
4 14
8 Other financial assetsMarch 31, 2022 March 31, 2021
(a) Other financial assets carried at amortised cost (unsecured, considered good, unless otherwise stated)
Non-current Fixed deposit with maturity of more than 12 months 1,113 1,733 Margin money deposits - refer note (i) below 375 376 Security deposit 339 349
1,827 2,458
(i) Margin money deposit is used to secure: Term loan - Federal bank 370 370 Guarantees given 5 6
Current Interest accrued on fixed deposit 26 52 Unbilled revenue # 8,418 5,454 Security deposit 389 798 Interest accrued on loan to subsidiary - refer note 39 31 - Other receivables 11 34
8,875 6,338
Security deposit - credit impaired 1 1 Less: Allowance for credit impaired loans (1) (1) Less: loss allowance on unbilled revenue (169) (121)
8,706 6,217 # Classified as financial asset as right to consideration is unconditional and is due only after a
passage of time. Includes ` 89 from related party. Refer note 39
(b) Derivative instruments carried at fair value through OCI Cash flow hedges Foreign currency forward contracts 249 523
249 523 Total other current financial assets 8,955 6,740

Corporate Overview1 Statutory Reports2 Financial Statements3
247
Annual Report 2021-22
Notes to the Standalone Financial Statements for the year ended March 31, 2022(All amounts in ` Lacs, unless otherwise stated)
9 Income tax assets (net)March 31, 2022 March 31, 2021
Non - current 679 1,408
Income tax assets (net) 679 1,408
10 Other assetsMarch 31, 2022 March 31, 2021
Non - currentPrepaid expenses 1 7
1 7CurrentPrepaid expenses 982 772Balances with statutory / government authorities 170 449Advance to employees against expenses 58 22Advance to suppliers 92 59Other advances 100 -Unbilled revenue # 1,870 480
3,272 1,782Less: loss allowance on unbilled revenue (37) (11)
3,235 1,771
# Classified as non-financial assets as the contractual right to consideration is dependent upon completion on contractual milestones.
11 Deferred tax assets (net)March 31, 2022 March 31, 2021
Deferred tax assets (net) 697 1,026
697 1,026
Significant components and movement in deferred tax assets and liabilities during the year ended March 31, 2022 :
April 01, 2021 Recognised in profit or loss
[charge/(credit)]
Foreign currency translation reserve
March 31, 2022
Deferred tax liabilityMutual funds 54 307 - 361Goodwill 91 63 - 154 Derivative assets 128 - (80) 48 Total deferred tax liabilities 273 370 (80) 563 Deferred tax assetsProperty, plant and equipment and intangible assets
(75) 14 - (61)
Loss allowance on trade receivables (318) 11 - (307)Lease liability and right-of-use assets (125) (7) - (132)Provision for gratuity and leave encashment
(618) 111 (24) (531)
Others (163) (66) - (229)Total deferred tax assets (1,299) 63 (24) (1,260)Deferred tax assets (net) (1,026) 433 (104) (697)

248
Annual Report 2021-22
Notes to the Standalone Financial Statements for the year ended March 31, 2022(All amounts in ` Lacs, unless otherwise stated)
Significant components and movement in deferred tax assets and liabilities during the year ended March 31, 2021 :
April 01, 2020 Recognised in profit or loss
[charge/(credit)]
Foreign currency translation reserve
March 31, 2021
Deferred tax liabilityMutual funds - 54 - 54 Goodwill - 91 - 91 Derivative assets - - 128 128 Total deferred tax liabilities - 145 128 273 Deferred tax assetsProperty, plant and equipment and intangible assets
- (75) - (75)
Loss allowance on trade receivables - (318) - (318)Lease liability and right-of-use assets - (125) - (125)Provision for gratuity and leave encashment
- (582) (36) (618)
Others - (163) - (163)Total deferred tax assets - (1,263) (36) (1,299)Deferred tax assets (net) - (1,118) 92 (1,026)
12 Investments Carried at fair value through statement of profit and loss
March 31, 2022 March 31, 2021 March 31, 2022 March 31, 2021Units in Lacs Units in Lacs Amount Amount
CurrentAditya Birla - Money manager fund - Growth 3 - 803 -Aditya Birla - Savings Fund - Growth 19 16 8,370 6,759Axis - Banking and PSU debt fund - Growth 1 - 3,062 -Axis - Treasury Advantage Fund - Growth - 1 - 2,954HDFC - Ultra short term fund - Growth 727 756 9,023 9,028ICICI Prudential - Liquid fund - Growth - 5 - 1,487ICICI Prudential - Savings Fund - Growth - - - -ICICI Prudential - Short term - Growth # - 9 - 405ICICI Prudential - Short term fund - Growth 72 - 3,679 -ICICI Prudential - Ultra short term fund - Growth 367 301 8,785 6,865IDFC - Banking and PSU debt fund - Growth 175 - 3,578 -IDFC - Ultra short term fund - Growth - 365 - 4,368Kotak - Banking & PSU Debt fund - Growth 76 - 4,119 -Kotak - Savings Fund - Growth - 210 - 7,282L&T - Banking & PSU Debt fund - Growth 194 - 4,087 -Nippon - Banking and PSU debt fund - Growth 27 - 459 -UTI - Ultra short term fund - Growth * - 435 -
46,400 39,148 Note:
# Nil units of mutual funds of ICICI prudential mutual fund (March 31, 2021 - 9 Lacs units) is pledged with RBL Bank as security towards packing credit facilities availed by the Company for the year ended March 31, 2022.
* Units are not presented as they are below the rounding off norms adopted by the Company.
Aggregate book value of quoted investments 46,400 39,148Aggregate market value of quoted investments 46,400 39,148Aggregate book value of unquoted investments - -Aggregate market value of unquoted investments - -

Corporate Overview1 Statutory Reports2 Financial Statements3
249
Annual Report 2021-22
Notes to the Standalone Financial Statements for the year ended March 31, 2022(All amounts in ` Lacs, unless otherwise stated)
13 Trade receivables Carried at amortised cost
March 31, 2022 March 31, 2021
Current
Trade receivables - others 14,521 10,912
Trade receivables - related party - refer note 39 1,606 698
Total trade receivables 16,127 11,610
Break-up for security details
Unsecured, considered good 17,351 12,875
17,351 12,875
Impairment allowance
Unsecured, considered good (1,224) (1,265)
Trade receivables net of impairment 16,127 11,610
Trade receivables Ageing ScheduleAs at March 31, 2022 Outstanding for the following periods from the due date of payment Total
Current but not due
Less than 6 months
6 months-1 years
1-2 years 2-3 years More than 3 years
Undisputed Trade receivables - considered good
12,788 3,625 385 337 93 123 17,351
Undisputed Trade receivables - which have significant increase in credit risk
- - - - - - -
Undisputed Trade receivables - credit impaired
- - - - - - -
Disputed Trade receivables - considered good
- - - - - - -
Disputed Trade receivables - which have significant increase in credit risk
- - - - - - -
Disputed Trade receivables - credit impaired
- - - - - - -
Total 12,788 3,625 385 337 93 123 17,351Less: Impairment allowance - - - - - - (1,224)Total 16,127

250
Annual Report 2021-22
Notes to the Standalone Financial Statements for the year ended March 31, 2022(All amounts in ` Lacs, unless otherwise stated)
As at March 31, 2021 Outstanding for the following periods from the due date of payment TotalCurrent but
not dueLess than 6 months
6 months-1 years
1-2 years 2-3 years More than 3 years
Undisputed Trade receivables - considered good
8,969 3,428 221 126 29 102 12,875
Undisputed Trade receivables - which have significant increase in credit risk
- - - - - - -
Undisputed Trade receivables - credit impaired
- - - - - - -
Disputed Trade receivables - considered good
- - - - - - -
Disputed Trade receivables - which have significant increase in credit risk
- - - - - - -
Disputed Trade receivables - credit impaired
- - - - - - -
Total 8,969 3,428 221 126 29 102 12,875 Less: Impairment allowance - - - - - - (1,265)Total 11,610
(i) No trade or other receivable are due from directors or other officers of the Company either severally or jointly with any other person. Nor any trade or other receivable are due from firms or private companies respectively in which any director is a partner, a director or a member.
(ii) Trade receivables are non-interest bearing and are generally on terms of immediate to 180 days.
(iii) For terms and conditions relating to related party receivables refer note 39.
(iv) For unbilled revenue refer note 8
14 Cash and cash equivalentsMarch 31, 2022 March 31, 2021
Balances with banks:
- in current accounts 4,521 3,548
- in EEFC accounts 1,080 2,029
Deposits with original maturity of less than three months - refer note below - 2,375
5,601 7,952
Note:
Short-term deposits are made for varying periods of between one day and three months, depending on the immediate cash requirements of the Company, and earn interest at the respective short-term deposit rates.
15 Bank and bank balance other than cash and cash equivalentsMarch 31, 2022 March 31, 2021
Fixed deposit 9,092 2,940
Margin money deposits - refer note (i) below 972 2,995
Balances with bank in unpaid dividend account 7 -
10,071 5,935
(i) Margin money deposit is used to secure:
Working capital facility and bank overdrafts 200 2,100
Guarantees given 772 895

Corporate Overview1 Statutory Reports2 Financial Statements3
251
Annual Report 2021-22
Notes to the Standalone Financial Statements for the year ended March 31, 2022(All amounts in ` Lacs, unless otherwise stated)
16 Share Capital Equity share capital i) Authorised share capital
Numbers AmountEquity share capital of ` 2 eachAs at April 1, 2020 5,00,00,000 1,000Increase during the year - refer note below 17,93,00,000 3,586As at March 31, 2021 22,93,00,000 4,586Increase during the year - - As at March 31, 2022 22,93,00,000 4,586
On April 29, 2020, the Board of Directors of the Company increased the authorised share capital of the Company to ` 4,586 Lacs divided into 22,93,00,000 equity shares of ` 2 each.
ii) Issued, subscribed and fully paid up Equity share capital
Numbers AmountEquity share capital of ` 2 each, fully paid upAs at April 1, 2020 4,38,99,177 879Conversion of preference shares during the year - refer note (1) below 9,08,47,235 1,817Exercise of share options - refer note (2) below 4,10,386 8Issued during the year - refer note (3) below 66,26,506 133As at March 31, 2021 14,17,83,304 2,837Exercise of share options - refer note (2) below 8,25,563 17As at March 31, 2022 14,26,08,867 2,854
(1) During the year ended March 31, 2021, 5,57,345 Series A 14% Non Cumulative Compulsorily Convertible Preference Shares (CCPS) were converted into equity at a ratio of 1:163.
(2) During the year ended March 31, 2022, Employee Benefit Trust (EBT) issued 8,25,563 (March 31, 2021 - 4,10,386) equity shares to the employees upon exercise of employee stock options.
(3) During the year ended March 31, 2021, the Company has allotted 66,26,506 equity shares of face value ` 2 each, at a premium of ` 164 per share for cash as a part of an initial public offering vide board resolution dated September 15, 2020. Transaction costs pertaining to the issue, net of reimbursements have been debited to securities premium account.
(iii) Terms/ rights attached to equity shares The Company has a single class of equity share of par value ` 2 each. Each holder of the equity shares is entitled to one
vote per share and carries a right to dividends as and when declared by the Company.
In the event of liquidation of the Company, the holders of equity shares, will be entitled to receive any of the remaining assets of the Company after distribution of all preferential amounts.
(iv) Details of shareholders holding more than 5% shares in the Company: -
March 31, 2022 March 31, 2021No of Shares Holding percentage No of Shares Holding percentage
Equity shares of ` 2 each fully paidMr. Ashok Soota (Promoter) 6,00,68,668 42.12% 6,00,61,701 42.36%Ashok Soota Medical Research LLP 1,79,48,784 12.59% 1,79,48,784 12.66%
As per the records of the Company, including its register of shareholders/members and other declarations received from shareholders regarding beneficial interest, the above shareholding represents legal ownership of shares.
(v) The Company has not issued any bonus shares or shares for consideration other than cash during the period of five years immediately preceding the reporting date.

252
Annual Report 2021-22
Notes to the Standalone Financial Statements for the year ended March 31, 2022(All amounts in ` Lacs, unless otherwise stated)
(vi) Details of shares held by promoters
As at March 31, 2022 Promoter name
No. of Shares at the beginning
of the year
Change during
the year
No. of Shares at the end of the year
% of Total Shares
% change during
the yearEquity shares of ` 2 each fully paid
Mr. Ashok Soota 6,00,61,701 6,967 6,00,68,668 42.12% 0.01%
As at March 31, 2021 Promoter name
No. of shares at the beginning
of the year
Change during
the year
No. of shares at the end of the year
% of Total Shares
% change during
the yearEquity shares of ` 2 each fully paid
Mr. Ashok Soota 1,55,43,017 4,45,18,684 6,00,61,701 42.36% 286.42%
17 Instrument entirely in the nature of equity i) Authorised share capital
Numbers Amount
Series A 14% Non Cumulative Compulsorily Convertible Preference shares of ` 652 each
As at April 1, 2020 7,50,000 4,890
Decrease during the year - refer note below (5,50,000) (3,586)
As at March 31, 2021 2,00,000 1,304
Change during the year - -
As at March 31, 2022 2,00,000 1,304
On April 29, 2020, the Board of Directors of the Company reduced the authorised share capital of the Company to ` 1,304 Lacs divided into 2,00,000 preference shares of ` 652 each.
ii) Issued, subscribed and fully paid up Non Cumulative Compulsorily Convertible Preference Share Capital
Numbers Amount
Series A 14% Non Cumulative Compulsorily Convertible Preference Shares of ` 652 each
As at April 1, 2020 5,57,345 3,634
Conversion into equity shares during the year - refer note (16) (ii) (1) (5,57,345) (3,634)
As at March 31, 2021 - -
Change during the year - -
As at March 31, 2022 - -
(iii) Terms/ rights attached to convertible preference shares (a) Each holder of CCPS is entitled to receive a preferential non-cumulative dividend at 14% per annum on the par value
of each share if declared by the Board of directors. Holders of CCPS shall receive preferential dividend in preference to dividend payable on equity shares and shall not participate in any further dividends declared on Equity Shares. Preference shareholders are also entitled to vote in the shareholders meeting.
Holders of CCPS are entitled to participate in the surplus proceeds (which is subject to a limit of two times the amount invested) from the liquidation event, if any, on a pro-rata basis along with all other holders of equity shares on a fully diluted basis.
The holders of the preference share at their option can require the Company to convert all or a part of Series A preference shares held by them into equity shares at any time during the conversion period in according to the conversion ratio defined in the agreement (i.e. 1:163).

Corporate Overview1 Statutory Reports2 Financial Statements3
253
Annual Report 2021-22
Notes to the Standalone Financial Statements for the year ended March 31, 2022(All amounts in ` Lacs, unless otherwise stated)
All the preference share s shall be converted into equity shares in the ratio of 1:163 on occurrence of the following event:
1- On expiry of the conversion period.
2- Later of (a) Date of filing Red herring prospectus with SEBI (b) Such other date as may be permitted by law in connection with Qualified IPO.
3- Upon the holders of a majority of the investors shares exercising the conversion right with respect to preference shares held by them
(iv) Details of shares held by promotersAs at March 31, 2022 Promoter
nameNo. of shares
at the beginning of the year
Change during
the year
No. of shares at the end of the year
% of Total Shares
% change during
the yearSeries A 14% Non Cumulative Compulsorily Convertible Preference shares of ` 652 each
Mr. Ashok Soota - - - 0.00% 0.00%
As at March 31, 2021 Promoter name
No. of Shares at the beginning
of the year
Change during
the year
No. of Shares at the end of the year
% of Total Shares
% change during
the yearSeries A 14% Non Cumulative Compulsorily Convertible Preference shares of ` 652 each
Mr. Ashok Soota 3,59,601 (3,59,601) - 0.00% (100)%
Treasury shares
No of shares
As at April 1, 2020 54,90,638
Issue for cash on exercise of share options (4,10,386)
As at March 31, 2021 50,80,252
Issue for cash on exercise of share options (8,25,563)
As at March 31, 2022 42,54,689
For the terms/rights attached to treasury shares refer note 16 (iii) above
18 Other equityMarch 31, 2022 March 31, 2021
Securities premium account 41,205 40,454Retained earnings 22,388 10,637Cash flow hedge reserve 142 378Share options outstanding reserve 385 361
64,120 51,830a) Securities premium account Opening balance 40,454 27,781 Conversion of preference shares during the year - refer note (16) (ii) (1) - 1,817 Increase during the year - refer note (16) (ii) (3) - 10,867 Transaction costs, net of recovery or reimbursement of expense on issue of
shares - refer note (16) (ii) (3) 327 (456)
Exercise of share option by employees 154 64 Transferred from ESOP reserve for options exercised 270 381 Closing balance 41,205 40,454

254
Annual Report 2021-22
Notes to the Standalone Financial Statements for the year ended March 31, 2022(All amounts in ` Lacs, unless otherwise stated)
March 31, 2022 March 31, 2021b) Retained earnings Opening balance 10,637 (5,457) Profit for the year 18,648 16,193 Other comprehensive income recognised directly in retained earnings (73) (108) Dividend - refer note 19 (6,830) - Transferred from share option outstanding reserve for options forfeited 6 9 Closing balance 22,388 10,637
c) Cash flow hedge reserve Opening balance 378 (730) Net movement on effective portion of cash flow hedges - refer note 37 (236) 1,108 Closing balance 142 378
d) Share options outstanding reserve Opening balance 361 454 Share based payment expense - refer note 42 300 297 Transferred to retained earnings for options forfeited (6) (9) Transferred to securities premium for options exercised (270) (381) Closing balance 385 361
(i) Nature and purpose of other reserves a) Securities premium account : Securities premium account has been created consequent to issue of shares at premium. The reserve can be utilised
in accordance with the provisions of the Companies Act 2013.
b) Retained earnings : Retained earnings comprises of prior years and current year's undistributed earnings/accumulated losses after tax.
c) Cash flow hedge reserve : The Company uses foreign currency forward contracts to hedge the highly probable forecasted transaction and
interest rate swaps to hedge the interest rate risk associated with foreign currency term loan. The effective portion of fair value gain/loss of the hedge instrument is recognised in the cash flow hedge reserve. Amounts recognised in the cash flow hedge reserve is reclassified to the Statement of Profit and Loss when the hedged item affects profit or loss.
d) Share options outstanding reserve : The share based payment reserve is used to recognise the grant date fair value of options issued to employees
under Employee Stock Option Plan.
19 Distribution madeMarch 31, 2022 March 31, 2021
Dividends on equity shares declared and paid :Final dividend paid for the year ended on March 31, 2021 : ` 3/- per share 4,311 -Interim dividend for the year ended on March 31, 2022 : 1.75/- per share (March 31, 2021 : Nil)
2,519 -
6,830 -

Corporate Overview1 Statutory Reports2 Financial Statements3
255
Annual Report 2021-22
Notes to the Standalone Financial Statements for the year ended March 31, 2022(All amounts in ` Lacs, unless otherwise stated)
20 Borrowings Carried at amortised cost
March 31, 2022 March 31, 2021Non currentSecuredForeign currency term loan from bank - refer note (a) below 3,793 5,658
3,793 5,658Less: Current maturities of term loans (2,069) (1,997)Total non-current borrowings 1,724 3,661CurrentSecuredLoans repayable on demand from banks Foreign currency loan (PCFC) - refer note (b) and (c) below 15,271 10,972Current maturities of term loans Foreign currency term loan from bank - refer note (a) below 2,069 1,997Total current borrowings 17,340 12,969
Notes
(a) Foreign currency term loan of ` 6,025 Lacs (USD 8.25 Mn) from Federal bank carries a fixed interest rate of 3.2% per annum (March 31, 2021 : 3.45% per annum). The loan is repayable in 36 equal monthly instalments commencing from February 28, 2021 and will mature on Feb 28, 2024. The loan is secured by the way of exclusive charge on movable fixed assets of the Company (excluding leased asset charged to Hewlett packard) and also by lien on fixed deposit equivalent to two months instalments plus interest (refer note 8). The loan is raised exclusively for funding the acquisition of Happiest Minds Inc. (formerly known as PGS Inc.).
The interest rate on the loan was revised to 3.2% per annum w.e.f June 01, 2021. The Company has not incurred any transaction fees for such modification and the modification has not resulted in the derecognition of the original liability. No gain/ losses was recognized pursuant to the modification."
(b) PCFC loan taken from Kotak Mahindra carries an interest rate ranging 1.2% p.a. (March 31, 2021 - 1.25 % to 3.76 % p.a.) and is repayable within 120 days.
PCFC loan taken from RBL bank carries an interest rate ranging 1.28% to 1.32% p.a. (March 31, 2021 - 1.90% to 4.07% p.a.) and is repayable within 90-120 days.
PCFC loan taken from Federal bank carries an interest rate of 1.10% to 1.39% p.a. (March 31, 2021 - 2.3% p.a.) and is repayable within 90 days.
PCFC loan taken from ICICI bank carries an interest rate of 1.15% to 1.45% p.a. (March 31, 2021 - 2.3% p.a.) and is repayable within 90 days."
(c) PCFC are fully secured by the way of pari-passu charge on current assets of the Company. PCFC from RBL is additionally secured by the way of lien on mutual funds of Nil (March 31, 2021 - ̀ 405 Lacs) (refer note 12). PCFC from Kotak Mahindra is secured by way to lien on fixed deposits to the extent of Nil (March 31, 2021 - ` 600 Lacs) (Refer note 15).
(d) PCFC loan from RBL bank, Federal bank and Kotak Mahindra contains covenants pertaining to current ratio, interest coverage ratio, EBIDTA to interest ratio, total outstanding liability to adjusted tangible net worth ratio. The Company has satisfied all the debt covenants prescribed in the terms of the loan. Other loans doesnt have any debt convenants. The Company has not defaulted in any of the loans payable.

256
Annual Report 2021-22
Notes to the Standalone Financial Statements for the year ended March 31, 2022(All amounts in ` Lacs, unless otherwise stated)
The table below details change in the Company's liabilities arising from financing activities, including both cash and non-cash changes
Non-currentborrowings #
Currentborrowings
As at April 01, 2020 927 6,916
Financing cash flows (net) 4,725 4,213
Non cash movements:
Amortisation of transaction cost 11 -
Foreign exchange difference (5) (157)
As at March 31, 2021 5,658 10,972
Financing cash flows (net) (2,053) 4,012
Non cash movements:
Amortisation of transaction cost 15 -
Foreign exchange difference 173 287
As at March 31, 2022 3,793 15,271
#Current maturities of term loans are included in the Non-current borrowings
21 Lease liabilities Carried at amortised cost
March 31, 2022 March 31, 2021Non currentLease liabilities 5,911 2,645
5,911 2,645Less: Current maturities of lease liabilities (1,792) (1,422)Total non-current lease liabilities 4,119 1,223CurrentLease liabilities 1,792 1,422Total current lease liabilities 1,792 1,422
(i) Movement in lease liabilities for year ended March 31, 2022 and March 31, 2021:
March 31, 2022 March 31, 2021Balance at beginning of the year 2,645 3,543Additions 5,291 1,052Finance cost incurred during the period - refer note 31 487 328Payment of lease liabilities (2,512) (2,286)Translation difference - 8Balance at the end of the year 5,911 2,645
(ii) The table below provides details regarding the contractual maturities of lease liabilities as at March 31,
2022 and March 31, 2021
March 31, 2022 March 31, 2021Less than one year 2,264 1,600 one to five years 4,769 1,328 more than five years - -
(iii) The Company had total cash outflow of ` 2,512 Lacs during the year ended March 31, 2022 (March 31, 2021 - ` 2,286 Lacs) for leases recognized in balance sheet. The Company has made a non-cash addition to right-of-use assets and lease liabilities of ` 5,291 Lacs during the year ended March 31, 2022 (March 31, 2021 - ` 1052 Lacs).

Corporate Overview1 Statutory Reports2 Financial Statements3
257
Annual Report 2021-22
Notes to the Standalone Financial Statements for the year ended March 31, 2022(All amounts in ` Lacs, unless otherwise stated)
22 Other financial liabilitiesMarch 31, 2022 March 31, 2021
Non-currentCarried at fair value through profit or lossContingent consideration - 2,455
- 2,455CurrentCarried at amortised costEmployee related liabilities 4,254 3,584Unpaid dividend 7 -
4,261 3,584Carried at fair value through profit or lossContingent consideration - 1,276
- 1,276Carried at fair value through other comprehensive incomeCash flow hedgesForeign currency forward contracts 60 17
60 17Total other current financial liabilities 4,321 4,877
23 ProvisionsMarch 31, 2022 March 31, 2021
Non-currentProvision for gratuity - refer note 35 1,618 1,653
1,618 1,653CurrentProvision for gratuity - refer note 35 240 240Provision for compensated absences 1,432 1,243Other provisionsProvision for warranty 26 25
1,698 1,508
Movement during the year - Provision for warrantyBalance as at April 01, 2020 65Arising during the year -Utilised/ reversed during the year (40)Balance as at March 31, 2021 25Arising during the year 1Utilised/ reversed during the year -Balance as at March 31, 2022 26
24 Contract liabilitiesMarch 31, 2022 March 31, 2021
Unearned revenue - refer note (i) below 972 365 972 365
(i) The Company has rendered the service and have recognised the revenue of ` 354 Lacs (March 31, 2021: ` 484 Lacs) during the year from the unearned revenue balance at the beginning of the year.

258
Annual Report 2021-22
Notes to the Standalone Financial Statements for the year ended March 31, 2022(All amounts in ` Lacs, unless otherwise stated)
25 Trade payables Carried at amortised cost
March 31, 2022 March 31, 2021Total outstanding dues of Micro enterprises and Small enterprises - refer note (iii) below
79 95
Total outstanding dues of creditors other than Micro enterprises and Small enterprises
5,215 3,876
5,294 3,971
Trade payables Ageing Schedule
As at March 31, 2022 Outstanding for the following periods from the due date of payment
Total
Less than1 years
1-2 years 2-3 years More than3 years
Total outstanding dues of micro enterprises and small enterprises
79 - - - 79
Total outstanding dues of creditors other than micro enterprises and small enterprises
802 13 1 20 836
Disputed dues of micro enterprises and small enterprises
- - - - -
Disputed dues of creditors other than micro enterprises and small enterprises
- - - - -
Provision for expenses - - - - 4,379
881 13 1 20 5,294
As at March 31, 2021 Outstanding for the following periods from the due date of payment
Total
Less than1 years
1-2 years 2-3 years More than3 years
Total outstanding dues of micro enterprises and small enterprises
95 - - - 95
Total outstanding dues of creditors other than micro enterprises and small enterprises
563 6 10 5 584
Disputed dues of micro enterprises and small enterprises
- - - - -
Disputed dues of creditors other than micro enterprises and small enterprises
- - - - -
Provision for expenses - - - - 3,292
658 6 10 5 3,971
Terms and conditions of above trade payables:
(i) Trade payables are non-interest bearing and are normally settled on 0 to 90 days terms
(ii) For explanation of company's liquidity risk - refer note 37 (3)
(iii) Disclosure required under Clause 22 of Micro, Small and Medium Enterprise Development Act, 2006 - refer below note

Corporate Overview1 Statutory Reports2 Financial Statements3
259
Annual Report 2021-22
Notes to the Standalone Financial Statements for the year ended March 31, 2022(All amounts in ` Lacs, unless otherwise stated)
Disclosure required under Clause 22 of Micro, Small and Medium Enterprise Development Act, 2006Particulars March 31, 2022 March 31, 2021The principal amount and the interest due thereon remaining unpaid to any supplier as at the end of each accounting year:Principal amount due to micro and small enterprises 79 95Interest due on the above - -(i) The amount of interest paid by the buyer in terms of Section 16 of the MSMED
Act, 2006 along with the amounts of the payment made to the supplier beyond the appointed day during each accounting year
- -
(ii) The amount of interest due and payable for the period of delay in making payment (which has been paid but beyond appointed day during the year) but without adding the interest specified under the MSMED Act, 2006
- -
(iii) The amount of interest accrued and remaining unpaid at the end of each accounting year
- -
(iv) The amount of further interest remaining due and payable even in the succeeding years, until such date when the interest dues as above are actually paid to the small enterprise for the purpose of disallowance as a deductible expenditure under Section 23 of the MSMED Act, 2006
- -
26 Other liabilitiesMarch 31, 2022 March 31, 2021
CurrentStatutory dues payable 2,223 1,475Other payables 204 449
2,427 1,924
27 Revenue from contract with customersFor the year ended
March 31, 2022 March 31, 2021Sale of service 1,03,303 76,061 Sale of licenses 51 35
1,03,354 76,096
27.1 Disaggregated revenue informationSegment For the year ended March 31, 2022
Infrastructure Management &
Security Services
Digital BusinessServices
ProductEngineering
Services
Total
Revenue from contract with customers 24,046 26,998 52,310 1,03,354Total revenue from contracts with customers 24,046 26,998 52,310 1,03,354
India 8,821 4,185 3,674 16,680Outside India 15,225 22,813 48,636 86,674Total revenue from contracts with customers 24,046 26,998 52,310 1,03,354
Timing of revenue recognitionLicenses transferred at a point in time 22 28 - 50Fixed price project - services transferred over time 11,355 11,451 3,906 26,712Time and material - services transferred over time 12,669 15,519 48,404 76,592Total revenue from contracts with customers 24,046 26,998 52,310 1,03,354

260
Annual Report 2021-22
Notes to the Standalone Financial Statements for the year ended March 31, 2022(All amounts in ` Lacs, unless otherwise stated)
Segment For the year ended March 31, 2021Infrastructure
Management & Security Services
Digital BusinessServices
ProductEngineering
Services
Total
Revenue from contract with customers 16,421 20,043 39,632 76,096 Total revenue from contracts with customers 16,421 20,043 39,632 76,096
India 6,078 2,103 2,283 10,464 Outside India 10,343 17,941 37,348 65,632 Total revenue from contracts with customers 16,421 20,044 39,631 76,096
Timing of revenue recognitionLicenses transferred at a point in time - 35 - 35 Fixed price project - services transferred over time 7,053 9,289 2,429 18,771 Time and material - services transferred over time 9,368 10,720 37,202 57,290 Total revenue from contracts with customers 16,421 20,044 39,631 76,096
27.2 Contract balancesFor the year ended
March 31, 2022 March 31, 2021Trade receivables 16,127 11,610 Unbilled revenue 8,249 5,333 Contract assets 1,833 469 Contract liability 972 365
27.3 Reconciling the amount of revenue recognised in the statement of profit and loss with the contracted price
For the year endedMarch 31, 2022 March 31, 2021
Revenue as per contract price 1,04,000 76,554 Discount (646) (458)Revenue from contract with customers 1,03,354 76,096
The Company has applied practical expedient as given in Ind AS 115 for not disclosing the remaining performance obligation for contracts that have original expected duration of one year or lesser. The Company have fixed price contracts for a period of more than one year, the remaining performance obligation for these contracts is ` 8,488 Lacs (March 31, 2021: ` 7,089 Lacs). The revenue for remaining performance obligation is expected to be recognised over period of 1-3 years (March 31, 2021: 1-4 years).
28 Other incomeFor the year ended
March 31, 2022 March 31, 2021Interest income on: Deposits with bank 507 709 Loan to subsidiary - refer note 39 31 - Income tax refund 46 49 Financial instrument measured at amortised cost 83 80
667 838

Corporate Overview1 Statutory Reports2 Financial Statements3
261
Annual Report 2021-22
Notes to the Standalone Financial Statements for the year ended March 31, 2022(All amounts in ` Lacs, unless otherwise stated)
For the year endedMarch 31, 2022 March 31, 2021
Fair value gain on investment measured at FVTPL 1,377 184Gain on sale of investments measured at FVTPL 368 671Exchange gain 788 79Settlement claim - refer note (i) below - 212Gain on property, plant and equipment sold / scrapped, net 10 -Rent concession - refer note (ii) below 323 302Insurance claim - refer note (iii) below 200 -Miscellaneous income 38 56
3,104 1,504 3,771 2,342
(i) The Company had entered into Membership Interest Purchase Agreement on May 29, 2017 to acquire interest in OSS Cube LLC. As per terms of Membership Interest Purchase Agreement, the sellers of OSS Cube LLC had to pay ` 100 Lacs towards shortfall in working capital and accounts receivable for which the Company made a claim with the sellers through US attorneys in May 2018. The Counsel representing sellers responded in June 2018, admitting the claim to the extent of ` 63 Lacs and have made a counterclaim of ` 558 Lacs for breach of earn-out/contingent payment. On 15th April 2020, a settlement was reached and settlement agreement has been entered by both the parties wherein the sellers have agreed to pay ` 212 Lacs (USD 2,80,000) over an agreed period of time and all claims by the seller have been relinquished.
The Company is also subject to certain other claims and suits that arise from time to time in the ordinary conduct of its business. While the Company currently believes that such claims, individually or in aggregate, will not have a material adverse impact on its financial position, cash flows, or results of operations, the litigation and other claims are subject to inherent uncertainties, and management’s view of these matters may change in the future. Were an unfavourable final outcome to occur in any one or more of these matters, there exists the possibility of a material adverse impact on the Company’s business, reputation, financial condition, cash flows, and results of operations for the period in which the effect becomes reasonably estimable.
The Company received settlement amount of ̀ 212 Lacs (USD 2,80,000) from OSS Cube LLC wide settlement and mutual release agreement signed on April 15, 2020 which was recorded by the Company in the Profit and Loss Statement during the year ended March 31, 2021."
(ii) During the year ended March 31, 2022 and March 31, 2021, there is a rent concession allowed as a direct consequence of the Covid-19 pandemic. Rent concession has resulted in revised consideration for the lease that is less than the consideration for the lease immediately preceding the change. Reduction in lease payments affect only payments originally due on or before the June 30, 2022 (revised from earlier period of June 30,2021) and there is no substantive change to other terms and conditions of the lease. As a practical expedient, the Company has elected not to assess rent concession as a lease modification. The Company has accounted the change in lease payments resulting from rent concession in the same way as it would account for the change under Ind AS 116, if the change were not a lease modification.
(iii) An American national and an ex-employee on September 9, 2019 had filed a class-action complaint against the Parent Company before the United States District Court, Northern District of California, San Jose Division, alleging that the Parent Company engaged in discriminatory employment practices. During the adjudication process, the Court felt that the matter could be resolved through mediation and directed the parties to go in for an mediation/ settlement. The parties concluded a settlement of ` 200 Lacs during year ended March 2021. During the year ended March 31, 2022, the Company received reimbursements from the insurance company covering its claim covering settlement and related expenses amounting to ` 200 Lacs which has been presented under ‘Other Income’.

262
Annual Report 2021-22
Notes to the Standalone Financial Statements for the year ended March 31, 2022(All amounts in ` Lacs, unless otherwise stated)
29 Employee benefits expenseFor the year ended
March 31, 2022 March 31, 2021Salaries, wages and bonus 56,841 41,297 Contribution to provident and other funds 2,808 2,087 Employee stock compensation expense - refer note 42 300 297 Gratuity expense - refer note 35 518 408 Compensated absences 607 689 Staff welfare expenses 136 234
61,210 45,012
30 Depreciation and amortisation expenseFor the year ended
March 31, 2022 March 31, 2021Depreciation of property, plant and equipment - refer note 3 71 88 Amortisation of intangible assets - refer note 4 105 44 Depreciation of right-of-use assets - refer note 5 2,247 1,931
2,423 2,063
31 Finance costsFor the year ended
March 31, 2022 March 31, 2021Interest expense on:Borrowings 343 289Lease liabilities- refer note 21 487 328Unwinding of interest in contingent consideration - 28
830 645
32 Other expensesFor the year ended
March 31, 2022 March 31, 2021Power and fuel 204 184Subcontractor charges 10,754 6,797Repairs and maintenance- Buildings 107 101- Equipments 24 27- Others 245 208Rent expenses - refer note (ii) below 237 151Advertising and business promotion expenses 111 69Commission 99 139Communication costs 271 257Insurance 48 44Legal and professional fees 458 190 Audit fees - refer note (i) below 67 81 Software license cost 2,150 1,732Rates and taxes 96 61Recruitment charges 881 351Sitting fees to non-executive directors - refer note 39 54 56Commission to non-executive directors - refer note 39 26 24Corporate social responsibility ('CSR') expenditure - refer note 40 215 75

Corporate Overview1 Statutory Reports2 Financial Statements3
263
Annual Report 2021-22
Notes to the Standalone Financial Statements for the year ended March 31, 2022(All amounts in ` Lacs, unless otherwise stated)
For the year endedMarch 31, 2022 March 31, 2021
Impairment loss allowance on trade receivables -41 845Impairment loss / (written back) on loans - 59Impairment loss allowance on unbilled revenue 74 41Travelling and conveyance 892 427Postage and courier 94 25Training expense 248 120Miscellaneous expenses 263 52
17,577 12,116
(i) Payment to auditors:
For the year endedMarch 31, 2022 March 31, 2021
As auditor: Audit fee 65 70In other capacity Certification fees - 9Reimbursement of expenses 2 2
67 81
(ii) Rent expense recorded under other expenses are lease rental for short-term leases
33 Income tax expenseFor the year ended
March 31, 2022 March 31, 2021a) Statement of profit or loss Current tax 6,004 3,527 Adjustment of tax relating to earlier periods - - Deferred tax credit 433 (1,118) Income tax expense 6,437 2,409
b) Statement of other comprehensive income On net movement on effective portion of cash flow hedges 80 (128) On re-measurement losses on defined benefit plans 24 36
104 (92)Reconciliation of tax expense and tax based on accounting profit:Profit before income tax expense 25,085 18,602Tax at the Indian tax rate of 25.17% (March 31, 2021: 25.17%) 6,314 4,682Tax effect of:Utilisation of previous year losses on which no deferred tax was created - (400)Deferred tax recognised during the year net of reversal of temporary difference - (1,831)Permanent difference 54 -Others 69 (42)Income tax expense 6,437 2,409

264
Annual Report 2021-22
Notes to the Standalone Financial Statements for the year ended March 31, 2022(All amounts in ` Lacs, unless otherwise stated)
34 Earnings per share ['EPS'] The following reflects the income and share data used in the basic and diluted EPS computations:
For the year endedMarch 31, 2022 March 31, 2021
Profit after tax attributable to equity holders of the Company (a) (` in Lacs) 18,648 16,193Weighted average number of shares outstanding during the year for basic EPS (b) 14,11,64,508 13,82,98,186Weighted average number of shares outstanding during the year for diluted EPS (c) 14,44,10,568 14,18,87,367Basic earnings per share (in `) (a/b) 13.21 11.71Diluted earnings per share (in `) (a/c) 12.91 11.41Equity share reconciliation for EPSEquity share outstanding 14,11,64,508 12,27,00,079CCPS convertible into Equity shares - 1,55,98,107Total considered for basic EPS 14,11,64,508 13,82,98,186Add: ESOP options / CCPS 32,46,060 35,89,181Total considered for diluted EPS 14,44,10,568 14,18,87,367
35 Employee benefits plan (i) Defined contribution plans - Provident Fund and others The Company makes contributions for qualifying employees to Provident Fund and other defined contribution plans.
During the year, the Company recognised ̀ 2,808 Lacs (March 31, 2021 : ̀ 2,087 Lacs) towards defined contribution plans.
(ii) Defined benefit plans (funded): The Company provides for gratuity for employees in India as per the Payment of Gratuity (Amendment) Act, 2018.
Employees who are in continuous service for a period of 5 years are eligible for gratuity. The amount of gratuity payable on retirement/ termination is the employees last drawn basic salary per month computed proportionately for 15 days salary multiplied for the number of years of service. The Gratuity plan of the Company is funded with qualifying Insurance Company.
Gratuity is a defined benefit plan and Company is exposed to the following risks:
Interest risk A decrease in the bond interest rate will increase the plan liability.Investment risk The present value of the defined benefit plan liability is calculated using a discount rate which
is determined by reference to market yields at the end of the reporting period on government bonds. If the return on plan asset is below this rate, it will create a plan deficit. Currently, for the plan in India, it has a relatively balanced mix of investments in government securities and other debt instruments.
Salary risk The present value of the defined benefit plan liability is calculated by reference to the future salaries of members. As such, an increase in the salary of the members more than assumed level will increase the plan's liability.
Longevity risk Since the benefits under the plan is not payable for life time and payable till retirement age only, plan does not have any longevity risk.
Concentration risk Plan is having a concentration risk as all the assets are invested with the insurance company.
March 31, 2022 March 31, 2021Current 240 240Non-current 1,618 1,653
1,858 1,893

Corporate Overview1 Statutory Reports2 Financial Statements3
265
Annual Report 2021-22
Notes to the Standalone Financial Statements for the year ended March 31, 2022(All amounts in ` Lacs, unless otherwise stated)
The following table sets out movement in defined benefits liability and the amount recognised in the financial statements:
Changes in the defined benefit obligation and fair value of plan assets for the year ended March 31, 2022:
Defined benefit obligation (A)
Fair value of plan assets (B)
Net amount(A-B)
As at April 1, 2021 1,997 104 1,893Current service cost 413 - 413Net interest expense 111 6 105Total amount recognised in statement of profit and loss 524 6 518Benefits paid (188) (188) -RemeasurementReturn on plan assets - - -Actuarial (gains)/losses arising from changes in demographic assumptions
(138) - (138)
Actuarial (gains)/losses arising from changes in financial assumptions
(21) - (21)
Experience adjustments 256 - 256Total amount recognised in other comprehensive income 97 - 97Contributions by employer - 650 (650)As at March 31, 2022 2,430 572 1,858
Changes in the defined benefit obligation and fair value of plan assets for the year ended March 31, 2021:
Defined benefit obligation (A)
Fair value of plan assets (B)
Net amount(A-B)
As at April 1, 2020 1,539 44 1,495 Current service cost 322 - 322 Net interest expense 89 3 86 Total amount recognised in statement of profit and loss 411 3 408 Benefits paid (99) (99) - RemeasurementReturn on plan assets - 2 (2)Actuarial (gains)/losses arising from changes in demographic assumptions
(7) - (7)
Actuarial (gains)/losses arising from changes in financial assumptions
160 - 160
Experience adjustments (7) - -7 Total amount recognised in other comprehensive income 146 2 144 Contributions by employer - 154 (154)As at March 31, 2021 1,997 104 1,893
Changes in the defined benefit obligation and fair value of plan assets for the year ended March 31, 2021:
March 31, 2022 March 31, 2021Insurance fund 572 104 Total 572 104

266
Annual Report 2021-22
Notes to the Standalone Financial Statements for the year ended March 31, 2022(All amounts in ` Lacs, unless otherwise stated)
The principal assumptions used in determining gratuity benefit obligations for the company’s plans are shown below:
March 31, 2022 March 31, 2021Discount rate 5.66% 5.58%Expected return on plan assets 5.66% 5.58%Future salary increases 8.00 % p.a. 11.00% p.a. for the next 1 year,
7.00% p.a. for the next 2 years, starting from the 2nd year 9.00 % p.a.
thereafter, starting from the 4th yearEmployee turnover 25.00% 20.00%Mortality Indian Assured Lives Mortality
2012-14 (Urban)Indian Assured Lives Mortality
(2006-08)
A quantitative sensitivity analysis for significant assumptions are as shown below:
Sensitivity Level March 31, 2022 March 31, 2021Defined benefit obligation on increase/decrease in assumptions
Increase Decrease Increase DecreaseDiscount rate 1% increase / decrease (76) 83 (87) 96 Future salary increase 1% increase / decrease 79 (75) 91 (85)Attrition rate 1% increase / decrease (20) 21 (28) 30
The above sensitivity analyses are based on a change in an assumption while holding all other assumptions constant. In practice, this is unlikely to occur, and changes in some of the assumptions may be correlated. When calculating the sensitivity of the defined benefit obligation to significant actuarial assumptions the same method (present value of the defined benefit obligation calculated with the projected unit credit method at the end of the reporting period) has been applied as when calculating the defined benefit liability recognised in the balance sheet.
The following payments are expected cash flows to the defined benefit plan in future years: Expected contributions to defined benefits plan for the year ended March 31, 2022 is ̀ 240 Lacs (March 31, 2021 : ̀ 240
Lacs). The weighted average duration of the defined benefit plan obligation at the end of the reporting period is 4 years (March 31, 2021: 6 years). The expected maturity analysis of undiscounted gratuity is as follows:
March 31, 2022 March 31, 2021Within the next 12 months 511 294 Between 2 and 5 years 1,381 1,000 Between 6 and 10 years 760 751 Beyond 10 years 351 645
36 Fair value measurement i) The carrying value of financial assets by categories is as follows:
March 31, 2022 March 31, 2021Measured at fair value through other comprehensive income (FVOCI)Foreign currency forward contracts 249 523Total financial assets measured at FVOCI 249 523Measured at fair value through statement of profit and loss (FVTPL)Investment in mutual funds 46,400 39,148Total financial assets measured at FVTPL 46,400 39,148Measured at amortised costInvestment in subsidiary 6,025 9,720Security deposits 728 1,147 Loans to employees 4 14Loans to related parties 2,274 -Other financial assets 9,805 7,528Trade receivables 16,127 11,610Bank and bank balance other than cash and cash equivalents 10,071 5,935Cash and cash equivalents 5,601 7,952Total financial assets measured at amortised cost 50,635 43,906Total financial assets 97,284 83,577
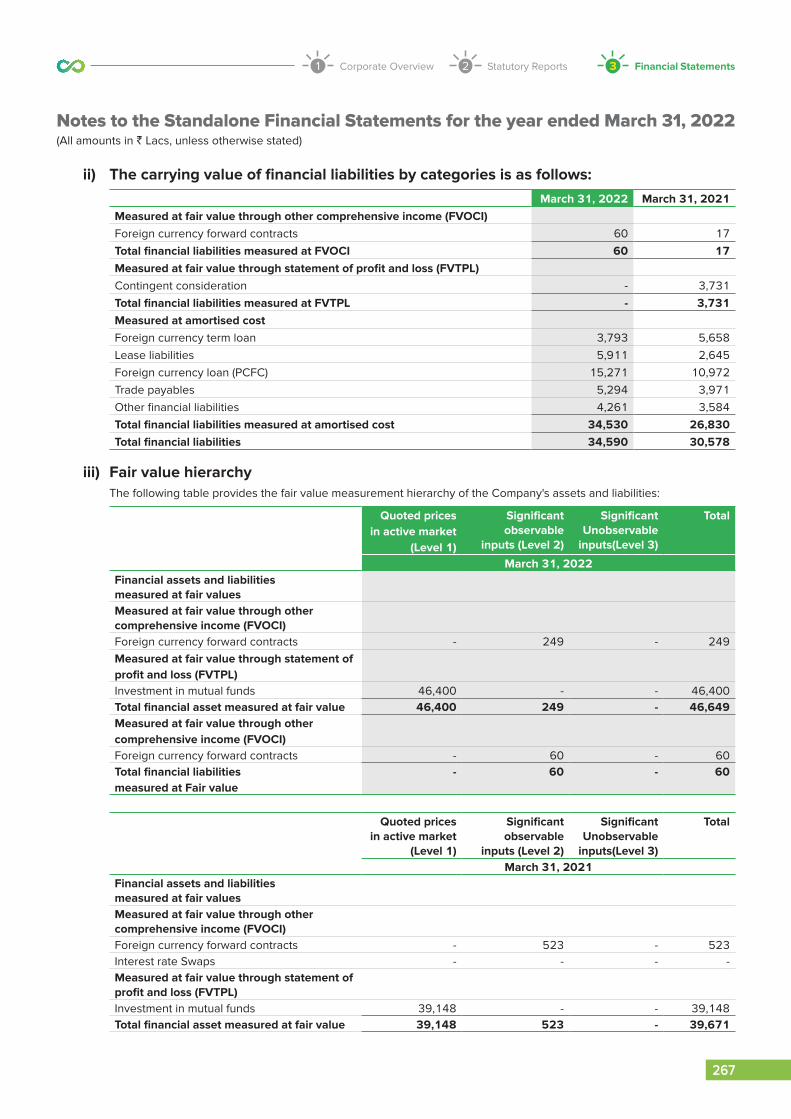
Corporate Overview1 Statutory Reports2 Financial Statements3
267
Annual Report 2021-22
Notes to the Standalone Financial Statements for the year ended March 31, 2022(All amounts in ` Lacs, unless otherwise stated)
ii) The carrying value of financial liabilities by categories is as follows: March 31, 2022 March 31, 2021
Measured at fair value through other comprehensive income (FVOCI)Foreign currency forward contracts 60 17Total financial liabilities measured at FVOCI 60 17Measured at fair value through statement of profit and loss (FVTPL)Contingent consideration - 3,731Total financial liabilities measured at FVTPL - 3,731Measured at amortised costForeign currency term loan 3,793 5,658Lease liabilities 5,911 2,645Foreign currency loan (PCFC) 15,271 10,972Trade payables 5,294 3,971Other financial liabilities 4,261 3,584Total financial liabilities measured at amortised cost 34,530 26,830Total financial liabilities 34,590 30,578
iii) Fair value hierarchy The following table provides the fair value measurement hierarchy of the Company's assets and liabilities:
quoted prices in active market
(Level 1)
Significant observable
inputs (Level 2)
SignificantUnobservable
inputs(Level 3)
Total
March 31, 2022Financial assets and liabilities measured at fair valuesMeasured at fair value through other comprehensive income (FVOCI)Foreign currency forward contracts - 249 - 249Measured at fair value through statement of profit and loss (FVTPL)Investment in mutual funds 46,400 - - 46,400Total financial asset measured at fair value 46,400 249 - 46,649Measured at fair value through other comprehensive income (FVOCI)Foreign currency forward contracts - 60 - 60Total financial liabilities measured at Fair value
- 60 - 60
quoted prices in active market
(Level 1)
Significant observable
inputs (Level 2)
SignificantUnobservable
inputs(Level 3)
Total
March 31, 2021Financial assets and liabilities measured at fair valuesMeasured at fair value through other comprehensive income (FVOCI)Foreign currency forward contracts - 523 - 523 Interest rate Swaps - - - - Measured at fair value through statement of profit and loss (FVTPL)Investment in mutual funds 39,148 - - 39,148 Total financial asset measured at fair value 39,148 523 - 39,671

268
Annual Report 2021-22
Notes to the Standalone Financial Statements for the year ended March 31, 2022(All amounts in ` Lacs, unless otherwise stated)
quoted prices in active market
(Level 1)
Significant observable
inputs (Level 2)
SignificantUnobservable
inputs(Level 3)
Total
March 31, 2021Measured at fair value through statement of profit and loss (FVTPL)Contingent consideration - - 3,731 3,731 Measured at fair value through other comprehensive income (FVOCI)Foreign currency forward contracts - 17 - 17 Total financial liabilities measured at Fair value
- 17 3,731 3,748
Notes:
The fair value of the financial assets and liabilities are measured at the amount at which the instrument could be exchanged in a current transaction between willing parties, other than in a forced or liquidation sale. The following methods and assumptions were used to estimate the fair values:
a) The fair value of liquid mutual funds is based on the net assets value (NAV) as declared by the fund house.
b) The Company has entered into foreign currency forward contract to hedge the highly probable forecast transaction. The derivative financial instrument is entered with the financial institutions with investment grade ratings. Foreign exchange forward contracts are valued based on valuation models which include use of market observable inputs, the mark to market valuation is provided by the financial institution as at reporting date. The valuation of derivative contracts are categorised as level 2 in fair value hierarchy disclosure.
c) The management assessed that cash and cash equivalent, trade receivables, trade payables, other financial assets (current), other financial liability (current), bank overdraft and cash credit, lease liabilities (current) and loans to employees approximates their fair value largely due to short-term maturities of these instruments. Further the management also estimates that the carrying amount of foreign currency term loan at fixed interest rates are the reasonable approximation of their fair value and the difference between carrying amount and their fair value is not significant.
d) The Company has valued contingent consideration by using the monte carlo simulation approach.
e) The fair value of remaining financial instruments are determined on transaction date based on discounted cash flows calculated using lending/ borrowing rate. Subsequently, these are carried at amortized cost. The carrying amount of the remaining financial instruments are the reasonable approximation of their fair value.
For financial assets carried at fair value, their carrying amount are equal to their fair value.
Level 3 inputs Weighted range Sensitivity March 31, 2021
Contingent consideration
Standard deviation on revenue and EBIDTA growth
5% Increase and decrease in standard deviation by 1% would decrease contingent consideration by ` 177 Lacs and increase contingent consideration by ` 225 Lacs.
Discount rate 3% Increase and decrease in discount rate by 1% would decrease contingent consideration by ` 70 Lacs and increase contingent consideration by ` 72 Lacs.

Corporate Overview1 Statutory Reports2 Financial Statements3
269
Annual Report 2021-22
Notes to the Standalone Financial Statements for the year ended March 31, 2022(All amounts in ` Lacs, unless otherwise stated)
37 Financial risk management The Company’s principal financial liabilities comprise of borrowings, lease obligation, trade and other payables. The main
purpose of these financial liabilities is to finance the Company’s operations. The Company’s principal financial assets include security deposits, investments, trade and other receivables and cash and cash equivalents that is derived directly from its operations. The Company also enters into derivative transactions for hedging purpose.
The Company's activities exposes it to market risk, liquidity risk and credit risk. The Company's risk management is carried out by the management under the policies approved by the Board of Directors that help in identification, measurement, mitigation and reporting all risks associated with the activities of the Company. These risks are identified on a continuous basis and assessed for the impact on the financial performance. All derivative activities for risk management purposes are carried out by specialist teams that have the appropriate skills, experience and supervision. It is the Company’s policy that no trading in derivatives for speculative purposes will be undertaken. The Board of Directors reviews and agrees policies for managing each of these risks, which are summarised below.
1. Market risk Market risk is the risk that the fair value of future cash flows of a financial instrument will fluctuate because of changes
in market prices. Market risk comprises three types of risk: interest rate risk, currency risk and equity price risk. Financial instruments affected by market risk include loans and borrowings, deposits, investments, and derivative financial instruments.
i. Foreign currency risk The Company’s operates in various geographies and is exposed to foreign exchange risk on its various currency
exposures. The risk of changes in foreign exchange rates relates primarily to the Company’s operating activities.
The Company uses foreign currency forward contract governed by its board approved policy to mitigate its foreign currency risk that are expected to occur within next 12 months period for forecasted sales. The counterparty for these contracts is generally a reputed scheduled bank. The Company reports quarterly to a committee of the board, which monitors foreign exchange risks and policies implemented to manage its foreign exchange exposures.
When a derivative is entered into for the purpose of being a hedge, the Company negotiates the terms of those derivatives to match the terms of the hedged exposure. For hedges of forecast transactions, the derivatives cover the period of exposure from the point the cash flows of the transactions are forecasted up to the point of sale that is denominated in the foreign currency.
Hedge effectiveness is determined at inception and periodic prospective effectiveness testing is done to ensure the relationship exist between the hedged items and hedging instruments, including whether the hedging instruments is expected to offset changes in cash flows of hedge items.

270
Annual Report 2021-22
Notes to the Standalone Financial Statements for the year ended March 31, 2022(All amounts in ` Lacs, unless otherwise stated)
a) The Company's exposure in foreign currency at the end of reporting period :
Currency Particulars March 31, 2022 March 31, 2021FC ` FC `
Financial assetsUSD Trade receivables 142 10,796 99 7,266
Loans 30 2,277 * 4Other financial assets 87 6,602 59 4,282Bank accounts 46 3,506 32 2,316Derivative assetsForeign exchange forward contracts# (505) (38,970) (493) (36,071)Net exposure on foreign currency risk (assets) - - - -Financial liabilityBorrowings 252 19,092 228 16,673Trade payables 7 530 5 353Other financial liabilities 20 1,553 28 2,034Other liabilities 9 667 8 599Net exposure on foreign currency risk (liabilities) 288 21,842 269 19,659Net exposure on foreign currency risk (assets-liabilities)
(288) (21,842) (269) (19,659)
Currency Particulars March 31, 2022 March 31, 2021FC ` FC `
EURO Financial assetsTrade receivables 7 627 15 1,328Other financial assets 6 543 2 131Bank accounts 10 838 * 18Derivative assetsForeign exchange forward contracts# (9) (811) (12) (1,031)Net exposure on foreign currency risk (assets) 14 1,197 5 446Financial liabilityTrade payables 1 52 * (1)Other liabilities * 13 * 16Net exposure on foreign currency risk (liabilities) 1 65 - 15Net exposure on foreign currency risk (assets-liabilities)
13 1,132 5 431
Financial assetsGBP Trade receivables 6 568 8 771
Loans * 7 * 2Other financial assets 5 452 2 212Bank accounts 4 422 1 134Net exposure on foreign currency risk (assets) 15 1,449 11 1,119Financial liabilityTrade payables - - * 23Other financial liabilities 4 360 5 509Other liabilities 1 121 1 113Net exposure on foreign currency risk (liabilities) 5 481 6 645Net exposure on foreign currency risk (assets-liabilities)
10 968 5 474
# Represents outstanding foreign currency forward contracts. The outstanding forward contracts as March 31, 2022 and March 31, 2021 are within the maturity period of 12 months.
* Represents number below rounding off norms of the Company.

Corporate Overview1 Statutory Reports2 Financial Statements3
271
Annual Report 2021-22
Notes to the Standalone Financial Statements for the year ended March 31, 2022(All amounts in ` Lacs, unless otherwise stated)
b) The sensitivity of profit or loss to changes in foreign exchange rates arising mainly from foreign currency denominated financial instrument:
Impact on profit before taxMarch 31, 2022 March 31, 2021
USD sensitivity`/ USD increases by 5% (1,092) (983)`/ USD decreases by 5% 1,092 983EURO sensitivity`/ EURO increases by 5% 57 22`/ EURO decreases by 5% (57) (22)GBP sensitivity`/ GBP increases by 5% 48 24`/ GBP decreases by 5% (48) (24)
* Sensitivity is calculated holding all other variables constant
In management’s opinion, the sensitivity analysis is unrepresentative of the inherent foreign exchange risk as the year end exposure does not reflect the exposure during the year.
ii. Interest rate risk The Company is not exposed to interest rate risk as at March 31, 2022 since all its financial assets or liabilities are either
non-interest bearing or are at fixed interest rate and are carried at amortised cost.
iii. Price risk The company exposure to price risk arises for investment in mutual funds held by the company. To manage its price risk
arising from investments in mutual funds, the Company diversifies its portfolio.
Sensitivity: The sensitivity of profit or loss to change in Net assets value (NAV) as at year end for investment in mutual funds.
Impact on profit before taxMarch 31, 2022 March 31, 2021
NAV increases by 5% 2,320 1,957
NAV decreases by 5% (2,320) (1,957)
Impact of Hedge activities (a) The following provides the details of hedging instrument and its impact on balance sheet
March 31, 2022Currency Nominal value
(Foreign Currency)Amount in ` Line item in
the balance sheetFair value* gain/(loss)
Cash flow hedgeForeign currency risk(for highly probable forecast transactions)
-
- Foreign currency forward contracts
`/USD 505 38,970 Other financial assets/(liabilities)
154
- Foreign currency forward contracts
`/EURO 9 811 Other financial assets/(liabilities)
35
* represents the impact of mark to market value at year end.
March 31, 2021Currency Nominal value
(Foreign Currency)Amount in ` Line item in
the balance sheetFair value* gain/(loss)
Cash flow hedgeForeign currency risk(for highly probable forecast transactions)
-
- Foreign currency forward contracts
`/USD 493 37,248 Other financial assets/(liabilities)
457
- Foreign currency forward contracts
`/EURO 12 1,096 Other financial assets/(liabilities)
49

272
Annual Report 2021-22
Notes to the Standalone Financial Statements for the year ended March 31, 2022(All amounts in ` Lacs, unless otherwise stated)
(b) The effect o (b) The effect of cash flow hedge in hedge reserve and statement of profit and loss:
Highly probableforecast sales
Interest rateswaps
Total
Balance as at April 01, 2020 (744) 14 (730)
Hedge gain/(loss) recognised in OCI 912 (31) 881
Amount reclassified from OCI to statement of profit and loss 338 17 355Income tax effect (128) - (128)Balance as at March 31, 2021 378 - 378Hedge gain/(loss) recognised in OCI 189 - 189Amount reclassified from OCI to statement of profit and loss (505) - (505)Income tax effect 80 - 80
Balance as at March 31, 2022 142 - 142
Reclassification for foreign currency forward contracts is recognised in foreign exchange gain or loss in Statement of Profit and Loss.
2. Credit risk Credit risk is the risk that counter party will not meet its obligations under a financial instruments or customer contract
leading to a financial loss. The Company is exposed to credit risk from its operating activities (primarily trade receivables, unbilled revenue and contract assets) and from its investing activities and from investing activities (primarily deposits with banks and investments in mutual funds).
Revenue from one customer comprises around 14% of the total revenue of the Company. The remaining revenue of the Company is spread across wide range of customers. For receivables turnover ratio, refer note 43.
(i) Trade receivables, unbilled revenue and contract assets. Trade receivables, unbilled revenue and contract assets are typically unsecured and derived from revenue from
contracts with customers. Customer credit risks is managed by each business units subject to Company's policy and procedures which involves continuously monitoring the credit worthiness of customers to which the Company grants credits in the normal course of business. The Company follows ‘simplified approach’ for recognition of impairment loss allowance on trade receivable. Under the simplified approach, the Company does not track changes in credit risk. Rather, it recognizes impairment loss allowance based on lifetime expected credit losses at each reporting date, right from initial recognition. The company uses a provision matrix to determine impairment loss allowance on the portfolio of trade receivables. The provision matrix takes into account available external and internal credit risk factors and the Company's historical experience with customers. Ageing of trade receivables and the provision in books for trade receivables:
Not due 1-180days
181-365days
1-2years
2-3years
More than3 years
Total
As at March 31, 2022
Trade receivables 12,788 3,625 385 337 93 123 17,351
Unbilled receivables 10,288
Allowance for expected credit loss
(1,430)
Net Trade receivables 12,788 3,625 385 337 93 123 26,209 As at March 31, 2021Trade receivables 8,969 3,428 221 126 29 102 12,875 Unbilled receivables 5,934 Allowance for expected credit loss
(1,397)
Total 8,969 3,428 221 126 29 102 17,412
Reconciliation of loss allowance March 31, 2022 March 31, 2021Opening balance as at April, 1 (1,265) (2,516)Allowance made during the year (net) - refer note 32 41 (845)Utilised during the year - 2,096Closing balance as at March, 31 (1,224) (1,265)

Corporate Overview1 Statutory Reports2 Financial Statements3
273
Annual Report 2021-22
Notes to the Standalone Financial Statements for the year ended March 31, 2022(All amounts in ` Lacs, unless otherwise stated)
Other financial assets and cash deposit
Credit risk from balances with the banks, loans, investments in mutual funds and other financial assets are managed by the company based on the company policy and is managed by the Company's Treasury Team. Investment of surplus fund is made only with approved counterparties. The Company's maximum exposure to credit risk is the carrying amount of such assets as disclosed in note 37 above.
Reconciliation of loss allowance March 31, 2022 March 31, 2021
Opening balance as at April, 1 (133) (145)
Allowance made during the year - refer note 32 (74) (41)
Utilised during the year - 53
Closing balance as at March, 31 (207) (133)
3. Liquidity risk Liquidity risk is the risk that the Company may not be able to meet its present and future cash and collateral obligations
without incurring unacceptable losses. The Company's objective it to, at all times maintain optimum levels of liquidity to meet its cash and collateral requirements. The Company closely monitors its position and maintains adequate source of financing.
The Company has access to the following undrawn borrowing facilities at the end of the reporting period:
March 31, 2022 March 31, 2021RBL Bank Limited 2,233 14Kotak Mahindra Bank Limited 725 300 HDFC Bank Limited 1,000 1,000 Federal Bank Limited 37 1,500 ICICI Bank Limited 2,234 2,800
6,229 5,614
The table below summarises the maturity profile of the Company’s financial liabilities at the reporting date. The amounts are based on contractual undiscounted payments.
Particulars Less than 1 year More than 1 year Total
As at March 31, 2022
Borrowings (including current maturities) 17,355 1,737 19,092
Lease liabilities 2,264 4,769 7,033
Trade payables 5,294 - 5,294
Foreign currency forward contracts 60 - 60
Other current financial liabilities # 4,385 26 4,411
29,358 6,532 35,890
As at March 31, 2021
Borrowings (including current maturities) 12,984 3,689 16,673
Lease liabilities 1,600 1,328 2,928
Trade payables 3,971 - 3,971
Foreign currency forward contracts 17 - 17
Contingent consideration 1,829 3,476 5,305
Other current financial liabilities # 3,752 123 3,875
24,153 8,616 32,769
# Includes future interest payable on outstanding borrowings

274
Annual Report 2021-22
Notes to the Standalone Financial Statements for the year ended March 31, 2022(All amounts in ` Lacs, unless otherwise stated)
38 Capital management For the purpose of the Company’s capital management, capital includes issued equity capital, convertible preference shares,
securities premium and all other equity reserves. The primary objective of the Company’s capital management is to maintain a strong capital base to ensure sustained growth in business and to maximize the shareholders value. The capital management focuses to maintain an optimal structure that balances growth and maximizes shareholder value.
The Company manages its capital structure and makes adjustments in light of changes in economic conditions and the requirements of the financial covenants. To maintain or adjust the capital structure, the Company may adjust the dividend payment to shareholders, return capital to shareholders or issue new shares. The Company includes within net debt, interest bearing loans and borrowings, less cash and cash equivalents. The Company's gearing ratio, which is net debt divided by total capital plus net debt is as below:
Particulars March 31, 2022 March 31, 2021Borrowings (including current maturities) 19,064 16,630Less : Cash and cash equivalents (5,601) (7,952)Net (cash and cash equivalents)/debt (A) 13,463 8,678Equity 66,974 54,667Total equity capital (B) 66,974 54,667Total debt and equity (C )=(A)+(B) 80,437 63,345Gearing ratio (A)/(C ) 17% 14%
No changes were made in the objectives, policies or processes for managing capital during the year ended March 31, 2022 and March 31, 2021.
39 Related party disclosure (i) List of related parties and relationship
Key management personnel (KMP) 1. Mr. Ashok Soota (Executive Chairman)2. Mr. Venkatraman N (Managing Director - w.e.f November 4, 2020 and CFO)3. Mr. Girish Paranjpe (Independent director) (till March 10, 2020)4. Mr. Avneet Singh Kochar (Non executive director) (till November 4, 2020)5. Mr. Joseph Vinod Anantharaju (Director) (w.e.f November 4, 2020)6. Mr. Praveen Darshankar (Company Secretary & Compliance Officer)7. Mrs. Anita Ramachandran (Independent director) (w.e.f June 04, 2020)8. Mr. Rajendra Kumar Srivastava (Independent director) (w.e.f June 04,2020)9. Mrs. Shubha Rao Mayya (Independent director) (w.e.f June 04,2020)
Wholly owned subsidiaries Happiest Minds Technology LLC *Happiest Minds Inc. (formerly known as PGS Inc.) (w.e.f January 27, 2021)
Relatives of KMP 1. Mr. Suresh Soota2. Mr. Deepak Soota3. Ms. Kunku Soota4. Mrs. Usha Samuel5. Mrs. Jayalakshmi Venkatraman
Entities under the control of KMP SKAN Research TrustHappiest Health Systems Private LimitedAshok Soota Medical Research LLP
Entity having significant influence over the reporting entity
CMDB II (till September 7, 2020)
Post employment benefit plan (PEBP) Happiest Minds Technologies Pvt. Ltd. Employees group gratuity trust
* Liquidated on June 1, 2020, and thus ceases to be a subsidiary. Refer note 44.
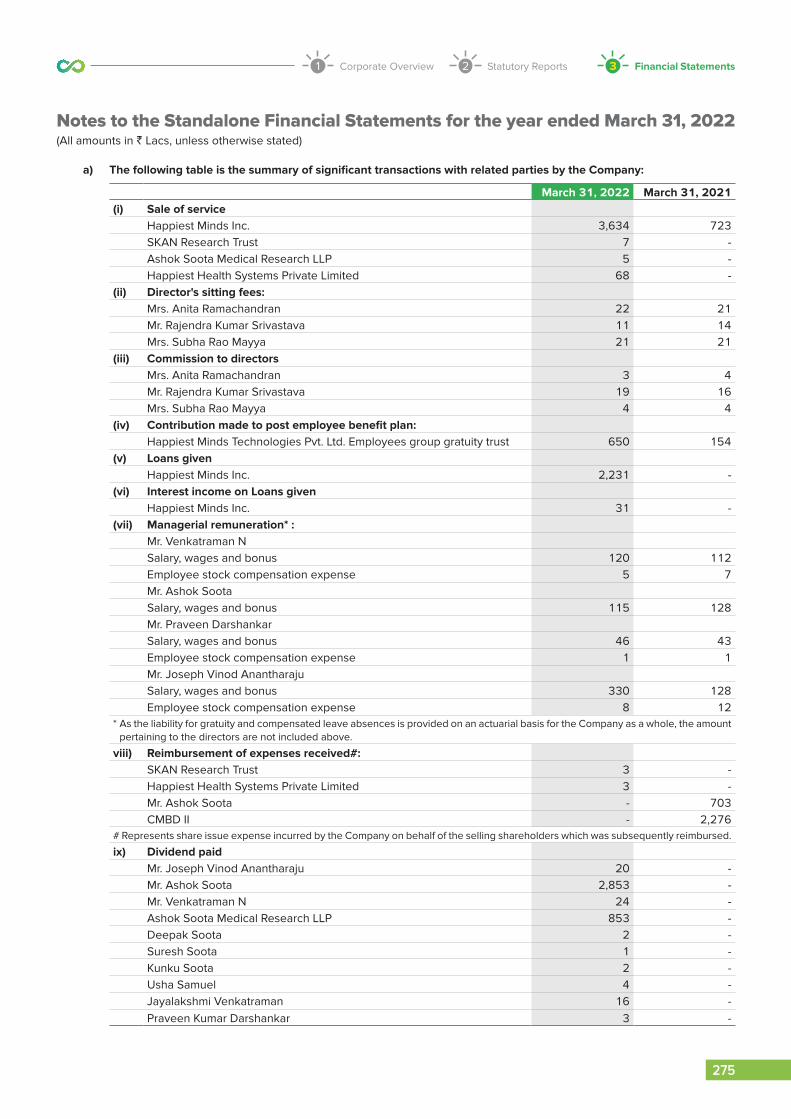
Corporate Overview1 Statutory Reports2 Financial Statements3
275
Annual Report 2021-22
Notes to the Standalone Financial Statements for the year ended March 31, 2022(All amounts in ` Lacs, unless otherwise stated)
a) The following table is the summary of significant transactions with related parties by the Company:
March 31, 2022 March 31, 2021(i) Sale of service
Happiest Minds Inc. 3,634 723SKAN Research Trust 7 -Ashok Soota Medical Research LLP 5 -Happiest Health Systems Private Limited 68 -
(ii) Director's sitting fees:Mrs. Anita Ramachandran 22 21Mr. Rajendra Kumar Srivastava 11 14Mrs. Subha Rao Mayya 21 21
(iii) Commission to directorsMrs. Anita Ramachandran 3 4Mr. Rajendra Kumar Srivastava 19 16Mrs. Subha Rao Mayya 4 4
(iv) Contribution made to post employee benefit plan:Happiest Minds Technologies Pvt. Ltd. Employees group gratuity trust 650 154
(v) Loans givenHappiest Minds Inc. 2,231 -
(vi) Interest income on Loans givenHappiest Minds Inc. 31 -
(vii) Managerial remuneration* :Mr. Venkatraman NSalary, wages and bonus 120 112Employee stock compensation expense 5 7Mr. Ashok SootaSalary, wages and bonus 115 128Mr. Praveen DarshankarSalary, wages and bonus 46 43Employee stock compensation expense 1 1Mr. Joseph Vinod AnantharajuSalary, wages and bonus 330 128Employee stock compensation expense 8 12
* As the liability for gratuity and compensated leave absences is provided on an actuarial basis for the Company as a whole, the amount pertaining to the directors are not included above.
viii) Reimbursement of expenses received#:SKAN Research Trust 3 -Happiest Health Systems Private Limited 3 -Mr. Ashok Soota - 703CMBD II - 2,276
# Represents share issue expense incurred by the Company on behalf of the selling shareholders which was subsequently reimbursed.
ix) Dividend paidMr. Joseph Vinod Anantharaju 20 -Mr. Ashok Soota 2,853 -Mr. Venkatraman N 24 -Ashok Soota Medical Research LLP 853 -Deepak Soota 2 -Suresh Soota 1 -Kunku Soota 2 -Usha Samuel 4 -Jayalakshmi Venkatraman 16 -Praveen Kumar Darshankar 3 -

276
Annual Report 2021-22
Notes to the Standalone Financial Statements for the year ended March 31, 2022(All amounts in ` Lacs, unless otherwise stated)
x) Details of CCPS converted:
March 31, 2021
Date of resolution Name of related party No. of CCPS converted No. of equity shares Amount
May 13, 2020 Mr. Ashok Soota 3,58,728 5,84,72,664 2,339
July 10, 2020 Mr. Ashok Soota 1,129 1,84,027 7
July 10, 2020 Mr. Venkatraman N 2,099 3,42,137 14
July 10, 2020 CMDB II 1,67,173 2,72,49,199 1,090
July 10, 2020 Mr. Suresh Soota 193 31,459 1
July 10, 2020 Mr. Deepak Soota 301 49,063 2
July 10, 2020 Ms. Kunku Soota 260 42,380 2
July 10, 2020 Mrs. Usha Samuel 482 78,566 3
b) The balances receivable from and payable to related parties are as follows :
March 31, 2022 March 31, 2021
(i) Trade receivables:
Happiest Minds Inc. 1,600 698
SKAN Research Trust 6 -
(ii) Unbilled receivables:
Happiest Minds Inc. 22 -
Happiest Health Systems Private Limited 67 -
(iii) Loans given
Happiest Minds Inc. 2,274 -
(iv) Accrued interest on Loans given
Happiest Minds Inc. 31
(v) Other financial liability
Happiest Minds Inc. - 3,731
(vi) Trade payables
Mrs. Anita Ramachandran 3 4
Mr. Rajendra Kumar Srivastava 19 16
Mrs. Subha Rao Mayya 4 4
Terms and conditions of transactions with related parties:
The sales to and purchases from related parties are made on terms equivalent to those that prevail in arm’s length transactions. Loans of ` 738 (USD 1 mn) ` 1492 (USD 2 mn) given to Happiest Minds Inc. carries an interest rate of 4.93% p.a and 5.367% p.a. respectively and is repayable after 3 years. All other outstanding balances at the year-end are unsecured, interest free and settlement occurs in cash. There have been no guarantees provided or received for any related party receivables or payables. For the year ended March 31, 2022, the Company has not recorded any impairment of receivables relating to amounts owed by related parties (March 31, 2021: Nil). This assessment is undertaken each financial year through examining the financial position of the related party and the market in which the related party operates.
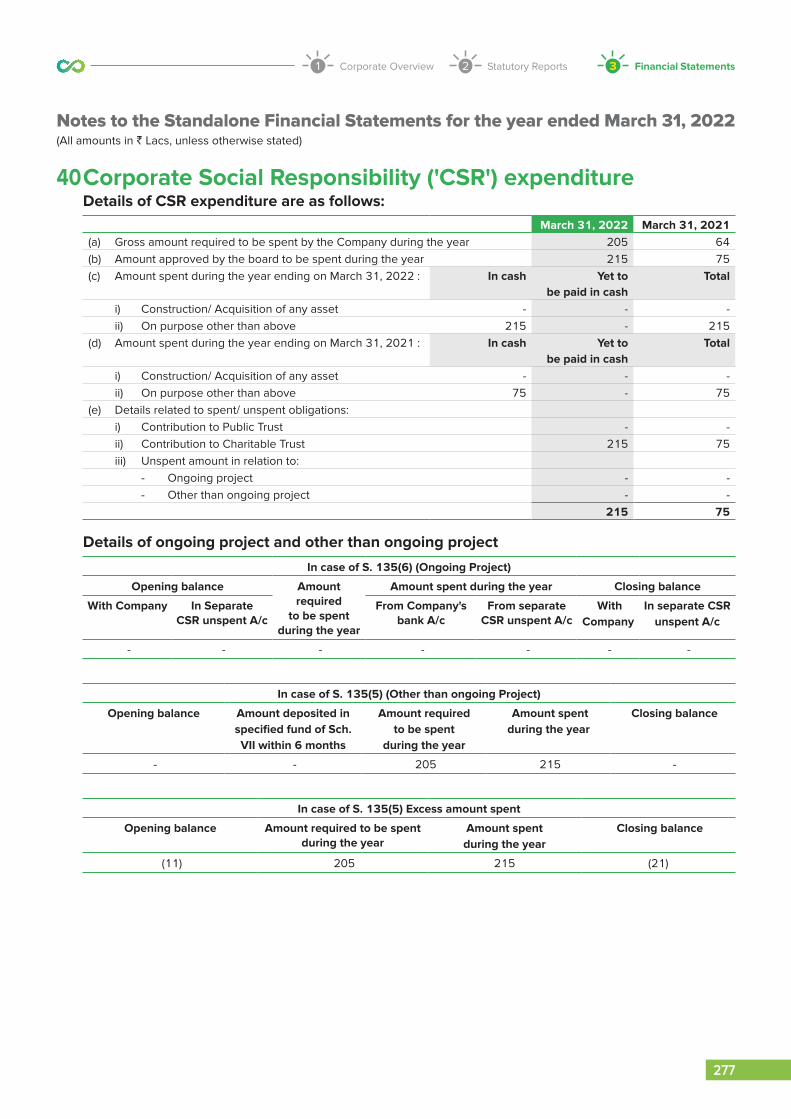
Corporate Overview1 Statutory Reports2 Financial Statements3
277
Annual Report 2021-22
Notes to the Standalone Financial Statements for the year ended March 31, 2022(All amounts in ` Lacs, unless otherwise stated)
40 Corporate Social Responsibility ('CSR') expenditure Details of CSR expenditure are as follows:
March 31, 2022 March 31, 2021(a) Gross amount required to be spent by the Company during the year 205 64(b) Amount approved by the board to be spent during the year 215 75(c) Amount spent during the year ending on March 31, 2022 : In cash yet to
be paid in cashTotal
i) Construction/ Acquisition of any asset - - - ii) On purpose other than above 215 - 215(d) Amount spent during the year ending on March 31, 2021 : In cash yet to
be paid in cashTotal
i) Construction/ Acquisition of any asset - - - ii) On purpose other than above 75 - 75(e) Details related to spent/ unspent obligations: i) Contribution to Public Trust - - ii) Contribution to Charitable Trust 215 75 iii) Unspent amount in relation to: - Ongoing project - - - Other than ongoing project - -
215 75
Details of ongoing project and other than ongoing project
In case of S. 135(6) (Ongoing Project)
Opening balance Amountrequired
to be spentduring the year
Amount spent during the year Closing balance
With Company In Separate CSR unspent A/c
From Company's bank A/c
From separate CSR unspent A/c
With Company
In separate CSR unspent A/c
- - - - - - -
In case of S. 135(5) (Other than ongoing Project)
Opening balance Amount deposited in specified fund of Sch. VII within 6 months
Amount required to be spent
during the year
Amount spent during the year
Closing balance
- - 205 215 -
In case of S. 135(5) Excess amount spent
Opening balance Amount required to be spent during the year
Amount spent during the year
Closing balance
(11) 205 215 (21)

278
Annual Report 2021-22
Notes to the Standalone Financial Statements for the year ended March 31, 2022(All amounts in ` Lacs, unless otherwise stated)
41 Commitments and Contingent Liabilities i) Capital Commitments
March 31, 2022 March 31, 2021Capital commitments towards purchase of capital assets 638 152
ii) Other claims against the Company not provided for in the books a) Compounding and Settlement Applications filed by the Company
A compounding application has been filed by the Company before the National Company Law Tribunal (NCLT) and Registrar of Companies, Bombay (“RoC”), in relation to allotments of Equity Shares made by the Company during year ended March 31, 2013 and 2014 under ESOP Scheme 2011 and ESOP Scheme 2011 USA, where certain allotments were made in contravention of Section 67(3) of the Companies Act, 1956.
The Board, vide a resolution passed at its meeting held on August 4, 2020 voluntarily decided to provide an exit offer to the shareholders. Upon completion of the exit offer, the Company has filed a compounding application with the RoC (which will be forwarded to the National Company Law Tribunal, Bengaluru bench upon approval) and a settlement application with SEBI.
The matter has been closed by ROC bangalore vide letter dated February 1, 2022 citing no contravention of Section 67(3).
b) With respect to the License Agreement entered in June 2018 between the Company and a customer, for providing software services, the customer terminated the agreement claiming non-satisfactory delivery of services and damages of ` 623 Lacs. The customer has also initiated arbitration proceedings which is the Company is currently contesting and is of the view that no that claim is not tenable and accordingly no adjustments are made in the financial statements.
c) There are numerous interpretative issues relating to the Supreme Court (SC) judgement on PF dated February 28, 2019. As a matter of caution, the Group has taken cognizance of the matter on a prospective basis from the date of the SC order. The Group will update its provision, if any, required, on receiving further clarity on the subject.
d) The Company is also subject to certain other claims and suits that arise from time to time in the ordinary conduct of its business. While the Company currently believes that such claims, individually or in aggregate, will not have a material adverse impact on its financial position, cash flows, or results of operations, the litigation and other claims are subject to inherent uncertainties, and management’s view of these matters may change in the future. Were an unfavourable final outcome to occur in any one or more of these matters, there exists the possibility of a material adverse impact on the Company’s business, reputation, financial condition, cash flows, and results of operations for the period in which the effect becomes reasonably estimable.
42 Share based payments Employee Share Option Plan (ESOP) The Company instituted the Employee Share Option Plan 2011 (""ESOP 2011"") and Equity Incentive Plan 2011 (""EIP
2011"") for eligible employees during the year ended March 2012 which was approved by the Board of Directors (Board) on October 18, 2011 and January 19, 2012 duly amended by the Board on January 22, 2015.
Besides the above plan, the Company has also instituted Employee Share Option Plan 2014 (""ESOP 2014"") duly approved by the Board on October 20, 2014 and by the shareholders on January 22, 2015. The Company has also instituted Employee Share Option Plan 2015 (""ESOP 2015"") duly approved by the Board on June 30, 2015 and by the shareholders on July 22, 2015. During year ended 2018, the Company has amended ESOP 2014 and all options granted under ESOP 2014 be deemed to be granted under ESOP 2011 duly approved by the Board on October 25, 2017. The plans are separate for USA employees (working out of the United States America - ""USA"") and employees working outside USA. The Company administers these plans.
On April 29, 2020 the Board of the Company approved Happiest Minds Employee Stock Option Scheme 2020 (""ESOP 2020"") consisting of 70,00,000 equity shares. The Company will henceforth issue grants under the ESOP 2020 only.
The contractual term of each option granted is 5-8 years.

Corporate Overview1 Statutory Reports2 Financial Statements3
279
Annual Report 2021-22
Notes to the Standalone Financial Statements for the year ended March 31, 2022(All amounts in ` Lacs, unless otherwise stated)
Key features of these plans are provided in the below table:
Key Terms ESOP 2011 ESOP 2014 / EIP 2011 for US Employees
ESOP 2015 / EIP 2011 for US Employees
ESOP 2020
Class of Share Equity Shares (as amended vide board meeting held on April 26, 2017 and Annual general meeting held on July 31, 2017).
Pursuant to conversion of Class B Non-voting Equity Shares (entitled under ESOP 2014) to Equity shares (as amended vide board meeting held on April 26, 2017 and Annual general meeting held on July 31, 2017), the Board of Directors at its meeting held on October 25, 2017 approved the administration of options granted and shares allotted under erstwhile ESOP 2014 to ESOP 2011.
Equity Shares (as amended vide board meeting held on April 26, 2017 and Annual general meeting held on July 31, 2017).
Equity Shares (as amended vide board meeting held on April 29, 2020 and extra ordinary general meeting held on May 13, 2020).
Ownership Legal Ownership Legal Ownership Legal Ownership
Vesting Pattern Four-year vesting term and vest at the rate of 15%, 20%, 30% and 35% at the end of 1,2,3 and 4 years respectively from the date of grant and become fully exercisable, subject to employee being in the employment of the Company.
Exercise Price Exercisable at an exercise price of ` 2, ` 3, ` 5 and ` 6 per option.
Exercisable at an exercise price of ` 2 and ` 6 per option.
Exercisable at an exercise price of ` 2, ` 6.25, ` 9.50, ` 11.50 and ` 26 per option.
No grant has been made under this scheme
Economic Benefits / Voting Rights
The holders of the equity shares will be entitled to the economic benefits of holding these shares only after the completion of the various vesting terms mentioned above and shall acquire voting rights as a shareholder of the Company as duly approved by the shareholders at the meeting held on July 31, 2017.
For the year endedMarch 31, 2022 March 31, 2021
Employee stock compensation expense 300 297
Movements during the year The following table illustrates the number and weighted average exercise price of share options during the year
March 31, 2022
Options - India/UK Plan Employee Stock Ownership Plan 2011 Employee Stock Ownership Plan 2015No. of options WAEP* No. of options WAEP*
Outstanding at the beginning of the year
1,27,868 5.98 39,65,379 25.31
Granted during the year - - - -Exercised during the year (35,600) 5.24 (8,13,898) 23.26Forfeited during the year (3,600) 6.00 (3,92,774) 25.82Outstanding options as at the end of the year
88,668 6.28 27,58,707 25.85
Weighted Average Remaining Contractual Life
0.12 years 4.59 years

280
Annual Report 2021-22
Notes to the Standalone Financial Statements for the year ended March 31, 2022(All amounts in ` Lacs, unless otherwise stated)
Options - USA Plan Equity Incentive Plan for US Employees-2011
Equity Incentive Plan for US Employees-2011
No. of options WAEP* No. of options WAEP*Outstanding at the beginning of the year
20,000 6.00 49,470 24.18
Granted during the year - - - - Exercised during the year (4,000) 6.00 (17,890) 20.98Forfeited during the year - - (1,750) 26.00 Outstanding options as at the end of the year
16,000 6.00 29,830 26.00
Weighted Average Remaining Contractual Life
0.42 years 3.66 years
March 31, 2021
Options - India/UK Plan Employee Stock Ownership Plan 2011 Employee Stock Ownership Plan 2015No. of options WAEP* No. of options WAEP*
Outstanding at the beginning of the year
2,41,788 5.86 50,28,066 24.59
Granted during the year - - 37,000 26.00 Exercised during the year (92,170) 5.77 (5,74,205) 18.95 Forfeited during the year (21,750) 5.56 (5,25,482) 25.37 Outstanding options as at the end of the year
1,27,868 5.98 39,65,379 25.31
Weighted Average Remaining Contractual Life 0.18 years 5.07 years
Options - USA Plan Equity Incentive Plan for US Employees-2011
Equity Incentive Plan for US Employees-2011
No. of options WAEP* No. of options WAEP*Outstanding at the beginning of the year
20,000 6.00 56,375 24.41
Granted during the year - - - - Exercised during the year - - (6,905) 26.00Forfeited during the year - - - - Outstanding options as at the end of the year
20,000 6.00 49,470 24.18
Weighted Average Remaining Contractual Life
0.8 years 3.73 years
* Weighted Average Exercise Price
No options were granted during the year. The weighted average fair value of the options granted during the year ended March 31, 2021 is ` 12.23.
The weighted average share price of shares exercised during the year is ` 963.88 (March 31, 2021 - ` 372.61)
Exercisable options as at March 31, 2022 - 8,47,466 options (March 31, 2021 - 7,77,628 options) and weighted average exercise price - ` 22.92 (March 31, 2020 - ` 18.59)
The Black Scholes valuation model has been used for computing the weighted average fair value considering the following inputs:
March 31, 2022 March 31, 2021Expected dividend yield NA 0.00%Expected Annual Volatility of Shares NA 50.00%Risk-free interest rate (%) NA 6.98%Exercise price (`) NA 26.00 Expected life of the options granted (in years) NA 3-6 years
The expected life of the stock is based on historical data and current expectations and is not necessarily indicative of exercise patterns that may occur. The expected volatility reflects the assumption that the historical volatility over a period similar to the life of the options is indicative of future trends, which may also not necessarily be the actual outcome.

Corporate Overview1 Statutory Reports2 Financial Statements3
281
Annual Report 2021-22
Notes to the Standalone Financial Statements for the year ended March 31, 2022(All amounts in ` Lacs, unless otherwise stated)
43 Ratio analysis and its elementsRatio Numerator Denominator March
31, 2022March
31, 2021% Change
Current ratio Current Assets Current Liabilities 2.67 2.71 -1%
Debt- Equity Ratio Total Debt Shareholder’s Equity 0.37 0.35 6%
Debt ServiceCoverage ratio
Earnings for debt service = Net profit after taxes + Non-cash operating expenses
Debt service = Interest & Lease Payments + Principal Repayments
4.46 4.93 -10%
Return on Equity ratio Net Profits after taxes – Preference Dividend
Average Shareholder’s Equity
0.31 0.40 -23%
Trade Receivable Turnover Ratio
Net revenue Average Trade Receivable
7.45 6.59 13%
Trade Payable Turnover Ratio
Net credit purchases = Gross credit purchases - purchase return
Average Trade Payables 3.76 3.26 15%
Net Capital Turnover Ratio
Net revenue Working capital = Current assets – Current liabilities
1.83 1.65 11%
Net Profit ratio Net Profit Net sales = Total sales - sales return
0.18 0.21 -14%
Return on Capital Employed
Earnings before interest and taxes
Capital Employed = Tangible Net Worth + Total Debt + Deferred Tax liability
0.28 0.26 8%
Return on Investment Interest (Finance Income) and gain from mutual funds
Investments (includes mutual funds, and fixed deposits)
0.04 0.04 0%
44 Liquidation of subsidiary The Company in its Board Meeting on March 16, 2020 passed a resolutions to voluntarily dissolve and wind up the operation
of its subsidiary, i.e. Happiest Minds Technologies LLC, USA. Pursuant to such resolutions, the Company had filed a request for termination of the aforesaid subsidiary and received a certificate from the Office of Secretary of State approving such winding up on June 1, 2020 and consequent to such approval the Company has liquidated its subsidiary.
45 The Board of Directors of the Company at their meeting held on May 5, 2022, recommended the payout of a final dividend of ` 2/- per equity share of face value ` 2/- each for the financial year ended March 31, 2022 . This recommendation is subject to approval of shareholders at the 11th Annual General Meeting of the Company scheduled to be held on June 30, 2022.
46 The financial statements of the Company for year ended March 31, 2021 were audited by M/s S.R.Batliboi & Associates LLP, Chartered Accountants, the predecessor auditor who have expressed an unmodified audit opinion.
47 The Company had acquired 100% voting interest in Happiest Minds Inc. (erstwhile PGS Inc.) vide definitive agreements signed on January 27,2021, for a total recorded consideration of US $ 13.31 Mn (` 9,720 Lacs), comprising cash consideration of US $ 8.25 Mn (` 6,025 Lacs) and fair-valued contingent consideration in the form of warrants of US $ 5.06 Mn (` 3,696 Lacs) payable over next 3 years.
During the year ended March 31, 2022, the Company re-evaluated its primary obligation for pay-outs of the contingent consideration and concluded that the obligation for the pay-out of the contingent consideration is with its subsidiary, Happiest Minds Inc., and the Company’s obligation is restricted to ensure that sufficient cash flows are available with Happiest Minds Inc. to meet its obligations. Consequently, the contingent consideration of US $ 5.06 Mn (` 3,696 Lacs) and investment in Happiest Minds Inc. (erstwhile PGC Inc.) of US$ 5.06 Mn (` 3,696 Lacs) has been reversed in the standalone balance sheet of the Company.

282
Annual Report 2021-22
Notes to the Standalone Financial Statements for the year ended March 31, 2022(All amounts in ` Lacs, unless otherwise stated)
48 The Code on Social Security, 2020 ('Code') relating to employee benefits during employment and post-employment benefits received Presidential assent in September 2020. The Code has been published in the Gazette of India. However, the date on which the Code will come into effect has not been notified and the final rules/interpretation have not yet been issued. The Company will assess the impact of the Code when it comes into effect and will record any related impact in the period in which the Code becomes effective.
49 The full impact of COVID-19 still remains uncertain and could be different from the estimates considered while preparing these Standalone Financial Statements. The Company will continue to closely monitor any material changes to future economic conditions.
50 The Company maintains the information and documents as required under the transfer pricing regulations under Section 92-92F of the Income Tax Act, 1961. The management is in the process of updating the transfer pricing documentation for the financial year 2021 - 2022 and is of the view that its transactions are at arm’s length and the aforesaid legislation will not have any impact on the financial statements, particularly on the amount of tax expense and that of provision for taxation.
51 Previous year's figures have been regrouped/ reclassified wherever necessary to conform with current year classification.
As per our report of even datefor Deloitte Haskins and SellsChartered AccountantsICAI Firm's Registration Number: 008072S
for and on behalf of the Board of Directors:Happiest Minds Technologies LimitedCIN : L72900KA2011PLC057931
Vikas BagariaPartnerMembership no.: 060408Place: Bengaluru, IndiaDate: May 5, 2022
Ashok SootaExecutive ChairmanDIN : 00145962 Place: Bengaluru, IndiaDate: May 5, 2022
Venkatraman NarayananManaging Director & Chief Financial OfficerDIN : 01856347 Place: Bengaluru, IndiaDate: May 5, 2022
Praveen DarshankarCompany Secretary & Compliance OfficerFCS No.: F6706Place: Bengaluru, IndiaDate: May 5, 2022

Corporate Overview1 Statutory Reports2 Financial Statements3
283
Annual Report 2021-22
OpinionWe have audited the accompanying consolidated financial statements of Happiest Minds Technologies Limited (”the Parent”/ “the Holding Company”) and its subsidiary, (the Parent/ Holding Company and its subsidiary together referred to as “the Group”), which comprise the Consolidated Balance Sheet as at March 31, 2022, and the Consolidated Statement of Profit and Loss (including Other Comprehensive Income), the Consolidated Statement of Cash Flows and the Consolidated Statement of Changes in Equity for the year then ended, and a summary of significant accounting policies and other explanatory information, in which are incorporated the financial statements of Happiest Minds Technologies Share Ownership Plans Trust (the “ESOP trust”) for the year ended on that date audited by the other auditors (‘trust auditor’).
In our opinion and to the best of our information and according to the explanations given to us, and based on the consideration of reports of the trust auditor on separate financial statements of the ESOP trust, the aforesaid consolidated financial statements give the information required by the Companies Act, 2013 (“the Act”) in the manner so required and give a true and fair view in conformity with the Indian Accounting Standards prescribed under section 133 of the Act read with the Companies (Indian Accounting Standards) Rules, 2015, as amended (‘Ind AS’), and other accounting principles generally accepted in India, of the consolidated state of affairs of the Group as at March 31, 2022, and their consolidated profit/loss, their consolidated total comprehensive income, their consolidated cash flows and their consolidated changes in equity for the year ended on that date.
Basis for OpinionWe conducted our audit of the consolidated financial statements in accordance with the Standards on Auditing specified under section 143 (10) of the Act (SAs). Our responsibilities under those Standards are further described in the Auditor’s Responsibility for the Audit of the Consolidated Financial Statements section of our report. We are independent of the Group, in accordance with the Code of Ethics issued by the Institute of Chartered Accountants of India (ICAI) together with the ethical requirements that are relevant to our audit of the consolidated financial statements under the provisions of the Act and the Rules made thereunder, and we have fulfilled our other ethical responsibilities in accordance with these requirements and the ICAI’s Code of Ethics. We believe that the audit evidence obtained by us and the audit evidence obtained by the trust auditor in terms of their report referred to in the sub-paragraphs of the Other Matters section below, is sufficient and appropriate to provide a basis for our audit opinion on the consolidated financial statements.
Key Audit MattersKey audit matters are those matters that, in our professional judgment, were of most significance in our audit of the consolidated financial statements of the current period. These matters were addressed in the context of our audit of the consolidated financial statements as a whole, and in forming our opinion thereon, and we do not provide a separate opinion on these matters. We have determined the matters described below to be the key audit matters to be communicated in our report.
INDEPENDENT AUDITOR’S REPORTTo The Members of Happiest Minds Technologies Limited
Report on the Audit of the Consolidated Financial Statements

284
Annual Report 2021-22
Sr. No. Key Audit Matter Auditor’s Response
1 Fixed price contracts using the percentage of completion method
(refer note 2(a) and note 26 of the consolidated Ind AS financial statement)
Revenue from fixed-price contracts, where the performance obligations are satisfied over time, is recognized using the percentage-of-completion method. Use of the percentage-of-completion method requires the Company to determine the project costs incurred to date as a percentage of total estimated project costs required to complete the project. The estimation of total project costs involves significant judgement and is assessed throughout the period of the contract to reflect any changes based on the latest available information.
We identified the revenue recognition for fixed price contracts where the percentage-of-completion method is used as a key audit matter because of the significant judgement involved in estimating the efforts to complete such contracts. This estimate has a high inherent uncertainty and requires consideration of progress of the contract, efforts incurred to-date and estimates of efforts required to complete the remaining contract performance obligations over the lives of the contracts.
This required a high degree of auditor judgement in evaluating the audit evidence supporting the estimated efforts to complete and a higher extent of audit effort to evaluate the reasonableness of the total estimated efforts used to recognise revenue on fixed-price contracts.
Principal audit procedures performed:
Our audit procedures related to estimates of efforts to complete for fixed-price contracts accounted using the percentage-of-completion method included the following, among others:
• We tested the effectiveness of controls relating to (1) recording of efforts incurred and estimation of efforts to complete the contract performance obligations, and (2) access and application controls pertaining to time recording and allocation systems, which prevents unauthorized changes to recording of efforts incurred.
• We evaluated management’s ability to reasonably estimate the progress towards satisfying the performance obligation by comparing actual information to estimates for performance obligations that have been fulfilled.
• We selected a sample of fixed price contracts with customers accounted using percentage-of-completion method and performed the following:
• Read the contract and based on the terms and conditions evaluated whether recognizing revenue over time was appropriate, and the contract was included in management’s calculation of revenue over time.
• Evaluated other information that supported the estimates of the progress towards satisfying the performance obligation.
• Evaluated the appropriateness of and consistency in the application of management’s policies and methodologies to estimate progress towards satisfying the performance obligation.
• Compared efforts incurred with data from the timesheet application system
• Tested the estimate for consistency with the status of delivery of milestones and customer acceptances to identify possible delays in achieving milestones, which require changes in estimated efforts to complete the remaining performance obligations.
• We assessed the adequacy of disclosures made in the financial statements with respect to revenue recognized during the year as required by applicable Indian Accounting Standards
Information Other than the Financial Statements and Auditor’s Report Thereon• The Parent’s/ Holding Company’s Board of Directors is responsible for the other information. The other information comprises
the information included in the annual report 2021-22, but does not include the consolidated financial statements, standalone financial statements and our auditor’s report thereon. The report is expected to be made available to us after the date of this auditor's report.
• Our opinion on the consolidated financial statements does not cover the other information and we do not express any form of assurance conclusion thereon.
• In connection with our audit of the consolidated financial statements, our responsibility is to read the other information identified above, when it becomes available, and in doing so, consider whether the other information is materially inconsistent with the consolidated financial statements or our knowledge obtained during the course of our audit or otherwise appears to be materially misstated. Other information so far as it relates to the ESOP trust, is traced from its financial statements audited by the trust auditor.

Corporate Overview1 Statutory Reports2 Financial Statements3
285
Annual Report 2021-22
• When we read the Annual report, if we conclude that there is a material misstatement therein, we are required to communicate the matter to those charged with governance as required under SA 720 ‘The Auditor’s responsibilities Relating to Other Information’.
Management’s Responsibility for the Consolidated Financial StatementsThe Parent’s/ Holding Company’s Board of Directors is responsible for the matters stated in section 134(5) of the Act with respect to the preparation of these consolidated financial statements that give a true and fair view of the consolidated financial position, consolidated financial performance including other comprehensive income, consolidated cash flows and consolidated changes in equity of the Group in accordance with the Ind AS and other accounting principles generally accepted in India. The respective Board of Directors of the companies included in the Group are responsible for maintenance of adequate accounting records in accordance with the provisions of the Act for safeguarding the assets of the Group and for preventing and detecting frauds and other irregularities; selection and application of appropriate accounting policies; making judgments and estimates that are reasonable and prudent; and design, implementation and maintenance of adequate internal financial controls, that were operating effectively for ensuring the accuracy and completeness of the accounting records, relevant to the preparation and presentation of the financial statements that give a true and fair view and are free from material misstatement, whether due to fraud or error, which have been used for the purpose of preparation of the consolidated financial statements by the Directors of the Parent/ Holding Company, as aforesaid.
In preparing the consolidated financial statements, the respective Board of Directors of the companies included in the Group are responsible for assessing the ability of the respective entities to continue as a going concern, disclosing, as applicable, matters related to going concern and using the going concern basis of accounting unless the respective Board of Directors either intends to liquidate their respective entities or to cease operations, or has no realistic alternative but to do so.
The respective Board of Directors of the companies included in the Group are also responsible for overseeing the financial reporting process of the Group.
Auditor’s Responsibility for the Audit of the Consolidated Financial StatementsOur objectives are to obtain reasonable assurance about whether the consolidated financial statements as a whole are free from material misstatement, whether due to fraud or error, and to issue an auditor’s report that includes our opinion. Reasonable assurance is a high level of assurance, but is not a guarantee that an audit conducted in accordance with SAs will always detect a material misstatement when it exists. Misstatements can arise from fraud or error and are considered material if, individually or in the aggregate, they could reasonably be expected to influence the economic decisions of users taken on the basis of these consolidated financial statements.
As part of an audit in accordance with SAs, we exercise professional judgment and maintain professional skepticism throughout the audit. We also:
• Identify and assess the risks of material misstatement of the consolidated financial statements, whether due to fraud or error, design and perform audit procedures responsive to those risks, and obtain audit evidence that is sufficient and appropriate to provide a basis for our opinion. The risk of not detecting a material misstatement resulting from fraud is higher than for one resulting from error, as fraud may involve collusion, forgery, intentional omissions, misrepresentations, or the override of internal control.
• Obtain an understanding of internal financial control relevant to the audit in order to design audit procedures that are appropriate in the circumstances. Under section 143(3)(i) of the Act, we are also responsible for expressing our opinion on whether the Parent/ Holding Company has adequate internal financial controls system in place and the operating effectiveness of such controls.
• Evaluate the appropriateness of accounting policies used and the reasonableness of accounting estimates and related disclosures made by the management.
• Conclude on the appropriateness of management’s use of the going concern basis of accounting and, based on the audit evidence obtained, whether a material uncertainty exists related to events or conditions that may cast significant doubt on the ability of the Group and its associates and jointly controlled entities/ joint ventures to continue as a going concern. If we conclude that a material uncertainty exists, we are required to draw attention in our auditor’s report to the related disclosures in the consolidated financial statements or, if such disclosures are inadequate, to modify our opinion. Our conclusions are based on the audit evidence obtained up to the date of our auditor’s report. However, future events or conditions may cause the Group and its associates and jointly controlled entities/ joint ventures to cease to continue as a going concern.
• Evaluate the overall presentation, structure and content of the consolidated financial statements, including the disclosures, and whether the consolidated financial statements represent the underlying transactions and events in a manner that achieves fair presentation.
• Obtain sufficient appropriate audit evidence regarding the financial information of the ESOP trust or entity within the Group to express an opinion on the consolidated financial statements. We are responsible for the direction, supervision and performance
286
Annual Report 2021-22
of the audit of the financial statements of such entity included in the consolidated financial statements of which we are the independent auditors. For the ESOP trust included in the consolidated financial statements, which have been audited by the trust auditor, such trust auditor remains responsible for the direction, supervision and performance of the audits carried out by them. We remain solely responsible for our audit opinion.
Materiality is the magnitude of misstatements in the consolidated financial statements that, individually or in aggregate, makes it probable that the economic decisions of a reasonably knowledgeable user of the consolidated financial statements may be influenced. We consider quantitative materiality and qualitative factors in (i) planning the scope of our audit work and in evaluating the results of our work; and (ii) to evaluate the effect of any identified misstatements in the consolidated financial statements.
We communicate with those charged with governance of the Parent/ Holding Company and such other entities included in the consolidated financial statements of which we are the independent auditors regarding, among other matters, the planned scope and timing of the audit and significant audit findings, including any significant deficiencies in internal control that we identify during our audit.
We also provide those charged with governance with a statement that we have complied with relevant ethical requirements regarding independence, and to communicate with them all relationships and other matters that may reasonably be thought to bear on our independence, and where applicable, related safeguards.
From the matters communicated with those charged with governance, we determine those matters that were of most significance in the audit of the consolidated financial statements of the current period and are therefore the key audit matters. We describe these matters in our auditor’s report unless law or regulation precludes public disclosure about the matter or when, in extremely rare circumstances, we determine that a matter should not be communicated in our report because the adverse consequences of doing so would reasonably be expected to outweigh the public interest benefits of such communication.
Other Matters(a) We did not audit the financial statements/ financial information of the ESOP trust included in the standalone financial statements
of the companies included in the Group whose financial statements/financial information reflect total assets of ` 46,284 Lacs as at March 31, 2022 and total revenue of ` NIL for the year ended on that date, as considered in the respective standalone financial statements of the companies included in the Group. The financial statements / financial information of the ESOP trust have been audited by the trust auditor whose reports have been furnished to us or other auditors, and our opinion in so far as it relates to the amounts and disclosures included in respect of the ESOP trust and our report in terms of subsection (3) of Section 143 of the Act, in so far as it relates to the aforesaid ESOP trust, is based solely on the report of such trust auditor.
Our opinion on the consolidated financial statements above and our report on Other Legal and Regulatory Requirements below, is not modified in respect of the above matters with respect to our reliance on the work done and the reports of the trust auditor and the financial statements / financial information certified by the Management.
Report on Other Legal and Regulatory Requirements1. As required by Section 143(3) of the Act, based on our audit and on the consideration of the reports of the trust auditors on
the separate financial statements/ financial information of the trust referred to in the Other Matters section above we report, to the extent applicable that:
a) We have sought and obtained all the information and explanations which to the best of our knowledge and belief were necessary for the purposes of our audit of the aforesaid consolidated financial statements.
b) In our opinion, proper books of account as required by law relating to preparation of the aforesaid consolidated financial statements have been kept so far as it appears from our examination of the reports of the trust auditors.
c) The Consolidated Balance Sheet, the Consolidated Statement of Profit and Loss including Other Comprehensive Income, the Consolidated Statement of Cash Flows and the Consolidated Statement of Changes in Equity dealt with by this Report are in agreement with the relevant books of account maintained for the purpose of preparation of the consolidated financial statements and with the financial statements received from the trust auditors.
d) In our opinion, the aforesaid consolidated financial statements comply with the Ind AS specified under Section 133 of the Act.
e) On the basis of the written representations received from the directors of the Parent/ Holding Company as on March 31, 2022 taken on record by the Board of Directors of the Company, none of the directors of the Group companies, incorporated in India is disqualified as on March 31, 2022 from being appointed as a director in terms of Section 164 (2) of the Act.
f) With respect to the adequacy of the internal financial controls over financial reporting and the operating effectiveness of such controls, refer to our separate Report in “Annexure A” which is based on the auditors’ reports of the Parent/ Holding

Corporate Overview1 Statutory Reports2 Financial Statements3
287
Annual Report 2021-22
company. Our report expresses an unmodified opinion on the adequacy and operating effectiveness of internal financial controls over financial reporting of the Parent/ Holding Company.
g) With respect to the other matters to be included in the Auditor’s Report in accordance with the requirements of section 197(16) of the Act, as amended, In our opinion and to the best of our information and according to the explanations given to us, the remuneration paid by the Parent/ Holding Company to its directors during the year is in accordance with the provisions of section 197 of the Act.
h) With respect to the other matters to be included in the Auditor’s Report in accordance with Rule 11 of the Companies (Audit and Auditors) Rules, 2014,as amended in our opinion and to the best of our information and according to the explanations given to us:
i) The consolidated financial statements disclose the impact of pending litigations on the consolidated financial position of the Group.
ii) Provision has been made in the consolidated financial statements, as required under the applicable law or accounting standards, for material foreseeable losses, if any, on long-term contracts including derivative contracts;
iii) There were no amounts which were required to be transferred to the Investor Education and Protection Fund by the Parent/ Holding Company.
iv) (a) The respective Managements of the Parent/ Holding Company and its subsidiary which are companies incorporated in India, whose financial statements have been audited under the Act, have represented to us that, to the best of their knowledge and belief, other than as disclosed in the notes to the accounts, no funds (which are material either individually or in the aggregate) have been advanced or loaned or invested (either from borrowed funds or share premium or any other sources or kind of funds) by the Parent/ Holding Company or any of such subsidiaries to or in any other person(s) or entity(ies), including foreign entities (“Intermediaries”), with the understanding, whether recorded in writing or otherwise, that the Intermediary shall, directly or indirectly lend or invest in other persons or entities identified in any manner whatsoever by or on behalf of the Parent/ Holding Company or any of such subsidiaries (“Ultimate Beneficiaries”) or provide any guarantee, security or the like on behalf of the Ultimate Beneficiaries.
(b) The management has represented that, to the best of their knowledge and belief, no funds (which are maintained either individually or in aggregate) have been received by the Group from any person or entity, including foreign entities (“Funding Parties”), with the understanding whether recorded in writing or otherwise, that the Group, shall, directly or indirectly, lend or invest in other persons or entities identified in any manner whatsoever by or on behalf of the Funding Party (“Ultimate Beneficiaries”) or provide any guarantee, security or the like on behalf of the Ultimate Beneficiaries.
(c) Based on the audit procedures that has been considered reasonable and appropriate in the circumstances performed by us, nothing has come to our notice that has caused us to believe that the representations under sub-clause (i) and (ii) of Rule 11(e), as provided under (a) and (b) above, contain any material misstatement.
v) The final dividend proposed in the previous year, declared and paid by the Parent/ Holding Company during the year is in accordance with section 123 of the Act, as applicable.
As stated in note 48 to the financial statements, the Board of Directors of the Parent/ Holding Company have proposed final dividend for the year which is subject to the approval of the members at the ensuing Annual General Meeting. The amount of dividend proposed is in accordance with section 123 of the Act, as applicable.
2. With respect to the matters specified in Clause (xxi) of paragraph 3 and paragraph 4 of the Companies (Auditor’s Report) Order, 2020 (“the Order”) issued by the Central Government in terms of Section 143(11) of the Act, according to the information and explanations given to us, and based on the audit report under section 143 issued by us and the auditors of respective companies included in the consolidated financial statements, as provided to us by the Management of the Parent/ Holding Company, we report that CARO is applicable only to the Parent/ Holding Company and not to any other company included in the consolidated financial statements. We have not reported any qualification or adverse remark in the CARO report of the Parent/ Holding Company.
For Deloitte Haskins & SellsChartered Accountants(Firm’s Registration No. 008072S)
______________________(Vikas Bagaria)(Partner)(Membership No. 060408)UDIN : 22060408AJROPK5394Place: BengaluruDate: May 05, 2022

288
Annual Report 2021-22
ANNEXURE “A” TO THE INDEPENDENT AUDITOR’S REPORT (Referred to in paragraph (h) under ‘Report on Other Legal and Regulatory Requirements’ section of our report to the Members of Happiest Minds Technologies Limited of even date) Report on the Internal Financial Controls Over Financial Reporting under Clause (i) of Sub-section 3 of Section 143 of the Companies Act, 2013 (“the Act”)In conjunction with our audit of the consolidated Ind AS (retain as applicable) financial statements of the Company as of and for the year ended March 31, 2022, we have audited the internal financial controls over financial reporting of Happiest Minds Technologies Limited (hereinafter referred to as “the Holding Company” / “Parent”), as of that date.
Management’s Responsibility for Internal Financial ControlsThe Board of Directors of the Holding company / Parent, is responsible for establishing and maintaining internal financial controls based on the internal control over financial reporting criteria established by the Company considering the essential components of internal control stated in the Guidance Note on Audit of Internal Financial Controls Over Financial Reporting issued by the Institute of Chartered Accountants of India (“the ICAI)”. These responsibilities include the design, implementation and maintenance of adequate internal financial controls that were operating effectively for ensuring the orderly and efficient conduct of its business, including adherence to the Holding Company’s/ Parent’s policies, the safeguarding of its assets, the prevention and detection of frauds and errors, the accuracy and completeness of the accounting records, and the timely preparation of reliable financial information, as required under the Companies Act, 2013.
Auditor’s ResponsibilityOur responsibility is to express an opinion on the Holding Company's/ Parent’s internal financial controls over financial reporting based on our audit. We conducted our audit in accordance with the Guidance Note on Audit of Internal Financial Controls Over Financial Reporting (the “Guidance Note”) issued by the Institute of Chartered Accountants of India and the Standards on Auditing, prescribed under Section 143(10) of the Companies Act, 2013, to the extent applicable to an audit of internal financial controls. Those Standards and the Guidance Note require that we comply with ethical requirements and plan and perform the audit to obtain reasonable assurance about whether adequate internal financial controls over financial reporting was established and maintained and if such controls operated effectively in all material respects.
Our audit involves performing procedures to obtain audit evidence about the adequacy of the internal financial controls system over financial reporting and their operating effectiveness. Our audit of internal financial controls over financial reporting included obtaining an understanding of internal financial controls over financial reporting, assessing the risk that a material weakness exists, and testing and evaluating the design and operating effectiveness of internal control based on the assessed risk. The procedures selected depend on the auditor’s judgement, including the assessment of the risks of material misstatement of the financial statements, whether due to fraud or error.
We believe that the audit evidence we have obtained, is sufficient and appropriate to provide a basis for our audit opinion on the Holding Company’s/ Parent’s internal financial controls system over financial reporting.
Meaning of Internal Financial Controls Over Financial ReportingA company's internal financial control over financial reporting is a process designed to provide reasonable assurance regarding the reliability of financial reporting and the preparation of financial statements for external purposes in accordance with generally accepted accounting principles. A company's internal financial control over financial reporting includes those policies and procedures that (1) pertain to the maintenance of records that, in reasonable detail, accurately and fairly reflect the transactions and dispositions of the assets of the company; (2) provide reasonable assurance that transactions are recorded as necessary to permit preparation of financial statements in accordance with generally accepted accounting principles, and that receipts and expenditures of the company are being made only in accordance with authorisations of management and directors of the company; and (3) provide reasonable assurance regarding prevention or timely detection of unauthorised acquisition, use, or disposition of the company's assets that could have a material effect on the financial statements.

Corporate Overview1 Statutory Reports2 Financial Statements3
289
Annual Report 2021-22
Inherent Limitations of Internal Financial Controls Over Financial ReportingBecause of the inherent limitations of internal financial controls over financial reporting, including the possibility of collusion or improper management override of controls, material misstatements due to error or fraud may occur and not be detected. Also, projections of any evaluation of the internal financial controls over financial reporting to future periods are subject to the risk that the internal financial control over financial reporting may become inadequate because of changes in conditions, or that the degree of compliance with the policies or procedures may deteriorate.
OpinionIn our opinion to the best of our information and according to the explanations given to us, the Holding Company / Parent, has, in all material respects, an adequate internal financial controls system over financial reporting and such internal financial controls over financial reporting were operating effectively as at March 31, 2022, based on the internal control over financial reporting criteria established by the Company considering the essential components of internal control stated in the Guidance Note on Audit of Internal Financial Controls Over Financial Reporting issued by the Institute of Chartered Accountants of India”.
For Deloitte Haskins & SellsChartered Accountants(Firm’s Registration No. 008072S)
______________________(Vikas Bagaria)(Partner)(Membership No. 060408)UDIN : 22060408AJROPK5394Place: BengaluruDate: May 05, 2022

290
Annual Report 2021-22
Notes As atMarch 31, 2022
As atMarch 31, 2021
AssetsNon-current assetsProperty, plant and equipment 3 78 69Capital work-in-progress 3 - 14Goodwill 4 7,896 7,644Other intangible assets 4 2,396 2,966Intangible assets under development 4 35 -Right-of-use assets 5 5,390 2,150Financial assetsi. Investments 11 762 -iii. Other financial assets 7 1,827 2,458Income tax assets (net) 8A 680 1,408Other assets 9 1 7Deferred tax assets (net) 10 A 697 1,026Total non-current assets 19,762 17,742
Current assetsFinancial assetsi. Investments 11 46,400 39,148ii. Trade receivables 12 16,738 12,192iii. Cash and cash equivalents 13 6,729 8,583iv. Bank balance other than cash and cash equivalents 14 10,071 5,935v. Loans 6 4 14vi. Other financial assets 7 9,405 6,779Other assets 9 3,392 1,802Total current assets 92,739 74,453Total assets 1,12,501 92,195
Equity and liabilitiesEquityEquity share capital 15 2,854 2,837Instruments entirely in the nature of equity 16 - -Other equity 17 63,726 51,762Equity attributable to equity holders of the parent 66,580 54,599Non-controlling interest - -Total equity 66,580 54,599
LiabilitiesNon-current liabilitiesFinancial liabilitiesi. Borrowings 19 1,724 3,661ii. Lease liabilities 20 4,119 1,223iii. Other financial liabilities 21 1,291 2,455Provisions 22 1,618 1,653Deferred tax liabilities (net) 10 B 468 725Total non-current liabilities 9,220 9,717
Consolidated Balance Sheet as at March 31, 2022(All amounts in ` Lacs, unless otherwise stated)
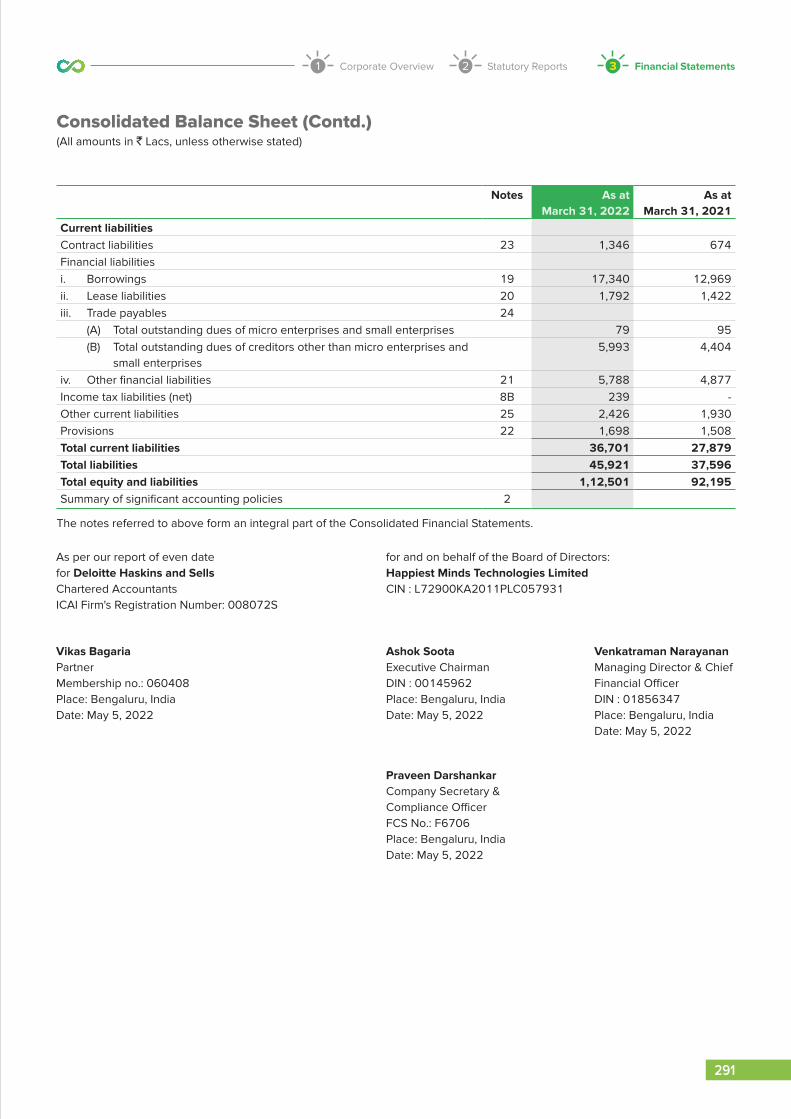
Corporate Overview1 Statutory Reports2 Financial Statements3
291
Annual Report 2021-22
Consolidated Balance Sheet (Contd.)(All amounts in ` Lacs, unless otherwise stated)
Notes As atMarch 31, 2022
As atMarch 31, 2021
Current liabilitiesContract liabilities 23 1,346 674Financial liabilitiesi. Borrowings 19 17,340 12,969ii. Lease liabilities 20 1,792 1,422iii. Trade payables 24 (A) Total outstanding dues of micro enterprises and small enterprises 79 95 (B) Total outstanding dues of creditors other than micro enterprises and
small enterprises 5,993 4,404
iv. Other financial liabilities 21 5,788 4,877 Income tax liabilities (net) 8B 239 - Other current liabilities 25 2,426 1,930 Provisions 22 1,698 1,508 Total current liabilities 36,701 27,879 Total liabilities 45,921 37,596 Total equity and liabilities 1,12,501 92,195 Summary of significant accounting policies 2
The notes referred to above form an integral part of the Consolidated Financial Statements.
As per our report of even datefor Deloitte Haskins and SellsChartered AccountantsICAI Firm's Registration Number: 008072S
for and on behalf of the Board of Directors:Happiest Minds Technologies LimitedCIN : L72900KA2011PLC057931
Vikas BagariaPartnerMembership no.: 060408Place: Bengaluru, IndiaDate: May 5, 2022
Ashok SootaExecutive ChairmanDIN : 00145962 Place: Bengaluru, IndiaDate: May 5, 2022
Venkatraman NarayananManaging Director & Chief Financial OfficerDIN : 01856347 Place: Bengaluru, IndiaDate: May 5, 2022
Praveen DarshankarCompany Secretary & Compliance OfficerFCS No.: F6706Place: Bengaluru, IndiaDate: May 5, 2022

292
Annual Report 2021-22
Notes For the year endedMarch 31, 2022
For the year endedMarch 31, 2021
Income
Revenue from contracts with customers 26 1,09,365 77,341
Other income 27 3,710 2,424
Total income 1,13,075 79,765
Expenses
Employee benefits expense 28 62,000 45,238
Depreciation and amortisation 29 3,288 2,274
Finance costs 30 995 649
Other expenses 31 21,598 13,002
Total expenses 87,881 61,163
Profit before exceptional items and tax 25,194 18,602
Exceptional items 32 609 -
Profit before tax 24,585 18,602
Tax expense 33
Current tax 6,266 3,527
Adjustment of tax relating to earlier periods 44 -
Deferred tax charge/ (credit) 155 (1,171)
6,465 2,356
Profit for the year 18,120 16,246
Other comprehensive income
Other comprehensive income to be reclassified to profit or loss in subsequent periods
Exchange differences on translating the financial statements of a foreign operation
202 22
Net movement on effective portion of cash flow hedges 37 (316) 1,236
Income tax effect 33 80 (127)
Net other comprehensive income to be reclassified to profit or loss in subsequent periods
(34) 1,131
Other comprehensive income not to be reclassified to profit or loss in subsequent periods
Re-measurement losses on defined benefit plans 35 (97) (144)
Income tax effect 33 24 36
Net other comprehensive income not to be reclassified to profit or loss in subsequent periods
(73) (108)
Consolidated Statement of Profit and Loss for the year ended March 31, 2022(All amounts in ` Lacs, unless otherwise stated)

Corporate Overview1 Statutory Reports2 Financial Statements3
293
Annual Report 2021-22
Consolidated Statement of Profit and Loss (Contd.)(All amounts in ` Lacs, unless otherwise stated)
Notes For the year endedMarch 31, 2022
For the year endedMarch 31, 2021
Other comprehensive income for the year, net of tax (107) 1,023
Total comprehensive income for the year 18,013 17,269
Profit for the year 18,120 16,246
Attributable to:
Equity holders of the parent 18,120 16,246
Non-controlling interests - -
Total comprehensive income for the year 18,013 17,269
Attributable to:
Equity holders of the parent 18,013 17,269
Non-controlling interests - -
Earnings per equity share 34
Equity shares of par value ` 2/- each
Basic, computed on the basis of profit for the year attributable to equity holders of the parent (`)
12.84 11.75
Diluted, computed on the basis of profit for the year attributable to equity holders of the parent (`)
12.55 11.45
Summary of significant accounting policies 2
The notes referred to above form an integral part of the Consolidated Financial Statements.
As per our report of even datefor Deloitte Haskins and SellsChartered AccountantsICAI Firm's Registration Number: 008072S
for and on behalf of the Board of Directors:Happiest Minds Technologies LimitedCIN : L72900KA2011PLC057931
Vikas BagariaPartnerMembership no.: 060408Place: Bengaluru, IndiaDate: May 5, 2022
Ashok SootaExecutive ChairmanDIN : 00145962 Place: Bengaluru, IndiaDate: May 5, 2022
Venkatraman NarayananManaging Director & Chief Financial OfficerDIN : 01856347 Place: Bengaluru, IndiaDate: May 5, 2022
Praveen DarshankarCompany Secretary & Compliance OfficerFCS No.: F6706Place: Bengaluru, IndiaDate: May 5, 2022
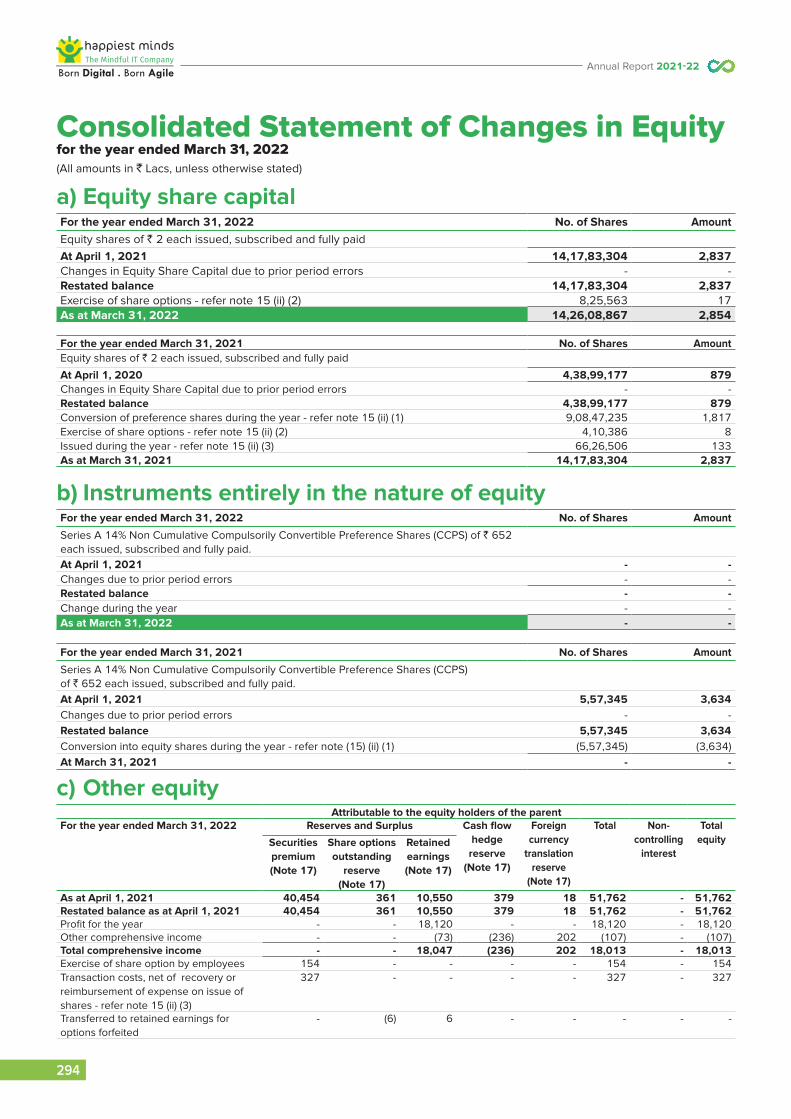
294
Annual Report 2021-22
a) Equity share capitalFor the year ended March 31, 2022 No. of Shares AmountEquity shares of ` 2 each issued, subscribed and fully paidAt April 1, 2021 14,17,83,304 2,837 Changes in Equity Share Capital due to prior period errors - - Restated balance 14,17,83,304 2,837 Exercise of share options - refer note 15 (ii) (2) 8,25,563 17 As at March 31, 2022 14,26,08,867 2,854
For the year ended March 31, 2021 No. of Shares AmountEquity shares of ` 2 each issued, subscribed and fully paid
At April 1, 2020 4,38,99,177 879 Changes in Equity Share Capital due to prior period errors - - Restated balance 4,38,99,177 879 Conversion of preference shares during the year - refer note 15 (ii) (1) 9,08,47,235 1,817 Exercise of share options - refer note 15 (ii) (2) 4,10,386 8 Issued during the year - refer note 15 (ii) (3) 66,26,506 133 As at March 31, 2021 14,17,83,304 2,837
b) Instruments entirely in the nature of equityFor the year ended March 31, 2022 No. of Shares Amount
Series A 14% Non Cumulative Compulsorily Convertible Preference Shares (CCPS) of ` 652 each issued, subscribed and fully paid.At April 1, 2021 - - Changes due to prior period errors - - Restated balance - - Change during the year - - As at March 31, 2022 - -
For the year ended March 31, 2021 No. of Shares Amount
Series A 14% Non Cumulative Compulsorily Convertible Preference Shares (CCPS) of ` 652 each issued, subscribed and fully paid.At April 1, 2021 5,57,345 3,634 Changes due to prior period errors - - Restated balance 5,57,345 3,634 Conversion into equity shares during the year - refer note (15) (ii) (1) (5,57,345) (3,634)At March 31, 2021 - -
c) Other equityAttributable to the equity holders of the parent
For the year ended March 31, 2022 Reserves and Surplus Cash flow hedge
reserve (Note 17)
Foreign currency
translation reserve
(Note 17)
Total Non-controlling
interest
Total equitySecurities
premium (Note 17)
Share options outstanding
reserve (Note 17)
Retained earnings(Note 17)
As at April 1, 2021 40,454 361 10,550 379 18 51,762 - 51,762 Restated balance as at April 1, 2021 40,454 361 10,550 379 18 51,762 - 51,762 Profit for the year - - 18,120 - - 18,120 - 18,120 Other comprehensive income - - (73) (236) 202 (107) - (107)Total comprehensive income - - 18,047 (236) 202 18,013 - 18,013 Exercise of share option by employees 154 - - - - 154 - 154 Transaction costs, net of recovery or reimbursement of expense on issue of shares - refer note 15 (ii) (3)
327 - - - - 327 - 327
Transferred to retained earnings for options forfeited
- (6) 6 - - - - -
Consolidated Statement of Changes in Equity for the year ended March 31, 2022(All amounts in ` Lacs, unless otherwise stated)

Corporate Overview1 Statutory Reports2 Financial Statements3
295
Annual Report 2021-22
Consolidated Statement of Changes in Equity (Contd.)(All amounts in ` Lacs, unless otherwise stated)
Attributable to the equity holders of the parentFor the year ended March 31, 2022 Reserves and Surplus Cash flow
hedge reserve
(Note 17)
Foreign currency
translation reserve
(Note 17)
Total Non-controlling
interest
Total equitySecurities
premium (Note 17)
Share options outstanding
reserve (Note 17)
Retained earnings(Note 17)
Transferred to securities premium for options exercised
270 (270) - - - - - -
Dividend - refer note 18 - - (6,830) - - (6,830) - (6,830)Share-based payments expense - refer note 44
- 300 - - - 300 - 300
As at March 31, 2022 41,205 385 21,773 143 220 63,726 - 63,726
For the year ended March 31, 2021 Attributable to the equity holders of the parentReserves and Surplus Cash flow
hedge reserve
(Note 17)
Foreigncurrency
translationreserve
(Note 17)
Total Non-controlling
interest
TotalequitySecurities
premium (Note 17)
Share optionsoutstanding
reserve (Note 17)
Retainedearnings(Note 17)
As at April 1, 2020 27,781 454 (5,597) (730) 110 22,018 - 22,018Restated balance as at April 1, 2020 27,781 454 (5,597) (730) 110 22,018 - 22,018Profit for the year - - 16,246 - - 16,246 - 16,246Other comprehensive income - - (108) 1,109 22 1,023 - 1,023Total comprehensive income - - 16,138 1,109 22 17,269 - 17,269Conversion of preference shares during the year - refer note 15 (ii) (1)
1,817 - - - - 1817 - 1,817
Increase during the year - refer note 15 (ii) (3)
10,867 - - - - 10867 - 10,867
Reclassified to profit or loss on liquidation of subsidiary - refer note (i) below
(114) (114) - -114
Exercise of share option by employees 64 - - - - 64 - 64Transaction costs, net of recovery or reimbursement of expense on issue of shares - refer note 15 (ii) (3)
(456) - - - - (456) - (456)
Transferred to retained earnings for options forfeited
- (9) 9 - - - - -
Transferred to securities premium for options exercised
381 (381) - - - - - -
Share-based payments expense - refer note 44
- 297 - - - 297 - 297
As at March 31, 2021 40,454 361 10,550 379 18 51,762 - 51,762
(i) Liquidation of subsidiary The Group has liquidated its subsidiary i.e. Happiest Minds Technologies LLC during the year ended March 31, 2021.
Pursuant to such liquidation, the cumulative balance lying in foreign currency translation reserve has been reclassified to statement of profit and loss. Refer note 46.
The notes referred to above form an integral part of the Consolidated Financial Statement.As per our report of even datefor Deloitte Haskins and SellsChartered AccountantsICAI Firm's Registration Number : 008072S
for and on behalf of the Board of Directors:Happiest Minds Technologies LimitedCIN : L72900KA2011PLC057931
Vikas BagariaPartnerMembership no : 060408Place: Bengaluru, IndiaDate: May 5, 2022
Ashok SootaExecutive ChairmanDIN : 00145962 Place: Bengaluru, IndiaDate: May 5, 2022
Venkatraman NarayananManaging Director & Chief Financial OfficerDIN : 01856347 Place: Bengaluru, IndiaDate: May 5, 2022
Praveen DarshankarCompany Secretary & Compliance OfficerFCS No.: F6706Place: Bengaluru, IndiaDate: May 5, 2022

296
Annual Report 2021-22
Notes For the year endedMarch 31, 2022
For the year endedMarch 31, 2021
Operating activitiesProfit before tax 24,585 18,602 Adjustments to reconcile profit before tax to net cash flows:Depreciation/ amortisation of property, plant and equipment, intangibles and right-of-use assets
29 3,288 2,274
(Gain)/ loss on disposal of property, plant and equipment, net 27 (10) - Share-based payment expense 28 300 297 Gain on investment carried at fair value through profit and loss 27 (368) (184)Gain on sale of investment carried at fair value through profit and loss 27 (1,377) (671)Interest income 27 (636) (838)Fair value loss on contingent consideration 32 609 - Gain on liquidation of subsidiary 27 - (82)Net unrealised foreign exchange loss 27 404 66 Rent concession 27 (323) (302)Impairment loss on financial assets 31 189 1,021 Finance costs 30 995 649 Operating cash flow before working capital changes 27,656 20,832
Movements in working capital:Increase in trade receivables (4,526) (511)Decrease in loans 10 50 Increase in non-financial assets (1,610) (279)Increase in financial assets (3,078) (1,429)Increase/ (decrease) in trade payables 1,489 (644)Increase/ (decrease) in financial liabilities 1,004 (1,684)Increase in provisions 58 516 Increase/ (decrease) in contract liabilities 660 (43)Increase in other non-financial liabilities 496 1,109
22,159 17,917 Income tax paid, net of refunds (5,347) (3,600)Net cash flows from operating activities (A) 16,812 14,317
Investing activitiesPurchase of property, plant and equipment 3 (67) (78)Purchase of intangible assets 4 (346) (19)Proceeds from sale of property, plant and equipment 10 - Proceeds from subleasing the premises - 7 Investment in equity shares of TECH4TH Solutions Inc. (762) - Investment in bank deposit, net (3,020) 6,931 Acquisition of subsidiary - (6,025)Proceeds from sale of mutual funds 34,542 39,313 Purchase of mutual funds (40,049) (69,269)Interest received 84 777 Net cash flows used in investing activities (A) (9,608) (28,363)
Consolidated Statement of Cash Flows for the year ended March 31, 2022(All amounts in ` Lacs, unless otherwise stated)

Corporate Overview1 Statutory Reports2 Financial Statements3
297
Annual Report 2021-22
Consolidated Statement of Cash Flows (Contd.)(All amounts in ` Lacs, unless otherwise stated)
Notes For the year endedMarch 31, 2022
For the year endedMarch 31, 2021
Financing activitiesRepayment of long-term borrowings (2,053) (1,256)Proceeds from long-term borrowings - 5,981 Proceeds / (Repayment) of short-term borrowings (net) 4,012 4,213 Security deposits given - (300)Payment of principal portion of lease liabilities (1,702) (1,661)Payment of interest portion of lease liabilities (487) (328)Payment of contingent consideration (1,861) - Proceeds from issue of Equity share capital (net of transaction costs) - 10,544 Dividend paid (6,830) - Proceeds from exercise of share options 171 72 Interest paid (328) (281)Net cash flows from/ (used) in financing activities (C) (9,078) 16,984
Net increase in cash and cash equivalents [(A)+(B)+(C)] (1,874) 2,938 Net foreign exchange difference 20 (6)Cash and cash equivalents at the beginning of the year 8,583 4,353 Cash acquired on acquisition of subsidiary - 1,298 Cash and cash equivalents at the end of the year 6,729 8,583
Components of cash and cash equivalents 13Balance with banks- on current account 5,649 4,179 - in EEFC accounts 1,080 2,029 Deposits with original maturity of less than three months - 2,375 Total cash and cash equivalents 6,729 8,583 Non-cash investing activities:Acquisition of subsidiary - 3,695 Acquisition of Right-of-use assets 5 5,487 1,075 Refer note 19 and 20 for changes in liabilities arising from financing activities and for non-cash financing activities.Summary of significant accounting policies 2
The notes referred to above form an integral part of the Consolidated Financial Statements.
As per our report of even datefor Deloitte Haskins and SellsChartered AccountantsICAI Firm's Registration Number: 008072S
for and on behalf of the Board of Directors:Happiest Minds Technologies LimitedCIN : L72900KA2011PLC057931
Vikas BagariaPartnerMembership no.: 060408Place: Bengaluru, IndiaDate: May 5, 2022
Ashok SootaExecutive ChairmanDIN : 00145962 Place: Bengaluru, IndiaDate: May 5, 2022
Venkatraman NarayananManaging Director & Chief Financial OfficerDIN : 01856347 Place: Bengaluru, IndiaDate: May 5, 2022
Praveen DarshankarCompany Secretary & Compliance OfficerFCS No.: F6706Place: Bengaluru, IndiaDate: May 5, 2022

298
Annual Report 2021-22
Corporate InformationHappiest Minds Technologies Limited (“Happiest Minds” or “the Company” or ""the Parent Company"") together with its subsidiary (collectively ""the Group"") is engaged in a next generation IT solutions & services Company, enabling organizations to capture the business benefits of emerging technologies of cloud computing, social media, mobility solutions, business intelligence, analytics, unified communications and internet of things. The Group offers high degree of skills, IPs and domain expertise across a set of focused areas that include Digital Transformation & Enterprise Solutions, Product Engineering, Infrastructure Management, Security, Testing and Consulting. The Group focuses on industries in the Retail/CPG, BFSI, Travel & Transportation, Manufacturing and Media space. Happiest Minds provide a smart, secure and connected experience to its Customers. In the solution space, focus areas are Security, M2M and Mobility solutions.
The Company is a limited company, incorporated and domiciled in India and has a branch office at United States of America, United Kingdom, Australia, Canada, Netherland, Singapore, Malaysia and Dubai. The registered office of the Company is situated at #53/1-4, Hosur Main Road, Madivala (next to Madivala Police Station) Bangalore 560068.
The Group's Consolidated Financial Statements (CFS) for the year ended March 31, 2022 were approved by Board of Directors on May 05, 2022.
1 Basis of preparation of Consolidated Financial Statementsa) Basis of preparation The Consolidated Financial Statements (CFS) of the Company have been prepared in accordance with Indian Accounting
Standards (Ind AS) notified under the Companies (Indian Accounting Standards) Rules, 2015 (as amended from time to time) and presentation requirements of Division II of Schedule III to the Companies Act, 2013, (Ind AS compliant Schedule III), as applicable to the CFS.
This note provides a list of the significant accounting policies adopted in the preparation of the Consolidated Financial Statements. These policies have been consistently applied to all the years presented, unless otherwise stated.
These Consolidated Financial Statements have been prepared for the Group as a going concern on the basis of relevant Ind AS that are effective at the Group’s annual reporting date, March 31, 2022.
The Consolidated Financial Statements have been prepared on an accrual basis under the historical cost convention except for the following that are measured at fair value as required by relevant:
a) Defined benefit plan - plan assets measured at fair value
b) Certain financial assets and liabilities measured at fair value (refer accounting policy regarding financial instruments)
c) Derivative financial instruments and
d) Contingent consideration
b) Functional currency and presentation currency These Consolidated Financial Statements are presented in India Rupee (`), which is also functional currency of the Parent
Company. All the values are rounded off to the nearest Lacs (` 00,000) unless otherwise indicated.
c) Use of estimates and judgements In preparing these Consolidated Financial Statements, management has made judgements, estimates and assumptions that
affect the application of accounting policies and the reported amounts of assets, liabilities, the disclosures of contingent assets and liabilities at the date of the financial statements and reported amounts of income and expenses during the period. Actual results may differ from these estimates.
Appropriate changes in estimates are made as management becomes aware of changes in circumstances surrounding estimate. Changes in estimate are reflected in the financial statements in the period in which changes are made and, if material, their effects are disclosed in the notes to the Consolidated Financial Statements.
Notes to the Consolidated Financial Statements for the year ended March 31, 2022(All amounts in ` Lacs, unless otherwise stated)

Corporate Overview1 Statutory Reports2 Financial Statements3
299
Annual Report 2021-22
Notes to the Consolidated Financial Statements for the year ended March 31, 2022(All amounts in ` Lacs, unless otherwise stated)
Judgements:
Information about judgements made in applying accounting policies that have the most significant effects on the amounts recognised in the Consolidated Financial Statements is included in the following notes:
- Note 2(c) and 2(d)- Useful life of property, plant and equipment and intangible assets;
- Note 2(g) - Lease classification;
- Note 2(h) - Financial instrument; and
- Note 2(l)- Measurement of defined benefit obligations: key actuarial assumptions.
Assumption and estimation uncertainties
Information about assumptions and estimation uncertainties that have a significant risk of resulting in a material adjustment in the year ended March 31, 2022 is included in the following notes:
- Note 2(e) - Impairment test of non-financial assets; key assumptions underlying recoverable amounts including the recoverability of expenditure on internally-generated intangible assets;
- Note 2(n)- Recognition of deferred tax assets: availability of future taxable profit against which tax losses carried forward can be used;
- Note 2(h) - Impairment of financial assets
- Note 2(p) - Recognition and measurement of provisions and contingencies: key assumptions about the likelihood and magnitude of an outflow of resources; and
- Note 2(i) - Fair value measurement
d) Current and non-current classification The Group presents assets and liabilities in the balance sheet based on current/ non-current classification.
An asset is treated as current when it is:
• Expected to be realized or intended to be sold or consumed in normal operating cycle
• Held primarily for the purpose of trading
• Expected to be realized within twelve months after the reporting period, or
• Cash or cash equivalent unless restricted from being exchanged or used to settle a liability for at least twelve months after the reporting period"
All other assets are classified as non-current.
A liability is current when:
• It is expected to be settled in normal operating cycle,
• It is held primarily for the purpose of trading,
• It is due to be settled within twelve months after the reporting period, or
• There is no unconditional right to defer the settlement of the liability for at least twelve months after the reporting period.
The Group classifies all other liabilities as non-current.
Deferred tax assets and liabilities are classified as non-current assets and liabilities.
The operating cycle is the time between the acquisition of assets for processing and their realisation in cash and cash equivalents. The Group has identified twelve months as its operating cycle.
e) Basis of Consolidation The Consolidated Financial Statements comprise the financial statements of the Parent Company and its subsidiary as at
March 31, 2022. Control is achieved when the Group is exposed, or has rights, to variable returns from its involvement with the investee and has the ability to affect those returns through its power over the investee.

300
Annual Report 2021-22
Notes to the Consolidated Financial Statements for the year ended March 31, 2022(All amounts in ` Lacs, unless otherwise stated)
The Group re-assesses whether or not it controls an investee if facts and circumstances indicate that there are changes to one or more of the three elements of control. Consolidation of a subsidiary begins when the Group obtains control over the subsidiary and ceases when the Group loses control of the subsidiary. Assets, liabilities, income and expenses of a subsidiary acquired or disposed of during the year are included in the Consolidated Financial Statements from the date the Group gains control until the date the Group ceases to control the subsidiary.
Consolidated Financial Statements are prepared using uniform accounting policies for like transactions and other events in similar circumstances. If a member of the Group uses accounting policies other than those adopted in the Consolidated Financial Statements for like transactions and events in similar circumstances, appropriate adjustments are made to that Group member’s financial statements in preparing the Consolidated Financial Statements to ensure conformity with the Group’s accounting policies.
The financial statements of all entities used for the purpose of consolidation are drawn up to same reporting date as that of the Parent Company, i.e., year ended on 31 March. When the end of the reporting period of the parent is different from that of a subsidiary, the subsidiary prepares, for consolidation purposes, additional financial information as of the same date as the financial statements of the parent to enable the parent to consolidate the financial information of the subsidiary, unless it is impracticable to do so
Consolidation procedure:
(a) Combine like items of assets, liabilities, equity, income, expenses and cash flows of the Parent Company with those of its subsidiaries on line by line basis. For this purpose, income and expenses of the subsidiaries are based on the amounts of the assets and liabilities recognised in the Consolidated Financial Statements at the acquisition date.
(b) Offset (eliminate) the carrying amount of the parent’s investment in each subsidiary and the parent’s portion of equity of each subsidiary. Business combinations policy explains how to account for any related goodwill.
(c) Eliminate in full intragroup assets and liabilities, equity, income, expenses and cash flows relating to transactions between entities of the group (profits or losses resulting from intragroup transactions that are recognised in assets, such as inventory and fixed assets, are eliminated in full). Intragroup losses may indicate an impairment that requires recognition in the Consolidated Financial Statements. Ind AS 12 Income Taxes applies to temporary differences that arise from the elimination of profits and losses resulting from intragroup transactions.
Profit and loss and each component of OCI are attributed to the equity holders of the parent of the Group and to the non-controlling interests, even if this results in the non-controlling interests having a deficit balance. When necessary, adjustments are made to the financial statements of subsidiaries to bring their accounting policies in line with the Group’s accounting policies. All intra-group assets and liabilities, equity, income, expenses and cash flows relating to transactions between members of the Group are eliminated in full on consolidation.
A change in the ownership interest of a subsidiary, without a loss of control, is accounted for as an equity transaction.
If the Group loses control over a subsidiary, it derecognises the related assets (including goodwill), liabilities, non-controlling interest and other components of equity, while any resultant gain or loss is recognised in profit and loss. Any investment retained is recognised at fair value.
The subsidiary companies which are included in the consolidation and the Company’s holdings therein are as under:
Name of Company Nature of Business
Country of incorporation
Ownership interest as at March 31, 2022
Ownership interest as at March 31, 2021
Happiest Minds Technologies LLC, IT services United States of America Nil * NilHappiest Minds Inc. (formerly known as PGS Inc.)
IT services United States of America 100%** 100%
*Liquidated on June 2020, refer note 46
** refer note 45

Corporate Overview1 Statutory Reports2 Financial Statements3
301
Annual Report 2021-22
Notes to the Consolidated Financial Statements for the year ended March 31, 2022(All amounts in ` Lacs, unless otherwise stated)
2 Significant accounting policies The accounting policies set out below have been applied consistently to the periods presented in these Consolidated
Financial Statements.
a Revenue recognition
The Group derives revenue primarily from rendering of services and sale of licenses. Revenue is recognised upon transfer of control of promised products or services to customers in an amount that reflects the consideration the Group expects to receive in exchange for those products or services. The Group is a principal in rendering of services and agent in relation to sale of licenses. Amounts disclosed as revenue are net of trade allowances, rebates and Goods and Services tax (GST), amounts collected on behalf of third parties and includes reimbursement of out-of-pocket expenses, with corresponding expenses included in cost of revenues.
Revenue from the rendering of services and sale of license is recognised when the Group satisfies its performance obligations to its customers as below:
Rendering of services
The Group applies judgement to determine whether each product or service promised to a customer is capable of being distinct, and is distinct in the context of the contract, if not, the promised product or service is combined and accounted as a single performance obligation.In determining the transaction price for rendering of services, the Group considers the effect of variable consideration, existence of a significant financing component, non-cash consideration, and consideration payable to the customers if any. Revenue is recognised net of trade and cash discounts. The Group allocates the arrangement consideration to separately identifiable performance obligation deliverables based on their relative stand-alone selling price. In cases where the Group is unable to determine the stand-alone selling price, the Group uses expected cost-plus margin approach in estimating the stand-alone selling price. Volume discounts are recorded as a reduction of revenue. When the amount of discount varies with the levels of revenue, volume discount is recorded based on estimate of future revenue from the customer.
Revenues from services comprise primarily income from time-and-material and fixed price contracts. Revenue with respect to time-and-material contracts is recognised over the period of time as the related services are performed. Revenue with respect to fixed price contracts where performance obligation is transferred over time are recognized using the "percentage of completion" method. The Group uses the percentage of completion method using the input (cost expended) method to measure progress towards completion in respect of fixed price contracts. Percentage of completion method accounting relies on estimates of total expected contract revenue and costs. This method is followed when reasonably dependable estimates of the revenues and costs applicable to various elements of the contract can be made. Key factors that are reviewed in estimating the future costs to complete include estimates of future labor costs and productivity efficiencies. Because the financial reporting of these contracts depends on estimates that are assessed continually during the term of these contracts, revenue recognized, profit and timing of revenue for remaining performance obligations are subject to revisions as the contract progresses to completion. When estimates indicate that a loss will be incurred, the loss is provided for in the period in which the loss becomes probable.. Provisions for estimated losses on contracts-in-progress are recorded in the period in which such losses become probable based on the current contract estimates.
Trade receivables
A receivable is recognised if an amount of consideration that is unconditional (i.e., only the passage of time is required before payment of the consideration is due). Refer to accounting policies of financial assets.
Variable consideration
If the consideration in a contract includes a variable amount, the Group estimates the amount of consideration to which it will be entitled in exchange for transferring the goods to the customer. The variable consideration is estimated at contract inception and constrained until it is highly probable that a significant revenue reversal in the amount of cumulative revenue recognised will not occur when the associated uncertainty with the variable consideration is subsequently resolved.

302
Annual Report 2021-22
Notes to the Consolidated Financial Statements for the year ended March 31, 2022(All amounts in ` Lacs, unless otherwise stated)
Sale of licenses
The Group is a reseller for sale of right to use licenses and acting as agent in the arrangement. The revenue for sale of right to use license is recognised at point in time when control on use of license is transferred to the customer.
Contract balances
Contract assets: The Group classifies its right to consideration in exchange for deliverables as either a receivable or as unbilled revenue. A receivable is a right to consideration that is unconditional upon passage of time. Revenues in excess of billings is recorded as unbilled revenue and is classified as a financial asset where the right to consideration is unconditional upon passage of time. Unbilled revenue which is conditional is classified as other current asset. Trade receivables and unbilled revenue is presented net of impairment.
Contract liabilities: A contract liability (which we referred to as Unearned Revenue) is the obligation to transfer goods or services to a customer for which the Group has received consideration (or an amount of consideration is due) from the customer. If a customer pays consideration before the Group transfers goods or services to the customer, a contract liability is recognised when the payment is received.
Interest income
Interest income is recognised when it is probable that the economic benefits will flow to the Group and the amount of income can be measured reliably. Interest income is accrued on a time basis, by reference to the principle outstanding and at the effective interest rate applicable, which is the rate that discounts estimated future cash receipts through the expected life of the financial asset to that asset's net carrying amount on initial recognition. Interest income is included under the head ‘other income’ in the statement of profit and loss.
For all financial instruments measured at amortised cost, interest income is recorded using the effective interest rate, which is the rate that exactly discounts the estimated future cash payments or receipts over the expected life of the financial instrument or a shorter period, where appropriate, to the net carrying amount of the financial asset. Interest income is included in other income in the statement of profit and loss.
Dividend income
Dividend income on investments is accounted when the right to receive the dividend is established, which is generally when shareholders approve the dividend. Dividend income is included under the head “Other income” in the statement of profit and loss.
b Business Combination Business combinations are accounted for using the acquisition method. The cost of an acquisition is measured as the aggregate
of the consideration transferred, which is measured at acquisition date fair value, and the amount of any non-controlling interests in the acquiree. For each business combination, the Group elects whether to measure the non-controlling interests in the acquiree at fair value or at the proportionate share of the acquiree’s identifiable net assets. Acquisition-related costs are expensed as incurred and included in other expenses.
At the acquisition date, the identifiable assets acquired and the liabilities assumed are recognised at their acquisition date fair values. For this purpose, the liabilities assumed include contingent liabilities representing present obligation and they are measured at their acquisition fair values irrespective of the fact that outflow of resources embodying economic benefits is not probable. However, the following assets and liabilities acquired in a business combination are measured at the basis indicated below:
• Deferred tax assets or liabilities, and the assets or liabilities related to employee benefit arrangements are recognised and measured in accordance with Ind AS 12 Income Tax and Ind AS 19 Employee Benefits respectively.
• Liabilities or equity instruments related to share based payment arrangements of the acquiree or share – based payments arrangements of the Group entered into to replace share-based payment arrangements of the acquiree are measured in accordance with Ind AS 102 Share-based Payments at the acquisition date.
• Assets (or disposal Groups) that are classified as held for sale in accordance with Ind AS 105 Non-current Assets Held for Sale and Discontinued Operations are measured in accordance with that standard.
• Reacquired rights are measured at a value determined on the basis of the remaining contractual term of the related contract. Such valuation does not consider potential renewal of the reacquired right.

Corporate Overview1 Statutory Reports2 Financial Statements3
303
Annual Report 2021-22
Notes to the Consolidated Financial Statements for the year ended March 31, 2022(All amounts in ` Lacs, unless otherwise stated)
When the Group acquires a business, it assesses the financial assets and liabilities assumed for appropriate classification and designation in accordance with the contractual terms, economic circumstances and pertinent conditions as at the acquisition date. This includes the separation of embedded derivatives in host contracts by the acquiree.
Any contingent consideration to be transferred by the acquirer is recognised at fair value at the acquisition date. Contingent consideration classified as an asset or liability that is a financial instrument and within the scope of Ind AS 109 Financial Instruments, is measured at fair value with changes in fair value recognised in statement of profit and loss in accordance with Ind AS 109. If the contingent consideration is not within the scope of Ind AS 109, it is measured in accordance with the appropriate Ind AS and shall be recognised in statement of profit and loss. Contingent consideration that is classified as equity is not re-measured at subsequent reporting dates and subsequent its settlement is accounted for within equity.
Goodwill is initially measured at cost, being the excess of the aggregate of the consideration transferred and any previous interest held, over the net identifiable assets acquired and liabilities assumed. If the fair value of the net assets acquired is in excess of the aggregate consideration transferred, the Group re-assesses whether it has correctly identified all of the assets acquired and all of the liabilities assumed and reviews the procedures used to measure the amounts to be recognised at the acquisition date. If the reassessment still results in an excess of the fair value of net assets acquired over the aggregate consideration transferred, then the gain is recognised in Other Comprehensive Income (OCI) and accumulated in equity as capital reserve. However, if there is no clear evidence of bargain purchase, the entity recognises the gain directly in equity as capital reserve, without routing the same through OCI.
After initial recognition, goodwill is measured at cost less any accumulated impairment losses. For the purpose of impairment testing, goodwill acquired in a business combination is, from the acquisition date, allocated to each of the Group’s cash-generating units that are expected to benefit from the combination, irrespective of whether other assets or liabilities of the acquiree are assigned to those units.
c Property, plant and equipment Capital work in progress is stated at cost, net of accumulated impairment loss if any.
Property, plant and equipment are stated at historical cost less accumulated depreciation, and accumulated impairment loss, if any. Historical cost comprises of the purchase price including duties and non-refundable taxes, borrowing cost if capitalisation criteria are met, directly attributable expenses incurred to bring the asset to the location and condition necessary for it to be capable of being operated in the manner intended by management and initial estimate of decommissioning, restoring and similar liabilities.
Subsequent costs related to an item of property, plant and equipment are recognised as a separate asset, as appropriate, only when it is probable that future economic benefits associated with the item will flow to the Group and the cost of the item can be measured reliably. The carrying amount of any component accounted for as a separate asset is derecognised when replaced. All other repairs and maintenance are recognised in statement of profit and loss during the reporting period when they are incurred.
An item of property, plant and equipment is derecognised on disposal or when no future economic benefits are expected from its use or disposal. The gains or losses arising from derecognition are measured as the difference between the net disposal proceeds and the carrying amount of the asset and are recognised in the statement of profit and loss when the asset is derecognised.
Property, plant and equipment individually costing ` 5,000 or less are depreciated at 100% in the year in which such assets are ready to use.
Depreciation is calculated using the straight-line method over their estimated useful lives as follows:
The estimates of useful lives of tangible assets are as follows:
Class of asset Useful life as per schedule II Useful life as per GroupFurniture and fixtures 10 years 5 yearsOffice equipment 5 years 4 yearsComputer systems 6 years for servers
3 years for other than servers2.5-3 years
Leasehold improvements are amortised over the period of the lease or life of the asset whichever is less.

304
Annual Report 2021-22
Notes to the Consolidated Financial Statements for the year ended March 31, 2022(All amounts in ` Lacs, unless otherwise stated)
The useful lives have been determined based on technical evaluation done by the management's expert which in certain instances are different from those specified by Schedule II to the Companies Act, 2013, in order to reflect the actual usage of the assets. The assets residual values and useful life are reviewed, and adjusted if appropriate, at the end of each reporting period. An asset's carrying amount is written down immediately to its recoverable amount if the asset's carrying amount is greater than its estimated recoverable amount.
d Intangible assets
Goodwill
Goodwill on acquisitions of business is included in intangible assets. Goodwill is not amortised but it is tested for impairment annually, or more frequently if events or changes in circumstances indicate that it might be impaired, and is carried at cost less accumulated impairment losses. Gains and losses on the disposal of a business include the carrying amount of goodwill relating to the business sold.
Goodwill is allocated to cash-generating units for the purpose of impairment testing. The allocation is made to those cash-generating units or Group of cash-generating units that are expected to benefit from the business combination in which the goodwill arose. The units or Group of units are identified at the lowest level at which goodwill is monitored for internal management purposes.
Other intangible assets
Intangible assets acquired separately are measured on initial recognition at cost. The cost of intangible assets acquired in a business combination is their fair value at the date of acquisition. Following initial recognition, intangible assets are carried at cost less any accumulated amortisation and accumulated impairment losses.
An item of intangible asset is derecognised on disposal or when no future economic benefits are expected from its use or disposal. The gains or losses arising from derecognition are measured as the difference between the net disposal proceeds and the carrying amount of the asset and are recognised in the statement of profit and loss when the asset is derecognised.
Amortisation methods and periods
The Group amortises intangible assets with a finite useful life using the straight-line method over the following periods:
Asset Life in Years
Computer software 2.5-3 years
Non compete fees 3 years
Customer relations 3 years
The estimated useful life of the intangible assets and the amortisation period are reviewed at the end of the each financial year and the amortisation period is revised to reflect the changed pattern, if any.
Research costs are expensed as incurred. Development expenditures on an individual project are recognised as an intangible asset when the Group can demonstrate:
- The technical feasibility of completing the intangible asset so that the asset will be available for use or sale
- Its intention to complete and its ability and intention to use or sell the asset
- How the asset will generate future economic benefits
- The availability of resources to complete the asset
- The ability to measure reliably the expenditure during development"
Subsequent costs related to Intangible assets are recognised as a separate asset, as appropriate, only when it is probable that future economic benefits associated with the item will flow to the Group and the cost of the item can be measured reliably.
e Impairment of non-financial assets
The Group assesses, at each reporting date, whether there is an indication that an asset may be impaired. If any indication exists, or when annual impairment testing for an asset is required, the Group estimates the asset’s recoverable amount.

Corporate Overview1 Statutory Reports2 Financial Statements3
305
Annual Report 2021-22
Notes to the Consolidated Financial Statements for the year ended March 31, 2022(All amounts in ` Lacs, unless otherwise stated)
An asset’s recoverable amount is the higher of an asset’s or cash-generating unit’s (CGU) fair value less costs of disposal and its value in use. The recoverable amount is determined for an individual asset, unless the asset does not generate cash inflows that are largely independent of those from other assets or groups of assets. When the carrying amount of an asset or CGU exceeds its recoverable amount, the asset is considered impaired and is written down to its recoverable amount.
In assessing value in use, the estimated future cash flows are discounted to their present value using a pre-tax discount rate that reflects current market assessments of the time value of money and the risks specific to the asset. In determining fair value less costs of disposal, recent market transactions are taken into account. If no such transactions can be identified, an appropriate valuation model is used. These calculations are corroborated by valuation multiples, quoted share prices for publicly traded companies or other available fair value indicators.
The Group bases its impairment calculation on detailed budgets and forecast calculations, which are prepared separately for each of the Group’s Cash Generating Unit's (CGU's) to which the individual assets are allocated. These budgets and forecast calculations generally cover a period of five years. For longer periods, a long-term growth rate is calculated and applied to project future cash flows after the fifth year. To estimate cash flow projections beyond periods covered by the most recent budgets/forecasts, the Group extrapolates cash flow projections in the budget using a steady or declining growth rate for subsequent years, unless an increasing rate can be justified. In any case, this growth rate does not exceed the long-term average growth rate for the products, industries, or country or countries in which the Group operates, or for the market in which the asset is used.
Impairment losses of continuing operations, including impairment on inventories, are recognised in the statement of profit and loss, except for properties previously revalued with the revaluation surplus taken to Other Comprehensive Income (OCI). For such properties, the impairment is recognised in OCI up to the amount of any previous revaluation surplus.
For assets excluding goodwill, an assessment is made at each reporting date to determine whether there is an indication that previously recognised impairment losses no longer exist or have decreased. If such indication exists, the Group estimates the asset’s or Cash Generating Unit's (CGU’s) recoverable amount. A previously recognised impairment loss is reversed only if there has been a change in the assumptions used to determine the asset’s recoverable amount since the last impairment loss was recognised. The reversal is limited so that the carrying amount of the asset does not exceed its recoverable amount, nor exceed the carrying amount that would have been determined, net of depreciation, had no impairment loss been recognised for the asset in prior years. Such reversal is recognised in the statement of profit and loss unless the asset is carried at a revalued amount, in which case, the reversal is treated as a revaluation increase.
Goodwill is tested for impairment annually and when circumstances indicate that the carrying value may be impaired.
Impairment is determined for goodwill by assessing the recoverable amount of each Cash Generating Unit (CGU) (or group of CGUs) to which the goodwill relates. When the recoverable amount of the CGU is less than its carrying amount, an impairment loss is recognised. Impairment losses relating to goodwill cannot be reversed in future periods.
f Borrowing cost
Borrowing costs directly attributable to the acquisition, construction or production of an asset that necessarily takes a substantial period of time to get ready for its intended use or sale are capitalised as part of the cost of the asset. All other borrowing costs are expensed in the period in which they occur. Borrowing costs consist of interest and other costs that an entity incurs in connection with the borrowing of funds. Borrowing cost also includes exchange differences to the extent regarded as an adjustment to the borrowing costs.
g Leases
The Group has lease contracts for various items of computers, vehicles and buildings used in its operations. Lease terms generally ranges between 1 and 5 years.
The Group assesses at contract inception whether a contract is, or contains, a lease. That is, if the contract conveys the right to control the use of an identified asset for a period of time in exchange for consideration.

306
Annual Report 2021-22
Notes to the Consolidated Financial Statements for the year ended March 31, 2022(All amounts in ` Lacs, unless otherwise stated)
Group as lessee
The Group applies a single recognition and measurement approach for all leases, except for short-term leases and leases of low-value assets. The Group recognises lease liabilities to make lease payments and right-of-use assets representing the right to use the underlying assets.
Right-of-use assets
The Group recognises right-of-use assets at the commencement date of the lease (i.e., the date the underlying asset is available for use). Right-of-use assets are measured at cost, less any accumulated depreciation and impairment losses, and adjusted for any remeasurement of lease liabilities. The cost of right-of-use assets includes the amount of lease liabilities recognised, initial direct costs incurred, and lease payments made at or before the commencement date less any lease incentives received. Right-of-use assets are depreciated on a straight-line basis over the shorter of the lease term and the estimated useful lives of the assets.
If ownership of the leased asset transfers to the Group at the end of the lease term or the cost reflects the exercise of a purchase option, depreciation is calculated using the estimated useful life of the asset.
The right-of-use assets are also subject to impairment. Refer to the accounting policies in note 2(e) for policy on impairment of non-financial assets.
Lease liabilities
At the commencement date of the lease, the Group recognises lease liabilities measured at the present value of lease payments to be made over the lease term. The lease payments include fixed payments (including in-substance fixed payments) less any lease incentives receivable, variable lease payments that depend on an index or a rate, and amounts expected to be paid under residual value guarantees. The lease payments also include the exercise price of a purchase option reasonably certain to be exercised by the Group and payments of penalties for terminating the lease, if the lease term reflects the Group exercising the option to terminate. Variable lease payments that do not depend on an index or a rate are recognised as expenses (unless they are incurred to produce inventories) in the period in which the event or condition that triggers the payment occurs.
In calculating the present value of lease payments, the Group uses its incremental borrowing rate at the lease commencement date because the interest rate implicit in the lease is not readily determinable. After the commencement date, the amount of lease liabilities is increased to reflect the accretion of interest and reduced for the lease payments made. In addition, the carrying amount of lease liabilities is remeasured if there is a modification, a change in the lease term, a change in the lease payments (e.g., changes to future payments resulting from a change in an index or rate used to determine such lease payments) or a change in the assessment of an option to purchase the underlying asset."
Short-term leases and leases of low-value assets
The Group applies the short-term lease recognition exemption to its short-term leases of machinery and equipment (i.e., those leases that have a lease term of 12 months or less from the commencement date and do not contain a purchase option). It also applies the lease of low-value assets recognition exemption to leases of office equipment that are considered to be low value. Lease payments on short-term leases and leases of low-value assets are recognised as expense on a straight-line basis over the lease term.
Lease and non-lease component
As per Ind AS - 116, “As a practical expedient, a lessee may elect, by class of underlying asset, not to separate non-lease components from lease components, and instead account for each lease component and any associated non-lease components as a single lease component.
The Group has not opted for this practical expedient and have accounted for Lease component only.
Extension and termination option
The Group has several lease contracts that include extension and termination options. These options are negotiated by management to provide flexibility in managing the leased-asset portfolio and align with the Group’s business needs.

Corporate Overview1 Statutory Reports2 Financial Statements3
307
Annual Report 2021-22
Notes to the Consolidated Financial Statements for the year ended March 31, 2022(All amounts in ` Lacs, unless otherwise stated)
Management exercises significant judgement in determining whether these extension and termination options are reasonably certain to be exercised. Management have not considered any future cash outflow for which they are potentially exposed arising due to extension and termination options.
h Financial Instruments Financial instrument is any contract that gives rise to a financial asset of one entity and a financial liability or equity instrument
of another entity.
Non-derivative financial instruments :
a) Financial assets
Initial recognition and measurement
Financial assets are classified, at initial recognition, as subsequently measured at amortised cost, fair value through Other Comprehensive Income (OCI), and fair value through profit or loss.
The classification of financial assets at initial recognition depends on the financial asset’s contractual cash flow characteristics and the Group’s business model for managing them. With the exception of trade receivables that do not contain a significant financing component or for which the Group has applied the practical expedient, the Group initially measures a financial asset at its fair value plus, in the case of a financial asset not at fair value through profit or loss, transaction costs. Trade receivables that do not contain a significant financing component or for which the Group has applied the practical expedient are measured at the transaction price determined under Ind AS - 115.
In order for a financial asset to be classified and measured at amortised cost or fair value through other comprehensive income (OCI), it needs to give rise to cash flows that are ‘solely payments of principle and interest (SPPI)’ on the principle amount outstanding. This assessment is referred to as the SPPI test and is performed at an instrument level. Financial assets with cash flows that are not SPPI are classified and measured at fair value through profit or loss, irrespective of the business model.
The Group’s business model for managing financial assets refers to how it manages its financial assets in order to generate cash flows. The business model determines whether cash flows will result from collecting contractual cash flows, selling the financial assets, or both. Financial assets classified and measured at amortised cost are held within a business model with the objective to hold financial assets in order to collect contractual cash flows while financial assets classified and measured at fair value through other comprehensive income are held within a business model with the objective of both holding to collect contractual cash flows and selling.
Purchases or sales of financial assets that require delivery of assets within a time frame established by regulation or convention in the market place (regular way trades) are recognised on the trade date, i.e., the date that the Group commits to purchase or sell the asset.
Subsequent measurement
For purposes of subsequent measurement, financial assets are classified in four categories:
• Debt instruments at amortised cost
• Debt instruments at Fair Value Through Other Comprehensive Income (FVTOCI)
• Debt instruments, derivatives and equity instruments at Fair Value Through Profit and Loss (FVTPL)
• Equity instruments measured at Fair Value Through Other Comprehensive Income (FVTOCI)
Debt instruments at amortised cost
A ‘Debt instrument’ is measured at the amortised cost if both the following conditions are met:
a) The asset is held within a business model whose objective is to hold assets for collecting contractual cash flows, and
b) Contractual terms of the asset give rise on specified dates to cash flows that are solely payments of principle and interest (SPPI) on the principle amount outstanding.

308
Annual Report 2021-22
Notes to the Consolidated Financial Statements for the year ended March 31, 2022(All amounts in ` Lacs, unless otherwise stated)
After initial measurement, such financial assets are subsequently measured at amortised cost using the Effective Interest Rate (EIR) method. Amortised cost is calculated by taking into account any discount or premium on acquisition and fees or costs that are an integral part of the EIR. The EIR amortisation is included in other income in the statement of profit and loss. The losses arising from impairment are recognised in the statement of profit and loss. This category generally applies to trade and other receivables. For more information on receivables, refer to Note 12.
Debt instrument at FVTOCI
A ‘Debt instrument’ is classified as at the Fair Value Through Other Comprehensive Income (FVTOCI) if both of the following criteria are met:
a) The objective of the business model is achieved both by collecting contractual cash flows and selling the financial assets, and
b) The asset’s contractual cash flows represent solely payments of principle and interest (SPPI).
Debt instruments included within the FVTOCI category are measured initially as well as at each reporting date at fair value. Fair value movements are recognised in the Other Comprehensive Income (OCI). However, the Group recognizes interest income, impairment losses & reversals and foreign exchange gain or loss in the statement of profit and loss. On derecognition of the asset, cumulative gain or loss previously recognised in OCI is reclassified from the equity to profit and loss. Interest earned whilst holding FVTOCI debt instrument is reported as interest income using the Effective Interest Rate (EIR) method.
Debt instrument at FVTPL
FVTPL is a residual category for debt instruments. Any debt instrument, which does not meet the criteria for categorization as at amortized cost or as Fair Value Through Other Comprehensive Income (FVTOCI), is classified as at Fair Value Through Profit or Loss (FVTPL).
In addition, the Group may elect to designate a debt instrument, which otherwise meets amortized cost or FVTOCI criteria, as at FVTPL. However, such election is allowed only if doing so reduces or eliminates a measurement or recognition inconsistency (referred to as ‘accounting mismatch’). The Group has not designated any debt instrument as at FVTPL.
Debt instruments included within the FVTPL category are measured at fair value with all changes recognised in the Statement of Profit and Loss.
Equity investments
All equity investments in scope of Ind AS - 109 are measured at fair value. Equity instruments which are held for trading and contingent consideration recognised by an acquirer in a business combination to which Ind AS - 103 applies are classified as at Fair Value Through Profit or Loss (FVTPL). For all other equity instruments, the Group may make an irrevocable election to present in Other Comprehensive Income (OCI) subsequent changes in the fair value. The Group makes such election on an instrument-by-instrument basis. The classification is made on initial recognition and is irrevocable.
If the Group decides to classify an equity instrument as at Fair Value Through Other Comprehensive Income (FVTOCI), then all fair value changes on the instrument, excluding dividends, are recognised in the OCI. There is no recycling of the amounts from OCI to profit and loss, even on sale of investment. However, the Group may transfer the cumulative gain or loss within equity.
Equity instruments included within the FVTPL category are measured at fair value with all changes recognised in the Statement of Profit and Loss.
Derecognition
A financial asset (or, where applicable, a part of a financial asset or part of a Group of similar financial assets) is primarily derecognised (i.e. removed from the Group’s Consolidated Balance Sheet) when:
• The rights to receive cash flows from the asset have expired, or

Corporate Overview1 Statutory Reports2 Financial Statements3
309
Annual Report 2021-22
Notes to the Consolidated Financial Statements for the year ended March 31, 2022(All amounts in ` Lacs, unless otherwise stated)
• The Group has transferred its rights to receive cash flows from the asset or has assumed an obligation to pay the received cash flows in full without material delay to a third party under a ‘pass-through’ arrangement and either (a) the Group has transferred substantially all the risks and rewards of the asset, or (b) the Group has neither transferred nor retained substantially all the risks and rewards of the asset, but has transferred control of the asset.
When the Group has transferred its rights to receive cash flows from an asset or has entered into a pass-through arrangement, it evaluates if and to what extent it has retained the risks and rewards of ownership. When it has neither transferred nor retained substantially all of the risks and rewards of the asset, nor transferred control of the asset, the Group continues to recognise the transferred asset to the extent of the Group’s continuing involvement. In that case, the Group also recognises an associated liability. The transferred asset and the associated liability are measured on a basis that reflects the rights and obligations that the Group has retained.
Reclassification of financial assets
The Group determines classification of financial assets on initial recognition. After initial recognition, no reclassification is made for financial assets which are equity instruments and financial liabilities. For financial assets which are debt instruments, a reclassification is made only if there is a change in the business model for managing those assets. Changes to the business model are expected to be infrequent. The Group’s senior management determines change in the business model as a result of external or internal changes which are significant to the Group’s operations. Such changes are evident to external parties. A change in the business model occurs when the Group either begins or ceases to perform an activity that is significant to its operations. If the Group reclassifies financial assets, it applies the reclassification prospectively from the reclassification date which is the first day of the immediately next reporting period following the change in business model. The Group does not restate any previously recognised gains, losses (including impairment gains or losses) or interest.
Impairment of financial assets
In accordance with Ind AS - 109, the Group applies expected credit loss (ECL) model for measurement and recognition of impairment loss on the following financial assets and credit risk exposure:
a) Financial assets that are debt instruments, and are measured at amortised cost e.g., loans, deposits, trade receivables, unbilled receivables and bank balance
b) Trade receivables or any contractual right to receive cash or another financial asset that result from transactions that are within the scope of Ind AS - 115.
The Group follows ‘simplified approach’ for recognition of impairment loss allowance on:
• Trade receivables, unbilled revenue and contract assets
The application of simplified approach does not require the Group to track changes in credit risk. Rather, it recognises impairment loss allowance based on lifetime ECLs at each reporting date, right from its initial recognition.
The Group recognises an allowance for expected credit losses (ECLs) for all debt instruments not held at fair value through profit or loss. ECLs are based on the difference between the contractual cash flows due in accordance with the contract and all the cash flows that the Group expects to receive, discounted at an approximation of the original effective interest rate. The expected cash flows will include cash flows from the sale of collateral held or other credit enhancements that are integral to the contractual terms.
For recognition of impairment loss on other financial assets and risk exposure, the Group determines that whether there has been a significant increase in the credit risk since initial recognition. If credit risk has not increased significantly, 12-month ECL is used to provide for impairment loss. However, if credit risk has increased significantly, lifetime ECL is used. If, in a subsequent period, credit quality of the instrument improves such that there is no longer a significant increase in credit risk since initial recognition, then the entity reverts to recognising impairment loss allowance based on 12-month ECL.

310
Annual Report 2021-22
Notes to the Consolidated Financial Statements for the year ended March 31, 2022(All amounts in ` Lacs, unless otherwise stated)
b) Financial Liabilities :
Initial recognition and measurement
Financial liabilities are classified, at initial recognition, as financial liabilities at Fair Value Through Profit or Loss (FVTPL), loans and borrowings, or as payables, as appropriate.
All financial liabilities are recognised initially at fair value and, in the case of loans and borrowings and payables, net of directly attributable transaction costs.
The Group’s financial liabilities include trade and other payables, loans and borrowings including bank overdrafts. The subsequent measurement of financial liabilities depends on their classification, which is described below.
Subsequent measurement
The measurement of financial liabilities depends on their classification, as described below:
Financial liabilities at Fair Value Through Profit or Loss (FVTPL)
Financial liabilities at Fair Value Through Profit or Loss (FVTPL) include financial liabilities held for trading and financial liabilities designated upon initial recognition as at fair value through profit or loss. Financial liabilities are classified as held for trading if they are incurred for the purpose of repurchasing in the near term. This category also includes derivative financial instruments entered into by the Group that are not designated as hedging instruments in hedge relationships as defined by Ind AS 109. Separated embedded derivatives are also classified as held for trading unless they are designated as effective hedging instruments. Gains or losses on liabilities held for trading are recognised in the statement of profit and loss.
Financial liabilities designated upon initial recognition at fair value through profit and loss are designated as such at the initial date of recognition, and only if the criteria in Ind AS - 109 are satisfied. For liabilities designated as FVTPL, fair value gains or losses attributable to changes in own credit risk are recognised in Other Comprehensive Income (OCI). These gain or loss are not subsequently transferred to statement of profit and loss. However, the Group may transfer the cumulative gain or loss within equity. All other changes in fair value of such liability are recognised in the statement of profit and loss. The Group has not designated any financial liability as at fair value through profit or loss.
c) Loans and borrowings
After initial recognition, interest-bearing loans and borrowings are subsequently measured at amortised cost using the Effective Interest Rate (EIR) method. Gains or losses are recognised in the statement of profit and loss when the liabilities are derecognised as well as through the EIR amortisation process.
Amortised cost is calculated by taking into account any discount or premium on acquisition and fees or costs that are an integral part of the EIR. The EIR amortisation is included as finance costs in the statement of profit and loss.
This category generally applies to borrowings. For more information refer note 19.
Derecognition
A financial liability is derecognised when the obligation under the liability is discharged or cancelled or expires. When an existing financial liability is replaced by another from the same lender on substantially different terms, or the terms of an existing liability are substantially modified, such an exchange or modification is treated as the derecognition of the original liability and the recognition of a new liability. The difference in the respective carrying amounts is recognised in the statement of profit and loss.
d) Offsetting of financial instruments
Financial assets and financial liabilities are offset and the net amount presented in the balance sheet when, and only when, the Group current has a legally enforceable right to set off the amounts and it intends either to settle them on a net basis or to realize the asset and settle the liability simultaneously.
Corporate Overview1 Statutory Reports2 Financial Statements3
311
Annual Report 2021-22
Notes to the Consolidated Financial Statements for the year ended March 31, 2022(All amounts in ` Lacs, unless otherwise stated)
Derivative financial instruments :
Initial recognition and subsequent measurement :
The Group uses derivative financial instruments, such as forward currency contracts and interest rate swaps to hedge its foreign currency risks and interest rate risks, respectively. Such derivative financial instruments are initially recognised at fair value on the date on which a derivative contract is entered into and are subsequently re-measured at fair value. Derivatives are carried as financial assets when the fair value is positive and as financial liabilities when the fair value is negative.
Any gains or losses arising from changes in the fair value of derivatives are taken directly to profit and loss, except for the effective portion of cash flow hedges, which is recognised in Other Comprehensive Income (OCI) and later reclassified to statement of profit and loss when the hedge item affects profit or loss or treated as basis adjustment if a hedged forecast transaction subsequently results in the recognition of a non-financial asset or non-financial liability.
For the purpose of hedge accounting, hedges are classified as:
• Fair value hedges when hedging the exposure to changes in the fair value of a recognised asset or liability or an unrecognised firm commitment
• Cash flow hedges when hedging the exposure to variability in cash flows that is either attributable to a particular risk associated with a recognised asset or liability or a highly probable forecast transaction or the foreign currency risk in an unrecognised firm commitment
• Hedges of a net investment in a foreign operation
At the inception of a hedge relationship, the Group formally designates and documents the hedge relationship to which it wishes to apply hedge accounting and the risk management objective and strategy for undertaking the hedge.
The documentation includes identification of the hedging instrument, the hedged item, the nature of the risk being hedged and how the Group will assess whether the hedging relationship meets the hedge effectiveness requirements (including the analysis of sources of hedge ineffectiveness and how the hedge ratio is determined). A hedging relationship qualifies for hedge accounting if it meets all of the following effectiveness requirements:
• There is ‘an economic relationship’ between the hedged item and the hedging instrument.
• The effect of credit risk does not ‘dominate the value changes’ that result from that economic relationship.
• The hedge ratio of the hedging relationship is the same as that resulting from the quantity of the hedged item that the Group actually hedges and the quantity of the hedging instrument that the Group actually uses to hedge that quantity of hedged item.
Hedges that meet all the qualifying criteria for hedge accounting are accounted for, as described below:
Cash flow hedges
The Group designates certain foreign exchange forward and interest rate swaps as cash flow hedges with an intention to hedge its existing liabilities and highly probable transaction in foreign currency. When a derivative is designated as a cash flow hedge instrument, the effective portion of changes in the fair value of the derivative is recognised in other comprehensive income and accumulated in the cash flow hedge reserve. Any ineffective portion of changes in the fair value of the derivative is recognised immediately in the Statement of Profit and Loss. If the hedging instrument no longer meets the criteria for hedge accounting, then hedge accounting is discontinued prospectively. If the hedging instrument expires or is sold, terminated or exercised, the cumulative gain or loss on the hedging instrument recognised in cash flow hedge reserve till the period the hedge was effective remains in cash flow hedge reserve until the forecasted transaction occurs. The cumulative gain or loss previously recognised in the cash flow hedge reserve is transferred to the net profit in the Statement of Profit and Loss upon the occurrence of the related forecasted transaction. If the forecasted transaction is no longer expected to occur, then the amount accumulated in cash flow hedge reserve is reclassified to the Statement of Profit and Loss.
Compulsorily Convertible Preference Shares (CCPS)
Compulsorily Convertible Preference Shares (CCPS) are classified as a liability or equity components based on the terms of the contract and in accordance with Ind AS - 32 (Financial instruments: Presentation). CCPS issued by the Group

312
Annual Report 2021-22
Notes to the Consolidated Financial Statements for the year ended March 31, 2022(All amounts in ` Lacs, unless otherwise stated)
classified as equity is carried at its transaction value and shown within "other equity". CCPS issued by the Group classified as liability is initially recognised at fair value (issue price). Subsequent to initial recognition, such CCPS is fair valued through the statement of profit and loss. On modification of CCPS from liability to equity, the CCPS is recorded at the fair value of CCPS classified as equity and the difference in fair value is recorded as a gain/ loss on modification in the Statement of Profit and Loss.
i Fair value measurement
‘Fair value’ is the price that would be received to sell an asset or paid to transfer a liability in an orderly transaction between market participants at the measurement date in the principal or, in its absence, the most advantageous market to which the Group has access at that date. The fair value of a liability reflects its non-performance risk. All assets and liabilities for which fair value is measured or disclosed in the financial statements are categorised within the fair value hierarchy, described as follows, based on the lowest level input that is significant to the fair value measurement as a whole:
- Level 1 - Quoted (unadjusted) market prices in active markets for identical assets or liabilities
- Level 2 - Valuation techniques for which the lowest level input that is significant to the fair value measurement is directly or indirectly observable
- Level 3- Valuation techniques for which the lowest level input that is significant to the fair value measurement is unobservable
For assets and liabilities that are recognised in the financial statements on a recurring basis, the Group determines whether transfers have occurred between levels in the hierarchy by re-assessing categorisation (based on the lowest level input that is significant to the fair value measurement as a whole) at the end of each reporting period.
j Cash and cash equivalents
Cash and cash equivalents in the balance sheet and cash flow statement comprise cash at banks and on hand and short-term deposits with an original maturity of three months or less, which are subject to an insignificant risk of changes in value.
For the purpose of the Consolidated Cash Flow Statement, cash and cash equivalents consist of cash and short-term deposits, as defined above, net of outstanding bank overdrafts as they are considered an integral part of the Group’s cash management.
k Foreign currency translation
Functional and presentation currency
Items included in the financial statements of the Group are measured using the currency of the primary economic environment in which the entity operates (the functional currency). The financial statements are presented in Indian rupee (`), which is functional and presentation currency of the Parent Company
Transactions and balances
Foreign currency transactions are translated into the functional currency using the exchange rates at the dates of the transactions. Foreign exchange gains and losses resulting from the settlement of such transactions and from the translation of monetary assets and liabilities denominated in foreign currencies at year end exchange rates are recognised in Statement of Profit and Loss.
Monetary assets and liabilities denominated in foreign currencies are translated at the functional currency spot rates of exchange at the reporting date.
Exchange differences arising on settlement or translation of monetary items are recognised in the statement of profit and loss with the exception of the following:
- Exchange differences arising on monetary items that forms part of a reporting entity’s net investment in a foreign operation are recognised in the statement of profit and loss in the separate financial statements of the reporting entity or the individual financial statements of the foreign operation, as appropriate. In the financial statements that include the foreign operation and the reporting entity (e.g., Consolidated Financial Statements when the foreign operation is a subsidiary), such exchange differences are recognised initially in Other Comprehensive Income (OCI). These exchange differences are reclassified from equity to the statement of profit and loss on disposal of the net investment.

Corporate Overview1 Statutory Reports2 Financial Statements3
313
Annual Report 2021-22
Notes to the Consolidated Financial Statements for the year ended March 31, 2022(All amounts in ` Lacs, unless otherwise stated)
- Exchange differences arising on monetary items that are designated as part of the hedge of the Group’s net investment of a foreign operation. These are recognised in OCI until the net investment is disposed of, at which time, the cumulative amount is reclassified to the Statement of Profit and Loss.
- Tax charges and credits attributable to exchange differences on those monetary items are also recorded in OCI.
Non-monetary items that are measured in terms of historical cost in a foreign currency are translated using the exchange rates at the dates of the initial transactions. Non-monetary items measured at fair value in a foreign currency are translated using the exchange rates at the date when the fair value is determined. The gain or loss arising on translation of non-monetary items measured at fair value is treated in line with the recognition of the gain or loss on the change in fair value of the item (i.e., translation differences on items whose fair value gain or loss is recognised in OCI or the statement of profit and loss are also recognised in OCI or the statement of profit and loss, respectively).
In determining the spot exchange rate to use on initial recognition of the related asset, expense or income (or part of it) on the derecognition of a non-monetary asset or non-monetary liability relating to advance consideration, the date of the transaction is the date on which the Group initially recognises the non-monetary asset or non-monetary liability arising from the advance consideration. If there are multiple payments or receipts in advance, the Group determines the transaction date for each payment or receipt of advance consideration.
Group Companies
On consolidation, the assets and liabilities of foreign operations are translated into ` at the rate of exchange prevailing at the reporting date and their profit or loss are translated at exchange rates prevailing at the dates of the transactions. For practical reasons, the Group uses an average rate to translate income and expense items, if the average rate approximates the exchange rates at the dates of the transactions. The exchange differences arising on translation for consolidation are recognised in Other Comprehensive Income (OCI). On disposal of a foreign operation, the component of OCI relating to that particular foreign operation is recognised in the statement of profit and loss.
Any goodwill arising in the acquisition/ business combination of a foreign operation and any fair value adjustments to the carrying amounts of assets and liabilities arising on the acquisition are treated as assets and liabilities of the foreign operation and translated at the spot rate of exchange at the reporting date.
Any goodwill or fair value adjustments arising in business combinations/ acquisitions, which occurred before the date of transition to Ind AS ( April 1, 2018), are treated as assets and liabilities of the entity rather than as assets and liabilities of the foreign operation. Therefore, those assets and liabilities are non-monetary items already expressed in the functional currency of the Parent Company and no further translation differences occur.
Gain or loss on a subsequent disposal of any foreign operation excludes translation differences that arose before the date of transition but includes only translation differences arising after the transition date
l Employee Benefits Short-term obligations
Liabilities for wages and salaries, including non-monetary benefits that are expected to be settled wholly within 12 months after the end of the period in which the employees render the related service are recognised in respect of employees' services up to the end of the reporting period and are measured at the amounts expected to be paid when the liabilities are settled. The liabilities are presented as current financial liabilities in the balance sheet.
Accumulated leave, which is expected to be utilized within the next 12 months, is treated as short-term employee benefit. The Group measures the expected cost of such absences as the additional amount that it expects to pay as a result of the unused entitlement that has accumulated at the reporting date.
Other long-term employee benefit obligations
The liabilities for leave balance are not expected to be settled wholly within 12 months after the end of the period in which the employees render the related service. They are therefore measured as the present value of expected future payments to be made in respect of services provided by employees up to the end of the reporting period using the projected unit credit method. The benefits are discounted using the market yields on government bonds at the end of the reporting period that

314
Annual Report 2021-22
Notes to the Consolidated Financial Statements for the year ended March 31, 2022(All amounts in ` Lacs, unless otherwise stated)
have terms approximating to the terms of the related obligation. Remeasurements as a result of experience adjustments and changes in actuarial assumptions are recognised in statement of profit and loss.
The obligations are presented as current liabilities in the balance sheet if the entity does not have an unconditional right to defer settlement for at least twelve months after the reporting period, regardless of when the actual settlement is expected to occur.
Post-employment obligations
The Group operates the following post-employment schemes:
(a) defined benefit plans - gratuity, and
(b) defined contribution plans such as provident fund.
Gratuity obligations
The liability or asset recognised in the balance sheet in respect of defined benefit gratuity plan is the present value of the defined benefit obligation at the end of the reporting period less the fair value of plan assets. The defined benefit obligation is calculated annually by an independent actuary using the projected unit credit method.
The present value of the defined benefit obligation is determined by discounting the estimated future cash outflows by reference to market yields at the end of the reporting period on government bonds that have term approximating the term of the related obligation. The net interest cost is calculated by applying the discount rate to the net balance of the defined benefit obligation and the fair value of plan assets.
Remeasurement gains and losses arising from experience adjustments and changes in actuarial assumptions are recognised in the period in which they occur, directly in other comprehensive income. They are included in retained earnings in the Statement of Changes in Equity and in the balance sheet. Such accumulated re-measurement balances are never reclassified into the Statement of Profit and Loss subsequently.
Changes in the present value of the defined benefit obligation resulting from plan amendments or curtailments are recognised immediately in profit and loss as past service costs.
Defined contribution plan
Retirement benefit in the form of provident fund scheme, Social security, National Insurance, Superannuation, Medicare schemes are the defined contribution plans. The Group has no obligation, other than the contribution payable. The Group recognizes contribution payable to these schemes as an expenditure, when an employee renders the related service.
m Employee share based payments Certain employees of the Company receive remuneration in the form of share-based payments, whereby employees render
services as consideration for equity instruments.
Equity-settled transactions:
The cost of equity-settled transactions is determined by the fair value at the date when the grant is made using a Black Scholes model except for the option on date of modification of plan from cash settled to equity settled transaction.
That cost is recognised, together with a corresponding increase in employees stock option reserves in equity, over the period in which the performance and/or service conditions are fulfilled in employee benefits expense. The cumulative expense recognised for equity-settled transactions at each reporting date until the vesting date reflects the extent to which the vesting period has expired and the Group’s best estimate of the number of equity instruments that will ultimately vest. The expense or credit in the statement of profit and loss for a period represents the movement in cumulative expense recognised as at the beginning and end of that period and is recognised in employee benefits expense.
Service and non-market performance conditions are not taken into account when determining the grant date fair value of awards, but the likelihood of the conditions being met is assessed as part of the Group’s best estimate of the number of equity instruments that will ultimately vest. Market performance conditions are reflected within the grant date fair value. Any other conditions attached to an award, but without an associated service requirement, are considered to be non-vesting conditions.

Corporate Overview1 Statutory Reports2 Financial Statements3
315
Annual Report 2021-22
Notes to the Consolidated Financial Statements for the year ended March 31, 2022(All amounts in ` Lacs, unless otherwise stated)
Non-vesting conditions are reflected in the fair value of an award and lead to an immediate expensing of an award unless there are also service and/or performance conditions.
No expense is recognised for awards that do not ultimately vest because non-market performance and/or service conditions have not been met. Where awards include a market or non-vesting condition, the transactions are treated as vested irrespective of whether the market or non-vesting condition is satisfied, provided that all other performance and/or service conditions are satisfied.
The dilutive effect of outstanding options is reflected as additional share dilution in the computation of diluted earnings per share.
n Taxation Income tax comprises of current tax and deferred tax. It is recognised in the Statement of Profit and Loss except to the extent
that it relates to an item recognised directly in the Other Comprehensive Income.
Current income tax
Current income tax assets and liabilities are measured at the amount expected to be recovered from or paid to the taxation authorities. The tax rates and tax laws used to compute the amount are those that are enacted or substantively enacted, at the reporting date in the countries where the Group operates and generates taxable income.
Current income tax relating to items recognised outside the Statement of Profit and Loss is recognised outside profit and loss (either in other comprehensive income or in equity). Current tax items are recognised in correlation to the underlying transaction either in Other Comprehensive Income (OCI) or directly in equity. Management periodically evaluates positions taken in the tax returns with respect to situations in which applicable tax regulations are subject to interpretation and establishes provisions where appropriate.
In the situations where one or more entities in the Group are entitled to a tax holiday under the Income-tax Act, 1961 enacted in India or tax laws prevailing in the respective tax jurisdictions where they operate, no deferred tax (asset or liability) is recognised in respect of temporary differences which reverse during the tax holiday period, to the extent the concerned entity’s gross total income is subject to the deduction during the tax holiday period. Deferred tax in respect of temporary differences which reverse after the tax holiday period is recognised in the year in which the temporary differences originate. However, the Group restricts recognition of deferred tax assets to the extent it is probable that sufficient future taxable income will be available against which such deferred tax assets can be realized. For recognition of deferred taxes, the temporary differences which originate first are considered to reverse first.
Current tax assets and current tax liabilities are offset when there is a legally enforceable right to set off the recognised amounts, and there is an intention to settle the asset and the liability on a net basis.
Deferred tax
Deferred tax is provided using the liability method on temporary differences between the tax bases of assets and liabilities and their carrying amounts for financial reporting purposes at the reporting date.
Deferred tax liabilities are recognised for all taxable temporary differences, except:
• When the deferred tax liability arises from the initial recognition of goodwill or an asset or liability in a transaction that is not a business combination and, at the time of the transaction, affects neither the accounting profit nor taxable profit and loss
• In respect of taxable temporary differences associated with investments in subsidiaries, associates and interests in joint ventures, when the timing of the reversal of the temporary differences can be controlled and it is probable that the temporary differences will not reverse in the foreseeable future
Deferred tax assets are recognised for all deductible temporary differences, the carry forward of unused tax credits and any unused tax losses. Deferred tax assets are recognised to the extent that it is probable that taxable profit will be available against which the deductible temporary differences, and the carry forward of unused tax credits and unused tax losses can be utilised, except:
• When the deferred tax asset relating to the deductible temporary difference arises from the initial recognition of an asset or liability in a transaction that is not a business combination and, at the time of the transaction, affects neither the accounting profit nor taxable profit and loss

316
Annual Report 2021-22
Notes to the Consolidated Financial Statements for the year ended March 31, 2022(All amounts in ` Lacs, unless otherwise stated)
• In respect of deductible temporary differences associated with investments in subsidiaries, associates and interests in joint ventures, deferred tax assets are recognised only to the extent that it is probable that the temporary differences will reverse in the foreseeable future and taxable profit will be available against which the temporary differences can be utilised
The carrying amount of deferred tax assets is reviewed at each reporting date and reduced to the extent that it is no longer probable that sufficient taxable profit will be available to allow all or part of the deferred tax asset to be utilised. Unrecognised deferred tax assets are re-assessed at each reporting date and are recognised to the extent that it has become probable that future taxable profits will allow the deferred tax asset to be recovered.
Deferred tax assets and liabilities are measured at the tax rates that are expected to apply in the year when the asset is realised, or the liability is settled, based on tax rates (and tax laws) that have been enacted or substantively enacted at the reporting date.
Deferred tax relating to items recognised outside profit and loss is recognised outside profit or loss (either in other comprehensive income or in equity). Deferred tax items are recognised in correlation to the underlying transaction either in OCI or directly in equity.
Tax benefits acquired as part of a business combination, but not satisfying the criteria for separate recognition at that date, are recognised subsequently if new information about facts and circumstances change. Acquired deferred tax benefits recognised within the measurement period reduce goodwill related to that acquisition if they result from new information obtained about facts and circumstances existing at the acquisition date. If the carrying amount of goodwill is zero, any remaining deferred tax benefits are recognised in OCI/ capital reserve depending on the principle explained for bargain purchase gains. All other acquired tax benefits realised are recognised in profit and loss.
The Group offsets deferred tax assets and deferred tax liabilities if and only if it has a legally enforceable right to set off current tax assets and current tax liabilities and the deferred tax assets and deferred tax liabilities relate to income taxes levied by the same taxation authority on either the same taxable entity or different taxable entities which intend either to settle current tax liabilities and assets on a net basis, or to realise the assets and settle the liabilities simultaneously, in each future period in which significant amounts of deferred tax liabilities or assets are expected to be settled or recovered.
Minimum Alternate Tax (MAT)
Minimum alternate tax (MAT) paid in a year is charged to the statement of profit and loss as current tax for the year. The deferred tax asset is recognised for MAT credit available only to the extent that it is probable that the concerned company will pay normal income tax during the specified period, i.e., the period for which MAT credit is allowed to be carried forward. In the year in which the company recognizes MAT credit as an asset, it is created by way of credit to the statement of profit and loss and shown as part of deferred tax asset. The Group reviews the “MAT credit entitlement” asset at each reporting date and writes down the asset to the extent that it is no longer probable that it will pay normal tax during the specified period.
o Treasury shares
The Group has created an Employee Benefit Trust (EBT) for providing share-based payment to its employees. The Group uses EBT as a vehicle for distributing shares to employees under the employee remuneration schemes. The EBT buys shares from the Parent Company, for giving shares to employees. The Group treats EBT as its extension and shares held by EBT are treated as treasury shares. Refer note 16.
No gain or loss is recognised in Statement of Profit and Loss on the issue or cancellation of the Group's own equity instruments.
On consolidation of EBT with the Group, the value of shares held by trust is shown as a deduction from equity (i.e. reduction from share capital to the extent of face value and remaining from securities premium). Gains/ losses recognized by the trust on issue of shares are shown as a part of securities premium.
Share options exercised during the reporting period are issued from the treasury shares.

Corporate Overview1 Statutory Reports2 Financial Statements3
317
Annual Report 2021-22
Notes to the Consolidated Financial Statements for the year ended March 31, 2022(All amounts in ` Lacs, unless otherwise stated)
p Provisions and Contingent Liabilities
Provisions
Provisions are recognised when there is a present obligation (legal or constructive) as a result of a past event, it is probable that an outflow of resources embodying economic benefits will be required to settle the obligation, in respect of which a reliable estimate can be made of the amount of the obligation.
If the effect of the time value of money is material, provisions are discounted using a current pre-tax rate that reflects, when appropriate, the risks specific to the liability. When discounting is used, the increase in the provision due to the passage of time is recognised as a finance cost.
Provision for warranty
As per the terms of the contracts, the Group provides post-contract services / warranty support to some of its customers. The Group accounts for the post-contract support / provision for warranty on the basis of the information available with the management duly taking into account the current and past technical estimates. The estimate of such warranty-related costs is revised annually.
Contingent Liabilities
A contingent liability is a possible obligation that arises from past events and whose existence will be confirmed only by the occurrence or non-occurrence of one or more uncertain future events not wholly within the control of the Group or a present obligation that is not recognised because it is not probable that an outflow of resources will be required to settle the obligation. A contingent liability also arises in extremely rare cases where there is a liability that cannot be recognised because it cannot be measured reliably. The Group does not recognize a contingent liability but discloses it in the financial statements, unless the possibility of an outflow of resources embodying economic benefits is remote.
q Segment reporting Operating segments are reported in a manner consistent with the internal reporting provided to the chief operating decision
maker (CODM). The Group has identified three reportable segment based on the dominant source, nature of risks and return and the internal organisation and management structure and for which discrete financial information is available. The Executive Management Committee monitors the operating results of its business units separately for the purpose of making decisions about resource allocation and performance assessment. Refer note 43 for segment information.
r Earnings/(Loss) per share Basic earnings per share is calculated by dividing the net profit or loss attributable to equity holders of Parent Company (after
deducting preference dividends and attributable taxes) by the weighted average number of equity shares outstanding during the period (including treasury shares).
The weighted average number of equity shares outstanding during the period is adjusted for events such as bonus issue, bonus element in a rights issue, share split, and reverse share split (consolidation of shares) that have changed the number of equity shares outstanding, without a corresponding change in resources.
For the purpose of calculating diluted earnings per share, the net profit and loss for the period attributable to equity shareholders of the Parent Company and the weighted average number of shares outstanding during the period are adjusted for the effects of all dilutive potential equity shares. The weighted average number of shares takes into account the weighted average effect of changes in treasury share transactions and CCPS during the year
Ordinary shares that will be issued upon the conversion of a mandatorily convertible instrument are included in the calculation of basic earnings per share from the date the contract is entered into.
s Non-current assets held for sale and discontinued operations The Group classifies non-current assets and disposal groups as held for sale if their carrying amounts will be recovered
principally through a sale rather than through continuing use.
Non-current assets and disposal groups classified as held for sale are measured at the lower of their carrying amount and fair value less costs to sell. Costs to sell are the incremental costs directly attributable to the disposal of an asset (disposal group), excluding finance costs and income tax expense.

318
Annual Report 2021-22
Notes to the Consolidated Financial Statements for the year ended March 31, 2022(All amounts in ` Lacs, unless otherwise stated)
The criteria for held for sale classification is regarded as met only when the sale is highly probable, and the asset or disposal group is available for immediate sale in its present condition. Actions required to complete the sale/ distribution should indicate that it is unlikely that significant changes to the sale will be made or that the decision to sell will be withdrawn. Management must be committed to the sale and the sale expected within one year from the date of classification.
For these purposes, sale transactions include exchanges of non-current assets for other non-current assets when the exchange has commercial substance. The criteria for held for sale classification is regarded met only when the assets or disposal group is available for immediate sale in its present condition, subject only to terms that are usual and customary for sales of such assets (or disposal groups), its sale is highly probable; and it will genuinely be sold, not abandoned. The group treats sale of the asset or disposal group to be highly probable when:
- The appropriate level of management is committed to a plan to sell the asset (or disposal group),
- An active programme to locate a buyer and complete the plan has been initiated (if applicable),
- The asset (or disposal group) is being actively marketed for sale at a price that is reasonable in relation to its current fair value,
- The sale is expected to qualify for recognition as a completed sale within one year from the date of classification, and
- Actions required to complete the plan indicate that it is unlikely that significant changes to the plan will be made or that the plan will be withdrawn.
Property, plant and equipment and intangible are not depreciated, or amortised assets once classified as held for sale.
Assets and liabilities classified as held for sale are presented separately from other items in the balance sheet.
A disposal group qualifies as discontinued operation if it is a component of an entity that either has been disposed of, or is classified as held for sale, and:
- Represents a separate major line of business or geographical area of operations,
- Is part of a single co-ordinated plan to dispose of a separate major line of business or geographical area of operations ,or
- Is a subsidiary acquired exclusively with a view to resale
Additional disclosures are provided in note 46.
t Change in accounting policies and disclosure (i) Amendment to Ind AS 116 : Covid-19- Related Rent Concessions.
MCA issued an amendment to Ind AS 116 Covid-19-Related Rent Concessions beyond 30 June 2021 to update the condition for lessees to apply the relief to a reduction in lease payments originally due on or before 30 June 2022 from 30 June 2021. The amendment applies to annual reporting periods beginning on or after April 1, 2021. In case a lessee has not yet approved the financial statements for issue before the issuance of this amendment, then the same may be applied for annual reporting periods beginning on or after April 1, 2020.
The group has continued to apply the practical expedient for the extended period. Refer note 27
(ii) Amendment to Ind AS 103 Business Combination:
The amendment states that to qualify for recognition as part of applying the acquisition method, the identifiable assets acquired and liabilities assumed must meet the definitions of assets and liabilities in the Framework for the Preparation and Presentation of Financial Statements in accordance with Indian Accounting Standards* issued by the Institute of Chartered Accountants of India at the acquisition date. Therefore, the acquirer does not recognise those costs as part of applying the acquisition method. Instead, the acquirer recognises those costs in its post-combination financial statements in accordance with other Ind AS.
These amendments had no impact on the financial statements of the Group.
(iii) Interest Rate Benchmark Reform – Phase 2: Amendments to Ind AS 109, Ind AS 107, Ind AS 104 and Ind AS 116
The amendments provide temporary reliefs which address the financial reporting effects when an interbank offered rate (IBOR) is replaced with an alternative nearly risk-free interest rate (RFR).
Corporate Overview1 Statutory Reports2 Financial Statements3
319
Annual Report 2021-22
Notes to the Consolidated Financial Statements for the year ended March 31, 2022(All amounts in ` Lacs, unless otherwise stated)
These amendments had no impact on the financial statements of the Group.
(iv) Amendment to Ind AS 105, Ind AS 16 and Ind AS 28
The definition of “Recoverable amount” is amended such that the words “the higher of an asset’s fair value less costs to sell and its value in use” are replaced with “higher of an asset’s fair value less costs of disposal and its value in use”. The consequential amendments are made in Ind AS 105, Ind AS 16 and Ind AS 28.
These amendments had no impact on the financial statements of the Group.
(v) Amendments to Schedule III to the Companies Act, 2013 (“Schedule III”)
The MCA had notified the amendments to Schedule III to the Companies Act, 2013 on 24 March 2021. The amendment contained significant additional disclosures requirement in the financial statements. The Group has adopted such changes in preparing these Consolidated Financial Statements.
u Standards notified but not yet effective:
(i) Amendments to Ind AS 37– Provisions, Contingent Liabilities and Contingent Assets
The amendment specifies that the ‘cost of fulfilling’ a contract comprises the ‘costs that relate directly to the contract’. Costs that relate directly to a contract can either be incremental costs of fulfilling that contract (examples would be direct labour, materials) or an allocation of other costs that relate directly to fulfilling contracts (an example would be the allocation of the depreciation charge for an item of property, plant and equipment used in fulfilling the contract). The effective date for adoption of this amendment is annual periods beginning on or after April1,2022, although early adoption is permitted. The Group has evaluated the amendment and there is no impact on its financial statements.
There were no other standard notified but not yet effective upto the date of issuance of the Group's financial statements.
v Critical estimates and judgements
The preparation of the financial statements requires management to make judgements, estimates and assumptions that affect the reported amounts of revenues, expenses, assets and liabilities, and the grouping disclosures, and the disclosure of contingent liabilities. Uncertainty about these assumptions and estimates could result in outcomes that require a material adjustment to the carrying amount of asset or liability affected in future periods. The areas involving significant estimates or critical judgements are:
Significant estimates
(a) Defined benefit plans
The cost of the defined benefit gratuity plan and other post-employment benefit and the present value of the gratuity obligation are determined using actuarial valuations. An actuarial valuation involves making various assumptions that may differ from actual developments in the future. These include the determination of the discount rate and future salary increases. Due to complexities involved in the valuation and its long term nature, a defined benefit obligation is highly sensitive to changes in these assumptions. All assumptions are reviewed at each reporting date.
The parameter most subject to change is the discount rate. The mortality rate is based on publicly available mortality table in India. The mortality tables tend to change only at interval in response to demographic changes. Further salary increases and gratuity increases are based on expected future inflation rates. Further details about the gratuity obligations are given in Note 35.
(b) Revenue recognition
The Group uses the percentage-of-completion method in accounting for its fixed-price contracts. Use of the percentage-of-completion method requires the Group to estimate the efforts or costs expended to date as a proportion of the total efforts or costs to be expended. Efforts or costs expended have been used to measure progress towards completion as there is a direct relationship between input and productivity.
Provisions for estimated losses, if any, on uncompleted contracts are recorded in the period in which such losses become probable based on the expected contract estimates at the reporting date.

320
Annual Report 2021-22
Notes to the Consolidated Financial Statements for the year ended March 31, 2022(All amounts in ` Lacs, unless otherwise stated)
(c) Uncertainty relating to the global health pandemic on COVID-19
In assessing the recoverability of receivables including unbilled receivables, contract assets and contract costs, goodwill, intangible assets, and certain investments, the Group has considered internal and external information up to the date of approval of these consolidated financial statements including credit reports and economic forecasts. Based on the current indicators of future economic conditions, the Group expects to recover the carrying amount of these assets.
The Group bases its assessment on the belief that the probability of occurrence of forecasted transactions is not impacted by COVID-19. The Group has considered the effect of changes, if any, in both counterparty credit risk and its own credit risk while assessing hedge effectiveness and measuring hedge ineffectiveness and continues to believe that COVID-19 has no impact on effectiveness of its hedges. The impact of COVID-19 may be different from what we have estimated as of the date of approval of these consolidated financial statements and the Group will continue to closely monitor any material changes to future economic conditions.
Critical judgements
(a) Deferred taxes
Deferred tax liabilities are recognised for all taxable temporary differences. Deferred tax assets are recognised for all the deductible temporary differences, carry forward of unused tax credits and unused tax losses, however the same is restricted to the extent of the deferred tax liabilities unless it is probable that sufficient taxable profit will be available against which the deductible temporary differences, and the carry forward of unused tax credits and unused tax losses can be utilised. Also refer Note 10 (A) and 10 (B).

Corporate Overview1 Statutory Reports2 Financial Statements3
321
Annual Report 2021-22
Notes to the Consolidated Financial Statements for the year ended March 31, 2022(All amounts in ` Lacs, unless otherwise stated)
3 Property, plant and equipmentComputerSystems
Officeequipments
Furnitureand fixtures
Leasehold improvements
Total Capital work-in-progress
Cost or valuationAs at April 01, 2020 217 116 24 46 403 - Additions 44 18 2 - 64 14 Disposals (13) - - - (13) - Deletion on liquidation of subsidiary - refer note (i) below
(1) - (1) - (2) -
As at March 31, 2021 247 134 25 46 452 14 Additions 45 11 - 11 67 Transfers from CWIP - - - 14 14 (14)Disposals (27) (1) - - (28)As at March 31, 2022 265 144 25 71 505 - Accumulated depreciationAs at April 01, 2020 188 78 16 28 310 - Charge for the year 44 20 9 15 88 - Disposals (13) - - - (13) - Deletion on liquidation of subsidiary - refer note (i) below
(1) - (1) - (2) -
As at March 31, 2021 218 98 24 43 383 - Charge for the year 37 18 - 16 71 - Disposals (27) - - - (27) - As at March 31, 2022 228 116 24 59 427 - Net book valueAs at March 31, 2021 29 36 1 3 69 14 As at March 31, 2022 37 28 1 12 78 -
Note:
(i) The Group liquidated its subsidiary i.e. Happiest Minds Technologies LLC during the year ended March 31, 2021. On liquidation, balance lying in gross block and accumulated depreciation has been reversed during the year ended March 31, 2021.
(ii) Refer note 19 for details of charge created on the Property, plant and equipment.
There are no CWIP as at March 31, 2022.
As at March 31, 2021 Amount in CWIP for a period Total
Less than 1 years
1-2 years 2-3 years More than 3 years
Projects in progress 14 - - - 14
Projects temporarily suspended - - - - -
Total 14 - - - 14

322
Annual Report 2021-22
Notes to the Consolidated Financial Statements for the year ended March 31, 2022(All amounts in ` Lacs, unless otherwise stated)
4 Goodwill and other intangible assets i) Goodwill
March 31, 2022 March 31, 2021Cost or valuationDeemed cost As at April 01 9,532 2,990 Acquisition of subsidiary - refer note 45 - 7,020 Deletion on liquidation of subsidiary - refer note (i) below - (492)Exchange difference 252 14 As at March 31 9,784 9,532 Accumulated ImpairmentAs at April 01 1,888 2,380 Deletion on liquidation of subsidiary - refer note (i) below - (492)As at March 31 1,888 1,888 Net book value as at March 31 7,896 7,644
ii) Other intangible assetsOther intangible assets Intangible
assets underdevelopment
Trademark Customerrelationships
Non-compete
Computersoftware
Exclusivelicense
Total
Cost or valuation
Deemed cost
As at April 01, 2020 32 577 42 254 - 905 17
Additions - - - 19 - 19 -
Acquisition of subsidiary - refer note 45 88 2,612 51 263 94 3,108 -
Transfer from intangible assets under development
- - - 17 - 17 (17)
Deletion on liquidation of subsidiary - refer note (i) below
(32) (373) (31) - - (436) -
Exchange difference - 5 - 1 - 6
As at March 31, 2021 88 2,821 62 554 94 3,619 -
Additions - - - 311 - 311 35
Exchange difference 3 94 2 9 3 111 -
As at March 31, 2022 91 2,915 64 874 97 4,041 35
Accumulated amortisation/ Impairment
As at April 01, 2020 32 574 41 186 - 833 -
Charge for the year 11 166 5 61 12 255 -
Deletion on liquidation of subsidiary - refer note (i) below
(32) (373) (31) - - (436) -
Exchange difference - 1 - - - 1 -
As at March 31, 2021 11 368 15 247 12 653 -
Charge for the year 45 666 17 194 48 970
Exchange difference 1 18 - 2 1 22
As at March 31, 2022 57 1,052 32 443 61 1,645 -
Net book value
As at March 31, 2021 77 2,453 47 307 82 2,966 -
As at March 31, 2022 34 1,863 32 431 36 2,396 35
Note:
(i) The Group liquidated its subsidiary i.e. Happiest Minds Technologies LLC during the year ended March 31, 2021. On liquidation, balance lying in gross block and accumulated amortisation and impairment has been reversed during the year ended March 31, 2021.

Corporate Overview1 Statutory Reports2 Financial Statements3
323
Annual Report 2021-22
Notes to the Consolidated Financial Statements for the year ended March 31, 2022(All amounts in ` Lacs, unless otherwise stated)
Intangibles assets under development Ageing (IAUD)As at March 31, 2022 Amount in IAUD for a period Total
Less than 1 years
1-2 years 2-3 years More than 3 years
Projects in progress 35 - - - 35 Projects temporarily suspended - - - - -
Total 35 - - - 35
There were no IAUD as at March 31, 2021.
Impairment of goodwill
The Goodwill of ̀ 1,888 Lacs relates to business acquisition of OSS Cube Solutions Limited, ̀ 611 Lacs relates to the business acquisition of Cupola Technology Private Limited and ` 7,285 Lacs related to the business acquisition of Happiest Minds Inc. (formerly known as PGS Inc.) which has been allocated to OSS Cube, Internet of things (IoT) and DBS-PGS cash generating units (CGUs) respectively. Goodwill related to OSS cube is fully impaired.
Goodwill is tested for impairment on an annual basis by the Group. The recoverable value of the CGU is determined based on value-in-use calculation using the cash flow projections based on the financial budgets approved by the management covering a five year period.
The Group acquired Happiest Minds Inc. (formerly known as PGS Inc.) during the year ended March 31, 2021. There had neither been significant time lapse from the date of such acquisition to the reporting date (i.e. March 31, 2021) nor any significant change in business had occured during the period and thus the management believed that there would not be any material impact on the value of goodwill on performing the impairment assessment. Hence the management did not carry out impairment testing of goodwill for the year ended March 31, 2021.
The following table sets out the key assumptions for calculation of value-in-use for these CGUs:
IoT DBS-PGS March 31, 2022 March 31, 2021 March 31, 2022 March 31, 2021
Discount rate 22.32% 20.01% 20.93% Refer note aboveLong term growth rate 4.00% 4.00% 2.00% Refer note aboveSales growth 20.00% 10.00% 25.00% Refer note aboveCarrying value of goodwill 611 611 7,285 7,034
The discount rate is based on the Weighted Average Cost of Capital (WACC) which represents the weighted average return attributable to all the assets of the Cash Generating Unit (CGU).
There is no impairment noted in the IoT and DBS-PGS CGUs based on the assessment performed by the management. Management has performed sensitivity analysis around the base assumption and have concluded that no reasonable possible change in key assumptions would cause the recoverable amount of the IoT and DBS-PGS CGUs lower than the carrying amount of respective CGU.
5 Right-of-use assets Computer systems Office buildings Motor vehicles Total
As at April 01 2020 672 2,304 30 3,006 Additions 609 466 - 1,075 Depreciation (448) (1,464) (19) (1,931)As at March 31, 2021 833 1,306 11 2,150 Additions 1,495 3,992 - 5,487 Depreciation (750) (1,492) (5) (2,247)As at March 31, 2022 1,578 3,806 6 5,390

324
Annual Report 2021-22
Notes to the Consolidated Financial Statements for the year ended March 31, 2022(All amounts in ` Lacs, unless otherwise stated)
The average lease period of the leased assets is 4.7 years.
The group recognized the following income and expense in the statement of profit and loss pertaining to leased assets:
March 31, 2022 March 31, 2021Rent concession income 323 302
323 302 Interest expense on lease liabilities 487 328 Depreciation of Right-of-use assets 2,247 1,931 Rent expense pertaining to short- term leases 284 166
3,018 2,425
6 Loans Carried at amortised cost
March 31, 2022 March 31, 2021Current Loans considered good - Unsecured Loans to employees 4 14
4 14
7 Other financial assetsMarch 31, 2022 March 31, 2021
(a) Other financial assets carried at amortised cost (unsecured, considered good, unless otherwise stated)
Non-current Fixed deposit with maturity of more than 12 months 1,113 1,733 Margin money deposits - refer note (i) below 375 376 Security deposit 339 349
1,827 2,458
(i) Margin money deposit is used to secure: Term loan - Federal bank 370 370 Guarantees given 5 6
Current Interest accrued on fixed deposit 26 52 Unbilled revenue# 8,911 5,493 Security deposit 389 798 Other receivables 11 34
9,337 6,377
Security deposit - credit impaired 1 1 Less: Allowance for credit impaired loans (1) (1) Less: loss allowance on unbilled revenue (181) (121)
9,156 6,256 # Classified as financial asset as right to consideration is unconditional and is due only after a
passage of time. Includes ` 67 from related party. Refer note 39
(b) Derivative instruments carried at fair value through OCI Cash flow hedges Foreign currency forward contracts 249 523
249 523 Total other current financial assets 9,405 6,779

Corporate Overview1 Statutory Reports2 Financial Statements3
325
Annual Report 2021-22
Notes to the Consolidated Financial Statements for the year ended March 31, 2022(All amounts in ` Lacs, unless otherwise stated)
8A Income tax assets (net)March 31, 2022 March 31, 2021
Non - current 680 1,408
Income tax assets (net) 680 1,408
8B Income tax liabilities (net)March 31, 2022 March 31, 2021
Current 239 -
Income tax liabilities (net) 239 -
9 Other assets Unsecured, considered good, unless otherwise stated
March 31, 2022 March 31, 2021Non - currentPrepaid expenses 1 7
1 7CurrentPrepaid expenses 1,033 798 Balances with statutory / government authorities 170 449 Advance to employees against expenses 58 22 Advance to suppliers 97 64 Other advances 100 - Unbilled revenue # 1,973 480
3,431 1,813 Less: loss allowance on unbilled revenue (39) (11)
3,392 1,802
# Classified as non-financial assets as the contractual right to consideration is dependent upon completion on contractual milestones.
10 Deferred tax assets (net)March 31, 2022 March 31, 2021
Deferred tax assets (net) 697 1,026
697 1,026
Significant components and movement in deferred tax assets and liabilities during the year ended March 31, 2022 :
April 01, 2021 Recognised in profit or loss
[charge/(credit)]
Foreign currency translation reserve
March 31, 2022
Deferred tax liability
Mutual funds 54 307 - 361
Goodwill 91 63 - 154
Derivative assets 128 - (80) 48
Total deferred tax liabilities 273 370 (80) 563

326
Annual Report 2021-22
Notes to the Consolidated Financial Statements for the year ended March 31, 2022(All amounts in ` Lacs, unless otherwise stated)
April 01, 2021 Recognised in profit or loss
[charge/(credit)]
Foreign currency translation reserve
March 31, 2022
Deferred tax assets
Property, plant and equipment and intangible assets
(75) 14 - (61)
Loss allowance on trade receivables (318) 11 - (307)
Lease liability and right-of-use assets (125) (7) - (132)
Provision for gratuity and leave encashment
(618) 111 (24) (531)
Others (163) (66) - (229)
Total deferred tax assets (1,299) 63 (24) (1,260)
Deferred tax assets (net) (1,026) 433 (104) (697)
Significant components and movement in deferred tax assets and liabilities during the year ended March 31, 2021 :
April 01, 2020 Recognised in profit or loss
[charge/(credit)]
Foreign currency translation reserve
March 31, 2021
Deferred tax liability
Mutual funds - 54 - 54
Goodwill - 91 - 91
Derivative assets - - 128 128
Total deferred tax liabilities - 70 128 198
Deferred tax assets
Property, plant and equipment and intangible assets
- (75) - -75
Loss allowance on trade receivables - (318) - (318)
Lease liability and right-of-use assets - (125) - (125)
Provision for gratuity and leave encashment
- (582) (36) (618)
Others - (163) - (163)
Total deferred tax assets - (1,188) (36) (1,224)
Deferred tax assets (net) - (1,118) 92 (1,026)
10B Deferred tax liabilities (net)March 31, 2022 March 31, 2021
Deferred tax liabilities (net) 468 725
468 725

Corporate Overview1 Statutory Reports2 Financial Statements3
327
Annual Report 2021-22
Notes to the Consolidated Financial Statements for the year ended March 31, 2022(All amounts in ` Lacs, unless otherwise stated)
Significant components and movement in deferred tax assets and liabilities during the year ended March 31, 2022 :
April 01, 2021 Recognised in profit or loss
[charge/(credit)]
Foreign currency translation reserve
March 31, 2022
Deferred tax liability
Property, plant and equipment and intangible assets
725 (216) 22 531
Total deferred tax liabilities 725 (216) 22 531
Deferred tax Assets
Loss allowance on trade receivables - (62) (1) (63)
Total deferred tax assets - (62) (1) (63)
Deferred tax liabilities (net) 725 (278) 21 468
Significant components and movement in deferred tax assets and liabilities during the year ended March 31, 2021 :
April 01, 2020 Acquisition of subsidiary
- refer note 45
Recognised in profit or loss
[charge/(credit)]
Foreign currency translation
reserve
March 31, 2021
Deferred tax liabilityProperty, plant and equipment and intangible assets
- 777 (53) 1 725
Total deferred tax liabilities - 777 (53) 1 725
11 Investments Non-current Carried at fair value through other comprehensive income [FVTOCI] (fully paid)
March 31, 2022 March 31, 2021
Unquoted
134 (March 31, 2021 : Nil) Series A Common Shares of $ 0.01 par value of TECH4TH Solutions Inc.
762 -
762 -
Investment at fair value through OCI represents investment in unquoted equity shares. These equity shares have been designated as FVTOCI as they are not held for trading.
Current Carried at fair value through statement of profit and loss
March 31, 2022 March 31, 2021 March 31, 2022 March 31, 2021Units in Lacs Units in Lacs Amount Amount
QuotedAditya Birla - Money manager fund - Growth 3 - 803 - Aditya Birla - Savings Fund - Growth 19 16 8,370 6,759 Axis - Banking and PSU debt fund - Growth 1 - 3,062 - Axis - Treasury Advantage Fund - Growth - 1 - 2,954 HDFC - Ultra short term fund - Growth 727 756 9,023 9,028 ICICI Prudential - Liquid fund - Growth - 5 - 1,487 ICICI Prudential - Savings Fund - Growth - - - - ICICI Prudential - Short term - Growth # - 9 - 405

328
Annual Report 2021-22
Notes to the Consolidated Financial Statements for the year ended March 31, 2022(All amounts in ` Lacs, unless otherwise stated)
March 31, 2022 March 31, 2021 March 31, 2022 March 31, 2021Units in Lacs Units in Lacs Amount Amount
ICICI Prudential - Short term fund - Growth 72 - 3,679 - ICICI Prudential - Ultra short term fund - Growth 367 301 8,785 6,865 IDFC - Banking and PSU debt fund - Growth 175 - 3,578 - IDFC - Ultra short term fund - Growth - 365 - 4,368 Kotak - Banking & PSU Debt fund - Growth 76 - 4,119 - Kotak - Savings Fund - Growth - 210 - 7,282 L&T - Banking & PSU Debt fund - Growth 194 - 4,087 - Nippon - Banking and PSU debt fund - Growth 27 - 459 - UTI - Ultra short term fund - Growth * - 435 -
46,400 39,148 Note:
# Nil units of mutual funds of ICICI prudential mutual fund (March 31, 2021 - 9 Lacs units) is pledged with RBL Bank as security towards packing credit facilities availed by the Parent Company for the year ended March 31, 2022.
* Units are not presented as they are below the rounding off norms adopted by the Group.
Aggregate book value of quoted investments 46,400 39,148
Aggregate market value of quoted investments 46,400 39,148
Aggregate value of unquoted investments 762 -
Aggregate amount of impairment in value of investments - -
12 Trade receivables Carried at amortised cost
March 31, 2022 March 31, 2021
Current
Trade receivables - others 16,732 12,192
Trade receivables - related party - refer note 39 6 -
Total trade receivables 16,738 12,192
Break-up for security details
Unsecured, considered good 18,248 13,593
18,248 13,593
Impairment allowance
Unsecured, considered good (1,510) (1,401)
Trade receivables net of impairment 16,738 12,192

Corporate Overview1 Statutory Reports2 Financial Statements3
329
Annual Report 2021-22
Notes to the Consolidated Financial Statements for the year ended March 31, 2022(All amounts in ` Lacs, unless otherwise stated)
Trade receivables Ageing ScheduleAs at March 31, 2022 Outstanding for the following periods from the due date of payment Total
Current but not due
Less than 6 months
6 months-1 years
1-2 years 2-3 years More than 3 years
Undisputed Trade receivables - considered good
13,346 3,714 484 448 130 126 18,248
Undisputed Trade receivables - which have significant increase in credit risk
- - - - - - -
Undisputed Trade receivables - credit impaired
- - - - - - -
Disputed Trade receivables - considered good
- - - - - - -
Disputed Trade receivables - which have significant increase in credit risk
- - - - - - -
Disputed Trade receivables - credit impaired
- - - - - - -
Total 13,346 3,714 484 448 130 126 18,248 Less: Impairment allowance (1,510)Total 16,738
As at March 31, 2021 Outstanding for the following periods from the due date of payment TotalCurrent but
not dueLess than 6 months
6 months-1 years
1-2 years 2-3 years More than 3 years
Undisputed Trade receivables - considered good
9,201 3,760 282 177 37 136 13,593
Undisputed Trade receivables - which have significant increase in credit risk
- - - - - - -
Undisputed Trade receivables - credit impaired
- - - - - - -
Disputed Trade receivables - considered good
- - - - - - -
Disputed Trade receivables - which have significant increase in credit risk
- - - - - - -
Disputed Trade receivables - credit impaired
- - - - - - -
Total 9,201 3,760 282 177 37 136 13,593 Less: Impairment allowance (1,401)Total 12,192
(i) No trade or other receivable are due from directors or other officers of the company either severally or jointly with any other person. Nor any trade or other receivable are due from firms or private companies respectively in which any director is a partner, a director or a member.
(ii) Trade receivables are non-interest bearing and are generally on terms of immediate to 180 days.
(iii) For terms and conditions relating to related party receivables refer note 39.
(iv) For unbilled revenue refer note 7
13 Cash and cash equivalentsMarch 31, 2022 March 31, 2021
Balances with banks:- in current accounts 5,649 4,179 - in EEFC accounts 1,080 2,029 Deposits with original maturity of less than three months - refer note below - 2,375
6,729 8,583

330
Annual Report 2021-22
Notes to the Consolidated Financial Statements for the year ended March 31, 2022(All amounts in ` Lacs, unless otherwise stated)
Note:
Short-term deposits are made for varying periods of between one day and three months, depending on the immediate cash requirements of the Group, and earn interest at the respective short-term deposit rates.
14 Bank and bank balance other than cash and cash equivalentsMarch 31, 2022 March 31, 2021
Fixed deposit 9,092 2,940
Margin money deposits - refer note (i) below 972 2,995
Balances with bank in unpaid dividend account 7 -
10,071 5,935
(i) Margin money deposit is used to secure:
Working capital facility and bank overdrafts 200 2,100
Guarantees given 772 895
15 Share Capital Equity share capital i) Authorised share capital
Numbers AmountEquity share capital of ` 2 eachAs at April 01,2020 5,00,00,000 1,000Increase during the year - refer note below 17,93,00,000 3,586As at March 31, 2021 22,93,00,000 4,586Increase during the year - refer note below - - As at March 31, 2022 22,93,00,000 4,586
On April 29, 2020, the Board of Directors of the Company increased the authorised share capital of the Company to `. 4,586 Lacs divided into 22,93,00,000 equity shares of ` 2 each.
ii) Issued, subscribed and fully paid up Equity share capital
Numbers AmountEquity share capital of ` 2 each, fully paid upAs at April 01,2020 4,38,99,177 879Conversion of preference shares during the year - refer note (1) below 9,08,47,235 1,817Exercise of share options - refer note (2) below 4,10,386 8Issued during the year - refer note (3) below 66,26,506 133As at March 31, 2021 14,17,83,304 2,837Exercise of share options - refer note (2) below 8,25,563 17As at March 31, 2022 14,26,08,867 2,854
(1) During the year ended March 31, 2021, 5,57,345 Series A 14% Non Cumulative Compulsorily Convertible Preference Shares (CCPS) were converted into equity at a ratio of 1:163.
(2) During the year ended March 31, 2022, Employee Benefit Trust (EBT) issued 8,25,563 (March 31, 2021 - 4,10,386) equity shares to the employees upon exercise of employee stock options.
(3) During the year ended March 31, 2021, the Company has allotted 66,26,506 equity shares of face value ` 2 each, at a premium of ` 164 per share for cash as a part of an initial public offering vide board resolution dated September 15, 2020. Transaction costs pertaining to the issue, net of reimbursements have been debited to securities premium account.
(iii) Terms/ rights attached to equity shares The Company has a single class of equity share of par value ` 2 each. Each holder of the equity shares is entitled to one
vote per share and carries a right to dividends as and when declared by the Company.

Corporate Overview1 Statutory Reports2 Financial Statements3
331
Annual Report 2021-22
Notes to the Consolidated Financial Statements for the year ended March 31, 2022(All amounts in ` Lacs, unless otherwise stated)
In the event of liquidation of the Company, the holders of equity shares, will be entitled to receive any of the remaining assets of the Company after distribution of all preferential amounts.
(iv) Details of shareholders holding more than 5% shares in the Company:
March 31, 2022 March 31, 2021No. of Shares Holding percentage No. of Shares Holding percentage
Equity shares of ` 2 each fully paidMr. Ashok Soota (Promoter) 6,00,68,668 42.12% 6,00,61,701 42.36%Ashok Soota Medical Research LLP 1,79,48,784 12.59% 1,79,48,784 12.66%
As per the records of the Company, including its register of shareholders/members and other declarations received from shareholders regarding beneficial interest, the above shareholding represents legal ownership of shares.
(v) The Company has not issued any bonus shares or shares for consideration other than cash during the period of five years immediately preceding the reporting date.
(vi) Details of shares held by promoters
As at March 31, 2022 Promoter name
No. of Shares at the beginning
of the year
Change during
the year
No. of shares at the end of the year
% of Total Shares
% change during
the yearEquity shares of ` 2 each fully paid
Mr. Ashok Soota 6,00,61,701 6,967 6,00,68,668 42.12% 0.01%
As at March 31, 2021 Promoter name
No. of Shares at the beginning
of the year
Change during
the year
No. of Shares at the end of the year
% of Total Shares
% change during
the yearEquity shares of ` 2 each fully paid
Mr. Ashok Soota 1,55,43,017 4,45,18,684 6,00,61,701 42.36% 286.42%
16 Instrument entirely in the nature of equity i) Authorised share capital
Numbers Amount
Series A 14% Non Cumulative Compulsorily Convertible Preference shares of ` 652 each
As at April 1, 2020 7,50,000 4,890
Decrease during the year - refer note below (5,50,000) (3,586)
As at March 31, 2021 2,00,000 1,304
Change during the year - -
As at March 31, 2022 2,00,000 1,304
On April 29, 2020, the Board of Directors of the Company reduced the authorised share capital of the Company to ` 1,304 Lacs divided into 2,00,000 preference shares of ` 652 each.
ii) Issued, subscribed and fully paid up Non Cumulative Compulsorily Convertible Preference Share
Numbers AmountSeries A 14% Non Cumulative Compulsorily Convertible Preference Shares of ` 652 eachAs at April 01, 2020 5,57,345 3,634Conversion into equity shares during the year - refer note (15) (ii) (1) (5,57,345) (3,634)As at March 31, 2021 - - Conversion into equity shares during the year - - As at March 31, 2022 - -

332
Annual Report 2021-22
Notes to the Consolidated Financial Statements for the year ended March 31, 2022(All amounts in ` Lacs, unless otherwise stated)
(iii) Terms/ rights attached to convertible preference shares (a) Each holder of CCPS is entitled to receive a preferential non-cumulative dividend at 14% per annum on the par
value of each share if declared by the Board Of Directors. Holders of CCPS shall receive preferential dividend in preference to dividend payable on equity shares and shall not participate in any further dividends declared on equity shares. Preference shareholders are also entitled to vote in the shareholders meeting.
Holders of Series A 14% Non Cumulative Compulsorily Convertible Preference Shares (CCPS) are entitled to participate in the surplus proceeds (which is subject to a limit of two times the amount invested) from the Liquidation Event, if any, on a pro-rata basis along with all other holders of equity shares on a fully diluted basis.
The holders of the preference share at their option can require the Company to convert all or a part of Series A preference shares held by them into equity shares at any time during the conversion period in according to the conversion ratio defined in the agreement (i.e. 1:163).
All the preference shares shall be converted into equity shares in the ratio of 1:163 on occurrence of the following event:
1 On expiry of the conversion period.
2 Later of (a) Date of filing Red herring prospectus with SEBI (b) Such other date as may be permitted by law in connection with Qualified IPO.
3 Upon the holders of a majority of the investors shares exercising the conversion right with respect to preference shares held by them.
(iv) Details of shares held by promotersAs at March 31, 2022 Promoter
nameNo. of shares
at the beginning of the year
Change during
the year
No. of shares at the end of the year
% of Total Shares
% change during
the yearSeries A 14% Non Cumulative Compulsorily Convertible Preference shares of ` 652 each
Mr. Ashok Soota - - - 0.00% 0.00%
As at March 31, 2021 Promoter name
No of shares at the beginning
of the year
Change during
the year
No. of shares at the end of the year
% of Total Shares
% change during
the yearSeries A 14% Non Cumulative Compulsorily Convertible Preference shares of ` 652 each
Mr. Ashok Soota 3,59,601 (3,59,601) - 0.00% -100%
Treasury shares
No of shares
As at April 01 2020 54,90,638
Issue for cash on exercise of share options (4,10,386)
As at March 31, 2021 50,80,252
Issue for cash on exercise of share options (8,25,563)
As at March 31, 2022 42,54,689
For the terms/rights attached to treasury shares refer note 15 (iii) above
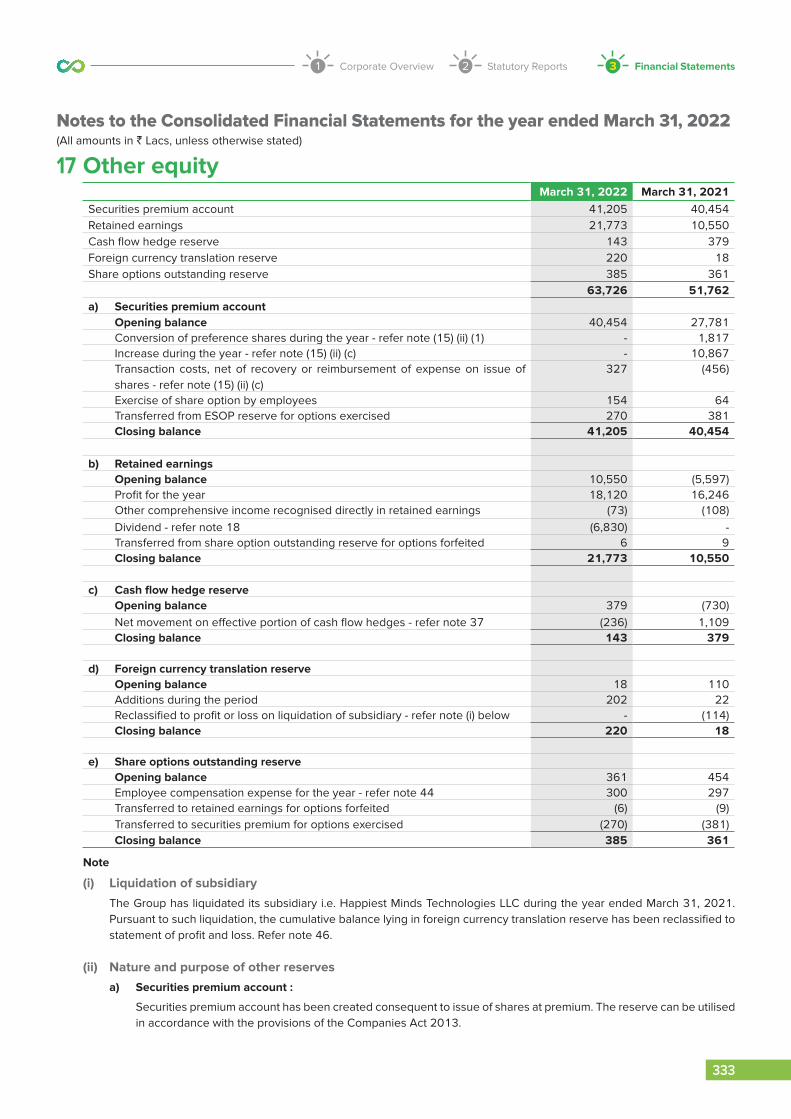
Corporate Overview1 Statutory Reports2 Financial Statements3
333
Annual Report 2021-22
Notes to the Consolidated Financial Statements for the year ended March 31, 2022(All amounts in ` Lacs, unless otherwise stated)
17 Other equityMarch 31, 2022 March 31, 2021
Securities premium account 41,205 40,454 Retained earnings 21,773 10,550 Cash flow hedge reserve 143 379 Foreign currency translation reserve 220 18 Share options outstanding reserve 385 361
63,726 51,762 a) Securities premium account Opening balance 40,454 27,781 Conversion of preference shares during the year - refer note (15) (ii) (1) - 1,817 Increase during the year - refer note (15) (ii) (c) - 10,867 Transaction costs, net of recovery or reimbursement of expense on issue of
shares - refer note (15) (ii) (c) 327 (456)
Exercise of share option by employees 154 64 Transferred from ESOP reserve for options exercised 270 381 Closing balance 41,205 40,454
b) Retained earnings Opening balance 10,550 (5,597) Profit for the year 18,120 16,246 Other comprehensive income recognised directly in retained earnings (73) (108) Dividend - refer note 18 (6,830) - Transferred from share option outstanding reserve for options forfeited 6 9 Closing balance 21,773 10,550
c) Cash flow hedge reserve Opening balance 379 (730) Net movement on effective portion of cash flow hedges - refer note 37 (236) 1,109 Closing balance 143 379
d) Foreign currency translation reserve Opening balance 18 110 Additions during the period 202 22 Reclassified to profit or loss on liquidation of subsidiary - refer note (i) below - (114) Closing balance 220 18
e) Share options outstanding reserve Opening balance 361 454 Employee compensation expense for the year - refer note 44 300 297 Transferred to retained earnings for options forfeited (6) (9) Transferred to securities premium for options exercised (270) (381) Closing balance 385 361
Note
(i) Liquidation of subsidiary The Group has liquidated its subsidiary i.e. Happiest Minds Technologies LLC during the year ended March 31, 2021.
Pursuant to such liquidation, the cumulative balance lying in foreign currency translation reserve has been reclassified to statement of profit and loss. Refer note 46.
(ii) Nature and purpose of other reserves a) Securities premium account :
Securities premium account has been created consequent to issue of shares at premium. The reserve can be utilised in accordance with the provisions of the Companies Act 2013.

334
Annual Report 2021-22
Notes to the Consolidated Financial Statements for the year ended March 31, 2022(All amounts in ` Lacs, unless otherwise stated)
b) Retained earnings :
Retained earnings comprises of prior year's and current year's undistributed earnings/accumulated losses after tax.
c) Cash flow hedge reserve :
The Group uses foreign currency forward contracts to hedge the highly probable forecasted transaction and interest rate swaps to hedge the interest rate risk associated with foreign currency term loan. The effective portion of fair value gain/loss of the hedge instrument is recognised in the cash flow hedge reserve. Amounts recognised in the cash flow hedge reserve is reclassified to the Statement of Profit and Loss when the hedged item affects profit or loss.
d) Foreign currency translation reserve :
Exchange differences arising on translation of the foreign operations are recognised in other comprehensive income as described in accounting policy and accumulated in a separate reserve within equity. The cumulative amount is reclassified to statement of profit and loss when the net investment is disposed-off.
e) Share options outstanding reserve :
The share based payment reserve is used to recognise the grant date fair value of options issued to employees under Employee Stock Option Plan.
18 Distribution madeMarch 31, 2022 March 31, 2021
Dividends on equity shares declared and paid :Final dividend paid for the year ended on March 31, 2021 : ` 3/- per share 4,311 - Interim dividend for the year ended on March 31, 2022 : 1.75/- per share (March 31, 2021 : Nil)
2,519 -
6,830 -
19 Borrowings Carried at amortised cost
March 31, 2022 March 31, 2021Non currentSecuredForeign currency term loan from bank - refer note (a) below 3,793 5,658
3,793 5,658 Less: Current maturities of term loans (2,069) (1,997)Total non-current borrowings 1,724 3,661 CurrentSecuredLoans repayable on demand from banks Foreign currency loan (PCFC) - refer note (b) and (c) below 15,271 10,972Current maturities of term loans Foreign currency term loan from bank - refer note (a) below 2,069 1,997 Total current borrowings 17,340 12,969
Notes
(a) Foreign currency term loan of ` 6,025 Lacs (USD 8.25 Mn) from Federal bank carries a fixed interest rate of 3.2% per annum (March 31, 2021 : 3.45% per annum). The loan is repayable in 36 equal monthly instalments commencing from February 28, 2021 and will mature on Feb 28, 2024. The loan is secured by the way of exclusive charge on movable fixed assets of the Parent Company (excluding leased asset charged to Hewlett packard) and also by lien on fixed deposit equivalent to two months instalments plus interest. The loan was raised exclusively for funding the acquisition of Happiest Minds Inc. (formerly known as PGS Inc.)

Corporate Overview1 Statutory Reports2 Financial Statements3
335
Annual Report 2021-22
Notes to the Consolidated Financial Statements for the year ended March 31, 2022(All amounts in ` Lacs, unless otherwise stated)
The interest rate on the loan was revised to 3.2% per annum w.e.f June 01, 2021. The Parent Company has not incurred any transaction fees for such modification and the modification has not resulted in the derecognition of the original liability. No gain/ losses was recognized pursuant to the modification.
(b) PCFC loan taken from Kotak Mahindra carries an interest rate ranging 1.2% p.a. (March 31, 2021 - 1.25 % to 3.76 % p.a.) and is repayable within 120 days.
PCFC loan taken from RBL bank carries an interest rate ranging 1.28% to 1.32% p.a. (March 31, 2021 - 1.90% to 4.07% p.a.) and is repayable within 90-120 days.
PCFC loan taken from Federal bank carries an interest rate of 1.10% to 1.39% p.a. (March 31, 2021 - 2.3% p.a.) and is repayable within 90 days.
PCFC loan taken from ICICI bank carries an interest rate of 1.15% to 1.45% p.a. (March 31, 2021 - 2.3% p.a.) and is repayable within 90 days.
(c) PCFC are fully secured by the way of pari-passu charge on current assets of the Parent Company. PCFC from RBL is additionally secured by the way of lien on mutual funds of Nil (March 31, 2021 - ` 405 Lacs) (refer note 11). PCFC from Kotak Mahindra is secured by way to lien on fixed deposits to the extent of Nil (March 31, 2021 - ̀ 600 Lacs) (Refer note 14).
The table below details change in the Group's liabilities arising from financing activities, including both cash and non-cash changes
Non-currentborrowings #
Currentborrowings
As at April 01, 2020 927 6,916
Financing cash flows (net) 4,725 4,213
Non cash movements:
Amortisation of transaction cost 11 -
Foreign exchange difference (5) (157)
As at March 31, 2021 5,658 10,972
Financing cash flows (net) (2,053) 4,012
Non cash movements:
Amortisation of transaction cost 15 -
Foreign exchange difference 173 287
As at March 31, 2022 3,793 15,271
# Current maturities of term loans are included in the Non-current borrowings
20 Lease liabilities Carried at amortised cost
March 31, 2022 March 31, 2021Non currentLease liabilities 5,911 2,645
5,911 2,645 Less: Current maturities of lease liabilities (1,792) (1,422)Total non-current lease liabilities 4,119 1,223 CurrentLease liabilities 1,792 1,422 Total current lease liabilities 1,792 1,422

336
Annual Report 2021-22
Notes to the Consolidated Financial Statements for the year ended March 31, 2022(All amounts in ` Lacs, unless otherwise stated)
(i) Movement in lease liabilities for year ended March 31, 2022 and March 31, 2021:
March 31, 2022 March 31, 2021Balance at beginning of the year 2,645 3,547 Additions 5,291 1,052 Finance cost incurred during the period - refer note 30 487 328 Payment of lease liabilities (2,512) (2,290)Exchange difference - 8 Balance at the end of the year 5,911 2,645
(ii) The table below provides details regarding the contractual maturities of lease liabilities as at March 31, 2022
and March 31, 2021
March 31, 2022 March 31, 2021Less than one year 2,264 1,600 One to five years 4,769 1,328 More than five years - -
(iii) The Group had total cash outflows of ` 2,512 Lacs during the year ended March 31, 2022 (March 31, 2021 - ` 2,290 Lacs) for leases recognized in balance sheet. The Group has made a non-cash addition to right-of-use assets and lease liabilities of ` 5,291 Lacs during the year ended March 31, 2022 (March 31, 2021 - ` 1,052 Lacs).
21 Other financial liabilitiesMarch 31, 2022 March 31, 2021
Non-currentCarried at fair value through profit or lossContingent consideration - refer note 32, 36 and 37 1,291 2,455
1,291 2,455 CurrentCarried at amortised costEmployee related liabilities 4,254 3,584 Unpaid dividend 7 -
4,261 3,584 Carried at fair value through profit or lossContingent consideration - refer note 32, 36 and 37 1,467 1,276
1,467 1,276 Carried at fair value through other comprehensive incomeCash flow hedgesForeign currency forward contracts 60 17
60 17 Total other current financial liabilities 5,788 4,877

Corporate Overview1 Statutory Reports2 Financial Statements3
337
Annual Report 2021-22
Notes to the Consolidated Financial Statements for the year ended March 31, 2022(All amounts in ` Lacs, unless otherwise stated)
22 ProvisionsMarch 31, 2022 March 31, 2021
Non-currentProvision for gratuity - refer note 35 1,618 1,653
1,618 1,653 CurrentProvision for gratuity - refer note 35 240 240Provision for compensated absences 1,432 1,243Other provisionsProvision for warranty 26 25
1,698 1,508Movement during the year - Provision for warrantyBalance as at April 01, 2020 65 Arising during the year - Utilised/ reversed during the year (40)Balance as at March 31, 2021 25 Arising during the year 1 Utilised/ reversed during the year - Balance as at March 31, 2022 26
23 Contract liabilitiesMarch 31, 2022 March 31, 2021
CurrentUnearned revenue - refer note (i) below 1,346 674
1,346 674
(i) The Group has rendered the service and have recognised the revenue of ̀ 474 Lacs (March 31, 2021: ̀ 484 Lacs) during the year from the unearned revenue balance at the beginning of the year.
24 Trade payables Carried at amortised cost
March 31, 2022 March 31, 2021Total outstanding dues of micro enterprises and small enterprises - refer note (iii) below
79 95
Total outstanding dues of creditors other than micro enterprises and small enterprises
5,993 4,404
6,072 4,499
Trade payables Ageing ScheduleAs at March 31, 2022 Outstanding for the following periods from the due
date of payment Total
Less than1 years
1-2 years 2-3 years More than3 years
Total outstanding dues of micro enterprises and small enterprises
79 - - - 79
Total outstanding dues of creditors other than micro enterprises and small enterprises
1,141 13 1 20 1,175
Disputed dues of micro enterprises and small enterprises
- - - - -
Disputed dues of creditors other than micro enterprises and small enterprises
- - - - -
Provision for expenses - - - - 4,818 1,220 13 1 20 6,072

338
Annual Report 2021-22
Notes to the Consolidated Financial Statements for the year ended March 31, 2022(All amounts in ` Lacs, unless otherwise stated)
As at March 31, 2021 Outstanding for the following periods from the due date of payment
Total
Less than1 years
1-2 years 2-3 years More than3 years
Total outstanding dues of micro enterprises and small enterprises
95 - - - 95
Total outstanding dues of creditors other than micro enterprises and small enterprises
1,054 6 10 5 1,075
Disputed dues of micro enterprises and small enterprises
- - - - -
Disputed dues of creditors other than micro enterprises and small enterprises
- - - - -
Provision for expenses - - - - 3,329
1,149 6 10 5 4,499
Terms and conditions of above trade payables:
(i) Trade payables are non-interest bearing and are normally settled on 0 to 90 days terms
(ii) For explanation of Group's liquidity risk - refer note 37 (3)
(iii) Disclosure required under Clause 22 of Micro, Small and Medium Enterprise Development Act, 2006 - refer below note
Disclosure required under Clause 22 of Micro, Small and Medium Enterprise Development Act, 2006Particulars March 31, 2022 March 31, 2021The principal amount and the interest due thereon remaining unpaid to any supplier as at the end of each accounting year:Principal amount due to micro and small enterprises 79 95Interest due on the above - -(i) The amount of interest paid by the buyer in terms of Section 16 of the MSMED
Act, 2006 along with the amounts of the payment made to the supplier beyond the appointed day during each accounting year
- -
(ii) The amount of interest due and payable for the period of delay in making payment (which has been paid but beyond appointed day during the year) but without adding the interest specified under the MSMED Act, 2006
- -
(iii) The amount of interest accrued and remaining unpaid at the end of each accounting year
- -
(iv) The amount of further interest remaining due and payable even in the succeeding years, until such date when the interest dues as above are actually paid to the small enterprise for the purpose of disallowance as a deductible expenditure under Section 23 of the MSMED Act, 2006
- -
25 Other liabilitiesMarch 31, 2022 March 31, 2021
CurrentStatutory dues payable 2,223 1,481 Other payables 203 449
2,426 1,930

Corporate Overview1 Statutory Reports2 Financial Statements3
339
Annual Report 2021-22
Notes to the Consolidated Financial Statements for the year ended March 31, 2022(All amounts in ` Lacs, unless otherwise stated)
26 Revenue from contract with customersFor the year ended
March 31, 2022 March 31, 2021Sale of service 1,09,314 77,306 Sale of licenses 51 35
1,09,365 77,341
26.1 Disaggregated revenue informationSegment For the year ended March 31, 2022
Infrastructure Management &
Security Services
Digital BusinessServices
ProductEngineering
Services
Total
Revenue from contract with customers 24,168 32,887 52,310 1,09,365 Total revenue from contracts with customers 24,168 32,887 52,310 1,09,365
India 8,821 8,099 3,674 20,594 Outside India 15,347 24,788 48,636 88,771 Total revenue from contracts with customers 24,168 32,887 52,310 1,09,365
Timing of revenue recognitionLicenses transferred at a point in time 22 28 - 50 Fixed price project - services transferred over time 11,331 12,610 3,906 27,847 Time and material - services transferred over time 12,815 20,249 48,404 81,468 Total revenue from contracts with customers 24,168 32,887 52,310 1,09,365
Segment For the year ended March 31, 2021Infrastructure
Management & Security Services
Digital Business Services
ProductEngineering
Services
Total
Revenue from contract with customers 16,421 21,288 39,632 77,341 Total revenue from contracts with customers 16,421 21,288 39,632 77,341
India 6,078 2,103 2,283 10,464 Outside India 10,343 19,186 37,348 66,877 Total revenue from contracts with customers 16,421 21,289 39,631 77,341
Timing of revenue recognitionLicenses transferred at a point in time - 35 - 35 Fixed price project - services transferred over time 7,053 10,588 2,429 20,070 Time and material - services transferred over time 9,368 10,666 37,202 57,236 Total revenue from contracts with customers 16,421 21,289 39,631 77,341
26.2 Contract balancesFor the year ended
March 31, 2022 March 31, 2021Trade receivables 16,738 12,192 Unbilled revenue 8,730 5,372 Contract assets 1,934 469 Contract liability 1,346 674
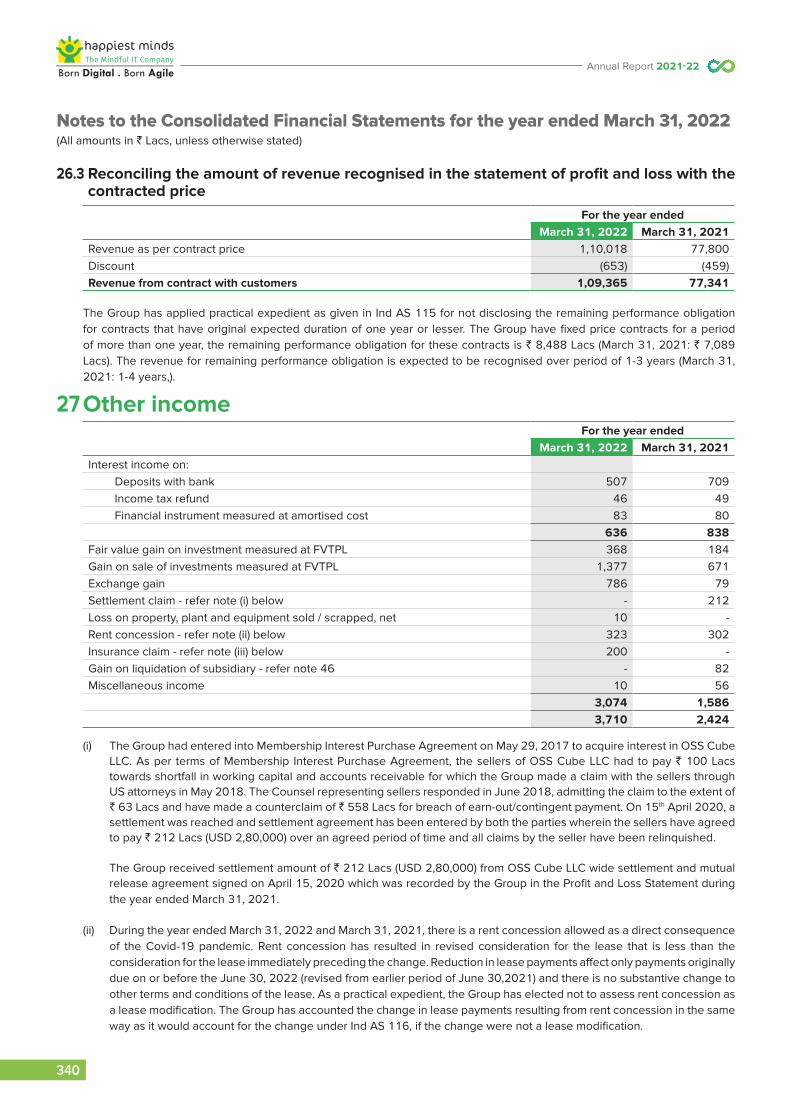
340
Annual Report 2021-22
Notes to the Consolidated Financial Statements for the year ended March 31, 2022(All amounts in ` Lacs, unless otherwise stated)
26.3 Reconciling the amount of revenue recognised in the statement of profit and loss with the contracted price
For the year endedMarch 31, 2022 March 31, 2021
Revenue as per contract price 1,10,018 77,800 Discount (653) (459)Revenue from contract with customers 1,09,365 77,341
The Group has applied practical expedient as given in Ind AS 115 for not disclosing the remaining performance obligation for contracts that have original expected duration of one year or lesser. The Group have fixed price contracts for a period of more than one year, the remaining performance obligation for these contracts is ` 8,488 Lacs (March 31, 2021: ` 7,089 Lacs). The revenue for remaining performance obligation is expected to be recognised over period of 1-3 years (March 31, 2021: 1-4 years,).
27 Other incomeFor the year ended
March 31, 2022 March 31, 2021Interest income on: Deposits with bank 507 709 Income tax refund 46 49 Financial instrument measured at amortised cost 83 80
636 838 Fair value gain on investment measured at FVTPL 368 184 Gain on sale of investments measured at FVTPL 1,377 671 Exchange gain 786 79 Settlement claim - refer note (i) below - 212 Loss on property, plant and equipment sold / scrapped, net 10 - Rent concession - refer note (ii) below 323 302 Insurance claim - refer note (iii) below 200 - Gain on liquidation of subsidiary - refer note 46 - 82 Miscellaneous income 10 56
3,074 1,586 3,710 2,424
(i) The Group had entered into Membership Interest Purchase Agreement on May 29, 2017 to acquire interest in OSS Cube LLC. As per terms of Membership Interest Purchase Agreement, the sellers of OSS Cube LLC had to pay ` 100 Lacs towards shortfall in working capital and accounts receivable for which the Group made a claim with the sellers through US attorneys in May 2018. The Counsel representing sellers responded in June 2018, admitting the claim to the extent of ` 63 Lacs and have made a counterclaim of ` 558 Lacs for breach of earn-out/contingent payment. On 15th April 2020, a settlement was reached and settlement agreement has been entered by both the parties wherein the sellers have agreed to pay ` 212 Lacs (USD 2,80,000) over an agreed period of time and all claims by the seller have been relinquished.
The Group received settlement amount of ` 212 Lacs (USD 2,80,000) from OSS Cube LLC wide settlement and mutual release agreement signed on April 15, 2020 which was recorded by the Group in the Profit and Loss Statement during the year ended March 31, 2021.
(ii) During the year ended March 31, 2022 and March 31, 2021, there is a rent concession allowed as a direct consequence of the Covid-19 pandemic. Rent concession has resulted in revised consideration for the lease that is less than the consideration for the lease immediately preceding the change. Reduction in lease payments affect only payments originally due on or before the June 30, 2022 (revised from earlier period of June 30,2021) and there is no substantive change to other terms and conditions of the lease. As a practical expedient, the Group has elected not to assess rent concession as a lease modification. The Group has accounted the change in lease payments resulting from rent concession in the same way as it would account for the change under Ind AS 116, if the change were not a lease modification.

Corporate Overview1 Statutory Reports2 Financial Statements3
341
Annual Report 2021-22
Notes to the Consolidated Financial Statements for the year ended March 31, 2022(All amounts in ` Lacs, unless otherwise stated)
(iii) An American national and an ex-employee on September 9, 2019 had filed a class-action complaint against the Parent Company before the United States District Court, Northern District of California, San Jose Division, alleging that the Parent Company engaged in discriminatory employment practices. During the adjudication process, the Court felt that the matter could be resolved through mediation and directed the parties to go in for an mediation/ settlement. The parties concluded a settlement of ` 200 Lacs during year ended March 2021. During the quarter ended June 30, 2021, the Company received reimbursements from the insurance company covering its claim covering settlement and related expenses amounting to ` 200 Lacs which has been presented under ‘Other Income’.
28 Employee benefits expenseFor the year ended
March 31, 2022 March 31, 2021Salaries, wages and bonus 57,598 41,522 Contribution to provident fund 2,839 2,087 Employee stock compensation expense - refer note 44 300 297 Gratuity expense - refer note 35 518 409 Compensated absences 607 689 Staff welfare expenses 138 234
62,000 45,238
29 Depreciation and amortisation expenseFor the year ended
March 31, 2022 March 31, 2021
Depreciation of property, plant and equipment - refer note 3 71 88
Amortisation of intangible assets - refer note 4 970 255
Depreciation of right-of-use assets - refer note 5 2,247 1,931
3,288 2,274
30 Finance costsFor the year ended
March 31, 2022 March 31, 2021
Interest expense on:
Borrowings 343 293
Lease liabilities - refer note 20 487 328
Unwinding of interest in contingent consideration 165 28
995 649
31 Other expensesFor the year ended
March 31, 2022 March 31, 2021Power and fuel 204 184 Subcontractor charges 14,056 7,445 Repairs and maintenance- Buildings 107 101 - Equipments 24 27 - Others 246 209 Rent expenses - refer note (ii) below 284 166 Advertising and business promotion expenses 282 101 Commission 99 174 Communication costs 278 257

342
Annual Report 2021-22
Notes to the Consolidated Financial Statements for the year ended March 31, 2022(All amounts in ` Lacs, unless otherwise stated)
For the year endedMarch 31, 2022 March 31, 2021
Insurance 48 46 Legal and professional fees 473 192 Audit fees - refer note (i) below 67 81 Software license cost 2,429 1,788 Rates and taxes 96 69 Recruitment charges 916 360 Impairment loss allowance on trade receivables 101 980 Impairment loss allowance on unbilled revenue 88 41 Sitting fees to non-executive directors - refer note 39 54 56 Commission to non-executive directors - refer note 39 26 24 Corporate social responsibility ('CSR') expenditure - refer note 40 215 75 Travelling and conveyance 893 427 Postage and courier 94 25 Training expense 248 120 Miscellaneous expenses 270 54
21,598 13,002
(i) Payment to auditors:
For the year endedMarch 31, 2022 March 31, 2021
As auditor: Audit fee 65 70 In other capacity Certification fees - 9 Reimbursement of expenses 2 2
67 81
(ii) Rent expense recorded under other expenses are lease rental for short-term leases
32 Exceptional ItemsFor the year ended
March 31, 2022 March 31, 2021
Fair valuation loss on contingent consideration 609 -
609 -
The Group had acquired 100% voting interest in Happiest Minds Inc. (erstwhile PGS Inc.) vide definitive agreements signed on January 27, 2021, for a total recorded consideration of US $ 13.31 Mn (` 9,720 Lacs), comprising cash consideration of US $ 8.25 Mn (` 6,025 Lacs) and fair-valued contingent consideration in the form of warrants of US $ 5.06 Mn (` 3,696 Lacs) payable over the next 3 years. The contingent consideration was classified as a financial liability within the scope of Ind AS 109 'Financial Instruments' and was measured at fair value. Ind AS 109 mandates that any subsequent changes in such fair value will have to be recognized in the statement of profit and loss. The Group carried out a fair valuation during the year ended

Corporate Overview1 Statutory Reports2 Financial Statements3
343
Annual Report 2021-22
Notes to the Consolidated Financial Statements for the year ended March 31, 2022(All amounts in ` Lacs, unless otherwise stated)
March 31,2022 and there was increase in the liability basis increasing expectation of payout. The said increase amounting to ` 609 Lacs has been recognised in the statement of profit and loss and disclosed as ‘Exceptional Item’.
33 Income tax expenseFor the year ended
March 31, 2022 March 31, 2021a) Statement of profit or loss Current tax 6,266 3,527 Adjustment of tax relating to earlier periods 44 - Deferred tax credit 155 (1,171) Income tax expense 6,465 2,356
b) Statement of other comprehensive income On net movement on effective portion of cash flow hedges 80 (127) On re-measurement losses on defined benefit plans 24 36
104 (91)Reconciliation of tax expense and tax based on accounting profit:Profit before income tax expense 24,585 18,602 Tax at the Indian tax rate of 25.17% (March 31, 2021 : 25.17%) 6,188 4,682 Tax effect of:Utilisation of previous year losses for which no deferred tax was created - (400)Deferred tax recognised during the year net of reversal of temporary difference - (1,831)Adjustment of tax relating to earlier periods 44 Permanent difference 242 Difference in tax rates (49) (8)Others 40 (87)Income tax expense 6,465 2,356
34 Earnings per share ['EPS'] The following reflects the income and share data used in the basic and diluted EPS computations:
For the year ended
March 31, 2022 March 31, 2021
Profit after tax attributable to equity holders of the Parent Company (a) (` in Lacs) 18,120 16,246
Weighted average number of shares outstanding during the year for basic EPS (b) 14,11,64,508 13,82,98,186
Weighted average number of shares outstanding during the year for diluted EPS (c) 14,44,10,568 14,18,87,367
Basic Earning per share (in `) (a/b) 12.84 11.75
Diluted Earnings per share (in `) (a/c) 12.55 11.45
Equity shares reconciliation for EPS
Equity shares outstanding 14,11,64,508 12,27,00,079
CCPS convertible into Equity shares - 1,55,98,107
Total considered for Basic EPS 14,11,64,508 13,82,98,186
Add: ESOP options / CCPS 32,46,060 35,89,181
Total considered for diluted shares 14,44,10,568 14,18,87,367

344
Annual Report 2021-22
Notes to the Consolidated Financial Statements for the year ended March 31, 2022(All amounts in ` Lacs, unless otherwise stated)
35 Employee benefits plan (i) Defined contribution plans - Provident Fund and others The Group makes contributions for qualifying employees to Provident Fund and other defined contribution plans.
During the year, the Group recognised ` 2,839 Lacs (March 31, 2021 : ` 2,087 Lacs ) towards defined contribution plans.
(ii) Defined benefit plans (funded): The Group provides for gratuity for employees in India as per the Payment of Gratuity (Amendment) Act, 2018.
Employees who are in continuous service for a period of 5 years are eligible for gratuity. The amount of gratuity payable on retirement/ termination is the employees last drawn basic salary per month computed proportionately for 15 days salary multiplied for the number of years of service. The Gratuity plan of the Group is funded with qualifying life insurance Company.
Gratuity is a defined benefit plan and Group is exposed to the following risks:
Interest risk A decrease in the bond interest rate will increase the plan liability.Investment risk The present value of the defined benefit plan liability is calculated using a discount rate which
is determined by reference to market yields at the end of the reporting period on government bonds. If the return on plan asset is below this rate, it will create a plan deficit. Currently, for the plan in India, it has a relatively balanced mix of investments in government securities, and other debt instruments.
Salary risk The present value of the defined benefit plan liability is calculated by reference to the future salaries of members. As such, an increase in the salary of the members more than assumed level will increase the plan's liability.
Longevity risk Since the benefits under the plan is not payable for life time and payable till retirement age only, plan does not have any longevity risk.
Concentration risk Plan is having a concentration risk as all the assets are invested with the insurance company.
March 31, 2022 March 31, 2021Current 240 240 Non-current 1,618 1,653
1,858 1,893
The following table sets out movement in defined benefits liability and the amount recognised in the financial statements:
Changes in the defined benefit obligation and fair value of plan assets for the year ended March 31, 2022:
Defined benefit obligation (A)
Fair value of plan assets (B)
Net amount(A-B)
As at April 1, 2021 1,997 104 1,893 Current service cost 413 - 413 Net interest expense 111 6 105 Total amount recognised in statement of profit and loss 524 6 518 Benefits paid (188) (188) - RemeasurementReturn on plan assets - - - Actuarial changes arising from changes in demographic assumptions
(138) - (138)
Actuarial changes arising from changes in financial assumptions
(21) - (21)
Experience adjustments 256 - 256 Total amount recognised in other comprehensive income 97 - 97 Contributions by employer - 650 (650)As at March 31, 2022 2,430 572 1,858

Corporate Overview1 Statutory Reports2 Financial Statements3
345
Annual Report 2021-22
Notes to the Consolidated Financial Statements for the year ended March 31, 2022(All amounts in ` Lacs, unless otherwise stated)
Changes in the defined benefit obligation and fair value of plan assets for the year ended March 31, 2021:
Defined benefit obligation (A)
Fair value of plan assets (B)
Net amount(A-B)
As at April 1, 2020 1,539 44 1,495 Current service cost 322 - 322 Net interest expense 89 3 86 Total amount recognised in statement of profit and loss 411 3 408 Benefits paid (99) (99) - RemeasurementReturn on plan assets - 2 (2)Actuarial changes arising from changes in demographic assumptions
(7) - (7)
Actuarial changes arising from changes in financial assumptions
160 - 160
Experience adjustments (7) - (7)Total amount recognised in other comprehensive income 146 2 144 Contributions by employer - 154 (154)As at March 31, 2021 1,997 104 1,893
The major categories of plan assets of the fair value of the total plan assets are as follows:
March 31, 2022 March 31, 2021Insurance fund 572 104 Total 572 104
The principal assumptions used in determining gratuity benefit obligations for the Group’s plans are shown below:
March 31, 2022 March 31, 2021Discount rate 5.66% 5.58%Expected return on plan assets 5.66% 5.58%Future salary increases 8.00 % p.a. 11.00% p.a. for the next 1 year, 7.00%
p.a. for the next 2 years, starting from the 2nd year 9.00 p.a. thereafter, starting
from the 4th yearEmployee turnover 25.00% 20.00%Mortality Indian Assured Lives Mortality
2012-14 (Urban)Indian Assured Lives Mortality
(2006-08)
A quantitative sensitivity analysis for significant assumptions are as shown below:
Sensitivity Level March 31, 2022 March 31, 2021Defined benefit obligation on increase/decrease in assumptions
Increase Decrease Increase DecreaseDiscount rate 1% increase / decrease (76) 83 (87) 96 Future salary increase 1% increase / decrease 79 (75) 91 (85)Attrition rate 1% increase / decrease (20) 21 (28) 30
The above sensitivity analysis are based on a change in an assumption while holding all other assumptions constant. In practice, this is unlikely to occur, and changes in some of the assumptions may be correlated. When calculating the sensitivity of the defined benefit obligation to significant actuarial assumptions the same method (present value of the defined benefit obligation calculated with the projected unit credit method at the end of the reporting period) has been applied as when calculating the defined benefit liability recognised in the Balance Sheet.
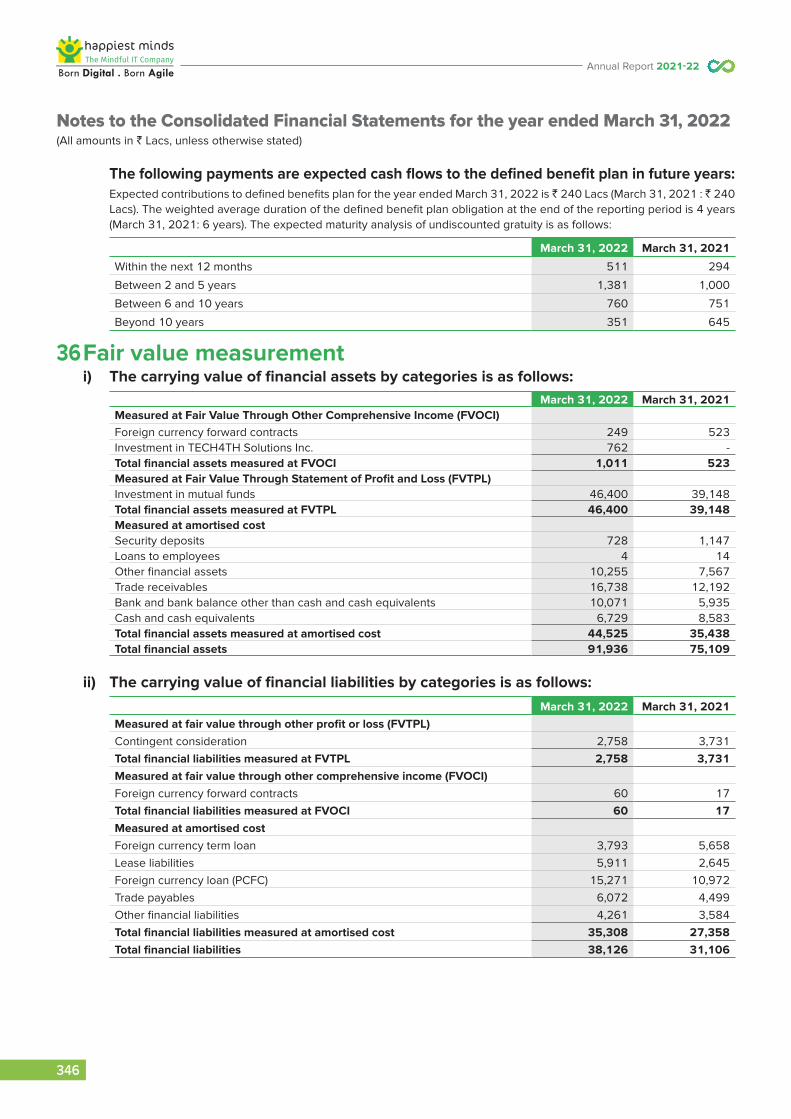
346
Annual Report 2021-22
Notes to the Consolidated Financial Statements for the year ended March 31, 2022(All amounts in ` Lacs, unless otherwise stated)
The following payments are expected cash flows to the defined benefit plan in future years: Expected contributions to defined benefits plan for the year ended March 31, 2022 is ̀ 240 Lacs (March 31, 2021 : ̀ 240
Lacs). The weighted average duration of the defined benefit plan obligation at the end of the reporting period is 4 years (March 31, 2021: 6 years). The expected maturity analysis of undiscounted gratuity is as follows:
March 31, 2022 March 31, 2021
Within the next 12 months 511 294
Between 2 and 5 years 1,381 1,000
Between 6 and 10 years 760 751
Beyond 10 years 351 645
36 Fair value measurement i) The carrying value of financial assets by categories is as follows:
March 31, 2022 March 31, 2021Measured at Fair Value Through Other Comprehensive Income (FVOCI)Foreign currency forward contracts 249 523 Investment in TECH4TH Solutions Inc. 762 - Total financial assets measured at FVOCI 1,011 523 Measured at Fair Value Through Statement of Profit and Loss (FVTPL)Investment in mutual funds 46,400 39,148 Total financial assets measured at FVTPL 46,400 39,148 Measured at amortised costSecurity deposits 728 1,147 Loans to employees 4 14 Other financial assets 10,255 7,567 Trade receivables 16,738 12,192 Bank and bank balance other than cash and cash equivalents 10,071 5,935 Cash and cash equivalents 6,729 8,583 Total financial assets measured at amortised cost 44,525 35,438 Total financial assets 91,936 75,109
ii) The carrying value of financial liabilities by categories is as follows:March 31, 2022 March 31, 2021
Measured at fair value through other profit or loss (FVTPL)Contingent consideration 2,758 3,731 Total financial liabilities measured at FVTPL 2,758 3,731 Measured at fair value through other comprehensive income (FVOCI)Foreign currency forward contracts 60 17 Total financial liabilities measured at FVOCI 60 17 Measured at amortised costForeign currency term loan 3,793 5,658 Lease liabilities 5,911 2,645 Foreign currency loan (PCFC) 15,271 10,972 Trade payables 6,072 4,499 Other financial liabilities 4,261 3,584 Total financial liabilities measured at amortised cost 35,308 27,358 Total financial liabilities 38,126 31,106

Corporate Overview1 Statutory Reports2 Financial Statements3
347
Annual Report 2021-22
Notes to the Consolidated Financial Statements for the year ended March 31, 2022(All amounts in ` Lacs, unless otherwise stated)
iii) Fair value hierarchy The following table provides the fair value measurement hierarchy of the Company's assets and liabilities:
Quoted prices in active market
(Level 1)
Significant observable
inputs (Level 2)
SignificantUnobservable
inputs(Level 3)
Total
March 31, 2022Financial assets and liabilities measured at fair valuesMeasured at fair value through other comprehensive income (FVOCI)Foreign currency forward contracts - 249 - 249 Investment in TECH4TH Solutions Inc. - - 762 762 Measured at fair value through statement of profit and loss (FVTPL)Investment in mutual funds 46,400 - - 46,400 Total financial asset measured at fair value 46,400 249 762 47,411 Measured at fair value through other comprehensive income (FVOCI)Foreign currency forward contracts - 60 - 60Measured at fair value through statement of profit and loss (FVTPL)Contingent consideration - - 2,758 2,758 Total financial liabilities measured at Fair value
- 60 2,758 2,818
Quoted prices in active market
(Level 1)
Significant observable
inputs (Level 2)
SignificantUnobservable
inputs(Level 3)
Total
March 31, 2021
Financial assets and liabilities measured at fair values
Measured at fair value through other comprehensive income (FVOCI)
Foreign currency forward contracts - 523 - 523
Measured at fair value through statement of profit and loss (FVTPL)
Investment in mutual funds 39,148 - - 39,148
Total financial asset measured at fair value 39,148 523 - 39,671
Measured at fair value through other comprehensive income (FVOCI)
Foreign currency forward contracts - 17 - 17
Measured at fair value through statement of profit and loss (FVTPL)
Contingent consideration - - 3,731 3,731
Total financial liabilities measured at Fair value
- 17 3,731 3,748
Notes:
The fair value of the financial assets and liabilities are measured at the amount at which the instrument could be exchanged in a current transaction between willing parties, other than in a forced or liquidation sale. The following methods and assumptions were used to estimate the fair values:

348
Annual Report 2021-22
Notes to the Consolidated Financial Statements for the year ended March 31, 2022(All amounts in ` Lacs, unless otherwise stated)
a) In respect of investments in mutual funds, the fair value represents net assets value (NAV) as stated by the fund house in their published statements.
b) The fair valuation of Investment in TECH4TH Solutions Inc. is determined on the reporting date by discounted cash flow method.
c) The Group has entered into foreign currency forward contract to hedge the highly probable forecast transaction. The derivative financial instrument is entered with the financial institutions with investment grade ratings. Foreign exchange forward contracts are valued based on valuation models which include use of market observable inputs, the mark to market valuation is provided by the financial institution as at reporting date. The valuation of derivative contracts are categorised as level 2 in fair value hierarchy disclosure.
d) The management assessed that cash and cash equivalent, trade receivables, trade payables, other financial assets(current), other financial liability (current), bank overdraft and cash credit, lease liabilities (current) and loans to employees approximates their fair value largely due to short-term maturities of these instruments. Further the management also estimates that the carrying amount of foreign currency term loan at fixed interest rates are the reasonable approximation of their fair value and the difference between carrying amount and their fair value is not significant.
e) The Group has value contingent consideration by using the monte carlo simulation approach.
f) The fair value of remaining financial instruments are determined on transaction date based on discounted cash flows calculated using lending/ borrowing rate. Subsequently, these are carried at amortized cost. The carrying amount of the remaining financial instruments are the reasonable approximation of their fair value.
For financial assets carried at fair value, their carrying amount are equal to their fair value.
Valuation Inputs and relationship to fair value
Level 3 inputs Weighted range Sensitivity
March 31, 2022
Contingent consideration
Standard deviation on revenue and EBIDTA growth
5% Increase and decrease in standard deviation by 1% would decrease contingent consideration by ` 131 lacs and increase contingent consideration by ` 170 lacs respectively.
Discount rate 3% Increase and decrease in discount rate by 1% would decrease contingent consideration by ` 38 lacs and increase contingent consideration by ` 39 lacs respectively.
Level 3 inputs Weighted range Sensitivity
March 31, 2021
Contingent consideration
Standard deviation on revenue and EBIDTA growth
5% Increase and decrease in standard deviation by 1% would decrease contingent consideration by ` 177 lacs and increase contingent consideration by ` 225 lacs respectively.
Discount rate 3% Increase and decrease in discount rate by 1% would decrease contingent consideration by ` 70 lacs and increase contingent consideration by ` 72 lacs respectively.

Corporate Overview1 Statutory Reports2 Financial Statements3
349
Annual Report 2021-22
Notes to the Consolidated Financial Statements for the year ended March 31, 2022(All amounts in ` Lacs, unless otherwise stated)
Reconciliation of Contingent consideration measured at FVTPL
March 31, 2022 March 31, 2021
As at April 1 3,731 -
Acquisition of subsidiary - refer note 45 - 3,695
Amount recognised in profit and loss statement - refer note 30 and 32 774 28
Settlement during the year (1,861) -
Foreign currency translation reserve 114 8
As at March 31 2,758 3,731
37 Financial risk management The Group’s principal financial liabilities comprise of borrowings, lease obligation, trade and other payables. The main purpose
of these financial liabilities is to finance the Group’s operations. The Group’s principal financial assets include security deposits, investments, trade and other receivables and cash and cash equivalents that is derived directly from its operations. The Group also enters into derivative transactions for hedging purpose.
The Group's activities exposes it to market risk, liquidity risk and credit risk. The Group's risk management is carried out by the management under the policies approved of the Board of Directors that help in identification, measurement, mitigation and reporting all risks associated with the activities of the Group. These risks are identified on a continuous basis and assessed for the impact on the financial performance. All derivative activities for risk management purposes are carried out by specialist teams that have the appropriate skills, experience and supervision. It is the Group’s policy that no trading in derivatives for speculative purposes may be undertaken. The Board of Directors reviews and agrees policies for managing each of these risks, which are summarised below.
1. Market risk Market risk is the risk that the fair value of future cash flows of a financial instrument will fluctuate because of changes
in market prices. Market risk comprises three types of risk: interest rate risk, currency risk and equity price risk. Financial instruments affected by market risk include loans and borrowings, deposits, investments, and derivative financial instruments.
i. Foreign currency risk The group’s operates in various geographies and is exposed to foreign exchange risk on its various currency
exposures. The risk of changes in foreign exchange rates relates primarily to the group’s operating activities.
The group uses foreign currency forward contract governed by its board approved policy to mitigate its foreign currency risk that are expected to occur within next 12 months period for forecasted sales. The counterparty for these contracts is generally a reputed scheduled bank. The group reports quarterly to a committee of the board, which monitors foreign exchange risks and policies implemented to manage its foreign exchange exposures.
When a derivative is entered into for the purpose of being a hedge, the group negotiates the terms of those derivatives to match the terms of the hedged exposure. For hedges of forecast transactions, the derivatives cover the period of exposure from the point the cash flows of the transactions are forecasted up to the point of sale that is denominated in the foreign currency.
Hedge effectiveness is determined at inception and periodic prospective effectiveness testing is done to ensure the relationship exist between the hedged items and hedging instruments, including whether the hedging instruments is expected to offset changes in cash flows of hedge items.

350
Annual Report 2021-22
Notes to the Consolidated Financial Statements for the year ended March 31, 2022(All amounts in ` Lacs, unless otherwise stated)
a) The Group's exposure in foreign currency at the end of reporting period :
Amount in Lacs
Currency Particulars March 31, 2022 March 31, 2021FC ` FC `
USD Financial assetsTrade receivables 142 10,796 99 7,266 Loans 30 2,277 * 4 Other financial assets 87 6,602 59 4,282 Bank accounts 46 3,506 32 2,316 Derivative assetsForeign exchange forward contracts# (505) (38,970) (493) (36,071)Net exposure on foreign currency risk (assets) - - - - Financial liabilityBorrowings 252 19,092 228 16,673 Trade payables 7 530 5 353 Other financial liabilities 20 1,553 28 2,034 Other liabilities 9 667 8 599 Net exposure on foreign currency risk (liabilities) 288 21,842 269 19,659 Net exposure on foreign currency risk (assets-liabilities)
(288) (21,842) (269) (19,659)
EURO Financial assetsTrade receivables 7 627 15 1,328 Other financial assets 6 543 2 131 Bank accounts 10 838 * 18 Derivative assetsForeign exchange forward contracts# (9) (811) (12) (1,031)Net exposure on foreign currency risk (assets) 14 1,197 5 446 Financial liabilityTrade payables 1 52 * (1)Other liabilities * 13 * 16 Net exposure on foreign currency risk (liabilities) 1 65 * 15 Net exposure on foreign currency risk (assets-liabilities)
13 1,132 5 431
GBP Financial assetsFinancial assetsTrade receivables 6 568 8 771 Loans * 7 * 2 Other financial assets 5 452 2 212 Bank accounts 4 422 1 134 Net exposure on foreign currency risk (assets) 15 1,449 11 1,119 Financial liabilityTrade payables - - * 23 Other financial liabilities 4 360 5 509 Other liabilities 1 121 1 113 Net exposure on foreign currency risk (liabilities) 5 481 6 645 Net exposure on foreign currency risk (assets-liabilities)
10 968 5 474
# Represents outstanding foreign currency forward contracts. The outstanding forward contracts as March 31, 2022 and March 31, 2021 are within the maturity period of 12 months.
* Represents number below rounding off norms of the Company.
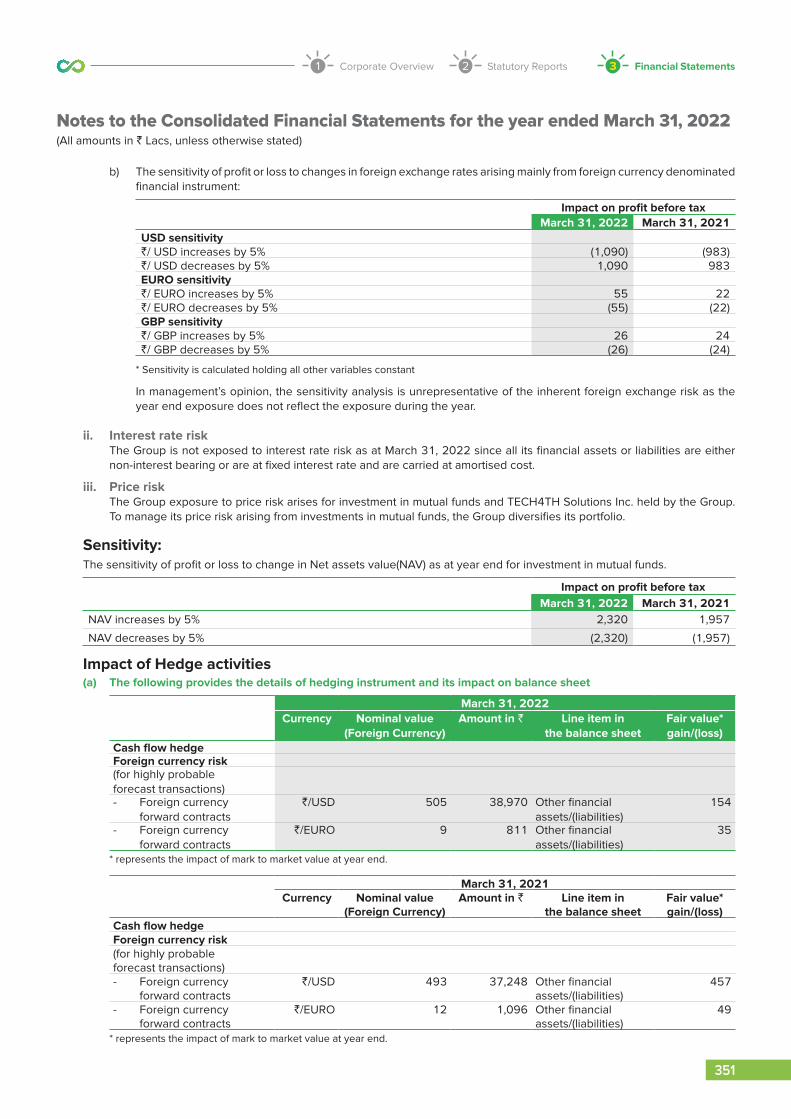
Corporate Overview1 Statutory Reports2 Financial Statements3
351
Annual Report 2021-22
Notes to the Consolidated Financial Statements for the year ended March 31, 2022(All amounts in ` Lacs, unless otherwise stated)
b) The sensitivity of profit or loss to changes in foreign exchange rates arising mainly from foreign currency denominated financial instrument:
Impact on profit before taxMarch 31, 2022 March 31, 2021
USD sensitivity`/ USD increases by 5% (1,090) (983)`/ USD decreases by 5% 1,090 983 EURO sensitivity`/ EURO increases by 5% 55 22 `/ EURO decreases by 5% (55) (22)GBP sensitivity`/ GBP increases by 5% 26 24 `/ GBP decreases by 5% (26) (24)
* Sensitivity is calculated holding all other variables constant
In management’s opinion, the sensitivity analysis is unrepresentative of the inherent foreign exchange risk as the year end exposure does not reflect the exposure during the year.
ii. Interest rate risk The Group is not exposed to interest rate risk as at March 31, 2022 since all its financial assets or liabilities are either
non-interest bearing or are at fixed interest rate and are carried at amortised cost.
iii. Price risk The Group exposure to price risk arises for investment in mutual funds and TECH4TH Solutions Inc. held by the Group.
To manage its price risk arising from investments in mutual funds, the Group diversifies its portfolio.
Sensitivity: The sensitivity of profit or loss to change in Net assets value(NAV) as at year end for investment in mutual funds.
Impact on profit before taxMarch 31, 2022 March 31, 2021
NAV increases by 5% 2,320 1,957
NAV decreases by 5% (2,320) (1,957)
Impact of Hedge activities (a) The following provides the details of hedging instrument and its impact on balance sheet
March 31, 2022Currency Nominal value
(Foreign Currency)Amount in ` Line item in
the balance sheetFair value* gain/(loss)
Cash flow hedgeForeign currency risk(for highly probable forecast transactions)- Foreign currency
forward contracts `/USD 505 38,970 Other financial
assets/(liabilities) 154
- Foreign currency forward contracts
`/EURO 9 811 Other financial assets/(liabilities)
35
* represents the impact of mark to market value at year end.
March 31, 2021Currency Nominal value
(Foreign Currency)Amount in ` Line item in
the balance sheetFair value* gain/(loss)
Cash flow hedgeForeign currency risk(for highly probable forecast transactions)- Foreign currency
forward contracts `/USD 493 37,248 Other financial
assets/(liabilities) 457
- Foreign currency forward contracts
`/EURO 12 1,096 Other financial assets/(liabilities)
49
* represents the impact of mark to market value at year end.

352
Annual Report 2021-22
Notes to the Consolidated Financial Statements for the year ended March 31, 2022(All amounts in ` Lacs, unless otherwise stated)
(b) The effect of cash flow hedge in hedge reserve and statement of profit and loss:
Highly probableforecast sales
Interest rateswaps
Total
Balance as at April 1, 2020 (744) 14 (730)Hedge gain/(loss) recognised in Other Comprehensive Income (OCI)
912 (31) 881
Amount reclassified from OCI to statement of profit and loss 338 17 355 Income tax effect (127) - (127)Balance as at March 31, 2021 379 - 379 Hedge gain/(loss) recognised in Other Comprehensive Income (OCI)
189 - 189
Amount reclassified from OCI to statement of profit and loss (505) - (505)Income tax effect 80 - 80 Balance as at March 31, 2022 143 - 143
Reclassification for foreign currency forward contracts is recognised in foreign exchange gain or loss in Statement of Profit and Loss.
2. Credit risk Credit risk is the risk that counter party will not meet its obligations under a financial instruments or customer contract
leading to a financial loss. The Group is exposed to credit risk from its operating activities (primarily trade receivables, unbilled revenue and contract assets) and from its investing activities and from investing activities (primarily deposits with banks and investments in mutual funds).
Revenue from one customer comprises around 13% of the total revenue of the Group. The remaining revenue of the Group is spread accross wide range of customers.For receivables turnover ratio, refer note 47.
(i) Trade receivables, unbilled revenue and contract assets. Trade receivables, unbilled revenue and contract assets are typically unsecured and derived from revenue from
contracts with customers. Customer credit risks is managed by each business units subject to Group's policy and procedures which involves continuously monitoring the credit worthiness of customers to which the Group grants credits in the normal course of business. The Group follows ‘simplified approach’ for recognition of impairment loss allowance on trade receivable. Under the simplified approach, the Group does not track changes in credit risk. Rather, it recognizes impairment loss allowance based on lifetime Expected Credit Losses (ECLs) at each reporting date, right from initial recognition. The Group uses a provision matrix to determine impairment loss allowance on the portfolio of trade receivables. The provision matrix takes into account available external and internal credit risk factors and the Group's historical experience with customers. Ageing of trade receivables and the provision in books for trade receivables:
Not due 1-180days
181-365days
1-2years
2-3years
More than3 years
Total
As at March 31, 2022
Trade receivables 13,346 3,714 484 448 130 126 18,248
Unbilled Revenue 10,884
Allowance for expected loss (1,730)
Net Trade receivables 13,346 3,714 484 448 130 126 27,402
As at March 31, 2021
Trade receivables 9,201 3,760 282 177 37 136 13,593
Unbilled Revenue 5,973
Allowance for expected loss (1,533)
Net Trade receivables 9,201 3,760 282 177 37 136 18,033
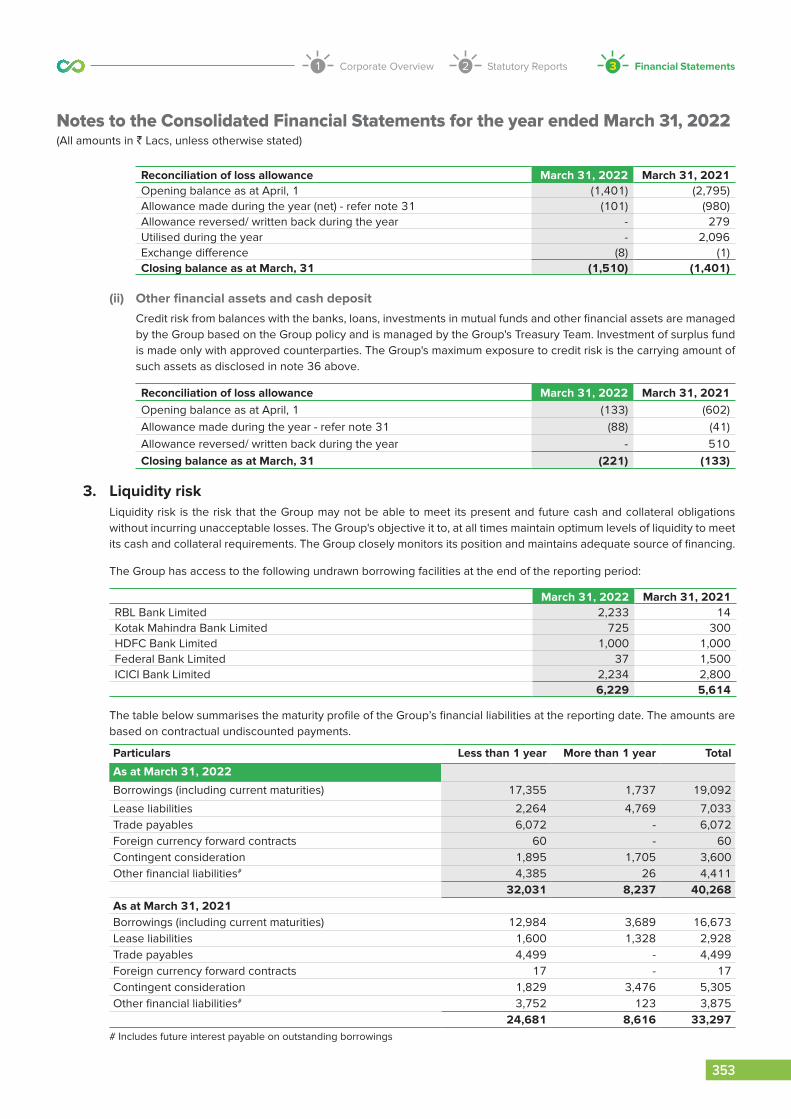
Corporate Overview1 Statutory Reports2 Financial Statements3
353
Annual Report 2021-22
Notes to the Consolidated Financial Statements for the year ended March 31, 2022(All amounts in ` Lacs, unless otherwise stated)
Reconciliation of loss allowance March 31, 2022 March 31, 2021Opening balance as at April, 1 (1,401) (2,795)Allowance made during the year (net) - refer note 31 (101) (980)Allowance reversed/ written back during the year - 279 Utilised during the year - 2,096 Exchange difference (8) (1)Closing balance as at March, 31 (1,510) (1,401)
(ii) Other financial assets and cash deposit Credit risk from balances with the banks, loans, investments in mutual funds and other financial assets are managed
by the Group based on the Group policy and is managed by the Group's Treasury Team. Investment of surplus fund is made only with approved counterparties. The Group's maximum exposure to credit risk is the carrying amount of such assets as disclosed in note 36 above.
Reconciliation of loss allowance March 31, 2022 March 31, 2021Opening balance as at April, 1 (133) (602)Allowance made during the year - refer note 31 (88) (41)Allowance reversed/ written back during the year - 510 Closing balance as at March, 31 (221) (133)
3. Liquidity risk Liquidity risk is the risk that the Group may not be able to meet its present and future cash and collateral obligations
without incurring unacceptable losses. The Group's objective it to, at all times maintain optimum levels of liquidity to meet its cash and collateral requirements. The Group closely monitors its position and maintains adequate source of financing.
The Group has access to the following undrawn borrowing facilities at the end of the reporting period:
March 31, 2022 March 31, 2021RBL Bank Limited 2,233 14 Kotak Mahindra Bank Limited 725 300 HDFC Bank Limited 1,000 1,000 Federal Bank Limited 37 1,500 ICICI Bank Limited 2,234 2,800
6,229 5,614
The table below summarises the maturity profile of the Group’s financial liabilities at the reporting date. The amounts are based on contractual undiscounted payments.
Particulars Less than 1 year More than 1 year Total
As at March 31, 2022
Borrowings (including current maturities) 17,355 1,737 19,092
Lease liabilities 2,264 4,769 7,033 Trade payables 6,072 - 6,072 Foreign currency forward contracts 60 - 60 Contingent consideration 1,895 1,705 3,600 Other financial liabilities# 4,385 26 4,411
32,031 8,237 40,268 As at March 31, 2021Borrowings (including current maturities) 12,984 3,689 16,673 Lease liabilities 1,600 1,328 2,928 Trade payables 4,499 - 4,499 Foreign currency forward contracts 17 - 17 Contingent consideration 1,829 3,476 5,305 Other financial liabilities# 3,752 123 3,875
24,681 8,616 33,297 # Includes future interest payable on outstanding borrowings

354
Annual Report 2021-22
Notes to the Consolidated Financial Statements for the year ended March 31, 2022(All amounts in ` Lacs, unless otherwise stated)
38 Capital management For the purpose of the Group’s capital management, capital includes issued equity capital, convertible preference shares,
securities premium and all other equity reserves. The primary objective of the Group’s capital management is to maintain a strong capital base to ensure sustained growth in business and to maximize the shareholders value. The capital management focuses to maintain an optimal structure that balances growth and maximizes shareholder value.
The Group manages its capital structure and makes adjustments in light of changes in economic conditions and the requirements of the financial covenants. To maintain or adjust the capital structure, the Group may adjust the dividend payment to shareholders, return capital to shareholders or issue new shares. The Group includes within net debt, interest bearing loans and borrowings, less cash and cash equivalents. The Group's gearing ratio, which is net debt divided by total capital plus net debt is as below:
Particulars March 31, 2022 March 31, 2021Borrowings (including current maturities) 19,064 16,630 Less : Cash and cash equivalents (6,729) (8,583)Net (cash and cash equivalents)/debt (A) 12,335 8,047 Equity 66,580 54,599 Total equity capital (B) 66,580 54,599 Total debt and equity (C )=(A)+(B) 78,915 62,646 Gearing ratio (A)/(C ) 16% 13%
No changes were made in the objectives, policies or processes for managing capital during the year ended March 31, 2022 and March 31, 2021.
During the year the group has not defaulted in any loan covenants.
39 Related party disclosure (i) List of related parties and relationship
Key management personnel (KMP) 1. Mr. Ashok Soota (Executive Chairman)
2. Mr. Venkatraman N (Managing Director - w.e.f November 4, 2020 and CFO)
3. Mr. Girish Paranjpe (Independent director) (till March 10, 2020)
4. Mr. Avneet Singh Kochar (Non executive director) (till November 4, 2020)
5. Mr. Joseph Vinod Anantharaju (Director) (w.e.f November 4, 2020)
6. Mr. Praveen Darshankar (Company Secretary & Compliance Officer)
7. Mrs. Anita Ramachandran (Independent director) (w.e.f June 04, 2020)
8. Mr. Rajendra Kumar Srivastava (Independent director) (w.e.f June 04,2020)
9. Mrs. Shubha Rao Mayya (Independent director) (w.e.f June 04,2020)
Entity having significant influence over the reporting entity
CMDB II (till September 7, 2020)
Relatives of KMP 1. Mr. Suresh Soota
2. Mr. Deepak Soota
3. Ms. Kunku Soota
4. Mrs. Usha Samuel
Entities under the control of KMP SKAN Research Trust
Happiest Health Systems Private Limited
Ashok Soota Medical Research LLP
Post employment benefit plan (PEBP) Happiest Minds Technologies Pvt. Ltd. Employees group gratuity trust

Corporate Overview1 Statutory Reports2 Financial Statements3
355
Annual Report 2021-22
Notes to the Consolidated Financial Statements for the year ended March 31, 2022(All amounts in ` Lacs, unless otherwise stated)
a) The following table is the summary of significant transactions with related parties by the Company:
March 31, 2022 March 31, 2021(i) Sale of service
SKAN Research Trust 7 - Ashok Soota Medical Research LLP 5 - Happiest Health Systems Private Limited 68 -
(ii) Director's sitting fees:Mrs. Anita Ramachandran 22 21 Mr. Rajendra Kumar Srivastava 11 14 Mrs. Subha Rao Mayya 21 21
(iii) Commission to directorsMrs. Anita Ramachandran 3 4 Mr. Rajendra Kumar Srivastava 19 16 Mrs. Subha Rao Mayya 4 4
(iv) Contribution made to post employee benefit plan:Happiest Minds Technologies Pvt. Ltd. Employees group gratuity trust 650 154
(v) Managerial remuneration* :Mr. Venkatraman NSalary, wages and bonus 120 112Employee stock compensation expense 5 7Mr. Ashok SootaSalary, wages and bonus 115 128Mr. Praveen DarshankarSalary, wages and bonus 46 43Employee stock compensation expense 1 1Mr. Joseph Vinod AnantharajuSalary, wages and bonus 330 128Employee stock compensation expense 8 12
* As the liability for gratuity and compensated leave absences is provided on an actuarial basis for the Group as a whole, the amount pertaining to the directors are not included above.
vi) Reimbursement of expenses received#:SKAN Research Trust 3 -Happiest Health Systems Private Limited 3 -Mr. Ashok Soota - 703CMBD II - 2,276
# Represents share issue expense incurred by the Company on behalf of the selling shareholders which was subsequently reimbursed.
vii) Dividend paidMr. Joseph Vinod Anantharaju 20 -Mr. Ashok Soota 2,853 -Mr. Venkatraman N 24 -Ashok Soota Medical Research LLP 853 -Deepak Soota 2 -Suresh Soota 1 -Kunku Soota 2 -Usha Samuel 4 -Jayalakshmi Venkatraman 16 -Praveen Kumar Darshankar 3 -

356
Annual Report 2021-22
Notes to the Consolidated Financial Statements for the year ended March 31, 2022(All amounts in ` Lacs, unless otherwise stated)
viii) Details of CCPS converted:
March 31, 2021Date of resolution Name of related party No of CCPS converted No of equity shares AmountMay 13, 2020 Mr. Ashok Soota 3,58,728 5,84,72,664 2,339 July 10, 2020 Mr. Ashok Soota 1,129 1,84,027 7 July 10, 2020 Mr. Venkatraman N 2,099 3,42,137 14 July 10, 2020 CMDB II 1,67,173 2,72,49,199 1,090 July 10, 2020 Mr. Suresh Soota 193 31,459 1 July 10, 2020 Mr. Deepak Soota 301 49,063 2 July 10, 2020 Ms. Kunku Soota 260 42,380 2 July 10, 2020 Mrs. Usha Samuel 482 78,566 3
b) The balances receivable from and payable to related parties are as follows :
March 31, 2022 March 31, 2021(i) Trade receivables:
SKAN Research Trust 6 - (ii) Unbilled receivables:
Happiest Health Systems Private Limited 67 - (vi) Trade Payables
Mrs. Anita Ramachandran 3 4 Mr. Rajendra Kumar Srivastava 19 16 Mrs. Subha Rao Mayya 4 4
Terms and conditions of transactions with related parties:
The sales to and purchases from related parties are made on terms equivalent to those that prevail in arm’s length transactions. Outstanding balances at the year-end are unsecured and interest free and settlement occurs in cash. There have been no guarantees provided or received for any related party receivables or payables. For the year ended March 31, 2022, the Group has not recorded any impairment of receivables relating to amounts owed by related parties . This assessment is undertaken each financial year through examining the financial position of the related party and the market in which the related party operates.
40 Corporate Social Responsibility ('CSR') expenditure Details of CSR expenditure are as follows:
March 31, 2022 March 31, 2021(a) Gross amount required to be spent by the Group during the year 205 64(b) Amount approved by the board to be spent during the year 215 75(c) Amount spent during the year ending on March 31, 2022 : In cash Yet to
be paid in cashTotal
i) Construction/ Acquisition of any asset - - - ii) On purpose other than above 215 - 215(d) Amount spent during the year ending on March 31, 2021 : In cash Yet to
be paid in cashTotal
i) Construction/ Acquisition of any asset - - - ii) On purpose other than above 75 - 75(e) Details related to spent/ unspent obligations: i) Contribution to Public Trust - - ii) Contribution to Charitable Trust 215 75 iii) Unspent amount in relation to: - Ongoing project - - - Other than ongoing project - -
215 75

Corporate Overview1 Statutory Reports2 Financial Statements3
357
Annual Report 2021-22
Notes to the Consolidated Financial Statements for the year ended March 31, 2022(All amounts in ` Lacs, unless otherwise stated)
Details of ongoing project and other than ongoing projectIn case of S. 135(6) (Ongoing Project)
Opening balance Amountrequired
to be spentduring the year
Amount spent during the year Closing balance
With Company In Separate CSR unspent A/c
From Company's bank A/c
From separate CSR unspent A/c
With Company
In separate CSR unspent A/c
- - - - - - -
In case of S. 135(5) (Other than ongoing Project)Opening balance Amount deposited in
specified fund of Sch. VII within 6 months
Amount required to be spent
during the year
Amount spent during the year
Closing balance
- - 205 215 -
In case of S. 135(5) Excess amount spentOpening balance Amount required to be spent
during the yearAmount spent during the year
Closing balance
(11) 205 215 (21)
41 Interest in other entities a) Subsidiary The Group's subsidiary is set out below. Unless otherwise stated, they have share capital consisting solely of equity
shares that are held directly by the Group and proportion of ownership interests held equals the voting rights held by the Group. The country of incorporation or registration is also their principal place of business:
Name of entity Principle activity
Country of Incorporation
Ownership interest
held by the group %
Ownership interest
held by the group %
March 31, 2022 March 31, 2021
Happiest Minds Technologies LLC* IT Services USA Nil Nil
Happiest Minds Inc. (formerly known as PGS Inc.)#
IT Services USA 100 100
* Liquidated on June 1, 2020. Refer note 46
# Refer note 45
b) Additional information, as required under schedule III of the Companies Act, 2013, as required enterprises considered as subsidiary.
March 31, 2022Net assets Share in profit or loss Share in other
comprehensive incomeShare in total
comprehensive incomeAs a % of
Consolidated net assets
Amount As a % of Consolidated profit or loss
Amount As a % of Consolidated
OCI
Amount As a % of Consolidated
TCI
Amount
Parent companyHappiest Minds Technologies Ltd
100.6% 66,974 102.9% 18,648 288.8% (309) 101.8% 18,339
SubsidiaryHappiest Minds Inc. (formerly known as PGS Inc.)
(4.9%) (3,252) 0.8% 141 0.0% - 0.8% 141
Other adjustments: 4.3% 2,858 (3.7%) (669) (188.8%) 202 (2.6%) (467)Total 100% 66,580 100% 18,120 100% (107) 100% 18,013

358
Annual Report 2021-22
Notes to the Consolidated Financial Statements for the year ended March 31, 2022(All amounts in ` Lacs, unless otherwise stated)
March 31, 2021
Net assets Share in profit or loss Share in other comprehensive income
Share in total comprehensive income
As a % of Consolidated
net assets
Amount As a % of Consolidated profit or loss
Amount As a % of Consolidated
OCI
Amount As a % of Consolidated
TCI
Amount
Parent company
Happiest Minds Technologies Ltd
100.1% 54,667 99.7% 16193 97.8% 1,000 99.6% 17,193
Subsidiary
Happiest Minds Technologies LLC
0.0% - 0.5% 79 0.0% - 0.4% 79
Happiest Minds Inc.(formerly known as PGS Inc.)
0.8% 425 0.3% 54 0.0% - 0.3% 54
Other adjustments: (0.9%) (493) (0.5%) (80) 2.2% 23 (0.3%) (57)
Total 100% 54,599 100% 16,246 100% 1,023 100% 17,269
42 Commitments and Contingent Liabilities i) Capital Commitments
March 31, 2022 March 31, 2021Capital commitments towards purchase of capital assets 638 152
ii) Other claims against the Group not provided for in the books a) Compounding and Settlement Applications filed by the Group
A compounding application had been filed by the Group before the National Company Law Tribunal (NCLT) and Registrar of Companies, Bombay (“RoC”), in relation to allotments of Equity Shares made by the Company during year ended March 31, 2013 and 2014 under ESOP Scheme 2011 and ESOP Scheme 2011 USA, where certain allotments were made in contravention of Section 67(3) of the Companies Act, 1956.
The Board, vide a resolution passed at its meeting held on August 4, 2020 voluntarily decided to provide an exit offer to the shareholders. Upon completion of the exit offer, the Company had filed a compounding application with the RoC (which will be forwarded to the National Company Law Tribunal, Bengaluru bench upon approval) and a settlement application with SEBI.
The matter has been closed by ROC bangalore vide letter dated February 1, 2022 citing no contravention of Section 67(3).
b) With respect to the License Agreement entered in June 2018 between the Group and a customer, for providing software services, the customer terminated the agreement claiming non-satisfactory delivery of services and damages of ` 623 Lacs. The customer has also initiated arbitration proceedings which the Parent Company is currently contesting and is of the view that the claim is not tenable and accordingly no adjustments are made in the financial statements.
c) There are numerous interpretative issues relating to the Supreme Court (SC) judgement on PF dated February 28, 2019. As a matter of caution, the Group has taken cognizance of the matter on a prospective basis from the date of the SC order. The Group will update its provision, if any, required, on receiving further clarity on the subject.
d) The Group is also subject to certain other claims and suits that arise from time to time in the ordinary conduct of its business. While the Group currently believes that such claims, individually or in aggregate, will not have a material adverse impact on its financial position, cash flows, or results of operations, the litigation and other claims are subject to inherent uncertainties, and management’s view of these matters may change in the future. Were an unfavourable final outcome to occur in any one or more of these matters, there exists the possibility of a material adverse impact on the Group’s business, reputation, financial condition, cash flows, and results of operations for the period in which the effect becomes reasonably estimable.

Corporate Overview1 Statutory Reports2 Financial Statements3
359
Annual Report 2021-22
Notes to the Consolidated Financial Statements for the year ended March 31, 2022(All amounts in ` Lacs, unless otherwise stated)
43 Segment Information A. Description of segments and principal activities The Group executive management committee examines the Group's performance on the basis of its business units and
has identified three reportable segments:
i) Infrastructure Management & Security Services (IMSS): Infrastructure Management and Security Services (IMSS) group delivers integrated end-to-end infrastructure and
security solutions with specialization in cloud, virtualization and mobility across a multitude of industry verticals and geographies. The group provides advisory, transformation, managed & hosted services and secure intelligence solutions to clients. This group has unique productized solution platforms for smart infrastructure and security solutions provides quick to deploy, mature service delivery over Global SOC/NOC.
ii) Digital Business Services (DBS): Digital Business Services group delivers enterprise applications and customised solutions that enable organizations to
be smarter and accelerate business transformations. The group provides advisory, design & architecture, custom-app development, package implementation, testing and on-going support services to IT initiatives. The business drivers for these applications are: increasing market share, enhancing customer engagement, improving agility and efficiency of internal operations, reducing cost, driving differentiation and standardizing business processes.
iii) Product Engineering Services (PES): Product Engineering Services group assists software product companies in building robust products and services that
integrate mobile, cloud and social technologies. The group helps clients understand the impact of new technologies and incorporate these technologies into their product roadmap. This group focuses on technology depth, innovation and solution accelerators allows us to deliver time-to-market, growth and cost benefits to clients.
B. Segment revenue, segment results other information as at/ for the year:Year ended March 31, 2022 IMSS DBS PES Total
Revenue from contracts with customersExternal customers 24,168 32,887 52,310 1,09,365 Inter-segment - - - - Segment revenue 24,168 32,887 52,310 1,09,365 Segment results 5,917 8,789 20,693 35,399
Reconciliation to profit after tax:Interest income 636 Net gain on investments carried at fair value through profit or loss
1,745
Other unallocable income 1,329 Unallocable finance cost (995)Unallocable depreciation and amortisation expenses (3,288)Other unallocable expenses (10,241)Tax (6,465)Profit for the year 18,120
Segment assets 7,202 19,140 12,632 38,974 Reconciliation to total assets:
Investments 47,162 Derivative instruments 249 Other unallocable assets 26,116 Total 1,12,501

360
Annual Report 2021-22
Notes to the Consolidated Financial Statements for the year ended March 31, 2022(All amounts in ` Lacs, unless otherwise stated)
Year ended March 31, 2022 IMSS DBS PES Total
Segment liability 1,234 9,144 1,884 12,262 Reconciliation to total liabilities:Borrowings 19,064 Other unallocable liabilities 14,595 Total 45,921
Year ended March 31, 2021 IMSS DBS PES Total
Revenue from contracts with customersExternal customers 16,421 21,288 39,632 77,341Inter-segment - - - -Segment revenue 16,421 21,288 39,632 77,341Segment results 3,967 7,106 15,924 26,997
Reconciliation to profit after tax:Interest income 838Net gain on investments carried at fair value through profit or loss
855
Other unallocable income 647Unallocable finance cost (642)Unallocable depreciation and amortisation cost (2,198)Other unallocable expenses (7,895)Tax (2,356)Profit for the year 16,246
Segment assets 4,282 5,741 8,284 18,307
Reconciliation to total assets:Investments 39,148Derivative instruments 523Other unallocable assets 34,217Total 92,195
Segment liability 396 1,874 1,174 3,444Reconciliation to total liabilities:Borrowings 18,627Other unallocable liabilities 15,525Total 37,596
Note
(i) Assets (other than accounts receivable and unbilled revenue) and liabilities (other than unearned revenue) of the Group are used interchangeably between segments, and the management believes that it can not be allocated to specific segment.
(ii) The expense / income that are not directly attributable and that cannot be allocated to a business segment on a reasonable basis are shown as unallocable expenses

Corporate Overview1 Statutory Reports2 Financial Statements3
361
Annual Report 2021-22
Notes to the Consolidated Financial Statements for the year ended March 31, 2022(All amounts in ` Lacs, unless otherwise stated)
C. Entity-wide disclosures i) The amount of revenue from external customers broken down by location of customers is shown below:
For the year endedMarch 31, 2022 March 31, 2021
India 20,594 10,464 USA 71,141 56,517 UK 11,332 7,611 Others 6,298 2,749
1,09,365 77,341
ii) The break-up of non-current assets by location of assets is shown below:
As atMarch 31, 2022 March 31, 2021
India 6,382 2,902 USA 9,412 9,940 UK 1 1
15,795 12,843
Non-current assets for this purpose consists of Property, plant and equipment, intangible assets and right-of-use assets.
ii) Revenue from customers of the Group which is individually more than 10 percent of the Group's total revenue:
As atMarch 31, 2022 March 31, 2021
One customer 12.97% 14.52%
44 Share based payments Employee Share Option Plan (ESOP) The Parent Company instituted the Employee Share Option Plan 2011 (""ESOP 2011"") and Equity Incentive Plan 2011 (""EIP
2011"") for eligible employees during the year ended March 2012 which was approved by the Board of Directors (Board) on October 18, 2011 and January 19, 2012 duly amended by the Board on January 22, 2015.
Besides the above plan, the Parent Company has also instituted Employee Share Option Plan 2014 (""ESOP 2014"") duly approved by the Board on October 20, 2014 and by the shareholders on January 22, 2015. The Parent Company has also instituted Employee Share Option Plan 2015 (""ESOP 2015"") duly approved by the Board on June 30, 2015 and by the shareholders on July 22, 2015. During year ended 2018, the Parent Company has amended ESOP 2014 and all options granted under ESOP 2014 be deemed to be granted under ESOP 2011 duly approved by the Board on October 25, 2017. The plans are separate for USA employees (working out of the United States America - ""USA"") and employees working outside USA. The Parent Company administers these plans.
On April 29, 2020 the Board of the Parent Company approved Happiest Minds Employee Stock Option Scheme 2020 (""ESOP 2020"") consisting of 70,00,000 equity shares. The Parent Company will henceforth issue grants under the ESOP 2020 only.
The contractual term of each option granted is 5-8 years.

362
Annual Report 2021-22
Notes to the Consolidated Financial Statements for the year ended March 31, 2022(All amounts in ` Lacs, unless otherwise stated)
Key features of these plans are provided in the below table:
Key Terms ESOP 2011 ESOP 2014 / EIP 2011 for US Employees
ESOP 2015 / EIP 2011 for US Employees
ESOP 2020
Class of Share Equity Shares (as amended vide board meeting held on April 26, 2017 and Annual general meeting held on July 31, 2017).
Pursuant to conversion of Class B Non-voting Equity Shares (entitled under ESOP 2014) to Equity shares (as amended vide board meeting held on April 26, 2017 and Annual general meeting held on July 31, 2017), the Board of Directors at its meeting held on October 25, 2017 approved the administration of options granted and shares allotted under erstwhile ESOP 2014 to ESOP 2011.
Equity Shares (as amended vide board meeting held on April 26, 2017 and Annual general meeting held on July 31, 2017).
Equity Shares (as amended vide board meeting held on April 29, 2020 and extra ordinary general meeting held on May 13, 2020).
Ownership Legal Ownership Legal Ownership Legal Ownership
Vesting Pattern Four-year vesting term and vest at the rate of 15%, 20%, 30% and 35% at the end of 1,2,3 and 4 years respectively from the date of grant and become fully exercisable, subject to employee being in the employment of the Parent Company.
Exercise Price Exercisable at an exercise price of ` 2, ` 3, ` 5 and ` 6 per option.
Exercisable at an exercise price of ` 2 and ` 6 per option.
Exercisable at an exercise price of ` 2, ` 6.25, ` 9.50, ` 11.50 and ` 26 per option.
No grant has been made under this scheme
Economic Benefits / Voting Rights
The holders of the equity shares will be entitled to the economic benefits of holding these shares only after the completion of the various vesting terms mentioned above and shall acquire voting rights as a shareholder of the Parent Company as duly approved by the shareholders at the meeting held on July 31, 2017.
For the year endedMarch 31, 2022 March 31, 2021
Employee stock compensation expense 300 297
Movements during the year The following table illustrates the number and weighted average exercise price of share options during the year
March 31, 2022
Options - India/UK Plan Employee Stock Ownership Plan 2011 Employee Stock Ownership Plan 2015No. of options WAEP* No. of options WAEP*
Outstanding at the beginning of the year
1,27,868 5.98 39,65,379 25.31
Granted during the year - - - - Exercised during the year (35,600) 5.24 (8,13,898) 23.26 Forfeited during the year (3,600) 6.00 (3,92,774) 25.82 Outstanding options as at the end of the year
88,668 6.28 27,58,707 25.85
Weighted Average Remaining Contractual Life
0.12 years 4.59 years

Corporate Overview1 Statutory Reports2 Financial Statements3
363
Annual Report 2021-22
Notes to the Consolidated Financial Statements for the year ended March 31, 2022(All amounts in ` Lacs, unless otherwise stated)
Options - USA Plan Equity Incentive Plan for US Employees-2011
Equity Incentive Plan for US Employees-2011
No. of options WAEP* No. of options WAEP*Outstanding at the beginning of the year
20,000 6.00 49,470 24.18
Granted during the year - - - - Exercised during the year (4,000) 6.00 (17,890) 20.98Forfeited during the year - - (1,750) 26.00 Outstanding options as at the end of the year
16,000 6.00 29,830 26.00
Weighted Average Remaining Contractual Life
0.42 years 3.66 years
March 31, 2021
Options - India/UK Plan Employee Stock Ownership Plan 2011 Employee Stock Ownership Plan 2015No. of options WAEP* No. of options WAEP*
Outstanding at the beginning of the year
2,41,788 5.86 50,28,066 24.59
Granted during the year - - 37,000 26.00 Exercised during the year (92,170) 5.77 (5,74,205) 18.95 Forfeited during the year (21,750) 5.56 (5,25,482) 25.37 Outstanding options as at the end of the year
1,27,868 5.98 39,65,379 25.31
Weighted Average Remaining Contractual Life
0.18 years 5.07 years
Options - USA Plan Equity Incentive Plan for US Employees-2011
Equity Incentive Plan for US Employees-2011
No. of options WAEP* No. of options WAEP*Outstanding at the beginning of the year
20,000 6.00 56,375 24.41
Granted during the year - - - - Exercised during the year - - (6,905) 26.00 Forfeited during the year - - - - Outstanding options as at the end of the year
20,000 6.00 49,470 24.18
Weighted Average Remaining Contractual Life
0.8 years 3.73 years
* Weighted Average Exercise Price
No options were granted during the year. The weighted average fair value of the options granted during the year ended March 31, 2021 is ` 12.23.
The weighted average share price of shares exercised during the year is ` 963.88 (March 31, 2021 - ` 372.61)
Exercisable options as at March 31, 2022 - 8,47,466 options (March 31, 2021 - 7,77,628 options) and weighted average exercise price - ` 22.92 (March 31, 2021 - ` 18.59)
The Black Scholes valuation model has been used for computing the weighted average fair value considering the following inputs:
March 31, 2022 March 31, 2021Expected dividend yield NA 0.00%Expected Annual Volatility of Shares NA 50.00%Risk-free interest rate (%) NA 6.98%Exercise price (`) NA 26.00 Expected life of the options granted (in years) NA 3-6 years
The expected life of the stock is based on historical data and current expectations and is not necessarily indicative of exercise patterns that may occur. The expected volatility reflects the assumption that the historical volatility over a period similar to the life of the options is indicative of future trends, which may also not necessarily be the actual outcome.

364
Annual Report 2021-22
Notes to the Consolidated Financial Statements for the year ended March 31, 2022(All amounts in ` Lacs, unless otherwise stated)
45Business acquisitions Acquisition during the year ended March 31, 2021 On January 27, 2021, the Company signed definitive agreements acquiring 100% voting interest in PGS Inc., a US based
end-to-end digital e-commerce solutions Company, from Moonscape Inc., USA (Parent Company of PGS Inc.) for total computed/recorded consideration of US $ 13.31 Mn (` 9,720 Lacs), comprising cash consideration of US $ 8.25 Mn (` 6,025 Lacs) and fair-valued contingent consideration in the form of warrants of US $ 5.06 Mn (` 3,696 Lacs) over the next three years, to be settled by PGS Inc. to Moonscape Inc. with the backing by Company, of the warrant liability settlement, subject to achievement of set targets for respective years. The excess of purchase consideration recorded/paid over fair value of net assets and intangible assets acquired has been attributed to goodwill amounting to ` 7,020 Lacs. The acquisition is expected to strengthen Company’s digital e-commerce solutions to its customers looking for online offering of their products/services.
The following table presents the purchase consideration, fair value of assets and liabilities acquired and goodwill recognised on the date of control.
Details of Fair value recognised on acquisition:
March 31, 2021Intangible assets 3,107 Trade receivables 1,451 Other Financial assets - Cash and cash equivalent 1,298 Other Financial liabilities (424)Other current liabilities (290)Contract liability (297)Trade payables (1,368)Deferred tax liability on intangible assets (777)Total fair value of net assets acquired (A) 2,700 Fair value of purchase consideration (B) 9,720 Goodwill arising on acquisition (C)- (A-B) 7,020
The goodwill of ` 7,020 Lacs comprises the value of expected synergies arising from the acquisition which is not separately recognised. Goodwill is not deductible for tax purpose. Refer note 4
March 31, 2021Purchase considerationCash consideration 6,025 Fair value of contingent consideration 3,695 Total purchase consideration 9,720
Transaction costs relating to acquisition have been expensed and are included in other expenses.
Revenue and profit contribution: The acquired business contributed revenues of ̀ 1,955 Lacs and incurred net profit of ̀ 18 Lacs to the Group post its acquisition
till the year ended March 31, 2021.
If the acquisition had occurred on April 1, 2020, consolidated pro-forma revenue would have been ` 8,339 Lacs and net profit of ` 193 Lacs respectively for the year ended March 31, 2021. These amounts have been calculated using the subsidiary’s financial statements and adjusting them for:
a) differences in the accounting policies between the Group and the subsidiary, and
b) the additional depreciation and amortisation that would have been charged assuming the fair value adjustments to property, plant and equipment and intangible assets had applied from April 1, 2020, together with the consequential tax effects.

Corporate Overview1 Statutory Reports2 Financial Statements3
365
Annual Report 2021-22
Notes to the Consolidated Financial Statements for the year ended March 31, 2022(All amounts in ` Lacs, unless otherwise stated)
46 Discontinued operations - Liquidation of subsidiary The Company in its Board Meeting on March 16, 2020 passed a resolution to voluntarily dissolve and wind up the operation
of its subsidiary, i.e. Happiest Minds Technologies LLC, USA. Pursuant to such resolution, the Company had filed a request for termination of the aforesaid subsidiary and received a certificate from the Office of Secretary of State approving such winding up on June 1, 2020 and consequent to such approval the Company has liquidated its subsidiary.
Pursuant to such liquidation, the Company de-recognised the assets and liabilities and recognised a gain of ` 82 Lacs (refer note 26) including foreign currency translation reserve balance that has been reclassified as gain on liquidation of subsidiary under other income in Statement of Profit and Loss on such liquidation.
The operation of the aforesaid subsidiary is not material to the Group. Hence, the Group has disclosed the results and financial position of such subsidiary via this note. All other notes and disclosure given in the Consolidated Financial Statements includes the financial effect of the subsidiary operations and financial positions. The carrying amount of assets and liabilities in these Consolidated Financial Statements include approximates the fair value.
The results of Happiest Minds Technologies LLC, USA for the year are presented below:
March 31, 2021Other income 80
80 Other expense 1 Finance cost -
1 Profit /(loss) before tax 79 Tax expense - Profit /(loss) after tax from discontinued operations 79
There were no assets and liabilities of Happiest Minds Technologies LLC, USA as at March 31, 2021.
47 Ratio analysis and its elementsRatio Numerator Denominator March
31, 2022March
31, 2021%
ChangeReason for Variance
Current ratio Current Assets Current Liabilities 2.53 2.67 -5%
Shareholder's equity was lower as at March 31, 2020 resulting in higher return on equity for the year ended March 31, 2021
Debt- Equity Ratio Total Debt Shareholder’s Equity 0.38 0.35 9%Debt Service Coverage ratio
Earnings for debt service = Net profit after taxes + Non-cash operating expenses
Debt service = Interest & Lease Payments + Principal Repayments
5.88 5.61 5%
Return on Equity ratio
Net Profits after taxes – Preference Dividend
Average Shareholder’s Equity
0.30 0.40 -25%
Trade Receivable Turnover Ratio
Net revenue Average Trade Receivable
7.56 6.53 16%
Trade Payable Turnover Ratio
Net credit purchases = Gross credit purchases - purchase return
Average Trade Payables 4.02 3.27 23%
Net Capital Turnover Ratio
Net revenue Working capital = Current assets – Current liabilities
1.95 1.66 17%
Net Profit ratio Net Profit Net sales = Total sales - sales return
0.17 0.21 -19%
Return on Capital Employed
Earnings before interest and taxes
Capital Employed = Tangible Net Worth + Total Debt + Deferred Tax liability
0.31 0.30 3%
Return on Investment
Interest (Finance Income) and gain from mutual funds
Investments (includes mutual funds, investment in TECH4TH Solutions Inc. and fixed deposits)
0.04 0.04 0%

366
Annual Report 2021-22
Notes to the Consolidated Financial Statements for the year ended March 31, 2022(All amounts in ` Lacs, unless otherwise stated)
48 The Board of Directors of the Parent Company at their meeting held on May 5, 2022 recommended the payout of a final dividend of ` 2/- per equity share of face value ` 2/- each for the financial year ended March 31, 2022. This recommendation is subject to approval of shareholders at the 11th Annual General Meeting of the Group scheduled to be held on June 30, 2022.
49 The financial statements of the Company for year ended March 31, 2021 were audited by M/s S.R.Batliboi & Associates LLP, Chartered Accountants, the predecessor auditor who have expressed an unmodified audit opinion.
50 The Code on Social Security, 2020 ('Code') relating to employee benefits during employment and post-employment benefits received Presidential assent in September 2020. The Code has been published in the Gazette of India. However, the date on which the Code will come into effect has not been notified and the final rules/interpretation have not yet been issued. The Group will assess the impact of the Code when it comes into effect and will record any related impact in the period in which the Code becomes effective.
51 The full impact of COVID-19 still remains uncertain and could be different from the estimates considered while preparing these Consolidated Financial Statements. The Group will continue to closely monitor any material changes to future economic conditions.
52 The Company maintains the information and documents as required under the transfer pricing regulations under Section 92-92F of the Income Tax Act, 1961. The management is in the process of updating the transfer pricing documentation for the financial year 2021 - 2022 and is of the view that its transactions are at arm’s length and the aforesaid legislation will not have any impact on the financial statements, particularly on the amount of tax expense and that of provision for taxation.
53 Previous year's figures have been regrouped/ reclassified wherever necessary to conform with current year classification.
As per our report of even datefor Deloitte Haskins and SellsChartered AccountantsICAI Firm's Registration Number: 008072S
for and on behalf of the Board of Directors:Happiest Minds Technologies LimitedCIN : L72900KA2011PLC057931
Vikas BagariaPartnerMembership no.: 060408Place: Bengaluru, IndiaDate: May 5, 2022
Ashok SootaExecutive ChairmanDIN : 00145962 Place: Bengaluru, IndiaDate: May 5, 2022
Venkatraman NarayananManaging Director & Chief Financial OfficerDIN : 01856347 Place: Bengaluru, IndiaDate: May 5, 2022
Praveen DarshankarCompany Secretary & Compliance OfficerFCS No.: F6706Place: Bengaluru, IndiaDate: May 5, 2022

BOARD OF DIRECTORSAshok Soota Executive Chairman
Joseph Anantharaju Executive Vice Chairman
Venkatraman Narayanan Managing Director & CFO
Anita Ramachandran Independent Director
Rajendra Kumar Srivastava Independent Director
Shubha Rao Mayya Independent Director
COMMITTEES OF THE BOARD AUDIT Shubha Rao Mayya - Chairperson Anita Ramachandran - Member Venkatraman Narayanan - Member
NOMINATION, REMUNERATION & BOARD GOVERNANCE Rajendra Kumar Srivastava - Chairperson Ashok Soota - Member Anita Ramachandran - Member Shubha Rao Mayya - Member
CORPORATE SOCIAL RESPONSIBILITY Joseph Anantharaju - Chairperson Ashok Soota - Member Shubha Rao Mayya - Member
ADMINISTRATIVE AND STAKEHOLDERS RELATIONSHIP Anita Ramachandran - Chairperson Shubha Rao Mayya - Member Venkatraman Narayanan - Member
RISK MANAGEMENT Joseph Anantharaju - Chairperson Anita Ramachandran - Member Shubha Rao Mayya - Member Venkatraman Narayanan - Member
STRATEGIC INITIATIVES Rajendra Kumar Srivastava - Chairperson Ashok Soota - MemberAnita Ramachandran - Member Joseph Anantharaju - Member Venkatraman Narayanan - Member
COUNSEL/LEGAL CONSULTANTS Khaitan & Co Uday Shankar Associates Wilson Elser Moskowitz Edelman & Dicker LLP Collyer Bristow LLP Habbu & Park Eastern Bridge Kingston Smith LLPGoel & Anderson, LLC
STATUTORY AUDITORS Deloitte Haskins & Sells LLP
CONTACT DETAILS For Queries Relating to Shares [email protected] (RTA) Toll Free Number: 1800 3094001 [email protected] (Company) Phone: +91 80 6196 0300
For queries on Results/ Management Meetings [email protected] Phone: +91 80 6196 0300
WEBSITE https://www.happiestminds.com/
BANKERS Kotak Mahindra Bank Ltd RBL Bank Ltd Federal Bank Ltd ICICI Bank Ltd HDFC Bank Ltd Axis Bank LimitedStandard Chartered Bank Bank of America Citibank NA JP Morgan Chase Bank NA
SUBSIDIARY Happiest Minds Inc DBA Pimcore Global Services 3 Sugar Creek Center Blvd Ste#100 Sugar Land, TX 77478
REGISTERED & CORPORATE OFFICE Happiest Minds Technologies Limited #53/1-4, Hosur Main Road, Madivala (Next to Madivala Police Station) Bengaluru - 560068, Karnataka, India CIN: L72900KA2011PLC057931 Phone: +91 80 6196 0300/0400
OFFICES/PRESENCE INDIA Bengaluru - 1 Happiest Minds Technologies Limited SMILES 1, 3rd & 4th Floor SJR Equinox, Sy. No. 47/8 Doddathogur Village, Begur Hobli Electronics City Phase 1 Hosur Road, Bengaluru - 560100 P: +91 80 3965 3000 Bengaluru - 2 Happiest Minds Technologies Limited SMILES 2, 3 & 4 Registered Office: #53/1-4, Hosur Main RoadMadivala, (Next to Madivala Police Station) Bengaluru-560068, Karnataka, India P: +91 80 6196 0300, +91 80 6196 0400 F: +91 80 6196 0700 Pune SMILES 6 8th Floor B Wing, MCCIA Trade Tower Senapati Bapat Road, Pune - 411016 Phone: +91 20 6666 8100
Noida, NCR SMILES 5, 2nd Floor, A-42/6, Pinnacle Tower Sector-62, Noida, UP - 201301 Phone: +91 120 4740 700
UNITED STATES California 101, Metro Drive, Suite 360San Jose, CA - 95110Phone: +1 408 520 7611
Texas - 13 Sugar Creek Center BlvdSuite 100Sugar Land, TX - 77478
Texas - 211514 Cherry Heart CTAustin, TX - 78750
Washington8441, 154th Avenue NESuite 206, Redmond, Seattle, WA - 98052
Massachusetts1 Birchwood DriveWestford, MA - 01886
Nebraska3869 S 181 St, Omaha, NE - 68130 Atlanta2055 Avonleigh Dr, Cumming, Atlanta GA - 30041
UNITED KINGDOM Berkshire 450 Brook Drive Green Park Reading RG2 6UU Phone: +44 118 3340066 Fax: +44 118 3340067
CANADA Toronto 4950 Yonge Street, Suite 2200 Toronto ON M2N 6K1 Canada
AUSTRALIA Sydney Level 20, Tower 2, Darling Park 201, Sussex StreetSydney, NSW 2000 Australia Phone: +61 2 9006 1020
UAE Dubai Dubai Digital Park, DSO, A4 - 313 Telephone: +9714 5472539
THE NETHERLANDS Amsterdam Herikerbergweg 238 Place 1101 CM Amsterdam Zuidoost Telephone: +31 020 57 888 14
Corporate Information

DESIGNED FOR PERPETUITY
HAPPIEST MINDS
www.happiestminds.com