Embed Size (px)
Citation preview

PET Imaging of a4b2* Nicotinic Acetylcholine Receptors:Quantitative Analysis of 18F-Nifene Kinetics in theNonhuman Primate
Ansel T. Hillmer1,2, Dustin W. Wooten1,2, Maxim S. Slesarev2, Elizabeth O. Ahlers2, Todd E. Barnhart1,Dhanabalan Murali1,2, Mary L. Schneider3, Jogeshwar Mukherjee4, and Bradley T. Christian1,2,5
1Department of Medical Physics, University of Wisconsin-Madison, Madison, Wisconsin; 2Waisman Brain Imaging Laboratory,University of Wisconsin-Madison, Madison, Wisconsin; 3Department of Kinesiology, University of Wisconsin-Madison, Madison,Wisconsin; 4Department of Radiological Sciences, University of California-Irvine, Irvine, California; and 5Department of Psychiatry,University of Wisconsin-Madison, Madison, Wisconsin
The PET radioligand 2-fluoro-3-[2-((S)-3-pyrrolinyl)methoxy]pyr-idine (18F-nifene) is an a4b2* nicotinic acetylcholine receptor(nAChR) agonist developed to provide accelerated in vivo equi-librium compared with existing a4b2* radioligands. The goal ofthis work was to analyze the in vivo kinetic properties of 18F-nifene with both kinetic modeling and graphical analysis tech-niques. Methods: Dynamic PET experiments were performedon 4 rhesus monkeys (female; age range, 9–13 y) using a small-animal PET scanner. Studies began with a high-specific-activity18F-nifene injection, followed by a coinjection of 18F-nifene andunlabeled nifene at 60 min. Sampling of arterial blood with me-tabolite analysis was performed throughout the experiment toprovide a parent radioligand input function. In vivo kinetics werecharacterized with both a 1-tissue-compartment model (1TCM)and a 2-tissue-compartment model, Logan graphical methods(both with and without blood sampling), and the multilinear ref-erence tissue model. Total distribution volumes and nondis-placeable binding potentials (BPND) were used to compareregional binding of 18F-nifene. Regions examined include theanteroventral thalamus, lateral geniculate body, frontal cortex,subiculum, and cerebellum. Results: The rapid uptake andbinding of 18F-nifene in nAChR-rich regions of the brain wasappropriately modeled using the 1TCM. No evidence for spe-cific binding of 18F-nifene in the cerebellum was detected on thebasis of the coinjection studies, suggesting the suitability of thecerebellum as a reference region. Total distribution volumes inthe cerebellum were 6.91 6 0.61 mL/cm3. BPND values calcu-lated with the 1TCM were 1.60 6 0.17, 1.35 6 0.16, 0.26 60.08, and 0.30 6 0.07 in the anteroventral thalamus, lateralgeniculate body, frontal cortex, and subiculum, respectively.For all brain regions, there was a less than 0.04 absolute differ-ence in the average BPND values calculated with each of the1TCM, multilinear reference tissue model, and Logan methods.Conclusion: The fast kinetic properties and specific regionalbinding of 18F-nifene promote extension of the radioligand intopreclinical animal models and human subjects.
Key Words: nAChR; PET; nicotine; 18F-nifene; compartmentmodeling
J Nucl Med 2012; 53:1471–1480DOI: 10.2967/jnumed.112.103846
Much work in the last 15 y has been devoted towarddeveloping suitable PET radioligands to image a4b2* nico-tinic acetylcholine receptors (nAChRs). These ligands bindwith varying affinities to nAChRs containing either the b2 ora4 subunit, but most commonly to the a4b2 subtype, result-ing in the notation a4b2*. The impetus for developing theseprobes stems from the interest in this receptor system’s in-volvement in neurodevelopment, tobacco and alcohol addic-tion, and neuropathology. The disruption of cholinergicneurotransmission has been implicated in Alzheimer disease,leading to the application of acetylcholinesterase inhibitorsas a treatment option for the symptoms of Alzheimer disease(1,2). Evidence of declining nAChR densities has been asso-ciated with Alzheimer disease, Parkinson disease, and healthyaging (3,4). Alterations from normal nAChR functioninghave been implicated in other neurodegenerative diseases,including epilepsy (5), tobacco abuse (6), schizophrenia (7),and deficiencies in neurodevelopment, such as effects due tofetal alcohol exposure (8).
11C-nicotine was the first radioligand developed for target-ing a4b2* nAChR binding; however, it was found to havehigh nonspecific binding and rapid dissociation, renderingit unsuitable for PET studies (9). The radioligand 2-18F-FA-85380 (2-18F-FA) has been used the most extensivelyfor PET studies of a4b2* nAChRs (10,11). Because of itsslow in vivo behavior, PET experiments using 2-18F-FA re-quire more than 5 h of imaging for accurate measurementof a4b2* nAChR binding throughout all regions of the brain(12). Applications of this radioligand for PET studies haveincluded studies of healthy aging (13), Alzheimer disease(14), Parkinson disease (15), and epilepsy (16).
Received Feb. 2, 2012; revision accepted Apr. 30, 2012.For correspondence or reprints contact: Ansel T. Hillmer, Department of
Medical Physics, University of Wisconsin-Madison, 1111 Highland Ave.,Madison, WI 53705.E-mail: [email protected] online Jul. 31, 2012.COPYRIGHT ª 2012 by the Society of Nuclear Medicine and Molecular
Imaging, Inc.
ANALYSIS OF 18F-NIFENE KINETICS • Hillmer et al. 1471

The prolonged scanning procedures required for 2-18F-FAquantification has spurred the development of various newa4b2* nAChR radioligands with faster kinetic properties,including both agonists and antagonists (17). Agonist radio-ligands, in particular, are of great interest because other re-ceptor systems, including the dopamine and serotoninsystems, have found agonist radioligands to exhibit increasedsensitivity to competing endogenous neurotransmitter levels(18,19). This feature of nAChR radioligands will prove vitalin evaluating acetylcholinesterase inhibitors for applicationswith Alzheimer disease. The a4b2* agonist radioligand2-fluoro-3-[2-((S)-3-pyrrolinyl)methoxy]pyridine (18F-nifene)was developed with the aim of improving on the success of2-18F-FA by creating an analog with faster kinetic propertiesand a similar binding profile (20). Previous studies haveshown that 18F-nifene exhibits fast transient equilibrium timesof approximately 30 min, resulting in scanning procedures ofless than an hour. Elevated 18F-nifene binding in a4b2*nAChR-rich regions of the brain was also observed, withtarget-to-background binding levels suitable for applicationsin preclinical research (21). These studies preliminarily dem-onstrated the viability of 18F-nifene PET experiments fortranslation into human subjects.The goal of the present work was to extend previous
studies with 18F-nifene by examining its behavior in arterialblood to obtain quantitative measures of a4b2* nAChRbinding with both model-based and graphical analysis tech-niques. The anteroventral thalamus and lateral geniculatebody were analyzed because of their high binding levelsand their role in a variety of neurodegenerative deficits,while the subiculum and frontal cortex were also examinedas targets because of alterations in binding associated withAlzheimer disease and tobacco addiction (2,22). Blockingstudies with unlabeled nifene were performed to evaluatethe viability of the cerebellum to serve as a region of neg-ligible detectable specific binding for techniques using ref-erence region graphical analysis. These studies providea necessary step toward validating the use of 18F-nifenefor studying the nAChR system during neurodevelopmentand in disease-specific models.
MATERIALS AND METHODS
RadiochemistryA secondary goal of this work was to improve the chemical
purity of 18F-nifene from previously reported methods (20,21). Spe-cifically, high-performance liquid chromatography (HPLC) methodswere modified to enhance the separation of the intermediateN-Boc-18F-nifene from precursor after substitution. A 16-MeVPETtrace cyclotron (GE Healthcare) bombarded 18O-enriched waterwith protons, creating 18F-fluoride, which was separated from theenriched water with a QMA cartridge (Waters). After elution of 18Fwith 1.2 mL of Kryptofix (Merck)–K2CO3 solution, the 18F wasazeotropically distilled in a customized chemistry processing con-trol unit. Once dry, 0.5 mg of nitro precursor (2-nitro-3-[2-((S)-N-tert-butoxycarbonyl-3-pyrroline)methoxy]pyridine; ABX) in 250mL of anhydrous acetonitrile and 150 mL of anhydrous dimethyl-sulfoxide was added for the reaction, which was heated to 120�C for
10 min. The mixture was then extracted with 4 mL of methylenechloride and passed through a neutral alumina Sep-Pak (Waters).The methylene chloride was dried and the product purified withHPLC. The use of a new separation method—consisting ofa C-18 Prodigy column (10 mm, 250 · 10 mm; Phenomenex) witha mobile phase of 55% 0.05 M sodium acetate, 27% methanol, and18% tetrahydrofuran at a flow rate of 8.0 mL/min—was incorpo-rated into the 18F-nifene purification. This HPLC method was pre-viously developed for the synthesis of 18F-MPPF, a serotonin5-hydroxytryptamine subtype 1A radioligand whose precursoralso contains a nitro-leaving group (23). Retention time of theN-Boc-18F-nifene was approximately 14 min. The collectedeluate (;5 mL) was then diluted in 50 mL of water, trappedon a C-18 Sep-Pak (Waters), and eluted with 1 mL of acetoni-trile. Deprotection was performed with the addition of 200 mLof 6 N HCl, followed by heating at 80�C for 10 min. The mixturewas then dried and pH adjusted to 7.0 with sodium bicarbonate.Ethanol (0.5 mL) and sterile saline were added for a total volumeof 10 mL. This final product was purified with a preconditioned C-18Sep-Pak (Waters) to remove any residual intermediate species (i.e.,remaining Boc-protected product), followed by sterile filtration witha 0.22-mm Millipore filter for final formulation.
SubjectsPET scans with 18F-nifene were acquired for 4 Macaca mulatta
(rhesus monkey) subjects (4 females; weight range, 6.6–11.9 kg).All housing and experimental procedures obeyed institutionalguidelines and were approved by the institutional animal careand use committee. Subjects were anesthetized before PETprocedures with ketamine (10 mg/kg intramuscularly) and main-tained on 1%–1.5% isoflurane for the duration of the experiment.Atropine sulfate (0.27 mg intramuscularly) was administeredto minimize secretions. Body temperature, breathing rate, heartrate, and blood oxygen saturation levels were recorded for theduration of the experiment. The radiotracer was administeredvia bolus injection in the saphenous vein, and arterial blood sam-ples were withdrawn from the tibial artery in the opposing limb.After completion of the experiment, the subject was returned toits cage and monitored until fully alert.
Data AcquisitionA Concorde microPET P4 scanner was used for the acquisition
of PET data. This scanner has an axial field of view of 7.8 cm,a transaxial field of view of 19 cm, and a reported in-plane spatialresolution of 1.75 mm (24), which is slightly degraded to a2.80-mm spatial resolution in the reconstructed image using thedescribed experimental conditions and processing methods. Thesubject’s head was held in a stereotactic headholder to obtainconsistency in subject placement. A 518-s transmission scan wasthen acquired with a 57Co rotating point source. Data acquisitionbegan simultaneously with a bolus injection of 89–126 MBq (2.4–3.4 mCi) of 18F-nifene and continued for 60 min. A second in-jection of 76–124 MBq (2.1–3.4 mCi) of 18F-nifene mixed withunlabeled nifene was administered at 60 min to examine specificbinding in the cerebellum. Details of each study are presented inTable 1.
For blood analysis, a 2$ NaI(Tl) well counter cross-calibratedwith the PET scanner was used for radioactivity assay. Arterialblood was obtained in 500-mL volumes, with rapid sampling im-mediately after each 18F-nifene injection and slowing to 10-minsampling by the end of the experiment. Once withdrawn, whole-
1472 THE JOURNAL OF NUCLEAR MEDICINE • Vol. 53 • No. 9 • September 2012

blood samples were mixed with 50 mL of heparinized saline,assayed for radioactivity, and centrifuged for 5 min. Plasma samplesin 250-mL volumes were extracted, mixed with 50 mL of sodiumbicarbonate, and assayed for radioactivity. To denature the pro-teins in the plasma, 1 mL of acetonitrile was added to the samples,followed by 30 s of centrifugation. The supernatant was extractedin volumes of 850 mL for radioactivity assay. Select samples wereconcentrated and spotted on aluminum-backed silica gel thin-layerchromatography (TLC) plates (Whatman). The plates were devel-oped in a mobile phase of 50% methanol:50% 0.1 M ammoniumacetate and exposed to a phosphor plate for at least 3 h. Plateswere read with a Cyclone storage phosphor system (PerkinElmer)to determine the relative concentrations of metabolites in theplasma for each sample.
To account for radiometabolites, TLC data were analyzed withImageJ software (National Institutes of Health), and the fraction ofradioactivity in the 18F-nifene peak relative to the total spottedradioactivity was measured for each sample. The measured timecourse of the parent 18F-nifene in the plasma was parameterizedby fitting the data to a biexponential function, producing a uniqueparent curve for each subject. This function describing the fractionof nonmetabolized parent was then applied as a correction to theradioactivity measured in the acetonitrile extract to produce valuesconveying the time course of 18F-nifene parent present in thearterial blood. To examine the sensitivity of compartment-modelparameter estimates to variations in the metabolite correction,analysis of the cerebellum region was also performed witha group-based (averaged) metabolite correction.
Plasma protein binding was examined with Centrifree ultrafil-tration units (Millipore) to determine the free fraction of radio-ligand in the plasma. Before the administration of radiotracer,blood was drawn from subjects and centrifuged to yield a 250-mLplasma sample. 18F-nifene was added to each sample in 25-mLvolumes, and samples were incubated for 15 min at 37�C beforeseparation, which occurred via ultrafiltration for 15 min at 2,000g.A similar procedure was performed with 250 mL of saline tocorrect for nonspecific binding of the radioligand to the filtrationunit. The stability of the free fraction has not yet been fully char-acterized for 18F-nifene and was therefore not incorporated intothe subsequent analysis of the data; it is reported solely to provideadditional information concerning the in vivo behavior of18F-nifene.
Data AnalysisPET data were binned from list mode into time frames of 8 · 30 s,
6 · 1 min, 24 · 2 min, 12 · 30 s, 6 · 1 min, and 18 · 2 min. The
sinograms were reconstructed with 2-dimensional filtered backpro-jection using a 0.5-cm21 ramp filter. Corrections for arc, scatter,attenuation, and scanner normalization were applied during recon-struction. The reconstructed images were processed with a denoisingalgorithm (25) using a 3 · 3 · 4 voxel filtering kernel. The finalimages had a matrix size of 128 · 128 · 63 corresponding to voxeldimensions of 1.90 · 1.90 · 1.21 mm.
Circular regions of interest were drawn over brain regionsdefined on the PET images. Cerebellum regions of interest werehand drawn on early summed images (0–8 min) with 4-voxel-diameter circles over 3 consecutive transverse slices to includemainly gray matter while avoiding the vermis region, resultingin a region volume of 663 mm3 (152 voxels). Regions of highand moderate binding were identified in late summed images,from 20 to 40 min. Two general regions were selected from thethalamus, the anteroventral thalamus and lateral geniculate body,both drawn with 3-voxel-diameter circles over 3 consecutivetransverse slices, yielding corresponding volumes of 231 mm3
(53 voxels) for the anteroventral thalamus and 161 mm3 (37 voxels)for the lateral geniculate body. The frontal cortex was identifiedwith 4-voxel-diameter circles over 3 consecutive sagittal slices,resulting in a volume of 763 mm3 (175 voxels), whereas thesubiculum was delineated with 3-voxel-diameter circles over3 consecutive transverse planes, giving a volume of 314 mm3
(72 voxels). Time–activity curves were extracted for all regionsof interest.
Model-based and graphical analysis methods were both appliedfor the analysis of the 18F-nifene PET data. One-tissue- and2-tissue-compartment models (1TCM and 2TCM, respectively)were used for the model-based analysis. The compartment-modelanalyses are described by the following equations:
1TCM: dCT
dt5 K1CA 2 k
02CT
2TCM: dCND
dt5 K1CA 2
�k2 1 k3
�CND 1 k4CS
dCS
dt5 k3CND 2 k4CS;
where CA is the concentration of parent radioligand in the arterialplasma. K1 (mL/min/mL) and k2 (min21) describe plasma–to–tissuetransport and plasma–to–tissue clearance, respectively. CND repre-sents the concentration of radiotracer present in the nondisplaceablecompartment, which contains both free and nonspecifically bound
TABLE 1Summary of Experiment Protocols
First injection Second injection
Subject no.
Subject
mass (kg)
Specific activity
(GBq/mmol)
Injected dose
(MBq)
Specific activity
(GBq/mmol)
Injected dose
(MBq)
M1 6.6 255 114 1. 7 113M2 6.7 160 126 6.8 124
M3 11.9 .400 99 7.4 78
M4 8.6 120 89 0.56 76
Specific activities reported here are recorded at time of injection.
ANALYSIS OF 18F-NIFENE KINETICS • Hillmer et al. 1473

radioligand, and CS represents the concentration of radiotracerin the specifically bound compartment. Transfer between thesecompartments conveying the reversible process of specific bindingis described by the association rate k3 and the dissociation rate k4,both of which have units of min21. The 1TCM contains only theconcentration of total radioactivity in the tissue, CT, and includesonly the parameters K1 and k
02. In regions of negligible specific
binding, k02 is equal to k2, whereas in regions with rapidly equil-
ibrating specific binding, k02 is equivalent to k2(1 1 k3/k4)21. Vol-
umes of distribution (VT) were calculated for each region usingdata from the high-specific-activity injection (t, 60 min) with theequation VT 5 K1/k
02 for the 1TCM and VT 5 K1/k2(11 k3/k4) for
the 2TCM (26). VT was also calculated with the Logan graphicalmethod with blood sampling using a linearization time of t* 520 min for all regions to provide for comparison with a graphicalanalysis technique (27).
For modeling calculations, the decay-corrected PET signal ina given region of tissue represents PET 5 CND 1 CS 1 fVCWB,where fV is the fractional blood volume, assumed to be 0.04, andCWB is the concentration of radioactivity in the whole blood.Parameter estimations were performed with COMKAT software(28) with configurations for the 1TCM and 2TCM. Model com-parison was evaluated with the corrected Akaike informationcriteria (cAIC):
cAIC 5 2k 1 n ln
�RSS
n
�1
2kðk 1 1Þn 2 k 2 1
;
where k is the number of parameters in the model, n is the numberof observations used for the fit, and RSS is the residual sum ofsquares for the fit (29).
Analysis of data from the cerebellum included PET data for thesecond low-specific-activity 18F-nifene injection (t. 60 min). Theplasma input function from 15 to 60 min was fit to a biexponentialfunction and then extrapolated out past the time of the secondinjection. These extrapolated values were then subtracted fromthe observed data to strip away the first injection’s residual radio-activity from the second injection. A similar method was used tocorrect the cerebellum time–activity curves by fitting the cerebel-lum data from 20 to 60 min to a biexponential function and thensubtracting the extrapolated data from the second injection. Cer-ebellum VT values were calculated for the second injection withthe compartment modeling techniques described, with distinctparameters determined for each separate injection.
Receptor-specific binding of 18F-nifene was characterized byestimation of the binding potential (BPND). BPND values werecalculated with 2 graphical analysis techniques, the Logan graph-ical method (30) and the multilinear reference tissue model(MRTM) (31). The 3 methods previously discussed for VT calcu-lation (1TCM, 2TCM, and Logan with blood sampling) were alsoused to result in 5 different approaches to calculate BPND. Forapproaches with VT estimation, the relation BPND 5 VT/VND 2 1was used, where VND is the volume of distribution for non-displaceable uptake and is equivalent to the estimation BPND 5DVR 2 1 used in the reference region approaches. The cerebellumwas assumed to be a reference region devoid of specific bindingwhere VT 5 VND, consistent with findings presented herein andthose reported previously (21,32). Differences in parameter esti-mates between analysis methods were investigated by plottingBPND values calculated from a given method against each of theother methods and fitting the data to a line. The slope was then
subjected to a linear regression t test to determine the deviation ofthe slope from unity.
Because Logan reference region analysis is widely used forbinding quantification, the proper linearization time of thisapproach was closely examined. Values reported herein useda linearization time of t* 5 20 min for all regions and omitted themean efflux term
—k2 . The necessary time for stability of BPND
values calculated with this method was examined by varying thelength of data analyzed from 30 to 60 min. Additionally, the in-clusion of
—k2 5 0.20 min21 and a t* 5 5 min was also examined
to increase the number of points on the Logan plot for improvedquantification.
RESULTS
Radiochemistry
The new HPLC purification procedure improved separa-tion of the remaining nifene precursor from the intermedi-ate N-Boc-18F-nifene after substitution, as demonstrated byFigure 1. This modified first purification also eliminated theneed for a second HPLC separation after deprotection, be-cause this step could instead be performed with a simpleC-18 Sep-Pak extraction. As a result, the overall synthesistime was reduced from 2.5 to 1.5 h, with overall batchyields ranging from 500 to 1,500 MBq, corresponding toa 10%–20% decay-corrected radiochemical yield. Chemi-cal purities were improved by 380% with the new HPLCpurification method, primarily from the elimination of theN-Boc species, whereas end-of-synthesis specific activitieswere consistently in excess of 200 GBq/mmol.
18F-Nifene in Blood18F-nifene is rapidly metabolized in the plasma, with all
radiolabeled metabolite species being more polar than theparent compound (Fig. 2). The radioactivity in the plasmadue to presumed metabolites was predominately shown by2 overlapping peaks. Parent radioligand concentrations inplasma quickly fell to 40% after 15 min and 25% in 50 min
FIGURE 1. Semipreparative HPLC trace of N-Boc-18F-nifene pu-
rification, performed with C-18 column and mobile phase of 55%0.05 M NaAc, 27% MeOH, and 18% tetrahydrofuran at 8.0 mL/min.
UV5 ultraviolet.
1474 THE JOURNAL OF NUCLEAR MEDICINE • Vol. 53 • No. 9 • September 2012
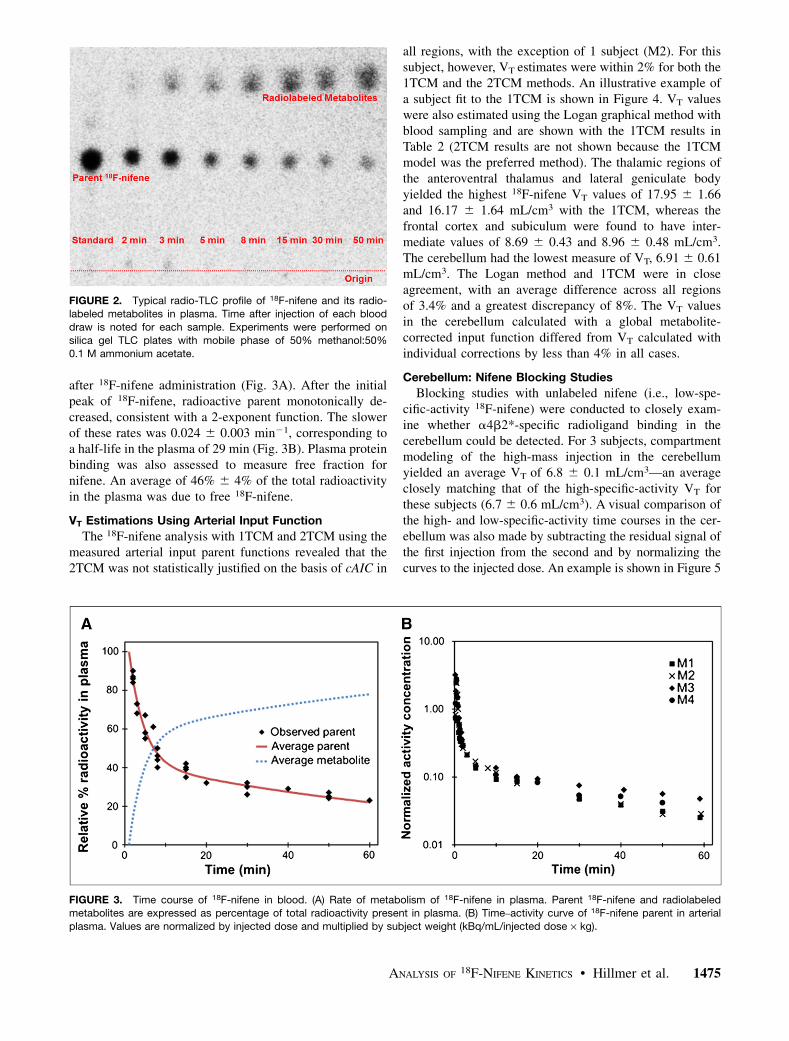
after 18F-nifene administration (Fig. 3A). After the initialpeak of 18F-nifene, radioactive parent monotonically de-creased, consistent with a 2-exponent function. The slowerof these rates was 0.024 6 0.003 min21, corresponding toa half-life in the plasma of 29 min (Fig. 3B). Plasma proteinbinding was also assessed to measure free fraction fornifene. An average of 46% 6 4% of the total radioactivityin the plasma was due to free 18F-nifene.
VT Estimations Using Arterial Input Function
The 18F-nifene analysis with 1TCM and 2TCM using themeasured arterial input parent functions revealed that the2TCM was not statistically justified on the basis of cAIC in
all regions, with the exception of 1 subject (M2). For thissubject, however, VT estimates were within 2% for both the1TCM and the 2TCM methods. An illustrative example ofa subject fit to the 1TCM is shown in Figure 4. VT valueswere also estimated using the Logan graphical method withblood sampling and are shown with the 1TCM results inTable 2 (2TCM results are not shown because the 1TCMmodel was the preferred method). The thalamic regions ofthe anteroventral thalamus and lateral geniculate bodyyielded the highest 18F-nifene VT values of 17.95 6 1.66and 16.17 6 1.64 mL/cm3 with the 1TCM, whereas thefrontal cortex and subiculum were found to have inter-mediate values of 8.69 6 0.43 and 8.96 6 0.48 mL/cm3.The cerebellum had the lowest measure of VT, 6.91 6 0.61mL/cm3. The Logan method and 1TCM were in closeagreement, with an average difference across all regionsof 3.4% and a greatest discrepancy of 8%. The VT valuesin the cerebellum calculated with a global metabolite-corrected input function differed from VT calculated withindividual corrections by less than 4% in all cases.
Cerebellum: Nifene Blocking Studies
Blocking studies with unlabeled nifene (i.e., low-spe-cific-activity 18F-nifene) were conducted to closely exam-ine whether a4b2*-specific radioligand binding in thecerebellum could be detected. For 3 subjects, compartmentmodeling of the high-mass injection in the cerebellumyielded an average VT of 6.8 6 0.1 mL/cm3—an averageclosely matching that of the high-specific-activity VT forthese subjects (6.7 6 0.6 mL/cm3). A visual comparison ofthe high- and low-specific-activity time courses in the cer-ebellum was also made by subtracting the residual signal ofthe first injection from the second and by normalizing thecurves to the injected dose. An example is shown in Figure 5
FIGURE 2. Typical radio-TLC profile of 18F-nifene and its radio-labeled metabolites in plasma. Time after injection of each blood
draw is noted for each sample. Experiments were performed on
silica gel TLC plates with mobile phase of 50% methanol:50%
0.1 M ammonium acetate.
FIGURE 3. Time course of 18F-nifene in blood. (A) Rate of metabolism of 18F-nifene in plasma. Parent 18F-nifene and radiolabeledmetabolites are expressed as percentage of total radioactivity present in plasma. (B) Time–activity curve of 18F-nifene parent in arterial
plasma. Values are normalized by injected dose and multiplied by subject weight (kBq/mL/injected dose · kg).
ANALYSIS OF 18F-NIFENE KINETICS • Hillmer et al. 1475

for the subject for which blood sampling was unavailable forthe second injection. All curves follow highly similar timecourses, suggesting negligible perturbation due to the pres-ence of blocking doses of nifene.
BPND Calculations
BPND values for the various methods are shown in Table2. In the high-binding thalamic regions, values of 1.60 60.17 and 1.35 6 0.16 were measured with the 1TCM in theanteroventral thalamus and lateral geniculate body, respec-tively. The lower-binding regions of the subiculum andfrontal cortex yielded respective values of 0.30 6 0.07and 0.26 6 0.08. The largest difference in BPND betweenall methods for all regions was 15% (in the frontal cortex),whereas the average difference was 1%, suggesting goodagreement between the various methods. No statisticallysignificant (a , 0.1) difference was detected between anyof the methods presented here, indicating that all of themethods yielded consistent results.
Using a t* 5 20 min with omission of—k2 for the Logan
reference region method, a scan time of at least 45 minyielded BPND values within 5% of those generated witha scan time of 60 min in all subjects under the aforemen-tioned analysis conditions, indicating good stability of themetric. Additionally, the inclusion of
—k2 5 0.20 min21 and
a t* 5 5 min for this analysis method revealed BPND valueswithin 2% of values calculated without
—k2 , indicating agree-
ment between the 2 methods. A voxelwise image of BPNDvalues calculated with the Logan graphical method was gen-erated for visualization of 18F-nifene uptake (Fig. 6).
FIGURE 4. Sample time–activity curves (M4) of 18F-nifene in rhe-
sus monkey brain cerebellum and anteroventral thalamus, shown
with fits generated by 1TCM. Values are normalized by injected
dose and multiplied by subject weight (kBq/mL/injected dose ·kg). AVT 5 anteroventral thalamus; conc 5 concentration.
TABLE 2Measured VT and BPND Values of 18F-Nifene
1TCM Logan with blood sampling
Subject no. Region VT (mL/cm3) BPND* VT (mL/cm3) BPND MRTM, BPND Logan ref, BPND
M1 CB 7.44 7.68AVT 20.41 1.74 20.83 1.71 1.70 1.68
LG 18.56 1.50 19.11 1.49 1.45 1.44
FC 9.04 0.22 9.31 0.21 0.20 0.20
SB 9.26 0.25 9.50 0.24 0.24 0.24M2 CB 6.28 6.13
AVT 16.98 1.70 16.43 1.68 1.67 1.67
LG 15.29 1.44 15.11 1.46 1.45 1.44
FC 8.06 0.28 7.92 0.29 0.28 0.28SB 8.25 0.31 8.03 0.31 0.30 0.30
M3 CB 6.48 6.18AVT 16.93 1.61 15.54 1.51 1.54 1.52
LG 14.97 1.31 13.97 1.26 1.26 1.27
FC 8.89 0.37 8.27 0.34 0.34 0.34SB 9.10 0.40 8.56 0.39 0.38 0.38
M4 CB 7.42 7.49AVT 17.47 1.35 17.86 1.38 1.44 1.35
LG 15.85 1.14 16.29 1.17 1.20 1.14FC 8.78 0.18 9.11 0.22 0.21 0.20
SB 9.25 0.25 9.33 0.25 0.25 0.24
Average 6 SD CB 6.91 6 0.61 6.87 6 0.83AVT 17.95 6 1.66 1.60 6 0.17 17.67 6 2.32 1.57 6 0.15 1.59 6 0.12 1.56 6 0.15
LG 16.17 6 1.64 1.35 6 0.16 16.12 6 2.21 1.35 6 0.15 1.34 6 0.13 1.32 6 0.15FC 8.69 6 0.43 0.26 6 0.08 8.65 6 0.66 0.26 6 0.06 0.26 6 0.07 0.26 6 0.07
SB 8.96 6 0.48 0.30 6 0.07 8.86 6 0.69 0.29 6 0.07 0.29 6 0.06 0.29 6 0.07
*BPND for 1TCM was calculated as VT/VT(CB) 2 1.
CB 5 cerebellum; AVT 5 anteroventral thalamus; LG 5 lateral geniculate body; FC 5 frontal cortex; SB 5 subiculum.
1476 THE JOURNAL OF NUCLEAR MEDICINE • Vol. 53 • No. 9 • September 2012

DISCUSSION
18F-nifene was developed to fulfill the need for a rapidlyequilibrating a4b2* PET radioligand to advance research onthis system by the neuroimaging community. The fast equili-bration times of 18F-nifene provide advantages in both greatlyreducing the time of scan procedures and potentially detectingchanges in endogenous acetylcholine levels. The 45-min im-aging requirement for 18F-nifene quantification is approxi-mately 7-fold shorter than with the current a4b2* standardradiotracer, 2-18F-FA, providing reductions in both experimen-tal complexity and cost. More recently developed a4b2*radioligands, including 18F-AZAN (33), 18F-ZW-104 (34),and (2)-18F-NCFHEB (35), show improvements over2-18F-FA both in increased binding levels and in reducedscan times, although each requires at least 90-min acquisitionsfor quantification, at least double the time required for 18F-nifene. To build on our earlier studies, we have made significantimprovements in radiochemical production and included themeasurement of an arterial input function for use in the assayof specific binding and blocking studies with unlabeled nifene.
Arterial blood samples were acquired to examine thetime course of 18F-nifene available to the tissue and toquantify the presence of radiolabeled metabolites. Radio-TLC provided a well-separated profile of 18F-nifene andradiolabeled metabolites, which allowed for characteriza-tion of radiolabeled species in the plasma while avoidingthe use of HPLC analysis due to poor data quality resultingfrom low counting rates and injectate purification. Metab-olism of 18F-nifene occurred rapidly at first and then slowedto a metabolism rate with a half-life of 63 min. The increaseof radiolabeled metabolites in arterial blood samples wasconsistent between all subjects, ranging between 68% and74% at 30 min after injection. Differences in VT in thecerebellum between the global and individual metabolite-corrected input functions were less than 4%, indicating thata moderate level of uncertainty could be tolerated in themeasurement of radiolabeled metabolites. This finding sug-gests the potential use of a global parent metabolite correc-tion, although additional validation would be required toexamine age and sex-dependent variations in nifene metab-olism. All detected radiolabeled metabolites were less lipo-philic than the 18F-nifene parent, suggesting that thesemetabolites cross the blood–brain barrier at a substantiallylower rate than nifene. These observations are in agreementwith previous studies of 18F-nifene and its metabolites inthe rat brain (36). Additionally, the ratio of radioactivityin the cerebellum to radioactivity of the parent 18F-nifenein the plasma was found to be constant or slowly decreasingafter 40 min, suggesting that there was no buildup of radio-labeled metabolites in the brain.
The possible presence of a4b2* binding in the cerebel-lum was examined by introducing a second administrationof 18F-nifene coinjected with unlabeled nifene. Previously,it was found that 0.03 mg (2)nicotine per kilogram quali-tatively had no effect on cerebellum time–activity curves,suggesting the suitability of the cerebellum as a referenceregion (21). The work presented herein confirms this resultusing quantitative analysis performed with blood sampling.For the 3 subjects for which blood sampling was availableto the end of the study, the introduction of high-mass nifeneyielded VT values (6.8 6 0.1 mL/cm3) that were consistent
FIGURE 5. Representative time–activity curve of 18F-nifene in cer-
ebellum from high-specific-activity injection (¤) (specific activity,
210 GBq/mmol) and high-mass injection (s) (specific activity, 0.6GBq/mmol) for 1 subject (M4). Values are normalized to injected dose.
FIGURE 6. Specific binding of 18F-nifene in rhesus monkey. Slices were chosen to focus on visualization of thalamus. Images weregenerated using voxelwise calculation of BPND with Logan graphical method.
ANALYSIS OF 18F-NIFENE KINETICS • Hillmer et al. 1477

with the values calculated from the first injection (6.76 0.6mL/cm3) with the same 1TCM analysis, found here to beappropriate in evaluating regions of elevated 18F-nifenebinding. The similarity in VT despite high levels of unla-beled nifene suggests that the specific binding component(VS) in the cerebellum is lower than the sensitivity limits ofthe PET scanner and analysis techniques used here. Thisfinding of a negligible VS is in agreement with other studiesexamining 2-18F-FA in the cerebellum of the rhesus mon-key (32). Other PET studies have found small but signifi-cant cerebellar a4b2* nAChR expression in baboons (10)and humans (12), rendering the cerebellum problematic asa reference region in these species. The moderate BPNDvalues of 18F-nifene, however, may allow for the use ofa valid reference region in humans in white matter regionssuch as the corpus callosum or the pons, as previouslydemonstrated with 2-18F-FA (14). We briefly examinedthe corpus callosum as a reference region with the presentdata, however, the lack of MRI data resulted in high noisefrom the extracted time–activity curves and consequentlyhigher variability in thalamic BPND values than that pre-sented herein.In brain regions with elevated 18F-nifene binding, com-
partment modeling yielded a similar quality of fitting re-sults (i.e., sum of squares) with both the 1TCM and the2TCM, suggesting that the additional parameters of the2TCM were not statistically warranted as specified bythe cAIC. The selection of the 1TCM in regions of elevatedbinding suggests a lack of binding parameter identificationdue to fast equilibration between the nondisplaceable andspecifically bound compartments. This result was alsofound in previous PET studies with 11C-nicotine (9), how-ever, no other a4b2* nAChR radioligands to our knowl-edge exhibit this behavior. The fast kinetics of 18F-nifeneare also reflected in the short 45-min scanning procedurerequirement, which is advantageous in minimizing discom-fort to the subjects when extending these imaging methodsto diseased populations. The rapid binding and dissociationof 18F-nifene may also provide increased sensitivity of 18F-nifene binding to changes in endogenous levels of acetyl-choline in vivo, as previously observed by in vitro workwith acetylcholinesterase inhibitors (37).BPND values were highest in thalamic regions of the brain,
with intermediate levels of binding in the frontal cortex andsubiculum. The level of 18F-nifene binding in the frontalcortex was consistently lower than that of the subiculum.Similarly, the reduction in specific binding after the second(high-mass) 18F-nifene injection followed the same rank or-der decrease across these regions. Furthermore, in the studywith the lowest receptor occupancy by unlabeled ligand, themeasured occupancy in the frontal cortex (24%) and subiculum(31%) compared well with the value measured in the thala-mus (34%). Although the coefficient of variation across the4 subjects was slightly higher in the intermediate-bindingregions (;30%) than in the anteroventral thalamus (11%),the consistent rank order and agreement in receptor occu-
pancy levels in the frontal cortex and subiculum suggest that18F-nifene provides adequate sensitivity to a4b2* bindingin regions of intermediate uptake. We therefore do not ruleout potential applications of 18F-nifene in detecting smallchanges in a4b2* nAChR density in cortical regions, suchas findings examining 2-18F-FA uptake in patients with Alz-heimer disease (14). Partial-volume effects should be consid-ered in these cortical and hippocampal regions, particularly inpatients with brain atrophy. The lack of MRI data preventedthe application of a partial-volume correction in the presentanalysis, which could have resulted in underestimation ofBPND values.
Comparison of VND between 18F-nifene and other a4b2*radioligands provides insight into the differences in their im-aging properties. Multiple-injection studies of 2-18F-FA inbaboons found VND values of 4.90 6 0.46 g/mL in the thal-amus and 4.256 0.48 g/mL in the cerebellum (38). Studies of2-18F-FA in the rhesus monkey yielded a VND value of 4.3260.17 mL/cm3 (when removing the correction for plasma freefraction) (32). Our present work indicates VND values of 6.960.6 mL/cm3 for 18F-nifene in the rhesus monkey. Similarly, theclearance of radioligand from the blood is much faster for 18F-nifene (0.024 6 0.003 min21) than 2-18F-FA (0.0056 60.0017 min21). This large VND value for 18F-nifene indicatesthat it is more readily taken up from the blood into the non-displaceable compartment (e.g., free and nonspecifically boundradiotracer) and retained.
To gauge the level of a4b2* receptor occupancy in targetregions, we have also examined data from the second in-jection in regions with specific binding. The rapid in vivokinetics of 18F-nifene allow for approximations of thechange in specific binding after high-mass injections ofnifene. These data can be used to estimate the in vivoequilibrium dissociation constant (KDapp) of 18F-nifene fora4b2* nAChRs through the use of a Scatchard-type anal-ysis (39). For this analysis, the 1TCM was used to calculateBPND values for both the first and the second injection inthe thalamus. The ratio of these 2 values was used as a mea-sure of in vivo receptor fractional occupancy (occupancy 51 – BPND(block)/BPND(baseline)). The free radioligand (F) wasestimated by averaging the radioligand signal in the refer-ence region at 20 min after coinjection (t 5 80 min) to theend of the study and dividing by the specific activity. Plot-ting receptor occupancy against F yielded a nonlinearScatchard plot, which was fit to the equation occupancy 5F/(KDapp 1 F) to estimate a value of KDapp, as shown inFigure 7. The analysis yielded a preliminary KDapp value of3 6 1 pmol/mL. This value is 2–3 times greater than thethalamic KDapp value for 2-18F-FA reported by Gallezotet al. (38). When compared with 2-18F-FA, the larger KDapp
of nifene is consistent with its smaller BPND, assuming theycompete for the same pool of receptors. Because of thesmall number of subjects and the uncertainty in the precisemeasurement of the free nifene concentration, this analysisprovides only an approximation of KDapp; thus, additional stud-ies will be required to establish the precision and variability
1478 THE JOURNAL OF NUCLEAR MEDICINE • Vol. 53 • No. 9 • September 2012

of this estimate. The present work provides a basis for guidingfuture experimental design of improved identification of re-ceptor density (Bmax) and KDapp.
CONCLUSION
The present work characterized the behavior of 18F-nifene inthe blood and found the 1TCM to most appropriately describethe data, further demonstrating the rapid equilibration times of18F-nifene and suggesting potential applications in measuringchanges in endogenous acetylcholine levels. The cerebellumwas quantitatively confirmed as a suitable reference region inthe rhesus monkey, and sensitivity of 18F-nifene to smallchanges in binding in areas of low uptake was found. Thesecharacteristics, combined with the requirement of 45-min scantimes for accurate quantification, give 18F-nifene unique advan-tages over other available a4b2* nAChR radioligands andpromote the extension of 18F-nifene to disease-specific animalmodels, with the potential for studies in human subjects.
DISCLOSURE STATEMENT
The costs of publication of this article were defrayed inpart by the payment of page charges. Therefore, and solelyto indicate this fact, this article is hereby marked “adver-tisement” in accordance with 18 USC section 1734.
ACKNOWLEDGMENTS
We thank the following for their contributions to thisresearch: Professor R. Jerry Nickles and Drs. Jonathan Engleand Greg Severin for technical discussions and graciousassistance in isotope production and Julie Larson, LeslieResch, and the staff at Harlow Center for BiologicalPsychology (RR000167) for assistance in animal handlingand data acquisition. This work was supported by NIH grants
AA017706 and CA142188. No other potential conflict ofinterest relevant to this article was reported.
REFERENCES
1. Gotti C, Clementi F. Neuronal nicotinic receptors: from structure to pathology.
Prog Neurobiol. 2004;74:363–396.
2. Court J, Martin-Ruiz C, Piggott M, Spurden D, Griffiths M, Perry E. Nicotinic
receptor abnormalities in Alzheimer’s disease. Biol Psychiatry. 2001;49:175–
184.
3. Burghaus L, Schutz U, Krempel U, Lindstrom J, Schroder H. Loss of nicotinic
acetylcholine receptor subunits a4 and a7 in the cerebral cortex of Parkinson
patients. Parkinsonism Relat Disord. 2003;9:243–246.
4. Hellstrom-Lindahl E, Court JA. Nicotinic acetylcholine receptors during prenatal de-
velopment and brain pathology in human aging. Behav Brain Res. 2000;113:159–168.
5. Scheffer IE, Berkovic SF. The genetics of human epilepsy. Trends Pharmacol
Sci. 2003;24:428–433.
6. Poirier M-F, Canceil O, Bayle F, et al. Prevalence of smoking in psychiatric
patients. Prog Neuropsychopharmacol Biol Psychiatry. 2002;26:529–537.
7. Sacco KA, Bannon KL, George TP. Nicotinic receptor mechanisms and cognition in
normal states and neuropsychiatric disorders. J Psychopharmacol. 2004;18:457–474.
8. Baer JS, Sampson PD, Barr HM, Connor PD, Streissguth AP. A 21-year longi-
tudinal analysis of the effects of prenatal alcohol exposure on young adult drink-
ing. Arch Gen Psychiatry. 2003;60:377–385.
9. Muzic RF, Berridge MS, Friedland RP, Zhu N, Nelson AD. PET quantification of
specific binding of carbon-11-nicotine in human brain. J Nucl Med. 1998;39:
2048–2054.
10. Valette H, Bottlaender M, Dolle F, et al. Imaging central nicotinic acetylcholine
receptors in baboons with [18F]fluoro-A-85380. J Nucl Med. 1999;40:1374–1380.
11. Gallezot J-D, Bottlaender M, Gregoire M-C, et al. In vivo imaging of human
cerebral nicotinic acetylcholine receptors with 2-18F-fluoro-A-85380 and PET.
J Nucl Med. 2005;46:240–247.
12. Kimes AS, Chefer SI, Matochik JA, et al. Quantification of nicotinic acetylcho-
line receptors in the human brain with PET: bolus plus infusion administration of
2-[18F]F-A85380. Neuroimage. 2008;39:717–727.
13. Ellis JR, Nathan PJ, Villemagne VL, et al. The relationship between nicotinic
receptors and cognitive functioning in healthy aging: an in vivo positron emis-
sion tomography (PET) study with 2-[18F]fluoro-A-85380. Synapse. 2009;63:
752–763.
14. Kendziorra K, Wolf H, Meyer PM, et al. Decreased cerebral a4b2* nicotinic
acetylcholine receptor availability in patients with mild cognitive impairment
and Alzheimer’s disease assessed with positron emission tomography. Eur J
Nucl Med Mol Imaging. 2011;38:515–525.
15. Meyer PM, Strecker K, Kendziorra K, et al. Reduced a4b2*-nicotinic acetyl-
choline receptor binding and its relationship to mild cognitive and depressive
symptoms in Parkinson disease. Arch Gen Psychiatry. 2009;66:866–877.
16. Picard F, Bruel D, Servent D, et al. Alteration of the in vivo nicotinic receptor
density in ADNFLE patients: a PET study. Brain. 2006;129:2047–2060.
17. Horti AG, Gao Y, Kuwabara H, Dannals RF. Development of radioligands with
optimized imaging properties for quantification of nicotinic acetylcholine recep-
tors by positron emission tomography. Life Sci. 2010;86:575–584.
18. Narendran R, Hwang D-R, Slifstein M, et al. In vivo vulnerability to competition
by endogenous dopamine: comparison of the D2 receptor agonist radiotracer
(-)-N-[11C]propyl-norapomorphine ([11C]NPA) with the D2 receptor antagonist
radiotracer [11C]-raclopride. Synapse. 2004;52:188–208.
19. Paterson LM, Tyacke RJ, Nutt DJ, Knudsen GM. Measuring endogenous 5-HT
release by emission tomography: promises and pitfalls. J Cereb Blood Flow
Metab. 2010;30:1682–1706.
20. Pichika R, Easwaramoorthy B, Collins D, et al. Nicotinic a4b2 receptor imaging
agents: part II. Synthesis and biological evaluation of 2-[18F]fluoro-3-[2-((S)-3-
pyrrolinyl)methoxy]pyridine (18F-nifene) in rodents and imaging by PET in non-
human primate. Nucl Med Biol. 2006;33:295–304.
21. Hillmer AT, Wooten DW, Moirano JM, et al. Specific a4b2 nicotinic acetylcholine
receptor binding of [F-18]nifene in the rhesus monkey. Synapse. 2011;65:1309–1318.
22. Perry DC, Davila-Garcıa MI, Stockmeier CA, Kellar KJ. Increased nicotinic
receptors in brains from smokers: membrane binding and autoradiography stud-
ies. J Pharmacol Exp Ther. 1999;289:1545–1552.
23. Le Bars D, Lemaire C, Ginovart N, et al. High-yield radiosynthesis and pre-
liminary in vivo evaluation of p-[18F]MPPF, a fluoro analog of WAY-100635.
Nucl Med Biol. 1998;25:343–350.
24. Tai C, Chatziioannou A, Siegel S, et al. Performance evaluation of the microPET
P4: a PET system dedicated to animal imaging. Phys Med Biol. 2001;46:1845–
1862.
FIGURE 7. Change in thalamic binding with varying masses of un-
labeled nifene. Thalamus-to-cerebellum ratio curves are shown,
which include second high-mass 18F-nifene injection at 60 min. Inset
shows nonlinear Scatchard plot, illustrating calculation of approxi-mate KDapp value. AVT 5 anteroventral thalamus; CB 5 cerebellum.
ANALYSIS OF 18F-NIFENE KINETICS • Hillmer et al. 1479

25. Christian BT, Vandehey NT, Floberg JM, Mistretta CA. Dynamic PET denoising
with HYPR processing. J Nucl Med. 2010;51:1147–1154.
26. Innis RB, Cunningham VJ, Delforge J, et al. Consensus nomenclature for in vivo
imaging of reversibly binding radioligands. J Cereb Blood Flow Metab. 2007;27:
1533–1539.
27. Logan J, Fowler JS, Volkow ND, et al. Graphical analysis of reversible radio-
ligand binding from time-activity measurements applied to [N-11C-methyl]-
(-)-cocaine PET studies in human subjects. J Cereb Blood Flow Metab. 1990;10:
740–747.
28. Muzic RF, Cornelius S. COMKAT: compartment model kinetic analysis tool.
J Nucl Med. 2001;42:636–645.
29. Hurvich CM, Tsai C-L. Regression and time series model selection in small
samples. Biometrika. 1989;76:297–307.
30. Logan J, Fowler JS, Volkow ND, et al. Distribution volume ratios without blood
sampling from graphical analysis of PET data. J Cereb Blood Flow Metab.
1996;16:834–840.
31. Ichise M, Ballinger JR, Golan H, et al. Noninvasive quantification of dopamine
D2 receptors with iodine-123-IBF SPECT. J Nucl Med. 1996;37:513–520.
32. Chefer SI, London ED, Koren AO, et al. Graphical analysis of 2-[18F]FA binding to
nicotinic acetylcholine receptors in rhesus monkey brain. Synapse. 2003;48:25–34.
33. Kuwabara H, Wong DF, Gao Y, et al. PET Imaging of nicotinic acetylcholine
receptors in baboons with 18F-AZAN, a radioligand with improved brain kinet-
ics. J Nucl Med. 2012;53:121–129.
34. Valette H, Xiao Y, Peyronneau MA, et al. 18F-ZW-104: a new radioligand for
imaging neuronal nicotinic acetylcholine receptors—in vitro binding properties
and PET studies in baboons. J Nucl Med. 2009;50:1349–1355.
35. Brust P, Patt JT, Deuther-Conrad W, et al. In vivo measurement of nicotinic
acetylcholine receptors with [18F]Norchloro-fluoro-homoepibatidine. Synapse.
2008;62:205–218.
36. Kant R, Constantinescu CC, Parekh P, et al. Evaluation of 18F-nifene binding
to a4b2 nicotinic receptors in the rat brain using microPET imaging. EJNMMI
Research. 2011;1:6.
37. Easwaramoorthy B, Pichika R, Collins D, et al. Effect of acetylcholinesterase
inhibitors on the binding of nicotinic a4b2 receptor PET radiotracer, 18F-Nifene :
a measure of acetylcholine competition. Synapse. 2007;61:29–36.
38. Gallezot J-D, Bottlaender MA, Delforge J, et al. Quantification of cerebral nic-
otinic acetylcholine receptors by PET using 2-[18F]fluoro-A-85380 and the multi-
injection approach. J Cereb Blood Flow Metab. 2008;28:172–189.
39. Farde L, Hall H, Ehrin E, Sedvall G. Quantitative analysis of D2 dopamine
receptor binding in the living human brain by PET. Science. 1986;231:258–261.
1480 THE JOURNAL OF NUCLEAR MEDICINE • Vol. 53 • No. 9 • September 2012
![Relationship between nicotinic receptors and cognitive function in early Alzheimer’s disease: A 2-[18F]fluoro-A-85380 PET study](https://img.pdfslide.net/doc/110x75/6358dbe6c2cb8a15fc064e78/relationship-between-nicotinic-receptors-and-cognitive-function-in-early-alzheimers.jpg)
![PET imaging with [18F]fluoroethoxybenzovesamicol ([18F]FEOBV) following selective lesion of cholinergic pedunculopontine tegmental neurons in rat](https://img.pdfslide.net/doc/110x75/634aa5b56bb2dc8f25054806/pet-imaging-with-18ffluoroethoxybenzovesamicol-18ffeobv-following-selective.jpg)


![The metabolic anatomy of Parkinson's disease: Complementary [18F]fluorodeoxyglucose and [18F]fluorodopa positron emission tomographic studies](https://img.pdfslide.net/doc/110x75/634c1d4b526bce8bbe0c08da/the-metabolic-anatomy-of-parkinsons-disease-complementary-18ffluorodeoxyglucose-1700043549.jpg)
![Quantification of cerebral nicotinic acetylcholine receptors by PET using 2-[18F]fluoro-A-85380 and the multiinjection approach](https://img.pdfslide.net/doc/110x75/635b09559d85dc43cb073f14/quantification-of-cerebral-nicotinic-acetylcholine-receptors-by-pet-using-2-18ffluoro-a-85380.jpg)
![Feasibility of [18F]-2-Fluoro-A85380-PET Imaging of Human Vascular Nicotinic Acetylcholine Receptors In Vivo](https://img.pdfslide.net/doc/110x75/6361863028d79112c801a3f8/feasibility-of-18f-2-fluoro-a85380-pet-imaging-of-human-vascular-nicotinic-acetylcholine.jpg)


![Simplified quantification of nicotinic receptors with 2[18F]F-A-85380 PET](https://img.pdfslide.net/doc/110x75/635b09704028fc5adf017dba/simplified-quantification-of-nicotinic-receptors-with-218ff-a-85380-pet.jpg)


