Embed Size (px)
Citation preview
molecules
Article
Pharmacokinetics and Metabolism ofLiposome-Encapsulated2,4,6-Trihydroxygeranylacetophenone in Rats UsingHigh-Resolution Orbitrap Liquid ChromatographyMass Spectrometry
Yamen Alkhateeb 1 , Qais Bashir Jarrar 2 , Faridah Abas 3 , Yaya Rukayadi 3 ,Chau Ling Tham 4 , Yuen Kah Hay 5 and Khozirah Shaari 1,3,*
1 Laboratory of Natural Product, Institute of Bioscience, Universiti Putra Malaysia,Serdang 43400, Selangor, Malaysia; [email protected]
2 Department of Applied Pharmaceutical Sciences, Faculty of Pharmacy, Al-Isra University,Amman 11622, Jordan; [email protected]
3 Department of Food Science, Faculty of Food Science and Technology, Universiti Putra Malaysia,Serdang 43400, Selangor, Malaysia; [email protected] (F.A.); [email protected] (Y.R.)
4 Department of Biomedical Science, Faculty of Medicine & Health Sciences, Universiti Putra Malaysia,Serdang 43400 UPM, Selangor, Malaysia; [email protected]
5 School of Pharmaceutical Sciences, Universiti Sains Malaysia, Glugor 11800, Penang, Malaysia;[email protected]
* Correspondence: [email protected]; Tel.: +603-9769-1481
Academic Editor: Young G. ShinReceived: 30 April 2020; Accepted: 20 May 2020; Published: 6 July 2020
�����������������
Abstract: 2,4,6-trihydroxy-3-geranylacetophenone (tHGA) is a bioactive compound that showsexcellent anti-inflammatory properties. However, its pharmacokinetics and metabolism have yet tobe evaluated. In this study, a sensitive LC-HRMS method was developed and validated to quantifytHGA in rat plasma. The method showed good linearity (0.5–80 ng/mL). The accuracy and precisionwere within 10%. Pharmacokinetic investigations were performed on three groups of six rats. The firsttwo groups were given oral administrations of unformulated and liposome-encapsulated tHGA,respectively, while the third group received intraperitoneal administration of liposome-encapsulatedtHGA. The maximum concentration (Cmax), the time required to reach Cmax (tmax), elimination half-life(t1/2) and area under curve (AUC0–24) values for intraperitoneal administration were 54.6 ng/mL,1.5 h, 6.7 h, and 193.9 ng/mL·h, respectively. For the oral administration of unformulated andformulated tHGA, Cmax values were 5.4 and 14.5 ng/mL, tmax values were 0.25 h for both, t1/2 valueswere 6.9 and 6.6 h, and AUC0–24 values were 17.6 and 40.7 ng/mL·h, respectively. The liposomalformulation improved the relative oral bioavailability of tHGA from 9.1% to 21.0% which was a2.3-fold increment. Further, a total of 12 metabolites were detected and structurally characterized.The metabolites were mainly products of oxidation and glucuronide conjugation.
Keywords: pharmacokinetics; metabolism; trihydroxygeranylacetophenone; liposomes; LC-HRMSmethod validation
1. Introduction
The chemical diversity of natural products is more complex than any chemical library made byhumans, representing a massive reservoir of valuable molecules. As history has shown, it has yieldeda huge number of drug leads, many of which have been successfully developed into clinical drugs.
Molecules 2020, 25, 3069; doi:10.3390/molecules25133069 www.mdpi.com/journal/molecules
Molecules 2020, 25, 3069 2 of 17
Despite a period of declining use of natural products in drug discovery screening, triggered by perceiveddisadvantages of natural products (access and supply, intellectual property rights, complex chemistryand inherent slowness of working with natural products), pharmaceutical companies are turning theirinterests back to natural product compounds, which clearly shows that they still command a crucialrole in healthcare. There are better opportunities to explore their biological activities and many ofthe associated technical drawbacks in natural products research have been lessened. For example,developments in chemical synthesis technologies are now able to overcome the challenges in theisolation and purification of active compounds from complex extracts and made it available in sufficientamounts. The aromatic compound 2,4,6-trihydroxy-3-geranylacetophenone (tHGA) was originally anatural and bioactive compound isolated from the leaves of Melicope ptelefolia [1]. Our research grouphas demonstrated its anti-inflammatory properties, including the airway inflammation, with a potencycomparable to clinically used drugs (Zileuton and Ketotifen), in several in vitro and in vivo studies [2–9].The dual COX-2/5-LOX inhibition activity of tHGA makes it a promising anti-inflammatory andanti-allergic drug with fewer adverse effects [10].
Drug metabolism and pharmacokinetics (DMPK) play a sensitive and essential role in the processof drug discovery and development. Pharmacokinetics is proposed to study the fate of drugs in thebody over a period of time, including the bodily absorption, distribution, metabolism, and excretion ofdrugs in vivo [11]. Information on the pharmacokinetics, as well as the metabolic products of a drug,is crucial in the assessment and understanding of the drug candidate’s efficacy and safety. In addition,it is important to reduce the clinical failures related to poor pharmacokinetic properties or toxicmetabolites. The quality of DMPK studies is highly correlated with the quality of the bioanalysis dataproduced. High-resolution LC-MS technologies have been the preferred tool to identify and quantifythe drug and its metabolites in the complex matrix due to its superior sensitivity and specificity [12].
In this study, a bioanalytical LC-MS method was developed and validated to quantify tHGA in ratplasma. The method was successfully applied to evaluate the pharmacokinetic properties of tHGA afteroral (PO) and intraperitoneal (IP) administration to rats. Furthermore, a non-target screening methodwas used to identify the metabolites of tHGA in rat plasma, urine, and feces using a high-resolutionorbitrap UHPLC-MS system. To the best of our knowledge, there has not been any bioanalyticalmethod developed to quantify tHGA in plasma and nothing is known about the pharmacokinetics andthe metabolism of tHGA. This information is a must-have for a better insight into its clinical potential.
2. Results
2.1. Method Validation
As shown in Figure 1, comparison between the chromatogram of blank plasma samples, and thechromatogram of plasma samples spiked with 0.5 ng/mL of tHGA.
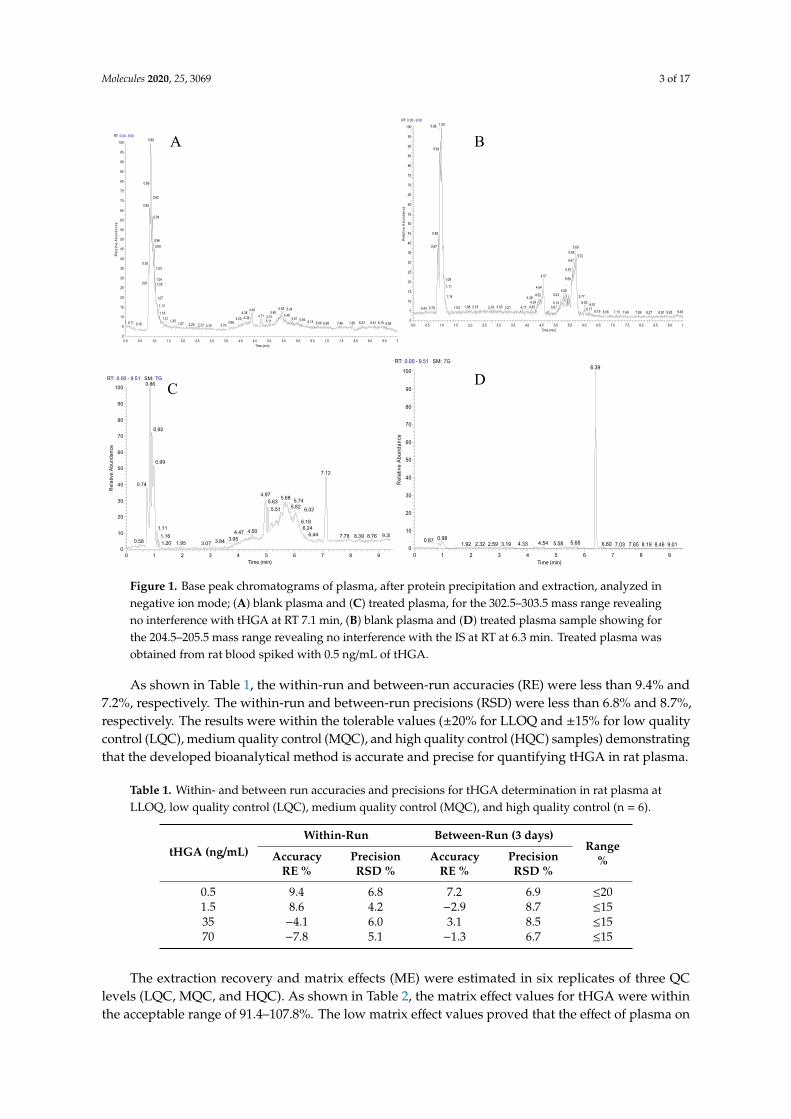
(lower limit of quantification, LLOQ), after protein precipitation and extraction, illustrated thatthere was no significant interference from endogenous compounds of rat plasma observed at theretention times of tHGA (7.1 min) and the internal standard IS (6.3 min) which was used to minimizethe matrix and ionization effects [13].
The calibration curves exhibited good linearity based on three individual calibration curvesconstructed on three different days over a concentration range of 0.5 to 80 ng/mL of tHGA. The meanlinear regression equation obtained for the calibration curves were y = 0.0098x + 0.0007 (day one),y = 0.0137x + 0.0017 (day two) and y = 0.0138x + 0.002 (day three) with coefficient of determinations(R2) of 0.9995, 0.9967 and 0.9971, respectively. The results showed a good relationship betweentHGA concentration and the response of the LC-MS system which proved the ability of this methodto accurately measure an unknown concentration of tHGA in plasma samples. The LLOQ value,which is the lowest concentration that can be quantified with accuracy and precision of less than 20%,was 0.5 ng/mL. This low LLOQ value revealed the excellent sensitivity of the method and its suitabilityfor the pharmacokinetic study.
Molecules 2020, 25, 3069 3 of 17
Molecules 2020, 25, x FOR PEER REVIEW 3 of 18
Figure 1. Base peak chromatograms of plasma, after protein precipitation and extraction, analyzed in negative ion mode; (A) blank plasma and (C) treated plasma, for the 302.5–303.5 mass range revealing no interference with tHGA at RT 7.1 min, (B) blank plasma and (D) treated plasma sample showing for the 204.5–205.5 mass range revealing no interference with the IS at RT at 6.3 min. Treated plasma was obtained from rat blood spiked with 0.5 ng/mL of tHGA.
The calibration curves exhibited good linearity based on three individual calibration curves constructed on three different days over a concentration range of 0.5 to 80 ng/mL of tHGA. The mean linear regression equation obtained for the calibration curves were y = 0.0098x + 0.0007 (day one), y = 0.0137x + 0.0017 (day two) and y = 0.0138x + 0.002 (day three) with coefficient of determinations (R2) of 0.9995, 0.9967 and 0.9971, respectively. The results showed a good relationship between tHGA concentration and the response of the LC-MS system which proved the ability of this method to accurately measure an unknown concentration of tHGA in plasma samples. The LLOQ value, which is the lowest concentration that can be quantified with accuracy and precision of less than 20%, was 0.5 ng/mL. This low LLOQ value revealed the excellent sensitivity of the method and its suitability for the pharmacokinetic study.
As shown in Table 1, the within-run and between-run accuracies (RE) were less than 9.4% and 7.2%, respectively. The within-run and between-run precisions (RSD) were less than 6.8% and 8.7%, respectively. The results were within the tolerable values (±20% for LLOQ and ±15% for low quality control (LQC), medium quality control (MQC), and high quality control (HQC) samples) demonstrating that the developed bioanalytical method is accurate and precise for quantifying tHGA in rat plasma.
RT: 0.00 - 9.50
0.0 0.5 1.0 1.5 2.0 2.5 3.0 3.5 4.0 4.5 5.0 5.5 6.0 6.5 7.0 7.5 8.0 8.5 9.0 9Time (min)
0
5
10
15
20
25
30
35
40
45
50
55
60
65
70
75
80
85
90
95
100
Rel
ativ
e A
bund
ance
0.89
0.86
0.92
0.85
0.94
0.960.99
0.821.03
1.040.81 1.05
1.07
1.135.42 5.444.40 5.404.381.18 5.484.71 4.734.341.31 4.20 5.61 5.941.36 5.11 6.143.960.11 8.22 8.61 8.797.886.66 6.85 7.46 8.951.670.18 2.29 2.33 3.702.76
RT: 0.00 - 9.50
0.0 0.5 1.0 1.5 2.0 2.5 3.0 3.5 4.0 4.5 5.0 5.5 6.0 6.5 7.0 7.5 8.0 8.5 9.0 9Time (min)
0
5
10
15
20
25
30
35
40
45
50
55
60
65
70
75
80
85
90
95
100
Rel
ativ
e A
bund
ance
1.000.98
0.94
0.88
0.87 5.695.68
5.725.67
5.574.57
5.561.09
1.11 4.545.28
5.234.52 5.771.14 4.394.34 6.005.14 6.012.18 4.301.98 3.032.76 5.074.173.211.530.790.43 6.17 6.19 9.457.136.56 9.288.818.277.897.45
RT: 0.00 - 9.51 SM: 7G
0 1 2 3 4 5 6 7 8 9Time (min)
0
10
20
30
40
50
60
70
80
90
100
Rel
ativ
e A
bund
ance
0.86
0.92
0.99
7.12
0.74
4.97 5.68 5.745.635.825.51 6.02
6.181.11 6.244.504.47 6.44 9.358.768.397.781.16 3.953.840.58 1.951.20 3.07
RT: 0.00 - 9.51 SM: 7G
0 1 2 3 4 5 6 7 8 9Time (min)
0
10
20
30
40
50
60
70
80
90
100
Rel
ativ
e A
bund
ance
6.39
0.980.87 5.684.54 5.584.332.321.92 2.59 3.19 6.60 7.03 7.65 8.19 8.46 9.01
A
C
B
D
Figure 1. Base peak chromatograms of plasma, after protein precipitation and extraction, analyzed innegative ion mode; (A) blank plasma and (C) treated plasma, for the 302.5–303.5 mass range revealingno interference with tHGA at RT 7.1 min, (B) blank plasma and (D) treated plasma sample showing forthe 204.5–205.5 mass range revealing no interference with the IS at RT at 6.3 min. Treated plasma wasobtained from rat blood spiked with 0.5 ng/mL of tHGA.
As shown in Table 1, the within-run and between-run accuracies (RE) were less than 9.4% and7.2%, respectively. The within-run and between-run precisions (RSD) were less than 6.8% and 8.7%,respectively. The results were within the tolerable values (±20% for LLOQ and ±15% for low qualitycontrol (LQC), medium quality control (MQC), and high quality control (HQC) samples) demonstratingthat the developed bioanalytical method is accurate and precise for quantifying tHGA in rat plasma.
Table 1. Within- and between run accuracies and precisions for tHGA determination in rat plasma atLLOQ, low quality control (LQC), medium quality control (MQC), and high quality control (n = 6).
tHGA (ng/mL)Within-Run Between-Run (3 days)
Range%Accuracy
RE %PrecisionRSD %
AccuracyRE %
PrecisionRSD %
0.5 9.4 6.8 7.2 6.9 ≤201.5 8.6 4.2 −2.9 8.7 ≤1535 −4.1 6.0 3.1 8.5 ≤1570 −7.8 5.1 −1.3 6.7 ≤15
The extraction recovery and matrix effects (ME) were estimated in six replicates of three QClevels (LQC, MQC, and HQC). As shown in Table 2, the matrix effect values for tHGA were withinthe acceptable range of 91.4–107.8%. The low matrix effect values proved that the effect of plasma on
Molecules 2020, 25, 3069 4 of 17
accuracy and precision of the analysis of tHGA was tolerable and thus, the method is reliable for thedetermination of tHGA concentrations in plasma. The recoveries of tHGA and the IS ranged between96.3–100.3% and 95.6–99.6%, respectively. These results indicated that ACN is an efficient solvent toextract tHGA and IS from rat plasma, giving consistent results.
Table 2. The matrix effect, recovery, and stability of tHGA in rat plasma (n = 6).
tHGA(ng/mL) ME (%) Recovery
tHGA (%)Recovery
IS (%)Stability RE (%)
Short-Term (4 ◦C) Long-Term (−80 ◦C)
1.5 91.4 ± 4.2 99.6 ± 11.7 99.6 ± 2.8 −4.66 ± 11.9 5.93 ± 2.8
35 104.1 ± 6.1 100.3 ± 10.5 99.6 ± 3.5 - -70 107.8 ± 5.1 96.3 ± 11.0 95.6 ± 3.3 5.34 ± 6.9 5.34 ± 5.1
Dilution integrity was performed in five replicates after ten-fold dilution of a high concentration(500 ng/mL) sample of tHGA in rat plasma. The mean accuracy (RE%) and precision (RSD%) were−5.3%and 9.0%, respectively. Carry-over was evaluated by injecting blank plasma samples in duplicatesafter ULOQ. Following this, the peak areas of tHGA in the blank were compared with the peak area ofLLOQ. The mean carry-over percentage was 6.3% ± 2.8. The results demonstrated that the impact ofthe dilution on the accuracy and precision of the analysis for samples with a concentration higher thanULOQ was within the range and the measured concentration was not changed due to residual tHGAfrom a preceding sample.
The short- and long-term stability studies for tHGA were conducted for LQC and HQC samples(n = 6), and the data are summarized in Table 2. The QC plasma samples were stable for at least 24 hin the autosampler set at 4 ◦C post sample preparation with accuracy from −4.6% to 5.3%. The QCplasma samples for long-term storage of 1 month at −80 ◦C had an accuracy of 5.3–5.9%.
2.2. Pharmacokinetic Study
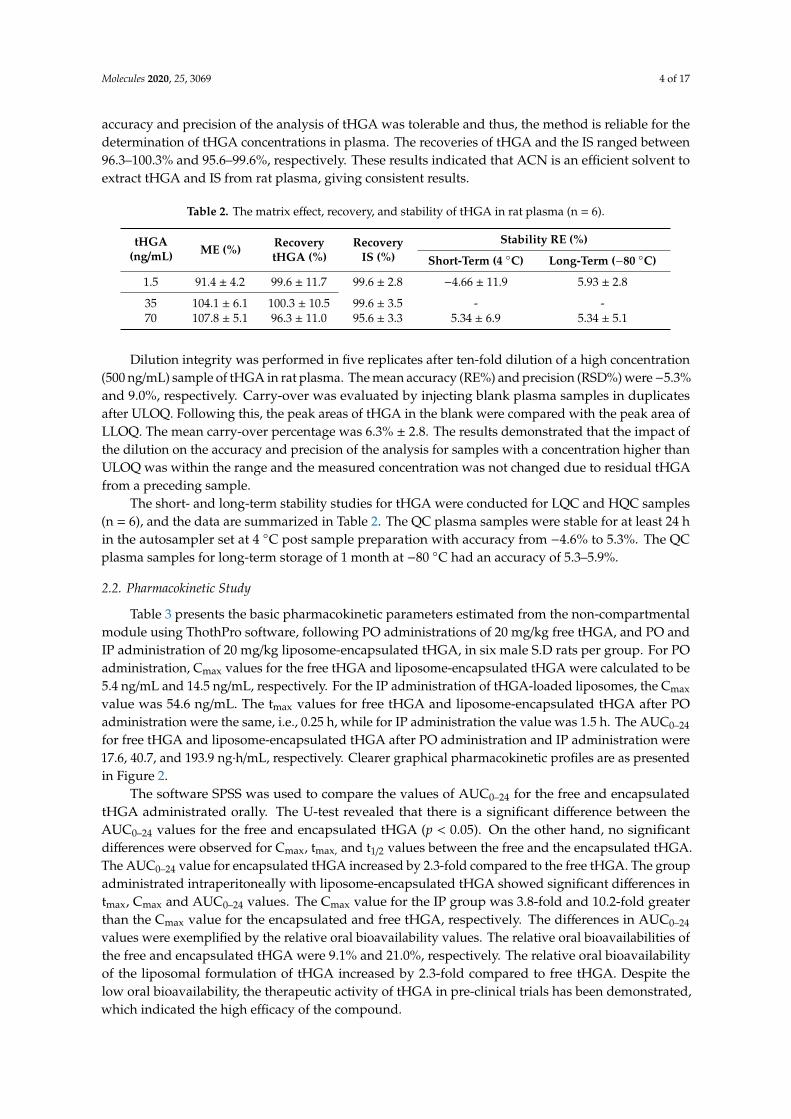
Table 3 presents the basic pharmacokinetic parameters estimated from the non-compartmentalmodule using ThothPro software, following PO administrations of 20 mg/kg free tHGA, and PO andIP administration of 20 mg/kg liposome-encapsulated tHGA, in six male S.D rats per group. For POadministration, Cmax values for the free tHGA and liposome-encapsulated tHGA were calculated to be5.4 ng/mL and 14.5 ng/mL, respectively. For the IP administration of tHGA-loaded liposomes, the Cmax
value was 54.6 ng/mL. The tmax values for free tHGA and liposome-encapsulated tHGA after POadministration were the same, i.e., 0.25 h, while for IP administration the value was 1.5 h. The AUC0–24
for free tHGA and liposome-encapsulated tHGA after PO administration and IP administration were17.6, 40.7, and 193.9 ng·h/mL, respectively. Clearer graphical pharmacokinetic profiles are as presentedin Figure 2.
The software SPSS was used to compare the values of AUC0–24 for the free and encapsulatedtHGA administrated orally. The U-test revealed that there is a significant difference between theAUC0–24 values for the free and encapsulated tHGA (p < 0.05). On the other hand, no significantdifferences were observed for Cmax, tmax, and t1/2 values between the free and the encapsulated tHGA.The AUC0–24 value for encapsulated tHGA increased by 2.3-fold compared to the free tHGA. The groupadministrated intraperitoneally with liposome-encapsulated tHGA showed significant differences intmax, Cmax and AUC0–24 values. The Cmax value for the IP group was 3.8-fold and 10.2-fold greaterthan the Cmax value for the encapsulated and free tHGA, respectively. The differences in AUC0–24
values were exemplified by the relative oral bioavailability values. The relative oral bioavailabilities ofthe free and encapsulated tHGA were 9.1% and 21.0%, respectively. The relative oral bioavailabilityof the liposomal formulation of tHGA increased by 2.3-fold compared to free tHGA. Despite thelow oral bioavailability, the therapeutic activity of tHGA in pre-clinical trials has been demonstrated,which indicated the high efficacy of the compound.
Molecules 2020, 25, 3069 5 of 17
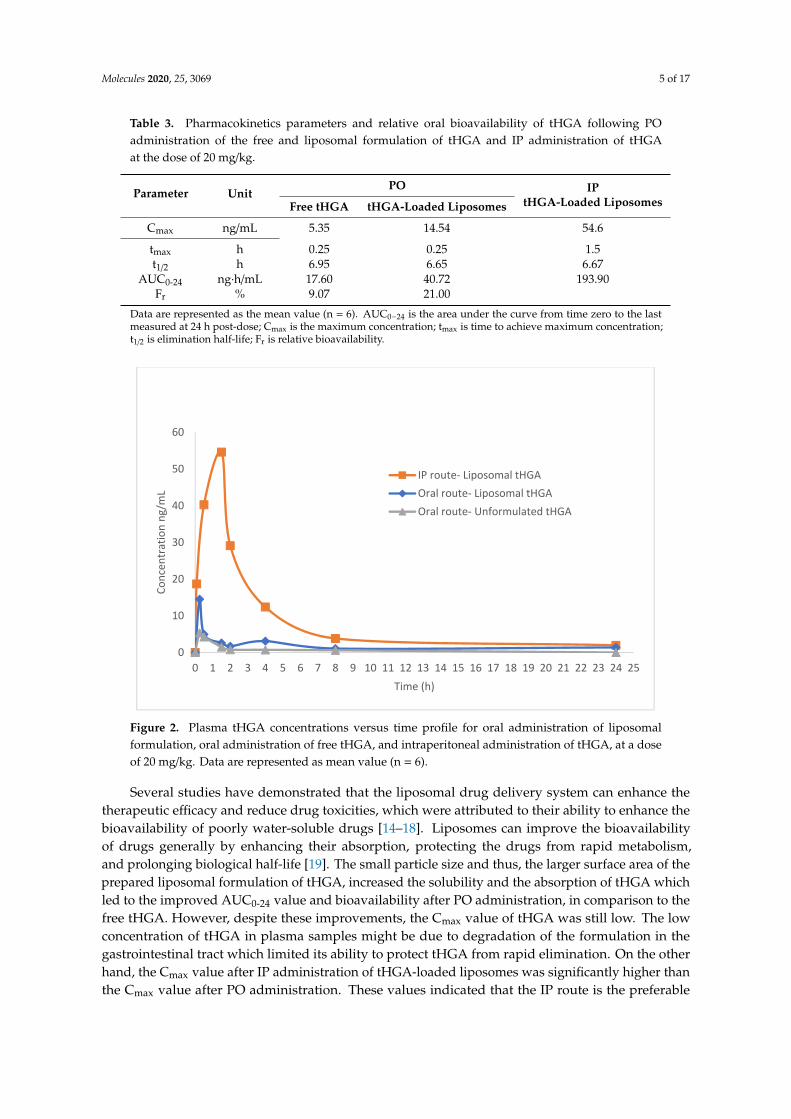
Table 3. Pharmacokinetics parameters and relative oral bioavailability of tHGA following POadministration of the free and liposomal formulation of tHGA and IP administration of tHGAat the dose of 20 mg/kg.
Parameter UnitPO IP
tHGA-Loaded LiposomesFree tHGA tHGA-Loaded Liposomes
Cmax ng/mL 5.35 14.54 54.6
tmax h 0.25 0.25 1.5t1/2 h 6.95 6.65 6.67
AUC0-24 ng·h/mL 17.60 40.72 193.90Fr % 9.07 21.00
Data are represented as the mean value (n = 6). AUC0–24 is the area under the curve from time zero to the lastmeasured at 24 h post-dose; Cmax is the maximum concentration; tmax is time to achieve maximum concentration;t1/2 is elimination half-life; Fr is relative bioavailability.
Molecules 2020, 25, x FOR PEER REVIEW 5 of 18
Table 3. Pharmacokinetics parameters and relative oral bioavailability of tHGA following PO administration of the free and liposomal formulation of tHGA and IP administration of tHGA at the dose of 20 mg/kg.
Parameter Unit PO IP
tHGA-Loaded Liposomes Free tHGA tHGA-Loaded Liposomes Cmax ng/mL 5.35 14.54 54.6 tmax h 0.25 0.25 1.5 t1/2 h 6.95 6.65 6.67
AUC0-24 ng.h/mL 17.60 40.72 193.90 Fr % 9.07 21.00
Data are represented as the mean value (n = 6). AUC0–24 is the area under the curve from time zero to the last measured at 24 h post-dose; Cmax is the maximum concentration; tmax is time to achieve maximum concentration; t1/2 is elimination half-life; Fr is relative bioavailability.
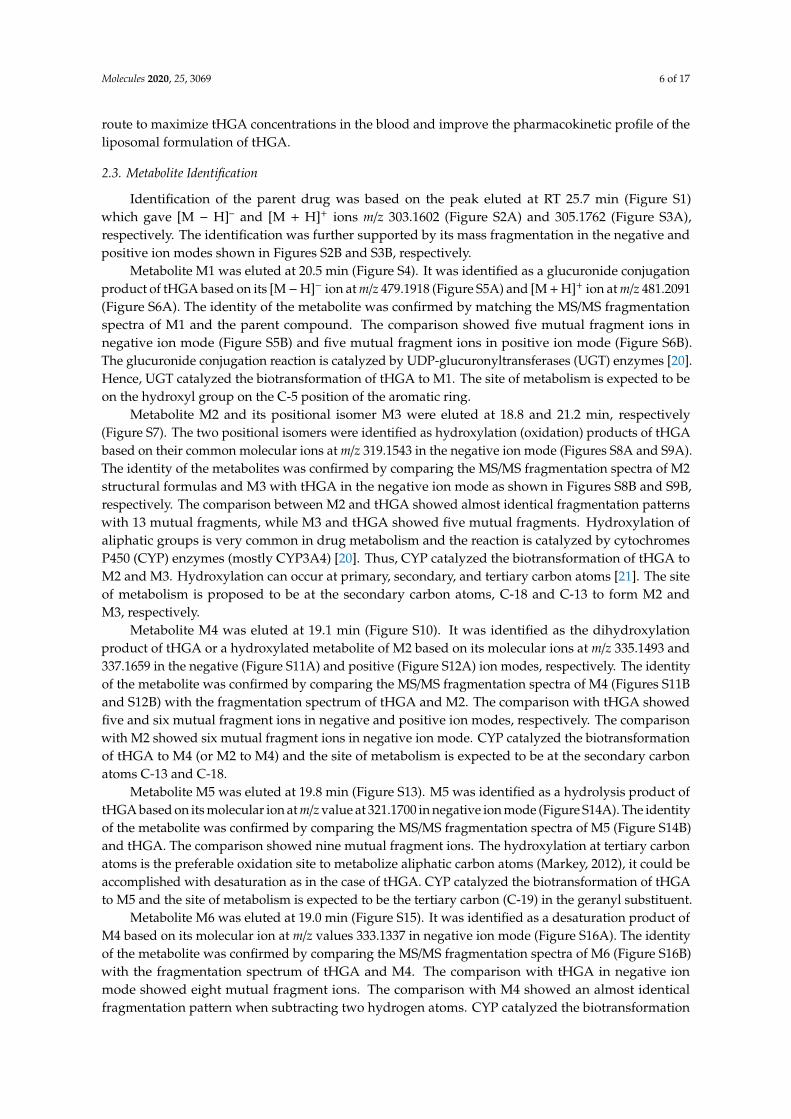
Figure 2. Plasma tHGA concentrations versus time profile for oral administration of liposomal formulation, oral administration of free tHGA, and intraperitoneal administration of tHGA, at a dose of 20 mg/kg. Data are represented as mean value (n = 6).
The software SPSS was used to compare the values of AUC0–24 for the free and encapsulated tHGA administrated orally. The U-test revealed that there is a significant difference between the AUC0–24 values for the free and encapsulated tHGA (p < 0.05). On the other hand, no significant differences were observed for Cmax, tmax, and t1/2 values between the free and the encapsulated tHGA. The AUC0–24 value for encapsulated tHGA increased by 2.3-fold compared to the free tHGA. The group administrated intraperitoneally with liposome-encapsulated tHGA showed significant differences in tmax, Cmax and AUC0–24 values. The Cmax value for the IP group was 3.8-fold and 10.2-fold greater than the Cmax value for the encapsulated and free tHGA, respectively. The differences in AUC0–
24 values were exemplified by the relative oral bioavailability values. The relative oral bioavailabilities of the free and encapsulated tHGA were 9.1% and 21.0%, respectively. The relative oral bioavailability of the liposomal formulation of tHGA increased by 2.3-fold compared to free tHGA. Despite the low oral bioavailability, the therapeutic activity of tHGA in pre-clinical trials has been demonstrated, which indicated the high efficacy of the compound.
Several studies have demonstrated that the liposomal drug delivery system can enhance the therapeutic efficacy and reduce drug toxicities, which were attributed to their ability to enhance the bioavailability of poorly water-soluble drugs [14–18]. Liposomes can improve the bioavailability of
0
10
20
30
40
50
60
0 1 2 3 4 5 6 7 8 9 10 11 12 13 14 15 16 17 18 19 20 21 22 23 24 25
Conc
entr
atio
n ng
/mL
Time (h)
IP route- Liposomal tHGAOral route- Liposomal tHGAOral route- Unformulated tHGA
Figure 2. Plasma tHGA concentrations versus time profile for oral administration of liposomalformulation, oral administration of free tHGA, and intraperitoneal administration of tHGA, at a doseof 20 mg/kg. Data are represented as mean value (n = 6).
Several studies have demonstrated that the liposomal drug delivery system can enhance thetherapeutic efficacy and reduce drug toxicities, which were attributed to their ability to enhance thebioavailability of poorly water-soluble drugs [14–18]. Liposomes can improve the bioavailabilityof drugs generally by enhancing their absorption, protecting the drugs from rapid metabolism,and prolonging biological half-life [19]. The small particle size and thus, the larger surface area of theprepared liposomal formulation of tHGA, increased the solubility and the absorption of tHGA whichled to the improved AUC0-24 value and bioavailability after PO administration, in comparison to thefree tHGA. However, despite these improvements, the Cmax value of tHGA was still low. The lowconcentration of tHGA in plasma samples might be due to degradation of the formulation in thegastrointestinal tract which limited its ability to protect tHGA from rapid elimination. On the otherhand, the Cmax value after IP administration of tHGA-loaded liposomes was significantly higher thanthe Cmax value after PO administration. These values indicated that the IP route is the preferable
Molecules 2020, 25, 3069 6 of 17
route to maximize tHGA concentrations in the blood and improve the pharmacokinetic profile of theliposomal formulation of tHGA.
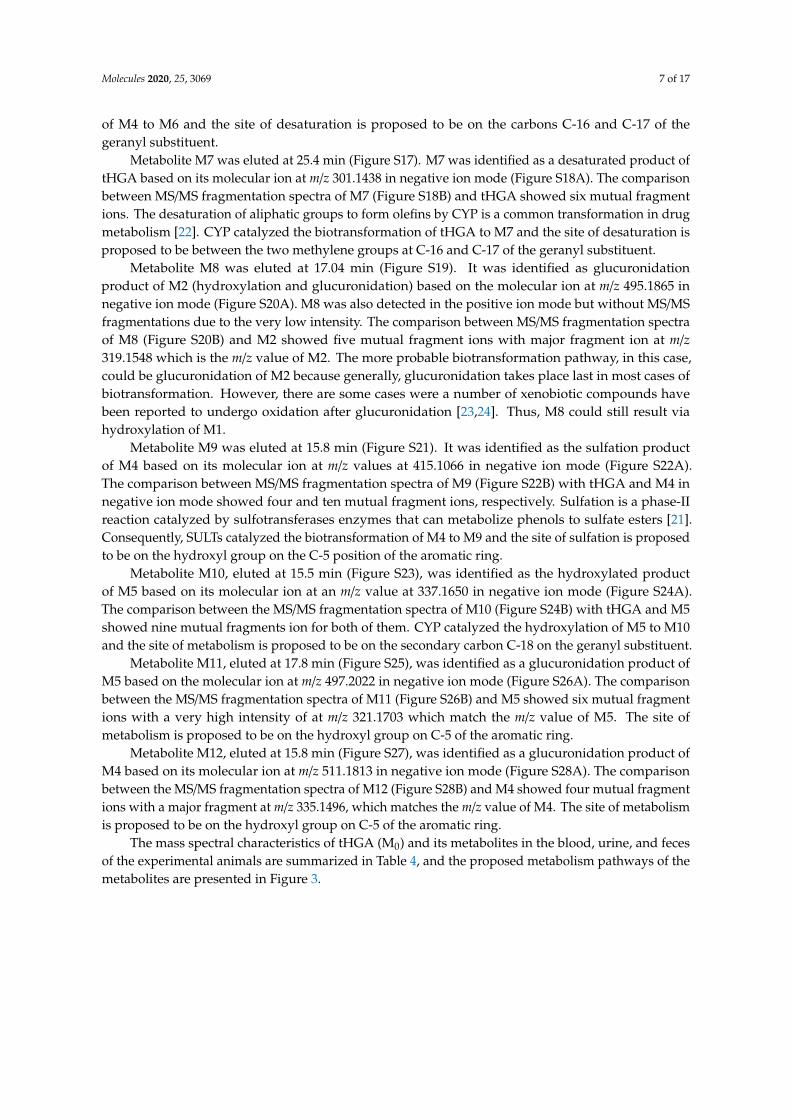
2.3. Metabolite Identification
Identification of the parent drug was based on the peak eluted at RT 25.7 min (Figure S1)which gave [M − H]– and [M + H]+ ions m/z 303.1602 (Figure S2A) and 305.1762 (Figure S3A),respectively. The identification was further supported by its mass fragmentation in the negative andpositive ion modes shown in Figures S2B and S3B, respectively.
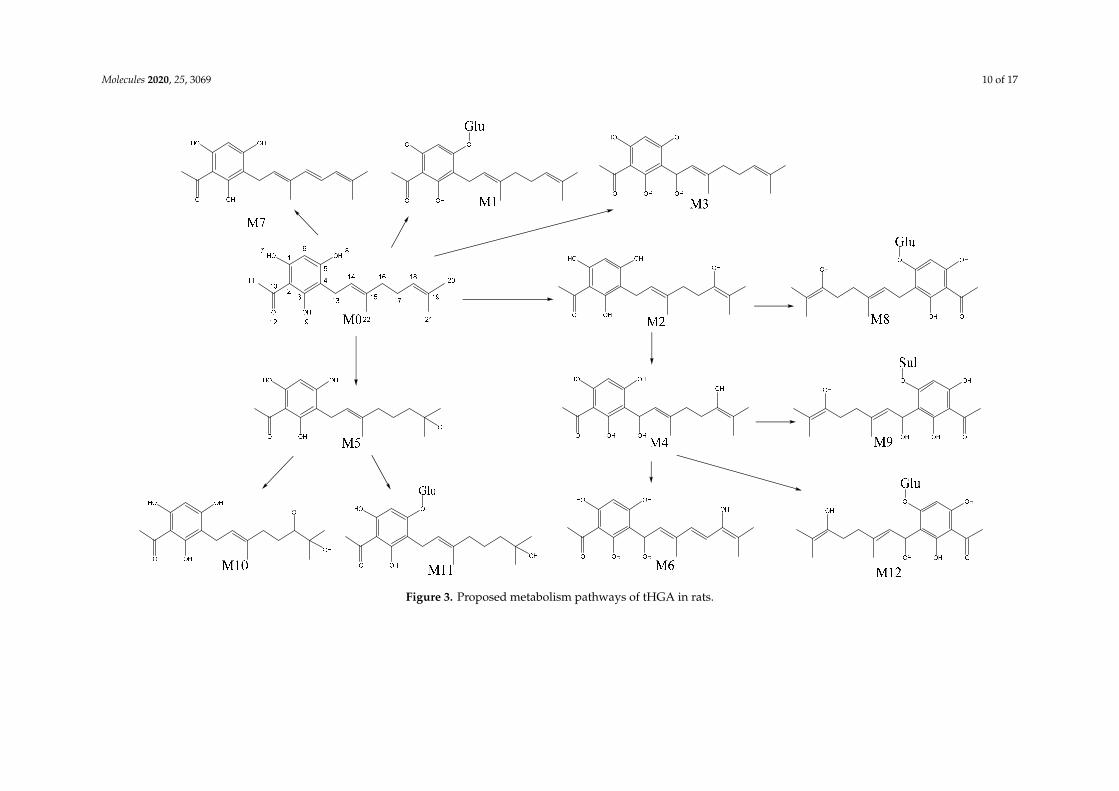
Metabolite M1 was eluted at 20.5 min (Figure S4). It was identified as a glucuronide conjugationproduct of tHGA based on its [M−H]− ion at m/z 479.1918 (Figure S5A) and [M + H]+ ion at m/z 481.2091(Figure S6A). The identity of the metabolite was confirmed by matching the MS/MS fragmentationspectra of M1 and the parent compound. The comparison showed five mutual fragment ions innegative ion mode (Figure S5B) and five mutual fragment ions in positive ion mode (Figure S6B).The glucuronide conjugation reaction is catalyzed by UDP-glucuronyltransferases (UGT) enzymes [20].Hence, UGT catalyzed the biotransformation of tHGA to M1. The site of metabolism is expected to beon the hydroxyl group on the C-5 position of the aromatic ring.
Metabolite M2 and its positional isomer M3 were eluted at 18.8 and 21.2 min, respectively(Figure S7). The two positional isomers were identified as hydroxylation (oxidation) products of tHGAbased on their common molecular ions at m/z 319.1543 in the negative ion mode (Figures S8A and S9A).The identity of the metabolites was confirmed by comparing the MS/MS fragmentation spectra of M2structural formulas and M3 with tHGA in the negative ion mode as shown in Figures S8B and S9B,respectively. The comparison between M2 and tHGA showed almost identical fragmentation patternswith 13 mutual fragments, while M3 and tHGA showed five mutual fragments. Hydroxylation ofaliphatic groups is very common in drug metabolism and the reaction is catalyzed by cytochromesP450 (CYP) enzymes (mostly CYP3A4) [20]. Thus, CYP catalyzed the biotransformation of tHGA toM2 and M3. Hydroxylation can occur at primary, secondary, and tertiary carbon atoms [21]. The siteof metabolism is proposed to be at the secondary carbon atoms, C-18 and C-13 to form M2 andM3, respectively.
Metabolite M4 was eluted at 19.1 min (Figure S10). It was identified as the dihydroxylationproduct of tHGA or a hydroxylated metabolite of M2 based on its molecular ions at m/z 335.1493 and337.1659 in the negative (Figure S11A) and positive (Figure S12A) ion modes, respectively. The identityof the metabolite was confirmed by comparing the MS/MS fragmentation spectra of M4 (Figures S11Band S12B) with the fragmentation spectrum of tHGA and M2. The comparison with tHGA showedfive and six mutual fragment ions in negative and positive ion modes, respectively. The comparisonwith M2 showed six mutual fragment ions in negative ion mode. CYP catalyzed the biotransformationof tHGA to M4 (or M2 to M4) and the site of metabolism is expected to be at the secondary carbonatoms C-13 and C-18.
Metabolite M5 was eluted at 19.8 min (Figure S13). M5 was identified as a hydrolysis product oftHGA based on its molecular ion at m/z value at 321.1700 in negative ion mode (Figure S14A). The identityof the metabolite was confirmed by comparing the MS/MS fragmentation spectra of M5 (Figure S14B)and tHGA. The comparison showed nine mutual fragment ions. The hydroxylation at tertiary carbonatoms is the preferable oxidation site to metabolize aliphatic carbon atoms (Markey, 2012), it could beaccomplished with desaturation as in the case of tHGA. CYP catalyzed the biotransformation of tHGAto M5 and the site of metabolism is expected to be the tertiary carbon (C-19) in the geranyl substituent.
Metabolite M6 was eluted at 19.0 min (Figure S15). It was identified as a desaturation product ofM4 based on its molecular ion at m/z values 333.1337 in negative ion mode (Figure S16A). The identityof the metabolite was confirmed by comparing the MS/MS fragmentation spectra of M6 (Figure S16B)with the fragmentation spectrum of tHGA and M4. The comparison with tHGA in negative ionmode showed eight mutual fragment ions. The comparison with M4 showed an almost identicalfragmentation pattern when subtracting two hydrogen atoms. CYP catalyzed the biotransformation
Molecules 2020, 25, 3069 7 of 17
of M4 to M6 and the site of desaturation is proposed to be on the carbons C-16 and C-17 of thegeranyl substituent.
Metabolite M7 was eluted at 25.4 min (Figure S17). M7 was identified as a desaturated product oftHGA based on its molecular ion at m/z 301.1438 in negative ion mode (Figure S18A). The comparisonbetween MS/MS fragmentation spectra of M7 (Figure S18B) and tHGA showed six mutual fragmentions. The desaturation of aliphatic groups to form olefins by CYP is a common transformation in drugmetabolism [22]. CYP catalyzed the biotransformation of tHGA to M7 and the site of desaturation isproposed to be between the two methylene groups at C-16 and C-17 of the geranyl substituent.
Metabolite M8 was eluted at 17.04 min (Figure S19). It was identified as glucuronidationproduct of M2 (hydroxylation and glucuronidation) based on the molecular ion at m/z 495.1865 innegative ion mode (Figure S20A). M8 was also detected in the positive ion mode but without MS/MSfragmentations due to the very low intensity. The comparison between MS/MS fragmentation spectraof M8 (Figure S20B) and M2 showed five mutual fragment ions with major fragment ion at m/z319.1548 which is the m/z value of M2. The more probable biotransformation pathway, in this case,could be glucuronidation of M2 because generally, glucuronidation takes place last in most cases ofbiotransformation. However, there are some cases were a number of xenobiotic compounds havebeen reported to undergo oxidation after glucuronidation [23,24]. Thus, M8 could still result viahydroxylation of M1.
Metabolite M9 was eluted at 15.8 min (Figure S21). It was identified as the sulfation productof M4 based on its molecular ion at m/z values at 415.1066 in negative ion mode (Figure S22A).The comparison between MS/MS fragmentation spectra of M9 (Figure S22B) with tHGA and M4 innegative ion mode showed four and ten mutual fragment ions, respectively. Sulfation is a phase-IIreaction catalyzed by sulfotransferases enzymes that can metabolize phenols to sulfate esters [21].Consequently, SULTs catalyzed the biotransformation of M4 to M9 and the site of sulfation is proposedto be on the hydroxyl group on the C-5 position of the aromatic ring.
Metabolite M10, eluted at 15.5 min (Figure S23), was identified as the hydroxylated productof M5 based on its molecular ion at an m/z value at 337.1650 in negative ion mode (Figure S24A).The comparison between the MS/MS fragmentation spectra of M10 (Figure S24B) with tHGA and M5showed nine mutual fragments ion for both of them. CYP catalyzed the hydroxylation of M5 to M10and the site of metabolism is proposed to be on the secondary carbon C-18 on the geranyl substituent.
Metabolite M11, eluted at 17.8 min (Figure S25), was identified as a glucuronidation product ofM5 based on the molecular ion at m/z 497.2022 in negative ion mode (Figure S26A). The comparisonbetween the MS/MS fragmentation spectra of M11 (Figure S26B) and M5 showed six mutual fragmentions with a very high intensity of at m/z 321.1703 which match the m/z value of M5. The site ofmetabolism is proposed to be on the hydroxyl group on C-5 of the aromatic ring.
Metabolite M12, eluted at 15.8 min (Figure S27), was identified as a glucuronidation product ofM4 based on its molecular ion at m/z 511.1813 in negative ion mode (Figure S28A). The comparisonbetween the MS/MS fragmentation spectra of M12 (Figure S28B) and M4 showed four mutual fragmentions with a major fragment at m/z 335.1496, which matches the m/z value of M4. The site of metabolismis proposed to be on the hydroxyl group on C-5 of the aromatic ring.
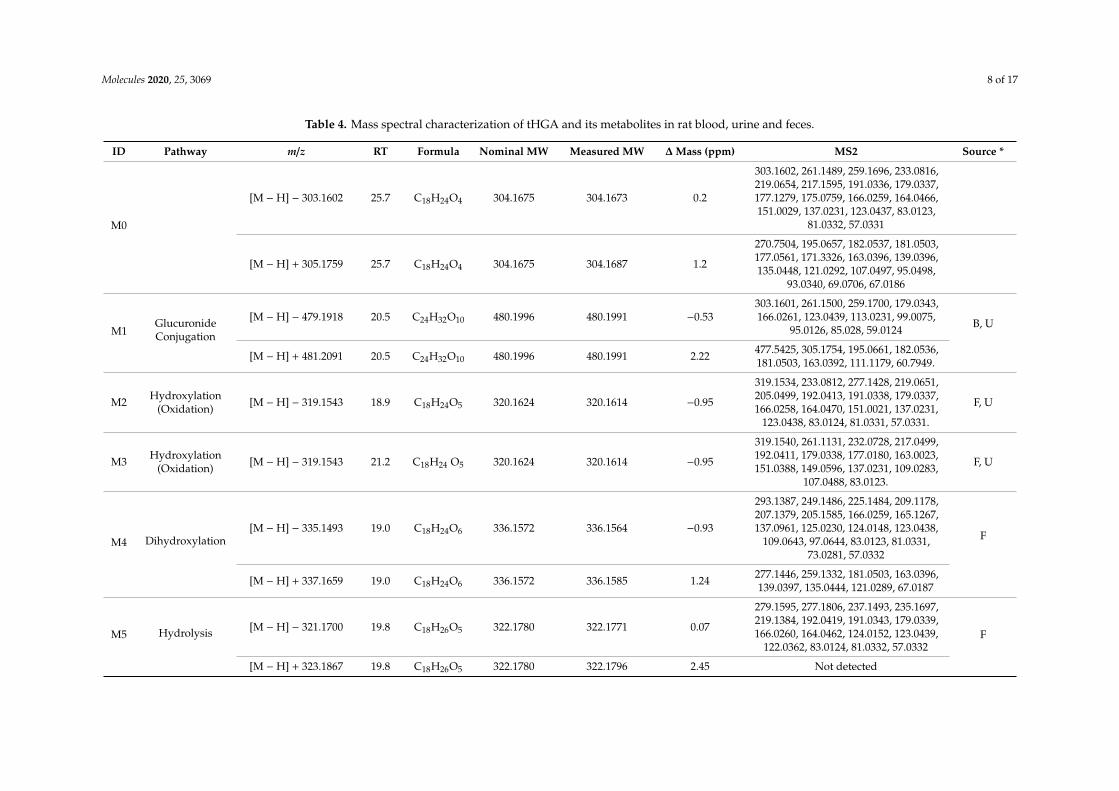
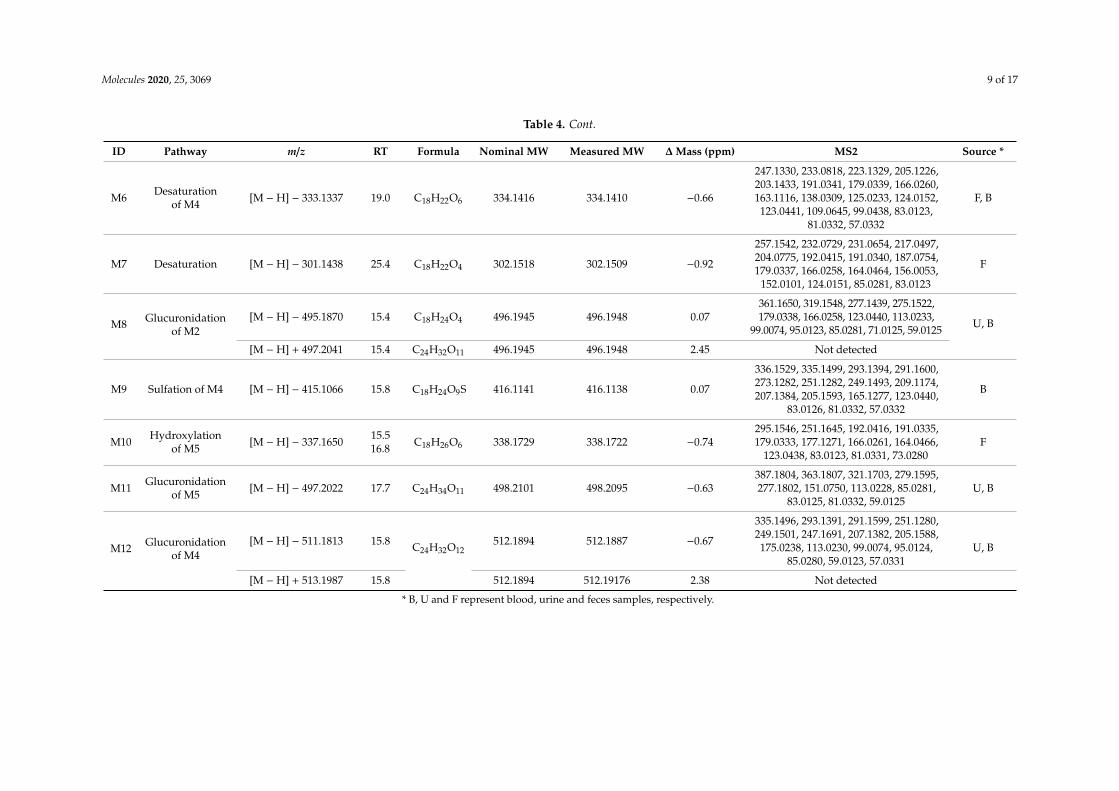
The mass spectral characteristics of tHGA (M0) and its metabolites in the blood, urine, and fecesof the experimental animals are summarized in Table 4, and the proposed metabolism pathways of themetabolites are presented in Figure 3.
Molecules 2020, 25, 3069 8 of 17
Table 4. Mass spectral characterization of tHGA and its metabolites in rat blood, urine and feces.
ID Pathway m/z RT Formula Nominal MW Measured MW ∆ Mass (ppm) MS2 Source *
M0
[M − H] − 303.1602 25.7 C18H24O4 304.1675 304.1673 0.2
303.1602, 261.1489, 259.1696, 233.0816,219.0654, 217.1595, 191.0336, 179.0337,177.1279, 175.0759, 166.0259, 164.0466,151.0029, 137.0231, 123.0437, 83.0123,
81.0332, 57.0331
[M − H] + 305.1759 25.7 C18H24O4 304.1675 304.1687 1.2
270.7504, 195.0657, 182.0537, 181.0503,177.0561, 171.3326, 163.0396, 139.0396,135.0448, 121.0292, 107.0497, 95.0498,
93.0340, 69.0706, 67.0186
M1GlucuronideConjugation
[M − H] − 479.1918 20.5 C24H32O10 480.1996 480.1991 −0.53303.1601, 261.1500, 259.1700, 179.0343,166.0261, 123.0439, 113.0231, 99.0075,
95.0126, 85.028, 59.0124 B, U
[M − H] + 481.2091 20.5 C24H32O10 480.1996 480.1991 2.22 477.5425, 305.1754, 195.0661, 182.0536,181.0503, 163.0392, 111.1179, 60.7949.
M2 Hydroxylation(Oxidation) [M − H] − 319.1543 18.9 C18H24O5 320.1624 320.1614 −0.95
319.1534, 233.0812, 277.1428, 219.0651,205.0499, 192.0413, 191.0338, 179.0337,166.0258, 164.0470, 151.0021, 137.0231,
123.0438, 83.0124, 81.0331, 57.0331.
F, U
M3 Hydroxylation(Oxidation) [M − H] − 319.1543 21.2 C18H24 O5 320.1624 320.1614 −0.95
319.1540, 261.1131, 232.0728, 217.0499,192.0411, 179.0338, 177.0180, 163.0023,151.0388, 149.0596, 137.0231, 109.0283,
107.0488, 83.0123.
F, U
M4 Dihydroxylation[M − H] − 335.1493 19.0 C18H24O6 336.1572 336.1564 −0.93
293.1387, 249.1486, 225.1484, 209.1178,207.1379, 205.1585, 166.0259, 165.1267,137.0961, 125.0230, 124.0148, 123.0438,
109.0643, 97.0644, 83.0123, 81.0331,73.0281, 57.0332
F
[M − H] + 337.1659 19.0 C18H24O6 336.1572 336.1585 1.24 277.1446, 259.1332, 181.0503, 163.0396,139.0397, 135.0444, 121.0289, 67.0187
M5 Hydrolysis [M − H] − 321.1700 19.8 C18H26O5 322.1780 322.1771 0.07
279.1595, 277.1806, 237.1493, 235.1697,219.1384, 192.0419, 191.0343, 179.0339,166.0260, 164.0462, 124.0152, 123.0439,
122.0362, 83.0124, 81.0332, 57.0332F
[M − H] + 323.1867 19.8 C18H26O5 322.1780 322.1796 2.45 Not detected
Molecules 2020, 25, 3069 9 of 17
Table 4. Cont.
ID Pathway m/z RT Formula Nominal MW Measured MW ∆ Mass (ppm) MS2 Source *
M6 Desaturationof M4 [M − H] − 333.1337 19.0 C18H22O6 334.1416 334.1410 −0.66
247.1330, 233.0818, 223.1329, 205.1226,203.1433, 191.0341, 179.0339, 166.0260,163.1116, 138.0309, 125.0233, 124.0152,
123.0441, 109.0645, 99.0438, 83.0123,81.0332, 57.0332
F, B
M7 Desaturation [M − H] − 301.1438 25.4 C18H22O4 302.1518 302.1509 −0.92
257.1542, 232.0729, 231.0654, 217.0497,204.0775, 192.0415, 191.0340, 187.0754,179.0337, 166.0258, 164.0464, 156.0053,
152.0101, 124.0151, 85.0281, 83.0123
F
M8 Glucuronidationof M2
[M − H] − 495.1870 15.4 C18H24O4 496.1945 496.1948 0.07361.1650, 319.1548, 277.1439, 275.1522,179.0338, 166.0258, 123.0440, 113.0233,
99.0074, 95.0123, 85.0281, 71.0125, 59.0125 U, B
[M − H] + 497.2041 15.4 C24H32O11 496.1945 496.1948 2.45 Not detected
M9 Sulfation of M4 [M − H] − 415.1066 15.8 C18H24O9S 416.1141 416.1138 0.07
336.1529, 335.1499, 293.1394, 291.1600,273.1282, 251.1282, 249.1493, 209.1174,207.1384, 205.1593, 165.1277, 123.0440,
83.0126, 81.0332, 57.0332
B
M10 Hydroxylationof M5 [M − H] − 337.1650 15.5
16.8 C18H26O6 338.1729 338.1722 −0.74295.1546, 251.1645, 192.0416, 191.0335,179.0333, 177.1271, 166.0261, 164.0466,
123.0438, 83.0123, 81.0331, 73.0280F
M11 Glucuronidationof M5 [M − H] − 497.2022 17.7 C24H34O11 498.2101 498.2095 −0.63
387.1804, 363.1807, 321.1703, 279.1595,277.1802, 151.0750, 113.0228, 85.0281,
83.0125, 81.0332, 59.0125U, B
M12 Glucuronidationof M4
[M − H] − 511.1813 15.8 C24H32O12512.1894 512.1887 −0.67
335.1496, 293.1391, 291.1599, 251.1280,249.1501, 247.1691, 207.1382, 205.1588,175.0238, 113.0230, 99.0074, 95.0124,
85.0280, 59.0123, 57.0331U, B
[M − H] + 513.1987 15.8 512.1894 512.19176 2.38 Not detected
* B, U and F represent blood, urine and feces samples, respectively.
Molecules 2020, 25, 3069 10 of 17
Molecules 2020, 25, x FOR PEER REVIEW 10 of 18
Figure 3. Proposed metabolism pathways of tHGA in rats.
Figure 3. Proposed metabolism pathways of tHGA in rats.
Molecules 2020, 25, 3069 11 of 17
3. Materials and Methods
3.1. Chemicals and Reagents
tHGA was synthesized, purified, and fully characterized by suitable spectroscopic techniquesin our laboratory (unpublished manuscript). The purity of tHGA was 98.4% as determinedby qNMR. Acetonitrile, water and formic acid (LC-MS grade) were purchased from FisherScientific (Pittsburgh, PA, USA). Ibuprofen was purchased from Sigma-Aldrich (St. Louis, MO, USA).Ultrapure water for HPLC was taken from a Sartorius Arium 611DI ultra-pure water purificationsystem (Sartorius Stedim Biotech, Goettingen, Germany). ProlipoTM Duo was purchased from LucasMeyer (Le Blanc Mesnil, France).
3.2. Animals, Dosing and Sampling
Thirty healthy male Sprague-Dawley (S.D.) rats, weighing between 180 and 225 g on the day ofdosing, were kept in polypropylene cage base with stainless steel wire top clips for three days before theexperiment. The living environment of the animals was controlled as follows: 12/12-h dark/light cycle,temperature maintained between 22 to 25 ◦C, daily feeding with commercial pellet food, and tap water.Rats were fasted 12 h before dosing and labeled with a designated number at the base of their tails.The rats were then randomly divided into six groups as follows:
• Group 1 (n = 6) were dosed orally with 20 mg/kg of free tHGA.• Group 2 (n = 6) were dosed orally with 20 mg/kg of liposomes-encapsulated tHGA.• Group 3 (n = 6) were dosed intraperitoneally with 20 mg/kg of liposomes-encapsulated tHGA• Group 4 (n = 4) were dosed orally with 20 mg/kg of liposomes-encapsulated tHGA.• Group 5 (n = 4, control) were dosed orally with blank liposomes formulation (for urine and
feces collection).• Group 6 (n = 4, control) were dosed orally with blank liposomes formulation (for blood collection).
Groups 1 to 3 were used for the single-dose pharmacokinetic study. An aliquot of 200 µL ofblood was drawn from each rat via the tail vein into polypropylene tubes containing a disodiumK2EDTA solution (10%) as an anticoagulant at the pre-specified time points; at 0.25, 0.5, 1.5, 2, 4, 8 and24 h for groups 1 and 2 after PO dose, and at 0.08, 0.5, 1.5, 2, 4, 8 and 24 h for group 3 after IP dose.Blood samples were centrifuged at 14,000 rpm at 20 ◦C for 10 min to separate the plasma which wasthen stored under −80 ◦C until further analysis. Animals were allowed to feed two hours after the firstsample time point.
Groups 4 to 6 were used for single-dose drug metabolism study. Each rat was kept in individualmetabolic cages. Urine and faeces were collected from each rat in the tHGA-treated group 4 and controlgroup 5 at four different times over a period of 24 h. The samples were stored at −80 ◦C until furtheranalysis. For the determination of plasma metabolites, blood was sampled from each rat in the controlgroup 6, according to the same procedure as in the pharmacokinetic study. Blood samples collectedfrom the tHGA-treated group 2 in the pharmacokinetics study were also used for the metabolism study.
All experiments and animal handling were performed in accordance with the principlesand guidelines of animal care and use committee (IACUC) with approval obtained from IACUC(UPM/IACUC/AUP-R079/2018).
3.3. Preparation of Solutions
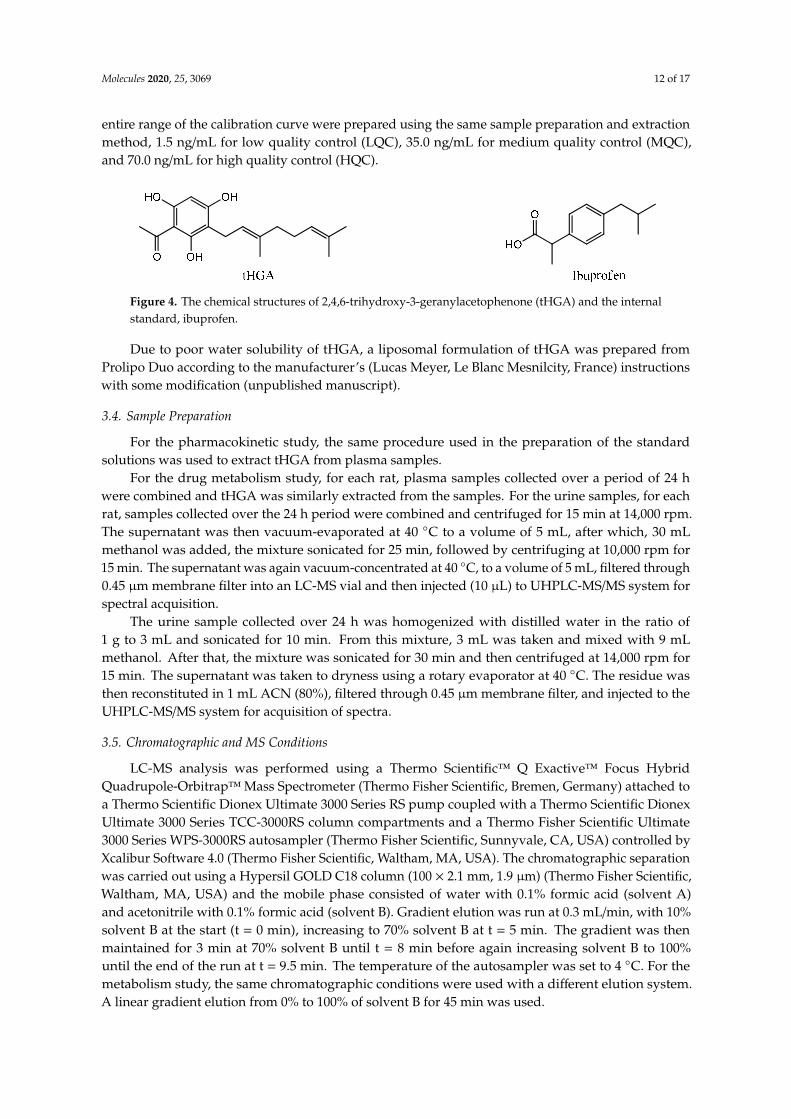
A freshly prepared stock solution of tHGA was prepared in acetonitrile and appropriately dilutedto obtain standard solutions with concentrations ranging from 0.5 to 80 ng/mL. A 5 µL aliquot of eachconcentration was then added to 45 µL of blank rat plasma and 200 µL acetonitrile containing 1 µg/mLof ibuprofen as an internal standard (Figure 4). The mixture was vortexed for 30 s and centrifuged for10 min at 14,000 rpm. The supernatant was transferred into LC-MS vials and 10 µL was injected into theLC-MS system for spectral acquisition. Three different concentrations of QC samples representing the
Molecules 2020, 25, 3069 12 of 17
entire range of the calibration curve were prepared using the same sample preparation and extractionmethod, 1.5 ng/mL for low quality control (LQC), 35.0 ng/mL for medium quality control (MQC),and 70.0 ng/mL for high quality control (HQC).
Molecules 2020, 25, x FOR PEER REVIEW 12 of 18
was injected into the LC-MS system for spectral acquisition. Three different concentrations of QC samples representing the entire range of the calibration curve were prepared using the same sample preparation and extraction method, 1.5 ng/mL for low quality control (LQC), 35.0 ng/mL for medium quality control (MQC), and 70.0 ng/mL for high quality control (HQC).
Figure 4. The chemical structures of 2,4,6-trihydroxy-3-geranylacetophenone (tHGA) and the internal standard, ibuprofen.
Due to poor water solubility of tHGA, a liposomal formulation of tHGA was prepared from Prolipo Duo according to the manufacturer’s (Lucas Meyer, Le Blanc Mesnilcity , France)instructions with some modification (unpublished manuscript).
3.4. Sample Preparation
For the pharmacokinetic study, the same procedure used in the preparation of the standard solutions was used to extract tHGA from plasma samples.
For the drug metabolism study, for each rat, plasma samples collected over a period of 24 h were combined and tHGA was similarly extracted from the samples. For the urine samples, for each rat, samples collected over the 24 h period were combined and centrifuged for 15 min at 14,000 rpm. The supernatant was then vacuum-evaporated at 40 °C to a volume of 5 mL, after which, 30 mL methanol was added, the mixture sonicated for 25 min, followed by centrifuging at 10,000 rpm for 15 min. The supernatant was again vacuum-concentrated at 40 °C, to a volume of 5 mL, filtered through 0.45 µm membrane filter into an LC-MS vial and then injected (10 µL) to UHPLC-MS/MS system for spectral acquisition.
The urine sample collected over 24 h was homogenized with distilled water in the ratio of 1g to 3mL and sonicated for 10 min. From this mixture, 3 mL was taken and mixed with 9 mL methanol. After that, the mixture was sonicated for 30 min and then centrifuged at 14,000 rpm for 15 min. The supernatant was taken to dryness using a rotary evaporator at 40 °C. The residue was then reconstituted in 1 mL ACN (80%), filtered through 0.45 µm membrane filter, and injected to the UHPLC-MS/MS system for acquisition of spectra.
3.5. Chromatographic and MS Conditions
LC-MS analysis was performed using a Thermo Scientific™ Q Exactive™ Focus Hybrid Quadrupole-Orbitrap™ Mass Spectrometer (Thermo Fisher Scientific, Bremen, Germany) attached to a Thermo Scientific Dionex Ultimate 3000 Series RS pump coupled with a Thermo Scientific Dionex Ultimate 3000 Series TCC-3000RS column compartments and a Thermo Fisher Scientific Ultimate 3000 Series WPS-3000RS autosampler (Thermo Fisher Scientific, Sunnyvale, CA, USA) controlled by Xcalibur Software 4.0 (Thermo Fisher Scientific, Waltham, MA, USA). The chromatographic separation was carried out using a Hypersil GOLD C18 column (100 × 2.1 mm, 1.9 µm) (Thermo Fisher Scientific, Waltham, MA, USA) and the mobile phase consisted of water with 0.1% formic acid (solvent A) and acetonitrile with 0.1% formic acid (solvent B). Gradient elution was run at 0.3 mL/min, with 10% solvent B at the start (t = 0 min), increasing to 70% solvent B at t = 5 min. The gradient was then maintained for 3 min at 70% solvent B until t = 8 min before again increasing solvent B to 100% until the end of the run at t = 9.5 min. The temperature of the autosampler was set to 4 °C. For the metabolism study, the same chromatographic conditions were used with a different elution system. A linear gradient elution from 0% to 100% of solvent B for 45 min was used.
Figure 4. The chemical structures of 2,4,6-trihydroxy-3-geranylacetophenone (tHGA) and the internalstandard, ibuprofen.
Due to poor water solubility of tHGA, a liposomal formulation of tHGA was prepared fromProlipo Duo according to the manufacturer’s (Lucas Meyer, Le Blanc Mesnilcity, France) instructionswith some modification (unpublished manuscript).
3.4. Sample Preparation
For the pharmacokinetic study, the same procedure used in the preparation of the standardsolutions was used to extract tHGA from plasma samples.
For the drug metabolism study, for each rat, plasma samples collected over a period of 24 hwere combined and tHGA was similarly extracted from the samples. For the urine samples, for eachrat, samples collected over the 24 h period were combined and centrifuged for 15 min at 14,000 rpm.The supernatant was then vacuum-evaporated at 40 ◦C to a volume of 5 mL, after which, 30 mLmethanol was added, the mixture sonicated for 25 min, followed by centrifuging at 10,000 rpm for15 min. The supernatant was again vacuum-concentrated at 40 ◦C, to a volume of 5 mL, filtered through0.45 µm membrane filter into an LC-MS vial and then injected (10 µL) to UHPLC-MS/MS system forspectral acquisition.
The urine sample collected over 24 h was homogenized with distilled water in the ratio of1 g to 3 mL and sonicated for 10 min. From this mixture, 3 mL was taken and mixed with 9 mLmethanol. After that, the mixture was sonicated for 30 min and then centrifuged at 14,000 rpm for15 min. The supernatant was taken to dryness using a rotary evaporator at 40 ◦C. The residue wasthen reconstituted in 1 mL ACN (80%), filtered through 0.45 µm membrane filter, and injected to theUHPLC-MS/MS system for acquisition of spectra.
3.5. Chromatographic and MS Conditions
LC-MS analysis was performed using a Thermo Scientific™ Q Exactive™ Focus HybridQuadrupole-Orbitrap™Mass Spectrometer (Thermo Fisher Scientific, Bremen, Germany) attached toa Thermo Scientific Dionex Ultimate 3000 Series RS pump coupled with a Thermo Scientific DionexUltimate 3000 Series TCC-3000RS column compartments and a Thermo Fisher Scientific Ultimate3000 Series WPS-3000RS autosampler (Thermo Fisher Scientific, Sunnyvale, CA, USA) controlled byXcalibur Software 4.0 (Thermo Fisher Scientific, Waltham, MA, USA). The chromatographic separationwas carried out using a Hypersil GOLD C18 column (100 × 2.1 mm, 1.9 µm) (Thermo Fisher Scientific,Waltham, MA, USA) and the mobile phase consisted of water with 0.1% formic acid (solvent A)and acetonitrile with 0.1% formic acid (solvent B). Gradient elution was run at 0.3 mL/min, with 10%solvent B at the start (t = 0 min), increasing to 70% solvent B at t = 5 min. The gradient was thenmaintained for 3 min at 70% solvent B until t = 8 min before again increasing solvent B to 100%until the end of the run at t = 9.5 min. The temperature of the autosampler was set to 4 ◦C. For themetabolism study, the same chromatographic conditions were used with a different elution system.A linear gradient elution from 0% to 100% of solvent B for 45 min was used.
Molecules 2020, 25, 3069 13 of 17
Mass spectrometric detection was operated under a heated electrospray ion source (H-ESI II)in negative ionization mode. The H-ESI parameters were optimized as follows: spray voltage3.5 kV, capillary temperature 320 ◦C, S-lens RF level 55, sheath gas flow rate 45, auxiliary gas 10 andsweep gas 2 (manufacturer’s units). Nitrogen was used for the source, Orbitrap bath gas, and thehigher energy collision dissociation (HCD) cell collision. A targeted SIM data-dependent MS/MS(tSIM/ddMS2) acquisition was used with an inclusion mass list containing m/z and retention time oftHGA. The resolution was 35,000 (FWHM) at m/z 200, with automatic gain control (AGC) target of5 × 104 ions and an auto maximum ion injection time (IT).
For the identification of tHGA and its metabolites simultaneously, MS detection was operatedunder a heated electrospray ion source (H-ESI II) using positive/negative switching ionization mode tomaximize metabolite coverage in every injection. The H-ESI parameters were optimized as follows:spray voltage (+) and (−) 4.2 and 3.5 kV respectively, capillary temperature 320 ◦C, S-lens RF level55, sheath gas flow rate 45, auxiliary gas 10 and sweep gas 2 (manufacturer’s units). Nitrogen wasused for the source, Orbitrap bath gas, and the higher energy collision dissociation (HCD) cell collision.The full-scan MS data were recorded across the mass range of 50–1500 m/z. The resolution was70,000 (FWHM) at m/z 200, with automatic gain control (AGC) target of 1 × 10⁶ ions and an automaximum ion injection time (IT).
3.6. Method Validation
The developed method was validated for rat plasma following the European Medicines Agencyguidelines (EMA) [25]. The selectivity was evaluated by any interferents observed at the retentiontimes and mass transitions of tHGA and the IS in six different blank rat plasma samples which wereprocessed using the same sample preparation method and injected into the UHPLC-MS/MS system.The chromatograms of blank plasma samples were compared to that of known concentrations of tHGAplasma samples.
The calibration curve was assessed to evaluate the response of the LC-HRMS instrument withregards to the concentration of tHGA over the range of 0.5–80 ng/mL. A total of seven calibration curvepoints were prepared using plasma samples spiked with various concentrations of tHGA (0.5, 1, 5, 10,20, 40 and 80 ng/mL) and with 10 µg/mL of the IS solution. The points were run in duplicates, and thelinear regression was expressed as y = ax + b, where y is the peak area of tHGA divided by the peakarea of IS; a is the slope of the curve; x is the measured concentration of tHGA and b is the intercept ofthe curve on the y-axis. The coefficient of determination (R2) was used to estimate the linearity of thestandard curve.
The lower limit of quantification (LLOQ) was chosen to be the lowest concentration of the standardcurve at which the accuracy and precision were within ±20%. LLOQ was established by measuring sixspiked plasma samples.
Within-run accuracy and precision were determined using six replicates of QC samples atfour different concentrations (0.5, 1.5, 35, and 70 ng/mL). Between-run accuracy and precision weredetermined using six replicates of the QC samples at four concentrations in three different days.The accuracy and the precision were expressed by percent relative error (RE) and relative standarddeviation (RSD), respectively. RE and RSD should be less than 15% except for LLOQ less than 20%.
To assess the matrix effect, six blank plasma samples were extracted using PPT then spiked withtHGA at three QC concentration levels (1.5, 35 and 70 ng/mL). In addition, six samples of tHGA weredissolved in the solvent (80% acetonitrile in water) at equivalent concentrations. The matrix effect wascalculated by comparing the peak areas of post-extraction spiked samples with the peak areas of tHGAin the solvent and expressed as a percentage. The effect should be ≤15%.
The recovery percentage was measured by comparing the peak area of six replicates of QC samples(pre-extraction) at three QC levels (1.5, 35 and 70 ng/mL) with the peak area of six post-extractionspiked samples at equivalent concentrations. The percent recovery was calculated and expressed asa percentage.
Molecules 2020, 25, 3069 14 of 17
A dilution integrity test was conducted using a high concentration sample of tHGA prepared inrat plasma (500 ng/mL) which was about six times beyond the upper limit of quantification (80 ng/mL).The analysis was demonstrated after a 10-fold dilution of the concentrated sample with blank plasmato reach a concentration of 50 ng/mL. The mean accuracy after dilution, expressed by RE, and precision,expressed by RSD should be ≤15%.
Carry-over was evaluated by injecting blank plasma samples immediately after the upper limit ofquantification in duplicate and the response of the blank plasma was compared with the response ofthe lower limit of quantification. The ratio should be ≤20%.
Stability tests were performed to ensure that all steps in sample preparation, analysis, and storagedid not affect the concentration of tHGA. Short- and long-term stability studies of tHGA in plasma wasassessed using six replicates at two concentration levels, LQC and HQC. The QC samples were analyzedagainst the standard curve which was freshly prepared. The short-term stability was evaluated byanalyzing the processed QC samples kept in the autosampler (4 ◦C) for 24 h. For long-term stability,tHGA plasma samples in low and high concentrations were stored at −80 ◦C for 1 month.
3.7. Data Analysis
The pharmacokinetic parameters namely, maximum concentration (Cmax), the elimination half-life(t1/2) area under the curve (AUC0–24) were analyzed using ThothPro software (ThothPro™, version 4.3.0,Gdansk, Poland) after intraperitoneal and oral administrations at a dose of 20 mg/kg of tHGA bynon-compartmental model and analyzed using Statistical Package for the Social Science Version 20.0(SPSS Inc. Chicago, IL, USA). AUC0–t was obtained by a linear-up/log-down trapezoidal method.The time to reach maximum concentration (tmax) was obtained from a concentration-time curve,the relative bioavailability was calculated according to the following equation:
FR = (AUCPO × DIP)/(AUCIP × DPO) × 100 (1)
where FR is the relative bioavailability; AUCPO is the area under the curve of a plasma concentrationversus time plot for PO administration; DO is the amount of drug dosed by PO administration; AUCIP isthe area under the curve of a plasma concentration versus time plot for intraperitoneal administration;DIP is the amount of drug dosed by intraperitoneal administration.
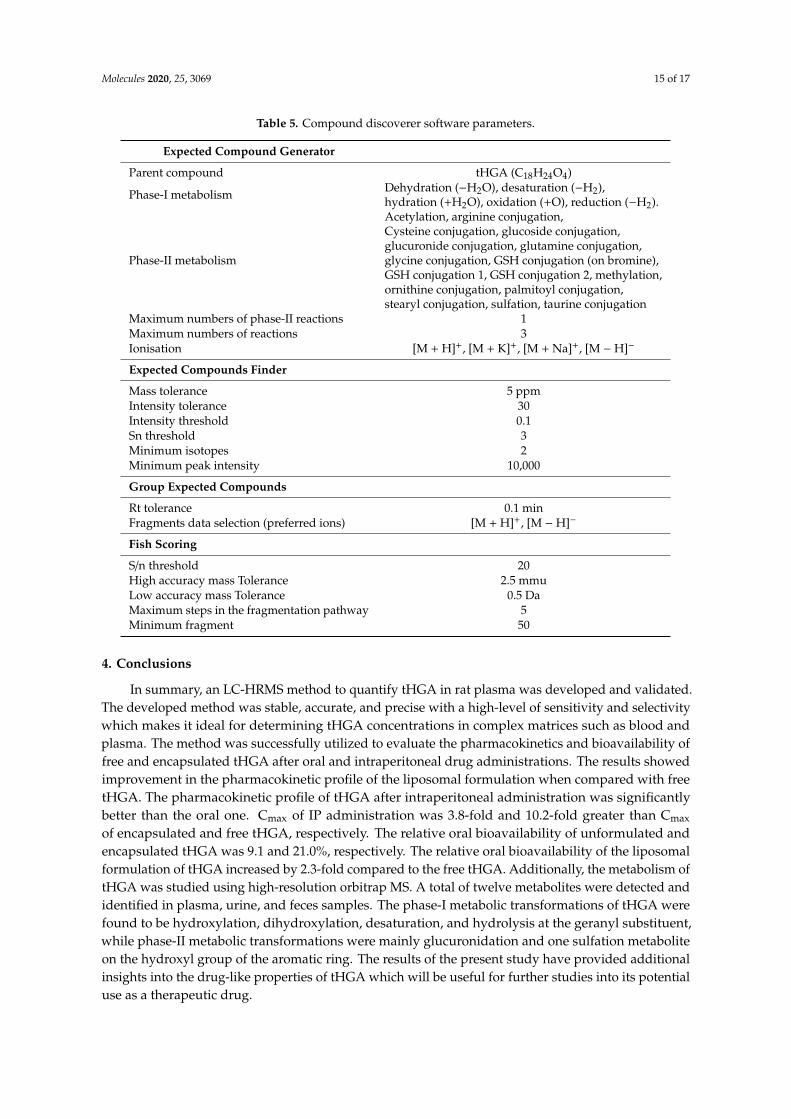
All MS data acquired using the Q Exactive MS were controlled by Xcalibur 4.0 software(Thermo Fisher Scientific). The MS data from plasma-, urine-, and feces-treated, as well as the controlsamples were analyzed using Compound Discoverer software 2.1 (Thermo Fisher Scientific) for theidentification of tHGA metabolites. The software extracted information about metabolite m/z valuesdepending on a list of expected metabolites. As no standards or literature information were availableto confirm tHGA metabolites structure, tentative elucidation of the metabolites was performedaccording to Schymanski classification [26]. A list of putative metabolites with the probable metabolismpathway was created for peaks based on MS, MS/MS fragmentation and the isotopic pattern of tHGA.The matching percentage between measured and theoretical MS/MS spectra was determined dependingon the existence/absence of theoretical fragments in the MS/MS spectra generated experimentally.The important parameters of the software are listed in Table 5. In addition, the site of metabolismwas determined based on the tHGA structure with the help of a web server site for metabolismpredictor [27,28].
Molecules 2020, 25, 3069 15 of 17
Table 5. Compound discoverer software parameters.
Expected Compound Generator
Parent compound tHGA (C18H24O4)
Phase-I metabolism Dehydration (−H2O), desaturation (−H2),hydration (+H2O), oxidation (+O), reduction (−H2).
Phase-II metabolism
Acetylation, arginine conjugation,Cysteine conjugation, glucoside conjugation,glucuronide conjugation, glutamine conjugation,glycine conjugation, GSH conjugation (on bromine),GSH conjugation 1, GSH conjugation 2, methylation,ornithine conjugation, palmitoyl conjugation,stearyl conjugation, sulfation, taurine conjugation
Maximum numbers of phase-II reactions 1Maximum numbers of reactions 3Ionisation [M + H]+, [M + K]+, [M + Na]+, [M − H]−
Expected Compounds Finder
Mass tolerance 5 ppmIntensity tolerance 30Intensity threshold 0.1Sn threshold 3Minimum isotopes 2Minimum peak intensity 10,000
Group Expected Compounds
Rt tolerance 0.1 minFragments data selection (preferred ions) [M + H]+, [M − H]−
Fish Scoring
S/n threshold 20High accuracy mass Tolerance 2.5 mmuLow accuracy mass Tolerance 0.5 DaMaximum steps in the fragmentation pathway 5Minimum fragment 50
4. Conclusions
In summary, an LC-HRMS method to quantify tHGA in rat plasma was developed and validated.The developed method was stable, accurate, and precise with a high-level of sensitivity and selectivitywhich makes it ideal for determining tHGA concentrations in complex matrices such as blood andplasma. The method was successfully utilized to evaluate the pharmacokinetics and bioavailability offree and encapsulated tHGA after oral and intraperitoneal drug administrations. The results showedimprovement in the pharmacokinetic profile of the liposomal formulation when compared with freetHGA. The pharmacokinetic profile of tHGA after intraperitoneal administration was significantlybetter than the oral one. Cmax of IP administration was 3.8-fold and 10.2-fold greater than Cmax
of encapsulated and free tHGA, respectively. The relative oral bioavailability of unformulated andencapsulated tHGA was 9.1 and 21.0%, respectively. The relative oral bioavailability of the liposomalformulation of tHGA increased by 2.3-fold compared to the free tHGA. Additionally, the metabolism oftHGA was studied using high-resolution orbitrap MS. A total of twelve metabolites were detected andidentified in plasma, urine, and feces samples. The phase-I metabolic transformations of tHGA werefound to be hydroxylation, dihydroxylation, desaturation, and hydrolysis at the geranyl substituent,while phase-II metabolic transformations were mainly glucuronidation and one sulfation metaboliteon the hydroxyl group of the aromatic ring. The results of the present study have provided additionalinsights into the drug-like properties of tHGA which will be useful for further studies into its potentialuse as a therapeutic drug.
Molecules 2020, 25, 3069 16 of 17
Supplementary Materials: Supplementary materials are available online.
Author Contributions: Conceptualization, K.S.; Data curation, Y.A.; Funding acquisition, K.S.; Investigation, Y.A.;Resources, Q.B.J.; Supervision, F.A., Y.R. and K.S.; Writing—original draft, Y.A.; Writing—review and editing,C.L.T., Y.K.H. and K.S. All authors have read and agreed to the published version of the manuscript.
Funding: This research was financially supported by the Ministry of Higher Education (FRGS/1/2018/SKK06/UPM/01/1).
Acknowledgments: The first author gratefully acknowledges support from the Ministry of Higher Education,Malaysia for the international scholarship.
Conflicts of Interest: The authors declare that they have no conflicts of interest.
References
1. Shaari, K.; Safri, S.; Abas, F.; Lajis, N.H.; Israf, D. A geranylacetophenone from the leaves of Melicopeptelefolia. Nat. Product Res. 2006, 20, 415–419. [CrossRef] [PubMed]
2. Shaari, K.; Suppaiah, V.; Wai, L.K.; Stanslas, J.; Tejo, B.A.; Israf, D.A.; Abas, F.; Ismail, I.S.; Shuaib, N.H.;Zareen, S. Bioassay-guided identification of an anti-inflammatory prenylated acylphloroglucinol fromMelicope ptelefolia and molecular insights into its interaction with 5-lipoxygenase. Bioorg. Med. Chem. 2011,19, 6340–6347. [CrossRef] [PubMed]
3. Ismail, N.; Jambari, N.N.; Zareen, S.; Akhtar, M.N.; Shaari, K.; Zamri-Saad, M.; Tham, C.L.; Sulaiman, M.R.;Lajis, N.H.; Israf, D.A. A geranyl acetophenone targeting cysteinyl leukotriene synthesis prevents allergicairway inflammation in ovalbumin-sensitized mice. Toxicol. Appl. Pharmacol. 2012, 259, 257–262. [CrossRef][PubMed]
4. Lee, Y.Z.; Shaari, K.; Cheema, M.S.; Tham, C.L.; Sulaiman, M.R.; Israf, D.A. An orally active geranylacetophenone attenuates airway remodeling in a murine model of chronic asthma. Eur. J. Pharmacol. 2017,797, 53–64. [CrossRef] [PubMed]
5. Chong, Y.J.; Musa, N.F.; Ng, C.H.; Shaari, K.; Israf, D.A.; Tham, C.L. Barrier protective effects of2,4,6-trihydroxy-3-geranyl acetophenone on lipopolysaccharides-stimulated inflammatory responses inhuman umbilical vein endothelial cells. J. Ethnopharmacol. 2016, 192, 248–255. [CrossRef] [PubMed]
6. Tan, J.W.; Israf, D.A.; Harith, H.H.; Hashim, N.F.M.; Ng, C.H.; Shaari, K.; Tham, C.L. Anti-allergic activity of2,4,6-trihydroxy-3-geranylacetophenone (tHGA) via attenuation of IgE-mediated mast cell activation andinhibition of passive systemic anaphylaxis. Toxicol. Appl. Pharmacol. 2017, 319, 47–58. [CrossRef]
7. Tan, J.W.; Israf, D.A.; Hashim, N.F.M.; Cheah, Y.K.; Harith, H.H.; Shaari, K.; Tham, C.L. LAT is essential forthe mast cell stabilising effect of tHGA in IgE-mediated mast cell activation. Biochem. Pharmacol. 2017, 144,132–148. [CrossRef]
8. Lee, Y.Z.; Yap, H.M.; Shaari, K.; Tham, C.L.; Sulaiman, M.R.; Israf, D.A. Blockade of eosinophil-inducedbronchial epithelial-mesenchymal transition with a geranyl acetophenone in a coculture model.Front. Pharmacol. 2017, 8, 837. [CrossRef]
9. Yap, H.M.; Lee, Y.Z.; Harith, H.H.; Tham, C.L.; Cheema, M.S.; Shaari, K.; Israf, D.A. The geranyl acetophenonetHGA attenuates human bronchial smooth muscle proliferation via inhibition of AKT phosphorylation.Sci. Rep. 2018, 8, 16640. [CrossRef]
10. Liaras, K.; Fesatidou, M.; Geronikaki, A. Thiazoles and thiazolidinones as COX/LOX inhibitors. Molecules2018, 23, 685. [CrossRef]
11. Rescigno, A.; Segre, G. Drug and Tracer Kinetics; Blaisdell Pub. Co.: Waltham, MA, USA, 1966.12. Ramanathan, R. Mass Spectrometry in Drug Metabolism and Pharmacokinetics; John Wiley & Sons:
Hoboken, NJ, USA, 2011.13. Bergeron, A.; Furtado, M.; Garofolo, F. Importance of using highly pure internal standards for successful
liquid chromatography/tandem mass spectrometric bioanalytical assays. Rapid Commun. Mass Spectrum.2009, 23, 1287–1297. [CrossRef] [PubMed]
14. Arafat, M.; Kirchhoefer, C.; Mikov, M.; Sarfraz, M.; Löbenberg, R. Nanosized liposomes containing bile salt:A vesicular nanocarrier for enhancing oral bioavailability of BCS class III drug. J. Pharm. Pharm. Sci. 2017,20, 305–318. [CrossRef] [PubMed]
15. Zhu, Y.; Wang, M.; Zhang, J.; Peng, W.; Firempong, C.K.; Deng, W.; Wang, Q.; Wang, S.; Shi, F.; Yu, J.Improved oral bioavailability of capsaicin via liposomal nanoformulation: Preparation, in vitro drug releaseand pharmacokinetics in rats. Arch. Pharm. Res. 2015, 38, 512–521. [CrossRef] [PubMed]
Molecules 2020, 25, 3069 17 of 17
16. Wang, Y.; Wang, S.; Firempong, C.K.; Zhang, H.; Wang, M.; Zhang, Y.; Zhu, Y.; Yu, J.; Xu, X. Enhancedsolubility and bioavailability of naringenin via liposomal nanoformulation: Preparation and in vitro andin vivo evaluations. Aaps Pharmscitech 2017, 18, 586–594. [CrossRef] [PubMed]
17. Jarrar, Q.B.; Hakim, M.N.; Cheema, M.S.; Zakaria, Z.A. In vitro characterization and in vivo performance ofmefenamic acid-sodium diethyldithiocarbamate based liposomes. Braz. J. Pharm. Sci. 2019, 55. [CrossRef]
18. Jarrar, Q.B.; Hakim, M.N.; Zakaria, Z.A.; Cheema, M.S.; Moshawih, S. Renal ultrastructural alterationsinduced by various preparations of mefenamic acid. Ultrastruct. Pathol. 2020, 44, 130–140. [CrossRef]
19. Rushmi, Z.T.; Akter, N.; Mow, R.J.; Afroz, M.; Kazi, M.; de Matas, M.; Rahman, M.; Shariare, M.H. The impactof formulation attributes and process parameters on black seed oil loaded liposomes and their performancein animal models of analgesia. Saudi Pharm. J. 2017, 25, 404–412. [CrossRef]
20. Zhang, D.; Zhu, M.; Humphreys, W.G. Drug Metabolism in Drug Design and Development: Basic Conceptsand Practice; John Wiley & Sons: Hoboken, NJ, USA, 2007. [CrossRef]
21. Markey, S.P. Pathways of drug metabolism. In Principles of Clinical Pharmacology, 3rd ed.; Atkinson, A.J.,Huang, S.M., Lertora, J.J.L., Markey, S.P., Eds.; Academic Press: Bethesda, MD, USA, 2012; pp. 153–172.
22. Ji, L.; Faponle, A.S.; Quesne, M.G.; Sainna, M.A.; Zhang, J.; Franke, A.; Kumar, D.; van Eldik, R.; Liu, W.;de Visser, S.P. Drug metabolism by cytochrome P450 enzymes: What distinguishes the pathways leading tosubstrate hydroxylation over desaturation? Chem. Eur. J. 2015, 21, 9083–9092. [CrossRef]
23. Delaforge, M.; Pruvost, A.; Perrin, L.; Andre, F. Cytochrome P450-mediated oxidation of glucuronidederivatives: Example of estradiol-17β-glucuronide oxidation to 2-hydroxy-estradiol-17β-glucuronide byCYP 2C8. Drug Metab. Dispos. 2005, 33, 466–473. [CrossRef]
24. Kim, T.H.; Choi, D.; Kim, J.Y.; Lee, J.H.; Koo, S.-H. Fast food diet-induced non-alcoholic fatty liver diseaseexerts early protective effect against acetaminophen intoxication in mice. BMC Gastroenterol. 2017, 17, 124.[CrossRef]
25. Committee for Medicinal Products for Human Use. Guideline on Bioanalytical Method Validation;European Medicines Agency: London, UK, 2011; Available online: https://www.ema.europa.eu/en/
bioanalytical-method-validation (accessed on 10 March 2019).26. Schymanski, E.L.; Jeon, J.; Gulde, R.; Fenner, K.; Ruff, M.; Singer, H.P.; Hollender, J. Identifying small
molecules via high resolution mass spectrometry: Communicating confidence. Environ. Sci. Technol. 2014,48, 2097–2098. [CrossRef] [PubMed]
27. Rudik, A.; Dmitriev, A.; Lagunin, A.; Filimonov, D.; Poroikov, V. SOMP: Web server for in silico prediction ofsites of metabolism for drug-like compounds. Bioinformatics 2015, 31, 2046–2048. [CrossRef] [PubMed]
28. SOMP. Site of Metabolism Prediction. Available online: http://www.way2drug.com/SOMP/ (accessed on20 June 2019).
Sample Availability: Samples of the compounds are available from the authors.
© 2020 by the authors. Licensee MDPI, Basel, Switzerland. This article is an open accessarticle distributed under the terms and conditions of the Creative Commons Attribution(CC BY) license (http://creativecommons.org/licenses/by/4.0/).


