Embed Size (px)
Citation preview
Turkish Journal of Computer and Mathematics Education Vol.12 No.14(2021), 4338- 4352
4338
Research Article
Pharmacological screening of mast cell stabilizing, anti-inflammatory and
anti-oxidant activity of Calotropis proceraextracts
Chandrakant P. Rathod, Mahavir H. Ghante*
Center for Research of Pharmaceutical Science, Nanded Pharmacy College,
Shyam Nagar, Nanded.
*Corresponding Author E-mail: [email protected]
Abstract
Calotropis procera (Ait.) R. Br., a wild growing plant of family Asclepiadaceae, is well known
for its medicinal properties which is widely used in traditional medicine to treat various diseases.
C. procera flowers showed various levels of preliminary phytochemical screening of extract has
revealed the presence of carbohydrates, flavonoids, polyphenols, tannins and saponins, alkaloids,
proteins and amino acids.Acute toxicity test has done for the flowers of C. procera as per the
standard method (OECD No: 423).
The present study was evaluated for phytochemical screening, mast cell stabilizing, anti-
inflammatory and antioxidant activity of ethyl acetate extract of C. procera
Keywords: Calotropis procera, mast cell stabilizing, antioxidant and anti-inflammatory activity.
Introduction
The herbal medicines occupy distinct position right from the primitive period to present day. The
ethnobotanical pharmacology is as old as man himself. These medicines have less side effects
and man can get the herbs easily from nature. India being a tropical country is blessed with vast
natural resources and ancient knowledge for its judicious utilization. However, in order to make
these remedies acceptable to modern medicine, there is a need to scientifically evaluate them, to
identify the active principles and to understand the mechanism of action. [1-4]
It is found in most parts of the world in dry, sandy and alkaline soils and warm climate and is
more common in south western and central India and western Himalayas. It is found in waste
lands and grows as a weed in agricultural lands. In ancient Ayurvedic medicines the plant
Calotropis procera was known as “Rakta arka”.Different parts of this plant have been reported to
exhibit anti-inflammatory, analgesic, and antioxidant properties. C.procera has revealed the
enormous diversity of its medicinal uses and popular use of the plant for a wide range of
common ailments like fevers, rheumatism, indigestion, cough, cold, eczema, asthma,
elephantiasis, nausea, vomiting and diarrhea. Either the whole plant or a plant part used singly or
mixed with other plant materials to enhance the efficacy. [5-7]
Calotropis procera Linn., also known as Alarka, Surya, Suuryaahvya, Vikirna, Vasuka, Tapana,
Tuulaphala, Kshirparna, Arkaparna, Aasphota Aakh, Madaar, Ashar in India, belongs to the
Asclepiadaceae family and grows in tropical region and most abundant in Bangladesh, India,
Burma, Pakistan and in the sub Himalayan tract. This plant was used first time as a medicinal
plant by Ved Sushruta, which is about 800–900 AD. It is used from very ancient period in folk
beliefs as well as a drug of choice for different ailments.Different parts of the plant have been
used in Indian traditional system of medicine for the treatment of leprosy, ulcers, tumors, piles
and diseases of spleen, liver and abdomen. [8-9]
Turkish Journal of Computer and Mathematics Education Vol.12 No.14(2021), 4338- 4352
4339
Research Article
The present study was evaluated for phytochemical screening, mast cell stabilizing, anti-
inflammatory and antioxidant activity of the extract of Calotropis procerafor antiasthmatic
potential.
Methods
Chemicals
All the chemicals used were of analytical grade, n-hexane, dichloromethane, ethyl acetate, and
methanol (Merck lif. Sci. Pvt. Ltd. India)
Plant material
Flowers of Calotropis procera were collected in August 2019, from Nanded Localities,
(Maharashtra, India), and the plant was authenticated by Botanical survey of India, Pune,
Maharashtra, India. A voucher specimen (CPR2CG) was deposited in the herbarium for further
use.
Extraction
Extraction was carried out with 300 g of the dried powdered flower material of Calotropis
procera. The plant material was sequentially extracted with hexane, dichloromethane, ethyl
acetate, methanol and water using Soxhlet extractor. All the extracts were concentrated in rotary
evaporator under reduced pressure.
Animals
Albino mice of either sex weighing (25-30 g) were housed under standard husbandry conditions
having free access to food and water. Animal Ethical Committee of the Institute approved all the
protocols of the study (Proposal no. SNIOP/CPCSEA/IAEC/CP-PL/12-2021).
Phytochemical Screening and Standardization of Plant Extracts.
Preliminary phytochemicals screening
All the extracts were screened for presence of phytoconstituentsviz alkaloids, flavonoids,
tannins, steroids, triterpenoids, proteins and sugars [10]
The stock solution was prepared from the crude extract (100 mg): and was dissolved in 10 ml of
mother solvents. The obtained stock solutions were subjected to preliminary phytochemical
screening. [11, 12]
Test for tannins and Phenols:
The following reagents were added separately to the extract solution (prepared by dissolving 500
mg of extract in 25 ml of alcohol)
Ferric chloride test: -Extract solution (2-3 ml) was mixed with FeCl3 solution (2ml; prepared by
dissolving 5 g of FeCl3 in ethanol). Presence of polyphenol was indicated by the appearance of
blue or greenish black colour to the solutionshows the presence of tannins.
Lead acetate test: - Extract solution (2-3 ml) was mixed with lead acetate (2ml; 10% solution
prepared in distilled water). Presence of polyphenol was indicated by the appearance of white
precipitate.Precipitate indicates the presence of tannins.
Potassium permanganate test: - Extract solution (2-3 ml) was mixed with KMnO4 solution
(3ml; 5% prepared in distilled water). Presence of tannins or polyphenol was indicated by the
decolourization of colored mixture.
Turkish Journal of Computer and Mathematics Education Vol.12 No.14(2021), 4338- 4352
4340
Research Article
Potassium dichromate test: - Extract solution (2-3 ml) was mixed with K2S4O4 (3 ml; 5%
prepared in distilled water). Presence of tannins or polyphenol was indicated by the development
of dark red colour to the reaction mixture.
Acetic acid test- - Extract solution (2-3 ml) was mixed withacetic acid (3ml).
Presence of tannins was indicated by the formation of red colour.
Gelatin solution test: - Extract solution (2-3 ml) was mixed with gelatin solution 3 ml (1% w/v
solution was mixed with 10% NaCl), Presence of tannins was indicated by the development of
white precipitate.
Test for alkaloids
Few mg of the sample was taken in 5 ml of 1.5% v/v hydrochloric acid and filtered. The filtrate
was then tested using following reagents:
Turkish Journal of Computer and Mathematics Education Vol.12 No.14(2021), 4338- 4352
4341
Research Article
Dragendorff’s reagent
It is a solution of potassium bismuth iodide. It was prepared by dissolving bismuth nitrate (8 gm)
in nitric acid (20 ml), and separately dissolving potassium iodide (27.2 gm) in water (50 ml),
mixing the two solutions, and making up the volume to 100 ml. Above Dragendorff’s reagent
was sprayed on Whatman No. 1 filter paper then the paper was dried. The test filtrate after
basification with dilute ammonia was extracted with chloroform and the chloroform extract was
applied on the filter paper, impregnated with Dragendorff’s reagent, with the help of a capillary
tube. Development of an orange red color on the paper indicated the presence of alkaloids.
Dragendorff’s test- Extract filtrate (2ml) was mixed with Dragendorff’s reagent (1ml). Presence
of alkaloids was indicated appearance of Orange precipitate.
Mayer’s Reagent
1.36 gm of mercuric chloride, and 3 gm of potassium iodide were dissolved in water to make 100
ml. To a little of each extract taken in dilute hydrochloric acid in a watch glass, few drops of the
reagent was added, formation of cream colored precipitate shows the presence of
alkaloid.Mayer’s test- Filtrate (2ml) and Mayer’s reagent (1ml) was mixed in test tube. Presence
of alkaloids was indicated appearance of cream colored precipitate.
Hager’s reagent
It is a saturated solution of picric acid in water. When the test filtrate was treated with this
reagent, yellow precipitate was obtained indicating the presence of alkaloids.
Hager’s test- Filtrate (2ml) and Hager’s reagent (1ml) was mixed in test tube. Presence of
alkaloids was indicated by appearance of Yellow colored precipitate.
Wagner’s Reagent
It is a solution of potassium triiodide in water which was prepared by dissolving 1.3 gm iodine in
a solution of potassium iodide (2 gm) in water to make 100 ml. Formation of brown precipitate
after addition of this reagent in extract indicates the presence of alkaloids.to the extracts (1 g)
dilHCl (10-15 ml) was mixed well and filtered. Obtained filtrate was treated with following test
reagents for the detection of alkaloids.
Wagner’s test- Filtrate (2ml) and Wagner’s reagent (1ml) was mixed in test tube. The
appearance of reddish brown precipitate indicated Presence of alkaloids.
Test for flavonoids and coumarins:
Shinoda test- To the extracts (25mg), absolute ethanol (5 ml), Conc. HCl (2ml) and magnesium
turnings (0.5 g) were added. Presence of flavonoids was indicated by the appearance of pink or
magenta colour.
Coumarins test- Extracts (20-25mg) was placed in a test tube and covered with whatmann filter
paper moistened with dil. NaOH. This test tube was kept in a boiling water bath for 5-10 min and
Turkish Journal of Computer and Mathematics Education Vol.12 No.14(2021), 4338- 4352
4342
Research Article
covered paper was observed in UV chamber for fluorescence. Appearance of yellow or green
fluorescence indicated presence of coumarins.
Test for steroids:
Salkowski reaction- To the extracts (15-20 mg) in chloroform (2-3 ml), Conc. H2SO4 (2ml) was
added to form a lower layer. Presence of plant sterols was indicated by reddish color to
chloroform layer and fluorescence greenish yellow color to acid layer.
Liebermann- Burchard reaction- Extracts (15-20 mg) in chloroform (2-3 ml), acetic anhydride
(2ml) and conc. H2SO4 (1-2ml) was added to form a lower layer. Presence of steroids was
indicated by change in color from red to blue or green.
Liebermann reaction- Extracts (25 mg) in chloroform (2-3 ml), acetic anhydride (3ml) and
conc. H2SO4 (2-3 drops) was mixed uniformly, Presence of sterol was indicated by appearance of
blue colour.
Test for saponins:
Foam Test- Extract (0.25 g) was dissolved in water and shaken vigorously with sodium
carbonate. Presence of saponin was indicated by the stable froth/Honeycomb like foam
Heamolytic test: - Sample was added to one drop of blood placed on glass slide. Hemolytic
zone indicated the presence of saponins.
Test for proteins
Biuret test - Extract solution (3 ml), 4 % NaOH (1 ml) and 1 % CuSO4 (1ml) was mixed in test
tube. Presence of proteins was indicated by violet or pink color.
Million’s test - Extract solution (3 ml) and million’s reagent (5 ml) was mixed in test tube and
boiled for 5 min. Presence of proteins was indicated by formation of white precipitate and
change in color of precipitate from brick red to red.
Xanthoproteic test: - 3 mlofSample was mixed with 1 ml of concentrated sulphuric acid,
formation of precipitate shows positive test.
Test for terpenoids
Liebermann–Burchard test
Few mg of the sample was dissolved in 1 ml of chloroform and few drops of acetic
anhydride. Concentrated sulphuric acid was added by the side of the test tube. Production of
purple color indicates the presence of triterpenoids and blue–green color indicates the
presence of sterols.
Test for triterpenoids: - The dry crude plant extract (5 mg) was dissolved in chloroform (2 ml)
and then acetic anhydride (1 ml) was added to it. One milliliter of concentrated sulphuric acid
was then added to the solution. The formation of reddish violate color shows the presence of
triterpenoids.
Test for anthraquinone glycosides
Borntrager’s test: - To 3 ml of the sample, dilute sulphuric acid was added, boiled, and flittered.
To the filtrate equal volume of chloroform was added, and shaken. After separating the organic
layer, ammonia was added. Turning pink of ammonical layer indicates the presence of said
glycosides.
Turkish Journal of Computer and Mathematics Education Vol.12 No.14(2021), 4338- 4352
4343
Research Article
Test for carbohydrates
Molisch's test: - Extract solution (2 ml), was mixed with alpha-naphthol solution (2-3 drops)
and Conc. H2SO4 (1ml) was added to form layer in the tube. A deep violet coloured ring at the
junction of two layers indicated the presence of carbohydrates.
Fehling’s test: -Fehling’s solution A and B (1 ml each), were mixed and boiled for 1 min. To
this extract solution (2 ml) was added and heated in boiling water for 1 min. To this extract
solution (2 ml) was added and heated in boiling water bath for 10 min. The appearances of brick
red precipitate indicated presence of carbohydrates.
Benedict’s test: -Benedict’s reagent (2 ml) was added to extract solution (2 ml) And heated
water bath for 10 min. The changes in color from yellow to green or red indicated presence of
reducing sugar.
Baefoed’s test – Equal volume (2 ml each) of barfoed’s reagent and extract solution was mixed,
boiled for 2 min and cooled. The appearance of red precipitate showed presence of
monosaccharide.
Test for Cardiac glycosides
Keller-Kiliani test: - To the test extract (15-20 mg) in chloroform (2-3 ml), glacial acetic acid (1
ml) and 5% FeCl3 (3-% drops) was added. Conc. H2SO4 was added to the mixture so as to form
layer and observed for the appearance of reddish brown ring at the junction and bluish green in
the upper layer indicated presence of cardiac glycosides.
Legal’s test: - Extract solution (1ml), pyridine (1ml) and sodium nitropruside (1ml) was mixed
in test tube. Appearance of pink or red indicated positive test.
Standardization
Determination of total phenolic content (TPC)
Total phenolic content was determined using Folin-Ciocalteu reagent[13]
.The reaction mixture
consists of 1 ml of extract solution (100 ug/ml) mixed with FC reagent (4 ml,1:10 diluted with
distilled water), after 10 min incubation in dark, sodium carbonate (5 ml ,7.5%) was added to the
mixture which was followed by 90 min incubation at 30°C. Phenolic content of these samples
was determined spectrophotometrically using a UV visible spectrophotometer at 760 nm.
The standard curve was prepared using gallic acid (0.1mg/mL) as standard.
Determination of total flavonoid content (TFC)
The total flavonoid content was determined [14]
.The plant extracts (500μl) was added to 2%
aluminium chloride (AlCl3) solution in methanol (500μl) and incubated at 30°C for 10 min.
Readings were obtained at 368nm in UV-visible spectrophotometer. The standard curve was
prepared considering quercitin as standard compound.
In Vitro Evaluation of Anti-oxidant Activity
Determination of DPPH radical scavenging activity
0.3mM DPPH solution (2ml) was prepared in methanol, of which 0.5mL of this solution was
mixed with 100μL of extracts. The mixture was kept in dark for incubation at 37˚C for 30 min.
The absorbance was measured spectrophotometrically at 517nm[13]
.
Turkish Journal of Computer and Mathematics Education Vol.12 No.14(2021), 4338- 4352
4344
Research Article
The ability to scavenge DPPH radical was calculated using following formula:
Absorbance of the control – Absorbance of sample
%Inhibition = X 100
Absorbance of control
ABTS radical scavenging assay
Stock solutions included 7 mM ABTS solution and 2.4 mM potassium persulfate/ ammonium
persulfate solution. The working solution was prepared by mixing the two stock solutions in
equal quantities and allowing them to react for 12h at 30ºC in the dark. The solution was then
diluted by mixing 1 mL ABTS solution with 60 ml methanol to obtain an OD of 0.706±0.001 at
734 nm using the spectrophotometer[14]
.
Plant extracts (1 mL) were allowed to react with 1 mL of the ABTS solution and the OD was
taken at 734 nm after 7 min using the spectrophotometer. All the readings were taken in
triplicates. The ABTS scavenging capacity of the extract was calculated as:
ABTScontrol – ABTSsample
ABTS radical scavenging activity (%) = X 100
ABTScontrol
ABTS control is the absorbance of ABTS radical + methanol;
ABTS sample is the absorbance of ABTS radical + sample extract/standard.
In Vivo Evaluation of Crude Extracts
Acute toxicity study-
The OECD guideline # 423 was followed for the acute oral toxicity study for fixing the dose [15]
.
Adult Swiss albino mice of both sexes having weight 20-25gm were randomly selected for acute
toxicity tests. The animals were divided into control and test groups containing three animals
each. The control group received the vehicle (normal saline) while the test groups got graded
doses (200, 400, 600, 800 and1000 mg/kg) of different extracts orally. The animals were
observed carefully up to 4 hours and then occasionally up to 48 hours for seeing any toxic sign or
symptom like behavioral changes, locomotion, loss of righting reflex, convulsions etc. and
further supervised for a period of 14 days for occurrence of any significant changes in the
autonomic or behavioral responses and mortality.
Evaluation of acute anti-inflammatory activity (Carrageenan- induced paw edema in rats)-
During anti-inflammatory studies, paw edema was induced by injecting 0.1 ml of 1% (w/v)
Carrageenan suspension into the sub planter region of the right hind paw of the rats [19-21].
The
control group was orally administered saline (10 ml/kg) while the standard group was given
Turkish Journal of Computer and Mathematics Education Vol.12 No.14(2021), 4338- 4352
4345
Research Article
Indomethacin (5 mg/kg) and Test drug groups were given 100 mg/kg, 200mg/kg & 300 mg/kg of
the test drug extract 1 hour before Carrageenan injection. The measurement of paw edema was
carried out by displacement technique using plethysmometer to find out the circumference of
paw edema immediately before and after at 1 hr, 2 hr, 3 hr and 4 hours following the
Carrageenan injection. The inhibitory activity was calculated according to the formula
(Ct-Co) control – (Ct-Co) treated
% Inhibition = ------------------------------------------ × 100
(Ct-Co) control
Where Ct is the paw circumference at time t, Co is the paw circumference before Carrageenan
injection and (Ct - Co) is edema or change in paw size after time t.
Statistical analysis
The data were statistically analyzed using one-way ANOVA followed by Dunnet’s t test for
individual comparison of groups with control. Results were expressed as Mean ± SEM. p < 0.05
was used to indicate statistical significance.
Mast cell stabilizing study-
Mice were divided into 17 groups (n=3) animals in each groups for every plant. A three-day drug
treatment schedule was followed. Control group treated with 1% Tween-80 (5 mL/kg),
intraperitoneally; test groups were treated with Extracts at doses of 100, 200 and 300mg/kg, and
standard group received sodium chromoglycate at dose of 50 mg/kg. On the fourth day, entire
mice were injected with, 10 mL/kg, 0.9% saline solution, into peritoneal cavity, by gentle
massage, the peritoneal fluid was collected after five minute and transferred into test tube
containing 7-10 mL RPMI-1640 (Roswell Park Memorrial Institute) buffer medium (pH 7.2-7.4)
composed with L- Glutamine and 25 mM Hepes buffer, without sodium bicarbonate[23]
.
This solution was then centrifuged at 400-500 rpm. Pellets of mast cell were washed with same
buffer medium twice by centrifugation, discarding supernatant. The cell suspension from treated
and control group of rats were challenged with egg albumin (100 µg/mL) and incubated at 37ºC
for 10 min. The cell suspension was stained with 1% toludine blue and observed under
microscope. Degranulated mast cells observed are like burst instead of intact. Total 100 cells
were counted from different visual areas and percent protection against degranulation was
calculated.
Results& Discussion
EXTRACTION OF PLANT MATERIAL
Extraction was carried out with 300 g of the dried powdered material of Calotropis procera
flower. The plant material was successively extracted with polarity series by using hexane,
dichloromethane, ethyl acetate, methanol and water. All the extracts were concentrated in rotary
evaporator under reduced pressure.
Phytochemical screening and standardization of plants extracts
Preliminary Phytochemical screening
Turkish Journal of Computer and Mathematics Education Vol.12 No.14(2021), 4338- 4352
4346
Research Article
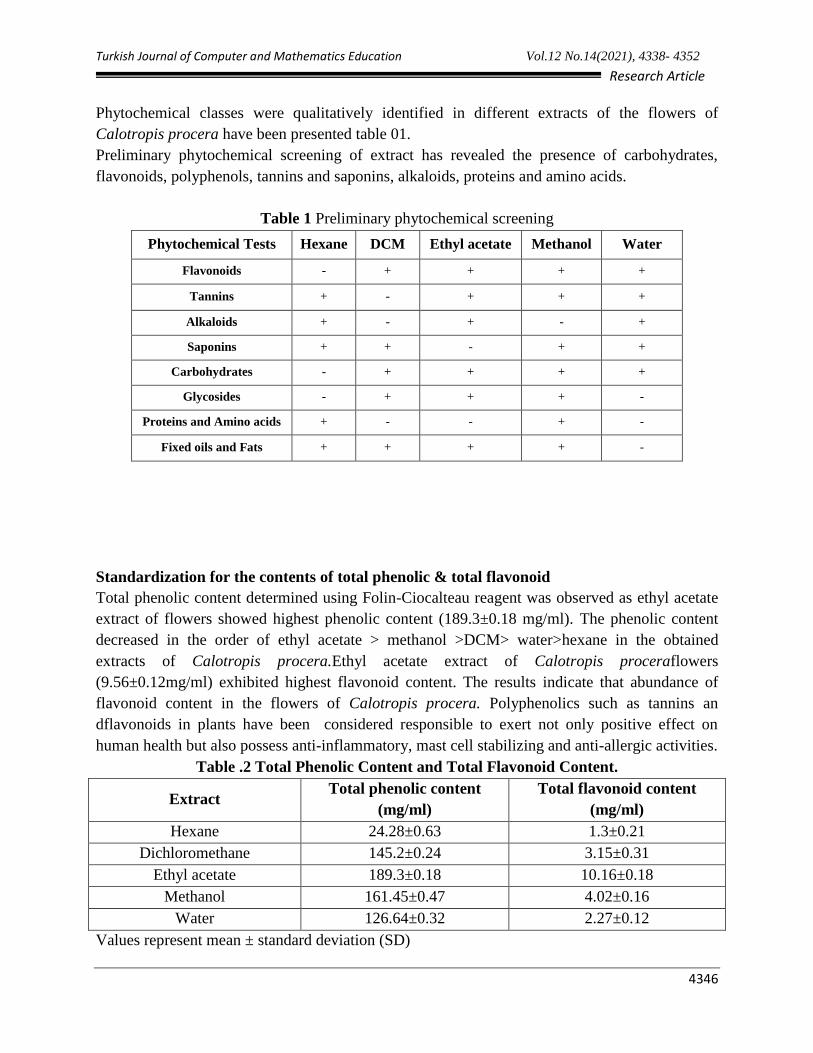
Phytochemical classes were qualitatively identified in different extracts of the flowers of
Calotropis procera have been presented table 01.
Preliminary phytochemical screening of extract has revealed the presence of carbohydrates,
flavonoids, polyphenols, tannins and saponins, alkaloids, proteins and amino acids.
Table 1 Preliminary phytochemical screening
Phytochemical Tests Hexane DCM Ethyl acetate Methanol Water
Flavonoids - + + + +
Tannins + - + + +
Alkaloids + - + - +
Saponins + + - + +
Carbohydrates - + + + +
Glycosides - + + + -
Proteins and Amino acids + - - + -
Fixed oils and Fats + + + + -
Standardization for the contents of total phenolic & total flavonoid
Total phenolic content determined using Folin-Ciocalteau reagent was observed as ethyl acetate
extract of flowers showed highest phenolic content (189.3±0.18 mg/ml). The phenolic content
decreased in the order of ethyl acetate > methanol >DCM> water>hexane in the obtained
extracts of Calotropis procera.Ethyl acetate extract of Calotropis proceraflowers
(9.56±0.12mg/ml) exhibited highest flavonoid content. The results indicate that abundance of
flavonoid content in the flowers of Calotropis procera. Polyphenolics such as tannins an
dflavonoids in plants have been considered responsible to exert not only positive effect on
human health but also possess anti-inflammatory, mast cell stabilizing and anti-allergic activities.
Table .2 Total Phenolic Content and Total Flavonoid Content.
Extract Total phenolic content
(mg/ml)
Total flavonoid content
(mg/ml)
Hexane 24.28±0.63 1.3±0.21
Dichloromethane 145.2±0.24 3.15±0.31
Ethyl acetate 189.3±0.18 10.16±0.18
Methanol 161.45±0.47 4.02±0.16
Water 126.64±0.32 2.27±0.12
Values represent mean ± standard deviation (SD)
Turkish Journal of Computer and Mathematics Education Vol.12 No.14(2021), 4338- 4352
4347
Research Article
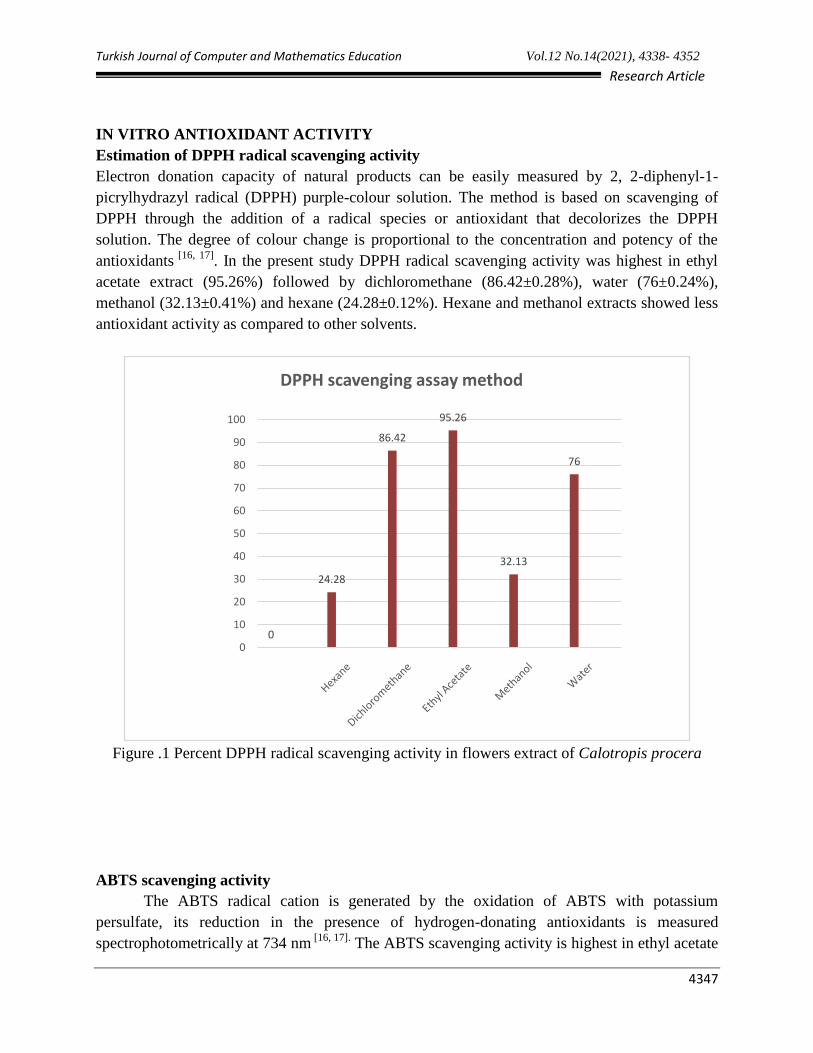
IN VITRO ANTIOXIDANT ACTIVITY
Estimation of DPPH radical scavenging activity
Electron donation capacity of natural products can be easily measured by 2, 2-diphenyl-1-
picrylhydrazyl radical (DPPH) purple-colour solution. The method is based on scavenging of
DPPH through the addition of a radical species or antioxidant that decolorizes the DPPH
solution. The degree of colour change is proportional to the concentration and potency of the
antioxidants [16, 17]
. In the present study DPPH radical scavenging activity was highest in ethyl
acetate extract (95.26%) followed by dichloromethane (86.42±0.28%), water (76±0.24%),
methanol (32.13±0.41%) and hexane (24.28±0.12%). Hexane and methanol extracts showed less
antioxidant activity as compared to other solvents.
Figure .1 Percent DPPH radical scavenging activity in flowers extract of Calotropis procera
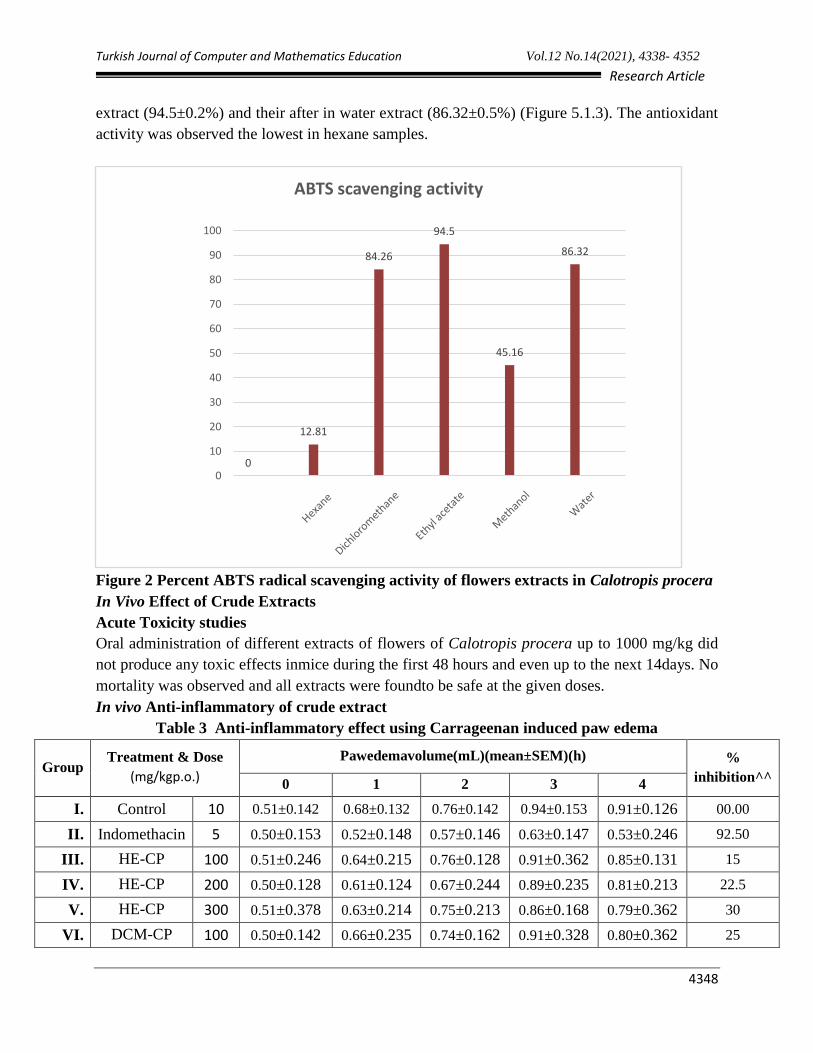
ABTS scavenging activity
The ABTS radical cation is generated by the oxidation of ABTS with potassium
persulfate, its reduction in the presence of hydrogen-donating antioxidants is measured
spectrophotometrically at 734 nm [16, 17].
The ABTS scavenging activity is highest in ethyl acetate
0
24.28
86.42
95.26
32.13
76
0
10
20
30
40
50
60
70
80
90
100
DPPH scavenging assay method
Turkish Journal of Computer and Mathematics Education Vol.12 No.14(2021), 4338- 4352
4348
Research Article
extract (94.5±0.2%) and their after in water extract (86.32±0.5%) (Figure 5.1.3). The antioxidant
activity was observed the lowest in hexane samples.
Figure 2 Percent ABTS radical scavenging activity of flowers extracts in Calotropis procera
In Vivo Effect of Crude Extracts
Acute Toxicity studies
Oral administration of different extracts of flowers of Calotropis procera up to 1000 mg/kg did
not produce any toxic effects inmice during the first 48 hours and even up to the next 14days. No
mortality was observed and all extracts were foundto be safe at the given doses.
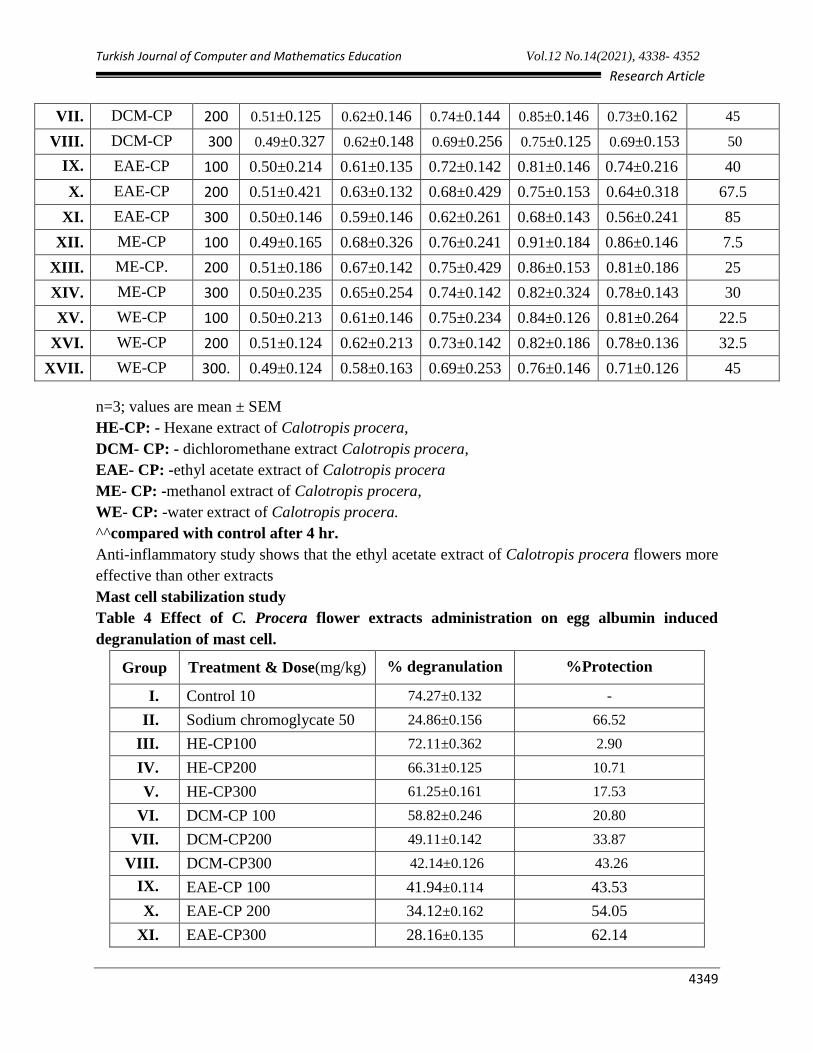
In vivo Anti-inflammatory of crude extract
Table 3 Anti-inflammatory effect using Carrageenan induced paw edema
Group Treatment & Dose
(mg/kgp.o.)
Pawedemavolume(mL)(mean±SEM)(h) %
inhibition^^ 0 1 2 3 4
I. Control 10 0.51±0.142 0.68±0.132 0.76±0.142 0.94±0.153 0.91±0.126 00.00
II. Indomethacin 5 0.50±0.153 0.52±0.148 0.57±0.146 0.63±0.147 0.53±0.246 92.50
III. HE-CP 100 0.51±0.246 0.64±0.215 0.76±0.128 0.91±0.362 0.85±0.131 15
IV. HE-CP 200 0.50±0.128 0.61±0.124 0.67±0.244 0.89±0.235 0.81±0.213 22.5
V. HE-CP 300 0.51±0.378 0.63±0.214 0.75±0.213 0.86±0.168 0.79±0.362 30
VI. DCM-CP 100 0.50±0.142 0.66±0.235 0.74±0.162 0.91±0.328 0.80±0.362 25
0
12.81
84.26
94.5
45.16
86.32
0
10
20
30
40
50
60
70
80
90
100
ABTS scavenging activity
Turkish Journal of Computer and Mathematics Education Vol.12 No.14(2021), 4338- 4352
4349
Research Article
VII. DCM-CP 200 0.51±0.125 0.62±0.146 0.74±0.144 0.85±0.146 0.73±0.162 45
VIII. DCM-CP 300 0.49±0.327 0.62±0.148 0.69±0.256 0.75±0.125 0.69±0.153 50
IX. EAE-CP 100 0.50±0.214 0.61±0.135 0.72±0.142 0.81±0.146 0.74±0.216 40
X. EAE-CP 200 0.51±0.421 0.63±0.132 0.68±0.429 0.75±0.153 0.64±0.318 67.5
XI. EAE-CP 300 0.50±0.146 0.59±0.146 0.62±0.261 0.68±0.143 0.56±0.241 85
XII. ME-CP 100 0.49±0.165 0.68±0.326 0.76±0.241 0.91±0.184 0.86±0.146 7.5
XIII. ME-CP. 200 0.51±0.186 0.67±0.142 0.75±0.429 0.86±0.153 0.81±0.186 25
XIV. ME-CP 300 0.50±0.235 0.65±0.254 0.74±0.142 0.82±0.324 0.78±0.143 30
XV. WE-CP 100 0.50±0.213 0.61±0.146 0.75±0.234 0.84±0.126 0.81±0.264 22.5
XVI. WE-CP 200 0.51±0.124 0.62±0.213 0.73±0.142 0.82±0.186 0.78±0.136 32.5
XVII. WE-CP 300. 0.49±0.124 0.58±0.163 0.69±0.253 0.76±0.146 0.71±0.126 45
n=3; values are mean ± SEM HE-CP: - Hexane extract of Calotropis procera,
DCM- CP: - dichloromethane extract Calotropis procera,
EAE- CP: -ethyl acetate extract of Calotropis procera
ME- CP: -methanol extract of Calotropis procera,
WE- CP: -water extract of Calotropis procera. ^^compared with control after 4 hr.
Anti-inflammatory study shows that the ethyl acetate extract of Calotropis procera flowers more
effective than other extracts
Mast cell stabilization study
Table 4 Effect of C. Procera flower extracts administration on egg albumin induced
degranulation of mast cell.
Group Treatment & Dose(mg/kg) % degranulation %Protection
I. Control 10 74.27±0.132 -
II. Sodium chromoglycate 50 24.86±0.156 66.52
III. HE-CP100 72.11±0.362 2.90
IV. HE-CP200 66.31±0.125 10.71
V. HE-CP300 61.25±0.161 17.53
VI. DCM-CP 100 58.82±0.246 20.80
VII. DCM-CP200 49.11±0.142 33.87
VIII. DCM-CP300 42.14±0.126 43.26
IX. EAE-CP 100 41.94±0.114 43.53
X. EAE-CP 200 34.12±0.162 54.05
XI. EAE-CP300 28.16±0.135 62.14
Turkish Journal of Computer and Mathematics Education Vol.12 No.14(2021), 4338- 4352
4350
Research Article
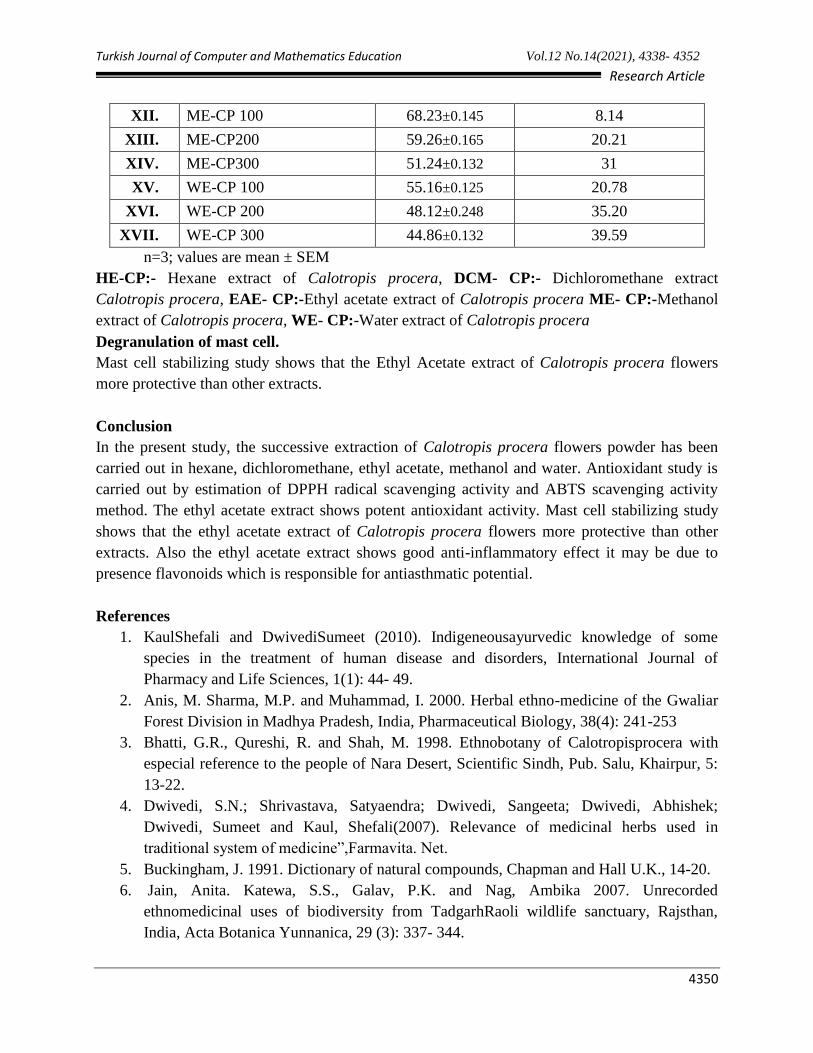
XII. ME-CP 100 68.23±0.145 8.14
XIII. ME-CP200 59.26±0.165 20.21
XIV. ME-CP300 51.24±0.132 31
XV. WE-CP 100 55.16±0.125 20.78
XVI. WE-CP 200 48.12±0.248 35.20
XVII. WE-CP 300 44.86±0.132 39.59
n=3; values are mean ± SEM HE-CP:- Hexane extract of Calotropis procera, DCM- CP:- Dichloromethane extract
Calotropis procera, EAE- CP:-Ethyl acetate extract of Calotropis procera ME- CP:-Methanol
extract of Calotropis procera, WE- CP:-Water extract of Calotropis procera
Degranulation of mast cell.
Mast cell stabilizing study shows that the Ethyl Acetate extract of Calotropis procera flowers
more protective than other extracts.
Conclusion
In the present study, the successive extraction of Calotropis procera flowers powder has been
carried out in hexane, dichloromethane, ethyl acetate, methanol and water. Antioxidant study is
carried out by estimation of DPPH radical scavenging activity and ABTS scavenging activity
method. The ethyl acetate extract shows potent antioxidant activity. Mast cell stabilizing study
shows that the ethyl acetate extract of Calotropis procera flowers more protective than other
extracts. Also the ethyl acetate extract shows good anti-inflammatory effect it may be due to
presence flavonoids which is responsible for antiasthmatic potential.
References
1. KaulShefali and DwivediSumeet (2010). Indigeneousayurvedic knowledge of some
species in the treatment of human disease and disorders, International Journal of
Pharmacy and Life Sciences, 1(1): 44- 49.
2. Anis, M. Sharma, M.P. and Muhammad, I. 2000. Herbal ethno-medicine of the Gwaliar
Forest Division in Madhya Pradesh, India, Pharmaceutical Biology, 38(4): 241-253
3. Bhatti, G.R., Qureshi, R. and Shah, M. 1998. Ethnobotany of Calotropisprocera with
especial reference to the people of Nara Desert, Scientific Sindh, Pub. Salu, Khairpur, 5:
13-22.
4. Dwivedi, S.N.; Shrivastava, Satyaendra; Dwivedi, Sangeeta; Dwivedi, Abhishek;
Dwivedi, Sumeet and Kaul, Shefali(2007). Relevance of medicinal herbs used in
traditional system of medicine”,Farmavita. Net.
5. Buckingham, J. 1991. Dictionary of natural compounds, Chapman and Hall U.K., 14-20.
6. Jain, Anita. Katewa, S.S., Galav, P.K. and Nag, Ambika 2007. Unrecorded
ethnomedicinal uses of biodiversity from TadgarhRaoli wildlife sanctuary, Rajsthan,
India, Acta Botanica Yunnanica, 29 (3): 337- 344.
Turkish Journal of Computer and Mathematics Education Vol.12 No.14(2021), 4338- 4352
4351
Research Article
7. Jain, Anita, Katewa, S.S., Galav, Praveen and Nag, Ambika, 2008. Some therapeutic uses
of biodiversity among the tribals of Rajasthan, India, J. traditional Knowledge, 7 (2):
256-262.
8. Khare, C.P. (Ed.), 2007. Indian Medicinal Plants, an Illustrated Dictionary. Springer
Science, Springer Verlag, Berlin/Heidelberg, Germany, pp. 113–114.
9. Babu, S. Ananda, and H. GurumalleshPrabu. "Synthesis of AgNPs using the extract of
Calotropis procera flower at room temperature." Materials Letters 65.11 (2011): 1675-
1677.
10. Evans WC. Trease and Evans Pharmacognosy. 16th
ed. London: Saunders Elsevier, 2009.
11. Kokate CK. Practical Pharmacognosy. 4th
ed. New Delhi: VallabhPrakashan, 2005, 107-
111.
12. Harborne JB. Phytochemical Methods. A Guide to Modern Techniques of Plant Analysis.
2nd
ed. London: Chapmann and Hall, 1984, 192.
13. Ghatak, A.A.; Chaturvedi, P.A.; Desai, N.S. Indian Grape Wines: A Potential Source of
Phenols, Polyphenols, and Antioxidants. Int.J.Food.Prop. 2014, 17, 818-828.
14. Pai, T.V.; Sawant, S.Y.; Ghatak, A.A.; Chaturvedi, P.A.; Gupte, A.M.; Desai,N.S.
Characterization of Indian beers: chemical composition and antioxidant potential. J. Food
Sci.Technol. 2015, 52 (3), 1414–1423.
15. Anonymous . Organisation for Economic Cooperation and Development; Paris: 2001.
OECDGuidelines for the Testing of Chemicals. OECD 425. Acute Oral Toxicity-Modified
Up and DownProcedure.
16. Chaturvedi, P.A.; Ghatak, A.A.; Desai, N.S. Evaluation of radical scavenging potential of
Woodfordiafruticosa from different altitudes. J. Plant.Biochem.Biotech. 2011, 17, 17-22.
17. Gayathri, P.; Jeyanthi, G.P. Radical scavenging activity of Saracaindica bark extracts and
its inhibitory effect on the enzymes of carbohydrate metabolism. Int. J. Chemical. Pharm.
Sci. 2013, 4, 87-96.
18. Saeed, N.; Khan, M. R.; Shabbir, M. Antioxidant activity, total phenolic and total
flavonoid contents of whole plant extracts Torilisleptophylla L. BMC Complement
Altern Med. 2012, 12, 1-12.
19. Winter CA, Rusley EA, Muss CW, Carageenan–induced oedema in hind paws of rats as
an assay of antiinflammatory drugs, Proc. Soc. Exp. Biol. Med., 111, 1962, 544-547.
20. Bamgbose SOA, Noamesi BK, Studies on Cryptolepine inhibition of Carrageenan-
induced oedema, Plant. Med., 42, 1981, 392-396.
21. Regilane Matos da Silva et al., Anti-inflammatory, anti-nociceptive and antipyretic
effects of hydroethanolic extract from Macrosiphoniavelame (A. St.-Hil.) M. Arg. in
animal models, Braz. J. Pharm. Sci., 46(3), São Paulo July/Sept. 2010. 22. Karle PP, Dhawale SC, Navghare VV, Shivpuje SS. Optimization of extraction
conditions andevaluation of Manilkarazapota (L.) P. Royenfruit peel extract for in vitro
Turkish Journal of Computer and Mathematics Education Vol.12 No.14(2021), 4338- 4352
4352
Research Article
α-glucosidaseenzyme inhibition and free radicalscavenging potential. Future Journal of
Pharmaceutical Sciences 2021; 7(151): 1-10.
23. Okpo SO, Adeyemi OO. The anti-allergic effects of Crinum glaucum aqueous extract.
Phytomedicine 2002; 9: 438-41.


