Embed Size (px)
Citation preview

Phase stability and microstructure in devitrified Al-richAl–Y–Ni alloys
A.L. Vasilieva, M. Aindowa,*, M.J. Blackburna, T.J. Watsonb
aDepartment of Metallurgy and Materials Engineering, Institute of Materials Science, University of Connecticut, Storrs, CT 06269-3136, USAbPratt & Whitney, Materials & Process Engineering, Structural Alloys & Processes, 400 Main Street, Mail Stop 114-40, East Hartford, CT 06108, USA
Received 1 September 2003; accepted 24 November 2003
Abstract
A transmission electron microscopy study has been performed on the phase distribution and morphology in a series of fourAl-rich Al–Ni–Y alloys. The alloys were produced from amorphous gas-atomized powder precursors by hot compaction and
extrusion. They had fine fully devitrified microstructures and in each case these were three-phase consisting of: a-Al, binary Al3Nior Al3Y (depending on alloy composition), and a ternary phase. The same ternary phase was present in each alloy and this wasfound to correspond to Al19Ni5Y3. This phase has the orthorhombic Al19Ni5Gd3-type crystal structure but has not been reportedpreviously in the Al–Ni–Y system. The presence of thin embedded slabs of the equilibrium Al23Ni6Y4 compound within the
Al19Ni5Y3 particles indicated that this structure may be metastable, although it did not decompose even after extended annealing.# 2004 Elsevier Ltd. All rights reserved.
Keywords: A. Ternary alloy systems; B. Phase identification; B. Precipitates; D. Microstructure; F. Electron microscopy, transmission
1. Introduction
In 1988, two groups reported independently theproduction of amorphous Al-rich Al–RE–TM alloys(RE-rare earth and TM-transition metal) with aremarkable combination of properties including lowdensity, high ductility, high strength and relativelylow cost [1,2]. The details of the mechanical behaviorwere dictated by the precise compositions and micro-structures of the alloys, the highest tensile strengths(>1.5 GPa) being obtained for those heat-treated togive amorphous matrices with homogeneous distributionsof nanoscale fcc-Al particles [3–5]. In partially crystal-line Al–Y–Ni alloys it was found that the best ductilitiescorresponded to microstructures with approximately20% by volume of fcc-Al crystalline particles, 10 nm orless in diameter. The binary and ternary intermetalliccompounds formed in this system after more extendedannealing were considered to be embrittling phases
which led to reduced bend ductilities at higher solutecontents [2]. However, subsequent work has shown that itis possible to define compositions and phase distributionsin devitrified Al–Y–Ni alloys that combine intermediatestrength (700–800 MPa) with quite high ductility. Indeveloping an understanding of this behavior, it isnecessary to define clearly the structures and morphol-ogies of the phases that can arise in the devitrified state.
For Al–Y–Ni alloys, the situation is complicatedsomewhat by the variety of different intermetallic phaseswhich have been reported [6–20] and a summary ofthose with >60 at.% Al is presented in Table 1. Thestability (or otherwise) of the various phases wasclarified in a recent study by Raggio et al. [20] whereinthe authors performed an exhaustive literature survey,and then compared the results described by others withdata obtained from a series of ternary alloys subjectedto long-term heat treatments. The only phase aboutwhich there is significant controversy is the Al16Ni3Yphase, first reported by Rykhal and Zarechnyuk [15].Although other groups also claim to have observed thisphase [21–23], only the symmetry and lattice parametershave been reported, not the atomic positions. Moreover,Raggio et al. [20] discounted this phase, at least as an
0966-9795/$ - see front matter # 2004 Elsevier Ltd. All rights reserved.
doi:10.1016/j.intermet.2003.11.007
Intermetallics 12 (2004) 349–362
www.elsevier.com/locate/intermet
* Corresponding author. Tel.: +1-860-486-2644; fax: +1-860-486-
4745.
E-mail address: [email protected] (M. Aindow).

equilibrium compound, because electron probe micro-analysis revealed no phase with this stoichiometry, andalloys with this composition were all found to be multi-phase irrespective of thermal history.
In this paper we present the results of a transmissionelectron microscopy (TEM) study on the crystal struc-tures and morphologies exhibited by each of the phasesin a set of four Al-rich Al–Y–Ni alloys which contain1.7–4.5 at.% Y and 3.5–10.1 at.% Y. It is shown that anorthorhombic phase with parameters close to thosereported previously for Al16Ni3Y is indeed present ineach of these alloys, even after annealing at highhomologous temperatures, but that the composition israther different from that cited in the literature. Themorphological features of the ternary compound arealso discussed.
2. Experimental
Powders of the four alloys were prepared from pre-prepared master melt by gas atomization at Valimet
Corporation. The -325 mesh fractions were hot pressedat 300 MPa and 400 �C, in aluminum containers beforefinal consolidation by extrusion. The canned compactswere heated to 350–450 �C and extruded with a reduc-tion of 23:1. The compositions of the four extrusionswere determined as follows:
1. Al–2.6 at.% Y–9.5 at.% Ni (7.2 wt.% Y–17.7
wt.% Ni)2. Al–4.5 at.% Y–10.1 at.% Ni (12.3 wt.% Y–17.9
wt.% Ni)3. Al–4.3 at.% Y–3.5 at.% Ni (12.4 wt.% Y–6.6
wt.% Ni)4. Al–1.7 at.% Y–6.4 at.% Ni (5.0 wt.% Y–12.5
wt.% Ni)These compositions are plotted in Fig. 1, which is aschematic diagram showing the Al-rich corner of an iso-thermal section of the Al–Y–Ni phase diagram, togetherwith the pertinent intermetallic phases. All four alloys lieclose to pseudo-binary sections connecting the Al phase tothe ternary phases Al16Ni3Y/ Al9Ni3Y or Al23Ni6Y4.
Table 1
Structural data for the Al-rich phases (560 at.%) that have been reported in the Al–Ni–Y system
Phase
Space group Prototype Crystal class Lattice parameters (nm) ReferenceAl
Fm3m Cu Cubic a=0.405 [6]Al6Ni
Icosahedral a=1.600 [7]Al4Ni
Icosahedral a=0.400 [7]Al3Ni
Pnma Fe3C Orthorhombic a=0.661 [8]b=0.736
c=0.481
Al3Ni2
P3m1 Al3Ni2 Hexagonal a=0.404 [8]b=0.490
Al3Ni2
Im3m W Cubic a=0.286 [9]Al4Y
Pm3m Al4Ba Tetragonal a=0.417 [10]b=0.977
Al3Y
Pm3m Cu3Au Cubic a=0.432 [11]Al3Y
P63/mmc Ni3Sn Hexagonal a=0.628 [12]b=0.458
Al3Y
R3m Pb3Ba Rhombohedral a=0.620 [12]b=2.118
Al2Y
Fd3m Cu2Mg Cubic a=0.7861 [13,14]Al16Ni3Y
Cmcm ? Orthorhombic a=0.408 [15]b=1.604
c=2.729
Al23Ni6Y4
C2/m Al23Ni6Y4 Monoclinic a=1.5836 [16]b=0.4068
c=1.8311
�=112.97�
Al9Ni3Y
R32 Al9Ni3Er Rhombohedral a=0.729 [17]c=2.743
Al4NiY
Cmcm Al4NiY Orthorhombic a=0.408 [18]b=1.544
c=0.662
Al3NiY
Pnma Al3NiY Orthorhombic a=0.816 [19]b=0.405
c=1.064
350 A.L. Vasiliev et al. / Intermetallics 12 (2004) 349–362

Sections of the extrusions were annealed under argonat temperatures of 500, 550 and 610 �C for periods of0.5–48 h. Samples for TEM were prepared perpendicularto the extrusion direction, by punching 3 mm diameterdiscs from the slices, grinding mechanically to 100–150mm and then thinning to perforation by electro-polishingand/or ion-beam milling. For the as-received samples,final thinning was performed by twin-jet electropolishingin a Struers TenuPol-5 using an electrolyte which consistsof 70% butanol, 20% perchloric acid and 10% ethanol.The best results were obtained at a temperature of 5–7 �C, a potential of 40 V and a moderate flow rate.Differential thinning effects in annealed specimens weretoo severe for effective electro-polishing and thus finalthinning for these samples was carried out by ion milling.This was accomplished on pre-perforated samples bymilling for 15–30 min in a Gatan model 600 Duomillusing Ar ions at an accelerating voltage of 4 kV.
Microstructural analyses were performed in a PhilipsEM-420 TEM equipped with a Kevex-Noran Be-windowEDS system, and operated at an accelerating voltage of100 kV. To obtain a consistent value of the cameralength for the selected area diffraction patterns acquiredduring tilting experiments, the objective lens current wasset at a fixed value and the height of the sample wasadjusted to the image plane. High resolution TEM(HRTEM) lattice images were obtained in a JEOLJEM-2010 TEM equipped with a UHR objective lenspolepiece (Cs�0.5 mm) and operated at an accelerating
voltage of 200 kV. In this configuration, the point-to-point resolution at Scherzer defocus is less than 0.19 nm.Simulations of the diffraction patterns were producedusing Stadelmann’s EMS software package [24] whereasfor the HRTEM images the programs CrystalKit andMacTempas developed by Kilaas [25] were used.
3. Results
3.1. General microstructure
Representative TEM images obtained from each ofthe four alloys are presented in Figs. 2(a–d) with thecorresponding selected area electron diffraction patterns(SADPs) inset. Although the powder from which theseextrusions were produced contained a significantvolume fraction of amorphous phase, it was clear thatcomplete devitrification had occurred during processing.All of the alloys exhibited a mixed polycrystallinemicrostructure containing three phases: face-centered cubica-Al, a binary phase and a ternary phase. A summary ofthe structural data is presented in Table 2. In each case,the a-Al was equiaxed and exhibited a range of grainsizes between 100 and 600 nm.
For alloys 1, 2 and 4, the binary phase consisted ofequi-axed particles of Al3Ni with the orthorhombicFe3C-type crystal structure (Pnma, a=0.661 nm,b=0.736 nm, c=0.481 nm). An image of one such
Fig. 1. Schematic diagram of the Al-rich corner for an isothermal ternary section showing the compositions of the four alloys investigated.
A.L. Vasiliev et al. / Intermetallics 12 (2004) 349–362 351

Al3Ni particle in alloy 1 is presented in Fig. 3 togetherwith the corresponding EDS spectrum, a [100] zone axisSADP and a simulated SADP for comparison.
For alloy 3, the binary phase was identified as Al3Yand this occurred in the form of equi-axed particles 50–300 nm in diameter. An image of one such particle andthe corresponding EDS spectrum are shown in Fig. 4(a)and (b), respectively. Analyses of the electron diffraction
data obtained from such particles revealed that theyexhibited the crystal structure of the high-temperaturePb3Ba-type polymorph (R3m, a=0.620 nm, c=2.118nm), rather than the Ni3Sn-type low-temperature form.The two phases can be distinguished clearly in zone axesperpendicular to [0001]. One example is shown inFig. 4(c) together with a simulated pattern [Fig. 4(d)].The experimental pattern was obtained with the beam
Fig. 2. Bright field TEM images with inset SADPs showing the overall microstructures for: (a) Alloy 1 (Al–2.6Y–9.5Ni); (b) Alloy 2 (Al–4.5Y–
10.1Ni); (c) Alloy 3 (Al–4.3Y–3.5Ni); and (d) Alloy 4 (Al–1.7Y–6.4Ni), all in atomic percent.
Table 2
Summary of the microstructural parameters for the four alloys in the as-extruded condition
Alloy 1
Alloy 2 Alloy 3 Alloy 4�-Al
Grain size, nm
200–500 100–300 400–600 200–400Binary phase
Composition
Al3Ni Al3Ni Al3Y Al3NiStructure type
Fe3C (Pnma) Fe3C (Pnma) Pb3Ba (R3m) Fe3C (Pnma)Sizes, nm
50–500 200–400 50–300 50–500Ternary phase
Morphology
Equiaxed, some faceting Equiaxed, Rod-like Equiaxed, some elongationSizes, mm
50–300 100–300 30–300 wide 50–400200–2000 long
352 A.L. Vasiliev et al. / Intermetallics 12 (2004) 349–362

Fig. 3. Analysis of an Al3Ni particle: (a) bright field TEM image, (b) EDS spectrum, (c) SADP obtained at the [001] zone axis, and (d) simulation of
the pattern expected at this orientation.
Fig. 4. Analysis of an Al3Y particle: (a) bright field TEM image, (b) EDS spectrum, (c) SADP obtained at the [1120] zone axis, and (d) simulation of
the pattern expected at this orientation.
A.L. Vasiliev et al. / Intermetallics 12 (2004) 349–362 353

direction parallel to [1120] and showed a characteristicmodulation in the intensity of the diffracted beams inthe 000n systematic row. Many of these particlesshowed contrast characteristic of planar defects and thefeatures of these were revealed most clearly in HRTEMimages such as Fig. 5(a). The images showed a variety ofplanar defects, including twins or stacking faults on{1101} and {1102} planes. The character of these defectswas confirmed by analyzing the additional reflectionsobserved in SADPs and an example is shown inFig. 5(b). A more detailed study on the structure of thedefects in this compound will be presented elsewhere.
3.2. Identification of the ternary phase
The ternary phase particles in the four alloys exhib-ited a range of sizes and morphologies and these dataare summarized in Table 2. The particles in alloys 1, 2and 4 were mainly equiaxed and had diameters in therange of 50–400 nm. The larger particles in these alloystended to adopt more faceted morphologies, and inalloy 4 some of the particles were elongated with aspectratios of up to 2. In alloy 3, however, all of the ternaryparticles adopted elongated rod-like morphologies withwidths of 30 to 300 nm, lengths of 200 nm to 2 mm andaspect ratios of up to 10. Despite these morphologicaldifferences, preliminary chemical and structural dataindicated that the ternary phase was the same in each ofthe four alloys. It was, however, not possible to recon-cile these data with any of the phases listed in Table 1. Adetailed description of the way in which the phase wasidentified is presented below.
The composition of the ternary phase was measuredusing EDS and consistent results were obtained fromparticle to particle both within a particular sample, andfrom alloy to alloy. Quantification of the spectra was,however, complicated by the lack of a suitable ternarystandard and by difficulties in measuring the thickness
of the sample at the locations analyzed. To obtain asemi-quantitative analysis, a total of 16 spectra wereacquired from examples of the largest ternary particlesin each alloy, thereby minimizing any contribution fromsurrounding phases. An estimate was made of the sam-ple thickness in each case. Each of the spectra was thenanalyzed using the binary compound present in therespective alloy as a standard, and assuming that these areline compounds (i.e., that they exhibit the 3:1 stoichio-metry exactly). The mean of the compositions obtainedwas Al–17.0 at.% Ni–9.5 at.% Y. A comparison ofthese values with the compositions of the known Al-richAl–Ni–Y ternary compounds suggests that the compoundis Al23Ni6Y4, Al9Ni3Y, or Al4NiY, although the latterseems less likely.
The crystal structure exhibited by the ternary phasewas then investigated using electron diffraction techniques.Particles in each alloy were tilted systematically until thezone axis with the highest symmetry and the smallestspacings between diffraction maxima was identified.Examples of SADPs obtained from particles in eachalloy at this zone axis, together with images of thecorresponding particles are shown in Fig. 6. We notethat many of the particles exhibited planar featuresresembling stacking faults lying on one particular plane,which gave rise to pronounced streaks in the SADPsalong the corresponding systematic rows of reflections.The reciprocal lattice vector parallel to the zone axiswas denoted a*, that corresponding to the fundamentalreflection with the larger spacing as b*, and that for thefundamental reflection with finer spacing as c*. It isalong the rows parallel to c* that the streaks areobserved. By recording SADPs at this zone axis fromregions which include both the particle and the surround-ing a-Al grains (e.g., Fig. 7), the spacings of diffractionmaxima from these grains can be used to verify the cameralength calibration, enabling values for the magnitude of b*and c* to be measured accurately. Interplanar spacings of
Fig. 5. (a) HRTEM image obtained from the interior of an Al3Y particle at the [1120] zone axis showing twins parallel to (0001) with occasional
twins and stacking faults on {1101} and {1102}; (b) corresponding SADP showing reflections arising from twins on (0001) and (1101) plane (one
example of each of these is indicated with an arrow in black and white, respectively).
354 A.L. Vasiliev et al. / Intermetallics 12 (2004) 349–362

0.799 nm and 2.689 nm, respectively, are computedfrom these measurements. The magnitude of a* wasmeasured from the radius of the first order Lauezone (FOLZ) in Kossel-type convergent beam electrondiffraction (CBED) patterns obtained at this zone axis.One example of such a pattern is shown in Fig. 8.Converting the radius of the FOLZ ring to a Laue zone
spacing parallel to the beam direction (i.e. the magni-tude of a*), we obtain an interplanar spacing of 0.403nm. Thus, the diffraction data are consistent with anorthorhombic structure having lattice parameters ofa=0.403 nm, b=0.799 nm and c=2.689 nm. Theseparameters do not correspond to those of theAl23Ni6Y4, Al9Ni3Y, or Al4NiY phases. They are, how-ever, consistent with the spacings reported for the
Fig. 6. Bright field TEM images with inset SADPs obtained from particles of the ternary phase in: (a) Alloy 1 (Al–2.6Y–9.5Ni); (b) Alloy 2
(Al–4.5Y–10.1Ni); (c) Alloy 3 (Al–4.3Y–3.5Ni); and (d) Alloy 4 (Al–1.7Y–6.4Ni),—all in atomic percent.
Fig. 7. SADP obtained from a ternary particle with the primitive
reciprocal lattice vectors for the structure indicated. There are addi-
tional reflections that arise from the surrounding matrix which can be
used for internal calibration of the effective camera length. The arrow
indicates the position of the 002 reflection for a-Al.
Fig. 8. Kossel-type CBED pattern obtained from a ternary particle at
the same zone axis orientation as that shown in Figs. 7 and 8. The
arrow indicates the position of the first order Laue zone ring.
A.L. Vasiliev et al. / Intermetallics 12 (2004) 349–362 355

Al16Ni3Y phase by Rykal and Zarechnyuk [15] with theexception of a factor of 2 for the b parameter. This dis-crepancy could easily be accounted for if the structurefactor for the 010 reflection were to be zero such thatthe observed b*=020. The orthorhombic structure wasfurther confirmed by systematic tilting of a single largeparticle from [100] about c* through angles whichwould sample other low-index [h k 0] zone axessequentially. The orientations at which these zone axeswould occur for an orthorhombic structure witha=0.403 nm, b=1.598 nm and c=2.689 nm were alsocomputed. An image of the particle obtained with thebeam direction close to [100] is shown in Fig. 9(a) withthe orientation of the b and c axes indicated. TheSADPs obtained at tilt angles of 0�, 23�, 30�, 38�, 53�
and 63� about c* away from [100] are shown inFig. 9(b)–(g), respectively. It was not possible to reachthe [110] zone axis in this particle because this laybeyond the tilt limit for the goniometer, but a patternobtained from a different particle is included as Fig. 9(h)for comparison. As shown in Table 3, the interplanarspacings calculated for the diffraction vector perpendi-cular to c* in each pattern correspond very closely tothose expected on the basis of the lattice parametersgiven above. We note that there is clear evidence forlattice centering, in that finite intensity was onlyobserved in hk0 reflections for which h+k=2n. More-over, on tilting along the 00l Kikuchi band to a positionbetween zone axes, a clear modulation arises in whichodd-order reflections are very weak (Fig. 10). Thusmost, if not all, of the intensity observed in these reflec-tions at zone axis orientations must arise from pluralscattering, i.e., 00l reflections with 1 6¼2n may also bekinematically forbidden.
Further evidence concerning the character of theternary phase was obtained from HRTEM images suchas Fig. 11, which was obtained with the beam directionparallel to [100]. In most areas, such images exhibit onlythe periodicities that one would expect from the dif-fraction data (i.e., b=1.598 nm and c=2.689 nm). Inthe ‘‘faulted’’ regions, however, different periodicitiesare observed, suggesting that these are actually thinembedded slabs of a different phase. One example isshown in Fig. 11 wherein the periodicity parallel to [001]changes from 2.69 to 1.69 nm. In this case, the embed-ded slab is only one layer thick, but slabs of up to 7layers in thickness have been observed in other particles.
It seems likely that these embedded regions corres-pond to thin slabs of the monoclinic compoundAl23Ni6Y4, discovered by Gladyshevskii and Parthe [16][a=1.5836 nm, b=0.4068 nm, c=1.8311 nm,b=112.97�, Fig. 12(a)]. The a parameter for thiscompound is almost identical to the b parameter of themain phase, and the periodicity of 1.69 nm is very closeto the component of c resolved perpendicular to a.Thus, the thin slab of this phase in Fig. 11 is oriented
along [010]. To confirm this, simulations were per-formed of the images which would be expected for thiscompound at the [010] zone axis and a series of suchsimulations for different values of objective lens defocusand specimen thickness are shown in Fig. 12(b). We notethat, for small thicknesses and defocus values close to 0,dark spots in the images correspond to the positions ofcolumns of Y atoms, and therefore images obtained under
Fig. 9. Example of a tilting experiment used to confirm the diffraction
analysis of the lattice parameters for the ternary phase: (a) bright field
TEM of a large rod-like particle in alloy 3 with the orientations of the
b and c axes indicated; (b)–(g) zone axis SADPs obtained by tilting
through the angle indicated about the c axis; (h) SADP obtained at the
[110] zone axis from a different ternary particle in the same specimen.
356 A.L. Vasiliev et al. / Intermetallics 12 (2004) 349–362

these conditions allow for the most straightforward inter-pretation. An excellent match was obtained between theexperimental and simulated images, confirming theidentification of the embedded slabs as Al23Ni6Y4. ForFig. 11, the best fit was obtained at t=3–5 nm and�f=�5 to 0 nm. Thus, when used in conjunction withthe simulations, these regions act as an internal calibra-tion for defocus and specimen thickness, enablingstructural models for the main ternary phase to be tested.A wide variety of different structural models wereconsidered but, for brevity, we present below onlydetails of the structure that gave the best match to themain ternary phase. We note, however, that this wasthe only structure considered which gave an acceptablematch to the data.
A comparison of the electron diffraction andHRTEM data presented here with that obtained by the
present authors from the t-phase in Al–Gd–Ni–Fealloys [26] suggested that the ternary Al–Ni–Y phasemay bear a significant resemblance to the Al19Ni5Gd3
phase. This compound, described by Gladyshevskii etal. [27], has an orthorhombic structure, space groupCmcm, with lattice parameters a=0.409 nm, b=1.599nm c=2.709 nm. These parameters are very similar tothose of the ternary phase in the present alloys. To testwhether these compounds could be isostructural, imagesimulations were performed by substituting Y for Gd inthe Al19Ni5Gd3 structure and using the lattice para-meters obtained from the electron diffraction data forthe ternary phase. The [100] projection of this modelstructure, the simulated [100] SADP and a series ofsimulated HRTEM images at different values of objec-tive lens defocus and specimen thickness are shown inFigs. 13(a–c), respectively. The SADP gave an excellentmatch to the experimental patterns with the same spacingsand systematic absences as observed experimentally.Moreover, the simulated HRTEM images matched theexperimental images extremely well at the calibratedvalues of thickness and defocus.
To further test this model, a structural supercellwas constructed which consists of a slab of the modelstructure two unit cells in height, with a slab of theAl23Ni6Y4 one unit cell high on top. These phases areoriented such that: [010]19�5�3 k [100]23�6�4 and[100]19�5�3 k [010]23�6�4 with the interface plane parallelto (001)19�5�3 and the origin of the Al23Ni6Y4 structureshifted by 0.2 nm parallel to [001]19�5�3. This is shown inFig. 14(a). Simulations were performed at defocus and
Table 3
Summary of the data analysis for the tilting experiment shown in
Fig. 10. The experimental values of the tilt and interplanar spacings
for the appropriate hk0 reflection are shown, together with those
expected for an orthorhombic structure with lattice parameters:
a=0.403 nm, b=1.598 nm and c=2.689 nm
Tilt, o,exp
Tilt, o,cal dexp, nm dcal, A (hkl)0
0 0.799 0.799 02021.5
24 0.158 0.162 19029.5
29.5 0.191 0.198 17038
38.3 0.241 0.249 15053
53 0.313 0.307 13063
64.5 0.172 0.178 2400.396
0.390 110Fig. 10. Typical SADP showing the distribution of intensity in the 00n
systematic row away from any zone axis.
Fig. 11. HRTEM image obtained from a region within a ternary
phase particle with the beam direction parallel to [100]. The image
contains a ‘‘fault’’ at which there is a change in periodicity along [001].
The inset is a simulation obtained using the structural model shown in
Fig. 15, and the adjacent regions outlined in black and white are the
unit cells of the Al19Ni5Y3 and Al23Ni6Al4 structures, respectively.
A.L. Vasiliev et al. / Intermetallics 12 (2004) 349–362 357

Fig. 12. Simulation of HRTEM images for Al23Ni6Al4: (a) [010] projection of the unit cell. (b) simulations showing the effect of thickness and
objective lens defocus on contrast in images obtained at the [010] zone axis.
Fig. 13. Simulation of TEM data expected for the proposed Al19Ni5Y3 phase: (a) [100] projection of the unit cell, (b) simulated [100] zone axis
SADP, and (c) simulations showing the effect of thickness and objective lens defocus on contrast in HRTEM images obtained at the [100] zone axis.
358 A.L. Vasiliev et al. / Intermetallics 12 (2004) 349–362
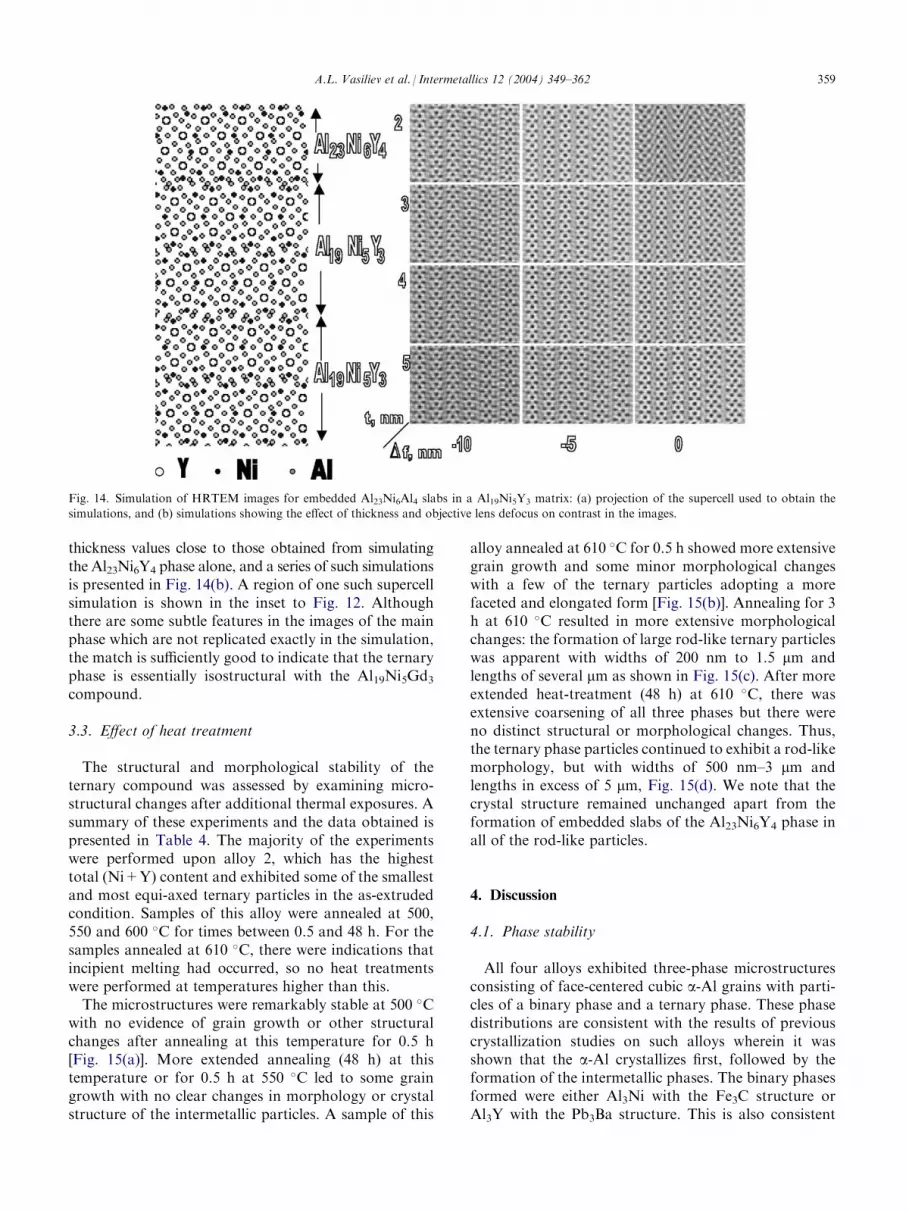
thickness values close to those obtained from simulatingthe Al23Ni6Y4 phase alone, and a series of such simulationsis presented in Fig. 14(b). A region of one such supercellsimulation is shown in the inset to Fig. 12. Althoughthere are some subtle features in the images of the mainphase which are not replicated exactly in the simulation,the match is sufficiently good to indicate that the ternaryphase is essentially isostructural with the Al19Ni5Gd3
compound.
3.3. Effect of heat treatment
The structural and morphological stability of theternary compound was assessed by examining micro-structural changes after additional thermal exposures. Asummary of these experiments and the data obtained ispresented in Table 4. The majority of the experimentswere performed upon alloy 2, which has the highesttotal (Ni+Y) content and exhibited some of the smallestand most equi-axed ternary particles in the as-extrudedcondition. Samples of this alloy were annealed at 500,550 and 600 �C for times between 0.5 and 48 h. For thesamples annealed at 610 �C, there were indications thatincipient melting had occurred, so no heat treatmentswere performed at temperatures higher than this.
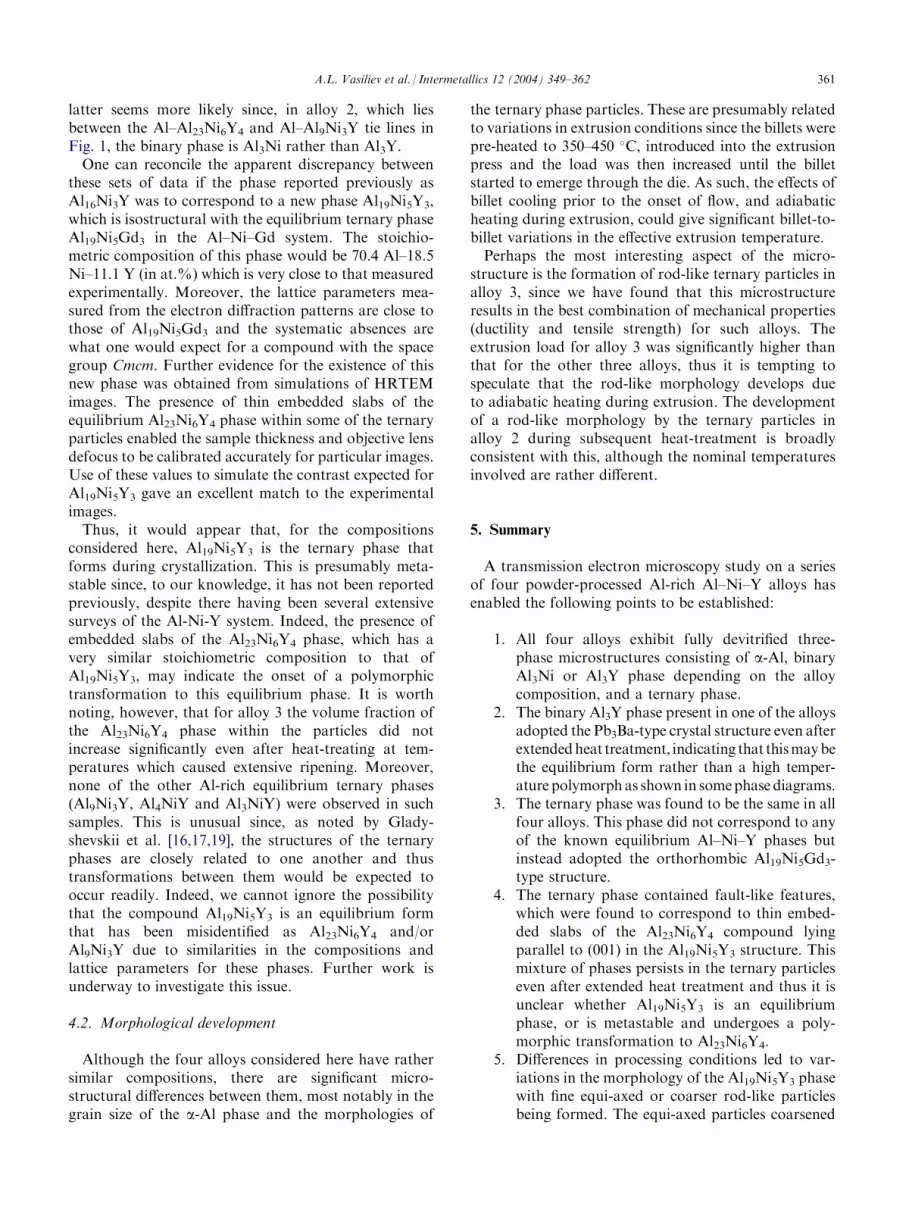
The microstructures were remarkably stable at 500 �Cwith no evidence of grain growth or other structuralchanges after annealing at this temperature for 0.5 h[Fig. 15(a)]. More extended annealing (48 h) at thistemperature or for 0.5 h at 550 �C led to some graingrowth with no clear changes in morphology or crystalstructure of the intermetallic particles. A sample of this
alloy annealed at 610 �C for 0.5 h showed more extensivegrain growth and some minor morphological changeswith a few of the ternary particles adopting a morefaceted and elongated form [Fig. 15(b)]. Annealing for 3h at 610 �C resulted in more extensive morphologicalchanges: the formation of large rod-like ternary particleswas apparent with widths of 200 nm to 1.5 mm andlengths of several mm as shown in Fig. 15(c). After moreextended heat-treatment (48 h) at 610 �C, there wasextensive coarsening of all three phases but there wereno distinct structural or morphological changes. Thus,the ternary phase particles continued to exhibit a rod-likemorphology, but with widths of 500 nm–3 mm andlengths in excess of 5 mm, Fig. 15(d). We note that thecrystal structure remained unchanged apart from theformation of embedded slabs of the Al23Ni6Y4 phase inall of the rod-like particles.
4. Discussion
4.1. Phase stability
All four alloys exhibited three-phase microstructuresconsisting of face-centered cubic a-Al grains with parti-cles of a binary phase and a ternary phase. These phasedistributions are consistent with the results of previouscrystallization studies on such alloys wherein it wasshown that the a-Al crystallizes first, followed by theformation of the intermetallic phases. The binary phasesformed were either Al3Ni with the Fe3C structure orAl3Y with the Pb3Ba structure. This is also consistent
Fig. 14. Simulation of HRTEM images for embedded Al23Ni6Al4 slabs in a Al19Ni5Y3 matrix: (a) projection of the supercell used to obtain the
simulations, and (b) simulations showing the effect of thickness and objective lens defocus on contrast in the images.
A.L. Vasiliev et al. / Intermetallics 12 (2004) 349–362 359

with the results of previous investigations on Al–Ni–Yalloys fabricated by either melt-spinning [21,23] or byinduction melting followed by extended annealing [6].Although there are several published phase diagrams inwhich the hexagonal Ni3Sn structure is given as theequilibrium form for Al3Y phase under ambient condi-tions, this phase was not observed in these studies or inour work. Indeed, Raggio et al. [20] have suggested thatthis hexagonal polymorph first reported by Bailey [12]may be a metastable form of the compound.
The values of the lattice parameters for the ternaryphase in these alloys, as measured using electron dif-fraction techniques, do not correspond to those for anyof the known equilibrium Al-rich Al–Ni–Y ternarycompounds. The values are very close to those reportedby Rykhal and Zarechnuk for the compound Al16Ni3Y[15], however the composition of the phase as measuredby EDS did not correspond to a compound with thisstoichiometry. Indeed, the EDS data are more con-sistent with the phase being Al9Ni3Y or Al23Ni6Y4. The
Fig. 15. Bright field TEM images showing the effect of annealing on the microstructures in: (a) alloy 2 after 30 min at 500 �C, (b) alloy 2 after 30 min
at 610 �C, (c) alloy 2 after 3 h at 610 �C, and (d) alloy 3 after 48 h at 610 �C.
Table 4
Summary of the microstructural parameters obtained from the heat-treatment experiments
Alloy #
Annealing temperature(�C)
Annealing time
(h)
Al grain size
(mm)
Binary phase size
(mm)
Ternary phase morphology and size
(mm)
2
500 0.5 0.1–0.3 0.1–0.2 Equiaxed 0.1–0.3500
48 0.5–2 0.3–0.5 Mostly equiaxed, 0.4–0.6few rod-like width �0.4
550
0.5 0.2–0.4 0.1–0.3 Equiaxed 0.1–0.4610
0.5 0.1–0.4 0.1–0.4 Mostly equiaxed, 0.4–0.6few rod-like width-0.4
610
24 1–5 1–3 Rod-like, length 1–8Width 0.2–1.5
3
610 48 1–5 2–3 Rod-like, length-> 5 Width 0.5–34
550 0.5 0.2–0.4 0.1–0.5 0.1–0.4 Mostly equiaxed.Few rod-like
360 A.L. Vasiliev et al. / Intermetallics 12 (2004) 349–362
latter seems more likely since, in alloy 2, which liesbetween the Al–Al23Ni6Y4 and Al–Al9Ni3Y tie lines inFig. 1, the binary phase is Al3Ni rather than Al3Y.
One can reconcile the apparent discrepancy betweenthese sets of data if the phase reported previously asAl16Ni3Y was to correspond to a new phase Al19Ni5Y3,which is isostructural with the equilibrium ternary phaseAl19Ni5Gd3 in the Al–Ni–Gd system. The stoichio-metric composition of this phase would be 70.4 Al–18.5Ni–11.1 Y (in at.%) which is very close to that measuredexperimentally. Moreover, the lattice parameters mea-sured from the electron diffraction patterns are close tothose of Al19Ni5Gd3 and the systematic absences arewhat one would expect for a compound with the spacegroup Cmcm. Further evidence for the existence of thisnew phase was obtained from simulations of HRTEMimages. The presence of thin embedded slabs of theequilibrium Al23Ni6Y4 phase within some of the ternaryparticles enabled the sample thickness and objective lensdefocus to be calibrated accurately for particular images.Use of these values to simulate the contrast expected forAl19Ni5Y3 gave an excellent match to the experimentalimages.
Thus, it would appear that, for the compositionsconsidered here, Al19Ni5Y3 is the ternary phase thatforms during crystallization. This is presumably meta-stable since, to our knowledge, it has not been reportedpreviously, despite there having been several extensivesurveys of the Al-Ni-Y system. Indeed, the presence ofembedded slabs of the Al23Ni6Y4 phase, which has avery similar stoichiometric composition to that ofAl19Ni5Y3, may indicate the onset of a polymorphictransformation to this equilibrium phase. It is worthnoting, however, that for alloy 3 the volume fraction ofthe Al23Ni6Y4 phase within the particles did notincrease significantly even after heat-treating at tem-peratures which caused extensive ripening. Moreover,none of the other Al-rich equilibrium ternary phases(Al9Ni3Y, Al4NiY and Al3NiY) were observed in suchsamples. This is unusual since, as noted by Glady-shevskii et al. [16,17,19], the structures of the ternaryphases are closely related to one another and thustransformations between them would be expected tooccur readily. Indeed, we cannot ignore the possibilitythat the compound Al19Ni5Y3 is an equilibrium formthat has been misidentified as Al23Ni6Y4 and/orAl9Ni3Y due to similarities in the compositions andlattice parameters for these phases. Further work isunderway to investigate this issue.
4.2. Morphological development
Although the four alloys considered here have rathersimilar compositions, there are significant micro-structural differences between them, most notably in thegrain size of the a-Al phase and the morphologies of
the ternary phase particles. These are presumably relatedto variations in extrusion conditions since the billets werepre-heated to 350–450 �C, introduced into the extrusionpress and the load was then increased until the billetstarted to emerge through the die. As such, the effects ofbillet cooling prior to the onset of flow, and adiabaticheating during extrusion, could give significant billet-to-billet variations in the effective extrusion temperature.
Perhaps the most interesting aspect of the micro-structure is the formation of rod-like ternary particles inalloy 3, since we have found that this microstructureresults in the best combination of mechanical properties(ductility and tensile strength) for such alloys. Theextrusion load for alloy 3 was significantly higher thanthat for the other three alloys, thus it is tempting tospeculate that the rod-like morphology develops dueto adiabatic heating during extrusion. The developmentof a rod-like morphology by the ternary particles inalloy 2 during subsequent heat-treatment is broadlyconsistent with this, although the nominal temperaturesinvolved are rather different.
5. Summary
A transmission electron microscopy study on a seriesof four powder-processed Al-rich Al–Ni–Y alloys hasenabled the following points to be established:
1. All four alloys exhibit fully devitrified three-
phase microstructures consisting of a-Al, binaryAl3Ni or Al3Y phase depending on the alloycomposition, and a ternary phase.2. The binary Al3Y phase present in one of the alloys
adopted the Pb3Ba-type crystal structure even afterextendedheat treatment, indicating that thismaybethe equilibrium form rather than a high temper-ature polymorphas shown in somephasediagrams.3. The ternary phase was found to be the same in all
four alloys. This phase did not correspond to anyof the known equilibrium Al–Ni–Y phases butinstead adopted the orthorhombic Al19Ni5Gd3-type structure.4. The ternary phase contained fault-like features,
which were found to correspond to thin embed-ded slabs of the Al23Ni6Y4 compound lyingparallel to (001) in the Al19Ni5Y3 structure. Thismixture of phases persists in the ternary particleseven after extended heat treatment and thus it isunclear whether Al19Ni5Y3 is an equilibriumphase, or is metastable and undergoes a poly-morphic transformation to Al23Ni6Y4.5. Differences in processing conditions led to var-
iations in the morphology of the Al19Ni5Y3 phasewith fine equi-axed or coarser rod-like particlesbeing formed. The equi-axed particles coarsenedA.L. Vasiliev et al. / Intermetallics 12 (2004) 349–362 361

into a rod-like morphology during annealing athigh temperatures.
Acknowledgements
This work was supported by DARPA-DSO/AFRLunder Contract No F33615-01-2-5217 with Dr. D.Hardwick as technical monitor.
References
[1] He Y, Poon SJ, Shiflet GJ. Science 1988;241:1640.
[2] Inoue A, Ohtera K, Tsai AP, Masumoto T. Jap J Appl Phys
1988;27:L280–0L479.
[3] Kim YH, Inoue A, Masumoto T. Mater Trans JIM 1990;8:747.
[4] Kim YH, Inoue A, Masumoto T. Mater Trans JIM 1991;32:331.
[5] Zhong ZC, Jiang XY, Greer AL. Mater Sci Eng 1997;A226-
228:531.
[6] Villars P, Calvert LD. Pearson’s handbook of crystallographic
data for intermetallic phases. ASM; 1991.
[7] Li XZ, Kuo KH. Phil Mag Lett 1988;58:167.
[8] Bradley AJ, Taylor A. Phil Mag 1937;23:1049.
[9] Nastasi M. J Less Comm Metals 1991;168:91.
[10] Kripyakevich PI, Gladyshevskii EI. Sov Phys Cryst 1961;6:95.
[11] Dagerhamn T. Ark Kemi 1967;27:363.
[12] Bailey DM. Acta Cryst 1967;23:729.
[13] Appa-Rao B, Vishnuvardhan Reddy C, Murthy KS, Kistaiah P.
J Less Comm Met 1987;134:91.
[14] Foley JC, Thoma DJ, Perepezko JH. Metal Mater Trans 1994;
25A:231.
[15] Rykhal RM, Zarechnyuk OS. Dopov Acad Nauk Ukr SSR 1977;
A4:375.
[16] Gladyshevskii RE, Parthe E. Acta Cryst 1992;C48:232.
[17] Gladyshevskii RE, Cenzual K, Flack HD, Parthe E. Acta Cryst
1993;B49:468.
[18] Rykhal RM, Zarechnyuk OS, Yarmolyuk YP. Sov Phys Cryst
1972;17:453.
[19] Gladyshevskii RE, Parthe E. Acta Cryst 1992;C48:229.
[20] Raggio R, Borzone G, Ferro R. Intermetallics 2000;8:247.
[21] Latuch J, Matyja H, Fadeeva VI. Mater Sci Eng 1994;
A179:A180:506.
[22] Latuch J, Zielinski W, Matyja H. J Appl Cryst 1998;17:152.
[23] Kulik T, Latuch J. J Metastable Nanocryst Mat 2001;10:194.
[24] Stadelmann PA. Ultramicrocopy 1987;21:131.
[25] Kilaas R. In: Bailey GW, editor. 45th Annual Proc of EMSA.
Baltimore (MD): San Francisco Press; 1987. p. 66.
[26] Vasiliev AL, Aindow M, Blackburn MJ, Watson TJ. (in
preparation).
[27] Gladyshevskii RE, Cenzual K, Parthe E. J Solid State Chem
1992;100:9.
362 A.L. Vasiliev et al. / Intermetallics 12 (2004) 349–362


