Embed Size (px)
Citation preview

Aquatic Botany 76 (2003) 299–315
Phosphorus uptake kinetics of a dominant tropicalseagrassThalassia testudinum
Amy F. Gras1, Marguerite S. Koch∗, Christopher J. Madden1
Aquatic Plant Ecology Laboratory, Biological Sciences Department, Florida AtlanticUniversity, 777 Glades Road, Boca Raton, FL 33431, USA
Received 17 October 2002; received in revised form 23 April 2003; accepted 23 April 2003
Abstract
Although nitrogen is primarily the dominant nutrient limiting seagrass production in temperateestuaries, phosphorus (P) limitation can be important in tropical carbonate-dominated seagrasssystems. While nitrogen uptake kinetics of seagrasses are moderately well established, very limiteddata exist on the dynamics of P-uptake. In this study, we determined the kinetics of dissolvedinorganic phosphorus (Pi) uptake for a dominant tropical seagrassThalassia testudinumacross arange of Pi levels (0.5–25�M). Under this broad range, leaf Pi-uptake (�mol g−1 dw h−1) rateswere similar under light (Vmax = 1.90) and dark (Vmax = 2.10) conditions, while root Pi-uptakerates declined 30% in the dark, and were significantly lower than leaves under both light (Vmax =0.57) and dark (Vmax = 0.38) conditions. At lower Pi concentrations (0.5–5.0�M), leaf Vmax was2–3-fold lower (0.50–0.77), while rootVmaxwas the same at high and low Pi ranges. Based on linearand non-linear models of Pi-uptake kinetics forT. testudinum, leaves can contribute a majority ofthe P sequestered by the plant when surface and porewater Pi levels are equally low (0.05–0.5�M).Based on the calculated P-demand ofT. testudinumin South Florida, solely root or leaf uptakecan account for the P requirements ofT. testudinumwhen porewater or surface water Pi levels are0.5�M. However, when surface and porewater Pi levels are extremely low (<0.10�M), such asin Florida Bay and other carbonate seagrass systems where Pi sequestration by the sediment ishighly efficient, even root+ leaf Pi-uptake rates do not meet the P requirements for growth andP-limitation may occur.© 2003 Elsevier Science B.V. All rights reserved.
Keywords:Phosphorus; Nutrient uptake; Seagrass; Nutrient cycling; Kinetics
∗ Corresponding author. Tel.:+1-561-297-3325; fax:+1-561-297-2749.E-mail address:[email protected] (M.S. Koch).
1 Present address: South Florida Water Management District (SFWMD), Everglades Division,3301 Gun Club Road, West Palm Beach, FL 33406, USA.
0304-3770/$ – see front matter © 2003 Elsevier Science B.V. All rights reserved.doi:10.1016/S0304-3770(03)00069-X

300 A.F. Gras et al. / Aquatic Botany 76 (2003) 299–315
1. Introduction
Seagrass ecosystems, including tropical and subtropical seagrasses found in oligotrophicenvironments, rank amongst the most productive coastal marine ecosystems worldwide(Odum, 1959; Fourqurean et al., 2001). In order for seagrasses to maintain these high ratesof productivity, adequate nutrients must be continually supplied and/or recycled within thebeds (Hemminga et al., 1991). Low allochthonous nutrient inputs and a high phosphorus (P)adsorptive capacity of carbonate sediments characterize tropical seagrass beds. This resultsin extremely low dissolved inorganic phosphorus (Pi) concentrations in the water columnand sediment porewaters of seagrass ecosystems of the Caribbean, Bahamas, South Florida,and other tropical/subtropical regions (<0.03–0.6�M; Patriquin, 1972; Morse et al., 1987;Fourqurean et al., 1993; Jensen et al., 1998; Koch et al., 2001), with some notable exceptions(Erftemeijer et al., 1994). Low surface and porewater Pi levels have been implicated in theobserved P-limited growth of some tropical seagrass species (Short et al., 1985; Short, 1987;Powell et al., 1989; Fourqurean et al., 1992a,b).
In view of the efficiency of P sequestration by carbonate sediments and low Pi avail-ability, tropical seagrasses should have evolved efficient Pi-uptake strategies to main-tain adequate nutrients in support of high rates of primary productivity. This is particu-larly true in light of the fact that seagrasses reside in a dynamic environment with rapidleaf turnover rates and accompanied nutrient losses. Seagrasses have also been foundto posses a limited capacity to resorb and retain limiting nutrients, an important plantstrategy for nutrient conservation in oligotrophic environments (Hemminga et al., 1999).While many studies have focused on nutrient cycling in seagrasses at the ecosystem scale(seeAlongi, 1998), a better understanding of Pi-uptake kinetics in seagrasses is requiredto accurately model growth and production in tropical environments that are P-limited.To date, few data are available on seagrass Pi-uptake kinetics for either temperate ortropical seagrass species (for review seeTouchette and Burkholder, 2000). Also, con-troversy surrounds the relative importance of above-ground versus below-ground nutri-ent uptake in meeting the nutrient requirements of aquatic plants (Denny, 1980; Brix andLyngby, 1985).
Although most seagrasses and other submerged aquatic vegetation (SAV) are physio-logically capable of absorbing nutrients from both sediment and water column sources(Patriquin, 1972; McRoy and Barsdate, 1970; Carignan and Kalff, 1980; Thursby andHarlin, 1982, 1984; Short and McRoy, 1984; Brix and Lyngby, 1985; Rattray et al., 1991;Pedersen et al., 1997; Terrados and Williams, 1997), it has been assumed that nutrientuptake by SAV roots dominate over leaf uptake in estuaries where porewater nutrient con-centrations are high relative to surface waters (Bole and Allan, 1978; Carignan and Kalff,1980; Bulthuis and Woelkerling, 1981). While this paradigm is long standing, it is pri-marily based on evidence from temperate systems, where sediment fertility is generallyhigh. We hypothesize that leaf P-uptake may be more important for seagrasses in tropicalcarbonate-dominated meadows where porewater Pi levels can be as low as surface waters.The fact that SAV leaves can take up Pi at rates that are equal to or greater than roots acrossa broad range of trophic states (McRoy et al., 1972; Penhale and Thayer, 1980; Thursbyand Harlin, 1984; Stapel et al., 1996), supports the idea that leaf uptake could be importantto the nutrient budgets of tropical seagrass communities.

A.F. Gras et al. / Aquatic Botany 76 (2003) 299–315 301
Currently, no data are available on the Pi-uptake kinetics of the dominant tropical westernAtlantic seagrassThalassia testudinum. The objective of this study was to quantify Pi-uptakekinetics forT. testudinumroots and leaves under light and dark conditions across a rangeof Pi concentrations. We determined Pi-uptake kinetics at levels approaching saturation(up to 25�M), as well as upper levels found in situ in oligotrophic carbonate-dominatedseagrass beds (0.5�M). In addition, we tested the root-dominance paradigm establishedin temperate systems that if root Pi supply rates are high, leaf Pi-uptake rates declineand vise versa (Thursby and Harlin, 1982, 1984; McRoy and Barsdate, 1970). We alsodetermined if leaf and/or root Pi-uptake rates could meet plant P demand based onT.testudinumproductivity rates in South Florida at low (0.05�M), medium (0.10�M), andhigh (0.50�M) Pi concentrations.
2. Experimental methods
2.1. Thalassia testudinum collection and preparation
T. testudinumplants were collected in November 1999 and May 2000 from ButtonwoodSound in eastern Florida Bay (25◦07′N, 80◦27′W; approximate water depth 1 m). Plantswere uprooted in sods to prevent root and rhizome damage and washed free of sediments.The plants were transported in a dark cooler to the Gumbo Limbo Marine Laboratory inBoca Raton, FL.
When plants were collected, 200 l of Florida Bay water was also taken from the middleof the northeastern portion of Florida Bay (adjacent to Duck Key) for use as experimentalmedium. At the lab, plants were gently separated into individual short shoots, each with atleast 4 leaves, a section of rhizome (5–6 cm), and intact roots. Plants were acclimated for 5days prior to experimentation in aerated low-nutrient Florida Bay water (35 PSU or ppt) at25◦C on a 12 h photoperiod under light-saturated conditions (∼500–600�mol PAR m−2
s−1). Following acclimation, epiphytes were gently scraped from the leaves, senescent tissueremoved, and roots were carefully washed in low-nutrient seawater to remove carbonatesediments.
2.2. Partitioned chambers
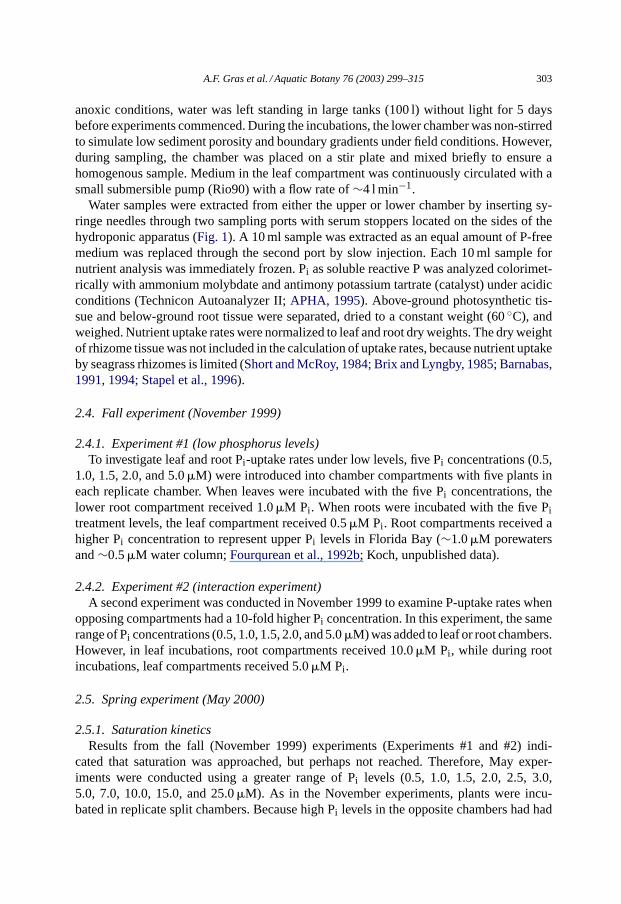
A cylindrical hydroponic chamber (50 cm height× 15 cm diameter; 4 l upper compart-ment, 2 l lower compartment,Fig. 1) was used for P-uptake experiments. Chambers wereconstructed of clear acrylic plastic with two sampling ports in both upper and lower cham-bers. A dark acrylic disc in the center of the chamber held five short shoots and separatedabove- and below-ground plant material into two isolated compartments. All lower com-partments were covered with foil during experiments to simulate dark sediment conditions.Individual T. testudinumshoots were threaded through rubber stoppers and sealed aroundthe non-photosynthetic tissue of the short shoot with a non-toxic sealant (plumber’s putty).The rubber stoppers were subsequently placed into the holes of the acrylic disc. To as-sure that water was not mixing between compartments, a red dye was added to the upperchambers of all experimental units at the end of the incubation. A sample of the lower

302 A.F. Gras et al. / Aquatic Botany 76 (2003) 299–315
Fig. 1. Cylindrical hydroponic partitioned chamber (upper compartment: 4 l, lower compartment: 2 l) used forPi -uptake experiments. Lower compartment was maintained under dark conditions during incubations.
chamber water was taken after approximately 1 h and examined spectrophotometrically at520 nm (Shizumatzu UV 620). No dye was detected in the lower compartments, thus wefelt confident that no leakage had occurred during incubations. The same chambers andmethodology for plant insertion have been used subsequently to isolate different hyper-salinity levels in upper and lower chambers with success (Koch, unpublished data), furthervalidating the split chamber design.
2.3. Experimental setup and sampling
Prior to the experiment, Florida Bay water (∼200 l, 35 PSU) was filtered using 200�mmesh filter bags (40 cm× 30 cm) and autoclaved to remove phytoplankton and bacteria.Although below-ground chamber experimental media was not purged with N2 to create
A.F. Gras et al. / Aquatic Botany 76 (2003) 299–315 303
anoxic conditions, water was left standing in large tanks (100 l) without light for 5 daysbefore experiments commenced. During the incubations, the lower chamber was non-stirredto simulate low sediment porosity and boundary gradients under field conditions. However,during sampling, the chamber was placed on a stir plate and mixed briefly to ensure ahomogenous sample. Medium in the leaf compartment was continuously circulated with asmall submersible pump (Rio90) with a flow rate of∼4 l min−1.
Water samples were extracted from either the upper or lower chamber by inserting sy-ringe needles through two sampling ports with serum stoppers located on the sides of thehydroponic apparatus (Fig. 1). A 10 ml sample was extracted as an equal amount of P-freemedium was replaced through the second port by slow injection. Each 10 ml sample fornutrient analysis was immediately frozen. Pi as soluble reactive P was analyzed colorimet-rically with ammonium molybdate and antimony potassium tartrate (catalyst) under acidicconditions (Technicon Autoanalyzer II;APHA, 1995). Above-ground photosynthetic tis-sue and below-ground root tissue were separated, dried to a constant weight (60◦C), andweighed. Nutrient uptake rates were normalized to leaf and root dry weights. The dry weightof rhizome tissue was not included in the calculation of uptake rates, because nutrient uptakeby seagrass rhizomes is limited (Short and McRoy, 1984; Brix and Lyngby, 1985; Barnabas,1991, 1994; Stapel et al., 1996).
2.4. Fall experiment (November 1999)
2.4.1. Experiment #1 (low phosphorus levels)To investigate leaf and root Pi-uptake rates under low levels, five Pi concentrations (0.5,
1.0, 1.5, 2.0, and 5.0�M) were introduced into chamber compartments with five plants ineach replicate chamber. When leaves were incubated with the five Pi concentrations, thelower root compartment received 1.0�M Pi. When roots were incubated with the five Pitreatment levels, the leaf compartment received 0.5�M Pi. Root compartments received ahigher Pi concentration to represent upper Pi levels in Florida Bay (∼1.0�M porewatersand∼0.5�M water column;Fourqurean et al., 1992b; Koch, unpublished data).
2.4.2. Experiment #2 (interaction experiment)A second experiment was conducted in November 1999 to examine P-uptake rates when
opposing compartments had a 10-fold higher Pi concentration. In this experiment, the samerange of Pi concentrations (0.5, 1.0, 1.5, 2.0, and 5.0�M) was added to leaf or root chambers.However, in leaf incubations, root compartments received 10.0�M Pi, while during rootincubations, leaf compartments received 5.0�M Pi.
2.5. Spring experiment (May 2000)
2.5.1. Saturation kineticsResults from the fall (November 1999) experiments (Experiments #1 and #2) indi-
cated that saturation was approached, but perhaps not reached. Therefore, May exper-iments were conducted using a greater range of Pi levels (0.5, 1.0, 1.5, 2.0, 2.5, 3.0,5.0, 7.0, 10.0, 15.0, and 25.0�M). As in the November experiments, plants were incu-bated in replicate split chambers. Because high Pi levels in the opposite chambers had had

304 A.F. Gras et al. / Aquatic Botany 76 (2003) 299–315
no effect on Pi-uptake in roots or leaves, opposite non-treatment compartments received2.0�M Pi.
2.6. Nutrient uptake rates and kinetics
Nutrient uptake rates in the light were calculated from Pi concentration changes in thechamber every hour over a 10 h period. Subsequent to light incubations, lights were extin-guished to determine dark uptake rates. The next morning, after an approximate 14 h darkincubation, chambers were sampled for Pi . Phosphorus uptake rates (�mol P g−1 dw h−1)in the light were calculated based on the linear slopes of Pi-uptake over the 10 h incuba-tion. Dark uptake rates were based on Pi concentrations at the end of the light incubation(17:00 h) minus the concentration after the 14 h dark interval.
2.6.1. Michaelis–Menten kineticsPi-uptake rates as a function of Pi concentration was calculated using the Michaelis–
Menten (MM) non-linear hyperbolic model. Plots of Pi-uptake versus substrate concen-tration (V versus [S]) were linearized using the Lineweaver–Burke double reciprocaltransformation ([S]−1 versus V−1). In the Lineweaver–Burke transformation, they-interceptis equal to 1/Vmax, while thex-intercept is equal to−1/Km. The parametersVmax andKmfrom the Lineweaver–Burke transformation were then used as initial starting parameters forthe non-linear hyperbolic run (Sigma Plot, Jandel Inc., 1999). Standard errors of the modelwere generated from the last iteration of the model run. These error terms represent theasymptotic standard errors of the parameters and define the uncertainty in the estimate ofregression coefficients. In general, the coefficients are within approximately two standarderrors of the reported coefficient. Michaelis–Menten Pi-uptake parameters were defined atsaturating (0–25�M) and low Pi ranges (0–5�M).
2.6.2. Pi-affinityLeaf and root Pi-affinities were calculated using the initial linear slope of the hyperbolic
curve at 0–2�M Pi (Short and McRoy, 1984; Stapel et al., 1996). t-tests were performedto examine significant differences between slopes (V/[S]) for light versus dark incubationsand root versus leaf Pi-affinities during May experiments. The Pi-affinities for November1999 interaction Experiments #1 and #2 were also compared to determine if increases inambient Pi concentrations affected leaf or root Pi-uptake rates in opposing chambers. Allsignificant differences are reported at theP < 0.05 level.
3. Results
3.1. Phosphorus saturation kinetics (0–25µM)
Leaves consistently showed a higherVmax than roots in both the light and dark acrossthe 0–25�M Pi range (Fig. 2, Table 1). Under light and dark conditions, leafVmax wasapproximately 70–80% higher than rootVmax (Fig. 2, Table 1). Vmax in the leaf was similarunder both light and dark conditions, while rootVmax declined approximately 30% in the

A.F. Gras et al. / Aquatic Botany 76 (2003) 299–315 305
Fig. 2. Pi -uptake rates (�mol g−1 dw h−1) in May by Thalassia testudinumleaves and roots in the light and darkas a function of Pi concentration (0–25�M). Curves represent best fit using Michaelis–Menten kinetics.
Table 1Michaelis–Menten kinetic parameters:Vmax andKm, with asymptotic standard errors of the parameters in paren-theses
Experiment Pi range (�M) Vmax (�mol g−1 dw h−1) Km (�M) R2 P-level
MayLeaf light 0–25 1.90 (0.25) 11.3 (2.96) 0.92 <0.01
0–5 0.50 (0.10) 1.20 (0.63) 0.66 <0.01
Leaf dark 0–25 2.10 (0.39) 12.4 (4.48) 0.94 <0.010–5 0.77 (0.25) 3.48 (1.86) 0.93 <0.01
Root light 0–25 0.55 (0.06) 3.09 (0.95) 0.82 <0.010–5 0.63 (0.22) 3.90 (2.33) 0.77 <0.01
Root dark 0–25 0.38 (0.05) 4.05 (1.48) 0.85 <0.010–5 0.38 (0.13) 3.14 (1.71) 0.92 <0.01
November(1) Leaf light 0–5 n.d.a n.d.a n.d.a n.d.a
(2) Leaf light 0–5 0.93 (0.13) 1.05 (0.41) 0.85 <0.01(1) Root light 0–5 1.12 (0.39) 2.69 (1.84) 0.79 <0.01(2) Root light 0–5 1.27 (0.61) 3.01 (2.46) 0.77 <0.01
Parameters presented for high (0–25�M) and low Pi range (0–5�M) in May. November data presented forExperiments #1 (1) and #2 (2). The level of significance (P) and theR2 of the regression are given.
a n.d.: not determined because of linearity.

306 A.F. Gras et al. / Aquatic Botany 76 (2003) 299–315
dark (Fig. 2, Table 1). Half saturation constants (Km) for the leaves in the 0–25�M Pi rangewere higher than the roots in both the light and dark, indicating a lower P affinity in the leafthan the root at high Pi concentrations (Table 1). Plant exposure to light versus dark did notaffect the half saturation constant (Km) in leaves or roots ofT. testudinum.
3.2. Phosphorus saturation kinetics (0–5µM)
P-uptake kinetics within a lower range of Pi concentrations (0–5�M) also fit a non-linearhyperbolic model (Fig. 3a–c; R2 = 0.66–0.93;Table 1), with the exception of Novemberleaf light data from Experiment #1 which was linear. These data indicate that Pi-uptake maybe approaching saturation even at relatively low Pi concentrations (<5�M). LeafVmax wasestimated to be∼3-fold lower at Pi concentrations<5�M compared to the<25�M range(Fig. 3a,Table 1). This decline inVmaxresulted in leafKm estimates of an order of magnitudelower, while rootKm remained comparatively similar at high versus low Pi ranges (Table 1).
Based on the May and November experiments, seasonality shifts inVmaxandKm occurred.Root and leafVmax were 2–3-fold higher in November than May (Table 1), and root andleaf Km values were slightly lower in November. However, more seasonal data is requiredto draw firm conclusions about seasonal variability of Pi-uptake kinetics inT. testudinum.
3.3. Affinity for P at low P concentrations (0–2µM)
The linear Pi-uptake kinetics observed at Pi concentrations<2.0�M has been definedas P affinity or alpha, and corresponds more closely with upper levels of Pi concentrationsfound in Florida Bay and other tropical estuaries and lagoons. At these Pi levels, the affinityfor Pi by the leaves was two-fold higher than roots under both light and in dark conditionsduring the growing season in May (Fig. 4a, Table 2). Contrary to findings in May, however,November leaf and root affinity in Experiments #1 and #2 were not significantly different(Fig. 4b, Table 2). Also, differences in light versus dark root uptake observed at higher Piconcentrations were not observed at<2�M Pi (Table 2).
Table 2Leaf and root Pi -affinity, defined as the slope of the linear equation at low Pi concentrations (0–2�M)
Experiment Equation R2 P-level
MayLeaf light y = 0.2310x + 0.0315 0.79 <0.001Leaf dark y = 0.1916x − 0.0111 0.63 <0.001Root light y = 0.1022x + 0.0074 0.99 <0.001Root dark y = 0.0940x − 0.0006 0.92 <0.001
November(1) Leaf light y = 0.1627x + 0.0407 0.69 <0.001(2) Leaf light y = 0.1939x + 0.1910 0.64 <0.001(1) Root light y = 0.2322x + 0.0117 0.53 <0.001(2) Root light y = 0.2360x − 0.0007 0.90 <0.001
May results are for leaf and root in the light and dark. November results are for leaf and root in the light forExperiments #1 (1) and #2 (2). The level of significance (P) andR2 of the linear model are given.

A.F. Gras et al. / Aquatic Botany 76 (2003) 299–315 307
Fig. 3. Pi -uptake rates (�mol g−1 dw h−1) by Thalassia testudinumleaves and roots in the light as a functionof Pi concentration (0–5�M) in (a) May 2000, (b) November 1999 (Experiment #1), and (c) November 1999(Experiment #2). Curves represent best fit using Michaelis–Menten kinetics.
Leaf and root uptake rates from May were compared to November Experiment #1, dueto the relatively low Pi concentrations used in the May experiments (2�M, leaf and root)and November Experiment #1 (0.5�M leaf, 1�M root). The affinity for Pi by roots wassignificantly higher in November than in May, while the affinity for Pi in the leaves was not

308 A.F. Gras et al. / Aquatic Botany 76 (2003) 299–315
significantly different from leaves in May and November (Table 2), suggesting that seasonaldifferences in leaf uptake may be minimal at Pi levels of 0.5–2.0�M.
3.4. Interaction results
Ten-fold higher P concentrations in the opposite chamber compartment during NovemberExperiments #1 and #2 did not result in significant changes in leaf or root Pi-uptake rates.No significant differences were found in the affinity of leaves for Pi between Experiments#1 and #2 (Fig. 4, Table 2). The affinity of roots for P was also similar when exposed tohigh versus low Pi levels in the leaf chamber (Table 2).
Fig. 4. Phosphorus affinity (V/[S]), defined as Pi -uptake rates (�mol g−1 dw h−1) within the linear portion of thenon-linear hyperbolic curve from 0 to 2�M. Data are shown for (a) May 2000, and (b) November 1999 experimentsfor Thalassia testudinumleaves and roots.

A.F. Gras et al. / Aquatic Botany 76 (2003) 299–315 309
4. Discussion
One of the dominant tropical Atlantic–Caribbean seagrasses,T. testudinum, is shown hereto sequester Pi into both leaves and roots according to Michaelis–Menten kinetics. We as-cribe these kinetics solely to absorption, because P-uptake rates were determined over a 10 hperiod, without determination of the initial adsorption of ions onto the plant surface, a rapid5–20 min response (Short and McRoy, 1984; Perez-Llorens and Niell, 1995; Stapel et al.,1996). Many other tropical and temperate seagrass studies have shown Michaelis–Mentensaturation kinetics at high Pi and inorganic nitrogen concentrations (McRoy and Barsdate,1970; McRoy et al., 1972; Penhale and Thayer, 1980; Thursby and Harlin, 1984; Brix andLyngby, 1985; Perez-Llorens and Niell, 1995; Stapel et al., 1996), with few exceptions(Paling and McComb, 1994).
Although inorganic nitrogen uptake kinetics have been described for several seagrassspecies (Touchette and Burkholder, 2000), T. testudinumPi-uptake parameters can only becontrasted with three seagrass species for which Pi-uptake kinetics have been determined(Table 3). In the 25�M Pi rangeVmax andKm for T. testudinumleaves are remarkablysimilar to those ofThalassia hemprichii, a tropical seagrass of the Spermonde Archipelagoin Indonesia (Table 3). This is the case regardless of the fact thatT. testudinumplants fromFlorida Bay are exposed to surface water Pi concentrations over an order of magnitudelower (median= 0.04�M, n = 2575,Boyer et al., 1997) than those experienced byT.hemprichii in Indonesia (0.8–1.4�M; Erftemeijer and Herman, 1994). While Pi-uptakekinetics of the twoThalassiaspecies is similar at high Pi concentrations,T. testudinumappears to approach saturation at Pi levels 50% lower (5�M) thanT. hemprichii(10�M).However, the linear uptake affinity (α) for the two species were similar, ranging between0.13 and 0.23 (Table 3). Thus, at Pi concentrations less than 2�M, closer to the upperrange experienced byT. testudinumin Florida Bay (1.1�M, Boyer et al., 1997) and T.hemprichii in Indonesia (0.8–1.4�M), the leaves of bothThalassiaspecies take up Pi atsimilar rates.
Zostera noltiiandRuppia maritima, the only other two seagrass species for which Pikinetics have been determined, exhibit slightly different Pi-uptake kinetics compared toThalassia. Some of these differences may be attributable to experimental design. For ex-ample, the length of incubation for Pi-uptake and pretreatment of plants prior to uptakeexperiments. Over short 5 min incubations,Z. noltii excised leaves and leaves of intactplants show aVmax 10-fold greater thanThalassia(Table 3). These maximum Pi-uptakerates include both rapid adsorption onto the leaf surface and absorption of Pi by leaves.Further, these plants had been P-starved 24 h prior to uptake experiments. If maximumuptake rates are calculated from the longer 180 min incubation in the same study,Z. noltiiPi-uptake rates (0.9–3.0�mol g−1 dw h−1) at high concentrations of Pi (25–30�M) alignmore closely with those ofThalassia(Table 3). In addition, linear affinities ofZ. noltii leavesfor Pi more closely follow those ofThalassiawhen utilizing data from the 180 min incuba-tion (Table 3). AlthoughThalassiaandZ. noltii show similar rate constants for Pi-uptake,an exception is found in the submerged macrophyteR. maritima, which exhibits a highVmax even during long incubations (12–15 h). These data, albeit limited, indicate consistentleaf Pi-uptake kinetic parameters among seagrass species when adjusted for experimentaldesign with moderate inter-specific differences.

310 A.F. Gras et al. / Aquatic Botany 76 (2003) 299–315
Table 3A review of inorganic phosphorus (Pi ), kinetic parameters, the maximum uptake rate at saturationVmax
(�mol g−1 dw h−1), the half saturation constantKm (�M), and linear affinity (α) defined as the initial linearportion of uptake for seagrass and other SAVs across various Pi concentrations
Species experiment/site Michaelis–Menten kinetics Linear affinity kinetics
Vmax Km Pi (�M) α Pi (M) Reference
Thalassia testudinumLeaf light (600 min) 1.9 11.93 0.5–25 0.23 0–2 This studyLeaf dark (720 min) 2.1 12.43 0.5–25 0.19 0–2 This studyRoot light (600 min) 0.57 3.75 0.5–25 0.10 0–2 This studyRoot dark (720 min) 0.38 4.05 0.5–25 0.09 0–2 This study
Thalassia hemprichiiLeaf–mudflat (600 min)a 2.2 7.7 5–50 0.19 0–10 Stapel et al. (1996)Leaf—reef coast (600 min)a 2.5 11 5–70 0.13 0–10 Stapel et al. (1996)Leaf—reef shelf (600 min)a 3.2 15 5–50 0.13 0–10 Stapel et al. (1996)
Zostera noltiiExcised leaf (5 min) 7.0 10.0 2.5–25 0.52b 2.5–5.4 Perez-Llorens
and Niell (1995)Leaf whole plant (5 min) 43.0 12.1 1.9–30 1.54b 1.9–5.8 Perez-Llorens
and Niell (1995)Excised leaf (180 min)c 0.9 7.0 2.5–25 0.14b 2.5–5.4 Perez-Llorens
and Niell (1995)Leaf whole plant (180 min)c 3.0 7.1 1.9–30 0.15b 1.9–5.8 Perez-Llorens and
Niell (1995)
Ruppia maritimaLeaf−Pi root (900–1080 min) 14.1 9.2 2.5–20 – – Thursby and
Harlin (1984)Leaf+Pi root (900–1080 min) 9.7 8.1 2.5–20 – – Thursby and
Harlin (1984)Root−/+ Pi leaf (900–1080 min) 4.6 3.1 2.5–20 – – Thursby and
Harlin (1984)a Maximum incubation time.b Values are the linear slopes calculated by using initial 2Pi concentrations and associated uptake rates.c Kinetic parameters generated by Edwards and Walker model (Fig. 4, Perez-Llorens and Niell, 1995).
Dependence on light for maximum nutrient uptake rates varies among seagrass species.Leaf Pi-uptake was light-independent in this study. We found no differences in leafVmax,Km, orα in light and dark conditions. These results refute the supposition thatT. testudinumleaf Pi-uptake is promoted by or coupled to photophosphorylation. Our observations areconsistent with results byLee and Dunton (1999), who measured similar light and darkleaf uptake rates of NH4+ and NO3
− for T. testudinum. The light-independent pattern isalso consistent with shorter-term (2 h) kinetic experiments of Pi-uptake byT. testudinumleaf segments with and without epiphytes under both light and dark conditions (0–25�M;Donovan and Koch, in preparation). By contrast,Zostera marinaandZ. notii leaf Pi-uptakerates decline during dark periods (McRoy and Barsdate, 1970; McRoy et al., 1972; Brixand Lyngby, 1985), and therefore Pi-uptake may be linked to photophosphorylation in thesespecies.

A.F. Gras et al. / Aquatic Botany 76 (2003) 299–315 311
While T. testudinumleaf Pi-uptake rates were similar under light and dark conditions,root Vmax declined by 33 and 40% in the dark across the 0–25 and 0–5�M Pi range,respectively. This decline in rootVmax implies that there may be a relationship betweenphotosynthesis and root Pi-uptake inT. testudinum. Patriquin (1972)suggested that maxi-mum Pi-uptake rates inT. testudinumroots occur during periods of active photosynthesis.However,Patriquin (1972)based this supposition on a weak correlation between rhizomewater-soluble Pi (�mol g−1 wet wt.) and leaf growth rates (mg per shoot per day), withoutdirect measurements of diel changes of soluble Pi in plant tissues. Our data indicate thatroot Pi-uptake is light dependent inT. testudinum.
Root Pi-uptake was significantly lower than leaves under both light and dark conditionsin T. testudinum. Apoplastic barriers such as suberin lamellae, suberized hypodermal cellwalls, and casparian bands are reported in seagrass species includingT. testudinum, andmay limit root uptake (Tomlinson, 1969; Barnabas, 1991). These restrictions, and the factthat seagrass leaves possess efficient apoplastic nutrient transfer routes to photosyntheticcells (Barnabas, 1988), could explain higher leafVmaxat saturating Pi concentrations. Theseresults are consistent withR. maritima’s 2–3-fold greaterVmax in leaves versus roots at highPi concentrations (Table 3).
Root Pi-uptake kinetic parameters have not been reported for any other seagrass speciesthat we could compare to ourT. testudinumdata. However, root Pi-uptake rates havebeen determined forT. hemprichii(Stapel et al., 1996) andZ. marina(Brix and Lyngby,1985) at Pi levels within the range investigated in this study, and can be used to contrastseagrass leaf to root Pi-uptake ratios. At 6.4�M Pi, T. hemprichiihad similar leaf androot (1�mol g−1 dw h−1) Pi-uptake rates. In contrast, we found 2–3-fold higher Pi-uptakerates forT. testudinumleaves versus roots at 6.4�M, based on the Michaelis–Mentenmodel kinetics and the broad Pi range of 0–25�M. When we applied kinetic parame-ters generated using lower Pi concentrations (0–5�M) however, leaf:root Pi-uptake ratios(0.42:0.55�mol g−1 dw h−1) approach unity (0.76) under light conditions. At the low Pirange of 0–2�M, linear affinities exhibited a leaf:root ratio of one during the Novemberexperiments and a ratio of two during the May growing season. The temperate counterpartto T. testudinum, Z. marinahad a leaf to root Pi-uptake ratio of 1 in a 48 h32P translocationstudy, also treated with Pi concentrations of 6.45�M (Brix and Lyngby, 1985). However,in theBrix and Lyngby (1985)study, rates of Pi-uptake (leaf range 0.03 to 0.10 and roots0.06�mol g−1 dw h−1) were 10 times lower than those reported forThalassiaby Stapelet al. (1996)and in this study. The above synthesis suggests that seagrass leaves have thecapacity to contribute as much as, or more, to the total acquisition of Pi by seagrass plantswhen exposed to similar Pi concentrations. The importance of leaf uptake was also evidentwhen roots were exposed to higher Pi levels than leaves. These results are consistent withthose found forT. hemprichiiduring short-term nutrient pulse experiments (Stapel et al.,1996). The potential importance of leaf uptake in oligotrophic environments is highlightedwhen we calculate the percent contribution of leaf versus root Pi to the overall P demandof T. testudinumfrom Florida Bay.
Plant nutrient demands can be estimated from leaf growth rates and plant P contentbecause the N and P demand for leaf growth generally constitutes∼95% of seagrass nutrientrequirements (Erftemeijer et al., 1993; Stapel et al., 1996). Average leaf production forT.testudinumin Florida Bay is 16.9 ± 0.7 mg g−1 per day (Zieman et al., 1999), averaging

312 A.F. Gras et al. / Aquatic Botany 76 (2003) 299–315
Table 4Leaf (L) and root (R) Pi -uptake rates (�mol g−1 dw h−1) calculated based on a range of Pi concentrations in FloridaBay
Experiment Range of Pi concentrations
Low (0.05�M) Mid (0.10�M) High (0.50�M)
May L: lightMM (0–25�M) 0.0079 n 51% 0.0158 n 52% 0.0764 y 53%MM (0–5�M) 0.0200 n 38% 0.0385 y 38% 0.1471 y 40%LA (0–2�M) 0.0431 y 78% 0.0546 y 76% 0.1470 y 72%
May L: darkMM (0–25�M) 0.0084 n 65% 0.0168 n 65% 0.0812 y 66%MM (0–5�M) 0.0108 n 64% 0.0213 n 65% 0.0960 y 65%LA (0–2�M) −0.0015 n 0% 0.0081 n 48% 0.8470 y 95%
May R: lightMM (0–25�M) 0.0075 n 49% 0.0148 n 48% 0.0671 y 47%MM (0–5�M) 0.0332 y 62% 0.0630 y 62% 0.2250 y 61%LA (0–2�M) 0.0125 n 23% 0.0176 n 24% 0.0585 y 29%
May R: darkMM (0–25�M) 0.0046 n 35% 0.0092 n 35% 0.0418 y 34%MM (0–5�M) 0.0060 n 36% 0.0117 n 36% 0.0522 y 35%LA (0–2�M) 0.0041 n 100% 0.0088 n 52% 0.0464 y 5%
May L + R: lightMM (0–25�M) 0.01540 n 100% 0.03060 y 100% 0.14350 y 100%MM (0–5�M) 0.05320 y 100% 0.10150 y 100% 0.37210 y 100%LA (0–2�M) 0.05560 y 100% 0.07220 y 100% 0.20550 y 100%
May L + R: darkMM (0–25�M) 0.01300 n 100% 0.02600 y 100% 0.12300 y 100%MM (0–5�M) 0.01680 n 100% 0.03300 y 100% 0.14820 y 100%LA (0–2�M) 0.00130 n 100% 0.01150 n 100% 0.88800 y 100%
Pi-uptake rates are calculated using Michaelis–Menten (MM) kinetics at high and low Pi concentrations as well asthe linear affinity index (LA). It is noted whether the uptake rates satisfy (y: yes, n: no) leaf nutrient requirements,based on the calculated P demand ofThalassia testudinumin Florida Bay: 0.0216�mol g−1 dw h−1, and percentcontributed by leaf vs. root tissue. The total uptake by the leaf and root is also calculated.
18.3 mg g−1 per day for the South Florida region (Fourqurean et al., 2001). Using the meanpercent P (0.095± 0.039%) forT. testudinumleaf tissues collected from 50 sites acrossFlorida Bay (Fourqurean et al., 1992a), and assuming no translocation between plant parts,the yearly average plant demand for NE Florida Bay is 0.0216�mol P g−1 dw h−1. This Prequirement is lower than that reported forT. hemprichii(0.047–0.075�mol P g−1 dw h−1;Stapel et al., 1996) in Indonesia, whereThalassiarelative growth rates are higher (range:12–56 mg g−1 per day) than those in South Florida (3.2 to 34.2 mg g−1 per day).
Assuming a 0.0216�mol P g−1 dw h−1 demand for P byT. testudinum, we calculatedwhether or not leaf or root Pi-uptake or both could meet the plant P requirements during thegrowing season (May) at 3 levels of Pi (0.05, 0.1, and 0.5�M; Table 4). To assess modelsensitivity to calculating P requirements, three modeling approaches were used to calculate

A.F. Gras et al. / Aquatic Botany 76 (2003) 299–315 313
Pi-uptake rates: Michaelis–Menten non-linear kinetics at high and low ranges, and the linearaffinity (α) (Table 4). Based on this exercise, some consistent patterns emerge. For example,leaf uptake accounts for >50% of the Pi taken up 72% of the time using all models, and100% of the time using MM kinetics up to 25�M Pi andα, with the exception of leaf-dark(0.05 and 1.0�M). Secondly, at fairly low Pi levels of 0.5�M, solely leaf or root uptakecould satisfy the average requirements of P forT. testudinum. Finally, at the extremelylow level of 0.05�M Pi, greater light-dependency emerged as a factor in satisfying the Prequirements ofT. testudinum, even in the leaves that showed light independence forVmaxandα. These results indicate that at very low ambient Pi levels, satisfying P requirementsof the plants becomes extremely sensitive to they-intercept where Pi-uptake could eitherbe positive or negative. Several authors have tried to calculateSmin (the Pi concentrationat which uptake is zero), but primarily using uptake kinetics based on experiments with Piconcentrations orders of magnitude greater thanSmin. No studies to date have focused onseagrass nutrient uptake kinetics at levels found in highly oligotrophic tropical carbonatesystems such as Florida Bay. At this time, it may be prudent not to over interpret calculatedPi-uptake rates at 0.05�M based on experiments with the lowest uptake rates determined at10-times higher Pi levels (0.5�M). We are currently investigating the kinetics of Pi-uptakein T. testudinumat the extreme low range (0.02–1.0�M), to determine if these Pi-uptakekinetics vary from those discernable for seagrass at higher ranges tested in this and otherstudies.
In conclusion,T. testudinumexhibited Michaelis–Menten kinetics across the broad rangeof Pi concentrations examined in this study (0–25�M). Leaf Pi-uptake rates were light-independent. In contrast, root Pi-uptake rates declined 30% in the dark. At saturation, leafVmax was 3–6 times greater than roots; while at lower Pi concentrations, uptake rates weremore similar between roots and leaves. LeafVmax declined 2–3-fold at lower Pi concentra-tions (0–5�M). RootVmax remained the same at high and low Pi ranges. Applying linearand non-linear models of Pi-uptake kinetics,T. testudinumleaves contributed a majorityof the Pi sequestered by the plant where surface and porewater Pi levels were equally low(0.05–0.5�M). Based on the calculated P-demand ofT. testudinumin South Florida, solelyroot or leaf uptake could account for the P requirements ofT. testudinumat 0.5�M Pi;while under highly oligotrophic conditions (0.05�M), the sum of root and leaf Pi-uptakecould not provide the P necessary for growth, particularly under dark conditions. Thesedata suggest that P-limitation may occur inT. testudinumwhen surface and porewater Pilevels are extremely low (<0.10�M), such as in carbonate seagrass systems where Pi se-questration by the sediment and associated biota are highly efficient, but is probably not afactor at higher Pi concentrations. Further research is required on Pi-uptake kinetics in the<0.50�M Pi range.
Acknowledgements
This research was supported by the South Florida Water Management District (SFWMD)as a part of their ongoing Everglades research in Florida Bay. Everglades National Park isrecognized for field support through the use of the Key Largo Ranger Station boats andfacilities. Laboratory assistance was provided by several members of the Aquatic Plant

314 A.F. Gras et al. / Aquatic Botany 76 (2003) 299–315
Ecology Lab. We would also like to thank Chelsea Donovan, Samantha Evans, Steve Kelly,and Karl Picard for their excellent advice and dedicated assistance in the field and laboratory.We are grateful for the time of two anonymous reviewers who significantly improved thismanuscript.
References
Alongi, D.M., 1998. Coastal Ecosystem Processes. CRC Press, Boca Raton, FL.American Public Health Association, 1995. Standard Methods for the Examination of Water and Wastewater, 19th
ed. Washington, DC.Barnabas, A.D., 1988. Apoplastic tracer studies in the leaves of a seagrass. I. Pathway through epidermal and
mesophyll tissues. Aquat. Bot. 32, 63–77.Barnabas, A.D., 1991.Thalassodendron ciliatum(Forssk.) Den Hartog: root structure and histochemistry in relation
to apoplastic transport. Aquat. Bot. 40, 129–143.Barnabas, A.D., 1994. Apoplastic and symplastic pathways in leaves and roots of the seagrassHalodule uninervis
(Forssk.) Aschers. Aquat. Bot. 47, 155–174.Bole, J.B., Allan, J.R., 1978. Uptake of phosphorus from the sediment by aquatic plants,Myriophyllum spicatum
andHydrilla verticillata. Water Res. 12, 353–358.Boyer, J.N., Fourqurean, J.W., Jones, R.D., 1997. Spatial characterization of water quality in Florida Bay and
Whitewater Bay by multivariate analyses: zones of similar influence. Estuaries 20, 743–758.Brix, H., Lyngby, J.E., 1985. Uptake and translocation of phosphorus in eelgrass (Zostera marina). Mar. Biol. 90,
111–116.Bulthuis, D.A., Woelkerling, W.J., 1981. Effects of in situ nitrogen and phosphorus enrichment of the sediments
of the seagrassHeterozostera tasmanica(Martens ex Aschers) den Hartog in western Port, Victoria, Australia.J. Exp. Mar. Biol. Ecol. 53, 193–207.
Carignan, R., Kalff, J., 1980. Phosphorus sources for aquatic weeds: water or sediments? Science 207, 987–989.Denny, P., 1980. Solute movement in submerged angiosperms. Biol. Rev. 55, 65–92.Erftemeijer, P.L.A., Herman, P.M.J., 1994. Seasonal changes in environmental variables, biomass, production and
nutrient contents in two contrasting tropical intertidal seagrass beds in South Sulawesi, Indonesia. Oecologia99, 45–59.
Erftemeijer, P.L.A., Osinga, R., Mars, A.E., 1993. Primary production of seagrass beds in South Sulawesi(Indonesia): a comparison of habitats, methods, and species. Aquat. Bot. 46, 67–90.
Erftemeijer, P.L.A., Stapel, J., Smekens, J.E., Drossaert, W.M.E., 1994. The limited effect of in situ phosphorusand nitrogen additions to seagrass beds on carbonate and terrigenous sediments in South Sulawesi, Indonesia.J. Exp. Mar. Biol. Ecol. 182, 123–140.
Fourqurean, J.W., Zieman, J.C., Powell, G.V.N., 1992a. Phosphorus limitation of primary production in FloridaBay: evidence from C:N:P ratios of the dominant seagrassThalassia testudinum. Limnol. Oceanogr. 37, 162–171.
Fourqurean, J.W., Zieman, J.C., Powell, G.V.N., 1992b. Relationships between porewater nutrients and seagrassesin a subtropical carbonate environment. Mar. Biol. 114, 57–65.
Fourqurean, J.W., Jones, R.D., Zieman, J.C., 1993. Processes influencing water column nutrient characteristicsand phosphorous limitation of phytoplankton biomass in Florida Bay, FL, USA: inferences from spatialdistributions. Estuar. Coast. Shelf Sci. 36, 295–314.
Fourqurean, J.W., Willsie, A., Rose, C.D., Rutten, L.M., 2001. Spatial and temporal pattern in seagrass communitycomposition and productivity in South Florida. Mar. Biol. 138, 341–354.
Hemminga, M.A., Harrison, P.G., VanLent, F., 1991. The balance of nutrient losses and gains in seagrass meadows.Mar. Ecol. Prog. Ser. 71, 85–96.
Hemminga, M.A., Marbà, N., Stapel, J., 1999. Leaf nutrient resorption, leaf lifespan and the retention of nutrientsin seagrass systems. Aquat. Bot. 65, 141–158.
Jensen, H.S., McGlathery, K.J., Marino, R., Howarth, R.W., 1998. Forms and availability of sediment phosphorusin carbonate sand of Bermuda seagrass beds. Limnol. Oceanogr. 43, 799–810.

A.F. Gras et al. / Aquatic Botany 76 (2003) 299–315 315
Koch, M.S., Benz, R.E., Rudnick, D.T., 2001. Solid-phase phosphorus pools in highly organic carbonate sedimentsof northeastern Florida Bay. Estuar. Coast. Shelf Sci. 52, 270–291.
Lee, K.S., Dunton, K.H., 1999. Inorganic nitrogen acquisition in the seagrassThalassia testudinum: developmentof a whole plant nitrogen budget. Limnol. Oceanogr. 44, 1204–1215.
McRoy, C.P., Barsdate, R.J., 1970. Phosphate absorption in eelgrass. Limnol. Oceanogr. 15, 6–13.McRoy, C.P., Barsdate, R.J., Nebert, M., 1972. Phosphorus cycling in an eelgrass (Z. marinaL.) ecosystem.
Limnol. Oceanogr. 17, 58–67.Morse, J.W., Zullig, J.J., Iverson, R.L., Choppin, G.R., Mucci, A., Millero, F.J., 1987. The influences of seagrass
beds on carbonate sediments in the Bahamas. Mar. Chem. 22, 71–83.Odum, A., 1959. In: Lobban, C.S., Harrison, P.J., 1995 (Eds.), Seaweed Ecology and Physiology. Cambridge
University Press, UK.Paling, E.I., McComb, A.J., 1994. Nitrogen and phosphorus uptake in seedlings of the seagrassAmphibolis
antarcticain western Australia. Hydrobiologia 294, 1–4.Patriquin, D.G., 1972. The origin of nitrogen and phosphorus for the marine angiospermThalassia testudinum.
Mar. Biol. 15, 35–46.Pedersen, M.F., Paling, E.I., Walker, D.I., 1997. Nitrogen uptake and allocation in the seagrassAmphibolis
antarctica. Aquat. Bot. 56, 105–117.Penhale, P.A., Thayer, G.W., 1980. Uptake and transfer of carbon and phosphorus by eelgrass (Zostera marinaL.)
and its epiphytes. J. Exp. Mar. Biol. Ecol. 42, 113–123.Perez-Llorens, J.L., Niell, F.X., 1995. Short term phosphate uptake kinetics inZostera noltiiHornem: a comparision
between excised leaves and sediment rooted plants. Hydrobiologia 297, 17–27.Powell, G.V.N., Kenworthy, W.J., Forqurean, J.W., 1989. Experimental evidence for nutrient limitation of seagrass
growth in a tropical estuary with restricted circulation. Bull. Mar. Sci. 44, 324–340.Rattray, M.R., Howard-Williams, C., Brown, J.M.A., 1991. Sediment and water as sources of nitrogen and
phosphorus for submerged rooted aquatic macrophytes. Aquat. Bot. 40, 225–237.Short, F.T., 1987. Effects of sediment nutrients on seagrasses: literature review and mesocosm experiment. Aquat.
Bot. 27, 41–57.Short, F.T., McRoy, C.P., 1984. Nitrogen uptake by the leaves and roots of the seagrassZostera marinaL. Bot.
Mar. 27, 547–555.Short, F.T., Davis, M.W., Gibson, R.A., Zimmerman, C.F., 1985. Evidence for phosphorus limitation in carbonate
sediments of the seagrassSyringodium filiforme. Estuar. Coast. Shelf. Sci. 20, 419–430.Stapel, J., Aarts, T.L., van Duynhoven, B.H.M., de Groot, J.D., van den Hoogen, P.H.W., Hemminga, M.A., 1996.
Nutrient uptake by the leaves and roots of the seagrassThalassia hemprichiiin the Spermonde Archipelago,Indonesia. Mar. Ecol. Prog. Ser. 134, 195–206.
Terrados, J., Williams, S.L., 1997. Leaf versus root nitrogen uptake by the surfgrassPhyllospadix torreyi. Mar.Ecol. Prog. Ser. 149, 267–277.
Thursby, J.B., Harlin, M.M., 1982. Leaf–root interaction in the uptake of ammonia byZostera marina. Mar. Biol.72, 109–112.
Thursby, J.B., Harlin, M.M., 1984. Interaction of leaves and roots ofRuppia maritimain the uptake of phosphate,ammonia, and nitrate. Mar. Biol. 83, 61–67.
Tomlinson, P.B., 1969. On the morphology and anatomy of turtle grass,Thalassia testudinum(Hydrocharitaceae).II. Anatomy and development of the root in relation to function. Bull. Mar. Sci. 19, 57–71.
Touchette, B.W., Burkholder, J.M., 2000. Review of nitrogen and phosphorus metabolism in seagrasses. J. Exp.Mar. Biol. Ecol. 250, 133–167.
Zieman, J.C., Fourqurean, J.W., Frankovich, T.A., 1999. Seagrass die-off in Florida Bay: long-term trends inabundance and growth of turtle grass,Thalassia testudinum. Estuaries 22, 460–470.