Embed Size (px)
Citation preview
arX
iv:0
903.
4401
v2 [
phys
ics.
atom
-ph]
20
Apr
200
9
Photoassociation and coherent transient dynamics in the interaction of ultracold
rubidium atoms with shaped femtosecond pulses - II. Theory
Andrea Merli, Frauke Eimer, Fabian Weise, and Albrecht LindingerInstitut fur Experimentalphysik, Freie Universitat Berlin, Arnimallee 14, D-14195 Berlin, Germany
Wenzel Salzmann, Terry Mullins, Simone Gotz, Roland Wester, and Matthias Weidemuller∗
Physikalisches Institut, Universitat Freiburg, Hermann Herder Str. 3, D-79104 Freiburg i. Br.
Ruzin Aganoglu and Christiane P. KochInstitut fur Theoretische Physik, Freie Universitat Berlin, Arnimallee 14, D-14195 Berlin, Germany+
Photoassociation of ultracold rubidium atoms with femtosecond laser pulses is studied theoret-ically. The spectrum of the pulses is cut off in order to suppress pulse amplitude at and close tothe atomic resonance frequency. This leads to long tails of the laser pulse as a function of timegiving rise to coherent transients in the photoassociation dynamics. They are studied as a functionof cutoff position and chirp of the pulse. Molecule formation in the electronically excited state isattributed to off-resonant excitation in the strong-field regime.
PACS numbers: 32.80.Qk,34.50.Rk
I. INTRODUCTION
Cooling, trapping and manipulation of atoms andmolecules in the ultracold regime (T ≤ 100 µK) repre-sents one of the most active research fields in contempo-rary atomic, molecular, and optical physics. Photoas-sociation is the formation of molecules when two col-liding atoms are excited by laser light into bound vi-brational levels of an electronically excited state. Us-ing continuous-wave lasers, photoassociation of ultracoldatoms can be employed to study collisional properties ofultracold atoms, in particular long-range potential en-ergy curves [1]. If followed by spontaneous emission, italso serves to form ultracold molecules in their electronicground state [2].
The use of short laser pulses for photoassociation ofultracold atoms has been suggested in theory work forabout a decade [3, 4, 5, 6, 7, 8, 9, 10]. Initially, the maingoal was to find a photoassociation scheme that would al-low for larger formation rates of excited state molecules[4, 5]. In order to coherently produce ultracold moleculesin their electronic ground state, the pump-dump scenariowas adapted to photoassociation [6, 7, 8]: A pump pulsecreates a vibrational wavepacket on the electronically ex-cited state which travels toward its inner turning pointwhere it is sent to the ground state by the dump pulse.Other coherent control schemes such as adiabatic pas-sage [9] and pulse optimization using genetic algorithmswere investigated as well [10]. Coherent photoassocia-tion using short laser pulses is closely linked to the ulti-mate goal of ultracold molecule formation, the stabiliza-
∗now at: Physikalisches Institut, Ruprecht-Karls-Universitat Hei-
delberg, Philosophenweg 12, D-69120 Heidelberg, Germany+corresponding author: [email protected]
tion of the molecules into their vibrational ground state[11, 12, 13, 14]. This has been discussed in theory workin the context of optimal control [15] and coherent pulseaccumulation [16].
In the theoretical studies on short-pulse photoassocia-tion, pulses with a spectral bandwidth of a few wavenum-bers were suggested. This choice is motivated by therequirement of exciting a narrow band of transitionswith large free-bound Franck-Condon factors close tothe atomic resonance without exciting atomic transi-tions. This spectral bandwidth corresponds to transform-limited pulse durations of a few picoseconds. However,pulse shaping capabilities for such pulses have yet to bedeveloped.
Femtosecond pulses on the other hand can be shapedwith a number of techniques, but they have a very broadspectrum, addressing both molecular and atomic transi-tions. Since the probability of atomic transitions is sev-eral orders of magnitude larger than that of photoasso-ciation transitions, the pulse spectral amplitude at theatomic resonance frequency needs to be completely sup-pressed in order to record any molecular signal. Thisis most easily achieved by putting a knife edge into theFourier plane of the pulse shaper [17]. The correspond-ing sharp cutoff in the spectrum of the femtosecond pulseleads to long tails of the pulse as a function of time andinduces coherent transient dynamics [18, 19]. The tran-sients are reflected in oscillations of the molecular pop-ulation and can be measured by ionization detection ofthe excited state molecules [20]. Photoassociation of ul-tracold atoms with shaped femtosecond laser pulses hasthus been demonstrated recently in a break-through ex-periment [20].
This paper presents a detailed explanation of the ex-perimental results obtained by femtosecond photoasso-ciation of ultracold rubidium atoms with shaped pulsesbased on theoretical calculations. The details of the ex-
2
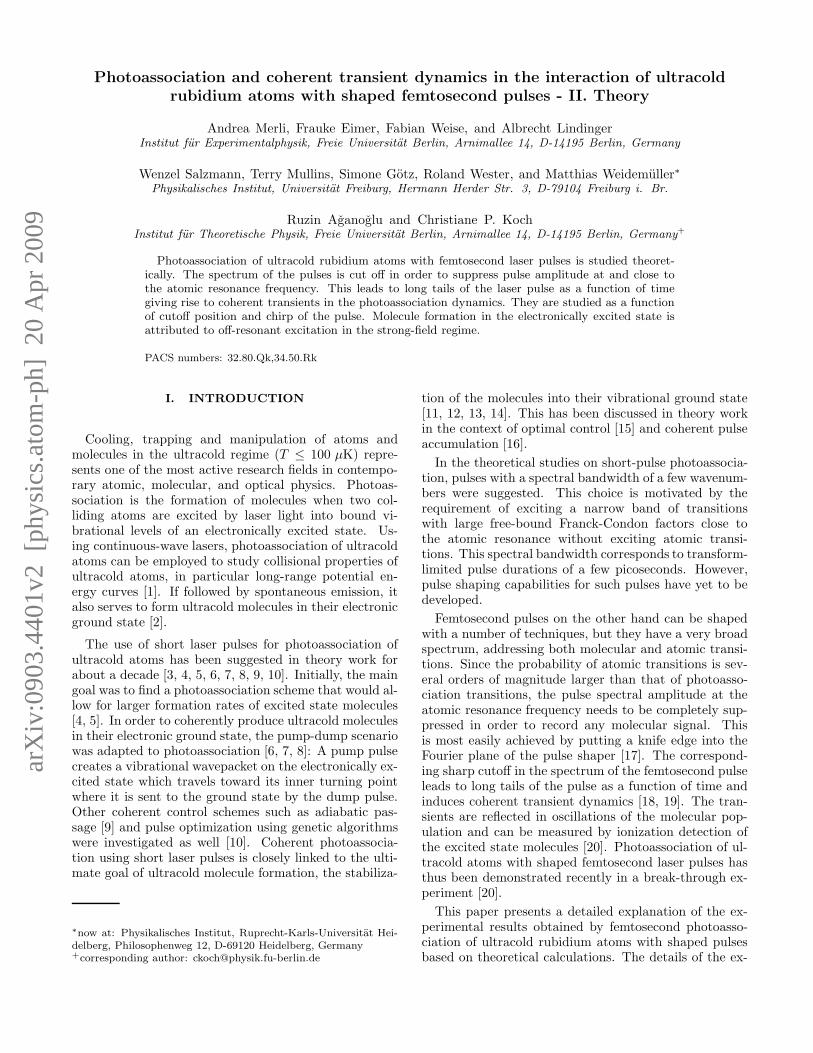
perimental setup as well as the major part of the ex-perimental results is found in Ref. [21]. Figure 1 de-picts the proposed photoassociation mechanism includ-ing the potential energy curves considered in the calcu-lations. A first laser field (the pump pulse, indicated bythe red arrow) excites two atoms from their ground state(5s+5s) into long-range bound molecular levels of an elec-tronically excited state (correlated to the 5s+5p1/2 or5s+5p3/2 asymptotes). The initial scattering state with arelative scattering energy corresponding to the trap tem-perature of 100 µK is shown on the ground state. Theexcited state wavefunction after the pulse is over as wellas one exemplary excited state vibrational wavefunctionare displayed in the first excited state of Fig. 1. In orderto detect the excited state molecules, a second laser field(the probe pulse, indicated by the green arrow) transfersthem to the ionic state.
The paper is organized as follows: Section II briefly re-views the theoretical description of two rubidium atomsexcited by a photoassociation laser pulse. The photoas-sociation mechanism based on strong-field off-resonantexcitation is described in detail in Sec. III while the co-herent transient dynamics are studied in Sec. IV. Theo-retical and experimental results are compared in Sec. Vand Sec. VI concludes.
II. THEORETICAL APPROACH
In order to gain detailed insight into the mechanismof femtosecond photoassociation, the pump excitationstep was simulated in quantum dynamical calculationsof the light-molecule interaction. The pump pulse trans-fers population between the ground and first excited elec-tronic states. The probe step was not explicitly takeninto account. Rather, it was assumed that any popula-tion of the first excited state is ionized alike.
In a two-channel picture, the Hamiltonian describingtwo rubidium atoms subject to excitation by a laser fieldin the dipole and rotating-wave approximations is givenby
H =
(
T + Vg(R) µE(t)
−µE(t)∗ T + Ve(R) − ∆
)
. (1)
Here, R denotes the internuclear distance, T the kineticenergy operator and Vg/e the ground and excited statepotential energy curves. The parameter ∆=~(ω0 − ωL)represents the detuning of the pump pulse central fre-quency relative to the 5s + 5p1/2 and 5s + 5p3/2 asymp-totes, respectively. The off-diagonal elements of theHamiltonian describe the electric dipole coupling with µ
denoting the transition dipole and E(t) the electric fieldof the pump pulse. The R-dependence of the transitiondipole was neglected which is justified for excitation atlong range.
A two-channel picture assumes that no couplings be-tween electronic states, for example due to spin-orbit in-teraction, play a role on the timescale of the dynamics.
FIG. 1: (color online) Scheme of the femtosecond pump-probesequence involving the Rb2 potential energy curves of theelectronic ground state, the attractive potentials of the firstelectronically excited state correlating to the 5s+5p1/2 and
5s+5p3/2 asymptotes, and the cationic state of Rb+
2 . Theinitial scattering state, the wavefunction amplitude after thepump pulse and one sample excited state vibrational wave-function (v = 14 of the 0−
g (5s+5p3/2) state) are also depicted.
It is then possible to consider pairwise combinations ofground and excited electronic states in Eq. (1). An analy-sis of the dynamics has confirmed that this assumption isjustified: The dynamics are purely long-range and dom-inated by electronic transitions due to the laser field.
The potential energy curves are taken from Ref. [22]and matched to the long-range dispersion potentials,
3
(C3/R3+)C6/R6 + C8/R8 + C10/R10 with the Cn coeffi-cients found in Refs. [23, 24]. Potential energy curves inthe Hund’s case (c) representation were obtained by ap-proximating the spin-orbit couplings by their asymptoticvalues and subsequent diagonalization, see e.g. Ref. [25].Of all potential curves correlating to the 5s + 5p1/2
and 5s + 5p3/2 asymptotes, those with attractive char-acter and dipole-allowed transitions were taken into ac-count (0−g , 1g and 0+
u correlating to the 5s+5p1/2 asymp-
tote and 0−g , 1g, 0+u and 1u correlating to the 5s+5p3/2
asymptote). Moreover simulations were also performedfor two repulsive potential energy curves, those of the1u(5s + 5p3/2) and 2g(5s + 5p3/2) states. Note that theexcited state potentials differ by their effective C3 coeffi-cients and strengths of transition dipole moment.
The Hamiltonian, Eq. (1), is represented on a mappedFourier grid [26, 27]. Vibrational wavefunctions suchas the one for v = 14 of the 0−g (5s + 5p3/2) excitedstate shown in Fig. 1 are obtained by diagonalizing theHamiltonian with E(t) set to zero. The photoassocia-tion dynamics were studied by numerically solving thetime-dependent Schrodinger equation (TDSE),
i~∂
∂t
(
Ψg(R; t)Ψe(R; t)
)
= H
(
Ψg(R; t)Ψe(R; t)
)
, (2)
using the Chebyshev propagator [28]. Ψg/e(R; t) de-notes the ground (excited) state component of the time-dependent wavefunction. The initial state is taken tobe the scattering state with scattering energy closest toEscatt/kB = Ttrap where kB denotes the Boltzmann con-stant and Ttrap the temperature of the trap. In principlean average over all thermally populated scattering statesneeds to be performed [8]. However, since the dynam-ics are dominated by electronic transitions, the differentnodal structures of the scattering states at very largedistances do not play a role and simulations for a singleinitial state are sufficient.
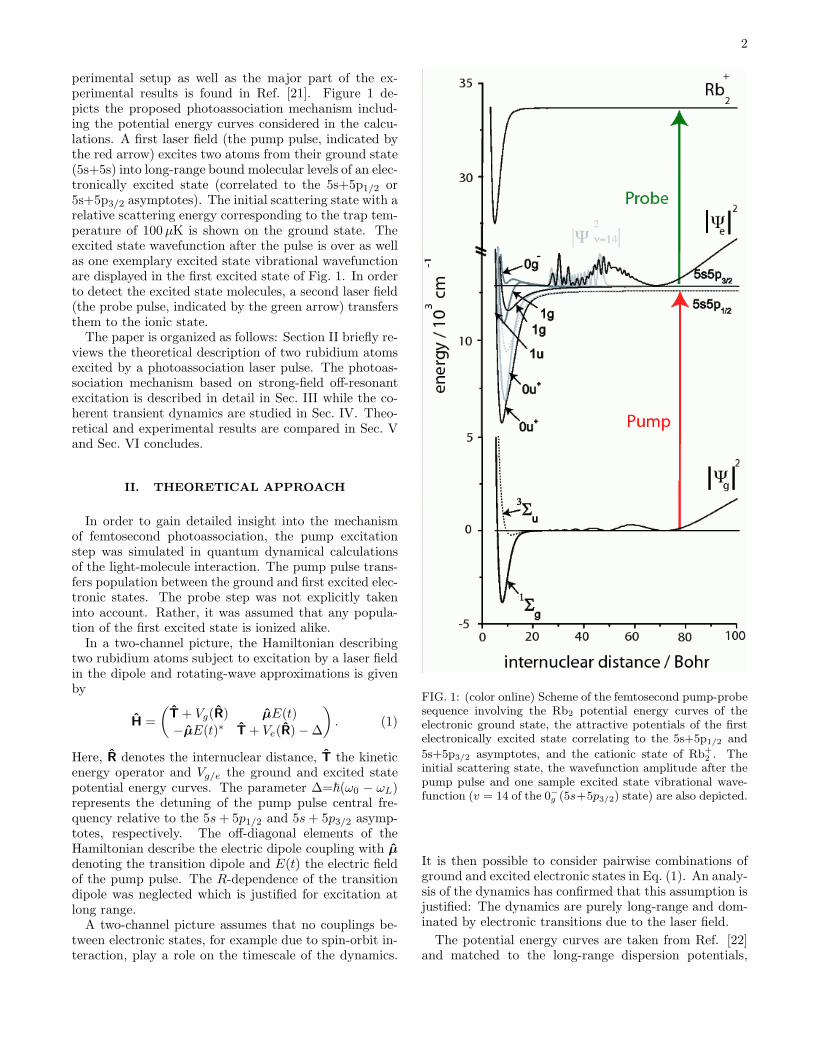
The pulses entering Eqs. (1) and (2) were obtained sim-ilar to the experimental procedure. In the experiment anoptical low pass filter was employed in the Fourier planeof the zero dispersion compressor to manipulate the spec-tral shape of the pump pulse close to the D1 or D2 atomicline in such a way, that all frequencies above the chosenatomic resonance, the respective resonance frequency it-self, and some frequencies below this particular line werecut off. This is done in order to prevent the loss of thecaptured atoms due to resonant three-photon ionizationand photon pressure [17]. In the case of excitation nearthe D2 line, perturbing frequencies near the D1 atomicresonance due to the large spectral bandwith of the fem-tosecond pulse were also removed from the pump pulsespectrum. In order to model those experimental pumppulses, a Gaussian transform-limited laser field is sub-jected to one or two cuts of spectral amplitude in thefrequency domain. The sharp cuts lead to very long tran-sients of the pulse in the time-domain representation, cf.Fig. 2, i.e. the temporal behavior strongly deviates froma transform limited profile. The pulse has long tails,
reaching out to a few picoseconds before and after themaximum as shown in Fig. 2. If two cuts are applied,the tails show a beat pattern that depends on the spe-cific cut positions, cf. Fig. 2(b). Within the tails, theelectric field oscillates with a frequency that matches thespectral cutoff frequency, cf. Fig. 4. The influence of thespecific shape of the pump pulses in time and frequencydomain on the dynamics will be discussed in Sec. IV. Theparameters defining the pulse are the central wavelength,spectral width, energy, linear chirp rate and spectral cut-off positions.
The time-dependent population of the first electroni-cally excited state is calculated as weighted sum of thepossible transitions from the singlet ground and lowesttriplet state with the ratio 1:3. In order to take the fi-nite duration of the probe pulse into account, the mea-sured ion signal was obtained by convoluting the time-dependent excited state population with a Gaussian of500 fs full-width at half maximum (FWHM)[33].
III. PHOTOASSOCIATION
The photoassociation dynamics is illustrated in Fig. 1by the nuclear wavefunctions, Ψg(R; t) and Ψe(R; t),in the ground and excited state potentials, when thepulse is over, at about t = 18 ps after the pump pulsemaximum. The aΣ+
u (5s + 5s) lowest triplet state and0−g (5s+5p3/2) excited state were employed in this exam-ple. Pump pulse parameters like pulse energy and cutoffposition correspond to those used in the actual experi-ment. Specifically, the cutoff positions for the exampledisplayed in Fig. 1 and Fig. 3(b), were −15 cm−1 and−218.3 cm−1 below the D2 resonance, the central wave-length λL = 785 nm, spectral bandwidth ∆λL = 25 nm,laser power P = 30 mW, repetition rate 100 kHz andbeam radius rB = 300 µm, corresponding to a peak fieldamplitude of 99 MV/m. Inspection of Fig. 1 reveals thatno nuclear dynamics has taken place on the time scale ofthe pulse including its long tails: The excited state wavepacket, created by the pump pulse, completely reflectsthe nodal structure of the initial scattering state at longrange. This is not surprising since the vibrational peri-ods of weakly bound excited state levels are on the orderof several tens of picoseconds, while the ground state dy-namics evolves even more slowly.
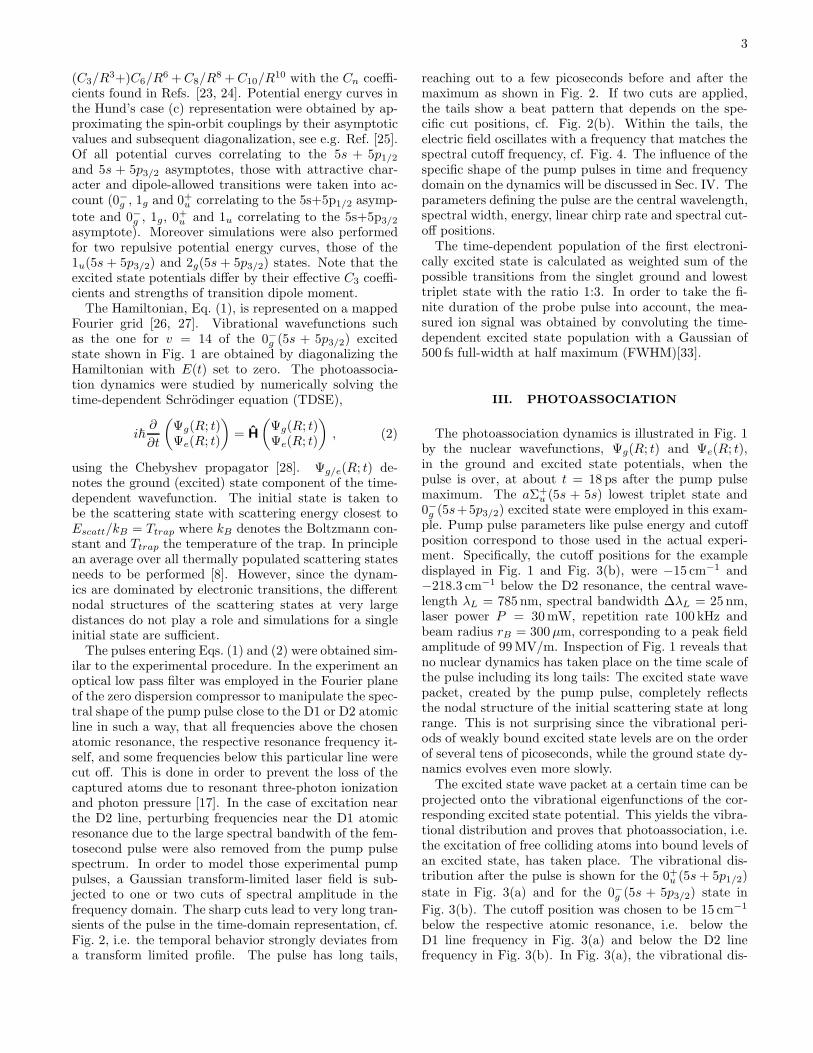
The excited state wave packet at a certain time can beprojected onto the vibrational eigenfunctions of the cor-responding excited state potential. This yields the vibra-tional distribution and proves that photoassociation, i.e.the excitation of free colliding atoms into bound levels ofan excited state, has taken place. The vibrational dis-tribution after the pulse is shown for the 0+
u (5s + 5p1/2)
state in Fig. 3(a) and for the 0−g (5s + 5p3/2) state in
Fig. 3(b). The cutoff position was chosen to be 15 cm−1
below the respective atomic resonance, i.e. below theD1 line frequency in Fig. 3(a) and below the D2 linefrequency in Fig. 3(b). In Fig. 3(a), the vibrational dis-
4
FIG. 2: (color online) Temporal field envelope of cut pump pulse spectrum (shown in the insets) below the D1 (a) and D2 (b)atomic resonance. Tails to both sides of the peak are caused by the spectral cutoff.
FIG. 3: (color online) Calculated population distribution in the excited 0+u (5s + 5p1/2) (a) and 0−
g (5s + 5p3/2) (b) states. Thesolid line displays the spectral pump pulse amplitude where the transition energies from the initial ground state scattering stateto the bound excited state vibrational levels were matched to the pump pulse spectrum.
tribution is characterized by a maximum near v′ = 400.These vibrational levels have large bond lengths on theorder of 1000 a0 and low binding energies of about 1 GHzor 0.03 cm−1. They lie energetically above the spectralcutoff of the pulse. Their population therefore necessar-ily arises from off-resonant excitation. This is caused bythe high peak intensity of the pump pulse. Only a smallfraction of the total excited state population resides in vi-brational levels that are resonant within the pump pulsespectrum. For a spectral cutoff detuned by -15 cm−1 fromthe atomic line, resonant excitation occurs for vibrationallevels below v′ = 290, cf. inset of Fig. 3(a). Comparedto the weakly bound, long range levels around v′ = 400,their population is suppressed by two orders of magni-tude. This is due to much smaller free-bound Franck-Condon factors. The distribution among these levels re-produces the weak-field result, i.e. it is proportional tothe Franck-Condon factors multiplied by the spectral en-
velope of the pump pulse [10, 29]. The apparant con-tradiction of producing within one calculation weak-field(below v′ = 290) and strong-field (near v′ = 400) resultsis easily resolved by noting that the decisive quantity isthe Rabi frequency, i.e. the product of transition dipoleand electric field. Since the Franck-Condon factors varyover several orders of magnitude, qualitatively differentresults are obtained for different regions of the excitedstate vibrational spectrum.
A pattern similar to that of the D1 line results is ob-served for the D2 line, cf. Fig. 3(a) and (b). In thiscase, the excited state potential, the purely long range0−g (5s + 5p3/2) state, is only about 28 cm−1 deep andresonant excitation occurs for vibrational levels belowv′ = 15. Due to the shallowness of the potential, onlya small part of the pulse spectrum serves for excitation,cf. the inset of Fig. 2(b). If an excited state potentialwith a deep minimum such as that of the 1g(5s + 5p3/2
5
state is employed (data not shown), a picture equiva-lent to Fig. 3(a) emerges. In both cases the vibrationalspectrum is dominated by levels which are off-resonantlyexcited, above v′ = 90 for the 0−g (5s + 5p3/2) state (with
binding energies of less than 0.05 cm−1 or 1.5 GHz). Itis instructive to compare the amplitudes of the excitedstate vibrational level with v′ = 14 and the excited statewave packet after the pulse, shown in Fig. 1, to the vi-brational distributions of Fig. 3(b). The short range partof the wave packet at internuclear distances R ≤ 50 a0
corresponds to vibrational levels with v′ ≤ 14. The to-tal excited state population is dominated by the weaklybound levels and electronically excited continuum states.Population of the latter, however, corresponds to excita-tion of the initial colliding atom pair to an excited pair offree atoms and cannot be regarded as photoassociation.
IV. COHERENT TRANSIENT DYNAMICS
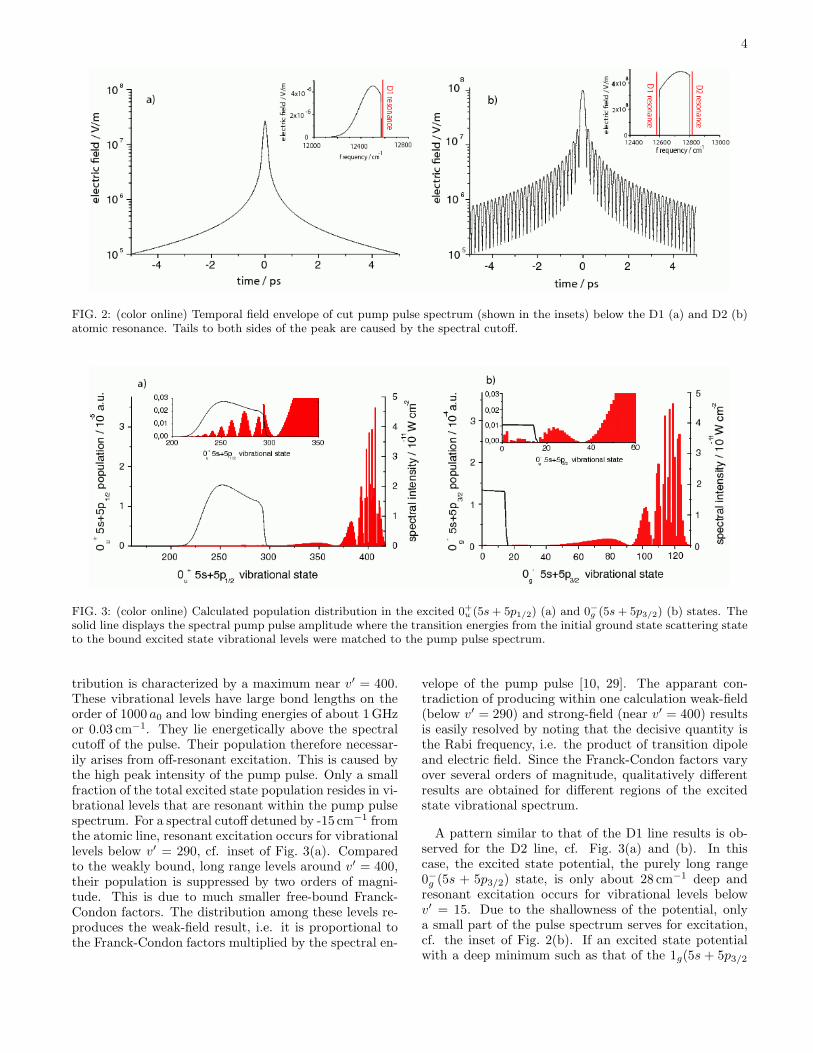
Solving the time-dependent Schrodinger equation al-lows for a detailed study and analysis of the dynam-ics induced by the pump pulse. Figure 4 displays theexcited state population,
∫
dR|Ψe(R; t)|2, and the fre-quency of the induced dipole, i.e. the derivative of thetime-dependent phase, φ〈µ〉(t), of
∫
dRΨ∗g(R; t)µΨe(R; t)〉
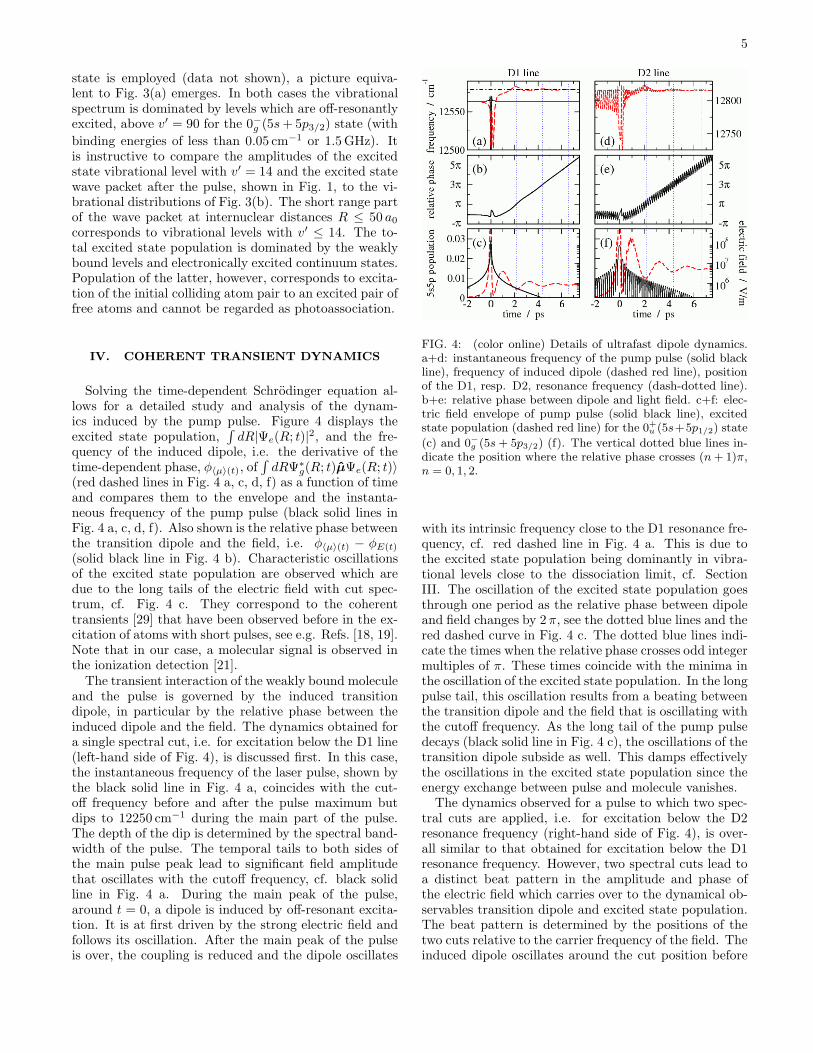
(red dashed lines in Fig. 4 a, c, d, f) as a function of timeand compares them to the envelope and the instanta-neous frequency of the pump pulse (black solid lines inFig. 4 a, c, d, f). Also shown is the relative phase betweenthe transition dipole and the field, i.e. φ〈µ〉(t) − φE(t)
(solid black line in Fig. 4 b). Characteristic oscillationsof the excited state population are observed which aredue to the long tails of the electric field with cut spec-trum, cf. Fig. 4 c. They correspond to the coherenttransients [29] that have been observed before in the ex-citation of atoms with short pulses, see e.g. Refs. [18, 19].Note that in our case, a molecular signal is observed inthe ionization detection [21].
The transient interaction of the weakly bound moleculeand the pulse is governed by the induced transitiondipole, in particular by the relative phase between theinduced dipole and the field. The dynamics obtained fora single spectral cut, i.e. for excitation below the D1 line(left-hand side of Fig. 4), is discussed first. In this case,the instantaneous frequency of the laser pulse, shown bythe black solid line in Fig. 4 a, coincides with the cut-off frequency before and after the pulse maximum butdips to 12250 cm−1 during the main part of the pulse.The depth of the dip is determined by the spectral band-width of the pulse. The temporal tails to both sides ofthe main pulse peak lead to significant field amplitudethat oscillates with the cutoff frequency, cf. black solidline in Fig. 4 a. During the main peak of the pulse,around t = 0, a dipole is induced by off-resonant excita-tion. It is at first driven by the strong electric field andfollows its oscillation. After the main peak of the pulseis over, the coupling is reduced and the dipole oscillates
FIG. 4: (color online) Details of ultrafast dipole dynamics.a+d: instantaneous frequency of the pump pulse (solid blackline), frequency of induced dipole (dashed red line), positionof the D1, resp. D2, resonance frequency (dash-dotted line).b+e: relative phase between dipole and light field. c+f: elec-tric field envelope of pump pulse (solid black line), excitedstate population (dashed red line) for the 0+
u (5s+5p1/2) state
(c) and 0−
g (5s + 5p3/2) (f). The vertical dotted blue lines in-dicate the position where the relative phase crosses (n + 1)π,n = 0, 1, 2.
with its intrinsic frequency close to the D1 resonance fre-quency, cf. red dashed line in Fig. 4 a. This is due tothe excited state population being dominantly in vibra-tional levels close to the dissociation limit, cf. SectionIII. The oscillation of the excited state population goesthrough one period as the relative phase between dipoleand field changes by 2 π, see the dotted blue lines and thered dashed curve in Fig. 4 c. The dotted blue lines indi-cate the times when the relative phase crosses odd integermultiples of π. These times coincide with the minima inthe oscillation of the excited state population. In the longpulse tail, this oscillation results from a beating betweenthe transition dipole and the field that is oscillating withthe cutoff frequency. As the long tail of the pump pulsedecays (black solid line in Fig. 4 c), the oscillations of thetransition dipole subside as well. This damps effectivelythe oscillations in the excited state population since theenergy exchange between pulse and molecule vanishes.
The dynamics observed for a pulse to which two spec-tral cuts are applied, i.e. for excitation below the D2resonance frequency (right-hand side of Fig. 4), is over-all similar to that obtained for excitation below the D1resonance frequency. However, two spectral cuts lead toa distinct beat pattern in the amplitude and phase ofthe electric field which carries over to the dynamical ob-servables transition dipole and excited state population.The beat pattern is determined by the positions of thetwo cuts relative to the carrier frequency of the field. Theinduced dipole oscillates around the cut position before
6
the main peak of the pulse. This oscillation is of littlerelevance, however, since the amplitude of the induceddipole which is related to the excited state population isextremely small. It dips down to 12725 cm−1 during themain peak of the pulse and oscillates with its intrinsicfrequency close to the D2 resonance superimposed withthe fast beat pattern after the main peak is over. Whilethe beat patterns are easily resolved in the calculationswhere a time step of 1 fs was employed (the results shownin Fig. 4 are not convoluted with a Gaussian represent-ing the effect of the probe pulse), they require a probepulse with FWHM of 100 or less and a sufficiently goodsignal-to-noise ratio to be observed experimentally in e.g.the excited state population. In the experiment discussedhere the comparatively long duration of the probe pulsedoes not allow for the observation of this beat pattern.
The coherent transients are solely due to electronictransitions as explained in detail below in Section V.Their dynamics can therefore also be modelled in theframework of dressed states of a two-level system. Thisapproach has the advantage of yielding analytic expres-sions which describe the coherent interactions causing thedipole modulations [30].
V. COMPARISON OF THEORETICAL AND
EXPERIMENTAL RESULTS
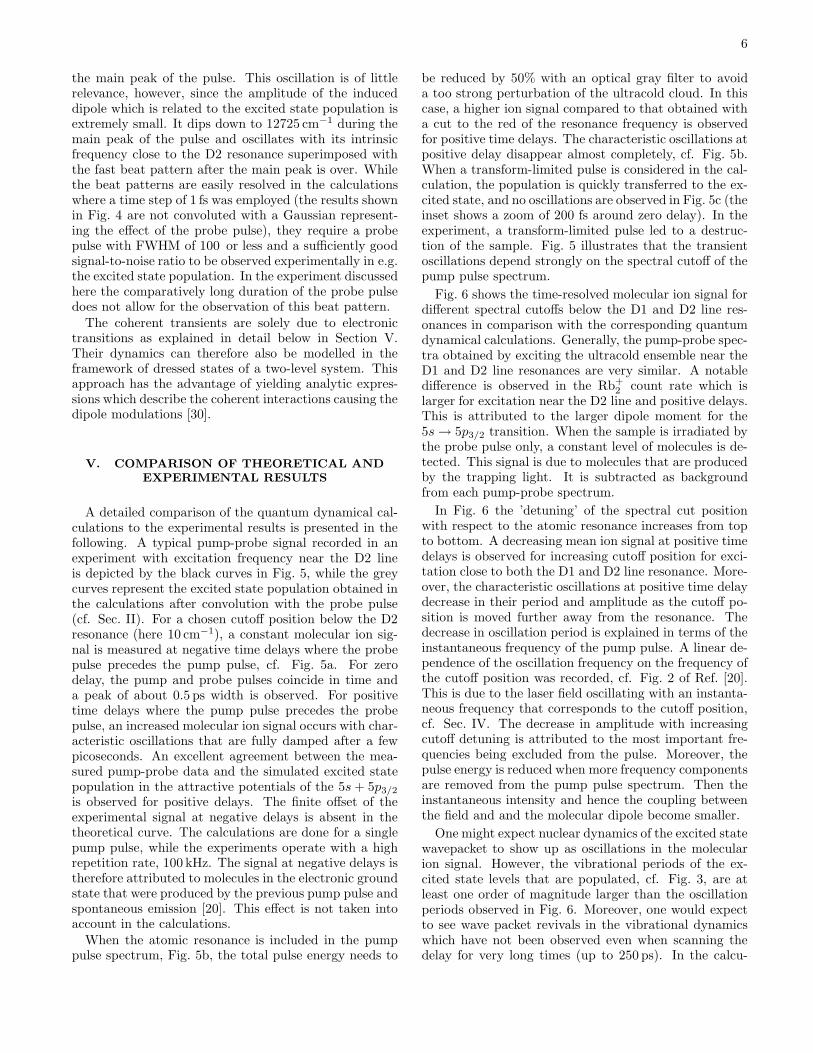
A detailed comparison of the quantum dynamical cal-culations to the experimental results is presented in thefollowing. A typical pump-probe signal recorded in anexperiment with excitation frequency near the D2 lineis depicted by the black curves in Fig. 5, while the greycurves represent the excited state population obtained inthe calculations after convolution with the probe pulse(cf. Sec. II). For a chosen cutoff position below the D2resonance (here 10 cm−1), a constant molecular ion sig-nal is measured at negative time delays where the probepulse precedes the pump pulse, cf. Fig. 5a. For zerodelay, the pump and probe pulses coincide in time anda peak of about 0.5 ps width is observed. For positivetime delays where the pump pulse precedes the probepulse, an increased molecular ion signal occurs with char-acteristic oscillations that are fully damped after a fewpicoseconds. An excellent agreement between the mea-sured pump-probe data and the simulated excited statepopulation in the attractive potentials of the 5s + 5p3/2
is observed for positive delays. The finite offset of theexperimental signal at negative delays is absent in thetheoretical curve. The calculations are done for a singlepump pulse, while the experiments operate with a highrepetition rate, 100 kHz. The signal at negative delays istherefore attributed to molecules in the electronic groundstate that were produced by the previous pump pulse andspontaneous emission [20]. This effect is not taken intoaccount in the calculations.
When the atomic resonance is included in the pumppulse spectrum, Fig. 5b, the total pulse energy needs to
be reduced by 50% with an optical gray filter to avoida too strong perturbation of the ultracold cloud. In thiscase, a higher ion signal compared to that obtained witha cut to the red of the resonance frequency is observedfor positive time delays. The characteristic oscillations atpositive delay disappear almost completely, cf. Fig. 5b.When a transform-limited pulse is considered in the cal-culation, the population is quickly transferred to the ex-cited state, and no oscillations are observed in Fig. 5c (theinset shows a zoom of 200 fs around zero delay). In theexperiment, a transform-limited pulse led to a destruc-tion of the sample. Fig. 5 illustrates that the transientoscillations depend strongly on the spectral cutoff of thepump pulse spectrum.
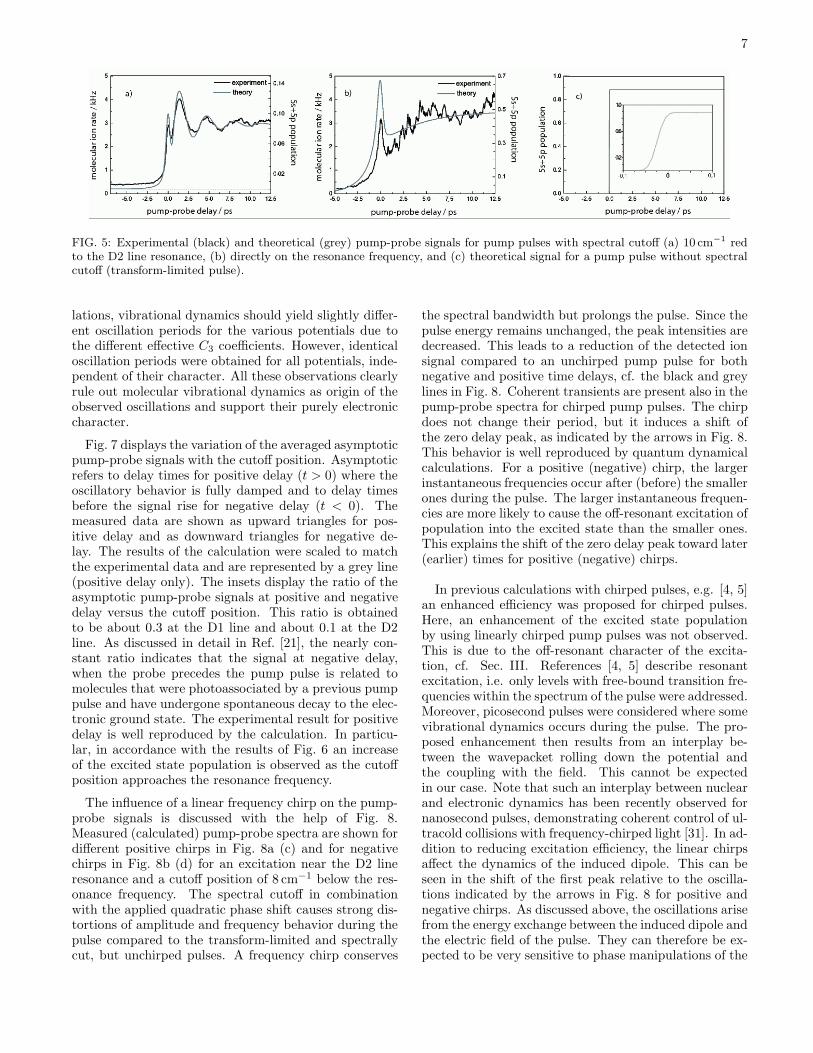
Fig. 6 shows the time-resolved molecular ion signal fordifferent spectral cutoffs below the D1 and D2 line res-onances in comparison with the corresponding quantumdynamical calculations. Generally, the pump-probe spec-tra obtained by exciting the ultracold ensemble near theD1 and D2 line resonances are very similar. A notabledifference is observed in the Rb+
2 count rate which islarger for excitation near the D2 line and positive delays.This is attributed to the larger dipole moment for the5s → 5p3/2 transition. When the sample is irradiated bythe probe pulse only, a constant level of molecules is de-tected. This signal is due to molecules that are producedby the trapping light. It is subtracted as backgroundfrom each pump-probe spectrum.
In Fig. 6 the ’detuning’ of the spectral cut positionwith respect to the atomic resonance increases from topto bottom. A decreasing mean ion signal at positive timedelays is observed for increasing cutoff position for exci-tation close to both the D1 and D2 line resonance. More-over, the characteristic oscillations at positive time delaydecrease in their period and amplitude as the cutoff po-sition is moved further away from the resonance. Thedecrease in oscillation period is explained in terms of theinstantaneous frequency of the pump pulse. A linear de-pendence of the oscillation frequency on the frequency ofthe cutoff position was recorded, cf. Fig. 2 of Ref. [20].This is due to the laser field oscillating with an instanta-neous frequency that corresponds to the cutoff position,cf. Sec. IV. The decrease in amplitude with increasingcutoff detuning is attributed to the most important fre-quencies being excluded from the pulse. Moreover, thepulse energy is reduced when more frequency componentsare removed from the pump pulse spectrum. Then theinstantaneous intensity and hence the coupling betweenthe field and and the molecular dipole become smaller.
One might expect nuclear dynamics of the excited statewavepacket to show up as oscillations in the molecularion signal. However, the vibrational periods of the ex-cited state levels that are populated, cf. Fig. 3, are atleast one order of magnitude larger than the oscillationperiods observed in Fig. 6. Moreover, one would expectto see wave packet revivals in the vibrational dynamicswhich have not been observed even when scanning thedelay for very long times (up to 250 ps). In the calcu-
7
FIG. 5: Experimental (black) and theoretical (grey) pump-probe signals for pump pulses with spectral cutoff (a) 10 cm−1 redto the D2 line resonance, (b) directly on the resonance frequency, and (c) theoretical signal for a pump pulse without spectralcutoff (transform-limited pulse).
lations, vibrational dynamics should yield slightly differ-ent oscillation periods for the various potentials due tothe different effective C3 coefficients. However, identicaloscillation periods were obtained for all potentials, inde-pendent of their character. All these observations clearlyrule out molecular vibrational dynamics as origin of theobserved oscillations and support their purely electroniccharacter.
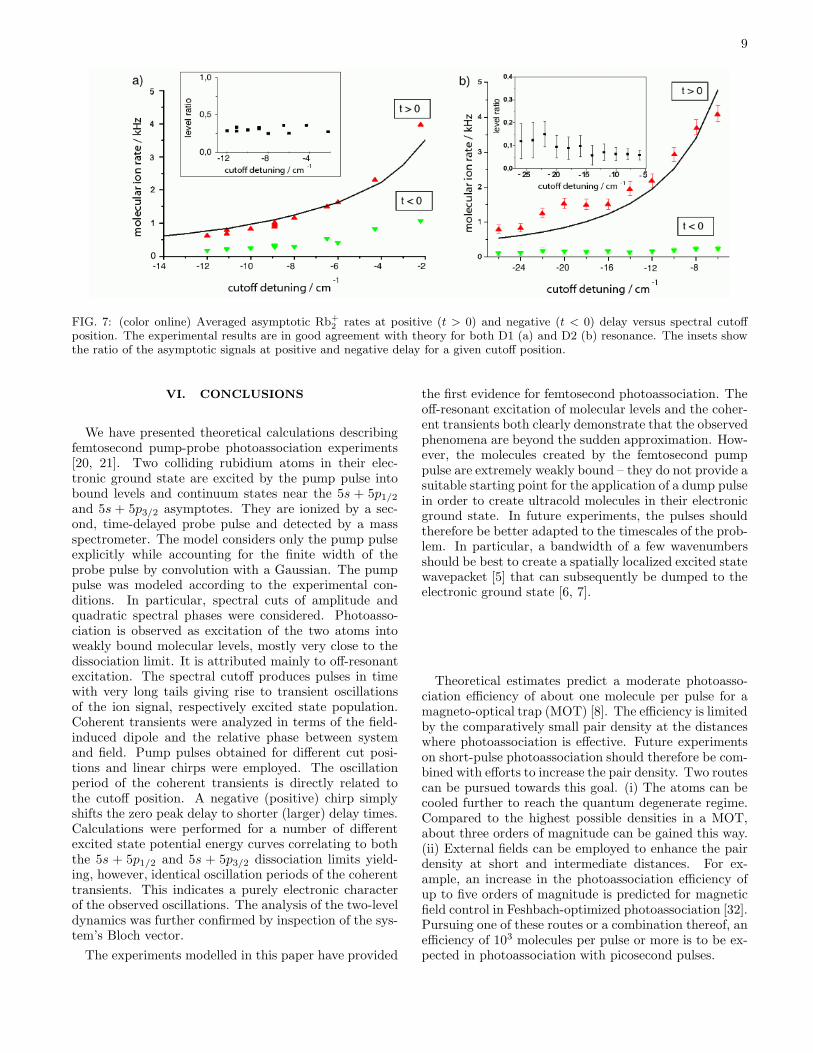
Fig. 7 displays the variation of the averaged asymptoticpump-probe signals with the cutoff position. Asymptoticrefers to delay times for positive delay (t > 0) where theoscillatory behavior is fully damped and to delay timesbefore the signal rise for negative delay (t < 0). Themeasured data are shown as upward triangles for pos-itive delay and as downward triangles for negative de-lay. The results of the calculation were scaled to matchthe experimental data and are represented by a grey line(positive delay only). The insets display the ratio of theasymptotic pump-probe signals at positive and negativedelay versus the cutoff position. This ratio is obtainedto be about 0.3 at the D1 line and about 0.1 at the D2line. As discussed in detail in Ref. [21], the nearly con-stant ratio indicates that the signal at negative delay,when the probe precedes the pump pulse is related tomolecules that were photoassociated by a previous pumppulse and have undergone spontaneous decay to the elec-tronic ground state. The experimental result for positivedelay is well reproduced by the calculation. In particu-lar, in accordance with the results of Fig. 6 an increaseof the excited state population is observed as the cutoffposition approaches the resonance frequency.
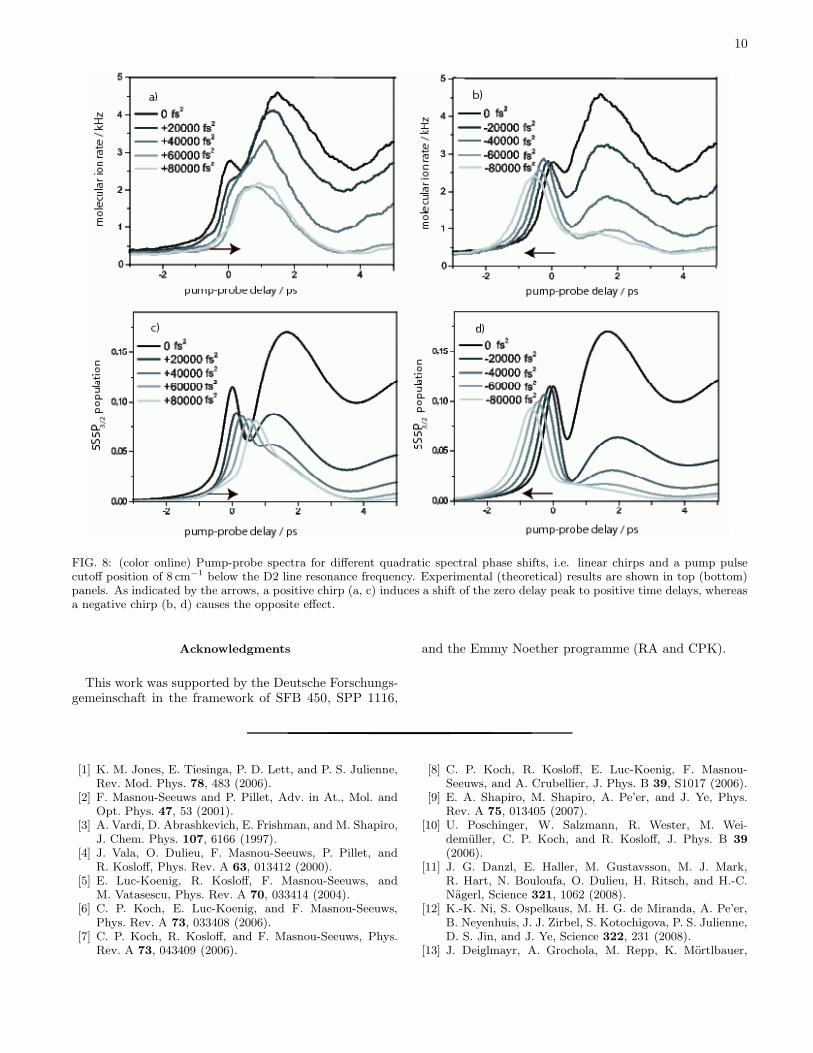
The influence of a linear frequency chirp on the pump-probe signals is discussed with the help of Fig. 8.Measured (calculated) pump-probe spectra are shown fordifferent positive chirps in Fig. 8a (c) and for negativechirps in Fig. 8b (d) for an excitation near the D2 lineresonance and a cutoff position of 8 cm−1 below the res-onance frequency. The spectral cutoff in combinationwith the applied quadratic phase shift causes strong dis-tortions of amplitude and frequency behavior during thepulse compared to the transform-limited and spectrallycut, but unchirped pulses. A frequency chirp conserves
the spectral bandwidth but prolongs the pulse. Since thepulse energy remains unchanged, the peak intensities aredecreased. This leads to a reduction of the detected ionsignal compared to an unchirped pump pulse for bothnegative and positive time delays, cf. the black and greylines in Fig. 8. Coherent transients are present also in thepump-probe spectra for chirped pump pulses. The chirpdoes not change their period, but it induces a shift ofthe zero delay peak, as indicated by the arrows in Fig. 8.This behavior is well reproduced by quantum dynamicalcalculations. For a positive (negative) chirp, the largerinstantaneous frequencies occur after (before) the smallerones during the pulse. The larger instantaneous frequen-cies are more likely to cause the off-resonant excitation ofpopulation into the excited state than the smaller ones.This explains the shift of the zero delay peak toward later(earlier) times for positive (negative) chirps.
In previous calculations with chirped pulses, e.g. [4, 5]an enhanced efficiency was proposed for chirped pulses.Here, an enhancement of the excited state populationby using linearly chirped pump pulses was not observed.This is due to the off-resonant character of the excita-tion, cf. Sec. III. References [4, 5] describe resonantexcitation, i.e. only levels with free-bound transition fre-quencies within the spectrum of the pulse were addressed.Moreover, picosecond pulses were considered where somevibrational dynamics occurs during the pulse. The pro-posed enhancement then results from an interplay be-tween the wavepacket rolling down the potential andthe coupling with the field. This cannot be expectedin our case. Note that such an interplay between nuclearand electronic dynamics has been recently observed fornanosecond pulses, demonstrating coherent control of ul-tracold collisions with frequency-chirped light [31]. In ad-dition to reducing excitation efficiency, the linear chirpsaffect the dynamics of the induced dipole. This can beseen in the shift of the first peak relative to the oscilla-tions indicated by the arrows in Fig. 8 for positive andnegative chirps. As discussed above, the oscillations arisefrom the energy exchange between the induced dipole andthe electric field of the pulse. They can therefore be ex-pected to be very sensitive to phase manipulations of the
8
FIG. 6: Experimental (black) and theoretical (gray) pump-probe signals for pump pulses with different spectral cutoff positionsred to the D1 line resonance (5s+5p1/2-asymptote, left) and D2 line resonance (5s+5p3/2-asymptote, right), respectively. Theconstant level of molecules measured by irradiating with the probe pulse only is indicated by the dashed lines, and the zero ofthe theoretical results is shifted to coincide with this level.
pulse which also affect the relative phase between dipoleand field.
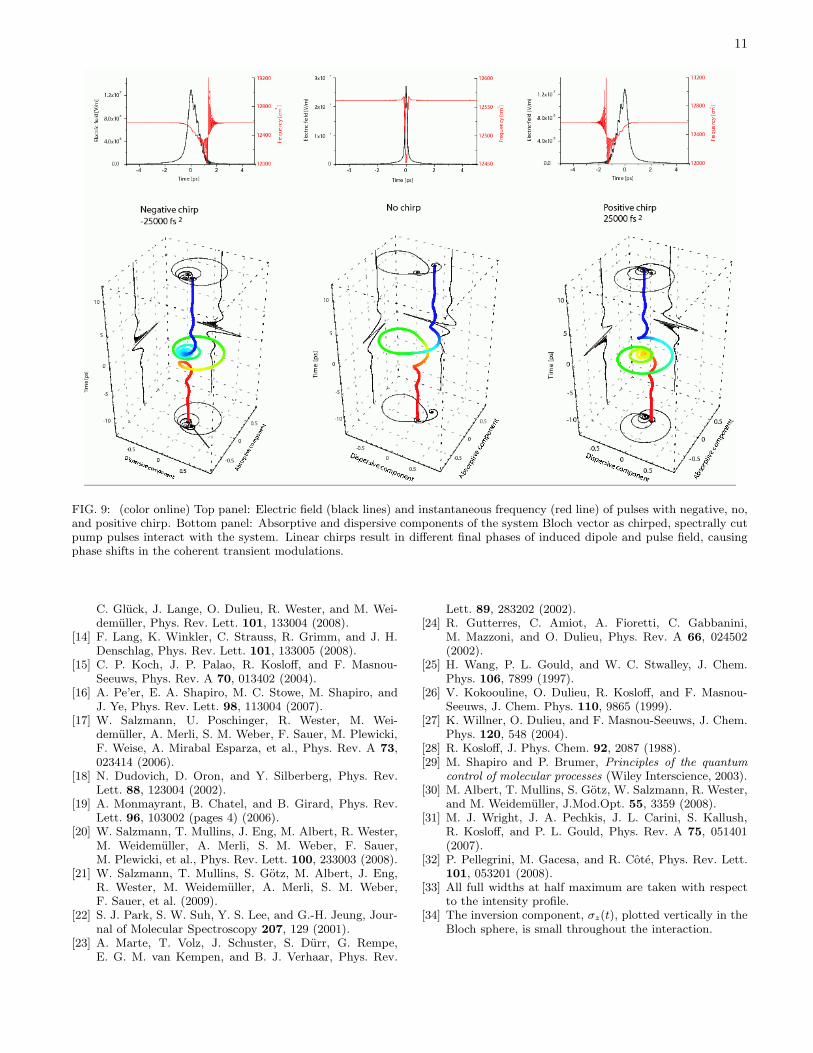
Since the molecular dynamics is reduced to the elec-tronic dynamics, i.e. to that of a two-level system, theinteraction between the molecule and the field can alsobe analyzed in terms of the evolution of the Bloch vector[30]. Fig. 9 shows the dispersive and absorptive compo-nents, u(t) = ρge(t)+ρeg(t) and v(t) = i(ρge(t)−ρeg(t)),of the Bloch vectors for chirped and unchirped pulses ver-sus time [34]. For unchirped pulses, cf. middle graph inFig. 9, the Bloch vector moves merely through a singleloop in the u − v plane during the main pulse peak. Forchirped pulses the Bloch vectors perform rapid rotations
in the u − v plane during the main pulse peak as theinstantaneous frequency of the pulse varies, cf. Fig. 4a.For negative (positive) chirps, cf. the left (right) graphof Fig. 9, the rapid rotations occur before (after) t = 0.As a result the final position of the Bloch vector in theu−v plane is different for different sign of the chirp. Themodulations on the absorptive component that are re-sponsible for the energy exchange between molecule andfield then oscillate with a phase offset compared to zerochirp.
9
FIG. 7: (color online) Averaged asymptotic Rb+
2 rates at positive (t > 0) and negative (t < 0) delay versus spectral cutoffposition. The experimental results are in good agreement with theory for both D1 (a) and D2 (b) resonance. The insets showthe ratio of the asymptotic signals at positive and negative delay for a given cutoff position.
VI. CONCLUSIONS
We have presented theoretical calculations describingfemtosecond pump-probe photoassociation experiments[20, 21]. Two colliding rubidium atoms in their elec-tronic ground state are excited by the pump pulse intobound levels and continuum states near the 5s + 5p1/2
and 5s + 5p3/2 asymptotes. They are ionized by a sec-ond, time-delayed probe pulse and detected by a massspectrometer. The model considers only the pump pulseexplicitly while accounting for the finite width of theprobe pulse by convolution with a Gaussian. The pumppulse was modeled according to the experimental con-ditions. In particular, spectral cuts of amplitude andquadratic spectral phases were considered. Photoasso-ciation is observed as excitation of the two atoms intoweakly bound molecular levels, mostly very close to thedissociation limit. It is attributed mainly to off-resonantexcitation. The spectral cutoff produces pulses in timewith very long tails giving rise to transient oscillationsof the ion signal, respectively excited state population.Coherent transients were analyzed in terms of the field-induced dipole and the relative phase between systemand field. Pump pulses obtained for different cut posi-tions and linear chirps were employed. The oscillationperiod of the coherent transients is directly related tothe cutoff position. A negative (positive) chirp simplyshifts the zero peak delay to shorter (larger) delay times.Calculations were performed for a number of differentexcited state potential energy curves correlating to boththe 5s + 5p1/2 and 5s + 5p3/2 dissociation limits yield-ing, however, identical oscillation periods of the coherenttransients. This indicates a purely electronic characterof the observed oscillations. The analysis of the two-leveldynamics was further confirmed by inspection of the sys-tem’s Bloch vector.
The experiments modelled in this paper have provided
the first evidence for femtosecond photoassociation. Theoff-resonant excitation of molecular levels and the coher-ent transients both clearly demonstrate that the observedphenomena are beyond the sudden approximation. How-ever, the molecules created by the femtosecond pumppulse are extremely weakly bound – they do not provide asuitable starting point for the application of a dump pulsein order to create ultracold molecules in their electronicground state. In future experiments, the pulses shouldtherefore be better adapted to the timescales of the prob-lem. In particular, a bandwidth of a few wavenumbersshould be best to create a spatially localized excited statewavepacket [5] that can subsequently be dumped to theelectronic ground state [6, 7].
Theoretical estimates predict a moderate photoasso-ciation efficiency of about one molecule per pulse for amagneto-optical trap (MOT) [8]. The efficiency is limitedby the comparatively small pair density at the distanceswhere photoassociation is effective. Future experimentson short-pulse photoassociation should therefore be com-bined with efforts to increase the pair density. Two routescan be pursued towards this goal. (i) The atoms can becooled further to reach the quantum degenerate regime.Compared to the highest possible densities in a MOT,about three orders of magnitude can be gained this way.(ii) External fields can be employed to enhance the pairdensity at short and intermediate distances. For ex-ample, an increase in the photoassociation efficiency ofup to five orders of magnitude is predicted for magneticfield control in Feshbach-optimized photoassociation [32].Pursuing one of these routes or a combination thereof, anefficiency of 103 molecules per pulse or more is to be ex-pected in photoassociation with picosecond pulses.
10
FIG. 8: (color online) Pump-probe spectra for different quadratic spectral phase shifts, i.e. linear chirps and a pump pulsecutoff position of 8 cm−1 below the D2 line resonance frequency. Experimental (theoretical) results are shown in top (bottom)panels. As indicated by the arrows, a positive chirp (a, c) induces a shift of the zero delay peak to positive time delays, whereasa negative chirp (b, d) causes the opposite effect.
Acknowledgments
This work was supported by the Deutsche Forschungs-gemeinschaft in the framework of SFB 450, SPP 1116,
and the Emmy Noether programme (RA and CPK).
[1] K. M. Jones, E. Tiesinga, P. D. Lett, and P. S. Julienne,Rev. Mod. Phys. 78, 483 (2006).
[2] F. Masnou-Seeuws and P. Pillet, Adv. in At., Mol. andOpt. Phys. 47, 53 (2001).
[3] A. Vardi, D. Abrashkevich, E. Frishman, and M. Shapiro,J. Chem. Phys. 107, 6166 (1997).
[4] J. Vala, O. Dulieu, F. Masnou-Seeuws, P. Pillet, andR. Kosloff, Phys. Rev. A 63, 013412 (2000).
[5] E. Luc-Koenig, R. Kosloff, F. Masnou-Seeuws, andM. Vatasescu, Phys. Rev. A 70, 033414 (2004).
[6] C. P. Koch, E. Luc-Koenig, and F. Masnou-Seeuws,Phys. Rev. A 73, 033408 (2006).
[7] C. P. Koch, R. Kosloff, and F. Masnou-Seeuws, Phys.Rev. A 73, 043409 (2006).
[8] C. P. Koch, R. Kosloff, E. Luc-Koenig, F. Masnou-Seeuws, and A. Crubellier, J. Phys. B 39, S1017 (2006).
[9] E. A. Shapiro, M. Shapiro, A. Pe’er, and J. Ye, Phys.Rev. A 75, 013405 (2007).
[10] U. Poschinger, W. Salzmann, R. Wester, M. Wei-demuller, C. P. Koch, and R. Kosloff, J. Phys. B 39
(2006).[11] J. G. Danzl, E. Haller, M. Gustavsson, M. J. Mark,
R. Hart, N. Bouloufa, O. Dulieu, H. Ritsch, and H.-C.Nagerl, Science 321, 1062 (2008).
[12] K.-K. Ni, S. Ospelkaus, M. H. G. de Miranda, A. Pe’er,B. Neyenhuis, J. J. Zirbel, S. Kotochigova, P. S. Julienne,D. S. Jin, and J. Ye, Science 322, 231 (2008).
[13] J. Deiglmayr, A. Grochola, M. Repp, K. Mortlbauer,
11
FIG. 9: (color online) Top panel: Electric field (black lines) and instantaneous frequency (red line) of pulses with negative, no,and positive chirp. Bottom panel: Absorptive and dispersive components of the system Bloch vector as chirped, spectrally cutpump pulses interact with the system. Linear chirps result in different final phases of induced dipole and pulse field, causingphase shifts in the coherent transient modulations.
C. Gluck, J. Lange, O. Dulieu, R. Wester, and M. Wei-demuller, Phys. Rev. Lett. 101, 133004 (2008).
[14] F. Lang, K. Winkler, C. Strauss, R. Grimm, and J. H.Denschlag, Phys. Rev. Lett. 101, 133005 (2008).
[15] C. P. Koch, J. P. Palao, R. Kosloff, and F. Masnou-Seeuws, Phys. Rev. A 70, 013402 (2004).
[16] A. Pe’er, E. A. Shapiro, M. C. Stowe, M. Shapiro, andJ. Ye, Phys. Rev. Lett. 98, 113004 (2007).
[17] W. Salzmann, U. Poschinger, R. Wester, M. Wei-demuller, A. Merli, S. M. Weber, F. Sauer, M. Plewicki,F. Weise, A. Mirabal Esparza, et al., Phys. Rev. A 73,023414 (2006).
[18] N. Dudovich, D. Oron, and Y. Silberberg, Phys. Rev.Lett. 88, 123004 (2002).
[19] A. Monmayrant, B. Chatel, and B. Girard, Phys. Rev.Lett. 96, 103002 (pages 4) (2006).
[20] W. Salzmann, T. Mullins, J. Eng, M. Albert, R. Wester,M. Weidemuller, A. Merli, S. M. Weber, F. Sauer,M. Plewicki, et al., Phys. Rev. Lett. 100, 233003 (2008).
[21] W. Salzmann, T. Mullins, S. Gotz, M. Albert, J. Eng,R. Wester, M. Weidemuller, A. Merli, S. M. Weber,F. Sauer, et al. (2009).
[22] S. J. Park, S. W. Suh, Y. S. Lee, and G.-H. Jeung, Jour-nal of Molecular Spectroscopy 207, 129 (2001).
[23] A. Marte, T. Volz, J. Schuster, S. Durr, G. Rempe,E. G. M. van Kempen, and B. J. Verhaar, Phys. Rev.
Lett. 89, 283202 (2002).[24] R. Gutterres, C. Amiot, A. Fioretti, C. Gabbanini,
M. Mazzoni, and O. Dulieu, Phys. Rev. A 66, 024502(2002).
[25] H. Wang, P. L. Gould, and W. C. Stwalley, J. Chem.Phys. 106, 7899 (1997).
[26] V. Kokoouline, O. Dulieu, R. Kosloff, and F. Masnou-Seeuws, J. Chem. Phys. 110, 9865 (1999).
[27] K. Willner, O. Dulieu, and F. Masnou-Seeuws, J. Chem.Phys. 120, 548 (2004).
[28] R. Kosloff, J. Phys. Chem. 92, 2087 (1988).[29] M. Shapiro and P. Brumer, Principles of the quantum
control of molecular processes (Wiley Interscience, 2003).[30] M. Albert, T. Mullins, S. Gotz, W. Salzmann, R. Wester,
and M. Weidemuller, J.Mod.Opt. 55, 3359 (2008).[31] M. J. Wright, J. A. Pechkis, J. L. Carini, S. Kallush,
R. Kosloff, and P. L. Gould, Phys. Rev. A 75, 051401(2007).
[32] P. Pellegrini, M. Gacesa, and R. Cote, Phys. Rev. Lett.101, 053201 (2008).
[33] All full widths at half maximum are taken with respectto the intensity profile.
[34] The inversion component, σz(t), plotted vertically in theBloch sphere, is small throughout the interaction.


