Embed Size (px)
Citation preview

Dyes and Pigments 75 (2007) 533e543www.elsevier.com/locate/dyepig
Photocatalytic degradation of azo dye (Reactive Red 120) inTiO2/UV system: Optimization and modeling using a response
surface methodology (RSM) based on the central composite design
Il-Hyoung Cho, Kyung-Duk Zoh*
Department of Environmental Health, Institute of Health & Environment, School of Public Health,
Seoul National University, 28 Yunkeon, Jongro, Seoul 110-799, Korea
Received 24 November 2005; received in revised form 18 March 2006; accepted 28 June 2006
Available online 27 October 2006
Abstract
The aim of our research was to apply experimental design methodology in the optimization of photocatalytic degradation of azo dye (Re-active Red 120). The reactions were mathematically described as the function of parameters such as amount of TiO2 (X1), dye concentration (X2)and UV intensity (X3), and were modeled by the use of response surface methodology (RSM). These experiments were carried out as a centralcomposite design (CCD) consisting of 20 experiments determined by the 23 full factorial designs with six axial points and six center points. Thedegradation of azo dye (RR120) followed an apparent first-order rate law in every pH condition. The results show that the responses of colorremoval (%) (Y1) in photocatalysis of dyes were significantly affected by the synergistic effect of linear term of UV intensity (X3) and the an-tagonistic effect of quadratic term of UV intensity (X3
2). Significant factors and synergistic effects for the TOC removal (%) (Y2) were the linearterms of TiO2 (X1), and UV intensity (X3). However, the quadratic terms of TiO2 (X1
2) and UV intensity (X32) had an antagonistic effect on Y2
responses. Canonical analysis indicates that the stationary point was a saddle point for Y1 response whereas a maximum point for Y2 response.The estimated ridge of maximum responses and optimal conditions for Y1 and Y2 using canonical analysis were 100% and 67.27%, respectively.The experimental values agreed with the predicted ones, indicating suitability of the model employed and the success of RSM in optimizing theconditions of photocatalysis.� 2006 Elsevier Ltd. All rights reserved.
Keywords: Reactive Red 120; TiO2; Photocatalysis; Response surface methodology (RSM); Central composite design (CCD); Canonical and ridge analyses
1. Introduction
Azo dyes, containing one or more azo bond (eN]Ne), ac-count for 60e70% of all textile dyestuffs used [1]. Other func-tional groups characterizing this class of compounds are alsothe auxochromes such as eNH2, eOH, eCOOH, eSO3Hwhich are responsible for the increase of the color intensityand of the affinity with the fibers [2]. It is estimated that about10e15% of the total production of colorants is lost duringtheir synthesis and dyeing processes [3]. Reactive dyes exhibit
* Corresponding author. Tel.: þ82 2 740 8891; fax: þ82 2 745 9104.
E-mail address: [email protected] (K.-D. Zoh).
0143-7208/$ - see front matter � 2006 Elsevier Ltd. All rights reserved.
doi:10.1016/j.dyepig.2006.06.041
a wide range of different chemical structures, primarily basedon substituted aromatic and heterocyclic groups. Since reac-tive dyes are highly soluble in water, their removal fromwastewater is difficult by conventional coagulation and the ac-tivated sludge processes [4e6]. AOPs were based on the gen-eration of very reactive species such as hydroxyl radicals(OH
�) that oxidize a broad range of pollutants quickly and
non-selectively. Decolorization of azo reactive dyes by AOPs(O3/UV [7], H2O2/UV [8], Fe2þ/H2O2 [9], TiO2/UV [10])has been described by several authors. Response surface meth-odology (RSM), an experimental strategy for seeking theoptimum conditions for a multivariable system, is an efficienttechnique for optimization. Recently, it has been successfullyapplied to a different process for achieving its optimization

534 I.-H. Cho, K.-D. Zoh / Dyes and Pigments 75 (2007) 533e543
using experimental designs, which include TiO2-coated/UVoxidation [11,12], TiO2 slurry/UVoxidation [13,14], O3 oxida-tion [15] and electrochemical oxidation [16]. However, the ef-ficiency of treatment and the effect of interaction of variousparameters using experimental design methodology duringAOP processes have not been reported.
In this work, the TiO2/UV process was applied on the com-mercially available azo reactive dye C.I. Reactive Red 120. Afull factorial design (23) using the experimental design meth-odology was employed for the optimization of degradationconditions (measured by color and, TOC reduction of azo re-active dye) so that the main effects and interactions amongvariables can be estimated by keeping to a minimum the num-ber of experiments.
2. Experimental design and central compositedesign (CCD)
To find the optimum conditions for degradation of the reac-tive dye in a circular type reactor, the experimental design asa function of the selected main factors has to be determined.As shown in Fig. 1, this rotatable experimental plan was car-ried out as a central composite design (CCD) consisting of 20experiments. For three variables (n¼ 3) and two levels (low(�) and high (þ)), the total number of experiments was 20 de-termined by the expression: 2n (23¼ 8: factor points)þ 2n(2� 3¼ 6: axial points)þ 6 (center points: six replications),as shown in Tables 1 and 2.
The factors (variables) in this experiment were the dye con-centration (X1), TiO2 concentration (X2) and light intensity(X3). A full second-order polynomial model obtained by mul-tiple regression technique for three factors by using the SASpackage (SAS Institute, Cary, NC, USA) and MINITABpackage (Minitab Institute, USA) was adopted to describethe response surface. In developing the regression equation
X3
X1
X2
Factorial point Central point Axial point
Fig. 1. Schematic diagram of central composite design (CCD) as a function of
X1 (TiO2 concentration), X2 (dye concentration), and X3 (UV intensity) accord-
ing to the 23 factorial design with six axial points and six central points (rep-
lication) (fixed factors: pH¼ 5, total volume¼ 3 L, flow rate¼ 1 L min�1).
developed by BoxeHunter [17], the test factors were codedaccording to the following equation:
xi ¼Xi�Xio
DXi
ð1Þ
where xi is the coded value of the ith independent variable, Xi
the natural value of the ith independent variable, Xio the natu-ral value of the ith independent variable at the center point,and DXi is the step change value.
Y ¼ b0þXk
i¼1
bixiþXk�1
i¼1
Xk
j¼2
bijxixj þXk
i¼1
biix2i þ e ð2Þ
where Y is the predicted response, b0 and the offset term, bi thelinear effect, bij the squared effect and bii is the interactioneffect. The three significant independent variables X1, X2,and X3 and the mathematical relationship of the response Y
Table 1
The original and coded levels of the input variables
Original factors Coded levels
�2 �1 0 1 þ2
TiO2 concentration
(g L�1): X1
0.5 1 1.5 2 2.5
Dye concentration
(mg L�1): X2
25 50 75 100 125
UV intensity
(mW cm�2): X3
0 3 6 9 12
Table 2
The 23 factorial and central composite design for experiment
Experiment
run
Pattern Block Variables in coded levels Comment
X1 X2 X3
1 � � � 1 �1 �1 �1 Full factorial
2 � þ þ �1 þ1 þ1 Full factorial
3 þ � þ þ1 �1 þ1 Full factorial
4 þ þ � þ1 þ1 �1 Full factorial
5 0 0 0 0 0 0 Center e full
factorial
6 0 0 0 0 0 0 Center e full
factorial
7 � � þ 2 �1 �1 þ1 Full factorial
8 � þ � �1 þ1 �1 Full factorial
9 þ � � þ1 �1 �1 Full factorial
10 þ þ þ þ1 þ1 þ1 Full factorial
11 0 0 0 0 0 0 Center e full
factorial
12 0 0 0 0 0 0 Center e full
factorial
13 �0 0 3 �2 0 0 Axial
14 þ0 0 þ2 0 0 Axial
15 0 � 0 0 �2 0 Axial
16 0 þ 0 0 þ2 0 Axial
17 0 0 � 0 0 �2 Axial
18 0 0 þ 0 0 þ2 Axial
19 0 0 0 0 0 0 Center e axial
20 0 0 0 0 0 0 Center e axial

535I.-H. Cho, K.-D. Zoh / Dyes and Pigments 75 (2007) 533e543
on these variables can be approximated by quadratic/(second-degree) polynomial equation as shown below:
Y ¼ b0þ b1X1 þ b2X2þ b3X3þ b11X21 þ b22X2
2 þ b33X23
þ b12X1X2þ b13X1X3 þ b23X2X3 ð3Þ
where Y is the predicted response, b0 the constant, b1, b2, andb3 the linear coefficients, b12, b13, and b23 the cross-productcoefficients, and b11, b22, and b33 are the quadraticcoefficients.
3. Materials and methods
3.1. Materials
The molecular formula of Reactive Red 120 (Ewha Chem-icals Co., Ltd) with purity of >85% used in this study is shownin Table 3. Standard dye solution was prepared with a concen-tration of 50 mg L�1, and lmax was determined with a UV-spectrophotometer (Shimadzu UV-1201). Titanium dioxideused was anatase (Aldrich, 99.9þ%). pH adjustments wereconducted with 0.1 M H2SO4 and 0.1 M NaOH. All otherchemicals were of analytical grades.
3.2. Photoreactor system and analysis
The entire experimental setup is shown in Fig. 2. All theexperiments were carried out in a continuous flow througheight columns (each 10 mm in diameter) with a recirculationof the suspension. The UV lamps used in this study were40 W blacklight blue fluorescent lamps (General ElectricsCo., F40BLB, 1200-mm length, 32.5-mm diameter) withmaximum emission at 254 nm. UV intensity was measuredwith a VLX-3W radiometer (Cole Parmer), which measuresUV radiation at 254 nm. The effective volume of photoreac-tor was 1.88 L (550 mm (wide)� 640 mm (length)�110 mm (height)). During operation, the photoreactor waswrapped in an aluminum foil to avoid any illumination byambient light. The samples obtained from the photocatalyticreactions were analyzed by UVevis spectroscopy (Shi-madzu UV-1201), absorption at lmax was 530 nm for azo
dye of Reactive Red 120. TOC of photoreaction solutionwas measured by a TOC analyzer (Shimadzu, TOC500).
4. Results and discussions
4.1. The absorption spectrum and photocatalyticdiscoloration of Reactive Red 120 (RR120)
The temporal absorption spectral changes during the pho-tocatalytic degradation of Reactive Red 120 in illuminatedaqueous TiO2 suspensions are displayed in Fig. 3. TheUVevis absorption of Reactive Red 120 is characterized byone band in the visible region, with its maxima located at530 nm and by three bands at 215, 240, and 290 nm. Thesedifferent peaks are attributed to the benzene and naphthalenerings substituted with SO3
� and OH groups. The subsequentillumination of the aqueous Reactive Red 120 causes contin-uous decrease of the intensities of UV and vis bands of Re-active Red 120 with increasing irradiation time, which is notaccompanied by the appearance of new absorption bands inthe UVevis region.
4.2. Photocatalytic kinetics on the effect of pH fordecolorization of RR120
The experiments were carried out with a dye concentra-tion of 50 mg L�1 at pH 3, 5, 7, 9 and 11 for 90 min. Thewastewater from dye industries usually has a wide range ofpH values. pH plays an important role both in the character-istics of dye wastes and in the generation of hydroxyl radi-cals. Hence, the effect of pH in the degradation of dyes byUV irradiation was investigated. The interpretation of pHeffect on the efficiency of the photodegradation process isa difficult task since three possible reaction mechanismscan contribute to dye degradation, namely, hydroxyl radicalattack, direct oxidation by the positive hole, and direct reduc-tion by the electron in the conducting band.
According to the literature reports [18,19], the pH of the so-lution significantly affects TiO2 activity, including the chargeon the particles, the size of the aggregates it forms and the po-sitions of the conductance and valence bands. pH changes canthus influence the adsorption of dye molecules onto the TiO2
Table 3
Chemical structure of dyes and the properties of Reactive Red 120
Chemical structure
Molecular formula C44H24Cl2N14Na6O20S6
Molecular weight 1470 g mol�1
Water solubility 70 g L�1
Class Diazo (eN]Ne bond)

536 I.-H. Cho, K.-D. Zoh / Dyes and Pigments 75 (2007) 533e543
ColumnReflection plate
UV Lamp
Pump
3-waySampling
port
Fig. 2. Schematic diagram of the circular type photocatalytic reactor system.
surfaces, an important step for the photocatalytic oxidation totake place [20].
TiOH þ Hþ 4 TiOHþ2 ð4Þ
TiOH þ OH�4 TiO� þ H2O ð5Þ
The point of zero charge (pzc) of the TiO2 (DegussaP25) is at pH 6.8 [21,22]. Thus, the TiO2 surface is posi-tively charged in acidic media (pH< 6.8), whereas it is neg-atively charged under alkaline conditions (pH> 6.8) [22,23].Since R has three sulfonic groups in its structure, which isnegatively charged, the acidic solution favors adsorption of
Wavelength (nm)
200 300 400 500 600
Ab
so
rb
an
ce
0.0
0.2
0.4
0.6
0.8
1.0
1.2
1.4
1.6
1.80 min
10 min
20 min
40 min
90 min
Fig. 3. UVevis absorption spectrum of Reactive Red 120 (RR120) at different
irradiation times (experimental conditions: pH¼ 5, TiO2¼ 2 g L�1, dye con-
centration¼ 50 mg L�1, UV intensity¼ 9 mW cm�2, total volume¼ 3 L,
flow rate¼ 1 L min�1).
dye onto the photocatalyst surface, thus kobs increases asshown in Fig. 4 and Table 4. Thus, decolorization efficiencyincreased. At this pH, there is also the formation of OH�
radicals, which react with dye molecules and increase thedecolorization level. As the pH of the solution increased,the adsorption of dye molecules onto the catalyst surfacedecreased. Therefore, decolorization level was observed tobe low at basic pH. Similar results have been reported forthe photocatalytic oxidation of other azo dyes [24,25]. How-ever, the photocatalytic degradation rate at alkaline pH wasfaster than that of at neutral pH.
Time (min)
0 10 20 30 40 50 60 70 80 90
Deco
lo
rizatio
n (%
)
0
20
40
60
80
100
Fig. 4. Effect of initial pH on the photocatalytic oxidation of azo dye (Reactive
Red 120) (experimental conditions: TiO2¼ 2 g L�1, dye concen-
tration¼ 50 mg L�1, UV intensity¼ 9 mW cm�2, total volume¼ 3 L, flow
rate¼ 1 L min�1).
537I.-H. Cho, K.-D. Zoh / Dyes and Pigments 75 (2007) 533e543
4.3. The second-order model and analysis of variance(ANOVA)
All 20 experimental runs of central composite design(CCD) were performed in accordance with Table 2. As shownin Table 5, central composite design is composed of three in-dependent variables X (TiO2 concentration (X1), dye concen-tration (X2), and UV intensity (X3)), and the response Y (%of color removal (Y1), and % of TOC removal (Y2)). The re-gression equations given in Table 6 were obtained from theanalysis of variances.
Using 10, 5, and 1% significance levels, a model is consid-ered significant if the p-value (significance probability value)is less than 0.1, 0.05, and 0.001, respectively. From the p-values presented in Table 7, it can be concluded that for tworesponses (Y1, Y2), linear contribution and quadratic contribu-tion of the model were significant, whereas for the responsesY1 and Y2, cross-product contribution of the model wasinsignificant.
Actual (observed) value versus predicted value displays thereal responses’ data plotted against the predicted responses
Table 4
Apparent first-order rate constant kobs, half-life t1/2, and correlation coefficients
R2 for degradation of Reactive Red 120 (50 ppm) at different pH
Azo dye pH kobs (min�1) t1/2 (min) R2
Reactive Red 120 3 0.0323 21.46 0.991
5 0.0448 15.47 0.995
7 0.0240 31.22 0.990
9 0.0319 21.72 0.991
11 0.0287 21.15 0.990
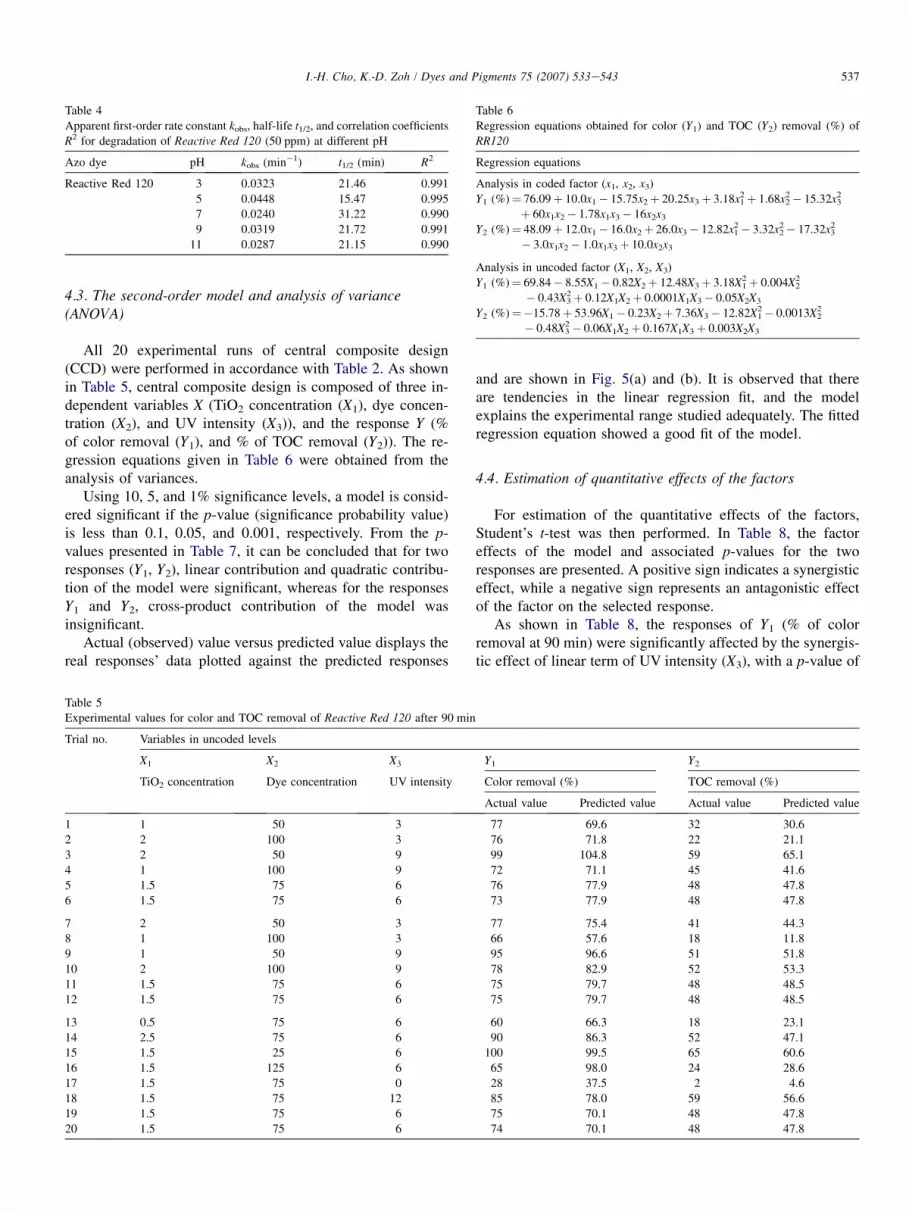
and are shown in Fig. 5(a) and (b). It is observed that thereare tendencies in the linear regression fit, and the modelexplains the experimental range studied adequately. The fittedregression equation showed a good fit of the model.
4.4. Estimation of quantitative effects of the factors
For estimation of the quantitative effects of the factors,Student’s t-test was then performed. In Table 8, the factoreffects of the model and associated p-values for the tworesponses are presented. A positive sign indicates a synergisticeffect, while a negative sign represents an antagonistic effectof the factor on the selected response.
As shown in Table 8, the responses of Y1 (% of colorremoval at 90 min) were significantly affected by the synergis-tic effect of linear term of UV intensity (X3), with a p-value of
Table 6
Regression equations obtained for color (Y1) and TOC (Y2) removal (%) of
RR120
Regression equations
Analysis in coded factor (x1, x2, x3)
Y1 (%)¼ 76.09þ 10.0x1� 15.75x2þ 20.25x3þ 3.18x12þ 1.68x2
2� 15.32x32
þ 60x1x2� 1.78x1x3� 16x2x3
Y2 (%)¼ 48.09þ 12.0x1� 16.0x2þ 26.0x3� 12.82x12� 3.32x2
2� 17.32x32
� 3.0x1x2� 1.0x1x3þ 10.0x2x3
Analysis in uncoded factor (X1, X2, X3)
Y1 (%)¼ 69.84� 8.55X1� 0.82X2þ 12.48X3þ 3.18X12þ 0.004X2
2
� 0.43X32þ 0.12X1X2þ 0.0001X1X3� 0.05X2X3
Y2 (%)¼�15.78þ 53.96X1� 0.23X2þ 7.36X3� 12.82X12� 0.0013X2
2
� 0.48X32� 0.06X1X2þ 0.167X1X3þ 0.003X2X3
Table 5
Experimental values for color and TOC removal of Reactive Red 120 after 90 min
Trial no. Variables in uncoded levels
X1 X2 X3 Y1 Y2
TiO2 concentration Dye concentration UV intensity Color removal (%) TOC removal (%)
Actual value Predicted value Actual value Predicted value
1 1 50 3 77 69.6 32 30.6
2 2 100 3 76 71.8 22 21.1
3 2 50 9 99 104.8 59 65.1
4 1 100 9 72 71.1 45 41.6
5 1.5 75 6 76 77.9 48 47.8
6 1.5 75 6 73 77.9 48 47.8
7 2 50 3 77 75.4 41 44.3
8 1 100 3 66 57.6 18 11.8
9 1 50 9 95 96.6 51 51.8
10 2 100 9 78 82.9 52 53.3
11 1.5 75 6 75 79.7 48 48.5
12 1.5 75 6 75 79.7 48 48.5
13 0.5 75 6 60 66.3 18 23.1
14 2.5 75 6 90 86.3 52 47.1
15 1.5 25 6 100 99.5 65 60.6
16 1.5 125 6 65 98.0 24 28.6
17 1.5 75 0 28 37.5 2 4.6
18 1.5 75 12 85 78.0 59 56.6
19 1.5 75 6 75 70.1 48 47.8
20 1.5 75 6 74 70.1 48 47.8
538 I.-H. Cho, K.-D. Zoh / Dyes and Pigments 75 (2007) 533e543
Table 7
Analysis of variance for two responses (Y1, Y2)
Source of variation Responses
Y1 Y2
F value p-value F value p-value
Model 21.45 0.0036*** 26.43 <0.0001***
Linear contribution 6.23 0.0005*** 68.61 <0.0001***
Quadratic contribution 7.31 0.0541* 9.80 0.0025**
Cross-product contribution 0.71 0.5566 0.88 0.4853
*Significant at 10% ( p-value); **significant at 5% ( p-value); and ***significant at 1% ( p-value).
0.023, and the antagonistic effect of quadratic term of UV in-tensity (X3
2) ( p-value of 0.040). Table 8 also showed that theeffect of the initial TiO2 concentration (X1), and reactive dye(X2) was less pronounced than UV intensity (mW cm�2), how-ever the favorable quadratic effect (X3
2) indicates that % degra-dation is improved at very low value. Finally, the mostsignificant effect of first-order (linear term) derives from theinitial intensity of UV (X3).
Observed value(%)
0 20 40 60 80 100
Pred
icted
valu
e(%
)
0
20
40
60
80
100(a)
Observed value(%)
0 20 40 60 80
Pred
icted
valu
e(%
)
0
10
20
30
40
50
60
70(b)
Fig. 5. The observed values (%) plotted against the predicted values (%) de-
rived from the model of color (Y1) and TOC (Y2) removal (%) in uncoded
values for t¼ 90 min. The long dash line is the regression line with regression
coefficient R¼ 0.90 (a) and 0.96 (b). Each point refers to the experiment num-
ber listed in Table 5.
Significant factors for the responses Y2 were linear terms ofthe TiO2 (X1), UV intensity (X3), with p-values of 0.019 and0.037, respectively. All above-mentioned factors show syner-gistic effect in the increase of TOC removal (%) of ReactiveRed 120. Additionally, the quadratic terms of TiO2 (X1
2) andUV intensity (X3
2) have an antagonistic effect on Y2 responses( p-values of 0.016 and 0.003, respectively). Although the first-order effect shows that increases in both variables, TiO2 (X1)and UV intensity (X3), favor TOC removal (%), an antagonis-tic effect was also observed between these two parameters.The simultaneous increase of TiO2 (X1
2) and UV intensity(X3
2) is adverse for the reaction, as shown by the second-ordereffect (pure quadratic) of the last term in the polynomialexpression.
4.5. Main and interaction effect plots
The main effect (mean) plot is appropriate for analyzingdata in a designed experiment, with respect to important fac-tors, where the factors are at two or more levels. Fig. 6(a)and 6(b) show the main effect plots of three variables (factors)on % of color and TOC removal, respectively. The applicationof the main effect (mean) plot to the defective springs data setresults in the following conclusions:
Ranked list of factors (excluding interactions)� Qualitatively, factor X3 is the most important with differ-
ence between the two points, of approximately 56 and57% in Y1 and Y2, respectively.� Qualitatively, factor X2 is the second most important to X3
in Y1 and Y2.� Qualitatively, factor X1 is the third most important to X3 in
Y1 and Y2.
Increasing the concentration of TiO2 can enhance theproduction of these species and leads to the greater removalof target organics. The results indicate that the increase inthe TiO2 concentration is associated with increase in the %of decolorization and TOC removal as shown in Fig. 6(a)and 6(b), respectively.
However, initial slopes of the curve increase greatly by in-creasing the catalyst loading from 0.5 to 1 g L�1, above whichinitial slopes are nearly equal. At lower loading levels, such as0.5 g L�1, the catalyst surface and absorption of light by thecatalyst surface are the limiting factors, and an increase in

539I.-H. Cho, K.-D. Zoh / Dyes and Pigments 75 (2007) 533e543
Table 8
Factor effects and associated p-values for two responses
Relationship Factor Responses
Y1 Y2
Factor effect p-value Factor effect p-value
Main effects Linear X1 �0.30 0.773 2.945 0.019**
Linear X2 �1.42 0.187 �0.661 0.527
Linear X3 2.67 0.023** 2.496 0.037**
Interactions Pure quadratic X12 0.49 0.640 �3.050 0.016**
X22 1.64 0.140 �0.762 0.468
X32 �2.35 0.040** �4.133 0.003*
Cross product X1� X2 0.52 0.614 �0.417 0.688
X2� X3 �1.39 0.196 0.139 0.893
X1� X3 0.00 1.000 1.390 0.202
*Significant at 10% ( p-value); **significant at 5% ( p-value); and ***significant at 1% ( p-value).
(þ) Synergistic effect (factor effect).
(�) Antagonistic effect (factor effect).
Fig. 6. Main effect plots for color (a) and TOC (b) removal (%) in uncoded value for t¼ 90 min.

540 I.-H. Cho, K.-D. Zoh / Dyes and Pigments 75 (2007) 533e543
catalyst loading greatly enhances the process efficiency. Onthe other hand, at higher loading levels, irradiation field insidethe reaction medium is leveled off due to the light scatteringby catalyst particles [26,27].
As seen in Fig. 6(a) and (b), the removal efficiency ofcolor is inversely affected by the dye concentration. Thisnegative effect can be explained as follows: as the dye con-centration increases, the equilibrium adsorption of the dyeonto the TiO2 surface active sites increases, hence competi-tive adsorption of OH� on the same sites decreases, resultingin the lower formation rate of OH
�radical which is the prin-
cipal oxidant indispensable for the high degradation effi-ciency [28,29].
Also, the results (Fig. 6(a)) on the UV intensity are similarto TiO2 concentration where the efficiency of the photo-oxida-tion reaction increased linearly with UV intensity up to a point,beyond which no further increases were observed. It is possi-ble that the TiO2 surface was fully utilized at 9 mW cm�2 ofUV and the excitation of electronehole pair by UV irradiationwas a maximum at that point [30,31]. If so, further increases inUV intensity would have no additional effect on the rate ofproduction of OH� radical.
In addition to the effect of each of the variables such asTiO2 concentration, UV intensity, and dye concentration onthe removal of dye individually, it is also important to checkthe interaction effect of these variables, especially two-factorsinteraction effect. Interaction plots were constructed by plot-ting both variables together on the same graph, and are shownin Fig. 7(a) and (b). This plot indicates that the most signifi-cant factor is UV intensity (X3) in Y1 and Y2 and the most sig-nificant interaction is between TiO2 (X1) and UV intensity(X3).
As can be seen in Fig. 7(a), the highest % of decoloriza-tion is reached at TiO2 (1.5 g L�1) and 12 mW cm�2 of UVintensity at dye concentration (75 mg L�1) in line of interac-tion effect between TiO2 (X1) and UV intensity (X3). Theinteraction of TiO2 (1.5 g L�1)/UV intensity (0 mW cm�2)in the absence of UV illumination at reactive dye(75 mg L�1), however, presented very low efficiency of thecolor removal (%). Run 17 in the dark condition (TiO2 alone)as shown in Table 5 showed approximately 28% of decolor-ization after 90 min, but no by-product was produced. Thisresult indicates that a portion of reactive dye was not de-graded, but rather adsorbed onto the TiO2 particles. For thehighest % of TOC removal in Y2, Fig. 7(b) showed thatthe response was quite similar to Y1 response. As mentioned,the most favorable TOC removal (%) for Y2 was obtained byTiO2 (1.5 g L�1) e 12 mW cm�2 of UV intensity at dye con-centration (75 mg L�1) in line of interaction effect betweenTiO2 (X1) and UV intensity (X3). Compared to the factorsinteraction between of TiO2 (X1) and UV intensity (X3),however, the dye concentration (X2) and UV intensity (X3)were considerably higher in the % of decolorization andTOC removal. Thus, qualitatively, the interaction effect be-tween dye concentration (X2) and UV intensity (X3) is thesecond most important to between TiO2 (X1) and UVintensity (X3).
4.6. Response surface (contour) plots and optimizationconditions
Canonical analysis using SAS package is a mathematicalapproach to examine the overall shape of the curve, to locatethe stationary point of the response surface, and to decidewhether it describes a maximum, minimum, or saddle point.Three-dimensional (3D) and contour (2D) plots for the pre-dicted responses were also formed, based on the model poly-nomial functions to assess the change of the response surfaceas shown in Figs. 8 and 9. The relationship between the depen-dent (Y1, Y2) and independent variables (X1, X2, X3) can be alsofurther understood by these plots. Since the model has morethan two factors, one factor was held constant for each dia-gram; therefore, a total of six response surface diagramswere produced for each response (Y1, Y2). Fig. 8(a) describingthe minimum point for Y1 response shows graphical 3D and2D representations of the polynomial obtained from the ma-trix. As shown in Fig. 8(b), the stationary point of the responsesurface shows the saddle point. The responses’ surface andcontour plots showing effect of dye and UV intensity on the% of decolorization have saddle behavior as shown inFig. 8(c).
Next, the effects of TiO2 (X1) and dye (X2) concentrations,while keeping UV intensity (X3) at the middle level(6 mW cm�2), are shown in Fig. 9(a). As shown in Fig. 9(a),the increase in TiO2 concentration (X1) and the decrease inUV intensity (X3) increased in % of TOC removal at theranges of TiO2 concentration (2 g L�1) and dye concentrationof less than 50 mg L�1 described as the saddle point for Y2
response.The effect of dye concentration (X2) and UV intensity (X3)
at the middle TiO2 concentration (X1) of 1.5 g L�1 is alsoshown in Fig. 9(b) which described as the maximum pointfor Y2 response. This contour plot indicates a wide range ofTOC removal (%) combinations resulting in a low dye concen-tration. On the contrary, working at low UV intensity values,the quantity of dye concentration added did not significantlyaffect the % of TOC removal.
The resulting response surface and contour plots is shownin Fig. 9(c). This result demonstrates that the response surfacehas a maximum point. Therefore, several optima could befound depending on the UV intensity. On the other hand, theinfluence of UV intensity on the % of TOC removal was de-pendent on the TiO2 concentration. The stationary points(maximum, minimum, and saddle points) were obtained by ca-nonical analysis and the response surface around these station-ary points was evaluated. Also, the coordinates of localminima in terms of the processing variables were determinedby differentiating Eq. (6) for TiO2 concentration, Eq. (7) fordye concentration, and Eq. (8) for UV intensity to X1, X2,X3, and setting the result thus obtained equal to zero, accord-ing to the following equations [32]:
�vtTiO2
vX1
�X2;X3
¼ 0 ð6Þ

541I.-H. Cho, K.-D. Zoh / Dyes and Pigments 75 (2007) 533e543
Fig. 7. Two-way interaction plots for color (a) and TOC (b) removal (%) in uncoded values for t¼ 90 min.
�vtDye
vX2
�X1;X3
¼ 0 ð7Þ
�vtUV
vX3
�X1;X2
¼ 0 ð8Þ
The conditions obtained at the saddle point for total Y1
responses were X1¼ 1.63 g L�1, X2¼ 45.2 mg L�1 andX3¼ 8.1 mW cm�2, and the conditions at maximum pointfor total Y2 responses were X1¼ 1.92 g L�1, X2¼ 34.7 mg L�1
and X3¼ 8.5 mW cm�2. These points were located within theexperimental ranges, implying that the analytical techniquescould be used to identify the minimum condition. The princi-pal effects of processing variables appear to be unidirectional;however, at certain conditions, comparing with TOC charac-teristics, the decolorization characteristics demonstrate con-flicting interactions. In general, higher UV intensity andlower dye concentration favorably improved % of color andTOC removal. It may be necessary to make an acceptable
compromise in all the response results. However, it shouldalso be noted that the above general observations are onlytrue for the regions bound by the stationary point.
4.7. Model validation and confirmation
Verification experiments performed at the predicted condi-tions derived by from ridge analysis of RSM demonstratedthat the experimental values were reasonably close to the pre-dicted values as shown in Table 9, indicating the validity andadequacy of the predicted models. Moreover, the verificationexperiments also proved that the predicted values of the % ofdecolorization and TOC removal could be achieved within95% confidence interval of the experimental values.
5. Conclusions
The optimization and the modeling of photocatalytic degra-dation of azo dye (Reactive Red 120) were performed by usinga composite experimental design. The ensuing mathematical

542 I.-H. Cho, K.-D. Zoh / Dyes and Pigments 75 (2007) 533e543
Fig. 8. Surface and contour plots of color removal (%) in uncoded values for t¼ 90 min. (a) X1 (TiO2) and X2 (dye) in fixed X3 (UV) at 6 mW cm�2, (b) X2 (dye)
and X3 (UV) in fixed X1 (TiO2) at 1.5 g L�1, (c) X1 (TiO2) and X3 (UV) in fixed X2 (dye) at 75 mg L�1.
model could predict the photocatalytic degradation at anypoint in the experimental domain as well as the determinationof the optimal degradation conditions. Acidic and alkaline pHtook less time (the half-time t1/2) for complete decolourizationcompared with neutral pH. At neutral pH, the rate of azo dye(RR120) degradation is low in terms of decolorization com-pared with that at acidic and alkaline pH. The high correlationin the model indicates that the second-order polynomial model
could be used to optimize the photocatalytic degradation ofdye. The conditions to get 100% for Y1 response of decoloriza-tion were found to be 1.63 g L�1 TiO2 (X1), 45.2 mg L�1 of re-active dye (X2), and 8.1 mW cm�2 of UV intensity (X3) and theconditions to get 67.27% for Y2 response of TOC removal towere 1.92 g L�1 TiO2 (X1), 34.7 mg L�1 of reactive dye (X2),and 8.5 mW cm�2 of UV intensity (X3), respectively. Underoptimized conditions, the experimental values agreed with
Fig. 9. Surface and contour plots of TOC removal (%) in uncoded values for t¼ 90 min. (a) X1 (TiO2) and X2 (dye) in fixed X3 (UV) at 6 mW cm�2, (b) X2 (dye)
and X3 (UV) in fixed X1 (TiO2) at 1.5 g L�1, (c) X1 (TiO2) and X3 (UV) in fixed X2 (dye) at 75 mg L�1.

543I.-H. Cho, K.-D. Zoh / Dyes and Pigments 75 (2007) 533e543
the values predicted by the ridge analysis. These results impli-cate that the optimization using a response surface methodol-ogy based on the central composite design can save the timeand effort by the estimation of the optimum conditions ofthe maximum removal of dye.
References
[1] Muruganandham M, Swaminathan M. Solar photocatalytic degradation
of a reactive azo dye in TiO2-suspension. Solar Energy Materials and So-
lar Cells 2004;81(4):439e57.
[2] Molinari R, Pirillo F, Falco M, Loddo V, Palmisano L. Photocatalytic
degradation of dyes by using a membrane reactor. Chemical Engineering
and Processing 2004;43(9):1103e14.
[3] Konstantinou IK, Albanis TA. TiO2-assisted photocatalytic degradation
of azo dyes in aqueous solution: kinetic and mechanistic investigations.
A review. Applied Catalysis B: Environmental 2004;49(1):1e14.
[4] Tang C, Chen V. The photocatalytic degradation of reactive black 5 using
TiO2/UV in an annular photoreactor. Water Research 2004;38(11):
2775e81.
[5] Akyol A, Yatmaz HC, Bayramoglu M. Photocatalytic decolorization
of Remazol Red RR in aqueous ZnO suspensions. Applied Catalysis
B: Environmental 2004;54(1):19e24.
[6] Gouvea CA, Wypych F, Moraes SG, Duran N, Nagata N, Peralta-
Zamora P. Semiconductor-assisted photocatalytic degradation of reactive
dyes in aqueous solution. Chemosphere 2000;40(4):433e40.
[7] Uygur A. An overview of oxidative and photooxidative decolorization
treatments of textile waste waters. Journal of the Society of Dyers and
Colourists 1997;113:211e7.
[8] Aplin R, Waite TD. Comparison of three advanced oxidation processes
for degradation of textile dyes. Water Science and Technology
2000;42(5):345e54.
[9] Moraes SG, Freire RS, Duran N. Degradation and toxicity reduction of
textile effluent by combined photocatalytic and ozonation processes.
Chemosphere 2000;40(4):369e73.
[10] Masten SJ, Davies SHR. The use of ozonation to degrade organic
contaminants in wastewaters. Water Science and Technology
1994;28(4):180e5.
[11] Danion A, Bordes C, Disdier J, Gauvrit JV, Guillard C, Lanteri P, et al.
Optimization of a single TiO2-coated optical fiber reactor using experi-
mental design. Journal of Photochemistry and Photobiology A: Chemis-
try 2004;168(3):161e7.
[12] Fernandez J, Kiwi J, Baeza J, Freer J, Lizama C, Mansilla HD. Orange II
photocatalysis on immobilised TiO2: effect of the pH and H2O2. Applied
Catalysis B: Environmental 2004;48(3):205e11.
Table 9
Comparison of experimental and predicted values of two responses (Y1, Y2) at
the optimal levels predicted by RSM for additional experiments (three trials)
Response Optimal conditions Stationary
point
Predicted
value (%)aObserved
value (%)b
Y1 X1¼ 1.63 g L�1,
X2¼ 45.2 mg L�1,
X3¼ 8.1 mW cm�2
Saddle 100 98� 2
Y2 X1¼ 1.92 g L�1,
X2¼ 34.7 mg L�1,
X3¼ 8.5 mW cm�2
Maximum 67.3 66� 3
a Predicted using ridge analysis of response surface quadratic model.b Mean� standard deviation of triplicate determinations from different
experiments.
[13] Amat AM, Arques A, Bossmann SH, Braun A, Gob S, Miranda MA,
et al. Oxidative degradation of 2,4-xylidine by photosensitization with
2,4,6-triphenylpyrylium: homogeneous and heterogeneous catalysis.
Chemosphere 2004;57(9):1123e30.
[14] Lizama C, Freer J, Baeza J, Mansilla HD. Optimized photodegradation of
Reactive Blue 19 on TiO2 and ZnO suspensions. Catalysis Today
2002;76(2):235e46.
[15] Chen LC. Effects of factors and interacted factors on the optimal decol-
orization process of methyl orange by ozone. Water Research
2000;34(3):974e82.
[16] Gursesa A, Yalcina M, Dogarb C. Electrocoagulation of some reactive
dyes: a statistical investigation of some electrochemical variables. Waste
Management 2000;22:491e4.
[17] Box G, Hunter WG. Statistics for experimenters: an introduction to de-
sign, data analysis, and model building. Wiley; 1987.
[18] Neppolian B, Choi HC, Sakthivel S, Arabindoo B, Murugesan V. Solar/
UV-induced photocatalytic degradation of three commercial textile dyes.
Journal of Hazardous Materials 2002;89(2e3):303e17.
[19] Toor AP, Verma A, Jotshi CK, Bajpai PK, Singh V. Photocatalytic deg-
radation of Direct Yellow 12 dye using UV/TiO2 in a shallow pond slurry
reactor. Dyes and Pigments 2006;68:53e60.
[20] Alaton IA, Balcioglu IA, Bahnemann DW. Advanced oxidation of a reac-
tive dyebath effluent: comparison of O3, H2O2/UV-C and TiO2/UV-A
processes. Water Research 2002;32:1143.
[21] Hasnat MA, Siddiquey A, Nuruddin A. Comparative photocatalytic stud-
ies of degradation of a cationic and an anionic dye. Dyes and Pigments
2005;66(3):185e8.
[22] Kusvuran E, Irmak S, Yavuz I, Samil A, Erbatur O. Comparison of the
treatment methods efficiency for decolorization and mineralization of
Reactive Black 5 azo dye. Journal of Hazardous Materials 2005;
119(1e3):109e16.
[23] Daneshvar N, Rabbani M, Modirshahla N, Behnajady MA. Kinetic
modeling of photocatalytic degradation of Acid Red 27 in UV/TiO2 pro-
cess. Journal of Photochemistry and Photobiology A: Chemistry
2004;168(1e2):39e45.
[24] Kusvuran E, Gulnaz O, Irmak S, Atanur OM, Yavuz HI, Erbatur O. Com-
parison of several advanced oxidation processes for the decolorization of
Reactive Red 120 azo dye in aqueous solution. Journal of Hazardous
Materials 2004;109(1e3):85e93.
[25] Tang WZ, An H. UV/TiO2 photocatalytic oxidation of commercial dyes
in aqueous solutions. Chemosphere 1995;31(9):4157e70.
[26] Son HS, Lee SJ, Cho IH, Zoh KD. Kinetics and mechanism of
TNT degradation in TiO2 photocatalysis. Chemosphere 2004;57(4):
309e17.
[27] Adesina AA. The photo-oxidative degradation of sodium dodecyl sulfate
in aerated aqueous TiO2 suspension. Journal of Photochemistry and
Photobiology A: Chemistry 1998;118:111e22.
[28] Daneshvar N, Salari D, Khataee AR. Photocatalytic degradation of azo
dye acid red 14 in water: investigation of the effect of operational param-
eters. Journal of Photochemistry and Photobiology A: Chemistry
2003;157(1):111e6.
[29] Tennakone K, Kiridena WCB, Punchihewa S. Photodegradation of visi-
ble-light-absorbing organic compounds in the presence of semiconductor
catalysts. Journal of Photochemistry and Photobiology A: Chemistry
1992;68(3):389e93.
[30] Sakthivela S, Neppolianb B, Shankarb MV, Arabindoob B,
Palanichamyb Mand, Murugesan V. Solar photocatalytic degradation of
azo dye: comparison of photocatalytic efficiency of ZnO and TiO2. Solar
Energy Materials and Solar Cells 2003;77:65.
[31] Minero C, Maurino V, Pelizzetti E. Heterogeneous photocatalytic trans-
formations of s-triazine derivatives. Research on Chemical Intermediates
1997;23:291e310.
[32] Pandey PK, Ramaswamy HS, St-Gelais D. Effect of high pressure pro-
cessing on rennet coagulation properties of milk. Innovative Food Sci-
ence and Emerging Technologies 2003;4(3):245e56.


