Embed Size (px)
Citation preview

PLEASE SCROLL DOWN FOR ARTICLE
This article was downloaded by: [B-on Consortium - 2007]On: 18 March 2011Access details: Access Details: [subscription number 919435512]Publisher Taylor & FrancisInforma Ltd Registered in England and Wales Registered Number: 1072954 Registered office: Mortimer House, 37-41 Mortimer Street, London W1T 3JH, UK
Marine Biology ResearchPublication details, including instructions for authors and subscription information:http://www.informaworld.com/smpp/title~content=t713735885
Phylogeographical history of the white seabream Diplodus sargus(Sparidae): Implications for insularityMercedes González-Wangüemertab; Elsa Froufec; Angel Pérez-Ruzafad; Paulo Alexandrinoa
a Centro de Investigação em Biodiversidade e Recursos Genéticos (CIBIO), Universidade do Porto,Porto, Portugal b Centro de Ciências do Mar (CCMAR), Universidade do Algarve, Faro, Portugal c
CIIMAR, Centro Interdisciplinar de Investigação Marinha e Ambiental, Porto, Portugal d Departamentode Ecología e Hidrología, Facultad de Biología, Universidad de Murcia, Murcia, Spain
First published on: 18 March 2011
To cite this Article González-Wangüemert, Mercedes , Froufe, Elsa , Pérez-Ruzafa, Angel and Alexandrino, Paulo(2011)'Phylogeographical history of the white seabream Diplodus sargus (Sparidae): Implications for insularity ', MarineBiology Research, 7: 3, 250 — 260, First published on: 18 March 2011 (iFirst)To link to this Article: DOI: 10.1080/17451000.2010.499438URL: http://dx.doi.org/10.1080/17451000.2010.499438
Full terms and conditions of use: http://www.informaworld.com/terms-and-conditions-of-access.pdf
This article may be used for research, teaching and private study purposes. Any substantial orsystematic reproduction, re-distribution, re-selling, loan or sub-licensing, systematic supply ordistribution in any form to anyone is expressly forbidden.
The publisher does not give any warranty express or implied or make any representation that the contentswill be complete or accurate or up to date. The accuracy of any instructions, formulae and drug dosesshould be independently verified with primary sources. The publisher shall not be liable for any loss,actions, claims, proceedings, demand or costs or damages whatsoever or howsoever caused arising directlyor indirectly in connection with or arising out of the use of this material.

ORIGINAL ARTICLE
Phylogeographical history of the white seabream Diplodus sargus
(Sparidae): Implications for insularity
MERCEDES GONZALEZ-WANGUEMERT1,2*, ELSA FROUFE3, ANGEL
PEREZ-RUZAFA4 & PAULO ALEXANDRINO1
1Centro de Investigacao em Biodiversidade e Recursos Geneticos (CIBIO), Universidade do Porto, Porto, Portugal, 2Centro de
Ciencias do Mar (CCMAR), Universidade do Algarve, Faro, Portugal, 3CIIMAR, Centro Interdisciplinar de Investigacao
Marinha e Ambiental, Porto, Portugal, and 4Departamento de Ecologıa e Hidrologıa, Facultad de Biologıa, Universidad de
Murcia, Murcia, Spain
Abstract
Partial sequences of the mitochondrial control region and its comparison with previously published cytochrome b (cyt-b)and microsatellite data were used to investigate the influence of island isolation and connectivity on white seabream geneticstructure. To achieve this, a total of 188 individuals from four island localities (Castellamare and Mallorca, MediterraneanSea; Azores and Canary Islands, Atlantic Ocean) and five coastal localities (Banyuls, Murcia and Tunisia, MediterraneanSea; Galicia and Faro, Atlantic Ocean) were analysed. Results showed high haplotype diversity and low to moderatenucleotide diversity in all populations (except for the Canary Islands). This pattern of genetic diversity is attributed to arecent population expansion which is corroborated by other results such as cyt-b network and demographic analyses. Lowdifferentiation among Mediterranean/Atlantic and coastal/island groups was shown by the AMOVA and FST values,although a weak phylogeographic break was detected using cyt-b data. However, we found a clear and significant island/distance effect with regard to the Azores islands. Significant genetic differentiation has been detected between the Azoresislands and all other populations. The large geographical distance between the European continental slope and the Azoresislands is a barrier to gene flow within this region and historic events such as glaciation could also explain this geneticdifferentiation.
Key words: Connectivity, fishes, islands, mtDNA, phylogeography, population structure
Introduction
In the marine realm, a high potential for dispersal
and/or the absence of strong barriers to migration
are believed to guarantee high connectivity between
distant populations, and to limit long-term popula-
tion subdivision. Conversely, species with low dis-
persal potential are expected to have clear patterns
of genetic structure (Duran et al. 2004). There are
examples showing that such expectations may be
unfounded (Uthicke & Benzie 2000; Lazoski et al.
2001), because a variety of biological, ecological and
historical factors might contribute to the struc-
turing of the populations through space and time
(Gonzalez-Wanguemert et al. 2004, 2007; Perez-Ruzafa
et al. 2006). In fact, marine fish species may exhibit
population structure owing to spawning behaviour
and self-recruitment (Gonzalez-Wanguemert et al.
2007), these being highly influenced by environ-
mental conditions and habitat characteristics (Gibson
1994; Cardinale & Arrhenius 2000; Pitchford et al.
2005). Also, ecological factors such as discontinuity
in suitable habitat may reduce gene flow among
populations of marine organisms. This loss of habitat
for species is very common between islands and
continental coasts, favouring the genetic divergence
between populations (Riginos & Nachman 2001;
Duran et al. 2004; Sa-Pinto et al. 2008; Zulliger et al.
2009). Some authors have found high genetic
*Correspondence: M. Gonzalez-Wanguemert, Centro de Ciencias do Mar (CCMAR), Universidade do Algarve, Campus de Gambelas,
8005-139 Faro, Portugal. E-mail: [email protected]; [email protected].
Published in collaboration with the University of Bergen and the Institute of Marine Research, Norway, and the Marine Biological Laboratory,
University of Copenhagen, Denmark
Marine Biology Research, 2011; 7: 250�260
(Accepted 19 May 2010; Published online 21 March 2011)
ISSN 1745-1000 print/ISSN 1745-1019 online # 2011 Taylor & Francis
DOI: 10.1080/17451000.2010.499438
Downloaded By: [B-on Consortium - 2007] At: 15:41 18 March 2011

differentiation between oceanic island and contin-
ental populations from the North Atlantic Ocean
linked to isolation by current systems and geo-
graphic distances (Emerson 2002; Schonhuth et al.
2005; Domingues et al. 2007; Sa-Pinto et al. 2008).
Together with these features, we must also con-
sider historical factors that might contribute to the
genetic structuring of the populations. In our study
area (Mediterranean Sea and northeastern Atlantic
Ocean) we must consider events which occurred
during the Pliocene: the northeastern Atlantic ex-
perienced a progressive cooling and the sea surface
temperatures in the Azores islands experienced an
additional cooling (2�38C) (Crowley 1981; Briggs
1996; Adams et al. 1999; Domingues et al. 2006).
Several authors (e.g. Briggs 1974; Santos et al.
1995) suggested that this probably resulted in the
mass extinction of littoral fish from the Azores, and
that most of the organisms now present would have
come from southern regions. Santos et al. (1995)
suggested a post-glacial colonization of the Azores
from Madeira or the western coast of Africa.
However, other authors (e.g. Barton et al. 1998;
Domingues et al. 2007) maintained that sea surface
temperatures around the Azores did not decrease
meaningfully, so the elimination of littoral fish
populations by glaciation was unlikely. On the other
hand, the Mediterranean Sea was gradually sepa-
rated from the Atlantic Ocean during the Messinian
Salinity Crisis (5.59�5.33 Ma), although short
periods of separation between the Atlantic and
Mediterranean waters occurred during the Quatern-
ary in response to cyclical ice ages and the associated
sea level changes (Patarnello et al. 2007).
Diplodus sargus (Linnaeus, 1758) is a commercial
species which includes seven subspecies (Bauchot
& Hureau 1990) in the Atlantic and Indian Oceans,
the Mediterranean Sea and the Persian Gulf. The
life history of D. sargus shows a pattern consistent
with digynic hermaphroditism, changing from male
to female through a nonfunctional intersexual phase.
White seabream achieve sexual maturity during the
second or third year of life. Spawning occurs from
March to June and the onset and duration of
spawning season appear to be influenced by sea
water temperatures (Morato et al. 2003). Diplodus
sargus larvae spend 3�4 weeks in the open sea before
reaching a favourable environment for metamorpho-
sis and later recruitment into the adult population
(Gonzalez-Wanguemert et al. 2004). During this
phase of the life cycle, larvae are at the mercy of
prevailing currents. This species behaves as ‘cyclic
migrants’ and can migrate into lagoons after meta-
morphosis and spend the early stages of their life
cycle in these environments with very different tem-
peratures and salinities. Juveniles move to shallow
areas (B5 m) whilst adults are more abundant in
the surf zone (Pajuelo & Lorenzo 2004) at depths of
between 10 and 50 m depending upon substrate
availability (Harmelin-Vivien et al. 1995).
Several authors have studied the genetic struc-
ture of D. sargus using different molecular markers
(Lenfant & Planes 1996, 2002; Gonzalez-Wanguemert
et al. 2004, 2006, 2007, 2010; Bargelloni et al. 2005;
Perez-Ruzafa et al. 2006; Domingues et al. 2007). In
general, allozyme studies detected significant genetic
differentiation between populations at different spa-
tial (101�103 km) and temporal scales in the Med-
iterranean and Atlantic regions. However, some authors
did not find signs of genetic differentiation among
Atlantic and Mediterranean populations of D. sargus
using allozymes (Bargelloni et al. 2005) and mito-
chondrial control region and the first intron of the
S7 ribosomal protein gene (Domingues et al. 2007).
Gonzalez-Wanguemert et al. (2010) found signifi-
cant genetic differentiation between the Azores
population and other studied populations using
microsatellites and cyt-b region. These last authors
suggested that the breakdown of effective genetic
exchange between the Azores and the others samples
could be explained simultaneously by hydrographic
(deep water) and hydrodynamic (isolating current
regimes) factors acting as barriers to the free dis-
persal of white seabream (adults and larvae) and by
historical factors which could have favoured the
survival of Azorean white seabream population at
the last glaciation.
In this study, we want to analyse the influence of
isolation and connectivity on the white seabream
genetic structure considering a number of localities
and individuals distributed across the Western and
Central Mediterranean Sea and Northeastern Atlantic
Ocean. To achieve this aim, we analysed a highly
variable marker (control region) and the obtained
data were compared with previously published data
from cyt-b region and microsatellites (Gonzalez-
Wanguemert et al. 2010). Discussions considering
data from mtDNA (cyt-b and control region) and
nuclear (microsatellites) markers can finally try to
conclude which are the factors that can explain the
white seabream genetic structure.
Material and methods
Current patterns from study area
The Northeastern Atlantic Current system is domi-
nated by the Gulf Stream, which splits into two main
branches, the North Atlantic Current (North) and
the Azores Current (East) (Domingues et al. 2006).
Close to the Azores Islands, each of these currents
divides into two branches, one of which flows south,
Phylogeography of white seabream 251
Downloaded By: [B-on Consortium - 2007] At: 15:41 18 March 2011
feeding the Canaries Current (Santos et al. 1995)
(Figure 1). Mediterranean physical oceanography is
forced by topography, wind stress and buoyancy flux
at the surface due to fresh water inputs and heat
fluxes (Robinson et al. 2001; Patarnello et al. 2007).
Atlantic water is less dense than Mediterranean
water, and enters at the surface through the Strait
of Gibraltar. This mass of water forms a semi-permanent
anticyclonic gyre in the Alboran Sea (SE Spain),
generating an oceanic front located from Almeria to
Oran (AOF, Figure 1). This surface water flows
to the East following the North African coast
(Algerian Current) with eddies near the Libyan
coast (Alhammoud et al. 2004) (Figure 1).
Sampling and DNA extractions
To achieve the defined aims, we analysed a total
of 188 individuals from four island localities
(Castellamare and Mallorca, Mediterranean Sea;
Azores and Canary Islands, Atlantic Ocean) and
five continental coastal localities (Banyuls, Murcia
and Tunisia, Mediterranean Sea; Galicia and Faro,
Atlantic Ocean) (Figure 1). Samples were collected
at local markets while some individuals were
sampled by SCUBA diving during 2004�2005.
Muscle samples were removed from fresh fish and
stored in 99% ethanol immediately after collection.
Total genomic DNA was extracted from small (3�5 mg) pieces of tissue following a protocol based on
Sambrook et al. (1989) with minor modifications
(increasing the time of Proteinase K digestion to
24 h and adding 7 ml Proteinase K per sample). The
extracted DNA was resuspensed in an elution
buffer and stored at �208C until further use.
PCR amplification and sequencing
We used sequences of non-coding mitochondrial,
control region, because it has been demonstrated
that this genetic marker shows adequate levels of
sequence variation in the sparid family for popula-
tion genetic and phylogeography studies (Jousson
et al. 2000; Bargelloni et al. 2005).
We amplified a 416-bp fragment of the control
region for 188 individuals by polymerase chain
reaction (PCR) using the primers described in
Summerer et al. (2001) and Kocher et al. (1989).
Reactions of 24 ml total volume contain 2.5 ml of
10� buffer (Ecogen); 1.5 mM MgCl2, (Ecogen);
200 mM dNTP mix; 0.5 U Taq DNA polymerase
(Ecogen); 0.25 mM of each primer; 5�50 ng of DNA.
PCR cycles were performed on a Biometra T3
Thermocycler under the following conditions: 3
min at 948C, followed by 30 cycles of denaturing
at 948C for 30 s, annealing at 558C for 40 s and
extension at 728C for 40 s; finishing with an exten-
sion step at 728C for 5 min.
PCR products were electrophoresed and purified
using the ExoSAP-IT (USBEurope GmbH). Puri-
fied DNA was sequenced with an ABI sequenc-
ing kit (Big Dye Terminator Cycle Sequencing
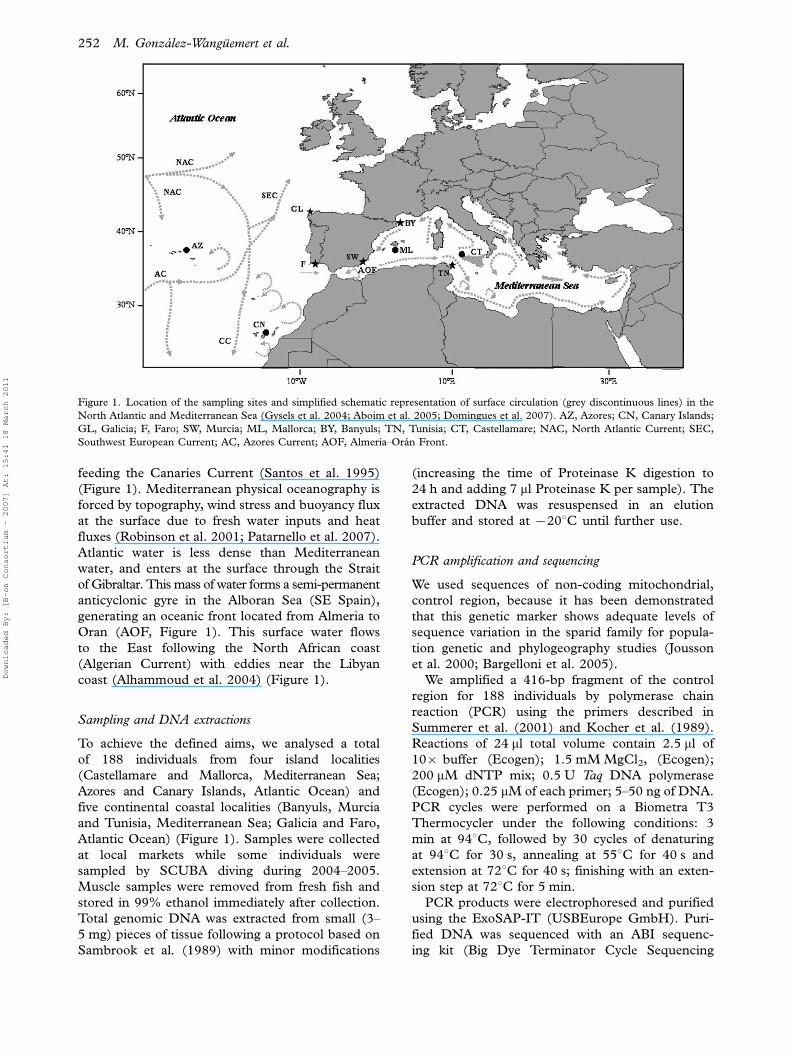
Figure 1. Location of the sampling sites and simplified schematic representation of surface circulation (grey discontinuous lines) in the
North Atlantic and Mediterranean Sea (Gysels et al. 2004; Aboim et al. 2005; Domingues et al. 2007). AZ, Azores; CN, Canary Islands;
GL, Galicia; F, Faro; SW, Murcia; ML, Mallorca; BY, Banyuls; TN, Tunisia; CT, Castellamare; NAC, North Atlantic Current; SEC,
Southwest European Current; AC, Azores Current; AOF, Almerıa�Oran Front.
252 M. Gonzalez-Wanguemert et al.
Downloaded By: [B-on Consortium - 2007] At: 15:41 18 March 2011
v. 2.0-ABI PRISM, Applied Biosystems) and then
analysed with an ABI 3700 automated sequencer.
Chromatograms obtained from the automated se-
quencer were read using BIOEDIT Sequence Align-
ment editor (Hall 1999).
Population genetic analysis
Genetic diversity parameters, FST values and results
of AMOVA analysis and Mantel’s test (cyt-b) were
taken from a previous paper (Gonzalez-Wanguemert
et al. 2010) to compare with the control region data.
To evaluate the genetic diversity of populations,
haplotype and nucleotide diversities were calculated
from control region data using ARLEQUIN version
2.000 (Schneider et al. 2000). The same program and
region was used to calculate the pairwise FST values
among populations and among groups (coastal/island
and Mediterranean/Atlantic groups). Their signifi-
cance was tested by performing 10,000 permutations.
Correlations between geographic distances and
FST values were tested using Mantel’s (1967) test.
Probabilities were calculated from the distribution
of 1000 randomized matrices computed by permu-
tation. Mantel’s test was performed using the MANTEL
procedure from the ‘Genetix’ package (Belkhir et al.
1996�2004).
We also performed an analysis of molecular var-
iance (AMOVA) to examine hierarchical population
structure, pooling the localities into two groups,
‘island’ (the Azores and Canary Islands, Mallorca
and Castellamare) and ‘coastal’ (Banyuls, Tunisia,
Galicia, Faro and Murcia). Also, another two groups,
Mediterranean (Murcia, Banyuls, Tunisia, Castella-
mare and Mallorca) and Atlantic (the Azores and
Canary Islands, Galicia and Faro), were tested as an
independent nesting design. Significance was esti-
mated with 10,000 permutations of the data matrix
(Guo 1992).
An exact test of population differentiation based
on haplotype frequencies (Raymond & Rousset
1995) was performed to test the null hypothesis
that observed haplotype distribution is random with
respect to sampling location. The significance of
individual tests was estimated by comparison with
simulated distributions constructed from 10,000
random permutations of the original data matrix.
Demographic history
To study the historical demography of the popula-
tions, we analysed the mismatch distributions of
pairwise differences between all individuals grouped
by region (Mediterranean and Atlantic) and insular-
ity (island and coastal) using control region and cyt-b
(ARLEQUIN, v. 2.000). These analyses discriminate
whether a population has remained demographically
stable over time or has undergone a rapid population
expansion (Rogers & Harpending 1992).
ARLEQUIN was used to test for departures from
mutation-drift equilibrium with Tajima’s D test (Tajima
1989). We also assessed the history of effective
population size by means of other statistics such as
Fu’s FS (Fu 1997), using DNASP version 4.10.9
(Rozas et al. 2003). Fu (1997) has noticed that the
FS statistic was very sensitive to population demo-
graphic expansion, which generally lead to large
negative Fs values. The significance of the FS statistic
was tested by generating random samples under the
hypothesis of selective neutrality and population
equilibrium, using a coalescent simulation algorithm
adapted from Hudson (1990).
The time of possible population expansions (t)
was calculated through the relationship t�2ut (Rogers
& Harpending 1992), where t is the mode of the
mismatch distribution, u is the mutation rate of the
sequence considering that u�2mk (m is the mutation
rate per nucleotide and k is the number of nucleo-
tides). A mutation rate of 11% per nucleotide per
million years (Myr) was used for control region
(Bargelloni et al. 2003).
Results
Genetic diversity
A total of 188 individuals were sequenced for the
mtDNA control region (410 bp) and the overall
diversity was high with 131 different haplotypes
whose sequences were registered in Genbank
[EF428560, GQ995933�GQ996062]. We found a
total of 125 polymorphic sites and 140 mutations.
Only nine haplotypes were shared among different
individuals; the other 122 haplotypes were singletons.
Two of the shared haplotypes were represented in
more than one geographical area (Mediterranean Sea
and Atlantic Ocean), while the other seven were only
shared between individuals restricted to the same
geographical area. The number of haplotypes per
population ranged from 12 to 19 (Table I). The most
common haplotype (CR-15) was found in
five localities (Mallorca, Tunisia, Murcia, Faro and
Canary Islands) and 93.1% of haplotypes were
population-specific. The haplotype network with
many reticulate relationships was not conclusive for
control region. Haplotype diversity was high, but
nucleotide diversity within each population was
moderate to low (Table I).
Genetic differentiation among populations
AMOVAs (Table II) using control region data
and considering two different nesting designs
Phylogeography of white seabream 253
Downloaded By: [B-on Consortium - 2007] At: 15:41 18 March 2011

(‘coastal�island’ and ‘Mediterranean�Atlantic’) indi-
cated that the highest proportion of the variance was
attributed to variation within populations (99.05%
and 98.89%, respectively) and a significant but small
variance component was attributable to variation
among populations within groups (1.10% and
0.90%) (Table II).
Significant FST values were found in pairwise
comparisons between some Mediterranean locali-
ties (Tunisia, Galicia and Murcia) and the Azores
(Table III). Significant genetic differentiation was
also detected between Mediterranean localities such
as Banyuls and Tunisia/Murcia. Similarly, exact tests
of population differentiation showed significant dif-
ferences (PB0.05) for the same pairs of populations
(data not shown).
FST values (control region data and previous
published cyt-b data) (Table III) showed that the
Azores sample was the most genetically differentiated
population, so we tested to confirm whether genetic
differentiation detected among Mediterranean/
Atlantic groups and ‘island/coastal’ groups was real
or whether it resulted from differentiation of the
Azores population.
A significant differentiation is shown between the
Mediterranean and Atlantic basins considering each
geographical region as a single panmictic metapo-
pulation (control region: FST�0.004, P�0.020;
previous cyt-b data: FST�0.036, P�0.008). This
genetic differentiation was still significant (cyt-b)
when we removed the Azores population from the
Atlantic group (cyt-b: FST�0.040, P�0.013; con-
trol region: FST�0.002, P�0.110). No differentia-
tion was detected between ‘coastal’ and ‘island’
groups using control region data (FST�0.001,
P�0.212). However, the same analysis detecteda
significant differentiation using cyt-b data (FST�0.016, P�0.05), but the FST value decreased
when Azores was not considered (FST��0.004,
P�0.517).
Mantel tests did not show evidence of a pattern
of genetic differentiation in relation to geographic
Table I. Diversity measures for the populations of Diplodus sargus. Abbreviations indicate number of individuals (N), number of haplotypes
(Nh), nucleotide diversity (p) and haplotype diversity (h). Cyt-b data published Gonzalez-Wanguemert et al. (2010).
Control region Cyt-b
Populations N Nh p h Nh p h
Azores 20 15 0.0230 0.9766 3 0.0011 0.6377
Canary 20 12 0.0247 0.9872 2 0.0003 0.2000
Galicia 23 16 0.0290 0.9933 6 0.0011 0.5507
Faro 20 12 0.0234 1.0000 4 0.0009 0.5524
Murcia 20 18 0.0214 0.9656 7 0.0022 0.8381
Banyuls 21 12 0.0244 0.9429 6 0.0022 0.8889
Mallorca 22 16 0.0218 0.9926 7 0.0019 0.7647
Tunisia 22 19 0.0271 1.0000 7 0.0014 0.6883
Castellamare 20 12 0.0176 1.0000 5 0.0015 0.7091
Total 188 131 0.0244 0.9874 23 0.0163 0.7200
Table II. Hierarchical analysis of molecular variance (AMOVA) results for Diplodus sargus. We have considered four groups: island group
(Azores and Canary Islands, Mallorca and Castellamare localities), coastal group (Banyuls, Tunisia, Galicia, Faro and Murcia localities),
Mediterranean group (Murcia, Banyuls, Tunisia, Castellamare and Mallorca localities) and Atlantic group (the Azores and Canary Islands,
Galicia and Faro). Significant values ( PB0.05) are in bold. Cyt-b data published in Gonzalez-Wanguemert et al. (2010).
Molecular marker Source of variation Total variance (%) Fixation indices
Control region Among groups (Coast�Island) �0.16 FCT��0.0016
Among populations within groups 1.10 FSC�0.0110
Within populations 99.05 FST�0.0095
Control region Among groups (Med�Atl) 0.21 FCT�0.0021
Among populations within groups 0.90 FSC�0.0090
Within populations 98.89 FST�0.0111
Cytb Among groups (Coast�Island) 0.68 FCT�0.0068
Among populations within groups 3.97 FSC�0.0399
Within populations 95.35 FST�0.0465
Cytb Among groups (Med�Atl) 2.97 FCT�0.0297
Among populations within groups 2.61 FSC�0.0269
Within populations 94.42 FST�0.0558
254 M. Gonzalez-Wanguemert et al.
Downloaded By: [B-on Consortium - 2007] At: 15:41 18 March 2011

distance (control region: Z�1062.36; r�0.046;
P�0.417; cyt-b: Z�7310.23, r�0.392, P�0.087).
The same test considering only Iberian coastal
samples (Galicia, Faro, Murcia and Banyuls), which
are more likely to be connected by gene flow given
the habitat continuity, did not detect a pattern either
(control region: Z�125.84, r��0.629, P� 0.75;
cyt-b: Z�464.20, r�0.705, P�0.140).
Demographic history
We performed one set of analyses considering each
geographical region (Mediterranean and Atlantic)
using control region data (Figure 2). Mismatch
distributions were not different from the sudden
expansion model for the Mediterranean and Atlantic
groups (Figure 2a; Table IV). Tajima’s D was sig-
nificant for the Mediterranean group and Fu’s FS
were significant for both groups (Table IV). The
same analyses were performed using ‘coastal’ and
‘islands’ groups and only the FS values were sig-
nificant (Table IV; Figure 2b). Considering these
data, we only detected a significant Mediterranean
expansion which took place approximately 121,383
years ago.
Mismatch distribution analyses were also per-
formed using cyt-b data. The least-squares procedure
to fit model mismatch distribution and observed
distribution did not converge after 1800 steps.
Tajima’s D was significant for the Mediterranean
group and FS values were significant for Mediterra-
nean and Atlantic groups (Table IV). We carried out
another set of analyses considering ‘island’ and
‘coastal’ groups and Tajima’s D and Fu’s FS were
significant for both groups (Table IV; Figure 2d).
Discussion
Nucleotide and haplotype diversities can provide
some information on the history of white seabream
populations. High haplotype diversity (control
region) and low to moderate nucleotide diversity
(control region and cyt-b) were found in all popula-
tions analysed. This pattern of genetic diversity can
be attributed to a recent population expansion after
a low effective population size caused by founder
events or bottlenecks (Grant & Bowen 1998; Aboim
et al. 2005). This explanation is also consistent with
the star-shaped haplotype network detected for cyt-b
from populations of Diplodus sargus in previous work
(Gonzalez-Wanguemert et al. 2010) whose shape
is obtained after the expansion event. Our data
suggest that expansion may have happened in the
Mediterranean region 121,383 years ago. Similar
expansion events for D. sargus were detected using
control region data by Bargelloni et al. (2005). These
authors considered the loss of an ancestral Mediter-
ranean clade during environmentally less suitable
periods and a subsequent re-colonization of the
vacant niche by the Atlantic clade. This hypothesis
would also be supported by our data.
A greater number of unique haplotypes was found
in the populations from the Mediterranean Sea
(control region: 75 haplotypes; cytb: 13 haplotypes)
than in the Atlantic populations (control region:
54 haplotypes; cytb: five haplotypes). This would
point to historical isolation followed by secondary
contact with D. sargus invading the Mediterranean
Sea from the Atlantic Ocean but considering the
survival of Mediterranean haplotypes throughout.
Other factors could also explain these results, such
as a more stable effective population size over time in
the Mediterranean Sea or an older origin of D. sargus
in the Mediterranean Sea. However, this last hy-
pothesis does not seem likely considering Summerer
et al.’s (2001) D. sargus phylogeny.
Low differentiation among Mediterranean and
Atlantic groups was shown by the AMOVA (control
region and cyt-b) and FST values (control region).
Similar FST values using control region data were
Table III. Population pairwise FST values from cyt-b data (below the diagonal) and control region (above diagonal). Cyt-b data published
Gonzalez-Wanguemert et al. (2010).
BY ML TN F CN AZ GL SW CT
BY � 0.166 0.0278* 0.0070 0.0150 0.0123 0.0310* 0.0411* 0.0291
ML �0.0334 � �0.0048 �0.0111 �0.0036 0.0093 0.0070 �0.0035 �0.0011
TN �0.0054 �0.0170 � �0.0039 0.0026 0.0116* 0.0034 0.0053 �0.0039
F 0.0498 0.0045 �0.0356 � �0.0064 �0.0056 0.0035 0.0020 0.0000
CN 0.2334* 0.1275** 0.0863 0.0409 � �0.0020 0.0096 0.0094 0.0064
AZ 0.1011* 0.0857* 0.0886* 0.1044* 0.1865* � 0.0149* 0.0290* 0.0121
GL 0.0558 0.0054 �0.0219 �0.0450 0.0302 0.1087* � 0.0207* 0.0035
SW �0.0213 0.0226 0.0027 0.0403 0.2240* 0.1208* 0.0644 � 0.0156
CT �0.0387 �0.0294 �0.0563 �0.0488 0.1002 0.0779 �0.0343 �0.0230 �
*PB0.05. BY, Banyuls; ML, Mallorca; TN, Tunisia; F, Faro; CN, Canary Islands; AZ, Azores Islands; GL, Galicia; SW, Murcia; CT,
Castellamare.
Phylogeography of white seabream 255
Downloaded By: [B-on Consortium - 2007] At: 15:41 18 March 2011

shown by Bargelloni et al. (2005), who did not reject
the null hypothesis of panmixia. The simplest
explanation for slight genetic structure is that gene
flow permits the homogenization of gene frequencies
across geographic populations. However, the lack of
population structure may not be solely the result of
exchange of sufficient individuals to prevent popula-
tion divergence, as the slight genetic differences found
among some populations of D. sargus are also con-
sistent with a recent divergence. So, the genetic
similarity of the populations from two regions could
be explained by the insufficient time to accumulate
genetic differences. The Strait of Gibraltar has been
proposed to be the divide between two marine bio-
geographical regions (Quignard 1978; Turon et al.
2003; Baus et al. 2005; Lemaire et al. 2005).
However, a clear phylogenetic break has never been
observed and some species from diverse taxa show
no differentiation at all between Atlantic and
Mediterranean populations (Bargelloni et al. 2003,
2005; Costagliola et al. 2004; Duran et al. 2004;
Stamatis et al. 2004; Zardoya et al. 2004; Domingues
Figure 2. Mismatch distributions (frequency distributions of pairwise differences among haplotypes) of Diplodus sargus for each of the
Mediterranean, Atlantic, coastal and island populations. (Control region, A�B and cyt-b, C�D; black bars, observed data; continuous line
with black dots, simulated data.)
256 M. Gonzalez-Wanguemert et al.
Downloaded By: [B-on Consortium - 2007] At: 15:41 18 March 2011

et al. 2006, 2007; Patarnello et al. 2007; Comesana
et al. 2008; Gonzalez-Wanguemert et al. 2010). We
found considerable levels of gene flow between the
Atlantic and the Mediterranean populations for D.
sargus (data not shown), with all the comparisons
showing Nm values greater than 1. Diplodus sargus
adults spawn in the open sea from March to June
with the larvae spending 3�4 weeks in the open sea
before reaching a favourable environment for recruit-
ment (Gonzalez-Wanguemert et al. 2004). So, the
most likely time for migration is during the extended
pelagic phase, when larvae are at the mercy of
prevailing currents. In fact, any gene flow at present
is likely to be unidirectional from the Atlantic into the
Mediterranean, because of the physical oceanography
at the Atlanto-Mediterranean boundary (Duran et al.
2004). Previous results from white seabream micro-
satellites corroborated the absence of significant
genetic differentiation between Atlantic and Medi-
terranean populations, although these markers de-
tected the highest FST values among the Azores and
other populations (Gonzalez-Wanguemert et al. 2010).
It is important to highlight the significant genetic
differentiation found between the Azores (control
region and cyt-b) and all other populations, but not
associated with the transition between Atlantic
Ocean and Mediterranean Sea. Pinera et al. (2007)
working on Pagellus bogaraveo confirmed this result
and suggested that the differences found between
Atlantic and Mediterranean regions in previous
works are the consequence of the high geographic
distances between the Azores Islands and the con-
tinental coast. It must also be noted that phyloge-
netic analysis (data not shown) and the haplotype
network for cyt-b data (Gonzalez-Wanguemert et al.
2010) revealed a small clade of haplotypes that only
occurred in the Azores population. This is suggestive
of some degree of isolation. The Azores islands
showed the lowest number of migrants compared
with the all other populations (Nem�0.97�1.87).
It is possible that the large geographical distance
between the European continental slope and the
Azores islands is a barrier to gene flow within this
region. The current system (Figure 1) can also
influence the isolation of the Azores. The scarce
dispersal routes from the Azores may include larval
dispersal via the Canary Current such as has been
described for Helicolenus dactylopterus (Aboim et al.
2005). However, our data do not support this
hypothesis because we detected high and significant
FST values (cyt-b and microsatellites) between the
Azores and Canarian localities. We must also con-
sider historical aspects. The results agree with the
predicted phylogeographic effects caused by the
decline of the Azorean sea surface temperatures to
values similar to those prevailing nowadays in
western Iberia (Domingues et al. 2006, 2007). The
Azores population survived glaciations and the large
Table IV. Parameters of the sudden expansion model and the goodness-of-fit test to the model with respective significances. S, number of
sites with substitutions; u0 pre-expansion population size; u1, post-expansion population size; t, time in number of generations; SSD, sum of
squared deviations. Tajima’s D and Fu’s FS values and their statistical significance are shown.
Groups Mediterranean Atlantic Island Coastal
Control region Parameters
S 97 97 83 105
u0 3.320 0.012 1.952 1.986
u1 54.346 92.734 42.474 61.582
t 7.688 12.298 10.009 10.007
Goodness-of-fit-test
SSD 0.001 0.0005 0.002 0.001
P 0.759 0.949 0.800 0.649
Tajima’s D-test �1.618 �1.504 �1.452 �1.538
P 0.042 0.058 0.067 0.052
Fu’s FS �24.528 �24.445 �24.570 �24.382
P 0.000 0.000 0.000 0.000
Cyt-b Parameters
S 19 8 12 15
u0 0.000 0.000
u1 2657.500 1123.594
t 1.004 1.072
Goodness-of-fit-test
SSD No fit No fit 0.0135 0.007
P 0.000 0.05
Tajima’s D-test �2.074 �1.470 �1.800 �1.929
P 0.008 0.063 0.024 0.015
Fu’s FS �15.192 �6.744 �8.103 �11.796
P 0.000 0.000 0.000 0.000
Phylogeography of white seabream 257
Downloaded By: [B-on Consortium - 2007] At: 15:41 18 March 2011
geographic distance to continental slope impeded
gene flow between populations; these facts would
explain the several private haplotypes detected in the
Azores population and the high FST values. How-
ever, the Canary Islands were severely affected by
the decrease of sea surface temperature (Barton
et al. 1998). In fact, this locality only showed two
cyt-b haplotypes and the lowest values of haplotype
diversity (hcyt-b�0.200) and observed heterozygosity
(Ho�0.467) (Gonzalez-Wanguemert et al. 2010).
Gene flow between coastal and island samples did
not seem to comply with an isolation by distance
model (IBD). Iberian coastal samples (Galicia, Faro,
Murcia and Banyuls) with geographic continuity did
not follow this model either. However, other authors
working with Mediterranean and Atlantic D. sargus
populations (Domingues et al. 2007) detected an
IBD from control region data. They considered that
this pattern stems from two white seabream features:
its benthopelagic nature and its survival during the
drops in sea surface temperatures during last glacia-
tions, allowing the possibility of movements of adults
from the Azores to the Iberian coast. We do not
agree with these considerations. Although the
benthopelagic nature of D. sargus is a fact, it is
unlikely that the mobility of the adults allows rapid
mixing between populations from the European
mainland coast and the Azores islands because of
the 1800 km distance and waters deeper than
4000 m. The presence of seamounts in this area
does not justify their use as stepping-stones such as
Domingues et al. (2007) argued. The depth of
waters between these seamounts and the lack of
prey (echinoderms) for D. sargus (Rosecchi 1985,
1987; Figueiredo et al. 2005) would prevent the
movements of D. sargus adults from the Azores
islands to the Iberian coast and vice versa. The
white seabream is a diurnal omnivore, feeding on
algae, sea urchins, worms, gastropods and amphi-
pods. Algae were the most commonly consumed
items and Echinodermata were the second com-
posed mostly of the sea urchins Arbacia lixula,
Sphaerechinus granularis and Paracentrotus lividus
(Figueiredo et al. 2005) which do not inhabit greater
depths. Also, some ontogenetic differences can be
observed, such as an increase in consumption of sea
urchins with increasing size of fish, so it is very
difficult for adult white seabream to find prey
between the seamounts.
In general, isolation promotes differentiation by
reducing gene flow between insular and continental
populations (Sa-Pinto et al. 2008). However, we
have only detected clear differentiation between the
Azores islands and the continental populations. The
rest of island populations (Mallorca, Castellamare
and Canary Islands) did not show the same pattern.
In fact, AMOVA using control region and cyt-b data
did not detect a significant genetic differentiation
between the ‘island’ and ‘coast’ groups and the
FST value between these two groups without the
Azores population was low and non-significant.
Mediterranean island localities (Mallorca and Cas-
tellamare) have shown poor genetic differentiation
with the other populations, which indicates a high
gene flow. These islands are located near continental
coasts and show high connectivity favoured by the
oceanographic current system.
Conclusion
Low differentiation among coastal/island and Medi-
terranean/Atlantic groups was shown, although weak
evidence of a phylogeographic break was detected
using the cyt-b marker. However, we found a clear
island/distance effect with regard to the Azores.
Significant genetic differentiation between the Azores
islands compared to all populations has been de-
tected. The large geographical distance between the
European continental slope and the Azores Islands is
a barrier to gene flow within this region and historical
events such as glaciations have also had an influence
on this genetic differentiation.
Acknowledgements
We thank Dr Sofıa Gamito, Dr Philippe Lenfant,
Dr Ben Stobart, Dr Lilia Barhi and Tomas Vega for
providing samples from Faro, Banyuls, Mallorca,
Tunisia and Castellamare, respectively. We are grate-
ful to Dr Fernando Canovas for useful comments.
This work received partial financial support from the
SENECA Program Murcia University (PB/56/FS/
02-03000/PI/05) and the AECI Program (Agencia
Espanola de Cooperacion Internacional. Ministerio
de Asuntos Exteriores, A/4396/05- A/6704/06). M.G.W.
was supported by a M.E.C. (Ministerio de Educa-
cion y Ciencia) postdoctoral grant.
References
Aboim MA, Menezes GM, Schlitt T, Rogers D. 2005. Genetic
structure and history of populations of the deep-sea fish
Helicolenus dactylopterus (Delaroche, 1809) inferred from
mtDNA sequence analysis. Molecular Ecology 14:1343�54.
Adams J, Maslin M, Thomas E. 1999. Sudden climate transitions
during the Quaternary. Progress in Physic Geography 23:1�36.
Alhammoud B, Beranger K, Mortier L, Crepon M, Dekeyser I.
2004. Surface circulation of the Levantine Basin: Comparison
of model results with observations. Progress in Oceanography
66:299�320.
Bargelloni L, Alarcon JA, .Alvarez MC, Penzo E, Magoulas A,
Palma J, et al. 2005. The Atlantic�Mediterranean transition:
Discordant genetic patterns in two seabream species, Diplodus
puntazzo (Cetti) and Diplodus sargus (L.). Molecular Phylogen-
tics and Evolution 36:523�35.
258 M. Gonzalez-Wanguemert et al.
Downloaded By: [B-on Consortium - 2007] At: 15:41 18 March 2011

Bargelloni L, Alarcon JA, .Alvarez MC, Penzo E, Magoulas A,
Reis C, et al. 2003. Discord in the family Sparidae
(Teleostei): Divergent phylogeographical patterns across the
Atlantic�Mediterranean divide. Journal of Evolutionary Biol-
ogy 16:1149�58.
Barton ED, Aristegui J, Tett P, Canton M, Garcıa-Braun J,
Hernandez-Leon S, et al. 1998. The transition zone of the
Canary Current upwelling region. Progress in Oceanography
41:455�504.
Bauchot ML, Hureau JC. 1990. Sparidae. In: Whitehead PJP,
Bauchot ML, Hureau JC, Nielsen J, Tortuese, editors. Fishes of
the North-Eastern Atlantic and Mediterranean. Paris: UN-
ESCO, p 883�907.
Baus E, Darrock DJ, Bruford MW. 2005. Gene-flow patterns in
Atlantic and Mediterranean populations of the Lusitanian sea
star Asterina gibossa. Molecular Ecology 14:3373�82.
Belkhir K, Borsa P, Goudet J, Chicki L, Bonhomme F. 1996�2004. GENETIX 4.05, logiciel sous WindowsTM pour la
genetique des populations. Laboratoire Genome, Populations,
Interactions, CNRS UMR 5000, Universite de Montpellier II,
Montpellier (France). Computer program. Available on http://
www.univ-montp2.fr/genetix/genetix/ genetix.htm
Briggs JC. 1974. Marine Zoogeography. New York, NY:
McGraw-Hill Press.
Briggs JC. 1996. Global Biogeography. Developments in Paleon-
tology and Stratigraphy. Vol. 14. Amsterdam: Elsevier.
Cardinale M, Arrhenius F. 2000. The influence of stock structure
and environmental conditions on the recruitment process of
Baltic cod estimated using a generalized additive model.
Canadian Journal of Fisheries and Aquatic Science 57:2402�09.
Comesana AS, Martınez-Areal MT, Sanjuan A. 2008. Genetic
variation in the mitochondrial DNA control region among
horse mackerel (Trachurus trachurus) from the Atlantic and
Mediterranean areas. Fisheries Research 89:122�31.
Costagliola D, Robertson DR, Guidetti P, Stefanni S, Wirtz P,
Heiser JB, et al. 2004. Evolution of coral reef fish Thalassoma
pavo spp. (Labridae). 2. Evolution of the eastern Atlantic
species. Marine Biology 144:377�83.
Crowley TJ. 1981. Temperature and circulation changes in the
eastern north Atlantic during the last 150,000 years: Evidence
from the planktonic foraminiferal record. Marine Micropaleon-
tology 6:97�129.
Domingues V, Santos R, Brito A, Alexandrou M, Almada V. 2007.
Mitochondrial and nuclear markers reveal isolation by distance
and effects of Pleistocene glaciations in the northeastern
Atlantic and Mediterranean populations of the white seabream
(Diplodus sargus, L.). Journal of Experimental Marine Biology
and Ecology 346:102�13.
Domingues V, Santos R, Brito A, Almada V. 2006. Historical
population dynamics and demography of the eastern Atlantic
pomacentrid Chromis limbata (Valenciennes, 1833). Molecular
Phylogenetics and Evolution 40:139�47.
Duran S, Palacın C, Becerro MA, Turon X, Giribert G. 2004.
Genetic diversity and population structure of the comercially
harvested sea urchin Paracentrotus lividus (Echinodermata,
Echinoidea). Molecular Ecology 13:3317�28.
Emerson BC. 2002. Evolution on oceanic islands: Molecular
phylogenetic approaches to understanding pattern and process.
Molecular Ecology 15:449�58.
Figuereido M, Morato T, Barreiros JP, Afonso P, Santos R. 2005.
Feeding ecology of the white seabream, Diplodus sargus, and the
ballan wrasse, Labrus bergylta, in the Azores. Fisheries Research
75:107�19.
Fu YX. 1997. Statistical tests of neutrality of mutations against
population growth, hitchhiking and background selection.
Genetics 147:915�25.
Gibson RN. 1994. Impact of habitat quality and quantity on the
recruitment of flatfishes. Netherlands Journal of Sea Research
32:191�206.
Gonzalez-Wanguemert M, Canovas F, Perez-Ruzafa A, Marcos
C, Alexandrino P. 2010. Connectivity patterns inferred from
the genetic structure of white seabream (Diplodus sargus L.).
Journal of Experimental Marine Biology and Ecology 383:23�31.
Gonzalez-Wanguemert M, Perez-Ruzafa A, Canovas F, Garcıa-
Charton JA, Marcos C. 2007. Temporal genetic variation in
populations of Diplodus sargus from the SW Mediterranean.
Marine Ecology Progress Series 334:237�44.
Gonzalez-Wanguemert M, Perez-Ruzafa A, Garcıa-Charton JA,
Marcos C. 2006. Genetic differentiation and gene flow of two
sparidae subspecies, Diplodus sargus sargus and Diplodus sargus
cadenati in Atlantic and south-west Mediterranean populations.
Biological Journal of the Linnean Society 89:705�18.
Gonzalez-Wanguemert M, Perez-Ruzafa A, Marcos C, Garcıa-
Charton J. 2004. Genetic differentiation of Diplodus sargus
(Pisces: Sparidae) populations in Southwest Mediterranean.
Biological Journal of the Linnean Society 82:249�61.
Grant WS, Bowen BW. 1998. Shallow population histories in
deep evolutionary lineages of marine fishes: Insights from
sardines and anchovies and lessons for conservation. Journal
of Heredity 89:415�26.
Guo SW, Thompson EA. 1992. Performing the exact test of
Hardy�Weinberg proportion for multiple alleles. Biometrics
48:361�72.
Gysels ES, Hellemans B, Patarnello T, Volckaert FAM. 2004.
Current and historic gene flow of the sandy goby Pomatochistus
minutus on the European Continental Shelf and in the
Mediterranean Sea. Biological Journal of the Linnean Society
83:561�76.
Hall TA. 1999. BIOEDIT: A user-friendly biological sequence
alignment, editor and analysis program for Windows 95/98/NT.
Nucleic Acids Symposium Series 41:95�98.
Harmelin-Vivien ML, Harmelin JG, Leboulleux V. 1995. Micro-
habitat requirements for settlement of juvenile sparid fishes on
Mediterranean rocky shores. Hydrobiologia 300/301:309�20.
Hudson RR. 1990. Gene genealogies and the coalescent process.
In: Futuyma D, Antonovics J, editors. Oxford Surveys in
Evolutionary Biology. Vol. 7. New York, NY: Oxford University
Press. p 1�44.
Jousson O, Bartoli P, Pawlowski J. 2000. Cryptic speciation
among instestinal parasites (Trematoda: Digenea) infecting
sympatric host fishes (Sparidae). Journal of Evolutionary
Biology 13:778�85.
Kocher TD, Thomas WK, Meyer A, Edwards SV, Paabo SF,
Villablanca FX, et al. 1989. Dynamics of mtDNA evolution in
animals: amplification and sequencing with conserved primers.
Proceedings of the National Academy of Sciences USA
86:6196�200.
Lazoski C, Sole-Cava AM, Boury-Esnault N, Klatau M, Russo
CAM. 2001. Cryptic speciation in a high gene flow scenario in
the oviparous marine sponge Chondrosia reniformis. Marine
Biology 139:421�29.
Lemaire C, Versini J, Bonhomme F. 2005. Maintenance of genetic
differentiation across a transition zone in the sea: Discordance
between nuclear and cytoplasmatic markers. Journal of Evolu-
tionary Biology 18:70�80.
Lenfant P, Planes S. 1996. Genetic differentiation of white sea
bream within the Lion’s Gulf and the Ligurian Sea (Mediter-
ranean Sea). Journal of Fish Biology 49:613�21.
Lenfant P, Planes S. 2002. Temporal genetic changes between
cohorts in a natural population of a marine fish, Diplodus sargus.
Biological Journal of the Linnean Society 76:9�20.
Phylogeography of white seabream 259
Downloaded By: [B-on Consortium - 2007] At: 15:41 18 March 2011

Mantel N. 1967. The detection of disease clustering and general-
ized regression approach. Canadian Research 27:209�20.
Morato T, Afonso P, Lourinho P, Nash RDM, Santos S. 2003.
Reproductive biology and recruitment of the white sea bream in
the Azores. Journal of Fish Biology 63:59�72.
Pajuelo JG, Lorenzo JM. 2004. Basic characteristics of the
population dynamic and state of exploitation of Moroccan
white seabream Diplodus sargus cadenati (Sparidae) in the
Canarian archipelago. Journal of Applied Ichthiology 20:15�21.
Patarnello T, Filip A, Volckaert MJ, Castilho R. 2007. Pillars of
Hercules: Is the Atlantic�Mediterranean transition a phylogeo-
graphical break? Molecular Ecology 16:4426�44.
Perez-Ruzafa A, Gonzalez-Wanguemert M, Lenfant P, Marcos C,
Garcıa-Charton JA. 2006. Effects of fishing protection on the
genetic structure of fish populations. Biological Conservation
129:244�55.
Pinera JA, Blanco G, Vazquez E, Sanchez JA. 2007. Genetic
diversity of blackspot seabream (Pagellus bogaraveo) populations
of Spanish Coasts: A preliminary study. Marine Biology
151:2153�58.
Pitchford JW, James A, Briendly J. 2005. Quantifying the effects of
individual and environmental variability in fish recruitment.
Fisheries Oceanography 14:150�60.
Quignard JP. 1978. La Mediterranee, creuset ichthyologique.
Bolletino Zoologico 45(suppl):23�36.
Raymond M, Rousset F. 1995. An exact test for population
differentiation. Evolution 49:1280�83.
Riginos C, Nachman MW. 2001. Population subdivision in
marine environments: The contributions of biogeography,
geographical distance and discontinuous habitat to genetic
differentiation. Molecular Ecology 10:1439�53.
Robinson AR, Leslie WG, Theocharis A, Lascaratos A. 2001.
Ocean circulation currents: Mediterranean Sea Circulation. In:
Turekian KK, Thorpe SA, editors. Encyclopedia of Ocean
Sciences. London: Academic Press. p 1689�706.
Rogers AR, Harpending H. 1992. Population growth makes waves
in the distribution of pairwise differences. Molecular Biology
and Evolution 9:552�59.
Rosecchi E. 1985. Ethologie alimentaire des sparidae, Diplodus
annularis, Diplodus sargus, Diplodus vulgaris, Pagellus erythrinus,
Sparus aurata du Golf du Lion et des etangs palavasiens. These
de doctoral, Universite des Sciences et Techniques du Langue-
doc. 281 pages.
Rosecchi E. 1987. L’alimentation de Diplodus annularis, Diplodus
sargus, Diplodus vulgaris, et Sparus aurata (Pisces, Sparidae)
dans le Golfe du Lion et des lagunes littorales. Reveu des
Travaux de l Institut des Peches Maritimes 49:125�41.
Rozas J, Sanchez del Barrio JC, Messeguer X, Rozas R. 2003.
DnaSP, DNA polymorphism analyses by the coalescent and
other methods. Bioinformatics 19:2496�97.
Sambrook E, Fritsch F, Maniatis T. 1989. Molecular Cloning.
New York, NY: Cold Spring Harbour Press. 1659 pages.
Santos RS, Hawkins S, Monteiro LR, Alves M, Isidro EJ. 1995.
Marine research, resources and conservation in the Azores.
Aquatic Conservation: Marine and Freshwater Ecology 5:311�54.
Sa-Pinto A, Branco M, Soyanda D, Alexandrino P. 2008. Patterns
of colonization, evolution and gene flow in species of the genus
Patella in the Macaronesian Islands. Molecular Ecology
17:519�32.
Schneider S, Roessli D, Excoffier L. 2000. ARLEQUIN ver
2.000: A software for population genetics data analysis.
Genetics and Biometry Laboratory. University of Geneva,
Geneva. Computer Program.
Schonhuth S, .Alvarez Y, Rico V, Gonzalez JA, Santana JI,
Gouveia E, et al. 2005. Molecular identification and biometric
analysis of Macaronesian archipelago stocks of Berix splendens.
Fisheries Research 73:299�309.
Stamatis C, Triantafyllidis A, Moutou K.A, Mamuris Z. 2004.
Mitochondrial DNA variation in northeast Atlantic and Med-
iterranean populations of Norway lobster, Nephrops norvegicus.
Molecular Ecology 16:1377�90.
Summerer M, Hanel R, Sturmbauer C. 2001. Mitochondrial
phylogeny and biogeographic affinities of sea bream of the
genus Diplodus (Sparidae). Journal of Fish Biology 59:1639�52.
Tajima F. 1989. The effect of change in population size on DNA
polymorphisms. Genetics 123:597�601.
Turon X, Tarjuelo I, Duran S, Pascual M. 2003. Characterising
invasion processes with genetic data: An Atlantic clade of
Clavelina lepadiformis (Ascidiacea) introduced into Mediterra-
nean harbours. Hydrobiologia 503:29�35.
Uthicke S, Benzie JAH. 2000. Allozyme electrophoresis indicates
high gene flow between populations of Holothuria (Microthele)
nobilis (Echinodermata: Holothuroidea) on the Great Barrier
Reef. Marine Biology 137:819�25.
Zardoya R, Castilho R, Grande C, Favre-Krey L, Caetano S,
Marcato S, et al. 2004. Differential population structuring of
two closely related fish species, the mackerel (Scomber scombrus)
and the chub mackerel (Scomber japonicus), in the Mediterra-
nean Sea. Molecular Ecology 13:1785�98.
Zulliger DE, Tanner S, Ruch M, Ribi G. 2009. Genetic structure
of the high dispersal Atlanto-Mediterreanean sea star Astro-
pecten aranciacus revealed by mitochondrial DNA sequences
and microsatellite loci. Marine Biology 156:597�610.
Editorial responsibility: Gavin Gouws
260 M. Gonzalez-Wanguemert et al.
Downloaded By: [B-on Consortium - 2007] At: 15:41 18 March 2011


