Embed Size (px)
Citation preview

Journal Identification = DENTAL Article Identification = 1805 Date: April 21, 2011 Time: 2:53 pm
d e n t a l m a t e r i a l s 2 7 ( 2 0 1 1 ) 598–607
avai lab le at www.sc iencedi rec t .com
journa l homepage: www. int l .e lsev ierhea l th .com/ journa ls /dema
Physical properties of current dental nanohybrid andnanofill light-cured resin composites
Irini D. Sideridou ∗, Maria M. Karabela, Evangelia Ch. VouvoudiLaboratory of Organic Chemical Technology, Department of Chemistry, Aristotle University of Thessaloniki,Thessaloniki GR-54124, Greece
a r t i c l e i n f o
Article history:
Received 12 March 2010
Received in revised form
3 February 2011
Accepted 4 February 2011
Keywords:
Dental nanohybrid
Dental nanofill
Sorption-solubility-volumetric
change
Volumetric shrinkage
Flexural strength and modulus
Thermogravimetric analysis
a b s t r a c t
Objectives. The purpose of this work was the detailed study of sorption characteristics of
water or artificial saliva, the determination of flexural strength and the flexural modu-
lus, and the study of the thermal stability of some current commercial dental light-cured
nanocomposites containing nano-sized filler particles.
Methods. Three nanohydrid dental composites (Tetric EvoCeram (TEC), Grandio (GR) and
Protofill-nano (PR)) and two nanofill composites (Filtek Supreme Body (FSB) and the Filtek
Supreme Translucent (FST)) were used in this work. The volumetric shrinkage due to poly-
merization was first determined. Also the sorption, solubility and volumetric increase were
measured after storage of composites in water or artificial saliva for 30 days. The flexural
strength and flexural modulus were measured using a three-point bending set-up according
to the ISO-4049 specification, after immersion of samples in water or artificial saliva for 1
day or 30 days. Thermal analysis technique TGA method was used to investigate the thermal
stability of composites.
Results. GR and TEC composites showed statistically no difference in volumetric shrinkage
(%) which is lower than the other composites, which follow the order PR < FSB < FST. The
amount of sorbed water and solubility is not statistically different than those in artificial
saliva. In all the composites studied the amount of water, which is sorbed (% on composite) is
not statistically different than the amount of water, which is desorbed and follows the order:
GR < TEC < PR < FSB < FST. After immersion in water for 1 day the highest flexural strength
showed the FSB and the lowest TEC. GR, PR and FST showed no statistically different flexural
strength. The flexural modulus of composites after immersion for one day follows the order
TEC < PR≤FST < FSB < GR.
Significance. Among the composites studied, Grandio had the lowest polymer matrix content,
consisting mainly of Bis-GMA. It showed the lowest polymerization shrinkage and water
sorption and the highest flexural strength and flexural modulus after immersion in water or
artificial saliva for 30 days. The water and artificial saliva generally showed the same effect
on physical properties of the studied composites. Thermogravimetric analysis gave good
information about the structure and the amount of organic polymer matrix of composites.
© 2011 Academy
∗ Corresponding author. Fax: +30 210 2310 997769.E-mail address: [email protected] (I.D. Sideridou).
0109-5641/$ – see front matter © 2011 Academy of Dental Materials. Pudoi:10.1016/j.dental.2011.02.015
of Dental Materials. Published by Elsevier Ltd. All rights reserved.
blished by Elsevier Ltd. All rights reserved.

Journal Identification = DENTAL Article Identification = 1805 Date: April 21, 2011 Time: 2:53 pm
2 7
1
TtnnhT“m
pdbslewpta
cbpoOit
t(fippti
vc(F(clpatedw
aospild
d e n t a l m a t e r i a l s
. Introduction
he term “nanotechnology” has evolved over the years viaerminology drift to mean “anything smaller than microtech-ology” such as nano powders and other things that areanoscale in size, but not referring to mechanisms thatave been purposefully built from nanoscale components.his evolved version of the term is more properly labelednanoscale bulk technology” while the original meaning is
ore properly labeled “molecular nanotechnology [1].The most traditional dental composites for restorative
urposes are hybrid and microfill types. Hybrids offer interme-iate esthetic properties but excellent mechanical propertiesy the incorporation of fillers with different average particleizes (15–20 �m and 0.01–0.05 �m). Microfill composites wereaunched in the market to overcome the problems of poorsthetic properties. These materials are usually formulatedith colloidal silica (around 50% in volume) with an averagearticle size of 0.02 �m and a range of 0.01–0.05 �m. Unfor-unately the mechanical properties are considered low forpplication in regions of high occlusal force [2].
Based on the definition “nanoscale bulk technology” newlasses of dental composites, so-called nanocomposites, haveeen developed and marketed during recent years. Nanocom-osites are claimed to combine the good mechanical strengthf the hybrids [3–5] and the superior polish of the microfills [6].ther positive features reported are high wear resistance [7–9]
mproved optical characteristics [4] and reduced polymeriza-ion shrinkage [3,10].
Nanocomposites are available as nanohybrid types con-aining milled glass fillers and discrete nanoparticles40–50 nm) and as nanofill types, containing both nano-sizedller particles, called nanomers and agglomerations of thesearticles described as “nanoclusters” [4]. The nanoclustersrovide a distinct reinforcing mechanism compared withhe microfill or nanohybrid systems resulting in significantmprovements to the strength and reliability [11].
This work is concerned first with the determination of theolumetric shrinkage after polymerization of three currentommercial nanohybrids – Tetric EvoCeram (TEC), GrandioGR) and Protofill-nano (PR) – and two nanofill composites –iltek Supreme Body (FSB) and Filtek Supreme TranslucentFST). The composites were then immersed in water or artifi-ial saliva 37 ◦C for 30 days for the determination of the sorbediquid and volume increase. After that the composites wereut into a desiccator at 37 ◦C for 30-days and desorption of thebsorbed water or artificial saliva was determined. Based onhis experimental data the amount of unreacted monomersxtracted by water or artificial saliva during immersion for 30ays, known as “solubility” of the composites in these liquids,as calculated.
In an aqueous oral environment, polymer compositesbsorb water and release unreacted monomers. The releasef unpolymerized monomers from polymer composites maytimulate the growth of bacteria around the restoration and
romote allergic reactions in some patients. Also the waterngress into dental composites in the oral cavity can, over time,ead to deterioration of the physical/mechanical propertiesue to hydrolytic breakdown of the bond between the silane-
( 2 0 1 1 ) 598–607 599
filler particles, filler matrix debonding or even hydrolyticdegradation of the fillers. However, some water ingress mayhave a positive side effect, such as the expansion of the com-posite compensating for polymerization shrinkage leading toimproved marginal sealing. Thus the solvent uptake by dentalcomposite is generally a very important property which mustbe investigated. In the authors’ previous work the sorption ofwater [12–15] or ethanol/water solution [14] or ethanol [15] bylight-cured dental resins and commercial polymer compos-ites, was studied. Also the sorption kinetics of ethanol/watersolution by dental resins and composites, was investigated[16].
In the present study the flexural strength and moduluswere also determined, using a three-point bending set-upaccording to the ISO-4049 specification, after immersion ofsamples in water or artificial saliva for 1 day or 30 days. Theweight changes of the above composites were also measuredas a function of temperature by Thermogravimetric Analysis(TGA). TGA is a technique in which the mass of the sample ismonitored as a function of temperature, while the sample issubjected to a controlled program. TGA has been used for thestudy of the thermal stability of dental composites [17–19].
2. Materials and methods
2.1. Materials
Five commercially available dental light-cured compositeswere studied; Tetric EvoCeram (TEC; Ivoclar-Vivadent, Schaan,Liechtenstein), Grandio (GR; VOCO, Cuxhaven, Germany),Protofill-nano (PR; Germany), Filtek Supreme Body (FSB; 3M-ESPE, St. Paul, MN, USA) and Filtek Supreme Translucent (FST;3M-ESPE, St. Paul, MN, USA). Their specifications are listed inTable 1.
2.2. Artificial saliva
The SAGF medium used as artificial saliva in this work andits composition is given in Table 2 [20]. The pH of the SAGFmedium was adjusted to 6.8, because this value was closer tothat of saliva in the mouth after its emission from the canals.The artificial saliva and the samples were sterilized together(0.5 atm/120 ◦C/20 min) to avoid colonization of microorgan-isms. The use of the SAGF medium required special care,because the solution was supersaturated in carbon dioxidewith regard to the air. As a result it tended to lose CO2 gas,which led to an increase in pH, so before each experiment,the pH of solution was controlled.
2.3. Volumetric shrinkage
The volumetric shrinkage was measured based onArchimedes’ Principle, as described in Refs. [21,22]. Thedensities of uncured composites were first measured, usinga Mettler-Toledo AG64 balance. From each test material,
uncured sphere-shaped specimens were carefully formed insuch a way that trapped air bubbles were avoided. Since theuncured materials were rather sticky, a thin polyester film(thickness 0.05 mm) was fixed on the special holder of the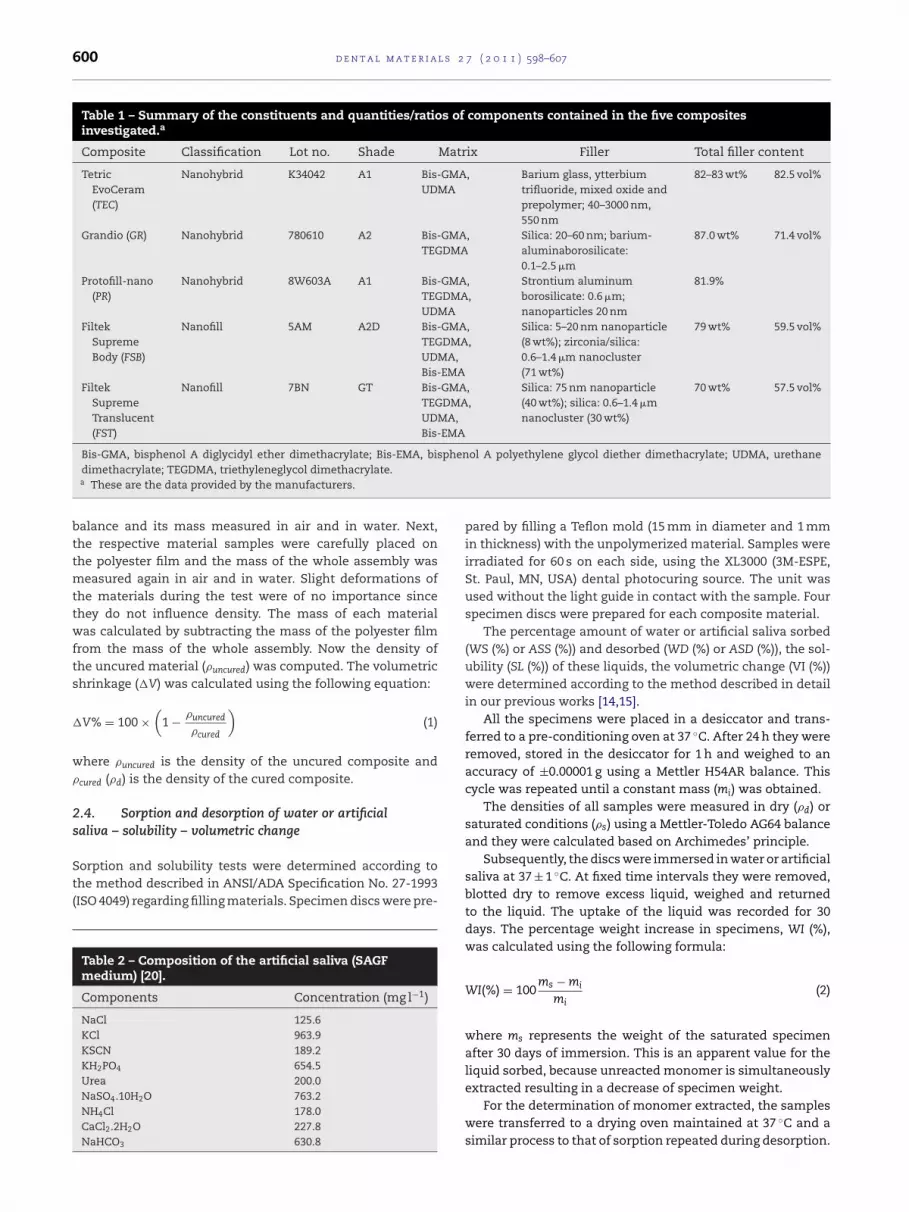
Journal Identification = DENTAL Article Identification = 1805 Date: April 21, 2011 Time: 2:53 pm
600 d e n t a l m a t e r i a l s 2 7 ( 2 0 1 1 ) 598–607
Table 1 – Summary of the constituents and quantities/ratios of components contained in the five compositesinvestigated.a
Composite Classification Lot no. Shade Matrix Filler Total filler content
TetricEvoCeram(TEC)
Nanohybrid K34042 A1 Bis-GMA,UDMA
Barium glass, ytterbiumtrifluoride, mixed oxide andprepolymer; 40–3000 nm,550 nm
82–83 wt% 82.5 vol%
Grandio (GR) Nanohybrid 780610 A2 Bis-GMA,TEGDMA
Silica: 20–60 nm; barium-aluminaborosilicate:0.1–2.5 �m
87.0 wt% 71.4 vol%
Protofill-nano(PR)
Nanohybrid 8W603A A1 Bis-GMA,TEGDMA,UDMA
Strontium aluminumborosilicate: 0.6 �m;nanoparticles 20 nm
81.9%
FiltekSupremeBody (FSB)
Nanofill 5AM A2D Bis-GMA,TEGDMA,UDMA,Bis-EMA
Silica: 5–20 nm nanoparticle(8 wt%); zirconia/silica:0.6–1.4 �m nanocluster(71 wt%)
79 wt% 59.5 vol%
FiltekSupremeTranslucent(FST)
Nanofill 7BN GT Bis-GMA,TEGDMA,UDMA,Bis-EMA
Silica: 75 nm nanoparticle(40 wt%); silica: 0.6–1.4 �mnanocluster (30 wt%)
70 wt% 57.5 vol%
sphen
Bis-GMA, bisphenol A diglycidyl ether dimethacrylate; Bis-EMA, bidimethacrylate; TEGDMA, triethyleneglycol dimethacrylate.a These are the data provided by the manufacturers.balance and its mass measured in air and in water. Next,the respective material samples were carefully placed onthe polyester film and the mass of the whole assembly wasmeasured again in air and in water. Slight deformations ofthe materials during the test were of no importance sincethey do not influence density. The mass of each materialwas calculated by subtracting the mass of the polyester filmfrom the mass of the whole assembly. Now the density ofthe uncured material (�uncured) was computed. The volumetricshrinkage (�V) was calculated using the following equation:
�V% = 100 ×(
1 − �uncured
�cured
)(1)
where �uncured is the density of the uncured composite and�cured (�d) is the density of the cured composite.
2.4. Sorption and desorption of water or artificialsaliva – solubility – volumetric change
Sorption and solubility tests were determined according tothe method described in ANSI/ADA Specification No. 27-1993(ISO 4049) regarding filling materials. Specimen discs were pre-
Table 2 – Composition of the artificial saliva (SAGFmedium) [20].
Components Concentration (mg l−1)
NaCl 125.6KCl 963.9KSCN 189.2KH2PO4 654.5Urea 200.0NaSO4.10H2O 763.2NH4Cl 178.0CaCl2.2H2O 227.8NaHCO3 630.8
ol A polyethylene glycol diether dimethacrylate; UDMA, urethane
pared by filling a Teflon mold (15 mm in diameter and 1 mmin thickness) with the unpolymerized material. Samples wereirradiated for 60 s on each side, using the XL3000 (3M-ESPE,St. Paul, MN, USA) dental photocuring source. The unit wasused without the light guide in contact with the sample. Fourspecimen discs were prepared for each composite material.
The percentage amount of water or artificial saliva sorbed(WS (%) or ASS (%)) and desorbed (WD (%) or ASD (%)), the sol-ubility (SL (%)) of these liquids, the volumetric change (VI (%))were determined according to the method described in detailin our previous works [14,15].
All the specimens were placed in a desiccator and trans-ferred to a pre-conditioning oven at 37 ◦C. After 24 h they wereremoved, stored in the desiccator for 1 h and weighed to anaccuracy of ±0.00001 g using a Mettler H54AR balance. Thiscycle was repeated until a constant mass (mi) was obtained.
The densities of all samples were measured in dry (�d) orsaturated conditions (�s) using a Mettler-Toledo AG64 balanceand they were calculated based on Archimedes’ principle.
Subsequently, the discs were immersed in water or artificialsaliva at 37 ± 1 ◦C. At fixed time intervals they were removed,blotted dry to remove excess liquid, weighed and returnedto the liquid. The uptake of the liquid was recorded for 30days. The percentage weight increase in specimens, WI (%),was calculated using the following formula:
WI(%) = 100ms − mi
mi(2)
where ms represents the weight of the saturated specimenafter 30 days of immersion. This is an apparent value for theliquid sorbed, because unreacted monomer is simultaneously
extracted resulting in a decrease of specimen weight.For the determination of monomer extracted, the sampleswere transferred to a drying oven maintained at 37 ◦C and asimilar process to that of sorption repeated during desorption.

Journal Identification = DENTAL Article Identification = 1805 Date: April 21, 2011 Time: 2:53 pm
2 7
Tff
W
i3e3s
S
a
W
a(
W
wic
W
w1ws
ur
V
ws
2
FdbptuoaabEt
d e n t a l m a t e r i a l s
he percentage amount of water or artificial saliva desorbedrom specimens, WD (%) or ASD (%), was calculated using theollowing formula:
D(%) or ASD(%) = 100ms − md
ms(3)
n which md represents the weight of the specimen after0-days desorption. The amount of unreacted monomerxtracted by water or artificial saliva, during immersion for0 days, known as “solubility” (SL) of the composite in theseolvents, was calculated from the equation:
L(%) = 100mi − md
mi(4)
The percentage amount of water or artificial salivabsorbed is then given by the formula:
S(%) or ASS(%) = WI(%) + SL(W or AS)(%) (5)
The percentage amount of water or artificial salivabsorbed was also calculated as % sorption on polymer matrixWSR(%) or AASR(%)) using the equation:
SR(%) = WS(%)a
or AASR(%) = AASR(%)a
(5a)
here a is the %-wt amount of polymer matrix in the compos-te. Also the absorbed amount of water or artificial saliva wasalculated in �g/mm3 using the equation:
S(�g/mm3) = WI(�g/mm3) + SL(�g/mm3) (5b)
here WI(�g/mm3) = 106((ms − mi)/V), SL(�g/mm3) =06((mi − md)/V) and V the volume of discs in cubic millimetersas determined from the diameter and the thickness of the
pecimen disc measured at five points.Furthermore, the % volume increase VI (%) is calculated
sing the available data of densities for the dry (�d) and satu-ated (�s) specimens:
I(%) = 100 (�d − �s) + w�d
�s(6)
here w represents the % sorbed water (WS%) or artificialaliva (ASS%).
.5. Flexural properties
lexural properties were determined according to the methodescribed in ANSI/ADA Specification No. 27-1993 for resinased filling materials or ISO 4049. Specimens were pre-ared by filling a Teflon mold (2 mm × 2 mm × 25 mm) withhe unpolymerized composite, taking care to minimize thentrapped air. The upper and ower surfaces of the mold wereverlaid with glass slides covered by a Mylar sheet to avoiddhesion with the unpolymerized material. The completed
ssembly was held together with spring clips and irradiatedy overlapping, using a XL 3000 dental photocuring unit (3M-SPE, St. Paul, MN, USA). This source consisted of a 75 Wungsten halogen lamp, which emits radiation between 420( 2 0 1 1 ) 598–607 601
and 500 nm and has the maximum peak at 470 nm. The unitwas used without the light guide at a contact point on theglass slides. The samples were irradiated for 60 s on each side.Then the mold was dismantled and the composite carefullyremoved by flexing the Teflon mold. Twenty five specimen barswere prepared for each composite.
The specimens were divided into five groups of five sam-ples each. The first group consisted of dry samples measuredimmediately after preparation. The second and third groupconsisted of samples, which had been stored in distilled waterat (37 ± 1) ◦C in dark for periods 1 and 30 days, correspond-ingly. The fourth and fifth group consisted of samples, whichhad been stored in artificial saliva at (37 ± 1) ◦C in the dark forperiods 1 and 30 days, correspondingly. The samples of groupsII–V were immersed in their solution immediately after prepa-ration. The specimens were bent in a three-point transversetesting rig with 20 mm between the two supports (3-pointbending). The rig was fitted to a mechanical testing machine(Instron, model 3344). All bend tests were carried out with aconstant cross-head speed of 0.75 ± 0.25 mm/min until frac-ture occurred. The load and the corresponding deflection wererecorded. The flexural modulus (E), in MPa, and the flexu-ral strength (�), in MPa, were calculated using the followingequations:
E = F1l3
4bdh3and � = 3Fl
2bh2
where F1 represents the load in Newtons exerted on thespecimen, F the maximum load in Newtons exerted on thespecimen at the point of fracture, l the distance in mmbetween the supports, h the height of specimen in mmmeasured immediately prior to testing, b the width of thespecimen in mm measured immediately prior to testing andd is the deflection corresponding to the load F1.
2.6. Thermogravimetic analysis
Thermogravimetric Analysis was performed on a Pyris 1 TGA(Perkin Elmer) Thermal Analyzer using about 5 mg of eachsample. It evaluated weight changes as a function of temper-ature during a thermal program ranging from 30 to 700 ◦C atthe heating rate of 10 ◦C min−1 in nitrogen atmosphere (flow20 ml/min) followed by cooling to room temperature.
2.7. Statistical analysis
The values reported in tables and figures represent mean val-ues ± standard deviation of replicates. One-way analysis ofvariance (ANOVA) test, followed by Tukey’s test, for multiplecomparisons between means to determine significant differ-ences was used at a significance level set at p ≤ 0.05.
3. Results
The determined mean values and standard deviations of the
percentage of volumetric shrinkage of the studied compositesare shown in Fig. 1.In Table 3 the sorption of water (37 ± 1 ◦C) by the studiedcomposites after immersion in water for 30 days is shown.

Journal Identification = DENTAL Article Identification = 1805 Date: April 21, 2011 Time: 2:53 pm
602 d e n t a l m a t e r i a l s 2 7 ( 2 0 1 1 ) 598–607
Table 3 – Sorption/desorption of water (37 ± 1 ◦C) by the studied composites after immersion in water for 30 days [means(S.D.)]*, n = 4.
Composite Sorption oncomposite (%)
Desorption oncomposite (%)
Sorption onpolymermatrix (%)
Sorption oncomposite(�g/mm3)
TEC 1.10 (0.02)A 1.13 (0.02)A 6.29 (0.11)a 23.00 (0.40)GR 0.68 (0.01)B 0.72 (0.02)B 5.21 (0.11) 14.65 (0.38)PR 1.30 (0.02)C 1.28 (0.02)C 7.17 (0.08) 24.90 (0.99)FSB 1.59 (0.01)D 1.63 (0.04)D 7.41 (0.03) 31.13 (0.44)FST 1.66 (0.04)E 1.68 (0.04)E 6.05 (0.16)a 29.00 (1.51)
∗ Common corresponding uppercase letters in a given row and lowercase letters in a given column indicate no significant difference (p ≤ 0.05).
Table 4 – Solubility and volume increase of the studied composites after immersion in water for 30 days [means (S.D.)]*,n = 4.
Composite Solubility (%) Solubility (�g/mm3) % Volume increase
TEC 0.09 (0.02)a 1.84 (0.31)d 0.41 (0.62)g,h
GR 0.09 (0.02)a 2.03 (0.38)d 0.00 (0.00)h
PR 0.28 (0.03)b 5.43 (0.63)e 1.12 (0.64)gb,c 4.90 (0.82)e,f 0.82 (0.17)g
3.78 (0.32)f 1.00 (0.12)g
te no significant difference (p ≤ 0.05).
TEC GR PR FSB FST0,0
0,2
0,4
0,6
0,8
1,0
1,2
1,4
1,6
1,8
2,0a
% s
orp
tion
water artificial saliva
FSB 0.25 (0.05)FST 0.22 (0.02)c
∗ Common corresponding lowercase letters in a given column indica
The solubility in water and the volume increase is shown inTable 4.
Analogously, the results obtained for the sorption of artifi-cial saliva (37 ± 1 ◦C) are shown in Tables 5 and 6.
In Fig. 2a the sorption (%) is compared, in Fig. 2b the solu-bility (%) is compared and finally in Fig. 3 the volume increase(%) of studied composites after immersion in water or artificialsaliva (37 ± 1 ◦C) is compared.
The results obtained for the flexural strength and flexuralmodulus of the studied composites after immersion in water37 ± 1 ◦C for 1 day or 30 days are shown in Table 7. Correspond-ingly the results obtained after immersion of composites inartificial saliva 37 ± 1 ◦C for 1 day or 30 days are shown inTable 8.
The effect of the aging in liquid medium on flexuralstrength of the studied composites is shown in Fig. 4. Cor-respondingly the effect of the aging in liquid medium on theflexural modulus is shown in Fig. 5.
TEC
GR
PR
FSB
FST
0,0 0,5 1,0 1,5 2,0 2,5
volumetric shrinkage (%)
Fig. 1 – Means values and standard deviations of thepercentage of volumetric shrinkage of the studiedcomposites.
b
TEC GR PR FSB FST0,00
0,05
0,10
0,15
0,20
0,25
0,30
0,35
0,40
0,45
So
lubi
lity
(%)
water artificial saliva
Fig. 2 – (a) Sorption of water or artificial saliva 37 ◦C by thestudied composites after immersion in the liquid for 30days. (b) Effect of the liquid medium aging on solubility ofstudied composites after immersion in water or artificialsaliva for 30 days.

Journal Identification = DENTAL Article Identification = 1805 Date: April 21, 2011 Time: 2:53 pm
d e n t a l m a t e r i a l s 2 7 ( 2 0 1 1 ) 598–607 603
Table 5 – Sorption of artificial saliva (37 ± 1 ◦C) by the studied composites after immersion in artificial saliva for 30 days[means (S.D.)]*, n = 4.
Composite Sorption oncomposite (%)
Desorption oncomposite (%)
Sorption onpolymermatrix (%)
Sorption oncomposite(�g/mm3)
TEC 1.11 (0.02)A 1.08 (0.01)A 6.37 (0.10) 23.30 (0.80)a
GR 0.63 (0.01)B 0.63 (0.03)B 4.82 (0.06) 13.60 (0.69)PR 1.29 (0.02)C 1.26 (0.01)C 7.15 (0.11) 24.58 (0.85)a
FSB 1.58 (0.02)D 1.55 (0.02)D 7.33 (0.09) 30.84 (0.63)FST 1.67 (0.03)E 1.64 (0.03)E 6.07 (0.12) 29.42 (0.09)
∗ Common corresponding uppercase letters in a given row and lowercase letters in a given column indicate no significant difference (p ≤ 0.05).
Table 6 – Solubility and volume increase of the studied composites after immersion in artificial saliva for 30 days [means(S.D.)]*, n = 4.
Composite Solubility (%) Solubility (�g/mm3) % Volume increase
TEC 0.09 (0.01)a 1.98 (0.11)b 1.26 (0.40)c
GR 0.06 (0.02)a 1.25 (0.40)b −0.22 (0.67)d
PR 0.36 (0.04) 6.24 (0.42) 0.71 (0.38)c,d
FSB 0.28 (0.01) 5.48 (0.15) 0.75 (0.74)c,d
FST 0.22 (0.04) 3.33 (0.74) 0.92 (0.71)c,d
*Common corresponding lowercase letters in a given column indicate no significant difference (p ≤ 0.05).
Table 7 – Flexural strength, �, and flexural modulus, E, of studied composites after immersion in water (37 ± 1 ◦C) for 1day or 30 days [means (S.D.)]*, n = 5.
Composite Flexural strength [MPa] Flexural modulus [GPa]
1 day 30 days 1 day 30 days
TEC 98.88 (5.94)a 79.49 (8.11) 7.72 (0.20) 6.94 (0.33)GR 116.37 (3.70)b,A 116.13 (5.28)A 14.81 (0.07)B 14.44 (0.76)B
PR 107.47 (7.47)a,b 98.04 (2.69)c 8.36 (0.24)d,C 8.24 (0.33)C
FSB 144.36 (9.84) 95.57 (4.87)c 10.14 (0.21) 9.21 (0.26)FST 103.69 (11.14)a,b 94.23 (11.19)c 8.42 (0.22)d 7.58 (0.12)
*Common corresponding lowercase letters in a given column and uppercase letters in a given row indicate no significant difference (p ≤ 0.05).
Table 8 – Flexural strength, �, and flexural modulus, E, of studied composites after immersion in artificial saliva(37 ± 1 ◦C) for 1 day or 30 days [means (S.D.)]*, n = 5.
Composite Flexural strength [MPa] Flexural modulus [GPa]
1 day 30 days 1 day 30 days
TEC 105.39 (3.20)a 76.94 (6.55)c 8.03 (0.14) 7.33 (0.23)GR 112.24 (0.86)b 101.49 (3.91) 14.92 (0.32)A 14.91 (0.32)A
PR 115.97 (10.39)a,b 79.91 (6.08)c 8.76 (0.10)e,C 8.46 (0.17)C
FSB 147.93 (5.65) 86.36 (8.20)c 10.49 (0.20) 9.75 (0.24)FST 127.19 (26.45)a,b 80.46 (12.81)c 8.54 (0.22)e 8.03 (0.22)
*Common corresponding lowercase letters in a given column and uppercase letters in a given row indicate no significant difference (p ≤ 0.05).
Table 9 – Temperatures (◦C) with the maximum degradation rate of each step of thermal degradation of studiedcomposites.
Composite 1st weight loss 2nd weight loss Weight loss at800 ◦C (%)
Organicmatrixa
Weight loss at2 steps (%)
T1 (◦C) Weight loss (%) T2 (◦C) Weight loss (%)
TEC 340.1 4.43 425.4 19.06 28.52 17.50 23.49GR — — 424.3 12.23 14.54 13.00 12.23PR 322.8 11.0 415.2 10.87 25.40 18.10 21.83FSB 319.4 3.57 412.9 16.64 26.20 21.50 20.21FST 344.8 6.66 419.9 16.92 29.79 27.50 23.59
aThese are the data provided by the manufacturers.

Journal Identification = DENTAL Article Identification = 1805 Date: April 21, 2011 Time: 2:53 pm
604 d e n t a l m a t e r i a l s 2 7 ( 2 0 1 1 ) 598–607
TEC GR PR FSB FST0,0
0,4
0,8
1,2
1,6
2,0V
olum
e In
crea
se (
%)
water saliva
Fig. 3 – Volume increase (%) of studied composites afterimmersion in water or artificial saliva for 30 days.
TEC GR PR FSB FST0
2
4
6
8
10
12
14
16
Fle
xura
l mo
dulu
s [G
Pa
]
water saliva
immersion for 1 daya
2
4
6
8
10
12
14
16
Fle
xura
l mod
ulus
[GP
a]
water saliva
immersion for 30 daysb
In Fig. 6 the thermograms of the TGA and the thermogramsof the first derivative (dTGA) are shown. In Table 9 the temper-atures with the maximum degradation rate of each step ofthermal degradation of the studied composites and the corre-sponding weight loss are shown.
TEC GR PR FSB FST0
30
60
90
120
150
180
Fle
xura
l str
eng
th [M
Pa
]
water saliva
immersion for 1 daya
TEC GR PR FSB FST0
20
40
60
80
100
120
140immersion for 30 days
Fle
xura
l str
eng
th [
MP
a]
water salivab
Fig. 4 – Effect of the liquid medium aging on flexuralstrength of studied composites after storage in water orartificial saliva for (a) 1 day and (b) 30 days.
TEC GR PR FSB FST0
Fig. 5 – Effect of the liquid medium aging on flexuralmodulus of studied composites after storage in water or
artificial saliva for (a) 1 day and (b) 30 days.4. Discussion
The volumetric shrinkage (%) of studied composites followsthe order Grandio (GR) < Tetric EvoCeram (TEC) < Protofill-nano(PR) < Filtek Supreme Body (FSB) < Filtek Supreme Translucent(FST) (Fig. 1). This order seems to depend on the total contentof organic matrix of composites. GR contains the least amountof organic matrix (13.0 wt-%) and FST the most (30.0 wt-%)(Table 1). However, PR showed higher shrinkage than TEC,although they both contain about the same amount of organicmatrix (∼18.0 wt-%). This is attributed to the different chem-istry of their organic matrix. The organic matrix of PR consistsof Bis-GMA, UDMA and TEGDMA, while that of TEC consistsof Bis-GMA and UDMA. It is known that the polymerizationshrinkage of composites depends on the degree of conversionof monomers during polymerization; the greater the degreeof polymerization the greater the shrinkage. It is well knownalso from literature [23] that TEGDMA shows a much greaterdegree of conversion than both Bis-GMA and UDMA.
After polymerization the composites were immersed inwater or artificial saliva. Water or artificial saliva uptake in
the polymeric phase of polymer composites causes generallytwo opposing processes. The solvent will extract unreactedcomponents, mainly monomer resulting in shrinkage, loss ofweight and reduction in mechanical properties. Conversely
Journal Identification = DENTAL Article Identification = 1805 Date: April 21, 2011 Time: 2:53 pm
d e n t a l m a t e r i a l s 2 7 ( 2 0 1 1 ) 598–607 605
80070060050040030020010070
75
80
85
90
95
100
Temperature (C)o
wei
ght l
oss
(%)
-3,5
-3,0
-2,5
-2,0
-1,5
-1,0
-0,5
0,0
deri. weight loss (%
/min)
TEC
80070060050040030020010084
86
88
90
92
94
96
98
100
Temperature (oC)
wei
ght l
oss
(%)
GR
-1,8
-1,6
-1,4
-1,2
-1,0
-0,8
-0,6
-0,4
-0,2
0,0
der.weight loss (%
/min)
80070060050040030020010070
75
80
85
90
95
100
Temperature (C)o
wei
ght l
oss
(%)
-2,5
-2,0
-1,5
-1,0
-0,5
0,0der. w
eight loss (%/m
in)FSB
80070060050040030020010065
70
75
80
85
90
95
100
Temperature (oC)
wei
ght l
oss
(%)
-2,5
-2,0
-1,5
-1,0
-0,5
0,0
der. weight loss (%
/min)
FST
80070060050040030020010070
75
80
85
90
95
100
Temperature (oC)
wei
ght l
oss
(%)
-1,6
-1,4
-1,2
-1,0
-0,8
-0,6
-0,4
-0,2
0,0
der. weiht loss (%
/min)
PR
of st
siwsioipdTmitlwt
Fig. 6 – TGA and dTGA curves
olvent uptake leads to a swelling of the composite and anncrease in weight. The solvent diffuses into the polymer net-ork and separates the chains creating expansion. However
ince the polymer network contains microvoids created dur-ng polymerization and free volume between chains, a partf the solvent is accommodated without creating a change
n volume. Thus the dimensional change of a polymer com-osite in a solvent is complex and difficult to predict andepends on the chemical structure of the polymer matrix.he hydrophilicity of the polymer needs to be of sufficientagnitude to distend the polymer. In all the composites stud-
ed the amount of water sorbed is not statistically different
o the amount of water which is desorbed (Table 3) and fol-ows the order: GR < TEC < PR < FSB < FST. This order shows thatater sorption seems to depend on the polymer matrix con-ent. However PR, which has the same matrix content as TEC,
udied composites in nitrogen.
showed statistically higher water sorption. This shows thatthe water sorption of composites depends also on the matrixchemistry. PR contains TEGDMA, which is known to be ofgreater hydrophilicity than Bis-GMA and UDMA [12]. Whenthe amount of sorbed water was calculated on the basis ofthe content of composite in polymer matrix (Table 3) then theorder was different GR < FST≤TEC < PR < FSB.
The GR and TEC with lower polymer matrix content showedalso lower solubility than that of PR, FSB and FST (Table 4).Analogous behavior was observed in artificial saliva (Table 6).
The amount of sorbed water (Fig. 2a), the solubility (Fig. 2b)and the volume increase (Fig. 3) is not statistically different
from the corresponding quantities observed in the case ofartificial saliva.After immersion in water for 1 day FSB (79 wt% fillercontent) showed the greatest flexural strength and TEC

Journal Identification = DENTAL Article Identification = 1805 Date: April 21, 2011 Time: 2:53 pm
l s 2
r
606 d e n t a l m a t e r i a
(82–83 wt%) the lowest. GR (87 wt%), PR (81.9 wt%) and FST(70 wt%) showed no statistically different flexural strength(Table 3). This result shows that the flexural strengthdepends not only on the filler content but also on the fillerchemistry.
After immersion in water for 30 days the flexural strengthof TEC remained constant while that of all other compositesdecreased. It is worthy of note that after immersion in waterfor 30 days GR showed the greatest flexural strength and TECthe lowest. FSB, FST and PR showed no statistically differentflexural strength, which was less than that of GR but higherthan that of TEC.
The flexural modulus of composites after immersion forone day follows the order TEC < PR≤FST < FSB < GR and afterimmersion for 30 days the order TEC < FST < PR < FSB < GR(Table 3). It is interesting to note that the flexural mod-ulus of GR and PR remained constant after immersionin water for 30 days, while that of FSB, PR and TECdecreased.
Comparison of flexural strength after immersion for 1 dayin water or artificial saliva showed the values obtained arecomparable. When the composites remained in water or arti-ficial saliva for 30 days, the saliva had a stronger effect onthe flexural strength for GR and PR and no significant differ-ence was observed for the other composites. Comparison offlexural modulus after immersion in water or artificial salivadid not show any significant difference ( p < 0.05) for 1 day or30 days.
Thermogravimetric analysis of dental composites gavegood information about the structure and the amount of theorganic matrix. In the authors’ previous work [24] the ther-mal degradation mechanism of neat dental resins Bis-GMA,Bis-EMA, UDMA and TEGDMA was studied. Differences inthe chemical structure of the resins considerably influencethe degradation behavior of the resins. Bis-GMA and Bis-EMAshowed one-step degradation mechanism with a maximumrate corresponding to 415 and 424 ◦C respectively [24]. Onthe contrary TEGDMA and UDMA showed two degradationsteps with maximum rate at 306 and 403 ◦C for TEGDMA and357 and 444 ◦C for UDMA. GR showed only a strong peakat 424 ◦C (19.06%, wt/wt) revealing that the organic matrixconsists mainly of Bis-GMA rather than TEGDMA (Table 1).FSB showed a shoulder at 319 ◦C (3.6%, wt/wt) and a strongpeak at 413 ◦C (16.6%, wt/wt). Also FST showed a shoulderat 345 ◦C (6.7%, wt/wt) and a strong peak at 420 ◦C (16.9%,wt/wt). These results confirm that these composites containboth aromatic and aliphatic dimethacrylate resins, and showthat the aromatic content (Bis-GMA and Bis-EMA) is higherthan that of the aliphatic (TEGDMA and UDMA). They alsoconfirm that FST contains more organic matrix than FSB. TECshowed a small peak at 340 ◦C (4.4%, wt/wt) which must beattributed to the UDMA it contains, and a strong peak at 424 ◦C(19.06%, wt/wt) due to the Bis-GMA content. PR showed twostrong peaks at 323 ◦C (11.0%, wt/wt) and at 415 ◦C (10.9%,wt/wt) which show that this composite contains about equal
quantities of aromatic (Bis-GMA) and aliphatic (TEGDMA andUDMA) resins. All composites showed a weight loss higherthan their organic matrix content at 800 ◦C, which must be dueto the condensation reactions of surface hydroxyl groups ofthe filler.7 ( 2 0 1 1 ) 598–607
e f e r e n c e s
[1] Suzuki T, Kyoizumi H, Finger WJ, Kanehira M, Endo T,UtterodtA, Hisamitsu H, Komatsu M. Resistance of nanofilland nanohybrid resin composites to toothbrush abrasionwith calcium carbonate slurry. Dent Mater J 2009;28:708–16.
[2] Van Noort R. Introduction to Dental Materials. 3rd ed.London, UK: Elsevier; 2007.
[3] Moszner N, Salz U. New developments of polymeric dentalcomposites. Prog Polym Sci 2001;26:535–76.
[4] Mitra SB, WU D, Holmes BN. An application ofnanotechnology in advanced dental materials. J Am DentAssoc 2003;134:1382–90.
[5] Moszner N, Klapdohr S. Nanotechnology for dentalcomposites. Int J Nanotechnol 2004;1:130–56.
[6] Turssi CP, Saad JR, Duarte SL, Rodrigues AL. Compositesurfaces after finishing and polishing techniques. Am J Dent2000;13:136–8.
[7] Yap AU, Tan CH, Chung SM. Wear behaviour of newcomposite restoratives. Oper Dent 2004;29:269–74.
[8] Turssi CP, Ferracane JL, Serra MC. Abrasive wear of resincomposites as related to finishing and polishing procedures.Dent Mater 2005;21:641–8.
[9] Terry DA. Direct applications of a nanocomposites resinsystem. Part 1. The evolution of contemporary compositematerials. Pract Proced Aesthet Dent 2004;16(6):417–22.
[10] Chen MH, Chen CR, Hsu SH, Sun SP, Su WF. Low shrinkagelight curable nanocomposite for dental restorative material.Dent Mater 2006;22:138–45.
[11] Curtis AR, Palin WM, Fleming GJP, Shortall ACC, Marquis PM.The mechanical properties of nanofilled resin-basedcomposites: the impact of dry and wet cyclic pre-loading onbi-axial flexure strength. Dent Mater 2009;25:188–97.
[12] Sideridou I, Tserki V, Papanastasiou G. Study of watersorption, solubility and modulus of elasticity of light-cureddimethacrylate-based dental resins. Biomaterials2003;24:655–65.
[13] Sideridou ID, Achilias DS, Spyroudi C, Karabela M. Watersorption characteristics of light-cured dental resins andcomposites based on Bis-EMA/PCDMA. Biomaterials2004;25:367–76.
[14] Karabela MM, Sideridou ID. Effect of the structure of silanecoupling agent on sorption charactersistics of solvents bydental resin-nanocomposites. Dent Mater 2008;24:1631–9.
[15] Sideridou ID, Karabela MM, Vouvoudi EC. Volumetricdimensional changes of dental light-cured dimethacrylateresins after sorption of water or ethanol. Dent Mater2008:1131–6.
[16] Sideridou ID, Achilias DS, Karabela MM. Sorption kinetics ofethanol/water solution by dimethacrylate-based dentalresins and resin-composites. J Biomed Mater Res B: ApplBiomater 2007;81B:207–18.
[17] Acharya A, Greener EH. Thermogravimetric analysis ofcomposite restorative resins. J Dent Res1972;September–October:1363–8.
[18] Vaidyanathan J, Vaidyanathan TK, Wang Y, Viswanadhan T.Thermoanalytical characterization of visible light curedental composites. J Oral Rehabil 1992;19:49–64.
[19] Bernardi MIB, Rojas SS, Andreeta MRB, de S, Rastelli AN,Hernandes AC, Bagnato VS. Thermal analysis and structuralinvestigation of different dental composite resins. J ThermAnal Calorim 2008;94:791–6.
[20] Gal J-Y, Fovet Y, Adib-Yadzi M. Review: about a syntheticsaliva for in vitro studies. Talanta 2001;53:1103–15.
[21] Uhl A, Mills RW, Rzanny AE, Jandt KD. Time dependence ofcomposite shrinkage using halogen and LED light curing.Dent Mater 2005;21:278.

Journal Identification = DENTAL Article Identification = 1805 Date: April 21, 2011 Time: 2:53 pm
2 7
d e n t a l m a t e r i a l s[22] Sideridou ID, Karabela MM, Micheliou CN, Karagiannidis PG,
Logotheditis S. Physical properties of a hybrid and ananohybrid light-cured resin composite. J Biomater Sci2009;20:1831–44.[23] Sideridou I, Tserki V, Papanastasiou G. Effect of chemicalstructure on degree of conversion in light-cured
( 2 0 1 1 ) 598–607 607
dimethacrylate-based dental resins. Biomaterials
2002;23:1819–29.[24] Achilias DS, Karabela MM, Sideridou ID. Thermaldegradation of light-cured dimethacrylate resins. Part I.Isoconversional kinetic analysis. Thermochim Acta2008;472:74–83.