Embed Size (px)
Citation preview

F o o d B i o s c i e n c e 7 ( 2 0 1 4 ) 4 5 – 5 5
Available online at www.sciencedirect.com
http://dx.doi.org/102212-4292/& 2014 Pu
nCorresponding aE-mail address: d
journal homepage: www.elsevier.com/locate/fbio
Physicochemical, functional and sensory propertiesof mellorine enriched with different vegetable juicesand TOPSIS approach to determine optimumjuice concentration
Gokturk Ozturka, Mahmut Doganb,n, Omer Said Tokerc
aAhi Evran University, Kaman Vocational College, Food Technology Programme, 40300 Kirsehir, TurkeybErciyes University, Engineering Faculty, Food Engineering Department, 38039 Kayseri, TurkeycYildiz Technical University, Faculty of Chemical and Metallurgical Engineering, Food Engineering Department,34210 İstanbul, Turkey
a r t i c l e i n f o
Article history:
Received 4 September 2013
Received in revised form
3 March 2014
Accepted 1 May 2014
Keywords:
Mellorine
Rheology
Functional properties
Power-law model
Exponential model
Multi-criteria decision technique
.1016/j.fbio.2014.05.001blished by Elsevier Ltd.
uthor. Tel.: þ90 352 [email protected] (M.
a b s t r a c t
In this study different concentrations (2.5%, 5%, 10%) of beetroot, red cabbage and broccoli
juices were added to mellorine to increase its bio-functional properties. Some physicochemical
(brix, pH) and bio-functional properties (total phenolic and flavanoid content and DPPH activity)
of the juices were determined and total phenolic content of broccoli, beetroot, and red cabbage
juices were found to be 419.8, 570.6 and 1131.9 mg/L, respectively. The rheological, physico-
chemical properties of mellorine mixes and functional and sensory properties of mellorine
enrinched with vegetable juices in different concentrations were investigated. All mixes
showed shear thinning behavior. The apparent viscosity and consistency index values (K)
decreased with increase in vegetable juice concentration. Total phenolic, total flavonoid and
DPPH radical scavenging activity increased with increasing all vegetable juice concentration
added to the formulation. Regarding sensory properties, among the samples containing
vegetable juice, broccoli juice containing sample in concentration of 5% had the highest scores
considering colour and appearance, body and consistency and taste and colour properties.
TOPSIS (Technique for order preference by similarity to ideal solution) was performed to
determine optimum vegetable juice type and concentration regarding bio-functional and
sensory properties. According to TOPSIS, the mellorine including 10% red cabbage juice was
found as the best sample when considering determined conditions.
& 2014 Published by Elsevier Ltd.
1. Introduction
Mellorine, mainly composed of milk, vegetable oil, sugar,emulsifier and stabiliser, is one of the ice cream products orfrozen desserts (Clarke, 2004) and it has a complex structuresimilar to the dairy ice cream (Goff, 2002). Unlike dairy ice
4937; fax: þ90 352 437 578Dogan).
cream, in mellorine formulation, all or some proportion ofdairy fat is substituted with vegetable based oils (Clarke, 2004;Keeney, 2012). Using vegetable oils in the production ofmellorine does not negatively influence sensory profiles ofmellorine, even they contribute to a positive effect on humannutrition since they contain remarkable amount of
4.

F o o d B i o s c i e n c e 7 ( 2 0 1 4 ) 4 5 – 5 546
unsaturated fatty acids (Anonymous, 2013; Hyvönen, Linna,Tuorila, & Dijksterhuis, 2003; Nadeem, Abdullah, & Ellahi,2010). Mellorine is consumed by people of all age throughoutworldwide as an alternative product to ice cream (Karasu,Dogan, Toker,& Dogan, 2014); therefore, increasing function-ality of the product is important for human health sincemellorine is poor in terms of natural phytochemicals such asphenolics (O’Connell & Fox, 2001). Bio-functional properties ofmellorine or dairy ice cream can be improved by addingbiologically active compounds or substances containing thesecompounds to ice cream formulation. For this reason, in recentyears, a variety of researches has been conducted to fortify icecream formulation with phenolic compounds by adding somefruits (Karaman et al., 2014; Sun-Waterhouse, Edmonds,Wadhwa, & Wibisono, 2011), fruit pulp (El–Samahy, Youssef, &Moussa–Ayoub, 2009), herbal tea (Karaman & Kayacier, 2012)and some phenolics (Sagdic, Ozturk, Cankurt, & Tornuk, 2012) toice cream mix in different concentrations.
Fruits and vegetables are rich in phenolic compoundswhich contribute to colour and taste of the product (Blasa,Gennari, Angelino, & Ninfali, 2010). Furthermore, plantscontain a variety of antioxidants such as phenolics andflavonoids, which have a protective effect against somediseases, for instance cardiovascular diseases and some typesof cancer caused by free radicals, especially reactive oxygenspecies (Fraga, 2010; Keller, 2009). Broccoli and red cabbage areamong Cruciferous vegetables, which have attracted much inter-est in recent years due to a number of compounds with highantioxidant activities, such as phenolics, predominantly kaemp-ferol and hydroxycinnamic acids derivates, and cyanidin deri-vates, respectively (Chun, Smith, Sakagawa, & Lee, 2004;Heimler, Vignolini, Dini, Vincieri, & Romani, 2006; Wu andPrior, 2005). They are also a good source of glucosinolates,known as sulphur-containing substances which have cancer-protective properties. The sulphur-containing substances havebeen studied to understand their functional specifications incancer research in vitro and vivo studies (Higdon, Delage,Williams, & Dashwood, 2007; Podsedek, 2007). One of theseresearches, Boivin et al. (2009), studied the antiproliferative andantioxidant activities of common vegetables, and those vegeta-bles were divided into four groups (little, intermediate, high, andvery high) according to their effects on certain types of cancer-ous tumour cells. According to this classification beetroot,broccoli and red cabbage were classified in high group; thereforeusage of these vegetables for improving functionality of theproduct is beneficial for human health.
Increasing the bio-functional properties of the productalone is not sufficient for the acceptability of the product(Gurmeric, Dogan, Toker, Senyigit, & Ersoz, 2013). Therefore,sensorial analysis was performed to determine consumer’sacceptance or rejection of a new product. Although sensoryanalysis is useful for determination of the formulation of theproduct, it is very difficult to interpret the results since as onesample might be preferred regarding one sensory property(such as taste), the other sample might be preferred con-sidering the other sensory property (such as odor). Obtainingone score from different sensory properties, which might becarried out by multi-criteria decision techniques, is facilita-tive for interpretation or decision. Multi-criteria decisiontechniques can deal with decision problems considering a
number of decision criteria simultaneously (Pohekar &Ramachandran, 2004). They can be used for the evaluationof alternatives based on the determined criteria by using anumber of qualitative and/or quantitative criteria (Ozcan,Celebi, & Esnaf, 2011). One of the multi-criteria decisiontechniques is the TOPSIS (technique for order preference bysimilarity to ideal solution) which provides a decision hier-archy and requires pairwise comparison between criteria(Balli & Korukoglu, 2009). According to the TOPSIS method,the best alternative is nearest to the positive ideal solutionand farthest from the negative ideal solution (Benitez, Martin,& Roman, 2007; Lin, Wang, Chen, & Chang, 2008). Althoughthere have been many studies about the application of multi-criteria decision making techniques in different areas, wehave found only two studies, one of them is related toapplication of different multi-criteria decision techniques onsensory properties of the prebiotic pudding sample (Gurmericet al., 2013) and the other one is about combination ofsensory properties and bioactive properties of persimmonenriched ice cream with TOPSIS method (Karaman et al.,2014), about this subject in the food bioscience field.
The aim of this study was to determine how differentvegetable juices at different concentrations affect the bio-functional, rheological and some physicochemical propertiesof mellorine mix, and to determine the optimum concentra-tion by the TOPSIS technique considering bioactive andsensorial features.
2. Material and methods
2.1. Material
Skimmed milk powder, vegetable oil (sunflower oil), sugar,potable water, broccoli, red cabbage and red beetroot werepurchased from a local market in Kayseri, emulsifier (mono-and di-glyceride) was obtained from Safiye Cikrikcioglu Voca-tional College, in Erciyes University and xanthan gum wasobtained from Sigma. Methanol, sodium carbonate, Folin-Ciocalteau reagent, sodium nitrite, aluminium chloride andsodium hydroxide were obtained from Merck Co. and DPPHwas obtained from Sigma Co.
2.2. Preparation of mellorine
Broccoli, red cabbage and red beetroot were washed and thenpressed to prepare their juices after they were cut small parts.Vegetable juices pasteurised at 90 1C for 1 min with magneticstirrer prior adding to mellorine mix. The mellorine mix(basic mix) was prepared according to method described byKaraman and Kayacier (2012) with some modifications. Themix formulations contained 14% sugar, 11% skimmed milkpowder, 7% vegetable oil, 0.3% emulsifier and 0.2% xanthangum. Ingredients were added to the drinking water in thefollowing order: vegetable oil at 30 1C, skimmed milk powderat 40 1C, sugar at 50 1C, dry mixture (remained sugarþemülsifierþxanthan gum) at 70 1C. The mixture obtainedwas heated to 85 1C and held for 30 s at this temperaturefor pasteurisation. The pasteurised mix was cooled to 4 1Cand then aged for 22 h at 4 1C. Pasteurised vegetable juices

F o o d B i o s c i e n c e 7 ( 2 0 1 4 ) 4 5 – 5 5 47
were added to the aged mix at concentrations of 2.5, 5 and10% (w/w). All experiments were done in duplicate. Themellorine including vegetable juices was semi-frozen usinga ice cream maker (Simac II Gelataio GC 5000). After thefreezing process, which took exactly 16 min, the semi-frozensamples were packaged. The frozen mellorine samples werehardened by a batch freezer and stored at �18 1C for 24 h.
2.3. Rheological measurements
The rheological properties of the mixes were determinedusing a controlled rheometer (Thermo-Haake, RheoStress 1,Germany) with a temperature control unit (Haake, KarlsruheK15 Germany). The measurements were carried out using acone-plate configuration (cone diameter 35 mm, angle 41, gapsize 0.140 mm) in the shear rate range of 0.1–100 s�1 at 20 1C.The rheological parameters of the mixes were calculatedusing RheoWin Data Manager (RheoWin Pro V. 2.96, Haake,Karlsruhe, Germany) based on the Power law model
σ ¼K_γn ð1Þin which σ is shear stress (Pa), K is consistency coefficient(Pa sn), γ is shear rate (1/s), and n is flow behaviour index(dimensionless).
The apparent viscosity of the mixes (η50) represents theshear rate in the mouth (Bourne, 2002). To determine theeffect of vegetable juice concentration on apparent viscosityat shear rate of 50 s�1, the following equations were used
η50 ¼ η1ðCa1Þ ð2Þ
η50 ¼ η2expða2CÞ ð3Þwhere η1 and η2 is constant for concentration effect (Pa s), a1and a2 are constant, C is concentration.
2.4. Physicochemical analysis
The total solids, pH, ash, colour, overrun and melting rate of thesamples were determined. The samples were dried at 105 1C for4 h in a drying oven (Memmert, Germany) (AOAC, 1990). The pHvalues were determined by a pH meter (Inolab Terminal Level 3,Germany) until a constant value was observed on the screen.The dry ash procedure was performed at 55 1C in an ash furnace(Protherm, Turkey) without black residual after it was dried at105 1C for 3 h in the oven (Kurt, 1990). The colour values of themix samples were measured with colourimeter (Lovibond RTSeries Reflectance Tintometer, England) calibrated with a whiteand black area. Overrun was calculated according to the follow-ing equation (Arbuckle, 1986)
me of the samplesample
� �� 100 ð4Þ
The hardened samples (approximately 40 g) were placedon a wire mesh over a glass beaker and allowed to melt in theoven at 25 1C. The melting rate of the samples was calculatedaccording to the proportion of the dripped weight to initialweight of the samples.
Overrunð%Þ ¼ weight of the mix�weight of the same voluweight of the same volume of the
2.5. Bioactivity analysis
2.5.1. ExtractionTen grams of each sample was weighed and put into a 100 mLbottle. The sample was diluted to 1:5 with 80% methanol.This mixture was left at room temperature for 15 h forextraction. The extracts were centrifuged at 13,000 rpm for10 min, and the supernatant was filtered through a 0.22 mmmicrofilter into a 15 mL falcon tube. By following this proce-dure, extracts were obtained for analysis of total phenolic andflavonoid content and DPPH activity.
2.5.2. Total phenolic contentThe amount of total phenolics in the samples was determinedaccording to the method described by Sun, Powers, and Tang(2007) with some modifications. 1.5 mL of Folin-Ciocalteureagent (1:10 v/v, diluted with distilled water) was added to0.2 mL extract of the sample. After 5min, 1.5 mL of 2% (w/v) ofsodium carbonate was added and then the absorbance of allsamples was measured at 750 nm using a UV–vis spectrophot-ometer (Agilent 8453, Germany) after incubating at room tem-perature for 30min. Gallic acid was used as a standard.
2.5.3. Total flavonoid contentTotal flavonoid analysis was performed according to thealuminium chloride colourimetric method described byZhishen, Mengcheng, and Jianming (1999). 4 mL of distilledwater was added to 1 mL of the extract. 0.3 mL of 5% NaNO2
(w/v) was added to the test tube before adding 0.3 mL of 10%AlCl3 (w/v) at 5th min. After 2 mL of NaOH (1M) was added tothe test tube at 11th min, the total volume was completed to10 mL with distilled water. The absorbance of the sampleswas measured at 510 nm using the UV–vis spectrophotometeragainst the prepared blank and observed data were expressedas mg catechin equivalent.
2.5.4. DPPH radical scavenging activityDPPH radical scavenging activity (RSA) was determinedaccording to the method described by Faller and Fialho(2009). After 0.1 mL of the filtrate was mixed in with 3.9 mLof 0.1 mM DPPH solution (in 80% methanol), the mixture wascovered with aluminium foil and incubated at room tem-perature in the dark place for 30 min. The absorbance of thesamples was measured at 517 nm using the UV–vis spectro-photometer. The antioxidant capacity of the samples wascalculated using the following equation
%RSA¼ 1� absorbance of sample at 517 nmabsorbance of control at 517 nm
� �ð5Þ
2.5.5. Sensory evaluationTwenty eight panelists were selected from academic staff orgraduate students of the Food Engineering Department at

Dec
isio
n
Appearance (0.25)
Consistency (0.2)
Bio
activ
ity
Sens
ory
Prop
ertie
s
K
M1
M2
M3
P1
P2
P3
B1
B2
B3
DPPH (0.125)
Taste (0.3)
Phenolic (0.125)
Fig. 1 – The decision hierarchy of the determination of vegetable juice concentration added to mellorine based on the sensorialand bioactivity properties (B: Broccoli, M: Red cabbage, P: Beetroot, 1: 2.5%, 2: 5%, 3: 10%). (For interpretation of the referencesto color in this figure legend, the reader is referred to the web version of this article.)
F o o d B i o s c i e n c e 7 ( 2 0 1 4 ) 4 5 – 5 548
Erciyes University, Kayseri. Panelists cleaned their palateswith potable water after analysing each sample. Beforesensory analyses, the panelists were informed about theaim and requirements of the sensorial analyses. The colourand appearance, taste and odour, and consistency of the icecream samples were evaluated by the panelists. Panelistswere cleaned their palate before proceeding the next sample.Five-point hedonic scale was used for the sensory evaluationof the samples (1: extremely dislike, 2: dislike, 3: not too bad,4: like, 5: extremely like).
2.6. Application of TOPSIS method
The hierarchy of TOPSIS for decision is shown in Fig. 1. TheTOPSIS method is composed of six steps (Balli & Korukoglu,2009).
Step 1. The decision matrix is normalised by the followingequation
xij ¼aijffiffiffiffiffiffiffiffiffiffiffiffiffiffiffi∑m
k ¼ 1a2kj
s k¼ 1; 2; 3…; i;…; k; i¼ 1; 2;… ð6Þ
where xij is the normalised value and aij is the real value ofthe criteria.
Step 2. The weighted normalised decision matrix isformed (weight of each criteria as presented in Fig. 1, deter-mined based on opinion of the staff and graduate students(totally 15 person) of the Food Engineering Department inErciyes University (average value was calculated for eachcriterion)) using Eq. (7).
vij ¼ xij �wij ð7Þ
where vij is the weighted normalised value and wij is theweight of each criteria.

F o o d B i o s c i e n c e 7 ( 2 0 1 4 ) 4 5 – 5 5 49
Step 3. The positive and negative ideal solutions aredetermined.
An¼ {v1n, v2n, v3n…,vnn} (maximum values)A�¼ {v1
�, v2�, v3
�…,vn�} (minimum values)
Step 4. The distance of each alternative from the positiveand negative ideal solution is calculated according to thefollowing equations
dn
i ¼ffiffiffiffiffiffiffiffiffiffiffiffiffiffiffiffiffiffiffiffiðvij�vn
j Þ2q
ð8Þ
d�i ¼
ffiffiffiffiffiffiffiffiffiffiffiffiffiffiffiffiffiffiffiffiðvij�v�
j Þq 2
ð9Þ
where dn
i and di� is the distance of alternative from positive
and negative ideal solution, respectively.
Fig. 2 – Shear rate versus shear stress curves of the mellorine samM: Samples containing red cabbage juice, B: Samples containing
Table 1 – Rheological parameters of the Power law model dete
Sample K (Pa sn) n
K 1.62670.022a 0.30670P1 1.41170.064cb 0.30470P2 1.34470.034cd 0.30770P3 1.23370.049e 0.30970M1 1.42970.093cb 0.30370M2 1.38070.039c 0.29970M3 1.20970.059e 0.30770B1 1.48170.066b 0.29970B2 1.38470.039cb 0.29270B3 1.27270.028de 0.30870
Different letters in the same column indicate significant differences (Po0.containing red cabbage juice, B: Samples containing broccoli juice, 1: 2.5
Step 5. The closeness coefficient of each alternative (C) isobtained using Eq. (10).
C¼ d�i
dn
i þ d�i
ð10Þ
Step 6. The ranking of the alternatives is determined basedon the C values. The alternative with the highest C value isselected as the best alternative.
2.7. Statistical analysis
The statistical analysis of the samples was performed by theSPSS Statistics 17.0.1 programme. Differences between thesamples were determined by Duncan’s test (Ural & Kilic,2006).
ples,. (K: Control mix, P: Samples containing beetroot juice,broccoli juice, 1: 2.5%, 2: 5%, 3: 10%).
rmined for the mellorine mixes.
R2 η50 (Pa s)
.017a 0.998 0.09770.003a
.017a 0.999 0.08770.002bc
.011a 0.999 0.08470.001cd
.009a 0.999 0.07870.002ef
.013a 0.999 0.08670.004bcd
.009a 0.999 0.08370.001cde
.008a 0.999 0.07670.002f
.006a 0.999 0.08670.004bcd
.003a 0.999 0.08370.001cde
.011a 0.999 0.07670.002f
05), (K: Control mix, P: Samples containing beetroot juice, M: Samples%, 2: 5%, 3: 10%).

Table 2 – Effect of the type and concentration of vegetable juices on the apparent viscosity of mixes at 20 1C.
Sample Power-law model Exponential model
η50¼η1 (Ca1) η50¼η2 exp (a2C)
η1 a1 R2 η2 a2 R2
P 0.093973 �0.077749 0.979 0.090279 �0.014586 0.999M 0.093919 �0.087612 0.970 0.089846 �0.016591 0.999B 0.095156 �0.068159 0.964 0.091243 �0.011591 0.895
P: Samples including beetroot juice, M: Samples including red cabbage juice, B: Samples including broccoli juice.
F o o d B i o s c i e n c e 7 ( 2 0 1 4 ) 4 5 – 5 550
3. Results and discussion
3.1. Rheological properties
The shear stress versus shear rate data of the mellorinesamples including different vegetable juices in differentconcentrations are shown in Fig. 2. As seen, the apparentviscosity of the samples decreased with shear rate, indicatingthe shear thinning behaviour of the mellorine mix samples.Shear thinning behavior of ice cream mixes was reported indifferent studies (Dogan, Kayacier, Toker, Yilmaz, & Karaman,2013a; Toker et al., 2013a; Toker, Yılmaz, Karaman, Doğan, &Kayacıer, 2012a). Usage of vegetable oil instead of milk fat didnot influence the flow behavior of the sample. Dickinson andStainsby (1982) reported that the shear thinning behaviour ofthe ice cream mix is related with the complex involvement ofpartially broken-down micellar casein at the droplet surface.The rheological parameters (consistency coefficient (K), flowbehaviour index (n) and apparent viscosity values (η50)) of themellorine samples including different vegetable juices atdifferent concentrations are summarized in Table 1. It canbe seen that the Ostwald de Waele model (also known asPower law model) described well the steady shear flowbehaviour of the mellorine samples (R2Z0.998), which wasagreement with the previous studies (Dogan et al., 2013a;Karaman & Kayacier, 2012; Toker et al., 2012a, 2013a).
The consistency coefficient and apparent viscosity valuesof the mixes decreased with increase in the vegetable juiceconcentration while there were no significant changes in theflow behaviour index (n) (P40.05). The results reported fortrend between K and n or η50 and n were consistent withprevious studies (Dogan, Toker, & Goksel, 2011; Dogan, Toker,Aktar & Goksel, 2013b; Goksel et al., 2013; Toker, Dogan,Canyılmaz, Ersöz, & Kaya, 2013b; Toker, Dogan, & Goksel,2012b). The consistency coefficient of the samples variedbetween 1.209 and 1.626 Pa sn, which decreased with increas-ing fruit juice concentration in the mix samples. The n valuesof the samples changed between 0.292 and 0.309, thus alsoindicating shear thinning behaviour of the mellorine sam-ples. The results of our study were similar to the findings ofKaraman and Kayacier (2012), Aime, Arntfield, Malcolmson,and Ryland (2001), and Dogan and Kayacier (2007).
The apparent viscosity value of mixes at 20 1C rangedbetween 0.076 and 0.097 Pa s. The η50 value of mix sampleswas significantly affected by the addition of vegetable juices(Po0.05), but no significant difference was found among the
vegetable juice type and concentration (P40.05). Karamanand Kayacier (2012) investigated the rheological and physi-cochemical properties of ice cream mix enriched with sometea, and they reported that the η50 value of the ice cream mixand mix enriched with black tea brewed at 40 1C was found tobe 0.91 Pa s and 1.13 Pa s at 20 1C, respectively. In addition, η50value of ice cream mixes, prepared with dairy cream, weredetermined as higher (0.467–1.950 Pa s) than that of the mixesfound in this study. The raw materials used in ice creamproduction, such as fat type, sweetener and stabiliser/emul-sifier, and their concentrations affect the viscosity of icecream mix (Junior & Lannes, 2011; Bahramparvar & Tehrani,2011). Lower η50 value of mellorine when compared with icecream mixes might have explained by the fact that viscosityof vegetable oil found in the formulation is lower than that ofthe dairy fat. Yalcin, Toker, and Dogan (2012) reported thatviscosity of oils decreased with increase in polyunsaturatedfatty acid composition of the oils. Because of the high watercontent in the vegetables juices, the water content of thesamples increased with vegetable juice concentration, whichcaused a decrease in the viscosity values of the mellorinemixes. El–Samahy et al. (2009) reported that the viscosity ofice cream enriched with cactus pulp increased as concentra-tion of cactus pulp increased, whereas Hwang, Shyu, and Hsu(2009) found that the viscosity of ice cream containing grapewine lees increased by increasing of grape wine lees concen-tration from 50 g/kg to 150 g/kg.
The relationship between vegetable juice concentrationand the η50 values was determined using power-law andexponential models. As shown in Table 2, the effect ofvegetable concentration on the η50 of the samples wasexplained better by the exponential model for the mellorinecontaining beetroot juice and red cabbage juice, while thepower-law model explained better the relation between juiceconcentration and η50 value of mellorine containing broccolijuice. In the study of Dogan et al. (2013a), effect of gumconcentration on the η50 values of the ice cream samples wasbetter described by the exponential model (R2¼0.980).
3.2. The physicochemical characteristics
Brix value of the broccoli, beetroot and red cabbage juices wasfound to be 5.60, 6.67 and 9.91, respectively. pH value of thesejuices was determined as 7.09, 6.69 and 6.98, respectively.Some physicochemical properties of the mellorine mixeswith different concentrations of vegetable juices are shownin Table 3. The effect of vegetable juice type and

Table 3 – Physicochemical properties of the mellorine mixes with different concentrations of vegetable juices.
Sample pH Dry matterx Ashx L a b
K 7.6870.01a 33.7270.17a 0.33470.002f 65.2370.11a �1.5370.02d 2.5570.05e
P1 7.6170.01d 32.7470.36b 0.34370.006e 56.6170.11e 9.9870.08c 1.8070.12f
P2 7.5570.03e 31.9470.30c,d 0.35570.007d 52.1870.14f 14.9870.10b 2.5970.10e
P3 7.4870.01f 30.8170.35e 0.39470.007a 46.3370.65g 19.9770.62a 4.3270.07d
M1 7.6570.01b 32.5670.02b 0.34470.005e 56.4570.59e �4.9370.15h �7.0770.29g
M2 7.6170.00d 31.8670.14d 0.35270.005d 52.3270.39f �6.3270.11i �10.5970.11h
M3 7.5670.00e 30.7570.19e 0.36270.005c 45.7470.68h �6.3470.14i �14.7070.09i
B1 7.6370.01c 32.8070.11b 0.34570.003e 64.6570.20b �2.3270.06e 4.6670.10c
B2 7.6170.01d 32.1970.22c 0.35370.006d 63.9170.23c �2.9270.02f 6.2870.13b
B3 7.5570.00e 30.6070.12e 0.38070.002b 62.5670.29d �3.9170.07g 9.1370.03a
Different letters in the same column are statistically significant by Duncan’s test at 0.05 level of significance, (K: Control mix, P: Samplescontaining beetroot juice, M: Samples containing red cabbage juice, B: Samples, containing broccoli juice, 1: 2.5%, 2: 5%, 3: 10%).x Expressed as a percentage.
Table 4 – Physical properties of the mellorine with different concentrations of vegetable juices.
Sample Overrunx Melting ratex
45th min 60th min 75th min
K 33.6270.63a 11.3870.85e 42.2270.92e 74.7670.48e
P1 32.7070.13b 14.5170.32d 45.1470.44d 79.4070.34c,d
P2 30.7071.16c,d 15.4970.41c 46.2871.22c,d 80.7670.34b
P3 29.9070.69d 18.3770.14a,b 48.6170.42a,b 83.4670.42a
M1 32.5370.46b 14.4370.24d 44.9670.45d 78.8670.69c,d
M2 31.2770.52c 15.4870.32c 45.3770.40d 79.7970.52b,c
M3 30.0170.46d 17.8870.15b 48.3270.24b 83.1770.99a
B1 32.4370.29b 14.2170.13d 45.0670.61d 78.9070.32d
B2 31.1970.55c 15.2570.07c 47.5471.30b,c 79.9170.49b,c
B3 30.0170.96d 18.5770.29a 49.6570.57a 82.9870.88a
Different letters in the same column are statistically significant by Duncan’s test at 0.05 level of significance (K: Control mix, P: Samplescontaining beetroot juice, M: Samples containing red cabbage juice, B: Samples containing broccoli juice, 1: 2.5%, 2: 5%, 3: 10%).x Expressed as a percentage.
F o o d B i o s c i e n c e 7 ( 2 0 1 4 ) 4 5 – 5 5 51
concentration on pH, dry matter and ash content of themellorine was found as statistically significant (Po0.05). Thedry matter, pH values and ash content of the mixes variedbetween 30.60–33.72%, 7.48–7.68, 0.334–0.394%, respectively.The dry matter and pH values of the mellorine mixesdecreased with increasing vegetable juice concentrationwhile its ash content increased.
The overrun values of ice cream samples ranged from29.90% to 33.62%. Vegetable juice type and concentrationsignificantly influenced the overrun values of the samples(Po0.05). Overrun, which is a measure of increase in volume,influences some characteristics of ice cream, such as meltingdown and hardness (Sofjan & Hartel, 2004). The overrun ofmellorine decreased as vegetable juices concentrationincreased, since water content of the ice cream samplesincreased with addition of vegetable juice. Hwang et al.(2009) observed that the overrun of samples decreased asgrape wine lees were added to the ice cream. Similar resultsconsidering overrun values were also reported by Sun-Waterhouse et al. (2011) and El–Samahy et al. (2009).
The melting rate of the ice cream samples was determinedas a function of time (45th min, 60th min, 75th min). Theaddition of vegetable juice affected the melting rate, depend-ing on the concentration of vegetable juice (Po0.05), but no
difference between the type of vegetable juices was found(P40.05). Previous studies indicated that stabiliser/emulsi-fiers had an important role in some of the desirable proper-ties of ice cream and related products, such as meltingresistance and overrun (Guven, Karaca, & Kacar, 2003;Keçeli & Konar, 2003; Moeenfard & Tehrani, 2008; Rezaei,Khomeiri, Kashaninejad, & Aalami, 2011). A decrease inoverrun and an increase in melting rate in the mellorinesamples including vegetable juices could be explained by thehigher water content of the vegetable juices, resulting thedecaying of the stabiliser/emulsifier system (Bahramparvar &Tehrani, 2011; Lal, O’Connor, & Eyres, 2006). The possiblereason for the higher melting rate of the mellorine containingvegetable juices could be explained by the effect of overrunon melting properties (Sofjan & Hartel, 2004). The authorsrevealed that resistance to melting in the ice cream withhigher overrun was better than with lower overrun Table 4.
3.3. Bioactive properties of the mellorine samples
Phenolic content of the broccoli, red beetroot and red cabbagejuices was determined to be 420, 571 and 1132 mg/L, respec-tively. Red cabbage juice was found as the juice one had thehighest phenolic content. Flavanoid content of these juices
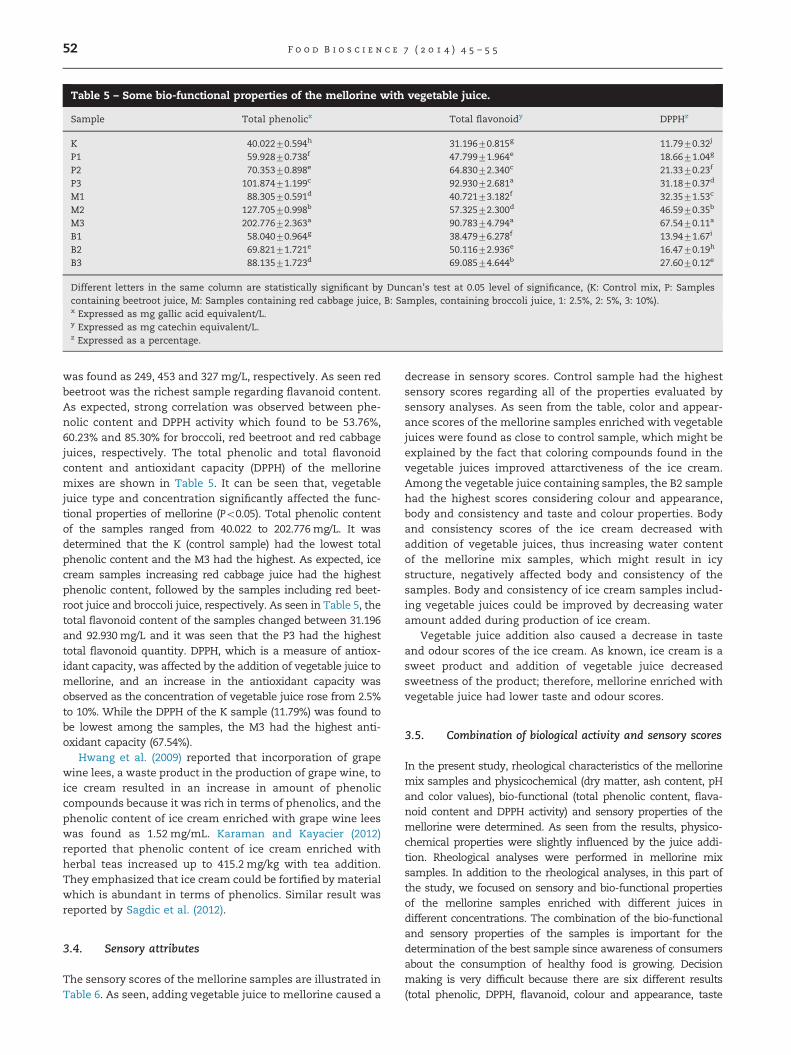
Table 5 – Some bio-functional properties of the mellorine with vegetable juice.
Sample Total phenolicx Total flavonoidy DPPHz
K 40.02270.594h 31.19670.815g 11.7970.32j
P1 59.92870.738f 47.79971.964e 18.6671.04g
P2 70.35370.898e 64.83072.340c 21.3370.23f
P3 101.87471.199c 92.93072.681a 31.1870.37d
M1 88.30570.591d 40.72173.182f 32.3571.53c
M2 127.70570.998b 57.32572.300d 46.5970.35b
M3 202.77672.363a 90.78374.794a 67.5470.11a
B1 58.04070.964g 38.47976.278f 13.9471.67i
B2 69.82171.721e 50.11672.936e 16.4770.19h
B3 88.13571.723d 69.08574.644b 27.6070.12e
Different letters in the same column are statistically significant by Duncan’s test at 0.05 level of significance, (K: Control mix, P: Samplescontaining beetroot juice, M: Samples containing red cabbage juice, B: Samples, containing broccoli juice, 1: 2.5%, 2: 5%, 3: 10%).x Expressed as mg gallic acid equivalent/L.y Expressed as mg catechin equivalent/L.z Expressed as a percentage.
F o o d B i o s c i e n c e 7 ( 2 0 1 4 ) 4 5 – 5 552
was found as 249, 453 and 327 mg/L, respectively. As seen redbeetroot was the richest sample regarding flavanoid content.As expected, strong correlation was observed between phe-nolic content and DPPH activity which found to be 53.76%,60.23% and 85.30% for broccoli, red beetroot and red cabbagejuices, respectively. The total phenolic and total flavonoidcontent and antioxidant capacity (DPPH) of the mellorinemixes are shown in Table 5. It can be seen that, vegetablejuice type and concentration significantly affected the func-tional properties of mellorine (Po0.05). Total phenolic contentof the samples ranged from 40.022 to 202.776mg/L. It wasdetermined that the K (control sample) had the lowest totalphenolic content and the M3 had the highest. As expected, icecream samples increasing red cabbage juice had the highestphenolic content, followed by the samples including red beet-root juice and broccoli juice, respectively. As seen in Table 5, thetotal flavonoid content of the samples changed between 31.196and 92.930 mg/L and it was seen that the P3 had the highesttotal flavonoid quantity. DPPH, which is a measure of antiox-idant capacity, was affected by the addition of vegetable juice tomellorine, and an increase in the antioxidant capacity wasobserved as the concentration of vegetable juice rose from 2.5%to 10%. While the DPPH of the K sample (11.79%) was found tobe lowest among the samples, the M3 had the highest anti-oxidant capacity (67.54%).
Hwang et al. (2009) reported that incorporation of grapewine lees, a waste product in the production of grape wine, toice cream resulted in an increase in amount of phenoliccompounds because it was rich in terms of phenolics, and thephenolic content of ice cream enriched with grape wine leeswas found as 1.52 mg/mL. Karaman and Kayacier (2012)reported that phenolic content of ice cream enriched withherbal teas increased up to 415.2 mg/kg with tea addition.They emphasized that ice cream could be fortified by materialwhich is abundant in terms of phenolics. Similar result wasreported by Sagdic et al. (2012).
3.4. Sensory attributes
The sensory scores of the mellorine samples are illustrated inTable 6. As seen, adding vegetable juice to mellorine caused a
decrease in sensory scores. Control sample had the highestsensory scores regarding all of the properties evaluated bysensory analyses. As seen from the table, color and appear-ance scores of the mellorine samples enriched with vegetablejuices were found as close to control sample, which might beexplained by the fact that coloring compounds found in thevegetable juices improved attarctiveness of the ice cream.Among the vegetable juice containing samples, the B2 samplehad the highest scores considering colour and appearance,body and consistency and taste and colour properties. Bodyand consistency scores of the ice cream decreased withaddition of vegetable juices, thus increasing water contentof the mellorine mix samples, which might result in icystructure, negatively affected body and consistency of thesamples. Body and consistency of ice cream samples includ-ing vegetable juices could be improved by decreasing wateramount added during production of ice cream.
Vegetable juice addition also caused a decrease in tasteand odour scores of the ice cream. As known, ice cream is asweet product and addition of vegetable juice decreasedsweetness of the product; therefore, mellorine enriched withvegetable juice had lower taste and odour scores.
3.5. Combination of biological activity and sensory scores
In the present study, rheological characteristics of the mellorinemix samples and physicochemical (dry matter, ash content, pHand color values), bio-functional (total phenolic content, flava-noid content and DPPH activity) and sensory properties of themellorine were determined. As seen from the results, physico-chemical properties were slightly influenced by the juice addi-tion. Rheological analyses were performed in mellorine mixsamples. In addition to the rheological analyses, in this part ofthe study, we focused on sensory and bio-functional propertiesof the mellorine samples enriched with different juices indifferent concentrations. The combination of the bio-functionaland sensory properties of the samples is important for thedetermination of the best sample since awareness of consumersabout the consumption of healthy food is growing. Decisionmaking is very difficult because there are six different results(total phenolic, DPPH, flavanoid, colour and appearance, taste

Table 6 – Sensory scores of the mellorine samples.
Sample Colour and appearance Body and consistency Taste and odour
K 4.8670.38a 4.5770.54a 4.5770.54a
P1 3.7170.76b 3.7170.76ab 3.5770.79bc
P2 4.0070.82b 3.5771.13b 3.7170.95abc
P3 4.0070.58b 3.2970.76b 3.2970.76bc
M1 3.7170.49b 3.4370.79b 2.7170.49c
M2 3.7170.95b 3.5770.54b 3.0070.82c
M3 4.1470.90ab 3.1470.70b 3.1471.35bc
B1 4.4370.54ab 3.7170.76ab 3.4370.54bc
B2 4.5770.54ab 3.8670.69ab 4.1470.70ab
B3 4.2970.76ab 3.4370.98b 3.0071.00c
Different letters in the same column are statistically significant by Duncan’s test at 0.05 level of significance, (K: Control mix, P: Samplescontaining beetroot juice, M: Samples containing red cabbage, juice, B: Samples containing broccoli juice, 1: 2.5%, 2: 5%, 3: 10%).
Table 7 – Normalised and weighted normalised decision matrix.
Alternatives Appearance Consistency Taste Phenolic DPPH
Normalised K 0.3695 0.3962 0.4132 0.1255 0.1128P1 0.2821 0.3217 0.3228 0.1879 0.1786P2 0.3041 0.3095 0.3354 0.2205 0.2041P3 0.3041 0.2853 0.2975 0.3193 0.2984M1 0.2821 0.2974 0.2450 0.2768 0.3096M2 0.2821 0.3095 0.2712 0.4003 0.4458M3 0.3148 0.2723 0.2839 0.6357 0.6463B1 0.3368 0.3217 0.3101 0.1819 0.1334B2 0.3475 0.3347 0.3743 0.2189 0.1576B3 0.3262 0.2974 0.2712 0.2763 0.2641
Weighted normalised K 0.0924 0.0792 0.1240 0.0157 0.0141P1 0.0705 0.0643 0.0968 0.0235 0.0223P2 0.0760 0.0619 0.1006 0.0276 0.0255P3 0.0760 0.0571 0.0892 0.0399 0.0373M1 0.0705 0.0595 0.0735 0.0346 0.0387M2 0.0705 0.0619 0.0814 0.0500 0.0557M3 0.0787 0.0545 0.0852 0.0795 0.0808B1 0.0842 0.0643 0.0930 0.0227 0.0167B2 0.0869 0.0669 0.1123 0.0274 0.0197B3 0.0815 0.0595 0.0814 0.0345 0.0330
(K: Control mix, P: Samples containing beetroot juice, M: Samples containing red cabbage juice, B: Samples containing broccoli juice, 1: 2.5%,2: 5%, 3: 10%).
Table 8 – Positive (An) and negative ideal solution (A�) forthe criteria.
Criteria An A�
Appearance and colour 0.0924 0.0705Body and consistency 0.0792 0.0545Taste and odour 0.1240 0.0735Total phenolic 0.0795 0.0157DPPH 0.0808 0.0141
F o o d B i o s c i e n c e 7 ( 2 0 1 4 ) 4 5 – 5 5 53
and odour, consistency). While one sample is better whenconsidering one criterion, another sample is better based ondifferent criteria. Therefore, a comparison of the alternatives orthe samples is very difficult. In order to ease comparison, theTOPSIS method was applied. As seen from Fig. 1, there are tenalternatives and five criteria. Initially, the importance of thecriteria is determined by considering different opinions obtainedfrom students and academicians. Fig. 1 also shows the ratio ofthe criteria. For example, while the importance of the totalphenolic content was 12.5%, that of taste was 30% in decisionmaking. Table 7 shows the normalised and weighted normalisedmatrices which are formed as mentioned in Section 2 by usingreal values. After obtaining the weighted normalised matrices,the positive and negative ideal solutions of each criterion weredetermined (Table 8). The distance of each alternative from thenegative and positive ideal solution was calculated by using Eqs.(8) and (9). Table 9 shows the distance values and closeness
coefficient of each sample. As seen from the C values, the M3sample was selected as the best sample based on the determinedcriteria. This result was interesting because the sensory scores ofthat sample were very low when compared with the othersamples. However, the total phenolic and DPPH activity of thatsample was very high, which is the reason why the M3 sample

Table 9 – Distance from positive (din), negative (di�) andcloseness coefficient (C) values of each alternative.
Alternatives din di
� C
K 0.0923 0.0919 0.4991P1 0.0894 0.0677 0.4309P2 0.0828 0.0679 0.4506P3 0.0736 0.0564 0.4340M1 0.0848 0.0522 0.3810M2 0.0639 0.0561 0.4676M3 0.0480 0.0753 0.6107B1 0.0926 0.0656 0.4147B2 0.0822 0.0755 0.4787B3 0.0814 0.0535 0.3968
(K: Control mix, P: Samples containing beetroot juice, M: Samplescontaining red cabbage juice, B: Samples containing broccoli juice,1: 2.5%, 2: 5%, 3: 10%).
F o o d B i o s c i e n c e 7 ( 2 0 1 4 ) 4 5 – 5 554
was the best sample. Determination of weight of criteria is veryimportant for decision. The ranking of the samples changed asthe weight of criteria is changed. The difference between Cvalues of the unenriched and enriched samples might bedecreased by increasing of weight of sensory scores. However,as the importance of the bioactive properties is increased, thedifferences between the C values of the samples might beincreased; therefore, assigning a weight of criteria will eventuallyaffect the final decision. According to the results, it was seen thatTOPSIS can be successfully used in food industry to easecomparison and decision.
4. Conclusion
The addition of vegetable juices to the mellorine mixdecreased the apparent viscosity, dry matter and overrun,however, the ash content and melting rate increased. Allmixes had a pseudoplastic flow behaviour. The bio-functionalproperties, such as phenolic, flavonoid and DPPH, of themellorine containing vegetable juices were significantlyaffected by increasing the vegetable juice concentration.Mellorine with 10% red cabbage juice (M3) was higher thanthe other samples in terms of the phenolic quantity andDPPH while control (K) was the lowest. In order to comparethe samples easily, the TOPSIS method was used consideringthe bioactivity and sensory properties. In the determinedconditions, M3 sample was found as the best sample. Accord-ing to the results of this study, it is observed that the use ofTOPSIS or similar techniques is possible in the food industryarea in order to facilitate decision making or comparison.
Acknowledgments
The authors would like to thank the Erciyes UniversityResearch Project Unit (Project No. FBY-10-3094) for financialsupport of this work.
r e f e r e n c e s
Aime, D. B., Arntfield, S. D., Malcolmson, L. J., & Ryland, D. (2001).
Textural analysis of fat reduced vanilla ice cream products.
Food Research International, 34, 237–246.Anonymous, (2013). ⟨http://www.americanpalmoil.com/
publications/ice%20cream.pdf⟩.AOAC, (1990) Official Methods of Analysis of the Association of
Official Analytical Chemists (15th Edition), Washington, USA.Arbuckle, W. S. (1986). Ice cream (4th ed.). New York: Van Nostrand
Reinhold.Bahramparvar, M., & Tehrani, M. M. (2011). Application and
functions of stabilizers in ice cream. Food Reviews International,27, 389–407.
Balli, S., & Korukoglu, S. (2009). Operating system selection using
fuzzy AHP and TOPSIS methods. Computers and Mathematicswith Applications, 14, 119–130.
Benitez, J. M., Martin, J. C., & Roman, C. (2007). Using fuzzy
member for measuring quality of service in the hotel industry.
Tourism Management, 28, 544–555.Blasa, M., Gennari, L., Angelino, G., & Ninfali, P., (2010). Chapter 3;
Fruit and vegetable antioxidants in health, 37–58 pp. In:
Bioactive foods in promoting health fruit and vegetables (RR
Watson, VR Preedy). Academic Press Publication, USA.Boivin, D., Lamy, S., Lord-Dufour, S., Jackson, J., Beaulieu, E., Cote,
M., et al., (2009). Antiproliferative and antioxidant activities of
common vegetables: A comparative study. Food Chemistry, 112(2), 374–380.
Bourne, M. C. (2002). Physics and texture. In: Food texture and
viscosity, concept and measurement. Academic Press,
Harcourt Place, London, UK, pp. 59–106 (Chapter 3).Chun, O. K., Smith, N., Sakagawa, A., & Lee, C. Y. (2004).
Antioxidant properties of raw and processed cabbages.
International Journal of Food Science, 55, 191–199.Clarke, C. (2004). The science of ice cream. The Royal Society of
Chemistry (Cambridge, UK), 187.Dickinson, E., & Stainsby, G. (1982). Colloids in food. London:
Applied Science Publishers.Dogan, M., & Kayacier, A. (2007). The effect of ageing at a low
temperature on the rheological properties of
Kahramanmaras-type ice cream mix. International Journal ofFood Properties, 10, 19–24.
Dogan, M., Kayacier, A., Toker, O. S., Yilmaz, M. T., & Karaman, S.
(2013a). Steady, dynamic creep, and recovery analysis of ice
cream mixes added with different concentrations of xanthan
gum. Food and Bioprocess Technology, 6, 1420–1433.Dogan, M., Toker, O. S., Aktar, T., & Goksel, M. (2013b).
Optimization of gum combination in prebiotic instant hot
chocolate beverage model system in terms of rheological
aspect: Mixture design approach. Food and BioprocessTechnology, 6, 783–794.
Dogan, M., Toker, O. S., & Goksel, M. (2011). Rheological behaviour
of instant hot chocolate beverage: Part 1. Optimization of the
effect of different starches and gums. Food Biophysics, 6,512–518.
El–Samahy, S. K., Youssef, K. M., & Moussa–Ayoub, T. E. (2009).
Producing ice cream with concentrated cactus pear pulp: A
preliminary study. Journal of the Professional Association forCactus Development, 11, 1–12.
Faller, A. L. K., & Fialho, E. (2009). The antioxidant capacity and
polyphenol content of organic and conventional retail
vegetables after domestic cooking. Food Research International,42, 210–215.
Fraga, C. G. (2010). Plant phenolics and human health: biochemistry,nutrition, and pharmacology (p. 593)USA: John Wiley & Sons,
Inc593.

F o o d B i o s c i e n c e 7 ( 2 0 1 4 ) 4 5 – 5 5 55
Goff, H. D. (2002). Formation and stabilisation of structure in ice-cream and related products. Current Opinion in Colloid andInterface Science, 7, 432–437.
Goksel, M., Dogan, M., Toker, O. S., Ozgen, S., Sarioglu, K., & Oral,R. A. (2013). The effect of starch concentration andtemperature on grape molasses: Rheological and texturalproperties. Food and Bioprocess Technology, 6, 259–271.
Gurmeric, V., Dogan, M., Toker, O. S., Senyigit, E., & Ersoz, N. B.(2013). Application of different multi-criteria decisiontechniques to determine optimum flavour of prebioticpudding based on sensory analyses. Food and BioprocessTechnology, 6, 2844–2859.
Guven, M., Karaca, O. B., & Kacar, A. (2003). The effects of thecombined use of stabilizers containing locust bean gum andof the storage time on Kahramanmaras-type ice creams.International Journal of Dairy Technology, 56, 223–228.
Heimler, D., Vignolini, P., Dini, M. G., Vincieri, F. F., & Romani, A.(2006). Antiradical activity and polyphenol composition oflocal Brassicaceae edible varieties. Food Chemistry, 99, 464–469.
Higdon, J. V., Delage, B., Williams, D. E., & Dashwood, R. H. (2007).Cruciferous vegetables and human cancer risk: Epidemiologicevidence and mechanistic basis. Pharmaceutical Research, 55,224–236.
Hwang, J. Y., Shyu, Y. S., & Hsu, C. K. (2009). Grape wine leesimproves the rheological and adds antioxidant properties toice cream. LWT—Food Science and Technology, 42, 312–318.
Hyvonen, L., Linna, M., Tuorila, H., & Dijksterhuis, G. (2003).Perception of melting and flavor release of ıce creamcontaining different types and contents of fat. Journal of DairyScience, 86, 1130–1138.
Junior, E. S., & Lannes, S. C. S. (2011). Effect of different sweetenerblends and fat types on ice cream properties. Ciência eTecnologia de Alimentos, Campinas, 31(1), 217–220.
Karaman, S., & Kayacier, A. (2012). Rheology of ice cream mixflavored with black tea or herbal teas and effect of flavoring onthe sensory properties of ice cream. Food and BioprocessTechnology, 5, 3159–3169.
Karaman, S., Toker, O. S., Yuksel, F., Cam, M., Kayacier, A., &Dogan, M. (2014). Physicochemical, bioactive, and sensoryproperties of persimmon-based ice cream: Technique fororder preference by similarity to ideal solution to determineoptimum concentration. Journal of Dairy Science, 97, 97–110.
Karasu, S., Dogan, M., Toker, O.S., & Canıyılmaz, E. (2014).Modeling of rheological properties of mellorine mix includingdifferent oil and gum types by combined design, ANN andANFIS models. Turkish Journal of Agriculture and Forestry, 38http://dx.doi.org/10.3906/tar-1312-9.
Keceli, T., & Konar, A. (2003). Salep ve alternatif bazı stabilizatormaddelerin inek sutunden yapılan dondurmalarınozelliklerine olan etkileri. Gıda, 28, 415–419.
Keeney, P. G. (2012). Ice cream and frozen desserts. Ullmann’sencyclopedia of industrial chemistry (pp. 543–550)Weinheim:Wiley-VCH Verlag GmbH & Co. KGaA543–550.
Keller, R. B. (2009). Flavonoids: Biosynthesis, Biological Effects andDietary Sources (p. 347)USA: Nova Science Publishers, Inc347.
Kurt, A. (1990). Sut ve Mamulleri Muayene ve Analiz MetotlarıRehberi, 4. baskı, Ataturk Universitesi Yayınları: 252/d ZiraatFak. Yay, 18.
Lal, S. N. D., O’Connor, C. J., & Eyres, L. (2006). Application ofemulsifiers/stabilizers in dairy products of high rheology.Advances in Colloid and Interface Science, 123–126, 433–437.
Lin, M. C., Wang, C. C., Chen, M. S., & Chang, C. A. (2008). UsingAHP and TOPSIS approaches in customer-driven productdesign process. Computer in Industry, 59, 17–31.
Moeenfard, M., & Tehrani, M. M. (2008). Effect of some stabilizerson the physicochemical and sensory properties of ıce creamtype frozen yogurt. American-Eurasian Journal of Agricultural andEnvironmental Sciences, 4, 584–589.
Nadeem, M., Abdullah, M., & Ellahi, M. Y. (2010). Effect ofincorporating rape seed oil on quality of ice cream.Mediterranean Journal of Nutrition and Metabolism, 3, 121–126.
Ozcan, T., Celebi, N., & Esnaf, S. (2011). Comparative analysis ofmulti-criteria decision making methodologies andimplementation of a warehouse location selection problem.Expert System with Applications, 38, 9773–9779.
O’Connell, J. E., & Fox, P. F. (2001). Significance and applications ofphenolic compounds in the production and quality of milkand dairy products: A review. International Dairy Journal, 11,103–120.
Podsedek, A. (2007). Natural antioxidants and antioxidantcapacity of Brassica vegetables: A review. LWT—Food Scienceand Technology, 40, 1–11.
Pohekar, S. D., & Ramachandran, M. (2004). Application of multi-criteria decision making to sustainable energy planning—Areview. Renewable and Sustainable Energy Reviews, 8, 365–381.
Rezaei, R., Khomeiri, M., Kashaninejad, M., & Aalami, M. (2011).Effects of guar gum and arabic gum on the physicochemical,sensory and flow behaviour characteristics of frozen yoghurt.International Journal of Dairy Technology, 64, 563–568.
Sagdic, O., Ozturk, I., Cankurt, H., & Tornuk, F. (2012). Interactionbetween some phenolic compounds and probiotic bacteriumin functional ice cream production. Food and BioprocessTechnology, 5, 2964–2971.
Sofjan, R. P., & Hartel, R. W. (2004). Effects of overrun on structuraland physical characteristics of ice cream. International DairyJournal, 14, 255–262.
Sun, T., Powers, J. R., & Tang, J. (2007). Evaluation of theantioxidant activity of asparagus, broccoli and their juices.Food Chemistry, 105, 101–106.
Sun-Waterhouse, D., Edmonds, L., Wadhwa, S. S., & Wibisono, R.(2011). Producing ice cream using a substantial amount ofjuice from kiwifruit with green, gold or red flesh. Food ResearchInternational, 50, 647–656.
Toker, O. S., Dogan, M., Canyılmaz, E., Ersoz, N. B., & Kaya, Y.(2013b). The effects of different gums and their ınteractionson the rheological properties of a dairy dessert: A mixturedesign approach. Food and Bioprocess Technolohy, 6, 896–908.
Toker, O. S., Dogan, M., & Goksel, M. (2012b). Prediction ofrheological parameters of model instant hot chocolatebeverage by adaptive neuro fuzzy inference system.Milchwissenchaft-Milk Science International, 67(1), 22–25.
Toker, O. S., Karaman, S., Yuksel, F., Dogan, M., Kayacier, A., &Yilmaz, M. T. (2013a). Temperature dependency of steady,dynamic, and creep-recovery rheological properties of icecream mix. Food and Bioprocess Technology, 6, 2974–2985.
Toker, O. S., Yılmaz, M. T., Karaman, S., Dogan, M., & Kayacıer, A.(2012a). Adaptive neuro-fuzzy inference system amd artificialneural network estimation of apparent viscosity of ice-creammixes stabilized with different concentrations of xanthangum. Applied Rheology, 22, 63918.
Ural, A., & Kilic, I. (2006). Data analysis with SPSS. Turkey: DetayPublishing, Ankara.
Wu, X., & Prior, R. L. (2005). Identification and characterization ofanthocyanins by high-performance liquidchromatography�electrospray ıonization�tandem massspectrometry in common foods in the United States:Vegetables, nuts, and grains. Journal of Agricultural and FoodChemistry, 53, 3101–3113.
Yalcin, H., Toker, O. S., & Dogan, M. (2012). Effect of oil type andfatty acid composition on dynamic and steady shear rheologyof vegetable oils. Journal of Oleo Science, 61, 181–187.
Zhishen, J., Mengcheng, T., & Jianming, W. (1999). Thedetermination of flavonoid contents in mulberry and theirscavenging effects on superoxide radicals. Food Chemistry, 64,555–559.


