Embed Size (px)
Citation preview
Neural Plasticity
Guest Editors: Matteo Caleo, Giorgio M. Innocenti, and Maurice Ptito
Physiology and Plasticity of Interhemispheric Connections
Physiology and Plasticity of InterhemisphericConnections
Neural Plasticity
Physiology and Plasticity of InterhemisphericConnections
Guest Editors: Matteo Caleo, Giorgio M. Innocenti,and Maurice Ptito

Copyright © 2013 Hindawi Publishing Corporation. All rights reserved.
This is a special issue published in “Neural Plasticity.” All articles are open access articles distributed under the Creative Commons Attri-bution License, which permits unrestricted use, distribution, and reproduction in any medium, provided the original work is properlycited.

Editorial Board
Robert Adamec, CanadaShimon Amir, CanadaMichel Baudry, USAMichael S. Beattie, USAClive Raymond Bramham, NorwayAnna Katharina Braun, GermanySumantra Chattarji, IndiaRobert Chen, CanadaDavid Diamond, USAM. B. Dutia, UKRichard Dyck, CanadaZygmunt Galdzicki, USAPreston E. Garraghty, USAPaul E. Gold, USAManuel B. Graeber, AustraliaAnthony Hannan, Australia
George W. Huntley, USAYuji Ikegaya, JapanLeszek Kaczmarek, PolandJeansok J. Kim, USAEric Klann, USAMałgorzata Kossut, PolandFrederic Libersat, IsraelStuart C. Mangel, UKAage R. Møller, USADiane K. O’Dowd, USASarah L. Pallas, USAA. Pascual-Leone, USAMaurizio Popoli, ItalyBruno Poucet, FranceLucas Pozzo-Miller, USAVilayanur S. Ramachandran, USA
Kerry J. Ressler, USASusan J. Sara, FranceTimothy Schallert, USAMenahem Segal, IsraelPanagiotis Smirniotis, USAIvan Soltesz, USAMichael G. Stewart, UKNaweed I. Syed, CanadaDonald A. Wilson, USAJ. R. Wolpaw, USAChun-Fang Wu, USAJ. M. Wyss, USALin Xu, ChinaMin Zhuo, Canada
Contents
Physiology and Plasticity of Interhemispheric Connections, Matteo Caleo, Giorgio M. Innocenti,and Maurice PtitoVolume 2013, Article ID 176183, 2 pages
The Visual Callosal Connection: A Connection Like Any Other?, Kerstin E. SchmidtVolume 2013, Article ID 397176, 11 pages
Splenium of Corpus Callosum: Patterns of Interhemispheric Interaction in Children and Adults,Maria G. KnyazevaVolume 2013, Article ID 639430, 12 pages
Axon Guidance Mechanisms for Establishment of Callosal Connections, Mitsuaki Nishikimi, Koji Oishi,and Kazunori NakajimaVolume 2013, Article ID 149060, 7 pages
Functional Topography of Human Corpus Callosum: An fMRI Mapping Study,Mara Fabri and Gabriele PolonaraVolume 2013, Article ID 251308, 15 pages
Maturation of Corpus Callosum Anterior Midbody Is Associated with Neonatal Motor Function in EightPreterm-Born Infants, Preethi Mathew, Kerstin Pannek, Pamela Snow, M. Giulia D’Acunto, AndreaGuzzetta, Stephen E. Rose, Paul B. Colditz, and Simon FinniganVolume 2013, Article ID 359532, 7 pages
Motor Control and Neural Plasticity through Interhemispheric Interactions, Naoyuki Takeuchi,Yutaka Oouchida, and Shin-Ichi IzumiVolume 2012, Article ID 823285, 13 pages
Interhemispheric Control of Unilateral Movement, Vincent Beaule, Sara Tremblay, and Hugo TheoretVolume 2012, Article ID 627816, 11 pages
Activity-Dependent Callosal Axon Projections in Neonatal Mouse Cerebral Cortex,Yoshiaki Tagawa and Tomoo HiranoVolume 2012, Article ID 797295, 10 pages
Deafferentation-Induced Plasticity of Visual Callosal Connections: Predicting Critical Periods andAnalyzing Cortical Abnormalities Using Diffusion Tensor Imaging, Jaime F. Olavarria, Andrew S. Bock,Lindsey A. Leigland, and Christopher D. KroenkeVolume 2012, Article ID 250196, 18 pages
Hindawi Publishing CorporationNeural PlasticityVolume 2013, Article ID 176183, 2 pageshttp://dx.doi.org/10.1155/2013/176183
Editorial
Physiology and Plasticity of Interhemispheric Connections
Matteo Caleo,1 Giorgio M. Innocenti,2 and Maurice Ptito3,4
1 CNR Neuroscience Institute, Via G. Moruzzi 1, 56124 Pisa, Italy2 Department of Neuroscience, Karolinska Institutet, Retzius vag 8, SE-171 77 Stockholm, Sweden3 Ecole d’Optometrie, Universite de Montreal, Montreal, QC, Canada H3T 1P14 Brain Lab, Department of Neuroscience and Pharmacology, Faculty of Health Sciences, University of Copenhagen,2200 Copenhagen, Denmark
Correspondence should be addressed to Matteo Caleo; [email protected]
Received 17 April 2013; Accepted 17 April 2013
Copyright © 2013 Matteo Caleo et al. This is an open access article distributed under the Creative Commons Attribution License,which permits unrestricted use, distribution, and reproduction in any medium, provided the original work is properly cited.
The corpus callosum (CC for aficionados) is the largest fiberbundle in the brain and establishes connections between thehemispheres, and predominantly, but not solely, between thecortical areas. Functionally mysterious for a long time, itshared with the pineal gland the honor of being consideredthe site of the soul [1]. The work on split brain in animals andhumans performed by Gazzaniga, Mayer, Trevarthen, andSperry, motivating the Nobel Prize to the latter, brought theCC on the stage of forefront international research. In spiteof this, several questions remained open. What precisely isthe function of the CC? What are the cellular and molecularmechanisms that persuade a set of cortical axons to takea route to the contralateral hemisphere? Which signals areresponsible for the topography of callosal connections? Is theCC modifiable (plastic) in the adult brain? These questionsare addressed in many recent studies and are represented bythe papers collected in this issue.
M. Fabri and G. Polonara provide a functional map ofcallosal topography by charting the BOLD signal evoked incallosal axons by taste, tactile, auditory, and visual stimuliand by motor tasks. This approach is at the frontier of what isusually obtained from BOLD signals. It provides results thatare compatible with what is predicted by anatomy in the caseof axons originating from primary areas, but it also showsactivations that could not have been predicted from anatomy,probably due to axons originating in multisensory areas.
K. E. Schmidt finds that, in the visual cortex, CC connec-tions have a multiplicative shift of the responses and this is aninteresting finding that goes beyond the old debate of whethercallosal connections are excitatory or inhibitory. The finding
is placed within the frame of the historical question of thegeneral nature of callosal connections. Hubel and Wiesel [2]were the first to propose that callosal connections are akinto intracortical connections, which have been “stretched”between the hemispheres. They wrote “. . .a special set ofconnections exists for dealing with the midline representationof the visual fields. These fibers might be expected to serve thesame functions as intracortical fibers linking cells with receptivefields clustered in other, more outlying parts of the visual fields.”and the same concept was taken up some more times byothers. The importance of the issue cannot be overempha-sized. If indeed CC connections are like lateral or otherintrahemispheric connections, they provide a general andadvantageous model for the study of cortical connectivity.Callosal axons can be sectioned (as in the work quoted above)or reversibly inactivated far more easily and cleanly thanmost other lateral or intrahemispheric connections. Callosalaxons can be studied in isolation at the cellular and molecularlevels. Pathological alterations of callosal connections canherald conditions of more general cortical misconnectivity(discussed in [3]). If the nature of CC connections is indeedas reiterated by Schmidt, most of the papers collected in thisissue can be read in a broader and fundamental framework.
V. Beaule et al. focus on the role of CC connectionsin disentangling bilateral manual movements. From juve-nile, to adult, to pathological conditions, the degrees ofmanual independence are differently modulated and thismay be due to inhibitory action of callosal connections.Interestingly, inhibition between the hemispheres has beenrepeatedly reported for the motor functions, particularly in
2 Neural Plasticity
man, although it has been observed in the visual cortex aswell, where it seems to be quickly overridden by the excitatoryinteractions [4].
Over the last 30 years, developmental work on the CC hasfocused on three main themes: (i) the molecular mechanismsof axonal guidance between the hemispheres, (ii) the estab-lishment of topographical connections, and (iii) the role ofactivity in the development of the connections. M. Nishikimiet al. review the first of the above themes, with special atten-tion to the midline structures and neighboring axons. Theyalso describe alterations in these navigational mechanismsthat result in callosal dysgenesis in humans and mice. Y.Tagawa and T. Hirano review the last of the above issuesand provide information on the molecular mechanisms bywhich spontaneous activity sculpts callosal projections. Theyconclude that both presynaptic and postsynaptic neuronalactivities are critically involved in callosal axon development,and discuss the intracellular signaling pathways that workdownstream of neuronal firing.
It may be added that the overproduction and eliminationof axons in development are central to the second of thethemes above and continue to provide testable hypotheses onthe nature of developmental plasticity of cortical connectivity[5]. Also, not only the topography of the connections but alsothe callosal axons themselves differentiate in developmentwith axons from different areas acquiring different diametersand lengths, and therefore, presumably, generating specificconduction delays between the hemispheres [6].
Noninvasive structural and functional imaging tech-niques are taking an increasingly large share of brain studies,but this raises the question of how novel and more traditional,firmly established methodologies map onto each other. TheCC is practically unavoidable in non-invasive structuralstudies, and, therefore, it can provide some general answersbecause of its central position in the brain, its relative“simplicity” and the amount of anatomical and functionalinformation available. J. F. Olavarria et al. relate the criticalperiod of callosal development, as defined by the reorgani-zation of visual callosal connections caused by early enu-cleation, to the development of water diffusion parameters.This is important new information that complements theview that callosal plasticity relates to axonal maturation anddifferentiation. M. G. Knyazeva places callosal maturationas estimated by MRI and coherence EEG analysis, withinthe context of excitatory and inhibitory interactions betweenthe hemispheres. P. Mathew et al. report data in preterminfants showing a relation between motor-specific scores andfractional anisotropy of anterior midbody of CC, the regionwhere axons interconnecting motor areas course. Finally N.Takeuchi et al. introduce the concept of adult CC plasticitythat might be elicited by trans-cranial stimulation in humans.They also discuss the use of brain stimulation techniques as apossible rehabilitation strategy to reinstate interhemisphericbalance in patients with stroke.
Acknowledgments
The Editors thank the contributors to this special issue andthe referees who made it possible, with the hope that the
collected papers shall provide a useful milestone within a fastgrowing area of basic and clinical neuroscience.
Matteo CaleoGiorgio M. Innocenti
Maurice Ptito
References
[1] De La Peyronie, “Observations par lesquelles on tache dedecouvrir la partie du cerveau ou l’ame exerce ses fonctions,”Histoire de L’Academie Royale des Sciences, pp. 199–218, 1744.
[2] D. H. Hubel and T. N. Wiesel, “Cortical and callosal connectionsconcerned with the vertical meridian of visual fields in the cat.,”Journal of Neurophysiology, vol. 30, no. 6, pp. 1561–1573, 1967.
[3] G. M. Innocenti, F. Ansermet, and J. Parnas, “Schizophrenia,neurodevelopment and corpus callosum,” Molecular Psychiatry,vol. 8, no. 3, pp. 261–274, 2003.
[4] V. A. Makarov, K. E. Schmidt, N. P. Castellanos, L. Lopez-Aguado, and G. M. Innocenti, “Stimulus-dependent interactionbetween the visual areas 17 and 18 of the 2 hemispheres of theferret (Mustela putorius),” Cerebral Cortex, vol. 18, no. 8, pp.1951–1960, 2008.
[5] G. M. Innocenti, “Subcortical regulation of cortical develop-ment: some effects of early, selective deprivations,” Progress inBrain Research, vol. 164, pp. 23–37, 2007.
[6] R. Caminiti, H. Ghaziri, R. Galuske, P. R. Hof, and G. M.Innocenti, “Evolution amplified processing with temporallydispersed slow neuronal connectivity in primates,” Proceedingsof the National Academy of Sciences of the United States ofAmerica, vol. 106, no. 46, pp. 19551–19556, 2009.
Hindawi Publishing CorporationNeural PlasticityVolume 2013, Article ID 397176, 11 pageshttp://dx.doi.org/10.1155/2013/397176
Review Article
The Visual Callosal Connection: A Connection Like Any Other?
Kerstin E. Schmidt1,2
1 Brain Institute, University of Rio Grande do Norte, Av. Nascimento de Castro 2155, 59056-450 Natal, RN, Brazil2Max-Planck-Institute for Brain Research, Deutschordenstrasse 46, 60528 Frankfurt, Germany
Correspondence should be addressed to Kerstin E. Schmidt; [email protected]
Received 7 November 2012; Accepted 27 February 2013
Academic Editor: Maurice Ptito
Copyright © 2013 Kerstin E. Schmidt. This is an open access article distributed under the Creative Commons Attribution License,which permits unrestricted use, distribution, and reproduction in any medium, provided the original work is properly cited.
Recent work about the role of visual callosal connections in ferrets and cats is reviewed, and morphological and functionalhomologies between the lateral intrinsic and callosal network in early visual areas are discussed. Both networks selectively linkdistributed neuronal groups with similar response properties, and the actions exerted by callosal input reflect the functionaltopography of those networks. This supports the notion that callosal connections perpetuate the function of the lateralintrahemispheric circuit onto the other hemisphere. Reversible deactivation studies indicate that the main action of visual callosalinput is a multiplicative shift of responses rather than a changing response selectivity. Both the gain of that action and its excitatory-inhibitory balance seem to be dynamically adapted to the feedforward drive by the visual stimulus onto primary visual cortex.Taken together anatomical and functional evidence from corticocortical and lateral circuits further leads to the conclusion thatvisual callosal connections share more features with lateral intrahemispheric connections on the same hierarchical level and lesswith feedback connections. I propose that experimental results about the callosal circuit in early visual areas can be interpretedwith respect to lateral connectivity in general.
1. Introduction
In the mammalian brain, connections between homologousareas extend through the corpus callosum and link the featurespaces represented in the two hemispheres and separated atthe body’s midline. Many functions have been attributed tocallosal connections and a great anatomical variety in degreeof myelination and fibre diameter has been described asbeing compatible with direct or indirect excitatory and alsoinhibitory function [1]. Most likely, the corpus callosum is acollection of different pathways whose function is criticallylinked to the species and the cortical area that is intercon-nected.
Accordingly, different types of callosal actions can beobserved. Those include actions which based on an anatom-ical asymmetry contribute to the functional asymmetry ofsome cognitive systems in higher mammals, others whichresult from the specific position of the connections withinthe brain’s topography, and finally those which simply extendthe intrinsic network of intracortical short- and long-rangeconnections onto the contralateral hemisphere in order toensure functional integrity over the midline [2, 3].
The first group certainly includes actions contributingto the lateralization of higher cognitive functions. Here, onehemisphere might inhibit the other hemisphere in order forone function to predominate and this creates hemisphericdominance for the respective system.
Connections in the motor system responsible for biman-ual coordination may mediate the second group of actions.Possibly also to this group belong callosal connections inthe visual system of front-eyed animals, which due to theirlocalization evidently act in that part of the visual field wherestereoscopic function is expressed.
The last group might dominate in primary sensorycortices where the sensory periphery is separated into the twohemispheres at the body’s midline and has to be united viathe callosal connection. Based on anatomical and functionalevidence there is reason to believe that these connectionsperpetuate the intrahemispheric function of the lateral andintrinsic network into the other hemisphere. As such intrinsicand callosal connections could be parts of the same circuit atthe same level of cortical hierarchy.
In this paper, recent work about callosal connectionsbetween homotopic areas of the primary visual cortices (areas
2 Neural Plasticity
17 an 18) and their contribution to visual processing inbinocular mammals will be embedded into the backgroundof previous research. Arguments for a specific callosal versusperpetuation of intrahemispheric functions will be discussed.This work has been obtained in carnivores, that is, ferrets andcats, using cortical deactivation. Further, most of the men-tioned previous work using similar approaches also stemsfrom cats unless stated otherwise.
2. Morphology Concerning VisualCallosal Connections
Virtually all retinotopically defined areas in the two hemi-spheres are densely interconnected by callosal connections[4, 5]. In the primary visual cortices, their density is greatestat the border between areas 17 and 18 where the verticalmeridian of the visual field is represented [6–8]. Thus,early on they were suspected to simply unify the two halfrepresentations of the visual field in the two hemispheres[7, 9]. In accordance with this, the split-chiasm preparationconfirmed that indirect input through the corpus callosummatches the direct and ipsilateral responses in orientationpreference and receptive field position [3, 10].
In carnivores’ early visual areas, visual callosal connec-tions between the two hemispheres clearly accumulate atthe areal borders (for review see [11]) but the higher theinterconnected areas are situated in the cortical hierarchy theless confined callosal connections seem to be and also the lesshomotopic (cat: [4, 12]; ferret: [13]). This might be expectedfrom the increasing receptive field sizes.
More detailed studies of the connectivity at the 17/18border in cats revealed nonhomotopic connectivity patternsalready in primary visual cortex. Neurons in areas 17 and 18seem to project to the 17/18-transition zone on the contralat-eral hemisphere, whereas projections originating from the17/18-transition zone terminate preferentially in area 17 or 18on the other side [14–16].
The retinotopic relationship though seems to be alwaysmaintained as clearly acallosal regions have been associatedwith the visual periphery and callosal zones with centralvisual field representations in both cats [12] and ferrets [17]and also tree shrew [18]. This was also confirmed on the singlecell level [19].
In cats, callosal axons originate from and terminate onsimilar classes of cells in supragranular and to a lesser extentin infragranular layers in cats (for review see [11]). Themajority of fibres stem from pyramidal and spiny stellatecells in layer III, superficial layer IV, and layer VI [4, 20–22].This has been largely confirmed by complete reconstructionsof single axons demonstrating in detail that most of thesynaptic boutons are situated in layer III, one-third in layer IV,and only a minority in infragranular layers [19]. In contrast,visual callosal connections dominate in infragranular layersin ferrets [13], as also in rodents [23].
In several mammals, a part of the ipsilateral visual field isrepresented bilaterally in areas 17 and 18 [24–26]. In the cat,the ipsilateral representation in the contralateral hemisphereincreases from 4∘ in central parts to 23∘ towards upper andlower elevations [12, 18, 27] accompanying the visual field
magnification and also the extent of the callosally projectingzone. In more lateral-eyed animals like ferrets, tree shrews,or sheep, the zone of overlap is even greater but seems to beconfined to area 17 [28–31] where columns of the ipsilateraleye dominate. Information about the ipsilateral field is likelyconveyed by ganglion cells in the temporal retina that projectto the medial interlaminar nucleus of the lateral geniculatenucleus [32–34] which then projects to the 17/18 border[27]. Even though callosal connections could possibly extendover a larger zone than the bilaterally represented stripe,it would be difficult to clarify if and where in the visualfield callosal input provides information, which cannot beprovided by the feedforward geniculocortical loop. Morelikely, this composite organization strengthens the hypothesisthat callosal connections in the early visual areas perpetuatethe intrahemispheric lateral network and- under normalcircumstances-serve rather modulatory than feedforwarddriving functions.
However, when the geniculocortical input is taken awayby the split-chiasm preparation, callosal connections areable to directly—but more weakly—drive receiving neuronsin the transcallosal zone [3, 9, 35, 36]. Similarly, lateralintrinsic connections have been reported to take over drivingfunctions in adult plasticity ([37], see also [38] for primatework).
3. Morphological Similarities between LateralIntrinsic and Callosal Connections
Intralaminar connections running horizontally provide thenumerically strongest synaptic input to both excitatory [39]and inhibitory circuits [40] within the primary visual cortex.Surprisingly, a recent study claims that synapses formed bylong-range projections from outside the functional columns’range clearly outnumber local synapses giving more emphasisto those connections [41]. Although being in an anatomi-cally unique localization within the brain’s circuits callosalconnections share important anatomical (and functional)properties with that intracortical network of long-rangelateral connections.
Long-range lateral connections confined to the primaryvisual cortex of one hemisphere display a patchy reciprocalnetwork of axon terminals extending over horizontal dis-tances of up to 8 mm (for review [42]).
Like their “relatives” confined to the same hemisphere[43–45], callosal terminals arborize in the target zone at moreor less regular intervals of 100–2000𝜇m [46, 47] and ca.980 𝜇m [19] and interconnected neuron populations tend toform clusters [22, 48–51]. Those clusters have been shownto coincide with orientation domains, indicating connectionsbetween neurons of similar orientation preference [19, 51],like it has been observed for long-range lateral connections[51–54]. Interestingly, in the lateral-eyed tree shrew, thecongruence between intrinsic and callosal circuits seems tobe broken and callosal fibers are less specific [18].
Yet another topographical similarity between intrinsicand interhemispheric circuits might render visual callosalconnections a true subset of long-range lateral connections.The latter exhibit elliptic axonal arbor fields interconnecting
Neural Plasticity 3
not only neurons of the same preference orientation butamong them those with receptive fields aligning along theiraxis of colinearity within the visual field (cat: [55], treeshrew: [56], squirrel monkey: [57]). This axial selectivity washypothesized to be the anatomical substrate for the physio-logical finding that responses to optimally oriented stimuliin the classical receptive field of a neuron are enhancedwhen collinearly aligned contours are presented outside theclassical receptive field [58, 59]. Astonishingly, the same kindof anatomy was described for axon arbors of cat callosalprojection neurons in the target hemisphere [19].
This suggests a close relation between the Gestalt criterialike common shape (orientation selectivity) and colinearity(axial selectivity) and the topology of both long-range intrin-sic and callosal connections. One could imagine that bothtypes of lateral network equally support perceptual groupingby modulating the saliency of distributed cortical responsesin a context-dependent way [55] and thus would be membersof the same circuit as suggested earlier [22].
Further, the postnatal development of callosal connec-tions undergoes similar phases [47] as that of long-rangeintrinsic connections [60]. Callosal axons are initially impre-cise and exuberant and attain their adult specificity byelimination of ectopic axon terminals [61]. Like for intrinsicconnections [62–64], normal visual experience is necessaryto eliminate these ectopic connections [48, 65–69]. Finally,both circuits exhibit a high degree of selectivity in the adult,and both projections are susceptible to experience-dependentmodifications during development in the same manner [51].
4. Stimulus-Dependent Gain of Callosal Action
In earlier studies of visual callosal function, the corpuscallosum has often been transsected and the optic chiasmsplit in order to separate the callosal from the geniculocorticalinput [3, 70]. This is a rather invasive approach as it abolishesall fibres from the nasal retina and thus the major inputto central primary visual cortex. Further, in the recoveryperiod after the split-chiasm surgery and before the actualmeasurement rearrangements of connectivity or synapticstrength are possible. Cooling deactivation of the visualcortex was introduced by Payne and colleagues [71] in studiesof interhemispheric interactions and was later extended toother studies [72–74]. It is less invasive than sectioning orlesioning and the effects are reversible. Although deactivatingthe 17/18-border region does not directly interrupt callosalfibres, the anatomy of the visual pathways assures that thismethod is adequately suited to reveal the influence of theinterhemispheric projection on the other hemisphere.
In a series of deactivation experiments in ferrets and cats,we recorded optical images, single unit [75, 76] and localfield potential data [77, 78] while presenting different stimulicovering both hemifields. We positioned a cooling deviceonto the previously identified 17/18 border in the contralateralhemisphere in order to reversibly deactivate callosal inputfrom the transition zone and the adjacent central parts ofareas 17 and 18.
The results from optical recordings with continuouswhole-field gratings demonstrate that maps of orientation
preference in both ferret areas 17 and 18 get weaker andless specific when cooling the contralateral hemisphere,predominantly in the 17/18-border zone. As this zone receivesstrong callosal input [13, 79] removing this input degradesthe differential responses to gratings particularly strongly inthat region. However, as in cats [36], the lateral influencespreads into areas 17 and 18. This is still in agreement withthe anatomy as, in particular, area 18 in the ferret is denselylinked transcallosally [13].
At the electrophysiological level, both increases anddecreases are observed with grating stimulation but deterio-ration of the responses predominates [75, 76]. When probingthe circuit with random dot textures (RDT), a visual stimulusthat activates more neurons but in a less selective mannerthan gratings [80, 81], the callosal influence grows larger andalmost exclusively excitatory [76]. This also holds as largelytrue when correcting for differences in contrast and baselinespike rate. Chance et al. [82] suggested that within activecortical circuits, the overall level of synaptic (background)input to a neuron acts as a gain control signal that modu-lates responsiveness to an excitatory drive. This means that,naturally, amplification can act better when cortical neuronsare stimulated in an unselective manner like with RDTs andwhen overall background levels of synaptic activity are notyet saturated like it might be the case with gratings. Ourresults indicate that the gain of the input delivered via callosalconnections is dynamically adapted to the feedforward driveby the external stimulus via the geniculocortical loop andprobably also to the lateral intrahemispheric drive. The lattermust be the case as the global nature of RDTs is onlyrevealed when considering the larger context outside theclassical receptive field. Such a joint stimulus-dependentgain control by lateral intrinsic and callosal circuits couldamplify small signals such as weakly tuned input deliveredby geniculocortical afferents [83, 84].
5. Excitatory and Inhibitory Nature ofthe Callosal Circuit
The majority of callosal projecting neurons are of excitatorynature and in both, carnivores and rodents, only a few directlyprojecting inhibitory neurons have been observed [85, 86].Their target cells in the receiving hemisphere are mainlyexcitatory neurons [22, 46] and mainly excitatory synapses onpyramidal and spiny stellate have been reported [19, 20, 87].However, some projections onto inhibitory neurons also exist[88].
Most of the long-range intrinsic axon collaterals withinearly visual areas also contact other pyramids and the major-ity of axon boutons are excitatory [89–91]. In summary, onlyabout 5% of the postsynaptic structures of long-range intrin-sic connections in cat primary visual cortex is GABAergic [89,90]. Studies from macaque monkey indicate that long-rangeconnections contact dendrites of spiny and nonspiny cells inthe proportion to which these cell types occur in the cortex(ratio spiny: nonspiny = 80%: 20%) [91, 92]. Reconstructionof biocytin-labeled large basket cells revealed that, in cat areas17 and 18, the density of inhibitory boutons is highest close tothe core of the injection site and the longer-range collaterals
4 Neural Plasticity
are slightly less selective for isoorientation domains thanexcitatory connections [93, 94]. In summary, the inhibitorynetwork extends more locally than the excitatory network,and it is less selective yet involves more neurons [94, 95].
If we extrapolate from there to the network linkingthe two hemispheres, we would expect both inhibition andexcitation with a strong bias towards the excitatory influencemediated by visual callosal connections. We would alsoexpect some stimulus dependency in both excitatory andinhibitory actions. This is indeed what can be observed.
In the spiking activity of both ferret and cat primary visualcortex, we find more facilitating than suppressive actions ofcallosal input [75, 76]. This is roughly in line with previousexperiments applying either cooling deactivation [71, 96] orGABA/bicuculline infusion [97] to the contralateral hemi-sphere in cats. Payne et al. had reported a more balancedpicture of inhibitory and excitatory interactions and a layerdependency.
In our most recent study, we compared different visualstimuli and observe a stimulus dependency in the balanceof excitation and inhibition contributed via the interhemi-spheric connection [76]. With high contrast full-field grat-ings, about 7% of all actions exhibit significant inhibitorycharacter, whereas 48% are significantly excitatory. Witha lesser salient and unstructured stimulus—random dottextures (RDT)- more cells are significantly affected (73% asopposed to 58% with gratings) and almost exclusively in afacilitating manner. In order to exclude that the larger callosalaction was due to unselective recruitment of a larger pop-ulation of neurons with RDT, we increased the orientationcontent by elongating the dots to form randomly scatteredbars of a certain orientation. Responses to this controlstimulus are also more strongly and exclusively excitatorybiased by callosal input. This led us to conclude that strengthand nature of callosal actions onto their target cells in primaryvisual cortex are not easily related to the presence or absenceof the orientation component. Rather, the balance betweenexcitation and inhibition depends on the local and globalcomposition of the external stimulus driving the system. Anoriented grating, which selectively recruits interconnectedpopulations of similar orientation preference all over, notonly provokes more recurrent isoorientation excitation thanRDT but also is likely to be balanced by recurrent inhibition[98]. The latter can be mediated by inhibitory neurons fromthe contralateral hemisphere. However, in accordance withthe anatomical ratios of long-range excitatory and inhibitorylong-range circuits facilitating influences on spiking activ-ity dominate and were never outnumbered by suppressiveactions (between 10–30%). Individual suppressive actionscan be prominent but are only unravelled with adequatestimulation [75, 76].
With whole-field gratings more inhibitory effects areobserved in local field potentials indicating that not all possi-ble transcallosal inhibition becomes suprathreshold [78].
6. Callosal Input and Response Selectivity
In Schmidt et al. [75], it has been shown that the subpop-ulation of neurons preferring cardinal contours are more
affected than others by callosal input in their responsiveness.This can be also observed for the population spiking datain cats ([76] not shown). A similar dominance for neuronspreferring cardinal contours is observed for stimulus-evokedsynchronization [77].
Higher numbers of neurons preferring contours of cardi-nal orientations have been counted in the central visual fieldof both cats [48, 99, 100] and macaque monkeys [101]. Inaccordance with this, a larger cortical area is devoted to therepresentation of cardinal orientations in both ferrets ([102],our own baseline data in [75]) and cats [103] and responses areusually more vigorous and apparently faster when recordedwith intrinsic signal imaging [104].
Exactly those neurons are more susceptible to the lackof callosal input than neurons preferring oblique contoursindicating an asymmetry in the underlying network facili-tating cardinal responses. Such asymmetries have not beenobserved for long-range intrinsic connections but are notexcluded since this question was never specifically addressedby previous anatomical studies.
However, true changes in orientation and direction indi-ces constitute only a small fraction of the total selectivityin deactivation studies [75, 76]. If at all, direction selectiv-ity changes are usually larger than changes in orientationselectivity [76] as might be expected in particular for neu-rons preferring directions of motion crossing the verticalmidline.
Although isooriented stimuli with opposite directionsof motion in the two hemifields have not been compareddirectly with those for coherent motion, the results of pre-vious deactivation studies (S3 stimulus in [77, 78]) supportthe notion that among neurons with the same orientationpreference those preferring similar directions of motion arepreferentially linked via the corpus callosum as suggestedbefore [105]. Along a similar line of evidence, asymmetriccallosal influences on the two directions of motion have beenreported early [71] and neurons preferring horizontal motion(and vertical contours) were differently affected by callosalinput than others [75, 106].
This has been recently explicitly tested using Gabor stim-uli centred on receptive fields close to the vertical merid-ian representation (Peiker, Schmitt, Wunderle, Eriksson,Schmidt, unpublished observation). When the direction ofmovement of a vertically oriented grating patch matchedthe movement out of the cooled hemifield responses wereselectively and more strongly impaired than those to theopposite direction into the cooled hemifield.
Interestingly, Girardin and Martin [107] attribute effec-tive changes in preferred orientation of area 17 single cellsobserved with local GABA application but not with localcooling [108]. These relatively small changes might haveescaped other investigations of lateral including callosal inputbecause of the undersampling of orientations. Usually nodifferences smaller than 22.5∘ are tested.
However, it might also be possible that connectionsprobed in the area 17 deactivation study rather belong tothe local short-range network as the distance between GABAinfusion and recording sites was smaller than 500 𝜇m [107].Here, the circuit is rather unselective and the inhibitory
Neural Plasticity 5
network might be much stronger than over larger distances([94], for review [42]).
When deactivating local connections between columns oforthogonal orientation in area 18, broadening of orientationtuning curves has been observed in 65% of the neurons [109].This number decays to 5% when deactivating sites of similarpreference [110], which is more comparable to the situationwhen deactivating long-range callosal input. As Girardin andMartin [107] we also do not note large absolute changes inbandwidth ([75, 76] (data not shown)).
7. Callosal Input and Multiplicative Scaling
In general, despite significant response changes, neuronslargely keep their tuning profiles in the absence of lateralinput. Wunderle et al. [76] approached the modifications ofthe tuning curves by a linear model and concluded that,in the majority of cases, they can be well described by themultiplication of the tuning curve with a constant factor.The bigger the rate decreases when lacking callosal input themore does the modification approximates a multiplication ofinput rates. Much fewer units exhibit a pronounced additiveshift. They are mainly observed with grating stimulationand then are often accompanied by rate increase duringcooling deactivation. This points towards a positive corre-lation between additive scaling and inhibition on the onehand, and multiplicative scaling and excitation on the other[76]. It also emphasizes that the transition between thetwo types of action is continuous and—as the excitatory-inhibitory balance—input dependent. Multiplicative scalingmainly preserves the neuron’s response selectivity. It seemsto be a dominating mechanism of action in corticocorticalcircuits as it can be deduced—even though not explicitlystated—from publications about feedback [111], contextualmodulation [112], and spatial attention shifts [113, 114].
8. Callosal Interactions and Timing
Isooriented neurons in both hemispheres can synchronizetheir activity, a function that is interrupted when sectioningthe corpus callosum in cats [115] and monkeys [116]. Whengratings of the same orientation are presented simultaneouslyto both hemifields, the coherence can increase both betweenthe hemispheres in both ferrets and humans [117–121] andwithin one and the same receiving hemisphere [77, 78].
Influences on precise local and interhemispheric timingof responses are in accordance with the anatomy of callosalaxons. In general, the majority of callosal projection fibresreveal short latencies between the two hemispheres of about2–6 ms [21]. This is enabled by relatively fast conductiondelays [122]. A diversity of callosal axon diameters [5, 14–126] corresponds in turn to different axonal conductionvelocities, which compensate for offsets in distance [127]. Inagreement, computer simulations have shown that despite alarge divergence and clustering of axon terminals [8], spikescan arrive synchronously at the target synapses [122]. Becausethese targets are preferentially neurons of similar orientationpreference as the projection neurons on the other side, precise
temporal interactions between the hemispheres are expectedto be stimulus dependent.
In accordance, local synchronization and desynchroniza-tion of multiple sites close to the 17/18 border of the receivinghemisphere have been shown to be mediated by isoorientedbut not by cross-oriented input from the contralateral hemi-sphere [77]. Similarly, synchronization between the hemi-spheres occurs more likely for collinear and like stimulation[117, 118].
Significant effects of callosal input on the synchronizationbehaviour in the receiving hemisphere cannot be observedwhen the two hemifields are stimulated unequally, that is,with two gratings of orthogonal orientations or moving intoopposite directions. Here, different neuronal populations arestimulated which are probably not selectively interconnectedvia the corpus callosum—neither by the excitatory nor theinhibitory projection. Therefore, a deactivation of one of thetwo pools will not have a significant influence on the timingwithin the other population.
In the absence of patterned stimulation (isoluminantmonitor) deactivating the contralateral hemisphere increasesthe overall synchronization between various sites within thereceiving hemisphere [77] and decreases the spiking vari-ability [128]. This might indicate that because of their targetselectivity callosal connections provide correlated input andthus also correlated noise to the target neurons [129], whichincreases variability and thus decreases synchronized firingbetween distant sites [130].
9. Callosal Input and Binocularity
In normal cats, callosal connections as intrinsic connections[131] do not seem to necessarily interconnect domains of thesame eye with each other [14, 15, 51]. Rather, ocular specificityof connections seems to depend on the retinotopic position;for example, neurons in the two hemispheres receiving inputfrom the same retina part are selectively linked [14, 15]. Thisimplies connections between neurons driven by the same eyeas well as between neurons driven by different eyes.
Earlier experiments sectioning the corpus callosum orlesioning the contralateral cortex in cats claimed that callosalafferents contribute a major part to the binocularity of callosalneurons in cats [132–135]. However, this result was notconfirmed by other studies [136–138] and a developmentalstudy indicated that there is a postnatal critical period for theinfluence of corpus callosum section on binocularity [139].
In small rodents, where the majority of the retinal fibrescross at the chiasm, the contribution of callosal input tobinocularity and its development is inevitably larger (forreview [140]). It cannot be excluded, that visual callosalconnections cover a different spectrum of functions in thesespecies than in carnivores and primates.
Our own findings using reversible deactivation in cats donot reveal any significant reduction of binocular units at the17/18 border [106]. This strongly indicates that—in stereo-scopic mammals—binocularity as such does not dependon the integrity of the callosal network but rather on thegeniculocortical input as would be expected from any long-range lateral network intrinsic to one hemisphere. However,
6 Neural Plasticity
responses evoked by the two eyes separately were differentlyaffected supporting a role of the corpus callosum in stereo-scopic function as suggested before for humans [141, 142]and animals with disparity selective neurons [138, 143]. Inferrets, who also have a large proportion of disparity selectiveneurons [144], we observe a more complex influence ofcallosal input on vertically preferring units than on others.This is compatible with the interpretation that those units,which presumably participate in horizontal disparity codingat the midline, are under the control of callosal interactions[75]. However, it does not necessarily distinguish the callosalas different from the intrahemispheric circuits. The lattercould serve the same function in more peripheral acallosalbut binocular representations of the visual field. In agree-ment, these parts reveal normal stereovision in the split-braincondition in humans [142].
10. Comparison between Feedback andInterhemispheric Circuits
Methodologically, all manipulations applied to study callosalfunction like cutting, lesioning, or cooling inevitably disabledirect or indirect lateral projections from both contralateralareas 18 and 17 or even more extrastriate cortices to therecipient transcallosal zone.
Thus, visual callosal projections as a “broad band” inter-hemispheric connection could be also viewed as a spe-cial type of feedback (and even feedforward) connection.Anatomically, feedback connections from higher visual areasto primary visual cortex also exhibit anisotropically arrangedclusters and thus a topographical relationship with thefunctional architecture of the interconnected structures asintrinsic connections do (macaque [145, 146]). They havebeen shown to integrate from a more comprehensive part ofthe visual field than the long-range intrinsic circuits and thusto be apt to contribute information from a larger modulatorysurround to which intrinsic circuits do not have accessto (for review [147, 148]). One of the main conclusions isthat feedback connections are important for differentiating afigure from the background, particularly in the case of lowsalience stimuli [149].
Surprisingly, in former deactivation studies in cats, extra-striate areas like posterior middle suprasylvian cortex (pMS)[73, 74] and area 21 [111, 150] have been demonstrated toalready influence basic response properties of neurons inearly visual areas like orientation or direction selectivity. Thiswas not the case when deactivating the feedforward loop fromarea 17 to 18 [151] and from area 17 to area 21a [152].
Earlier, we had observed that the impact of deactivatinga projection area was proportional to the density of thisarea’s projecting fibres to its target area, that is, area 18 [73,153]. Having applied the same technique to the same animalusing the same grating stimulus [76] puts us in the positionto compare also the functional impact of the prominentpMS feedback circuit with that of callosal input. The formerprojection to central area 18 is numerically much strongerthan the latter from the contralateral hemisphere (26.5%versus 4.7% of all inputs from visual structures [154]). Forthe callosal inactivation study [76], the strength of the callosal
input might be slightly underestimated since the majority ofour units stems from neurons located very close to the denselyinterconnected 17/18 border.
Both feedback and interhemispheric connections do notinstruct the layout of orientation preference maps but theloss of map vector strengths is indeed much stronger withoutpMS feedback (up to 50% [73]) than without the contralateralinput (20–25% [75, 76]).
Therefore, it is surprising that, on average, single unitspike rates to moving gratings in cat early visual areas areonly slightly more affected when deactivating pMS feedbackprojections ([73], estimated mean response change −18%)than by removing callosal input ([76], mean response change:−14%). However, changes in direction selectivity of singleunits and maps related to pMS input are relevant [73, 74],whereas direction selectivity changes related to callosal inputare tiny [76].
In summary, the comparison points out that despitetopographical similarities (patchiness) both quantitative andqualitative differences exist between the functional impactof feedback and interhemispheric connections to primaryvisual cortex. These differences also do not easily correlatewith the anatomical numerical differences confirming thatthe majority of interhemispheric input (as approached bythe cooling technique) has different characteristics thanintrahemispheric feedback circuits.
11. Conclusion
In the present paper, recent studies on the physiology of visualcallosal connections of cats and ferrets are discussed. Mostof these recent findings have been obtained by reversiblydeactivating the contralateral visual areas, a condition thatin human patients resembles a hemianopia caused by aunilateral occipital lesion. In these patients, visual processingin the intact hemifield is disturbed [154, 155]. In agreement,our animal studies reveal that contralateral deactivationexerts a considerable impact on intrahemispheric processingof visual responses.
Namely, it is observed that the callosal influence inearly visual areas—although largest close to the areal borderbetween areas 17 and 18—continues widely into both areas. Inaccordance with the anatomy of the callosal circuit, actionsoccur preferentially between coactivated neurons of similarorientation (or direction) preference. In the majority ofcases, they are excitatory, do not alter response selectivitydramatically, and can be described as a multiplicative scalingof responses. Additive tuning shifts occur less frequently andmore often with gratings than with lesser salient stimuli.Similarly, different excitatory-inhibitory ratios are observedwith different input regimes and thus seem to reflect adynamical adaptation of the callosal and intrinsic circuits tothe external feedforward drive via the geniculocortical loop.We hypothesize that the transition from modulatory multi-plicative to additive driving action as well as the transitionfrom excitation to inhibition is a continuum rather than a dis-crete step. The interhemispheric circuit cannot be decoupledfrom the remaining cortical network. Thus, the transitionbetween the different callosal actions will depend critically on
Neural Plasticity 7
the actual contribution of all possible feedforward, lateral,and feedback input sources.
Taken together anatomical and functional evidence fromcorticocortical and lateral circuits, we further come to theconclusion that visual callosal connections share a majority ofanatomical and functional features with lateral connectionson the same hierarchical level and less with feedback con-nections. This might justify interpreting experimental resultsabout the callosal circuit with respect to lateral connectivityin general.
References
[1] J. S. Bloom and G. W. Hynd, “The role of the corpus callosumin interhemispheric transfer of information: excitation or inhi-bition?” Neuropsychology Review, vol. 15, no. 2, pp. 59–71, 2005.
[2] F. Conti, M. Fabri, and T. Manzoni, “Bilateral receptive fieldsand callosal connectivity of the body midline representationin the first somatosensory area of primates,” SomatosensoryResearch, vol. 3, no. 4, pp. 273–289, 1986.
[3] G. Berlucchi and G. Rizzolatti, “Binocularly driven neurons invisual cortex of split-chiasm cats,” Science, vol. 159, no. 3812, pp.308–310, 1968.
[4] M. A. Segraves and A. C. Rosenquist, “The afferent and efferentcallosal connections of retinotopically defined areas in catcortex,” Journal of Neuroscience, vol. 2, no. 8, pp. 1090–1107, 1982.
[5] P. M. Daniel and D. Whitteridge, “The representation of thevisual field on the cerebral cortex in monkeys,” The Journal ofphysiology, vol. 159, pp. 203–221, 1961.
[6] P. Berbel and G. M. Innocenti, “The development of the corpuscallosum in cats: a light- and electron-microscopic study,”Journal of Comparative Neurology, vol. 276, no. 1, pp. 132–156,1988.
[7] D. H. Hubel and T. N. Wiesel, “Cortical and callosal connectionsconcerned with the vertical meridian of visual fields in the cat,”Journal of Neurophysiology, vol. 30, no. 6, pp. 1561–1573, 1967.
[8] J. C. Houzel, C. Milleret, and G. Innocenti, “Morphology ofcallosal axons interconnecting areas 17 and 18 of the cat,”European Journal ofNeuroscience, vol. 6, no. 6, pp. 898–917, 1994.
[9] B. P. Choudhury, D. Whitteridge, and M. E. Wilson, “Thefunction of the callosal connection of the visual cortex,” Quar-terly Journal of Experimental Physiology and Cognate MedicalSciences, vol. 50, pp. 214–219, 1965.
[10] F. Lepore and J. P. Guillemot, “Visual receptive field propertiesof cells innervated through the corpus callosum in the cat,”Experimental Brain Research, vol. 46, no. 3, pp. 413–424, 1982.
[11] G. M. Innocenti, “General organization of callosal connectionsin the cerebral cortex,” in Cerebral Cortex, A. Peters and E. G.Jones, Eds., vol. 5, pp. 291–353, Plenum, New York, NY, USA,1986.
[12] B. R. Payne and D. F. Siwek, “The visual map in the corpuscallosum of the cat,” Cerebral Cortex, vol. 1, no. 2, pp. 173–188,1991.
[13] G. M. Innocenti, P. R. Manger, I. Masiello, I. Colin, and L.Tettoni, “Architecture and callosal connections of visual areas 17,18, 19 and 21 in the ferret (Mustela putorius),” Cerebral Cortex,vol. 12, no. 4, pp. 411–422, 2002.
[14] J. F. Olavarria, “Non-mirror-symmetric patterns of callosallinkages in areas 17 and 18 in cat visual cortex,” Journal ofComparative Neurology, vol. 366, no. 4, pp. 643–655, 1996.
[15] J. F. Olavarria, “Callosal connections correlate preferentiallywith ipsilateral cortical domains in cat areas 17 and 18, and withcontralateral domains in the 17/18 transition zone,” Journal ofComparative Neurology, vol. 433, no. 4, pp. 441–457, 2001.
[16] S. V. Alekseenko, S. N. Toporova, and F. N. Makarov, “Neuronalconnection of the cortex and reconstruction of the visual space,”Neuroscience and Behavioral Physiology, vol. 35, no. 4, pp. 435–442, 2005.
[17] G. M. Innocenti, P. R. Manger, I. Masiello, I. Colin, and L.Tettoni, “Architecture and callosal connections of visual areas 17,18, 19 and 21 in the ferret (Mustela putorius),” Cerebral Cortex,vol. 12, no. 4, pp. 411–422, 2002.
[18] W. H. Bosking, J. C. Crowley, and D. Fitzpatrick, “Spatial codingof position and orientation in primary visual cortex,” NatureNeuroscience, vol. 5, no. 9, pp. 874–882, 2002.
[19] N. L. Rochefort, P. Buzas, N. Quenech’Du et al., “Functionalselectivity of interhemispheric connections in cat visual cortex,”Cerebral Cortex, vol. 19, no. 10, pp. 2451–2465, 2009.
[20] R. A. Fisken, L. J. Garey, and T. P. Powell, “The intrinsic, asso-ciation and commissural connections of area 17 on the visualcortex,” Philosophical Transactions of the Royal Society B, vol.272, no. 919, pp. 487–536, 1975.
[21] G. M. Innocenti, “The primary visual pathway through thecorpus callosum: morphological and functional aspects in thecat,” Archives Italiennes de Biologie, vol. 118, no. 2, pp. 124–188,1980.
[22] T. Voigt, S. LeVay, and M. A. Stamnes, “Morphological andimmunocytochemical observations on the visual callosal pro-jections in the cat,” Journal of Comparative Neurology, vol. 272,no. 3, pp. 450–460, 1988.
[23] J. Olavarria and R. C. Van Sluyters, “Organization and postnataldevelopment of callosal connections in the visual cortex of therat,” Journal of Comparative Neurology, vol. 239, no. 1, pp. 1–26,1985.
[24] J. Leicester and J. Stone, “Ganglion, amacrine and horizontalcells of the cat’s retina,” Vision Research, vol. 7, no. 9-10, pp. 695–IN1, 1967.
[25] R. J. Tusa, L. A. Palmer, and A. C. Rosenquist, “The retinotopicorganization of area 17 (striate cortex) in the cat,” Journal ofComparative Neurology, vol. 177, no. 2, pp. 213–235, 1978.
[26] R. J. Tusa, A. C. Rosenquist, and L. A. Palmer, “Retinotopic orga-nization of areas 18 and 19 in the cat,” Journal of ComparativeNeurology, vol. 185, no. 4, pp. 657–678, 1979.
[27] B. R. Payne, “Function of the corpus callosum in the representa-tion of the visual field in cat visual cortex,” Visual neuroscience,vol. 5, no. 2, pp. 205–211, 1990.
[28] M. I. Law, K. R. Zahs, and M. P. Stryker, “Organization ofprimary visual cortex (area 17) in the ferret,” Journal of Com-parative Neurology, vol. 278, no. 2, pp. 157–180, 1988.
[29] L. E. White, W. H. Bosking, S. M. Williams, and D. Fitzpatrick,“Maps of central visual space in Ferret V1 and V2 lack matchinginputs from the two eyes,” Journal of Neuroscience, vol. 19, no.16, pp. 7089–7099, 1999.
[30] W. H. Bosking, R. Kretz, M. L. Pucak, and D. Fitzpatrick,“Functional specificity of callosal connections in tree shrewstriate cortex,” Journal of Neuroscience, vol. 20, no. 6, pp. 2346–2359, 2000.
[31] P. G. H. Clarke and D. Whitteridge, “The cortical visual areasof the sheep,” Journal of Physiology, vol. 256, no. 3, pp. 497–508,1976.
8 Neural Plasticity
[32] R. B. Illing and H. Waessle, “The retinal projection to thethalamus in the cat: a quantitative investigation and a com-parison with the retinotectal pathway,” Journal of ComparativeNeurology, vol. 202, no. 2, pp. 265–285, 1981.
[33] W. R. Levick, D. L. Kirk, and H. G. Wagner, “Neurophysiologicaltracing of a projection from temporal retina to contralateralvisual cortex of the cat,” Vision Research, vol. 21, no. 11, pp. 1677–1679, 1981.
[34] M. H. Rowe and B. Dreher, “Retinal W-cell projections to themedial interlaminar nucleus in the cat: implications for gan-glion cell classification,” Journal of Comparative Neurology, vol.204, no. 2, pp. 117–133, 1982.
[35] N. Berardi, S. Bisti, and L. Maffei, “The transfer of visualinformation across the corpus callosum: spatial and temporalproperties in the cat,” Journal of Physiology, vol. 384, pp. 619–632, 1987.
[36] N. L. Rochefort, P. Buzas, Z. F. Kisvarday, U. T. Eysel, and C.Milleret, “Layout of transcallosal activity in cat visual cortexrevealed by optical imaging,” NeuroImage, vol. 36, no. 3, pp.804–821, 2007.
[37] C. D. Gilbert, W. Li, and V. Piech, “Perceptual learning and adultcortical plasticity,” Journal of Physiology, vol. 587, pp. 2743–2751,2009.
[38] F. Chavane, D. Sharon, D. Jancke, O. Marre, Y. Fregnac, and A.Grinvald, “Lateral spread of orientation selectivity in V1 iscontrolled by intracortical cooperativity,” Frontiers in SystemsNeuroscience, vol. 5, p. 4, 2011.
[39] T. Binzegger, R. J. Douglas, and K. A. C. Martin, “A quantitativemap of the circuit of cat primary visual cortex,” Journal ofNeuroscience, vol. 24, no. 39, pp. 8441–8453, 2004.
[40] D. Katzel, B. V. Zemelman, C. Buetfering, M. Wolfel, and G.Miesenbock, “The columnar and laminar organization of inhib-itory connections to neocortical excitatory cells,” Nature Neuro-science, vol. 14, no. 1, pp. 100–109, 2011.
[41] A. Stepanyants, L. M. Martinez, A. S. Ferecsko, and Z. F.Kisvarday, “The fractions of short- and long-range connectionsin the visual cortex,” Proceedings of the National Academy ofSciences of the United States of America, vol. 106, no. 9, pp. 3555–3560, 2009.
[42] K. E. Schmidt and S. Lowel, “Long-range intrinsic connectionsin cat primary visual cortex,” in The Cat Primary Visual Cortex,A. Peters and B. R. Payne, Eds., pp. 387–426, Academic Press,San Diego, Calif, USA, 2002.
[43] C. D. Gilbert and T. N. Wiesel, “Clustered intrinsic connectionsin cat visual cortex,” Journal of Neuroscience, vol. 3, no. 5, pp.1116–1133, 1983.
[44] K. A. C. Martin and D. Whitteridge, “Form, function andintracortical projections of spiny neurones in the striate visualcortex of the cat,” Journal of Physiology, vol. 353, pp. 463–504,1984.
[45] Z. F. Kisvarday and U. T. Eysel, “Cellular organization ofreciprocal patchy networks in layer III of cat visual cortex (area17),” Neuroscience, vol. 46, no. 2, pp. 275–286, 1992.
[46] J. C. Houzel, C. Milleret, and G. Innocenti, “Morphology ofcallosal axons interconnecting areas 17 and 18 of the cat,”European Journal ofNeuroscience, vol. 6, no. 6, pp. 898–917, 1994.
[47] D. Aggoun-Zouaoui, “Growth of callosal terminal arbors in pri-mary visual areas of the cat,” European Journal of Neuroscience,vol. 8, no. 6, pp. 1132–1148, 1996.
[48] N. E. Berman and B. R. Payne, “Alterations in connectionsof the corpus callosum following convergent and divergentstrabismus,” Brain Research, vol. 274, no. 2, pp. 201–212, 1983.
[49] G. M. Innocenti, “Postnatal development of corticocorticalconnections,” The Italian Journal of Neurological Sciences, sup-plement 5, pp. 25–28, 1986.
[50] J. Boyd and J. Matsubara, “Tangential organization of callosalconnectivity in the cat’s visual cortex,” Journal of ComparativeNeurology, vol. 347, no. 2, pp. 197–210, 1994.
[51] K. E. Schmidt, “Functional specificity of long-range intrinsicand interhemispheric connections in the visual cortex of stra-bismic cats,” Journal of Neuroscience, vol. 17, no. 14, pp. 5480–5492, 1997.
[52] C. D. Gilbert and T. N. Wiesel, “Columnar specificity of intrinsichorizontal and corticocortical connections in cat visual cortex,”Journal of Neuroscience, vol. 9, no. 7, pp. 2432–2422, 1989.
[53] R. Malach, Y. Amir, M. Harel, and A. Grinvald, “Relation-ship between intrinsic connections and functional architecturerevealed by optical imaging and in vivo targeted biocytininjections in primate striate cortex,” Proceedings of the NationalAcademy of Sciences of the United States of America, vol. 90, no.22, pp. 10469–10473, 1993.
[54] P. Buzas, U. T. Eysel, and Z. F. Kisvarday, “Functional topogra-phy of single cortical cells: an intracellular approach combinedwith optical imaging,” Brain Research Protocols, vol. 3, no. 2, pp.199–208, 1998.
[55] K. E. Schmidt, “The perceptual grouping criterion of colinearityis reflected by anisotropies of connections in the primary visualcortex,” European Journal of Neuroscience, vol. 9, no. 5, pp. 1083–1089, 1997.
[56] W. H. Bosking, Y. Zhang, B. Schofield, and D. Fitzpatrick,“Orientation selectivity and the arrangement of horizontal con-nections in tree shrew striate cortex,” Journal of Neuroscience,vol. 17, no. 6, pp. 2112–2127, 1997.
[57] L. C. Sincich and G. G. Blasdel, “Oriented axon projections inprimary visual cortex of the monkey,” Journal of Neuroscience,vol. 21, no. 12, pp. 4416–4426, 2001.
[58] J. I. Nelson and B. J. Frost, “Intracortical facilitation among co-oriented, co-axially aligned simple cells in cat striate cortex,”Experimental Brain Research, vol. 61, no. 1, pp. 54–61, 1985.
[59] M. K. Kapadia, M. Ito, C. D. Gilbert, and G. Westheimer,“Improvement in visual sensitivity by changes in local context:parallel studies in human observers and in V1 of alert monkeys,”Neuron, vol. 15, no. 4, pp. 843–856, 1995.
[60] R. A. Galuske and W. Singer, “The origin and topography oflong-range intrinsic projections in cat visual cortex: a develop-mental study,” Cerebral Cortex, vol. 6, no. 3, pp. 417–430, 1996.
[61] G. M. Innocenti and R. Caminiti, “Postnatal shaping of callosalconnections from sensory areas,” Experimental Brain Research,vol. 38, no. 4, pp. 381–394, 1980.
[62] H. J. Luhmann, W. Singer, and L. Martinez-Millan, “Horizontalinteractions in cat striate cortex: I. Anatomical substrate andpostnatal development,” European Journal of Neuroscience, vol.2, no. 4, pp. 344–357, 1990.
[63] E. M. Callaway and L. C. Katz, “Effects of binocular deprivationon the development of clustered horizontal connections in catstriate cortex,” Proceedings of the National Academy of Sciencesof the United States of America, vol. 88, no. 3, pp. 745–749, 1991.
[64] E. S. Ruthazer and M. P. Stryker, “The role of activity in thedevelopment of long-range horizontal connections in area 17 ofthe ferret,” Journal ofNeuroscience, vol. 16, no. 22, pp. 7253–7269,1996.
[65] R. D. Lund, D. E. Mitchell, and G. H. Henry, “Squint-inducedmodification of callosal connections in cats,” Brain Research,vol. 144, no. 1, pp. 169–172, 1978.
Neural Plasticity 9
[66] G. M. Innocenti and D. O. Frost, “Effects of visual experience onthe maturation of the efferent system to the corpus callosum,”Nature, vol. 280, no. 5719, pp. 231–234, 1979.
[67] M. Cynader, F. Lepore, and J. P. Guillemot, “Inter-hemisphericcompetition during postnatal development,” Nature, vol. 290,no. 5802, pp. 139–140, 1981.
[68] A. J. Elberger, E. L. Smith, and J. M. White, “Spatial dissociationof visual inputs alters the origin of the corpus callosum,”Neuroscience Letters, vol. 35, no. 1, pp. 19–24, 1983.
[69] C. Milleret and J. C. Houzel, “Visual interhemispheric transferto areas 17 and 18 in cats with convergent strabismus,” EuropeanJournal of Neuroscience, vol. 13, no. 1, pp. 137–152, 2001.
[70] M. Ptito, “Functions of the corpus callosum as derived fromsplit-chiasm studies in cats,” in The Parallel Brain:The CognitiveNeuroscience of the Corpus Callosum, E. Zaidel and M. Iacoboni,Eds., pp. 139–153, Massachusetts Institute of Technology Press,Cambridge, Mass, USA, 2003.
[71] B. R. Payne, D. F. Siwek, and S. G. Lomber, “Complex transcal-losal interactions in visual cortex,” Visual neuroscience, vol. 6,no. 3, pp. 283–289, 1991.
[72] S. G. Lomber, P. Cornwell, J. S. Sun, M. A. MacNeil, and B. R.Payne, “Reversible inactivation of visual processing operationsin middle suprasylvian cortex of the behaving cat,” Proceedingsof the National Academy of Sciences of the United States ofAmerica, vol. 91, no. 8, pp. 2999–3003, 1994.
[73] R. A. W. Galuske, K. E. Schmidt, R. Goebel, S. G. Lomber,and B. R. Payne, “The role of feedback in shaping neuralrepresentations in cat visual cortex,” Proceedings of the NationalAcademy of Sciences of the United States of America, vol. 99, no.26, pp. 17083–17088, 2002.
[74] K. E. Schmidt, S. G. Lomber, B. R. Payne, and R. A. W. Galuske,“Pattern motion representation in primary visual cortex ismediated by transcortical feedback,” NeuroImage, vol. 54, no. 1,pp. 474–484, 2011.
[75] K. E. Schmidt, S. G. Lomber, and G. M. Innocenti, “Specificityof neuronal responses in primary visual cortex is modulatedby interhemispheric corticocortical input,” Cerebral Cortex, vol.20, no. 12, pp. 2776–2786, 2010.
[76] T. Wunderle, D. Eriksson, and K. E. Schmidt, “Multiplicativemechanism of lateral interactions revealed by controlling inter-hemispheric input,” Cerebral Cortex, 2012.
[77] C. Carmeli, L. Lopez-Aguadao, K. E. Schmidt, O. De Feo, andG. M. Innocenti, “A novel interhemispheric interaction: modu-lation of neuronal cooperativity in the visual areas,” PLoS ONE,vol. 2, no. 12, Article ID e1287, 2007.
[78] V. A. Makarov, K. E. Schmidt, N. P. Castellanos, L. Lopez-Aguado, and G. M. Innocenti, “Stimulus-dependent interactionbetween the visual areas 17 and 18 of the 2 hemispheres of theferret (Mustela putorius),” Cerebral Cortex, vol. 18, no. 8, pp.1951–1960, 2008.
[79] A. M. Grigonis, R. B. Rayos del Sol-Padua, and E. H. Murphy,“Visual callosal projections in the adult ferret,” Visual neuro-science, vol. 9, no. 1, pp. 99–103, 1992.
[80] B. C. Skottun, D. H. Grosof, and R. L. De Valois, “Responses ofsimple and complex cells to random dot patterns: a quantitativecomparison,” Journal of Neurophysiology, vol. 59, no. 6, pp. 1719–1735, 1988.
[81] F. Worgotter and U. T. Eysel, “Axis of preferred motion isa function of bar length in visual cortical receptive fields,”Experimental Brain Research, vol. 76, no. 2, pp. 307–314, 1989.
[82] F. S. Chance, L. F. Abbott, and A. D. Reyes, “Gain modulationfrom background synaptic input,” Neuron, vol. 35, no. 4, pp.773–782, 2002.
[83] R. Ben-Yishai, R. L. Bar-Or, and H. Sompolinsky, “Theory oforientation tuning in visual cortex,” Proceedings of the NationalAcademy of Sciences of the United States of America, vol. 92, no.9, pp. 3844–3848, 1995.
[84] H. Sompolinsky and R. Shapley, “New perspectives on themechanisms for orientation selectivity,” Current Opinion inNeurobiology, vol. 7, no. 4, pp. 514–522, 1997.
[85] E. H. Buhl and W. Singer, “The callosal projection in cat visualcortex as revealed by a combination of retrograde tracing andintracellular injection,” Experimental Brain Research, vol. 75, no.3, pp. 470–476, 1989.
[86] F. Conti, M. Fabri, and T. Manzoni, “Bilateral receptive fieldsand callosal connectivity of the body midline representationin the first somatosensory area of primates,” SomatosensoryResearch, vol. 3, no. 4, pp. 273–289, 1986.
[87] K. Shoumura, “An attempt to relate the origin and distributionof commissural fibers to the presence of large and mediumpyramids in layer III in the cat’s visual cortex,” Brain Research,vol. 67, no. 1, pp. 13–25, 1974.
[88] K. A. C. Martin, P. Somogyi, and D. Whitteridge, “Physiologicaland morphological properties of identified basket cells in thecat’s visual cortex,” Experimental Brain Research, vol. 50, no. 2-3, pp. 193–200, 1983.
[89] Z. F. Kisvarday, K. A. Martin, T. F. Freund, Z. Magloczky, D.Whitteridge, and P. Somogyi, “Synaptic targets of HRP-filledlayer III pyramidal cells in the cat striate cortex,” ExperimentalBrain Research, vol. 64, no. 3, pp. 541–552, 1986.
[90] S. LeVay, “The patchy intrinsic projections of visual cortex,”Progress in Brain Research, vol. 75, pp. 147–161, 1988.
[91] B. A. McGuire, C. D. Gilbert, P. K. Rivlin, and T. N. Wiesel,“Targets of horizontal connections in macaque primary visualcortex,” Journal of Comparative Neurology, vol. 305, no. 3, pp.370–392, 1991.
[92] S. H. Hendry, H. D. Schwark, E. G. Jones, and J. Yan, “Numbersand proportions of GABA-immunoreactive neurons in differentareas of monkey cerebral cortex,” Journal of Neuroscience, vol. 7,no. 5, pp. 1503–1519, 1987.
[93] Z. F. Kisvarday, D. S. Kim, U. T. Eysel, and T. Bonhoeffer,“Relationship between lateral inhibitory connections and thetopography of the orientation map in cat visual cortex,” Euro-pean Journal of Neuroscience, vol. 6, no. 10, pp. 1619–1632, 1994.
[94] Z. F. Kisvarday, E. Toth, M. Rausch, and U. T. Eysel, “Orienta-tion-specific relationship between populations of excitatory andinhibitory lateral connections in the visual cortex of the cat,”Cerebral Cortex, vol. 7, no. 7, pp. 605–618, 1997.
[95] J. M. Crook, “Evidence for a contribution of lateral inhibitionto orientation tuning and direction selectivity in cat visualcortex: reversible inactivation of functionally characterized sitescombined with neuroanatomical tracing techniques,” EuropeanJournal of Neuroscience, vol. 10, no. 6, pp. 2056–2075, 1998.
[96] B. R. Payne, “Neuronal interactions in cat visual cortex medi-ated by the corpus callosum,” Behavioural Brain Research, vol.64, no. 1-2, pp. 55–64, 1994.
[97] J. S. Sun, B. Li, M. H. Ma, and Y. C. Diao, “Transcallosal circuitryrevealed by blocking and disinhibiting callosal input in the cat,”Visual Neuroscience, vol. 11, no. 2, pp. 189–197, 1994.
[98] M. Stimberg, K. Wimmer, R. Martin et al., “The operatingregime of local computations in primary visual cortex,”CerebralCortex, vol. 19, no. 9, pp. 2166–2180, 2009.
10 Neural Plasticity
[99] J. D. Pettigrew, T. Nikara, and P. O. Bishop, “Responses tomoving slits by single units in cat striate cortex,” ExperimentalBrain Research, vol. 6, no. 4, pp. 373–390, 1968.
[100] G. A. Orban and H. Kennedy, “The influence of eccentricity onreceptive field types and orientation selectivity in areas 17 and18 of the cat,” Brain Research, vol. 208, no. 1, pp. 203–208, 1981.
[101] R. J. Mansfield, “Neural basis of orientation perception inprimate vision,” Science, vol. 186, no. 4169, pp. 1133–1135, 1974.
[102] D. M. Coppola, L. E. White, D. Fitzpatrick, and D. Purves,“Unequal representation of cardinal and oblique contours inferret visual cortex,” Proceedings of the National Academy ofSciences of the United States of America, vol. 95, no. 5, pp. 2621–2623, 1998.
[103] G. Wang, S. Ding, and K. Yunokuchi, “Representation ofcardinal contour overlaps less with representation of nearbyangles in cat visual cortex,” Journal of Neurophysiology, vol. 90,no. 6, pp. 3912–3920, 2003.
[104] G. Wang, M. Nagai, and J. Okamura, “Orientation dependencyof intrinsic optical signal dynamics in cat area 18,” NeuroImage,vol. 57, no. 3, pp. 1140–1153, 2011.
[105] J. C. Houzel, M. L. Carvalho, and R. Lent, “Interhemisphericconnections between primary visual areas: beyond the midlinerule,” Brazilian Journal of Medical and Biological Research, vol.35, no. 12, pp. 1441–1453, 2002.
[106] C. Peiker, T. Wunderle, D. Eriksson, and K. E. Schmidt,“The influence of callosal input on monocular and binocularresponses in primary visual cortex,” in Proceedings of theNeuroscience Meeting Planner, Program No. 694.04, Society forNeuroscience, Washington, DC, USA, 2011.
[107] C. C. Girardin and K. A. C. Martin, “Inactivation of lateralconnections in cat area 17,” European Journal of Neuroscience,vol. 29, no. 10, pp. 2092–2102, 2009.
[108] C. C. Girardin and K. A. C. Martin, “Cooling in cat visualcortex: stability of orientation selectivity despite changes inresponsiveness and spike width,” Neuroscience, vol. 164, no. 2,pp. 777–787, 2009.
[109] J. M. Crook, Z. F. Kisvarday, and U. T. Eysel, “GABA-inducedinactivation of functionally characterized sites in cat visualcortex (area 18): effects on direction selectivity,” Journal ofNeurophysiology, vol. 75, no. 5, pp. 2071–2088, 1996.
[110] J. M. Crook, Z. F. Kisvarday, and U. T. Eysel, “GABA-inducedinactivation of functionally characterized sites in cat striatecortex: effects on orientation tuning and direction selectivity,”Visual Neuroscience, vol. 14, no. 1, pp. 141–158, 1997.
[111] C. Wang, W. J. Waleszczyk, W. Burke, and B. Dreher, “Feedbacksignals from cat’s area 21a enhance orientation selectivity of area17 neurons,” Experimental Brain Research, vol. 182, no. 4, pp.479–490, 2007.
[112] W. Li, P. Thier, and C. Wehrhahn, “Contextual influence onorientation discrimination of humans and responses of neuronsin V1 of alert monkeys,” Journal of Neurophysiology, vol. 83, no.2, pp. 941–954, 2000.
[113] C. J. McAdams and J. H. R. Maunsell, “Effects of attentionon orientation-tuning functions of single neurons in macaquecortical area V4,” Journal of Neuroscience, vol. 19, no. 1, pp. 431–441, 1999.
[114] S. Treue and J. C. Martınez Trujillo, “Feature-based attentioninfluences motion processing gain in macaque visual cortex,”Nature, vol. 399, no. 6736, pp. 575–579, 1999.
[115] A. K. Engel, P. Konig, A. K. Kreiter, and W. Singer, “Interhemi-spheric synchronization of oscillatory neuronal responses in catvisual cortex,” Science, vol. 252, no. 5010, pp. 1177–1179, 1991.
[116] L. G. Nowak, M. H. J. Munk, J. I. Nelson, A. C. James, and J.Bullier, “Structural basis of cortical synchronization. I. Threetypes of interhemispheric coupling,” Journal of Neurophysiology,vol. 74, no. 6, pp. 2379–2400, 1995.
[117] D. C. Kiper, M. G. Knyazeva, L. Tettoni, and G. M. Innocenti,“Visual stimulus-dependent changes in interhemispheric EEGcoherence in ferrets,” Journal of Neurophysiology, vol. 82, no. 6,pp. 3082–3094, 1999.
[118] C. Carmeli, M. G. Knyazeva, G. M. Innocenti, and O. DeFeo, “Assessment of EEG synchronization based on state-spaceanalysis,” NeuroImage, vol. 25, no. 2, pp. 339–354, 2005.
[119] M. G. Knyazeva, D. C. Kiper, V. Y. Vildavski, P. A. Despland,M. Maeder-Ingvar, and G. M. Innocenti, “Visual stimulus-dependent changes in interhemispheric EEG coherence inhumans,” Journal of Neurophysiology, vol. 82, no. 6, pp. 3095–3107, 1999.
[120] M. G. Knyazeva, E. Fornari, R. Meuli, G. Innocenti, and P.Maeder, “Imaging of a synchronous neuronal assembly in thehuman visual brain,” NeuroImage, vol. 29, no. 2, pp. 593–604,2006.
[121] G. M. Innocenti, “Some new trends in the study of the corpuscallosum,” Behavioural Brain Research, vol. 64, no. 1-2, pp. 1–8,1994.
[122] G. M. Innocenti, P. Lehmann, and J. C. Houzel, “Computationalstructure of visual callosal axons,” European Journal of Neuro-science, vol. 6, no. 6, pp. 918–935, 1994.
[123] Y. C. Diao, W. G. Jia, N. V. Swindale, and M. S. Cynader,“Functional organization of the cortical 17/18 border region inthe cat,” Experimental Brain Research, vol. 79, no. 2, pp. 271–282,1990.
[124] S. G. Waxman and H. A. Swadlow, “Ultrastructure of visualcallosal axons in the rabbit,” Experimental Neurology, vol. 53, no.1, pp. 115–127, 1976.
[125] A. S. LaMantia and P. Rakic, “Axon overproduction andelimination in the corpus callosum of the developing rhesusmonkey,” Journal of Neuroscience, vol. 10, no. 7, pp. 2156–2175,1990.
[126] F. Aboitiz, A. B. Scheibel, R. S. Fisher, and E. Zaidel, “Individualdifferences in brain asymmetries and fiber composition in thehuman corpus callosum,” Brain Research, vol. 598, no. 1-2, pp.154–161, 1992.
[127] J. C. Houzel and C. Milleret, “Visual inter-hemispheric process-ing: constraints and potentialities set by axonal morphology,”Journal of Physiology Paris, vol. 93, no. 4, pp. 271–284, 1999.
[128] T. Wunderle, The impact of cortico-cortical connections on theresponse properties of neurons in primary visual cortex [Ph.D.thesis], 2011.
[129] M. N. Shadlen and W. T. Newsome, “The variable dischargeof cortical neurons: implications for connectivity, computation,and information coding,” Journal of Neuroscience, vol. 18, no. 10,pp. 3870–3896, 1998.
[130] E. Salinas and T. J. Sejnowski, “Impact of correlated synapticinput on output firing rate and variability in simple neuronalmodels,” Journal of Neuroscience, vol. 20, no. 16, pp. 6193–6209,2000.
[131] S. Lowel and W. Singer, “Selection of intrinsic horizontalconnections in the visual cortex by correlated neuronal activity,”Science, vol. 255, no. 5041, pp. 209–212, 1992.
[132] B. Dreher and L. J. Cottee, “Visual receptive field properties ofcells in area 18 of cat’s cerebral cortex before and after acutelesions in area 17,” Journal of Neurophysiology, vol. 38, no. 4, pp.735–750, 1975.
Neural Plasticity 11
[133] B. R. Payne, A. J. Elberger, N. Berman, and E. H. Murphy,“Binocularity in the cat visual cortex is reduced by sectioningthe corpus callosum,” Science, vol. 207, no. 4435, pp. 1097–1099,1980.
[134] C. Blakemore, Y. Diao, and M. Pu, “Possible functions of theinterhemispheric connexions between visual cortical areas inthe cat,” Journal of Physiology, vol. 337, pp. 331–349, 1983.
[135] U. Yinon, M. Chen, S. Zamir, and S. Gelerstein, “Corpuscallosum transection reduces binocularity of cells in the visualcortex of adult cats,”Neuroscience Letters, vol. 92, no. 3, pp. 280–284, 1988.
[136] F. Lepore, A. Samson, and S. Molotchnikoff, “Effects on binoc-ular activation of cells in visual cortex of the cat following thetransection of the optic tract,” Experimental Brain Research, vol.50, no. 2-3, pp. 392–396, 1983.
[137] D. Minciacchi and A. Antonini, “Binocularity in the visualcortex of the adult cat does not depend on the integrity of thecorpus callosum,” Behavioural Brain Research, vol. 13, no. 2, pp.183–192, 1984.
[138] J. C. Gardner and M. S. Cynader, “Mechanisms for binoculardepth sensitivity along the vertical meridian of the visual field,”Brain Research, vol. 413, no. 1, pp. 60–74, 1987.
[139] A. J. Elberger and E. L. Smith, “The critical period for corpuscallosum section to affect cortical binocularity,” ExperimentalBrain Research, vol. 57, no. 2, pp. 213–223, 1985.
[140] M. Pietrasanta, L. Restani, and M. Caleo, “The corpus callosumand the visual cortex: plasticity is a game for two,” NeuralPlasticity, vol. 2012, Article ID 838672, 10 pages, 2012.
[141] C. Blakemore, “Binocular depth discrimination and thenasotemporal division,” Journal of Physiology, vol. 205, no. 2, pp.471–497, 1969.
[142] D. E. Mitchell and C. Blakemore, “Binocular depth perceptionand the corpus callosum,” Vision Research, vol. 10, no. 1, pp. 49–54, 1970.
[143] F. Lepore, A. Samson, M. C. Paradis, M. Ptito, and J. P. Guille-mot, “Binocular interaction and disparity coding at the 17-18 border: contribution of the corpus callosum,” ExperimentalBrain Research, vol. 90, no. 1, pp. 129–140, 1992.
[144] C. Kalberlah, C. Distler, and K. P. Hoffmann, “Sensitivity torelative disparity in early visual cortex of pigmented and albinoferrets,” Experimental Brain Research, vol. 192, no. 3, pp. 379–389, 2009.
[145] A. Angelucci, J. B. Levitt, E. J. S. Walton, J. M. Hupe, J. Bullier,and J. S. Lund, “Circuits for local and global signal integrationin primary visual cortex,” Journal of Neuroscience, vol. 22, no. 19,pp. 8633–8646, 2002.
[146] A. Shmuel, M. Korman, A. Sterkin et al., “Retinotopic axisspecificity and selective clustering of feedback projections fromV2 to V1 in the Owl monkey,” Journal of Neuroscience, vol. 25,no. 8, pp. 2117–2131, 2005.
[147] A. Angelucci and J. Bullier, “Reaching beyond the classicalreceptive field of V1 neurons: horizontal or feedback axons?”Journal of Physiology Paris, vol. 97, no. 2-3, pp. 141–154, 2003.
[148] C. D. Gilbert and M. Sigman, “Brain states: top-down influencesin sensory processing,”Neuron, vol. 54, no. 5, pp. 677–696, 2007.
[149] J. Bullier, J. M. Hupe, A. C. James, and P. Girard, “The role offeedback connections in shaping the responses of visual corticalneurons,” Progress in Brain Research, vol. 134, pp. 193–204, 2001.
[150] C. Wang, W. J. Waleszczyk, W. Burke, and B. Dreher, “Mod-ulatory influence of feedback projections from area 21a onneuronal activities in striate cortex of the cat,” Cerebral Cortex,vol. 10, no. 12, pp. 1217–1232, 2000.
[151] P. Girard and J. Bullier, “Visual activity in area V2 duringreversible inactivation of area 17 in the macaque monkey,”Journal of Neurophysiology, vol. 62, no. 6, pp. 1287–1302, 1989.
[152] A. Michalski, B. M. Wimborne, and G. H. Henry, “The effect ofreversible cooling of cat’s primary visual cortex on the responsesof area 21a neurons,” Journal of Physiology, vol. 466, pp. 133–156,1993.
[153] B. R. Payne and S. G. Lomber, “Quantitative analyses ofprincipal and secondary compound parieto-occipital feedbackpathways in cat,” Experimental Brain Research, vol. 152, no. 4,pp. 420–433, 2003.
[154] G. V. Paramei and B. A. Sabel, “Contour-integration deficitson the intact side of the visual field in hemianopia patients,”Behavioural Brain Research, vol. 188, no. 1, pp. 109–124, 2008.
[155] J. Schadow, N. Dettler, G. V. Paramei et al., “Impairments ofGestalt perception in the intact hemifield of hemianopicpatients are reflected in gamma-band EEG activity,” Neuropsy-chologia, vol. 47, no. 2, pp. 556–568, 2009.
Hindawi Publishing CorporationNeural PlasticityVolume 2013, Article ID 639430, 12 pageshttp://dx.doi.org/10.1155/2013/639430
Review Article
Splenium of Corpus Callosum: Patterns of InterhemisphericInteraction in Children and Adults
Maria G. Knyazeva1,2
1 LREN, Department of Clinical Neuroscience, Centre Hospitalier Universitaire Vaudois (CHUV) and University of Lausanne,CH-1011 Lausanne, Switzerland
2Department of Radiology, Centre Hospitalier Universitaire Vaudois (CHUV) and University of Lausanne,CH-1011 Lausanne, Switzerland
Correspondence should be addressed to Maria G. Knyazeva; [email protected]
Received 13 December 2012; Revised 8 February 2013; Accepted 9 February 2013
Academic Editor: Maurice Ptito
Copyright © 2013 Maria G. Knyazeva. This is an open access article distributed under the Creative Commons Attribution License,which permits unrestricted use, distribution, and reproduction in any medium, provided the original work is properly cited.
The splenium of the corpus callosum connects the posterior cortices with fibers varying in size from thin late-myelinating axonsin the anterior part, predominantly connecting parietal and temporal areas, to thick early-myelinating fibers in the posterior part,linking primary and secondary visual areas. In the adult human brain, the function of the splenium in a given area is defined bythe specialization of the area and implemented via excitation and/or suppression of the contralateral homotopic and heterotopicareas at the same or different level of visual hierarchy. These mechanisms are facilitated by interhemispheric synchronization ofoscillatory activity, also supported by the splenium. In postnatal ontogenesis, structural MRI reveals a protracted formation of thesplenium during the first two decades of human life. In doing so, the slow myelination of the splenium correlates with the formationof interhemispheric excitatory influences in the extrastriate areas and the EEG synchronization, while the gradual increase ofinhibitory effects in the striate cortex is linked to the local inhibitory circuitry. Reshaping interactions between interhemisphericallydistributed networks under various perceptual contexts allows sparsification of responses to superfluous information from thevisual environment, leading to a reduction of metabolic and structural redundancy in a child’s brain.
1. Introduction
The splenium is a name of the posterior part of the corpuscallosum (CC). In Greek this word means a bandage striptied around an injury or a damaged part of someone’s body.Although the association of the name with the respectivestructure is not immediately clear from the most commonsagittal images of the brain (Figure 1(a)), which create anillusion of the CC as a structure that can only be artificiallypartitioned, the basal view of the splenium from Gray’s Atlas(Figure 1(b)) completely justifies its name and shows that thesplenium fibers connect occipital and parietal cortices, aswell as inferior and medial temporal regions (including theposterior cingulate).
According to anatomical tracing studies, the fiber com-position of the splenium is heterogeneous: its anterior partincludes thin late-myelinating fibers from parietal and medialtemporal association areas, while the posterior part contains
thick early-myelinating fibers linking primary/secondaryvisual areas [1–5]. Most of the splenium fibers are reciprocaland connect the hemispheres homotopically, while somefibers are heterotopic, although homoareal, and others linkdifferent cortical areas [6–9]. The splenium connections areunevenly distributed across cortical areas both in humans andin nonhuman primates [7, 10, 11]. They are relatively denseand widely distributed in the extrastriate cortices, whereas inthe striate cortex, callosal fibers are located in a narrow stripalong the V1/V2 border representing the vertical meridian ofthe visual field.
These basic aspects of the splenium organization aresupplemented by recent neuroimaging findings. In vivotracing—diffusion tensor imaging (DTI)—studies describe amore detailed spatial organization of fibers within the humansplenium [3, 5, 12]. According to these reports, the middlepart of the splenium carries fibers connecting dorsal visualand association parietal areas, the superior-posterior part
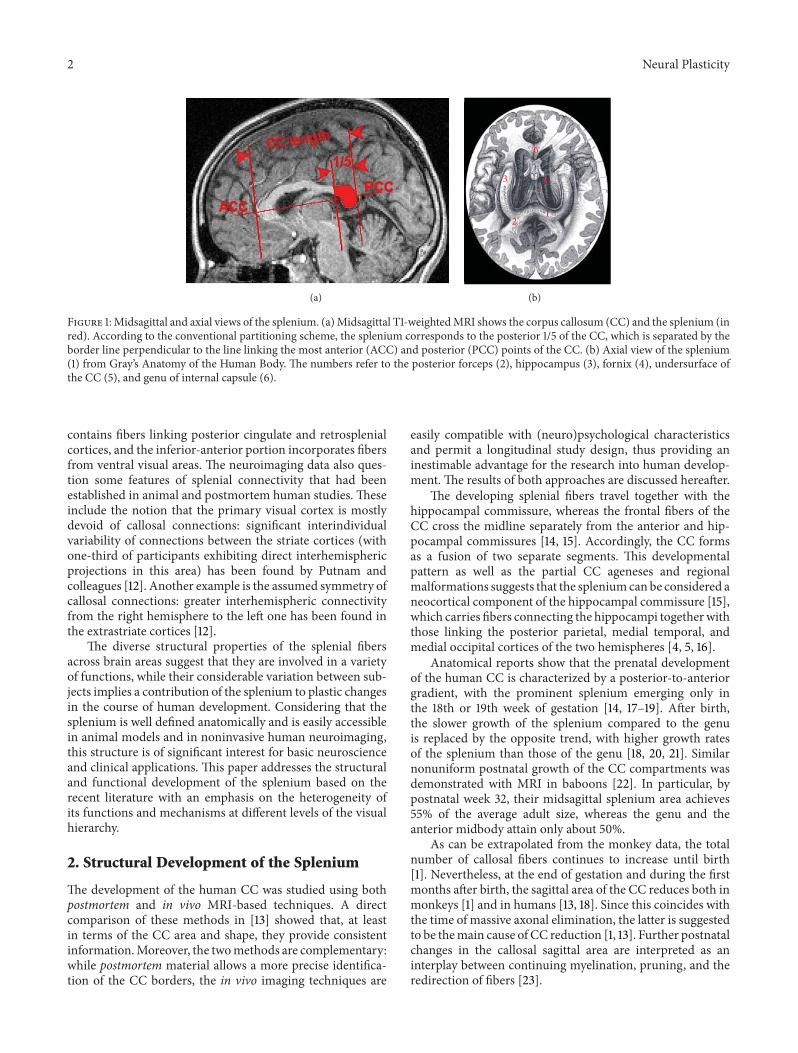
2 Neural Plasticity
(a)
1
43 5
6
2
(b)
Figure 1: Midsagittal and axial views of the splenium. (a) Midsagittal T1-weighted MRI shows the corpus callosum (CC) and the splenium (inred). According to the conventional partitioning scheme, the splenium corresponds to the posterior 1/5 of the CC, which is separated by theborder line perpendicular to the line linking the most anterior (ACC) and posterior (PCC) points of the CC. (b) Axial view of the splenium(1) from Gray’s Anatomy of the Human Body. The numbers refer to the posterior forceps (2), hippocampus (3), fornix (4), undersurface ofthe CC (5), and genu of internal capsule (6).
contains fibers linking posterior cingulate and retrosplenialcortices, and the inferior-anterior portion incorporates fibersfrom ventral visual areas. The neuroimaging data also ques-tion some features of splenial connectivity that had beenestablished in animal and postmortem human studies. Theseinclude the notion that the primary visual cortex is mostlydevoid of callosal connections: significant interindividualvariability of connections between the striate cortices (withone-third of participants exhibiting direct interhemisphericprojections in this area) has been found by Putnam andcolleagues [12]. Another example is the assumed symmetry ofcallosal connections: greater interhemispheric connectivityfrom the right hemisphere to the left one has been found inthe extrastriate cortices [12].
The diverse structural properties of the splenial fibersacross brain areas suggest that they are involved in a varietyof functions, while their considerable variation between sub-jects implies a contribution of the splenium to plastic changesin the course of human development. Considering that thesplenium is well defined anatomically and is easily accessiblein animal models and in noninvasive human neuroimaging,this structure is of significant interest for basic neuroscienceand clinical applications. This paper addresses the structuraland functional development of the splenium based on therecent literature with an emphasis on the heterogeneity ofits functions and mechanisms at different levels of the visualhierarchy.
2. Structural Development of the Splenium
The development of the human CC was studied using bothpostmortem and in vivo MRI-based techniques. A directcomparison of these methods in [13] showed that, at leastin terms of the CC area and shape, they provide consistentinformation. Moreover, the two methods are complementary:while postmortem material allows a more precise identifica-tion of the CC borders, the in vivo imaging techniques are
easily compatible with (neuro)psychological characteristicsand permit a longitudinal study design, thus providing aninestimable advantage for the research into human develop-ment. The results of both approaches are discussed hereafter.
The developing splenial fibers travel together with thehippocampal commissure, whereas the frontal fibers of theCC cross the midline separately from the anterior and hip-pocampal commissures [14, 15]. Accordingly, the CC formsas a fusion of two separate segments. This developmentalpattern as well as the partial CC ageneses and regionalmalformations suggests that the splenium can be considered aneocortical component of the hippocampal commissure [15],which carries fibers connecting the hippocampi together withthose linking the posterior parietal, medial temporal, andmedial occipital cortices of the two hemispheres [4, 5, 16].
Anatomical reports show that the prenatal developmentof the human CC is characterized by a posterior-to-anteriorgradient, with the prominent splenium emerging only inthe 18th or 19th week of gestation [14, 17–19]. After birth,the slower growth of the splenium compared to the genuis replaced by the opposite trend, with higher growth ratesof the splenium than those of the genu [18, 20, 21]. Similarnonuniform postnatal growth of the CC compartments wasdemonstrated with MRI in baboons [22]. In particular, bypostnatal week 32, their midsagittal splenium area achieves55% of the average adult size, whereas the genu and theanterior midbody attain only about 50%.
As can be extrapolated from the monkey data, the totalnumber of callosal fibers continues to increase until birth[1]. Nevertheless, at the end of gestation and during the firstmonths after birth, the sagittal area of the CC reduces both inmonkeys [1] and in humans [13, 18]. Since this coincides withthe time of massive axonal elimination, the latter is suggestedto be the main cause of CC reduction [1, 13]. Further postnatalchanges in the callosal sagittal area are interpreted as aninterplay between continuing myelination, pruning, and theredirection of fibers [23].
Neural Plasticity 3
Structural MRI-based studies report the prolongedgrowth of the total CC area and splenium (among other CCsubdivisions) from birth adulthood in nonhuman primates,including chimpanzees [24], Bonnet macaques [25], andcapuchin monkeys [26]. Since the end of the 1990s, severallaboratories have applied mesh-based computational MRItechniques to the analysis of the sagittal callosal area in chil-dren and adolescents [27–30]. In this method, aimed towardlongitudinal research, four-dimensional quantitative maps ofgrowth patterns are reconstructed by computing a three-dimensional elastic deformation field, which rearranges theshape of the CC in the earlier scan into the shape in thelater scan [30]. These groups reported greater increase in thesplenium than in the anterior CC regions in children andadolescents aged 4–18 years [27, 28], 6–15 years [29], and 7–22years [30].
Alternative imaging methods provide converging results.To assess the CC development in healthy children of 3–15 years, Kim and collaborators [31] used multiecho T2relaxometry based on the longer T2 relaxation times of watermolecules within the axon and extracellular space unboundto macromolecules. During development, the axonal diam-eters in the splenium grow in parallel with the reductionof their density [1, 2]. Therefore, the continuing increase ofaxonal size should correlate with the increase of T2 relaxationtimes. The measurements in genu and splenium revealedthat the relaxation times significantly correlate with ageonly in the splenium, suggesting its prominent growth inthe late childhood and adolescence. DTI studies, althoughinconsistent about the anterior-to-posterior gradient of CCmaturation, nevertheless show that the splenium developsgradually through adolescence [32, 33].
Recently, in a large computational mesh-modeling MRIstudy of 190 children and adolescents aged 5–18 years, Ludersand coauthors [34] confirmed that the callosal area increaseswith age and revealed the age-, sex-, and region-specificrates of growth. In particular, in a result qualitatively similarto previous neuroimaging studies (e.g., [29]), the youngerchildren showed the most pronounced growth in the anteriorCC, while the splenium began to overtake the anterior partsof the CC starting from the age of 9-10 years in girls and of11-12 years in boys.
A synthesis of the postmortem anatomical and in vivoMRIdata suggests that periods of accelerated growth of the genualternate with periods when the splenium picks up speed.Such shifts occur around birth time (the splenium speedsup compared to the genu), in early childhood (the genubegins to outrun the splenium), and in middle childhood(the splenium once more takes the lead in growth). Themechanisms behind these changes seem to be age-specific. Inthe context of the first postnatal spurt of splenium growth,the data of Chalupa and colleagues from their tract tracingstudies in rhesus monkeys are of interest [35, 36]. Theyshowed that, in late fetal development, the elimination ofCC axons in the visual areas is less pronounced than that inthe sensorimotor cortex. If the lower proportion of axonalretraction in the posterior areas is also characteristic forhumans, this phenomenon could explain the higher spleniumgrowth in the early postnatal period.
The last period, characterized by an anterior-to-posteriorgradient of the CC development, is in humans likely relatedto the protracted myelination of the splenium. Myelina-tion starts at 3-4 months after birth and continues intoadulthood [21, 37]. In adults only 16% of the CC fibersremain unmyelinated [2]. To analyze the link between CCarea and myelination, Fornari and colleagues (2007) usedmagnetization transfer imaging (MTI) in children of 7 to13 years of age [38]. MTI estimates the efficiency of mag-netization exchange in biological tissues between a pool offree protons in intra- and extracellular water and a poolof protons bound to macromolecules (for review, see [39]).As shown in an in vitro experiment, the contribution ofthe myelin sheets to the MT contrast is nine times largerthan the contributions of intra/extracellular water [40]. Apostmortem study of the multiple sclerosis brain demon-strated highly significant correlations between morphome-tric and MTI measures of myelin content [41]. Since themost important contributors to the magnetization transfereffect are the extent, concentration, and integrity of myelinmembranes, MTI permits an accurate evaluation of changesin myelination in children, aging people, and populationswith myelination abnormalities [42–44]. Consistently withpreviously reviewed reports, in a group of healthy children,the most robust direct correlation between the MTI index ofmyelination and a child’s age has been shown by Fornari andcolleagues for the area of the splenium [38].
Myelination in the nervous system is a plasticity-dependent process [45]. The size of the CC in animals andhumans increases with learning or training [46–48]. It islikely that nonmonotonic growth of the splenium probablyreflects its plastic tuning to the heterochronically maturingvisual functions in childhood and adolescence. More specif-ically, the accelerated growth of the splenium in the firstpostnatal weeks/months coincides with the fast developmentof sensitivity to orientation, direction of motion, and dispar-ity [49]. Another period of relatively high growth rates thatstarts in middle childhood accompanies improvement of thefunctions associated with spatial integration (see Sections 5and 6).
3. Known and Assumed Mechanisms andFunctions of the Splenium
Before proceeding any further, it should be noted thatthe tasks performed by the CC within the framework ofinterhemispheric integration as well as the physiologicalmechanisms implementing these tasks remain to be studiedfurther. At a functional level, basic physiological effects of theCC are conceptualized as excitation and inhibition. Specifi-cally, excitation refers to the tendency of one site to activatethe symmetric location in the other hemisphere, whileinhibition refers to the opposite effect [50]. Since cortico-cortical long-distance connections are mainly excitatory,the interhemispherically induced suppression of a responsenecessarily includes local inhibitory interneurons. Therefore,the interhemispheric effects resulting from a summationof multiple diversified events at a neuronal/synaptic level
4 Neural Plasticity
require a very cautious interpretation at a network level,especially in noninvasive human research.
In a decades’ long debate about the excitatory, inhibitory,or mixed nature of interhemispheric effects of the CC, theexcitatory function seemed to get the majority of support.To this end, in 2005 Bloom and Hynd [50] wrote thefollowing: “The available research, no matter how limited,primarily supports the notion that the corpus callosumserves a predominantly excitatory function.” Recent researchhas revealed a more complicated picture, in which theCC functions and mechanisms not only change along itsanterior-to-posterior axis depending on the cortical area oforigin/destination, but also vary within a singular area.
The application of sophisticated experimental methodsby the group of Innocenti substantially enriched our under-standing of the repertoire of splenial functions [51–53].By combining local reversible thermal inactivation in onehemisphere with optical imaging of intrinsic signals or elec-trophysiological recordings in the other hemisphere, theseauthors showed that the splenium fibers connecting visualareas 17/18 of the ferret modulate the driving thalamocorticalinput by means of inhibitory effects at short latencies andof excitatory effects at longer latencies [52]. The latenciesof inhibitory effects are compatible with higher conduc-tion velocities of thick early-myelinating fibers, whereas theexcitation is apparently driven by thinner axons with lowerconduction velocities. All the modulatory influences arestimulus-specific [53]. Their interplay with axonal geometrycan change the synchronization of stimulus-driven local fieldpotential [51]. Considering that synchronization serves torecruit neuronal populations to common activity [54, 55],such effects of the splenium might not be limited to the areaof their destination—a narrow strip at the 17/18 border—butaffect the functionality of a significant part of the area (seeSection 4).
Not much is known about the splenium functions in theextrastriate areas. However, comparing the splenium connec-tions between the striate cortex, where they are thick (heavilymyelinated), sparse, and concentrated along the border, andextrastriate cortices, where interhemispheric connections arethin, dense, and widely distributed [7], it is difficult to escapethe conclusion that the functions of splenium fibers varyacross visual areas. The conventional assumption is that thefunctional role of the splenium in a particular extrastriatearea is defined by its specialization. For instance, Olavarriaand Abel (1996) [56] reported that callosal cells are assem-bled in regular protrusions into V2 of the monkey. Theseprotrusions are distributed along the V1/V2 border at theintervals corresponding to the arrangement of thick and thinstripes. Given that the stripes are specific to the organizationof the V2 and correspond to the functional streams engagedin the processing of orientation and direction [57, 58], thisstructural evidence suggests some area-specific functions ofthe splenium beside establishing continuity across the visualfield.
One such function is figure-ground segregation, whichrefers to the ability of the visual system to segment images ofthe external world into objects and background. To this end,a mechanism has been proposed for the isolation of a figure
from the background through the detection of its borders [59,60]. It relies on inhibition among neurons with neighboringreceptive fields tuned to the same feature. As a result, withina homogenous region, similarly tuned neurons mutuallyinhibit their activity, whereas at borders, such neurons areless inhibited due to regional heterogeneity. The receptivefields that implement this border-detecting mechanism arecharacterized by center-surround antagonism, that is, theyhave a receptive field center that is excited by a particularimage feature and surround that is inhibited by the samefeature. Desimone and colleagues (1993) found that, in V4 ofthe monkey, the classical receptive fields (excitatory centers)are mostly limited to the contralateral visual field, whiletheir suppressive surround might extend into the ipsilateralvisual field up to 16∘ from the vertical meridian [61]. Inthese experiments, dissection of the CC abolished muchof the inhibition from the ipsilateral part of the surround,demonstrating its involvement in the core mechanisms offigure-ground segregation implemented in the V4.
Callosal connections are structurally, functionally, anddevelopmentally similar to long-range intrahemispheric cor-ticocortical connections [11, 62]. With the exception of the CCagenesis, there are no pathologies in which they are specif-ically involved [63]. Nonetheless, since intrahemisphericmechanisms within a single level of the visual hierarchy arerealized via lateral intracortical horizontal fibers and short-range association fibers (U-fibers), the number of whichis orders of magnitude greater than that of splenial fibersexecuting the same functions interhemispherically [64], onemay speculate that the CC should have some adaptationscompensating for its limited number of connections, and,therefore, interhemispheric networks should differ from therespective intrahemispheric networks.
Finally, the functions of the splenium may encompasscommunication among different levels of hierarchy. Theinactivation of higher-order visual areas weakens the sup-pressive surround of neurons in lower-order areas, suggestinga role for top-down connections in this mechanism [65]. Theheterotopic splenial fibers [6, 9], especially those betweenassociation and primary visual areas, could mediate suchfeedback.
4. Development of InterhemisphericSynchronization in the Visual Brain
As stated in the previous section, the interhemispheric syn-chronization of network activity can be involved in a varietyof functions. The impact of the splenium in synchronizingthe electrical activity between the hemispheres is supportedby animal models and noninvasive human studies [66–68]. Kiper and colleagues [67] examined interhemisphericsynchronization in ferrets, in which, like in other mammals,the splenium fibers located along the V1/V2 border selectivelyconnect neurons with the receptive fields having similarorientation preferences and placed near the vertical meridianof the visual field. For this structure of connectivity, thebinding-through-synchronization hypothesis [55] predictsan increase of interhemispheric synchronization in response
Neural Plasticity 5
to the bilateral collinear stimuli near the vertical meridiancompared to the noncollinear stimuli.
Indeed, by contrasting differently oriented and locatedbilateral gratings before and after the section of the CC, theauthors have shown that interhemispheric synchronization ofepidural EEG increases in response to the isooriented grat-ings near the vertical meridian compared to the orthogonallyoriented gratings, whereas callosotomy abolishes the effectsof stimulus configuration. The same set of stimuli used ina noninvasive human study [68] induces similar changes ofinterhemispheric synchronization in surface EEG, whereasthe reduction of interhemispheric synchronization in theabsence of the splenium in humans was shown in acallosaland split-brain individuals [69–71].
It is safe to assume that even less dramatic changes ininterhemispheric connectivity that occur in human postnataldevelopment, for example, myelination of the spleniumfibers, would also affect the interhemispheric synchroniza-tion of neural networks. The network activity of the brain isoscillatory in nature. Oscillations provide a temporal framefor neuronal firing by means of synchronization of pre-and postsynaptic potentials [54, 55]. In the context of thisdiscussion, oscillations in the EEG alpha band are of specialinterest. First, the alpha rhythm is the most prominentoscillatory activity that can easily be recorded by meansof noninvasive surface EEG within a wide range of ages.Second, it is generated by visual cortical circuits interactingwith thalamocortical loops [72, 73] and has a relativelynarrow frequency range between 8 and 12 Hz. Third, thealpha rhythm is characterized by a protracted course ofdevelopment in children [74, 75] comparable with that of theCC.
In 7- to 12-month-old infants, the activity that canbe recorded over the occipital-parietal cortex within thefrequency range 5–9 Hz has the properties of alpha rhythmand is considered its precursor [76]. Alpha peak frequencylogarithmically increases with age [75], providing the bestestimate of maturation among the EEG parameters [74, 77].In parallel, the spatial organization of alpha rhythm develops.In a high-density EEG study, Srinivasan showed that, atthe peak alpha frequency, the 6- to 11-year-old childrendemonstrate lower long-range synchronization between theanterior and posterior Laplacian EEG signals in comparisonto the young adults [78]. Thus, the typical feature of adultEEG—high coherence between distant EEG signals in thealpha band—is still absent in middle childhood.
Farber and Knyazeva demonstrated an immaturity oflong-range interactions for the case of interhemisphericconnections [79]. They analyzed the development of theinterhemispheric coherence of alpha rhythm in 320 healthychildren and adolescents aged 2–17 years. Interhemisphericsynchronization rapidly increased with age in early childhood(between 2 and 7 years), whereas in middle childhood andadolescence the increase rate progressively slowed down.This developmental trajectory was also best approximatedby logarithmic function. The striking similarity betweenthe trajectories of the alpha frequency and synchronizationdevelopment and that of the white matter maturation [80, 81]suggest that the processes are closely related.
Theoretically, the frequency of coupled oscillatorsdepends on connection strength and time delays betweenthem [82, 83]. To this end, combined EEG-DTI studieshave found that, in adults, individual alpha frequencyis linked to the structural properties of corticocorticaland thalamocortical connections [84, 85]. The strongestcorrelation between an individual alpha frequency andfractional anisotropy, which reflects the joint contribution offiber density and myelination, was found for the splenium.
To summarize, although studies directly analyzing linksbetween interhemispheric alpha synchronization and struc-tural maturation of the splenium remain to be performed, thedevelopment of alpha rhythm in children seems to be closelylinked to the maturation of the CC. Moreover, the increaseof interhemispheric alpha synchronization with age impliesthat the long-range interhemispheric interactions become anincreasingly important regulator of visual functions. On theother hand, the relatively low level of functional cooperationbetween the hemispheres in the immature brain suggeststhe predominance of local intrahemispheric mechanismsunderlying vision in young children.
5. Visual Functions with a Protracted Courseof Development
The extended structural and functional maturation of thesplenium inspires me to consider the perceptual functionswith protracted developmental trajectories, although it is notclear a priori whether such a gradual development dependson the inter- or the intrahemispheric mechanisms. Mostvisual functions achieve adult levels within the first fewmonths (e.g., contrast, motion, and orientation sensitivity)or the first few years (grating acuity and binocularity) ofpostnatal life. In contrast, visual spatial integration (SI)develops slowly. SI refers to the processes that assemble localinformation across the visual field to implement a globalrepresentation of spatially extended objects in the brain.Behavioral experiments consistently show that the basicmechanisms of spatio-temporal integration are available inthe first months or even weeks of human life. Infants treat thecoherently moving parts of a display as belonging to the sameobject [86], differentiate upright from inverted biomotiondisplays [87], and integrate component motions into coherentpattern motion over large regions of space [88].
Yet the development of perceptual organization abilitiestakes a long trajectory through childhood and adolescence.Thus, sensitivity to global form in glass patterns is adult-like only at 9 years of age [89]. In a contour-detection task,children significantly improve grouping operations between5 and 14 years of age [90]. Sensitivity to biological andglobal motion advances between 6 and 14 years of age [91].Experiments with complex visual displays like hierarchicalshapes and compound letters reveal that even in adolescencevisual perception is biased toward representing local elements[92, 93]. Furthermore, the organization principles, workingin early life, improve with age and so does the ability touse collinearity for the integration of spatially distant linesegments, which increases at least until 10 years of age [94].
6 Neural Plasticity
The neural basis of this protracted course of functionalmaturation is discussed in the following sections.
6. Myelination of the Splenium ShapesFunctional Activation in Extrastriate Areas
In adults, cognitive performance correlates with the size ofthe callosal area [95] and cognitive impairment with thedemyelination of the splenium [96]. Apparently, myelinationfacilitates interhemispheric interaction by enhancing thecoordination of interhemispheric input [97], which leads to amore efficient recruitment of the target neural population tocommon activity [98, 99]. If this is the case for the developingsplenium in children, a correlation between its myelinationand the activation of respective networks is to be expected.
To test this in [38], we used a simple interhemisphericparadigm that requires only passive viewing of visual stimuli,verified earlier by us [67, 68] and by others in animal andhuman experiments. Being minimally demanding, this taskis applicable to groups of various age and health across thelifespan. Specifically, subjects fixated on large high-contrastbilateral gratings including horizontal collinear coherentlydrifting gratings (stimulus CG) and noncollinear orthogo-nally oriented and drifting gratings (stimulus NG). Of thetwo stimuli, only CG is fusible into a single image, whilethe NG is expected to induce a segmentation of the imagebetween the right and left visual fields. Functional magneticresonance imaging (fMRI) shows that, across different agegroups, the contrast CG > NG manifests highly reproducibleactivations (Figure 2(a)) in the ventral-stream V3v/V4 areas[38, 98–100]. In adults, these activations correlate with inter-hemispheric EEG synchronization [98, 99] and, therefore,can be considered a neural substrate of interhemisphericintegration.
First, we investigated whether the activation of theseintegration-specific areas is affected by splenium maturation.Children of 7–13 years of age were scanned while theyviewed the gratings [38]. By implementing fMRI and MTIprotocols in the same scanning session, we could estimateboth functional and structural aspects of interhemisphericinteraction. Each stimulus induced widespread activationover the striate and extrastriate areas. The activation asso-ciated with the CG>NG contrast was limited in childrento the V3v part of the adults’ activation (Figure 2(a)). Thismodulation of BOLD signal manifested by the networkspresumably involved in the interhemispheric integration wascorrelated with the myelination of the splenial system offibers [38]. Apparently, by changing the speed of transmissionand the effective geometry of the CC fibers, myelinationallows well-synchronized input to the opposite hemisphere,resulting in enhanced activation [97–99]. This effect pointsto the excitatory aspect of splenium function.
7. Transsplenial Inhibition inAdults and Children
In order to test other aspects of the development of interhemi-spheric interaction via the posterior callosal connections,
we reanalyzed the fMRI time series from this experiment[100] with dynamic causal modeling (DCM), a method forevaluating effective connectivity, that is, the influence thatone local neural system (source) exerts on another (target)[101, 102]. DCM differentiates positive coupling (excitation)that results in correlated increased activity between sourceand target regions from negative coupling (inhibition) thatleads to a relative decrease in the target activation comparedto the source. Although the term inhibition is conventionallyused in the DCM literature, its true meaning in this contextis the suppression of activation response due to a variety ofprocesses at a cellular level, including inhibition per se.
The visual interhemispheric integration task describedin the previous section is wellsuited for modeling effectiveconnectivity since its neural substrate is a relatively restrictednetwork, the nodes of which can be clearly identified, and theeffects of the stimuli can be described in terms of factorialdesign. The latter allows one to model main factors as drivingcontext-independent effects (in this case, stimulation withany grating stimulus compared to gray-screen (background))and interactions, resulting from experimental manipulations,as modulatory (context-dependent) effects (here it is theeffect of interhemispheric integration in response to CGcompared to any grating stimulus). Specifically, DCM allowsan analysis of such an interaction in terms of modulatoryconnections, that is, by defining their architecture and thecharacter of effect.
We used two pairs of interhemispherically symmetricregions for the model: one pair in the primary visual cortex,where the driving input arrived, and another pair in theextrastriate visual cortex, where the response varied depend-ing on the stimulus (Figure 2(b)). The nodes were limited tothe 4 mm radius spheres centered on the local maxima withinthese predefined territories. According to the probabilisticcytoarchitectonic atlas [103], one pair of nodes in eachhemisphere occupied the territory on both sides of the V1/V2border, while another one was located at the V3v/V4 border(Figure 2(b)). In this model, the driving signals induced byvisual stimulation arrive in the left and right primary visualcortices (V1L and V1R nodes of the model) and spread withinthe model between the V1L, V1R, V3L, and V3R nodesby means of reciprocal intrahemispheric, interhemispheric,homotopic, and heterotopic connections. On the assumptionthat each of these intrinsic connections can be modulated,the structure of modulatory connections reproduced thearchitecture of intrinsic connections. We used this model forcomparison of children (the same group of 7–13 years as in[38]) and adults that viewed the same gratings.
The intrinsic (driving) effective connections (all excita-tory) between the visual areas were significant in both groupsand did not differ between children and adults, in keepingwith a large body of evidence that basic visual networks inte-grated via long-distance reciprocal pathways are establishedearly in the course of development. The modulation inducedby the CG stimulus was conveyed by lateral and feedbackconnections, all of which were inhibitory. The strongestmodulation manifested by strengthened mutual suppressionwas found between the primary visual areas in both subjects’groups.
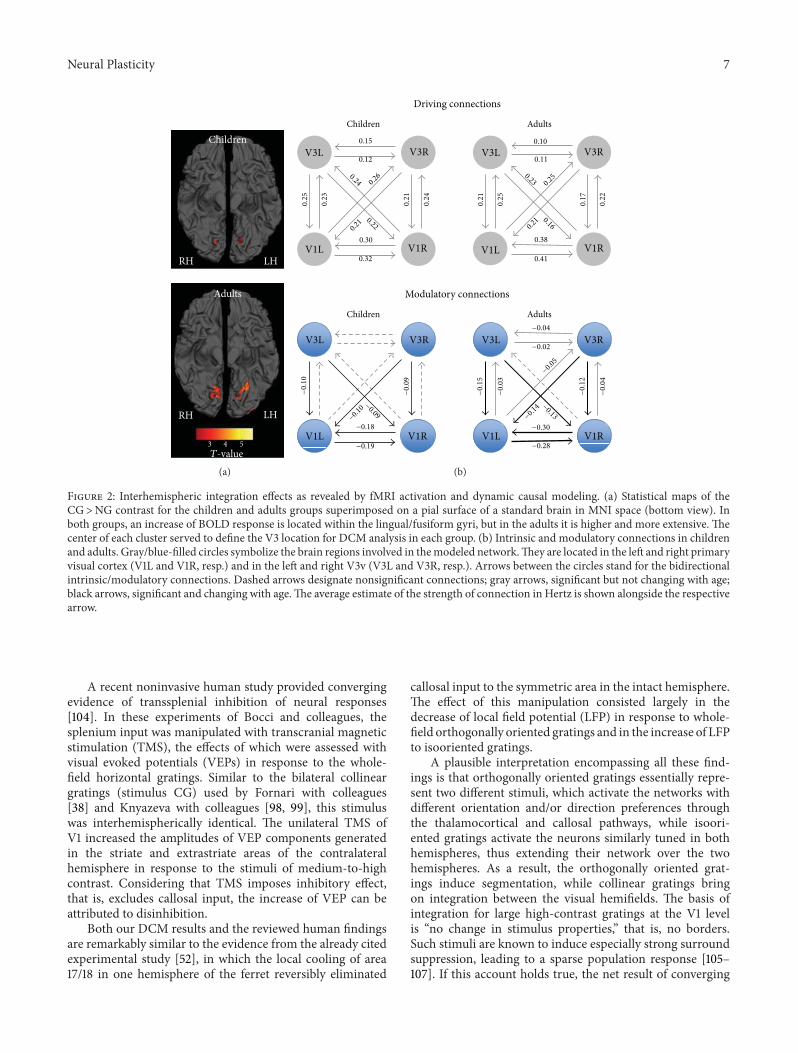
Neural Plasticity 7
Children
RH LH
Adults
3 4 5
RH LH
𝑇-value
(a)
Children
V1L
V3L V3L
Adults
V1L
0.25
0.23
Driving connections
Children Adults
0.41
0.38
0.25
0.10
0.11
0.21
0.17
0.22
0.32
0.30
0.21
0.22
0.15
0.12
0.25
0.21
0.23
0.24
−0.18
−0.19
−0.10
−0.09
−0.09
−0.13−
0.14
−0.10
−0.30
−0.28
−0.04
−0.02
−0.15
−0.12
−0.05
−0.03
−0.04
V3L
V1L V1R
V3RV3RV3L
V1L V1R
V1R
V3RV3R
V1R
Modulatory connections
0.160.21
0.24 0.26
(b)
Figure 2: Interhemispheric integration effects as revealed by fMRI activation and dynamic causal modeling. (a) Statistical maps of theCG>NG contrast for the children and adults groups superimposed on a pial surface of a standard brain in MNI space (bottom view). Inboth groups, an increase of BOLD response is located within the lingual/fusiform gyri, but in the adults it is higher and more extensive. Thecenter of each cluster served to define the V3 location for DCM analysis in each group. (b) Intrinsic and modulatory connections in childrenand adults. Gray/blue-filled circles symbolize the brain regions involved in the modeled network. They are located in the left and right primaryvisual cortex (V1L and V1R, resp.) and in the left and right V3v (V3L and V3R, resp.). Arrows between the circles stand for the bidirectionalintrinsic/modulatory connections. Dashed arrows designate nonsignificant connections; gray arrows, significant but not changing with age;black arrows, significant and changing with age. The average estimate of the strength of connection in Hertz is shown alongside the respectivearrow.
A recent noninvasive human study provided convergingevidence of transsplenial inhibition of neural responses[104]. In these experiments of Bocci and colleagues, thesplenium input was manipulated with transcranial magneticstimulation (TMS), the effects of which were assessed withvisual evoked potentials (VEPs) in response to the whole-field horizontal gratings. Similar to the bilateral collineargratings (stimulus CG) used by Fornari with colleagues[38] and Knyazeva with colleagues [98, 99], this stimuluswas interhemispherically identical. The unilateral TMS ofV1 increased the amplitudes of VEP components generatedin the striate and extrastriate areas of the contralateralhemisphere in response to the stimuli of medium-to-highcontrast. Considering that TMS imposes inhibitory effect,that is, excludes callosal input, the increase of VEP can beattributed to disinhibition.
Both our DCM results and the reviewed human findingsare remarkably similar to the evidence from the already citedexperimental study [52], in which the local cooling of area17/18 in one hemisphere of the ferret reversibly eliminated
callosal input to the symmetric area in the intact hemisphere.The effect of this manipulation consisted largely in thedecrease of local field potential (LFP) in response to whole-field orthogonally oriented gratings and in the increase of LFPto isooriented gratings.
A plausible interpretation encompassing all these find-ings is that orthogonally oriented gratings essentially repre-sent two different stimuli, which activate the networks withdifferent orientation and/or direction preferences throughthe thalamocortical and callosal pathways, while isoori-ented gratings activate the neurons similarly tuned in bothhemispheres, thus extending their network over the twohemispheres. As a result, the orthogonally oriented grat-ings induce segmentation, while collinear gratings bringon integration between the visual hemifields. The basis ofintegration for large high-contrast gratings at the V1 levelis “no change in stimulus properties,” that is, no borders.Such stimuli are known to induce especially strong surroundsuppression, leading to a sparse population response [105–107]. If this account holds true, the net result of converging
8 Neural Plasticity
thalamocortical and callosal inputs induced by a strongvisual stimulus extending into both hemifields would be asuppression of the V1 response.
Therefore, the splenium can be involved in the adaptiveprocess of neuronal response sparsification through suppres-sive mechanisms activated by redundant visual information.In a natural vision, when the entire retina is simultaneouslystimulated, such a mechanism is essential for the efficientprocessing of moving images [105, 107]. Moreover, it is likelythat inhibition is more important for the processing of visualinformation in an awake animal than anesthetized animalmodels suggest [97, 108].
In addition to the lateral effective connections betweenthe primary visual areas, effective feedback connections fromthe extrastriate V3v/V4 nodes convey inhibitory modula-tion induced by the isooriented stimulus in both groups(Figure 2(b)). This is consistent with animal models, wherethe large spatial extent of surround suppression togetherwith its short latent period suggests the involvement offeedback signals from the extrastriate cortex transmitted byfast myelinated fibers [65, 109, 110].
In our DCM model, the inhibitory feedback is carried byheterotopic interhemispheric connections. Since there are noassumptions about the number of synapses implementing aconnection in DCM, it remains to be demonstrated whetherthe heterotopic callosal connections shown in animals andhumans [6, 9] are implicated. The experiments of Banand colleagues (2006) suggest such a possibility [111]. Theyhave found that the BOLD response to the arcs presentedsymmetrically in the lower visual field quadrants is signif-icantly lower compared to the response to the same arcslocated asymmetrically (diagonally). In the absence of directinterhemispheric V1 connections between the low and highvisual quadrants, this change of V1 activation is likely dueto the top-down influences from the extrastriate areas. Theshortest pathway for such an effect would be the heterotopicsplenial fibers [9].
8. Formation of InterhemisphericInhibition with Age: Some Implicationsfor Development
As demonstrated by Lassonde and colleagues, childrenyounger than 10 years of age show remarkably small deficitsafter callosotomy [112, 113]. Although visual functions largelyescaped examination, the set of various tasks includingintermanual comparisons and naming of shapes and objects,as well as localization of touch, leave few doubts about close-to-normal performance even at their first neuropsychologicalassessment after the surgery and about the remarkably fastcompensation of residual deficits. In contrast, children olderthan 10 years of age and adolescents show a full-blownsplit-brain syndrome. Similar to adult split-brain patients,these children demonstrate a breakdown in interhemisphericcommunication, including the loss of intermanual transferand integration of tactile information and difficulty namingobjects held in the nondominant hand. Nevertheless, theyrecover more rapidly and completely than adults [112].
Cumulatively, the data of Lassonde and colleagues suggestthat some functions of the immature CC can be sharedwith alternative pathways, thus accounting for minimal post-operative deficits in young children. However, continuingdevelopment leads to the cortex rewiring through eliminationof overproduced connections [23]. The resulting patterns ofconnectivity may have a limited capacity for reorganization.Ptito and Lepore obtained direct evidence in favor of thisview in experiments on cats with the posterior CC sectionedeither before this structure reached maturity or after itsmaturation [114]. To disconnect each eye from the contralat-eral hemisphere, all these animals had the optic chiasmasectioned in adulthood and then were monocularly trainedon a visual discrimination task. Only cats with early callosaltranssection showed a capacity for the interhemispherictransfer of pattern discriminations. Thus, in parallel with CCmaturation, other connections become inaccessible, limitingplastic postoperative changes with age.
Yet the majority of functions are probably not stronglyreorganized in the ontogenesis but gradually improve withCC development. Our DCM-based findings shed new lighton the nature of callosal functions with a protracted courseof development [100]. Specifically, in contrast to excitatoryconnections that show no signs of changes between childrenand adults, interhemispheric modulatory connections (bothlateral and descending) strengthen with age (Figure 2(b)).The increase of interhemispheric suppression in the primaryvisual cortex of adults compared to that in children was thestrongest effect observed. Interestingly, although the strengthof inhibitory connections correlated with age, it did notcorrelate with the MTI indices of splenium myelination[100]. This is in line with previously reviewed experimentalevidence for the involvement of fast, that is, thick and early-myelinating, fibers in interhemispheric inhibitory effects[52].
Alternatively, since the CC neurons are generally exci-tatory but may target local inhibitory neurons [7], inter-hemispheric inhibition can be implemented via polysy-naptic pathways with long-distance excitatory and localinhibitory components. Then the correlation with age inthe absence of a correlation with myelination apparentlyreflects the development of local connections. Indeed, thelocal GABAergic mechanisms of the primary visual cortexanalyzed postmortem manifest the extended development,which continues well into the second and third decades of life[115].
It should be noted that from an ontogenetic perspec-tive, the prolonged formation of transsplenial modulationbetween the primary visual areas challenges the conventionalview that posits the prior maturation of the early visual cortexas a precondition for the later development of higher-orderventral stream regions [116].
The modulatory effects transmitted in our model viainterhemispheric top-down effective connections are alsoweaker in children than those in adults. Considering the agesof the children in this group (7–13 years), the DCM evidencepoints to the slow formation of feedback connections, whichmight be a part of the neural network that enables collinear-ity detection [90]. The available data on their structural
Neural Plasticity 9
maturation are limited to the connections between V2 and V1[117, 118]. According to these postmortem anatomical studies,the upper layers of V1, which receive the feedback and callosalconnections, seem to be immature at 5 years of age.
The reviewed literature together with structural andfunctional MRI, EEG, and DCM evidence obtained by theauthor’s group points to a slow structural development of thesplenium in human ontogenesis and to a gradual formationof transsplenial effective connections conveying inhibitoryinfluences. An important outcome of the protracted mat-uration of the mechanisms with splenial involvement is agreater efficiency of neuronal networks. Reshaping inter-actions between interhemispherically distributed networksunder various perceptual contexts allows sparse responsesto superfluous information from the visual environment.Another aspect of these processes is a reduction of well-known metabolic and structural redundancy in children’sbrains [23, 119].
Acknowledgment
This work was supported by Swiss National Foundation Grantno. 320030-127538/1.
References
[1] A. S. Lamantia and P. Rakic, “Cytological and quantitativecharacteristics of four cerebral commissures in the rhesusmonkey,” Journal of Comparative Neurology, vol. 291, no. 4, pp.520–537, 1990.
[2] F. Aboitiz, A. B. Scheibel, R. S. Fisher, and E. Zaidel, “Fibercomposition of the human corpus callosum,” Brain Research,vol. 598, no. 1-2, pp. 143–153, 1992.
[3] R. F. Dougherty, M. Ben-Shachar, G. Deutsch, P. Potanina, R.Bammer, and B. A. Wandell, “Occipital-callosal pathways inchildren validation and atlas development,” Annals of the NewYork Academy of Sciences, vol. 1064, pp. 98–112, 2005.
[4] S. Hofer and J. Frahm, “Topography of the human corpuscallosum revisited-Comprehensive fiber tractography usingdiffusion tensor magnetic resonance imaging,”NeuroImage, vol.32, no. 3, pp. 989–994, 2006.
[5] M. Saenz and I. Fine, “Topographic organization of V1 projec-tions through the corpus callosum in humans,”NeuroImage, vol.52, no. 4, pp. 1224–1229, 2010.
[6] M. A. Segraves and G. M. Innocenti, “Comparison of thedistributions of ipsilaterally and contralaterally projecting cor-ticocortical neurons in cat visual cortex using two fluorescenttracers,” Journal ofNeuroscience, vol. 5, no. 8, pp. 2107–2118, 1985.
[7] G. M. Innocenti, “General organization of callosal connectionsin the cerebral cortex,” in Cerebral Cortex, E. G. Jones and A.Peters, Eds., pp. 291–353, Plenum, New York, NY, USA, 1986.
[8] J. M. Clarke and E. Zaidel, “Anatomical-behavioral relation-ships: corpus callosum morphometry and hemispheric special-ization,” Behavioural Brain Research, vol. 64, no. 1-2, pp. 185–202, 1994.
[9] S. Clarke, “The role of homotopic and heterotopic callosalconnections in man,” in The Parallel Brain: The CognitiveNeuroscience of the Corpus Callosum, E. Zaidel and M. Iacoboni,Eds., pp. 461–472, MIT Press, Cambridge, Mass, USA, 2003.
[10] D. C. Van Essen, W. T. Newsome, and J. L. Bixby, “Thepattern of interhemispheric connections and its relationship toextrastriate visual areas in the macaque monkey,” Journal ofNeuroscience, vol. 2, no. 3, pp. 265–283, 1982.
[11] H. Kennedy, C. Meissirel, and C. Dehay, “Callosal pathways andtheir compliancy to general rules governing the organization ofcorticocortical connectivity,” in Vision and Visual Dysfunction,Vol 3: Neuroanatomy of the Visual Pathways andTheir Develop-ment, B. Dreher and S. Robinson, Eds., pp. 324–359, Macmillan,London, UK, 1991.
[12] M. C. Putnam, M. S. Steven, K. W. Doron, A. C. Riggall, andM. S. Gazzaniga, “Cortical projection topography of the humansplenium: hemispheric asymmetry and individual differences,”Journal of Cognitive Neuroscience, vol. 22, no. 8, pp. 1662–1669,2010.
[13] S. Clarke, R. Kraftsik, H. Van der Loos, and G. M. Innocenti,“Forms and measures of adult and developing human corpuscallosum: is there sexual dimorphism?” Journal of ComparativeNeurology, vol. 280, no. 2, pp. 213–230, 1989.
[14] L. J. Richards, C. Plachez, and T. Ren, “Mechanisms regulatingthe development of the corpus callosum and its agenesis inmouse and human,” Clinical Genetics, vol. 66, no. 4, pp. 276–289, 2004.
[15] C. Raybaud, “The corpus callosum, the other great forebraincommissures, and the septum pellucidum: anatomy, develop-ment, and malformation,” Neuroradiology, vol. 52, no. 6, pp.447–477, 2010.
[16] F. Aboitiz and J. Montiel, “One hundred million years ofinterhemispheric communication: the history of the corpuscallosum,” Brazilian Journal of Medical and Biological Research,vol. 36, no. 4, pp. 409–420, 2003.
[17] W. Hewitt, “The development of the human corpus callosum,”Journal of Anatomy, vol. 96, pp. 355–358, 1962.
[18] P. Rakic and P. I. Yakovlev, “Development of the corpuscallosum and cavum septi in man,” Journal of ComparativeNeurology, vol. 132, no. 1, pp. 45–72, 1968.
[19] T. Ren, A. Anderson, W. B. Shen et al., “Imaging, anatomical,and molecular analysis of callosal formation in the developinghuman fetal brain,” The Anatomical Record Part A, vol. 288, no.2, pp. 191–204, 2006.
[20] P. I. Yakovlev and A. R. Lecours, “The myelogenetic cycles ofregional maturation of the brain,” in Regional Development ofthe Brain in Early Life, A. Minkowski, Ed., pp. 3–70, BlackwellScientific, London, UK, 1967.
[21] H. C. Kinney, B. A. Brody, A. S. Kloman, and F. H. Gilles,“Sequence of central nervous system myelination in humaninfancy. II. Patterns of myelination in autopsied infants,” JournalofNeuropathology andExperimentalNeurology, vol. 47, no. 3, pp.217–234, 1988.
[22] K. A. Phillips and P. Kochunov, “Tracking development of thecorpus callosum in fetal and early postnatal baboons usingmagnetic resonance imaging,” Open Neuroimaging Journal, vol.5, supplement M6, pp. 181–187, 2011.
[23] G. M. Innocenti and D. J. Price, “Exuberance in the develop-ment of cortical networks,” Nature Reviews Neuroscience, vol. 6,no. 12, pp. 955–965, 2005.
[24] W. D. Hopkins and K. A. Phillips, “Cross-sectional analysisof the association between age and corpus callosum size inchimpanzees (Pan troglodytes,” Developmental Psychobiology,vol. 52, no. 2, pp. 133–141, 2010.
[25] P. J. Pierre, W. D. Hopkins, J. P. Taglialatela, C. J. Lees, andA. J. Bennett, “Age-related neuroanatomical differences from
10 Neural Plasticity
the juvenile period to adulthood in mother-reared macaques(Macaca radiata),” Brain Research, vol. 1226, pp. 56–60, 2008.
[26] K. A. Phillips and C. C. Sherwood, “Age-related differences incorpus callosum area of capuchin monkeys,” Neuroscience, vol.202, pp. 202–208, 2012.
[27] J. N. Giedd, J. W. Snell, N. Lange et al., “Quantitative magneticresonance imaging of human brain development: ages 4–18,”Cerebral Cortex, vol. 6, no. 4, pp. 551–560, 1996.
[28] J. N. Giedd, J. Blumenthal, N. O. Jeffries et al., “Brain develop-ment during childhood and adolescence: a longitudinal MRIstudy,” Nature Neuroscience, vol. 2, no. 10, pp. 861–863, 1999.
[29] P. M. Thompson, J. N. Gledd, R. P. Woods, D. MacDonald, A.C. Evans, and A. W. Toga, “Growth patterns in the developingbrain detected by using continuum mechanical tensor maps,”Nature, vol. 404, no. 6774, pp. 190–193, 2000.
[30] M. K. Chung, K. J. Worsley, T. Paus et al., “A unified statisticalapproach to deformation-based morphometry,” NeuroImage,vol. 14, no. 3, pp. 595–606, 2001.
[31] E. Y. Kim, D. H. Kim, E. Yoo et al., “Visualization of maturationof the corpus callosum during childhood and adolescenceusing T2 relaxometry,” International Journal of DevelopmentalNeuroscience, vol. 25, no. 6, pp. 409–414, 2007.
[32] L. Snook, L. A. Paulson, D. Roy, L. Phillips, and C. Beaulieu,“Diffusion tensor imaging of neurodevelopment in children andyoung adults,” NeuroImage, vol. 26, no. 4, pp. 1164–1173, 2005.
[33] N. C. R. McLaughlin, R. H. Paul, S. M. Grieve et al., “Diffusiontensor imaging of the corpus callosum: a cross-sectional studyacross the lifespan,” International Journal of DevelopmentalNeuroscience, vol. 25, no. 4, pp. 215–221, 2007.
[34] E. Luders, P. M. Thompson, and A. W. Toga, “The developmentof the corpus callosum in the healthy human brain,” Journal ofNeuroscience, vol. 30, no. 33, pp. 10985–10990, 2010.
[35] L. M. Chalupa and H. P. Killackey, “Process elimination under-lies ontogenetic change in the distribution of callosal projectionneurons in the postcentral gyrus of the fetal rhesus monkey,”Proceedings of the National Academy of Sciences of the UnitedStates of America, vol. 86, no. 3, pp. 1076–1079, 1989.
[36] L. M. Chalupa, H. P. Killackey, C. J. Snider, and B. Lia, “Callosalprojection neurons in area 17 of the fetal rhesus monkey,”Developmental Brain Research, vol. 46, no. 2, pp. 303–308, 1989.
[37] B. A. Brody, H. C. Kinney, A. S. Kloman, and F. H. Gilles,“Sequence of central nervous system myelination in humaninfancy. I. An autopsy study of myelination,” Journal of Neu-ropathology and Experimental Neurology, vol. 46, no. 3, pp. 283–301, 1987.
[38] E. Fornari, M. G. Knyazeva, R. Meuli, and P. Maeder, “Myeli-nation shapes functional activity in the developing brain,”NeuroImage, vol. 38, no. 3, pp. 511–518, 2007.
[39] J. R. Wozniak and K. O. Lim, “Advances in white matterimaging: a review of in vivo magnetic resonance methodologiesand their applicability to the study of development and aging,”Neuroscience and Biobehavioral Reviews, vol. 30, no. 6, pp. 762–774, 2006.
[40] G. J. Stanisz, A. Kecojevic, M. J. Bronskill, and R. M. Henkel-man, “Characterizing white matter with magnetization transferand T
2,” Magnetic Resonance Medicine, vol. 42, no. 6, pp. 1128–
1136, 1999.
[41] K. Schmierer, F. Scaravilli, D. R. Altmann, G. J. Barker, and D. H.Miller, “Magnetization transfer ratio and myelin in postmortemmultiple sclerosis brain,” Annals of Neurology, vol. 56, no. 3, pp.407–415, 2004.
[42] T. Button, D. Altmann, D. Tozer et al., “Magnetization transferimaging in multiple sclerosis treated with alemtuzumab,” Mul-tiple Sclerosis Journal, vol. 19, no. 2, pp. 241–244, 2013.
[43] M. Gozzi, D. M. Nielson, R. K. Lenroot et al., “A magnetizationtransfer imaging study of corpus callosum myelination in youngchildren with autism,” Biological Psychiatry, vol. 72, no. 3, pp.215–220, 2012.
[44] E. Fornari, P. Maeder, R. Meuli, J. Ghika, and M. G. Knyazeva,“Demyelination of superficial white matter in early Alzheimer’sdisease: a magnetization transfer imaging study,” Neurobiologyof Aging, vol. 33, no. 2, pp. 428.e7–428.e19, 2012.
[45] R. D. Fields, “Myelination: an overlooked mechanism of synap-tic plasticity?” Neuroscientist, vol. 11, no. 6, pp. 528–531, 2005.
[46] J. A. Markham, M. M. Herting, A. E. Luszpak, J. M. Juraska, andW. T. Greenough, “Myelination of the corpus callosum in maleand female rats following complex environment housing duringadulthood,” Brain Research, vol. 1288, pp. 9–17, 2009.
[47] T. Blumenfeld-Katzir, O. Pasternak, M. Dagan, and Y. Assaf,“Diffusion MRI of structural brain plasticity induced by alearning and memory task,” PLoS ONE, vol. 6, no. 6, Article IDe20678, 2011.
[48] G. Schlaug, L. Jancke, Y. Huang, J. F. Staiger, and H. Steinmetz,“Increased corpus callosum size in musicians,” Neuropsycholo-gia, vol. 33, no. 8, pp. 1047–1055, 1995.
[49] J. Atkinson, The Developing Visual Brain, vol. 32 of OxfordPsychology Series, Oxford University Press, 2002.
[50] J. S. Bloom and G. W. Hynd, “The role of the corpus callosumin interhemispheric transfer of information: excitation or inhi-bition?” Neuropsychology Review, vol. 15, no. 2, pp. 59–71, 2005.
[51] C. Carmeli, L. Lopez-Aguadao, K. E. Schmidt, O. De Feo,and G. M. Innocenti, “A novel interhemispheric interaction:modulation of neuronal cooperativity in the visual areas,” PLoSONE, vol. 2, no. 12, Article ID e1287, 2007.
[52] V. A. Makarov, K. E. Schmidt, N. P. Castellanos, L. Lopez-Aguado, and G. M. Innocenti, “Stimulus-dependent interactionbetween the visual areas 17 and 18 of the 2 hemispheres of theferret (Mustela putorius),” Cerebral Cortex, vol. 18, no. 8, pp.1951–1960, 2008.
[53] K. E. Schmidt, S. G. Lomber, and G. M. Innocenti, “Specificityof neuronal responses in primary visual cortex is modulatedby interhemispheric corticocortical input,” Cerebral Cortex, vol.20, no. 12, pp. 2776–2786, 2010.
[54] J. Lisman and G. Buzsaki, “A neural coding scheme formedby the combined function of gamma and theta oscillations,”Schizophrenia Bulletin, vol. 34, no. 5, pp. 974–980, 2008.
[55] J. Fell and N. Axmacher, “The role of phase synchronization inmemory processes,” Nature Reviews Neuroscience, vol. 12, no. 2,pp. 105–118, 2011.
[56] J. F. Olavarria and P. L. Abel, “The distribution of callosalconnections correlates with the pattern of cytochrome oxidasestripes in visual area V2 of Macaque monkeys,” Cerebral Cortex,vol. 6, no. 4, pp. 631–639, 1996.
[57] H. D. Lu, G. Chen, H. Tanigawa, and A. W. Roe, “A motiondirection map in macaque V2,” Neuron, vol. 68, no. 5, pp. 1002–1013, 2010.
[58] X. An, H. Gong, L. Qian et al., “Distinct functional organiza-tions for processing different motion signals in V1, V2, and V4of macaque,” The Journal of Neuroscience, vol. 32, no. 39, pp.13363–13379, 2012.
[59] S. Grossberg and E. Mingolla, “Neural dynamics of formperception: boundary. boundary completion, illusory figures,
Neural Plasticity 11
and neon color spreading,” Psychological Review, vol. 92, no. 2,pp. 173–211, 1985.
[60] L. Itti and C. Koch, “Computational modelling of visual atten-tion,” Nature Reviews Neuroscience, vol. 2, no. 3, pp. 194–203,2001.
[61] R. Desimone, J. Moran, S. J. Schein, and M. Mishkin, “A role forthe corpus callosum in visual area V4 of the macaque,” VisualNeuroscience, vol. 10, no. 1, pp. 159–171, 1993.
[62] P. D. Zufferey, F. Jin, H. Nakamura, L. Tettoni, and G. M.Innocenti, “The role of pattern vision in the development ofcortico-cortical connections,”European Journal ofNeuroscience,vol. 11, no. 8, pp. 2669–2688, 1999.
[63] G. M. Innocenti, F. Ansermet, and J. Parnas, “Schizophrenia,neurodevelopment and corpus callosum,” Molecular Psychiatry,vol. 8, no. 3, pp. 261–274, 2003.
[64] A. Schuz and V. Braitenberg, “The human cortical white matter:quantitative aspects of cortico-cortical long-range connectiv-ity,” in Cortical Areas, Unity and Diversity: Conceptual Advancesin Brain Research, A. Schultz and R. Miller, Eds., pp. 377–386,Taylor & Francis, London, UK, 2002.
[65] A. Angelucci and J. Bullier, “Reaching beyond the classicalreceptive field of V1 neurons: horizontal or feedback axons?”Journal of Physiology Paris, vol. 97, no. 2-3, pp. 141–154, 2003.
[66] A. K. Engel, P. Konig, A. K. Kreiter, and W. Singer, “Interhemi-spheric synchronization of oscillatory neuronal responses in catvisual cortex,” Science, vol. 252, no. 5010, pp. 1177–1179, 1991.
[67] D. C. Kiper, M. G. Knyazeva, L. Tettoni, and G. M. Innocenti,“Visual stimulus-dependent changes in interhemispheric EEGcoherence in ferrets,” Journal of Neurophysiology, vol. 82, no. 6,pp. 3082–3094, 1999.
[68] M. G. Knyazeva, D. C. Kiper, V. Y. Vildavski, P. A. Despland,M. Maeder-Ingvar, and G. M. Innocenti, “Visual stimulus-dependent changes in interhemispheric EEG coherence inhumans,” Journal of Neurophysiology, vol. 82, no. 6, pp. 3095–3107, 1999.
[69] T. Koeda, M. Knyazeva, C. Njiokiktjien, E. J. Jonkman, L. DeSonneville, and V. Vildavsky, “The EEG in acallosal children.Coherence values in the resting state: left hemisphere com-pensatory mechanism?” Electroencephalography and ClinicalNeurophysiology, vol. 95, no. 6, pp. 397–407, 1995.
[70] T. Nielsen, J. Montplaisir, and M. Lassonde, “Sleep architecturein agenesis of the corpus callosum: laboratory assessment offour cases,” Journal of Sleep Research, vol. 1, no. 3, pp. 197–200,1992.
[71] M. Brazdil, J. Brichta, V. Krajca, R. Kuba, and P. Daniel,“Interhemispheric EEG coherence after corpus callosotomy,”European Journal of Neurology, vol. 4, no. 4, pp. 419–425, 1997.
[72] F. Lopes da Silva, “Neural mechanisms underlying brain waves:from neural membranes to networks,” Electroencephalographyand Clinical Neurophysiology, vol. 79, no. 2, pp. 81–93, 1991.
[73] F. Lopes da Silva, “Functional localization of brain sources usingEEG and/or MEG data: volume conductor and source models,”Magnetic Resonance Imaging, vol. 22, no. 10, pp. 1533–1538, 2004.
[74] D. A. Farber and V. V. Alferova, The Electroencephalogramof Children and Adolescents, Pedagogika Publishing House,Moscow, Russia, 1972.
[75] C. G. Bernhard and C. R. Skoglund, “On the alpha frequencyof human brain potentials as a function of age,” SkandinavischesArchiv fur Physiologie, vol. 82, no. 2, pp. 178–184, 2012.
[76] T. A. Stroganova, E. V. Orekhova, and I. N. Posikera, “EEG alpharhythm in infants,” Clinical Neurophysiology, vol. 110, no. 6, pp.997–1012, 1999.
[77] P. Valdes, R. Biscay, L. Galan, J. Bosch, S. Szava, and T. Virues,“High resolution spectral EEG norms for topography,” BrainTopography, vol. 3, pp. 281–282, 1990.
[78] R. Srinivasan, “Spatial structure of the human alpha rhythm:global correlation in adults and local correlation in children,”Clinical Neurophysiology, vol. 110, no. 8, pp. 1351–1362, 1999.
[79] D. A. Farber and M. G. Knyazeva, “Electrophysiological corre-lates of interhemispheric interaction in ontogenesis,” in Pedi-atric Behavioural Neurology, G. Ramaekers and C. Njiokiktjien,Eds., vol. 3, pp. 86–99, Suyi Publications, Amsterdam, TheNetherlands, 1991.
[80] J. B. Colby, J. D. Van Horn, and E. R. Sowell, “Quantitative invivo evidence for broad regional gradients in the timing of whitematter maturation during adolescence,”NeuroImage, vol. 54, no.1, pp. 25–31, 2011.
[81] C. Lebel, M. Gee, R. Camicioli, M. Wieler, W. Martin, andC. Beaulieu, “Diffusion tensor imaging of white matter tractevolution over the lifespan,” NeuroImage, vol. 60, no. 1, pp. 340–352, 2012.
[82] O. David and K. J. Friston, “A neural mass model for MEG/EEG:coupling and neuronal dynamics,” NeuroImage, vol. 20, no. 3,pp. 1743–1755, 2003.
[83] R. C. Sotero, N. J. Trujillo-Barreto, Y. Iturria-Medina, F. Car-bonell, and J. C. Jimenez, “Realistically coupled neural massmodels can generate EEG rhythms,” Neural Computation, vol.19, no. 2, pp. 478–512, 2007.
[84] P. A. Valdes-Hernandez, A. Ojeda-Gonzalez, E. Martınez-Montes et al., “White matter architecture rather than corticalsurface area correlates with the EEG alpha rhythm,” NeuroIm-age, vol. 49, no. 3, pp. 2328–2339, 2010.
[85] K. Jann, A. Federspiel, S. Giezendanner et al., “Linking brainconnectivity across different time scales with electroencephalo-gram, functional magnetic resonance imaging, and diffusiontensor imaging,” Brain Connectivity, vol. 2, no. 1, pp. 11–20, 2012.
[86] E. S. Spelke, “Principles of object perception,” Cognitive Science,vol. 14, no. 1, pp. 29–56, 1990.
[87] F. Simion, L. Regolin, and H. Bulf, “A predisposition forbiological motion in the newborn baby,” Proceedings of theNational Academy of Sciences of the United States of America,vol. 105, no. 2, pp. 809–813, 2008.
[88] K. R. Dobkins, I. Fine, A. C. Hsueh, and C. Vitten, “Patternmotion integration in infants,” Journal of Vision, vol. 4, no. 3,pp. 144–155, 2004.
[89] T. L. Lewis, D. Ellemberg, D. Maurer, M. Dirks, F. Wilkinson,and H. R. Wilson, “A window on the normal development ofsensitivity to global form in glass patterns,” Perception, vol. 33,no. 4, pp. 409–418, 2004.
[90] I. Kovacs, P. Kozma, A. Feher, and G. Benedek, “Late maturationof visual spatial integration in humans,” Proceedings of theNational Academy of Sciences of the United States of America,vol. 96, no. 21, pp. 12204–12209, 1999.
[91] B. S. Hadad, D. Maurer, and T. L. Lewis, “Long trajectory forthe development of sensitivity to global and biological motion,”Developmental Science, vol. 14, no. 6, pp. 1330–1339, 2011.
[92] C. J. Mondloch, S. Geldart, D. Maurer, and S. de Schonen,“Developmental changes in the processing of hierarchicalshapes continue into adolescence,” Journal of ExperimentalChild Psychology, vol. 84, no. 1, pp. 20–40, 2003.
[93] K. S. Scherf, M. Behrmann, R. Kimchi, and B. Luna, “Emergenceof global shape processing continues through adolescence,”Child Development, vol. 80, no. 1, pp. 162–177, 2009.
12 Neural Plasticity
[94] B. S. Hadad and R. Kimchi, “Developmental trends in utilizingperceptual closure for grouping of shape: effects of spatialproximity and collinearity,” Perception and Psychophysics, vol.68, no. 8, pp. 1264–1273, 2006.
[95] E. Luders, K. L. Narr, P. M. Thompson, and A. W. Toga,“Neuroanatomical correlates of intelligence,” Intelligence, vol. 37,no. 2, pp. 156–163, 2009.
[96] C. Carmeli, A. Donati, V. Antille et al., “Demyelination inamnestic mild cognitive impairment: a magnetization transferimaging study,” in Society for Neuroscience Abstracts, vol. 38,New Orleans, La, USA, 2012.
[97] G. M. Innocenti, “Dynamic interactions between the cerebralhemispheres,” Experimental Brain Research, vol. 192, no. 3, pp.417–423, 2009.
[98] M. G. Knyazeva, E. Fornari, R. Meuli, G. Innocenti, and P.Maeder, “Imaging of a synchronous neuronal assembly in thehuman visual brain,” NeuroImage, vol. 29, no. 2, pp. 593–604,2006.
[99] M. G. Knyazeva, E. Fornari, R. Meuli, and P. Maeder, “Inter-hemispheric integration at different spatial scales: the evidencefrom EEG coherence and fMRI,” Journal ofNeurophysiology, vol.96, no. 1, pp. 259–275, 2006.
[100] R. Rytsar, E. Fornari, and M. G. Knyazeva, “Development ofspatial integration depends on top-down and interhemisphericeffects: a DCM analysis,” submitted.
[101] K. J. Friston, L. Harrison, and W. Penny, “Dynamic causalmodelling,” NeuroImage, vol. 19, no. 4, pp. 1273–1302, 2003.
[102] K. E. Stephan, W. D. Penny, R. J. Moran, H. E. M. den Ouden,J. Daunizeau, and K. J. Friston, “Ten simple rules for dynamiccausal modeling,” NeuroImage, vol. 49, no. 4, pp. 3099–3109,2010.
[103] S. B. Eickhoff, K. E. Stephan, H. Mohlberg et al., “A new SPMtoolbox for combining probabilistic cytoarchitectonic maps andfunctional imaging data,” NeuroImage, vol. 25, no. 4, pp. 1325–1335, 2005.
[104] T. Bocci, M. Caleo, E. Giorli et al., “Transcallosal inhibitiondampens neural responses to high contrast stimuli in humanvisual cortex,” Neuroscience, vol. 187, pp. 43–51, 2011.
[105] D. Tadin, J. S. Lappin, L. A. Gilroy, and R. Blake, “Perceptualconsequences of centre-surround antagonism in visual motionprocessing,” Nature, vol. 424, no. 6946, pp. 312–315, 2003.
[106] C. C. Pack, J. N. Hunter, and R. T. Born, “Contrast dependenceof suppressive influences in cortical area MT of alert macaque,”Journal of Neurophysiology, vol. 93, no. 3, pp. 1809–1815, 2005.
[107] R. N. Sachdev, M. R. Krause, and J. A. Mazer, “Surroundsuppression and sparse coding in visual and barrel cortices,”Frontiers in Neural Circuits, vol. 6, p. 43, 2012.
[108] B. Haider, M. Hausser, and M. Carandini, “Inhibition dominatessensory responses in the awake cortex,” Nature, vol. 493, no.7430, pp. 97–100, 2012.
[109] M. A. Smith, W. Bair, and J. Anthony Movshon, “Dynamicsof suppression in macaque primary visual cortex,” Journal ofNeuroscience, vol. 26, no. 18, pp. 4826–4834, 2006.
[110] H. J. Alitto and Y. Dan, “Function of inhibition in visual corticalprocessing,” Current Opinion in Neurobiology, vol. 20, no. 3, pp.340–346, 2010.
[111] H. Ban, H. Yamamoto, M. Fukunaga et al., “Toward a commoncircle: interhemispheric contextual modulation in human earlyvisual areas,” Journal of Neuroscience, vol. 26, no. 34, pp. 8804–8809, 2006.
[112] M. Lassonde, H. Sauerwein, G. Geoffroy, and M. Decarie,“Effects of early and late transection of the corpus callosumin children. A study of tactile and tactuomotor transfer andintegration,” Brain, vol. 109, no. 5, pp. 953–967, 1986.
[113] M. Lassonde, H. Sauerwein, A. J. Chicoine, and G. Geoffroy,“Absence of disconnexion syndrome in callosal agenesis andearly callosotomy: brain reorganization or lack of structuralspecificity during ontogeny?” Neuropsychologia, vol. 29, no. 6,pp. 481–495, 1991.
[114] M. Ptito and F. Lepore, “Interocular transfer in cats with earlycallosal transection,” Nature, vol. 301, no. 5900, pp. 513–515,1983.
[115] J. G. Pinto, K. R. Hornby, D. G. Jones, and K. M. Murphy,“Developmental changes in GABAergic mechanisms in humanvisual cortex across the lifespan,” Frontiers in Cellular Neuro-science, vol. 4, article 16, pp. 1–12, 2010.
[116] I. P. Conner, S. Sharma, S. K. Lemieux, and J. D. Mendola,“Retinotopic organization in children measured with fMRI,”Journal of Vision, vol. 4, no. 6, pp. 509–523, 2004.
[117] A. Burkhalter, “Development of forward and feedback connec-tions between areas V1 and V2 of human visual cortex,”CerebralCortex, vol. 3, no. 5, pp. 476–487, 1993.
[118] A. Burkhalter, K. L. Bernardo, and V. Charles, “Development oflocal circuits in human visual cortex,” Journal of Neuroscience,vol. 13, no. 5, pp. 1916–1931, 1993.
[119] P. R. Huttenlocher, “Morphometric study of human cerebralcortex development,” Neuropsychologia, vol. 28, no. 6, pp. 517–527, 1990.
Hindawi Publishing CorporationNeural PlasticityVolume 2013, Article ID 149060, 7 pageshttp://dx.doi.org/10.1155/2013/149060
Review Article
Axon Guidance Mechanisms for Establishment of CallosalConnections
Mitsuaki Nishikimi, Koji Oishi, and Kazunori Nakajima
Department of Anatomy, School of Medicine, Keio University, 35 Shinanomachi, Shinjuku-ku, Tokyo 160-8582, Japan
Correspondence should be addressed to Koji Oishi; [email protected] and Kazunori Nakajima; [email protected]
Received 6 June 2012; Revised 30 December 2012; Accepted 21 January 2013
Academic Editor: Giorgio M. Innocenti
Copyright © 2013 Mitsuaki Nishikimi et al. This is an open access article distributed under the Creative Commons AttributionLicense, which permits unrestricted use, distribution, and reproduction in any medium, provided the original work is properlycited.
Numerous studies have investigated the formation of interhemispheric connections which are involved in high-ordered functionsof the cerebral cortex in eutherian animals, including humans. The development of callosal axons, which transfer and integrateinformation between the right/left hemispheres and represent the most prominent commissural system, must be strictly regulated.From the beginning of their growth, until reaching their targets in the contralateral cortex, the callosal axons are guided mainly bytwo environmental cues: (1) the midline structures and (2) neighboring? axons. Recent studies have shown the importance of axonaguidance by such cues and the underlying molecular mechanisms. In this paper, we review these guidance mechanisms during thedevelopment of the callosal neurons. Midline populations express and secrete guidance molecules, and “pioneer” axons as well asinteractions between the medial and lateral axons are also involved in the axon pathfinding of the callosal neurons. Finally, wedescribe callosal dysgenesis in humans and mice, that results from a disruption of these navigational mechanisms.
1. IntroductionInterhemispheric connections are essential components ofthe complex neural network in eutherian animals [1, 2].Among such connections, the corpus callosum (CC) is themost prominent commissural connection, composed of cal-losal axons, in the brain. In humans, the corpus callosumconsists of about 200 million axons, making it the mostprominent fiber tract within the central nervous system [3,4]. Many studies have clarified the molecular mechanisminvolved in the development of the CC in humans usingmouse experiments [5].
Callosal neurons are mostly found in layers II/III andlayer V of the cerebral cortex in rodents [6]. Recently,molecules related to the identities of the general or subtypesof cortical neurons have been disclosed. Alcamo et al.reported that Satb2, a DNA-binding protein, has a key rolein the specification of callosal neurons and the formation ofcorticocortical connections [7].
Developmentally, callosal axons from layer V first startto project to the contralateral targets, and callosal axonsfrom the upper layers follow the preexisting axons. After the
callosal axons start to elongate, they are guided by many cueswithin their pathfinding route [6]. Although the importanceof such cues in the development of callosal axons has beenknown for over 30 years [8], it still remained unclear untilrecently how these cues help callosal axons encounteringthem to project precisely to their targets. Recent studies have,however, revealed the detailed mechanisms in the regulationof axon guidance by these structures. Midline structures,which consist of glia and neurons, express or secrete short-or long-range guidance molecules [9]. In the contralateralcortex, where the callosal axons terminate, interactions withpostsynaptic neurons play important roles, in an activity-dependent manner, in ensuring proper projections [10–12].
In this paper, we first focus on how the callosal axonsare guided by the cues that they encounter, namely, the (1)midline structures and (2) neighboring axons, from the timethat they start to grow until they reach their targets in the con-tralateral cortex. Then, we describe the activity-dependentdevelopment of the interhemispheric connections. Finally,the consequences of callosal agenesis in humans and mice arereviewed.
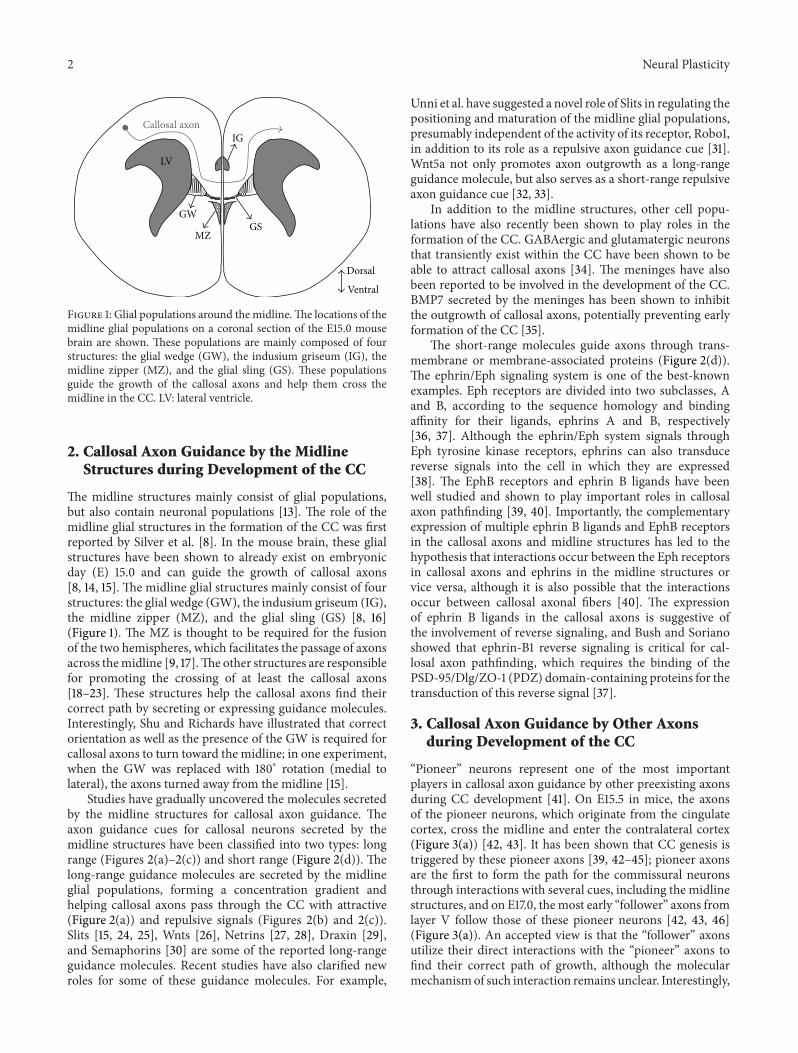
2 Neural Plasticity
IG
GWGS
MZ
Callosal axon
LV
Dorsal
Ventral
Figure 1: Glial populations around the midline. The locations of themidline glial populations on a coronal section of the E15.0 mousebrain are shown. These populations are mainly composed of fourstructures: the glial wedge (GW), the indusium griseum (IG), themidline zipper (MZ), and the glial sling (GS). These populationsguide the growth of the callosal axons and help them cross themidline in the CC. LV: lateral ventricle.
2. Callosal Axon Guidance by the MidlineStructures during Development of the CC
The midline structures mainly consist of glial populations,but also contain neuronal populations [13]. The role of themidline glial structures in the formation of the CC was firstreported by Silver et al. [8]. In the mouse brain, these glialstructures have been shown to already exist on embryonicday (E) 15.0 and can guide the growth of callosal axons[8, 14, 15]. The midline glial structures mainly consist of fourstructures: the glial wedge (GW), the indusium griseum (IG),the midline zipper (MZ), and the glial sling (GS) [8, 16](Figure 1). The MZ is thought to be required for the fusionof the two hemispheres, which facilitates the passage of axonsacross the midline [9, 17]. The other structures are responsiblefor promoting the crossing of at least the callosal axons[18–23]. These structures help the callosal axons find theircorrect path by secreting or expressing guidance molecules.Interestingly, Shu and Richards have illustrated that correctorientation as well as the presence of the GW is required forcallosal axons to turn toward the midline; in one experiment,when the GW was replaced with 180∘ rotation (medial tolateral), the axons turned away from the midline [15].
Studies have gradually uncovered the molecules secretedby the midline structures for callosal axon guidance. Theaxon guidance cues for callosal neurons secreted by themidline structures have been classified into two types: longrange (Figures 2(a)–2(c)) and short range (Figure 2(d)). Thelong-range guidance molecules are secreted by the midlineglial populations, forming a concentration gradient andhelping callosal axons pass through the CC with attractive(Figure 2(a)) and repulsive signals (Figures 2(b) and 2(c)).Slits [15, 24, 25], Wnts [26], Netrins [27, 28], Draxin [29],and Semaphorins [30] are some of the reported long-rangeguidance molecules. Recent studies have also clarified newroles for some of these guidance molecules. For example,
Unni et al. have suggested a novel role of Slits in regulating thepositioning and maturation of the midline glial populations,presumably independent of the activity of its receptor, Robo1,in addition to its role as a repulsive axon guidance cue [31].Wnt5a not only promotes axon outgrowth as a long-rangeguidance molecule, but also serves as a short-range repulsiveaxon guidance cue [32, 33].
In addition to the midline structures, other cell popu-lations have also recently been shown to play roles in theformation of the CC. GABAergic and glutamatergic neuronsthat transiently exist within the CC have been shown to beable to attract callosal axons [34]. The meninges have alsobeen reported to be involved in the development of the CC.BMP7 secreted by the meninges has been shown to inhibitthe outgrowth of callosal axons, potentially preventing earlyformation of the CC [35].
The short-range molecules guide axons through trans-membrane or membrane-associated proteins (Figure 2(d)).The ephrin/Eph signaling system is one of the best-knownexamples. Eph receptors are divided into two subclasses, Aand B, according to the sequence homology and bindingaffinity for their ligands, ephrins A and B, respectively[36, 37]. Although the ephrin/Eph system signals throughEph tyrosine kinase receptors, ephrins can also transducereverse signals into the cell in which they are expressed[38]. The EphB receptors and ephrin B ligands have beenwell studied and shown to play important roles in callosalaxon pathfinding [39, 40]. Importantly, the complementaryexpression of multiple ephrin B ligands and EphB receptorsin the callosal axons and midline structures has led to thehypothesis that interactions occur between the Eph receptorsin callosal axons and ephrins in the midline structures orvice versa, although it is also possible that the interactionsoccur between callosal axonal fibers [40]. The expressionof ephrin B ligands in the callosal axons is suggestive ofthe involvement of reverse signaling, and Bush and Sorianoshowed that ephrin-B1 reverse signaling is critical for cal-losal axon pathfinding, which requires the binding of thePSD-95/Dlg/ZO-1 (PDZ) domain-containing proteins for thetransduction of this reverse signal [37].
3. Callosal Axon Guidance by Other Axonsduring Development of the CC
“Pioneer” neurons represent one of the most importantplayers in callosal axon guidance by other preexisting axonsduring CC development [41]. On E15.5 in mice, the axonsof the pioneer neurons, which originate from the cingulatecortex, cross the midline and enter the contralateral cortex(Figure 3(a)) [42, 43]. It has been shown that CC genesis istriggered by these pioneer axons [39, 42–45]; pioneer axonsare the first to form the path for the commissural neuronsthrough interactions with several cues, including the midlinestructures, and on E17.0, the most early “follower” axons fromlayer V follow those of these pioneer neurons [42, 43, 46](Figure 3(a)). An accepted view is that the “follower” axonsutilize their direct interactions with the “pioneer” axons tofind their correct path of growth, although the molecularmechanism of such interaction remains unclear. Interestingly,
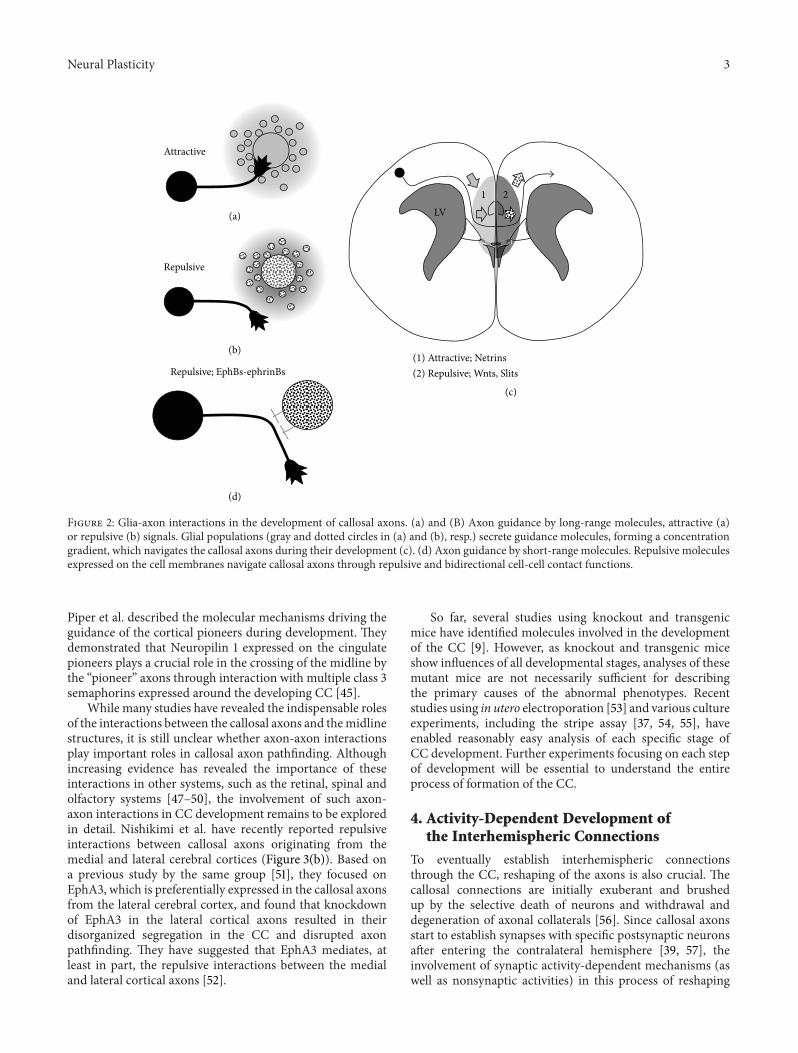
Neural Plasticity 3
Repulsive
Attractive
1 2
LV
Repulsive; EphBs-ephrinBs
(1) Attractive; Netrins
(2) Repulsive; Wnts, Slits
(a)
(b)
(c)
(d)
Figure 2: Glia-axon interactions in the development of callosal axons. (a) and (B) Axon guidance by long-range molecules, attractive (a)or repulsive (b) signals. Glial populations (gray and dotted circles in (a) and (b), resp.) secrete guidance molecules, forming a concentrationgradient, which navigates the callosal axons during their development (c). (d) Axon guidance by short-range molecules. Repulsive moleculesexpressed on the cell membranes navigate callosal axons through repulsive and bidirectional cell-cell contact functions.
Piper et al. described the molecular mechanisms driving theguidance of the cortical pioneers during development. Theydemonstrated that Neuropilin 1 expressed on the cingulatepioneers plays a crucial role in the crossing of the midline bythe “pioneer” axons through interaction with multiple class 3semaphorins expressed around the developing CC [45].
While many studies have revealed the indispensable rolesof the interactions between the callosal axons and the midlinestructures, it is still unclear whether axon-axon interactionsplay important roles in callosal axon pathfinding. Althoughincreasing evidence has revealed the importance of theseinteractions in other systems, such as the retinal, spinal andolfactory systems [47–50], the involvement of such axon-axon interactions in CC development remains to be exploredin detail. Nishikimi et al. have recently reported repulsiveinteractions between callosal axons originating from themedial and lateral cerebral cortices (Figure 3(b)). Based ona previous study by the same group [51], they focused onEphA3, which is preferentially expressed in the callosal axonsfrom the lateral cerebral cortex, and found that knockdownof EphA3 in the lateral cortical axons resulted in theirdisorganized segregation in the CC and disrupted axonpathfinding. They have suggested that EphA3 mediates, atleast in part, the repulsive interactions between the medialand lateral cortical axons [52].
So far, several studies using knockout and transgenicmice have identified molecules involved in the developmentof the CC [9]. However, as knockout and transgenic miceshow influences of all developmental stages, analyses of thesemutant mice are not necessarily sufficient for describingthe primary causes of the abnormal phenotypes. Recentstudies using in utero electroporation [53] and various cultureexperiments, including the stripe assay [37, 54, 55], haveenabled reasonably easy analysis of each specific stage ofCC development. Further experiments focusing on each stepof development will be essential to understand the entireprocess of formation of the CC.
4. Activity-Dependent Development ofthe Interhemispheric Connections
To eventually establish interhemispheric connectionsthrough the CC, reshaping of the axons is also crucial. Thecallosal connections are initially exuberant and brushedup by the selective death of neurons and withdrawal anddegeneration of axonal collaterals [56]. Since callosal axonsstart to establish synapses with specific postsynaptic neuronsafter entering the contralateral hemisphere [39, 57], theinvolvement of synaptic activity-dependent mechanisms (aswell as nonsynaptic activities) in this process of reshaping
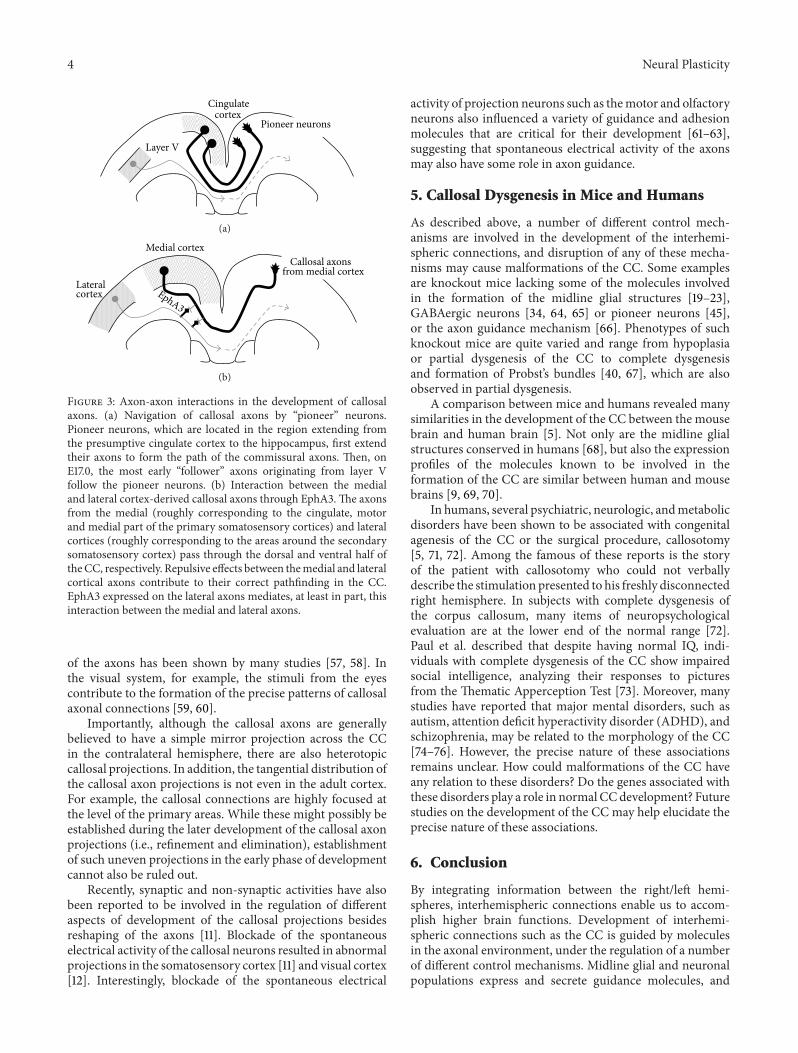
4 Neural Plasticity
Layer V
Cingulate cortex
Pioneer neurons
(a)
EphA3
Lateral cortex
Medial cortex
Callosal axons from medial cortex
(b)
Figure 3: Axon-axon interactions in the development of callosalaxons. (a) Navigation of callosal axons by “pioneer” neurons.Pioneer neurons, which are located in the region extending fromthe presumptive cingulate cortex to the hippocampus, first extendtheir axons to form the path of the commissural axons. Then, onE17.0, the most early “follower” axons originating from layer Vfollow the pioneer neurons. (b) Interaction between the medialand lateral cortex-derived callosal axons through EphA3. The axonsfrom the medial (roughly corresponding to the cingulate, motorand medial part of the primary somatosensory cortices) and lateralcortices (roughly corresponding to the areas around the secondarysomatosensory cortex) pass through the dorsal and ventral half ofthe CC, respectively. Repulsive effects between the medial and lateralcortical axons contribute to their correct pathfinding in the CC.EphA3 expressed on the lateral axons mediates, at least in part, thisinteraction between the medial and lateral axons.
of the axons has been shown by many studies [57, 58]. Inthe visual system, for example, the stimuli from the eyescontribute to the formation of the precise patterns of callosalaxonal connections [59, 60].
Importantly, although the callosal axons are generallybelieved to have a simple mirror projection across the CCin the contralateral hemisphere, there are also heterotopiccallosal projections. In addition, the tangential distribution ofthe callosal axon projections is not even in the adult cortex.For example, the callosal connections are highly focused atthe level of the primary areas. While these might possibly beestablished during the later development of the callosal axonprojections (i.e., refinement and elimination), establishmentof such uneven projections in the early phase of developmentcannot also be ruled out.
Recently, synaptic and non-synaptic activities have alsobeen reported to be involved in the regulation of differentaspects of development of the callosal projections besidesreshaping of the axons [11]. Blockade of the spontaneouselectrical activity of the callosal neurons resulted in abnormalprojections in the somatosensory cortex [11] and visual cortex[12]. Interestingly, blockade of the spontaneous electrical
activity of projection neurons such as the motor and olfactoryneurons also influenced a variety of guidance and adhesionmolecules that are critical for their development [61–63],suggesting that spontaneous electrical activity of the axonsmay also have some role in axon guidance.
5. Callosal Dysgenesis in Mice and Humans
As described above, a number of different control mech-anisms are involved in the development of the interhemi-spheric connections, and disruption of any of these mecha-nisms may cause malformations of the CC. Some examplesare knockout mice lacking some of the molecules involvedin the formation of the midline glial structures [19–23],GABAergic neurons [34, 64, 65] or pioneer neurons [45],or the axon guidance mechanism [66]. Phenotypes of suchknockout mice are quite varied and range from hypoplasiaor partial dysgenesis of the CC to complete dysgenesisand formation of Probst’s bundles [40, 67], which are alsoobserved in partial dysgenesis.
A comparison between mice and humans revealed manysimilarities in the development of the CC between the mousebrain and human brain [5]. Not only are the midline glialstructures conserved in humans [68], but also the expressionprofiles of the molecules known to be involved in theformation of the CC are similar between human and mousebrains [9, 69, 70].
In humans, several psychiatric, neurologic, and metabolicdisorders have been shown to be associated with congenitalagenesis of the CC or the surgical procedure, callosotomy[5, 71, 72]. Among the famous of these reports is the storyof the patient with callosotomy who could not verballydescribe the stimulation presented to his freshly disconnectedright hemisphere. In subjects with complete dysgenesis ofthe corpus callosum, many items of neuropsychologicalevaluation are at the lower end of the normal range [72].Paul et al. described that despite having normal IQ, indi-viduals with complete dysgenesis of the CC show impairedsocial intelligence, analyzing their responses to picturesfrom the Thematic Apperception Test [73]. Moreover, manystudies have reported that major mental disorders, such asautism, attention deficit hyperactivity disorder (ADHD), andschizophrenia, may be related to the morphology of the CC[74–76]. However, the precise nature of these associationsremains unclear. How could malformations of the CC haveany relation to these disorders? Do the genes associated withthese disorders play a role in normal CC development? Futurestudies on the development of the CC may help elucidate theprecise nature of these associations.
6. Conclusion
By integrating information between the right/left hemi-spheres, interhemispheric connections enable us to accom-plish higher brain functions. Development of interhemi-spheric connections such as the CC is guided by moleculesin the axonal environment, under the regulation of a numberof different control mechanisms. Midline glial and neuronalpopulations express and secrete guidance molecules, and
Neural Plasticity 5
“pioneer” axons help in the axon pathfinding of the callosalneurons. Disruption of these navigational mechanisms maycause dysgenesis of the corpus callosum. It would be of greatinterest to conduct detailed investigation of the mechanismsunderlying CC development, especially in view of theirrelevance in the pathogenesis of human disorders.
Conflict of Interests
The authors declared that they have no conflict of interests.
Acknowledgments
This work was supported by the Strategic Research Programfor Brain Sciences (“Understanding of molecular and envi-ronmental bases for brain health”) and Grants-in-Aid forScientific Research from the Ministry of Education, Culture,Sports, Science and Technology of Japan and the JapanSociety for the Promotion of Science.
References
[1] B. D. Mitchell and J. D. Macklis, “Large-scale maintenanceof dual projections by callosal and frontal cortical projectionneurons in adult mice,” Journal of Comparative Neurology, vol.482, no. 1, pp. 17–32, 2005.
[2] R. Mihrshahi, “The corpus callosum as an evolutionary innova-tion,” Journal of Experimental Zoology B, vol. 306, no. 1, pp. 8–17,2006.
[3] A. Biegon, J. L. Eberling, B. C. Richardson et al., “Humancorpus callosum in aging and Alzheimer’s disease: a magneticresonance imaging study,” Neurobiology of Aging, vol. 15, no. 4,pp. 393–397, 1994.
[4] M. G. Funnell, P. M. Corballis, and M. Gazzaniga, “Cortical andsubcortical interhemispheric interactions following partial andcomplete callosotomy,” Archives of Neurology, vol. 57, no. 2, pp.185–189, 2000.
[5] D. Kamnasaran, “Agenesis of the corpus callosum: lessons fromhumans and mice,” Clinical and Investigative Medicine, vol. 28,no. 5, pp. 267–282, 2005.
[6] R. M. Fame, J. L. MacDonald, and J. D. Macklis, “Development,specification, and diversity of callosal projection neurons,”Trends in Neurosciences, vol. 34, no. 1, pp. 41–50, 2011.
[7] E. A. Alcamo, L. Chirivella, M. Dautzenberg et al., “Satb2regulates callosal projection neuron identity in the developingcerebral cortex,” Neuron, vol. 57, no. 3, pp. 364–377, 2008.
[8] J. Silver, S. E. Lorenz, D. Wahlstein, and J. Coughlin, “Axonalguidance during development of the great cerebral commis-sures: descriptive and experimental studies, in vivo, on the roleof preformed glial pathways,” Journal of Comparative Neurology,vol. 210, no. 1, pp. 10–29, 1982.
[9] L. J. Richards, C. Plachez, and T. Ren, “Mechanisms regulatingthe development of the corpus callosum and its agenesis inmouse and human,” Clinical Genetics, vol. 66, no. 4, pp. 276–289, 2004.
[10] Y. Tagawa, H. Mizuno, and T. Hirano, “Activity-dependentdevelopment of interhemispheric connections in the visualcortex,” Reviews in the Neurosciences, vol. 19, no. 1, pp. 19–28,2008.
[11] C. L. Wang, L. Zhang, Y. Zhou et al., “Activity-dependent devel-opment of callosal projections in the somatosensory cortex,”Journal of Neuroscience, vol. 27, no. 42, pp. 11334–11342, 2007.
[12] H. Mizuno, T. Hirano, and Y. Tagawa, “Evidence for activity-dependent cortical wiring: formation of interhemispheric con-nections in neonatal mouse visual cortex requires projectionneuron activity,” Journal of Neuroscience, vol. 27, no. 25, pp.6760–6770, 2007.
[13] R. R. Sturrock, “Identification of mitotic cells in the central ner-vous system by electron microscopy of re-embedded semithinsections,” Journal of Anatomy, vol. 138, no. 4, pp. 657–673, 1984.
[14] T. Shu, Y. Li, A. Keller, and L. J. Richards, “The glial sling isa migratory population of developing neurons,” Development,vol. 130, no. 13, pp. 2929–2937, 2003.
[15] T. Shu and L. J. Richards, “Cortical axon guidance by the glialwedge during the development of the corpus callosum,” Journalof Neuroscience, vol. 21, no. 8, pp. 2749–2758, 2001.
[16] T. Shu, A. C. Puche, and L. J. Richards, “Development ofmidline glial populations at the corticoseptal boundary,” Journalof Neurobiology, vol. 57, no. 1, pp. 81–94, 2003.
[17] J. Silver, M. A. Edwards, and P. Levitt, “Immunocytochemicaldemonstration of early appearing astroglial structures that formboundaries and pathways along axon tracts in the fetal brain,”Journal of Comparative Neurology, vol. 328, no. 3, pp. 415–436,1993.
[18] T. Shu, K. G. Butz, C. Plachez, R. M. Gronostajski, and L. J.Richards, “Abnormal development of forebrain midline glia andcommissural projections in Nfia knock-out mice,” Journal ofNeuroscience, vol. 23, no. 1, pp. 203–212, 2003.
[19] S. Tole, G. Gutin, L. Bhatnagar, R. Remedios, and J. M. Hebert,“Development of midline cell types and commissural axontracts requires Fgfr1 in the cerebrum,” Developmental Biology,vol. 289, no. 1, pp. 141–151, 2006.
[20] S. E. Bilasy, T. Satoh, T. Terashima, and T. Kataoka, “RA-GEF-1 (Rapgef2) is essential for proper development of the midlinecommissures,”Neuroscience Research, vol. 71, no. 3, pp. 200–209,2011.
[21] C. Sanchez-Camacho, J. A. Ortega, I. Ocana, S. Alcantara, andP. Bovolenta, “Appropriate Bmp7 levels are required for thedifferentiation of midline guidepost cells involved in corpuscallosum formation,” Developmental Neurobiology, vol. 71, no.5, pp. 337–350, 2011.
[22] M. Piper, R. X. Moldrich, C. Lindwall et al., “Multiple non-cell-autonomous defects underlie neocortical callosal dysgenesis inNfib-deficient mice,” Neural Development, vol. 4, no. 1, p. 43,2009.
[23] M. Piper, G. Barry, J. Hawkins et al., “NFIA controls telen-cephalic progenitor cell differentiation through repression ofthe Notch effector Hes1,” Journal of Neuroscience, vol. 30, no. 27,pp. 9127–9139, 2010.
[24] A. Bagri, O. Marın, A. S. Plump et al., “Slit proteins preventmidline crossing and determine the dorsoventral position ofmajor axonal pathways in the mammalian forebrain,” Neuron,vol. 33, no. 2, pp. 233–248, 2002.
[25] W. Andrews, A. Liapi, C. Plachez et al., “Robo1 regulates thedevelopment of major axon tracts and interneuron migrationin the forebrain,” Development, vol. 133, no. 11, pp. 2243–2252,2006.
[26] T. R. Keeble, M. M. Halford, C. Seaman et al., “The Wnt receptorRyk is required for Wnt5a-mediated axon guidance on the con-tralateral side of the corpus callosum,” Journal of Neuroscience,vol. 26, no. 21, pp. 5840–5848, 2006.
6 Neural Plasticity
[27] T. Shu, K. M. Valentino, C. Seaman, H. M. Cooper, and L. J.Richards, “Expression of the netrin-1 receptor, deleted in col-orectal cancer (DCC), is largely confined to projecting neuronsin the developing forebrain,” Journal of Comparative Neurology,vol. 416, no. 2, pp. 201–212, 2000.
[28] T. Serafini, S. A. Colamarino, E. D. Leonardo et al., “Netrin-1is required for commissural axon guidance in the developingvertebrate nervous system,” Cell, vol. 87, no. 6, pp. 1001–1014,1996.
[29] S. M. Islam, Y. Shinmyo, T. Okafuji et al., “Draxin, a repulsiveguidance protein for spinal cord and forebrain commissures,”Science, vol. 323, no. 5912, pp. 388–393, 2009.
[30] H. Zhao, T. Maruyama, Y. Hattori et al., “A molecular mecha-nism that regulates medially oriented axonal growth of upperlayer neurons in the developing neocortex,” Journal of Compar-ative Neurology, vol. 519, no. 5, pp. 834–848, 2011.
[31] D. K. Unni, M. Piper, R. X. Moldrich et al., “Multiple Slitsregulate the development of midline glial populations and thecorpus callosum,” Developmental Biology, vol. 365, no. 1, pp. 36–49, 2012.
[32] L. Li, B. I. Hutchins, and K. Kalil, “Wnt5a induces simultaneouscortical axon outgrowth and repulsive axon guidance throughdistinct signaling mechanisms,” Journal of Neuroscience, vol. 29,no. 18, pp. 5873–5883, 2009.
[33] L. Li, B. I. Hutchins, and K. Kalil, “Wnt5a induces simultaneouscortical axon outgrowth and repulsive turning through distinctsignaling mechanisms,” Science Signaling, vol. 3, no. 147, p. pt2,2010.
[34] M. Niquille, S. Garel, F. Mann et al., “Transient neuronal pop-ulations are required to guide callosal axons: a role for sema-phorin 3C,” PLoS Biology, vol. 7, no. 10, Article ID e1000230,2009.
[35] Y. Choe, J. A. Siegenthaler, and S. J. Pleasure, “A cascadeof morphogenic signaling initiated by the meninges controlscorpus callosum formation,” Neuron, vol. 73, no. 4, pp. 698–712,2012.
[36] A. Martınez and E. Soriano, “Functions of ephrin/Eph interac-tions in the development of the nervous system: emphasis onthe hippocampal system,” Brain Research Reviews, vol. 49, no. 2,pp. 211–226, 2005.
[37] J. O. Bush and P. Soriano, “Ephrin-B1 regulates axon guidance byreverse signaling through a PDZ-dependent mechanism,”Genesand Development, vol. 23, no. 13, pp. 1586–1599, 2009.
[38] A. Davy and P. Soriano, “Ephrin signaling in vivo: look bothways,” Developmental Dynamics, vol. 232, no. 1, pp. 1–10, 2005.
[39] C. Lindwall, T. Fothergill, and L. J. Richards, “Commissureformation in the mammalian forebrain,” Current Opinion inNeurobiology, vol. 17, no. 1, pp. 3–14, 2007.
[40] S. W. Mendes, M. Henkemeyer, and D. J. Liebl, “MultipleEph receptors and B-class ephrins regulate midline crossingof corpus callosum fibers in the developing mouse forebrain,”Journal of Neuroscience, vol. 26, no. 3, pp. 882–892, 2006.
[41] C. Plachez and L. J. Richards, “Mechanisms of axon guidance inthe developing nervous system,” Current Topics in Developmen-tal Biology, vol. 69, pp. 267–346, 2005.
[42] S. E. Koester and D. D. M. O’Leary, “Axons of early generatedneurons in cingulate cortex pioneer the corpus callosum,”Journal of Neuroscience, vol. 14, no. 11, pp. 6608–6620, 1994.
[43] B. G. Rash and L. J. Richards, “A role for cingulate pioneeringaxons in the development of the corpus callosum,” Journal ofComparative Neurology, vol. 434, no. 2, pp. 147–157, 2001.
[44] L. C. deAzevedo, C. Hedin-Pereira, and R. Lent, “Callosalneurons in the cingulate cortical plate and subplate of humanfetuses,” Journal of Comparative Neurology, vol. 386, no. 1, pp.60–70, 1997.
[45] M. Piper, C. Plachez, O. Zalucki et al., “Neuropilin 1-Sema sig-naling regulates crossing of cingulate pioneering axons duringdevelopment of the corpus callosum,” Cerebral Cortex, vol. 19,supplement 1, pp. i11–i21, 2009.
[46] H. S. Ozaki and D. Wahlsten, “Timing and origin of the firstcortical axons to project through the corpus callosum and thesubsequent emergence of callosal projection cells in mouse,”Journal of Comparative Neurology, vol. 400, no. 2, pp. 197–206,1998.
[47] S. O. Chan and K. Y. Chung, “Changes in axon arrangement inthe retinofugal [correction of retinofungal] pathway of mouseembryos: confocal microscopy study using single- and double-dye label,” Journal of Comparative Neurology, vol. 406, no. 2, pp.251–262, 1999.
[48] B. W. Gallarda, D. Bonanomi, D. Muller et al., “Segregation ofaxial motor and sensory pathways via heterotypic trans-axonalsignaling,” Science, vol. 320, no. 5873, pp. 233–236, 2008.
[49] D. T. Plas, J. E. Lopez, and M. C. Crair, “Pretarget sorting ofretinocollicular axons in the mouse,” Journal of ComparativeNeurology, vol. 491, no. 4, pp. 305–319, 2005.
[50] T. Imai, T. Yamazaki, R. Kobayakawa et al., “Pre-Target axonsorting establishes the neural map topography,” Science, vol. 325,no. 5940, pp. 585–590, 2009.
[51] C. Kudo, I. Ajioka, Y. Hirata, and K. Nakajima, “Expressionprofiles of EphA3 at both the RNA and protein level inthe developing mammalian forebrain,” Journal of ComparativeNeurology, vol. 487, no. 3, pp. 255–269, 2005.
[52] M. Nishikimi, K. Oishi, H. Tabata, K. Torii, and K. Nakajima,“Segregation and pathfinding of callosal axons through EphA3signaling,” Journal of Neuroscience, vol. 31, no. 45, pp. 16251–16260, 2011.
[53] H. Tabata and K. Nakajima, “Efficient in utero gene transfersystem to the developing mouse brain using electroporation:visualization of neuronal migration in the developing cortex,”Neuroscience, vol. 103, no. 4, pp. 865–872, 2001.
[54] B. Knoll, C. Weinl, A. Nordheim, and F. Bonhoeffer, “Stripeassay to examine axonal guidance and cell migration,” NatureProtocols, vol. 2, no. 5, pp. 1216–1224, 2007.
[55] T. Maruyama, M. Matsuura, K. Suzuki, and N. Yamamoto,“Cooperative activity of multiple upper layer proteins for thala-mocortical axon growth,” Developmental Neurobiology, vol. 68,no. 3, pp. 317–331, 2008.
[56] G. M. Innocenti, “Growth and reshaping of axons in theestablishment of visual callosal connections,” Science, vol. 212,no. 4496, pp. 824–827, 1981.
[57] G. M. Innocenti and D. J. Price, “Exuberance in the develop-ment of cortical networks,” Nature Reviews Neuroscience, vol. 6,no. 12, pp. 955–965, 2005.
[58] J. H. Leslie and E. Nedivi, “Activity-regulated genes as mediatorsof neural circuit plasticity,” Progress in Neurobiology, vol. 94, no.3, pp. 223–237, 2011.
[59] J. Olavarria and R. C. Van Sluyters, “Callosal connections ofthe posterior neocortex in normal-eyed, congenitally anoph-thalmic, and neonatally enucleated mice,” Journal of Compar-ative Neurology, vol. 230, no. 2, pp. 249–268, 1984.
[60] G. M. Innocenti, D. O. Frost, and J. Illes, “Maturation of visualcallosal connections in visually deprived kittens: a challenging
Neural Plasticity 7
critical period,” Journal of Neuroscience, vol. 5, no. 2, pp. 255–267, 1985.
[61] M. G. Hanson and L. T. Landmesser, “Normal patterns of spon-taneous activity are required for correct motor axon guidanceand the expression of specific guidance molecules,” Neuron, vol.43, no. 5, pp. 687–701, 2004.
[62] S. Serizawa, K. Miyamichi, H. Takeuchi, Y. Yamagishi, M.Suzuki, and H. Sakano, “A neuronal identity code for theodorant receptor-specific and activity-dependent axon sorting,”Cell, vol. 127, no. 5, pp. 1057–1069, 2006.
[63] K. Itoh, B. Stevens, M. Schachner, and R. D. Fields, “Regulatedexpression of the neural cell adhesion molecule L1 by specificpatterns of neural impulses,” Science, vol. 270, no. 5240, pp.1369–1372, 1995.
[64] V. Conti, C. Marini, S. Gana, J. Sudi, W. B. Dobyns, and R.Guerrini, “Corpus callosum agenesis, severe mental retardation,epilepsy, and dyskinetic quadriparesis due to a novel mutationin the homeodomain of ARX,” American Journal of MedicalGenetics, Part A, vol. 155, no. 4, pp. 892–897, 2011.
[65] G. Friocourt, K. Poirier, S. Rakic, J. G. Parnavelas, and J. Chelly,“The role of ARX in cortical development,” European Journal ofNeuroscience, vol. 23, no. 4, pp. 869–876, 2006.
[66] T. Ren, J. Zhang, C. Plachez, S. Mori, and L. J. Richards, “Dif-fusion tensor magnetic resonance imaging and tract-tracinganalysis of probst bundle structure in netrin1- and DCC-deficient mice,” Journal of Neuroscience, vol. 27, no. 39, pp.10345–10349, 2007.
[67] H. S. Ozaki and D. Wahlsten, “Cortical axon trajectories andgrowth cone morphologies in fetuses of acallosal mouse strains,”Journal of Comparative Neurology, vol. 336, no. 4, pp. 595–604,1993.
[68] R. Lent, D. Uziel, M. Baudrimont, and C. Fallet, “Cellular andmolecular tunnels surrounding the forebrain commissures ofhuman fetuses,” Journal of Comparative Neurology, vol. 483, no.4, pp. 375–382, 2005.
[69] A. L. S. Donahoo and L. J. Richards, “Understanding the mech-anisms of callosal development through the use of transgenicmouse models,” Seminars in Pediatric Neurology, vol. 16, no. 3,pp. 127–142, 2009.
[70] T. Ren, A. Anderson, W. B. Shen et al., “Imaging, anatomical,and molecular analysis of callosal formation in the developinghuman fetal brain,”Anatomical Record A, vol. 288, no. 2, pp. 191–204, 2006.
[71] J. K. Gupta and R. J. Lilford, “Assessment and management offetal agenesis of the corpus callosum,” Prenatal Diagnosis, vol.15, no. 4, pp. 301–312, 1995.
[72] H. C. Sauerwein and M. Lassonde, “Cognitive and sensori-motor functioning in the absence of the corpus callosum: neu-ropsychological studies in callosal agenesis and callosotomizedpatients,” Behavioural Brain Research, vol. 64, no. 1-2, pp. 229–240, 1994.
[73] L. K. Paul, B. Schieffer, and W. S. Brown, “Social processingdeficits in agenesis of the corpus callosum: narratives from theThematic Apperception Test,” Archives of Clinical Neuropsychol-ogy, vol. 19, no. 2, pp. 215–225, 2004.
[74] B. Egaas, E. Courchesne, and O. Saitoh, “Reduced size of corpuscallosum in autism,” Archives of Neurology, vol. 52, no. 8, pp.794–801, 1995.
[75] I. K. Lyoo, G. G. Noam, C. K. Lee, H. K. Lee, B. P. Kennedy,and P. F. Renshaw, “The corpus callosum and lateral ventriclesin children with attention-deficit hyperactivity disorder: a brain
magnetic resonance imaging study,” Biological Psychiatry, vol.40, no. 10, pp. 1060–1063, 1996.
[76] O. Lungu and E. Stip, “Agenesis of corpus callosum and emo-tional information processing in schizophrenia,” Front Psychia-try, vol. 3, p. 1, 2012.
Hindawi Publishing CorporationNeural PlasticityVolume 2013, Article ID 251308, 15 pageshttp://dx.doi.org/10.1155/2013/251308
Research Article
Functional Topography of Human Corpus Callosum:An fMRI Mapping Study
Mara Fabri1 and Gabriele Polonara2
1 Sezione di Neuroscienze e Biologia Cellulare, Dipartimento di Medicina Sperimentale e Clinica,Universita Politecnica delle Marche, 60020 Ancona, Italy
2 Sezione di Scienze Radiologiche, Dipartimento di Scienze Cliniche Specialistiche e Odontostomatologiche,Universita Politecnica delle Marche, 60020 Ancona, Italy
Correspondence should be addressed to Mara Fabri; [email protected]
Received 7 September 2012; Revised 26 November 2012; Accepted 4 December 2012
Academic Editor: Giorgio M. Innocenti
Copyright © 2013 M. Fabri and G. Polonara. This is an open access article distributed under the Creative Commons AttributionLicense, which permits unrestricted use, distribution, and reproduction in any medium, provided the original work is properlycited.
The concept of a topographical map of the corpus callosum (CC) has emerged from human lesion studies and from electro-physiological and anatomical tracing investigations in other mammals. Over the last few years a rising number of researchershave been reporting functional magnetic resonance imaging (fMRI) activation in white matter, particularly the CC. In this studythe scope for describing CC topography with fMRI was explored by evoking activation through simple sensory stimulation andmotor tasks. We reviewed our published and unpublished fMRI and diffusion tensor imaging data on the cortical representation oftactile, gustatory, auditory, and visual sensitivity and of motor activation, obtained in 36 normal volunteers and in 6 patients withpartial callosotomy. Activation foci were consistently detected in discrete CC regions: anterior (taste stimuli), central (motor tasks),central and posterior (tactile stimuli), and splenium (auditory and visual stimuli). Reconstruction of callosal fibers connectingactivated primary gustatory, motor, somatosensory, auditory, and visual cortices by diffusion tensor tracking showed bundlescrossing, respectively, through the genu, anterior and posterior body, and splenium, at sites harboring fMRI foci. These data confirmthat the CC commissure has a topographical organization and demonstrate that its functional topography can be explored withfMRI.
1. Introduction
The corpus callosum (CC) connects the cerebral hemispheresand provides for interhemispheric integration and transfer ofinformation. Ever since electrophysiological recording fromcallosal fibers showed somatosensory receptive fields in theanterior portion of the cat commissure [1, 2] and visualinputs to the splenium [3, 4], it was hypothesized that the CCwas endowed with a topographical organization. Subsequentelectrophysiological [5] and neuroanatomical findings [6, 7]obtained from nonhuman primates after selective corticalablation or tracing injections, plus a vast body of dataranging from postmortem investigations [8] to studies ofpatients with CC lesions or callosal resection (split-brainsubjects; [9]; see [10–12] for a review), lent further support
to the notion. Such organization seems to result in modality-specific regions [13], where the anterior callosal fibers inter-connecting the frontal lobes transfer motor information andposterior fibers, which connect the parietal, temporal, andoccipital lobes bilaterally, are responsible for the integrationof somatosensory (posterior midbody), auditory (isthmus),and visual (splenium) information.
The hypothesis was finally confirmed by studies largelycarried out in subjects with callosal resection. Functionalmagnetic resonance imaging (fMRI) investigations of split-brain patients by our group [12, 14, 15] provided evidencethat interhemispheric transfer in the tactile modality is likelymediated by fibers running through the posterior part of thecallosal body, thus confirming that the posterior midbody isthe tactual channel. A recent study of nonepileptic patients
2 Neural Plasticity
with transection of different portions of the anterior CCperformed to remove cysts [9] provided further confirmationdemonstrating that the middle part of the genu is involved inmotor coordination and the anterior portion of the body inthe transfer of simple somesthetic information.
Investigations of other sensory modalities have shownthat the splenium is crucial for the interhemispheric transferof visual [16] (see data and literature in [17]) as well asauditory information [18, 19].
The advent of functional MRI subsequently made it pos-sible to study the intact brain noninvasively. In recent yearsan increasing number of fMRI studies have described whitematter (WM) activation in the anterior CC during behavioraltasks involving interhemispheric transfer [20–23] as well asduring voluntary swallowing, which is not a specific inter-hemispheric transfer task [24]. A BOLD (blood oxygenationlevel dependent) effect was also detected in the posteriorcallosal region (isthmus and splenium) during an interhemi-spheric transfer task based on the crossed nature of thevisual and motor systems which assumed that informationmust cross the CC to elicit a behavioral response (“crossedcondition”; [23]). The anterior CC has been seen to beinvolved in transferring information between prefrontal andpremotor regions, and the posterior CC in information trans-fer between parietal, occipital, and temporal cortices [25–28].
These reports, documenting callosal functional activationduring behavioral tasks, prompted a review of our pub-lished and unpublished fMRI data—obtained from studiesof the cortical representation of gustatory, tactile, auditory,and visual sensitivity and of motor activation in normalsubjects—to establish whether the BOLD effect could bedetected in callosal WM and whether the activation focievoked by a range of simple sensory stimuli and motortasks were consistent with a topographical organization.Indeed activation foci were consistently present in discreteCC regions: anterior (taste stimuli), central (motor tasks),central and posterior (tactile stimuli), isthmus (auditorystimuli) and splenium (visual stimuli), demonstrating thatthe functional topography of the CC can be explored withfMRI [29]. Very recently we administered the peripheralsensory stimulation protocols previously applied to studynormal subjects (described in [29]) to patients with partialcallosotomy (Polonara et al., submitted). The results wereanalyzed for evidence of a specific BOLD effect in theextant callosal portions, further to document the notion ofa functional CC map. Diffusion tensor imaging (DTI) datawere acquired in control subjects and in patients and analyzedto establish whether CC activation was colocalized with tractsseeded from activated clusters in cortical areas involved byspecific sensory stimuli.
In this paper, the results obtained in normal subjects andin callosotomy patients are presented together to provide anoverview of the functional organization of the CC.
2. Methods
2.1. Subjects. The data were collected from 36 normal vol-unteers (age range 22–51 years, 20 women; Table 1) and 6callosotomy patients (age age range 22–51 years, 2 women;
Table 2) during studies of gustatory, tactile, auditory, visual,and motor cortical representation. The callosotomy, per-formed to treat drug-resistant epilepsy, involved the anteriorCC in 4 subjects (L.M., O.T., R.V., and D.B.), the posteriorCC in one (M.C.) and the central CC in the last patient(P.F.; Table 2). All subjects (controls and patients) gave theirinformed consent to participate in the study, whose experi-mental protocol was approved by the local ethics committee.Handedness was evaluated by the Oldfield inventory [30].Tactile stimulation was applied to 22 normal subjects andto all 6 patients, gustatory stimulation to 13 controls and 4patients, and visual stimulation to 14 control subjects and5 patients; one control subject and 3 patients also receivedauditory stimulation. Seven normal subjects were scannedwhile performing the motor tasks (Table 1). All stimuliwere presented according to a block-design protocol thatalternated periods of rest and of stimulation. Taste and touchstimuli were applied to the left or right side in differentsessions; visual stimuli were presented to the left or rightvisual field (LVF; RVF) in the same session, or to the centralvisual field (CVF) in a separate session. Auditory stimuliwere presented alternatively to the left and right ear in thesame session (2 patients) or bilaterally to both ears (the otherpatient and the control subject).
2.2. Imaging Protocols. For all investigations, subjects wereplaced in a 1.5 Tesla (T) scanner (Signa Excite NV/i CV/i,General Electric Medical System, Milwaukee, WI, USA)equipped with 50 mT/m gradients, with their head restrainedwithin a circularly polarized head coil. They were instructedto keep their eyes closed and find a comfortable positionand relax, avoiding even minimal movement; their ears wereplugged.
2.2.1. Functional Imaging. An identical 4-step experimentalprocedure was applied in all cases. In the first step, ananatomical three-plane localizer (2D SPGR, TR 120 ms, TE15 ms, Flip Angle 70∘, FOV 23 × 23 cm, slice thickness 5 mm,Matrix 256 × 256, 1 Nex, scan time 31 s) was acquired. Thesecond step entailed acquisition of a 3D data set (IR PrepFast SPGR; TR 15.2 ms, TE 6.9 ms, TI 500 ms, Flip Angle15∘, FOV 29 × 29 cm, slice thickness 1 mm, Matrix 288 ×288, 1 Nex, and scan time 8 : 20 min). The third involvedacquisition of 10 (20 in more recent studies) contiguous5-mm-thick axial or oblique functional images with asingle-shot T2∗-weighted gradient-echo EPI sequence (TR3000 ms, TE 60 ms, Flip Angle 90∘, FOV 28 × 21 cm, Matrix96 × 64, 1 Nex, scan time 5 : 12 min). In the fourth stephigh-resolution axial (or oblique) anatomical images wereacquired from 10 selected planes (2D SPGR, TR 100 ms,TE 12 ms, Flip Angle 70∘, FOV 28 × 21 cm, thickness 5 mm,Matrix 256 × 256, 1 Nex, scan time 3 : 17 min for 10 images)so that functional activation images could be superimposedonto the anatomical landmarks, to show blood vessels whichare possible sources of BOLD signal. In more recent studiesthe images were acquired from 20 rather than 10 axial planes.
One thousand (or 2000) axial or oblique functionalimages (100 per section, 1 image/3 s) were acquired during
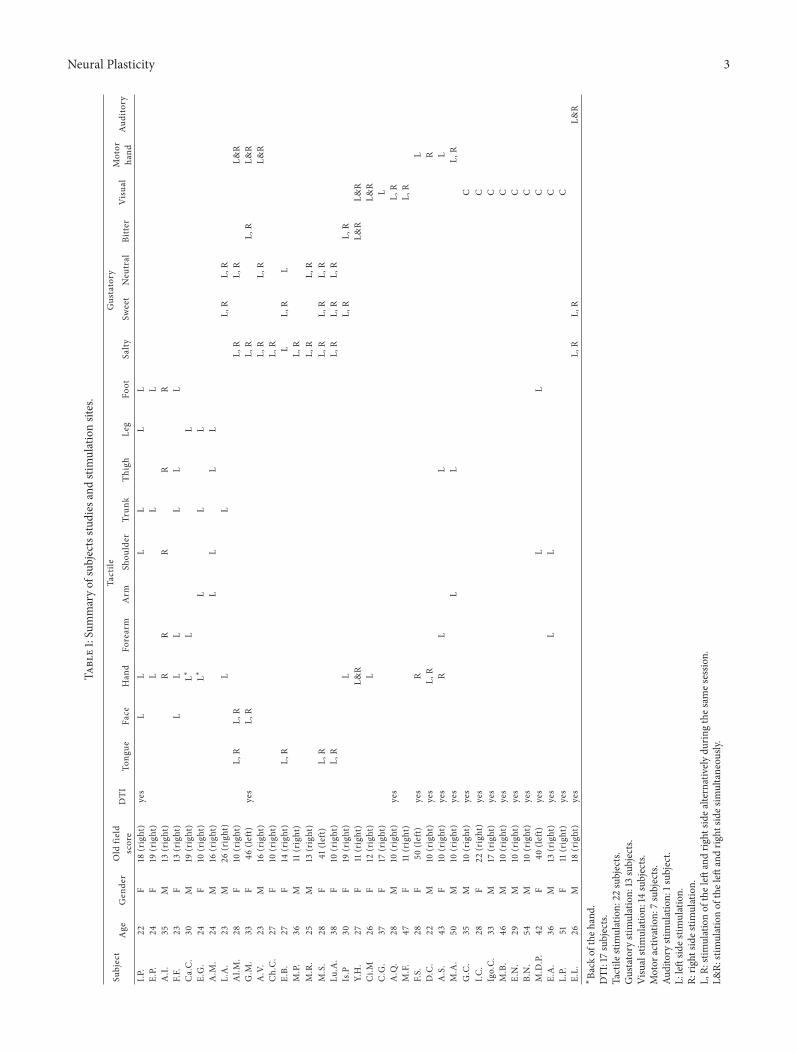
Neural Plasticity 3
Ta
ble
1:Su
mm
ary
of
sub
ject
sst
ud
ies
and
stim
ula
tio
nsi
tes.
Su
bje
ctT
acti
leG
ust
ato
ry
Ag
eG
end
erO
ldfi
eld
sco
reD
TI
To
ng
ue
Fac
eH
and
Fo
rear
mA
rmS
ho
uld
erT
run
kT
hig
hL
egF
oo
tS
alt
yS
wee
tN
eutr
al
Bit
ter
Vis
ua
lM
oto
r
han
dA
ud
ito
ry
I.P.
22
F18
(rig
ht)
yes
LL
LL
LL
E.P
.2
4F
19(r
igh
t)L
LL
A.I
.3
5M
13(r
igh
t)R
RR
RR
F.F.
23
F13
(rig
ht)
LL
LL
LL
Ca.
C.
30
M19
(rig
ht)
L∗
LL
E.G
.2
4F
10(r
igh
t)L∗
LL
L
A.M
.2
4M
16(r
igh
t)L
LL
L
L.A
.2
3M
26
(rig
ht)
LL
L,
RL
,R
Al.
M.
28
F10
(rig
ht)
L,
RL
,R
L,
RL
,R
L&
R
G.M
.33
F4
6(l
eft)
yes
L,
RL
,R
L,
RL
&R
A.V
.2
3M
16(r
igh
t)L
,R
L,
RL
&R
Ch
.C.
27
F10
(rig
ht)
L,
R
E.B
.2
7F
14(r
igh
t)L
,R
LL
,R
L
M.P
.3
6M
11(r
igh
t)L
,R
M.R
.2
5M
13(r
igh
t)L
,R
L,
R
M.S
.2
8F
41
(lef
t)L
,R
L,
RL
,R
L,
R
Lu
.A.
38
F10
(rig
ht)
L,
RL
,R
L,
RL
,R
Is.P
30
F19
(rig
ht)
LL
,R
L,
R
Y.H
.2
7F
11(r
igh
t)L
&R
L&
RL
&R
Ci.
M2
6F
12(r
igh
t)L
L&
R
C.G
.3
7F
17(r
igh
t)L
A.Q
.2
8M
10(r
igh
t)y
esL
,R
M.F
.4
7F
11(r
igh
t)L
,R
F.S
.2
8F
50
(lef
t)y
esR
L
D.C
.2
2M
10(r
igh
t)y
esL
,R
R
A.S
.4
3F
10(r
igh
t)y
esR
LL
L
M.A
.5
0M
10(r
igh
t)y
esL
LL
,R
G.C
.3
5M
10(r
igh
t)y
esC
I.C
.2
8F
22
(rig
ht)
yes
C
Igo
.C.
33M
17(r
igh
t)y
esC
M.B
.4
6M
10(r
igh
t)y
esC
E.N
.2
9M
10(r
igh
t)y
esC
B.N
.5
4M
10(r
igh
t)y
esC
M.D
.P.
42
F4
0(l
eft)
yes
LL
C
E.A
.3
6M
13(r
igh
t)y
esL
LC
L.P
.5
1F
11(r
igh
t)y
esC
E.L
.2
6M
18(r
igh
t)y
esL
,R
L,
RL
&R
∗B
ack
of
the
han
d.
DT
I:17
sub
ject
s.T
acti
lest
imu
lati
on
:22
sub
ject
s.G
ust
ato
ryst
imu
lati
on
:13
sub
ject
s.V
isu
alst
imu
lati
on
:14
sub
ject
s.M
oto
rac
tiva
tio
n:7
sub
ject
s.A
ud
ito
ryst
imu
lati
on
:1su
bje
ct.
L:l
eftsi
de
stim
ula
tio
n.
R:r
igh
tsi
de
stim
ula
tio
n.
L,R
:sti
mu
lati
on
of
the
left
and
righ
tsi
de
alte
rnat
ivel
yd
uri
ng
the
sam
ese
ssio
n.
L&
R:s
tim
ula
tio
no
fth
ele
ftan
dri
ght
sid
esi
mu
ltan
eou
sly.
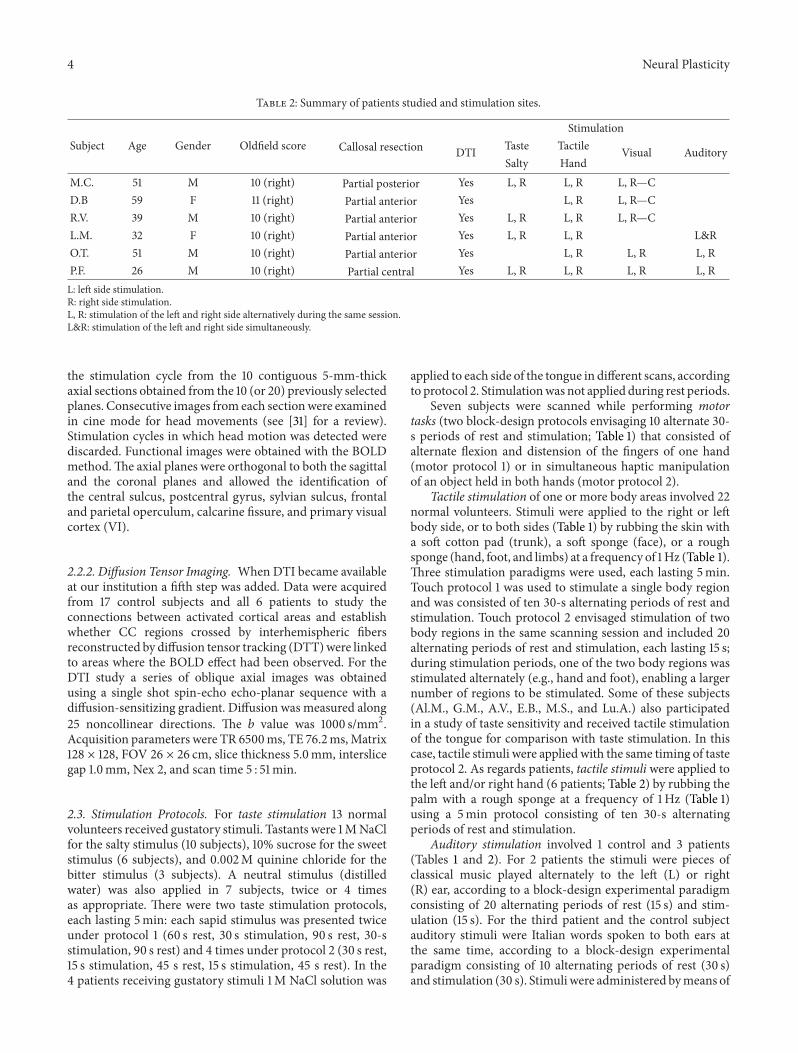
4 Neural Plasticity
Table 2: Summary of patients studied and stimulation sites.
Stimulation
Subject Age Gender Oldfield score Callosal resectionDTI
Taste TactileVisual Auditory
Salty Hand
M.C. 51 M 10 (right) Partial posterior Yes L, R L, R L, R—C
D.B 59 F 11 (right) Partial anterior Yes L, R L, R—C
R.V. 39 M 10 (right) Partial anterior Yes L, R L, R L, R—C
L.M. 32 F 10 (right) Partial anterior Yes L, R L, R L&R
O.T. 51 M 10 (right) Partial anterior Yes L, R L, R L, R
P.F. 26 M 10 (right) Partial central Yes L, R L, R L, R L, R
L: left side stimulation.R: right side stimulation.L, R: stimulation of the left and right side alternatively during the same session.L&R: stimulation of the left and right side simultaneously.
the stimulation cycle from the 10 contiguous 5-mm-thickaxial sections obtained from the 10 (or 20) previously selectedplanes. Consecutive images from each section were examinedin cine mode for head movements (see [31] for a review).Stimulation cycles in which head motion was detected werediscarded. Functional images were obtained with the BOLDmethod. The axial planes were orthogonal to both the sagittaland the coronal planes and allowed the identification ofthe central sulcus, postcentral gyrus, sylvian sulcus, frontaland parietal operculum, calcarine fissure, and primary visualcortex (VI).
2.2.2. Diffusion Tensor Imaging. When DTI became availableat our institution a fifth step was added. Data were acquiredfrom 17 control subjects and all 6 patients to study theconnections between activated cortical areas and establishwhether CC regions crossed by interhemispheric fibersreconstructed by diffusion tensor tracking (DTT) were linkedto areas where the BOLD effect had been observed. For theDTI study a series of oblique axial images was obtainedusing a single shot spin-echo echo-planar sequence with adiffusion-sensitizing gradient. Diffusion was measured along
25 noncollinear directions. The 𝑏 value was 1000 s/mm2.Acquisition parameters were TR 6500 ms, TE 76.2 ms, Matrix128 × 128, FOV 26 × 26 cm, slice thickness 5.0 mm, interslicegap 1.0 mm, Nex 2, and scan time 5 : 51 min.
2.3. Stimulation Protocols. For taste stimulation 13 normalvolunteers received gustatory stimuli. Tastants were 1 M NaClfor the salty stimulus (10 subjects), 10% sucrose for the sweetstimulus (6 subjects), and 0.002 M quinine chloride for thebitter stimulus (3 subjects). A neutral stimulus (distilledwater) was also applied in 7 subjects, twice or 4 timesas appropriate. There were two taste stimulation protocols,each lasting 5 min: each sapid stimulus was presented twiceunder protocol 1 (60 s rest, 30 s stimulation, 90 s rest, 30-sstimulation, 90 s rest) and 4 times under protocol 2 (30 s rest,15 s stimulation, 45 s rest, 15 s stimulation, 45 s rest). In the4 patients receiving gustatory stimuli 1 M NaCl solution was
applied to each side of the tongue in different scans, accordingto protocol 2. Stimulation was not applied during rest periods.
Seven subjects were scanned while performing motortasks (two block-design protocols envisaging 10 alternate 30-s periods of rest and stimulation; Table 1) that consisted ofalternate flexion and distension of the fingers of one hand(motor protocol 1) or in simultaneous haptic manipulationof an object held in both hands (motor protocol 2).
Tactile stimulation of one or more body areas involved 22normal volunteers. Stimuli were applied to the right or leftbody side, or to both sides (Table 1) by rubbing the skin witha soft cotton pad (trunk), a soft sponge (face), or a roughsponge (hand, foot, and limbs) at a frequency of 1 Hz (Table 1).Three stimulation paradigms were used, each lasting 5 min.Touch protocol 1 was used to stimulate a single body regionand was consisted of ten 30-s alternating periods of rest andstimulation. Touch protocol 2 envisaged stimulation of twobody regions in the same scanning session and included 20alternating periods of rest and stimulation, each lasting 15 s;during stimulation periods, one of the two body regions wasstimulated alternately (e.g., hand and foot), enabling a largernumber of regions to be stimulated. Some of these subjects(Al.M., G.M., A.V., E.B., M.S., and Lu.A.) also participatedin a study of taste sensitivity and received tactile stimulationof the tongue for comparison with taste stimulation. In thiscase, tactile stimuli were applied with the same timing of tasteprotocol 2. As regards patients, tactile stimuli were applied tothe left and/or right hand (6 patients; Table 2) by rubbing thepalm with a rough sponge at a frequency of 1 Hz (Table 1)using a 5 min protocol consisting of ten 30-s alternatingperiods of rest and stimulation.
Auditory stimulation involved 1 control and 3 patients(Tables 1 and 2). For 2 patients the stimuli were pieces ofclassical music played alternately to the left (L) or right(R) ear, according to a block-design experimental paradigmconsisting of 20 alternating periods of rest (15 s) and stim-ulation (15 s). For the third patient and the control subjectauditory stimuli were Italian words spoken to both ears atthe same time, according to a block-design experimentalparadigm consisting of 10 alternating periods of rest (30 s)and stimulation (30 s). Stimuli were administered by means of
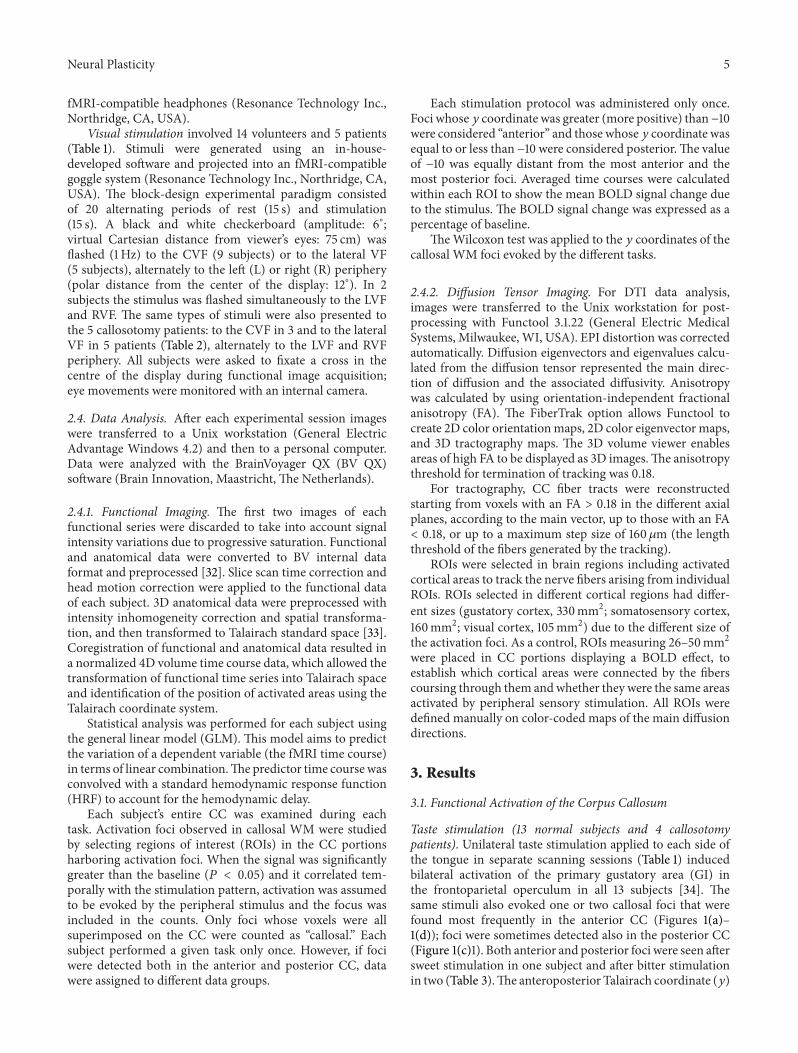
Neural Plasticity 5
fMRI-compatible headphones (Resonance Technology Inc.,Northridge, CA, USA).
Visual stimulation involved 14 volunteers and 5 patients(Table 1). Stimuli were generated using an in-house-developed software and projected into an fMRI-compatiblegoggle system (Resonance Technology Inc., Northridge, CA,USA). The block-design experimental paradigm consistedof 20 alternating periods of rest (15 s) and stimulation(15 s). A black and white checkerboard (amplitude: 6∘;virtual Cartesian distance from viewer’s eyes: 75 cm) wasflashed (1 Hz) to the CVF (9 subjects) or to the lateral VF(5 subjects), alternately to the left (L) or right (R) periphery(polar distance from the center of the display: 12∘). In 2subjects the stimulus was flashed simultaneously to the LVFand RVF. The same types of stimuli were also presented tothe 5 callosotomy patients: to the CVF in 3 and to the lateralVF in 5 patients (Table 2), alternately to the LVF and RVFperiphery. All subjects were asked to fixate a cross in thecentre of the display during functional image acquisition;eye movements were monitored with an internal camera.
2.4. Data Analysis. After each experimental session imageswere transferred to a Unix workstation (General ElectricAdvantage Windows 4.2) and then to a personal computer.Data were analyzed with the BrainVoyager QX (BV QX)software (Brain Innovation, Maastricht, The Netherlands).
2.4.1. Functional Imaging. The first two images of eachfunctional series were discarded to take into account signalintensity variations due to progressive saturation. Functionaland anatomical data were converted to BV internal dataformat and preprocessed [32]. Slice scan time correction andhead motion correction were applied to the functional dataof each subject. 3D anatomical data were preprocessed withintensity inhomogeneity correction and spatial transforma-tion, and then transformed to Talairach standard space [33].Coregistration of functional and anatomical data resulted ina normalized 4D volume time course data, which allowed thetransformation of functional time series into Talairach spaceand identification of the position of activated areas using theTalairach coordinate system.
Statistical analysis was performed for each subject usingthe general linear model (GLM). This model aims to predictthe variation of a dependent variable (the fMRI time course)in terms of linear combination. The predictor time course wasconvolved with a standard hemodynamic response function(HRF) to account for the hemodynamic delay.
Each subject’s entire CC was examined during eachtask. Activation foci observed in callosal WM were studiedby selecting regions of interest (ROIs) in the CC portionsharboring activation foci. When the signal was significantlygreater than the baseline (𝑃 < 0.05) and it correlated tem-porally with the stimulation pattern, activation was assumedto be evoked by the peripheral stimulus and the focus wasincluded in the counts. Only foci whose voxels were allsuperimposed on the CC were counted as “callosal.” Eachsubject performed a given task only once. However, if fociwere detected both in the anterior and posterior CC, datawere assigned to different data groups.
Each stimulation protocol was administered only once.Foci whose 𝑦 coordinate was greater (more positive) than −10were considered “anterior” and those whose𝑦 coordinate wasequal to or less than −10 were considered posterior. The valueof −10 was equally distant from the most anterior and themost posterior foci. Averaged time courses were calculatedwithin each ROI to show the mean BOLD signal change dueto the stimulus. The BOLD signal change was expressed as apercentage of baseline.
The Wilcoxon test was applied to the 𝑦 coordinates of thecallosal WM foci evoked by the different tasks.
2.4.2. Diffusion Tensor Imaging. For DTI data analysis,images were transferred to the Unix workstation for post-processing with Functool 3.1.22 (General Electric MedicalSystems, Milwaukee, WI, USA). EPI distortion was correctedautomatically. Diffusion eigenvectors and eigenvalues calcu-lated from the diffusion tensor represented the main direc-tion of diffusion and the associated diffusivity. Anisotropywas calculated by using orientation-independent fractionalanisotropy (FA). The FiberTrak option allows Functool tocreate 2D color orientation maps, 2D color eigenvector maps,and 3D tractography maps. The 3D volume viewer enablesareas of high FA to be displayed as 3D images. The anisotropythreshold for termination of tracking was 0.18.
For tractography, CC fiber tracts were reconstructedstarting from voxels with an FA > 0.18 in the different axialplanes, according to the main vector, up to those with an FA< 0.18, or up to a maximum step size of 160𝜇m (the lengththreshold of the fibers generated by the tracking).
ROIs were selected in brain regions including activatedcortical areas to track the nerve fibers arising from individualROIs. ROIs selected in different cortical regions had differ-
ent sizes (gustatory cortex, 330 mm2; somatosensory cortex,
160 mm2; visual cortex, 105 mm2) due to the different size ofthe activation foci. As a control, ROIs measuring 26–50 mm2
were placed in CC portions displaying a BOLD effect, toestablish which cortical areas were connected by the fiberscoursing through them and whether they were the same areasactivated by peripheral sensory stimulation. All ROIs weredefined manually on color-coded maps of the main diffusiondirections.
3. Results
3.1. Functional Activation of the Corpus Callosum
Taste stimulation (13 normal subjects and 4 callosotomypatients). Unilateral taste stimulation applied to each side ofthe tongue in separate scanning sessions (Table 1) inducedbilateral activation of the primary gustatory area (GI) inthe frontoparietal operculum in all 13 subjects [34]. Thesame stimuli also evoked one or two callosal foci that werefound most frequently in the anterior CC (Figures 1(a)–1(d)); foci were sometimes detected also in the posterior CC(Figure 1(c)1). Both anterior and posterior foci were seen aftersweet stimulation in one subject and after bitter stimulationin two (Table 3). The anteroposterior Talairach coordinate (𝑦)

6 Neural Plasticity
1 2
(a) (b)
1 2
(c) (d)
1 2 3
(e)
Figure 1: Callosal BOLD effect evoked by different tastants innormal subjects: (a) callosal foci evoked by the salty stimulus in 2subjects (Al.M. and E.B.), both displaying activation in the anteriorportion of the CC (green arrows), (b) callosal foci evoked by theneutral stimulus in subject E.B. displaying the activation in theanterior portion of the CC (green arrow), (c) callosal focus evokedby the sweet stimulus in 2 subjects (L.A. and E.B.), both exhibitingactivation in the foremost portion of the corpus callosum (greenarrows); a posterior focus, likely in the splenium, is also visiblein subject L.A. (1), (d) callosal foci evoked by the bitter stimulusin subject L.E., displaying activation in the anterior portion of theCC (green arrow), and (e) callosal fibers arising from a corticalROI selected in area GI (1, green circle) cross through the anteriorCC (2 and 3, yellow arrows). Numbers on each brain represent theTalairach coordinates (𝑥, 𝑦, 𝑧) of each focus (green arrows). On DTIimages, a thin white line demarcates the CC. SS, Sylvian sulcus.
of the posterior foci ranged from −31 to −40, and that of theanterior foci from 9 to 23. The mean 𝑦 values of the anteriorfoci activated by the sweet stimulus appeared to be signifi-cantly more anterior than those evoked by salty and bittertastants (Table 3). In these subjects interhemispheric fiberscrossing through the anterior CC were visible (Figure 1(e)),as detailed below.
Also in the 4 patients a salty stimulus applied to each sideof the tongue in separate scanning sessions (Table 2) inducedbilateral activation of area GI [34]. In the 2 subjects whoseanterior CC was spared (M.C. and P.F.) the same stimulusalso evoked a callosal focus in the anterior CC (Figure 2(a)1).The mean 𝑦 coordinate of the callosal foci was 22.5 (Table 3;𝑃 < 0.05). In these 2 patients interhemispheric fibers crossingthrough the spared anterior CC were visible (Figure 2(a)2), asdetailed below. In the other 2 patients and in P.F. an activationfocus was also noted in the posterior CC (mean 𝑦 coordinate:
1 2
(a)
(b) (c)
Figure 2: Activation evoked by taste stimulation in patient M.C.Bilateral cortical activation in the frontoparietal operculum (notshown) was seen in this subject, who also displayed a callosal focus((a)1, green arrow). Fibers arising from the activated cortex crossthrough the anterior CC ((a)2, yellow arrow), (b) and (c) activationfoci evoked in the splenium by taste stimuli in patients P.F. and L.M.,respectively. No callosal fibers connecting taste areas crossed thissplenium. On DTI images, a thin white line outlines the spared CC((a)2). Numbers on each brain represent the Talairach coordinates(𝑥, 𝑦, 𝑧) of each focus (green arrows).
−35.33; Table 3; Figures 2(b) and 2(c)). The coordinates ofboth anterior and posterior foci evoked by taste stimulationwere similar to those observed in control subjects [29].
Motor Activation (7 Normal Subjects). Alternate flexion anddistension of the fingers of a hand and object manipulationwith both hands evoked foci in cortical motor areas and inthe middle portion of the CC (Figure 3(a)2)—where anteriorfoci evoked by tactile hand and foot stimulation were alsoobserved—in all 7 subjects (Table 3). The values of the ycoordinate (1 to −23) overlapped with those of the anteriorsomatosensory foci. The interhemispheric fibers linking theactivated motor cortical areas crossed through the middlepart of the CC (Figures 3(b)1 and 3(b)2) at sites harboringthe BOLD foci.
Tactile Stimulation (22 Normal Subjects and 6 CallosotomyPatients). Unilateral tactile stimuli applied to left or rightbody regions (Table 1) activated the primary (SI; [35, 36])and secondary (SII; [37]) somatosensory areas in the parietalcortex in all 22 subjects. They also evoked callosal foci,more frequently in the middle CC and in the posteriorcallosal body (Figure 4). Stimuli applied to the hand andfoot evoked a BOLD focus in the middle of the CC(Figure 4(a)), while stimulation of proximal body regions(trunk, shoulder, and thigh) activated fibers in more posteriorregions (Figure 4(b)). Stimulation of the arm, foot, and legalso activated posterior fibers (Figure 4(c)) that were not,however, clearly distinguishable from those activated by the
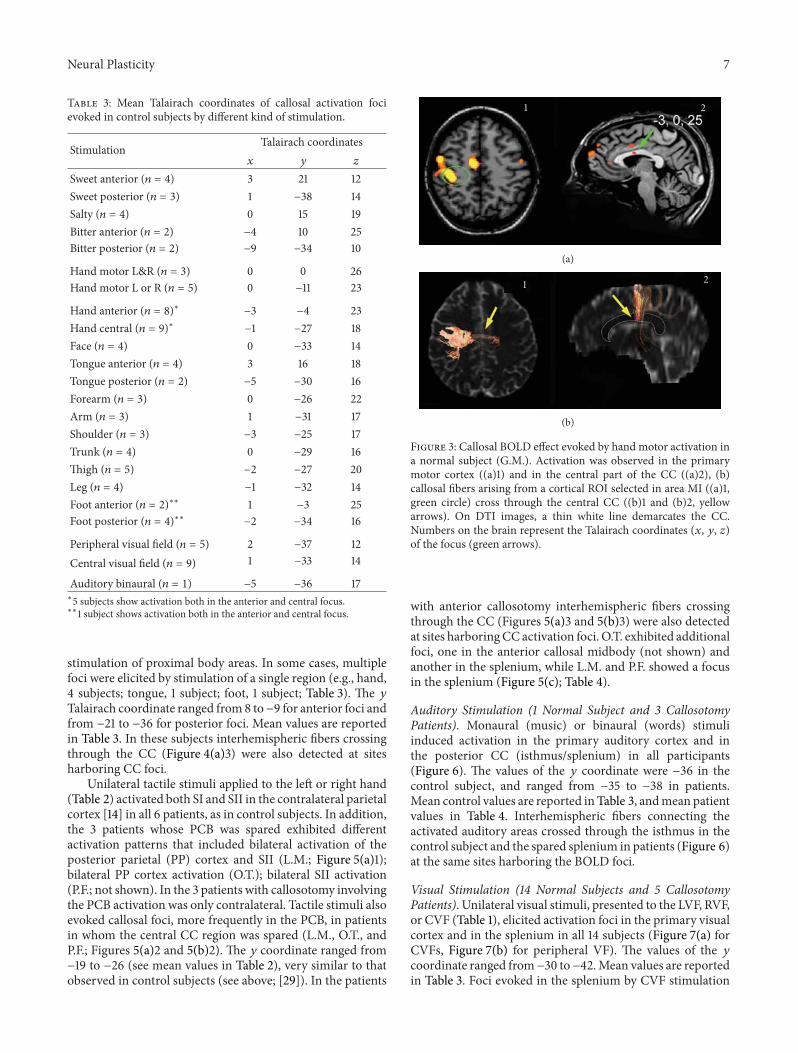
Neural Plasticity 7
Table 3: Mean Talairach coordinates of callosal activation focievoked in control subjects by different kind of stimulation.
StimulationTalairach coordinates
𝑥 𝑦 𝑧
Sweet anterior (𝑛 = 4) 3 21 12
Sweet posterior (𝑛 = 3) 1 −38 14
Salty (𝑛 = 4) 0 15 19
Bitter anterior (𝑛 = 2) −4 10 25
Bitter posterior (𝑛 = 2) −9 −34 10
Hand motor L&R (𝑛 = 3) 0 0 26
Hand motor L or R (𝑛 = 5) 0 −11 23
Hand anterior (𝑛 = 8)∗ −3 −4 23
Hand central (𝑛 = 9)∗ −1 −27 18
Face (𝑛 = 4) 0 −33 14
Tongue anterior (𝑛 = 4) 3 16 18
Tongue posterior (𝑛 = 2) −5 −30 16
Forearm (𝑛 = 3) 0 −26 22
Arm (𝑛 = 3) 1 −31 17
Shoulder (𝑛 = 3) −3 −25 17
Trunk (𝑛 = 4) 0 −29 16
Thigh (𝑛 = 5) −2 −27 20
Leg (𝑛 = 4) −1 −32 14
Foot anterior (𝑛 = 2)∗∗ 1 −3 25
Foot posterior (𝑛 = 4)∗∗ −2 −34 16
Peripheral visual field (𝑛 = 5) 2 −37 12
Central visual field (𝑛 = 9) 1 −33 14
Auditory binaural (𝑛 = 1) −5 −36 17∗5 subjects show activation both in the anterior and central focus.∗∗1 subject shows activation both in the anterior and central focus.
stimulation of proximal body areas. In some cases, multiplefoci were elicited by stimulation of a single region (e.g., hand,4 subjects; tongue, 1 subject; foot, 1 subject; Table 3). The 𝑦Talairach coordinate ranged from 8 to−9 for anterior foci andfrom −21 to −36 for posterior foci. Mean values are reportedin Table 3. In these subjects interhemispheric fibers crossingthrough the CC (Figure 4(a)3) were also detected at sitesharboring CC foci.
Unilateral tactile stimuli applied to the left or right hand(Table 2) activated both SI and SII in the contralateral parietalcortex [14] in all 6 patients, as in control subjects. In addition,the 3 patients whose PCB was spared exhibited differentactivation patterns that included bilateral activation of theposterior parietal (PP) cortex and SII (L.M.; Figure 5(a)1);bilateral PP cortex activation (O.T.); bilateral SII activation(P.F.; not shown). In the 3 patients with callosotomy involvingthe PCB activation was only contralateral. Tactile stimuli alsoevoked callosal foci, more frequently in the PCB, in patientsin whom the central CC region was spared (L.M., O.T., andP.F.; Figures 5(a)2 and 5(b)2). The 𝑦 coordinate ranged from−19 to −26 (see mean values in Table 2), very similar to thatobserved in control subjects (see above; [29]). In the patients
1 2
(a)
1 2
(b)
Figure 3: Callosal BOLD effect evoked by hand motor activation ina normal subject (G.M.). Activation was observed in the primarymotor cortex ((a)1) and in the central part of the CC ((a)2), (b)callosal fibers arising from a cortical ROI selected in area MI ((a)1,green circle) cross through the central CC ((b)1 and (b)2, yellowarrows). On DTI images, a thin white line demarcates the CC.Numbers on the brain represent the Talairach coordinates (𝑥, 𝑦, 𝑧)of the focus (green arrows).
with anterior callosotomy interhemispheric fibers crossingthrough the CC (Figures 5(a)3 and 5(b)3) were also detectedat sites harboring CC activation foci. O.T. exhibited additionalfoci, one in the anterior callosal midbody (not shown) andanother in the splenium, while L.M. and P.F. showed a focusin the splenium (Figure 5(c); Table 4).
Auditory Stimulation (1 Normal Subject and 3 CallosotomyPatients). Monaural (music) or binaural (words) stimuliinduced activation in the primary auditory cortex and inthe posterior CC (isthmus/splenium) in all participants(Figure 6). The values of the 𝑦 coordinate were −36 in thecontrol subject, and ranged from −35 to −38 in patients.Mean control values are reported in Table 3, and mean patientvalues in Table 4. Interhemispheric fibers connecting theactivated auditory areas crossed through the isthmus in thecontrol subject and the spared splenium in patients (Figure 6)at the same sites harboring the BOLD foci.
Visual Stimulation (14 Normal Subjects and 5 CallosotomyPatients). Unilateral visual stimuli, presented to the LVF, RVF,or CVF (Table 1), elicited activation foci in the primary visualcortex and in the splenium in all 14 subjects (Figure 7(a) forCVFs, Figure 7(b) for peripheral VF). The values of the 𝑦coordinate ranged from−30 to−42. Mean values are reportedin Table 3. Foci evoked in the splenium by CVF stimulation
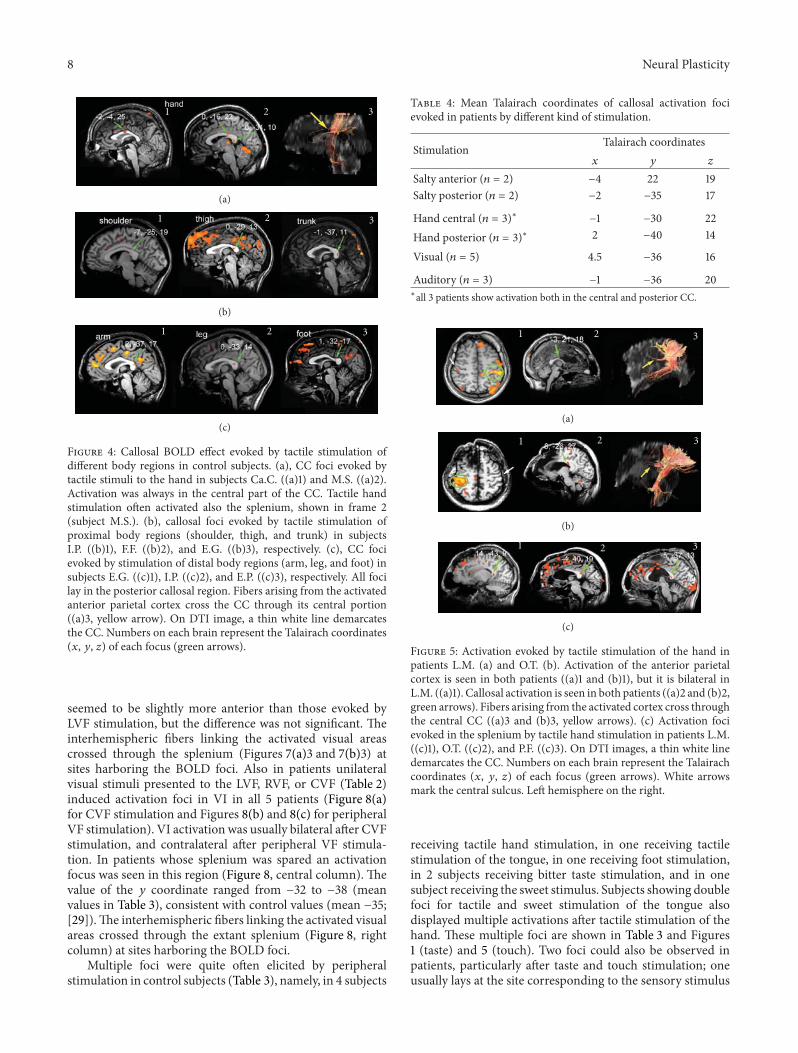
8 Neural Plasticity
1 2 3
(a)
1 2 3
(b)
1 2 3
(c)
Figure 4: Callosal BOLD effect evoked by tactile stimulation ofdifferent body regions in control subjects. (a), CC foci evoked bytactile stimuli to the hand in subjects Ca.C. ((a)1) and M.S. ((a)2).Activation was always in the central part of the CC. Tactile handstimulation often activated also the splenium, shown in frame 2(subject M.S.). (b), callosal foci evoked by tactile stimulation ofproximal body regions (shoulder, thigh, and trunk) in subjectsI.P. ((b)1), F.F. ((b)2), and E.G. ((b)3), respectively. (c), CC focievoked by stimulation of distal body regions (arm, leg, and foot) insubjects E.G. ((c)1), I.P. ((c)2), and E.P. ((c)3), respectively. All focilay in the posterior callosal region. Fibers arising from the activatedanterior parietal cortex cross the CC through its central portion((a)3, yellow arrow). On DTI image, a thin white line demarcatesthe CC. Numbers on each brain represent the Talairach coordinates(𝑥, 𝑦, 𝑧) of each focus (green arrows).
seemed to be slightly more anterior than those evoked byLVF stimulation, but the difference was not significant. Theinterhemispheric fibers linking the activated visual areascrossed through the splenium (Figures 7(a)3 and 7(b)3) atsites harboring the BOLD foci. Also in patients unilateralvisual stimuli presented to the LVF, RVF, or CVF (Table 2)induced activation foci in VI in all 5 patients (Figure 8(a)for CVF stimulation and Figures 8(b) and 8(c) for peripheralVF stimulation). VI activation was usually bilateral after CVFstimulation, and contralateral after peripheral VF stimula-tion. In patients whose splenium was spared an activationfocus was seen in this region (Figure 8, central column). Thevalue of the 𝑦 coordinate ranged from −32 to −38 (meanvalues in Table 3), consistent with control values (mean −35;[29]). The interhemispheric fibers linking the activated visualareas crossed through the extant splenium (Figure 8, rightcolumn) at sites harboring the BOLD foci.
Multiple foci were quite often elicited by peripheralstimulation in control subjects (Table 3), namely, in 4 subjects
Table 4: Mean Talairach coordinates of callosal activation focievoked in patients by different kind of stimulation.
StimulationTalairach coordinates
𝑥 𝑦 𝑧
Salty anterior (𝑛 = 2) −4 22 19
Salty posterior (𝑛 = 2) −2 −35 17
Hand central (𝑛 = 3)∗ −1 −30 22
Hand posterior (𝑛 = 3)∗ 2 −40 14
Visual (𝑛 = 5) 4.5 −36 16
Auditory (𝑛 = 3) −1 −36 20∗all 3 patients show activation both in the central and posterior CC.
1 2 3
(a)
1 2 3
(b)
1 2 3
(c)
Figure 5: Activation evoked by tactile stimulation of the hand inpatients L.M. (a) and O.T. (b). Activation of the anterior parietalcortex is seen in both patients ((a)1 and (b)1), but it is bilateral inL.M. ((a)1). Callosal activation is seen in both patients ((a)2 and (b)2,green arrows). Fibers arising from the activated cortex cross throughthe central CC ((a)3 and (b)3, yellow arrows). (c) Activation focievoked in the splenium by tactile hand stimulation in patients L.M.((c)1), O.T. ((c)2), and P.F. ((c)3). On DTI images, a thin white linedemarcates the CC. Numbers on each brain represent the Talairachcoordinates (𝑥, 𝑦, 𝑧) of each focus (green arrows). White arrowsmark the central sulcus. Left hemisphere on the right.
receiving tactile hand stimulation, in one receiving tactilestimulation of the tongue, in one receiving foot stimulation,in 2 subjects receiving bitter taste stimulation, and in onesubject receiving the sweet stimulus. Subjects showing doublefoci for tactile and sweet stimulation of the tongue alsodisplayed multiple activations after tactile stimulation of thehand. These multiple foci are shown in Table 3 and Figures1 (taste) and 5 (touch). Two foci could also be observed inpatients, particularly after taste and touch stimulation; oneusually lays at the site corresponding to the sensory stimulus
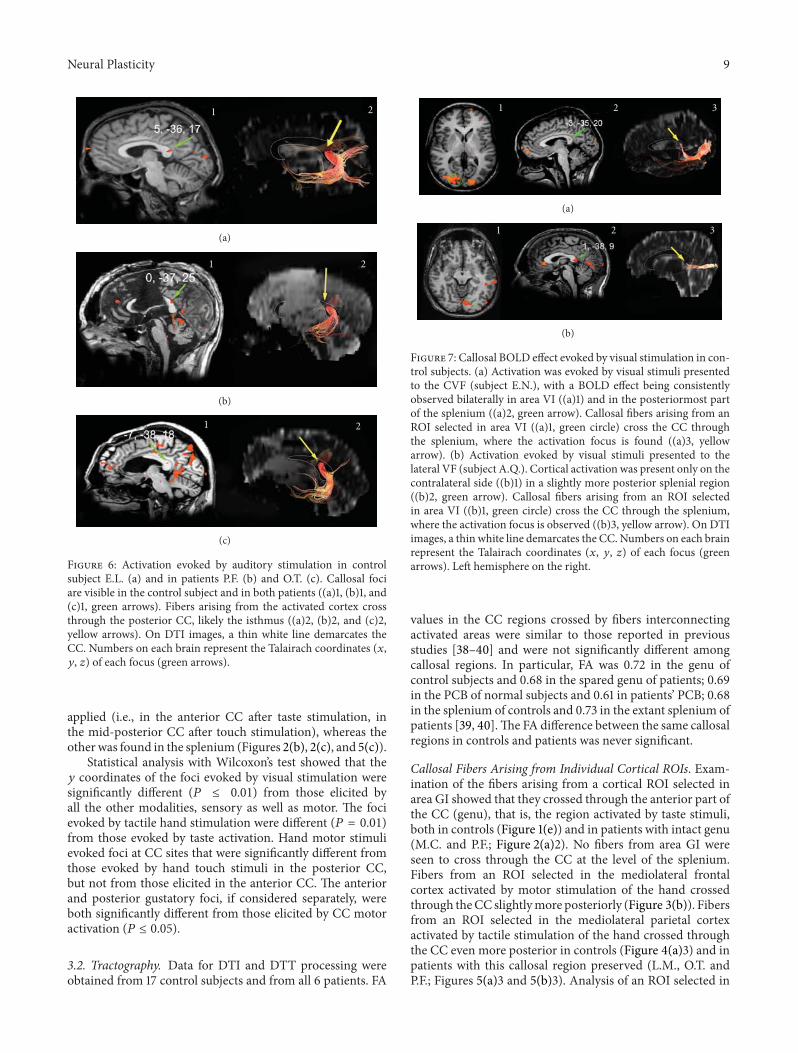
Neural Plasticity 9
1 2
(a)
1 2
(b)
1 2
(c)
Figure 6: Activation evoked by auditory stimulation in controlsubject E.L. (a) and in patients P.F. (b) and O.T. (c). Callosal fociare visible in the control subject and in both patients ((a)1, (b)1, and(c)1, green arrows). Fibers arising from the activated cortex crossthrough the posterior CC, likely the isthmus ((a)2, (b)2, and (c)2,yellow arrows). On DTI images, a thin white line demarcates theCC. Numbers on each brain represent the Talairach coordinates (𝑥,𝑦, 𝑧) of each focus (green arrows).
applied (i.e., in the anterior CC after taste stimulation, inthe mid-posterior CC after touch stimulation), whereas theother was found in the splenium (Figures 2(b), 2(c), and 5(c)).
Statistical analysis with Wilcoxon’s test showed that the𝑦 coordinates of the foci evoked by visual stimulation weresignificantly different (𝑃 ≤ 0.01) from those elicited byall the other modalities, sensory as well as motor. The focievoked by tactile hand stimulation were different (𝑃 = 0.01)from those evoked by taste activation. Hand motor stimulievoked foci at CC sites that were significantly different fromthose evoked by hand touch stimuli in the posterior CC,but not from those elicited in the anterior CC. The anteriorand posterior gustatory foci, if considered separately, wereboth significantly different from those elicited by CC motoractivation (𝑃 ≤ 0.05).
3.2. Tractography. Data for DTI and DTT processing wereobtained from 17 control subjects and from all 6 patients. FA
1 2 3
(a)
1 2 3
(b)
Figure 7: Callosal BOLD effect evoked by visual stimulation in con-trol subjects. (a) Activation was evoked by visual stimuli presentedto the CVF (subject E.N.), with a BOLD effect being consistentlyobserved bilaterally in area VI ((a)1) and in the posteriormost partof the splenium ((a)2, green arrow). Callosal fibers arising from anROI selected in area VI ((a)1, green circle) cross the CC throughthe splenium, where the activation focus is found ((a)3, yellowarrow). (b) Activation evoked by visual stimuli presented to thelateral VF (subject A.Q.). Cortical activation was present only on thecontralateral side ((b)1) in a slightly more posterior splenial region((b)2, green arrow). Callosal fibers arising from an ROI selectedin area VI ((b)1, green circle) cross the CC through the splenium,where the activation focus is observed ((b)3, yellow arrow). On DTIimages, a thin white line demarcates the CC. Numbers on each brainrepresent the Talairach coordinates (𝑥, 𝑦, 𝑧) of each focus (greenarrows). Left hemisphere on the right.
values in the CC regions crossed by fibers interconnectingactivated areas were similar to those reported in previousstudies [38–40] and were not significantly different amongcallosal regions. In particular, FA was 0.72 in the genu ofcontrol subjects and 0.68 in the spared genu of patients; 0.69in the PCB of normal subjects and 0.61 in patients’ PCB; 0.68in the splenium of controls and 0.73 in the extant splenium ofpatients [39, 40]. The FA difference between the same callosalregions in controls and patients was never significant.
Callosal Fibers Arising from Individual Cortical ROIs. Exam-ination of the fibers arising from a cortical ROI selected inarea GI showed that they crossed through the anterior part ofthe CC (genu), that is, the region activated by taste stimuli,both in controls (Figure 1(e)) and in patients with intact genu(M.C. and P.F.; Figure 2(a)2). No fibers from area GI wereseen to cross through the CC at the level of the splenium.Fibers from an ROI selected in the mediolateral frontalcortex activated by motor stimulation of the hand crossedthrough the CC slightly more posteriorly (Figure 3(b)). Fibersfrom an ROI selected in the mediolateral parietal cortexactivated by tactile stimulation of the hand crossed throughthe CC even more posterior in controls (Figure 4(a)3) and inpatients with this callosal region preserved (L.M., O.T. andP.F.; Figures 5(a)3 and 5(b)3). Analysis of an ROI selected in

10 Neural Plasticity
1 2 3
(a)
1 2 3
(b)
1 2 3
(c)
Figure 8: Activation evoked by visual stimulation in callosotomypatients. (a) CVF stimulation in patient D.B. Cortical activationis seen in the occipital cortex of both hemispheres ((a)1) and inthe splenium ((a)2, green arrow). Fibers arising from the activatedcortex ((a)1, green circle) cross the CC through the extant part ofthe splenium ((a)3, yellow arrow). (b) and (c) Activation evokedby peripheral visual stimulation in patients O.T. (b) and P.F. (c).Cortical activation is seen in the occipital cortex of the contralateralhemisphere ((b)1 and (c)1) and in the splenium ((b)2 and (c)1 and2, green arrows). Fibers arising from the activated cortex ((b)1 and(c)1, green circles) cross the CC through the spared portion of thesplenium ((b)3 and (c)3, yellow arrows). Note that in VI the fiberbundle arising from the representation of the peripheral retina andcrossing the splenium is much thinner than the bundle arising fromthe foveal representation, pictured in (a). On DTI images, a thinwhite line demarcates the CC. Numbers on each brain represent theTalairach coordinates (𝑥, 𝑦, 𝑧) of each focus (green arrows). Lefthemisphere on the right.
the primary auditory area showed fibers crossing through theisthmus/splenium, at a site activated by auditory stimulation,both in the unique control subject and in patients (Figure 6).Finally, analysis of an ROI selected in the activated regionof VI showed fibers crossing through the splenium, at a siteactivated by visual stimuli, both in controls (Figure 7) and inpatients (Figure 8).
Callosal ROIs. When ROIs were selected in the genu, anteriorbody, PCB, isthmus, and splenium harboring activation foci,the callosal fibers were seen to interconnect, respectively, thefrontoparietal opercula and prerolandic, parietal, temporal,and occipital regions, which harbored foci activated by tastestimulation of the tongue, hand motor tasks, tactile stimu-lation of the hand and trunk, and visual stimulation. Thesefindings regarded both control subjects and patients [41].
Even though activation foci were seen in the spleniumof some patients after taste or touch stimulation, no inter-hemispheric fibers from gustatory or somatosensory corticalareas were seen to cross through the CC at this level; similarly,no callosal fibers coursed from the foci in the splenium tocortical regions other than occipital or temporal areas.
Finally, no correlation was observed between the FAvalues of the different callosal regions and the occurrence ofthe activation foci.
4. Discussion
In this paper we review our data showing the callosalactivation evoked by a variety of peripheral sensory stimuliin a group of normal subjects (controls) and in 6 partialcallosotomy patients. Altogether these findings show that (i)a callosal BOLD effect can be evoked by peripheral sensorystimulation and by motor tasks other than interhemispherictransfer tasks, (ii) CC activation foci occupy consistentlocations that are related to the sensory or motor stimulusapplied, and (iii) the topographical map of the CC thusobtained is in line with human postmortem data [8], withthe investigations of patients with CC injury or surgicalresection [9, 14, 15, 42–46] see ([10, 11], for a review), and withelectrophysiological recording and neuroanatomical animalstudies [1–3, 5–7].
4.1. Basis of Callosal Activation. To date, a callosal BOLDeffect has been described in relation to visual and motorstimulation [20–24, 47] and, recently, in response to sim-ple sensory stimuli [29]. Energy-dependent processes alsotake place in WM, since they are often axon conductionmediated (at the level of the nodes of Ranvier) by adenosinetriphosphate-dependent Na+-K+ ion pumps that restore ionicgradients across the neuron membrane after action potentialpropagation [48, 49]. Moreover, it has been shown that theinhibition of voltage-dependent Na+ channels suppresses thefMRI response to forepaw somatosensory activation [48].In addition, according to recent evidence, spiking activity isalso correlated with fMRI activation [50–52]. The notion ofa BOLD effect in WM is therefore becoming accepted. It hastentatively been explained with the involvement of astrocytes[53, 54] acting on vessel dilation to meet the greater metabolicdemand from the heightened activity, which in turn resultsin increased neurotransmitter release in the extracellularenvironment, in raised K+ levels in the extracellular mediumdue to augmented neural activity, and/or in increased cyto-plasmic Ca++ [53, 55]. Both astrocytes and capillaries arefound in the commissure [56], and since callosal axon fibersneed energy to conduct action potentials, the mechanism islikely active in CC fibers too. According to another—purelyphysical—hypothesis the heat generated by the increasedaxonal metabolic activity would be sufficient per se to producecallosal microvessel vasodilation (LeBihan, 2009, personalcommunication).
4.2. Topography of Callosal Activation. The foci evoked bydifferent types of sensory stimuli and by motor stimulation

Neural Plasticity 11
occupied different locations along the commissure. Apartfrom some exceptions that will be addressed below, thetopographical distribution of the callosal activation foci wasconsistent with the functional organization of the commis-sure as emerging from anatomical and neuropsychologicalstudies. In our subjects foci induced by taste stimuli laymainly in the anterior CC, that is, the genu and anterior body,which also harbored foci elicited by tactile stimulation of thetongue. The overlap is likely due to the complex nature oftaste, which includes a tactile component.
The foci evoked by hand motor stimulation and by tactilestimuli of different body regions were seen in the anterior andposterior body and in the isthmus, respectively. In particular,proximal body representations seem to be connected bycallosal fibers running through the posterior isthmus andanterior splenium (Figure 9). A dorsoventral topographicalorganization could not be recognized.
As expected, foci evoked by auditory and visual stimuliwere found in the callosal region corresponding to theisthmus/splenium and splenium, respectively. Callosal fociactivated by central or peripheral VF stimulation lay at siteswhose coordinates were not significantly different.
Unlike previous investigations of the callosal BOLDeffect, the sensory stimuli and motor tasks employed inour studies did not require interhemispheric transfer. CCactivation was nonetheless observed, suggesting that allinformation reaching a cortical area is likely transferred tothe opposite hemisphere and used to build a continuousrepresentation of the external world.
As noted above, activation was sometimes found inunexpected callosal regions. This is the case of a posteriorfocus, which was often evoked by taste stimuli in somecontrols and patients in addition to the anterior foci seenin all subjects. Similarly, tactile stimulation of the hand andfoot elicited a focus in the anterior part of the posteriorbody in the CC regions activated by the hand motor tasks;in addition, stimulation of the hand produced a focus inthe splenium in some control subjects and in some patients.The first explanation that comes to mind, that which theavailable data cannot, however, rule out, is that the “ectopic”foci are artifacts. However, since their presence does notappear to be accidental, they are in fact probably related tothe activity evoked by peripheral stimuli. Thus, the anteriorfocus observed after tactile hand and foot stimulation couldbe associated with motor cortex activation, which is ofteninduced by tactile stimulation of these regions [35]; the focievoked in the splenium by taste and hand tactile stimuli mightresult from concurrent activation of high-order associationareas, like the posterior parietal cortex (PPC) in the case oftactile stimuli, and/or temporal areas for both taste and tactilestimuli; the fact the PPC and temporal areas are connectedby fibers crossing though the splenium [58, 59] may explainthose findings.
4.3. Correspondence with Tractography Data. The functionalcallosal topography sketched by the foci described herein,apart from the exception mentioned above, is in line with thetopographical organization of CC fibers described in previousanatomical studies [25, 58–61]. The fibers connecting the
30
30
20
20
10
100
0
Hands (both) FootBitter
Salty
Tongue
Tongue
(tactile)
Hand (single)Forearm
TightHand
Hand
Auditory
Arm
FaceFootShoulder
TrunkLeg
Sweet
Sweet
Bitter
Centralvisual field
−10 −20 −30 −40
Gustatory stimulation
Motor activation
Tactile stimulation
Visual stimulationAuditory stimulation
Peripheral
visual field
(a)
30
30
20
20
10
100
0 −10 −20 −30 −40
Anteroposterior axis D
ors
ove
ntr
al a
xis
Salty
Salty
Hand
Hand
Auditory
Visual
(b)
Frontoparietalopercula
Precentralcortical areas
Parietalcortical areas
Temporal corticalareas
Occipitalcortical areas
1
2
(c)
Figure 9: Summary schematic diagram showing the similar distri-bution of the callosal activation foci evoked by different stimulustypes in controls (a) and patients (b). In (c) the distribution ofcallosal foci is compared to that of the crossing site of callosalfibers seen in our work and in the studies of Witelson [57] (graylines), Hofer and Frahm (line 1, [58]), and Chao et al. (line 2, [59]).(a and b). Each dot represents the “mean” value of the 𝑦 and 𝑧Talairach coordinates (reported on the respective Cartesian axes) ofthe foci evoked by different stimuli. Yellow: foci evoked by gustatorystimuli; green: foci evoked by hand motor tasks; red: foci evokedby tactile stimuli; black: foci evoked by auditory stimuli; blue: focievoked by visual stimuli. See the text for a detailed description.(c) shows the crossing sites of interhemispheric fibers connectingthe sensory and motor cortical areas activated by the relevantperipheral stimuli. Vertical gray lines mark the main CC subdivisionaccording to Witelson [57]. Line 1 and line 2 on the bottom showthe CC subdivision according to Hofer and Frahm (Figure 3 of[58]) and Chao et al. (Figure 7 of [59]): colored tracts mark the CCcrossing sites of fibers from frontal opercular cortical areas (yellow),motor cortices (green), anterior and posterior parietal cortices (red),temporal cortices (black), and occipital cortices (blue).
12 Neural Plasticity
prefrontal cortical areas were seen to cross through theanterior part of the CC, those connecting the premotorand motor cortical areas crossed at the level of the centralcallosal body (see also [62]), those connecting the parietalcortical areas crossed through the posterior callosal body, andthe fibers linking the occipital and temporal areas crossedat the level of the splenium [38, 63]. In all our tests andsubjects, the fibers arising from the cortical areas activatedby each stimulus type crossed through the CC in a regioncorresponding to the one harboring the relevant callosalfocus/i. The coincidence of callosal BOLD activation andcrossing point of the DTT-reconstructed interhemisphericbundles (Figure 9) strongly suggests that the CC foci evokedby sensory stimulation and motor tasks may be due tothe activation of the fibers connecting the activated areasto the corresponding contralateral areas and carrying spe-cific information. In all control subjects and in patientsthe presence of callosal foci in the spared callosal regionsbroadly corresponded with bilateral activation of the corticalareas reached by specific unilateral peripheral sensory input.Although an exact correspondence cannot at present bedemonstrated due to technical limitations (i.e., BOLD andDTI data cannot be coregistered and shown in the sameimage), we are convinced that it does exist, at least based onthe consistency of the observations.
4.4. Comparison with Other Studies. The present outline ofCC topography is based on the study of fibers arising fromdifferent sensory areas activated by relevant peripheral stim-uli. With regard to taste we analyzed different submodalities(tastants); in the touch modality we studied discrete bodyrepresentations, and in the visual modality we exploredthe activation evoked by peripheral and central visual fieldstimulation. With regard to auditory stimulation our data arestill confined to a small number of subjects and stimuli, whilemotor activation was only analyzed in controls. We decidedto include the data from all, even small samples, becausetogether with those from larger samples they may helpprovide a more comprehensive picture of callosal functionaltopography.
The main difference between previous human aftermortem and DTI studies and monkey neuroanatomical trac-ing investigations is that the topographical map outlinedby our data is less precise. In brief, we have two sets ofdata one of which agrees with several studies from otherlaboratories; the other set is ostensibly in contrast withprevious knowledge. Often, multiple foci (usually two) wereactivated by the stimulation of a single body region. Thishappened for tactile hand stimulation and sometimes also fortaste and tactile foot stimulation. The multiple foci contrastwith the single callosal sites identified in previous DTTstudies [58–62]. The discrepancy might be due to the factthat the natural peripheral stimulation applied in our fMRIstudies may have involved a larger number of areas thanprimary sensory and/or motor cortical ones, whereas DTIand monkey neuroanatomical studies address the trajectoriesof fibers arising in circumscribed cortical areas. In particular,tactile stimulation of the hand or foot evokes activation in
the primary motor cortex [35], which could anticipate anaction of the limb receiving the tactile stimulus, explaininga subsequent callosal activation (as in interhemispherictransmission aimed at motor output coordination). Spleniumactivation could also account for the good performance ofcallosotomy patients in whom only the splenium survives intasks involving interhemispheric transfer of tactile informa-tion, a commonly reported observation [12, 64, 65]. It maybe therefore hypothesized that the splenium is involved inthe transfer of touch information, providing for a degree ofplasticity in patients with callosal partial resection. Furtherevidence from neuropsychological studies of taste sensitivityin callosotomy patients [66, 67] points to a role for thesplenium in transferring taste information. The splenialcallosal foci elicited by unilateral taste stimulation in ourstudies lend support to this notion. An involvement of thesplenium in the transfer of information other than visualsensory data could be due to the prominent role of thevisual representation of the external environment, typical ofhumans, where sensory experience is usually associated witha visual component.
Previous papers describing callosal activation reporteda BOLD effect in the anterior portion of the CC (see dataand literature in [68]). Fibers interconnecting prefrontal andmotor cortical areas course through this region and are likelyinvolved in behavioral visuomotor interhemispheric transfertasks, like those evoking callosal activation in those studies.Anterior CC activation has been hypothesized to be relatedto the involvement of fibers carrying interhemispheric infor-mation between these cortical areas. The data reviewed in thepresent study were obtained from simple sensory stimulationthat did not involve a motor output, and from simple motortasks. This may explain the WM activation seen in regionswhere sensory or motor fibers cross through the commissure.
5. Conclusions
In the present paper we have reported the data collected innormal subjects (controls) and in some callosotomy patientsduring fMRI studies on peripheral sensory stimulation. Ithas been shown that a BOLD effect can be evoked in thecorpus callosum by peripheral sensory stimulation and bymotor tasks and that CC activation foci occupy consistentlocations related to the sensory or motor stimulus applied;it has thus emerged that a functional topographical map ofthe CC is in line with previous investigations. Further studies,however, combining fMRI and DTI, are needed to provide abetter understanding of the topography of callosal activationand to confirm or exclude its correspondence with fibercrossing. It would be also interesting to clarify if callosal fibrescarrying information about different submodality or differentregions of the sensory periphery also follow any particularorganization. As pointed out by Pandya and Seltzer “Theunderstanding of the precise topography for commissuralfibers allows one to assess the nature of functional deficitsfollowing selective commissural lesions and to predict thelocalization of functions within cerebral commissural sys-tems” [7].
Neural Plasticity 13
Acknowledgments
The studies described in this paper were carried out withthe collaboration of Professors Tullio Manzoni (recentlydeceased) and Ugo Salvolini, who provided invaluable helpand criticisms, of Dr. Giulia Mascioli, who performed most ofthe fMRI data analysis, and of Doctors Aldo Paggi and Nico-letta Foschi, the neurologists responsible for patient care. Theauthors gratefully acknowledge their contributions. They arealso grateful to Ms. Gabriella Venanzi for scheduling sessionswith patients, to Dr. Gian Luca Cavola for preparing the visualstimuli and to Dr. Silvia Modena for the language revision.They are grateful to the volunteers and patients who partici-pated in the study, to their families, and to the technical staffof the Radiology Institute, particularly Mr. Gianrico Contiand Mr. Luigi Imperiale, for their assistance during scan ses-sions and data transfer. The study was supported by MinisteroIstruzione, Universita e Ricerca (MIUR; PRIN 2007, 2009).
References
[1] G. M. Innocenti, T. Manzoni, and G. Spidalieri, “Cutaneousreceptive fields of single fibers of the corpus callosum,” BrainResearch, vol. 40, no. 2, pp. 507–512, 1972.
[2] G. M. Innocenti, T. Manzoni, and G. Spidalieri, “Patternsof the somesthetic messages transferred through the corpuscallosum,” Experimental Brain Research, vol. 19, no. 5, pp. 447–466, 1974.
[3] G. Berlucchi, M. S. Gazzaniga, and G. Rizzolatti, “Microelec-trode analysis of transfer of visual information by the corpuscallosum,”Archives Italiennes de Biologie, vol. 105, no. 4, pp. 583–596, 1967.
[4] D. H. Hubel and T. N. Wiesel, “Cortical and callosal connectionsconcerned with the vertical meridian of visual fields in the cat,”Journal of Neurophysiology, vol. 30, no. 6, pp. 1561–1573, 1967.
[5] J. P. Guillemot, L. Richer, L. Prevost, M. Ptito, and F. Lepore,“Receptive field properties of somatosensory callosal fibres inthe monkey,” Brain Research, vol. 402, no. 2, pp. 293–302, 1987.
[6] D. N. Pandya, E. A. Karol, and D. Heilbronn, “The topographicaldistribution of interhemispheric projections in the corpuscallosum of the rhesus monkey,” Brain Research, vol. 32, no. 1,pp. 31–43, 1971.
[7] D. N. Pandya and B. Seltzer, “The topography of commissuralfibers,” in Two Hemispheres-One Brain: Functions of the CorpusCallosum, F. Lepore, M. Ptito, and H. H. Jasper, Eds., pp. 47–73,Alan Liss, New York, NY, USA, 1986.
[8] M. C. de Lacoste, J. B. Kirkpatrick, and E. D. Ross, “Topographyof the human corpus callosum,” Journal of Neuropathology andExperimental Neurology, vol. 44, no. 6, pp. 578–591, 1985.
[9] S. Caille, H. C. Sauerwein, A. Schiavetto, J.-G. Villemure, andM. Lassonde, “Sensory and motor interhemispheric integrationafter section of different portions of the anterior corpus callo-sum in nonepileptic patients,” Neurosurgery, vol. 57, no. 1, pp.50–59, 2005.
[10] G. Berlucchi, “Some effects of cortical and callosal damage onconscious and unconscious processing of visual informationand other sensory inputs,” Progress in Brain Research, vol. 144,pp. 79–93, 2004.
[11] M. S. Gazzaniga, “Forty-five years of split-brain research andstill going strong,” Nature Reviews of Neuroscience, vol. 6, no. 8,pp. 653–659, 2005.
[12] M. Fabri, M. del Pesce, A. Paggi et al., “Contribution of posteriorcorpus callosum to the interhemispheric transfer of tactileinformation,” Cognitive Brain Research, vol. 24, no. 1, pp. 73–80,2005.
[13] M. G. Funnell, P. M. Corballis, and M. Gazzaniga, “Cortical andsubcortical interhemispheric interactions following partial andcomplete callosotomy,” Archives of Neurology, vol. 57, no. 2, pp.185–189, 2000.
[14] M. Fabri, G. Polonara, A. Quattrini, U. Salvolini, M. delPesce, and T. Manzoni, “Role of the corpus callosum in thesomatosensory activation of the ipsilateral cerebral cortex: anfMRI study of callosotomized patients,” European Journal ofNeuroscience, vol. 11, no. 11, pp. 3983–3994, 1999.
[15] M. Fabri, G. Polonara, M. del Pesce, A. Quattrini, U. Salvolini,and T. Manzoni, “Posterior corpus callosum and interhemi-spheric transfer of somatosensory information: an fMRI andneuropsychological study of a partially callosotomized patient,”Journal of Cognitive Neuroscience, vol. 13, no. 8, pp. 1071–1079,2001.
[16] M. S. Gazzaniga and H. Freedman, “Observations on visualprocesses after posterior callosal section,”Neurology, vol. 23, no.10, pp. 1126–1130, 1973.
[17] S. Clarke, P. Maeder, R. Meuli et al., “Interhemispheric transferof visual motion information after a posterior callosal lesion:a neuropsychological and fMRI study,” Experimental BrainResearch, vol. 132, no. 1, pp. 127–133, 2000.
[18] M. Sugishita, K. Otomo, K. Yamazaki, H. Shimizu, M. Yoshioka,and A. Shinohara, “Dichotic listening in patients with partialsection of the corpus callosum,” Brain, vol. 118, no. 2, pp. 417–427, 1995.
[19] S. Pollmann, M. Maertens, D. Y. von Cramon, J. Lepsien, andK. Hugdahl, “Dichotic listening in patients with splenial andnonsplenial callosal lesions,” Neuropsychology, vol. 16, no. 1, pp.56–64, 2002.
[20] M. Tettamanti, E. Paulesu, P. Scifo et al., “Interhemispherictransmission of visuomotor information in humans: fMRIevidence,” Journal of Neurophysiology, vol. 88, no. 2, pp. 1051–1058, 2002.
[21] K. Omura, T. Tsukamoto, Y. Kotani, Y. Ohgami, M. Minami, andY. Inoue, “Different mechanisms involved in interhemispherictransfer of visuomotor information,” NeuroReport, vol. 15, no.18, pp. 2707–2711, 2004.
[22] B. Weber, V. Treyer, N. Oberholzer et al., “Attention and inter-hemispheric transfer: a behavioral and fMRI study,” Journal ofCognitive Neuroscience, vol. 17, no. 1, pp. 113–123, 2005.
[23] E. L. Mazerolle, R. C. N. D’Arcy, X. Song, and S. D. Beyea,“Detecting fMRI activation in white matter: interhemispherictransfer across the corpus callosum,” BioMed Central Neuro-science, vol. 9, pp. 84–94, 2008.
[24] K. Mosier and I. Bereznaya, “Parallel cortical networks forvolitional control of swallowing in humans,”Experimental BrainResearch, vol. 140, no. 3, pp. 280–289, 2001.
[25] M. Zarei, H. Johansen-Berg, S. Smith, O. Ciccarelli, A. J.Thompson, and P. M. Matthews, “Functional anatomy of inter-hemispheric cortical connections in the human brain,” Journalof Anatomy, vol. 209, no. 3, pp. 311–320, 2006.
[26] B. U. Meyer, S. Roricht, H. Grafin von Einsiedel, F. Kruggel,and A. Weindl, “Inhibitory and excitatory interhemispherictransfers between motor cortical areas in normal human andpatients with abonormalities of the corpus callosum,”Brain, vol.118, no. 2, pp. 429–440, 1995.
14 Neural Plasticity
[27] A. Stancak Jr., C. H. Lucking, and R. Kristeva-Feige, “Lateral-ization of movement related potentials and the size of corpuscallosum,” NeuroReport, vol. 11, no. 2, pp. 329–332, 2000.
[28] L. Bonzano, A. Tacchino, L. Roccatagliata, G. Abbruzzese, G. L.Mancardi, and M. Bove, “Callosal contributions to simultane-ous bimanual finger movements,” Journal of Neuroscience, vol.28, no. 12, pp. 3227–3233, 2008.
[29] M. Fabri, G. Polonara, G. Mascioli, U. Salvolini, and T. Manzoni,“Topographical organization of human corpus callosum: anfMRI mapping study,” Brain Research, vol. 1370, pp. 99–111, 2011.
[30] R. C. Oldfield, “The assessment and analysis of handedness: theEdinburgh inventory,”Neuropsychologia, vol. 9, no. 1, pp. 97–113,1971.
[31] S.-G. Kim and K. Urgubil, “Functional magnetic resonanceimaging of the human brain,” Journal of Neuroscience Methods,vol. 15, pp. 3821–3839, 1997.
[32] R. Goebel, F. Esposito, and E. Formisano, “Analysis of functionalimage analysis contest (FIAC) data with brainvoyager QX: fromsingle-subject to cortically aligned group general linear modelanalysis and self-organizing group independent componentanalysis,” Human Brain Mapping, vol. 27, no. 5, pp. 392–401,2006.
[33] J. Talairach and P. Tournoux, Co-Planar Stereotaxic Atlas of theHuman Brain, Georg Thieme, Stuttgart, Germany, 1988.
[34] M. Fabri, G. Polonara, G. Mascioli et al., “Cortical repre-sentation and lateralization of taste in man,” Proceedings ofPhysiological Societies, vol. 78P, 2005.
[35] G. Polonara, M. Fabri, T. Manzoni, and U. Salvolini, “Local-ization of the first (SI) and second (SII) somatic sensory areasin human cerebral cortex with fMRI,” American Journal ofNeuroradiology, vol. 20, no. 2, pp. 199–205, 1999.
[36] M. Fabri, G. Polonara, U. Salvolini, and T. Manzoni, “Bilateralcortical representation of the trunk midline in human firstsomatic sensory area,” Human Brain Mapping, vol. 25, no. 3, pp.287–296, 2005.
[37] M. Fabri, G. Polonara, G. Mascioli, U. Salvolini, and T. Manzoni,“Bilateral representation of peripheral touch receptors in thesecond somatosensory cortex: a human functional study,” inProceedings of the 36th International Congress of PhysiologicalSciences, Kyoto, Japan, August 2009.
[38] J. S. Shimony, H. Burton, A. A. Epstein, D. G. McLaren, S. W.Sun, and A. Z. Snyder, “Diffusion tensor imaging reveals whitematter reorganization in early blind humans,” Cerebral Cortex,vol. 16, no. 11, pp. 1653–1661, 2006.
[39] G. Polonara, M. Fabri, G. Mascioli, A. Paggi, T. Manzoni,and U. Salvolini, “Interhemispheric connectivity in patientswith callosal resection described and quantified using diffusiontensor imaging,” in Proceedings of the 32nd European Society forNeuroRadiology Annual Meeting, Genoa, Italy, September 2007.
[40] F. B. Pizzini, G. Mascioli, A. Beltramello et al., “Diffusion tensortracking of callosal fibers several years after callosotomy,” BrainResearch, vol. 1312, pp. 10–17, 2010.
[41] U. Salvolini, G. Polonara, G. Mascioli, M. Fabri, and T. Manzoni,“Organisation topographique du corps calleux chez l’homme.Etude cartographique en imagerie par resonance magnetiquefonctionnelle (IRMf),” Bulletin de l’Academie Nationale deMedecine, vol. 194, no. 3, pp. 17–31, 2010.
[42] B. T. Volpe, J. J. Sidtis, J. D. Holtzman, D. H. Wilson, andM. S. Gazzaniga, “Cortical mechanisms involved in praxis:observations following partial and complete section of thecorpus callosum in man,” Neurology, vol. 32, no. 6, pp. 645–650,1982.
[43] S. Bentin, A. Sahar, and M. Moscovitch, “Intermanual informa-tion transfer in patients with lesions in the trunk of the corpuscallosum,” Neuropsychologia, vol. 22, no. 5, pp. 601–611, 1984.
[44] G. L. Risse, J. Gates, G. Lund, R. C. Maxwell, and A. Rubens,“Interhemispheric transfer in patients with incomplete sectionof the corpus callosum,” Archives of Neurology, vol. 46, no. 4, pp.437–443, 1989.
[45] H. S. Levin, A. J. Mattson, M. Levander et al., “Effects of tran-scallosal surgery on interhemispheric transfer of information,”Surgical Neurology, vol. 40, no. 1, pp. 65–74, 1993.
[46] D. H. Geschwind, M. Iacoboni, M. S. Mega, D. W. Zaidel, T.Cloughesy, and E. Zaidel, “Alien hand syndrome: interhemi-spheric motor disconnection due to a lesion in the midbodyof the corpus callosum,” Neurology, vol. 45, no. 4, pp. 802–808,1995.
[47] R. C. N. D’Arcy, A. Hamilton, M. Jarmasz, S. Sullivan, and G.Stroink, “Exploratory data analysis reveals visuovisual inter-hemispheric transfer in functional magnetic resonance imag-ing,”Magnetic Resonance inMedicine, vol. 55, no. 4, pp. 952–958,2006.
[48] I. Kida, F. Hyder, and K. L. Behar, “Inhibition of voltage-dependent sodium channels suppresses the functional mag-netic resonance imaging response to forepaw somatosensoryactivation in the rodent,” Journal of Cerebral Blood Flow andMetabolism, vol. 21, no. 5, pp. 585–591, 2001.
[49] P. J. Magistretti, “Brain energy metabolism,” in FundamentalNeuroscience, M. J. Zigmond, F. E. Bloom, S. C. Landis, J. L.Roberts, and L. R. Squire, Eds., pp. 339–360, Academic Press,San Diego, Calif, USA, 2003.
[50] M. Iacoboni, “Visuo-motor integration and control in thehuman posterior parietal cortex: evidence from TMS andfMRI,” Neuropsychologia, vol. 44, no. 13, pp. 2691–2699, 2006.
[51] A. J. Smith, H. Blumenfeld, K. L. Behar, D. L. Rothman, R.G. Shulman, and F. Hyder, “Cerebral energetics and spikingfrequency: the neurophysiological basis of fMRI,” Proceedings ofthe National Academy of Sciences of the United States of America,vol. 99, no. 16, pp. 10765–10770, 2002.
[52] Y. Nir, I. Dinstein, R. Malach, and D. J. Heeger, “BOLD andspiking activity,” Nature Neuroscience, vol. 11, no. 5, pp. 523–524,2008.
[53] D. J. Rossi, “Another BOLD role for astrocytes: coupling bloodflow to neural activity,” Nature Neuroscience, vol. 9, no. 2, pp.159–161, 2006.
[54] D. Jakovcevic and D. R. Harder, “Role of astrocytes in matchingblood flow to neuronal activity,” Current Topics in Developmen-tal Biology, vol. 79, pp. 75–97, 2007.
[55] T. Takano, G. F. Tian, W. Peng et al., “Astrocyte-mediatedcontrol of cerebral blood flow,” Nature Neuroscience, vol. 9, no.2, pp. 260–267, 2006.
[56] S. J. Rabi, C. Madhavi, B. Antonisamy, and R. Koshi, “Quan-titative analysis of the human corpus callosum under lightmicroscopy,” European Journal of Anatomy, vol. 11, no. 2, pp. 95–100, 2007.
[57] S. F. Witelson, “Hand and sex differences in the isthmus andgenu of the human corpus callosum. A postmortem morpho-logical study,” Brain, vol. 112, no. 3, pp. 799–835, 1989.
[58] S. Hofer and J. Frahm, “Topography of the human corpus callo-sum revisited-comprehensive fiber tractography using diffusiontensor magnetic resonance imaging,” NeuroImage, vol. 32, no. 3,pp. 989–994, 2006.
Neural Plasticity 15
[59] Y. P. Chao, K. H. Cho, C. H. Yeh, K. H. Chou, J. H. Chen, andC. P. Lin, “Probabilistic topography of human corpus callosumusing cytoarchitectural parcellation and high angular resolutiondiffusion imaging tractography,”HumanBrainMapping, vol. 30,no. 10, pp. 3172–3187, 2009.
[60] O. Abe, Y. Masutani, S. Aoki et al., “Topography of the humancorpus callosum using diffusion tensor tractography,” Journal ofComputer Assisted Tomography, vol. 28, no. 4, pp. 533–539, 2004.
[61] H. Huang, J. Zhang, H. Jiang et al., “DTI tractography basedparcellation of white matter: application to the mid-sagittalmorphology of corpus callosum,” NeuroImage, vol. 26, no. 1, pp.195–205, 2005.
[62] M. Wahl, B. Lauterbach-Soon, E. Hattingen et al., “Humanmotor corpus callosum: topography, somatotopy, and linkbetween microstructure and function,” Journal of Neuroscience,vol. 27, no. 45, pp. 12132–12138, 2007.
[63] R. F. Dougherty, M. Ben-Shachar, R. Bammer, A. A. Brewer, andB. A. Wandell, “Functional organization of human occipital-callosal fiber tracts,” Proceedings of the National Academy ofSciences of the United States of America, vol. 102, no. 20, pp.7350–7355, 2005.
[64] H. W. Gordon, J. E. Bogen, and R. W. Sperry, “Absence ofdeconnexion syndrome in two patients with partial section ofthe neocommissures,” Brain, vol. 94, no. 2, pp. 327–336, 1971.
[65] G. Geffen, J. Nilsson, K. Quinn, and E. L. Teng, “The effectof lesions of the corpus callosum on finger localization,”Neuropsychologia, vol. 23, no. 4, pp. 497–514, 1985.
[66] S. Aglioti, G. Tassinari, M. C. Corballis, and G. Berlucchi,“Incomplete gustatory lateralization as shown by analysis oftaste discrimination after callosotomy,” Journal of CognitiveNeuroscience, vol. 12, no. 2, pp. 238–245, 2000.
[67] S. M. Aglioti, G. Tassinari, M. Fabri et al., “Taste laterality in thesplit brain,” European Journal of Neuroscience, vol. 13, no. 1, pp.195–200, 2001.
[68] J. R. Gawryluk, K. D. Brewer, S. D. Beyea, and R. C. N.D’Arcy, “Optimizing the detection of white matter fMRI usingasymmetric spin echo spiral,” NeuroImage, vol. 45, no. 1, pp. 83–88, 2009.
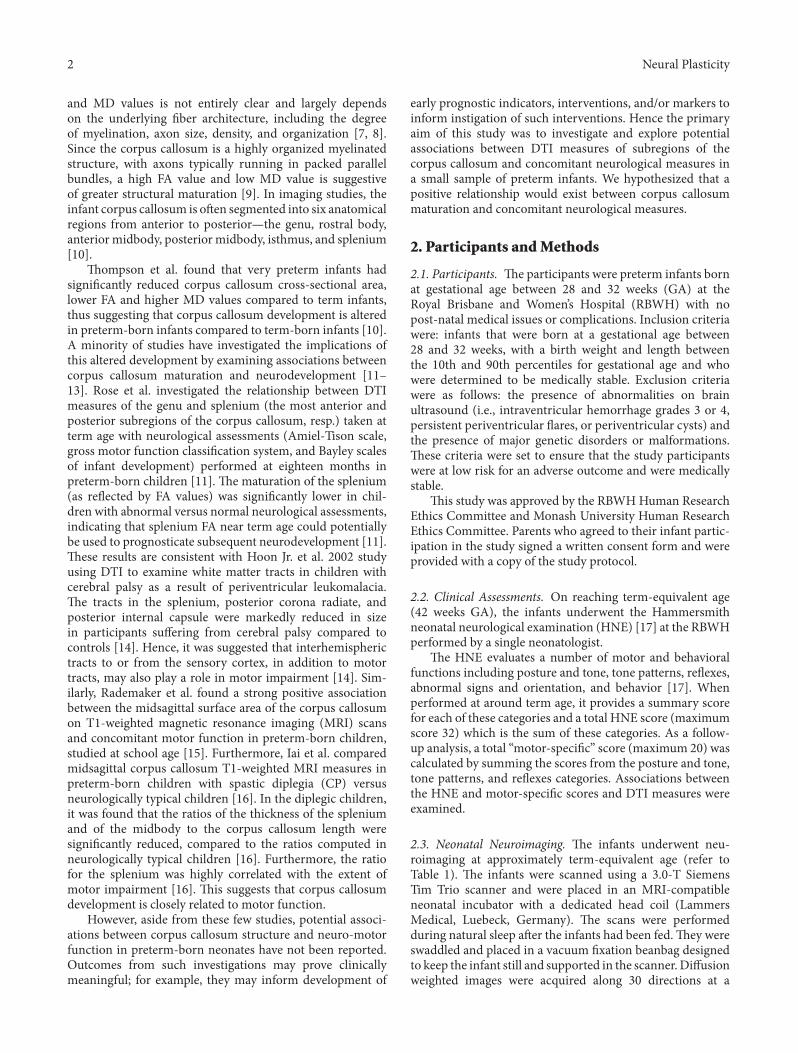
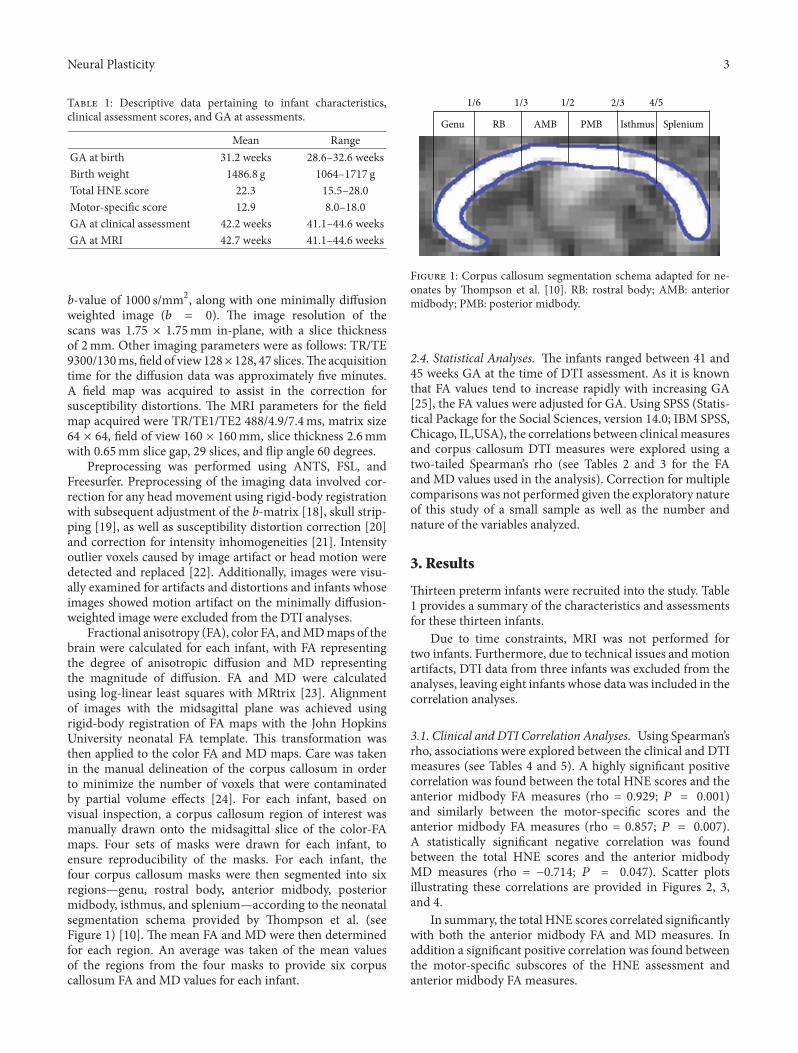
Genu RB AMB PMB Isthmus Splenium
1/6 1/3 1/2 2/3 4/5
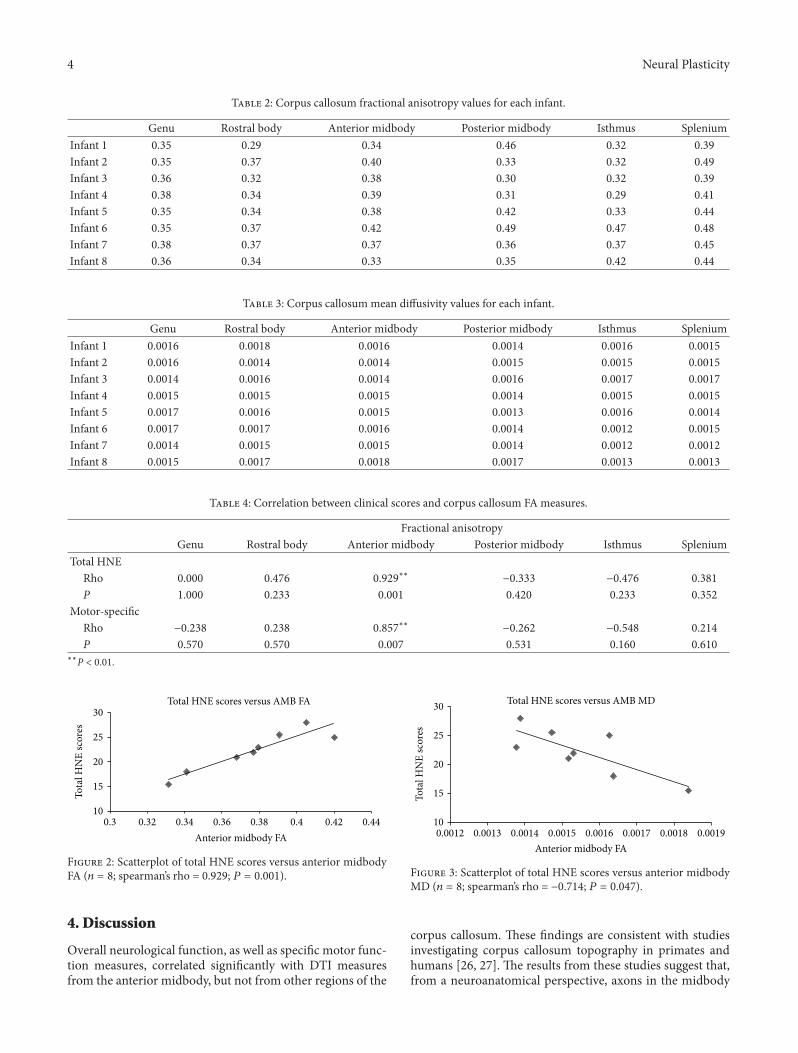
10
15
20
25
30
0.3 0.32 0.34 0.36 0.38 0.4 0.42 0.44
To
tal
HN
E s
core
s
Anterior midbody FA
Total HNE scores versus AMB FA
10
15
20
25
30
To
tal
HN
E s
core
s
Anterior midbody FA
0.0012 0.0013 0.0014 0.0015 0.0016 0.0017 0.0018 0.0019
Total HNE scores versus AMB MD
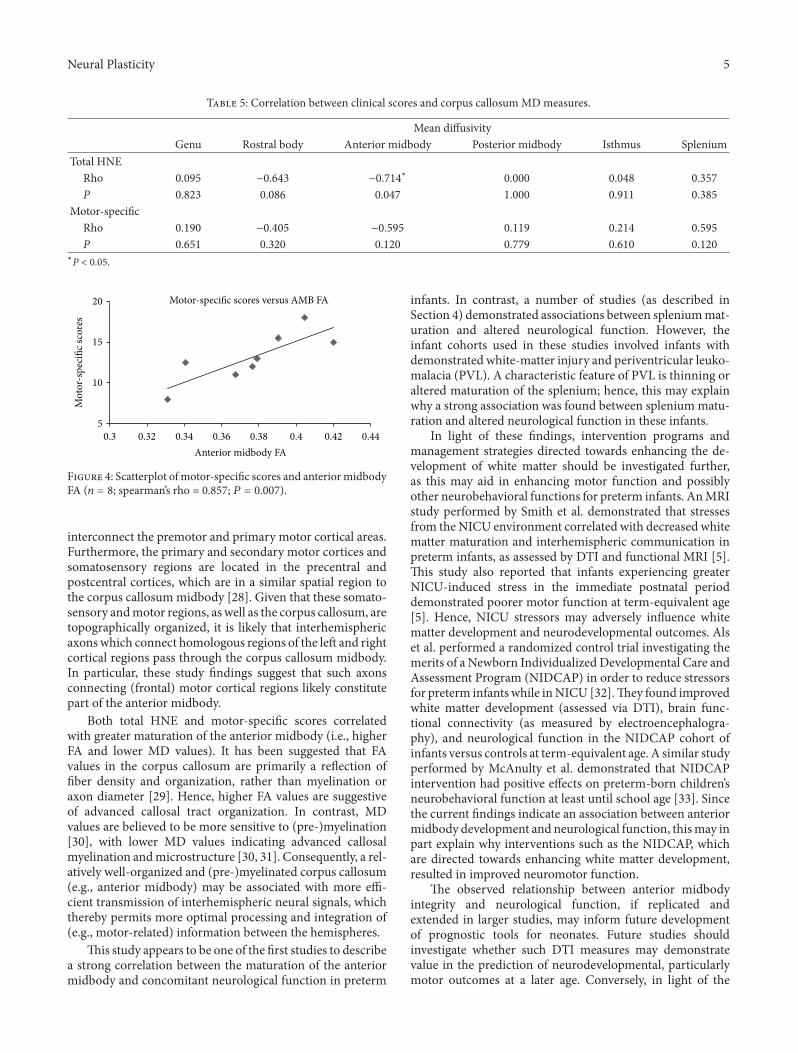
5
10
15
20
Mo
tor-
spec
ific
sco
res
0.3 0.32 0.34 0.36 0.38 0.4 0.42 0.44
Anterior midbody FA
Motor-specific scores versus AMB FA
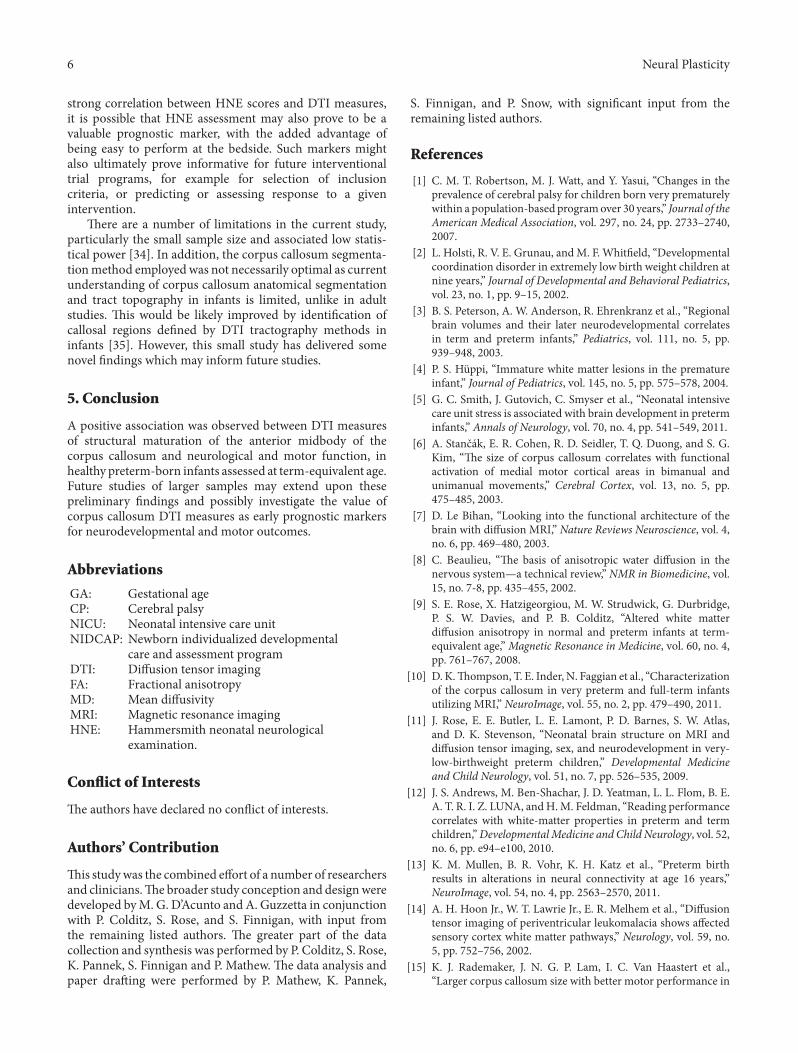
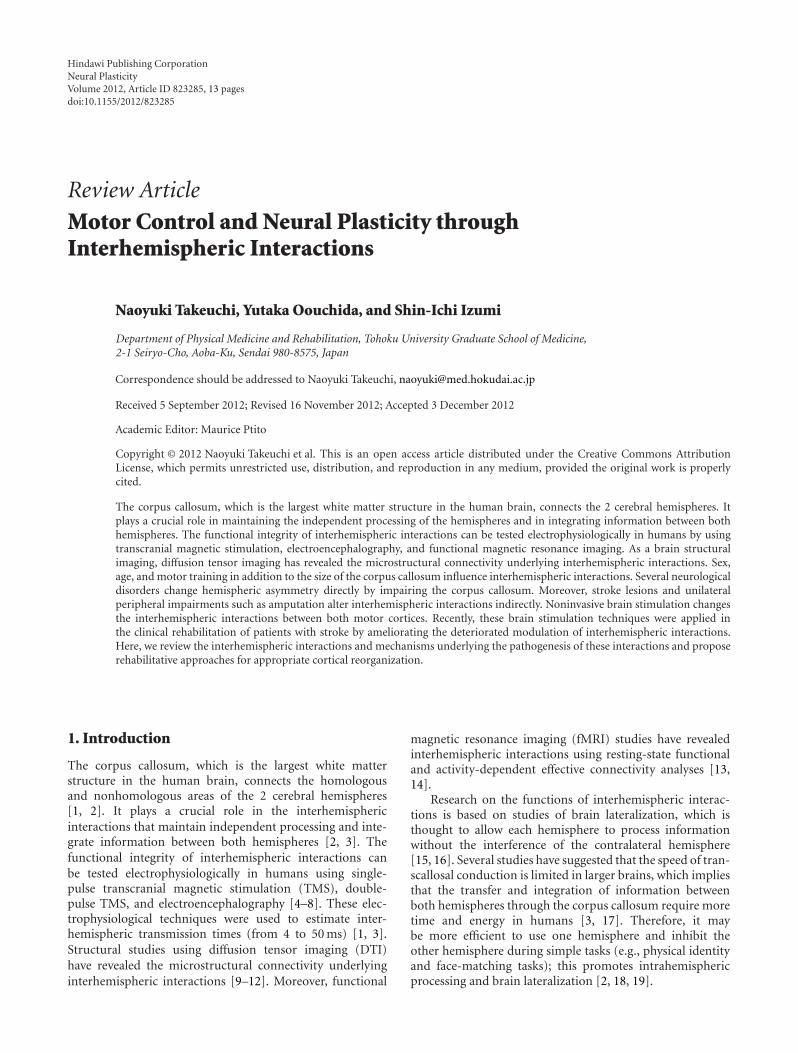
Hindawi Publishing CorporationNeural PlasticityVolume 2012, Article ID 823285, 13 pagesdoi:10.1155/2012/823285
Review Article
Motor Control and Neural Plasticity throughInterhemispheric Interactions
Naoyuki Takeuchi, Yutaka Oouchida, and Shin-Ichi Izumi
Department of Physical Medicine and Rehabilitation, Tohoku University Graduate School of Medicine,2-1 Seiryo-Cho, Aoba-Ku, Sendai 980-8575, Japan
Correspondence should be addressed to Naoyuki Takeuchi, [email protected]
Received 5 September 2012; Revised 16 November 2012; Accepted 3 December 2012
Academic Editor: Maurice Ptito
Copyright © 2012 Naoyuki Takeuchi et al. This is an open access article distributed under the Creative Commons AttributionLicense, which permits unrestricted use, distribution, and reproduction in any medium, provided the original work is properlycited.
The corpus callosum, which is the largest white matter structure in the human brain, connects the 2 cerebral hemispheres. Itplays a crucial role in maintaining the independent processing of the hemispheres and in integrating information between bothhemispheres. The functional integrity of interhemispheric interactions can be tested electrophysiologically in humans by usingtranscranial magnetic stimulation, electroencephalography, and functional magnetic resonance imaging. As a brain structuralimaging, diffusion tensor imaging has revealed the microstructural connectivity underlying interhemispheric interactions. Sex,age, and motor training in addition to the size of the corpus callosum influence interhemispheric interactions. Several neurologicaldisorders change hemispheric asymmetry directly by impairing the corpus callosum. Moreover, stroke lesions and unilateralperipheral impairments such as amputation alter interhemispheric interactions indirectly. Noninvasive brain stimulation changesthe interhemispheric interactions between both motor cortices. Recently, these brain stimulation techniques were applied inthe clinical rehabilitation of patients with stroke by ameliorating the deteriorated modulation of interhemispheric interactions.Here, we review the interhemispheric interactions and mechanisms underlying the pathogenesis of these interactions and proposerehabilitative approaches for appropriate cortical reorganization.
1. Introduction
The corpus callosum, which is the largest white matterstructure in the human brain, connects the homologousand nonhomologous areas of the 2 cerebral hemispheres[1, 2]. It plays a crucial role in the interhemisphericinteractions that maintain independent processing and inte-grate information between both hemispheres [2, 3]. Thefunctional integrity of interhemispheric interactions canbe tested electrophysiologically in humans using single-pulse transcranial magnetic stimulation (TMS), double-pulse TMS, and electroencephalography [4–8]. These elec-trophysiological techniques were used to estimate inter-hemispheric transmission times (from 4 to 50 ms) [1, 3].Structural studies using diffusion tensor imaging (DTI)have revealed the microstructural connectivity underlyinginterhemispheric interactions [9–12]. Moreover, functional
magnetic resonance imaging (fMRI) studies have revealedinterhemispheric interactions using resting-state functionaland activity-dependent effective connectivity analyses [13,14].
Research on the functions of interhemispheric interac-tions is based on studies of brain lateralization, which isthought to allow each hemisphere to process informationwithout the interference of the contralateral hemisphere[15, 16]. Several studies have suggested that the speed of tran-scallosal conduction is limited in larger brains, which impliesthat the transfer and integration of information betweenboth hemispheres through the corpus callosum require moretime and energy in humans [3, 17]. Therefore, it maybe more efficient to use one hemisphere and inhibit theother hemisphere during simple tasks (e.g., physical identityand face-matching tasks); this promotes intrahemisphericprocessing and brain lateralization [2, 18, 19].
2 Neural Plasticity
However, processing tasks that share and integrate theinformation between hemispheres (e.g., dichotic word-listening task) require facilitative communication betweenhemispheres [20]. Even in motor tasks, the timing andaccuracy of bimanual motor tasks are thought to be predom-inantly programmed by one of the hemispheres. To monitorthe activity of the motor regions of the opposite hemisphere,sending an efference copy of the planned motor program tothe opposite hemisphere through the corpus callosum allowsthe optimal timing of movements in both hands [21, 22].Thus, the lateralization hypothesis can be explained by boththe inhibitory and excitatory theories of interhemisphericinteractions [2].
The ability to perform precisely coordinated movementsusing both hands is an important aspect of particular humanabilities, such as tying a string, peeling a fruit with aknife, typing, and playing a musical instrument. It is nowknown that modulations of interhemispheric interactionsare involved in the control of the unimanual and bimanualcoordinations that generate the spatially and temporallyprecise coordinated limb movements that enable humansto perform different movements [1]. Moreover, it has beenreported that interhemispheric interactions contribute to theacquisition of bimanual skills [1, 6].
Recent studies have revealed that the modulation of inter-hemispheric interactions relates to neural plasticity, whichrefers to the ability of the brain to develop new neuronalinterconnections, acquire new functions, and compensatefor impairments [23–25]. However, little is known aboutthe mechanisms underlying the relation between corticalreorganization and changes in interhemispheric interactionresulting from various diseases or brain stimulation. Thispaper focuses on the following 4 important aspects ofmotor interhemispheric interactions: (1) the inhibitoryand excitatory theories of interhemispheric interaction,(2) the finding that nonpathological factors can influenceinterhemispheric interactions, (3) the pathologies that alterinterhemispheric interactions, and (4) the relation betweeninterhemispheric interaction and neural plasticity. Assess-ments of interhemispheric interactions have elucidated themechanisms underlying the physiological processes thatmodulate motor control and led to the formulation ofinterventional strategies that improve motor function afterneurological disorders, which is a critical issue of clinicalneurorehabilitation [25, 26]. The purposes of this paperwere to provide a comprehensive overview of motor inter-hemispheric interactions to promote the understanding oftheir underlying mechanisms and to suggest approaches forappropriate neural plasticity.
2. The Inhibitory and Excitatory Theories ofInterhemispheric Interactions
It has been estimated that the corpus callosum is the pathwaythrough which one hemisphere can inhibit the other, thusfacilitating brain lateralization. Alternatively, the corpuscallosum integrates information across the cerebral hemi-spheres and serves an excitatory function in interhemispheric
communication [2, 3, 15]. In this section, we discuss these 2contrasting theories, the inhibitory and excitatory theories,of motor interhemispheric interaction.
2.1. The Inhibitory Theory. The inhibitory theory positsthat the corpus callosum maintains independent processingbetween the hemispheres, hinders activity in the opposinghemisphere, and allows the development of hemisphericasymmetries [2]. A TMS study has demonstrated thatinterhemispheric inhibition from the contralateral to theipsilateral motor cortex increases during a voluntary toniccontraction of a hand muscle [4]. This finding indicates thatthe voluntary activation of the motor cortex by a unimanualmotor task is associated with the increased interhemisphericinhibition of the nonactive motor cortex. It is thought thatthis effect might work as an important mechanism foravoiding the unwanted coactivation of the nonactive motorcortex and the mirror activity of the nontask hand. Thisidea is further supported by the finding that the strength ofthe interhemispheric inhibition in healthy subjects correlatesnegatively with the amount of electromyographic mirroractivity in the nontask hand during voluntary unilateral handmovement [27].
Handedness may be related to inhibitory interhemi-spheric interactions. Although it remains controversialwhether interhemispheric inhibition from the dominantmotor cortex differs from the nondominant motor cortexunder resting condition [28–30] physiological evidence sug-gests an asymmetry in interhemispheric inhibition betweenthe motor cortices during unilateral movement [5, 29].Netz et al. demonstrated that interhemispheric inhibitionfrom the dominant motor cortex during a voluntary toniccontraction of the dominant hand muscle was strongerthan interhemispheric inhibition from the nondominantmotor cortex during a voluntary tonic contraction of thenondominant hand muscle [5]. Moreover, Duque et al.showed that interhemispheric inhibition from the non-dominant motor cortex was very weak at dominant handmovement onset, whereas interhemispheric inhibition fromthe dominant motor cortex was strong at nondominanthand movement onset [29]. These results indicate thathemispheric asymmetry promotes highly accurate controlof the fine motor movements of the dominant hand bydampening the interference from the nondominant motorcortex.
2.2. The Excitatory Theory. The excitatory theory posits thatthe corpus callosum shares and integrates informationbetween the hemispheres, resulting in greater connectiv-ity, which decreases brain lateralization by masking theunderlying hemispheric asymmetries in tasks that requireinterhemispheric exchange [15, 31]. This theory is supportedby the disconnection syndrome, which occurs becauseof callosotomy. Patients with disconnection syndrome areunable to integrate information from the hemispheres,suggesting that communication between the hemispheresand the sharing of information are necessary for normalmovements [15, 32, 33].
Neural Plasticity 3
As a motor system, the excitatory interhemispheric inter-action plays an important role in the adjustment of move-ment onset. A TMS study revealed that interhemisphericinteraction from the nonactive to the active motor cortextranslates from inhibitory to excitatory effects around move-ment onset [34]. This excitatory effect in the active motorcortex is believed to support the execution of voluntarymovement. The adjustment of interhemispheric facilitationwas shown not only in the primary motor cortices butalso in motor-related areas. A previous study reportedthat the right premotor cortex also exerted an excitatoryinfluence on the left primary motor cortex during thepreparation for a movement using the dominant right hand[35]. Moreover, the excitatory interhemispheric interactionmay be dependent on the cortical areas that are involvedin the motor task. A recent study performed using TMSrevealed that the movement-related facilitation from theright premotor to the left primary motor cortex supports theperformance of antiphase bimanual movements [22]. Thisextent of excitatory interactions between hemispheres waspositively related to the performance of antiphase bimanualmovements, but not of in-phase movements. Antiphasebimanual movements are tasks that are more difficult thanin-phase bimanual movements [7, 36]. The recruitmentof bilateral brain regions during tasks with high levels ofcomplexity provides evidence for an excitatory function ofthe corpus callosum and its ability to integrate informationbetween the hemispheres [20]. Therefore, antiphase biman-ual movements might require interhemispheric facilitationbetween the primary motor cortex and the premotor cortex,unlike in-phase bimanual movements.
However, the findings of interhemispheric interactionsduring in-phase movements support the inhibitory theory.The maximum speed of bimanual in-phase movements wasthe highest in subjects that exhibited weak inhibition ofboth homologous motor cortices [22]. Interhemisphericinhibition works to prevent mirror movements when aunimanual movement is performed, whereas interhemi-spheric disinhibition between homologous motor corticesmay promote in-phase bimanual movements that allow thesynchronous control of both hands [37–39].
These findings suggest that, depending on the motortask, the interhemispheric interactions may be inhibitoryor excitatory, so that homologous muscles are adjusted[22]. This is in line with the suggestion that differentchannels in the corpus callosum convey either inhibitoryor excitatory information between the hemispheres [31].Moreover, this channel theory is supported by neurophysi-ological studies that showed that excitatory circuits throughthe corpus callosum share excitatory transcallosal fiberswith inhibitory circuits. Interhemispheric excitatory effectsresult from monosynaptic connections through glutamater-gic excitatory transcallosal fibers, whereas interhemisphericinhibitory effects are mediated by gamma-aminobutyricacidergic inhibitory interneurons, which are also activatedby the excitatory transcallosal fibers [40, 41]. Therefore,inhibitory or excitatory interactions through interhemi-spheric communication can vary at different time pointsduring the movement and according to the different cortical
areas that are involved in the processing demands of themotor task or may even occur simultaneously [15].
3. Nonpathological Factors CanInfluence Motor InterhemisphericInteractions
The degree of connectivity between the hemispheres isreflected in the size of the corpus callosum [2, 31, 42]. Inaddition to the size of the corpus callosum, it has beenreported that age, sex, and motor training influence theinterhemispheric interactions in healthy individuals. In thissection, we will discuss how these factors influence motorfunction by altering interhemispheric interactions.
3.1. Age. Several studies have revealed a correlation betweeninterhemispheric interactions and age [43–47]. The corpuscallosum is not formed until 6–8 years of age [48]. In linewith the anatomical findings, Mayston et al. demonstratedsignificant interhemispheric inhibition in adults, whereasinterhemispheric inhibition was absent in children [43].Therefore, it is thought that mirror movements occur inyoung children because of the immaturity of the corpuscallosum, which fails to inhibit the ipsilateral motor pro-jections or motor overflow from the active motor cortex tothe nonactive motor cortex [45, 49, 50]. A developmentaltrend has been shown in which mirror movements decreasesignificantly until 6–8 years of age, which is the age rangeat which the myelination of the corpus callosum occurs[43, 50].
Aging also influences interhemispheric interactions.Several MRI studies have reported that aging increasesthe atrophy of the corpus callosum [44, 46]. Moreover,an electrophysiological study performed using TMS hasrevealed that aging decreases interhemispheric inhibition[47]. Therefore, in older adults, the reduction of interhemi-spheric inhibition might induce the reappearance of mirrormovements that are observed in young children [51]. Inaddition to mirror movements, the age-related degenerationof the corpus callosum may alter the activity of neuralrecruitment. Many studies reported that healthy older adultsexhibit bilateral activation of the motor cortex during aunilateral movement [52–54]. A previous report showed thatrecruitment of the ipsilateral motor cortex in older adultswas correlated with reduced interhemispheric connectivityduring a unilateral hand movement [54]. Therefore, theage-related degeneration of the corpus callosum may leadto a reduction in the hemispheric asymmetry because ofthe failed inhibition of the contralateral hemisphere [54,55]. Another possible explanation for the reduction of thehemispheric asymmetry in neural activity in older adultscould be that the neuronal processing in one hemisphereis reduced, requiring both hemispheres to work togetherto solve a given task. However, older adults exhibitinga reduction in hemispheric asymmetry during unilateralmovement had poor motor performance [54]. From thepoint of view of the excitatory theory, the bilateral activationobserved in older adults may lead to the impairment in the
4 Neural Plasticity
effective use of the excitatory interhemispheric interactionsbecause of degeneration of the corpus callosum, resulting ina failure to compensate for the poor performance.
However, the role of the overactivation of cortices inolder adults may vary according to the brain region involvedin tasks. The results of previous studies supported the ideathat overrecruitment of bilateral prefrontal activation com-pensates cognitive tasks in older adults [56, 57]. In additionto cognitive tasks, age-related increase in the activity of thesupplementary motor area and left secondary somatosensorycortex was positively correlated with coordinative abilityin antiphase bimanual movement [58]. The activation ofbilateral hemispheres in older adults may not necessarilyresult exclusively from age-related dysfunction of the corpuscallosum, and the increased activation observed in olderadults may have positive or negative effects on performance,depending on the role played by the activated brain region inthe task [54, 59, 60].
3.2. Sex. Several studies have reported morphological andmicrostructural differences in the corpus callosum betweenmen and women. The relative size of the corpus callosumproportional to cerebral volume was larger in womencompared to men [61, 62], but corpus callosum microstruc-tural connectivity was greater in men compared to women[63, 64]. However, whether these differences in the corpuscallosum observed between men and women influencefunctional hemispheric asymmetry remains controversial[61, 65, 66]. Therefore, in this section, we will mainly discussthe influence of female hormones on interhemisphericinteractions. An effect of female hormones on the functionalhemispheric asymmetry of motor control in postmenopausalwomen with and without female hormone therapy has beenreported [67]. Similar to younger healthy subjects [68], post-menopausal women undergoing female hormone therapyexhibited pronounced functional hemispheric asymmetryduring a motor task [67]. In contrast, postmenopausalcontrol women who did not receive female hormone therapyexhibited reduced hemispheric asymmetry, similar to thatobserved in older adults. As mentioned previously, it isthought that a reduction of hemispheric asymmetry maypartly result from the failed inhibition of the contralateralhemisphere in older adults because of an age-related dys-function of the corpus callosum [54, 55]. Therefore, femalehormones may exert positive effects on interhemisphericinteractions that are related to the maintenance of inde-pendent processing between the hemispheres in the motorsystem [67]. Moreover, this hypothesis is consistent withthe results of a TMS study that showed that young womenhave stronger interhemispheric inhibition compared withthat in young men [69]. However, it has been reportedthat high estradiol and progesterone levels in young womencorrelate negatively with interhemispheric inhibition, asassessed using TMS [70]. In addition to interhemisphericinhibition, previous reports showed that the menstrual cycleinfluences motor cortical excitability [71, 72]. Although itis clear that female hormones influence interhemisphericinteractions, future studies are needed to clarify the detailed
mechanisms underlying the effect of female hormones oninterhemispheric interactions.
3.3. Motor Training. As described previously, modulation ofinterhemispheric interactions influences human movementpatterns, such as handedness. In contrast, motor trainingitself can change interhemispheric interactions. Changes ininterhemispheric interactions mediated by motor traininghave been reported, especially in musical training [73–76]. Musical training is characterized by bimanual training,which includes coordinated and independent movements ofboth hands. Several studies have reported that musicianshave more symmetrical hemispheric function than non-musicians, as assessed using evaluation methods such asspeech-induced facilitation of corticospinal excitability andinterhemispheric transfer time using event-related potentialsfor visual information [73, 74]. Moreover, it has beenreported that musicians who initiated musical training earlyin their lives exhibit a larger corpus callosum compared withthat in musicians who started learning music later in theirlives and in nonmusicians [75, 76]. These results indicate thatthe plastic developmental changes in the corpus callosumthat are caused by extensive bimanual training duringchildhood result in more symmetrical brains and equallyefficient connections between both hemispheres because ofincreased interhemispheric interactions.
In addition to bimanual training, interhemisphericinteractions may contribute to motor acquisitions, such asintermanual transfer, as it is well known that motor learningusing one hand improves the performance of the otherhand [77, 78]. A previous study using TMS revealed thatunimanual sequence-specific training induces a reductionin interhemispheric inhibition of the untrained hemisphere.Moreover, this reduction in interhemispheric inhibition wascorrelated with an improvement in the nonspecific perfor-mance of the untrained hand [79]. Therefore, the decreasedinterhemispheric interaction induced by unilateral motortraining may support general aspects of motor performancein the contralateral hand, rather than enhance the specificskill being learned.
In contrast to motor training, the nonused limb mayalso influence interhemispheric interactions. A recent studyrevealed that transient arm immobilization reduced theinterhemispheric inhibition from the immobilized to thenonimmobilized motor cortex [80]. Moreover, this reduc-tion in interhemispheric inhibition increased the corti-cospinal excitability of the nonimmobilized motor cortexwhen subjects were free to move the nonimmobilized armand might result in the facilitation of the use-dependentplasticity of the nonimmobilized limb. Thus, excessivebalance and imbalance between the use of both limbs mod-ify the interhemispheric interaction and influence motorperformance. However, it is illogical to think that differentphenomena, such as unilateral motor training and the non-use of a limb, have a positive effect on the motor performanceof the opposite limb via only a reduction in interhemisphericinhibition. Therefore, future studies are needed to identifyother mechanisms, including excitatory interhemisphericinteraction and/or the role of the motor-related cortices.
Neural Plasticity 5
4. Pathologies Alter InterhemisphericInteractions
Studies of callosotomy or callosal lesions have providedmuch insight into the functions of interhemispheric inter-actions via the impairment of the corpus callosum [2, 15,33]. Several neurological disorders alter interhemisphericinteractions through impairment of the corpus callosum.Moreover, stroke and amputations can indirectly alterthe functions of interhemispheric interactions because ofimbalances between the hemispheres. In this section, wediscuss the changes in the morphology and function of thecorpus callosum in traumatic brain injury, multiple sclerosis,Parkinsonian syndromes, stroke, and amputation.
4.1. Direct Changes in Interhemispheric Interactions. Lesionsof the corpus callosum are commonly detected in patientswith traumatic brain injury [81–83]. Diffuse axonal injurycaused by acceleration-deceleration and rotational forcesis considered an important factor in the formation of alesion of the corpus callosum [81, 82]. Electrophysiologicaland anatomical studies have showed that interhemisphericinteractions are deteriorated after a traumatic brain injury[81–84]. A recent study using DTI revealed that the lowintegrity of hemispheric connections through the corpuscallosum was associated with poor performance of bimanualhand movements [85].
Multiple sclerosis is an inflammatory disease that affectsmyelinated axons and leads to neurological and cognitiveimpairments. Therefore, the corpus callosum, which is thelargest white matter structure in the brain, is considereda target for inflammation. Corpus callosum degeneration,which has been described frequently [86–88], can result inimpaired interhemispheric communication [87], includingan impairment of the interhemispheric inhibition of thecontralateral motor cortex [86]. Moreover, a study usingDTI showed that poor timing accuracy during a bimanualmotor task was correlated with the degree of corpus callosumdamage in patients with multiple sclerosis [10].
Impairments of interhemispheric inhibition detectedusing TMS have been reported in patients with Parkinsoniansyndromes, including patients with corticobasal degenera-tion and progressive supranuclear palsy [89, 90]. MRI hasrevealed that these electrophysiological abnormalities areassociated with atrophy of the corpus callosum [90, 91]. Asubgroup of Parkinson’s patients with mirror movementsexhibited abnormally reduced interhemispheric inhibition[92].
Several studies using MRI reported the atrophy andreduction in microstructural connectivity of the corpuscallosum in patients with schizophrenia [93, 94]. Previouslongitudinal study of patients with schizophrenia suggestedthat the atrophy of the corpus callosum might partly resultfrom developmental or maturational abnormalities of thisstructure [95]. Moreover, a reduction in the microstructuralconnectivity of the corpus callosum has been reported inother diseases, such as spinocerebellar ataxia types 1 and2 (which exhibit white matter degeneration) [96] and fetal
alcohol spectrum disorders (in which the white matter ispossibly damaged by prenatal alcohol exposure) [97].
4.2. Indirect Changes of Interhemispheric Interactions. Severalstudies have reported that stroke lesions indirectly disruptinterhemispheric interactions [34, 98, 99]. TMS studies haveshowed that interhemispheric inhibition persisted from theunaffected to the affected hemisphere around the onsetof the movement of the paretic hand in stroke patients,whereas the interhemispheric interaction in healthy controlschanged from inhibitory to excitatory influence on theactive motor cortex closer to the time of movement onset[34, 98]. This abnormal adjustment of interhemisphericinhibition correlates with motor function deficits, stronglysuggesting that altered interhemispheric interactions canresult in motor deficits in patients with stroke [34, 98](Figure 1(a)). The increased excitability in the unaffectedhemisphere because of an imbalance in both hemispheresand excessive use of the nonparetic side after stroke, resultingin overactive excitability in the unaffected hemisphere thatstrongly inhibits the affected hemisphere through the corpuscallosum, is a mechanism that could possibly explain thisobservation [25, 34]. Moreover, an fMRI study using anactivity-dependent connectivity analysis also reported thatthe amount of inhibitory influence from the contralesionalto the ipsilesional motor cortex during the movement ofthe paretic hand was negatively correlated with the motorfunction of the paretic hand in patients with subcorticalstroke [100]. Thus, the issue of how interhemisphericinteractions affect motor performance is highly relevantto the assessment of motor recovery after stroke [101,102]. However, a relation between excessive interhemisphericinhibition from the contralesional motor cortex and motorimpairment has been reported mainly in patients withchronic subcortical stroke and during movement. Theinterhemispheric interaction may vary depending on thestage of the stroke, the site of the lesion, and movementconditions [14, 103, 104]. In contrast to the studies that theexcessive interhemispheric interaction had a negative effectof motor recovery [34, 98, 100], fMRI study reported thatthe resting-state functional connectivity between both hemi-spheres became strong with motor recovery in patients withsubcortical stroke [13]. Therefore, longitudinal neuroimag-ing and electrophysiological studies must be performedto demonstrate the dynamic change in interhemisphericinteraction between both hemispheres during the process offunctional recovery [14, 103]. In addition to stroke, recentstudies revealed that indirect changes in interhemisphericinteractions through the corpus callosum occur after changesin peripheral organs, such as limb amputation [105, 106].This change in interhemispheric interaction may reflect theinterhemispheric imbalance induced by the reorganizationof the deafferented sensorimotor cortex after amputationand/or experience-dependent changes in the representationof the overuse of the intact limb [107, 108]. Recently, Simoeset al. showed that patients with amputations had decreasedmicrostructural connectivity of the corpus callosum com-pared with that in healthy volunteers [105]. A previous
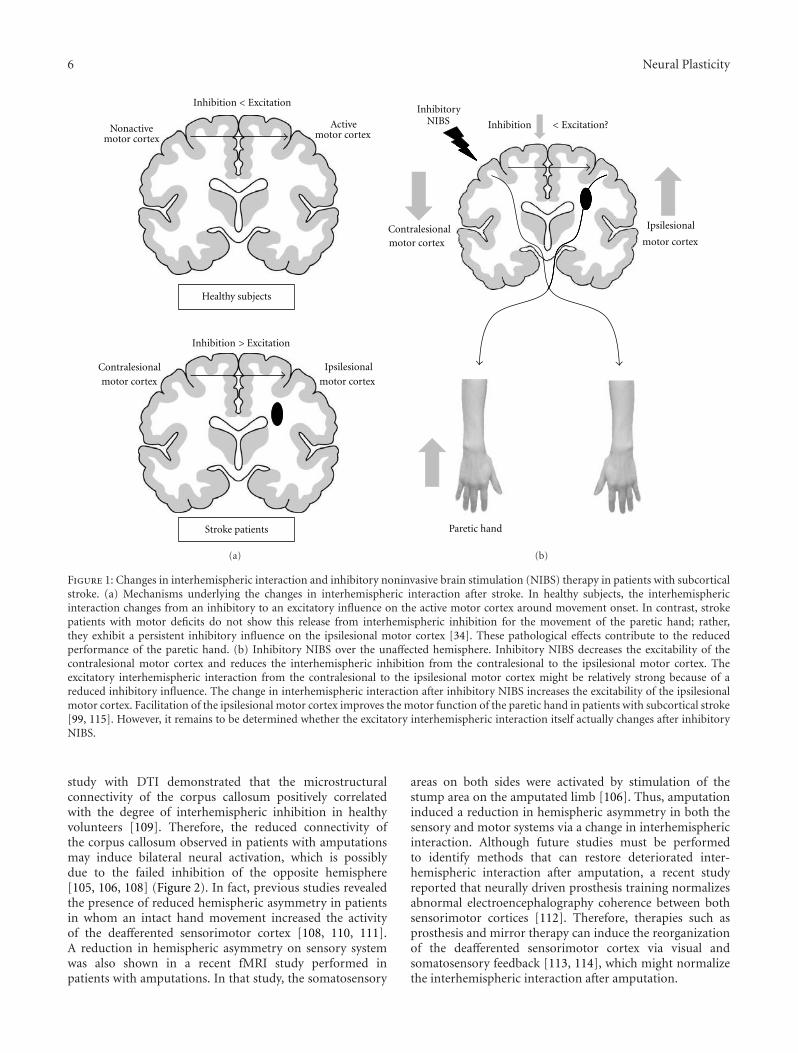
6 Neural Plasticity
Inhibition < Excitation
Inhibition > Excitation
Healthy subjects
Stroke patients
Contralesional
motor cortex
Ipsilesional
motor cortex
Activemotor cortex
Nonactivemotor cortex
(a)
Paretic hand
InhibitoryNIBS Inhibition < Excitation?
Contralesionalmotor cortex
Ipsilesional
motor cortex
(b)
Figure 1: Changes in interhemispheric interaction and inhibitory noninvasive brain stimulation (NIBS) therapy in patients with subcorticalstroke. (a) Mechanisms underlying the changes in interhemispheric interaction after stroke. In healthy subjects, the interhemisphericinteraction changes from an inhibitory to an excitatory influence on the active motor cortex around movement onset. In contrast, strokepatients with motor deficits do not show this release from interhemispheric inhibition for the movement of the paretic hand; rather,they exhibit a persistent inhibitory influence on the ipsilesional motor cortex [34]. These pathological effects contribute to the reducedperformance of the paretic hand. (b) Inhibitory NIBS over the unaffected hemisphere. Inhibitory NIBS decreases the excitability of thecontralesional motor cortex and reduces the interhemispheric inhibition from the contralesional to the ipsilesional motor cortex. Theexcitatory interhemispheric interaction from the contralesional to the ipsilesional motor cortex might be relatively strong because of areduced inhibitory influence. The change in interhemispheric interaction after inhibitory NIBS increases the excitability of the ipsilesionalmotor cortex. Facilitation of the ipsilesional motor cortex improves the motor function of the paretic hand in patients with subcortical stroke[99, 115]. However, it remains to be determined whether the excitatory interhemispheric interaction itself actually changes after inhibitoryNIBS.
study with DTI demonstrated that the microstructuralconnectivity of the corpus callosum positively correlatedwith the degree of interhemispheric inhibition in healthyvolunteers [109]. Therefore, the reduced connectivity ofthe corpus callosum observed in patients with amputationsmay induce bilateral neural activation, which is possiblydue to the failed inhibition of the opposite hemisphere[105, 106, 108] (Figure 2). In fact, previous studies revealedthe presence of reduced hemispheric asymmetry in patientsin whom an intact hand movement increased the activityof the deafferented sensorimotor cortex [108, 110, 111].A reduction in hemispheric asymmetry on sensory systemwas also shown in a recent fMRI study performed inpatients with amputations. In that study, the somatosensory
areas on both sides were activated by stimulation of thestump area on the amputated limb [106]. Thus, amputationinduced a reduction in hemispheric asymmetry in both thesensory and motor systems via a change in interhemisphericinteraction. Although future studies must be performedto identify methods that can restore deteriorated inter-hemispheric interaction after amputation, a recent studyreported that neurally driven prosthesis training normalizesabnormal electroencephalography coherence between bothsensorimotor cortices [112]. Therefore, therapies such asprosthesis and mirror therapy can induce the reorganizationof the deafferented sensorimotor cortex via visual andsomatosensory feedback [113, 114], which might normalizethe interhemispheric interaction after amputation.
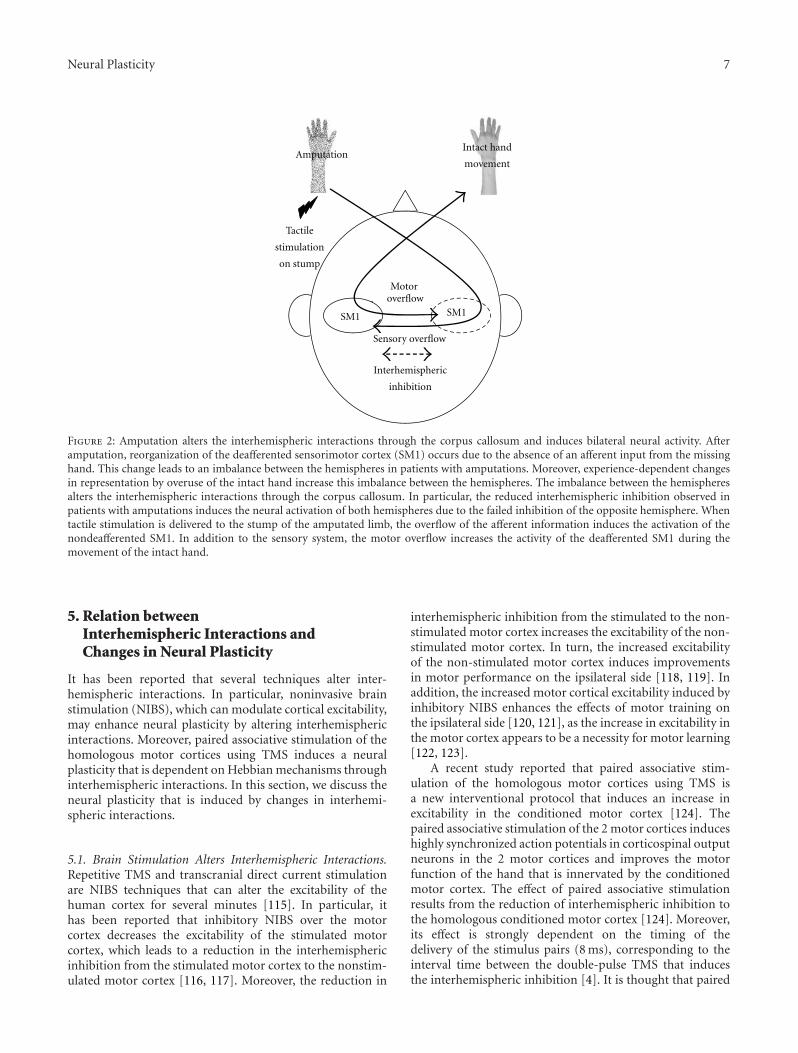
Neural Plasticity 7
SM 1 SM1
Interhemispheric
inhibition
Amputation
Sensory overflow
Motoroverflow
Tactile
stimulation
on stump
SM1 SM1
Intact hand
movement
Figure 2: Amputation alters the interhemispheric interactions through the corpus callosum and induces bilateral neural activity. Afteramputation, reorganization of the deafferented sensorimotor cortex (SM1) occurs due to the absence of an afferent input from the missinghand. This change leads to an imbalance between the hemispheres in patients with amputations. Moreover, experience-dependent changesin representation by overuse of the intact hand increase this imbalance between the hemispheres. The imbalance between the hemispheresalters the interhemispheric interactions through the corpus callosum. In particular, the reduced interhemispheric inhibition observed inpatients with amputations induces the neural activation of both hemispheres due to the failed inhibition of the opposite hemisphere. Whentactile stimulation is delivered to the stump of the amputated limb, the overflow of the afferent information induces the activation of thenondeafferented SM1. In addition to the sensory system, the motor overflow increases the activity of the deafferented SM1 during themovement of the intact hand.
5. Relation betweenInterhemispheric Interactions andChanges in Neural Plasticity
It has been reported that several techniques alter inter-hemispheric interactions. In particular, noninvasive brainstimulation (NIBS), which can modulate cortical excitability,may enhance neural plasticity by altering interhemisphericinteractions. Moreover, paired associative stimulation of thehomologous motor cortices using TMS induces a neuralplasticity that is dependent on Hebbian mechanisms throughinterhemispheric interactions. In this section, we discuss theneural plasticity that is induced by changes in interhemi-spheric interactions.
5.1. Brain Stimulation Alters Interhemispheric Interactions.Repetitive TMS and transcranial direct current stimulationare NIBS techniques that can alter the excitability of thehuman cortex for several minutes [115]. In particular, ithas been reported that inhibitory NIBS over the motorcortex decreases the excitability of the stimulated motorcortex, which leads to a reduction in the interhemisphericinhibition from the stimulated motor cortex to the nonstim-ulated motor cortex [116, 117]. Moreover, the reduction in
interhemispheric inhibition from the stimulated to the non-stimulated motor cortex increases the excitability of the non-stimulated motor cortex. In turn, the increased excitabilityof the non-stimulated motor cortex induces improvementsin motor performance on the ipsilateral side [118, 119]. Inaddition, the increased motor cortical excitability induced byinhibitory NIBS enhances the effects of motor training onthe ipsilateral side [120, 121], as the increase in excitability inthe motor cortex appears to be a necessity for motor learning[122, 123].
A recent study reported that paired associative stim-ulation of the homologous motor cortices using TMS isa new interventional protocol that induces an increase inexcitability in the conditioned motor cortex [124]. Thepaired associative stimulation of the 2 motor cortices induceshighly synchronized action potentials in corticospinal outputneurons in the 2 motor cortices and improves the motorfunction of the hand that is innervated by the conditionedmotor cortex. The effect of paired associative stimulationresults from the reduction of interhemispheric inhibition tothe homologous conditioned motor cortex [124]. Moreover,its effect is strongly dependent on the timing of thedelivery of the stimulus pairs (8 ms), corresponding to theinterval time between the double-pulse TMS that inducesthe interhemispheric inhibition [4]. It is thought that paired
8 Neural Plasticity
associative stimulation induces a neural plasticity that isdependent on the Hebbian learning rule via which synapsesincrease their efficacy if the synapse consistently assiststhe postsynaptic target neuron in the generation of actionpotentials [125].
5.2. Motor Stroke Therapy via Interhemispheric InteractionModulation. As mentioned previously, excessive interhemi-spheric inhibition from the unaffected hemisphere deteri-orates the motor function of the paretic hand in patientswith stroke. Therefore, improvement of the motor deficits ofthese patients may be achieved by decreasing the excitabilityof the unaffected hemisphere using NIBS [101, 102]. Infact, it has been reported that inhibitory NIBS over theunaffected hemisphere in patients with stroke decreases theinterhemispheric inhibition from the unaffected hemisphereto the affected hemisphere and increases the excitabilityof the affected hemisphere, resulting in facilitated motorlearning and motor recovery in the paretic hand [99, 115](Figure 1(b)). A recent study also suggested that inhibitoryNIBS over the contralesional motor cortex might influencethe ability of the ipsilesional motor cortex to undergo plasticmodifications by preparing the cortical ground for successfuluse-dependent plasticity in stroke patients [126].
Although it has been reported that inhibitory NIBSover the unaffected hemisphere facilitates motor recoveryduring the acute stage of stroke [127, 128], a recentstudy showed that inhibitory NIBS did not facilitate motorrecovery in patients with stroke in the acute stage [129].This implies that the interhemispheric inhibition fromthe contralesional to the ipsilesional motor cortex doesnot necessarily correlate with motor impairment in allpatients with stroke. Moreover, Lotze et al. have shownthat disrupting the contralesional motor cortex via TMSmay cause deterioration of the complex motor performanceof the paretic hand in patients with chronic stroke withinternal capsule infarcts [130]. Therefore, inhibitory NIBSdelivered over the contralesional motor cortex might beassociated with a risk of deteriorating complex movementsin some patients with stroke. Furthermore, it has beennoted that inhibitory NIBS reduces the interhemisphericinhibition that controls bimanual movement [131, 132]. Infact, recent studies reported that inhibitory repetitive TMSover the unaffected hemisphere transiently deteriorated per-formance in the antiphase bimanual tapping task in patientswith stroke [133, 134]. Therefore, it should be noted thatinhibitory NIBS is associated with a risk of deterioratingsome motor functions by altering the motor network system[103, 135].
6. Conclusion
This paper focused on the mechanisms underlying motorcontrol and neural plasticity that relate to interhemisphericinteractions to suggest approaches for appropriate cor-tical reorganization. Inhibitory or excitatory interactionsthat occur via interhemispheric communication may varydepending on the different time points during the movement
and different cortical areas that are involved in the processingdemands of the motor task. The age-related degenerationof the corpus callosum may induce the engagement ofboth hemispheres partly because of the failed inhibition ofthe contralateral hemisphere. Female hormones may exertpositive effects on the interhemispheric communication thatis related to maintaining independent processing betweenthe hemispheres in the motor system. Plastic developmentalchanges that are caused by extensive bimanual trainingduring childhood result in more symmetrical brains andequally efficient connections between the hemispheres. Sev-eral neurological disorders, such as traumatic brain injury,multiple sclerosis, and Parkinsonian syndromes, directlyalter interhemispheric interactions by impairing the corpuscallosum. Stroke lesions indirectly disrupt interhemisphericinhibition, which is highly relevant to the research onmotor recovery after stroke. In addition, amputations mayindirectly alter interhemispheric interactions between sen-sorimotor cortices. Inhibitory NIBS reduces the interhemi-spheric inhibition from the stimulated motor cortex tothe non-stimulated motor cortex. The paired associativestimulation of the homologous motor cortices using TMSinduces a neural plasticity that is dependent on Hebbianmechanisms that occur via interhemispheric interactions.Inhibitory NIBS over the unaffected hemisphere in patientswith stroke can improve the motor function of the paretichand by reducing the interhemispheric inhibition from theunaffected hemisphere to the affected hemisphere. However,it should be noted that inhibitory NIBS might worsenbimanual movements by reducing the interhemispheric inhi-bition that controls them. Assessments of interhemisphericinteractions have provided information on the mechanismsunderlying the physiological processes involved in motorcontrol and have allowed the formulation of interventionalstrategies that can improve motor function in neurologicaldisorders, which is a critical issue in clinical neurorehabilita-tion.
Acknowledgment
This work was supported by JSPS Grant-in-Aid for ScientificResearch no. 23650314.
References
[1] M. Wahl and U. Ziemann, “The human motor corpus cal-losum,” Reviews in the Neurosciences, vol. 19, no. 6, pp. 451–466, 2008.
[2] L. J. van der Knaap and I. J. M. van der Ham, “How doesthe corpus callosum mediate interhemispheric transfer? Areview,” Behavioural Brain Research, vol. 223, no. 1, pp. 211–221, 2011.
[3] A. Nowicka and P. Tacikowski, “Transcallosal transfer of in-formation and functional asymmetry of the human brain,”Laterality, vol. 16, no. 1, pp. 35–74, 2011.
[4] A. Ferbert, A. Priori, J. C. Rothwell, B. L. Day, J. G. Colebatch,and C. D. Marsden, “Interhemispheric inhibition of thehuman motor cortex,” Journal of Physiology, vol. 453, pp.525–546, 1992.
Neural Plasticity 9
[5] J. Netz, U. Ziemann, and V. Homberg, “Hemispheric asym-metry of transcallosalinhibition in man,” Experimental BrainResearch, vol. 104, no. 3, pp. 527–533, 1995.
[6] F. G. Andres, T. Mima, A. E. Schulman, J. Dichgans, M. Hal-lett, and C. Gerloff, “Functional coupling of human corticalsensorimotor areas during bimanual skill acquisition,” Brain,vol. 122, no. 5, pp. 855–870, 1999.
[7] D. J. Serrien and P. Brown, “The functional role of interhemi-spheric synchronization in the control of bimanual timingtasks,” Experimental Brain Research, vol. 147, no. 2, pp. 268–272, 2002.
[8] R. Chen, D. Yung, and J. Y. Li, “Organization of ipsilateralexcitatory and inhibitory pathways in the human motorcortex,” Journal of Neurophysiology, vol. 89, no. 3, pp. 1256–1264, 2003.
[9] H. Johansen-Berg, V. Della-Maggiore, T. E. J. Behrens, S.M. Smith, and T. Paus, “Integrity of white matter in thecorpus callosum correlates with bimanual co-ordinationskills,” NeuroImage, vol. 36, supplement 2, pp. 16–21, 2007.
[10] L. Bonzano, A. Tacchino, L. Roccatagliata, G. Abbruzzese,G. L. Mancardi, and M. Bove, “Callosal contributionsto simultaneous bimanual finger movements,” Journal ofNeuroscience, vol. 28, no. 12, pp. 3227–3233, 2008.
[11] I. Koerte, F. Heinen, T. Fuchs et al., “Anisotropy of callosalmotor fibers in combination with transcranial magneticstimulation in the course of motor development,” Investiga-tive Radiology, vol. 44, no. 5, pp. 279–284, 2009.
[12] T. Baumer, G. Thomalla, J. Kroeger et al., “Interhemisphericmotor networks are abnormal in patients with Gilles de laTourette syndrome,” Movement Disorders, vol. 25, no. 16, pp.2828–2837, 2010.
[13] L. Wang, C. Yu, H. Chen et al., “Dynamic functional re-organization of the motor execution network after stroke,”Brain, vol. 133, no. 4, pp. 1224–1238, 2010.
[14] C. Grefkes and G. R. Fink, “Reorganization of cerebralnetworks after stroke: new insights from neuroimaging withconnectivity approaches,” Brain, vol. 134, no. 5, pp. 1264–1276, 2011.
[15] J. S. Bloom and G. W. Hynd, “The role of the corpus callosumin interhemispheric transfer of information: excitation orinhibition?” Neuropsychology Review, vol. 15, no. 2, pp. 59–71, 2005.
[16] M. Magat and C. Brown, “Laterality enhances cognition inAustralian parrots,” Proceedings of the Royal Society B, vol.276, no. 1676, pp. 4155–4162, 2009.
[17] R. Olivares, J. Montiel, and F. Aboitiz, “Species differencesand similarities in the fine structure of the mammaliancorpus callosum,” Brain, Behavior and Evolution, vol. 57, no.2, pp. 98–105, 2001.
[18] C. Urgesi, E. Bricolo, and S. M. Aglioti, “Hemisphericmetacontrol and cerebral dominance in healthy individualsinvestigated by means of chimeric faces,” Cognitive BrainResearch, vol. 24, no. 3, pp. 513–525, 2005.
[19] S. E. Welcome and C. Chiarello, “How dynamic is interhemi-spheric interaction? Effects of task switching on the across-hemisphere advantage,” Brain and Cognition, vol. 67, no. 1,pp. 69–75, 2008.
[20] M. Y. Yazgan, B. E. Wexler, M. Kinsbourne, B. Peterson, and J.F. Leckman, “Functional significance of individual variationsin callosal area,” Neuropsychologia, vol. 33, no. 6, pp. 769–779,1995.
[21] G. M. Geffen, D. L. Jones, and L. B. Geffen, “Interhemi-spheric control of manual motor activity,” Behavioural BrainResearch, vol. 64, no. 1-2, pp. 131–140, 1994.
[22] G. Liuzzi, V. Horniß, M. Zimerman, C. Gerloff, and F. C.Hummel, “Coordination of uncoupled bimanual movementsby strictly timed interhemispheric connectivity,” Journal ofNeuroscience, vol. 31, no. 25, pp. 9111–9117, 2011.
[23] J. A. Hosp and A. R. Luft, “Cortical plasticity duringmotor learning and recovery after ischemic stroke,” NeuralPlasticity, vol. 2011, Article ID 871296, 9 pages, 2011.
[24] E. Dayan and L. G. Cohen, “Neuroplasticity subservingmotor skill learning,” Neuron, vol. 72, no. 3, pp. 443–454,2011.
[25] N. Takeuchi and S.-I. Izumi, “Maladaptive plasticity formotor recovery after stroke: mechanisms and approaches,”Neural Plasticity, vol. 2012, Article ID 359728, 9 pages, 2012.
[26] M. A. Perez and L. G. Cohen, “Interhemispheric inhibitionbetween primary motor cortices: what have we learned?”Journal of Physiology, vol. 587, no. 4, pp. 725–726, 2009.
[27] A. Hubers, Y. Orekhov, and U. Ziemann, “Interhemisphericmotor inhibition: its role in controlling electromyographicmirror activity,” European Journal of Neuroscience, vol. 28, no.2, pp. 364–371, 2008.
[28] T. Baumer, E. Dammann, F. Bock, S. Kloppel, H. R. Siebner,and A. Munchau, “Laterality of interhemispheric inhibitiondepends on handedness,” Experimental Brain Research, vol.180, no. 2, pp. 195–203, 2007.
[29] J. Duque, N. Murase, P. Celnik et al., “Intermanual dif-ferences in movement-related interhemispheric inhibition,”Journal of Cognitive Neuroscience, vol. 19, no. 2, pp. 204–213,2007.
[30] L. De Gennaro, R. Cristiani, M. Bertini et al., “Handednessis mainly associated with an asymmetry of corticospinalexcitability and not of transcallosal inhibition,” ClinicalNeurophysiology, vol. 115, no. 6, pp. 1305–1312, 2004.
[31] J. M. Clarke and E. Zaidel, “Anatomical-behavioral rela-tionships: corpus callosum morphometry and hemisphericspecialization,” Behavioural Brain Research, vol. 64, no. 1-2,pp. 185–202, 1994.
[32] S. W. Kennerley, J. Diedrichsen, E. Hazeltine, A. Semjen, andR. B. Ivry, “Callosotomy patients exhibit temporal uncou-pling during continuous bimanual movements,” NatureNeuroscience, vol. 5, no. 4, pp. 376–381, 2002.
[33] A. A. Asadi-Pooya, A. Sharan, M. Nei, and M. R. Sperling,“Corpus callosotomy,” Epilepsy and Behavior, vol. 13, no. 2,pp. 271–278, 2008.
[34] N. Murase, J. Duque, R. Mazzocchio, and L. G. Cohen, “In-fluence of interhemispheric interactions on motor functionin chronic stroke,” Annals of Neurology, vol. 55, no. 3, pp.400–409, 2004.
[35] G. Liuzzi, V. Horniß, J. Hoppe et al., “Distinct temporospatialinterhemispheric interactions in the human primary andpremotor cortex during movement preparation,” CerebralCortex, vol. 20, no. 6, pp. 1323–1331, 2010.
[36] D. J. Serrien, A. C. Nirkko, and M. Wiesendanger, “Role ofthe corpus callosum in bimanual coordination: a comparisonof patients with congenital and acquired callosal damage,”European Journal of Neuroscience, vol. 14, no. 11, pp. 1897–1905, 2001.
[37] Y. Aramaki, M. Honda, and N. Sadato, “Suppression of thenon-dominant motor cortex during bimanual symmetricfinger movement: a functional magnetic resonance imagingstudy,” Neuroscience, vol. 141, no. 4, pp. 2147–2153, 2006.
[38] C. Grefkes, S. B. Eickhoff, D. A. Nowak, M. Dafotakis, and G.R. Fink, “Dynamic intra- and interhemispheric interactions
10 Neural Plasticity
during unilateral and bilateral hand movements assessedwith fMRI and DCM,” NeuroImage, vol. 41, no. 4, pp. 1382–1394, 2008.
[39] Y. Maki, K. F. K. Wong, M. Sugiura, T. Ozaki, and N. Sadato,“Asymmetric control mechanisms of bimanual coordination:an application of directed connectivity analysis to kinematicand functional MRI data,” NeuroImage, vol. 42, no. 4, pp.1295–1304, 2008.
[40] Y. Kawaguchi, “Receptor subtypes involved in callosally-induced postsynaptic potentials in rat frontal agranularcortex in vitro,” Experimental Brain Research, vol. 88, no. 1,pp. 33–40, 1992.
[41] F. Conti and T. Manzoni, “The neurotransmitters and postsy-naptic actions of callosally projecting neurons,” BehaviouralBrain Research, vol. 64, no. 1-2, pp. 37–53, 1994.
[42] A. Stancak, C. H. Lucking, and R. Kristeva-Feige, “The sizeof corpus callosum and functional connectivities of corticalregions in finger and shoulder movements,” Cognitive BrainResearch, vol. 13, no. 1, pp. 61–74, 2002.
[43] M. J. Mayston, L. M. Harrison, and J. A. Stephens, “A neu-rophysiological study of mirror movements in adults andchildren,” Annals of Neurology, vol. 45, no. 5, pp. 583–594,1999.
[44] S. Takeda, Y. Hirashima, H. Ikeda, H. Yamamoto, M.Sugino, and S. Endo, “Determination of indices of thecorpus callosum associated with normal aging in Japaneseindividuals,” Neuroradiology, vol. 45, no. 8, pp. 513–518,2003.
[45] K. E. Hoy, P. B. Fitzgerald, J. L. Bradshaw, C. A. Armatas, andN. Georgiou-Karistianis, “Investigating the cortical origins ofmotor overflow,” Brain Research Reviews, vol. 46, no. 3, pp.315–327, 2004.
[46] J. Persson, L. Nyberg, J. Lind et al., “Structure-functioncorrelates of cognitive decline in aging,” Cerebral Cortex, vol.16, no. 7, pp. 907–915, 2006.
[47] P. Talelli, W. Waddingham, A. Ewas, J. C. Rothwell, and N.S. Ward, “The effect of age on task-related modulation ofinterhemispheric balance,” Experimental Brain Research, vol.186, no. 1, pp. 59–66, 2008.
[48] G. H. Moll, H. Heinrich, S. Wischer, F. Tergau, W. Paulus,and A. Rothenberger, “Motor system excitability in healthychildren: developmental aspects from transcranial magneticstimulation,” Electroencephalography and Clinical Neurophys-iology. Supplement, vol. 51, pp. 243–249, 1999.
[49] K. Muller, F. Kass-Iliyya, and M. Reitz, “Ontogeny ofipsilateral corticospinal projections: a developmental studywith transcranial magnetic stimulation,” Annals of Neurology,vol. 42, no. 5, pp. 705–711, 1997.
[50] J. K. Shim, S. Karol, J. Hsu, and M. A. de Oliveira, “Handdigit control in children: motor overflow in multi-fingerpressing force vector space during maximum voluntary forceproduction,” Experimental Brain Research, vol. 186, no. 3, pp.443–456, 2008.
[51] P. K. Addamo, M. Farrow, K. E. Hoy, J. L. Bradshaw, andN. Georgiou-Karistianis, “The effects of age and attentionon motor overflow production: a review,” Brain ResearchReviews, vol. 54, no. 1, pp. 189–204, 2007.
[52] V. S. Mattay, F. Fera, A. Tessitore et al., “Neurophysiologicalcorrelates of age-related changes in human motor function,”Neurology, vol. 58, no. 4, pp. 630–635, 2002.
[53] A. Riecker, K. Groschel, H. Ackermann, C. Steinbrink, O.Witte, and A. Kastrup, “Functional significance of age-related
differences in motor activation patterns,” NeuroImage, vol.32, no. 3, pp. 1345–1354, 2006.
[54] J. Langan, S. J. Peltier, J. Bo, B. W. Fling, R. C. Welsh, and R. D.Seidler, “Functional implications of age differences in motorsystem connectivity,” Frontiers in Systems Neuroscience, vol. 4,article 17, 2010.
[55] R. L. Buckner, “Memory and executive function in aging andad: multiple factors that cause decline and reserve factors thatcompensate,” Neuron, vol. 44, no. 1, pp. 195–208, 2004.
[56] P. A. Reuter-Lorenz, J. Jonides, E. E. Smith et al., “Agedifferences in the frontal lateralization of verbal and spatialworking memory revealed by PET,” Journal of CognitiveNeuroscience, vol. 12, no. 1, pp. 174–187, 2000.
[57] R. Cabeza, N. D. Anderson, J. K. Locantore, and A. R.McIntosh, “Aging gracefully: compensatory brain activity inhigh-performing older adults,” NeuroImage, vol. 17, no. 3, pp.1394–1402, 2002.
[58] D. J. Goble, J. P. Coxon, A. Van Impe, J. De Vos, N.Wenderoth, and S. P. Swinnen, “The neural control ofbimanual movements in the elderly: brain regions exhibitingage-related increases in activity, frequency-induced neuralmodulation, and task-specific compensatory recruitment,”Human Brain Mapping, vol. 31, no. 8, pp. 1281–1295, 2010.
[59] S. J. Colcombe, A. F. Kramer, K. I. Erickson, and P. Scalf, “Theimplications of cortical recruitment and brain morphologyfor individual differences in inhibitory function in aginghumans,” Psychology and Aging, vol. 20, no. 3, pp. 363–375,2005.
[60] C. E. Wierenga, M. Benjamin, K. Gopinath et al., “Age-related changes in word retrieval: role of bilateral frontal andsubcortical networks,” Neurobiology of Aging, vol. 29, no. 3,pp. 436–451, 2008.
[61] T. N. Mitchell, S. L. Free, M. Merschhemke, L. Lemieux, S. M.Sisodiya, and S. D. Shorvon, “Reliable callosal measurement:population normative data confirm sex-related differences,”American Journal of Neuroradiology, vol. 24, no. 3, pp. 410–418, 2003.
[62] C. M. Leonard, S. Towler, S. Welcome et al., “Size matters:cerebral volume influences sex differences in neuroanatomy,”Cerebral Cortex, vol. 18, no. 12, pp. 2920–2931, 2008.
[63] F. Liu, L. Vidarsson, J. D. Winter, H. Tran, and A. Kassner,“Sex differences in the human corpus callosum microstruc-ture: a combined T2 myelin-water and diffusion tensormagnetic resonance imaging study,” Brain Research, vol.1343, no. C, pp. 37–45, 2010.
[64] K. Menzler, M. Belke, E. Wehrmann et al., “Men andwomen are different: diffusion tensor imaging reveals sexualdimorphism in the microstructure of the thalamus, corpuscallosum and cingulum,” NeuroImage, vol. 54, no. 4, pp.2557–2562, 2011.
[65] K. M. Haut and D. M. Barch, “Sex influences on material-sensitive functional lateralization in working and episodicmemory: men and women are not all that different,”NeuroImage, vol. 32, no. 1, pp. 411–422, 2006.
[66] R. L. Muetzel, P. F. Collins, B. A. Mueller, A. M. Schissel,K. O. Lim, and M. Luciana, “The development of corpuscallosum microstructure and associations with bimanual taskperformance in healthy adolescents,” NeuroImage, vol. 39, no.4, pp. 1918–1925, 2008.
[67] U. Bayer and M. Hausmann, “Hormone therapy in post-menopausal women affects hemispheric asymmetries in finemotor coordination,” Hormones and Behavior, vol. 58, no. 3,pp. 450–456, 2010.
Neural Plasticity 11
[68] M. Hausmann, I. J. Kirk, and M. C. Corballis, “Influence oftask complexity on manual asymmetries,” Cortex, vol. 40, no.1, pp. 103–110, 2004.
[69] L. De Gennaro, M. Bertini, F. Pauri et al., “Callosal effectsof transcranial magnetic stimulation (TMS): the influence ofgender and stimulus parameters,” Neuroscience Research, vol.48, no. 2, pp. 129–137, 2004.
[70] M. Hausmann, M. Tegenthoff, J. Sanger, F. Janssen, O.Gunturkun, and P. Schwenkreis, “Transcallosal inhibitionacross the menstrual cycle: a TMS study,” Clinical Neurophys-iology, vol. 117, no. 1, pp. 26–32, 2006.
[71] M. J. Smith, J. C. Keel, B. D. Greenberg et al., “Menstrual cycleeffects on cortical excitability,” Neurology, vol. 53, no. 9, pp.2069–2072, 1999.
[72] M. J. Smith, L. F. Adams, P. J. Schmidt, D. R. Rubinow, andE. M. Wassermann, “Effects of ovarian hormones on humancortical excitability,” Annals of Neurology, vol. 51, no. 5, pp.599–603, 2002.
[73] K. L. Lin, M. Kobayashi, and A. Pascual-Leone, “Effects ofmusical training on speech-induced modulation in corti-cospinal excitability,” NeuroReport, vol. 13, no. 6, pp. 899–902, 2002.
[74] L. L. M. Patston, I. J. Kirk, M. H. S. Rolfe, M. C. Corballis,and L. J. Tippett, “The unusual symmetry of musicians:musicians have equilateral interhemispheric transfer forvisual information,” Neuropsychologia, vol. 45, no. 9, pp.2059–2065, 2007.
[75] D. J. Lee, Y. Chen, and G. Schlaug, “Corpus callosum:musician and gender effects,” NeuroReport, vol. 14, no. 2, pp.205–209, 2003.
[76] G. Schlaug, M. Forgeard, L. Zhu, A. Norton, A. Norton,and E. Winner, “Training-induced neuroplasticity in youngchildren,” Annals of the New York Academy of Sciences, vol.1169, pp. 205–208, 2009.
[77] J. Vaid and J. Stiles-Davis, “Mirror writing: an advantage forthe left-handed?” Brain and Language, vol. 37, no. 4, pp. 616–627, 1989.
[78] S. T. Grafton, E. Hazeltine, and R. B. Ivry, “Motor sequencelearning with the nondominant left hand: a PET functionalimaging study,” Experimental Brain Research, vol. 146, no. 3,pp. 369–378, 2002.
[79] M. A. Perez, S. P. Wise, D. T. Willingham, and L. G. Cohen,“Neurophysiological mechanisms involved in transfer ofprocedural knowledge,” Journal of Neuroscience, vol. 27, no.5, pp. 1045–1053, 2007.
[80] L. Avanzino, M. Bassolino, T. Pozzo, and M. Bove, “Use-dependent hemispheric balance,” Journal of Neuroscience, vol.31, no. 9, pp. 3423–3428, 2011.
[81] R. Scheid, C. Preul, O. Gruber, C. Wiggins, and D. Y. VonCramon, “Diffuse axonal injury associated with chronic trau-matic brain injury: evidence from T2∗-weighted Gradient-echo imaging at 3 T,” American Journal of Neuroradiology, vol.24, no. 6, pp. 1049–1056, 2003.
[82] F. Tomaiuolo, G. A. Carlesimo, M. Di Paola et al., “Grossmorphology and morphometric sequelae in the hippocam-pus, fornix, and corpus callosum of patients with severenon-missile traumatic brain injury without macroscopicallydetectable lesions: a T1 weighted MRI study,” Journal ofNeurology, Neurosurgery and Psychiatry, vol. 75, no. 9, pp.1314–1322, 2004.
[83] C. H. Salmond, D. K. Menon, D. A. Chatfield et al.,“Diffusion tensor imaging in chronic head injury survivors:correlations with learning and memory indices,” NeuroIm-age, vol. 29, no. 1, pp. 117–124, 2006.
[84] N. Takeuchi, K. Ikoma, T. Chuma, and Y. Matsuo, “Measure-ment of transcallosal inhibition in traumatic brain injury bytranscranial magnetic stimulation,” Brain Injury, vol. 20, no.9, pp. 991–996, 2006.
[85] K. Caeyenberghs, A. Leemans, J. Coxon et al., “Bimanualcoordination and corpus callosum microstructure in youngadults with traumatic brain injury: a diffusion tensor imag-ing study,” Journal of Neurotrauma, vol. 28, no. 6, pp. 897–913, 2011.
[86] S. C. Manson, J. Palace, J. A. Frank, and P. M. Matthews, “Lossof interhemispheric inhibition in patients with multiplesclerosis is related to corpus callosum atrophy,” ExperimentalBrain Research, vol. 174, no. 4, pp. 728–733, 2006.
[87] N. P. Warlop, E. Achten, J. Debruyne, and G. Vingerhoets,“Diffusion weighted callosal integrity reflects interhemi-spheric communication efficiency in multiple sclerosis,”Neuropsychologia, vol. 46, no. 8, pp. 2258–2264, 2008.
[88] M. Gadea, L. Marti-Bonmatı, E. Arana, R. Espert, A. Sal-vador, and B. Casanova, “Corpus callosum function in verbaldichotic listening: inferences from a longitudinal follow-upof relapsing-remitting multiple sclerosis patients,” Brain andLanguage, vol. 110, no. 2, pp. 101–105, 2009.
[89] A. A. Kuhn, P. Grosse, K. Holtz, P. Brown, B. U. Meyer, andA. Kupsch, “Patterns of abnormal motor cortex excitability inatypical parkinsonian syndromes,” Clinical Neurophysiology,vol. 115, no. 8, pp. 1786–1795, 2004.
[90] A. Wolters, J. Classen, E. Kunesch, A. Grossmann, and R.Benecke, “Measurements of transcallosally mediated corti-cal inhibition for differentiating Parkinsonian syndromes,”Movement Disorders, vol. 19, no. 5, pp. 518–528, 2004.
[91] C. Trompetto, A. Buccolieri, R. Marchese, L. Marinelli, G.Michelozzi, and G. Abbruzzese, “Impairment of transcallosalinhibition in patients with corticobasal degeneration,” Clini-cal Neurophysiology, vol. 114, no. 11, pp. 2181–2187, 2003.
[92] J. Y. Li, A. J. Espay, C. A. Gunraj et al., “Interhemisphericand ipsilateral connections in Parkinson’s disease: relation tomirror movements,” Movement Disorders, vol. 22, no. 6, pp.813–821, 2007.
[93] M. Kubicki, H. Park, C. F. Westin et al., “DTI and MTRabnormalities in schizophrenia: analysis of white matterintegrity,” NeuroImage, vol. 26, no. 4, pp. 1109–1118, 2005.
[94] M. Walterfang, A. G. Wood, D. C. Reutens et al., “Morphol-ogy of the corpus callosum at different stages of schizophre-nia: cross-sectional study in first-episode and chronic illness,”British Journal of Psychiatry, vol. 192, no. 6, pp. 429–434,2008.
[95] A. Keller, N. O. Jeffries, J. Blumenthal et al., “Corpus callosumdevelopment in childhood-onset schizophrenia,” Schizophre-nia Research, vol. 62, no. 1-2, pp. 105–114, 2003.
[96] R. D. Nave, A. Ginestroni, C. Tessa et al., “Brain white matterdamage in SCA1 and SCA2. An in vivo study using voxel-based morphometry, histogram analysis of mean diffusivityand tract-based spatial statistics,” NeuroImage, vol. 43, no. 1,pp. 10–19, 2008.
[97] E. R. Sowell, A. Johnson, E. Kan et al., “Mapping whitematter integrity and neurobehavioral correlates in childrenwith fetal alcohol spectrum disorders,” The Journal of Neuro-science, vol. 28, no. 6, pp. 1313–1319, 2008.
[98] J. Duque, F. Hummel, P. Celnik, N. Murase, R. Mazzocchio,and L. G. Cohen, “Transcallosal inhibition in chronicsubcortical stroke,” NeuroImage, vol. 28, no. 4, pp. 940–946,2005.
[99] N. Takeuchi, T. Chuma, Y. Matsuo, I. Watanabe, and K.Ikoma, “Repetitive transcranial magnetic stimulation of
12 Neural Plasticity
contralesional primary motor cortex improves hand functionafter stroke,” Stroke, vol. 36, no. 12, pp. 2681–2686, 2005.
[100] C. Grefkes, D. A. Nowak, S. B. Eickhoff et al., “Corticalconnectivity after subcortical stroke assessed with functionalmagnetic resonance imaging,” Annals of Neurology, vol. 63,no. 2, pp. 236–246, 2008.
[101] D. A. Nowak, C. Grefkes, M. Ameli, and G. R. Fink, “Inter-hemispheric competition after stroke: brain stimulationto enhance recovery of function of the affected hand,”Neurorehabilitation and Neural Repair, vol. 23, no. 7, pp. 641–656, 2009.
[102] N. Takeuchi, T. Tada, M. Toshima, Y. Matsuo, and K. Ikoma,“Repetitive transcranial magnetic stimulation over bilateralhemispheres enhances motor function and training effect ofparetic hand in patients after stroke,” Journal of RehabilitationMedicine, vol. 41, no. 13, pp. 1049–1054, 2009.
[103] F. C. Hummel, P. Celnik, A. Pascual-Leone et al., “Contro-versy: noninvasive and invasive cortical stimulation showefficacy in treating stroke patients,” Brain Stimulation, vol. 1,no. 4, pp. 370–382, 2008.
[104] R. Schulz, C. Gerloff, and F. C. Hummel, “Non-invasive brainstimulation in neurological diseases,” Neuropharmacology,vol. 64, no. 1, pp. 579–587, 2013.
[105] E. L. Simoes, I. Bramati, E. Rodrigues et al., “Func-tional expansion of sensorimotor representation and struc-tural reorganization of callosal connections in lower limbamputees,” The Journal of Neuroscience, vol. 32, no. 9, pp.3211–3220, 2012.
[106] A. Bjorkman, A. Weibull, J. Olsrud, H. Henrik Ehrsson,B. Rosen, and I. M. Bjorkman-Burtscher, “Phantom digitsomatotopy: a functional magnetic resonance imaging studyin forearm amputees,” The European Journal of Neuroscience,vol. 36, no. 1, pp. 2098–2106, 2012.
[107] S. H. Frey, S. Bogdanov, J. C. Smith, S. Watrous, and W.C. Breidenbach, “Chronically deafferented sensory cortexrecovers a grossly typical organization after allogenic handtransplantation,” Current Biology, vol. 18, no. 19, pp. 1530–1534, 2008.
[108] S. Bogdanov, J. Smith, and S. H. Frey, “Former hand terri-tory activity increases after amputation during intact handmovements, but is unaffected by illusory visual feedback,”Neurorehabilitation and Neural Repair, vol. 26, no. 6, pp. 604–615, 2012.
[109] M. Wahl, B. Lauterbach-Soon, E. Hattingen et al., “Humanmotor corpus callosum: topography, somatotopy, and linkbetween microstructure and function,” Journal of Neuro-science, vol. 27, no. 45, pp. 12132–12138, 2007.
[110] J. J. M. Kew, M. C. Ridding, J. C. Rothwell et al., “Reor-ganization of cortical blood flow and transcranial magneticstimulation maps in human subjects after upper limbamputation,” Journal of Neurophysiology, vol. 72, no. 5, pp.2517–2524, 1994.
[111] K. MacIver, D. M. Lloyd, S. Kelly, N. Roberts, and T.Nurmikko, “Phantom limb pain, cortical reorganization andthe therapeutic effect of mental imagery,” Brain, vol. 131, no.8, pp. 2181–2191, 2008.
[112] G. Di Pino, C. Porcaro, M. Tombini et al., “A neurally-interfaced hand prosthesis tuned inter-hemispheric commu-nication,” Restorative Neurology and Neuroscience, vol. 30, no.5, pp. 407–418, 2012.
[113] G. L. Moseley, A. Gallace, and C. Spence, “Is mirror therapyall it is cracked up to be? Current evidence and future dir-ections,” Pain, vol. 138, no. 1, pp. 7–10, 2008.
[114] G. Di Pino, E. Guglielmelli, and P. M. Rossini, “Neuroplastic-ity in amputees: main implications on bidirectional interfac-ing of cybernetic hand prostheses,” Progress in Neurobiology,vol. 88, no. 2, pp. 114–126, 2009.
[115] F. C. Hummel and L. G. Cohen, “Non-invasive brain sti-mulation: a new strategy to improve neurorehabilitation afterstroke?” Lancet Neurology, vol. 5, no. 8, pp. 708–712, 2006.
[116] F. Gilio, V. Rizzo, H. R. Siebner, and J. C. Rothwell, “Effectson the right motor hand-area excitability produced bylow-frequency rTMS over human contralateral homologouscortex,” Journal of Physiology, vol. 551, no. 2, pp. 563–573,2003.
[117] P. K. Pal, R. Hanajima, C. A. Gunraj et al., “Effect of low-frequency repetitive transcranial magnetic stimulation oninterhemispheric inhibition,” Journal of Neurophysiology, vol.94, no. 3, pp. 1668–1675, 2005.
[118] M. Kobayashi, S. Hutchinson, H. Theoret, G. Schlaug, andA. Pascual-Leone, “Repetitive TMS of the motor corteximproves ipsilateral sequential simple finger movements,”Neurology, vol. 62, no. 1, pp. 91–98, 2004.
[119] B. W. Vines, D. G. Nair, and G. Schlaug, “Contralateraland ipsilateral motor effects after transcranial direct currentstimulation,” NeuroReport, vol. 17, no. 6, pp. 671–674, 2006.
[120] N. Takeuchi, T. Tada, M. Toshima, T. Chuma, Y. Matsuo,and K. Ikoma, “Inhibition of the unaffected motor cortex by1 HZ repetitive transcranial magnetic stimulation enhancesmotor performance and training effect of the paretic handin patients with chronic stroke,” Journal of RehabilitationMedicine, vol. 40, no. 4, pp. 298–303, 2008.
[121] M. Kobayashi, H. Theoret, and A. Pascual-Leone, “Sup-pression of ipsilateral motor cortex facilitates motor skilllearning,” European Journal of Neuroscience, vol. 29, no. 4, pp.833–836, 2009.
[122] A. Pascual-Leone, F. Tarazona, J. Keenan, J. M. Tormos,R. Hamilton, and M. D. Catala, “Transcranial magneticstimulation and neuroplasticity,” Neuropsychologia, vol. 37,no. 2, pp. 207–217, 1998.
[123] W. Muellbacher, U. Zlemann, J. Wissel et al., “Early consol-idation in human primary motor cortex,” Nature, vol. 415,no. 6872, pp. 640–644, 2002.
[124] V. Rizzo, H. S. Siebner, F. Morgante, C. Mastroeni, P.Girlanda, and A. Quartarone, “Paired associative stimulationof left and right human motor cortex shapes interhemi-spheric motor inhibition based on a hebbian mechanism,”Cerebral Cortex, vol. 19, no. 4, pp. 907–915, 2009.
[125] T. J. Sejnowski, “The book of Hebb,” Neuron, vol. 24, no. 4,pp. 773–776, 1999.
[126] M. Zimerman, K. F. Heise, J. Hoppe, L. G. Cohen, C. Gerloff,and F. C. Hummel, “Modulation of training by single-sessiontranscranial direct current stimulation to the intact motorcortex enhances motor skill acquisition of the paretic hand,”Stroke, vol. 43, no. 8, pp. 2185–2191, 2012.
[127] J. Liepert, S. Zittel, and C. Weiller, “Improvement of dex-terity by single session low-frequency repetitive transcranialmagnetic stimulation over the contralesional motor cortexin acute stroke: a double-blind placebo-controlled crossovertrial,” Restorative Neurology and Neuroscience, vol. 25, no. 5-6,pp. 461–465, 2007.
[128] E. M. Khedr, M. R. Abdel-Fadeil, A. Farghali, and M. Qaid,“Role of 1 and 3 Hz repetitive transcranial magnetic stim-ulation on motor function recovery after acute ischaemicstroke,” European Journal of Neurology, vol. 16, no. 12, pp.1323–1330, 2009.
Neural Plasticity 13
[129] J. Seniow, M. Bilik, M. Lesniak, K. Waldowski, S. Iwanski,and A. Czlonkowska, “Transcranial magnetic stimulationcombined with physiotherapy in rehabilitation of post-stroke hemiparesis: a randomized, double-blind, placebo-controlled study,” Neurorehabilitation Neural and Repair, vol.26, no. 9, pp. 1072–1079, 2012.
[130] M. Lotze, J. Markert, P. Sauseng, J. Hoppe, C. Plewnia, andC. Gerloff, “The role of multiple contralesional motor areasfor complex hand movements after internal capsular lesion,”Journal of Neuroscience, vol. 26, no. 22, pp. 6096–6102, 2006.
[131] C. Gerloff and F. G. Andres, “Bimanual coordination andinterhemispheric interaction,” Acta psychologica, vol. 110, no.2-3, pp. 161–186, 2002.
[132] A. Stancak, E. R. Cohen, R. D. Seidler, T. Q. Duong, and S. G.Kim, “The size of corpus callosum correlates with functionalactivation of medial motor cortical areas in bimanual andunimanual movements,” Cerebral Cortex, vol. 13, no. 5, pp.475–485, 2003.
[133] N. Takeuchi and K. Ikoma, “1 Hz rTMS over unaffectedhemisphere in stroke patients alters bilateral movements andcoupling between motor areas,” Clinical Neurophysiology, vol.121, supplement 1, p. s316, 2010.
[134] N. Takeuchi, T. Tada, Y. Matsuo, and K. Ikoma, “Low-frequency repetitive TMS plus anodal transcranial DCSprevents transient decline in bimanual movement induced bycontralesional inhibitory rTMS after stroke,” Neurorehabili-tation and Neural Repair, vol. 26, no. 8, pp. 988–998, 2012.
[135] N. Takeuchi and S.-I. Izumi, “Noninvasive brain stimulationfor motor recovery after stroke: mechanisms and futureviews,” Stroke Research and Treatment, vol. 2012, Article ID584727, 10 pages, 2012.
Hindawi Publishing CorporationNeural PlasticityVolume 2012, Article ID 627816, 11 pagesdoi:10.1155/2012/627816
Review Article
Interhemispheric Control of Unilateral Movement
Vincent Beaule,1, 2 Sara Tremblay,1, 2 and Hugo Theoret1, 2
1 Department of Psychology, University of Montreal, Montreal, QC, Canada H3C 3J72 Research Center, Sainte-Justine Hospital, University of Montreal, Montreal, QC, Canada H3T 1C5
Correspondence should be addressed to Hugo Theoret, [email protected]
Received 28 August 2012; Accepted 4 November 2012
Academic Editor: Matteo Caleo
Copyright © 2012 Vincent Beaule et al. This is an open access article distributed under the Creative Commons Attribution License,which permits unrestricted use, distribution, and reproduction in any medium, provided the original work is properly cited.
To perform strictly unilateral movements, the brain relies on a large cortical and subcortical network. This network enables healthyadults to perform complex unimanual motor tasks without the activation of contralateral muscles. However, mirror movements(involuntary movements in ipsilateral muscles that can accompany intended movement) can be seen in healthy individuals if a taskis complex or fatiguing, in childhood, and with increasing age. Lateralization of movement depends on complex interhemisphericcommunication between cortical (i.e., dorsal premotor cortex, supplementary motor area) and subcortical (i.e., basal ganglia)areas, probably coursing through the corpus callosum (CC). Here, we will focus on transcallosal interhemispheric inhibition (IHI),which facilitates complex unilateral movements and appears to play an important role in handedness, pathological conditions suchas Parkinson’s disease, and stroke recovery.
1. Introduction
Humans have a natural tendency towards symmetricalcontraction of homologous muscles (also called voluntarymirror movements), which are known to require less corticalactivation than alternated bimanual movements or unilateralmovements [1, 2]. For example, it has been shown thatif bimanual movements are executed with the upperlimbs,there is a strong tendency towards synchronization of motorpatterns [3]. This is why the execution of strictly unilat-eral motor movement requires complex interhemisphericinteractions between a wide range of cortical areas. Theseinteractions are needed to restrict motor output to thecontralateral primary motor cortex (M1) that controls theintended hand movement, which belongs to the “nonmirror-ing” transformation network [4]. Experimental and clinicaldata suggest a relevant role of the corpus callosum (CC) inthis network. For example, children, who have an immatureCC, have a higher incidence of mirror movements (MM), asdo some patients with agenesis of the CC [5]. This networkenables healthy adults to perform strictly unilateral tasks,although some subtle MM can be observed in the unusedhand if the task is complex or fatiguing [6].
Any dysfunction in the complex network that underliesunilateral movement, which relies in part on inhibitory
interhemispheric interactions, can contribute to the presenceof MM. In the present paper, we will review specific aspectsof the nonmirroring transformation network to higlightits role in lateralization of voluntary movements. Currentdata regarding physiological mirroring seen in healthy adultsand the role of IHI in the lateralization of movements willalso be discussed. Finally, the neuroanatomical substrates ofthe nonmirroring network and the effects of aging on thereappearance of MM will be presented.
2. Mirror Movements
2.1. MM in Children. MM are movements that are observedin the contralateral hand that are the mirror reversals ofthe intended movement of the active hand. MM observedin children are explained by an undermyelinated nervoussystem [5, 7] that does not permit the interhemisphericcommunication necessary for the restriction of motor outputto the M1 contralateral to the intended movement. Thecorpus callosum (CC) is the biggest white matter bundle ofthe brain and its function is to connect both hemispheres[8, 9], and it appears that its incomplete myelinisationcould partly explain MM in healthy children [5]. However,it is important to note that immaturity of other parts of
2 Neural Plasticity
the distributed “nonmirroring” network may also play animportant role in MM seen in children. MM are seen inhealthy children and decrease with increasing age until theage of 10 years [5, 10, 11]. There seems to be a substantialdecrease in MM, particularly from 5 to 8 years of age, whichhas led some authors to suggest that it may serve as adevelopmental cue [12, 13]. The overt MM seen in healthychildren disappear with maturation of the central nervoussystem and myelinisation of the CC [5, 14, 15], and there is asignificant relationship between chronological age and size ofthe CC [16]. As the myelinisation of the CC occurs, there is aconcomitant increase in IHI between the two motor cortices,which could also be used as a marker of motor development[17]. Therefore, the ability to execute unilateral motor tasksseems to rely on the correct maturation of this transcallosalinhibitory system since impaired inhibition is associated withMM [7, 18]. Notwithstanding these observations, MM havebeen only sporadically reported in patients with agenesis ofthe CC, whereas most acallosal patients display no overt MM,suggesting a relative role played by the CC in MM. Becauseof the reduced IHI seen in children, the ipsilateral M1controlling the mirror hand has a higher level of excitation ifthe voluntary hand is active. Consequently, bilateral corticalactivity can be recorded in healthy children when performinga unilateral task [5], which enhances the probability of MM.In healthy adults, transcallosal IHI presumably suppressesactivity in the ipsilateral M1 resulting in strictly unilateralmovements. MM seen in healthy children thus seem to be theresult of the bilateral activity of both M1 when performing aunilateral task. These observations provide strong evidencethat a mature central nervous system capable of transcallosalIHI is a key factor in controlling unwanted MM whenperforming a unimanual task.
2.2. The Role of Interhemispheric Inhibition in UnilateralMovements. To perform strictly unilateral movements thereis a “nonmirroring” process that restricts the motor outputin the contralateral hemisphere and suppresses motor acti-vation of the mirror hand [19, 20]. When an individual ispreparing to execute a finger movement, it is followed by atemporary inhibition of the homologous M1 controlling themirror finger in the passive hand [19]. TMS-induced MEPsare progressively facilitated in the 80–120 ms preceding EMGonset in healthy adults [21–23]. This shift in facilitation ofthe contralateral M1 and inhibition of the ipsilateral M1following intended movements could be linked to interhemi-spheric interactions of the two M1. If a participant is asked toprepare a hand movement in a reaction time paradigm anda conditioning TMS pulse is applied over the ipsilateral M1followed by a test pulse over the contralateral M1, IHI will bestronger immediately after the go signal. But as the voluntarymovement onset nears, IHI is released, leading to increasedexcitability [24–26]. By comparison, if the conditioning pulseis delivered to the contralateral M1, which will then inhibitthe ipsilateral M1, the inhibition remains deep from thebeginning through the end of movement preparation [24–26].
It has been suggested that the ability to perform unilateralfinger movements without MM depends on the appropriate
modulation of IHI between the contralateral and ipsilateralM1 that occurs during movement preparation [19, 25, 27].This hypothesis, that the transcallosal increase in IHI orig-inating from the active M1 to the mirror M1 is responsiblefor the inhibition of undesired MM, was tested during abimanual motor task by Hubers and colleagues [28]. Inthat study, participants had to maintain a tonic isometriccontraction of the mirror hand while the active hand wasexecuting short-duration contractions. It was found thatIHI was inversely correlated with motor overflow in themirror hand. That is, the more the M1 contralateral to theactive hand executing short contractions (M1-active) wasable to inhibit the ipsilateral M1 (M1-mirror), the less mirroractivity was seen in the mirror hand performing a tonicisometric contraction. This phenomenon was further testedusing low-frequency rTMS to interfere with the M1-active todetermine whether releasing inhibition from the M1-activewould enhance mirror activity in the hand maintaining thetonic contraction. In line with the hypothesis, less IHI fromthe active M1 to the mirror M1 was found, resulting inincreased mirroring [28]. This further suggests that the activeM1 is partly responsible for the inhibition of MM throughIHI to the mirror M1. Similarly, Kobayashi and colleagues[29] reported that low-frequency rTMS over M1 resulted inenhanced motor performance (finger-tapping task) of theipsilateral hand. Notably, the increase in performance wasassociated with increased excitability of the unstimulatedM1, which was possibly obtained by suppressing inhibitionfrom the stimulated M1 to the contralateral M1. It waslater shown that the same protocol could improve thelearning of a simple motor task in the ipsilateral hand whiledisturbing learning in the contralateral hand [30]. These twostudies suggest that when a unilateral hand movement isexecuted, activation of the active M1 has an influence on thecontralateral M1, acting as a “brake” that, when withdrawn,can disinhibit the contralateral M1 and lead to behavioralimprovement [31]. Therefore, it seems that IHI modulationis crucial for restricting the motor output to the contralateralM1 and inhibiting the mirror M1 for an accurate, strictlyunilateral, movement of the hand.
Additional evidence for the presence of mutual inhibitionbetween motor cortices comes from stroke patients, whereIHI towards the affected M1, which controls the paretichand, is increased [24]. Moreover, it appears that strongerIHI towards the affected hemisphere is negatively correlatedwith motor function recovery, suggesting a direct relation-ship between increased IHI from the intact hemisphere tothe lesioned hemisphere and poor recuperation of motorfunction in chronic stroke patients [24]. Following on this,it is not surprising applying low-frequency rTMS over thenonaffected M1 to reduce its excitability can improve motorfunction in the paretic hand of stroke patients througha mechanism by which transcallosal inhibition from thenonaffected hemisphere is released, leading to increasedexcitability and function of the affected M1 [32].
IHI between the motor cortices can also be tested by thebrief interruption or attenuation of voluntary EMG activityproduced by focal single-pulse TMS of the ipsilateral M1,the so-called ipsilateral silent period (iSP) [33]. Similarly
Neural Plasticity 3
to IHI [34], the iSP is mediated by a transcallosal pathway[35, 36], but the two measures appear to rely on differentneural substrates [37]. There is evidence that the iSP reflectsa key phenomenon that helps restrict motor output in thecontralateral M1. Indeed, it seems that activation of the M1performing a voluntary movement with the contralateralhand increases interhemispheric inhibition as measured bythe iSP. This evidence points to a pivotal role for themechanism underlying the iSP in suppressing unwanted MMand controlling unilateral movement [33].
Numerous factors have been reported to modulate inter-hemispheric interactions. For example, in a force generationtask, it was shown that when a participant is maintaining acontraction at 70% maximal force, IHI has a disinhibitoryeffect on the M1 ipsilateral to the voluntary contraction,as reflected by reduced short intracortical inhibition (SICI).This suggests a change in IHI depending on task features[38]. Along the same line, it has been shown that IHIdiffers depending on which arm muscle is tested. Indeed, IHIfrom different arm representations does not strictly followa “proximal-to-distal” gradient but instead may depend onthe role that each muscle plays in functional movementsynergies [39]. Finally, it has also been reported that trainingcan modulate IHI. This was pointed out in a study testingprofessional musicians, who require enhanced coordination.It was found that IHI is lower in musicians as compared tocontrols, suggesting a modulatory effect of training on IHI[40].
2.3. Physiological Mirroring in Healthy Adults. It is knownthat the amount of mirror EMG activity seen in healthysubjects increases if the task is demanding, if fatigue isinduced, if there are cognitive distractions or decreasedattentional capacities, and if age increases [41–45]. A pro-tocol has been developed to probe physiological mirroringin healthy adults, following the observation that facilitationof the motor response can be achieved by simultaneouscontraction of ipsilateral and contralateral hand muscles[46, 47]. This leads Mayston and collaborators [5] to reportthat involuntary mirror EMG activity of the right first dorsalinterosseous (FDI) muscle can be induced in healthy adultsif they maintain a background isometric muscle contractionwith the mirror FDI (right) while performing intendedunilateral brief phasic contractions with the left homologousmuscle, resulting in motor overflow to the right hand. Thisprotocol has been used in numerous studies where it has beenrepeatedly shown that mirror activity can occur in healthyparticipants [5, 48, 49], which is assumed to result from thetransfer of activation from the task-M1 to the mirror-M1through the CC [48].
Since physiological mirroring in healthy individualscannot be explained by an ipsilateral projection originatingfrom the M1 contralateral to the intended movement,alternate mechanisms must be proposed. There is growingevidence suggesting that physiological mirroring depends onthe activation of the ipsilateral M1, which normally has acrossed CS tract connecting to the mirror hand [50–52].This transfer of activation is thought to occur through atranscallosal pathway [1, 20, 34]. Therefore, the CC seems to
play an important role in restricting motor overflow since,through callosal fibers, each M1 can have an interhemi-spheric influence over the other. This influence can eitherbe a direct excitatory effect or an indirect inhibitory effectby excitating inhibitory interneurons [44, 53]. Evidence for atranscallosal role in IHI comes in part from studies showingthat patients with agenesis of the CC display no IHI [35, 54]and that children have no IHI and an immature CC [5]. Withthis in mind, some authors have suggested that an intact andfully myelinated CC is necessary for effective IHI, which isalso important to suppress activity in the contralateral M1[28].
The relationship between a functional CC and IHI wasinvestigated in a study that combined TMS and diffusion ten-sor imaging (DTI). A direct correlation was found betweenfractional anisotropy (FA) of the CC, which represents thecoherence of diffusion of water molecules along the WMtract, and the strength of IHI evaluated by Ferbert’s paired-pulse TMS protocol [55]. Other studies have investigatedthe link between IHI and measures of FA in the CC inhealthy humans [56] and patients with WM dysfunction[57] and suggest that WM tract integrity can be usedas a predictor of IHI in healthy and diseased individuals[55, 58]. These results confirm that proper myelinationof the CC is important since it enables rapid conductionof nerve impulses and, at the same time, isolates axonsto prevent unwanted interference to enhance quality ofinterhemispheric communication coursing through the CC[5].
The CC appears to play an important role in the controlof unilateral movements and in preventing mirroring byfacilitating interactions to keep motor outputs contralateralto intended movements [35, 53]. This is in line with studiesin monkeys, where species that do not display bimanualskills do not possess direct transcallosal M1-M1 connections[59], whereas in macaques, in whom M1-M1 connections arefound, skilled coordination abilities are seen [60]. Similarly,in humans, studies with patients with an abnormal CC haveshown that it is crucial for fast and complex unilateral andbilateral coordination, as well as for the ability to learn newbimanual skills [61–63]. Other evidence for a crucial role ofthe CC as part of the nonmirroring transformations networkcomes from patients with schizophrenia. There is growingevidence that the development of the CC is abnormal inschizophrenia, leading to impaired transcallosal connectivityof the two hemispheres [64]. This was confirmed using DTIand MRI, in which structural abnormalities and reducedvolume of the CC were observed [65] for first-episodepatients as well as high-risk individuals [66]. It was suggestedthat CC abnormalities could result in neurological soft signs(NSSs) [67]. NSSs have a high prevalence in schizophrenia,with 50–65% of patients being affected [68]. Individualswith schizophrenia display higher levels of motor overflow inthe nonactive hand compared to controls [67]. The higherincidence of mirroring activity in the nonactive hand ofschizophrenia patients was later associated with deficientintracortical inhibition originating from the M1 ipsilateralto the active hand [69], which in turn could be associatedwith reduced IHI between the active and nonactive M1.
4 Neural Plasticity
With low IHI, each M1 shows a higher degree of excitationexpressed by lower intracortical inhibition, thus enhancingthe possibility that overflow occurs in the nonactive hand[29, 69].
2.4. MM in Adults. If MM persist after the age of 10, they areconsidered pathological. There are different genetic aetiolo-gies that can explain the persistent presence of MM. They canbe seen in adults that do not have other motor abnormalitiesand are then called congenital mirror movements (CMM)[54, 70–73]. They can also be found in genetic syndromeslike Kallmann’s syndrome [74–76], Klippel-Feil syndrome[77, 78], congenital hemiparesis [79, 80], and schizophrenia[67, 81, 82]. MM can also reappear later in life in acquiredconditions like Parkinson’s disease (PD) [49, 83], stroke[84, 85], and can be present in normal aging [43, 44, 86].
The neurophysiological hallmark of CMM is the presenceof an ipsilateral, fast-conducting corticospinal tract connect-ing the contralateral M1 to the ipsilateral hand. Evidencefor this aberrant ipsilateral connection comes in part fromtranscranial magnetic stimulation (TMS) studies where ithas been repeatedly shown that in individuals with CMM,the ipsilateral motor evoked potential (MEP) elicited, whileat rest by a single TMS pulse over M1 has the exact samelatency as the contralateral MEP [72]. This rules out thepossibility that the involuntary mirror electromyographic(EMG) response is the result of a transcallosal transfer ofexcitability from the contralateral M1 to the ipsilateral M1since such a transfer is expected to take about 8-9 ms [87].Along the same lines, Lepage and collaborators [54] reportedthe case of a patient with agenesis of the corpus callosum(CC) showing ipsilateral and contralateral MEPs of the samelatency.
Some evidence suggests that a gene, the deleted incolorectal carcinoma (DCC), may be responsible for CMM[88–90]. The DCC gene stands for deleted in colorectalcancer and is a receptor for netrin-1, which is a proteinnecessary for axon guidance across the body’s midline [89–91]. It seems that there is a genetic heterogeneity that causesCMM since three different mutations on the DCC genehave been reported to cause CMM in three different families[90]. The role of the DCC gene has been confirmed bythe fact that “knocking out” the DCC gene or the ephringene in a mouse results in movements being synchronizedin a mirror-like fashion [91, 92]. This suggests a possiblemisdirected ipsilateral corticospinal projection occurringwhen the CS tract crosses the midline, possibly explainingthe presence of MM in this population [89]. However, inseveral other familial cases of CMM, no DCC mutations havebeen identified, which led to the discovery of a novel generesponsible for CMM [93]. It was found that a mutation onthe RAD51 gene could also lead to CMM. The RAD51 gene ismostly present in the mouse cortex at a developmental stagecritical for the correct establishment of the corticospinaltract (CST) [93]. These findings strongly suggest that CMMreported in otherwise healthy adults are the result of specificmutations that affect either the DCC or RAD51 genesculminating in an aberrant ipsilateral CST.
2.5. MM in Pathological Conditions. MM are also seen in spe-cific conditions. Kallmann’s syndrome (KS) is mainly charac-terized by hypogonadotrophic, hypogonadism, and anosmia[75]. However, only the X-linked form of KS is associatedwith MM [74]. Mayston and collaborators [75] suggestedan abnormally developed ipsilateral tract as an explanationfor MM in KS, as MM exhibited by KS patients had theexact same latency as the contralateral voluntary response.Also, it was reported that mirror responses decreased in sizeat the same time as the contralateral response if the TMScoil was moved away from the maximum response region,suggesting that the ipsilateral and contralateral corticospinal(CS) axons projecting to both hands are connected to thesame M1 in both hemispheres. The pathological ipsilateraltract in XKS is suggested to innervate bilateral motoneuronsof the distal upper limb muscles with a variable size effectas measured by MM [76]. MM are also found in Klippel-Feil syndrome (KFS), which is characterized by a shortneck, impaired cervical mobility, and low airline [77] and iscommonly associated with MM [78]. In these patients, theMM are mainly observed in the distal upper limb muscle[77]. An autopsy of a deceased patient with KFS revealedthe absence of pyramidal decussation of the CS tract [94].The bilateral motor responses exhibited in KFS patientsshow comparable properties to contralateral responses seenin healthy controls [77]. In patients with MM in KFS[77] and XKS [75], if they are performing unimanualvoluntary movements, it is possible to observe a shortduration central peak in the cross-correlograms obtainedfrom multiunit EMG activity recorded simultaneously fromboth homologous muscles. This activity contrasts withcontrol subjects who only display a contralateral response,thus adding weight to a possible abnormal corticospinalbranching of their motor cortex projection. MM may alsooccur in patients with severe congenital hemiparesis [79, 80].In this pathological condition, the unaffected motor cortexhas abnormal ipsilateral corticospinal fibers branching tothe paretic hand, thus resulting in MM. Interestingly, thesepatients are, to some extent, capable of lateralized motoractivity [79]. This was reported in an experiment wheremirror hand activity was recorded with EMG, showing thatit was less activated than the hand performing the intendedcontraction. It was thus suggested that a reorganization of theCST in these patients results in separate pathways connectingthe unaffected motor cortex to both hands. It was shownthat an intended contraction of the paretic hand is followedby an inhibition of the crossed CST to the good hand, asseen with reduced MEPs in the mirror hand compared witha rest condition [79]. This suggests that in patients withhemiparesis, the unaffected motor cortex is able to inhibithomologous motor representations [79].
2.6. The Case of Right Handedness. There is growing evi-dence suggesting that manual preference in the use ofone hand could be explained by an asymmetry in IHI[26]. For example, IHI from the dominant M1 towardsthe nondominant M1 was compared with IHI from thenondominant M1 towards the dominant M1, where it wasfound that the former was deeper [95]. This was also
Neural Plasticity 5
shown by Duque and colleagues [26], who reported thatmodulation of IHI with movements of the right and lefthands in right-handed healthy subjects was asymmetrical.In the preparation of movement, the balance in IHI wasprofound in both hemispheres, which could help restrictMM during unilateral motor tasks. However, as movementonset approached, an asymmetry began to appear, revealingincreased disinhibition of the contralateral M1 during righthand movement compared with left hand movement. Theshift in IHI leading to higher excitation was only seen whenthe right hand was performing the task, whereas IHI towardsthe nondominant M1 remained deep. In the nondominantM1, when the left hand was performing the task, there wasan almost constant IHI balance towards each hemisphere[26]. This asymmetrical modulation of IHI with regards toright and left hands movement could play an importantrole in fine motor coordination of the dominant hand.The release of inhibition from the nondominant hemisphereto the dominant hemisphere executing a task with thecontralateral hand leads to enhanced excitation of thedominant hemisphere while at the same time maintaininga deep inhibition of the nondominant mirror hemisphere,which restrains the occurrence of MM [96]. This importantexcitatory gain could allow more refined movements bythe dominant hand through effective intracortical excitatoryconnections of the dominant hemisphere with better controlover antagonistic and irrelevant representations [97].
It has been suggested that in order to counteract higherIHI towards the nondominant M1 controlling the left handin right-handed subjects, the nondominant M1 has to recruitmore corticospinal neurons to accomplish comparable per-formance to that of the right hand [98]. This has led to thehypothesis that the increased mobilization of corticospinalneurons required by the nondominant hand could expressitself in the form of interhemispheric facilitation towards theipsilateral, dominant M1 [26]. It could also be an adaptivemechanism aimed at counteracting the higher levels ofinhibition targeting the right hemisphere. Since the rightM1 inhibits the left M1 at lesser levels, through IHI, whenthe right M1 is active in a task, the left M1, which isnot fully inhibited, could maintain slight IHI towards theright M1 forcing the right M1 to recruit more CS neuronsto perform as well as the right hand. There is evidencefor this asymmetry, as it was found that the ipsilateraldominant cortex is more active during left hand movementthan the ipsilateral nondominant cortex during right handmovements [6, 19]. It is thus possible that the left M1activity that is seen during left hand movement results inpersistent IHI towards the nondominant active M1, leadingto poorer performance with the nondominant hand [26].Along the same lines, increased MM in the right hand ofright-handed subjects might be a consequence of the leftM1 contribution during hand movements performed withthe nondominant hand [99]. Taken together, these datamay partly explain why the protocol used by Mayston andcollaborators [5] can induce mirror movements in healthyparticipants more easily when the right hand maintains thetonic, isometric contraction, while the left hand performsbrief movements. The tonic contraction of the dominant
right hand keeps the left M1 activated, which then leads togreater IHI towards the right M1. This higher inhibition inthe right M1 could then result in even lower IHI towardsthe dominant M1, which has greater excitability, as shown byreduced intracortical inhibition [100]. This higher excitationlevel in the dominant M1 makes it more vulnerable to theexcitation that is produced by bimanual movement, whichhas to be inhibited [35]. However, since the dominant M1 isoverexcited, it results in slight motor overflow. This is moreeasily achieved with the right hand because if the left hand istonically contracted, the right M1 produces less IHI towardsthe left M1, which is then able to restrict motor overflow,without expanding it to the contralateral hemisphere. At thesame time, IHI of the dominant M1 is also stronger, loweringthe activation of the contralateral M1, thus producing lowermotor overflow in the nondominant left hand [48]. However,it should be noted that MM in the nondominant handusing the Mayston protocol have also been reported [48].It should be mentioned that IHI from the dominant to thenondominant M1 is but one of the mechanisms that havebeen proposed to explain hand dominance. For example,there is evidence that enhanced efficiency of motor neuronesynchronization may be present in the arm preferentiallyused by an individual [101]. It has also been suggested thatthat a release of inhibitory input to the contralateral M1from a more strongly activated right M1 may facilitate betterbimanual coordination [102].
3. Neuroanatomical Substrates
To perform unilateral movements, the brain relies on alargely distributed network of motor cortical and subcorticalareas, which is called the nonmirroring network. Theunderstanding of this network and the mechanism involvedin restricting motor output to the contralateral muscle,which requires the transformation of a default bilateralMM to a lateralized unilateral movement, is starting toemerge. Data from healthy humans, patients, and lesionedmonkeys support the view that this network relies on thesupplementary motor area (SMA) [103], the dorsal premotorcortex (dPMC) [1], the ipsilteral M1 [26, 28], and the basalganglia [83].
3.1. Dorsal Premotor Cortex. Studies using positron emissiontomography have shown that right dorsal premotor cortexactivation is more important during out-of-phase bimanualmovements compared to in-phase movements, also knownas voluntary MM [104]. This points to a role for the dPMCin the nonmirroring process since it is recruited more promi-nently when asymmetrical movements are required com-pared to voluntary mirroring. The functional importanceof the dPMC in the nonmirroring process was confirmedby an rTMS study where stimulation was applied overthe right dPMC of healthy participants while performinga unilateral contraction of the left hand. It was shownthat disruption of the right dPMC increased excitability ofthe CS projections from the left M1 to the right mirrorhand. This was seen only if the left hand was performing avoluntary contraction [1]. This suggests that the right dPMC

6 Neural Plasticity
plays a role in the nonmirroring network responsible to therestriction of motor output in the right M1 when the lefthand is performing a unilateral manual task. This idea wasfurther supported by Giovannelli and colleagues [49], wherethey showed that low-frequency rTMS of the right dPMCenhances physiological mirroring in healthy adults. It shouldbe noted that in both of these studies, stimulation of dPMCresulted in no overt MM, although slight motor overflowwas present in the mirror hand. This suggests that thedPMC is part of a network of areas underlying nonmirroringtransformations [1] that contribute in restricting the motoroutput to the hemisphere contralateral to the intendedmovement [1, 49].
3.2. Supplementary Motor Area. There is evidence suggestinga role for the supplementary motor area (SMA) in thenonmirroring cortical network since unilateral ablation ofthe SMA in monkeys produces long-lasting decreases inbimanual coordination, with greater effect if the lesion islocated in SMA contralateral to the nondominant hand[105]. Additional lesion evidence comes from the report ofa man who suffered an infarct to the right SMA and in whichmirror movements were seen when writing and performingbimanual coordination tasks [103]. This suggested that theSMA was part of the nonmirroring transformation of motorprograms which originated in the left hemisphere prior toexecution by the right M1 of left hand movement [103].Similarly impaired motor control was seen in three patientswith unilateral ablation of the SMA to help control epilepsy,in which alternating movements were impaired in the handneeding reciprocal coordination [106]. Neuroimaging inhealthy humans has also revealed greater activation of theSMA when bilateral, asymmetric movements are performedcompared with symmetric movements, similarly to what isobserved in dPMC [2, 104]. SMA involvement in nonmir-roring transformations can also be seen anatomically since itprojects bilaterally to M1 via the CC and reaches the PMCand the contralateral SMA [107]. In fact, M1 receives itsmajor ipsilateral projection from the SMA [108]. The role ofthe SMA in motor control seems crucial since disturbancesin bimanual coordination that include MM may be presentin patients with SMA damage [103].
The idea that the nonmirroring program of motorcontrol relies on a large neural network involving the dPMCand SMA is supported by studies using scalp movement-related cortical potentials (MRCP). It seems that bothunilateral and bilateral voluntary movements are precededby a premovement EEG potential called the Bereitschaftspo-tential (BP), which is a slow negativity, that is, bilaterallydistributed over extensive areas of the scalp and that occursapproximatively two seconds before movement onset [109,110]. With regards to hand movements, the main source ofthis “early” BP is believed be located in the bilateral SMAand lateral precentral gyrus [110], although some studieshave reported higher amplitudes over the contralateral SMA[111]. This premovement activity suggests a role for theSMA in the preparation of upcoming movement and itsbilateral presence, in addition to its connection to ipsilateraland contralateral M1 [108], which makes the SMA a perfect
candidate for an integrative role in coordinating bimanualmovements [112]. Following the early BP, there is an increasein its gradient approximatively 400 ms before movementonset, which exhibits a markedly different scalp distributionand is called Negative Slope (NS0) [113]. The NS0 originatesin M1 and PMC and shows precise somatotopy [110, 111],and if it is bilaterally distributed during unilateral handmovements, rather than being predominantly contralateral,bilateral activation of M1 is present and may result in MM,probably through the lack of transcallosal inhibition [110].Following contralateral NS0 is the motor potential (MP),which peaks concurrently with movement onset. The MPis localized in a restricted area of the contralateral scalpand is thought to reflect the activity of pyramidal tractneurons taking place in the contralateral M1 [110]. Thesefindings are in agreement with the SMA playing a majorrole in the preparation of movement, since it is activatedearly during motor preparation and is bilaterally distributed.This bilateral activation is followed by restricted contralateralactivations in PMC and M1, which in turn will give rise tostrictly unilateral movements.
3.3. Basal Ganglia. It has also been suggested that thebasal ganglia could play a substantial role in sequentialmovements, in the timing movements, and in selectingthe muscles required for a motor task, as well as for theexecution of overlearned motor programs [114]. With thisin mind, it is not surprising that the SMA receives strongindirect projections from the basal ganglia (GPi) via thethalamus [115]. In PD, evidence points out to impairedbasal ganglia function through depleted substantia nigradopaminergic cells, leading to reduced motor control [116].Interestingly, MM are one of the symptoms that can bepresent in PD [83]. There is neurophysiological evidencethat MM in PD are the result of M1 activation ipsilaterallyto the intended movement rather than resulting from thepresence of an ipsilateral CS pathway [83]. Hence, it hasbeen hypothesized that MM in PD are the result of adeficiency of the basal ganglia to support the cortical networkthat is believed to underlie nonmirroring transformationsnecessary for unilateral movements [49, 83]. Dysfunctionalbasal ganglia should have a consequence on its outputtowards the SMA, which is what is seen in PD, wherecerebral blood flow in SMA is reduced compared to healthyindividuals [117]. Further evidence that the SMA is impairedin PD comes from the fact that the early BP is reduced [118].An alternative explanation for the presence of MM in PD isthat abnormalities of the basal ganglia can lead to a loss ofcortical inhibition, which may produce excessive activationin superfluous muscles when performing voluntary move-ment [119]. Indeed, intracortical inhibition has been shownto be reduced in untreated PD patients, reflecting abnormalexcitability of the motor pathway [120].
To perform lateralize unilateral movements, the brainrelies on a distributed network which seems to imply thedPMC, the SMA, and the basal ganglia. The disruption of anypart of this network enhances the natural tendency towardssymmetrical bimanual movement. But only modest effectsare seen when disrupting parts of this network suggesting
Neural Plasticity 7
that none of these brains regions are solely responsible forthe nonmirroring process.
4. MM and Aging
MM are seen in healthy children up to the age of 10years and probably reflect the fact that a fully maturedCC is associated with greater IHI, underlying the ability toperform complex unilateral motor tasks [5]. As was seenearlier, if MM continue after that age they are consideredabnormal and are usually the consequence of the presenceof an ipsilateral fast-conducting CS tract originating fromboth M1s [4]. However, even in the absence of an aberrantipsilateral projection, an intact CC is needed to restrictmotor output in the hemisphere contralateral to an intendedmovement. As such, if the CC is dysfunctional, for instancein schizophrenia [65], motor abnormalities such as increasedmotor overflow can be seen [67]. Even in healthy subjectswith an intact CC, physiological mirroring can be present,especially when performing complex and fatiguing motortasks [35].
With increasing age, motor overflow also appears toincrease [43]. This could be linked to the fact that normalaging is associated with numerous morphological changeswithin the brain, including atrophy of grey and white matter[121]. Neuroimaging studies have shown that in additionto quantitative decreases in white matter, the quality of theremaining WM is compromised in older adults [122]. Inotherwise healthy older individuals, there is a decrease inthe size and myelination of CC fibres, which is believed tolead to abnormal transcallosal communication. In turn, thiswould result in increased motor overflow to the hemisphereipsilateral to the intended movement and ultimately MM.However, recent findings suggest that the naturally occurringreduction of transcallosal pathways is related to a surprisingshift in the link between callosal integrity and IHI. Indeed,it was found that older adults with greater callosal tractintegrity also displayed a reduction in IHI and a significantlygreater interhemispheric facilitation [123]. This is consistentwith the HAROLD model proposed by Cabeza [124] inwhich it is suggested that age-related increases in bilateralactivation may be a compensatory mechanism to maintaingood functioning. There is evidence that the HAROLDmodel may generalize to motor function [125]. This wouldbe consistent with the reported age-related amplification ofmotor overflow in more demanding tasks in the elderly sinceincreasing the attentional demands of a given task is believedto favor recruitment of bilateral areas. This in turn wouldmean increased activity in the contralateral hemisphereresulting in mirror activity in the ipsilateral, nonactive hand[44]. It is therefore not surprising that normally occurringrecruitment of bilateral brain areas in a more demandingtask, as well as the consequent motor overflow observed inhealthy adults, seems to be enhanced with increasing age.Furthermore, since transcallosal integrity in older adultsis associated with lower levels of IHI and a shift towardsinterhemispheric facilitation, it could partly explain thehigher bilateral brain recruitment that is needed for theelderly to maintain good functioning in demanding tasks,
but also as a consequence creating increased motor overflow.Taken together, these data suggest that healthy older adultsbenefit from interhemispheric cooperation between specificbrain areas, which is reflected in higher interhemisphericfacilitation, lower IHI, and greater overflow to the con-tralateral motor cortex [123]. This also suggests an adaptivemechanism since greater motor overflow in older adults isassociated with increased dexterity [43].
Acknowledgments
This work was supported by grants from the NationalSciences and Engineering Research Council of Canada andthe Fonds de Recherche en Sante du Quebec. V. Beaule wassupported by a scholarship from the Fonds de Recherche enSante du Quebec. S. Tremblay was supported by a VanierCanada Graduate scholarship of the Canadian Institutes ofHealth Research.
References
[1] M. Cincotta, A. Borgheresi, F. Balestrieri et al., “Involvementof the human dorsal premotor cortex in unimanual motorcontrol: an interference approach using transcranial mag-netic stimulation,” Neuroscience Letters, vol. 367, no. 2, pp.189–193, 2004.
[2] C. Grefkes, S. B. Eickhoff, D. A. Nowak, M. Dafotakis, and G.R. Fink, “Dynamic intra- and interhemispheric interactionsduring unilateral and bilateral hand movements assessedwith fMRI and DCM,” NeuroImage, vol. 41, no. 4, pp. 1382–1394, 2008.
[3] S. P. Swinnen, D. E. Young, C. B. Walter, and D. J.Serrien, “Control of asymmetrical bimanual movements,”Experimental Brain Research, vol. 85, no. 1, pp. 163–173,1991.
[4] M. Cincotta and U. Ziemann, “Neurophysiology of uni-manual motor control and mirror movements,” ClinicalNeurophysiology, vol. 119, no. 4, pp. 744–762, 2008.
[5] M. J. Mayston, L. M. Harrison, and J. A. Stephens, “Aneurophysiological study of mirror movements in adults andchildren,” Annals of Neurology, vol. 45, no. 5, pp. 583–594,1999.
[6] U. Ziemann and M. Hallett, “Hemispheric asymmetry ofipsilateral motor cortex activation during unimanual motortasks: further evidence for motor dominance,” ClinicalNeurophysiology, vol. 112, no. 1, pp. 107–113, 2001.
[7] K. Muller, F. Kass-Iliyya, and M. Reitz, “Ontogeny ofipsilateral corticospinal projections: a developmental studywith transcranial magnetic stimulation,” Annals of Neurology,vol. 42, no. 5, pp. 705–711, 1997.
[8] M. S. Gazzaniga, “Cerebral specialization and interhemi-spheric communication. Does the corpus callosum enablethe human condition?” Brain, vol. 123, no. 7, pp. 1293–1326,2000.
[9] G. M. Innocenti, “Postnatal development of corticocorticalconnections,” Italian Journal of Neurological Sciences, vol. 5,pp. 25–28, 1986.
[10] C. A. Armatas, J. J. Summers, and J. L. Bradshaw, “Mirrormovements in normal adult subjects,” Journal of Clinical andExperimental Neuropsychology, vol. 16, no. 3, pp. 405–413,1994.
[11] M. Reitz and K. Muller, “Differences between “congenitalmirror movements” and “associated movements” in normal
8 Neural Plasticity
children: a neurophysiological case study,” NeuroscienceLetters, vol. 256, no. 2, pp. 69–72, 1998.
[12] H. J. Cohen, L. T. Taft, M. S. Mahadeviah, and H. G.Birch, “Developmental changes in overflow in normal andaberrantly functioning children,” The Journal of Pediatrics,vol. 71, no. 1, pp. 39–47, 1967.
[13] P. H. Wolff, C. E. Gunnoe, and C. Cohen, “Associated move-ments as a measure of developmental age,” DevelopmentalMedicine and Child Neurology, vol. 25, no. 4, pp. 417–429,1983.
[14] J. N. Giedd, J. M. Rumsey, F. X. Castellanos et al., “Aquantitative MRI study of the corpus callosum in childrenand adolescents,” Developmental Brain Research, vol. 91, no.2, pp. 274–280, 1996.
[15] J. N. Giedd, J. Blumenthal, N. O. Jeffries et al., “Developmentof the human corpus callosum during childhood andadolescence: a longitudinal MRI study,” Progress in Neuro-Psychopharmacology and Biological Psychiatry, vol. 23, no. 4,pp. 571–588, 1999.
[16] L. S. Allen, M. F. Richey, Y. M. Chai, and R. A. Gorski,“Sex differences in the corpus callosum of the living humanbeing,” Journal of Neuroscience, vol. 11, no. 4, pp. 933–942,1991.
[17] I. Koerte, F. Heinen, T. Fuchs et al., “Anisotropy of callosalmotor fibers in combination with transcranial magneticstimulation in the course of motor development,” Investiga-tive Radiology, vol. 44, no. 5, pp. 279–284, 2009.
[18] I. Koerte, L. Eftimov, R. P. Laubender et al., “Mirrormovements in healthy humans across the lifespan: effects ofdevelopment and ageing,” Developmental Medicine and ChildNeurology, vol. 52, no. 12, pp. 1106–1112, 2010.
[19] L. Leocani, L. G. Cohen, E. M. Wassermann, K. Ikoma, andM. Hallett, “Human corticospinal excitability evaluated withtranscranial magnetic stimulation during different reactiontime paradigms,” Brain, vol. 123, no. 6, pp. 1161–1173, 2000.
[20] J. Liepert, C. Dettmers, C. Terborg, and C. Weiller, “Inhibi-tion of ipsilateral motor cortex during phasic generation oflow force,” Clinical Neurophysiology, vol. 112, no. 1, pp. 114–121, 2001.
[21] P. M. Rossini, F. Zarola, E. Stalberg, and M. Caramia,“Pre-movement facilitation of motor-evoked potentials inman during transcranial stimulation of the central motorpathways,” Brain Research, vol. 458, no. 1, pp. 20–30, 1988.
[22] A. Pascual-Leone, J. Valls-Sole, E. M. Wassermann, J. Brasil-Neto, L. G. Cohen, and M. Hallett, “Effects of focal tran-scranial magnetic stimulation on simple reaction time toacoustic, visual and somatosensory stimuli,” Brain, vol. 115,no. 4, pp. 1045–1059, 1992.
[23] R. Chen, Z. Yaseen, L. G. Cohen, and M. Hallett, “Timecourse of corticospinal excitability in reaction time and self-paced movements,” Annals of Neurology, vol. 44, no. 3, pp.317–325, 1998.
[24] N. Murase, J. Duque, R. Mazzocchio, and L. G. Cohen,“Influence of interhemispheric interactions on motor func-tion in chronic stroke,” Annals of Neurology, vol. 55, no. 3,pp. 400–409, 2004.
[25] J. Duque, R. Mazzocchio, J. Dambrosia, N. Murase, E. Olivier,and L. G. Cohen, “Kinematically specific interhemisphericinhibition operating in the process of generation of avoluntary movement,” Cerebral Cortex, vol. 15, no. 5, pp.588–593, 2005.
[26] J. Duque, N. Murase, P. Celnik et al., “Intermanual dif-ferences in movement-related interhemispheric inhibition,”
Journal of Cognitive Neuroscience, vol. 19, no. 2, pp. 204–213,2007.
[27] S. P. Swinnen, “Intermanual coordination: from behaviouralprinciples to neural-network interactions,” Nature Reviews,vol. 3, no. 5, pp. 348–359, 2002.
[28] A. Hubers, Y. Orekhov, and U. Ziemann, “Interhemisphericmotor inhibition: its role in controlling electromyographicmirror activity,” European Journal of Neuroscience, vol. 28, no.2, pp. 364–371, 2008.
[29] M. Kobayashi, S. Hutchinson, H. Theoret, G. Schlaug, andA. Pascual-Leone, “Repetitive TMS of the motor corteximproves ipsilateral sequential simple finger movements,”Neurology, vol. 62, no. 1, pp. 91–98, 2004.
[30] M. Kobayashi, H. Theoret, and A. Pascual-Leone, “Sup-pression of ipsilateral motor cortex facilitates motor skilllearning,” European Journal of Neuroscience, vol. 29, no. 4, pp.833–836, 2009.
[31] L. Avanzino, M. Bove, C. Trompetto, A. Tacchino, C. Oglias-tro, and G. Abbruzzese, “1-Hz repetitive TMS over ipsilateralmotor cortex influences the performance of sequential fingermovements of different complexity,” European Journal ofNeuroscience, vol. 27, no. 5, pp. 1285–1291, 2008.
[32] N. Takeuchi, T. Chuma, Y. Matsuo, I. Watanabe, and K.Ikoma, “Repetitive transcranial magnetic stimulation ofcontralesional primary motor cortex improves hand functionafter stroke,” Stroke, vol. 36, no. 12, pp. 2681–2686, 2005.
[33] F. Giovannelli, A. Borgheresi, F. Balestrieri et al., “Modula-tion of interhemispheric inhibition by volitional motor activ-ity: an ipsilateral silent period study,” Journal of Physiology,vol. 587, no. 22, pp. 5393–5410, 2009.
[34] A. Ferbert, A. Priori, J. C. Rothwell, B. L. Day, J. G. Colebatch,and C. D. Marsden, “Interhemispheric inhibition of thehuman motor cortex,” Journal of Physiology, vol. 453, pp.525–546, 1992.
[35] B. U. Meyer, S. Roricht, H. Grafin von Einsiedel, F. Kruggel,and A. Weindl, “Inhibitory and excitatory interhemispherictransfers between motor cortical areas in normal human andpatients with abonormalities of the corpus callosum,” Brain,vol. 118, no. 2, pp. 429–440, 1995.
[36] F. Heinen, F. X. Glocker, U. Fietzek, B. U. Meyer, C.H. Lucking, and R. Korinthenberg, “Absence of translocalinhibition following focal magnetic stimulation in preschoolchildren,” Annals of Neurology, vol. 43, no. 5, pp. 608–612,1998.
[37] R. Chen, D. Yung, and J. Y. Li, “Organization of ipsilateralexcitatory and inhibitory pathways in the human motorcortex,” Journal of Neurophysiology, vol. 89, no. 3, pp. 1256–1264, 2003.
[38] M. A. Perez and L. G. Cohen, “Mechanisms underlyingfunctional changes in the primary motor cortex ipsilateral toan active hand,” Journal of Neuroscience, vol. 28, no. 22, pp.5631–5640, 2008.
[39] M. L. Harris-Love, M. A. Perez, R. Chen, and L. G. Cohen,“Interhemispheric inhibition in distal and proximal armrepresentations in the primary motor cortex,” Journal ofNeurophysiology, vol. 97, no. 3, pp. 2511–2515, 2007.
[40] M. C. Ridding, B. Brouwer, and M. A. Nordstrom, “Reducedinterhemispheric inhibition in musicians,” ExperimentalBrain Research, vol. 133, no. 2, pp. 249–253, 2000.
[41] I. Zijdewind and D. Kernell, “Bilateral interactions duringcontractions of intrinsic hand muscles,” Journal of Neuro-physiology, vol. 85, no. 5, pp. 1907–1913, 2001.
Neural Plasticity 9
[42] Z. Aranyi and K. M. Rosler, “Effort-induced mirror move-ments: a study of transcallosal inhibition in humans,”Experimental Brain Research, vol. 145, no. 1, pp. 76–82, 2002.
[43] J. A. Bodwell, R. K. Mahurin, S. Waddle, R. Price, and S.C. Cramer, “Age and features of movement influence motoroverflow,” Journal of the American Geriatrics Society, vol. 51,no. 12, pp. 1735–1739, 2003.
[44] Y. Baliz, C. Armatas, M. Farrow et al., “The influence ofattention and age on the occurrence of mirror movements,”Journal of the International Neuropsychological Society, vol.11, no. 7, pp. 855–862, 2005.
[45] P. K. Addamo, M. Farrow, K. E. Hoy, J. L. Bradshaw, andN. Georgiou-Karistianis, “The effects of age and attentionon motor overflow production—a review,” Brain ResearchReviews, vol. 54, no. 1, pp. 189–204, 2007.
[46] C. W. Hess, K. R. Mills, and N. M. F. Murray, “Magnetic stim-ulation of the human brain: facilitation of motor responsesby voluntary contraction of ipsilateral and contralateralmuscles with additional observations on an amputee,” Neu-roscience Letters, vol. 71, no. 2, pp. 235–240, 1986.
[47] M. J. Zwarts, “Central motor conduction in relation tocontra- and ipsilateral activation,” Electroencephalographyand Clinical Neurophysiology, vol. 85, no. 6, pp. 425–428,1992.
[48] M. Cincotta, F. Giovanelli, A. Borgheresi et al., “Surfaceelectromyography shows increased mirroring in Parkinson’sdisease patients without overt mirror movements,” Move-ment Disorders, vol. 21, no. 9, pp. 1461–1465, 2006.
[49] F. Giovannelli, A. Borgheresi, F. Balestrieri et al., “Role ofthe right dorsal premotor cortex in “physiological” mirrorEMG activity,” Experimental Brain Research, vol. 175, no. 4,pp. 633–640, 2006.
[50] M. Cincotta, S. Lori, P. F. Gangemi, F. Barontini, andA. Ragazzoni, “Hand motor cortex activation in a patientwith congenital mirror movements: a study of the silentperiod following focal transcranial magnetic stimulation,”Electroencephalography and Clinical Neurophysiology, vol.101, no. 3, pp. 240–246, 1996.
[51] M. Krams, R. Quinton, M. J. Mayston et al., “Mirrormovements in X-linked Kallmann’s syndrome. II. A PETstudy,” Brain, vol. 120, no. 7, pp. 1217–1228, 1997.
[52] M. Cincotta, A. Borgheresi, P. Boffi et al., “Bilateral motorcortex output with intended unimanual contraction incongenital mirror movements,” Neurology, vol. 58, no. 8, pp.1290–1293, 2002.
[53] J. S. Bloom and G. W. Hynd, “The role of the corpus callosumin interhemispheric transfer of information: excitation orinhibition?” Neuropsychology Review, vol. 15, no. 2, pp. 59–71, 2005.
[54] J. F. Lepage, V. Beaule, M. Srour et al., “Neurophysiologicalinvestigation of congenital mirror movements in a patientwith agenesis of the corpus callosum,” Brain Stimulation, vol.5, no. 2, pp. 137–140, 2011.
[55] M. Wahl, B. Lauterbach-Soon, E. Hattingen et al., “Humanmotor corpus callosum: topography, somatotopy, and linkbetween microstructure and function,” Journal of Neuro-science, vol. 27, no. 45, pp. 12132–12138, 2007.
[56] H. Johansen-Berg, V. Della-Maggiore, T. E. J. Behrens, S.M. Smith, and T. Paus, “Integrity of white matter in thecorpus callosum correlates with bimanual co-ordinationskills,” NeuroImage, vol. 36, supplement 2, pp. T16–T21,2007.
[57] L. Bonzano, A. Tacchino, L. Roccatagliata, G. Abbruzzese,G. L. Mancardi, and M. Bove, “Callosal contributions
to simultaneous bimanual finger movements,” Journal ofNeuroscience, vol. 28, no. 12, pp. 3227–3233, 2008.
[58] B. W. Fling, B. L. Benson, and R. D. Seidler, “Transcallosalsensorimotor fiber tract structure-function relationships,”Human Brain Mapping. In press.
[59] H. J. Gould III, C. G. Cusick, T. P. Pons, and J. H. Kaas, “Therelationship of corpus callosum connections to electricalstimulation maps of motor, supplementary motor, and thefrontal eye fields in owl monkeys,” Journal of ComparativeNeurology, vol. 247, no. 3, pp. 297–325, 1986.
[60] G. R. Leichnetz, “Afferent and efferent connections of thedorsolateral precentral gyrus (area 4, hand/arm region) inthe macaque monkey, with comparisons to area 8,” Journalof Comparative Neurology, vol. 254, no. 4, pp. 460–492, 1986.
[61] B. U. Meyer, S. Roricht, and C. Woiciechowsky, “Topographyof fibers in the human corpus callosum mediating inter-hemispheric inhibition between the motor cortices,” Annalsof Neurology, vol. 43, no. 3, pp. 360–369, 1998.
[62] F. G. Andres, T. Mima, A. E. Schulman, J. Dichgans, M. Hal-lett, and C. Gerloff, “Functional coupling of human corticalsensorimotor areas during bimanual skill acquisition,” Brain,vol. 122, no. 5, pp. 855–870, 1999.
[63] S. Caille, H. C. Sauerwein, A. Schiavetto, J. G. Villemure,and M. Lassonde, “Sensory and motor interhemisphericintegration after section of different portions of the anteriorcorpus callosum in nonepileptic patients,” Neurosurgery, vol.57, no. 1, pp. 50–58, 2005.
[64] T. J. Crow, “Schizophrenia as a transcallosal misconnectionsyndrome,” Schizophrenia Research, vol. 30, no. 2, pp. 111–114, 1998.
[65] C. Knochel, V. Oertel-Knochel, R. Schonmeyer et al.,“Interhemispheric hypoconnectivity in schizophrenia: fiberintegrity and volume differences of the corpus callosum inpatients and unaffected relatives,” NeuroImage, vol. 59, no. 2,pp. 926–934, 2012.
[66] K. Aydin, A. Ucok, and J. Guler, “Altered metabolic integrityof corpus callosum among individuals at ultra high risk ofSchizophrenia and first-episode patients,” Biological Psychia-try, vol. 64, no. 9, pp. 750–757, 2008.
[67] K. E. Hoy, N. Georgiou-Karistianis, M. Farrow, and P.B. Fitzgerald, “Neurological soft signs in schizophrenia:investigating motor overflow,” World Journal of BiologicalPsychiatry, vol. 10, no. 4, pp. 763–771, 2009.
[68] D. W. Heinrichs and R. W. Buchanan, “Significance andmeaning of neurological signs in schizophrenia,” AmericanJournal of Psychiatry, vol. 145, no. 1, pp. 11–18, 1988.
[69] A. Pascual-Leone, D. S. Manoach, R. Birnbaum, and D. C.Goff, “Motor cortical excitability in schizophrenia,” BiologicalPsychiatry, vol. 52, no. 1, pp. 24–31, 2002.
[70] G. D. Schott and M. A. Wyke, “Congenital mirror move-ments,” Journal of Neurology, Neurosurgery, and Psychiatry,vol. 44, no. 7, pp. 586–599, 1981.
[71] T. C. Britton, B. U. Meyer, and R. Benecke, “Central motorpathways in patients with mirror movements,” Journal ofNeurology Neurosurgery and Psychiatry, vol. 54, no. 6, pp.505–510, 1991.
[72] M. Cincotta, A. Ragazzoni, G. De Scisciolo, F. Pinto, S. Mau-rri, and F. Barontini, “Abnormal projection of corticospinaltracts in a patient with congenital mirror movements,”Neurophysiologie Clinique, vol. 24, no. 6, pp. 427–434, 1994.
[73] Y. Ueki, T. Mima, T. Oga et al., “Dominance of ipsilateralcorticospinal pathway in congenital mirror movements,”Journal of Neurology, Neurosurgery and Psychiatry, vol. 76, no.2, pp. 276–279, 2005.
10 Neural Plasticity
[74] B. Conrad, J. Kriebel, and W. D. Hetzel, “Hereditary biman-ual synkinesis combined with hypogonadotropic hypogo-nadism and anosmia in four brothers,” Journal of Neurology,vol. 218, no. 4, pp. 263–274, 1978.
[75] M. J. Mayston, L. M. Harrison, R. Quinton, J. A. Stephens,M. Krams, and P. M. G. Bouloux, “Mirror movements in X-linked Kallmann’s syndrome. I. A neurophysiological study,”Brain, vol. 120, no. 7, pp. 1199–1216, 1997.
[76] S. F. Farmer, L. M. Harrison, M. J. Mayston, A. Parekh,L. M. James, and J. A. Stephens, “Abnormal cortex-muscleinteractions in subjects with X-linked Kallmann’s syndromeand mirror movements,” Brain, vol. 127, no. 2, pp. 385–397,2004.
[77] S. F. Farmer, D. A. Ingram, and J. A. Stephens, “Mirrormovements studied in a patient with Klippel-Feil syndrome,”Journal of Physiology, vol. 428, pp. 467–484, 1990.
[78] S. A. Royal, R. S. Tubbs, M. G. D’Antonio, M. J. Rauzzino,and W. J. Oakes, “Investigations into the association betweencervicomedullary neuroschisis and mirror movements inpatients with Klippel-Feil syndrome,” American Journal ofNeuroradiology, vol. 23, no. 4, pp. 724–729, 2002.
[79] M. Cincotta, A. Borgheresi, P. Liotta et al., “Reorganizationof the motor cortex in a patient with congenital hemiparesisand mirror movements,” Neurology, vol. 55, no. 1, pp. 129–131, 2000.
[80] C. Gallea, T. Popa, S. Billot, A. Meneret, C. Depienne, and E.Roze, “Congenital mirror movements: a clue to understand-ing bimanual motor control,” Journal of Neurology, vol. 11,no. 258, pp. 1–9, 2011.
[81] Z. J. Daskalakis, B. K. Christensen, P. B. Fitzgerald, L.Roshan, and R. Chen, “The mechanisms of interhemisphericinhibition in the human motor cortex,” Journal of Physiology,vol. 543, no. 1, pp. 317–326, 2002.
[82] K. E. Hoy, P. B. Fitzgerald, J. L. Bradshaw et al., “Motoroverflow in schizophrenia,” Psychiatry Research, vol. 125, no.2, pp. 129–137, 2004.
[83] M. Cincotta, A. Borgheresi, F. Balestrieri et al., “Mechanismsunderlying mirror movements in Parkinson’s disease: a tran-scranial magnetic stimulation study,” Movement Disorders,vol. 21, no. 7, pp. 1019–1025, 2006.
[84] J. Netz, T. Lammers, and V. Homberg, “Reorganization ofmotor output in the non-affected hemisphere after stroke,”Brain, vol. 120, no. 9, pp. 1579–1586, 1997.
[85] M. Oliveri, P. M. Rossini, R. Traversa et al., “Left frontaltranscranial magnetic stimulation reduces contralesionalextinction in patients with unilateral right brain damage,”Brain, vol. 122, no. 9, pp. 1731–1739, 1999.
[86] P. K. Addamo, M. Farrow, K. E. Hoy, J. L. Bradshaw, and N.Georgiou-Karistianis, “The influence of task characteristicson younger and older adult motor overflow,” QuarterlyJournal of Experimental Psychology, vol. 62, no. 2, pp. 239–247, 2009.
[87] R. Q. Cracco, V. E. Amassian, P. J. Maccabee, and J. B. Cracco,“Comparison of human transcallosal responses evoked bymagnetic coil and electrical stimulation,” Electroencephalog-raphy and Clinical Neurophysiology, vol. 74, no. 6, pp. 417–424, 1989.
[88] M. Srour, M. Philibert, M. H. Dion et al., “Familial congenitalmirror movements: report of a large 4-generation family,”Neurology, vol. 73, no. 9, pp. 729–731, 2009.
[89] M. Srour, J. B. Riviere, J. M. T. Pham et al., “Mutations inDCC cause congenital mirror movements,” Science, vol. 328,no. 5978, p. 592, 2010.
[90] C. Depienne, M. Cincotta, S. Billot et al., “A novel DCCmutation and genetic heterogeneity in congenital mirrormovements,” Neurology, vol. 76, no. 3, pp. 260–264, 2011.
[91] K. Kullander, S. D. Croll, M. Zimmer et al., “Ephrin-B3 is themidline barrier that prevents corticospinal tract axons fromrecrossing, allowing for unilateral motor control,” Genes andDevelopment, vol. 15, no. 7, pp. 877–888, 2001.
[92] J. H. Finger, R. T. Bronson, B. Harris, K. Johnson, S. A.Przyborski, and S. L. Ackerman, “The netrin 1 receptorsUnc5h3 and Dcc are necessary at multiple choice pointsfor the guidance of corticospinal tract axons,” Journal ofNeuroscience, vol. 22, no. 23, pp. 10346–10356, 2002.
[93] C. Depienne, D. Bouteiller, A. Meneret et al., “RAD51haploinsufficiency causes congenital mirror movements inhumans,” American Journal of Human Genetics, vol. 2, no. 90,pp. 301–307, 2012.
[94] C. H. Gunderson and G. B. Solitare, “Mirror movementsin patients with the Klippel-Feil syndrome. Neuropathologicobservations,” Archives of Neurology, vol. 18, no. 6, pp. 675–679, 1968.
[95] J. Netz, U. Ziemann, and V. Homberg, “Hemispheric asym-metry of transcallosalinhibition in man,” Experimental BrainResearch, vol. 104, no. 3, pp. 527–533, 1995.
[96] W. J. Triggs, R. Calvanio, M. Levine, R. K. Heaton, and K. M.Heilman, “Predicting hand preference with performance onmotor tasks,” Cortex, vol. 36, no. 5, pp. 679–689, 2000.
[97] G. Hammond, D. Faulkner, M. Byrnes, F. Mastaglia, andG. Thickbroom, “Transcranial magnetic stimulation revealsasymmetrical efficacy of intracortical circuits in primarymotor cortex,” Experimental Brain Research, vol. 155, no. 1,pp. 19–23, 2004.
[98] K. Ikoma, A. Samii, B. Mercuri, E. M. Wassermann, and M.Hallett, “Abnormal cortical motor excitability in dystonia,”Neurology, vol. 46, no. 5, pp. 1371–1376, 1996.
[99] T. Verstynen, J. Diedrichsen, N. Albert, P. Aparicio, and R.B. Ivry, “Ipsilateral motor cortex activity during unimanualhand movements relates to task complexity,” Journal ofNeurophysiology, vol. 93, no. 3, pp. 1209–1222, 2005.
[100] M. Zoghi and M. A. Nordstrom, “Progressive suppression ofintracortical inhibition during graded isometric contractionof a hand muscle is not influenced by hand preference,”Experimental Brain Research, vol. 177, no. 2, pp. 266–274,2007.
[101] A. Schmied, J. P. Vedel, and S. Pagni, “Human spinallateralization assessed from motoneurone synchronization:dependence on handedness and motor unit type,” Journal ofPhysiology, vol. 480, no. 2, pp. 369–387, 1994.
[102] J. Duque, M. Davare, L. Delaunay et al., “Monitoringcoordination during bimanual movements: where is themastermind?” Journal of Cognitive Neuroscience, vol. 22, no.3, pp. 526–542, 2010.
[103] J. L. Chan and E. D. Ross, “Left-handed mirror writingfollowing right anterior cerebral artery infarction: evidencefor nonmirror transformation of motor programs by rightsupplementary motor area,” Neurology, vol. 38, no. 1, pp. 59–63, 1988.
[104] N. Sadato, Y. Yonekura, A. Waki, H. Yamada, and Y. Ishii,“Role of the supplementary motor area and the rightpremotor cortex in the coordination of bimanual fingermovements,” Journal of Neuroscience, vol. 17, no. 24, pp.9667–9674, 1997.
[105] C. Brinkman, “Supplementary motor area of the monkey’scerebral cortex: short- and long-term deficits after unilateral
Neural Plasticity 11
ablation and the effects of subsequent callosal section,”Journal of Neuroscience, vol. 4, no. 4, pp. 918–929, 1984.
[106] D. Laplane, J. Talairach, and V. Meininger, “Clinical con-sequences of corticectomies involving the supplementarymotor area in man,” Journal of the Neurological Sciences, vol.34, no. 3, pp. 301–314, 1977.
[107] D. N. Pandya and L. A. Vignolo, “Intra- and interhemisphericprojections of the precentral, premotor and arcuate areas inthe rhesus monkey,” Brain Research, vol. 26, no. 2, pp. 217–233, 1971.
[108] K. F. Muakkassa and P. L. Strick, “Frontal lobe inputs toprimate motor cortex: evidence for four somatotopicallyorganized ’premotor’ areas,” Brain Research, vol. 177, no. 1,pp. 176–182, 1979.
[109] A. Berardelli, J. C. Rothwell, P. D. Thompson, and M. Hallett,“Pathophysiology of bradykinesia in parkinson’s disease,”Brain, vol. 124, no. 11, pp. 2131–2146, 2001.
[110] H. Shibasaki and M. Hallett, “What is the Bereitschaftspo-tential?” Clinical Neurophysiology, vol. 117, no. 11, pp. 2341–2356, 2006.
[111] A. Ikeda, H. O. Luders, R. C. Burgess, and H. Shibasaki,“Movement-related potentials recorded from supplementarymotor area and primary motor area. Role of supplementarymotor area in voluntary movements,” Brain, vol. 115, no. 4,pp. 1017–1043, 1992.
[112] R. Cunnington, R. Iansek, J. L. Bradshaw, and J. G.Phillips, “Movement-related potentials associated withmovement preparation and motor imagery,” ExperimentalBrain Research, vol. 111, no. 3, pp. 429–436, 1996.
[113] H. Shibasaki, G. Barrett, E. Halliday, and A. M. Halliday,“Components of the movement-related cortical potentialand their scalp topography,” Electroencephalography andClinical Neurophysiology, vol. 49, no. 3-4, pp. 213–226, 1980.
[114] M. Jueptner and C. Weiller, “A review of differences betweenbasal ganglia and cerebellar control of movements as revealedby functional imaging studies,” Brain, vol. 121, no. 8, pp.1437–1449, 1998.
[115] J. E. Hoover and P. L. Strick, “Multiple output channels in thebasal ganglia,” Science, vol. 259, no. 5096, pp. 819–821, 1993.
[116] E. Kraft, A. W. Chen, A. W. Flaherty, A. J. Blood, K. K. Kwong,and B. G. Jenkins, “The role of the basal ganglia in bimanualcoordination,” Brain Research, vol. 1151, no. 1, pp. 62–73,2007.
[117] E. D. Playford, I. H. Jenkins, R. E. Passingham, R. S.Frackowiak, and D. J. Brooks, “Impaired activation of frontalareas during movement in Parkinson’s disease: a PET study,”Advances in neurology, vol. 60, pp. 506–510, 1993.
[118] J. P. R. Dick, J. C. Rothwell, B. L. Day et al., “TheBereitschaftspotential is abnormal in Parkinson’s disease,”Brain, vol. 112, no. 1, pp. 233–244, 1989.
[119] M. Hallett, “Transcranial magnetic stimulation and thehuman brain,” Nature, vol. 406, no. 6792, pp. 147–150, 2000.
[120] M. C. Ridding, R. Inzelberg, and J. C. Rothwell, “Changesin excitability of motor cortical circuitry patients withParkinson’s disease,” Annals of Neurology, vol. 37, no. 2, pp.181–188, 1995.
[121] V. S. Mattay, F. Fera, A. Tessitore et al., “Neurophysiologicalcorrelates of age-related changes in human motor function,”Neurology, vol. 58, no. 4, pp. 630–635, 2002.
[122] R. D. Seidler, J. A. Bernard, T. B. Burutolu et al., “Motorcontrol and aging: links to age-related brain structural,functional, and biochemical effects,” Neuroscience and Biobe-havioral Reviews, vol. 34, no. 5, pp. 721–733, 2010.
[123] B. W. Fling and R. D. Seidler, “Fundamental differences incallosal structure, neurophysiologic function, and bimanualcontrol in young and older adults,” Cerebral Cortex, EPUB,vol. 22, no. 11, pp. 2643–2652, 2012.
[124] R. Cabeza, “Hemispheric asymmetry reduction in olderadults: the HAROLD model,” Psychology and Aging, vol. 17,no. 1, pp. 85–100, 2002.
[125] C. Calautti, C. Serrati, and J. C. Baron, “Effects of ageon brain activation during auditory-cued thumb-to-indexopposition: a positron emission tomography study,” Stroke,vol. 32, no. 1, pp. 139–146, 2001.
Hindawi Publishing CorporationNeural PlasticityVolume 2012, Article ID 797295, 10 pagesdoi:10.1155/2012/797295
Review Article
Activity-Dependent Callosal Axon Projections inNeonatal Mouse Cerebral Cortex
Yoshiaki Tagawa1, 2 and Tomoo Hirano1
1 Department of Biophysics, Kyoto University Graduate School of Science, Kitashirakawa-Oiwake-cho, Sakyo-ku, Kyoto 606-8502, Japan2 CREST, Japan Science and Technology Agency, Kawaguchi, Saitama 332-0012, Japan
Correspondence should be addressed to Yoshiaki Tagawa, [email protected]
Received 31 July 2012; Accepted 21 October 2012
Academic Editor: Matteo Caleo
Copyright © 2012 Y. Tagawa and T. Hirano. This is an open access article distributed under the Creative Commons AttributionLicense, which permits unrestricted use, distribution, and reproduction in any medium, provided the original work is properlycited.
Callosal axon projections are among the major long-range axonal projections in the mammalian brain. They are formed duringthe prenatal and early postnatal periods in the mouse, and their development relies on both activity-independent and -dependentmechanisms. In this paper, we review recent findings about the roles of neuronal activity in callosal axon projections. In additionto the well-documented role of sensory-driven neuronal activity, recent studies using in utero electroporation demonstrated anessential role of spontaneous neuronal activity generated in neonatal cortical circuits. Both presynaptic and postsynaptic neuronalactivities are critically involved in the axon development. Studies have begun to reveal intracellular signaling pathway which worksdownstream of neuronal activity. We also review several distinct patterns of neuronal activity observed in the developing cerebralcortex, which might play roles in activity-dependent circuit construction. Such neuronal activity during the neonatal period canbe disrupted by genetic factors, such as mutations in ion channels. It has been speculated that abnormal activity caused by suchfactors may affect activity-dependent circuit construction, leading to some developmental disorders. We discuss a possibility thatgenetic mutation in ion channels may impair callosal axon projections through an activity-dependent mechanism.
1. Introduction
For developmental neuroscientists, interhemispheric axons(callosal axons) have been an excellent model to study howlong-range axonal projections develop in the brain. Callosalaxons form one of the major axonal tracts in the mammalianbrain, the corpus callosum, which visibly connects thetwo cerebral hemispheres. In the past decades, detailedanatomical and physiological studies in animal modelshave improved our understanding of the organization anddevelopment of callosal connections [1–8]. Recent geneticstudies have revealed molecular signals critical for the iden-tity specification of callosal projection neurons [9–12] andaxon guidance during the midline crossing [13–27]. Thesefindings have been relevant for not only basic neuroscientistsbut also clinical neuroscientists, because malformations suchas partial or complete agenesis of the corpus callosum areassociated with many human congenital disorders [18, 22].
In general, during formation of connections in thedeveloping brain, there is an early phase relying on activity
independent mechanisms (such as those involving axonguidance molecules) and a later phase requiring neuronalactivity [28–33]. As for callosal connections, an importantrole of neuronal activity in their formation is well established.For example, in the visual cortex, sensory-driven neuronalactivity is crucial for the formation of callosal connections[7, 34–37]. In addition, recent studies using mice as a modelhave begun to reveal critical roles of neuronal activity spon-taneously generated in neonatal cortical circuits [38–41].Sophisticated in vivo Ca2+ imaging and multiunit recordingshave uncovered several distinct patterns of neuronal activityoccurring in neonatal mouse cortex during the periods whencallosal axon projections develop [42–50]. Interestingly,some of the activities occurring in both hemispheres aresynchronized [47]. These new findings suggest that callosalaxon projections and connection formation are shapednot only by sensory-driven neuronal activity but also byspontaneous neuronal activity generated in the developingcerebral cortex.
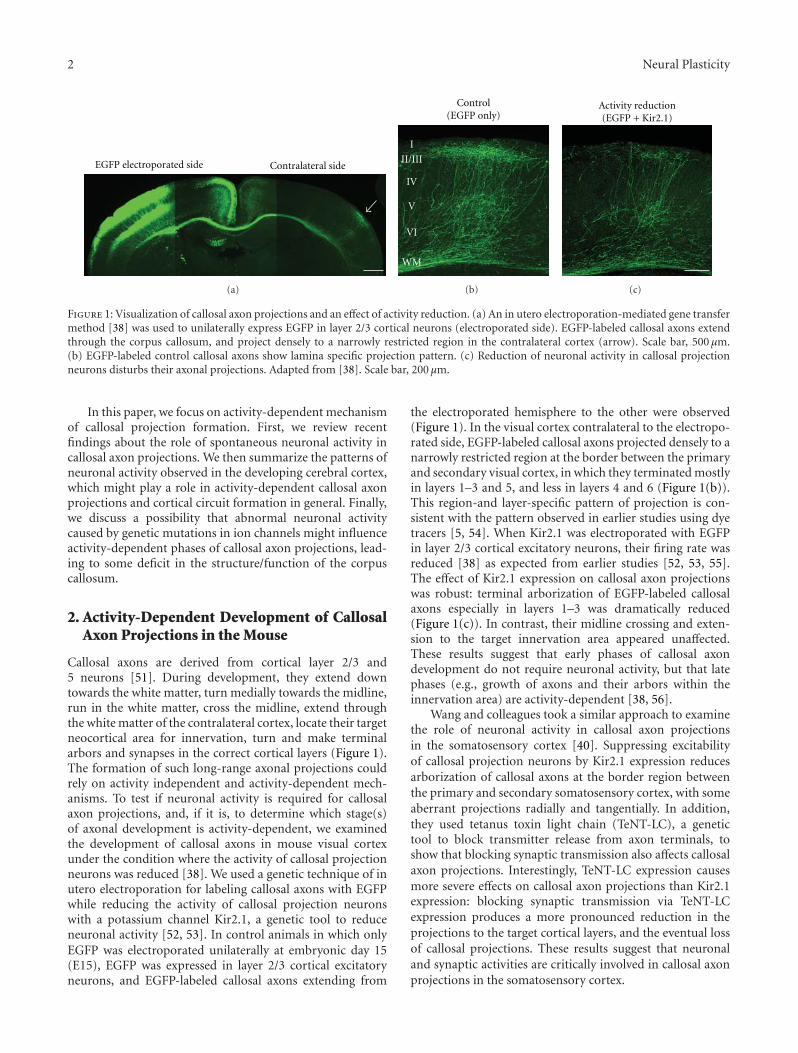
2 Neural Plasticity
EGFP electroporated side Contralateral side
(a)
I
II/III
IV
V
VI
WM
Control(EGFP only)
(b)
Activity reduction(EGFP + Kir2.1)
(c)
Figure 1: Visualization of callosal axon projections and an effect of activity reduction. (a) An in utero electroporation-mediated gene transfermethod [38] was used to unilaterally express EGFP in layer 2/3 cortical neurons (electroporated side). EGFP-labeled callosal axons extendthrough the corpus callosum, and project densely to a narrowly restricted region in the contralateral cortex (arrow). Scale bar, 500 μm.(b) EGFP-labeled control callosal axons show lamina specific projection pattern. (c) Reduction of neuronal activity in callosal projectionneurons disturbs their axonal projections. Adapted from [38]. Scale bar, 200 μm.
In this paper, we focus on activity-dependent mechanismof callosal projection formation. First, we review recentfindings about the role of spontaneous neuronal activity incallosal axon projections. We then summarize the patterns ofneuronal activity observed in the developing cerebral cortex,which might play a role in activity-dependent callosal axonprojections and cortical circuit formation in general. Finally,we discuss a possibility that abnormal neuronal activitycaused by genetic mutations in ion channels might influenceactivity-dependent phases of callosal axon projections, lead-ing to some deficit in the structure/function of the corpuscallosum.
2. Activity-Dependent Development of CallosalAxon Projections in the Mouse
Callosal axons are derived from cortical layer 2/3 and5 neurons [51]. During development, they extend downtowards the white matter, turn medially towards the midline,run in the white matter, cross the midline, extend throughthe white matter of the contralateral cortex, locate their targetneocortical area for innervation, turn and make terminalarbors and synapses in the correct cortical layers (Figure 1).The formation of such long-range axonal projections couldrely on activity independent and activity-dependent mech-anisms. To test if neuronal activity is required for callosalaxon projections, and, if it is, to determine which stage(s)of axonal development is activity-dependent, we examinedthe development of callosal axons in mouse visual cortexunder the condition where the activity of callosal projectionneurons was reduced [38]. We used a genetic technique of inutero electroporation for labeling callosal axons with EGFPwhile reducing the activity of callosal projection neuronswith a potassium channel Kir2.1, a genetic tool to reduceneuronal activity [52, 53]. In control animals in which onlyEGFP was electroporated unilaterally at embryonic day 15(E15), EGFP was expressed in layer 2/3 cortical excitatoryneurons, and EGFP-labeled callosal axons extending from
the electroporated hemisphere to the other were observed(Figure 1). In the visual cortex contralateral to the electropo-rated side, EGFP-labeled callosal axons projected densely to anarrowly restricted region at the border between the primaryand secondary visual cortex, in which they terminated mostlyin layers 1–3 and 5, and less in layers 4 and 6 (Figure 1(b)).This region-and layer-specific pattern of projection is con-sistent with the pattern observed in earlier studies using dyetracers [5, 54]. When Kir2.1 was electroporated with EGFPin layer 2/3 cortical excitatory neurons, their firing rate wasreduced [38] as expected from earlier studies [52, 53, 55].The effect of Kir2.1 expression on callosal axon projectionswas robust: terminal arborization of EGFP-labeled callosalaxons especially in layers 1–3 was dramatically reduced(Figure 1(c)). In contrast, their midline crossing and exten-sion to the target innervation area appeared unaffected.These results suggest that early phases of callosal axondevelopment do not require neuronal activity, but that latephases (e.g., growth of axons and their arbors within theinnervation area) are activity-dependent [38, 56].
Wang and colleagues took a similar approach to examinethe role of neuronal activity in callosal axon projectionsin the somatosensory cortex [40]. Suppressing excitabilityof callosal projection neurons by Kir2.1 expression reducesarborization of callosal axons at the border region betweenthe primary and secondary somatosensory cortex, with someaberrant projections radially and tangentially. In addition,they used tetanus toxin light chain (TeNT-LC), a genetictool to block transmitter release from axon terminals, toshow that blocking synaptic transmission also affects callosalaxon projections. Interestingly, TeNT-LC expression causesmore severe effects on callosal axon projections than Kir2.1expression: blocking synaptic transmission via TeNT-LCexpression produces a more pronounced reduction in theprojections to the target cortical layers, and the eventual lossof callosal projections. These results suggest that neuronaland synaptic activities are critically involved in callosal axonprojections in the somatosensory cortex.
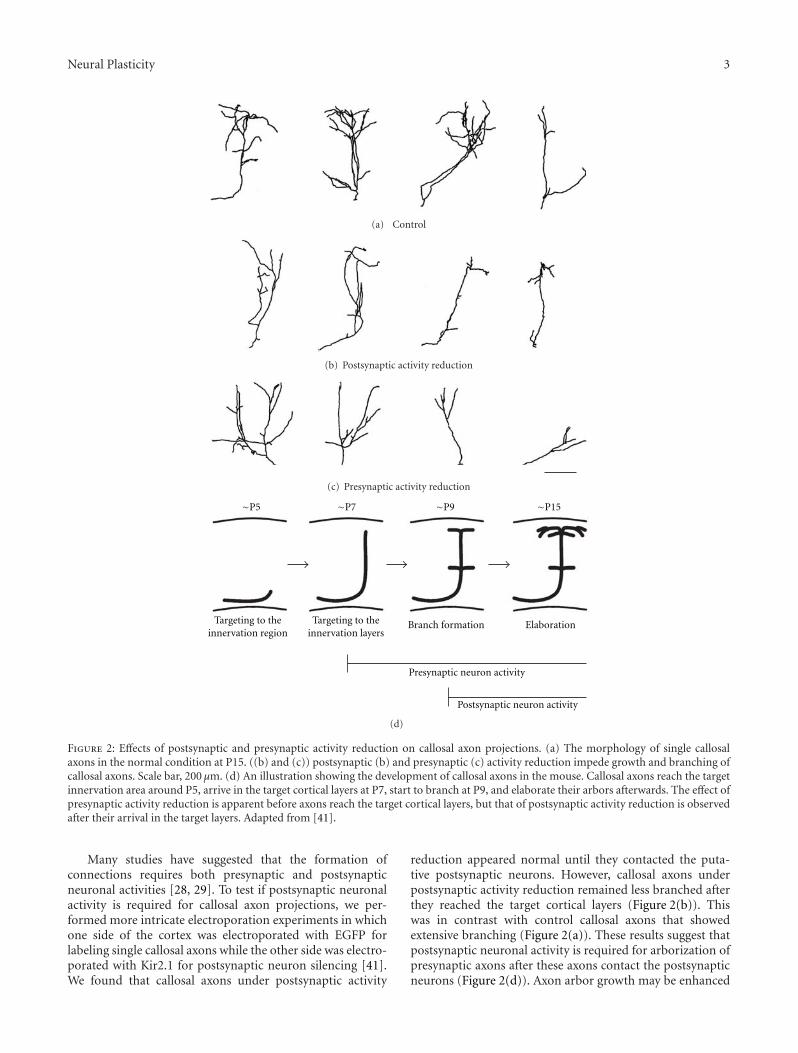
Neural Plasticity 3
(a) Control
(b) Postsynaptic activity reduction
(c) Presynaptic activity reduction
∼P5 ∼P7 ∼P9 ∼P15
Targeting to theinnervation region
Targeting to theinnervation layers
Branch formation Elaboration
Presynaptic neuron activity
Postsynaptic neuron activity
(d)
Figure 2: Effects of postsynaptic and presynaptic activity reduction on callosal axon projections. (a) The morphology of single callosalaxons in the normal condition at P15. ((b) and (c)) postsynaptic (b) and presynaptic (c) activity reduction impede growth and branching ofcallosal axons. Scale bar, 200 μm. (d) An illustration showing the development of callosal axons in the mouse. Callosal axons reach the targetinnervation area around P5, arrive in the target cortical layers at P7, start to branch at P9, and elaborate their arbors afterwards. The effect ofpresynaptic activity reduction is apparent before axons reach the target cortical layers, but that of postsynaptic activity reduction is observedafter their arrival in the target layers. Adapted from [41].
Many studies have suggested that the formation ofconnections requires both presynaptic and postsynapticneuronal activities [28, 29]. To test if postsynaptic neuronalactivity is required for callosal axon projections, we per-formed more intricate electroporation experiments in whichone side of the cortex was electroporated with EGFP forlabeling single callosal axons while the other side was electro-porated with Kir2.1 for postsynaptic neuron silencing [41].We found that callosal axons under postsynaptic activity
reduction appeared normal until they contacted the puta-tive postsynaptic neurons. However, callosal axons underpostsynaptic activity reduction remained less branched afterthey reached the target cortical layers (Figure 2(b)). Thiswas in contrast with control callosal axons that showedextensive branching (Figure 2(a)). These results suggest thatpostsynaptic neuronal activity is required for arborization ofpresynaptic axons after these axons contact the postsynapticneurons (Figure 2(d)). Axon arbor growth may be enhanced
4 Neural Plasticity
by synaptogenesis [57, 58]; an axon arbor making stablesynapses may grow further, while that making less stablesynapses may not be able to grow and eventually retract.Formation and maturation of synapses require coordinatedpresynaptic and postsynaptic activity [28, 29]. If either (orboth) were reduced, synapse formation would be suppressed,which may lead to poor arborization of presynaptic axons.This transsynaptic effect may be mediated by some retro-grade signal(s) from postsynaptic neurons to presynapticaxons. Possible candidates would be neurotrophins, whichare shown to act as retrograde messengers in mediatingactivity-dependent strengthening of synaptic connections[59–63].
We also found that the effect of presynaptic neuronalactivity reduction was apparent before axons reached thetarget cortical layers (Figures 2(c) and 2(d)) [41]. Thisresult suggests that the activity of projection neurons them-selves plays a role in axonal development before synapseformation. How does activity of callosal projection neuronsregulate their own axonal development? Neuronal activitymay modulate cytoskeleton rearrangement in the growingaxons. Ohnami and colleagues have found that RhoA, amember of Rho family small GTPases, acts as a positiveregulator for activity-dependent axon branching in corticalneurons [64]. It is also shown that neuronal activity canmodulate the expression or function of some guidancemolecules expressed on growing axons, thereby regulatingaxonal growth, pathfinding, fasciculation, and branching[65–68].
What intracellular signaling mediates activity-dependentaxonal development? Kir2.1 overexpression in cortical neu-rons hyperpolarizes their membrane potential and increasesthe threshold for evoking action potentials, thereby inhibit-ing the firing activity [38, 40, 52]. This reduction infiring could attenuate intracellular Ca2+ signaling. It isknown that Ca2+ plays a critical role in the regulationof neuronal morphogenesis including dendrite and axondevelopment [69–73]. There are many protein kinases andphosphatases whose activities are regulated by Ca2+. Ageta-Ishihara and colleagues showed that a member of theCa2+-dependent kinase family, Ca2+/calmodulin-dependentprotein kinase Iα (CaMKIα), plays a critical role in callosalaxon projections [74]. Using in vitro dissociated culturesystem, they found that blocking expression or functionof CaMKIα specifically impaired axonal, but not dendritic,growth of cortical neurons. They also found that activationof GABAA receptors promoted axonal growth in a CaMKIα-dependent manner. They further showed that in vivo RNAiknockdown of CaMKIα in callosal projection neurons byin utero electroporation disturbed their axonal projections.It is known that the action of GABA is excitatory in theneonatal period (until two weeks of age) [75]. Although itwas not shown whether GABA exerted its action on the cellbody and dendrites, or directly on the growing axons, theirresults suggest that CaMKIα is critically involved in activity-dependent callosal axon projections and that this activity isat least in part mediated by excitatory action of GABA.
Many issues remain to be addressed. For example,the work of Ageta-Ishihara and colleagues suggests that
CaMKIα is an important player which may work down-stream of neuronal activity, but other possible candidates(Ca2+-dependent and independent intracellular signalingmolecules) remain unexplored. In addition, these intracel-lular signaling molecules would influence the regulationof cytoskeletal proteins, thereby regulating growth andbranching of axons, but the precise molecular mechanism isunknown. It is important to note that some of intracellularsignaling molecules might work both activity dependentlyand independently: for example, they may be involved inmidline crossing of callosal axons under the control of someguidance molecules and subsequently play a role in axonarbor growth and branching under the control of neuronalactivity. If this is the case, intricate experiments such asthose using temporally controlled RNAi knockdown of targetmolecule would be necessary.
Another important issue to be addressed would be thepossible relationship between the process of thalamocorticalprojections and that of the formation of callosal connections.In the visual cortex during the neonatal period, the activityof cortical neurons is modulated by thalamocortical inputs,which transmit activity from the periphery (spontaneouslygenerated massive neuronal activity in the retina, called reti-nal waves) [50, 76]. Thalamocortical connectivity developsuntil P8 in the mouse [77], several days before callosalconnectivity forms [38]. Is thalamocortical innervation aprerequisite for callosal connections to establish? Does theactivity supplied by thalamocortical inputs play a role incallosal connection formation? These are important notonly from a developmental point of view but also from afunctional view. Thalamocortical projections are arrangedin the cortex in a retinotopic manner, and each visualcallosal axon projects to a retinotopically matched regionwithin the visual cortex [78–81]. Olavarria et al. haveshown that eye removal during the neonatal period altersretinotopically matched projection pattern of callosal axons[54, 82], suggesting a possibility that retinotopic informationconveyed through the retino-thalamo-cortical pathway influ-ences callosal connection formation. It would be interestingto examine whether eliminating thalamocortical projections(or suppressing activity of thalamocortical axons) also affectsretinotopically organized callosal projection pattern. In addi-tion, whether callosal axons under activity reduction (such asthose shown in Figures 2(b) and 2(c)) show retinotopicallycorrect projection pattern or not would be an importantissue to be addressed in future.
3. Patterns of Neuronal ActivityObserved in Rat/Mouse Cerebral Cortexduring the Neonatal Period
Recent studies have revealed that several distinct patterns ofneuronal activity take place in the rat/mouse cortex duringthe periods when callosal axon projections develop [42–50, 83–85]. Some of them are asynchronous (i.e., neurons fireaction potentials individually), and others are network eventsin which activities of many neurons are synchronized locallyor globally (called “cortical waves”). It is important to note
Neural Plasticity 5
that neurons in the sensory cortex can fire action potentialswithout sensory inputs. In development, cortical neuronsdifferentiate to express a combination of ion channels, bywhich they start to fire action potentials spontaneously.They also start to receive synaptic inputs as cortical networkmatures, which drive, boost and modulate firing activityof the developing cortical neurons. This neuronal activity,“spontaneously” generated in the developing neurons andcortical network, has been thought to contribute to the for-mation of connections in the cortex during the developmen-tal period before sensory inputs come in [28, 32, 33, 45, 86].
Garaschuk and colleagues used Ca2+ imaging techniqueto monitor neuronal activity in the developing corticalcircuits in a slice preparation [42], and later in the intactbrain [43, 49]. They found that spontaneous oscillatoryCa2+ waves traveled across cortical slices taken from P1–P4 rats and named them cortical early network oscillations(cENOs). cENOs were typically observed once per 1–12minutes, and many neurons (typically over 80% of theneurons in the recorded area) participated in the wave.cENOs were completely blocked by AMPA-and NMDA-typeglutamate receptor antagonists but not by GABA receptorantagonists, suggesting that cENOs are driven by glutamater-gic transmission. Later, by using a similar approach, Alleneand colleagues reported another synapse-driven networkpattern in neonatal cortical slices, named giant depolarizingpotentials (GDPs) [46]. GDPs are different from cENOs, inthat they are driven by GABAergic transmission, occur at ahigher frequency, recruit smaller number and more localizedpopulation of neurons. In addition, GDPs emerge at laterstages in cortical development than cENOs (P5–9 for GDPsversus P1–4 for cENOs). These differences may suggest thatcENOs and GDPs are involved in different aspects/phases ofcortical circuit formation. Ca2+ waves have been observed invivo rat/mouse cerebral cortex [43, 48–50], but these studiesdid not determine whether they corresponded to cENOs orGDPs.
Correlated Ca2+ activity mentioned above mostly reflectsneuronal firings [46]. Extracellular recordings have detectedsimilar network activities in neonatal rat/mouse cerebralcortex [44, 47, 76, 87, 88]. Yang and colleagues reportedthree distinct patterns of synchronized oscillatory activityin neonatal rat cortex: spindle-bursts, gamma oscillations,and long oscillations [47]. Spindle-bursts are neuronal burstfirings of 1-2 s in duration, ∼10 Hz in frequency, andobserved approximately every 10 s. Gamma oscillations areneuronal activities at a frequency of 30–40 Hz, duration of150–300 ms, and occur every 10–30 s. Spindle-bursts andgamma oscillations do not propagate but synchronize a localcortical network. In contrast, long oscillations propagate overlarge cortical regions. They occur every 20 m, last >40 s,and synchronize in the 10–20 Hz frequency range over 600–800 μm. The precise relationship between the two typesof Ca2+ waves (cENOs and GDPs) and the three types ofelectrical activities (spindle-bursts, gamma oscillations, andlong oscillations) is to be clarified.
All three types of electrical activity can be elicited by acti-vation of the periphery. For example, in the somatosensorycortex, tactile, or electrical stimulation of whiskers can
induce these network activities [47]. It has also been shownthat spontaneously generated correlated activity in the retina(retinal waves) is transmitted to induce spindle-bursts in thevisual cortex [76]. However, blocking the peripheral inputscan only reduce, but not eliminate, these network activities,suggesting that the peripheral inputs are not the onlymechanism to trigger these activities [50, 76]. Spindle-burstsare modulated by cholinergic inputs [89], and microcircuitsbetween cortical neurons and subplate neurons (a transientpopulation of neurons that resides in the neonatal corticalwhite matter) play a critical role in the generation of spindle-bursts [88, 90–92].
Interestingly, spindle-bursts and gamma oscillations aresometimes synchronized between hemispheres [47]. In thisexperiment, multielectrodes were inserted into both hemi-spheres simultaneously, and network activity recorded ineach hemisphere was compared. The amount of interhemi-spheric synchronization increases progressively from P0 toP7, parallel to the development of callosal connections. Itis not clear whether this synchronization occurs via callosalconnections nor whether these activities can travel betweenhemispheres though callosal axons; however, surgical tran-section of the corpus callosum in neonatal rats modulatesthe expression of spindle-bursts [87], suggesting an existenceof interhemispheric communication at this early stage. Thesynchronized neuronal activities between hemispheres mayplay a role in the formation and maturation of callosalconnections.
The activity of individual cortical neurons and corticalnetwork can be modulated by environmental factors. Forexample, the emergence of cENOs and GDPs is influenced byexperimental conditions such as anoxia and aglycemia [46].Some cortical network activity during neonatal periods isshown to be influenced by the hormone oxytocin, which isreleased by the mother during delivery [46, 93]. Alterationsin the activity of individual neurons and network caused bythese environmental factors may impede activity-dependentcircuit formation in the cortex, including callosal axonprojections.
The activity of cortical neurons and network can alsobe modulated by genetic factors. For example, geneticmutations in ion channels may affect excitability of neurons,causing some diseases such as epilepsy. KCNQ2 is a typeof K+ channels crucial for the regulation of excitability incortical neurons, and its genetic mutations are responsiblefor neonatal epilepsy (benign familial neonatal convulsions:BFNC) [95–99]. All disease-causing mutations in KCNQ2identified so far result in loss-of-function of channel activity[100]. Transgenic expression of a dominant-negative KCNQ2mutant channel in developing mouse cerebral cortex isshown to induce spontaneous seizures [94]. Another studyshows that a mouse model of human KCNQ2 mutation forBFNC exhibits early onset spontaneous seizures, reminiscentof the phenotype in human patients [101]. In both studies,reduced KCNQ2 channel activity resulted in abnormal cor-tical activity as recorded by electroencephalogram (EEG) orelectrocorticogram (ECoG). Dysfunction of KCNQ2 duringthe first postnatal week induces morphological changesin the hippocampus [94], implying that repeated seizures
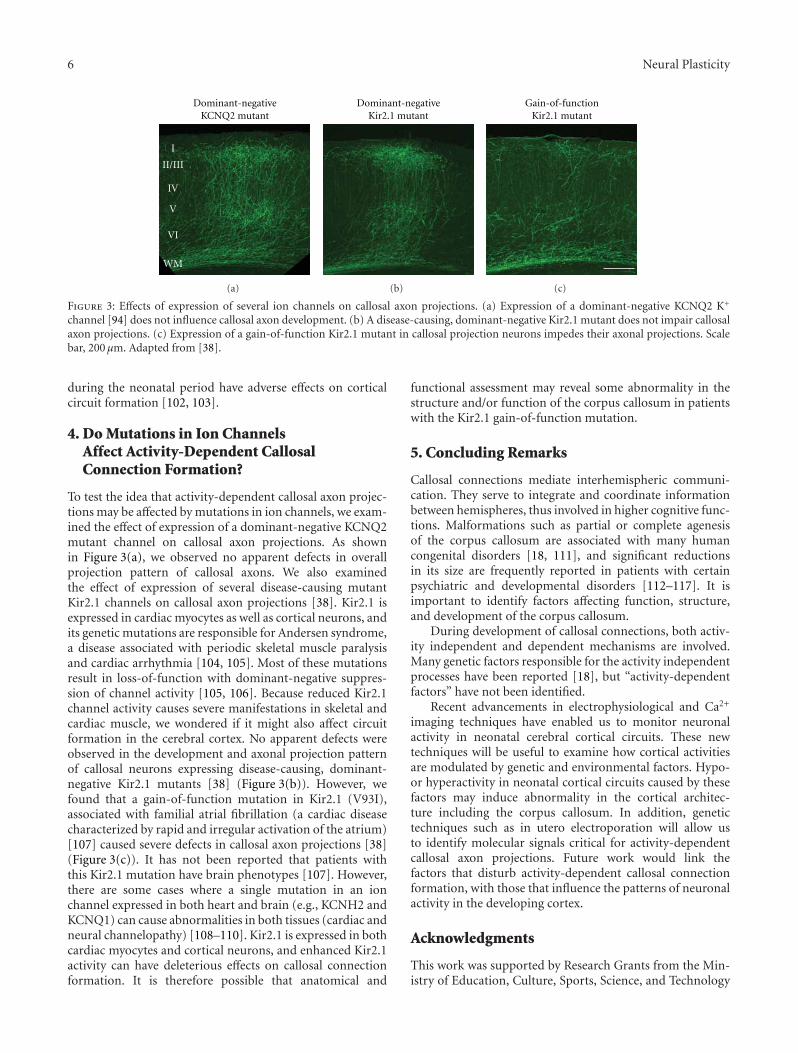
6 Neural Plasticity
I
II/III
IV
V
VI
WM
Dominant-negativeKCNQ2 mutant
(a)
Dominant-negativeKir2.1 mutant
(b)
Gain-of-functionKir2.1 mutant
(c)
Figure 3: Effects of expression of several ion channels on callosal axon projections. (a) Expression of a dominant-negative KCNQ2 K+
channel [94] does not influence callosal axon development. (b) A disease-causing, dominant-negative Kir2.1 mutant does not impair callosalaxon projections. (c) Expression of a gain-of-function Kir2.1 mutant in callosal projection neurons impedes their axonal projections. Scalebar, 200 μm. Adapted from [38].
during the neonatal period have adverse effects on corticalcircuit formation [102, 103].
4. Do Mutations in Ion ChannelsAffect Activity-Dependent CallosalConnection Formation?
To test the idea that activity-dependent callosal axon projec-tions may be affected by mutations in ion channels, we exam-ined the effect of expression of a dominant-negative KCNQ2mutant channel on callosal axon projections. As shownin Figure 3(a), we observed no apparent defects in overallprojection pattern of callosal axons. We also examinedthe effect of expression of several disease-causing mutantKir2.1 channels on callosal axon projections [38]. Kir2.1 isexpressed in cardiac myocytes as well as cortical neurons, andits genetic mutations are responsible for Andersen syndrome,a disease associated with periodic skeletal muscle paralysisand cardiac arrhythmia [104, 105]. Most of these mutationsresult in loss-of-function with dominant-negative suppres-sion of channel activity [105, 106]. Because reduced Kir2.1channel activity causes severe manifestations in skeletal andcardiac muscle, we wondered if it might also affect circuitformation in the cerebral cortex. No apparent defects wereobserved in the development and axonal projection patternof callosal neurons expressing disease-causing, dominant-negative Kir2.1 mutants [38] (Figure 3(b)). However, wefound that a gain-of-function mutation in Kir2.1 (V93I),associated with familial atrial fibrillation (a cardiac diseasecharacterized by rapid and irregular activation of the atrium)[107] caused severe defects in callosal axon projections [38](Figure 3(c)). It has not been reported that patients withthis Kir2.1 mutation have brain phenotypes [107]. However,there are some cases where a single mutation in an ionchannel expressed in both heart and brain (e.g., KCNH2 andKCNQ1) can cause abnormalities in both tissues (cardiac andneural channelopathy) [108–110]. Kir2.1 is expressed in bothcardiac myocytes and cortical neurons, and enhanced Kir2.1activity can have deleterious effects on callosal connectionformation. It is therefore possible that anatomical and
functional assessment may reveal some abnormality in thestructure and/or function of the corpus callosum in patientswith the Kir2.1 gain-of-function mutation.
5. Concluding Remarks
Callosal connections mediate interhemispheric communi-cation. They serve to integrate and coordinate informationbetween hemispheres, thus involved in higher cognitive func-tions. Malformations such as partial or complete agenesisof the corpus callosum are associated with many humancongenital disorders [18, 111], and significant reductionsin its size are frequently reported in patients with certainpsychiatric and developmental disorders [112–117]. It isimportant to identify factors affecting function, structure,and development of the corpus callosum.
During development of callosal connections, both activ-ity independent and dependent mechanisms are involved.Many genetic factors responsible for the activity independentprocesses have been reported [18], but “activity-dependentfactors” have not been identified.
Recent advancements in electrophysiological and Ca2+
imaging techniques have enabled us to monitor neuronalactivity in neonatal cerebral cortical circuits. These newtechniques will be useful to examine how cortical activitiesare modulated by genetic and environmental factors. Hypo-or hyperactivity in neonatal cortical circuits caused by thesefactors may induce abnormality in the cortical architec-ture including the corpus callosum. In addition, genetictechniques such as in utero electroporation will allow usto identify molecular signals critical for activity-dependentcallosal axon projections. Future work would link thefactors that disturb activity-dependent callosal connectionformation, with those that influence the patterns of neuronalactivity in the developing cortex.
Acknowledgments
This work was supported by Research Grants from the Min-istry of Education, Culture, Sports, Science, and Technology
Neural Plasticity 7
(MEXT) of Japan (21700350 and 23500388 to YoshiakiTagawa), Grant-in-Aid for Scientific Research on InnovativeAreas “Neural Diversity and Neocortical Organization” fromMEXT (23123508 to Yoshiaki Tagawa).
References
[1] D. Hubel and T. Wiesel, “Cortical and callosal connectionsconcerned with the vertical meridian of visual fields in thecat,” Journal of Neurophysiology, vol. 30, no. 6, pp. 1561–1573,1967.
[2] C. J. Shatz, “Anatomy of interhemispheric connections in thevisual system of Boston Siamese and ordinary cats,” Journalof Comparative Neurology, vol. 173, no. 3, pp. 497–518, 1977.
[3] D. van Essen, W. Newsome, and J. Bixby, “The patternof interhemispheric connections and its relationship toextrastriate visual areas in the macaque monkey,” Journal ofNeuroscience, vol. 2, no. 3, pp. 265–283, 1982.
[4] C. Blakemore, Y. Diao, M. Pu, Y. Wang, and Y. Xiao, “Possiblefunctions of the interhemispheric connexions between visualcortical areas in the cat,” Journal of Physiology, vol. 337, pp.331–349, 1983.
[5] J. Olavarria and V. M. Montero, “Relation of callosal andstriate-extrastriate cortical connections in the rat: morpho-logical definition of extrastriate visual areas,” ExperimentalBrain Research, vol. 54, no. 2, pp. 240–252, 1984.
[6] G. M. Innocenti, S. Clarke, and R. Kraftsik, “Intercharge ofcallosal and association projections in the developing visualcortex,” Journal of Neuroscience, vol. 6, no. 5, pp. 1384–1409,1986.
[7] G. M. Innocenti and D. J. Price, “Exuberance in the develop-ment of cortical networks,” Nature Reviews Neuroscience, vol.6, no. 12, pp. 955–965, 2005.
[8] M. Pietrasanta, L. Restani, and M. Caleo, “The corpuscallosum and the visual cortex: plasticity is a game for two,”Neural Plasticity, vol. 2012, Article ID 838672, 2012.
[9] M. Nieto, E. S. Monuki, H. Tang et al., “Expression of Cux-1and Cux-2 in the subventricular zone and upper layers II-IVof the cerebral cortex,” Journal of Comparative Neurology, vol.479, no. 2, pp. 168–180, 2004.
[10] E. A. Alcamo, L. Chirivella, M. Dautzenberg et al., “Satb2 reg-ulates callosal projection neuron identity in the developingcerebral cortex,” Neuron, vol. 57, no. 3, pp. 364–377, 2008.
[11] O. Britanova, C. de Juan Romero, A. Cheung et al., “Satb2 Isa postmitotic determinant for upper-layer neuron specifica-tion in the neocortex,” Neuron, vol. 57, no. 3, pp. 378–392,2008.
[12] R. M. Fame, J. L. Macdonald, and J. D. Macklis, “Devel-opment, specification, and diversity of callosal projectionneurons,” Trends in Neurosciences, vol. 34, no. 1, pp. 41–50,2011.
[13] T. Serafini, S. A. Colamarino, E. D. Leonardo et al., “Netrin-1is required for commissural axon guidance in the developingvertebrate nervous system,” Cell, vol. 87, no. 6, pp. 1001–1014, 1996.
[14] A. Fazeli, S. L. Dickinson, M. L. Hermiston et al., “Phenotypeof mice lacking functional deleted in colorectal cancer (Dcc)gene,” Nature, vol. 386, no. 6627, pp. 796–804, 1997.
[15] A. Bagri, O. Marın, A. S. Plump et al., “Slit proteins preventmidline crossing and determine the dorsoventral positionof major axonal pathways in the mammalian forebrain,”Neuron, vol. 33, no. 2, pp. 233–248, 2002.
[16] Z. Hu, X. Yue, G. Shi et al., “corpus callosum deficiency intransgenic mice expressing a truncated ephrin-A receptor,”Journal of Neuroscience, vol. 23, no. 34, pp. 10963–10970,2003.
[17] T. Shu, V. Sundaresan, M. M. Mccarthy, and L. J. Richards,“Slit2 guides both precrossing and postcrossing callosal axonsat the midline in vivo,” Journal of Neuroscience, vol. 23, no. 22,pp. 8176–8184, 2003.
[18] L. J. Richards, C. Plachez, and T. Ren, “Mechanisms regulat-ing the development of the corpus callosum and its agenesisin mouse and human,” Clinical Genetics, vol. 66, no. 4, pp.276–289, 2004.
[19] W. Andrews, A. Liapi, C. Plachez et al., “Robo1 regulates thedevelopment of major axon tracts and interneuron migrationin the forebrain,” Development, vol. 133, no. 11, pp. 2243–2252, 2006.
[20] T. R. Keeble, M. M. Halford, C. Seaman et al., “The Wntreceptor Ryk is required for Wnt5a-mediated axon guidanceon the contralateral side of the corpus callosum,” Journal ofNeuroscience, vol. 26, no. 21, pp. 5840–5848, 2006.
[21] S. W. Mendes, M. Henkemeyer, and D. J. Liebl, “MultipleEph receptors and B-class ephrins regulate midline crossingof corpus callosum fibers in the developing mouse forebrain,”Journal of Neuroscience, vol. 26, no. 3, pp. 882–892, 2006.
[22] C. Lindwall, T. Fothergill, and L. J. Richards, “Commissureformation in the mammalian forebrain,” Current Opinion inNeurobiology, vol. 17, no. 1, pp. 3–14, 2007.
[23] T. Ren, J. Zhang, C. Plachez, S. Mori, and L. J. Richards,“Diffusion tensor magnetic resonance imaging and tract-tracing analysis of probst bundle structure in netrin1- andDCC-deficient mice,” Journal of Neuroscience, vol. 27, no. 39,pp. 10345–10349, 2007.
[24] G. Lopez-Bendito, N. Flames, L. Ma et al., “Robo1 and Robo2cooperate to control the guidance of major axonal tracts inthe mammalian forebrain,” Journal of Neuroscience, vol. 27,no. 13, pp. 3395–3407, 2007.
[25] L. Li, B. I. Hutchins, and K. Kalil, “Wnt5a inducessimultaneous cortical axon outgrowth and repulsive axonguidance through distinct signaling mechanisms,” Journal ofNeuroscience, vol. 29, no. 18, pp. 5873–5883, 2009.
[26] M. Piper, C. Plachez, O. Zalucki et al., “Neuropilin 1-Semasignaling regulates crossing of cingulate pioneering axonsduring development of the corpus callosum,” Cerebral cortex,vol. 19, pp. i11–i21, 2009.
[27] M. Nishikimi, K. Oishi, H. Tabata, K. Torii, and K. Nakajima,“Segregation and pathfinding of callosal axons throughEphA3 signaling,” Journal of Neuroscience, vol. 31, no. 45, pp.16251–16260, 2011.
[28] L. C. Katz and C. J. Shatz, “Synaptic activity and theconstruction of cortical circuits,” Science, vol. 274, no. 5290,pp. 1133–1138, 1996.
[29] H. Cline, “Sperry and hebb: oil and vinegar?” Trends inNeurosciences, vol. 26, no. 12, pp. 655–661, 2003.
[30] M. Sur and J. L. Rubenstein, “Patterning and plasticity ofthe cerebral cortex,” Science, vol. 310, no. 5749, pp. 805–810,2005.
[31] A. D. Huberman, M. B. Feller, and B. Chapman, “Mecha-nisms underlying development of visual maps and receptivefields,” Annual Review of Neuroscience, vol. 31, pp. 479–509,2008.
[32] A. Bleckert and R. O. Wong, “Identifying roles for neuro-transmission in circuit assembly: insights gained from multi-ple model systems and experimental approaches,” Bioessays,vol. 33, no. 1, pp. 61–72, 2011.
8 Neural Plasticity
[33] N. Yamamoto and G. Lopez-Bendito, “Shaping brain connec-tions through spontaneous neural activity,” European Journalof Neuroscience, vol. 35, no. 10, pp. 1595–1604, 2012.
[34] G. M. Innocenti and D. O. Frost, “Effects of visual experienceon the maturation of the efferent system to the corpuscallosum,” Nature, vol. 280, no. 5719, pp. 231–234, 1979.
[35] C. Cusick and R. Lund, “Modification of visual callosalprojections in rats,” Journal of Comparative Neurology, vol.212, no. 4, pp. 385–398, 1982.
[36] J. Olavarria, R. Malach, and R. C. van Sluyters, “Developmentof visual callosal connections in neonatally enucleated rats,”Journal of Comparative Neurology, vol. 260, no. 3, pp. 321–348, 1987.
[37] P. D. Zufferey, F. Jin, H. Nakamura, L. Tettoni, and G. M.Innocenti, “The role of pattern vision in the developmentof cortico-cortical connections,” European Journal of Neuro-science, vol. 11, no. 8, pp. 2669–2688, 1999.
[38] H. Mizuno, T. Hirano, and Y. Tagawa, “Evidence for activity-dependent cortical wiring: formation of interhemisphericconnections in neonatal mouse visual cortex requires projec-tion neuron activity,” Journal of Neuroscience, vol. 27, no. 25,pp. 6760–6770, 2007.
[39] D. L. Chao and G. J. Wang, “Firing to wire: a role foractivity in establishing layer specificity in the cortex,” Journalof Neuroscience, vol. 27, no. 41, pp. 10922–10923, 2007.
[40] C. L. Wang, L. Zhang, Y. Zhou et al., “Activity-dependentdevelopment of callosal projections in the somatosensorycortex,” Journal of Neuroscience, vol. 27, no. 42, pp. 11334–11342, 2007.
[41] H. Mizuno, T. Hirano, and Y. Tagawa, “Pre-synaptic andpost-synaptic neuronal activity supports the axon develop-ment of callosal projection neurons during different post-natal periods in the mouse cerebral cortex,” European Journalof Neuroscience, vol. 31, no. 3, pp. 410–424, 2010.
[42] O. Garaschuk, J. Linn, J. Eilers, and A. Konnerth, “Large-scaleoscillatory calcium waves in the immature cortex,” NatureNeuroscience, vol. 3, no. 5, pp. 452–459, 2000.
[43] H. Adelsberger, O. Garaschuk, and A. Konnerth, “Corticalcalcium waves in resting newborn mice,” Nature Neuro-science, vol. 8, no. 8, pp. 988–990, 2005.
[44] R. Khazipov, A. Sirota, X. Leinekugel, G. L. Holmes, Y. Ben-Ari, and G. Buzsaki, “Early motor activity drives spindlebursts in the developing somatosensory cortex,” Nature, vol.432, no. 7018, pp. 758–761, 2004.
[45] R. Khazipov and H. J. Luhmann, “Early patterns of electricalactivity in the developing cerebral cortex of humans androdents,” Trends in Neurosciences, vol. 29, no. 7, pp. 414–418,2006.
[46] C. Allene, A. Cattani, J. B. Ackman et al., “Sequentialgeneration of two distinct synapse-driven network patternsin developing neocortex,” Journal of Neuroscience, vol. 28, no.48, pp. 12851–12863, 2008.
[47] J. W. Yang, I. L. Hanganu-Opatz, J. J. Sun, and H. J. Luhmann,“Three patterns of oscillatory activity differentially synchro-nize developing neocortical networks in vivo,” Journal ofNeuroscience, vol. 29, no. 28, pp. 9011–9025, 2009.
[48] P. Golshani, J. T. Goncalves, S. Khoshkhoo, R. Mostany,S. Smirnakis, and C. Portera-Cailliau, “Internally mediateddevelopmental desynchronization of neocortical networkactivity,” Journal of Neuroscience, vol. 29, no. 35, pp. 10890–10899, 2009.
[49] N. L. Rochefort, O. Garaschuk, R. I. Milos et al., “Sparsifica-tion of neuronal activity in the visual cortex at eye-opening,”
Proceedings of the National Academy of Sciences of the UnitedStates of America, vol. 106, no. 35, pp. 15049–15054, 2009.
[50] F. Siegel, J. A. Heimel, J. Peters, and C. Lohmann, “Peripheraland central inputs shape network dynamics in the developingvisual cortex in vivo,” Current Biology, vol. 22, no. 3, pp. 253–258, 2012.
[51] S. Jacobson and J. Q. Trojanowski, “The cells of origin ofthe corpus callosum in rat, cat and rhesus monkey,” BrainResearch, vol. 74, no. 1, pp. 149–155, 1974.
[52] D. C. Johns, R. Marx, R. E. Mains, B. O’Rourke, andE. Marban, “Inducible genetic suppression of neuronalexcitability,” Journal of Neuroscience, vol. 19, no. 5, pp. 1691–1697, 1999.
[53] J. Burrone, M. O’Byrne, and V. N. Murthy, “Multiple formsof synaptic plasticity triggered by selective suppression ofactivity in individual neurons,” Nature, vol. 420, no. 6914, pp.414–418, 2002.
[54] J. F. Olavarria and P. Safaeian, “Development of callosaltopography in visual cortex of normal and enucleated rats,”Journal of Comparative Neurology, vol. 496, no. 4, pp. 495–512, 2006.
[55] C. R. Yu, J. Power, G. Barnea et al., “Spontaneous neuralactivity is required for the establishment and maintenance ofthe olfactory sensory map,” Neuron, vol. 42, no. 4, pp. 553–566, 2004.
[56] Y. Tagawa, H. Mizuno, and T. Hirano, “Activity-dependentdevelopment of interhemispheric connections in the visualcortex,” Reviews in the Neurosciences, vol. 19, no. 1, pp. 19–28, 2008.
[57] M. P. Meyer and S. J. Smith, “Evidence from in vivo imagingthat synaptogenesis guides the growth and branching ofaxonal arbors by two distinct mechanisms,” Journal ofNeuroscience, vol. 26, no. 13, pp. 3604–3614, 2006.
[58] E. S. Ruthazer, J. Li, and H. T. Cline, “Stabilization ofaxon branch dynamics by synaptic maturation,” Journal ofNeuroscience, vol. 26, no. 13, pp. 3594–3603, 2006.
[59] L. Maffei, N. Berardi, L. Domenici, V. Parisi, and T.Pizzorusso, “Nerve growth factor (NGF) prevents the shift inocular dominance distribution of visual cortical neurons inmonocularly deprived rats,” Journal of Neuroscience, vol. 12,no. 12, pp. 4651–4662, 1992.
[60] R. J. Cabelli, A. Hohn, and C. J. Shatz, “Inhibition of oculardominance column formation by infusion of NT-4/5 orBDNF,” Science, vol. 267, no. 5204, pp. 1662–1667, 1995.
[61] S. Cohen-Cory and S. E. Fraser, “Effects of brain-derivedneurotrophic factor on optic axon branching and remod-elling in vivo,” Nature, vol. 378, no. 6553, pp. 192–196, 1995.
[62] H. Thoenen, “Neurotrophins and neuronal plasticity,” Sci-ence, vol. 270, no. 5236, pp. 593–598, 1995.
[63] X. H. Wang and M. M. Poo, “Potentiation of developingsynapses by postsynaptic release of neurotrophin-4,” Neuron,vol. 19, no. 4, pp. 825–835, 1997.
[64] S. Ohnami, M. Endo, S. Hirai et al., “Role of RhoA in activity-dependent cortical axon branching,” Journal of Neuroscience,vol. 28, no. 37, pp. 9117–9121, 2008.
[65] M. G. Hanson and L. T. Landmesser, “Normal patterns ofspontaneous activity are required for correct motor axonguidance and the expression of specific guidance molecules,”Neuron, vol. 43, no. 5, pp. 687–701, 2004.
[66] S. Serizawa, K. Miyamichi, H. Takeuchi, Y. Yamagishi, M.Suzuki, and H. Sakano, “A neuronal identity code forthe odorant receptor-specific and activity-dependent axonsorting,” Cell, vol. 127, no. 5, pp. 1057–1069, 2006.
Neural Plasticity 9
[67] X. Nicol, S. Voyatzis, A. Muzerelle et al., “cAMP oscillationsand retinal activity are permissive for ephrin signalingduring the establishment of the retinotopic map,” NatureNeuroscience, vol. 10, no. 3, pp. 340–347, 2007.
[68] E. Mire, C. Mezzera, E. Leyva-Dız et al., “Spontaneousactivity regulates Robo1 transcription to mediate a switch inthalamocortical axon growth,” Nature Neuroscience, vol. 15,no. 8, pp. 1134–1143, 2012.
[69] R. O. L. Wong and A. Ghosh, “Activity-dependent regulationof dendritic growth and patterning,” Nature Reviews Neuro-science, vol. 3, no. 10, pp. 803–812, 2002.
[70] C. Lohmann and R. O. L. Wong, “Regulation of dendriticgrowth and plasticity by local and global calcium dynamics,”Cell Calcium, vol. 37, no. 5, pp. 403–409, 2005.
[71] J. Q. Zheng and M. M. Poo, “Calcium signaling in neuronalmotility,” Annual Review of Cell and Developmental Biology,vol. 23, pp. 375–404, 2007.
[72] S. Takemoto-Kimura, K. Suzuki, S. Kamijo et al., “Dif-ferential roles for CaM kinases in mediating excitation-morphogenesis coupling during formation and maturationof neuronal circuits,” The European Journal of Neuroscience,vol. 32, no. 2, pp. 224–230, 2010.
[73] S. S. Rosenberg and N. C. Spitzer, “Calcium signaling inneuronal development,” Cold Spring Harbor Perspectives inBiology, vol. 3, no. 10, Article ID a004259, pp. 1–13, 2011.
[74] N. Ageta-Ishihara, S. Takemoto-Kimura, M. Nonaka et al.,“Control of cortical axon elongation by a GABA-drivenCa2+/calmodulin-dependent protein kinase cascade,” Journalof Neuroscience, vol. 29, no. 43, pp. 13720–13729, 2009.
[75] Y. Ben-Ari, “Excitatory actions of GABA during develop-ment: the nature of the nurture,” Nature Reviews Neuro-science, vol. 3, no. 9, pp. 728–739, 2002.
[76] I. L. Hanganu, Y. Ben-Ari, and R. Khazipov, “Retinal wavestrigger spindle bursts in the neonatal rat visual cortex,”Journal of Neuroscience, vol. 26, no. 25, pp. 6728–6736, 2006.
[77] G. Lopez-Bendito and Z. Molnar, “Thalamocortical devel-opment: how are we going to get there?” Nature ReviewsNeuroscience, vol. 4, no. 4, pp. 276–289, 2003.
[78] G. Berlucchi and G. Rizzolatti, “Binocularly driven neuronsin visual cortex of split-chiasm cats,” Science, vol. 159, no.3812, pp. 308–310, 1968.
[79] G. Innocenti, “General organization of callosal connectionsin the cerebral cortex,” in Cerebral Cortex, E. G. Jones andA. Peters, Eds., vol. 5, pp. 291–353, Plenum Press, New York,NY, USA, 1986.
[80] J. F. Olavarria, “Non-mirror-symmetric patterns of callosallinkages in areas 17 and 18 in cat visual cortex,” Journal ofComparative Neurology, vol. 366, no. 4, pp. 643–655, 1996.
[81] M. P. Stryker and A. Antonini, “Factors shaping the corpuscallosum,” Journal of Comparative Neurology, vol. 433, no. 4,pp. 437–440, 2001.
[82] J. F. Olavarria and R. Hiroi, “Retinal influences specifycortico-cortical maps by postnatal day six in rats and mice,”Journal of Comparative Neurology, vol. 459, no. 2, pp. 156–172, 2003.
[83] R. Yuste, A. Peinado, and L. C. Katz, “Neuronal domains indeveloping neocortex,” Science, vol. 257, no. 5070, pp. 665–669, 1992.
[84] C. Allene and R. Cossart, “Early NMDA receptor-drivenwaves of activity in the developing neocortex: physiologicalor pathological network oscillations?” Journal of Physiology,vol. 588, no. 1, pp. 83–91, 2010.
[85] J. Conhaim, C. R. Easton, M. I. Becker et al., “Developmentalchanges in propagation patterns and transmitter dependence
of waves of spontaneous activity in the mouse cerebralcortex,” Journal of Physiology, vol. 589, no. 10, pp. 2529–2541,2011.
[86] A. G. Blankenship and M. B. Feller, “Mechanisms underlyingspontaneous patterned activity in developing neural circuits,”Nature Reviews Neuroscience, vol. 11, no. 1, pp. 18–29, 2010.
[87] A. J. Marcano-Reik and M. S. Blumberg, “The corpuscallosum modulates spindle-burst activity within homotopicregions of somatosensory cortex in newborn rats,” EuropeanJournal of Neuroscience, vol. 28, no. 8, pp. 1457–1466, 2008.
[88] E. A. Tolner, A. Sheikh, A. Y. Yukin, K. Kaila, and P.O. Kanold, “Subplate neurons promote spindle bursts andthalamocortical patterning in the neonatal rat somatosensorycortex,” Journal of Neuroscience, vol. 32, no. 2, pp. 692–702,2012.
[89] I. L. Hanganu, J. F. Staiger, Y. Ben-Ari, and R. Khazipov,“Cholinergic modulation of spindle bursts in the neonatal ratvisual cortex in vivo,” Journal of Neuroscience, vol. 27, no. 21,pp. 5694–5705, 2007.
[90] E. Dupont, I. L. Hanganu, W. Kilb, S. Hirsch, and H. J.Luhmann, “Rapid developmental switch in the mechanismsdriving early cortical columnar networks,” Nature, vol. 439,no. 7072, pp. 79–83, 2006.
[91] I. L. Hanganu, A. Okabe, V. Lessmann, and H. J. Luh-mann, “Cellular mechanisms of subplate-driven and cholin-ergic input-dependent network activity in the neonatal ratsomatosensory cortex,” Cerebral Cortex, vol. 19, no. 1, pp. 89–105, 2009.
[92] P. O. Kanold and H. J. Luhmann, “The subplate and earlycortical circuits,” Annual Review of Neuroscience, vol. 33, pp.23–48, 2010.
[93] V. Crepel, D. Aronov, I. Jorquera, A. Represa, Y. Ben-Ari, andR. Cossart, “A parturition-associated nonsynaptic coherentactivity pattern in the developing hippocampus,” Neuron,vol. 54, no. 1, pp. 105–120, 2007.
[94] H. C. Peters, H. Hu, O. Pongs, J. F. Storm, and D. Isbrandt,“Conditional transgenic suppression of M channels in mousebrain reveals functions in neuronal excitability, resonanceand behavior,” Nature Neuroscience, vol. 8, no. 1, pp. 51–60,2005.
[95] C. Biervert, B. C. Schroeder, C. Kubisch et al., “A potassiumchannel mutation in neonatal human epilepsy,” Science, vol.279, no. 5349, pp. 403–406, 1998.
[96] C. Charlier, N. A. Singh, S. G. Ryan et al., “A pore mutationin a novel KQT-like potassium channel gene in an idiopathicepilepsy family,” Nature Genetics, vol. 18, no. 1, pp. 53–55,1998.
[97] N. A. Singh, C. Charlier, D. Stauffer et al., “A novel potassiumchannel gene, KCNQ2, is mutated in an inherited epilepsy ofnewborns,” Nature Genetics, vol. 18, no. 1, pp. 25–29, 1998.
[98] T. J. Jentsch, “Neuronal KCNQ potassium channels: physiol-ogy and role in disease,” Nature Reviews Neuroscience, vol. 1,no. 1, pp. 21–30, 2000.
[99] N. A. Singh, P. Westenskow, C. Charlier et al., “KCNQ2 andKCNQ3 potassium channel genes in benign familial neonatalconvulsions: expansion of the functional and mutationspectrum,” Brain, vol. 126, no. 12, pp. 2726–2737, 2003.
[100] S. Maljevic, T. V. Wuttke, and H. Lerche, “Nervous systemKV7 disorders: breakdown of a subthreshold brake,” Journalof Physiology, vol. 586, no. 7, pp. 1791–1801, 2008.
[101] N. A. Singh, J. F. Otto, E. J. Dahle et al., “Mouse models ofhuman KCNQ2 and KCNQ3 mutations for benign familialneonatal convulsions show seizures and neuronal plasticity
10 Neural Plasticity
without synaptic reorganization,” Journal of Physiology, vol.586, no. 14, pp. 3405–3423, 2008.
[102] Y. Ben-Ari and G. L. Holmes, “Effects of seizures ondevelopmental processes in the immature brain,” LancetNeurology, vol. 5, no. 12, pp. 1055–1063, 2006.
[103] Y. Bozzi, S. Casarosa, and M. Caleo, “Epilepsy as a neurode-velopmental disorder,” Frontiers in Psychiatry, vol. 3, ArticleID 19, 2012.
[104] N. M. Plaster, R. Tawil, M. Tristani-Firouzi et al., “Mutationsin Kir2.1 cause the developmental and episodic electricalphenotypes of Andersen’s syndrome,” Cell, vol. 105, no. 4, pp.511–519, 2001.
[105] M. Tristani-Firouzi, J. L. Jensen, M. R. Donaldson et al.,“Functional and clinical characterization of KCNJ2 muta-tions associated with LQT7 (Andersen syndrome),” Journalof Clinical Investigation, vol. 110, no. 3, pp. 381–388, 2002.
[106] S. Bendahhou, M. R. Donaldson, N. M. Plaster, M. Tristani-Firouzi, Y. H. Fu, and L. J. Ptacek, “Defective potassium chan-nel Kir2.1 trafficking underlies Andersen-Tawil syndrome,”Journal of Biological Chemistry, vol. 278, no. 51, pp. 51779–51785, 2003.
[107] M. Xia, Q. Jin, S. Bendahhou et al., “A Kir2.1 gain-of-function mutation underlies familial atrial fibrillation,”Biochemical and Biophysical Research Communications, vol.332, no. 4, pp. 1012–1019, 2005.
[108] J. N. Johnson, N. Hofman, C. M. Haglund, G. D. Cascino,A. A. M. Wilde, and M. J. Ackerman, “Identification ofa possible pathogenic link between congenital long QTsyndrome and epilepsy,” Neurology, vol. 72, no. 3, pp. 224–231, 2009.
[109] A. M. Goldman, E. Glasscock, J. Yoo, T. T. Chen, T. L.Klassen, and J. L. Noebels, “Arrhythmia in heart and brain:KCNQ1 mutations link epilepsy and sudden unexplaineddeath,” Science translational medicine, vol. 1, no. 2, p. 2ra6,2009.
[110] C. Omichi, Y. Momose, and S. Kitahara, “Congenital long QTsyndrome presenting with a history of epilepsy: misdiagnosisor relationship between channelopathies of the heart andbrain?” Epilepsia, vol. 51, no. 2, pp. 289–292, 2010.
[111] D. Kamnasaran, “Agenesis of the corpus callosum: lessonsfrom humans and mice,” Clinical and Investigative Medicine,vol. 28, no. 5, pp. 267–282, 2005.
[112] J. Bodensteiner, G. B. Schaefer, L. Breeding, and L. Cowan,“Hypoplasia of the corpus callosum: a study of 445 consecu-tive MRI scans,” Journal of Child Neurology, vol. 9, no. 1, pp.47–49, 1994.
[113] B. Egaas, E. Courchesne, and O. Saitoh, “Reduced size ofcorpus callosum in autism,” Archives of Neurology, vol. 52, no.8, pp. 794–801, 1995.
[114] J. S. Bloom and G. W. Hynd, “The role of the corpus callosumin interhemispheric transfer of information: excitation orinhibition?” Neuropsychology Review, vol. 15, no. 2, pp. 59–71, 2005.
[115] C. N. Vidal, R. Nicolson, T. J. DeVito et al., “Mapping corpuscallosum deficits in autism: an index of aberrant corticalconnectivity,” Biological Psychiatry, vol. 60, no. 3, pp. 218–225, 2006.
[116] D. Arnone, A. M. McIntosh, P. Chandra, and K. P. Ebmeier,“Meta-analysis of magnetic resonance imaging studies ofthe corpus callosum in bipolar disorder,” Acta PsychiatricaScandinavica, vol. 118, no. 5, pp. 357–362, 2008.
[117] J. Miyata, M. Yamada, C. Namiki et al., “Reduced whitematter integrity as a neural correlate of social cognitiondeficits in schizophrenia,” Schizophrenia Research, vol. 119,no. 1–3, pp. 232–239, 2010.
Hindawi Publishing CorporationNeural PlasticityVolume 2012, Article ID 250196, 18 pagesdoi:10.1155/2012/250196
Review Article
Deafferentation-Induced Plasticity of Visual CallosalConnections: Predicting Critical Periods and AnalyzingCortical Abnormalities Using Diffusion Tensor Imaging
Jaime F. Olavarria,1 Andrew S. Bock,1 Lindsey A. Leigland,2 andChristopher D. Kroenke2, 3
1 Department of Psychology, Behavioral Neuroscience Program, University of Washington, Box 351525, Seattle,WA 98195-1525, USA
2 Advanced Imaging Research Center and Department of Behavioral Neuroscience, Oregon Health and Science University,Mail Code L457, 3181 SW Sam Jackson Park Road, Portland, OR 97239, USA
3 Division of Neuroscience, Oregon National Primate Research Center, Oregon Health and Science University, Beaverton,OR 97006, USA
Correspondence should be addressed to Jaime F. Olavarria, [email protected] and Christopher D. Kroenke, [email protected]
Received 6 July 2012; Accepted 1 October 2012
Academic Editor: Matteo Caleo
Copyright © 2012 Jaime F. Olavarria et al. This is an open access article distributed under the Creative Commons AttributionLicense, which permits unrestricted use, distribution, and reproduction in any medium, provided the original work is properlycited.
Callosal connections form elaborate patterns that bear close association with striate and extrastriate visual areas. Although itis known that retinal input is required for normal callosal development, there is little information regarding the period duringwhich the retina is critically needed and whether this period correlates with the same developmental stage across species. Here wereview the timing of this critical period, identified in rodents and ferrets by the effects that timed enucleations have on maturecallosal connections, and compare it to other developmental milestones in these species. Subsequently, we compare these eventsto diffusion tensor imaging (DTI) measurements of water diffusion anisotropy within developing cerebral cortex. We observedthat the relationship between the timing of the critical period and the DTI-characterized developmental trajectory is strikinglysimilar in rodents and ferrets, which opens the possibility of using cortical DTI trajectories for predicting the critical period inspecies, such as humans, in which this period likely occurs prenatally. Last, we discuss the potential of utilizing DTI to distinguishnormal from abnormal cerebral cortical development, both within the context of aberrant connectivity induced by early retinaldeafferentation, and more generally as a potential tool for detecting abnormalities associated with neurodevelopmental disorders.
1. Introduction
The establishment of organized patterns of corticocorticalconnections in sensory systems depends on mechanismsregulating many temporal and spatial aspects of pathwaydevelopment, including the timing of axon arrival andinvasion of gray matter, arborization of axon terminals anddendrites, radial and tangential distribution of neuronalelements, and topographical organization of intrinsic andextrinsic projections. In the visual system, the role that theeyes have on the development of central visual pathways hasbeen studied in anophthalmic animals as well as through
various experimental manipulations of visual input, includ-ing the removal of retinal afferents through enucleation,dark rearing and visual deprivation following eyelid suture.These previous studies show that that abnormal visualinput induces anomalies in both interhemispheric (e.g.,reviewed in [1–4]) and intrahemispheric (see referencesin [5]) pathways. However, these studies also show thatvisual corticocortical pathways nevertheless develop underthe influence of abnormal visual input or in the absenceof retinal input, and that, although highly anomalous, theyoften resemble their normal counterparts in a number ofways. Together, these observations indicate that development
2 Neural Plasticity
of corticocortical circuits depends on the timely interactionbetween central and peripheral mechanisms. Compared withother approaches for manipulating visual input, enucleationhas the advantage that it can be performed long beforethe eyes open, which facilitates the study of the role ofretinal input before the onset of visual experience. In manystudies of the effect of enucleation on the development ofcorticocortical projections, the interhemispheric connectionthrough the corpus callosum has often been the system ofchoice because the overall distribution of callosal connec-tions in one hemisphere can be readily revealed followingmultiple injections of anatomical tracers into the oppositehemisphere. Moreover, the distribution of callosal cells andaxonal terminations form distinct patterns that extend overbroad cortical regions and are consistent among individualsof the same species.
At what developmental stage is input from the retinacritically needed for normal development of corticocorticalconnections? And, does this critical period correlate withthe same stage of brain development in different species?Here we address these questions focusing on the influencesthe eyes exert on the development of interhemisphericcallosal connections in visual cortex and on the size ofvisual areas. Additionally, we review some recent workin which diffusion tensor imaging (DTI) has been usedto directly characterize neuron morphology in developingcerebral cortical gray matter. This approach has potentialfor predicting the critical period for the effect of retinaldeafferentation on the patterns of visual callosal connectionsin different species, including humans, and for detectingand monitoring abnormal morphological development ofthe cerebral cortex.
2. Retinal Input Is Required during a BriefNeonatal Critical Period in Rodents
Studies in anophthalmic rats and mice [19–21] have shownthat the mature distributions of both intrahemisphericstriate-extrastriate and interhemispheric visual callosal con-nections are abnormal in these animals, indicating thatthe eyes play an important role in the specification ofcorticocortical pathways. To examine in more detail the rolethat the eyes have in the development of visual callosalpathways, Olavarria et al. [6] analyzed the effect of binocularor monocular enucleation performed at postnatal day 0(P0, within 24 h of birth) on the overall callosal pattern.The effects of binocular (BEP0) and monocular (MEP0)enucleation at birth in the rat are illustrated in Figure 1. Inthese experiments, the overall callosal patterns in one hemi-sphere were demonstrated following multiple intracorticalinjections of the anatomical tracer horseradish peroxidase(HRP) in the other hemisphere. This tracer is transportedboth anterogradely and retrogradely. Areas containing denseaccumulations of callosal cells and axon terminations appearblack, and the segmented lines indicate the border of area17 (striate cortex, primary visual cortex, V1). Figure 1(A)illustrates that in normal rats, callosal cells and terminationsform homogeneously labeled bands at the 17/18a border and
at the lateral border of area 18a. In addition, several narrowbands of callosal connections bridge the width of area 18a atseveral rostrocaudal levels. Figure 1(B) shows that binocularenucleation at birth increases the relative width of thecallosal band at the 17/18a border and causes the appearanceof discrete regions of reduced labeling within the 17/18acallosal band (white arrows in Figure 1(B)) and severaldensely labeled tongue-like regions that extend mediallyfrom this band well into area 17 (black arrow in Figure 1(B)).Moreover, these anomalous features are highly variableacross animals [6]. In rats monocularly enucleated at birth,the most prominent anomaly develops in the hemisphereipsilateral to the remaining eye, where an abnormal, denseband of callosal connections runs rostrocaudally throughthe center of area 17 (arrow in Figure 1(C)). Periodicfluctuations in the density of labeling along the length ofthis extra band give it a beaded appearance. The results fromexperiments using HRP, showing that enucleation inducesabnormalities in both the distribution of cell bodies as well asaxon terminations, are in agreement with experiments usingtracers that are primarily transported either anterogradelyor retrogradely [5, 22]. Possible mechanisms leading todistinctly different anomalies of the callosal pattern inbinocularly versus monocularly enucleated rodents havebeen discussed previously [6, 23].
To establish the age at which eye removal ceases toalter the normal course of callosal development, Olavarriaet al. [6] delayed the onset of blindness. These experimentsshowed that development of normal visual callosal patternsrequires retinal input during a brief time window extendingfrom postnatal day 4 (P4) to P6 [5, 6]. Indeed, even thoughthe callosal pathway is very immature at P6 [24], removal ofthe eyes at this age or later does not prevent the developmentof normal callosal patterns. In contrast, removal of the eyes atP4 or earlier results in patterns that are strikingly abnormalin both their overall distributions [6], as well as in thetopographic arrangement of point-to-point callosal linkages[5]. Moreover, virtually the same abnormalities observed inanimals enucleated at P4 are also present in animals enucle-ated at birth, or even in anophthalmic rats [20]. The fact thatenucleations at P4 produce results equivalent to enucleationsprior to P4 indicates that the eyes do not exert a significantinfluence on the development of corticocortical connectionsprior to P4. Therefore, the critical period during whichretinal input specifies the overall distribution and point-to-point topography of visual callosal connections occurs inthe range from P4 to P6 in rats. A critical period extendingfrom P4 to P6 has also been described for the visual callosalconnections in the mouse [5], and a recent study in the ratshowed that intrahemispheric striate-extrastriate projectionsalso become immune to the effect of enucleation by P6 [25].The mechanisms by which retinal input specifies the patternsof corticocortical connections during this critical periodare not known at present, but they may involve activity-dependent, as well as chemical cues [5, 6, 25].
The term critical period used here refers to a well-defined developmental stage during which the presence of aspecific factor (in this case the retinae) is critically required(hence critical period) for development to proceed normally
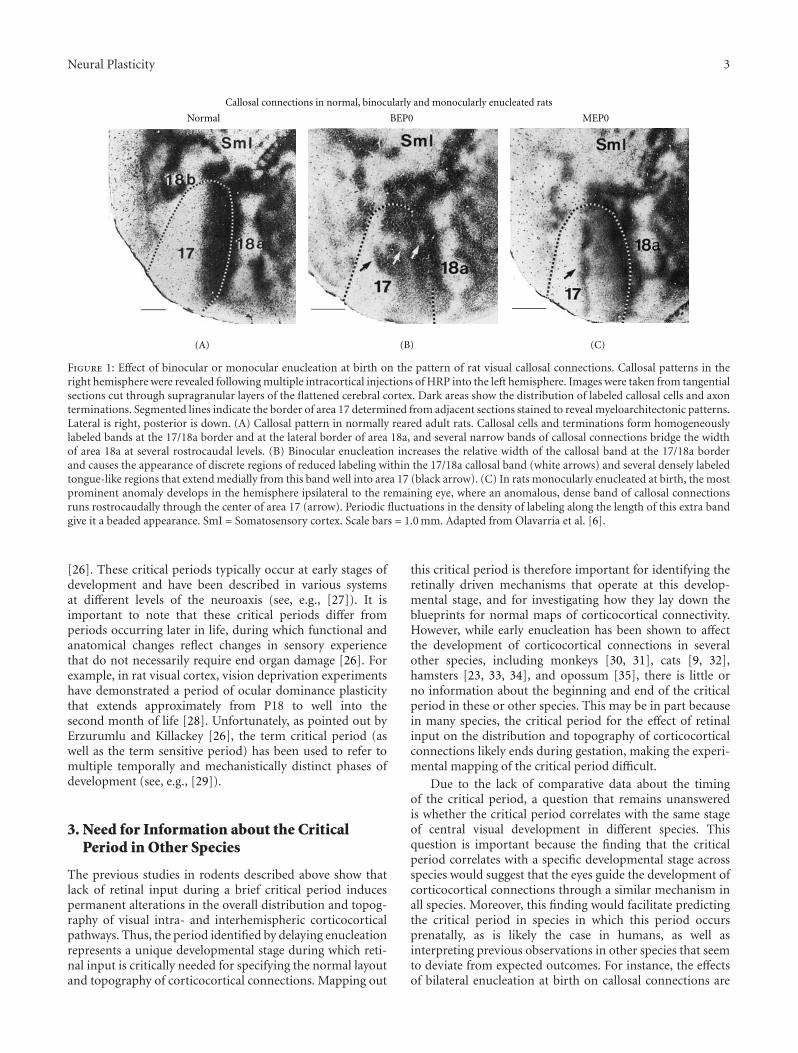
Neural Plasticity 3
Normal BEP0 MEP0
Callosal connections in normal, binocularly and monocularly enucleated rats
(A) (B) (C)
Figure 1: Effect of binocular or monocular enucleation at birth on the pattern of rat visual callosal connections. Callosal patterns in theright hemisphere were revealed following multiple intracortical injections of HRP into the left hemisphere. Images were taken from tangentialsections cut through supragranular layers of the flattened cerebral cortex. Dark areas show the distribution of labeled callosal cells and axonterminations. Segmented lines indicate the border of area 17 determined from adjacent sections stained to reveal myeloarchitectonic patterns.Lateral is right, posterior is down. (A) Callosal pattern in normally reared adult rats. Callosal cells and terminations form homogeneouslylabeled bands at the 17/18a border and at the lateral border of area 18a, and several narrow bands of callosal connections bridge the widthof area 18a at several rostrocaudal levels. (B) Binocular enucleation increases the relative width of the callosal band at the 17/18a borderand causes the appearance of discrete regions of reduced labeling within the 17/18a callosal band (white arrows) and several densely labeledtongue-like regions that extend medially from this band well into area 17 (black arrow). (C) In rats monocularly enucleated at birth, the mostprominent anomaly develops in the hemisphere ipsilateral to the remaining eye, where an anomalous, dense band of callosal connectionsruns rostrocaudally through the center of area 17 (arrow). Periodic fluctuations in the density of labeling along the length of this extra bandgive it a beaded appearance. SmI = Somatosensory cortex. Scale bars = 1.0 mm. Adapted from Olavarria et al. [6].
[26]. These critical periods typically occur at early stages ofdevelopment and have been described in various systemsat different levels of the neuroaxis (see, e.g., [27]). It isimportant to note that these critical periods differ fromperiods occurring later in life, during which functional andanatomical changes reflect changes in sensory experiencethat do not necessarily require end organ damage [26]. Forexample, in rat visual cortex, vision deprivation experimentshave demonstrated a period of ocular dominance plasticitythat extends approximately from P18 to well into thesecond month of life [28]. Unfortunately, as pointed out byErzurumlu and Killackey [26], the term critical period (aswell as the term sensitive period) has been used to refer tomultiple temporally and mechanistically distinct phases ofdevelopment (see, e.g., [29]).
3. Need for Information about the CriticalPeriod in Other Species
The previous studies in rodents described above show thatlack of retinal input during a brief critical period inducespermanent alterations in the overall distribution and topog-raphy of visual intra- and interhemispheric corticocorticalpathways. Thus, the period identified by delaying enucleationrepresents a unique developmental stage during which reti-nal input is critically needed for specifying the normal layoutand topography of corticocortical connections. Mapping out
this critical period is therefore important for identifying theretinally driven mechanisms that operate at this develop-mental stage, and for investigating how they lay down theblueprints for normal maps of corticocortical connectivity.However, while early enucleation has been shown to affectthe development of corticocortical connections in severalother species, including monkeys [30, 31], cats [9, 32],hamsters [23, 33, 34], and opossum [35], there is little orno information about the beginning and end of the criticalperiod in these or other species. This may be in part becausein many species, the critical period for the effect of retinalinput on the distribution and topography of corticocorticalconnections likely ends during gestation, making the experi-mental mapping of the critical period difficult.
Due to the lack of comparative data about the timingof the critical period, a question that remains unansweredis whether the critical period correlates with the same stageof central visual development in different species. Thisquestion is important because the finding that the criticalperiod correlates with a specific developmental stage acrossspecies would suggest that the eyes guide the development ofcorticocortical connections through a similar mechanism inall species. Moreover, this finding would facilitate predictingthe critical period in species in which this period occursprenatally, as is likely the case in humans, as well asinterpreting previous observations in other species that seemto deviate from expected outcomes. For instance, the effectsof bilateral enucleation at birth on callosal connections are

4 Neural Plasticity
significantly less severe in cats [9, 32, 36] than in rats [6,37] and ferrets [8]. Since cats are born at more advancedstages of development compared to rodents and ferrets, theseobservations raise that possibility that the critical periodduring which retinal influences specify the pattern of callosalconnections ends prenatally in the cat [8].
4. Effects of Neonatal Retinal Deafferentationon the Callosal Pattern in the Ferret,and Comparison with the Effects in the Cat
To address the lack of information about the critical periodin carnivores, we studied the effect of neonatal enucleationon the callosal pattern in the ferret [8] taking advantageof the fact that these animals are born at relatively earlystages of central nervous system (CNS) development [38].We characterized the abnormalities induced by neonatalenucleation on the distribution and number of callosal cellsin striate and extrastriate cortex and explored the periodduring which the presence of the eyes is required for thenormal development of the visual callosal pattern in thisspecies. The callosal patterns in normal adult ferrets werecompared to those in adult ferrets that had been enucleatedat P7 or P20, ages that approximately correspond to a periodspanning from P2.2 to P8 in the rat [14, 15]. Followingmultiple intracortical injections of horseradish peroxidase(HRP) into one hemisphere, patterns of callosal connectionswere studied in tangential sections cut through striate andextrastriate cortex of the unfolded and flattened contralateralhemisphere [8]. The locations of visual areas describedin previous physiological studies were estimated from therelation of these areas to gyral and sulcal landmarks [39,40]. In Figure 2(a), the location of visual areas, as well assomatosensory and auditory areas, are indicated in the intactferret brain, while in Figure 2(b), the borders of visual (finedotted lines) areas have been drawn across gyri (in gray)and sulci (in white) on the unfolded and flattened corticalmantle. Corresponding information for the cat is shown onFigures 2(c) and 2(d) for comparison [9].
The overall callosal pattern in normal ferrets(Figure 3(a)) bears some resemblance to that reconstructedin cats from tangential sections cut through the unfoldedand flattened cortex (Figure 3(d)) [9], particularly in thosecallosal features associated with visual areas identified asareas 17,18, 19, and 20 in both species [40–42]. In ferrets(Figure 3(a); see also [39]), as in cats (Figure 3(d)), twoparallel bands of callosal connections can be identified, onestraddling the border between areas 17 and 18, and the otherlocated at the lateral border of area 19. These bands and aseries of bridge-like bands or patches extending betweenthem at different anteroposterior locations separate severalacallosal areas (marked with black stars in Figures 3(a), and3(d)). The callosal bands correspond with representationsof central visual fields in both species [40, 43], while theacallosal islands correspond to areas representing peripheralvisual fields in areas 18 and 19 in both cats [44] and ferrets[40]. The callosal-free zone we observed on the suprasylviangyrus in all control ferrets (marked with black asterisks in
Figure 3(a)) may be homologous with an area devoid ofcallosal connections on the suprasylvian gyrus of normalcats [9]. In the ferret, this area seems to be shared by severalvisual areas mapped recently, including middle portions ofareas 21, and lateral portions of areas PPc and PPr [45].Further laterally, in the suprasylvian sulcus, several patches ofcallosal labeling are observed in both normal ferrets and cats,which appear to correspond to areas of central visual fieldrepresentation within the lateral suprasylvian visual areas ofthe cat [46], and within visual area SSY of the ferret [47, 48].
5. Enucleation at P7, but Not at P20,Induces Highly Anomalous Patterns ofCallosal Connections in Ferrets
Enucleation at P7 induces marked anomalies in the distri-bution of callosal connections in the ferret [8]. In area 17,the distribution of labeled callosal cells is relatively sparseas in control ferrets (Figure 3(b)). However, observations athigher magnification show that, unlike in control ferrets,callosal neurons are not restricted to regions near the anteriorborder of area 17, but are also observed in broader regions ofthis area. It is possible that the more widespread distributionof callosal cells in area 17 of BEP7 ferrets derives froman exuberant distribution present at early stages of normaldevelopment, as reported in other species (e.g., [6]). Testingthis possibility will require performing tracer injectionexperiments in area 17 of immature ferrets. In extrastriatecortex, the callosal pattern in BEP7 ferrets consists of patchesof labeled cells and axon terminations that are smaller andmore numerous than in controls, and they often occupyregions that are relatively free of callosal labeling in controlanimals (cf. Figures 3(a) and 3(b)). Several features thatare readily seen in all control ferrets are therefore eitherabsent or difficult to recognize in BEP7 ferrets, includingthe string of callosal patches located in area 18 close to thearea 17 border (indicated by arrows in Figure 3(a)), as wellas the acallosal areas that are consistently present in areas18 and 19 of control ferrets (marked with black stars inFigure 3(a)). However, other features of the callosal patternin control ferrets are recognizable in BEP7 ferrets, such as theacallosal area on the suprasylvian gyrus (marked with blackasterisks in Figures 3(a), and 3(b)), although this acallosalarea appears somewhat smaller in BEP7 ferrets. Based onprevious physiological subdivisions of ferret visual cortex[40, 49], these data indicate that regions showing abnormalpatterns of callosal connectivity encompassed many visualareas, including areas 18, 19, and 21.
In sharp contrast to observations in BEP7 ferrets, byP20 the development of callosal connections is no longersusceptible to disruption of visual input by binocular enu-cleation. Indeed, the callosal patterns in ferrets enucleatedat P20 are virtually indistinguishable from those in controlferrets (cf. Figures 3(a) and 3(c)). These results indicate thatthe development of the overall pattern of callosal connectionsdepends critically on retinal influences within the time rangeextending from P7 to P20. Supporting the impression thatcallosal connections in BEP7 ferrets tend to fill in spaces that
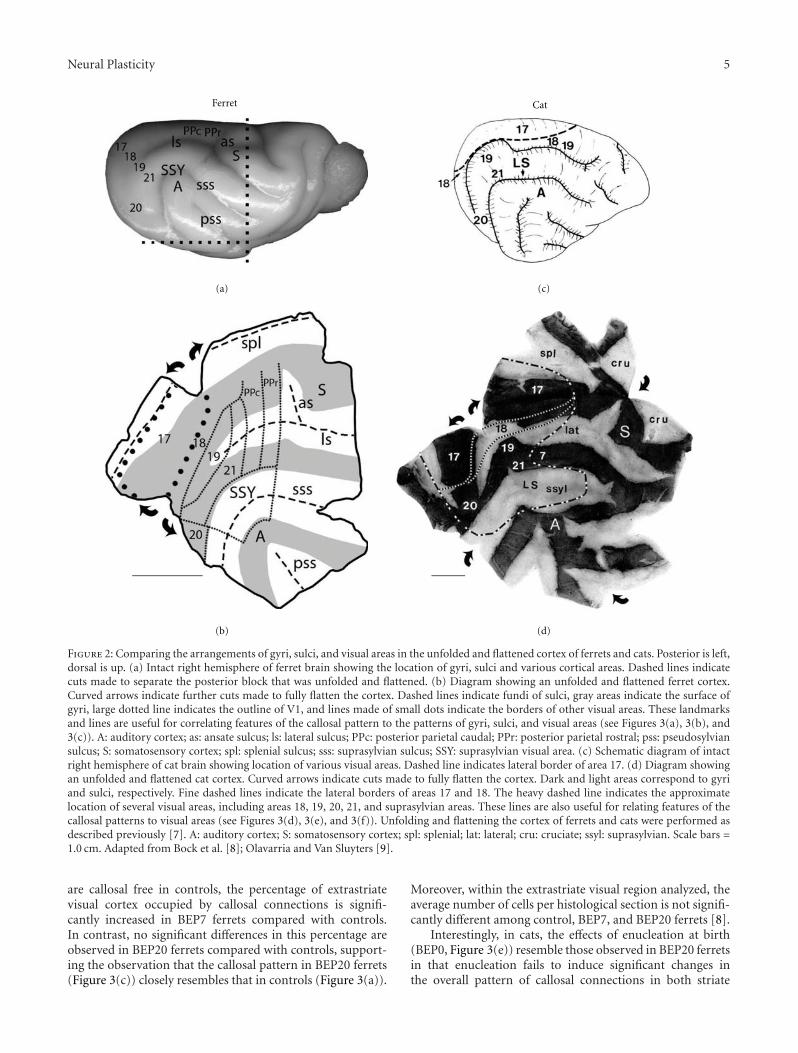
Neural Plasticity 5
(a)
(b)
(c)
(d)
Ferret Cat
Figure 2: Comparing the arrangements of gyri, sulci, and visual areas in the unfolded and flattened cortex of ferrets and cats. Posterior is left,dorsal is up. (a) Intact right hemisphere of ferret brain showing the location of gyri, sulci and various cortical areas. Dashed lines indicatecuts made to separate the posterior block that was unfolded and flattened. (b) Diagram showing an unfolded and flattened ferret cortex.Curved arrows indicate further cuts made to fully flatten the cortex. Dashed lines indicate fundi of sulci, gray areas indicate the surface ofgyri, large dotted line indicates the outline of V1, and lines made of small dots indicate the borders of other visual areas. These landmarksand lines are useful for correlating features of the callosal pattern to the patterns of gyri, sulci, and visual areas (see Figures 3(a), 3(b), and3(c)). A: auditory cortex; as: ansate sulcus; ls: lateral sulcus; PPc: posterior parietal caudal; PPr: posterior parietal rostral; pss: pseudosylviansulcus; S: somatosensory cortex; spl: splenial sulcus; sss: suprasylvian sulcus; SSY: suprasylvian visual area. (c) Schematic diagram of intactright hemisphere of cat brain showing location of various visual areas. Dashed line indicates lateral border of area 17. (d) Diagram showingan unfolded and flattened cat cortex. Curved arrows indicate cuts made to fully flatten the cortex. Dark and light areas correspond to gyriand sulci, respectively. Fine dashed lines indicate the lateral borders of areas 17 and 18. The heavy dashed line indicates the approximatelocation of several visual areas, including areas 18, 19, 20, 21, and suprasylvian areas. These lines are also useful for relating features of thecallosal patterns to visual areas (see Figures 3(d), 3(e), and 3(f)). Unfolding and flattening the cortex of ferrets and cats were performed asdescribed previously [7]. A: auditory cortex; S: somatosensory cortex; spl: splenial; lat: lateral; cru: cruciate; ssyl: suprasylvian. Scale bars =1.0 cm. Adapted from Bock et al. [8]; Olavarria and Van Sluyters [9].
are callosal free in controls, the percentage of extrastriatevisual cortex occupied by callosal connections is signifi-cantly increased in BEP7 ferrets compared with controls.In contrast, no significant differences in this percentage areobserved in BEP20 ferrets compared with controls, support-ing the observation that the callosal pattern in BEP20 ferrets(Figure 3(c)) closely resembles that in controls (Figure 3(a)).
Moreover, within the extrastriate visual region analyzed, theaverage number of cells per histological section is not signifi-cantly different among control, BEP7, and BEP20 ferrets [8].
Interestingly, in cats, the effects of enucleation at birth(BEP0, Figure 3(e)) resemble those observed in BEP20 ferretsin that enucleation fails to induce significant changes inthe overall pattern of callosal connections in both striate
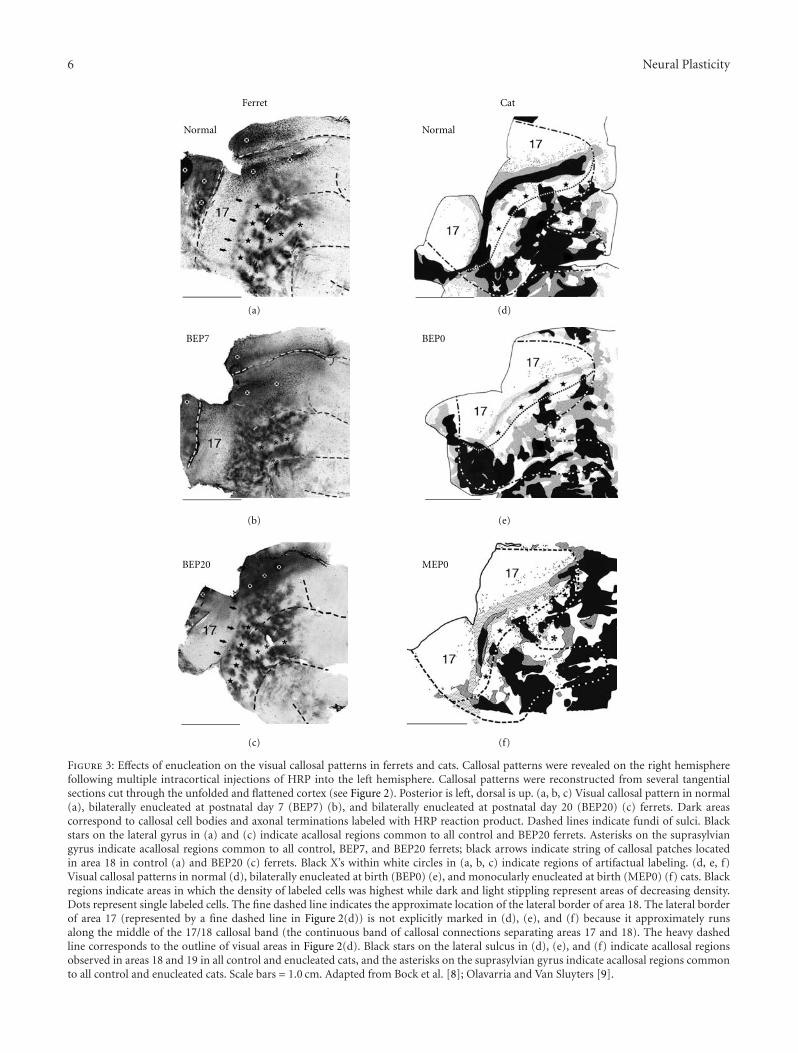
6 Neural Plasticity
(a)
(b)
(c)
(d)
Ferret Cat
Normal Normal
BEP0BEP7
BEP20 MEP0
(e)
(f)
Figure 3: Effects of enucleation on the visual callosal patterns in ferrets and cats. Callosal patterns were revealed on the right hemispherefollowing multiple intracortical injections of HRP into the left hemisphere. Callosal patterns were reconstructed from several tangentialsections cut through the unfolded and flattened cortex (see Figure 2). Posterior is left, dorsal is up. (a, b, c) Visual callosal pattern in normal(a), bilaterally enucleated at postnatal day 7 (BEP7) (b), and bilaterally enucleated at postnatal day 20 (BEP20) (c) ferrets. Dark areascorrespond to callosal cell bodies and axonal terminations labeled with HRP reaction product. Dashed lines indicate fundi of sulci. Blackstars on the lateral gyrus in (a) and (c) indicate acallosal regions common to all control and BEP20 ferrets. Asterisks on the suprasylviangyrus indicate acallosal regions common to all control, BEP7, and BEP20 ferrets; black arrows indicate string of callosal patches locatedin area 18 in control (a) and BEP20 (c) ferrets. Black X’s within white circles in (a, b, c) indicate regions of artifactual labeling. (d, e, f)Visual callosal patterns in normal (d), bilaterally enucleated at birth (BEP0) (e), and monocularly enucleated at birth (MEP0) (f) cats. Blackregions indicate areas in which the density of labeled cells was highest while dark and light stippling represent areas of decreasing density.Dots represent single labeled cells. The fine dashed line indicates the approximate location of the lateral border of area 18. The lateral borderof area 17 (represented by a fine dashed line in Figure 2(d)) is not explicitly marked in (d), (e), and (f) because it approximately runsalong the middle of the 17/18 callosal band (the continuous band of callosal connections separating areas 17 and 18). The heavy dashedline corresponds to the outline of visual areas in Figure 2(d). Black stars on the lateral sulcus in (d), (e), and (f) indicate acallosal regionsobserved in areas 18 and 19 in all control and enucleated cats, and the asterisks on the suprasylvian gyrus indicate acallosal regions commonto all control and enucleated cats. Scale bars = 1.0 cm. Adapted from Bock et al. [8]; Olavarria and Van Sluyters [9].
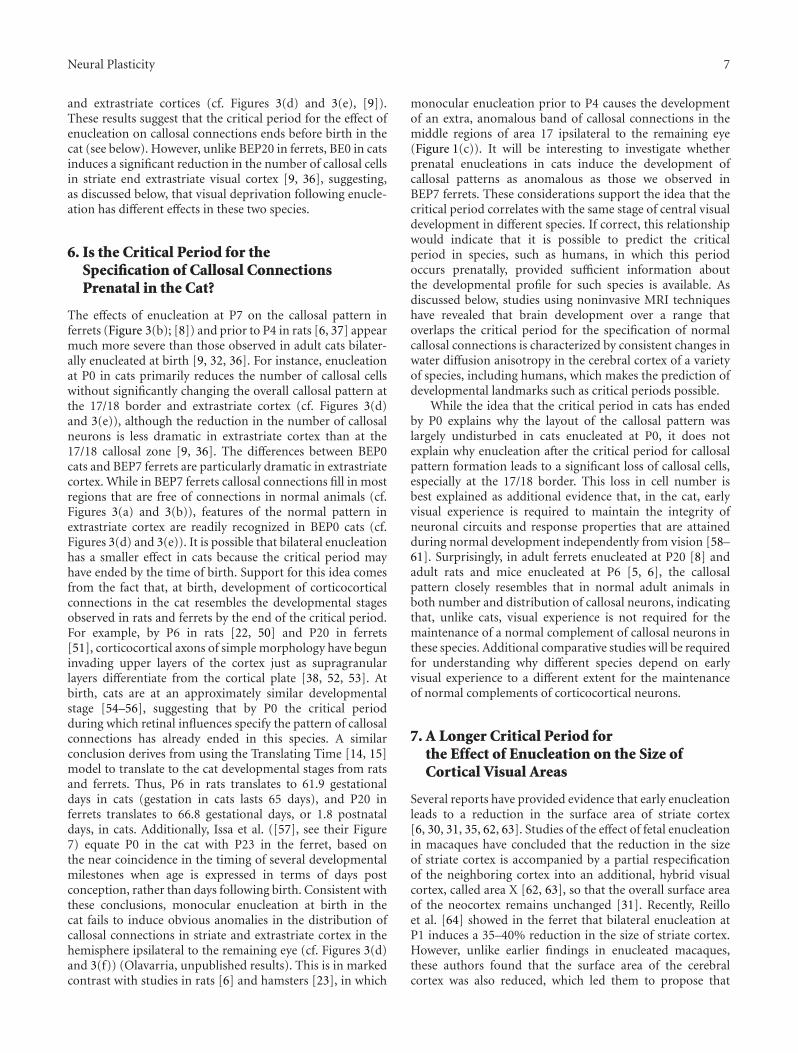
Neural Plasticity 7
and extrastriate cortices (cf. Figures 3(d) and 3(e), [9]).These results suggest that the critical period for the effect ofenucleation on callosal connections ends before birth in thecat (see below). However, unlike BEP20 in ferrets, BE0 in catsinduces a significant reduction in the number of callosal cellsin striate end extrastriate visual cortex [9, 36], suggesting,as discussed below, that visual deprivation following enucle-ation has different effects in these two species.
6. Is the Critical Period for theSpecification of Callosal ConnectionsPrenatal in the Cat?
The effects of enucleation at P7 on the callosal pattern inferrets (Figure 3(b); [8]) and prior to P4 in rats [6, 37] appearmuch more severe than those observed in adult cats bilater-ally enucleated at birth [9, 32, 36]. For instance, enucleationat P0 in cats primarily reduces the number of callosal cellswithout significantly changing the overall callosal pattern atthe 17/18 border and extrastriate cortex (cf. Figures 3(d)and 3(e)), although the reduction in the number of callosalneurons is less dramatic in extrastriate cortex than at the17/18 callosal zone [9, 36]. The differences between BEP0cats and BEP7 ferrets are particularly dramatic in extrastriatecortex. While in BEP7 ferrets callosal connections fill in mostregions that are free of connections in normal animals (cf.Figures 3(a) and 3(b)), features of the normal pattern inextrastriate cortex are readily recognized in BEP0 cats (cf.Figures 3(d) and 3(e)). It is possible that bilateral enucleationhas a smaller effect in cats because the critical period mayhave ended by the time of birth. Support for this idea comesfrom the fact that, at birth, development of corticocorticalconnections in the cat resembles the developmental stagesobserved in rats and ferrets by the end of the critical period.For example, by P6 in rats [22, 50] and P20 in ferrets[51], corticocortical axons of simple morphology have beguninvading upper layers of the cortex just as supragranularlayers differentiate from the cortical plate [38, 52, 53]. Atbirth, cats are at an approximately similar developmentalstage [54–56], suggesting that by P0 the critical periodduring which retinal influences specify the pattern of callosalconnections has already ended in this species. A similarconclusion derives from using the Translating Time [14, 15]model to translate to the cat developmental stages from ratsand ferrets. Thus, P6 in rats translates to 61.9 gestationaldays in cats (gestation in cats lasts 65 days), and P20 inferrets translates to 66.8 gestational days, or 1.8 postnataldays, in cats. Additionally, Issa et al. ([57], see their Figure7) equate P0 in the cat with P23 in the ferret, based onthe near coincidence in the timing of several developmentalmilestones when age is expressed in terms of days postconception, rather than days following birth. Consistent withthese conclusions, monocular enucleation at birth in thecat fails to induce obvious anomalies in the distribution ofcallosal connections in striate and extrastriate cortex in thehemisphere ipsilateral to the remaining eye (cf. Figures 3(d)and 3(f)) (Olavarria, unpublished results). This is in markedcontrast with studies in rats [6] and hamsters [23], in which
monocular enucleation prior to P4 causes the developmentof an extra, anomalous band of callosal connections in themiddle regions of area 17 ipsilateral to the remaining eye(Figure 1(c)). It will be interesting to investigate whetherprenatal enucleations in cats induce the development ofcallosal patterns as anomalous as those we observed inBEP7 ferrets. These considerations support the idea that thecritical period correlates with the same stage of central visualdevelopment in different species. If correct, this relationshipwould indicate that it is possible to predict the criticalperiod in species, such as humans, in which this periodoccurs prenatally, provided sufficient information aboutthe developmental profile for such species is available. Asdiscussed below, studies using noninvasive MRI techniqueshave revealed that brain development over a range thatoverlaps the critical period for the specification of normalcallosal connections is characterized by consistent changes inwater diffusion anisotropy in the cerebral cortex of a varietyof species, including humans, which makes the prediction ofdevelopmental landmarks such as critical periods possible.
While the idea that the critical period in cats has endedby P0 explains why the layout of the callosal pattern waslargely undisturbed in cats enucleated at P0, it does notexplain why enucleation after the critical period for callosalpattern formation leads to a significant loss of callosal cells,especially at the 17/18 border. This loss in cell number isbest explained as additional evidence that, in the cat, earlyvisual experience is required to maintain the integrity ofneuronal circuits and response properties that are attainedduring normal development independently from vision [58–61]. Surprisingly, in adult ferrets enucleated at P20 [8] andadult rats and mice enucleated at P6 [5, 6], the callosalpattern closely resembles that in normal adult animals inboth number and distribution of callosal neurons, indicatingthat, unlike cats, visual experience is not required for themaintenance of a normal complement of callosal neurons inthese species. Additional comparative studies will be requiredfor understanding why different species depend on earlyvisual experience to a different extent for the maintenanceof normal complements of corticocortical neurons.
7. A Longer Critical Period forthe Effect of Enucleation on the Size ofCortical Visual Areas
Several reports have provided evidence that early enucleationleads to a reduction in the surface area of striate cortex[6, 30, 31, 35, 62, 63]. Studies of the effect of fetal enucleationin macaques have concluded that the reduction in the sizeof striate cortex is accompanied by a partial respecificationof the neighboring cortex into an additional, hybrid visualcortex, called area X [62, 63], so that the overall surface areaof the neocortex remains unchanged [31]. Recently, Reilloet al. [64] showed in the ferret that bilateral enucleation atP1 induces a 35–40% reduction in the size of striate cortex.However, unlike earlier findings in enucleated macaques,these authors found that the surface area of the cerebralcortex was also reduced, which led them to propose that
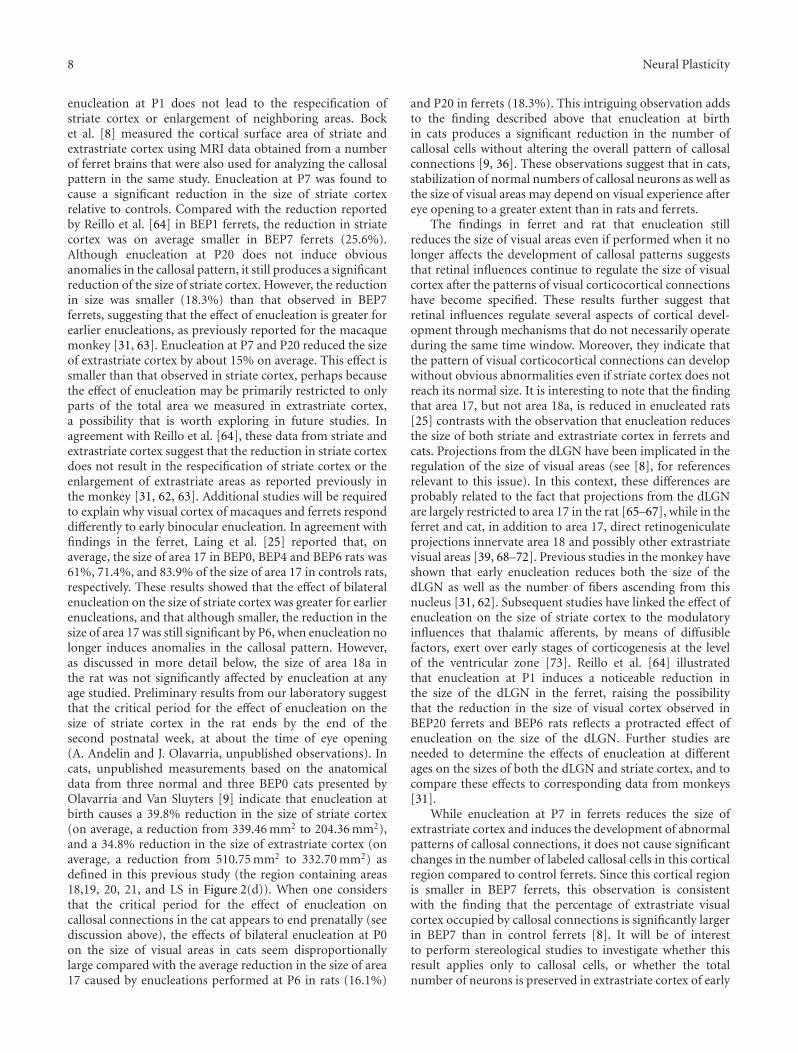
8 Neural Plasticity
enucleation at P1 does not lead to the respecification ofstriate cortex or enlargement of neighboring areas. Bocket al. [8] measured the cortical surface area of striate andextrastriate cortex using MRI data obtained from a numberof ferret brains that were also used for analyzing the callosalpattern in the same study. Enucleation at P7 was found tocause a significant reduction in the size of striate cortexrelative to controls. Compared with the reduction reportedby Reillo et al. [64] in BEP1 ferrets, the reduction in striatecortex was on average smaller in BEP7 ferrets (25.6%).Although enucleation at P20 does not induce obviousanomalies in the callosal pattern, it still produces a significantreduction of the size of striate cortex. However, the reductionin size was smaller (18.3%) than that observed in BEP7ferrets, suggesting that the effect of enucleation is greater forearlier enucleations, as previously reported for the macaquemonkey [31, 63]. Enucleation at P7 and P20 reduced the sizeof extrastriate cortex by about 15% on average. This effect issmaller than that observed in striate cortex, perhaps becausethe effect of enucleation may be primarily restricted to onlyparts of the total area we measured in extrastriate cortex,a possibility that is worth exploring in future studies. Inagreement with Reillo et al. [64], these data from striate andextrastriate cortex suggest that the reduction in striate cortexdoes not result in the respecification of striate cortex or theenlargement of extrastriate areas as reported previously inthe monkey [31, 62, 63]. Additional studies will be requiredto explain why visual cortex of macaques and ferrets responddifferently to early binocular enucleation. In agreement withfindings in the ferret, Laing et al. [25] reported that, onaverage, the size of area 17 in BEP0, BEP4 and BEP6 rats was61%, 71.4%, and 83.9% of the size of area 17 in controls rats,respectively. These results showed that the effect of bilateralenucleation on the size of striate cortex was greater for earlierenucleations, and that although smaller, the reduction in thesize of area 17 was still significant by P6, when enucleation nolonger induces anomalies in the callosal pattern. However,as discussed in more detail below, the size of area 18a inthe rat was not significantly affected by enucleation at anyage studied. Preliminary results from our laboratory suggestthat the critical period for the effect of enucleation on thesize of striate cortex in the rat ends by the end of thesecond postnatal week, at about the time of eye opening(A. Andelin and J. Olavarria, unpublished observations). Incats, unpublished measurements based on the anatomicaldata from three normal and three BEP0 cats presented byOlavarria and Van Sluyters [9] indicate that enucleation atbirth causes a 39.8% reduction in the size of striate cortex(on average, a reduction from 339.46 mm2 to 204.36 mm2),and a 34.8% reduction in the size of extrastriate cortex (onaverage, a reduction from 510.75 mm2 to 332.70 mm2) asdefined in this previous study (the region containing areas18,19, 20, 21, and LS in Figure 2(d)). When one considersthat the critical period for the effect of enucleation oncallosal connections in the cat appears to end prenatally (seediscussion above), the effects of bilateral enucleation at P0on the size of visual areas in cats seem disproportionallylarge compared with the average reduction in the size of area17 caused by enucleations performed at P6 in rats (16.1%)
and P20 in ferrets (18.3%). This intriguing observation addsto the finding described above that enucleation at birthin cats produces a significant reduction in the number ofcallosal cells without altering the overall pattern of callosalconnections [9, 36]. These observations suggest that in cats,stabilization of normal numbers of callosal neurons as well asthe size of visual areas may depend on visual experience aftereye opening to a greater extent than in rats and ferrets.
The findings in ferret and rat that enucleation stillreduces the size of visual areas even if performed when it nolonger affects the development of callosal patterns suggeststhat retinal influences continue to regulate the size of visualcortex after the patterns of visual corticocortical connectionshave become specified. These results further suggest thatretinal influences regulate several aspects of cortical devel-opment through mechanisms that do not necessarily operateduring the same time window. Moreover, they indicate thatthe pattern of visual corticocortical connections can developwithout obvious abnormalities even if striate cortex does notreach its normal size. It is interesting to note that the findingthat area 17, but not area 18a, is reduced in enucleated rats[25] contrasts with the observation that enucleation reducesthe size of both striate and extrastriate cortex in ferrets andcats. Projections from the dLGN have been implicated in theregulation of the size of visual areas (see [8], for referencesrelevant to this issue). In this context, these differences areprobably related to the fact that projections from the dLGNare largely restricted to area 17 in the rat [65–67], while in theferret and cat, in addition to area 17, direct retinogeniculateprojections innervate area 18 and possibly other extrastriatevisual areas [39, 68–72]. Previous studies in the monkey haveshown that early enucleation reduces both the size of thedLGN as well as the number of fibers ascending from thisnucleus [31, 62]. Subsequent studies have linked the effect ofenucleation on the size of striate cortex to the modulatoryinfluences that thalamic afferents, by means of diffusiblefactors, exert over early stages of corticogenesis at the levelof the ventricular zone [73]. Reillo et al. [64] illustratedthat enucleation at P1 induces a noticeable reduction inthe size of the dLGN in the ferret, raising the possibilitythat the reduction in the size of visual cortex observed inBEP20 ferrets and BEP6 rats reflects a protracted effect ofenucleation on the size of the dLGN. Further studies areneeded to determine the effects of enucleation at differentages on the sizes of both the dLGN and striate cortex, and tocompare these effects to corresponding data from monkeys[31].
While enucleation at P7 in ferrets reduces the size ofextrastriate cortex and induces the development of abnormalpatterns of callosal connections, it does not cause significantchanges in the number of labeled callosal cells in this corticalregion compared to control ferrets. Since this cortical regionis smaller in BEP7 ferrets, this observation is consistentwith the finding that the percentage of extrastriate visualcortex occupied by callosal connections is significantly largerin BEP7 than in control ferrets [8]. It will be of interestto perform stereological studies to investigate whether thisresult applies only to callosal cells, or whether the totalnumber of neurons is preserved in extrastriate cortex of early
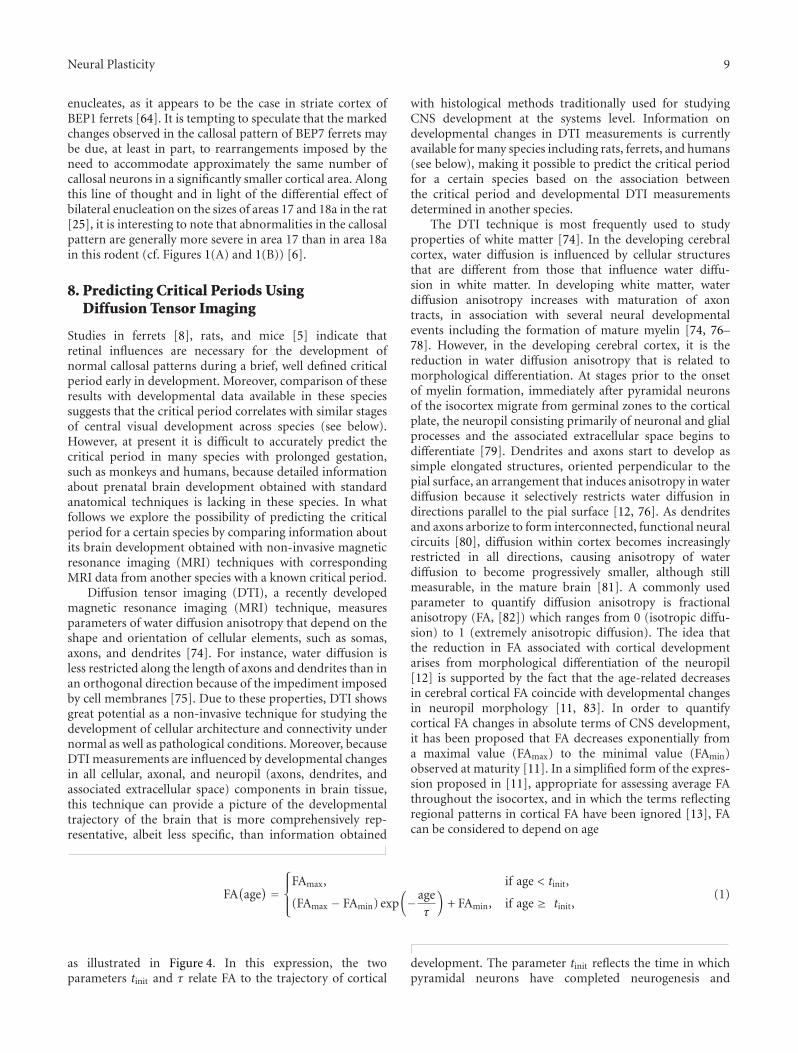
Neural Plasticity 9
enucleates, as it appears to be the case in striate cortex ofBEP1 ferrets [64]. It is tempting to speculate that the markedchanges observed in the callosal pattern of BEP7 ferrets maybe due, at least in part, to rearrangements imposed by theneed to accommodate approximately the same number ofcallosal neurons in a significantly smaller cortical area. Alongthis line of thought and in light of the differential effect ofbilateral enucleation on the sizes of areas 17 and 18a in the rat[25], it is interesting to note that abnormalities in the callosalpattern are generally more severe in area 17 than in area 18ain this rodent (cf. Figures 1(A) and 1(B)) [6].
8. Predicting Critical Periods UsingDiffusion Tensor Imaging
Studies in ferrets [8], rats, and mice [5] indicate thatretinal influences are necessary for the development ofnormal callosal patterns during a brief, well defined criticalperiod early in development. Moreover, comparison of theseresults with developmental data available in these speciessuggests that the critical period correlates with similar stagesof central visual development across species (see below).However, at present it is difficult to accurately predict thecritical period in many species with prolonged gestation,such as monkeys and humans, because detailed informationabout prenatal brain development obtained with standardanatomical techniques is lacking in these species. In whatfollows we explore the possibility of predicting the criticalperiod for a certain species by comparing information aboutits brain development obtained with non-invasive magneticresonance imaging (MRI) techniques with correspondingMRI data from another species with a known critical period.
Diffusion tensor imaging (DTI), a recently developedmagnetic resonance imaging (MRI) technique, measuresparameters of water diffusion anisotropy that depend on theshape and orientation of cellular elements, such as somas,axons, and dendrites [74]. For instance, water diffusion isless restricted along the length of axons and dendrites than inan orthogonal direction because of the impediment imposedby cell membranes [75]. Due to these properties, DTI showsgreat potential as a non-invasive technique for studying thedevelopment of cellular architecture and connectivity undernormal as well as pathological conditions. Moreover, becauseDTI measurements are influenced by developmental changesin all cellular, axonal, and neuropil (axons, dendrites, andassociated extracellular space) components in brain tissue,this technique can provide a picture of the developmentaltrajectory of the brain that is more comprehensively rep-resentative, albeit less specific, than information obtained
with histological methods traditionally used for studyingCNS development at the systems level. Information ondevelopmental changes in DTI measurements is currentlyavailable for many species including rats, ferrets, and humans(see below), making it possible to predict the critical periodfor a certain species based on the association betweenthe critical period and developmental DTI measurementsdetermined in another species.
The DTI technique is most frequently used to studyproperties of white matter [74]. In the developing cerebralcortex, water diffusion is influenced by cellular structuresthat are different from those that influence water diffu-sion in white matter. In developing white matter, waterdiffusion anisotropy increases with maturation of axontracts, in association with several neural developmentalevents including the formation of mature myelin [74, 76–78]. However, in the developing cerebral cortex, it is thereduction in water diffusion anisotropy that is related tomorphological differentiation. At stages prior to the onsetof myelin formation, immediately after pyramidal neuronsof the isocortex migrate from germinal zones to the corticalplate, the neuropil consisting primarily of neuronal and glialprocesses and the associated extracellular space begins todifferentiate [79]. Dendrites and axons start to develop assimple elongated structures, oriented perpendicular to thepial surface, an arrangement that induces anisotropy in waterdiffusion because it selectively restricts water diffusion indirections parallel to the pial surface [12, 76]. As dendritesand axons arborize to form interconnected, functional neuralcircuits [80], diffusion within cortex becomes increasinglyrestricted in all directions, causing anisotropy of waterdiffusion to become progressively smaller, although stillmeasurable, in the mature brain [81]. A commonly usedparameter to quantify diffusion anisotropy is fractionalanisotropy (FA, [82]) which ranges from 0 (isotropic diffu-sion) to 1 (extremely anisotropic diffusion). The idea thatthe reduction in FA associated with cortical developmentarises from morphological differentiation of the neuropil[12] is supported by the fact that the age-related decreasesin cerebral cortical FA coincide with developmental changesin neuropil morphology [11, 83]. In order to quantifycortical FA changes in absolute terms of CNS development,it has been proposed that FA decreases exponentially froma maximal value (FAmax) to the minimal value (FAmin)observed at maturity [11]. In a simplified form of the expres-sion proposed in [11], appropriate for assessing average FAthroughout the isocortex, and in which the terms reflectingregional patterns in cortical FA have been ignored [13], FAcan be considered to depend on age
FA(age) =
⎧⎪⎨⎪⎩
FAmax, if age < tinit,
(FAmax − FAmin) exp(−age
τ
)+ FAmin, if age ≥ tinit,
(1)
as illustrated in Figure 4. In this expression, the twoparameters tinit and τ relate FA to the trajectory of cortical
development. The parameter tinit reflects the time in whichpyramidal neurons have completed neurogenesis and

10 Neural Plasticity
migration to the cortical plate. The exponential decay timeconstant, τ, reflects the rate of morphological developmentof the neuropil. Importantly, for many species includinghumans, cortical FA changes take place prenatally. Therefore,to facilitate interspecies comparisons, the ages representedin Figure 4 are expressed as days post conception even whenthey fall after birth.
The progressive loss of cortical diffusion anisotropy withage has been quantified for rat [10, 84, 85], mouse [86, 87],ferret [11, 88], baboon [83], and human [12, 89–91]. Toassess the consistency of developmental stage dependent FAchanges between species, Leigland and Kroenke [13] ana-lyzed published cortical FA data using the above expression,in which the value of tinit for each species correspondsto the time period immediately following the genesis andsubsequent migration of pyramidal neurons from ventric-ular/subventricular zones to the cortical plate [11]. Theseauthors found a high degree of correlation between τ andrates of neuroanatomical development quantified throughlarge-scale comparative meta analyses of CNS development(see below) [15–17].
9. The Critical Period for the Effect ofEnucleation on Callosal ConnectionsCoincides with Similar Stages ofCortical FA Decay in Rodents and Ferrets
When the critical periods in rodents and ferrets are correlatedwith the developmental trajectories revealed by cortical FA,it becomes apparent that the critical period occurs over aremarkably similar developmental time span. In Figure 4, thetop graph illustrating how cerebral cortical FA decays withdevelopment represents available data from rat, ferret, andhuman. In order to fit the same curve, the data from each ofthese groups were transformed by shifting each curve so thatthe tinit values coincided and by scaling each species’ age bya factor proportional to 1/τ. Analysis of the data presentedby Huang et al. [10] in the rat yields values of 22 days and5 days, respectively, for tinit and τ (in which tinit is expressedas days post conception (PC); tinit is postnatal day 0.5 for therat). Thus, for the rat, the critical period for interhemisphericconnectivity specification corresponds to times in whichcortical FA ranges from 0.50 (on day P4; PC 25.5) to 0.33 (onday P6; PC 27.5) of the difference between FAmax and FAmin
(area shaded dark gray in Figure 4). By comparison, theP7–P20 (PC48–PC61) age range investigated in enucleatedferrets (light gray area in Figure 4) begins just prior to tinit
and extends until FA is 0.33 of the difference between FAmax
and FAmin. The values used for ferret tinit and τ were 49 dayspost conception (which corresponds to P8) and 10.7 days,respectively [11]. It should be noted that the critical periodhas been determined with greater precision in rodent speciesthan in ferrets. It is therefore likely that future studies willreveal that the ferret critical period extends through a shortertime range. For instance, based on the relationship betweenthe critical period and FA curve in the rat, we predict thatthe critical period for the ferret would extend approximatelyfrom P15 to P20 (PC56 to PC61, between the gray lines in
Figure 4). For humans, the FA curve is based on data fromMcKinstry et al., 2002 [12], in which tinit is 173 days postconception and τ is 39.8 days. Assuming that the criticalperiod in humans relates to the FA decay curve as in rats,we predict that the critical period for cortical connectivityin humans extends from about 201 days (28.7 weeks) to217 days (31 weeks) of gestation (between the gray lines inFigure 4).
An alternative procedure for correlating developmen-tal events across animal species was developed by Finlayand coworkers [14–17]. Using published data identifyingthe timing of specific developmental events obtained bystandard anatomical methods from many species, theseauthors derived a time model, called Translating Time(http://translatingtime.org/public/translate). This model isbased on three factors (a species score, an event score, andan interaction term). The species score reflects the rate ofdevelopment of a particular species. The event score reflectsthe timing of specific neural developmental events. Theinteraction term reflects a slower rate of cerebral corticaldevelopment in primates, relative to other structures in theCNS. In addition to predicting the ages of many species atspecific neurodevelopmental events, this model can also beused to translate the age of one species to that of another. Anin-depth comparison of interspecies DTI studies to resultsobtained using the translating time model is given in [13].Using this model the critical period determined in the ratand mouse (P4–P6; PC25.5–PC27.5) translates to a periodextending from about 138 days (19.7 weeks) to 150 days (21.4weeks) of gestation in humans. As illustrated in Figure 4,the critical period for humans predicted this way (bluebar) is significantly earlier than the one predicted usingthe relationship between the critical period and FA decaycurve established with data from the rat (between the graylines in Figure 4). In contrast, predictions for the ferretcritical period based on either cortical FA data (between graylines) or the translating time model (from P11 to P15.5,corresponding to PC52 to PC56.5, blue bar in Figure 4) arerelatively close to one another. It should be noted that theranges for both predictions for the ferret lie within the P7–P20 (PC48–PC61) range examined experimentally in thisspecies [8], and that further studies will be required to testthese predictions in this species.
Our prediction of the critical period in humans based onthe FA decay curve is consistent with available developmentaldata. In rodents and ferrets, fibers from the thalamuspenetrate layer 4 of the cerebral cortex before the onset ofthe critical period. In rodents, thalamic fibers project to layerIV in visual cortex as early as P3 [92], while in the ferretfibers of thalamic origin can be observed in cortical layerIV by the end of the first postnatal week [93]. By P6 inrats [22, 50] and P20 in ferrets [51], corticocortical axons ofsimple morphology begin invading upper cortical layers justas supragranular layers differentiate from the cortical plate[38, 52, 53]. These data suggest that the end of the criticalperiod in rodents and ferrets correlates with the arrival ofaxon terminals into supragranular layers and the beginningof arbor branching, which may contribute to the decrease ofcortical FA.
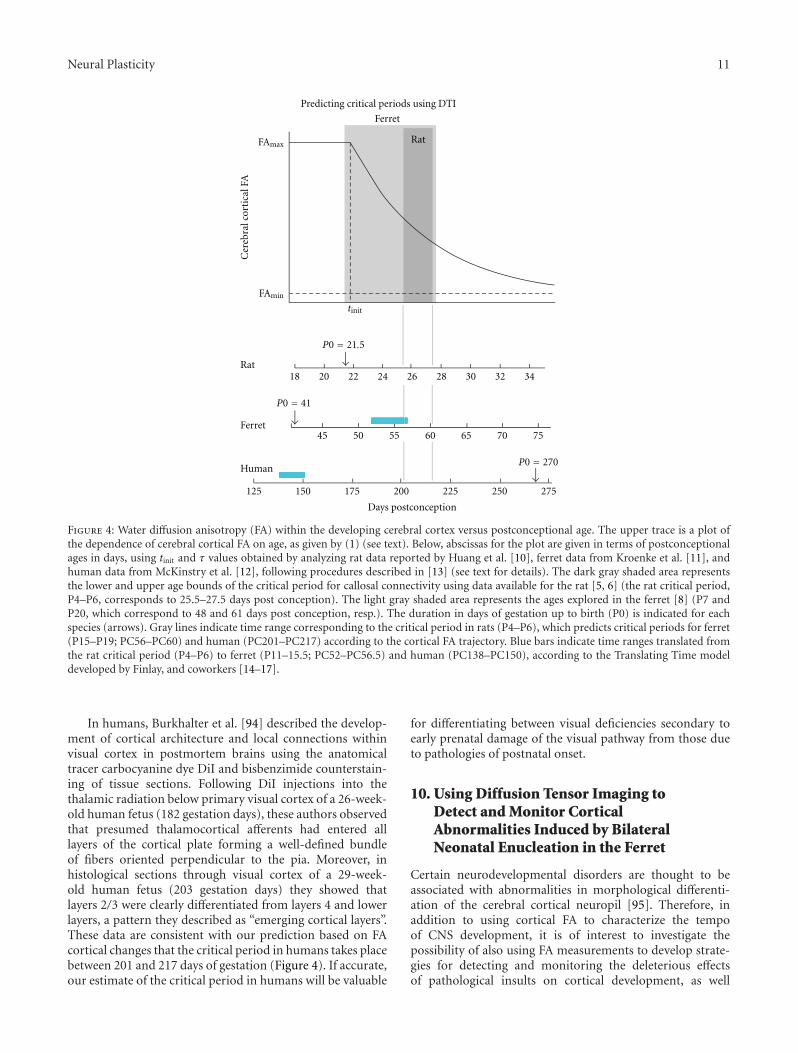
Neural Plasticity 11
Ferret
Rat
Predicting critical periods using DTI
FAmax
FAmin
tinit
P0 = 21.5
P0 = 41
P0 = 270
Days postconception
Human
Cer
ebra
l cor
tica
l FA
Ferret
Rat18 20 22 24 26 28 30 32 34
45 50 55 60 65 70 75
125 150 175 200 225 250 275
Figure 4: Water diffusion anisotropy (FA) within the developing cerebral cortex versus postconceptional age. The upper trace is a plot ofthe dependence of cerebral cortical FA on age, as given by (1) (see text). Below, abscissas for the plot are given in terms of postconceptionalages in days, using tinit and τ values obtained by analyzing rat data reported by Huang et al. [10], ferret data from Kroenke et al. [11], andhuman data from McKinstry et al. [12], following procedures described in [13] (see text for details). The dark gray shaded area representsthe lower and upper age bounds of the critical period for callosal connectivity using data available for the rat [5, 6] (the rat critical period,P4–P6, corresponds to 25.5–27.5 days post conception). The light gray shaded area represents the ages explored in the ferret [8] (P7 andP20, which correspond to 48 and 61 days post conception, resp.). The duration in days of gestation up to birth (P0) is indicated for eachspecies (arrows). Gray lines indicate time range corresponding to the critical period in rats (P4–P6), which predicts critical periods for ferret(P15–P19; PC56–PC60) and human (PC201–PC217) according to the cortical FA trajectory. Blue bars indicate time ranges translated fromthe rat critical period (P4–P6) to ferret (P11–15.5; PC52–PC56.5) and human (PC138–PC150), according to the Translating Time modeldeveloped by Finlay, and coworkers [14–17].
In humans, Burkhalter et al. [94] described the develop-ment of cortical architecture and local connections withinvisual cortex in postmortem brains using the anatomicaltracer carbocyanine dye DiI and bisbenzimide counterstain-ing of tissue sections. Following DiI injections into thethalamic radiation below primary visual cortex of a 26-week-old human fetus (182 gestation days), these authors observedthat presumed thalamocortical afferents had entered alllayers of the cortical plate forming a well-defined bundleof fibers oriented perpendicular to the pia. Moreover, inhistological sections through visual cortex of a 29-week-old human fetus (203 gestation days) they showed thatlayers 2/3 were clearly differentiated from layers 4 and lowerlayers, a pattern they described as “emerging cortical layers”.These data are consistent with our prediction based on FAcortical changes that the critical period in humans takes placebetween 201 and 217 days of gestation (Figure 4). If accurate,our estimate of the critical period in humans will be valuable
for differentiating between visual deficiencies secondary toearly prenatal damage of the visual pathway from those dueto pathologies of postnatal onset.
10. Using Diffusion Tensor Imaging toDetect and Monitor CorticalAbnormalities Induced by BilateralNeonatal Enucleation in the Ferret
Certain neurodevelopmental disorders are thought to beassociated with abnormalities in morphological differenti-ation of the cerebral cortical neuropil [95]. Therefore, inaddition to using cortical FA to characterize the tempoof CNS development, it is of interest to investigate thepossibility of also using FA measurements to develop strate-gies for detecting and monitoring the deleterious effectsof pathological insults on cortical development, as well
12 Neural Plasticity
as for assessing the efficacy of therapeutic interventionsinitiated at early stages of development while the brain isstill plastic. Previous studies have associated blindness withabnormalities of the cerebral cortical neuropil. For instance,Golgi studies of animals that have been dark-reared [96,97], stripe-reared [98], or binocularly-enucleated [99, 100]have documented effects on several aspects of dendriticdevelopment in the cerebral cortex, including abnormalitiesin dendritic fields of pyramidal cells, and reductions in thenumber of dendritic spines. At the cellular level, enucleationincreases the length of callosal axon branches and total lengthof arbors, without major effects on the number of branchtips [101], and reduces the proportion of multiple synapticboutons in the visual callosal projection [102]. In view of themassive effects that neonatal enucleation in the ferret has onvisual callosal connections, Bock et al. [18] decided to usethis animal model to explore the potential of DTI techniquesfor detecting abnormal cortical development induced byenucleation. These authors compared cortical FA betweencontrol and BEP7 ferrets using values measured at P31, whenneuronal morphological differentiation is still underway.
Due to the widespread distribution of callosal connec-tions in the brain, the overall cortical area affected byenucleation can be readily estimated by determining whichregions contain abnormal callosal patterns. In turn, thisgreatly facilitates the identification of areas to be analyzedwith DTI methods (Figure 5(a)). Data from one BEP7 animaland one control are illustrated in Figure 5(a), in whichcortical FA has been projected onto lateral views of ferretcerebral cortical surface models. This figure illustrates thatthe BEP7 surface exhibits greater FA (brighter yellow) thanthe control in visual areas (encircled by black dots) at P31,while no differences in FA are apparent in a control, non-visual area located more rostrally (encircled by blue-greendots). Figures 5(b) and 5(c) compare histograms from twoBEP7 and two control ferrets, and illustrate that differencesin cortical FA are observed in visual areas (Figure 5(b)),but not in the non-visual control area (Figure 5(c)). Theseresults show that cortical visual areas exhibiting differencesin callosal connectivity at adulthood were spatially correlatedwith regions exhibiting altered cortical FA at P31. In agree-ment with these results in ferrets, a preliminary comparisonperformed at P6 between normal and P0-enucleated ratsrevealed that anisotropy within deep layers of primary visualcortex is increased in the enucleated rats compared withnormal animals [103]. These results provide further evidencethat binocular enucleation perturbs the normal developmentof visual cortex, and supports the notion that DTI iscapable of detecting changes in connectivity associated withbinocular enucleation at early stages of brain development.It is important to note that, in addition to the abnormalitiesinduced on callosal connections, enucleation at P7 in theferret likely affects several other visual connection systems,including thalamocortical and ipsilateral, intrahemisphericcorticocortical projections [104–108]. It is therefore possiblethat the effect on FA within cerebral cortical gray matterobserved over much of visual cortex of BEP7 ferrets reflectsthe effect of enucleation on multiple pathways that eitherterminate or originate in visual cortex.
In order to directly examine the cellular-level determi-nants of the differences between control and BEP7 animalsobserved by DTI, a procedure was developed to quanti-tatively characterize orientation distributions of neuronalprocesses in Golgi-stained cerebral cortical tissue (Figure 6)[18]. For sets of visual and non-visual cortical locations,Golgi-stained neurons were compared between control andBEP7 animals. Figures 6(a) and 6(b) show that, in theP31 cortex, radially-oriented apical dendrites appear asdominant structures. To quantify the distributions of Golgi-stained processes in BEP7 and control animals, the imageswere skeletonized, and the resulting stained segments wereapproximated as lines (red overlays, Figures 6(a) and 6(b)[18]). Figure 6(c) shows that the distribution of line segmentpolar angles for the BEP7 animal is narrower than it isfor the control Golgi field. When fitted to a Von Misesdistribution, it was found that the BEP7 field is characterizedby a higher concentration parameter, κ = 2.08, than for thecontrol field, in which κ = 1.41. Figure 6(e) shows 7 suchcomparisons between BEP7 and control cerebral cortices,at locations indicated in Figure 6(d). In visual areas, theconcentration parameters were higher for BEP7 than controlferrets, consistent with a more uniform distribution of apicaldendrites for BEP7 ferrets compared to controls, whereassuch differences were not observed in non-visual areas. Thesedata suggest that the more coherent orientation of apicaldendrites observed in BEP7 ferrets accounts, at least in part,for increases in cortical FA measured in visual cortex of theseanimals.
11. Comparison with Other Studies and FutureDirections for the Use of Diffusion TensorImaging to Characterize CerebralCortical Neuropil Differentiation
One question that arises is whether abnormal developmentof cellular elements not detectable by Golgi staining, suchas radial glial cells, underlies the cortical FA differencesmeasured in enucleated animals. For example, one studypresenting both DTI and immunohistochemical data oncerebral cortical microarchitecture in the neonatal ratbrain [84] concluded that FA perturbations associated withhypoxic ischemic injury were related to the quantity ofneuronal and glial fibers oriented approximately parallelto apical dendrites. In normal ferrets, radial glial cellsdifferentiate into astrocytes by P21 [109], suggesting thatthey do not contribute significantly to cortical FA atthe age this analysis was performed (P31). Moreover, thepossibility that enucleation somehow delays differentiationof radial glia is unlikely because studies in other specieshave shown that enucleation does not affect the timing ofother developmental milestones, such as the formation oftopographically organized corticocortical projections [6, 22].Lastly, the findings reported in the ferret are consistentwith a study in the rat [101], which showed that bilateralenucleation increased the length of axon branches and arborswithout changing the number of branches, as well as a studyin the rat showing that visual deprivation alters dendritic

Neural Plasticity 13
0.1 FA 0.4
Control BEP7
D
A
(a)
Visual cortex
BEP7
Fractional anisotropy
Pro
babi
lity
0.6
0.4
0.2
0
Control
0.60.40.2 0.8
(b)
Control area
Fractional anisotropy
0.60.40.2 0.8
Pro
babi
lity
0.6
0.4
0.2
0
BEP7Control
(c)
Figure 5: Visual cortical FA is increased in BEP7 ferrets, relative to controls, at P31. (a) Cortical FA is projected onto lateral cortical surfacemodels for one control and one BEP7 ferret, according to the red/yellow color scale (posterior is left, dorsal is up). The BEP7 surface exhibitsgreater FA (brighter yellow) than the control in visual areas (encircled by black dots) at P31, while no differences in FA are apparent in acontrol, nonvisual area located more rostrally (encircled by blue-green dots). Blue dots indicate the approximate location of the horizontalmeridian representation. Red dots indicate crowns of gyri. (b, c) Histograms represent data from either two BEP7 or two control ferrets.Comparison of these histograms illustrates that differences in cortical FA are observed in visual areas (b), but not in the nonvisual controlarea (c). Adapted from Bock et al. [18].
bundle architecture in rat visual cortex [110], and a study inthe mouse showing a reduction in the number of spines onapical dendrites of pyramids in bilaterally enucleated animals[99]. Together, these results suggest that DTI is capable ofdetecting abnormalities induced by bilateral enucleation onthe differentiation of axonal and dendritic arbors in visualcortex.
Several recent studies have described approaches forquantitatively comparing light microscopy-based measure-ments of axon and/or dendrite fiber orientations to DTIresults. Overall, the strategy commonly used by these studiesis similar to ours [18], namely, diffusion MRI measurementsare performed on aldehyde-fixed post mortem tissue, thetissue is subsequently sectioned and stained, and an imageanalysis procedure is applied to determine the statisticaldistribution of fiber orientations within a specified regionof interest. Leergaard et al. [111] and Choe et al. [112]have conducted analyses in which diffusion MRI datafrom white matter were compared to 2D fiber orientationdistributions measured from myelin-stained tissue. These
two studies differed in their analysis of microscopy data.While Leergaard and co-workers manually traced fibers,Choe et al. performed an automated Fourier analysis togenerate fiber orientation distributions. Finally, Budde andco-workers [113] used Fourier analyses of images of cerebralcortical tissue following various neuronal and glial stainingprocedures to reveal a role of gliosis in cortical FA changesin adult cerebral cortex following traumatic brain injury. Toaddress limitations of 2D analysis, we have recently extendedthe analysis of Golgi-stained tissue in the developing ferretcerebral cortex to 3D by performing confocal microscopy ofreflected light [114]. This recent work will likely facilitatefuture improvements in the precision with which waterdiffusion MRI measurements of brain cellular morphologycan be validated.
The study by Bock et al. [18] provides evidence thatneonatal bilateral enucleation induces alterations of neuronalprocesses that can be detected by DTI at early stages of devel-opment, but some issues remain to be addressed in futurestudies. First, the developmental trajectory of the difference

14 Neural Plasticity
��
�
�
�
� 1, 234
5
n.v. 1 n.v. 2
Control BEP7
Pro
babi
lity
Angle (radians)
BEP7 κ = 2.08Control κ = 1.41
−π/2 −π/4 0 π/2π/4 1 2 3 4 5
1
2
3
4
5
0
Location
∗
∗ ∗κ
(a) (b)
(c)
(d)
(e)
Non-visual
1
Non-visual
2
Figure 6: Increased cerebral cortical diffusion anisotropy in the developing visual cortex accompanies reduction in the neuronal processorientation distribution width. (a, b) Golgi-stained visual cortex tissue visualized at 10x magnification from a P31 control (a) and BEP7 (b)ferret. Line segments (red) representing neuronal processes throughout a region of the cerebral cortex (corresponding to location 3 in (d))are overlaid on (a), and on an image obtained from the same region of a BEP7 visual cortex at P31 in (b). The polar angle for each linesegment was determined, and in (c), histograms representing the distribution of polar angles are shown for the control (black data points)and BEP7 (red data points) Golgi fields. (c) Solid lines represent the results of approximating the data points as a Von Mises distribution. Thedistribution observed for the BEP7 field is narrower, and hence characterized by a larger concentration parameter κ, than for the control.(d) Location of 5 other regions analyzed in control and BEP7 ferrets. Filled circles indicate fields obtained from coronal sections, and opencircles from axial sections. Filled and open orange circles indicate the locations of nonvisual areas (n.v.). (e) Concentration parameters forthe 5 other region of the visual cortex, obtained from pairs of coronal sections (solid bars in (e)) and axial sections (open bars in (e)). Forall 5 visual regions, κ is larger for BEP7 animals (red solid and open bars) than for controls (black solid and open bars). For visual locationsindicated with asterisks, 95% confidence intervals for BEP7 and control regions do not overlap [18]. Filled and open orange bars in (e)represent data analyzed for nonvisual regions of BEP7 cortices, while filled and open gray bars in e represent regions of nonvisual cortex incontrol cortices. Significant differences for nonvisual areas are not observed. Adapted from Bock et al. [18].
between normal and bilaterally enucleated ferrets must bemeasured by examining brains at postnatal ages other thanP31 in order to identify the developmental stage in whichDTI is most sensitive for detecting abnormal morphologicaldevelopment of cerebral cortical neurons. Second, while thestudy of Bock et al. [18] shows that DTI has sufficientsensitivity to detect enucleation-induced changes in neuronalmorphology using postmortem tissue, it is possible thatsensitivity differs when the procedure is performed in liveanimals. Postmortem DTI studies are instrumental in studiesthat validate DTI data with subsequent histological analyses,but future experiments involving DTI measurements in live
ferrets and incorporating rapid image acquisition techniquessuch as echoplanar imaging will be needed to explore thepossibility of extending these finding to living tissue in detail.
12. Conclusion
In conclusion, studies in rodents and ferret indicate that nor-mal development of interhemispheric and intrahemisphericcorticocortical connections requires retinal input duringbrief critical periods at early stages of pathway formation.Moreover, these critical periods correlate with similar stages
Neural Plasticity 15
of brain development in these animals, suggesting that theeyes guide the development of corticocortical connectionsthrough common mechanisms across species. Based on theobservation that the relationship between the timing ofthe critical period and the DTI-characterized developmentaltrajectory is strikingly similar in rodents and ferrets, weexplored the possibility of using cortical DTI trajectories forpredicting the critical period in species, such as humans,in which this period likely occurs prenatally. If accurate,our estimate of the critical period in humans will be usefulfor differentiating between visual deficiencies secondary toearly prenatal damage of the visual pathway from those dueto pathologies of postnatal onset. Finally, the MRI findingsreviewed above indicate that the effect of neonatal enucle-ation on the development of callosal and other neuronalsystems in the ferret provide an ideal experimental modelfor investigating the sensitivity of DTI for detecting abnor-malities in neuronal architecture. Specifically, the modeldescribed is amenable for systematically investigating howpatterns of water diffusion anisotropy within the cerebralcortex change during early stages of development. Suchstudies will be useful for understanding the morphologicalfactors underlying the DTI findings in human studies ofdevelopmental disorders of the CNS. By avoiding potentialconfounds related to in utero manipulations or pretermbirth, the use of newborn ferrets will greatly facilitate DTIanalysis of changes in diffusion anisotropy at stages of braindevelopment that in primate species occur before birth.The studies reviewed here thus provide a strategy for usingDTI to identify abnormalities early in brain development,thereby enabling therapeutic intervention before significantreduction of brain plasticity occurs.
Acknowledgments
Grant sponsor: National Institutes of Health; Grant no.R01NS070022 (to C. D. Kroenke and J. F. Olavarria). C. D.Kroenke received salary support from P51RR000163. L. A.Leigland received support from T32 AG023477. High-fieldMRI instrumentation used in this work was purchased withsupport from the W. M. Keck Foundation. Grant sponsor:Royalty Research Fund award, University of Washington (toJ. F. Olavarria).
References
[1] G. M. Innocenti, “The development of projections fromcerebral cortex,” Progress in Sens Physiology, vol. 12, pp. 64–114, 1991.
[2] G. M. Innocenti and D. J. Price, “Exuberance in the develop-ment of cortical networks,” Nature Reviews Neuroscience, vol.6, no. 12, pp. 955–965, 2005.
[3] J. F. Olavarria, “Influence of topography and ocular domi-nance on the functional organization of callosal connectionsin the cat striate cortex,” in The Cat Primary Visual Cortex,pp. 259–294, Academic Press, New York, NY, USA, 2002.
[4] M. Pietrasanta, L. Restani, and M. Caleo, “The corpuscallosum and the visual cortex: plasticity is a game for two,”Neural Plasticity, vol. 2012, Article ID 838672, 10 pages, 2012.
[5] J. F. Olavarria and R. Hiroi, “Retinal influences specifycortico-cortical maps by postnatal day six in rats and mice,”Journal of Comparative Neurology, vol. 459, no. 2, pp. 156–172, 2003.
[6] J. Olavarria, R. Malach, and R. C. Van Sluyters, “Develop-ment of visual callosal connections in neonatally enucleatedrats,” Journal of Comparative Neurology, vol. 260, no. 3, pp.321–348, 1987.
[7] J. Olavarria and R. C. Van Sluyters, “Unfolding and flatteningthe cortex of gyrencephalic brains,” Journal of NeuroscienceMethods, vol. 15, no. 3, pp. 191–202, 1985.
[8] A. S. Bock, C. D. Kroenke, E. N. Taber, and J. F. Olavarria,“Retinal input influences the size and corticocortical connec-tivity of visual cortex during postnatal development in theferret,” The Journal of Comparative Neurology, vol. 520, no. 5,pp. 914–932, 2012.
[9] J. F. Olavarria and R. C. Van Sluyters, “Overall patternof callosal connections in visual cortex of normal andenucleated cats,” Journal of Comparative Neurology, vol. 363,no. 2, pp. 161–176, 1995.
[10] H. Huang, A. Yamamoto, M. A. Hossain, L. Younes,and S. Mori, “Quantitative cortical mapping of fractionalanisotropy in developing rat brains,” Journal of Neuroscience,vol. 28, no. 6, pp. 1427–1433, 2008.
[11] C. D. Kroenke, E. N. Taber, L. A. Leigland, A. K. Knutsen,and P. V. Bayly, “Regional patterns of cerebral corticaldifferentiation determined by diffusion tensor MRI,” CerebralCortex, vol. 19, no. 12, pp. 2916–2929, 2009.
[12] R. C. McKinstry, A. Mathur, J. H. Miller et al., “Radialorganization of developing preterm human cerebral cortexrevealed by non-invasive water diffusion anisotropy MRI,”Cerebral Cortex, vol. 12, no. 12, pp. 1237–1243, 2002.
[13] L. A. Leigland and C. D. Kroenke, “A comparative analysisof cellular morphological differentiation within the cerebralcortex using diffusion tensor imaging,” Neuromethods, vol.50, pp. 329–351, 2011.
[14] B. Clancy, R. B. Darlington, and B. L. Finlay, “Translatingdevelopmental time across mammalian species,” Neuro-science, vol. 105, no. 1, pp. 7–17, 2001.
[15] B. Clancy, B. Kersh, J. Hyde, R. B. Darlington, K. J. S.Anand, and B. L. Finlay, “Web-based method for translatingneurodevelopment from laboratory species to humans,”Neuroinformatics, vol. 5, no. 1, pp. 79–94, 2007.
[16] B. L. Finlay and R. B. Darlington, “Linked regularities in thedevelopment and evolution of mammalian brains,” Science,vol. 268, no. 5217, pp. 1578–1584, 1995.
[17] R. B. Darlington, S. A. Dunlop, and B. L. Finlay, “Neuraldevelopment in metatherian and eutherian mammals: vari-ation and constraint,” The Journal of Comparative Neurology.,vol. 411, pp. 359–368, 1999.
[18] A. S. Bock, J. F. Olavarria, L. A. Leigland, E. N. Taber, S.N. Jespersen, and C. D. Kroenke, “Diffusion tensor imagingdetects early cerebral cortex abnormalities in neuronalarchitecture induced by bilateral neonatal enucleation:Anexperimental model in the ferret,” Frontiers in SystemsNeuroscience, vol. 4, p. 149, 2010.
[19] H. Bravo and O. Inzunza, “Effect of pre- and postnatal retinaldeprivation on the striate-peristriate cortical connections inthe rat,” Biological Research, vol. 27, no. 1, pp. 73–77, 1994.
[20] J. Olvarria, H. Bravo, and G. Ruiz, “The pattern of callosalconnections in posterior neocortex of congenitally anoph-thalmic rats,” Anatomy and Embryology, vol. 178, no. 2, pp.155–159, 1988.

16 Neural Plasticity
[21] J. Olavarria and R. C. Van Sluyters, “Callosal connectionsof the posterior neocortex in normal-eyed, congenitallyanophthalmic, and neonatally enucleated mice,” Journal ofComparative Neurology, vol. 230, no. 2, pp. 249–268, 1984.
[22] J. F. Olavarria and P. Safaeian, “Development of callosaltopography in visual cortex of normal and enucleated rats,”Journal of Comparative Neurology, vol. 496, no. 4, pp. 495–512, 2006.
[23] B. J. O’Brien and J. F. Olavarria, “Anomalous patterns ofcallosal connections develop in visual cortex of monocularlyenucleated hamsters,” Biological Research, vol. 28, no. 3, pp.211–218, 1995.
[24] J. Olavarria and R. C. Van Sluyters, “Organization andpostnatal development of callosal connections in the visualcortex of the rat,” Journal of Comparative Neurology, vol. 239,no. 1, pp. 1–26, 1985.
[25] R. J. Laing, A. S. Bock, J. Lasiene, and J. F. Olavarria, “Role ofretinal input on the development of striate-extrastriate pat-terns of connections in the rat,” The Journal of ComparativeNeurology, vol. 520, no. 14, pp. 3256–3276, 2012.
[26] R. S. Erzurumlu and H. P. Killackey, “Critical and sensitiveperiods in neurobiology,” Current Topics in DevelopmentalBiology, vol. 17, no. C, pp. 207–240, 1982.
[27] G. R. Belford and H. P. Killackey, “The sensitive period in thedevelopment of the trigeminal system of the neonatal rat,”Journal of Comparative Neurology, vol. 193, no. 2, pp. 335–350, 1980.
[28] M. Fagiolini, T. Pizzorusso, N. Berardi, L. Domenici, and L.Maffei, “Functional postnatal development of the rat primaryvisual cortex and the role of visual experience: dark rearingand monocular deprivation,” Vision Research, vol. 34, no. 6,pp. 709–720, 1994.
[29] J. C. Crowley and L. C. Katz, “Early development of oculardominance columns,” Science, vol. 290, no. 5495, pp. 1321–1324, 2000.
[30] C. Dehay, G. Horsburgh, M. Berland, H. Killackey, and H.Kennedy, “Maturation and connectivity of the visual cortexin monkey is altered by prenatal removal of retinal input,”Nature, vol. 337, no. 6204, pp. 265–267, 1989.
[31] C. Dehay, P. Giroud, M. Berland, H. Killackey, and H.Kennedy, “Contribution of thalamic input to the specifi-cation of cytoarchitectonic cortical fields in the primate:effects of bilateral enucleation in the fetal monkey on theboundaries, dimensions, and gyrification of striate andextrastriate cortex,” Journal of Comparative Neurology, vol.367, no. 1, pp. 70–89, 1996.
[32] G. M. Innocenti and D. O. Frost, “The postnatal developmentof visual callosal connections in the absence of visualexperience or of the eyes,” Experimental Brain Research, vol.39, no. 4, pp. 365–375, 1980.
[33] R. W. Rhoades and D. D. Dellacroce, “Neonatal enucleationinduces an asymmetric pattern of visual callosal connectionsin hamsters,” Brain Research, vol. 202, no. 1, pp. 189–195,1980.
[34] S. E. Fish, R. W. Rhoades, C. A. Bennett-Clarke, B. Figley, andR. D. Mooney, “Organization, development and enucleation-induced alterations in the visual callosal projection ofthe hamster: single axon tracing with Phaseolus vulgarisleucoagglutinin and Di-I,” European Journal of Neuroscience,vol. 3, no. 12, pp. 1255–1270, 1991.
[35] S. J. Karlen and L. Krubitzer, “Effects of bilateral enucleationon the size of visual and nonvisual areas of the brain,”Cerebral Cortex, vol. 19, no. 6, pp. 1360–1371, 2009.
[36] J. F. Olavarria, “The effect of visual deprivation on thenumber of callosal cells in the cat is less pronouncedin extrastriate cortex than in the 17/18 border region,”Neuroscience Letters, vol. 195, no. 3, pp. 147–150, 1995.
[37] C. G. Cusick and R. D. Lund, “Modification of visual callosalprojections in rats,” Journal of Comparative Neurology, vol.212, no. 4, pp. 385–398, 1982.
[38] C. A. Jackson, J. Peduzzi, and T. L. Hickey, “Visual cortexdevelopment in the ferret. I. Genesis and migration of visualcortex neurons,” Journal of Neuroscience, vol. 9, no. 4, pp.1242–1253, 1989.
[39] G. M. Innocenti, P. R. Manger, I. Masiello, I. Colin, and L.Tettoni, “Architecture and callosal connections of visual areas17, 18, 19 and 21 in the ferret (Mustela putorius),” CerebralCortex, vol. 12, no. 4, pp. 411–422, 2002.
[40] P. R. Manger, D. Kiper, I. Masiello et al., “The representationof the visual field in three extrastriate areas of the ferret(Mustela putorius) and the relationship of retinotopy andfield boundaries to caliosal connectivity,” Cerebral Cortex,vol. 12, no. 4, pp. 423–437, 2002.
[41] R. J. Tusa, L. A. Palmer, and A. C. Rosenquist, “Theretinotopic organization of area 17 (striate cortex) in the cat,”Journal of Comparative Neurology, vol. 177, no. 2, pp. 213–235, 1978.
[42] R. J. Tusa, A. C. Rosenquist, and L. A. Palmer, “Retinotopicorganization of areas 18 and 19 in the cat,” Journal ofComparative Neurology, vol. 185, no. 4, pp. 657–678, 1979.
[43] B. R. Payne, “Representation of the ipsilateral visual fieldin the transition zone between areas 17 and 18 of the cat’scerebral cortex,” Visual Neuroscience, vol. 4, no. 5, pp. 445–474, 1990.
[44] D. Sanides and K. Albus, “The distribution of interhemi-spheric projections in area 18 of the cat: coincidence withdiscontinuities of the representation of the visual field in thesecond visual area (V2),” Experimental Brain Research, vol.38, no. 2, pp. 237–240, 1980.
[45] P. R. Manger, I. Masiello, and G. M. Innocenti, “Arealorganization of the posterior parietal cortex of the ferret(Mustela putorius),” Cerebral Cortex, vol. 12, no. 12, pp.1280–1297, 2002.
[46] L. A. Palmer, A. C. Rosenquist, and R. J. Tusa, “Theretinotopic organization of lateral suprasylvian visual areasin the cat,” Journal of Comparative Neurology, vol. 177, no. 2,pp. 237–256, 1978.
[47] G. Cantone, J. Xiao, and J. B. Levitt, “Retinotopic organiza-tion of ferret suprasylvian cortex,” Visual Neuroscience, vol.23, no. 1, pp. 61–77, 2006.
[48] P. R. Manger, G. Engler, C. K. E. Moll, and A. K. Engel, “Loca-tion, architecture, and retinotopy of the anteromedial lateralsuprasylvian visual area (AMLS) of the ferret (Mustela puto-rius),” Visual Neuroscience, vol. 25, no. 1, pp. 27–37, 2008.
[49] P. R. Manger, H. Nakamura, S. Valentiniene, and G. M.Innocenti, “Visual areas in the lateral temporal cortex of theferret (Mustela putorius),” Cerebral Cortex, vol. 14, no. 6, pp.676–689, 2004.
[50] E. S. Ruthazer, A. R. Bachleda, and J. F. Olavarria, “Roleof interstitial branching in the development of visualcorticocortical connections: a time-lapse and fixed-tissueanalysis,” Journal of Comparative Neurology, vol. 518, no. 24,pp. 4963–4979, 2010.
[51] S. L. Juliano, S. L. Palmer, R. V. Sonty, S. Noctor, andG. F. Hill II, “Development of local connections inferret somatosensory cortex,” The Journal of ComparativeNeurology, vol. 374, no. 2, pp. 259–277, 1996.
Neural Plasticity 17
[52] M. P. D. Ignacio, E. J. Kimm, G. H. Kageyama, J. Yu, and R. T.Robertson, “Postnatal migration of neurons and formationof laminae in rat cerebral cortex,” Anatomy and Embryology,vol. 191, no. 2, pp. 89–100, 1995.
[53] K. Herrmann, “Differential distribution of AMPA receptorsand glutamate during pre- and postnatal development inthe visual cortex of ferrets,” The Journal of ComparativeNeurology, vol. 375, no. 1, pp. 1–17, 1996.
[54] C. J. Shatz and M. B. Luskin, “The relationship betweenthe geniculocortical afferents and their cortical target cellsduring development of the cat’s primary visual cortex,”Journal of Neuroscience, vol. 6, no. 12, pp. 3655–3668, 1986.
[55] D. J. Price and T. J. Zumbroich, “Postnatal development ofcorticortical efferents from area 17 in the cat’s visual cortex,”Journal of Neuroscience, vol. 9, no. 2, pp. 600–613, 1989.
[56] D. Aggoun-Zouaoui, “Growth of callosal terminal arborsin primary visual areas of the cat,” European Journal ofNeuroscience, vol. 8, no. 6, pp. 1132–1148, 1996.
[57] N. P. Issa, J. T. Trachtenberg, B. Chapman, K. R. Zahs,and M. P. Stryker, “The critical period for oculardominance plasticity in the Ferret’s visual cortex,” Journal ofNeuroscience, vol. 19, no. 16, pp. 6965–6978, 1999.
[58] Y. Fregnac and M. Imbert, “Early development of visualcortical cells in normal and dark-reared kittens: relationshipbetween orientation selectivity and ocular dominance,”Journal of Physiology, vol. 278, pp. 27–44, 1978.
[59] G. M. Innocenti, D. O. Frost, and J. Illes, “Maturation ofvisual callosal connections in visually deprived kittens: achallenging critical period,” Journal of Neuroscience, vol. 5,no. 2, pp. 255–267, 1985.
[60] M. C. Crair, D. C. Gillespie, and M. P. Stryker, “The roleof visual experience in the development of columns in catvisual cortex,” Science, vol. 279, no. 5350, pp. 566–570, 1998.
[61] P. D. Zufferey, F. Jin, H. Nakamura, L. Tettoni, and G. M.Innocenti, “The role of pattern vision in the developmentof cortico-cortical connections,” European Journal ofNeuroscience, vol. 11, no. 8, pp. 2669–2688, 1999.
[62] P. Rakic, “Specification of cerebral cortical areas,” Science,vol. 241, no. 4862, pp. 170–176, 1988.
[63] P. Rakic, I. Suner, and R. W. Williams, “A novel cytoarchitec-tonic area induced experimentally within the primate visualcortex,” Proceedings of the National Academy of Sciences of theUnited States of America, vol. 88, no. 6, pp. 2083–2087, 1991.
[64] I. Reillo, C. De Juan Romero, M. A. Garcıa-Cabezas, and V.Borrell, “A Role for intermediate radial glia in the tangentialexpansion of the mammalian cerebral cortex,” CerebralCortex, vol. 21, no. 7, pp. 1674–1694, 2011.
[65] J. Olavarria, “A horseradish peroxidase study of theprojections from the latero-posterior nucleus to three lateralperistriate areas in the rat,” Brain Research, vol. 173, no. 1,pp. 137–141, 1979.
[66] C. E. Ribak and A. Peters, “An autoradiographic study of theprojections from the lateral geniculate body of the rat,” BrainResearch, vol. 92, no. 3, pp. 341–368, 1975.
[67] W. Schober and E. Winkelmann, “The geniculo corticalprojections in albino rats,” Journal fur Hirnforschung, vol. 18,no. 1, pp. 1–20, 1977.
[68] M. J. Friedlander and K. A. C. Martin, “Development ofY-axon innervation of cortical area 18 in the cat,” Journal ofPhysiology, vol. 416, pp. 183–213, 1989.
[69] A. L. Humphrey, M. Sur, D. J. Uhlrich, and S. M. Sherman,“Termination patterns of individual X- and Y-cell axons inthe visual cortex of the cat: projections to area 18, to the
17/18 border region, and to both areas 17 and 18,” Journal ofComparative Neurology, vol. 233, no. 2, pp. 190–212, 1985.
[70] C. Redies, M. Diksic, and H. Riml, “Functional organizationin the ferret visual cortex: a double-label 2-deoxyglucosestudy,” Journal of Neuroscience, vol. 10, no. 8, pp. 2791–2803,1990.
[71] E. S. Ruthazer, G. E. Baker, and M. P. Stryker, “Developmentand organization of ocular dominance bands in primaryvisual cortex of the sable ferret,” Journal of ComparativeNeurology, vol. 407, no. 2, pp. 151–165, 1999.
[72] L. E. White, W. H. Bosking, S. M. Williams, and D.Fitzpatrick, “Maps of central visual space in Ferret V1 andV2 lack matching inputs from the two eyes,” Journal ofNeuroscience, vol. 19, no. 16, pp. 7089–7099, 1999.
[73] C. Dehay, P. Savatier, V. Cortay, and H. Kennedy, “Cell-cycle kinetics of neocortical precursors are influenced byembryonic thalamic axons,” Journal of Neuroscience, vol. 21,no. 1, pp. 201–214, 2001.
[74] S. Mori and J. Zhang, “Principles of diffusion tensor imagingand its applications to basic neuroscience research,” Neuron,vol. 51, no. 5, pp. 527–539, 2006.
[75] C. Beaulieu, “The basis of anisotropic water diffusion in thenervous system—a technical review,” NMR in Biomedicine,vol. 15, no. 7-8, pp. 435–455, 2002.
[76] J. J. Neil, S. I. Shiran, R. C. McKinstry et al., “Normal brainin human newborns: apparent diffusion coefficient anddiffusion anisotropy measured by using diffusion tensor MRimaging,” Radiology, vol. 209, no. 1, pp. 57–66, 1998.
[77] D. M. Wimberger, T. P. Roberts, A. J. Barkovich, L. M. Prayer,M. E. Moseley, and J. Kucharczyk, “Identification of ‘pre-myelination’ by diffusion-weighted mri,” Journal of ComputerAssisted Tomography, vol. 19, no. 1, pp. 28–33, 1995.
[78] C. Lebel, L. Walker, A. Leemans, L. Phillips, and C. Beaulieu,“Microstructural maturation of the human brain fromchildhood to adulthood,” NeuroImage, vol. 40, no. 3, pp.1044–1055, 2008.
[79] P. Rakic, “A small step for the cell, a giant leap for mankind:a hypothesis of neocortical expansion during evolution,”Trends in Neurosciences, vol. 18, no. 9, pp. 383–388, 1995.
[80] J. L. Conel, The Postnatal Development of the Human CerebralCortex, Harvard University Press, Cambridge, Mass, USA,1939.
[81] J. A. McNab, S. Jbabdi, S. C. L. Deoni, G. Douaud, T. E.J. Behrens, and K. L. Miller, “High resolution diffusion-weighted imaging in fixed human brain using diffusion-weighted steady state free precession,” NeuroImage, vol. 46,no. 3, pp. 775–785, 2009.
[82] P. J. Basser and C. Pierpaoli, “Microstructural andphysiological features of tissues elucidated by quantitative-diffusion-tensor MRI,” Journal of Magnetic Resonance B, vol.111, no. 3, pp. 209–219, 1996.
[83] C. D. Kroenke, D. C. Van Essen, T. E. Inder, S. Rees, G. L. Bret-thorst, and J. J. Neil, “Microstructural changes of the babooncerebral cortex during gestational development reflected inmagnetic resonance imaging diffusion anisotropy,” Journalof Neuroscience, vol. 27, no. 46, pp. 12506–12515, 2007.
[84] S. V. Sizonenko, E. J. Camm, J. R. Garbow et al.,“Developmental changes and injury induced disruptionof the radial organization of the cortex in the immature ratbrain revealed by in vivo diffusion tensor MRI,” CerebralCortex, vol. 17, no. 11, pp. 2609–2617, 2007.
[85] K. H. Bockhorst, P. A. Narayana, R. Liu et al., “Earlypostnatal development of rat brain: in vivo diffusion tensor
18 Neural Plasticity
imaging,” Journal of Neuroscience Research, vol. 86, no. 7, pp.1520–1528, 2008.
[86] S. Baloch, R. Verma, H. Huang et al., “Quantification ofbrain maturation and growth patterns in C57BL/6J mice viacomputational neuroanatomy of diffusion tensor images,”Cerebral Cortex, vol. 19, no. 3, pp. 675–687, 2009.
[87] P. Larvaron, O. Boespflug-Tanguy, J. P. Renou, and J. M.Bonny, “In vivo analysis of the post-natal development ofnormal mouse brain by DTI,” NMR in Biomedicine, vol. 20,no. 4, pp. 413–421, 2007.
[88] A. R. Barnette, J. J. Neil, C. D. Kroenke et al.,“Characterization of brain development in the ferretvia MRI,” Pediatric Research, vol. 66, no. 1, pp. 80–84, 2009.
[89] H. Huang, R. Xue, J. Zhang et al., “Anatomicalcharacterization of human fetal brain development withdiffusion tensor magnetic resonance imaging,” Journal ofNeuroscience, vol. 29, no. 13, pp. 4263–4273, 2009.
[90] R. K. Gupta, K. M. Hasan, R. Trivedi et al., “Diffusion tensorimaging of the developing human cerebrum,” Journal ofNeuroscience Research, vol. 81, no. 2, pp. 172–178, 2005.
[91] A. R. DeIpolyi, P. Mukherjee, K. Gill et al., “Comparingmicrostructural and macrostructural development of thecerebral cortex in premature newborns: diffusion tensorimaging versus cortical gyration,” NeuroImage, vol. 27, no. 3,pp. 579–586, 2005.
[92] G. H. Kageyama and R. T. Robertson, “Developmentof geniculocortical projections to visual cortex in rat:evidence for early ingrowth and synaptogenesis,” Journal ofComparative Neurology, vol. 335, no. 1, pp. 123–148, 1993.
[93] K. Herrmann, A. Antonini, and C. J. Shatz, “Ultrastructuralevidence for synaptic interactions between thalamocorticalaxons and subplate neurons,” European Journal ofNeuroscience, vol. 6, no. 11, pp. 1729–1742, 1994.
[94] A. Burkhalter, K. L. Bernardo, and V. Charles, “Developmentof local circuits in human visual cortex,” Journal ofNeuroscience, vol. 13, no. 5, pp. 1916–1931, 1993.
[95] R. M. Nitkin, “Dendritic mechanisms in brain function anddevelopmental disabilities,” Cerebral Cortex, vol. 10, no. 10,pp. 925–926, 2000.
[96] S. Borges and M. Berry, “The effects of dark rearing onthe development of the visual cortex of the rat,” Journal ofComparative Neurology, vol. 180, no. 2, pp. 277–300, 1978.
[97] P. D. Coleman and A. H. Riesen, “Evironmental effects oncortical dendritic fields. I. Rearing in the dark,” Journal ofAnatomy, vol. 102, no. 3, pp. 363–374, 1968.
[98] S. B. Tieman and H. V. B. Hirsch, “Exposure to lines ofonly one orientation modifies dendritic morphology ofcells in the visual cortex of the cat,” Journal of ComparativeNeurology, vol. 211, no. 4, pp. 353–362, 1982.
[99] D. Heumann and T. Rabinowicz, “Postnatal developmentof the visual cortex of the mouse after enucleation at birth,”Experimental Brain Research, vol. 46, no. 1, pp. 99–106, 1982.
[100] R. Ryugo, D. K. Ryugo, and H. P. Killackey, “Differentialeffect of enucleation on two populations of layer V pyramidalcells,” Brain Research, vol. 88, no. 3, pp. 554–559, 1975.
[101] J. F. Olavarrıa, R. Laing, R. Hiroi, and J. Lasiene, “Topographyand axon arbor architecture in the visual callosal pathway:effects of deafferentation and blockade of N-methyl-D-aspartate receptors,” Biological Research, vol. 41, no. 4, pp.413–424, 2008.
[102] S. A. Sorensen, T. A. Jones, and J. F. Olavarria, “Neonatalenucleation reduces the proportion of callosal boutons
forming multiple synaptic contacts in rat striate cortex,”Neuroscience Letters, vol. 351, no. 1, pp. 17–20, 2003.
[103] C. D. Kroenke, A. S. Bock, E. N. Taber, and J. F. Olavarria,“Use of diffusion tensor magnetic resonance imaging tomonitor anatomical differentiation of the cerebral cortexin normal and enucleated rats,” in Society for Neuroscience,Washington, DC, USA, 2008.
[104] N. E. J. Berman, “Alterations of visual cortical connections incats following early removal of retinal input,” DevelopmentalBrain Research, vol. 63, no. 1-2, pp. 163–180, 1991.
[105] D. Ankaoua and R. Malach, “Evidence for plasticity ofintrinsic horizontal connections in area 17 of the rat,” IsraelJournal of Medical Sciences, vol. 29, no. 9, pp. 555–569, 1993.
[106] J. Toldi, O. Feher, and J. R. Wolff, “Neuronal plasticityinduced by neonatal monocular (and binocular)enucleation,” Progress in Neurobiology, vol. 48, no. 3,pp. 191–218, 1996.
[107] E. S. Ruthazer and M. P. Stryker, “The role of activity in thedevelopment of long-range horizontal connections in area17 of the ferret,” Journal of Neuroscience, vol. 16, no. 22, pp.7253–7269, 1996.
[108] S. J. Karlen, D. M. Kahn, and L. Krubitzer, “Early blindnessresults in abnormal corticocortical and thalamocortical con-nections,” Neuroscience, vol. 142, no. 3, pp. 843–858, 2006.
[109] T. Voigt, “Development of glial cells in the cerebral wall offerrets: direct tracing of their transformation from radial gliainto astrocytes,” Journal of Comparative Neurology, vol. 289,no. 1, pp. 74–88, 1989.
[110] P. L. Gabbott and M. G. Stewart, “Visual deprivation altersdendritic bundle architecture in layer 4 of rat visual cortex,”Neuroscience, vol. 207, pp. 65–77, 2012.
[111] T. B. Leergaard, N. S. White, A. de Crespigny et al.,“Quantitative histological validation of diffusion MRI fiberorientation distributions in the rat brain,” PLoS ONE, vol. 5,no. 1, Article ID e8595, 2010.
[112] A. S. Choe, I. Stepniewska, D. C. Colvin, Z. Ding, and A.W. Anderson, “Validation of diffusion tensor MRI in thecentral nervous system using light microscopy: quantitativecomparison of fiber properties,” NMR in Biomedicine, vol.25, no. 7, pp. 900–908, 2012.
[113] M. D. Budde, L. Janes, E. Gold, L. C. Turtzo, and J. A.Frank, “The contribution of gliosis to diffusion tensoranisotropy and tractography following traumatic braininjury: validation in the rat using Fourier analysis of stainedtissue sections,” Brain, vol. 134, part 8, pp. 2248–2260, 2011.
[114] S. N. Jespersen, L. A. Leigland, A. Cornea, and C. D. Kroenke,“Determination of axonal and dendritic orientationdistributions within the developing cerebral cortex bydiffusion tensor imaging,” IEEE Transactions on MedicalImaging, vol. 31, pp. 16–32, 2012.


