Embed Size (px)
Citation preview
18
Pilot Gaze and Glideslope Control
JUNO KIM, STEPHEN A. PALMISANO, and APRIL ASHUniversity of Wollongong, AustraliaandROBERT S. ALLISONYork University, Canada
We examined the eye movements of pilots as they carried out simulated aircraft landings under day and night lighting con-ditions. Our five students and five certified pilots were instructed to quickly achieve and then maintain a constant 3-degreeglideslope relative to the runway. However, both groups of pilots were found to make significant glideslope control errors, es-pecially during simulated night approaches. We found that pilot gaze was directed most often toward the runway and to theground region located immediately in front of the runway, compared to other visual scene features. In general, their gaze wasskewed toward the near half of the runway and tended to follow the runway threshold as it moved on the screen. Contrary toexpectations, pilot gaze was not consistently directed at the aircraft’s simulated aimpoint (i.e., its predicted future touchdownpoint based on scene motion). However, pilots did tend to fly the aircraft so that this point was aligned with the runway thresh-old. We conclude that the supplementary out-of-cockpit visual cues available during day landing conditions facilitated glideslopecontrol performance. The available evidence suggests that these supplementary visual cues are acquired through peripheralvision, without the need for active fixation.
Categories and Subject Descriptors: J.4 [Computer Applications]: Social and Behavioral Sciences—Psychology; I.3.4 [Com-puting Methodologies]: Computer Graphics – Graphics Utilities—Virtual Device Interfaces; K.3 [Computer Milieux]: Com-puters and Education
General Terms: Experimentation, Human Factors, TheoryAdditional Key Words and Phrases: Vision, aviation, glideslope control, gaze, landing
ACM Reference Format:Kim, J., Palmisano, S. A., Ash, A., and Allison, R. S. 2010. Pilot gaze and glideslope control. ACM Trans. Appl. Percept. 7, 3,Article 18 (June 2010), 18 pages.DOI = 10.1145/1773965.1773969 http://doi.acm.org/10.1145/1773965.1773969
1. INTRODUCTION
1.1 Background
Landing a fixed-wing aircraft on a runway is one of the most challenging spatial navigation tasksencountered in the field of aviation [Grosz et al. 1995; Mulder et al. 2000]. In order to achieve a safe,
This study was funded in full by an Australian Research Council (ARC) Discovery grant DP0772398 awarded to Drs Palmisanoand Allison.Author’s address: Juno Kim, School of Psychology, University of Wollongong, Wollongong NSW 2522, Australia. email:[email protected] to make digital or hard copies of part or all of this work for personal or classroom use is granted without fee providedthat copies are not made or distributed for profit or commercial advantage and that copies show this notice on the first pageor initial screen of a display along with the full citation. Copyrights for components of this work owned by others than ACMmust be honored. Abstracting with credit is permitted. To copy otherwise, to republish, to post on servers, to redistribute tolists, or to use any component of this work in other works requires prior specific permission and/or a fee. Permissions may berequested from Publications Dept., ACM, Inc., 2 Penn Plaza, Suite 701, New York, NY 10121-0701 USA, fax +1 (212) 869-0481,or [email protected]© 2010 ACM 1544-3558/2010/06-ART18 $10.00
DOI 10.1145/1773965.1773969 http://doi.acm.org/10.1145/1773965.1773969
ACM Transactions on Applied Perception, Vol. 7, No. 3, Article 18, Publication date: June 2010.
18:2 • J. Kim et al.
soft and smooth landing on the runway tarmac, pilots are instructed to maintain a constant idealglideslope (of typically 3 degrees or 4 degrees, depending on the aircraft flown) with respect to theground at the aimpoint markings painted on the near end of the runway. During the final approach, thepilot must be able to detect any significant deviations in their glideslope and make corrections throughprecise coordination of the aircraft’s pitch angle and thrust. Failure to perceive and/or adequatelyadjust for significant glideslope deviations can lead to the pilot flying dangerously close to the ground,or when their approach is too high, result in an undesirably large sink (descent) rate on touchdown.In the present study, we examined the gaze patterns of pilots during the glideslope control phase ofsimulated fixed-wing aircraft landings. The goal was to identify the out-of-cockpit visual cues to whichpilots commonly attend and, therefore, may use to control this stage of the landing.
Theorists have proposed several visual cues that pilots could use to control aircraft glideslope whileapproaching the runway. In their early theoretical work, Gibson and colleagues [Gibson 1950; Gibsonet al. 1955] studied the patterns of visual motion produced by various forms of self-motion, which theycollectively termed “optical flow” patterns. They noted that (i) aircraft landing approaches generateradially expanding patterns of optical flow, and (ii) the focus of expansion (or FOE) of this optical flow(i.e., the point of zero optical velocity), always coincided with the aircraft’s future touchdown point (seealso Calvert [1954] and Palmisano and Gillam [2005]). Accordingly, they proposed that pilots couldvisually control their glideslope during aircraft landings by maintaining the optical alignment of theFOE with their desired touchdown point on the runway. However, the focus of expansion does notdirectly specify the angle of approach with respect to the runway ahead, and it is only informativeabout where the pilot is headed under restricted viewing conditions. The FOE of a pilot’s retinal flow(as opposed to the theoretical construct of optical flow) will typically only coincide with their headingwhen they actively track the FOE or keep their eyes stationary relative to the head. If the pilot visuallypursues a scene feature that is displaced from their heading direction, then the projection of its imageon the retina will not move (i.e., it will have a zero retinal velocity). The FOE in this case will nolonger be stationary and will move at the same velocity in the opposite direction to the pursuit eyemovement. Thus, in order to recover Gibson’s FOE, pilots would need to cancel the effects of theirhead or eye rotations from this retinal flow (allowing them to recover the optic flow due to their linearself-motion (see Regan and Beverley [1982]). In principle, this could be achieved using informationfrom the retinal flow or from extraretinal information (such as proprioception or efferent copies of theeye-movement motor command).
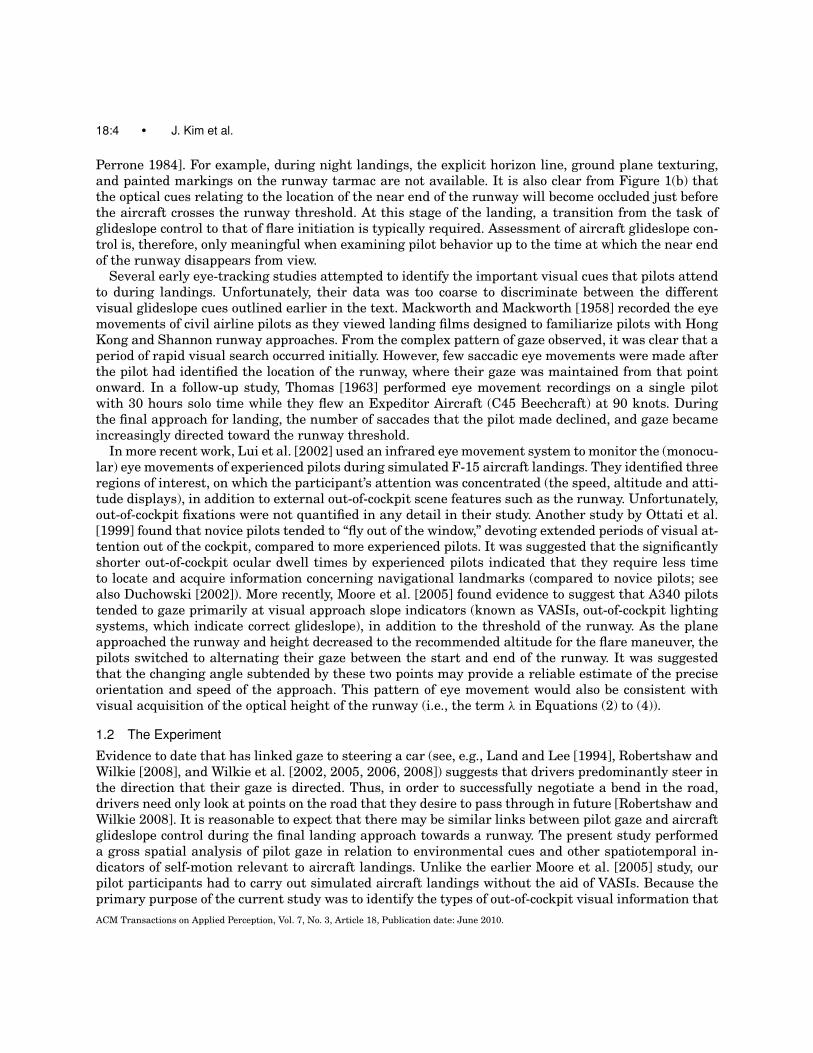
More recently, a growing number of theorists have argued that optical changes to the outline of therunway and/or its relation to the horizon (Figure 1) may be required to achieve accurate glideslopeperception and control [Galanis et al. 1998]. Figure 1(a) shows a schematic profile of an ideal 3-degreeapproach and the expected change from the ideal glideslope (γ ) that would result from either increasingor decreasing altitude (h) at a constant approach speed (v). The task of the pilot, therefore, is essentiallyto minimize their altitude error �h(x) relative to the ideal glideslope over the course of the landingapproach. Values of �h(x) that are positive indicate the aircraft’s glideslope is above the ideal level,whereas negative values of �h(x) indicate the aircraft’s glideslope is below the ideal level. The task,therefore, is to determine the optical cues that can be used to estimate the sign of �h(x), and thus�hγ (x).
In principle, pilots could maintain a constant glideslope during the final approach by keeping any orall of the following out-of-cockpit scene properties constant1: (i) the optical separation (χα) between thehorizon and the touchdown markers (i.e., their desired touchdown point) on the runway (the H-anglecue; see Figure 1(b) and Equation (1)), (ii) the perceived slant of the ground plane—relative to thepilot’s line of sight—at the location of the aimpoint (the optical slant cue), (iii) the ratio of the opticalheight of the runway (λ) to the optical width of its far end (β f ) (the form ratio cue; see Figure 1(b) and
ACM Transactions on Applied Perception, Vol. 7, No. 3, Article 18, Publication date: June 2010.
Pilot Gaze and Glideslope Control • 18:3
Fig. 1. A: Situational profile showing the effective positive linear relationships between change in height above ground level (h)and effective glide angle in comparison to the ideal glideslope (γ ) for a given distance from the runway threshold (x). B: Showsthe simulated visual scene from the cockpit as the aircraft approaches the runway along a 3-degree glideslope, including somepossible visual cues used by pilots to maintain a constant glideslope during the final approach (adapted from Galanis [1998]).C: Shows how cues relating to the near base of the runway become occluded a short distance before the aircraft crosses therunway threshold.
Equation (2)), (iv) the ratio between the optical height and width of the runway’s near end (βη) (theimplicit horizon cue; see Figure 1(b) and Equation (3)), and (v) the optical shape of the runway (theoptical shape cue; see Figure 1(b) and Equation (4)).
H-angle cue: χα = χr − θ (1)
Form ratio cue: a λ/β f (2)
Implicit Horizon cue: λ +a λ/βη (3)
Optical Shape cue: βη/{(βη − β f ).λ} = βη/2 tan(ω) (4)
The first three runway-based visual cues cannot provide the aircraft’s absolute glideslope with re-spect to the runway, without knowing the physical geometry of the runway (this is indicated by theterm “a” in Equations (2) and (3), which is the physical runway aspect ratio; see Galanis et al. [1998]).Nulling their instantaneous rate of change would allow for achieving and maintaining a constant, ifarbitrary, glideslope over time.1 In order to follow an ideal glideslope (i.e., 3 degrees) based on thesecues, pilots would need to make some auxiliary inference about runway geometry. However, theseterrain cues could be used in unison to improve the reliability of the resulting glideslope percept orthe precision of the control. For example, both the implicit horizon cue and also the optical shapecue involve optical parameters concerning the near end of the runway, so they could both be usedconcurrently with minimal change in gaze. Moreover, the availability of these cues depends on pre-vailing environmental and visual conditions [Galanis et al. 1998; Lintern and Liu 1991; Mertens 1981;
1One reviewer indicated that attention to the derivatives of these optical-rate runway cues (e.g., change in rate change ofimplicit horizon cue) and/or similar changes in the rate of runway splay angle [Flach et al. 1992] would also predict maintaineddeviations in glideslope.
ACM Transactions on Applied Perception, Vol. 7, No. 3, Article 18, Publication date: June 2010.
18:4 • J. Kim et al.
Perrone 1984]. For example, during night landings, the explicit horizon line, ground plane texturing,and painted markings on the runway tarmac are not available. It is also clear from Figure 1(b) thatthe optical cues relating to the location of the near end of the runway will become occluded just beforethe aircraft crosses the runway threshold. At this stage of the landing, a transition from the task ofglideslope control to that of flare initiation is typically required. Assessment of aircraft glideslope con-trol is, therefore, only meaningful when examining pilot behavior up to the time at which the near endof the runway disappears from view.
Several early eye-tracking studies attempted to identify the important visual cues that pilots attendto during landings. Unfortunately, their data was too coarse to discriminate between the differentvisual glideslope cues outlined earlier in the text. Mackworth and Mackworth [1958] recorded the eyemovements of civil airline pilots as they viewed landing films designed to familiarize pilots with HongKong and Shannon runway approaches. From the complex pattern of gaze observed, it was clear that aperiod of rapid visual search occurred initially. However, few saccadic eye movements were made afterthe pilot had identified the location of the runway, where their gaze was maintained from that pointonward. In a follow-up study, Thomas [1963] performed eye movement recordings on a single pilotwith 30 hours solo time while they flew an Expeditor Aircraft (C45 Beechcraft) at 90 knots. Duringthe final approach for landing, the number of saccades that the pilot made declined, and gaze becameincreasingly directed toward the runway threshold.
In more recent work, Lui et al. [2002] used an infrared eye movement system to monitor the (monocu-lar) eye movements of experienced pilots during simulated F-15 aircraft landings. They identified threeregions of interest, on which the participant’s attention was concentrated (the speed, altitude and atti-tude displays), in addition to external out-of-cockpit scene features such as the runway. Unfortunately,out-of-cockpit fixations were not quantified in any detail in their study. Another study by Ottati et al.[1999] found that novice pilots tended to “fly out of the window,” devoting extended periods of visual at-tention out of the cockpit, compared to more experienced pilots. It was suggested that the significantlyshorter out-of-cockpit ocular dwell times by experienced pilots indicated that they require less timeto locate and acquire information concerning navigational landmarks (compared to novice pilots; seealso Duchowski [2002]). More recently, Moore et al. [2005] found evidence to suggest that A340 pilotstended to gaze primarily at visual approach slope indicators (known as VASIs, out-of-cockpit lightingsystems, which indicate correct glideslope), in addition to the threshold of the runway. As the planeapproached the runway and height decreased to the recommended altitude for the flare maneuver, thepilots switched to alternating their gaze between the start and end of the runway. It was suggestedthat the changing angle subtended by these two points may provide a reliable estimate of the preciseorientation and speed of the approach. This pattern of eye movement would also be consistent withvisual acquisition of the optical height of the runway (i.e., the term λ in Equations (2) to (4)).
1.2 The Experiment
Evidence to date that has linked gaze to steering a car (see, e.g., Land and Lee [1994], Robertshaw andWilkie [2008], and Wilkie et al. [2002, 2005, 2006, 2008]) suggests that drivers predominantly steer inthe direction that their gaze is directed. Thus, in order to successfully negotiate a bend in the road,drivers need only look at points on the road that they desire to pass through in future [Robertshaw andWilkie 2008]. It is reasonable to expect that there may be similar links between pilot gaze and aircraftglideslope control during the final landing approach towards a runway. The present study performeda gross spatial analysis of pilot gaze in relation to environmental cues and other spatiotemporal in-dicators of self-motion relevant to aircraft landings. Unlike the earlier Moore et al. [2005] study, ourpilot participants had to carry out simulated aircraft landings without the aid of VASIs. Because theprimary purpose of the current study was to identify the types of out-of-cockpit visual information that
ACM Transactions on Applied Perception, Vol. 7, No. 3, Article 18, Publication date: June 2010.
Pilot Gaze and Glideslope Control • 18:5
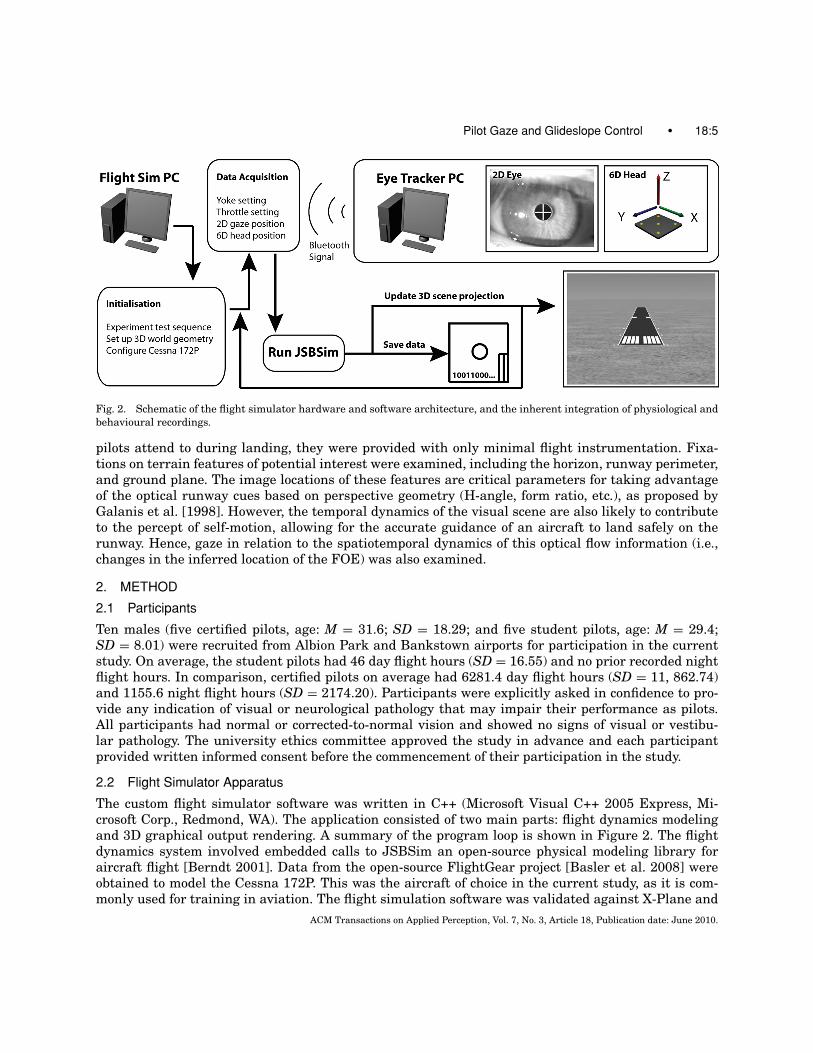
Fig. 2. Schematic of the flight simulator hardware and software architecture, and the inherent integration of physiological andbehavioural recordings.
pilots attend to during landing, they were provided with only minimal flight instrumentation. Fixa-tions on terrain features of potential interest were examined, including the horizon, runway perimeter,and ground plane. The image locations of these features are critical parameters for taking advantageof the optical runway cues based on perspective geometry (H-angle, form ratio, etc.), as proposed byGalanis et al. [1998]. However, the temporal dynamics of the visual scene are also likely to contributeto the percept of self-motion, allowing for the accurate guidance of an aircraft to land safely on therunway. Hence, gaze in relation to the spatiotemporal dynamics of this optical flow information (i.e.,changes in the inferred location of the FOE) was also examined.
2. METHOD
2.1 Participants
Ten males (five certified pilots, age: M = 31.6; SD = 18.29; and five student pilots, age: M = 29.4;SD = 8.01) were recruited from Albion Park and Bankstown airports for participation in the currentstudy. On average, the student pilots had 46 day flight hours (SD = 16.55) and no prior recorded nightflight hours. In comparison, certified pilots on average had 6281.4 day flight hours (SD = 11, 862.74)and 1155.6 night flight hours (SD = 2174.20). Participants were explicitly asked in confidence to pro-vide any indication of visual or neurological pathology that may impair their performance as pilots.All participants had normal or corrected-to-normal vision and showed no signs of visual or vestibu-lar pathology. The university ethics committee approved the study in advance and each participantprovided written informed consent before the commencement of their participation in the study.
2.2 Flight Simulator Apparatus
The custom flight simulator software was written in C++ (Microsoft Visual C++ 2005 Express, Mi-crosoft Corp., Redmond, WA). The application consisted of two main parts: flight dynamics modelingand 3D graphical output rendering. A summary of the program loop is shown in Figure 2. The flightdynamics system involved embedded calls to JSBSim an open-source physical modeling library foraircraft flight [Berndt 2001]. Data from the open-source FlightGear project [Basler et al. 2008] wereobtained to model the Cessna 172P. This was the aircraft of choice in the current study, as it is com-monly used for training in aviation. The flight simulation software was validated against X-Plane and
ACM Transactions on Applied Perception, Vol. 7, No. 3, Article 18, Publication date: June 2010.
18:6 • J. Kim et al.
MS flight simulator by three student and three private pilots. Flight dynamics were apparently similaracross the three software packages, and all of the testers reported a high degree of consistency in theexperience compared to real and simulated flight with equivalent Cessna (172 or 152) aircraft.
On different trials, the simulated final approach started at a height that was either “too low” (cor-responding to 2-degree approach), “ideal” (corresponding to a 3-degree approach), or “too high” (corre-sponding to a 4-degree approach) with respect to the runway, which was positioned 2km ahead in thedistance. Simulated approaches were made toward two different 30m wide runways, one being short(30m × 1331m) and the other being long (30m × 1819m). These dimensions were based on the physicaldimensions of runways 34 and 26 at Albion Park Airport. These runways both had six green thresholdlights (marking the start of the runway – luminance = 55cd/m2). Beyond the threshold, the shorterrunway had 11 white lights and the longer runway had 19 runway lights (luminance ranged between20 and 154cd/m2 based on their simulated distance). Beyond these white lights were 10 yellow runwayend warning lights (luminance = 59cd/m2) and 6 red runway end lights (luminance = 11 cd/m2). Theselights lined both the left and right edges of the runway and separated in depth by a simulated distanceof 50m. During day conditions, two white aimpoint markers (luminance = 141cd/m2) were visible onthe darker runway tarmac (luminance = 3.2cd/m2), and the runway was surrounded by a ground planecovered with textured grass (luminance = 24cd/m2). The ground plane extended 30km along the depthaxis and formed a false visible horizon. During night approaches, the runway lights were visible on anotherwise black background (luminance = 0.42cd/m2).
Displays were generated by a Dell Optiplex GX280 personal computer and sound presented through12V Dell A215 MultiMedia speakers. A PCI-e Radeon X300 video card with 128MB RAM was used torender and output 3D environmental scenes (±30-degree viewing angle) to a Mitsubishi XD400U dataprojector. Image frames were front-projected onto a projector screen (1.2m × 1.0m) to display the 3Dworldview from 2m in front of the pilot’s eye (maximum visual angle of approximately 42 degrees). Theprojector was situated high enough to allow the light beams to clear the top of the participant’s head,after the projector had been appropriately keystone corrected.
Pilots controlled their flight during the simulation using a PFC Mooney/Cirrus style yoke, with abuilt-in Cessna 172 push-pull throttle. Lateral control of the aircraft was automated within the soft-ware so that the simulation remained aligned with the center of the runway throughout the descent.This constraint was imposed in order to simplify the landing task to elevation (yoke) and thrust (throt-tle) control, as these parameters are most relevant for the glideslope control phase of flight. Positionsof the yoke and throttle were sampled with 8-bit resolution at a rate of 50Hz and used to update thestate of the simulator. State data of the flight simulator were written to file every 200ms, and datafrom the flight dynamics modeling algorithm was used to generate the 3D graphics (i.e., the pilot’sview from inside the aircraft cockpit). Text rendered along the bottom of the screen showed approachspeed in knots (KTS), engine power in revolutions per minute (RPM) and a constant 20-degree flapssetting (FLP).
The 2D screen coordinates of the runway vertices were determined using OpenSceneGraph calls.These data were used to synchronize the recordings of observer’s gaze (spatially and temporally) withrespect to known locations of ground targets. A specific bounding-box region of interest (the small-est rectangle that could enclose the 2D projection of an onscreen object) was calculated dynamicallyto facilitate the offline spatial synchronization of gaze with respect to each of the simulated visuallandmarks (runway, horizon, ground plane, etc.).
2.3 Eye Movement Recording
Eye movements of head free observers were determined in real time using infrared video oculogra-phy. A FIREFLY-MV 120Hz Firewire camera (Point Grey Research Inc., Richmond BC) was arranged
ACM Transactions on Applied Perception, Vol. 7, No. 3, Article 18, Publication date: June 2010.
Pilot Gaze and Glideslope Control • 18:7
to capture monocular images of the participant’s dominant eye. The 320 × 240 pixel images acquiredwere analyzed in real time using custom eye-tracking software that tracked the horizontal and verticalposition of the pupil (see Allison et al. [1996]). The horizontal and vertical position of the pupil’s centerof mass within the image was determined as the average location of all the continuous dark pixelsconforming to the pupil. These values were represented with 32-bit floating-point precision as opposedto integral image resolution, so as to improve the positional accuracy of the system. The eye-trackingsoftware performed real-time quadratic fitting to the determined angles of eye position in the horizon-tal and vertical directions over a three-point sliding window. This operation refined the accuracy of thesystem to better than 0.1 degree.
The eye-tracking algorithm was calibrated by instructing participants to fixate a series of planartargets presented on the projector screen in a 3 × 3 matrix arrangement. The calibration grid wasprojected over the entire area of the visual display to ensure adequate tracking range. Horizontal andvertical eye movement trajectories were interpolated within this matrix to determine gaze point witha positional resolution of approximately 0.5cm.
Simultaneous head movement recordings were obtained with six degrees of freedom (three angularand three linear) in order to account for changes in gaze attributed to head movement. Optical infraredactive markers were mounted comfortably on the head and an overhead Firewire camera was orientedto provide an orthogonal view of the top of the head. Mathematical transformation of the gaze (eyeand head) data was performed in real time to determine the gaze with respect to the simulated cockpitwindow. This resulted in a positional resolution of better than 0.5cm, after factoring in the distancefrom the screen and the better than 0.1-degree positional resolution of the eye tracker. Gaze datawith respect to the visual display were transmitted via wireless UDP network messages to the flightsimulator apparatus. Wireless networking was used in order to minimize the number of cables in thehardware system and the Bluetooth mode of transmission had sufficient temporal resolution to sustainreal-time functionality of the flight simulator. This hardware configuration allowed for direct temporalsynchronization of ocular and aeronautical events in the data-logging process.
2.4 Procedure
The eye- and head-tracking gear was placed on the participant and adjusted for comfort after they satin the cockpit chair with the yoke and throttle rigidly located for easy grasp and effective manipulationin both directions. The optical infrared head tracker was mounted comfortably on the participant’shead with an overhead Firewire head camera oriented so as to provide an orthogonal view of the topof his/her head.
Participants were then shown a prerecorded video of an ideal 3-degree glideslope approach to therunway from the initial final approach all the way to touchdown. The pretest video was a daylightapproach toward the longer of two runways used in the present study. A simulated flare maneuverwas performed as the plane crossed the runway threshold. As a result, the sink rate of the aircraftdecayed exponentially, with the final touchdown occurring near the aimpoint markings on the runway.Before starting the experimental trials, pilots were refamiliarized with the specifications of the Cessna172 and were provided with a summary sheet that outlined the green zones for engine RPMs andrecommended speed in knots for the aircraft approach toward the runway.
After viewing the video demonstration and receiving the briefing, the participant was instructed tofly one daytime approach and one nighttime approach (in random order), starting at the appropriateheight for 3-degree approach trajectory. For these practice flights, the longer runway was used (aspectratio: 60.0), rather than the shorter runway (aspect ratio: 44.3). After these practice runs, the eye-tracking system was configured and calibrated to track the participant’s dominant eye. In order to
ACM Transactions on Applied Perception, Vol. 7, No. 3, Article 18, Publication date: June 2010.
18:8 • J. Kim et al.
limit any potential artifacts associated with pupil dilation and contraction, the background luminanceof the calibration screen was roughly equated to the mean luminance of the simulated visual scene.This ensured that pupil size captured during the calibration phase would be similar to that of the testphase of the experiment.
The student/certified pilot participants performed day and night landings from each of the threestarting heights for the final approach. At the beginning of each trial, text was presented on an oth-erwise black screen instructing participants to set the throttle to an appropriate level for the finalapproach (nominally 70 knots). After the setting was made, an audio cue was presented to indicatethe start of the trial and a stationary, central fixation point was presented on the display for severalseconds and the gaze position conforming to the center of the display (the center of the 3 × 3 fixationmatrix) was obtained. Subsequent gaze positions during the active landing simulation phase of thetrial were referenced back to these data obtained with stationary central fixation. The trial concludedwhen the landing gear of the aircraft touched down on the ground.
2.5 Data Analysis
The study was implemented according to a 2 × 2 × 2 × 3 mixed design with two independent between-subjects groups (certified versus student pilots), two within-subjects lighting conditions (day versusnight), two within-subjects runway length conditions (long versus short), and three within-subjectslevels of initial starting height (too low, ideal, too high). Fixation durations were calculated for thefollowing regions of interest: (i) horizon (HOR), the geometric region from the far end of the runway tothe horizon and a same magnitude into the sky; (ii) SKY, all fixations above the upper limit of HOR; (iii)GRD, the ground plane immediately in front of the runway; (iv) LFT, and (v) RHT, the ground regionsto the left or right of the runway; (vi) RUN, the geometric region defined by the runway (i.e., widthof near base, βη; and optical height, λ). These data along with the on-screen runway position, and theparticipant’s horizontal and vertical gaze positions were recorded in the data-logging loop of the flightsimulator software. In addition to out-of-cockpit terrain cues, fixations on the three HUD indicatorswere also recorded (i.e., speed in knots, engine power in RPM, and flaps setting of 20 degrees).
Initially, glideslope performance across all conditions was examined in order to ascertain the abilityof pilots to maintain an ideal 3-degree glideslope up until they reached the runway threshold. Thiswas achieved by calculating the angular deviation of aircraft path from the ideal glideslope at eachsample point until they reached the runway threshold. Pilot’s gaze patterns were also compared withthe location of onscreen visual targets in order to determine fixation durations over each feature ofinterest. Where applicable, the optical projection of 2D visual fixations on the display was geometricallytransformed back into their simulated real-world 3D coordinates.
We were also able to correlate the time series of vertical gaze position with respect to locations ofpotential targets in the 3D scene. This allowed us to determine which terrain features in the visualscene pilots tracked more often than others. In particular, we considered the relationship between gazeand the projected aimpoint (point of intersection between glideslope and the ground plane), which wasessentially analogous to the FOE of optic flow produced by motion in the display.
3. RESULTS
3.1 Glideslope Performance
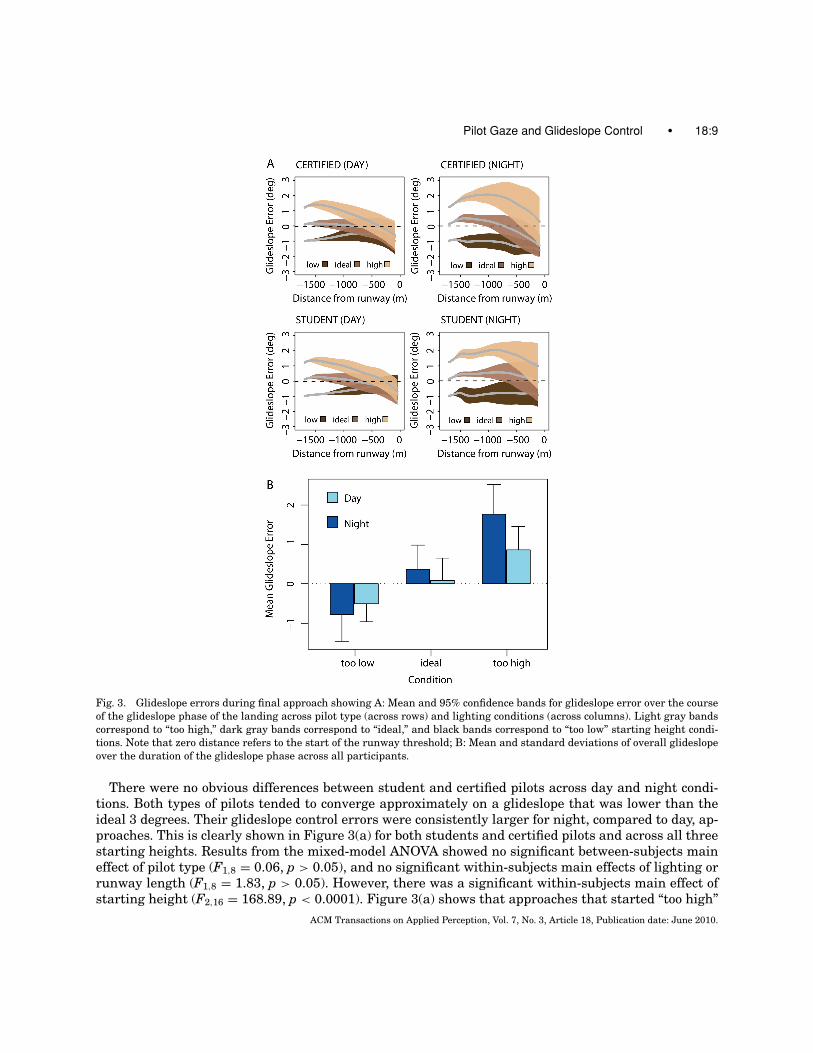
Data series plots in Figure 3(a) show the mean and 95% confidence intervals for the instantaneousglideslope error for each of the three initial starting height conditions (“too low,” “ideal,” and “toohigh”). Superimposed horizontal dashed lines show the expected target convergence level for the ideal3-degree approach. Separate axes present glideslope data for the two pilot types (across rows) and thetwo lighting conditions (across columns).
ACM Transactions on Applied Perception, Vol. 7, No. 3, Article 18, Publication date: June 2010.
Pilot Gaze and Glideslope Control • 18:9
Fig. 3. Glideslope errors during final approach showing A: Mean and 95% confidence bands for glideslope error over the courseof the glideslope phase of the landing across pilot type (across rows) and lighting conditions (across columns). Light gray bandscorrespond to “too high,” dark gray bands correspond to “ideal,” and black bands correspond to “too low” starting height condi-tions. Note that zero distance refers to the start of the runway threshold; B: Mean and standard deviations of overall glideslopeover the duration of the glideslope phase across all participants.
There were no obvious differences between student and certified pilots across day and night condi-tions. Both types of pilots tended to converge approximately on a glideslope that was lower than theideal 3 degrees. Their glideslope control errors were consistently larger for night, compared to day, ap-proaches. This is clearly shown in Figure 3(a) for both students and certified pilots and across all threestarting heights. Results from the mixed-model ANOVA showed no significant between-subjects maineffect of pilot type (F1,8 = 0.06, p > 0.05), and no significant within-subjects main effects of lighting orrunway length (F1,8 = 1.83, p > 0.05). However, there was a significant within-subjects main effect ofstarting height (F2,16 = 168.89, p < 0.0001). Figure 3(a) shows that approaches that started “too high”
ACM Transactions on Applied Perception, Vol. 7, No. 3, Article 18, Publication date: June 2010.
18:10 • J. Kim et al.
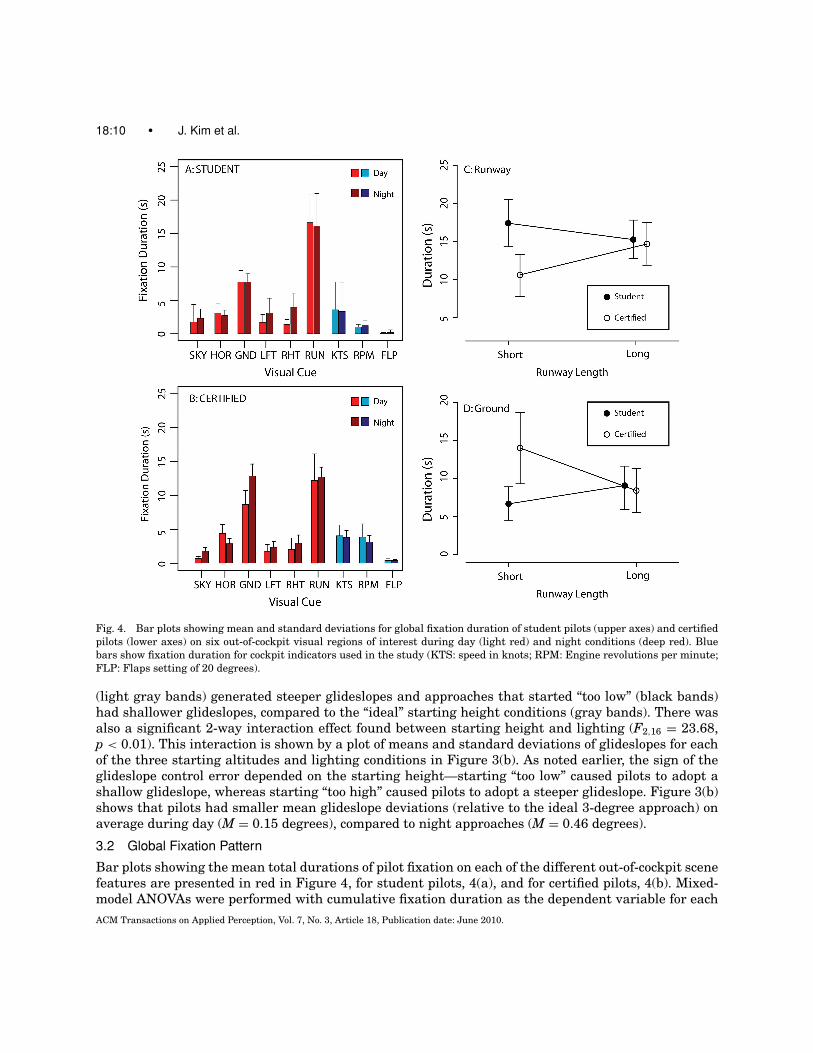
Fig. 4. Bar plots showing mean and standard deviations for global fixation duration of student pilots (upper axes) and certifiedpilots (lower axes) on six out-of-cockpit visual regions of interest during day (light red) and night conditions (deep red). Bluebars show fixation duration for cockpit indicators used in the study (KTS: speed in knots; RPM: Engine revolutions per minute;FLP: Flaps setting of 20 degrees).
(light gray bands) generated steeper glideslopes and approaches that started “too low” (black bands)had shallower glideslopes, compared to the “ideal” starting height conditions (gray bands). There wasalso a significant 2-way interaction effect found between starting height and lighting (F2,16 = 23.68,p < 0.01). This interaction is shown by a plot of means and standard deviations of glideslopes for eachof the three starting altitudes and lighting conditions in Figure 3(b). As noted earlier, the sign of theglideslope control error depended on the starting height—starting “too low” caused pilots to adopt ashallow glideslope, whereas starting “too high” caused pilots to adopt a steeper glideslope. Figure 3(b)shows that pilots had smaller mean glideslope deviations (relative to the ideal 3-degree approach) onaverage during day (M = 0.15 degrees), compared to night approaches (M = 0.46 degrees).
3.2 Global Fixation Pattern
Bar plots showing the mean total durations of pilot fixation on each of the different out-of-cockpit scenefeatures are presented in red in Figure 4, for student pilots, 4(a), and for certified pilots, 4(b). Mixed-model ANOVAs were performed with cumulative fixation duration as the dependent variable for each
ACM Transactions on Applied Perception, Vol. 7, No. 3, Article 18, Publication date: June 2010.
Pilot Gaze and Glideslope Control • 18:11
of the key terrain features of interest (HOR, GND, RUN, and LFT versus RHT). Fixation within theSKY region is also graphically shown for reference purposes.
For runway fixations (RUN), there were no significant main effects of pilot type (F1,8 = 4.29, p >
0.05), lighting (F1,8 = 0.01, p > 0.05), runway length (F1,8 = 0.75, p > 0.05), or starting height (F2,16 =1.38, p > 0.05). However, we did find a significant interaction between pilot type and runway lengthon the mean duration of runway fixations (F1,8 = 6.24, p < 0.05). As shown in Figure 4(c), the meandurations of student pilot fixations were shorter for long runway approaches (M = 15.3 s, SD = 5.6)than for short runway approaches (M = 17.4 s, SD = 6.8). In comparison, the mean durations ofcertified pilot fixations were longer for long runway approaches (M = 14.7 s, SD = 6.3) than for shortrunway approaches (M = 10.6 s, SD = 6.2).
Results from a mixed-model ANOVA for fixations along the horizon (HOR) showed no significantmain effects of pilot type (F1,8 = 1.84, p > 0.05), lighting (F1,8 = 1.99, p > 0.05), runway length (F1,8 =1.11, p > 0.05), or starting height (F1,8 = 1.51, p > 0.05) on horizon fixations. No significant interactionswere found between any of these independent variables.
For fixations on the ground plane (GND) in front of the runway, there were no significant maineffects of pilot type (F1,8 = 4.07, p > 0.05), lighting (F1,8 = 2.58, p > 0.05), runway length (F1,8 = 1.60,p > 0.05), or glideslope (F2,16 = 0.88, p > 0.05). However, we did find a significant interaction of pilottype across the two runway lengths (F1,8 = 8.94, p < 0.05). As shown in Figure 4(d), certified pilots(M = 14.0 s, SD = 10.5) were found to fixate the ground in front of the runway significantly longerthan students pilots (M = 6.7 s, SD = 5.0) when approaching the shorter of the two runways. However,ground fixation duration was found to be similar for certified (M = 8.5 s, SD = 6.5) and student pilots(M = 8.8 s, SD = 6.4) when approaching the longer runway.
We also found a significant effect of lighting on fixations directed laterally toward the left (LFT) andright (RHT) of the ground plane (F1,8 = 10.47, p < 0.01). Specifically, we found considerably greaterfixation on the left and right fields occurred during night runway approaches compared to day runwayapproaches.
The blue bars to the right in the axes of Figures 4(a) and 4(b) show the mean duration of fixationson the three available cockpit indicators: glide speed in knots (KTS); engine revolutions per minute(RPM); and the invariant 20-degree flaps (FLP). A mixed-model ANOVA was performed for fixations onthe KTS and RPM information fields of the cockpit HUD, which showed a significant effect of indicatortype (F2,7 = 6.77, p < 0.01). Bonferroni-corrected posthoc contrasts revealed greater mean durationof combined fixation on the KTS and RPM indicators (M = 2.81 s, SD = 2.89) compared to the FLPindicator (M = 0.27 s, SD = 0.52) (p < 0.01), but no difference between separate fixation durations onthe KTS (M = 3.74 s, SD = 3.67) and RPM (M = 2.31 s, SD = 2.56) indicators (p > 0.05). There wasno between-subjects effect of pilot type (F1,8 = 1.12, p > 0.05) and no within-subjects main effect oflighting (F1,8 = 0.82, p > 0.05).
3.3 Longitudinal Runway Fixations
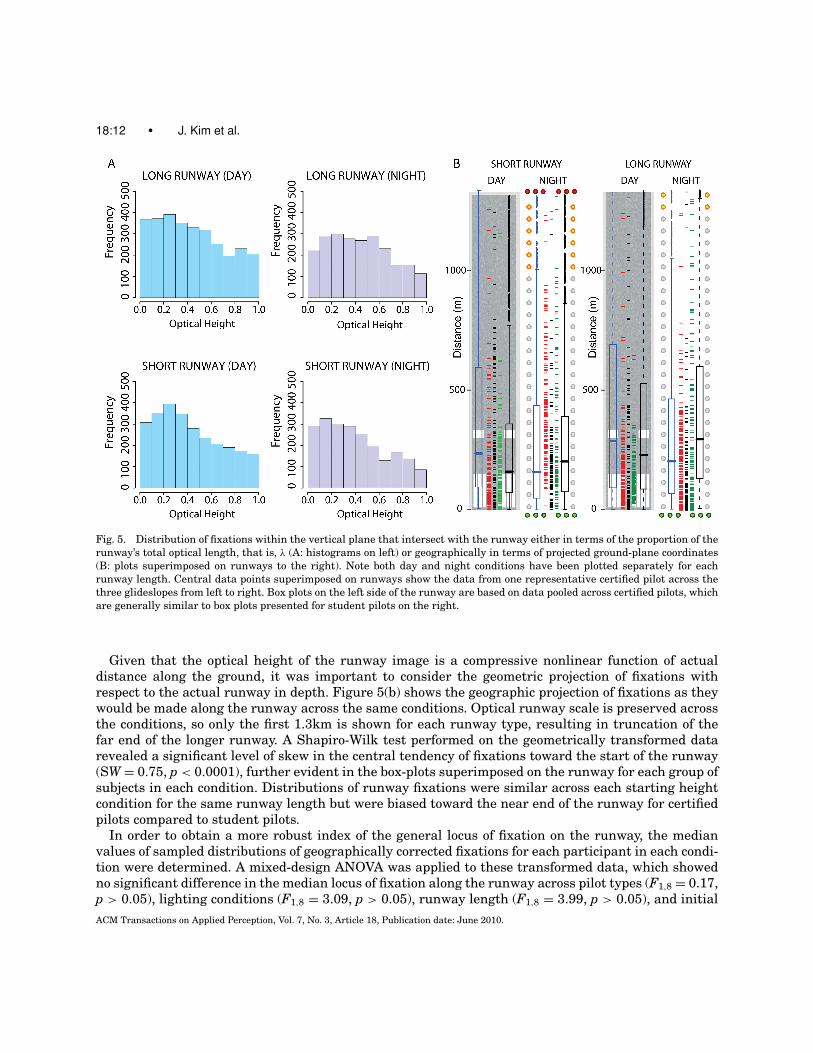
Analysis of fixations distributed along the optical height of the runway was performed by taking theoptical height of each fixation above the runway threshold as a proportion of the total vertical angularsubtense of the runway image (i.e., (fixation height – threshold) divided by λ). This expressed fixationlocation as a proportion of the optical height of the image of the runway (rather than in geographicunits). Figure 5(a) presents histograms showing cumulative counts of fixations as a function of scaledoptical runway height (data binned over 0.1λ intervals). Separate plots show fixations across conditionsof different runway lengths (between rows) and across different lighting conditions (between columns).On inspecting these histograms, it is clear that the overall density of fixations was optically skewedtoward the near half of the runway.
ACM Transactions on Applied Perception, Vol. 7, No. 3, Article 18, Publication date: June 2010.
18:12 • J. Kim et al.
Fig. 5. Distribution of fixations within the vertical plane that intersect with the runway either in terms of the proportion of therunway’s total optical length, that is, λ (A: histograms on left) or geographically in terms of projected ground-plane coordinates(B: plots superimposed on runways to the right). Note both day and night conditions have been plotted separately for eachrunway length. Central data points superimposed on runways show the data from one representative certified pilot across thethree glideslopes from left to right. Box plots on the left side of the runway are based on data pooled across certified pilots, whichare generally similar to box plots presented for student pilots on the right.
Given that the optical height of the runway image is a compressive nonlinear function of actualdistance along the ground, it was important to consider the geometric projection of fixations withrespect to the actual runway in depth. Figure 5(b) shows the geographic projection of fixations as theywould be made along the runway across the same conditions. Optical runway scale is preserved acrossthe conditions, so only the first 1.3km is shown for each runway type, resulting in truncation of thefar end of the longer runway. A Shapiro-Wilk test performed on the geometrically transformed datarevealed a significant level of skew in the central tendency of fixations toward the start of the runway(SW = 0.75, p < 0.0001), further evident in the box-plots superimposed on the runway for each group ofsubjects in each condition. Distributions of runway fixations were similar across each starting heightcondition for the same runway length but were biased toward the near end of the runway for certifiedpilots compared to student pilots.
In order to obtain a more robust index of the general locus of fixation on the runway, the medianvalues of sampled distributions of geographically corrected fixations for each participant in each condi-tion were determined. A mixed-design ANOVA was applied to these transformed data, which showedno significant difference in the median locus of fixation along the runway across pilot types (F1,8 = 0.17,p > 0.05), lighting conditions (F1,8 = 3.09, p > 0.05), runway length (F1,8 = 3.99, p > 0.05), and initial
ACM Transactions on Applied Perception, Vol. 7, No. 3, Article 18, Publication date: June 2010.
Pilot Gaze and Glideslope Control • 18:13
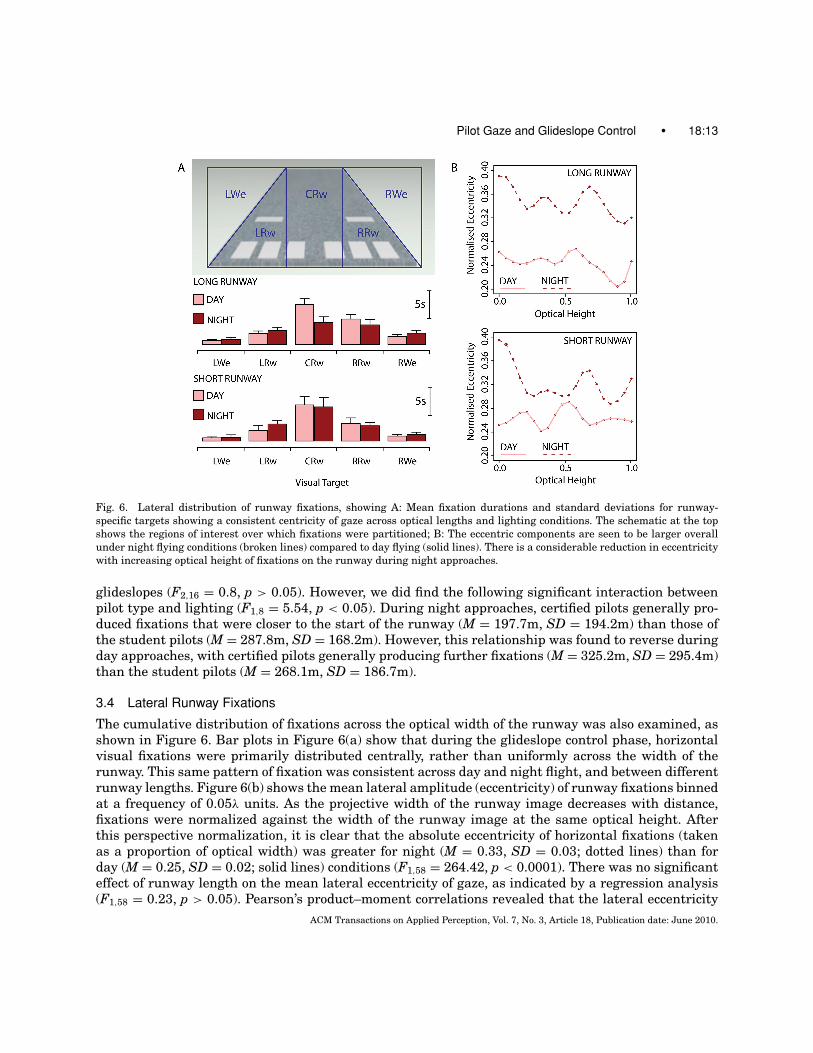
Fig. 6. Lateral distribution of runway fixations, showing A: Mean fixation durations and standard deviations for runway-specific targets showing a consistent centricity of gaze across optical lengths and lighting conditions. The schematic at the topshows the regions of interest over which fixations were partitioned; B: The eccentric components are seen to be larger overallunder night flying conditions (broken lines) compared to day flying (solid lines). There is a considerable reduction in eccentricitywith increasing optical height of fixations on the runway during night approaches.
glideslopes (F2,16 = 0.8, p > 0.05). However, we did find the following significant interaction betweenpilot type and lighting (F1,8 = 5.54, p < 0.05). During night approaches, certified pilots generally pro-duced fixations that were closer to the start of the runway (M = 197.7m, SD = 194.2m) than those ofthe student pilots (M = 287.8m, SD = 168.2m). However, this relationship was found to reverse duringday approaches, with certified pilots generally producing further fixations (M = 325.2m, SD = 295.4m)than the student pilots (M = 268.1m, SD = 186.7m).
3.4 Lateral Runway Fixations
The cumulative distribution of fixations across the optical width of the runway was also examined, asshown in Figure 6. Bar plots in Figure 6(a) show that during the glideslope control phase, horizontalvisual fixations were primarily distributed centrally, rather than uniformly across the width of therunway. This same pattern of fixation was consistent across day and night flight, and between differentrunway lengths. Figure 6(b) shows the mean lateral amplitude (eccentricity) of runway fixations binnedat a frequency of 0.05λ units. As the projective width of the runway image decreases with distance,fixations were normalized against the width of the runway image at the same optical height. Afterthis perspective normalization, it is clear that the absolute eccentricity of horizontal fixations (takenas a proportion of optical width) was greater for night (M = 0.33, SD = 0.03; dotted lines) than forday (M = 0.25, SD = 0.02; solid lines) conditions (F1,58 = 264.42, p < 0.0001). There was no significanteffect of runway length on the mean lateral eccentricity of gaze, as indicated by a regression analysis(F1,58 = 0.23, p > 0.05). Pearson’s product–moment correlations revealed that the lateral eccentricity
ACM Transactions on Applied Perception, Vol. 7, No. 3, Article 18, Publication date: June 2010.
18:14 • J. Kim et al.
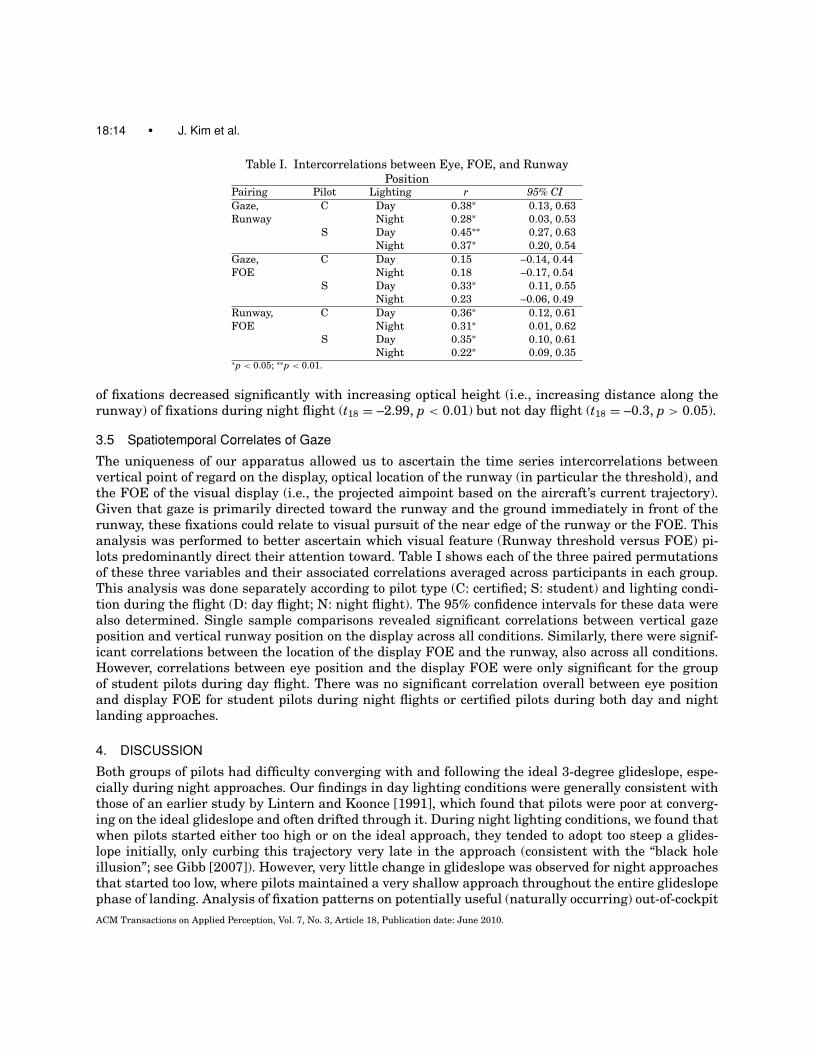
Table I. Intercorrelations between Eye, FOE, and RunwayPosition
Pairing Pilot Lighting r 95% CIGaze, C Day 0.38∗ 0.13, 0.63Runway Night 0.28∗ 0.03, 0.53
S Day 0.45∗∗ 0.27, 0.63Night 0.37∗ 0.20, 0.54
Gaze, C Day 0.15 –0.14, 0.44FOE Night 0.18 –0.17, 0.54
S Day 0.33∗ 0.11, 0.55Night 0.23 –0.06, 0.49
Runway, C Day 0.36∗ 0.12, 0.61FOE Night 0.31∗ 0.01, 0.62
S Day 0.35∗ 0.10, 0.61Night 0.22∗ 0.09, 0.35
∗p < 0.05; ∗∗p < 0.01.
of fixations decreased significantly with increasing optical height (i.e., increasing distance along therunway) of fixations during night flight (t18 = –2.99, p < 0.01) but not day flight (t18 = –0.3, p > 0.05).
3.5 Spatiotemporal Correlates of Gaze
The uniqueness of our apparatus allowed us to ascertain the time series intercorrelations betweenvertical point of regard on the display, optical location of the runway (in particular the threshold), andthe FOE of the visual display (i.e., the projected aimpoint based on the aircraft’s current trajectory).Given that gaze is primarily directed toward the runway and the ground immediately in front of therunway, these fixations could relate to visual pursuit of the near edge of the runway or the FOE. Thisanalysis was performed to better ascertain which visual feature (Runway threshold versus FOE) pi-lots predominantly direct their attention toward. Table I shows each of the three paired permutationsof these three variables and their associated correlations averaged across participants in each group.This analysis was done separately according to pilot type (C: certified; S: student) and lighting condi-tion during the flight (D: day flight; N: night flight). The 95% confidence intervals for these data werealso determined. Single sample comparisons revealed significant correlations between vertical gazeposition and vertical runway position on the display across all conditions. Similarly, there were signif-icant correlations between the location of the display FOE and the runway, also across all conditions.However, correlations between eye position and the display FOE were only significant for the groupof student pilots during day flight. There was no significant correlation overall between eye positionand display FOE for student pilots during night flights or certified pilots during both day and nightlanding approaches.
4. DISCUSSION
Both groups of pilots had difficulty converging with and following the ideal 3-degree glideslope, espe-cially during night approaches. Our findings in day lighting conditions were generally consistent withthose of an earlier study by Lintern and Koonce [1991], which found that pilots were poor at converg-ing on the ideal glideslope and often drifted through it. During night lighting conditions, we found thatwhen pilots started either too high or on the ideal approach, they tended to adopt too steep a glides-lope initially, only curbing this trajectory very late in the approach (consistent with the “black holeillusion”; see Gibb [2007]). However, very little change in glideslope was observed for night approachesthat started too low, where pilots maintained a very shallow approach throughout the entire glideslopephase of landing. Analysis of fixation patterns on potentially useful (naturally occurring) out-of-cockpit
ACM Transactions on Applied Perception, Vol. 7, No. 3, Article 18, Publication date: June 2010.
Pilot Gaze and Glideslope Control • 18:15
scene features revealed few differences between student and certified pilots. Both types of pilots spentmost of their time looking at the runway and ground lying immediately in front of the runway. Thetime spent fixating the horizon was similar across both day and night lighting conditions, and onlyrepresented a very small fraction of the total fixation time.
During night landings when the horizon or ground plane was not visible, pilots might have used therate of change of the runway’s form ratio and optical shape to control their glideslope. This notion issupported by the finding that both types of pilots were found to fixate on the near, compared to thefar end of the runway. Further analysis showed that lateral gaze eccentricity tended to be less duringday landings, with fixations being consistently aligned along the center line of the runway. The latterobservation appears generally consistent with visual acquisition of the optical height of the runway(i.e., λ). However, given that longitudinal runway fixations tended to be directed toward the near endof the runway (i.e., its threshold), it would be feasible to assume that pilots were able to acquire readilythe optical width of the near end of the runway (i.e., βη). This pattern of gaze could also be consistentwith the use of an implicit horizon cue that depends on both βη and λ [Galanis et al. 1998].
Gaze varied more eccentrically across the runway during simulated night flying, as opposed to dayflying. Fixations were more eccentric nearer to the runway threshold compared to more distant regionsof the runway. Unlike day flight, this pattern of gaze is more consistent with the visual acquisition ofthe ω angle associated with the alternative form of the optical shape cue that may not necessarilyrely on having direct knowledge concerning the width of the runway’s far end (refer to Equation (4);Galanis et al. [1998]). The large lateral gaze eccentricity at the near end and the overall greater lateraleccentricity of gaze at night could have facilitated the visual acquisition of runway shape information(i.e., the optical width of the near end as well as the inferred angle of runway slant using the ω angle).This potential for acquisition of the optical shape cue could have supplemented any use of the implicithorizon cue, especially at night when no other terrain cues were available.
In the present study, glideslope control was generally superior during day approaches (when hori-zon, ground and runway cues were all available) compared to night approaches (when only runwayperimeter cues were available). Thus, it is possible that the observed differences in gaze eccentricitybetween the two lighting conditions were due to the additional cues available during day approaches,which would have supplemented runway-related information. For example, there was no increase indirect fixation along the horizon during day compared to night approaches, which suggests that pilotsdo not actively acquire the location of the horizon via central vision. Rather, changes in the hori-zon location may alternatively be processed through peripheral vision. Hence, these findings do notnecessarily invalidate the usefulness of the H-angle cue in glideslope control. Moreover, the less ec-centric gaze observed during day approaches might have been due to the visibility of painted runwaylandmarks/markings, which could be used to provide an indication of optical slant of the runway at theaimpoint.
Compared to the apparent use of runway perimeter and terrain based features in central visionacquired through active fixation, evidence for the explicit use of the FOE in central vision was weaker,especially for certified pilots. Spatiotemporal correlations between eye position and the display FOEwere only found to reach significance for student pilots during day, but not night landings. Because ofthe distances involved, it might have been difficult for pilots to precisely detect the location of the FOEfrom the sparse optic flow provided by the runway lights at night. In this case, the perspective motionof the distant runway lights was likely to be below or close to detection threshold [Mertens 1978].However, during day lighting conditions, the optic flow was much denser and perspective motion of theentire scene was available (not just the perspective motion of the distant runway perimeter). Thus, inthese conditions, student pilots could have made use of all of this perspective motion (i.e., from bothnear and far parts of the scene) to determine the location FOE.
ACM Transactions on Applied Perception, Vol. 7, No. 3, Article 18, Publication date: June 2010.
18:16 • J. Kim et al.
In principle, alignment of the eyes with the near edge of the runway would facilitate guidance of theFOE toward the runway using peripheral vision. Previous studies have shown that performance tendsto be worse when participants are instructed to make heading judgments based on an eccentricallylocated, as opposed to a centrally aligned, FOE [van de Grind et al. 1983; Warren and Kurtz 1992].Despite this limitation, certified pilots could have determined the vertical location of the FOE [vande Grind et al. 1983] by attending to the rates of optical flow above and below the point of gaze todetermine its relative location [Gibson 1950; Gibson et al. 1955]. Certified pilots were in fact foundto direct their gaze more toward the foreground (start of runway and ground plane in front of therunway) during night landings compared to student pilots, especially when approaching the shorterof the two runways. Certified pilots also tended to have shallower glideslopes than students when theplane arrived at the runway threshold. This would appear to suggest that vertical gaze position playssome role in influencing the future glide path through the air and ultimately the final trajectory ofthe aircraft during later stages of the landing approach. This is consistent with the pattern of eyemovements during driving, where terrestrial steering of a car was shown to also be influenced byhorizontal gaze position on the road (see, e.g., Land and Lee [1994] and Robertshaw and Wilkie [2008]).
One alternative explanation for the bias in gaze toward the near end of the runway is that it is thepoint on the runway that will exhibit the greatest optical expansion velocity. As the pilot attemptsto maintain the FOE over the aimpoint markings on the runway, the dynamic range of expansionvelocities toward the near end of the runway will be greater than for locations toward the far end ofthe runway. Therefore, pilots in general may direct their gaze toward the near end of the runway so asto increase the optical resolution from which changes in visual cue dimensions involving the near endof the runway can be accurately detected.
Another interesting observation from our study was that pilots looked at the power (RPM) and speed(KTS) indicators equally. This appears to be a common strategy used by more experienced pilots toascertain their local glide speed. A long way out from the runway, pilots can make considerable changesin altitude before their glideslope is compromised. At closer geometric distances, this error term caninflate rapidly. Hence, regular attention to the power indicator (typically sampled in value rangingfrom 1,200 to 3,000RPMs during normal flight) provides a much finer resolution of measurement forpropulsion than glide speed (sampled in value between 55 and 75 knots). The private pilot with themost flight experience indicated that he gazed at the RPMs readily because power is commensurate forspeed at a particular angle of attack, so the RPM indicator provides instantaneous feedback to ensurethat enough power had been appropriately removed or added in order to regulate his approach speedand, therefore, altitude. These techniques provide the pilot with the ability to alter more smoothlytheir approach speed and ultimately their glide angle with respect to the runway.
The findings of the present study support the growing consensus in the literature that no singlevisual cue provides sufficient information for a pilot to infer their precise angle of approach with respectto the runway. The particularly poor performance observed during night landings supports the notionthat glideslope control information is provided by a variety of cues, some of which are only availableduring day flight. Under full cue conditions, it may be that all of the available visual information (i.e.,that provided by the implicit horizon, form ratio, optical runway shape, perceived ground slant andthe H-angle cue) is integrated to provide a coherent percept of glideslope. Contrary to some previousstudies, which suggest that inexperienced pilots are more likely to fly out-of-the-cockpit [Lui et al.2002], we show that student and certified pilots have a remarkably similar reliance on visual worldfeatures when only minimal flight instrumentation is provided. In our study, the altimeter was absentduring all conditions, since we were primarily interested in whether pilots could land with only out-of-cockpit information about heading and glideslope. This instrument normally receives many fixationsduring real-world flight [Moore et al. 2005]. Its absence from the flight simulation was likely to have
ACM Transactions on Applied Perception, Vol. 7, No. 3, Article 18, Publication date: June 2010.
Pilot Gaze and Glideslope Control • 18:17
encouraged pilots to engage visual out-of-cockpit ground plane features more than usual in order toretrieve information about their height above ground level.
In conclusion, we have found that pilots primarily synchronize their gaze with the runway ahead asthey progress through the glideslope phase of landing, and may make use of optical flow cues sampledperipherally to control their angle of inclination with respect to the runway at the desired touchdownpoint. There was indirect evidence for the possible use of implicit horizon and/or optical shape cues, atleast during night approaches. However, performance appeared to be considerably better when thesecues were supplemented with other visual scene features during day approaches. Future studies couldexamine the role of these auxiliary scene features by altering ground plane texture and the visibilityof the horizon line through simulated cloud or fog before and beyond the runway.
ACKNOWLEDGMENTS
Many thanks to Mr Graham Towse for his contribution in the design and implementation of the aircraftsimulator. Special thanks to Captain Martin Michael for his valued participation and comments.
REFERENCES
ALLISON, R. S., EIZENMAN, M., AND CHEUNG, B. S. 1996. Combined head and eye tracking system for dynamic testing of thevestibular system. IEEE Trans. Biomed. Eng. 43, 1073–1082.
BASLER, M., SPOTT, M., BUCHANAN, S., BERNDT, J., BUCKEL, B., MOORE, C., OLSON, C., PERRY, D., SELIG, M., ET AL. 2008. TheFlightGear Manual. http://www.flightgear.org/Docs/getstart/getstart.html.
BERNDT, J. 2001. JSBSim, a flight dynamics model. http://jsbsim.sourceforge.net/.CALVERT, E. S. 1954. Visual judgments in motion. J. Inst. Navigation. 7, 233–251.COHEN, J. 1988. Statistical Power Analysis for the Behavioral Sciences 2nd Ed. Erlbaum, Hillsdale, NJ.DUCHOWSKI, A. T. 2002. A breadth-first survey of eye tracking applications. Behav. Res. Method. Instrum. Comput. 34, 455–
470.FLACH, J. M., HAGEN, B. A., AND LARISH, J. F. 1992. Active regulation of altitude as a function of optical texture. Percept.
Psychophys. 51, 557–568.GALANIS, G., JENNINGS, A., AND BECKETT, P. 1998. A mathematical model of glide-slope perception in the visual approach to
landing. Int. J. Aviation Psych. 8 83–101.GIBB, R. W. 2007. Visual spatial disorientation: revisiting the black hole illusion. Aviation Space Environ. Med. 78, 801–808.GIBSON, J. J. 1950. The Perception of the Visual World. Houghton Mifflin, Boston, MA.GIBSON, J. J., OLUM, P., AND ROSENBLATT, F. 1955. Parallax and perspective during aircraft landings. Am. J. Psych. 68, 372–385.GROSZ, J., RYSDYK, R. T. H., BOOTSMA, R. J., MULDER, J. A., VAN DER VAART, J. C., AND VAN WIERINGEN, P. C. W. 1995. Perceptual
support for timing of the flare in the landing of an aircraft. In Local Application of the Ecological Approach to the Human-Machine Systems, P. Hancock, J. M. Flach, J. Caird, and K. Vincente, Eds. Lawrence Erlbaum, Hillsdale, NJ, 104–121.
LAND, M. F. AND LEE, D. N. 1994. Where we look when we steer. Nature 369, 6483, 742–744.LINTERN, G. AND KOONCE, J. M. 1991. Display magnification for simulated landing approaches. Int. J. Aviation Psych. 1, 57–70.LINTERN, G. AND LIU, Y. T. 1991. Explicit and implicit horizons for simulated landing approaches. Hum. Factors 33, 401–417.LIU, Z., YUAN, X., LIU, W., AND WANG, R. 2002. Characteristics of eye movement and cognition during simulated landing of
aircraft. Space Med. Med. Eng. 15, 379–380.MACKWORTH J. F. AND MACKWORTH, N. H. 1958. Eye fixations recorded on changing visual scenes by the television eye marker.
J. Opt. Soc. Am. 48, 438.MAJENDIE, A. M. A. 1960. The para-visual director. J. Inst. Navig. 13, 447–454.MERTENS, H. W. 1978. Perceived orientation of a runway model in nonpilots during simulated night approaches to landing.
Aviation Space Environ. Med. 49, 457–460.MERTENS, H. W. 1981. Perception of runway image shape and approach angle magnitude by pilots in simulated night landing
approaches. Aviation Space Environ. Med. 52, 373–386.MOORE, S. T., MACDOUGALL, H. G., COHEN, B., WUYTS, F., CLARK, J. B., LESCEU, X., AND SPEYER, J-J. 2005. Head-eye coordination
during simulated orbiter landings. In Proceedings of the Humans in Space Symposium.MULDER, M., PLEIJSANT, J. M., VAN DER VAART, H., AND VAN WIERINGEN, P. 2000. The effects of pictorial detail on the timing of
the landing flare: Results of a visual simulation experiment. Int. J. Aviation Psych. 10, 291–315.
ACM Transactions on Applied Perception, Vol. 7, No. 3, Article 18, Publication date: June 2010.
18:18 • J. Kim et al.
OTTATI, W. L., HICKOX, J. C., AND RICHTER, J. 1999. Eye scan patterns of experienced and novice pilots during visual flightrules (VFR) navigation. In Proceedings of the Human Factors and Ergonomics Society 43rd Annual Meeting. 66–70.
PALMISANO, S. AND GILLAM, B. J. 2005. Visual perception for touchdown during simulated landing. J. Exp. Psych. Appl. 11,19–32.
PERRONE, J. A. 1984. Visual slant misperception and the “black hole” landing situation. Aviation Space Environ. Med. 55,1020–1025.
REGAN, D. AND BEVERLEY, K. I. 1982. How do we avoid confounding the direction we are looking and the direction we aremoving? Science 215, 194–196.
ROBERTSHAW, K. D. AND WILKIE, R. M. 2008. Does gaze influence steering around a bend? J. Vision 8, 1–13.THOMAS, E. L. 1963. The eye movements of a pilot during aircraft landing. Aerosp. Med. 34, 424–426.VAN DE GRIND, W. A., VAN DOORN, A. J., AND KOENDERINK, J. J. 1983. Detection of coherent movement in peripherally viewed
random-dot patterns. J. Opt. Soc. Am. 73, 1674–1683.WARREN, W. H. AND KURTZ, K. J. 1992. The role of central and peripheral vision in perceiving the direction of self-motion.
Percept. Psychophys. 51, 443–454.WILKIE, R. M. AND WANN, J. P. 2002. Driving as night falls: the contribution of retinal flow and visual direction to the control
of steering. Curr. Biol. 12, 2014–2017.WILKIE, R. M. AND WANN, J. P. 2005. The role of visual and nonvisual information in the control of locomotion. J. Exp. Psych.
Hum. Percept. Perform. 31, 901–911.WILKIE, R. M. AND WANN, J. P. 2006. Judgments of path, not heading, guide locomotion. J. Exp. Psych. Hum. Percept. Perform.
32, 88–96.WILKIE, R. M. WANN, J. P., AND ALLISON, R. S. 2008. Active gaze, visual look-ahead and locomotor control. J. Exp. Psych. Hum.
Percept. Perform. 35, 1150–1164.
Received March 2009; revised May 2009; accepted June 2009
ACM Transactions on Applied Perception, Vol. 7, No. 3, Article 18, Publication date: June 2010.


