Embed Size (px)
Citation preview
Pinholes and Images: Children’s Conceptions of Light and Vision. I
KAREN RICE AND ELSA FEHER Natural Science Department, San Diego State University, San Diego, CA 92182
Introduction
How do children think of light? Do they think it propagates, and if so, how? How do they explain the formation of images? A number of investigators, from Piaget (1974) on, have examined these questions (Hawkins, 1978; Guesne, 1978, 1984, 1985; Guesne, Tiberghien and DelacBte, 1978; Stead and Osborne, 1980; Jung, 1981a, 1981b, 1982c, 1982d; Andersson and Karrqvist, 1983). The techniques used have ranged from asking the children general questions (“How do you see this?”, “Where is the light in the room?”) to posing tasks that involve mirrors and lenses.
We have addressed the questions of light propagation and image formation through a novel approach in a novel setting. The setting is a science center that houses interactive exhibits. The approach is to elicit and analyze children’s pre- dictidns and explanations of unfamiliar phenomena, in this case, the formation of images through pinholes by use of extended light sources. The chosen effect has the appeal of simplicity: We can investigate light propagation and image formation through one phenomenon that yields information on both questions without involv- ing either reflection or refraction.
Our findings indicate that a prevalent model among children for image formation involves light that carries information about the source and travels as a holistic entity in a preferential direction towards the object that modifies and/or transmits this information to the screen.
Procedures
The method of investigation used in this work is the clinical interview, in which the subjects are questioned about their thought processes as they carry out a series of predetermined tasks. The subjects are children, nine to thirteen years of age, who come to our local Science Center with their class field trips. The Science Center is a “museum of natural phenomena” where the exhibits possess features that allow the visitor to ask and answer “what if” questions: “What will happen if I change this or that?” These exhibits, similar in conception to good laboratory activities, lend themselves very well to be used for the tasks that form the basis of a Piaget-style interview (Feher and Rice, 1985).
Science Education 71(4): 629-639 (1987) 0 1987 John Wiley & Sons, Inc. CCC 0036-83261 87 I 040629- 1 1$04.00
630 RICE AND FEHER
SIZE OF
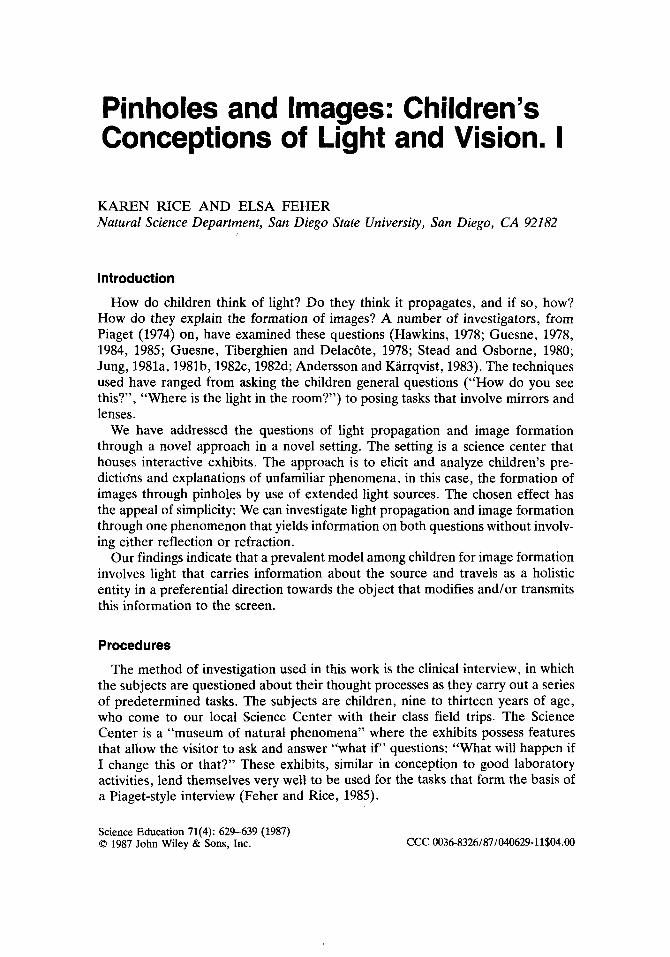
The work we report here is based on individual interviews with a total of 110 children at the site of the exhibit described below. The interviewer, wearing a Science Center staff badge, stations herself close to the exhibit. When a child approaches and starts investigating the props, the interviewer makes a suggestion (e.g., “Try the pegboard; it really makes an interesting pattern.”) and engages the child in dialog using questions from a protocol (see below). The data is recorded in notes, annotated sketches, and an audio tape recording of the dialog. The average duration of an interview is fifteen minutes. Not all children are asked all the questions of the comprehensive protocol. Therefore, some groups of children respond to partial protocols that are different from others and can be compared (Table I).
The exhibit used in this work consists of a large screen, a variety of light sources contained in a box, and an assortment of flat objects that provide apertures or windows to be placed between source and screen. In this work we confine ourselves to the use of a light source in the shape of a cross that is made of two perpendicular fluorescent tubes, each twenty centimeters long. The main apertures used are circular holes. One has a diameter d = 1 cm that is small compared to the dimen- sions of the source. The other has a diameter d = 25 cm that is comparable to the source. The source and screen are about two meters from each other; the objects containing the apertures are placed about two-thirds of the way from the source to the screen.
PREDICTED IMAGE NUMBER OF
25 cm
1 cm
APERTURE I
5 4 O/o 22% 80% 15%
l o Blended shapes I SUBJECTS + e*g. cl@+ I
24% 5%
41
’ cm I 500h
33% 17% I 42
I 22 50% N/A
LIGHT AND VISION. I 631
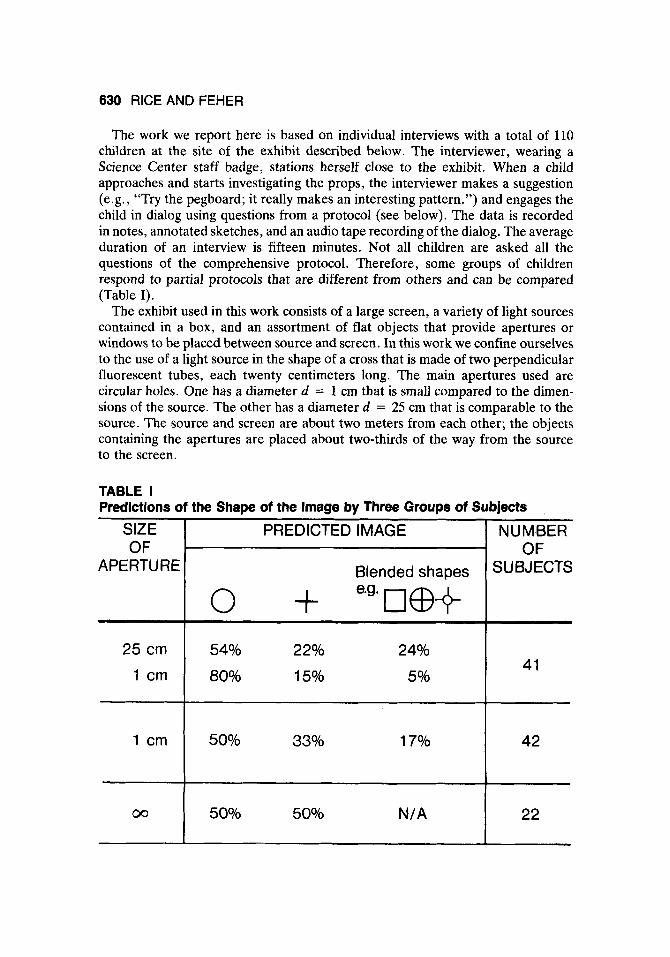
The phenomenon that is explored with this setup is the following: If the size of the aperture is comparable to or larger than the size of the source, the image on the screen will approximate the shape of the aperture; for very small or pinhole apertures, however, the image on the screen takes the shape of the source (Figure 1). If the source is asymmetric, the pinhole image is seen to be inverted regardless of the shape of the hole.
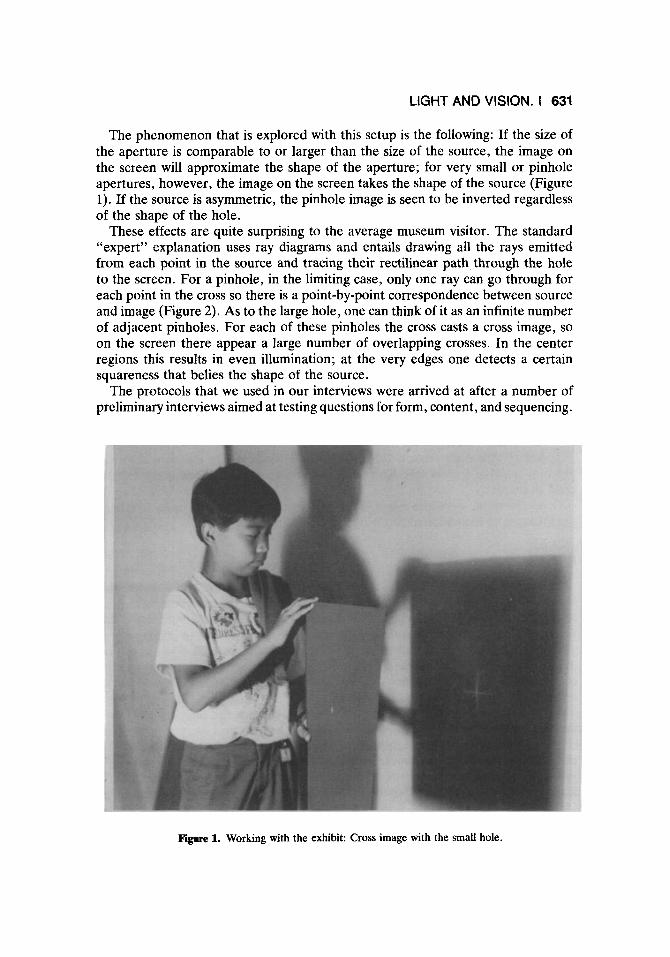
These effects are quite surprising to the average museum visitor. The standard “expert” explanation uses ray diagrams and entails drawing all the rays emitted from each point in the source and tracing their rectilinear path through the hole to the screen. For a pinhole, in the limiting case, only one ray can go through for each point in the cross so there is a point-by-point correspondence between source and image (Figure 2). As to the large hole, one can think of it as an infinite number of adjacent pinholes. For each of these pinholes the cross casts a cross image, so on the screen there appear a large number of overlapping crosses. In the center regions this results in even illumination; at the very edges one detects a certain squareness that belies the shape of the source.
The protocols that we used in our interviews were arrived at after a number of preliminary interviews aimed at testing questions for form, content, and sequencing.
Figure 1. Working with the exhibit: Cross image with the small hole.
632 RICE AND FEHER
Figure 2. “Expert” explanation of the pinhole image using ray diagram.
The basic protocol includes the following steps and questions:
1. “What will you see on the screen when we turn on the light if we place this (cardboard with large hole) here (between source and screen)?” “Can you draw what happens?” 2. “What will you see on the screen when we turn on the light if we place this (cardboard with small hole) here (between source and screen)?” “Can you draw what happens?” 3. Cross light is turned on with pinhole in place and the image is seen to be a cross. “How can you explain the cross on the screen?” “Can you draw what happens?” 4. Interviewer masks the top of the cross light so it looks like a T. “Can you explain why the T is upside down on the screen?”
Together with each request for a drawing, the interviewer makes a skeleton diagram showing a cross (the light source) and a circle (the round hole) for the child to fill in.
Other questions were also asked in the course of the interview in order to clarify the meaning of the children’s drawings and verbalizations.
Resu I ts
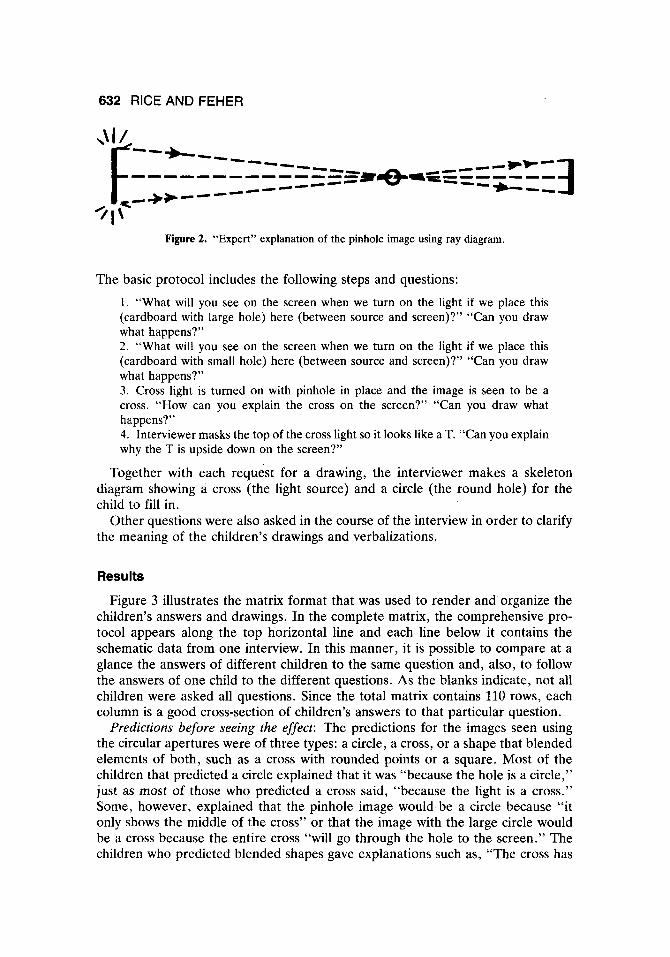
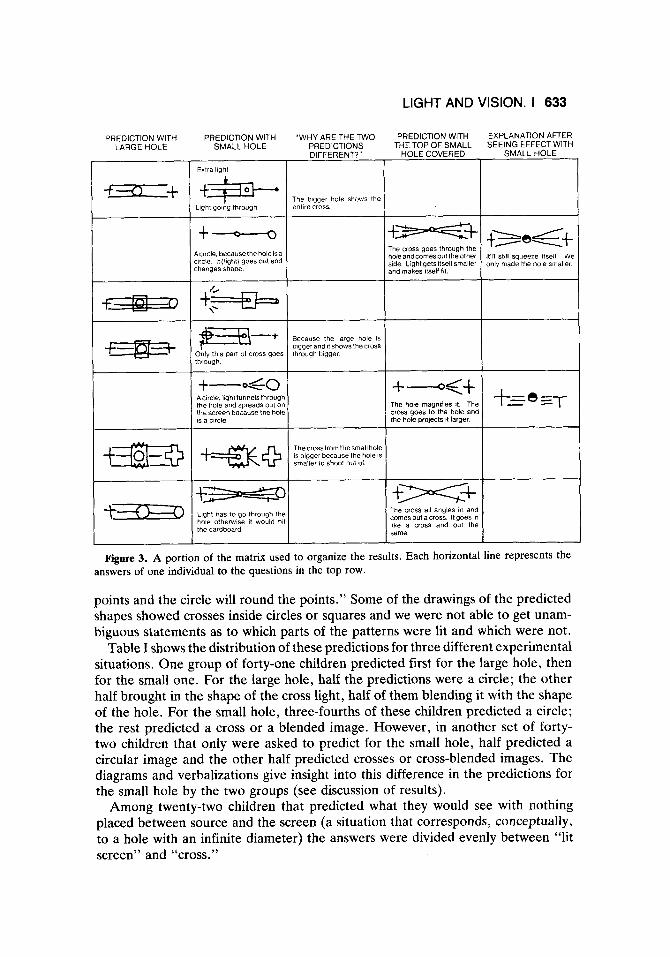
Figure 3 illustrates the matrix format that was used to render and organize the children’s answers and drawings. In the complete matrix, the comprehensive pro- tocol appears along the top horizontal line and each line below it contains the schematic data from one interview. In this manner, it is possible to compare at a glance the answers of different children to the same question and, also, to follow the answers of one child to the different questions. As the blanks indicate, not all children were asked all questions. Since the total matrix contains 110 rows, each column is a good cross-section of children’s answers to that particular question.
Predictions before seeing the effect: The predictions for the images seen using the circular apertures were of three types: a circle, a cross, or a shape that blended elements of both, such as a cross with rounded points or a square. Most of the children that predicted a circle explained that it was “because the hole is a circle,” just as most of those who predicted a cross said, “because the light is a cross.” Some, however, explained that the pinhole image would be a circle because “it only shows the middle of the cross” o r that the image with the large circle would be a cross because the entire cross “will go through the hole to the screen.” The children who predicted blended shapes gave explanations such as, “The cross has
LIGHT AND VISION. I 633
The hole magnifies it The cross qoes to the hole and the hole projects it larger
PREDICTION WITH LARGE HOLE
+= z-f
I =+ PREDICTION WITH
SMALL HOLE
Extra light
Light +--rlol--. going through
Acircle. becausethe holeea circle It(light) goesout and changesshape
Only this part of cross goes through
+-40 Acircle, lrghifunnels througt the hole and spreads out or the screen because Ihe hole IS a circle
+*+ +- Light has to go through tht hole otherwise It would hi the cardboard
“WHY ARE THE TWO PREDICTION WITH EXPLANATION AFTER PREDICTIONS THE TOP OF SMALL SEEING EFFECT WITH DIFFERENT? HOLE COVERED SMALL HOLE
The bigger hole shows the
+-+ The cross goes through the hole and comes out the other side Light gets itself Smaller and makes itself 111.
11‘11 still squeeze itself We only made the hole Smaller
Because the large hole is blggeranditshowsthecross lhrough bigger
Thecrossfromthesmall hole IS bigger because the hole 1s smaller to shoot out of
I I
I +x+ 1 The CIOSS all angles In and comes out a cross. It goes in like a cross and out the same.
Figure 3. A portion of the matrix used to organize the results. Each horizontal line represents the answers of one individual to the questions in the top row.
points and the circle will round the points.” Some of the drawings of the predicted shapes showed crosses inside circles or squares and we were not able to get unam- biguous statements as to which parts of the patterns were lit and which were not.
Table I shows the distribution of these predictions for three different experimental situations. One group of forty-one children predicted first for the large hole, then for the small one. For the large hole, half the predictions were a circle; the other half brought in the shape of the cross light, half of them blending it with the shape of the hole. For the small hole, three-fourths of these children predicted a circle; the rest predicted a cross or a blended image. However, in another set of forty- two children that only were asked to predict for the small hole, half predicted a circular image and the other half predicted crosses or cross-blended images. The diagrams and verbalizations give insight into this difference in the predictions for the small hole by the two groups (see discussion of results).
Among twenty-two children that predicted what they would see with nothing placed between source and the screen (a situation that corresponds, conceptually, to a hole with an infinite diameter) the answers were divided evenly between “lit screen” and “cross.”
634 RICE AND FEHER
Diagram made by children: The kinds of diagrams that children drew accom- panying their explanations of the predictions or of the actual effect were of the same basic types:
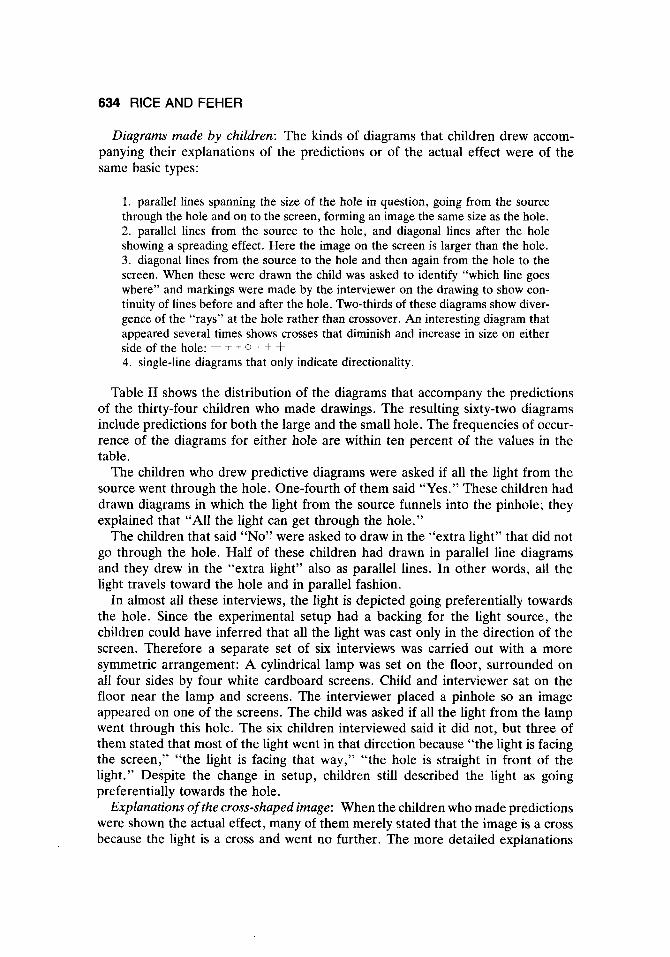
1. parallel lines spanning the size of the hole in question, going from the source through the hole and on to the screen, forming an image the same size as the hole. 2. parallel lines from the source to the hole, and diagonal lines after the hole showing a spreading effect. Here the image on the screen is larger than the hole. 3. diagonal lines from the source to the hole and then again from the hole to the screen. When these were drawn the child was asked to identify “which line goes where” and markings were made by the interviewer on the drawing to show con- tinuity of lines before and after the hole. Two-thirds of these diagrams show diver- gence of the “rays” at the hole rather than crossover. An interesting diagram that appeared several times shows crosses that diminish and increase in size on either side of the hole: t + + 0 1 + + 4. single-line diagrams that only indicate directionality.
Table I1 shows the distribution of the diagrams that accompany the predictions of the thirty-four children who made drawings. The resulting sixty-two diagrams include predictions for both the large and the small hole. The frequencies of occur- rence of the diagrams for either hole are within ten percent of the values in the table.
The children who drew predictive diagrams were asked if all the light from the source went through the hole. One-fourth of them said “Yes.” These children had drawn diagrams in which the light from the source funnels into the pinhole; they explained that “All the light can get through the hole.”
The children that said “No” were asked to draw in the “extra light” that did not go through the hole. Half of these children had drawn in parallel line diagrams and they drew in the “extra light” also as parallel lines. In other words, all the light travels toward the hole and in parallel fashion.
In almost all these interviews, the light is depicted going preferentially towards the hole. Since the experimental setup had a backing for the light source, the children could have inferred that all the light was cast only in the direction of the screen. Therefore a separate set of six interviews was carried out with a more symmetric arrangement: A cylindrical lamp was set on the floor, surrounded on ail four sides by four white cardboard screens. Child and interviewer sat on the floor near the lamp and screens. The interviewer placed a pinhole so an image appeared on one of the screens. The child was asked if all the light from the lamp went through this hole. The six children interviewed said it did not, but three of them stated that most of the light went in that direction because “the light is facing the screen,” “the light is facing that way,” “the hole is straight in front of the light.” Despite the change in setup, children still described the light as going preferentially towards the hole.
Explanations of the cross-shaped image: When the children who made predictions were shown the actual effect, many of them merely stated that the image is a cross because the light is a cross and went no further. The more detailed explanations
LIGHT AND VISION. I 635
TABLE II Frequency of Occurrence of Various Types of Light Propagation Diagrams (N = 62)
0
3 0 2 3
t: 0 0 a
7 40%
18%
v 14%
Other 1 4% address not only the shape but also the size of the image. We distinguish two types: Those that focus on the active role of the hole in changing the light in shape and/ or size:
0 Example: The light turns into a cross when it goes through. Those in which the role of the hole is passive and the emphasis is on the behavior of the light. 0 Example: The light gets itself smaller and goes through the hole and comes out the other side.
Table I11 shows the relative distribution of these types of explanations.
636 RICE AND FEHER
W
2 E n w < I- U W > z
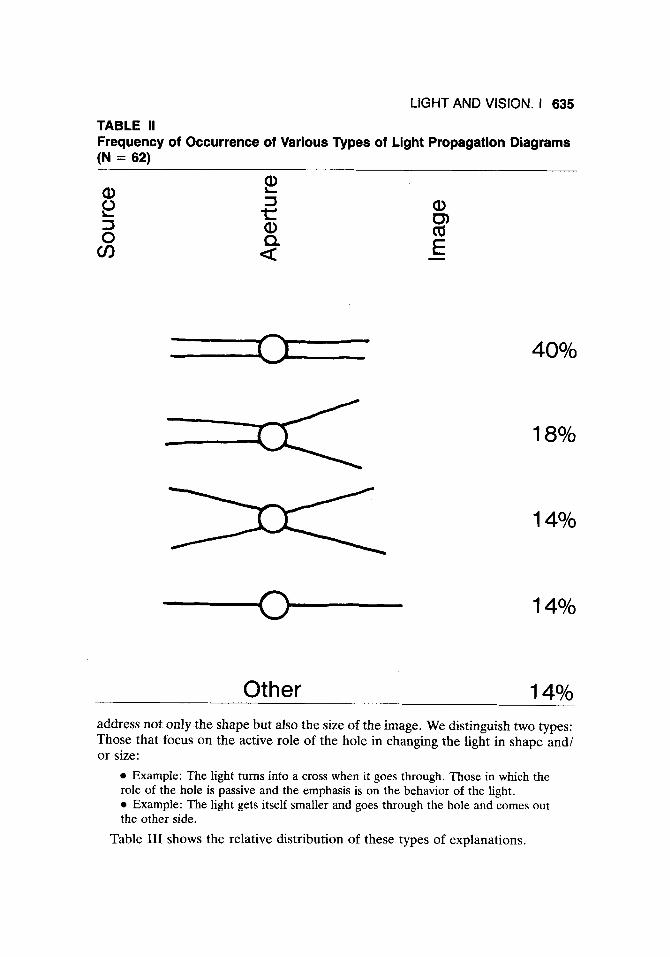
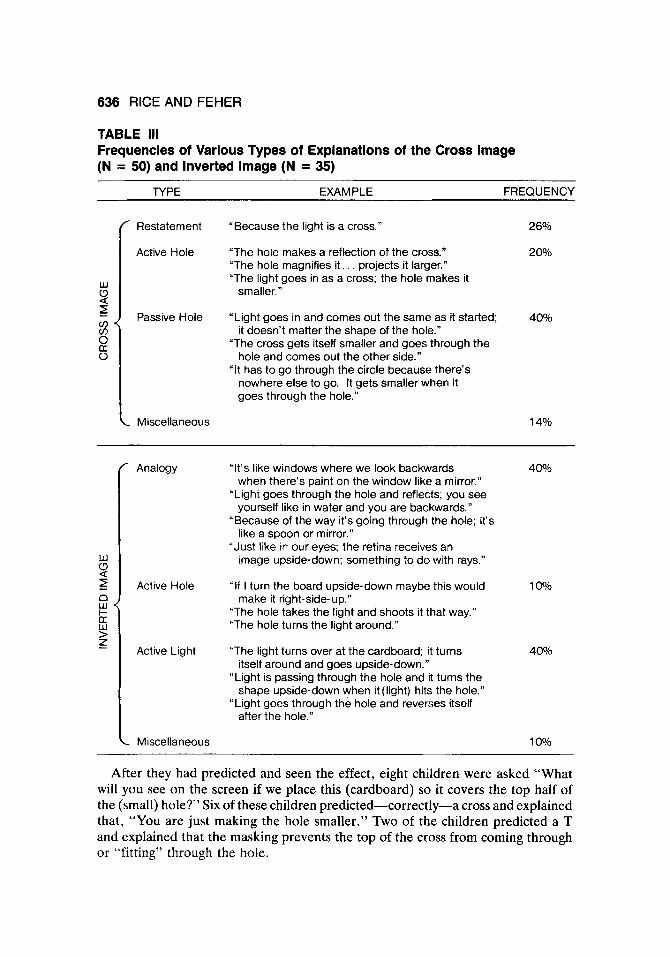
TABLE 111 Frequencies of Various Types of Explanations of the Cross Image (N = 50) and Inverted Image (N = 35)
/
\
TYPE EXAMPLE FREQUENCY
Restatement “Because the light is a cross.” 26Y0
Active Hole “The hole makes a reflection of the cross.” “The hole magnifies it.. . projects it larger.” “The light goes in as a cross; the hole makes it
20%
smaller.”
Passive Hole “Light goes in and comes out the same as it started;
“The cross gets itself smaller and goes through the
“It has to go through the circle because there’s
40% it doesn’t matter the shape of the hole.”
hole and comes out the other side.”
nowhere else to go. It gets smaller when it goes through the hole.”
L. Miscellaneous 14%
Analogy “It’s like windows where we look backwards 40% when there’s paint on the window like a mirror.”
“Light goes through the hole and reflects; you see yourself like in water and you are backwards.”
“Because of the way it‘s going through the hole; it‘s like a spoon or mirror.”
“Just like in our eyes; the retina receives an image upside-down; something to do with rays.”
Active Hole “If I turn the board upside-down maybe this would 10% make it right-side-up.’’
“The hole takes the light and shoots it that way.” “The hole turns the light around.”
“The light turns over at the cardboard; it turns itself around and goes upside-down.”
“Light is passing through the hole and it turns the shape upside-down when ittlight) hits the hole.”
“Light goes through the hole and reverses itself after the hole.”
Active Light 40%
c Miscellaneous 10%
After they had predicted and seen the effect, eight children were asked “What will you see on the screen if we place this (cardboard) so it covers the top half of the (small) hole?” Six of these children predicted-correctly-a cross and explained that, “You are just making the hole smaller.” Two of the children predicted a T and explained that the masking prevents the top of the cross from coming through or “fitting” through the hole.
LIGHT AND VISION. I 637
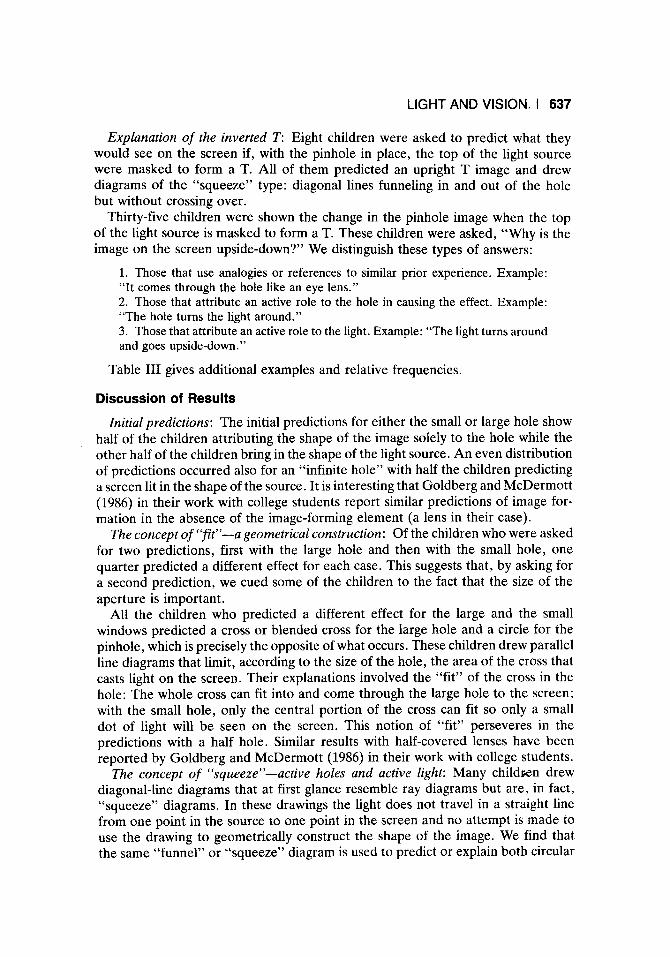
Explanation of the inverted T Eight children were asked to predict what they would see on the screen if, with the pinhole in place, the top of the light source were masked to form a T. All of them predicted an upright T image and drew diagrams of the “squeeze” type: diagonal lines funneling in and out of the hole but without crossing over.
Thirty-five children were shown the change in the pinhole image when the top of the light source is masked to form a T. These children were asked, “Why is the image on the screen upside-down?” We distinguish these types of answers:
1. Those that use analogies or references to similar prior experience. Example: “It comes through the hole like an eye lens.” 2. Those that attribute an active role to the hole in causing the effect. Example: “The hole turns the light around.” 3. Those that attribute an active role to the light. Example: “The light turns around and goes upside-down.”
Table I11 gives additional examples and relative frequencies.
Discussion of Results
Initial predictions: The initial predictions for either the small or large hole show half of the children attributing the shape of the image solely to the hole while the other half of the children bring in the shape of the light source. An even distribution of predictions occurred also for an “infinite hole” with half the children predicting a screen lit in the shape of the source. It is interesting that Goldberg and McDermott (1986) in their work with college students report similar predictions of image for- mation in the absence of the image-forming element (a lens in their case).
The concept of “fit”-a geometrical construction: Of the children who were asked for two predictions, first with the large hole and then with the small hole, one quarter predicted a different effect for each case. This suggests that, by asking for a second prediction, we cued some of the children to the fact that the size of the aperture is important.
All the children who predicted a different effect for the large and the small windows predicted a cross or blended cross for the large hole and a circle for the pinhole, which is precisely the opposite of what occurs. These children drew parallel line diagrams that limit, according to the size of the hole, the area of the cross that casts light on the screen. Their explanations involved the “fit” of the cross in the hole: The whole cross can fit into and come through the large hole to the screen; with the small hole, only the central portion of the cross can fit so only a small dot of light will be seen on the screen. This notion of “fit” perseveres in the predictions with a half hole. Similar results with half-covered lenses have been reported by Goldberg and McDermott (1986) in their work with college students.
The concept of “squeeze”-active holes and active light: Many children drew diagonal-line diagrams that at first glance resemble ray diagrams but are, in fact, “squeeze” diagrams. In these drawings the light does not travel in a straight line from one point in the source to one point in the screen and no attempt is made to use the drawing to geometrically construct the shape of the image. We find that the same “funnel” or “squeeze” diagram is used to predict or explain both circular
638 RICE AND FEHER
images and cross-shaped images. For these children, the shape of the image on the screen is not derived from the diagram but is postulated based on hunches as to how much influence the hole has in shaping the image. The explanations then rely on holes that are active (they attract the light and change it) or on light that is active (it changes itself).
Language: It is interesting that the term “reflection7’ occurs in these interviews when referring to the image. Close examination indicated that the children do not think that the images are actually caused by the reflection of light. Rather, since images in mirrors are often called reflections, the children generalize the use of the term to refer to any entity that reproduces the shape of an object. In fact, children often refer to shadows as reflections (Guesne, 1985; Feher and Rice, 1986).
Holistic models: The composite view afforded by children’s diagrams, predic- tions, and explanations is that light from the source travels as a whole and pref- erentially in the direction that “matters” in the problem at hand, in our case in the direction of the holes or screen.
Even if a drawing incorporates an array of diagonal lines emerging from a source, by and large the notion that each element of the source emits light equally in all directions (isotropically) is not there. It will be interesting to explore the stability of these conceptions in an experimental situation where the extended light source is composed of an array of elementary or quasi point sources (tiny light bulbs). This would allow us to separately investigate the concept of isotropic emission and the concept of holistic images.
Outcomes
Through this work with pinholes we have elucidated conceptions that are present in the naive learner’s thinking. By comparing these conceptions with the accepted scientists’ view, we can identify notions that are absent in the learner’s thinking and towards which we should direct our teaching. For example, the concept that is conspicuously missing in our interviews is that each element of the source emits light equally in all directions. Without this notion, a correct analytic interpretation of the pinhole phenomenon is not possible and certainly the more complex cases of image formation by mirrors and lenses cannot be correctly understood. This is an instructional challenge that begs attention.
However, there is more involved here than insights that inform the traditional instructional task of correcting misconceptions and filling conceptual gaps. The understanding brought about by this research should help us design classroom activities and museum exhibits that further learning and education in the broadest sense by strengthening the children’s inquisitiveness, their motivation, their inge- nuity as they attempt to “find out,” the coherence of their predictions and expla- nations, and the judgement they exercise in interpreting the world around them.
This work was supported in part by National Science Foundation, Grant No. MDR- 8652146, and was performed by K. Rice in partial fulfilIment for the Master in Science degree.
LIGHT AND VISION. I 639
References
Anderson, B. and Karrqvist, C. How Swedish pupils, aged 12-15 years, understand light
Feher, E. and Rice, K. Development of scientific concepts through the use of interactive
Feher, E. and Rice, K. Shadow Shapes. Science and children, 1986,24, 6-9. Goldberg, F. M. and McDermott, L. C. An investigation of student understanding of the
real image formed by a converging lens or concave mirror. American Journal of Physics,
Guesne, E. Lumibre et vision des objects: un example de reprksentations des phCnom2nes physiques pre-existant a l’enseignement. In G. DelacBte (Ed.), Physics Teaching in Schools. London: Taylor and Francis, 1978.
Guesne, E. Children’s ideas about light. New Trends in Physics Teaching Vol. N, E. J. Wenham (Ed.). Paris: UNESCO, 1984.
Guesne, E. Light. Children’s Ideas in Science, R. Driver, E. Guesne and A. Tiberghien (Eds.). Philadelphia: Open University Press, 1985.
Guesne, E., Tiberghien, A. and DelacBte, G. MCthodrs et resultats concernant l’analyse des conceptions des CBves dans differents domaines de la physique: Deux examples: les notions de chgleur et lumi2re. Revue FranGaise de Pedagogie, 1978, 45, 25-32.
and its properties. European Journal of Science Education, 1983,5, 387-402.
exhibits in a museum. Curator, 1985, 28, 35-46.
1987,55, 108-119.
Hawkins, D. Critical Barriers to Science Learning. Outlook, 1978, 29, 3-22. Jung, W. (a) Erhebungen zu schulervorstellungen in optik. Physica Didactica, 1981, 8, 137-
Jung, W. (b) Ergebnisse einer optik-erhebung. Physica Diductica, 1981, 9, 19-44. Jung, W. (c) Conceptual frameworks in elementary optics. Proceedings of the International
Workshop on Problems Concerning Students’ Representation of Physics and Chemistry Knowledge, W. Jung, H. Pfundt, and C. V. Rhoneck (Eds.). Ludwigsberg: Padagogische Hochschule, 1982.
155.
Jung, W. (d) Fallstudien zu optik. Physica Didactica, 1982, 9, 199-220. Piaget, J. Understanding Causality. New York: W. W. Norton and Company Inc., 1974. Stead, B. F., and Osborne, R. J. Exploring science students’ concepts of light. Australian
Science Teaching Journal, 1980,26, 84-90.
Accepted for publication 28 January 1987