Embed Size (px)
Citation preview

PLANETARY NEBULAE DETECTED IN THE SPITZER SPACE TELESCOPE GLIMPSE LEGACY SURVEY
Sun Kwok and Yong Zhang
Department of Physics, University of Hong Kong, Hong Kong; [email protected]
Nico Koning
University of Calgary, Calgary, AB T2N 1N4, Canada
Hsiu-Hui Huang
Institute of Astronomy and Astrophysics, Academia Sinica, Taipei, Taiwan
and
E. Churchwell
Department of Astronomy, University of Wisconsin-Madison, Madison, WI 53706
Received 2007 June 30; accepted 2007 August 15
ABSTRACT
We detected and imaged 30 planetary nebulae in the Sptizer Space Telescope Galactic Legacy Infrared Mid-PlaneSurvey Extraordinaire (GLIMPSE) survey. The distribution of warm dust is clearly shown in these images. From thederived fluxes at the 3.6, 4.5, 5.8, and 8.0 �mbands we are able to separate the photospheric, nebular, and dust emissioncomponents in the nebulae.
Subject headinggs: planetary nebulae: general — stars: AGB and post-AGB
1. INTRODUCTION
Planetary nebulae (PNs) are traditionally characterized by theiroptical emission-line spectrum arising from their ionized gas com-ponent. Multiwavelength observations of PNs, however, showthat PNs undergo a rich variety of radiation mechanisms, includ-ing millimeter/submillimeter line radiation from the molecularcomponent,X-ray continuum from the shocked bubble, radio free-free continuum emission from the ionized component, and infra-red emission from the dust component (Kwok 2000). From resultsof the IRAS survey, we learned the dust component has typicalcolor temperatures of 100Y200 K, and dust emission accounts foras much as�1/3 of the total energy output of the nebulae (Zhang& Kwok 1991). At wavelengths k>5 �m, the dust component isexpected to dominate over bound-free emission from the ionizedcomponent. Because the 5Y8 �m spectral region is difficult to ob-serve from the ground, the spectral energy distribution of PNsin this region is not well known. The Spitzer Space Telescope(Spitzer) is capable of performing imaging with high spatial res-olution and sensitivity in the 3Y8 �m region and offers the pos-sibility of mapping the dust distribution of PNs. In this paper, wereport our search and observations of PN candidates in the areacovered by the Galactic Legacy InfraredMid-Plane Survey Extra-ordinaire (GLIMPSE) survey, one of the Legacy Science Projectsof Spitzer. Through the experience learned from this exercise, wehope to be able to better characterize the spectral behavior of PNsin the transition spectral region between the nebular and dust com-ponents and to distinguish between PNs, compactH ii regions, andother stellar objects.
2. OBSERVATION
The data reported here were taken as part of the GLIMPSEsurvey.Observationswere obtained over the periods between 2004March 9 and 2004 November 1 with the Infrared Array Camera(IRAC; Fazio et al. 2004) on Spitzer. IRAC has four wavelengthbands centered at 3.6, 4.5, 5.8, and 8.0 �m, each of which has afield of view (FOV) of �5:20 ; 5:20. The detectors for the 3.6 and4.5 �mbands are 256 ; 256 pixel InSb arrays operating at�15K.
The detectors for the 5.8 and 8.0 �m bands are 256 ; 256 pixelSi:As arrays operating at�6K.All four bands are observed simul-taneously. The 3.6 and 5.8 �m bands FOVs are coincident on thesky and the 4.5 and 8.0 �m bands FOVs are coincident, but thecenter positions of the two pairs are offset by 6.730. The pixelsize in all four bands is�1.2200. The FWHM of the point-spreadfunctions was 1.6300, 1.7000, 1.8500, and 1.9400 at the 3.6, 4.5, 5.8,and 8.0 �m bands, respectively.The GLIMPSE survey covers the inner two-thirds of the Ga-
lactic plane (l ¼�10�� 65�; b ¼�1�; total area �220 deg2 )in all four IRAC bands. Details of the survey is described inChurchwell et al. (2004).
3. DATA PROCESSING
Data processing is performed by both the Spitzer ScienceCenter (SSC) and by the GLIMPSE team at the University ofWisconsinYMadison. The SSC archive provides these types ofdata to the public:
1. Rawdata that have undergone noprocessing other than beingpopulated with auxiliary science telemetry keywords. These dataare provided in the rare case that an observer wishes to process thedata in a manner different than that of the SSC.2. Basic calibrated data (BCD) is exposure level data that have
been through the IRAC pipeline. These data have gone throughsuch processing as the removal of instrumental signatures, calibra-tion into physical units and the addition of pointing information.One BCD is provided for each integration taken by IRAC as wellas several complimentary files. These files generally contain infor-mation about the quality of each pixel; provided so one can assessthe quality of and, if needed, repair each image.
A more detailed explanation of the SSC data processing can befound in the Spitzer Observer’s Manual, x 6.3.1
After the BCD, the GLIMPSE team combined the images into2� ; 2
�mosaics and took extra steps to correct for further instru-
mental artifacts such as the correction of zodiacal background,
1 See http://ssc.spitzer.caltech.edu/documents/som/.
426
The Astrophysical Journal Supplement Series, 174:426Y454, 2008 February
# 2008. The American Astronomical Society. All rights reserved. Printed in U.S.A.

excessive cosmic-ray hits, and other instrumental and downlinkproblems. Next, the flux densities and positions of point sourcesare determined using DAOPHOT, and the position of brightersources are checked against the 2MASS Point Source Catalogue.The point-source extraction is an iterative process where the ex-tracted sources are removed, then the residual image (image-pointsources) is plotted to check if a smooth background is observed orif there is a dip or bright spot where a source was extracted. A sec-ond iteration was made to compensate for either a dip (too muchflux was extracted) or a bright spot (too little flux extracted). Thistype of iteration was continued until the place where a source wasextracted was no longer identifiable. Particular care is invested inaccurately extracting point source fluxes when a source is locatedin a bright and spatially variable background such as occurs aroundthe central stars of PNs. Of course, as the background becomesbrighter and has strong gradients, photometric accuracy does suf-fer and the corresponding errors are larger.
The point-source lists obtained in the eight pointed observations(2 ; 2 s frames in each of the four bands) are merged to produceinput for the generation of the GLIMPSE Point Source CatalogandGLIMPSEPoint SourceArchive. The data are resampled, reg-istered to aGalactic coordinate system, and IRAC frames are back-ground matched, if necessary. The resulting images are turned intotiles of mosaicked images of 200 ; 200 pixels with pixel sizes ofapproximately 0.600.
The processed data sets are compared with the Macquarie/AAO/StrasbourgCatalogue of Galactic PlanetaryNebulae (MASH;Parker et al. 2003a, 2006). This catalog is a combination of theStrasbourg-ESOCatalogue of Galactic Planetary Nebulae (Ackeret al. 1992, 1996) and new PNs identified in the high-resolutionAAO/UKSAT H� survey of the MilkyWay (Parker et al. 1999,2003b). For each PN that lies in the GLIMPSE field, the corre-sponding GLIMPSE images are loaded into DS9 in a tiled pat-tern so each of the four bands can be seen at once. The images arethen centered on the coordinates of the PN. After zooming to anappropriate level, the four-band images are extracted.
The GLIMPSE Point Source Catalogue contains about 30 mil-lion sources, with a listing of the designation, position, and fluxof each, along with errors. A larger (�5 ;107) point source ar-chive compiled with less stringent reliability requirements is alsoproduced.
To obtain the total fluxes of extended sources, we first draw abox around the nebulae. The fluxes of all pixels within the box aretotaled and converted to units of mJy. The sum of all the fluxes ofsources found in the point-source archive within the box is thensubtracted off this total to derive a net flux. A box of the same sizeis also made on an ‘‘off’’ position away from the nebula. The netflux in this ‘‘off’’ position is then calculated using the same pro-cedure as the ‘‘on’’ position. Subtraction of the ‘‘off’’ net flux fromthe ‘‘on’’ net flux gives the total flux of the nebula.
4. RESULTS
A total of 30 PNs were detected. The four-band IRAC imagesof these PNs are displayed in Figures 1Y15. The measured totalfluxes in the four IRAC bands are listed in Table 1.
4.1. Spectral Energy Distribution
Additional fluxes were extracted from other data archives: theTwo Micron All Sky Survey (2MASS), Deep Near Infrared Sur-vey of the Southern Sky (DENIS),Midcourse Space Experiment(MSX ), and the Infrared Astronomical Satellite Point Source
Catalogue (IRAS PSC). The magnitude and fluxes of these mea-surements are tabulated in Table 2. By combining all the data, weare able to construct spectral energy distributions (SEDs) of thedetected sources, and each individual SED is displayed in Fig-ure 16. For some of the PNs with a large size, the data given bythese point source database only represent the lower limit offluxes. These objects are not included in Table 2 and Figure 16,even though they may be detected by these surveys. In somecases (e.g., PNG302.3�00.5, PNG321.0�00.6, PNG333.9+00.6),the JHK measurement arise from the central star, and the stellarcontinuum is clearly separated from the nebular emission seen inthe IRAC bands. As the stellar continuum is sharply decreasingwith increasingwavelength, their contributions to the IRACfluxesare probably negligible. We should note therefore that the JHKpoints presented in Figure 16 represent mostly the central starfluxes, but not necessarily the total fluxes from the nebulae. Theyare plottedmainly to illustrate the relative contributions of the cen-tral star and the nebula in different spectral regions.
4.2. IRAC Colors
Using the IRAC four-band photometry, we have constructedcolor-color diagrams for the detected PNs from the ½3:6�� ½4:5�and ½5:8�� ½8:0� colors, and the results are plotted in Figure 17.For starlike objects (blackbodies), their location on the plot willbe at the (0, 0) point. This is the case for PNG 342.7+00.7, whichhas a blackbody spectrum of about 1500 K (Fig. 16). The IRACcolors of PNG 306.4+00.2 are unlike those of a dust spectrumbut instead resemble the Rayleigh-Jeans tail of a blackbody of�1000 K.
The colors of our sample objects are generally very red and clus-ter around colors of ½3:6��½4:5��1 and ½5:8��½8:0��2. There aretwo objects (PNG333.9+00.6, PNG322.4�00.1) that have reddercolors and do not belong to this cluster. The peculiar color of PNG333.9+00.6 is due to the faintness of the 3.6 �m point, otherwisethe IRAC colors should follow nicely a reddened photosphericspectrum (Fig. 16). For PNG 322.4�00.1, the IRAC photometryagreeswell with the ISO spectrumof the object. The peculiar colorof PNG 322.4�00.1 can be attributed to the sharply rising spec-trum between 6 and 10 �m.
For comparison, Figure 17 also gives the colors presented byHora et al. (2004) for six PNs, and themodel predictions for youngand evolved PNs (Cohen et al. 2007). These points are located atapproximately the same position in the color-color diagram of oursample, although the models seem to slightly overestimate the½3:6��½4:5� colors.
4.3. Individual Objects
4.3.1. PNG 010.1+00.7
PNG 010.1+00.7 [=NGC 6537 = IRAS 18021�1950;R:A:(J2000:0) ¼18h05m13:3s, decl:(J2000:0) ¼�19�50013:600]is a type I PN with bipolar structure and has a central star with atemperature in the range (1:5Y2:5) ;105 K (Matsuura et al. 2005).Pottasch et al. (2000) obtained a nitrogen to oxygen ratio of 2.4for the PN. Itwas detected in theDENIS, 2MASS,MSX, and IRASsurveys, as well as by Spitzer in all four IRAC bands (Fig. 1). TheIJK photometry of the PN with DENIS has been presented bySchmeja & Kimeswenger (2002). The PN was also detected bythe NRAO VLA Sky Survey (NVSS; Condon & Kaplan 1998),whichmeasured a flux density of 428 �13 mJy at 1.4 GHz. NGC6537 was observed with the ISO Short Wavelength Spectrom-eter (SWS) and LongWavelength Spectrometer (LWS), covering
PLANETARY NEBULAE IN THE GLIMPSE SURVEY 427

Fig. 1.—SSC IRAC images of NGC 6537 (top) and NGC 6567 (bottom). The images for each object are arranged as follows: top left : 3.6 �m; top right: 4.5 �m; bottomleft : 5.8 �m; bottom right : 8.0 �m. The coordinates are in units of R.A. (J2000.0 on the horizontal scale) and decl. ( J2000.0 on the vertical scale).
428

Fig. 2.—SSC IRAC images of PNG 018.6�00.0 (top) and PNG 035.5�00.4 (bottom). The order of images are arranged as Fig. 1.
429

Fig. 3.—SSC IRAC images of A53 (top) and M1-71 (bottom). The order of images are arranged as Fig. 1.
430

Fig. 4.—SSC IRAC images of K3-42 (top) and M2-48 (bottom). The order of images are arranged as Fig. 1.
431

Fig. 5.—SSC IRAC images of PNG 295.7�00.2 (top) and PNG 296.8�00.9 (bottom). The order of images are arranged as Fig. 1.
432

Fig. 6.—SSC IRAC images of PNG 298.4+00.6 (top) and He 2-83 (bottom). The order of images are arranged as Fig. 1.
433

Fig. 7.—SSC IRAC images of PNG He 2-84 (top) and PNG 301.1+00.4 (bottom). The order of images are arranged as Fig. 1.
434

Fig. 8.—SSC IRAC images of PNG 302.3+00.5 (top) and PNG 306.4+00.2(bottom). The order of images are arranged as Fig. 1.
435

Fig. 9.—SSC IRAC images of PNG 309.5�00.7 (top) and He 2-111 (bottom). The order of images are arranged as Fig. 1.
436

Fig. 10.—SSC IRAC images of PNG 318.9+00.6 (top) and PNG 321.0�00.7 (bottom). The order of images are arranged as Fig. 1.
437

Fig. 11.—SSC IRAC images of PNG 321.3�00.3 (top) and PNG 322.4�00.1 (bottom). The order of images are arranged as Fig. 1.
438

Fig. 12.—SSC IRAC images of PNG 328.5�00.5 (top) and PNG 329.6�00.4 (bottom). The order of images are arranged as Fig. 1.
439
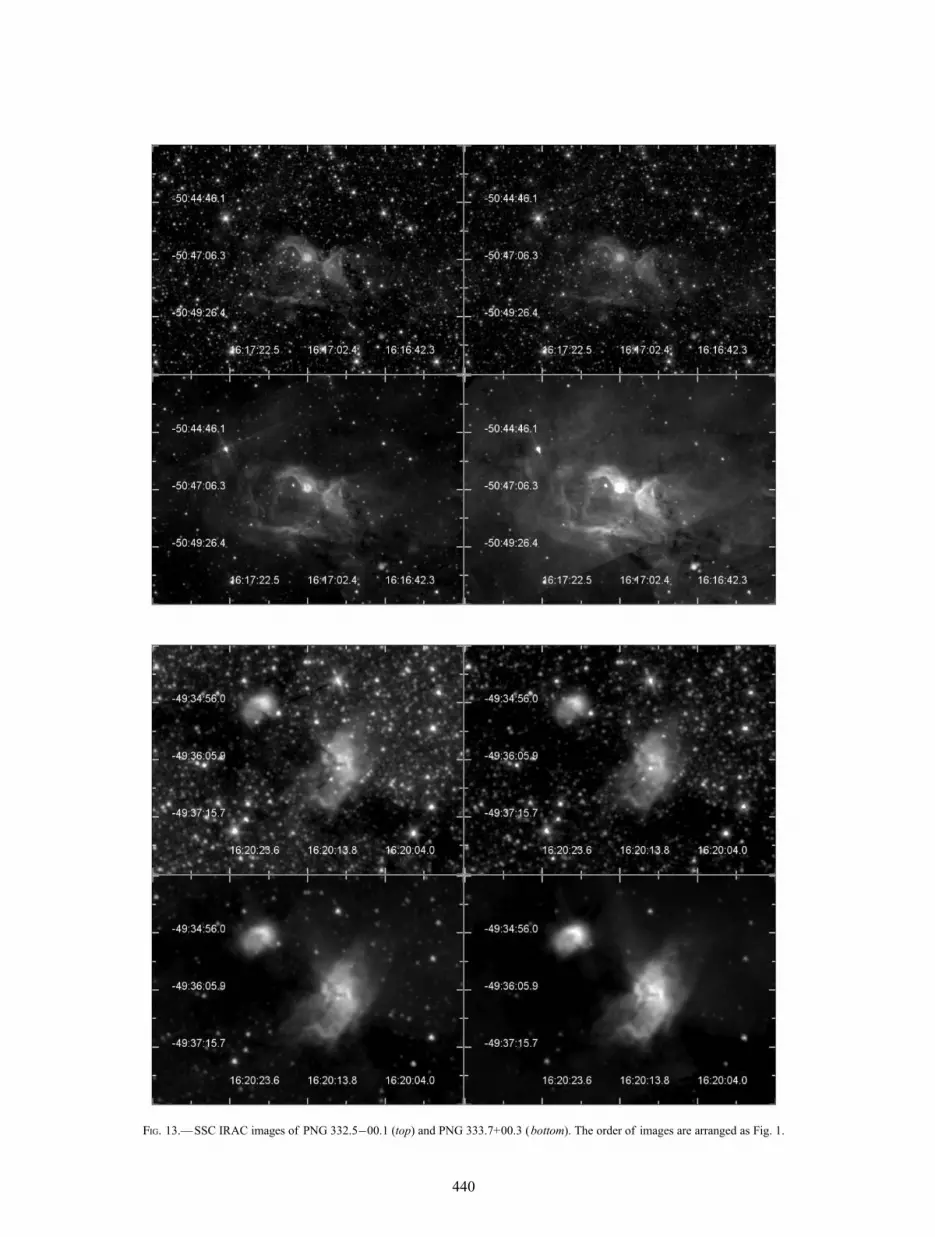
Fig. 13.—SSC IRAC images of PNG 332.5�00.1 (top) and PNG 333.7+00.3 (bottom). The order of images are arranged as Fig. 1.
440

Fig. 14.—SSC IRAC images of PNG 333.9+00.6 (top) and PNG 340.0+00.9 (bottom). The order of images are arranged as Fig. 1.
441

Fig. 15.—SSC IRAC images of PNG 342.7+00.7 (top) and PNG 343.9+00.8 (bottom). The order of images are arranged as Fig. 1.

wavelength ranges 2.38Y 45.2 �m and 40Y197 �m, respectively.The aromatic infrared band (AIB) emission at 7.7 �m and thefeatures of crystalline silicate at 15Y45 �m can clearly be seen inthe ISO spectra (Fig. 18).
Matsuura et al. (2005) presented optical and KS band imagesof this PN obtained with theHubble Space Telescope (HST ) andwith the infrared adaptive optics system on the Very Large Tele-scope (VLT), respectively. From these images they derived an ex-tinction map that points to a compact dust structure located at theneck of the bipolar flow. The IRAC images show that the dustemission arises predominantly from the compact central region,which probably corresponds to a dust torus. Very faint emissionfrom the symmetric lobes is seen in the IRAC 8.0 �m image only.
From theSEDof this object (Fig. 16), we can see that the flux inthe 8 �m band is dominated by AIB emission at 7.7 �m, with aminor contribution from the [Ne vi] line at 7.657 �m. From the8�m image, we can see that the AIB emission originates in amoreextended region than the dust thermal emission.
4.3.2. PNG 011.7�00.6
PNG011.7�00.6[=NGC6567=IRAS18108�1905;R:A:(J2000:0)¼18h13m45:0s,decl:(J2000:0)¼�19�04019:400] was detected in theDENIS, 2MASS, MSX, IRAS surveys and is detected by Spitzerin all four IRAC bands (Fig. 1). The NVSS survey (Condon &Kaplan 1998) gives a flux density of 163:3� 4:9 mJy at 1.4 GHz.NGC 6567 is an oval-shaped, type II PN. Hyung et al. (1993)presented the IUE spectra and obtained a low nitrogen-to-oxygenratio of 0.14. The optical image shows that it has a diameter of
7.6 00 (Acker et al. 1992, 1996). The 5.8 and 8.0 �m emissionsappear to come from a more extended region.
4.3.3. PNG 018.6�00.0
PNG018.6�00.0[R:A:(J2000:0)¼18h25m10:6s,decl:(J2000:0)¼�12� 42 0 2800 ] was discovered in the AAO/UKST H� and theIRAS surveys and is detected by Spitzer in all four IRAC bands(Fig. 2).
The H� image shows a faint and cometary structure. The com-etary structure, as frequently found for compact and ultracompactH ii regions, is often attributed to the interaction between the ISMand stellar mass loss. Comparison between the H� image and ourIRAC image suggests that the nebula may actually have a bipolarstructure with one of the optical lobes hidden due to dust obscu-ration. The IRAC images show an asymmetric bipolar structurewith the northwestern lobe likely to be in front. Fine details suchas filaments in the lobes can be seen in the IRAC images. The cen-tral star is also clearly detected. The combination of faintH� emis-sion and bright IR emission suggests that the object suffers fromlarge extinction.
The SED of this object (Fig. 16) shows strong AIB emission at7.7 �m and possibly a silicate absorption feature at 10 �m. Theseproperties suggest that it might actually be a young stellar object(YSO) deeply embedded in a dust envelope, and indeed Parkeret al. (2006) rejects this object as a PN candidate based on its mor-phology. Assuming this is a YSO and applying the color classi-fication criteria of Allen et al. (2004) we can identify it as a Class Isource.
TABLE 1
Spitzer IRAC Fluxes and Sizes of Detected Planetary Nebulae
Object
3.6
(mJy)
4.5
(mJy)
5.8
(mJy)
8.0
(mJy)
3.6
(arcsec)
4.5
(arcsec)
5.8
(arcsec)
8.0
(arcsec)
PNG 010.1+00.7 .................. 285 760 1307 4516 8 8 10 12
PNG 011.7�00.6 ................. 172 196 594 2023 8 8 10 12
PNG 018.6�00.0 ................. 1702 1742 14843 36825 40 60 90 120
PNG 035.5�00.4 ................. 32 48 48 141 10 10 10 10
PNG 040.3�00.4 ................. 31 26 69 180 15 20 20 20
PNG 055.5�00.5 ................. 120 137 279 1173 8 10 10 10
PNG 056.4�00.9 ................. 7.7 9.8 13.1 46.8 . . . . . . . . . 7
PNG 062.4�00.2 ................. 5 10 8 25 . . . . . . . . . 7
PNG 295.7�00.2 ................. 500 377 2764 7540 35 45 60 60
PNG 296.8�00.9 ................. 2.5 4.6 7.2 26 . . . . . . . . . 10
PNG 298.4+00.6 .................. 821 604 7423 21175 60 60 120 180
PNG 300.2+00.6 .................. 30 40 68 301 . . . . . . . . . 10
PNG 300.4�00.9 ................. 5 5 11 23 . . . . . . . . . 10
PNG 301.2+00.4 .................. 174 129 1149 3117 . . . . . . 40 ; 200 60 ; 250
PNG 302.2�00.5 ................. 10 12 35 103 . . . . . . 8 ; 36 10 ; 60
PNG 306.4+00.2................. 21 15 9 10 . . . . . . . . . . . .
PNG 309.5�00.7 ................. 3213 3416 27946 69643 210 ; 600 180 ; 450 240 ; 710 270 ; 750
PNG 315.0�00.3 ................. 20 31 68 243 . . . 10 10 15
PNG 318.9+00.6 .................. 18 16 29 151 . . . 10 10 20
PNG 321.0�00.7 ................. 26 30 81 290 . . . . . . 8 ; 24 10 ; 30
PNG 321.3�00.3 ................. 2486 3847 19018 36702 . . . . . . 160 ; 210 210 ; 270
PNG 322.4�00.1 ................. 138 218 299 3269 . . . . . . . . . . . .
PNG 328.5�00.5 ................. 31848 27238 209929 614354 180 ; 360 180 ; 360 360 ; 540 360 ; 580
PNG 329.6�00.4 ................. 2834 2760 24814 713010 . . . . . . 220 ; 400 250 ; 430
PNG 332.5�00.1 ................. 9313 8132 74326 208330 72 ; 280 108 ; 280 120 ; 430 180 ; 540
PNG 333.7+00.3 .................. 2787 2737 23777 63677 60 ; 90 60 ; 135 90 ; 180 120 ; 180
PNG 333.9+00.6 .................. 35 284 167 961 30 30 45 45
PNG 340.0+00.9 .................. . . . . . . . . . . . . 20 30 50 70
PNG 342.7+00.7 .................. 245 156 119 64 . . . . . . . . . . . .PNG 343.9+00.8 .................. 95 135 200 790 . . . . . . 10 12
PLANETARY NEBULAE IN THE GLIMPSE SURVEY 443

TABLE2
OtherFluxMeasurements
DENIS
2MASS
MSX
IRAS
Object
I
(mag)
J
(mag)
K
(mag)
J
(mag)
H
(mag)
K
(mag)
8.28�m
(Jy)
12.13�m
(Jy)
14.65�m
(Jy)
21.3
�m
(Jy)
12�m
(Jy)
25�m
(Jy)
60�m
(Jy)
100�m
(Jy)
PNG
010.1+00.7......................
12.440
10.800
9.460
10.589
10.181
9.196
3.559
5.055
17.922
35.083
7.718
58.300
189.900
166.100
PNG
011.7�00.6......................
12.622
11.509
10.358
11.759
11.561
10.298
1.706
2.770
4.159
4.570
2.711
7.258
<27.660
<379.000
PNG
018.6�00.0......................
...
...
...
...
...
...
...
...
...
...
16.200
63.910
627.100
1095.000
PNG
035.5�00.4......................
...
...
...
13.019
11.360
10.585
0.389
1.304
1.792
2.003
<1.821
3.552
<8.437
<211.600
PNG
040.3�00.4......................
...
...
...
...
...
...
...
...
...
...
2.856
0.724
<8.540
<96.500
PNG
055.5�00.5......................
...
...
...
11.582
11.276
10.297
1.345
4.871
10.568
19.233
4.250
32.900
20.980
58.060
PNG
056.4�00.9......................
...
...
...
14.205
13.712
12.760
...
...
...
...
0.504
<0.250
<0.400
<1.081
PNG
062.4�00.2......................
...
...
...
15.325
14.584
14.464
...
...
...
...
<1.027
0.760
7.424
<35.860
PNG
295.7�00.2......................
...
...
...
...
...
...
...
...
...
...
5.039
16.760
148.900
152.60
PNG
300.2+00.6.......................
10.975
10.657
10.379
10.569
10.473
10.417
0.246
1.814
1.066
9.794
0.996
15.900
14.020
<67.560
PNG
300.4�00.9......................
...
...
...
15.282
13.648
13.190
...
...
...
...
...
...
...
...
PNG
302.3�00.5......................
15.553
14.272
13.20
14.287
13.954
13.654
0.119
1.045
...
...
...
...
...
...
PNG
306.4+00.2.......................
10.808
10.393
9.838
10.500
10.271
9.887
...
...
...
...
...
...
...
...
PNG
315.0�00.3......................
16.419
15.210
...
15.221
14.735
13.552
0.238
0.254
1.493
0.907
<1.283
3.081
11.210:
<117.200
PNG
318.9+00.6......................
...
...
...
14.988
13.285
12.492
0.109
...
2.156
1.531
...
...
...
...
PNG
321.0�00.7......................
10.942
9.261
8.268
9.216
8.722
8.375
0.424
1.469
2.280
8.088
1.357
12.530
<13.630
<223.100
PNG
322.4�00.1......................
14.795
11.673
9.983
11.805
11.142
9.956
5.899
10.755
16.999
55.032
<16.700
70.930
35.430
<238.200
PNG
328.5�00.5......................
...
...
...
...
...
...
...
...
...
...
<248.100
815.300
11170.000
15900.000
PNG
333.9+00.6.......................
13.863
10.300
8.448
10.306
9.235
8.475
0.740
4.250
4.890
10.950
4.207
19.580
33.130
<222.300
PNG
342.7+00.7.......................
...
...
...
11.121
9.137
8.252
...
...
...
...
...
...
...
...
PNG
343.9+00.8.......................
15.445
12.044
10.435
12.292
11.791
10.440
1.491
2.379
12.897
27.139
2.354
39.590
40.890
<69.690
444

Fig. 16.—Spectral energy distributions (SEDs) of the PNs in our GLIMPSE sample. The filled triangles, filled diamonds, filled circles, open circles, and filled squaresare from the DENIS, 2MASS, GLIMPSE, IRAS, andMSX surveys, respectively. The open triangles are IRAS upper limits. The dashed and dotted lines are IRAS LRS2 andLRS3 spectra, respectively. The solid lines are the ISO observations.
445

Fig. 16—Continued
446

Fig. 16—Continued
447

Fig. 16—Continued
448

Fig. 16—Continued
449

4.3.4. PNG 035.5�00.4
PNG 035.5�00.4 [IRAS 18554+0203; R:A:(J2000:0) ¼18h57m59:5s, decl:(J2000:0) ¼ þ02
�0700800] was detected in the
2MASS, MSX, and IRAS surveys and is detected by Spitzer inall four IRAC bands ( Fig. 2). According to the NVSS survey, thenebula has a flux density of 96:2 � 3:9 mJy at 1.4 GHz (Condon& Kaplan 1998). The object was identified as a potential PN byKistiakowsky & Helfand (1995) from near-IR observations andclassified as a ‘‘likely PN’’ by Parker et al. (2006). The IRAC im-ages suggests a spherical structurewith a diameter of 1000. The near-IR image (Kistiakowsky & Helfand 1995) shows that the [S iii]lines originate in more compact regions than the dust emission.TheSED (Fig. 16) indicates a cold dust componentwithT <200K.
4.3.5. PNG 040.3�00.4
PNG 040.3�00.4 [A53=IRAS 19043+0319; R:A:(J2000:0) ¼19h06m45:7s, decl:(J2000:0) ¼þ06�2305600 ] was detected in theIRAS survey and is detected by Spitzer in all four IRAC bands(Fig. 3). It shows a classical ring structure with an inner radius of�500 and an outer radius of �10 00.
4.3.6. PNG 055.5�00.5
PNG055.5�00.5 [=M1-71=IRAS19342+1935; R:A:(J2000:0)¼19h36m25:5s, decl:(J2000:0) ¼þ19�4203000] was detected in the2MASS,MSX, and IRAS surveys and was detected by Spitzer inall four IRAC bands (Fig. 3). According to the NVSS survey, thenebula has a flux density of 84:1�2:6 mJy at 1.4 GHz (Condon& Kaplan 1998). Its central star is classified by Parthasarathyet al. (1998) in the class of weak emission line stars (WELs)or [WC]�PG1159 central stars, which represent the transitionstage between the [WC] central stars of PNs and the PG1159 (pre)white dwarfs. Wright et al. (2005) presented optical spectra andimages of the nebula and found that it consists of a bright bulgeand a faint disk extending approximately north to south. Thestructure is further confirmed by the IRAC 8.0 �m image. Theemission from the disk is too weak to be detected in the 3.6, 4.5,
and 5.8 �m images. The SED suggests the presence of cold dust(T < 100 K).
4.3.7. PNG 056.4�00.9
PNG 056.4�00.9 [=K3-42=IRAS 19373+2012; R:A:(J2000:0) ¼19h39m35:7s, decl:(J2000:0) ¼þ20�1900200] was detected in theIRAS survey and was detected by Spitzer in all four IRAC bands(Fig. 4). The IRAC images show a very compact structure. TheNVSS survey gives a flux density of 11:6 � 0:8 mJy at 1.4 GHz(Condon & Kaplan 1998). The PN was detected by Aaquist &Kwok (1990) in their VLA radio survey of compact PNs, whichgives a flux density of 19mJy at 5GHz. The SED suggests that the3.6, 4.5, and 5.8 �m bands are dominated by contributions frombound-free emission, whereas the 8.0 �m band is dominated bydust emission.
4.3.8. PNG 062.4�00.2
PNG 062.4�00.2 [=M2-48=IRAS 19483+2546; R:A:(J2000:0) ¼19h50m28:1s, decl:(J2000:0) ¼þ25
�5402200] was detected in the
2MASS and IRAS surveys and was detected by Spitzer in theIRAC 5.8 and 8.0 �m bands only (Fig. 4). The 3.6 and 4.5 �mbands only detects the bright nucleus. The NVSS survey gives aflux density of 17:0 � 0:7 mJy at 1.4 GHz (Condon & Kaplan1998). Optical imaging of the object suggests the presence ofbipolar outflows and bow shocks (Vazquez et al. 2000). Lopez-Martın et al. (2002) analyzed its kinematic structure from the neb-ula’s optical spectrum and classified it as a type I PN. The bipolarstructure can clearly be seen in the IRAC 5.8 and 8.0 �m images.
4.3.9. PNG 295.7�00.2
PNG 295.7�00.2 [=IRAS 11467�6155; R:A:(J2000:0)¼11h49m13:2s, decl:(J2000:0) ¼�62�1203000] was discovered inthe AAO/UKST H� and IRAS survey. It has an optical diameterof 40:700 ; 37:000 and was detected and resolved in all four IRACbands (Fig. 5). MacLeod et al. (1998) searched for 6.7 GHzmeth-anol masers for a IRAS-selected sample and did not detect meth-anol masers in this object. The IRAC images show that the objectis composed of two bright lobes embedded in a diffuse nebulawith extended tails in the north and west directions. The H� im-age, however, only reveals a compact emission region. Based on
Fig. 17.—IRAC color-color plot (½3:6��½4:5� vs. ½5:8��½8:0� ) from Table 1( filled circles),Hora et al. (2004,open circles), andCohen et al. (2007,open triangles).
Fig. 18.— ISO spectrum of NGC 6537. The arrows mark the features of crys-talline silicate at 16.5, 18.2, 19.5, 23.8, 28.0, 33.8, 29.6, 40.5, and 43.8�m.Anumberof strong atomic lines are identified.
KWOK ET AL.450 Vol. 174
the IRASfluxes,Whiteoak (1992) identified it as a compact H ii re-gion. Parker et al. (2006) rejects this object as a PN candidate basedon its morphology.
4.3.10. PNG 296.8�00.9
PNG 296.8�00.9 [R:A:(J2000:0)¼11h57m3:1s, decl:(J2000:0)¼�63�1204300] was discovered in the AAO/UKST H� survey. Ithas an optical diameter of 1300 ; 1100 andwas detected by Spitzerin the IRAC 5.8 and 8.0 �m bands only (Fig. 5). The H� imageshows a spiral structure, which, however, is not resolved in theIRAC images. The SED shows a very steep rise between the 5.8and 8.0 �m bands, which could be due to strong AIB emissions at7.7 �m.
4.3.11. PNG 298.4+00.6
PNG 298.4+00.6[R:A:(J2000:0)¼12h13m09:0s, decl:(J2000:0)¼�61�5002800] was discovered in the AAO/UKST H� survey. Ithas an optical diameter of 2400. This object is very red in theGLIMPSE field and was detected by Spitzer in the IRAC 4.5, 5.8,and 8.0 �m bands (Fig. 6). While the H� image shows an ap-proximately spherical structure, the IRAC images suggest that thedust emission is distributed in two bipolar lobes with some fila-ments in the outer diffuse regions.
4.3.12. PNG 300.2+00.6
PNG300.2+00.6 [He2-83=IRAS12259�6148;R:A:(J2000:0)¼12h28m45:6s, decl:(J2000:0) ¼�62�0503500] was detected by theDENIS, 2MASS,MSX, and IRAS surveys and was detected in allfour IRAC bands (Fig. 7).
The IRAC images show a spherical structure with a diameter of1000. Gorny et al. (1999) presented optical images of this PN, show-ing a similar appearance and size with those in the IRAC images.The SED (Fig. 16) shows the presence of cold dust (T <100 K)and a red companion star.
4.3.13. PNG 300.4�00.9
PNG 300.4�00.9 [=He 2-84; R:A:(J2000:0) ¼12h28m46:7s,decl:(J2000:0) ¼�63
�4403500] is a medium-excitation bipolar
PN with a narrow waist. The nebula has an optical diameter of3800 ; 3000 and is detected in the IRAC 4.5, 5.8, and 8.0 �mbands(Fig. 7). The PN was detected in the 2MASS survey but notincluded in the DENIS point source catalog due to its extendedsize. The optical images in Corradi & Schwarz (1993) and Gornyet al. (1999) show a distorted point symmetrical structure. TheIRAC images show that dust emission originates predominantlyin the bright waist. The faint extended emission was detected inthe 8.0 �m band only.
4.3.14. PNG 301.2+00.4
PNG301.2+00.4[R:A:(J2000:0)¼12h37m09:6s,decl:(J2000:0)¼�62
�2301000] was discovered in the AAO/UKST H� survey. It
has an optical diameter of 15:300 ; 12:900. This object is very redin the GLIMPSE field and is detected by Spitzer in the IRAC 4.5,5.8, and 8.0 �m bands (Fig. 7). The H� image shows a faintelliptical appearance, whereas the IRAC images shows a muchmore extended and bright structure. It is worth noting that anextended filament structure to the north of the PN appears in theGLIMPSE field but has no corresponding feature in the H� im-age. The difference between the IRAC and H� images representsthe different spatial distributions of dust and ionized gas.
4.3.15. PNG 302.3�00.5
PNG302.3�00.5[R:A:(J2000:0)¼12h46m27:1s, decl:(J2000:0)¼�63�2402200] was discovered in the AAO/UKST H� , DENIS,2MASS, andMSX surveys. It has an optical diameter of 2200 ; 1500
and was detected in the IRAC 5.8 and 8.0 �m bands (Fig. 8).According to the MASH catalog, H� has a much larger flux thanthe [O iii ] k5007 line, suggesting that the PN belongs to anextremely low excitation class. The H� image shows a very ellip-tical appearance and thus was classified as a bipolar PN by Parkeret al. (2006). However, the IRAC images show an edge-onringlike structure, which is probably a better description of itsmorphology. The SED (Fig. 16 ) suggests the presence of colddust (T < 150 K).
4.3.16. PNG 306.4+00.2
PNG306.4+00.2 [R:A:(J2000:0)¼13h22m5:5s, decl:(J2000:0)¼�62�240600]was discovered in the AAO/UKST H� , DENIS and2MASS surveys and was detected by Spitzer in all four IRACbands (Fig. 8). Both theH� and IRAC images show the extendedbipolar structure and bright central star. The diffuse nebula ismuch fainter than the central compact region. The SED (Fig. 16)probably represents the measurements of the central object.
4.3.17. PNG 309.5�00.7
PNG309.5�00.7[R:A:(J2000:0)¼13h49m52:1s, decl:(J2000:0)¼�62�4904100] was detected by Spitzer in all four IRAC bands(Fig. 9). This object is very red in the GLIMPSE field and has alarge size. The IRAC images show a cometary appearance, im-plying the interaction between the nebula and the ISM. This ob-ject is classified as an interstellar bubble based on its morphologyand is given the catalog number of S141 (where the prefix S standsfor south, not to be confused with objects in the Sharpless catalog,Churchwell et al. 2006). Parker et al. (2006) rejects this object as aPN candidate based on its morphology. We note that there is aseparate extended source southwest of the main nebula and has asimilar color to PNG 309.5�00.7. From the morphology of thissmaller nebula, it could be considered as a PN candidate.
4.3.18. PNG 315.0�00.3
PNG315.0�00.3 [=He2-111=Wray16-156=Sa2-106=IRAS14295�6036; R:A:(J2000:0) ¼ 14h33m18:2s, decl:(J2000:0) ¼�60�49044:200] was discovered in the DENIS, 2MASS, MSX,and IRAS surveys and is detected by Spitzer in all four IRACbands (Fig. 9). The ISO and IUE spectrawere presented byPottaschet al. (2000). It is a high-excitation type I PN and has an abnor-mally high helium abundance (He/H ¼ 0:25; Perinotto et al.2004). Both the optical (Corradi & Schwarz 1995) and IRAC im-ages show a bipolar structure. The SED (Fig. 16) suggests that theIR emission is dominated by thermal process of cold dust withT < 100 K.
4.3.19. PNG 318.9+00.6
PNG318.9+00.6[R:A:(J2000:0)¼14h57m35:5s,decl:(J2000:0)¼�58�1201600]was discovered in the AAO/UKST H� , 2MASS,and MSX surveys. It has an optical diameter of 27:200 ; 13:600
and was detected and resolved by Spitzer in all four IRACbands (Fig. 10). Both the H� and IRAC images show a el-liptical structure. The SED (Fig. 16) show that the 8.0 �m fluxis much larger than those of the other bands. This could be theresult of contribution from the 7.7 �m AIB feature, or the tran-sition to strong cold dust emission longward of this wavelength.
PLANETARY NEBULAE IN THE GLIMPSE SURVEY 451No. 2, 2008

At first we found that the 4.5 �m flux of this object to be anom-alously low. This is due to the fact that there is a bright pointsource in the 4.5 �m band (14 mJy) that is not detected in anyof the other bands. Since the extended flux is determined by anon-off subtraction process, there could be an oversubtractiondue to the presence of this point source.We decided to artificiallyadd back 14 mJy to the 4.5 �m extended flux, which leads to anapparently more reasonable SED.
4.3.20. PNG 321.0�00.7
PNG 321.0�00.7 [=IRAS 15127�5811; R:A:(J2000:0) ¼15h16m40:9s, decl:(J2000:0) ¼ �58�2202600] was discovered inthe AAO/UKST H� , DENIS, 2MASS,MSX, and IRAS surveys.It has an optical diameter of 17:000 ; 10:200 and is detected andresolved by Spitzer in all four IRAC bands (Fig. 11). Both theH� and IRAC images showan elliptical structure. The central com-pact core is clearly detected by the 3.6, 4.5, and 5.8 �m bands. TheSED (Fig. 16) shows a clear separation between the photosphericand dust components with the dust component beginning to dom-inate around 4 �m.
4.3.21. PNG 321.3�00.3
PNG 321.3�00.3 [R:A:(J2000:0)¼15h17m30:0s, decl:(J2000:0)¼�57
�5005900] was discovered in the AAO/UKST H� survey. It
has an optical diameter of 11200 ; 9700 and is detected and re-solved by Spitzer in all four IRAC bands (Fig. 11). The H� im-age shows a very faint and approximately circular structure. Theobject is very red, and the nebular structure is clearly defined bydust emission seen in the IRAC images. This object is classifiedas an interstellar bubble based on its morphology and is given thecatalog number of S89 (Churchwell et al. 2006).
4.3.22. PNG 322.4�00.1
PNG 322.4�00.1 [=Hen 2-124=Pe 2-8=Sa 3-28=IRAS15198�5758; R:A:(J2000:0) ¼ 15h23m43:5s, decl:(J2000:0) ¼�57�0902800] was discovered in the AAO/UKST H� , DENIS,2MASS, MSX, and IRAS surveys. It has an optical diameter of32:000 ; 15:100 and is detected and resolved by Spitzer in all fourIRACbands (Fig. 11). The IJK photometry of the PNwithDENIShas been presented by Schmeja & Kimeswenger (2002). It is alow-excitation PN. No X-ray emission is detected (Guerrero et al.2000). The H� image shows an elongated structure, whereasthe object in the IRAC images is compact. From the SED (Fig. 16),the 3.6, 4.5, and 5.8 �m band fluxes are consistent with nebularbound-free emission, with the dust emission dominating in the8.0 �m band.
The ISO spectrum of this object (Fig. 19) shows strong amor-phous silicate emission features at 10 and 18�m.The 8.0�mimagein Figure 11, therefore, traces the spatial distribution of amorphoussilicates.
4.3.23. PNG 328.5�00.5
PNG 328.5�00.5 [=IRAS 15557�5337; R:A:(J2000:0) ¼15h59m38:2s, decl:(J2000:0) ¼ �53�4503200] was discovered inthe AAO/UKST H� , DENIS, 2MASS,MSX, and IRAS surveys.It has an optical diameter of 22000 and is detected and resolved bySpitzer in all four IRACbands (Fig. 12). The object is very red andis saturated in the 8.0 �m band. Both the H� and IRAC imagesshow a clear bipolar structure with a tight waist. More details arerevealed by the IRAC images, which clearly show the symmetricpolar outflow filaments. Parker et al. (2006) rejects this object as aPN candidate based on its morphology. Given its large size and
red color, it could be an H ii region. No methanol maser was de-tected for the object (MacLeod et al. 1998).
4.3.24. PNG 329.6�00.4
PNG329.6�00.4[R:A:(J2000:0)¼16h04m52:8s,decl:(J2000:0)¼�53�0003200] was discovered in the AAO/UKST H� , DENIS,2MASS, andMSX surveys. It has an optical diameter of 7500 ; 15500
and is detected and resolved by Spitzer in all four IRAC bands(Fig. 12). TheH� images showa compact nucleuswith extremelyfaint extended emission. The IRAC images show a clear ringlikestructure. Parker et al. (2006) rejects this object as a PN candidatebased on itsmorphology. Its appearance and IR color are very sim-ilar with those of PNG 321.3�00.3, suggesting the two objectsmay share some common evolutionary origins. Indeed, both ob-jects are in the catalog of interstellar bubbles of Churchwell et al.(2006) with PNG 329.6�00.4 given the designation of S69.
4.3.25. PNG 332.5�00.1
PNG332.5�00.1 [R:A:(J2000:0)¼16h16m56:4s, decl:(J2000:0)¼�50
�4702300] was discovered in the AAO/UKST H� , DENIS,
2MASS, andMSX surveys. The nebula has an optical diameterof 3400 and shows a faint and approximately spherical structure.The nebula is detected and resolved by Spitzer in all four IRACbands (Fig. 13) and shows a much larger and more detailedstructure than in the optical image. The object is very red with aclear bipolar structure with some filamentary structures. It is pos-sible that the faint and spherical structure in the H� image rep-resents the central region of the nebula. Parker et al. (2006) rejectsthis object as a PN candidate based on its morphology.
4.3.26. PNG 333.7+00.3
PNG 333.7+00.3 [R:A:(J2000:0)¼16h20m09:6s, decl:(J2000:0)¼�49
�3505200] was discovered in the AAO/UKST H� , 2MASS,
andMSX surveys. It has an optical diameter of 11:500 ; 9:500 andhas a diffuse outer structure. The object is very red and shows anelliptical structure in all four IRAC bands. In the IRAC imagesthere is a bright extended source with similar IR colors in the NEof the object. The two may be related.
Fig. 19.— ISO spectrum of Pe 2-8 (PNG 322.4�00.1). A number of strongatomic lines are identified above the panel.
KWOK ET AL.452 Vol. 174

4.3.27. PNG 333.9+00.6
PNG333.9+00.6 [=PM5=IRAS16159�4906; R:A:(J2000:0) ¼16h19m40:16s, decl:(J2000:0) ¼�49�13059:700] was discoveredin the AAO/UKSTH� , DENIS, 2MASS, DENIS, and IRAS sur-vey. Optical spectra of the object were observed with the SAAO1.9m andMSSSO 2.3 m telescopes and the object is identified asa PNwith a [WN] central star (Morgan et al. 2003). It has an op-tical diameter of 3200 and is detected and resolved in all four IRACbands (Fig. 14). The H� and IRAC images show similar struc-tures of a bright central star surrounded by a spherical shell.
The bright IR emission in the central region can be attributed tobound-free emission from the circumstellar ionized gas.Dust emis-sion begins to dominate at 8 �m and is mostly distributed in theshell.
4.3.28. PNG 340.0+00.9
PNG340.0+00.9[R:A:(J2000:0)¼16h43m16:09s,decl:(J2000:0)¼�44
�3501900]was discovered in the AAO/UKST H� survey and
is detected in all four IRAC bands (Fig. 14). The object is veryred and almost invisible in the H� image. There are three othervery red extended sources in the IRAC images that may be relatedto the PN. Due to the presence of multiple extended components,the total flux is difficult to determine for this object and the cor-responding entry is therefore absent in Table 1.
4.3.29. PNG 342.7+00.7
PNG 342.7+00.7 [=H1-3; R:A:(J2000:0) ¼ 16h53m31:43s,decl:(J2000:0) ¼ �42�3901800] was discovered in the AAO/UKST H� and 2MASS surveys and is detected in all four IRACbands (Fig. 15). It is a low-excitation PN. TheH� image shows anapproximately elliptical structure with a distorted tail, whereasthe IRAC images only show a compact nucleus. No diffuse dustemission is detected. The object has a starlike SED (Fig. 16) witha color temperature of �150 K.
4.3.30. PNG 343.9+00.8
PNG 343.9+00.8 [=H1-5=IRAS 16538�4133; R:A:(J2000:0)¼16h57m23:7s,decl:(J2000:0) ¼�41
�3705600]was discovered in the
AAO/UKST H� , DENIS, 2MASS,MSX, and IRAS surveys is de-tected in all four IRAC bands (Fig. 15). It is a medium-excitationPN. Both the H� and IRAC images show a elliptical structure.The SED implies the presence of cold dust with a temperature of�100 K.
4.4. Nondetections
Anumber of PNs have no obvious counterparts in theGLIMPSEfields. Their names are listed below, and no further analysis wasdone on these objects: PNG 010.2+00.3, PNG 011.5+01.0,PNG 011.7�00.0, PNG 014.6+01.0, PNG 015.5�01.0,PNG 015.5�00.0, PNG 016.4�00.9, PNG 017.2+00.1,PNG 019.9+00.9, PNG 020.2�00.6, PNG 020.9+00.8,PNG 021.7�00.6, PNG 021.8�00.4, PNG 021.2+00.9,PNG 023.4+00.7, PNG 023.5�00.1, PNG 025.9�00.9,PNG 033.9�00.9, PNG 033.4+00.1, PNG 033.1+00.2,PNG 031.9�00.3, PNG 031.3�00.5, PNG 031.3�00.52,PNG 030.5�00.2, PNG 030.0+00.0, PNG 029.8+00.5,PNG 029.5+00.6, PNG 029.2�00.0, PNG 029.0+00.4,PNG 029.0+00.42, PNG 028.9+00.2, PNG 028.8�00.2,PNG 028.7�00.3, PNG 027.7+00.7, PNG 027.7�00.6,PNG 027.6�00.8, PNG 027.4�00.9, PNG 026.9�00.7,PNG 026.8�00.5, PNG 025.9�00.9, PNG 041.2�00.6,PNG 060.5�00.3, PNG 295.9�00.4, PNG 296.2�00.4,PNG 299.1�00.1, PNG 299.7+00.1, PNG 302.6�00.9,
PNG 302.7�00.9, PNG 303.3+00.0, PNG 303.6+00.5,PNG 308.4+00.4, PNG 309.5+00.8, PNG 310.0+00.3,PNG 310.6+00.2, PNG 311.7�00.9, PNG 312.1+00.3,PNG 312.2+00.1, PNG 312.8+00.2, PNG 314.6�00.1,PNG 314.9+00.5, PNG 315.9+00.3, PNG 317.5+00.8,PNG 331.2+00.0, PNG 332.3�00.9, PNG 333.2�00.6,PNG 334.0+00.7, PNG 336.0�00.4, PNG 337.3+00.6,PNG 337.4+00.3, PNG 337.6+00.7, PNG 338.1+00.4,PNG 339.1+00.9, PNG 339.9+00.5, PNG 340.3�00.5,PNG 340.8+00.8, PNG 343.3�00.6, PNG 345.4+00.1,PNG 346.9�00.0, PNG 347.0+00.3, PNG 347.2�00.8.
These PNs are not detected possibly for a variety of reasons.For some large objects (e.g., PNG 029.8+00.5, which is over 10
in size), the dust emission is probably just too diffuse to be seen.Others (e.g., PNG 302.7�00.9) lie in areas of general diffuseemission on the Galactic plane and are difficult to identify.
In several cases, there are nearby point sources that have arising flux distribution from 3.8 to 8.0 �m, similar to that ofPNs. For example, there is a point source (l ¼ 302:6125; b ¼�0:963673) near PNG 302.6�00.9 with fluxes of 3.358, 7.664,12.38, and 24.87 mJy at 3.6, 4.5, 5.8, and 8.0 �m, respectively.Other examples are a point source at l¼ 312:294; b¼ 0:0979 nearPNG 312.2+00.1 with fluxes 10.1, 7.241, 15.41, and 47.59 mJy,and a point source at l¼ 312:877; b¼ 0:232405 near PNG312.8+00.2 with fluxes of 16.7, 28.56, 49.12, 64.19 mJy. In allcases, no extended emission is found.
4.5. Object Classification
Although our sample objects are selected from the PN catalog,we have to bear inmind that the PNdesignation is not certainwith-out a complete spectral coverage. At the most elementary level,PNs can be separated from compact H ii regions by the relativestrengths of the H� and [O iii] lines (PNs have stronger [O iii]lines), and their respective infrared colors (H ii regions usuallyhaving redder colors). In terms of morphology, PNs usually pro-cess a greater degree of symmetry and less diffuse in appearance.But these guidelines are not foolproof, and confusion betweenthese two classes of objects is always a problem.
We have also detected a number of objects that bear PNGdesig-nations and are therefore emission-line objects. However, basedon their infraredmorphology, they are unlikely to bePNs.An anal-ysis of these objects (listed below) will be presented in a separatepaper: PNG 013.8+00.2, PNG 024.4+00.4, PNG 035.1�00.7,PNG 033.3+00.7, PNG 033.2+00.7, PNG 027.3�00.1,PNG 025.3�00.1, PNG 297.3�00.2, PNG 297.4�00.7,PNG 297.6�00.9, PNG 298.1�00.7, PNG 298.2�00.3,PNG 303.1�00.9, PNG 331.4+00.5, PNG 333.6�00.2,PNG 338.9�00.0.
5. DISCUSSION
Since the IRACband passes are broad, both line and continuumemissions contribute to the fluxes observed in our sample. In the5Y8 �m region, contribution to the continuum emission includesbound-free emission from the ionized nebula and thermal emis-sion fromdust. Emission lines, both atomic andmolecular, are pro-minent in the spectrum of PNs. In particular, a number of strongAIB (e.g., 3.3, 6.2, and 7.7 �m) emission features lie in the IRAC3.6, 5.8, and 8.0 �m bands, respectively. Since AIB emissions arecommon in carbon-rich PNs, we can only be certain that the4.5�mband is free fromAIB contributions. For oxygen-rich PNs,strong amorphous silicate emission features are expected to bepresent, and the 9.7 �m amorphous silicate feature can contrib-ute to the IRAC 8.0�mband. Since both the AIB and silicate fea-tures (together with their associated underlying continua) can be
PLANETARY NEBULAE IN THE GLIMPSE SURVEY 453No. 2, 2008

considered as solid-state features, wewill group them together andlabel such emissions as ‘‘dust’’ emission.
Examples of contributions from atomic lines to the IRACbands include H Br� at 4.05 �m to the 4.5 �m band, [Ar ii] at6.98 �mand [Ar iii] at 8.99 �m to the IRAC 8.0 �m band (Horaet al. 2004). Furthermore, a number of rotational transitions inthe ground vibrational state of molecular hydrogen lie withinthe IRAC bands. Examples include S(4) at 8.025 �m, S(5) at6.909 �m, S(6) at 6.109 �m, S(7) at 5.511 �m, S(8) at 5.053 �m,S(9) at 4.695 �m, S(10) at 4.410 �m, and S(11) at 4.181 �m, etc.Since most bipolar PNs show H2 emissions (Kastner et al. 1996)due to shock excitation, contribution from H2 lines is expected.In cases of evolved nebulaewhere there is no significant dust emis-sion, rotational transitions of H2 can in fact be the major contrib-utor of the IRAC fluxes (Hora et al. 2006).
The key question is, therefore, ‘‘do our IRAC images reflect thedistribution of the atomic,molecular, or solid-state components ofPNs?’’ From the SEDs shown in Figure 16we can see that inmanycases the 5Y8�mregion represents the beginning of the rise of thedust continuum emission that eventually peaks at�20Y30 �m. Soit is quite clear that at least in the long-wavelength bands (e.g., the8 �m band) the image is dominated by dust emission, althoughthis may include contribution from the features of the aromaticsolid-state component. Molecular hydrogen is not expected to bea major factor, except in the 4.5 �m band, where there is no AIBemission.
Comparisons between the IRAC8�m images of bipolar PNs inour sample to the mid-infrared (10 and 20�m) images of PNs ob-served with the Gemini Telescope show a lot of similarities (Volket al. 2006). In addition to a bright central component (believedto originate from the torus), strong emissions are also seen in thelobes. Since there is no doubt that the Gemini images reflect dust
emission, this conclusion can be reasonably extrapolated to theIRAC 8 �m images.
6. CONCLUSIONS
From the IRAC images of 30 PNs found in the GLIMPSE sur-vey, we have found that most of the nebulae have extendeddust emission. In cases where the nebulae show a bipolar mor-phology, dust is seen in the lobes in addition to the central regions.The 3Y8 �m IRAC photometry also much better defines the SEDsof PNs, showing a clear distinction between the photospheric, ne-bular bound-free, and dust emission components. In some cases,the high fluxes in the 8.0 �m band suggest contribution from the7.7 �mAIB emission, and the 8.0 �mband images therefore tracethe distribution of aromaticmaterials in the nebulae. Since the dis-covery of PNs by optical means is likely to be incomplete due togalactic dust obscuration, the infrared properties of PNs in thissample provide a good guide for future discovery of galactic PNsthrough infrared surveys.
We thank the GLIMPSE team at the University of Wisconsinfor their help in the processing of data. We also thank Kevin Volkfor reducing the ISO spectra. This work is supported in part by theNatural Sciences and Engineering Council of Canada, the Uni-versity of HongKong, and Academia Sinica, Taiwan. E. B. C. ac-knowledges support for this work from NASA contract 1224653to the University of Wisconsin at Madison. This work is based onobservations made with the Spitzer Space Telescope, which is op-erated by the Jet Propulsion Laboratory, California Institute ofTechnology, under a contract with NASA.
REFERENCES
Aaquist, O. B., & Kwok, S. 1990, A&A, 84, 229Acker, A., Marcout, J., & Ochsenbein, F. 1996, First Supplement to theStrasbourg-ESO Catalogue of Galactic Planetary Nebulae (Strasbourg:Obs. Strasbourg)
Acker, A., et al. 1992, Strasbourg-ESO Catalogue of Galactic Planetary Nebulae(Strasbourg: Obs. Strasbourg)
Allen, L. E., et al. 2004, ApJS, 154, 363Churchwell, E., et al. 2004, ApJ, 154, 332———. 2006, ApJ, 649, 759Cohen, M., et al. 2007, MNRAS, 374, 979Condon, J. J., & Kaplan, D. L. 1998, ApJS, 117, 361Corradi, R. L. M., & Schwarz, H. E. 1993, A&A, 278, 247———. 1995, A&A, 293, 871Fazio, G. G., et al. 2004, ApJS, 154, 10Gorny, S. K., Schwarz, H. E., Corradi, R. L. M., & Van Winckel, H. 1999,A&AS, 136, 145
Guerrero, M. A., Chu, Y.-H., & Gruendl, R. A. 2000, ApJ, 129, 295Hora, J. L., Latter, W. B., Allen, L. E., Marengo, M., Deutsch, L. K., & Pipher, J. L.2004, ApJS, 154, 296
Hora, J. L., Latter, W. B., Smith, H. A., & Marengo, M. 2006, ApJ, 652, 426Hyung, S., Aller, L. H., & Feibelman, W. A. 1993, PASP, 105, 1279Kastner, J. H., Weintraub, D. A., Gatley, I., Merrill, K. M., & Probst, R. G.1996, ApJ, 462, 777
Kistiakowsky, V., & Helfand, D. J. 1995, AJ, 110, 2225Kwok, S. 2000, The Origin and Evolution of Planetary Nebulae (Cambridge:Cambridge Univ. Press)
Lopez-Martın, L., et al. 2002, A&A, 338, 652
MacLeod, G. C., et al. 1998, AJ, 116, 2936Matsuura, M., Zijlstra, A. A., Gray, M. D., Molster, F. J., & Waters, L. B. F. M.2005, MNRAS, 363, 628
Morgan, D. H., Parker, Q. A., & Cohen, M. 2003, MNRAS, 346, 719Parker, Q. A., Phillipps, S., & Morgan, D. H. 1999, in ASP Conf. Ser. 168, NewPerspectives on the Interstellar Medium, ed. A. R. Taylor, T. L. Landecker,& G. Joncas (San Francisco: ASP), 126
Parker, Q. A., et al. 2003a, in IAU Symp. 209, Planetary Nebulae: Their Evo-lution and Role in the Universe, ed. S. Kwok, M. A. Dopita, & R. Sutherland(San Francisco: ASP), 41
———. 2003b, in IAU Symp. 209, Planetary Nebulae: Their Evolution andRole in the Universe, ed. S. Kwok, M. A. Dopita, & R. Sutherland (SanFrancisco: ASP), 25
Parker, Q. A., et al. 2006, MNRAS, 373, 79Parthasarathy, M., Acker, A., & Stenholm, B. 1998, A&A, 329, L9Perinotto, M., Morbidelli, L., & Scatarzi, A. 2004, MNRAS, 349, 793Pottasch, S. R., Beintema, D. A., & Feibelman, W. A. 2000, A&A, 363, 767Schmeja, S., & Kimeswenger, S. 2002, Rev. Mex. AA, 12, 176Vazquez, R., Lopez-Martın, L., Miranda, L. F., Esteban, C., Torrelles, J. M.,Arias, L., & Raga, A. C. 2000, A&A, 357, 1031
Whiteoak, J. B. Z. 1992, A&A, 262, 251Wright, S. A., Corradi, R. L. M., & Perinotto, M. 2005, A&A, 436, 967Volk, K., Hrivnak, B. J., & Kwok, S. 2006, in IAU Symp. 234, PlanetaryNebulae in Our Galaxy and Beyond, ed. M. J. Barlow & R. H. Mendez(Cambridge: Cambridge Univ. Press), 535
Zhang, C. Y., & Kwok, S. 1991, A&A, 250, 179
KWOK ET AL.454


