Embed Size (px)
Citation preview

1EEE234567891012311145678920123456789301234567894012345678950123456789EEEE
PLANNING AND DESIGN FOR SUS TAIN ABLE URBAN MOBILITY

1EEE234567891012311145678920123456789301234567894012345678950123456789EEEE
PLANNING AND DESIGN FOR SUS TAIN ABLE URBAN MOBILITY
GLOBAL REPORT ON HUMAN SETTLEMENTS 2013
United Nations Human Settlements Programme
First published 2013 (this electronic version has been revised on 15 January 2014 and includes errata reported by this date).by Routledge2 Park Square, Milton Park, Abingdon, Oxon, OX14 4RN
Simultaneously published in the USA and Canadaby Routledge711 Third Avenue, New York, NY 10017
Routledge is an imprint of the Taylor & Francis Group, an informa business
© 2013 United Nations Human Settlements Programme (UN-Habitat)
All rights reserved. No part of this book may be reprinted or reproduced or utilised in any form or by any electronic,mechanical, or other means, now known or hereafter invented, including photocopying and recording, or in anyinformation storage or retrieval system, without permission in writing from the publishers.
Trademark notice: Product or corporate names may be trademarks or registered trademarks, and are used only foridentification and explanation without intent to infringe.
United Nations Human Settlements Programme (UN-Habitat)PO Box 30030, GPO Nairobi 00100, KenyaTel: +254 20 762 3120Fax: +254 20 762 3477 / 4266 / 4267Web: www.unhabitat.org
DISCLAIMERThe designations employed and the presentation of the material in this publication do not imply the expression of anyopinion whatsoever on the part of the Secretariat of the United Nations concerning the legal status of any country,territory, city or area, or of its authorities, or concerning delimitation of its frontiers or boundaries, or regarding itseconomic system or degree of development. The analysis, conclusions and recommendations of the report do notnecessarily reflect the views of the United Nations Human Settlements Programme, the Governing Council of theUnited Nations Human Settlements Programme or its Member States.
British Library Cataloguing in Publication DataA catalogue record for this book is available from the British Library
Library of Congress Cataloging-in-Publication DataPlanning and design for sus tain able urban mobility : global report on human settlements 2013 / United Nations Human Settlements Programme.pages cmIncludes bibliographical references and index.1. Urban transportation. 2. Sus tain able devel op ment. I. United Nations Human Settlements Programme.HE305.P55 2013711¢.7—dc232013023163
HS Number: HS/031/13E (paperback)HS/033/13E (hardback)
ISBN: 978-0-415-72318-3 (paperback)978-1-315-85715-2 (ebook)978-92-1-131929-3 (UN-Habitat series)978-92-1-132568-3 (UN-Habitat paperback)978-92-1-132570-6 (UN-Habitat hardback)
Typeset in Weidemann BT and Gill Sans byFlorence Production Ltd, Stoodleigh, Devon, UKCover by Austin Ogola
1EEE234567891012311145678920123456789301234567894012345678950123456789EEEE
FOREWORD
For more than half a century, most countries have experienced rapid urban growth and increased use ofmotor vehicles. This has led to urban sprawl and even higher demand for motorized travel with a range ofenvironmental, social and economic consequences.
Urban transport is a significant source of greenhouse gas emissions and a cause of ill-health due to airand noise pollution. The traffic congestion created by unsustainable transportation systems is responsible forsignificant economic and productivity costs for commuters and goods transporters.
These challenges are most pronounced in developing country cities. It is here that approximately 90 percent of global population growth will occur in the coming decades. These cities are already struggling tomeet increasing demand for investment in transportation. That is why my Five-year Action Agenda, launchedin January 2012, highlights urban transport – with a focus on pollution and congestion – as a core area foradvancing sustainable development.
This year’s edition of the UN-Habitat Global Report on Human Settlements provides guidance ondeveloping sustainable urban transportation systems. The report outlines trends and conditions and reviewsa range of responses to urban transport challenges worldwide. The report also analyses the relationship betweenurban form and mobility, and calls for a future with more compact and efficient cities. It highlights the roleof urban planning in developing sustainable cities where non-motorized travel and public transport are thepreferred modes of transport.
I commend this report to all involved in developing sustainable cities and urban transport systems. Successin this area is essential for creating more equitable, healthy and productive urban living environments thatbenefit both people and the planet.
Ban Ki-moonSecretary-General
United Nations

1EEE234567891012311145678920123456789301234567894012345678950123456789EEEE
INTRODUCTION
Urban transport systems worldwide are faced by a multitude of challenges. In most cities, the economic dimensionsof such challenges tend to receive most attention. The traffic gridlocks experienced on city roads and highwayshave been the basis for the development of most urban transportation strategies and policies. The solution prescribedin most of these has been to build more infrastructures for cars, with a limited number of cities improving publictransport systems in a sustainable manner.
However, the transportation sector is also responsible for a number of other challenges that do not necessarilyget solved by the construction of new infrastructure. It is, for example, responsible for a large proportion of thegreenhouse gas emissions that lead to climate change. Furthermore, road traffic accidents are among the maincauses of premature deaths in most countries and cities. Likewise, the health effects of noise and air pollutioncaused by motorized vehicles are a major cause for concern. In some cities, the physical separation of residentialareas from places of employment, markets, schools and health services force many urban residents to spend increasingamounts of time, and as much as a third (and sometimes even more) of their income, on public transport.
While those among the urban populace that have access to a private car, or can afford to make regular use of public transport, see traffic jams and congestion as a major concern; this is a marginal issue for people livingin ‘transport poverty’. Their only affordable option for urban transportation is their own feet. Persons with lowhousehold incomes – but also others, including many women, and vulnerable groups such as the young, the elderly,the disabled, and ethnic and other minorities – form the bulk of those characterized as living in transport poverty.
Thus, when the Secretary-General of the United Nations launched his ‘5-year action agenda’ in January 2012, he identified sustainable transportation as one of the major building blocks of sustainable development. Inparticular, he stressed the need for urgent action to develop more sustainable urban ‘transport systems that can address rising congestion and pollution’. He noted that action was required by a range of actors, including ‘aviation, marine, ferry, rail, road and urban public transport providers, along with Governments andinvestors’.
Planning and Design for Sustainable Urban Mobility: Global Report on Human Settlements 2013seeks to highlight the transportation challenges experienced in cities all over the world, and identifies examplesof good practice from specific cities of how to address such challenges. The report also provides recommendationson how national, provincial and local governments and other stakeholders can develop more sustainable urbanfutures through improved planning and design of urban transport systems.
The report argues that the development of sustainable urban transport systems requires a conceptual leap.The purpose of ‘transportation’ and ‘mobility’ is to gain access to destinations, activities, services and goods. Thus,access is the ultimate objective of all transportation (save a small portion of recreational mobility). The constructionof more roads for low-income cities and countries is paramount to create the conditions to design effective transportsolutions. However, urban planning and design for these cities and others in the medium and high income bracketsis crucial to reduce distances and increase accessibility to enhancing sustainable urban transport solutions. If cityresidents can achieve access without having to travel at all (for instance through telecommuting), through moreefficient travel (online shopping or car-sharing), or by travelling shorter distances, this will contribute to reducingsome of the challenges currently posed by urban transport. Thus, urban planning and design should focus on howto bring people and places together, by creating cities that focus on accessibility, rather than simply increasing thelength of urban transport infrastructure or increasing the movement of people or goods.
The issue of urban form and functionality of the city is therefore a major focus of this report. Not only shouldurban planning focus on increased population densities; cities should also encourage the development of mixed-use areas. This implies a shift away from strict zoning regulations that have led to a physical separation of activitiesand functions, and thus an increased need for travel. Instead, cities should be built around the concept of ‘streets’,
Planning and Design for Sustainable Urban Mobilityviii
which can serve as the focus for building liveable communities. Cities should therefore encourage mixed land-use, both in terms of functions (i.e. residential, commercial, manufacturing, service functions and recreational)and in terms of social composition (i.e. with neighbourhoods containing a mixture of different income and social groups).
Such developments also have the potential to make better use of existing transport infrastructure. Most oftoday’s cities have been built as ‘zoned’ cities, which tends to make rather inefficient use of their infrastructure;as ‘everyone’ is travelling in the same direction at the same time. In such cities, each morning is characterized by(often severe) traffic jams on roads and congestion on public transport services leading from residential areas toplaces of work. At the same time, however, the roads, buses and trains going in the opposite direction are empty.In the afternoon the situation is the opposite. Thus, the infrastructure in such cities is operating at half capacityonly, despite congestion. In contrast, in cities characterized by ‘mixed land-use’ (such as Stockholm, Sweden),traffic flows are multidirectional – thus making more efficient use of the infrastructure – as residential areas andplaces of work are more evenly distributed across the urban landscape.
Furthermore, the report argues with strong empirical information that increased sustainability of urban passengertransport systems can be achieved through modal shifts – by increasing the modal share of public transport andnon-motorized transport modes (walking and bicycling), and by reducing private motorized transport. Again, anenhanced focus on urban planning and design is required, to ensure that cities are built to encourage environmentallysustainable transportation modes. While encouraging a shift to non-motorized transport modes, however, the reportacknowledges that such modes are best suited for local travel and that motorized transport (in particular publictransport) has an important role while travelling longer distances. However, in many (if not most) countries thereis a considerable stigma against public transport. The private car is often seen as the most desirable travel option.There is thus a need to enhance the acceptability of public transport systems. More needs to be done to increasereliability and efficiency of public transport services and to make these services more secure and safe.
The report also notes that most trips involve a combination of several modes of transport. Thus, modal integrationis stressed as a major component of any urban mobility strategy. For example, the construction of a high-capacitypublic transport system needs to be integrated with other forms of public transport, as well as with other modes.Such integration with various ‘feeder services’ is crucial to ensure that metros, light rail and bus rapid transit (BRT)systems can fully utilize their potential as a ‘high-capacity’ public transport modes. It is therefore essential thatplanners take into account how users (or goods) travel the ‘last (or first) mile’ of any trip. By way of an example,it is not much use to live ‘within walking distance’ of a metro (or BRT) station, if this implies crossing a busy eight-lane highway without a pedestrian crossing, or if one is unable to walk to the station (due to disability, or lack ofpersonal security). Likewise, it is unlikely that urban residents will make use of metros (and BRTs), if the neareststation is located beyond walking distance, and there is no public transport ‘feeder’ services providing access tothese stations or no secure parking options for private vehicles near the stations.
Yet, it is important to note that considerable investments are still required in urban transportation infrastructurein most cities, and particularly in developing countries. City authorities should ensure that such investments aremade where they are most needed. They should also make sure that they are commensurate with their financial,institutional and technical capacities. In many cities of developing countries, large proportions of the populationcannot afford to pay the fare required to use public transport, or to buy a bicycle. Others may find these modesof transport affordable, but choose not to use them as they find the safety and security of public transport to beinadequate (due to sexual harassment or other forms of criminal behaviour), and/or the roads to be unsafe forbicycle use or walking (due to lack of appropriate infrastructure). Investment in infrastructure for non-motorizedtransport or affordable (and acceptable) public transport systems is a more equitable (and sustainable) use of scarcefunds.
However, many cities and metropolitan areas, all around the world, experience considerable institutional,regulatory and governance problems when trying to address urban mobility challenges. In many cases national,regional and local institutions may be missing or their responsibilities may be overlapping, and even in conflictwith each other. To address such concerns, the report notes that it is essential that all stakeholders in urbantransport – including all levels of government, transport providers and operators, the private sector, and civil society (including transport users) – are engaged in the governance and development of urban mobility systems.
To ensure effective integration of transportation and urban development policies, it is essential that urbantransportation and land-use policies are fully integrated. Such integration is required at all geographic scales. Atthe micro level, much is to be gained from advancing the model of ‘complete streets’; an acknowledgement thatstreets serve numerous purposes, not just moving cars and trucks. At the macro level, there is considerable scopefor cross-subsidies between different parts of the urban mobility system, including through value-capturemechanisms which ensure that increased land and property values (generated by the development of high-capacitypublic transport systems) benefits the city at large, and the wider metropolitan region, rather than private sectoractors alone.
Planning and Design for Sustainable Urban Mobility: Global Report on Human Settlements 2013 isreleased at a time when the challenges of urban transportation demands are greater than ever. This is particularly
1EEE234567891012311145678920123456789301234567894012345678950123456789EEEE
the case in developing countries where populations (and the number of motorized vehicles) are growing at rateswhere urban infrastructure investments are unable to keep pace. I believe this report will serve as a starting pointto guide local authorities and other stakeholders to address the challenges faced by urban transportation systemsall over the world. The report provides some thought-provoking insights on how to build the cities of the futurein such a manner that the ultimate goal of urban transport – namely enhanced access to destinations, activities,services and goods – takes precedence over ever-increasing calls for increased urban mobility.
Dr Joan ClosUnder-Secretary-General and Executive Director
United Nations Human Settlements Programme (UN-Habitat)
Introduction ix

1EEE234567891012311145678920123456789301234567894012345678950123456789EEEE
ACKNOWLEDGEMENTS
MANAGEMENT TEAMEduardo López Moreno (Branch Coordinator); Mohamed Halfani (Unit Leader); Inge Jensen (projectcoordinator).
AUTHORS: UN-HABITAT CORE TEAMAnne Amin; Ben Arimah; Kevin John Barrett; Mohamed Halfani; Inge Jensen; Michael K. Kinyanjui; Udo Mbeche;Eduardo López Moreno; Raymond Otieno Otieno; Edlam Abera Yemeru.
AUTHORS: EXTERNAL CONSULTANTSRobert Cervero, Department of City and Regional Planning University of California Berkeley, California, US(Chapters 1, 5 and 10); Holger Dalkmann, Robin King, Srikanth Shastry and Dario Hidalgo, EMBARQ, theWRI Center for Sus tain able Transport, Washington, DC, US, and Juan Carloz Muñoz, The Across Latitudesand Cultures – Bus Rapid Transit Centre of Excellence (ALC-BRT) Centre of Excellence, Santiago, Chile (Chapter3); Jean-Paul Rodrigue, Department of Global Studies and Geography, Hofstra University, New York, US (Chapter4); David Banister, Transport Studies Unit, School of Geography and the Environ ment, University of Oxford,Oxford, UK (Chapter 7); Elliott Sclar, Center for Sus tain able Urban Devel op ment, Columbia University, NewYork, US (Chapter 8); Harry T. Dimitriou, OMEGA Centre, Bartlett School of Planning, University CollegeLondon, London, UK (Chapter 9).
AUTHORS/CONTRIBUTORS: UN-HABITAT INTERNSSusanna Ahola; Helen Conlon; Lauren Flemister; Eva Kabaru; Patricia Karamuta Baariu; Sarah Karge; CrispusKihara; Eulenda Mkwanazi; Michelle Oren; Oyan Solana; Isabel Wetzel.
PREPARATION OF STATISTICAL ANNEX (UN-HABITAT)Wandia Riunga; Inge Jensen; Julius Majale; Ann Kibet; Harith Gabow; Mercy Karori.
TECHNICAL SUPPORT TEAM (UN-HABITAT)Nelly Kan’gethe; Naomi Mutiso-Kyalo.
ADVOCACY, OUTREACH AND COMMUNICATION TEAM (UN-HABITAT)Victor Mgendi; Ana. B. Moreno; Austin Ogola.
Planning and Design for Sustainable Urban Mobilityxii
INTERNATIONAL ADVISERS (HS-NET ADVISORY BOARD MEMBERS)1
Samuel Babatunde Agbola, Department of Urban and Regional Planning, University of Ibadan, Ibadan,Nigeria; Louis Albrechts, Department of Architecture, Urbanism and Planning, KULeuven, Leuven, Belgium;Paul A. Barter, Lee Kuan Yew School of Public Policy, National University of Singapore, Singapore; PeterDroege, Institute of Architecture and Planning, University of Liechtenstein, Vaduz, Liechtenstein; IngemarElander, Centre for Urban and Regional Research, Örebro University, Örebro, Sweden; Xavier Godard,Independent Consultant, Aix en Provence, France; Ali Soliman Huzayyin, Faculty of Engineering, CairoUniversity, Cairo, Egypt; Alfonso Iracheta, Programme of Urban and Environ mental Studies, El ColégioMexiquense, Toluca, Mexico; A.K. Jain, Unified Traffic and Transport Infra struc ture (Planning and Engineering)Centre and School of Planning and Architecture, New Delhi, India; Won Bae Kim, Department of UrbanPlanning and Real Estate, Chung-Ang University, Anseong-si, Gyeonggi-do, Republic of Korea; DarshiniMahadevia, Faculty of Planning and Public Policy, CEPT University, Ahmedabad, India; David Maunder,Independent Consultant, London, UK; Asteria Leon Mlambo, Dar Rapid Transit Agency, Dar es Salaam, Tanzania;Aloysius Mosha, Department of Architecture and Planning, University of Botswana, Gaborone, Botswana;Mee Kam Ng, Centre for Urban Planning and Environ mental Management, University of Hong Kong, HongKong, China; Deike Peters, Sol Price School of Public Policy, University of Southern California, Los Angeles,US and Center for Metropolitan Studies, Technical University Berlin, Germany; Debra Roberts, eThekwiniMunicipality, Durban, South Africa; Pamela Robinson, School of Urban and Regional Planning, RyersonUniversity, Toronto, Canada; Francesc Robusté, Center for Innovation in Transport CENIT and TechnicalUniversity of Catalonia, BarcelonaTech, Spain; Elliott Sclar, Centre for Sus tain able Urban Devel op ment,Columbia University, New York, US; Graham Tipple, School of Architecture, Planning and Landscape, NewcastleUniversity, Newcastle, UK; Iván Tosics, Metropolitan Research Institute (Városkutatás Kft), Budapest,Hungary; Eduardo Alcantara de Vasconcellos, Instituto Movimento, São Paulo, Brazil; Vanessa Watson, Schoolof Architecture, Planning and Geomatics, University of Cape Town, Cape Town, South Africa; Belinda Yuen,Urban Devel op ment Unit, The World Bank, Washington, DC, US.
OTHER INTERNATIONAL ADVISERS AND CONTRIBUTORSTimothy Durant, ARUP, Bristol, UK; Stephen Bennett and Shailendra Kaushik, ARUP, Dubai, United ArabEmirates; Tiago Oliveira, ARUP, Dublin, Ireland; Tom Richardson and Colin Williams, ARUP, Hong Kong,People’s Republic of China; Gerard de Villiers, ARUP, Johannesburg, South Africa; Darren Briggs, Susan Claris,Richard Higgins, Josef Hargrave and Mark Watts, ARUP, London, UK; David Singleton, ARUP, Melbourne,Australia; Laura Frost, Amy Leitch and Trent Lethco, ARUP, New York, US; Ryan Falconer, ARUP, Perth,Western Australia; Kevin Vervuurt, ARUP, Amsterdam, The Netherlands; Wendy Walker, Asian Devel op mentBank, Bangkok, Thailand; Brooke A. Russell, C40 Cities Climate Leadership Group; Oscar Figueroa, CatholicUniversity of Chile, Chile; Sayel Cortes, Rodrigo Diaz, Ricardo Fernandez, Salvador Herrera, Hilda Martinez,Gisela Méndez and Claudio Alberto Sarmiento, CTS EMBARQ, Mexico; Gina Porter, Department ofAnthropology, Durham University, Durham, UK; Glen Weisbrod, Economic Devel op ment Research Group,US; Tejas Pande, EMBARQ, India; Robin King, EMBARQ, and Dario Hidalgo, EMBARQ, the WRI Center forSus tain able Transport, Washington, DC, US; Vincent Leiner, European Commission Directorate-General forMobility and Transport, Brussels, Belgium; Christof Hertel, European Institute for Sus tain able Transport,Hamburg, Germany; Ulrik Sylvest Nielsen, Gehl Architects, Copenhagen, Denmark; Carlos Felipe Pardo, GIZ,Bogotá, Colombia; Manfred Breithaupt and Michael Engelskirchen, GIZ, Eschborn, Germany; Nuno Quental,ICLEI – Local Govern ments for Sus tain ability; Xavier Godard, Independent consultant, Aix-en-Provence, France;Richard Meakin, Independent consultant, Bangkok, Thailand; Jeff Turner, Independent consultant, Leeds,UK; Roger Allport, Independent consultant, London, UK; Ed Dotson, Independent consultant, Melbourne,Australia; Eduardo Alcantara de Vasconcellos, Instituto Movimento, São Paulo, Brazil; Dawn Chui, LaurentDauby, Tony Dufays, Yildigoz Kaan, Bertram Ludwig, Minna Melleri, Mohamed Mezghani, Adrien Moulin,Eleonora Pazos, Rob Pearce, Jérôme Pourbaix, D.C. Prakash, Susanne Stölting, Tasuku Takahama and PhilipTurner, International Association of Public Transport (IUTP), Brussels, Belgium; Konrad Otto-Zimmerman,International Council for Local Environ mental Initiatives, Bonn, Germany; Christopher Kost, InternationalInstitute for Transportation and Devel op ment, Ahmedabad, India; Aimee Gauthier, Walter Hook, MichaelKodransky and Stephanie Lotshaw, International Institute for Transportation and Devel op ment, New York,US; Paul Barter, Lee Kuan Yew School of Public Policy, National University of Singapore, Singapore; GregMcGill, London South Bank University, UK; Philipp Rode, LSE Cities, London School of Economics and PoliticalScience, London, UK; Nick Low, Melbourne University, Australia; Barbara Crome, Ministry of Transport,
Acknowledgements xiii
1EEE234567891012311145678920123456789301234567894012345678950123456789EEEE
Building and Urban Devel op ment Permanent Representation of Germany to the EU, Brussels, Belgium; E. John Ward, OMEGA Centre, Bartlett School of Planning, University College London, London, UK; FabioDuarte, Pontifical Catholic University of Parana, Curitiba, Brazil; Marianne Vanderschuren, University of CapeTown, Cape Town, South Africa; Tony Vickers, West Berkshire Council, Newbury, UK.
ADVISERS (UN-HABITAT)Debashish Bhattacharjee; Lilia Blades; Jean Bonzi; Andre Dzikus; Vincent Kitio; Yvonne Kunz; Gora Mboup;Hilary Murphy; Bernard Gyergyay; Oyebanji O. Oyeyinka; Laura Petrella; Christian Schlosser; Anna Skibevaag;Xing Quan Zhang.
AUTHORS OF BACKGROUND PAPERSHeather Allen, International Association of Public Transport, Brussels, Belgium (‘Africa’s first full rapid bussystem: The Rea Vaya bus system in Johannesburg, Republic of South Africa’; ‘Integrated public transport,Nantes, France’; ‘Bus reform in Seoul, Republic of South Korea’; ‘An integrated approach to public transport,Tehran, Islamic Republic of Iran’; and ‘Public transport’); Karen Anderton, Transport Studies Unit, School ofGeography and the Environ ment, University of Oxford, Oxford, UK (‘Private motorized transport, LosAngeles, USA’); Anvita Arora, Innovative Transport Solutions, Delhi, India (‘Non-motorized trans port in peri-urban areas of Delhi, India’ and ‘Non-motorized urban transport, Pune City, Maharashtra, India’); RonaldoBalassiano and Richard William Campos Alexandre, Transport Engineering Programme, Federal University ofRio de Janeiro, Brazil (‘Informal motorized trans port in Rio de Janeiro, Brazil’); David Banister, TransportStudies Unit, School of Geography and the Environ ment, University of Oxford, Oxford, UK (‘Private motorizedtransport’); David Banister and Jian Liu, Transport Studies Unit, School of Geography and the Environ ment,University of Oxford, Oxford, UK (‘Urban trans port and the environ ment, Hangzhou, China’); David Banister,Transport Studies Unit, School of Geography and the Environ ment, University of Oxford, Oxford, UK andElspeth Finch, Environ ment, ATKINS, London, UK (‘Urban trans port and the environ ment, London, UK’);Paul A. Barter, Lee Kuan Yew School of Public Policy, National University of Singapore, Singapore and EdwardDotson, Independent consultant, Melbourne, Australia (‘Urban trans port institutions and governance andintegrated land use and transport, Singapore’); Juan Pablo Bocarejo, Research group on urban and regionalsus tain ability, Universidad de Los Andes, Bogotá, Colombia and Luis Eduardo Tafur Herrera, Research groupon urban and regional sus tain ability, Universidad de Los Andes, Bogotá, Colombia (‘Urban land usetransformation driven by an innovative transportation project, Bogotá, Colombia’); Robert Cervero, Departmentof City and Regional Planning University of California Berkeley, California, US (‘Informal motorized transport’);Hoong-Chor Chin, Department of Civil and Environ mental Engineering, National University of Singapore,Singapore (‘Sus tain able urban mobility in South-Eastern Asia and the Pacific’); Laetitia Dablanc, French Instituteof Science and Technology for Transport, Devel op ment and Networks, Marne-la-Vallée, France and AngélicaLozano, Engineering Institute, Universidad Nacional Autónoma de México, Mexico City, Mexico (‘Commercialgoods transport, Mexico City’); Laetitia Dablanc, French Institute of Science and Technology for Transport,Devel op ment and Networks, Marne-la-Vallée, France (‘Commercial goods transport, Paris, France’); Harry T.Dimitriou, OMEGA Centre, Bartlett School of Planning, University College London, London, UK (‘Urban land-use and trans port (mobility) planning’; and ‘Issues paper on sus tain able urban transport’); Edward Dotson,Independent consultant, Melbourne, Australia, and Doan Thi Phin, Independent consultant, Hanoi, Viet Nam(‘Urban trans port institutions and governance and integrated land use and transport, Hanoi, Viet Nam’); AhmedEl-Geneidy, Ehab Diab, Cynthia Jacques and Anais Mathez, School of Urban Planning, McGill University,Montréal, Canada (‘Sus tain able urban mobility in the Middle East and North Africa’); Oscar Figueroa, Instituteof Urban and Territorial Studies, Catholic University of Chile, Santiago, Chile and Claudia Rodríguez, UrbanPlanning, Ministry of Transports and Communications, Subsecretaria de Transportes, Santiago, Chile (‘Urbantransport, urban expansion and institutions and governance in Santiago, Chile’); Ann Frye, Independentconsultant, London, UK (‘Disabled and older persons and sus tain able urban mobility’); Xavier Godard,Independent consultant, Aix en Provence, France (‘Sus tain able urban mobility in “Francophone” Sub-SaharanAfrica’); Margaret Grieco, Transport Research Institute, Edinburgh Napier University, Edinburgh, UK (‘Accessto urban mobility’); Paola Jirón, Institute of Housing, Faculty of Architecture and Urbanism, University of Chile, Santiago, Chile (‘Sus tain able urban mobility in Latin America and the Caribbean’); A.K. Jain, UnifiedTraffic and Transport Infra struc ture (Planning and Engineering) Centre and School of Planning and Architecture,New Delhi, India (‘Sus tain able urban mobility in Southern Asia’); David A. King, Graduate School ofArchitecture, Planning and Preservation, Columbia University, New York, US (‘Exploring the perennial strugglefor sus tain able finance of the New York Metropolitan Transit Authority’); Tracy McMillan, Independentconsultant, Flagstaff, Arizona, US (‘Children and youth and sus tain able urban mobility’); Haixiao Pan, Kathy
Planning and Design for Sustainable Urban Mobilityxiv
Lo Hau Yan, Mingcai Xu, Song Ye, Peng Wei and Weiwei Liu, Department of Urban Planning, Tongji University,Shanghai, China (‘Sus tain able urban mobility in Eastern Asia’); Deike Peters, Sol Price School of Public Policy,University of Southern California, Los Angeles, US and Center for Metropolitan Studies, Technical UniversityBerlin, Germany (‘Gender and sus tain able urban mobility’); Gordon Pirie, Department of Geography and Environ -mental Studies, University of the Western Cape, Cape Town, South Africa (‘Sus tain able urban mobility in“Anglophone” Sub-Saharan Africa’); Gina Porter, Department of Anthropology, Durham University, Durham,UK (‘Urban trans port in Cape Coast, Ghana: A social sus tain ability analysis’); Andrea Rizvi, Urban Planning,Columbia University, New York, US (‘Alternative approaches to economically sus tain able mobility in India:Comparing Ahmedabad bus rapid transit and Delhi metro systems’); Wojciech Suchorzewski, Department of Civil Engineering, Warsaw University of Technology, Warsaw, Poland (‘Sus tain able urban mobility intransitional countries’); Ibnu Syabri, Pradono and Budhy T. Soegijanto, Research Group in Regional and UrbanInfra struc ture Systems, School of Architecture, Planning, and Policy Devel op ment, Institut Teknologi Bandung,Indonesia (SAPPD-ITB) (‘Embracing paratransit in Bandung Metropolitan Area, West Java, Indonesia’); GeetamTiwari, Indian Institute of Technology, Delhi, India (‘Non-motorized transport’); Natcha Tulyasuwan, UnitedNations Food and Agriculture Organization (FAO) of the United Nations, Montpellier, France (‘Private motorizedtransport, Bangkok, Thailand’); Jeff Turner, Independent consultant, Leeds, UK (‘Urban mass transit and socialsus tain ability in Jakarta, Indonesia’).
FINAN CIAL SUPPORTUN-Habitat is grateful for the finan cial support provided by the Govern ments of Norway and Sweden.
PUBLISHING TEAMWith thanks to the Editorial and Production teams at Routledge: Alice Aldous, Nicki Dennis, Joanna Endell-Cooper, Alex Hollingsworth and Tracey Scarlett; to Elizabeth Riley (copy-editor), and to all at Florence Production(typesetters).
IN MEMORY OF:Brian Williams (1957–2009), Chief, Transport Section, UN Habitat (1995–2009).
NOTES1 The HS-Net Advisory Board consists of experi enced researchers in the human settlements field, selected to represent the various geographical regions of the
world. The primary role of the Advisory Board is to advise UN-Habitat on the substantive content and organization of the Global Report on HumanSettlements.
1EEE234567891012311145678920123456789301234567894012345678950123456789EEEE
Foreword vIntroduction viiAcknowledgements xiList of Figures, Boxes and Tables xxiList of Acronyms and Abbreviations xxv
1 The Urban Mobility Challenge 1Accessibility is at the Core of Urban Mobility 2The Trans port Bias of Mobility 3Some of the Forces Promoting the Trans port Bias 5Trends and Conditions in Transport-Oriented Mobility Systems 6
Varying but declining dominance of public transport 6Informality 7Non-motorized transport 7Traffic congestion 8
Sus tain ability Challenges of Urban Mobility 9Integration of land-use and trans port planning 9Social dimensions 10Environ mental dimensions 11Economic dimensions 12Institutional and governance dimensions 12
Concluding Remarks and Structure of the Report 13Notes 14
2 The State of Urban Passen ger Transport 15Non-Motorized Transport 16
Devel op ing countries 16Developed countries 17Infra struc ture for non-motorized transport 18Impacts of non-motorized transport 20
Formal Public Transport 21Devel op ing countries 21Developed countries 21Infra struc ture for public transport 24Impacts of formal public transport 24
Informal Transport 26Devel op ing countries 26Developed countries 28Impacts of informal transport 28
Private Motorized Transport 30Developed countries 31Devel op ing countries 32
CONTENTS
Planning and Design for Sustainable Urban Mobilityxvi
Infra struc ture for private motorized transport 33Impacts of private motorized transport 34
Intermodality in Urban Transport 35Concluding Remarks and Lessons for Policy 36Notes 37
3 Metro, Light Rail and BRT 39Main Characteristics of Metro, Light Rail and BRT Systems 39
Metro 39Light rail 40Bus rapid transit 40Main physical characteristics, outputs and requirements 40
Examples of National Policies toward High-Capacity Public Transport in Devel op ing Countries 42
China 42India 42Brazil 43Mexico 43Kenya 43Morocco 43Nigeria 44South Africa 44
Metro Systems Around the World: Trends and Conditions 44Light Rail Systems Around the World: Trends and Conditions 47BRT Systems Around the World: Trends and Conditions 48Main Challenges Facing High-Capacity Public Transport Systems 51
Integration within the public trans port system 51Integration with other elements of the trans port system 51Integration with the built environ ment 52Quality of service 53Finance 53
Finan cial risks in public trans port project devel op ment 53Funding sources 54Public trans port subsidies 54
Institutions 54Concluding Remarks and Lessons for Policy 55Notes 56
4 Urban Goods Transport 57Urban Goods Transport: Key Components and Actors 57
Components of urban goods transport 58Actors and stakeholders in urban goods transport 59
Trends and Conditions of Urban Goods Transport 60Developed countries 61Devel op ing countries 62
Goods Transport in an Urban Context 63Terminal facilities 64Distribution facilities 65Logistics sprawl 65
Challenges of Urban Goods Transport 67Environ mental challenges 67Economic Challenges 68Social and institutional challenges 69
Existing Policy Responses 71Rationalization of deliveries 71Freight facilities 71Modal adaptation 72
1EEE234567891012311145678920123456789301234567894012345678950123456789EEEE
Concluding Remarks and Lessons for Policy 73Notes 73
5 Mobility and Urban Form 75Decentralization, Car Dependence and Travel 77
The dispersal metropolis 77Global urban density patterns and trends 78Urban trans port as a factor increasing urban sprawl 78Urban density and travel 79Other attributes of urban form influencing travel 80Urban form and travel 82
Urban Densities and Public Transport Thresholds 84Planning the Accessible City 87Built Environ ments and Travel at the Neigh bour hood Scale 90
Traditional neigh bour hoods and the new urbanism 92Transit-oriented devel op ment (TOD) 93Traffic-calmed and car-restricted neigh bour hoods 94
Corridor Contexts 95Mobility and devel op ment trade-offs 95Public transport-oriented corridors 96
Regional Context 99Connectivity and large urban configurations 99City cluster variances and trans port responses 99
Impacts of Transportation Investments on Urban Form 102Impacts of public trans port investments 102Public trans port and land price appreciation 103Bus-based public trans port and urban-form adjustments 104Impacts of motorways 104
Concluding Remarks and Lessons for Policy 105Notes 106
6 Equitable Access to Urban Mobility 107Affordable Urban Mobility 108
Challenges and impacts of urban poverty 108Policy responses and innovative practices 111
Supporting non-motorized transport 111Improving affordability and quality of service of public transport 112Improving affordability through urban form and land use 114
Vulnerable and Dis advan taged Groups and Urban Mobility 115Global conditions, trends and challenges 115Policy responses and innovative practices 118
Gender-sensitive design, infra struc ture and services 119Increasing pedestrian accessibility and safety 120‘Universal design’ or ‘access for all’ 120
Safety and Security in Urban Mobility Systems 121Global conditions, trends and challenges 121
Road traffic accidents 121Transportation security: Risks and fears related to the use of public transport 122
Policy responses and innovative practices 123Reducing road traffic accidents 123Improving the safety and security of vulnerable groups 125
Concluding Remarks and Lessons for Policy 126Notes 127
7 Urban Mobility and the Environ ment 129Environ mental Challenges in Urban Mobility Systems 129
Motorization and oil dependence 130Mobility and climate change 132
xviiContents
Planning and Design for Sustainable Urban Mobilityxviii
Dependence on motorized forms of trans port and urban sprawl 134Human health concerns 135
Air pollution 135Noise pollution 136Human health and physical activity 136Community severance, open spaces and mental health 136
Reducing the Number of Motorized Trips 136Reducing Travel Distances in Cities 138Changing the Modal Split 139Technological Innovation and Vehicle Efficiency 141
Efficiency and age of the vehicle stock 141Standards of fuels used and emissions from vehicles 142Alternative fuels 144Occupancy (load) factors 145
The Composite Solution 146Funding Mechanisms for Environ mentally Sus tain able Urban Mobility Systems 148Concluding Remarks and Lessons for Policy 149Notes 150
8 The Economics and Financing of Urban Mobility 153The Economic and Finan cial Challenges of Urban Mobility 154
The global dominance of private motorized transport 154Economic characteristics by mode and context 155
Non-motorized transport 155Public transport 155Informal motorized transport 157Private motorized transport 157
Economic Value of the Transport Sector 158From Economics of Mobility towards Economics of Access 159
What has time saving got to do with it? 159Measuring the value of access 159Urban mobility is both a private and a public good 160Road pricing is necessary but normally not sufficient to improve urban accessibility 160The private car versus public transport: Markets and modal choices 161
The Perennial Finan cial Problem: Costs Exceed Revenues 161User charges are never sufficient to finance public transport 161The high private cost of transport 162Good quality urban transport: The system is the solution 162
Expanding the Finan cial Options for Public and Non-Motorized Transport 163General revenue models 163Other allocations of public funds 164Value-capture models 166Other public–private partnerships 168Combination models 170
Concluding Remarks and Lessons for Policy 172Notes 173
9 Institutions and Governance for Urban Mobility 175Understanding Institutional and Governance Frameworks for Urban Mobility 175Conditions and Trends 176
Developed countries 176Countries with economies in transition 177Devel op ing countries 178
Africa 178Latin America and the Caribbean 178Western Asia 179South Asia 179South-Eastern Asia 180Eastern Asia 180
1EEE234567891012311145678920123456789301234567894012345678950123456789EEEE
Challenges and Underlying Influences 181Adaptation challenges 181Administrative and governance challenges 182Mobility policy, plan-making, management and regulatory challenges 182Resourcing and capacity-building challenges 183
Policy Responses and Innovative and ‘Successful’ Practices 185Integrated urban land-use and mobility planning 185Privatization, decentralization and centralization 186Addressing urban boundary complications 187Mobility policy, plan-making and management 188Main streaming environ mental concerns 189Main streaming mobility needs of the socially and economically dis advan taged 189Addressing freight movement needs 189Public trans port planning and service delivery 190Multi-modal integration 191Sus tain able funding 192
Concluding Remarks and Lessons for Policy 193Notes 194
10 Toward Sus tain able Urban Mobility 197Policies and Practices for Reframing Urban Mobility 198
Holistic and systemic thinking and action 198Trans port as a means, not an end 198Accessibility as a priority rather than transport 199
Policy and Operational Entry Points 199Enhancing the linkage between land use and transport 199Revitalizing urban planning and trans port engineering designs 200Realigning trans port infra struc ture investment and devel op ment 200Integrating urban trans port facilities and service operations 201Streamlining urban institutions and governance frameworks 202Readjusting legal and regulatory instruments 203
Concluding Remarks 203Notes 204
STATISTICAL ANNEX 205
Technical Notes 207Explanation of Symbols 207Country Groupings and Statistical Aggregates 207
World major groupings 207Sub-regional aggregates 207
Africa 207Asia 208Europe 208Latin America and the Caribbean 208Northern America 208Oceania 208
Nomenclature and Order of Presentation 208Definition of Terms 208Sources of Data 211Notes 211
Data Tables 213Regional Aggregates 213
A.1 Total population size, rate of change and population density 213A.2 Urban and rural population size and rate of change 214A.3 Urbanization and urban slum dwellers 215
xixContents
Planning and Design for Sustainable Urban Mobilityxx
A.4 Number of urban households, rate of change and mean household size 216A.5 Urban agglomerations 217
Country-Level Data 220B.1 Total population size, rate of change and population density 220B.2 Urban and rural population size and rate of change 224B.3 Urbanization and urban slum dwellers 228B.4 Number of urban households, rate of change and mean household size 232B.5 Access to drinking water and sanitation 236B.6 Poverty and inequality 240B.7 Transport infra struc ture 244B.8 Road motor vehicles and fuel prices 248B.9 Road traffic accidents 252
City-Level Data 256C.1 Urban agglomerations with 750,000 inhabitants or more: Population size
and rate of change 256C.2 Population of capital cities (2011) 266C.3 Access to services in selected cities 270
References 275Index 307
1EEE234567891012311145678920123456789301234567894012345678950123456789EEEE
FIGURES1.1 Average annual urban population increase, by region (1970–2045) 21.2 Passen ger light-duty vehicle fleet and ownership rates by region, estimates and
projections (1980–2035) 41.3 Transportation infra struc ture investments by mode, Europe (1995–2010) 51.4 Modal splits of urban trips (2005) 61.5 World oil consumption by sector 112.1 Urban travel modal shares in selected cities 172.2 Cycling and walking share of daily trips in Europe, North America and Australia
(1999–2009) 182.3 Number of inhabitants per bicycle, developed countries 182.4 Trans port investments in Indian cities under the Jawaharlal Nehru National Urban
Renewal Mission (by December 2011) (percentages) 192.5 Percentage of daily trips by public transport, selected cities in Europe, US and
Australia (2001 data) 222.6 Annual public trans port passen ger trips per capita, Australia (1930–2010) 222.7 Trans port investments in Africa (2008) 242.8 Length of public trans port networks, selected cities in Africa and
Latin America 252.9 Informal trans port market share and GDP per capita in ten selected cities in Africa 282.10 Total stock of motor vehicles, OECD and non-OECD countries (2005 and 2050) 312.11 Global sales of new cars (1990–1999 and 2012) 312.12 Vehicle kilometres travelled per capita for cars versus GDP per capita (1970–2008) 322.13 Car and motorcycle ownership rates, selected Asian cities 333.1 Initial cost versus capacity and speed 413.2 Growth of metro systems worldwide 453.3 Metro systems around the world 463.4 Evolution of BRT – Number of new cities each year and cumulative number of cities
with operational BRT systems (1970–2012) 493.5 BRT systems around the world, number of cities and system lengths (mid-2013) 504.1 Components of city logistics and their relative importance 594.2 Main stakeholders and relationships in urban freight distribution 604.3 World’s major gateways (sea and air freight) (2006) 614.4 Logistics sprawl: Location of terminals of large parcel and express trans port companies
in the Paris region (1974 and 2010) 664.5 City logistics and land use 675.1 Urban population densities of 1366 cities, mean densities by region (2000–2010) 785.2 Long-term decline in built-up area densities in 25 selected cities (1800–2000) 795.3 Influences of urban densities on transport-related energy consumption, 32 cities (1989) 805.4 Population density gradients of seven cities 815.5 Average land coverage by region, among 1366 cities (2000–2010) 815.6 Urban form and the spatial pattern of travel flows 82
LIST OF FIGURES, BOXES AND TABLES
Planning and Design for Sustainable Urban Mobilityxxii
5.7 Average trip lengths in Indian cities as a function of population densities 835.8 Average trip lengths in Indian cities as a function of total urban population 835.9 Relationship between urban form and cost-effective public transport 855.10 Urban population density and public trans port travel 865.11 Minimum urban densities needed for top-performance investments, fixed-guideway
capital costs in the US 875.12 Comparison of urban forms and transport-sector CO2 emissions in Atlanta (US)
and Barcelona (Spain) 895.13 Neighbourhood-scale TOD site design, with mixed-use development within a walkshed
(650 metres) of a public transport stop, with densities tapering with distance from the station 93
5.14 Mobility and accessibility trade-off along freeway corridor 965.15 Public trans port corridors as ‘necklaces of pearls’ 965.16 Stockholm’s necklace-of-pearls built form 975.17 Curitiba’s trinary road system, Brazil 985.18 Correspondence between daily public trans port boardings (vertical axis) and skyline
profile along Curitiba’s north to south trinary axis 985.19 Pearl River Delta mega-region 1005.20 Urban public trans port investments and urban-form outcomes 1026.1 Proportion of world population under the age of 15 (1950–2100) 1166.2 Proportion of world population 60 years and older (1950–2100) 1176.3 Road traffic fatalities by modes of transport 1227.1 Crude oil prices (1945–2011) 1317.2 Worldwide retail prices of petrol (2010) 1317.3 Per capita emissions of CO2 from (private and public) passen ger trans port in 84 cities (1995) 1347.4 Vehicle age distribution, selected countries 1427.5 Actual and projected greenhouse gas emissions from new passen ger vehicles,
by country and region 1438.1 Car ownership as a function of gross national income (2010) 1548.2 Average capital costs (infra struc ture and rolling stock) of major public trans port
modes, as a function of GDP per capita 1558.3 Average operating costs (operation, maintenance and replacement) of major public
trans port modes, as a function of GDP per capita 1568.4 Sources of operating revenue, selected cities 1648.5 Urban road pricing terminology 1659.1 Functions of unified metropolitan trans port authorities in India 1809.2 Organizational structure of trans port and land-use institutions in Shanghai, China 180
BOXES2.1 Modes of urban transport 152.2 An exercise in cycle-friendly design 202.3 Zero-fare public transport? 262.4 Auto-rickshaws: Taxis for the poor and middle class 272.5 Mini bus operators in Kampala (Uganda) and Nairobi (Kenya) 272.6 Gender differences in Nigerian motorcycle taxis 303.1 The growth of metros around the world 453.2 Metros, urban structure and land use 474.1 Urban planning and freight distribution 584.2 Gateway cities and global distribution 614.3 Non-motorized informal goods trans port in Asia and Africa 624.4 Relationships between formal and informal city logistics, Mexico City 634.5 Logistics sprawl, Paris, France 664.6 Land use and forms of city logistics 674.7 Cities and logistical performance 695.1 Suburbanization in Eastern Europe 765.2 Dispersed growth in India 775.3 Urban sprawl 775.4 Mobility and over-concentrated devel op ment in Beijing, China 84
List of Figures, Boxes and Tables xxiii
1EEE234567891012311145678920123456789301234567894012345678950123456789EEEE
5.5 Density thresholds for cost-effective public trans port in the US 865.6 Dysfunctional densities of Los Angeles, US 875.7 ‘Compact cities’ or ‘smart growth’ 885.8 5 Ds of built environ ments that influence travel 905.9 Land-use diversity 915.10 Transit-oriented devel op ment 935.11 Pearl River Delta mega-region 1005.12 Prerequisites to urban-form changes 1036.1 Understanding the parameters of urban transport 1086.2 Nairobi–Thika highway improvement project, Kenya 1106.3 Supporting non-motorized trans port investments in Africa 1116.4 Integrating non-motorized trans port into transportation systems in Bogotá, Colombia 1126.5 Metropolitan regional trans port plans and priorities, Atlanta, US 1146.6 Children and youth: Population trends 1166.7 Women’s participation in the trans port sector in China 1186.8 Private trans port for special groups 1196.9 Convention on the Rights of Persons with Disabilities (Article 9, paragraph 1) 1206.10 Rwanda’s road-safety programme 1236.11 Toolkits for road safety 1246.12 Reducing road traffic fatalities in Bogotá, Colombia 1247.1 Fuel subsidies 1327.2 Air pollutants 1357.3 A successful bicycle sharing system, Changwon, the Republic of Korea 1377.4 Internet shopping 1377.5 Trans port accessibility to Canary Wharf, London, UK 1387.6 Promoting sustainable transport solutions in Eastern African cities 1397.7 TransMilenio: Supporting sus tain able mobility in Bogotá, Colombia 1407.8 Sus tain able trans port in Hangzhou, China 1457.9 The Hybrid and Electric Bus Test Programme, Latin America 1457.10 Hybrid trucks 1467.11 Freight loads and emissions standards 1467.12 Car-free living: Vauban, Germany 1478.1 Public trans port cost recovery from fares 1578.2 Crossrail and agglomeration benefits, London, UK 1608.3 The high personal cost of urban transport: Anglophone Sub-Saharan Africa 1628.4 Urban road pricing initiatives 1648.5 Parking charges: A promising source of finance for public and non-motorized transport 1658.6 Versement transport, Paris, France 1668.7 Hong Kong and its Mass Transit Railway Corporation, China 1678.8 Value capture has a long history to ensure private sector profits 1678.9 Types of public–private partnerships 1688.10 Economic rationale for using public–private partnerships 1698.11 The use of a public–private partnership to upgrade the London Underground, UK 1698.12 Multiple funding sources: The New York Metropolitan Transportation Authority, US 1718.13 Funding of public trans port investments: Lessons from Delhi and Ahmedabad, India 1719.1 The Executive Council of Urban Transport (CETUD), in Dakar, Senegal 1789.2 Typical challenges of urban trans port institutions in South Asia 1799.3 The Land Transport Authority of Singapore 1799.4 Key challenges in integrated land-use and trans port planning 1819.5 The potential of social media and open source material 1849.6 Main causes for the sus tain able mobility planning achievements of Nantes, France 1859.7 Institutional framework for urban mobility in Santiago de Chile 1869.8 Social participation in decision-making: The ‘mobility pact’ in Barcelona, Spain 1879.9 Institutional devel op ments for urban mobility in Hanoi, Viet Nam 1879.10 Climate change activity at the state level, US 1889.11 The Freight Charter, Paris, France 1909.12 Land-use and trans port planning, Bogotá, Colombia 1909.13 Institutional and governance framework in support of light rail in Portland, Oregon, US 1919.14 The Lagos Metropolitan Area Transport Authority (LAMATA), Nigeria 1929.15 Functions of ‘Infra struc ture Australia’ 193
Planning and Design for Sustainable Urban Mobilityxxiv
TABLES2.1 Non-motorized trans port benefits 202.2 Global overview of structure of formal public transport 232.3 Global stock of motor vehicles and passen ger cars (2010) 302.4 Two-/three-wheeler use restrictions, selected Asian countries 332.5 Road trans port infra struc ture in selected cities 343.1 Main physical characteristics of metro, light rail and BRT 403.2 Outputs and requirements for metro, light rail and BRT 413.3 Metro systems by region 453.4 Metro systems with average daily ridership of more than 2 million passen gers per day 463.5 Top ten light rail and tram systems by ridership 483.6 Current state of BRT systems around the world (mid-2013) 493.7 The world’s major BRT systems 503.8 Examples of cities with infra struc ture, information systems and payment elements
that promote multi-modal connectivity 524.1 Major actors in urban freight distribution and their land-use handhold 644.2 Key challenges in urban goods transport 684.3 Social externalities of freight distribution 704.4 Main city logistics policies 715.1 5 D influences on VKT, expressed as average elasticities 915.2 Changes in retail sales transactions in pedestrianized areas of West German cities
(1965–1975) 956.1 Dimensions of poverty and the impact of improved transport 1106.2 Public trans port affordability index values for selected cities 1136.3 Female travel patterns and constraints in devel op ing countries 1166.4 Estimated prevalence of moderate and severe disability, by region, sex and age
(2004) 1176.5 Threats to security of person and property 1237.1 World trans port energy use and CO2 emissions, by mode 1307.2 Energy efficiency for urban transport, by mode of transport 1327.3 CO2 emissions levels overall and for trans port (2009) 1337.4 Planning and devel op ment measures taken in New York City and Singapore 1397.5 GlaxoSmithKline – 2010 corporate responsibility report 1488.1 Number of people employed by public trans port operators, by region (2009) 1588.2 Projected trans port infra struc ture investment, road and rail (2005–2030) 1589.1 Institutional models for urban mobility, mainland China 180
1EEE234567891012311145678920123456789301234567894012345678950123456789EEEE
LIST OF ACRONYMS ANDABBREVIATIONS
£ Sterling pound€ EuroADB Asian Development BankBRT bus rapid transitCBD central business districtCO2 carbon dioxideCNG compressed natural gasdB(A) decibelEU European UnionGDP gross domestic productHIV/AIDS human immunodeficiency virus infection/acquired immunodeficiency syndromekm2 square kilometreMTA Metropolitan Transportation Authority (New York, US)MTRC Mass Transit Railway Corporation (Hong Kong, China)NGO non-govern mental organizationNIMBY not-in-my-backyardNMT non-motorized transportNOx Nitrogen oxidesOECD Organisation for Economic Co-operation and Devel op mentPPP purchasing power parityRMB Chinese renminbi (yuan)SAR Special administrative region (of China; used about Hong Kong and Macao)SUV sports utility vehicleTfL Transport for London (UK)TOD transit-oriented devel op mentUITP International Association of Public TransportUK United Kingdom of Great Britain and Northern IrelandUNDP United Nations Development ProgrammeUS United States of AmericaUS$ US dollarVKT vehicle-kilometres travelledWHO World Health Organization

Hyper-mobility – the notion that more travel at fasterspeeds covering longer distances generates greatereconomic prosperity – seems to be a distinguishingfeature of urban areas, where more than half of the world’s population currently reside. By 2005,approximately 7.5 billion trips were made each dayin cities worldwide.1 In 2050, there may be three tofour times as many passen ger-kilometres travelled asin the year 2000, infra struc ture and energy pricespermitting.2 Freight movement could also rise morethan threefold during the same period.3 Mobilityflows have become a key dynamic of urbanization,with the associated infra struc ture invariably consti -tut ing the backbone of urban form. Yet, despite theincreasing level of urban mobility worldwide, accessto places, activities and services has become in -creasingly difficult. Not only is it less convenient –in terms of time, cost and comfort – to access loca -tions in cities, but the very process of moving aroundin cities generates a number of negative externalities.Accordingly, many of the world’s cities face an un -prece dented accessibility crisis, and are charac terizedby unsus tain able mobility systems.
This report examines the state of urban mobilityin different parts of the world. It explores the linkagesbetween urban form and mobility systems, with a viewto determining the essential conditions for promotingthe sus tain able movement of people and goods inurban settings. This introductory chapter reviews keyissues and concerns of urban mobility and providesa framework for the content of the rest of the report.It outlines devel op ment trends impacting on urbanmobility and then discusses urban mobility issues ofthe twenty-first century, including the challenges offostering sus tain able mobility.
Current urbanization patterns are causing un -precedented challenges to urban mobility systems,particularly in devel op ing countries. While theseareas accounted for less than 40 per cent of the globalpopulation growth in the early 1970s, this share hasnow increased to 86 per cent, and is projected toincrease to more than 100 per cent within the next
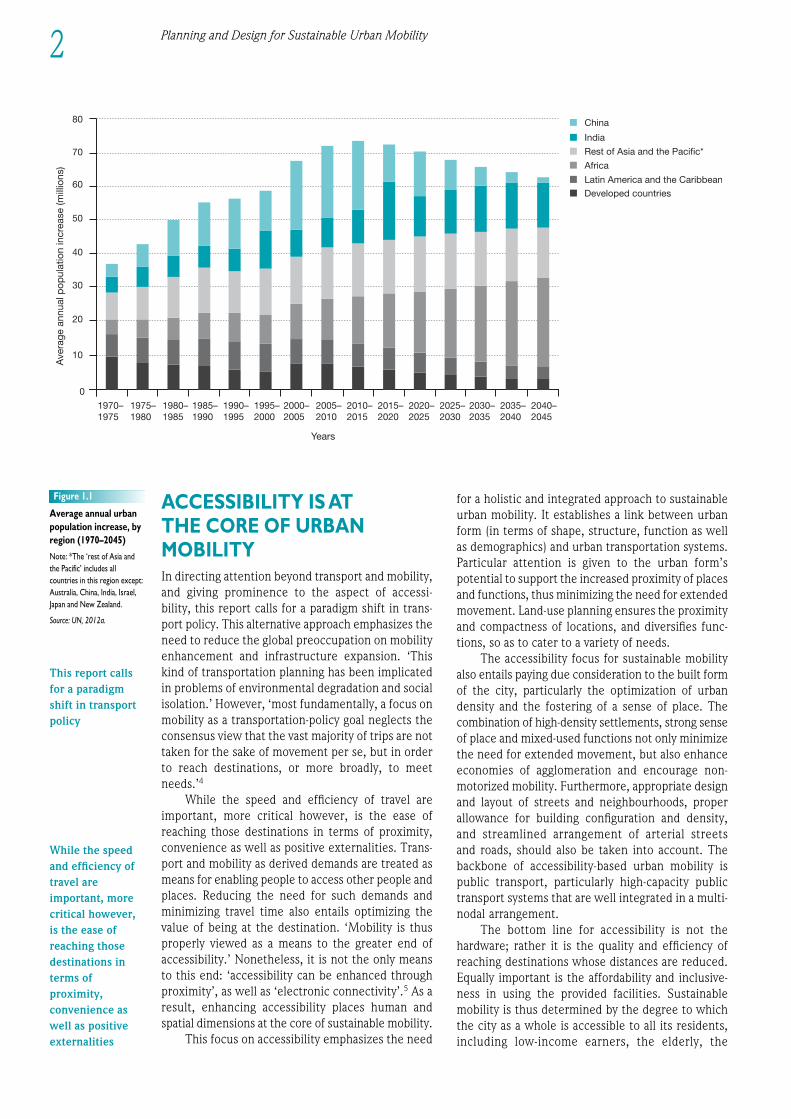
15 years, as the world’s rural population starts tocontract. What is perhaps even more striking is theregional patterns of urban population growth. Figure1.1 shows how an increasing share of this growth isprojected to occur in Africa (19 per cent of totalannual growth today, compared to 43 per cent in2045), while the combined annual urban popula-tion increase in developed countries, China, LatinAmerica and the Caribbean is projected to decreasefrom 46 per cent of the total today to 11 per centin 2045. Thus, it is the world’s poorest regions thatwill experi ence the greatest urban populationincrease. These are the regions that will face thegreatest challenges in terms of coping with increasingdemands for improved trans port infra struc ture. Infact, projections indicate that Africa will account forless than 5 per cent of the global investments in trans -port infra struc ture during the next few decades (seeTable 8.2).
A major point of departure for this report is thatsus tain able mobility extends beyond technicalities of increasing speed and improving the effective-ness and efficiency of trans port systems, to includedemand-oriented measures (e.g. promoting walkingand cycling, and reducing the need to travel), withthe latter representing a pivotal factor in achievingrelevant progress. It suggests that the prevailingchallenges of urban mobility are consequences of thepreoccupation with the means of mobility rather thanits end – which is the realization of accessibility.
This first chapter of the report starts with adiscussion of the need to focus on access as the basisfor urban mobility planning. It urges urban plannersand decision-makers to move away from a ‘trans portbias’ in urban mobility planning, towards a focus onthe human right to equitable access to opportunities.This is followed by a brief analysis of global condi-tions and trends with respect to the urban movementof people and goods. The last part of the chapterprovides a brief discussion of the social, environ -mental, economic and institutional dimensions of sus -tain ability in urban mobility systems.
1EEE234567891012311145678920123456789301234567894012345678950123456789EEEE
THE URBAN MOBILITY CHALLENGE
C H A P T E R 1
Despite theincreasing level ofurban mobilityworldwide, accessto places,activities andservices hasbecomeincreasinglydifficult
Sustainablemobility extendsbeyondtechnicalities ofincreasing speedand improving theeffectiveness andefficiency oftransport systems,to includedemand-orientedmeasures
2 Planning and Design for Sustainable Urban Mobility
ACCESSIBILITY IS AT THE CORE OF URBANMOBILITYIn directing attention beyond trans port and mobility,and giving prominence to the aspect of accessi-bility, this report calls for a paradigm shift in trans -port policy. This alternative approach emphasizes theneed to reduce the global preoccupation on mobilityenhancement and infra struc ture expansion. ‘Thiskind of transportation planning has been implicatedin problems of environmental degradation and socialisolation.’ However, ‘most fundamentally, a focus onmobility as a transportation-policy goal neglects theconsensus view that the vast majority of trips are nottaken for the sake of movement per se, but in orderto reach destinations, or more broadly, to meetneeds.’4
While the speed and efficiency of travel areimportant, more critical however, is the ease ofreaching those destinations in terms of proximity,convenience as well as positive externalities. Trans -port and mobility as derived demands are treated asmeans for enabling people to access other people andplaces. Reducing the need for such demands andminimizing travel time also entails optimizing thevalue of being at the destination. ‘Mobility is thusproperly viewed as a means to the greater end ofaccessibility.’ Nonetheless, it is not the only meansto this end: ‘accessibility can be enhanced throughproximity’, as well as ‘electronic connectivity’.5 As aresult, enhancing accessibility places human andspatial dimensions at the core of sustainable mobility.
This focus on accessibility emphasizes the need
for a holistic and integrated approach to sus tain ableurban mobility. It establishes a link between urbanform (in terms of shape, structure, function as wellas demographics) and urban transportation systems.Particular attention is given to the urban form’spotential to support the increased proximity of placesand functions, thus minimizing the need for extendedmovement. Land-use planning ensures the proximityand compactness of locations, and divers ifies func -tions, so as to cater to a variety of needs.
The accessibility focus for sus tain able mobilityalso entails paying due consideration to the built formof the city, particularly the optimization of urbandensity and the fostering of a sense of place. Thecombination of high-density settlements, strong senseof place and mixed-used functions not only minimizethe need for extended movement, but also enhanceeconomies of agglomeration and encourage non-motorized mobility. Further more, appropriate designand layout of streets and neigh bour hoods, properallowance for building configuration and density,and streamlined arrangement of arterial streets and roads, should also be taken into account. Thebackbone of accessibility-based urban mobility ispublic transport, particularly high-capacity publictrans port systems that are well integrated in a multi-nodal arrangement.
The bottom line for accessibility is not thehardware; rather it is the quality and efficiency ofreaching destinations whose distances are reduced.Equally important is the affordability and inclusive -ness in using the provided facilities. Sus tain ablemobility is thus determined by the degree to whichthe city as a whole is accessible to all its residents,including low-income earners, the elderly, the
Latin America and the CaribbeanDeveloped countries
Africa
Rest of Asia and the Pacific*
India
China
0
10
20
30
40
50
60
70
80
Years
1970–1975
1975–1980
1980–1985
1985–1990
1990–1995
1995–2000
2000–2005
2005–2010
2010–2015
2015–2020
2020–2025
2025–2030
2030–2035
2035–2040
2040–2045
Ave
rage
ann
ual p
opul
atio
n in
crea
se (m
illio
ns)
Figure 1.1
Average annual urban
population increase, by
region (1970–2045)
Note: *The ‘rest of asia and
the Pacific’ includes all
countries in this region except:
australia, China, India, Israel,
Japan and New Zealand.
Source: UN, 2012a.
This report callsfor a paradigmshift in transportpolicy
While the speedand efficiency oftravel areimportant, morecritical however,is the ease ofreaching thosedestinations interms ofproximity,convenience aswell as positiveexternalities
young, the disabled, as well as women with children.Further more, trans port interventions should be expli citly targeted to prevent negative outcomes. Bypermitting high levels of innovative services andgiving priority to public and non-motorized transport,the need for private cars is reduced. Strategies tochange public attitudes and encourage sus tain ableforms of mobility thus have a key role to play.
This alternative approach also brings to the forethe human rights dimension of sus tain able mobility:‘the right to mobility is universal to all human beings,and is essential for the effective practical realisationof most other basic human rights’.6 Beyond the policyimplications of such a profound acknowledgement,the observation also has an important bearing on thisreport. Recognizing mobility as an entitlement – i.e.to access destinations, functions or services – impliesa focus on people, and underscores the need to payattention to the obstacles that prevent them fromreaching destinations. Consequently, mobility is not only a matter of devel op ing trans port infrastruc-ture and services, but also of overcoming the social, economic, political and physical constraints to movement. These constraints are influenced byfactors such as: class, gender relations, poverty,physical disabilities, affordability, etc. Mobility isthus about granting access to opportunities and em -powering people to fully exercise their human rights.
Thus, associating sus tain able mobility withhuman rights takes it beyond the realm of func -tionality and economic justification. Instead it placesthe issue at the same level as other essential elementsrequired for the full realization of human rights.Indeed, there is a general consensus that all thepolitical, social, cultural and economic rights cannotbe realized without the component of accessibility(and thus equitable mobility). The underlying premise– within a human rights perspective – is that mobilityis not simply about reaching destinations; in the finalanalysis, it is about accessing oppor tunities. In thisregard – and acknowledging that access is a tacit rightthat all human beings are en titled to – there is a needto ensure that any con straints to enjoying this funda -mental entitlement are removed.
This report illustrates the contextual circum -stances of urban mobility challenges, which haverestricted access to cities by various social groups.Working towards sus tain able mobility, renewedefforts within and between govern ments, areessential in ensuring that solutions are inclusive,participatory, and that all budgetary and resourceimplications meet the needs of all citizens.
THE TRANS PORT BIAS OF MOBILITYIn many cities of the world, the equation of ‘mobil-ity’ with ‘transportation’ has fostered a tendency
towards increasing motorization, and a propensity to expand the network of urban roads. Highwaystructures, including viaducts and flyovers, tunnelsand foot-bridges have become standard features ofthe modern city and urban landscape. Encouragingthis whole process is the excessive sectorization oftransportation planning and management. Apart fromcausing a spiral of negative externalities, this approachfurther distorts the urban form and severelyundermines the environ mental, social and economicsus tain ability of cities. A major missing link whichthis report underscores is that sus tain able mobilityentails – and indeed requires – a closer connectionbetween trans port and land-use planning.
Globally, the trans port bias of urban mobility isdemonstrated by the dominance of motorization, andparticularly private motor vehicles as the preferredmeans of mobility. In 2010, there were more than1 billion motor vehicles worldwide (excluding two-wheelers).7 Based on data from 2005, nearly half ofall urban trips were made by private motorizedmodes, a figure that continues to climb.8 By 2010,developed countries had, on average, ten times asmany motor vehicles (excluding two-wheelers) percapita as devel op ing ones.9
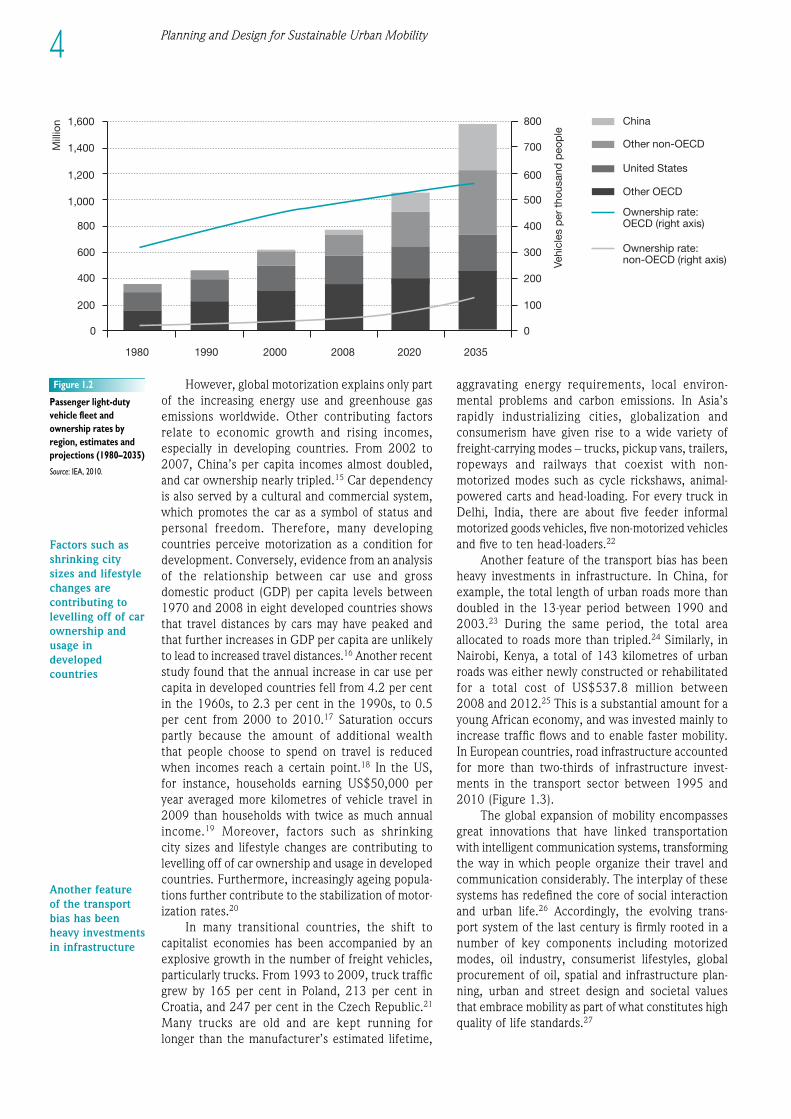
Meteoric increases in the number of motorvehicles in devel op ing countries mean that aredistribution of the ‘global travel pie’ is unfolding.By 2035, the number of light-duty motor vehicles –cars, sports utility vehicles (SUVs), light trucks andmini-vans – is projected to reach nearly 1.6 billion(Figure 1.2). The majority of these will be found indevel op ing countries, especially China, India andother Asian countries. China alone is projected tohave approximately 350 million private cars by 2035,nearly ten times as many as they had in 2008.10 Insome rapidly emerging economies such as India, thenumber of cars, trucks, and motorized two-wheelerson city streets is growing at a rate of more than 20per cent annually.11 Mexico City’s car population isincreasing faster than its human population – twonew cars enter into circulation every time a child isborn.12 In India, private vehicle growth exceedspopulation gains by a factor of three.13
The extent of global motorization is a majorcause for the increasing trends in energy use andcarbon emissions worldwide. This has fuelled low-density devel op ment and sprawling urban forms,which have gradually increased the dependence onmotorized transport. Further more, govern mentpolicies in the United States (US) have contributedtowards shaping car-dependent settlement patterns.Following the Second World War, the US govern-ment invested heavily in high-capacity highways and freeways and subsidized home mortgages, whilemost of its European counterparts channelled funds into devel op ment of urban rail systems, andsocial and market-rate housing near public trans portstops.14
1EEE234567891012311145678920123456789301234567894012345678950123456789EEEE
3The Urban Mobility Challenge
Mobility is notonly a matter ofdevelopingtransportinfrastructure andservices, but alsoof overcoming thesocial, economic,political andphysicalconstraints tomovement
In many cities ofthe world, theequation of‘mobility’ with‘transportation’has fostered atendency towardsincreasingmotorization, anda propensity toexpand thenetwork of urbanroads
Globally, thetransport bias ofurban mobility isdemonstrated bythe dominance of. . . private motorvehicles
The extent ofglobalmotorization is amajor cause forthe increasingtrends in energyuse and carbonemissionsworldwide
However, global motorization explains only partof the increasing energy use and greenhouse gasemissions worldwide. Other contributing factorsrelate to economic growth and rising incomes,especially in devel op ing countries. From 2002 to2007, China’s per capita incomes almost doubled,and car ownership nearly tripled.15 Car dependencyis also served by a cultural and commercial system,which promotes the car as a symbol of status andpersonal freedom. Therefore, many devel op ingcountries perceive motorization as a condition fordevel op ment. Conversely, evidence from an analysisof the relationship between car use and grossdomestic product (GDP) per capita levels between1970 and 2008 in eight developed countries showsthat travel distances by cars may have peaked andthat further increases in GDP per capita are unlikelyto lead to increased travel distances.16 Another recentstudy found that the annual increase in car use percapita in developed countries fell from 4.2 per centin the 1960s, to 2.3 per cent in the 1990s, to 0.5per cent from 2000 to 2010.17 Saturation occurspartly because the amount of additional wealth that people choose to spend on travel is reducedwhen incomes reach a certain point.18 In the US, for instance, households earning US$50,000 peryear averaged more kilometres of vehicle travel in2009 than households with twice as much annualincome.19 Moreover, factors such as shrinking city sizes and lifestyle changes are contributing tolevelling off of car ownership and usage in developedcoun tries. Further more, increasingly ageing popula -tions further contribute to the stabilization of motor -ization rates.20
In many transitional countries, the shift tocapitalist economies has been accompanied by anexplosive growth in the number of freight vehicles,particularly trucks. From 1993 to 2009, truck trafficgrew by 165 per cent in Poland, 213 per cent inCroatia, and 247 per cent in the Czech Republic.21
Many trucks are old and are kept running for longer than the manufacturer’s estimated lifetime,
aggra vating energy requirements, local environ-mental problems and carbon emissions. In Asia’srapidly industrializing cities, globalization andconsumerism have given rise to a wide variety offreight-carrying modes – trucks, pickup vans, trailers,ropeways and railways that coexist with non-motorized modes such as cycle rickshaws, animal-powered carts and head-loading. For every truck inDelhi, India, there are about five feeder informalmotorized goods vehicles, five non-motorized vehiclesand five to ten head-loaders.22
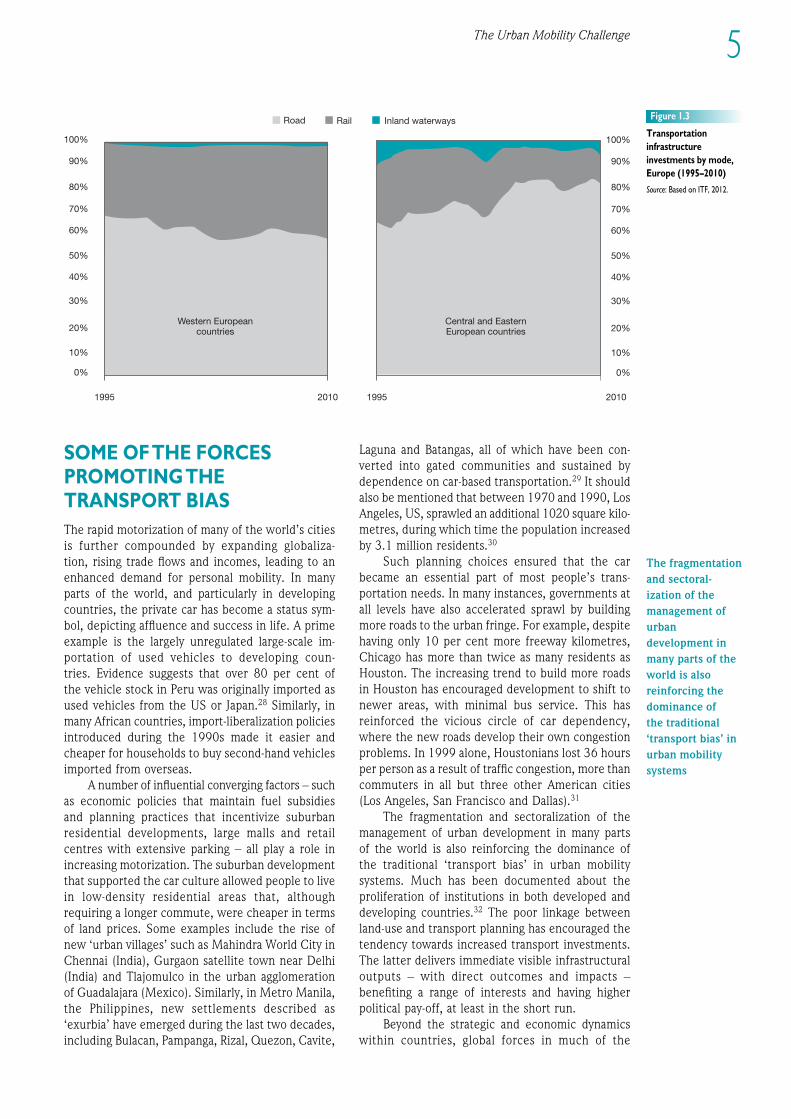
Another feature of the trans port bias has beenheavy investments in infra struc ture. In China, forexample, the total length of urban roads more thandoubled in the 13-year period between 1990 and2003.23 During the same period, the total areaallocated to roads more than tripled.24 Similarly, inNairobi, Kenya, a total of 143 kilometres of urbanroads was either newly constructed or rehabilitatedfor a total cost of US$537.8 million between 2008 and 2012.25 This is a substantial amount for a young African economy, and was invested mainly toincrease traffic flows and to enable faster mobility.In European countries, road infra struc ture accountedfor more than two-thirds of infra struc ture invest -ments in the trans port sector between 1995 and2010 (Figure 1.3).
The global expansion of mobility encompassesgreat innovations that have linked transportationwith intelligent communication systems, transformingthe way in which people organize their travel andcommunication considerably. The interplay of thesesystems has redefined the core of social interactionand urban life.26 Accordingly, the evolving trans-port system of the last century is firmly rooted in anumber of key components including motorizedmodes, oil industry, consumerist lifestyles, globalprocurement of oil, spatial and infra struc ture plan -ning, urban and street design and societal values that embrace mobility as part of what constitutes highquality of life standards.27
Planning and Design for Sustainable Urban Mobility4
Figure 1.2
Passenger light-duty
vehicle fleet and
ownership rates by
region, estimates and
projections (1980–2035)
Source: IEa, 2010.
Mill
ion
1980 1990 2000 2008 2020 2035
Vehi
cles
per
tho
usan
d p
eop
le
0
200
400
600
800
1,000
1,200
1,400
1,600
0
100
200
300
400
500
600
700
800 China
Other non-OECD
United States
Other OECD
Ownership rate:OECD (right axis)
Ownership rate:non-OECD (right axis)
Factors such asshrinking citysizes and lifestylechanges arecontributing tolevelling off of carownership andusage indevelopedcountries
Another featureof the transportbias has beenheavy investmentsin infrastructure
The Urban Mobility Challenge 5
1EEE234567891012311145678920123456789301234567894012345678950123456789EEEE
Road Rail Inland waterways
Western Europeancountries
Central and EasternEuropean countries
100%
90%
80%
70%
60%
50%
40%
30%
20%
10%
0%
2010199520101995
100%
90%
80%
70%
60%
50%
40%
30%
20%
10%
0%
Figure 1.3
Transportation
infrastructure
investments by mode,
Europe (1995–2010)
Source: Based on ITF, 2012.
SOME OF THE FORCESPROMOTING THE TRANS PORT BIAS
The rapid motorization of many of the world’s citiesis further compounded by expanding globaliza-tion, rising trade flows and incomes, leading to anenhanced demand for personal mobility. In manyparts of the world, and particularly in devel op ingcountries, the private car has become a status sym-bol, depicting affluence and success in life. A primeexample is the largely unregulated large-scale im -portation of used vehicles to devel op ing coun-tries. Evidence suggests that over 80 per cent of the vehicle stock in Peru was originally imported asused vehicles from the US or Japan.28 Similarly, inmany African countries, import-liberalization policiesintro duced during the 1990s made it easier andcheaper for households to buy second-hand vehiclesimported from overseas.
A number of influential converging factors – suchas economic policies that maintain fuel subsidies and planning practices that incentivize suburbanresidential devel op ments, large malls and retailcentres with extensive parking – all play a role inincreasing motorization. The suburban devel op mentthat supported the car culture allowed people to livein low-density residential areas that, althoughrequiring a longer commute, were cheaper in termsof land prices. Some examples include the rise of new ‘urban villages’ such as Mahindra World City inChennai (India), Gurgaon satellite town near Delhi(India) and Tlajomulco in the urban agglomerationof Guadalajara (Mexico). Similarly, in Metro Manila,the Philippines, new settlements described as‘exurbia’ have emerged during the last two decades,including Bulacan, Pampanga, Rizal, Quezon, Cavite,
Laguna and Batangas, all of which have been con -verted into gated communities and sustained bydependence on car-based transportation.29 It shouldalso be mentioned that between 1970 and 1990, LosAngeles, US, sprawled an additional 1020 square kilo -metres, during which time the population increasedby 3.1 million residents.30
Such planning choices ensured that the carbecame an essential part of most people’s trans -portation needs. In many instances, govern ments atall levels have also accelerated sprawl by buildingmore roads to the urban fringe. For example, despitehaving only 10 per cent more freeway kilometres,Chicago has more than twice as many residents asHouston. The increasing trend to build more roadsin Houston has encouraged devel op ment to shift tonewer areas, with minimal bus service. This hasrein forced the vicious circle of car dependency,where the new roads develop their own congestionproblems. In 1999 alone, Houstonians lost 36 hoursper person as a result of traffic congestion, more thancommuters in all but three other American cities (Los Angeles, San Francisco and Dallas).31
The fragmentation and sectoralization of themanagement of urban devel op ment in many parts of the world is also reinforcing the dominance of the traditional ‘trans port bias’ in urban mobilitysystems. Much has been documented about theproliferation of institutions in both developed anddevel op ing countries.32 The poor linkage betweenland-use and trans port planning has encouraged thetendency towards increased trans port investments.The latter delivers immediate visible infrastructuraloutputs – with direct outcomes and impacts –benefiting a range of interests and having higherpolitical pay-off, at least in the short run.
Beyond the strategic and economic dynamicswithin countries, global forces in much of the
The fragmentationand sectoral -ization of themanagement ofurbandevelopment inmany parts of theworld is alsoreinforcing thedominance of the traditional‘transport bias’ inurban mobilitysystems
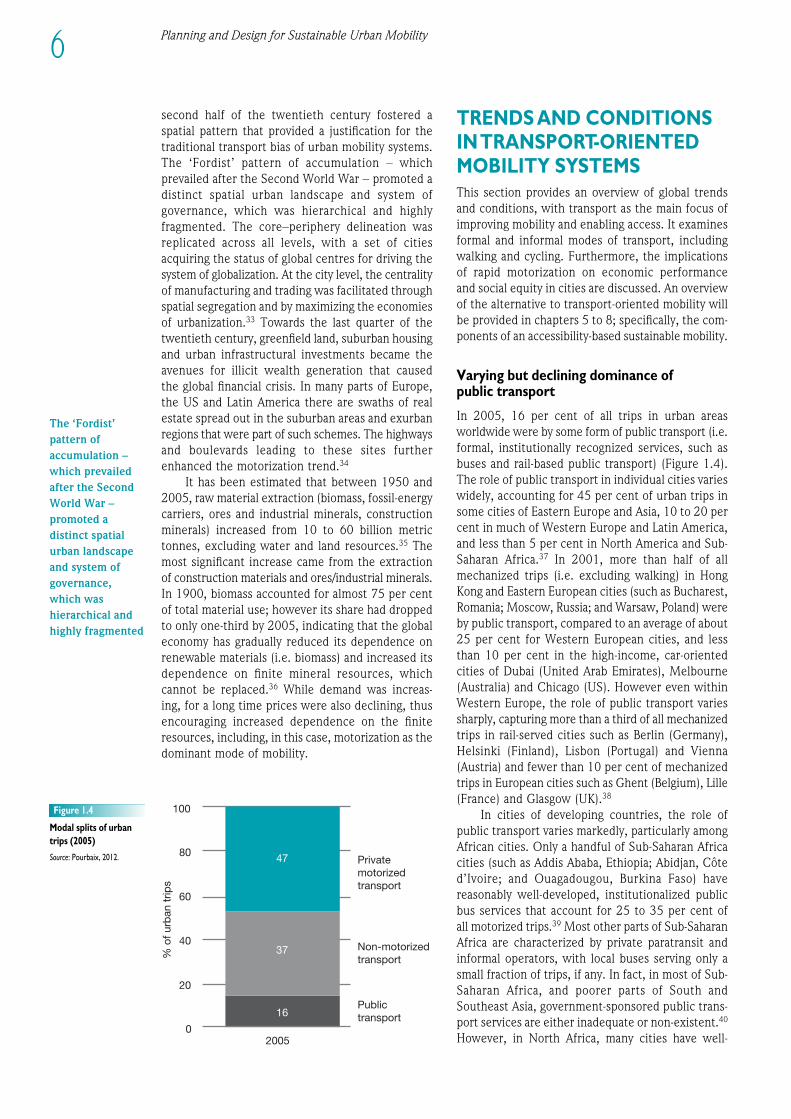
second half of the twentieth century fostered aspatial pattern that provided a justification for thetraditional trans port bias of urban mobility systems.The ‘Fordist’ pattern of accumulation – whichprevailed after the Second World War – promoted adistinct spatial urban landscape and system ofgovernance, which was hierarchical and highlyfragmented. The core–periphery delineation wasreplicated across all levels, with a set of citiesacquiring the status of global centres for driving thesystem of globalization. At the city level, the centralityof manufacturing and trading was facilitated throughspatial segregation and by maximizing the economiesof urbanization.33 Towards the last quarter of thetwentieth century, greenfield land, suburban housingand urban infrastructural investments became theavenues for illicit wealth generation that caused the global finan cial crisis. In many parts of Europe,the US and Latin America there are swaths of realestate spread out in the suburban areas and exurbanregions that were part of such schemes. The highwaysand boulevards leading to these sites furtherenhanced the motorization trend.34
It has been estimated that between 1950 and2005, raw material extraction (biomass, fossil-energycarriers, ores and industrial minerals, constructionminerals) increased from 10 to 60 billion metrictonnes, excluding water and land resources.35 Themost significant increase came from the extractionof construction materials and ores/industrial minerals.In 1900, biomass accounted for almost 75 per centof total material use; however its share had droppedto only one-third by 2005, indicating that the globaleconomy has gradually reduced its dependence onrenewable materials (i.e. biomass) and increased itsdependence on finite mineral resources, whichcannot be replaced.36 While demand was increas-ing, for a long time prices were also declining, thusencouraging increased dependence on the finiteresources, including, in this case, motorization as thedominant mode of mobility.
TRENDS AND CONDITIONSIN TRANSPORT-ORIENTEDMOBILITY SYSTEMSThis section provides an overview of global trendsand conditions, with trans port as the main focus ofimproving mobility and enabling access. It examinesformal and informal modes of transport, includingwalking and cycling. Further more, the implicationsof rapid motorization on economic performance and social equity in cities are discussed. An overviewof the alternative to transport-oriented mobility willbe provided in chapters 5 to 8; specifically, the com -ponents of an accessibility-based sus tain able mobility.
Varying but declining dominance ofpublic transport
In 2005, 16 per cent of all trips in urban areasworldwide were by some form of public trans port (i.e.formal, institutionally recognized services, such asbuses and rail-based public transport) (Figure 1.4).The role of public trans port in individual cities varieswidely, accounting for 45 per cent of urban trips insome cities of Eastern Europe and Asia, 10 to 20 percent in much of Western Europe and Latin America,and less than 5 per cent in North America and Sub-Saharan Africa.37 In 2001, more than half of allmechanized trips (i.e. excluding walking) in HongKong and Eastern European cities (such as Bucharest,Romania; Moscow, Russia; and Warsaw, Poland) wereby public transport, compared to an average of about25 per cent for Western European cities, and lessthan 10 per cent in the high-income, car-orientedcities of Dubai (United Arab Emirates), Melbourne(Australia) and Chicago (US). However even withinWestern Europe, the role of public trans port variessharply, capturing more than a third of all mechanizedtrips in rail-served cities such as Berlin (Germany),Helsinki (Finland), Lisbon (Portugal) and Vienna(Austria) and fewer than 10 per cent of mechanizedtrips in European cities such as Ghent (Belgium), Lille(France) and Glasgow (UK).38
In cities of devel op ing countries, the role ofpublic trans port varies markedly, particularly amongAfrican cities. Only a handful of Sub-Saharan Africacities (such as Addis Ababa, Ethiopia; Abidjan, Côted’Ivoire; and Ouagadougou, Burkina Faso) havereasonably well-developed, institutionalized publicbus services that account for 25 to 35 per cent ofall motorized trips.39 Most other parts of Sub-SaharanAfrica are characterized by private paratransit andinformal operators, with local buses serving only asmall fraction of trips, if any. In fact, in most of Sub-Saharan Africa, and poorer parts of South andSoutheast Asia, govern ment-sponsored public trans -port services are either inadequate or non-existent.40
However, in North Africa, many cities have well-2005
Public transport
Non-motorized transport
Private motorized transport
% o
f urb
an t
rips
0
20
40
60
80
100
47
37
16
Figure 1.4
Modal splits of urban
trips (2005)
Source: Pourbaix, 2012.
6 Planning and Design for Sustainable Urban Mobility
The ‘Fordist’pattern ofaccumulation –which prevailedafter the SecondWorld War –promoted adistinct spatialurban landscapeand system ofgovernance,which washierarchical andhighly fragmented
1EEE234567891012311145678920123456789301234567894012345678950123456789EEEE
7The Urban Mobility Challenge
developed public trans port systems, including formalbuses and informal shared taxis, and rail-based modes.In Egypt for example, Cairo’s metro has beenoperational and expanding since 1987. Similarly, amodern light rail system in Tunis, Tunisia, has beensuccessfully operating since the early 1990s. InCairo, public trans port (formal and informal) accountsfor more than 75 per cent of daily motorized trips.41
In South-Eastern Asia, conventional 50-passen -ger buses are the workhorse of the public trans portnetworks of most cities. In Bangkok, Thailand, 50 per cent of passen ger trips are by bus, rising to75 per cent during peak hours.42 In Eastern Asia,buses serve slightly larger shares of mechanized trips than metros in Taipei, China (14.4 versus 12.9 percent) and Shanghai, China (12.9 per cent versus 5.7per cent); whereas metros are more dominant inHong Kong, China (35.5 per cent of mechanizedtrips); Seoul, Republic of Korea (34.8 per cent); and greater Tokyo, Japan (57 per cent).43 ThroughoutLatin America, buses dominate, even in rail-servedcities such as São Paulo (Brazil), Santiago (Chile) and Buenos Aires (Argentina). As noted in Chapter3, the world’s most extensive bus rapid transit (BRT)networks are currently found in Latin America, where a total of 18 cities currently have some formof BRT system.44
Despite growing concerns over energy supplies,climate change and access for the poor, publictransport’s modal share of trips is expected to declineover the next decade in all world regions. If recenttrends continue, the number of trips made by publictrans port will increase by around 30 per centbetween 2005 and 2025, an estimate that is far lessthan the 80 per cent growth in trips by privatemotorized vehicles over the same period.45 In recentyears, public transport’s downward spiral has beenmost pronounced in Eastern Europe. The transitionto capitalist economies has brought with it substantialpublic trans port services cuts and disinvestments –the same kind of vicious cycle that has marginalizedpublic trans port in more advanced economies.
The declining market share of trips served bypublic trans port is cause for concern since they arethe most efficient forms of motorized mobility,particularly for low-income earners. The low anddecreasing role of public trans port renders it evenmore complicated to foster an effective linkagebetween land-use and trans port planning. More effortis devoted to control and regulation of the privateand informal sector operators whose main motivationis increasing profit.
Informality
Worldwide, the informal trans port sector providesmuch-needed (and much-valued) mobility, particu-larly for the poor. The lack of affordable and accessiblepublic trans port systems in devel op ing countries has
led to the proliferation of informal operators, suchas private microbus and mini bus services. Thesemodes help fill service gaps but can also worsen trafficcongestion and air quality. In some settings, informalcarriers are the only forms of public trans portavailable. In India, for example, only about 100 ofthe more than 5000 cities and towns have formalpublic trans port systems. Accordingly, conventionalpublic trans port has been replaced by more ubi -quitous but less affordable paratransit such asmotorcycle taxis, rickshaws, jeepneys and jitneys.46
Since cities in poorer countries seldom have theinstitutional and finan cial capacity to increase andsustain public trans port systems – and private firmstypically lack the capital and incentive to providecomprehensive trans port systems – small, private andinformal systems prevail. Like many market-basedsolutions, they provide a service that must be filled,but not without compromises to the environ ment andlack of service to those who are marginalized or livein less profit-rich locations.47 These are calledinformal public trans port or paratransit, becausethey serve the public and are essentially providing apublic good.
Non-motorized transport
Non-motorized transportation is often the dominantmode of urban mobility when public trans portservices are poor and incomes are low. In 2005, about37 per cent of urban trips worldwide were made byfoot or bicycle, which are the two major modes ofurban non-motorized trans port (Figure 1.4). For veryshort trips, walking is the main mode of trans port inboth developed and devel op ing countries. The modalshare of walking can be very high. In African cities, walking accounts for 30–35 per cent of alltrips. In Dakar (Senegal) and Douala (Cameroon) theshare is much higher, at over 60 per cent.48 Evidenceshows that non-motorized trans port is an import-ant com ponent in poorer and smaller cities, cap-turing as much as 90 per cent of all person-trips.49
Further more, in densely packed urban centres, non-motorized trans port provides access to placesthat motorized modes cannot reach, and is often thefastest means of getting around. In South Asia’sdensest, most congested cities, more than half of allpassen ger and goods trips are by foot, bicycles orrickshaw.50
Walking is often the only form of trans port for the very poor, when weather and topographypermit. Many people in devel op ing countries are‘captive walkers’, meaning that they walk becausethey cannot afford an alternative. For them, havinga well-connected and safe pedestrian environ mentis critical to meeting their daily needs.51 As the leastcostly form of mobility, walking allows the very poor to reduce their daily expenses, and thus hassignificant poverty impacts. The most visible indicator
Public transport’smodal share oftrips is expectedto decline overthe next decade inall world regions
The decliningmarket share of . . . publictransport is causefor concern since[it is] the mostefficient [form] of motorizedmobility,particularly forlow-incomeearners
Worldwide, theinformal transportsector providesmuch-needed(and much-valued) mobility,particularly forthe poor
Non-motorizedtransportation isoften thedominant mode ofurban mobilitywhen publictransport servicesare poor andincomes are low
Many people indevelopingcountries are‘captive walkers’,meaning that theywalk because theycannot afford analternative
8 Planning and Design for Sustainable Urban Mobility
of poverty in many cities, particularly in develop-ing countries, is the presence of slums and squattercommunities. Spatially, the field of movement inthese slums is very restricted, with such limitationsconstraining income and employment opportunitiesfor the urban poor. As a result, the affected popu -lation is forced to restrict their travel to essential tripsrelated to work, education and shopping.
In pursuit of trans port policies reflecting sus tain -able mobility, the promotion of walking and cyclingis very important. The bicycle is by far the mostenergy-effective means of passen ger trans port andoffers a relatively inexpensive means of improv-ing the accessibility of poor people. In developedcountries, bicycles are commonly used as a feedermode to public trans port services. A well-knownexample is the Netherlands, where bicycles are usedfor more than 40 per cent of trips in some cities.52
Historically, bicycles are particularly important inChinese cities.53 Non-motorized trans port shares are highest in smaller Chinese cities, in the rangesof 70 to 80 per cent.54
Bicycles serve relatively small shares of persontrips in many major African cities, however, cyclingis popular in smaller and secondary cities.55 Dan -gerous and crowded roads, and the absence ofprotected lanes, have discouraged cycling in manyAfrican cities.56 Still, bicycles can be an importantsource of economic livelihoods, as evidenced inKisumu, Kenya, where bicycle-taxis (bodaboda) ferrycommuters across town at half the price of a mataturide or in Bukoba, Tanzania, where some residentscarry passen gers or haul goods on their esekidos tosupplement their wages.57
In Bangladesh, India, Pakistan and Sri Lanka,bicycles serve as ‘mass transport’ in the form of cyclerickshaws, serving mostly women and children. InDhaka, Bangladesh, around 40 per cent of school tripsare by rickshaw.58 Also, rickshaw pulling often offersan entry point into the labour market for unskilledrural migrants to the cities of South Asia. In Dhaka,20 per cent of the population, or 2.5 million people,rely on rickshaw pulling for their livelihood, directlyor indirectly.59 This notwithstanding, rickshaws arebanned from Dhaka’s main roads for slowingmotorized traffic, and the view of some public officialsis that they detract from the city’s image as a modernmetropolis.
Traffic congestion
Traffic congestion is an undesirable by-product ofwidespread mobility in cities worldwide, and a majorfactor in restricting access in cities. A recent globalstudy of 20 major cities revealed that traffic con -gestion levels markedly worsened between 2007and 2010.60 Motorists in Moscow, Russia, reportedan average daily delay of two and a half hours.61
With a 24 per cent annual growth rate in the number
of registered motor vehicles, traffic conditions are deteriorating most rapidly in Beijing, China.62
In mid-2010, an ‘epic’ 100-kilometre, 9-day trafficjam was reported in China’s Heibei Province – alonga freeway that feeds into Beijing.63 The growingpopularity of helicopters is partly a response to therising congestion problem in Latin American citiessuch as Mexico City (Mexico), Santiago (Chile) andSão Paulo (Brazil).64
Congestion has widespread impacts on the urban quality of life, consumption of fossil fuels, airpollution and economic growth and prosperity. WorldBank studies from the 1990s estimated that trafficcongestion lowered the GDP of cities by some 3–6per cent, with the higher value applying mostly torapidly growing cities (e.g. places with busy porttraffic, reliance on just-in-time inventorying andmanufacturing, and other time-sensitive activities).65
Time losses from traffic congestion are estimated tocost the equivalent of 2 per cent of GDP in Europeand 2–5 per cent in Asia.66 The hidden external costsof traffic congestion in Metro Manila (the Philip -pines), Dakar (Senegal) and Abidjan (Côte d’Ivoire)have been pegged at nearly 5 per cent of those cities’GDPs.67 Such costs not only exact a burden on thepresent generation, but also commit futuregenerations to long-term debts, which can eventuallyslow global growth.
Traffic congestion is a major indication of thedisjuncture between land-use planning and trans-port systems. It not only exposes the limitation of a transport-oriented bias to mobility, but it alsoreveals the efficiency of land-use systems in a givencity. Limited road capacity, in the face of growingdemand for motorized mobility, partly explainsdeteriorating traffic conditions. In general, the per -centage of the total land area devoted to streets68
in devel op ing-country cities is considerably lower than in the cities of developed countries.69 In India,the annual growth rate in traffic during the 1990swas around 5 per cent in Mumbai, 7 per cent inChennai and 10 per cent in Delhi. However, noneof these cities have expanded their road supply byeven 1 per cent annually.70
In most devel op ing-country cities, the inade -quate quantity and structure of road infra structureis often associated with rapid population growth. Forinstance, Nairobi, Kenya – a city with approximately3.5 million inhabitants – has a shortage of collectorstreets and major thorough fares to serve trafficdemands, compared to devel oped-country cities of a similar size. The city’s arterials are mostly radialand the lack of circumferential roads force-funnelsmany peripheral trips through the central businessdistrict, with widespread effects on traffic flows.71
Central Bangkok, Thailand, has a fishbone streetpattern, featuring narrow local streets that channelmost motorized trips onto oversaturated thorough -fares. The absence of many collector-dis tributor
Traffic congestionis an undesirableby-product ofwidespreadmobility in citiesworldwide, and amajor factor inrestricting accessin cities
Traffic congestionis a majorindication of thedisjuncturebetween land-useplanning andtransport systems
1EEE234567891012311145678920123456789301234567894012345678950123456789EEEE
9The Urban Mobility Challenge
roads has contributed to inefficient patterns of trafficflows.72
Congested road infra struc ture in develop-ing countries, is further exacerbated by forms of en -croachment onto the carriageway, or excessiveprovisions for local access. The most common formsof encroachment are caused by street hawkers and informal trans port operators, which combine toblock the smooth flow of traffic. In Sub-SaharanAfrica, street vendors occupy around a third of road space in crowded cities.73 A further congestion-related prob lem is the absence of traffic managementin many devel op ing countries. Phnom Penh, Cam -bodia – a city of nearly 2 million inhabitants – has864 kilometres of roads, but just 36 traffic signals.74
In Lebanon, congestion is made worse by inadequateroad signage, a failure to manage limited supplies ofparking and a culture of aggressive, unruly driving.75
Freight movements can also contribute tocongestion. In most poor countries, the goods-movement sector lacks basic infra struc ture, such asfreight terminals, warehousing, parking and stagingareas, freight-forwarding centres and other logisticalneeds. Few devel op ing-country cities specifically plan for freight movements, thus a haphazard, dys -func tional arrangement of urban logistics is often the rule. An example is Lomé, Togo, where theabsence of a bypass road around the city causes trucksto leave the port and head directly into the core of the city.76 Heavy trucks contribute to (and sufferfrom) poor-quality roads – because wear-and-tearexpo nentially rises with the dead-axle weight of avehicle (e.g. one heavily loaded truck can inflict asmuch road damage as 10,000 passing cars).77 Conse -quently, road decay worsens congestion and increasesthe operating costs.
SUS TAIN ABILITYCHALLENGES OF URBANMOBILITYBuilding on the seminal Brundtland Report of 1987,78
a sus tain able urban mobility system is one thatsatisfies current mobility needs of cities withoutcompromising the ability of future generations tomeet their own needs.79 The idea of sus tain abilityin urban mobility has moved beyond a focus onecology and the natural environ ment to also includesocial, economic and institutional dimensions.Further more, it has moved beyond the preoccupationwith movement and flows within urban settings tolooking at enhancing proximity in space. A holisticand integrated approach to urban land-use and trans -port planning and investment is needed if urban areas are to become socially, environ mentally andeconomically sus tain able.
Accordingly, four pillars of sus tain ability areconsidered in the review and analysis of urbanmobility in this report; namely the social, environ -mental, economic and institutional dimensions.These are not separate or isolated, as there areimportant synergies and co-benefits. For instance,pursuing economic sus tain ability can also conferenviron mental benefits, such as instituting taxationpolicies that also conserve energy. In the early 2000s, Japan phased in reduced ownership taxes on fuel-efficient vehicles by 25 to 50 per cent andimposed higher charges on large-engine vehicles,including vehicles that were more than ten years ofage.80 While regulatory and fiscal instruments can beused to promote urban sus tain ability, as mentionedearlier, the most effective mechanism is the effectiveutilization of the planning process.
Integration of land-use and trans portplanning
As pointed out in the preceding sections, the ultimategoal of mobility is the capacity to traverse urbanspace. Relationships between locations, as well asimpedi ments and conveniences between them, arecritical in determining the ease and convenience ofaccessing them. The devel op ment of a sus tain abletransport ation system starts with the organization ofurban space. The main objective is to reduce the needfor mobility by reducing the number of trips andlength of travel distance. As a result, urban densityis optimized and functionality of urban placesenhanced. Sus tain ability entails a shift of emphasisfrom transportation to people and places. Inoperational terms, it still calls for improvement intransportation systems and even advocates forinnovations in other modes of communication, whilegiving emphasis to streamlining space utilization inits relationship with people.
Neglecting the connection between land use andmobility has created the urban sprawl evidenced inmost cities today. During the period since the SecondWorld War, the urban land area in developedcountries has doubled, while it has grown by a factorof five in devel op ing countries.81 From 1995 to2005, 85 per cent of the 78 largest cities in developedcountries experi enced a faster growth in theirsuburban areas than their urban cores.82 In Europe,studies of land-cover changes reveal that cities inEstonia, Latvia, Croatia, Slovakia, Poland, Hungary andBulgaria are experiencing the most sprawl.83
In many devel op ing countries, urban sprawlcomprises of two main contrasting types of devel op -ment in the same city. The first is characterized bylarge peri-urban areas with informal and illegalpatterns of land use. This is combined with a lack ofinfra struc ture, public facilities and basic services, andis often accompanied by little or no public trans portand by inadequate access roads. The other is a form
Few developing-country citiesspecifically planfor freightmovements, thusa haphazard,dysfunctionalarrangement ofurban logistics isoften the rule
The developmentof a sustainabletransportationsystem starts withthe organizationof urban space.The mainobjective is toreduce the needfor mobility byreducing thenumber of tripsand length oftravel distance
Neglecting theconnectionbetween land useand mobility hascreated the urbansprawl evidencedin most citiestoday
10 Planning and Design for Sustainable Urban Mobility
of ‘suburban sprawl’ in which residential zones forhigh- and middle-income groups and highly valuedcommercial and retail complexes are well connectedfor private motorized vehicles rather than by publictransport.
In the absence of regulatory controls and far-sighted urban planning, the pace of sprawl will mostlikely accelerate. Spread-out patterns of growth notonly increase the dependence on the private car, butalso consume farmland and open space, threatenestuaries and natural habitats, and burden municipaltreasuries with the high costs of expanding urbaninfra struc ture and services.
Land-use planning also entails paying attentionto the multiple scales of urban mobility. It traversesfrom the regional and metropolitan levels, throughthe city linkages and down to the neigh bour hood andstreet level. The urban form – emerging either froma haphazard process of locating settlements andactivities, or from strategically planned intervention– makes a big difference in mobility systems.Similarly, the design of streets and neigh bour hoodblocks promotes a sense of place and determines theaccessibility of such neigh bour hoods. The veryphysical configuration of the street may eitherencourage or discourage walking and bicycling. Keyconsiderations for sus tain able mobility include thepattern of street arrangement, the length of blocksand the relationship of buildings to pathways, stationsand central places.
The percentage of urban land allocated to streetsis one of the factors that influence the level of con -nectivity within urban areas. Another factor is howappropriately the streets are laid out to cater for thevarious mobility modes used within the city. A studyfound that a large number of cities in devel op ingcountries have low percentages of urban landallocated to streets; for example, 6 per cent in Bangui(Central African Republic), 6.1 per cent in Yerevan(Armenia), 11.1 per cent in Accra (Ghana) and 12.3per cent in Ouagadougou (Burkina Faso).84 This isdespite the fact that these cities are experiencingrapid rates of urbanization, a phenomenon which ispoised to impact on their mobility and hence levelsof accessibility. The same study found that cities indeveloped countries had significantly higher percent -ages of land allocated to streets, the average ratebeing 29 per cent.85 The linkages between urban landallocated to streets and the planning of accessiblecities are discussed further in Chapter 5.
Land-use and trans port planning have been calledfor and to some extent addressed since the 1970s.Nevertheless, a persisting challenge remains theapplication of integrated land-use and trans portplanning in practice, as well as dealing with existingtrans port infra struc ture and land-use patterns thatcannot always be easily changed, particularly in oldmiddle-size or larger cities. Accordingly, researchneeds to be directed to such pragmatic issues. It is
in making such critical decisions with respect toplaces and people that the pillars and principles ofsus tain ability can be operationalized.
Social dimensions
Urban trans port is socially sus tain able when mobilitybenefits are equally and fairly distributed, with fewif any inequalities in access to trans port infra struc -ture and services based on income, social and physicaldifferences (including gender, ethnicity, age or dis -abilities). Social sus tain ability is rooted in theprinciple of accessibility wherein equality existsamong all groups in terms of access to basic goods,services and activities – such as work, education,medical care, shopping, socializing – and to enablepeople to participate in civic life. It recognizes thecritical importance of mobility and accessibility in fullyenjoying human rights.
As earlier indicated, one important aspect ofaccessibility is the affordability of trans port modes.Affordable transportation means that people,including those with low incomes, can afford accessto basic services and activities (healthcare, shopping,school, work and social activities) without budgetstrain. For many urban dwellers in devel op ingcountries, the availability of reliable and affordablepublic trans port services can be the differencebetween being integrated into the economic andsocial life of a city or not. Unaffordable mobilityprevents the urban poor from breaking out of theshackles of inter-generational poverty. Further more,exorbitant expenditures on public trans port takemoney away from other essential needs, such as food,health care, education and shelter.
Where govern ments are unable to construct andsubsidize public trans port services, travellers oftenhave to pay large, sometimes exorbitant, shares oftheir incomes to private, often informal, paratransitoperators. Setting prices at whatever amount themarket will bear, informal operators invariably charge more per kilometre travelled than publiclysupported ones. In the poor informal housing settle -ments on the outskirts of Mexico City – beyond theservice juris diction of the city’s metro system –residents some times take two to three separatecollectivos (shared-ride taxis and microbuses) to reacha metro terminal that provides low-cost connectionsto the city and job opportunities.86 Travel can con -sume 25 per cent or more of daily wages.87 Time costscan also be exorbitant: 20 per cent of workers inMexico City spend more than three hours travellingto and from work each day.88 Studies show that takinga series of informal mini buses and motorized tricyclesto and from work can cost 20 to 25 per cent of dailywages in rapidly growing cities such as Delhi (India),Buenos Aires (Argentina) and Manila (the Philip -pines), and as much as 30 per cent in Nairobi (Kenya),Pretoria (South Africa) and Dar es Salaam (Tanzania).89
The urban form –emerging eitherfrom a haphazardprocess oflocatingsettlements andactivities, or fromstrategicallyplannedintervention –makes a bigdifference inmobility systems
Urban transport issociallysustainable whenmobility benefitsare equally andfairly distributed,with few if anyinequalities inaccess totransportinfrastructure andservices based onincome, social andphysicaldifferences
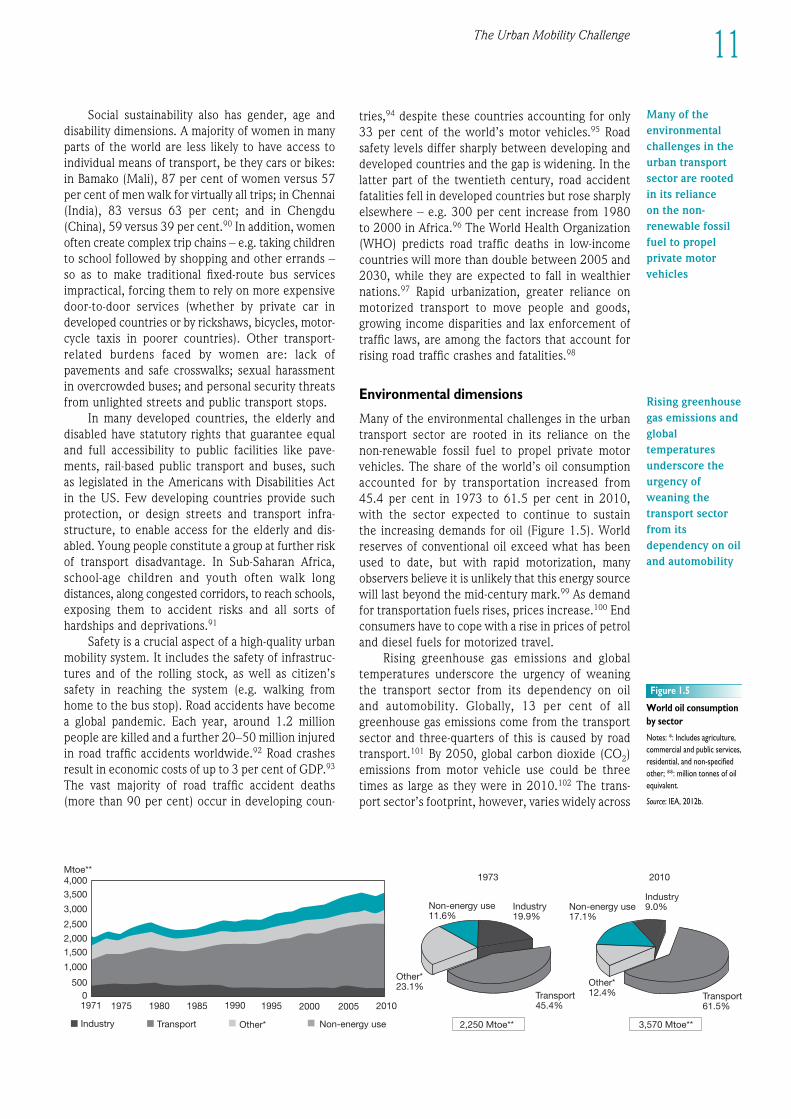
Mtoe**1973
Non-energy use11.6%
Other*23.1%
Industry19.9%
Transport45.4%
Non-energy use17.1%
Other*12.4%
Industry9.0%
Transport61.5%
2010
Industry Transport Other* Non-energy use 2,250 Mtoe**
4,000
3,500
3,000
2,500
2,000
1,500
1,000
50001971 1975 1980 1985 1990 1995 2000 2005 2010
3,570 Mtoe**
Figure 1.5
World oil consumption
by sector
Notes: *: Includes agriculture,
commercial and public services,
residential, and non-specified
other; **: million tonnes of oil
equivalent.
Source: IEa, 2012b.
Social sus tain ability also has gender, age anddisability dimensions. A majority of women in manyparts of the world are less likely to have access toindividual means of transport, be they cars or bikes:in Bamako (Mali), 87 per cent of women versus 57per cent of men walk for virtually all trips; in Chennai(India), 83 versus 63 per cent; and in Chengdu(China), 59 versus 39 per cent.90 In addition, womenoften create complex trip chains – e.g. taking childrento school followed by shopping and other errands –so as to make traditional fixed-route bus servicesimpractical, forcing them to rely on more expensivedoor-to-door services (whether by private car indeveloped countries or by rickshaws, bicycles, motor -cycle taxis in poorer countries). Other transport-related burdens faced by women are: lack ofpave ments and safe crosswalks; sexual harassmentin over crowded buses; and personal security threatsfrom unlighted streets and public trans port stops.
In many developed countries, the elderly anddisabled have statutory rights that guarantee equaland full accessibility to public facilities like pave -ments, rail-based public trans port and buses, suchas legislated in the Americans with Disabilities Actin the US. Few devel op ing countries provide suchprotection, or design streets and trans port infra -struc ture, to enable access for the elderly and dis -abled. Young people constitute a group at further riskof trans port dis advan tage. In Sub-Saharan Africa,school-age children and youth often walk longdistances, along congested corridors, to reach schools,exposing them to accident risks and all sorts ofhardships and deprivations.91
Safety is a crucial aspect of a high-quality urbanmobility system. It includes the safety of infra struc -tures and of the rolling stock, as well as citizen’ssafety in reaching the system (e.g. walking fromhome to the bus stop). Road accidents have becomea global pandemic. Each year, around 1.2 millionpeople are killed and a further 20–50 million injuredin road traffic accidents worldwide.92 Road crashesresult in economic costs of up to 3 per cent of GDP.93
The vast majority of road traffic accident deaths(more than 90 per cent) occur in devel op ing coun -
tries,94 despite these countries accounting for only33 per cent of the world’s motor vehicles.95 Roadsafety levels differ sharply between devel op ing anddeveloped countries and the gap is widening. In thelatter part of the twentieth century, road accidentfatalities fell in developed countries but rose sharplyelsewhere – e.g. 300 per cent increase from 1980to 2000 in Africa.96 The World Health Organization(WHO) predicts road traffic deaths in low-incomecountries will more than double between 2005 and2030, while they are expected to fall in wealthiernations.97 Rapid urbanization, greater reliance onmotorized trans port to move people and goods,growing income disparities and lax enforcement oftraffic laws, are among the factors that account forrising road traffic crashes and fatalities.98
Environ mental dimensions
Many of the environ mental challenges in the urbantrans port sector are rooted in its reliance on the non-renewable fossil fuel to propel private motorvehicles. The share of the world’s oil consumptionaccounted for by transportation increased from 45.4 per cent in 1973 to 61.5 per cent in 2010, with the sector expected to continue to sustain the increasing demands for oil (Figure 1.5). Worldreserves of conventional oil exceed what has beenused to date, but with rapid motorization, manyobservers believe it is unlikely that this energy sourcewill last beyond the mid-century mark.99 As demandfor transportation fuels rises, prices increase.100 Endconsumers have to cope with a rise in prices of petroland diesel fuels for motorized travel.
Rising greenhouse gas emissions and globaltemperatures underscore the urgency of weaning the trans port sector from its dependency on oil and automobility. Globally, 13 per cent of allgreenhouse gas emissions come from the trans portsector and three-quarters of this is caused by roadtransport.101 By 2050, global carbon dioxide (CO2)emissions from motor vehicle use could be threetimes as large as they were in 2010.102 The trans -port sector’s footprint, however, varies widely across
1EEE234567891012311145678920123456789301234567894012345678950123456789EEEE
11The Urban Mobility Challenge
Many of theenvironmentalchallenges in theurban transportsector are rootedin its reliance on the non-renewable fossilfuel to propelprivate motorvehicles
Rising greenhousegas emissions andglobaltemperaturesunderscore theurgency ofweaning thetransport sectorfrom itsdependency on oiland automobility
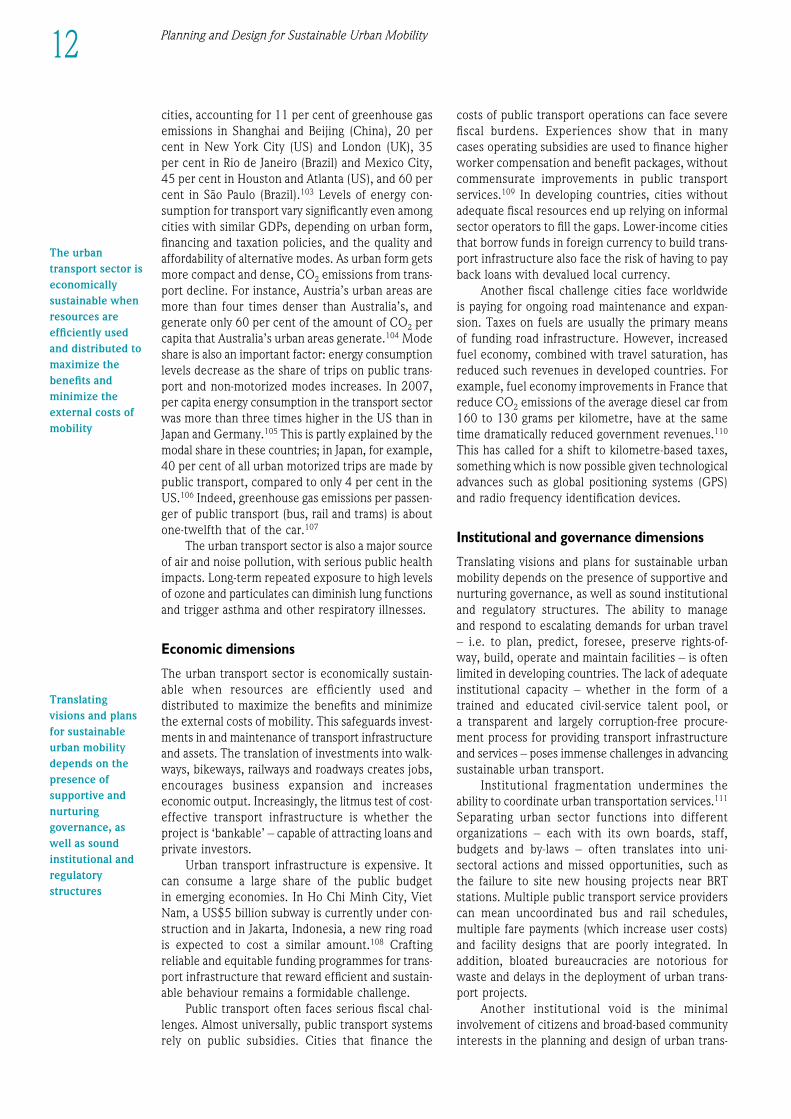
12 Planning and Design for Sustainable Urban Mobility
cities, accounting for 11 per cent of greenhouse gasemissions in Shanghai and Beijing (China), 20 percent in New York City (US) and London (UK), 35per cent in Rio de Janeiro (Brazil) and Mexico City,45 per cent in Houston and Atlanta (US), and 60 percent in São Paulo (Brazil).103 Levels of energy con -sumption for trans port vary significantly even amongcities with similar GDPs, depending on urban form,financing and taxation policies, and the quality andaffordability of alternative modes. As urban form getsmore compact and dense, CO2 emissions from trans -port decline. For instance, Austria’s urban areas aremore than four times denser than Australia’s, andgenerate only 60 per cent of the amount of CO2 percapita that Australia’s urban areas generate.104 Modeshare is also an important factor: energy consumptionlevels decrease as the share of trips on public trans -port and non-motorized modes increases. In 2007,per capita energy con sumption in the trans port sectorwas more than three times higher in the US than inJapan and Germany.105 This is partly explained by themodal share in these countries; in Japan, for example,40 per cent of all urban motorized trips are made bypublic transport, compared to only 4 per cent in theUS.106 Indeed, greenhouse gas emissions per passen -ger of public trans port (bus, rail and trams) is aboutone-twelfth that of the car.107
The urban trans port sector is also a major sourceof air and noise pollution, with serious public healthimpacts. Long-term repeated exposure to high levelsof ozone and particulates can diminish lung functionsand trigger asthma and other respiratory illnesses.
Economic dimensions
The urban trans port sector is economically sus tain -able when resources are efficiently used anddistributed to maximize the benefits and minimizethe external costs of mobility. This safeguards invest -ments in and maintenance of trans port infra struc tureand assets. The translation of investments into walk -ways, bikeways, railways and roadways creates jobs,encou rages business expansion and increaseseconomic output. Increasingly, the litmus test of cost-effective trans port infra struc ture is whether theproject is ‘bankable’ – capable of attracting loans andprivate investors.
Urban trans port infra struc ture is expensive. Itcan consume a large share of the public budget in emerging economies. In Ho Chi Minh City, VietNam, a US$5 billion subway is currently under con -struction and in Jakarta, Indonesia, a new ring roadis expected to cost a similar amount.108 Craftingreliable and equitable funding programmes for trans -port infra struc ture that reward efficient and sus tain -able behaviour remains a formidable challenge.
Public trans port often faces serious fiscal chal -lenges. Almost universally, public trans port systemsrely on public subsidies. Cities that finance the
costs of public trans port operations can face severefiscal burdens. Experi ences show that in many cases operating subsidies are used to finance higherworker compensation and benefit packages, withoutcom mensurate improvements in public trans portservices.109 In devel op ing countries, cities withoutadequate fiscal resources end up relying on informalsector operators to fill the gaps. Lower-income citiesthat borrow funds in foreign currency to build trans -port infra struc ture also face the risk of having to payback loans with devalued local currency.
Another fiscal challenge cities face worldwideis paying for ongoing road maintenance and expan -sion. Taxes on fuels are usually the primary meansof funding road infra struc ture. However, increasedfuel economy, combined with travel saturation, hasreduced such revenues in developed countries. Forexample, fuel economy improvements in France thatreduce CO2 emissions of the average diesel car from160 to 130 grams per kilometre, have at the sametime dramatically reduced govern ment revenues.110
This has called for a shift to kilometre-based taxes,something which is now possible given technologicaladvances such as global positioning systems (GPS)and radio frequency identification devices.
Institutional and governance dimensions
Translating visions and plans for sus tain able urbanmobility depends on the presence of supportive andnurturing governance, as well as sound institutionaland regulatory structures. The ability to manage and respond to escalating demands for urban travel– i.e. to plan, predict, foresee, preserve rights-of-way, build, operate and maintain facilities – is oftenlimited in devel op ing countries. The lack of adequateinstitutional capacity – whether in the form of atrained and educated civil-service talent pool, or a transparent and largely corruption-free procure-ment process for providing trans port infra struc tureand services – poses immense challenges in advancingsus tain able urban transport.
Institutional fragmentation undermines theability to coordinate urban transportation services.111
Separating urban sector functions into differentorganizations – each with its own boards, staff,budgets and by-laws – often translates into uni-sectoral actions and missed opportunities, such asthe failure to site new housing projects near BRTstations. Multiple public trans port service providerscan mean uncoordinated bus and rail schedules,multiple fare payments (which increase user costs)and facility designs that are poorly integrated. Inaddition, bloated bureaucracies are notorious forwaste and delays in the deployment of urban trans -port projects.
Another institutional void is the minimalinvolvement of citizens and broad-based communityinterests in the planning and design of urban trans -
The urbantransport sector iseconomicallysustainable whenresources areefficiently usedand distributed tomaximize thebenefits andminimize theexternal costs ofmobility
Translatingvisions and plansfor sustainableurban mobilitydepends on thepresence ofsupportive andnurturinggovernance, aswell as soundinstitutional andregulatorystructures
1EEE234567891012311145678920123456789301234567894012345678950123456789EEEE
13The Urban Mobility Challenge
port facilities and services. Decision-making needsto be more inclusive, transparent and democratic.Decen tralizing decision-making ensures greater voiceand legitimacy to non-govern mental organizations(NGOs) and civil society.
Lack of capacity for strategic planning andcoordination is a major problem in many cities of theworld, particularly in devel op ing countries. Institu -tions rarely have sufficient time or funds to expandtrans port infra struc ture fast enough to accommodatetravel demands. The ability to advance sus tain ablemobility programmes or introduce efficient pricingschemes presumes something that rarely exists – awell-managed trans port authority that sets clear andmeasurable objectives and rigorously appraises theexpenditure of funds in a transparent and accountablemanner.112 Often, the mechanisms for coordinatedmulti-sectoral planning are either weak or absent.Understanding the linkage between land-use andurban trans port planning is important for the multi -plicity of actors, levels and institutions involved.
CONCLUDING REMARKSAND STRUCTURE OF THEREPORTThis chapter has provided an overview of the implica -tions of the unfolding events of rapid urbanization,hyper-mobility and the health and climate hazardsassociated with car-dependent cities – all of whichare inextricably linked. During the past 100 years,the structural foundations for today’s urban mobilitysystems were derived from devel op mental circum -stances, when resources were cheap, urban popula -tions were low and modes of com munication werelimited. However, while the global trends discussedin this chapter pose uncertainties and risks, there arealso unprecedented opportunities for advancing sus -tain able urban mobility.
In order to become more sus tain able, citiesshould be more compact, encourage mixed land useand prioritize sus tain able modes of mobility such aspublic and non-motorized transport. Further more,urban mobility systems need to be inclusive, providingmobility opportunities for all. Improved urbanplanning will be critical toward designing and retro -fitting cities to better accommodate sus tain ablemodes. Compact, mixed-use cities with high-qualitypedestrian and cycling infra struc ture, combined withpolicy measures that charge the true social cost of
using private motorized vehicles, offer the best hopeof increasing the modal shares of sus tain able modesof mobility.
A paradigm shift is also needed in how trans -port users think about transportation and its relation-ship to the city. Of particular significance is the needfor govern ment institutions and planning processesto emphasize accessibility over mobility. Further -more, policies to encourage sus tain able urban mobil -ity should take into account social, environ mental,eco nomic as well as institutional dimensions of sus -tain ability. This calls for a more holistic and inclusiveframework for the planning, design and provision ofurban mobility systems and services. Accordingly,translating visions and plans for sus tain able urbantrans port futures depends on the presence of asupportive governance and regulatory structure.
The following nine chapters of this report analyseglobal trends, conditions and policy responses withrespect to urban mobility. They investigate theconnection between trans port and various aspects of urban form, and suggest measures towards thepromotion of sus tain able mobility. The discussion in the next three chapters focuses on trends andconditions with respect to the two main categoriesof urban transport: passen ger trans port in Chapters2 and 3 and goods trans port in Chapter 4. Theevidence presented in these chapters shows that,urban trans port policy and planning challenges indevel op ing countries and countries with economiesin transition differ significantly from those found inthe urban areas of developed countries; as do theresources and institutional frameworks at the disposalof policy-makers and planners. Notwithstanding, thebest choice of policy responses will also vary withineach region and even within countries.
Chapter 5 serves as the anchor of this report,exposing the basis of the prevailing anomalies andopportunities for corrective intervention. It looks atthe interrelation between mobility and the spatialstructure of the city, while stressing the need toreconfigure urban form to enhance accessibility. Theimportance of integrating trans port and land-useplanning is emphasized while the underlying prin -ciples of sus tain able devel op ment provide thenormative framework for change. The policy impli -ca tions discussed in Chapter 5 lay the ground for the subsequent discussion in Chapters 6 to 9, whichfocus on the social, environ mental, economic andinstitu tional dimensions of sus tain able mobility.Chapter 10 concludes the report and presents policyrecom mendations on how to enhance the sus tain -ability of urban mobility systems.
Lack of capacityfor strategicplanning andcoordination is amajor problem inmany cities of theworld, particularlyin developingcountries
In order tobecome moresustainable, cities should bemore compact,encourage mixedland use andprioritizesustainable modesof mobility suchas public and non-motorizedtransport
Translatingvisions and plansfor sustainableurban transportfutures dependson the presence ofa supportivegovernance andregulatorystructure
Planning and Design for Sustainable Urban Mobility14
NOTES1 Pourbaix, 2012.2 ITF, 2011.3 ITF, 2011.4 smaRT, 2008, p2.5 smaRT, 2008, p2.6 CEmR, 2007, Preamble.7 see Table 2.3.8 Pourbaix, 2011.9 see Table 2.3.
10 IEa, 2010.11 Pan, 2011; Tiwari, 2011.12 Jirón, 2011.13 Jain, 2011; World Bank, 2011b.14 altshuler, 1979; Pucher and
lefevre, 1996.15 kutzbach, 2010.16 see Figure 2.12 (and Figure 8.1).17 Newman and kenworthy,
2011b.18 millard-Ball and schipper, 2010;
ITF, 2011.19 ITF, 2011.20 ITF, 201121 suchorzewski, 2011.22 Jain, 2011.23 From 95,000 in 1990 to 208,000
kilometres in 2003 (Wenhua,2005).
24 From 892 million square metresin 1990 to 3156.5 million squaremetres in 2003 (Wenhua, 2005).
25 New african, 2012.26 sheller and Urry, 200327 Urry, 2004.28 Davis and kahn, 2011.29 alcazaren, 2004.30 Population Connection, 2009.31 lewyn, 2003.32 In varying degrees an
observation made by thegovernor of New yorkresonates for many cities in the
world. He said that ‘the simpletruth is that New york’s stateand local govern ments havebecome too big, too expensive,and too ineffective. In fact, therenow are more than 1,000 stateagencies – an ever proliferatingtangle of boards, commissions,councils, departments, divisions,offices, task forces and publicauthorities. likewise, Newyork’s antiquated system oflocal govern ment today consistsof more than 10,500 govern -mental entities. This oversizedand inefficient bureaucracy is aluxury taxpayers cannot afford’(Cuomo, 2010, p61).
33 see, for example, sassen, 2007;Hall, 1997.
34 Baily et al, 2008; Barth et al,2009.
35 swilling, 2012.36 swilling, 2012.37 Pourbaix, 2012.38 UITP, 2006.39 Pirie, 2011; godard, 2011b.40 Cervero, 2000; Hidalgo and
Carrigan, 2008.41 Huzayyin, 2004.42 Chin, 2011.43 Pan et al, 2011.44 Wright, 2011.45 Pourbaix, 2012.46 Jain, 2011.47 Cervero, 2000.48 UITP, 2011b.49 Pendakur, 2011.50 Jain, 2011.51 montgomery and Roberts,
2008.52 Pucher and Buehler, 2008.
53 Pendakur, 2011.54 Pucher et al, 2007.55 Pendakur, 2011.56 Pedankur, 2005.57 Pirie, 2011.58 Jain, 2011.59 Jain, 2011.60 IBm Corporation, 2010.61 IBm Corporation, 2010.62 IBm Corporation, 2010.63 guo and Fang, 2010.64 Jirón, 2011.65 kessides, 1993; World Bank,
1994; World Bank, 2002a.66 london European Partnership
for Transport, 2011.67 Chin, 2011; UITP, 2011b.68 For the purpose of this report,
the term ‘streets’ includes allcategories of road infra struc -ture, including arterial highways,primary and secondary roads, aswell as bikepaths and footpaths.
69 vasconcellos, 2001; see alsoUN-Habitat, 2013b.
70 Pucher et al, 2005.71 gonzales et al, 2009.72 Cervero, 1991.73 Pirie, 2011; Pendakur, 2005.74 Chin, 2011.75 El-geneidy et al, 2011.76 godard, 2011b.77 Papagiannakis and masad, 2008.78 WCED, 1987.79 Black, 1996; satoh and law,
2009.80 Hirota and Poot, 2005.81 OECD, 2010a.82 OECD, 2010b.83 Hirt and stanilov, 2009.84 UN-Habitat, 2013b; see also
vasconcellos, 2001.
85 UN-Habitat, 2013b; see alsovasconcellos, 2001.
86 Cervero, 1998.87 vasconcellos, 2001; kaltheier,
2002.88 World Bank, 2009b.89 Ferrarazzo and arauz, 2000;
kaltheier, 2002; Carruthers et al, 2005.
90 Peters, 2011.91 mcmillan, 2011.92 WHO, 2009.93 World Bank, 2008a.94 aeron-Thomas and Jacobs,
2011.95 see Table 2.3.96 World Bank, 2008a.97 WHO, 2008.98 aeron-Thomas and Jacobs,
2011.99 Black, 2010.
100 see Figure 7.1.101 UN-Habitat, 2011.102 ITF, 2011.103 IEa, 2011d; UN-Habitat, 2011.104 OECD, 2010a.105 OECD, 2009.106 korea Transport Institute, 2010.107 Jain, 2011, citing goodall, 2007.108 Chin, 2011.109 Pickrell, 1985; World Bank,
2002a.110 van Dender and Crist, 2011.111 Dimitriou, 2011.112 Huzzayin, 2005.
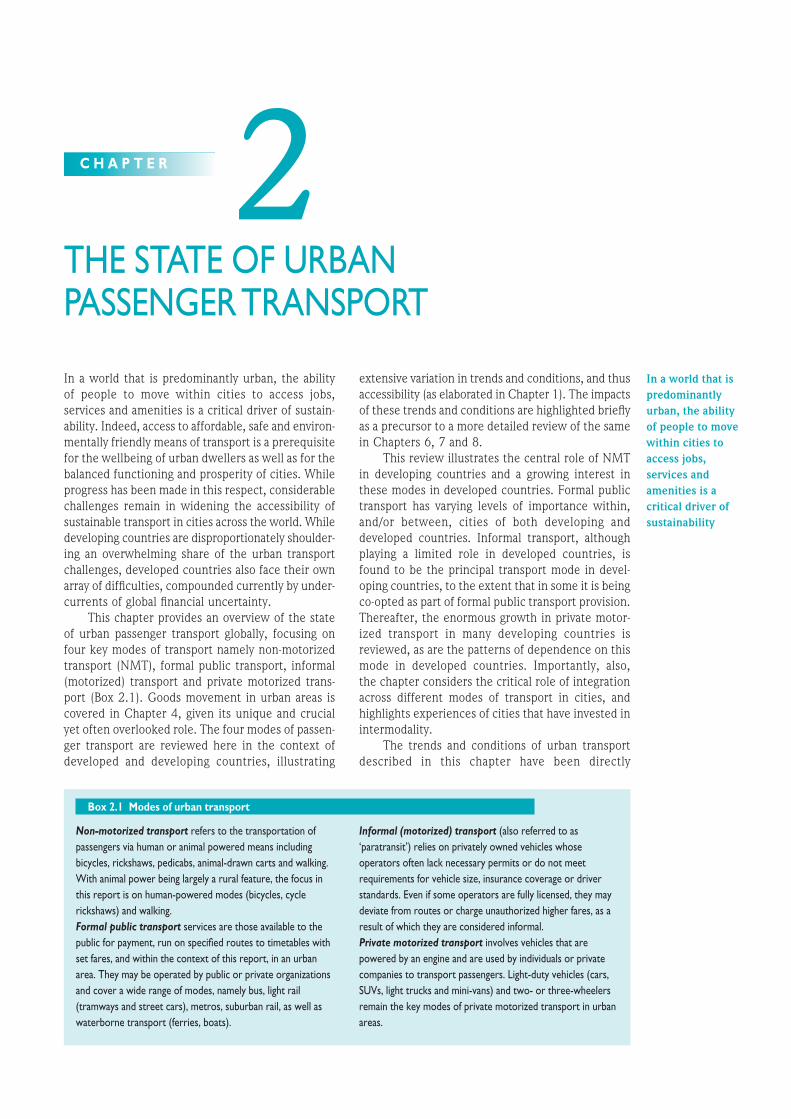
1EEE234567891012311145678920123456789301234567894012345678950123456789EEEE
In a world that is predominantly urban, the abilityof people to move within cities to access jobs,services and amenities is a critical driver of sus tain -ability. Indeed, access to affordable, safe and environ -mentally friendly means of trans port is a prerequisitefor the wellbeing of urban dwellers as well as for thebalanced functioning and prosperity of cities. Whileprogress has been made in this respect, considerablechal lenges remain in widening the accessibility of sus tain able trans port in cities across the world. Whiledevel op ing countries are disproportionately shoulder -ing an overwhelming share of the urban trans portchallenges, developed countries also face their ownarray of difficulties, compounded currently by under -currents of global finan cial uncertainty.
This chapter provides an overview of the stateof urban passen ger trans port globally, focusing onfour key modes of trans port namely non-motorizedtrans port (NMT), formal public transport, informal(motorized) trans port and private motorized trans -port (Box 2.1). Goods movement in urban areas iscovered in Chapter 4, given its unique and crucialyet often overlooked role. The four modes of passen -ger trans port are reviewed here in the context ofdeveloped and devel op ing countries, illustrating
extensive vari ation in trends and conditions, and thusaccessibility (as elaborated in Chapter 1). The impactsof these trends and conditions are highlighted brieflyas a precursor to a more detailed review of the samein Chapters 6, 7 and 8.
This review illustrates the central role of NMTin devel op ing countries and a growing interest inthese modes in developed countries. Formal publictrans port has varying levels of importance within,and/or between, cities of both devel op ing anddeveloped countries. Informal transport, althoughplaying a limited role in developed countries, isfound to be the principal trans port mode in devel -op ing countries, to the extent that in some it is beingco-opted as part of formal public trans port provision.Thereafter, the enormous growth in private motor -ized trans port in many devel op ing countries isreviewed, as are the patterns of dependence on thismode in developed countries. Importantly, also, the chapter considers the critical role of integrationacross different modes of trans port in cities, andhighlights experi ences of cities that have invested inintermodality.
The trends and conditions of urban trans portdescribed in this chapter have been directly
THE STATE OF URBAN PASSENGER TRANSPORT
C H A P T E R 2
Non-motorized transport refers to the transportation ofpassengers via human or animal powered means includingbicycles, rickshaws, pedicabs, animal-drawn carts and walking.With animal power being largely a rural feature, the focus inthis report is on human-powered modes (bicycles, cyclerickshaws) and walking.Formal public transport services are those available to thepublic for payment, run on specified routes to timetables withset fares, and within the context of this report, in an urbanarea. They may be operated by public or private organizationsand cover a wide range of modes, namely bus, light rail(tramways and street cars), metros, suburban rail, as well aswaterborne transport (ferries, boats).
Informal (motorized) transport (also referred to as‘paratransit’) relies on privately owned vehicles whoseoperators often lack necessary permits or do not meetrequirements for vehicle size, insurance coverage or driverstandards. Even if some operators are fully licensed, they maydeviate from routes or charge unauthorized higher fares, as aresult of which they are considered informal.Private motorized transport involves vehicles that arepowered by an engine and are used by individuals or privatecompanies to transport passengers. Light-duty vehicles (cars,SUVs, light trucks and mini-vans) and two- or three-wheelersremain the key modes of private motorized transport in urbanareas.
Box 2.1 Modes of urban transport
In a world that ispredominantlyurban, the abilityof people to movewithin cities toaccess jobs,services andamenities is acritical driver ofsustainability
16 Planning and Design for Sustainable Urban Mobility
influenced by land-use and urban planning decisionstaken at neigh bour hood, local and regional levels(Chapter 5), resulting in particular urban forms and functionality that hinder or facilitate accessibility.In turn, trans port investments and policies haveinfluenced the devel op ment of urban form andfunctionality in particular ways, thereby impacting onaccess to mobility. The interaction between thedevel op ment of urban spatial patterns and trans portis thus a key factor shaping accessibility in cities bothin physical and socioeconomic terms.
NON-MOTORIZED TRANSPORTThis section highlights the trends and conditions ofNMT around the world, including the provision of appropriate infra struc ture, as well as the relatedbenefits and challenges. Globally, walking andbicycling are the dominant modes of NMT. Yet, theneeds of NMT users are often ignored, while pedes -trians and cyclists together form a significant fractionof traffic accident victims. Most cities do not havededicated infra struc ture, and even if some Europeancities have been remodelled to become pedestrianand bicycle friendly, NMT users typically negotiatehostile urban environ ments. In London, UK, forinstance, many cyclists are killed annually by turningtrucks, despite the presence of bicycle lanes.
Devel op ing countries
NMT is the principal mode of transportation in mostcities of devel op ing countries, particularly Africa andAsia (Figure 2.1). In Dakar (Senegal), for instance,walking and cycling accounts for 71 per cent of tripswhile in Douala (Cameroon) it accounts for 60 percent. In Asia, the combined average share of cyclingand walking in Chinese cities, for instance, is 65 percent.1 Beijing, for instance, has a combined modalshare of walking and cycling of 53 per cent. In Indiancities (such as Ahmedabad, Bangalore, Delhi andMumbai) walking and cycling account for about athird of all trips. In Latin America, walking andcycling constitute more than one-third of the tripsin cities such as Santiago, Chile (37 per cent), Riode Janeiro, Brazil (37 per cent) and Guadalajara,Mexico (39 per cent), but are less significant in otherssuch as Buenos Aires, Argentina (9 per cent), La Paz,Bolivia (10 per cent) and Caracas, Venezuela (18 percent).2
Walking is the principal means of transportationin cities of devel op ing countries. This is largely notby choice, but rather driven by the lack of affordableand accessible alternatives, with most pedestriansbelonging to lower income groups.3 Among low-
income groups in Santiago (Chile), NMT provides amodal share of over 50 per cent, compared to only10 per cent among high-income groups.4 In Kenya,the majority of Nairobi’s slum inhabitants walk as theycannot afford motorized transport.5 On average,walking accounts for a significant proportion of tripsin African cities, and is particularly common amongwomen and children.6
Cycling caters for the mobility needs of consid -erable numbers of urban dwellers in devel op ing-country cities, especially in Asia. In mainland China,bicycle ownership is much higher than in other Asiancountries, with an estimated 600 million bicycles.7
In India, household bicycle ownership rates are high in cities such as Delhi (38 per cent), Ahmedabad(54 per cent) and Chandigarh (63 per cent).8 This is reflected in the relatively higher modal share ofcycling in these cities – Delhi (12 per cent) andAhmedabad (14 per cent). In some Asian countrieswith relatively higher incomes, however, the modalshare of cycling is much lower, such as in Singapore(1.6 per cent of work trips),9 the Republic of Korea(1.2 per cent)10 and Hong Kong SAR (0.5 per cent).11
In recent years, there has been a decline incycling in some Asian cities. This has been attributedto rising incomes and concomitant motorization, aswell as changing social perceptions, which tends tosee cycling as a means of trans port for the poor. Indiais a case in point where bicycle modal shares declinedfrom 30 per cent in 1994 to 11 per cent in 2008.12
Numbers also decreased in China, particularly in bigcities.13
In African cities, cycling plays a comparativelylimited role, accounting for less than 3 per cent oftotal trips in capital cities such as Bamako (Mali),Dakar (Senegal), Harare (Zimbabwe), Nairobi (Kenya)and Niamey (Niger). Cycling appears to be morepopular in smaller and secondary cities such asMorogoro (Tanzania) and Eldoret (Kenya) where itconstitutes 23 per cent and 12 per cent of total trips,respectively.14 In Latin America, cycling makes uponly a small share of total trans port trips, with bicycleuse being more in intermediate sized cities than inlarger ones. For example, while in Curico (Chile) themodal share is 9 per cent, the average share acrossChile is under 2 per cent.15
The three-wheeled rickshaw is a popular typeof urban trans port in Asia, especially in Cambodia,Indonesia, Myanmar, Thailand, the Philippines andViet Nam. Known as pedicabs (padyak) in MetroManila (the Philippines), they are able to operate innarrow alleys, walkways and other areas which areimpenetrable by other modes such as jeepneys (con -verted jeep taxis) and buses. In Bandung (Indonesia),pedicabs known as becaks make up 33 per cent ofall trips.16 In contrast, cycle rickshaws are uncommonin Africa, although they did exist in the 1990s in Kigali (Rwanda) and Bujumbura (Burundi).17 The useof tricycles however has been met with mixed
Walking is theprincipal means oftransportation incities ofdevelopingcountries . . . notby choice, butrather driven bythe lack ofaffordable andaccessiblealternatives
In recent years,there has been adecline in cyclingin some Asiancities [due] torising incomesand concomitantmotorization, aswell as changingsocial perceptions
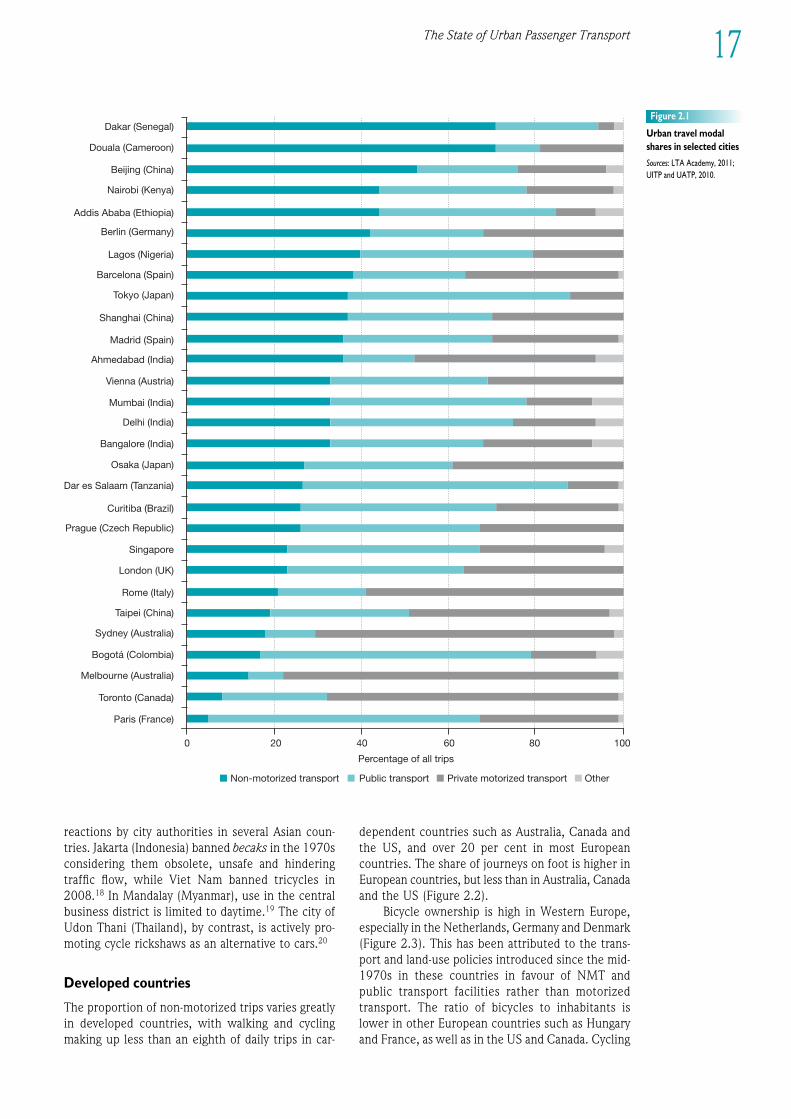
0 20 40 60 80 100
Percentage of all trips
Paris (France)
Toronto (Canada)
Melbourne (Australia)
Bogotá (Colombia)
Sydney (Australia)
Taipei (China)
Rome (Italy)
London (UK)
Singapore
Prague (Czech Republic)
Curitiba (Brazil)
Dar es Salaam (Tanzania)
Osaka (Japan)
Bangalore (India)
Delhi (India)
Mumbai (India)
Vienna (Austria)
Ahmedabad (India)
Madrid (Spain)
Shanghai (China)
Tokyo (Japan)
Barcelona (Spain)
Lagos (Nigeria)
Berlin (Germany)
Addis Ababa (Ethiopia)
Nairobi (Kenya)
Beijing (China)
Douala (Cameroon)
Dakar (Senegal)
Public transport Private motorized transport OtherNon-motorized transport
Figure 2.1
Urban travel modal
shares in selected cities
Sources: lTa academy, 2011;
UITP and UaTP, 2010.
1EEE234567891012311145678920123456789301234567894012345678950123456789EEEE
17The State of Urban Passenger Transport
reactions by city authorities in several Asian coun-tries. Jakarta (Indonesia) banned becaks in the 1970sconsidering them obsolete, unsafe and hinderingtraffic flow, while Viet Nam banned tricycles in2008.18 In Mandalay (Myanmar), use in the centralbusiness district is limited to daytime.19 The city ofUdon Thani (Thailand), by contrast, is actively pro -moting cycle rickshaws as an alternative to cars.20
Developed countries
The proportion of non-motorized trips varies greatlyin developed countries, with walking and cyclingmaking up less than an eighth of daily trips in car-
dependent countries such as Australia, Canada andthe US, and over 20 per cent in most Europeancountries. The share of journeys on foot is higher inEuropean countries, but less than in Australia, Canadaand the US (Figure 2.2).
Bicycle ownership is high in Western Europe,especially in the Netherlands, Germany and Denmark(Figure 2.3). This has been attributed to the trans -port and land-use policies introduced since the mid-1970s in these countries in favour of NMT andpublic trans port facilities rather than motorizedtransport. The ratio of bicycles to inhabitants islower in other European countries such as Hungaryand France, as well as in the US and Canada. Cycling
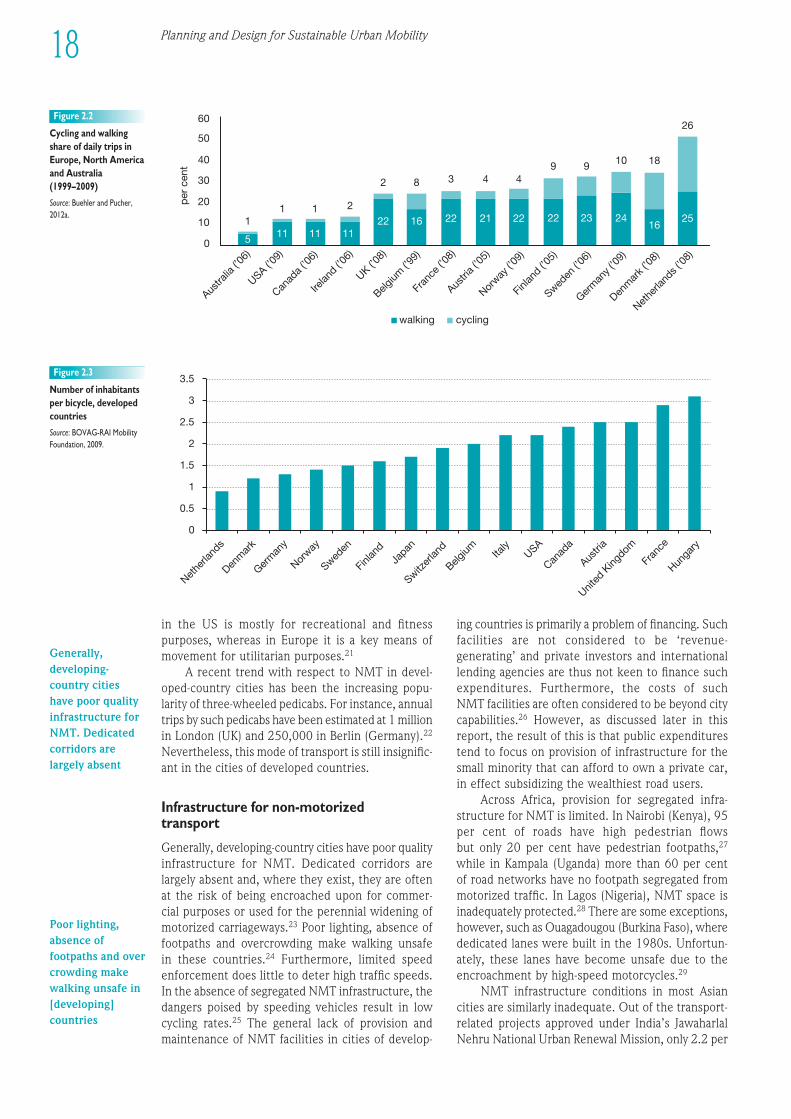
walking cycling
0
10
20
30
40
50
60
11 1 2
2 8 3 4 49 9 10 18
26
Austra
lia (’0
6)
USA (’09)
Canad
a (’0
6)
Irelan
d (’06)
UK (’08)
Belgium
(’99)
Fran
ce (’0
8)
Austri
a (’0
5)
Norway
(’09)
Finlan
d (’05)
Sweden
(’06)
Denm
ark (
’08)
Nethe
rland
s (’0
8)
Germ
any (
’09)
5 11 11 1122 16 22 21 22 22 23 24
1625
per
cen
t
Figure 2.2
Cycling and walkingshare of daily trips inEurope, North Americaand Australia(1999–2009)
Source: Buehler and Pucher,2012a.
0
0.5
1
1.5
2
2.5
3
3.5
Nethe
rland
s
Denm
ark
Germ
any
Norway
Sweden
Finlan
dJa
pan
Switzer
land
Belgium Ita
lyUSA
Canad
a
Austri
a
United
King
dom
Fran
ce
Hunga
ry
Figure 2.3
Number of inhabitantsper bicycle, developedcountries
Source: BOVAG-RAI MobilityFoundation, 2009.
18 Planning and Design for Sustainable Urban Mobility
in the US is mostly for recreational and fitnesspurposes, whereas in Europe it is a key means ofmovement for utilitarian purposes.21
A recent trend with respect to NMT in devel -oped-country cities has been the increasing popu-larity of three-wheeled pedicabs. For instance, annualtrips by such pedicabs have been estimated at 1 millionin London (UK) and 250,000 in Berlin (Germany).22
Nevertheless, this mode of trans port is still insignific -ant in the cities of developed countries.
Infra struc ture for non-motorizedtransport
Generally, devel op ing-country cities have poor qualityinfra struc ture for NMT. Dedicated corridors arelargely absent and, where they exist, they are oftenat the risk of being encroached upon for commer-cial purposes or used for the perennial widening ofmotorized carriageways.23 Poor lighting, absence offootpaths and over crowding make walking unsafe in these countries.24 Further more, limited speedenforcement does little to deter high traffic speeds.In the absence of segregated NMT infra struc ture, thedangers poised by speeding vehicles result in lowcycling rates.25 The general lack of provision andmaintenance of NMT facilities in cities of devel op -
ing countries is primarily a problem of financing. Suchfacilities are not considered to be ‘revenue-generating’ and private investors and internationallending agencies are thus not keen to finance suchexpenditures. Further more, the costs of such NMT facilities are often considered to be beyond citycapabilities.26 However, as discussed later in thisreport, the result of this is that public expenditurestend to focus on provision of infra struc ture for thesmall minority that can afford to own a private car,in effect subsidizing the wealthiest road users.
Across Africa, provision for segregated infra -struc ture for NMT is limited. In Nairobi (Kenya), 95per cent of roads have high pedestrian flows but only 20 per cent have pedestrian footpaths,27
while in Kampala (Uganda) more than 60 per centof road networks have no footpath segregated frommotor ized traffic. In Lagos (Nigeria), NMT space isinadequately protected.28 There are some exceptions,however, such as Ouagadougou (Burkina Faso), wherededicated lanes were built in the 1980s. Unfortun -ately, these lanes have become unsafe due to theencroachment by high-speed motorcycles.29
NMT infra struc ture conditions in most Asiancities are similarly inadequate. Out of the transport-related projects approved under India’s JawaharlalNehru National Urban Renewal Mission, only 2.2 per
Generally,developing-country citieshave poor qualityinfrastructure forNMT. Dedicatedcorridors arelargely absent
Poor lighting,absence offootpaths and overcrowding makewalking unsafe in[developing]countries
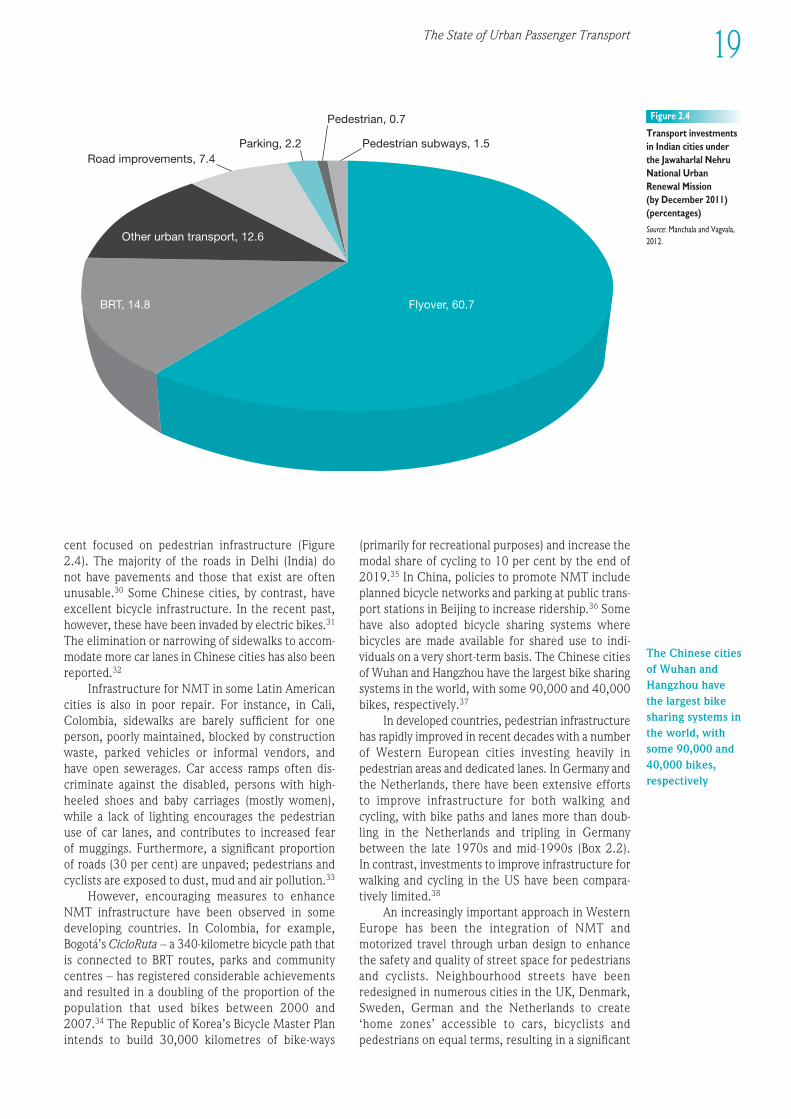
Flyover, 60.7BRT, 14.8
Other urban transport, 12.6
Road improvements, 7.4Parking, 2.2
Pedestrian, 0.7
Pedestrian subways, 1.5
Figure 2.4
Trans port investmentsin Indian cities underthe Jawaharlal NehruNational UrbanRenewal Mission (by December 2011)(percentages)
Source: Manchala and Vagvala,2012.
1EEE234567891012311145678920123456789301234567894012345678950123456789EEEE
19The State of Urban Passenger Transport
cent focused on pedestrian infra struc ture (Figure2.4). The majority of the roads in Delhi (India) donot have pavements and those that exist are oftenunusable.30 Some Chinese cities, by contrast, haveexcellent bicycle infra struc ture. In the recent past,however, these have been invaded by electric bikes.31
The elimination or narrowing of sidewalks to accom -modate more car lanes in Chinese cities has also beenreported.32
Infra struc ture for NMT in some Latin Americancities is also in poor repair. For instance, in Cali,Colombia, sidewalks are barely sufficient for oneperson, poorly maintained, blocked by constructionwaste, parked vehicles or informal vendors, and have open sewerages. Car access ramps often dis -criminate against the disabled, persons with high-heeled shoes and baby carriages (mostly women),while a lack of lighting encourages the pedestrian use of car lanes, and contributes to increased fearof muggings. Further more, a significant proportionof roads (30 per cent) are unpaved; pedestrians andcyclists are exposed to dust, mud and air pollution.33
However, encouraging measures to enhanceNMT infra struc ture have been observed in somedevel op ing countries. In Colombia, for example,Bogotá’s CicloRuta – a 340-kilometre bicycle path thatis connected to BRT routes, parks and communitycentres – has registered considerable achievementsand resulted in a doubling of the proportion of thepopulation that used bikes between 2000 and2007.34 The Republic of Korea’s Bicycle Master Planintends to build 30,000 kilometres of bike-ways
(primarily for recreational purposes) and increase themodal share of cycling to 10 per cent by the end of2019.35 In China, policies to promote NMT includeplanned bicycle networks and parking at public trans -port stations in Beijing to increase ridership.36 Somehave also adopted bicycle sharing systems wherebicycles are made available for shared use to indi -viduals on a very short-term basis. The Chinese citiesof Wuhan and Hangzhou have the largest bike sharingsystems in the world, with some 90,000 and 40,000bikes, respectively.37
In developed countries, pedestrian infra struc turehas rapidly improved in recent decades with a numberof Western European cities investing heavily inpedestrian areas and dedicated lanes. In Germany andthe Netherlands, there have been extensive effortsto improve infra struc ture for both walking andcycling, with bike paths and lanes more than doub-ling in the Netherlands and tripling in Germanybetween the late 1970s and mid-1990s (Box 2.2).In contrast, investments to improve infra struc ture forwalking and cycling in the US have been compara -tively limited.38
An increasingly important approach in WesternEurope has been the integration of NMT andmotorized travel through urban design to enhancethe safety and quality of street space for pedestriansand cyclists. Neigh bour hood streets have beenredesigned in numerous cities in the UK, Denmark,Sweden, German and the Netherlands to create‘home zones’ accessible to cars, bicyclists andpedestrians on equal terms, resulting in a significant
The Chinese citiesof Wuhan andHangzhou havethe largest bikesharing systems inthe world, withsome 90,000 and40,000 bikes,respectively
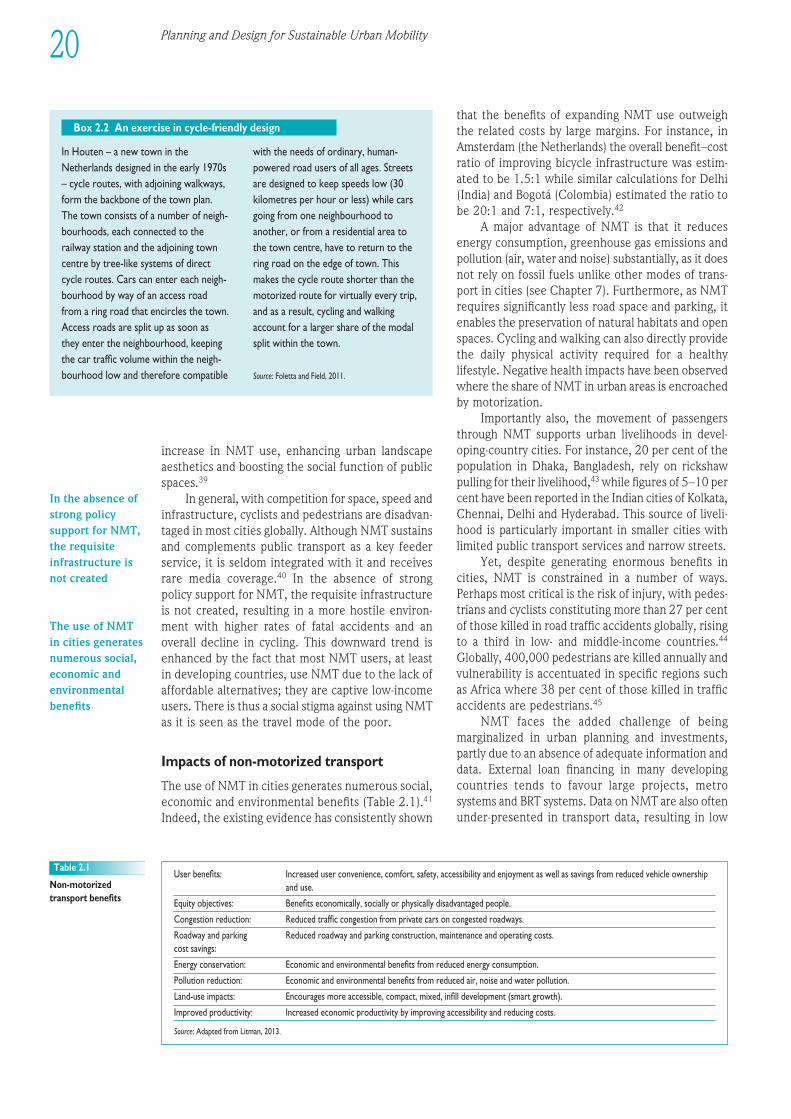
increase in NMT use, enhancing urban landscapeaesthetics and boosting the social function of publicspaces.39
In general, with competition for space, speed andinfra struc ture, cyclists and pedestrians are dis advan -taged in most cities globally. Although NMT sustainsand complements public trans port as a key feederservice, it is seldom integrated with it and receivesrare media coverage.40 In the absence of strongpolicy support for NMT, the requisite infra struc tureis not created, resulting in a more hostile environ -ment with higher rates of fatal accidents and anoverall decline in cycling. This downward trend isenhanced by the fact that most NMT users, at leastin devel op ing countries, use NMT due to the lack ofaffordable alternatives; they are captive low-incomeusers. There is thus a social stigma against using NMTas it is seen as the travel mode of the poor.
Impacts of non-motorized transport
The use of NMT in cities generates numerous social,economic and environ mental benefits (Table 2.1).41
Indeed, the existing evidence has consistently shown
that the benefits of expanding NMT use outweighthe related costs by large margins. For instance, inAmsterdam (the Netherlands) the overall benefit–costratio of improving bicycle infra struc ture was estim -ated to be 1.5:1 while similar calculations for Delhi(India) and Bogotá (Colombia) estimated the ratio tobe 20:1 and 7:1, respectively.42
A major advantage of NMT is that it reducesenergy consumption, greenhouse gas emissions andpollution (air, water and noise) substantially, as it doesnot rely on fossil fuels unlike other modes of trans -port in cities (see Chapter 7). Further more, as NMTrequires significantly less road space and parking, itenables the preservation of natural habitats and openspaces. Cycling and walking can also directly providethe daily physical activity required for a healthylifestyle. Negative health impacts have been observedwhere the share of NMT in urban areas is encroachedby motorization.
Importantly also, the movement of passen gersthrough NMT supports urban livelihoods in devel -oping-country cities. For instance, 20 per cent of thepopulation in Dhaka, Bangladesh, rely on rickshawpulling for their livelihood,43 while figures of 5–10 percent have been reported in the Indian cities of Kolkata,Chennai, Delhi and Hyderabad. This source of liveli -hood is particularly important in smaller cities withlimited public trans port services and narrow streets.
Yet, despite generating enormous benefits incities, NMT is constrained in a number of ways.Perhaps most critical is the risk of injury, with pedes -trians and cyclists constituting more than 27 per centof those killed in road traffic accidents globally, risingto a third in low- and middle-income countries.44
Globally, 400,000 pedestrians are killed annually andvulnerability is accentuated in specific regions suchas Africa where 38 per cent of those killed in trafficaccidents are pedestrians.45
NMT faces the added challenge of beingmarginalized in urban planning and investments,partly due to an absence of adequate information anddata. External loan financing in many devel op ingcountries tends to favour large projects, metrosystems and BRT systems. Data on NMT are also oftenunder-presented in trans port data, resulting in low
User benefits: Increased user convenience, comfort, safety, accessibility and enjoyment as well as savings from reduced vehicle ownershipand use.
Equity objectives: Benefits economically, socially or physically disadvantaged people.
Congestion reduction: Reduced traffic congestion from private cars on congested roadways.
Roadway and parking Reduced roadway and parking construction, maintenance and operating costs.cost savings:
Energy conservation: Economic and environ mental benefits from reduced energy consumption.
Pollution reduction: Economic and environ mental benefits from reduced air, noise and water pollution.
Land-use impacts: Encourages more accessible, compact, mixed, infill development (smart growth).
Improved productivity: Increased economic productivity by improving accessibility and reducing costs.
Source: Adapted from Litman, 2013.
Table 2.1
Non-motorizedtransport benefits
In Houten – a new town in theNetherlands designed in the early 1970s– cycle routes, with adjoining walkways,form the backbone of the town plan.The town consists of a number of neigh -bour hoods, each connected to therailway station and the adjoining towncentre by tree-like systems of directcycle routes. Cars can enter each neigh -bour hood by way of an access roadfrom a ring road that encircles the town.Access roads are split up as soon asthey enter the neigh bour hood, keepingthe car traffic volume within the neigh -bour hood low and therefore compatible
with the needs of ordinary, human-powered road users of all ages. Streetsare designed to keep speeds low (30kilometres per hour or less) while carsgoing from one neigh bour hood toanother, or from a residential area tothe town centre, have to return to thering road on the edge of town. Thismakes the cycle route shorter than themotorized route for virtually every trip,and as a result, cycling and walkingaccount for a larger share of the modalsplit within the town.
Source: Foletta and Field, 2011.
Box 2.2 An exercise in cycle-friendly design
20 Planning and Design for Sustainable Urban Mobility
In the absence ofstrong policysupport for NMT,the requisiteinfrastructure isnot created
The use of NMTin cities generatesnumerous social,economic andenvironmentalbenefits
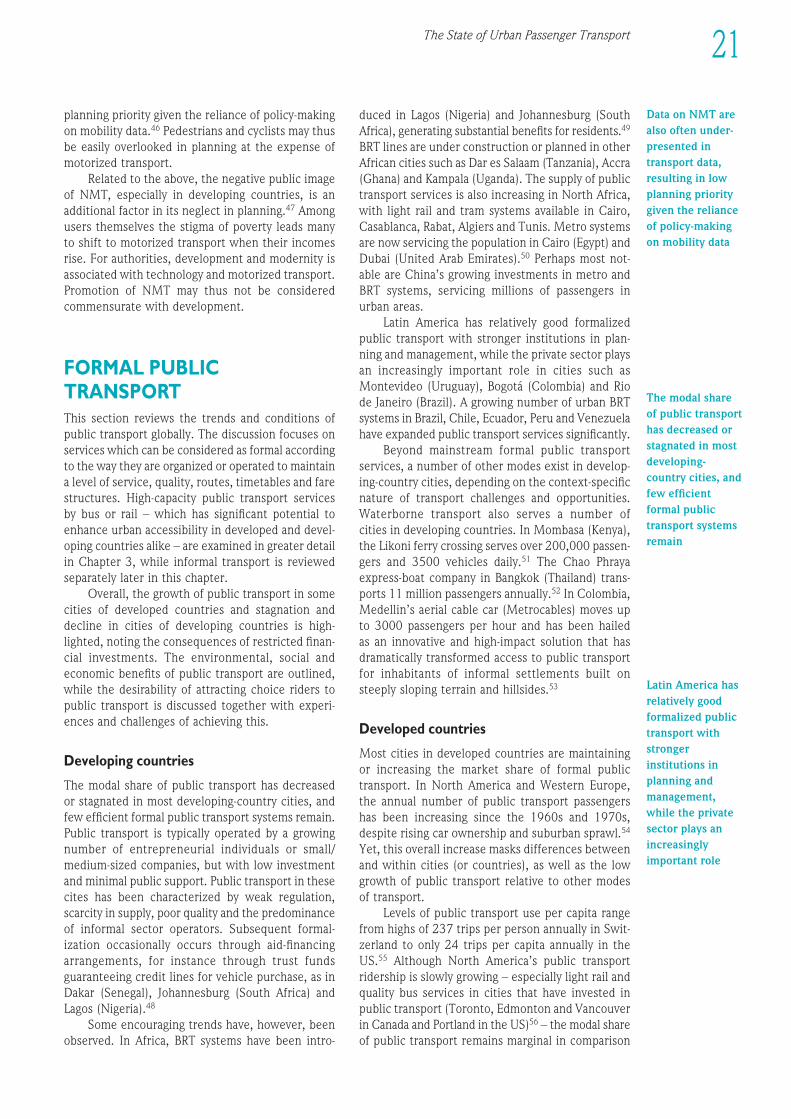
1EEE234567891012311145678920123456789301234567894012345678950123456789EEEE
21The State of Urban Passenger Transport
planning priority given the reliance of policy-makingon mobility data.46 Pedestrians and cyclists may thusbe easily overlooked in planning at the expense ofmotorized transport.
Related to the above, the negative public imageof NMT, especially in devel op ing countries, is anadditional factor in its neglect in planning.47 Amongusers themselves the stigma of poverty leads manyto shift to motorized trans port when their incomesrise. For authorities, devel op ment and modernity isassociated with technology and motorized transport.Promotion of NMT may thus not be consideredcommensurate with devel op ment.
FORMAL PUBLIC TRANSPORTThis section reviews the trends and conditions ofpublic trans port globally. The discussion focuses onservices which can be considered as formal accordingto the way they are organized or operated to maintaina level of service, quality, routes, timetables and farestructures. High-capacity public trans port services by bus or rail – which has significant potential toenhance urban accessibility in developed and devel -op ing countries alike – are examined in greater detailin Chapter 3, while informal trans port is reviewedseparately later in this chapter.
Overall, the growth of public trans port in somecities of developed countries and stagnation anddecline in cities of devel op ing countries is high -lighted, noting the consequences of restricted finan -cial investments. The environ mental, social andeconomic benefits of public trans port are outlined,while the desirability of attracting choice riders topublic trans port is discussed together with experi -ences and challenges of achieving this.
Devel op ing countries
The modal share of public trans port has decreasedor stagnated in most devel op ing-country cities, andfew efficient formal public trans port systems remain.Public trans port is typically operated by a growingnumber of entrepreneurial individuals or small/medium-sized companies, but with low investmentand minimal public support. Public trans port in thesecites has been characterized by weak regulation,scarcity in supply, poor quality and the predominanceof informal sector operators. Subsequent formal -ization occasionally occurs through aid-financingarrangements, for instance through trust fundsguaranteeing credit lines for vehicle purchase, as inDakar (Senegal), Johannesburg (South Africa) andLagos (Nigeria).48
Some encouraging trends have, however, beenobserved. In Africa, BRT systems have been intro -
duced in Lagos (Nigeria) and Johannesburg (SouthAfrica), generating substantial benefits for residents.49
BRT lines are under construction or planned in otherAfrican cities such as Dar es Salaam (Tanzania), Accra(Ghana) and Kampala (Uganda). The supply of publictrans port services is also increasing in North Africa,with light rail and tram systems available in Cairo,Casablanca, Rabat, Algiers and Tunis. Metro systemsare now servicing the population in Cairo (Egypt) andDubai (United Arab Emirates).50 Perhaps most not-able are China’s growing investments in metro andBRT systems, servicing millions of passen gers inurban areas.
Latin America has relatively good formalizedpublic trans port with stronger institutions in plan-ning and management, while the private sector playsan increasingly important role in cities such asMontevideo (Uruguay), Bogotá (Colombia) and Riode Janeiro (Brazil). A growing number of urban BRTsystems in Brazil, Chile, Ecuador, Peru and Venezuelahave expanded public trans port services significantly.
Beyond main stream formal public trans portservices, a number of other modes exist in devel op -ing-country cities, depending on the context-specificnature of trans port challenges and opportunities.Waterborne trans port also serves a number of cities in devel op ing countries. In Mombasa (Kenya),the Likoni ferry crossing serves over 200,000 passen -gers and 3500 vehicles daily.51 The Chao Phrayaexpress-boat company in Bangkok (Thailand) trans -ports 11 million passen gers annually.52 In Colombia,Medellin’s aerial cable car (Metrocables) moves upto 3000 passen gers per hour and has been hailed as an innovative and high-impact solution that hasdramatically transformed access to public trans portfor inhabitants of informal settlements built onsteeply sloping terrain and hillsides.53
Developed countries
Most cities in developed countries are main tainingor increasing the market share of formal publictransport. In North America and Western Europe, the annual number of public trans port passen gers has been increasing since the 1960s and 1970s,despite rising car ownership and suburban sprawl.54
Yet, this overall increase masks differences betweenand within cities (or countries), as well as the lowgrowth of public trans port relative to other modesof transport.
Levels of public trans port use per capita rangefrom highs of 237 trips per person annually in Swit -zerland to only 24 trips per capita annually in theUS.55 Although North America’s public trans portridership is slowly growing – especially light rail andquality bus services in cities that have invested inpublic trans port (Toronto, Edmonton and Vancouverin Canada and Portland in the US)56 – the modal shareof public trans port remains marginal in comparison
The modal shareof public transporthas decreased orstagnated in mostdeveloping-country cities, andfew efficientformal publictransport systemsremain
Latin America hasrelatively goodformalized publictransport withstrongerinstitutions inplanning andmanagement,while the privatesector plays anincreasinglyimportant role
Data on NMT arealso often under-presented intrans port data,resulting in lowplanning prioritygiven the relianceof policy-makingon mobility data
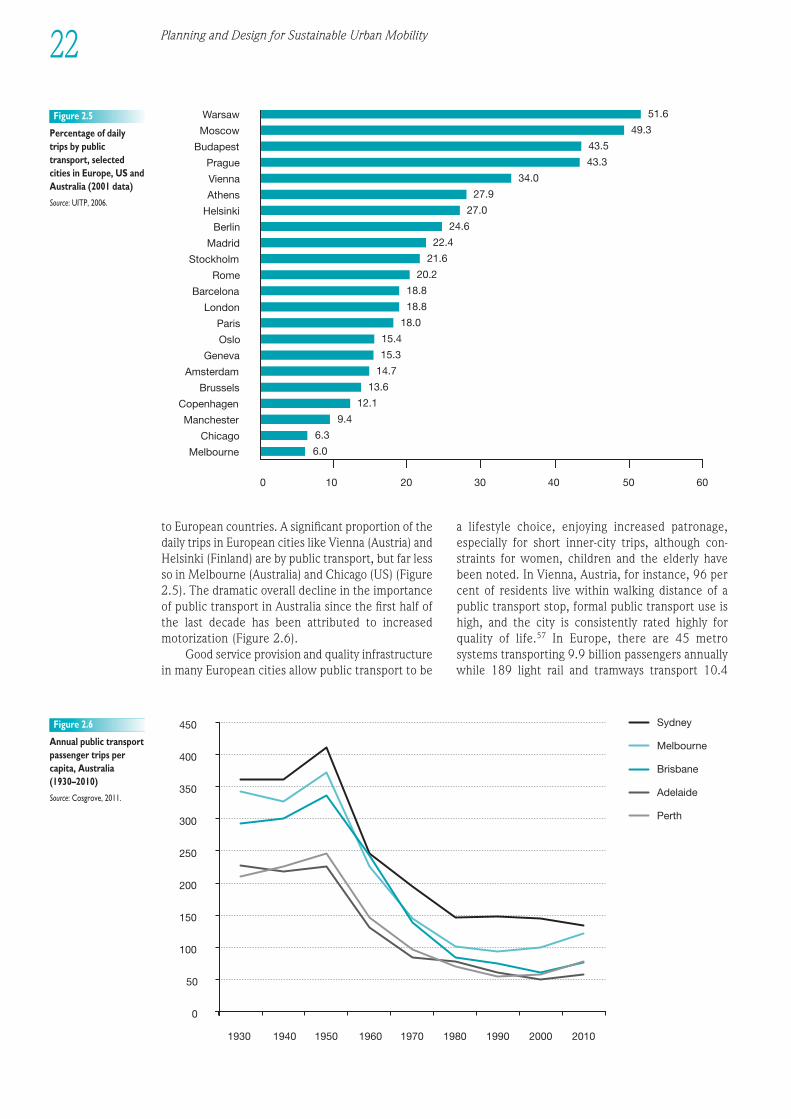
Planning and Design for Sustainable Urban Mobility22
6.0
6.3
9.4
12.1
13.6
14.7
15.3
15.4
18.0
18.8
18.8
20.2
21.6
22.4
24.6
27.0
27.9
34.0
43.3
43.5
49.3
51.6
0 10 20 30 40 50 60
Melbourne
Chicago
Manchester
Copenhagen
Brussels
Amsterdam
Geneva
Oslo
Paris
London
Barcelona
Rome
Stockholm
Madrid
Berlin
Helsinki
Athens
Vienna
Prague
Budapest
Moscow
Warsaw Figure 2.5
Percentage of dailytrips by publictransport, selectedcities in Europe, US andAustralia (2001 data)
Source: UITP, 2006.
to European countries. A significant proportion of thedaily trips in European cities like Vienna (Austria) andHelsinki (Finland) are by public transport, but far lessso in Melbourne (Australia) and Chicago (US) (Figure2.5). The dramatic overall decline in the importanceof public trans port in Australia since the first half ofthe last decade has been attributed to increasedmotorization (Figure 2.6).
Good service provision and quality infra struc turein many European cities allow public trans port to be
a lifestyle choice, enjoying increased patronage,especially for short inner-city trips, although con -straints for women, children and the elderly havebeen noted. In Vienna, Austria, for instance, 96 percent of residents live within walking distance of apublic trans port stop, formal public trans port use ishigh, and the city is consistently rated highly forquality of life.57 In Europe, there are 45 metrosystems trans porting 9.9 billion passen gers annuallywhile 189 light rail and tramways trans port 10.4
0
50
100
150
200
250
300
350
400
450
1930 1940 1950 1960 1970 1980 1990 2000 2010
Sydney
Melbourne
Brisbane
Adelaide
Perth
Figure 2.6
Annual public trans portpassen ger trips percapita, Australia(1930–2010)
Source: Cosgrove, 2011.
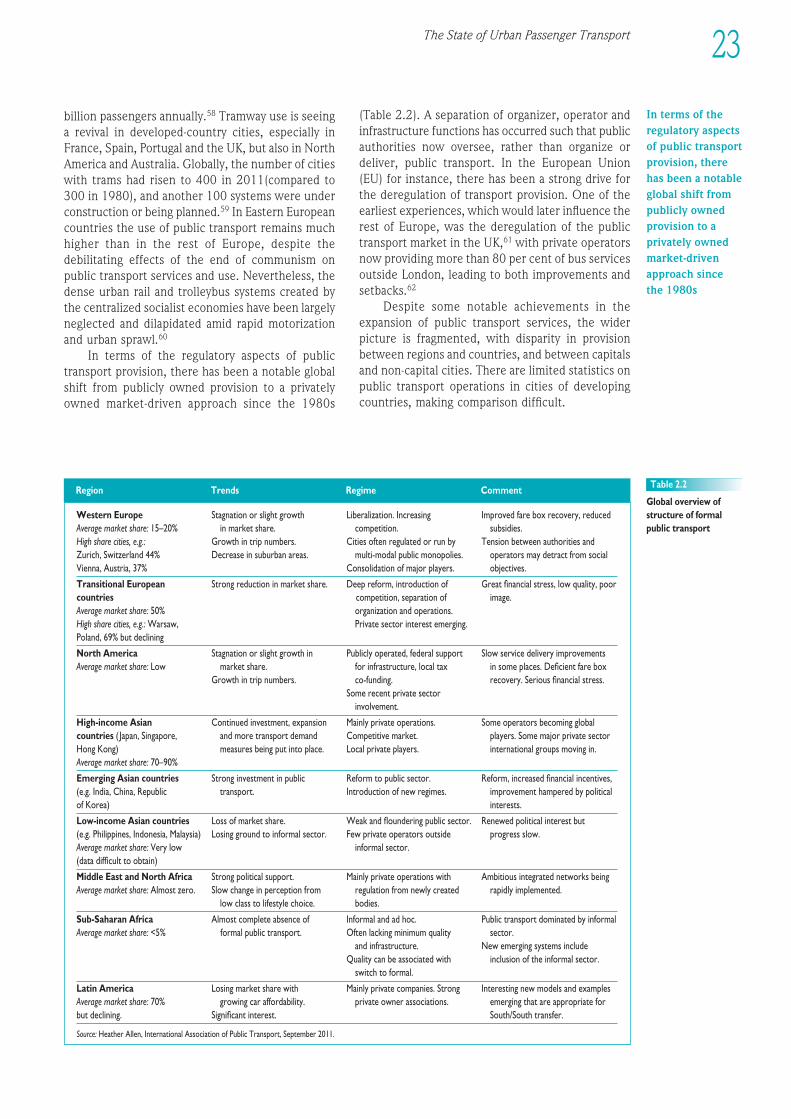
The State of Urban Passenger Transport 23
1EEE234567891012311145678920123456789301234567894012345678950123456789EEEE
billion passen gers annually.58 Tramway use is seeinga revival in devel oped-country cities, especially inFrance, Spain, Portugal and the UK, but also in NorthAmerica and Australia. Globally, the number of citieswith trams had risen to 400 in 2011(compared to300 in 1980), and another 100 systems were underconstruction or being planned.59 In Eastern Europeancountries the use of public trans port remains muchhigher than in the rest of Europe, despite thedebilitating effects of the end of communism onpublic trans port services and use. Nevertheless, thedense urban rail and trolleybus systems created bythe centralized socialist economies have been largelyneglected and dilap idated amid rapid motorizationand urban sprawl.60
In terms of the regulatory aspects of publictrans port provision, there has been a notable globalshift from publicly owned provision to a privatelyowned market-driven approach since the 1980s
(Table 2.2). A separation of organizer, operator andinfra struc ture functions has occurred such that publicauthorities now oversee, rather than organize ordeliver, public transport. In the European Union(EU) for instance, there has been a strong drive forthe deregulation of trans port provision. One of theearliest experi ences, which would later influence therest of Europe, was the deregulation of the publictrans port market in the UK,61 with private operatorsnow providing more than 80 per cent of bus servicesoutside London, leading to both improvements andsetbacks.62
Despite some notable achievements in theexpansion of public trans port services, the widerpicture is fragmented, with disparity in provisionbetween regions and countries, and between capitalsand non-capital cities. There are limited statistics onpublic trans port operations in cities of devel op ingcountries, making comparison difficult.
Western Europe Stagnation or slight growth Liberalization. Increasing Improved fare box recovery, reduced Average market share: 15–20% in market share. competition. subsidies.High share cities, e.g.: Growth in trip numbers. Cities often regulated or run by Tension between authorities and Zurich, Switzerland 44% Decrease in suburban areas. multi-modal public monopolies. operators may detract from social Vienna, Austria, 37% Consolidation of major players. objectives.
Transitional European Strong reduction in market share. Deep reform, introduction of Great finan cial stress, low quality, poor countries competition, separation of image.Average market share: 50% organization and operations. High share cities, e.g.: Warsaw, Private sector interest emerging.Poland, 69% but declining
North America Stagnation or slight growth in Publicly operated, federal support Slow service delivery improvements Average market share: Low market share. for infra struc ture, local tax in some places. Deficient fare box
Growth in trip numbers. co-funding. recovery. Serious finan cial stress.Some recent private sector
involvement.
High-income Asian Continued investment, expansion Mainly private operations. Some operators becoming global countries ( Japan, Singapore, and more trans port demand Competitive market. players. Some major private sector Hong Kong) measures being put into place. Local private players. international groups moving in.Average market share: 70–90%
Emerging Asian countries Strong investment in public Reform to public sector. Reform, increased finan cial incentives, (e.g. India, China, Republic transport. Introduction of new regimes. improvement hampered by political of Korea) interests.
Low-income Asian countries Loss of market share. Weak and floundering public sector. Renewed political interest but (e.g. Philippines, Indonesia, Malaysia) Losing ground to informal sector. Few private operators outside progress slow.Average market share: Very low informal sector.(data difficult to obtain)
Middle East and North Africa Strong political support. Mainly private operations with Ambitious integrated networks being Average market share: Almost zero. Slow change in perception from regulation from newly created rapidly implemented.
low class to lifestyle choice. bodies.
Sub-Saharan Africa Almost complete absence of Informal and ad hoc. Public trans port dominated by informal Average market share: <5% formal public transport. Often lacking minimum quality sector.
and infra struc ture. New emerging systems include Quality can be associated with inclusion of the informal sector.
switch to formal.
Latin America Losing market share with Mainly private companies. Strong Interesting new models and examples Average market share: 70% growing car affordability. private owner associations. emerging that are appropriate for but declining. Significant interest. South/South transfer.
Source: Heather Allen, International Association of Public Transport, September 2011.
Table 2.2
Global overview ofstructure of formalpublic transport
Region Trends Regime Comment
In terms of theregulatory aspectsof public transportprovision, therehas been a notableglobal shift frompublicly ownedprovision to aprivately ownedmarket-drivenapproach sincethe 1980s
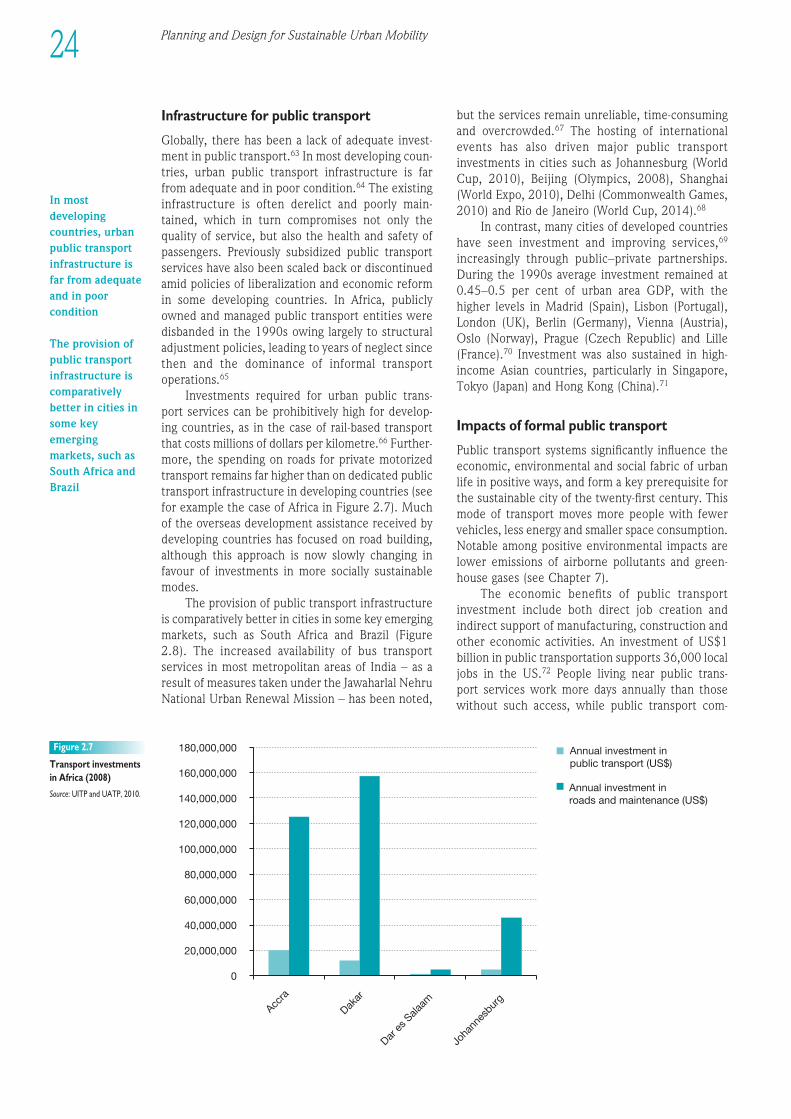
0
20,000,000
40,000,000
60,000,000
80,000,000
100,000,000
120,000,000
140,000,000
160,000,000
180,000,000 Annual investment inpublic transport (US$)
Annual investment inroads and maintenance (US$)
Accra
Dakar
Dar es
Sala
am
Joha
nnes
burg
Figure 2.7
Trans port investmentsin Africa (2008)
Source: UITP and UATP, 2010.
Infra struc ture for public transport
Globally, there has been a lack of adequate invest -ment in public transport.63 In most devel op ing coun -tries, urban public trans port infra struc ture is farfrom adequate and in poor condition.64 The existinginfra struc ture is often derelict and poorly main-tained, which in turn compromises not only thequality of service, but also the health and safety ofpassen gers. Previously subsidized public trans portservices have also been scaled back or discontinuedamid policies of liberalization and economic reformin some devel op ing countries. In Africa, publiclyowned and managed public trans port entities weredisbanded in the 1990s owing largely to structuraladjustment policies, leading to years of neglect sincethen and the dominance of informal trans portoperations.65
Investments required for urban public trans -port services can be prohibitively high for devel op -ing countries, as in the case of rail-based trans portthat costs millions of dollars per kilometre.66 Further -more, the spending on roads for private motorizedtrans port remains far higher than on dedicated publictrans port infra struc ture in devel op ing countries (seefor example the case of Africa in Figure 2.7). Muchof the overseas devel op ment assistance received bydevel op ing countries has focused on road building,although this approach is now slowly changing infavour of investments in more socially sus tain ablemodes.
The provision of public trans port infra struc tureis comparatively better in cities in some key emergingmarkets, such as South Africa and Brazil (Figure2.8). The increased availability of bus trans portservices in most metropolitan areas of India – as aresult of measures taken under the Jawaharlal NehruNational Urban Renewal Mission – has been noted,
but the services remain unreliable, time-consumingand over crowded.67 The hosting of internationalevents has also driven major public trans portinvestments in cities such as Johannesburg (WorldCup, 2010), Beijing (Olympics, 2008), Shanghai(World Expo, 2010), Delhi (Commonwealth Games,2010) and Rio de Janeiro (World Cup, 2014).68
In contrast, many cities of developed countrieshave seen investment and improving services,69
increasingly through public–private partnerships.During the 1990s average investment remained at0.45–0.5 per cent of urban area GDP, with thehigher levels in Madrid (Spain), Lisbon (Portugal),London (UK), Berlin (Germany), Vienna (Austria),Oslo (Norway), Prague (Czech Republic) and Lille(France).70 Investment was also sustained in high-income Asian countries, particularly in Singapore,Tokyo (Japan) and Hong Kong (China).71
Impacts of formal public transport
Public trans port systems significantly influence theeconomic, environ mental and social fabric of urbanlife in positive ways, and form a key prerequisite forthe sus tain able city of the twenty-first century. Thismode of trans port moves more people with fewervehicles, less energy and smaller space consumption.Notable among positive environ mental impacts arelower emissions of airborne pollutants and green -house gases (see Chapter 7).
The economic benefits of public trans portinvestment include both direct job creation andindirect support of manufacturing, construction andother economic activities. An investment of US$1billion in public transportation supports 36,000 localjobs in the US.72 People living near public trans-port services work more days annually than thosewithout such access, while public trans port com -
24 Planning and Design for Sustainable Urban Mobility
In mostdevelopingcountries, urbanpublic transportinfrastructure isfar from adequateand in poorcondition
The provision ofpublic transportinfrastructure iscomparativelybetter in cities insome keyemergingmarkets, such asSouth Africa andBrazil
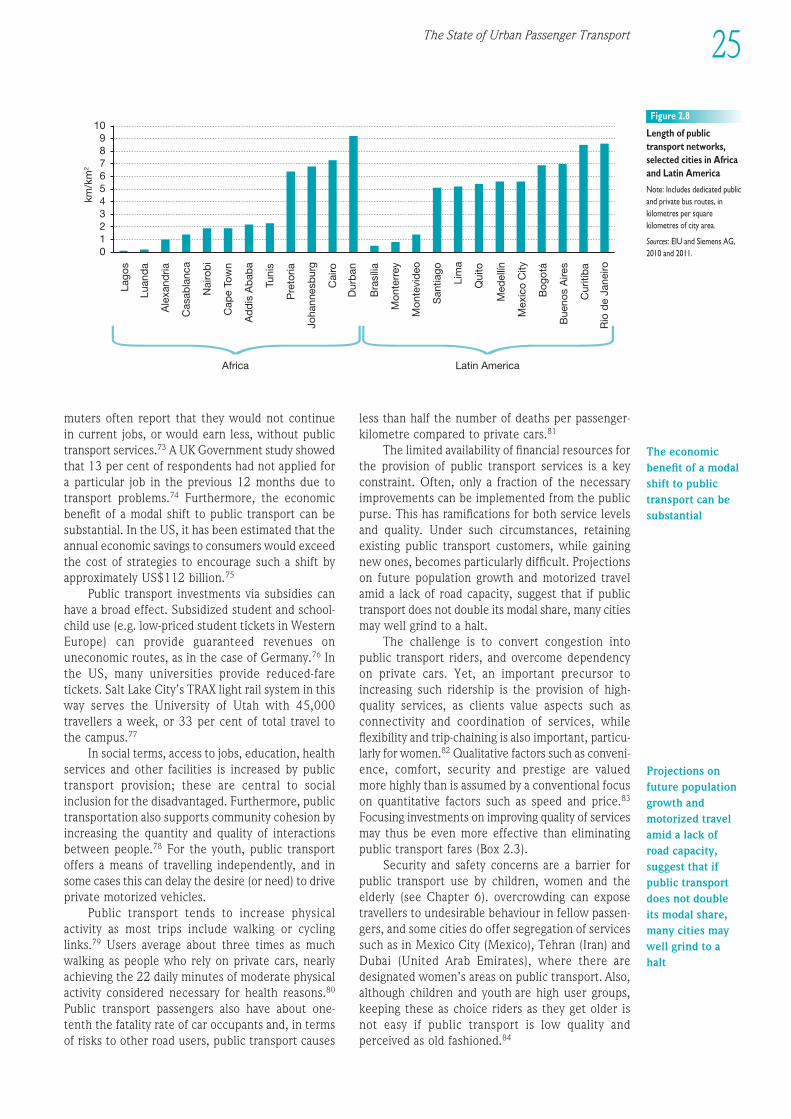
0 1 2 3 4 5 6 7 8 9
10 La
gos
Luan
da
Ale
xand
ria
Cas
abla
nca
Nai
rob
i
Cap
e To
wn
Ad
dis
Ab
aba
Tuni
s
Pre
toria
Joha
nnes
bur
g
Cai
ro
Dur
ban
Bra
sília
Mon
terr
ey
Mon
tevi
deo
San
tiago
Lim
a
Qui
to
Med
ellín
Mex
ico
City
Bog
otá
Bue
nos
Aire
s
Cur
itib
a
Rio
de
Jane
iro
Africa Latin America
km/k
m2
Figure 2.8
Length of publictransport networks,selected cities in Africaand Latin America
Note: Includes dedicated publicand private bus routes, inkilometres per squarekilometres of city area.
Sources: EIU and Siemens AG,2010 and 2011.
1EEE234567891012311145678920123456789301234567894012345678950123456789EEEE
25The State of Urban Passenger Transport
muters often report that they would not continue in current jobs, or would earn less, without publictrans port ser vices.73 A UK Govern ment study showedthat 13 per cent of respondents had not applied fora particular job in the previous 12 months due totrans port problems.74 Further more, the economicbenefit of a modal shift to public trans port can besubstantial. In the US, it has been estimated that theannual economic savings to consumers would exceedthe cost of strategies to encourage such a shift byapproximately US$112 billion.75
Public trans port investments via subsidies canhave a broad effect. Subsidized student and school -child use (e.g. low-priced student tickets in WesternEurope) can provide guaranteed revenues onuneconomic routes, as in the case of Germany.76 Inthe US, many universities provide reduced-faretickets. Salt Lake City’s TRAX light rail system in thisway serves the University of Utah with 45,000travellers a week, or 33 per cent of total travel tothe campus.77
In social terms, access to jobs, education, healthservices and other facilities is increased by publictrans port provision; these are central to socialinclusion for the dis advan taged. Further more, publictransportation also supports community cohesion byincreasing the quantity and quality of interactionsbetween people.78 For the youth, public trans portoffers a means of travelling independently, and insome cases this can delay the desire (or need) to driveprivate motorized vehicles.
Public trans port tends to increase physicalactivity as most trips include walking or cyclinglinks.79 Users average about three times as muchwalking as people who rely on private cars, nearlyachieving the 22 daily minutes of moderate physicalactivity considered necessary for health reasons.80
Public trans port passen gers also have about one-tenth the fatality rate of car occupants and, in termsof risks to other road users, public trans port causes
less than half the number of deaths per passen ger-kilometre compared to private cars.81
The limited availability of finan cial resources forthe provision of public trans port services is a keyconstraint. Often, only a fraction of the necessaryimprovements can be implemented from the publicpurse. This has ramifications for both service levelsand quality. Under such circumstances, retainingexisting public trans port customers, while gainingnew ones, becomes particularly difficult. Projectionson future population growth and motorized travelamid a lack of road capacity, suggest that if publictrans port does not double its modal share, many citiesmay well grind to a halt.
The challenge is to convert congestion intopublic trans port riders, and overcome dependencyon private cars. Yet, an important precursor toincreasing such ridership is the provision of high-quality services, as clients value aspects such asconnectivity and coordination of services, whileflexibility and trip-chaining is also important, particu -larly for women.82 Qualitative factors such as conveni -ence, comfort, security and prestige are valued more highly than is assumed by a conventional focuson quantitative factors such as speed and price.83
Focusing investments on improving quality of servicesmay thus be even more effective than eliminatingpublic trans port fares (Box 2.3).
Security and safety concerns are a barrier forpublic trans port use by children, women and theelderly (see Chapter 6). over crowding can exposetravellers to undesirable behaviour in fellow passen -gers, and some cities do offer segregation of servicessuch as in Mexico City (Mexico), Tehran (Iran) andDubai (United Arab Emirates), where there aredesignated women’s areas on public transport. Also,although children and youth are high user groups,keeping these as choice riders as they get older isnot easy if public trans port is low quality andperceived as old fashioned.84
The economicbenefit of a modalshift to publictransport can besubstantial
Projections onfuture populationgrowth andmotorized travelamid a lack ofroad capacity,suggest that ifpublic transportdoes not doubleits modal share,many cities maywell grind to ahalt
Planning and Design for Sustainable Urban Mobility26
The value of expanding public trans port servicesto enhance accessible mobility in cities is unques -tionable. Urban planning and land-use policies –together with trans port demand and fiscal measures– can encourage a shift in trans port behaviourtowards public transport. Authorities in many citiesmay, however, lack the resources and institutionalcapacity necessary to coordinate land-use and trans -port planning so that they generate such a modaltransition.
INFORMAL TRANSPORTThe informal sector – a term describing small-scaleeconomic activity and unregulated employment –supplies small-vehicle, low-performance services that fill the niche between formal taxis and conven -tional 50-passen ger capacity buses.85 This sectionexamines the conditions of informal trans portglobally, illus trating the dominance of this mode indevel op ing countries. Informal trans port is often theonly accessible means available in many of the world’spoorest cities. Although it provides important benefitsto the urban poor, informal trans port contributessignificantly to congestion, air and noise pollution andtraffic accidents. The role of informal trans port incomplementing formal trans port and in generatingbroader social benefit is considered together with thecosts entailed.
Devel op ing countries
Informal trans port is firmly entrenched in devel op -ing-country cities, often accounting for over half
of all motorized trips. In Africa, private carriersdominate, mainly mini buses and shared taxis withschedules and fares varying with demand, routesbeing semi-fixed and stopping points unregulated.The City of Nairobi (Kenya) has the world’s highestper capita use of informal trans port with matatumini -buses providing 662 trips per inhabitant per year,three-quarters of public trans port trips and 36 percent of traffic volumes. In Harare, Zimbabwe, mini -buses serve around 90 per cent of the market.86 InAlgiers (Algeria) the modal share for taxis and mini -buses is 56 per cent of motorized trips,87 while inGreater Cairo, Egypt, informal shared taxis increasedtheir modal share (of motorized trips) from 6 per centin 1987 to 37 per cent in 2001, and this has sincerisen even higher.88
In Lagos (Nigeria) the public-sector bus companyfailed under the weight of low fares and unsus tain -able subsidies, its mobility role taken over by danfos,midi-buses providing frequent and affordable services,but characterized by over crowding and aggressivedriving.89 A fast growing informal mode is motor-cycle taxis, with 60,000 of them in Cotonou (Benin)accounting for one-quarter of all trips.90 In Kampala,Uganda, residents resort to boda boda motorcycletaxis, despite fares being four to six times higher thanregular taxis.91 The lower investments required fromopera tors of informal trans port services are a keyincentive for entry into this sector.
Formal public trans port is often absent in manyAsian cities. In Istanbul, Turkey, an estimated 5000illegal taxis were in operation by the year 2000.92 InSana’a, Yemen, public trans port is almost entirelyreliant on informally operated vehicles, often old andpoorly maintained, posing safety, health and conges -tion challenges for the city.93 Mini buses and micro-buses serve 5–10 per cent of all trips in Thailand andIndonesia. Informal vehicles, dominated by thecolourful jeepneys (converted US army jeeps) provideas many as half of all trips in the Philippines.94 WhileNMT serves short-distance trips in Jakarta, Indonesia,motorcycle taxis (ojeks) cover longer distances.Hybrid, three-wheeled motor-taxis, bajas, providecomfort more akin to a private car, while largerthree-wheeled bemos carry up to eight passen gers,and mikrolets and mini buses carry 10 to 25 passen -gers.95 The rapid expansion in auto-rickshaws hasbeen observed in numerous Asian and African citiesin recent years (Box 2.4).
Informal trans port is a predominant mode inmost of Latin America, with the proliferation of vansand mini buses fuelled by a lowering of import tariffsand the inability of public trans port to meet trans -port demand. A flood of 10 to 15 passen ger vans inthe 1990s displaced pirate buses in Rio de Janeiro,while today an estimated 15,000 unlicensed vansoperate in São Paulo.96 The use of unlicensed vansin Brazil is also tied to perceived arduous and over -reaching registration procedures. In Santiago, Chile,
Would zero-fare public trans port
systems ‘even the playing field’ and
encourage travellers to shift from cars
to public transport? Would free public
trans port be good for society,
particularly lower-income or dis advan -
taged people?
Concession fares are an example
of addressing these social objectives
through partial subsidy. In a zero-fare
public trans port system the entire cost
of the system is subsidized. The passen -
ger does not directly pay for the trip,
the most obvious result being that
people are more likely to use public
transport, as has been the case in
Hasselt, a small city in Belgium. a similar
system associated with tourism is in
place in melbourne, australia. In Tallinn,
Estonia, zero-fare public trans port for all
its 420,000 inhabitants on all public
trans port services run by the city from 1
January 2013 is expected to significantly
increase ridership.
However, meeting dramatically
increased demand in large systems
would require considerable capital
investment. If funds were instead used
to increase service levels, perhaps new
passen gers may be attracted while
maintaining income from existing
passen gers. The income from new
passen gers may then at least partially
offset the costs of the improved service.
Sources: Brown et al, 2001; van goeverden et al, 2006;
Royal Institute of Technology, 2012.
Box 2.3 Zero-fare public transport?
Urban planningand land-usepolicies – togetherwith transportdemand and fiscalmeasures – canencourage a shiftin transportbehaviour towardspublic transport
Informal transportis firmlyentrenched indeveloping-country cities,often accountingfor over half of allmotorized trips
some 30,000 pirate taxis ply the streets. In Kingston,Jamaica, private station-wagons (called robots) poachcustomers from public operators by running aheadof buses.97 In Mexico City, around half of the mini -bus operators are not legitimately licensed or insured.Smaller door-to-door carriers concentrate on out-lying markets, such as in Bogotá, Colombia, wheretricimobiles in peripheral informal settlements serveshort trips of 1–2 kilometres at low costs (less thanUS$0.50 per trip).98 Because of rapid motorization,however, informal carriers are increasingly viewedas major contributors to worsening traffic congestion.
Informal trans port operators in devel op ingcountries serve not only low-income markets but also middle-income choice consumers looking forconvenience (e.g. door-to-door, taxi-like services).99
Low-income users also seek service quality, as in thecase of Uzbekistan, the Kyrgyz Republic and Braziliancities where surveys show that the poor are willingto pay more for better services.100 Further more,there are notable gender and age differences in theuse of informal trans port in cities, with mini busescatering to larger volume, longer distance trips,generally serving male customers. Motorcycle taxisoften cater to a younger crowd. Nearly two-thirds ofthe motorcycle-taxi passen gers in Bangkok, Thailand,are aged 16–25 years.101
Generally, the role of informal trans port appearsto decline as cities in devel op ing countries becomewealthier. For instance, the market share of informal
trans port in nine cities in Sub-Saharan Africa showsa negative correlation with local GDP per capitalevels (Figure 2.9). This inverse relationship betweenwealth and informal trans port can at times promptpublic authorities to ban them in the hope ofconveying a modern image.
Informal trans port services are nowhere near asvertically organized as formal services. Often,individual owner-operators provide the service, andthe sector is normally held together in a loosehorizontal fashion, dependent upon inter-personaland inter-operator linkages and fellowship amongstakeholders (Box 2.5).
Some devel op ing countries attempt to regulatemarket entry, vehicle and driver fitness and servicepractices with respect to informal transport. Forexample, in Nairobi, Kenya, the Ministry of Transportenforced that all seats be fitted with seatbelts in mini buses, while standing is no longer permitted onlarger buses.102 Red plates distinguish the 55,000legitimate shared-ride taxis of Beirut, Lebanon,although around 40 per cent of the plates areforged.103 However, circumvention of such regula -tions is widespread and enforcement is often ham -pered. Thus, in many poorer countries, govern-ments acquiesce to self-regulation and self-policingof informal transport. Indeed, many informal oper -ators often form route associations to minimizecollectively damaging behaviour and to increaseridership and profits.
The State of Urban Passenger Transport 27
1EEE234567891012311145678920123456789301234567894012345678950123456789EEEE
An auto-rickshaw or three-wheeler (variously known as tuk-tuk, trishaw, autorick, chakda, vikram, tempo, bajaj, tricycle, babytaxi, etc.) is a popular way to get around in many devel op ingcountries. These motorized versions of the traditionalrickshaw flourish in Bangladesh, Cambodia, Egypt, Ethiopia,Guatemala, India, Laos, Pakistan, the Philippines, Sri Lanka,Sudan and Thailand. In many Indian and Pakistani cities,motorcycle rickshaws – usually called phat-phati, chand gari(moon car) or qingqi (after the Chinese company) – alsopopulate city streets. In Afghanistan, auto-rickshaw use is
growing at 10 to 20 per cent per year in many cities. Auto-rickshaws are also an important source of employment,providing as much as 15 per cent of total urban jobs in someAsian cities.
Because two-stroke engines that power most auto-rickshaws are noisy and emit high levels of air emissions, localgovern ments in India and Pakistan have in recent yearsrequired that older models be replaced by cleaner and quieterthree-wheelers, powered by compressed natural gas.Sources: Cervero, 2000; Jain, 2011.
Box 2.4 Auto-rickshaws: Taxis for the poor and middle class
Informal transportoperators indevelopingcountries servenot only low-income marketsbut also middle-income choiceconsumerslooking forconvenience (e.g. door-to-door,taxi-like services)
Generally, therole of informaltransport appearsto decline as citiesin developingcountries becomewealthier
In Kampala and Nairobi, it is normal for mini bus owners to beinvestors rather than owner-drivers. Most owners have lessthan four vehicles. They usually hire out their mini buses for adaily fee to a principal driver, who may in turn employ asecond driver and one or more conductors. The driver keepsthe revenue collected but is responsible for paying the costs offuel, use of the mini bus terminals, the wages of any seconddriver and conductors, as well as any fines extorted from himby the police or the route associations. Drivers work very
long hours, with shifts averaging more than 12 hours a day,usually for six or seven days a week, although actual drivinghours are normally seven to eight hours. So as to maximizethe revenue from each trip, the mini bus driver will notnormally leave the terminal until the vehicle is full. This meansthat at off-peak times vehicles wait very long times at theterminal.
Sources: Gleave et al, 2005; Pirie, 2011.
Box 2.5 Mini bus operators in Kampala (Uganda) and Nairobi (Kenya)
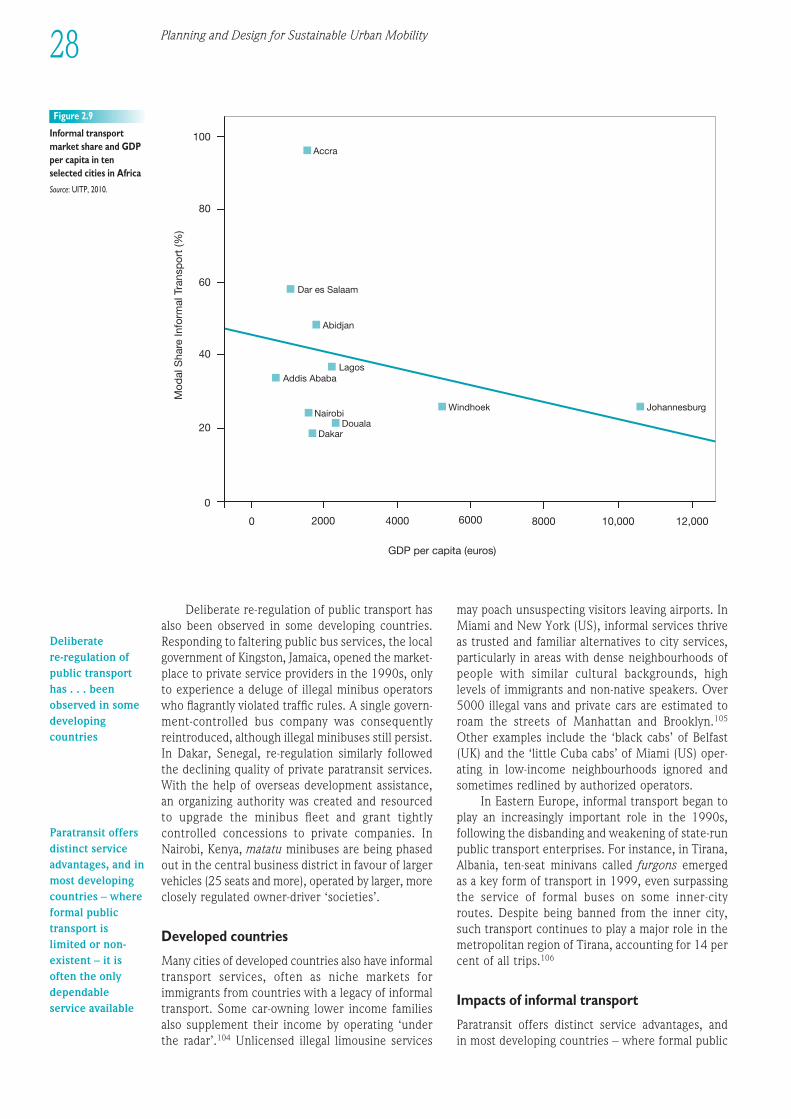
Deliberate re-regulation of public trans port hasalso been observed in some devel op ing countries.Responding to faltering public bus services, the localgovern ment of Kingston, Jamaica, opened the market -place to private service providers in the 1990s, onlyto experi ence a deluge of illegal mini bus opera torswho flagrantly violated traffic rules. A single govern -ment-controlled bus company was conse quentlyreintroduced, although illegal mini buses still persist.In Dakar, Senegal, re-regulation similarly followed the declining quality of private paratransit services.With the help of overseas devel op ment assistance,an organizing authority was created and resourcedto upgrade the mini bus fleet and grant tightlycontrolled concessions to private companies. InNairobi, Kenya, matatu mini buses are being phasedout in the central business district in favour of largervehicles (25 seats and more), operated by larger, moreclosely regulated owner-driver ‘societies’.
Developed countries
Many cities of developed countries also have informaltrans port services, often as niche markets forimmigrants from countries with a legacy of informaltransport. Some car-owning lower income familiesalso supplement their income by operating ‘underthe radar’.104 Unlicensed illegal limousine services
may poach unsuspecting visitors leaving airports. InMiami and New York (US), informal services thriveas trusted and familiar alternatives to city services,particularly in areas with dense neigh bour hoods ofpeople with similar cultural backgrounds, high levels of immigrants and non-native speakers. Over5000 illegal vans and private cars are estimated toroam the streets of Manhattan and Brooklyn.105
Other examples include the ‘black cabs’ of Belfast(UK) and the ‘little Cuba cabs’ of Miami (US) oper -ating in low-income neigh bour hoods ignored andsometimes redlined by authorized operators.
In Eastern Europe, informal trans port began toplay an increasingly important role in the 1990s,following the disbanding and weakening of state-runpublic trans port enterprises. For instance, in Tirana,Albania, ten-seat minivans called furgons emerged as a key form of trans port in 1999, even surpassingthe service of formal buses on some inner-city routes. Despite being banned from the inner city,such trans port continues to play a major role in themetropolitan region of Tirana, accounting for 14 percent of all trips.106
Impacts of informal transport
Paratransit offers distinct service advantages, and in most devel op ing countries – where formal public
28 Planning and Design for Sustainable Urban Mobility
GDP per capita (euros)
0 2000 4000 6000 8000 10,000 12,000
20
40
60
80
100
Mod
al S
hare
Info
rmal
Tra
nsp
ort
(%)
Dar es Salaam
Abidjan
Accra
Addis AbabaLagos
NairobiDouala
Dakar
Windhoek Johannesburg
0
Figure 2.9
Informal trans portmarket share and GDPper capita in tenselected cities in Africa
Source: UITP, 2010.
Deliberate re-regulation ofpublic transporthas . . . beenobserved in somedevelopingcountries
Paratransit offersdistinct serviceadvantages, and inmost developingcountries – whereformal publictransport islimited or non-existent – it isoften the onlydependableservice available
1EEE234567891012311145678920123456789301234567894012345678950123456789EEEE
29The State of Urban Passenger Transport
trans port is limited or non-existent – it is often theonly dependable service available. With fewer passen -gers per vehicle, paratransit is more frequent, therebyreducing waiting times and is also more flexible andadaptive by providing door-to-door service. Smallvehicles are suited to lower density settings, servingpolycentric trip patterns, functioning as comple-ments to large-vehicle, trunk-line services. They alsopenetrate the narrow streets of low-cost neigh bour -hoods and better negotiate congested traffic, and arethus faster, often offering a smoother ride and aguaranteed seat. Vehicles used for informal trans portcan also be more energy efficient, owing to higherload factors. In Abidjan, Côte d’Ivoire, mini buses usean average of 12 per cent less fuel per passen ger tripcompared to conventional buses.107
The greatest appeal of paratransit is that it isfinan cially remunerative. Driven by profit, operatorsrespond quickly to market trends and economize on costs. By organizing into route associations and co opera tives they can lower per-seat costs to thepoint of being competitive with larger companies.108
Data from mini bus operations in Abidjan (Côted’Ivoire), Dakar (Senegal) and Douala (Cameroon)reveal sizeable profit margins, fare-box revenuesexceed ing operating costs by 17–96 per cent.109 InJohannesburg (South Africa), the operating cost perpassen ger of formal public trans port is estimated tobe 13 times higher than informal transport.110
Importantly also, the informal sector is asignificant gateway employment for many recentimmigrants, making up an estimated 15 per cent of total employment in poor countries. In Dhaka,Bangladesh, the figure is close to 30 per cent.111 InCotonou, Benin (with just under 1 million inhabit -ants), motorcycle taxis alone provide 60,000 jobs,mostly for young men.112 Indirect employment is alsosignificant, as touts, changers (who provide smallchange) and a cadre of individuals who clean, main -tain, repair and rebuild informal carriers.113 Mostmotorcycle taxi operators in Bangkok (Thai land),Jakarta (Indonesia) and Yola (Nigeria) are ruralmigrants with no previous urban employment.114
While playing a critical role for the mobility ofmany urban residents, the informal trans port sectorfaces a number of constraints.115 A key challengefaced by operators relates to accessing commerciallines of credit. In the Caribbean and Sub-SaharanAfrica, banks are reluctant to lend to informaloperators. If they do, interest rates are often high(40 per cent or more per month) and payback periodsshort (three years or less). Unable to obtain creditthrough formal channels, some operators turn tostreet lenders, paying most of their daily earnings tocreditors and rarely getting out of debt. Operatorsthat lease vehicles pay to vehicle owners, often halfor more of their daily in-take, meaning few are ableto break out of poverty.116
Safety is an additional challenge, with accidentsoccurring because of poor (or lack of) driver train-ing, inappropriate vehicles and poor maintenance. In Abidjan, Côte d’Ivoire, mini buses (ghakas) areinvolved in around 10 per cent of accidents andshared taxis in 25 per cent. In Yopougon, Côted’Ivoire, shared taxis account for an estimated 90 percent of traffic accidents and nearly all associateddeaths in these accidents.117 In South Africa, morethan 2000 drivers, attendants and passen gers diedin paratransit-related violence during the 1990s,according to official statistics.118 Informal operatorsrarely insure vehicles (or passen gers), thus furtheraggravating accident impacts.
In environ mental terms, paratransit vehicles aresignificant atmospheric polluters due to two-strokeengines, excessive oil mixtures, low-grade fuels and poorly maintained engines.119 In Cambodia andLaos, tuk-tuk three-wheelers still rely on two-strokeengines. In Thailand, most two-stroke engines havebeen converted to less noisy and polluting four-stroke engines, some cities experimenting with solarpanel propulsion.120 In much of Sub-Saharan Africa,motorcycle taxis emit from both two-stroke enginesand excessive use of oil lubricant in fuels.
Without formal oversight, discrimination andharassment can be experi enced by informal trans portusers. In Malawi and South Africa, women report fearof rape and high levels of verbal abuse.121 Expecta -tions that women sit side-saddle on motorcycle taxiscan pose serious safety risks (Box 2.6). In the MiddleEast, cultural restrictions on haggling with maledrivers means women often pay higher fares. Mini -bus routes focusing on work connections rather than domestic journeys – along with paying at eachmode change – mean that Middle Eastern womenpay more than men.122 Young patrons are also vulner -able. In Dar es Salaam (Tanzania), some dala dala mini -buses do not allow children to board during rushhours because govern ment concessionary fares areseen as unprofitable.123
Corruption is frequently rife within the informaltrans port sector. Since most service providers are notfully licensed they must often pay bribes. In Dakar,Senegal, bribes to police officers by mini bus driverscomprise 5 per cent of total operating costs.124 InThailand, Bangkok’s win motorcycle taxi operatorscomplain of protection payments to police officialsand military officers.
Another consequence of weak regulatory controlis abuse of the labour market, seen through a dis -regard for minimum salaries, age limits, work-hourrestrictions and insufficient or absent insurance, etc.Informal workers have few other employment optionsand are often in debt to vehicle owners who set highrents or provide high-interest loans.
The informalsector is asignificantgatewayemployment formany recentimmigrants,making up anestimated 15 percent of totalemployment inpoor countries
Corruption isfrequently rifewithin theinformal transportsector
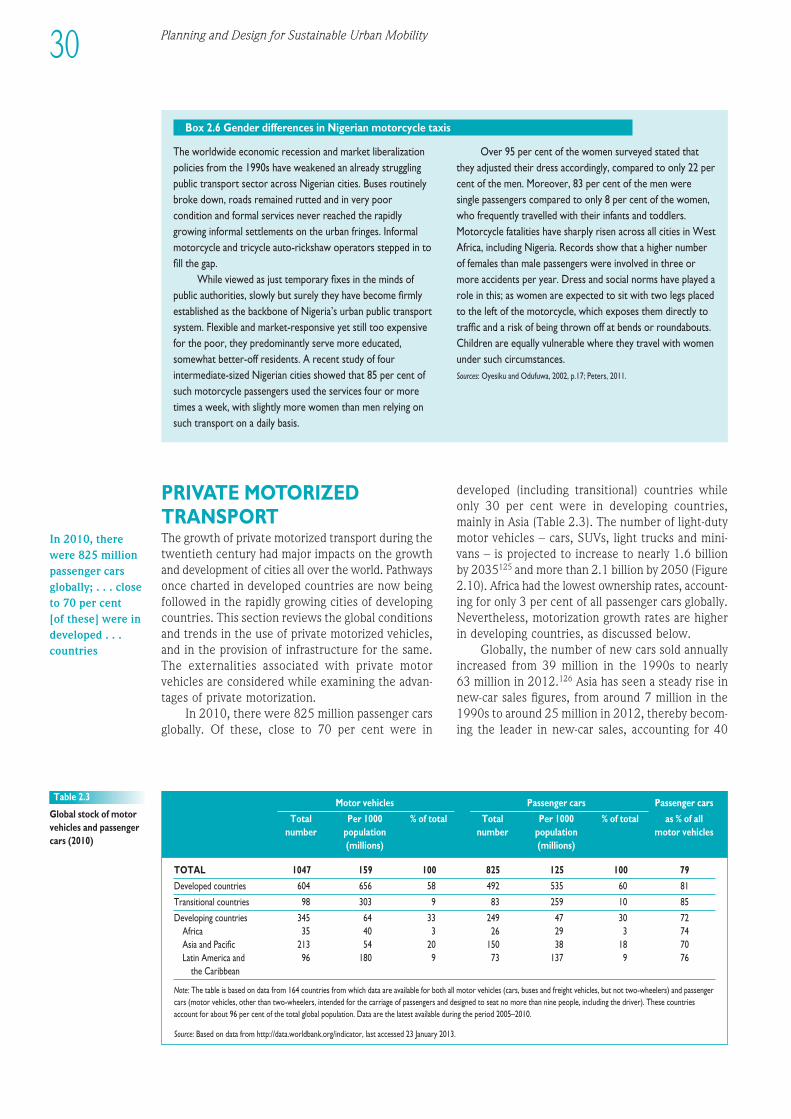
Planning and Design for Sustainable Urban Mobility30
The worldwide economic recession and market liberalizationpolicies from the 1990s have weakened an already strugglingpublic trans port sector across Nigerian cities. Buses routinelybroke down, roads remained rutted and in very poorcondition and formal services never reached the rapidlygrowing informal settlements on the urban fringes. Informalmotorcycle and tricycle auto-rickshaw operators stepped in tofill the gap.
While viewed as just temporary fixes in the minds ofpublic authorities, slowly but surely they have become firmlyestablished as the backbone of Nigeria’s urban public trans portsystem. Flexible and market-responsive yet still too expensivefor the poor, they predominantly serve more educated,somewhat better-off residents. A recent study of fourintermediate-sized Nigerian cities showed that 85 per cent ofsuch motorcycle passen gers used the services four or moretimes a week, with slightly more women than men relying onsuch trans port on a daily basis.
Over 95 per cent of the women surveyed stated thatthey adjusted their dress accordingly, compared to only 22 percent of the men. Moreover, 83 per cent of the men weresingle passen gers compared to only 8 per cent of the women,who frequently travelled with their infants and toddlers.Motorcycle fatalities have sharply risen across all cities in WestAfrica, including Nigeria. Records show that a higher numberof females than male passen gers were involved in three ormore accidents per year. Dress and social norms have played arole in this; as women are expected to sit with two legs placedto the left of the motorcycle, which exposes them directly totraffic and a risk of being thrown off at bends or roundabouts.Children are equally vulnerable where they travel with womenunder such circumstances.Sources: Oyesiku and Odufuwa, 2002, p.17; Peters, 2011.
Box 2.6 Gender differences in Nigerian motorcycle taxis
PRIVATE MOTORIZEDTRANSPORTThe growth of private motorized trans port during thetwentieth century had major impacts on the growthand devel op ment of cities all over the world. Pathwaysonce charted in developed countries are now beingfollowed in the rapidly growing cities of devel op ingcountries. This section reviews the global conditionsand trends in the use of private motorized vehicles,and in the provision of infra struc ture for the same.The externalities associated with private motorvehicles are considered while examining the advan -tages of private motorization.
In 2010, there were 825 million passen ger carsglobally. Of these, close to 70 per cent were in
developed (including transitional) countries whileonly 30 per cent were in devel op ing countries,mainly in Asia (Table 2.3). The number of light-dutymotor vehicles – cars, SUVs, light trucks and mini-vans – is projected to increase to nearly 1.6 billionby 2035125 and more than 2.1 billion by 2050 (Figure2.10). Africa had the lowest ownership rates, account -ing for only 3 per cent of all passen ger cars globally.Nevertheless, motorization growth rates are higherin devel op ing countries, as discussed below.
Globally, the number of new cars sold annuallyincreased from 39 million in the 1990s to nearly 63 million in 2012.126 Asia has seen a steady rise innew-car sales figures, from around 7 million in the1990s to around 25 million in 2012, thereby becom -ing the leader in new-car sales, accounting for 40
TOTAL 1047 159 100 825 125 100 79
Developed countries 604 656 58 492 535 60 81
Transitional countries 98 303 9 83 259 10 85
Devel op ing countries 345 64 33 249 47 30 72Africa 35 40 3 26 29 3 74Asia and Pacific 213 54 20 150 38 18 70Latin America and 96 180 9 73 137 9 76
the Caribbean
Note: The table is based on data from 164 countries from which data are available for both all motor vehicles (cars, buses and freight vehicles, but not two-wheelers) and passen gercars (motor vehicles, other than two-wheelers, intended for the carriage of passen gers and designed to seat no more than nine people, including the driver). These countriesaccount for about 96 per cent of the total global population. Data are the latest available during the period 2005–2010.
Source: Based on data from http://data.worldbank.org/indicator, last accessed 23 January 2013.
Table 2.3
Global stock of motorvehicles and passen gercars (2010)
Motor vehicles Passen ger cars Passen ger cars
Total Per 1000 % of total Total Per 1000 % of total as % of all number population number population motor vehicles
(millions) (millions)
In 2010, therewere 825 millionpassenger carsglobally; . . . closeto 70 per cent [of these] were indeveloped . . .countries
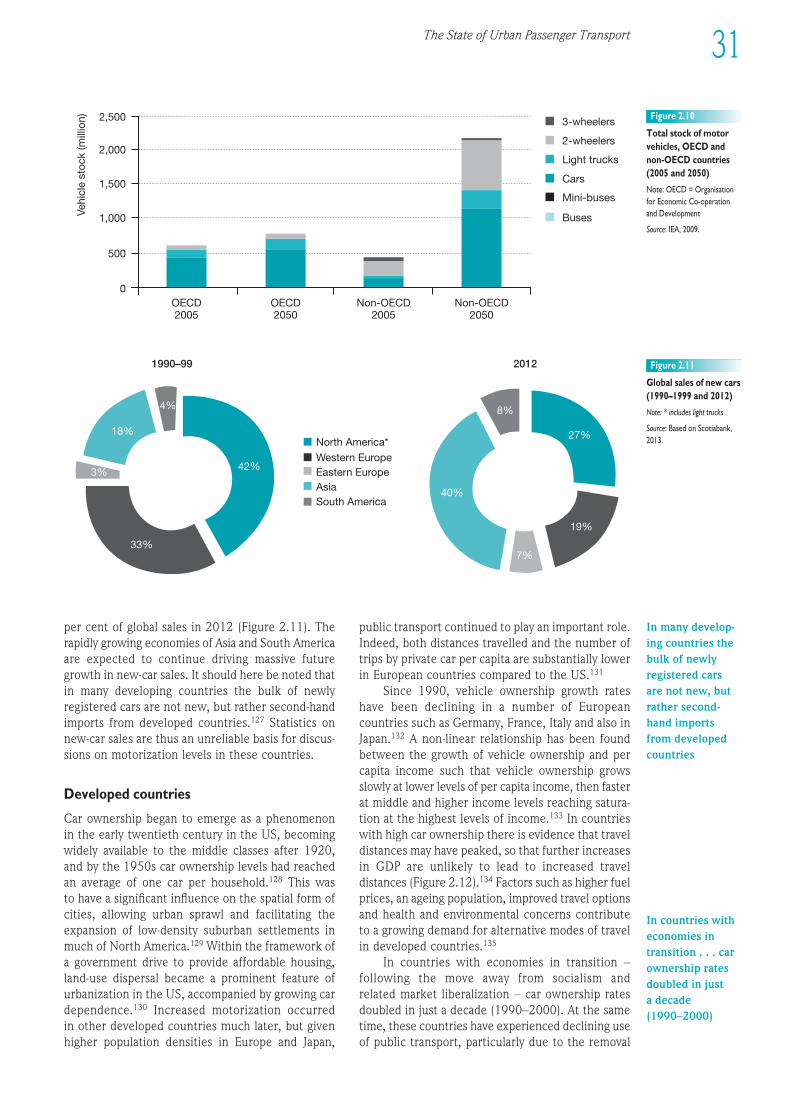
per cent of global sales in 2012 (Figure 2.11). Therapidly growing economies of Asia and South Americaare expected to continue driving massive futuregrowth in new-car sales. It should here be noted thatin many devel op ing countries the bulk of newlyregistered cars are not new, but rather second-handimports from developed countries.127 Statistics onnew-car sales are thus an unreliable basis for dis cus -sions on motorization levels in these countries.
Developed countries
Car ownership began to emerge as a phenomenonin the early twentieth century in the US, becomingwidely available to the middle classes after 1920, and by the 1950s car ownership levels had reachedan average of one car per household.128 This was to have a significant influence on the spatial form ofcities, allowing urban sprawl and facilitating theexpansion of low-density suburban settlements inmuch of North America.129 Within the framework ofa govern ment drive to provide affordable housing,land-use dispersal became a prominent feature ofurbanization in the US, accompanied by growing cardependence.130 Increased motorization occurred in other developed countries much later, but givenhigher population densities in Europe and Japan,
public trans port continued to play an important role.Indeed, both distances travelled and the number oftrips by private car per capita are substantially lowerin European countries compared to the US.131
Since 1990, vehicle ownership growth rateshave been declining in a number of Europeancountries such as Germany, France, Italy and also inJapan.132 A non-linear relationship has been foundbetween the growth of vehicle ownership and percapita income such that vehicle ownership growsslowly at lower levels of per capita income, then fasterat middle and higher income levels reaching satura -tion at the highest levels of income.133 In countrieswith high car ownership there is evidence that traveldistances may have peaked, so that further increasesin GDP are unlikely to lead to increased traveldistances (Figure 2.12).134 Factors such as higher fuelprices, an ageing population, improved travel optionsand health and environ mental concerns contributeto a growing demand for alternative modes of travelin developed countries.135
In countries with economies in transition –following the move away from socialism and related market liberalization – car ownership ratesdoubled in just a decade (1990–2000). At the sametime, these countries have experi enced declining useof public transport, particularly due to the removal
The State of Urban Passenger Transport 31
1EEE234567891012311145678920123456789301234567894012345678950123456789EEEE
3-wheelers
2-wheelers
Light trucks
Cars
Mini-buses
BusesVehi
cle
stoc
k (m
illio
n)
0
500
1,000
1,500
2,000
2,500
OECD2005
OECD2050
Non-OECD2005
Non-OECD2050
Figure 2.10
Total stock of motorvehicles, OECD andnon-OECD countries(2005 and 2050)
Note: OECD = Organisationfor Economic Co-operationand Devel op ment
Source: IEA, 2009.
1990–99
North America*Western EuropeEastern EuropeAsiaSouth America
4%
18%
3%
33%
42%
2012
8%
40%
7%
19%
27%
Figure 2.11
Global sales of new cars(1990–1999 and 2012)
Note: * includes light trucks
Source: Based on Scotiabank,2013.
In countries witheconomies intransition . . . carownership ratesdoubled in just a decade(1990–2000)
In many devel op -ing countries thebulk of newlyregistered cars are not new, butrather second-hand importsfrom developedcountries
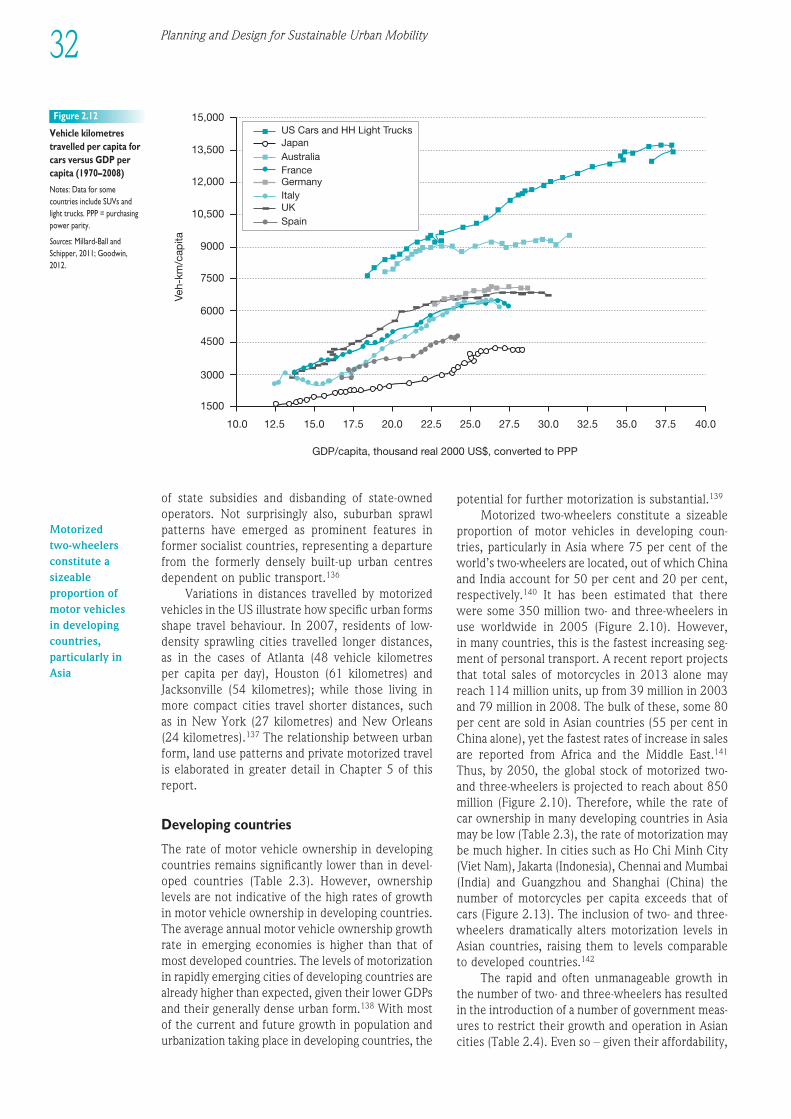
Planning and Design for Sustainable Urban Mobility32
of state subsidies and disbanding of state-ownedoperators. Not surprisingly also, suburban sprawlpatterns have emerged as prominent features informer socialist countries, representing a departurefrom the formerly densely built-up urban centresdependent on public transport.136
Variations in distances travelled by motorizedvehicles in the US illustrate how specific urban formsshape travel behaviour. In 2007, residents of low-density sprawling cities travelled longer distances, as in the cases of Atlanta (48 vehicle kilometres per capita per day), Houston (61 kilometres) andJacksonville (54 kilometres); while those living inmore compact cities travel shorter distances, suchas in New York (27 kilometres) and New Orleans (24 kilometres).137 The relationship between urbanform, land use patterns and private motorized travelis elaborated in greater detail in Chapter 5 of thisreport.
Devel op ing countries
The rate of motor vehicle ownership in devel op ingcountries remains significantly lower than in devel -oped countries (Table 2.3). However, ownershiplevels are not indicative of the high rates of growthin motor vehicle ownership in devel op ing countries.The average annual motor vehicle ownership growthrate in emerging economies is higher than that ofmost developed countries. The levels of motorizationin rapidly emerging cities of devel op ing countries arealready higher than expected, given their lower GDPsand their generally dense urban form.138 With mostof the current and future growth in population andurbanization taking place in devel op ing countries, the
potential for further motorization is substantial.139
Motorized two-wheelers constitute a sizeableproportion of motor vehicles in devel op ing coun-tries, particularly in Asia where 75 per cent of theworld’s two-wheelers are located, out of which Chinaand India account for 50 per cent and 20 per cent,respectively.140 It has been estimated that therewere some 350 million two- and three-wheelers inuse worldwide in 2005 (Figure 2.10). However, in many countries, this is the fastest increasing seg-ment of personal transport. A recent report projectsthat total sales of motorcycles in 2013 alone mayreach 114 million units, up from 39 million in 2003and 79 million in 2008. The bulk of these, some 80per cent are sold in Asian countries (55 per cent inChina alone), yet the fastest rates of increase in salesare reported from Africa and the Middle East.141
Thus, by 2050, the global stock of motorized two-and three-wheelers is projected to reach about 850million (Figure 2.10). Therefore, while the rate ofcar ownership in many devel op ing countries in Asiamay be low (Table 2.3), the rate of motorization maybe much higher. In cities such as Ho Chi Minh City(Viet Nam), Jakarta (Indonesia), Chennai and Mumbai(India) and Guangzhou and Shanghai (China) thenumber of motorcycles per capita exceeds that of cars (Figure 2.13). The inclusion of two- and three-wheelers dramatically alters motorization levels inAsian countries, raising them to levels comparableto developed countries.142
The rapid and often unmanageable growth in the number of two- and three-wheelers has resultedin the introduction of a number of govern ment meas -ures to restrict their growth and operation in Asiancities (Table 2.4). Even so – given their affordability,
GDP/capita, thousand real 2000 US$, converted to PPP
10.0 12.5 15.0 17.5 20.0 22.5 25.0 27.5 30.0 32.5 35.0 37.5 40.0
1500
3000
4500
6000
7500
9000
10,500
12,000
13,500
15,000
Veh-
km/c
apita
US Cars and HH Light TrucksJapanAustraliaFranceGermanyItalyUKSpain
Figure 2.12
Vehicle kilometrestravelled per capita forcars versus GDP percapita (1970–2008)
Notes: Data for somecountries include SUVs andlight trucks. PPP = purchasingpower parity.
Sources: Millard-Ball andSchipper, 2011; Goodwin,2012.
Motorized two-wheelersconstitute asizeableproportion ofmotor vehicles in developingcountries,particularly inAsia
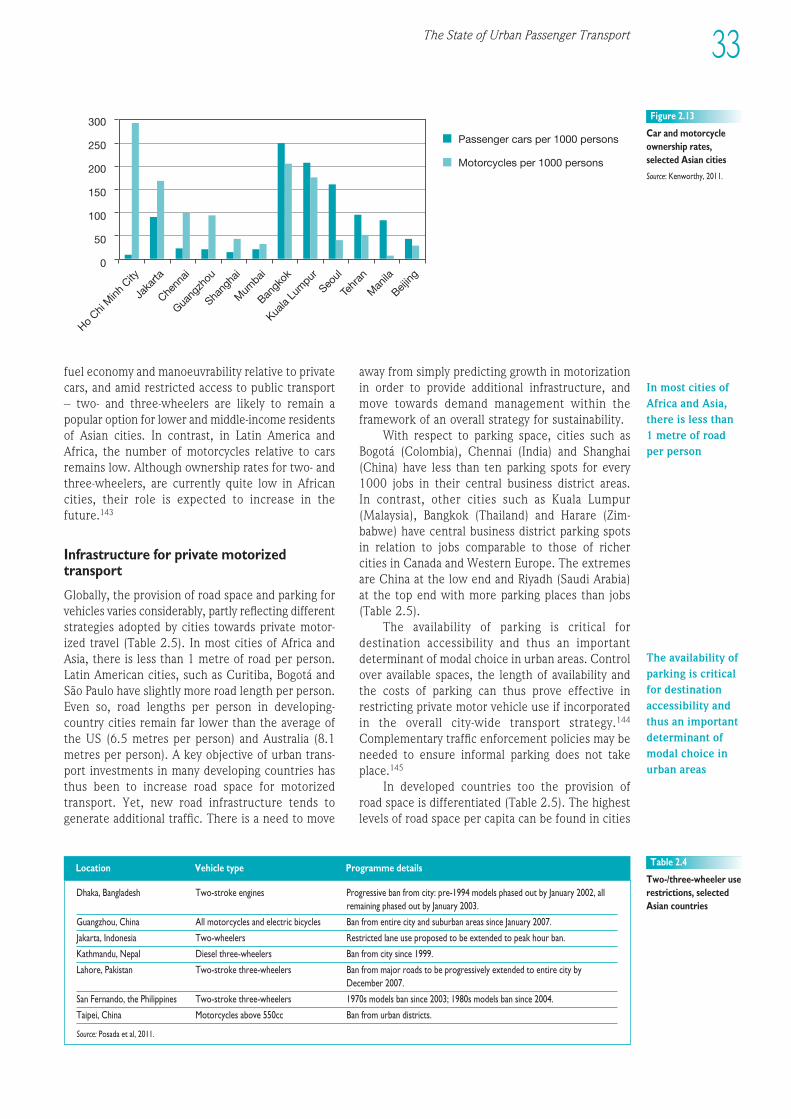
The State of Urban Passenger Transport 33
1EEE234567891012311145678920123456789301234567894012345678950123456789EEEE
300
250
200
150
100
50
0
Ho Chi
Minh
City
Jaka
rta
Chenn
ai
Guang
zhou
Shang
hai
Mum
bai
Bangk
ok
Kuala
Lum
pur
Seoul
Tehr
an
Man
ila
Beijing
Passenger cars per 1000 persons
Motorcycles per 1000 persons
Figure 2.13
Car and motorcycleownership rates,selected Asian cities
Source: Kenworthy, 2011.
fuel economy and manoeuvrability relative to privatecars, and amid restricted access to public trans port– two- and three-wheelers are likely to remain apopular option for lower and middle-income residentsof Asian cities. In contrast, in Latin America andAfrica, the number of motorcycles relative to carsremains low. Although ownership rates for two- andthree-wheelers, are currently quite low in Africancities, their role is expected to increase in thefuture.143
Infra struc ture for private motorizedtransport
Globally, the provision of road space and parking forvehicles varies considerably, partly reflecting differentstrategies adopted by cities towards private motor-ized travel (Table 2.5). In most cities of Africa andAsia, there is less than 1 metre of road per person.Latin American cities, such as Curitiba, Bogotá andSão Paulo have slightly more road length per person.Even so, road lengths per person in devel op ing-country cities remain far lower than the average ofthe US (6.5 metres per person) and Australia (8.1metres per person). A key objective of urban trans -port investments in many devel op ing countries hasthus been to increase road space for motorizedtransport. Yet, new road infra struc ture tends togenerate addi tional traffic. There is a need to move
away from simply predicting growth in motorizationin order to provide additional infra struc ture, andmove towards demand management within theframework of an overall strategy for sus tain ability.
With respect to parking space, cities such asBogotá (Colombia), Chennai (India) and Shanghai(China) have less than ten parking spots for every1000 jobs in their central business district areas. In contrast, other cities such as Kuala Lumpur(Malaysia), Bangkok (Thailand) and Harare (Zim -babwe) have central business district parking spotsin relation to jobs comparable to those of richer cities in Canada and Western Europe. The extremesare China at the low end and Riyadh (Saudi Arabia)at the top end with more parking places than jobs(Table 2.5).
The availability of parking is critical fordestination accessibility and thus an importantdeterminant of modal choice in urban areas. Controlover available spaces, the length of availability andthe costs of parking can thus prove effective inrestricting private motor vehicle use if incorporatedin the overall city-wide trans port strategy.144
Complementary traffic enforcement policies may beneeded to ensure informal parking does not takeplace.145
In developed countries too the provision of road space is differentiated (Table 2.5). The highestlevels of road space per capita can be found in cities
Dhaka, Bangladesh Two-stroke engines Progressive ban from city: pre-1994 models phased out by January 2002, allremaining phased out by January 2003.
Guangzhou, China All motorcycles and electric bicycles Ban from entire city and suburban areas since January 2007.
Jakarta, Indonesia Two-wheelers Restricted lane use proposed to be extended to peak hour ban.
Kathmandu, Nepal Diesel three-wheelers Ban from city since 1999.
Lahore, Pakistan Two-stroke three-wheelers Ban from major roads to be progressively extended to entire city byDecember 2007.
San Fernando, the Philippines Two-stroke three-wheelers 1970s models ban since 2003; 1980s models ban since 2004.
Taipei, China Motorcycles above 550cc Ban from urban districts.
Source: Posada et al, 2011.
Table 2.4
Two-/three-wheeler userestrictions, selectedAsian countries
Location Vehicle type Programme details
In most cities ofAfrica and Asia,there is less than1 metre of roadper person
The availability ofparking is criticalfor destinationaccessibility andthus an importantdeterminant ofmodal choice inurban areas
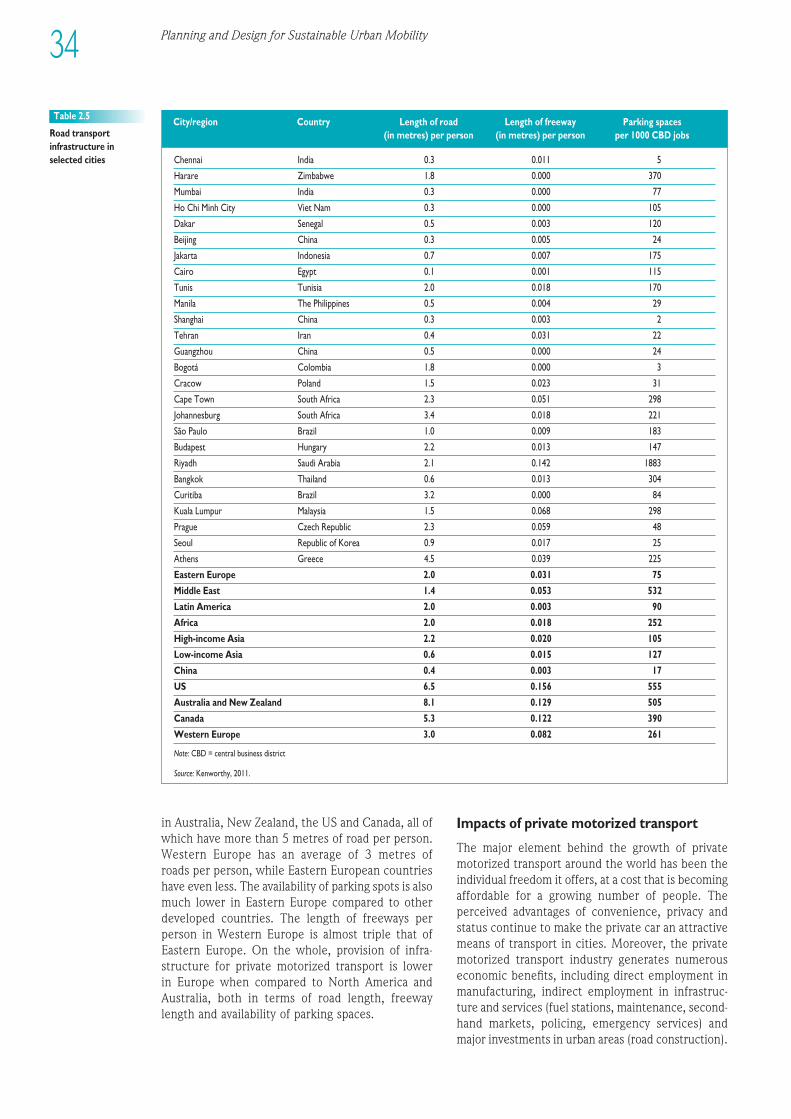
Chennai India 0.3 0.011 5
Harare Zimbabwe 1.8 0.000 370
Mumbai India 0.3 0.000 77
Ho Chi Minh City Viet Nam 0.3 0.000 105
Dakar Senegal 0.5 0.003 120
Beijing China 0.3 0.005 24
Jakarta Indonesia 0.7 0.007 175
Cairo Egypt 0.1 0.001 115
Tunis Tunisia 2.0 0.018 170
Manila The Philippines 0.5 0.004 29
Shanghai China 0.3 0.003 2
Tehran Iran 0.4 0.031 22
Guangzhou China 0.5 0.000 24
Bogotá Colombia 1.8 0.000 3
Cracow Poland 1.5 0.023 31
Cape Town South Africa 2.3 0.051 298
Johannesburg South Africa 3.4 0.018 221
São Paulo Brazil 1.0 0.009 183
Budapest Hungary 2.2 0.013 147
Riyadh Saudi Arabia 2.1 0.142 1883
Bangkok Thailand 0.6 0.013 304
Curitiba Brazil 3.2 0.000 84
Kuala Lumpur Malaysia 1.5 0.068 298
Prague Czech Republic 2.3 0.059 48
Seoul Republic of Korea 0.9 0.017 25
Athens Greece 4.5 0.039 225
Eastern Europe 2.0 0.031 75
Middle East 1.4 0.053 532
Latin America 2.0 0.003 90
Africa 2.0 0.018 252
High-income Asia 2.2 0.020 105
Low-income Asia 0.6 0.015 127
China 0.4 0.003 17
US 6.5 0.156 555
Australia and New Zealand 8.1 0.129 505
Canada 5.3 0.122 390
Western Europe 3.0 0.082 261
Note: CBD = central business district
Source: Kenworthy, 2011.
Table 2.5
Road trans portinfrastruc ture inselected cities
City/region Country Length of road Length of freeway Parking spaces (in metres) per person (in metres) per person per 1000 CBD jobs
in Australia, New Zealand, the US and Canada, all ofwhich have more than 5 metres of road per person.Western Europe has an average of 3 metres of roads per person, while Eastern European countrieshave even less. The availability of parking spots is alsomuch lower in Eastern Europe compared to otherdeveloped countries. The length of freeways perperson in Western Europe is almost triple that ofEastern Europe. On the whole, provision of infra -structure for private motorized trans port is lower in Europe when compared to North America andAustralia, both in terms of road length, freewaylength and availability of parking spaces.
Impacts of private motorized transport
The major element behind the growth of privatemotorized trans port around the world has been theindividual freedom it offers, at a cost that is becomingaffordable for a growing number of people. Theperceived advantages of convenience, privacy andstatus continue to make the private car an attractivemeans of trans port in cities. Moreover, the privatemotorized trans port industry generates numerouseconomic benefits, including direct employment inmanufacturing, indirect employment in infra struc-ture and services (fuel stations, maintenance, second-hand markets, policing, emergency services) andmajor investments in urban areas (road construction).
34 Planning and Design for Sustainable Urban Mobility
1EEE234567891012311145678920123456789301234567894012345678950123456789EEEE
35The State of Urban Passenger Transport
Overall, the automotive industry supports around 5 per cent of the total global workforce.146 However,a considerable range of externalities arise fromincreased motorization in cities. Taken together,these dwarf the benefits of this means of transport.Being heavily dependent on oil, one of the mostsignificant impacts of private motorized trans port ison the environ ment. Increased use of privatemotorized trans port also has impacts on health andsafety in cities.147
A further externality of private motorized trans -port is traffic congestion that imposes significant costson economic efficiency as time lost due to congestionreduces productivity. Congestion costs in Canada are as high as US$4.5 billion148 nationally of which80 per cent is accounted for by the country’s threelargest urban regions: Greater Toronto (43 per cent),Montreal (21 per cent) and Vancouver (17 percent).149 In the US, congestion has led urban Amer -icans to travel 5.5 billion hours more and to purchasean extra 11 billion litres of fuel for congestion-related costs of US$121 billion in 2011.150 In 2005,the cost of congestion in Australia’s eight capital cities was US$7.1 billion,151 comprised of private timecosts (37 per cent), business time costs (38 per cent),extra vehicle operating costs (13 per cent) and extraair population (12 per cent).152 The immense eco -nomic impact of traffic congestion is further illus -trated by the case of Cairo, which costs Egypt as muchas 4 per cent of its GDP.153 In São Paulo, Brazil, someof the wealthiest residents have resorted to theregular use of helicopters to beat traffic jams.154
Access to motorized trans port has not beenuniversal in cities, with gender, age, disability andincome having an impact. Also, in devel op ing coun -tries, travel by private motorized trans port is reservedfor a small group of high-income (often male) earners,and so its importance for women is comparativelyminor.155 However, this is changing, particularly in emerging economies such as China, India andBrazil, where middle-class women are increasinglyowning and driving cars. The number of femaledrivers in Russia, where car ownership functions asan important status symbol, has increased by 50 percent from 2000 to 2006.156 Similar trends have beenobserved in Mumbai, India, where (with womenearning higher incomes) traditional male-dominatedgender roles in car purchase decisions are chang -ing.157 Gender differences in access to motorizedtrans port in turn translate into differentiated accessto opportunities.
INTERMODALITY IN URBANTRANSPORTThe four modes of urban trans port discussed in thischapter are highly complementary in that urban
trips are often multi-modal, involving a combinationof more than one mode. Modal integration – or thecoordination of trans port infra struc ture, services,facilities and spatial configuration to enable seamlesslinks between at least two different modes, therebyfacilitating trip-chaining – is an essential prerequisitefor enabling multi-modal trips, and by implication alsourban accessibility. Strategies that facilitate thisinclude spatial, network, fare, information and institu -tional integration to allow smooth transfers betweendifferent modes of urban transport.158 It is particularlyimportant to facilitate easy transfers between othermodes and public trans port if its modal share is toincrease.
The critical importance of intermodality toenable accessibility in cities is recognized, thoughinterventions designed to enhance integration varyacross countries. Cities in Western Europe havetaken the lead in facilitating modal integration,especially between public and non-motorized trans -port. Cycling significantly increases the catchmentarea of public trans port stops beyond walking range,while access to public trans port makes longer tripspossible for bicyclists.159 In Germany, 70 bike stationslocated at train stations enable bicyclists and publictrans port users to smoothly transition from one modeto the other. In the city of Berlin alone 24,000 bikeparking spaces are available at public trans portstations.160 All metro and express interurban trainstations on the peripheries of the city now have bikeparking facilities. Guarded facilities for storing bikestogether with complementary services (maintenanceand repair) are available at all main train stations inthe Netherlands, where 35 per cent of train usersuse a bike to get to and from train stations.161 In theUK, train travellers are able to buy a discount busticket (PLUSBUS) that enables seamless transfer tobuses.162
North American cities have, to some degree, also witnessed an increase in facilities designed tointegrate cycling and public trans port services, withbike parking spaces increasing by 67 per cent inCanada and 26 per cent in the US between 2006 and 2008. Noteworthy examples include theSan Francisco Bay Area – where the Bay Area RapidTransit (BART) system has bike parking in almost all 43 stations – and Vancouver – where integrationbetween public trans port and bicycles is facilitatedby TransLink. TransLink, Vancouver’s multi-modaltransportation authority, has spent more than US$12million on such integration between 1999 and2009.163
Modal integration has been given minimaldeliberate consideration in devel op ing-country cities. Yet, although not by design, informal and non-motorized modes do serve as an important gapfiller by feeding other modes of transport. MexicoCity’s peseros vans, shared-ride taxis, and collectivemini buses connect the metro with outlying stations
Genderdifferences inaccess tomotorizedtransport in turntranslate intodifferentiatedaccess toopportunities
Cities in WesternEurope havetaken the lead infacilitating modalintegration,especiallybetween publicand non-motorizedtransport
Modal integrationhas been givenminimaldeliberateconsideration indeveloping-country cities. Yet . . . informaland non-motorized modesdo serve as animportant gapfiller by feedingother modes oftransport
Overall, theautomotiveindustry supportsaround 5 per centof the total globalworkforce
36 Planning and Design for Sustainable Urban Mobility
substituting, without subsidies, the failing publicbus system.
Some notable achievements in modal integra-tion are emerging in Asian and Latin American cities.In China, Guangzhou’s BRT system – which serves800,000 passen gers daily – is integrated with thecity’s bike lanes and bike share system, greatlyenhancing physical access to public trans portservices.164 The cities of São Paulo, Curitiba (both inBrazil), Bogotá (Colombia) and Santiago (Chile) haveall taken action to advance integration betweenpublic and non-motorized transport.165
Many of the attempts to facilitate intermodalitybetween non-motorized and public trans port in citiesto date have focused on integrating cycling. Yet, thecontribution of walking as a feeder to public trans -port systems has also been emphasized.166 This alsoapplies to devel op ing countries, where most publictrans port trips involve walking at both ends of the trip.An analysis of access trips for Delhi Metro (India), forinstance, found that often between 40 and 60 percent of the passen gers walk to the stations.167
CONCLUDING REMARKSAND LESSONS FOR POLICY‘Accessibility’ may be the ‘holy grail’ for the twenty-first century city. Yet, the trans port trends andconditions outlined in this chapter indicate thatcities remain inaccessible for large numbers of urbanresidents in spatial/physical or socioeconomic terms.In turn, such limitations restrict access to oppor -tunities for urban dwellers, with implications for theiroverall wellbeing and progress.
Public trans port offers the greatest potential toenhance accessibility in cities, but is non-existent ordeclining in most devel op ing countries, and increasesin developed countries are not commensurate withthe scale required to meet sus tain ability targets. Anew business model for funding public trans portneeds to be forged. Public trans port must alwaysremain affordable but a new commercial paradigmis needed that allows the social dimension of pro -viding a public service to be combined withefficiencies and commercial acumen to improve costrecovery. Moving from captive riders (passen gers) toclients and choice riders, making public trans port alifestyle choice, requires a strong customer focus.
Despite the multiple benefits it generates forboth users and society as a whole, NMT is oftenmarginalized and receives minimal priority in urbanmobility planning and investments, both in developedand devel op ing countries. It constitutes the principaland often only accessible means of trans port for themajority of residents in devel op ing-country citieswith most who opt for this mode doing so out of alack of choice. Yet, in most cities, NMT conditions
are extremely hostile. Investing in NMT to enhancethe safety and security of walking and cyclingconstitutes a key pillar of planning and design foraccessible mobility in cities. Innovative experi encesfrom both developed and devel op ing-country citiesthat have elevated NMT as a foundation for urbansus tain ability offer valuable insights to informplanning and investments elsewhere.
Perhaps one of the most alarming trends – whichgravely threatens urban accessibility – is the steadyincrease in the share of private motorized transport.Almost 60 years after the private car became firmlyfixed as the icon of the twentieth century, devel op -ing countries are experiencing extremely highmotorization rates further supported by policies,actions and investments that favour private motorizedover non-motorized and public trans port modes.While motorization rates have generally reachedsaturation levels in developed countries, many of theircities continue to bear the consequences of urbanand trans port planning and land-use policies thatfacilitated car dependency and urban sprawl. Whileit does perform a necessary function within the over all arena of urban transport, where it dominates,the externalities of private motorized trans port com -promise the fundamental sus tain ability imperativesin cities. Addressing the broader welfare concernsaround equal access to mobility thus necessitatesaction to enable shifts to more sus tain able modesthrough deliberate and targeted policies and invest -ments.
In the absence of accessible public trans portservices, informal trans port remains predominant indevel op ing countries and constitutes the main meansof motorized trips for most urban dwellers. Althoughit provides essential benefits to the urban poor interms of mobility and livelihoods, informal trans portgenerates a number of environ mental and economicexternalities. A significant challenge is to balance theefficiency and social equity aspects of informaltransport, i.e. to achieve the social benefits of free-market services without exceeding social costs. Thesector would benefit immensely from best-practiceexamples of successful regulation of service qualityand safety while at the same time allowing theinherent advantages of private competition andentrepreneurship to flourish.
Given the current state of urban trans portglobally, improved urban accessibility requiresfocusing on a number of vital pillars. Increasing themodal share of public trans port is a universallyapplicable strategy that has significant potential toaddress mobility challenges of both developed anddevel op ing countries. The role of high-capacity publictrans port systems in this respect is underscored inChapter 3 of this report and the social, environ mentaland economic sus tain ability benefits of public trans -port are featured in Chapters 6, 7 and 8. Efforts to
Cities remaininaccessible forlarge numbers ofurban residents inspatial/physical orsocioeconomicterms
In the absence ofaccessible publictransport services,informal transportremainspredominant indevelopingcountries
NOTES1 CAI-Asia, 2010.2 Hidalgo and Huizenga, 2013.3 See Chapter 6.4 Jirón, 2008.5 Adam Smith International, 2005,
p24.6 Peters, 2011; Pendakur, 2005,
p147.7 China Communications Press,
2008.8 ADB and CAI-Asia, 2009.9 Barter, 2008. This excludes
foreigners on work permits.10 Shin, 2007.11 Hong Kong Transport
Department, 2004.12 SUTP, 2012.13 Lorenz and Bufton, 2012.14 Pendakur, 2005.15 Jirón, 2011.16 Joewono and Kubota, 2005.17 Godard, 2011a.18 Hook and Replogle, 1996.19 UNCRD, 2008.20 SUTP, 2008.21 Pucher and Buehler, 2007.22 Rahman et al, 2010.23 Adam Smith International, 2005,
p101.24 Jain, 2011.25 Pendakur, 2005, p148.26 Beldean et al, 2007.27 iRAP, 2009b.28 Mitric, 2008, p50.29 Godard, 2011a.30 IDFC, 2010.31 ADB and CAI-Asia, 2009.32 Pucher et al, 2007.33 Moller, 2006; Jirón, 2011.34 Metropolis International
Institute, 2009.35 Shin, 2007.36 China Daily, 2010.37 Zeng, 2013. The Hangzhou
experi ence is discussed in Box7.8.
38 Pucher and Dijkstra, 2000.39 Goldman and Gorham, 2006.40 Jain, 2011.41 Litman, 2013.
42 I-ce, 2000.43 Wipperman and Sowula, 2007.44 WHO, 2013. See also Chapter
6.45 WHO, 2013; OECD/ITF,
2011a.46 OECD/ITF, 2011a.47 Cusset et al, 1995.48 UITP, 2010; Allen, 2011a.49 Mobereola, 2009.50 Wheeler, 2009.51 Kenya Ports Authority, 2012.52 Pichaironarongsongkram, 2012.53 Brand and Davila, 2011.54 Buehler and Pucher, 2012b.55 Buehler and Pucher, 2012b.56 Vuchic, 2005.57 Wiener Linien, 2010.58 ERRAC and UITP, 2009.59 Dresdner Verkehrsbetriebe AG,
2011.60 Pojani, 2010.61 Following the Transport Act of
1985.62 Lucas et al, 2001.63 Turro, 2011.64 Pendakur, 2005.65 UITP and UATP, 2010.66 Flyvbjerg et al, 2008.67 Singh, 2012.68 GEF, 2012.69 Vuchic, 2005.70 UITP, 2001.71 Pan et al, 2011.72 APTA, 2010.73 Yi, 2006; Crain & Associates
et al, 1999.74 Lucas et al, 2001.75 APTA, 2010.76 UITP, 2010.77 Light Rail Now, 2009.78 Litman, 2012a.79 Litman, 2010.80 Weinstein and Schimek, 2005;
Lachapelle et al, 2011;Cambridge Systematics, 2002.
81 Litman, 2012b.82 TRB, 1999; Litman, 2008a;
Peters, 2011.83 Litman, 2008b.
84 McMillan, 2011.85 UN-Habitat, 2009; Kirby et al,
1972; Cervero, 1997.86 Pirie, 2011.87 El-Geneidy et al, 2011.88 Huzayyin and Saleh, 2013;
Personal communication withProfessor Ali Huzzayin, CairoUniversity, Egypt, in April 2013.
89 Pirie, 2011.90 Godard, 2011.91 Pirie, 2011.92 TUBITAK, 2007.93 World Bank, 2010b.94 Kirby et al, 1972; Cervero,
1997.95 Cervero and Golub, 2011.96 Balassiano and Alexandre, 2011.97 Cervero, 2000.98 Jirón, 2011.99 Evans et al, 2003.
100 Gwilliam, 2002.101 Cervero, 2000.102 Adam Smith International, 2005.103 Aoun, 2010.104 Davis and Johnson, 1984;
Cervero, 1997.105 Cervero, 1998.106 Pojani, 2010.107 CERTU, 2002.108 Cervero, 2000.109 UITP, 2010.110 UITP, 2010.111 Jain, 2011.112 Godard, 2011.113 See also Chapter 8.114 Cervero, 2000.115 Cervero and Golub, 2011.116 Cervero, 2000.117 Kassi, 2007.118 Cervero, 2000.119 Silcock, 1981; Cervero, 2000;
Gwilliam, 2003.120 Macnamara, 2010.121 Porter et al, 2010.122 El-Geneidy et al, 2011.123 Olvera et al, 2003.124 Godard, 2011.125 See Figure 1.2.126 Scotiabank, 2013.
127 See discussion in Chapter 7.128 Nakicenovic, 1986; Schäfer
et al, 2009.129 See Chapter 5.130 Sheehan, 2002.131 FIA Foundation, undated.132 Litman, 2013.133 Dargay et al, 2007. See also
Figure 8.1.134 Schipper, 2011.135 Litman, 2013.136 Suchorzewski, 2011.137 Cortright et al, 2010.138 Dargay et al, 2007.139 Schäfer et al, 2009.140 Gakenheimer and Zegras, 2004.141 Freedonia Group, 2009.142 Gakenheimer and Zegras, 2004.143 Kenworthy, 2011.144 ADB and Ministry of Urban
Devel op ment (India), 2008.145 Shoup, 2005.146 Graham, 2010.147 These impacts are discussed
further in Chapter 7.148 Canadian$4.6 billion.149 Urban Transportation Task
Force, 2012.150 Schrank et al, 2012.151 Converted from Australian
dollars, at 2005 exchange rate ofUS$0.76=AU$1.00.
152 Bureau of Transport andRegional Economics, 2007.
153 World Bank, 2012a.154 Aziakou, 2013.155 Peters, 2011.156 Rodgers, 2006.157 Srivastava and Anderson,
2010.158 IDFC, 2010.159 Pucher and Buehler, 2009.160 Becker et al, 2008.161 Hegger, 2007.162 LINK, undated.163 Pucher and Buehler, 2009.164 ITDP, undated.165 Minteguiaga, 2010.166 Lavadinho, 2010.167 Tiwari, 2012.
enhance urban accessibility are best not limited tomode-specific interventions and investments. Thereis abounding evidence indicating that intermodality,or the integration of infra struc ture and servicesacross modes, to facilitate trip-chaining and multi-modal trips, is a vital precondition for accessibility.Urban planning and design principles that offerpotential for this are elaborated in greater detail inChapter 5. Effective institutional, regulatory and
policy frameworks are also indispensable tofacilitate urban, land-use and trans port planning inan integrated manner that encourages shifts towardsmore sus tain able modes of transport, as is discussedin Chapter 9. Finally, accessible mobility in citiescannot be considered in isolation from the move -ment of goods in urban areas that consumes signifi -cant space and interacts with passen ger trans port attimes in adverse ways, as accentuated in Chapter 4.
1EEE234567891012311145678920123456789301234567894012345678950123456789EEEE
37The State of Urban Passenger Transport

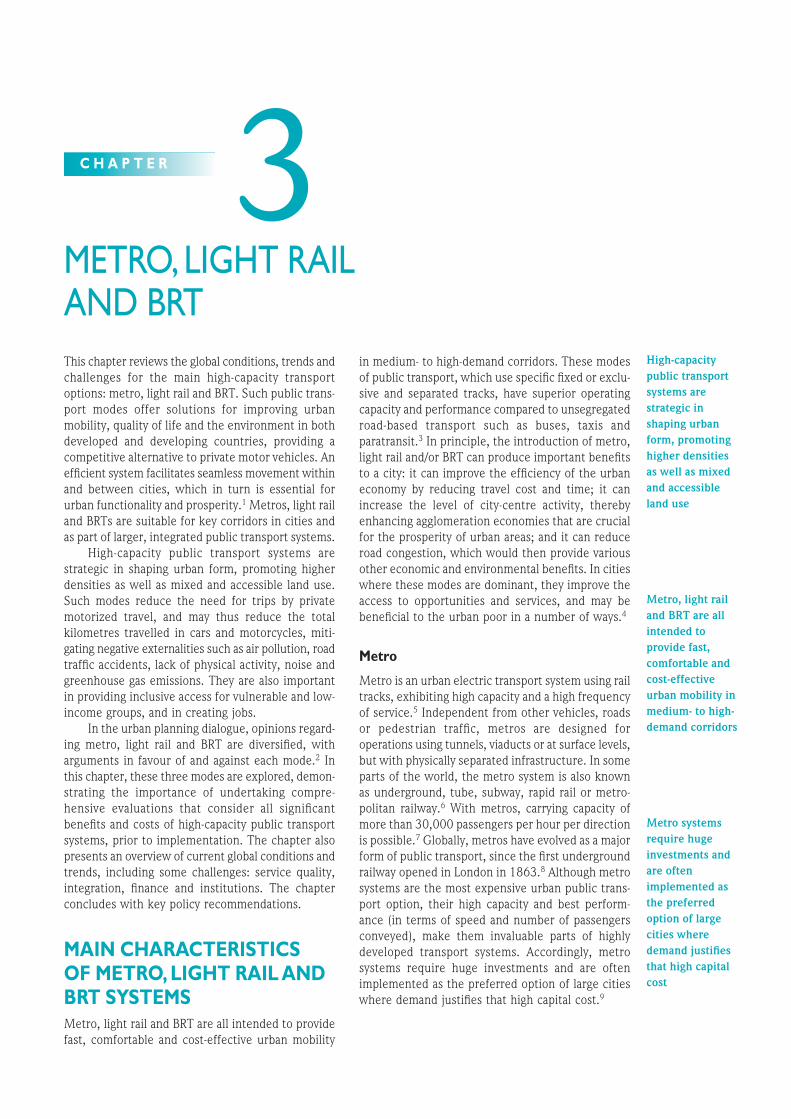
1EEE234567891012311145678920123456789301234567894012345678950123456789EEEE
METRO, LIGHT RAIL AND BRT
C H A P T E R 3This chapter reviews the global conditions, trends andchallenges for the main high-capacity trans portoptions: metro, light rail and BRT. Such public trans -port modes offer solutions for improving urbanmobility, quality of life and the environ ment in bothdeveloped and devel op ing countries, providing acompetitive alternative to private motor vehicles. Anefficient system facilitates seamless movement withinand between cities, which in turn is essential forurban functionality and prosperity.1 Metros, light railand BRTs are suitable for key corridors in cities andas part of larger, integrated public trans port systems.
High-capacity public trans port systems arestrategic in shaping urban form, promoting higherdensities as well as mixed and accessible land use.Such modes reduce the need for trips by privatemotorized travel, and may thus reduce the totalkilometres travelled in cars and motorcycles, miti -gating negative externalities such as air pollution, roadtraffic accidents, lack of physical activity, noise andgreenhouse gas emissions. They are also importantin providing inclusive access for vulnerable and low-income groups, and in creating jobs.
In the urban planning dialogue, opinions regard -ing metro, light rail and BRT are diversified, witharguments in favour of and against each mode.2 Inthis chapter, these three modes are explored, demon -strating the importance of undertaking compre -hensive evaluations that consider all significantbenefits and costs of high-capacity public trans portsystems, prior to implementation. The chapter alsopresents an overview of current global conditions andtrends, including some challenges: service quality,integration, finance and institutions. The chapterconcludes with key policy recommendations.
MAIN CHARACTERISTICSOF METRO, LIGHT RAIL ANDBRT SYSTEMSMetro, light rail and BRT are all intended to providefast, comfortable and cost-effective urban mobility
in medium- to high-demand corridors. These modesof public transport, which use specific fixed or exclu -sive and separated tracks, have superior operatingcapacity and performance compared to unsegregatedroad-based trans port such as buses, taxis andparatransit.3 In principle, the introduction of metro,light rail and/or BRT can produce important benefitsto a city: it can improve the efficiency of the urbaneconomy by reducing travel cost and time; it canincrease the level of city-centre activity, therebyenhancing agglomeration economies that are crucialfor the prosperity of urban areas; and it can reduceroad congestion, which would then provide variousother economic and environ mental benefits. In citieswhere these modes are dominant, they improve theaccess to opportunities and services, and may bebeneficial to the urban poor in a number of ways.4
Metro
Metro is an urban electric trans port system using railtracks, exhibiting high capacity and a high frequencyof service.5 Independent from other vehicles, roadsor pedestrian traffic, metros are designed foroperations using tunnels, viaducts or at surface levels,but with physically separated infra struc ture. In someparts of the world, the metro system is also knownas underground, tube, subway, rapid rail or metro -politan railway.6 With metros, carrying capacity ofmore than 30,000 passen gers per hour per directionis possible.7 Globally, metros have evolved as a majorform of public transport, since the first undergroundrailway opened in London in 1863.8 Although metrosystems are the most expensive urban public trans -port option, their high capacity and best perform-ance (in terms of speed and number of passen gerscon veyed), make them invaluable parts of highlydeveloped trans port systems. Accordingly, metrosystems require huge investments and are oftenimplemented as the preferred option of large citieswhere demand justifies that high capital cost.9
High-capacitypublic transportsystems arestrategic inshaping urbanform, promotinghigher densitiesas well as mixedand accessibleland use
Metro, light railand BRT are allintended toprovide fast,comfortable andcost-effectiveurban mobility inmedium- to high-demand corridors
Metro systemsrequire hugeinvestments andare oftenimplemented asthe preferredoption of largecities wheredemand justifiesthat high capitalcost
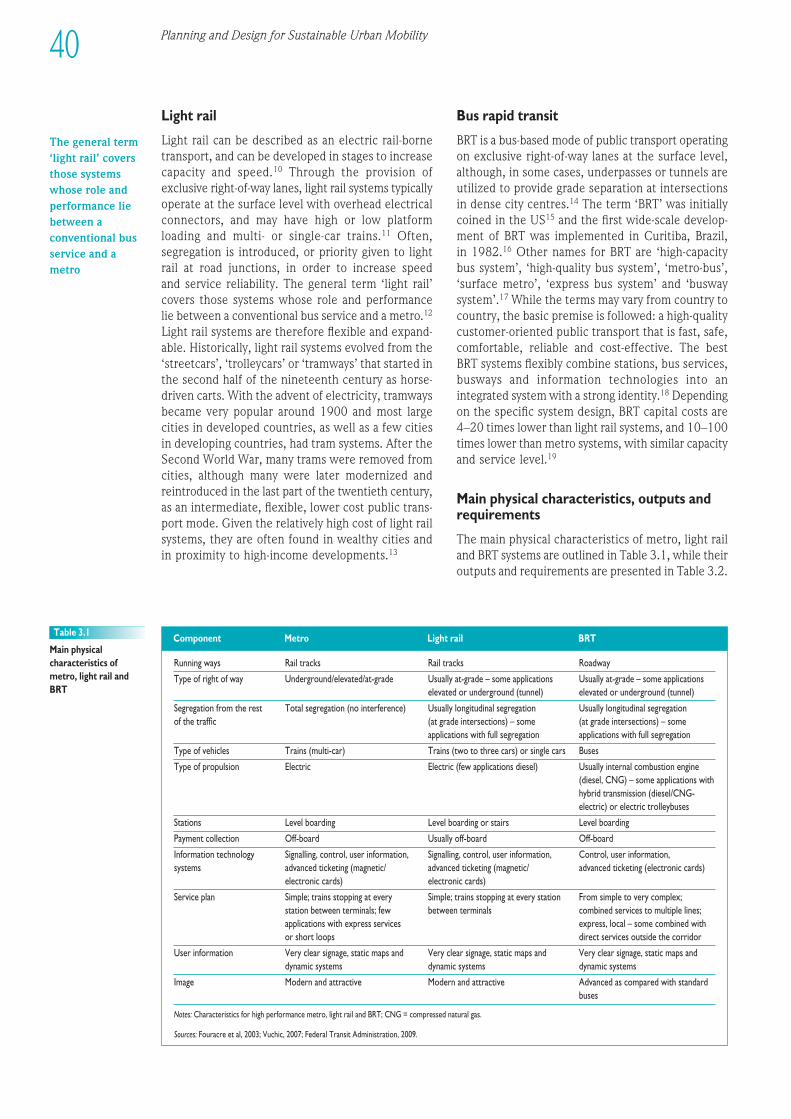
Running ways Rail tracks Rail tracks Roadway
Type of right of way Underground/elevated/at-grade Usually at-grade – some applications Usually at-grade – some applications elevated or underground (tunnel) elevated or underground (tunnel)
Segregation from the rest Total segregation (no interference) Usually longitudinal segregation Usually longitudinal segregation of the traffic (at grade intersections) – some (at grade intersections) – some
applications with full segregation applications with full segregation
Type of vehicles Trains (multi-car) Trains (two to three cars) or single cars Buses
Type of propulsion Electric Electric (few applications diesel) Usually internal combustion engine(diesel, CNG) – some applications withhybrid transmission (diesel/CNG-electric) or electric trolleybuses
Stations Level boarding Level boarding or stairs Level boarding
Payment collection Off-board Usually off-board Off-board
Information technology Signalling, control, user information, Signalling, control, user information, Control, user information, systems advanced ticketing (magnetic/ advanced ticketing (magnetic/ advanced ticketing (electronic cards)
electronic cards) electronic cards)
Service plan Simple; trains stopping at every Simple; trains stopping at every station From simple to very complex; station between terminals; few between terminals combined services to multiple lines; applications with express services express, local – some combined with or short loops direct services outside the corridor
User information Very clear signage, static maps and Very clear signage, static maps and Very clear signage, static maps and dynamic systems dynamic systems dynamic systems
Image Modern and attractive Modern and attractive Advanced as compared with standardbuses
Notes: Characteristics for high performance metro, light rail and BRT; CNG = compressed natural gas.
Sources: Fouracre et al, 2003; Vuchic, 2007; Federal Transit Administration, 2009.
Table 3.1
Main physicalcharacteristics ofmetro, light rail andBRT
Component Metro Light rail BRT
40 Planning and Design for Sustainable Urban Mobility
Light rail
Light rail can be described as an electric rail-bornetransport, and can be developed in stages to increasecapacity and speed.10 Through the provision ofexclusive right-of-way lanes, light rail systems typicallyoperate at the surface level with overhead electricalconnectors, and may have high or low platformloading and multi- or single-car trains.11 Often,segregation is introduced, or priority given to lightrail at road junctions, in order to increase speed and service reliability. The general term ‘light rail’covers those systems whose role and performancelie between a conventional bus service and a metro.12
Light rail systems are therefore flexible and expand -able. Historically, light rail systems evolved from the‘streetcars’, ‘trolleycars’ or ‘tramways’ that started inthe second half of the nineteenth century as horse-driven carts. With the advent of electricity, tramwaysbecame very popular around 1900 and most largecities in developed countries, as well as a few citiesin devel op ing countries, had tram systems. After theSecond World War, many trams were removed fromcities, although many were later modernized andreintroduced in the last part of the twentieth century,as an intermediate, flexible, lower cost public trans -port mode. Given the relatively high cost of light railsystems, they are often found in wealthy cities andin proximity to high-income devel op ments.13
Bus rapid transit
BRT is a bus-based mode of public trans port operatingon exclusive right-of-way lanes at the surface level,although, in some cases, underpasses or tunnels areutilized to provide grade separation at intersectionsin dense city centres.14 The term ‘BRT’ was initiallycoined in the US15 and the first wide-scale devel op -ment of BRT was implemented in Curitiba, Brazil, in 1982.16 Other names for BRT are ‘high-capacitybus system’, ‘high-quality bus system’, ‘metro-bus’,‘surface metro’, ‘express bus system’ and ‘buswaysystem’.17 While the terms may vary from country tocountry, the basic premise is followed: a high-qualitycustomer-oriented public trans port that is fast, safe,comfortable, reliable and cost-effective. The bestBRT systems flexibly combine stations, bus services,busways and information technologies into anintegrated system with a strong identity.18 Dependingon the specific system design, BRT capital costs are4–20 times lower than light rail systems, and 10–100times lower than metro systems, with similar capacityand service level.19
Main physical characteristics, outputs andrequirements
The main physical characteristics of metro, light railand BRT systems are outlined in Table 3.1, while theiroutputs and requirements are presented in Table 3.2.
The general term‘light rail’ coversthose systemswhose role andperformance liebetween aconventional busservice and ametro
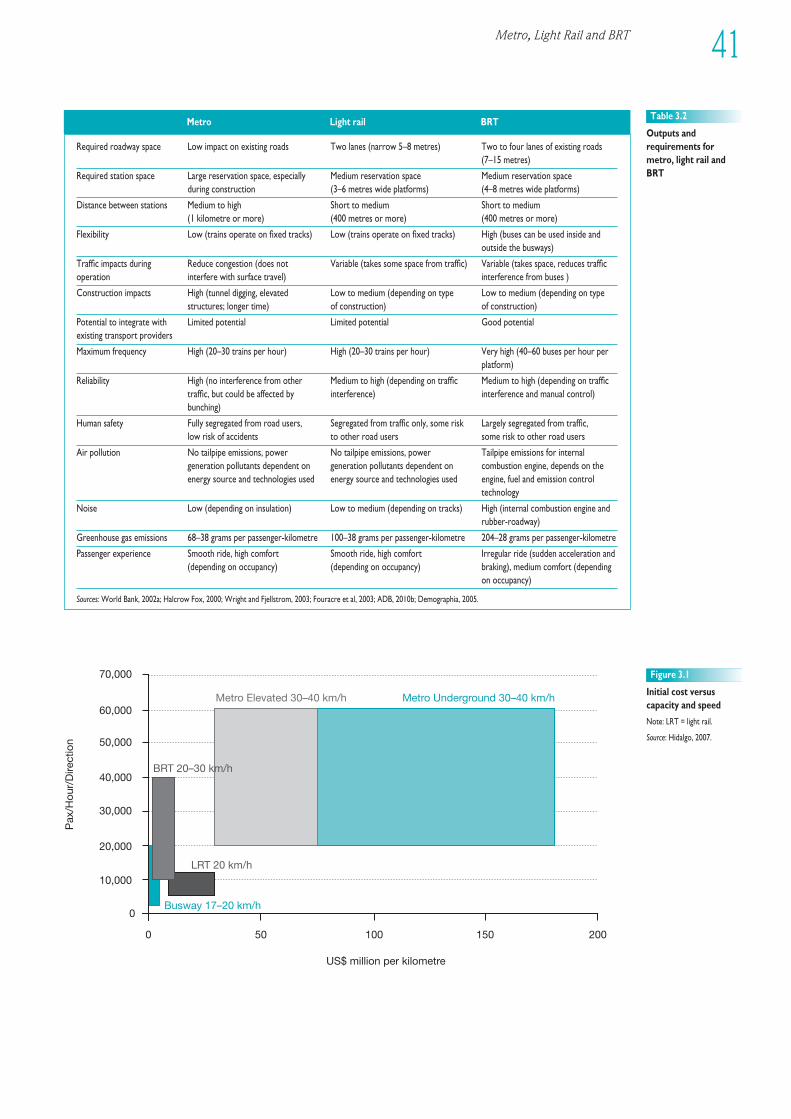
Required roadway space Low impact on existing roads Two lanes (narrow 5–8 metres) Two to four lanes of existing roads(7–15 metres)
Required station space Large reservation space, especially Medium reservation space Medium reservation space during construction (3–6 metres wide platforms) (4–8 metres wide platforms)
Distance between stations Medium to high Short to medium Short to medium (1 kilometre or more) (400 metres or more) (400 metres or more)
Flexibility Low (trains operate on fixed tracks) Low (trains operate on fixed tracks) High (buses can be used inside andoutside the busways)
Traffic impacts during Reduce congestion (does not Variable (takes some space from traffic) Variable (takes space, reduces traffic operation interfere with surface travel) interference from buses )
Construction impacts High (tunnel digging, elevated Low to medium (depending on type Low to medium (depending on type structures; longer time) of construction) of construction)
Potential to integrate with Limited potential Limited potential Good potentialexisting trans port providers
Maximum frequency High (20–30 trains per hour) High (20–30 trains per hour) Very high (40–60 buses per hour perplatform)
Reliability High (no interference from other Medium to high (depending on traffic Medium to high (depending on traffic traffic, but could be affected by interference) interference and manual control)bunching)
Human safety Fully segregated from road users, Segregated from traffic only, some risk Largely segregated from traffic, low risk of accidents to other road users some risk to other road users
Air pollution No tailpipe emissions, power No tailpipe emissions, power Tailpipe emissions for internal generation pollutants dependent on generation pollutants dependent on combustion engine, depends on the energy source and technologies used energy source and technologies used engine, fuel and emission control
technology
Noise Low (depending on insulation) Low to medium (depending on tracks) High (internal combustion engine andrubber-roadway)
Greenhouse gas emissions 68–38 grams per passen ger-kilometre 100–38 grams per passen ger-kilometre 204–28 grams per passen ger-kilometre
Passen ger experi ence Smooth ride, high comfort Smooth ride, high comfort Irregular ride (sudden acceleration and (depending on occupancy) (depending on occupancy) braking), medium comfort (depending
on occupancy)
Sources: World Bank, 2002a; Halcrow Fox, 2000; Wright and Fjellstrom, 2003; Fouracre et al, 2003; ADB, 2010b; Demographia, 2005.
Table 3.2
Outputs andrequirements for metro, light rail andBRT
Metro Light rail BRT
US$ million per kilometre
0 50 100 150 200
Pax
/Hou
r/D
irect
ion
0
10,000
20,000
30,000
40,000
50,000
60,000
70,000
Metro Elevated 30–40 km/h Metro Underground 30–40 km/h
LRT 20 km/h
Busway 17–20 km/h
BRT 20–30 km/h
Figure 3.1
Initial cost versuscapacity and speed
Note: LRT = light rail.
Source: Hidalgo, 2007.
1EEE234567891012311145678920123456789301234567894012345678950123456789EEEE
41Metro, Light Rail and BRT
Metro and light rail systems produce little noise, havelow emissions of air pollutants (including greenhousegases) and have high reliability. In addition, metrosystems do not use limited road space on the surface,thus ensuring a consistently reliable and high-qualityservice. Nevertheless, metro and light rail systemshave limited flexibility and require bus or inter -mediate public trans port feeder services for last-kilometre connectivity. Further more, the distancebetween stations is usually higher in metros than inlight rail and BRT in order to enable higher travelspeeds. While this speeds up long distance com -mutes, it also requires longer distances for passen -gers to access stations.
The key variables for evaluating high-capacitypublic trans port systems include capacity, commercialspeed and cost. Figure 3.1 indicates that BRT canprovide high-capacity services – similar to that ofmetros and higher than that of light rail systems –at a fraction of their capital costs.20 While commercialspeeds delivered by BRT and light rail systems areusually lower than metros, some BRT systems reachsignificantly higher speeds than light rail (when usingexpress services or fully separated facilities inexpressways). It is also important to note that whileelevated and underground metro systems averagesimilar capacities, their initial costs of constructionvary greatly (Figure 3.1). A more detailed discussionof construction and operating costs for the varioustrans port modes can be found in Chapter 8.
EXAMPLES OF NATIONALPOLICIES TOWARD HIGH-CAPACITY PUBLIC TRANS -PORT IN DEVEL OP INGCOUNTRIESRail-based public trans port systems have been anatural part of the devel op ment of urban infra -structure in developed countries’ cities. However,cities in devel op ing countries have struggled in this respect due to finan cial and institutional limi-tations. Nevertheless, in the last 15 years, severaldevel op ing-country cities have started implementingBRT systems, and some have initiated or expandedlight rail and metros. Further more, national govern -ments are co-financing public trans port infra struc-ture in order to support the large proportion of thepopu lation now living in urban areas, including con -siderations of energy security, economic efficiencyand climate change. This section provides examplesfrom selected devel op ing countries that haveintroduced national policies to support high-capacityurban public trans port systems.
China
In 2011, the Govern ment of China, through theMinistry of Transport, introduced the ‘public trans -port city’ project to improve the service level of urbanpublic trans port and alleviate traffic congestion inChinese cities. Supported by the Ministry of Trans -port, the demonstration projects (in 30 selectedcities) will include the construction of public trans -port hubs, implementation of ‘intelligent trans portsystems’, energy conservation and emission reductionpractices in public transport. Additional finan cialsupport for the demonstration projects will beprovided at the national level and co-financed byprovincial govern ments.
As a result of the national support, severalChinese cities have started the construction orexpanded their public trans port networks in theform of metro, light rail and BRT systems. Beijing,for instance, is implementing a very ambitious railexpansion programme. In 2012, the Beijing metrohad 16 lines, with 442 kilometres of track length and 251 stations, becoming the longest metro net -work in the world.21 Expansion plans call for 708 kilo metres of track in operation by 2015 and 1050kilometres by 2020.
A number of other Chinese cities are alsoexpanding their metro systems, namely: Hong Kong,Tianjin, Shanghai, Guangzhou, Dalian, Wuhan,Shenzhen, Chongqing, Nanjing, Shenyang, Chengdu,Guangfo, Xi’an, Suzhou, Kunming and Hangzhou. Inaddition, there are currently 18 cities with metro andlight rail systems under construction, and a further22 cities where construction is either being plannedor pending approval. With respect to BRT, a total of15 Chinese cities had operational systems, whileanother 11 systems were either under constructionor at the planning stage by 2012.
India
In 2005, the Govern ment of India created the US$20billion Jawaharlal Nehru National Urban RenewalMission (JnNURM) to fund urban infra struc tureimprovements and basic services to the urban poorin 65 cities for the 2005–2011 period.22 It isexpected that the programme will be renewed in2013, as part of the sixth five-year plan.
With finan cial and technical assistance from thenational, state and local govern ments, the cities ofKolkata, Chennai, Delhi and Bangalore currently haveoperational metro systems. Encouraged by Delhi’ssuccess, six other Indian cities have metro systemsunder construction, while metro systems in anothereleven cities are in various planning stages. In Delhi,where metro operations commenced in 2002, thereare currently 193 kilometres of metro tracks (with145 stations). Expansion plans include another 140kilometres (approved) and 139 kilometres (proposed)
42 Planning and Design for Sustainable Urban Mobility
The key variablesfor evaluatinghigh-capacitypublic transportsystems includecapacity,commercial speedand cost
In the last 15years, severaldeveloping-country citieshave startedimplementingBRT systems, andsome haveinitiated orexpanded lightrail and metros
With financial andtechnicalassistance fromthe national, stateand localgovernments, thecities of Kolkata,Chennai, Delhiand Bangalorecurrently haveoperational metrosystems
1EEE234567891012311145678920123456789301234567894012345678950123456789EEEE
43Metro, Light Rail and BRT
for a total network of 472 kilometres to be completedby 2021.23
In addition to the various metro systems underconstruction, busways exist in Delhi, Pune and Jaipur,while Ahmedabad has a fully operational BRT system(75 kilometres long, with additional 80 kilometresunder construction or being planned). Further more,BRT systems are currently being introduced in thecities of Rajkot, Surat, Indore, Hyderabad, Pimpri-Chinchwad, Visakapatnam and Bhopal. Another eightcities are planning the introduction of BRT systems.
Brazil
The Govern ment of Brazil is responsible for pro -moting improvements in public urban transport. Asa result, every city with more than 20,000 inhab itants(i.e. some 1600 cities) is required to develop amobility master plan linked to its urban devel op mentplans. The National Policy on Urban Mobility givespriority to non-motorized trans port and publictransportation, over private motorized transport. Italso seeks to limit or restrict motor vehicle use in agiven geographic area or during a specific time period.Other measures sought by the policy to reduce trafficcongestion and air pollution include establishingcongestion and pollution tolls, as well as emissionstandards for air pollutants.
To support investment in public transport, thefederal govern ment created two programmes ‘Pro-transporte’ and ‘Growth Acceleration Programme’,in preparation for the 2014 FIFA World Cup and the 2016 Summer Olympic Games. Projects includeBRT lanes in 9 of the 12 cities that will host WorldCup matches, including Rio de Janeiro and BeloHorizonte. In four cities, including São Paulo andBrasília, light rail systems such as monorails andtrams are being built, with another five cities planningthe adoption of the same. Currently, there are eightcities with metro: Belo Horizonte, Brasília, PortoAlegre, Fortaleza, Recife, Rio de Janeiro, São Pauloand Teresina.
Inspired by the bus lanes implemented inCuritiba in the 1970s, 31 cities in Brazil currentlyhave BRT systems or bus ways, totalling 696 kilo -metres. Most of the already existing busway corridorsin Brazil need renovation and the BRT systems offerthe opportunity of increasing public trans port produc -tivity, while overcoming the problems generated bythe multiple superimposed radial routes, convergingto terminals located at city centres. Several cities –including Belo Horizonte, Porto Alegre, Salvador,Brasília and Belém – are currently upgrading somesections of existing busways to BRT standards.
Mexico
In 2008, the Govern ment of Mexico created thePROTRAM (Federal Support Programme for PublicTransport), to improve urban trans port efficiency andto reduce urban greenhouse gas emissions. To date,PROTRAM has given finan cial support to 11 BRTsystems and 1 suburban rail system. Other pipelineprojects in 34 cities are earmarked for funding fromthis programme, which provides both grants andcredits.
Mexico has a metro system in its capital MexicoCity; light rail systems in Guadalajara and Monterrey;and BRT systems in León, Mexico City, Guadalajara,Ecatepec and Monterrey.
Kenya
In 2009, the Govern ment of Kenya launched theIntegrated National Transport Policy, which seeks to establish appropriate institutional and regulatoryframeworks to coordinate and harmonize themanagement and provision of passen ger trans portservices. Among the policy recommendations is theestablishment of independent institutions to manageurban passen ger trans port services and operations.24
The policy further envisions increasing use ofhigh-capacity public trans port through the provisionof railway infra struc ture for Nairobi and its environs.Consequently, the govern ment opened the SyokimauRailway station in the suburbs of Nairobi in 2012.The railway service from this station to the citycentre has reduced travel time by half over the 18-kilometre journey. Further more, authorities havealso ensured that the railway is integrated with othermodes, as last-mile link buses have been introducedto boost the city commuter train service.25
The trans port policy also envisages the provisionof infra struc ture to support public trans port services,i.e. bus lanes, promotion (through fiscal incentives)of high-occupancy public trans port vehicles and dis -couraging private motor vehicle use once the publictrans port system is efficient.26 In 2012, the Govern -ment of Kenya, supported by the World Bank,launched the National Urban Transport ImprovementProject (NUTRIP) to support the devel op ment ofselected high-capacity public trans port corridors.27
Morocco
The Govern ment of Morocco has embarked onreforming the trans port sector along three mainpillars: improving the sector’s governance; improvingthe efficiency and devel op ing the supply of urbantrans port services and infra struc ture; and improvingthe environ mental and social sus tain ability of urbantransport.28 Significant investments have been madetowards light rail systems in the cities of Casablancaand Rabat-Salé. Commissioned in 2011, the tramway
Inspired by thebus lanesimplemented inCuritiba in the1970s, 31 cities inBrazil currentlyhave BRT systemsor bus ways,totalling 696kilometres
Planning and Design for Sustainable Urban Mobility44
line between Rabat and Salé consists of 44 trams,with an expected daily ridership of 180,000 passen -gers. The total length of the dual-line tramway net -work is 19.5 kilometres and consists of 31 stationsthat are spaced a half kilometre apart.29
In Casablanca, the tramway devel op mentcompany acquired 74 trams for the 31 kilometres Y-shaped network, which commenced operations in2012. The line has 48 stops and has an expected dailyridership of 255,000 passen gers.30
Nigeria
Nigeria’s 2010 National Transport Policy seeks todevelop an efficient, self-sustaining and reliable publictrans port system, and to improve the infra struc tureand institutional framework for public trans portservice delivery. It also aims to enhance the capacityof the existing infra struc ture through proper main -tenance of roadways and efficient traffic management.Further more, it calls for the substantial expansionof urban infra struc ture, with emphasis on publictrans port infra struc ture – railway, dedicated busroutes, etc.31
The policy envisions the introduction of a high-capacity bus-based trans port system that can beaccommodated by the existing infra struc ture. Alreadythere are dedicated bus routes in Lagos, where a BRTis being implemented. The policy also aims topromote private sector participation in urban publictrans port services and in the long-term introducerapid rail systems into the country’s major cities.
To advance the efficiency of urban trans portsystem operations and management, an autonomousbody – the Municipal Transportation Agency – willbe established in each major city. The task of theseagencies will be, inter alia, the regulation, planning,designing and maintenance of urban trans port infra -struc ture facilities.
South Africa
In South Africa, the Public Transport Strategy aimsto improve public trans port by establishing anintegrated rapid public trans port network thatcomprises of an integrated package of rapid rail androad corridors. Through BRT, the govern ment aimsto link different parts of a city into a network andensure that by 2020, most city residents are no morethan 500 metres away from a BRT station.32 The BRTsystems are being implemented through public–private partnerships, whereby cities build andmaintain the infra struc ture for the operation of thebuses, stations, depots, control centres and a farecollection system. Private operators, by contrast,own and manage the buses, hire staff and provideservices on a long-term contract.
In Johannesburg, the Rea Vaya BRT is beingimplemented in phases across in the city since 2009.
Notably, the first trunk route running between EllisPark in Doornfontein and Thokoza Park in Sowetohas been completed. The long-term plan is for theRea Vaya route to cover 330 kilometres, allowingmore than 80 per cent of Johannesburg’s residentsto catch a bus within 500 metres from a BRT station.33
In addition to Johannesburg’s BRT system, CapeTown also has a BRT system known as MyCiTi,34
while Tshwane is implementing Tshwane BRT thatwill cover some 80 kilometres of bus lines.35
The Gauteng Provincial Govern ment hasimplemented Gautrain, which is South Africa’s firsthigh-speed passen ger railway line, connecting ORTambo International Airport with the cities ofJohannesburg and Pretoria. The 80-kilometre high-speed passen ger railway network comprises of tworoutes: the north–south line connecting Pretoria andHatfield Johannesburg; and an east–west line fromSandton to the airport, which is supported by anetwork of feeder buses serving most of its tenstations.
METRO SYSTEMS AROUNDTHE WORLD: TRENDS ANDCONDITIONSDue to govern ment stimulus programmes in thewake of the global finan cial crisis, the world marketfor railway infra struc ture and equipment has beengrowing at 3.2 per cent a year, and is set to grow ataround 2.7 per cent annually until 2017. Spendingon metro rail systems should grow faster still, atperhaps 6–8 per cent.36 Figure 3.2 shows the growthof metro rail systems around the world in terms ofthe number of cities with operational systems.37
By 1970, there were a total of 40 cities worldwidewith metro systems, followed by a rapid increaseduring the next four decades. Currently, there are187 cities with a metro system as part of their publictrans port system.38 Box 3.1 provides an overview of the growth of metros across the world. The rapidincrease in the number of rail-based systems is anindication of the importance of metros in facilitatingmobility, particularly in large urban areas that arebeyond city limits. Notably, metros are less prone tocongestion than roadways and are important to thoseresiding in peripheral locations, as they commute longdistances to employment centres and other activitynodes.39
The global distribution of metro systems inFigure 3.3 shows a concentration of metros inEurope, Eastern Asia and the eastern part of the US. The regional distribution in terms of number ofcities and ridership is presented in Table 3.3. Asiancities account for the largest share of metro ridership,totalling more than 51 million riders a day. In termsof total track length of metros, Asian cities account
The rapid increasein the number ofrail-based systemsis an indication ofthe importance of metros infacilitatingmobility,particularly inlarge urban areasthat are beyondcity limits
Asian citiesaccount for thelargest share ofmetro ridership,totalling morethan 51 millionriders a day
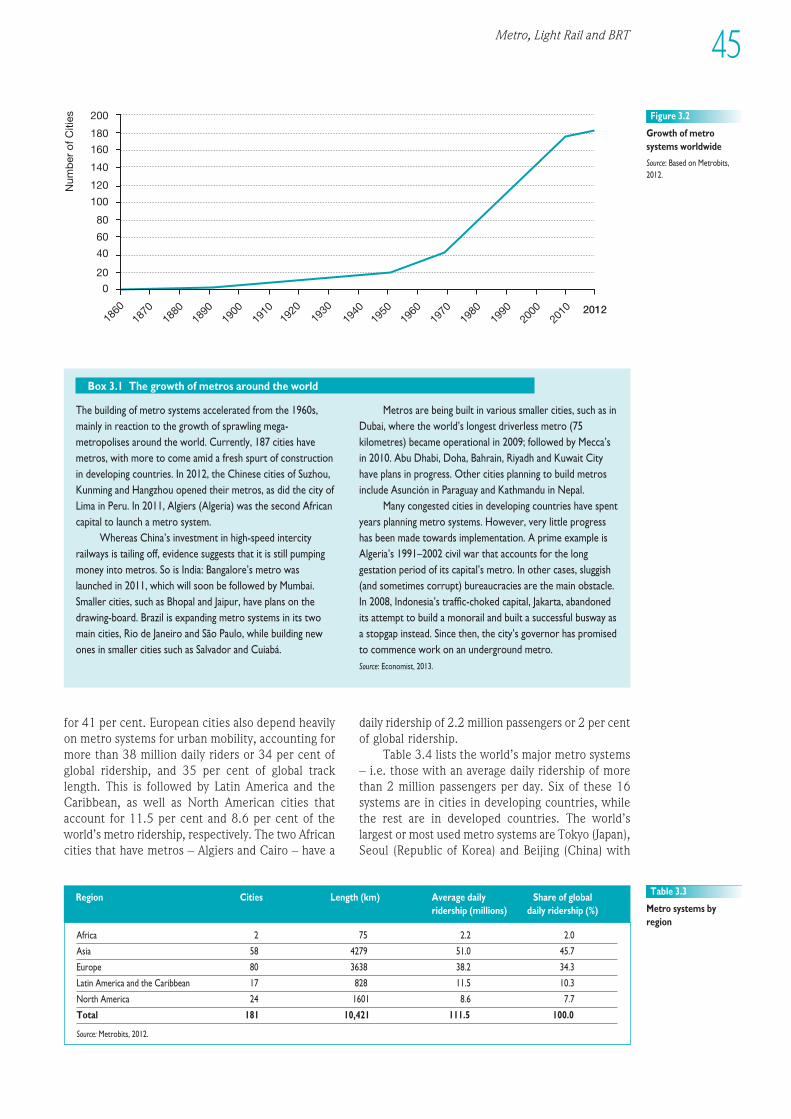
Metro, Light Rail and BRT 45
1EEE234567891012311145678920123456789301234567894012345678950123456789EEEE
201220
1020
0019
9019
8019
7019
6019
5019
4019
3019
1019
0018
9018
8018
7018
60
0
20
40
60
80
100
120
140
160
180
200
Num
ber
of C
ities
1920
Figure 3.2
Growth of metrosystems worldwide
Source: Based on Metrobits,2012.
The building of metro systems accelerated from the 1960s,mainly in reaction to the growth of sprawling mega-metropolises around the world. Currently, 187 cities havemetros, with more to come amid a fresh spurt of constructionin devel op ing countries. In 2012, the Chinese cities of Suzhou,Kunming and Hangzhou opened their metros, as did the city ofLima in Peru. In 2011, Algiers (Algeria) was the second Africancapital to launch a metro system.
Whereas China’s investment in high-speed intercityrailways is tailing off, evidence suggests that it is still pumpingmoney into metros. So is India: Bangalore’s metro waslaunched in 2011, which will soon be followed by Mumbai.Smaller cities, such as Bhopal and Jaipur, have plans on thedrawing-board. Brazil is expanding metro systems in its twomain cities, Rio de Janeiro and São Paulo, while building newones in smaller cities such as Salvador and Cuiabá.
Metros are being built in various smaller cities, such as inDubai, where the world’s longest driverless metro (75kilometres) became operational in 2009; followed by Mecca’sin 2010. Abu Dhabi, Doha, Bahrain, Riyadh and Kuwait Cityhave plans in progress. Other cities planning to build metrosinclude Asunción in Paraguay and Kathmandu in Nepal.
Many congested cities in devel op ing countries have spentyears planning metro systems. However, very little progresshas been made towards implementation. A prime example isAlgeria’s 1991–2002 civil war that accounts for the longgestation period of its capital’s metro. In other cases, sluggish(and sometimes corrupt) bureaucracies are the main obstacle.In 2008, Indonesia’s traffic-choked capital, Jakarta, abandonedits attempt to build a monorail and built a successful busway asa stopgap instead. Since then, the city’s governor has promisedto commence work on an underground metro.Source: Economist, 2013.
Box 3.1 The growth of metros around the world
for 41 per cent. European cities also depend heavilyon metro systems for urban mobility, accounting formore than 38 million daily riders or 34 per cent ofglobal ridership, and 35 per cent of global tracklength. This is followed by Latin America and theCaribbean, as well as North American cities thataccount for 11.5 per cent and 8.6 per cent of theworld’s metro ridership, respectively. The two Africancities that have metros – Algiers and Cairo – have a
daily ridership of 2.2 million passen gers or 2 per centof global ridership.
Table 3.4 lists the world’s major metro systems– i.e. those with an average daily ridership of morethan 2 million passen gers per day. Six of these 16systems are in cities in devel op ing countries, whilethe rest are in developed countries. The world’slargest or most used metro systems are Tokyo (Japan),Seoul (Republic of Korea) and Beijing (China) with
Africa 2 75 2.2 2.0
Asia 58 4279 51.0 45.7
Europe 80 3638 38.2 34.3
Latin America and the Caribbean 17 828 11.5 10.3
North America 24 1601 8.6 7.7
Total 181 10,421 111.5 100.0
Source: Metrobits, 2012.
Table 3.3
Metro systems byregion
Region Cities Length (km) Average daily Share of global ridership (millions) daily ridership (%)
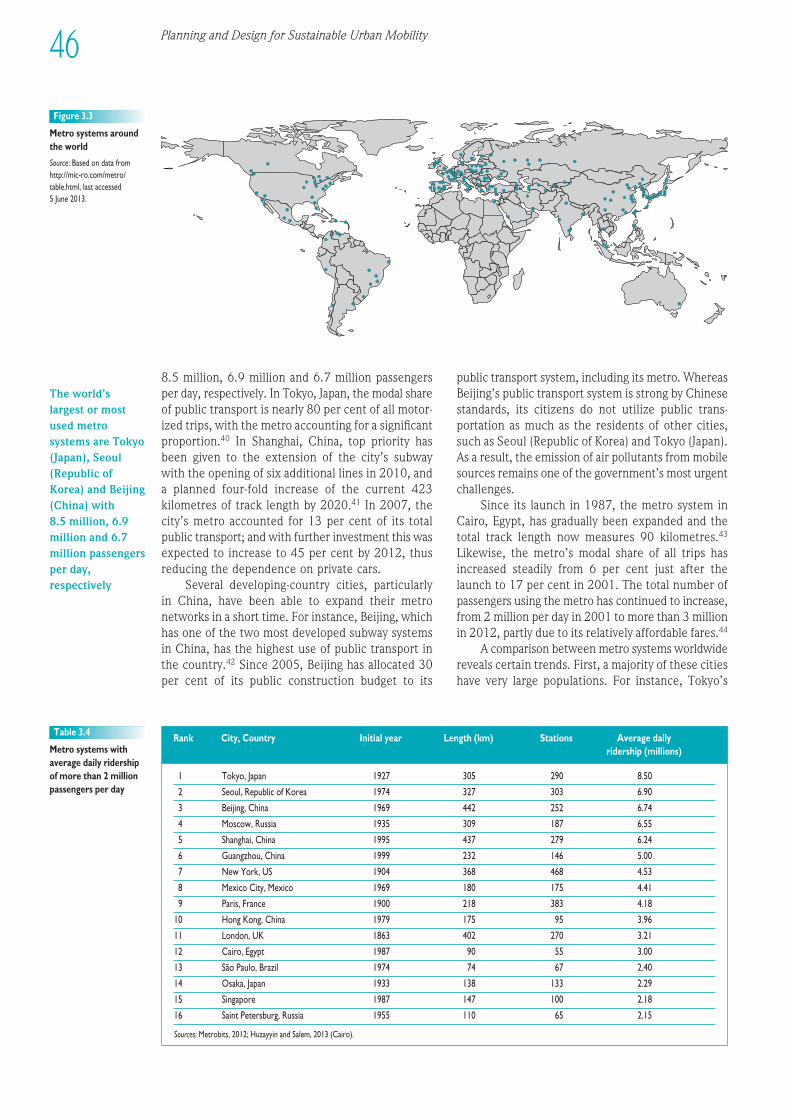
Planning and Design for Sustainable Urban Mobility46
Figure 3.3
Metro systems aroundthe world
Source: Based on data fromhttp://mic-ro.com/metro/table.html, last accessed 5 June 2013.
8.5 million, 6.9 million and 6.7 million passen gersper day, respectively. In Tokyo, Japan, the modal shareof public trans port is nearly 80 per cent of all motor -ized trips, with the metro accounting for a significantproportion.40 In Shanghai, China, top priority hasbeen given to the extension of the city’s subway with the opening of six additional lines in 2010, anda planned four-fold increase of the current 423kilometres of track length by 2020.41 In 2007, thecity’s metro accounted for 13 per cent of its totalpublic transport; and with further investment this wasexpected to increase to 45 per cent by 2012, thusreducing the dependence on private cars.
Several devel op ing-country cities, particularlyin China, have been able to expand their metronetworks in a short time. For instance, Beijing, whichhas one of the two most developed subway systemsin China, has the highest use of public trans port inthe country.42 Since 2005, Beijing has allocated 30per cent of its public construction budget to its
public trans port system, including its metro. WhereasBeijing’s public trans port system is strong by Chinesestandards, its citizens do not utilize public trans -portation as much as the residents of other cities,such as Seoul (Republic of Korea) and Tokyo (Japan).As a result, the emission of air pollutants from mobilesources remains one of the govern ment’s most urgentchallenges.
Since its launch in 1987, the metro system inCairo, Egypt, has gradually been expanded and thetotal track length now measures 90 kilometres.43
Likewise, the metro’s modal share of all trips hasincreased steadily from 6 per cent just after thelaunch to 17 per cent in 2001. The total number ofpassen gers using the metro has continued to increase,from 2 million per day in 2001 to more than 3 millionin 2012, partly due to its relatively affordable fares.44
A comparison between metro systems worldwidereveals certain trends. First, a majority of these citieshave very large populations. For instance, Tokyo’s
1 Tokyo, Japan 1927 305 290 8.50
2 Seoul, Republic of Korea 1974 327 303 6.90
3 Beijing, China 1969 442 252 6.74
4 Moscow, Russia 1935 309 187 6.55
5 Shanghai, China 1995 437 279 6.24
6 Guangzhou, China 1999 232 146 5.00
7 New York, US 1904 368 468 4.53
8 Mexico City, Mexico 1969 180 175 4.41
9 Paris, France 1900 218 383 4.18
10 Hong Kong, China 1979 175 95 3.96
11 London, UK 1863 402 270 3.21
12 Cairo, Egypt 1987 90 55 3.00
13 São Paulo, Brazil 1974 74 67 2.40
14 Osaka, Japan 1933 138 133 2.29
15 Singapore 1987 147 100 2.18
16 Saint Petersburg, Russia 1955 110 65 2.15
Sources: Metrobits, 2012; Huzayyin and Salem, 2013 (Cairo).
Table 3.4
Metro systems withaverage daily ridershipof more than 2 millionpassen gers per day
Rank City, Country Initial year Length (km) Stations Average daily ridership (millions)
The world’slargest or mostused metrosystems are Tokyo(Japan), Seoul(Republic ofKorea) and Beijing(China) with 8.5 million, 6.9million and 6.7million passengersper day,respectively
metro has the largest ridership in the world, and islocated in the world’s most populous urban agglom -eration (with some 37 million inhabitants45).Similarly, major urban agglomerations such as New York and Mexico City, each with an estimatedpopulation of more than 20 million have metrosystems that carry 4.5 million passen gers daily. Beinglarge also implies that metro cities are often the mostfiscally sound, while small municipalities lackeconomies of scale necessary to construct and operatemetros. Some of the links between metro systemsand urban structure are highlighted in Box 3.2, andfurther explored in Chapter 5.
Second, urban areas with metro systems haveoften extended or grown beyond their establishedboundaries, engulfing surrounding areas, adjacenttowns and sometimes into different provinces. For instance, Mexico City has encroached uponmunicipalities in two states. Tokyo (Japan), which has the world’s largest metro system, has 75 per centof its estimated 37.2 million population living insuburban areas.46 In China, Shanghai encom-passes a mega-urban region occupying an area of over6340 square kilometres, with the Beijing mega-urban region extending over 16,870 square kilo -metres.47 This implies that the governance of metrosystems has to go beyond the traditional city limits.The metro politization of neigh bouring districts,municipalities and cities through cross-boundaryinstitutions offers significant benefits in terms ofefficiency, construction and operation costs, includ-ing creating economic synergies among newly
connected areas. This is discussed in more detail inChapter 9.
Third, many of the cities with metro systems areeither capital cities or large cities in their respectivecountries. Capital cities account for 9 of the 16 citieswith the world’s largest metro systems (Table 3.4),and 27 per cent of all cities with metros. The restare major cities. For instance, in China, Japan andGermany, besides the capital cities, 15, 12 and 18cities in these countries respectively have metros.Being the national capital or major city can determinethe extent to which countries invest in metrosystems. This is because apart from generating morerevenue, capital or large cities dominate the systemof settlements and perform major administrative,commercial, diplomatic, finan cial and industrialfunctions. In order to perform these functionseffectively, capitals and other large cities need anefficient and integrated public trans port system thatincludes metros.
LIGHT RAIL SYSTEMSAROUND THE WORLD:TRENDS AND CONDITIONSLight rail is a flexible concept that evolved from thenineteenth century horse-driven rail carts.48 The re-emergence as an alternative means of trans port tocars or buses was due to its potential to mitigatecongestion and support mobility in urban centres.
Metro, Light Rail and BRT 47
1EEE234567891012311145678920123456789301234567894012345678950123456789EEEE
The integration of metro systems within the urban fabricmakes some important demands on the planning system.Rights-of-way must be established and protected. Space mustbe released for depots and terminals. In addition, where high-density ancillary devel op ments are intended, the land must beassembled into lots suitable for devel op ment and theappropriate densities of devel op ment sanctioned.
The most indisputable structuring effect of metros is thatthey allow central business districts in large dynamic cities tocontinue growing, where service by road, either by car or bus,would be increasingly frustrated by congestion. Without thehigh-capacity links, activities would begin to be decentralized.This has implications both for city planning and for projectevaluation. A conscious attempt to maintain the growth of thecity centre will save on public infra struc ture costs in otherareas; avoiding these extra costs is an important part of thelong-term benefit of metro investments.
Unfortunately, the magnitude of those savings is littleresearched, particularly in devel op ing countries, and theeconomic evaluation of metro investments is usually based onthe more conventional user cost–benefit appraisal. While that
may still be justifiable, in the interest of avoiding the worstkind of ‘white elephants’, a more wide-ranging multi-criteriaanalysis may be the most suitable way of ensuring that thoseunmeasured effects are taken into consideration. Anintegrated land use, urban trans port and air quality strategy,such as the Integrated Urban Transport Plan in São Paulo, isneeded to ensure that the metro system is adequately insertedin the urban structure.
Obtaining desirable structuring effects outside the citycentre is more difficult. Clustered multi-nuclear devel op mentassociated with station locations sometimes occursspontaneously, but normally requires either some planning bygovern ment (as in the cases of Singapore and Hong Kong,China) or close links between private ownership of the metrosystem and contiguous devel op ments (as is common in Japan).In both cases, this requires land to be assembled for devel op -ment in relatively large lots. This has been achieved bycomprehensive public ownership of land in Hong Kong, bycompulsory public purchase in Singapore and through marketmechanisms in some Japanese private railway devel op ments.Source: World Bank, 2002a.
Box 3.2 Metros, urban structure and land use
Urban areas withmetro systemshave oftenextended orgrown beyondtheir establishedboundaries,engulfingsurroundingareas, adjacenttowns andsometimes intodifferentprovinces
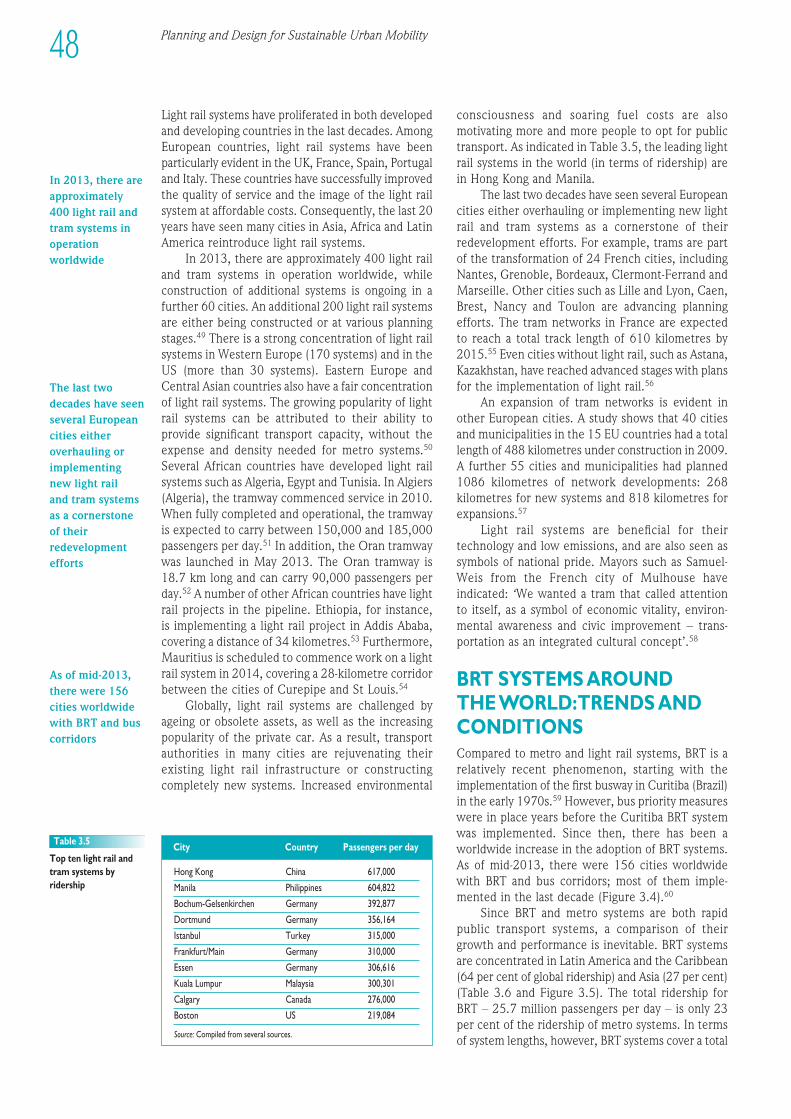
Light rail systems have proliferated in both developedand devel op ing countries in the last decades. AmongEuropean countries, light rail systems have beenparticularly evident in the UK, France, Spain, Portugaland Italy. These countries have successfully improvedthe quality of service and the image of the light railsystem at affordable costs. Consequently, the last 20years have seen many cities in Asia, Africa and LatinAmerica reintroduce light rail systems.
In 2013, there are approximately 400 light railand tram systems in operation worldwide, whileconstruction of additional systems is ongoing in afurther 60 cities. An additional 200 light rail systemsare either being constructed or at various planningstages.49 There is a strong concentration of light railsystems in Western Europe (170 systems) and in theUS (more than 30 systems). Eastern Europe andCentral Asian countries also have a fair concentrationof light rail systems. The growing popularity of lightrail systems can be attributed to their ability toprovide significant trans port capacity, without theexpense and density needed for metro systems.50
Several African countries have developed light railsystems such as Algeria, Egypt and Tunisia. In Algiers(Algeria), the tramway commenced service in 2010.When fully completed and operational, the tramwayis expected to carry between 150,000 and 185,000passen gers per day.51 In addition, the Oran tramwaywas launched in May 2013. The Oran tramway is18.7 km long and can carry 90,000 passen gers perday.52 A number of other African countries have lightrail projects in the pipeline. Ethiopia, for instance,is implementing a light rail project in Addis Ababa,covering a distance of 34 kilometres.53 Further more,Mauritius is scheduled to commence work on a lightrail system in 2014, covering a 28-kilometre corridorbetween the cities of Curepipe and St Louis.54
Globally, light rail systems are challenged byageing or obsolete assets, as well as the increasingpopularity of the private car. As a result, trans portauthorities in many cities are rejuvenating theirexisting light rail infra struc ture or constructingcompletely new systems. Increased environ mental
consciousness and soaring fuel costs are alsomotivating more and more people to opt for publictransport. As indicated in Table 3.5, the leading lightrail systems in the world (in terms of ridership) arein Hong Kong and Manila.
The last two decades have seen several Europeancities either overhauling or implementing new lightrail and tram systems as a cornerstone of theirredevel op ment efforts. For example, trams are partof the transformation of 24 French cities, includingNantes, Grenoble, Bordeaux, Clermont-Ferrand andMarseille. Other cities such as Lille and Lyon, Caen,Brest, Nancy and Toulon are advancing planningefforts. The tram networks in France are expectedto reach a total track length of 610 kilometres by2015.55 Even cities without light rail, such as Astana,Kazakhstan, have reached advanced stages with plansfor the implementation of light rail.56
An expansion of tram networks is evident inother European cities. A study shows that 40 citiesand municipalities in the 15 EU countries had a totallength of 488 kilometres under construction in 2009.A further 55 cities and municipalities had planned1086 kilometres of network devel op ments: 268kilometres for new systems and 818 kilometres forexpansions.57
Light rail systems are beneficial for theirtechnology and low emissions, and are also seen assymbols of national pride. Mayors such as Samuel-Weis from the French city of Mulhouse haveindicated: ‘We wanted a tram that called attentionto itself, as a symbol of economic vitality, environ -mental awareness and civic improvement – trans -portation as an integrated cultural concept’.58
BRT SYSTEMS AROUND THE WORLD: TRENDS ANDCONDITIONSCompared to metro and light rail systems, BRT is arelatively recent phenomenon, starting with theimplementation of the first busway in Curitiba (Brazil)in the early 1970s.59 However, bus priority measureswere in place years before the Curitiba BRT systemwas implemented. Since then, there has been aworldwide increase in the adoption of BRT systems.As of mid-2013, there were 156 cities worldwidewith BRT and bus corridors; most of them imple -mented in the last decade (Figure 3.4).60
Since BRT and metro systems are both rapidpublic trans port systems, a comparison of theirgrowth and performance is inevitable. BRT systemsare concentrated in Latin America and the Caribbean(64 per cent of global ridership) and Asia (27 per cent)(Table 3.6 and Figure 3.5). The total ridership forBRT – 25.7 million passen gers per day – is only 23per cent of the ridership of metro systems. In termsof system lengths, however, BRT systems cover a total
Planning and Design for Sustainable Urban Mobility48
Hong Kong China 617,000
Manila Philippines 604,822
Bochum-Gelsenkirchen Germany 392,877
Dortmund Germany 356,164
Istanbul Turkey 315,000
Frankfurt/Main Germany 310,000
Essen Germany 306,616
Kuala Lumpur Malaysia 300,301
Calgary Canada 276,000
Boston US 219,084
Source: Compiled from several sources.
Table 3.5
Top ten light rail andtram systems byridership
City Country Passen gers per day
In 2013, there areapproximately400 light rail andtram systems inoperationworldwide
The last twodecades have seenseveral Europeancities eitheroverhauling orimplementingnew light rail and tram systemsas a cornerstoneof theirredevelopmentefforts
As of mid-2013,there were 156cities worldwidewith BRT and buscorridors
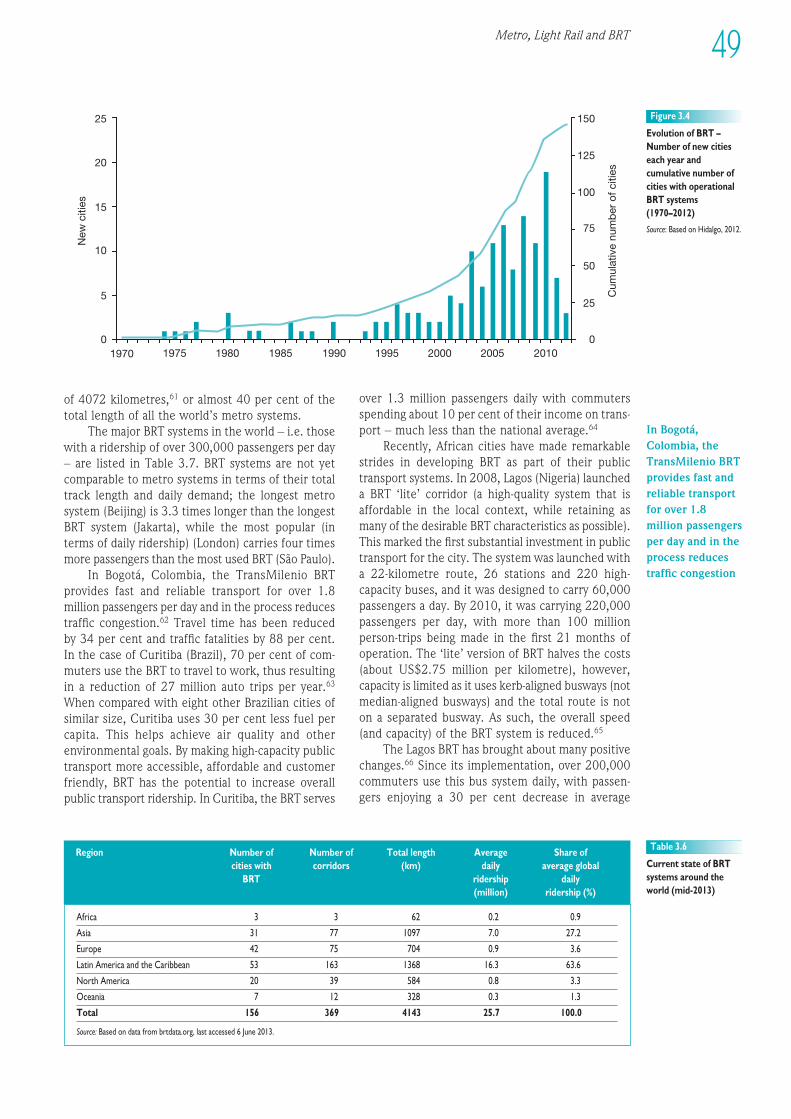
Metro, Light Rail and BRT 49
1EEE234567891012311145678920123456789301234567894012345678950123456789EEEE
New
citi
es
Cum
ulat
ive
num
ber
of c
ities
0
5
10
15
20
25
1970 1975 1980 1985 1990 1995 2000 2005 20100
25
50
75
100
125
150 Figure 3.4
Evolution of BRT –Number of new citieseach year andcumulative number ofcities with operationalBRT systems(1970–2012)
Source: Based on Hidalgo, 2012.
Africa 3 3 62 0.2 0.9
Asia 31 77 1097 7.0 27.2
Europe 42 75 704 0.9 3.6
Latin America and the Caribbean 53 163 1368 16.3 63.6
North America 20 39 584 0.8 3.3
Oceania 7 12 328 0.3 1.3
Total 156 369 4143 25.7 100.0
Source: Based on data from brtdata.org, last accessed 6 June 2013.
Table 3.6
Current state of BRTsystems around theworld (mid-2013)
Region Number of Number of Total length Average Share of cities with corridors (km) daily average global
BRT ridership daily (million) ridership (%)
of 4072 kilometres,61 or almost 40 per cent of thetotal length of all the world’s metro systems.
The major BRT systems in the world – i.e. thosewith a ridership of over 300,000 passen gers per day– are listed in Table 3.7. BRT systems are not yetcomparable to metro systems in terms of their totaltrack length and daily demand; the longest metrosystem (Beijing) is 3.3 times longer than the longestBRT system (Jakarta), while the most popular (interms of daily ridership) (London) carries four timesmore passen gers than the most used BRT (São Paulo).
In Bogotá, Colombia, the TransMilenio BRTprovides fast and reliable trans port for over 1.8million passen gers per day and in the process reducestraffic congestion.62 Travel time has been reducedby 34 per cent and traffic fatalities by 88 per cent.In the case of Curitiba (Brazil), 70 per cent of com -muters use the BRT to travel to work, thus resultingin a reduction of 27 million auto trips per year.63
When compared with eight other Brazilian cities ofsimilar size, Curitiba uses 30 per cent less fuel percapita. This helps achieve air quality and otherenviron mental goals. By making high-capacity publictrans port more accessible, affordable and customerfriendly, BRT has the potential to increase overallpublic trans port ridership. In Curitiba, the BRT serves
over 1.3 million passen gers daily with commutersspending about 10 per cent of their income on trans -port – much less than the national average.64
Recently, African cities have made remarkablestrides in devel op ing BRT as part of their public trans port systems. In 2008, Lagos (Nigeria) launcheda BRT ‘lite’ corridor (a high-quality system that isafford able in the local context, while retaining asmany of the desirable BRT characteristics as possible).This marked the first substantial investment in publictrans port for the city. The system was launched witha 22-kilometre route, 26 stations and 220 high-capacity buses, and it was designed to carry 60,000passen gers a day. By 2010, it was carrying 220,000passen gers per day, with more than 100 millionperson-trips being made in the first 21 months ofoperation. The ‘lite’ version of BRT halves the costs(about US$2.75 million per kilometre), however,capacity is limited as it uses kerb-aligned busways (notmedian-aligned busways) and the total route is noton a separated busway. As such, the overall speed(and capacity) of the BRT system is reduced.65
The Lagos BRT has brought about many positivechanges.66 Since its implementation, over 200,000commuters use this bus system daily, with passen -gers enjoying a 30 per cent decrease in average
In Bogotá,Colombia, theTransMilenio BRTprovides fast andreliable transportfor over 1.8million passengersper day and in theprocess reducestraffic congestion
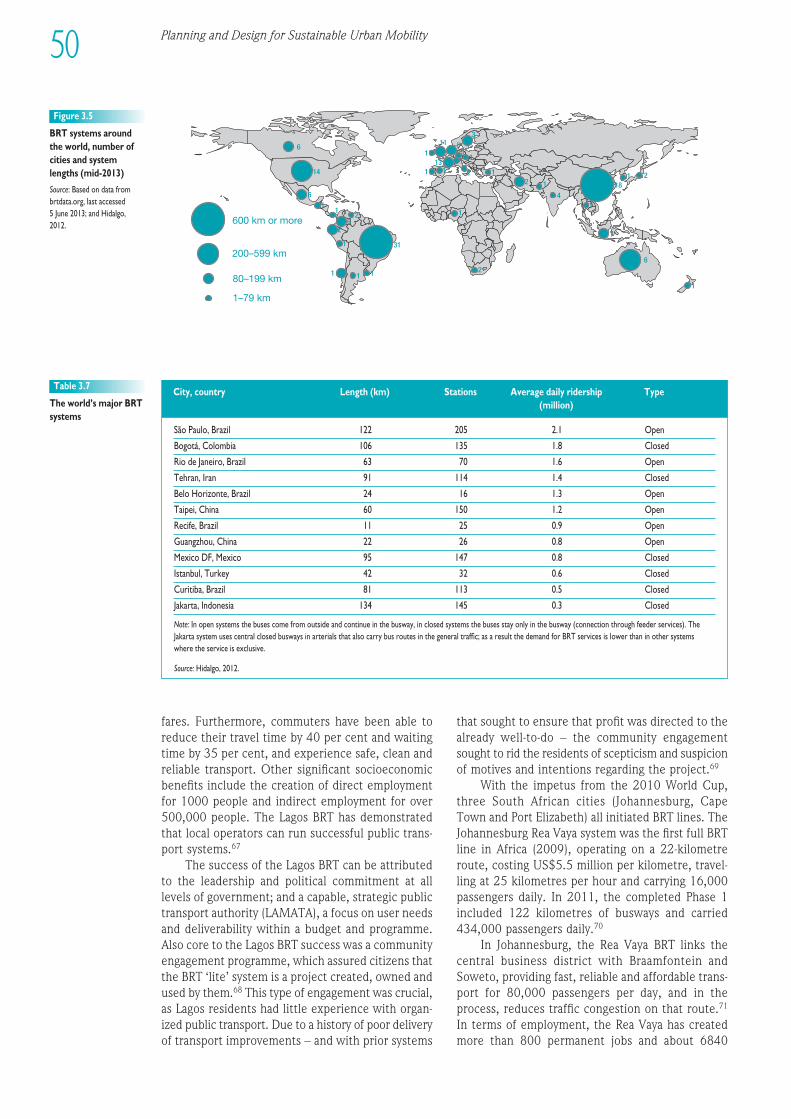
1–79 km
80–199 km
200–599 km
600 km or more
31
18
6
14
6
1
62
13
1
2
6
53
11
1
13
14
1
2 2
1
1
1
1
1
1 1
2
11
1
1
1
2
Figure 3.5
BRT systems aroundthe world, number ofcities and systemlengths (mid-2013)
Source: Based on data frombrtdata.org, last accessed 5 June 2013; and Hidalgo, 2012.
São Paulo, Brazil 122 205 2.1 Open
Bogotá, Colombia 106 135 1.8 Closed
Rio de Janeiro, Brazil 63 70 1.6 Open
Tehran, Iran 91 114 1.4 Closed
Belo Horizonte, Brazil 24 16 1.3 Open
Taipei, China 60 150 1.2 Open
Recife, Brazil 11 25 0.9 Open
Guangzhou, China 22 26 0.8 Open
Mexico DF, Mexico 95 147 0.8 Closed
Istanbul, Turkey 42 32 0.6 Closed
Curitiba, Brazil 81 113 0.5 Closed
Jakarta, Indonesia 134 145 0.3 Closed
Note: In open systems the buses come from outside and continue in the busway, in closed systems the buses stay only in the busway (connection through feeder services). TheJakarta system uses central closed busways in arterials that also carry bus routes in the general traffic; as a result the demand for BRT services is lower than in other systemswhere the service is exclusive.
Source: Hidalgo, 2012.
Table 3.7
The world’s major BRTsystems
City, country Length (km) Stations Average daily ridership Type(million)
fares. Further more, commuters have been able toreduce their travel time by 40 per cent and waitingtime by 35 per cent, and experi ence safe, clean andreliable transport. Other significant socioeconomicbenefits include the creation of direct employmentfor 1000 people and indirect employment for over500,000 people. The Lagos BRT has demonstratedthat local operators can run successful public trans -port systems.67
The success of the Lagos BRT can be attributedto the leadership and political commitment at alllevels of govern ment; and a capable, strategic publictrans port authority (LAMATA), a focus on user needsand deliverability within a budget and programme.Also core to the Lagos BRT success was a communityengagement programme, which assured citizens thatthe BRT ‘lite’ system is a project created, owned andused by them.68 This type of engagement was crucial,as Lagos residents had little experi ence with organ -ized public transport. Due to a history of poor deliveryof trans port improvements – and with prior systems
that sought to ensure that profit was directed to thealready well-to-do – the community engage mentsought to rid the residents of scepticism and suspicionof motives and intentions regarding the project.69
With the impetus from the 2010 World Cup,three South African cities (Johannesburg, Cape Town and Port Elizabeth) all initiated BRT lines. TheJohannesburg Rea Vaya system was the first full BRTline in Africa (2009), operating on a 22-kilometreroute, costing US$5.5 million per kilometre, travel -ling at 25 kilometres per hour and carrying 16,000passen gers daily. In 2011, the completed Phase 1included 122 kilometres of busways and carried434,000 passen gers daily.70
In Johannesburg, the Rea Vaya BRT links thecentral business district with Braamfontein andSoweto, providing fast, reliable and affordable trans -port for 80,000 passen gers per day, and in theprocess, reduces traffic congestion on that route.71
In terms of employment, the Rea Vaya has createdmore than 800 permanent jobs and about 6840
50 Planning and Design for Sustainable Urban Mobility
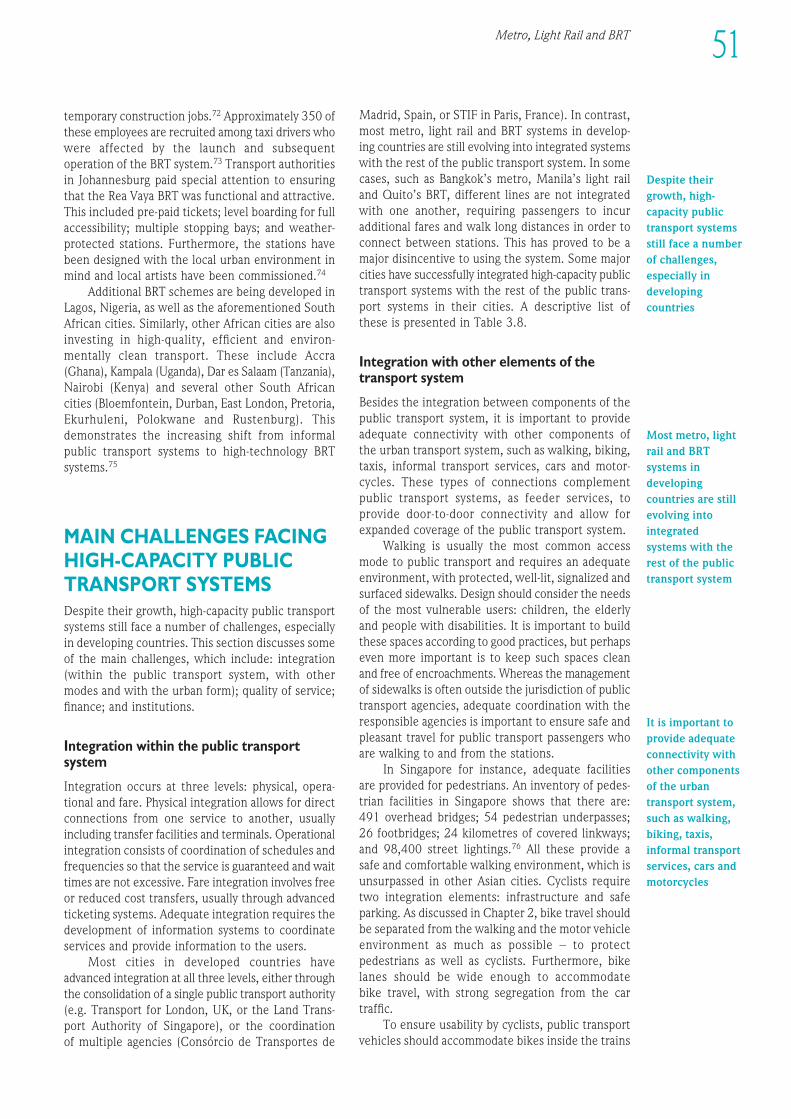
1EEE234567891012311145678920123456789301234567894012345678950123456789EEEE
51Metro, Light Rail and BRT
temporary construction jobs.72 Approximately 350 ofthese employees are recruited among taxi drivers whowere affected by the launch and subsequentoperation of the BRT system.73 Transport authoritiesin Johannesburg paid special attention to ensuringthat the Rea Vaya BRT was functional and attractive.This included pre-paid tickets; level boarding for fullaccessibility; multiple stopping bays; and weather-protected stations. Further more, the stations havebeen designed with the local urban environ ment inmind and local artists have been commissioned.74
Additional BRT schemes are being developed inLagos, Nigeria, as well as the aforementioned SouthAfrican cities. Similarly, other African cities are alsoinvesting in high-quality, efficient and environ -mentally clean transport. These include Accra(Ghana), Kampala (Uganda), Dar es Salaam (Tanzania),Nairobi (Kenya) and several other South Africancities (Bloemfontein, Durban, East London, Pretoria,Ekurhuleni, Polokwane and Rustenburg). Thisdemonstrates the increasing shift from informalpublic trans port systems to high-technology BRTsystems.75
MAIN CHALLENGES FACINGHIGH-CAPACITY PUBLICTRANS PORT SYSTEMSDespite their growth, high-capacity public trans portsystems still face a number of challenges, especiallyin devel op ing countries. This section discusses someof the main challenges, which include: integration(within the public trans port system, with othermodes and with the urban form); quality of service;finance; and institutions.
Integration within the public trans portsystem
Integration occurs at three levels: physical, opera -tional and fare. Physical integration allows for directconnections from one service to another, usuallyincluding transfer facilities and terminals. Operationalintegration consists of coordination of schedules andfrequencies so that the service is guaranteed and waittimes are not excessive. Fare integration involves freeor reduced cost transfers, usually through advancedticketing systems. Adequate integration requires thedevel op ment of information systems to coordinateservices and provide information to the users.
Most cities in developed countries haveadvanced integration at all three levels, either throughthe consolidation of a single public trans port authority(e.g. Transport for London, UK, or the Land Trans-port Authority of Singapore), or the coordination of multiple agencies (Consórcio de Transportes de
Madrid, Spain, or STIF in Paris, France). In contrast,most metro, light rail and BRT systems in devel op -ing countries are still evolving into integrated systemswith the rest of the public trans port system. In somecases, such as Bangkok’s metro, Manila’s light railand Quito’s BRT, different lines are not integratedwith one another, requiring passen gers to incuradditional fares and walk long distances in order toconnect between stations. This has proved to be amajor disincentive to using the system. Some majorcities have successfully integrated high-capacity publictrans port systems with the rest of the public trans -port systems in their cities. A descriptive list ofthese is presented in Table 3.8.
Integration with other elements of thetrans port system
Besides the integration between components of thepublic trans port system, it is important to provideadequate connectivity with other components of the urban trans port system, such as walking, biking,taxis, informal trans port services, cars and motor -cycles. These types of connections complementpublic trans port systems, as feeder services, toprovide door-to-door connectivity and allow forexpanded coverage of the public trans port system.
Walking is usually the most common accessmode to public trans port and requires an adequateenviron ment, with protected, well-lit, signalized andsurfaced sidewalks. Design should consider the needsof the most vulnerable users: children, the elderlyand people with disabilities. It is important to buildthese spaces according to good practices, but perhapseven more important is to keep such spaces cleanand free of encroachments. Whereas the managementof sidewalks is often outside the jurisdiction of publictrans port agencies, adequate coordination with theresponsible agencies is important to ensure safe andpleasant travel for public trans port passen gers whoare walking to and from the stations.
In Singapore for instance, adequate facilities are provided for pedestrians. An inventory of pedes -trian facilities in Singapore shows that there are: 491 overhead bridges; 54 pedestrian underpasses;26 footbridges; 24 kilometres of covered linkways;and 98,400 street lightings.76 All these provide a safe and comfortable walking environ ment, which isunsurpassed in other Asian cities. Cyclists require two integration elements: infra struc ture and safeparking. As discussed in Chapter 2, bike travel should be separated from the walking and the motor vehicleenviron ment as much as possible – to protectpedestrians as well as cyclists. Further more, bikelanes should be wide enough to accommodate bike travel, with strong segregation from the cartraffic.
To ensure usability by cyclists, public trans portvehicles should accommodate bikes inside the trains
Despite theirgrowth, high-capacity publictransport systemsstill face a numberof challenges,especially indevelopingcountries
Most metro, lightrail and BRTsystems indevelopingcountries are stillevolving intointegratedsystems with therest of the publictransport system
It is important toprovide adequateconnectivity withother componentsof the urbantransport system,such as walking,biking, taxis,informal transportservices, cars andmotorcycles
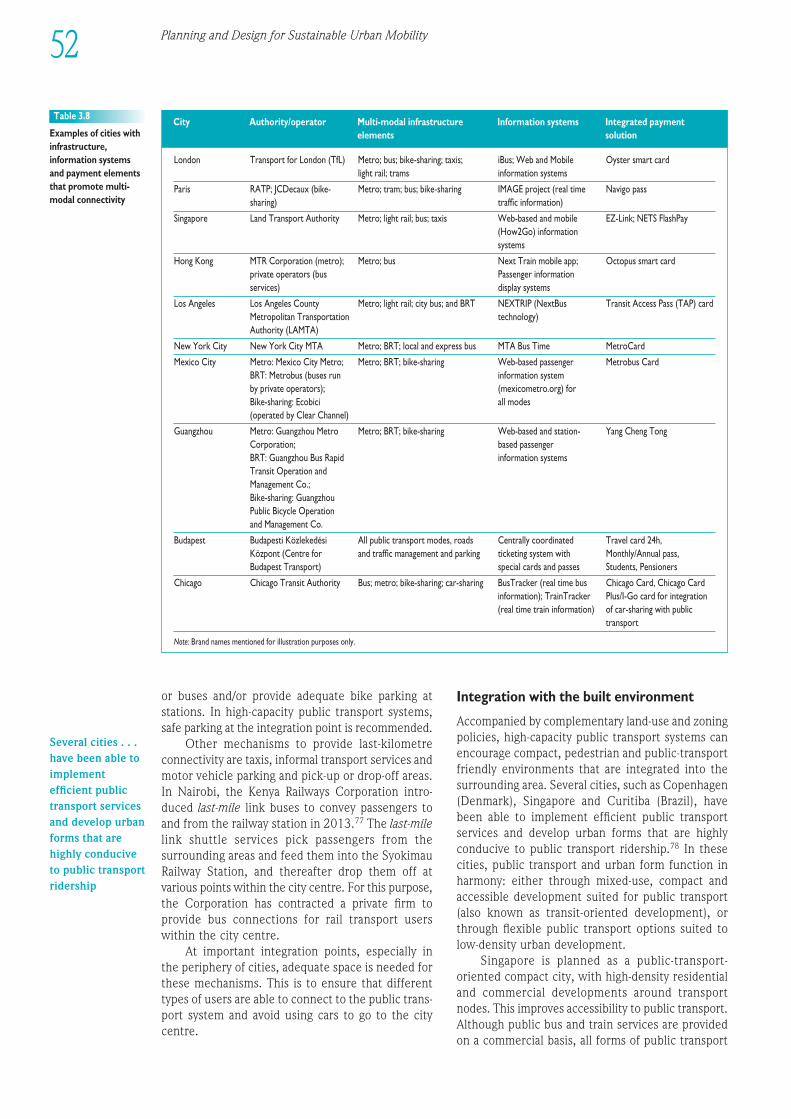
London Transport for London (TfL) Metro; bus; bike-sharing; taxis; iBus; Web and Mobile Oyster smart cardlight rail; trams information systems
Paris RATP; JCDecaux (bike- Metro; tram; bus; bike-sharing IMAGE project (real time Navigo passsharing) traffic information)
Singapore Land Transport Authority Metro; light rail; bus; taxis Web-based and mobile EZ-Link; NETS FlashPay(How2Go) information systems
Hong Kong MTR Corporation (metro); Metro; bus Next Train mobile app; Octopus smart cardprivate operators (bus Passen ger information services) display systems
Los Angeles Los Angeles County Metro; light rail; city bus; and BRT NEXTRIP (NextBus Transit Access Pass (TAP) cardMetropolitan Transportation technology)Authority (LAMTA)
New York City New York City MTA Metro; BRT; local and express bus MTA Bus Time MetroCard
Mexico City Metro: Mexico City Metro; Metro; BRT; bike-sharing Web-based passen ger Metrobus CardBRT: Metrobus (buses run information system by private operators); (mexicometro.org) for Bike-sharing: Ecobici all modes(operated by Clear Channel)
Guangzhou Metro: Guangzhou Metro Metro; BRT; bike-sharing Web-based and station- Yang Cheng TongCorporation; based passen ger BRT: Guangzhou Bus Rapid information systemsTransit Operation and Management Co.;Bike-sharing: Guangzhou Public Bicycle Operation and Management Co.
Budapest Budapesti Közlekedési All public trans port modes, roads Centrally coordinated Travel card 24h, Központ (Centre for and traffic management and parking ticketing system with Monthly/Annual pass, Budapest Transport) special cards and passes Students, Pensioners
Chicago Chicago Transit Authority Bus; metro; bike-sharing; car-sharing BusTracker (real time bus Chicago Card, Chicago Card information); TrainTracker Plus/I-Go card for integration (real time train information) of car-sharing with public
transport
Note: Brand names mentioned for illustration purposes only.
Table 3.8
Examples of cities withinfra struc ture,information systemsand payment elementsthat promote multi-modal connectivity
City Authority/operator Multi-modal infra struc ture Information systems Integrated payment elements solution
or buses and/or provide adequate bike parking atstations. In high-capacity public trans port systems,safe parking at the integration point is recommended.
Other mechanisms to provide last-kilometreconnectivity are taxis, informal trans port services andmotor vehicle parking and pick-up or drop-off areas.In Nairobi, the Kenya Railways Corporation intro -duced last-mile link buses to convey passen gers toand from the railway station in 2013.77 The last-milelink shuttle services pick passen gers from thesurrounding areas and feed them into the SyokimauRailway Station, and thereafter drop them off atvarious points within the city centre. For this purpose,the Corporation has contracted a private firm toprovide bus connections for rail trans port userswithin the city centre.
At important integration points, especially in the periphery of cities, adequate space is needed forthese mechanisms. This is to ensure that differenttypes of users are able to connect to the public trans -port system and avoid using cars to go to the citycentre.
Integration with the built environ ment
Accompanied by complementary land-use and zoningpolicies, high-capacity public trans port systems canencourage compact, pedestrian and public-trans portfriendly environ ments that are integrated into thesurrounding area. Several cities, such as Copenhagen(Denmark), Singapore and Curitiba (Brazil), havebeen able to implement efficient public trans portservices and develop urban forms that are highlyconducive to public trans port ridership.78 In thesecities, public trans port and urban form function inharmony: either through mixed-use, compact andaccessible devel op ment suited for public trans port(also known as transit-oriented devel op ment), orthrough flexible public trans port options suited tolow-density urban devel op ment.
Singapore is planned as a public-transport-oriented compact city, with high-density residentialand commercial devel op ments around trans portnodes. This improves accessibility to public transport.Although public bus and train services are providedon a commercial basis, all forms of public trans port
52 Planning and Design for Sustainable Urban Mobility
Several cities . . .have been able toimplementefficient publictransport servicesand develop urbanforms that arehighly conduciveto public transportridership
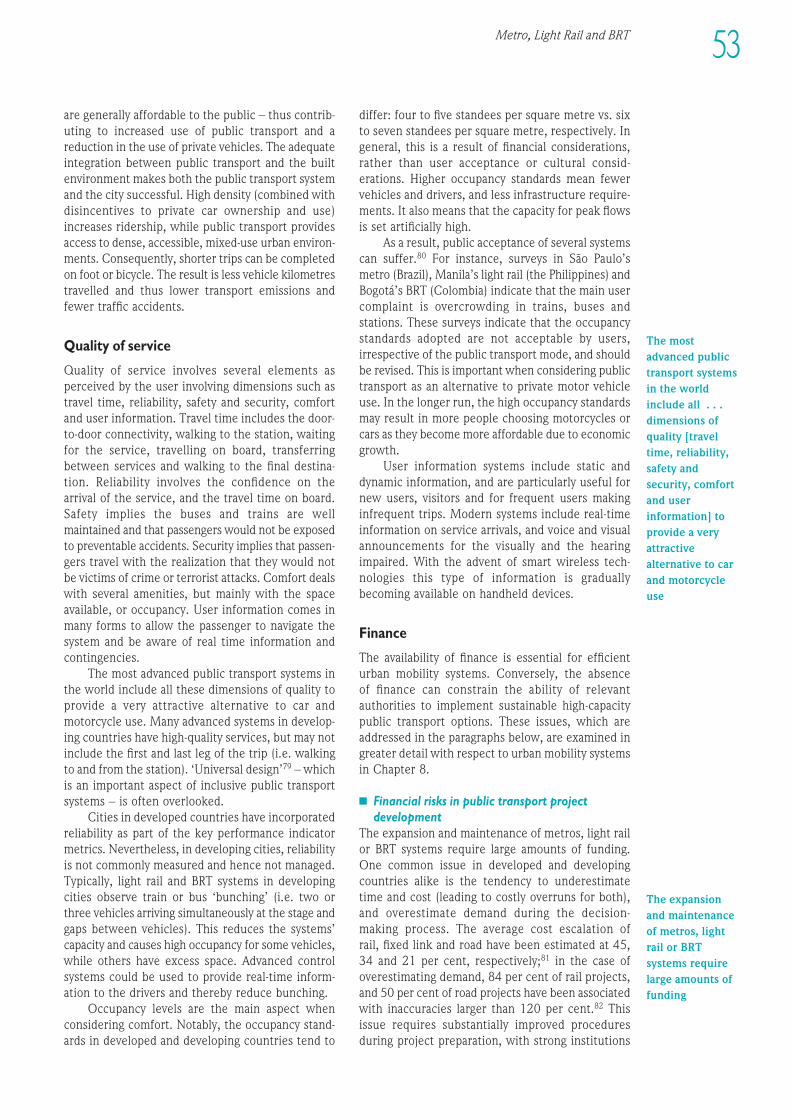
53Metro, Light Rail and BRT
are generally affordable to the public – thus contrib -uting to increased use of public trans port and areduction in the use of private vehicles. The adequateintegration between public trans port and the builtenviron ment makes both the public trans port systemand the city successful. High density (combined withdisincentives to private car ownership and use)increases ridership, while public trans port providesaccess to dense, accessible, mixed-use urban environ -ments. Consequently, shorter trips can be completedon foot or bicycle. The result is less vehicle kilometrestravelled and thus lower trans port emissions andfewer traffic accidents.
Quality of service
Quality of service involves several elements asperceived by the user involving dimensions such astravel time, reliability, safety and security, comfortand user information. Travel time includes the door-to-door connectivity, walking to the station, waitingfor the service, travelling on board, transferringbetween services and walking to the final destina-tion. Reliability involves the confidence on the arrival of the service, and the travel time on board.Safety implies the buses and trains are wellmaintained and that passen gers would not be exposedto preventable accidents. Security implies that passen -gers travel with the realization that they would notbe victims of crime or terrorist attacks. Comfort dealswith several amenities, but mainly with the spaceavailable, or occupancy. User information comes inmany forms to allow the passen ger to navigate thesystem and be aware of real time information andcontingencies.
The most advanced public trans port systems inthe world include all these dimensions of quality toprovide a very attractive alternative to car andmotorcycle use. Many advanced systems in devel op -ing countries have high-quality services, but may notinclude the first and last leg of the trip (i.e. walkingto and from the station). ‘Universal design’79 – whichis an important aspect of inclusive public trans portsystems – is often overlooked.
Cities in developed countries have incorporatedreliability as part of the key performance indicatormetrics. Nevertheless, in devel op ing cities, reliabilityis not commonly measured and hence not managed.Typically, light rail and BRT systems in devel op ingcities observe train or bus ‘bunching’ (i.e. two orthree vehicles arriving simultaneously at the stage andgaps between vehicles). This reduces the systems’capacity and causes high occupancy for some vehicles,while others have excess space. Advanced controlsystems could be used to provide real-time inform -ation to the drivers and thereby reduce bunching.
Occupancy levels are the main aspect whenconsidering comfort. Notably, the occupancy stand -ards in developed and devel op ing countries tend to
differ: four to five standees per square metre vs. sixto seven standees per square metre, respec tively. Ingeneral, this is a result of finan cial considerations,rather than user acceptance or cultural consid -erations. Higher occupancy standards mean fewervehicles and drivers, and less infra struc ture require -ments. It also means that the capacity for peak flowsis set artificially high.
As a result, public acceptance of several systemscan suffer.80 For instance, surveys in São Paulo’smetro (Brazil), Manila’s light rail (the Philippines) andBogotá’s BRT (Colombia) indicate that the main usercomplaint is over crowding in trains, buses andstations. These surveys indicate that the occupancystandards adopted are not acceptable by users,irrespective of the public trans port mode, and shouldbe revised. This is important when considering publictrans port as an alternative to private motor vehicleuse. In the longer run, the high occupancy standardsmay result in more people choosing motorcycles orcars as they become more affordable due to economicgrowth.
User information systems include static anddynamic information, and are particularly useful fornew users, visitors and for frequent users makinginfrequent trips. Modern systems include real-timeinformation on service arrivals, and voice and visualannouncements for the visually and the hearingimpaired. With the advent of smart wireless tech -nologies this type of information is graduallybecoming available on handheld devices.
Finance
The availability of finance is essential for efficienturban mobility systems. Conversely, the absence of finance can constrain the ability of relevantauthorities to implement sus tain able high-capacitypublic trans port options. These issues, which areaddressed in the paragraphs below, are examined ingreater detail with respect to urban mobility systemsin Chapter 8.
n Finan cial risks in public trans port projectdevel op ment
The expansion and maintenance of metros, light railor BRT systems require large amounts of funding. One common issue in developed and devel op ingcountries alike is the tendency to underestimate time and cost (leading to costly overruns for both),and overestimate demand during the decision-making process. The average cost escalation of rail, fixed link and road have been estimated at 45,34 and 21 per cent, respectively;81 in the case of over estimating demand, 84 per cent of rail projects,and 50 per cent of road projects have been associatedwith in accuracies larger than 120 per cent.82 Thisissue requires substantially improved proceduresduring project preparation, with strong institutions
1EEE234567891012311145678920123456789301234567894012345678950123456789EEEE
The mostadvanced publictransport systemsin the worldinclude all . . .dimensions ofquality [traveltime, reliability,safety andsecurity, comfortand userinformation] toprovide a veryattractivealternative to carand motorcycleuse
The expansionand maintenanceof metros, lightrail or BRTsystems requirelarge amounts offunding
54 Planning and Design for Sustainable Urban Mobility
and evaluation processes to ensure more reliable datato inform decision-making.
n Funding sourcesFunding for capital investments in high-capacitypublic trans port requires the participation of local,regional and national govern ments. Several countrieshave developed programmes to co-finance capitalinvestments in public transport, often supported bymulti-lateral devel op ment banks and internationaltechnical assistance programmes. It is important torecognize that the major multi-lateral devel op mentbanks – African Devel op ment Bank, Asian Devel op -ment Bank, Devel op ment Bank of Latin America, theEuropean Bank for Reconstruction and Devel op ment,the European Investment Bank, the Inter-AmericanDevel op ment Bank, the Islamic Devel op ment Bankand the World Bank – pledged US$175 billion during the Rio+20 Conference to support sus tain -able trans port between 2012 and 2022.83 This fundwill be used to promote all forms of sus tain abletransport, including public transport; bicycle andwalking infra struc ture; energy-efficient vehicles and fuels; railways; inland waterways; and road safety. Additional sources of international funding arethe climate change finan cial mechanisms, but theyare usually small, as compared with the fundingneeds.84
The national govern ments’ interest in publictrans port comes from the importance of cities for theproductivity of the countries, and national energysecurity and environ mental targets. Other consider -ations are equity and expanded access, as well asopportunities for low-income and vulnerable popu -lations living in urban areas. It is also important tohave adequate evaluation procedures to maximize the benefits of such investments and avoid costoverruns.85
In addition to transfers from different levels ofgovern ment, local authorities require innovativefunding mechanisms to support implementation andoperation of public trans port systems beyond the fare-box revenues.86 Several potential sources for suchfunding are discussed further in Chapter 8.
n Public trans port subsidiesAnother important aspect of finance is the issue ofsubsidies. Trans port economics literature has shownthat public trans port subsidies are efficient andsocially worthwhile as public trans port involvesseveral positive externalities (air quality, climatechange, road safety, physical activity). Thus, theprovision of subsidies to encourage operators tolower their existing fares and/or expand their existingfrequencies is socially desirable.87 The majority of thesocial benefits accrue from the ‘Mohring effect’,88
which indicates that subsidies increase ridership, and ridership increase engenders higher service fre -quencies, and the higher frequencies reduce the
average waiting times at public trans port stops.Hence, subsidies could be justified because of thescale economies conferred on riders. Nevertheless,subsidies need adequate management for them tobe targeted towards service improvements andserving the needs of vulnerable populations (lowincome, elderly, handicapped). Unmanaged subsidiesmay result in inefficiencies, such as excessiveoverheads, large number of operators and drivers, andhigh maintenance costs.89
Institutions
Urban trans port involves multiple institutions andlevels of govern ment that are not always wellcoordinated. Lack of coordination results in severalissues such as the lack of integration among publictrans port components, other trans port modes and thebuilt environ ment. Very often, the agencies respon -sible for metros, light rail or BRTs are only responsiblefor their respective mode, with minimal (if any)coordination with other components of the urbantrans port system. A second institutional issue is thelack of technical and managerial capacity. Manyagencies in devel op ing countries are not able toretain qualified personnel to plan, implement andmanage the complexity of public trans port projects.There is an urgent need to upgrade the technicalcapacity through training and professional devel op -ment programmes. The institutional and governancedimensions of sus tain able urban mobility systems arediscussed further in Chapter 9.
Significant opportunities exist to enhancetechnical and managerial capacity, through directexchanges among peer institutions and bench -marking. Some examples of these efforts include:
• Nova – a programme of international railwaybench marking, made up of a consortium ofmedium sized metro systems from around theworld: Bangkok (Thailand), Barcelona (Spain),Buenos Aires (Argentina), Brussels (Belgium),Delhi (India), Istanbul (Turkey), Lisbon (Portugal),Montréal (Canada), Naples (Italy), Newcastle (UK),Rio de Janeiro (Brazil), Singapore, Toronto(Canada) and Sydney (Australia). The four mainobjectives of Nova are: to build measures toestablish metro best practice; to providecomparative information both for the metro boardand the govern ment; to introduce a system ofmeasures for management; and to prioritize areasfor improvement.90
• CoMET – a programme of international railwaybenchmarking, made up of a consortium of largemetro systems from around the world: Beijing(China), Berlin (Germany), Guangzhou (China),Hong Kong (China), London (UK), Madrid (Spain),Mexico City (Mexico), Moscow (Russia), NewYork (US), Paris (France), Santiago (Chile), São
Funding forcapitalinvestments inhigh-capacitypublic transportrequires theparticipation oflocal, regional andnationalgovernments
Many agencies indevelopingcountries are notable to retainqualifiedpersonnel to plan,implement andmanage thecomplexity ofpublic transportprojects
1EEE234567891012311145678920123456789301234567894012345678950123456789EEEE
55Metro, Light Rail and BRT
Paulo (Brazil), Shanghai (China) and Taipei (China). Just like Nova, the four main objectivesof CoMET are: to build measures to establishmetro best practice; to provide comparativeinform ation both for the metro board and thegovern ment; to introduce a system of measuresfor management; and to prioritize areas forimprovement.91
• The International Bus Benchmarking Group (IBBG) – a programme of urban bus operationsbenchmarking, made up of medium and large busorganizations located around the world: Barcelona(Spain), Brussels (Belgium), Dublin (Ireland),Istanbul (Turkey), Lisbon (Portugal), London (UK),Montréal (Canada), New York (US), Paris (France),Seattle (US), Singapore, Sydney (Australia) andVancouver (Canada). IBBG was established in2004 to provide a confidential forum to shareexperi ences, compare performance, identify bestpractices and learn from one another in order formember organizations to improve performance.92
• SIBRT – whose mission is to cooperate and createa synergy for the promotion, consolidation andstrengthening of BRT and integrated trans portsystems, so that they become paradigms for thefuture of mobility in Latin America and the world,and to contribute effectively to improve the qualityof urban life.93
Additional exchanges are organized through industrialassociations such as the International Association ofPublic Transport (global),94 the American PublicTransportation Association (US),95 Canadian UrbanTransit Association (Canada),96 and AssociaçãoNacional de Transportes Públicos (Brazil).97
CONCLUDING REMARKSAND LESSONS FOR POLICYThis chapter has presented empirical evidence of thetrends and conditions as well as challenges withrespect to the role of high-capacity public trans portsystems worldwide. These systems play importantsocial, economic and environ mental roles in termsof facilitating more efficient urban mobility systemsand sus tain able urban devel op ment patterns. Suchhigh-capacity public trans port systems are primarilyappropriate for large and dense urban agglomera-tions, and serve as important parts of integratedpublic trans port systems. Accordingly, they shouldbe designed to provide a competitive and viablealterna tive to private cars and motorcycles.
Globally, metro systems have an average of 112million passen gers per day. Asian cities account for
46 per cent of global ridership, followed by Europeancities with 34 per cent of global ridership. As of 2013,there are only two African cities with metro systems.Ridership on light rail systems is significantly lower,although there are some 400 light rail and tramsystems in operation worldwide. Most of these arefound in Europe and the US, although the two lightrail systems with the highest number of passen gersare both located in Asia.
As of mid-2013, there were 156 cities worldwidewith BRT system. The total ridership for BRT, whichis about 26 million passen gers per day, is less thana quarter of that of metro systems. Most BRT systemsare located in devel op ing countries, particularly inLatin America and the Caribbean, and Asia.
Metro, light rail and BRT systems have differentcharacteristics, each with its benefits and drawbacks.This report calls for an advanced evaluation of thecosts and benefits of high-capacity public trans portsystems, prior to their implementation. It is alsoimportant to avoid endless discussions about alterna -tives, as the worst case scenario is ‘to-do-nothing’.
A major issue relating to the successful imple -mentation of high-capacity public trans port systemsis an accurate understanding of the requirements andperceptions of its potential users. In order to ensuremaximum ridership on metro, light rail and BRTsystems, these need to be designed and implementedin a manner that meets the aspirations of potentialriders.
Integration is important for public trans portsystems to be efficient and sus tain able. The mostefficient systems are those that have achieved routeintegration; integration with other public trans portsystems; integration with private motorized trans-port (including through encouraging drivers of privatecars to park outside the city centre and use publictrans port for parts of their daily commute); inte -gration with non-motorized modes (through easyaccess for pedestrians and/or bicycle parking andallowing bicycles onto public trans port vehicles);and fare integration: allowing users to travelthroughout the urban public trans port system on asingle ticket, or at reduced rates when switchingbetween operators and/or lines. Integration alsoincludes the built environ ment dimension: dense,mixed-use and accessible urban forms enhance rider -ship and vice versa.
Technical inadequacies in the construction ofpublic trans port systems, such as ramps, gaps, stepsor waiting areas, represent significant challenges forvulnerable groups. Many high-capacity public trans -port systems are also characterized by real orperceived security risks. These challenges and risksoften lead to reduced ridership and exclusion of manypotential users, especially women, children, theelderly, disabled and minorities.
Integration isimportant forpublic transportsystems to beefficient andsustainable
The most efficientsystems are thosethat have achievedroute integration;integration withother publictransport systems;integration withprivate motorizedtransport . . . ;integration withnon-motorizedmodes . . . ; andfare integration
Integration alsoincludes the builtenvironmentdimension: dense,mixed-use andaccessible urbanforms enhanceridership and viceversa
Planning and Design for Sustainable Urban Mobility56
NOTES1 UN-Habitat, 2013a.2 See, for example, Fouracre
et al, 2003; Wright andFjellstrom, 2003; Litman, 2007;Hensher, 2007; Vuchic, 2007;Systra, 2008; Salter et al, 2011.
3 World Bank, 2002a.4 World Bank, 2002a.5 UITP, undated.6 APTA, 1994.7 ERRAC-UITP, 2009.8 Transport for London,
undated a.9 ERRAC-UITP, 2009.
10 UITP, undated.11 APTA, 1994.12 UITP, undated.13 World Bank, 2002a.14 ITDP, 2007.15 Levinson et al, 2003.16 Lindau et al, 2010.17 Wright and Hook, 2007.18 Levinson et al, 2003.19 ITDP, 2007.20 It should be noted that it is
possible to find systems withhigher costs and capacities thanthose indicated in the table;nevertheless these can beconsidered as exceptional cases.
21 Economist, 2013.22 MoUD, 2005; Pai and Hidalgo,
2009. See also Box 8.13.
23 DMRC, undated.24 Republic of Kenya, 2009.25 Omwenga, 2013.26 Republic of Kenya, 2009.27 World Bank, 2013.28 Asmaa et al, 2012.29 Net Resources International,
2012.30 Railway Gazette International,
2012.31 Federal Republic of Nigeria,
2010.32 South African Govern ment
Information, 2012.33 Rea Vaya, undated.34 City of Cape Town, 2013.35 City of Tshwane, undated.36 Economist, 2013.37 Transport for London,
undated a.38 Metrobits, 2012.39 World Bank, 2002a.40 McKinsey Global Institute, 2010.41 McKinsey Global Institute, 2010;
Doi and Asano, 2011.42 McKinsey Global Institute, 2010.43 Huzayyin and Salem, 2013.44 Huzayyin and Salem, 2013.45 UN, 2011b.46 Cox, 2012.47 UN-Habitat, 2004.48 UITP, undated.49 UITP, undated.
50 UITP, 2004.51 Issam, 2011.52 Trade Arabia, 2013.53 Ethiopian Railways Corporation,
2011.54 Republic of Mauritius, 2013.55 UPI, 2008.56 ADB, 2012a.57 ERRAC-UITP, 2009.58 UPI, 2008.59 Hidalgo, 2011.60 See Table 3.6.61 brtdata.org, last accessed 5 June
2013.62 Hidalgo, 2008.63 Goodman et al, 2006.64 Goodman et al, 2006.65 Gauthier and Weinstock, 2010.66 World Bank, 2009a.67 World Bank, 2009a.68 Mobereola, 2009.69 Mobereola, 2009.70 TRB, 2011; ITDP, 2008.71 McCaul, 2009.72 Rea Vaya, 2011a.73 Rea Vaya, 2011b.74 McCaul, 2009.75 Gauthier and Weinstock, 2010.76 LTA, 2012.77 Omwenga, 2013.78 Cervero, 1998.79 See Chapter 6.80 Hidalgo and Carrigan, 2008.
81 Flyvbjerg et al, 2003.82 Flyvbjerg et al, 2008.83 ADB, 2012b.84 Dalkmann and Brannigan, 2007.85 Owen et al, 2012.86 CODATU, 2009; Scheurer et al,
2000.87 Savage and Small, 2010.88 Mohring, 1972.89 Obeng, 2012.90 http://www.nova-metros.org,
last accessed 21 May 2013.91 http://www.comet-metros.org,
last accessed 21 May 2013.92 http://www.busbenchmarking.
org, last accessed 21 May 2013.93 http://www.sibrtonline.org, last
accessed 21 May 2013.94 http://www.uitp.org, last
accessed 21 May 2013.95 http://www.apta.com, last
accessed 21 May 2013.96 http://www.cutaactu.ca, last
accessed 21 May 2013.97 http://portal.antp.org.br, last
accessed 21 May 2013.
1EEE234567891012311145678920123456789301234567894012345678950123456789EEEE
Urban goods transport, also known as urban freightdistribution, concerns a vast range of activitiesinsuring an adequate level of service for a variety ofurban supply chains. While cities have always beenimportant producers and consumers of goodshistorically, much of these activities were takingplace in proximity to major trans port terminals, withlimited quantities of freight entering the city itself.The functional specialization of cities, the globaldivision of production, the emergence of intermodalterminals, the rise of service activities, global con -sumerism, as well as increasing standards of livingare all correlated with an increased demand forurban goods trans port in cities. This is characterizedby a higher frequency of deliveries, and largerquantities of freight shipments coming from, boundto or transiting through urban areas. The scale,intensity and complexity of urban goods trans portnecessitate additional forms of organization andmanagement in many large cities, which is the realmof city logistics. City logistics concerns the means toenable goods trans port in urban areas by improvingthe efficiency of urban freight transportation andmitigating the environ mental and social impacts.
The need for city logistics is often a derivedoutcome of the new demands imposed by globalsupply chains on regional and urban landscapes.1
Since most of the goods consumed in cities originatefrom outside locations, urban goods trans port iscommonly referred to as the ‘last mile’ along a supplychain. Urban goods trans port is thus concerned withestablishing an effective interface between theregional or global realms of freight trans port and the last mile of urban freight distribution. While mari-time shipping, air cargo or rail are the privilegedmodes for long-distance goods transport, the vehicle,particularly the truck, remains the dominant urbanmode as it is perceived to be the most suitable toservice specific origins and destinations within thecomplex urban grid of streets and highways. This lastmile requires a shift to different distribution strategiesmore suitable to an urban context, often resulting
in congestion, delays and additional costs propor -tionally higher than the distance concerned.
The sus tain ability of cities cannot be reviewedwithout due consideration to the role of goodstransport.2 Indeed, while a city can be perceived asan economic, social, political and cultural entity,urban freight distribution underlines the physical andmanagerial activities necessary to support all of theabove. However, compared to passen ger transport,urban freight distribution has to a large extent beenneglected by urban trans port policy-makers. Yet, itis extremely important for the social and economicviability of urban areas and has widespread ramifi -cations for the environ ment, trans port infra struc turesand overall trends in mobility. The sector is also facedwith a number of challenges such as congestion,parking for deliveries and reverse logistics (e.g.recycling and garbage collection).3
This chapter thus reviews the trends andconditions of goods trans port in urban areas, bothwithin the formal and informal sectors. It outlinesthe fundamental contribution of goods trans port forurban life, and points to the externalities generatedby the sector. The elaboration of goods trans port pro -cesses, in both developed and devel op ing coun tries,sheds light on the contrasts and similarities acrosscountries. Importantly also, the chapter shows howgoods movement interacts with, and is shaped by,the urban context in quite specific ways.
URBAN GOODS TRANSPORT:KEY COMPONENTS ANDACTORSUrban goods transport, as it relates to cities and theirpopulations, is the set of all activities ensuring thattheir material demands are satisfied. The focus is onthe city as a place of production, distribution andconsumption of material goods, but also the hand-ling of waste as an outcome of these activities.
URBAN GOODS TRANSPORT
C H A P T E R 4Urban goodstransport, alsoknown as urbanfreightdistribution,concerns a vastrange of activitiesinsuring anadequate level ofservice for avariety of urbansupply chains
Urban freightdistribution has toa large extentbeen neglected byurban transportpolicy-makers
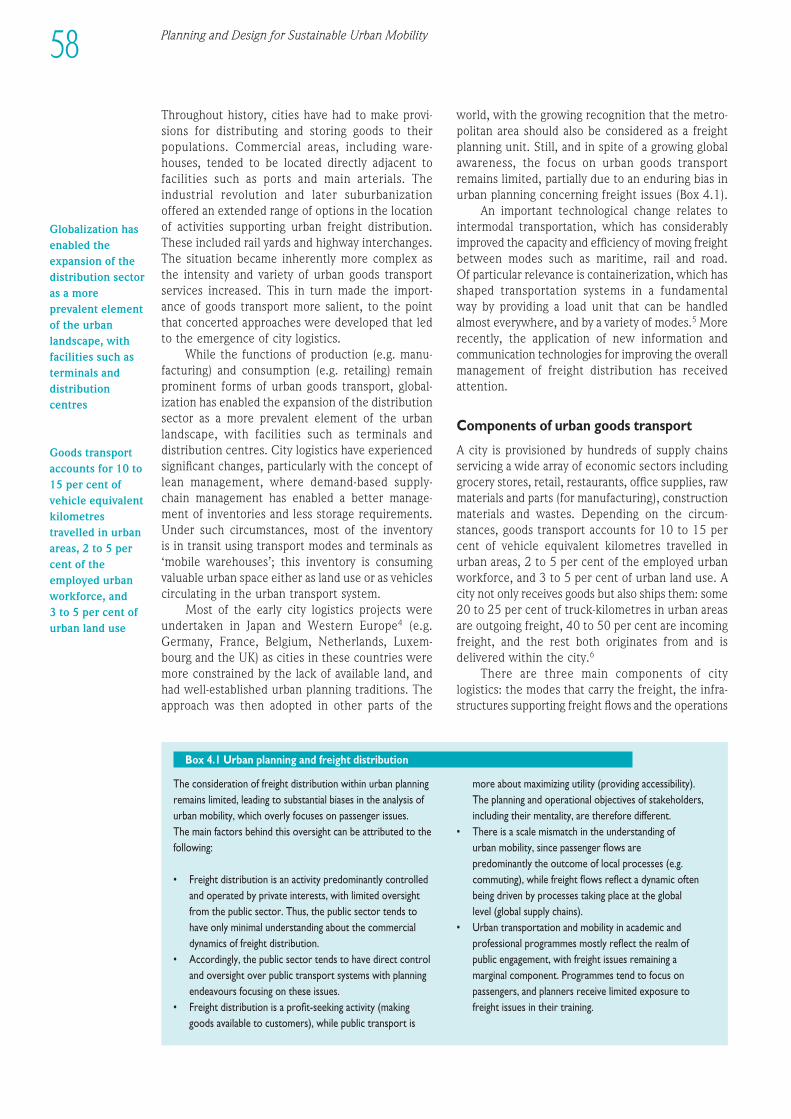
The consideration of freight distribution within urban planningremains limited, leading to substantial biases in the analysis ofurban mobility, which overly focuses on passen ger issues. The main factors behind this oversight can be attributed to thefollowing:
• Freight distribution is an activity predominantly controlledand operated by private interests, with limited oversightfrom the public sector. Thus, the public sector tends tohave only minimal understanding about the commercialdynamics of freight distribution.
• Accordingly, the public sector tends to have direct controland oversight over public trans port systems with planningendeavours focusing on these issues.
• Freight distribution is a profit-seeking activity (makinggoods available to customers), while public trans port is
more about maximizing utility (providing accessibility). The planning and operational objectives of stakeholders,including their mentality, are therefore different.
• There is a scale mismatch in the understanding ofurban mobility, since passen ger flows arepredominantly the outcome of local processes (e.g.commuting), while freight flows reflect a dynamic oftenbeing driven by processes taking place at the globallevel (global supply chains).
• Urban transportation and mobility in academic andprofessional programmes mostly reflect the realm of public engagement, with freight issues remaining a marginal component. Programmes tend to focus onpassen gers, and planners receive limited exposure tofreight issues in their training.
Box 4.1 Urban planning and freight distribution
Through out history, cities have had to make pro vi -sions for distributing and storing goods to theirpopulations. Commercial areas, including ware -houses, tended to be located directly adjacent tofacilities such as ports and main arterials. Theindustrial revolution and later suburbanization offered an extended range of options in the locationof activities supporting urban freight distribution.These included rail yards and highway interchanges.The situation became inherently more complex asthe intensity and variety of urban goods trans portservices increased. This in turn made the import-ance of goods trans port more salient, to the pointthat concerted approaches were developed that ledto the emergence of city logistics.
While the functions of production (e.g. manu -facturing) and consumption (e.g. retailing) remainprominent forms of urban goods transport, global -ization has enabled the expansion of the distributionsector as a more prevalent element of the urbanlandscape, with facilities such as terminals anddistribution centres. City logistics have experi encedsignificant changes, particularly with the concept oflean management, where demand-based supply-chain management has enabled a better manage-ment of inventories and less storage requirements.Under such circumstances, most of the inventory is in transit using trans port modes and terminals as‘mobile warehouses’; this inventory is consumingvaluable urban space either as land use or as vehiclescirculating in the urban trans port system.
Most of the early city logistics projects wereunder taken in Japan and Western Europe4 (e.g.Germany, France, Belgium, Netherlands, Luxem -bourg and the UK) as cities in these countries weremore constrained by the lack of available land, andhad well-established urban planning traditions. Theapproach was then adopted in other parts of the
world, with the growing recognition that the metro -politan area should also be considered as a freightplanning unit. Still, and in spite of a growing globalawareness, the focus on urban goods trans portremains limited, partially due to an enduring bias inurban planning concerning freight issues (Box 4.1).
An important technological change relates tointermodal transportation, which has considerablyimproved the capacity and efficiency of moving freightbetween modes such as maritime, rail and road. Of particular relevance is containerization, which hasshaped transportation systems in a fundamental way by providing a load unit that can be handledalmost everywhere, and by a variety of modes.5 Morerecently, the application of new information andcommunication technologies for improving the overallmanagement of freight distribution has receivedattention.
Components of urban goods transport
A city is provisioned by hundreds of supply chainsservicing a wide array of economic sectors includinggrocery stores, retail, restaurants, office supplies, rawmaterials and parts (for manufacturing), constructionmaterials and wastes. Depending on the circum -stances, goods trans port accounts for 10 to 15 percent of vehicle equivalent kilometres travelled inurban areas, 2 to 5 per cent of the employed urbanworkforce, and 3 to 5 per cent of urban land use. Acity not only receives goods but also ships them: some20 to 25 per cent of truck-kilometres in urban areasare outgoing freight, 40 to 50 per cent are incomingfreight, and the rest both originates from and isdelivered within the city.6
There are three main components of citylogistics: the modes that carry the freight, the infra -struc tures supporting freight flows and the operations
58 Planning and Design for Sustainable Urban Mobility
Globalization hasenabled theexpansion of thedistribution sectoras a moreprevalent elementof the urbanlandscape, withfacilities such asterminals anddistributioncentres
Goods transportaccounts for 10 to15 per cent ofvehicle equivalentkilometrestravelled in urbanareas, 2 to 5 percent of theemployed urbanworkforce, and 3 to 5 per cent ofurban land use
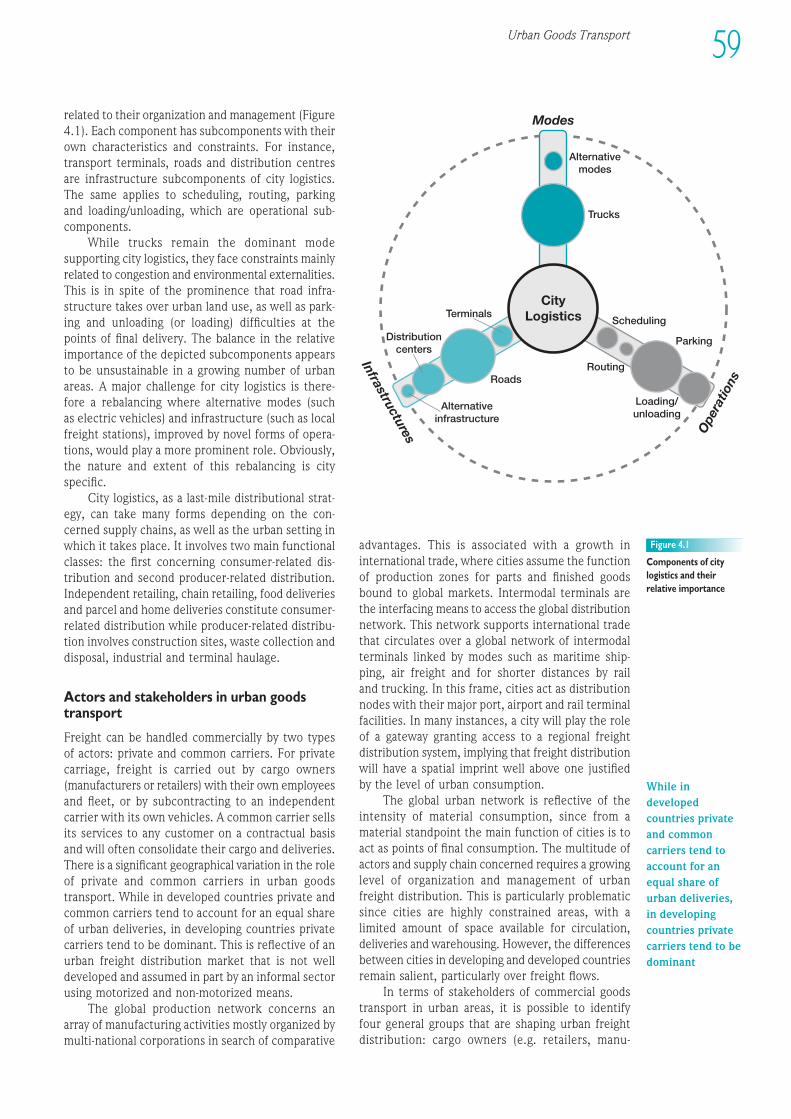
related to their organization and management (Figure4.1). Each component has subcomponents with theirown characteristics and constraints. For instance,trans port terminals, roads and distribution centresare infra struc ture subcomponents of city logistics.The same applies to scheduling, routing, parking and loading/unloading, which are operational sub -components.
While trucks remain the dominant modesupporting city logistics, they face constraints mainlyrelated to congestion and environ mental externalities.This is in spite of the prominence that road infra -struc ture takes over urban land use, as well as park -ing and unloading (or loading) difficulties at thepoints of final delivery. The balance in the relativeimportance of the depicted subcomponents appearsto be unsus tain able in a growing number of urbanareas. A major challenge for city logistics is there-fore a rebalancing where alternative modes (such as electric vehicles) and infra struc ture (such as localfreight stations), improved by novel forms of opera -tions, would play a more prominent role. Obviously,the nature and extent of this rebalancing is cityspecific.
City logistics, as a last-mile distributional strat -egy, can take many forms depending on the con -cerned supply chains, as well as the urban setting inwhich it takes place. It involves two main functionalclasses: the first concerning consumer-related dis -tribu tion and second producer-related distribution.Independent retailing, chain retailing, food deliveriesand parcel and home deliveries constitute consumer-related distribution while producer-related distribu -tion involves construction sites, waste collection anddisposal, industrial and terminal haulage.
Actors and stakeholders in urban goodstrans port
Freight can be handled commercially by two typesof actors: private and common carriers. For privatecarriage, freight is carried out by cargo owners(manufacturers or retailers) with their own employeesand fleet, or by subcontracting to an independentcarrier with its own vehicles. A common carrier sellsits services to any customer on a contractual basisand will often consolidate their cargo and deliveries.There is a significant geographical variation in the roleof private and common carriers in urban goodstransport. While in developed countries private andcommon carriers tend to account for an equal shareof urban deliveries, in devel op ing countries privatecarriers tend to be dominant. This is reflective of anurban freight distribution market that is not welldeveloped and assumed in part by an informal sectorusing motorized and non-motorized means.
The global production network concerns anarray of manufacturing activities mostly organized bymulti-national corporations in search of comparative
advantages. This is associated with a growth ininternational trade, where cities assume the functionof production zones for parts and finished goodsbound to global markets. Intermodal terminals arethe interfacing means to access the global distributionnetwork. This network supports international tradethat circulates over a global network of intermodalterminals linked by modes such as maritime ship-ping, air freight and for shorter distances by rail and trucking. In this frame, cities act as distributionnodes with their major port, airport and rail terminalfacilities. In many instances, a city will play the roleof a gateway granting access to a regional freightdistribution system, implying that freight distributionwill have a spatial imprint well above one justifiedby the level of urban consumption.
The global urban network is reflective of theintensity of material consumption, since from amaterial standpoint the main function of cities is toact as points of final consumption. The multitude ofactors and supply chain concerned requires a growinglevel of organization and management of urbanfreight distribution. This is particularly problematicsince cities are highly constrained areas, with alimited amount of space available for circulation,deliveries and warehousing. However, the differencesbetween cities in devel op ing and developed countriesremain salient, particularly over freight flows.
In terms of stakeholders of commercial goodstrans port in urban areas, it is possible to identify four general groups that are shaping urban freightdistribution: cargo owners (e.g. retailers, manu -
Modes
Ope
ratio
ns
Infrastructures
Alternativemodes
Trucks
Scheduling
Parking
Routing
Loading/unloading
Alternativeinfrastructure
Roads
Terminals
Distributioncenters
CityLogistics
Figure 4.1
Components of citylogistics and theirrelative importance
1EEE234567891012311145678920123456789301234567894012345678950123456789EEEE
59Urban Goods Transport
While indevelopedcountries privateand commoncarriers tend toaccount for anequal share ofurban deliveries,in developingcountries privatecarriers tend to bedominant
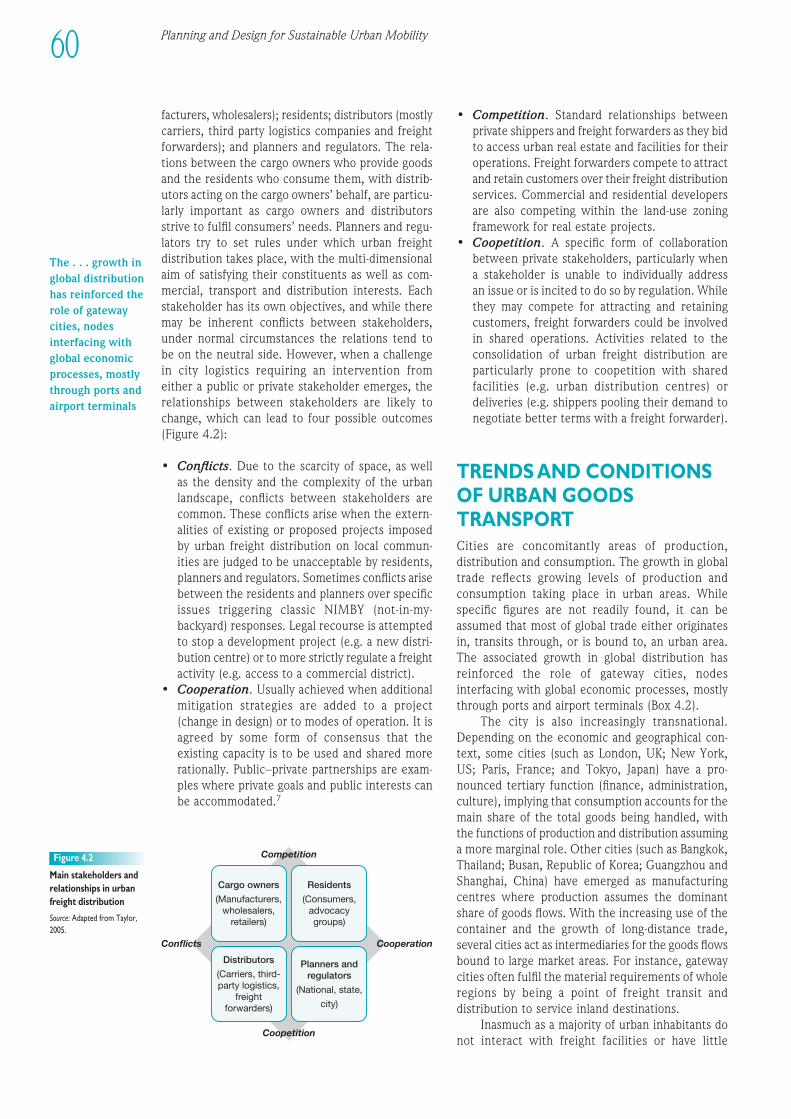
Competition
Coopetition
CooperationConflicts
Cargo owners
(Manufacturers,wholesalers,
retailers)
Residents
(Consumers,advocacygroups)
Distributors
(Carriers, third-party logistics,
freightforwarders)
Planners andregulators
(National, state,
city)
Figure 4.2
Main stakeholders andrelationships in urbanfreight distribution
Source: Adapted from Taylor,2005.
facturers, wholesalers); residents; distributors (mostlycarriers, third party logistics companies and freightforwarders); and planners and regulators. The rela -tions between the cargo owners who provide goodsand the residents who consume them, with distrib -utors acting on the cargo owners’ behalf, are particu -larly important as cargo owners and distrib utorsstrive to fulfil consumers’ needs. Planners and regu -lators try to set rules under which urban freightdistribution takes place, with the multi-dimensionalaim of satisfying their constituents as well as com -mercial, trans port and distribution interests. Eachstakeholder has its own objectives, and while theremay be inherent conflicts between stake holders,under normal circumstances the relations tend to be on the neutral side. However, when a challengein city logistics requiring an inter vention from either a public or private stakeholder emerges, therelation ships between stakeholders are likely tochange, which can lead to four possible outcomes(Figure 4.2):
• Conflicts. Due to the scarcity of space, as wellas the density and the complexity of the urbanlandscape, conflicts between stakeholders arecommon. These conflicts arise when the extern -alities of existing or proposed projects imposedby urban freight distribution on local commun-ities are judged to be unacceptable by residents,planners and regulators. Sometimes conflicts arisebetween the residents and planners over specificissues triggering classic NIMBY (not-in-my-backyard) responses. Legal recourse is attemptedto stop a devel op ment project (e.g. a new dis tri -bution centre) or to more strictly regu late a freightactivity (e.g. access to a commercial district).
• Cooperation. Usually achieved when additionalmitigation strategies are added to a project (change in design) or to modes of operation. It isagreed by some form of consensus that theexisting capacity is to be used and shared morerationally. Public–private partnerships are exam -ples where private goals and public interests canbe accommodated.7
• Competition. Standard relationships betweenprivate shippers and freight forwarders as they bidto access urban real estate and facilities for theiroperations. Freight forwarders compete to attractand retain customers over their freight distributionservices. Commercial and residential developersare also competing within the land-use zoningframework for real estate projects.
• Coopetition. A specific form of collaborationbetween private stakeholders, particularly whena stakeholder is unable to individually address an issue or is incited to do so by regulation. Whilethey may compete for attracting and retainingcustomers, freight forwarders could be involvedin shared operations. Activities related to thecon solidation of urban freight distribution areparticularly prone to coopetition with sharedfacilities (e.g. urban distribution centres) ordeliveries (e.g. shippers pooling their demand tonegotiate better terms with a freight forwarder).
TRENDS AND CONDITIONSOF URBAN GOODSTRANSPORTCities are concomitantly areas of production,distribution and consumption. The growth in globaltrade reflects growing levels of production andconsumption taking place in urban areas. Whilespecific figures are not readily found, it can beassumed that most of global trade either originatesin, transits through, or is bound to, an urban area.The associated growth in global distribution hasreinforced the role of gateway cities, nodesinterfacing with global economic processes, mostlythrough ports and airport terminals (Box 4.2).
The city is also increasingly transnational.Depending on the economic and geographical con -text, some cities (such as London, UK; New York,US; Paris, France; and Tokyo, Japan) have a pro -nounced tertiary function (finance, administration,culture), implying that consumption accounts for themain share of the total goods being handled, withthe functions of production and distribution assuminga more marginal role. Other cities (such as Bangkok,Thailand; Busan, Republic of Korea; Guangzhou andShanghai, China) have emerged as manufacturingcentres where production assumes the dominantshare of goods flows. With the increasing use of thecontainer and the growth of long-distance trade,several cities act as intermediaries for the goods flowsbound to large market areas. For instance, gatewaycities often fulfil the material requirements of wholeregions by being a point of freight transit anddistribution to service inland destinations.
Inasmuch as a majority of urban inhabitants donot interact with freight facilities or have little
60 Planning and Design for Sustainable Urban Mobility
The . . . growth inglobal distributionhas reinforced therole of gatewaycities, nodesinterfacing withglobal economicprocesses, mostlythrough ports andairport terminals
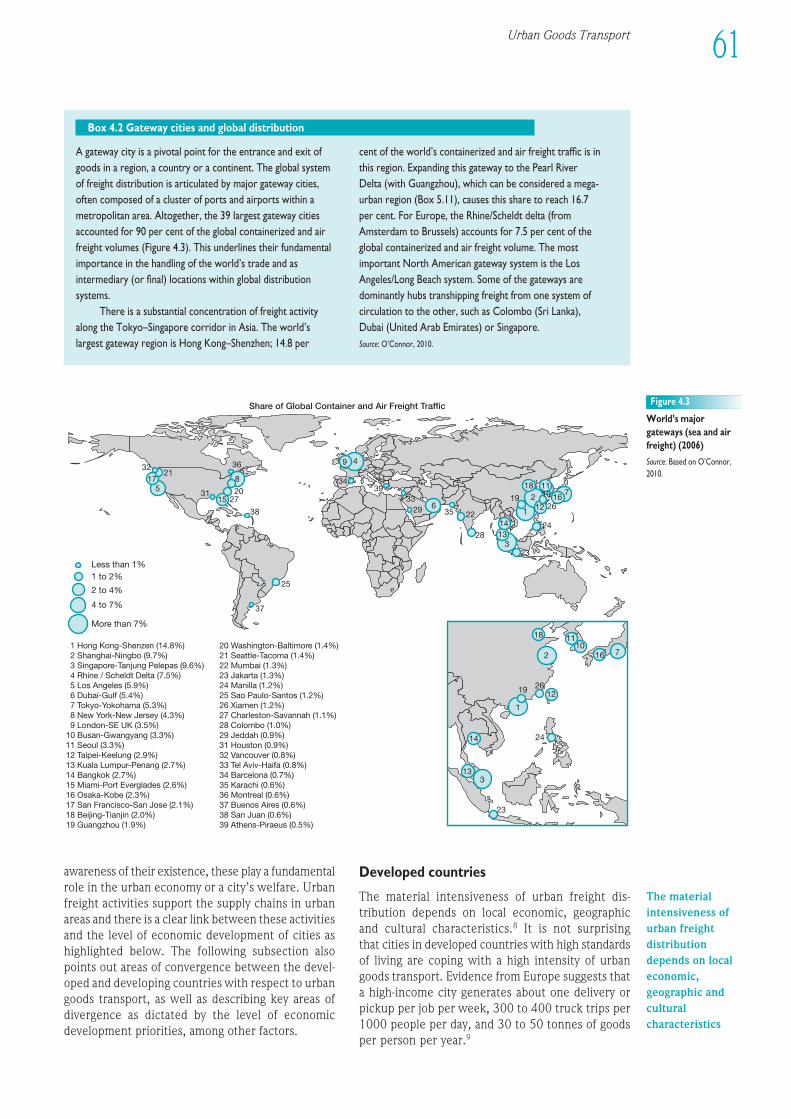
A gateway city is a pivotal point for the entrance and exit ofgoods in a region, a country or a continent. The global systemof freight distribution is articulated by major gateway cities,often composed of a cluster of ports and airports within ametropolitan area. Altogether, the 39 largest gateway citiesaccounted for 90 per cent of the global containerized and airfreight volumes (Figure 4.3). This underlines their fundamentalimportance in the handling of the world’s trade and asintermediary (or final) locations within global distributionsystems.
There is a substantial concentration of freight activityalong the Tokyo–Singapore corridor in Asia. The world’slargest gateway region is Hong Kong–Shenzhen; 14.8 per
cent of the world’s containerized and air freight traffic is inthis region. Expanding this gateway to the Pearl RiverDelta (with Guangzhou), which can be considered a mega-urban region (Box 5.11), causes this share to reach 16.7per cent. For Europe, the Rhine/Scheldt delta (fromAmsterdam to Brussels) accounts for 7.5 per cent of theglobal containerized and air freight volume. The mostimportant North American gateway system is the LosAngeles/Long Beach system. Some of the gateways aredominantly hubs transhipping freight from one system ofcirculation to the other, such as Colombo (Sri Lanka),Dubai (United Arab Emirates) or Singapore.Source: O’Connor, 2010.
Box 4.2 Gateway cities and global distribution
23
19 26
7 1 Hong Kong-Shenzen (14.8%) 2 Shanghai-Ningbo (9.7%) 3 Singapore-Tanjung Pelepas (9.6%) 4 Rhine / Scheldt Delta (7.5%) 5 Los Angeles (5.9%) 6 Dubai-Gulf (5.4%) 7 Tokyo-Yokohama (5.3%) 8 New York-New Jersey (4.3%) 9 London-SE UK (3.5%)10 Busan-Gwangyang (3.3%)11 Seoul (3.3%)12 Taipei-Keelung (2.9%)13 Kuala Lumpur-Penang (2.7%)14 Bangkok (2.7%)15 Miami-Port Everglades (2.6%)16 Osaka-Kobe (2.3%)17 San Francisco-San Jose (2.1%)18 Beijing-Tianjin (2.0%)19 Guangzhou (1.9%)
20 Washington-Baltimore (1.4%)21 Seattle-Tacoma (1.4%)22 Mumbai (1.3%)23 Jakarta (1.3%)24 Manilla (1.2%)25 Sao Paulo-Santos (1.2%)26 Xiamen (1.2%)27 Charleston-Savannah (1.1%)28 Colombo (1.0%)29 Jeddah (0.9%)31 Houston (0.9%)32 Vancouver (0.8%) 33 Tel Aviv-Haifa (0.8%)34 Barcelona (0.7%)35 Karachi (0.6%)36 Montreal (0.6%)37 Buenos Aires (0.6%)38 San Juan (0.6%)39 Athens-Piraeus (0.5%)
Less than 1%1 to 2%
2 to 4%
4 to 7%
More than 7%
Share of Global Container and Air Freight Traffic
37
25
38
15 27
1
2
3
4
5
6
7
8
9
11
12
1314
10 16
1718
1920
21
22
23
24
26
28
29
31
32
33
34
35
36
39
1
24
2
1110
7
18
12
14
313
16
Figure 4.3
World’s majorgateways (sea and airfreight) (2006)
Source: Based on O’Connor,2010.
1EEE234567891012311145678920123456789301234567894012345678950123456789EEEE
61Urban Goods Transport
awareness of their existence, these play a funda mentalrole in the urban economy or a city’s welfare. Urbanfreight activities support the supply chains in urbanareas and there is a clear link between these activitiesand the level of economic devel op ment of cities ashighlighted below. The following sub section alsopoints out areas of convergence between the devel -oped and devel op ing countries with respect to urbangoods transport, as well as describing key areas ofdivergence as dictated by the level of economicdevel op ment priorities, among other factors.
Developed countries
The material intensiveness of urban freight dis -tribution depends on local economic, geographicand cultural characteristics.8 It is not surprising that cities in developed countries with high standardsof living are coping with a high intensity of urbangoods transport. Evidence from Europe suggests thata high-income city generates about one delivery orpickup per job per week, 300 to 400 truck trips per1000 people per day, and 30 to 50 tonnes of goodsper person per year.9
The materialintensiveness ofurban freightdistributiondepends on localeconomic,geographic andculturalcharacteristics
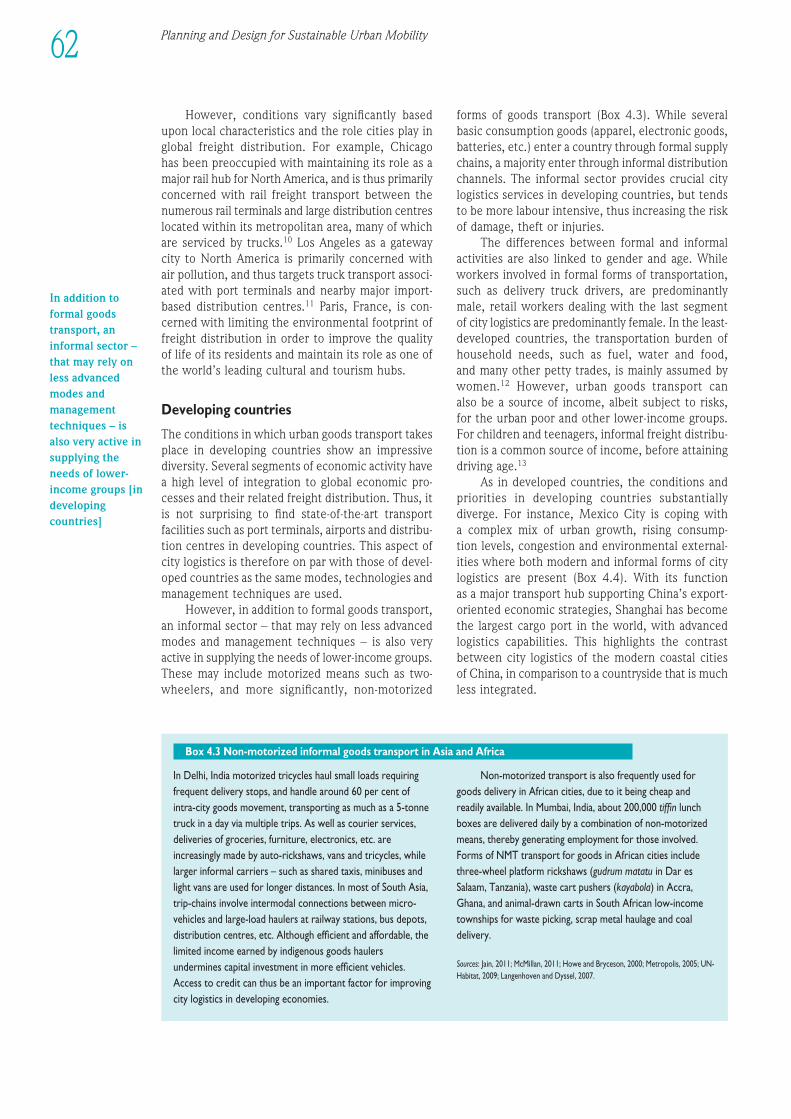
Planning and Design for Sustainable Urban Mobility62
However, conditions vary significantly basedupon local characteristics and the role cities play inglobal freight distribution. For example, Chicago has been preoccupied with maintaining its role as amajor rail hub for North America, and is thus primarilyconcerned with rail freight trans port between thenumerous rail terminals and large distribution centreslocated within its metropolitan area, many of whichare serviced by trucks.10 Los Angeles as a gatewaycity to North America is primarily concerned withair pollution, and thus targets truck trans port associ -ated with port terminals and nearby major import-based distribution centres.11 Paris, France, is con-cerned with limiting the environ mental footprint offreight distribution in order to improve the qualityof life of its residents and maintain its role as one ofthe world’s leading cultural and tourism hubs.
Devel op ing countries
The conditions in which urban goods trans port takesplace in devel op ing countries show an impressivediversity. Several segments of economic activity havea high level of integration to global economic pro -cesses and their related freight distribution. Thus, itis not surprising to find state-of-the-art trans portfacilities such as port terminals, airports and distribu -tion centres in devel op ing countries. This aspect ofcity logistics is therefore on par with those of devel -oped countries as the same modes, technol ogies andmanagement techniques are used.
However, in addition to formal goods transport,an informal sector – that may rely on less advancedmodes and management techniques – is also veryactive in supplying the needs of lower-income groups.These may include motorized means such as two-wheelers, and more significantly, non-motorized
forms of goods trans port (Box 4.3). While severalbasic consumption goods (apparel, electronic goods,batteries, etc.) enter a country through formal supplychains, a majority enter through informal distributionchannels. The informal sector provides crucial citylogistics services in devel op ing countries, but tendsto be more labour intensive, thus increasing the riskof damage, theft or injuries.
The differences between formal and informalactivities are also linked to gender and age. Whileworkers involved in formal forms of transportation,such as delivery truck drivers, are predominantlymale, retail workers dealing with the last segmentof city logistics are predominantly female. In the least-developed countries, the transportation burden ofhousehold needs, such as fuel, water and food, and many other petty trades, is mainly assumed bywomen.12 However, urban goods trans port can also be a source of income, albeit subject to risks,for the urban poor and other lower-income groups.For children and teenagers, informal freight distribu -tion is a common source of income, before attainingdriving age.13
As in developed countries, the conditions andpriorities in devel op ing countries substantiallydiverge. For instance, Mexico City is coping with a complex mix of urban growth, rising consump-tion levels, congestion and environ mental external-ities where both modern and informal forms of citylogistics are present (Box 4.4). With its function as a major trans port hub supporting China’s export-oriented economic strategies, Shanghai has becomethe largest cargo port in the world, with advancedlogistics capabilities. This highlights the contrastbetween city logistics of the modern coastal citiesof China, in comparison to a countryside that is muchless integrated.
In Delhi, India motorized tricycles haul small loads requiringfrequent delivery stops, and handle around 60 per cent ofintra-city goods movement, transporting as much as a 5-tonnetruck in a day via multiple trips. As well as courier services,deliveries of groceries, furniture, electronics, etc. areincreasingly made by auto-rickshaws, vans and tricycles, whilelarger informal carriers – such as shared taxis, mini buses andlight vans are used for longer distances. In most of South Asia,trip-chains involve intermodal connections between micro-vehicles and large-load haulers at railway stations, bus depots,distribution centres, etc. Although efficient and affordable, thelimited income earned by indigenous goods haulersundermines capital investment in more efficient vehicles.Access to credit can thus be an important factor for improvingcity logistics in devel op ing economies.
Non-motorized trans port is also frequently used forgoods delivery in African cities, due to it being cheap andreadily available. In Mumbai, India, about 200,000 tiffin lunchboxes are delivered daily by a combination of non-motorizedmeans, thereby generating employment for those involved.Forms of NMT trans port for goods in African cities includethree-wheel platform rickshaws (gudrum matatu in Dar esSalaam, Tanzania), waste cart pushers (kayabola) in Accra,Ghana, and animal-drawn carts in South African low-incometownships for waste picking, scrap metal haulage and coaldelivery.
Sources: Jain, 2011; McMillan, 2011; Howe and Bryceson, 2000; Metropolis, 2005; UN-Habitat, 2009; Langenhoven and Dyssel, 2007.
Box 4.3 Non-motorized informal goods trans port in Asia and Africa
In addition toformal goodstransport, aninformal sector –that may rely onless advancedmodes andmanagementtechniques – isalso very active insupplying theneeds of lower-income groups [indevelopingcountries]
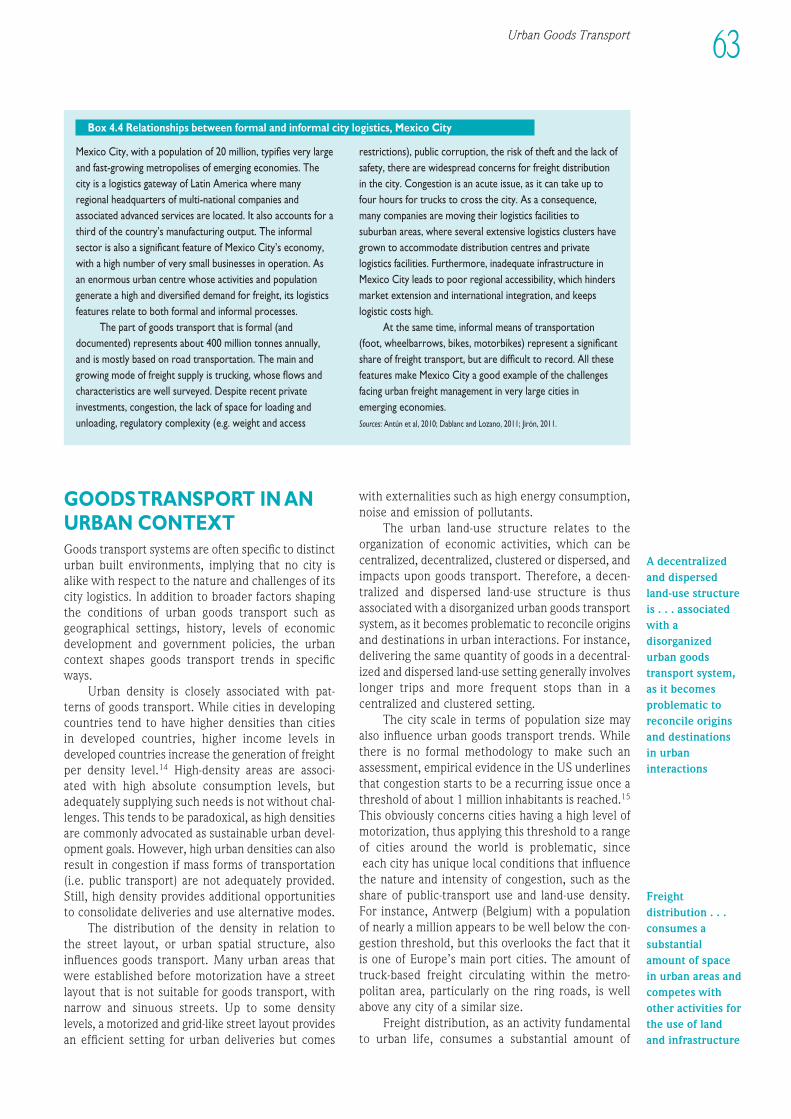
Urban Goods Transport 63
1EEE234567891012311145678920123456789301234567894012345678950123456789EEEE
Mexico City, with a population of 20 million, typifies very largeand fast-growing metropolises of emerging economies. Thecity is a logistics gateway of Latin America where manyregional headquarters of multi-national companies andassociated advanced services are located. It also accounts for athird of the country’s manufacturing output. The informalsector is also a significant feature of Mexico City’s economy,with a high number of very small businesses in operation. Asan enormous urban centre whose activities and populationgenerate a high and diversified demand for freight, its logisticsfeatures relate to both formal and informal processes.
The part of goods trans port that is formal (anddocumented) represents about 400 million tonnes annually,and is mostly based on road transportation. The main andgrowing mode of freight supply is trucking, whose flows andcharacteristics are well surveyed. Despite recent privateinvestments, congestion, the lack of space for loading andunloading, regulatory complexity (e.g. weight and access
restrictions), public corruption, the risk of theft and the lack ofsafety, there are widespread concerns for freight distributionin the city. Congestion is an acute issue, as it can take up tofour hours for trucks to cross the city. As a consequence,many companies are moving their logistics facilities tosuburban areas, where several extensive logistics clusters havegrown to accommodate distribution centres and privatelogistics facilities. Further more, inadequate infra struc ture inMexico City leads to poor regional accessibility, which hindersmarket extension and international integration, and keepslogistic costs high.
At the same time, informal means of transportation(foot, wheelbarrows, bikes, motorbikes) represent a significantshare of freight transport, but are difficult to record. All thesefeatures make Mexico City a good example of the challengesfacing urban freight management in very large cities inemerging economies.Sources: Antún et al, 2010; Dablanc and Lozano, 2011; Jirón, 2011.
Box 4.4 Relationships between formal and informal city logistics, Mexico City
GOODS TRANS PORT IN ANURBAN CONTEXTGoods trans port systems are often specific to distincturban built environ ments, implying that no city isalike with respect to the nature and challenges of itscity logistics. In addition to broader factors shapingthe conditions of urban goods trans port such asgeographical settings, history, levels of economicdevel op ment and govern ment policies, the urbancontext shapes goods trans port trends in specificways.
Urban density is closely associated with pat-terns of goods transport. While cities in devel op ingcountries tend to have higher densities than citiesin developed countries, higher income levels indeveloped countries increase the generation of freightper density level.14 High-density areas are associ-ated with high absolute consumption levels, but ade quately supplying such needs is not without chal -lenges. This tends to be paradoxical, as high densitiesare commonly advocated as sus tain able urban devel -op ment goals. However, high urban densities can alsoresult in congestion if mass forms of transportation(i.e. public transport) are not ade quately provided.Still, high density provides addi tional opportunitiesto consolidate deliveries and use alternative modes.
The distribution of the density in relation to the street layout, or urban spatial structure, alsoinfluences goods transport. Many urban areas thatwere established before motorization have a streetlayout that is not suitable for goods transport, withnarrow and sinuous streets. Up to some densitylevels, a motorized and grid-like street layout providesan efficient setting for urban deliveries but comes
with externalities such as high energy consumption,noise and emission of pollutants.
The urban land-use structure relates to theorganization of economic activities, which can becentralized, decentralized, clustered or dispersed, andimpacts upon goods transport. Therefore, a decen -tralized and dispersed land-use structure is thusassociated with a disorganized urban goods trans portsystem, as it becomes problematic to reconcile originsand destinations in urban inter actions. For instance,delivering the same quantity of goods in a decentral -ized and dispersed land-use setting generally involveslonger trips and more frequent stops than in acentralized and clustered setting.
The city scale in terms of population size mayalso influence urban goods trans port trends. Whilethere is no formal methodology to make such anassessment, empirical evidence in the US underlinesthat congestion starts to be a recurring issue once athreshold of about 1 million inhabitants is reached.15
This obviously concerns cities having a high level ofmotorization, thus applying this threshold to a rangeof cities around the world is problematic, sinceeach city has unique local conditions that influencethe nature and intensity of congestion, such as theshare of public-trans port use and land-use density.For instance, Antwerp (Belgium) with a populationof nearly a million appears to be well below the con -gestion threshold, but this overlooks the fact that itis one of Europe’s main port cities. The amount oftruck-based freight circulating within the metro -politan area, particularly on the ring roads, is wellabove any city of a similar size.
Freight distribution, as an activity fundamentalto urban life, consumes a substantial amount of
A decentralizedand dispersedland-use structureis . . . associatedwith adisorganizedurban goodstransport system,as it becomesproblematic toreconcile originsand destinationsin urbaninteractions
Freightdistribution . . .consumes asubstantialamount of spacein urban areas andcompetes withother activities forthe use of landand infrastructure
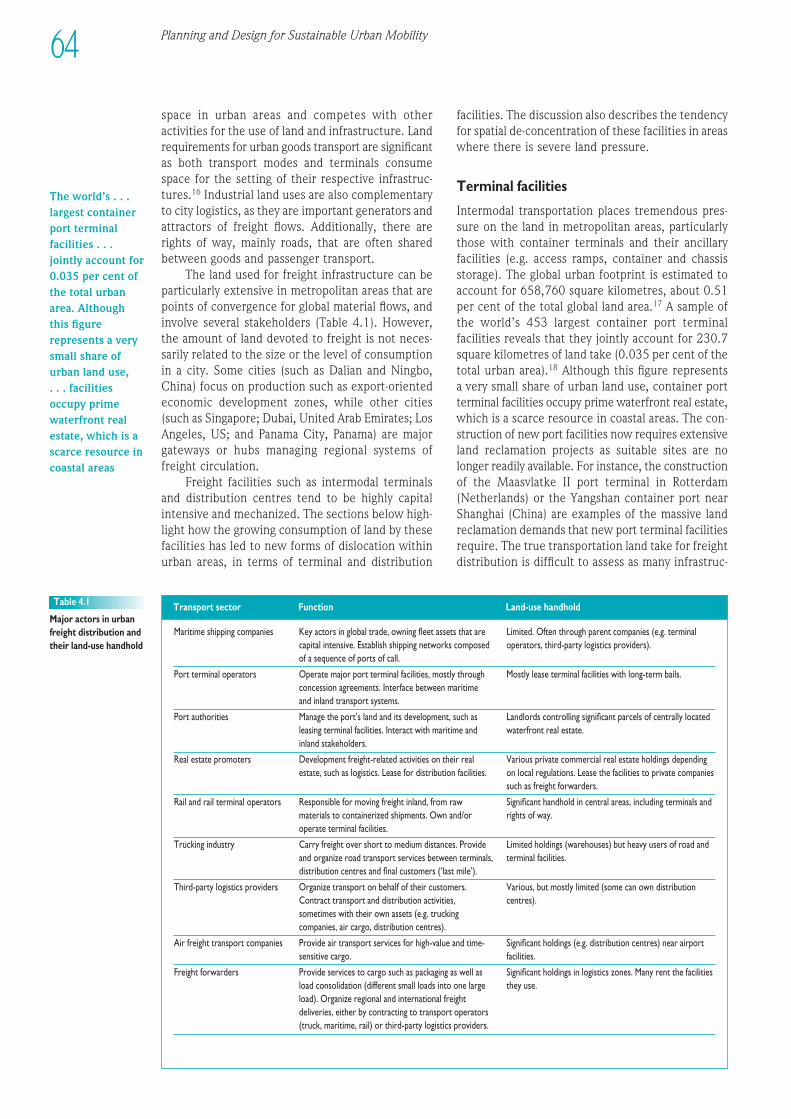
Maritime shipping companies Key actors in global trade, owning fleet assets that are Limited. Often through parent companies (e.g. terminal capital intensive. Establish shipping networks composed operators, third-party logistics providers).of a sequence of ports of call.
Port terminal operators Operate major port terminal facilities, mostly through Mostly lease terminal facilities with long-term bails.concession agreements. Interface between maritime and inland trans port systems.
Port authorities Manage the port’s land and its devel op ment, such as Landlords controlling significant parcels of centrally located leasing terminal facilities. Interact with maritime and waterfront real estate.inland stakeholders.
Real estate promoters Devel op ment freight-related activities on their real Various private commercial real estate holdings depending estate, such as logistics. Lease for distribution facilities. on local regulations. Lease the facilities to private companies
such as freight forwarders.
Rail and rail terminal operators Responsible for moving freight inland, from raw Significant handhold in central areas, including terminals and materials to containerized shipments. Own and/or rights of way.operate terminal facilities.
Trucking industry Carry freight over short to medium distances. Provide Limited holdings (warehouses) but heavy users of road and and organize road trans port services between terminals, terminal facilities.distribution centres and final customers (‘last mile’).
Third-party logistics providers Organize trans port on behalf of their customers. Various, but mostly limited (some can own distribution Contract trans port and distribution activities, centres).sometimes with their own assets (e.g. trucking companies, air cargo, distribution centres).
Air freight trans port companies Provide air trans port services for high-value and time- Significant holdings (e.g. distribution centres) near airport sensitive cargo. facilities.
Freight forwarders Provide services to cargo such as packaging as well as Significant holdings in logistics zones. Many rent the facilities load consolidation (different small loads into one large they use.load). Organize regional and international freight deliveries, either by contracting to trans port operators (truck, maritime, rail) or third-party logistics providers.
Table 4.1
Major actors in urbanfreight distribution andtheir land-use handhold
64 Planning and Design for Sustainable Urban Mobility
space in urban areas and competes with otheractivities for the use of land and infra struc ture. Landrequirements for urban goods trans port are significantas both trans port modes and terminals consumespace for the setting of their respective infra struc -tures.16 Industrial land uses are also complementaryto city logistics, as they are important generators andattractors of freight flows. Additionally, there arerights of way, mainly roads, that are often sharedbetween goods and passen ger transport.
The land used for freight infra struc ture can beparticularly extensive in metropolitan areas that arepoints of convergence for global material flows, andinvolve several stakeholders (Table 4.1). However,the amount of land devoted to freight is not neces -sarily related to the size or the level of consumptionin a city. Some cities (such as Dalian and Ningbo,China) focus on production such as export-orientedeconomic devel op ment zones, while other cities(such as Singapore; Dubai, United Arab Emirates; LosAngeles, US; and Panama City, Panama) are majorgateways or hubs managing regional systems offreight circulation.
Freight facilities such as intermodal terminalsand distribution centres tend to be highly capitalintensive and mechanized. The sections below high -light how the growing consumption of land by thesefacilities has led to new forms of dislocation withinurban areas, in terms of terminal and distribution
facilities. The discussion also describes the tendencyfor spatial de-concentration of these facilities in areaswhere there is severe land pressure.
Terminal facilities
Intermodal transportation places tremendous pres -sure on the land in metropolitan areas, particularlythose with container terminals and their ancillaryfacilities (e.g. access ramps, container and chassisstorage). The global urban footprint is estimated toaccount for 658,760 square kilometres, about 0.51per cent of the total global land area.17 A sample ofthe world’s 453 largest container port terminalfacilities reveals that they jointly account for 230.7square kilometres of land take (0.035 per cent of thetotal urban area).18 Although this figure representsa very small share of urban land use, container portterminal facilities occupy prime waterfront real estate,which is a scarce resource in coastal areas. The con -struction of new port facilities now requires extensiveland reclamation projects as suitable sites are nolonger readily available. For instance, the constructionof the Maasvlatke II port terminal in Rotterdam(Netherlands) or the Yangshan container port nearShanghai (China) are examples of the massive landreclamation demands that new port terminal facilitiesrequire. The true transportation land take for freightdistribution is difficult to assess as many infra struc -
The world’s . . .largest containerport terminalfacilities . . .jointly account for0.035 per cent ofthe total urbanarea. Althoughthis figurerepresents a verysmall share ofurban land use, . . . facilitiesoccupy primewaterfront realestate, which is ascarce resource incoastal areas
Trans port sector Function Land-use handhold
1EEE234567891012311145678920123456789301234567894012345678950123456789EEEE
65Urban Goods Transport
tures, such as roads and airports, are mainly used forpassen ger trans port and can be considered as sharedfacilities.
Wherever there is an intermodal facility, thereis a tendency to have an agglomeration of distributionfacilities. This is particularly the case for large airportslocated near clusters of distribution centres andthird-party logistics services providers; air freightbeing a time sensitive endeavour requiring supplychain managers to be in proximity. As a result, a newurban form, the ‘aerotropolis’ is taking shape aroundmajor airports.19 It contains an inner zone of dis -tribution centres, logistics complexes and just-in-timemanufacturers. In addition, it includes a ring of officeparks, hotels, restaurants and convention centres, and then a largely residential periphery, which servesas the home to those who work in the aerotropolis.High-capacity highways and rail lines provide accessto the rest of the metropolitan area, within whichan aerotropolis is set. These activities are competingat a global level, which commonly implies that theeconomy of the aerotropolis tends to be linked moreto global processes than to regional ones. Dubai,United Arab Emirates, may be the best example ofa planned aerotropolis, but several Asian airports(such as such as Bangkok, Thailand; Singa pore; andKuala Lumpur, Malaysia) have initiated this type ofdevel op ment. A few examples can also be found inthe US and Europe, including Dallas-Fort Worth (US)and Schiphol (Netherlands).
Distribution facilities
Distribution land requirements include variousfacilities to hold freight in bulk storage facilities (e.g.oil reservoirs or grain silos) and warehousing facilitiesfor break-bulk (e.g. consumer goods in containers).Distribution centres consume a lot of space, as a wide array of added-value activities are performed on a one floor design, including consolidation anddeconsol idation, cross-docking and storage. The lastof these can also require specialized facilities, suchas cold storage for supporting urban food distribution.It was estimated that for England and Wales alone,ware housing was accounting for 0.8 per cent of non-agricultural and forestry land.20
The spatial distribution of industrial, commer-cial and logistics facilities has a direct impact on thenumber of vehicle-kilometres, and the average triplength that will be necessary to reach stores, indus -tries and households. In cities such as Chicago, US,which emerged after the late nineteenth and earlytwentieth centuries, most of the freight-related activ -ities such as industries, warehouses and terminalswere located in close proximity to the central busi -ness district. A majority (more than two-thirds, in the case of European cities) of all shipments to andfrom urban areas are organized from terminals and distribution centres. As a result, a contemporary
pattern where logistics are specialized and separatedfrom other urban activities has emerged.
Global supply chains rely on novel forms ofurban land use such as the logistics zone, which isa planned area entirely devoted to freight distribution.While in the past, the agglomeration of freight dis -tribution activities would organically take place whereland was available, and where (road) accessibility wassuitable, logistics zones are often set by large trans -national real estate promoters and some, labelled as ‘freight villages’, can include ancillary activitiessuch as hotels, convention centres and restaurants.In some devel op ing countries (Brazil, Malaysia), theexport-oriented free trade zone has become a citywithin the city, with a value proposition based onforeign investments and access to global marketsthrough port and airport facilities. China, with itsspecial economic zones, epitomizes this type ofdevel op ment, which sheds light on Chinese urban -ization processes along its coastal areas. In the last30 years, employment opportunities in special eco -nomic zones such as Shenzhen (China), were astrong driver behind the migration of 100 to 140million people from inland provinces.21
Logistics sprawl
Another key trend is logistics sprawl, or the spatialde-concentration of logistics facilities in metropolitanareas. Confronted with the severe land pressure inlarge cities, as well as with the large urban renewalprojects that took place during the 1960s and 1970s,logistics and trans port companies began to followcentrifugal locational patterns (Box 4.5). The physicalmoves were achieved through small-scale changes intheir spatial organization, with the closing of urbandistribution centres and the opening of new ones inthe periphery. Greater land requirements and betteraccessibility to highways were two of the main drivingforces.
While it results in the creation of new spaces,better fitting the functional and operational charac -teristics of freight distribution, logistics sprawl alsocreates challenges. With globalization, large terminaland warehousing facilities have generated demandsfor land to support urban goods distribution, but alsoconflicts and dislocations. Another impact of logisticssprawl concerns the patterns and the modes ofcommuting. Due to their low density and suburbansettings, logistics zones are generally not well servicedby public trans port and contribute to automobiledependency.
The spatial structure of metropolitan areas has led to forms of city logistics that seek to providethe most suitable distribution strategy, based uponthe level of density. While higher density levels areassociated with congestion and difficulties for urbandeliveries, they also offer additional opportunities for alternative forms of urban distribution (Box 4.6).
Wherever there isan intermodalfacility, there is atendency to havean agglomerationof distributionfacilities
Distributioncentres consume a lot of space, as a wide array of added-valueactivities areperformed on aone floor design,includingconsolidation anddeconsolidation,cross-docking andstorage
Withglobalization,large terminal andwarehousingfacilities havegenerateddemands for land to supporturban goodsdistribution, butalso conflicts anddislocations
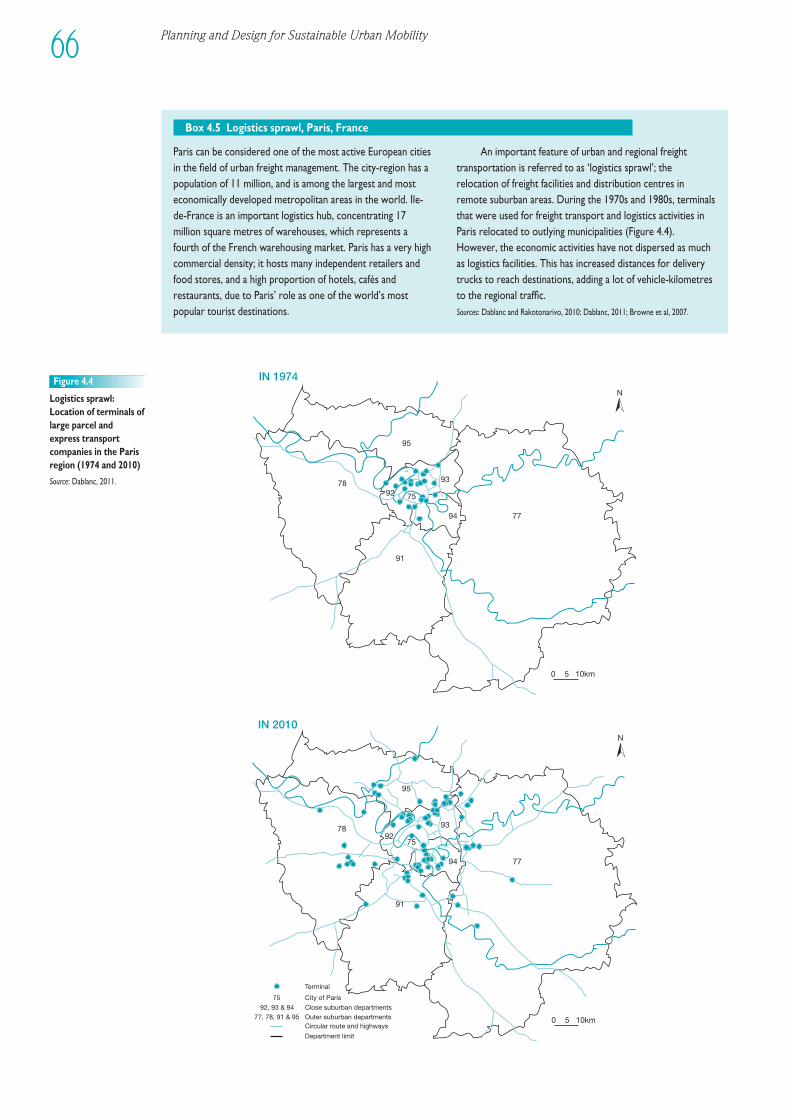
Planning and Design for Sustainable Urban Mobility66
7794
93
95
75
91
78
N
IN 2010
0 5 10km
92
Terminal
City of Paris
Close suburban departmentsOuter suburban departmentsCircular route and highways
Department limit
75
92, 93 & 9477, 78, 91 & 95
7794
93
95
75
91
78
N
IN 1974
0 5 10km
92
Figure 4.4
Logistics sprawl:Location of terminals oflarge parcel andexpress trans portcompanies in the Parisregion (1974 and 2010)
Source: Dablanc, 2011.
Paris can be considered one of the most active European citiesin the field of urban freight management. The city-region has apopulation of 11 million, and is among the largest and mosteconomically developed metropolitan areas in the world. Ile-de-France is an important logistics hub, concentrating 17million square metres of warehouses, which represents afourth of the French warehousing market. Paris has a very highcommercial density; it hosts many independent retailers andfood stores, and a high proportion of hotels, cafés andrestaurants, due to Paris’ role as one of the world’s mostpopular tourist destinations.
An important feature of urban and regional freighttransportation is referred to as ‘logistics sprawl’; therelocation of freight facilities and distribution centres inremote suburban areas. During the 1970s and 1980s, terminalsthat were used for freight trans port and logistics activities inParis relocated to outlying municipalities (Figure 4.4).However, the economic activities have not dispersed as muchas logistics facilities. This has increased distances for deliverytrucks to reach destinations, adding a lot of vehicle-kilometresto the regional traffic.Sources: Dablanc and Rakotonarivo, 2010; Dablanc, 2011; Browne et al, 2007.
Box 4.5 Logistics sprawl, Paris, France
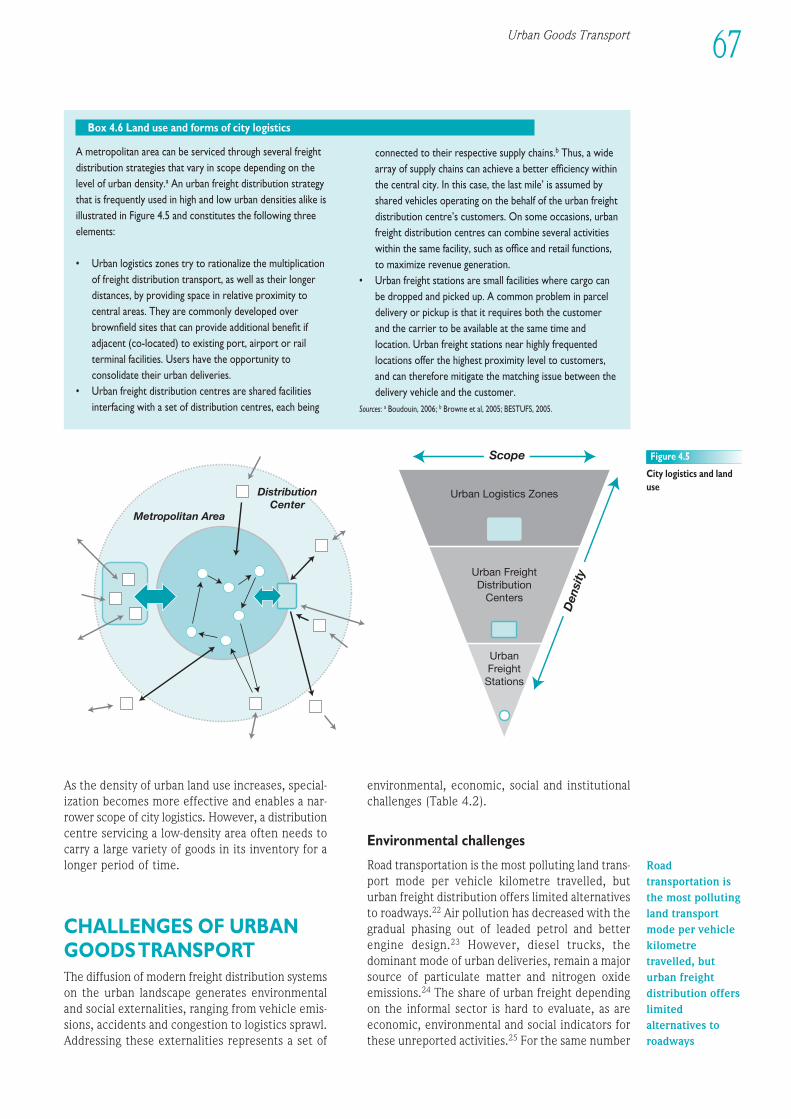
Urban Goods Transport 67
1EEE234567891012311145678920123456789301234567894012345678950123456789EEEE
A metropolitan area can be serviced through several freightdistribution strategies that vary in scope depending on thelevel of urban density.a An urban freight distribution strategythat is frequently used in high and low urban densities alike isillustrated in Figure 4.5 and constitutes the following threeelements:
• Urban logistics zones try to rationalize the multiplicationof freight distribution transport, as well as their longerdistances, by providing space in relative proximity tocentral areas. They are commonly developed overbrownfield sites that can provide additional benefit ifadjacent (co-located) to existing port, airport or railterminal facilities. Users have the opportunity toconsolidate their urban deliveries.
• Urban freight distribution centres are shared facilitiesinterfacing with a set of distribution centres, each being
connected to their respective supply chains.b Thus, a widearray of supply chains can achieve a better efficiency withinthe central city. In this case, the last mile’ is assumed byshared vehicles operating on the behalf of the urban freightdistribution centre’s customers. On some occasions, urbanfreight distribution centres can combine several activitieswithin the same facility, such as office and retail functions,to maximize revenue generation.
• Urban freight stations are small facilities where cargo canbe dropped and picked up. A common problem in parceldelivery or pickup is that it requires both the customerand the carrier to be available at the same time andlocation. Urban freight stations near highly frequentedlocations offer the highest proximity level to customers,and can therefore mitigate the matching issue between thedelivery vehicle and the customer.
Sources: a Boudouin, 2006; b Browne et al, 2005; BESTUFS, 2005.
Box 4.6 Land use and forms of city logistics
Urban Logistics Zones
Urban FreightDistribution
Centers
UrbanFreight
Stations
Scope
Den
sity
Metropolitan Area
DistributionCenter
Figure 4.5
City logistics and landuse
As the density of urban land use increases, special -ization becomes more effective and enables a nar -rower scope of city logistics. However, a distributioncentre servicing a low-density area often needs tocarry a large variety of goods in its inventory for alonger period of time.
CHALLENGES OF URBANGOODS TRANSPORTThe diffusion of modern freight distribution systemson the urban landscape generates environ mentaland social externalities, ranging from vehicle emis -sions, accidents and congestion to logistics sprawl.Addressing these externalities represents a set of
environ mental, economic, social and institutionalchallenges (Table 4.2).
Environ mental challenges
Road transportation is the most polluting land trans -port mode per vehicle kilometre travelled, buturban freight distribution offers limited alternativesto roadways.22 Air pollution has decreased with thegradual phasing out of leaded petrol and betterengine design.23 However, diesel trucks, thedominant mode of urban deliveries, remain a majorsource of particulate matter and nitrogen oxideemissions.24 The share of urban freight dependingon the informal sector is hard to evaluate, as areeconomic, environ mental and social indicators forthese unreported activities.25 For the same number
Roadtransportation isthe most pollutingland transportmode per vehiclekilometretravelled, buturban freightdistribution offerslimitedalternatives toroadways
of tonne-kilometres, urban freight distribution tendsto be more polluting, often twice as much as long-distance freight transport. The main reasons are asfollows:
• Vehicle age. Urban delivery vehicles are olderthan the average freight trans port truck. It iscommon that trucks end their lifecycle in drayageoperations26 between port or rail terminals andurban distribution centres. The renewal of freightfleets is generally slower than that for non-urbanroad freight traffic, because urban freight involvesnumerous competing small operators that cutcosts as much as possible. This problem is com -pounded in devel op ing countries where vehiclesare even older, and thus more prone to higheremissions and accidents.
• Vehicle size. Urban delivery vehicles tend to besmaller than standard freight trucks, implyingthat some economies of scale advantages are lost.While smaller vehicles may be prone to feweremissions per kilometre travelled, at an aggregatelevel, this may result in more emissions becauseof a greater number of vehicles required to carrythe same amount of freight.
• Operating speeds and idling. Urban operatingspeeds are slower due to congestion and trafficrestrictions, implying that the engines of deliveryvehicles are running at speeds consistently lowerthan the optimal speed. This results in higher fuelconsumption and higher emission levels. Constantacceleration and deceleration due to traffic lightsand traffic congestion result in an increase in fuelconsumption, as well as the wear on vehicles.Vehicle idling is frequent either for deliveries orat stops, which contributes to emissions.
Greenhouse gas emissions and noise pollution areother environ mental effects of urban freight trans -port. Trucks account for 22 per cent of the globalgreenhouse gas emissions generated by transporta -tion,27 but due to circulation conditions in urban areasthis share is higher. For instance, in large Europeancities, freight trans port is responsible for a third of transport-related nitrogen oxides and half of
transport-related particulate matter emissions, mostlydue to a higher reliance on diesel fuels for trucks.In London, freight distribution accounts for less than10 per cent of urban traffic but contributes to 30per cent of nitrogen oxide emissions and 63 per centof particulate emissions.28 In the metropolitan areaof Mexico City, about 60 per cent of particulatematters generated by mobile sources were fromfreight vehicles.29 While little is known about thepotential vulnerability of urban goods trans port toclimate change, it is assumed that events such asfloods, storms and heat waves will be as disruptiveto urban goods trans port as they are to urban activitiesin general.30
Since urban areas are large consumers of finalgoods, the issue of reverse logistics deservesconsideration, as it involves the collection of wastesand recycling of materials.31 City logistics and environ -mentally sus tain able logistics (green logistics) are thusdecisively linked. Most developed countries haveformal recycling programmes, while in devel op ingcountries cities essentially leave a significant shareof the recycling of goods to the informal sector. Therecycling of used goods, packages and cardboardtakes specific forms; scavengers and recyclers are animportant feature of city life, with active informalsupply chains. The urban landscape of devel op ingcountries also includes active street vending,providing a wide range of retail and food goods.Informal settlements are also an important com -ponent of the city landscape in many devel op ingcountries, and have specific characteristics and supplyneeds that are not well documented.
Economic challenges
The growth in the amount of freight circulatingwithin urban areas has further exacerbated trafficcongestion. Urban goods trans port is usually subjectto smaller volumes but with frequent deliveries, asinventory levels in urban stores tend to be low. Dueto the limited availability of storage space in centralareas, urban goods are delivered regularly fromdistribution centres at the periphery. However,despite peak-hour traffic congestion, a regular flowof deliveries must be maintained. This incites freightdistribution activities to take place during the nightif possible. Further more, many stores in high-densityareas have limited capacity to accommodate deliv -eries, implying that delivery trucks must park alongthe street in the vicinity of the store, preferably infront. This induces the usage of smaller trucks betterable to circulate within urban areas and find parkingspace for deliveries. It is not uncommon for trucksto double-park for short deliveries, thus seriouslyimpeding local circulation.
Since real estate is at a premium in urban areas, stores tend to have limited warehousing spaceand are smaller in size. Urban freight distribution
68 Planning and Design for Sustainable Urban Mobility
Environ mental challenges Mitigate environ mental externalities (emissions, noise).Reverse logistic flows (waste and recycling).
Economic challenges Capacity of urban freight trans port systems (congestion).Lower driving speeds and frequent disruptions (reliability).Distribution sprawl (space consumption).E-commerce (home deliveries).
Social and institutional Health and safety (accidents, hazardous materials).challenges Passen ger/freight interferences (conflicts).
Access (allowable vehicles, streets and delivery hours).Zoning (land use, logistics zones, urban freight distribution centres).
Challenges Dimensions
Table 4.2
Key challenges in urbangoods transport
Trucks accountfor 22 per cent of the globalgreenhouse gasemissionsgenerated bytransportation,but due tocirculationconditions inurban areas thisshare is higher
No international comparative analysis of the logisticalperformance of cities has yet been undertaken, butcountry-wide surveys have been compiled in recent yearsby the World Bank. The logistics performance index (LPI) is a composite index based on proxy measures for trans port and information infra struc ture, supply chainmanagement and trade facilitation capabilities. Theseindicator scores are calculated using a world survey ofinternational freight forwarders and express carriers. LPIvalues range from 1 (worst) to 5 (best) and show thatbuilding the capacity to connect firms, suppliers andconsumers, is key, in a context where predictability andreliability are becoming as important as costs in supplychain management. An LPI value of less than 3 reflects anarray of problems within a country’s freight distributionsystem, causing undue delays and additional costs. Forinstance, a difference of one point lower in the LPI isrelated to two to four additional days of port hinterlandaccess, and a 25 per cent higher physical inspection rate at customs. The performance metrics of the LPI do notcapture the environ mental and social externalities oflogistics.
While the LPI reflects global trade and supply chains, itcan also be reflective of the logistical capabilities of cities. For instance, a low LPI is reflective of inefficient customsprocedures, including governance that does not appropriatelyregulate and mitigate urban freight distribution. Of the world’scities with more than 1 million inhabitants, 334 millioninhabitants lived in cities within countries with a low LPI (lessthan 3), and 593 million lived in cities with below average LPIconditions (between 3 and 3.5). Only 330 million people wereliving in cities of more than 1 million inhabitants, with good LPIconditions (more than 3.5). It can thus be inferred that morethan half of the world’s urban population are living in citieswhere the logistical capabilities are deficient. This assessmentshould be interpreted with caution, as significant nationaldifferences exist, for example, between coastal China, whichhas efficient export-oriented freight distribution systems, andits interior provinces where the quality of trans port infra struc -tures is more inadequate. Port and airport cities tend to havemore capabilities for city logistics, because of the availability ofinternational trade infra struc tures and a concentration of thirdparty logistics service providers.Source: Arvis et al, 2010.
Box 4.7 Cities and logistical performance
is subject to smaller volumes, with time-sensitivefreight necessary to replenish a constant demand.This requires a high frequency of deliveries, par -ticularly considering high sales volumes, whichimposes a contradiction in the cargo load. Stores incentral areas would benefit from the economies ofscale of larger deliveries, but the setting does notpermit this advantage. This is one of the reasons whyretailing has emerged in suburban areas. Large storeswith ample parking space can have their own cargodocking bays that can accommodate the largestdelivery trucks available; the benefits of economiesof scale are multiplied with economies of distribution.
The tendency of large urban areas to have highcongestion levels poses a challenge towards thereliability of freight distribution. This is particularlythe case for the disruptions and lower driving speedsthat urban congestion imposes, making urban freightdistribution prone to inefficiencies, compared tocirculation taking place in a suburban or non-urbansetting. Although there have been some attempts toassess countries’ performance on trade logistics (seefor example Box 4.7), the logistical performance ofcities remains problematic and difficult to assess.However, evidence shows that port and airport citiestend to have more capabilities for city logisticsbecause of the availability of international trade infra -struc tures and a concentration of third-party logisticsservice providers. A share of these capabilities is usedfor urban freight distribution.
The diffusion of e-commerce has also creatednew forms of demands and new forms of urban dis -
tribution with a growth in home deliveries.32 Theparcels industry has been booming, largely becauseof e-commerce, and in some cases has been proactiveat establishing novel forms of last-mile deliveries.
Social and institutional challenges
From a social standpoint, the interactions betweenpeople and freight in cities create many disturbancesrelated to health, safety (accidents) and the qualityof life (Table 4.3). Urban goods trans port can havesubstantial impacts on the communities they originatefrom, are bound to or are transiting through. This is particularly the case when large freight facilitiessuch as a port, airport, rail yard or distributioncentres are operating. Passen ger and freight trans -port do not mingle well, particularly during com -muting around peak hours where both systemsseriously impair their respective capacity and per -formance. In devel op ing countries, traffic con gestionis a significant operational problem for city logistics,with slow non-motorized vehicles sharing urbanroads with motorized traffic.
Freight-intensive activities such as terminals,container storage areas, warehouses and truck depotscan be an aesthetic blight on the urban landscape,and are associated with lower property values. Asmany freight facilities operate on a 24-hour basis,lights can be an annoyance and a source of poten-tial sleep disruption. Further more, living or working in proximity to roads or terminals with substantialfreight activities exposes residents, particularly
1EEE234567891012311145678920123456789301234567894012345678950123456789EEEE
69Urban Goods Transport
The tendency oflarge urban areasto have highcongestion levelsposes a challengetowards thereliability offreightdistribution
Freight-intensiveactivities such asterminals,container storageareas, warehousesand truck depotscan be anaesthetic blight onthe urbanlandscape, and areassociated withlower propertyvalues
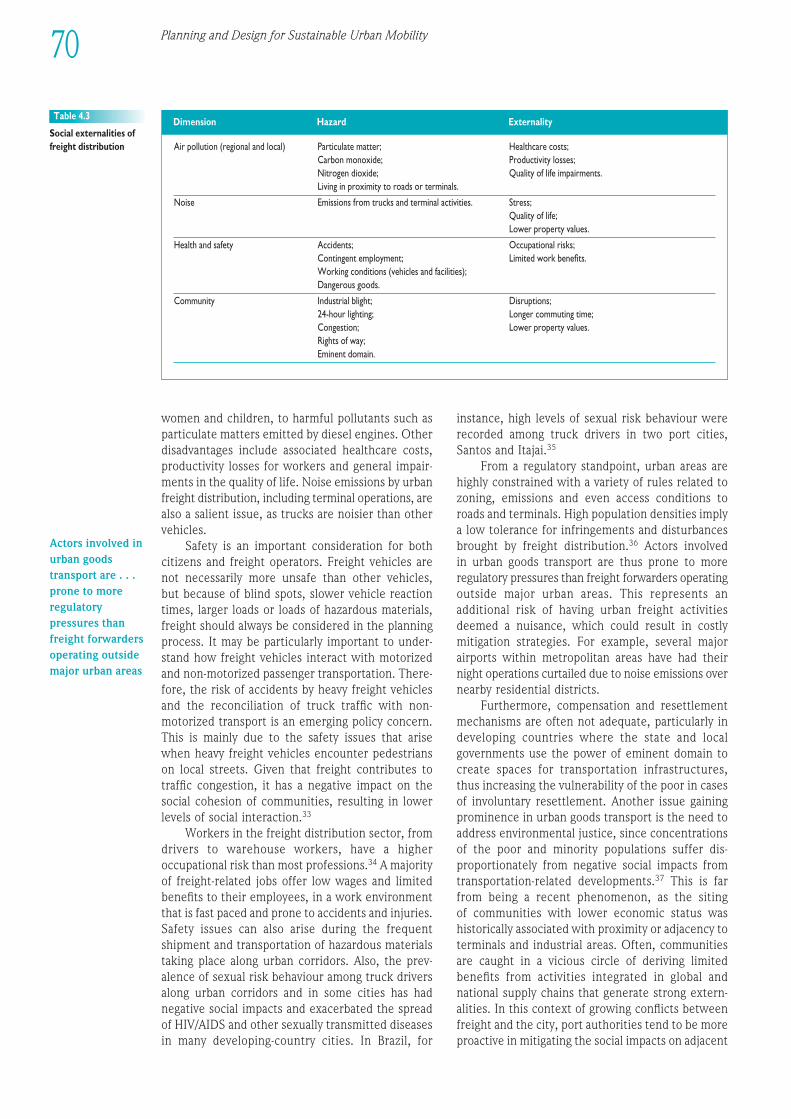
Planning and Design for Sustainable Urban Mobility70
women and children, to harmful pollutants such asparticulate matters emitted by diesel engines. Otherdis advan tages include associated healthcare costs,productivity losses for workers and general impair -ments in the quality of life. Noise emissions by urbanfreight distribution, including terminal operations, arealso a salient issue, as trucks are noisier than othervehicles.
Safety is an important consideration for bothcitizens and freight operators. Freight vehicles arenot necessarily more unsafe than other vehicles, but because of blind spots, slower vehicle reactiontimes, larger loads or loads of hazardous materials,freight should always be considered in the planningprocess. It may be particularly important to under -stand how freight vehicles interact with motorizedand non-motorized passen ger transportation. There -fore, the risk of accidents by heavy freight vehiclesand the reconciliation of truck traffic with non-motorized trans port is an emerging policy concern.This is mainly due to the safety issues that arise when heavy freight vehicles encounter pedestrianson local streets. Given that freight contributes totraffic congestion, it has a negative impact on thesocial cohesion of communities, resulting in lowerlevels of social interaction.33
Workers in the freight distribution sector, fromdrivers to warehouse workers, have a higheroccupational risk than most professions.34 A majorityof freight-related jobs offer low wages and limitedbenefits to their employees, in a work environ mentthat is fast paced and prone to accidents and injuries.Safety issues can also arise during the frequentshipment and transportation of hazardous materialstaking place along urban corridors. Also, the prev -alence of sexual risk behaviour among truck driversalong urban corridors and in some cities has hadnegative social impacts and exacerbated the spreadof HIV/AIDS and other sexually transmitted diseasesin many devel op ing-country cities. In Brazil, for
instance, high levels of sexual risk behaviour wererecorded among truck drivers in two port cities,Santos and Itajai.35
From a regulatory standpoint, urban areas arehighly constrained with a variety of rules related tozoning, emissions and even access conditions toroads and terminals. High population densities implya low tolerance for infringements and disturbancesbrought by freight distribution.36 Actors involved in urban goods trans port are thus prone to moreregulatory pressures than freight forwarders operatingoutside major urban areas. This represents anadditional risk of having urban freight activitiesdeemed a nuisance, which could result in costlymitigation strategies. For example, several majorairports within metropolitan areas have had theirnight operations curtailed due to noise emissions overnearby residential districts.
Further more, compensation and resettlementmechanisms are often not adequate, particularly indevel op ing countries where the state and localgovern ments use the power of eminent domain tocreate spaces for transportation infra struc tures, thus increasing the vulnerability of the poor in casesof involuntary resettlement. Another issue gainingprominence in urban goods trans port is the need toaddress environ mental justice, since concentrationsof the poor and minority populations suffer dis -proportionately from negative social impacts fromtransportation-related devel op ments.37 This is farfrom being a recent phenomenon, as the siting of communities with lower economic status washistorically associated with proximity or adjacency toterminals and industrial areas. Often, communitiesare caught in a vicious circle of deriving limitedbenefits from activities integrated in global andnational supply chains that generate strong extern -alities. In this context of growing conflicts betweenfreight and the city, port authorities tend to be moreproactive in mitigating the social impacts on adjacent
Air pollution (regional and local) Particulate matter; Healthcare costs;Carbon monoxide; Productivity losses;Nitrogen dioxide; Quality of life impairments.Living in proximity to roads or terminals.
Noise Emissions from trucks and terminal activities. Stress;Quality of life;Lower property values.
Health and safety Accidents; Occupational risks;Contingent employment; Limited work benefits.Working conditions (vehicles and facilities);Dangerous goods.
Community Industrial blight; Disruptions;24-hour lighting; Longer commuting time;Congestion; Lower property values.Rights of way;Eminent domain.
Table 4.3
Social externalities offreight distribution
Dimension Hazard Externality
Actors involved inurban goodstransport are . . .prone to moreregulatorypressures thanfreight forwardersoperating outsidemajor urban areas
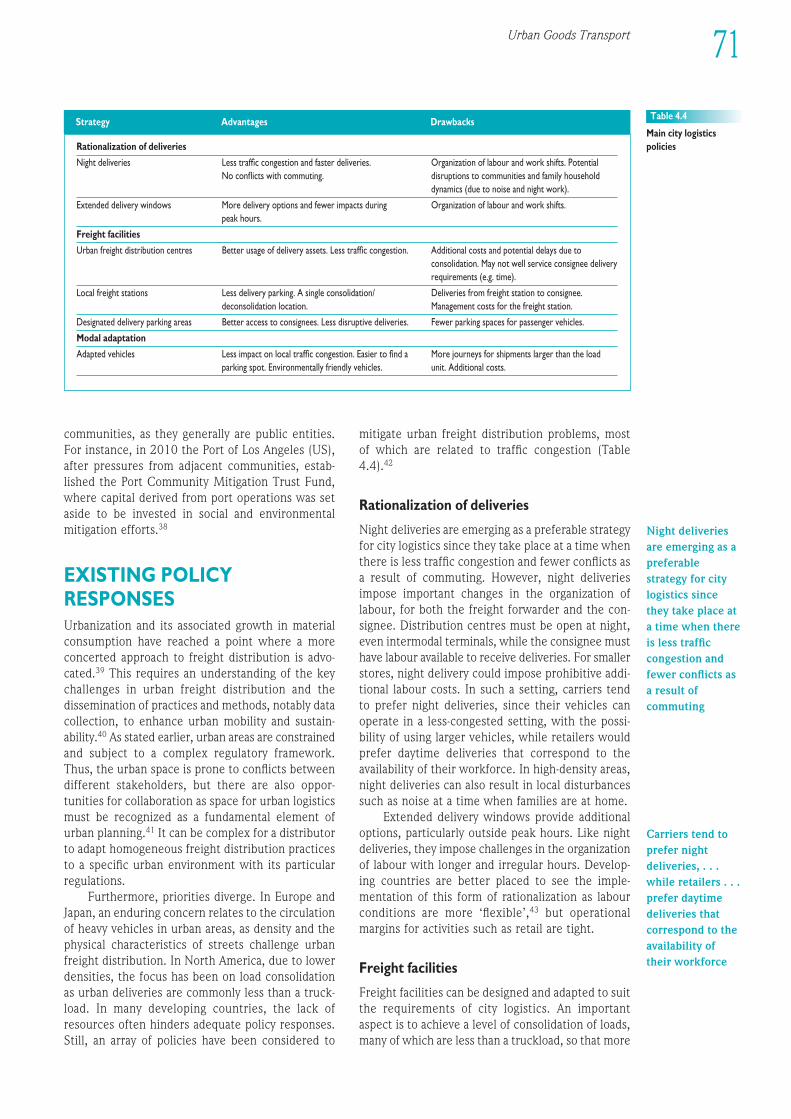
Urban Goods Transport 71
1EEE234567891012311145678920123456789301234567894012345678950123456789EEEE
communities, as they generally are public entities.For instance, in 2010 the Port of Los Angeles (US),after pressures from adjacent communities, estab -lished the Port Community Mitigation Trust Fund,where capital derived from port operations was setaside to be invested in social and environ mentalmitigation efforts.38
EXISTING POLICYRESPONSESUrbanization and its associated growth in materialconsumption have reached a point where a moreconcerted approach to freight distribution is advo -cated.39 This requires an understanding of the keychallenges in urban freight distribution and thedissemination of practices and methods, notably datacollection, to enhance urban mobility and sus tain -ability.40 As stated earlier, urban areas are constrainedand subject to a complex regulatory framework.Thus, the urban space is prone to conflicts betweendifferent stakeholders, but there are also oppor -tunities for collaboration as space for urban logisticsmust be recognized as a fundamental element ofurban planning.41 It can be complex for a distributorto adapt homogeneous freight distribution practicesto a specific urban environ ment with its particularregulations.
Further more, priorities diverge. In Europe andJapan, an enduring concern relates to the circulationof heavy vehicles in urban areas, as density and thephysical characteristics of streets challenge urbanfreight distribution. In North America, due to lowerdensities, the focus has been on load consolidationas urban deliveries are commonly less than a truck -load. In many devel op ing countries, the lack ofresources often hinders adequate policy responses.Still, an array of policies have been considered to
mitigate urban freight distribution problems, mostof which are related to traffic congestion (Table4.4).42
Rationalization of deliveries
Night deliveries are emerging as a preferable strategyfor city logistics since they take place at a time whenthere is less traffic congestion and fewer conflicts asa result of commuting. However, night deliveriesimpose important changes in the organization oflabour, for both the freight forwarder and the con -signee. Distribution centres must be open at night,even intermodal terminals, while the consignee musthave labour available to receive deliveries. For smallerstores, night delivery could impose prohibitive addi -tional labour costs. In such a setting, carriers tendto prefer night deliveries, since their vehicles canoperate in a less-congested setting, with the possi -bility of using larger vehicles, while retailers wouldprefer daytime deliveries that correspond to theavailability of their workforce. In high-density areas,night deliveries can also result in local disturbancessuch as noise at a time when families are at home.
Extended delivery windows provide additionaloptions, particularly outside peak hours. Like nightdeliveries, they impose challenges in the organizationof labour with longer and irregular hours. Devel op -ing countries are better placed to see the imple -mentation of this form of rationalization as labourconditions are more ‘flexible’,43 but operationalmargins for activities such as retail are tight.
Freight facilities
Freight facilities can be designed and adapted to suitthe requirements of city logistics. An importantaspect is to achieve a level of consolidation of loads,many of which are less than a truckload, so that more
Rationalization of deliveries
Night deliveries Less traffic congestion and faster deliveries. Organization of labour and work shifts. Potential No conflicts with commuting. disruptions to communities and family household
dynamics (due to noise and night work).
Extended delivery windows More delivery options and fewer impacts during Organization of labour and work shifts.peak hours.
Freight facilities
Urban freight distribution centres Better usage of delivery assets. Less traffic congestion. Additional costs and potential delays due toconsolidation. May not well service consignee deliveryrequirements (e.g. time).
Local freight stations Less delivery parking. A single consolidation/ Deliveries from freight station to consignee. deconsolidation location. Management costs for the freight station.
Designated delivery parking areas Better access to consignees. Less disruptive deliveries. Fewer parking spaces for passen ger vehicles.
Modal adaptation
Adapted vehicles Less impact on local traffic congestion. Easier to find a More journeys for shipments larger than the load parking spot. Environ mentally friendly vehicles. unit. Additional costs.
Table 4.4
Main city logisticspolicies
Strategy Advantages Drawbacks
Night deliveriesare emerging as apreferablestrategy for citylogistics sincethey take place ata time when thereis less trafficcongestion andfewer conflicts asa result ofcommuting
Carriers tend toprefer nightdeliveries, . . .while retailers . . .prefer daytimedeliveries thatcorrespond to theavailability oftheir workforce
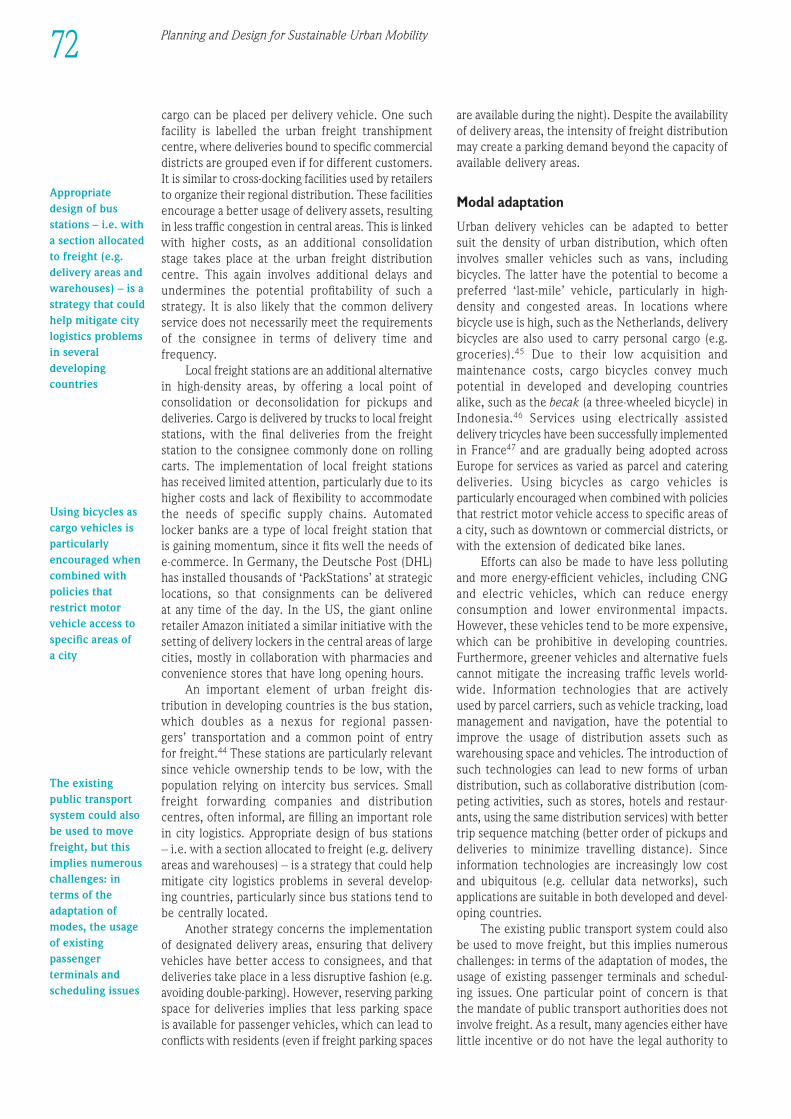
72 Planning and Design for Sustainable Urban Mobility
cargo can be placed per delivery vehicle. One suchfacility is labelled the urban freight transhipmentcentre, where deliveries bound to specific commercialdistricts are grouped even if for different customers.It is similar to cross-docking facilities used by retailersto organize their regional distribution. These facilitiesencourage a better usage of delivery assets, resultingin less traffic congestion in central areas. This is linkedwith higher costs, as an additional consolidationstage takes place at the urban freight distributioncentre. This again involves additional delays andundermines the potential profitability of such astrategy. It is also likely that the common deliveryservice does not necessarily meet the requirementsof the consignee in terms of delivery time andfrequency.
Local freight stations are an additional alternativein high-density areas, by offering a local point ofconsolidation or deconsolidation for pickups anddeliveries. Cargo is delivered by trucks to local freightstations, with the final deliveries from the freightstation to the consignee commonly done on rollingcarts. The implementation of local freight stations has received limited attention, particularly due to itshigher costs and lack of flexibility to accommodatethe needs of specific supply chains. Automated locker banks are a type of local freight station thatis gaining momentum, since it fits well the needs ofe-commerce. In Germany, the Deutsche Post (DHL)has installed thousands of ‘PackStations’ at strategiclocations, so that consignments can be delivered at any time of the day. In the US, the giant onlineretailer Amazon initiated a similar initiative with thesetting of delivery lockers in the central areas of largecities, mostly in collaboration with pharmacies andconvenience stores that have long opening hours.
An important element of urban freight dis -tribution in devel op ing countries is the bus station,which doubles as a nexus for regional passen-gers’ transportation and a common point of entry for freight.44 These stations are particularly relevantsince vehicle ownership tends to be low, with thepopulation relying on intercity bus services. Smallfreight forwarding companies and distributioncentres, often informal, are filling an important rolein city logistics. Appropriate design of bus stations– i.e. with a section allocated to freight (e.g. deliveryareas and warehouses) – is a strategy that could helpmitigate city logistics problems in several devel op -ing countries, particularly since bus stations tend tobe centrally located.
Another strategy concerns the implementationof designated delivery areas, ensuring that deliveryvehicles have better access to consignees, and thatdeliveries take place in a less disruptive fashion (e.g.avoiding double-parking). However, reserving parkingspace for deliveries implies that less parking spaceis available for passen ger vehicles, which can lead toconflicts with residents (even if freight parking spaces
are available during the night). Despite the availabilityof delivery areas, the intensity of freight distributionmay create a parking demand beyond the capacity ofavailable delivery areas.
Modal adaptation
Urban delivery vehicles can be adapted to better suit the density of urban distribution, which ofteninvolves smaller vehicles such as vans, includingbicycles. The latter have the potential to become apreferred ‘last-mile’ vehicle, particularly in high-density and congested areas. In locations wherebicycle use is high, such as the Netherlands, deliverybicycles are also used to carry personal cargo (e.g.groceries).45 Due to their low acquisition andmaintenance costs, cargo bicycles convey muchpotential in developed and devel op ing countriesalike, such as the becak (a three-wheeled bicycle) inIndonesia.46 Services using electrically assisteddelivery tricycles have been successfully implementedin France47 and are gradually being adopted acrossEurope for services as varied as parcel and cateringdeliveries. Using bicycles as cargo vehicles isparticularly encouraged when combined with policiesthat restrict motor vehicle access to specific areas ofa city, such as downtown or commercial districts, orwith the extension of dedicated bike lanes.
Efforts can also be made to have less pollutingand more energy-efficient vehicles, including CNGand electric vehicles, which can reduce energyconsumption and lower environ mental impacts.However, these vehicles tend to be more expensive,which can be prohibitive in devel op ing countries.Further more, greener vehicles and alternative fuelscannot mitigate the increasing traffic levels world -wide. Information technologies that are actively used by parcel carriers, such as vehicle tracking, loadmanagement and navigation, have the potential toimprove the usage of distribution assets such aswarehousing space and vehicles. The introduction ofsuch technologies can lead to new forms of urbandistribution, such as collaborative distribution (com -peting activities, such as stores, hotels and restaur -ants, using the same distribution services) with bettertrip sequence matching (better order of pickups anddeliveries to minimize travelling distance). Sinceinformation technologies are increasingly low costand ubiquitous (e.g. cellular data networks), suchapplications are suitable in both developed and devel -op ing countries.
The existing public trans port system could alsobe used to move freight, but this implies numerouschallenges: in terms of the adaptation of modes, theusage of existing passen ger terminals and schedul-ing issues. One particular point of concern is that the mandate of public trans port authorities does notinvolve freight. As a result, many agencies either havelittle incentive or do not have the legal authority to
Appropriatedesign of busstations – i.e. witha section allocatedto freight (e.g.delivery areas andwarehouses) – is astrategy that couldhelp mitigate citylogistics problemsin severaldevelopingcountries
Using bicycles ascargo vehicles isparticularlyencouraged whencombined withpolicies thatrestrict motorvehicle access tospecific areas of a city
The existingpublic transportsystem could alsobe used to movefreight, but thisimplies numerouschallenges: interms of theadaptation ofmodes, the usageof existingpassengerterminals andscheduling issues
NOTES1 Taniguchi and Thompson, 2008.2 Boschmann and Kwan, 2008;
Goldman and Gorham, 2006.3 OECD, 2003.4 Benjelloun et al, 2010.5 Hesse and Rodrigue, 2004.6 Dablanc, 2009.7 See Chapter 8.8 Ambrosini and Routhier, 2004.9 Dablanc, 2007.
10 Cidell, 2010.11 Geroliminis and Daganzo, 2005.12 Riverson et al, 2005; Porter,
2011.13 McMillan, 2011.14 See Chapter 5.
15 Texas Transportation Institute,2010.
16 Hesse, 2008.17 Schneider et al, 2009.18 Rodrigue, 2011. Surface figures
are assembled through aninventory of terminal facilitiesusing the websites of portauthorities, terminal operatorsand Drewry ShippingConsultants (2010).
19 Kasarda and Lindsey, 2011.20 McKinnon, 2009.21 National Bureau of Statistics of
China, 2009.22 Dings and Dijkstra, 1997.
23 See Chapter 7.24 Dablanc, 2008.25 Dablanc, 2009.26 The trans port of goods over
short distances.27 OECD/ITF, 2008.28 Banister and Finch, 2011.29 SMA-GDF, 2008.30 Satterthwaite et al, 2007.31 Browne and Allen, 1999.32 Visser and Nemoto, 2002.33 Hart and Parkhurst, 2011.34 EASHW, 2011.35 Ferreira et al, 2008.36 Rodrigue et al, 2009.37 Matsuoka et al, 2009.
38 Reuters, 2010.39 Patier, 2001.40 Patier and Routhier, 2008.41 ADEME, 2010.42 Anderson et al, 2005.43 Often due to poor
implementation of labourstandards.
44 Boupda, 2010.45 Basterfield, 2011.46 Syabri et al, 2011.47 http://www.lapetitereine.com,
last accessed 23 May 2012.48 Chiffi, undated.
develop freight initiatives. Fares can also be an issue,since public trans port fare systems are per passen -ger with no equivalent for freight. From a logisticsperspective, the rationale behind using public trans -port is limited, as it involves load-break and potentialbreaches in integrity. Many attempts at devel op ing‘cargo-trams’ (tramways adapted to carry cargo) have failed, such as the ambitious cargo-tram projectin Amsterdam (the Netherlands) that went bank-rupt in 2009.48 The expansion of passen ger railservices in suburban areas often raises conflicts, dueto the dominance that freight assumes in interurbanservices. For instance, passen ger rail services andfreight trains that share the same track segments are likely to result in delays and schedule integrityissues. Outside building new rail infra struc tures,the options are limited to stringent infra struc turesharing agreements between passen gers and freightrail services.
CONCLUDING REMARKSAND LESSONS FOR POLICYThe city of the twenty-first century is a city of intenseflows of people, material and information. As such,goods trans port is a fundamental component of the urban environ ment, an issue that until recentlywas neglected in the planning process. The challengeis to balance the need to ensure efficiency of goodstransport, while minimizing externalities such ascongestion, the emission of pollutants, noise andaccidents.
As new strategies and practices are imple -mented, and also because of a trend towards higherenergy prices, more efficient urban freight distri -bution systems will emerge as part of a transitiontowards greener forms of city logistics. Such strat -egies are centred mostly around the rationalizationof deliveries; the devel op ment of freight facilitiesbetter adapted to the urban environ ment; and amodal adaptation (vehicles, including non-motorizedmodes, better adapted to urban circulation). Whilethese strategies are likely to reflect the unique modaland infrastructural lattice of each city, it remainsuncertain if advances in city logistics will be sufficientto cope with growing levels of congestion and therelated socioeconomic externalities, particularly indevel op ing countries. Accordingly, unique forms ofcity logistics are emerging in devel op ing countries,due to significant differences in levels of income anddensity. However, these cases are far less docu -mented.
Goods trans port remains a fundamental ele-ment of urban sus tain ability. Thus, it is essential thatthe role and impact of goods trans port in the urbancontext is taken into consideration, if planningaccessible mobility for passen gers is to be effective.This is especially so when considering the closeinteractions between urban land use, form and goods trans port within an increasingly contestedlandscape.
1EEE234567891012311145678920123456789301234567894012345678950123456789EEEE
73Urban Goods Transport
Passenger railservices andfreight trains thatshare the sametrack segmentsare likely to resultin delays andschedule integrityissues
It is essential thatthe role andimpact of goodstransport in theurban context is taken intoconsideration, if planningaccessiblemobility forpassengers is tobe effective

MOBILITY AND URBAN FORM
C H A P T E R 5Heightened concerns over climate change, risinggasoline prices, traffic congestion and social exclusionhave sparked renewed interest to explore the linkbetween mobility and urban form.1 Worldwide, cityofficials share relatively similar concerns about traveltime, air quality, road accidents, social integration,better accessibility and improved use of differentmodal trans port solutions.
Despite this, most cities, particularly in devel -op ing countries and emerging economies, continueto prioritize motorized trans port and related urbaninfra struc ture. A large number of cities both in thedevel op ing and developed countries are experiencingfast and uncontrolled growth in their peripheries.Consequently, there is a wide variety of urban forms,defined by land-use and transportation systems thatare not conducive to the provision of ‘efficient’ formsof urban mobility. There can be little doubt thatdesigning neigh bour hoods, cities and regions in a waythat can reduce private car dependency, promotehealthier, more sus tain able urban forms and a varietyof travel solutions, can make the city more accessibleto all. The pressure to develop sus tain able trans -portation and mobility systems is particularly acutein urban areas.
In recent years, city planners, developers andpolicy-makers have increasingly looked towardsdesigning more compact cities with a mixture of landuses in order to achieve a more sus tain able urbanform. The ‘compact city’ policy, although difficult toimplement, can help shorten travel distances, thuslower emissions and fuel consumption, reduce travelcosts and improve quality of life in many cities.However, there is need for better solutions on howto move from current unsus tain able trends in urbanform and transportation towards a more sus tain ablefuture.
There is increasing evidence that the form andfunctionality of the city is crucial for the promotionof sus tain able mobility. Indeed, transforming citieswherein a mix of activities is closer together, in amore compact configuration, and interlaced by
high-quality pedestrian and bicycle infra struc ture, istantamount to the creation of a more accessible city.As stressed in Chapter 1, accessibility lies at the coreof achieving an urban form that is environ mentallysus tain able, socially equitable and inclusive, withhigher potential to generate economic interactionsthat lead to productivity and income gains. Sus tain -able mobility is an outcome of how cities and neigh -bour hoods are designed and take form, but it alsoshapes the urban form itself. This reflects the power -ful, bi-directional relationship between mobility and urban form that underscores the importance ofcare fully coordinating and integrating the two. A re -invigorated notion of urban planning, solid institu -tions and governing structures is therefore required,which can lead a process for this transformativechange.
A number of pressing mobility and environ -mental issues, which policy-makers at all levels of govern ment are wrestling with today, hinge onchanges in the design and form of cities for a moreefficient and sus tain able solution. With the trans portsector accounting for nearly a quarter of greenhousegas emissions in metropolitan areas worldwide,campaigns to stabilize the global climate include thecreation of less car-dependent urban forms.2 Stop-ping sprawl,3 promoting public-transport-orientedgrowth and creating compact, walkable neigh bour -hoods that reduce vehicle-kilometres travelled (VKT)per person are the cornerstones of such campaigns. The EU’s Climate Change Programme calls for thepromotion of ‘low-emission land-use activities’ as away to moderate VKT growth, making an interestingconnection between urban form and transport.4
It is important to track VKT per capita, as it is thestrongest single correlate of environ mental degrada -tion and resource consumption in the urban trans -port sector. It has been projected that, in the absenceof substantial reductions in VKT per capita worldwide,all increases in fuel-efficient and low-carbon fuels will only slow, not reverse, the rise in per capita CO2emissions.5
1EEE234567891012311145678920123456789301234567894012345678950123456789EEEE
The form andfunctionality ofthe city is crucialfor the promotionof sustainablemobility
Accessibility liesat the core ofachieving anurban form that isenvironmentallysustainable,socially equitableand inclusive
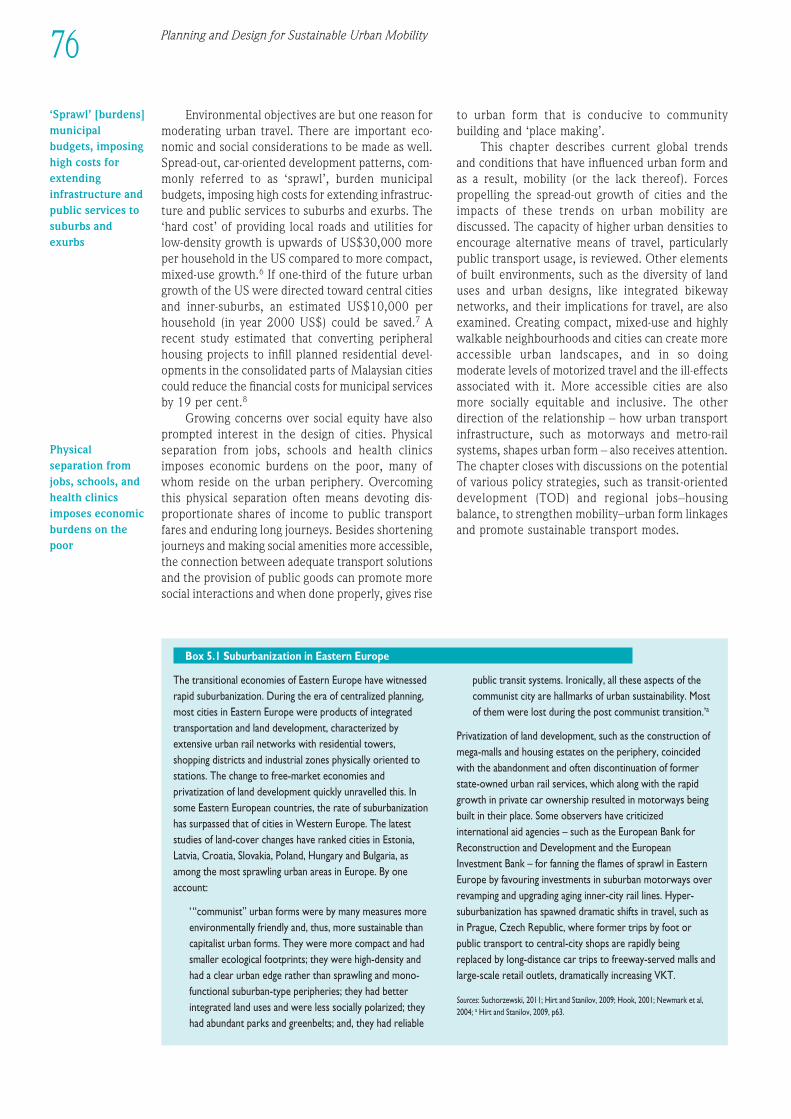
Environ mental objectives are but one reason formoderating urban travel. There are important eco -nomic and social considerations to be made as well.Spread-out, car-oriented devel op ment patterns, com -monly referred to as ‘sprawl’, burden municipalbudgets, imposing high costs for extending infra struc -ture and public services to suburbs and exurbs. The‘hard cost’ of providing local roads and utilities forlow-density growth is upwards of US$30,000 moreper household in the US compared to more compact,mixed-use growth.6 If one-third of the future urbangrowth of the US were directed toward central citiesand inner-suburbs, an estimated US$10,000 perhousehold (in year 2000 US$) could be saved.7 Arecent study estimated that converting peripheralhousing projects to infill planned residential devel -op ments in the consolidated parts of Malaysian citiescould reduce the finan cial costs for municipal servicesby 19 per cent.8
Growing concerns over social equity have alsoprompted interest in the design of cities. Physicalseparation from jobs, schools and health clinicsimposes economic burdens on the poor, many ofwhom reside on the urban periphery. Overcomingthis physical separation often means devoting dis -proportionate shares of income to public trans portfares and enduring long journeys. Besides shorteningjourneys and making social amenities more accessible,the connection between adequate trans port solutionsand the provision of public goods can promote moresocial interactions and when done properly, gives rise
to urban form that is conducive to communitybuilding and ‘place making’.
This chapter describes current global trendsand conditions that have influenced urban form andas a result, mobility (or the lack thereof). Forcespropelling the spread-out growth of cities and theimpacts of these trends on urban mobility arediscussed. The capacity of higher urban densities toencourage alternative means of travel, particularlypublic trans port usage, is reviewed. Other elementsof built environ ments, such as the diversity of landuses and urban designs, like integrated bikewaynetworks, and their implications for travel, are alsoexamined. Creating compact, mixed-use and highlywalkable neigh bour hoods and cities can create moreaccessible urban landscapes, and in so doingmoderate levels of motorized travel and the ill-effectsassociated with it. More accessible cities are alsomore socially equitable and inclusive. The otherdirection of the relationship – how urban trans portinfra struc ture, such as motorways and metro-railsystems, shapes urban form – also receives attention.The chapter closes with discussions on the potentialof various policy strategies, such as transit-orienteddevel op ment (TOD) and regional jobs–housingbalance, to strengthen mobility–urban form linkagesand promote sus tain able trans port modes.
Planning and Design for Sustainable Urban Mobility76
The transitional economies of Eastern Europe have witnessedrapid suburbanization. During the era of centralized planning,most cities in Eastern Europe were products of integratedtransportation and land devel op ment, characterized byextensive urban rail networks with residential towers,shopping districts and industrial zones physically oriented tostations. The change to free-market economies andprivatization of land devel op ment quickly unravelled this. Insome Eastern European countries, the rate of suburbanizationhas surpassed that of cities in Western Europe. The lateststudies of land-cover changes have ranked cities in Estonia,Latvia, Croatia, Slovakia, Poland, Hungary and Bulgaria, asamong the most sprawling urban areas in Europe. By oneaccount:
‘“communist” urban forms were by many measures moreenviron mentally friendly and, thus, more sus tain able thancapitalist urban forms. They were more compact and hadsmaller ecological footprints; they were high-density andhad a clear urban edge rather than sprawling and mono-functional suburban-type peripheries; they had betterintegrated land uses and were less socially polarized; theyhad abundant parks and greenbelts; and, they had reliable
public transit systems. Ironically, all these aspects of thecommunist city are hallmarks of urban sus tain ability. Mostof them were lost during the post communist transition.’a
Privatization of land devel op ment, such as the construction ofmega-malls and housing estates on the periphery, coincidedwith the abandonment and often discontinuation of formerstate-owned urban rail services, which along with the rapidgrowth in private car ownership resulted in motorways beingbuilt in their place. Some observers have criticizedinternational aid agencies – such as the European Bank forReconstruction and Devel op ment and the EuropeanInvestment Bank – for fanning the flames of sprawl in EasternEurope by favouring investments in suburban motorways overrevamping and upgrading aging inner-city rail lines. Hyper-suburbanization has spawned dramatic shifts in travel, such asin Prague, Czech Republic, where former trips by foot orpublic trans port to central-city shops are rapidly beingreplaced by long-distance car trips to freeway-served malls andlarge-scale retail outlets, dramatically increasing VKT.
Sources: Suchorzewski, 2011; Hirt and Stanilov, 2009; Hook, 2001; Newmark et al,2004; a Hirt and Stanilov, 2009, p63.
Box 5.1 Suburbanization in Eastern Europe
‘Sprawl’ [burdens]municipalbudgets, imposinghigh costs forextendinginfrastructure andpublic services tosuburbs andexurbs
Physicalseparation fromjobs, schools, andhealth clinicsimposes economicburdens on thepoor
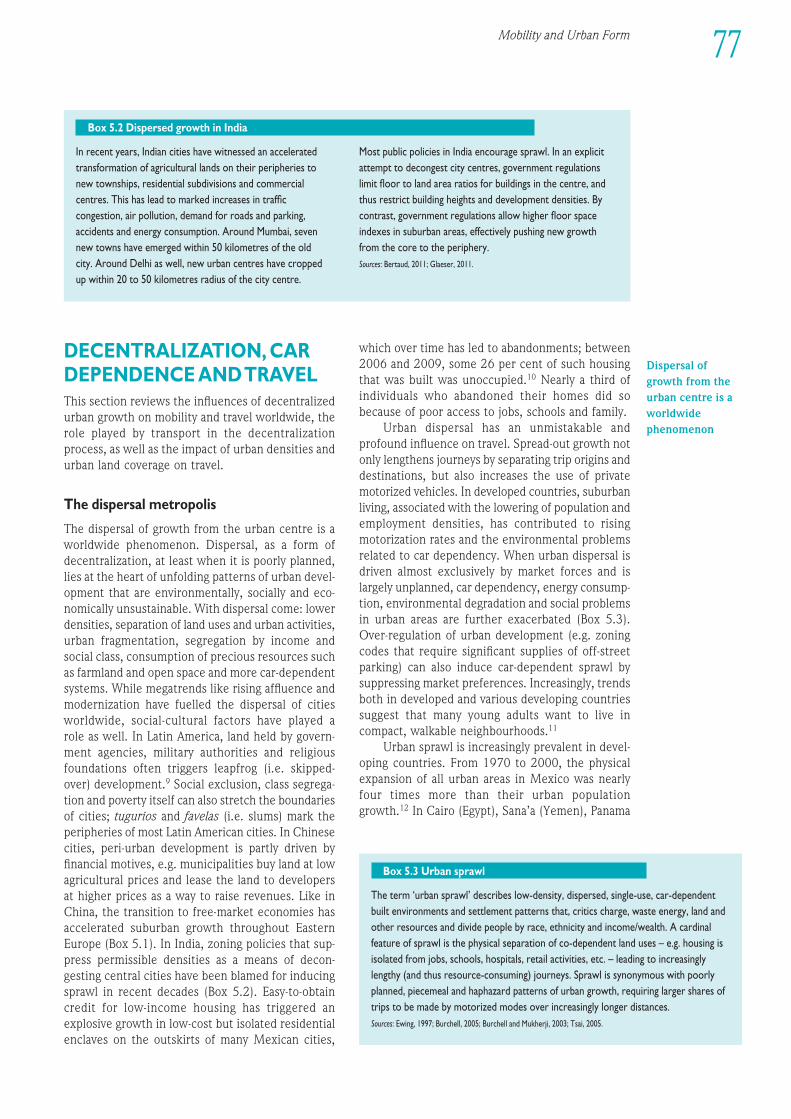
DECENTRALIZATION, CARDEPENDENCE AND TRAVELThis section reviews the influences of decentralizedurban growth on mobility and travel worldwide, therole played by trans port in the decentralizationprocess, as well as the impact of urban densities andurban land coverage on travel.
The dispersal metropolis
The dispersal of growth from the urban centre is aworldwide phenomenon. Dispersal, as a form ofdecentralization, at least when it is poorly planned,lies at the heart of unfolding patterns of urban devel -op ment that are environ mentally, socially and eco -nomically unsus tain able. With dispersal come: lowerdensities, separation of land uses and urban activities,urban fragmentation, segregation by income andsocial class, consumption of precious resources suchas farmland and open space and more car-dependentsystems. While megatrends like rising affluence andmodernization have fuelled the dispersal of citiesworldwide, social-cultural factors have played a role as well. In Latin America, land held by govern -ment agencies, military authorities and religiousfounda tions often triggers leapfrog (i.e. skipped-over) devel op ment.9 Social exclusion, class segrega -tion and poverty itself can also stretch the boundariesof cities; tugurios and favelas (i.e. slums) mark theperipheries of most Latin American cities. In Chinesecities, peri-urban devel op ment is partly driven byfinan cial motives, e.g. municipalities buy land at lowagricultural prices and lease the land to developersat higher prices as a way to raise revenues. Like inChina, the transition to free-market economies hasaccelerated suburban growth throughout EasternEurope (Box 5.1). In India, zoning policies that sup -press permissible densities as a means of decon -gesting central cities have been blamed for inducingsprawl in recent decades (Box 5.2). Easy-to-obtaincredit for low-income housing has triggered anexplosive growth in low-cost but isolated residentialenclaves on the outskirts of many Mexican cities,
which over time has led to abandonments; between2006 and 2009, some 26 per cent of such housingthat was built was unoccupied.10 Nearly a third ofindividuals who abandoned their homes did sobecause of poor access to jobs, schools and family.
Urban dispersal has an unmistakable andprofound influence on travel. Spread-out growth notonly lengthens journeys by separating trip origins anddestinations, but also increases the use of privatemotorized vehicles. In developed countries, suburbanliving, associated with the lowering of population andemployment densities, has contributed to risingmotorization rates and the environ mental problemsrelated to car dependency. When urban dispersal isdriven almost exclusively by market forces and islargely unplanned, car dependency, energy consump -tion, environ mental degradation and social problemsin urban areas are further exacerbated (Box 5.3).Over-regulation of urban devel op ment (e.g. zoningcodes that require significant supplies of off-streetparking) can also induce car-dependent sprawl bysuppressing market preferences. Increasingly, trendsboth in developed and various devel op ing countriessuggest that many young adults want to live incompact, walkable neigh bour hoods.11
Urban sprawl is increasingly prevalent in devel -op ing countries. From 1970 to 2000, the physicalexpansion of all urban areas in Mexico was nearlyfour times more than their urban populationgrowth.12 In Cairo (Egypt), Sana’a (Yemen), Panama
Mobility and Urban Form 77
1EEE234567891012311145678920123456789301234567894012345678950123456789EEEE
In recent years, Indian cities have witnessed an acceleratedtransformation of agricultural lands on their peripheries tonew townships, residential subdivisions and commercialcentres. This has lead to marked increases in trafficcongestion, air pollution, demand for roads and parking,accidents and energy consumption. Around Mumbai, sevennew towns have emerged within 50 kilometres of the old city. Around Delhi as well, new urban centres have croppedup within 20 to 50 kilometres radius of the city centre.
Most public policies in India encourage sprawl. In an explicitattempt to decongest city centres, govern ment regulationslimit floor to land area ratios for buildings in the centre, andthus restrict building heights and devel op ment densities. Bycontrast, govern ment regulations allow higher floor spaceindexes in suburban areas, effectively pushing new growthfrom the core to the periphery.Sources: Bertaud, 2011; Glaeser, 2011.
Box 5.2 Dispersed growth in India
The term ‘urban sprawl’ describes low-density, dispersed, single-use, car-dependentbuilt environ ments and settlement patterns that, critics charge, waste energy, land andother resources and divide people by race, ethnicity and income/wealth. A cardinalfeature of sprawl is the physical separation of co-dependent land uses – e.g. housing isisolated from jobs, schools, hospitals, retail activities, etc. – leading to increasinglylengthy (and thus resource-consuming) journeys. Sprawl is synonymous with poorlyplanned, piecemeal and haphazard patterns of urban growth, requiring larger shares oftrips to be made by motorized modes over increasingly longer distances.Sources: Ewing, 1997; Burchell, 2005; Burchell and Mukherji, 2003; Tsai, 2005.
Box 5.3 Urban sprawl
Dispersal ofgrowth from theurban centre is aworldwidephenomenon
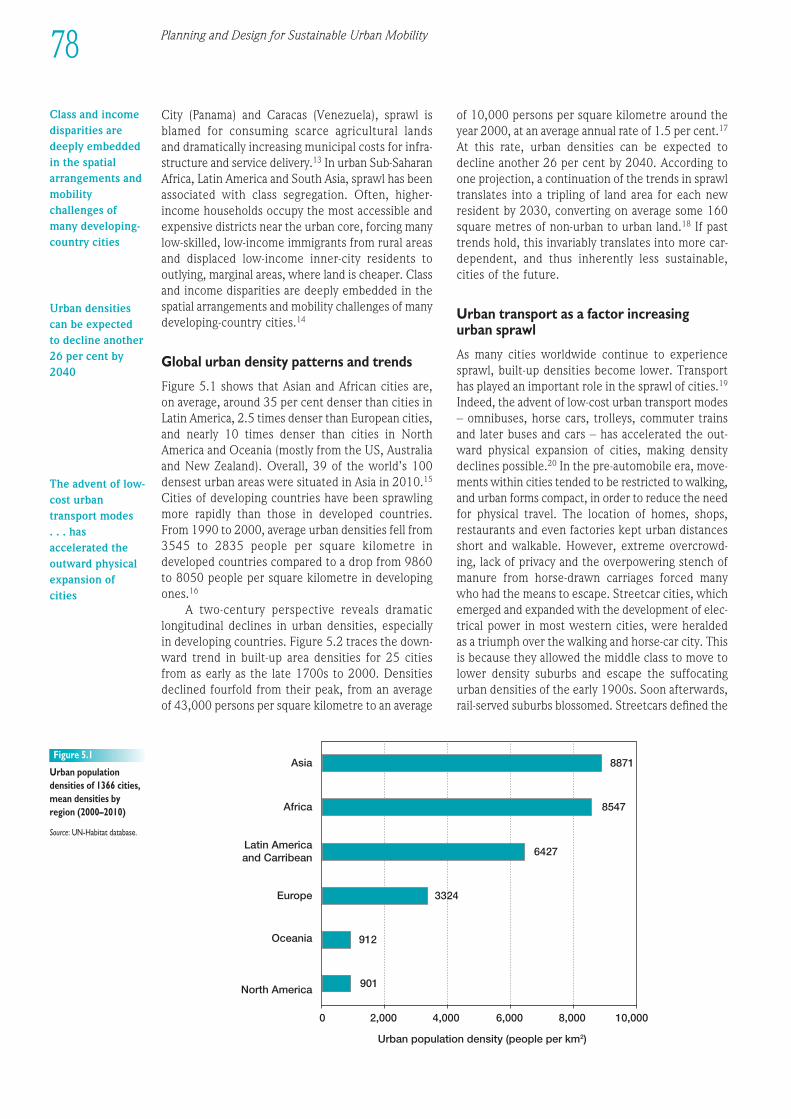
City (Panama) and Caracas (Venezuela), sprawl isblamed for consuming scarce agricultural lands and dramatically increasing municipal costs for infra -struc ture and service delivery.13 In urban Sub-SaharanAfrica, Latin America and South Asia, sprawl has beenassociated with class segregation. Often, higher-income households occupy the most accessible andexpensive districts near the urban core, forcing manylow-skilled, low-income immigrants from rural areasand displaced low-income inner-city residents tooutlying, marginal areas, where land is cheaper. Classand income disparities are deeply embedded in thespatial arrangements and mobility challenges of manydevel op ing-country cities.14
Global urban density patterns and trends
Figure 5.1 shows that Asian and African cities are,on average, around 35 per cent denser than cities inLatin America, 2.5 times denser than European cities,and nearly 10 times denser than cities in NorthAmerica and Oceania (mostly from the US, Australiaand New Zealand). Overall, 39 of the world’s 100densest urban areas were situated in Asia in 2010.15
Cities of devel op ing countries have been sprawlingmore rapidly than those in developed countries.From 1990 to 2000, average urban densities fell from3545 to 2835 people per square kilometre indeveloped countries compared to a drop from 9860to 8050 people per square kilometre in devel op ingones.16
A two-century perspective reveals dramaticlongitudinal declines in urban densities, especially in devel op ing countries. Figure 5.2 traces the down-ward trend in built-up area densities for 25 cities from as early as the late 1700s to 2000. Densitiesdeclined fourfold from their peak, from an averageof 43,000 persons per square kilometre to an average
of 10,000 persons per square kilometre around theyear 2000, at an average annual rate of 1.5 per cent.17
At this rate, urban densities can be expected todecline another 26 per cent by 2040. According toone projection, a continuation of the trends in sprawltranslates into a tripling of land area for each newresident by 2030, converting on average some 160square metres of non-urban to urban land.18 If pasttrends hold, this invariably translates into more car-dependent, and thus inherently less sus tain able,cities of the future.
Urban trans port as a factor increasingurban sprawl
As many cities worldwide continue to experi encesprawl, built-up densities become lower. Trans porthas played an important role in the sprawl of cities.19
Indeed, the advent of low-cost urban trans port modes– omnibuses, horse cars, trolleys, commuter trainsand later buses and cars – has accelerated the out -ward physical expansion of cities, making densitydeclines possible.20 In the pre-automobile era, move -ments within cities tended to be restricted to walking,and urban forms compact, in order to reduce the needfor physical travel. The location of homes, shops,restaurants and even factories kept urban distancesshort and walkable. However, extreme over crowd-ing, lack of privacy and the overpowering stench ofmanure from horse-drawn carriages forced manywho had the means to escape. Streetcar cities, whichemerged and expanded with the devel op ment of elec -trical power in most western cities, were heraldedas a triumph over the walking and horse-car city. Thisis because they allowed the middle class to move tolower density suburbs and escape the suffocatingurban densities of the early 1900s. Soon afterwards,rail-served suburbs blossomed. Streetcars defined the
Asia
Africa
Latin Americaand Carribean
Europe
Oceania
North America
0 2,000 4,000 6,000 8,000 10,000
Urban population density (people per km2)
8871
8547
6427
3324
912
901
Figure 5.1
Urban populationdensities of 1366 cities,mean densities byregion (2000–2010)
Source: UN-Habitat database.
78 Planning and Design for Sustainable Urban Mobility
Urban densitiescan be expectedto decline another26 per cent by2040
The advent of low-cost urbantransport modes . . . hasaccelerated theoutward physicalexpansion ofcities
Class and incomedisparities aredeeply embeddedin the spatialarrangements andmobilitychallenges ofmany developing-country cities
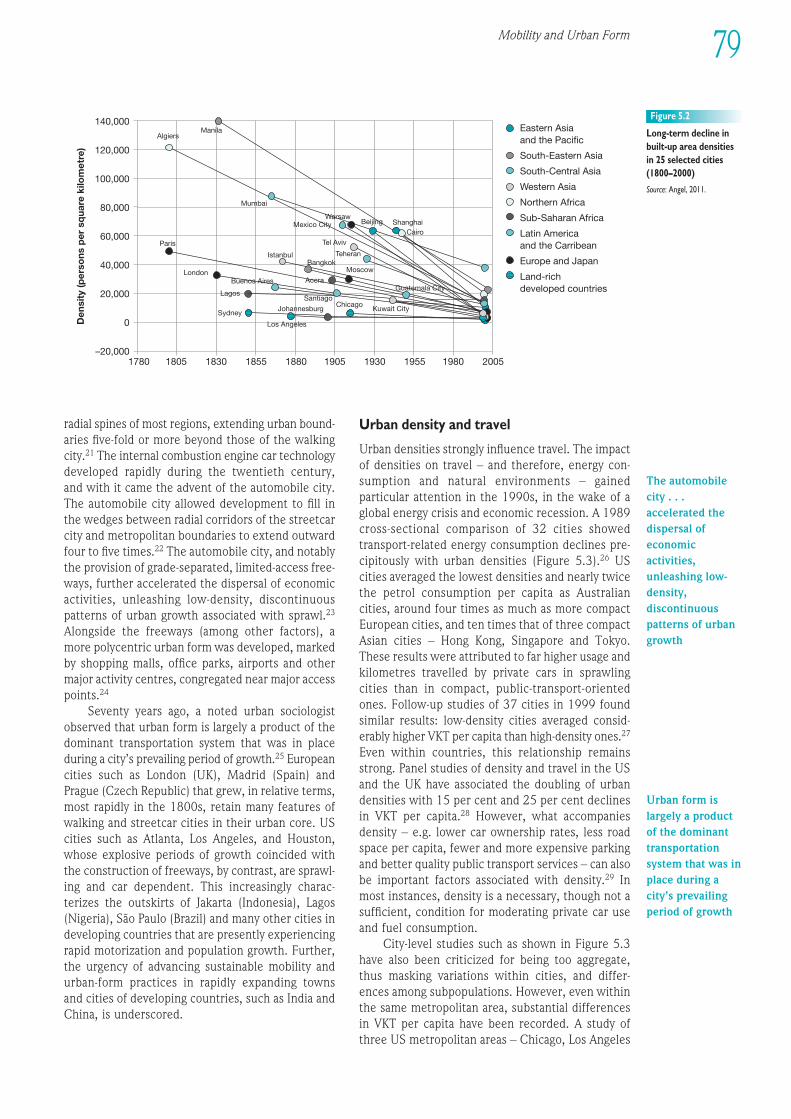
140,000
120,000
100,000
80,000
60,000
40,000
20,000
0
–20,0001780 1805 1830 1855 1880 1905 1930 1955 1980 2005
Eastern Asiaand the Pacific
South-Eastern Asia
South-Central Asia
Western Asia
Northern Africa
Sub-Saharan Africa
Latin Americaand the Carribean
Europe and Japan
Land-richdeveloped countries
Den
sity
(per
sons
per
sq
uare
kilo
met
re)
ManilaAlgiers
Mumbai
Paris
London
Mexico CityWarsaw
Beijing ShanghaiCairo
Istanbul
Tel Aviv
TeheranBangkok
Moscow
AccraBuenos Aires
Lagos
Sydney
Los Angeles
Johannesburg
SantiagoChicago
Kuwait City
Guatemala City
Figure 5.2
Long-term decline inbuilt-up area densitiesin 25 selected cities(1800–2000)
Source: Angel, 2011.
1EEE234567891012311145678920123456789301234567894012345678950123456789EEEE
79Mobility and Urban Form
radial spines of most regions, extending urban bound -aries five-fold or more beyond those of the walkingcity.21 The internal combustion engine car technologydeveloped rapidly during the twentieth century, and with it came the advent of the automobile city.The automobile city allowed devel op ment to fill inthe wedges between radial corridors of the streetcarcity and metropolitan boundaries to extend outwardfour to five times.22 The automobile city, and notablythe provision of grade-separated, limited-access free -ways, further accelerated the dispersal of economicactivities, unleashing low-density, discontinuous pat terns of urban growth associated with sprawl.23
Alongside the freeways (among other factors), amore polycentric urban form was developed, markedby shopping malls, office parks, airports and othermajor activity centres, congregated near major accesspoints.24
Seventy years ago, a noted urban sociologistobserved that urban form is largely a product of thedominant transportation system that was in placeduring a city’s prevailing period of growth.25 Europeancities such as London (UK), Madrid (Spain) andPrague (Czech Republic) that grew, in relative terms,most rapidly in the 1800s, retain many features ofwalking and streetcar cities in their urban core. UScities such as Atlanta, Los Angeles, and Houston,whose explosive periods of growth coincided withthe construction of freeways, by contrast, are sprawl -ing and car dependent. This increasingly charac -terizes the outskirts of Jakarta (Indonesia), Lagos(Nigeria), São Paulo (Brazil) and many other cities indevel op ing countries that are presently experiencingrapid motorization and population growth. Further,the urgency of advancing sus tain able mobility andurban-form practices in rapidly expanding towns and cities of devel op ing countries, such as India andChina, is underscored.
Urban density and travel
Urban densities strongly influence travel. The impactof densities on travel – and therefore, energy con -sumption and natural environ ments – gainedparticular attention in the 1990s, in the wake of aglobal energy crisis and economic recession. A 1989cross-sectional comparison of 32 cities showedtransport-related energy consumption declines pre -cipitously with urban densities (Figure 5.3).26 UScities averaged the lowest densities and nearly twicethe petrol consumption per capita as Australiancities, around four times as much as more compactEuropean cities, and ten times that of three compactAsian cities – Hong Kong, Singapore and Tokyo.These results were attributed to far higher usage andkilometres travelled by private cars in sprawlingcities than in compact, public-transport-orientedones. Follow-up studies of 37 cities in 1999 foundsimilar results: low-density cities averaged consid -erably higher VKT per capita than high-density ones.27
Even within countries, this relationship remainsstrong. Panel studies of density and travel in the USand the UK have associated the doubling of urbandensities with 15 per cent and 25 per cent declinesin VKT per capita.28 However, what accompaniesdensity – e.g. lower car ownership rates, less roadspace per capita, fewer and more expensive parkingand better quality public trans port services – can alsobe important factors associated with density.29 Inmost instances, density is a necessary, though not asufficient, condition for moderating private car useand fuel consumption.
City-level studies such as shown in Figure 5.3have also been criticized for being too aggregate, thus masking variations within cities, and differ-ences among subpopulations. However, even withinthe same metropolitan area, substantial differencesin VKT per capita have been recorded. A study ofthree US metropolitan areas – Chicago, Los Angeles
The automobilecity . . .accelerated thedispersal ofeconomicactivities,unleashing low-density,discontinuouspatterns of urbangrowth
Urban form islargely a productof the dominanttransportationsystem that was inplace during acity’s prevailingperiod of growth
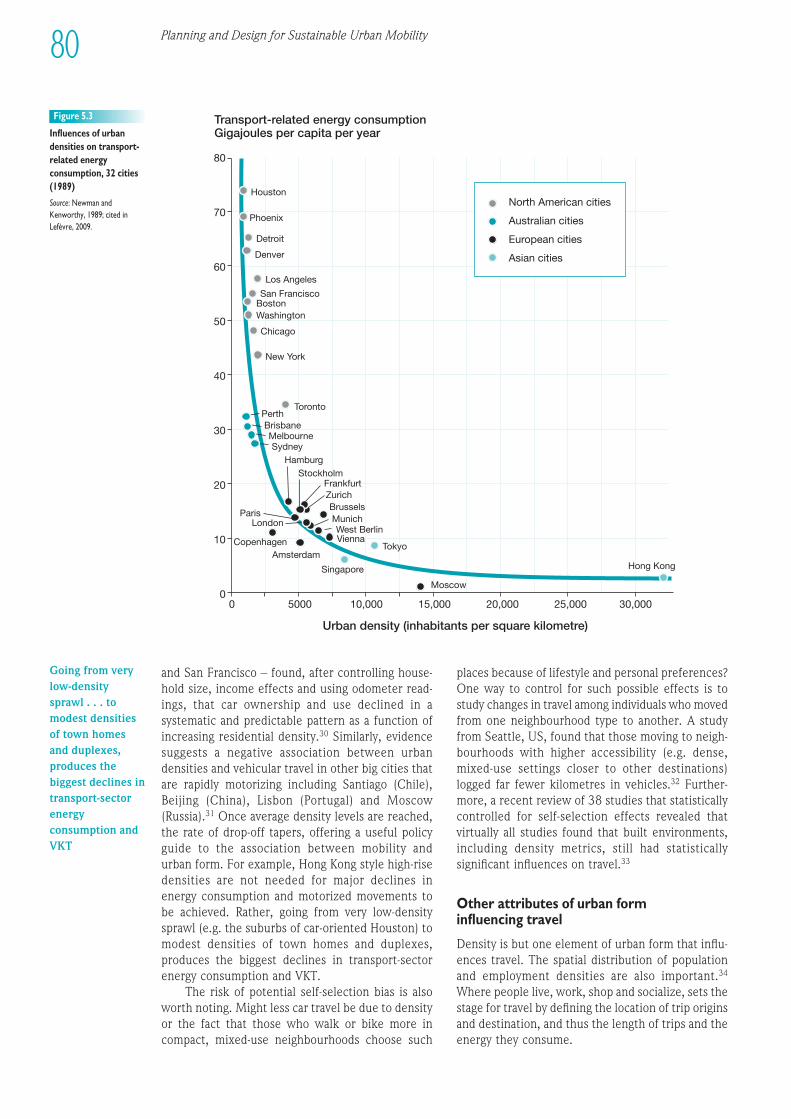
80
70
60
50
40
30
20
10
00 5000 10,000 15,000 20,000 25,000 30,000
Transport-related energy consumptionGigajoules per capita per year
Urban density (inhabitants per square kilometre)
Houston
Phoenix
Detroit
Denver
Los Angeles
San FranciscoBostonWashington
Chicago
New York
TorontoPerthBrisbaneMelbourneSydney
HamburgStockholm
FrankfurtZurichBrusselsMunichWest BerlinVienna
ParisLondon
Tokyo
Singapore
AmsterdamCopenhagen
Moscow
Hong Kong
North American cities
Australian cities
European cities
Asian cities
Figure 5.3
Influences of urbandensities on transport-related energyconsumption, 32 cities(1989)
Source: Newman andKenworthy, 1989; cited inLefèvre, 2009.
80 Planning and Design for Sustainable Urban Mobility
Going from verylow-densitysprawl . . . tomodest densitiesof town homesand duplexes,produces thebiggest declines intransport-sectorenergyconsumption andVKT
and San Francisco – found, after controlling house -hold size, income effects and using odometer read -ings, that car ownership and use declined in asystematic and predictable pattern as a function ofincreasing residential density.30 Similarly, evidencesuggests a negative association between urbandensities and vehicular travel in other big cities thatare rapidly motorizing including Santiago (Chile),Beijing (China), Lisbon (Portugal) and Moscow(Russia).31 Once average density levels are reached,the rate of drop-off tapers, offering a useful policyguide to the association between mobility and urban form. For example, Hong Kong style high-risedens ities are not needed for major declines in energy consumption and motorized movements tobe achieved. Rather, going from very low-densitysprawl (e.g. the suburbs of car-oriented Houston) tomodest densities of town homes and duplexes,produces the biggest declines in transport-sectorenergy consumption and VKT.
The risk of potential self-selection bias is alsoworth noting. Might less car travel be due to densityor the fact that those who walk or bike more incompact, mixed-use neigh bour hoods choose such
places because of lifestyle and personal preferences?One way to control for such possible effects is tostudy changes in travel among individuals who movedfrom one neigh bour hood type to another. A studyfrom Seattle, US, found that those moving to neigh -bour hoods with higher accessibility (e.g. dense,mixed-use settings closer to other destinations)logged far fewer kilometres in vehicles.32 Further -more, a recent review of 38 studies that statisticallycontrolled for self-selection effects revealed thatvirtually all studies found that built environ ments,including density metrics, still had statisticallysignificant influences on travel.33
Other attributes of urban forminfluencing travel
Density is but one element of urban form that influ -ences travel. The spatial distribution of populationand employment densities are also important.34
Where people live, work, shop and socialize, sets thestage for travel by defining the location of trip originsand destination, and thus the length of trips and theenergy they consume.
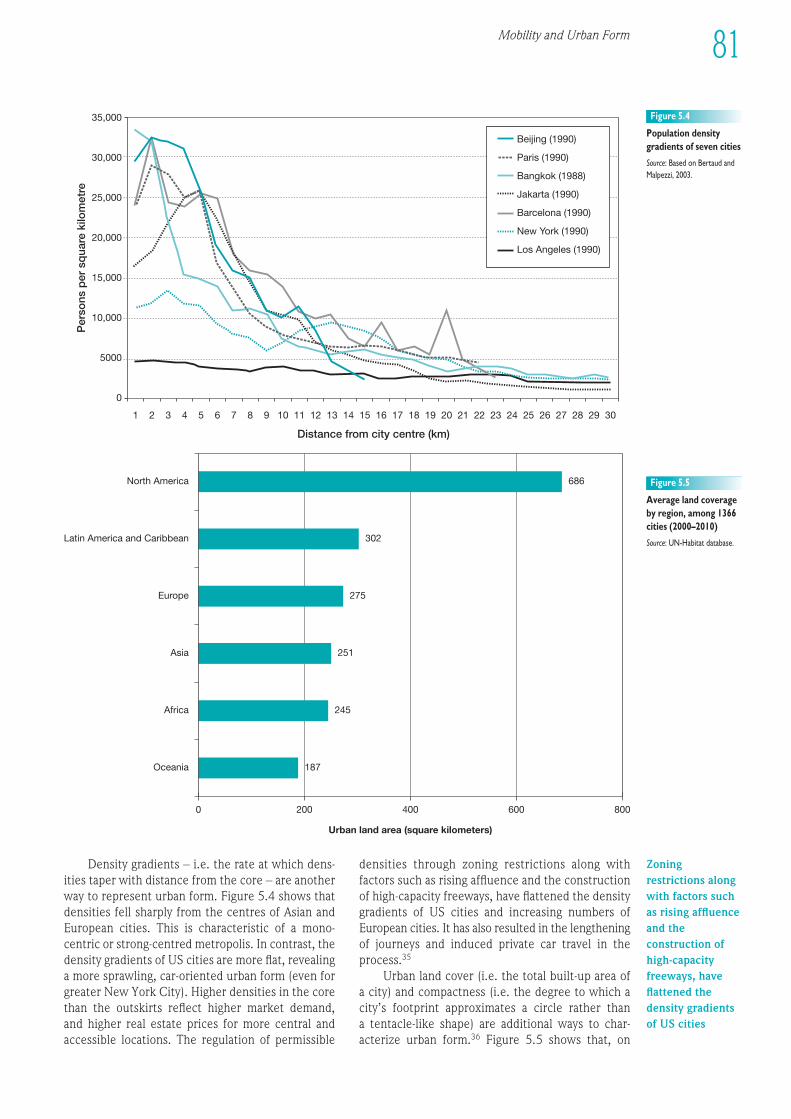
35,000
30,000
25,000
20,000
15,000
10,000
5000
0
1 2 3 4 5 6 7 8 9 10 11 12 13 14 15 16 17 18 19 20 21 22 23 24 25 26 27 28 29 30
Distance from city centre (km)
Per
sons
per
sq
uare
kilo
met
re
Beijing (1990)
Paris (1990)
Bangkok (1988)
Jakarta (1990)
Barcelona (1990)
New York (1990)
Los Angeles (1990)
Figure 5.4
Population densitygradients of seven cities
Source: Based on Bertaud andMalpezzi, 2003.
North America 686
Latin America and Caribbean 302
Europe 275
Asia 251
Africa 245
Oceania 187
0 200 400
Urban land area (square kilometers)
600 800
Figure 5.5
Average land coverageby region, among 1366cities (2000–2010)
Source: UN-Habitat database.
1EEE234567891012311145678920123456789301234567894012345678950123456789EEEE
81Mobility and Urban Form
Density gradients – i.e. the rate at which dens -ities taper with distance from the core – are anotherway to represent urban form. Figure 5.4 shows thatdensities fell sharply from the centres of Asian andEuropean cities. This is characteristic of a mono-centric or strong-centred metropolis. In contrast, thedensity gradients of US cities are more flat, revealinga more sprawling, car-oriented urban form (even forgreater New York City). Higher densities in the corethan the outskirts reflect higher market demand, and higher real estate prices for more central andaccessible locations. The regulation of permissible
densities through zoning restrictions along withfactors such as rising affluence and the constructionof high-capacity freeways, have flattened the densitygradients of US cities and increasing numbers ofEuropean cities. It has also resulted in the lengtheningof journeys and induced private car travel in theprocess.35
Urban land cover (i.e. the total built-up area ofa city) and compactness (i.e. the degree to which acity’s footprint approximates a circle rather than a tentacle-like shape) are additional ways to char -acterize urban form.36 Figure 5.5 shows that, on
Zoningrestrictions alongwith factors suchas rising affluenceand theconstruction ofhigh-capacityfreeways, haveflattened thedensity gradientsof US cities
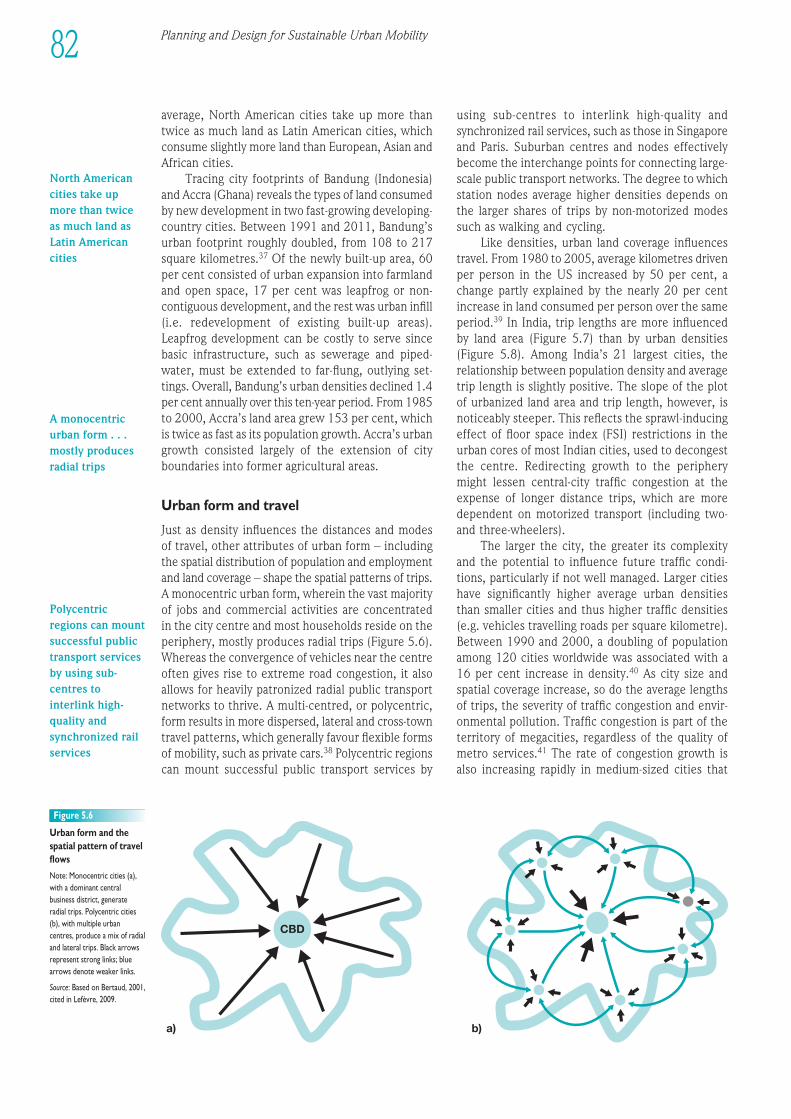
Planning and Design for Sustainable Urban Mobility82
b)a)
CBD
average, North American cities take up more thantwice as much land as Latin American cities, whichconsume slightly more land than European, Asian andAfrican cities.
Tracing city footprints of Bandung (Indonesia)and Accra (Ghana) reveals the types of land consumedby new devel op ment in two fast-growing devel op ing-country cities. Between 1991 and 2011, Bandung’surban footprint roughly doubled, from 108 to 217square kilometres.37 Of the newly built-up area, 60per cent consisted of urban expansion into farmlandand open space, 17 per cent was leapfrog or non-contiguous devel op ment, and the rest was urban infill(i.e. redevel op ment of existing built-up areas).Leapfrog devel op ment can be costly to serve sincebasic infra struc ture, such as sewerage and piped-water, must be extended to far-flung, outlying set -tings. Overall, Bandung’s urban densities declined 1.4per cent annually over this ten-year period. From 1985to 2000, Accra’s land area grew 153 per cent, whichis twice as fast as its population growth. Accra’s urbangrowth consisted largely of the extension of cityboundaries into former agricultural areas.
Urban form and travel
Just as density influences the distances and modesof travel, other attributes of urban form – includingthe spatial distribution of population and employmentand land coverage – shape the spatial patterns of trips.A monocentric urban form, wherein the vast majorityof jobs and commercial activities are concentratedin the city centre and most households reside on theperiphery, mostly produces radial trips (Figure 5.6).Whereas the convergence of vehicles near the centreoften gives rise to extreme road congestion, it alsoallows for heavily patronized radial public trans portnetworks to thrive. A multi-centred, or polycentric,form results in more dispersed, lateral and cross-towntravel patterns, which generally favour flexible formsof mobility, such as private cars.38 Polycentric regionscan mount successful public trans port services by
using sub-centres to interlink high-quality andsynchronized rail services, such as those in Singaporeand Paris. Suburban centres and nodes effectivelybecome the interchange points for connecting large-scale public trans port networks. The degree to whichstation nodes average higher densities depends onthe larger shares of trips by non-motorized modessuch as walking and cycling.
Like densities, urban land coverage influencestravel. From 1980 to 2005, average kilometres drivenper person in the US increased by 50 per cent, achange partly explained by the nearly 20 per centincrease in land consumed per person over the sameperiod.39 In India, trip lengths are more influencedby land area (Figure 5.7) than by urban densities(Figure 5.8). Among India’s 21 largest cities, therelationship between population density and averagetrip length is slightly positive. The slope of the plotof urbanized land area and trip length, however, isnoticeably steeper. This reflects the sprawl-inducingeffect of floor space index (FSI) restrictions in theurban cores of most Indian cities, used to decongestthe centre. Redirecting growth to the peripherymight lessen central-city traffic congestion at theexpense of longer distance trips, which are moredependent on motorized trans port (including two-and three-wheelers).
The larger the city, the greater its complexityand the potential to influence future traffic condi -tions, particularly if not well managed. Larger citieshave significantly higher average urban densitiesthan smaller cities and thus higher traffic densities(e.g. vehicles travelling roads per square kilometre).Between 1990 and 2000, a doubling of populationamong 120 cities worldwide was associated with a16 per cent increase in density.40 As city size andspatial coverage increase, so do the average lengthsof trips, the severity of traffic congestion and envir -onmental pollution. Traffic congestion is part of theterritory of megacities, regardless of the quality ofmetro services.41 The rate of congestion growth isalso increasing rapidly in medium-sized cities that
Figure 5.6
Urban form and thespatial pattern of travelflows
Note: Monocentric cities (a),with a dominant centralbusiness district, generateradial trips. Polycentric cities(b), with multiple urbancentres, produce a mix of radialand lateral trips. Black arrowsrepresent strong links; bluearrows denote weaker links.
Source: Based on Bertaud, 2001,cited in Lefèvre, 2009.
North Americancities take upmore than twiceas much land asLatin Americancities
A monocentricurban form . . .mostly producesradial trips
Polycentricregions can mountsuccessful publictrans port servicesby using sub-centres tointerlink high-quality andsynchronized railservices
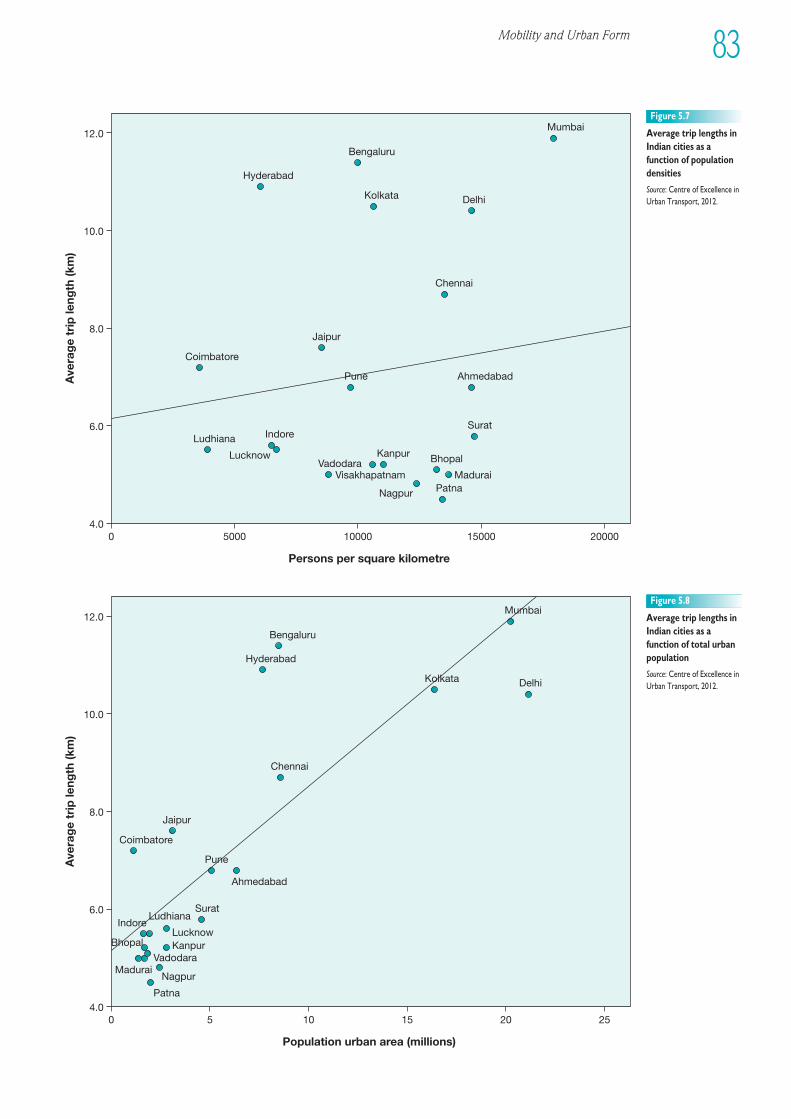
Mobility and Urban Form 83
1EEE234567891012311145678920123456789301234567894012345678950123456789EEEE
Persons per square kilometre
Ave
rag
e tr
ip le
ngth
(km
)
12.0
10.0
8.0
6.0
4.00 5000 10000 15000 20000
Hyderabad
Bengaluru
Kolkata Delhi
Mumbai
Chennai
Jaipur
Coimbatore
Pune Ahmedabad
Surat
Bhopal
Patna
KanpurVadodara
IndoreLudhiana
Lucknow
Nagpur
MaduraiVisakhapatnam
Figure 5.7
Average trip lengths inIndian cities as afunction of populationdensities
Source: Centre of Excellence inUrban Transport, 2012.
Population urban area (millions)
Ave
rag
e tr
ip le
ngth
(km
)
12.0
10.0
8.0
6.0
4.00 5 10 15 20 25
Hyderabad
Bengaluru
Kolkata Delhi
Mumbai
Chennai
Jaipur
Coimbatore
Pune
Ahmedabad
Surat
Patna
KanpurBhopal
Vadodara
IndoreLudhiana
Lucknow
NagpurMadurai
Figure 5.8
Average trip lengths inIndian cities as afunction of total urbanpopulation
Source: Centre of Excellence inUrban Transport, 2012.
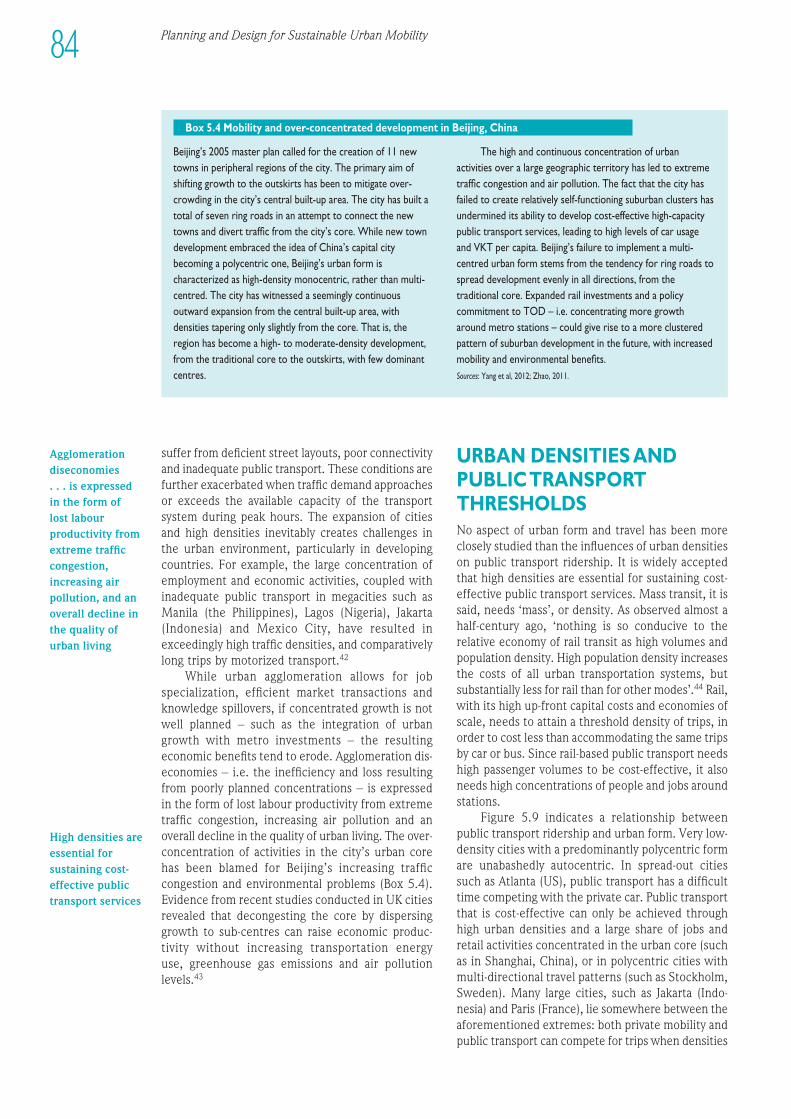
Beijing’s 2005 master plan called for the creation of 11 newtowns in peripheral regions of the city. The primary aim ofshifting growth to the outskirts has been to mitigate over -crowding in the city’s central built-up area. The city has built atotal of seven ring roads in an attempt to connect the newtowns and divert traffic from the city’s core. While new towndevel op ment embraced the idea of China’s capital citybecoming a polycentric one, Beijing’s urban form ischaracterized as high-density monocentric, rather than multi-centred. The city has witnessed a seemingly continuousoutward expansion from the central built-up area, withdensities tapering only slightly from the core. That is, theregion has become a high- to moderate-density devel op ment,from the traditional core to the outskirts, with few dominantcentres.
The high and continuous concentration of urbanactivities over a large geographic territory has led to extremetraffic congestion and air pollution. The fact that the city hasfailed to create relatively self-functioning suburban clusters hasundermined its ability to develop cost-effective high-capacitypublic trans port services, leading to high levels of car usageand VKT per capita. Beijing’s failure to implement a multi-centred urban form stems from the tendency for ring roads tospread devel op ment evenly in all directions, from thetraditional core. Expanded rail investments and a policycommitment to TOD – i.e. concentrating more growtharound metro stations – could give rise to a more clusteredpattern of suburban devel op ment in the future, with increasedmobility and environ mental benefits.Sources: Yang et al, 2012; Zhao, 2011.
Box 5.4 Mobility and over-concentrated devel op ment in Beijing, China
suffer from deficient street layouts, poor connectivityand inadequate public transport. These conditions arefurther exacerbated when traffic demand approachesor exceeds the available capacity of the trans portsystem during peak hours. The expansion of citiesand high densities inevitably creates challenges in the urban environ ment, particularly in devel op ingcountries. For example, the large concentration ofemployment and economic activities, coupled withinadequate public trans port in megacities such asManila (the Philippines), Lagos (Nigeria), Jakarta(Indonesia) and Mexico City, have resulted inexceedingly high traffic densities, and comparativelylong trips by motorized transport.42
While urban agglomeration allows for jobspecialization, efficient market transactions andknowledge spillovers, if concentrated growth is notwell planned – such as the integration of urbangrowth with metro investments – the resultingeconomic benefits tend to erode. Agglomeration dis -economies – i.e. the inefficiency and loss resultingfrom poorly planned concentrations – is expressedin the form of lost labour productivity from extremetraffic congestion, increasing air pollution and anoverall decline in the quality of urban living. The over-concentration of activities in the city’s urban corehas been blamed for Beijing’s increasing trafficcongestion and environ mental problems (Box 5.4).Evidence from recent studies conducted in UK citiesrevealed that decongesting the core by dispersinggrowth to sub-centres can raise economic produc-tivity without increasing transportation energy use, greenhouse gas emissions and air pollutionlevels.43
URBAN DENSITIES ANDPUBLIC TRANS PORTTHRESHOLDSNo aspect of urban form and travel has been moreclosely studied than the influences of urban densitieson public trans port ridership. It is widely acceptedthat high densities are essential for sustaining cost-effective public trans port services. Mass transit, it issaid, needs ‘mass’, or density. As observed almost ahalf-century ago, ‘nothing is so conducive to therelative economy of rail transit as high volumes andpopulation density. High population density increasesthe costs of all urban transportation systems, butsubstantially less for rail than for other modes’.44 Rail,with its high up-front capital costs and economies ofscale, needs to attain a threshold density of trips, inorder to cost less than accommodating the same tripsby car or bus. Since rail-based public trans port needshigh passen ger volumes to be cost-effective, it alsoneeds high concentrations of people and jobs aroundstations.
Figure 5.9 indicates a relationship betweenpublic trans port ridership and urban form. Very low-density cities with a predominantly polycentric formare unabashedly autocentric. In spread-out citiessuch as Atlanta (US), public trans port has a difficulttime competing with the private car. Public trans portthat is cost-effective can only be achieved throughhigh urban densities and a large share of jobs andretail activities concentrated in the urban core (suchas in Shanghai, China), or in polycentric cities withmulti-directional travel patterns (such as Stockholm,Sweden). Many large cities, such as Jakarta (Indo -nesia) and Paris (France), lie somewhere between theaforementioned extremes: both private mobility andpublic trans port can compete for trips when densities
84 Planning and Design for Sustainable Urban Mobility
Agglomerationdiseconomies . . . is expressedin the form of lost labourproductivity fromextreme trafficcongestion,increasing airpollution, and anoverall decline inthe quality ofurban living
High densities areessential forsustaining cost-effective publictransport services
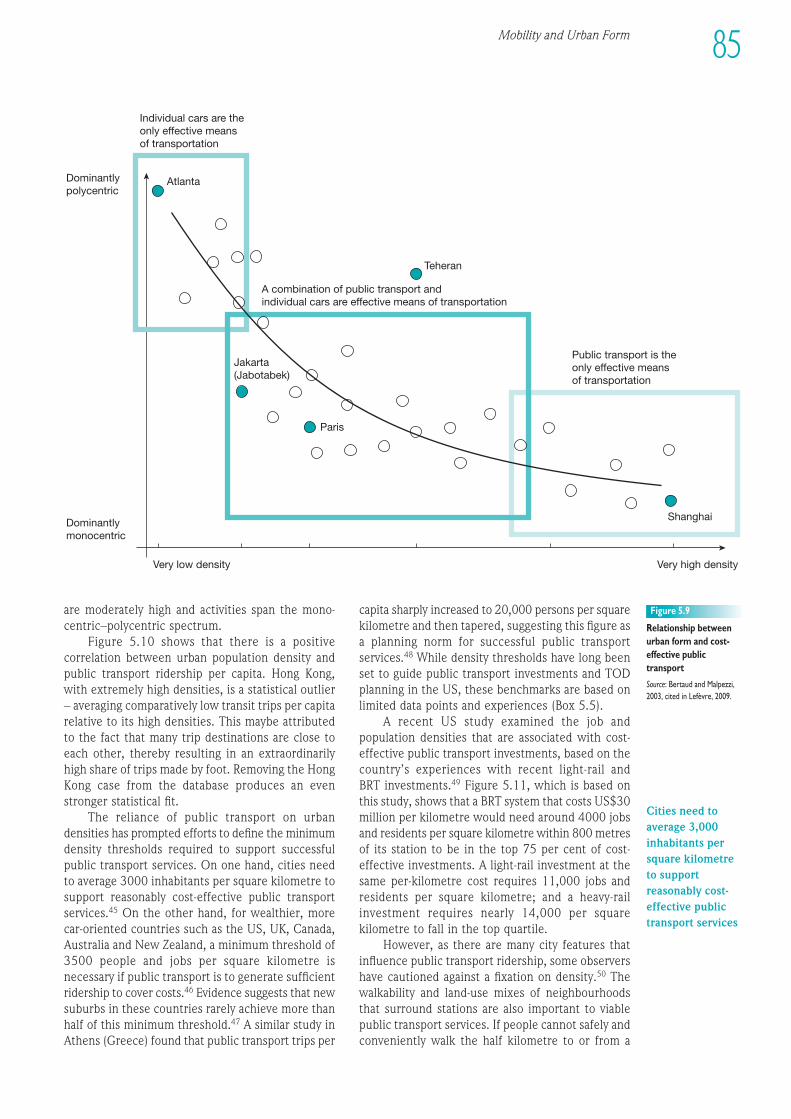
Very low density
Dominantlymonocentric
Dominantlypolycentric
Individual cars are theonly effective meansof transportation
Very high density
Shanghai
Paris
Teheran
Atlanta
Jakarta(Jabotabek)
Public transport is theonly effective meansof transportation
A combination of public transport andindividual cars are effective means of transportation
Figure 5.9
Relationship betweenurban form and cost-effective publictransport
Source: Bertaud and Malpezzi,2003, cited in Lefèvre, 2009.
1EEE234567891012311145678920123456789301234567894012345678950123456789EEEE
85Mobility and Urban Form
are moderately high and activities span the mono -centric–polycentric spectrum.
Figure 5.10 shows that there is a positivecorrelation between urban population density andpublic trans port ridership per capita. Hong Kong, with extremely high densities, is a statistical outlier– averaging comparatively low transit trips per capitarelative to its high densities. This maybe attributedto the fact that many trip destinations are close toeach other, thereby resulting in an extraordinarilyhigh share of trips made by foot. Removing the HongKong case from the database produces an evenstronger statistical fit.
The reliance of public trans port on urbandensities has prompted efforts to define the minimumdensity thresholds required to support successfulpublic trans port services. On one hand, cities needto average 3000 inhabitants per square kilometre tosupport reasonably cost-effective public trans portservices.45 On the other hand, for wealthier, morecar-oriented countries such as the US, UK, Canada,Australia and New Zealand, a minimum threshold of3500 people and jobs per square kilometre isnecessary if public trans port is to generate sufficientridership to cover costs.46 Evidence suggests that newsuburbs in these countries rarely achieve more thanhalf of this minimum threshold.47 A similar study inAthens (Greece) found that public trans port trips per
capita sharply increased to 20,000 persons per squarekilometre and then tapered, suggesting this figure asa planning norm for successful public trans portservices.48 While density thresholds have long beenset to guide public trans port investments and TODplanning in the US, these benchmarks are based onlimited data points and experi ences (Box 5.5).
A recent US study examined the job andpopulation densities that are associated with cost-effective public trans port investments, based on thecountry’s experi ences with recent light-rail and BRT investments.49 Figure 5.11, which is based onthis study, shows that a BRT system that costs US$30million per kilometre would need around 4000 jobsand residents per square kilometre within 800 metresof its station to be in the top 75 per cent of cost-effective investments. A light-rail investment at thesame per-kilometre cost requires 11,000 jobs andresidents per square kilometre; and a heavy-railinvestment requires nearly 14,000 per squarekilometre to fall in the top quartile.
However, as there are many city features thatinfluence public trans port ridership, some observershave cautioned against a fixation on density.50 Thewalkability and land-use mixes of neigh bour hoodsthat surround stations are also important to viablepublic transport services. If people cannot safely andconveniently walk the half kilometre to or from a
Cities need toaverage 3,000inhabitants persquare kilometreto supportreasonably cost-effective publictransport services
Population per square kilometre
Ann
ual p
ublic
tra
nsp
ort
jour
neys
per
inha
bit
ant
1000
800
600
400
200
00 10000 20000 30000
Prague
Budapest
Warsaw
Zurich
Moscow
Singapore
São Paulo
London
Tallinn
Bern
Graz
Stockholm
Lisbon Paris
Hamburg
OsloBologna
AthensBarcelona
Marseille
ValenciaBilbaoGlasgow
Manchester
SevilleLille
Claremont-Ferrand
DubaiChicago
Melbourne
Copenhagen
Stuttgart
LyonsDublin Newcastle
Ghent MadridBrussels
Milan
AmsterdamBerlinHelsinki
Rome
Krakow
Munich
Hong Kong
Vienna
Geneva
Tunis
RotterdamNantes
Figure 5.10
Urban populationdensity and publictrans port travel
Note: Data drawn from asample of 50 cities in 2001,primarily in developedcountries.
Source: UITP, 2006.
The devel op ment of minimum density thresholds forsuccessful public trans port investments in the US has been thefocus of numerous studies under taken and policy initiativesintroduced to the world’s most car-dependent country.Between the 1960s and 1970s, it was estimated, that the highcosts of heavy-rail investment required a minimum net resi dential density of at least 3000 households per square kilo -metre. A minimal light-rail investment, by comparison, wouldrequire at least 2400 households per square kilometre. A more recent study of 59 capital investments in public trans -port in the US since 1970, found light rail to be more cost-effective than heavy rail, resulting in approximately 7000people and jobs per gross square kilometre. Across these 59 US projects, a 10 per cent increase in total pop ula tion and
jobs per square kilometre corresponded with a 3.2 per centdecrease in annualized capital costs per rider.
While capital investment costs also rise with density, US experi ences show the increased ridership more thanoffsets these costs per passen ger kilo metre. As a result, thejustification for fixed-guideway public trans port investmentshas led to the adoption of density thresholds in US cities. Thecity of San Diego, for instance, has adopted TOD guidelinesthat call for a minimum of 6300 dwelling units per squarekilometre for light rail services serving urban transit-orienteddistricts. In its TOD guidelines, metro Portland has set slightlyhigher thresholds – 7500 dwelling units per square kilo metrefor devel op ment within one city block of light rail stations.Sources: Pushkarev and Zupan, 1977; Guerra and Cervero, 2011.
Box 5.5 Density thresholds for cost-effective public trans port in the US
86 Planning and Design for Sustainable Urban Mobility
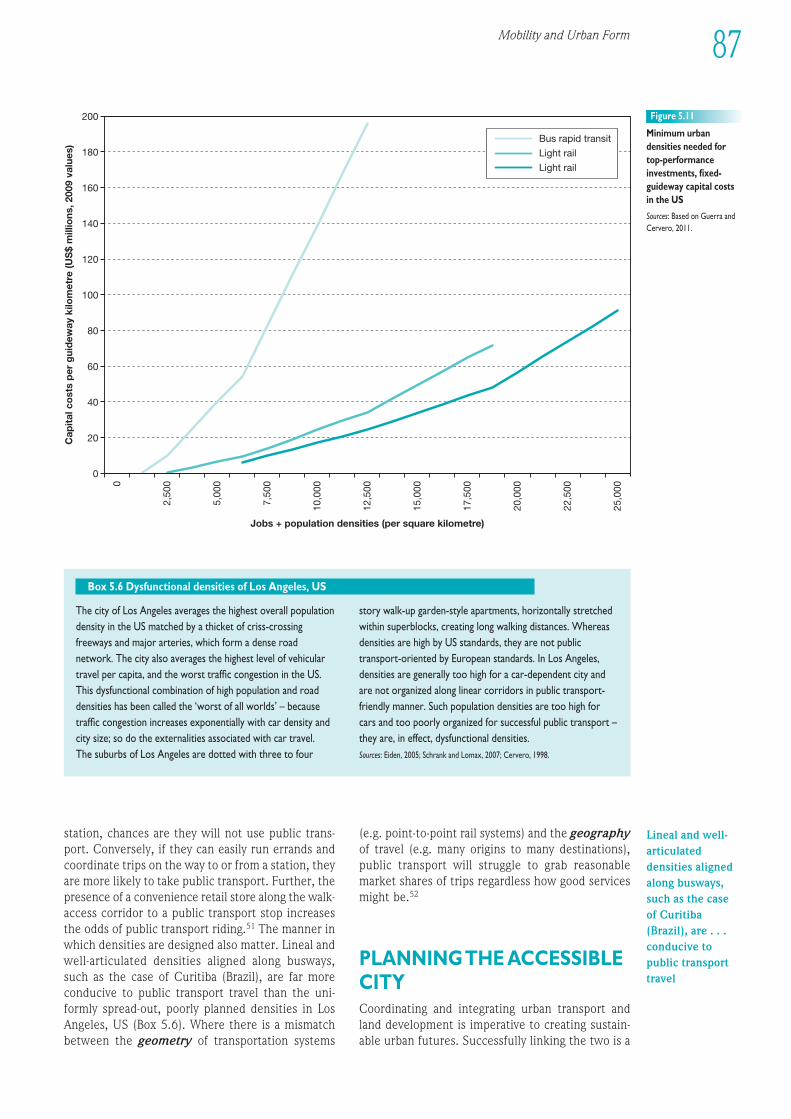
200
180
160
140
120
100
80
60
40
20
0
0
2,50
0
5,00
0
7,50
0
10,0
00
12,5
00
15,0
00
17,5
00
20,0
00
22,5
00
25,0
00
Cap
ital
co
sts
per
gui
dew
ay k
ilom
etre
(US
$ m
illio
ns, 2
009
valu
es)
Jobs + population densities (per square kilometre)
Bus rapid transit
Light rail
Light rail
Figure 5.11
Minimum urbandensities needed fortop-performanceinvestments, fixed-guideway capital costsin the US
Sources: Based on Guerra andCervero, 2011.
The city of Los Angeles averages the highest overall populationdensity in the US matched by a thicket of criss-crossingfreeways and major arteries, which form a dense roadnetwork. The city also averages the highest level of vehiculartravel per capita, and the worst traffic congestion in the US.This dysfunctional combination of high population and roaddensities has been called the ‘worst of all worlds’ – becausetraffic congestion increases exponentially with car density andcity size; so do the externalities associated with car travel. The suburbs of Los Angeles are dotted with three to four
story walk-up garden-style apartments, horizontally stretchedwithin superblocks, creating long walking distances. Whereasdensities are high by US standards, they are not publictransport-oriented by European standards. In Los Angeles,densities are generally too high for a car-dependent city andare not organized along linear corridors in public transport-friendly manner. Such population densities are too high forcars and too poorly organized for successful public transport –they are, in effect, dysfunctional densities.Sources: Eiden, 2005; Schrank and Lomax, 2007; Cervero, 1998.
Box 5.6 Dysfunctional densities of Los Angeles, US
1EEE234567891012311145678920123456789301234567894012345678950123456789EEEE
87Mobility and Urban Form
station, chances are they will not use public trans -port. Conversely, if they can easily run errands andcoordinate trips on the way to or from a station, theyare more likely to take public transport. Further, thepresence of a convenience retail store along the walk-access corridor to a public trans port stop increasesthe odds of public trans port riding.51 The manner inwhich densities are designed also matter. Lineal andwell-articulated densities aligned along busways,such as the case of Curitiba (Brazil), are far moreconducive to public trans port travel than the uni -formly spread-out, poorly planned densities in LosAngeles, US (Box 5.6). Where there is a mismatchbetween the geometry of transportation systems
(e.g. point-to-point rail systems) and the geographyof travel (e.g. many origins to many destinations),public trans port will struggle to grab reasonablemarket shares of trips regardless how good servicesmight be.52
PLANNING THE ACCESSIBLECITYCoordinating and integrating urban trans port and land devel op ment is imperative to creating sus tain -able urban futures. Successfully linking the two is a
Lineal and well-articulateddensities alignedalong busways,such as the caseof Curitiba(Brazil), are . . .conducive topublic transporttravel
Planning and Design for Sustainable Urban Mobility88
signature feature of ‘compact cities’ or ‘smart growth’(Box 5.7).53 Successful integration means making theconnections between trans port and urban devel op -ment work in both directions. As noted, the designand layout of a city strongly influence travel demand.At the same time, transportation infra struc ture is anessential feature that shapes the city. The coordin -ation and integration of trans port planning and devel -op ment, as well as spatial planning and devel op mentare key.
The coordinated planning of urban mobility andland devel op ment starts with a collective vision ofthe future city, shared by city govern ment and majorstakeholders of civil society. Thereafter, a strategicplan that orchestrates urban devel op ment is devel -oped to realize the shared vision, and must include,among other things, building the institutional,regulatory and fiscal capacities to implement the plan.A strategy plan aims to translate urban devel op mentgoals into long-range implementation in terms ofwhere and in what form devel op ment and redevel -op ment occurs, and the tools (e.g. laws and regula -tions, fiscal instruments, organizational reforms)necessary to achieve desired outcomes.54 Vision-ing the future city as a precursor to transportationdecision-making reflects the derived nature of travel.People travel to reach places, and it is these placesthat serve the purposes of trips and the aspirationsof people who make them. Well-planned cities, suchas Singapore, Stockholm (Sweden) and Curitiba(Brazil), crafted cogent visions of the future to shapetransportation investments and achieve the bestoutcomes, whether measured in economic prosperity,energy resourcefulness, cleanliness of the naturalenviron ment or quality of life.55
The city of Copenhagen (Denmark) and itscelebrated ‘Finger Plan’ is a text-book example of along-term planning vision, which shaped rail invest -
ments and urban growth. A five-finger hand becamethe metaphor for defining where growth would and would not occur. Each finger was oriented to a traditional Danish market town within the orbit of metropolitan Copenhagen. The construction of rail-based public trans port was purposed to steergrowth along the desired growth axes, in advance oftravel demand. Also, greenbelt wedges set aside as agri cultural preserves, open space and naturalhabitats were designated and major infra struc ture wasdirected away from the districts.
Ottawa, Canada, with a population under900,000, offers a good example of concordancebetween urban vision and transportation invest-ments. The 1974 plan called for a multi-centredurban structure, with five directional corridors offuture growth emanating from the city centre.Ottawa’s leaders began with a concept plan thatdefined desired growth axes, thereafter invested in ahigh-quality, high-capacity busway to drive growthalong these corridors. A combination of land-useregula tions and incentives (e.g. targeted infra struc -ture invest ments) channelled commercial and em -ployment growth to the busway corridors. The plan mandated, for example, that all shopping centres over354,000 square metres gross leasable space had to besited near the busway or future extensions. Trans -portation demand management measures such asmandatory parking charges were also introduced. In2007, Ottawa adopted guidelines that called forbuilding designs and set-backs that create attractivehuman-scale devel op ment; public art to enlivenstation areas; and short street blocks to make it easierand more enjoyable for pedestrians to access buswaystations.56 Since 1990, the public transport’s modeshare in Ottawa has remained steady at 15 per centof daily trips, while declining in nearly all otherCanadian cities.57
‘Compact cities’ or ‘smart growth’ are terms that have gainedcurrency in the field of urban planning for describing urbandevel op ment that is compact, resource-efficient and lessdependent on the use of private cars. The term of ‘smartgrowth’ is most commonly used in North America, while inEurope and Australia the term ‘compact city’ is often used toconnote similar concepts. As an antidote to sprawl, theseterms aim to reduce the municipal fiscal burden ofaccommodating new growth, while at the same timepromoting walking and cycling, historical preservation, mixed-income housing that helps reduce social and class segregationand diversity of housing and mobility choices that appeal to arange of lifestyle preferences. Ten accepted principles thatdefine such devel op ments have:
1 mixed-land uses;2 compact building design;3 a range of housing opportunities and choices;4 walkable neigh bour hoods;5 distinctive, attractive communities with a strong sense of
place;6 preservation of open space, farmland, natural beauty and
critical environ mental areas;7 devel op ment directed towards existing communities;8 a variety of transportation choices;9 devel op ment decisions that are predictable, fair and cost
effective;10 community and stakeholder collaboration in devel op ment
decisions.Sources: Bullard, 2007; Duany et al, 2000; http://www.smartgrowth.org/network.php,last accessed 6 May 2013.
Box 5.7 ‘Compact cities’ or ‘smart growth’
Design and layoutof a city stronglyinfluence traveldemand
Well-plannedcities, such asSingapore,Stockholm, andCuritiba, craftedcogent visions of the future to shapetransportationinvestments andachieve the bestoutcomes
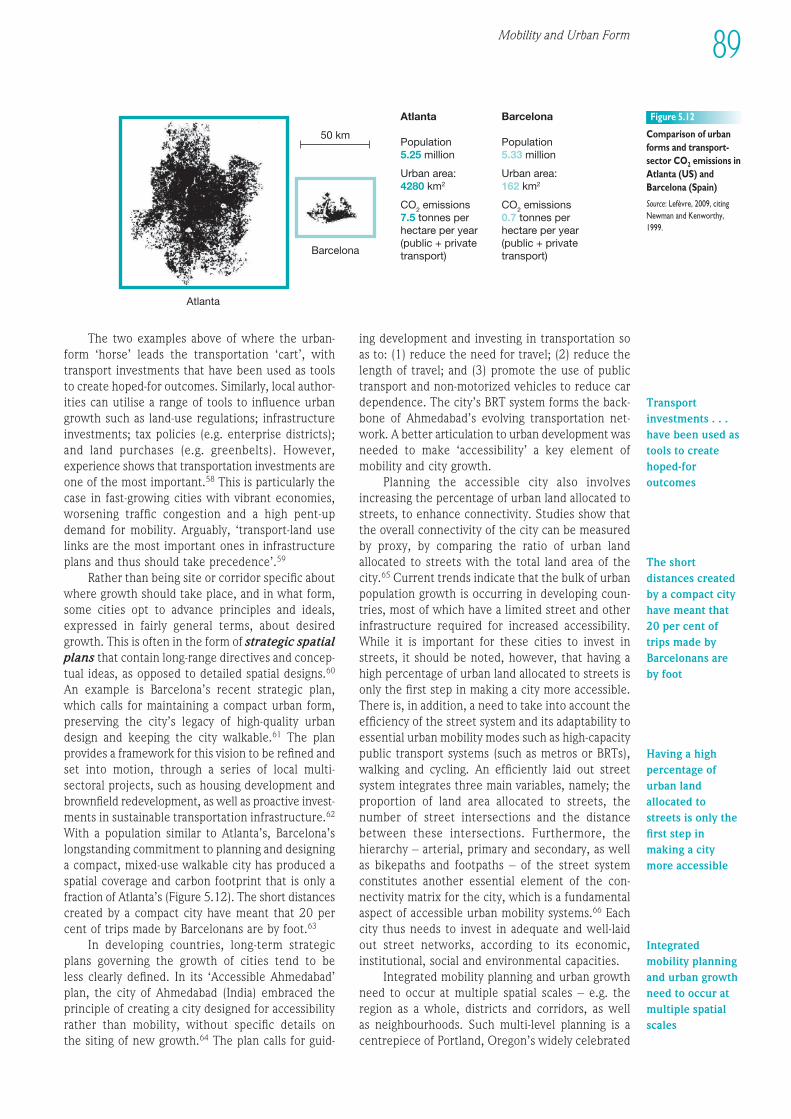
Mobility and Urban Form 89
1EEE234567891012311145678920123456789301234567894012345678950123456789EEEE
The two examples above of where the urban-form ‘horse’ leads the transportation ‘cart’, withtrans port investments that have been used as toolsto create hoped-for outcomes. Similarly, local author -ities can utilise a range of tools to influence urbangrowth such as land-use regulations; infra struc tureinvestments; tax policies (e.g. enterprise districts);and land purchases (e.g. greenbelts). However,experi ence shows that transportation investments areone of the most important.58 This is particularly thecase in fast-growing cities with vibrant economies,worsening traffic congestion and a high pent-updemand for mobility. Arguably, ‘transport-land uselinks are the most important ones in infra struc tureplans and thus should take precedence’.59
Rather than being site or corridor specific aboutwhere growth should take place, and in what form,some cities opt to advance principles and ideals,expressed in fairly general terms, about desiredgrowth. This is often in the form of strategic spatialplans that contain long-range directives and con cep -tual ideas, as opposed to detailed spatial designs.60
An example is Barcelona’s recent strategic plan,which calls for maintaining a compact urban form,preserving the city’s legacy of high-quality urbandesign and keeping the city walkable.61 The planprovides a framework for this vision to be refined andset into motion, through a series of local multi-sectoral projects, such as housing devel op ment andbrownfield redevel op ment, as well as proactive invest -ments in sus tain able transportation infra struc ture.62
With a population similar to Atlanta’s, Barcelona’slongstanding commitment to planning and designinga compact, mixed-use walkable city has produced aspatial coverage and carbon footprint that is only afraction of Atlanta’s (Figure 5.12). The short distancescreated by a compact city have meant that 20 percent of trips made by Barcelonans are by foot.63
In devel op ing countries, long-term strategicplans governing the growth of cities tend to be less clearly defined. In its ‘Accessible Ahmedabad’ plan, the city of Ahmedabad (India) embraced theprinciple of creating a city designed for accessibilityrather than mobility, without specific details on the siting of new growth.64 The plan calls for guid-
ing devel op ment and investing in transportation soas to: (1) reduce the need for travel; (2) reduce thelength of travel; and (3) promote the use of publictrans port and non-motorized vehicles to reduce cardependence. The city’s BRT system forms the back -bone of Ahmedabad’s evolving transportation net -work. A better articulation to urban devel op ment wasneeded to make ‘accessibility’ a key element ofmobility and city growth.
Planning the accessible city also involvesincreasing the percentage of urban land allocated tostreets, to enhance connectivity. Studies show thatthe overall connectivity of the city can be measuredby proxy, by comparing the ratio of urban landallocated to streets with the total land area of thecity.65 Current trends indicate that the bulk of urbanpopulation growth is occurring in devel op ing coun -tries, most of which have a limited street and otherinfra struc ture required for increased accessi bility.While it is important for these cities to invest instreets, it should be noted, however, that having ahigh percentage of urban land allocated to streets isonly the first step in making a city more accessible.There is, in addition, a need to take into account theefficiency of the street system and its adaptability toessential urban mobility modes such as high-capacitypublic trans port systems (such as metros or BRTs),walking and cycling. An efficiently laid out streetsystem integrates three main variables, namely; theproportion of land area allocated to streets, thenumber of street intersections and the distancebetween these intersections. Further more, thehierarchy – arterial, primary and secondary, as wellas bikepaths and footpaths – of the street systemconstitutes another essential element of the con -nectivity matrix for the city, which is a fundamentalaspect of accessible urban mobility systems.66 Eachcity thus needs to invest in adequate and well-laidout street networks, according to its economic,institu tional, social and environ mental capacities.
Integrated mobility planning and urban growthneed to occur at multiple spatial scales – e.g. theregion as a whole, districts and corridors, as well as neigh bour hoods. Such multi-level planning is acentrepiece of Portland, Oregon’s widely celebrated
Atlanta
Population5.25 million
Urban area:4280 km2
CO2 emissions7.5 tonnes perhectare per year(public + privatetransport)
Barcelona
Population5.33 million
Urban area:162 km2
CO2 emissions0.7 tonnes perhectare per year(public + privatetransport)
Atlanta
Barcelona
50 km
Figure 5.12
Comparison of urbanforms and transport-sector CO2 emissions inAtlanta (US) andBarcelona (Spain)
Source: Lefèvre, 2009, citingNewman and Kenworthy,1999.
Transportinvestments . . .have been used astools to createhoped-foroutcomes
The shortdistances createdby a compact cityhave meant that20 per cent oftrips made byBarcelonans areby foot
Having a highpercentage ofurban landallocated tostreets is only thefirst step inmaking a citymore accessible
Integratedmobility planningand urban growthneed to occur atmultiple spatialscales
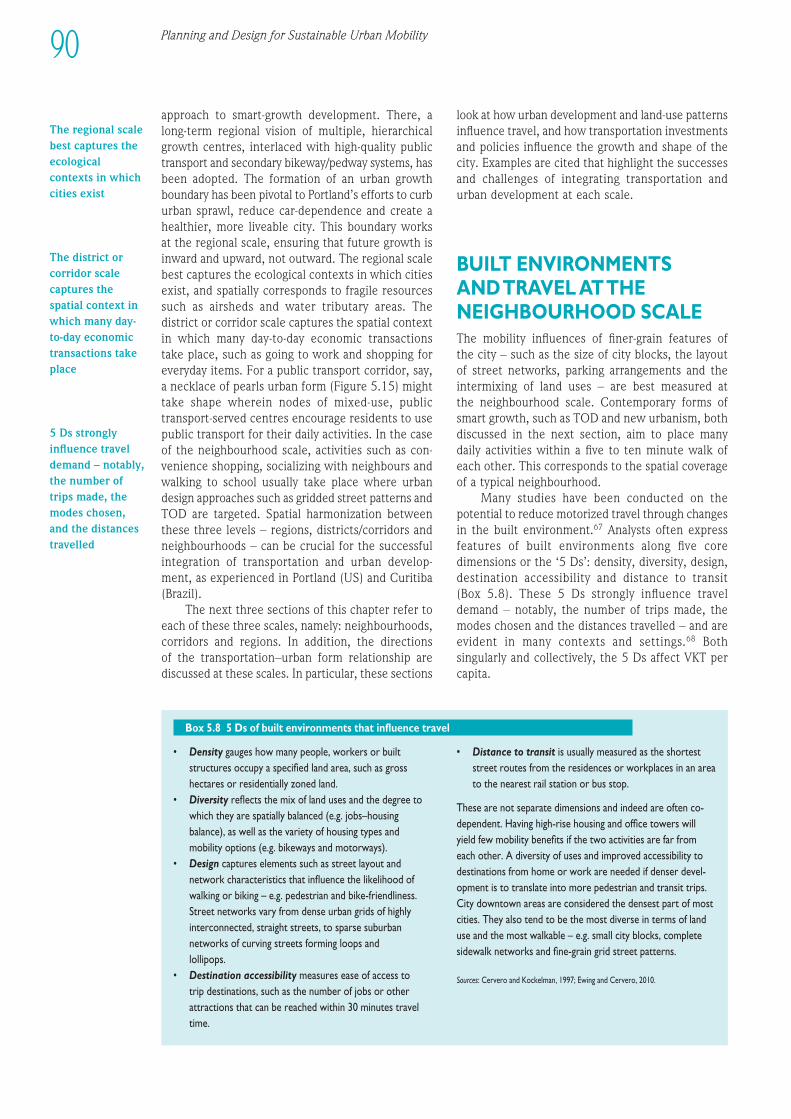
approach to smart-growth devel op ment. There, along-term regional vision of multiple, hierarchicalgrowth centres, interlaced with high-quality publictrans port and secondary bikeway/pedway systems, hasbeen adopted. The formation of an urban growthboundary has been pivotal to Portland’s efforts to curburban sprawl, reduce car-dependence and create ahealthier, more liveable city. This boundary worksat the regional scale, ensuring that future growth isinward and upward, not outward. The regional scalebest captures the ecological contexts in which citiesexist, and spatially corresponds to fragile resourcessuch as airsheds and water tributary areas. Thedistrict or corridor scale captures the spatial contextin which many day-to-day economic transactions take place, such as going to work and shopping foreveryday items. For a public trans port corridor, say,a necklace of pearls urban form (Figure 5.15) mighttake shape wherein nodes of mixed-use, publictransport-served centres encourage residents to usepublic trans port for their daily activities. In the caseof the neigh bour hood scale, activities such as con -venience shopping, socializing with neigh bours andwalking to school usually take place where urbandesign approaches such as gridded street patterns andTOD are targeted. Spatial harmonization betweenthese three levels – regions, districts/corridors andneigh bour hoods – can be crucial for the suc cess fulintegration of transportation and urban devel op -ment, as experi enced in Portland (US) and Curitiba(Brazil).
The next three sections of this chapter refer toeach of these three scales, namely: neigh bour hoods,corridors and regions. In addition, the directions of the transportation–urban form relationship arediscussed at these scales. In particular, these sections
look at how urban devel op ment and land-use patternsinfluence travel, and how transportation investmentsand policies influence the growth and shape of thecity. Examples are cited that highlight the successesand challenges of integrating transportation andurban devel op ment at each scale.
BUILT ENVIRON MENTS AND TRAVEL AT THE NEIGH BOUR HOOD SCALEThe mobility influences of finer-grain features of the city – such as the size of city blocks, the layoutof street networks, parking arrangements and theinter mixing of land uses – are best measured at the neigh bour hood scale. Contemporary forms ofsmart growth, such as TOD and new urbanism, bothdiscussed in the next section, aim to place many daily activities within a five to ten minute walk ofeach other. This corresponds to the spatial coverageof a typical neigh bour hood.
Many studies have been conducted on thepotential to reduce motorized travel through changesin the built environ ment.67 Analysts often expressfeatures of built environ ments along five coredimensions or the ‘5 Ds’: density, diversity, design,destination accessibility and distance to transit (Box 5.8). These 5 Ds strongly influence traveldemand – notably, the number of trips made, themodes chosen and the distances travelled – and areevident in many contexts and settings.68 Bothsingularly and collectively, the 5 Ds affect VKT percapita.
Planning and Design for Sustainable Urban Mobility90
• Density gauges how many people, workers or builtstructures occupy a specified land area, such as grosshectares or residentially zoned land.
• Diversity reflects the mix of land uses and the degree towhich they are spatially balanced (e.g. jobs–housingbalance), as well as the variety of housing types andmobility options (e.g. bikeways and motorways).
• Design captures elements such as street layout andnetwork characteristics that influence the likelihood ofwalking or biking – e.g. pedestrian and bike-friendliness.Street networks vary from dense urban grids of highlyinterconnected, straight streets, to sparse suburbannetworks of curving streets forming loops and lollipops.
• Destination accessibility measures ease of access to trip destinations, such as the number of jobs or otherattractions that can be reached within 30 minutes traveltime.
• Distance to transit is usually measured as the shorteststreet routes from the residences or workplaces in an areato the nearest rail station or bus stop.
These are not separate dimensions and indeed are often co-dependent. Having high-rise housing and office towers willyield few mobility benefits if the two activities are far fromeach other. A diversity of uses and improved accessibility todestinations from home or work are needed if denser devel -op ment is to translate into more pedestrian and transit trips.City downtown areas are considered the densest part of mostcities. They also tend to be the most diverse in terms of landuse and the most walkable – e.g. small city blocks, completesidewalk networks and fine-grain grid street patterns.
Sources: Cervero and Kockelman, 1997; Ewing and Cervero, 2010.
Box 5.8 5 Ds of built environ ments that influence travel
The regional scalebest captures theecologicalcontexts in whichcities exist
The district orcorridor scalecaptures thespatial context inwhich many day-to-day economictransactions takeplace
5 Ds stronglyinfluence traveldemand – notably,the number oftrips made, themodes chosen,and the distancestravelled
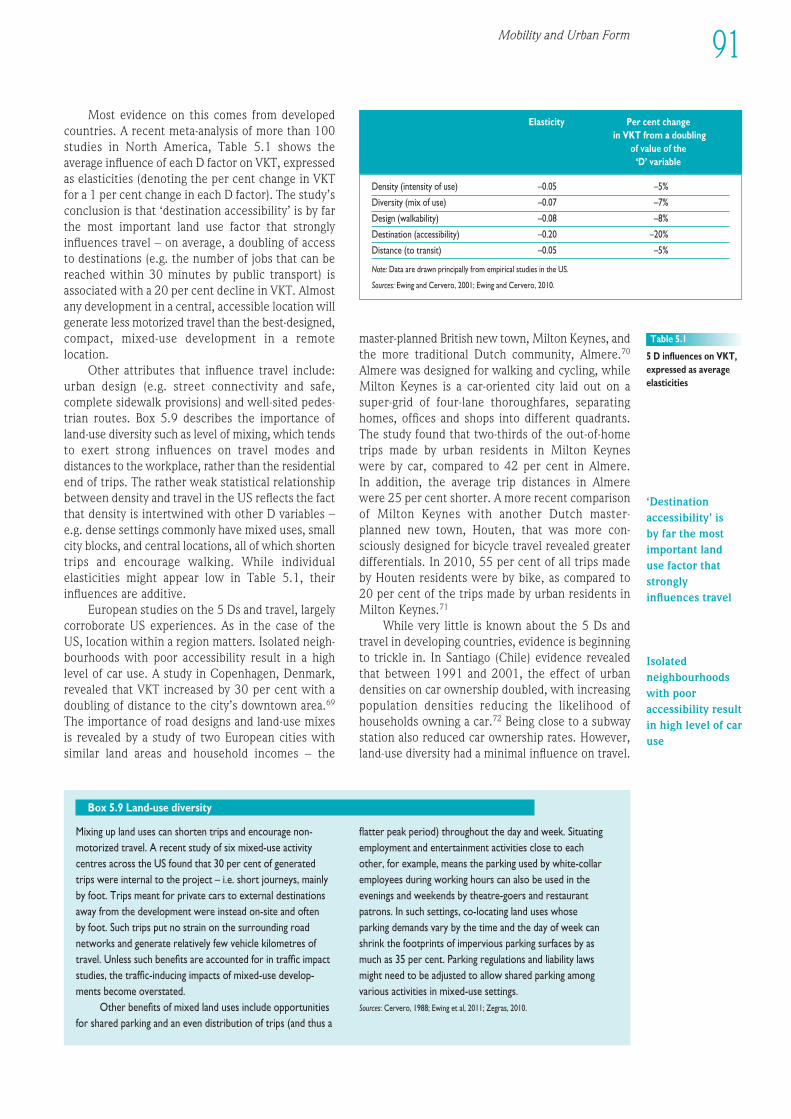
Most evidence on this comes from developedcountries. A recent meta-analysis of more than 100studies in North America, Table 5.1 shows theaverage influence of each D factor on VKT, expressedas elasticities (denoting the per cent change in VKTfor a 1 per cent change in each D factor). The study’sconclusion is that ‘destination accessibility’ is by farthe most important land use factor that stronglyinfluences travel – on average, a doubling of accessto destinations (e.g. the number of jobs that can bereached within 30 minutes by public transport) isassociated with a 20 per cent decline in VKT. Almostany devel op ment in a central, accessible location willgenerate less motorized travel than the best-designed,compact, mixed-use devel op ment in a remotelocation.
Other attributes that influence travel include:urban design (e.g. street connectivity and safe,complete sidewalk provisions) and well-sited pedes -trian routes. Box 5.9 describes the importance ofland-use diversity such as level of mixing, which tendsto exert strong influences on travel modes anddistances to the workplace, rather than the residentialend of trips. The rather weak statistical relationshipbetween density and travel in the US reflects the factthat density is intertwined with other D variables –e.g. dense settings commonly have mixed uses, smallcity blocks, and central locations, all of which shortentrips and encourage walking. While individualelasticities might appear low in Table 5.1, theirinfluences are additive.
European studies on the 5 Ds and travel, largelycorroborate US experi ences. As in the case of theUS, location within a region matters. Isolated neigh -bour hoods with poor accessibility result in a high level of car use. A study in Copenhagen, Denmark,revealed that VKT increased by 30 per cent with adoubling of distance to the city’s downtown area.69
The importance of road designs and land-use mixesis revealed by a study of two European cities withsimilar land areas and household incomes – the
master-planned British new town, Milton Keynes, andthe more traditional Dutch community, Almere.70
Almere was designed for walking and cycling, whileMilton Keynes is a car-oriented city laid out on asuper-grid of four-lane thoroughfares, separatinghomes, offices and shops into different quadrants.The study found that two-thirds of the out-of-hometrips made by urban residents in Milton Keyneswere by car, compared to 42 per cent in Almere. In addition, the average trip distances in Almere were 25 per cent shorter. A more recent comparisonof Milton Keynes with another Dutch master-planned new town, Houten, that was more con -sciously designed for bicycle travel revealed greaterdifferentials. In 2010, 55 per cent of all trips madeby Houten residents were by bike, as compared to20 per cent of the trips made by urban residents inMilton Keynes.71
While very little is known about the 5 Ds andtravel in devel op ing countries, evidence is beginningto trickle in. In Santiago (Chile) evidence revealedthat between 1991 and 2001, the effect of urbandensities on car ownership doubled, with increasingpopulation densities reducing the likelihood ofhouseholds owning a car.72 Being close to a subwaystation also reduced car ownership rates. However,land-use diversity had a minimal influence on travel.
Mobility and Urban Form 91
1EEE234567891012311145678920123456789301234567894012345678950123456789EEEE
Density (intensity of use) –0.05 –5%
Diversity (mix of use) –0.07 –7%
Design (walkability) –0.08 –8%
Destination (accessibility) –0.20 –20%
Distance (to transit) –0.05 –5%
Note: Data are drawn principally from empirical studies in the US.
Sources: Ewing and Cervero, 2001; Ewing and Cervero, 2010.
Table 5.1
5 D influences on VKT,expressed as averageelasticities
Elasticity Per cent changein VKT from a doubling
of value of the ‘D’ variable
Mixing up land uses can shorten trips and encourage non-motorized travel. A recent study of six mixed-use activitycentres across the US found that 30 per cent of generatedtrips were internal to the project – i.e. short journeys, mainlyby foot. Trips meant for private cars to external destinationsaway from the devel op ment were instead on-site and often by foot. Such trips put no strain on the surrounding roadnetworks and generate relatively few vehicle kilometres oftravel. Unless such benefits are accounted for in traffic impactstudies, the traffic-inducing impacts of mixed-use devel op -ments become overstated.
Other benefits of mixed land uses include opportunitiesfor shared parking and an even distribution of trips (and thus a
flatter peak period) throughout the day and week. Situatingemployment and entertainment activities close to each other, for example, means the parking used by white-collaremployees during working hours can also be used in theevenings and weekends by theatre-goers and restaurantpatrons. In such settings, co-locating land uses whose parking demands vary by the time and the day of week canshrink the footprints of impervious parking surfaces by asmuch as 35 per cent. Parking regulations and liability lawsmight need to be adjusted to allow shared parking amongvarious activities in mixed-use settings.Sources: Cervero, 1988; Ewing et al, 2011; Zegras, 2010.
Box 5.9 Land-use diversity
‘Destinationaccessibility’ is by far the mostimportant landuse factor thatstronglyinfluences travel
Isolatedneighbourhoodswith pooraccessibility resultin high level of caruse
92 Planning and Design for Sustainable Urban Mobility
In Colombia, a study of Bogotá residents found thatwhile density and land-use diversity had very littleinfluence on the amount of time spent walking and cycling, neigh bour hood design attributes suchas street connectivity and sidewalk provisions hadsignificant impacts.73 Moving from a neigh bour-hood in Bogotá with low levels of road connectivity(measured by the ratio of links to intersections) tohigher levels, resulted in an increased likelihood (by 220 per cent) that residents walked 30 minutesor more per day.74 Many of Bogotá’s older neigh -bourhoods that evolved organically during the pre-car era had strict zoning laws, thereby resulting inurban neigh bour hoods that exhibit similar densities,mixes of land use and access to public transit. Thequality of the walking environ ment varied, however,and did not strongly influence non-motorized travel.Similarly, in Taipei and Hong Kong (China) streetdesigns tend to strongly influence walking, as com -pared to high densities and mixed land uses (whichare commonplace in both cities).75
The quality of the walking environ ment hasimportant age and gender dimensions. In Teheran,a recent study found highly walkable neigh bour -hoods to be most conducive to the elderly, resultingin their walking more often.76 Environ ments designedwith more street lighting and a mixture of land uses that generate foot traffic are likely to decreasethe risk of violence to women.77 Further, people ofall ages and genders tend to socialize more and arephysically active in compact, mixed-use neigh bour -hoods.78 Well-designed streetscapes with destinationsclose by tend to draw city residents to sidewalks andpublic spaces, creating what urban designers call‘natural surveillance’ and more ‘eyes on the street’.79
Bogotá’s proactive investment in walkways, plazas andsidewalks close by, and the city’s connection to theTransmilenio BRT system has further enhanced publicsafety and encouraged households to upgrade theirhomes and neigh bour hoods.80
Expanded, improved and better connectedpathways are important features of slum upgradingprogrammes. In La Vega Barrio, one of Caracas,Venezuela’s largest and oldest informal settlements,30 pathways that criss-cross steep hillsides havebeen built or rehabilitated to enhance access to jobs,schools and medical clinics, as part of a major neigh -bour hood upgrading initiative.81 Design features such as smaller city blocks can also encourage foottravel in devel op ing cities. Smaller blocks mean that trips made by foot are likely to be less circuitous.In Ahmedabad, India, only 13 per cent of trips madeby those living in neigh bour hoods with an averageblock size of 4 hectares, were by foot, compared tothe recorded 36 per cent in a similar neigh bour hood,with average block sizes of 1.2 hectares.82
Experi ences from China reveal how changes inbuilt environ ments fundamentally change travel in rapidly growing settings. Paralleling China’s shift
to a market economy have been dramatic transform -ations of urban environ ments – from a traditionalhigh-density, pedestrian- and cyclist-oriented urbanform to an increasingly spread-out, auto-orientedone.83 The liberalization of land markets in the 1990sresulted in the displacement of many Chineseworking-class households to the periphery – oftento isolated superblock devel op ment enveloped bywide streets.84 The change from organ ically evolved,mixed-use enclaves – where many people lived,worked and shopped in the same area – to car-ori ented large-block suburbs, dramatic ally enlargedhouseholds’ travel footprints. A study on the travelimpacts of 900 households that moved from Shang -hai’s urban core to isolated, superblock and gatedhousing units on the periphery revealed dra maticshifts from non-motorized to motorized travel andjourneys of far longer duration. This resulted in a 50 per cent increase in VKT from the householdssurveyed.85 Another study found that residents living in higher-density areas in Shanghai, with smaller blocks and denser street networks averagedaround one-half of the car ownership levels, com-pared to the urban residents living in more car-oriented, superblock districts.86 Moreover, residentsof pedestrian/cycle-friendly neigh bour hoods travelledshorter distances than those of other neigh bour -hoods, even in cases whereby the travel mode wasthe same.
Globally, various neigh bour hood designs andretrofits are being introduced to reduce the need fortravel by private cars and invite more sus tain ableforms of mobility. Among these are: traditional neigh -bour hoods, also known as new urbanism; TOD; andcar-restricted districts.
Traditional neigh bour hoods and the newurbanism
Before the advent of the private car, traditionalneigh bour hoods were compact and highly walk-able. Daily activities (e.g. shops, restaurants andschools) that were no more than five minutes awaywere characteristic of the pre-automobile era.87
In the early 1980s, an urban design movement,called ‘new urbanism’, was developed in the US. Thismovement sought to return neigh bour hoods to their pre-automobile designs and ambiances – placesthat promoted walking, allowed daily face-to-faceinteraction of people from all walks of life and pro -vided a range of housing types, workplaces, commer -cial-retail offerings and public places.88 Diversity andplace-making became catchwords of the movement.89
In contrast to the sameness and sterility of suburbansprawl, new urbanism emphasized the fine details ofwhat makes communities enjoyable, distinctive andfunctional – such as gridiron street patterns wellsuited to walking, prominent civic spaces that drawpeople together (and thus help build social capital),
The quality of thewalkingenvironment hasimportant age andgenderdimensions
Globally, variousneighbourhooddesigns andretrofits are beingintroduced toreduce the needfor travel byprivate cars andinvite moresustainable formsof mobility
[In the pre-automobile era],traditionalneighbourhoodswere compact andhighly walkable
‘New urbanism’ . . . sought toreturnneighbourhoodsto their pre-automobiledesigns andambiances
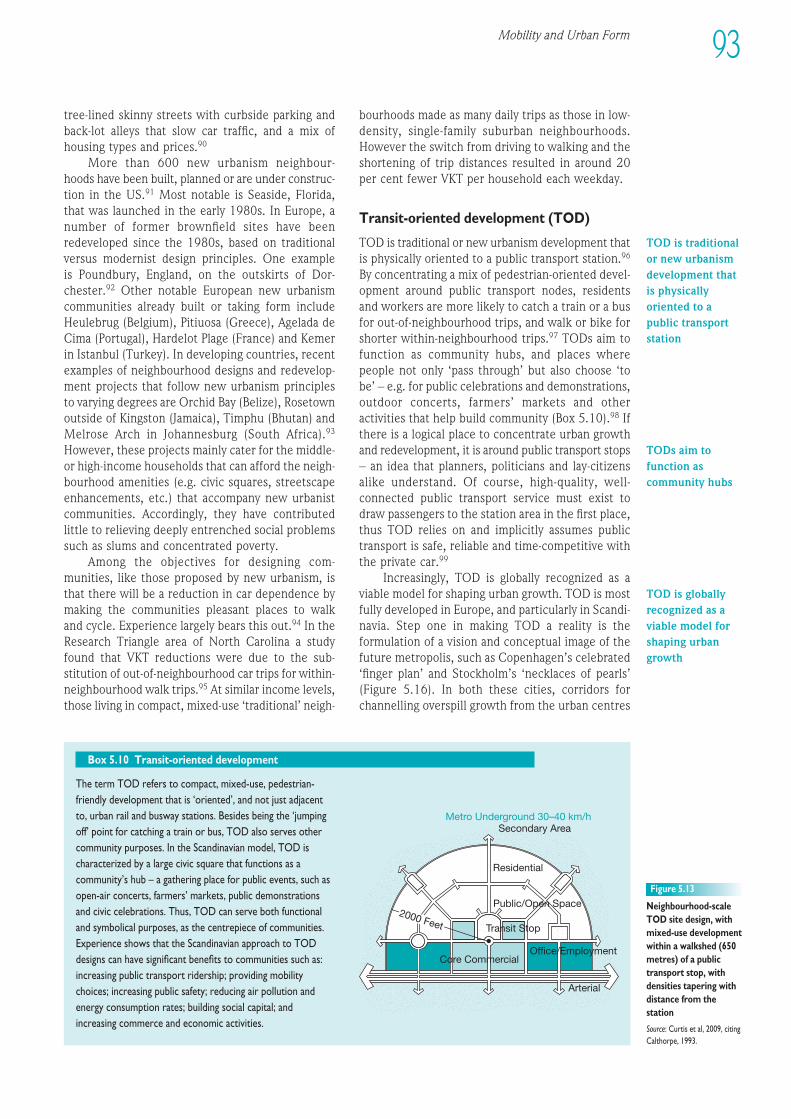
1EEE234567891012311145678920123456789301234567894012345678950123456789EEEE
93Mobility and Urban Form
tree-lined skinny streets with curbside parking andback-lot alleys that slow car traffic, and a mix ofhousing types and prices.90
More than 600 new urbanism neigh bour-hoods have been built, planned or are under con struc -tion in the US.91 Most notable is Seaside, Florida,that was launched in the early 1980s. In Europe, anumber of former brownfield sites have beenredeveloped since the 1980s, based on traditionalversus modernist design principles. One example is Poundbury, England, on the outskirts of Dor-chester.92 Other notable European new urbanismcommunities already built or taking form includeHeulebrug (Belgium), Pitiuosa (Greece), Agelada deCima (Portugal), Hardelot Plage (France) and Kemerin Istanbul (Turkey). In devel op ing countries, recentexamples of neigh bour hood designs and redevel op -ment projects that follow new urbanism principlesto varying degrees are Orchid Bay (Belize), Rosetownoutside of Kingston (Jamaica), Timphu (Bhutan) andMelrose Arch in Johannesburg (South Africa).93
However, these projects mainly cater for the middle-or high-income households that can afford the neigh -bour hood amenities (e.g. civic squares, streetscapeenhancements, etc.) that accompany new urbanistcommunities. Accordingly, they have contributedlittle to relieving deeply entrenched social problemssuch as slums and concentrated poverty.
Among the objectives for designing com -munities, like those proposed by new urbanism, isthat there will be a reduction in car dependence bymaking the communities pleasant places to walk and cycle. Experi ence largely bears this out.94 In theResearch Triangle area of North Carolina a studyfound that VKT reductions were due to the sub -stitution of out-of-neigh bour hood car trips for within-neigh bour hood walk trips.95 At similar income levels,those living in compact, mixed-use ‘traditional’ neigh -
bour hoods made as many daily trips as those in low-density, single-family suburban neigh bour hoods.However the switch from driving to walking and theshortening of trip distances resulted in around 20per cent fewer VKT per household each weekday.
Transit-oriented devel op ment (TOD)
TOD is traditional or new urbanism devel op ment thatis physically oriented to a public trans port station.96
By concentrating a mix of pedestrian-oriented devel -op ment around public trans port nodes, residentsand workers are more likely to catch a train or a busfor out-of-neigh bour hood trips, and walk or bike forshorter within-neigh bour hood trips.97 TODs aim tofunction as community hubs, and places wherepeople not only ‘pass through’ but also choose ‘tobe’ – e.g. for public celebrations and demonstrations,outdoor concerts, farmers’ markets and otheractivities that help build community (Box 5.10).98 Ifthere is a logical place to concentrate urban growthand redevel op ment, it is around public trans port stops– an idea that planners, politicians and lay-citizensalike understand. Of course, high-quality, well-connected public trans port service must exist todraw passen gers to the station area in the first place,thus TOD relies on and implicitly assumes publictrans port is safe, reliable and time-competitive withthe private car.99
Increasingly, TOD is globally recognized as aviable model for shaping urban growth. TOD is mostfully developed in Europe, and particularly in Scandi -navia. Step one in making TOD a reality is theformulation of a vision and conceptual image of thefuture metropolis, such as Copenhagen’s celebrated‘finger plan’ and Stockholm’s ‘necklaces of pearls’(Figure 5.16). In both these cities, corridors forchannelling overspill growth from the urban centres
The term TOD refers to compact, mixed-use, pedestrian-friendly devel op ment that is ‘oriented’, and not just adjacentto, urban rail and busway stations. Besides being the ‘jumpingoff’ point for catching a train or bus, TOD also serves othercommunity purposes. In the Scandinavian model, TOD ischaracterized by a large civic square that functions as acommunity’s hub – a gathering place for public events, such asopen-air concerts, farmers’ markets, public demonstrationsand civic celebrations. Thus, TOD can serve both functionaland symbolical purposes, as the centrepiece of communities.Experi ence shows that the Scandinavian approach to TODdesigns can have significant benefits to communities such as:increasing public trans port ridership; providing mobilitychoices; increasing public safety; reducing air pollution andenergy consumption rates; building social capital; andincreasing commerce and economic activities.
Box 5.10 Transit-oriented devel op ment
Metro Underground 30–40 km/hSecondary Area
Residential
Public/Open Space
Core CommercialOffice/Employment
Arterial
Transit Stop
2000 Feet
Figure 5.13
Neigh bour hood-scaleTOD site design, withmixed-use devel op mentwithin a walkshed (650metres) of a publictrans port stop, withdensities tapering withdistance from thestation
Source: Curtis et al, 2009, citingCalthorpe, 1993.
TOD is traditionalor new urbanismdevelopment thatis physicallyoriented to apublic transportstation
TODs aim tofunction ascommunity hubs
TOD is globallyrecognized as aviable model forshaping urbangrowth
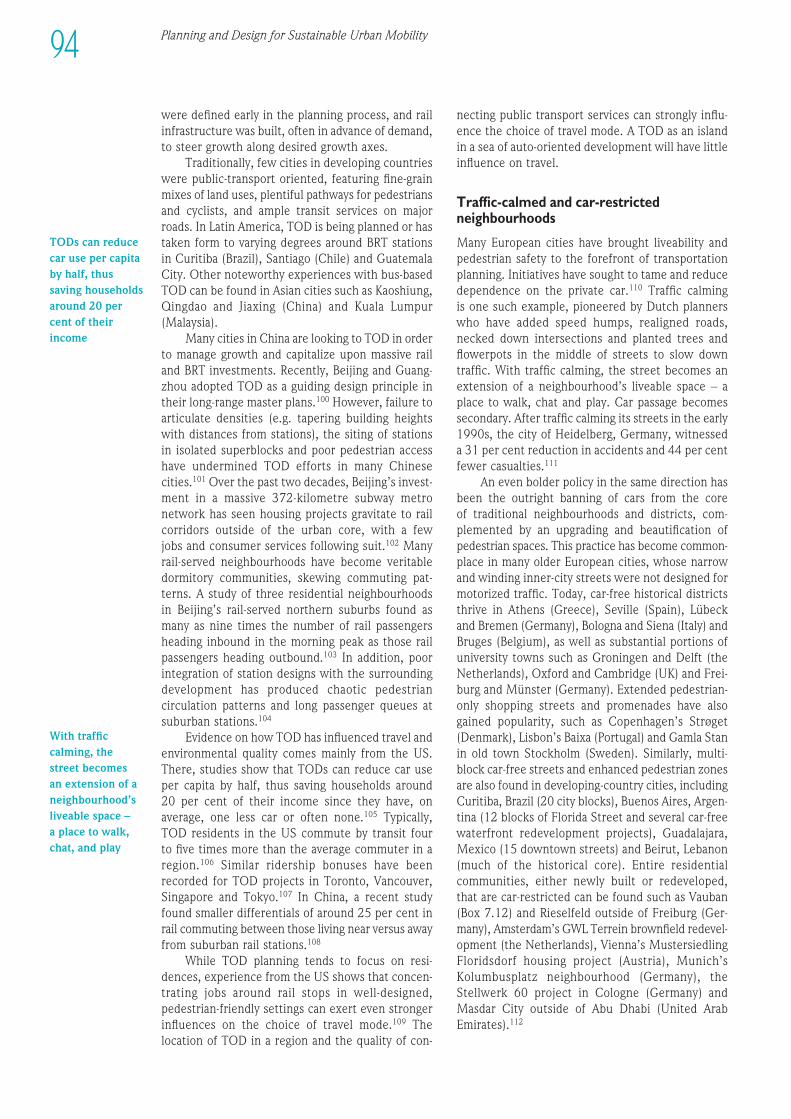
Planning and Design for Sustainable Urban Mobility94
were defined early in the planning process, and railinfra struc ture was built, often in advance of demand,to steer growth along desired growth axes.
Traditionally, few cities in devel op ing countrieswere public-trans port oriented, featuring fine-grainmixes of land uses, plentiful pathways for pedestriansand cyclists, and ample transit services on majorroads. In Latin America, TOD is being planned or hastaken form to varying degrees around BRT stationsin Curitiba (Brazil), Santiago (Chile) and GuatemalaCity. Other noteworthy experi ences with bus-basedTOD can be found in Asian cities such as Kaoshiung,Qingdao and Jiaxing (China) and Kuala Lumpur(Malaysia).
Many cities in China are looking to TOD in orderto manage growth and capitalize upon massive railand BRT investments. Recently, Beijing and Guang -zhou adopted TOD as a guiding design principle intheir long-range master plans.100 However, failure toarticulate densities (e.g. tapering building heightswith distances from stations), the siting of stationsin isolated superblocks and poor pedestrian accesshave undermined TOD efforts in many Chinesecities.101 Over the past two decades, Beijing’s invest -ment in a massive 372-kilometre subway metronetwork has seen housing projects gravitate to railcorridors outside of the urban core, with a few jobs and consumer services following suit.102 Manyrail-served neigh bour hoods have become veritabledormitory communities, skewing commuting pat -terns. A study of three residential neigh bour hoodsin Beijing’s rail-served northern suburbs found asmany as nine times the number of rail passen gersheading inbound in the morning peak as those railpassen gers heading outbound.103 In addition, poorintegration of station designs with the surroundingdevel op ment has produced chaotic pedestriancirculation patterns and long passen ger queues atsuburban stations.104
Evidence on how TOD has influenced travel andenviron mental quality comes mainly from the US.There, studies show that TODs can reduce car useper capita by half, thus saving households around 20 per cent of their income since they have, onaverage, one less car or often none.105 Typically, TOD resi dents in the US commute by transit four to five times more than the average commuter in aregion.106 Similar ridership bonuses have beenrecorded for TOD projects in Toronto, Vancouver,Singapore and Tokyo.107 In China, a recent studyfound smaller differen tials of around 25 per cent inrail commuting between those living near versus awayfrom suburban rail stations.108
While TOD planning tends to focus on resi -dences, experi ence from the US shows that concen -trating jobs around rail stops in well-designed,pedestrian-friendly settings can exert even strongerinfluences on the choice of travel mode.109 Thelocation of TOD in a region and the quality of con -
necting public trans port services can strongly influ -ence the choice of travel mode. A TOD as an islandin a sea of auto-oriented devel op ment will have littleinfluence on travel.
Traffic-calmed and car-restricted neigh bour hoods
Many European cities have brought liveability andpedestrian safety to the forefront of transportationplanning. Initiatives have sought to tame and reducedependence on the private car.110 Traffic calming is one such example, pioneered by Dutch plannerswho have added speed humps, realigned roads,necked down intersections and planted trees andflowerpots in the middle of streets to slow downtraffic. With traffic calming, the street becomes anextension of a neigh bour hood’s liveable space – aplace to walk, chat and play. Car passage becomessecondary. After traffic calming its streets in the early1990s, the city of Heidelberg, Germany, witnesseda 31 per cent reduction in accidents and 44 per centfewer casualties.111
An even bolder policy in the same direction hasbeen the outright banning of cars from the core of traditional neigh bour hoods and districts, com -plemented by an upgrading and beautification ofpedestrian spaces. This practice has become common -place in many older European cities, whose narrowand winding inner-city streets were not designed formotorized traffic. Today, car-free historical districtsthrive in Athens (Greece), Seville (Spain), Lübeck and Bremen (Germany), Bologna and Siena (Italy) andBruges (Belgium), as well as substantial portions ofuniversity towns such as Groningen and Delft (theNetherlands), Oxford and Cambridge (UK) and Frei -burg and Münster (Germany). Extended pedestrian-only shopping streets and promenades have alsogained popularity, such as Copenhagen’s Strøget(Denmark), Lisbon’s Baixa (Portugal) and Gamla Stanin old town Stockholm (Sweden). Similarly, multi-block car-free streets and enhanced pedestrian zonesare also found in devel op ing-country cities, includingCuritiba, Brazil (20 city blocks), Buenos Aires, Argen -tina (12 blocks of Florida Street and several car-freewaterfront redevel op ment projects), Guadalajara,Mexico (15 downtown streets) and Beirut, Lebanon(much of the historical core). Entire residentialcommunities, either newly built or redeveloped, that are car-restricted can be found such as Vauban(Box 7.12) and Rieselfeld outside of Freiburg (Ger -many), Amsterdam’s GWL Terrein brownfield redevel-opment (the Netherlands), Vienna’s MustersiedlingFloridsdorf housing project (Austria), Munich’sKolumbus platz neigh bour hood (Germany), theStellwerk 60 project in Cologne (Germany) andMasdar City outside of Abu Dhabi (United ArabEmirates).112
TODs can reducecar use per capitaby half, thussaving householdsaround 20 percent of theirincome
With trafficcalming, thestreet becomes an extension of aneighbourhood’sliveable space – a place to walk,chat, and play
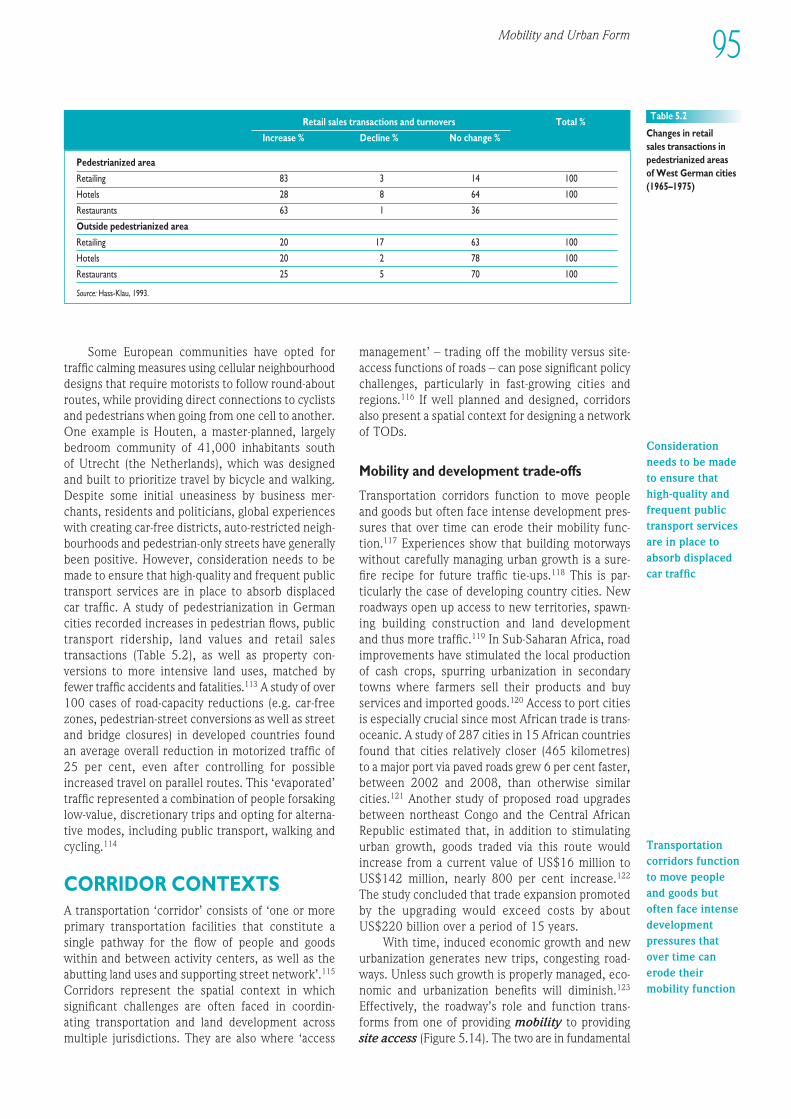
Some European communities have opted fortraffic calming measures using cellular neigh bour hooddesigns that require motorists to follow round-aboutroutes, while providing direct connections to cyclistsand pedestrians when going from one cell to another.One example is Houten, a master-planned, largelybedroom community of 41,000 inhabitants south of Utrecht (the Netherlands), which was designedand built to prioritize travel by bicycle and walking.Despite some initial uneasiness by business mer -chants, residents and politicians, global experi enceswith creating car-free districts, auto-restricted neigh -bour hoods and pedestrian-only streets have generallybeen positive. However, consideration needs to bemade to ensure that high-quality and frequent publictrans port services are in place to absorb displacedcar traffic. A study of pedestrianization in Germancities recorded increases in pedestrian flows, publictrans port ridership, land values and retail salestransactions (Table 5.2), as well as property con -versions to more intensive land uses, matched byfewer traffic accidents and fatalities.113 A study of over100 cases of road-capacity reductions (e.g. car-freezones, pedestrian-street conversions as well as streetand bridge closures) in developed countries foundan average overall reduction in motorized traffic of25 per cent, even after controlling for possibleincreased travel on parallel routes. This ‘evaporated’traffic represented a combination of people forsakinglow-value, discretionary trips and opting for alterna -tive modes, including public transport, walking andcycling.114
CORRIDOR CONTEXTSA transportation ‘corridor’ consists of ‘one or moreprimary transportation facilities that constitute asingle pathway for the flow of people and goodswithin and between activity centers, as well as theabutting land uses and supporting street network’.115
Corridors represent the spatial context in whichsignificant challenges are often faced in coordin-ating transportation and land devel op ment acrossmultiple jurisdictions. They are also where ‘access
management’ – trading off the mobility versus site-access functions of roads – can pose significant policychallenges, particularly in fast-growing cities andregions.116 If well planned and designed, corridorsalso present a spatial context for designing a networkof TODs.
Mobility and devel op ment trade-offs
Transportation corridors function to move people and goods but often face intense devel op ment pres -sures that over time can erode their mobility func -tion.117 Experi ences show that building motorwayswithout carefully managing urban growth is a sure-fire recipe for future traffic tie-ups.118 This is par -ticularly the case of devel op ing country cities. Newroadways open up access to new territories, spawn-ing building construction and land devel op ment and thus more traffic.119 In Sub-Saharan Africa, roadimprovements have stimulated the local productionof cash crops, spurring urbanization in secondarytowns where farmers sell their products and buyservices and imported goods.120 Access to port citiesis especially crucial since most African trade is trans -oceanic. A study of 287 cities in 15 African countriesfound that cities relatively closer (465 kilometres)to a major port via paved roads grew 6 per cent faster,between 2002 and 2008, than otherwise similarcities.121 Another study of proposed road upgradesbetween northeast Congo and the Central AfricanRepublic estimated that, in addition to stimulatingurban growth, goods traded via this route wouldincrease from a current value of US$16 million toUS$142 million, nearly 800 per cent increase.122
The study concluded that trade expansion promotedby the upgrading would exceed costs by aboutUS$220 billion over a period of 15 years.
With time, induced economic growth and newurbanization generates new trips, congesting road -ways. Unless such growth is properly managed, eco -nomic and urbanization benefits will diminish.123
Effectively, the roadway’s role and function trans -forms from one of providing mobility to providing site access (Figure 5.14). The two are in fundamental
Mobility and Urban Form 95
1EEE234567891012311145678920123456789301234567894012345678950123456789EEEE
Pedestrianized area
Retailing 83 3 14 100
Hotels 28 8 64 100
Restaurants 63 1 36
Outside pedestrianized area
Retailing 20 17 63 100
Hotels 20 2 78 100
Restaurants 25 5 70 100
Source: Hass-Klau, 1993.
Table 5.2
Changes in retail sales transactions inpedestrianized areas of West German cities (1965–1975)
Retail sales transactions and turnovers Total %
Increase % Decline % No change %
Considerationneeds to be madeto ensure thathigh-quality andfrequent publictransport servicesare in place toabsorb displacedcar traffic
Transportationcorridors functionto move peopleand goods butoften face intensedevelopmentpressures thatover time canerode theirmobility function
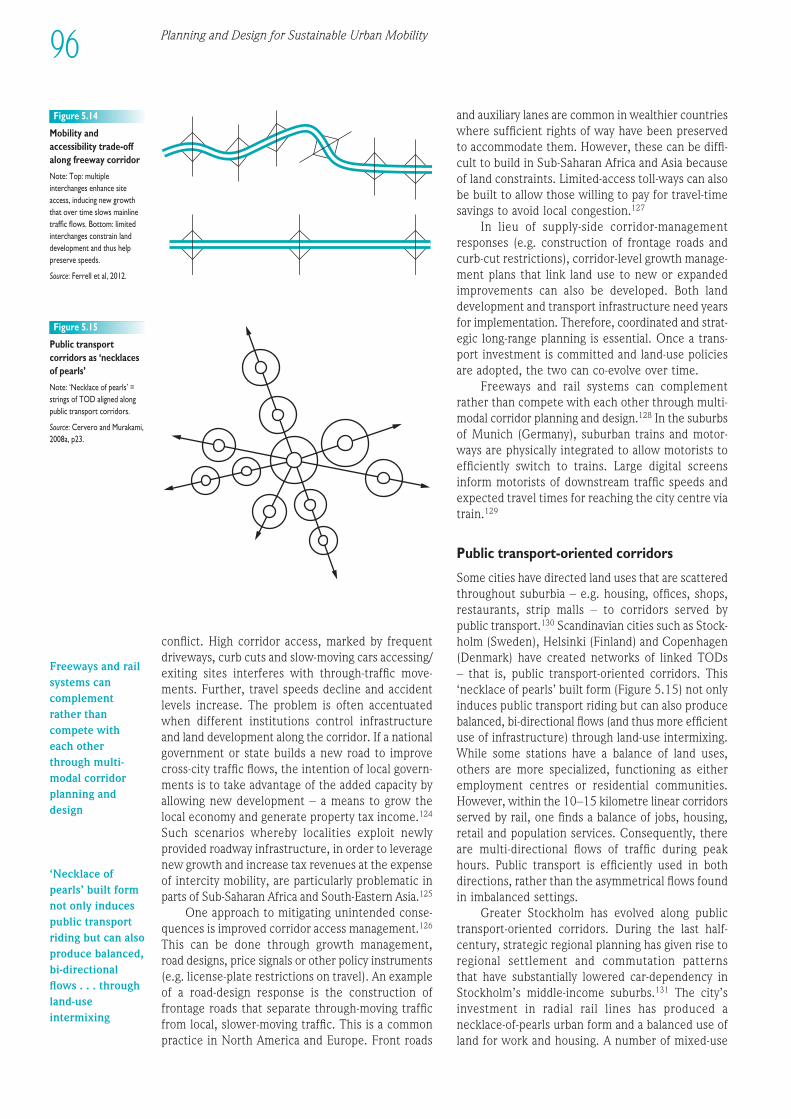
conflict. High corridor access, marked by frequentdriveways, curb cuts and slow-moving cars accessing/exiting sites interferes with through-traffic move -ments. Further, travel speeds decline and accidentlevels increase. The problem is often accentuatedwhen different institutions control infra struc tureand land devel op ment along the corridor. If a nationalgovern ment or state builds a new road to improvecross-city traffic flows, the intention of local govern -ments is to take advantage of the added capacity byallowing new devel op ment – a means to grow thelocal economy and generate property tax income.124
Such scenarios whereby localities exploit newlyprovided roadway infra struc ture, in order to leveragenew growth and increase tax revenues at the expenseof intercity mobility, are particularly problematic inparts of Sub-Saharan Africa and South-Eastern Asia.125
One approach to mitigating unintended conse -quences is improved corridor access management.126
This can be done through growth management, road designs, price signals or other policy instruments(e.g. license-plate restrictions on travel). An exampleof a road-design response is the construction offrontage roads that separate through-moving trafficfrom local, slower-moving traffic. This is a commonpractice in North America and Europe. Front roads
and auxiliary lanes are common in wealthier countrieswhere sufficient rights of way have been preservedto accommodate them. However, these can be diffi -cult to build in Sub-Saharan Africa and Asia becauseof land constraints. Limited-access toll-ways can alsobe built to allow those willing to pay for travel-timesavings to avoid local congestion.127
In lieu of supply-side corridor-managementresponses (e.g. construction of frontage roads andcurb-cut restrictions), corridor-level growth manage -ment plans that link land use to new or expandedimprovements can also be developed. Both landdevel op ment and trans port infra struc ture need yearsfor implementation. Therefore, coordinated and strat -egic long-range planning is essential. Once a trans -port investment is committed and land-use policiesare adopted, the two can co-evolve over time.
Freeways and rail systems can complementrather than compete with each other through multi-modal corridor planning and design.128 In the suburbsof Munich (Germany), suburban trains and motor -ways are physically integrated to allow motorists toefficiently switch to trains. Large digital screensinform motorists of downstream traffic speeds andexpected travel times for reaching the city centre viatrain.129
Public transport-oriented corridors
Some cities have directed land uses that are scatteredthroughout suburbia – e.g. housing, offices, shops,restaurants, strip malls – to corridors served bypublic transport.130 Scandinavian cities such as Stock -holm (Sweden), Helsinki (Finland) and Copenhagen(Denmark) have created networks of linked TODs – that is, public transport-oriented corridors. This‘necklace of pearls’ built form (Figure 5.15) not onlyinduces public trans port riding but can also producebalanced, bi-directional flows (and thus more efficientuse of infra struc ture) through land-use intermixing.While some stations have a balance of land uses,others are more specialized, functioning as eitheremployment centres or residential communities.However, within the 10–15 kilometre linear corridorsserved by rail, one finds a balance of jobs, housing,retail and population services. Consequently, thereare multi-directional flows of traffic during peakhours. Public trans port is efficiently used in bothdirections, rather than the asymmetrical flows foundin imbalanced settings.
Greater Stockholm has evolved along publictransport-oriented corridors. During the last half-century, strategic regional planning has given rise toregional settlement and commutation patterns that have substantially lowered car-dependency inStockholm’s middle-income suburbs.131 The city’sinvestment in radial rail lines has produced anecklace-of-pearls urban form and a balanced use ofland for work and housing. A number of mixed-use
Figure 5.14
Mobility andaccessibility trade-offalong freeway corridor
Note: Top: multipleinterchanges enhance siteaccess, inducing new growththat over time slows mainlinetraffic flows. Bottom: limitedinterchanges constrain landdevel op ment and thus helppreserve speeds.
Source: Ferrell et al, 2012. ,
Figure 5.15
Public trans portcorridors as ‘necklacesof pearls’
Note: ‘Necklace of pearls’ =strings of TOD aligned alongpublic trans port corridors.
Source: Cervero and Murakami,2008a, p23.
96 Planning and Design for Sustainable Urban Mobility
Freeways and railsystems cancomplementrather thancompete witheach otherthrough multi-modal corridorplanning anddesign
‘Necklace ofpearls’ built form not only inducespublic transportriding but can alsoproduce balanced,bi-directionalflows . . . throughland-useintermixing
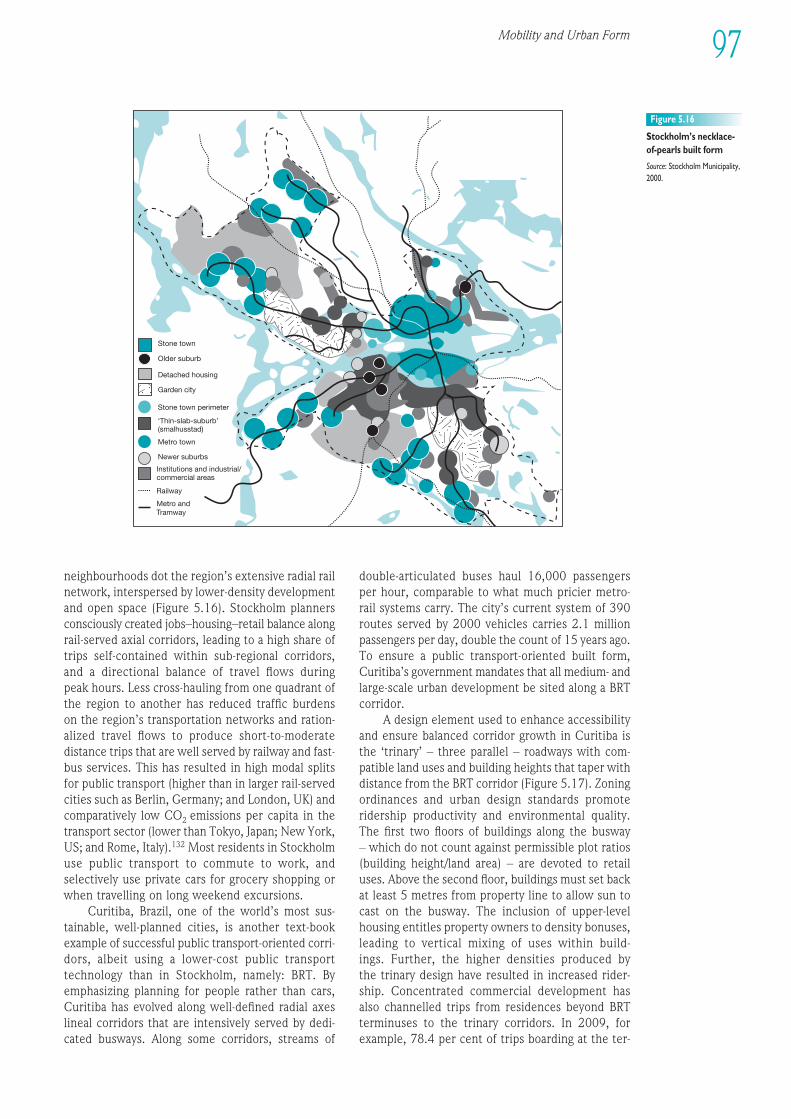
neigh bour hoods dot the region’s extensive radial railnetwork, interspersed by lower-density devel op mentand open space (Figure 5.16). Stockholm plannersconsciously created jobs–housing–retail balance alongrail-served axial corridors, leading to a high share oftrips self-contained within sub-regional corridors,and a directional balance of travel flows during peak hours. Less cross-hauling from one quadrant ofthe region to another has reduced traffic burdens on the region’s transportation networks and ration -alized travel flows to produce short-to-moderatedistance trips that are well served by railway and fast-bus services. This has resulted in high modal splitsfor public trans port (higher than in larger rail-servedcities such as Berlin, Germany; and London, UK) andcomparatively low CO2 emissions per capita in thetrans port sector (lower than Tokyo, Japan; New York,US; and Rome, Italy).132 Most residents in Stockholmuse public trans port to commute to work, andselectively use private cars for grocery shopping orwhen travelling on long weekend excursions.
Curitiba, Brazil, one of the world’s most sus-tain able, well-planned cities, is another text-bookexample of successful public transport-oriented corri -dors, albeit using a lower-cost public trans porttechnology than in Stockholm, namely: BRT. Byemphasizing planning for people rather than cars,Curitiba has evolved along well-defined radial axeslineal corridors that are intensively served by dedi -cated busways. Along some corridors, streams of
double-articulated buses haul 16,000 passen gers per hour, comparable to what much pricier metro-rail systems carry. The city’s current system of 390routes served by 2000 vehicles carries 2.1 millionpassen gers per day, double the count of 15 years ago.To ensure a public transport-oriented built form,Curitiba’s govern ment mandates that all medium- andlarge-scale urban devel op ment be sited along a BRTcorridor.
A design element used to enhance accessibilityand ensure balanced corridor growth in Curitiba isthe ‘trinary’ – three parallel – roadways with com -patible land uses and building heights that taper withdistance from the BRT corridor (Figure 5.17). Zoningordinances and urban design standards promoteridership productivity and environ mental quality.The first two floors of buildings along the busway – which do not count against permissible plot ratios(building height/land area) – are devoted to retailuses. Above the second floor, buildings must set backat least 5 metres from property line to allow sun tocast on the busway. The inclusion of upper-levelhousing entitles property owners to density bonuses,leading to vertical mixing of uses within build-ings. Further, the higher densities produced by the trinary design have resulted in increased rider-ship. Con centrated commercial devel op ment hasalso chan nelled trips from residences beyond BRTterminuses to the trinary corridors. In 2009, forexample, 78.4 per cent of trips boarding at the ter -
Stone town
Older suburb
Detached housing
Stone town perimeter
Garden city
‘Thin-slab-suburb’(smalhusstad)
Metro town
Newer suburbs
Institutions and industrial/commercial areas
Railway
Metro andTramway
Figure 5.16
Stockholm’s necklace-of-pearls built form
Source: Stockholm Municipality,2000.
1EEE234567891012311145678920123456789301234567894012345678950123456789EEEE
97Mobility and Urban Form
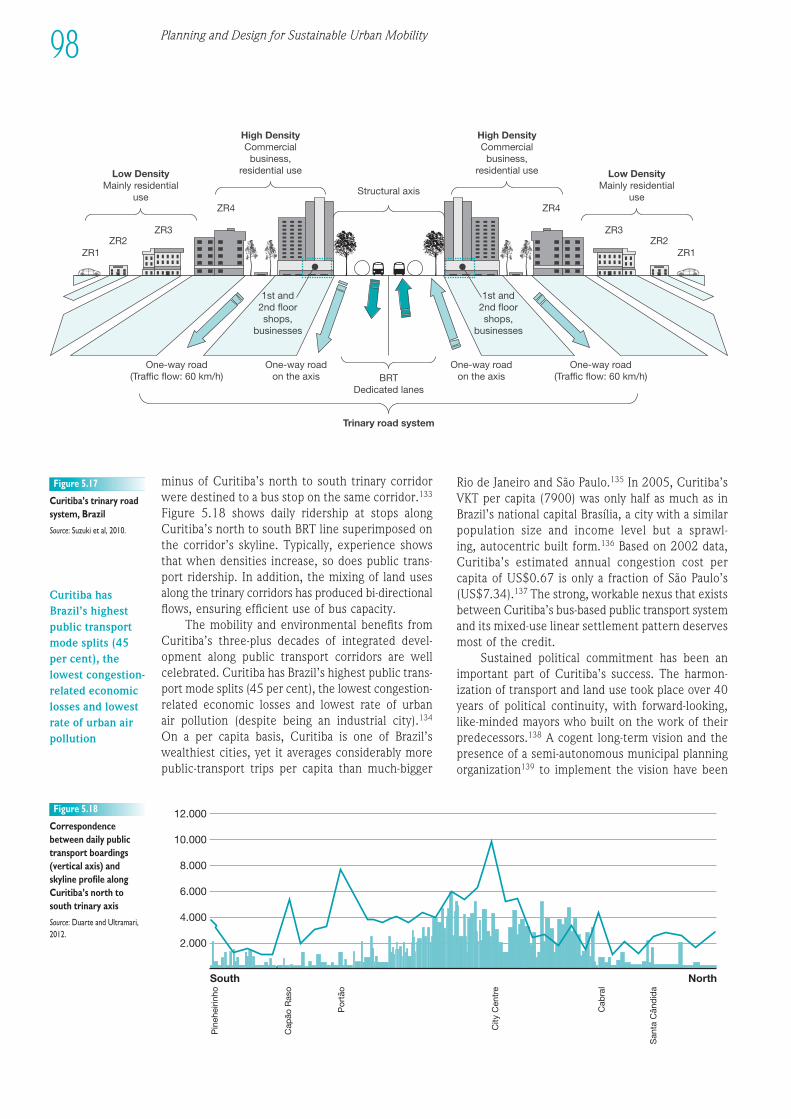
Structural axis
1st and2nd floorshops,
businesses
One-way road(Traffic flow: 60 km/h)
One-way roadon the axis
ZR1ZR2
ZR3
BRTDedicated lanes
Trinary road system
High DensityCommercial
business,residential useLow Density
Mainly residentialuse
ZR4
1st and2nd floorshops,
businesses
One-way road(Traffic flow: 60 km/h)
One-way roadon the axis
ZR1ZR2
ZR3
High DensityCommercial
business,residential use Low Density
Mainly residentialuse
ZR4
Figure 5.17
Curitiba’s trinary roadsystem, Brazil
Source: Suzuki et al, 2010.
12.000
10.000
8.000
6.000
4.000
2.000
South North
Pin
ehei
rinho
Cap
ão R
aso
Por
tão
City
Cen
tre
Cab
ral
San
ta C
ând
ida
Figure 5.18
Correspondencebetween daily publictrans port boardings(vertical axis) andskyline profile alongCuritiba’s north tosouth trinary axis
Source: Duarte and Ultramari,2012.
minus of Curitiba’s north to south trinary corridorwere destined to a bus stop on the same corridor.133
Figure 5.18 shows daily ridership at stops alongCuritiba’s north to south BRT line superimposed onthe corridor’s skyline. Typically, experi ence showsthat when densities increase, so does public trans -port ridership. In addition, the mixing of land usesalong the trinary corridors has produced bi-directionalflows, ensuring efficient use of bus capacity.
The mobility and environ mental benefits fromCuritiba’s three-plus decades of integrated devel -opment along public trans port corridors are wellcelebrated. Curitiba has Brazil’s highest public trans -port mode splits (45 per cent), the lowest congestion-related economic losses and lowest rate of urban air pollution (despite being an industrial city).134
On a per capita basis, Curitiba is one of Brazil’swealth iest cities, yet it averages considerably morepublic-trans port trips per capita than much-bigger
Rio de Janeiro and São Paulo.135 In 2005, Curitiba’sVKT per capita (7900) was only half as much as inBrazil’s national capital Brasília, a city with a similarpopula tion size and income level but a sprawl-ing, autocentric built form.136 Based on 2002 data,Curitiba’s estimated annual congestion cost percapita of US$0.67 is only a fraction of São Paulo’s(US$7.34).137 The strong, workable nexus that existsbetween Curitiba’s bus-based public trans port systemand its mixed-use linear settlement pattern deservesmost of the credit.
Sustained political commitment has been animportant part of Curitiba’s success. The harmon -ization of trans port and land use took place over 40years of political continuity, with forward-looking,like-minded mayors who built on the work of theirpredecessors.138 A cogent long-term vision and thepresence of a semi-autonomous municipal planningorganization139 to implement the vision have been
98 Planning and Design for Sustainable Urban Mobility
Curitiba hasBrazil’s highestpublic transportmode splits (45per cent), thelowest congestion-related economiclosses and lowestrate of urban airpollution
1EEE234567891012311145678920123456789301234567894012345678950123456789EEEE
99Mobility and Urban Form
crucial in allowing the city to chart a sus tain able urbanpathway.
In recent years, Curitiba has begun to experi -ence the limits of rubber-tire technologies. Withbuses operating on 30-second intervals on mainroutes during the peak hour, bunching problems havedisrupted and slowed services. Veritable elephant-trains of buses have increased operating costs andprecluded the kinds of economies of scale enjoyedby single-driver operated trains. Extreme over crowd -ing has prompted many middle-class choice travellersto switch to driving.140 A long-discussed light-rail line,to replace over crowded buses, has yet to gainmomentum due to cost concerns.141
Curitiba has also been criticized for giving shortshrift to intermodal connections to BRT corridors.Only six of the city’s 22 BRT stations, for example,are connected by dedicated bicycle paths, which isa smaller share than Bogotá’s Transmilenio BRT.142
REGIONAL CONTEXTCities have grown and spilled beyond their walls and jurisdictional boundaries for centuries. However,the devel op ment of city clusters and large urbanagglomerations is more recent. The modern approachto new town devel op ment began with EbenezerHoward’s concept of the ‘Garden City’ in 1898,leading to the evolution of Letchworth and WelwynGarden City.143 This devel op ment was followed bythe UK new towns movement in the late 1940s,which has since been emulated in many countries,particularly in the building of new national capitalssuch as Canberra (Australia), Dodoma (Tanzania)and New Delhi (India), which are designed as clusteror regional cities. Many countries, especially China,have adopted new towns as the preferred plan-ning approaches previously adopted in European andUS cities.144 For example, Shanghai has developedextensive plans for its metropolitan region. OtherAsian cities, such as Delhi (India), Kuala Lumpur(Malaysia) and Jakarta (Indonesia), are perusing new town approaches to the planning and devel op -ment of their region based on clusters. Navi Mumbai,adjacent to the Indian city of Mumbai, is beingplanned as the largest new town in the world.145 LatinAmerican cities such as Buenos Aires (Argentina), Riode Janeiro (Brazil), Santiago (Chile) and Mexico Cityhave also adopted new town approaches to regionaldevel op ment based on clusters. The concept of citycluster devel op ment was applied to the planning ofAbuja (Nigeria) and Brasília (Brazil), Shanghai (China),Mumbai (India) and Hanoi (Viet Nam), promotingcross-river expansion into new urban growth areas.Growth triangles, such as in Singapore, Jahor Baru(Malaysia) and Bintan (Indonesia), and Shenzhen,Hong Kong and Macau (China), are examples ofnetwork planning approaches based on a regionalagglomeration concept.
Connectivity and large urbanconfigurations
Cities of different sizes have increasingly started tomerge and form new spatial configurations thattypically take three principal forms, namely: mega-regions, urban corridors and city regions. Theseforms act as nodes where global and regional flowsof people, capital, goods and information combineand commingle, resulting in faster growth, bothdemo graphic and economic, than the growth of thecountries where they are located.146 Connectivity andregional trans port are crucial for the devel op ment ofthese large agglomerations.
In some cases, large cities such as Cairo (Egypt),Mexico City or Bangalore (India) are creating largeurban configurations in which they dominate thesurrounding regional space, amalgamating other cities and towns within their economic orbit. Inother cases, two or more large cities, such as Mumbaiand Delhi in India; São Paulo and Rio de Janeiro inBrazil; or Ibadan, Lagos (Nigeria) and Accra (Ghana)form trans port corridors for the purposes of indus-trial devel op ment, business services and trade. Still, in other cases, the govern ment creates planned‘supra-agglomerations’ as part of a regional andnational devel op ment strategy. This is the case inChina, where the Guangdong Provincial Govern mentrecently announced the devel op ment of the PearlRiver Delta mega-region, which would include ninelarge cities, with an aggregate surface area of 40,000square kilometres, and an impressive trans port infra -struc ture (Box 5.11). Similarly, the large economic -ally prosperous cities of Shanghai and Guangzhouhave invested in infra struc ture to connect peripheraltowns and enhance the large urban configuration.147
Such large urban configurations, grouped innetworks of cities, amplify the benefits of economiesof agglomeration, increasing efficiencies and enhanc -ing connectivity. They also generate economies ofscale that are beneficial in terms of labour markets,as well as trans port and communication infra struc -ture, which in turn increases local consumer demand.
City cluster variances and trans portresponses
There are significant differences in the patterns ofcity clusters between regions and sub-regions. Theseare explained by factors related to geography, climate,population size, natural resources, culture, landmanagement, political history, infra struc ture, marketsand levels of devel op ment. In addition, they are alsodefined by economic activities and the roles playedby trans port and connectivity.
In Europe, urban and regional planning has hadmuch more influence than in any other region of theworld. Large urban configurations have been locatedalong major trans port routes that use multi-modal
A cogent long-term vision andthe presence of asemi-autonomousmunicipalplanningorganization toimplement thevision have beencrucial in allowing[Curitiba] . . . to chart asustainable urbanpathway
Connectivity andregional transportare crucial for thedevelopment of . . . largeagglomerations
Large urbanconfigurations,grouped innetworks of cities,amplify thebenefits ofeconomies ofagglomeration,increasingefficiencies andenhancingconnectivity
In Europe, urbanand regionalplanning has hadmuch moreinfluence than inany other regionof the world
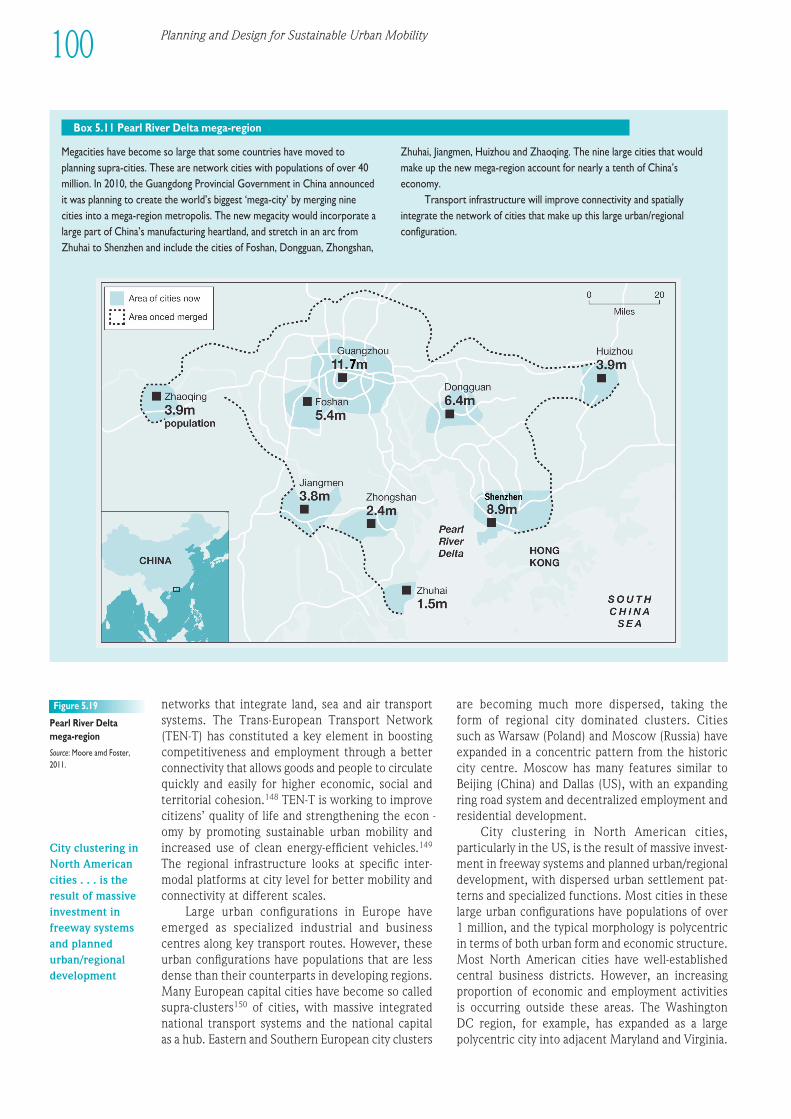
Megacities have become so large that some countries have moved to
planning supra-cities. These are network cities with populations of over 40
million. In 2010, the Guangdong Provincial Govern ment in China announced
it was planning to create the world’s biggest ‘mega-city’ by merging nine
cities into a mega-region metropolis. The new megacity would incorporate a
large part of China’s manufacturing heartland, and stretch in an arc from
Zhuhai to Shenzhen and include the cities of Foshan, Dongguan, Zhongshan,
Zhuhai, Jiangmen, Huizhou and Zhaoqing. The nine large cities that would
make up the new mega-region account for nearly a tenth of China’s
economy.
Trans port infra struc ture will improve connectivity and spatially
integrate the network of cities that make up this large urban/regional
configuration.
Box 5.11 Pearl River Delta mega-region
networks that integrate land, sea and air trans portsystems. The Trans-European Transport Network(TEN-T) has constituted a key element in boostingcompetitiveness and employment through a betterconnectivity that allows goods and people to circulatequickly and easily for higher economic, social andterritorial cohesion.148 TEN-T is working to improvecitizens’ quality of life and strengthening the econ -omy by promoting sus tain able urban mobility andincreased use of clean energy-efficient vehicles.149
The regional infra struc ture looks at specific inter -modal platforms at city level for better mobility andconnectivity at different scales.
Large urban configurations in Europe haveemerged as specialized industrial and businesscentres along key trans port routes. However, theseurban configurations have populations that are lessdense than their counterparts in devel op ing regions.Many European capital cities have become so calledsupra-clusters150 of cities, with massive integratednational trans port systems and the national capitalas a hub. Eastern and Southern European city clusters
are becoming much more dispersed, taking the form of regional city dominated clusters. Cities such as Warsaw (Poland) and Moscow (Russia) haveexpanded in a concentric pattern from the historiccity centre. Moscow has many features similar toBeijing (China) and Dallas (US), with an expandingring road system and decentralized employment andresidential devel op ment.
City clustering in North American cities,particularly in the US, is the result of massive invest -ment in freeway systems and planned urban/regionaldevel op ment, with dispersed urban settlement pat -terns and specialized functions. Most cities in theselarge urban configurations have populations of over1 million, and the typical morphology is polycentricin terms of both urban form and economic structure.Most North American cities have well-establishedcentral business districts. However, an increasingproportion of economic and employment activitiesis occurring outside these areas. The Washington DC region, for example, has expanded as a large poly centric city into adjacent Maryland and Virginia.
100 Planning and Design for Sustainable Urban Mobility
Figure 5.19
Pearl River Delta
mega-region
Source: Moore amd Foster,
2011.
City clustering inNorth Americancities . . . is theresult of massiveinvestment infreeway systemsand plannedurban/regionaldevelopment
1EEE234567891012311145678920123456789301234567894012345678950123456789EEEE
101Mobility and Urban Form
Large urbanagglomerations inAsia are moredispersed and lesswell-planned
Africa has veryfew large urbanconfigurations.Those inexistence tend tobe linear alongtransportcorridors orcoastal tradingroutes . . . andmajor arterialroads betweenadjacentprovincial cities
It is made up of cluster or sub-regional global employ -ment centres located near the intersection of thebeltway and freeway systems. This is repeated incities such as Dallas, Boston, San Francisco, LosAngeles and Chicago, to name just a few.
A network of strategic highways made up of260,000 kilometres, known as the National High-way System, connects major airports, ports, rail ortruck terminals, railway stations, pipeline terminalsand other strategic trans port facilities in the US.Although the system includes 4 per cent of thenation’s roads, it carries more than 40 per cent ofthe highway traffic, 75 per cent of heavy truck trafficand 90 per cent of tourist traffic. All urban areas with a popu lation of over 50,000 and about 90 percent of America’s population live within 8 kilometresof the network, which is the longest in the world.151
Inter-city or high-speed rail systems in the US areundersized, with only one high-speed rail line inoperation. The Acela Express runs between Washing -ton and Boston via New York City (633 kilometres).As a result of the dispersed population and greatdistance between major cities, high-speed rail in theUS is of less value than air or car travel. In com -parison, China with its high population densities hasa high-speed railway network that spans over morethan 8300 kilometres already in service, and about17,000 kilometres under construction.152
Large urban agglomerations in Asia are moredispersed and less well planned. Densities of largeurban agglomerations in newly industrialized coun -tries are typically much higher – over 15,000 personsper square kilometre – but in city regions, they can be twice as high, particularly in inner-city areas.Large urban configurations are becoming morespecialized, including industrial cluster devel op ment(high technology and traditional manufacturing) and services (health, technology and transport). Thereis significant variance in the city cluster devel op-ment in Asian sub-regions. The lack of basic services,over crowding and high levels of congestion andpollution in South, Central and South-Eastern Asia have led to a dispersed pattern of urban city clusterdevel op ment, with industrial/commercial devel op -ment moving out from the congested inner-city areas. Cities in these sub-regions are becoming much bigger, more decentralized and specialized.Some cities, such as Manila (the Philippines), Delhi(India) and Kuala Lumpur (Malaysia), have welldeveloped sub-metropolitan centres of employment,including commercial centres and large export enter -prise zones. However, the links and integration oftrans portation systems and services between thecity centres are poor. Uncontrolled leapfrogging ofurban devel op ment and satellite city devel opment has occurred unabatedly in most cities in thesesub-regions. As a result, urban densities across thesecity clusters are rapidly declining, with some cities
record ing annual decreases in density rates of morethan 3 per cent.153
Based on the regional planning principle to uselarge cities to drive the devel op ment of small cities,China has pursued its strategy of spatial concen-tration of urban population and industries. Clusters of cities are grouped along the horizontal axes ofLonghai Railway (Lianyungang–Lanzhou) and thecoastal area of China, along Beijing–Guangzhou andBeijing–Harbin Railways and Baotou–Kunming trans -portation corridors, respectively. Africa has very fewlarge urban configurations. Those in existence tendto be linear along trans port corridors or coastaltrading routes (e.g. the Abidjan (Côte d’Ivoire)–Accra (Ghana)–Lagos (Nigeria) corridor) and majorarterial roads between adjacent provincial cities(Johannesburg–Pretoria, South Africa, and Lagos–Ibadan, Nigeria). The Abidjan–Lagos coastal corridor(998 kilometres) links some of the largest andeconomically most dynamic capitals in Africa, suchas Abidjan, Accra, Lomé, Cotonou and Lagos. The cor -ridor serves a population of over 35 million peoplewith up to 10,000 people and several thousandvehicles crossing borders daily, accounting for thehighest traffic in West and Central Africa.154 Thesecorridors are not properly planned. As a result, trans -port services are poor and so are infra struc ture andtrans port logistics. Employment in these areas isdriven primarily by trading, natural resources and low-level services. The typical pattern combines highpopulation density in inner cities and low densitiesin outer areas. Eastern, Middle and Southern Africanlarge urban agglomerations tend to form into low-density urban cluster devel op ment, dispersed overlarge peri-urban areas. This results in poor connec -tivity and nascent trans port infra struc ture.
Despite having the highest proportion of urbanpopulation in the world, Latin American and theCarib bean region has very few large urban con figura -tions. Initially, the historic pattern of urbanizationwas monocentric. However, with the devel op mentof secondary cities and better connectivity, a citycluster pattern has emerged resulting in a polycentricurban growth. Recently, a small number of mega-regions have emerged, such as the one that stretchesfrom São Paulo to Rio de Janeiro (Brazil) that is hometo 43 million people. This mega-region is mainlyserved by road and commercial flights, though thereis a project to develop a high-speed train in the nearfuture. City regions such as Rio de Janeiro, Santiago(Chile) and Caracas (Venezuela) are constrained byphysical geography, leading to spillover corridordevel op ment along valleys and inter-provincialhighways. Various other large cities are growing ina diffuse, low-density pattern with peripheral indus -trial devel op ment and housing.
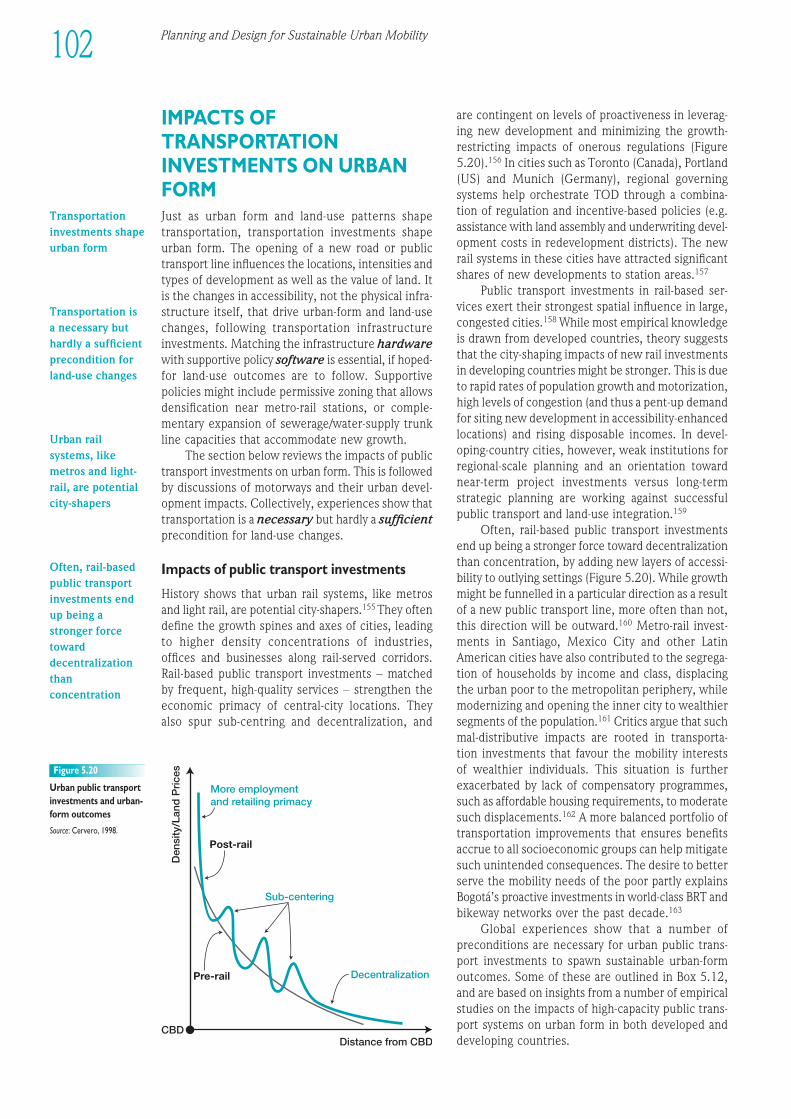
IMPACTS OFTRANSPORTATIONINVESTMENTS ON URBANFORMJust as urban form and land-use patterns shapetransportation, transportation investments shapeurban form. The opening of a new road or publictrans port line influences the locations, intensities andtypes of devel op ment as well as the value of land. Itis the changes in accessibility, not the physical infra -struc ture itself, that drive urban-form and land-usechanges, following transportation infra struc tureinvestments. Matching the infra struc ture hardwarewith supportive policy software is essential, if hoped-for land-use outcomes are to follow. Supportivepolicies might include permissive zoning that allowsdensification near metro-rail stations, or comple -men tary expansion of sewerage/water-supply trunkline capacities that accommodate new growth.
The section below reviews the impacts of publictrans port investments on urban form. This is followedby discussions of motorways and their urban devel -op ment impacts. Collectively, experi ences show thattransportation is a necessary but hardly a sufficientprecondition for land-use changes.
Impacts of public trans port investments
History shows that urban rail systems, like metrosand light rail, are potential city-shapers.155 They oftendefine the growth spines and axes of cities, leadingto higher density concentrations of industries, offices and businesses along rail-served corridors. Rail-based public trans port investments – matchedby frequent, high-quality services – strengthen theeconomic primacy of central-city locations. They also spur sub-centring and decentralization, and
are contingent on levels of proactiveness in leverag-ing new devel opment and minimizing the growth-restricting im pacts of onerous regulations (Figure5.20).156 In cities such as Toronto (Canada), Portland(US) and Munich (Germany), regional governingsystems help orchestrate TOD through a combina-tion of regulation and incentive-based policies (e.g.assistance with land assembly and underwriting devel -op ment costs in redevel op ment districts). The newrail systems in these cities have attracted significantshares of new devel op ments to station areas.157
Public trans port investments in rail-based ser -vices exert their strongest spatial influence in large,congested cities.158 While most empirical know ledgeis drawn from developed countries, theory suggeststhat the city-shaping impacts of new rail investmentsin devel op ing countries might be stronger. This is dueto rapid rates of population growth and motorization,high levels of congestion (and thus a pent-up demandfor siting new devel op ment in accessibility-enhancedlocations) and rising dispos able incomes. In devel -oping-country cities, however, weak institutions forregional-scale planning and an orienta tion towardnear-term project invest ments versus long-termstrategic planning are working against successfulpublic trans port and land-use integration.159
Often, rail-based public trans port investmentsend up being a stronger force toward decentralizationthan concentration, by adding new layers of accessi -bility to outlying settings (Figure 5.20). While growthmight be funnelled in a particular direction as a resultof a new public trans port line, more often than not,this direction will be outward.160 Metro-rail invest -ments in Santiago, Mexico City and other LatinAmerican cities have also contributed to the segrega-tion of households by income and class, displacingthe urban poor to the metropolitan periphery, whilemodernizing and opening the inner city to wealthiersegments of the population.161 Critics argue that suchmal-distributive impacts are rooted in transporta-tion investments that favour the mobility interestsof wealthier individuals. This situation is furtherexacerbated by lack of compensatory programmes,such as affordable housing requirements, to moderatesuch displacements.162 A more balanced portfolio oftransportation improvements that ensures benefitsaccrue to all socioeconomic groups can help mitigatesuch unintended consequences. The desire to betterserve the mobility needs of the poor partly explainsBogotá’s proactive investments in world-class BRT andbikeway networks over the past decade.163
Global experi ences show that a number ofpreconditions are necessary for urban public trans -port investments to spawn sus tain able urban-formoutcomes. Some of these are outlined in Box 5.12,and are based on insights from a number of empiricalstudies on the impacts of high-capacity public trans -port systems on urban form in both developed anddevel op ing countries.
Den
sity
/Lan
d P
rice
s
Distance from CBDCBD
Post-rail
Pre-rail
More employmentand retailing primacy
Sub-centering
Decentralization
Figure 5.20
Urban public trans portinvestments and urban-form outcomes
Source: Cervero, 1998.
102 Planning and Design for Sustainable Urban Mobility
Transportationinvestments shapeurban form
Transportation isa necessary buthardly a sufficientprecondition forland-use changes
Urban railsystems, likemetros and light-rail, are potentialcity-shapers
Often, rail-basedpublic transportinvestments endup being astronger forcetowarddecentralizationthanconcentration
Public trans port and land priceappreciation
Accessibility benefits conferred by rail systems getcapitalized into land prices. Higher values of rail-served parcels in turn exert market pressures tointensify land devel op ment. Land-value premiums ofcommercial parcels within walking distance of metro-rail stations are sometimes as high as 100 per centin the downtowns of some large cities.164 A surveyof 150 rail projects in the US, UK and Europe foundthat public trans port services generated posi tiveeffects on residential as well as commercial prop er -
ties, though the magnitude of impacts varied con -siderably.165 When rail investments are carefully co -ordinated with land devel op ment through public–private partner ships, as in Portland, Oregon, theresults can be dramatic and catalytic. Portland’s eastand west light rail lines attracted over US$2.4 billionin investment within walking distance of theirstations.166 The city’s new streetcar line through themixed residential-commercial Pearl District triggeredUS$2.3 billion in private investments. According toestimates, every dollar in public investment in publictrans port lever aged US$31 in private investments inPortland.167
1EEE234567891012311145678920123456789301234567894012345678950123456789EEEE
103Mobility and Urban Form
Proactive planning is necessary if decentralized growth isto take the form of sub-centres. Whether decentralizedgrowth takes a multi-centred form rests largely with thedegree of public commitment to strategic station-areaplanning, carried out on a regional scale. Experi ences in citiessuch as Toronto (Canada), Stockholm (Sweden), Munich(Germany), Hong Kong (China) and Singapore show that anaggressive stand to leverage the benefits of rail services canlead to more concentrated forms of decentralized growth.Given public-resource commitments, railways and busways do not only strengthen the core but also produce multiplesub-centres.
Railways and busways can spur central-city redevel op ment under the right conditions. When govern ment agencies are willing to absorb some of the risks inherent in redevel op ing economically stagnant neigh bour hoods, public trans port can help attract privatecapital and breathe new life into struggling areas, as revealed in large cities such as Tokyo (Japan), Hong Kong (China),London (UK), San Francisco Bay Area and metropolitanWashington (US).
Other pro-devel op ment measures must accompany publictrans port investments. In addition to finan cial incentives,experi ences show that supportive policies and public actionsmust be in place to leverage land devel op ment. Foremostamong these are:
• permissive and incentive zoning (e.g. density bonuses);• the availability of nearby vacant or easy-to-assemble and
developable parcels;• support for land-use changes among local residents (i.e.
organized opposition and NIMBY forces);• a hospitable physical setting (in terms of aesthetics, ease of
pedestrian circulation and a healthy neigh bour hood image);• complementary public improvements (e.g. upgrading of
sidewalks, expansion of water and sanitation trunk-linecapacities and burying utilities);
• an absence of physical constraints (e.g. pre-emption of landdevel op ment by park-and-ride lots or the siting of a stationin a busy freeway median).
Public trans port service incentives and private car‘equalizers’ (disincentives)a help induce station-area land-use changes. The provision of frequent and reliable rail andfeeder bus connections is needed if private capital is to beenticed to station areas. Only then will railways become time-competitive with the private car. Such pro-public trans portmeasures often need to be accompanied by ‘equalizer’ policiesa that remove many of the built-in incentives to drive,such as the availability of plentiful, low-cost parking.Congestion pricing in Singapore, Stockholm (Sweden) andLondon (UK) partly explains why railway services in thesecities are heavily patronized and not unrelated, and why newland devel op ment is occurring around these cities’ rail stations.The combination of TOD and transportation demandmanagement can be especially powerful, yielding synergisticbenefits, as suggested by experi ences in Singapore,Copenhagen (Denmark), Stockholm and Ottawa (Canada).
Network effects matter. For fixed-guideway public trans portsystems (e.g. railways and BRT systems with exclusive rights ofway) to induce large-scale land-use changes, it is essential thatthey mimic the geographic coverage and regional accessibilityof their chief competitors, limited-access freeways andhighways. Good intermodal connections between high-capacitypublic trans port systems and secondary systems, like bus andparatransit feeders, serve to extend the spatial reach ofbackbone systems. The strong city-shaping influences ofmetros in Paris (France), London (UK) and Tokyo (Japan) are,to a large extent, a result of such network effects, whereinrailways serve shares of origin-destination combinations thatare comparable to freeway and motorway networks. Theaddition of a new railway or BRT line creates spillovers andsynergies, benefiting not only the newly served corridors butexisting ones as well. For existing metro lines, newly openedlines increase the number of regional origin-destinationcombinations that can be served.
Note: a The term ‘equalizer’ is preferred to ‘disincentive’ as such policies are notpunitive, and aim to ‘level the playing field’ so as to remove any unfair advantages toprivate car travel.
Sources: Knight and Trygg, 1977; Pucher and Lefèvre, 1996; Cervero, 1998; Cerveroet al, 2005; Mees, 2009; Suzuki et al, 2013.
Box 5.12 Prerequisites to urban-form changes
Accessibilitybenefits conferredby rail systems getcapitalized intoland prices
104 Planning and Design for Sustainable Urban Mobility
Land-value appreciation presents an opportunityto recapture the value created by public investmentsin public transport, as practiced in Hong Kong, China (Box 8.7) and Tokyo, Japan (through privaterailway consortia). Public trans port value captures notonly add revenues to the public coffers, but also bysharing the value-added from public investments, landspecula tion is reduced. In Hong Kong, the ‘Rail+Property’ approach also creates market demand thatensures high-ridership services.168 Hong Kong’sversion of public–private partnership is not about off-loading the cost of building railways to the private sector. Rather, it is about ‘co-devel op ment’– each sector bringing a natural advantage to the table (e.g. land acquisition powers in the case of the public sector; access to equity capital in the caseof the private sector). The resulting ‘win–win’ situ -ation leads to finan cially viable investments and anintimate connection between rail systems and nearbyreal-estate devel op ment that attracts tenants, newinves tors and public trans port riders. Public-trans portjoint devel op ments (e.g. the leasing of air rightsabove metro-rail stations to private developers) areanother way to finan cially capitalize on the accessi -bility benefits conferred by public rail investments.169
Bus-based public trans port and urban-form adjustments
Conventional wisdom holds that traditional busservices have imperceptible influences on urbanform and land-use patterns because, in contrast tomany rail systems, they fail to deliver appreciableaccessibility benefits. This is especially the case indeveloped countries where high levels of private carownership mean conventional buses are considerablyslower than cars for the vast majority of trips. Theability to alter bus service levels, change bus routing,as well as the stigma attached to the low-incomestatus of bus patrons, most likely suppress the land-devel op ment impacts of conventional busservices. An exception, however, is BRT whereinbuses are provided with an exclusive, dedicated lane,which significantly improves the quality of service.BRT investments in Ottawa (Canada), Pittsburgh(US), Brisbane (Australia) and Curitiba (Brazil)generated land-use benefits that were as large asthose that would have been created by railway invest -ments.170 Thus, it is not public trans port ‘hardware’– i.e. steel-wheel trains or rubber-tire buses – thatunleash land-use changes, but rather the quality of service and more specifically, the comparativetravel-time savings of taking public trans port vis-à-vis the private car.
As with rail, where BRT investments havetriggered land intensification, property markets have responded. Significant land price increases have also been recorded near BRT stops in Bogotá(Colom bia), Seoul (Republic of Korea), Brisbane(Australia) and Los Angeles (US).171 One study
re vealed that multi-family housing units within five-minutes walking distance of Bogotá’s TransMilenioBRT, were rented for appreciably more per squaremetre than those units located farther away.172
Pedestrian-friendly environ ments near TransMileniostops, further increased land-value benefits.173
Bogotá’s Trans Milenio has also enjoyed networkeffects: the addi tion of new TransMilenio linesincreased housing rents for currently served resi -dences more than opening new lines to previouslyunserved ones.174 Such land-value appreciationscreate opportunities for value capture, just as withurban rail systems. Bogotá practices value capture tofinance urban infra struc ture under a programmecalled Plusvalia, however implementation problems– including high revenue collection costs and chargesof assessment biases and institutional corruption –have undermined the pro gramme.175 More successfulhas been Ahmeda bad’s programme of exactingsurcharges from landholders, for the right to increasetheir building densities by up to 30 per cent, alongthe 89-kilometre Janmarg BRT system in India. Someof the funds received are channelled towards buildingaffordable housing, particularly for low-incomehouseholds displaced by BRT expansion. In addition,the construction of parallel cycle tracks to theJanmarg BRT is helping to create multi-modalcorridors and an ethos of ‘complete streets’ in theminds of system designers and local citizens.176
Impacts of motorways
Motorways generally exert stronger influences onurban form than public trans port lines.177 Sinceaccess is nearly ubiquitous with a car-based system,activities tend to be dispersed and segregated. USmetropolises such as Los Angeles and Phoenix aretestaments to the sprawling effects of motorways.Like a rail system, whatever clustering and agglom -eration occurs tends to be around freeway inter -changes – e.g. shopping malls and large stand-aloneretail outlets. Also, impacts are often context specific,shaped by the permissiveness of land-use regula-tions and local real estate market demands. Otherimpacts include the institutional capacity to sup -plement roadways with other supportive infra struc -ture to accom modate new growth, and the ability tomoderate potential neigh bour hood opposition tonearby infra struc ture investments.
Worldwide, the impacts of new roads may varyconsiderably. In poorer countries, road investmentsgenerate new economic growth, opening access tonew markets and expanding trade-sheds. Developedcountries, by contrast, experi ence impacts that arelargely redistributive, hence shifting growth thatmight otherwise occur in some settings to newlyserved highway settings.178 This is mainly due to thefact that accessibility levels are usually already so highin developed settings that the economic impacts ofany new highway tend to be marginal.
Motorwaysgenerally exertstrongerinfluences onurban form thanpublic transportlines
In poorercountries, roadinvestmentsgenerate neweconomic growth,opening access tonew markets andexpanding trade-sheds
Public transportvalue captures notonly add revenuesto the publiccoffers, but also . . . [reduces] landspeculation
1EEE234567891012311145678920123456789301234567894012345678950123456789EEEE
105Mobility and Urban Form
CONCLUDING REMARKSAND LESSONS FOR POLICYA paradigm shift is occurring in the relationshipbetween transportation systems, mobility and cities.Public-policy turnarounds, like the removal ofelevated freeways, the building of high-rise downtowntowers interlaced by great pedestrian infra struc-ture and transit-oriented corridors, all recognize thattravel is a ‘derived demand’ – secondary to theprimary objective of connecting people and places.As long as transportation is rightfully cast as a meansto an end, and not an end in and of itself, policiescan be put into place that enhance mobility whileavoiding (or at least reducing) negative externalitiesand promoting community stability and cohesion.
Urban form is principally a product of thedominant transportation system in place during the period of a region’s prevailing growth. Cities thatgrew rapidly when high-capacity public trans portsystems were being built, such as Toronto (Canada)and Curitiba (Brazil) have high-density and lineal builtforms. Those that sprouted at the time when free-ways were being built – such as in Phoenix andHouston (US) – have low-density, autocentric layouts.As cities develop and prosper in devel op ing coun-tries, unprecedented opportunities will arise forlinking land devel op ment and trans port infra struc -ture. While levels of motorization are stabilizing in developed countries, they are increasing rapidlyelsewhere. Given the fact that a vast majority offuture urban growth is projected for cities with acurrent population of less than 500,000 inhabitants,a bus-based form of smaller scale TOD interlaced by high-quality infra struc ture for pedestrians andcyclists may be appropriate in many urban settings.Cities introducing railway and BRT solutions arebound to trigger meaningful land-use changes,including rapid growth and rising real incomes. This,of course, assumes there is supportive planning andzoning, public-sector leveraging and risk sharing, acommitment to travel-demand management toremove many built-in incentives to car use, and thecapacity to manage the land-use shifts that are putinto motion by transportation infra struc tureinvestments.
There are signs that cities in different parts ofthe world are moving towards the devel op ment of more compact forms. Numerous cities have un -veiled devel op ment plans that emphasize urbandesigns that shorten trips, create complete streets,encourage mixed-use devel op ments and make cities more liveable.179 Globally, there is a growingappreciation in various devel op ing-country cities that integrated trans port and land-use planning iscritical toward future economic success, more equit -able devel op ment and environ mentally sus tain ablesolutions.
Global experi ences reveal that a cogent regionalvision helps considerably in ensuring transporta-tion investments produce desired urban-form out -comes. Visions need visionaries, such as Curitiba’sJaime Lerner, Bogotá’s Enrique Peñalosa and Seoul’sMyong-Bak Lee. However, visions are malleable, andare therefore subject to change as realities unfold.Often, cities are path dependent in their spatialevolutions, thus breaking away from established prac -tices can be difficult and slow. Traditionally, high -ways were built to serve urban sprawl, which in turnrequires the construction of more highways. Thisvicious cycle of road construction and urban growthfeeding off each other is often difficult to break.Accordingly, sustained leadership in working towarda common urban-form visionary becomes all themore crucial.
While the importance of linking land use and cityform to transportation and mobility is increasinglyrecognized, moving from rhetoric to reality is notalways easy. The list of true success stories is quiteshort. Whereas the experi ences of Curitiba (Brazil),Portland (US), Singapore, Copenhagen (Denmark)and Stockholm (Sweden) are well-chronicled, thereis a need for best-case practices that are directlyapplicable and relevant to the unique problems ofcities in devel op ing countries. Another notable gapis the limited knowledge about the influences of‘goods movements’ on urban devel op ment patternsand vice versa. The siting of large warehouse distri -bution complexes on urban peripheries no doubtcontributes to sprawl. As noted in Chapter 4, thespatial needs for goods handling and freight terminals,warehousing, commercial markets and the array offormal and informal delivery carriers are rarely givendue priority in urban planning. Opportunities existfor improving urban logistics, such as the creationof freight consolidation centres on the periphery thatallow a single truck to deliver goods to multipledestinations. Compact, mixed-use devel op ment,moreover, can promote efficient urban logistics byallowing few-stop deliveries.
The integration of transportation, city form andfunction and mobility strategies are not, in and ofthemselves, a panacea to the multitude of problemsfacing today’s major cities. Transportation and land-use integration, with the devel op ment of more sus -tain able densities in strategic locations, is but oneof a number of strategies that must be pursued ifsubstantial headway is to be made in shrinking thetrans port sector’s ecological footprint. In addition tothe environ mental dividends of improved trans -portation and land-use integration, there are otherreasons – such as social inclusion, economic growthand municipal cost savings – for creating moreaccessible, more liveable and less car-dependentcities of the future. Such issues are discussed in thenext three chapters of this report.
As cities developand prosper indevelopingcountries,unprecedentedopportunities willarise for linkingland developmentand transportinfrastructure
A bus-based formof smaller scaleTOD interlaced byhigh-qualityinfrastructure forpedestrians andcyclists may beappropriate inmany urbansettings
A cogent regionalvision helpsconsiderably inensuringtransportationinvestmentsproduce desiredurban-formoutcomes
The importance oflinking land-useand city form totransportation andmobility isincreasinglyrecognized
NOTES1 In this report, the term ‘urban
form’ is used broadly to expressthe physical layout, design, spaceand morphology of cities,including buildings, roads andstreets. It represents the spatialconfiguration of a city and, asdiscussed throughout thechapter, is both shaped by andgives form to transportationinfra struc ture and services. The term ‘built environ ment’ isoften used to reflect the manyphysical dimensions of a city andits neigh bour hoods thatinfluence travel. In this report,terms such as urban form, landuse and built environ ment areused interchangeably.
2 World Bank, 2006b, p4; UN-Habitat, 2011.
3 See Box 5.3.4 Rusche, 2010.5 Condon, 2008.6 Calthorpe, 2011.7 Burchell, 2005.8 Osman et al, 2008.9 Gakenheimer, 2011.
10 Infonavit, 2011.11 Levine, 2006; Shoup, 2005;
Davis et al, 2012.12 UN-Habitat, 2010.13 El-Geneidy et al, 2011;
UN-Habitat, 2010.14 Sandhu and Sandhu, 2007.15 UN-Habitat database.16 Angel et al, 2005.17 Angel, 2011.18 Angel et al, 2005.19 Hall, 1996.20 Muller, 2004; Angel, 2011.21 Muller, 2004.22 Muller, 2004; Schaeffer and
Sclar, 1980.23 Calthorpe and Fulton, 2001.24 Giuliano, 2004.25 Hoyt, 1939.26 Newman and Kenworthy, 1989.27 Kenworthy and Laube, 1999.28 Ewing and Cervero, 2010;
Banister, 2005.29 Minadali et al, 2004.30 Holtzclaw et al, 2002; National
Research Council, 2009.31 Zegras, 2010; Zhao, 2011;
Sager et al, 2011.32 Krizek, 2003.33 Cao et al, 2009.34 Anas et al, 1998.35 Downs, 2004; Cervero, 1998.36 Angel et al, 2010; Angel, 2011.37 Angel, 2011.38 Bertaud, 2001; Giuliano, 2004.39 Calthorpe, 2011.40 Angel, 2011.41 IBM, 2010 and 2011.42 Gwilliam, 2002.43 Bettencourt et al, 2010;
Echenique et al, 2012.44 Meyer et al, 1965, p246.45 Bertaud and Richardson, 2004;
Lefèvre, 2009.46 Newman et al, 2009; Banister,
2008.47 Newman et al, 2009; Rudlin
and Falk, 2009.48 Milakis et al, 2008.49 Guerra and Cervero, 2011.50 Calthorpe, 2011; Vuchic, 2007;
Walker, 2011.51 By 3 per cent according to
one US study (Cervero, 1996).52 Muller, 2004; Cervero, 1998.53 Cervero, 1997.54 Krels, 2007.55 Cervero, 1998.56 Municipality of Ottawa, 2007.57 Municipality of Ottawa, 2008.58 Giuliano, 2004; Banister,
2005.59 UN-Habitat, 2009, p29.60 Santacana, 2000; Marshall,
2000.61 Barcelona City Council, 2006.62 UN-Habitat, 2009.63 Lefèvre, 2009.64 Swamy et al, 2012.65 UN-Habitat, 2013b.66 UN-Habitat, 2013b.67 Ewing and Cervero, 2010.68 Cervero and Kockelman,
1997; Ewing and Cervero, 2001; Ewing and Cervero, 2010.
69 Naess, 2001.70 Potter, 1984; Haq, 1997.71 Foletta, 2011.72 Zegras and Hannan, 2011.73 Cervero et al, 2009.74 Cervero et al, 2009; Rodriquez
et al, 2009; Estupiñán andRodriquez, 2008.
75 Zhang, 2004; Lin and Yang,2009.
76 Lotfi and Koohsari, 2011.77 Meleis, 2011.78 Brownson et al, 2001;
Ainsworth et al, 2007.79 Jacobs, 1961.80 Tarazona, 2008.81 World Economic Forum,
2012.82 Swamy et al, 2012.83 Pan et al, 2009.84 Li and Siu, 2001.85 Cervero and Day, 2008.86 Pan et al, 2009.87 Muller, 2004; Warner,
1962.88 Calthorpe, 1993; Katz,
1994; Kunstler, 1994.89 Haas, 2008.90 Duany et al, 2000; Kunstler,
1998; Talen, 2005.91 http://en.wikipedia.org/wiki/
New_urbanism, last accessed 6 May 2013.
92 Watson et al, 2004.93 http://en.wikipedia.org/wiki/
New_Urbanism, last accessed 6 May 2013.
94 Ewing and Cervero, 2010.95 Khattak and Rodriquez, 2005.96 Calthorpe, 1993; Bernick and
Cervero, 1997.97 Cervero et al, 2005.98 Calthorpe, 1993; Bernick and
Cervero, 1997; Bertolini andSpit, 1998.
99 Vuchic, 2007; Walker, 2011.100 Cervero, 2009; Cervero and
Murakami, 2009; Li and Huang, 2010.
101 Zhang, 2007.102 Zhang, 2007.103 Liu and Zhang, 2004.104 Zhang, 2007.105 Cervero, 2008.106 Lund et al, 2006; Arrington and
Cervero 2008.107 Cervero, 1998; Yang and Lew,
2009; Chorus, 2009.108 Cervero and Day, 2008.109 Cervero, 2007; Kolko 2011;
Guerra et al, 2012.110 Banister, 2005; Banister, 2008;
Dupuy, 2011.111 Button, 2010, p270.112 http://en.wikipedia.org/wiki/
List_of_car-free_places, lastaccessed 6 May 2013.
113 Hass-Klau, 1990 and 1993.114 Goodwin et al, 1998.115 Williams, 2000, p2.116 Moore et al, 2007.117 Williams, 2000; Ewing, 1995.118 Cervero, 2002.119 Boarnet, 1997; Krugman, 1991;
Fujita et al, 1999; Bhatta andDrennan, 2003.
120 Storeygard, 2011; Buys et al,2010.
121 Storeygard, 2011.122 Buys et al, 2010.123 Boarnet, 1997; Cervero, 2002.124 Deakin, 1989.125 Teravaninthorn and Raballand,
2009; UN-ESCAP, 2006a.126 Williams, 2000.127 Poole and Orski, 2003.128 Ferrell et al, 2012.129 Cervero, 1998.130 Moore et al, 2007; Ferrell et al,
2012.131 See also Chapter 9.132 McKinsey and Company,
2008.133 Duarte and Ultramari, 2012.134 Cervero, 2009; Suzuki et al,
2010.135 Cervero, 2009.136 Santos, 2011.137 Suzuki et al, 2010.138 Santos, 2011; Suzuki et al,
2010.
139 The Institute for Research andUrban Planning (IPUCC).
140 Lubow, 2007.141 Duarte and Ultramari, 2012.142 Duarte and Rojas, 2012.143 Roberts, 2012; Howard, 1898.144 den Hartog, 2009.145 Vedula, 2007.146 UN-Habitat, 2012.147 UN-Habitat, 2012.148 EC, 2012.149 EC, 2012.150 Roberts, 2012.151 US Department of
Transportation, 2009.152 http://en.wikipedia.org/wiki/
High-speed_rail_by_country#United_States, last accessed 7 May 2013.
153 Roberts and Kanaley, 2006.154 World Bank Ghana Office,
2010.155 Muller, 2004.156 Cervero and Landis, 1997;
Bollinger and Ihlandfelt, 1997;Giuliano, 2004.
157 Cervero and Seskin, 1995;Cervero, 1998.
158 Thomson, 1977; Cervero, 1998;Giuliano, 2004.
159 Gakenheimer, 2011; Suzuki et al, 2013.
160 Institution of Civil Engineers,1990; Allport, 2011.
161 Figueroa, 1990; Gwilliam, 2002.
162 Vasconcellos, 2001.163 Peñalosa, 2002; Cervero,
2005b.164 Cervero, 1998.165 RICS, 2002.166 Calthorpe, 2011.167 Calthorpe, 2011.168 Cervero and Murakami, 2009.169 Cervero et al, 2005; Smith
and Gihring, 2006; Center forTransit-Oriented Devel op ment,2008.
170 Levinson et al, 2003.171 Rodriquez and Targa, 2004;
Cervero, 2006; Estupiñán andRodriquez, 2008.
172 Rodriquez and Targa, 2004.173 Estupiñán and Rodriquez,
2008.174 Rodriquez and Mojica, 2009.175 Rodriquez, 2012.176 Centre of Excellence in Urban
Transport, 2012; Suzuki et al,2013.
177 Giuliano, 2004; Boarnet, 1997.178 Boarnet, 1998; Boarnet and
Haughwout, 2000; Boarnet andChalermpong, 2001.
179 Bangkok MetropolitanAdministration, 2010.
106 Planning and Design for Sustainable Urban Mobility
EQUITABLE ACCESS TO URBAN MOBILITY
C H A P T E R 6Mobility is a social and economic need. The avail -ability of trans port options, and the way they aredelivered, can present major challenges to themobility of many residents in today’s cities. Invest -ments in urban trans port infra struc ture do little toalleviate the mobility difficulties of the urban pooror other vulnerable and dis advan taged groups if theservices provided are unaffordable or physicallyinaccessible. Such barriers contribute to socio-spatialinequities in urban areas, including discriminationagainst vulnerable and dis advan taged groups. Thesebarriers are not only fiscal or technical in nature, butarise from political, social and institutional factors thatprevent progress towards socially sus tain able urbanmobility systems. Thus, this chapter focuses on theaspects of urban mobility that relate to providingaffordable access to opportunities, minimizing socialexclusion and improving the quality of life for all.
In recent years, trans port policy has begun tofocus more intently on new assessment and evalu -ation regimes, to better articulate the impacts oftrans port investments. Whereas trans port projectsundergo environ mental and economic impact assess -ments, the application of social impact assess mentsis relatively less advanced.1 Integrating social dimen -sions throughout the lifecycle of trans port projectsenhances their potential to bring life-changingbenefits to the end users, while reducing the risk ofnegative social outcomes.2 The additional effortinvested in social analysis can bring disproportionatereturns: projects that are more appropriate, sus tain -able, safe and high quality, and that enhance com -munity engagement and participation.
As city mobility systems become increasinglymotorized, travellers are vulnerable to traffic-relatedconflicts and accidents, congestion, as well as thecosts of motorized transport, while penalizing thosewho cannot afford a car. Without a good publictrans portation system, travellers face a complextrade-off between shelter security, travel distance andtravel mode.3 At the same time, non-motorized roadusers (primarily pedestrians and cyclists) and public
trans port users – particularly in devel op ing countries– are often overlooked in the design and modern -ization of transportation infra struc ture.4
As noted in Chapter 1, the main purpose ofurban mobility systems is to provide access to basic goods, services and activities – such as work,education, medical care, shopping, socializing – andto enable people to participate in civic life. TheHabitat Agenda explicitly calls for full accessibility towork, goods and services – to affordable public trans -port – including for those belonging to vulnerableand dis advan taged groups, stressing that priorityshould be given to the needs of women and children‘who often bear the greatest burden of poverty’.5 Yet,in reality, people and communities do not have equalaccess to urban opportunities. The unequal accessper se is not necessarily problematic, however, thedistribution of impacts (benefits, dis advan tages andcosts) can be considered ‘unfair’, in which case thisbecomes an issue of social equity. Considerations ofequity in urban mobility systems frequently analysedisparities in access to urban opportunities, as wellas disparities in income and travel-related costs. Inlight of these challenges, the satisfaction of themobility needs of all groups of society is a necessarycondition for supporting equal chances in life.6
Ultimately, restrictions in access to urban oppor -tunities may imply an abuse of human rights, mostnotably economic, social and cultural rights (such asthe rights to free choice of employment; the rightto public health, medical care, social security andsocial services; the right to education and training;and the right to equal participation in culturalactivities) and the right of access to any place orservice intended for use by the general public.
This daunting information raises the question:what do we mean by socially sus tain able urbanmobility? As there are competing perceptions andapplications of ‘social sus tain ability’,7 some cities optfor a single, encompassing definition that deniesmuch of the concept’s complexity. Additionally,translating the complex subjective, qualitative and
1EEE234567891012311145678920123456789301234567894012345678950123456789EEEE
The availability oftransport options,and the way theyare delivered, canpresent majorchallenges to themobility of manyresidents intoday’s cities
In reality, peopleand communitiesdo not have equalaccess to urbanopportunities
Affordability refers to the extent to which the finan cial costof journeys puts an individual or household in the position ofhaving to make sacrifices to travel, or to the extent to whichthey can afford to travel when they want to.Availability of trans port is used to refer to route possibilities,timings and frequency.Accessibility describes the ease with which all categories ofpassen ger can use public transport. For example, buses withhigh steps are difficult to board, particularly if they are one-
person operated and there is no assistance. Accessibility alsoincludes ease of finding out about travel possibilities, i.e. theinformation function.Acceptability is another important quality of public transport,either because of the trans port or the standards of thetraveller. For example, travellers may be deterred from usingpublic trans port due to lack of personal security on buses andtrains.Source: Carruthers et al, 2005.
Box 6.1 Understanding the parameters of urban transport
political dimensions of social sus tain ability into easy-to-measure quantitative indicators is complicated (atbest).8 In order to produce meaningful results,metrics must be tailored to reflect unique socio-cultural characteristics of contexts and locations,hindering the adoption of any one common measure -ment. Nonetheless, it is important to consider theelements of social sus tain ability in any evaluation ofmobility modes, since these social implications affectbehavioural choices, which are ultimately responsiblefor the success or failure of any urban mobilitysystem.
Meeting the mobility needs of burgeoning urbanpopulations in a socially inclusive (and equitable)manner will not be an easy task. The most criticalchallenge is the heterogeneity of urban populationsand the spatial dispersion of social and economicactivities. The best way to meet the mobility needsof the poor and vulnerable and dis advan taged groupsis to provide adequate public trans port and appro -priate infra struc ture for non-motorized modes oftravel. Further more, improved urban planning, newtechnologies and infra struc ture measures are needed.Notably, emphasis should be placed on moving peopleand goods, freely and safely, and facilitating equitableaccess to services.
This chapter documents global trends, conditionsand challenges with respect to equitable access tourban mobility. It highlights actual and potentialpolicy responses and practices that may addresssocial equity and enhance social sus tain ability inurban mobility systems. The first section discussesaffordability as an important aspect of equitableaccess. It notes that trans port expenditures affectlow-income households disproportionately. Thesecond section discusses the access of dis advan -taged groups to urban mobility systems. This providesthe necessary background to understand and accom -modate the differential mobility needs of variouspopulation segments. The third section exploresissues relating to safety and security in urban mobilitysystems. It distinguishes between the problems oftrans port safety (accidents and damages) and theproblems of trans port security (privacy and freedom
from fear). The final section provides concludingcomments and lessons for policy.
AFFORDABLE URBANMOBILITYIn order for urban mobility systems to be socially sus tain able, urban public trans port must be afford-able to the majority of the urban population, and in particular for those that have no other way oftravelling to access basic goods, services and activities.This is a critical equity objective that can reduceburdens and expand opportunities, particularly topersons who are vulnerable and/or dis advan taged.Based on the discussion in earlier chapters, thissection analyses challenges and impacts related toequitable access and public trans port affordability.It also examines policy responses designed topromote affordable transportation. It finishes bypresenting good practices and policies from aroundthe world, pointing the way towards successfultransformation of urban mobility culture.
Challenges and impacts of urban poverty
An understanding of the travel patterns of urbanpublic trans port users is required to determine theextent of their mobility challenges. The notion ofmotility implies the balance between accessibility(i.e. transportation opportunities: public trans port andother modes) and individual skills (i.e. how to usethe transportation on offer), with the user’s appro -priation of the mobility system (i.e. their experi ences,habits, perceptions and values linked to travel modeand space).9 As such, access is the most im portantfacet of motility, because it sets the scene for possiblemobility. Improved trans port connections can helpin tackling social exclusion through addressingbarriers posed by the accessibility, avail ability,acceptability, and affordability of the urbanmobility system (Box 6.1). In such cases, informationfrom and the participation of all stakeholders,throughout the planning process, is needed in thedevel op ment of mobility systems.
108 Planning and Design for Sustainable Urban Mobility
Improvedtransportconnections canhelp in tacklingsocial exclusionthroughaddressingbarriers posed bythe accessibility,availability,acceptability, andaffordability ofthe urban mobilitysystem
1EEE234567891012311145678920123456789301234567894012345678950123456789EEEE
109Equitable Access to Urban Mobility
International research into the relationshipsbetween trans port and poverty indicates that the poor are increasingly concentrated on the peripheryof urban areas.10 As a result, they travel longerdistances than many better-off groups and their needfor affordable trans port is increased. This implies thatwhere (transportation) inequities persist, theseexacerbate social exclusion and poverty, both at theindividual and at the society level. In this case,poverty is viewed as the lack of finan cial resourcesto meet basic individual or household needs, whilesocial exclusion refers to existing barriers that makeit difficult for people to participate fully in society.11
The choice of mobility mode is related to incomelevels.12 For those with low incomes there are veryfew affordable choices. As a result, in many devel -op ing countries, only a small proportion of trips areundertaken using motorized vehicles.13 The prev -alence of long walking trips indicates poor access andlack of affordable mobility options. Therefore, it isessential that pedestrians must be accounted for inany public trans port policy. In Tianjin, China, 80 percent of all commuter trips are by non-motorizedmodes, mainly bicycles.14 Cycling offers an inexpen -sive means of improving accessibility for all. In someEuropean countries, the use of bicycles as a modeof trans port is steadily increasing, both as a mainmode and as a subsidiary or feeder mode.15 However,in Africa and Latin America, it is often neglected interms of design and safety, due to negative socialrepresentations, associating bicycle use withpoverty.16
In devel op ing countries, car ownership remainsthe privilege of a small (although rapidly growing)minority. In some countries of Africa and parts of Asia,vehicle ownership rates are as low as three motorvehicles per 1000 population.17 Hence, finan ciallydeprived households depend exclusively on publictrans port (formal or informal) for motorized trips, andare exposed to the risks of increasing trans port costs.In many developed countries, the dependency onprivate motorized trans port tends to increase percapita transportation costs and reduce transporta-tion affordability.18 As most road infra struc ture issubsidized, there is no incentive for car owners toshift to cleaner travel options, as it costs so muchless to drive. Yet, urban sprawl and car-dependenturban growth continue worldwide, and can com -promise the levels of accessibility among vulnerableand dis advan taged groups, such as the elderly andchildren.19
Socioeconomic differences in travel patterns inmany developed countries (such as the UK and theUS) indicate that the poor and ethnic and otherminorities are less likely to have cars and are morelikely to travel by public transport. From Delhi toShanghai and Brussels to New York, the provision ofeconomical and convenient ‘last-mile connectivity’ –i.e. from the trip ends to the point of accessing public
trans port systems – remains a major issue ofconcern.20 Poor walking and cycling environ mentsfurther accentuate the problem for public trans portusers, particularly the disabled and elderly. In largercities, the trend is towards fixed-route bus services,which often implies that journeys become morecomplex, often involving interchanges and lengthywaiting and walking times. Evidence suggests thatpublic trans port deficiencies in urban areas have agreater impact on the poor than on other groups.21
However, the fares charged by private informaloperators are often higher than publicly operatedones, particularly if one takes into account the lackof fare integration between routes. While a passen -ger of a public trans port service may often pay a flatrate for a trip that involves several individual legs,such fare integration is rare among informal trans -port providers. Consequently, the poor are forced tocarefully prioritize their mobility needs andexpenditure.
For many urban dwellers, the cost of mobilityis very high in relation to their household incomes.In cities of devel op ing countries, between 8 and 16per cent of household income is spent on transport.Among the poorest households in large cities, thisrises to more than 25 per cent.22 Thus, the level andquality of trans port services are often lower for thosein low-income areas, where commuters are heavilydependent on public trans port for their mobilityneeds. People have little option but to endure adeteriorating service. The disproportionate finan cialburden felt by the poor in reaching job opportunitiesis not limited to devel op ing countries. Data from theUS suggest that low-income earners spend nearlytwice as much of their income reaching their placeof employment compared to the non-poor (6.1 percent versus 3.8 per cent).23
Constrained mobility is an important element ofthe social exclusion that defines urban poverty.24 Asoutlined above: without effective trans port systems,poor households are unable to access basic goods,services and activities. It is important also to considerthe flow of social capital in the form of information,news or job opportunities facilitated through trans -port networks.25 Table 6.1 illustrates how improvedmobility has a significant impact on the four majordimensions of poverty.
As indicated in Table 6.1 there are severalimportant links between trans port infra struc ture and services and different dimensions of poverty. Poor people’s lack of assets and technologies meansthat production – for the market as well as for the household – is time and energy intensive. Thegreatest proportion of the lowest productivity, mosttime-consuming work is done by women.26 Byfocusing more investment in the infra struc ture andservices used by (and appropriate to) women, their‘time poverty’ can be drastically reduced.
The provision ofeconomical andconvenient ‘last-mile connectivity’– i.e. from the tripends to the pointof accessingpublic transportsystems – remainsa major issue ofconcern
Public transportdeficiencies inurban areas have agreater impact onthe poor than onother groups
In cities ofdevelopingcountries,between 8 and 16per cent ofhousehold incomeis spent ontransport
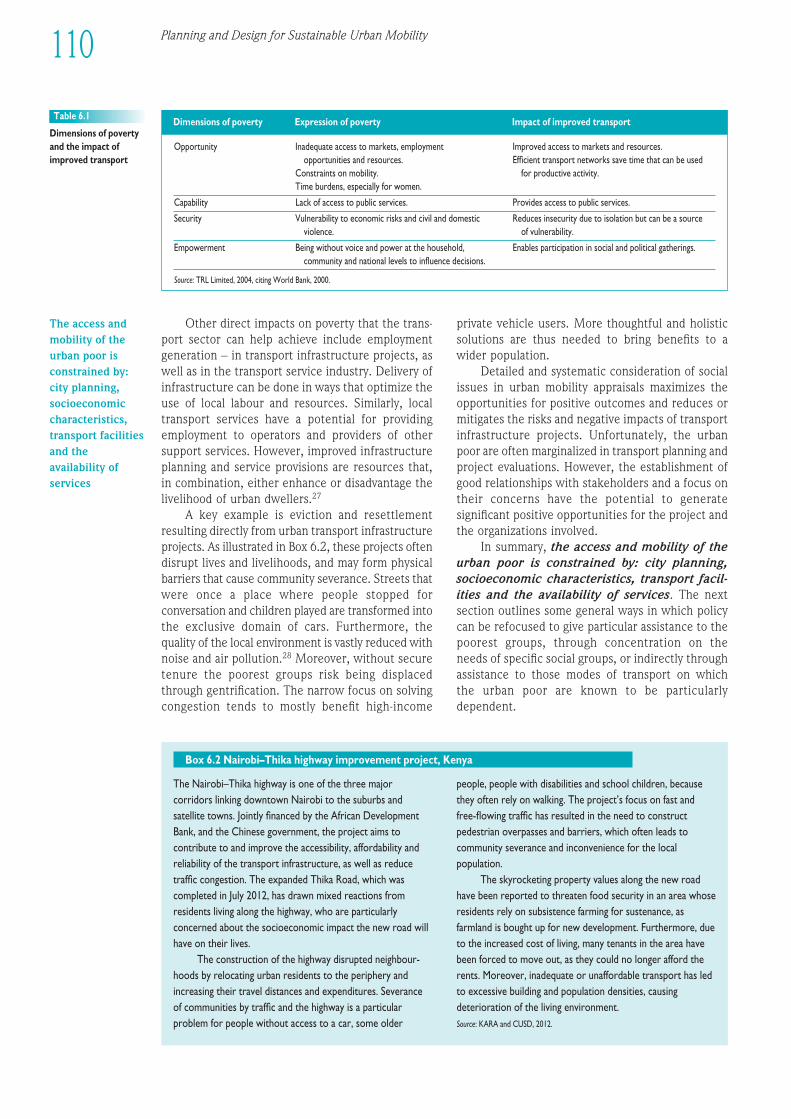
Opportunity Inadequate access to markets, employment Improved access to markets and resources.opportunities and resources. Efficient trans port networks save time that can be used
Constraints on mobility. for productive activity.Time burdens, especially for women.
Capability Lack of access to public services. Provides access to public services.
Security Vulnerability to economic risks and civil and domestic Reduces insecurity due to isolation but can be a source violence. of vulnerability.
Empowerment Being without voice and power at the household, Enables participation in social and political gatherings.community and national levels to influence decisions.
Source: TRL Limited, 2004, citing World Bank, 2000.
Table 6.1
Dimensions of povertyand the impact ofimproved transport
Dimensions of poverty Expression of poverty Impact of improved transport
The Nairobi–Thika highway is one of the three majorcorridors linking downtown Nairobi to the suburbs andsatellite towns. Jointly financed by the African Devel op mentBank, and the Chinese govern ment, the project aims tocontribute to and improve the accessibility, affordability andreliability of the trans port infra struc ture, as well as reducetraffic congestion. The expanded Thika Road, which wascompleted in July 2012, has drawn mixed reactions fromresidents living along the highway, who are particularlyconcerned about the socioeconomic impact the new road willhave on their lives.
The construction of the highway disrupted neigh bour -hoods by relocating urban residents to the periphery andincreasing their travel distances and expenditures. Severanceof communities by traffic and the highway is a particularproblem for people without access to a car, some older
people, people with disabilities and school children, becausethey often rely on walking. The project’s focus on fast andfree-flowing traffic has resulted in the need to constructpedestrian overpasses and barriers, which often leads tocommunity severance and inconvenience for the localpopulation.
The skyrocketing property values along the new roadhave been reported to threaten food security in an area whoseresidents rely on subsistence farming for sustenance, asfarmland is bought up for new devel op ment. Further more, dueto the increased cost of living, many tenants in the area havebeen forced to move out, as they could no longer afford therents. Moreover, inadequate or unaffordable trans port has ledto excessive building and population densities, causingdeterioration of the living environ ment.Source: KARA and CUSD, 2012.
Box 6.2 Nairobi–Thika highway improvement project, Kenya
Other direct impacts on poverty that the trans -port sector can help achieve include employmentgeneration – in trans port infra struc ture projects, aswell as in the trans port service industry. Delivery ofinfra struc ture can be done in ways that optimize theuse of local labour and resources. Similarly, localtrans port services have a potential for providingemployment to operators and providers of othersupport services. However, improved infra struc tureplanning and service provisions are resources that,in combination, either enhance or dis advan tage thelivelihood of urban dwellers.27
A key example is eviction and resettlementresulting directly from urban trans port infra struc tureprojects. As illustrated in Box 6.2, these projects oftendisrupt lives and livelihoods, and may form physicalbarriers that cause community severance. Streets thatwere once a place where people stopped forconversation and children played are transformed intothe exclusive domain of cars. Further more, thequality of the local environ ment is vastly reduced withnoise and air pollution.28 Moreover, without securetenure the poorest groups risk being displacedthrough gentrification. The narrow focus on solvingcongestion tends to mostly benefit high-income
private vehicle users. More thoughtful and holisticsolutions are thus needed to bring benefits to awider population.
Detailed and systematic consideration of socialissues in urban mobility appraisals maximizes theopportunities for positive outcomes and reduces ormitigates the risks and negative impacts of trans portinfra struc ture projects. Unfortunately, the urbanpoor are often marginalized in trans port planning andproject evaluations. However, the establishment ofgood relationships with stakeholders and a focus ontheir concerns have the potential to generatesignificant positive opportunities for the project andthe organizations involved.
In summary, the access and mobility of theurban poor is constrained by: city planning,socio economic characteristics, trans port facil -ities and the availability of services. The nextsection outlines some general ways in which policycan be refocused to give particular assistance to thepoorest groups, through concentration on the needs of specific social groups, or indirectly throughassistance to those modes of trans port on which the urban poor are known to be particularlydependent.
110 Planning and Design for Sustainable Urban Mobility
The access andmobility of theurban poor isconstrained by:city planning,socioeconomiccharacteristics,transport facilitiesand theavailability ofservices
In 2008–2009, African govern ment ministers participated inworkshops that developed framework agreements thatrecognized the importance of trans port infra struc ture andurban planning. The need to raise investments in non-motorized trans port infra struc ture is identified as a keycomponent to an integrated approach in trans port for Africa.
The agreed article in the ‘Eastern Africa RegionalFramework Agreement on Air Pollution’, endorsed the idea
of a 10 per cent investment policy as follows: ‘Encourage theuse of non-motorized trans port systems that have manyadvantages and are used by an overwhelming majority, but areconstantly overlooked. At a minimum 10% of infra struc turecosts should be dedicated to this majority and the focusshould be on safety. Particular emphasis should be given tohigh-demand, mixed-use roads in urban and peri-urban areas’.Source: Worldwatch Institute, 2008, p4.
Box 6.3 Supporting non-motorized trans port investments in Africa
1EEE234567891012311145678920123456789301234567894012345678950123456789EEEE
111Equitable Access to Urban Mobility
Policy responses and innovative practices
This section highlights some ambitious policy res -ponses that have been introduced in recent years toaddress the challenges outlined above. Achievingtrans port affordability objectives requires actionsthat support non-motorized transport; reduce thefinan cial costs of trans port services; and increasetransportation affordability through improved land-use accessibility.
n Supporting non-motorized transportTrans port policy measures can reduce levels of caruse by supporting walking and cycling.29 These modesare relatively low cost, and they are important forshort trips, which make up the largest share of tripsin urban areas.30 Non-motorized trans port can bestimulated by a policy package consisting of invest -ments in facilities, improved transportation networks,awareness campaigns, as well as disincentives for the use of private motorized vehicles. Many cities indeveloped countries recognize the need to planwalkable environ ments and street network designsthat promote neigh bourly interactions, and throughthis, the devel op ment of social capital.31
Some significant trans port interventions offerinteresting lessons. Amsterdam (the Netherlands) and Copenhagen (Denmark) have high levels ofbicycle use and very low death rates from road trafficaccidents.32 The high modal shares were madepossible through decades of investment in non-motorized trans port infra struc ture. This includeswide-scale improvements to pedestrian and bicyclefacilities; devel op ment of facilities for intermodalconnectivity; and adoption of complete pedestrianand bicycle design standards, wherever feasible.Many other cities have moved away from car-centricurban models and embraced full pedestrianization ofdowntown commercial areas such as observed inShanghai (China) and Curitiba (Brazil).33 This hasprovided economic savings and benefits, reflected inincreased land values. 34
Combining public trans port and cycling canprovide a high level of affordable mobility. A case inpoint is vélib, a free public bicycle rental scheme in Paris, France.35 Hangzhou (China)36 and Mexico
City have also established bicycle hire schemes toencourage cycling at a minimum cost to taxpayersand users of the scheme. Such policies are increas -ingly linked with investments in BRT systems, forinstance in Delhi (India), Guangzhou (China), Jakarta(Indonesia) and Dar es Salaam (Tanzania), placingnon-motorized trans port infra struc ture as importantfeeder networks for BRT ridership.37 Box 6.3 high -lights recent devel op ments in Africa that encourageincreasing investments in non-motorized trans portinfra struc ture.
The need to consider bicycle designs that willaccommodate both environ mental requirements and commuters’ needs is essential.38 Recently, theInstitute for Transportation and Devel op ment Policy(ITDP) succeeded in the commercial adoption of animproved Indian cycle rickshaw. Reduced weightand greater comfort have allowed rickshaw oper-ators to increase their wages by 20–50 per cent.39
However, whereas they are important for the survivalof numerous owner-drivers, rickshaws had beenbanned from major roads in Dhaka as a way to reduceroad congestion. Such policies can have adverseimpacts on vulnerable and dis advan taged persons,such as loss of employment and reduced mobilitylevels.40 Uganda, meanwhile, was home to about200,000 boda bodas (bicycle-taxis) in 2000, 41 whichprovide employment for large numbers of previouslyunemployed youth. Subsequently, there has been awidespread increase in the use of motorcycle taxiswithin both Uganda and Kenya.42
Training is an important strategic instrument not only for disseminating new knowledge but alsofor capacity building and increasing the awarenessof the needs of non-motorized trans port users. Theprivate sector could be a key partner in supply-sideinterventions to increase bicycle ownership and usethrough the promotion of micro-credit programmesand providing cycling education. In the 1990s,women in Pudukkottai, India, were provided withloans to purchase bicycles and given cycling lessons,so that they could access a literacy programme.Additionally, the programme provided employmentopportunities for the women, who were trained asbicycle mechanics. Five years later, it is now sociallyacceptable for women to ride a bicycle, and bicycles
Non-motorizedtransport can bestimulated by apolicy packageconsisting ofinvestments infacilities,improvedtransportationnetworks,awarenesscampaigns, aswell asdisincentives forthe use of privatemotorizedvehicles
Planning and Design for Sustainable Urban Mobility112
are being used for going to school, fetching waterand going to hospital during an emergency. Theexample of Bogotá, Colombia, shows that strongnon-motorized trans port policies, awareness cam -paigns and political commitment can bring about ashift in public attitudes towards non-motorizedtransport, as well as enhanced social inclusion (Box6.4).43 However, there is still a lot to be done, andthe Transmileno system still needs to be furtherdeveloped to fulfil its promises. One of the majorcritiques is the lack of coverage, as many groups ofpeople are excluded from the current 84-kilometresystem simply because it is not yet operating in theirneighborhoods. Thus, many of Bogotá’s residents arestill relying on the traditional bus system, which is,in effect, operating in competition with Trans -mileno.44
Most cities in devel op ing countries are highdensity and therefore suitable for policies promotingnon-motorized transport. Travel-demand manage -ment has a key role to play in this context. Such urbanpolicies affect the demand for travel through thepricing and regulation of different modes of transport.An important benefit of travel-demand manage-ment strategies, besides improving the quality of low-cost transportation modes, has been increas-ing public trans port affordability for low-incomegroups.45 In the UK, there has been a change fromroad building towards the introduction of demand-man agement initiatives. Progressively, London hasexperi enced a modal shift, in part due to its con -gestion charging scheme, making it possible toconvert traffic lanes to bicycle lanes.46 The adoptionof automated bus lane enforcement has dramaticallyimproved the speed and reliability of bus services.Generally, con sumers are able to save money if theyuse alterna tive modes, routes or travel times to avoiddriving on congested roads.47
n Improving affordability and quality of serviceof public transport
Public trans port fares should be set at rates that allowcommuters to use it. In devel op ing countries, faresare often set above competitive equilibrium levels.48
This promotes excessive entry of buses, and is furtherexacerbated by the capture of the regulator. Sincebuses are not perfect substitutes, price competitionis not an effective mechanism for regulating theoptimal quantity of buses in the market. To minimizewaiting time, most riders prefer to use the first busthat arrives, even though a cheaper bus may comealong in a few minutes. Time, not fares, seems to bethe most important variable for the rider. Thissimplifies the bus operator’s market power to raisefares.49
Notably, consideration should be made to ensurethat the fare (plus subsidies) covers the cost ofoperation, and at the same time remains affordableto the public. This is particularly important, as settingfares artificially low – without compensating serviceproviders – can undermine the viability of a trans -port system. For instance, the bus fare needed tocover the operating costs in Lomé (Togo) was 295CFA Francs. Yet, the fares charged were 250 CFAFrancs, which was later reduced to 200 CFA Francs(by the govern ment), thereby resulting in an oper -ating deficit of 22 million.50 Thus, a delicate balancemust be struck between the consumer’s convenienceand willingness to pay, and the operator’s need tobalance its budgets (or to make a profit, in the caseof private-sector operators).51
The promotion of affordable transportationrequires a robust framework that defines and meas -ures transportation affordability appropriately.Conventional planning tends to consider a relativelylimited range of trans port affordability impacts andobjectives. To address this limitation, the WorldBank has developed an affordability index to addressthe need for easily available and comprehensive,
During the administration of Mayor Enrique Peñalosa, Bogotá’svisionary goal was centred on liveability, social equity andreclamation of public space. To achieve this, the administrationestablished policies in seven areas: institutional strengthening,restraining private car use, public space, public transport, non-motorized transport, road maintenance and trafficmanagement.
Large investment in infra struc ture for non-motorizedand public trans port was justified by its impact on equality.Inclusive investments for all, such as bicycle lanes, pedestrianhighways and the BRT system, demonstrated a commitment topublic good over private ownership. Likewise, actions such asthe removal of cars from sidewalks, car-free Sundays andestablishing a highway solely for Transmileno, exhibited
consideration to those on low incomes who do not benefitfrom investment in motorized trans port infra struc ture. Thetheme of equality was a key driver in the devel op ment of a357-kilometre long bicycle network (known as cicloruttas). Thebicycle network was deliberately designed to run through low-income and wealthy areas in order to promote integration anda sense that all citizens had an equal stake in city-wide devel op -ment. These devel op ments acted as ‘social equalizers’,providing the poor with better trans port links and free leisurefacilities. People supported the measures once they sawresults, and Peñalosa left office with a record approval rating.Decisive leadership, political will and strong institutions werethe critical factors contributing to success.Source: Ardila and Menckhoff, 2002.
Box 6.4 Integrating non-motorized trans port into transportation systems in Bogotá, Colombia
Travel-demandmanagement . . .[affects] thedemand for travelthrough thepricing andregulation ofdifferent modes oftransport
Public transportfares . . . indevelopingcountries, . . . areoften set abovecompetitiveequilibrium levels
Conventionalplanning tends toconsider arelatively limitedrange of transportaffordabilityimpacts andobjectives
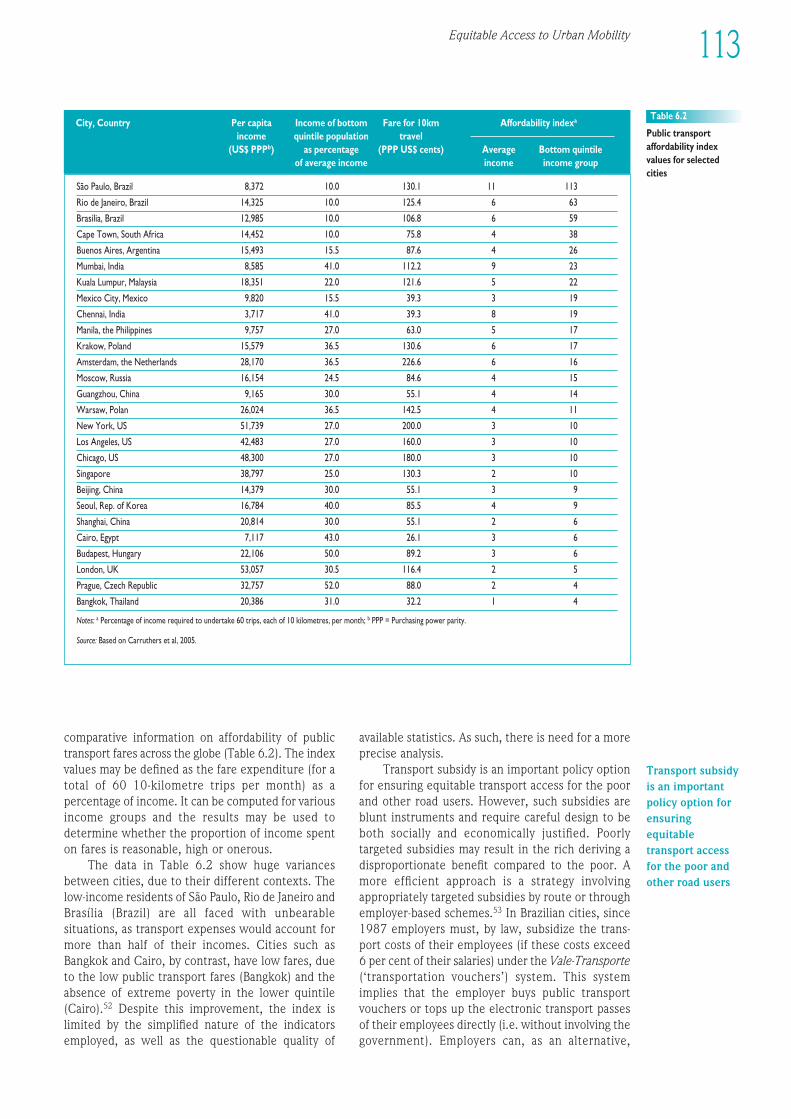
Equitable Access to Urban Mobility 113
1EEE234567891012311145678920123456789301234567894012345678950123456789EEEE
comparative information on affordability of publictrans port fares across the globe (Table 6.2). The indexvalues may be defined as the fare expenditure (for atotal of 60 10-kilometre trips per month) as apercentage of income. It can be computed for variousincome groups and the results may be used todetermine whether the proportion of income spenton fares is reasonable, high or onerous.
The data in Table 6.2 show huge variancesbetween cities, due to their different contexts. Thelow-income residents of São Paulo, Rio de Janeiro andBrasília (Brazil) are all faced with unbearablesituations, as trans port expenses would account formore than half of their incomes. Cities such asBangkok and Cairo, by contrast, have low fares, dueto the low public trans port fares (Bangkok) and theabsence of extreme poverty in the lower quintile(Cairo).52 Despite this improvement, the index islimited by the simplified nature of the indicatorsemployed, as well as the questionable quality of
available statistics. As such, there is need for a moreprecise analysis.
Trans port subsidy is an important policy optionfor ensuring equitable trans port access for the poorand other road users. However, such subsidies areblunt instruments and require careful design to beboth socially and economically justified. Poorlytargeted subsidies may result in the rich deriving adisproportionate benefit compared to the poor. Amore efficient approach is a strategy involvingappropriately targeted subsidies by route or throughemployer-based schemes.53 In Brazilian cities, since1987 employers must, by law, subsidize the trans -port costs of their employees (if these costs exceed6 per cent of their salaries) under the Vale-Transporte(‘transportation vouchers’) system. This systemimplies that the employer buys public trans portvouchers or tops up the electronic trans port passesof their employees directly (i.e. without involving thegovern ment). Employers can, as an alternative,
São Paulo, Brazil 8,372 10.0 130.1 11 113
Rio de Janeiro, Brazil 14,325 10.0 125.4 6 63
Brasília, Brazil 12,985 10.0 106.8 6 59
Cape Town, South Africa 14,452 10.0 75.8 4 38
Buenos Aires, Argentina 15,493 15.5 87.6 4 26
Mumbai, India 8,585 41.0 112.2 9 23
Kuala Lumpur, Malaysia 18,351 22.0 121.6 5 22
Mexico City, Mexico 9,820 15.5 39.3 3 19
Chennai, India 3,717 41.0 39.3 8 19
Manila, the Philippines 9,757 27.0 63.0 5 17
Krakow, Poland 15,579 36.5 130.6 6 17
Amsterdam, the Netherlands 28,170 36.5 226.6 6 16
Moscow, Russia 16,154 24.5 84.6 4 15
Guangzhou, China 9,165 30.0 55.1 4 14
Warsaw, Polan 26,024 36.5 142.5 4 11
New York, US 51,739 27.0 200.0 3 10
Los Angeles, US 42,483 27.0 160.0 3 10
Chicago, US 48,300 27.0 180.0 3 10
Singapore 38,797 25.0 130.3 2 10
Beijing, China 14,379 30.0 55.1 3 9
Seoul, Rep. of Korea 16,784 40.0 85.5 4 9
Shanghai, China 20,814 30.0 55.1 2 6
Cairo, Egypt 7,117 43.0 26.1 3 6
Budapest, Hungary 22,106 50.0 89.2 3 6
London, UK 53,057 30.5 116.4 2 5
Prague, Czech Republic 32,757 52.0 88.0 2 4
Bangkok, Thailand 20,386 31.0 32.2 1 4
Notes: a Percentage of income required to undertake 60 trips, each of 10 kilometres, per month; b PPP = Purchasing power parity.
Source: Based on Carruthers et al, 2005.
Table 6.2
Public trans portaffordability indexvalues for selectedcities
City, Country Per capita Income of bottom Fare for 10km Affordability indexa
income quintile population travel (US$ PPPb) as percentage (PPP US$ cents) Average Bottom quintile
of average income income income group
Transport subsidyis an importantpolicy option forensuringequitabletransport accessfor the poor andother road users
The State of Georgia and the Atlanta metropolitan region haveexperi enced constant growth since the 1990s. Suburban areascontinue to expand, resulting in large-scale needs for trans portinfra struc ture projects. However, this urban sprawlencourages disinvestment in housing and infra struc turedecline, placing a strain on the provision of public trans portservices, particularly in older inner-city areas where AfricanAmericans and other minorities are concentrated.
Recognizing the spatial distribution (and economic andenviron mental impact) of highway spending, there is a growingneed for Atlanta’s metropolitan region to connect its evolvingplans for infra struc ture investment with the realities of land-use patterns. The regional trans port plan for 2000–2025 helpsguide the prioritization and funding of transportationinvestments. It has been hailed as ‘an excellent example toillustrate how the metropolitan growth can be managed byproper land use-transportation planning and policy-makingwithout compromising sus tain ability’.a However, Atlanta’s
regional transportation policies have actually exacerbatedsprawl-related problems, with unintended consequences thatare not evenly distributed. The trans port strategies weredesigned to serve commuters from distant (more affluent)suburbs, with no provision for reverse commute that mighthelp lower-income (primarily African American) communitiesreach suburban employment opportunities (for example asdomestic workers, gardeners, etc., in the more affluentsuburban households).
This resulted in a lawsuit and subsequentreconsideration of objectives. US$300 million state fundsallocated to the proposed sprawl-inducing road programmewas redirected to public transport, footpaths, bicycle pathsand road safety and maintenance projects. It also led thefederal govern ment to scrutinize the distribution oftransportation benefits and burdens among ethnic groups inthe Atlanta metropolitan region.Sources: Replogle and Kodransky, 2010, pp4–5; a Ong et al, 2010, p96.
Box 6.5 Metropolitan regional trans port plans and priorities, Atlanta, US
114 Planning and Design for Sustainable Urban Mobility
The affordabilityof urban mobilitycan be increasedby improvingland-useaccessibility, andaddressing thephysicalseparation ofactivities and themeans by whichdistance can bereduced
The integration of land use andtravel-demandmanagementmeasures cansubstantiallyenhanceaccessibility andlead to improvedpublic transportaffordability
provide staff transport.54 However, the system appliesonly to the employees of the formal sector, meaningthat more than 50 per cent of the urban workforce(including the major part of the poor and low-incomepopulation) is excluded from the scheme.55
The reform of the urban public trans port sectorin Kazakhstan is an illustration of a project resultingin poverty alleviation for the poor. Prior to reform,the public trans port system was characterized byinadequate services, as well as crowded and lengthywaiting times. A trans port intervention was initiatedto deregulate and liberalize the provision of trans -port services, as well as improve the quality of theservice.56 Consequently, transportation affordabilityfor trans port users improved due to the reduction infares.
Many cities (and regions) are modernizing theirfare payment technologies, and integrating faresystems between different public trans port routes,modes and even operators, for users’ convenience.Experi ence with the ‘Oyster’ smartcard ticketingscheme in London, UK, has resulted in increased buspatronage, due to the simplified fare system and easeof interchange. This has also empowered commuterswith information on the range of fully integrated fare products and improved service coordination.57
Another positive devel op ment can be observed inSeoul, Republic of Korea, where the implementa-tion of ‘smart cards’ allows commuters to transferfrom one mode to another at a discounted rate.58
A recep tive institutional environ ment helps to create inte grated and unified tariff systems, resultingin cost-effectiveness in ticketing. An exemplary model is Germany’s transport federa tions (verkehrs -verbund).59
n Improving affordability through urban formand land use
The affordability of urban mobility can be increasedby improving land-use accessibility, and addressingthe physical separation of activities and the meansby which distance can be reduced. The intention is to build sus tain able mobility into the patterns ofurban form and layouts, and make public transport,pedestrian and bicycle use practical and affordable.Accessibility planning60 offers a new way to ensurethat urban residents can reach the services andfacilities they need by walking, cycling and publictransport. Box 6.5 presents institutional arrange -ments created in Atlanta, US, that allow for thecoordination of land-use and trans port infra struc tureinvestments, which could improve affordability andaccessibility, particularly for ethnic minorities.
The integration of land use and travel-demandmanagement measures can substantially enhanceaccessibility and lead to improved public trans portaffordability. Curitiba, Brazil, is a case in point, with40 years of carefully integrating urbanization andtransportation improvements.61 By replacing carswith people, Curitiba has evolved along five well-defined linear corridors that protect the city centre.Zoning laws encourage high-density commercialdevel op ment along these trans port corridors, thusreducing the amount of travel needed to access basicgoods, services and activities. Mini buses are used toquickly and efficiently trans port individuals fromresidential neigh bour hoods to express bus lines.Compared with other Brazilian cities of its size,Curitiba uses 30 percent less petrol per capita, andaffordable fares make it possible for the average low-income family to spend around 10 per cent of its
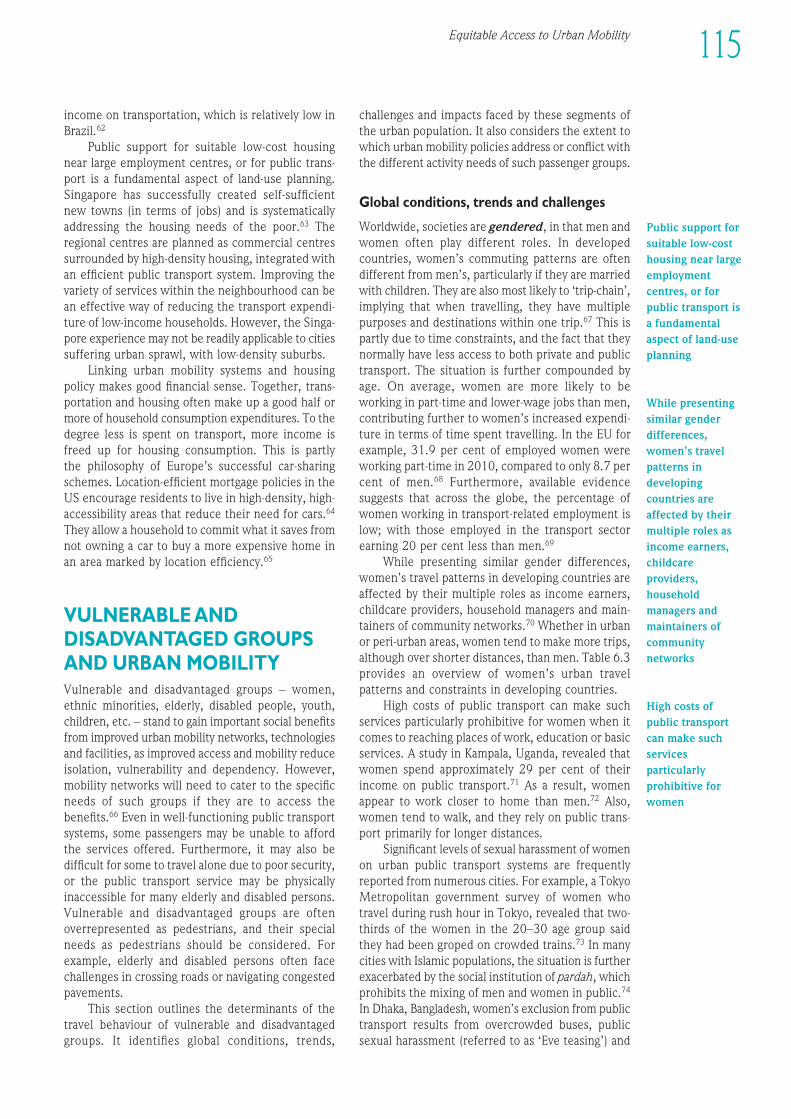
1EEE234567891012311145678920123456789301234567894012345678950123456789EEEE
115Equitable Access to Urban Mobility
income on transportation, which is relatively low inBrazil.62
Public support for suitable low-cost housingnear large employment centres, or for public trans -port is a fundamental aspect of land-use planning.Singapore has successfully created self-sufficient new towns (in terms of jobs) and is systematicallyaddressing the housing needs of the poor.63 Theregional centres are planned as commercial centressurrounded by high-density housing, integrated withan efficient public trans port system. Improving thevariety of services within the neigh bour hood can bean effective way of reducing the trans port expendi -ture of low-income households. However, the Singa -pore experi ence may not be readily applicable to citiessuffering urban sprawl, with low-density suburbs.
Linking urban mobility systems and housingpolicy makes good finan cial sense. Together, trans -portation and housing often make up a good half ormore of household consumption expenditures. To thedegree less is spent on transport, more income isfreed up for housing consumption. This is partly the philosophy of Europe’s successful car-sharingschemes. Location-efficient mortgage policies in theUS encourage residents to live in high-density, high-accessibility areas that reduce their need for cars.64
They allow a household to commit what it saves fromnot owning a car to buy a more expensive home inan area marked by location efficiency.65
VULNERABLE AND DIS ADVAN TAGED GROUPSAND URBAN MOBILITYVulnerable and dis advan taged groups – women,ethnic minorities, elderly, disabled people, youth,children, etc. – stand to gain important social benefitsfrom improved urban mobility networks, technologiesand facilities, as improved access and mobility reduceisolation, vulnerability and dependency. However,mobility networks will need to cater to the specificneeds of such groups if they are to access thebenefits.66 Even in well-functioning public trans portsystems, some passen gers may be unable to affordthe services offered. Further more, it may also bedifficult for some to travel alone due to poor security,or the public trans port service may be physicallyinaccessible for many elderly and disabled persons.Vulnerable and dis advan taged groups are oftenoverrepresented as pedestrians, and their specialneeds as pedestrians should be considered. Forexample, elderly and disabled persons often facechallenges in crossing roads or navigating congestedpavements.
This section outlines the determinants of thetravel behaviour of vulnerable and dis advan tagedgroups. It identifies global conditions, trends,
challenges and impacts faced by these segments ofthe urban population. It also considers the extent towhich urban mobility policies address or conflict withthe different activity needs of such passen ger groups.
Global conditions, trends and challenges
Worldwide, societies are gendered, in that men andwomen often play different roles. In developedcountries, women’s commuting patterns are oftendifferent from men’s, particularly if they are marriedwith children. They are also most likely to ‘trip-chain’,implying that when travelling, they have multiplepurposes and destinations within one trip.67 This ispartly due to time constraints, and the fact that theynormally have less access to both private and publictransport. The situation is further compounded byage. On average, women are more likely to beworking in part-time and lower-wage jobs than men,contributing further to women’s increased expendi -ture in terms of time spent travelling. In the EU forexample, 31.9 per cent of employed women wereworking part-time in 2010, compared to only 8.7 percent of men.68 Further more, available evidencesuggests that across the globe, the percentage ofwomen working in transport-related employment islow; with those employed in the trans port sectorearning 20 per cent less than men.69
While presenting similar gender differences,women’s travel patterns in devel op ing countries areaffected by their multiple roles as income earners,childcare providers, household managers and main -tainers of community networks.70 Whether in urbanor peri-urban areas, women tend to make more trips,although over shorter distances, than men. Table 6.3provides an overview of women’s urban travelpatterns and constraints in devel op ing countries.
High costs of public trans port can make suchservices particularly prohibitive for women when itcomes to reaching places of work, education or basicservices. A study in Kampala, Uganda, revealed thatwomen spend approximately 29 per cent of theirincome on public transport.71 As a result, womenappear to work closer to home than men.72 Also,women tend to walk, and they rely on public trans -port primarily for longer distances.
Significant levels of sexual harassment of womenon urban public trans port systems are frequentlyreported from numerous cities. For example, a TokyoMetropolitan govern ment survey of women whotravel during rush hour in Tokyo, revealed that two-thirds of the women in the 20–30 age group saidthey had been groped on crowded trains.73 In manycities with Islamic populations, the situation is furtherexacerbated by the social institution of pardah, whichprohibits the mixing of men and women in public.74
In Dhaka, Bangladesh, women’s exclusion from publictrans port results from over crowded buses, publicsexual harassment (referred to as ‘Eve teasing’) and
Public support forsuitable low-costhousing near largeemploymentcentres, or forpublic transport isa fundamentalaspect of land-useplanning
While presentingsimilar genderdifferences,women’s travelpatterns indevelopingcountries areaffected by theirmultiple roles asincome earners,childcareproviders,householdmanagers andmaintainers ofcommunitynetworks
High costs ofpublic transportcan make suchservicesparticularlyprohibitive forwomen
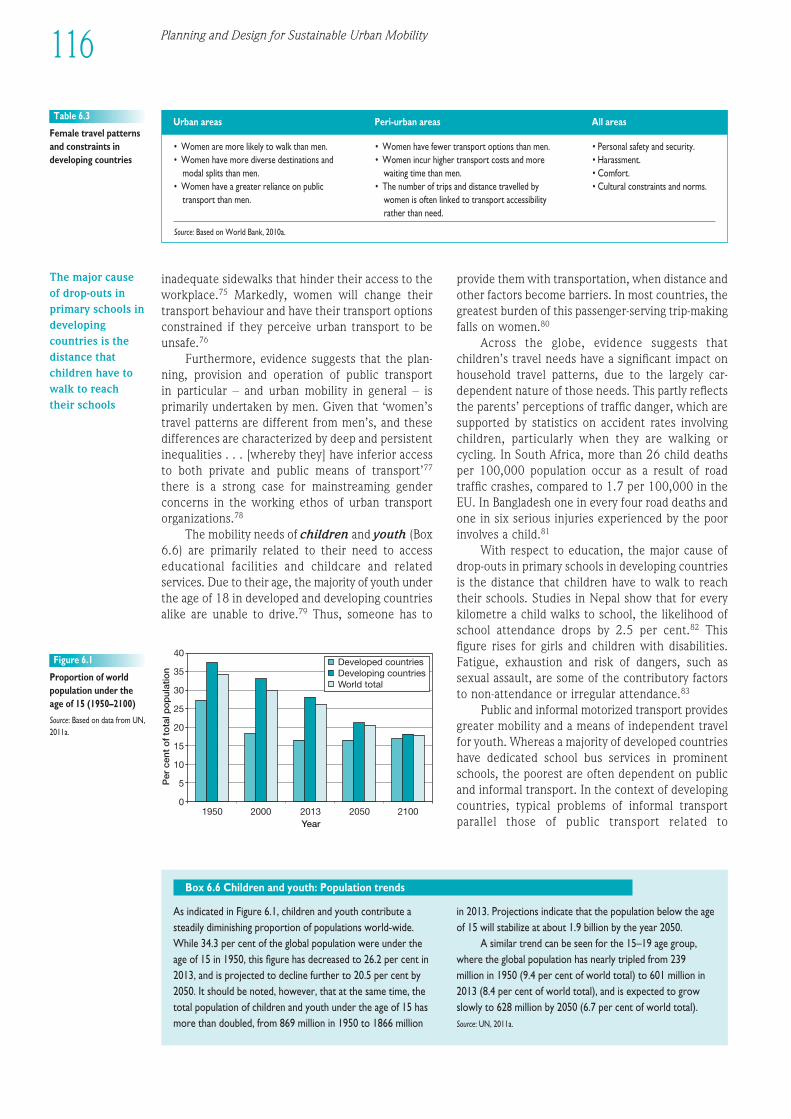
inadequate sidewalks that hinder their access to theworkplace.75 Markedly, women will change theirtrans port behaviour and have their trans port optionsconstrained if they perceive urban trans port to beunsafe.76
Further more, evidence suggests that the plan -ning, provision and operation of public trans portin particular – and urban mobility in general – isprimarily undertaken by men. Given that ‘women’stravel patterns are different from men’s, and thesedifferences are characterized by deep and persistentinequalities . . . [whereby they] have inferior accessto both private and public means of transport’77
there is a strong case for main streaming genderconcerns in the working ethos of urban trans portorganizations.78
The mobility needs of children and youth (Box6.6) are primarily related to their need to accesseducational facilities and childcare and relatedservices. Due to their age, the majority of youth underthe age of 18 in developed and devel op ing countriesalike are unable to drive.79 Thus, someone has to
provide them with transportation, when distance andother factors become barriers. In most countries, thegreatest burden of this passen ger-serving trip-makingfalls on women.80
Across the globe, evidence suggests thatchildren’s travel needs have a significant impact onhousehold travel patterns, due to the largely car-dependent nature of those needs. This partly reflectsthe parents’ perceptions of traffic danger, which aresupported by statistics on accident rates involvingchildren, particularly when they are walking orcycling. In South Africa, more than 26 child deathsper 100,000 population occur as a result of roadtraffic crashes, compared to 1.7 per 100,000 in theEU. In Bangladesh one in every four road deaths andone in six serious injuries experi enced by the poorinvolves a child.81
With respect to education, the major cause ofdrop-outs in primary schools in devel op ing countriesis the distance that children have to walk to reachtheir schools. Studies in Nepal show that for everykilometre a child walks to school, the likelihood ofschool attendance drops by 2.5 per cent.82 Thisfigure rises for girls and children with disabilities.Fatigue, exhaustion and risk of dangers, such assexual assault, are some of the contributory factorsto non-attendance or irregular attendance.83
Public and informal motorized trans port providesgreater mobility and a means of independent travelfor youth. Whereas a majority of developed countrieshave dedicated school bus services in prominentschools, the poorest are often dependent on publicand informal transport. In the context of devel op ingcountries, typical problems of informal trans portparallel those of public trans port related to
• Women are more likely to walk than men. • Women have fewer trans port options than men. • Personal safety and security.• Women have more diverse destinations and • Women incur higher trans port costs and more • Harassment.
modal splits than men. waiting time than men. • Comfort.• Women have a greater reliance on public • The number of trips and distance travelled by • Cultural constraints and norms.
trans port than men. women is often linked to trans port accessibility rather than need.
Source: Based on World Bank, 2010a.
Table 6.3
Female travel patternsand constraints indevel op ing countries
Urban areas Peri-urban areas All areas
As indicated in Figure 6.1, children and youth contribute asteadily diminishing proportion of populations world-wide.While 34.3 per cent of the global population were under theage of 15 in 1950, this figure has decreased to 26.2 per cent in2013, and is projected to decline further to 20.5 per cent by2050. It should be noted, however, that at the same time, thetotal population of children and youth under the age of 15 hasmore than doubled, from 869 million in 1950 to 1866 million
in 2013. Projections indicate that the population below the ageof 15 will stabilize at about 1.9 billion by the year 2050.
A similar trend can be seen for the 15–19 age group,where the global population has nearly tripled from 239million in 1950 (9.4 per cent of world total) to 601 million in2013 (8.4 per cent of world total), and is expected to growslowly to 628 million by 2050 (6.7 per cent of world total).Source: UN, 2011a.
Box 6.6 Children and youth: Population trends
Per
cen
t o
f to
tal p
op
ulat
ion
Year
Developed countriesDeveloping countriesWorld total
40
35
30
25
20
15
10
5
01950 2000 2013 2050 2100
Figure 6.1
Proportion of worldpopulation under theage of 15 (1950–2100)
Source: Based on data from UN,2011a.
116 Planning and Design for Sustainable Urban Mobility
The major causeof drop-outs inprimary schools indevelopingcountries is thedistance thatchildren have towalk to reachtheir schools
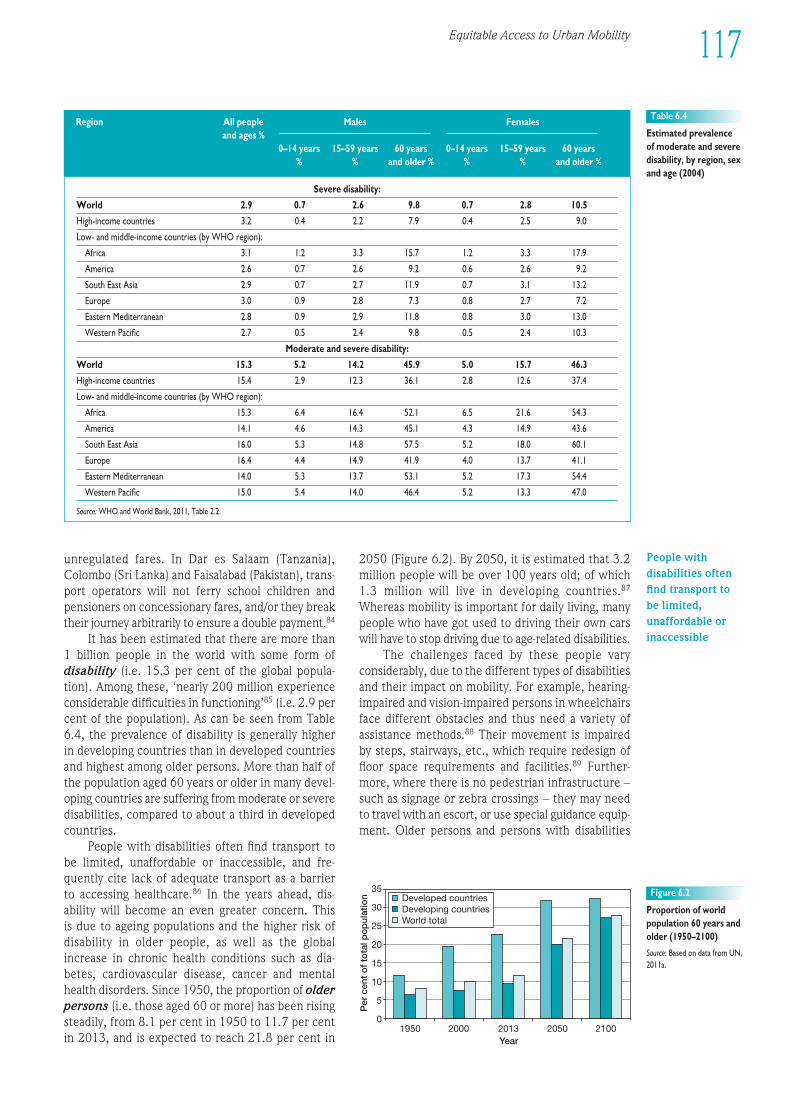
unregulated fares. In Dar es Salaam (Tanzania),Colombo (Sri Lanka) and Faisalabad (Pakistan), trans -port operators will not ferry school children andpensioners on concessionary fares, and/or they breaktheir journey arbitrarily to ensure a double payment.84
It has been estimated that there are more than1 billion people in the world with some form ofdisability (i.e. 15.3 per cent of the global popula-tion). Among these, ‘nearly 200 million experi enceconsiderable difficulties in functioning’85 (i.e. 2.9 percent of the population). As can be seen from Table6.4, the prevalence of disability is generally higherin devel op ing countries than in developed countriesand highest among older persons. More than half ofthe population aged 60 years or older in many devel -op ing countries are suffering from moderate or severedisabilities, compared to about a third in developedcountries.
People with disabilities often find trans port tobe limited, unaffordable or inaccessible, and fre -quently cite lack of adequate trans port as a barrierto accessing healthcare.86 In the years ahead, dis -ability will become an even greater concern. This is due to ageing populations and the higher risk ofdisability in older people, as well as the globalincrease in chronic health conditions such as dia -betes, cardiovascular disease, cancer and mentalhealth disorders. Since 1950, the proportion of olderpersons (i.e. those aged 60 or more) has been risingsteadily, from 8.1 per cent in 1950 to 11.7 per centin 2013, and is expected to reach 21.8 per cent in
2050 (Figure 6.2). By 2050, it is estimated that 3.2million people will be over 100 years old; of which1.3 million will live in devel op ing countries.87
Whereas mobility is important for daily living, manypeople who have got used to driving their own carswill have to stop driving due to age-related disabilities.
The challenges faced by these people varyconsiderably, due to the different types of disabilitiesand their impact on mobility. For example, hearing-impaired and vision-impaired persons in wheelchairsface different obstacles and thus need a variety ofassistance methods.88 Their movement is impairedby steps, stairways, etc., which require redesign offloor space requirements and facilities.89 Further -more, where there is no pedestrian infra struc ture –such as signage or zebra crossings – they may needto travel with an escort, or use special guidance equip -ment. Older persons and persons with dis abilities
Severe disability:
World 2.9 0.7 2.6 9.8 0.7 2.8 10.5
High-income countries 3.2 0.4 2.2 7.9 0.4 2.5 9.0
Low- and middle-income countries (by WHO region):
Africa 3.1 1.2 3.3 15.7 1.2 3.3 17.9
America 2.6 0.7 2.6 9.2 0.6 2.6 9.2
South East Asia 2.9 0.7 2.7 11.9 0.7 3.1 13.2
Europe 3.0 0.9 2.8 7.3 0.8 2.7 7.2
Eastern Mediterranean 2.8 0.9 2.9 11.8 0.8 3.0 13.0
Western Pacific 2.7 0.5 2.4 9.8 0.5 2.4 10.3
Moderate and severe disability:
World 15.3 5.2 14.2 45.9 5.0 15.7 46.3
High-income countries 15.4 2.9 12.3 36.1 2.8 12.6 37.4
Low- and middle-income countries (by WHO region):
Africa 15.3 6.4 16.4 52.1 6.5 21.6 54.3
America 14.1 4.6 14.3 45.1 4.3 14.9 43.6
South East Asia 16.0 5.3 14.8 57.5 5.2 18.0 60.1
Europe 16.4 4.4 14.9 41.9 4.0 13.7 41.1
Eastern Mediterranean 14.0 5.3 13.7 53.1 5.2 17.3 54.4
Western Pacific 15.0 5.4 14.0 46.4 5.2 13.3 47.0
Source: WHO and World Bank, 2011, Table 2.2.
Table 6.4
Estimated prevalenceof moderate and severedisability, by region, sexand age (2004)
Region All people Males Femalesand ages %
0–14 years 15–59 years 60 years 0–14 years 15–59 years 60 years % % and older % % % and older %
1EEE234567891012311145678920123456789301234567894012345678950123456789EEEE
117Equitable Access to Urban Mobility
Per
cen
t o
f to
tal p
op
ulat
ion
Year
Developed countriesDeveloping countriesWorld total
35
30
25
20
15
10
5
01950 2000 2013 2050 2100
Figure 6.2
Proportion of worldpopulation 60 years andolder (1950–2100)
Source: Based on data from UN,2011a.
People withdisabilities oftenfind transport tobe limited,unaffordable orinaccessible
would thus benefit from design modifications suchas better information systems and low-floor vehicles.90
Privately run services such as shared taxis and mini -buses are preferred by older and disabled personsdue to their demand for door-to-door services.Nevertheless, most of these vehicles are not able toaccommodate the users of wheelchairs and can beprohibitively costly. The alternative of hiring privatetrans port is often out of the price range of disabledpeople, and parking spaces exclusively for their usein the central city are limited.
While many countries have legislative frame -works requiring these challenges be addressed,effective responses are limited. African countries inparticular suffer from insufficient monitoring, imple -mentation and realization of such legislation.91 Theadoption of the United Nations’ Standard Rules onthe Equalization of Opportunities for Persons withDisabilities in 199492 and the Convention on theRights of Persons with Disabilities in 200693 signalledbroad international consensus on how disabilityissues should be addressed. National regulations arealso in place on a country-by-country basis.
It should also be noted that many persons sufferfrom several different types of vulnerability and/ordis advan tage. Women with disabilities for exampleoften suffer compounded discrimination on thegrounds of gender and available income in additionto the impairment.
Policy responses and innovative practices
There is a wide range of policy options and initiativesin place in some cities that have worked to improvemobility for the urban poor and enhance urbanaccess for vulnerable and dis advan taged groups.Some of the policies and programmes described heredo not require expenditure. Others could result insavings or payback from spin-off effects throughmore cost-effective management. Cities at variouslevels of devel op ment can draw on the experi ences
of other cities for further devel op ment or for im -proving existing conditions. The actual design of thepolicy or practice will have to be modified for thespecific circumstances of each individual city.
In recent years, there have been significantdevel op ments in the methodologies associated withgender planning in respect of accessibility, mobilityand trans port organization. Evidence shows thatmany countries have integrated gender into theirtrans port programmes and projects.94 Opportunitiesneed to be provided for women to gain meaningfuland beneficial employment in the trans port sector.Hiring female bus operators was a key componentof the Trans Jakarta BRT initiative in Indonesia,which provided Indonesian women with a firstopportunity of formal, regularized employment in thesector.95 Experi ence shows that increased femalerecruitment helps advance gender equality in societyin general, and also increases women’s level ofcomfort and security in negotiating trans portsituations.96
Such a focus on gender issues is justified by thefact that it enhances the effectiveness of actions inthe trans port sector, and therefore impacts on povertyreduction. Data on user needs and access constraintsshould be gender disaggregated and collected throughroutine trans port project monitoring and evalua-tion processes.97 A recent World Bank pilot study inLesotho that promotes the use of cognitive map-ping exercises and geographic information system(GIS) for gender-sensitive trans port planning is a goodexample of one such programme to map targetedstakeholder use patterns for integration with plan -ning.98 The participation of women trans port usersis critical for the establishment of equitable practiceand the devel op ment of gender-sensitive under -standing of trans port needs and systems (Box 6.7).
Establishing a sus tain able urban trans port systemrequires a comprehensive and integrated approachto policy-making, with the aim of delivering people-oriented, affordable and environ mentally friendly
As part of an urban trans port project in Liaoning Province,China, women were integrated into the various phases of theproject, with the specific aim of increasing their participation.The project specification was established through communityparticipation with separate focus groups for both men andwomen. This made it possible to identify the number ofjourneys made on a daily basis, which prompted priority to begiven to the issue of pavements, road drainage, hard shouldersand their separation from the carriageway used by motorvehicles, lighting and signing.
By providing a specific forum for women, plannerslearned about specific concerns, opportunities and needs
voiced by a key stakeholder in the project that may not havebeen raised in mix-gendered discussions. Women expressedconcerns about the lack of security encountered in usingbuses: dark alleys, lengthy waiting times and vulnerability totraffic accident and injury. The outcome led to changes beingmade to the initial project in order to hasten improvements tosecondary roads and traffic management. Precedence wasgiven to the creation of pathways and pedestrian crossings, the installation of public lighting and improved frequency ofbus services.Source: Duchène, 2011.
Box 6.7 Women’s participation in the trans port sector in China
118 Planning and Design for Sustainable Urban Mobility
The participationof womentransport users iscritical for theestablishment ofequitable practiceand thedevelopment ofgender-sensitiveunderstanding oftransport needsand systems
Many cities, particularly in developed countries, promote theuse of private trans port for disabled people by licensing theuse of scooters, motorized three-wheelers or electricwheelchairs. Further more, street or pavement designs aremodified to accept them. In Belgium, loans and grants areprovided for car-adaptation and training costs, both of whichallow disabled people to enter the labour force. In many partsof the world, protected right or left turns are used as a safetymeasure particularly for the elderly, as well as designatedturning lanes which aid in channelling the disabled away fromthrough-traffic.
Many elderly people prefer to use private motorvehicles; however, the standards therein need to be tailored to
meet the needs of the elderly and frail. Car designs need totake the functional mobility limitations of elderly, frail anddisabled groups into account. Extensive research in roadstandards is important for finding the most suitable conditionsfor disabled and elderly road users.
Although the issue of aging populations has been less of apolitical issue in devel op ing countries, it should be noted thatthe conditions for many aging and disabled road users in suchcountries are often deplorable, thus obstructing their right ofaccess.Source: OECD, 2001, citing OECD, 1986.
Box 6.8 Private trans port for special groups
1EEE234567891012311145678920123456789301234567894012345678950123456789EEEE
119Equitable Access to Urban Mobility
mobility systems. The following sections give practicalexamples of policy responses that seek to delivertransportation that is gender sensitive, efficient, safeand responsive to the mobility needs of vulnerableand dis advan taged groups.
n Gender-sensitive design, infra struc ture andservices
Public transportation planning must be based on arecognition of the distinct needs of women’s distinctroles, needs and experi ences. As such, gender main -streaming is essential. In Bangladesh, an Asian Devel -op ment Bank project aims to improve infra struc turefacilities and the design of trans port vehicles.99 Theproject takes account of women’s specific needs(public toilets, separate market stalls, lower steps inbuses, etc.). It also reserves 15 per cent of the smallbusinesses located along the roads under constructionfor women.100 The small modifications made to theexisting infra struc ture balance women’s needs forprivacy with their need for social inclusion. Further -more, it begins the process of further integratingwomen into social and economic domains that aretraditionally segregated by sex, and often dominatedby men.
Other policy initiatives focus on safeguardingwomen’s safety and comfort in urban transport.Passen ger rail cars reserved for ‘women only’ havebeen implemented in Japan, Brazil, Egypt, Mexico,India, Belarus and the Philippines. Similarly, women-only taxis are found in countries with large Islamicpopulations, such as Lebanon, Syria and the UnitedArab Emirates.101 Most of these cabs are clearlymarked in pink and feature women drivers. Whereassuch sex-segregated initiatives are often debated, theyhave undoubtedly improved conditions for femalepassen gers.102
In France, rolling stock manufacturers pledge tofollow a charter proposed by an association calledFemmes en mouvement, les transports au féminin,which requires the association to be present during
the design of new vehicles.103 Consultations arecarried out in relation to safety, accessibility, internalconfiguration and respect for the environ ment. This helps to improve the gender sensitive design ofpublic trans port vehicles to accommodate womenwith children and/or shopping bags such as women-only carriages, child seating, storage spaces for pramsand shopping.
In many devel op ing countries, means of trans -port such as carts, bicycles and animals are considereda cost-effective manner to assist in meeting women’smobility needs.104 Bicycles have often been recom -mended as a means of increasing the overall mobilityof women, to enhance their socioeconomic and polit -ical participation. A study in India shows women’spreference for the door-to-door demand serviceprovided by auto-rickshaws.105 The construction ofsegregated lanes for auto-rickshaws can reduce timeburdens and benefit dis advan taged groups.
New mobility services – such as carpoolingschemes reserved for women – are beginning tothrive throughout North America and Europe.106
Such programmes provide the convenience of in -expensive access.107 Families, commuters and em -ployers are able to share cars at different times ofthe day, with subsidized or preferential parking. InGermany, well-lit parking sections have been set asidefor women near stairs and elevators in multi-storeyparking lots to ensure their safety.108 Similarly, lawssupporting disability parking privileges ensure thatpersons with disabilities have access to parking thatdoes not present an undue hardship. For instance,the UK’s blue badge disabled parking scheme helpsdisabled people with severe mobility problems toaccess goods and services, by allowing them to parkclose to their destination.109
Private trans port options for many elderly anddisabled travellers are also increasing (Box 6.8).There are a number of stable non-motorized vehicles,such as three-wheeled bicycles, hand-operatedbicycles and a variety of carts in use. In Bangladesh,
Publictransportationplanning must bebased on arecognition of thedistinct needs ofwomen’s distinctroles, needs andexperiences
‘To enable persons with disabilities to live independently and participate fully in all aspects of life, States Parties shall takeappropriate measures to ensure to persons with disabilities access, on an equal basis with others, to the physical environ ment, totransportation, . . . and to other facilities and services open or provided to the public. . . . These measures, which shall include theidentification and elimination of obstacles and barriers to accessibility, shall apply to, inter alia: (a) Buildings, roads, transportationand other indoor and outdoor facilities, including schools, housing, medical facilities and workplaces’.Source: http://www.un.org/disabilities/documents/convention/convoptprot-e.pdf, last accessed 25 March 2013.
Box 6.9 Convention on the Rights of Persons with Disabilities (Article 9, paragraph 1)
120 Planning and Design for Sustainable Urban Mobility
Building exclusivesidewalks ascomponents ofroad and transportprojects respondswell to . . .vulnerable users’travel needs byincreasingpedestrianaccessibility andsafety
hand-propelled tricycles provide valuable localmobility and are environ mentally friendly.110 Othermotorized vehicles on the market include electricwheelchairs, three-wheeled motorized vehicles andcars and vans with hand controls.
Fare structures allow govern ments to determinewho pays and who benefits.111 In countries such asthe UK, Denmark, Spain (Madrid) and Mexico(Mexico City), just to mention a few, specialcategories of passen gers – such as students, children,the elderly and the unemployed – travel free or atleast at a reduced fare.112 There is a strong case forcross-subsidies to increase affordability, as has beendone in Bogotá, Colombia, where the fare for low-income groups is subsidized by that of higher-incomegroups.113 Integrated fare structures make it relativelyeasy and less expensive for vulnerable and dis advan -taged groups to travel, particularly when undertakingtrip-chains. For example, in Denmark, finan cial grantsfrom the govern ment have allowed integration of trainand regional bus services, enabling passen gerscrossing regional borders to use a single ticket – evenif the journey requires a transfer involving differentpublic trans port companies. Similar grants haveallowed free public trans port for children under theage of 12 who are accompanied by an adult.114
n Increasing pedestrian accessibility and safetyBuilding exclusive sidewalks as components of roadand trans port projects responds well to women’s and other vulnerable users’ travel needs by increasingpedestrian accessibility and safety. A majority ofcities in developed countries have launched a curb-cut programme whereby all new sidewalks will bebuilt with curb cuts that allow wheeled pedestriantraffic to negotiate the height change comfortablywhile at the same time helping sight-impaired peopleidentify the street margin when using walking aidssuch as a cane.115 Cities such as Mexico City, Rio deJaneiro (Brazil) and Pretoria (South Africa) haveinstalled thousands of curb cuts to existingfootways.116 Agencies such as the World Bank are alsoincreasing their focus on improving infra struc ture fornon-motorized transport.117
In Tokyo, Japan, a textured surface identifies thechange in level, including the direction, of thepedestrian crossing.118 The textured area is bright
yellow and clearly visible, with curb cuts installed inexisting sidewalks. At key intersections, the timingsof the pedestrian crossing lights have been increasedby 20 per cent to accommodate the slower crossingspeed of elderly or disabled pedestrians.119 Locationsfor the installation of light and sound signals forpedestrian crossings are also identified. Differentsounds inform pedestrians whether or not it is safeto cross and whether they are crossing in an east towest direction or a north to south direction.120 InOttawa, Canada, for example, ‘peep-peep’ sounds areused for east to west crossings and ‘cuckoo’ soundsfor north to south.121 Pedestrians may press a buttonto activate the pedestrian crossing light. In somecases, where there is sufficient wheelchair traffic,wheelchair sensors may be installed.
The make-up of streets and the built environ -ment can play a role in physical activity promotionand active travel behaviours, especially amongchildren to and from school.122 For instance, theavailability of paved roads had a significant influencein school attendance levels in a community inMorocco. Attendance rates rose from 21 per cent to48 per cent for girls and from 58 per cent to 76 percent for boys.123 School travel is an opportunity toshift a portion of car trips to walking and cycling, ifaccessibility, safety and the social benefits of theexperi ence are recognized and addressed.
n ‘Universal design’ or ‘access for all’Across the globe, many countries are introducinglegislation that requires trans port services to bemade more accessible, to conform to internationallaw (Box 6.9). South Africa, for example, has adoptedan integrated national disability strategy committedto devel op ing accessible and affordable publictransport. In 2010, the UK govern ment passed anact that covers accessibility issues related to age,ethnicity, gender and disability as part of a singleintegrated approach to ensure equal access for all.124
In Europe, and more recently in North America,access to urban public trans port has been transformedby the introduction of low-floor vehicles.125 Passen -gers in wheelchairs can board the bus via a simpleramp or directly from the sidewalk if the curb is raisedat stops. Inside the bus, there is space to parkwheelchairs and strollers, where they can be secured
Integrated farestructures make itrelatively easy andless expensive forvulnerable anddis advan tagedgroups to travel,particularly whenundertaking trip-chains
1EEE234567891012311145678920123456789301234567894012345678950123456789EEEE
121Equitable Access to Urban Mobility
with a clamp belt. This caters for people with smallchildren or baggage, persons with disabilities and frailelderly persons.
In Delhi, India, a local NGO has worked withtrans port authorities to make metro stations barrierfree; to include safety features and tactile guideways126 on platforms; and to ensure carriages haveadequate space for wheelchair users.127 Similarly, aforum bringing together an advocacy group for thedisabled in Mexico City has led to thousands of kerbramps on major streets and the introduction ofaccessible buses and trolley buses.128
Accessible taxis, both purpose-built and modifiedvans, are also becoming more prevalent. In Canada,the Province of Ontario offers a grant to adapt taxisto accommodate all users.129 Private-sector companiesmay adapt one or more of their fleet and provideregular service and they send accessible taxis todisabled passen gers who call for them. A variationon taxi service is the ‘Dial-a-ride’ service that worksin many cities in the US and the UK.130 In Berlin, a‘telebus’ operates on the same principle.131 Often,disabled passen gers are given a ‘travel card’ andthen allowed a certain number of rides.
Some attempts have also been made to ensurethat information is availed to passen gers in an easilyunderstood manner. For instance, a number of taxisin Hong Kong have audio devices that provide thetaxi fare in English, Putonghua and Cantonese.132 Itis also important that authorities promote disabilityawareness and training of public trans port drivers andconductors to improve the assistance they offerpassen gers with special needs. Part of Mexico City’spublic information campaign aims to raise awarenessamong the general public about the integrated systemof accessible pedestrian and trans port services in thecity. Sensitivity training for taxi drivers has also beenconsidered.133
SAFETY AND SECURITY IN URBAN MOBILITYSYSTEMSSafety and security are key components in creatingsus tain able urban mobility systems, particularly inmaking roads safer and more secure for vulnerableand dis advan taged road users, including the poor.Likewise, improving the safety and security of trans -port modes can be an extremely important step inencouraging trans port users to change to alterna-tive (and more sus tain able) modes. Numerous terrorattacks against urban infra struc ture during the lasttwo decades have compelled stakeholders to under -stand trans port security as more than a single elementof the global networks that move people and goods.134 Once a routine component of moderntrans portation, security now represents an urgentnational priority.
Global conditions, trends and challenges
This section examines the trends and impacts oftraffic accidents in urban areas.135 It considersreducing the global burden of such accidents throughimproved policies, road design and safety and trafficmanagement. It also looks at transportation securitymore generally, in terms of people’s (real or per -ceived) assessments of personal security. Due to thepaucity of data on urban areas, this section refers toroad traffic accident data at the national level.
n Road traffic accidentsRoad traffic accidents are the ninth leading cause of death worldwide, accounting for 2.2 per cent ofall deaths or 1.2 million deaths per year. The WHOestimates that a further 20–50 million are injured inroad traffic crashes each year. The highest road trafficfatality rates occur in Africa and the Middle East(about 32 per year per 100,000 population). Theaverage road traffic fatality rate of devel op ingcountries (about 20 per year per 100,000 population)is nearly twice that of developed countries. In fact,more than 90 per cent of fatalities occur in devel op -ing countries,136 despite the fact that these countrieshave only 33 per cent of all registered vehicles.137
About half of the fatalities are in the mostproductive age group (15–44 years). In the 15–29years age group, road traffic accidents are the leadingcause of death. Males are overrepresented amongfatalities in all age groups.138 The most vulnerableroad users – pedestrians, cyclists and motorized two-wheelers – account for nearly half of all road trafficfatalities. And, as can be seen from Figure 6.3, theproportion of fatalities among such vulnerable usersis significantly higher in devel op ing countries thanin developed countries.
The predominance of vulnerable road-usercasualties in Asian and African countries can beattributed to the unique traffic mix on the roads,characterized by the abundance of vehicles and non-motorized transport, as well as a lack of segregatedfacilities in the road network.139 Poor enforcementof traffic safety regulations due to inadequateresources, administrative problems and corruption,exacerbate the situation further.140 Arguably, thenumber of accidents and fatalities is likely to increasebefore they can be reduced, placing a strain on thepoor public health infra struc ture in devel op ingcountries. In India, road traffic injury patients accountfor 10–30 per cent of all admissions to surgicalwards.141 Delays in emergency response time cancompromise the patient’s recovery, resulting inadverse health outcomes and long-term disability.Further more, lack of trained expertise in trauma care,in many devel op ing countries in particular, oftenresults in treatable injuries becoming permanent orlife threatening.142 The annual cost of road trafficaccidents in devel op ing countries has been estimated
Safety andsecurity are keycomponents increatingsustainable urbanmobility systems
Road trafficaccidents are theninth leadingcause of deathworldwide
In the 15–29years age group,road trafficaccidents are theleading cause ofdeath
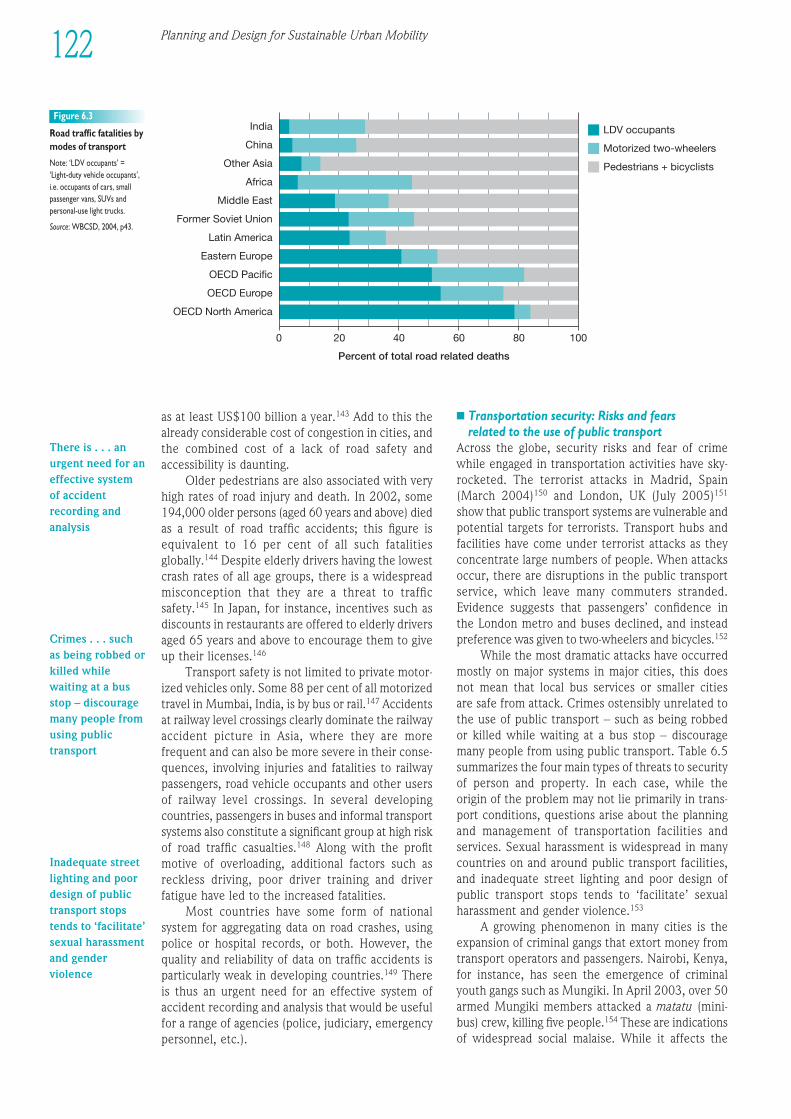
122 Planning and Design for Sustainable Urban Mobility
as at least US$100 billion a year.143 Add to this thealready considerable cost of congestion in cities, andthe combined cost of a lack of road safety andaccessibility is daunting.
Older pedestrians are also associated with veryhigh rates of road injury and death. In 2002, some194,000 older persons (aged 60 years and above) diedas a result of road traffic accidents; this figure isequivalent to 16 per cent of all such fatalitiesglobally.144 Despite elderly drivers having the lowestcrash rates of all age groups, there is a widespreadmisconception that they are a threat to trafficsafety.145 In Japan, for instance, incentives such asdiscounts in restaurants are offered to elderly driversaged 65 years and above to encourage them to giveup their licenses.146
Trans port safety is not limited to private motor -ized vehicles only. Some 88 per cent of all motorizedtravel in Mumbai, India, is by bus or rail.147 Accidentsat railway level crossings clearly dominate the railwayaccident picture in Asia, where they are morefrequent and can also be more severe in their conse -quences, involving injuries and fatalities to railwaypassen gers, road vehicle occupants and other usersof railway level crossings. In several devel op ingcountries, passen gers in buses and informal trans portsystems also constitute a significant group at high riskof road traffic casualties.148 Along with the profitmotive of overloading, additional factors such asreckless driving, poor driver training and driverfatigue have led to the increased fatalities.
Most countries have some form of nationalsystem for aggregating data on road crashes, usingpolice or hospital records, or both. However, thequality and reliability of data on traffic accidents isparticularly weak in devel op ing countries.149 Thereis thus an urgent need for an effective system ofaccident recording and analysis that would be usefulfor a range of agencies (police, judiciary, emergencypersonnel, etc.).
n Transportation security: Risks and fearsrelated to the use of public transport
Across the globe, security risks and fear of crimewhile engaged in transportation activities have sky-rocketed. The terrorist attacks in Madrid, Spain(March 2004)150 and London, UK (July 2005)151
show that public trans port systems are vulnerable andpotential targets for terrorists. Trans port hubs andfacilities have come under terrorist attacks as theyconcentrate large numbers of people. When attacksoccur, there are disruptions in the public trans portservice, which leave many commuters stranded.Evidence suggests that passen gers’ confidence inthe London metro and buses declined, and insteadpreference was given to two-wheelers and bicycles.152
While the most dramatic attacks have occurredmostly on major systems in major cities, this doesnot mean that local bus services or smaller cities are safe from attack. Crimes ostensibly unrelated tothe use of public trans port – such as being robbedor killed while waiting at a bus stop – discouragemany people from using public transport. Table 6.5summarizes the four main types of threats to securityof person and property. In each case, while theorigin of the problem may not lie primarily in trans -port conditions, questions arise about the planningand management of transportation facilities andservices. Sexual harassment is widespread in manycountries on and around public trans port facilities,and inadequate street lighting and poor design ofpublic trans port stops tends to ‘facilitate’ sexualharassment and gender violence.153
A growing phenomenon in many cities is theexpansion of criminal gangs that extort money fromtrans port operators and passen gers. Nairobi, Kenya,for instance, has seen the emergence of criminalyouth gangs such as Mungiki. In April 2003, over 50armed Mungiki members attacked a matatu (mini -bus) crew, killing five people.154 These are indicationsof widespread social malaise. While it affects the
India
China
Other Asia
Africa
Middle East
Former Soviet Union
Latin America
Eastern Europe
OECD Pacific
OECD Europe
OECD North America
LDV occupants
Motorized two-wheelers
Pedestrians + bicyclists
0 20 40 60 80 100
Percent of total road related deaths
Figure 6.3
Road traffic fatalities bymodes of transport
Note: ‘LDV occupants’ =‘Light-duty vehicle occupants’,i.e. occupants of cars, smallpassen ger vans, SUVs andpersonal-use light trucks.
Source: WBCSD, 2004, p43.
There is . . . anurgent need for aneffective systemof accidentrecording andanalysis
Crimes . . . suchas being robbed orkilled whilewaiting at a busstop – discouragemany people fromusing publictransport
Inadequate streetlighting and poordesign of publictransport stopstends to ‘facilitate’sexual harassmentand genderviolence
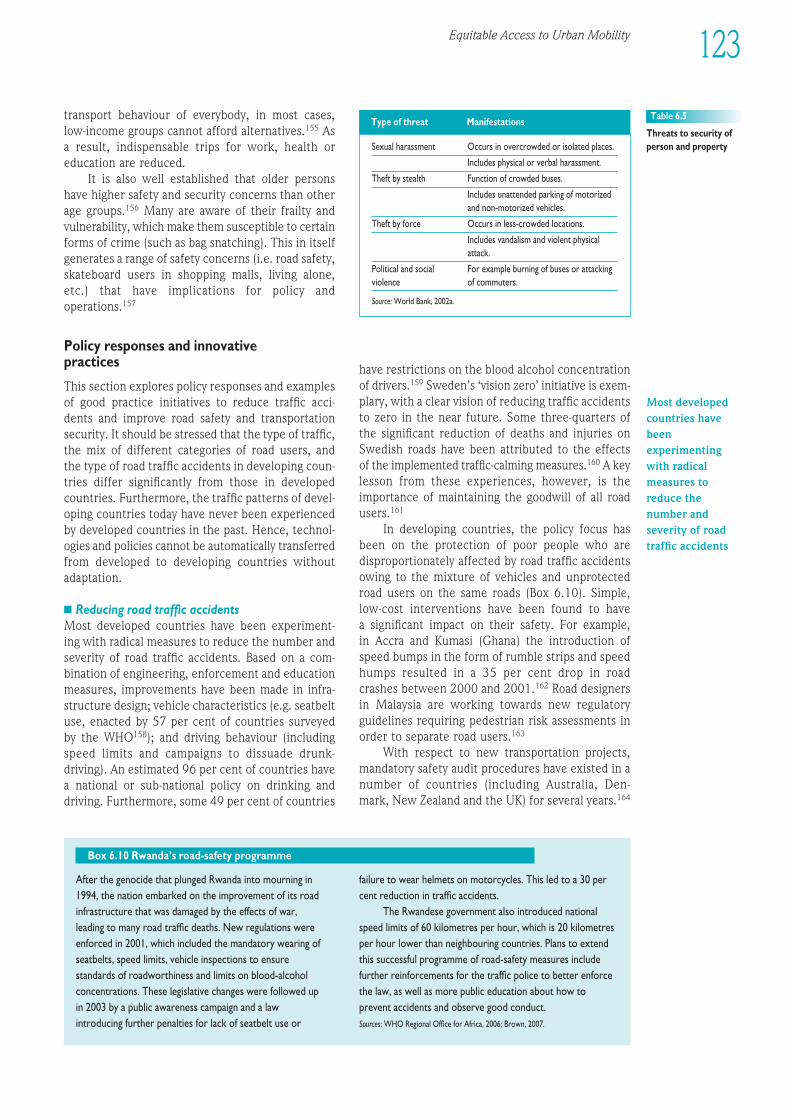
trans port behaviour of everybody, in most cases,low-income groups cannot afford alternatives.155 Asa result, indispensable trips for work, health oreducation are reduced.
It is also well established that older persons have higher safety and security concerns than otherage groups.156 Many are aware of their frailty andvulnerability, which make them susceptible to certainforms of crime (such as bag snatching). This in itselfgenerates a range of safety concerns (i.e. road safety,skateboard users in shopping malls, living alone,etc.) that have implications for policy andoperations.157
Policy responses and innovative practices
This section explores policy responses and examplesof good practice initiatives to reduce traffic acci-dents and improve road safety and transportationsecurity. It should be stressed that the type of traffic,the mix of different categories of road users, and the type of road traffic accidents in devel op ing coun -tries differ significantly from those in developedcountries. Further more, the traffic patterns of devel -op ing countries today have never been experi encedby developed countries in the past. Hence, technol -ogies and policies cannot be automatically transferredfrom developed to devel op ing countries withoutadaptation.
n Reducing road traffic accidentsMost developed countries have been experiment-ing with radical measures to reduce the number andseverity of road traffic accidents. Based on a com -bination of engineering, enforcement and educationmeasures, improvements have been made in infra -struc ture design; vehicle characteristics (e.g. seatbeltuse, enacted by 57 per cent of countries surveyedby the WHO158); and driving behaviour (includingspeed limits and campaigns to dissuade drunk-driving). An estimated 96 per cent of countries havea national or sub-national policy on drinking anddriving. Further more, some 49 per cent of countries
have restrictions on the blood alcohol concentrationof drivers.159 Sweden’s ‘vision zero’ initiative is exem -plary, with a clear vision of reducing traffic accidentsto zero in the near future. Some three-quarters ofthe significant reduction of deaths and injuries onSwedish roads have been attributed to the effects of the implemented traffic-calming measures.160 A keylesson from these experi ences, however, is theimportance of maintaining the goodwill of all roadusers.161
In devel op ing countries, the policy focus hasbeen on the protection of poor people who aredisproportionately affected by road traffic accidentsowing to the mixture of vehicles and unprotectedroad users on the same roads (Box 6.10). Simple, low-cost interventions have been found to have a significant impact on their safety. For example, in Accra and Kumasi (Ghana) the introduction ofspeed bumps in the form of rumble strips and speedhumps resulted in a 35 per cent drop in road crashes between 2000 and 2001.162 Road designersin Malaysia are working towards new regulatoryguidelines requiring pedes trian risk assessments inorder to separate road users.163
With respect to new transportation projects,mandatory safety audit procedures have existed in anumber of countries (including Australia, Den-mark, New Zealand and the UK) for several years.164
Sexual harassment Occurs in over crowded or isolated places.
Includes physical or verbal harassment.
Theft by stealth Function of crowded buses.
Includes unattended parking of motorizedand non-motorized vehicles.
Theft by force Occurs in less-crowded locations.
Includes vandalism and violent physicalattack.
Political and social For example burning of buses or attacking violence of commuters.
Source: World Bank, 2002a.
Table 6.5
Threats to security ofperson and property
Type of threat Manifestations
After the genocide that plunged Rwanda into mourning in1994, the nation embarked on the improvement of its roadinfra struc ture that was damaged by the effects of war,leading to many road traffic deaths. New regulations wereenforced in 2001, which included the mandatory wearing ofseatbelts, speed limits, vehicle inspections to ensurestandards of roadworthiness and limits on blood-alcoholconcentrations. These legislative changes were followed upin 2003 by a public awareness campaign and a lawintroducing further penalties for lack of seatbelt use or
failure to wear helmets on motorcycles. This led to a 30 percent reduction in traffic accidents.
The Rwandese govern ment also introduced nationalspeed limits of 60 kilometres per hour, which is 20 kilometresper hour lower than neigh bouring countries. Plans to extendthis successful programme of road-safety measures includefurther reinforcements for the traffic police to better enforcethe law, as well as more public education about how toprevent accidents and observe good conduct.Sources: WHO Regional Office for Africa, 2006; Brown, 2007.
Box 6.10 Rwanda’s road-safety programme
1EEE234567891012311145678920123456789301234567894012345678950123456789EEEE
123Equitable Access to Urban Mobility
Most developedcountries havebeenexperimentingwith radicalmeasures toreduce thenumber andseverity of roadtraffic accidents
Planning and Design for Sustainable Urban Mobility124
Such procedures are also at various phases of imple -mentation in devel op ing countries such as India,South Africa and Thailand.165
The enforcement of traffic regulations, govern-ing all road users and vehicles, is essential for thesafety of cyclists, other non-motorized vehicle usersand motorcyclists. In Iran, a law was passed in 2004,making the use of helmets compulsory countrywidefor motorcycle users. By 2007, fatalities per 100,000inhabitants decreased from 38.2 to 31.8. Some 40 per cent of countries surveyed by the WHO havea comprehensive motorcycle helmet law, in whichsome countries have clearly defined standards forboth motorcycle drivers and their passen gers.166
Exclusive motorcycle lanes can be created andseparated from the main carriageway by a physicalmedian, as observed in Kuala Lumpur (Malaysia). Box6.11 presents a toolkit for addressing road safety.
Most countries provide some pedestrianfacilities, but in most cases the road environ ment isnot designed with pedestrians in mind. In manydeveloped countries ‘pedestrian refuges’ – elevatedislands designed usually in the middle of streets –are a common feature to offer pedestrian safetywhen crossing the road. Such crossings are rare indevel op ing countries. Instead, zebra crossings (where
pedestrians are supposed to be granted immediatepriority over approaching vehicles) are provided insome devel op ing countries. Other low-cost pedestrianfacilities – which are affordable at a wide scale andcan be easily implemented – include pedestrianfootways, controlled signals for at-grade pedestriancrossings, grade-separated crossings, and segregatedbicycle lanes. As evidenced by pilot projects, trafficcalming and the redesign of roads can reduce thevulnerability of pedestrians and cyclists to road trafficaccidents.167
Other effective interventions for road safetyinclude better land-use management for optimizedtraffic flow and the promotion of alternative modesof transportation such as public trans port (Box 6.12).For instance, Singapore has been successful in reduc -ing car journeys and alleviating traffic congestionthrough a combination of integrated land-use andtrans port planning, and demand-management meas -ures. This can help to reduce traffic accidents byminimizing the number and length of motorizedtrips.168 Similarly, in Brazil, Curitiba’s high-capacitytraffic-management system has not only improvedurban trans port and mobility but has also reducedthe number of accidents along its routes, through theconstruction of safer infra struc ture.169 Higher occu -
The International Road Assessment Programme (iRAP) hasdeveloped a toolkit that rates roads according to criteria forsafety design, maps fatalities and serious injuries across theroad network, and makes cost/benefit calculations for fatality reductions based on implementation of proposedcountermeasures. It then applies tailored solutions. The iRAP methodology provides:
• ‘Star rating’ tables and maps showing the safety of roads orcar occupants, motorcyclist, cyclists and pedestrians.
• A road inventory database with 30 inspected attributesdescribing the network.
• An estimate of the numbers being killed and seriouslyinjured on each inspected road.
• A recommended network-wide countermeasureprogramme for consideration by local stakeholders andfunding bodies.
In Malaysia, it has been estimated that an investment ofUS$180 million in road design improvements could deliverUS$3 billion in benefits and prevent over 30,000 deaths andserious injuries over 20 years. iRAP has pilot projects in Chile, Costa Rica, Malaysia and South Africa showing positivecost–benefit ratios. Positive economic outcomes combinedwith the alleviation of human suffering make investment insafer roads a devel op ment priority.
Sources: iRAP, 2009a and 2011.
Box 6.11 Toolkits for road safety
Since 1993, Colombian legislation requires all vehicle ownersto be insured. As a result, a 3 per cent levy was instituted onall vehicle insurance policies, earmarking that money for a‘road accident prevention fund’. This resulted in Colombia’stime-record high for the reduction of traffic fatalities – 7874 in 1995.
In Bogotá, several programmes have been introduced toprevent and mitigate road traffic deaths and injury. Typically,
bars are closed at 1am instead of 3am, and citizens arecautioned against driving under the influence of alcohol. Thestiff penalties deter people, who instead opt for alternativemeans of transportation (such as carpooling), resulting in thereduction of road traffic fatalities in Bogotá from 1387 in 1995to 697 in 2002.
Source: WHO, 2004.
Box 6.12 Reducing road traffic fatalities in Bogotá, Colombia
The enforcementof trafficregulations . . . is essential for the safety ofcyclists, othernon-motorizedvehicle users andmotorcyclists
Traffic calmingand the redesignof roads canreduce thevulnerability ofpedestrians andcyclists to roadtraffic accidents
Equitable Access to Urban Mobility 125
1EEE234567891012311145678920123456789301234567894012345678950123456789EEEE
pancy vehicles are given priority in the road network,thus reducing the exposure risk of pedestrians andother road users. Surrounding areas have also beenimproved with better lighting and other equipmentto make the trans port system safer, more efficientand more user friendly.
The responsibility for regulating traffic andenforcing rules falls with the police. However, manypolice agencies in devel op ing countries are plaguedwith poor enforcement of regulations – due to a lackof resources, unsatisfactory systems or generalinefficiency on the part of the staff. Evidence suggeststhat a sustained systemic approach to road policing,with international support, can improve the perform -ance (and image) of the police. A study of enhancedtraffic enforcement in Uganda showed a 17 per centdrop in road deaths. The implemented scheme wasworth US$72,000 and an average cost-effectivenessof US$27 per life year saved.170
Partnerships between community groups, civilsociety and NGOs and the police can help inpreventing and mitigating traffic accidents, andenforcing trans port safety measures.171 For example,in Bangalore, India, the World Bank’s Global RoadSafety Partnership has created partnerships to launcha campaign against drunk-driving, and to improveroadways in high-traffic areas to enhance safety.172
In addition, the Centres for Disease Control andPrevention have been working with the ministries ofhealth and other groups in Mexico, Colombia and El Salvador to reduce injuries to pedestrians, cyclistsand motor-vehicle occupants.173
n Improving the safety and security ofvulnerable groups
‘Safe route to school’ programmes exist world-wide.174 Spearheaded by Denmark in the 1970s, theprogramme focuses on engineering enforcement,education and encouragement of safe walking andcycling for schoolchildren.175 Under the Road TrafficAct, police and local authorities are responsible forthe safety of children on school journeys. Thisinvolves many improvements on local roads, includingslow-speed areas, ‘road narrowings’, traffic islands and separate foot and bicycle paths. The programmehas been highly successful, and in some localities theaccident frequency has been reduced by 85 percent.176 Denmark’s experi ence with these pro -grammes has provided an example for many othercountries worldwide.
Many European cities are working towardslimiting through-traffic on their streets to protectchildren, deaf people and those in wheelchairs fromaccidents.177 The Netherlands has developed anamicable street-design solution for sharing of spacebetween pedestrian and motor traffic in residentialareas.178 Selected areas are designated woonerfs(‘living streets’) and they are clearly marked with atraffic sign based on the image of a house. The street
design is modified giving priority to pedestrians,with the pavement clearly demarcating areas whereparking is acceptable. Through-traffic slows down dueto the judicious use of speed bumps and windingthoroughfares. The harshness of asphalt and concreteis softened with amenities such as trees and flowerboxes, small areas where children may play andbenches where adults may meet with each other. By 2011 it was estimated that some 20 per cent of the population of the Netherlands were living inwoonerfs.179 Similar initiatives have been introducedin a number of other countries as well, includingNorway (where they are called gatetun)180 and theUK (‘home streets’).
Since the 1980s, trans port planners in somecountries have taken into consideration the personalsecurity of passen gers using public transportationsystems, especially women. In Toronto, Canada, a‘request stop’ service was launched in 1980 for thehours after dark, allowing a female passen ger to askthe bus driver to stop along the route, where it ismore convenient for the woman to get off, notneces sarily at the bus stop. This was done to shortenthe woman’s walk between bus and destination. Theservice was later adopted in Montreal in 1996,181 andlater in a few UK cities.182 Other measures taken toimprove the personal safety of passen gers in Torontoinclude increasing the presence of security personnelin stations, adding more services at night and raisingawareness among station employees, drivers andpassen gers.183
Environ mental design plays an important role inreducing crime in public transport. In the US, theWashington Metropolitan Area Transit Authority184
and the New York Port Authority Bus Terminal areclassic examples of success stories of applied securitydesign against crime in rail trans port environ ments.185
In each case, environ mental design shares the creditfor increased security with strategic policing, strictmaintenance procedures and ‘zero tolerance’ policiesin enforcing rules and regulations. Another exampleof crime prevention through environ mental designis evident in the UK, where closed circuit televisioncameras are used widely to monitor public spacessuch as shopping malls, car parks and a few residentialareas.186
The emergence of low-cost open-source mappingtools; widespread cellular network coverage in devel -op ing countries; declining costs of mobile phonehardware; and increasing internet use by publicagencies have resulted in unprecedented oppor tun -ities to support trans port planning and manage-ment in devel op ing countries.187 Some three-quartersof the world’s inhabitants now have access to amobile phone. The number of mobile subscriptionsgrew from fewer than 1 billion in 2000 to over 6billion in 2012; nearly 5 billion of these are in devel -op ing countries. In 2011 alone, more than 30 billionmobile applications, or ‘apps’ (the software that
Many Europeancities are workingtowards limitingthrough-traffic ontheir streets toprotect children,deaf people andthose inwheelchairs fromaccidents
126 Planning and Design for Sustainable Urban Mobility
extends the capabilities of phones, for instance tobecome mobile wallets, navigational aids or price-comparison tools) were downloaded.188
Advances in technology now make it possible to respond to specific needs, including those ofparticularly vulnerable groups such as women,persons with limited mobility and persons with dis -abilities. This could mean benefiting from newopportunities through safer and easier trans portaccess. In Egypt, an innovative website ‘HarassMap’was launched in December 2010 to help report andmap cases of harassment.189 Due to the affordableand adaptable technology, victims of harassment areable to anonymously report incidents by simplysending an SMS message to this website.
Another innovation is the ‘Access Advisr’, a pilotweb application in the UK that uses crowd-sourcingto identify local people’s needs in order to improveaccessibility to the existing public trans port networkfor disabled and older persons.190 The applicationidentifies problem areas for accessible transport, andallows the review of information about the physicalinfra struc ture, and to rate it – through a live feed-back community of users who can contribute theirviews, photos and videos based on their own experi -ences.
CONCLUDING REMARKSAND LESSONS FOR POLICYMobility is required to ensure access to basic goods,services and activities, and in that sense it is essen-tial to social equity. Restrictions on such access mayimply an abuse of human rights. In order to ensureequitable access, cities need to understand the trans port needs of all urban dwellers, distinguishingbetween the priorities of men and women, the youngand old, the able and the disabled. There is thus a need to understand the purposes and uses thatwould be derived from improved access, and theconstraints preventing those needs from beingfulfilled. While social objectives are often acknow -ledged in trans port strategies, experi ences show that very little practice goes beyond pilot schemesand case studies. Yet, the importance of the socialsus tain ability of urban trans port cannot be under -estimated; it is a key prerequisite for social devel op -ment.
In theory, there are already both awareness and some knowledge of the role that mobility playsin terms of improving – or worsening – a person’squality of life. However, the complex dynamics areoften not well understood. This leads to a situationwhereby those responsible for taking action fall back on traditional solutions; namely: infra struc turedevel op ment, improvement of conditions for privatetransport, and lump-sum payments or untargeted
subsidies. Trans port subsidy is an important policyoption for ensuring equitable trans port access. How -ever, it is essential that such subsidies are designedcarefully to target the poor and other vulnerable anddis advan taged groups.
Good mobility policies should contribute topoverty reduction by recognizing both the necessityof improved macroeconomic efficiency, and the needfor direct targeting of trans port interventions. Therehas been a tendency to treat these two dimensionsof trans port policy separately, with the result that aneffective and unified approach to urban mobility hasbeen lacking. One way of dealing with this is byensuring that poverty reduction becomes an explicitobjective of trans port policies, with clear strategiesto bring the benefits of economic efficiency to poorpeople, through redistribution and direct targetingprogrammes, including preferential treatment ofspecific vulnerable and dis advan taged groups.
In order to minimize poor accessibility, appro -priate urban planning and land use is essential. As aderived demand, trans port infra struc ture that enablesaccess to low-cost trans port can make a crucialcontribution to poverty reduction. However, large-scale trans port infra struc ture projects tend to benefithigh-income groups the most. The poor and otherlow-income groups are often displaced to make wayfor the projects, and may derive little or no benefit.
Accessibility planning is viewed as a mechanismfor ensuring equity and reducing mobility. Devel op -ing services and facilities on a localized basis thatplaces trans port within easy and affordable reach ofthe poor, forms a central principle within a sus tain -able urban mobility paradigm. Greater attentionshould be given to investments in bus-priority andnon-motorized trans port facilities, in order to reducethe negative impacts of congestion. In some devel -oped countries, it may even be possible to learn fromthe experi ence of some devel op ing countries, wherethe urban poor are supported by the existence ofcheap (mostly informal) trans port solutions. Manylow-cost actions can be implemented, which focuson both walking and cycling facilities, especially inpoorly equipped areas. Such interventions couldcontribute to the welfare of the urban poor, as wellas the economic activities of petty traders andhawkers.
While great strides have been made in devel op -ing gender-appropriate trans port policies anduniversal design solutions, consistent implementationis still lacking. Moving towards greater equity in urbanmobility is an essential prerequisite for achieving sus -tain able urban mobility systems. Concerted effortsmust be made by decision-makers to establish mobil -ity systems that address the needs of all populationgroups, especially the poor, the young, the elderlyand the disabled.
The mere existence of gender-main streamingmaterials and official (international or national) policy
The importance ofthe socialsustainability ofurban transportcannot beunderestimated; it is a keyprerequisite forsocialdevelopment
To minimize pooraccessibility,appropriate urbanplanning and landuse is essential
Accessibilityplanning isviewed as amechanism forensuring equityand reducingmobility
Greater equity inurban mobility isan essentialprerequisite forachievingsustainable urbanmobility systems
NOTES1 TRL Limited, 2004.2 World Bank, 1999a.3 World Bank, 2008b.4 World Bank, 1999a.5 Habitat Agenda, paragraphs
61c(vii), 85(c), 93 and 116(UNCHS, 1997).
6 Hans and Becker, 2007.7 Polèse and Stren, 2000.8 Lucas, 2004.9 Kaufmann et al, 2004.10 Gannon and Liu, 1997.11 Godard, 2011a.12 Hook, 2006.13 See Figure 2.1.14 Cervero, 2011.15 World Bank, 2002a.16 Booth et al, 2000.17 http://data.worldbank.org/
indicator, last accessed 26March 2013. See also Chapter 2and Figure 8.1.
18 Litman, 2006a.19 Alberta Health Services, 2008.20 Choudhry, 2013.21 Barone and Rebelo, 2003.22 Worldwatch Institute, 2008.23 Cervero, 2011.24 Barter, 2002.25 Godard, 2011b.26 Blackden and Wodon (eds),
2006.27 World Bank, 2002a.28 See Chapter 7.29 Cervero, 2005a.30 Witting et al, 2006.31 Leyden, 2003.32 DeMaio, 2009.33 Hook, 2003.34 Kunieda and Gauthier, 2007.35 DeMaio, 2009.36 See Box 7.8.37 Worldwatch Institute, 2008.38 Lessons from the World Bank’s
Sub-Saharan Africa TransportProgram in Kenya and Tanzania
give many insights to the viabilityof non-motorized trans portdesigns (Pendakur, 2005, p7).
39 Worldwatch Institute, 2008.40 Efroymson and Rahman,
2005.41 Renner et al, 2008.42 Starkey et al, 2002. See also
discussion in Chapter 2.43 Witting et al, 2006.44 See, for instance, Flower,
2012.45 Litman, 2006a.46 Hook, 2003.47 Litman, 2006a.48 Estache and Gómez-Lobo,
2005.49 Hague, 2001.50 Godard, 2011b.51 Kunieda and Gauthier, 2007.52 Godard, 2011a.53 Estupiñán et al, 2007.54 Cervero, 1998.55 CODATU, 2009.56 World Bank, 2000.57 Broaddus et al, 2009.58 Broaddus et al, 2009.59 Pucher and Kurth, 1996;
Cervero, 1998.60 See, for example, Social
Exclusion Unit, 2003.61 Cervero, 2005a.62 Rogat et al, 2009, p87. For
comparison with other cities,see Table 6.2.
63 Broaddus et al, 2009.64 Litman, 2006a.65 It should be noted that many of
the above mentioned policiesand schemes may be extremelydifficult to implement in cities ofdevel op ing countries.
66 Many poverty studies cite trans -port as a key factor associatedwith deprivation (see Booth et al, 2000).
67 Rosenbloom, 2005.68 http://epp.eurostat.ec.europa.
eu/portal/page/portal/eurostat/home/, last accessed 25 March2013.
69 Duchène, 2011.70 World Bank, undated b.71 Kamuhanda and Schmidt, 2009.72 Srinivasan, 2005.73 Johnston, 2004. See also
http://www.stopstreetharassment.org/resources/statistics/statistics-academic-studies/, last accessed 26 March 2013.
74 Peters, 2011.75 World Bank, 1999a.76 Kunieda and Gauthier, 2007.77 Peters, 2011, p1.78 A comprehensive ‘one-step
resource’ on gender main -streaming in trans port can be found in World Bank(undated a).
79 Gilbert et al, 2009.80 Rosenbloom, 2005.81 Commission for Global Road
Safety, 2006.82 UNICEF, 1999.83 Vuri, 2008.84 Maunder et al, 2004.85 WHO and World Bank, 2011,
p xi.86 WHO and World Bank, 2011.87 UN, 2011a.88 In India it is estimated that only
5 per cent of the estimated 10 million people who havedifficulty moving about receivethe wheelchairs, calipers(braces) and other devices, and the accompanyingtherapeutic services that they need.
89 D’Souza et al, 2010.90 Bailey, 2004.91 WHO and World Bank, 2011.
92 http://www.un.org/esa/socdev/enable/dissre00.htm, lastaccessed 25 March 2013.
93 http://www.un.org/disabilities/default.asp?id=150, last accessed25 March 2013.
94 Duchène, 2011.95 Kunieda and Gauthier, 2007.96 Peters, 2011.97 Peters, 2011.98 Peters, 2011.99 The Third Rural Infra struc ture
Project (Gajewski et al, 2007).100 Pulley et al, 2001.101 Peters, 2001.102 Peters, 2011.103 Duchène, 2011.104 This is particularly relevant with
respect to women’s productiveand domestic tasks in ruralareas.
105 Astrop, 1996.106 Martin and Shaheen, 2011.107 Rosenbloom and Burns,
1993.108 Peters, 2011.109 Department for Transport, UK,
2012.110 Frye, 2011.111 World Bank, 2006a.112 OECD, 2001 and 2002.113 Cervero, 2005b.114 OECD, 2002, p91.115 World Institute on Disability,
2005.116 Venter et al, undated.117 World Bank, 2002a.118 Japan Society of Traffic
Engineers, 2007.119 Lai, 2010.120 Barlow et al, 2004.121 Robichand and Gunter, 2012.122 Dellinger and Staunton, 2002.123 African Union and the UNECA,
2005, p26.124 Hepple, 2010.
documents alone does not mean that gender issuccessfully integrated in the trans port sector.Particular attention needs to be paid to gender issues,and consideration given to the differential needs and demands arising from varying gender contexts.Similarly, it is increasingly being recognized thatthere is a need for an analysis of gender that acknow -ledges income differences, in order to assess howindividuals experi ence urban mobility. Accordingly,it is crucial that women are represented in theplanning, design and decision-making of all trans portinvestments (including user panels).
As noted earlier in this report, urban mobilityis primarily a means to an end: to provide access tobasic goods, services and activities. In this con-text, the core social requirement for an urbanmobility system is that it delivers its services equallyto different localities, interest groups and acrossgenerations. Similarly, the negative impacts shouldbe distributed fairly among all users. Granting
equitable access for all will involve devel op ing andimplementing appropriate measures and controlmechanisms, which include the following:
• Fare and pricing policies;• Flexible routing and servicing;• Establishing schedules that are considerate of
people’s activity patterns and time budgets;• Acknowledging the importance of the services
provided by the informal sector and by non-motorized transport;
• Introducing innovative trans port services that alsomake use of opportunities provided by informationand communication technologies;
• Addressing the safety and security concerns andother needs of trans port users;
• Eliminating gender biases by integrating the trans -port needs of women into trans port policy andplanning processes.
1EEE234567891012311145678920123456789301234567894012345678950123456789EEEE
127Equitable Access to Urban Mobility
128 Planning and Design for Sustainable Urban Mobility
125 Department for Transport, UK,2010.
126 Tactile guide-ways is a system oftextured ground surfaceindicators found on manyfootpaths, stairs and platformsto assist blind and vision-impaired pedestrians.
127 Samarthyam, 2010.128 Venter et al, undated.129 UNCHS, 1993.130 UNCHS, 1993.131 OECD, 2001.132 Chan, 2010.133 Rickert, 2001.134 Carter et al, 2002.135 This section builds on the
findings of UN-Habitat (2007).136 WHO, 2009.137 See Table 2.3.138 Males had nearly three times the
fatality rate of women (about 28
and 20 deaths per 100,000population, respectively) (Peden et al, 2004).
139 Nantulya and Reich, 2003.140 WHO, 2009.141 Aeron-Thomas et al, 2004.142 WHO, 2004 and 2009.143 WHO, 2009.144 WHO, 2004.145 Hu et al, 1993.146 Japan Probe, 2008.147 Patel and Sharma, 1998.148 Nantulya and Muli-Musiime,
2001.149 World Bank, 2002a.150 Taylor et al, 2005.151 Nascu, 2009.152 Von Winterfeldt and Prager,
2010; Fasolo, 2009.153 Anand and Tiwari, 2006; Tiwari,
2011.154 UN-Habitat, 2007.
155 World Bank, 2002a.156 OECD, 2001.157 Loewen et al, 1993.158 WHO, 2009.159 WHO, 2009.160 City of Göteborg, 2006.161 UN-Habitat, 2007.162 Afukaar et al, 2003.163 WHO, 2009.164 Macaulay and McInerney, 2002.165 Jain et al, 2011.166 WHO, 2009.167 In the Sub-Saharan Africa
Transport Program (WorldBank, 2002a).
168 UN-Habitat, 2007.169 UN-Habitat, 2007.170 Andrews, 2010.171 UN-Habitat, 2007.172 Lauridsen and Bjørnskau, 2004.173 Bhalla et al, 2008.174 Van Vliet, 1983.
175 Osborne, 2005.176 Dellinger and Staunton, 2002.177 Department for Transport, UK,
2002.178 de Wit and Talens, undated.179 Wassenberg and Lupi, 2011.180 Elvik, 2010 (section 3.4).181 Todes et al, 2009.182 Scottish Executive Central
Research Unit, 2000.183 Kunieda and Gauthier, 2007.184 LaVigne, 1997.185 DeBlasio, 2004.186 UN-Habitat, 2007.187 Schuster and Perez Brito,
2011.188 World Bank, 2012b. See also
Box 9.5.189 harassmap.org/en/, last accessed
25 March 2013.190 http://www.accessadvisr.net, last
accessed 25 March 2013.
URBAN MOBILITY AND THE ENVIRON MENT
C H A P T E R 7The increasing mobility experi enced in cities all overthe world brings enormous benefits to society andalso provides the essential means by which a city canfunction effectively. The increasing urban mobilityis manifested in three major forms: an increase inthe number of trips made, an increase in the lengthof each trip, and – last but not least – an increasingmotorization of urban people and goods movement.The environ mental consequences of the increasedmotorization – and in particular the use of privatemotorized vehicles (cars and motorcycles) – arecause for major concerns, not only locally in the city,but also globally, as the trans port sector is one ofthe major contributors to greenhouse gas emissions,the major cause of climate change.
In the past, it has often been argued that trans -port is an essential prerequisite for economic growth,at least for cities at an early stage in their devel op -ment. It has also been argued that this relationshipis not so important for cities in developed countrieswhere there is already an extensive network ofroutes and where levels of accessibility are alreadyhigh.1 Recent debates have argued for prosperitywithout growth,2 meaning that economic growth(and transport) needs to be more closely aligned withenviron mental and social priorities.
It is increasingly being acknowledged that urbandevel op ment has to be based not only on economicgrowth, but also on social equity (and equal access)and environ mental sus tain ability. Thus interventionsin urban mobility systems should not only addressthe economic benefits of higher levels of accessibility(and mobility), but at the same time take account ofthe social and environ mental implications of followingparticular policy pathways.3
The purpose of this chapter is to highlight envir -on mental sus tain ability concerns within urbanmobility systems. This includes the identification ofenviron mental costs and a discussion of the meansby which their impacts can be reduced. The chapteracknowledges that urban mobility will always useresources and generate externalities,4 but its impact
on the urban environ ment can be substantiallyreduced, so that it remains within acceptable limitsand makes a strong contribution to other aspects ofsus tain ability, including intergenerational concerns.
The first section of the chapter identifies themain environ mental challenges facing urban mobility,focusing on oil dependence, greenhouse gas emiss -ions, sprawl and human health concerns. This isfollowed by five sections that discuss the policyresponses to these challenges. The second to fourthsections focus on reducing the number of trips made,reducing travel distances in cities and changing themodal split towards non-motorized and publictransport. The fifth section discusses the potentialof technology in reducing the negative externalitiesof motorization by addressing the efficiency and ageof the vehicle stock, standards of fuels used andemissions from vehicles and alternatives to oil-basedfuels, and the need for increased efficiency in theuse of vehicles. The sixth section argues that, inpractical terms, a combination of several approachesis likely to be most effective. This is followed by asection that (briefly) discusses international fundingmechanisms to achieve environ mentally sus tain ableurban mobility systems. The final section contains abrief summary and some major lessons for policy.
ENVIRON MENTALCHALLENGES IN URBANMOBILITY SYSTEMSEnviron mental concerns have, over the last fewdecades, become central to the debates about sus -tain able urban mobility. Yet, in practice, devel op -mental objectives seem to take priority overenvir on mental concerns. A key message underpinningthe discussion in this chapter is the need to find themeans by which both devel op mental and environ -mental concerns can be addressed at the same time,in mutually supporting ways.
1EEE234567891012311145678920123456789301234567894012345678950123456789EEEE
Theenvironmentalconsequences ofthe increasedmotorization . . .are cause formajor concerns, . . . as thetransport sector isone of the majorcontributors to . . . climatechange
Environmentalconcerns have . . . become central tothe debates aboutsustainable urbanmobility. Yet, in practice,developmentalobjectives seem totake priority overenvironmentalconcerns
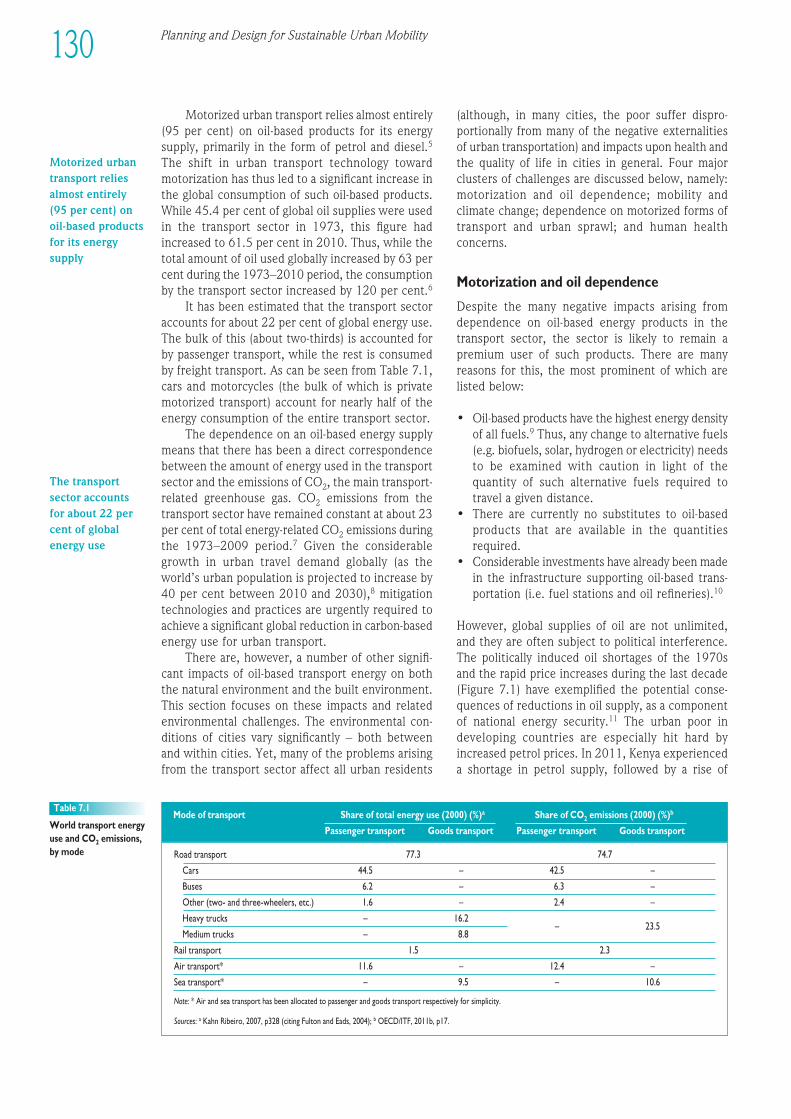
Planning and Design for Sustainable Urban Mobility130
Motorized urban trans port relies almost entirely(95 per cent) on oil-based products for its energysupply, primarily in the form of petrol and diesel.5
The shift in urban trans port technology towardmotorization has thus led to a significant increase inthe global consumption of such oil-based products.While 45.4 per cent of global oil supplies were usedin the trans port sector in 1973, this figure hadincreased to 61.5 per cent in 2010. Thus, while thetotal amount of oil used globally increased by 63 percent during the 1973–2010 period, the consumptionby the trans port sector increased by 120 per cent.6
It has been estimated that the trans port sectoraccounts for about 22 per cent of global energy use.The bulk of this (about two-thirds) is accounted forby passen ger transport, while the rest is consumedby freight transport. As can be seen from Table 7.1,cars and motorcycles (the bulk of which is privatemotorized transport) account for nearly half of theenergy consumption of the entire trans port sector.
The dependence on an oil-based energy supplymeans that there has been a direct correspondencebetween the amount of energy used in the trans portsector and the emissions of CO2, the main transport-related greenhouse gas. CO2 emissions from thetrans port sector have remained constant at about 23per cent of total energy-related CO2 emissions duringthe 1973–2009 period.7 Given the considerablegrowth in urban travel demand globally (as theworld’s urban population is projected to increase by40 per cent between 2010 and 2030),8 mitigationtechnologies and practices are urgently required toachieve a significant global reduction in carbon-basedenergy use for urban transport.
There are, however, a number of other signifi -cant impacts of oil-based trans port energy on boththe natural environ ment and the built environ ment.This section focuses on these impacts and relatedenviron mental challenges. The environ mental con -di tions of cities vary significantly – both between and within cities. Yet, many of the problems arisingfrom the trans port sector affect all urban residents
(although, in many cities, the poor suffer dispro -portionally from many of the negative externalitiesof urban transportation) and impacts upon health andthe quality of life in cities in general. Four majorclusters of challenges are discussed below, namely:motorization and oil dependence; mobility andclimate change; dependence on motorized forms oftrans port and urban sprawl; and human healthconcerns.
Motorization and oil dependence
Despite the many negative impacts arising fromdepen d ence on oil-based energy products in thetrans port sector, the sector is likely to remain apremium user of such products. There are manyreasons for this, the most prominent of which arelisted below:
• Oil-based products have the highest energy densityof all fuels.9 Thus, any change to alternative fuels(e.g. biofuels, solar, hydrogen or electricity) needsto be examined with caution in light of thequantity of such alternative fuels required totravel a given distance.
• There are currently no substitutes to oil-basedproducts that are available in the quantitiesrequired.
• Considerable investments have already been madein the infra struc ture supporting oil-based trans -portation (i.e. fuel stations and oil refineries).10
However, global supplies of oil are not unlimited, and they are often subject to political interference.The politically induced oil shortages of the 1970s and the rapid price increases during the last decade(Figure 7.1) have exemplified the potential conse -quences of reductions in oil supply, as a componentof national energy security.11 The urban poor indevel op ing countries are especially hit hard byincreased petrol prices. In 2011, Kenya experi enceda shortage in petrol supply, followed by a rise of
Road transport 77.3 74.7
Cars 44.5 – 42.5 –
Buses 6.2 – 6.3 –
Other (two- and three-wheelers, etc.) 1.6 – 2.4 –
Heavy trucks – 16.2– 23.5
Medium trucks – 8.8
Rail transport 1.5 2.3
Air transport* 11.6 – 12.4 –
Sea transport* – 9.5 – 10.6
Note: * Air and sea trans port has been allocated to passen ger and goods trans port respectively for simplicity.
Sources: a Kahn Ribeiro, 2007, p328 (citing Fulton and Eads, 2004); b OECD/ITF, 2011b, p17.
Table 7.1
World trans port energyuse and CO2 emissions,by mode
Mode of transport Share of total energy use (2000) (%)a Share of CO2 emissions (2000) (%)b
Passen ger transport Goods transport Passen ger transport Goods transport
Motorized urbantransport reliesalmost entirely(95 per cent) onoil-based productsfor its energysupply
The transportsector accountsfor about 22 percent of globalenergy use
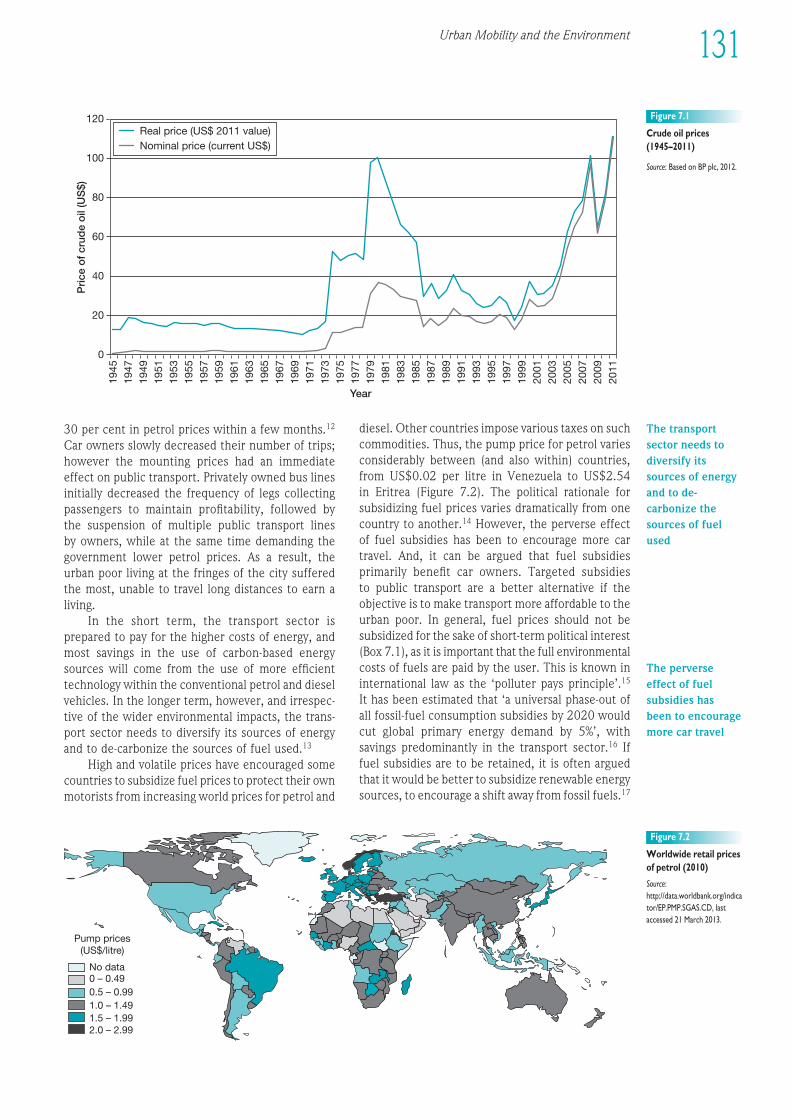
Urban Mobility and the Environment 131
1EEE234567891012311145678920123456789301234567894012345678950123456789EEEE
1945
1947
1949
1951
1953
1955
1957
1959
1961
1963
1965
1967
1969
1971
1973
1975
1977
1979
1981
1983
1985
1987
1989
1991
1993
1995
1997
1999
2001
2003
2005
2007
2009
2011
120
100
80
60
40
20
0
Pri
ce o
f cr
ude
oil
(US
$)
Year
Real price (US$ 2011 value)Nominal price (current US$)
Figure 7.1
Crude oil prices(1945–2011)
Source: Based on BP plc, 2012.
30 per cent in petrol prices within a few months.12
Car owners slowly decreased their number of trips;however the mounting prices had an immediateeffect on public transport. Privately owned bus linesinitially decreased the frequency of legs collectingpassen gers to maintain profitability, followed by the suspension of multiple public trans port lines by owners, while at the same time demanding thegovern ment lower petrol prices. As a result, theurban poor living at the fringes of the city sufferedthe most, unable to travel long distances to earn aliving.
In the short term, the trans port sector isprepared to pay for the higher costs of energy, andmost savings in the use of carbon-based energysources will come from the use of more efficienttechnology within the conventional petrol and dieselvehicles. In the longer term, however, and irrespec -tive of the wider environ mental impacts, the trans -port sector needs to diversify its sources of energyand to de-carbonize the sources of fuel used.13
High and volatile prices have encouraged somecountries to subsidize fuel prices to protect their ownmotorists from increasing world prices for petrol and
diesel. Other countries impose various taxes on suchcommodities. Thus, the pump price for petrol variesconsiderably between (and also within) countries,from US$0.02 per litre in Venezuela to US$2.54 in Eritrea (Figure 7.2). The political rationale forsubsidizing fuel prices varies dramatically from onecountry to another.14 However, the perverse effectof fuel subsidies has been to encourage more cartravel. And, it can be argued that fuel subsidies pri marily benefit car owners. Targeted subsidies to public trans port are a better alternative if theobjective is to make trans port more affordable to theurban poor. In general, fuel prices should not besubsidized for the sake of short-term political interest(Box 7.1), as it is important that the full environ mentalcosts of fuels are paid by the user. This is known ininternational law as the ‘polluter pays principle’.15
It has been estimated that ‘a universal phase-out ofall fossil-fuel consumption subsidies by 2020 wouldcut global primary energy demand by 5%’, withsavings predominantly in the trans port sector.16 If fuel subsidies are to be retained, it is often arguedthat it would be better to subsidize renewable energysources, to encourage a shift away from fossil fuels.17
Pump prices(US$/litre)
No data0 – 0.490.5 – 0.991.0 – 1.491.5 – 1.992.0 – 2.99
Figure 7.2
Worldwide retail pricesof petrol (2010)
Source:http://data.worldbank.org/indicator/EP.PMP.SGAS.CD, lastaccessed 21 March 2013.
The transportsector needs todiversify itssources of energyand to de-carbonize thesources of fuelused
The perverseeffect of fuelsubsidies hasbeen to encouragemore car travel
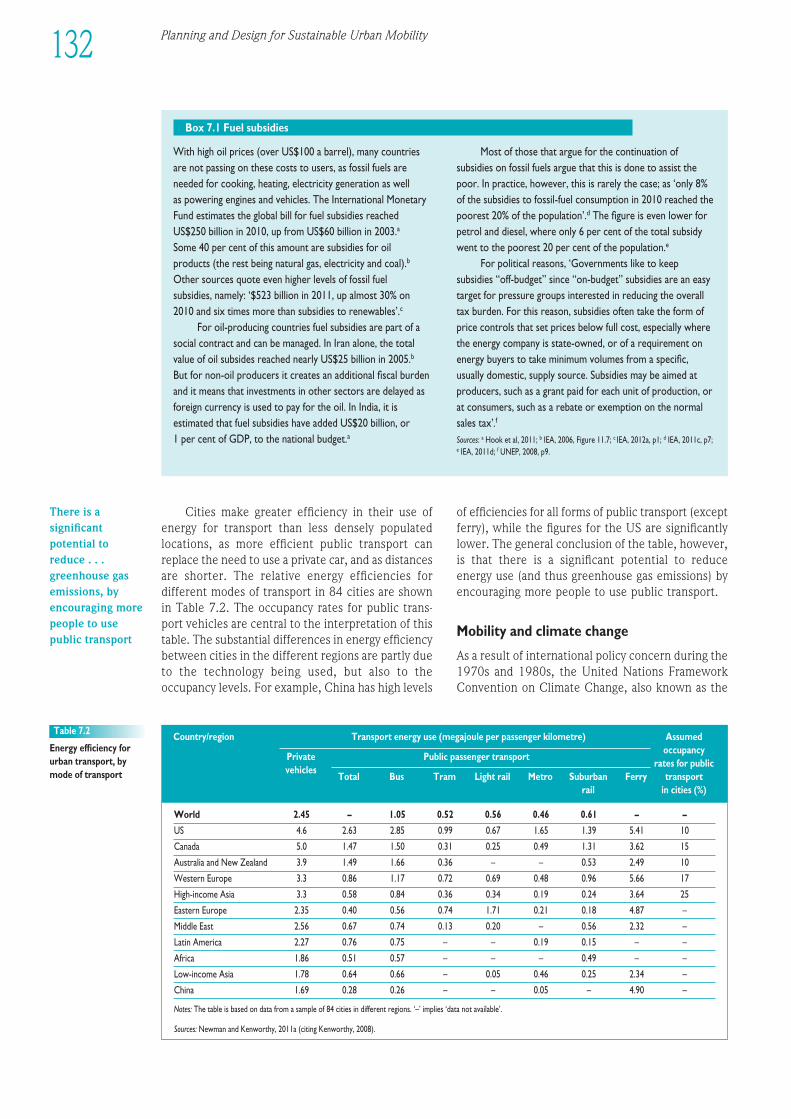
Planning and Design for Sustainable Urban Mobility132
With high oil prices (over US$100 a barrel), many countriesare not passing on these costs to users, as fossil fuels areneeded for cooking, heating, electricity generation as well as powering engines and vehicles. The International MonetaryFund estimates the global bill for fuel subsidies reachedUS$250 billion in 2010, up from US$60 billion in 2003.a
Some 40 per cent of this amount are subsidies for oil products (the rest being natural gas, electricity and coal).b
Other sources quote even higher levels of fossil fuel subsidies, namely: ‘$523 billion in 2011, up almost 30% on2010 and six times more than subsidies to renewables’.c
For oil-producing countries fuel subsidies are part of asocial contract and can be managed. In Iran alone, the totalvalue of oil subsides reached nearly US$25 billion in 2005.b
But for non-oil producers it creates an additional fiscal burdenand it means that investments in other sectors are delayed asforeign currency is used to pay for the oil. In India, it isestimated that fuel subsidies have added US$20 billion, or 1 per cent of GDP, to the national budget.a
Most of those that argue for the continuation ofsubsidies on fossil fuels argue that this is done to assist thepoor. In practice, however, this is rarely the case; as ‘only 8%of the subsidies to fossil-fuel consumption in 2010 reached thepoorest 20% of the population’.d The figure is even lower forpetrol and diesel, where only 6 per cent of the total subsidywent to the poorest 20 per cent of the population.e
For political reasons, ‘Govern ments like to keepsubsidies “off-budget” since “on-budget” subsidies are an easytarget for pressure groups interested in reducing the overalltax burden. For this reason, subsidies often take the form ofprice controls that set prices below full cost, especially wherethe energy company is state-owned, or of a requirement onenergy buyers to take minimum volumes from a specific,usually domestic, supply source. Subsidies may be aimed atproducers, such as a grant paid for each unit of production, orat consumers, such as a rebate or exemption on the normalsales tax’.f
Sources: a Hook et al, 2011; b IEA, 2006, Figure 11.7; c IEA, 2012a, p1; d IEA, 2011c, p7; e IEA, 2011d; f UNEP, 2008, p9.
Box 7.1 Fuel subsidies
Cities make greater efficiency in their use ofenergy for trans port than less densely populatedlocations, as more efficient public trans port canreplace the need to use a private car, and as distancesare shorter. The relative energy efficiencies fordifferent modes of trans port in 84 cities are shownin Table 7.2. The occupancy rates for public trans -port vehicles are central to the interpretation of thistable. The substantial differences in energy efficiencybetween cities in the different regions are partly dueto the technology being used, but also to theoccupancy levels. For example, China has high levels
of efficiencies for all forms of public trans port (exceptferry), while the figures for the US are significantlylower. The general conclusion of the table, however,is that there is a significant potential to reduceenergy use (and thus greenhouse gas emissions) byencouraging more people to use public transport.
Mobility and climate change
As a result of international policy concern during the1970s and 1980s, the United Nations FrameworkConvention on Climate Change, also known as the
World 2.45 – 1.05 0.52 0.56 0.46 0.61 – –
US 4.6 2.63 2.85 0.99 0.67 1.65 1.39 5.41 10
Canada 5.0 1.47 1.50 0.31 0.25 0.49 1.31 3.62 15
Australia and New Zealand 3.9 1.49 1.66 0.36 – – 0.53 2.49 10
Western Europe 3.3 0.86 1.17 0.72 0.69 0.48 0.96 5.66 17
High-income Asia 3.3 0.58 0.84 0.36 0.34 0.19 0.24 3.64 25
Eastern Europe 2.35 0.40 0.56 0.74 1.71 0.21 0.18 4.87 –
Middle East 2.56 0.67 0.74 0.13 0.20 – 0.56 2.32 –
Latin America 2.27 0.76 0.75 – – 0.19 0.15 – –
Africa 1.86 0.51 0.57 – – – 0.49 – –
Low-income Asia 1.78 0.64 0.66 – 0.05 0.46 0.25 2.34 –
China 1.69 0.28 0.26 – – 0.05 – 4.90 –
Notes: The table is based on data from a sample of 84 cities in different regions. ‘–’ implies ‘data not available’.
Sources: Newman and Kenworthy, 2011a (citing Kenworthy, 2008).
Table 7.2
Energy efficiency forurban transport, bymode of transport
Country/region Trans port energy use (megajoule per passen ger kilometre) Assumed
Private Public passen ger transportoccupancy
vehiclesrates for public
Total Bus Tram Light rail Metro Suburban Ferry transport rail in cities (%)
There is asignificantpotential toreduce . . .greenhouse gasemissions, byencouraging morepeople to usepublic transport
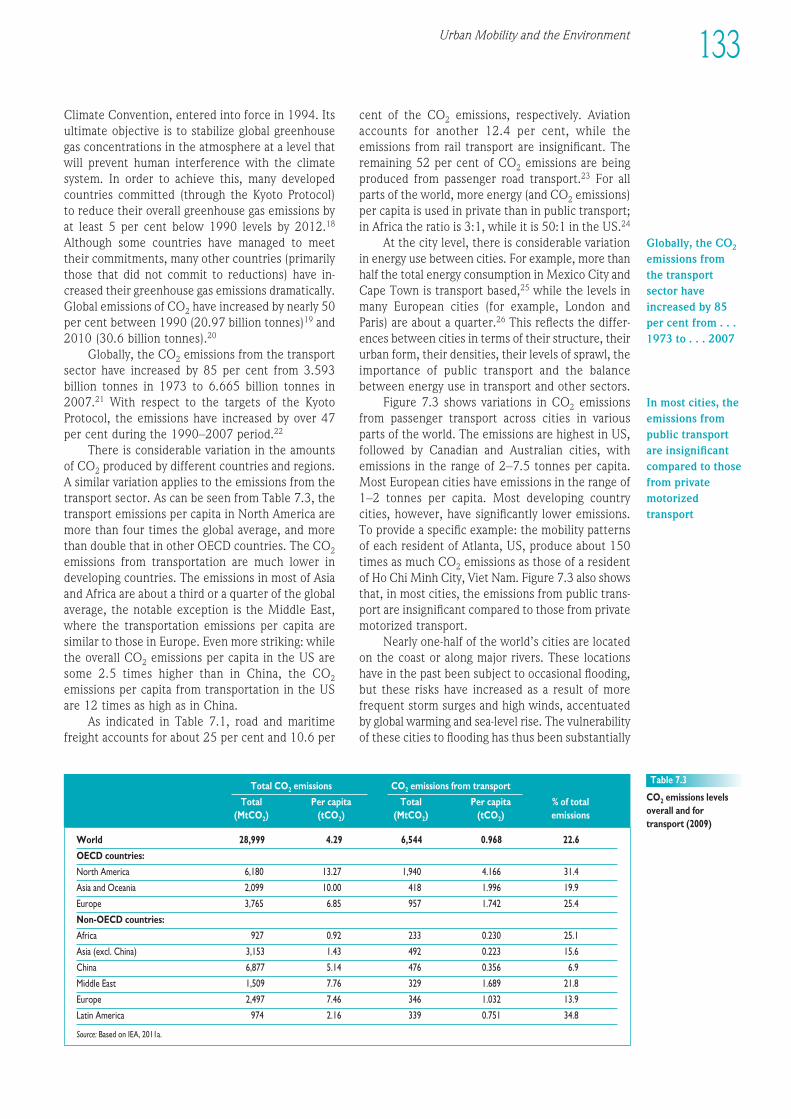
Urban Mobility and the Environment 133
1EEE234567891012311145678920123456789301234567894012345678950123456789EEEE
World 28,999 4.29 6,544 0.968 22.6
OECD countries:
North America 6,180 13.27 1,940 4.166 31.4
Asia and Oceania 2,099 10.00 418 1.996 19.9
Europe 3,765 6.85 957 1.742 25.4
Non-OECD countries:
Africa 927 0.92 233 0.230 25.1
Asia (excl. China) 3,153 1.43 492 0.223 15.6
China 6,877 5.14 476 0.356 6.9
Middle East 1,509 7.76 329 1.689 21.8
Europe 2,497 7.46 346 1.032 13.9
Latin America 974 2.16 339 0.751 34.8
Source: Based on IEA, 2011a.
Table 7.3
CO2 emissions levelsoverall and fortransport (2009)
Total CO2 emissions CO2 emissions from transport
Total Per capita Total Per capita % of total (MtCO2) (tCO2) (MtCO2) (tCO2) emissions
Globally, the CO2
emissions fromthe transportsector haveincreased by 85per cent from . . .1973 to . . . 2007
In most cities, theemissions frompublic transportare insignificantcompared to thosefrom privatemotorizedtransport
Climate Convention, entered into force in 1994. Itsultimate objective is to stabilize global greenhousegas concentrations in the atmosphere at a level thatwill prevent human interference with the climatesystem. In order to achieve this, many developedcountries committed (through the Kyoto Protocol) to reduce their overall greenhouse gas emissions byat least 5 per cent below 1990 levels by 2012.18
Although some countries have managed to meettheir commitments, many other countries (primarilythose that did not commit to reductions) have in -creased their greenhouse gas emissions dramatically.Global emissions of CO2 have increased by nearly 50per cent between 1990 (20.97 billion tonnes)19 and2010 (30.6 billion tonnes).20
Globally, the CO2 emissions from the trans portsector have increased by 85 per cent from 3.593billion tonnes in 1973 to 6.665 billion tonnes in2007.21 With respect to the targets of the KyotoProtocol, the emissions have increased by over 47per cent during the 1990–2007 period.22
There is considerable variation in the amountsof CO2 produced by different countries and regions.A similar variation applies to the emissions from thetrans port sector. As can be seen from Table 7.3, thetrans port emissions per capita in North America aremore than four times the global average, and morethan double that in other OECD countries. The CO2emissions from transportation are much lower indevel op ing countries. The emissions in most of Asiaand Africa are about a third or a quarter of the globalaverage, the notable exception is the Middle East,where the transportation emissions per capita aresimilar to those in Europe. Even more striking: whilethe overall CO2 emissions per capita in the US aresome 2.5 times higher than in China, the CO2emissions per capita from transportation in the USare 12 times as high as in China.
As indicated in Table 7.1, road and maritimefreight accounts for about 25 per cent and 10.6 per
cent of the CO2 emissions, respectively. Aviationaccounts for another 12.4 per cent, while theemissions from rail trans port are insignificant. Theremaining 52 per cent of CO2 emissions are beingproduced from passen ger road transport.23 For allparts of the world, more energy (and CO2 emissions)per capita is used in private than in public transport;in Africa the ratio is 3:1, while it is 50:1 in the US.24
At the city level, there is considerable variationin energy use between cities. For example, more thanhalf the total energy consumption in Mexico City andCape Town is trans port based,25 while the levels inmany European cities (for example, London andParis) are about a quarter.26 This reflects the differ -ences between cities in terms of their structure, theirurban form, their densities, their levels of sprawl, theimportance of public trans port and the balancebetween energy use in trans port and other sectors.
Figure 7.3 shows variations in CO2 emissionsfrom passen ger trans port across cities in variousparts of the world. The emissions are highest in US,followed by Canadian and Australian cities, withemissions in the range of 2–7.5 tonnes per capita.Most European cities have emissions in the range of1–2 tonnes per capita. Most devel op ing countrycities, however, have significantly lower emissions.To provide a specific example: the mobility patternsof each resident of Atlanta, US, produce about 150times as much CO2 emissions as those of a residentof Ho Chi Minh City, Viet Nam. Figure 7.3 also showsthat, in most cities, the emissions from public trans -port are insignificant compared to those from privatemotorized transport.
Nearly one-half of the world’s cities are locatedon the coast or along major rivers. These locationshave in the past been subject to occasional flooding,but these risks have increased as a result of morefrequent storm surges and high winds, accentuatedby global warming and sea-level rise. The vulnerabilityof these cities to flooding has thus been substantially
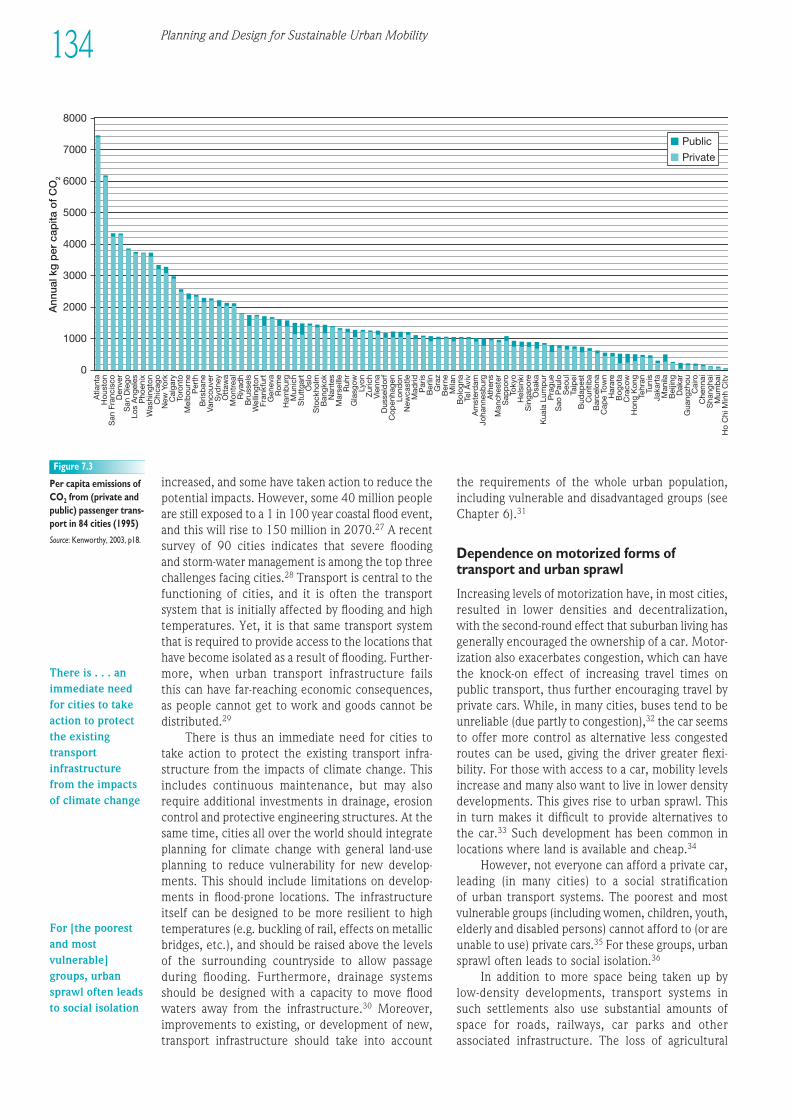
8000
7000
6000
5000
4000
3000
2000
1000
0
Ann
ual k
g p
er c
apita
of
CO
2
Atla
nta
Hou
ston
San
Fra
ncis
coD
enve
rS
an D
iego
Los
Ang
eles
Pho
enix
Was
hing
ton
Chi
cago
New
Yor
kC
alga
ryTo
ront
oM
elb
ourn
eP
erth
Bris
ban
eVa
ncou
ver
Syd
ney
Ott
awa
Mon
trea
lR
iyad
hB
russ
els
Wel
lingt
onFr
ankf
urt
Gen
eva
Rom
eH
amb
urg
Mun
ich
Stu
ttga
rtO
slo
Sto
ckho
lmB
angk
okN
ante
sM
arse
ille
Ruh
rG
lasg
owLy
onZ
uric
hV
ienn
aD
usse
ldor
fC
open
hage
nLo
ndon
New
cast
leM
adrid
Par
isB
erlin
Gra
zB
erne
Mila
nB
olog
naTe
l Avi
vA
mst
erd
amJo
hann
esb
urg
Ath
ens
Man
ches
ter
Sap
por
oTo
kyo
Hel
sink
iS
inga
por
eO
saka
Kua
la L
ump
urP
ragu
eS
ao P
aulo
Seo
ulTa
ipei
Bud
apes
tC
uriti
ba
Bar
celo
naC
ape
Tow
nH
arar
eB
ogot
aC
raco
wH
ong
Kon
gTe
hran
Tuni
sJa
kart
aM
anila
Bei
jing
Dak
arG
uang
zhou
Cai
roC
henn
aiS
hang
hai
Mum
bai
Ho
Chi
Min
h C
ity
Public
Private
Figure 7.3
Per capita emissions ofCO2 from (private andpublic) passen ger trans -port in 84 cities (1995)
Source: Kenworthy, 2003, p18.
increased, and some have taken action to reduce thepotential impacts. However, some 40 million peopleare still exposed to a 1 in 100 year coastal flood event,and this will rise to 150 million in 2070.27 A recentsurvey of 90 cities indicates that severe flooding and storm-water management is among the top threechallenges facing cities.28 Trans port is central to thefunctioning of cities, and it is often the trans portsystem that is initially affected by flooding and hightemperatures. Yet, it is that same trans port systemthat is required to provide access to the locations thathave become isolated as a result of flooding. Further -more, when urban trans port infra struc ture fails this can have far-reaching economic consequences,as people cannot get to work and goods cannot bedistributed.29
There is thus an immediate need for cities totake action to protect the existing trans port infra -struc ture from the impacts of climate change. Thisincludes continuous maintenance, but may alsorequire additional investments in drainage, erosioncontrol and protective engineering structures. At thesame time, cities all over the world should integrateplanning for climate change with general land-useplanning to reduce vulnerability for new devel op -ments. This should include limitations on devel op -ments in flood-prone locations. The infra struc tureitself can be designed to be more resilient to hightemperatures (e.g. buckling of rail, effects on metallicbridges, etc.), and should be raised above the levelsof the surrounding countryside to allow passageduring flooding. Further more, drainage systemsshould be designed with a capacity to move floodwaters away from the infra struc ture.30 Moreover,improvements to existing, or devel op ment of new,trans port infra struc ture should take into account
the requirements of the whole urban population,including vulnerable and dis advan taged groups (seeChapter 6).31
Dependence on motorized forms oftrans port and urban sprawl
Increasing levels of motorization have, in most cities,resulted in lower densities and decentralization,with the second-round effect that suburban living hasgenerally encouraged the ownership of a car. Motor -ization also exacerbates congestion, which can havethe knock-on effect of increasing travel times onpublic transport, thus further encouraging travel byprivate cars. While, in many cities, buses tend to beunreliable (due partly to congestion),32 the car seemsto offer more control as alternative less congestedroutes can be used, giving the driver greater flexi -bility. For those with access to a car, mobility levelsincrease and many also want to live in lower densitydevel op ments. This gives rise to urban sprawl. Thisin turn makes it difficult to provide alternatives tothe car.33 Such devel op ment has been common inlocations where land is available and cheap.34
However, not everyone can afford a private car,leading (in many cities) to a social stratification of urban trans port systems. The poorest and mostvulnerable groups (including women, children, youth,elderly and disabled persons) cannot afford to (or areunable to use) private cars.35 For these groups, urbansprawl often leads to social isolation.36
In addition to more space being taken up by low-density devel op ments, trans port systems in such settlements also use substantial amounts ofspace for roads, railways, car parks and otherassociated infra struc ture. The loss of agricultural
134 Planning and Design for Sustainable Urban Mobility
There is . . . animmediate needfor cities to takeaction to protectthe existingtransportinfrastructurefrom the impactsof climate change
For [the poorestand mostvulnerable]groups, urbansprawl often leadsto social isolation
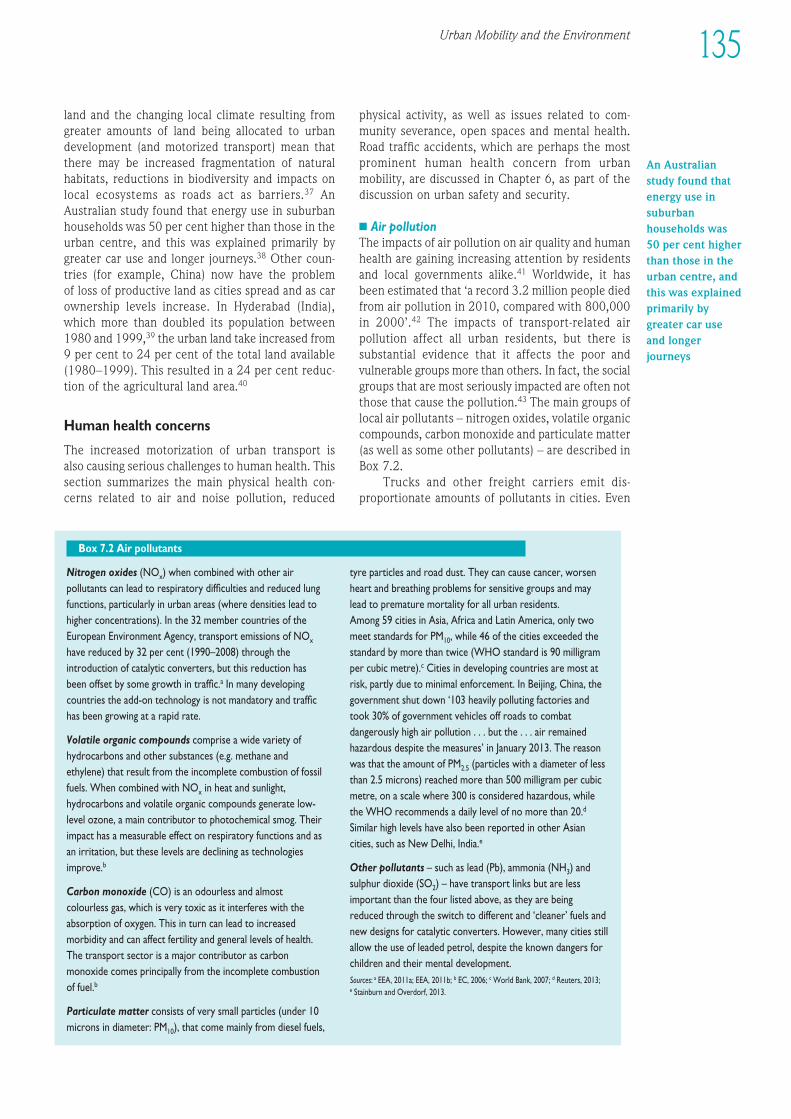
1EEE234567891012311145678920123456789301234567894012345678950123456789EEEE
135Urban Mobility and the Environment
land and the changing local climate resulting fromgreater amounts of land being allocated to urbandevel op ment (and motorized transport) mean thatthere may be increased fragmentation of naturalhabitats, reductions in biodiversity and impacts onlocal ecosystems as roads act as barriers.37 AnAustralian study found that energy use in suburbanhouseholds was 50 per cent higher than those in theurban centre, and this was explained primarily bygreater car use and longer journeys.38 Other coun-tries (for example, China) now have the problem of loss of productive land as cities spread and as carownership levels increase. In Hyderabad (India),which more than doubled its population between1980 and 1999,39 the urban land take increased from9 per cent to 24 per cent of the total land available(1980–1999). This resulted in a 24 per cent reduc -tion of the agricultural land area.40
Human health concerns
The increased motorization of urban trans port is also causing serious challenges to human health. Thissection summarizes the main physical health con -cerns related to air and noise pollution, reduced
physical activity, as well as issues related to com -munity severance, open spaces and mental health.Road traffic accidents, which are perhaps the mostprominent human health concern from urbanmobility, are discussed in Chapter 6, as part of thediscussion on urban safety and security.
n Air pollutionThe impacts of air pollution on air quality and humanhealth are gaining increasing attention by residentsand local govern ments alike.41 Worldwide, it hasbeen estimated that ‘a record 3.2 million people diedfrom air pollution in 2010, compared with 800,000in 2000’.42 The impacts of transport-related air pol lution affect all urban residents, but there is sub stantial evidence that it affects the poor andvulnerable groups more than others. In fact, the socialgroups that are most seriously impacted are often notthose that cause the pollution.43 The main groups oflocal air pollutants – nitrogen oxides, volatile organiccom pounds, carbon monoxide and particulate matter (as well as some other pollutants) – are described inBox 7.2.
Trucks and other freight carriers emit dis -proportionate amounts of pollutants in cities. Even
Nitrogen oxides (NOx) when combined with other airpollutants can lead to respiratory difficulties and reduced lungfunctions, particularly in urban areas (where densities lead tohigher concentrations). In the 32 member countries of theEuropean Environ ment Agency, trans port emissions of NOx
have reduced by 32 per cent (1990–2008) through theintroduction of catalytic converters, but this reduction hasbeen offset by some growth in traffic.a In many devel op ingcountries the add-on technology is not mandatory and traffichas been growing at a rapid rate.
Volatile organic compounds comprise a wide variety ofhydrocarbons and other substances (e.g. methane andethylene) that result from the incomplete combustion of fossilfuels. When combined with NOx in heat and sunlight,hydrocarbons and volatile organic compounds generate low-level ozone, a main contributor to photochemical smog. Theirimpact has a measurable effect on respiratory functions and asan irritation, but these levels are declining as technologiesimprove.b
Carbon monoxide (CO) is an odourless and almostcolourless gas, which is very toxic as it interferes with theabsorption of oxygen. This in turn can lead to increasedmorbidity and can affect fertility and general levels of health.The trans port sector is a major contributor as carbonmonoxide comes principally from the incomplete combustionof fuel.b
Particulate matter consists of very small particles (under 10microns in diameter: PM10), that come mainly from diesel fuels,
tyre particles and road dust. They can cause cancer, worsenheart and breathing problems for sensitive groups and maylead to premature mortality for all urban residents. Among 59 cities in Asia, Africa and Latin America, only twomeet standards for PM10, while 46 of the cities exceeded thestandard by more than twice (WHO standard is 90 milligramper cubic metre).c Cities in devel op ing countries are most atrisk, partly due to minimal enforcement. In Beijing, China, thegovern ment shut down ‘103 heavily polluting factories andtook 30% of govern ment vehicles off roads to combatdangerously high air pollution . . . but the . . . air remainedhazardous despite the measures’ in January 2013. The reasonwas that the amount of PM2.5 (particles with a diameter of lessthan 2.5 microns) reached more than 500 milligram per cubicmetre, on a scale where 300 is considered hazardous, whilethe WHO recommends a daily level of no more than 20.d
Similar high levels have also been reported in other Asiancities, such as New Delhi, India.e
Other pollutants – such as lead (Pb), ammonia (NH3) andsulphur dioxide (SO2) – have trans port links but are lessimportant than the four listed above, as they are beingreduced through the switch to different and ‘cleaner’ fuels andnew designs for catalytic converters. However, many cities stillallow the use of leaded petrol, despite the known dangers forchildren and their mental devel op ment.Sources: a EEA, 2011a; EEA, 2011b; b EC, 2006; c World Bank, 2007; d Reuters, 2013; e Stainburn and Overdorf, 2013.
Box 7.2 Air pollutants
An Australianstudy found thatenergy use insuburbanhouseholds was50 per cent higherthan those in theurban centre, andthis was explainedprimarily bygreater car useand longerjourneys
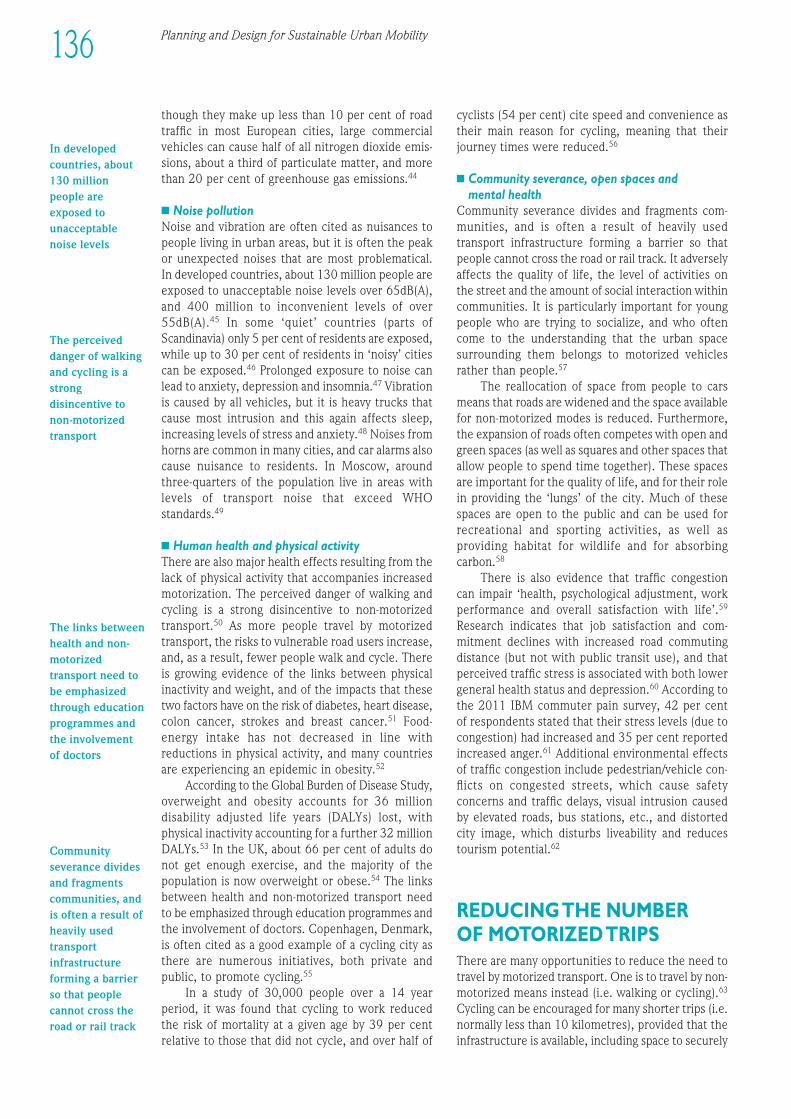
Planning and Design for Sustainable Urban Mobility136
In developedcountries, about130 millionpeople areexposed tounacceptablenoise levels
The perceiveddanger of walkingand cycling is astrongdisincentive tonon-motorizedtransport
The links betweenhealth and non-motorizedtransport need tobe emphasizedthrough educationprogrammes andthe involvementof doctors
Communityseverance dividesand fragmentscommunities, andis often a result ofheavily usedtransportinfrastructureforming a barrierso that peoplecannot cross theroad or rail track
though they make up less than 10 per cent of roadtraffic in most European cities, large commercialvehicles can cause half of all nitrogen dioxide emis -sions, about a third of particulate matter, and morethan 20 per cent of greenhouse gas emissions.44
n Noise pollutionNoise and vibration are often cited as nuisances topeople living in urban areas, but it is often the peakor unexpected noises that are most problematical.In developed countries, about 130 million people areexposed to unacceptable noise levels over 65dB(A),and 400 million to inconvenient levels of over55dB(A).45 In some ‘quiet’ countries (parts ofScandinavia) only 5 per cent of residents are exposed,while up to 30 per cent of residents in ‘noisy’ citiescan be exposed.46 Prolonged exposure to noise canlead to anxiety, depression and insomnia.47 Vibrationis caused by all vehicles, but it is heavy trucks thatcause most intrusion and this again affects sleep,increasing levels of stress and anxiety.48 Noises fromhorns are common in many cities, and car alarms alsocause nuisance to residents. In Moscow, aroundthree-quarters of the population live in areas withlevels of trans port noise that exceed WHOstandards.49
n Human health and physical activityThere are also major health effects resulting from thelack of physical activity that accompanies increasedmotorization. The perceived danger of walking andcycling is a strong disincentive to non-motorizedtransport.50 As more people travel by motorizedtransport, the risks to vulnerable road users increase,and, as a result, fewer people walk and cycle. Thereis growing evidence of the links between physicalinactivity and weight, and of the impacts that thesetwo factors have on the risk of diabetes, heart disease,colon cancer, strokes and breast cancer.51 Food-energy intake has not decreased in line withreductions in physical activity, and many countriesare experiencing an epidemic in obesity.52
According to the Global Burden of Disease Study,overweight and obesity accounts for 36 milliondisability adjusted life years (DALYs) lost, withphysical inactivity accounting for a further 32 millionDALYs.53 In the UK, about 66 per cent of adults donot get enough exercise, and the majority of thepopulation is now overweight or obese.54 The linksbetween health and non-motorized trans port needto be emphasized through education programmes andthe involvement of doctors. Copenhagen, Denmark,is often cited as a good example of a cycling city asthere are numerous initiatives, both private andpublic, to promote cycling.55
In a study of 30,000 people over a 14 yearperiod, it was found that cycling to work reducedthe risk of mortality at a given age by 39 per centrelative to those that did not cycle, and over half of
cyclists (54 per cent) cite speed and convenience astheir main reason for cycling, meaning that theirjourney times were reduced.56
n Community severance, open spaces andmental health
Community severance divides and fragments com -munities, and is often a result of heavily used trans port infra struc ture forming a barrier so thatpeople cannot cross the road or rail track. It adverselyaffects the quality of life, the level of activities onthe street and the amount of social interaction withincommunities. It is particularly important for youngpeople who are trying to socialize, and who oftencome to the understanding that the urban spacesurrounding them belongs to motorized vehiclesrather than people.57
The reallocation of space from people to carsmeans that roads are widened and the space availablefor non-motorized modes is reduced. Further more,the expansion of roads often competes with open andgreen spaces (as well as squares and other spaces thatallow people to spend time together). These spacesare important for the quality of life, and for their rolein providing the ‘lungs’ of the city. Much of thesespaces are open to the public and can be used forrecreational and sporting activities, as well asproviding habitat for wildlife and for absorbingcarbon.58
There is also evidence that traffic congestion can impair ‘health, psychological adjustment, workperformance and overall satisfaction with life’.59
Research indicates that job satisfaction and com -mitment declines with increased road commuting dis tance (but not with public transit use), and thatperceived traffic stress is associated with both lowergeneral health status and depression.60 According tothe 2011 IBM commuter pain survey, 42 per centof respondents stated that their stress levels (due tocongestion) had increased and 35 per cent reportedincreased anger.61 Additional environ mental effectsof traffic congestion include pedestrian/vehicle con -flicts on congested streets, which cause safetyconcerns and traffic delays, visual intrusion causedby elevated roads, bus stations, etc., and distortedcity image, which disturbs liveability and reducestourism potential.62
REDUCING THE NUMBER OF MOTORIZED TRIPSThere are many opportunities to reduce the need totravel by motorized transport. One is to travel by non-motorized means instead (i.e. walking or cycling).63
Cycling can be encouraged for many shorter trips (i.e.normally less than 10 kilometres), provided that theinfra struc ture is available, including space to securely
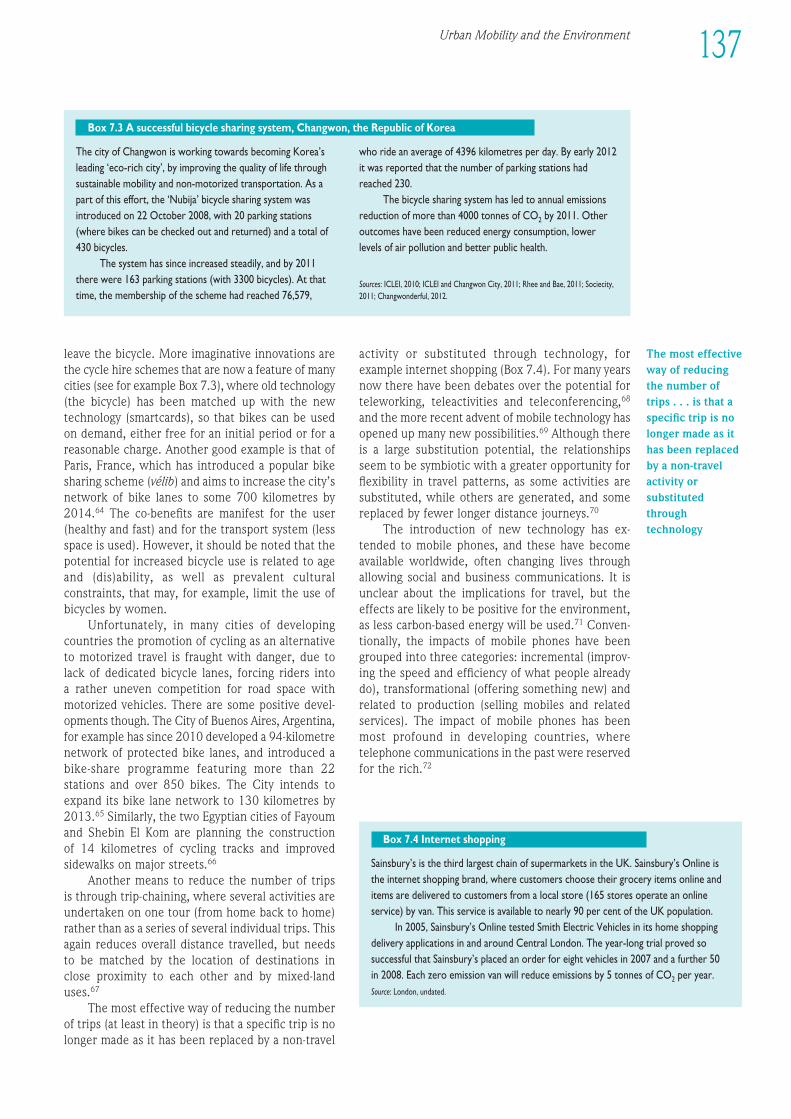
Urban Mobility and the Environment 137
1EEE234567891012311145678920123456789301234567894012345678950123456789EEEE
The city of Changwon is working towards becoming Korea’sleading ‘eco-rich city’, by improving the quality of life throughsus tain able mobility and non-motorized transportation. As apart of this effort, the ‘Nubija’ bicycle sharing system wasintroduced on 22 October 2008, with 20 parking stations(where bikes can be checked out and returned) and a total of430 bicycles.
The system has since increased steadily, and by 2011there were 163 parking stations (with 3300 bicycles). At thattime, the membership of the scheme had reached 76,579,
who ride an average of 4396 kilometres per day. By early 2012 it was reported that the number of parking stations hadreached 230.
The bicycle sharing system has led to annual emissionsreduction of more than 4000 tonnes of CO2 by 2011. Otheroutcomes have been reduced energy consumption, lowerlevels of air pollution and better public health.
Sources: ICLEI, 2010; ICLEI and Changwon City, 2011; Rhee and Bae, 2011; Sociecity,2011; Changwonderful, 2012.
Box 7.3 A successful bicycle sharing system, Changwon, the Republic of Korea
Sainsbury’s is the third largest chain of supermarkets in the UK. Sainsbury’s Online isthe internet shopping brand, where customers choose their grocery items online anditems are delivered to customers from a local store (165 stores operate an onlineservice) by van. This service is available to nearly 90 per cent of the UK population.
In 2005, Sainsbury’s Online tested Smith Electric Vehicles in its home shoppingdelivery applications in and around Central London. The year-long trial proved sosuccessful that Sainsbury’s placed an order for eight vehicles in 2007 and a further 50 in 2008. Each zero emission van will reduce emissions by 5 tonnes of CO2 per year.Source: London, undated.
Box 7.4 Internet shopping
The most effectiveway of reducingthe number oftrips . . . is that aspecific trip is nolonger made as ithas been replacedby a non-travelactivity orsubstitutedthroughtechnology
leave the bicycle. More imaginative innovations arethe cycle hire schemes that are now a feature of manycities (see for example Box 7.3), where old technology(the bicycle) has been matched up with the newtechnology (smartcards), so that bikes can be usedon demand, either free for an initial period or for areasonable charge. Another good example is that ofParis, France, which has introduced a popular bikesharing scheme (vélib) and aims to increase the city’snetwork of bike lanes to some 700 kilometres by2014.64 The co-benefits are manifest for the user(healthy and fast) and for the trans port system (lessspace is used). However, it should be noted that thepotential for increased bicycle use is related to ageand (dis)ability, as well as prevalent culturalconstraints, that may, for example, limit the use ofbicycles by women.
Unfortunately, in many cities of devel op ingcountries the promotion of cycling as an alternativeto motorized travel is fraught with danger, due tolack of dedicated bicycle lanes, forcing riders into a rather uneven competition for road space withmotorized vehicles. There are some positive devel -op ments though. The City of Buenos Aires, Argentina,for example has since 2010 developed a 94-kilometrenetwork of protected bike lanes, and introduced abike-share programme featuring more than 22stations and over 850 bikes. The City intends toexpand its bike lane network to 130 kilometres by2013.65 Similarly, the two Egyptian cities of Fayoumand Shebin El Kom are planning the construction of 14 kilometres of cycling tracks and improvedsidewalks on major streets.66
Another means to reduce the number of tripsis through trip-chaining, where several activities areundertaken on one tour (from home back to home)rather than as a series of several individual trips. Thisagain reduces overall distance travelled, but needsto be matched by the location of destinations in close proximity to each other and by mixed-landuses.67
The most effective way of reducing the numberof trips (at least in theory) is that a specific trip is nolonger made as it has been replaced by a non-travel
activity or substituted through technology, forexample internet shopping (Box 7.4). For many yearsnow there have been debates over the potential forteleworking, teleactivities and teleconferencing,68
and the more recent advent of mobile technology hasopened up many new possibilities.69 Although thereis a large substitution potential, the relationshipsseem to be symbiotic with a greater opportunity forflexibility in travel patterns, as some activities aresubstituted, while others are generated, and somereplaced by fewer longer distance journeys.70
The introduction of new technology has ex -tended to mobile phones, and these have becomeavailable worldwide, often changing lives throughallowing social and business communications. It isunclear about the implications for travel, but theeffects are likely to be positive for the environ ment,as less carbon-based energy will be used.71 Conven -tionally, the impacts of mobile phones have beengrouped into three categories: incremental (improv -ing the speed and efficiency of what people alreadydo), transformational (offering something new) andrelated to production (selling mobiles and relatedservices). The impact of mobile phones has been most profound in devel op ing countries, wheretelephone communications in the past were reservedfor the rich.72
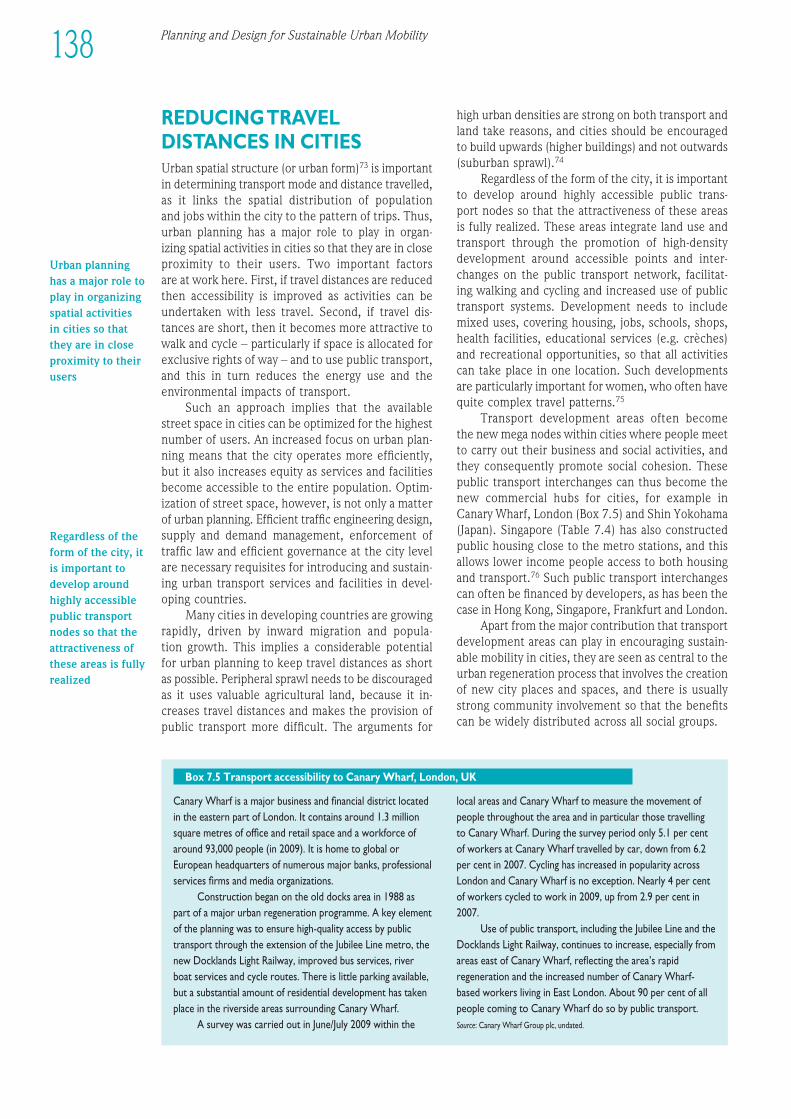
Planning and Design for Sustainable Urban Mobility138
REDUCING TRAVELDISTANCES IN CITIESUrban spatial structure (or urban form)73 is importantin determining trans port mode and distance travelled,as it links the spatial distribution of population and jobs within the city to the pattern of trips. Thus,urban planning has a major role to play in organ-izing spatial activities in cities so that they are in closeproximity to their users. Two important factors are at work here. First, if travel distances are reducedthen accessibility is improved as activities can beunder taken with less travel. Second, if travel dis -tances are short, then it becomes more attractive towalk and cycle – particularly if space is allocated forexclusive rights of way – and to use public transport,and this in turn reduces the energy use and theenviron mental impacts of transport.
Such an approach implies that the availablestreet space in cities can be optimized for the highestnumber of users. An increased focus on urban plan -ning means that the city operates more efficiently,but it also increases equity as services and facilitiesbecome accessible to the entire population. Optim -ization of street space, however, is not only a matterof urban planning. Efficient traffic engin eering design,supply and demand management, enforcement oftraffic law and efficient governance at the city levelare necessary requisites for introducing and sustain -ing urban trans port services and facilities in devel -op ing countries.
Many cities in devel op ing countries are growingrapidly, driven by inward migration and popula-tion growth. This implies a considerable potential for urban planning to keep travel distances as shortas possible. Peripheral sprawl needs to be discouragedas it uses valuable agricultural land, because it in -creases travel distances and makes the provision ofpublic trans port more difficult. The arguments for
high urban densities are strong on both trans port andland take reasons, and cities should be encouragedto build upwards (higher buildings) and not outwards(suburban sprawl).74
Regardless of the form of the city, it is importantto develop around highly accessible public trans-port nodes so that the attractiveness of these areasis fully realized. These areas integrate land use andtrans port through the promotion of high-densitydevel op ment around accessible points and inter -changes on the public trans port network, facilitat-ing walking and cycling and increased use of publictrans port systems. Devel op ment needs to includemixed uses, covering housing, jobs, schools, shops,health facilities, educa tional services (e.g. crèches)and recreational oppor tunities, so that all activitiescan take place in one location. Such devel op mentsare particularly important for women, who often havequite complex travel patterns.75
Trans port devel op ment areas often become the new mega nodes within cities where people meetto carry out their business and social activities, andthey consequently promote social cohesion. Thesepublic trans port interchanges can thus become thenew commercial hubs for cities, for example inCanary Wharf, London (Box 7.5) and Shin Yokohama(Japan). Singapore (Table 7.4) has also constructedpublic housing close to the metro stations, and thisallows lower income people access to both housingand transport.76 Such public trans port interchangescan often be financed by developers, as has been thecase in Hong Kong, Singapore, Frankfurt and London.
Apart from the major contribution that trans portdevel op ment areas can play in encouraging sus tain -able mobility in cities, they are seen as central to theurban regeneration process that involves the creationof new city places and spaces, and there is usuallystrong community involvement so that the benefitscan be widely distributed across all social groups.
Canary Wharf is a major business and finan cial district locatedin the eastern part of London. It contains around 1.3 millionsquare metres of office and retail space and a workforce ofaround 93,000 people (in 2009). It is home to global orEuropean headquarters of numerous major banks, professionalservices firms and media organizations.
Construction began on the old docks area in 1988 aspart of a major urban regeneration programme. A key elementof the planning was to ensure high-quality access by publictrans port through the extension of the Jubilee Line metro, thenew Docklands Light Railway, improved bus services, riverboat services and cycle routes. There is little parking available,but a substantial amount of residential devel op ment has takenplace in the riverside areas surrounding Canary Wharf.
A survey was carried out in June/July 2009 within the
local areas and Canary Wharf to measure the movement ofpeople throughout the area and in particular those travellingto Canary Wharf. During the survey period only 5.1 per centof workers at Canary Wharf travelled by car, down from 6.2per cent in 2007. Cycling has increased in popularity acrossLondon and Canary Wharf is no exception. Nearly 4 per centof workers cycled to work in 2009, up from 2.9 per cent in2007.
Use of public transport, including the Jubilee Line and theDocklands Light Railway, continues to increase, especially fromareas east of Canary Wharf, reflecting the area’s rapidregeneration and the increased number of Canary Wharf-based workers living in East London. About 90 per cent of allpeople coming to Canary Wharf do so by public transport.Source: Canary Wharf Group plc, undated.
Box 7.5 Trans port accessibility to Canary Wharf, London, UK
Urban planninghas a major role toplay in organizingspatial activitiesin cities so thatthey are in closeproximity to theirusers
Regardless of theform of the city, itis important todevelop aroundhighly accessiblepublic transportnodes so that theattractiveness ofthese areas is fullyrealized
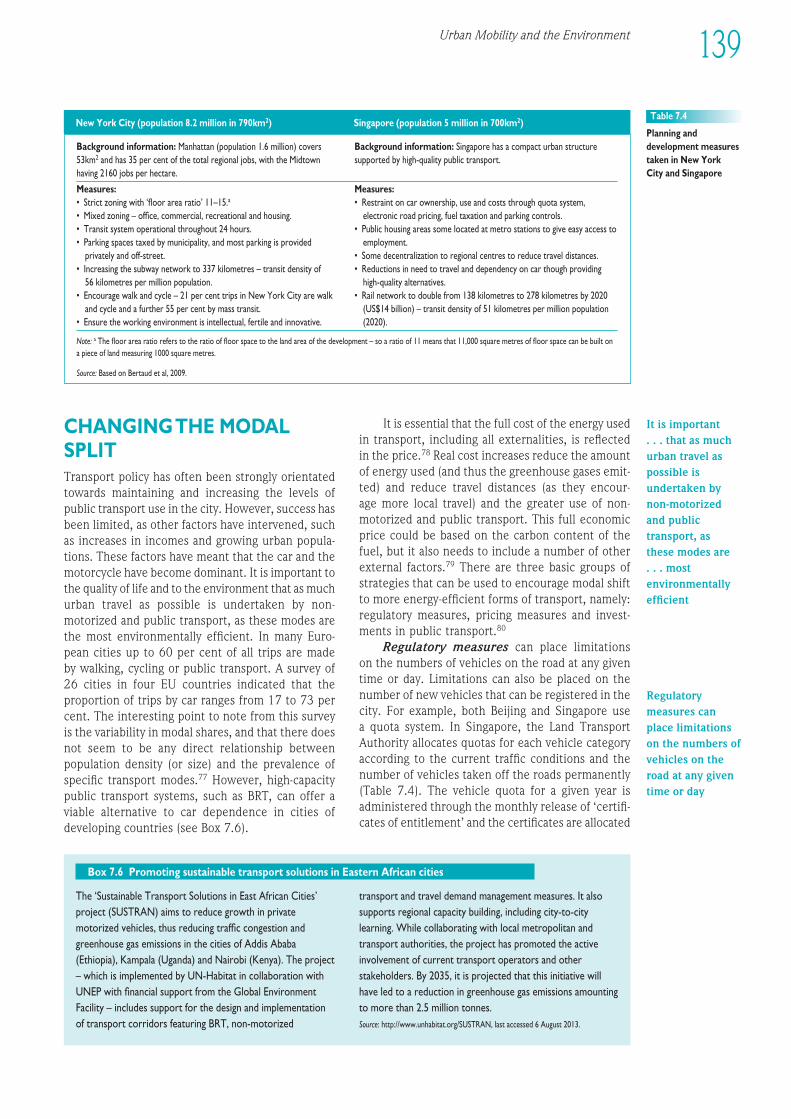
Urban Mobility and the Environment 139
1EEE234567891012311145678920123456789301234567894012345678950123456789EEEE
CHANGING THE MODAL SPLITTrans port policy has often been strongly orientatedtowards maintaining and increasing the levels ofpublic trans port use in the city. However, success hasbeen limited, as other factors have intervened, suchas increases in incomes and growing urban popula -tions. These factors have meant that the car and themotorcycle have become dominant. It is important tothe quality of life and to the environ ment that as muchurban travel as possible is undertaken by non-motorized and public transport, as these modes arethe most environ mentally efficient. In many Euro-pean cities up to 60 per cent of all trips are made by walking, cycling or public transport. A survey of26 cities in four EU countries indicated that theproportion of trips by car ranges from 17 to 73 percent. The interesting point to note from this surveyis the variability in modal shares, and that there doesnot seem to be any direct relationship betweenpopulation density (or size) and the prevalence ofspecific trans port modes.77 However, high-capacitypublic transport systems, such as BRT, can offer aviable alternative to car depen dence in cities ofdeveloping countries (see Box 7.6).
It is essential that the full cost of the energy usedin transport, including all externalities, is reflectedin the price.78 Real cost increases reduce the amountof energy used (and thus the greenhouse gases emit -ted) and reduce travel distances (as they encour-age more local travel) and the greater use of non-motorized and public transport. This full economicprice could be based on the carbon content of thefuel, but it also needs to include a number of otherexternal factors.79 There are three basic groups ofstrategies that can be used to encourage modal shiftto more energy-efficient forms of transport, namely:regulatory measures, pricing measures and invest -ments in public transport.80
Regulatory measures can place limitations on the numbers of vehicles on the road at any giventime or day. Limitations can also be placed on thenumber of new vehicles that can be registered in thecity. For example, both Beijing and Singapore use a quota system. In Singapore, the Land TransportAuthority allocates quotas for each vehicle categoryaccording to the current traffic conditions and thenumber of vehicles taken off the roads permanently(Table 7.4). The vehicle quota for a given year isadministered through the monthly release of ‘certifi -cates of entitlement’ and the certificates are allocated
Background information: Manhattan (population 1.6 million) covers Background information: Singapore has a compact urban structure 53km2 and has 35 per cent of the total regional jobs, with the Midtown supported by high-quality public transport.having 2160 jobs per hectare.
Measures: Measures:• Strict zoning with ‘floor area ratio’ 11–15.a • Restraint on car ownership, use and costs through quota system, • Mixed zoning – office, commercial, recreational and housing. electronic road pricing, fuel taxation and parking controls.• Transit system operational throughout 24 hours. • Public housing areas some located at metro stations to give easy access to • Parking spaces taxed by municipality, and most parking is provided employment.
privately and off-street. • Some decentralization to regional centres to reduce travel distances.• Increasing the subway network to 337 kilometres – transit density of • Reductions in need to travel and dependency on car though providing
56 kilometres per million population. high-quality alternatives.• Encourage walk and cycle – 21 per cent trips in New York City are walk • Rail network to double from 138 kilometres to 278 kilometres by 2020
and cycle and a further 55 per cent by mass transit. (US$14 billion) – transit density of 51 kilometres per million population • Ensure the working environ ment is intellectual, fertile and innovative. (2020).
Note: a The floor area ratio refers to the ratio of floor space to the land area of the devel op ment – so a ratio of 11 means that 11,000 square metres of floor space can be built ona piece of land measuring 1000 square metres.
Source: Based on Bertaud et al, 2009.
Table 7.4
Planning anddevelopment measurestaken in New York City and Singapore
New York City (population 8.2 million in 790km2) Singapore (population 5 million in 700km2)
The ‘Sustainable Transport Solutions in East African Cities’project (SUSTRAN) aims to reduce growth in privatemotorized vehicles, thus reducing traffic congestion andgreenhouse gas emissions in the cities of Addis Ababa(Ethiopia), Kampala (Uganda) and Nairobi (Kenya). The project– which is implemented by UN-Habitat in collaboration withUNEP with financial support from the Global EnvironmentFacility – includes support for the design and implementationof transport corridors featuring BRT, non-motorized
transport and travel demand management measures. It alsosupports regional capacity building, including city-to-citylearning. While collaborating with local metropolitan andtransport authorities, the project has promoted the activeinvolvement of current transport operators and otherstakeholders. By 2035, it is projected that this initiative willhave led to a reduction in greenhouse gas emissions amountingto more than 2.5 million tonnes. Source: http://www.unhabitat.org/SUSTRAN, last accessed 6 August 2013.
Box 7.6 Promoting sustainable transport solutions in Eastern African cities
It is important . . . that as muchurban travel aspossible isundertaken bynon-motorizedand publictransport, as these modes are . . . mostenvironmentallyefficient
Regulatorymeasures canplace limitationson the numbers ofvehicles on theroad at any giventime or day
The first two phases of the TransMilenio BRT system inBogotá, Colombia, were completed by 2003, and it has a totalof 84 kilometres of median busways, about 25 per cent ofwhich is completely segregated from other traffic. The finalphase (of another 100 kilometres, which was due to becompleted in 2012) has been delayed due to unresolvedpolitical issues (including plans to construct a metro).
By 2011, the BRT system included some 1190 articulatedbuses, 10 bi-articulated buses, 114 access stations (withprepayment), 6 terminals and 4 intermediate integratedstations. In addition there were 448 feeder buses, running on61 feeder routes with 420 line-kilometres. TransMilenio isfrequently cited as a ‘good practice’ BRT project, and it carriessome 1.7 million passen gers per weekday, with 43,000 passen -gers moving each hour in one direction. The uniqueness ofBogotá’s system is the ‘transformation of a busway corridorwith severe pollution, safety problems and aestheticallydispleasing into a new BRT system with significantly lowertravel times, lower noise and fewer greenhouse gasemissions’.a
By drastically reducing existing travel times and acting onthe radial corridors connecting residential areas to the centralbusiness district, TransMilenio has done much to reinforce theattractiveness of the city centre. Public acceptance of theproject is over 70 per cent, but there have been complaintsabout over crowding and the time taken for interchange fromthe feeder lines. Further more, many people still lack access tothe system as the network does not extend to the locationswhere the poor are living. In 2005, the population located inthe more remote parts of the city accounted for 65 per centof the total population, as the land there was cheaper and thus
more affordable for low-income people. In fact, land-use valueincreases around the TransMilenio corridors have beenestimated to be close to 20 per cent.
While the TransMilenio system has played an importantrole in contributing to more sus tain able mobility system inBogotá, it is worth noting that it was introduced as part ofwider policy package, which also included the followingcomponents:
• Devel op ment of 285,500 square metres of walkways,green spaces, road dividers, sidewalks and shadedpromenades, with 11 metropolitan parks, 3149 neigh bour -hood parks and 323 smaller scale parks.
• Construction of 350 kilometres of bikeways contributedto an increase in bicycle use from 1 per cent in 1995 to 7 per cent in 2010, when there were a total of 1498 bikeparking locations.
• In addition, the introduction of the ciclovia system impliesthat some 120 kilometres of main roads are closed tomotor vehicles for seven hours every Sunday, so thatstreets can be used by people for walking, cycling, joggingand meeting each other.
• Peak and license plate (pico y placa) restrictions duringpeak hours (6–9 am and 4–7 pm) using plate numbers for40 per cent of the private cars.
• Fees and taxes: 20 per cent petrol surcharge (revenueallocated to public trans port infra struc ture and roadmaintenance) and car-free weekday in February (approvedby popular vote).
Sources: Bocarejo and Tafur, 2011; Hidalgo and Carrigan, 2010; Hidalgo et al, 2007;Rodriquez and Targa, 2004; a Estupiñán and Rodriquez, 2008, p299.
Box 7.7 TransMilenio: Supporting sus tain able mobility in Bogotá, Colombia
140 Planning and Design for Sustainable Urban Mobility
Very few citieshave introducedpricing as amechanism tolimit the numbersof cars cominginto the centralarea
through an auction.81 In Bogotá, Colombia, the picoy placa (Box 7.7) limits the numbers of vehicles onthe road on a given day by allowing odd and evennumber plates to be used on alternative days.82
However, this latter type of measure may encouragehigher income-residents to buy a second car, oftenwith an older, less efficient engine (thus leading toincreased emissions).
Parking regulations are important as this relatesto the allocation of space in cities by price and timeof day, and it covers both on-street and off-streetlocations (Box 8.5). As part of the congestion chargingscheme in London, UK (introduced in 2003), parkingavailability was reassessed both within the pricing area(to reduce it) and outside the area to encourage com -muters to leave their cars at home.83 Many cities havealso introduced park-and-ride schemes where driversleave their cars at the periphery and continue theirjourneys into the centre by public transport. A recentsurvey of 45 schemes in Europe found rather unevenimplementation, but where deployment had takenplace there was strong public support, as traffic levelsand levels of pollution had been reduced.84
Pricing measures include electronic roadpricing (Singapore), congestion charging or cordonpricing (London, UK, and Stockholm, Sweden),85
and parking pricing to reflect the value of the spaceused. But very few cities have introduced pricing asa mechanism to limit the numbers of cars cominginto the central area, and even in those cities thathave introduced schemes, it has only covered a smallpart of the city. In addition, fuel prices are oftentaxed, although the levels vary considerably fromcountry to country, as it relates both to the levels ofduty imposed and the additional national and localtaxes imposed.86 Some countries have tried to usefuel duty escalators, so that the real price of petroland diesel increase over time to reflect the fulleconomic costs, but this has proved unpopular withthe oil industry, car manufacturers, as well asmotorists.87 All of these measures have primarily beenintroduced to raise revenues88 and to address conges -tion issues, even though it has been acknowledgedthat there are also environ mental benefits.89
Public trans port fare subsidies can have socialobjectives in increasing the mobility of low-income
1EEE234567891012311145678920123456789301234567894012345678950123456789EEEE
141Urban Mobility and the Environment
households, but it is important that such subsidy goes to the identified user. It is also important tomake sure that the quality of the public trans portfleet is maintained at a high environ mental standard,and that operators are given an incentive to invest.But sub sidies have much wider impacts on liveli -hoods, as illustrated by a study of public trans portin Sub-Saharan Africa:
‘Subsidies and other forms of compensation canhelp formal public trans port but an integratedframework and a level playing field are alsoneeded for all types of trans port to flourish.Finan cial mechanisms should be put in place tosupport the system, integrating the differenttypes of collective trans port rather than allowingprofits to be scooped up by the informal sectorwith no regard for the burden of costs they mightplace on local govern ments and society as awhole. This can include trust funds, better creditfacilities, land-value capture and other sourcesof revenues that can be used to help build sus tain able low-carbon trans port systems thatwill allow Africa to flourish and developeconomically.’90
As noted above, subsidization is a form ofincentive to encourage people to change theirbehaviour, and it can also apply to cars. For example,incentives can be given to encourage the purchaseof more efficient cars and electric vehicles, wherepurchase prices are subsidized, or where preferentialparking is given, or exemption from paying thecongestion charge is given. All three of theseincentives have been introduced in the UK.91
Investment in public trans port and publictrans port infra struc ture are both central to makesure that priority is given to this trans port mode, asit allows the greatest number of people to be carriedmost efficiently. Public trans port has to share spaceon congested roads with other traffic, and this re -duces its efficiency. Trams have provided one effec -tive means to introduce ‘clean’ trans port that has aclear priority through control (traffic signals) andexclusive tracks.92
More recently, BRT is seen as a flexible andcheap means to invest in high-quality public trans -port with a separate right of way.93 As discussed inChapter 3, BRT potentially offers a high-capacity,relatively inexpensive and flexible form of publictrans port in many cities. BRT systems have good envir -on mental credentials and can be introduced in avariety of different forms. Box 7.7 looks at how BRTcan be combined into part of an integrated set ofmeasures that have the potential to change percep -tions of public transport.
TECHNOLOGICALINNOVATION AND VEHICLEEFFICIENCYThis section presents technological and other policyresponses related to increasing the efficiency ofmotorized vehicles and the use of the best availabletechnology. This implies that the use of carbon-based fuels should be substantially reduced andcleaner low-carbon fuels should replace them for allforms of motorized trans port (freight and passen ger).As noted earlier in this chapter, the amount of CO2produced by motorized vehicles is directly related tothe amount of fuel used, and there is considerablepotential for reductions.94
However, it should be remembered that effi -ciency gains must be set against the growth intraffic,95 as this often outweighs those gains. Thediscussion below focuses on four main issues, namely:the efficiency and age of the vehicle stock, standardsof fuels used in vehicles, the potential of alternativefuels, and vehicle occupancy.
It is here important to note that there is asubstantial potential for technological ‘leapfrogging’.Thus there is no reason why cities in devel op ingcountries have to follow the same high-motorization(and high-pollution) pathway as that followed indeveloped countries. Rapid urbanization in manydevel op ing countries thus presents an opportunityto invest in the low-carbon city trans port system ofthe future. That having been said, it is important tonote that this cannot be undertaken without sub -stantial finan cial support from the developed coun -tries. This means that effective mechanisms need tobe established, such as the fuel security credits beingtested by the Asian Devel op ment Bank,96 or initiativesunder the clean devel op ment mechanism of theKyoto Protocol.97
Efficiency and age of the vehicle stock
The scale of any emission reduction is dependent ona set of factors such as the efficiency and turnoverrate of the vehicle stock, the distance driven by eachvehicle, and the tendency to buy larger and heaviervehicles. New vehicle technology has reduced thefuel use per unit of power by 50 per cent over a 15year period (1990–2005), yet most of that potentialsaving has been negated by the overall increase inpower and weight, particularly in the US. Thus thenet effect has been no change.98
The introduction of new technologies does not,however, lead to immediate cuts in emissions. Theefficiency of any single vehicle on the road is alwayslower than that of the newest technology. In general,this implies that overall emissions depend on theaverage age of the vehicle fleet in any particularcountry (or city). And, in the countries with the oldest
Public transportfare subsidies canhave socialobjectives inincreasing themobility of low-incomehouseholds, but itis important thatsuch subsidy goesto the identifieduser
Investment inpublic transportand publictransportinfrastructure areboth central tomake sure thatpriority is given tothis transportmode
Efficiency gainsmust be setagainst the growthin traffic, as thisoften outweighsthose gains
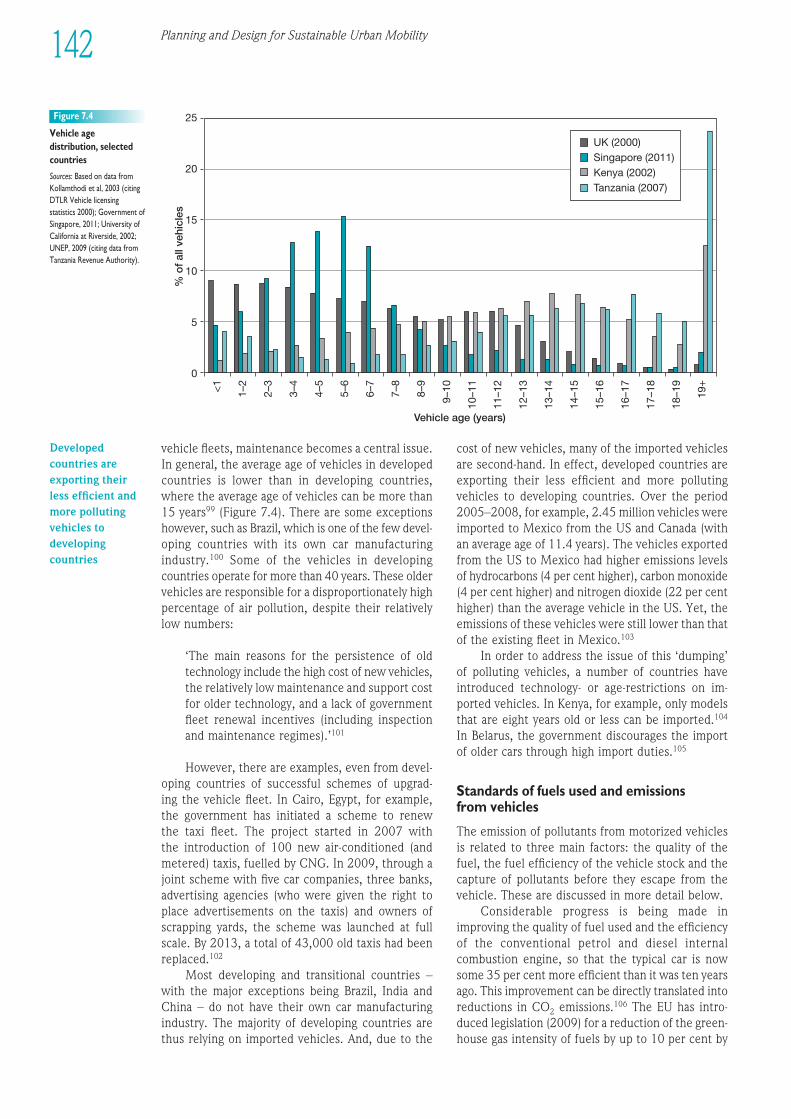
Planning and Design for Sustainable Urban Mobility142
vehicle fleets, maintenance becomes a central issue.In general, the average age of vehicles in developedcountries is lower than in devel op ing countries,where the average age of vehicles can be more than15 years99 (Figure 7.4). There are some exceptionshowever, such as Brazil, which is one of the few devel -op ing countries with its own car manufacturingindustry.100 Some of the vehicles in devel op ingcountries operate for more than 40 years. These oldervehicles are responsible for a disproportionately highpercentage of air pollution, despite their relativelylow numbers:
‘The main reasons for the persistence of oldtechnology include the high cost of new vehicles,the relatively low maintenance and support costfor older technology, and a lack of govern mentfleet renewal incentives (including inspectionand maintenance regimes).’101
However, there are examples, even from devel -op ing countries of successful schemes of upgrad-ing the vehicle fleet. In Cairo, Egypt, for example,the govern ment has initiated a scheme to renew the taxi fleet. The project started in 2007 with the introduction of 100 new air-conditioned (andmetered) taxis, fuelled by CNG. In 2009, through ajoint scheme with five car companies, three banks,advertising agencies (who were given the right toplace advertisements on the taxis) and owners ofscrapping yards, the scheme was launched at fullscale. By 2013, a total of 43,000 old taxis had beenreplaced.102
Most devel op ing and transitional countries –with the major exceptions being Brazil, India andChina – do not have their own car manufacturingindustry. The majority of devel op ing countries arethus relying on imported vehicles. And, due to the
cost of new vehicles, many of the imported vehiclesare second-hand. In effect, developed countries areexporting their less efficient and more pollutingvehicles to devel op ing countries. Over the period2005–2008, for example, 2.45 million vehicles wereimported to Mexico from the US and Canada (withan average age of 11.4 years). The vehicles exportedfrom the US to Mexico had higher emissions levelsof hydrocarbons (4 per cent higher), carbon monoxide(4 per cent higher) and nitrogen dioxide (22 per centhigher) than the average vehicle in the US. Yet, theemissions of these vehicles were still lower than thatof the existing fleet in Mexico.103
In order to address the issue of this ‘dumping’of polluting vehicles, a number of countries haveintroduced technology- or age-restrictions on im -ported vehicles. In Kenya, for example, only modelsthat are eight years old or less can be imported.104
In Belarus, the govern ment discourages the importof older cars through high import duties.105
Standards of fuels used and emissionsfrom vehicles
The emission of pollutants from motorized vehiclesis related to three main factors: the quality of thefuel, the fuel efficiency of the vehicle stock and thecapture of pollutants before they escape from thevehicle. These are discussed in more detail below.
Considerable progress is being made inimproving the quality of fuel used and the efficiencyof the conventional petrol and diesel internalcombustion engine, so that the typical car is nowsome 35 per cent more efficient than it was ten yearsago. This improvement can be directly translated intoreductions in CO2 emissions.106 The EU has intro -duced legislation (2009) for a reduction of the green -house gas intensity of fuels by up to 10 per cent by
25
20
15
10
5
0
% o
f al
l veh
icle
s
UK (2000)Singapore (2011)Kenya (2002)Tanzania (2007)
<1
1–2
2–3
3–4
4–5
5–6
6–7
7–8
8–9
9–10
10–1
1
11–1
2
12–1
3
13–1
4
14–1
5
15–1
6
16–1
7
17–1
8
18–1
9
19+
Vehicle age (years)
Figure 7.4
Vehicle agedistribution, selectedcountries
Sources: Based on data fromKollamthodi et al, 2003 (citingDTLR Vehicle licensingstatistics 2000); Govern ment ofSingapore, 2011; University ofCalifornia at Riverside, 2002;UNEP, 2009 (citing data fromTanzania Revenue Authority).
Developedcountries areexporting theirless efficient andmore pollutingvehicles todevelopingcountries
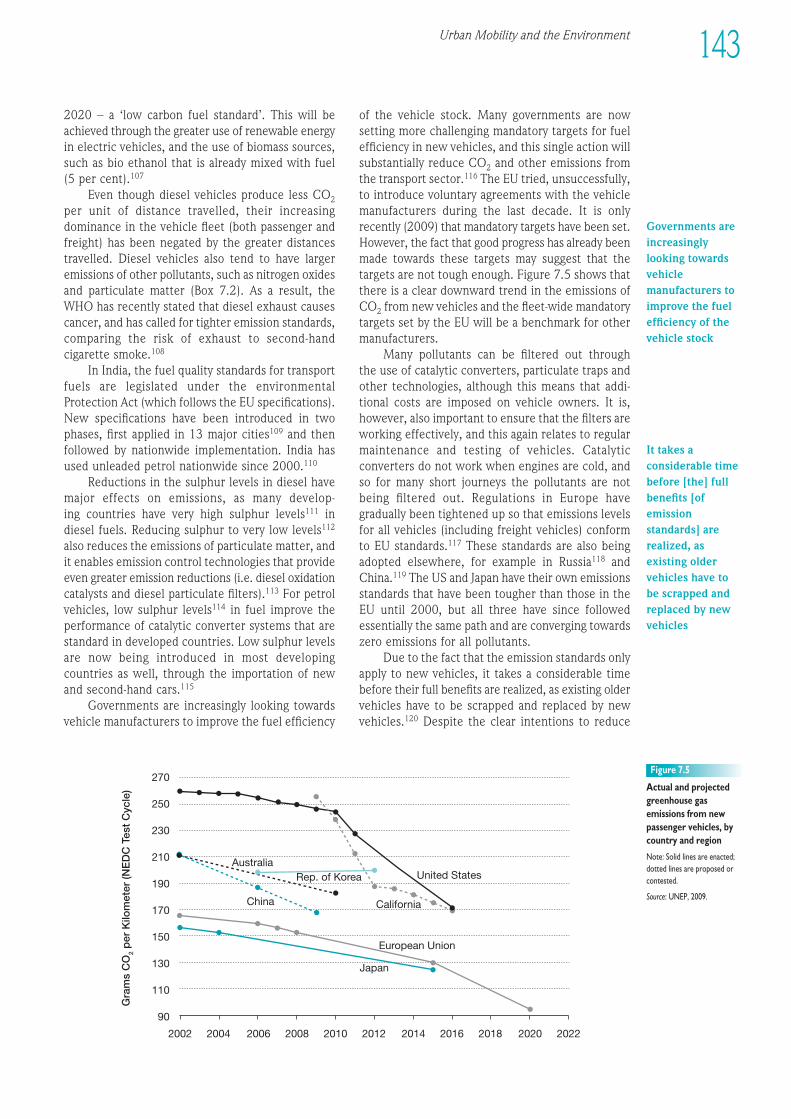
Urban Mobility and the Environment 143
1EEE234567891012311145678920123456789301234567894012345678950123456789EEEE
2020 – a ‘low carbon fuel standard’. This will beachieved through the greater use of renewable energyin electric vehicles, and the use of biomass sources,such as bio ethanol that is already mixed with fuel(5 per cent).107
Even though diesel vehicles produce less CO2per unit of distance travelled, their increasingdominance in the vehicle fleet (both passen ger andfreight) has been negated by the greater distancestravelled. Diesel vehicles also tend to have largeremissions of other pollutants, such as nitrogen oxidesand particulate matter (Box 7.2). As a result, theWHO has recently stated that diesel exhaust causescancer, and has called for tighter emission standards,comparing the risk of exhaust to second-handcigarette smoke.108
In India, the fuel quality standards for trans portfuels are legislated under the environ mentalProtection Act (which follows the EU specifications).New specifications have been introduced in twophases, first applied in 13 major cities109 and thenfollowed by nationwide implementation. India hasused unleaded petrol nationwide since 2000.110
Reductions in the sulphur levels in diesel havemajor effects on emissions, as many devel op- ing countries have very high sulphur levels111 indiesel fuels. Reducing sulphur to very low levels112
also reduces the emissions of particulate matter, andit enables emission control technologies that provideeven greater emission reductions (i.e. diesel oxidationcatalysts and diesel particulate filters).113 For petrolvehicles, low sulphur levels114 in fuel improve theperformance of catalytic converter systems that arestandard in developed countries. Low sulphur levelsare now being introduced in most devel op ingcountries as well, through the importation of newand second-hand cars.115
Govern ments are increasingly looking towardsvehicle manufacturers to improve the fuel efficiency
of the vehicle stock. Many govern ments are nowsetting more challenging mandatory targets for fuelefficiency in new vehicles, and this single action willsubstantially reduce CO2 and other emissions fromthe trans port sector.116 The EU tried, unsuccessfully,to introduce voluntary agreements with the vehiclemanufacturers during the last decade. It is onlyrecently (2009) that mandatory targets have been set.However, the fact that good progress has already beenmade towards these targets may suggest that thetargets are not tough enough. Figure 7.5 shows thatthere is a clear downward trend in the emissions ofCO2 from new vehicles and the fleet-wide mandatorytargets set by the EU will be a benchmark for othermanufacturers.
Many pollutants can be filtered out through the use of catalytic converters, particulate traps andother technologies, although this means that addi -tional costs are imposed on vehicle owners. It is,however, also important to ensure that the filters areworking effectively, and this again relates to regularmaintenance and testing of vehicles. Catalyticconverters do not work when engines are cold, andso for many short journeys the pollutants are notbeing filtered out. Regulations in Europe havegradually been tightened up so that emissions levelsfor all vehicles (including freight vehicles) conformto EU standards.117 These standards are also beingadopted elsewhere, for example in Russia118 andChina.119 The US and Japan have their own emissionsstandards that have been tougher than those in theEU until 2000, but all three have since followedessentially the same path and are converging towardszero emissions for all pollutants.
Due to the fact that the emission standards onlyapply to new vehicles, it takes a considerable timebefore their full benefits are realized, as existing oldervehicles have to be scrapped and replaced by newvehicles.120 Despite the clear intentions to reduce
270
250
230
210
190
170
150
130
110
90
2002 2004 2006 2008 2010 2012 2014 2016 2018 2020 2022
Gra
ms
CO
2 p
er K
ilom
eter
(NE
DC
Tes
t C
ycle
)
United States
California
European Union
Japan
China
AustraliaRep. of Korea
Figure 7.5
Actual and projectedgreenhouse gasemissions from newpassen ger vehicles, bycountry and region
Note: Solid lines are enacted;dotted lines are proposed orcontested.
Source: UNEP, 2009.
Governments areincreasinglylooking towardsvehiclemanufacturers toimprove the fuelefficiency of thevehicle stock
It takes aconsiderable timebefore [the] fullbenefits [ofemissionstandards] arerealized, asexisting oldervehicles have tobe scrapped andreplaced by newvehicles
144 Planning and Design for Sustainable Urban Mobility
key emissions from vehicles, in practice it will take10–15 years to work its way through the entirevehicle stock in developed countries. In devel op ingcountries, with their considerably older vehicle stockit will take even longer.
Add-on technology (principally the catalyticconverter), cleaner fuels and more efficient andlighter vehicles have helped reduce the levels ofpollutants from petrol engine vehicles by 80 per cent.There are, however, questions about whether thetechnology is working efficiently and the rate ofchange in the existing vehicle fleet, particularly inthose cities with the most rapid increase in levels ofcar ownership. Further more, there are still concernsover whether the same levels of air quality improve -ment can be achieved in diesel vehicles.121 And, theproblem of particulates is still present as this resultsfrom fuels (diesel), from tyres and from other sources,and this is much harder to control (and is a particularproblem for freight trucks in urban areas).
The belief that add-on technology can ‘solve’ the air quality issue is too simple. As noted above,there are important limitations relating to whetherthe catalytic converters are working, whether dieselemissions can be controlled effectively, the timetaken for all vehicles to be fitted, and the slowswitch to alternative fuels. When set against thegrowth in car ownership and use, the catalytic con -verter really only gives a maximum of ten years‘breathing space’ before pollution levels start to riseagain. In the US, for example, the catalytic converterhas been compulsory since 1979, and the full benefitshave already worked their way into the entire carfleet. The CO2 problem has not been addressed, asreduction in fuel use is the only means to reducesuch emissions.122
Alternative fuels
In order to reduce the dependence on oil – and toreduce the emissions of greenhouse gases and otherpollutants – there has been much debate over theintroduction of alternative fuels in the trans portsector. However, while searching for alternatives, itis important to keep in mind the fact that bothpetrol and diesel have very high energy densities,123
and that there have already been substantialinvestments in support infra struc ture in mostcountries (e.g. fuel stations). Thus, alternatives needto have a high energy output and they must beproduced cleanly and cheaply, and in sufficientquantities.
In the near future, it is unlikely that anyalternative fuel can replace the established oil-basedsources of fuel, as they cannot be produced (ordistributed) in the quantities required. This meansthat all alternative fuels are likely to be niche markets.However, these may in turn develop to mass-marketoptions in the longer term. In situations where there
is less established supporting infra struc ture (e.g. indevel op ing countries), the introduction of new fuelsmay happen earlier. This provides an opportunity toinitiate new solutions to urban motorization in devel -op ing countries. This is already evident in somecountries through the use of BRT and electric vehicles(including e-bikes).
In terms of policy, the EU seeks to halve the use of conventionally fuelled cars by 2030, to phasesuch cars out of cities by 2050, and to achievecarbon-free goods movement in cities by 2030. TheEU believes that technological innovation will play amajor role in this process, combined with regulationsand standards being set by individual govern ments,demand management, road pricing and local city-levelcontrols.124
The public discussion related to alternative fuelsstarted with a focus on greater efficiency withinexisting internal combustion engines. As discussedabove, efficiency levels have improved substantially,and a further halving of CO2 emissions is expectedover the next ten years (Figure 7.5). Public debatehas since moved onto biofuels and hydrogen.However, the potential of biofuels has been restrictedby the conflicts arising from increasing food prices,as increasing production of energy crops has led toreduced areas of agricultural land producing foodcrops.125 The production of liquid fuels from sugar,biomass and cellulose also requires huge amounts ofwater. Likewise, the potential of hydrogen as a cleanfuel has been questioned because of the energyrequired in its production (often from carbonproducts, such as oil or coal), and because of issuesrelated to the storage and distribution of thehydrogen.126
More recently, the electric vehicle has emergedas a more suitable alternative for urban transport.Such vehicles include hybrid electric vehicles, plug-in hybrid electric vehicles127 and other electricvehicles (including battery-driven vehicles). Increaseduse of such vehicles would solve many of the localpollution problems. However, the energy still has tobe generated (often from coal), and there are issuesrelating to the recharging infra struc ture, the use ofmaterials and the need for a lifecycle approach toenergy use and emissions.128
The most positive devel op ments have comefrom hybrid vehicles that combine conventionalinternal combustion engine with electric vehicletechnology, as this allows both electric power at lowspeeds and a combination of internal combustionengine and electric power at higher speeds. In suchhybrid vehicles, the conventional engine is supportedby a battery that can be recharged while the vehicleis being used. Greenhouse gases and other pollutantsare still being emitted, but these vehicles provide adirect substitute for the conventional car, but useonly about 60 per cent of the fuel. Over the lifetimeof the car it is likely that there are cost savings to
The belief thatadd-on technologycan ‘solve’ the airquality issue is toosimple
In the near future,it is unlikely thatany alternativefuel can replacethe establishedoil-based sourcesof fuel, as they cannot beproduced (or distributed) in the quantitiesrequired
The most positivedevelopmentshave come fromhybrid vehiclesthat combineconventionalinternalcombustionengine withelectric vehicletechnology
The city of Hangzhou (population 8.1 million in 2009) seeks tobuild a highly integrated and low-carbon intensive trans portnetwork that consists of metro, BRT, cycle and walking, watertrans port and electric vehicles. A key element of this strategyis the world’s largest public bicycle programme. In 2009, some67 per cent of all trips were by foot, cycle and electric bike.This accounted for 9.6 million out of 14.4 million trips madeeach day – the CO2 emissions per trip are 250 grammes(about a third of the level in London). The sus tain able trans -port strategy includes the following elements:
• A metro system of 69 kilometres (2011), to be extendedto 278 kilometres by 2050.
• Nine BRT routes, with a further ten planned for 2020.• Smart card operated systems for buses, taxis, bicycles and
other forms of public transport.• Seamless connections and zero interchange strategies for
public trans port transfers.
• Central city divided into eight walking areas withpedestrian priority.
• Free public bicycle service (for first hour or more if usingpublic transport), with 17,342 bikes and 800 service points(June 2009).
• 1130 kilometres of bike routes by 2020.• Subsidy for electric cars up to US$18,000 or about 50 per
cent of purchase price and free charging initially.• Four electric vehicle charging stations, 38 sub charging and
battery swap stations and 3500 charging posts by 2012.• Plans for 1100 electric vehicles to be used by the public
sector, and electric buses and taxis are being tested.• Electric bikes are cheap and flexible, costing US$150–300.
The running costs are 2 per cent of those of a car,averaging at US$2.25 per 100 kilometres. In 2007 therewere 600,000 electric bikes in Hangzhou.
Sources: Banister and Liu, 2011; Keirstead and Brandon, 2011.
Box 7.8 Sus tain able trans port in Hangzhou, China
The Hybrid and Electric Bus Test Programme was launched inJune 2011 by the C40 Cities Climate Leadership Group inpartnership with the Clinton Climate Initiative. In fiveparticipating cities – Bogotá, Curitiba, Rio de Janeiro, Santiagode Chile and São Paulo – the programme seeks to reduce thecarbon footprint of public transportation and develop amarket for fuel-efficient, low-carbon buses in Latin America.
Supported by the Inter-American Devel op ment Bank,the programme brings together cities, bus technologycompanies and local trans port operators to test bustechnology performance in city-specific driving conditions andduty cycles. Ultimately, the programme aims to catalyse the
deployment of up to 9000 buses across Latin American citiesover the next five years, with annual CO2 emission reductionsof 475,000 tonnes.
The programme compares hybrid diesel-electrictechnology and conventional diesel technology. Promisingfindings show that hybrid technology is at least 32 per centmore fuel efficient and produces fewer local air pollutants andgreenhouse gases than conventional diesel buses; while electricbuses have zero on-road emissions and are 250 per cent morefuel efficient than normal diesel buses.Source: Manuel Olivera, Director, C40-CCI Hybrid and Electric Bus Test Programme(personal communication, 8 October 2012).
Box 7.9 The Hybrid and Electric Bus Test Programme, Latin America
the user, as the higher purchase prices are com -pensated for by lower fuel costs.
China has introduced a series of policies aimingto facilitate electric vehicle industrialization andcommercialization, including pilot projects, stan-dard announcements and purchase subsidies. In the industrial sector, a group of car manufacturershas announced mass production plans for electricvehicles.129 In some cities, electric vehicles are begin -ning to make a significant impact in terms of theirshare of public trans port and public service vehiclefleets. This includes delivery vehicles, buses andother services (e.g. taxis). In June 2010, six citieswere chosen to implement electric vehicle purchasesubsidies with a maximum of US$9000 per vehiclein the private car market.130 One of these ‘electric’trans port cities is Hangzhou, where a variety ofmeas ures have been combined to achieve an inno -vative and environ mentally beneficial trans portpathway (Box 7.8).
Although, worldwide, most attention has beengiven to technological innovation for the private car,there is also considerable potential within cities touse electric power and hybrid technologies for publicand freight transport. London, UK, for example, hadmore than 300 hybrid buses in operation by Decem -ber 2012,131 and similar initiatives are currentlyunderway in Latin America (Box 7.9). Electric truckshave been used for local deliveries (Box 7.4) andhybrid vehicles have become more commonly usedby global companies (Box 7.10). These vehicles areintensively used, and they can be recharged andmaintained at the company’s own sites.
Occupancy (load) factors
The range of technological solutions that can be usedto address the issues of improved vehicle efficienciesand reduced levels of CO2 emissions are extensive.However, technology cannot provide the whole
1EEE234567891012311145678920123456789301234567894012345678950123456789EEEE
145Urban Mobility and the Environment
There is . . .considerablepotential withincities to useelectric powerand hybridtechnologies forpublic and freighttransport
solution to the environ mental impacts of urbanmobility. Improved vehicle standards, better fuels,alternative fuels and innovation can all make animportant contribution, but effective policy actionshere need to be combined with strategies to reducethe need to travel, the distances travelled and themodes of trans port used (see below).
Underlying all strategies, however, is theimportance of vehicle occupancy (freight and passen -ger), and the efficiency figures illustrate the import -ance of occupancy (or load) (Box 7.11). Fully ladenvehicles (public and private, freight and passen ger)are far more efficient than empty ones. This alsoreduces environ mental impacts, improves the qualityof the urban area and contributes to reducingcongestion.
‘High-occupancy vehicle’ lanes or car-pool laneshave been introduced in some cities (primarily indeveloped countries) to increase vehicle occupan-cies. Vehicles that travel in a high-occupancy vehiclelane must carry at least one (sometimes two) passen -gers in addition to the driver. Some high-occupancyvehicle lanes are in operation only during certainhours. Outside of those hours, they may be used byall vehicles.132 High-occupancy vehicle lanes have also been introduced in some devel op ing coun-
tries. On such example is South Africa where suchlanes have been introduced to facilitate bus trans -port in particular.133 According to critics, however,few buses are using these lanes – primarily becausethe lanes are on the wrong side of the road withrespect to loading and off-loading of passen gers,forci ng buses to constantly change lanes – and, dueto lack of controls, these lanes are now used primarilyby private cars.134
THE COMPOSITE SOLUTIONThe preceding sections have presented a number ofexamples of interventions to enhance environ -mentally sus tain able urban mobility systems. Each of the examples has illustrated the impact of specifictypes of policies. In most cases of successful imple -mentation, however, it is not a single policy that hasbeen introduced – but rather a package of measures.Such ‘packages’ are more likely to gain publicacceptance, and they allow a mixture of policies thatmay be seen as dis advan tageous to individual users,but promote overall welfare gains to society (see forexample Box 7.7). Yet, while policy packaging cancertainly support effective and efficient policy-making(not least through enhancing interventions’ imple -mentation and the ex-ante mitigation of unintendedeffects), the packaging process requires a deep andholistic appreciation of policy subsystems, togetherwith a structured approach, if its benefits are to begenuinely realized.135
To promote the environ mental argument it isimportant to consider a wide range of effects thatcontribute co-benefits. For example, health can beviewed in three main ways, as less motorized trafficor ‘cleaner’ vehicles improve local air quality, asslower travel leads to improvements in road safetyand as non-motorized trans port has direct healthbenefits. In addition, these improvements are likelyto have a positive effect on climate change throughreductions in CO2 emissions. All these factors leadto important co-benefits that need to be included inall environ mental evaluation.
In order to achieve the EU 2050 target of zerocarbon emissions from trans port in cities136 somecommunities have started moving towards the ‘car-free city’. One such community is Vauban (inFreiburg, Germany). It was constructed on a scalethat facilitates movement by local public transport,walking and cycling (Box 7.12). Vauban offers oneexample of how many of the different elementsoutlined in this chapter can be brought together intoa coherent set of proposals. Based on this experi enceit seems that urban residents can live in a car-freeenviron ment, provided that: the right trans port linksare established (i.e. to the main station and the city
New regulations in many cities restrict access to the city centre based on the age andload of the vehicle:
• In Amsterdam (the Netherlands), a truck may make deliveries in limited accesszones if it meets the following four conditions: it must be less than eight years old,meet the Euro II standard, have a maximum length of 10 metres, and load orunload at least 80 per cent of its merchandise in the central city.
• In London, the Low Emission Zone (set up in 2008) prohibits trucks older than theEuro III standard to enter the metropolitan area (the area surrounded by the M25highway, totalling 1580 square kilometres).
• In Tokyo, since 2003, the most polluting diesel vehicles have been prohibited fromthe city centre.
Source: World Bank and DfID, 2009, p23.
Box 7.11 Freight loads and emissions standards
A number of global delivery companies (FedEx, DHL, TNT and UPS) have testedhybrid delivery trucks and these are slowly beginning to be introduced into their fleets.FedEx together with Eaton Corporation have developed a diesel hybrid electric vehicledelivery truck and launched a pilot project with 20 hybrid electric vehicle diesel trucks(in 2004). The Eaton truck is a medium weight pick-up delivery truck that operates inurban areas with many short stops for collection and delivery. By 2009 FedEx had afleet of 264 hybrid electric trucks, and they have covered more than 4 million miles ofservice (2004–2009), reducing fuel use by more than 570,000 litres and CO2 emissionsby 1521 metric tonnes.Source: FedEx, undated.
Box 7.10 Hybrid trucks
146 Planning and Design for Sustainable Urban Mobility
Urban residentscan live in a car-free environment,provided that: theright transportlinks areestablished . . . ;there are localfacilities andservices; andthere aresufficient reasonsfor not owning acar
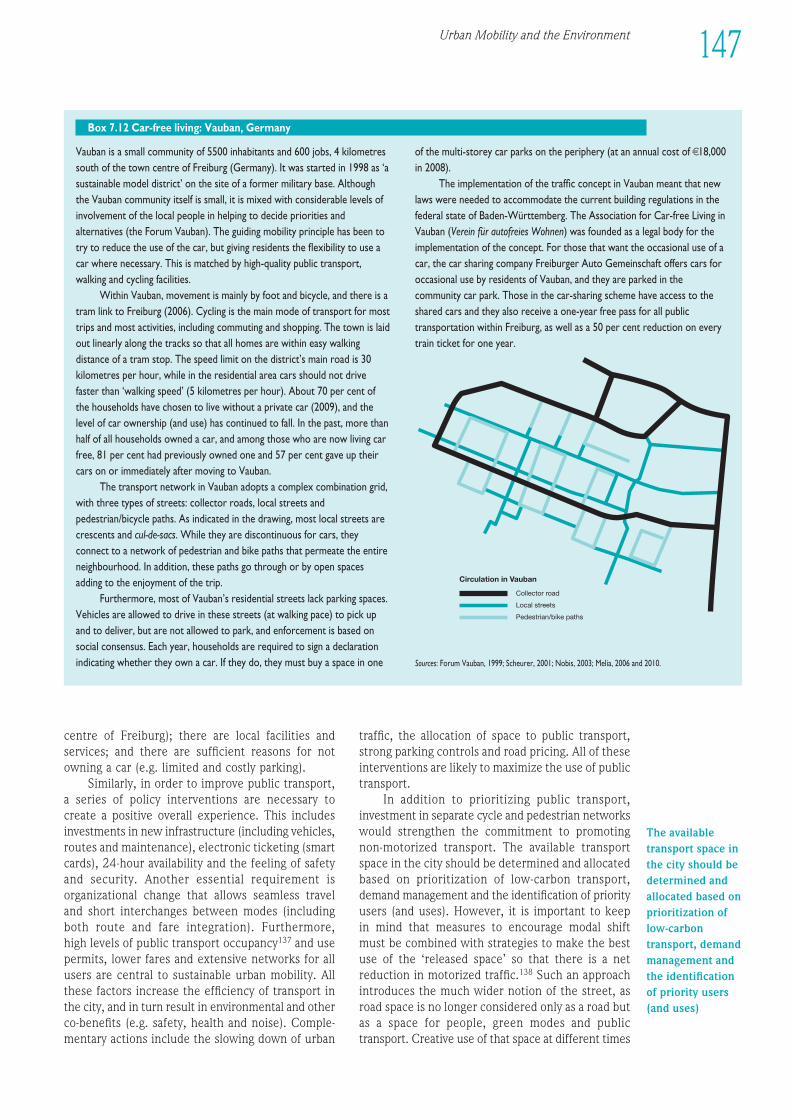
Vauban is a small community of 5500 inhabitants and 600 jobs, 4 kilometressouth of the town centre of Freiburg (Germany). It was started in 1998 as ‘asus tain able model district’ on the site of a former military base. Althoughthe Vauban community itself is small, it is mixed with considerable levels ofinvolvement of the local people in helping to decide priorities andalternatives (the Forum Vauban). The guiding mobility principle has been totry to reduce the use of the car, but giving residents the flexibility to use acar where necessary. This is matched by high-quality public transport,walking and cycling facilities.
Within Vauban, movement is mainly by foot and bicycle, and there is atram link to Freiburg (2006). Cycling is the main mode of trans port for mosttrips and most activities, including commuting and shopping. The town is laidout linearly along the tracks so that all homes are within easy walkingdistance of a tram stop. The speed limit on the district’s main road is 30kilometres per hour, while in the residential area cars should not drivefaster than ‘walking speed’ (5 kilometres per hour). About 70 per cent ofthe households have chosen to live without a private car (2009), and thelevel of car ownership (and use) has continued to fall. In the past, more thanhalf of all households owned a car, and among those who are now living carfree, 81 per cent had previously owned one and 57 per cent gave up theircars on or immediately after moving to Vauban.
The trans port network in Vauban adopts a complex combination grid,with three types of streets: collector roads, local streets andpedestrian/bicycle paths. As indicated in the drawing, most local streets arecrescents and cul-de-sacs. While they are discontinuous for cars, theyconnect to a network of pedestrian and bike paths that permeate the entireneigh bour hood. In addition, these paths go through or by open spacesadding to the enjoyment of the trip.
Further more, most of Vauban’s residential streets lack parking spaces.Vehicles are allowed to drive in these streets (at walking pace) to pick upand to deliver, but are not allowed to park, and enforcement is based onsocial consensus. Each year, households are required to sign a declarationindicating whether they own a car. If they do, they must buy a space in one
of the multi-storey car parks on the periphery (at an annual cost of €18,000in 2008).
The implementation of the traffic concept in Vauban meant that newlaws were needed to accommodate the current building regulations in thefederal state of Baden-Württemberg. The Association for Car-free Living inVauban (Verein für autofreies Wohnen) was founded as a legal body for theimplementation of the concept. For those that want the occasional use of acar, the car sharing company Freiburger Auto Gemeinschaft offers cars foroccasional use by residents of Vauban, and they are parked in thecommunity car park. Those in the car-sharing scheme have access to theshared cars and they also receive a one-year free pass for all publictransportation within Freiburg, as well as a 50 per cent reduction on everytrain ticket for one year.
Sources: Forum Vauban, 1999; Scheurer, 2001; Nobis, 2003; Melia, 2006 and 2010.
Box 7.12 Car-free living: Vauban, Germany
Collector road
Circulation in Vauban
Local streets
Pedestrian/bike paths
1EEE234567891012311145678920123456789301234567894012345678950123456789EEEE
147Urban Mobility and the Environment
centre of Freiburg); there are local facilities andservices; and there are sufficient reasons for notowning a car (e.g. limited and costly parking).
Similarly, in order to improve public transport,a series of policy interventions are necessary tocreate a positive overall experi ence. This includesinvestments in new infra struc ture (including vehicles,routes and maintenance), electronic ticketing (smartcards), 24-hour availability and the feeling of safetyand security. Another essential requirement isorganizational change that allows seamless traveland short interchanges between modes (includingboth route and fare integration). Further more, high levels of public trans port occupancy137 and usepermits, lower fares and extensive networks for allusers are central to sus tain able urban mobility. Allthese factors increase the efficiency of trans port inthe city, and in turn result in environ mental and otherco-benefits (e.g. safety, health and noise). Comple -mentary actions include the slowing down of urban
traffic, the allocation of space to public transport,strong parking controls and road pricing. All of theseinterventions are likely to maximize the use of publictransport.
In addition to prioritizing public transport,investment in separate cycle and pedestrian networkswould strengthen the commitment to promotingnon-motorized transport. The available trans portspace in the city should be determined and allocatedbased on prioritization of low-carbon transport,demand management and the identification of priorityusers (and uses). However, it is important to keepin mind that measures to encourage modal shiftmust be combined with strategies to make the bestuse of the ‘released space’ so that there is a netreduction in motorized traffic.138 Such an approachintroduces the much wider notion of the street, asroad space is no longer considered only as a road butas a space for people, green modes and publictransport. Creative use of that space at different times
The availabletransport space inthe city should bedetermined andallocated based onprioritization oflow-carbontransport, demandmanagement andthe identificationof priority users(and uses)
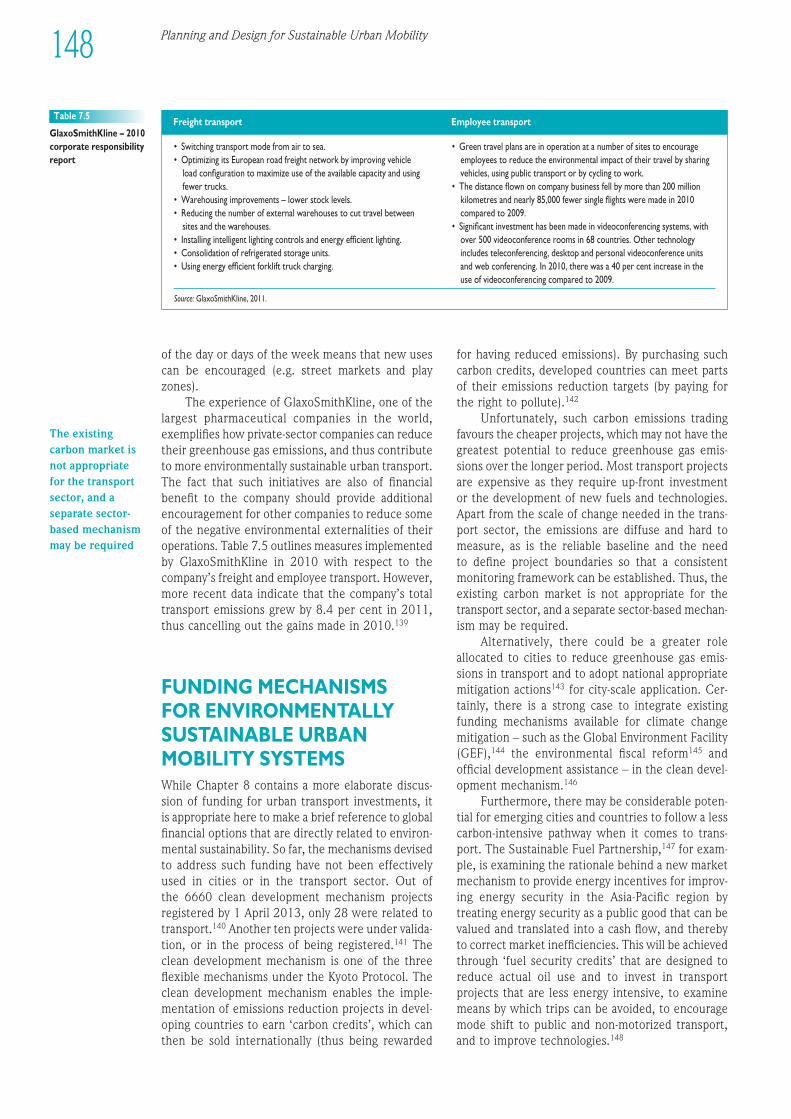
• Switching trans port mode from air to sea. • Green travel plans are in operation at a number of sites to encourage • Optimizing its European road freight network by improving vehicle employees to reduce the environ mental impact of their travel by sharing
load configuration to maximize use of the available capacity and using vehicles, using public trans port or by cycling to work.fewer trucks. • The distance flown on company business fell by more than 200 million
• Warehousing improvements – lower stock levels. kilometres and nearly 85,000 fewer single flights were made in 2010 • Reducing the number of external warehouses to cut travel between compared to 2009.
sites and the warehouses. • Significant investment has been made in videoconferencing systems, with • Installing intelligent lighting controls and energy efficient lighting. over 500 videoconference rooms in 68 countries. Other technology • Consolidation of refrigerated storage units. includes teleconferencing, desktop and personal videoconference units • Using energy efficient forklift truck charging. and web conferencing. In 2010, there was a 40 per cent increase in the
use of videoconferencing compared to 2009.
Source: GlaxoSmithKline, 2011.
Table 7.5
GlaxoSmithKline – 2010corporate responsibilityreport
Freight transport Employee transport
148 Planning and Design for Sustainable Urban Mobility
The existingcarbon market isnot appropriatefor the transportsector, and aseparate sector-based mechanismmay be required
of the day or days of the week means that new usescan be encouraged (e.g. street markets and playzones).
The experi ence of GlaxoSmithKline, one of thelargest pharmaceutical companies in the world,exemplifies how private-sector companies can reducetheir greenhouse gas emissions, and thus contributeto more environ mentally sus tain able urban transport.The fact that such initiatives are also of finan cialbenefit to the company should provide additionalencouragement for other companies to reduce someof the negative environ mental externalities of theiroperations. Table 7.5 outlines measures implementedby GlaxoSmithKline in 2010 with respect to thecompany’s freight and employee transport. However,more recent data indicate that the company’s totaltrans port emissions grew by 8.4 per cent in 2011,thus cancelling out the gains made in 2010.139
FUNDING MECHANISMSFOR ENVIRON MENTALLYSUS TAIN ABLE URBANMOBILITY SYSTEMSWhile Chapter 8 contains a more elaborate discus-sion of funding for urban trans port investments, itis appropriate here to make a brief reference to globalfinan cial options that are directly related to environ -mental sus tain ability. So far, the mechanisms devisedto address such funding have not been effectivelyused in cities or in the trans port sector. Out of the 6660 clean devel op ment mechanism projectsregistered by 1 April 2013, only 28 were related totransport.140 Another ten projects were under valida -tion, or in the process of being registered.141 Theclean devel op ment mechanism is one of the threeflexible mechanisms under the Kyoto Protocol. Theclean devel op ment mechanism enables the imple -mentation of emissions reduction projects in devel -op ing countries to earn ‘carbon credits’, which canthen be sold internationally (thus being rewarded
for having reduced emissions). By purchasing suchcarbon credits, developed countries can meet partsof their emissions reduction targets (by paying forthe right to pollute).142
Unfortunately, such carbon emissions tradingfavours the cheaper projects, which may not have thegreatest potential to reduce greenhouse gas emis-sions over the longer period. Most trans port projectsare expensive as they require up-front investment or the devel op ment of new fuels and technologies.Apart from the scale of change needed in the trans -port sector, the emissions are diffuse and hard tomeasure, as is the reliable baseline and the need to define project boundaries so that a consistentmonitoring framework can be established. Thus, theexisting carbon market is not appropriate for thetrans port sector, and a separate sector-based mechan -ism may be required.
Alternatively, there could be a greater roleallocated to cities to reduce greenhouse gas emis-sions in trans port and to adopt national appropriatemitigation actions143 for city-scale application. Cer -tainly, there is a strong case to integrate existingfunding mechanisms available for climate changemitigation – such as the Global Environ ment Facility(GEF),144 the environ mental fiscal reform145 andofficial devel op ment assistance – in the clean devel -op ment mechanism.146
Further more, there may be considerable poten -tial for emerging cities and countries to follow a lesscarbon-intensive pathway when it comes to trans-port. The Sus tain able Fuel Partnership,147 for exam -ple, is examining the rationale behind a new marketmechan ism to provide energy incentives for improv -ing energy security in the Asia-Pacific region bytreating energy security as a public good that can bevalued and translated into a cash flow, and therebyto correct market inefficiencies. This will be achievedthrough ‘fuel security credits’ that are designed toreduce actual oil use and to invest in trans portprojects that are less energy intensive, to examinemeans by which trips can be avoided, to encouragemode shift to public and non-motorized transport,and to improve technologies.148
1EEE234567891012311145678920123456789301234567894012345678950123456789EEEE
149Urban Mobility and the Environment
There are also considerable overlaps betweenmany general devel op ment programmes – fundedthrough official devel op ment assistance – and globalpublic goods programmes, including climate changemitigations strategies such as public-sector invest -ments in clean transportation.149 Further more,although it is currently not mentioned specific-ally, there should be considerable scope to includefunding for sus tain able urban mobility – particu-larly in devel op ing countries – in the discussions oninnovative devel op ment financing mechanismscurrently being explored in the global economicarena.150 Thus, both of these sources of funding couldbe drawn upon to finance environ mentally sus tain -able urban mobility systems.
CONCLUDING REMARKSAND LESSONS FOR POLICYWhen sensitively planned and appropriately sup -ported by sus tain able infra struc ture, compact citiesare the world’s most efficient settlement pattern.Urban density reduces the overall spatial footprintof devel op ment and allows for greater preservationof natural areas. It also allows for more efficient useof trans port infra struc ture, which reduces emissionsand resource use. However, current trends in motor -ization and oil dependence – and the increaseddependence on private motorized trans port – posemajor challenges to the devel op ment of environ -mentally sus tain able urban mobility systems, namely:
• greenhouse gas emissions: the main cause ofglobal climate change, which could have catas -trophic impacts on urban transportation systems;
• urban sprawl: leading to increasing trip lengthsand thus increased dependence on the private carto meet individual mobility needs;
• air and noise pollution, and decreased physicalactivity: have major negative impacts on the healthof urban residents;
• road traffic accidents: are among the leadingcauses of premature deaths in cities all around theworld;
• community severance: where major trans portinfra struc ture disrupts neigh bour hoods and servesas physical barriers to human interaction.
To address these challenges, there is a need for policyinterventions that encourage change in five majorareas, namely: a reduction of the number of motor -ized trips made (i.e. telecommuting, online shoppingor a shift to non-motorized transport); reduced traveldistances in cities (i.e. changes to the urban form);changes in the modal split (i.e. encouraging publictransport); technological innovations that reduce thenegative externalities of motorized trans port (i.e.
more efficient fuels and reduced emissions); andincreased vehicle efficiency (i.e. higher occupancyrates).
Most policy interventions may be grouped inthree categories: regulatory measures; pricingmeasures; and investments in public trans port andpublic (and non-motorized) trans port infra struc ture.Regulatory measures may be used to limit the num-ber of cars on the roads at any particular time, or torestrict the number of parking places in inner-cityareas, both of which may encourage a modal shifttowards public transport. Such measures may alsobe used to reduce emissions from motor vehicles toencourage the use of more energy-efficient vehicles,and to encourage more efficient use of infra struc tureand vehicles, for example through the introductionof dedicated high-occupancy vehicle lanes.
Pricing measures may be used to discourage theuse of private motorized trans port – in the form ofelectronic road pricing, congestion charging, park-ing pricing, fuel taxes, etc. – or to encourage the useof more energy-efficient vehicles – for example salesduties related to engine size. Similarly, such measuresmay also be used in the form of subsidies to encour -age the use of public trans port (fare subsidies) andto encourage the purchase of more efficient vehicles(subsidies on low-emission fuels, vehicle purchaseprices, exemptions from congestion or parkingcharges, etc.).
Investments in public transport, and infra struc -ture for public and non-motorized transport, may alsoplay a major role in encouraging shifts to more sus -tain able modes of transport. Improved connectivity,increased capacity, enhanced quality and reducedtravel times for such modes are major factors encour -aging city residents to reduce their reliance on theprivate car.
However, the perhaps most effective approach(at least in the longer term) to reduce the environ -mental impact of urban mobility is to reconsider theurban spatial structure. As discussed in Chapter 5,urban form plays an important part in determiningboth trans port mode and distance travelled, as it linksthe spatial distribution of population and jobs (as wellas other destinations) to the pattern of trips. Throughincreased (population and job) densities and mixed-use devel op ments, urban planning may play a majorrole in organizing spatial activities in cities so thatthey are in close proximity to their users. Well-planned, densely populated settlements can reducethe need for private motorization and decrease traveldistances, thus making it more attractive to walk andcycle. Further more, urban planning based on transit-oriented devel op ment (or similar approaches) helpsto maximize urban densities around trans port nodesand encourages a modal shift to public transport.Such an integration of land-use and trans port planningis a core component of a strategy to create environ -mentally sus tain able urban mobility systems.
There is a needfor policyinterventions thatencourage . . . : a reduction of the number ofmotorized tripsmade . . . ;reduced traveldistances in cities. . . ; changes inthe modal split . . . ; technologicalinnovations thatreduce thenegativeexternalities ofmotorizedtransport . . . ; and increasedvehicle efficiency
The perhaps mosteffective approach. . . to reduce theenvironmentalimpact of urbanmobility is toreconsider theurban spatialstructure
NOTES1 Banister and Berechman,
2000.2 Jackson, 2009.3 Perrels et al, 2008.4 Such externalities include the
costs that are imposed by oneset of users on other users andon society more generally, andwhere these costs are not paidby the polluter (Maddison et al,1996).
5 Carpenter et al, 2008, p439;Banister, 2005.
6 IEA, 2012b. See Figure 1.5.7 IEA, 2009. See also UN-Habitat,
2011; and Barker et al, 2007.For details on how theseemissions distribute acrossmodes, see Table 7.1.
8 UN, 2012a.9 Energy density is the amount of
energy per unit volume of fuel(Savage, 2011).
10 With respect to this last point,this indicates that devel op ingcountries may more easily findalternatives to oil-basedtransport, as these may havelower levels of investment in‘conventional’ trans port infra -struc ture. This might be seen asan opportunity for devel op ingcountries to make the transitionto a low-carbon trans portsystem.
11 Gilbert and Perl, 2010.12 Afrique en ligne, 2011.13 Banister et al, 2011. This is so
despite recent devel op ment interms of the extraction ofunconventional oils, which havethe potential to dramaticallyincrease oil supply in short andmedium term (Gordon andTsay, 2013).
14 See for example UNEP, 2008.15 See for example Principle 16 of
the ‘Rio Declaration on Environ -ment and Devel op ment’,http://www.unep.org/Documents.Multilingual/Default.asp?documentid=78&articleid=1163, lastaccessed 30 January 2013. The removal of subsidies is
necessary, but not sufficient, to ensure payment of the fullenviron mental costs of fuels.
16 IEA, 2010, p569.17 See IEA, 2010, pp571–572.18 UN-Habitat, 2011, pp17–20.19 IEA, 2011a, p13.20 IEA, 2011b.21 Yet, as noted earlier in this
chapter, emissions from thetrans port sector have remainedconstant at about 23 per cent of total CO2 emissions.
22 OECD/ITF, 2011b.23 OECD/ITF, 2011b, Table 4.24 UITP, 2001.25 UN-Habitat, 2008.26 UN-Habitat, 2008.27 Nicholls et al, 2008.28 LSE cities et al, 2013.29 UN-Habitat, 2011.30 For a more elaborate
discussion on this, see UN-Habitat, 2011.
31 Due to the limited access toprivate modes of trans port ofthe urban poor, evacuationplans should provide sufficient(and free) public trans portservices in case of evacuation.
32 BRT systems seem to providean answer to the congestionproblem, as these buses travel indedicated lanes.
33 Banister, 2007.34 See Chapter 5.35 See Chapter 6.36 Lucas, 2009. This issue is
discussed at more length inChapter 6.
37 Banister, 1998.38 Perkins and Hamnett, 2002,
p11.39 From 2.5 million to 5.3 million
(UN, 2012a).40 From 42 per cent to 31 per
cent of total land area (Ernst,2011).
41 See for example the attentionpaid to air pollution ahead ofthe 2008 Olympic Games inBeijing China (UNEP, 2007a).
42 Vidal, 2013; citing Lim et al,2012.
43 Walker, 2012.44 EC-Environ ment, 2011.45 UN, 1997. See also EEA, 2001.
The WHO noise standard fortraffic areas is 70 dB (Berglundet al, 1999, p65).
46 OECD, 1991.47 OECD, 1991.48 OECD, 1991; UN, 1997.49 Suchorzewski, 2011.50 Woodcock et al, 2007; Roberts
and Edwards, 2010.51 Bull et al, 2004.52 Woodcock et al, 2007 and
2009.53 James et al, 2004; WHO, 2009,
Table A4.54 Overweight and obesity
increase with age. In England,the percentage of adults whoare obese has roughly doubledsince the mid-1980s (OxfordUniversity, 2007).
55 See for example http://www.copenhagenize.com/, lastaccessed 6 February 2013.
56 Andersen et al, 2000.57 Vasconcellos, 2011, p351.58 Gehl, 1996; Gehl and Gemzøe,
2001.59 Ontario College of Family
Physicians, 2005, p3.60 Ontario College of Family
Physicians, 2005.61 IBM Corporation, 2011.62 Huzayyin, 2011.63 This option is discussed in more
detail in the section below on‘Changing the Modal Split’.
64 Pineau, 2010. See also Chapter 6.
65 Paula Bisiau, Director for Sus tain able Transportation, City of Buenos Aires (personalcommunication, 8 October2012).
66 Sus tain able Transport Project for Egypt, 2011.
67 The relationship between travelbehaviour and urban form isdiscussed in more detail inChapter 5.
68 Banister and Stead, 2004.69 Larsen et al, 2006.
70 Lyons and Kenyon, 2003.71 See for example Hampshire
et al, 2012; Porter, 2012.72 Castells, 2000; Etzo and
Collender, 2010. See alsoEconomist, 2009.
73 See Chapter 5.74 Glaeser, 2011.75 Chew, 2011.76 Chew, 2011.77 ADONIS, 1999.78 See note 4 above, and
Chapter 8.79 See the discussion above in the
section on ‘EnvironmentalChallenges in Urban MobilitySystems’.
80 Note that governance issues are also important for effectiveimplementation (see UN-Habitat, 2011, p108; andChapter 9 below).
81 Barter and Dotson, 2011.82 The pico y placa in Bogotá was
introduced in 1998, and waslater replicated in Medellín in2005. A similar system (hoy-no-circula), which restricts driversfrom using their vehicles oneweekday per week, wasintroduced in Mexico City in1989 (Gallego et al, 2011).
83 Banister, 2003.84 Dijk and Montalvo, 2011.85 US Department of
Transportation, 2006.86 See also the discussion on fuel
subsidies in the section on‘Motorization and oildependence’ above.
87 The UK introduced such ascheme in 1993, but it wasabolished in 2000 due to publicdiscontent (Politics.co.uk,undated).
88 See discussion in Chapter 8.89 Anas and Lindsay, 2011.90 UITP, 2010, p22.91 Office for Low Emissions
Vehicles, 2011. Many othercountries have introducedsimilar measures, seehttp://en.wikipedia.org/wiki/Govern ment_incentives_for_
While the above interventions are discussedseparately in the report, it is essential to considerthem as components of a package of measures. Such‘packages’ are more likely to be publicly acceptable,as they allow a mixture of policies, some of whichmay be seen as dis advan tageous to individual users,yet as a package they may be seen as supporting thepublic good. To ensure successful implementationof environ mental policies, some of which may involveradical change, public acceptability should be a majorconcern. Communities and other stakeholders shouldthus be involved in all phases of policy devel op ment,including initial discussions, decision-making andimplementation.
The strategic planning of the city, and the roleplayed by trans port systems, needs to be balancedby actions taken at the neigh bour hood level, in asupportive govern ment environ ment at all levels. Itis at the neigh bour hood level that cycling and walkingbecome important modes of trans port – for accessto employment and other services and facilities – andthese complement the need to travel longer distancesby public trans port to other parts of the city. City-wide decisions need to take account of therequirements of the population and businesses – i.e.to ensure access to destinations – so that movementcan take place in an efficient and environ mentallysus tain able manner.
150 Planning and Design for Sustainable Urban Mobility
To ensuresuccessfulimplementation ofenvironmentalpolicies, . . .publicacceptabilityshould be a majorconcern
1EEE234567891012311145678920123456789301234567894012345678950123456789EEEE
151Urban Mobility and the Environment
plug-in_electric_vehicles (lastaccessed 30 January 2013).
92 Hall and Hass-Klau, 1985. See also Bauer et al 2006;Dresdner Verkehrbetriebe AG, 2011.
93 Wright, 2010. See also Chapter3 above.
94 See the section above on‘Motorization and oildependence’.
95 Including increases due to the‘rebound effect’, which impliesthat environ mental policies donot achieve all of their statedaims, as people tend to travelmore if they think that they are doing it more efficiently(Herring and Sorrell, 2008).
96 ADB, 2010a.97 See the section below on
‘Funding Mechanisms forEnviron mentally Sus tain ableUrban Mobility Systems’.
98 Schipper, 2011.99 UNEP, 2009.
100 The average age of all motorvehicles in Brazil in 2010 was 8.7 years (Kliment, 2011),comparable to countries such asSwitzerland: 8.2 years (FederalStatistical Office, Switzerland,2012); and the Netherlands, 8.6 years (Central Bureau ofStatistics, Netherlands).
101 UNEP, 2009, p17.102 Huzayyin and Salem, 2013.
Personal communication withProfessor Ali Huzzayin, CairoUniversity, Egypt, March 2013.
103 Davis and Kahn, 2011.104 Kenya Revenue Authority,
undated.105 UNEP, 2009.106 UNEP, 2009.107 See also the section on
‘Alternative fuels’ below.108 Gallagher, 2012.109 The 13 cities are Delhi, Mumbai,
Kolkata, Chennai, Bangalore,Hyderabad, Ahmedabad, Pune,Surat, Kanpur, Agra, Lucknowand Sholapur.
110 ACFA, 2010.111 Often more than 5000 parts
per million.112 i.e. 50 parts per million and
less.113 UNEP, 2007b, p8.114 i.e. 500 parts per million and
less.115 UNEP, 2007b, p9.116 The Obama administration in
the US is suggesting a fuel-economy standard of 23kilometres per litre average foran automaker’s whole fleet by2025, boosting the price of anew vehicle by at least US$2100(Healey, 2011).
117 See DieselNet, 2012a and2012b.
118 Regional Environ mental Centrefor the Caucasus, 2008.
119 An et al, 2011.120 See also the previous section on
‘Efficiency and age of the vehiclestock’.
121 Bleviss et al, 1996.122 Banister, 1998.123 See the section on
‘Motorization and oildependence’ above.
124 EC, 2011.125 The potential of biofuels may
improve, subject to thesuccessful devel op ment of‘second generation biofuels’ –which seek to utilize local‘biomass consisting of theresidual non-food parts ofcurrent crops, such as stems,leaves and husks that are leftbehind once the food crop hasbeen extracted, as well as . . .non food crops’ (http://en.wikipedia.org/wiki/Second_generation_biofuels, lastaccessed 6 February 2013).
126 Evenson, 2004.127 A hybrid electric vehicle is a
vehicle that uses both anelectric motor and a petrolengine to power the vehicle. A plug-in hybrid electric vehicleis a hybrid electric vehicle that is capable of storing energy
from the grid in onboardbatteries.
128 The conventional approach has been to look at energy useand emissions from a ‘tank-to-wheels’ perspective only, i.e.only the energy used and thecarbon emissions producedfrom the use of the vehicle itself(i.e. the petrol or the electricityfrom the onboard battery). A lifecycle approach implies a‘well-to-wheels’ approach,i.e. all energy used and carbonemissions produced from thesource of the energy to the finaluser (Graham and Reedman,2010).
129 Liu, 2012.130 Banister and Liu, 2011
(RMB60,000).131 Trans port for London, undated
b.132 Ministry of Transport, Ontario,
2007. For an overview of somecities that have introduced high-occupancy vehicle lanes, seehttp://en.wikipedia.org/wiki/High-occupancy_vehicle_lane,last accessed 30 January 2013.
133 De Vries et al, 2010.134 Debra Roberts during the
eighth meeting of the HS-NetAdvisory Board, 20 November2012.
135 Givoni et al, 2013.136 See the section above on
‘Alternative fuels’.137 See the section above on
‘Occupancy (load) factors’.138 Banister and Marshall, 2000.139 GlaxoSmithKline, 2012.140 These 28 projects were
categorized as follows: BRT (13 projects); motorbikes (4 projects); modal shift fromroad to rail (7 projects); moreefficient vehicles (1 project);regenerative braking forrailways (i.e. that the kineticenergy from braking isrecovered and later reused) (1 project); biodiesel fortransport (1 project); and cable
cars (1 project) (UNEP RisøCentre, 2013).
141 UNEP Risø Centre, 2013.142 See UN-Habitat, 2011, p20.143 ‘National appropriate
mitigation actions’ (NAMAs) are a set of actions and policiesthat can be undertaken bycountries as part of acommitment to reducegreenhouse gas emissions.
144 Under GEF, by 2011, there hadbeen 45 ‘sus tain able trans portand urban systems’ projectsfunded over 20 years,accounting for 6 per cent oftotal projects (GEF, 2011, p5).Within the countryprogrammes, the CleanTechnology Fund has allocatedabout 14 per cent of investmentto transport, as of December2011 (CIF, 2011, p14).
145 See World Bank, 2005.146 Bertaud et al, 2009.147 ADB, 2010a.148 ‘The credits will give a value to
the fuel security benefit arisingfrom improvements in fuelconsumption. Trading in thecredits could help devel op ingcountries to access additionalfunds to carry out policies andtechnologies that may nototherwise meet investmentrequirements from a traditionalcost–benefit analysis . . .Accounting for fuelconsumption is far easier thanaccounting for greenhouse gasemissions . . . and, as withcarbon emissions, reducing atonne of oil-equivalent is lesscostly in Asia than in Europe orNorth America’ (IntellAsia.Net,2011).
149 UN, 2012b, p7.150 See, for example, the
discussions of the UnitedNations High-level Panel onFinancing for Devel op ment and the Leading Group onInnovative Financing for Devel op ment (UN, 2012b).

THE ECONOMICS AND FINANCINGOF URBAN MOBILITY
C H A P T E R 8This chapter seeks to provide an understanding ofthe economics and finan cial options that determinethe success or failure of urban mobility systems. Eachsuch system includes a range of mobility options, fromwalking to rail-based metro systems. In economicterms, the various modes of urban mobility are bothcomplementary and competitive. They are comple -mentary because residents typically avail themselvesof more than one travel mode as they go about thedaily activities of urban life. At the same time thesemodal alternatives often compete for passen gers. Ifbetter-coordinated and sus tain able trans port systemsare to evolve out of such complex systems, it is goingto require an understanding of the incentives anddisincentives faced by buyers and sellers of trans portservices.
The ways that urban trans port options emergeand evolve depend heavily upon the costs of theseoptions and the ways in which these costs arefinanced: either directly in fares, indirectly in taxesand fees or absorbed as pollution, climate change,congestion, road traffic deaths and injuries, or othersocial costs. Thus, this chapter reviews the economicsand financing of urban mobility in light of its impactson the ways the choices are made to explicitly payfor or implicitly absorb the costs.
In matters of urban trans port economics, finan -cial arrangements are always paramount. Financesystems can encourage (or discourage) the alignmentof economic, environ mental and social goals. Differen -tials in investments and operating funds among modal alternatives have social, spatial, environ mentaland equity impacts. These may be good or bad, asthe various modes compete for scarce urban spaceand market shares. Whether by indecision or decision,such choices are made continually, and thus out -comes in this regard are results of – and impact upon– public policy.
To understand the finan cial dynamics, it is
necessary to understand the economic relationshipsamong and within urban travel modes. With theexception of rail-based modes (which travel onsegregated rights of way) all other forms of urbanmovement – from walking to motorized travel – relyon access to a shared system of sidewalks, streets,roads and highways. Thus, while different modes ofurban movement appear to be physically and finan -cially independent of one another, they are none -theless physically and finan cially inter dependentbecause of their shared (and usually competitive) useof public infra struc ture.
The improvement of urban mobility systemsrequires strategic choices regarding the structuresthrough which the infra struc ture and equipmentthat service urban public trans port are financed.Public trans port must be bolstered as both a viablealternative to private cars (and motorcycles) and astrong supportive and complementary supplement tonon-motorized mobility. As a result, there is a needto address the incentives and disincentives built intocurrent finan cial configurations.
In order to address the issues outlined above,the first section below presents a brief overview ofthe conditions and trends that determine theeconomics of urban mobility. This is followed bydiscussions on the economic role of trans port in thefunctioning of an urban economy, and the need tomove away from economics of mobility towardseconomics of access. The fourth section develops anunderstanding of the systems of incentives anddisincentives built into the current methods used tofinance urban trans port systems. Based on thisdiscussion, the fifth section proposes policies andplans that permit urban trans port to make a majorcontribution to the realization of socially and environ -mentally sus tain able cities, while the final sectioncontains some concluding remarks and lessons forpolicy.
1EEE234567891012311145678920123456789301234567894012345678950123456789EEEE
In economicterms, the variousmodes of urbanmobility are bothcomplementaryand competitive
Differentials ininvestments andoperating fundsamong modalalternatives havesocial, spatial,environmentaland equityimpacts
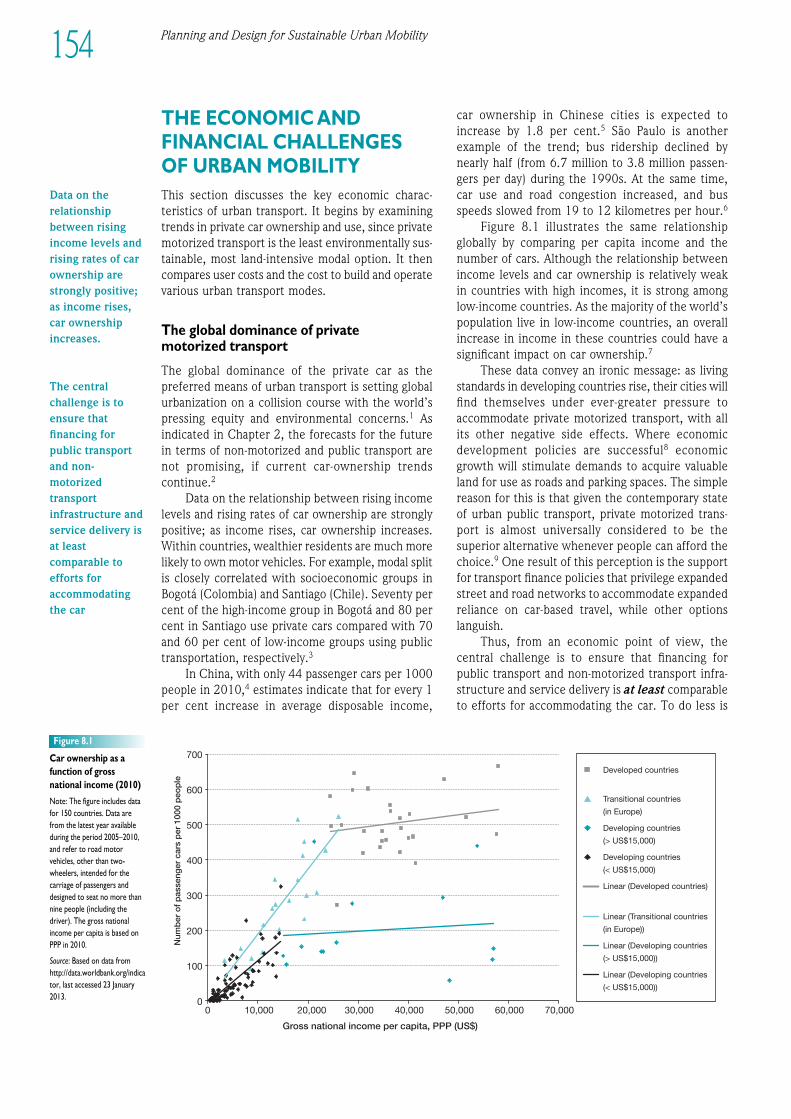
Planning and Design for Sustainable Urban Mobility154
700
600
500
400
300
200
100
0
Num
ber
of
pas
seng
er c
ars
per
100
0 p
eop
le
0 10,000 20,000 30,000 40,000 50,000 60,000 70,000
Gross national income per capita, PPP (US$)
Developed countries
Transitional countries
(in Europe)
Developing countries
(> US$15,000)
Developing countries
(< US$15,000)
Linear (Developed countries)
Linear (Transitional countries
(in Europe))
Linear (Developing countries
(> US$15,000))
Linear (Developing countries
(< US$15,000))
THE ECONOMIC ANDFINAN CIAL CHALLENGESOF URBAN MOBILITY
This section discusses the key economic charac -teristics of urban transport. It begins by examiningtrends in private car ownership and use, since privatemotorized trans port is the least environ mentally sus -tain able, most land-intensive modal option. It thencompares user costs and the cost to build and operatevarious urban trans port modes.
The global dominance of privatemotorized transport
The global dominance of the private car as thepreferred means of urban trans port is setting globalurbanization on a collision course with the world’spressing equity and environ mental concerns.1 Asindicated in Chapter 2, the forecasts for the futurein terms of non-motorized and public trans port arenot promising, if current car-ownership trendscontinue.2
Data on the relationship between rising incomelevels and rising rates of car ownership are stronglypositive; as income rises, car ownership increases.Within countries, wealthier residents are much morelikely to own motor vehicles. For example, modal splitis closely correlated with socioeconomic groups inBogotá (Colombia) and Santiago (Chile). Seventy percent of the high-income group in Bogotá and 80 percent in Santiago use private cars compared with 70and 60 per cent of low-income groups using publictransportation, respectively.3
In China, with only 44 passen ger cars per 1000people in 2010,4 estimates indicate that for every 1per cent increase in average disposable income,
car ownership in Chinese cities is expected toincrease by 1.8 per cent.5 São Paulo is anotherexample of the trend; bus ridership declined bynearly half (from 6.7 million to 3.8 million passen -gers per day) during the 1990s. At the same time,car use and road congestion increased, and busspeeds slowed from 19 to 12 kilometres per hour.6
Figure 8.1 illustrates the same relationshipglobally by comparing per capita income and thenumber of cars. Although the relationship betweenincome levels and car ownership is relatively weakin countries with high incomes, it is strong amonglow-income countries. As the majority of the world’spopulation live in low-income countries, an overallincrease in income in these countries could have asignificant impact on car ownership.7
These data convey an ironic message: as livingstandards in devel op ing countries rise, their cities willfind themselves under ever-greater pressure toaccommodate private motorized transport, with allits other negative side effects. Where economicdevel op ment policies are successful8 economicgrowth will stimulate demands to acquire valuableland for use as roads and parking spaces. The simplereason for this is that given the contemporary stateof urban public transport, private motorized trans -port is almost universally considered to be thesuperior alternative whenever people can afford thechoice.9 One result of this perception is the supportfor trans port finance policies that privilege expandedstreet and road networks to accommodate expandedreliance on car-based travel, while other optionslanguish.
Thus, from an economic point of view, thecentral challenge is to ensure that financing forpublic trans port and non-motorized trans port infra -struc ture and service delivery is at least comparableto efforts for accommodating the car. To do less is
Figure 8.1
Car ownership as a
function of gross
national income (2010)
Note: The figure includes data
for 150 countries. Data are
from the latest year available
during the period 2005–2010,
and refer to road motor
vehicles, other than two-
wheelers, intended for the
carriage of passen gers and
designed to seat no more than
nine people (including the
driver). The gross national
income per capita is based on
PPP in 2010.
Source: Based on data from
http://data.worldbank.org/indica
tor, last accessed 23 January
2013.
Data on therelationshipbetween risingincome levels andrising rates of carownership arestrongly positive;as income rises,car ownershipincreases.
The centralchallenge is toensure thatfinancing forpublic transportand non-motorizedtransportinfrastructure andservice delivery isat leastcomparable toefforts foraccommodatingthe car
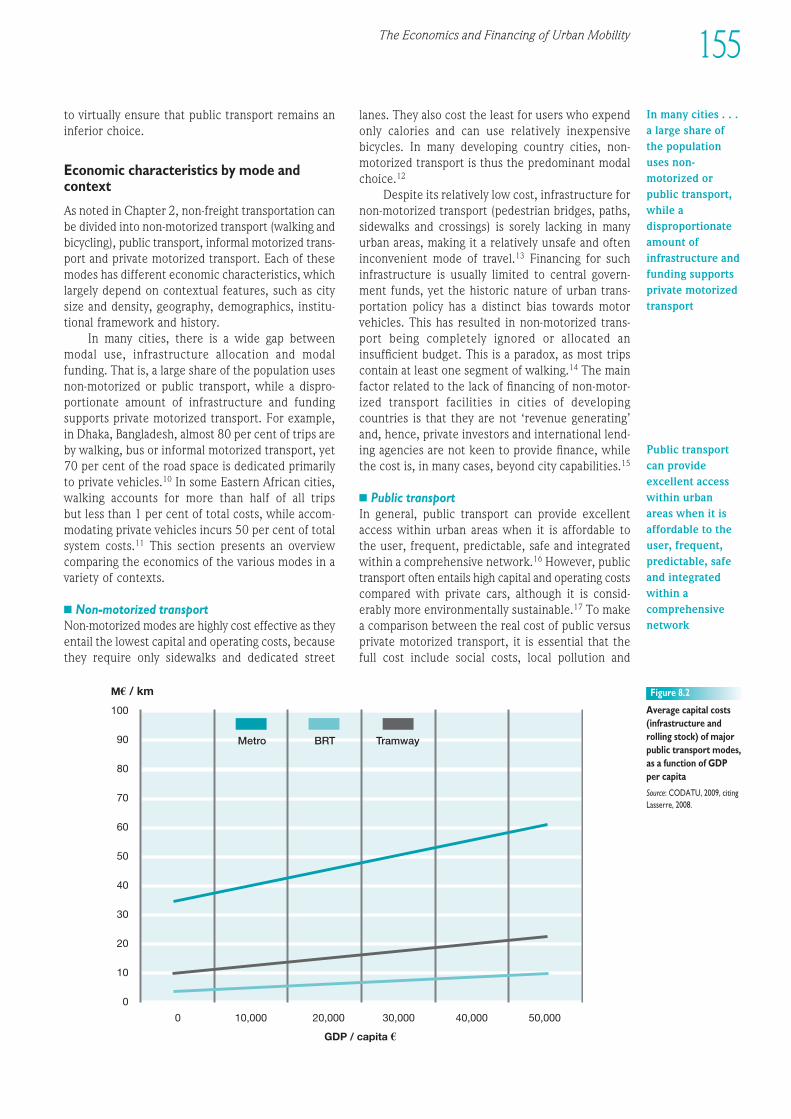
to virtually ensure that public trans port remains aninferior choice.
Economic characteristics by mode andcontext
As noted in Chapter 2, non-freight transportation canbe divided into non-motorized trans port (walking andbicycling), public transport, informal motorized trans -port and private motorized transport. Each of thesemodes has different economic characteristics, whichlargely depend on contextual features, such as citysize and density, geography, demographics, institu -tional framework and history.
In many cities, there is a wide gap betweenmodal use, infra struc ture allocation and modalfunding. That is, a large share of the population usesnon-motorized or public transport, while a dispro -portionate amount of infra struc ture and fundingsupports private motorized transport. For example,in Dhaka, Bangladesh, almost 80 per cent of trips areby walking, bus or informal motorized transport, yet70 per cent of the road space is dedicated primarilyto private vehicles.10 In some Eastern African cities,walking accounts for more than half of all trips but less than 1 per cent of total costs, while accom -modating private vehicles incurs 50 per cent of totalsystem costs.11 This section presents an overviewcomparing the economics of the various modes in avariety of contexts.
n Non-motorized transportNon-motorized modes are highly cost effective as theyentail the lowest capital and operating costs, becausethey require only sidewalks and dedicated street
lanes. They also cost the least for users who expendonly calories and can use relatively inexpensivebicycles. In many devel op ing country cities, non-motorized trans port is thus the predominant modalchoice.12
Despite its relatively low cost, infra struc ture fornon-motorized trans port (pedestrian bridges, paths,sidewalks and crossings) is sorely lacking in manyurban areas, making it a relatively unsafe and ofteninconvenient mode of travel.13 Financing for suchinfra struc ture is usually limited to central govern-ment funds, yet the historic nature of urban trans -portation policy has a distinct bias towards motorvehicles. This has resulted in non-motorized trans -port being completely ignored or allocated aninsufficient budget. This is a paradox, as most tripscontain at least one segment of walking.14 The mainfactor related to the lack of financing of non-motor -ized trans port facilities in cities of devel op ingcountries is that they are not ‘revenue generating’and, hence, private investors and international lend -ing agencies are not keen to provide finance, whilethe cost is, in many cases, beyond city capabilities.15
n Public transportIn general, public trans port can provide excellentaccess within urban areas when it is affordable tothe user, frequent, predictable, safe and integratedwithin a comprehensive network.16 However, publictrans port often entails high capital and operating costscompared with private cars, although it is consid -erably more environ mentally sus tain able.17 To makea comparison between the real cost of public versusprivate motorized transport, it is essential that thefull cost include social costs, local pollution and
The Economics and Financing of Urban Mobility 155
1EEE234567891012311145678920123456789301234567894012345678950123456789EEEE
100
90
80
70
60
50
40
30
20
10
0
0 10,000 20,000 30,000 40,000 50,000
M€ / km
GDP / capita €
Metro BRT Tramway
Figure 8.2
Average capital costs(infra struc ture androlling stock) of majorpublic trans port modes,as a function of GDPper capita
Source: CODATU, 2009, citingLasserre, 2008.
In many cities . . .a large share ofthe populationuses non-motorized orpublic transport,while adisproportionateamount ofinfrastructure andfunding supportsprivate motorizedtransport
Public transportcan provideexcellent accesswithin urbanareas when it isaffordable to theuser, frequent,predictable, safeand integratedwithin acomprehensivenetwork
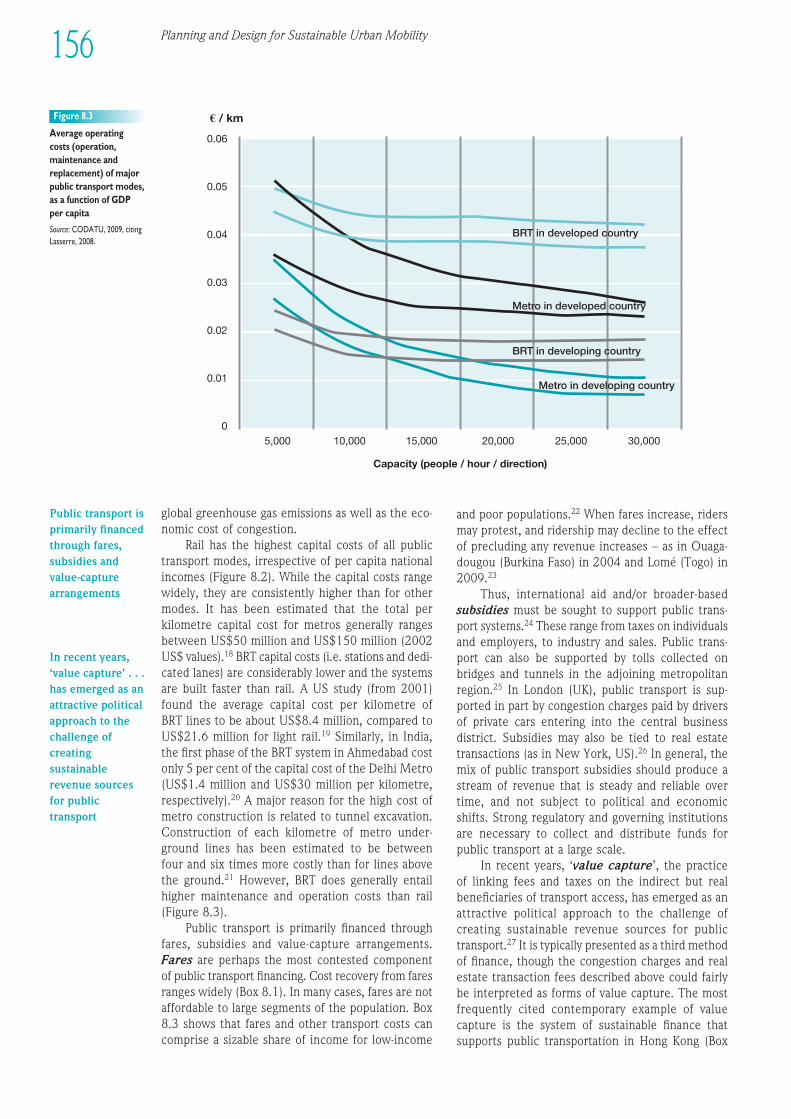
Planning and Design for Sustainable Urban Mobility156
0.06
0.05
0.04
0.03
0.02
0.01
05,000 10,000 15,000 20,000 25,000 30,000
€ / km
Capacity (people / hour / direction)
BRT in developed country
Metro in developed country
BRT in developing country
Metro in developing country
Figure 8.3
Average operatingcosts (operation,maintenance andreplacement) of majorpublic trans port modes,as a function of GDPper capita
Source: CODATU, 2009, citingLasserre, 2008.
Public transport isprimarily financedthrough fares,subsidies andvalue-capturearrangements
In recent years,‘value capture’ . . .has emerged as anattractive politicalapproach to thechallenge ofcreatingsustainablerevenue sourcesfor publictransport
global greenhouse gas emissions as well as the eco -nomic cost of congestion.
Rail has the highest capital costs of all publictrans port modes, irrespective of per capita nationalincomes (Figure 8.2). While the capital costs rangewidely, they are consistently higher than for othermodes. It has been estimated that the total per kilo metre capital cost for metros generally rangesbetween US$50 million and US$150 million (2002US$ values).18 BRT capital costs (i.e. stations and dedi -cated lanes) are considerably lower and the systemsare built faster than rail. A US study (from 2001)found the average capital cost per kilometre of BRT lines to be about US$8.4 million, compared toUS$21.6 million for light rail.19 Similarly, in India,the first phase of the BRT system in Ahmedabad costonly 5 per cent of the capital cost of the Delhi Metro(US$1.4 million and US$30 million per kilometre,respectively).20 A major reason for the high cost ofmetro construction is related to tunnel excavation.Construction of each kilometre of metro under-ground lines has been estimated to be between four and six times more costly than for lines abovethe ground.21 However, BRT does generally entail higher maintenance and operation costs than rail(Figure 8.3).
Public trans port is primarily financed throughfares, subsidies and value-capture arrangements.Fares are perhaps the most contested componentof public trans port financing. Cost recovery from faresranges widely (Box 8.1). In many cases, fares are notaffordable to large segments of the population. Box8.3 shows that fares and other trans port costs cancomprise a sizable share of income for low-income
and poor populations.22 When fares increase, ridersmay protest, and ridership may decline to the effectof precluding any revenue increases – as in Ouaga -dougou (Burkina Faso) in 2004 and Lomé (Togo) in2009.23
Thus, international aid and/or broader-basedsubsidies must be sought to support public trans -port systems.24 These range from taxes on individualsand employers, to industry and sales. Public trans -port can also be supported by tolls collected onbridges and tunnels in the adjoining metropolitanregion.25 In London (UK), public trans port is sup -ported in part by congestion charges paid by driversof private cars entering into the central businessdistrict. Subsidies may also be tied to real estatetransactions (as in New York, US).26 In general, themix of public trans port subsidies should produce astream of revenue that is steady and reliable overtime, and not subject to political and economicshifts. Strong regulatory and governing institutionsare necessary to collect and distribute funds forpublic trans port at a large scale.
In recent years, ‘value capture’, the practiceof linking fees and taxes on the indirect but realbeneficiaries of trans port access, has emerged as anattractive political approach to the challenge ofcreating sus tain able revenue sources for publictransport.27 It is typically presented as a third methodof finance, though the congestion charges and realestate transaction fees described above could fairlybe interpreted as forms of value capture. The mostfrequently cited contemporary example of valuecapture is the system of sus tain able finance thatsupports public transportation in Hong Kong (Box
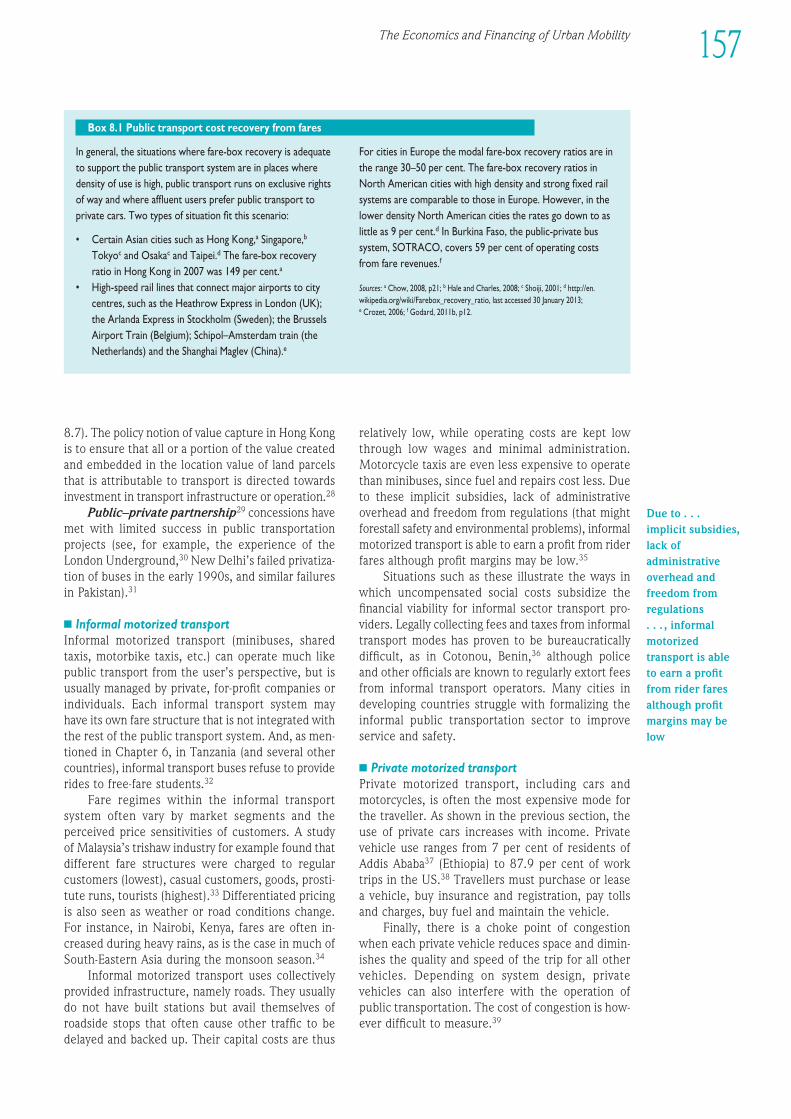
The Economics and Financing of Urban Mobility 157
1EEE234567891012311145678920123456789301234567894012345678950123456789EEEE
8.7). The policy notion of value capture in Hong Kongis to ensure that all or a portion of the value createdand embedded in the location value of land parcelsthat is attributable to trans port is directed towardsinvestment in trans port infra struc ture or operation.28
Public–private partnership29 concessions havemet with limited success in public transportationprojects (see, for example, the experi ence of theLondon Underground,30 New Delhi’s failed privatiza -tion of buses in the early 1990s, and similar failuresin Pakistan).31
n Informal motorized transportInformal motorized trans port (mini buses, sharedtaxis, motorbike taxis, etc.) can operate much likepublic trans port from the user’s perspective, but isusually managed by private, for-profit companies orindividuals. Each informal trans port system may have its own fare structure that is not integrated withthe rest of the public trans port system. And, as men -tioned in Chapter 6, in Tanzania (and several othercountries), informal trans port buses refuse to providerides to free-fare students.32
Fare regimes within the informal trans portsystem often vary by market segments and theperceived price sensitivities of customers. A studyof Malaysia’s trishaw industry for example found thatdifferent fare structures were charged to regularcustomers (lowest), casual customers, goods, prosti -tute runs, tourists (highest).33 Differentiated pricingis also seen as weather or road conditions change.For instance, in Nairobi, Kenya, fares are often in -creased during heavy rains, as is the case in much ofSouth-Eastern Asia during the monsoon season.34
Informal motorized trans port uses collectivelyprovided infra struc ture, namely roads. They usuallydo not have built stations but avail themselves ofroadside stops that often cause other traffic to bedelayed and backed up. Their capital costs are thus
relatively low, while operating costs are kept lowthrough low wages and minimal administration.Motorcycle taxis are even less expensive to operatethan mini buses, since fuel and repairs cost less. Dueto these implicit subsidies, lack of administrativeoverhead and freedom from regulations (that mightforestall safety and environ mental problems), informalmotorized trans port is able to earn a profit from riderfares although profit margins may be low.35
Situations such as these illustrate the ways inwhich uncompensated social costs subsidize thefinan cial viability for informal sector trans port pro -viders. Legally collecting fees and taxes from informaltrans port modes has proven to be bureaucraticallydifficult, as in Cotonou, Benin,36 although policeand other officials are known to regularly extort feesfrom informal trans port operators. Many cities indevel op ing countries struggle with formalizing theinformal public transportation sector to improveservice and safety.
n Private motorized transportPrivate motorized transport, including cars andmotorcycles, is often the most expensive mode forthe traveller. As shown in the previous section, theuse of private cars increases with income. Privatevehicle use ranges from 7 per cent of residents ofAddis Ababa37 (Ethiopia) to 87.9 per cent of worktrips in the US.38 Travellers must purchase or leasea vehicle, buy insurance and registration, pay tollsand charges, buy fuel and maintain the vehicle.
Finally, there is a choke point of congestionwhen each private vehicle reduces space and dimin -ishes the quality and speed of the trip for all othervehicles. Depending on system design, privatevehicles can also interfere with the operation ofpublic transportation. The cost of congestion is how -ever difficult to measure.39
In general, the situations where fare-box recovery is adequateto support the public trans port system are in places wheredensity of use is high, public trans port runs on exclusive rightsof way and where affluent users prefer public trans port toprivate cars. Two types of situation fit this scenario:
• Certain Asian cities such as Hong Kong,a Singapore,b
Tokyoc and Osakac and Taipei.d The fare-box recoveryratio in Hong Kong in 2007 was 149 per cent.a
• High-speed rail lines that connect major airports to citycentres, such as the Heathrow Express in London (UK);the Arlanda Express in Stockholm (Sweden); the BrusselsAirport Train (Belgium); Schipol–Amsterdam train (theNetherlands) and the Shanghai Maglev (China).e
For cities in Europe the modal fare-box recovery ratios are inthe range 30–50 per cent. The fare-box recovery ratios inNorth American cities with high density and strong fixed railsystems are comparable to those in Europe. However, in thelower density North American cities the rates go down to aslittle as 9 per cent.d In Burkina Faso, the public-private bussystem, SOTRACO, covers 59 per cent of operating costsfrom fare revenues.f
Sources: a Chow, 2008, p21; b Hale and Charles, 2008; c Shoiji, 2001; d http://en.wikipedia.org/wiki/Farebox_recovery_ratio, last accessed 30 January 2013; e Crozet, 2006; f Godard, 2011b, p12.
Box 8.1 Public trans port cost recovery from fares
Due to . . .implicit subsidies,lack ofadministrativeoverhead andfreedom fromregulations . . . , informalmotorizedtransport is ableto earn a profitfrom rider faresalthough profitmargins may below
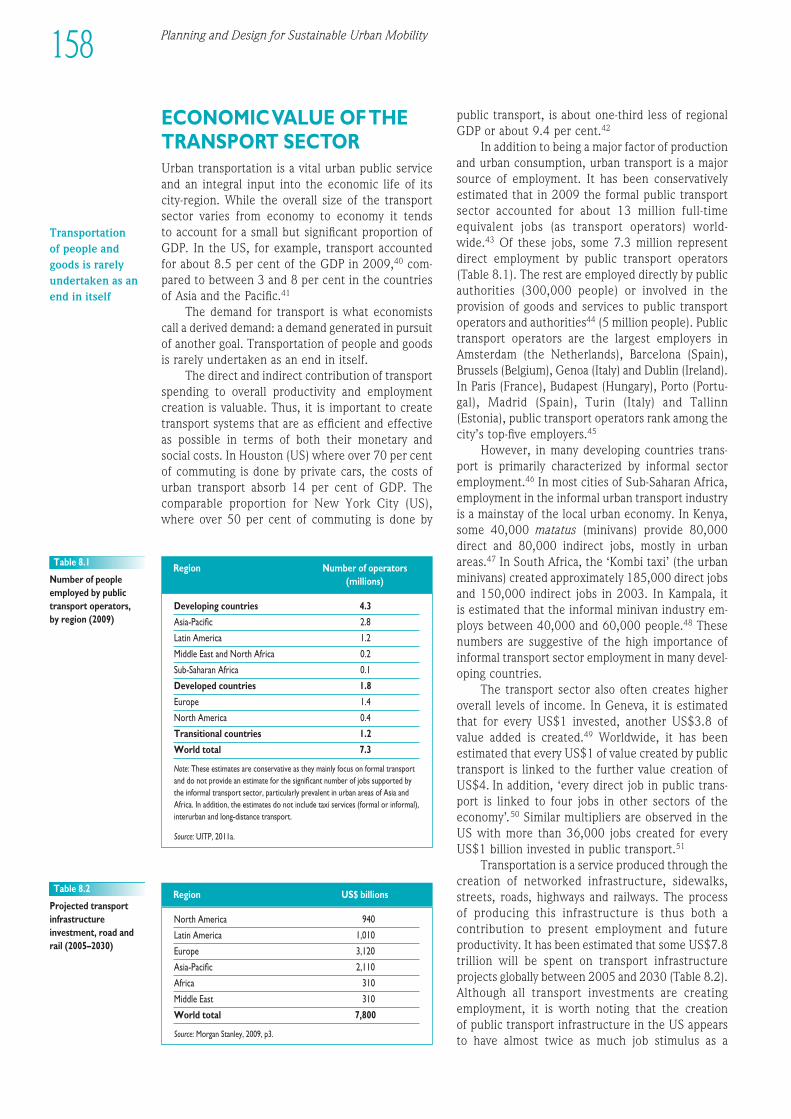
ECONOMIC VALUE OF THETRANS PORT SECTORUrban transportation is a vital urban public serviceand an integral input into the economic life of itscity-region. While the overall size of the trans portsector varies from economy to economy it tends to account for a small but significant proportion ofGDP. In the US, for example, trans port accountedfor about 8.5 per cent of the GDP in 2009,40 com -pared to between 3 and 8 per cent in the countriesof Asia and the Pacific.41
The demand for trans port is what economistscall a derived demand: a demand generated in pursuitof another goal. Transportation of people and goodsis rarely undertaken as an end in itself.
The direct and indirect contribution of trans portspending to overall productivity and employmentcreation is valuable. Thus, it is important to createtrans port systems that are as efficient and effectiveas possible in terms of both their monetary andsocial costs. In Houston (US) where over 70 per centof commuting is done by private cars, the costs ofurban trans port absorb 14 per cent of GDP. Thecomparable proportion for New York City (US),where over 50 per cent of commuting is done by
public transport, is about one-third less of regionalGDP or about 9.4 per cent.42
In addition to being a major factor of productionand urban consumption, urban trans port is a majorsource of employment. It has been conservativelyestimated that in 2009 the formal public trans portsector accounted for about 13 million full-timeequivalent jobs (as trans port operators) world-wide.43 Of these jobs, some 7.3 million representdirect employment by public trans port operators(Table 8.1). The rest are employed directly by publicauthor ities (300,000 people) or involved in theprovision of goods and services to public trans portoperators and authorities44 (5 million people). Publictrans port operators are the largest employers inAmsterdam (the Netherlands), Barcelona (Spain),Brussels (Belgium), Genoa (Italy) and Dublin (Ireland).In Paris (France), Budapest (Hungary), Porto (Portu -gal), Madrid (Spain), Turin (Italy) and Tallinn(Estonia), public trans port operators rank among thecity’s top-five employers.45
However, in many devel op ing countries trans -port is primarily characterized by informal sectoremployment.46 In most cities of Sub-Saharan Africa,employment in the informal urban trans port industryis a mainstay of the local urban economy. In Kenya,some 40,000 matatus (minivans) provide 80,000direct and 80,000 indirect jobs, mostly in urbanareas.47 In South Africa, the ‘Kombi taxi’ (the urbanminivans) created approximately 185,000 direct jobsand 150,000 indirect jobs in 2003. In Kampala, it is estimated that the informal minivan industry em-ploys between 40,000 and 60,000 people.48 Thesenumbers are suggestive of the high importance ofinformal trans port sector employment in many devel -op ing countries.
The trans port sector also often creates higheroverall levels of income. In Geneva, it is estimatedthat for every US$1 invested, another US$3.8 ofvalue added is created.49 Worldwide, it has beenestimated that every US$1 of value created by publictrans port is linked to the further value creation ofUS$4. In addition, ‘every direct job in public trans -port is linked to four jobs in other sectors of theeconomy’.50 Similar multipliers are observed in theUS with more than 36,000 jobs created for everyUS$1 billion invested in public transport.51
Transportation is a service produced through thecreation of networked infra struc ture, sidewalks,streets, roads, highways and railways. The processof producing this infra struc ture is thus both acontribution to present employment and futureproductivity. It has been estimated that some US$7.8trillion will be spent on trans port infra struc tureprojects globally between 2005 and 2030 (Table 8.2).Although all trans port investments are creatingemployment, it is worth noting that the creation of public trans port infra struc ture in the US appearsto have almost twice as much job stimulus as a
Planning and Design for Sustainable Urban Mobility158
Devel op ing countries 4.3
Asia-Pacific 2.8
Latin America 1.2
Middle East and North Africa 0.2
Sub-Saharan Africa 0.1
Developed countries 1.8
Europe 1.4
North America 0.4
Transitional countries 1.2
World total 7.3
Note: These estimates are conservative as they mainly focus on formal trans portand do not provide an estimate for the significant number of jobs supported bythe informal trans port sector, particularly prevalent in urban areas of Asia andAfrica. In addition, the estimates do not include taxi services (formal or informal),interurban and long-distance transport.
Source: UITP, 2011a.
Table 8.1
Number of peopleemployed by publictrans port operators, by region (2009)
Region Number of operators (millions)
North America 940
Latin America 1,010
Europe 3,120
Asia-Pacific 2,110
Africa 310
Middle East 310
World total 7,800
Source: Morgan Stanley, 2009, p3.
Table 8.2
Projected trans portinfra struc tureinvestment, road andrail (2005–2030)
Region US$ billions
Transportation of people andgoods is rarelyundertaken as anend in itself
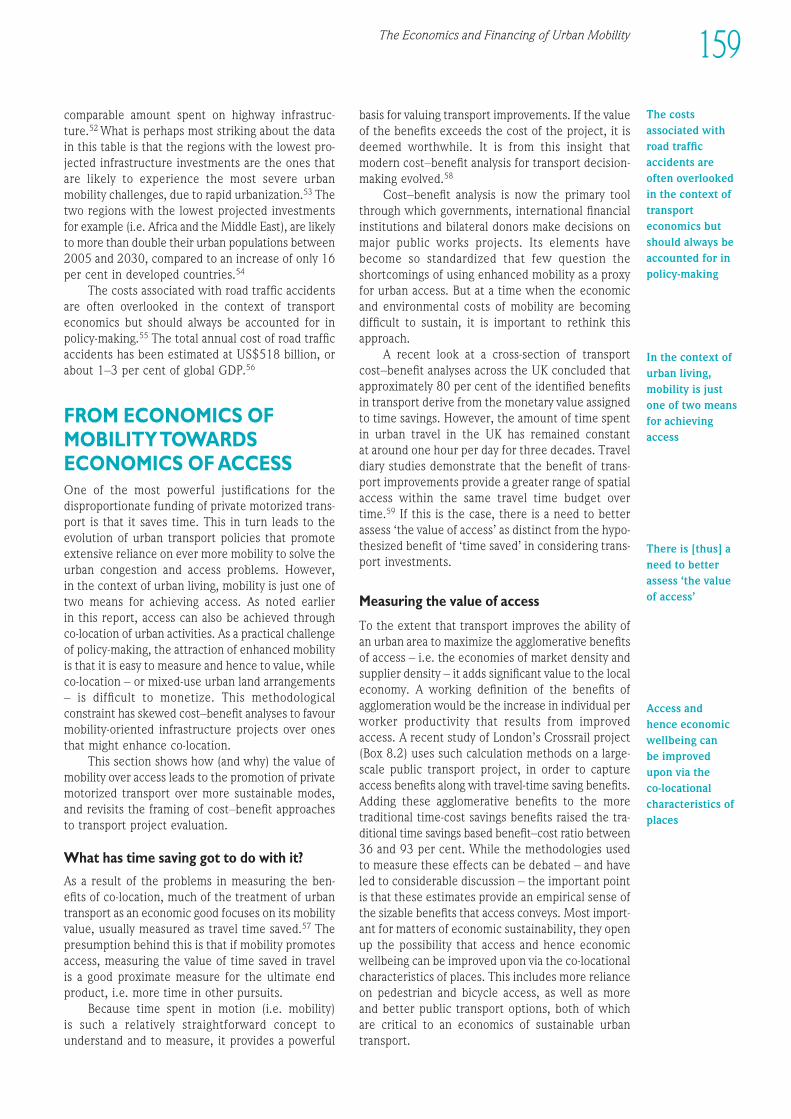
comparable amount spent on highway infra struc -ture.52 What is perhaps most striking about the datain this table is that the regions with the lowest pro -jected infra struc ture investments are the ones thatare likely to experi ence the most severe urbanmobility challenges, due to rapid urbanization.53 Thetwo regions with the lowest projected investmentsfor example (i.e. Africa and the Middle East), are likelyto more than double their urban populations between2005 and 2030, compared to an increase of only 16per cent in developed countries.54
The costs associated with road traffic accidentsare often overlooked in the context of trans porteconomics but should always be accounted for inpolicy-making.55 The total annual cost of road trafficaccidents has been estimated at US$518 billion, orabout 1–3 per cent of global GDP.56
FROM ECONOMICS OFMOBILITY TOWARDSECONOMICS OF ACCESSOne of the most powerful justifications for thedisproportionate funding of private motorized trans -port is that it saves time. This in turn leads to theevolution of urban trans port policies that promoteextensive reliance on ever more mobility to solve theurban congestion and access problems. However, in the context of urban living, mobility is just one oftwo means for achieving access. As noted earlier in this report, access can also be achieved throughco-location of urban activities. As a practical challengeof policy-making, the attraction of enhanced mobilityis that it is easy to measure and hence to value, whileco-location – or mixed-use urban land arrangements– is difficult to monetize. This methodologicalconstraint has skewed cost–benefit analyses to favourmobility-oriented infra struc ture projects over onesthat might enhance co-location.
This section shows how (and why) the value ofmobility over access leads to the promotion of privatemotorized trans port over more sus tain able modes,and revisits the framing of cost–benefit approachesto trans port project evaluation.
What has time saving got to do with it?
As a result of the problems in measuring the ben-efits of co-location, much of the treatment of urbantrans port as an economic good focuses on its mobilityvalue, usually measured as travel time saved.57 Thepresumption behind this is that if mobility promotesaccess, measuring the value of time saved in travelis a good proximate measure for the ultimate endproduct, i.e. more time in other pursuits.
Because time spent in motion (i.e. mobility) is such a relatively straightforward concept tounderstand and to measure, it provides a powerful
basis for valuing trans port improvements. If the valueof the benefits exceeds the cost of the project, it isdeemed worthwhile. It is from this insight thatmodern cost–benefit analysis for trans port decision-making evolved.58
Cost–benefit analysis is now the primary toolthrough which govern ments, international finan cialinstitutions and bilateral donors make decisions onmajor public works projects. Its elements havebecome so standardized that few question theshortcomings of using enhanced mobility as a proxyfor urban access. But at a time when the economicand environ mental costs of mobility are becomingdifficult to sustain, it is important to rethink thisapproach.
A recent look at a cross-section of trans portcost–benefit analyses across the UK concluded thatapproximately 80 per cent of the identified benefitsin trans port derive from the monetary value assignedto time savings. However, the amount of time spentin urban travel in the UK has remained constant at around one hour per day for three decades. Traveldiary studies demonstrate that the benefit of trans -port improvements provide a greater range of spatialaccess within the same travel time budget overtime.59 If this is the case, there is a need to betterassess ‘the value of access’ as distinct from the hypo -thesized benefit of ‘time saved’ in considering trans -port investments.
Measuring the value of access
To the extent that trans port improves the ability ofan urban area to maximize the agglomerative benefitsof access – i.e. the economies of market density andsupplier density – it adds significant value to the localeconomy. A working definition of the benefits ofagglomeration would be the increase in individual perworker productivity that results from improvedaccess. A recent study of London’s Crossrail project(Box 8.2) uses such calculation methods on a large-scale public trans port project, in order to captureaccess benefits along with travel-time saving benefits.Adding these agglomerative benefits to the moretraditional time-cost savings benefits raised the tra -ditional time savings based benefit–cost ratio between36 and 93 per cent. While the method ologies usedto measure these effects can be debated – and haveled to considerable discussion – the important pointis that these estimates provide an empirical sense ofthe sizable benefits that access conveys. Most import -ant for matters of economic sus tain ability, they openup the possibility that access and hence economicwellbeing can be improved upon via the co-locationalcharacteristics of places. This includes more relianceon pedestrian and bicycle access, as well as more and better public trans port options, both of whichare critical to an economics of sus tain able urbantransport.
The Economics and Financing of Urban Mobility 159
1EEE234567891012311145678920123456789301234567894012345678950123456789EEEE
In the context ofurban living,mobility is justone of two meansfor achievingaccess
There is [thus] aneed to betterassess ‘the valueof access’
Access and hence economicwellbeing can be improved upon via the co-locationalcharacteristics ofplaces
The costsassociated withroad trafficaccidents areoften overlookedin the context oftrans porteconomics butshould always beaccounted for inpolicy-making
Crossrail is a new addition to the London Underground, whichis scheduled to start operations in 2018. It is intended toincrease carrying capacity by 10 per cent in the portion of thesystem serving central London. Using conventional analysis,Crossrail yielded a strong traditional benefit–cost ratio of 2.55.Fifty-four per cent of the benefit takes the form of travel-timesaving and 43 per cent from increased network carryingcapacity.
By including the wider economic benefits ofagglomeration, a second benefit–cost ratio was calculated. Inthe latter instance the ratio increases to between 3.47 and4.91. About one-third of this increased benefit is due to higher
worker productivity, due to the higher levels of urbanizationand localization economies created by improved access. Theremainder of the added benefit is linked to increased taxrevenue generated from the transformation of less productiveto more productive jobs plus the improved locational value ofthe areas served and increased labour force participation.
Comparing the initial benefit–cost ratio with thebenefit–cost ratios that include the wider economic benefits ofaccess and agglomeration, the ratio increases between 36 percent (at a benefit–cost ratio of 3.47) and 93 per cent (at abenefit–cost ratio of 4.91).Source: Jenkins et al, 2010 (see also http://www.crossrail.co.uk/).
Box 8.2 Crossrail and agglomeration benefits, London, UK
Urban mobility is both a private and apublic good
An economic analysis of sus tain able urban mobilitymust consider the complex nature of mobility as aneconomic good. Mobility as a commodity lends itselfto the standard economics of supply and demand, asit is conceivable in the context of private marketswhere buyers and sellers agree upon quantities andprices. Even the presence of ‘externalities’ is cor rect -able via disincentives, such as taxes on negativeexternalities (like air pollution) and congestioncharging and parking fees (Box 8.5) to discourageexcessive car use and incentives for positive external -ities, such as access to ‘free’ bicycles and well-designed and walkable streets.
In the language of economics, mobility has thetwo distinguishing characteristics of a private good,rivalry in consumption and excludability in ownership.Rivalry refers to the notion that what one individualconsumes cannot also be consumed by another. If one individual buys a ticket to a certain seat on atrain, a second individual cannot occupy the sameseat for the same trip. Excludability means that theowners of the vehicle can deny entry to those notpurchasing a ticket to ride.
While the case for mobility as a private good ispowerful, the case for the access that it creates as apublic good is more compelling, and for the samereasons. Turning the two characteristics of a privategood around implies a public good: non-rivalry inconsumption and non-excludability in ownership.Access is characterized by both non-rivalry and non-excludability. When one person accesses the city byworking or living there, she does not harm another’sability to access the city. In fact, she increases thevalue of another person accessing the city. Althoughone can conceive of exceptions, access to a city’sopportunities is likewise non-excludable, becausethere is no entry fee to a city. The mobility optionone must use to get there, however, may be charac -terized by both rivalry and excludability, depending
on congestion and fares. This means that the standardeconomic analysis of supply and demand, based asit is on the presumption of private goods, is a limitedtool for establishing useful finan cial models to supporturban mobility.
The working formulation for an economics ofsus tain able urban mobility is one in which theplanning and policy target is maximum access andminimal mobility. An ideal sus tain able city is onewhere the need to expend resources in movementof people and goods is at the lowest possible level.The co-locational properties of the city – the oppor -tunities for specialization and innovation madepossible by the density and diversity of people andfirms – are the desired social good. Mobility servesas the means to access these goods. The economicsus tain ability of urban mobility relates the valuecreated by trans port in enhancing accessibility evenas it minimizes the environ mental and social costsof mobility. Thus, as physical realities, cities are theco-location of activities to avoid the need to travel.60
Road pricing is necessary but normallynot sufficient to improve urbanaccessibility
There is considerable evidence that car users inmost countries do not pay a high enough price tocover the full cost to society of this travel mode.61
In practical terms, this implies that the society at largeis in effect subsidizing private motorized trans port(through the costs of addressing economic, social andenviron mental externalities). From the point of viewof conventional microeconomics, the standarddiagnosis is that the market for urban car travel isinefficient. The policy solutions to correct thatinefficiency call for ‘getting prices right’.
The policy recommendations that flow from‘right’ pricing are the creation of methods toeffectively raise the cost of car usage to better reflectthe environ mental and social costs that this travelmode imposes on society. ‘Full cost pricing’, as this
160 Planning and Design for Sustainable Urban Mobility
The standardeconomic analysisof supply anddemand . . . is alimited tool forestablishinguseful financialmodels to supporturban mobility
As physicalrealities, cities arethe co-location ofactivities to avoidthe need to travel
Car users in mostcountries do notpay a high enoughprice to cover thefull cost to societyof this travelmode
1EEE234567891012311145678920123456789301234567894012345678950123456789EEEE
161The Economics and Financing of Urban Mobility
approach is known, seeks to impose licenses and feesvia taxes on drivers that approximate the economicvalue of the social and environ mental costs. Anexample of this can be seen in Singapore where thegovern ment has implemented a number of finan cialdisincentives to curb car ownership,62 and encouragea modal shift to non-motorized and public transport.
However, even if this policy worked as predicted,it is at best a partial solution, as the goal of suchpricing is to decrease the use of cars. Unless therevenues raised are sufficient to cover the costs ofadded public trans port to provide substitute service,such pricing is at best a necessary and not a sufficientcondition in terms of meeting the access needs of acity-region. Further more, such a policy has significantrisks in terms of social equity. The drivers that itprices out of the market will be the ones with theleast ability to pay the higher costs. Moreover, it doesnothing to meet the ongoing needs of the large massof lower-income residents who were not driving inthe first place. Thus, policies are also required thatdirectly address the underlying reasons for urbantravel, and that address the problems of those forwhom, even at comparatively low market prices, cartravel is out of reach.63
The private car versus public transport:Markets and modal choices
If one considers the data presented in Figure 8.1 andnothing else, it is easy to conclude that there is stronguniversal urban desire for car-based travel. If that isthe wish of the world’s urban population, shouldn’tpolicy and planning goals aim to satisfy this marketdemand in a manner that is as environ mentally soundand socially equitable as possible? It is difficult toargue with that policy interpretation given the globallypoor state of public trans port alternatives.
The problem with this view is technologicalreality. The idealized promise of the car can only beachieved in cities if certain unlikely technologicalchanges are made: if vehicles cost little to own andmaintain, use little energy, do not pollute and emitgreenhouse gases, and lack the physical need forexpanded road space and parking places. Lackingthese conditions, pressing social and environ mentalconcerns will continue to render the dream ofpersonal freedom of mobility as theoretical fantasy– or as an unrelenting urban nightmare – if attemptedin practice.
As the evidence presented in this report makesexceedingly clear, there are public trans portalternatives – as well as pedestrian and other non-motorized forms of travel – that can make a scalabledifference in terms of both personal mobility andurban sus tain ability. The experi ences in some Asianand European cities – where public trans port tripspeeds exceed those of private cars – exemplify thepotential of enhanced public transport.64 In light of
this, a more realistic interpretation of Figure 8.1 isthat it reflects things as they are: a less than idealchoice between an often unreliable and unsafe publicsystem and being stuck in slow-moving traffic in acar-based system.
However, it is public finance, and not privatemarket decisions, that is the final arbiter of thequantity and quality of the urban trans port options.The reason that public finance becomes the crucialdeterminant of the choices that define privatemarkets is that once one moves beyond walking andother forms of non-motorized transport, motorizedtrans port modes are never fully supported by chargesto travellers. Motorized trans port requires fundingbeyond what users pay directly, as discussed in thesection below. In order to develop urban publictrans port systems that are of sufficient quality andquantity, and that also reduce environ mental andsocial equity problems, policy-makers must confrontthe reality that user charges will never be sufficient.
THE PERENNIAL FINAN CIALPROBLEM: COSTS EXCEEDREVENUESThe continual fiscal challenge for any urban publictrans port supplier is avoiding a negative cash flow:attaining either a zero balance between income andexpenditure, or a positive cash flow to finance futureimprovements. This requires bridging the differencebetween fare revenues and the full costs of servicewhile encouraging efficient operations in a mannerthat is sus tain able over time. This challenge is noteasy nor are the solutions free of controversy. Thissection explores the dimensions of this chronicfunding gap. The next section explores potentialsolutions.
User charges are never sufficient tofinance public transport
There is no obvious theoretical reason that preventsurban public trans port from covering its full costs viacharges on its users. But in practice, as noted in Box8.1, there are only a handful of instances where faresrepresent both full cost recovery and sufficient profitto permit a private market to sus tain ably meet theneeds of passen ger travel.65 The experi ence in sometransitional countries, such as Poland, in the early1990s captures the essence of the problem:
‘. . . cost recovery in major cities appeared to betoo low to generate sufficient funds for replacingand modernizing bus and tram fleets. It led toworsening of the quality of public trans port andwas another reason . . . for undesirable modalshifts.’66
There are publictransportalternatives . . .that can make a . . . difference interms of bothpersonal mobilityand urbansustainability
Policy-makersmust confront thereality that usercharges will neverbe sufficient
Studies from Nairobi (Kenya), Lagos (Nigeria) and South Africashow that lower-income households pay from 15 to 54 percent of their income in transportation costs. Publictransportation fares are high and poorly regulated. In Lagos,for example, bus drivers often force riders to exit and re-board paying an additional fare to continue their trip. Ridersmust often bargain with drivers for the price of the fare. Forthe poor, high trans port costs diminish their access to basicneeds. It erodes the efficiency of individual economic activitiesas well as reducing national and municipal economic efficiency.
Further more, a 1990 study of four Eastern African citiesshowed that non-motorized trans port – walking and cycling –was inadequately accommodated. Walking meets up to half thetrans port demand and accounts for only 1 per cent of the totaltrans port costs. In contrast, private motorized trans portmeets less than 10 per cent of demand, yet accounts for overhalf the costs.
Source: Pirie, 2011.
Box 8.3 The high personal cost of urban transport: Anglophone Sub-Saharan Africa
162 Planning and Design for Sustainable Urban Mobility
Urban transport,because itfacilitates access,is fundamentally apublic good
The value ofurban transport isdirectly related toits quality as anintegrated system,distinct from acollection ofindependentmodal options andspecific routes
This experi ence highlights the two ways thatpolicy-makers have attempted to ‘solve’ the cash-flowproblem: fare increases and competitive tendering.These solutions typically fall short because policy-makers are often not clear about their policy goals.Is urban trans port a private good with some publicbenefits or is it a public good with private benefits?Depending on how one chooses to answer thatquestion, the policy outcomes are very different. Thisreport is built around the clear premise that urbantransport, because it facilitates access, is funda -mentally a public good. The policy goal is to streng -then the use of public (and non-motorized) transport.Its private good’s features can be leveraged to providesome of the needed revenue, but that, by itself, willnot be adequate.
If public trans port is viewed solely as a meansof private conveyance to satisfy private demands, ithas a higher chance of success, but such success hasa price. The trans port system either does not operateat sufficient volume to positively impact urban spatialpatterns in a sus tain able or equitable manner, or –if the volume is adequate – the quality is exceedinglylow and everyone who can avoid it does. Rising ratesof car ownership and car use for work and educationtrips are the result. The starting point for confrontingthe finan cial challenge is to recognize that if urbanpublic trans port is to generate its valuable publicgoods benefits (i.e. to promote access), revenuesources beyond the fare box are needed.
No matter how hard policy-makers and officialstry to make public trans port self-supporting throughthe fare box and reorganizational moves, such ascompetitive tendering to improve efficiency, thesereforms always fall short. It is not that fare policy andorganizational form are unimportant; on the contrary,they are exceedingly important. By themselves thesesecond-order conditions are not sufficient if accessi -bility is the policy goal. The policy challenge is tobroaden both the sus tain able mass usage of theservice and encourage revenue sources that gobeyond the fare box. The goal is to create viable finan -cial models that align organizational forms for servicedelivery with the unique trans port needs of eachmetropolitan area.
The high private cost of transport
As discussed above,67 the problem on the consumerside is that while travellers in devel op ing coun-tries do pay high trans port prices relative to theirincome, the amount paid is insufficient relative tothe revenue sums required at full cost recovery.Trans portation costs for urban and low-income popu -lations are always high, measured either in terms ofmoney or time (Box 8.3). In developed coun tries, thecosts tend to be in money terms. In devel op ingcountries, people tend to spend more hours of theday in moving from place to place.
Poor-quality transportation entails high coststhat are often not distributed equally across the cityor within households. For example, women maybecome stranded as they attempt to link trips forchildcare and employment; the elderly may reducethe number of trips they make; and children may havedangerous or tedious trips to school. Only countingthe monetary expenditure of travel, measured interms of personal or household incomes, these costscan account for anywhere from one-tenth to one-fifthof income for high-income individuals and house -holds. For the poor, it can account for nearly half oftheir income.
These income constraints limit the amount of revenue that users can contribute to the costs ofmaintaining the urban trans port system. This problemis especially acute in devel op ing countries. Attemptsto resolve revenue shortfalls by increasing the coststo populations that are already paying a fare thatseverely taxes their ability to pay is clearly anextremely inequitable approach, and is thus notlikely to succeed.
Good quality urban transport: Thesystem is the solution
The value of urban trans port is directly related to its quality as an integrated system, distinct from acollection of independent modal options and specificroutes. The more options that urban residents haveto access work, education, shopping, social connec -tions, etc., the more value-added the city creates.68
1EEE234567891012311145678920123456789301234567894012345678950123456789EEEE
163The Economics and Financing of Urban Mobility
The finan cial danger is that in a quest for savingmoney, specific routes are at times valued on anindividual basis and not as part of a system. Individualroutes can at times cover operating costs andoccasionally some or all of their capital cost whentravel demand is sufficiently intense. This typicallyoccurs along major public trans port routes servingthe highest density portions of urban central businessdistricts. Singapore and Hong Kong are the bestexamples of this. However, the public goods valueof access derives from the existence of entire urbantrans port systems and not just travel on its densestroutes.69 Less-dense routes that make the entiresystem viable often cost more to operate than therevenue from fares can cover. But without thesefeeders, the diversity of opportunities that contributeto the creation of urban value would be lost. Thegreater the degree of system integration within and across modes, the higher the degree of valuableaccess the system creates. To achieve that valuablegoal requires public-led investments in infra struc ture,equipment and service delivery.
EXPANDING THE FINAN CIAL OPTIONS FOR PUBLIC AND NON-MOTORIZED TRANSPORTIn what direction should the public sector proceedin order to expand finan cial support for urban publicand non-motorized trans port beyond user-generatedrevenues? This section examines four possibleapproaches (as well as combinations of these),namely:
• Direct allocations from general municipal andnational revenues (i.e. from general taxations);
• Other allocations from govern ment sources;• Finan cial arrangements that allow the trans port
system to capture a portion of the value that theycreate through urban access (i.e. value capture);
• Other arrangements that allow public–privatepartnerships to capture the value created by trans -port systems.70
General revenue models
The most common way in which govern ments meetthe funding gap for urban trans port is via allocationsfrom general tax receipts. It reflects a general beliefin the public goods value that the service creates.To the extent that govern ments treat public trans -port as just one among many public services such aspolice protection and education, this arrangement canwork well. This approach is widespread in China, forexample. Urban trans port there is typically supported
through general revenue allocations from the localmunicipal govern ment, with rail-based more favouredthan bus-based. In Shanghai, as part of its accom -modation of World Expo, the govern ment allocatedan additional US$541 million71 to ensure smoothoperations in 2009.72
In virtually every city there are some generalrevenues used to support the urban trans port systemin one way or another. In Curitiba, Brazil, the fareson the BRT system cover the operating costs for theprivate companies that supply services, includingreduced and free tickets for some categories ofriders. Nonetheless, the user-generated revenuedoes not cover all of the infra struc ture costs. Themunici pality supports the construction and main -tenance of the street-based exclusive rights of wayon which the system operates from its generalrevenue sources.73
One of the weaknesses of general revenue as afinan cial source is its political vulnerability. In citieswhere public trans port is viewed as a largely privategood, any forms of public support are often lookedupon as temporary and easily dispensed with in thebelief that the fiscal problems are the self-inflictedwounds of an incompetent industry. This is especiallythe case in austere fiscal times (such as the currentglobal finan cial crisis), when politicians can adopt thisrationale as they search for a politically easy place tocut public spending. These losses of support alwayscause cuts in services and higher fares, just whenmore people need mobility to find work and have lessmoney to spend on it.
Another form of political vulnerability that should be mentioned here is that related to changesin political leadership at the city and national level.This applies not only to changing political directionsrelated to the rise and fall of support for specificpolitical parties, but also to the departure of indi -viduals that may have championed specific initiativesin the trans port sector.
Figure 8.4 provides an overview of sources ofoperating revenue for public trans port in fivedeveloped country cities. The figure indicates thatthree of the public trans port operators – TriMet inPortland (US), Translink in Vancouver (Canada) and Sytral in Lyon (France) – collect more thanthree-quarters of their operating revenues from eitherfares or dedicated tax revenues (over which they exertsome degree of control). Operators that rely ondirect funding from local, provincial or nationalgovern ments for their revenue streams may moreeasily be subject to the negative effects of changingpolitical climates.
Ideally, funding for non-motorized trans portshould come from normal operative budgets fromdepartments dealing with transportation and publicworks.74 However, funding for such infra struc tureinvestments could also be drawn from revenues fromadvertising, road pricing/taxes and private-sector
The public goodsvalue of accessderives from theexistence ofentire urbantransport systemsand not justtravels on itsdensest routes
The greater thedegree of systemintegration withinand across modes,the higher thedegree of valuableaccess the systemcreates
The most commonway in whichgovernments meetthe funding gapfor urbantransport is viaallocations fromgeneral taxreceipts
One of theweaknesses ofgeneral revenuesas a financialsource is itspoliticalvulnerability
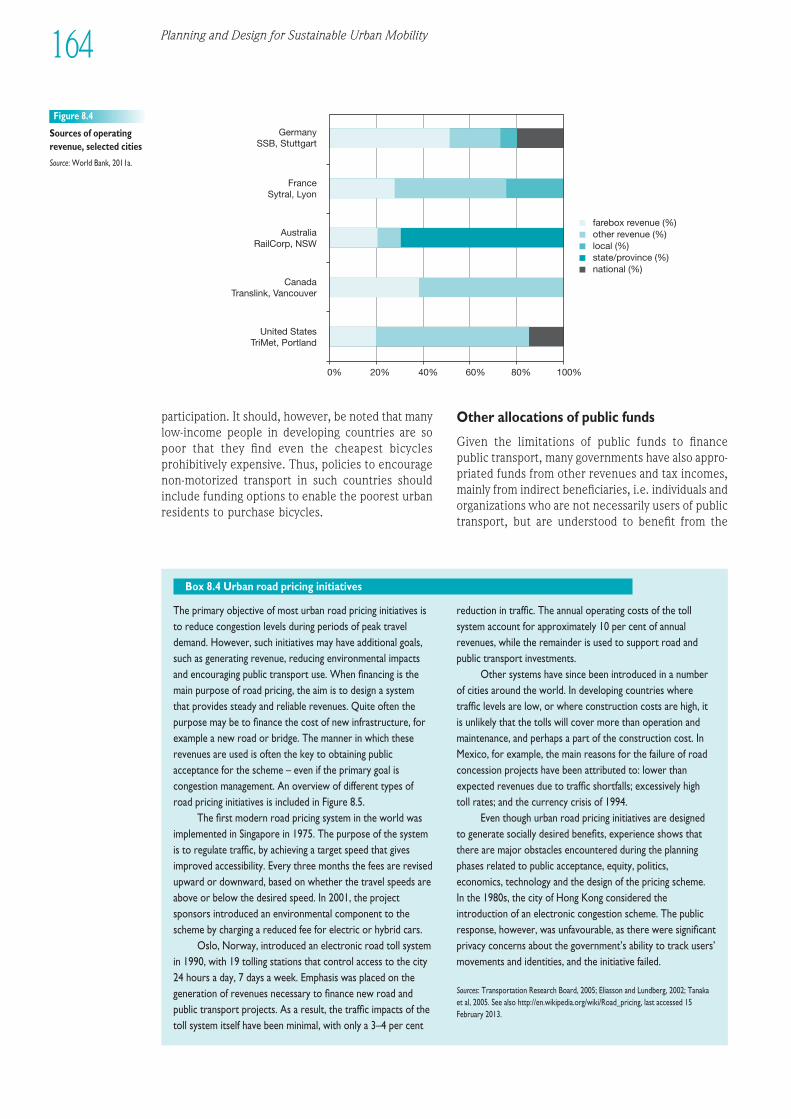
GermanySSB, Stuttgart
FranceSytral, Lyon
AustraliaRailCorp, NSW
CanadaTranslink, Vancouver
United StatesTriMet, Portland
0% 20% 40% 60% 80% 100%
farebox revenue (%)other revenue (%)local (%)state/province (%)national (%)
Figure 8.4
Sources of operatingrevenue, selected cities
Source: World Bank, 2011a.
The primary objective of most urban road pricing initiatives isto reduce congestion levels during periods of peak traveldemand. However, such initiatives may have additional goals,such as generating revenue, reducing environ mental impactsand encouraging public trans port use. When financing is themain purpose of road pricing, the aim is to design a systemthat provides steady and reliable revenues. Quite often thepurpose may be to finance the cost of new infra struc ture, forexample a new road or bridge. The manner in which theserevenues are used is often the key to obtaining publicacceptance for the scheme – even if the primary goal iscongestion management. An overview of different types ofroad pricing initiatives is included in Figure 8.5.
The first modern road pricing system in the world wasimplemented in Singapore in 1975. The purpose of the systemis to regulate traffic, by achieving a target speed that givesimproved accessibility. Every three months the fees are revisedupward or downward, based on whether the travel speeds areabove or below the desired speed. In 2001, the projectsponsors introduced an environ mental component to thescheme by charging a reduced fee for electric or hybrid cars.
Oslo, Norway, introduced an electronic road toll systemin 1990, with 19 tolling stations that control access to the city24 hours a day, 7 days a week. Emphasis was placed on thegeneration of revenues necessary to finance new road andpublic trans port projects. As a result, the traffic impacts of thetoll system itself have been minimal, with only a 3–4 per cent
reduction in traffic. The annual operating costs of the tollsystem account for approximately 10 per cent of annualrevenues, while the remainder is used to support road andpublic trans port investments.
Other systems have since been introduced in a numberof cities around the world. In devel op ing countries wheretraffic levels are low, or where construction costs are high, itis unlikely that the tolls will cover more than operation andmaintenance, and perhaps a part of the construction cost. InMexico, for example, the main reasons for the failure of roadconcession projects have been attributed to: lower thanexpected revenues due to traffic shortfalls; excessively hightoll rates; and the currency crisis of 1994.
Even though urban road pricing initiatives are designedto generate socially desired benefits, experi ence shows thatthere are major obstacles encountered during the planningphases related to public acceptance, equity, politics,economics, technology and the design of the pricing scheme. In the 1980s, the city of Hong Kong considered theintroduction of an electronic congestion scheme. The publicresponse, however, was unfavourable, as there were significantprivacy concerns about the govern ment’s ability to track users’movements and identities, and the initiative failed.
Sources: Transportation Research Board, 2005; Eliasson and Lundberg, 2002; Tanaka et al, 2005. See also http://en.wikipedia.org/wiki/Road_pricing, last accessed 15February 2013.
Box 8.4 Urban road pricing initiatives
164 Planning and Design for Sustainable Urban Mobility
participation. It should, however, be noted that manylow-income people in devel op ing countries are sopoor that they find even the cheapest bicyclesprohibitively expensive. Thus, policies to encouragenon-motorized trans port in such countries shouldinclude funding options to enable the poorest urbanresidents to purchase bicycles.
Other allocations of public funds
Given the limitations of public funds to financepublic transport, many govern ments have also appro -priated funds from other revenues and tax incomes,mainly from indirect beneficiaries, i.e. individuals andorganizations who are not necessarily users of publictransport, but are understood to benefit from the
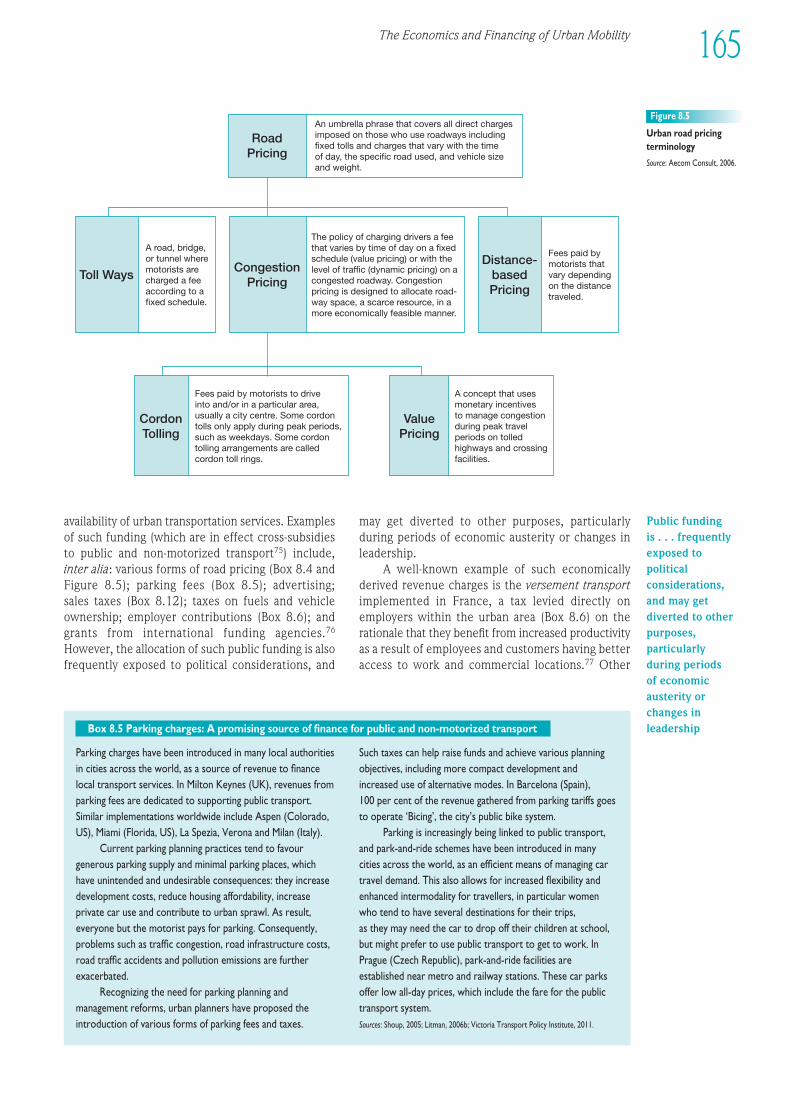
RoadPricing
Toll WaysCongestion
Pricing
Distance-basedPricing
CordonTolling
ValuePricing
An umbrella phrase that covers all direct chargesimposed on those who use roadways includingfixed tolls and charges that vary with the timeof day, the specific road used, and vehicle sizeand weight.
A road, bridge,or tunnel wheremotorists arecharged a feeaccording to afixed schedule.
A concept that usesmonetary incentivesto manage congestionduring peak travelperiods on tolledhighways and crossingfacilities.
Fees paid bymotorists thatvary dependingon the distancetraveled.
Fees paid by motorists to driveinto and/or in a particular area,usually a city centre. Some cordontolls only apply during peak periods,such as weekdays. Some cordontolling arrangements are calledcordon toll rings.
The policy of charging drivers a feethat varies by time of day on a fixedschedule (value pricing) or with thelevel of traffic (dynamic pricing) on acongested roadway. Congestionpricing is designed to allocate road-way space, a scarce resource, in amore economically feasible manner.
Figure 8.5
Urban road pricingterminology
Source: Aecom Consult, 2006.
1EEE234567891012311145678920123456789301234567894012345678950123456789EEEE
165The Economics and Financing of Urban Mobility
availability of urban transportation services. Examplesof such funding (which are in effect cross-subsidiesto public and non-motorized transport75) include,inter alia: various forms of road pricing (Box 8.4 andFigure 8.5); parking fees (Box 8.5); advertising; sales taxes (Box 8.12); taxes on fuels and vehicleowner ship; employer contributions (Box 8.6); andgrants from international funding agencies.76
However, the allocation of such public funding is alsofrequently exposed to political considerations, and
may get diverted to other purposes, particularlyduring periods of economic austerity or changes inleadership.
A well-known example of such economicallyderived revenue charges is the versement trans portimplemented in France, a tax levied directly onemployers within the urban area (Box 8.6) on therationale that they benefit from increased productivityas a result of employees and customers having betteraccess to work and commercial locations.77 Other
Parking charges have been introduced in many local authoritiesin cities across the world, as a source of revenue to financelocal trans port services. In Milton Keynes (UK), revenues fromparking fees are dedicated to supporting public transport.Similar implementations worldwide include Aspen (Colorado,US), Miami (Florida, US), La Spezia, Verona and Milan (Italy).
Current parking planning practices tend to favourgenerous parking supply and minimal parking places, whichhave unintended and undesirable consequences: they increasedevel op ment costs, reduce housing affordability, increaseprivate car use and contribute to urban sprawl. As result,everyone but the motorist pays for parking. Consequently,problems such as traffic congestion, road infra struc ture costs,road traffic accidents and pollution emissions are furtherexacerbated.
Recognizing the need for parking planning andmanagement reforms, urban planners have proposed theintroduction of various forms of parking fees and taxes.
Such taxes can help raise funds and achieve various planningobjectives, including more compact devel op ment andincreased use of alternative modes. In Barcelona (Spain), 100 per cent of the revenue gathered from parking tariffs goesto operate ‘Bicing’, the city’s public bike system.
Parking is increasingly being linked to public transport,and park-and-ride schemes have been introduced in manycities across the world, as an efficient means of managing cartravel demand. This also allows for increased flexibility andenhanced intermodality for travellers, in particular womenwho tend to have several destinations for their trips, as they may need the car to drop off their children at school,but might prefer to use public trans port to get to work. InPrague (Czech Republic), park-and-ride facilities areestablished near metro and railway stations. These car parksoffer low all-day prices, which include the fare for the publictrans port system.Sources: Shoup, 2005; Litman, 2006b; Victoria Trans port Policy Institute, 2011.
Box 8.5 Parking charges: A promising source of finance for public and non-motorized transport
Public funding is . . . frequentlyexposed topoliticalconsiderations,and may getdiverted to otherpurposes,particularlyduring periods of economicausterity orchanges inleadership
Planning and Design for Sustainable Urban Mobility166
benefits include increased property values where landis serviced by public trans port and for other road userswho experi ence less congestion.
Value-capture models
Since direct public funding is almost always politicallyvulnerable (particularly in periods of finan cialausterity), it is preferable to link publicly sponsoredforms of finan cial support as directly as possible tothe benefits urban mobility bestows upon indirectbeneficiaries. It is within that context that location-based taxes and assessments to support trans portservice have become popularly labelled as value-capture systems. The term reflects the reality thaturban trans port does, via external benefits, createvalue for parties not directly using the service. Thisapproach is politically appealing because it is able toexplain how the charge relates to the benefit and toprovide qualitative support commensurate with theneeds of a growing city.
Hong Kong is undoubtedly the best-knowninstance where a provider of public trans port coversthe full costs and attains a profit through the use ofa value-capture model.78 The essential elements ofthis unusual situation result from the unique, public-private, corporate structure of the service provider,i.e. the Mass Transit Railway Corporation (MTRC)(Box 8.7). It has both a public mission to provide trans -port to a major city, but at the same time (thanks tothe public trading of its minority shares) it is stronglygoverned by the earnings considerations of theprivate market. This arrangement bestows import-ant urban access benefits on the entire Hong Kongregion. And, due to a direct linkage to the ongoingreal estate yields, the MTRC is able to sustain urbanpublic trans port via the process of value capture.
The practice as it has evolved in Hong Kong isunique to the institutional arrangements there.
However, the underlying principle has widespreadapplicability. Although the term value capture is ofrecent vintage, the principle has long been under -stood as an important element in the creation ofurban public transportation (Box 8.8). The lessonlearned from the Hong Kong experi ence is that it ispossible to practice value capture in service to thepublic interest. However, other cities also have a tra -dition of financing transportation projects by taxingreal estate that benefits from infra struc ture projects.In Bogotá, Colombia, for example, road expansion,improvement of public space, bicycle paths andTransMilenio lines have all benefited from this kindof financing.79
It is the principle of creating an agency that iscapable of bridging the land use and trans port dividein the service of enhanced urban access that is theimportant lesson to draw from the experi ence. Therange of experiments with parking fees, highway tolls, congestion charges and land taxes are all varia -tions on the principle of value capture (Box 8.4). Tax-increment financing also works according to thesame principle: when a site’s value increases due tothe implementation of new trans port infra struc ture,the govern ment can anticipate an additional incre -ment in real estate taxes, and can borrow against thisanticipated tax revenue to finance imple mentation ofthe trans port infra struc ture.80 Similarly, private inves -tors may provide capital for transportation projects inexchange for a share of revenue over time.81
Value-capture approaches work best in citieswhere there is initially low per capita car use andwhere the population is growing.82 The first conditionmeans that there is less resistance to overcoming cardependence and the second means that there is astrong potential customer base for the system. Theseconditions hold almost universally in the rapidlygrowing cities of Sub-Saharan Africa and Asia. Incities where population growth is stable or even
Versement trans port was first introduced in 1971 for the Ile de France (Paris) region, with the purpose of providing aconsistent funding base to operate and invest in publictransport. Versement trans port is a compulsory tax levied onpublic and private companies with more than nine employees,with rates collected as a percentage of a company’s totalpayroll costs (although with a fixed ceiling imposed by thestate). Over the years, the geographical coverage of thisscheme has extended to all metropolitan areas with a publictrans port authority. The tax rate is determined by localauthorities but varies from region to region, ranging from 0.5 per cent to 2.6 per cent.
Before this tax was implemented, public trans port inFrance was mainly funded through user fares. However therevenue base generated from versement trans port now
represents a major source of finance, which has lowered thecosts of public trans port while also supporting large-scaleinfra struc ture projects, such as Strasbourg’s light-rail systemand the implementation of the metro in Marseille. In 2007, the incomes from versement trans port in the Paris regionaccounted for a third of all funds allocated to public transport.
However, critics believe that versement trans port addsmore to the cost of labour, something which is undesirablegiven the high rates of unemployment. It has also beencriticized for encouraging urban sprawl, as companies relocatetheir business outside the main urban area to avoid payingsuch taxes.
Sources: CODATU, 2009; Cabinet Alain Thomas, undated; Bouf and Hensher, 2007;Allen, 2011b.
Box 8.6 Versement transport, Paris, France
Value-captureapproaches workbest in citieswhere there isinitially low percapita car use andwhere thepopulation isgrowing
The Economics and Financing of Urban Mobility 167
1EEE234567891012311145678920123456789301234567894012345678950123456789EEEE
Hong Kong’s MTRC builds, owns and operates all the raillines in Hong Kong. MTRC is unique among publictransportation providers, in that it is a private for-profitcorporation that is 76.7 per cent owned by the Hong KongSpecial Administrative Region, which in turn owns all land inHong Kong. The rest of the shares are publicly traded on theHong Kong stock exchange. Due to its relationship withMTRC, the govern ment is able to capture the monetary valueof the access and agglomeration economies that its trans portservice generates.
Hong Kong’s unique finan cial model works as follows.The Hong Kong govern ment makes land around future stationstops available to the MTRC on long-term lease at pre-trans port devel op ment prices. The MTRC then sells the rightsto develop these sites – at post-devel op ment prices – todesignated private developers, who leverage the stationlocations for the creation of shopping malls and housing. The substantial difference between the two prices pays for thecapital cost of the new rail infra struc ture.
Further more, and most importantly, MTRC alsonegotiates a share of future property-devel op ment profitsand/or a co-ownership position from the highest bidder,
i.e. the MTRC retains a long-term claim on the rental incomestream of these projects. Thus, MTRC is paid up front for land,plus a post-devel op ment share of the devel op ment’s revenues,in addition to collecting fares. It is that long-term claim onurban value that turns this enterprise from just anotherstruggling provider of public trans port into a sterlingcorporate performer.
Between 2001 and 2005, property devel op ments – i.e. devel op ment, investment and management – produced 62 per cent of MTRC’s revenues. Railway income, made upmainly of fare-box receipts, generated 28 per cent of totalincome. The remaining 10 per cent of income was generatedfrom advertisement and ownership of other assets (i.e. telecommunication leases and convenience retail shops).
One of the strong factors in the success of MTRC is that– in addition to satisfying initial conditions (there is a strongfinan cial disincentive to car ownership, and population densityis quite high) – more than 40 per cent of Hong Kong’spopulation resides within 500 metres of an MTRC station andone in five households live within 200 metres of a station.Sources: Pan et al, 2011; Cervero and Murakami, 2008b; MTRC, undated.
Box 8.7 Hong Kong and its Mass Transit Railway Corporation, China
declining and car use is extensive – as is the case inmany cities of North America and Europe – valuecapture via claims on rising real estate revenues willtypically be disappointing, no matter how well they areorgan ized.
Assuming that the right demographic and modaluse conditions exist, the next most critical factor isthe distance between places of residence and publictrans port stops, whether they are BRT or rail. It hasbeen estimated that for every 10 per cent increasein distance from a public trans port station, there isa 1 per cent decline in property values.83 Hence thecloser the target population is to the public trans -port stops, the higher is the relative real estate value
and the larger is the potential base of support forthe system (Box 8.7).
Three institutional factors in particular are vitallyimportant in the successful deployment of value-capture mechanisms:
• Municipal govern ments need strong capability tovalue land and levy land taxes as well as imposefees on car users in the form of congestion chargesand parking fees.
• These govern ments need a strong ability toregulate (if not control) the assembly of landparcels that line up with plans for building trans -port infra struc ture.
In the early days of modern public transport, the latenineteenth and early twentieth centuries, private developerswho built the first street railway systems understood theconnection between the public trans port improvements theywere creating and land values in the streets that abutted thesystems. They purchased land at the outskirts of the city andgained franchises to operate public trans port over the streetsrunning through the parcels of land they owned. They theninstalled the street rail infra struc ture and as soon as the landhad been developed and sold, the revenue-losing public trans -port routes were abandoned to the public sector to maintainfrom that time forward.
Starting in the 1910s, these systems began to falter andbecause they were by then vital public services, they soonbecame publicly owned and operated systems with thedifference between costs and fare revenues provided bymunicipal general funds. The history of urban public trans -port in North America is replete with examples of this. In1917, for example, the Commonwealth of Massachusettspassed its first public control act, taking over the publictrans port routes running through the City of Boston to itssuburbs.Sources: Edel et al, 1984; Schrag, 2000; Schaeffer and Sclar, 1980.
Box 8.8 Value capture has a long history to ensure private sector profits
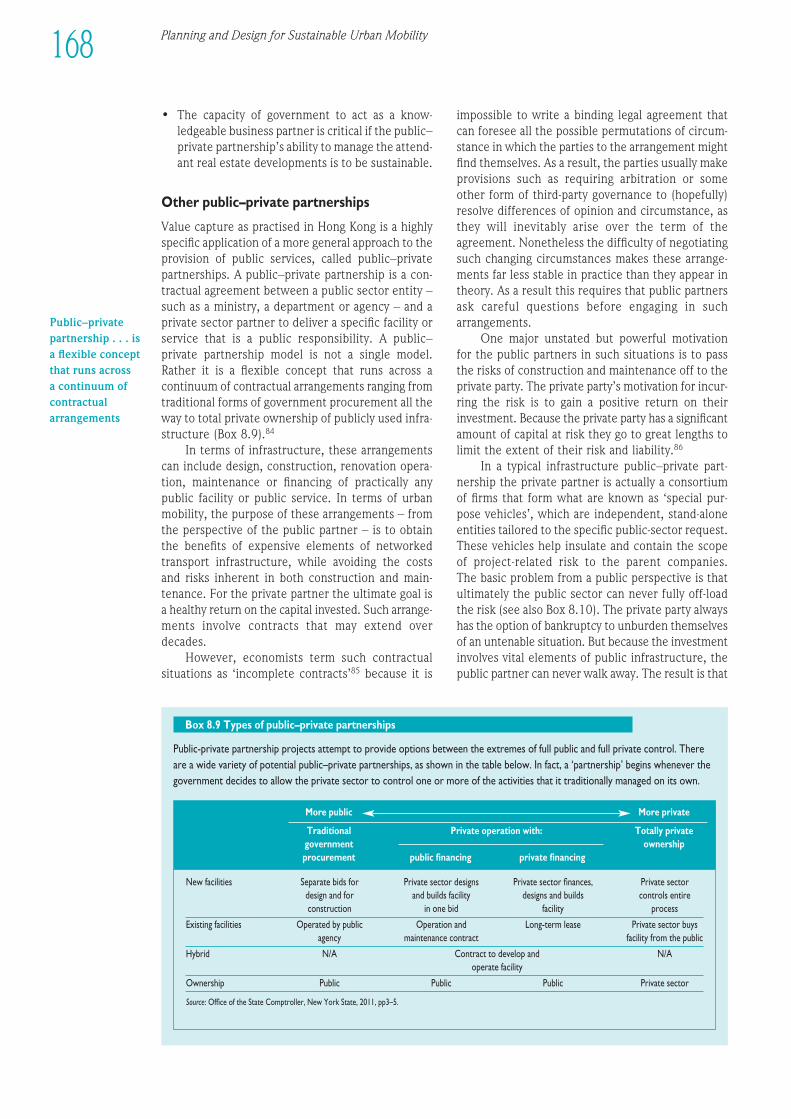
Public-private partnership projects attempt to provide options between the extremes of full public and full private control. Thereare a wide variety of potential public–private partnerships, as shown in the table below. In fact, a ‘partnership’ begins whenever thegovern ment decides to allow the private sector to control one or more of the activities that it traditionally managed on its own.
Box 8.9 Types of public–private partnerships
• The capacity of govern ment to act as a know -ledgeable business partner is critical if the public–private partnership’s ability to manage the attend -ant real estate devel op ments is to be sus tain able.
Other public–private partnerships
Value capture as practised in Hong Kong is a highlyspecific application of a more general approach to theprovision of public services, called public–privatepartnerships. A public–private partnership is a con -tractual agreement between a public sector entity –such as a ministry, a department or agency – and aprivate sector partner to deliver a specific facility orservice that is a public responsibility. A public–private partnership model is not a single model.Rather it is a flexible concept that runs across acontinuum of contractual arrangements ranging fromtraditional forms of govern ment procurement all theway to total private ownership of publicly used infra -struc ture (Box 8.9).84
In terms of infra struc ture, these arrangementscan include design, construction, renovation opera -tion, maintenance or financing of practically anypublic facility or public service. In terms of urbanmobility, the purpose of these arrangements – fromthe perspective of the public partner – is to obtainthe benefits of expensive elements of networkedtrans port infra struc ture, while avoiding the costsand risks inherent in both construction and main -tenance. For the private partner the ultimate goal isa healthy return on the capital invested. Such arrange -ments involve contracts that may extend overdecades.
However, economists term such contractualsituations as ‘incomplete contracts’85 because it is
impossible to write a binding legal agreement thatcan foresee all the possible permutations of circum -stance in which the parties to the arrangement mightfind themselves. As a result, the parties usually makeprovisions such as requiring arbitration or someother form of third-party governance to (hopefully)resolve differences of opinion and circumstance, asthey will inevitably arise over the term of theagreement. Nonetheless the difficulty of negotiatingsuch changing circumstances makes these arrange -ments far less stable in practice than they appear intheory. As a result this requires that public partnersask careful questions before engaging in sucharrangements.
One major unstated but powerful motivation for the public partners in such situations is to passthe risks of construction and maintenance off to theprivate party. The private party’s motivation for incur -ring the risk is to gain a positive return on theirinvestment. Because the private party has a significantamount of capital at risk they go to great lengths tolimit the extent of their risk and liability.86
In a typical infra struc ture public–private part -nership the private partner is actually a consortiumof firms that form what are known as ‘special pur-pose vehicles’, which are independent, stand-aloneentities tailored to the specific public-sector request.These vehicles help insulate and contain the scopeof project-related risk to the parent companies. The basic problem from a public perspective is thatultimately the public sector can never fully off-loadthe risk (see also Box 8.10). The private party alwayshas the option of bankruptcy to unburden themselvesof an untenable situation. But because the investmentinvolves vital elements of public infra struc ture, thepublic partner can never walk away. The result is that
168 Planning and Design for Sustainable Urban Mobility
New facilities Separate bids for Private sector designs Private sector finances, Private sector design and for and builds facility designs and builds controls entire construction in one bid facility process
Existing facilities Operated by public Operation and Long-term lease Private sector buys agency maintenance contract facility from the public
Hybrid N/A Contract to develop and N/Aoperate facility
Ownership Public Public Public Private sector
Source: Office of the State Comptroller, New York State, 2011, pp3–5.
More public More private
Traditional Private operation with: Totally private govern ment ownershipprocurement public financing private financing
Public–privatepartnership . . . isa flexible conceptthat runs across a continuum ofcontractualarrangements
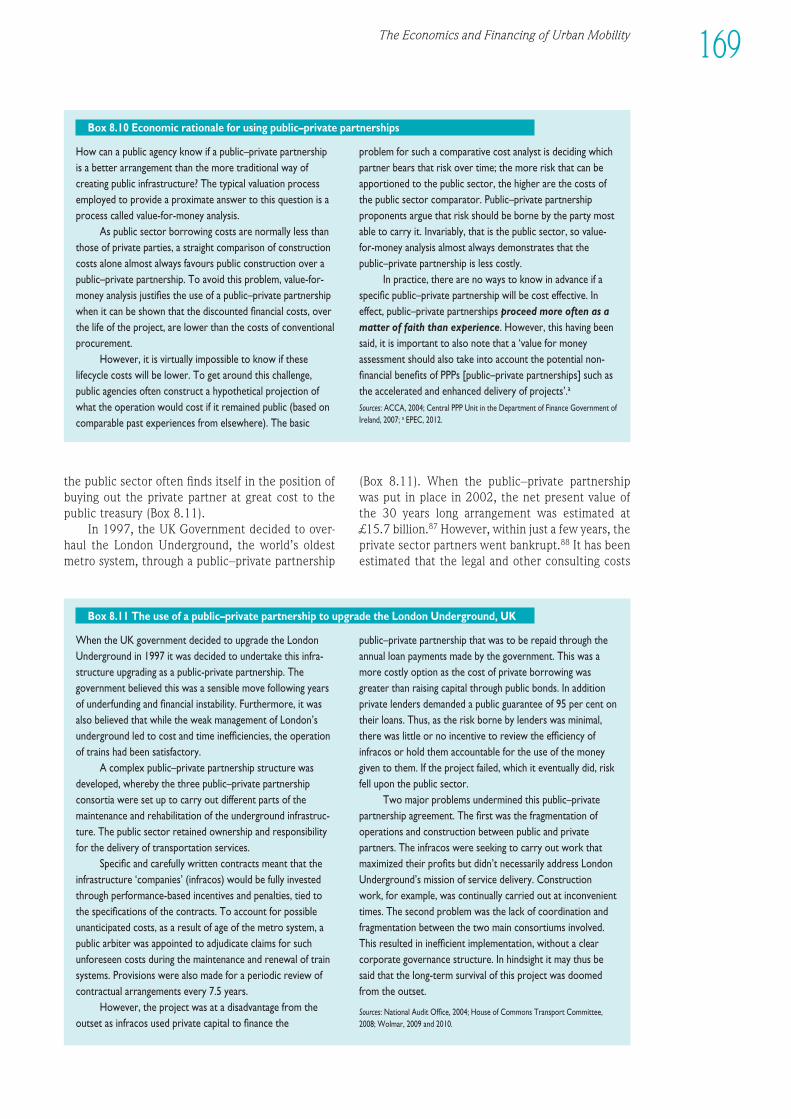
How can a public agency know if a public–private partnershipis a better arrangement than the more traditional way ofcreating public infra struc ture? The typical valuation processemployed to provide a proximate answer to this question is aprocess called value-for-money analysis.
As public sector borrowing costs are normally less thanthose of private parties, a straight comparison of constructioncosts alone almost always favours public construction over apublic–private partnership. To avoid this problem, value-for-money analysis justifies the use of a public–private partnershipwhen it can be shown that the discounted finan cial costs, overthe life of the project, are lower than the costs of conventionalprocurement.
However, it is virtually impossible to know if theselifecycle costs will be lower. To get around this challenge,public agencies often construct a hypothetical projection ofwhat the operation would cost if it remained public (based oncomparable past experi ences from elsewhere). The basic
problem for such a comparative cost analyst is deciding whichpartner bears that risk over time; the more risk that can beapportioned to the public sector, the higher are the costs ofthe public sector comparator. Public–private partnershipproponents argue that risk should be borne by the party mostable to carry it. Invariably, that is the public sector, so value-for-money analysis almost always demonstrates that thepublic–private partnership is less costly.
In practice, there are no ways to know in advance if aspecific public–private partnership will be cost effective. Ineffect, public–private partnerships proceed more often as amatter of faith than experi ence. However, this having beensaid, it is important to also note that a ‘value for moneyassessment should also take into account the potential non-finan cial benefits of PPPs [public–private partnerships] such asthe accelerated and enhanced delivery of projects’.a
Sources: ACCA, 2004; Central PPP Unit in the Department of Finance Govern ment ofIreland, 2007; a EPEC, 2012.
Box 8.10 Economic rationale for using public–private partnerships1EEE234567891012311145678920123456789301234567894012345678950123456789EEEE
169The Economics and Financing of Urban Mobility
the public sector often finds itself in the position ofbuying out the private partner at great cost to thepublic treasury (Box 8.11).
In 1997, the UK Govern ment decided to over -haul the London Underground, the world’s oldestmetro system, through a public–private partnership
(Box 8.11). When the public–private partnership was put in place in 2002, the net present value ofthe 30 years long arrangement was estimated at£15.7 billion.87 However, within just a few years, theprivate sector partners went bankrupt.88 It has beenestimated that the legal and other consulting costs
When the UK govern ment decided to upgrade the LondonUnderground in 1997 it was decided to undertake this infra -struc ture upgrading as a public-private partnership. Thegovern ment believed this was a sensible move following yearsof underfunding and finan cial instability. Further more, it wasalso believed that while the weak management of London’sunderground led to cost and time inefficiencies, the operationof trains had been satisfactory.
A complex public–private partnership structure wasdeveloped, whereby the three public–private partnershipconsortia were set up to carry out different parts of themaintenance and rehabilitation of the underground infra struc -ture. The public sector retained ownership and responsibilityfor the delivery of transportation services.
Specific and carefully written contracts meant that theinfra struc ture ‘companies’ (infracos) would be fully investedthrough performance-based incentives and penalties, tied tothe specifications of the contracts. To account for possibleunanticipated costs, as a result of age of the metro system, apublic arbiter was appointed to adjudicate claims for suchunforeseen costs during the maintenance and renewal of trainsystems. Provisions were also made for a periodic review ofcontractual arrangements every 7.5 years.
However, the project was at a dis advan tage from theoutset as infracos used private capital to finance the
public–private partnership that was to be repaid through theannual loan payments made by the govern ment. This was amore costly option as the cost of private borrowing wasgreater than raising capital through public bonds. In additionprivate lenders demanded a public guarantee of 95 per cent ontheir loans. Thus, as the risk borne by lenders was minimal,there was little or no incentive to review the efficiency ofinfracos or hold them accountable for the use of the moneygiven to them. If the project failed, which it eventually did, riskfell upon the public sector.
Two major problems undermined this public–privatepartnership agreement. The first was the fragmentation ofoperations and construction between public and privatepartners. The infracos were seeking to carry out work thatmaximized their profits but didn’t necessarily address LondonUnderground’s mission of service delivery. Constructionwork, for example, was continually carried out at inconvenienttimes. The second problem was the lack of coordination andfragmentation between the two main consortiums involved.This resulted in inefficient implementation, without a clearcorporate governance structure. In hindsight it may thus besaid that the long-term survival of this project was doomedfrom the outset.
Sources: National Audit Office, 2004; House of Commons Trans port Committee,2008; Wolmar, 2009 and 2010.
Box 8.11 The use of a public–private partnership to upgrade the London Underground, UK
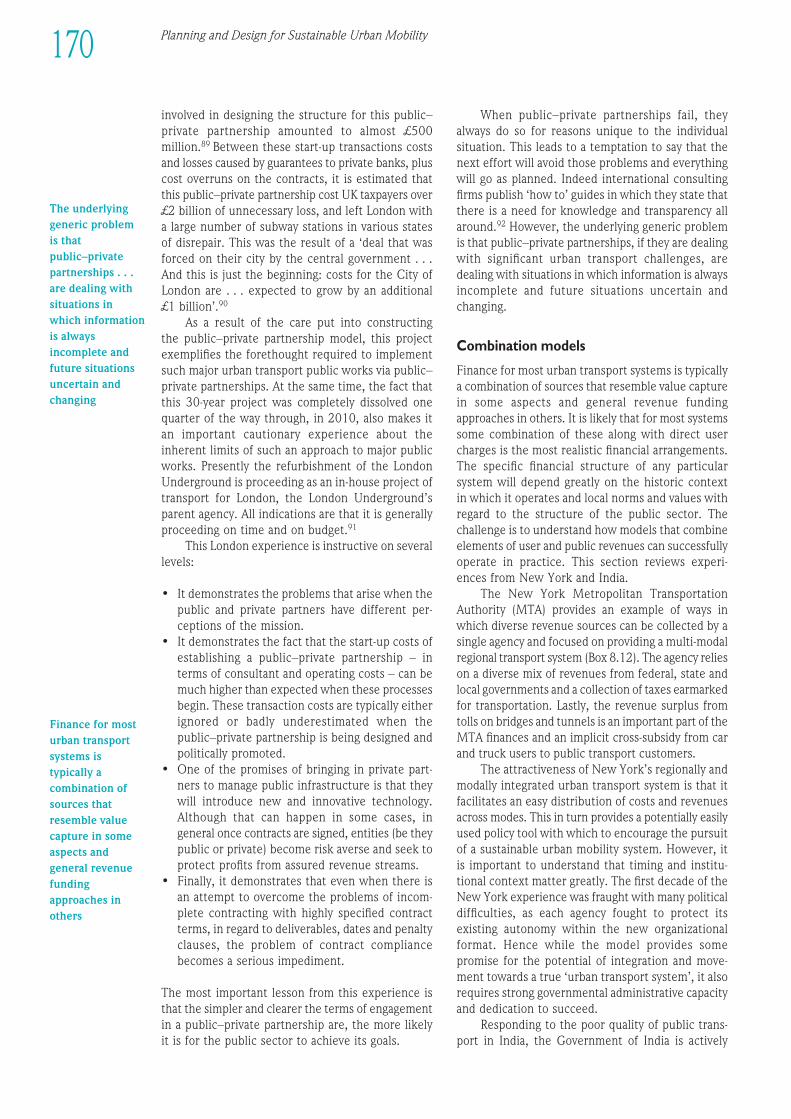
involved in designing the structure for this public–private partnership amounted to almost £500million.89 Between these start-up transactions costsand losses caused by guarantees to private banks, pluscost overruns on the contracts, it is estimated thatthis public–private partnership cost UK taxpayers over£2 billion of unnecessary loss, and left London witha large number of subway stations in various statesof disrepair. This was the result of a ‘deal that wasforced on their city by the central govern ment . . .And this is just the beginning: costs for the City ofLondon are . . . expected to grow by an additional£1 billion’.90
As a result of the care put into constructing the public–private partnership model, this projectexemplifies the forethought required to implementsuch major urban trans port public works via public–private partnerships. At the same time, the fact thatthis 30-year project was completely dissolved onequarter of the way through, in 2010, also makes itan important cautionary experi ence about theinherent limits of such an approach to major publicworks. Presently the refurbishment of the LondonUnderground is proceeding as an in-house project oftrans port for London, the London Underground’sparent agency. All indications are that it is generallyproceeding on time and on budget.91
This London experi ence is instructive on severallevels:
• It demonstrates the problems that arise when thepublic and private partners have different per -ceptions of the mission.
• It demonstrates the fact that the start-up costs ofestablishing a public–private partnership – interms of consultant and operating costs – can bemuch higher than expected when these processesbegin. These transaction costs are typically eitherignored or badly underestimated when thepublic–private partnership is being designed andpolitically promoted.
• One of the promises of bringing in private part-ners to manage public infra struc ture is that theywill introduce new and innovative technology.Although that can happen in some cases, ingeneral once contracts are signed, entities (be theypublic or private) become risk averse and seek toprotect profits from assured revenue streams.
• Finally, it demonstrates that even when there isan attempt to overcome the problems of incom -plete contracting with highly specified contractterms, in regard to deliverables, dates and penaltyclauses, the problem of contract compliancebecomes a serious impediment.
The most important lesson from this experi ence isthat the simpler and clearer the terms of engagementin a public–private partnership are, the more likelyit is for the public sector to achieve its goals.
When public–private partnerships fail, theyalways do so for reasons unique to the individualsituation. This leads to a temptation to say that thenext effort will avoid those problems and everythingwill go as planned. Indeed international consultingfirms publish ‘how to’ guides in which they state thatthere is a need for knowledge and transparency allaround.92 However, the underlying generic problemis that public–private partnerships, if they are dealingwith significant urban trans port challenges, aredealing with situations in which information is alwaysincomplete and future situations uncertain andchanging.
Combination models
Finance for most urban trans port systems is typicallya combination of sources that resemble value capturein some aspects and general revenue fundingapproaches in others. It is likely that for most systemssome combination of these along with direct usercharges is the most realistic finan cial arrangements.The specific finan cial structure of any particularsystem will depend greatly on the historic contextin which it operates and local norms and values withregard to the structure of the public sector. Thechallenge is to understand how models that combineelements of user and public revenues can successfullyoperate in practice. This section reviews experi -ences from New York and India.
The New York Metropolitan TransportationAuthority (MTA) provides an example of ways inwhich diverse revenue sources can be collected by asingle agency and focused on providing a multi-modalregional trans port system (Box 8.12). The agency relieson a diverse mix of revenues from federal, state andlocal govern ments and a collection of taxes earmarkedfor transportation. Lastly, the revenue surplus fromtolls on bridges and tunnels is an important part of theMTA finances and an implicit cross-subsidy from carand truck users to public trans port customers.
The attractiveness of New York’s regionally andmodally integrated urban trans port system is that itfacilitates an easy distribution of costs and revenuesacross modes. This in turn provides a potentially easilyused policy tool with which to encourage the pursuitof a sus tain able urban mobility system. However, itis important to understand that timing and institu -tional context matter greatly. The first decade of theNew York experi ence was fraught with many politicaldifficulties, as each agency fought to protect itsexisting autonomy within the new organizationalformat. Hence while the model provides somepromise for the potential of integration and move -ment towards a true ‘urban trans port system’, it alsorequires strong govern mental administrative capacityand dedication to succeed.
Responding to the poor quality of public trans -port in India, the Govern ment of India is actively
170 Planning and Design for Sustainable Urban Mobility
Finance for mosturban transportsystems istypically acombination ofsources thatresemble valuecapture in someaspects andgeneral revenuefundingapproaches inothers
The underlyinggeneric problemis thatpublic–privatepartnerships . . .are dealing withsituations inwhich informationis alwaysincomplete andfuture situationsuncertain andchanging
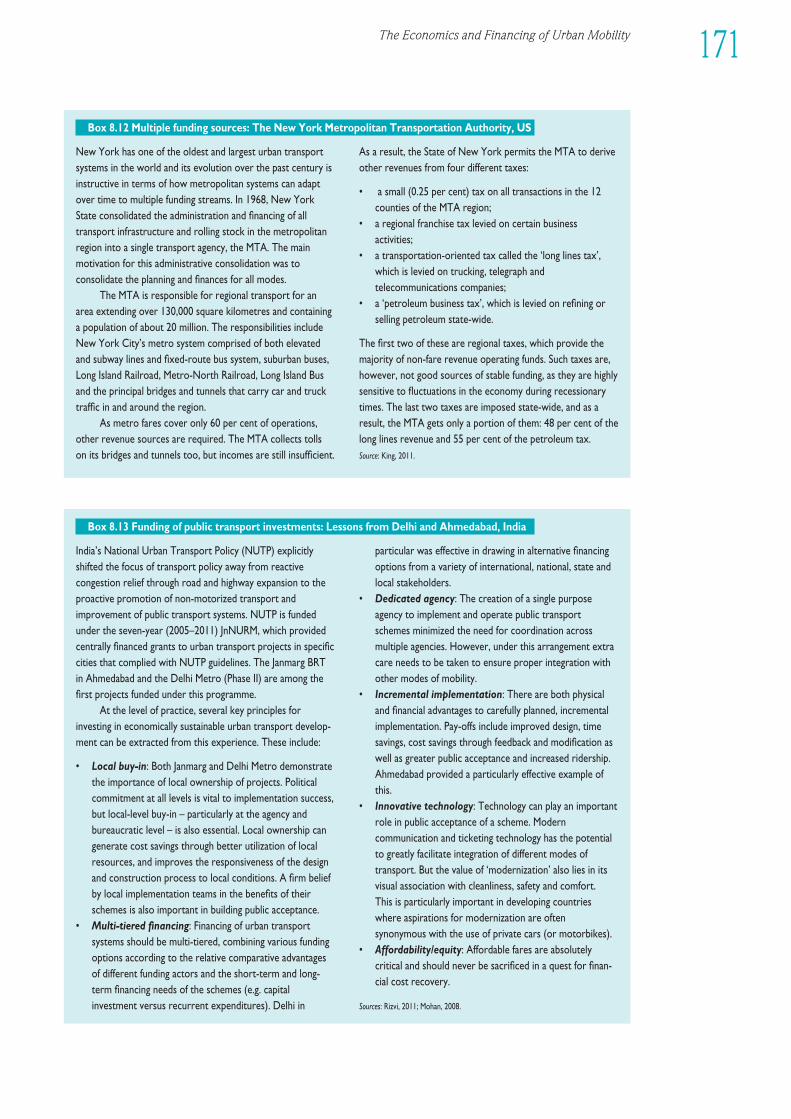
New York has one of the oldest and largest urban trans portsystems in the world and its evolution over the past century isinstructive in terms of how metropolitan systems can adaptover time to multiple funding streams. In 1968, New YorkState consolidated the administration and financing of all trans port infra struc ture and rolling stock in the metropolitanregion into a single trans port agency, the MTA. The mainmotivation for this administrative consolidation was toconsolidate the planning and finances for all modes.
The MTA is responsible for regional trans port for anarea extending over 130,000 square kilometres and containinga population of about 20 million. The responsibilities includeNew York City’s metro system comprised of both elevatedand subway lines and fixed-route bus system, suburban buses,Long Island Railroad, Metro-North Railroad, Long Island Busand the principal bridges and tunnels that carry car and trucktraffic in and around the region.
As metro fares cover only 60 per cent of operations,other revenue sources are required. The MTA collects tollson its bridges and tunnels too, but incomes are still insufficient.
As a result, the State of New York permits the MTA to deriveother revenues from four different taxes:
• a small (0.25 per cent) tax on all transactions in the 12counties of the MTA region;
• a regional franchise tax levied on certain business activities;
• a transportation-oriented tax called the ‘long lines tax’,which is levied on trucking, telegraph andtelecommunications companies;
• a ‘petroleum business tax’, which is levied on refining orselling petroleum state-wide.
The first two of these are regional taxes, which provide themajority of non-fare revenue operating funds. Such taxes are,however, not good sources of stable funding, as they are highlysensitive to fluctuations in the economy during recessionarytimes. The last two taxes are imposed state-wide, and as aresult, the MTA gets only a portion of them: 48 per cent of thelong lines revenue and 55 per cent of the petroleum tax.Source: King, 2011.
Box 8.12 Multiple funding sources: The New York Metropolitan Transportation Authority, US
India’s National Urban Transport Policy (NUTP) explicitlyshifted the focus of trans port policy away from reactivecongestion relief through road and highway expansion to theproactive promotion of non-motorized trans port andimprovement of public trans port systems. NUTP is fundedunder the seven-year (2005–2011) JnNURM, which providedcentrally financed grants to urban trans port projects in specificcities that complied with NUTP guidelines. The Janmarg BRTin Ahmedabad and the Delhi Metro (Phase II) are among thefirst projects funded under this programme.
At the level of practice, several key principles forinvesting in economically sus tain able urban trans port devel op -ment can be extracted from this experi ence. These include:
• Local buy-in: Both Janmarg and Delhi Metro demonstratethe importance of local ownership of projects. Politicalcommitment at all levels is vital to implementation success,but local-level buy-in – particularly at the agency andbureaucratic level – is also essential. Local ownership cangenerate cost savings through better utilization of localresources, and improves the responsiveness of the designand construction process to local conditions. A firm beliefby local implementation teams in the benefits of theirschemes is also important in building public acceptance.
• Multi-tiered financing: Financing of urban trans portsystems should be multi-tiered, combining various fundingoptions according to the relative comparative advantagesof different funding actors and the short-term and long-term financing needs of the schemes (e.g. capitalinvestment versus recurrent expenditures). Delhi in
particular was effective in drawing in alternative financingoptions from a variety of international, national, state andlocal stakeholders.
• Dedicated agency: The creation of a single purposeagency to implement and operate public trans portschemes minimized the need for coordination acrossmultiple agencies. However, under this arrangement extracare needs to be taken to ensure proper integration withother modes of mobility.
• Incremental implementation: There are both physicaland finan cial advantages to carefully planned, incrementalimplementation. Pay-offs include improved design, timesavings, cost savings through feedback and modification aswell as greater public acceptance and increased ridership.Ahmedabad provided a particularly effective example ofthis.
• Innovative technology: Technology can play an importantrole in public acceptance of a scheme. Moderncommunication and ticketing technology has the potentialto greatly facilitate integration of different modes oftransport. But the value of ‘modernization’ also lies in itsvisual association with cleanliness, safety and comfort. This is particularly important in devel op ing countrieswhere aspirations for modernization are oftensynonymous with the use of private cars (or motorbikes).
• Affordability/equity: Affordable fares are absolutelycritical and should never be sacrificed in a quest for finan -cial cost recovery.
Sources: Rizvi, 2011; Mohan, 2008.
Box 8.13 Funding of public trans port investments: Lessons from Delhi and Ahmedabad, India
1EEE234567891012311145678920123456789301234567894012345678950123456789EEEE
171The Economics and Financing of Urban Mobility
172 Planning and Design for Sustainable Urban Mobility
promoting sus tain able urban trans port devel op ment,formalized in the National Urban Transport Policy (of 2006), through the use of strong finan cial incen -tives targeted at local govern ments. The Janmarg BRT and Delhi Metro projects present two alterna-tive responses to this new policy (Box 8.13). Althoughthey differ in terms of scale, mode and specificapproaches, the different solutions made by the twoprojects reflect similar common successful principlesfor financing sus tain able urban mobility systems.
The two Indian projects illustrate the ways inwhich national govern ments can organize finance tostimulate local investments in urban public transport.Both cases show how supportive national policies,accompanied by finan cial incentives, can play a criticalrole in the adoption and implementation of more sus tain able forms of urban transport. Further more,both experi ences were backed by significant grantcontributions towards capital costs. The experi encesdemonstrate the importance of inter-govern mentalcooperation and the need for a clear local publicauthority over the operation of public trans portsystems.93
Overall, there is an important lesson hereconcerning the need to ensure that – as a generalrule of thumb – operating costs should be tied tofares, but capital costs need a broader source ofrevenues, a source that relates to the broader accessvalues that the system creates. The MTRC in HongKong provides a good example of this (Box 8.7).
CONCLUDING REMARKSAND LESSONS FOR POLICYIn order to be sus tain able, urban mobility systemsmust be organized by a finan cial model that isdesigned to protect the important public goods aspectof public transport. As the experi ences recounted inthis chapter make clear, there is a wide and flex-ible range of ways in which these models can beorganized. However, there is no simple ‘best-practice’approach to designing such finan cial models. Instead,one should look beyond the individual experi encesand look for principles that can be replicated inanother setting. This section presents seven prin -ciples that should inform the evolution of sus tain -able urban trans port finance.
The goal of an urban mobility system, as a publicgood, is to promote access and not mobility.Mobility is merely one means to the achievement ofthat larger end. Consequently, policies should reflectthe value of access and not the time saved throughenhanced mobility systems.
High-density and mixed-use locations reducethe need for mobility and provide access throughco-location of important urban activities. In terms
of modal options, it is important that these be inte -grated so that users can move easily from one mode to another. For example, park-and-ride lots at the periphery of a dense urban settlement canallow travel lers to easily leave cars and enter publictrans port for the final legs of journeys into these places.
An urban area with good public trans port is more likely to also have urban spaces conducive topedestrian access and non-motorized transport. Onlypublic trans port developed as a public goodcan make this happen. Once that is in place, thechallenges from private motorized trans port arereduced to a point where they are practically solvable.
Urban public trans port should aim to be ahigh-quality service. An urban public trans portsystem that is viewed largely as a system for the useof the poor quickly becomes a poor system. If govern -ment is seeking to induce car drivers to use publictransport, it is important that the alternative be safe,reliable, comfortable and plentiful. A system used byresidents from all walks of life is a system that ispolitically (as well as economically) sus tain able.
Cities should strive towards full cost pricingfor cars. Cars do not pay prices that match the fullvalue of the economic and social costs that theyimpose in the pursuit of access. Revenues collectedvia congestion pricing and licensing fees shouldreflect the costs that private car use imposes on urbanlife. However, it is both short sighted and ineffectiveto attempt to sustain public trans port systems viamonies raised by car-based charges. These moniesalone will almost never be sufficient to allow for thecreation and finan cial sus tain ability of high-qualityurban public transport.
Schemes that successfully permit urban trans -port to be supported by the value of the access thatthey create can provide a strong basis for sus tain-able urban mobility. Value capture can be done viareal estate taxes that reflect the value of location as well as through complex land investments. Themore exclusive and high density the modes of travel,such as rail and BRT, the higher will be the capture-able values. Further more, in terms of land use, thecloser the places of residence and other activities areto terminals, the higher values and volume of usecan be expected. Value capture does not work as wellon more ordinary bus routes or in places where caruse is already very high and/or where populations arestagnant or shrinking.
Good public trans port requires a capablepublic sector. The debate about the relativeefficiency of public and private agents in theproduction of public trans port has been an irrelevantdistraction. Regardless of organizational form, the keyto success in creating effective urban mobility systemsis always a capable public governing authorityoperating in a transparent manner.
High-density andmixed-uselocations reducethe need formobility andprovide accessthrough co-location ofimportant urbanactivities
Cities shouldstrive towards fullcost pricing forcars
Schemes thatsuccessfullypermit urbantransport to besupported by thevalue of theaccess that theycreate can providea strong basis forsustainable urbanmobility
NOTES1 See discussion in Chapters 6
and 7.2 See Chapter 2.3 Jirón, 2011, pp3–4.4 http://data.worldbank.org/
indicator, last accessed 23January 2013.
5 Darido et al, 2009.6 Jirón, 2011, p8.7 It should here be noted that
the number of car registrationsmay overstate the number ofcars in regular use. Individualsmay use public transportationfor daily trips and still own carsthat they use only occasionally.Residents of cities with high-quality public trans port systems,amenable land uses, and tolls or congestion charges (such asin Stockholm, Sweden, forexample) may own cars, butmay not use those cars for theirjourneys to work or otherregular travel.
8 And without active efforts toimprove both the quality andquantity of urban publictransport.
9 Crozet, 2006.10 Jain, 2011, p16.11 Pirie, 2011, p35.12 See Chapter 2.13 Pirie, 2011.14 The issue of co-modality is
highlighted in other chapters of this report.
15 World Bank IndependentEvaluation Group, 2007.
16 See Chapter 2.17 See section below on ‘The
Perennial Finan cial Problem:Costs Exceed Revenues’.
18 Flyvbjerg et al, 2008; Railway-technology.com, undated;Chandran, 2010.
19 Capital costs for buses using‘high occupancy vehicle lanes’and arterial streets were foundto be US$5.6 million and US$0.4 million, respectively.However, the study alsoshowed that BRT capital costsvary considerably – fromUS$4.3 million to US$34.2million – due to factors such ascost of the roadway, stationstructures, park-and-ridefacilities, traffic signal systemsand vehicles (United StatesGeneral Accounting Office,2001).
20 Chandran, 2010.21 Flyvbjerg et al, 2008.22 Chapter 6 discusses the issue
of fare affordability as part ofthe wider discussion onequitable access to urbanmobility.
23 Godard, 2011b, p52.24 See the section below on
‘General revenue models’.25 The section below on ‘Other
allocations of public funds’provides a further discussion
on various forms of roadpricing.
26 King, 2011.27 See the section on ‘Value-
capture models’.28 Value capture is discussed in
more detail below in the sectionin ‘Value-capture models’.
29 Public–private partnerships arediscussed in more detail belowin the section in ‘Otherpublic–private partnerships’.
30 See Box 8.11.31 Jain, 2011, p33.32 Pirie, 2011, p4.33 Rimmer, 1982.34 Cervero, 1991.35 Pirie, 2011, p13.36 Godard, 2011b, p21.37 Pirie, 2011, p18.38 Pucher and Renne, 2003.39 As discussed in the section on
‘From Economics of MobilityTowards Economics of Access’below, cost–benefit analysesoften measure the value of timeaccording to average wages.Using similar methods, the cost of vehicle congestion hasbeen estimated at US$0.845 per litre of petrol in the US, and US$0.190 in the UK. By comparison, pollutioncontributes comparatively lessto the total marginal externalcost of driving (US$0.048 andUS$0.053, in each countryrespectively) (Parry and Small,2005).
40 US Census Bureau, 2012.41 UN-ESCAP, 2006b.42 Vivier and Mezghani, 2001.43 UITP, 2011a.44 Such as management,
technical/maintenance, ticketinspectors, customer advisorsand other tasks.
45 UITP, 2011.46 See Chapter 6.47 Chitere and Kibua, 2004.48 Pirie, 2011.49 Mueller, 2011.50 UITP, 2009, p3.51 Weisbrod and Reno, 2009,
p31.52 SmartGrowthAmerica, 2010.53 See Chapter 1.54 UN, 2012a.55 See also discussion on road
traffic accidents in Chapter 6.56 WHO, 2009.57 See for example Small and
Verhoef, 2007; Goméz-Ibañez et al (eds), 1999.
58 Two studies in particular playeda major role, both of whichwere completed in 1962: thecomprehensive study oftransport and land-use planningfor post-War Chicago (see forexample Black, 1990) and thecost–benefit analysis ofLondon’s Victoria Line (seeFoster and Beesley, 1963;Beesley and Foster, 1965).
59 Metz, 2008.60 Jacobs, 1970; Schaeffer and
Sclar, 1980; Glaeser, 2011.61 Parry and Small, 2005.62 Bertaud et al, 2009; CODATU,
2009.63 Typically, advocates for raising
the cost of car usage also arguefor transferring the revenuesreceived to public transport.While this is a reasonable step,it has never been demonstratedthat these revenues alone aresufficient to address the fullcosts of adequately enhancedpublic transport. Further more,by only going that far in policyterms, these advocates avoidthe more politically charged but still underlying substantiveissues of urban equity.
64 Crozet, 2007.65 The case of the Hong Kong
trans port system is discussed inBox 8.7 below. It does make aprofit, but that comes largelyfrom its ability to leverage thevalue of the real estate aroundits stations. See also Figure 8.4.
66 Suchorzewski, 2011, p40.67 See the section on ‘Public
transport’ above.68 Schaeffer and Sclar, 1980;
Glaeser, 2011.69 It is import to note that this
problem is endemic to passen -ger trans port in general and notto urban public trans port inparticular. Intercity passen gerrail systems do not cover fullcosts through fares. Individualairlines do make profits onindividual routes, though eventhese are not steady. Profitsfluctuate with fuel costs andbusiness cycles. Mostimportantly, the air trafficcontrol system, on whichindividual private routes depend,is publicly maintained.
70 This chapter does not include adiscussion of the role of officialdevel op ment assistance andforeign direct investments forthe financing of urban transport,although this may play anincreasing role in the future. ‘A global devel op mentpartnership should promote theflow of longer-term investment,including FDI [foreign directinvestment], to a greaternumber of devel op ing countriesand into critical sectors such as transport’ (UN System TaskTeam on the Post-2015 UNDevel op ment Agenda, 2013,p10). However, from ananalytical point of view, suchfinance should be consideredprimarily as direct publicallocation, subject toconsiderations beyond thecontrol of local authorities, orsubject to arrangements similar
to those of private–publicpartnerships. Chapter 7 includesa discussion on internationalfunding mechanisms for environ -mentally sus tain able transport.
71 Cost in local currency was RMB3.7 billion. Exchange rate ofUS$1 = RMB 6.83 (in 2009).
72 Pan et al, 2011.73 Interview with Mayor Cássio
Taniguchi in the spring of 2004at Curitiba City Hall. See alsoCODATU, 2009, p37.
74 Hook, 2005.75 This is discussed in Chapter 7,
from the perspective ofchanging the modal split.
76 CODATU, 2009; Hook, 2005.In devel op ing countries, theremay also be some potential forfunding through the clean devel op ment mechanismdiscussed in Chapter 7.
77 See also Figure 8.4, whichindicates that versement trans portfunding contributes about aquarter of the total revenuestream for the public trans portcompany Sytral, in Lyon, France.
78 As noted earlier, only a handfulof public trans port providersworldwide are making a profit(Box 8.1).
79 Bocarejo and Tafur, 2011.80 See, for example, Denver Urban
Renewal Authority, undated;Dye and Merriman, 2006. TheCity of Chicago, US, forexample, has a large number oftax increment districts (http://en.wikipedia.org/wiki/Tax_increment_financing, lastaccessed 30 January 2013).
81 Jain, 2011.82 Salon and Shewmake, 2011.83 Salon and Shewmake, 2011.84 This report does not provide
a detailed analysis on howpublic–private partnerships inthe trans port sector work. For that, see, for example: EPEC (2012); Office of the StateComptroller, New York State(2011); EC (2003); Central PPPUnit in the Department ofFinance Govern ment of Ireland(2007).
85 Salanie, 2005; Sclar, 2000.86 See for example Sullivan and
Burris, 2006; Holeywell, 2011;Wolf, 2011.
87 National Audit Office, 2004, p1.
88 Metronet in 2007 and TubeLines in 2009 (House ofCommons TransportCommittee, 2008, p5).
89 House of Commons TransportCommittee, 2008, p15.
90 Sanger and Crawley, 2009.91 Transport for London, 2011.92 See for example, http://www.
deloitte.com/partneringforvalue,last accessed 29 July 2013.
93 Rizvi, 2011; Mohan, 2008.
1EEE234567891012311145678920123456789301234567894012345678950123456789EEEE
173The Economics and Financing of Urban Mobility

INSTITUTIONS AND GOVERNANCEFOR URBAN MOBILITY
C H A P T E R 9Institutional and governance frameworks are thestructures through which political, technical andfinan cial decisions are translated into resourceallocation and priority setting for implementing urbanmobility plans, programmes and projects. No matterhow good the policy recommendations, their imple -mentation is dependent upon how fit-for-purposethese institutional and governance frame works areto direct, manage, resource and deliver them. Visionsof sus tain able urban mobility cannot be translatedinto plans, nor can plans be successfully imple -mented, without addressing the very sus tain abilityof the key organizations involved and their institu -tional and governance frameworks.
Institutional and governance frameworks andtheir related networks are critical to how well (andhow fast) urban trans port infra struc ture and servicesare planned, appraised, delivered and operated. Theyare also essential to how well joined-up urban mobilityplanning is with land-use devel op ments, and howconsistent both are with the declared goals of sus -tain able devel op ment.
In many cities, formal institutions that affect the trans port sector frequently operate in a less thandesirable manner. This is particularly the case indevel op ing countries. Notwithstanding this, peopleand goods continue to circulate, and indeed in manycases traffic continues to rise. The issue here,however, is with what suboptimum level of efficiencyis this achieved, at what opportunity cost and atwhose cost does this growth take place?
The chapter starts with a clarification of the mainterms used in the discussion of urban mobilityinstitutions and governance. This is followed by aregional review of current conditions and trends ofinstitutional and governance devel op ments that affecturban mobility policy-making, planning and manage -ment and ultimately, many aspects of urban land-usedevel op ments. A number of key institutional andgovernance challenges and underlying influencesfacing cities are then drawn from this review. Thechapter also contains a discussion of policy responses
to these challenges, with some detailed examplesdrawn from good practice. It ends with concludingremarks and lessons for policy makers.
UNDERSTANDINGINSTITUTIONAL ANDGOVERNANCEFRAMEWORKS FOR URBANMOBILITYThe interaction of the institutional structure andagency actors is characterized by both formaldimensions (i.e. rules and laws) and informal dimen -sions (i.e. customs and traditions), which impactrelations between different branches of govern ment.1
In some instances, there are institutions (such astrade unions, city chambers of commerce andindustrial lobbying groups) that – although notformally part of the urban trans port decision-makingprocesses – possess varying degrees of influence. Theextent they do reflects their political influence andoften the power of their purse. Enlightened institut -ional and governance frameworks seek to make theseinfluences transparent.
Well-functioning institutions and a high level ofpolitical support are essential for creating andmaintaining good quality infra struc ture and servicesfor urban mobility.2 Urban mobility is also impactedby parties from outside the trans port sector associatedwith land use and social and environ mental impacts.In devel op ing countries in particular, powerful non-specialist stakeholders can exert influences thatseriously undermine efforts at achieving integrateddevel op ment between urban movement and landuse.3
The practice of policy-making and planning forurban mobility generally rests with institutions at thelevel of an urban area. However, as this may notcoincide with the administrative boundary of the
1EEE234567891012311145678920123456789301234567894012345678950123456789EEEE
Institutional andgovernanceframeworks andtheir relatednetworks arecritical to howwell . . . urbantransport infra-structure andservices areplanned,appraised,delivered andoperated
Well-functioninginstitutions and ahigh level ofpolitical supportare essential forcreating andmaintaining goodqualityinfrastructure andservices for urbanmobility
176 Planning and Design for Sustainable Urban Mobility
dominant city, organizations at a national (and some -times regional/provincial) govern ment level also setframeworks that can significantly influence policiesthat are (and are not) adopted.4 These influence theextent of the institutional integration of trans portmodes in an urban area, as well as the arrange-ments for their integration with other sectors. Thisis particularly the case with respect to land use,emissions, climate change, safety and finance. Insome major cities of devel op ing countries – wherenational (or regional/state) govern ments involvethemselves extensively in urban trans port policydecisions – many problems can arise. This is sobecause such levels of govern ment are typically morepowerful and exert more influence/control overbudgets assigned to the urban level. Further more,city authorities typically lack the strong managementand professional staff capabilities necessary to tacklethe challenges that confront them. As a result, whilethey may be fully aware of what needs to be done,coordination between the two levels of govern mentis often not easy and frequently unequal.
The role of informal structures and organizationsin the urban trans port sector needs to be emphasized.These are especially relevant to public transport,freight movement and non-motorized transport. Even in the well-ordered cities of many developedcountries, the informal sector and NGOs play anincreas ingly important role in facilitating and encour -aging sus tain able urban mobility. The involvementof such informal structures and organiza tions isessential for good governance and a ‘bottom-up’decision-making process that enables all stake holdersto participate. In the case of urban mobility, suchdecision-making should ideally em brace all keystakeholders involved in the provision of urban trans -port infra struc ture and services, as well as thoseimpacted by decisions the sector makes.
Likewise, institutional and governance frame -works should address concerns regarding obstaclesto the effective participation of the private sector.Thus, enabling and regulative mechanisms need tobe put in place by govern ment to ensure that informa -tion employed to support urban trans port proposalsare comprehensive, accurate, impartial and trans -parent.
CONDITIONS AND TRENDSDifferent parts of the world have different gover-nance structures for urban mobility delivery, withvarious institutional stakeholders influencing urbandevel op ment and mobility trends. It is particularlyimportant to note that the policy and planningchallenges of urban mobility in devel op ing coun-tries and in countries with economies in transitiondiffer significantly from those found in urban areasof developed countries. In general, the resources(human, technical and finan cial) and institutional
frameworks at the disposal of policy-makers andplanners in such cities are typically less well devel -oped. Thus, the sections below focus on selectedconditions and trends of institutional devel op mentsand governance, and their underlying influences, indeveloped countries, countries with economies intransition and devel op ing countries.
Developed countries
The institutional and governance frameworks forurban mobility in most of Europe reflect thecircumstances of mature developed economies andinstitutional and governance arrangements. By andlarge, European cities possess a well-educated inter -disciplinary professional class to serve the needs ofurban mobility in particular and urban devel op mentin general. The larger more populated countries allhave strong, multi-tier govern ments, as do the smallernorthern European countries. Significant differencesremain, however, particularly with respect to fundinglevels, technical capacities and organizational effi -ciencies among many of the Southern Europeancountries. In these countries, institutional andgovernance arrangements and technical capacities are less well developed and resourced. There is,nevertheless, cross-fertilization of ideas between allthese countries through numerous EU initiatives,with some significant improvements observed.5
The city of Nantes, France, has succeeded tointegrate the decision-making agencies in and aroundthe city into one body.6 These arrangements providevarious capabilities with the agency responsible forhighway and public spaces, housing, town planningand land-use devel op ment. This body also has thecompetence for all aspects of organizing public trans -port in the metropolitan area in which it has madesome notable advances. Since 2008, there has beenonly one agency responsible for all mobility mattersin Nantes.7 This organization is ‘responsible forstrategy as well as operational management of awhole range of aspects of sus tain able mobility,including roads and highway planning, traffic manage -ment, traffic and public road management, cyclingand parking policies, and management including alloff-street parking such as multi-storey car parks,park and rides and other sus tain able mobility servicessuch as car-pooling and car sharing’.8
Similar devel op ments are currently underway inLondon, where surface and underground rail systemsin the metropolitan region are increasingly integratedas part of the Mayor’s Transport Strategy for theGreater London Authority, which comes directlyunder the office of the mayor.9
Sixty years of private car-orientated trans portinfra struc ture investment and suburbanization inthe US have contributed to widespread urban trafficcongestion10 and created a significant urban mobilitydivide, which has seriously affected the mobility of
Even in the well-ordered cities ofmany developedcountries, theinformal sectorand NGOs play anincreasinglyimportant role infacilitating andencouragingsustainable urbanmobility
By and large,European citiespossess a well-educatedinterdisciplinaryprofessional classto serve the needsof urban mobilityin particular andurbandevelopment ingeneral
1EEE234567891012311145678920123456789301234567894012345678950123456789EEEE
177Institutions and Governance for Urban Mobility
MetropolitanAuckland . . .offers a uniquegovernanceframework forlocal authoritiesto managecouncil-controlledorganizations
The sharpreductions ingovernmentsubsidies inPoland . . . forcedpublic transportservices to raisefares drastically
those who cannot afford the ownership of a privatecar.11 This car dependency has been accentuated by an institutional emphasis on the importance ofpersonal mobility – whether related to distancesthat need to be travelled or to the general limitedavailability of public transport, particularly in lower-density cities.12
Given the history of motorization in the US, it is perhaps unexpected that the country hasintroduced legislation seeking to introduce a revolu -tion in the way urban transportation investments areplanned and implemented.13 This legislation lookedto a hierarchy of supporting transportation plans andprogrammes introduced and carried out by metro -politan planning organizations in cooperation withstates for major urban areas. However, the act doesnot give these planning organizations any new legalauthority in this area. Instead it emphasises ‘partner -ships’ between all relevant agencies, in order topromote area-wide interests and goals.14
In Canada, the federal govern ment acknow-ledges that insufficient funding, accompanied byfragmented planning and implementation of urbanmobility systems and related land use, are the majorobstacles to establishing efficient urban trans -portation networks.15 As a result, the Greater TorontoTransportation Agency was set up. This provided ‘thegovernance mechanism to plan, fund and deliverintegrated transportation and related land use for theentire urban region comprehensively and consistentlyover time’.16 Similarly in Vancouver, the governancestructure for urban trans port attempts to coordin-ate and achieve integration and a balance betweendifferent modes. To this end the Govern ment ofBritish Columbia created TransLink to assume manytransportation responsibilities previously held by the provincial govern ment (in 1998). TransLink isresponsible for the regional transportation networkof Metro Vancouver in British Columbia, includingpublic trans port and major roads and bridges.17
Australia has a federal governance structure, with responsibility for the integration of land use andtrans port largely resting with state and local gov -ernments. Although all recent major trans port infra -structure investments in its main cities have beenmade within the same federal institutional context,the responses to urban mobility challenges havebeen quite diverse.18 In the city of Perth, trans portand land-use planning portfolios reside within theWestern Australian Department of Planning andInfra struc ture, which has its own minister in the state govern ment. Public trans port is the responsi -bility of the Public Transport Authority, a govern mentagency whose res ponsibilities cover public trans port(bus, train and ferry services) in Perth and regionalcentres. Two other agencies (Main Roads and Depart ment of Transport) are responsible for othertrans port matters (i.e. major and minor roads, trans -port safety, etc.).19
New Zealand has seen several new devel op -ments in the institutional and governance structureof its major cities. From the perspective of the inte -gration of urban transport, ‘the restructuring ofmetropolitan Auckland is one of the most substantialand far-reaching local govern ment restructurings inrecent years. [It offers a] unique governance frame -work for local authorities’ to manage council-con -trolled organizations.20 The capital city of Wellingtonhas also employed a regional approach to the planningand delivery of its trans port infra struc ture andservices.21
Countries with economies in transition
Democratization, privatization and decentralizationhave been the three main institutional changeprocesses occurring in countries that emerged fromcommunism in Central and Eastern Europe. At theend of communist rule in the early 1990s, thesecountries had strong, centralized decision-makingsystems, and a tradition of state planning of urbanland use and transportation. They also had a relativelywell-educated professional class working in secureformal institutions, a dominance of public trans portover private car use, and a relatively deferential civilsociety.22
With democratization, the strength of influ-ence of different stakeholders changed. The voice ofthe citizenry became more fragmented, as wealthierresidents abandoned their dependency on publictrans port systems. At the same time, many publictrans port operators found themselves unable toextend their service to low-density devel op ments onthe periphery. Operators simultaneously sufferedfrom drastic reductions of subsidies that made publictrans port more expensive to provide and unaffordableto many potential users.23 The sharp reductions ingovern ment subsidies in Poland, for example, forcedpublic trans port services to raise fares drastically.Meanwhile, under-spending led to poorer publictrans port services, lower operational efficiencies anda reduction in public trans port hardware and relatedinfra struc ture investment. This resulted in a gapdevel op ing between revenue and expenditure to apoint that became exceedingly difficult to bridge.24
Privatization and neoliberal influences haveresulted in much more complex institutional decision-making devel op ments. Together with the absence of an understanding of how market forces operate,there has been an (unintentional) gradual under -mining of economic, social and environ mental dimen -sions of sus tain ability by govern ments, as a result oftheir extending the time between plan-making andimple mentation.
Decentralization – in the form of transfer ofresponsibility for regional and local infra struc ture andpublic trans port services to provincial and localgovern ments – has in some cases been excessive.
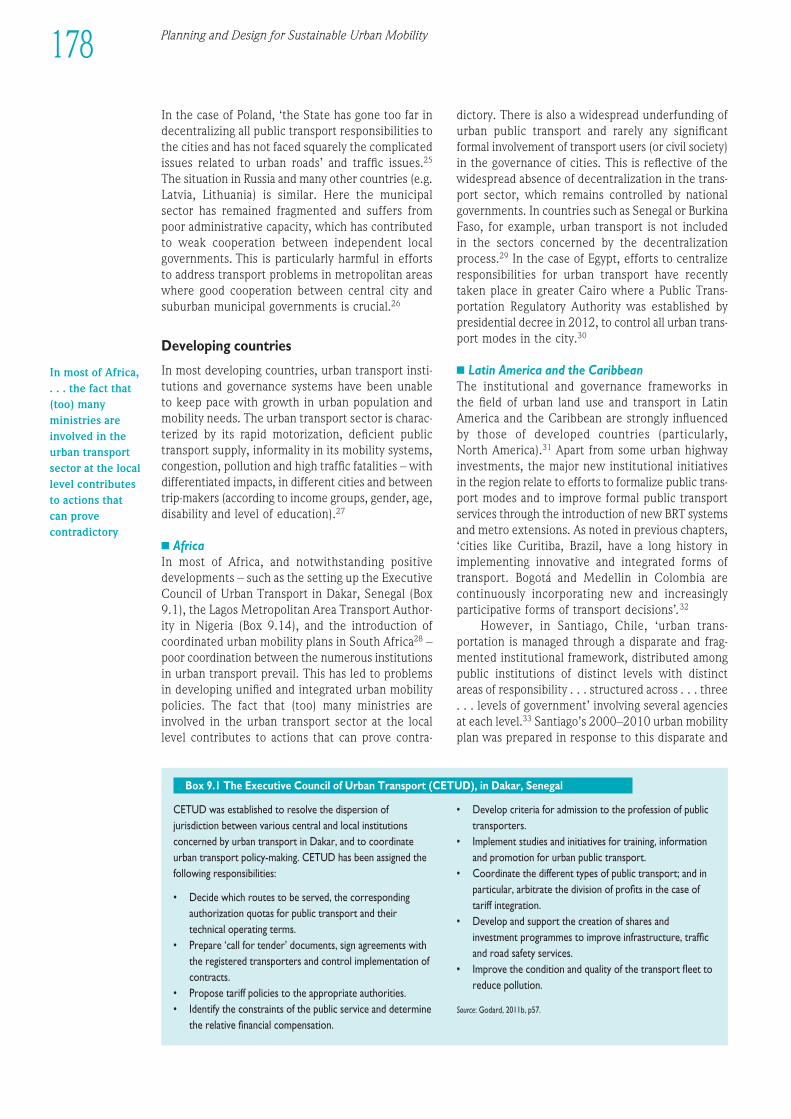
CETUD was established to resolve the dispersion ofjurisdiction between various central and local institutionsconcerned by urban trans port in Dakar, and to coordinateurban trans port policy-making. CETUD has been assigned thefollowing responsibilities:
• Decide which routes to be served, the correspondingauthorization quotas for public trans port and theirtechnical operating terms.
• Prepare ‘call for tender’ documents, sign agreements withthe registered transporters and control implementation ofcontracts.
• Propose tariff policies to the appropriate authorities.• Identify the constraints of the public service and determine
the relative finan cial compensation.
• Develop criteria for admission to the profession of publictransporters.
• Implement studies and initiatives for training, informationand promotion for urban public transport.
• Coordinate the different types of public transport; and inparticular, arbitrate the division of profits in the case oftariff integration.
• Develop and support the creation of shares andinvestment programmes to improve infra struc ture, trafficand road safety services.
• Improve the condition and quality of the trans port fleet toreduce pollution.
Source: Godard, 2011b, p57.
Box 9.1 The Executive Council of Urban Trans port (CETUD), in Dakar, Senegal
In the case of Poland, ‘the State has gone too far indecentralizing all public trans port responsibilities tothe cities and has not faced squarely the complicatedissues related to urban roads’ and traffic issues.25
The situation in Russia and many other countries (e.g.Latvia, Lithuania) is similar. Here the municipalsector has remained fragmented and suffers frompoor administrative capacity, which has contributedto weak cooperation between independent localgovern ments. This is particularly harmful in effortsto address trans port problems in metropolitan areaswhere good cooperation between central city andsuburban municipal govern ments is crucial.26
Devel op ing countries
In most devel op ing countries, urban trans port insti -tutions and governance systems have been unableto keep pace with growth in urban population andmobility needs. The urban trans port sector is charac -terized by its rapid motorization, deficient publictrans port supply, informality in its mobility systems,congestion, pollution and high traffic fatalities – withdifferentiated impacts, in different cities and betweentrip-makers (according to income groups, gender, age,disability and level of education).27
n AfricaIn most of Africa, and notwithstanding positive devel op ments – such as the setting up the ExecutiveCouncil of Urban Transport in Dakar, Senegal (Box9.1), the Lagos Metropolitan Area Transport Author-ity in Nigeria (Box 9.14), and the introduction ofcoordinated urban mobility plans in South Africa28 –poor coordination between the numerous institutionsin urban trans port prevail. This has led to problemsin devel op ing unified and integrated urban mobilitypolicies. The fact that (too) many ministries areinvolved in the urban trans port sector at the locallevel contributes to actions that can prove contra -
dictory. There is also a widespread underfunding ofurban public trans port and rarely any significantformal involvement of trans port users (or civil society)in the governance of cities. This is reflective of thewidespread absence of decentralization in the trans -port sector, which remains controlled by nationalgovern ments. In countries such as Senegal or BurkinaFaso, for example, urban trans port is not includedin the sectors concerned by the decentralizationprocess.29 In the case of Egypt, efforts to centralizeresponsibilities for urban trans port have recentlytaken place in greater Cairo where a Public Trans -portation Regulatory Authority was established bypresidential decree in 2012, to control all urban trans -port modes in the city.30
n Latin America and the CaribbeanThe institutional and governance frameworks in the field of urban land use and trans port in LatinAmerica and the Caribbean are strongly influencedby those of developed countries (particularly, North America).31 Apart from some urban highwayinvestments, the major new institutional initiativesin the region relate to efforts to formalize public trans -port modes and to improve formal public trans portservices through the introduction of new BRT systemsand metro extensions. As noted in previous chapters,‘cities like Curitiba, Brazil, have a long history inimplementing innovative and integrated forms oftransport. Bogotá and Medellin in Colombia arecontinuously incorporating new and increasinglyparticipative forms of trans port decisions’.32
However, in Santiago, Chile, ‘urban trans -portation is managed through a disparate and frag -mented institutional framework, distributed amongpublic institutions of distinct levels with dis tinctareas of responsibility . . . structured across . . . three. . . levels of govern ment’ involving several agenciesat each level.33 Santiago’s 2000–2010 urban mobilityplan was prepared in response to this dis parate and
178 Planning and Design for Sustainable Urban Mobility
In most of Africa,. . . the fact that(too) manyministries areinvolved in theurban transportsector at the locallevel contributesto actions that can provecontradictory
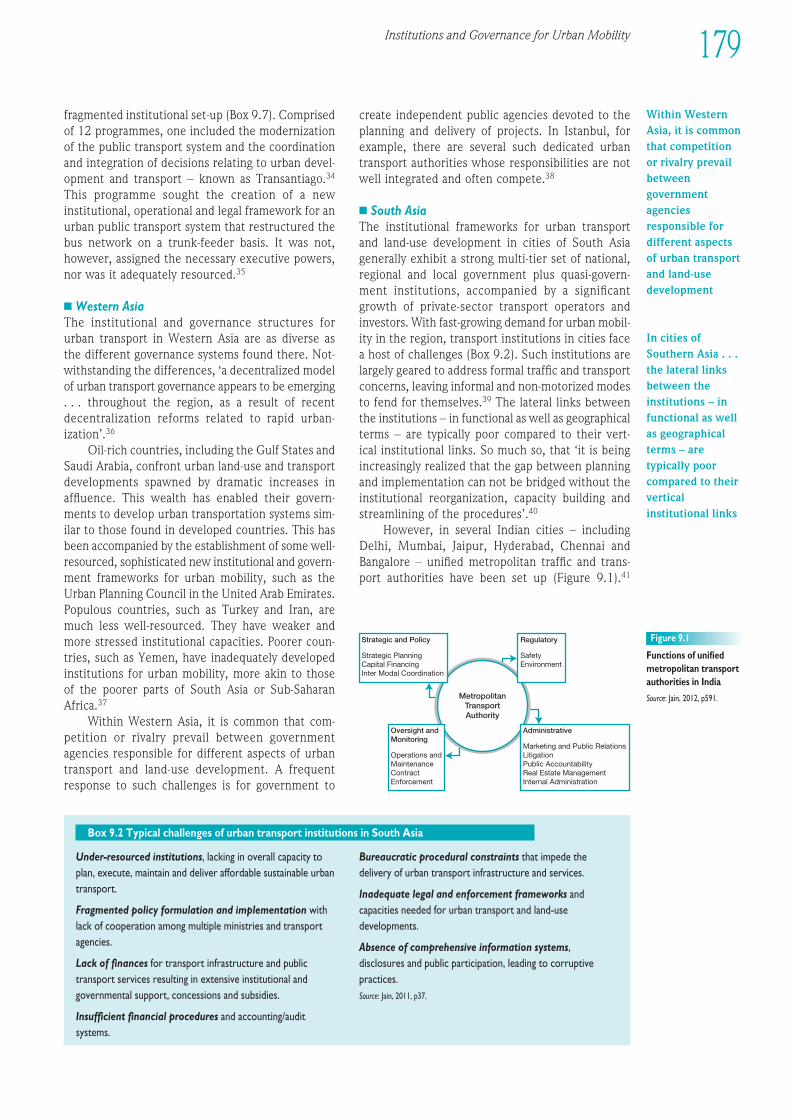
Under-resourced institutions, lacking in overall capacity toplan, execute, maintain and deliver affordable sus tain able urbantransport.
Fragmented policy formulation and implementation withlack of cooperation among multiple ministries and trans portagencies.
Lack of finances for trans port infra struc ture and public trans port services resulting in extensive institutional andgovern mental support, concessions and subsidies.
Insufficient finan cial procedures and accounting/auditsystems.
Bureaucratic procedural constraints that impede thedelivery of urban trans port infra struc ture and services.
Inadequate legal and enforcement frameworks andcapacities needed for urban trans port and land-use devel op ments.
Absence of comprehensive information systems,disclosures and public participation, leading to corruptivepractices.Source: Jain, 2011, p37.
Box 9.2 Typical challenges of urban trans port institutions in South Asia
1EEE234567891012311145678920123456789301234567894012345678950123456789EEEE
179Institutions and Governance for Urban Mobility
fragmented institutional set-up (Box 9.7). Comprisedof 12 programmes, one included the modernizationof the public trans port system and the coordinationand integration of decisions relating to urban devel -op ment and trans port – known as Transantiago.34
This programme sought the creation of a newinstitutional, operational and legal frame work for anurban public trans port system that restructured thebus network on a trunk-feeder basis. It was not,however, assigned the necessary executive powers,nor was it adequately resourced.35
n Western AsiaThe institutional and governance structures for urban trans port in Western Asia are as diverse as the different governance systems found there. Not -withstanding the differences, ‘a decentralized modelof urban trans port governance appears to be emerging. . . throughout the region, as a result of recentdecentralization reforms related to rapid urban -ization’.36
Oil-rich countries, including the Gulf States andSaudi Arabia, confront urban land-use and trans portdevel op ments spawned by dramatic increases inafflu ence. This wealth has enabled their govern -ments to develop urban transportation systems sim-ilar to those found in developed countries. This hasbeen accompanied by the establishment of some well-resourced, sophisticated new institutional and govern -ment frameworks for urban mobility, such as theUrban Planning Council in the United Arab Emirates.Populous countries, such as Turkey and Iran, aremuch less well-resourced. They have weaker andmore stressed institutional capacities. Poorer coun -tries, such as Yemen, have inadequately developedinstitutions for urban mobility, more akin to thoseof the poorer parts of South Asia or Sub-SaharanAfrica.37
Within Western Asia, it is common that com -petition or rivalry prevail between govern mentagencies responsible for different aspects of urbantrans port and land-use devel op ment. A frequentresponse to such challenges is for govern ment to
create independent public agencies devoted to theplanning and delivery of projects. In Istanbul, forexample, there are several such dedicated urbantrans port authorities whose responsibilities are notwell integrated and often compete.38
n South AsiaThe institutional frameworks for urban trans portand land-use devel op ment in cities of South Asiagenerally exhibit a strong multi-tier set of national,regional and local govern ment plus quasi-govern -ment institutions, accompanied by a significantgrowth of private-sector trans port operators andinvestors. With fast-growing demand for urban mobil -ity in the region, trans port institutions in cities facea host of challenges (Box 9.2). Such institutions arelargely geared to address formal traffic and trans portconcerns, leaving informal and non-motorized modesto fend for themselves.39 The lateral links betweenthe institutions – in functional as well as geographicalterms – are typically poor compared to their vert-ical institutional links. So much so, that ‘it is beingincreasingly realized that the gap between planningand implementation can not be bridged without theinstitutional reorganization, capacity building andstreamlining of the procedures’.40
However, in several Indian cities – includingDelhi, Mumbai, Jaipur, Hyderabad, Chennai andBangalore – unified metropolitan traffic and trans-port authorities have been set up (Figure 9.1).41
Within WesternAsia, it is commonthat competitionor rivalry prevailbetweengovernmentagenciesresponsible fordifferent aspectsof urban transportand land-usedevelopment
In cities ofSouthern Asia . . .the lateral linksbetween theinstitutions – infunctional as wellas geographicalterms – aretypically poorcompared to theirverticalinstitutional links
MetropolitanTransportAuthority
Strategic and Policy
Strategic PlanningCapital FinancingInter Modal Coordination
Regulatory
SafetyEnvironment
Oversight andMonitoring
Operations andMaintenanceContractEnforcement
Administrative
Marketing and Public RelationsLitigationPublic AccountabilityReal Estate ManagementInternal Administration
Figure 9.1
Functions of unifiedmetropolitan trans portauthorities in India
Source: Jain, 2012, p591.
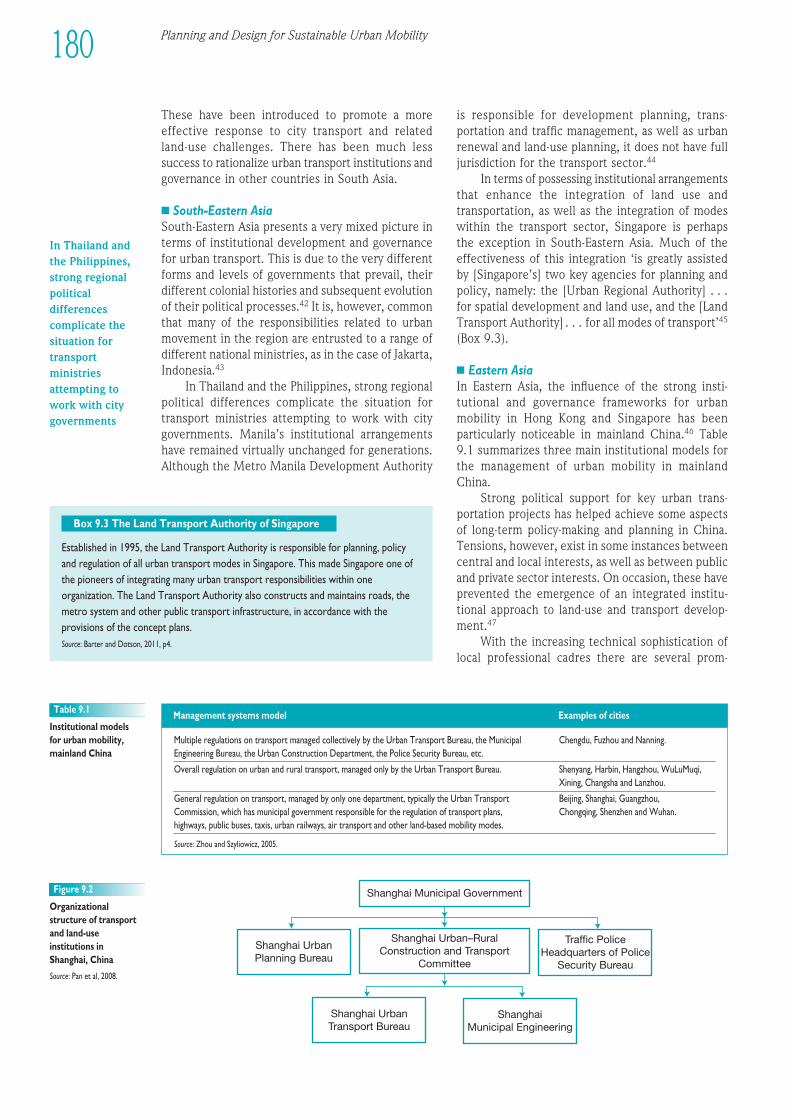
These have been introduced to promote a moreeffec tive response to city trans port and related land-use challenges. There has been much lesssuccess to ration alize urban trans port institutions andgovernance in other countries in South Asia.
n South-Eastern AsiaSouth-Eastern Asia presents a very mixed picture interms of institutional devel op ment and governancefor urban transport. This is due to the very differentforms and levels of govern ments that prevail, theirdifferent colonial histories and subsequent evolutionof their political processes.42 It is, however, commonthat many of the responsibilities related to urbanmovement in the region are entrusted to a range ofdifferent national ministries, as in the case of Jakarta,Indonesia.43
In Thailand and the Philippines, strong regionalpolitical differences complicate the situation fortrans port ministries attempting to work with citygovern ments. Manila’s institutional arrangementshave remained virtually unchanged for generations.Although the Metro Manila Devel op ment Authority
is responsible for devel op ment planning, trans -portation and traffic management, as well as urbanrenewal and land-use planning, it does not have fulljurisdiction for the trans port sector.44
In terms of possessing institutional arrangementsthat enhance the integration of land use andtransportation, as well as the integration of modeswithin the trans port sector, Singapore is perhaps the exception in South-Eastern Asia. Much of theeffectiveness of this integration ‘is greatly assistedby [Singapore’s] two key agencies for planning andpolicy, namely: the [Urban Regional Authority] . . .for spatial devel op ment and land use, and the [LandTransport Authority] . . . for all modes of transport’45
(Box 9.3).
n Eastern AsiaIn Eastern Asia, the influence of the strong insti -tutional and governance frameworks for urbanmobility in Hong Kong and Singapore has beenparticularly noticeable in mainland China.46 Table 9.1 summarizes three main institutional models forthe management of urban mobility in mainland China.
Strong political support for key urban trans -portation projects has helped achieve some aspectsof long-term policy-making and planning in China.Tensions, however, exist in some instances betweencentral and local interests, as well as between publicand private sector interests. On occasion, these haveprevented the emergence of an integrated institu -tional approach to land-use and trans port devel op -ment.47
With the increasing technical sophistication oflocal professional cadres there are several prom-
Multiple regulations on trans port managed collectively by the Urban Transport Bureau, the Municipal Chengdu, Fuzhou and Nanning.Engineering Bureau, the Urban Construction Department, the Police Security Bureau, etc.
Overall regulation on urban and rural transport, managed only by the Urban Transport Bureau. Shenyang, Harbin, Hangzhou, WuLuMuqi,Xining, Changsha and Lanzhou.
General regulation on transport, managed by only one department, typically the Urban Transport Beijing, Shanghai, Guangzhou, Commission, which has municipal govern ment responsible for the regulation of trans port plans, Chongqing, Shenzhen and Wuhan.highways, public buses, taxis, urban railways, air trans port and other land-based mobility modes.
Source: Zhou and Szyliowicz, 2005.
Table 9.1
Institutional models for urban mobility,mainland China
Management systems model Examples of cities
Shanghai Municipal Government
Shanghai UrbanPlanning Bureau
Shanghai Urban–RuralConstruction and Transport
Committee
Traffic PoliceHeadquarters of Police
Security Bureau
Shanghai UrbanTransport BureauShanghai UrbanTransport Bureau
Shanghai UrbanTransport Bureau
ShanghaiMunicipal Engineering
Figure 9.2
Organizationalstructure of trans portand land-useinstitutions in Shanghai, China
Source: Pan et al, 2008.
180 Planning and Design for Sustainable Urban Mobility
In Thailand andthe Philippines,strong regionalpoliticaldifferencescomplicate thesituation fortransportministriesattempting towork with citygovernments
Established in 1995, the Land Transport Authority is responsible for planning, policyand regulation of all urban trans port modes in Singapore. This made Singapore one ofthe pioneers of integrating many urban trans port responsibilities within oneorganization. The Land Transport Authority also constructs and maintains roads, themetro system and other public trans port infra struc ture, in accordance with theprovisions of the concept plans.Source: Barter and Dotson, 2011, p4.
Box 9.3 The Land Trans port Authority of Singapore
As transportation is a function of land use, one way ofeffectively reducing urban movement is by imposing tighterland-use controls and increasing densities. There are, however, a number of problems that can prevent this frommaterializing:
• Many agencies that influence and/or regulate land use havelittle or no responsibility for mobility policies. The result isa serious institutional ‘land-use/transportation disconnect’that prevents integrative actions, especially in cities thathave a weak tradition of urban land-use planning andcontrol.
• The skill-sets required by the two principal professionsinvolved are very different and employ very different
premises and logic. Obliging these professions to employ more joined-up thinking, as required in transit-orientated devel op ment projects, is a good way ofachieving this.
• Competitive forces among cities often have one citypitching against another, encouraging ‘sweetener deals’ to potential major investors in the form of exceptions and leniency in land-use policies and devel op ment control.
• Urban growth can prove impervious to local publicpolicies.
Sources: Mitchell and Rapkin, 1954; Dimitriou, 2011; Hajer, 1995; Downs, 1992.
Box 9.4 Key challenges in integrated land-use and trans port planning
1EEE234567891012311145678920123456789301234567894012345678950123456789EEEE
181Institutions and Governance for Urban Mobility
ising innovations in urban-mobility planning in China. Shanghai exemplifies this with its rational-iza tion of urban land-use and mobility managementstructures. Here urban trans port and related land-usedevel op ment functions are divided among threedepartments: the Urban Planning Bureau; the Urban-Rural Con struction and Transport Committee; and the Traffic Police Headquarters (Figure 9.2). Rail andwater trans port – which are highly significant inmost Chinese cities – however, are usually outsideof city control and are administered regionally or atthe state level.48
CHALLENGES ANDUNDERLYING INFLUENCESThis section describes the main challenges andunderlying influences related to urban trans portinstitutions and governance worldwide. These havebeen organized below under four main categories,namely challenges of adaptation; administration andgovernance; mobility policy, plan-making, manage -ment and regulation; and resourcing and capacity-building. Even though the challenges are presentedbelow as separate themes, it is important to appre -ciate the interconnectivity among them. For example,the challenge posed by fragmented decision-makingapplies virtually across all themes.
Adaptation challenges
There is a slow-growing acceptance among govern -ments (and many other stakeholders) of the needto change institutions and governance if sus tain-able mobility goals are to be delivered. The accept-ance of this need for transformation varies greatly indifferent cultural and devel op ment contexts, andbetween countries, cities, as well as different levelsof govern ment. There are, however, major defi cien -cies in the establishment of this capacity for change,
and in understanding how to change. The trans -formation implies embracing a broad definition of‘governance’ and managing the demand for move -ment that favours vulnerable and dis advan tagedgroups and the environ ment.49
The increased globalization and politici -zation of the environ mental debate bringschallenges that can have major local manifestations.Where manifestations are negative this generatestensions, which have influenced the thinking ofmany urban mobility stakeholders, as well as thoseengaged in urban land-use policy and planning. Thereare many examples of urban transportation policydocuments that express what changes need to occurand how ‘smart growth’ can propel more sus tain ableurban mobility planning.50 The degree to which thishas resulted in action, however, has been limited dueto the resistance to change within many institutions.Successful implementation of programmes based onmore holistic thinking typically requires strongpolitical leadership. Without such leadership, aspira -tions of more holistic thinking tend to flounder.51
There is increasing recognition that the inte -gration of land-use and trans port planning isnecessary to ensure the efficiency of urban mobilitysystems.52 However, it is important to recognize thecommonalities as well as differences between thenature and roles of participants in both fields, as wellas the limits to integration possible between the two(Box 9.4).53 The issue is not so much the differencein perspective, but rather the influence and powerthat accompanies these perspectives and their abilityto affect outcomes. Consultations in land-use devel -op ments are more about proposed one-time changesof use, whereas changes to urban mobility tend totake place on a continuous basis. Land-use planningmay, as a result, require structural changes in institu -tional and governance frameworks of a more perm -anent kind than for urban transportation.54
In devel op ing countries, where urban landownership and management policy and participatory
There is a slow-growingacceptance amonggovernments . . .of the need tochangeinstitutions andgovernance ifsustainablemobility goals areto be delivered
Integration ofland-use andtransport planningis necessary toensure theefficiency ofurban mobilitysystems
182 Planning and Design for Sustainable Urban Mobility
processes are generally less well developed,55
there is typically a lack of consultation in both urbanland-use and mobility planning. There is, nonethe-less, an increased understanding of the close linksbetween urban mobility and land-use planning as aresult of the land-value impact of trans port infra struc -ture on land use.56 These circumstances call for amore holistic approach to urban mobility planning,irrespective of cultural and devel op ment contexts.
Administrative and governancechallenges
As earlier indicated, democratization, privatizationand decentralization have been the three mainchallenges to the institutional changes occurring in Eastern Europe during the last two decades.57 Theabandonment or gradual dismantling of previouscentralized decision-making and planning has trans -formed the functions of many key transportationinfra struc tures and services. Meanwhile, the earlierdominance of public trans port over private car usehas been reversed. This has spawned new urban -ization and motorization challenges at a scale not seenbefore. Similar devel op ments can also be found insome devel op ing countries. This has brought newchallenges reflecting changes in the types andinfluences of stakeholders involved in urban infra -struc ture devel op ments and provision of trans portservices. Together with the advance of privatizationand neoliberal influences, such devel op ments haveproduced more complex institutional decision-makingarrangements, particularly with regard to trans portinfra struc ture and service investment deliveriesassociated with private-finance initiatives andpublic–private partnerships.58
Urban growth generally results in cities spillingover beyond their original administrative boundaries– absorbing neigh bouring settlements in a greatermetropolitan area. The discussion in the previoussection illustrates the complications associatedwith urban administrative boundaries, when rail- and road-based trans port services extend wellbeyond city boundaries into their hinterland as inter -city carriers for passen gers and goods. Thus decision-making is not only fragmented as a result overlap-ping institutional responsibilities; it also faces major challenges in terms of horizontal coordina-tion between lower tier govern ments and, moresignifi cantly, in terms of vertical integration.59 Theidentifi cation of a lead authority to provide strategicdirection in decision-making is thus a pre-requisiteof coordinated action.
Changes in organizational arrangements ofagencies are frequently made to address urbanmobility challenges. Such changes are particularlymade when a new administration comes to power,either at the national or municipal level. These chan -ges, however, have too often acquired a reputation for
doing little more than ‘moving the boxes around’ on an organizational chart and renaming them. Thisnegative perception of organizational reform can be attributed to: a failure to improve organizationalculture; a failure in business processes; and a failurein staff skills devel op ment. To achieve effective organ -izational change, all three need to be tackled together.
Of all challenges confronted by efforts topromote integrated urban land-use and mobilityplanning, perhaps the most corrosive is a bias againstintegrated planning and management. This biasis encountered within many institutions (both publicand private). While it is apparent that joined-upthink ing and actions are prerequisites to the success -ful pursuit of sus tain able devel op ment outcomes,there is growing evidence to suggest that severetensions emerge in contexts that also promote neo -liberal free market ‘solutions’ to public domainproblems. This is because free-market advocatesfrequently view integrated planning and manage-ment as synonymous to top-down comprehensiveplanning and management – which restricts inno -vation and is potentially wasteful due to its non-competitive high transaction costs.
Mobility policy, plan-making, managementand regulatory challenges
The main streaming of the mobility needs of thesocially and economically dis advan taged is amajor challenge, and includes gender concerns, aswell as the needs of the disabled, the elderly,children and youth.60 As noted in Chapter 6, the challenges relate to their dependence on non-motor ized movement, their restricted access tomotorized public and private trans port (especially on grounds of affordability and their capacity restric -tions), their vul nerability to traffic accidents, and othersafety and security concerns. Addressing these issuesrequires extensive investigations to better ascertainthe nature, distribution and scale of these concerns,to provide a basis for deciding how best to improvethe future design, management and delivery of public trans port services, including for securityenforce ment.
The issue of how best to plan, manage,operate and regulate urban public trans port –and the extent this involves enterprise operatorfunctions for building the needed roads or railwaysor operating buses – is a major international chal -lenge, especially where non-nationalized models ofpublic trans port governance exist. Some stakeholdersadvocate that these enterprises must over time betransformed into self-sustaining businesses operatingon commercial lines.61 Other stakeholders, however,do not consider it desirable (or inevitable) that publictrans port should always be commercially operated,and look to a more welfare-orientated approachinstead.62
Privatization andneoliberalinfluences . . .have producedmore complexinstitutionaldecision-makingarrangements
The identificationof a lead authorityto providestrategic directionin decision-making is . . . a pre-requisite of coordinatedaction
Of all challengesconfronted byefforts to promoteintegrated urbanland-use andmobility planning,perhaps the mostcorrosive is a biasagainst integratedplanning andmanagement
1EEE234567891012311145678920123456789301234567894012345678950123456789EEEE
183Institutions and Governance for Urban Mobility
In addition to the kinds of formal urban publictrans port systems referred to above, informal public trans port services ply the roads of many (ifnot most) cities of devel op ing countries. While some urban institutional arrangements show someaccom modation toward informal sector operators, theculture of city officials throughout devel op ingcountries is typically dismissive of informal modesof mobility.This is despite the widespread prevalenceof poverty in cities with a large majority of inhabitantsfor whom these modes of travel are vital.63
Freight movement is critical to the economiesof all cities. There is thus an ongoing call for increasedprivate investments to address the needs of freightmovement, in terms of infra struc ture and operations.Although significant world-wide, such investment isparticularly important for cities with major portsand/or airline hubs in devel op ing countries and coun -tries with economies in transition, where global -ization has opened up many new opportunities.Private investment in freight movement has seenmajor devel op ments in information and communi -cations technologies, which in turn have spawneddramatic changes to logistic services in the continuedsearch to reduce costs.
A major challenge to freight movement inmetropolitan areas of devel op ing countries has to dowith the location of logistics facilities, and theunpredictability of changes to land uses resulting fromthe absence of land-use zoning protection of exist-ing logistic centres. This has led many freightcompanies to move their logistic facilities to theperiphery, where land is cheaper and more freelyavailable.64 Such devel op ments have contributed toa growing ‘logistics sprawl’ of freight logistic anddistribution centres.
Challenges of multi-modal integration arenumerous and varied in urban areas globally. Theyare exceedingly important with respect to provisionof efficient public trans port and freight movement.A common challenge for urban institutions is theintegration of the planning, management and opera -tion of railways with road-based public trans portservices and other traffic. A larger challenge for fast-growing cities in devel op ing countries is the moreurgent task of facilitating convenient rail-road inter -changes for peak commuter journeys and ensuringintegration of fares.
Inter-agency collaboration among the organ -izations responsible for the planning, managementand operation of various urban modes of trans port –and the city planning organizations responsible forland devel op ments – is also essential. Establishingsuch collaboration is among the most funda-mental challenges for municipal and govern mentauthorities, especially where silo-thinking too oftenprevails.
There is a clear need to main stream environ -mental concerns65 in institutional and govern-
ance frameworks for urban mobility.66 Transport andnon-trans port engineering and environ mental depart -ments tend to compete over resources, funding andfor pre-eminence within governance structures.While the main streaming of trans port disciplines isa useful premise within organizational restructuring,the trans port department is often part of a biggerengineering or environ mental department that hasother priorities to balance. In practice, trans port isoften given greater importance where there areparticular pressures on the availability or value of land that constrain the distribution of people andjobs/goods/services.
Resourcing and capacity-buildingchallenges
Perhaps the most pervasive challenge for urban trans -port institutions globally is the lack of sustainedfunding for transportation infra struc ture andservices – not least for the institutional infra struc -ture. Combined with a poor understanding of urbaneconomics and the complex interplay between infra -struc ture investment, land-use planning and thevalue that the ‘public good’ of efficient mobility canprovide, these challenges together can pose ‘wickedproblems’.67 As noted in Chapter 8, cities can be self-financing in transportation and other essential infra -struc ture if economic rent from land value-addedthrough investment in infra struc ture is captured bythe city and ‘recycled’.68 However, few cities comeclose to practising the theory. As a result, cities areforced to develop plans for public trans port improve -ments that depend overwhelmingly on the fare boxto finance fixed assets.
The devel op ment of information andcommunications technologies69 can enhance theperformance of the urban transportation sector. The fast-changing world of such technologies offersnumerous possibilities – primarily through theinternet and mobile communication – to help addressthe current lack of sustained funding for urbantransportation infra struc ture and services (Box 9.5).These tools, however, are too often poorly under -stood and/or present numerous technological andfunding challenges (especially initially) to manyconventional civic institutions, particularly in devel -op ing countries.
This remains an important challenge as theopportunity costs of not employing such tools mount.In recognition of the potential for urban trans portinstitutions of information and communicationstechnologies, the United Nations has sought topromote tools that can monitor urban land and infra -struc ture devel op ments (including land values) so asto enhance the ability of govern ment decision-makersto better plan, manage and finance future urbandevel op ment as part of online capacity-buildingefforts.70
Inter-agencycollaborationamong theorganizationsresponsible forthe planning,management andoperation ofvarious urbanmodes oftransport . . . is . . . essential
Perhaps the mostpervasivechallenge forurban transportinstitutionsglobally is the lackof sustainedfunding fortransportationinfrastructure andservices
Institutionalcapacity-buildingand training ofstaff in the urbantransport sectorare always critical,regardless of thelevel ofdevelopment
Planning and Design for Sustainable Urban Mobility184
Institutional capacity-building and trainingof staff in the urban trans port sector are alwayscritical, regardless of the level of devel op ment andthe gender of trainee.71 These efforts are frequentlyrequired for pilots of new planning and managementprocesses, so that teething troubles and difficultiescan be resolved before moving to their widespreadintroduction.
Institutional capacity-building typically seeks toaddress issues raised at the local level. In so doing,it frequently includes: the training of local pro -fessional and technical staff, as well as politicalleaders; facilitating political–professional dialogue;enhancing communications of the public sector with the private sector; and improving govern mentdialogue with local communities and the non-govern ment sector.
Cities in devel op ing countries and countrieswith economies in transitions have additional capacity concerns – related to a backlog of long-term and structural institutional-capacity short-ages.72 It should be noted that many deprived citiesin developed countries as well are in need of suchattention. Both contexts confront institutionalcapacity-building challenges with regard to theintroduction of new approaches and tools, many ofwhich are increasingly based on information andcommunications tech nologies. They are also con -fronted with challenges associated with theintroduction of a more holistic understanding of
trans port and urban devel op ment, as in the case ofefforts to operationalize the sus tain ability vision inthe urban trans port sector.
At the international level, enhanced globalinformation and communications technologies nowfacilitate knowledge-sharing and lesson-learning notonly from developed to devel op ing countries, but alsobetween devel op ing countries.73 The challenge hereis in making judgements about the appropriatenessof the knowledge acquired/shared from an overseassource to one’s own devel op mental circumstancesand aspirations.
However, it should be noted that when trainingand capacity-building are provided as part of foreignaid technical assistance, participants are frequentlynot up to the required level to receive the course,nor are they originally trained/educated to work inthe field of their employment. Further more, in manyinstances, particularly in devel op ing countries, it isthe wrong individuals that are being trained. The ones invited for training courses are not the ones thatare actually doing the work; and in some cases(particularly when funded by overseas agencies),attendance on training courses is seen as a fringebenefit and a means to access travel, extra allow-ances, etc. Moreover, course organizers are fre -quently not aware of the realities of the workingenviron ments of the trainees and the training courseis often inadequately designed to meet the real needsof the participants.74
The evolving frontier of web 2.0, social media, open sourcematerial and volunteered geographic information needs to beconsidered, addressed and potentially embraced with respectto the devel op ment of urban mobility systems. Until relativelyrecently, the public sector, the private sector, or a partnershipbetween the two, were responsible for planning, design,implementation and operation of urban mobility systems, withcivil society actors being consulted at times as a routine part of the process of planning or implementation. Engineers,planners, bankers, architects and urban designers were the‘professionals’ whose expertise informed transportationefforts.
Today, however, civil society groups and individuals arevocal advocates for, and increasingly consider themselves to be‘experts’ in, sus tain able mobility efforts. While geospatialmobility and logistics data are largely proprietary in nature,civil society groups and individuals request and sometimesdemand access to govern ment-owned data sets. Further more,crowd-sourced and/or volunteered geographic informationdata sets are now emerging as open source alternatives toproprietary and private data, and are increasingly seen as
having the potential to enhance the sus tain ability of urbanmobility systems.
Open source material is currently being used for non-motorized vehicle mobility planning in many cities around theworld to expand infra struc ture for walking and cycling and toimprove the conditions and connectivity of existing networks.Further more, groups such as ‘seeclickfix.com’ crowd-sourcetips on problems that need fixing in communities (includingmobility-related issues) and then direct feedback andcomments to local govern ments or agencies with the powerto fix these problems. Likewise, mobile applications such as‘Moovit’ help riders make public-trans port system-accessdecisions based on crowd-sourced data about systemeffectiveness, efficiency and temporary problems that mightcause delays or disruptions. Moreover, the World Bank, inpartnership with federal and local transportation agencies inthe Philippines, is piloting an open data system of public trans -port routes, schedules and fares.Source: Personal communication with Professor Pamela Robinson, Ryerson University,Canada. See also http://seeclickfix.com/; www.moovitapp.com/;http://blogs.worldbank.org/transport/open-data-urban-transport, last accessed 1March 2013.
Box 9.5 The potential of social media and open source material
When training andcapacity-buildingare provided aspart of foreign aidtechnicalassistance,participants arefrequently not upto the requiredlevel to receivethe course, norare they originallytrained/educatedto work in thefield of theiremployment
Institutions and Governance for Urban Mobility 185
1EEE234567891012311145678920123456789301234567894012345678950123456789EEEE
The achievements are attributed to the city administration’s:
• long-term city-wide vision and strategy;• competence across required areas to enable integration
of decisions and actions to implement (i.e. pricing andavailability of parking, integrated ticketing, infra struc ture,etc.);
• ability to build consensus with surroundingmunicipalities, gain political support and implementintegrated policies and plans, gaining the advantages of awide service area;
• capability to make intelligent choices regarding: theintegration of modes and the use of a wider set of mobilitypossibilities over and above the car, including bike-sharing,car-pooling and walking options (such as pedestrian-onlyzones);
• sustained investment in quality infra struc ture andvehicles, thus providing attractive alternatives to privatecar use;
• provision of a high-quality public trans port service atan affordable price.
Source: Allen, 2011b, pp15–17.
Box 9.6 Main causes for the sus tain able mobility planning achievements of Nantes, France
The city of Nantesin France is at theforefront ofsustainablemobility planning
POLICY RESPONSES ANDINNOVATIVE AND‘SUCCESSFUL’ PRACTICESThis section presents a selection of innovative andsuccessful institutional and governance responses tomany of the challenges discussed in the previoussection. It should be stressed, however, that eachexample cited does not necessarily incorporate allfacets of good practice, more likely only selecteddimensions.
Integrated urban land-use and mobilityplanning
It is often argued that integration – in terms of land-use and trans port planning and/or intermodalintegration – can only be achieved if the agenciesresponsible are themselves integrated into oneagency. However, in the case of Singapore, the mech -anism of cross-agency committees is used instead.This has been successful as ‘the Singapore Govern -ment as a whole is relatively integrated, with less ofthe departmental silos culture frequently seen inother national and city govern ments’ in the region.75
The integration is also achieved by virtue of a largepercentage of its land being in govern ment owner -ship. This permits the Singapore govern ment to ‘useland release strategically as a proactive means to guidethe implementation of [its] Concept and Land UsePlans’ and for any other uses deemed to be in thepublic benefit.76 These arrangements facilitate theacquisition of land around metro stations beforeconstruction. Singapore’s metro system has attracted70 per cent of trips of all motorized modes within25 years of its inauguration in 1987. This representsa major achievement that has been largely attributedto its effective institutional and governance arrange -ments.77
The integration of urban land-use and mobilityplanning functions is also well reflected in othercountries. In the city of Seoul (Republic of Korea)
for example, the institutional structure for land useand trans port is directed by the mayor, with trans -portation responsibilities overseen by a vice mayor(who heads the City Transportation Headquarters)and land-use planning overseen by another vicemayor (who heads the Urban Planning Bureau). Themayor has an additional third arm of governance (theManagement and Planning Office) that oversees andlooks to manage and plan the integrative aspects ofboth.78 In Japan, the national and regional institu -tional structure is especially conducive to the devel -op ment of rail-orientated urban devel op ment.79 Thisfalls under the overall responsibility of the Ministryof Infra struc ture, Transport and Tourism, whichincludes five departments responsible for urbantransport, including the Railway Bureau.80
In Canada, the regional governance models that facilitated the set-up of the TransLink in Van -couver;81 the transportation arms of the CapitalRegion Board in Edmonton;82 and Metrolinx for theGreater Toronto and Hamilton Area83 have beenapplauded. All of these authorities ‘encourage region-wide coordination of land-use and transportationplanning and decision-making’.84 This includesattempts to coordinate and integrate different modesof transport.85
The city of Nantes in France is at the forefrontof sus tain able mobility planning. This is largely dueto its long-term vision and commitment to anintegrated approach to urban planning and trans portover some 30 years (Box 9.6).86 Nantes’ approach toprovide an integrated network of multi-modal trans -port services has, to some extent, helped the citymanage the growth of private car use, simultaneouslyretaining a high level of mobility for its citizens andpreserving their quality of life. The city is also a goodexample of how an employer tax on public trans portprovision (versement transport) has been widelyemployed across France.87 The city has further morebeen a pioneer in drawing up urban mobility plans.88
The latest of these (2010–2020) ‘sets out trans portpolicy for the next ten years and thematic action plansare elaborated on topics such as public transport,
This institutional framework for Santiago de Chile has thefollowing characteristics:
• Profound political, economic and regulatory changes(particularly in terms of liberalization and privatization)in national governance that have taken place since the1970s have greatly limited the role of govern ment in urbanservices provision.
• A wide-ranging approach to the improvement of publictransportation has included new regulations for the bussystem with respect to, among other things, its levels ofservice.
• An extensive construction programme of urban andsuburban highways has been delivered via public–privatepartnerships.
• The city-wide Transantiago programme introduced a busrapid trans port system that has become a centrepiece ofintegrating the city’s overall public trans port system.
• Although there has been strong technical and institutionalcapacity-building within the involved organizations, theaccumulated experi ence has unfortunately not resulted inentirely successful implementation. This is primarilyattributed to limitations within the institutions involvedand issues of governance relating to, among other things, the integration of land-use and urban trans portdevel op ments.
• There is an almost total compartmentalization betweenorganizations in the city, leading to problems ofcoordination. This has limited the institutional capacity for integrated management in urban trans port and landuse. It has also encouraged a tendency toward ‘reactivemanagement’ providing a context where decisions arepredominantly taken by a national authority.
Source: Figueroa and Rodriguez, 2011.
Box 9.7 Institutional framework for urban mobility in Santiago de Chile
186 Planning and Design for Sustainable Urban Mobility
Greaterawareness of therights of urbanresidents canpositivelyinfluence thegovernancestructures ofurbantransportation
non-motorized trans port . . . parking, traffic and roadsafety and inter- and multimodality aspects’.89
Privatization, decentralization andcentralization
In Chile, and in some other South American coun -tries, there is evidence that greater awareness of therights of urban residents can positively influence thegovernance structures of urban transportation.Citizen participation has played a role (to varyingdegrees) in a number of major urban public trans -port devel op ments in the region, including the Trans -Milenio (Box 7.7 and Box 9.12) and Tran santiagoprojects. The characteristics of the innovative insti -tutional framework established for the latter areoutlined in Box 9.7. Notwithstanding the innovativeideas behind this initiative, however, it has beenargued that the resultant institutional archi tecturehas become weak and predominantly reactive ratherthan proactive, with decisions taken mainly by centralgovern ment. This has partly been explained by thefact that there is no mayor with jurisdiction over alldistricts of the city and that Transantiago staff arenot public officials, and mainly work on short-termcontracts with no clear individual responsi bilities.90
The institutional and governance framework forurban trans port in Barcelona, Spain, is innovative inthat it allows a mix of public and private public trans -port operators to operate in the metropolitan area.Apart from cities in Scandinavia, Barcelona is one ofthe few cities in Europe where public and privateoperators coexist within the same jurisdiction. Such ‘mixed systems’ are believed to be capable ofincreasing competition in the local market, providingbetter information on costs, and ensuring that govern -
ments can guarantee a fail-safe service or reverse itsprivatization decision if contracts fail. Under thesearrangements, Barcelona has made it possible to out-source bus services in certain municipalities, eventhough the transportation authorities in the centreof Barcelona have chosen to retain delivery of theirservices. The main shortcoming of this model, how -ever, is that the public trans port provider (TransportsMetropolitans de Barcelona) retains a great deal ofautonomy from the regulator (Metropolitan Entity ofTransport), which makes it difficult to regulate theformer.91
Barcelona is also providing a good example of how to enhance public participation, with its‘mobility pact’ between the main stakeholders in thetrans port sector (Box 9.8). This initiative has sincebeen copied in a number of other cities. Barcelona’smobility pact encourages participation by all actors inthe field of urban mobility in Barcelona, and relatedactivities are canalized in both formal and informalways. Several newspapers do for example publish dailycolumns on mobility-related problems in the sectionon ‘letters from our readers’, often with a photo, withan oppor tunity for the responsible institution(s) torespond.
The city of Amman, Jordan, provides an exampleof a successful decentralized model of institutionaldevel op ment and governance for the urban trans portsector, due to its multi-stakeholder structure.92
The Greater Amman Municipality is responsible for policies and transportation system stewardship.At the national level, the Ministry of Transport isresponsible for all intermediate and long-term plansand studies, while the Public Transport RegulatoryCommission is responsible for public transportation.This Commission is affiliated with the Ministry of
In 1998, the City of Barcelona defined a ‘mobility pact’ amongits 62 mobility-related stakeholders (i.e. users, operators,manufacturers, providers, etc.). What started as media-oriented performance and a ‘politically correct’ initiative hasturned out to be a great tool to reach agreements andconsensus about priorities for how to use the city’s limitedstreet space. The initiative involves thematic meetings, twoannual general meetings (with the presence of the mayor) andfollow-up of key performance indicators.
The ‘ten commandments’ of the mobility pact are:
1. High-quality, integrated public transport.2. Maintain traffic speeds and improve the speed of surface
public transport.3. Increase the surface area and quality for pedestrian use.
4. Increase the number of parking spaces and improve theirquality.
5. Improve citizens’ information and road signals and signs.6. Legal regulations to be suited to the mobility of the city of
Barcelona.7. Improve road safety and respect among users of various
trans port modes.8. Less polluting fuels, and reduce air and noise pollution
caused by traffic.9. Promote the use of bicycles.
10. Efficient and orderly distribution of goods and productsthroughout the city.
Sources: Ajuntament de Barcelona (not dated); and personal communication withProfessor Francesc Robusté, Centre for Innovation in Transport (CENIT) andTechnical University of Catalonia.
Box 9.8 Social participation in decision-making: The ‘mobility pact’ in Barcelona, Spain
The positive aspects of institutional devel op ment andgovernance in Hanoi include:
• The creation of a single local govern ment area by theextension of the administrative boundary to create a‘Greater Hanoi’, which includes all areas likely to undergourbanization up to 2050.
• The establishment of a Department of Transport bybringing together most functions of urban trans port withinGreater Hanoi in a single agency.
• The introduction of strategic planning, thus reflectingthe decision of the central govern ment to decentralizeresponsibility for the preparation of construction masterplans for Hanoi.
• The intention to establish a public trans port authorityto be responsible for all aspects of public trans port inHanoi, and to undertake studies to clarify the roles andresponsibilities of this authority.
However, a number of issues still remain to be addressed,including:
• adopting enabling legislation for decentralization;• undertaking institutional devel op ment of the Department
of Transport;• providing resources for training and capacity building in the
trans port sector;• establishing a more integrated sector-wide approach to
meet the challenges facing trans port institutions.Source: Phin and Dotson, 2011, pp14–15.
Box 9.9 Institutional devel op ments for urban mobility in Hanoi, Viet Nam
1EEE234567891012311145678920123456789301234567894012345678950123456789EEEE
187Institutions and Governance for Urban Mobility
Transport but has its own finan cial and administrativeindependence.93
In contrast, a centralized model of institutionaldevel op ment and governance for urban trans port isshowing promise in Viet Nam. A relatively simple lineof authority between national and local govern menthas helped the establishment of strong city-widetrans port authorities of the kind recently proposedfor Hanoi (Box 9.9). The city offers good illustrationsof progress toward good practice (albeit slowly) ininstitutional devel op ment and governance in urbantrans port policy-making, land-use/trans port strategicplanning and in public trans port planning andmanagement.
Addressing urban boundarycomplications
As noted earlier in this chapter, Auckland, NewZealand, has recently seen the implementation of afar-reaching reorganization of its governing structure.As a result, a new council-controlled organization,Auckland Transport, was established in November2010, working under the new amalgamated AucklandCouncil. The new organization combines the exper -tise and functions of eight former local and regionalcouncils and a regional trans port authority (ARTA).All trans port functions and operations in Aucklandare now the responsibility of one organization.94
The establishment of Auckland Trans port assumesthat ‘the Long-Term Council Com munity Plan andDistrict Plan will continue to guide Auckland Council
A centralizedmodel ofinstitutionaldevelopment andgovernance forurban transport isshowing promisein Viet Nam

State climate action plans: As of April 2010, 33 US stateshad developed state climate action plans, with several othersin the process of doing so. Some have been formally adoptedby the respective governor or state legislature; others wereprepared as reports without any official action being taken.Many state departments of trans port have developedstrategies or policies for implementing the transportationelements of these plans. Yet others are taking a range ofadditional actions to reduce greenhouse gas emissions.
Local govern ment climate activities: Nearly 800 mayorshave signed the US Conference of Mayors Climate Protection
Agreement, agreeing to reduce greenhouse gas emissions to atleast 7 per cent below 1990 levels by 2012.
Climate planning by metropolitan planning organizations:Many metropolitan planning organizations, especially largerones, are analysing greenhouse gas emissions fromtransportation in their metropolitan areas, devel op ingtransportation greenhouse gas inventories and baselineprotections, as well as identifying possible strategies to reducegreenhouse gas emissions from transport.Source: AASHTO, 2012.
Box 9.10 Climate change activity at the state level, US
decision-making, pending decisions on a spatial planand infra struc ture investment plan.’ These newarrangements anticipate that ‘local boards will havean advisory role in identifying local service needs anda budget for planning and ‘place-shaping’.95
The decision that the local authority trans portnetwork for Auckland is best managed as a singlenetwork by Auckland Transport was premised on thebelief that it will provide a level of focus that couldnot be provided by the full Auckland Council withits multiplicity of responsibilities. The governanceframework allocates the main trans port roles toAuckland Transport with Auckland Council beingresponsible for its long-term council communityplan. This establishes council trans port funding forthe Auckland Transport, while the Auckland regionalland trans port strategy sets out the trans portoutcomes that the region wishes to achieve over a30-year period. Under these arrangements, AucklandTransport is responsible for planning and deliveringlocal ‘roads and footpaths . . . parking and train, busand ferry services’,96 including the preparation of theAuckland regional land trans port programme, whichsets out the trans port projects anticipated over thenext three years.
Continued urban growth in Stockholm, Sweden,has provided the impetus for the formation of a singleregional trans port body, Storstockholms Lokaltrafikin 1967. This agency assumed the public trans portresponsibilities that had been previously distributedamong individual municipalities. The integration ofservices and tariffs was a primary goal of this institu -tion – with bus, metro, regional rail, and ferry servicesall procured for the city by Storstockholms Lokaltrafik.Owned by the Stockholm City Council, Storstock -holms Lokaltrafik is the parent company for fouroperating companies, two dormant subsidiaries andsix associated companies. The organization’s activitiesinclude providing:97
• an operational ‘overview’ of the region’s publictrans port system and services;
• an overall service quality of the region’s publictrans port system and simultaneously beingresponsible for the supervision of maintenance;
• initiatives for the devel op ment of the system;• services for the purchases and procurements of
the region’s public trans port system.
Mobility policy, plan-making andmanagement
The State of Victoria, Australia, offers a good exampleof promoting institutional system integration and sus -tain ability for urban mobility through its recentlegislative reforms spawned by the State of VictoriaTransport Integration Act of 2010.98 Whereas Vic -toria’s urban trans port governance was in the pastdispersed among different parties with differingobjectives and interests, preventing the recognitionof the interconnected nature of trans port and landuse, the Act provided a common state policy frame -work. This framework seeks to:
• unify all elements of the trans port portfolio toensure that trans port agencies work togethertowards an integrated and sus tain able trans portsystem;
• recognize that the trans port system needs to besus tain able in both economic, social and environ -mental terms;
• enable the trans port system to be conceived andplanned as a single system rather than as separateor competing trans port modes;
• provide a universal framework for integrated andsus tain able trans port policy and operations;
• integrate land-use and trans port planning anddecision-making by extending the coverage of theAct to land-use agencies whose decisions arelikely to have a significant impact on the trans -port system;
• align the charters of trans port agencies with theoverarching policy framework to increase themodal share of public transport.
188 Planning and Design for Sustainable Urban Mobility
1EEE234567891012311145678920123456789301234567894012345678950123456789EEEE
189Institutions and Governance for Urban Mobility
EU’s plans tointroduce aframework for thepreparation ofurban mobilityplans are amongthe mostinnovativemeasures topromoteinstitutionaldevelopment andgovernance withinthe urbantransport sector
Hong Kong,China, is alreadyundertaking asystematicmonitoring andenforcement,against very clearrequirements andgoals with respectto the mobilityrights of thedisabled
Main streaming environ mental concerns
Although the Federal Govern ment of US has notenacted climate change legislation, there is a greatdeal of climate change activity at the level of thestates. These reveal significant advances being madethat perhaps defy the international impression of theUS federal govern ment’s negative attitudes to theclimate change agenda (Box 9.10).
In the UK, London ‘considers itself an exem-plar in moving towards a low carbon economy’. Itviews sus tain ability ‘primarily as an environ mentalquality with reductions in [carbon dioxide] and localpollutants being the major objectives’.99 In order toreduce its greenhouse gas emissions, London hasfocused on ‘investment in higher density devel op -ments and the use of trans port devel op ment areasat key interchanges that are public trans portaccessible. It is now considering alternative fuels andhas taken the lead in investing in an electric vehicleinfra struc ture, in cycle hire schemes and in cyclehighways’.100 Major infra struc ture investment is seenas a significant part of the Mayor’s 2010 TransportStrategy, in order to enhance the capacity and con -nectivity of the capital’s public trans port systemfollowing a history of underinvestment.101
Main streaming mobility needs of thesocially and economically dis advan taged
The EU’s plans to introduce a framework for thepreparation of urban mobility plans are among themost innovative measures to promote institutionaldevel op ment and governance within the urban trans -port sector. This represents a major pan-Europeaneffort at promoting walking, cycling and public trans -port in urban areas. The European Commissionrecommends:102
• the establishment of procedures and finan cial-support mechanisms at the European level forpreparing urban mobility audits and urban mobilityplans;
• the examination of the possibility of a mandatoryapproach to such plans for cities of a certain size;
• the linking of EU regional devel op ment andcohesion funds to cities and regions that havesubmitted a current, and independently validated‘urban mobility performance and sus tain abilityaudit’ certificate;
• the examination of the possibility of a Europeansupport framework for a progressive imple -mentation of urban mobility plans.
South Africa’s efforts to promote urban mobilityplans since 1999 do in some respects reflect thesedevel op ments in Europe.103 The ‘Moving SouthAfrica’ Project attempted to develop a strategicframework for trans port in the country. It called fortransparent decision-making, funding and pricing for
the trans port sector and looked to the reorientationof trans port towards customer needs. The govern -ment’s role was to provide a clear vision, the estab -lishment of strong institutions, the setting of clearrules for reinforcing the vision, the devel op ment ofhuman capacity, and the measuring and monitoringof performance. The project considered customersof the South African (urban) ‘trans port system to be disempowered and weakly organized’. It also con siders ‘the upgrading of customer power [as] aprecondition for improvement to the trans portsystem’.104
Another innovative international measure that has the potential to impact urban trans port institu -tional devel op ment and governance is initiatives toincrease the engagement of youth. With this in mind,the Youth for Public Transport Group was set up as part of UITP’s Youth Project.105 ‘The group was formedto recognize innovative public trans port projects thatinclude youth and to start a dialogue between youthgroups and govern ment through more formal mech -anisms so that young voices can be heard’.106 Yet,another initiative in this area is the Tanzanian initiativeto introduce a regulatory frame work and a ConsumerConsultative Council to repre sent the interests of allpublic trans port users (includ ing the disabled).107
Hong Kong, China, is already undertaking a system-atic monitoring and enforcement, against very clearrequire ments and goals with respect to the mobilityrights of the disabled.108
Addressing freight movement needs
The city of Paris has employed an explicit trans portpolicy for freight since the early 2000s, and haspromoted a Charter for freight movement (Box 9.11). Notwithstanding some disappointments, ‘Pariscan be considered one of the most active Europeancities in the field of urban freight management’.109
Some ‘two-thirds of shipments coming in and goingout of the metropolitan area of Ile-de-France gothrough a regional terminal in order to be transhippedand reorganised’,110 demonstrating the strategic roleof logistics terminals in large metropolitan areas.
The ‘National Programme for Freight in Cities’established by the French Ministry of Transport in 1993 carried out surveys of freight movement inFrance and established a database for urban freightdemand in the entire country. Based on this inform -ation it built a simulation model of future move-ments. A second phase of the surveys started in 2010. The surveys revealed the characteristics of‘logistics sprawl’ and that freight trans port generatesa large proportion of local transport-based pollu-tion in Ile-de-France. As a result, in 2011 the city of Paris was designated as one of six ‘zones for priority’to address air pollution produced by commercialvehicles, targeting especially the restriction of accessby old commercial vehicles.111
Planning and Design for Sustainable Urban Mobility190
Since 2001, urban goods transport, long neglected in Paris’mobility policies, has been brought to the municipal agenda aspart of a new approach in trans port planning, with the mainaim of alleviating the negative environ mental impacts of freightmovement.
In 2002 a consultation brought together the deputymayor with the various freight trans port stakeholders – as wellas rail operators, energy providers and other public agencies –with a view to informing each other of their respectivechallenges and priorities. In 2006, as a result of theseconsultations, a Freight Charter was signed by all parties.While not a legally binding document, it identifiedcommitments made. The most salient of the conclusions ofthis charter were that it:
• declared that consultation helped defuse conflicts beforethey break out, between parties that (previously) usuallynever met;
• introduced enforcement of truck access and deliveryregulations;
• highlighted the land scarcity for logistic activities, especiallyin the inner suburbs;
• suggested that experimenting with new forms of citylogistics organizations is an effective way of spreading newideas:
• concluded that the relevant jurisdiction for policies isregional rather than local given that freight flows traverseall local boundaries.
Source: Dablanc, 2011, pp8–10.
Box 9.11 The Freight Charter, Paris, France
Public trans port planning and servicedelivery
The TransMilenio system provides mass public trans -port services – in the form of a BRT system – for thecity of Bogotá, Colombia. It not only provides strat -egies to improve public trans port but also seeks torecuperate public space, discourage the use of carsand encourage cycling (Box 7.7). Devolving powerfrom national to newly created city govern ments with directly elected city mayors was an importantprecondition for TransMilenio (Box 9.12). A 1998law created a public entity with a mandate to manage,plan and control passen ger urban trans port servicesin the metropolitan area of Bogotá.112 By this law,the state builds and maintains the infra struc ture,while private companies acquire and operate thefleets of buses and other public trans port vehicles.TransMilenio itself has no contracts with theseoperating companies. Instead, the municipal authorityplaces the contracts and TransMilenio provides the
management service for infra struc ture (includingcycle paths) and trans port operations. The formalinstitutional link between TransMilenio and Bogotá’smunicipal authorities means that the influence ofcitizens (as users of transport) is strong. The resultis that there is ‘political leadership and authority to make the appropriate decisions necessary toimplement the trans port system’.113
Numerous institutional arrangements have alsorecently been set up in India to deliver and operateBRT systems, including in Ahmedabad whereAhmedabad Janmarg Ltd. was constituted to run/operate the system. While the Ahmedabad MunicipalCorporation remains the chief executing authorityof the system, the ‘use of local expertise in lieu ofinternational consultants not only ensured respon -siveness to local conditions and technology transfer,but was also effective in keeping cost low’.114 Withstate and national level support provided through asteering committee under the State Urban Devel op -ment and Urban Housing Ministry, together with
Colombia carried out an ambitious decentralization processin the mid-1980s, whereby mayors and governors previouslychosen by the president of the republic have since beenelected by universal suffrage and have become the authority incharge of the principal economic, social and environ mentaldevel op ments of their territory. These devel op ments werefacilitated by legislation introduced in the early 1990s that, inthe case of Bogotá, provided for a new organization to be setup (the Distrito Capital) giving more autonomy to theexecutive power (the mayor) and contributing to a betterfiscal organization. The ‘Territory Devel op ment Law’,introduced in 1991, sought to harmonize former legislation,instructing every municipality and district in Colombia toautonomously develop long-term plans.
In Bogotá, the mayor of the Distrito Capital was givenwide responsibilities in policy and planning, and in the devel op ment of projects in land use, transportation, health,environ ment, education, public services as well as otherrelevant domains, on the understanding they were consistentwith legal frameworks defined at a national level.
Enrique Peñalosa (who was mayor 1998–2001) oversawthe devel op ment of the TransMilenio BRT system, whichcommenced operations in 2000 (Box 7.7). Following itssuccess, mobility plans were prepared for Bogotá and itsregion in 2006. These built on many of the ideas and visions ofthe TransMilenio, and ensured complementarity andconsistency with the overall land-use plan.Sources: Bocarejo and Tafur, 2011; EcoPlan, 2000.
Box 9.12 Land-use and trans port planning, Bogotá, Colombia
The formalinstitutional linkbetweenTransMilenio andBogotá’smunicipalauthorities meansthat the influenceof citizens (asusers of transport)is strong
Institutions and Governance for Urban Mobility 191
1EEE234567891012311145678920123456789301234567894012345678950123456789EEEE
finan cial and other incentives at the national level,this strong political commitment across several levelsof govern ment was instrumental to the imple -mentation of the project.
As in the case of the Janmarg BRT, the Delhimetro was financed from multi-tiered funds andplanned as an integral part of a larger multi-modaltrans port system. It similarly enjoyed widespreadpolitical support in central govern ment, even thoughthe larger scale of the Delhi project presented greaterchallenges. What is most significant about theinstitutional arrangements for this project is that itis being promoted as a viable public trans port modelfor other South Asian cities.115
The rail-oriented urban devel op ment strategyemployed throughout Japan is also interesting. Thisis supported by national and city govern ments,promoted by influential private rail companies andreinforced by the country’s govern ment. The railcompanies are part of large Japanese commercial andindustrial consortia that also have real estate andretailing interests, as well as construction and bankinginterests. These seek to take advantage of land devel -op ments around stations so as to ensure maximumuse of their rail networks. They do this by acquiringlarge areas of land along proposed rail extensions priorto any devel op ment. Japan’s rail-orientated devel op -ment strategy has especially benefited from thecountry’s land readjustment programme. Here irreg -ular patterns of agricultural land holdings were in thepast rearranged into regular building plots andequipped with basic urban infra struc ture, with a smallpercentage of each landowner’s holding providingland for roads and parks to cover the costs of theproject.116
Throughout the US, the perception of urbanpublic trans port is largely poor. The improvement ofthe image and performance of this mode of travelthus has major governance dimensions. In responseto this, new investments have been made in light railand BRT, especially in some of the smaller but rapidly
growing cities, such Portland, Oregon and Salt LakeCity, Utah. In the case of Portland (Box 9.13), govern -ance of land use and trans port policy have beenemployed as twin pillars for the creation of additionalcapacity and as a stimulus for growth.
Multi-modal integration
The city of Stockholm and its surrounding region areregarded as having one of Europe’s best public trans -port systems. Together they are renowned for theirprogressive approaches to integrated urban land useand trans port planning, and multi-modal integration,with its public trans port services being of specialinterest to those concerned about sus tain able urbanmobility.117 The current devel op ment plan for theStockholm region foresees a polycentric structure ofseven new ‘cores’ for urban growth, with public trans -port recognized as key to meeting the increasedmobility demands spawned by these new growthcentres (Figure 5.16).118 It is envisaged that thesecores will eventually function as independent multi-modal urban trans port hubs that will enhance theoverall efficiency of the utilization of transportationand land use within the region.
To enhance multi-modal integration of passen -ger services, in August 2012 StorstockholmsLokaltrafik appointed Deutsche Bahn Arriva to pro-vide a new regional trans port service that involvesplanning and operating an integrated and complexsystem of bus and rail. This is the largest multi-modal trans port contract of its kind in Sweden, andafter implementation of the second phase of the con -tract119 it is estimated that these services will carrysome 94 million passen gers per year.120
There are also some encouraging devel op-ments in some African cities where metropolitantrans port authorities have recently been establishedto integrate the governance of disparate modes. An exam ple is the establishment (in 2002) of theMetropolitan Area Transport Authority in Lagos
Strategy to improve public transport: As part of a broaderstrategy for Portland, a light rail system – comprised of 38closely spaced stations – has increased walking trips andreduced the demand for parking.Revenue earning system to finance the project: To helpfinance the project, city parking charges were increased, andthe city issued bonds backed by future parking revenuespredicted to raise US$28.5 million. Property owners along theline also agreed to form a ‘local improvement district’ thatlooked to generate a further US$10 million, while a taxincrement and mix of other sources generated another US$11 million.
Accompanying urban revitalization strategy: The PortlandDevel op ment Council was set up to stimulate the privatemarket by investing – prior to the project – in new housing,commercial opportunities and open space in locations near thelight rail stations. This permitted the city to leverage publicimprovements necessary to support a more balanced, higherdensity devel op ment that in turn generated a significant streamof tax revenue.
Source: Ong et al, 2010, pp97–98.
Box 9.13 Institutional and governance framework in support of light rail in Portland, Oregon, US
Japan’s rail-orientateddevelopmentstrategy has . . .benefited fromthe country’s landreadjustmentprogramme
There are . . .some encouragingdevelopments insome Africancities wheremetropolitantransportauthorities haverecently beenestablished tointegrate thegovernance ofdisparate modes
Planning and Design for Sustainable Urban Mobility192
(Nigeria) (Box 9.14), and (in 1997) the ExecutiveCouncil of Urban Transport in Dakar (Senegal) (Box9.1).121 In Abidjan (Côte d’Ivoire), in 2002, a stateboard (AGETU) was established for the managementand coordination of public transport, with themanagement of the mini buses and taxi licencesamong its principal tasks. This organization has,unfortunately, from the outset been hampered by itsconflict with the municipalities of Abidjan who havebeen reluctant to transfer the funds obtained fromthe fees and taxes levied on shared taxis.122
Other cities have also made – or are in the pro -cess of proposing – important changes to their publictrans port and mobility systems. The municipality ofMontevideo, Uruguay, has since 2005 sought totransform its public transport, freight and commercialdevel op ments to offer greater connectivity to ports,airports and rail termini, simultaneously emphasizingthe importance of non-motorized movement.123
Similarly, the city authority of Rosario, Argentina, hasafter a ten year experi ence in strategic planningdecided to strategically invest in pedestrian accessto public trans port services and cycle routes. It hasalso imposed tight parking controls. This demon -strates how small cities can function in the broaderterritorial context.124
Sus tain able funding
Like Singapore, Hong Kong (China) is widelyconsidered to have a successfully organized andsustained funding of its urban trans port system. Theingredients of Hong Kong’s success can be attributedto its progressive trans port policies maintained over the last 30 years; its ‘effective regulatory andco-ordination mechanisms that subjugated allagencies and trans port operators to basic policyobjectives’, and finan cial discipline maintained by all under takings, both privately owned or run oncommercial lines.125 As noted in Chapter 8, HongKong’s metro projects have always been self-finan cing, due to its successful policy of value capture,
made possible thorough a full integration of land-useand trans portation planning. The income generatedby the MTRC from its highly profitable rail-orientatedproperty devel op ment, together with its fare-boxrevenues from the very high patronage levels itsservices enjoy, makes MTRC one of the few profit -able railway companies in the world.126
Mainland China has retained state ownership ofland, which has enabled its urban public authorities– as in the case of Hong Kong and Singapore – tocapture far more of the land-value increases asso -ciated with transportation and other urban infra struc -ture investments than in most cities elsewhere. Theadoption of land leases in China (generally of 70years) for urban transport-related mixed-use devel -op ments offers huge scope and potential for similarfinan cial rewards for the public sector. However, insome cases such rewards are not materializing at thescale expected. It has been suggested that this is dueto the excessively close links that have developedbetween some city mayors and leading entrepreneurs,involving non-transparent transactions and conflictsof interests.127
The mayoral supervision responsibilities pro-vide the mayor in Greater London (UK) with themandate and power to rapidly design and implementcongestion charging, which has both improved themobility into and through central London, and provedpopular at the same time.128 Further more, in March2012, the mayor was given the power129 to raisemoney for infra struc ture projects through the intro -duction of the community infra struc ture levy. Theserevenues will be charged on most devel op ments inLondon at differential rates depending on zones,ranging from £20 to £50 per square metre.130 Despitethese initiatives, however, the investment demandslook set to remain challenging due to a backlog ofinfra struc ture investment over the last 50 years.
In the face of such infra struc ture investmentchallenges, some national govern ments (principallyin developed countries) have established nationalagencies specifically assigned responsibilities for
The LAMATA project, funded by US$100 million of WorldBank credit in 2002, involves re-regulation of the informalsector, and using road rehabilitation as a lever and aninstrument to reduce poverty through employment on roadworks.
Public trans port service franchises have been introducedon roads improved by the project while other (non-franchise)operators are prohibited from using these roads.
On the institutional side, the project has helped tocreate a regulatory authority (LAMATA), with a finan cialcapacity through a new Transport Fund. The fund is fed by
budget transfers from the Lagos state govern ment, and a share of road user charges.
No provision has been made to seek street spaceexclusivity for public trans port vehicles, reflecting a soberassessment of what was ‘politically feasible’.
The project design is unusual in that investments in onemode (road infra struc ture) are used to leverage regulatorychanges for another mode (public trans port services). This waspossible because the client govern ment (Lagos state) hasjurisdiction over both modal systems.Source: Mitric, 2008, p50.
Box 9.14 The Lagos Metropolitan Area Trans port Authority (LAMATA), Nigeria
Hong Kong . . . iswidely consideredto have asuccessfullyorganized andsustained fundingof its urbantransport system
In the face of . . .infrastructureinvestmentchallenges, somenationalgovernments . . .have establishednational agenciesspecificallyassignedresponsibilitiesfor the planning,appraisal andfunding of criticalinfrastructure
Institutions and Governance for Urban Mobility 193
1EEE234567891012311145678920123456789301234567894012345678950123456789EEEE
Infra struc ture Australia is a statutory body, established underthe Infra struc ture Australia Act of 2008. It advises govern -ments, investors and infra struc ture owners on a wide range ofissues that include:
• Australia’s current and future infra struc ture needs;• Mechanisms for financing infra struc ture investments;• Policy, pricing and regulation and their impacts on
investment and on the efficiency of the delivery, operationand use of national infra struc ture networks.
Infra struc ture Australia’s focus is on assisting Australiangovern ments to develop a strategic blueprint for unlockinginfra struc ture bottlenecks and to modernize the country’seconomic infra struc ture. Infra struc ture Australia reportsregularly to the Council of Australian Govern ments throughthe Federal Minister for Infra struc ture and Transport. Infra struc ture Australia has 12 members, appointed by theFederal Minister for Infra struc ture and Transport.
Source: Infra struc ture Australia, 2011.
Box 9.15 Functions of ‘Infra struc ture Australia’
The challenges ofurban mobilitysystems can onlybe addressed ifthey are seen aspoliticalchallenges,requiring politicalconsultation,decision andimplementation
Participation andconsultationshould also beextended toinformal sectortransportoperators (andtheirorganizations)
the planning, appraisal and funding of critical infra -struc ture, including major urban trans port schemes.In Australia, for example, ‘Infra struc ture Australia’,provides advice to the Treasury on budget prioritiesand allocations in major infra struc ture investments(Box 9.15) and how best to engage with the privatesector in financing such projects.
CONCLUDING REMARKSAND LESSONS FOR POLICYThe challenges of urban mobility systems can onlybe addressed if they are seen as political challenges,requiring political consultation, decision and imple -mentation, as opposed to seeing them as purelytechnical challenges requiring the ‘right’ technicalsolutions. Thus, urban governance and related insti -tutional and regulatory frameworks are at the heartof devel op ing sus tain able urban mobility systems,and, indeed, sus tain able cities. The primary purposesof such frameworks should be to remove obstaclesto the effective participation of all stakeholders inthe decision-making process; ensure that informationemployed to support urban trans port proposals iscomprehensive, accurate, impartial and transparent;and facilitate effective implementation of politicaldecisions.
The devel op ment of effective urban governanceand institutional frameworks is a complex issue.There are no universal solutions. However, this doesnot imply that the identification of ‘good practice’ isfutile. Urban trans port agencies and related organ -izations need to be aware of lessons of urban mobilityplanning ‘successes’ (and ‘failures’) from elsewhere(and other times). Further more, the concept of sus -tain able devel op ment is increasingly acknowledgedas a key determinant of funding by internationaldevel op ment agencies in their dealings with localdecision-makers. Thus, it is expected that the‘success’ in attracting external funding to achievemore sus tain able outcomes in urban trans port will,over time, lead to a spreading of good practice.
The institutional architecture for urban trans portplanning interventions and investments shouldfacilitate holistic thinking and integrated actionsconsistent with strategies for sus tain ability. Thus, anddue to their high costs, ad hoc, short-term, politicallyexpedient decision-making should be avoided. Inpractice, political champions have played a criticalpart in creating integration in urban governance.Strong political leadership does play an importantpart in the planning and delivery of major trans portinfra struc ture projects in particular.131 It is importantthat such leadership is transparent and account -able, to ensure that it doesn’t become personal andtransitional. This may not only enhance people’strust in the institutions and governance structures,but also ensure that these do not collapse once theirchampion leaves office.
The objectives, political will, processes andeffectiveness of public engagement undertaken byurban trans port organizations are context dependent.Without effective participation, proper stakeholderinfluence cannot be brought to bear. Measures needto be introduced that ensure that the mobility needsand ‘accessibility rights’ of vulnerable and dis ad -vantaged groups are addressed. Participation andconsultation should also be extended to informalsector trans port operators (and their organizations),in particular due to their essential role in providingaffordable mobility options for low-income groups inmost devel op ing countries.
In urban areas where no single governanceauthority exists, this has proved a major impedimentto integration in the field of urban transport. Thedevel op ment of sus tain able urban mobility systemsrequires a matching of authority with territory.‘Effective’ institutions for governing integrated trans port systems require empowerment that per-mits them to execute their responsibilities withintheir designated area boundaries. Evidence suggeststhat if institutions are matched to location – cir -cumstances that encourage public trans port systems,political insti tutions, existing policy frameworks,etc., to evolve in a mutually supportive manner – thetask of integration is largely a matter of operational
NOTES1 Hudson and Lowe, 2004, p149.2 Imran, 2010; Low et al, 2003.3 Huzayyin, 2002.4 Dotson, 2011.5 Marshall and Banister, 2007.6 Nantes Métropole.7 Autorité Organisatrice de la
Mobilité Durable.8 Allen, 2011b, p5. See also Box
9.6.9 GLA, 2010.
10 See Schrank et al, 2012; andChapter 2. See also Chapter 7on the environ mental effects ofthis car dependency.
11 See, for example, Box 6.5.12 Replogle and Kodransky, 2010,
p1.13 The Intermodal Surface
Transportation Efficiency Act of1991 (ISTEA).
14 Cullingworth and Caves, 2009.15 Canadian Urban Transit
Association, 2010.16 Irwin, 2003, p2.17 CBC News, 2007.18 Sayeg, 2009, pp23–27.19 Glover and Low, 2004.20 McKinlay, 2011, p1. The
restructured Auckland Councilcame into being on 1 November2010. See also the section on‘Addressing urban boundarycomplications’ below.
21 Greater Wellington RegionalCouncil, 2009, p3.
22 Suchorzewski, 2011.23 See World Bank, 2002b, p2.24 Suchorzewski, 2011.25 World Bank, 1999b, piii.26 Suchorzewski, 2011.27 Pirie, 2011; Jirón, 2011; Jain,
2011; Pan et al, 2011; Chin,2011; Balassiano and Alexandre,2011.
28 Ministry of Transport, 1999.29 Godard, 2011b, p54.30 Ragheb, 2010; personal
communication with ProfessorAli Huzzayin, Cairo University,Egypt, in March 2013.
31 Figueroa and Rodriguez, 2011.32 Jirón, 2011, p2.33 Figueroa and Rodriguez, 2011,
pp6–7.34 Figueroa and Rodriguez, 2011,
p12.35 Jirón, 2011, p57.36 El-Geneidy et al, 2011, p40.37 El-Geneidy et al, 2011.38 Houpin, 2011, p96.39 Arora, 2011, p5.40 Jain, 2011, p38.41 These bodies were created by
govern ment – for cities withpopulations in excess of 1 million – to put in place orreview legal frameworks forurban mobility planning, provide overall urban trans portpolicy guidance and introducethe implementation ofregulations to facilitate localgovern ments to formulatepolicies, plans and programmesfor the sector.
42 Chin, 2011.43 In Jakarta, Indonesia, the
responsibilities for urban trans -port planning, financing anddevel op ment processes aredivided among the Ministry ofPublic Works, the Ministry ofHome Affairs, the National LandAgency, the Ministry of Tradeand Industry and the Ministry ofAgriculture and the NationalPlanning Agency (Susantono,1998).
44 Meakin, 2002.
45 Barter and Dotson, 2011, p8.46 Pan et al, 2011.47 Pan et al, 2011.48 Pan et al, 2011.49 See Chapters 6 and 7.50 See, for example, the set of
sourcebooks for policy-makerson urban trans port produced byGTZ (seehttp://www.sutp.org/index.php,last accessed 19 February 2013) and ITDP’s numerouspublications, especially thoseadvocating sus tain able urbantrans port promoted by BRTschemes (see http://www.itdp.org/library/publications/, lastaccessed 19 February 2013).
51 Failures to commit to urbantrans port as an ‘important’ part of policy-making are often attributed to politicalexpediency. Wheredemocracies exist, votes aresought, won and lost on ashorter timeframe than mosttrans port investments can yieldtangible benefits.
52 World Bank, 2011a, p4.53 See Grieving and Kemper, 1999;
ISIS, 2003.54 The integration of land-use and
trans port planning poses majororganizational concerns; such as ‘can traffic management belinked with trans port planninginto one institutional entity?’and ‘should this be within atechnical division (i.e. the CityEngineering Department) ratherthan with Highways Engineering(with the latter being an entityin its own right taking care ofroad expansion andmaintenance works)?’. There is
also the issue of different timehorizons: the long term(requiring strategic planning)and the short/immediate term(covering traffic management,public trans port (bus) planningand designs, as well as truckmovement management)(UNCHS, 1990). Further more,trans port devel op ments involvea category of ‘trans port serviceoperator’ (as distinct from‘user’), which is somewhatdifferent from the ‘owner’ and ‘occupier’ stakeholdercategorizations one finds withland-use changes.
55 UN-Habitat, 2009.56 See Chapters 5 and 8.57 See the discussion above on
conditions and trends in thesection on ‘Countries witheconomies in transition’.
58 Martin, 1993.59 World Bank, 2011a.60 See Peters, 2011; Frye, 2011;
McMillan, 2011.61 Such as the World Bank
(Dotson, 2011).62 Glover and Low, 2004. For a
discussion on differentgovernance models for publictransport, see PTUA, 2011.
63 Pirie, 2011, p6.64 Dablanc and Lozano, 2011,
pp11.65 See Chapter 7.66 Zegras, 2011.67 ‘Wicked problems’ describe
problems that are exceedinglydifficult or impossible to resolveon account of their incomplete,contradictory and changingfeatures that make themtypically difficult to identify
194 Planning and Design for Sustainable Urban Mobility
coord ination. Where there has been a history ofintense inter-agency competitiveness, the task ofintegration is far more problematic.
Experi ence indicates that there is a positiverelationship between effective integrated trans portsystems and jurisdictions that have experi ence indealing with ‘regional’ types of transport. Many of the cities with experi ence in dealing with issuesof regional governance have over time developedimproved multi-modal working relationships in thetrans port sector. Likewise, the extent of central -ization and the degree of effectiveness of urbantransportation institutions are very often positivelycorrelated to the detriment of sus tain able mobilityplanning. Thus – where ‘centralization’ representsthe extent to which each mode has its own organ -izational cultures, constituencies as well as powerfulinterest groups that benefit from a modal focus –organizations are frequently focusing on the interestsof the operator of a specific mode, rather than lookingto intermodal integration.
Effective institutional devel op ment and gov -ernance for urban mobility requires good land-useplanning, good public trans port planning and gooddemand management – designed wherever possibleto minimize the need to travel and to increase themodal shift toward public and non-motorized trans -port. To facilitate this, urban trans port and land-useplanning authorities require ongoing capacity-build-ing designed to keep abreast of key issues at all levels and for all sectors of the population. Despitethe increasing need for integrated land-use andmobility planning, most cities and countries stillseparate the functions of land-use and trans portplan ning at almost every level of govern ment. How -ever, the value of integrated policy-making, planningand management is increasingly being acknowledged,particularly (but not exclusively) in developedcountries.
The value ofintegrated policy-making, planningand managementis increasinglybeingacknowledged
and/or define. They areproducts of interdependentfactors that lead efforts to solve one dimension of a‘wicked problem’ to revealother problems (Churchman,1967; Rittel and Webber, 1973).
68 See Arnott et al, 1994; Shoup,2003.
69 Such as GPS, GIS, mobiletelephony, relational databases,computerized map displays,automated road-user chargingand enhanced digital infra struc ture systems.
70 Vickers, 2009.71 It is important to note that a
common ‘quick fix’ solution tothe absence of trainedprofessionals in devel op ingcountries – namely theimportation of foreignprofessionals to undertake thework at hand – is unsus tain able,as such professionals tend toleave with their skills once theircontracts expire.
72 Huzayyin, 1995.73 Dotson, 2011.74 Huzayyin, 1995. Such realities
have seriously hindered theefforts of many internationalagencies, such as the WorldBank (World Bank IndependentEvaluation Group, 2007).
75 Barter and Dotson, 2011, p8.76 Barter and Dotson, 2011, p8.77 Barter and Dotson, 2011.78 City of Seoul Govern ment,
2009.79 Pan et al, 2011, p43.80 See http://www.mlit.go.jp/en/
index.html, last accessed 19February 2013.
81 See http://www.translink.ca/en/About-Us.aspx, last accessed 19 February 2013.
82 See http://capitalregionboard.ab.ca/, last accessed 19 February2013.
83 See http://www.metrolinx.com/en/, last accessed 19 February2013.
84 Canadian Urban TransitAssociation, 2010, p11.
85 See for example Archdeacon,2008; Metrolinx, 2008.
86 As a result, the city of Nanteshas benefited from both nationaland international recognitionawards. The city was, forexample, the winner of theCIVITAS City of the Year award in 2009, and was namedas the European Green Capital for the year 2013 (Allen, 2011b).
87 See Box 8.6.88 A discussion of these plans is
included in the section on
‘Main streaming mobility needsof the socially and economicallydis advan taged’.
89 Allen, 2011b, p4.90 Figueroa and Rodriguez,
2011.91 Albalate, et al, 2012.92 El-Geneidy et al, 2011, p41.93 Kingdom of Jordan, undated.94 Auckland Transport, 2012.95 Offices of the New Zealand
Minister of Transport, 2009, p1.
96 Auckland Transport, 2012.97 Glover and Low, 2004.98 See http://www.thinking
transport.org.au/state-programs/victorian-transport-integration-act-2010, lastaccessed 19 February 2013.
99 Banister and Fitch, 2011, p3.100 Banister and Fitch, 2011, p3.101 GLA, 2010.102 EC, 2001.103 Ministry of Transport, 1999,
p21.104 Kane, 2002, p21.105 See www.youthforpt.org, last
accessed 19 February 2013.106 McMillan, 2011, p29.107 Kikoyo, undated.108 Lai, 2010.109 Dablanc, 2011, p3.110 Dablanc, 2011, p4.111 Dablanc, 2011, p8.
112 Jirón, 2011, p56.113 Jirón, 2011, p56.114 Rizvi, 2011, p7.115 Rizvi, 2011, p9.116 Pan et al, 2011. This form of
self-financing for urban land andinfra struc ture is known as the‘genbu contribution’.
117 Gullberg and Kaijser, 2004.118 Stockholm County Council,
2006; Ingo and Viehhauser,2005. The devel op ment plancovers the period up to 2030.
119 Scheduled to start in January2013.
120 Deutsche Bahn, 2012.121 Godard, 2011b, p57.122 Godard, 2011b, p55.123 Jirón, 2011, p48.124 Jirón, 2011, pp48–49.125 Meakin, 2002, p21.126 See Box 8.7.127 Zhao, 2010.128 Leape, 2006, p173.129 Under the Planning Act of
2008.130 Mayor of London, 2012.
These revenues will be collected by the Londonboroughs.
131 However, it should be notedthat strong political leadership inmany countries has coincidedwith rather authoritarianregimes.
1EEE234567891012311145678920123456789301234567894012345678950123456789EEEE
195Institutions and Governance for Urban Mobility

TOWARD SUS TAIN ABLE URBAN MOBILITY
C H A P T E R 10Global trends, such as rapid urbanization and motor -ization, pose tremendous challenges to urban mobilityand accessibility. Yet, the changing context withinwhich these are occurring, and the experi ence it isgenerating, present new opportunities for advan-cing innovative policies and programmes for sus tain-able devel op ment as a whole. The previous chaptershave discussed the scope and depth of numerouscontemporary challenges and best practices in urbanmobility and accessibility worldwide. This closingchapter ties the analysis together and focuses onpractices, policies and strategies that can be imple -mented, not only by local authorities but also bynational govern ments. The crux of this chapter is anelucidation of the concrete ramifications of keymessages espoused in the report pertaining to theshift from focusing on improving the efficiency ofurban transportation to enhancing accessibility in thecity as a whole.
Before embarking on policy recommendations itis appropriate, first, to revisit some of the dys -functional trends that were highlighted in the prelim -inary chapters and that necessitate the paradigmaticshift reiterated throughout this report. Indeed, themost prominent trend emerging from Chapters 2 to4 is that, generally, it is becoming more difficult toaccess places, opportunities and services in manycities of the world. Owing to urban sprawl, distancesbetween functional destinations have become longer;widespread congestion has increased travel time; and high capital, as well as operating, expenses haveled to increasing costs of accessibility. As a result, anumber of social groups are structurally discouragedfrom accessing many parts of the cities where theylive, and a number of city residents are thereforedeprived of the full benefits offered by urbanization.Further more, poor accessibility has reduced theefficiency and functionality of many cities in theworld.
Another trend highlighted in this report is thesteady increase in the share of private motorizedtransport, including the extremely high motorization
rates in devel op ing countries. This also occurs inregions where the dominant mode of mobilityremains non-motorized transportation, such as in thecase of Africa and Asia. Apart from the inherentinequity associated with private motorized transport,the negative externalities it generates are quitesubstantial. It has been revealed that there is arelative stagnation and even decline of public trans -port in cities of devel op ing countries, even thoughit constitutes a most effective means of enhancingurban accessibility, as well as of promoting sus tain -able urban devel op ment.
The report also reveals that the configuration ofcities in terms of form, structure and function hasbeen highly influenced by the dominance of privatetrans port infra struc ture, facilities and services. Theembedded imperative of private motorization as thedominant mobility mode has dictated the layout and design of streets and neigh bour hoods; dispersionof densities; and location of functions. Perpetuationof this model in much of the past century has gen -erated a self-replicating crisis of urban accessibility:more vehicles, necessitating more infra struc ture,compel ling a need for more vehicles, fostering morespatial expansion, calling for additional infra struc-ture and vehicles, with the vicious circle continuingad infinitum. At the same time, in most cities, theneglect of urban freight distribution and managementof freight transport, both in land-use and trans portplanning tends to make goods transportation a majorimpediment to sus tain able urban mobility and toaccessing the city.
Underlying all the above challenges has been amarked distortion in the institutional structures,management systems, as well as legal and regulatoryframeworks. Fragmentation among institutions deal -ing with different aspects of mobility and accessibilityis rife. The management principles and norms guid-ing planning, design and even delivery tend to com -pound the problems instead of ameliorating them.More over, the regulatory instruments are not fullycom patible with the demands of sus tain ability.
1EEE234567891012311145678920123456789301234567894012345678950123456789EEEE
A number ofsocial groups arestructurallydiscouraged fromaccessing manyparts of the citieswhere they live
The configurationof cities . . . hasbeen highlyinfluenced by thedominance ofprivate transportinfrastructure,facilities andservices
The neglect ofurban freightdistribution andmanagement offreight transporttends to makegoodstransportation amajor impedimentto sustainableurban mobility
198 Planning and Design for Sustainable Urban Mobility
The report has highlighted that the world marketfor railway infra struc ture and equipment has beengrowing at 3.2 per cent a year, and is set to grow ataround 2.7 per cent annually.1 However, the globaldistribution of metro systems shows a concentrationof metros in Europe, Eastern Asia and the easternpart of the US. It is further noted that in mega-citiesof devel op ing countries where the mobility demandon major corridors is appropriately high, metrosremain the only economically and environ mentallyviable public trans port system. For cities which donot have the passen ger threshold for metros and theeco nomic capacity to invest in them, bus rapid transit(BRT) has become a viable option, at least in the shortand medium term.
On the whole, the report acknowledges thecritical importance of accessibility for enhancing the economies of agglomeration and urbanization. Itanalyses how the urban function is improved andpotential of value enhancement realized throughaccessibility. However, the report shows that theprocess of value generation through accessibility hasnot been optimally utilized in many cities of both thedeveloped and devel op ing countries. In the latter case this has been largely due to the separation andsectoralization of land use and transportation, as wellas the inadequate integration among trans port modes.In the case of some cities in developed countries,delays and procrastinations in investments andexpansion have led to lost opportunities.
The report underlines that urban mobility andaccessibility are key for promoting sus tain ableurban devel op ment. They are also directly connectedto urban stock and flows – in terms of spatial devel -opment and consolidation of the built form. They are therefore associated with value creation, improve -ment of welfare and enhancement of citizenship.Further more, urban mobility systems have thepotential to positively impact on material and energyflows. However, these systems have not ade quatelycontributed to the desired outcomes owing to theirprevailing shortcomings. This report therefore empha -sizes that there is an urgent need to reframe urbanmobility policies and practices in order to addressthese shortcomings.
POLICIES AND PRACTICESFOR REFRAMING URBANMOBILITYThe overall challenges as well as positive experi-ences and practices discussed in this report form thebasis for key lessons to be drawn for adaptation and replication. They underline the multi-dimensionalnature of sus tain able urban mobility in terms of bothpolicy and operational implications. Coherence instrategic interventions and linkages among processes
are some of the essential principles that emerge fromthe preceding chapters. It is reckoned that theultimate enhancement of accessibility is neither afunction of hardware – be it highways, rail or vehicles– nor an outcome of ad hoc spatial delocalization anddecongestion.
This report advocates for a paradigm shift inaddressing urban mobility. The signposts of how tomake the shift are written throughout the report. The discussion below summarizes some of the keyattributes for a recalibration of how cities aredesigned and planned and how urban trans portservices are organized and delivered in the quest formore sus tain able mobility.
Holistic and systemic thinking and action
Urban mobility is finely woven into the spatial, social, economic, political and environ mental fabricof cities. In charting a path for sus tain able urbanmobil ity, it is essential to apply an ecological andsystems framework that recognizes this. Many of thecontem porary challenges facing cities – for exampleauto-dependent sprawl, persistent poverty, lack ofaccountability and participatory decision-making – arestructural in nature, rooted in current regulatory,institutional and economic systems and approaches.Only by recognizing the systemic nature of problems(mispricing leads to overconsumption of roads in peak periods; sprawling settlement patterns renderpublic trans port systems ineffectual; urban design formachines rather than people creates cities for carsrather than people) can significant headway be madein charting a sus tain able mobility future.
Trans port as a means, not an end
It is essential that travel is recognized as a ‘deriveddemand’ – i.e. derived from the need for people tosocially and economically ‘interact’. The end or objec -tive of most travel is to meet a friend, earn income,attend school or purchase a good, not movement per se. Cars, trains, buses and bikes are simply themeans to achieve these ends. Making this distinctionshifts the focus to ‘people’ and ‘places’ and away from‘movement’. This realization envisages cities, neigh -bour hoods, regions and mobility systems as tools that promote desired societal outcomes – such as live ability and affordable access – with trans portplaying a supportive role. Operationally, this cantake the form of compact, mixed-use communitiesthat dramatically shorten trip distances and improvepedestrian and bicycling infra struc ture. Compactcities are less reliant on private cars and minimizedistances travelled, thereby conserving energy, landand environ mental resources. They are also moreresilient, enabling them to better adapt to the vagariesand uncertainties of climate change and other globalunknowns.
Value generationthroughaccessibility has not beenoptimally utilizedin many cities of . . . developed anddevelopingcountries
Urban mobilityand accessibilityare key forpromotingsustainable urbandevelopment
Urban mobility isfinely woven intothe spatial, social,economic,political andenvironmentalfabric of cities
It is essential thattravel isrecognized as a‘derived demand’– i.e. derived fromthe need forpeople to sociallyand economically‘interact’. . . . thisdistinction shiftsthe focus to‘people’ and‘places’ and awayfrom ‘movement’
1EEE234567891012311145678920123456789301234567894012345678950123456789EEEE
199Toward Sustainable Urban Mobility
Accessibility as a priority rather thantransport
Related to this notion of travel as a derived demandand transportation as a means to an end is the coreprinciple of accessibility. Accessible cities not onlyput places (e.g. homes and workplaces, or ‘triporigins and destinations’) closer to each other, butalso provide safe and efficient pedestrian and cyclingcorridors and affordable, high-quality public trans portoptions. That is, they are accessible to all. Recastingthe sector’s primary objective as one of enhancingaccessibility invariably leads to a different set ofpolicies and strategies, like transit-oriented devel op -ment and the provision of highly interconnectedbikeway networks. These strategies not only conserveland, energy and finan cial resources, but also helpthe poor and those without private motorized vehiclesto access goods and services within the city. In short,accessible cities are inclusive, resourceful and pro-poor.
POLICY AND OPERATIONALENTRY POINTSFrom the above normative framework, the follow-ing section presents six policy and operational areasthat can be developed to suit different settings andthrough which accessibility-based sus tain able mobilitycan be achieved. These are: enhancing the linkagebetween land use and transport; revitalizing urbanplanning and trans port engineering designs;realigning trans port infra struc ture investment anddevel op ment; integrating urban trans port facilitiesand service operations; streamlining urban institu -tions and governance framework; and readjust-ing legal and regulatory instruments. Each of theseis discussed in some more detail in the sectionsbelow.
The generic designation of the above categoriesreflects everyday policy processes. These policy areashave been adopted for this conclusion for tworeasons. First, to underscore the fact that the shiftbeing advocated in this report is mainly viable whenundertaken within existing institutional structuresand processes. Second, to highlight that since theseare generic proposals, they would have to be slightlyadapted to each city’s unique circumstances prior toactual implementation. Further more, the categoriesare also deemed appropriate because they allow forencompassing a variety of settings and levels ofdevel op ment. However, the overall logic of the sixcategories lies in their strategic linkage and theircumulative potential for triggering policy andoperational change.
Enhancing the linkage between land useand transport
While the pitfalls of overreliance on technological and supply-side solutions to urban mobility areacknow ledged, the important role of trans port cannotbe discounted. The missing ingredient causing theobserved pitfall has been the disconnect between theessence of land use and the logic of transport. Thisconnection needs to be re-established for sus tain ableurban mobility to be achieved; and it can only beeffectively initiated at the highest level – throughnational urban policy initiatives.
Indeed, the national urban policy is givenprominence for this connection mainly because ofits role as a statutory instrument that not onlyarticulates a vision for urban devel op ment, but alsodefines the relationship among sectors, agencies andstakeholders. When properly articulated, nationalurban policy offers the most authoritative instrumentfor elevating the linkage between land-use and trans -port planning beyond the bureaucratic and polit-ical compromises often reached. As elaborated inChapter 5, the integration is not simply a technicalexercise at the local level. It represents a totality ofhow cities are at a given time, while also identifyingthe parameters of their future growth. Substantiveguidelines are therefore required to ensure effectiveharnessing of the dynamic synergy of a given nationalurban system. These guidelines should then subse -quently be translated at the sub-national level – fromregion, through metropolitan area, to the municipalityand ultimately at the neigh bour hood and street level.
An integrated approach to land use and trans -port harmonizes planning of the two processes outof the bounded confines of specific ministry anddepartmental mandates, turning them into a coord -inated and integrated exercise at policy and opera -tional levels. It shifts the focus of planning fromplacement of structures and designation of land useto that of enabling the realization of people’s needsand everyday functions in the most efficient and sus -tain able manner. Within this approach, the keychallenge is therefore not merely to overcome theseparate handling of trans port and land-use plan-ning; or even to ensure a juxtaposition of the two.Rather, it is to foster an organic integration of theentire continuum of a multi-modal mobility within aholistic and sus tain able land-use system wheredynamic synergies are harnessed; interconnectionsare promoted; and functionality optimized. In thewhole process, the aspect of design serves as a mainbridge linking the key dimensions and attributes forensuring sus tain ability and accessibility.
In many cities of the world, particularly thosein devel op ing countries, there is a persisting challengeof identifying whose responsibility it is to take theintegration of land use and trans port (and ideas suchas those mentioned above) from theory to a practical
Accessible cities . . . put . . . triporigins anddestinationscloser to eachother, [and]provide safe andefficientpedestrian andcycling corridorsand affordable,high-qualitypublic transportoptions
When properlyarticulated,national urbanpolicy offers themost authoritativeinstrument forelevating thelinkage betweenland-use andtransport planning
An integratedapproach to landuse and transport. . . shifts thefocus of planningfrom placement ofstructures anddesignation ofland use to . . .enabling therealization ofpeople’s needsand everydayfunctions
200 Planning and Design for Sustainable Urban Mobility
level. This is particularly the case in view of existingconstraints of land geography, activity distribution andevolution, economic and finan cial constraints, andinstitutional and regulatory limitations.
The comprehensive integration of land-use andtrans port needs to be thematically cross-cutting and multi-sectoral. This reflects the co-dependenceof urban systems – for example urban growth inducedby a world-class high-capacity public trans portinvestment increases the demand for electric powerand water capacity, new housing construction andbusiness centres. Multi-sectoral planning also exploitsopportunities for economizing on the costs of urbanservices and infra struc ture outlays, such as usingrights of way reserved for a new fixed-guidewaypublic trans port line to also lay broadband cable,storm-runoff channels and utility lines.
Revitalizing urban planning and trans portengineering designs
The strong connection between trans port ‘supply anddemand’ and urban form is a key theme highlightedthroughout this report. These influence and reinforceeach other both in positive and negative ways. Thevarious cases highlighted in the report demonstratethat the convenience of mobility and the degree ofaccessibility in cities are determined by the processesemanating from the relationship between the pat -terns of trans port and urban form in the given setting.From the analysis of Chapter 5 on urban form, andthe elaboration of sus tain ability pillars in the subse -quent chapters, an important organizing prin ciple canbe deduced. Namely, the linkage between urban formand trans port is realized through the optimization ofdensity, enhanced proximity and co-location, as wellas improvements in the functionality and inclusive -ness of places and facilities.
Sus tain able densities are essential for sus tainablemobility; not only because of its minimum energyconsumption and smaller environ mental footprint,but also because it contributes to increasing proximityand co-location. Density can be optimized throughthe use of regulatory instruments, such as zoning laws and the application of locational incen tives, suchas infrastructural investments, as well as throughdesign interventions. Compact configurations com -ple mented with transport-oriented devel op mentminimize private motorization while making it viablefor cities to invest in different modes of publictransportation. Different density configurations andgradients are discussed in the report demonstratingthe range of options in promoting compactness forsus tain able mobility. However, a caution is alsoregistered that while density is necessary, it is not asufficient condition especially for moderating privatecar use and for arresting urban sprawl.
The notion of sus tain able density is applied inthe report in the strict sense of making a distinction
with the condition of over crowding or with slum-like concentration of populations. The plannedoptimization of density advocated in this reportenables the attainment of economies of scale, making it viable to provide a range of facilities at theleast cost. The compactness engendered allows formore public space while also exerting a minimumimpact on the environ ment. Coupled with appro -priate design it encourages non-motorized and publictransportation, fosters conviviality and strengthensa sense of place.
A related attribute is the need to ensure diversityand mixed-use neigh bour hoods. Through the use ofplanning, a variety of housing types is provided, thelocation of jobs and housing is balanced and a rangeof everyday amenities are located within easy reach.Mixed-land use promotes non-motorized trans port byincreasing proximity and reducing the need to travel,thus allowing for accomplishing many activities withshorter and fewer trips. All this is achieved throughthe creative deployment of planning and design and innovative trans port engineering and planningdesigns.
The quality of the connection between pointsof origin and destination is enhanced by thefunctionality and inclusiveness of those places andfacil ities. The value of access is enhanced by increas -ing the functionality of each place, thus reducing not only distances but also the number of trips. Also,the fostering of inclusiveness and a sense of placeremoves inhibitions and promotes identity andconviviality. Trans port engineering design and urbandesign are central tools at this level and, as demon -strated in Chapter 5, street configurations, trans portnodes and neigh bour hood layouts are the main areaswhere interventions take place.
While a lot more research is needed onintegrating freight distribution into the frameworkof sus tain able urban mobility through planning anddesign, there are a few practices that have beendeveloped and that can contribute to reducing theprevailing shortcomings of freight distribution incities. These include: rationalization of delivery,improving freight facilities and promoting modaladaptation. However, it has been noted in the reportthat the commercial logic of freight distributiontends to be at variance with most of the principlesof sus tain able urban devel op ment.
Realigning trans port infra struc tureinvestment and devel op ment
This report acknowledges that the choice of infra -struc ture investments – particularly budgeting andfinancing aspects – is central in determining thechoices and options for sus tain able mobility. It isimportant that gradual steps are taken to correct the current imbalance in funding and investmentsbetween private and public modes of transport. More
Sustainabledensities areessential forsustainablemobility
The value ofaccess isenhanced byincreasing thefunctionality ofeach place, thusreducing . . .distances [and]the number oftrips
Practices that . . .can contribute toreducing theprevailingshortcomings offreightdistribution incities . . . include:rationalization ofdelivery,improving freightfacilities andpromoting modaladaptation
The choice ofinfrastructureinvestments are central indetermining the choices andoptions forsustainablemobility
1EEE234567891012311145678920123456789301234567894012345678950123456789EEEE
201Toward Sustainable Urban Mobility
public resources need to be allocated to facilities thatcater to the needs of the majority of people in bothdeveloped and devel op ing countries. The current biastowards roads and highways needs to be correctedso that more funding is assigned to devel op ing andexpanding non-motorized and high-capacity publictrans port infra struc ture.
It is particularly important that cities investingin metro, light rail and high-end BRT systems directlarger shares of future growth to public trans portcorridors. Transport-oriented devel op ment canreverse the kind of car-based sprawl that eats intothe green agenda of cities. However, it is importantthat a proper alignment between land-use and trans -port layout is maintained, otherwise the reverse –i.e. urban sprawl – can be further extended by high-capacity public trans port systems.
It is also important that the urban trans portsector is treated as an integrated whole throughsystems financing and pricing. This is best accom -plished by pooling fiscal resources into a central fundand distributing them among modes and pro grammesin accordance with well-defined objectives, such as air-quality improvements and reduced trafficcongestion. Such coordinated and centralizedfinancing is today practised throughout the US,Canada, Singapore and Japan. Dedicated, long-termfunding is also essential to allow strategic, forward-looking planning, such as preserving rights of wayfor future infra struc ture investments. However, it isimportant to note that in some cities of devel op ingcountries it is easier to negotiate and secure fundingfor metro, light rail or BRT systems than for meetingthe (very marginal) cost of implementing integrationfacilities with other urban trans port modes – suchas buses, informal share taxis and cars – at metro,light rail or BRT stations.
Owing to the finan cial constraints of localgovern ments and increased interest by privateinvestors, the global urban trans port sector haswitnessed a surge in public–private partnerships.These partnerships are managed through contracts,franchises, concessions and, in some instances, thetrans port services have undergone full privatiza-tion. Public–private partnerships have the potentialto inject efficiencies in the urban trans port sectorand also stimulate innovations, such as market-basedpricing and automated toll collection. They may alsodraw in private capital where public funding isrestricted. Public–private partnerships have generallyworked best in rapidly growing and urbanizingcountries and regions – such as the Republic ofKorea and Taiwan (China) – and where there is theinstitutional capacity to oversee and regulate privateactors. This underscores the need to achieve botheconomic and institutional sus tain ability. However,this report also highlights the potential dangers ofusing public–private partnerships in urban mobilityprojects,2 as experi ences from a number of cities
indicate that the finan cial risks in such projects tendto be carried by the public at large rather than bythe private sector partners involved.
The implementation of principles of economicefficiency is essential to the urban public trans portsector, since it has major finan cial implications onlocal govern ments. For instance, while urban railsystems handle large loads, they do so at very high,and potentially finan cially crippling, costs. The highcapital investments and subsequent operating costsneeded to support a metro investment must becarefully examined to ensure that local and nationalgovern ments have the finan cial capacity to maintainits services. Unless a city’s urban densities arecomparatively high and finan cial resources areplentiful, lower-cost BRT investments – as recentlyimplemented by cities such as Jakarta (Indonesia),Ahmedabad (India), Lagos (Nigeria) and Chiang Mai(Thailand) – present a more practical option forinvestment in high-capacity public transport.
A key point made in this report is that the sus -tain ability of urban mobility systems is highlydependent on the finan cial models designed toprotect the public goods dimension of both land useand the trans port system. Among other financingsources, the option of value capture is highlyrecommended as a complement to public funding.Through recouping the increase of value in adjacentland and converting it into public finance forreinvestment in urban mobility systems, the linkagebetween land use and trans port is reinforced. Thisapproach is also politically appealing as it directlydemonstrates the linkage between charges levied andthe benefits provided.
Integrating urban trans port facilities andservice operations
The linkage of trans port to land use is not onlylimited to the hardware and the physical dimensionsof the two processes. Transport-oriented devel op -ment and traffic-calming interventions discussed inthis report also involve the systemic and managerialaspects of ensuring convenience, efficiency, aes -thetics and safety of mobility. The operation of multi-modal neigh bour hood stations; the ambiancesurrounding flow of vehicles, bicycles and pedestrianin streets; and the procedures at toll-collection points,have to be synchronized in a manner that ensures apleasant mobility experi ence.
The urban trans port sector must ascribe to theprinciple of economic efficiency for the simple reasonthat waste and unsound expenditures could implythat scarce finan cial resources are directed to otherproductive and beneficial societal uses, be they edu -cation, healthcare or private consumption. Efficientland-use patterns (e.g. compact, mixed and walkable)allow for less reliance on expensive mobility systemsin general. Properly designed trans port systems also
More funding[needs to be]assigned todeveloping andexpanding non-motorized andhigh-capacitypublic transportinfrastructure
Transport-orienteddevelopment canreverse . . . car-based sprawl
The sustainabilityof urban mobilitysystems is . . .dependent on thefinancial modelsdesigned toprotect the publicgoods dimensionof . . . land useand the transportsystem
Value capture is highlyrecommended asa complement topublic funding
202 Planning and Design for Sustainable Urban Mobility
contribute to business expansion, increased economicoutput and employment generation. Indeed, mobilityis indisputably a necessary (though not a sufficient)precondition to economic growth and expansion.
Efficiency must underpin management, opera -tional and system design practices throughout theurban trans port sector. In the case of high-capacitypublic trans port systems, this can take the form ofredeploying buses and equipment to high-ridershipmarkets that produce the highest fare-box returns.In doing so, it is necessary to adopt the regulationsthat allow operators to develop ‘out of fare-box’financing resources such as value capture, advertisingat stations, stops and vehicles, etc., in order to cross-subsidize services, thus, reducing or eliminatinggovern ment subsidies. For non-motorized transport,it might mean building bikeway overpasses at busyjunctions where careful cost–benefit calculationsreveal a net societal gain. The report highlights thedifficulties faced by cities of devel op ing countries in securing funding to cover construction and main -tenance costs of non-motorized trans port infra -structure, from both public and other sources. Asnon-motorized trans port facilities are not revenuegenerating, they are rarely attractive to internationalfunding agencies or the private sector. Efforts areneeded to reach innovative ideas that point out theenviron mental and societal gains made from non-motorized transport.3 For urban goods movement,night or off-peak deliveries, freight stations andconsolidation centres that allow shared-use of deliveryvehicles, and bicycle carriers suited to the constraintsof urban circulation, might be called for. For parking,efficiency might be achieved by installing sensors inparking stalls to monitor occupancy so that chargescan be varied according to demand and motorists can be real-time navigated to the closest availableparking space.4
Because transportation is both a private and a public good – conferring benefits to both individualusers and society at large – a combination of usercharges and public support is often needed toefficiently and equitably finance trans port infra struc -ture and services. User fees, such as public trans -port fares and road charges, encourage efficientbehaviour. When fuel taxes rise, increased pricesencourage motorists to acquire more fuel-efficientvehicles or switch to public transport. Funding trans -port facilities through general sales, income taxes orborrowing provides no incentive to be efficient orsocially responsible; as such charges are completelyunrelated to the cost imposed on the trans portsystem or the benefits received.
Integrated transportation and urban devel op -ment must occur at all geographic scales. At the microlevel, much is to be gained from advancing the modelof ‘complete streets’, an acknowledgement thatstreets serve numerous purposes, not just movingcars and trucks. The ‘complete streets’ movement,
gaining steam throughout Europe, much of NorthAmerica and in parts of Eastern Asia, views road rightof way as ‘public spaces’, managing and even slowingmovements in favour of public transport, walking andcycling. One example is multi-way boulevards thatprovide spaces for cars, buses, pedestrians and some -times even tramways – packaged with good designsthat emphasize high-quality spaces and safety.5 Non-motorized modes of trans port such as walking andcycling, enliven a city, promote social interaction andallow a more physically active lifestyle. Some citieshave gone one step further, reclaiming land oncegiven over to motorways and freeways to pedes-trians, cyclists and public transport. Seoul’s ChengGye Cheon freeway-to-greenway conversion, madepossible in part by expanded BRT services to absorblost roadway capacity, has not only reduced inner-city traffic congestion but has also been credited withspurring central-city redevel op ment and urban infill.The 6-kilometre inner-city greenway laced with bikepaths and urban art is today Seoul’s second mostpopular tourist destination.6
Progressive projects and programmes – such asgreen transport-oriented devel op ment and completestreets – do not suddenly appear, but rather beginwith thoughtful plans and visions. Trans port planningneeds to be well integrated with land-use plan-ning at all levels of govern ment. Through both carrots(e.g. finan cial aid) and sticks (e.g. regulatoryrequirements), national govern ments are uniquelypositioned to encourage state/provincial, regionaland local institutions to link trans port investment andurban devel op ment strategies in master plans, zoningpractices and infra struc ture design standards.Integrated trans port and land-use planning devel -opment must also be emphasized in national urbandevel op ment policies and plans. India’s nationalurban trans port policy of 2006, for example, em -braces integrated trans port and land-use planning asits number-one priority. In fact, half the cost ofpreparing integrated trans port and land-use plans inIndian cities is covered by the central govern ment.7
Streamlining urban institutions andgovernance framework
Innovative ideas and policies geared towards sus -tainable mobility require strong institutional andgovernance structures to oversee their successfulimplementation. Political will, sound leadership,transparency and accountability are essential inbuilding public trust. Also vital to the entire processare the planning institutions, as these are capable ofcreating compelling visions of urban futures. More -over, participatory mechanisms must be in place toensure that planning and investment decisions aresocially inclusive and representative of all segmentsof society. This implies giving non-state actors andcity residents, such as neigh bour hood associations,
Mobility isindisputably anecessary . . .precondition toeconomic growth
Becausetransportation isboth a private anda public good, . . .a combination ofuser charges andpublic support isoften needed toefficiently andequitably financetransportinfrastructure andservices
Integratedtransportation andurbandevelopment mustoccur at allgeographic scales
Innovative ideasand policiesgeared towardssustainablemobility requirestronginstitutional andgovernancestructures tooversee theirsuccessfulimplementation
1EEE234567891012311145678920123456789301234567894012345678950123456789EEEE
203Toward Sustainable Urban Mobility
a place at the negotiating table when makingimportant urban mobility decisions. In strengtheninginstitutions, it is essential that finan cial resources bechannelled into training and capacity-building of theconcerned personnel in order to empower them totake on the complex challenges of the urbantransportation sector.
The devel op ment of a fully integrated and sus -tain able multi-modal urban transportation systemrequires a robust regional governance structure,which gives rise to inter-municipal cooperation. Thisfosters accountability and provides a territorialcontext for coordinating growth and services withina region’s travel-shed. Regional institutions need tobe endowed with the power of regulatory oversightand funding capacities to finance transportationinvestments and service management.
As noted above, while most of the innovationsintroduced in urban trans port will come from localand regional actors, higher levels of govern ment alsohave a crucial role to play. National urban trans portpolicies that promote integrated planning and providecapital loans and technical assistance can help smallercities chart a sus tain able urban trans port course.8
Brazil has had a national urban trans port policy forover 25 years, helping nurture sus tain able trans portpractices in BRT-served cities such as Curitiba andBelo Horizonte. India’s Ministry of Urban Devel op -ment is today actively promoting transport-orienteddevel op ment along planned and existing BRTcorridors through finan cial support for formingunified metropolitan trans port authorities.9
Technology itself can be an enabler of moregrassroots and inclusive policy-making in urbantransport. Social media, for example, allows like-minded individuals to coalesce and shape publicdiscourse. In 2008, during a period when theTransMilenio BRT system in Bogotá, Colombia, wassuffering from problems of extreme over crowdingand long queues at ticket offices, residents turnedto social media to organize a large public protest.Active media coverage led to even louder publicoutcries, eventually prompting local leaders tointroduce various capacity-expansion initiatives,including lengthening some of the key modularstations, expanding services and introducing morearticulated buses.10
There is also a need to inject efficiencies,accountability and transparency into the urban trans -port decision-making process. This requires the devel -op ment and institutionalization of planning processesand evaluation approaches that are based on objectivemeasures of performance and tied to well-articulatedgoals and hoped-for outcomes. This promotes bothtransparency and accountability. At the same time,there is need for an open and democratic planningand decision-making process, in particular given thebroad reach of the urban trans port sector and itsmerits. This will not only bring the voices of all
citizens – women and men, children, the elderly, thedisabled, businesses, govern ments, NGOs and civilsociety at large – to the table, but will also ensurethat the needs of the least advantaged are clearlyrecognized and fully acted upon.
Responsibilities for the urban trans port sectorare being decentralized across the world, fromEastern Europe, to Sub-Saharan Africa and South -Eastern Asia. Human and finan cial resources areneeded for the successful handover of functions andinvestment responsibilities from central to localgovern ments. There is a need for metropolitanplanning and operating authorities that reflect regionsas ‘ecological units’ – i.e. by allowing planning andgovernance over a geographic territory that mimicscommute-sheds, trade-sheds and air basins. Humanresource devel op ment plans and integrated, viableand dependable urban trans port funding programmesare also needed.
Readjusting legal and regulatoryinstruments
The interventions highlighted above call for changesin the management of space, the built form, theengineering of transport, social behaviour, as well asin the institutional and financing arrangementsrelated to urban devel op ment. These elements arebuilt upon the legacy of a legal foundation that hasperpetuated mobility systems which this report hasfound to be severely wanting. Any transformationwould therefore entail major reform in the legal andregulatory framework relating to urban management.For example, the ordinances guiding the planningprocess have to be amended away from often appliedsegregation of use and rigid zoning towards fosteringmore mixed-use and compactness. The same appliesto building codes and standards, mandates andauthority allocated to different institutions, and alsosanctions directed at reducing negative externalities.
While significant progress has been achieved insome cities, in terms of incorporating the necessarylaws and regulation for realizing some of the aboveobjectives, much remains to be done. The dire needfor fostering inclusiveness and environ mentalprotection not only calls for the enactment of acomprehensive set of statutes, but also requires theconsolidation of enforcement capacity to ensure thatthe laws and regulations are abided by.
CONCLUDING REMARKSUrban sus tain able mobility as a devel op ment issuecuts across the intersection of the most urgentchallenges confronting the global community today.Neither the efforts towards reducing greenhouse gasemissions, nor the measures being taken to arrestthe growing economic inequalities among and withinnations, can be tackled without also addressing the
A fully integratedand sustainablemulti-modal urbantransportationsystem requires arobust regionalgovernancestructure
While most of theinnovationsintroduced inurban transportwill come fromlocal and regionalactors, higherlevels ofgovernment alsohave a crucial roleto play
The interventionshighlighted [inthis report] callfor changes in themanagement ofspace, the builtform, theengineering oftransport, socialbehaviour, . . .[and] in theinstitutional andfinancingarrangementsrelated to urbandevelopment
Urban sustainablemobility . . . cuts across theintersection of the most urgentchallengesconfronting theglobal communitytoday
NOTES1 Economist, 2013.2 See Chapter 8.3 Beldean et al, 2007.4 Shoup, 2011.5 Jacobs et al, 2002.6 Kang and Cervero, 2009.7 Govern ment of India, 2006.8 Gakenheimer, 2011.9 Cervero, 2013.
10 Parra, 2012.
204 Planning and Design for Sustainable Urban Mobility
issue of sus tain able mobility. Similarly, the questtowards eliminating poverty and fostering sharedprosperity cannot succeed without also redressing theprevailing distortions in urban mobility systems andexisting impediments on accessing the modern city.
This report has demonstrated that mobilitysystems contribute to the morphology of the city,both in terms of the spatial layout as well as in theconfiguration of its built form. In so far as these
two elements are related to the productivity anddynamism of the city in the broader setting, theimpact of urban mobility is therefore local as well asmacro. The report suggests that along the three keypillars of sus tain able devel op ment – and within thefoundations of robust, integrated and participatoryinstitutions – it is possible to initiate and promoteinterventions that can effectively enhance theaccessibility of cities today.
It is possible toinitiate andpromoteinterventions thatcan effectivelyenhance theaccessibility ofcities today
GENERAL DISCLAIMERThe designations employed and presentation of thedata do not imply the expression of any opinionwhatsoever on the part of the Secretariat of theUnited Nations concerning the legal status of anycountry, city or area or of its authorities, orconcerning the delimitation of its frontiers orboundaries.
STATISTICAL ANNEX
1EEE234567891012311145678920123456789301234567894012345678950123456789EEEE

TECHNICAL NOTES
1EEE234567891012311145678920123456789301234567894012345678950123456789EEEE
The Statistical Annex comprises 17 tables coveringsuch broad statistical categories as demography,households, housing, economic and social indicators.The Annex is divided into two sections presentingdata at the regional, country and city levels. TablesA.1 to A.5 present regional-level data grouped bygeographic distribution. Tables B.1 to B.9 containcountry-level data, while Tables C.1 to C.3 aredevoted to city-level data. Data have been compiledfrom various international sources, from nationalstatistical offices and from the United Nations.
EXPLANATION OF SYMBOLSThe following symbols have been used in presentingdata throughout the Statistical Annex:
category not applicable ..data not available . . .magnitude zero –
COUNTRY GROUPINGS ANDSTATISTICAL AGGREGATES
World major groupings
Developed countries: All countries and areas ofEurope and Northern America, as well as Australia,Cyprus, Israel, Japan and New Zealand.1
Devel op ing countries: All countries and areas notlisted under ‘developed countries’ above.1
Least developed countries: Afghanistan, Angola,Bangladesh, Benin, Bhutan, Burkina Faso, Burundi,Cambodia, Central African Republic, Chad, Comoros,Democratic Republic of the Congo, Djibouti,Equatorial Guinea, Eritrea, Ethiopia, Gambia, Guinea,Guinea-Bissau, Haiti, Kiribati, Lao People’s Demo -cratic Republic, Lesotho, Liberia, Madagascar,Malawi, Mali, Mauritania, Mozambique, Myanmar,Nepal, Niger, Rwanda, Samoa, São Tomé andPríncipe, Senegal, Sierra Leone, Solomon Islands,
Somalia, Sudan, Timor-Leste, Togo, Tuvalu, Uganda,United Republic of Tanzania, Vanuatu, Yemen,Zambia.1
Sub-Saharan Africa: Angola, Benin, Botswana,Burkina Faso, Burundi, Cameroon, Cape Verde,Central African Republic, Chad, Comoros, Congo,Côte d’Ivoire, Democratic Republic of the Congo,Djibouti, Egypt, Equatorial Guinea, Eritrea, Ethiopia,Gabon, Gambia, Ghana, Guinea, Guinea-Bissau,Kenya, Lesotho, Liberia, Madagascar, Malawi, Mali, Mauritania, Mauritius, Mayotte, Morocco,Mozam bique, Namibia, Niger, Nigeria, Réunion,Rwanda, Saint Helena, São Tomé and Príncipe,Senegal, Seychelles, Sierra Leone, Somalia, SouthAfrica, South Sudan, Sudan, Swaziland, Togo,Uganda, United Republic of Tanzania, Zambia,Zimbabwe.1
Sub-regional aggregates
n Africa
Eastern Africa: Burundi, Comoros, Djibouti, Eritrea,Ethiopia, Kenya, Madagascar, Malawi, Mauritius,Mayotte, Mozambique, Réunion, Rwanda, Seychelles,Somalia, South Sudan, Uganda, United Republic ofTanzania, Zambia, Zimbabwe.
Middle Africa: Angola, Cameroon, Central AfricanRepublic, Chad, Congo, Democratic Republic of theCongo, Equatorial Guinea, Gabon, São Tomé andPríncipe.
Northern Africa: Algeria, Egypt, Libyan ArabJamahiriya, Morocco, Sudan, Tunisia, WesternSahara.
Southern Africa: Botswana, Lesotho, Namibia, SouthAfrica, Swaziland.
Western Africa: Benin, Burkina Faso, Cape Verde,Côte d’Ivoire, Gambia, Ghana, Guinea, Guinea-Bissau, Liberia, Mali, Mauritania, Niger, Nigeria,Saint Helena, Senegal, Sierra Leone, Togo.
208 Planning and Design for Sustainable Urban Mobility
n Asia
Eastern Asia: China, Hong Kong SAR of China,Macao SAR of China, Democratic People’s Republicof Korea, Japan, Mongolia, Republic of Korea.
South-Central Asia: Afghanistan, Bangladesh,Bhutan, India, Iran (Islamic Republic of), Kazakhstan,Kyrgyzstan, Maldives, Nepal, Pakistan, Sri Lanka,Tajikistan, Turkmenistan, Uzbekistan.
South-Eastern Asia: Brunei Darussalam, Cambodia,Indonesia, Lao People’s Democratic Republic, Malay -sia, Myanmar, Philippines, Singapore, Thailand,Timor-Leste, Viet Nam.
Western Asia: Armenia, Azerbaijan, Bahrain, Cyprus,Georgia, Iraq, Israel, Jordan, Kuwait, Lebanon,Occupied Palestinian Territory, Oman, Qatar, SaudiArabia, Syrian Arab Republic, Turkey, United ArabEmirates, Yemen.
n Europe
Eastern Europe: Belarus, Bulgaria, Czech Republic,Hungary, Moldova, Poland, Romania, RussianFederation, Slovakia, Ukraine.
Northern Europe: Channel Islands, Denmark,Estonia, Faroe Islands, Finland, Iceland, Ireland, Isleof Man, Latvia, Lithuania, Norway, Sweden, UnitedKingdom.
Southern Europe: Albania, Andorra, Bosnia andHerzegovina, Croatia, Gibraltar, Greece, Holy See,Italy, Malta, Montenegro, Portugal, San Marino,Serbia, Slovenia, Spain, The former Yugoslav Republicof Macedonia.
Western Europe: Austria, Belgium, France,Germany, Liechtenstein, Luxembourg, Monaco,Netherlands, Switzerland.
n Latin America and the Caribbean
Caribbean: Anguilla, Antigua and Barbuda, Aruba,Bahamas, Barbados, British Virgin Islands, CaymanIslands, Cuba, Dominica, Dominican Republic,Grenada, Guadeloupe, Haiti, Jamaica, Martinique,Montserrat, Netherlands Antilles, Puerto Rico, SaintKitts and Nevis, Saint Lucia, Saint Vincent and theGrenadines, Trinidad and Tobago, Turks and CaicosIslands, United States Virgin Islands.
Central America: Belize, Costa Rica, El Salvador,Guatemala, Honduras, Mexico, Nicaragua, Panama.
South America: Argentina, Bolivia, Brazil, Chile,Colombia, Ecuador, Falkland Islands (Malvinas),French Guiana, Guyana, Paraguay, Peru, Suriname,Uruguay, Venezuela (Bolivarian Republic of).
n Northern America
Bermuda, Canada, Greenland, Saint-Pierre-et-Miquelon, United States of America.
n Oceania
Australia/New Zealand: Australia, New Zealand.
Melanesia: Fiji, New Caledonia, Papua New Guinea,Solomon Islands, Vanuatu.
Micronesia: Guam, Kiribati, Marshall Islands,Micronesia (Federated States of), Nauru, NorthernMariana Islands, Palau.
Polynesia: American Samoa, Cook Islands, FrenchPolynesia, Niue, Pitcairn, Samoa, Tokelau, Tonga,Tuvalu, Wallis and Futuna Islands.
NOMENCLATURE ANDORDER OF PRESENTATIONTables A.1 to A.5 contain regional data, grouped ingeographic aggregates. Tables B.1 to B.9 and C.1 toC.3 contain country- and city-level data, respectively.In these tables, the countries or areas are listed inEnglish alphabetical order within the macro-regionsof Africa, Asia, Europe, Latin America, NorthernAmerica and Oceania. Countries or area names arepresented in the form commonly used within theUnited Nations Secretariat for statistical purposes.Due to space limitations, the short name is used –for example, the United Kingdom of Great Britain andNorthern Ireland is referred to as ‘United Kingdom’.
DEFINITION OF TERMSAccess to electricity: percentage of householdsthat, within their housing unit, are connected toelectricity.
Access to piped water: percentage of householdsthat, for source of drinking water, are connected topiped water within their housing unit, tap placed inthe yard or plot outside the house.
Access to telephone: percentage of householdsthat, within their housing unit, are connected totelephone.
Access to mobile: percentage of households withmobile phone.
Gini index: the extent to which the distribution ofincome (or, in some cases, consumption expenditure)or assets (such as land) among individuals orhouseholds within an economy deviates from aperfectly equal distribution. A Lorenz curve plots thecumulative percentages of total income receivedagainst the cumulative number of recipients, startingwith the poorest individual or household. The Giniindex measures the area between the Lorenz curve
1EEE234567891012311145678920123456789301234567894012345678950123456789EEEE
209Technical Notes
and a hypothetical line of absolute equality, expressedas a percentage of the maximum area under the line.Thus, a Gini index of 0 represents perfect equality,while an index of 1 implies absolute inequality.
Gross national income: the sum of value added byall resident producers plus any product taxes (lesssubsidies) not included in the valuation of output plusnet receipts of primary income (compensation ofemployees and property income) from abroad. Dataare in current US dollars converted using the WorldBank Atlas method.
Gross national income per capita: gross nationalincome (GNI) divided by mid-year population. GNIper capita in US dollars is converted using the WorldBank Atlas method.
Gross national income PPP: gross national incomeconverted to international dollars using purchasingpower parity (PPP) rates. An international dollar hasthe same purchasing power over GNI as a US dollarhas in the United States of America.
Household: the concept of household is based onthe arrangements made by persons, individually orin groups, for providing themselves with food or otheressentials for living. A household may be either:
1. A one-person household: a person who makesprovision for his or her own food or otheressentials for living without combining with anyother person to form a part of a multi-personhousehold.
2. A multi-person household: a group of two or morepersons living together who make commonprovision for food or other essentials for living.The persons in the group may pool their incomesand may, to a greater or lesser extent, have acommon budget; they may be related or unrelatedpersons or constitute a combination of personsboth related and unrelated. This concept of house -hold is known as the ‘housekeeping’ con cept. Itdoes not assume that the number of householdsand housing units is equal. Although the conceptof housing unit implies that it is a space occu-pied by one household, it may also be occupiedby more than one household or by a part of ahousehold (e.g. two nuclear households that shareone housing unit for economic reasons or onehousehold in a polygamous society routinelyoccupying two or more housing units).
Household connection to improved drinkingwater: percentage of households that, within theirhousing unit, are connected to any of the followingtypes of water supply for drinking: piped water,public tap, borehole or pump, protected well,protected spring or rainwater.
Improved drinking water coverage: percentage ofpeople using improved drinking water sources or
delivery points. Improved drinking water technologiesare more likely to provide safe drinking water thanthose characterized as unimproved. Improveddrinking water sources: piped water into dwelling,plot or yard; public tap/standpipe; tube well/borehole;protected dug well; protected spring; rainwatercollection. Unimproved drinking water sources:unprotected dug well; unprotected spring; cart withsmall tank/drum; bottled water;2 tanker-truck; surfacewater (river, dam, lake, pond, stream, canal, irrigationchannels).
Improved sanitation coverage: percentage ofpeople using improved sanitation facilities. Improvedsanitation facilities are more likely to prevent humancontact with human excreta than unimprovedfacilities.
International poverty line: based on nationallyrepresentative primary household surveys conductedby national statistical offices or by private agenciesunder the supervision of govern ment or internationalagencies and obtained from govern ment statisticaloffices and World Bank country departments.(Population below US$1.25 a day and Populationbelow US$2 a day): percentages of the populationliving on less than $1.25 a day and $2 a day at 2005international prices. As a result of revisions in PPPexchange rates, poverty rates for individual countriescannot be compared with poverty rates reported inearlier editions
Level of urbanization: percentage of the populationresiding in places classified as urban. Urban andrural settlements are defined in the national contextand vary among countries (the definitions of urbanare generally national definitions incorporated withinthe latest census).
National population below national poverty line:percentage of the country’s population living belowthe national poverty line. National estimates arebased on population weighted subgroup estimatesfrom household surveys.
Persons in housing units: number of personsresident in housing units.
Population, rural: mid-year estimates andprojections (medium variant) of the populationresiding in human settlements classified as rural (seealso ‘Population, urban’ below).
Population, total: mid-year population estimatesand projections for the world, region, countries orareas. The Population Division of the United NationsDepartment of Economic and Social Affairs updates,every two years, population estimates and projectionsby incorporating new data, new estimates and newanalyses of data on population, fertility, mortality andinternational migration. Data from new populationcensuses and/or demographic surveys are used to
210 Planning and Design for Sustainable Urban Mobility
verify and update old estimates of population ordemographic indicators, or to make new ones andto check the validity of the assumptions made in theprojections. Population rate of change (calculated byUN-Habitat) refers to the average annual percentagechange of population during the indicated period foreach country, major regions and global totals. Theformula used throughout the annex is as follows: r= [(1/t) x ln(A2/A1)] x 100, where ‘A1’ is a value atany given year; ‘A2’ is a value at any given year laterthan the year of ‘Al’; ‘t’ is the year interval between‘Al’ and ‘A2’; and ‘ln’ is the natural logarithm function.Population, urban: mid-year population of areasdefined as urban in each country and reported to theUnited Nations. Estimates of the world’s urbanpopulation would change significantly if China, India,and a few other populous nations were to changetheir definition of urban centres. According to China’sState Statistical Bureau, by the end of 1996 urbanresidents accounted for about 43 percent of China’spopulation, while in 1994 only 20 percent of thepopulation was considered urban. In addition to thecontinuous migration of people from rural to urbanareas, one of the main reasons for this shift was therapid growth in the hundreds of towns reclassifiedas cities in recent years. Because the estimates inthe table are based on national definitions of whatconstitutes a city or metropolitan area, cross-countrycomparisons should be made with caution.
Population density: mid-year population divided byland area in square kilometres.
Pump price for fuels: refer to the pump prices ofthe most widely sold grade of petrol and of dieselfuel. Prices have been converted from the localcurrency to US dollars.
Railways: length of railway route available for trainservice, irrespective of the number of parallel tracks.Passen gers carried by railway are the number ofpassen gers (in millions) transported by rail multi-plied by kilometres travelled (m-p-km). Goods hauledby railway are the volume of goods transported byrailway, measured in metric tons multiplied bykilometres travelled (m-t-km).
Road motor vehicles: include cars, buses and freightvehicles but not two-wheelers.
Road traffic deaths: any person killed immediatelyor dying within 30 days as a result of a road trafficaccident.
Passen ger cars: refer to road motor vehicles, otherthan two-wheelers, intended for the carriage ofpassen gers and designed to seat no more than ninepeople (including the driver). Other motor vehicles:road motor vehicles exclusive of passen ger cars.
Roads: motorways, highways, main or national roads,and secondary or regional roads. A motorway is a roadspecially designed and built for motor vehicles thatseparates the traffic flowing in opposite directions.Total road network: includes motorways, highwaysand main or national roads, secondary or regionalroads, and all other roads in a country. Paved roads:roads surfaced with crushed stone (macadam) andhydrocarbon binder or bitumized agents, withconcrete or with cobblestones, as a percentage of allof the country’s roads measured in length. Passen -gers carried by roads are the number of people (inmillions) transported by road multiplied by kilometrestravelled (m-p-km). Goods hauled by road are thevolume of goods transported by road vehicles,measured in millions of metric tons multiplied bykilometres travelled (m-t-km).
Survey year: the year in which the underlying datawere collected.
Urban poverty rate: percentage of the urbanpopulation living below the national urban povertyline.
Urban slum dwellers: individuals residing inhousing with one or more of the following conditions:inadequate drinking water; inadequate sanitation;poor structural quality/durability of housing; over -crowding; and insecurity of tenure.
Urban agglomerations and capital cities: the term ‘urban agglomeration’ refers to the populationcontained within the contours of a contiguousterritory inhabited at urban density levels withoutregard to administrative boundaries. It usually in -corporates the population in a city or town plus thatin the suburban areas lying outside of but beingadjacent to the city boundaries. Whenever possible,data classified according to the concept of urbanagglomeration are used. However, some countries donot produce data according to the concept of urbanagglomeration but use instead that of metropolitanarea or city proper. If possible, such data are adjustedto conform to the concept of urban agglomeration.When sufficient information is not available to permitsuch an adjustment, data based on the concept ofcity proper or metropolitan area are used. The sourceslisted online indicate whether data were adjusted to conform to the urban agglomeration concept orwhether a different concept was used. Table C.1contains revised estimates and projections for allurban agglomerations comprising 750,000 or moreinhabitants.
NOTES1 United Nations Inter-Agency
and Expert Group on theMillennium Devel op ment GoalsIndicators (official emailcommunication, 28 March2012).
2 Bottled water is consideredimproved only when thehousehold uses water from animproved source for cookingand personal hygiene.
1EEE234567891012311145678920123456789301234567894012345678950123456789EEEE
211Technical Notes
SOURCES OF DATAThe Statistical Tables have been compiled from thefollowing UN-Habitat databases:
United Nations Human Settlements Programme (UN-Habitat), Global Urban Indicators Database 2012
United Nations Human Settlements Programme (UN-Habitat), Urban Info 2010
In addition, various statistical publications from theUnited Nations and other international organizationshave been used. These include:
United Nations, Department of Economic and Social Affairs,Population Division (2010), World Population Prospects:The 2009 Revision, United Nations, New York
United Nations, Department of Economic and Social Affairs,Population Division (2012) World Urbanization Pros -pects: The 2011 Revision, United Nations, New York
World Bank (2001) World Devel op ment Indicators 2001,World Bank, Washington, DC
World Bank (2004) World Devel op ment Indicators 2004,World Bank, Washington, DC
World Bank (2006) World Devel op ment Report 2006, WorldBank, Washington, DC
World Bank (2012) World Devel op ment Indicators 2012,World Bank, Washington, DC
World Bank (2012) World Devel op ment Indicators Onlinedatabase, http://data.worldbank.org/indicator
World Health Organization (WHO) (2004) World Report onRoad Traffic Injury Prevention 2004, WHO, Geneva
World Health Organization (WHO) (2013) Global StatusReport on Road Safety 2013, WHO, Geneva
World Health Organization (WHO) and United NationsChildren’s Fund (UNICEF) Joint Monitoring Programmefor Water Supply and Sanitation (JMP) (2012) Progresson Sanitation and Drinking-Water 2012 Update, WHOand UNICEF, Geneva and New York, www. unicef.org/media/files/JMPreport2012.pdf

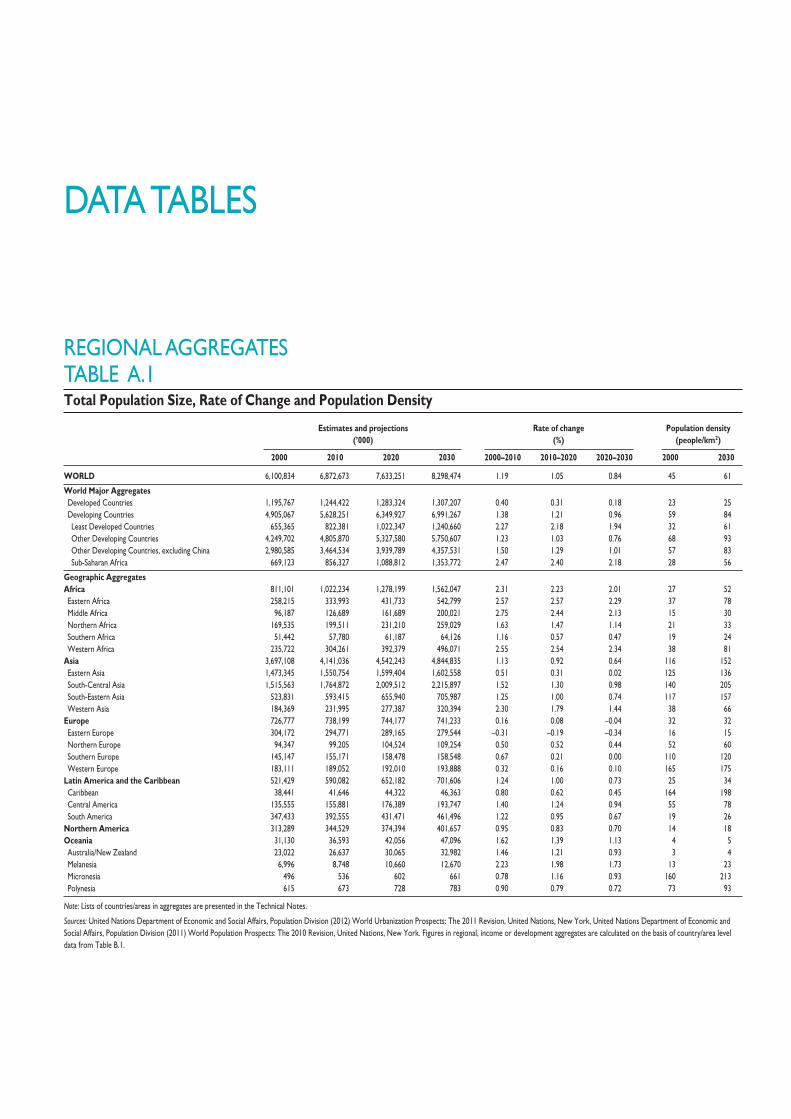
Estimates and projections Rate of change Population density (’000) (%) (people/km2)
2000 2010 2020 2030 2000–2010 2010–2020 2020–2030 2000 2030
WORLD 6,100,834 6,872,673 7,633,251 8,298,474 1.19 1.05 0.84 45 61
World Major AggregatesDeveloped Countries 1,195,767 1,244,422 1,283,324 1,307,207 0.40 0.31 0.18 23 25Developing Countries 4,905,067 5,628,251 6,349,927 6,991,267 1.38 1.21 0.96 59 84Least Developed Countries 655,365 822,381 1,022,347 1,240,660 2.27 2.18 1.94 32 61Other Developing Countries 4,249,702 4,805,870 5,327,580 5,750,607 1.23 1.03 0.76 68 93Other Developing Countries, excluding China 2,980,585 3,464,534 3,939,789 4,357,531 1.50 1.29 1.01 57 83Sub-Saharan Africa 669,123 856,327 1,088,812 1,353,772 2.47 2.40 2.18 28 56
Geographic AggregatesAfrica 811,101 1,022,234 1,278,199 1,562,047 2.31 2.23 2.01 27 52Eastern Africa 258,215 333,993 431,733 542,799 2.57 2.57 2.29 37 78Middle Africa 96,187 126,689 161,689 200,021 2.75 2.44 2.13 15 30Northern Africa 169,535 199,511 231,210 259,029 1.63 1.47 1.14 21 33Southern Africa 51,442 57,780 61,187 64,126 1.16 0.57 0.47 19 24Western Africa 235,722 304,261 392,379 496,071 2.55 2.54 2.34 38 81
Asia 3,697,108 4,141,036 4,542,243 4,844,835 1.13 0.92 0.64 116 152Eastern Asia 1,473,345 1,550,754 1,599,404 1,602,558 0.51 0.31 0.02 125 136South-Central Asia 1,515,563 1,764,872 2,009,512 2,215,897 1.52 1.30 0.98 140 205South-Eastern Asia 523,831 593,415 655,940 705,987 1.25 1.00 0.74 117 157Western Asia 184,369 231,995 277,387 320,394 2.30 1.79 1.44 38 66
Europe 726,777 738,199 744,177 741,233 0.16 0.08 –0.04 32 32Eastern Europe 304,172 294,771 289,165 279,544 –0.31 –0.19 –0.34 16 15Northern Europe 94,347 99,205 104,524 109,254 0.50 0.52 0.44 52 60Southern Europe 145,147 155,171 158,478 158,548 0.67 0.21 0.00 110 120Western Europe 183,111 189,052 192,010 193,888 0.32 0.16 0.10 165 175
Latin America and the Caribbean 521,429 590,082 652,182 701,606 1.24 1.00 0.73 25 34Caribbean 38,441 41,646 44,322 46,363 0.80 0.62 0.45 164 198Central America 135,555 155,881 176,389 193,747 1.40 1.24 0.94 55 78South America 347,433 392,555 431,471 461,496 1.22 0.95 0.67 19 26
Northern America 313,289 344,529 374,394 401,657 0.95 0.83 0.70 14 18Oceania 31,130 36,593 42,056 47,096 1.62 1.39 1.13 4 5Australia/New Zealand 23,022 26,637 30,065 32,982 1.46 1.21 0.93 3 4Melanesia 6,996 8,748 10,660 12,670 2.23 1.98 1.73 13 23Micronesia 496 536 602 661 0.78 1.16 0.93 160 213Polynesia 615 673 728 783 0.90 0.79 0.72 73 93
Note: Lists of countries/areas in aggregates are presented in the Technical Notes.
Sources: United Nations Department of Economic and Social Affairs, Population Division (2012) World Urbanization Prospects: The 2011 Revision, United Nations, New York, United Nations Department of Economic andSocial Affairs, Population Division (2011) World Population Prospects: The 2010 Revision, United Nations, New York. Figures in regional, income or development aggregates are calculated on the basis of country/area leveldata from Table B.1.
DATA TABLES
REGIONAL AGGREGATESTABLE A.1Total Population Size, Rate of Change and Population Density
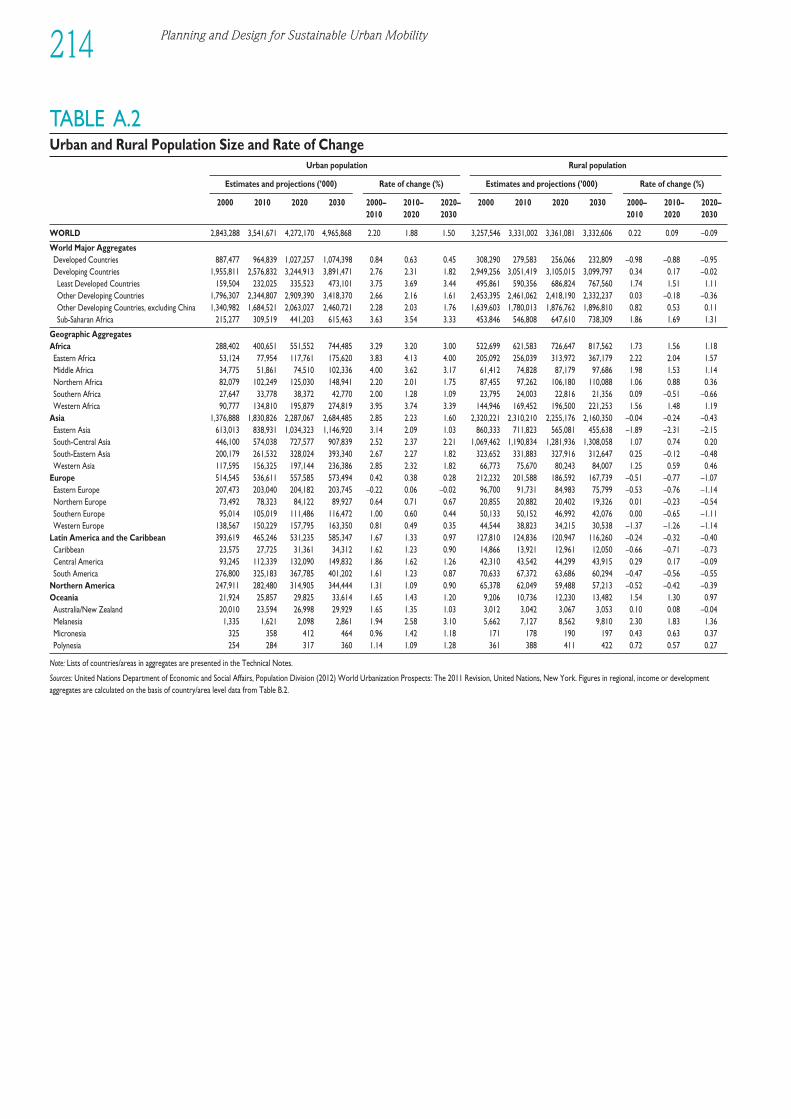
Planning and Design for Sustainable Urban Mobility214
TABLE A.2Urban and Rural Population Size and Rate of Change
Urban population Rural population
Estimates and projections (’000) Rate of change (%) Estimates and projections (’000) Rate of change (%)
2000 2010 2020 2030 2000– 2010– 2020– 2000 2010 2020 2030 2000– 2010– 2020–2010 2020 2030 2010 2020 2030
WORLD 2,843,288 3,541,671 4,272,170 4,965,868 2.20 1.88 1.50 3,257,546 3,331,002 3,361,081 3,332,606 0.22 0.09 –0.09
World Major AggregatesDeveloped Countries 887,477 964,839 1,027,257 1,074,398 0.84 0.63 0.45 308,290 279,583 256,066 232,809 –0.98 –0.88 –0.95Developing Countries 1,955,811 2,576,832 3,244,913 3,891,471 2.76 2.31 1.82 2,949,256 3,051,419 3,105,015 3,099,797 0.34 0.17 –0.02Least Developed Countries 159,504 232,025 335,523 473,101 3.75 3.69 3.44 495,861 590,356 686,824 767,560 1.74 1.51 1.11Other Developing Countries 1,796,307 2,344,807 2,909,390 3,418,370 2.66 2.16 1.61 2,453,395 2,461,062 2,418,190 2,332,237 0.03 –0.18 –0.36Other Developing Countries, excluding China 1,340,982 1,684,521 2,063,027 2,460,721 2.28 2.03 1.76 1,639,603 1,780,013 1,876,762 1,896,810 0.82 0.53 0.11Sub-Saharan Africa 215,277 309,519 441,203 615,463 3.63 3.54 3.33 453,846 546,808 647,610 738,309 1.86 1.69 1.31
Geographic AggregatesAfrica 288,402 400,651 551,552 744,485 3.29 3.20 3.00 522,699 621,583 726,647 817,562 1.73 1.56 1.18Eastern Africa 53,124 77,954 117,761 175,620 3.83 4.13 4.00 205,092 256,039 313,972 367,179 2.22 2.04 1.57Middle Africa 34,775 51,861 74,510 102,336 4.00 3.62 3.17 61,412 74,828 87,179 97,686 1.98 1.53 1.14Northern Africa 82,079 102,249 125,030 148,941 2.20 2.01 1.75 87,455 97,262 106,180 110,088 1.06 0.88 0.36Southern Africa 27,647 33,778 38,372 42,770 2.00 1.28 1.09 23,795 24,003 22,816 21,356 0.09 –0.51 –0.66Western Africa 90,777 134,810 195,879 274,819 3.95 3.74 3.39 144,946 169,452 196,500 221,253 1.56 1.48 1.19
Asia 1,376,888 1,830,826 2,287,067 2,684,485 2.85 2.23 1.60 2,320,221 2,310,210 2,255,176 2,160,350 –0.04 –0.24 –0.43Eastern Asia 613,013 838,931 1,034,323 1,146,920 3.14 2.09 1.03 860,333 711,823 565,081 455,638 –1.89 –2.31 –2.15South-Central Asia 446,100 574,038 727,577 907,839 2.52 2.37 2.21 1,069,462 1,190,834 1,281,936 1,308,058 1.07 0.74 0.20South-Eastern Asia 200,179 261,532 328,024 393,340 2.67 2.27 1.82 323,652 331,883 327,916 312,647 0.25 –0.12 –0.48Western Asia 117,595 156,325 197,144 236,386 2.85 2.32 1.82 66,773 75,670 80,243 84,007 1.25 0.59 0.46
Europe 514,545 536,611 557,585 573,494 0.42 0.38 0.28 212,232 201,588 186,592 167,739 –0.51 –0.77 –1.07Eastern Europe 207,473 203,040 204,182 203,745 –0.22 0.06 –0.02 96,700 91,731 84,983 75,799 –0.53 –0.76 –1.14Northern Europe 73,492 78,323 84,122 89,927 0.64 0.71 0.67 20,855 20,882 20,402 19,326 0.01 –0.23 –0.54Southern Europe 95,014 105,019 111,486 116,472 1.00 0.60 0.44 50,133 50,152 46,992 42,076 0.00 –0.65 –1.11Western Europe 138,567 150,229 157,795 163,350 0.81 0.49 0.35 44,544 38,823 34,215 30,538 –1.37 –1.26 –1.14
Latin America and the Caribbean 393,619 465,246 531,235 585,347 1.67 1.33 0.97 127,810 124,836 120,947 116,260 –0.24 –0.32 –0.40Caribbean 23,575 27,725 31,361 34,312 1.62 1.23 0.90 14,866 13,921 12,961 12,050 –0.66 –0.71 –0.73Central America 93,245 112,339 132,090 149,832 1.86 1.62 1.26 42,310 43,542 44,299 43,915 0.29 0.17 –0.09South America 276,800 325,183 367,785 401,202 1.61 1.23 0.87 70,633 67,372 63,686 60,294 –0.47 –0.56 –0.55
Northern America 247,911 282,480 314,905 344,444 1.31 1.09 0.90 65,378 62,049 59,488 57,213 –0.52 –0.42 –0.39Oceania 21,924 25,857 29,825 33,614 1.65 1.43 1.20 9,206 10,736 12,230 13,482 1.54 1.30 0.97Australia/New Zealand 20,010 23,594 26,998 29,929 1.65 1.35 1.03 3,012 3,042 3,067 3,053 0.10 0.08 –0.04Melanesia 1,335 1,621 2,098 2,861 1.94 2.58 3.10 5,662 7,127 8,562 9,810 2.30 1.83 1.36Micronesia 325 358 412 464 0.96 1.42 1.18 171 178 190 197 0.43 0.63 0.37Polynesia 254 284 317 360 1.14 1.09 1.28 361 388 411 422 0.72 0.57 0.27
Note: Lists of countries/areas in aggregates are presented in the Technical Notes.
Sources: United Nations Department of Economic and Social Affairs, Population Division (2012) World Urbanization Prospects: The 2011 Revision, United Nations, New York. Figures in regional, income or developmentaggregates are calculated on the basis of country/area level data from Table B.2.
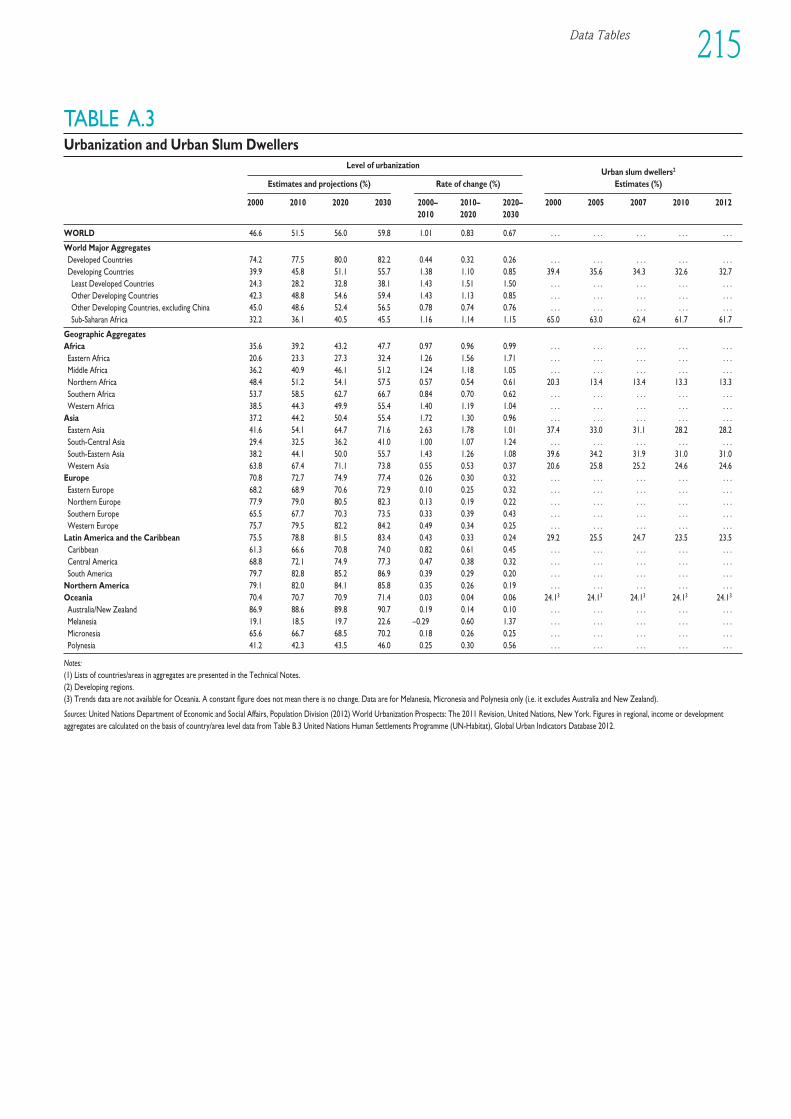
Data Tables 215
TABLE A.3Urbanization and Urban Slum Dwellers
Level of urbanizationUrban slum dwellers2
Estimates and projections (%) Rate of change (%) Estimates (%)
2000 2010 2020 2030 2000– 2010– 2020– 2000 2005 2007 2010 20122010 2020 2030
WORLD 46.6 51.5 56.0 59.8 1.01 0.83 0.67 . . . . . . . . . . . . . . .
World Major AggregatesDeveloped Countries 74.2 77.5 80.0 82.2 0.44 0.32 0.26 . . . . . . . . . . . . . . .Developing Countries 39.9 45.8 51.1 55.7 1.38 1.10 0.85 39.4 35.6 34.3 32.6 32.7Least Developed Countries 24.3 28.2 32.8 38.1 1.43 1.51 1.50 . . . . . . . . . . . . . . .Other Developing Countries 42.3 48.8 54.6 59.4 1.43 1.13 0.85 . . . . . . . . . . . . . . .Other Developing Countries, excluding China 45.0 48.6 52.4 56.5 0.78 0.74 0.76 . . . . . . . . . . . . . . .Sub-Saharan Africa 32.2 36.1 40.5 45.5 1.16 1.14 1.15 65.0 63.0 62.4 61.7 61.7
Geographic AggregatesAfrica 35.6 39.2 43.2 47.7 0.97 0.96 0.99 . . . . . . . . . . . . . . .Eastern Africa 20.6 23.3 27.3 32.4 1.26 1.56 1.71 . . . . . . . . . . . . . . .Middle Africa 36.2 40.9 46.1 51.2 1.24 1.18 1.05 . . . . . . . . . . . . . . .Northern Africa 48.4 51.2 54.1 57.5 0.57 0.54 0.61 20.3 13.4 13.4 13.3 13.3Southern Africa 53.7 58.5 62.7 66.7 0.84 0.70 0.62 . . . . . . . . . . . . . . .Western Africa 38.5 44.3 49.9 55.4 1.40 1.19 1.04 . . . . . . . . . . . . . . .
Asia 37.2 44.2 50.4 55.4 1.72 1.30 0.96 . . . . . . . . . . . . . . .Eastern Asia 41.6 54.1 64.7 71.6 2.63 1.78 1.01 37.4 33.0 31.1 28.2 28.2South-Central Asia 29.4 32.5 36.2 41.0 1.00 1.07 1.24 . . . . . . . . . . . . . . .South-Eastern Asia 38.2 44.1 50.0 55.7 1.43 1.26 1.08 39.6 34.2 31.9 31.0 31.0Western Asia 63.8 67.4 71.1 73.8 0.55 0.53 0.37 20.6 25.8 25.2 24.6 24.6
Europe 70.8 72.7 74.9 77.4 0.26 0.30 0.32 . . . . . . . . . . . . . . .Eastern Europe 68.2 68.9 70.6 72.9 0.10 0.25 0.32 . . . . . . . . . . . . . . .Northern Europe 77.9 79.0 80.5 82.3 0.13 0.19 0.22 . . . . . . . . . . . . . . .Southern Europe 65.5 67.7 70.3 73.5 0.33 0.39 0.43 . . . . . . . . . . . . . . .Western Europe 75.7 79.5 82.2 84.2 0.49 0.34 0.25 . . . . . . . . . . . . . . .
Latin America and the Caribbean 75.5 78.8 81.5 83.4 0.43 0.33 0.24 29.2 25.5 24.7 23.5 23.5Caribbean 61.3 66.6 70.8 74.0 0.82 0.61 0.45 . . . . . . . . . . . . . . .Central America 68.8 72.1 74.9 77.3 0.47 0.38 0.32 . . . . . . . . . . . . . . .South America 79.7 82.8 85.2 86.9 0.39 0.29 0.20 . . . . . . . . . . . . . . .
Northern America 79.1 82.0 84.1 85.8 0.35 0.26 0.19 . . . . . . . . . . . . . . .Oceania 70.4 70.7 70.9 71.4 0.03 0.04 0.06 24.13 24.13 24.13 24.13 24.13
Australia/New Zealand 86.9 88.6 89.8 90.7 0.19 0.14 0.10 . . . . . . . . . . . . . . .Melanesia 19.1 18.5 19.7 22.6 –0.29* 0.60 1.37 . . . . . . . . . . . . . . .Micronesia 65.6 66.7 68.5 70.2 0.18 0.26 0.25 . . . . . . . . . . . . . . .Polynesia 41.2 42.3 43.5 46.0 0.25 0.30 0.56 . . . . . . . . . . . . . . .
Notes:(1) Lists of countries/areas in aggregates are presented in the Technical Notes.(2) Developing regions.(3) Trends data are not available for Oceania. A constant figure does not mean there is no change. Data are for Melanesia, Micronesia and Polynesia only (i.e. it excludes Australia and New Zealand).
Sources: United Nations Department of Economic and Social Affairs, Population Division (2012) World Urbanization Prospects: The 2011 Revision, United Nations, New York. Figures in regional, income or developmentaggregates are calculated on the basis of country/area level data from Table B.3 United Nations Human Settlements Programme (UN-Habitat), Global Urban Indicators Database 2012.
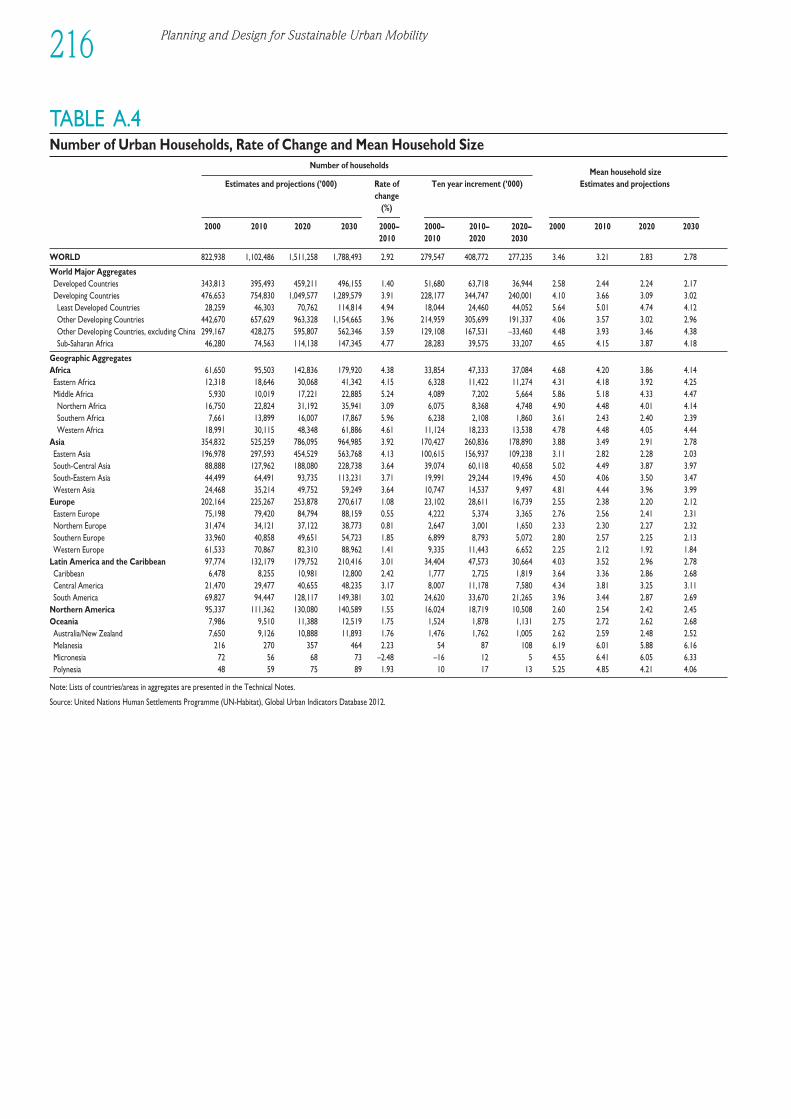
Planning and Design for Sustainable Urban Mobility216
TABLE A.4Number of Urban Households, Rate of Change and Mean Household Size
Number of householdsMean household size
Estimates and projections (’000) Rate of Ten year increment (’000) Estimates and projectionschange
(%)
2000 2010 2020 2030 2000– 2000– 2010– 2020– 2000 2010 2020 20302010 2010 2020 2030
WORLD 822,938 1,102,486 1,511,258 1,788,493 2.92 279,547 408,772 277,235 3.46 3.21 2.83 2.78
World Major AggregatesDeveloped Countries 343,813 395,493 459,211 496,155 1.40 51,680 63,718 36,944 2.58 2.44 2.24 2.17Developing Countries 476,653 754,830 1,049,577 1,289,579 3.91 228,177 344,747 240,001 4.10 3.66 3.09 3.02Least Developed Countries 28,259 46,303 70,762 114,814 4.94 18,044 24,460 44,052 5.64 5.01 4.74 4.12Other Developing Countries 442,670 657,629 963,328 1,154,665 3.96 214,959 305,699 191,337 4.06 3.57 3.02 2.96Other Developing Countries, excluding China 299,167 428,275 595,807 562,346 3.59 129,108 167,531 –33,460 4.48 3.93 3.46 4.38Sub-Saharan Africa 46,280 74,563 114,138 147,345 4.77 28,283 39,575 33,207 4.65 4.15 3.87 4.18
Geographic AggregatesAfrica 61,650 95,503 142,836 179,920 4.38 33,854 47,333 37,084 4.68 4.20 3.86 4.14Eastern Africa 12,318 18,646 30,068 41,342 4.15 6,328 11,422 11,274 4.31 4.18 3.92 4.25Middle Africa 5,930 10,019 17,221 22,885 5.24 4,089 7,202 5,664 5.86 5.18 4.33 4.47Northern Africa 16,750 22,824 31,192 35,941 3.09 6,075 8,368 4,748 4.90 4.48 4.01 4.14Southern Africa 7,661 13,899 16,007 17,867 5.96 6,238 2,108 1,860 3.61 2.43 2.40 2.39Western Africa 18,991 30,115 48,348 61,886 4.61 11,124 18,233 13,538 4.78 4.48 4.05 4.44
Asia 354,832 525,259 786,095 964,985 3.92 170,427 260,836 178,890 3.88 3.49 2.91 2.78Eastern Asia 196,978 297,593 454,529 563,768 4.13 100,615 156,937 109,238 3.11 2.82 2.28 2.03South-Central Asia 88,888 127,962 188,080 228,738 3.64 39,074 60,118 40,658 5.02 4.49 3.87 3.97South-Eastern Asia 44,499 64,491 93,735 113,231 3.71 19,991 29,244 19,496 4.50 4.06 3.50 3.47Western Asia 24,468 35,214 49,752 59,249 3.64 10,747 14,537 9,497 4.81 4.44 3.96 3.99
Europe 202,164 225,267 253,878 270,617 1.08 23,102 28,611 16,739 2.55 2.38 2.20 2.12Eastern Europe 75,198 79,420 84,794 88,159 0.55 4,222 5,374 3,365 2.76 2.56 2.41 2.31Northern Europe 31,474 34,121 37,122 38,773 0.81 2,647 3,001 1,650 2.33 2.30 2.27 2.32Southern Europe 33,960 40,858 49,651 54,723 1.85 6,899 8,793 5,072 2.80 2.57 2.25 2.13Western Europe 61,533 70,867 82,310 88,962 1.41 9,335 11,443 6,652 2.25 2.12 1.92 1.84
Latin America and the Caribbean 97,774 132,179 179,752 210,416 3.01 34,404 47,573 30,664 4.03 3.52 2.96 2.78Caribbean 6,478 8,255 10,981 12,800 2.42 1,777 2,725 1,819 3.64 3.36 2.86 2.68Central America 21,470 29,477 40,655 48,235 3.17 8,007 11,178 7,580 4.34 3.81 3.25 3.11South America 69,827 94,447 128,117 149,381 3.02 24,620 33,670 21,265 3.96 3.44 2.87 2.69
Northern America 95,337 111,362 130,080 140,589 1.55 16,024 18,719 10,508 2.60 2.54 2.42 2.45Oceania 7,986 9,510 11,388 12,519 1.75 1,524 1,878 1,131 2.75 2.72 2.62 2.68Australia/New Zealand 7,650 9,126 10,888 11,893 1.76 1,476 1,762 1,005 2.62 2.59 2.48 2.52Melanesia 216 270 357 464 2.23 54 87 108 6.19 6.01 5.88 6.16Micronesia 72 56 68 73 –2.48 –16 12 5 4.55 6.41 6.05 6.33Polynesia 48 59 75 89 1.93 10 17 13 5.25 4.85 4.21 4.06
Note: Lists of countries/areas in aggregates are presented in the Technical Notes.
Source: United Nations Human Settlements Programme (UN-Habitat), Global Urban Indicators Database 2012.
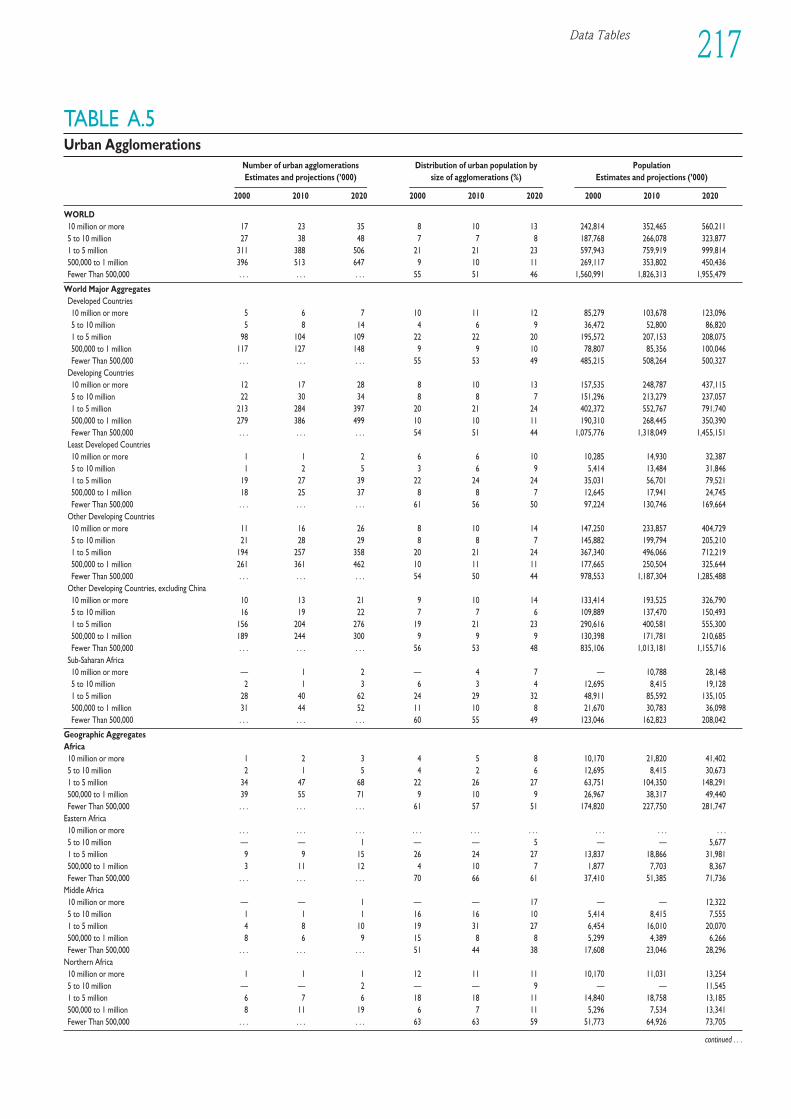
Data Tables 217
TABLE A.5Urban Agglomerations
Number of urban agglomerations Distribution of urban population by PopulationEstimates and projections (’000) size of agglomerations (%) Estimates and projections (’000)
2000 2010 2020 2000 2010 2020 2000 2010 2020
WORLD10 million or more 17 23 35 8 10 13 242,814 352,465 560,2115 to 10 million 27 38 48 7 7 8 187,768 266,078 323,8771 to 5 million 311 388 506 21 21 23 597,943 759,919 999,814500,000 to 1 million 396 513 647 9 10 11 269,117 353,802 450,436Fewer Than 500,000 . . . . . . . . . 55 51 46 1,560,991 1,826,313 1,955,479
World Major AggregatesDeveloped Countries10 million or more 5 6 7 10 11 12 85,279 103,678 123,0965 to 10 million 5 8 14 4 6 9 36,472 52,800 86,8201 to 5 million 98 104 109 22 22 20 195,572 207,153 208,075500,000 to 1 million 117 127 148 9 9 10 78,807 85,356 100,046Fewer Than 500,000 . . . . . . . . . 55 53 49 485,215 508,264 500,327
Developing Countries10 million or more 12 17 28 8 10 13 157,535 248,787 437,1155 to 10 million 22 30 34 8 8 7 151,296 213,279 237,0571 to 5 million 213 284 397 20 21 24 402,372 552,767 791,740500,000 to 1 million 279 386 499 10 10 11 190,310 268,445 350,390Fewer Than 500,000 . . . . . . . . . 54 51 44 1,075,776 1,318,049 1,455,151
Least Developed Countries10 million or more 1 1 2 6 6 10 10,285 14,930 32,3875 to 10 million 1 2 5 3 6 9 5,414 13,484 31,8461 to 5 million 19 27 39 22 24 24 35,031 56,701 79,521500,000 to 1 million 18 25 37 8 8 7 12,645 17,941 24,745Fewer Than 500,000 . . . . . . . . . 61 56 50 97,224 130,746 169,664
Other Developing Countries10 million or more 11 16 26 8 10 14 147,250 233,857 404,7295 to 10 million 21 28 29 8 8 7 145,882 199,794 205,2101 to 5 million 194 257 358 20 21 24 367,340 496,066 712,219500,000 to 1 million 261 361 462 10 11 11 177,665 250,504 325,644Fewer Than 500,000 . . . . . . . . . 54 50 44 978,553 1,187,304 1,285,488
Other Developing Countries, excluding China10 million or more 10 13 21 9 10 14 133,414 193,525 326,7905 to 10 million 16 19 22 7 7 6 109,889 137,470 150,4931 to 5 million 156 204 276 19 21 23 290,616 400,581 555,300500,000 to 1 million 189 244 300 9 9 9 130,398 171,781 210,685Fewer Than 500,000 . . . . . . . . . 56 53 48 835,106 1,013,181 1,155,716
Sub-Saharan Africa10 million or more — 1 2 — 4 7 — 10,788 28,1485 to 10 million 2 1 3 6 3 4 12,695 8,415 19,1281 to 5 million 28 40 62 24 29 32 48,911 85,592 135,105500,000 to 1 million 31 44 52 11 10 8 21,670 30,783 36,098Fewer Than 500,000 . . . . . . . . . 60 55 49 123,046 162,823 208,042
Geographic AggregatesAfrica10 million or more 1 2 3 4 5 8 10,170 21,820 41,4025 to 10 million 2 1 5 4 2 6 12,695 8,415 30,6731 to 5 million 34 47 68 22 26 27 63,751 104,350 148,291500,000 to 1 million 39 55 71 9 10 9 26,967 38,317 49,440Fewer Than 500,000 . . . . . . . . . 61 57 51 174,820 227,750 281,747
Eastern Africa10 million or more . . . . . . . . . . . . . . . . . . . . . . . . . . .5 to 10 million — — 1 — — 5 — — 5,6771 to 5 million 9 9 15 26 24 27 13,837 18,866 31,981500,000 to 1 million 3 11 12 4 10 7 1,877 7,703 8,367Fewer Than 500,000 . . . . . . . . . 70 66 61 37,410 51,385 71,736
Middle Africa10 million or more — — 1 — — 17 — — 12,3225 to 10 million 1 1 1 16 16 10 5,414 8,415 7,5551 to 5 million 4 8 10 19 31 27 6,454 16,010 20,070500,000 to 1 million 8 6 9 15 8 8 5,299 4,389 6,266Fewer Than 500,000 . . . . . . . . . 51 44 38 17,608 23,046 28,296
Northern Africa10 million or more 1 1 1 12 11 11 10,170 11,031 13,2545 to 10 million — — 2 — — 9 — — 11,5451 to 5 million 6 7 6 18 18 11 14,840 18,758 13,185500,000 to 1 million 8 11 19 6 7 11 5,296 7,534 13,341Fewer Than 500,000 . . . . . . . . . 63 63 59 51,773 64,926 73,705
continued . . .
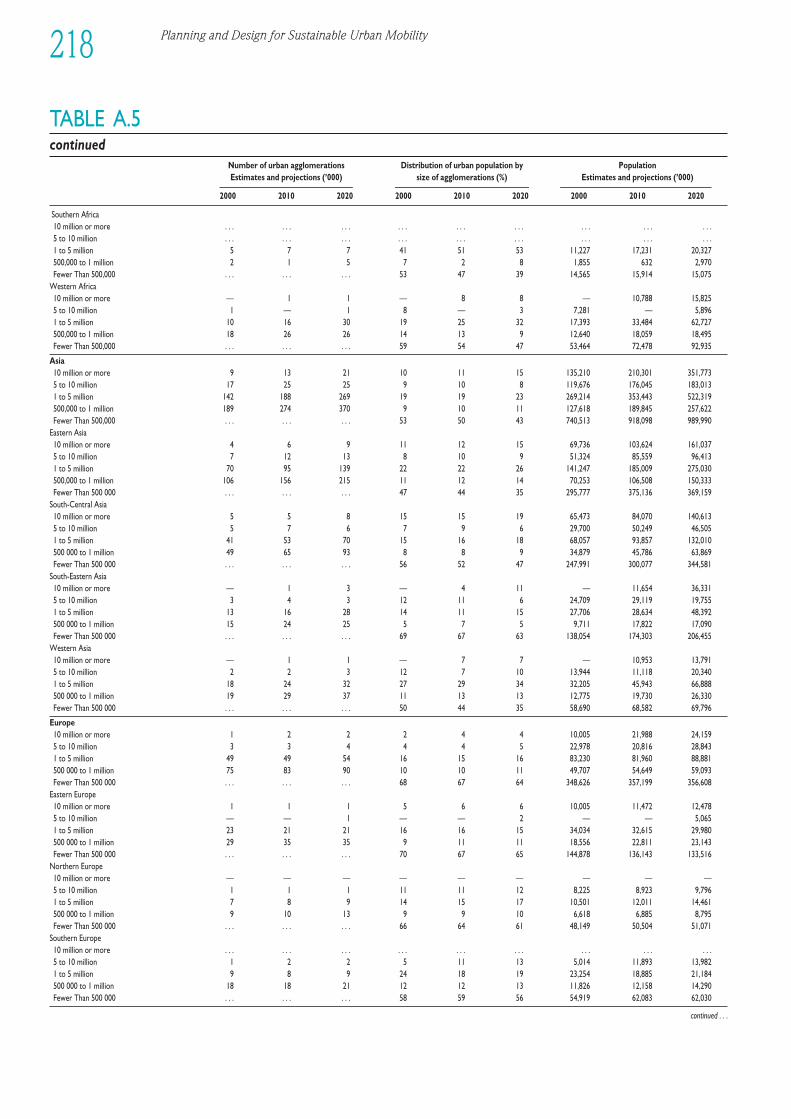
Planning and Design for Sustainable Urban Mobility218
TABLE A.5continued
Number of urban agglomerations Distribution of urban population by PopulationEstimates and projections (’000) size of agglomerations (%) Estimates and projections (’000)
2000 2010 2020 2000 2010 2020 2000 2010 2020
Southern Africa10 million or more . . . . . . . . . . . . . . . . . . . . . . . . . . .5 to 10 million . . . . . . . . . . . . . . . . . . . . . . . . . . .1 to 5 million 5 7 7 41 51 53 11,227 17,231 20,327500,000 to 1 million 2 1 5 7 2 8 1,855 632 2,970Fewer Than 500,000 . . . . . . . . . 53 47 39 14,565 15,914 15,075
Western Africa10 million or more — 1 1 — 8 8 — 10,788 15,8255 to 10 million 1 — 1 8 — 3 7,281 — 5,8961 to 5 million 10 16 30 19 25 32 17,393 33,484 62,727500,000 to 1 million 18 26 26 14 13 9 12,640 18,059 18,495Fewer Than 500,000 . . . . . . . . . 59 54 47 53,464 72,478 92,935
Asia10 million or more 9 13 21 10 11 15 135,210 210,301 351,7735 to 10 million 17 25 25 9 10 8 119,676 176,045 183,0131 to 5 million 142 188 269 19 19 23 269,214 353,443 522,319500,000 to 1 million 189 274 370 9 10 11 127,618 189,845 257,622Fewer Than 500,000 . . . . . . . . . 53 50 43 740,513 918,098 989,990
Eastern Asia10 million or more 4 6 9 11 12 15 69,736 103,624 161,0375 to 10 million 7 12 13 8 10 9 51,324 85,559 96,4131 to 5 million 70 95 139 22 22 26 141,247 185,009 275,030500,000 to 1 million 106 156 215 11 12 14 70,253 106,508 150,333Fewer Than 500 000 . . . . . . . . . 47 44 35 295,777 375,136 369,159
South-Central Asia10 million or more 5 5 8 15 15 19 65,473 84,070 140,6135 to 10 million 5 7 6 7 9 6 29,700 50,249 46,5051 to 5 million 41 53 70 15 16 18 68,057 93,857 132,010500 000 to 1 million 49 65 93 8 8 9 34,879 45,786 63,869Fewer Than 500 000 . . . . . . . . . 56 52 47 247,991 300,077 344,581
South-Eastern Asia10 million or more — 1 3 — 4 11 — 11,654 36,3315 to 10 million 3 4 3 12 11 6 24,709 29,119 19,7551 to 5 million 13 16 28 14 11 15 27,706 28,634 48,392500 000 to 1 million 15 24 25 5 7 5 9,711 17,822 17,090Fewer Than 500 000 . . . . . . . . . 69 67 63 138,054 174,303 206,455
Western Asia10 million or more — 1 1 — 7 7 — 10,953 13,7915 to 10 million 2 2 3 12 7 10 13,944 11,118 20,3401 to 5 million 18 24 32 27 29 34 32,205 45,943 66,888500 000 to 1 million 19 29 37 11 13 13 12,775 19,730 26,330Fewer Than 500 000 . . . . . . . . . 50 44 35 58,690 68,582 69,796
Europe10 million or more 1 2 2 2 4 4 10,005 21,988 24,1595 to 10 million 3 3 4 4 4 5 22,978 20,816 28,8431 to 5 million 49 49 54 16 15 16 83,230 81,960 88,881500 000 to 1 million 75 83 90 10 10 11 49,707 54,649 59,093Fewer Than 500 000 . . . . . . . . . 68 67 64 348,626 357,199 356,608
Eastern Europe10 million or more 1 1 1 5 6 6 10,005 11,472 12,4785 to 10 million — — 1 — — 2 — — 5,0651 to 5 million 23 21 21 16 16 15 34,034 32,615 29,980500 000 to 1 million 29 35 35 9 11 11 18,556 22,811 23,143Fewer Than 500 000 . . . . . . . . . 70 67 65 144,878 136,143 133,516
Northern Europe10 million or more — — — — — — — — —5 to 10 million 1 1 1 11 11 12 8,225 8,923 9,7961 to 5 million 7 8 9 14 15 17 10,501 12,011 14,461500 000 to 1 million 9 10 13 9 9 10 6,618 6,885 8,795Fewer Than 500 000 . . . . . . . . . 66 64 61 48,149 50,504 51,071
Southern Europe10 million or more . . . . . . . . . . . . . . . . . . . . . . . . . . .5 to 10 million 1 2 2 5 11 13 5,014 11,893 13,9821 to 5 million 9 8 9 24 18 19 23,254 18,885 21,184500 000 to 1 million 18 18 21 12 12 13 11,826 12,158 14,290Fewer Than 500 000 . . . . . . . . . 58 59 56 54,919 62,083 62,030
continued . . .
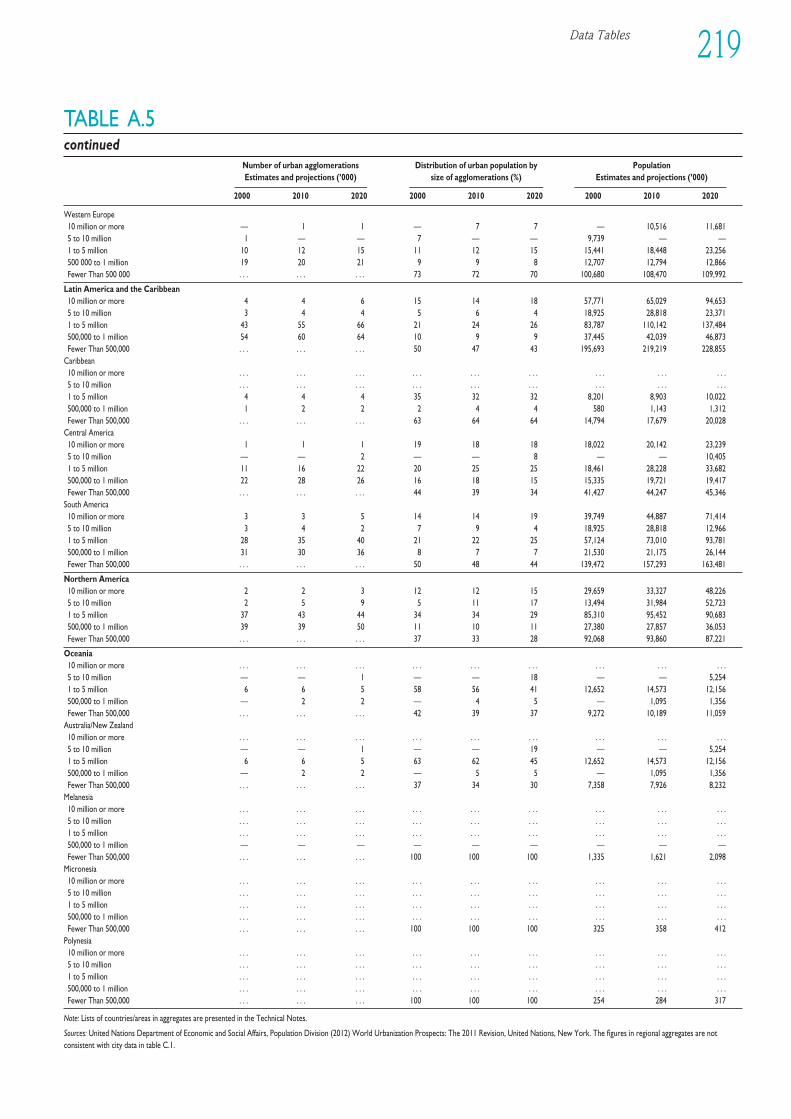
Data Tables 219
TABLE A.5continued
Number of urban agglomerations Distribution of urban population by PopulationEstimates and projections (’000) size of agglomerations (%) Estimates and projections (’000)
2000 2010 2020 2000 2010 2020 2000 2010 2020
Western Europe10 million or more — 1 1 — 7 7 — 10,516 11,6815 to 10 million 1 — — 7 — — 9,739 — —1 to 5 million 10 12 15 11 12 15 15,441 18,448 23,256500 000 to 1 million 19 20 21 9 9 8 12,707 12,794 12,866Fewer Than 500 000 . . . . . . . . . 73 72 70 100,680 108,470 109,992
Latin America and the Caribbean10 million or more 4 4 6 15 14 18 57,771 65,029 94,6535 to 10 million 3 4 4 5 6 4 18,925 28,818 23,3711 to 5 million 43 55 66 21 24 26 83,787 110,142 137,484500,000 to 1 million 54 60 64 10 9 9 37,445 42,039 46,873Fewer Than 500,000 . . . . . . . . . 50 47 43 195,693 219,219 228,855
Caribbean10 million or more . . . . . . . . . . . . . . . . . . . . . . . . . . .5 to 10 million . . . . . . . . . . . . . . . . . . . . . . . . . . .1 to 5 million 4 4 4 35 32 32 8,201 8,903 10,022500,000 to 1 million 1 2 2 2 4 4 580 1,143 1,312Fewer Than 500,000 . . . . . . . . . 63 64 64 14,794 17,679 20,028
Central America10 million or more 1 1 1 19 18 18 18,022 20,142 23,2395 to 10 million — — 2 — — 8 — — 10,4051 to 5 million 11 16 22 20 25 25 18,461 28,228 33,682500,000 to 1 million 22 28 26 16 18 15 15,335 19,721 19,417Fewer Than 500,000 . . . . . . . . . 44 39 34 41,427 44,247 45,346
South America10 million or more 3 3 5 14 14 19 39,749 44,887 71,4145 to 10 million 3 4 2 7 9 4 18,925 28,818 12,9661 to 5 million 28 35 40 21 22 25 57,124 73,010 93,781500,000 to 1 million 31 30 36 8 7 7 21,530 21,175 26,144Fewer Than 500,000 . . . . . . . . . 50 48 44 139,472 157,293 163,481
Northern America10 million or more 2 2 3 12 12 15 29,659 33,327 48,2265 to 10 million 2 5 9 5 11 17 13,494 31,984 52,7231 to 5 million 37 43 44 34 34 29 85,310 95,452 90,683500,000 to 1 million 39 39 50 11 10 11 27,380 27,857 36,053Fewer Than 500,000 . . . . . . . . . 37 33 28 92,068 93,860 87,221
Oceania10 million or more . . . . . . . . . . . . . . . . . . . . . . . . . . .5 to 10 million — — 1 — — 18 — — 5,2541 to 5 million 6 6 5 58 56 41 12,652 14,573 12,156500,000 to 1 million — 2 2 — 4 5 — 1,095 1,356Fewer Than 500,000 . . . . . . . . . 42 39 37 9,272 10,189 11,059
Australia/New Zealand10 million or more . . . . . . . . . . . . . . . . . . . . . . . . . . .5 to 10 million — — 1 — — 19 — — 5,2541 to 5 million 6 6 5 63 62 45 12,652 14,573 12,156500,000 to 1 million — 2 2 — 5 5 — 1,095 1,356Fewer Than 500,000 . . . . . . . . . 37 34 30 7,358 7,926 8,232
Melanesia10 million or more . . . . . . . . . . . . . . . . . . . . . . . . . . .5 to 10 million . . . . . . . . . . . . . . . . . . . . . . . . . . .1 to 5 million . . . . . . . . . . . . . . . . . . . . . . . . . . .500,000 to 1 million — — — — — — — — —Fewer Than 500,000 . . . . . . . . . 100 100 100 1,335 1,621 2,098
Micronesia10 million or more . . . . . . . . . . . . . . . . . . . . . . . . . . .5 to 10 million . . . . . . . . . . . . . . . . . . . . . . . . . . .1 to 5 million . . . . . . . . . . . . . . . . . . . . . . . . . . .500,000 to 1 million . . . . . . . . . . . . . . . . . . . . . . . . . . .Fewer Than 500,000 . . . . . . . . . 100 100 100 325 358 412
Polynesia10 million or more . . . . . . . . . . . . . . . . . . . . . . . . . . .5 to 10 million . . . . . . . . . . . . . . . . . . . . . . . . . . .1 to 5 million . . . . . . . . . . . . . . . . . . . . . . . . . . .500,000 to 1 million . . . . . . . . . . . . . . . . . . . . . . . . . . .Fewer Than 500,000 . . . . . . . . . 100 100 100 254 284 317
Note: Lists of countries/areas in aggregates are presented in the Technical Notes.
Sources: United Nations Department of Economic and Social Affairs, Population Division (2012) World Urbanization Prospects: The 2011 Revision, United Nations, New York. The figures in regional aggregates are notconsistent with city data in table C.1.
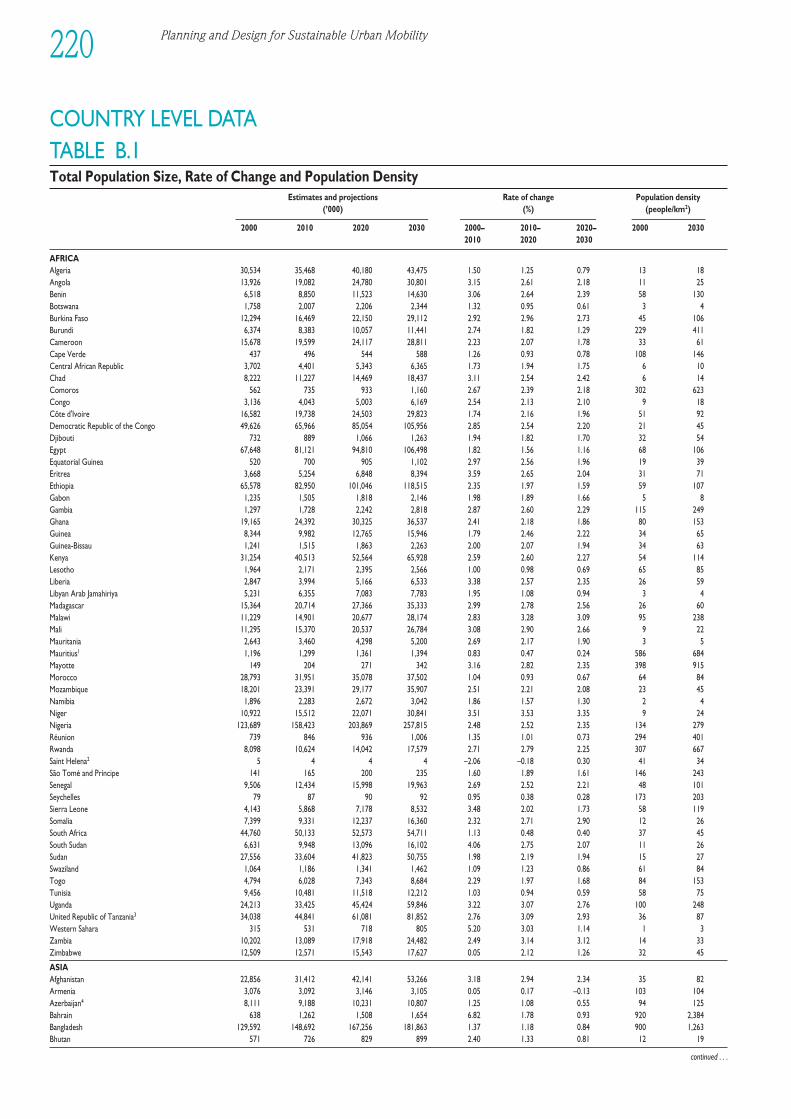
Planning and Design for Sustainable Urban Mobility220
TABLE B.1Total Population Size, Rate of Change and Population Density
Estimates and projections Rate of change Population density (’000) (%) (people/km2)
2000 2010 2020 2030 2000– 2010– 2020– 2000 20302010 2020 2030
AFRICAAlgeria 30,534 35,468 40,180 43,475 1.50 1.25 0.79 13 18Angola 13,926 19,082 24,780 30,801 3.15 2.61 2.18 11 25Benin 6,518 8,850 11,523 14,630 3.06 2.64 2.39 58 130Botswana 1,758 2,007 2,206 2,344 1.32 0.95 0.61 3 4Burkina Faso 12,294 16,469 22,150 29,112 2.92 2.96 2.73 45 106Burundi 6,374 8,383 10,057 11,441 2.74 1.82 1.29 229 411Cameroon 15,678 19,599 24,117 28,811 2.23 2.07 1.78 33 61Cape Verde 437 496 544 588 1.26 0.93 0.78 108 146Central African Republic 3,702 4,401 5,343 6,365 1.73 1.94 1.75 6 10Chad 8,222 11,227 14,469 18,437 3.11 2.54 2.42 6 14Comoros 562 735 933 1,160 2.67 2.39 2.18 302 623Congo 3,136 4,043 5,003 6,169 2.54 2.13 2.10 9 18Côte d'Ivoire 16,582 19,738 24,503 29,823 1.74 2.16 1.96 51 92Democratic Republic of the Congo 49,626 65,966 85,054 105,956 2.85 2.54 2.20 21 45Djibouti 732 889 1,066 1,263 1.94 1.82 1.70 32 54Egypt 67,648 81,121 94,810 106,498 1.82 1.56 1.16 68 106Equatorial Guinea 520 700 905 1,102 2.97 2.56 1.96 19 39Eritrea 3,668 5,254 6,848 8,394 3.59 2.65 2.04 31 71Ethiopia 65,578 82,950 101,046 118,515 2.35 1.97 1.59 59 107Gabon 1,235 1,505 1,818 2,146 1.98 1.89 1.66 5 8Gambia 1,297 1,728 2,242 2,818 2.87 2.60 2.29 115 249Ghana 19,165 24,392 30,325 36,537 2.41 2.18 1.86 80 153Guinea 8,344 9,982 12,765 15,946 1.79 2.46 2.22 34 65Guinea-Bissau 1,241 1,515 1,863 2,263 2.00 2.07 1.94 34 63Kenya 31,254 40,513 52,564 65,928 2.59 2.60 2.27 54 114Lesotho 1,964 2,171 2,395 2,566 1.00 0.98 0.69 65 85Liberia 2,847 3,994 5,166 6,533 3.38 2.57 2.35 26 59Libyan Arab Jamahiriya 5,231 6,355 7,083 7,783 1.95 1.08 0.94 3 4Madagascar 15,364 20,714 27,366 35,333 2.99 2.78 2.56 26 60Malawi 11,229 14,901 20,677 28,174 2.83 3.28 3.09 95 238Mali 11,295 15,370 20,537 26,784 3.08 2.90 2.66 9 22Mauritania 2,643 3,460 4,298 5,200 2.69 2.17 1.90 3 5Mauritius1 1,196 1,299 1,361 1,394 0.83 0.47 0.24 586 684Mayotte 149 204 271 342 3.16 2.82 2.35 398 915Morocco 28,793 31,951 35,078 37,502 1.04 0.93 0.67 64 84Mozambique 18,201 23,391 29,177 35,907 2.51 2.21 2.08 23 45Namibia 1,896 2,283 2,672 3,042 1.86 1.57 1.30 2 4Niger 10,922 15,512 22,071 30,841 3.51 3.53 3.35 9 24Nigeria 123,689 158,423 203,869 257,815 2.48 2.52 2.35 134 279Réunion 739 846 936 1,006 1.35 1.01 0.73 294 401Rwanda 8,098 10,624 14,042 17,579 2.71 2.79 2.25 307 667Saint Helena2 5 4 4 4 –2.06 –0.18 0.30 41 34São Tomé and Príncipe 141 165 200 235 1.60 1.89 1.61 146 243Senegal 9,506 12,434 15,998 19,963 2.69 2.52 2.21 48 101Seychelles 79 87 90 92 0.95 0.38 0.28 173 203Sierra Leone 4,143 5,868 7,178 8,532 3.48 2.02 1.73 58 119Somalia 7,399 9,331 12,237 16,360 2.32 2.71 2.90 12 26South Africa 44,760 50,133 52,573 54,711 1.13 0.48 0.40 37 45South Sudan 6,631 9,948 13,096 16,102 4.06 2.75 2.07 11 26Sudan 27,556 33,604 41,823 50,755 1.98 2.19 1.94 15 27Swaziland 1,064 1,186 1,341 1,462 1.09 1.23 0.86 61 84Togo 4,794 6,028 7,343 8,684 2.29 1.97 1.68 84 153Tunisia 9,456 10,481 11,518 12,212 1.03 0.94 0.59 58 75Uganda 24,213 33,425 45,424 59,846 3.22 3.07 2.76 100 248United Republic of Tanzania3 34,038 44,841 61,081 81,852 2.76 3.09 2.93 36 87Western Sahara 315 531 718 805 5.20 3.03 1.14 1 3Zambia 10,202 13,089 17,918 24,482 2.49 3.14 3.12 14 33Zimbabwe 12,509 12,571 15,543 17,627 0.05 2.12 1.26 32 45
ASIAAfghanistan 22,856 31,412 42,141 53,266 3.18 2.94 2.34 35 82Armenia 3,076 3,092 3,146 3,105 0.05 0.17 –0.13 103 104Azerbaijan4 8,111 9,188 10,231 10,807 1.25 1.08 0.55 94 125Bahrain 638 1,262 1,508 1,654 6.82 1.78 0.93 920 2,384Bangladesh 129,592 148,692 167,256 181,863 1.37 1.18 0.84 900 1,263Bhutan 571 726 829 899 2.40 1.33 0.81 12 19
continued . . .
COUNTRY LEVEL DATA
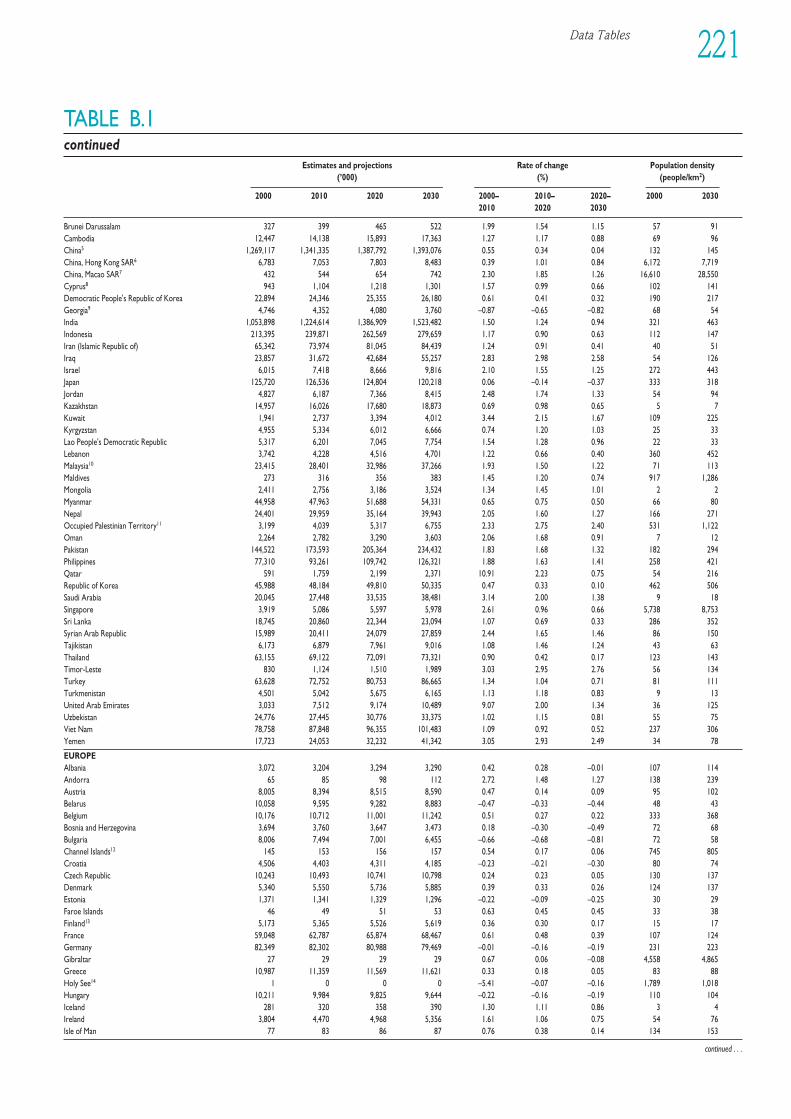
Data Tables 221
TABLE B.1continued
Estimates and projections Rate of change Population density (’000) (%) (people/km2)
2000 2010 2020 2030 2000– 2010– 2020– 2000 20302010 2020 2030
Brunei Darussalam 327 399 465 522 1.99 1.54 1.15 57 91Cambodia 12,447 14,138 15,893 17,363 1.27 1.17 0.88 69 96China5 1,269,117 1,341,335 1,387,792 1,393,076 0.55 0.34 0.04 132 145China, Hong Kong SAR6 6,783 7,053 7,803 8,483 0.39 1.01 0.84 6,172 7,719China, Macao SAR7 432 544 654 742 2.30 1.85 1.26 16,610 28,550Cyprus8 943 1,104 1,218 1,301 1.57 0.99 0.66 102 141Democratic People's Republic of Korea 22,894 24,346 25,355 26,180 0.61 0.41 0.32 190 217 Georgia9 4,746 4,352 4,080 3,760 –0.87 –0.65 –0.82 68 54India 1,053,898 1,224,614 1,386,909 1,523,482 1.50 1.24 0.94 321 463Indonesia 213,395 239,871 262,569 279,659 1.17 0.90 0.63 112 147Iran (Islamic Republic of) 65,342 73,974 81,045 84,439 1.24 0.91 0.41 40 51Iraq 23,857 31,672 42,684 55,257 2.83 2.98 2.58 54 126Israel 6,015 7,418 8,666 9,816 2.10 1.55 1.25 272 443Japan 125,720 126,536 124,804 120,218 0.06 –0.14 –0.37 333 318Jordan 4,827 6,187 7,366 8,415 2.48 1.74 1.33 54 94Kazakhstan 14,957 16,026 17,680 18,873 0.69 0.98 0.65 5 7Kuwait 1,941 2,737 3,394 4,012 3.44 2.15 1.67 109 225Kyrgyzstan 4,955 5,334 6,012 6,666 0.74 1.20 1.03 25 33Lao People's Democratic Republic 5,317 6,201 7,045 7,754 1.54 1.28 0.96 22 33Lebanon 3,742 4,228 4,516 4,701 1.22 0.66 0.40 360 452Malaysia10 23,415 28,401 32,986 37,266 1.93 1.50 1.22 71 113Maldives 273 316 356 383 1.45 1.20 0.74 917 1,286Mongolia 2,411 2,756 3,186 3,524 1.34 1.45 1.01 2 2Myanmar 44,958 47,963 51,688 54,331 0.65 0.75 0.50 66 80Nepal 24,401 29,959 35,164 39,943 2.05 1.60 1.27 166 271Occupied Palestinian Territory11 3,199 4,039 5,317 6,755 2.33 2.75 2.40 531 1,122Oman 2,264 2,782 3,290 3,603 2.06 1.68 0.91 7 12Pakistan 144,522 173,593 205,364 234,432 1.83 1.68 1.32 182 294Philippines 77,310 93,261 109,742 126,321 1.88 1.63 1.41 258 421Qatar 591 1,759 2,199 2,371 10.91 2.23 0.75 54 216Republic of Korea 45,988 48,184 49,810 50,335 0.47 0.33 0.10 462 506Saudi Arabia 20,045 27,448 33,535 38,481 3.14 2.00 1.38 9 18Singapore 3,919 5,086 5,597 5,978 2.61 0.96 0.66 5,738 8,753Sri Lanka 18,745 20,860 22,344 23,094 1.07 0.69 0.33 286 352Syrian Arab Republic 15,989 20,411 24,079 27,859 2.44 1.65 1.46 86 150Tajikistan 6,173 6,879 7,961 9,016 1.08 1.46 1.24 43 63Thailand 63,155 69,122 72,091 73,321 0.90 0.42 0.17 123 143Timor-Leste 830 1,124 1,510 1,989 3.03 2.95 2.76 56 134Turkey 63,628 72,752 80,753 86,665 1.34 1.04 0.71 81 111Turkmenistan 4,501 5,042 5,675 6,165 1.13 1.18 0.83 9 13United Arab Emirates 3,033 7,512 9,174 10,489 9.07 2.00 1.34 36 125Uzbekistan 24,776 27,445 30,776 33,375 1.02 1.15 0.81 55 75Viet Nam 78,758 87,848 96,355 101,483 1.09 0.92 0.52 237 306Yemen 17,723 24,053 32,232 41,342 3.05 2.93 2.49 34 78
EUROPEAlbania 3,072 3,204 3,294 3,290 0.42 0.28 –0.01 107 114Andorra 65 85 98 112 2.72 1.48 1.27 138 239Austria 8,005 8,394 8,515 8,590 0.47 0.14 0.09 95 102Belarus 10,058 9,595 9,282 8,883 –0.47 –0.33 –0.44 48 43Belgium 10,176 10,712 11,001 11,242 0.51 0.27 0.22 333 368Bosnia and Herzegovina 3,694 3,760 3,647 3,473 0.18 –0.30 –0.49 72 68Bulgaria 8,006 7,494 7,001 6,455 –0.66 –0.68 –0.81 72 58Channel Islands12 145 153 156 157 0.54 0.17 0.06 745 805Croatia 4,506 4,403 4,311 4,185 –0.23 –0.21 –0.30 80 74Czech Republic 10,243 10,493 10,741 10,798 0.24 0.23 0.05 130 137Denmark 5,340 5,550 5,736 5,885 0.39 0.33 0.26 124 137Estonia 1,371 1,341 1,329 1,296 –0.22 –0.09 –0.25 30 29Faroe Islands 46 49 51 53 0.63 0.45 0.45 33 38Finland13 5,173 5,365 5,526 5,619 0.36 0.30 0.17 15 17France 59,048 62,787 65,874 68,467 0.61 0.48 0.39 107 124Germany 82,349 82,302 80,988 79,469 –0.01 –0.16 –0.19 231 223Gibraltar 27 29 29 29 0.67 0.06 –0.08 4,558 4,865Greece 10,987 11,359 11,569 11,621 0.33 0.18 0.05 83 88Holy See14 1 0 0 0 –5.41 –0.07 –0.16 1,789 1,018Hungary 10,211 9,984 9,825 9,644 –0.22 –0.16 –0.19 110 104Iceland 281 320 358 390 1.30 1.11 0.86 3 4Ireland 3,804 4,470 4,968 5,356 1.61 1.06 0.75 54 76Isle of Man 77 83 86 87 0.76 0.38 0.14 134 153
continued . . .
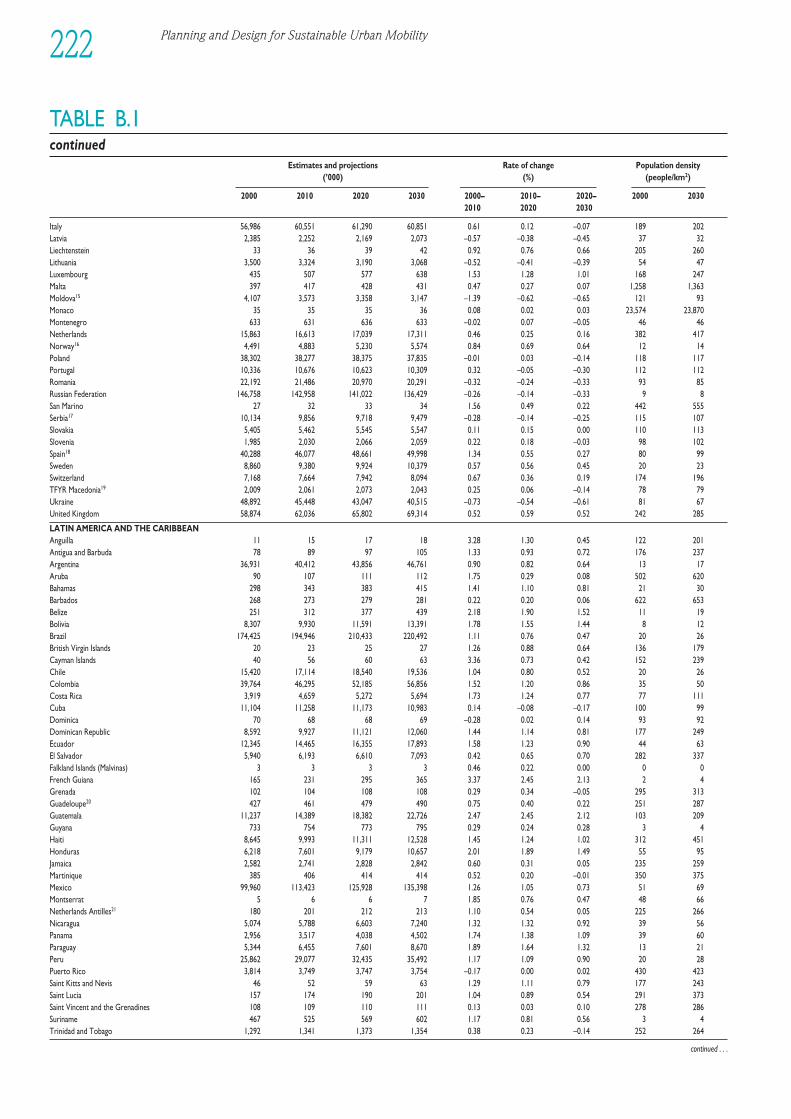
Planning and Design for Sustainable Urban Mobility222
TABLE B.1continued
Estimates and projections Rate of change Population density (’000) (%) (people/km2)
2000 2010 2020 2030 2000– 2010– 2020– 2000 20302010 2020 2030
Italy 56,986 60,551 61,290 60,851 0.61 0.12 –0.07 189 202Latvia 2,385 2,252 2,169 2,073 –0.57 –0.38 –0.45 37 32Liechtenstein 33 36 39 42 0.92 0.76 0.66 205 260Lithuania 3,500 3,324 3,190 3,068 –0.52 –0.41 –0.39 54 47Luxembourg 435 507 577 638 1.53 1.28 1.01 168 247Malta 397 417 428 431 0.47 0.27 0.07 1,258 1,363Moldova15 4,107 3,573 3,358 3,147 –1.39 –0.62 –0.65 121 93Monaco 35 35 35 36 0.08 0.02 0.03 23,574 23,870Montenegro 633 631 636 633 –0.02 0.07 –0.05 46 46Netherlands 15,863 16,613 17,039 17,311 0.46 0.25 0.16 382 417Norway16 4,491 4,883 5,230 5,574 0.84 0.69 0.64 12 14Poland 38,302 38,277 38,375 37,835 –0.01 0.03 –0.14 118 117Portugal 10,336 10,676 10,623 10,309 0.32 –0.05 –0.30 112 112Romania 22,192 21,486 20,970 20,291 –0.32 –0.24 –0.33 93 85Russian Federation 146,758 142,958 141,022 136,429 –0.26 –0.14 –0.33 9 8San Marino 27 32 33 34 1.56 0.49 0.22 442 555Serbia17 10,134 9,856 9,718 9,479 –0.28 –0.14 –0.25 115 107Slovakia 5,405 5,462 5,545 5,547 0.11 0.15 0.00 110 113Slovenia 1,985 2,030 2,066 2,059 0.22 0.18 –0.03 98 102Spain18 40,288 46,077 48,661 49,998 1.34 0.55 0.27 80 99Sweden 8,860 9,380 9,924 10,379 0.57 0.56 0.45 20 23Switzerland 7,168 7,664 7,942 8,094 0.67 0.36 0.19 174 196TFYR Macedonia19 2,009 2,061 2,073 2,043 0.25 0.06 –0.14 78 79Ukraine 48,892 45,448 43,047 40,515 –0.73 –0.54 –0.61 81 67United Kingdom 58,874 62,036 65,802 69,314 0.52 0.59 0.52 242 285
LATIN AMERICA AND THE CARIBBEANAnguilla 11 15 17 18 3.28 1.30 0.45 122 201Antigua and Barbuda 78 89 97 105 1.33 0.93 0.72 176 237Argentina 36,931 40,412 43,856 46,761 0.90 0.82 0.64 13 17Aruba 90 107 111 112 1.75 0.29 0.08 502 620Bahamas 298 343 383 415 1.41 1.10 0.81 21 30Barbados 268 273 279 281 0.22 0.20 0.06 622 653Belize 251 312 377 439 2.18 1.90 1.52 11 19Bolivia 8,307 9,930 11,591 13,391 1.78 1.55 1.44 8 12Brazil 174,425 194,946 210,433 220,492 1.11 0.76 0.47 20 26British Virgin Islands 20 23 25 27 1.26 0.88 0.64 136 179Cayman Islands 40 56 60 63 3.36 0.73 0.42 152 239Chile 15,420 17,114 18,540 19,536 1.04 0.80 0.52 20 26Colombia 39,764 46,295 52,185 56,856 1.52 1.20 0.86 35 50Costa Rica 3,919 4,659 5,272 5,694 1.73 1.24 0.77 77 111Cuba 11,104 11,258 11,173 10,983 0.14 –0.08 –0.17 100 99Dominica 70 68 68 69 –0.28 0.02 0.14 93 92Dominican Republic 8,592 9,927 11,121 12,060 1.44 1.14 0.81 177 249Ecuador 12,345 14,465 16,355 17,893 1.58 1.23 0.90 44 63El Salvador 5,940 6,193 6,610 7,093 0.42 0.65 0.70 282 337Falkland Islands (Malvinas) 3 3 3 3 0.46 0.22 0.00 0 0French Guiana 165 231 295 365 3.37 2.45 2.13 2 4Grenada 102 104 108 108 0.29 0.34 –0.05 295 313Guadeloupe20 427 461 479 490 0.75 0.40 0.22 251 287Guatemala 11,237 14,389 18,382 22,726 2.47 2.45 2.12 103 209Guyana 733 754 773 795 0.29 0.24 0.28 3 4Haiti 8,645 9,993 11,311 12,528 1.45 1.24 1.02 312 451Honduras 6,218 7,601 9,179 10,657 2.01 1.89 1.49 55 95Jamaica 2,582 2,741 2,828 2,842 0.60 0.31 0.05 235 259Martinique 385 406 414 414 0.52 0.20 –0.01 350 375Mexico 99,960 113,423 125,928 135,398 1.26 1.05 0.73 51 69Montserrat 5 6 6 7 1.85 0.76 0.47 48 66Netherlands Antilles21 180 201 212 213 1.10 0.54 0.05 225 266Nicaragua 5,074 5,788 6,603 7,240 1.32 1.32 0.92 39 56Panama 2,956 3,517 4,038 4,502 1.74 1.38 1.09 39 60Paraguay 5,344 6,455 7,601 8,670 1.89 1.64 1.32 13 21Peru 25,862 29,077 32,435 35,492 1.17 1.09 0.90 20 28Puerto Rico 3,814 3,749 3,747 3,754 –0.17 0.00 0.02 430 423Saint Kitts and Nevis 46 52 59 63 1.29 1.11 0.79 177 243Saint Lucia 157 174 190 201 1.04 0.89 0.54 291 373Saint Vincent and the Grenadines 108 109 110 111 0.13 0.03 0.10 278 286Suriname 467 525 569 602 1.17 0.81 0.56 3 4Trinidad and Tobago 1,292 1,341 1,373 1,354 0.38 0.23 –0.14 252 264
continued . . .
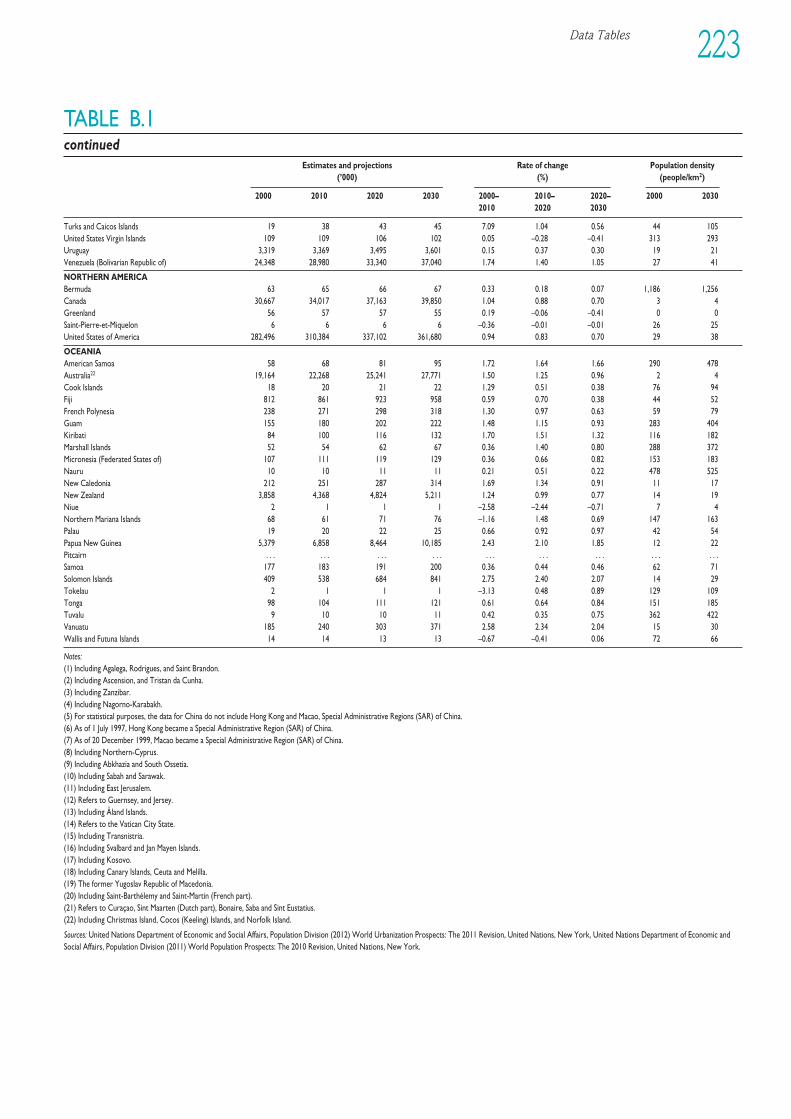
Data Tables 223
TABLE B.1continued
Estimates and projections Rate of change Population density (’000) (%) (people/km2)
2000 2010 2020 2030 2000– 2010– 2020– 2000 20302010 2020 2030
Turks and Caicos Islands 19 38 43 45 7.09 1.04 0.56 44 105United States Virgin Islands 109 109 106 102 0.05 –0.28 –0.41 313 293Uruguay 3,319 3,369 3,495 3,601 0.15 0.37 0.30 19 21Venezuela (Bolivarian Republic of) 24,348 28,980 33,340 37,040 1.74 1.40 1.05 27 41
NORTHERN AMERICABermuda 63 65 66 67 0.33 0.18 0.07 1,186 1,256Canada 30,667 34,017 37,163 39,850 1.04 0.88 0.70 3 4Greenland 56 57 57 55 0.19 –0.06 –0.41 0 0Saint-Pierre-et-Miquelon 6 6 6 6 –0.36 –0.01 –0.01 26 25United States of America 282,496 310,384 337,102 361,680 0.94 0.83 0.70 29 38
OCEANIAAmerican Samoa 58 68 81 95 1.72 1.64 1.66 290 478Australia22 19,164 22,268 25,241 27,771 1.50 1.25 0.96 2 4Cook Islands 18 20 21 22 1.29 0.51 0.38 76 94Fiji 812 861 923 958 0.59 0.70 0.38 44 52French Polynesia 238 271 298 318 1.30 0.97 0.63 59 79Guam 155 180 202 222 1.48 1.15 0.93 283 404Kiribati 84 100 116 132 1.70 1.51 1.32 116 182Marshall Islands 52 54 62 67 0.36 1.40 0.80 288 372Micronesia (Federated States of) 107 111 119 129 0.36 0.66 0.82 153 183Nauru 10 10 11 11 0.21 0.51 0.22 478 525New Caledonia 212 251 287 314 1.69 1.34 0.91 11 17New Zealand 3,858 4,368 4,824 5,211 1.24 0.99 0.77 14 19Niue 2 1 1 1 –2.58 –2.44 –0.71 7 4Northern Mariana Islands 68 61 71 76 –1.16 1.48 0.69 147 163Palau 19 20 22 25 0.66 0.92 0.97 42 54Papua New Guinea 5,379 6,858 8,464 10,185 2.43 2.10 1.85 12 22Pitcairn . . . . . . . . . . . . . . . . . . . . . . . . . . .Samoa 177 183 191 200 0.36 0.44 0.46 62 71Solomon Islands 409 538 684 841 2.75 2.40 2.07 14 29Tokelau 2 1 1 1 –3.13 0.48 0.89 129 109Tonga 98 104 111 121 0.61 0.64 0.84 151 185Tuvalu 9 10 10 11 0.42 0.35 0.75 362 422Vanuatu 185 240 303 371 2.58 2.34 2.04 15 30Wallis and Futuna Islands 14 14 13 13 –0.67 –0.41 0.06 72 66
Notes:(1) Including Agalega, Rodrigues, and Saint Brandon.(2) Including Ascension, and Tristan da Cunha.(3) Including Zanzibar.(4) Including Nagorno-Karabakh.(5) For statistical purposes, the data for China do not include Hong Kong and Macao, Special Administrative Regions (SAR) of China.(6) As of 1 July 1997, Hong Kong became a Special Administrative Region (SAR) of China.(7) As of 20 December 1999, Macao became a Special Administrative Region (SAR) of China.(8) Including Northern-Cyprus.(9) Including Abkhazia and South Ossetia.(10) Including Sabah and Sarawak.(11) Including East Jerusalem.(12) Refers to Guernsey, and Jersey.(13) Including Åland Islands.(14) Refers to the Vatican City State.(15) Including Transnistria.(16) Including Svalbard and Jan Mayen Islands.(17) Including Kosovo.(18) Including Canary Islands, Ceuta and Melilla.(19) The former Yugoslav Republic of Macedonia.(20) Including Saint-Barthélemy and Saint-Martin (French part).(21) Refers to Curaçao, Sint Maarten (Dutch part), Bonaire, Saba and Sint Eustatius.(22) Including Christmas Island, Cocos (Keeling) Islands, and Norfolk Island.
Sources: United Nations Department of Economic and Social Affairs, Population Division (2012) World Urbanization Prospects: The 2011 Revision, United Nations, New York, United Nations Department of Economic andSocial Affairs, Population Division (2011) World Population Prospects: The 2010 Revision, United Nations, New York.
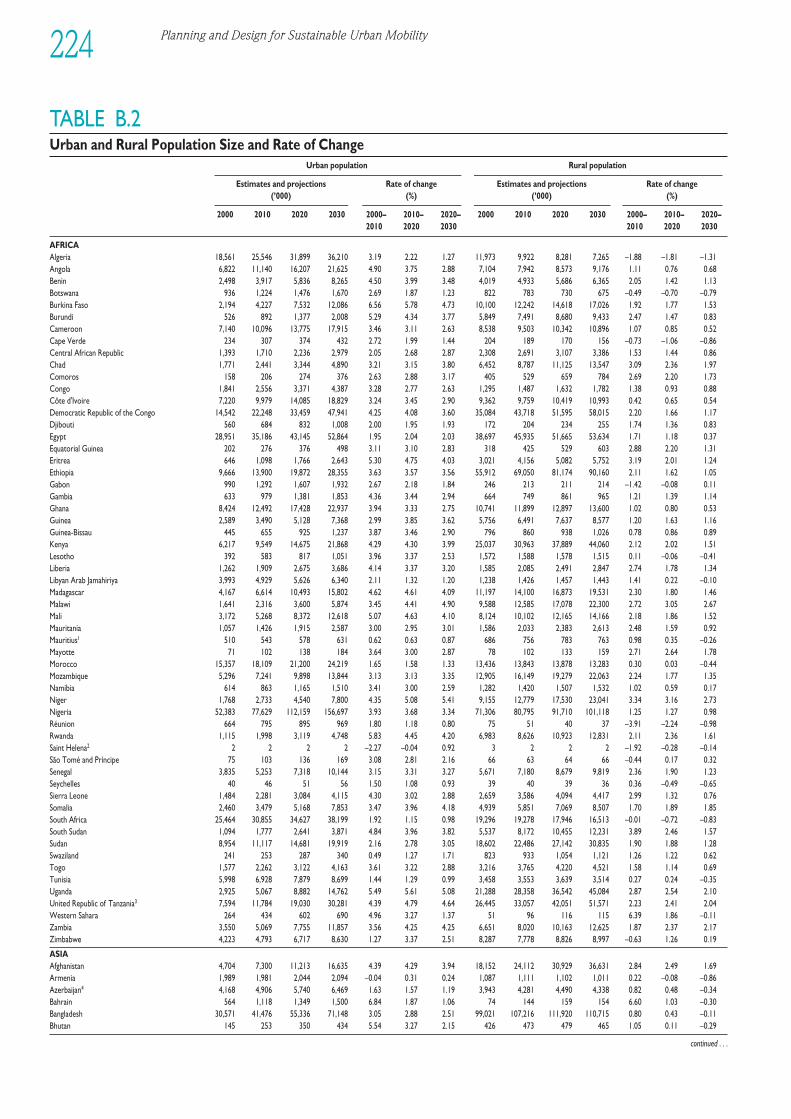
Planning and Design for Sustainable Urban Mobility224
TABLE B.2Urban and Rural Population Size and Rate of Change
Urban population Rural population
Estimates and projections Rate of change Estimates and projections Rate of change(’000) (%) (’000) (%)
2000 2010 2020 2030 2000– 2010– 2020– 2000 2010 2020 2030 2000– 2010– 2020–2010 2020 2030 2010 2020 2030
AFRICAAlgeria 18,561 25,546 31,899 36,210 3.19 2.22 1.27 11,973 9,922 8,281 7,265 –1.88 –1.81 –1.31Angola 6,822 11,140 16,207 21,625 4.90 3.75 2.88 7,104 7,942 8,573 9,176 1.11 0.76 0.68Benin 2,498 3,917 5,836 8,265 4.50 3.99 3.48 4,019 4,933 5,686 6,365 2.05 1.42 1.13Botswana 936 1,224 1,476 1,670 2.69 1.87 1.23 822 783 730 675 –0.49 –0.70 –0.79Burkina Faso 2,194 4,227 7,532 12,086 6.56 5.78 4.73 10,100 12,242 14,618 17,026 1.92 1.77 1.53Burundi 526 892 1,377 2,008 5.29 4.34 3.77 5,849 7,491 8,680 9,433 2.47 1.47 0.83Cameroon 7,140 10,096 13,775 17,915 3.46 3.11 2.63 8,538 9,503 10,342 10,896 1.07 0.85 0.52Cape Verde 234 307 374 432 2.72 1.99 1.44 204 189 170 156 –0.73 –1.06 –0.86Central African Republic 1,393 1,710 2,236 2,979 2.05 2.68 2.87 2,308 2,691 3,107 3,386 1.53 1.44 0.86Chad 1,771 2,441 3,344 4,890 3.21 3.15 3.80 6,452 8,787 11,125 13,547 3.09 2.36 1.97Comoros 158 206 274 376 2.63 2.88 3.17 405 529 659 784 2.69 2.20 1.73Congo 1,841 2,556 3,371 4,387 3.28 2.77 2.63 1,295 1,487 1,632 1,782 1.38 0.93 0.88Côte d'Ivoire 7,220 9,979 14,085 18,829 3.24 3.45 2.90 9,362 9,759 10,419 10,993 0.42 0.65 0.54Democratic Republic of the Congo 14,542 22,248 33,459 47,941 4.25 4.08 3.60 35,084 43,718 51,595 58,015 2.20 1.66 1.17Djibouti 560 684 832 1,008 2.00 1.95 1.93 172 204 234 255 1.74 1.36 0.83Egypt 28,951 35,186 43,145 52,864 1.95 2.04 2.03 38,697 45,935 51,665 53,634 1.71 1.18 0.37Equatorial Guinea 202 276 376 498 3.11 3.10 2.83 318 425 529 603 2.88 2.20 1.31Eritrea 646 1,098 1,766 2,643 5.30 4.75 4.03 3,021 4,156 5,082 5,752 3.19 2.01 1.24Ethiopia 9,666 13,900 19,872 28,355 3.63 3.57 3.56 55,912 69,050 81,174 90,160 2.11 1.62 1.05Gabon 990 1,292 1,607 1,932 2.67 2.18 1.84 246 213 211 214 –1.42 –0.08 0.11Gambia 633 979 1,381 1,853 4.36 3.44 2.94 664 749 861 965 1.21 1.39 1.14Ghana 8,424 12,492 17,428 22,937 3.94 3.33 2.75 10,741 11,899 12,897 13,600 1.02 0.80 0.53Guinea 2,589 3,490 5,128 7,368 2.99 3.85 3.62 5,756 6,491 7,637 8,577 1.20 1.63 1.16Guinea-Bissau 445 655 925 1,237 3.87 3.46 2.90 796 860 938 1,026 0.78 0.86 0.89Kenya 6,217 9,549 14,675 21,868 4.29 4.30 3.99 25,037 30,963 37,889 44,060 2.12 2.02 1.51Lesotho 392 583 817 1,051 3.96 3.37 2.53 1,572 1,588 1,578 1,515 0.11 –0.06 –0.41Liberia 1,262 1,909 2,675 3,686 4.14 3.37 3.20 1,585 2,085 2,491 2,847 2.74 1.78 1.34Libyan Arab Jamahiriya 3,993 4,929 5,626 6,340 2.11 1.32 1.20 1,238 1,426 1,457 1,443 1.41 0.22 –0.10Madagascar 4,167 6,614 10,493 15,802 4.62 4.61 4.09 11,197 14,100 16,873 19,531 2.30 1.80 1.46Malawi 1,641 2,316 3,600 5,874 3.45 4.41 4.90 9,588 12,585 17,078 22,300 2.72 3.05 2.67Mali 3,172 5,268 8,372 12,618 5.07 4.63 4.10 8,124 10,102 12,165 14,166 2.18 1.86 1.52Mauritania 1,057 1,426 1,915 2,587 3.00 2.95 3.01 1,586 2,033 2,383 2,613 2.48 1.59 0.92Mauritius1 510 543 578 631 0.62 0.63 0.87 686 756 783 763 0.98 0.35 –0.26Mayotte 71 102 138 184 3.64 3.00 2.87 78 102 133 159 2.71 2.64 1.78Morocco 15,357 18,109 21,200 24,219 1.65 1.58 1.33 13,436 13,843 13,878 13,283 0.30 0.03 –0.44Mozambique 5,296 7,241 9,898 13,844 3.13 3.13 3.35 12,905 16,149 19,279 22,063 2.24 1.77 1.35Namibia 614 863 1,165 1,510 3.41 3.00 2.59 1,282 1,420 1,507 1,532 1.02 0.59 0.17Niger 1,768 2,733 4,540 7,800 4.35 5.08 5.41 9,155 12,779 17,530 23,041 3.34 3.16 2.73Nigeria 52,383 77,629 112,159 156,697 3.93 3.68 3.34 71,306 80,795 91,710 101,118 1.25 1.27 0.98Réunion 664 795 895 969 1.80 1.18 0.80 75 51 40 37 –3.91 –2.24 –0.98Rwanda 1,115 1,998 3,119 4,748 5.83 4.45 4.20 6,983 8,626 10,923 12,831 2.11 2.36 1.61Saint Helena2 2 2 2 2 –2.27 –0.04 0.92 3 2 2 2 –1.92 –0.28 –0.14São Tomé and Príncipe 75 103 136 169 3.08 2.81 2.16 66 63 64 66 –0.44 0.17 0.32Senegal 3,835 5,253 7,318 10,144 3.15 3.31 3.27 5,671 7,180 8,679 9,819 2.36 1.90 1.23Seychelles 40 46 51 56 1.50 1.08 0.93 39 40 39 36 0.36 –0.49 –0.65Sierra Leone 1,484 2,281 3,084 4,115 4.30 3.02 2.88 2,659 3,586 4,094 4,417 2.99 1.32 0.76Somalia 2,460 3,479 5,168 7,853 3.47 3.96 4.18 4,939 5,851 7,069 8,507 1.70 1.89 1.85South Africa 25,464 30,855 34,627 38,199 1.92 1.15 0.98 19,296 19,278 17,946 16,513 –0.01 –0.72 –0.83South Sudan 1,094 1,777 2,641 3,871 4.84 3.96 3.82 5,537 8,172 10,455 12,231 3.89 2.46 1.57Sudan 8,954 11,117 14,681 19,919 2.16 2.78 3.05 18,602 22,486 27,142 30,835 1.90 1.88 1.28Swaziland 241 253 287 340 0.49 1.27 1.71 823 933 1,054 1,121 1.26 1.22 0.62Togo 1,577 2,262 3,122 4,163 3.61 3.22 2.88 3,216 3,765 4,220 4,521 1.58 1.14 0.69Tunisia 5,998 6,928 7,879 8,699 1.44 1.29 0.99 3,458 3,553 3,639 3,514 0.27 0.24 –0.35Uganda 2,925 5,067 8,882 14,762 5.49 5.61 5.08 21,288 28,358 36,542 45,084 2.87 2.54 2.10United Republic of Tanzania3 7,594 11,784 19,030 30,281 4.39 4.79 4.64 26,445 33,057 42,051 51,571 2.23 2.41 2.04Western Sahara 264 434 602 690 4.96 3.27 1.37 51 96 116 115 6.39 1.86 –0.11Zambia 3,550 5,069 7,755 11,857 3.56 4.25 4.25 6,651 8,020 10,163 12,625 1.87 2.37 2.17Zimbabwe 4,223 4,793 6,717 8,630 1.27 3.37 2.51 8,287 7,778 8,826 8,997 –0.63 1.26 0.19
ASIAAfghanistan 4,704 7,300 11,213 16,635 4.39 4.29 3.94 18,152 24,112 30,929 36,631 2.84 2.49 1.69Armenia 1,989 1,981 2,044 2,094 –0.04 0.31 0.24 1,087 1,111 1,102 1,011 0.22 –0.08 –0.86Azerbaijan4 4,168 4,906 5,740 6,469 1.63 1.57 1.19 3,943 4,281 4,490 4,338 0.82 0.48 –0.34Bahrain 564 1,118 1,349 1,500 6.84 1.87 1.06 74 144 159 154 6.60 1.03 –0.30Bangladesh 30,571 41,476 55,336 71,148 3.05 2.88 2.51 99,021 107,216 111,920 110,715 0.80 0.43 –0.11Bhutan 145 253 350 434 5.54 3.27 2.15 426 473 479 465 1.05 0.11 –0.29
continued . . .
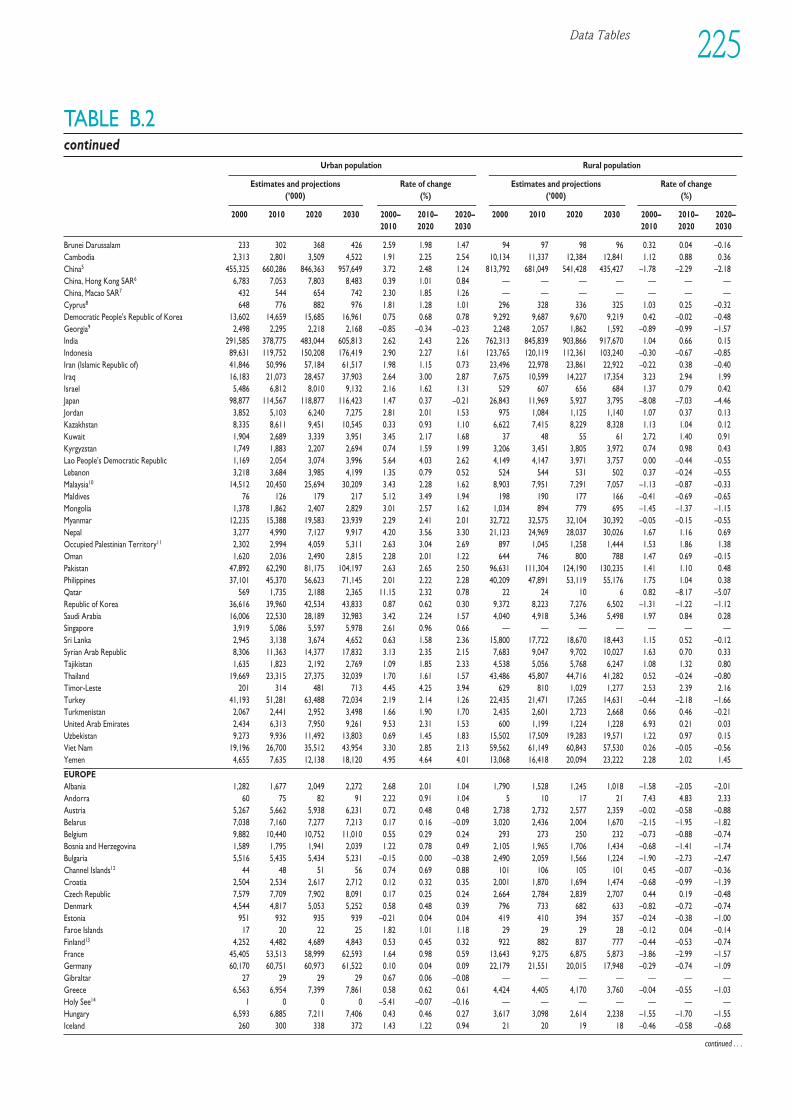
Data Tables 225
TABLE B.2continued
Urban population Rural population
Estimates and projections Rate of change Estimates and projections Rate of change(’000) (%) (’000) (%)
2000 2010 2020 2030 2000– 2010– 2020– 2000 2010 2020 2030 2000– 2010– 2020–2010 2020 2030 2010 2020 2030
Brunei Darussalam 233 302 368 426 2.59 1.98 1.47 94 97 98 96 0.32 0.04 –0.16Cambodia 2,313 2,801 3,509 4,522 1.91 2.25 2.54 10,134 11,337 12,384 12,841 1.12 0.88 0.36China5 455,325 660,286 846,363 957,649 3.72 2.48 1.24 813,792 681,049 541,428 435,427 –1.78 –2.29 –2.18China, Hong Kong SAR6 6,783 7,053 7,803 8,483 0.39 1.01 0.84 — — — — — — —China, Macao SAR7 432 544 654 742 2.30 1.85 1.26 — — — — — — —Cyprus8 648 776 882 976 1.81 1.28 1.01 296 328 336 325 1.03 0.25 –0.32Democratic People's Republic of Korea 13,602 14,659 15,685 16,961 0.75 0.68 0.78 9,292 9,687 9,670 9,219 0.42 –0.02 –0.48Georgia9 2,498 2,295 2,218 2,168 –0.85 –0.34 –0.23 2,248 2,057 1,862 1,592 –0.89 –0.99 –1.57India 291,585 378,775 483,044 605,813 2.62 2.43 2.26 762,313 845,839 903,866 917,670 1.04 0.66 0.15Indonesia 89,631 119,752 150,208 176,419 2.90 2.27 1.61 123,765 120,119 112,361 103,240 –0.30 –0.67 –0.85Iran (Islamic Republic of) 41,846 50,996 57,184 61,517 1.98 1.15 0.73 23,496 22,978 23,861 22,922 –0.22 0.38 –0.40Iraq 16,183 21,073 28,457 37,903 2.64 3.00 2.87 7,675 10,599 14,227 17,354 3.23 2.94 1.99Israel 5,486 6,812 8,010 9,132 2.16 1.62 1.31 529 607 656 684 1.37 0.79 0.42Japan 98,877 114,567 118,877 116,423 1.47 0.37 –0.21 26,843 11,969 5,927 3,795 –8.08 –7.03 –4.46Jordan 3,852 5,103 6,240 7,275 2.81 2.01 1.53 975 1,084 1,125 1,140 1.07 0.37 0.13Kazakhstan 8,335 8,611 9,451 10,545 0.33 0.93 1.10 6,622 7,415 8,229 8,328 1.13 1.04 0.12Kuwait 1,904 2,689 3,339 3,951 3.45 2.17 1.68 37 48 55 61 2.72 1.40 0.91Kyrgyzstan 1,749 1,883 2,207 2,694 0.74 1.59 1.99 3,206 3,451 3,805 3,972 0.74 0.98 0.43Lao People's Democratic Republic 1,169 2,054 3,074 3,996 5.64 4.03 2.62 4,149 4,147 3,971 3,757 0.00 –0.44 –0.55Lebanon 3,218 3,684 3,985 4,199 1.35 0.79 0.52 524 544 531 502 0.37 –0.24 –0.55Malaysia10 14,512 20,450 25,694 30,209 3.43 2.28 1.62 8,903 7,951 7,291 7,057 –1.13 –0.87 –0.33Maldives 76 126 179 217 5.12 3.49 1.94 198 190 177 166 –0.41 –0.69 –0.65Mongolia 1,378 1,862 2,407 2,829 3.01 2.57 1.62 1,034 894 779 695 –1.45 –1.37 –1.15Myanmar 12,235 15,388 19,583 23,939 2.29 2.41 2.01 32,722 32,575 32,104 30,392 –0.05 –0.15 –0.55Nepal 3,277 4,990 7,127 9,917 4.20 3.56 3.30 21,123 24,969 28,037 30,026 1.67 1.16 0.69Occupied Palestinian Territory11 2,302 2,994 4,059 5,311 2.63 3.04 2.69 897 1,045 1,258 1,444 1.53 1.86 1.38Oman 1,620 2,036 2,490 2,815 2.28 2.01 1.22 644 746 800 788 1.47 0.69 –0.15Pakistan 47,892 62,290 81,175 104,197 2.63 2.65 2.50 96,631 111,304 124,190 130,235 1.41 1.10 0.48Philippines 37,101 45,370 56,623 71,145 2.01 2.22 2.28 40,209 47,891 53,119 55,176 1.75 1.04 0.38Qatar 569 1,735 2,188 2,365 11.15 2.32 0.78 22 24 10 6 0.82 –8.17 –5.07Republic of Korea 36,616 39,960 42,534 43,833 0.87 0.62 0.30 9,372 8,223 7,276 6,502 –1.31 –1.22 –1.12Saudi Arabia 16,006 22,530 28,189 32,983 3.42 2.24 1.57 4,040 4,918 5,346 5,498 1.97 0.84 0.28Singapore 3,919 5,086 5,597 5,978 2.61 0.96 0.66 — — — — — — —Sri Lanka 2,945 3,138 3,674 4,652 0.63 1.58 2.36 15,800 17,722 18,670 18,443 1.15 0.52 –0.12Syrian Arab Republic 8,306 11,363 14,377 17,832 3.13 2.35 2.15 7,683 9,047 9,702 10,027 1.63 0.70 0.33Tajikistan 1,635 1,823 2,192 2,769 1.09 1.85 2.33 4,538 5,056 5,768 6,247 1.08 1.32 0.80Thailand 19,669 23,315 27,375 32,039 1.70 1.61 1.57 43,486 45,807 44,716 41,282 0.52 –0.24 –0.80Timor-Leste 201 314 481 713 4.45 4.25 3.94 629 810 1,029 1,277 2.53 2.39 2.16Turkey 41,193 51,281 63,488 72,034 2.19 2.14 1.26 22,435 21,471 17,265 14,631 –0.44 –2.18 –1.66Turkmenistan 2,067 2,441 2,952 3,498 1.66 1.90 1.70 2,435 2,601 2,723 2,668 0.66 0.46 –0.21United Arab Emirates 2,434 6,313 7,950 9,261 9.53 2.31 1.53 600 1,199 1,224 1,228 6.93 0.21 0.03Uzbekistan 9,273 9,936 11,492 13,803 0.69 1.45 1.83 15,502 17,509 19,283 19,571 1.22 0.97 0.15Viet Nam 19,196 26,700 35,512 43,954 3.30 2.85 2.13 59,562 61,149 60,843 57,530 0.26 –0.05 –0.56Yemen 4,655 7,635 12,138 18,120 4.95 4.64 4.01 13,068 16,418 20,094 23,222 2.28 2.02 1.45
EUROPEAlbania 1,282 1,677 2,049 2,272 2.68 2.01 1.04 1,790 1,528 1,245 1,018 –1.58 –2.05 –2.01Andorra 60 75 82 91 2.22 0.91 1.04 5 10 17 21 7.43 4.83 2.33Austria 5,267 5,662 5,938 6,231 0.72 0.48 0.48 2,738 2,732 2,577 2,359 –0.02 –0.58 –0.88Belarus 7,038 7,160 7,277 7,213 0.17 0.16 –0.09 3,020 2,436 2,004 1,670 –2.15 –1.95 –1.82Belgium 9,882 10,440 10,752 11,010 0.55 0.29 0.24 293 273 250 232 –0.73 –0.88 –0.74Bosnia and Herzegovina 1,589 1,795 1,941 2,039 1.22 0.78 0.49 2,105 1,965 1,706 1,434 –0.68 –1.41 –1.74Bulgaria 5,516 5,435 5,434 5,231 –0.15 0.00 –0.38 2,490 2,059 1,566 1,224 –1.90 –2.73 –2.47Channel Islands12 44 48 51 56 0.74 0.69 0.88 101 106 105 101 0.45 –0.07 –0.36Croatia 2,504 2,534 2,617 2,712 0.12 0.32 0.35 2,001 1,870 1,694 1,474 –0.68 –0.99 –1.39Czech Republic 7,579 7,709 7,902 8,091 0.17 0.25 0.24 2,664 2,784 2,839 2,707 0.44 0.19 –0.48Denmark 4,544 4,817 5,053 5,252 0.58 0.48 0.39 796 733 682 633 –0.82 –0.72 –0.74Estonia 951 932 935 939 –0.21 0.04 0.04 419 410 394 357 –0.24 –0.38 –1.00Faroe Islands 17 20 22 25 1.82 1.01 1.18 29 29 29 28 –0.12 0.04 –0.14Finland13 4,252 4,482 4,689 4,843 0.53 0.45 0.32 922 882 837 777 –0.44 –0.53 –0.74France 45,405 53,513 58,999 62,593 1.64 0.98 0.59 13,643 9,275 6,875 5,873 –3.86 –2.99 –1.57Germany 60,170 60,751 60,973 61,522 0.10 0.04 0.09 22,179 21,551 20,015 17,948 –0.29 –0.74 –1.09Gibraltar 27 29 29 29 0.67 0.06 –0.08 — — — — — — —Greece 6,563 6,954 7,399 7,861 0.58 0.62 0.61 4,424 4,405 4,170 3,760 –0.04 –0.55 –1.03Holy See14 1 0 0 0 –5.41 –0.07 –0.16 — — — — — — —Hungary 6,593 6,885 7,211 7,406 0.43 0.46 0.27 3,617 3,098 2,614 2,238 –1.55 –1.70 –1.55Iceland 260 300 338 372 1.43 1.22 0.94 21 20 19 18 –0.46 –0.58 –0.68
continued . . .
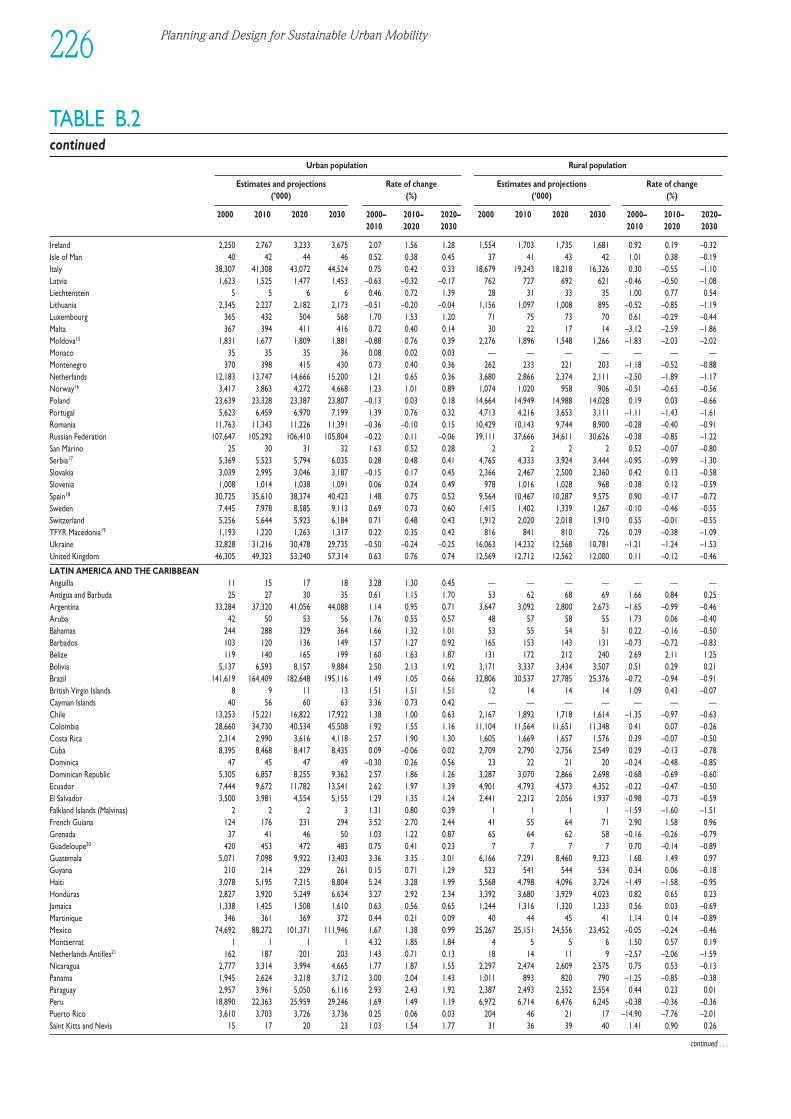
Planning and Design for Sustainable Urban Mobility226
TABLE B.2continued
Urban population Rural population
Estimates and projections Rate of change Estimates and projections Rate of change(’000) (%) (’000) (%)
2000 2010 2020 2030 2000– 2010– 2020– 2000 2010 2020 2030 2000– 2010– 2020–2010 2020 2030 2010 2020 2030
Ireland 2,250 2,767 3,233 3,675 2.07 1.56 1.28 1,554 1,703 1,735 1,681 0.92 0.19 –0.32Isle of Man 40 42 44 46 0.52 0.38 0.45 37 41 43 42 1.01 0.38 –0.19Italy 38,307 41,308 43,072 44,524 0.75 0.42 0.33 18,679 19,243 18,218 16,326 0.30 –0.55 –1.10Latvia 1,623 1,525 1,477 1,453 –0.63 –0.32 –0.17 762 727 692 621 –0.46 –0.50 –1.08Liechtenstein 5 5 6 6 0.46 0.72 1.39 28 31 33 35 1.00 0.77 0.54Lithuania 2,345 2,227 2,182 2,173 –0.51 –0.20 –0.04 1,156 1,097 1,008 895 –0.52 –0.85 –1.19Luxembourg 365 432 504 568 1.70 1.53 1.20 71 75 73 70 0.61 –0.29 –0.44Malta 367 394 411 416 0.72 0.40 0.14 30 22 17 14 –3.12 –2.59 –1.86Moldova15 1,831 1,677 1,809 1,881 –0.88 0.76 0.39 2,276 1,896 1,548 1,266 –1.83 –2.03 –2.02Monaco 35 35 35 36 0.08 0.02 0.03 — — — — — — —Montenegro 370 398 415 430 0.73 0.40 0.36 262 233 221 203 –1.18 –0.52 –0.88Netherlands 12,183 13,747 14,666 15,200 1.21 0.65 0.36 3,680 2,866 2,374 2,111 –2.50 –1.89 –1.17Norway16 3,417 3,863 4,272 4,668 1.23 1.01 0.89 1,074 1,020 958 906 –0.51 –0.63 –0.56Poland 23,639 23,328 23,387 23,807 –0.13 0.03 0.18 14,664 14,949 14,988 14,028 0.19 0.03 –0.66Portugal 5,623 6,459 6,970 7,199 1.39 0.76 0.32 4,713 4,216 3,653 3,111 –1.11 –1.43 –1.61Romania 11,763 11,343 11,226 11,391 –0.36 –0.10 0.15 10,429 10,143 9,744 8,900 –0.28 –0.40 –0.91Russian Federation 107,647 105,292 106,410 105,804 –0.22 0.11 –0.06 39,111 37,666 34,611 30,626 –0.38 –0.85 –1.22San Marino 25 30 31 32 1.63 0.52 0.28 2 2 2 2 0.52 –0.07 –0.80Serbia17 5,369 5,523 5,794 6,035 0.28 0.48 0.41 4,765 4,333 3,924 3,444 –0.95 –0.99 –1.30Slovakia 3,039 2,995 3,046 3,187 –0.15 0.17 0.45 2,366 2,467 2,500 2,360 0.42 0.13 –0.58Slovenia 1,008 1,014 1,038 1,091 0.06 0.24 0.49 978 1,016 1,028 968 0.38 0.12 –0.59Spain18 30,725 35,610 38,374 40,423 1.48 0.75 0.52 9,564 10,467 10,287 9,575 0.90 –0.17 –0.72Sweden 7,445 7,978 8,585 9,113 0.69 0.73 0.60 1,415 1,402 1,339 1,267 –0.10 –0.46 –0.55Switzerland 5,256 5,644 5,923 6,184 0.71 0.48 0.43 1,912 2,020 2,018 1,910 0.55 –0.01 –0.55TFYR Macedonia19 1,193 1,220 1,263 1,317 0.22 0.35 0.42 816 841 810 726 0.29 –0.38 –1.09Ukraine 32,828 31,216 30,478 29,735 –0.50 –0.24 –0.25 16,063 14,232 12,568 10,781 –1.21 –1.24 –1.53United Kingdom 46,305 49,323 53,240 57,314 0.63 0.76 0.74 12,569 12,712 12,562 12,000 0.11 –0.12 –0.46
LATIN AMERICA AND THE CARIBBEANAnguilla 11 15 17 18 3.28 1.30 0.45 — — — — — — —Antigua and Barbuda 25 27 30 35 0.61 1.15 1.70 53 62 68 69 1.66 0.84 0.25Argentina 33,284 37,320 41,056 44,088 1.14 0.95 0.71 3,647 3,092 2,800 2,673 –1.65 –0.99 –0.46Aruba 42 50 53 56 1.76 0.55 0.57 48 57 58 55 1.73 0.06 –0.40Bahamas 244 288 329 364 1.66 1.32 1.01 53 55 54 51 0.22 –0.16 –0.50Barbados 103 120 136 149 1.57 1.27 0.92 165 153 143 131 –0.73 –0.72 –0.83Belize 119 140 165 199 1.60 1.63 1.87 131 172 212 240 2.69 2.11 1.25Bolivia 5,137 6,593 8,157 9,884 2.50 2.13 1.92 3,171 3,337 3,434 3,507 0.51 0.29 0.21Brazil 141,619 164,409 182,648 195,116 1.49 1.05 0.66 32,806 30,537 27,785 25,376 –0.72 –0.94 –0.91British Virgin Islands 8 9 11 13 1.51 1.51 1.51 12 14 14 14 1.09 0.43 –0.07Cayman Islands 40 56 60 63 3.36 0.73 0.42 — — — — — — —Chile 13,253 15,221 16,822 17,922 1.38 1.00 0.63 2,167 1,892 1,718 1,614 –1.35 –0.97 –0.63Colombia 28,660 34,730 40,534 45,508 1.92 1.55 1.16 11,104 11,564 11,651 11,348 0.41 0.07 –0.26Costa Rica 2,314 2,990 3,616 4,118 2.57 1.90 1.30 1,605 1,669 1,657 1,576 0.39 –0.07 –0.50Cuba 8,395 8,468 8,417 8,435 0.09 –0.06 0.02 2,709 2,790 2,756 2,549 0.29 –0.13 –0.78Dominica 47 45 47 49 –0.30 0.26 0.56 23 22 21 20 –0.24 –0.48 –0.85Dominican Republic 5,305 6,857 8,255 9,362 2.57 1.86 1.26 3,287 3,070 2,866 2,698 –0.68 –0.69 –0.60Ecuador 7,444 9,672 11,782 13,541 2.62 1.97 1.39 4,901 4,793 4,573 4,352 –0.22 –0.47 –0.50El Salvador 3,500 3,981 4,554 5,155 1.29 1.35 1.24 2,441 2,212 2,056 1,937 –0.98 –0.73 –0.59Falkland Islands (Malvinas) 2 2 2 3 1.31 0.80 0.39 1 1 1 1 –1.59 –1.60 –1.51French Guiana 124 176 231 294 3.52 2.70 2.44 41 55 64 71 2.90 1.58 0.96Grenada 37 41 46 50 1.03 1.22 0.87 65 64 62 58 –0.16 –0.26 –0.79Guadeloupe20 420 453 472 483 0.75 0.41 0.23 7 7 7 7 0.70 –0.14 –0.89Guatemala 5,071 7,098 9,922 13,403 3.36 3.35 3.01 6,166 7,291 8,460 9,323 1.68 1.49 0.97Guyana 210 214 229 261 0.15 0.71 1.29 523 541 544 534 0.34 0.06 –0.18Haiti 3,078 5,195 7,215 8,804 5.24 3.28 1.99 5,568 4,798 4,096 3,724 –1.49 –1.58 –0.95Honduras 2,827 3,920 5,249 6,634 3.27 2.92 2.34 3,392 3,680 3,929 4,023 0.82 0.65 0.23Jamaica 1,338 1,425 1,508 1,610 0.63 0.56 0.65 1,244 1,316 1,320 1,233 0.56 0.03 –0.69Martinique 346 361 369 372 0.44 0.21 0.09 40 44 45 41 1.14 0.14 –0.89Mexico 74,692 88,272 101,371 111,946 1.67 1.38 0.99 25,267 25,151 24,556 23,452 –0.05 –0.24 –0.46Montserrat 1 1 1 1 4.32 1.85 1.84 4 5 5 6 1.50 0.57 0.19Netherlands Antilles21 162 187 201 203 1.43 0.71 0.13 18 14 11 9 –2.57 –2.06 –1.59Nicaragua 2,777 3,314 3,994 4,665 1.77 1.87 1.55 2,297 2,474 2,609 2,575 0.75 0.53 –0.13Panama 1,945 2,624 3,218 3,712 3.00 2.04 1.43 1,011 893 820 790 –1.25 –0.85 –0.38Paraguay 2,957 3,961 5,050 6,116 2.93 2.43 1.92 2,387 2,493 2,552 2,554 0.44 0.23 0.01Peru 18,890 22,363 25,959 29,246 1.69 1.49 1.19 6,972 6,714 6,476 6,245 –0.38 –0.36 –0.36Puerto Rico 3,610 3,703 3,726 3,736 0.25 0.06 0.03 204 46 21 17 –14.90 –7.76 –2.01Saint Kitts and Nevis 15 17 20 23 1.03 1.54 1.77 31 36 39 40 1.41 0.90 0.26
continued . . .
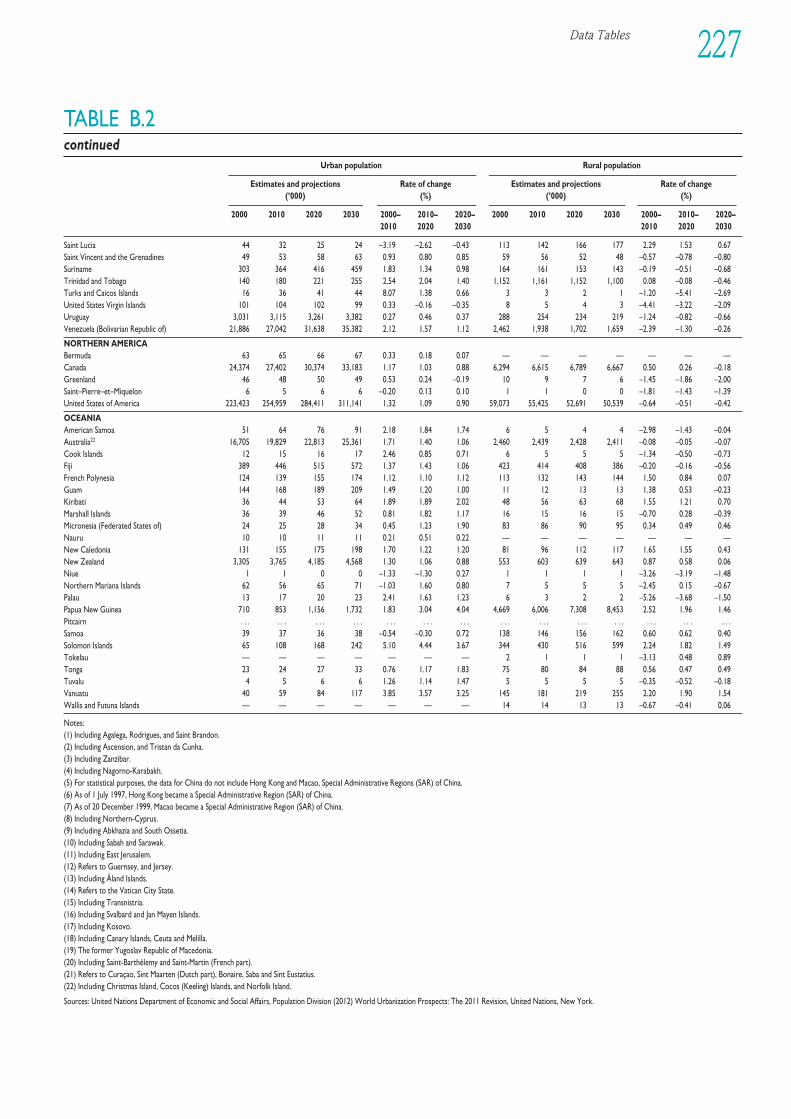
Data Tables 227
TABLE B.2continued
Urban population Rural population
Estimates and projections Rate of change Estimates and projections Rate of change(’000) (%) (’000) (%)
2000 2010 2020 2030 2000– 2010– 2020– 2000 2010 2020 2030 2000– 2010– 2020–2010 2020 2030 2010 2020 2030
Saint Lucia 44 32 25 24 –3.19 –2.62 –0.43 113 142 166 177 2.29 1.53 0.67Saint Vincent and the Grenadines 49 53 58 63 0.93 0.80 0.85 59 56 52 48 –0.57 –0.78 –0.80Suriname 303 364 416 459 1.83 1.34 0.98 164 161 153 143 –0.19 –0.51 –0.68Trinidad and Tobago 140 180 221 255 2.54 2.04 1.40 1,152 1,161 1,152 1,100 0.08 –0.08 –0.46Turks and Caicos Islands 16 36 41 44 8.07 1.38 0.66 3 3 2 1 –1.20 –5.41 –2.69United States Virgin Islands 101 104 102 99 0.33 –0.16 –0.35 8 5 4 3 –4.41 –3.22 –2.09Uruguay 3,031 3,115 3,261 3,382 0.27 0.46 0.37 288 254 234 219 –1.24 –0.82 –0.66Venezuela (Bolivarian Republic of) 21,886 27,042 31,638 35,382 2.12 1.57 1.12 2,462 1,938 1,702 1,659 –2.39 –1.30 –0.26
NORTHERN AMERICABermuda 63 65 66 67 0.33 0.18 0.07 — — — — — — —Canada 24,374 27,402 30,374 33,183 1.17 1.03 0.88 6,294 6,615 6,789 6,667 0.50 0.26 –0.18Greenland 46 48 50 49 0.53 0.24 –0.19 10 9 7 6 –1.45 –1.86 –2.00Saint–Pierre–et–Miquelon 6 5 6 6 –0.20 0.13 0.10 1 1 0 0 –1.81 –1.43 –1.39United States of America 223,423 254,959 284,411 311,141 1.32 1.09 0.90 59,073 55,425 52,691 50,539 –0.64 –0.51 –0.42
OCEANIAAmerican Samoa 51 64 76 91 2.18 1.84 1.74 6 5 4 4 –2.98 –1.43 –0.04Australia22 16,705 19,829 22,813 25,361 1.71 1.40 1.06 2,460 2,439 2,428 2,411 –0.08 –0.05 –0.07Cook Islands 12 15 16 17 2.46 0.85 0.71 6 5 5 5 –1.34 –0.50 –0.73Fiji 389 446 515 572 1.37 1.43 1.06 423 414 408 386 –0.20 –0.16 –0.56French Polynesia 124 139 155 174 1.12 1.10 1.12 113 132 143 144 1.50 0.84 0.07Guam 144 168 189 209 1.49 1.20 1.00 11 12 13 13 1.38 0.53 –0.23Kiribati 36 44 53 64 1.89 1.89 2.02 48 56 63 68 1.55 1.21 0.70Marshall Islands 36 39 46 52 0.81 1.82 1.17 16 15 16 15 –0.70 0.28 –0.39Micronesia (Federated States of) 24 25 28 34 0.45 1.23 1.90 83 86 90 95 0.34 0.49 0.46Nauru 10 10 11 11 0.21 0.51 0.22 — — — — — — —New Caledonia 131 155 175 198 1.70 1.22 1.20 81 96 112 117 1.65 1.55 0.43New Zealand 3,305 3,765 4,185 4,568 1.30 1.06 0.88 553 603 639 643 0.87 0.58 0.06Niue 1 1 0 0 –1.33 –1.30 0.27 1 1 1 1 –3.26 –3.19 –1.48Northern Mariana Islands 62 56 65 71 –1.03 1.60 0.80 7 5 5 5 –2.45 0.15 –0.67Palau 13 17 20 23 2.41 1.63 1.23 6 3 2 2 –5.26 –3.68 –1.50Papua New Guinea 710 853 1,156 1,732 1.83 3.04 4.04 4,669 6,006 7,308 8,453 2.52 1.96 1.46Pitcairn . . . . . . . . . . . . . . . . . . . . . . . . . . . . . . . . . . . . . . . . . .Samoa 39 37 36 38 –0.54 –0.30 0.72 138 146 156 162 0.60 0.62 0.40Solomon Islands 65 108 168 242 5.10 4.44 3.67 344 430 516 599 2.24 1.82 1.49Tokelau — — — — — — — 2 1 1 1 –3.13 0.48 0.89Tonga 23 24 27 33 0.76 1.17 1.83 75 80 84 88 0.56 0.47 0.49Tuvalu 4 5 6 6 1.26 1.14 1.47 5 5 5 5 –0.35 –0.52 –0.18Vanuatu 40 59 84 117 3.85 3.57 3.25 145 181 219 255 2.20 1.90 1.54Wallis and Futuna Islands — — — — — — — 14 14 13 13 –0.67 –0.41 0.06
Notes:(1) Including Agalega, Rodrigues, and Saint Brandon.(2) Including Ascension, and Tristan da Cunha.(3) Including Zanzibar.(4) Including Nagorno-Karabakh.(5) For statistical purposes, the data for China do not include Hong Kong and Macao, Special Administrative Regions (SAR) of China.(6) As of 1 July 1997, Hong Kong became a Special Administrative Region (SAR) of China.(7) As of 20 December 1999, Macao became a Special Administrative Region (SAR) of China.(8) Including Northern-Cyprus.(9) Including Abkhazia and South Ossetia.(10) Including Sabah and Sarawak.(11) Including East Jerusalem.(12) Refers to Guernsey, and Jersey.(13) Including Åland Islands.(14) Refers to the Vatican City State.(15) Including Transnistria.(16) Including Svalbard and Jan Mayen Islands.(17) Including Kosovo.(18) Including Canary Islands, Ceuta and Melilla.(19) The former Yugoslav Republic of Macedonia.(20) Including Saint-Barthélemy and Saint-Martin (French part).(21) Refers to Curaçao, Sint Maarten (Dutch part), Bonaire, Saba and Sint Eustatius.(22) Including Christmas Island, Cocos (Keeling) Islands, and Norfolk Island.
Sources: United Nations Department of Economic and Social Affairs, Population Division (2012) World Urbanization Prospects: The 2011 Revision, United Nations, New York.
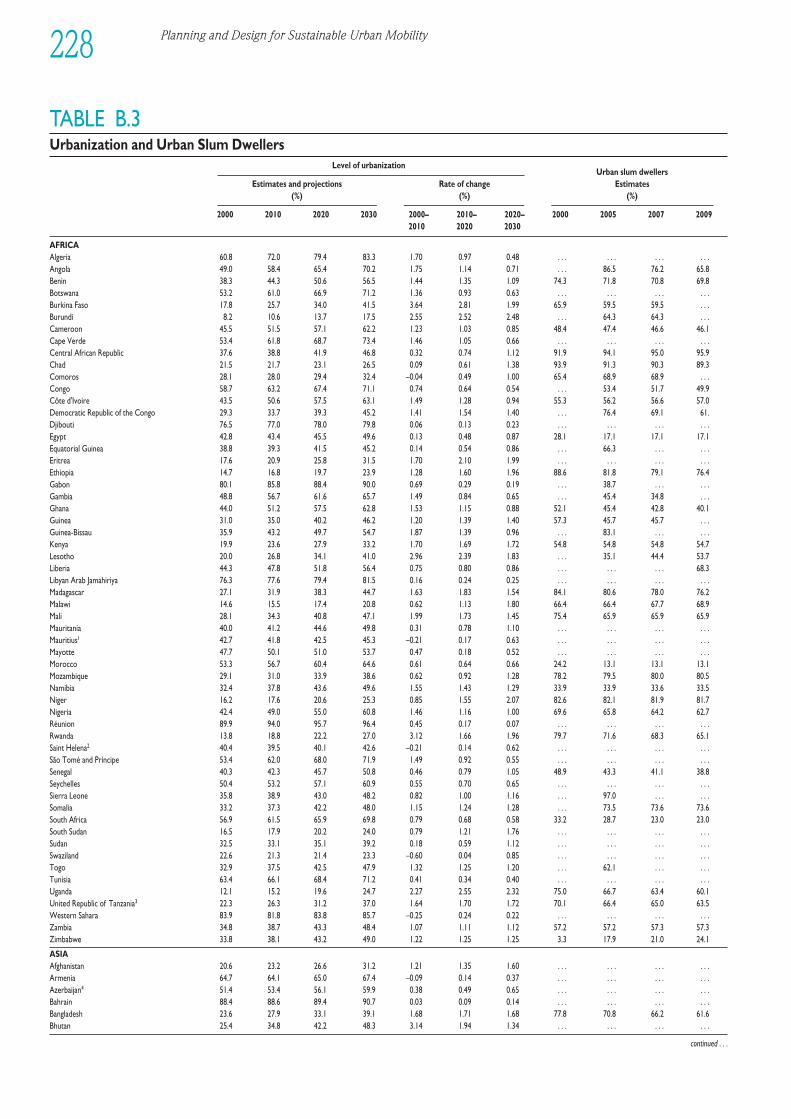
Planning and Design for Sustainable Urban Mobility228
TABLE B.3Urbanization and Urban Slum Dwellers
Level of urbanizationUrban slum dwellers
Estimates and projections Rate of change Estimates (%) (%) (%)
2000 2010 2020 2030 2000– 2010– 2020– 2000 2005 2007 20092010 2020 2030
AFRICAAlgeria 60.8 72.0 79.4 83.3 1.70 0.97 0.48 . . . . . . . . . . . .Angola 49.0 58.4 65.4 70.2 1.75 1.14 0.71 . . . 86.5 76.2 65.8Benin 38.3 44.3 50.6 56.5 1.44 1.35 1.09 74.3 71.8 70.8 69.8Botswana 53.2 61.0 66.9 71.2 1.36 0.93 0.63 . . . . . . . . . . . .Burkina Faso 17.8 25.7 34.0 41.5 3.64 2.81 1.99 65.9 59.5 59.5 . . .Burundi 8.2 10.6 13.7 17.5 2.55 2.52 2.48 . . . 64.3 64.3 . . .Cameroon 45.5 51.5 57.1 62.2 1.23 1.03 0.85 48.4 47.4 46.6 46.1Cape Verde 53.4 61.8 68.7 73.4 1.46 1.05 0.66 . . . . . . . . . . . .Central African Republic 37.6 38.8 41.9 46.8 0.32 0.74 1.12 91.9 94.1 95.0 95.9Chad 21.5 21.7 23.1 26.5 0.09 0.61 1.38 93.9 91.3 90.3 89.3Comoros 28.1 28.0 29.4 32.4 –0.04 0.49 1.00 65.4 68.9 68.9 . . .Congo 58.7 63.2 67.4 71.1 0.74 0.64 0.54 . . . 53.4 51.7 49.9Côte d'Ivoire 43.5 50.6 57.5 63.1 1.49 1.28 0.94 55.3 56.2 56.6 57.0Democratic Republic of the Congo 29.3 33.7 39.3 45.2 1.41 1.54 1.40 . . . 76.4 69.1 61.Djibouti 76.5 77.0 78.0 79.8 0.06 0.13 0.23 . . . . . . . . . . . .Egypt 42.8 43.4 45.5 49.6 0.13 0.48 0.87 28.1 17.1 17.1 17.1Equatorial Guinea 38.8 39.3 41.5 45.2 0.14 0.54 0.86 . . . 66.3 . . . . . .Eritrea 17.6 20.9 25.8 31.5 1.70 2.10 1.99 . . . . . . . . . . . .Ethiopia 14.7 16.8 19.7 23.9 1.28 1.60 1.96 88.6 81.8 79.1 76.4Gabon 80.1 85.8 88.4 90.0 0.69 0.29 0.19 . . . 38.7 . . . . . .Gambia 48.8 56.7 61.6 65.7 1.49 0.84 0.65 . . . 45.4 34.8 . . .Ghana 44.0 51.2 57.5 62.8 1.53 1.15 0.88 52.1 45.4 42.8 40.1Guinea 31.0 35.0 40.2 46.2 1.20 1.39 1.40 57.3 45.7 45.7 . . .Guinea-Bissau 35.9 43.2 49.7 54.7 1.87 1.39 0.96 . . . 83.1 . . . . . .Kenya 19.9 23.6 27.9 33.2 1.70 1.69 1.72 54.8 54.8 54.8 54.7Lesotho 20.0 26.8 34.1 41.0 2.96 2.39 1.83 . . . 35.1 44.4 53.7Liberia 44.3 47.8 51.8 56.4 0.75 0.80 0.86 . . . . . . . . . 68.3Libyan Arab Jamahiriya 76.3 77.6 79.4 81.5 0.16 0.24 0.25 . . . . . . . . . . . .Madagascar 27.1 31.9 38.3 44.7 1.63 1.83 1.54 84.1 80.6 78.0 76.2Malawi 14.6 15.5 17.4 20.8 0.62 1.13 1.80 66.4 66.4 67.7 68.9Mali 28.1 34.3 40.8 47.1 1.99 1.73 1.45 75.4 65.9 65.9 65.9Mauritania 40.0 41.2 44.6 49.8 0.31 0.78 1.10 . . . . . . . . . . . .Mauritius1 42.7 41.8 42.5 45.3 –0.21 0.17 0.63 . . . . . . . . . . . .Mayotte 47.7 50.1 51.0 53.7 0.47 0.18 0.52 . . . . . . . . . . . .Morocco 53.3 56.7 60.4 64.6 0.61 0.64 0.66 24.2 13.1 13.1 13.1Mozambique 29.1 31.0 33.9 38.6 0.62 0.92 1.28 78.2 79.5 80.0 80.5Namibia 32.4 37.8 43.6 49.6 1.55 1.43 1.29 33.9 33.9 33.6 33.5Niger 16.2 17.6 20.6 25.3 0.85 1.55 2.07 82.6 82.1 81.9 81.7Nigeria 42.4 49.0 55.0 60.8 1.46 1.16 1.00 69.6 65.8 64.2 62.7Réunion 89.9 94.0 95.7 96.4 0.45 0.17 0.07 . . . . . . . . . . . .Rwanda 13.8 18.8 22.2 27.0 3.12 1.66 1.96 79.7 71.6 68.3 65.1Saint Helena2 40.4 39.5 40.1 42.6 –0.21 0.14 0.62 . . . . . . . . . . . .São Tomé and Príncipe 53.4 62.0 68.0 71.9 1.49 0.92 0.55 . . . . . . . . . . . .Senegal 40.3 42.3 45.7 50.8 0.46 0.79 1.05 48.9 43.3 41.1 38.8Seychelles 50.4 53.2 57.1 60.9 0.55 0.70 0.65 . . . . . . . . . . . .Sierra Leone 35.8 38.9 43.0 48.2 0.82 1.00 1.16 . . . 97.0 . . . . . .Somalia 33.2 37.3 42.2 48.0 1.15 1.24 1.28 . . . 73.5 73.6 73.6South Africa 56.9 61.5 65.9 69.8 0.79 0.68 0.58 33.2 28.7 23.0 23.0South Sudan 16.5 17.9 20.2 24.0 0.79 1.21 1.76 . . . . . . . . . . . .Sudan 32.5 33.1 35.1 39.2 0.18 0.59 1.12 . . . . . . . . . . . .Swaziland 22.6 21.3 21.4 23.3 –0.60 0.04 0.85 . . . . . . . . . . . .Togo 32.9 37.5 42.5 47.9 1.32 1.25 1.20 . . . 62.1 . . . . . .Tunisia 63.4 66.1 68.4 71.2 0.41 0.34 0.40 . . . . . . . . . . . .Uganda 12.1 15.2 19.6 24.7 2.27 2.55 2.32 75.0 66.7 63.4 60.1United Republic of Tanzania3 22.3 26.3 31.2 37.0 1.64 1.70 1.72 70.1 66.4 65.0 63.5Western Sahara 83.9 81.8 83.8 85.7 –0.25 0.24 0.22 . . . . . . . . . . . .Zambia 34.8 38.7 43.3 48.4 1.07 1.11 1.12 57.2 57.2 57.3 57.3Zimbabwe 33.8 38.1 43.2 49.0 1.22 1.25 1.25 3.3 17.9 21.0 24.1
ASIAAfghanistan 20.6 23.2 26.6 31.2 1.21 1.35 1.60 . . . . . . . . . . . .Armenia 64.7 64.1 65.0 67.4 –0.09 0.14 0.37 . . . . . . . . . . . .Azerbaijan4 51.4 53.4 56.1 59.9 0.38 0.49 0.65 . . . . . . . . . . . .Bahrain 88.4 88.6 89.4 90.7 0.03 0.09 0.14 . . . . . . . . . . . .Bangladesh 23.6 27.9 33.1 39.1 1.68 1.71 1.68 77.8 70.8 66.2 61.6Bhutan 25.4 34.8 42.2 48.3 3.14 1.94 1.34 . . . . . . . . . . . .
continued . . .
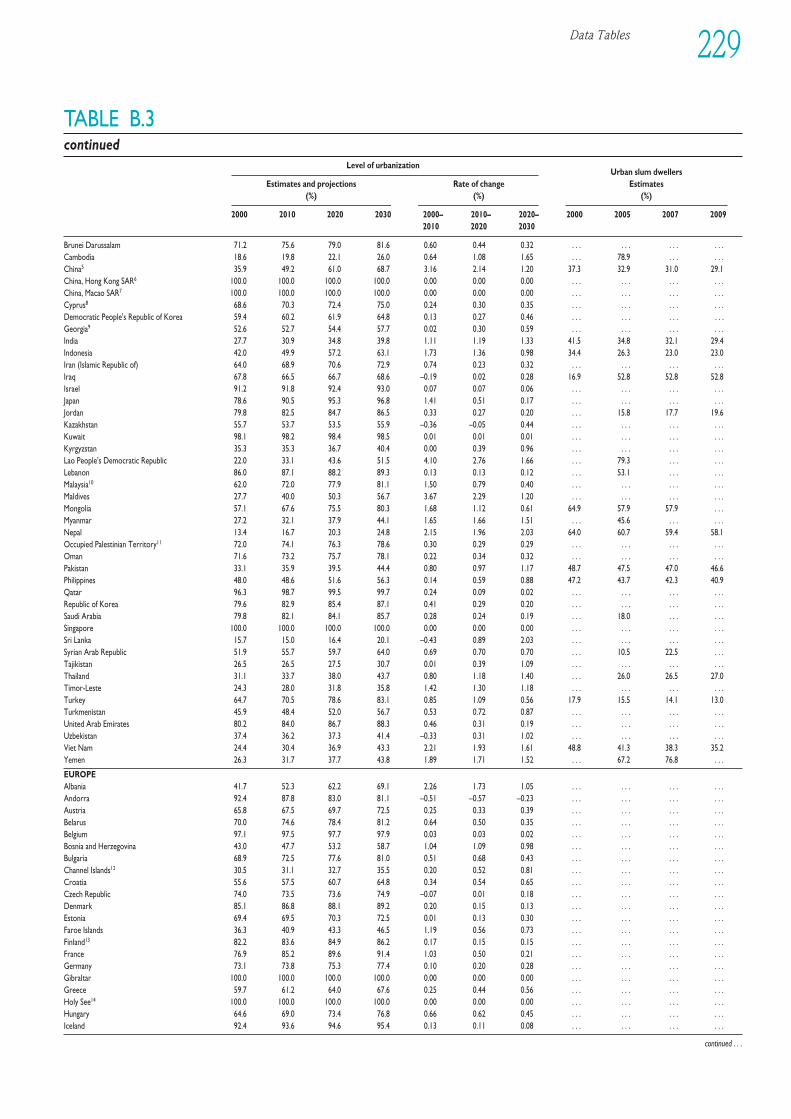
Data Tables 229
TABLE B.3continued
Level of urbanizationUrban slum dwellers
Estimates and projections Rate of change Estimates (%) (%) (%)
2000 2010 2020 2030 2000– 2010– 2020– 2000 2005 2007 20092010 2020 2030
Brunei Darussalam 71.2 75.6 79.0 81.6 0.60 0.44 0.32 . . . . . . . . . . . .Cambodia 18.6 19.8 22.1 26.0 0.64 1.08 1.65 . . . 78.9 . . . . . .China5 35.9 49.2 61.0 68.7 3.16 2.14 1.20 37.3 32.9 31.0 29.1China, Hong Kong SAR6 100.0 100.0 100.0 100.0 0.00 0.00 0.00 . . . . . . . . . . . .China, Macao SAR7 100.0 100.0 100.0 100.0 0.00 0.00 0.00 . . . . . . . . . . . .Cyprus8 68.6 70.3 72.4 75.0 0.24 0.30 0.35 . . . . . . . . . . . .Democratic People's Republic of Korea 59.4 60.2 61.9 64.8 0.13 0.27 0.46 . . . . . . . . . . . . Georgia9 52.6 52.7 54.4 57.7 0.02 0.30 0.59 . . . . . . . . . . . .India 27.7 30.9 34.8 39.8 1.11 1.19 1.33 41.5 34.8 32.1 29.4Indonesia 42.0 49.9 57.2 63.1 1.73 1.36 0.98 34.4 26.3 23.0 23.0Iran (Islamic Republic of) 64.0 68.9 70.6 72.9 0.74 0.23 0.32 . . . . . . . . . . . .Iraq 67.8 66.5 66.7 68.6 –0.19 0.02 0.28 16.9 52.8 52.8 52.8Israel 91.2 91.8 92.4 93.0 0.07 0.07 0.06 . . . . . . . . . . . .Japan 78.6 90.5 95.3 96.8 1.41 0.51 0.17 . . . . . . . . . . . .Jordan 79.8 82.5 84.7 86.5 0.33 0.27 0.20 . . . 15.8 17.7 19.6Kazakhstan 55.7 53.7 53.5 55.9 –0.36 –0.05 0.44 . . . . . . . . . . . .Kuwait 98.1 98.2 98.4 98.5 0.01 0.01 0.01 . . . . . . . . . . . .Kyrgyzstan 35.3 35.3 36.7 40.4 0.00 0.39 0.96 . . . . . . . . . . . .Lao People's Democratic Republic 22.0 33.1 43.6 51.5 4.10 2.76 1.66 . . . 79.3 . . . . . .Lebanon 86.0 87.1 88.2 89.3 0.13 0.13 0.12 . . . 53.1 . . . . . .Malaysia10 62.0 72.0 77.9 81.1 1.50 0.79 0.40 . . . . . . . . . . . .Maldives 27.7 40.0 50.3 56.7 3.67 2.29 1.20 . . . . . . . . . . . .Mongolia 57.1 67.6 75.5 80.3 1.68 1.12 0.61 64.9 57.9 57.9 . . .Myanmar 27.2 32.1 37.9 44.1 1.65 1.66 1.51 . . . 45.6 . . . . . .Nepal 13.4 16.7 20.3 24.8 2.15 1.96 2.03 64.0 60.7 59.4 58.1Occupied Palestinian Territory11 72.0 74.1 76.3 78.6 0.30 0.29 0.29 . . . . . . . . . . . .Oman 71.6 73.2 75.7 78.1 0.22 0.34 0.32 . . . . . . . . . . . .Pakistan 33.1 35.9 39.5 44.4 0.80 0.97 1.17 48.7 47.5 47.0 46.6Philippines 48.0 48.6 51.6 56.3 0.14 0.59 0.88 47.2 43.7 42.3 40.9Qatar 96.3 98.7 99.5 99.7 0.24 0.09 0.02 . . . . . . . . . . . .Republic of Korea 79.6 82.9 85.4 87.1 0.41 0.29 0.20 . . . . . . . . . . . .Saudi Arabia 79.8 82.1 84.1 85.7 0.28 0.24 0.19 . . . 18.0 . . . . . .Singapore 100.0 100.0 100.0 100.0 0.00 0.00 0.00 . . . . . . . . . . . .Sri Lanka 15.7 15.0 16.4 20.1 –0.43 0.89 2.03 . . . . . . . . . . . .Syrian Arab Republic 51.9 55.7 59.7 64.0 0.69 0.70 0.70 . . . 10.5 22.5 . . .Tajikistan 26.5 26.5 27.5 30.7 0.01 0.39 1.09 . . . . . . . . . . . .Thailand 31.1 33.7 38.0 43.7 0.80 1.18 1.40 . . . 26.0 26.5 27.0Timor-Leste 24.3 28.0 31.8 35.8 1.42 1.30 1.18 . . . . . . . . . . . .Turkey 64.7 70.5 78.6 83.1 0.85 1.09 0.56 17.9 15.5 14.1 13.0Turkmenistan 45.9 48.4 52.0 56.7 0.53 0.72 0.87 . . . . . . . . . . . .United Arab Emirates 80.2 84.0 86.7 88.3 0.46 0.31 0.19 . . . . . . . . . . . .Uzbekistan 37.4 36.2 37.3 41.4 –0.33 0.31 1.02 . . . . . . . . . . . .Viet Nam 24.4 30.4 36.9 43.3 2.21 1.93 1.61 48.8 41.3 38.3 35.2Yemen 26.3 31.7 37.7 43.8 1.89 1.71 1.52 . . . 67.2 76.8 . . .
EUROPEAlbania 41.7 52.3 62.2 69.1 2.26 1.73 1.05 . . . . . . . . . . . .Andorra 92.4 87.8 83.0 81.1 –0.51 –0.57 –0.23 . . . . . . . . . . . .Austria 65.8 67.5 69.7 72.5 0.25 0.33 0.39 . . . . . . . . . . . .Belarus 70.0 74.6 78.4 81.2 0.64 0.50 0.35 . . . . . . . . . . . .Belgium 97.1 97.5 97.7 97.9 0.03 0.03 0.02 . . . . . . . . . . . .Bosnia and Herzegovina 43.0 47.7 53.2 58.7 1.04 1.09 0.98 . . . . . . . . . . . .Bulgaria 68.9 72.5 77.6 81.0 0.51 0.68 0.43 . . . . . . . . . . . .Channel Islands12 30.5 31.1 32.7 35.5 0.20 0.52 0.81 . . . . . . . . . . . .Croatia 55.6 57.5 60.7 64.8 0.34 0.54 0.65 . . . . . . . . . . . .Czech Republic 74.0 73.5 73.6 74.9 –0.07 0.01 0.18 . . . . . . . . . . . .Denmark 85.1 86.8 88.1 89.2 0.20 0.15 0.13 . . . . . . . . . . . .Estonia 69.4 69.5 70.3 72.5 0.01 0.13 0.30 . . . . . . . . . . . .Faroe Islands 36.3 40.9 43.3 46.5 1.19 0.56 0.73 . . . . . . . . . . . .Finland13 82.2 83.6 84.9 86.2 0.17 0.15 0.15 . . . . . . . . . . . .France 76.9 85.2 89.6 91.4 1.03 0.50 0.21 . . . . . . . . . . . .Germany 73.1 73.8 75.3 77.4 0.10 0.20 0.28 . . . . . . . . . . . .Gibraltar 100.0 100.0 100.0 100.0 0.00 0.00 0.00 . . . . . . . . . . . .Greece 59.7 61.2 64.0 67.6 0.25 0.44 0.56 . . . . . . . . . . . .Holy See14 100.0 100.0 100.0 100.0 0.00 0.00 0.00 . . . . . . . . . . . .Hungary 64.6 69.0 73.4 76.8 0.66 0.62 0.45 . . . . . . . . . . . .Iceland 92.4 93.6 94.6 95.4 0.13 0.11 0.08 . . . . . . . . . . . .
continued . . .
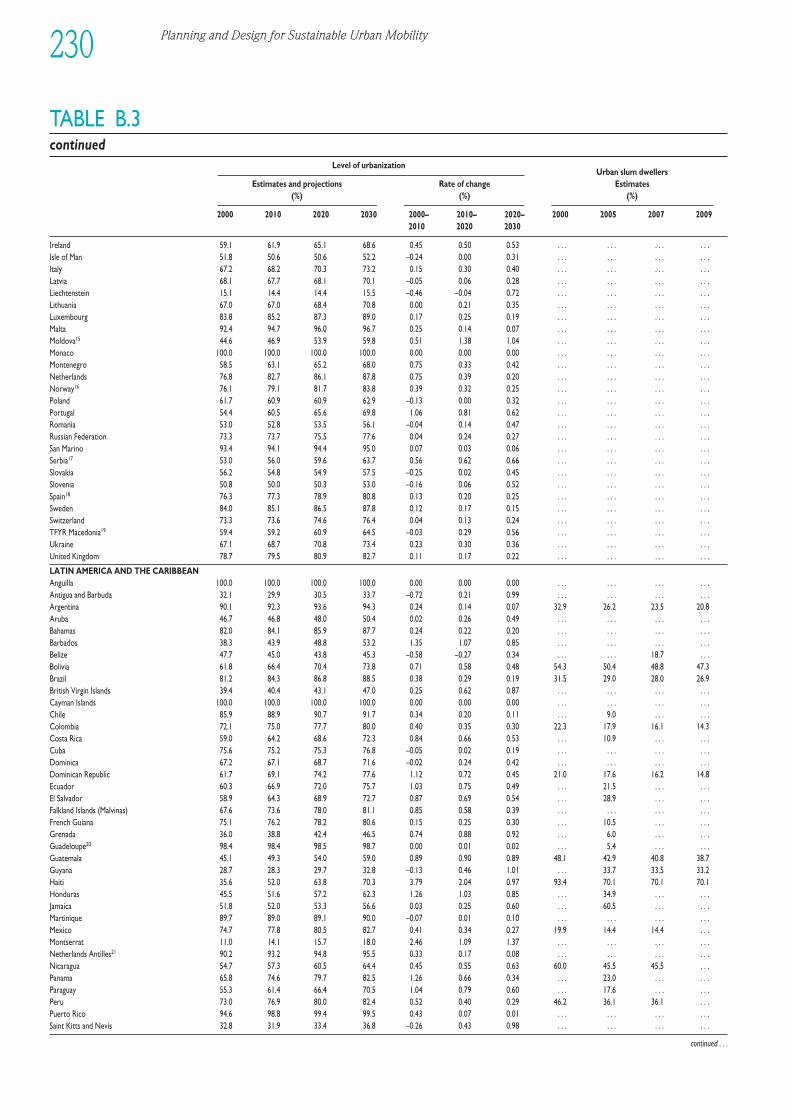
Planning and Design for Sustainable Urban Mobility230
TABLE B.3continued
Level of urbanizationUrban slum dwellers
Estimates and projections Rate of change Estimates (%) (%) (%)
2000 2010 2020 2030 2000– 2010– 2020– 2000 2005 2007 20092010 2020 2030
Ireland 59.1 61.9 65.1 68.6 0.45 0.50 0.53 . . . . . . . . . . . .Isle of Man 51.8 50.6 50.6 52.2 –0.24 0.00 0.31 . . . . . . . . . . . .Italy 67.2 68.2 70.3 73.2 0.15 0.30 0.40 . . . . . . . . . . . .Latvia 68.1 67.7 68.1 70.1 –0.05 0.06 0.28 . . . . . . . . . . . .Liechtenstein 15.1 14.4 14.4 15.5 –0.46 –0.04 0.72 . . . . . . . . . . . .Lithuania 67.0 67.0 68.4 70.8 0.00 0.21 0.35 . . . . . . . . . . . .Luxembourg 83.8 85.2 87.3 89.0 0.17 0.25 0.19 . . . . . . . . . . . .Malta 92.4 94.7 96.0 96.7 0.25 0.14 0.07 . . . . . . . . . . . .Moldova15 44.6 46.9 53.9 59.8 0.51 1.38 1.04 . . . . . . . . . . . .Monaco 100.0 100.0 100.0 100.0 0.00 0.00 0.00 . . . . . . . . . . . .Montenegro 58.5 63.1 65.2 68.0 0.75 0.33 0.42 . . . . . . . . . . . .Netherlands 76.8 82.7 86.1 87.8 0.75 0.39 0.20 . . . . . . . . . . . .Norway16 76.1 79.1 81.7 83.8 0.39 0.32 0.25 . . . . . . . . . . . .Poland 61.7 60.9 60.9 62.9 –0.13 0.00 0.32 . . . . . . . . . . . .Portugal 54.4 60.5 65.6 69.8 1.06 0.81 0.62 . . . . . . . . . . . .Romania 53.0 52.8 53.5 56.1 –0.04 0.14 0.47 . . . . . . . . . . . .Russian Federation 73.3 73.7 75.5 77.6 0.04 0.24 0.27 . . . . . . . . . . . .San Marino 93.4 94.1 94.4 95.0 0.07 0.03 0.06 . . . . . . . . . . . .Serbia17 53.0 56.0 59.6 63.7 0.56 0.62 0.66 . . . . . . . . . . . .Slovakia 56.2 54.8 54.9 57.5 –0.25 0.02 0.45 . . . . . . . . . . . .Slovenia 50.8 50.0 50.3 53.0 –0.16 0.06 0.52 . . . . . . . . . . . .Spain18 76.3 77.3 78.9 80.8 0.13 0.20 0.25 . . . . . . . . . . . .Sweden 84.0 85.1 86.5 87.8 0.12 0.17 0.15 . . . . . . . . . . . .Switzerland 73.3 73.6 74.6 76.4 0.04 0.13 0.24 . . . . . . . . . . . .TFYR Macedonia19 59.4 59.2 60.9 64.5 –0.03 0.29 0.56 . . . . . . . . . . . .Ukraine 67.1 68.7 70.8 73.4 0.23 0.30 0.36 . . . . . . . . . . . .United Kingdom 78.7 79.5 80.9 82.7 0.11 0.17 0.22 . . . . . . . . . . . .
LATIN AMERICA AND THE CARIBBEANAnguilla 100.0 100.0 100.0 100.0 0.00 0.00 0.00 . . . . . . . . . . . .Antigua and Barbuda 32.1 29.9 30.5 33.7 –0.72 0.21 0.99 . . . . . . . . . . . .Argentina 90.1 92.3 93.6 94.3 0.24 0.14 0.07 32.9 26.2 23.5 20.8Aruba 46.7 46.8 48.0 50.4 0.02 0.26 0.49 . . . . . . . . . . . .Bahamas 82.0 84.1 85.9 87.7 0.24 0.22 0.20 . . . . . . . . . . . .Barbados 38.3 43.9 48.8 53.2 1.35 1.07 0.85 . . . . . . . . . . . .Belize 47.7 45.0 43.8 45.3 –0.58 –0.27 0.34 . . . . . . 18.7 . . .Bolivia 61.8 66.4 70.4 73.8 0.71 0.58 0.48 54.3 50.4 48.8 47.3Brazil 81.2 84.3 86.8 88.5 0.38 0.29 0.19 31.5 29.0 28.0 26.9British Virgin Islands 39.4 40.4 43.1 47.0 0.25 0.62 0.87 . . . . . . . . . . . .Cayman Islands 100.0 100.0 100.0 100.0 0.00 0.00 0.00 . . . . . . . . . . . .Chile 85.9 88.9 90.7 91.7 0.34 0.20 0.11 . . . 9.0 . . . . . . Colombia 72.1 75.0 77.7 80.0 0.40 0.35 0.30 22.3 17.9 16.1 14.3Costa Rica 59.0 64.2 68.6 72.3 0.84 0.66 0.53 . . . 10.9 . . . . . .Cuba 75.6 75.2 75.3 76.8 –0.05 0.02 0.19 . . . . . . . . . . . .Dominica 67.2 67.1 68.7 71.6 –0.02 0.24 0.42 . . . . . . . . . . . .Dominican Republic 61.7 69.1 74.2 77.6 1.12 0.72 0.45 21.0 17.6 16.2 14.8Ecuador 60.3 66.9 72.0 75.7 1.03 0.75 0.49 . . . 21.5 . . . . . .El Salvador 58.9 64.3 68.9 72.7 0.87 0.69 0.54 . . . 28.9 . . . . . .Falkland Islands (Malvinas) 67.6 73.6 78.0 81.1 0.85 0.58 0.39 . . . . . . . . . . . .French Guiana 75.1 76.2 78.2 80.6 0.15 0.25 0.30 . . . 10.5 . . . . . .Grenada 36.0 38.8 42.4 46.5 0.74 0.88 0.92 . . . 6.0 . . . . . .Guadeloupe20 98.4 98.4 98.5 98.7 0.00 0.01 0.02 . . . 5.4 . . . . . .Guatemala 45.1 49.3 54.0 59.0 0.89 0.90 0.89 48.1 42.9 40.8 38.7Guyana 28.7 28.3 29.7 32.8 –0.13 0.46 1.01 . . . 33.7 33.5 33.2Haiti 35.6 52.0 63.8 70.3 3.79 2.04 0.97 93.4 70.1 70.1 70.1Honduras 45.5 51.6 57.2 62.3 1.26 1.03 0.85 . . . 34.9 . . . . . .Jamaica 51.8 52.0 53.3 56.6 0.03 0.25 0.60 . . . 60.5 . . . . . .Martinique 89.7 89.0 89.1 90.0 –0.07 0.01 0.10 . . . . . . . . . . . .Mexico 74.7 77.8 80.5 82.7 0.41 0.34 0.27 19.9 14.4 14.4 . . .Montserrat 11.0 14.1 15.7 18.0 2.46 1.09 1.37 . . . . . . . . . . . .Netherlands Antilles21 90.2 93.2 94.8 95.5 0.33 0.17 0.08 . . . . . . . . . . . .Nicaragua 54.7 57.3 60.5 64.4 0.45 0.55 0.63 60.0 45.5 45.5 . . .Panama 65.8 74.6 79.7 82.5 1.26 0.66 0.34 . . . 23.0 . . . . . .Paraguay 55.3 61.4 66.4 70.5 1.04 0.79 0.60 . . . 17.6 . . . . . .Peru 73.0 76.9 80.0 82.4 0.52 0.40 0.29 46.2 36.1 36.1 . . .Puerto Rico 94.6 98.8 99.4 99.5 0.43 0.07 0.01 . . . . . . . . . . . .Saint Kitts and Nevis 32.8 31.9 33.4 36.8 –0.26 0.43 0.98 . . . . . . . . . . . .
continued . . .
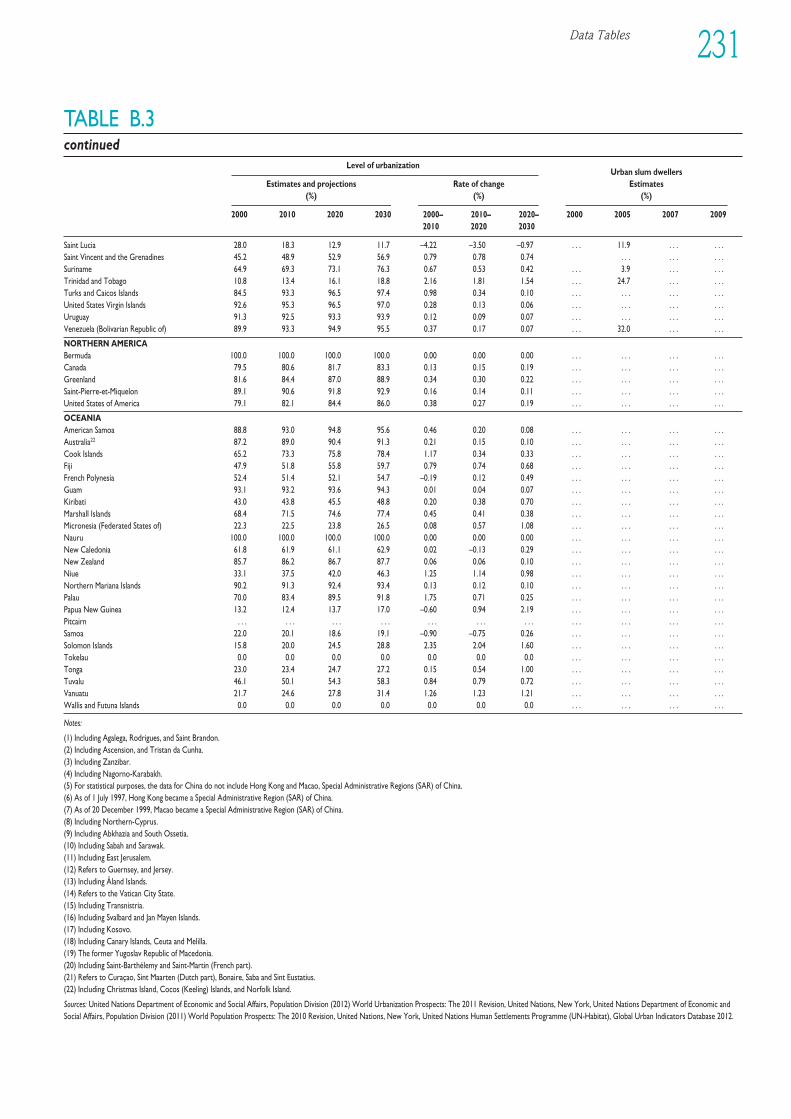
Data Tables 231
TABLE B.3continued
Level of urbanizationUrban slum dwellers
Estimates and projections Rate of change Estimates (%) (%) (%)
2000 2010 2020 2030 2000– 2010– 2020– 2000 2005 2007 20092010 2020 2030
Saint Lucia 28.0 18.3 12.9 11.7 –4.22 –3.50 –0.97 . . . 11.9 . . . . . .Saint Vincent and the Grenadines 45.2 48.9 52.9 56.9 0.79 0.78 0.74 . . . . . . . . .Suriname 64.9 69.3 73.1 76.3 0.67 0.53 0.42 . . . 3.9 . . . . . .Trinidad and Tobago 10.8 13.4 16.1 18.8 2.16 1.81 1.54 . . . 24.7 . . . . . .Turks and Caicos Islands 84.5 93.3 96.5 97.4 0.98 0.34 0.10 . . . . . . . . . . . .United States Virgin Islands 92.6 95.3 96.5 97.0 0.28 0.13 0.06 . . . . . . . . . . . .Uruguay 91.3 92.5 93.3 93.9 0.12 0.09 0.07 . . . . . . . . . . . .Venezuela (Bolivarian Republic of) 89.9 93.3 94.9 95.5 0.37 0.17 0.07 . . . 32.0 . . . . . .
NORTHERN AMERICABermuda 100.0 100.0 100.0 100.0 0.00 0.00 0.00 . . . . . . . . . . . .Canada 79.5 80.6 81.7 83.3 0.13 0.15 0.19 . . . . . . . . . . . .Greenland 81.6 84.4 87.0 88.9 0.34 0.30 0.22 . . . . . . . . . . . .Saint-Pierre-et-Miquelon 89.1 90.6 91.8 92.9 0.16 0.14 0.11 . . . . . . . . . . . .United States of America 79.1 82.1 84.4 86.0 0.38 0.27 0.19 . . . . . . . . . . . .
OCEANIAAmerican Samoa 88.8 93.0 94.8 95.6 0.46 0.20 0.08 . . . . . . . . . . . .Australia22 87.2 89.0 90.4 91.3 0.21 0.15 0.10 . . . . . . . . . . . .Cook Islands 65.2 73.3 75.8 78.4 1.17 0.34 0.33 . . . . . . . . . . . .Fiji 47.9 51.8 55.8 59.7 0.79 0.74 0.68 . . . . . . . . . . . .French Polynesia 52.4 51.4 52.1 54.7 –0.19 0.12 0.49 . . . . . . . . . . . .Guam 93.1 93.2 93.6 94.3 0.01 0.04 0.07 . . . . . . . . . . . .Kiribati 43.0 43.8 45.5 48.8 0.20 0.38 0.70 . . . . . . . . . . . .Marshall Islands 68.4 71.5 74.6 77.4 0.45 0.41 0.38 . . . . . . . . . . . .Micronesia (Federated States of) 22.3 22.5 23.8 26.5 0.08 0.57 1.08 . . . . . . . . . . . .Nauru 100.0 100.0 100.0 100.0 0.00 0.00 0.00 . . . . . . . . . . . .New Caledonia 61.8 61.9 61.1 62.9 0.02 –0.13 0.29 . . . . . . . . . . . .New Zealand 85.7 86.2 86.7 87.7 0.06 0.06 0.10 . . . . . . . . . . . .Niue 33.1 37.5 42.0 46.3 1.25 1.14 0.98 . . . . . . . . . . . .Northern Mariana Islands 90.2 91.3 92.4 93.4 0.13 0.12 0.10 . . . . . . . . . . . .Palau 70.0 83.4 89.5 91.8 1.75 0.71 0.25 . . . . . . . . . . . .Papua New Guinea 13.2 12.4 13.7 17.0 –0.60 0.94 2.19 . . . . . . . . . . . .Pitcairn . . . . . . . . . . . . . . . . . . . . . . . . . . . . . . . . .Samoa 22.0 20.1 18.6 19.1 –0.90 –0.75 0.26 . . . . . . . . . . . .Solomon Islands 15.8 20.0 24.5 28.8 2.35 2.04 1.60 . . . . . . . . . . . .Tokelau 0.0 0.0 0.0 0.0 0.0 0.0 0.0 . . . . . . . . . . . .Tonga 23.0 23.4 24.7 27.2 0.15 0.54 1.00 . . . . . . . . . . . .Tuvalu 46.1 50.1 54.3 58.3 0.84 0.79 0.72 . . . . . . . . . . . .Vanuatu 21.7 24.6 27.8 31.4 1.26 1.23 1.21 . . . . . . . . . . . .Wallis and Futuna Islands 0.0 0.0 0.0 0.0 0.0 0.0 0.0 . . . . . . . . . . . .
Notes:
(1) Including Agalega, Rodrigues, and Saint Brandon.(2) Including Ascension, and Tristan da Cunha.(3) Including Zanzibar.(4) Including Nagorno-Karabakh.(5) For statistical purposes, the data for China do not include Hong Kong and Macao, Special Administrative Regions (SAR) of China.(6) As of 1 July 1997, Hong Kong became a Special Administrative Region (SAR) of China.(7) As of 20 December 1999, Macao became a Special Administrative Region (SAR) of China.(8) Including Northern-Cyprus.(9) Including Abkhazia and South Ossetia.(10) Including Sabah and Sarawak.(11) Including East Jerusalem.(12) Refers to Guernsey, and Jersey.(13) Including Åland Islands.(14) Refers to the Vatican City State.(15) Including Transnistria.(16) Including Svalbard and Jan Mayen Islands.(17) Including Kosovo.(18) Including Canary Islands, Ceuta and Melilla.(19) The former Yugoslav Republic of Macedonia.(20) Including Saint-Barthélemy and Saint-Martin (French part).(21) Refers to Curaçao, Sint Maarten (Dutch part), Bonaire, Saba and Sint Eustatius.(22) Including Christmas Island, Cocos (Keeling) Islands, and Norfolk Island.
Sources: United Nations Department of Economic and Social Affairs, Population Division (2012) World Urbanization Prospects: The 2011 Revision, United Nations, New York, United Nations Department of Economic andSocial Affairs, Population Division (2011) World Population Prospects: The 2010 Revision, United Nations, New York, United Nations Human Settlements Programme (UN-Habitat), Global Urban Indicators Database 2012.
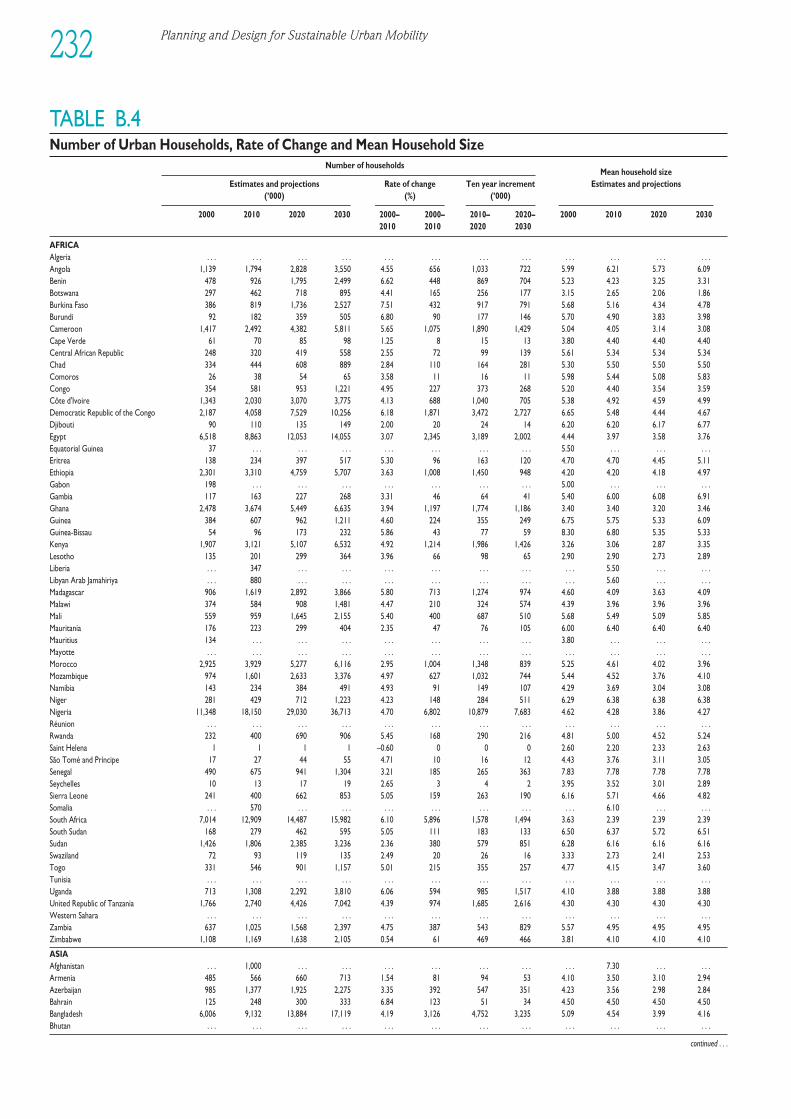
Planning and Design for Sustainable Urban Mobility232
TABLE B.4Number of Urban Households, Rate of Change and Mean Household Size
Number of householdsMean household size
Estimates and projections Rate of change Ten year increment Estimates and projections(’000) (%) (’000)
2000 2010 2020 2030 2000– 2000– 2010– 2020– 2000 2010 2020 20302010 2010 2020 2030
AFRICAAlgeria . . . . . . . . . . . . . . . . . . . . . . . . . . . . . . . . . . . .Angola 1,139 1,794 2,828 3,550 4.55 656 1,033 722 5.99 6.21 5.73 6.09Benin 478 926 1,795 2,499 6.62 448 869 704 5.23 4.23 3.25 3.31Botswana 297 462 718 895 4.41 165 256 177 3.15 2.65 2.06 1.86Burkina Faso 386 819 1,736 2,527 7.51 432 917 791 5.68 5.16 4.34 4.78Burundi 92 182 359 505 6.80 90 177 146 5.70 4.90 3.83 3.98Cameroon 1,417 2,492 4,382 5,811 5.65 1,075 1,890 1,429 5.04 4.05 3.14 3.08Cape Verde 61 70 85 98 1.25 8 15 13 3.80 4.40 4.40 4.40Central African Republic 248 320 419 558 2.55 72 99 139 5.61 5.34 5.34 5.34Chad 334 444 608 889 2.84 110 164 281 5.30 5.50 5.50 5.50Comoros 26 38 54 65 3.58 11 16 11 5.98 5.44 5.08 5.83Congo 354 581 953 1,221 4.95 227 373 268 5.20 4.40 3.54 3.59Côte d'Ivoire 1,343 2,030 3,070 3,775 4.13 688 1,040 705 5.38 4.92 4.59 4.99Democratic Republic of the Congo 2,187 4,058 7,529 10,256 6.18 1,871 3,472 2,727 6.65 5.48 4.44 4.67 Djibouti 90 110 135 149 2.00 20 24 14 6.20 6.20 6.17 6.77Egypt 6,518 8,863 12,053 14,055 3.07 2,345 3,189 2,002 4.44 3.97 3.58 3.76Equatorial Guinea 37 . . . . . . . . . . . . . . . . . . . . . 5.50 . . . . . . . . .Eritrea 138 234 397 517 5.30 96 163 120 4.70 4.70 4.45 5.11Ethiopia 2,301 3,310 4,759 5,707 3.63 1,008 1,450 948 4.20 4.20 4.18 4.97Gabon 198 . . . . . . . . . . . . . . . . . . . . . 5.00 . . . . . . . . .Gambia 117 163 227 268 3.31 46 64 41 5.40 6.00 6.08 6.91Ghana 2,478 3,674 5,449 6,635 3.94 1,197 1,774 1,186 3.40 3.40 3.20 3.46Guinea 384 607 962 1,211 4.60 224 355 249 6.75 5.75 5.33 6.09Guinea-Bissau 54 96 173 232 5.86 43 77 59 8.30 6.80 5.35 5.33Kenya 1,907 3,121 5,107 6,532 4.92 1,214 1,986 1,426 3.26 3.06 2.87 3.35Lesotho 135 201 299 364 3.96 66 98 65 2.90 2.90 2.73 2.89Liberia . . . 347 . . . . . . . . . . . . . . . . . . . . . 5.50 . . . . . .Libyan Arab Jamahiriya . . . 880 . . . . . . . . . . . . . . . . . . . . . 5.60 . . . . . .Madagascar 906 1,619 2,892 3,866 5.80 713 1,274 974 4.60 4.09 3.63 4.09Malawi 374 584 908 1,481 4.47 210 324 574 4.39 3.96 3.96 3.96Mali 559 959 1,645 2,155 5.40 400 687 510 5.68 5.49 5.09 5.85Mauritania 176 223 299 404 2.35 47 76 105 6.00 6.40 6.40 6.40Mauritius 134 . . . . . . . . . . . . . . . . . . . . . 3.80 . . . . . . . . .Mayotte . . . . . . . . . . . . . . . . . . . . . . . . . . . . . . . . . . . .Morocco 2,925 3,929 5,277 6,116 2.95 1,004 1,348 839 5.25 4.61 4.02 3.96Mozambique 974 1,601 2,633 3,376 4.97 627 1,032 744 5.44 4.52 3.76 4.10Namibia 143 234 384 491 4.93 91 149 107 4.29 3.69 3.04 3.08Niger 281 429 712 1,223 4.23 148 284 511 6.29 6.38 6.38 6.38Nigeria 11,348 18,150 29,030 36,713 4.70 6,802 10,879 7,683 4.62 4.28 3.86 4.27Réunion . . . . . . . . . . . . . . . . . . . . . . . . . . . . . . . . . . . .Rwanda 232 400 690 906 5.45 168 290 216 4.81 5.00 4.52 5.24Saint Helena 1 1 1 1 –0.60 0 0 0 2.60 2.20 2.33 2.63São Tomé and Príncipe 17 27 44 55 4.71 10 16 12 4.43 3.76 3.11 3.05Senegal 490 675 941 1,304 3.21 185 265 363 7.83 7.78 7.78 7.78Seychelles 10 13 17 19 2.65 3 4 2 3.95 3.52 3.01 2.89Sierra Leone 241 400 662 853 5.05 159 263 190 6.16 5.71 4.66 4.82Somalia . . . 570 . . . . . . . . . . . . . . . . . . . . . 6.10 . . . . . .South Africa 7,014 12,909 14,487 15,982 6.10 5,896 1,578 1,494 3.63 2.39 2.39 2.39South Sudan 168 279 462 595 5.05 111 183 133 6.50 6.37 5.72 6.51Sudan 1,426 1,806 2,385 3,236 2.36 380 579 851 6.28 6.16 6.16 6.16Swaziland 72 93 119 135 2.49 20 26 16 3.33 2.73 2.41 2.53Togo 331 546 901 1,157 5.01 215 355 257 4.77 4.15 3.47 3.60Tunisia . . . . . . . . . . . . . . . . . . . . . . . . . . . . . . . . . . . .Uganda 713 1,308 2,292 3,810 6.06 594 985 1,517 4.10 3.88 3.88 3.88United Republic of Tanzania 1,766 2,740 4,426 7,042 4.39 974 1,685 2,616 4.30 4.30 4.30 4.30Western Sahara . . . . . . . . . . . . . . . . . . . . . . . . . . . . . . . . . . . .Zambia 637 1,025 1,568 2,397 4.75 387 543 829 5.57 4.95 4.95 4.95Zimbabwe 1,108 1,169 1,638 2,105 0.54 61 469 466 3.81 4.10 4.10 4.10
ASIAAfghanistan . . . 1,000 . . . . . . . . . . . . . . . . . . . . . 7.30 . . . . . .Armenia 485 566 660 713 1.54 81 94 53 4.10 3.50 3.10 2.94Azerbaijan 985 1,377 1,925 2,275 3.35 392 547 351 4.23 3.56 2.98 2.84Bahrain 125 248 300 333 6.84 123 51 34 4.50 4.50 4.50 4.50Bangladesh 6,006 9,132 13,884 17,119 4.19 3,126 4,752 3,235 5.09 4.54 3.99 4.16Bhutan . . . . . . . . . . . . . . . . . . . . . . . . . . . . . . . . . . . .
continued . . .
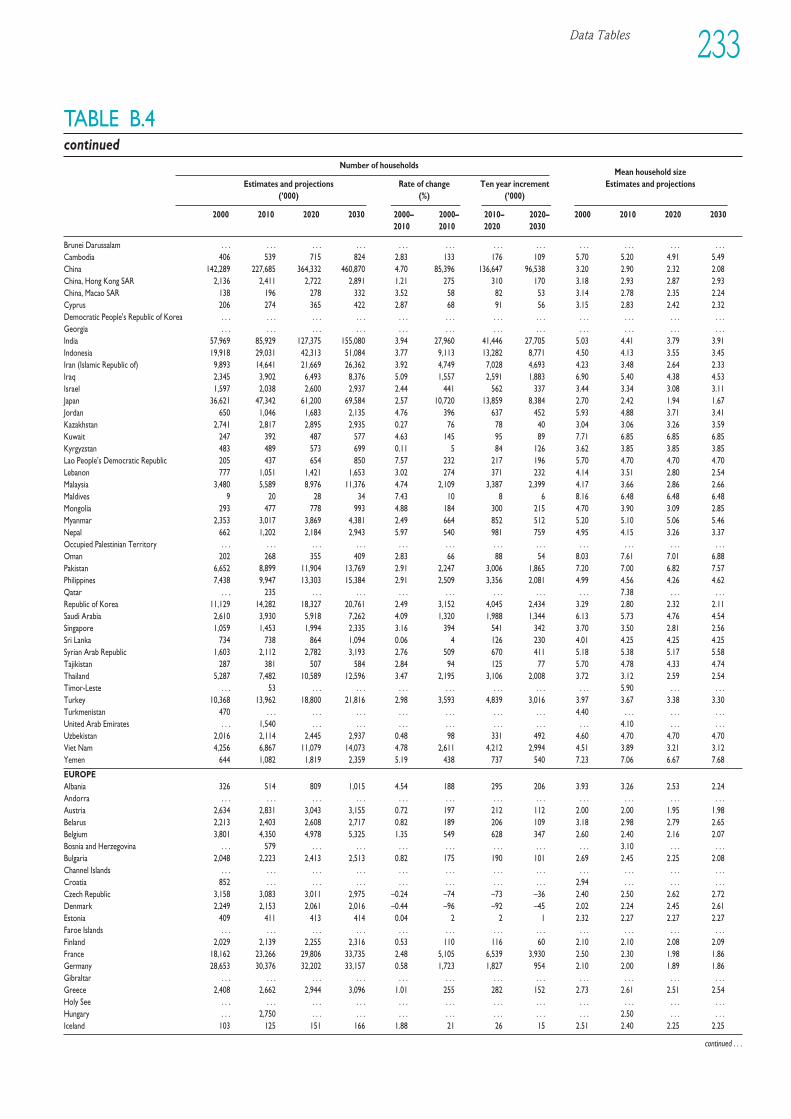
Data Tables 233
TABLE B.4continued
Number of householdsMean household size
Estimates and projections Rate of change Ten year increment Estimates and projections(’000) (%) (’000)
2000 2010 2020 2030 2000– 2000– 2010– 2020– 2000 2010 2020 20302010 2010 2020 2030
Brunei Darussalam . . . . . . . . . . . . . . . . . . . . . . . . . . . . . . . . . . . .Cambodia 406 539 715 824 2.83 133 176 109 5.70 5.20 4.91 5.49China 142,289 227,685 364,332 460,870 4.70 85,396 136,647 96,538 3.20 2.90 2.32 2.08China, Hong Kong SAR 2,136 2,411 2,722 2,891 1.21 275 310 170 3.18 2.93 2.87 2.93China, Macao SAR 138 196 278 332 3.52 58 82 53 3.14 2.78 2.35 2.24Cyprus 206 274 365 422 2.87 68 91 56 3.15 2.83 2.42 2.32Democratic People's Republic of Korea . . . . . . . . . . . . . . . . . . . . . . . . . . . . . . . . . . . .Georgia . . . . . . . . . . . . . . . . . . . . . . . . . . . . . . . . . . . .India 57,969 85,929 127,375 155,080 3.94 27,960 41,446 27,705 5.03 4.41 3.79 3.91Indonesia 19,918 29,031 42,313 51,084 3.77 9,113 13,282 8,771 4.50 4.13 3.55 3.45Iran (Islamic Republic of) 9,893 14,641 21,669 26,362 3.92 4,749 7,028 4,693 4.23 3.48 2.64 2.33Iraq 2,345 3,902 6,493 8,376 5.09 1,557 2,591 1,883 6.90 5.40 4.38 4.53Israel 1,597 2,038 2,600 2,937 2.44 441 562 337 3.44 3.34 3.08 3.11Japan 36,621 47,342 61,200 69,584 2.57 10,720 13,859 8,384 2.70 2.42 1.94 1.67Jordan 650 1,046 1,683 2,135 4.76 396 637 452 5.93 4.88 3.71 3.41Kazakhstan 2,741 2,817 2,895 2,935 0.27 76 78 40 3.04 3.06 3.26 3.59Kuwait 247 392 487 577 4.63 145 95 89 7.71 6.85 6.85 6.85Kyrgyzstan 483 489 573 699 0.11 5 84 126 3.62 3.85 3.85 3.85Lao People's Democratic Republic 205 437 654 850 7.57 232 217 196 5.70 4.70 4.70 4.70Lebanon 777 1,051 1,421 1,653 3.02 274 371 232 4.14 3.51 2.80 2.54Malaysia 3,480 5,589 8,976 11,376 4.74 2,109 3,387 2,399 4.17 3.66 2.86 2.66Maldives 9 20 28 34 7.43 10 8 6 8.16 6.48 6.48 6.48Mongolia 293 477 778 993 4.88 184 300 215 4.70 3.90 3.09 2.85Myanmar 2,353 3,017 3,869 4,381 2.49 664 852 512 5.20 5.10 5.06 5.46Nepal 662 1,202 2,184 2,943 5.97 540 981 759 4.95 4.15 3.26 3.37Occupied Palestinian Territory . . . . . . . . . . . . . . . . . . . . . . . . . . . . . . . . . . . .Oman 202 268 355 409 2.83 66 88 54 8.03 7.61 7.01 6.88Pakistan 6,652 8,899 11,904 13,769 2.91 2,247 3,006 1,865 7.20 7.00 6.82 7.57Philippines 7,438 9,947 13,303 15,384 2.91 2,509 3,356 2,081 4.99 4.56 4.26 4.62Qatar . . . 235 . . . . . . . . . . . . . . . . . . . . . 7.38 . . . . . .Republic of Korea 11,129 14,282 18,327 20,761 2.49 3,152 4,045 2,434 3.29 2.80 2.32 2.11Saudi Arabia 2,610 3,930 5,918 7,262 4.09 1,320 1,988 1,344 6.13 5.73 4.76 4.54Singapore 1,059 1,453 1,994 2,335 3.16 394 541 342 3.70 3.50 2.81 2.56Sri Lanka 734 738 864 1,094 0.06 4 126 230 4.01 4.25 4.25 4.25Syrian Arab Republic 1,603 2,112 2,782 3,193 2.76 509 670 411 5.18 5.38 5.17 5.58Tajikistan 287 381 507 584 2.84 94 125 77 5.70 4.78 4.33 4.74Thailand 5,287 7,482 10,589 12,596 3.47 2,195 3,106 2,008 3.72 3.12 2.59 2.54Timor-Leste . . . 53 . . . . . . . . . . . . . . . . . . . . . 5.90 . . . . . .Turkey 10,368 13,962 18,800 21,816 2.98 3,593 4,839 3,016 3.97 3.67 3.38 3.30Turkmenistan 470 . . . . . . . . . . . . . . . . . . . . . 4.40 . . . . . . . . .United Arab Emirates . . . 1,540 . . . . . . . . . . . . . . . . . . . . . 4.10 . . . . . .Uzbekistan 2,016 2,114 2,445 2,937 0.48 98 331 492 4.60 4.70 4.70 4.70Viet Nam 4,256 6,867 11,079 14,073 4.78 2,611 4,212 2,994 4.51 3.89 3.21 3.12Yemen 644 1,082 1,819 2,359 5.19 438 737 540 7.23 7.06 6.67 7.68
EUROPEAlbania 326 514 809 1,015 4.54 188 295 206 3.93 3.26 2.53 2.24Andorra . . . . . . . . . . . . . . . . . . . . . . . . . . . . . . . . . . . .Austria 2,634 2,831 3,043 3,155 0.72 197 212 112 2.00 2.00 1.95 1.98Belarus 2,213 2,403 2,608 2,717 0.82 189 206 109 3.18 2.98 2.79 2.65Belgium 3,801 4,350 4,978 5,325 1.35 549 628 347 2.60 2.40 2.16 2.07Bosnia and Herzegovina . . . 579 . . . . . . . . . . . . . . . . . . . . . 3.10 . . . . . .Bulgaria 2,048 2,223 2,413 2,513 0.82 175 190 101 2.69 2.45 2.25 2.08Channel Islands . . . . . . . . . . . . . . . . . . . . . . . . . . . . . . . . . . . .Croatia 852 . . . . . . . . . . . . . . . . . . . . . 2.94 . . . . . . . . .Czech Republic 3,158 3,083 3,011 2,975 –0.24 –74 –73 –36 2.40 2.50 2.62 2.72Denmark 2,249 2,153 2,061 2,016 –0.44 –96 –92 –45 2.02 2.24 2.45 2.61Estonia 409 411 413 414 0.04 2 2 1 2.32 2.27 2.27 2.27Faroe Islands . . . . . . . . . . . . . . . . . . . . . . . . . . . . . . . . . . . .Finland 2,029 2,139 2,255 2,316 0.53 110 116 60 2.10 2.10 2.08 2.09France 18,162 23,266 29,806 33,735 2.48 5,105 6,539 3,930 2.50 2.30 1.98 1.86Germany 28,653 30,376 32,202 33,157 0.58 1,723 1,827 954 2.10 2.00 1.89 1.86Gibraltar . . . . . . . . . . . . . . . . . . . . . . . . . . . . . . . . . . . .Greece 2,408 2,662 2,944 3,096 1.01 255 282 152 2.73 2.61 2.51 2.54Holy See . . . . . . . . . . . . . . . . . . . . . . . . . . . . . . . . . . . .Hungary . . . 2,750 . . . . . . . . . . . . . . . . . . . . . 2.50 . . . . . .Iceland 103 125 151 166 1.88 21 26 15 2.51 2.40 2.25 2.25
continued . . .
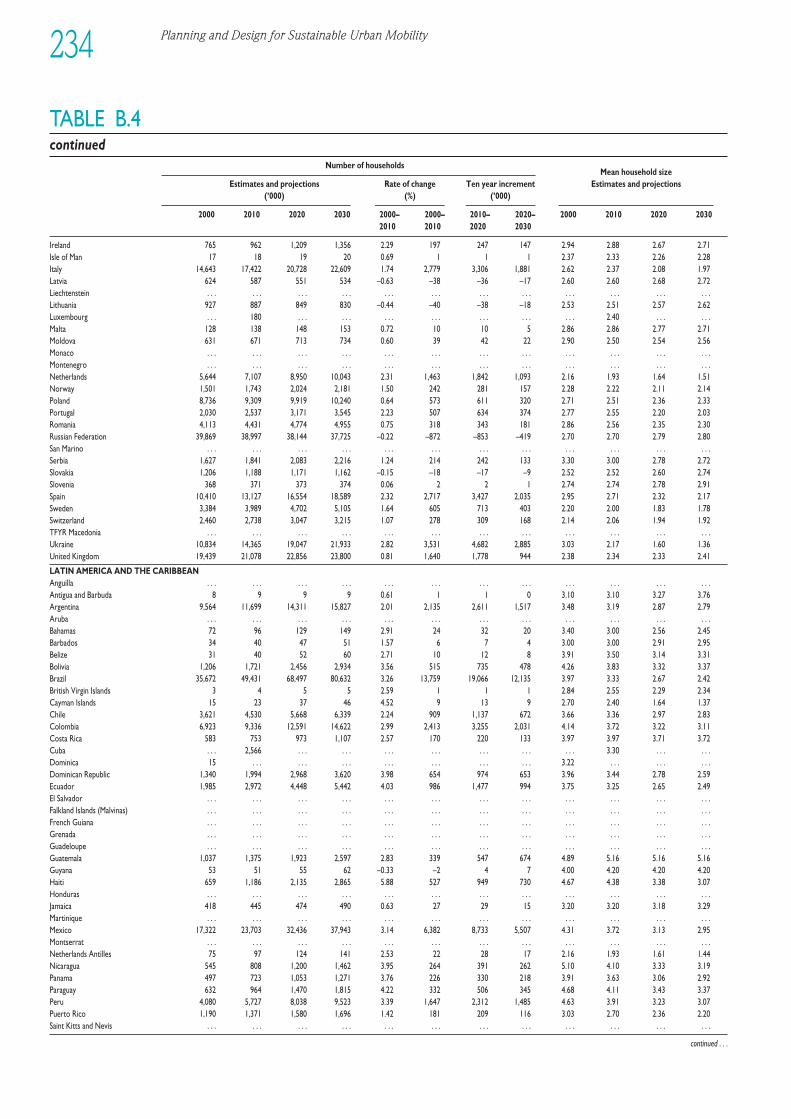
Planning and Design for Sustainable Urban Mobility234
TABLE B.4continued
Number of householdsMean household size
Estimates and projections Rate of change Ten year increment Estimates and projections(’000) (%) (’000)
2000 2010 2020 2030 2000– 2000– 2010– 2020– 2000 2010 2020 20302010 2010 2020 2030
Ireland 765 962 1,209 1,356 2.29 197 247 147 2.94 2.88 2.67 2.71Isle of Man 17 18 19 20 0.69 1 1 1 2.37 2.33 2.26 2.28Italy 14,643 17,422 20,728 22,609 1.74 2,779 3,306 1,881 2.62 2.37 2.08 1.97Latvia 624 587 551 534 –0.63 –38 –36 –17 2.60 2.60 2.68 2.72Liechtenstein . . . . . . . . . . . . . . . . . . . . . . . . . . . . . . . . . . . .Lithuania 927 887 849 830 –0.44 –40 –38 –18 2.53 2.51 2.57 2.62Luxembourg . . . 180 . . . . . . . . . . . . . . . . . . . . . 2.40 . . . . . .Malta 128 138 148 153 0.72 10 10 5 2.86 2.86 2.77 2.71Moldova 631 671 713 734 0.60 39 42 22 2.90 2.50 2.54 2.56Monaco . . . . . . . . . . . . . . . . . . . . . . . . . . . . . . . . . . . .Montenegro . . . . . . . . . . . . . . . . . . . . . . . . . . . . . . . . . . . .Netherlands 5,644 7,107 8,950 10,043 2.31 1,463 1,842 1,093 2.16 1.93 1.64 1.51Norway 1,501 1,743 2,024 2,181 1.50 242 281 157 2.28 2.22 2.11 2.14Poland 8,736 9,309 9,919 10,240 0.64 573 611 320 2.71 2.51 2.36 2.33Portugal 2,030 2,537 3,171 3,545 2.23 507 634 374 2.77 2.55 2.20 2.03Romania 4,113 4,431 4,774 4,955 0.75 318 343 181 2.86 2.56 2.35 2.30Russian Federation 39,869 38,997 38,144 37,725 –0.22 –872 –853 –419 2.70 2.70 2.79 2.80San Marino . . . . . . . . . . . . . . . . . . . . . . . . . . . . . . . . . . . .Serbia 1,627 1,841 2,083 2,216 1.24 214 242 133 3.30 3.00 2.78 2.72Slovakia 1,206 1,188 1,171 1,162 –0.15 –18 –17 –9 2.52 2.52 2.60 2.74Slovenia 368 371 373 374 0.06 2 2 1 2.74 2.74 2.78 2.91Spain 10,410 13,127 16,554 18,589 2.32 2,717 3,427 2,035 2.95 2.71 2.32 2.17Sweden 3,384 3,989 4,702 5,105 1.64 605 713 403 2.20 2.00 1.83 1.78Switzerland 2,460 2,738 3,047 3,215 1.07 278 309 168 2.14 2.06 1.94 1.92TFYR Macedonia . . . . . . . . . . . . . . . . . . . . . . . . . . . . . . . . . . . .Ukraine 10,834 14,365 19,047 21,933 2.82 3,531 4,682 2,885 3.03 2.17 1.60 1.36United Kingdom 19,439 21,078 22,856 23,800 0.81 1,640 1,778 944 2.38 2.34 2.33 2.41
LATIN AMERICA AND THE CARIBBEANAnguilla . . . . . . . . . . . . . . . . . . . . . . . . . . . . . . . . . . . .Antigua and Barbuda 8 9 9 9 0.61 1 1 0 3.10 3.10 3.27 3.76Argentina 9,564 11,699 14,311 15,827 2.01 2,135 2,611 1,517 3.48 3.19 2.87 2.79Aruba . . . . . . . . . . . . . . . . . . . . . . . . . . . . . . . . . . . .Bahamas 72 96 129 149 2.91 24 32 20 3.40 3.00 2.56 2.45Barbados 34 40 47 51 1.57 6 7 4 3.00 3.00 2.91 2.95Belize 31 40 52 60 2.71 10 12 8 3.91 3.50 3.14 3.31Bolivia 1,206 1,721 2,456 2,934 3.56 515 735 478 4.26 3.83 3.32 3.37Brazil 35,672 49,431 68,497 80,632 3.26 13,759 19,066 12,135 3.97 3.33 2.67 2.42British Virgin Islands 3 4 5 5 2.59 1 1 1 2.84 2.55 2.29 2.34Cayman Islands 15 23 37 46 4.52 9 13 9 2.70 2.40 1.64 1.37Chile 3,621 4,530 5,668 6,339 2.24 909 1,137 672 3.66 3.36 2.97 2.83Colombia 6,923 9,336 12,591 14,622 2.99 2,413 3,255 2,031 4.14 3.72 3.22 3.11Costa Rica 583 753 973 1,107 2.57 170 220 133 3.97 3.97 3.71 3.72Cuba . . . 2,566 . . . . . . . . . . . . . . . . . . . . . 3.30 . . . . . .Dominica 15 . . . . . . . . . . . . . . . . . . . . . 3.22 . . . . . . . . .Dominican Republic 1,340 1,994 2,968 3,620 3.98 654 974 653 3.96 3.44 2.78 2.59Ecuador 1,985 2,972 4,448 5,442 4.03 986 1,477 994 3.75 3.25 2.65 2.49El Salvador . . . . . . . . . . . . . . . . . . . . . . . . . . . . . . . . . . . .Falkland Islands (Malvinas) . . . . . . . . . . . . . . . . . . . . . . . . . . . . . . . . . . . .French Guiana . . . . . . . . . . . . . . . . . . . . . . . . . . . . . . . . . . . .Grenada . . . . . . . . . . . . . . . . . . . . . . . . . . . . . . . . . . . .Guadeloupe . . . . . . . . . . . . . . . . . . . . . . . . . . . . . . . . . . . .Guatemala 1,037 1,375 1,923 2,597 2.83 339 547 674 4.89 5.16 5.16 5.16Guyana 53 51 55 62 –0.33 –2 4 7 4.00 4.20 4.20 4.20Haiti 659 1,186 2,135 2,865 5.88 527 949 730 4.67 4.38 3.38 3.07Honduras . . . . . . . . . . . . . . . . . . . . . . . . . . . . . . . . . . . .Jamaica 418 445 474 490 0.63 27 29 15 3.20 3.20 3.18 3.29Martinique . . . . . . . . . . . . . . . . . . . . . . . . . . . . . . . . . . . .Mexico 17,322 23,703 32,436 37,943 3.14 6,382 8,733 5,507 4.31 3.72 3.13 2.95Montserrat . . . . . . . . . . . . . . . . . . . . . . . . . . . . . . . . . . . .Netherlands Antilles 75 97 124 141 2.53 22 28 17 2.16 1.93 1.61 1.44Nicaragua 545 808 1,200 1,462 3.95 264 391 262 5.10 4.10 3.33 3.19Panama 497 723 1,053 1,271 3.76 226 330 218 3.91 3.63 3.06 2.92Paraguay 632 964 1,470 1,815 4.22 332 506 345 4.68 4.11 3.43 3.37Peru 4,080 5,727 8,038 9,523 3.39 1,647 2,312 1,485 4.63 3.91 3.23 3.07Puerto Rico 1,190 1,371 1,580 1,696 1.42 181 209 116 3.03 2.70 2.36 2.20Saint Kitts and Nevis . . . . . . . . . . . . . . . . . . . . . . . . . . . . . . . . . . . .
continued . . .
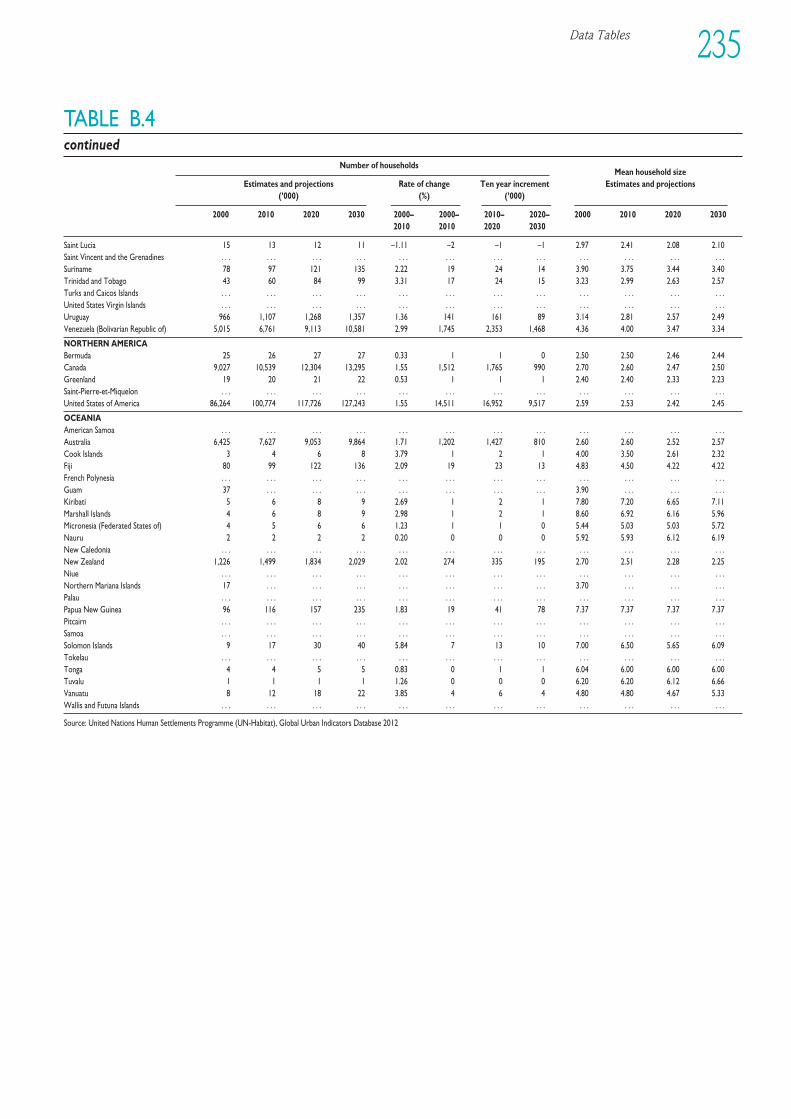
Data Tables 235
TABLE B.4continued
Number of householdsMean household size
Estimates and projections Rate of change Ten year increment Estimates and projections(’000) (%) (’000)
2000 2010 2020 2030 2000– 2000– 2010– 2020– 2000 2010 2020 20302010 2010 2020 2030
Saint Lucia 15 13 12 11 –1.11 –2 –1 –1 2.97 2.41 2.08 2.10Saint Vincent and the Grenadines . . . . . . . . . . . . . . . . . . . . . . . . . . . . . . . . . . . .Suriname 78 97 121 135 2.22 19 24 14 3.90 3.75 3.44 3.40Trinidad and Tobago 43 60 84 99 3.31 17 24 15 3.23 2.99 2.63 2.57Turks and Caicos Islands . . . . . . . . . . . . . . . . . . . . . . . . . . . . . . . . . . . .United States Virgin Islands . . . . . . . . . . . . . . . . . . . . . . . . . . . . . . . . . . . .Uruguay 966 1,107 1,268 1,357 1.36 141 161 89 3.14 2.81 2.57 2.49Venezuela (Bolivarian Republic of) 5,015 6,761 9,113 10,581 2.99 1,745 2,353 1,468 4.36 4.00 3.47 3.34
NORTHERN AMERICABermuda 25 26 27 27 0.33 1 1 0 2.50 2.50 2.46 2.44Canada 9,027 10,539 12,304 13,295 1.55 1,512 1,765 990 2.70 2.60 2.47 2.50Greenland 19 20 21 22 0.53 1 1 1 2.40 2.40 2.33 2.23Saint-Pierre-et-Miquelon . . . . . . . . . . . . . . . . . . . . . . . . . . . . . . . . . . . .United States of America 86,264 100,774 117,726 127,243 1.55 14,511 16,952 9,517 2.59 2.53 2.42 2.45
OCEANIAAmerican Samoa . . . . . . . . . . . . . . . . . . . . . . . . . . . . . . . . . . . .Australia 6,425 7,627 9,053 9,864 1.71 1,202 1,427 810 2.60 2.60 2.52 2.57Cook Islands 3 4 6 8 3.79 1 2 1 4.00 3.50 2.61 2.32Fiji 80 99 122 136 2.09 19 23 13 4.83 4.50 4.22 4.22French Polynesia . . . . . . . . . . . . . . . . . . . . . . . . . . . . . . . . . . . .Guam 37 . . . . . . . . . . . . . . . . . . . . . 3.90 . . . . . . . . .Kiribati 5 6 8 9 2.69 1 2 1 7.80 7.20 6.65 7.11Marshall Islands 4 6 8 9 2.98 1 2 1 8.60 6.92 6.16 5.96Micronesia (Federated States of) 4 5 6 6 1.23 1 1 0 5.44 5.03 5.03 5.72Nauru 2 2 2 2 0.20 0 0 0 5.92 5.93 6.12 6.19New Caledonia . . . . . . . . . . . . . . . . . . . . . . . . . . . . . . . . . . . .New Zealand 1,226 1,499 1,834 2,029 2.02 274 335 195 2.70 2.51 2.28 2.25Niue . . . . . . . . . . . . . . . . . . . . . . . . . . . . . . . . . . . .Northern Mariana Islands 17 . . . . . . . . . . . . . . . . . . . . . 3.70 . . . . . . . . .Palau . . . . . . . . . . . . . . . . . . . . . . . . . . . . . . . . . . . .Papua New Guinea 96 116 157 235 1.83 19 41 78 7.37 7.37 7.37 7.37Pitcairn . . . . . . . . . . . . . . . . . . . . . . . . . . . . . . . . . . . .Samoa . . . . . . . . . . . . . . . . . . . . . . . . . . . . . . . . . . . .Solomon Islands 9 17 30 40 5.84 7 13 10 7.00 6.50 5.65 6.09Tokelau . . . . . . . . . . . . . . . . . . . . . . . . . . . . . . . . . . . .Tonga 4 4 5 5 0.83 0 1 1 6.04 6.00 6.00 6.00Tuvalu 1 1 1 1 1.26 0 0 0 6.20 6.20 6.12 6.66Vanuatu 8 12 18 22 3.85 4 6 4 4.80 4.80 4.67 5.33Wallis and Futuna Islands . . . . . . . . . . . . . . . . . . . . . . . . . . . . . . . . . . . .
Source: United Nations Human Settlements Programme (UN-Habitat), Global Urban Indicators Database 2012
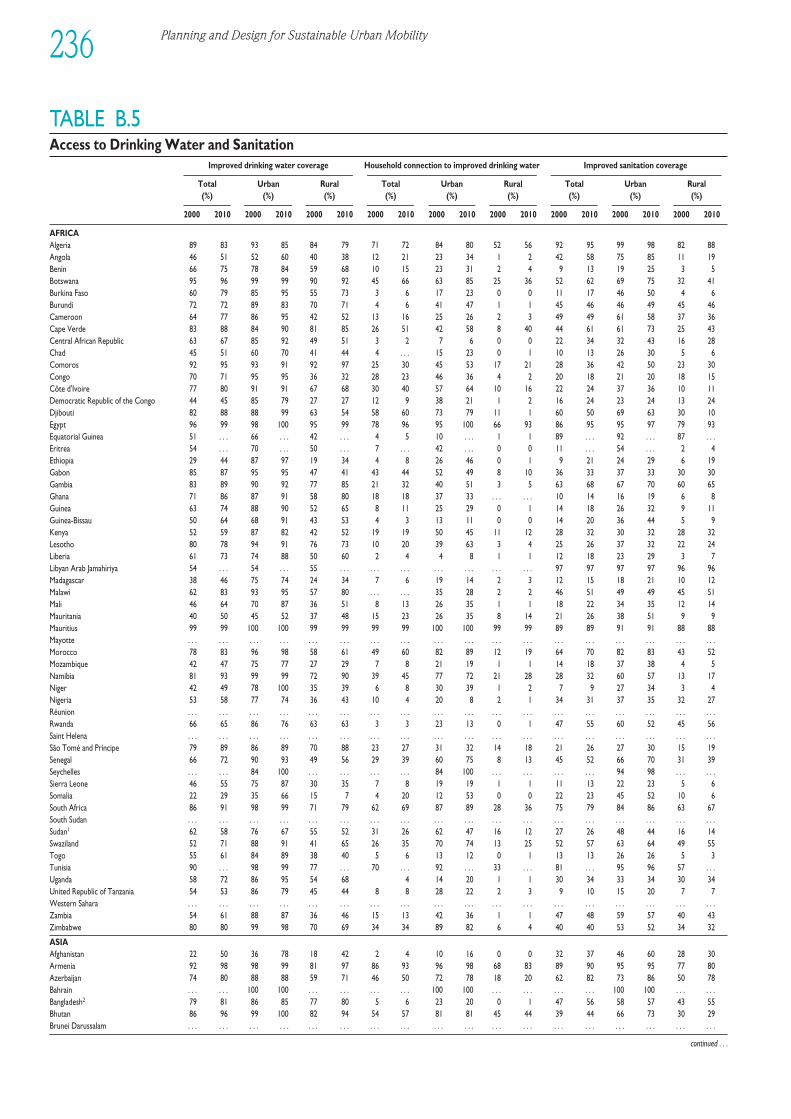
TABLE B.5Access to Drinking Water and Sanitation
Improved drinking water coverage Household connection to improved drinking water Improved sanitation coverage
Total Urban Rural Total Urban Rural Total Urban Rural (%) (%) (%) (%) (%) (%) (%) (%) (%)
2000 2010 2000 2010 2000 2010 2000 2010 2000 2010 2000 2010 2000 2010 2000 2010 2000 2010
AFRICAAlgeria 89 83 93 85 84 79 71 72 84 80 52 56 92 95 99 98 82 88Angola 46 51 52 60 40 38 12 21 23 34 1 2 42 58 75 85 11 19Benin 66 75 78 84 59 68 10 15 23 31 2 4 9 13 19 25 3 5Botswana 95 96 99 99 90 92 45 66 63 85 25 36 52 62 69 75 32 41Burkina Faso 60 79 85 95 55 73 3 6 17 23 0 0 11 17 46 50 4 6Burundi 72 72 89 83 70 71 4 6 41 47 1 1 45 46 46 49 45 46Cameroon 64 77 86 95 42 52 13 16 25 26 2 3 49 49 61 58 37 36Cape Verde 83 88 84 90 81 85 26 51 42 58 8 40 44 61 61 73 25 43Central African Republic 63 67 85 92 49 51 3 2 7 6 0 0 22 34 32 43 16 28Chad 45 51 60 70 41 44 4 . . . 15 23 0 1 10 13 26 30 5 6Comoros 92 95 93 91 92 97 25 30 45 53 17 21 28 36 42 50 23 30Congo 70 71 95 95 36 32 28 23 46 36 4 2 20 18 21 20 18 15Côte d'Ivoire 77 80 91 91 67 68 30 40 57 64 10 16 22 24 37 36 10 11Democratic Republic of the Congo 44 45 85 79 27 27 12 9 38 21 1 2 16 24 23 24 13 24Djibouti 82 88 88 99 63 54 58 60 73 79 11 1 60 50 69 63 30 10Egypt 96 99 98 100 95 99 78 96 95 100 66 93 86 95 95 97 79 93Equatorial Guinea 51 . . . 66 . . . 42 . . . 4 5 10 . . . 1 1 89 . . . 92 . . . 87 . . .Eritrea 54 . . . 70 . . . 50 . . . 7 . . . 42 . . . 0 0 11 . . . 54 . . . 2 4Ethiopia 29 44 87 97 19 34 4 8 26 46 0 1 9 21 24 29 6 19Gabon 85 87 95 95 47 41 43 44 52 49 8 10 36 33 37 33 30 30Gambia 83 89 90 92 77 85 21 32 40 51 3 5 63 68 67 70 60 65Ghana 71 86 87 91 58 80 18 18 37 33 . . . . . . 10 14 16 19 6 8Guinea 63 74 88 90 52 65 8 11 25 29 0 1 14 18 26 32 9 11Guinea-Bissau 50 64 68 91 43 53 4 3 13 11 0 0 14 20 36 44 5 9Kenya 52 59 87 82 42 52 19 19 50 45 11 12 28 32 30 32 28 32Lesotho 80 78 94 91 76 73 10 20 39 63 3 4 25 26 37 32 22 24Liberia 61 73 74 88 50 60 2 4 4 8 1 1 12 18 23 29 3 7Libyan Arab Jamahiriya 54 . . . 54 . . . 55 . . . . . . . . . . . . . . . . . . . . . 97 97 97 97 96 96Madagascar 38 46 75 74 24 34 7 6 19 14 2 3 12 15 18 21 10 12Malawi 62 83 93 95 57 80 . . . . . . 35 28 2 2 46 51 49 49 45 51Mali 46 64 70 87 36 51 8 13 26 35 1 1 18 22 34 35 12 14Mauritania 40 50 45 52 37 48 15 23 26 35 8 14 21 26 38 51 9 9Mauritius 99 99 100 100 99 99 99 99 100 100 99 99 89 89 91 91 88 88Mayotte . . . . . . . . . . . . . . . . . . . . . . . . . . . . . . . . . . . . . . . . . . . . . . . . . . . . . .Morocco 78 83 96 98 58 61 49 60 82 89 12 19 64 70 82 83 43 52Mozambique 42 47 75 77 27 29 7 8 21 19 1 1 14 18 37 38 4 5Namibia 81 93 99 99 72 90 39 45 77 72 21 28 28 32 60 57 13 17Niger 42 49 78 100 35 39 6 8 30 39 1 2 7 9 27 34 3 4Nigeria 53 58 77 74 36 43 10 4 20 8 2 1 34 31 37 35 32 27Réunion . . . . . . . . . . . . . . . . . . . . . . . . . . . . . . . . . . . . . . . . . . . . . . . . . . . . . .Rwanda 66 65 86 76 63 63 3 3 23 13 0 1 47 55 60 52 45 56Saint Helena . . . . . . . . . . . . . . . . . . . . . . . . . . . . . . . . . . . . . . . . . . . . . . . . . . . . . .São Tomé and Príncipe 79 89 86 89 70 88 23 27 31 32 14 18 21 26 27 30 15 19Senegal 66 72 90 93 49 56 29 39 60 75 8 13 45 52 66 70 31 39Seychelles . . . . . . 84 100 . . . . . . . . . . . . 84 100 . . . . . . . . . . . . 94 98 . . . . . .Sierra Leone 46 55 75 87 30 35 7 8 19 19 1 1 11 13 22 23 5 6Somalia 22 29 35 66 15 7 4 20 12 53 0 0 22 23 45 52 10 6South Africa 86 91 98 99 71 79 62 69 87 89 28 36 75 79 84 86 63 67South Sudan . . . . . . . . . . . . . . . . . . . . . . . . . . . . . . . . . . . . . . . . . . . . . . . . . . . . . .Sudan1 62 58 76 67 55 52 31 26 62 47 16 12 27 26 48 44 16 14Swaziland 52 71 88 91 41 65 26 35 70 74 13 25 52 57 63 64 49 55Togo 55 61 84 89 38 40 5 6 13 12 0 1 13 13 26 26 5 3Tunisia 90 . . . 98 99 77 . . . 70 . . . 92 . . . 33 . . . 81 . . . 95 96 57 . . .Uganda 58 72 86 95 54 68 4 14 20 1 1 30 34 33 34 30 34United Republic of Tanzania 54 53 86 79 45 44 8 8 28 22 2 3 9 10 15 20 7 7Western Sahara . . . . . . . . . . . . . . . . . . . . . . . . . . . . . . . . . . . . . . . . . . . . . . . . . . . . . .Zambia 54 61 88 87 36 46 15 13 42 36 1 1 47 48 59 57 40 43Zimbabwe 80 80 99 98 70 69 34 34 89 82 6 4 40 40 53 52 34 32
ASIAAfghanistan 22 50 36 78 18 42 2 4 10 16 0 0 32 37 46 60 28 30Armenia 92 98 98 99 81 97 86 93 96 98 68 83 89 90 95 95 77 80Azerbaijan 74 80 88 88 59 71 46 50 72 78 18 20 62 82 73 86 50 78Bahrain . . . . . . 100 100 . . . . . . . . . . . . 100 100 . . . . . . . . . . . . 100 100 . . . . . .Bangladesh2 79 81 86 85 77 80 5 6 23 20 0 1 47 56 58 57 43 55Bhutan 86 96 99 100 82 94 54 57 81 81 45 44 39 44 66 73 30 29Brunei Darussalam . . . . . . . . . . . . . . . . . . . . . . . . . . . . . . . . . . . . . . . . . . . . . . . . . . . . . .
continued . . .
Planning and Design for Sustainable Urban Mobility236
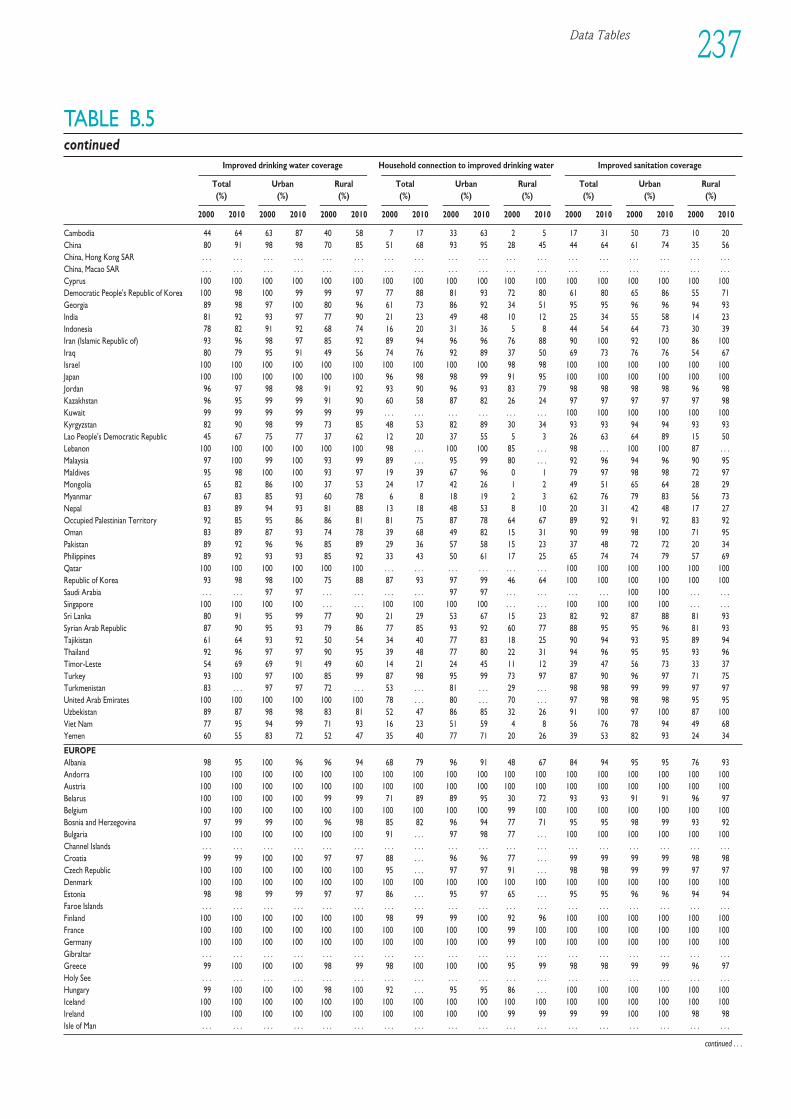
Data Tables 237
TABLE B.5continued
Improved drinking water coverage Household connection to improved drinking water Improved sanitation coverage
Total Urban Rural Total Urban Rural Total Urban Rural (%) (%) (%) (%) (%) (%) (%) (%) (%)
2000 2010 2000 2010 2000 2010 2000 2010 2000 2010 2000 2010 2000 2010 2000 2010 2000 2010
Cambodia 44 64 63 87 40 58 7 17 33 63 2 5 17 31 50 73 10 20China 80 91 98 98 70 85 51 68 93 95 28 45 44 64 61 74 35 56China, Hong Kong SAR . . . . . . . . . . . . . . . . . . . . . . . . . . . . . . . . . . . . . . . . . . . . . . . . . . . . . .China, Macao SAR . . . . . . . . . . . . . . . . . . . . . . . . . . . . . . . . . . . . . . . . . . . . . . . . . . . . . .Cyprus 100 100 100 100 100 100 100 100 100 100 100 100 100 100 100 100 100 100Democratic People's Republic of Korea 100 98 100 99 99 97 77 88 81 93 72 80 61 80 65 86 55 71Georgia 89 98 97 100 80 96 61 73 86 92 34 51 95 95 96 96 94 93India 81 92 93 97 77 90 21 23 49 48 10 12 25 34 55 58 14 23Indonesia 78 82 91 92 68 74 16 20 31 36 5 8 44 54 64 73 30 39Iran (Islamic Republic of) 93 96 98 97 85 92 89 94 96 96 76 88 90 100 92 100 86 100Iraq 80 79 95 91 49 56 74 76 92 89 37 50 69 73 76 76 54 67Israel 100 100 100 100 100 100 100 100 100 100 98 98 100 100 100 100 100 100Japan 100 100 100 100 100 100 96 98 98 99 91 95 100 100 100 100 100 100Jordan 96 97 98 98 91 92 93 90 96 93 83 79 98 98 98 98 96 98Kazakhstan 96 95 99 99 91 90 60 58 87 82 26 24 97 97 97 97 97 98Kuwait 99 99 99 99 99 99 . . . . . . . . . . . . . . . . . . 100 100 100 100 100 100Kyrgyzstan 82 90 98 99 73 85 48 53 82 89 30 34 93 93 94 94 93 93Lao People's Democratic Republic 45 67 75 77 37 62 12 20 37 55 5 3 26 63 64 89 15 50Lebanon 100 100 100 100 100 100 98 . . . 100 100 85 . . . 98 . . . 100 100 87 . . .Malaysia 97 100 99 100 93 99 89 . . . 95 99 80 . . . 92 96 94 96 90 95Maldives 95 98 100 100 93 97 19 39 67 96 0 1 79 97 98 98 72 97Mongolia 65 82 86 100 37 53 24 17 42 26 1 2 49 51 65 64 28 29Myanmar 67 83 85 93 60 78 6 8 18 19 2 3 62 76 79 83 56 73Nepal 83 89 94 93 81 88 13 18 48 53 8 10 20 31 42 48 17 27Occupied Palestinian Territory 92 85 95 86 86 81 81 75 87 78 64 67 89 92 91 92 83 92Oman 83 89 87 93 74 78 39 68 49 82 15 31 90 99 98 100 71 95Pakistan 89 92 96 96 85 89 29 36 57 58 15 23 37 48 72 72 20 34Philippines 89 92 93 93 85 92 33 43 50 61 17 25 65 74 74 79 57 69Qatar 100 100 100 100 100 100 . . . . . . . . . . . . . . . . . . 100 100 100 100 100 100Republic of Korea 93 98 98 100 75 88 87 93 97 99 46 64 100 100 100 100 100 100Saudi Arabia . . . . . . 97 97 . . . . . . . . . . . . 97 97 . . . . . . . . . . . . 100 100 . . . . . .Singapore 100 100 100 100 . . . . . . 100 100 100 100 . . . . . . 100 100 100 100 . . . . . .Sri Lanka 80 91 95 99 77 90 21 29 53 67 15 23 82 92 87 88 81 93Syrian Arab Republic 87 90 95 93 79 86 77 85 93 92 60 77 88 95 95 96 81 93Tajikistan 61 64 93 92 50 54 34 40 77 83 18 25 90 94 93 95 89 94Thailand 92 96 97 97 90 95 39 48 77 80 22 31 94 96 95 95 93 96Timor-Leste 54 69 69 91 49 60 14 21 24 45 11 12 39 47 56 73 33 37Turkey 93 100 97 100 85 99 87 98 95 99 73 97 87 90 96 97 71 75Turkmenistan 83 . . . 97 97 72 . . . 53 . . . 81 . . . 29 . . . 98 98 99 99 97 97United Arab Emirates 100 100 100 100 100 100 78 . . . 80 . . . 70 . . . 97 98 98 98 95 95Uzbekistan 89 87 98 98 83 81 52 47 86 85 32 26 91 100 97 100 87 100Viet Nam 77 95 94 99 71 93 16 23 51 59 4 8 56 76 78 94 49 68Yemen 60 55 83 72 52 47 35 40 77 71 20 26 39 53 82 93 24 34
EUROPEAlbania 98 95 100 96 96 94 68 79 96 91 48 67 84 94 95 95 76 93Andorra 100 100 100 100 100 100 100 100 100 100 100 100 100 100 100 100 100 100Austria 100 100 100 100 100 100 100 100 100 100 100 100 100 100 100 100 100 100Belarus 100 100 100 100 99 99 71 89 89 95 30 72 93 93 91 91 96 97Belgium 100 100 100 100 100 100 100 100 100 100 99 100 100 100 100 100 100 100Bosnia and Herzegovina 97 99 99 100 96 98 85 82 96 94 77 71 95 95 98 99 93 92Bulgaria 100 100 100 100 100 100 91 . . . 97 98 77 . . . 100 100 100 100 100 100Channel Islands . . . . . . . . . . . . . . . . . . . . . . . . . . . . . . . . . . . . . . . . . . . . . . . . . . . . . .Croatia 99 99 100 100 97 97 88 . . . 96 96 77 . . . 99 99 99 99 98 98Czech Republic 100 100 100 100 100 100 95 . . . 97 97 91 . . . 98 98 99 99 97 97Denmark 100 100 100 100 100 100 100 100 100 100 100 100 100 100 100 100 100 100Estonia 98 98 99 99 97 97 86 . . . 95 97 65 . . . 95 95 96 96 94 94Faroe Islands . . . . . . . . . . . . . . . . . . . . . . . . . . . . . . . . . . . . . . . . . . . . . . . . . . . . . .Finland 100 100 100 100 100 100 98 99 99 100 92 96 100 100 100 100 100 100France 100 100 100 100 100 100 100 100 100 100 99 100 100 100 100 100 100 100Germany 100 100 100 100 100 100 100 100 100 100 99 100 100 100 100 100 100 100Gibraltar . . . . . . . . . . . . . . . . . . . . . . . . . . . . . . . . . . . . . . . . . . . . . . . . . . . . . .Greece 99 100 100 100 98 99 98 100 100 100 95 99 98 98 99 99 96 97Holy See . . . . . . . . . . . . . . . . . . . . . . . . . . . . . . . . . . . . . . . . . . . . . . . . . . . . . .Hungary 99 100 100 100 98 100 92 . . . 95 95 86 . . . 100 100 100 100 100 100Iceland 100 100 100 100 100 100 100 100 100 100 100 100 100 100 100 100 100 100Ireland 100 100 100 100 100 100 100 100 100 100 99 99 99 99 100 100 98 98Isle of Man . . . . . . . . . . . . . . . . . . . . . . . . . . . . . . . . . . . . . . . . . . . . . . . . . . . . . .
continued . . .
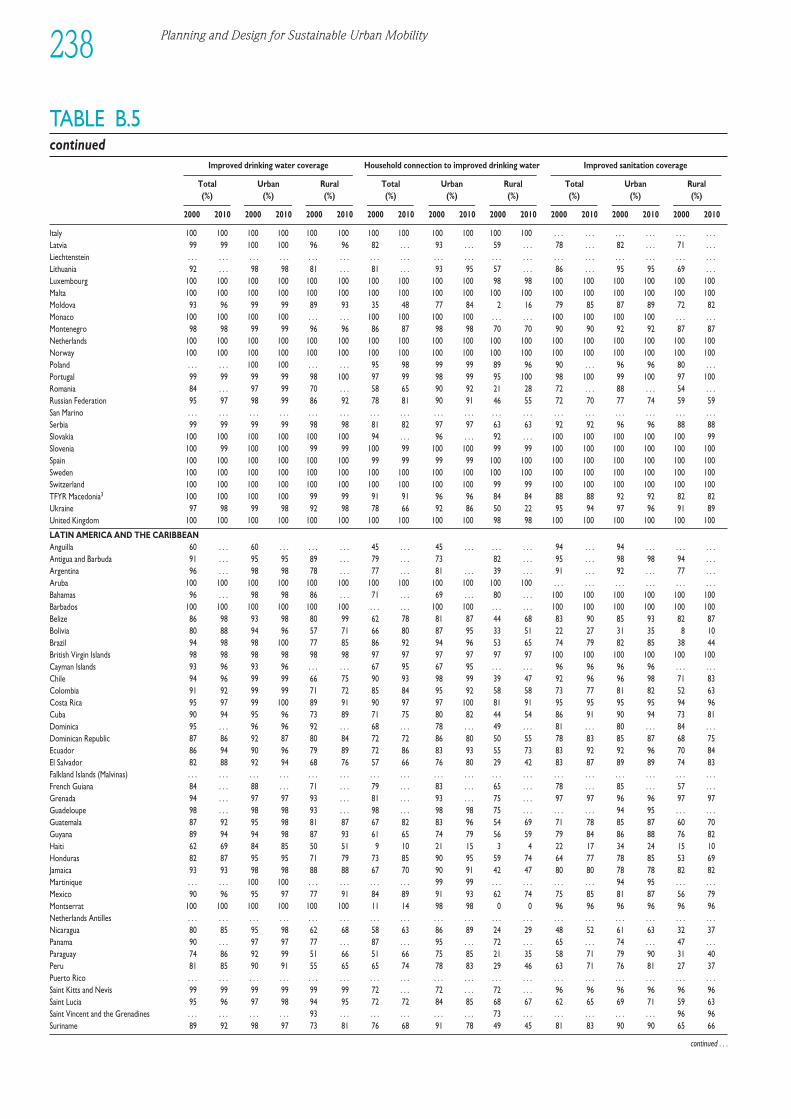
Planning and Design for Sustainable Urban Mobility238
TABLE B.5continued
Improved drinking water coverage Household connection to improved drinking water Improved sanitation coverage
Total Urban Rural Total Urban Rural Total Urban Rural (%) (%) (%) (%) (%) (%) (%) (%) (%)
2000 2010 2000 2010 2000 2010 2000 2010 2000 2010 2000 2010 2000 2010 2000 2010 2000 2010
Italy 100 100 100 100 100 100 100 100 100 100 100 100 . . . . . . . . . . . . . . . . . .Latvia 99 99 100 100 96 96 82 . . . 93 . . . 59 . . . 78 . . . 82 . . . 71 . . .Liechtenstein . . . . . . . . . . . . . . . . . . . . . . . . . . . . . . . . . . . . . . . . . . . . . . . . . . . . . .Lithuania 92 . . . 98 98 81 . . . 81 . . . 93 95 57 . . . 86 . . . 95 95 69 . . .Luxembourg 100 100 100 100 100 100 100 100 100 100 98 98 100 100 100 100 100 100Malta 100 100 100 100 100 100 100 100 100 100 100 100 100 100 100 100 100 100Moldova 93 96 99 99 89 93 35 48 77 84 2 16 79 85 87 89 72 82Monaco 100 100 100 100 . . . . . . 100 100 100 100 . . . . . . 100 100 100 100 . . . . . .Montenegro 98 98 99 99 96 96 86 87 98 98 70 70 90 90 92 92 87 87Netherlands 100 100 100 100 100 100 100 100 100 100 100 100 100 100 100 100 100 100Norway 100 100 100 100 100 100 100 100 100 100 100 100 100 100 100 100 100 100Poland . . . . . . 100 100 . . . . . . 95 98 99 99 89 96 90 . . . 96 96 80 . . .Portugal 99 99 99 99 98 100 97 99 98 99 95 100 98 100 99 100 97 100Romania 84 . . . 97 99 70 . . . 58 65 90 92 21 28 72 . . . 88 . . . 54 . . .Russian Federation 95 97 98 99 86 92 78 81 90 91 46 55 72 70 77 74 59 59San Marino . . . . . . . . . . . . . . . . . . . . . . . . . . . . . . . . . . . . . . . . . . . . . . . . . . . . . .Serbia 99 99 99 99 98 98 81 82 97 97 63 63 92 92 96 96 88 88Slovakia 100 100 100 100 100 100 94 . . . 96 . . . 92 . . . 100 100 100 100 100 99Slovenia 100 99 100 100 99 99 100 99 100 100 99 99 100 100 100 100 100 100Spain 100 100 100 100 100 100 99 99 99 99 100 100 100 100 100 100 100 100Sweden 100 100 100 100 100 100 100 100 100 100 100 100 100 100 100 100 100 100Switzerland 100 100 100 100 100 100 100 100 100 100 99 99 100 100 100 100 100 100TFYR Macedonia3 100 100 100 100 99 99 91 91 96 96 84 84 88 88 92 92 82 82Ukraine 97 98 99 98 92 98 78 66 92 86 50 22 95 94 97 96 91 89United Kingdom 100 100 100 100 100 100 100 100 100 100 98 98 100 100 100 100 100 100
LATIN AMERICA AND THE CARIBBEANAnguilla 60 . . . 60 . . . . . . . . . 45 . . . 45 . . . . . . . . . 94 . . . 94 . . . . . . . . .Antigua and Barbuda 91 . . . 95 95 89 . . . 79 . . . 73 82 . . . 95 . . . 98 98 94 . . .Argentina 96 . . . 98 98 78 . . . 77 . . . 81 . . . 39 . . . 91 . . . 92 . . . 77 . . .Aruba 100 100 100 100 100 100 100 100 100 100 100 100 . . . . . . . . . . . . . . . . . .Bahamas 96 . . . 98 98 86 . . . 71 . . . 69 . . . 80 . . . 100 100 100 100 100 100Barbados 100 100 100 100 100 100 . . . . . . 100 100 . . . . . . 100 100 100 100 100 100Belize 86 98 93 98 80 99 62 78 81 87 44 68 83 90 85 93 82 87Bolivia 80 88 94 96 57 71 66 80 87 95 33 51 22 27 31 35 8 10Brazil 94 98 98 100 77 85 86 92 94 96 53 65 74 79 82 85 38 44British Virgin Islands 98 98 98 98 98 98 97 97 97 97 97 97 100 100 100 100 100 100Cayman Islands 93 96 93 96 . . . . . . 67 95 67 95 . . . . . . 96 96 96 96 . . . . . .Chile 94 96 99 99 66 75 90 93 98 99 39 47 92 96 96 98 71 83Colombia 91 92 99 99 71 72 85 84 95 92 58 58 73 77 81 82 52 63Costa Rica 95 97 99 100 89 91 90 97 97 100 81 91 95 95 95 95 94 96Cuba 90 94 95 96 73 89 71 75 80 82 44 54 86 91 90 94 73 81Dominica 95 . . . 96 96 92 . . . 68 . . . 78 . . . 49 . . . 81 . . . 80 . . . 84 . . .Dominican Republic 87 86 92 87 80 84 72 72 86 80 50 55 78 83 85 87 68 75Ecuador 86 94 90 96 79 89 72 86 83 93 55 73 83 92 92 96 70 84El Salvador 82 88 92 94 68 76 57 66 76 80 29 42 83 87 89 89 74 83Falkland Islands (Malvinas) . . . . . . . . . . . . . . . . . . . . . . . . . . . . . . . . . . . . . . . . . . . . . . . . . . . . . .French Guiana 84 . . . 88 . . . 71 . . . 79 . . . 83 . . . 65 . . . 78 . . . 85 . . . 57 . . .Grenada 94 . . . 97 97 93 . . . 81 . . . 93 . . . 75 . . . 97 97 96 96 97 97Guadeloupe 98 . . . 98 98 93 . . . 98 . . . 98 98 75 . . . . . . . . . 94 95 . . . . . .Guatemala 87 92 95 98 81 87 67 82 83 96 54 69 71 78 85 87 60 70Guyana 89 94 94 98 87 93 61 65 74 79 56 59 79 84 86 88 76 82Haiti 62 69 84 85 50 51 9 10 21 15 3 4 22 17 34 24 15 10Honduras 82 87 95 95 71 79 73 85 90 95 59 74 64 77 78 85 53 69Jamaica 93 93 98 98 88 88 67 70 90 91 42 47 80 80 78 78 82 82Martinique . . . . . . 100 100 . . . . . . . . . . . . 99 99 . . . . . . . . . . . . 94 95 . . . . . .Mexico 90 96 95 97 77 91 84 89 91 93 62 74 75 85 81 87 56 79Montserrat 100 100 100 100 100 100 11 14 98 98 0 0 96 96 96 96 96 96Netherlands Antilles . . . . . . . . . . . . . . . . . . . . . . . . . . . . . . . . . . . . . . . . . . . . . . . . . . . . . .Nicaragua 80 85 95 98 62 68 58 63 86 89 24 29 48 52 61 63 32 37Panama 90 . . . 97 97 77 . . . 87 . . . 95 . . . 72 . . . 65 . . . 74 . . . 47 . . .Paraguay 74 86 92 99 51 66 51 66 75 85 21 35 58 71 79 90 31 40Peru 81 85 90 91 55 65 65 74 78 83 29 46 63 71 76 81 27 37Puerto Rico . . . . . . . . . . . . . . . . . . . . . . . . . . . . . . . . . . . . . . . . . . . . . . . . . . . . . .Saint Kitts and Nevis 99 99 99 99 99 99 72 . . . 72 . . . 72 . . . 96 96 96 96 96 96Saint Lucia 95 96 97 98 94 95 72 72 84 85 68 67 62 65 69 71 59 63Saint Vincent and the Grenadines . . . . . . . . . . . . 93 . . . . . . . . . . . . . . . 73 . . . . . . . . . . . . . . . 96 96Suriname 89 92 98 97 73 81 76 68 91 78 49 45 81 83 90 90 65 66
continued . . .
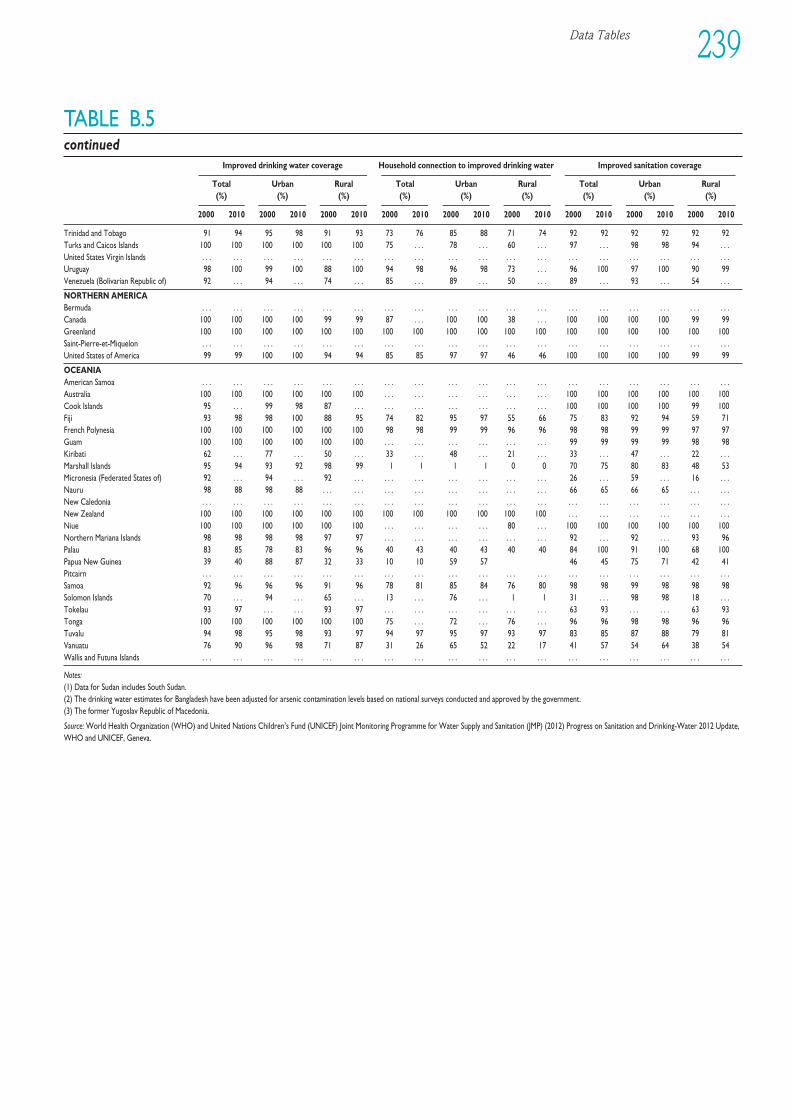
Data Tables 239
TABLE B.5continued
Improved drinking water coverage Household connection to improved drinking water Improved sanitation coverage
Total Urban Rural Total Urban Rural Total Urban Rural (%) (%) (%) (%) (%) (%) (%) (%) (%)
2000 2010 2000 2010 2000 2010 2000 2010 2000 2010 2000 2010 2000 2010 2000 2010 2000 2010
Trinidad and Tobago 91 94 95 98 91 93 73 76 85 88 71 74 92 92 92 92 92 92Turks and Caicos Islands 100 100 100 100 100 100 75 . . . 78 . . . 60 . . . 97 . . . 98 98 94 . . .United States Virgin Islands . . . . . . . . . . . . . . . . . . . . . . . . . . . . . . . . . . . . . . . . . . . . . . . . . . . . . .Uruguay 98 100 99 100 88 100 94 98 96 98 73 . . . 96 100 97 100 90 99Venezuela (Bolivarian Republic of) 92 . . . 94 . . . 74 . . . 85 . . . 89 . . . 50 . . . 89 . . . 93 . . . 54 . . .
NORTHERN AMERICABermuda . . . . . . . . . . . . . . . . . . . . . . . . . . . . . . . . . . . . . . . . . . . . . . . . . . . . . .Canada 100 100 100 100 99 99 87 . . . 100 100 38 . . . 100 100 100 100 99 99Greenland 100 100 100 100 100 100 100 100 100 100 100 100 100 100 100 100 100 100Saint-Pierre-et-Miquelon . . . . . . . . . . . . . . . . . . . . . . . . . . . . . . . . . . . . . . . . . . . . . . . . . . . . . .United States of America 99 99 100 100 94 94 85 85 97 97 46 46 100 100 100 100 99 99
OCEANIAAmerican Samoa . . . . . . . . . . . . . . . . . . . . . . . . . . . . . . . . . . . . . . . . . . . . . . . . . . . . . .Australia 100 100 100 100 100 100 . . . . . . . . . . . . . . . . . . 100 100 100 100 100 100Cook Islands 95 . . . 99 98 87 . . . . . . . . . . . . . . . . . . . . . 100 100 100 100 99 100Fiji 93 98 98 100 88 95 74 82 95 97 55 66 75 83 92 94 59 71French Polynesia 100 100 100 100 100 100 98 98 99 99 96 96 98 98 99 99 97 97Guam 100 100 100 100 100 100 . . . . . . . . . . . . . . . . . . 99 99 99 99 98 98Kiribati 62 . . . 77 . . . 50 . . . 33 . . . 48 . . . 21 . . . 33 . . . 47 . . . 22 . . .Marshall Islands 95 94 93 92 98 99 1 1 1 1 0 0 70 75 80 83 48 53Micronesia (Federated States of) 92 . . . 94 . . . 92 . . . . . . . . . . . . . . . . . . . . . 26 . . . 59 . . . 16 . . .Nauru 98 88 98 88 . . . . . . . . . . . . . . . . . . . . . . . . 66 65 66 65 . . . . . .New Caledonia . . . . . . . . . . . . . . . . . . . . . . . . . . . . . . . . . . . . . . . . . . . . . . . . . . . . . .New Zealand 100 100 100 100 100 100 100 100 100 100 100 100 . . . . . . . . . . . . . . . . . .Niue 100 100 100 100 100 100 . . . . . . . . . . . . 80 . . . 100 100 100 100 100 100Northern Mariana Islands 98 98 98 98 97 97 . . . . . . . . . . . . . . . . . . 92 . . . 92 . . . 93 96Palau 83 85 78 83 96 96 40 43 40 43 40 40 84 100 91 100 68 100Papua New Guinea 39 40 88 87 32 33 10 10 59 57 46 45 75 71 42 41Pitcairn . . . . . . . . . . . . . . . . . . . . . . . . . . . . . . . . . . . . . . . . . . . . . . . . . . . . . .Samoa 92 96 96 96 91 96 78 81 85 84 76 80 98 98 99 98 98 98Solomon Islands 70 . . . 94 . . . 65 . . . 13 . . . 76 . . . 1 1 31 . . . 98 98 18 . . .Tokelau 93 97 . . . . . . 93 97 . . . . . . . . . . . . . . . . . . 63 93 . . . . . . 63 93Tonga 100 100 100 100 100 100 75 . . . 72 . . . 76 . . . 96 96 98 98 96 96Tuvalu 94 98 95 98 93 97 94 97 95 97 93 97 83 85 87 88 79 81Vanuatu 76 90 96 98 71 87 31 26 65 52 22 17 41 57 54 64 38 54Wallis and Futuna Islands . . . . . . . . . . . . . . . . . . . . . . . . . . . . . . . . . . . . . . . . . . . . . . . . . . . . . .
Notes:(1) Data for Sudan includes South Sudan.(2) The drinking water estimates for Bangladesh have been adjusted for arsenic contamination levels based on national surveys conducted and approved by the government.(3) The former Yugoslav Republic of Macedonia.
Source: World Health Organization (WHO) and United Nations Children’s Fund (UNICEF) Joint Monitoring Programme for Water Supply and Sanitation (JMP) (2012) Progress on Sanitation and Drinking-Water 2012 Update,WHO and UNICEF, Geneva.
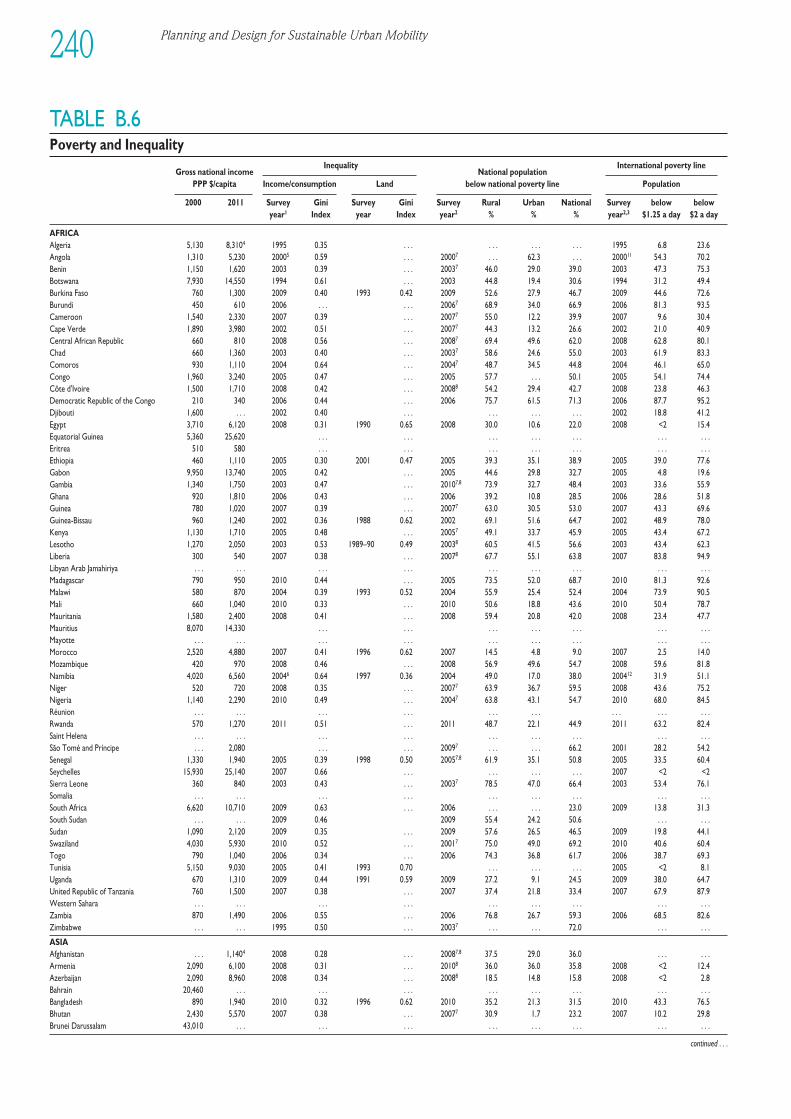
Planning and Design for Sustainable Urban Mobility240
TABLE B.6Poverty and Inequality
Gross national incomeInequality
National population International poverty line
PPP $/capita Income/consumption Land below national poverty line Population
2000 2011 Survey Gini Survey Gini Survey Rural Urban National Survey below belowyear1 Index year Index year2 % % % year2,3 $1.25 a day $2 a day
AFRICAAlgeria 5,130 8,3104 1995 0.35 . . . . . . . . . . . . 1995 6.8 23.6Angola 1,310 5,230 20005 0.59 . . . 20007 . . . 62.3 . . . 200011 54.3 70.2Benin 1,150 1,620 2003 0.39 . . . 20037 46.0 29.0 39.0 2003 47.3 75.3Botswana 7,930 14,550 1994 0.61 . . . 2003 44.8 19.4 30.6 1994 31.2 49.4Burkina Faso 760 1,300 2009 0.40 1993 0.42 2009 52.6 27.9 46.7 2009 44.6 72.6Burundi 450 610 2006 . . . . . . 20067 68.9 34.0 66.9 2006 81.3 93.5Cameroon 1,540 2,330 2007 0.39 . . . 20077 55.0 12.2 39.9 2007 9.6 30.4Cape Verde 1,890 3,980 2002 0.51 . . . 20077 44.3 13.2 26.6 2002 21.0 40.9Central African Republic 660 810 2008 0.56 . . . 20087 69.4 49.6 62.0 2008 62.8 80.1Chad 660 1,360 2003 0.40 . . . 20037 58.6 24.6 55.0 2003 61.9 83.3Comoros 930 1,110 2004 0.64 . . . 20047 48.7 34.5 44.8 2004 46.1 65.0Congo 1,960 3,240 2005 0.47 . . . 2005 57.7 . . . 50.1 2005 54.1 74.4Côte d'Ivoire 1,500 1,710 2008 0.42 . . . 20088 54.2 29.4 42.7 2008 23.8 46.3Democratic Republic of the Congo 210 340 2006 0.44 . . . 2006 75.7 61.5 71.3 2006 87.7 95.2Djibouti 1,600 . . . 2002 0.40 . . . . . . . . . . . . 2002 18.8 41.2Egypt 3,710 6,120 2008 0.31 1990 0.65 2008 30.0 10.6 22.0 2008 <2 15.4Equatorial Guinea 5,360 25,620 . . . . . . . . . . . . . . . . . . . . .Eritrea 510 580 . . . . . . . . . . . . . . . . . . . . .Ethiopia 460 1,110 2005 0.30 2001 0.47 2005 39.3 35.1 38.9 2005 39.0 77.6Gabon 9,950 13,740 2005 0.42 . . . 2005 44.6 29.8 32.7 2005 4.8 19.6Gambia 1,340 1,750 2003 0.47 . . . 20107,8 73.9 32.7 48.4 2003 33.6 55.9Ghana 920 1,810 2006 0.43 . . . 2006 39.2 10.8 28.5 2006 28.6 51.8Guinea 780 1,020 2007 0.39 . . . 20077 63.0 30.5 53.0 2007 43.3 69.6Guinea-Bissau 960 1,240 2002 0.36 1988 0.62 2002 69.1 51.6 64.7 2002 48.9 78.0Kenya 1,130 1,710 2005 0.48 . . . 20057 49.1 33.7 45.9 2005 43.4 67.2Lesotho 1,270 2,050 2003 0.53 1989–90 0.49 20038 60.5 41.5 56.6 2003 43.4 62.3Liberia 300 540 2007 0.38 . . . 20078 67.7 55.1 63.8 2007 83.8 94.9Libyan Arab Jamahiriya . . . . . . . . . . . . . . . . . . . . . . . . . . .Madagascar 790 950 2010 0.44 . . . 2005 73.5 52.0 68.7 2010 81.3 92.6Malawi 580 870 2004 0.39 1993 0.52 2004 55.9 25.4 52.4 2004 73.9 90.5Mali 660 1,040 2010 0.33 . . . 2010 50.6 18.8 43.6 2010 50.4 78.7Mauritania 1,580 2,400 2008 0.41 . . . 2008 59.4 20.8 42.0 2008 23.4 47.7Mauritius 8,070 14,330 . . . . . . . . . . . . . . . . . . . . .Mayotte . . . . . . . . . . . . . . . . . . . . . . . . . . .Morocco 2,520 4,880 2007 0.41 1996 0.62 2007 14.5 4.8 9.0 2007 2.5 14.0Mozambique 420 970 2008 0.46 . . . 2008 56.9 49.6 54.7 2008 59.6 81.8Namibia 4,020 6,560 20046 0.64 1997 0.36 2004 49.0 17.0 38.0 200412 31.9 51.1Niger 520 720 2008 0.35 . . . 20077 63.9 36.7 59.5 2008 43.6 75.2Nigeria 1,140 2,290 2010 0.49 . . . 20047 63.8 43.1 54.7 2010 68.0 84.5Réunion . . . . . . . . . . . . . . . . . . . . . . . . . . .Rwanda 570 1,270 2011 0.51 . . . 2011 48.7 22.1 44.9 2011 63.2 82.4Saint Helena . . . . . . . . . . . . . . . . . . . . . . . . . . .São Tomé and Príncipe . . . 2,080 . . . . . . 20097 . . . . . . 66.2 2001 28.2 54.2Senegal 1,330 1,940 2005 0.39 1998 0.50 20057,8 61.9 35.1 50.8 2005 33.5 60.4Seychelles 15,930 25,140 2007 0.66 . . . . . . . . . . . . 2007 <2 <2Sierra Leone 360 840 2003 0.43 . . . 20037 78.5 47.0 66.4 2003 53.4 76.1Somalia . . . . . . . . . . . . . . . . . . . . . . . . . . .South Africa 6,620 10,710 2009 0.63 . . . 2006 . . . . . . 23.0 2009 13.8 31.3South Sudan . . . . . . 2009 0.46 2009 55.4 24.2 50.6 . . . . . .Sudan 1,090 2,120 2009 0.35 . . . 2009 57.6 26.5 46.5 2009 19.8 44.1Swaziland 4,030 5,930 2010 0.52 . . . 20017 75.0 49.0 69.2 2010 40.6 60.4Togo 790 1,040 2006 0.34 . . . 2006 74.3 36.8 61.7 2006 38.7 69.3Tunisia 5,150 9,030 2005 0.41 1993 0.70 . . . . . . . . . 2005 <2 8.1Uganda 670 1,310 2009 0.44 1991 0.59 2009 27.2 9.1 24.5 2009 38.0 64.7United Republic of Tanzania 760 1,500 2007 0.38 . . . 2007 37.4 21.8 33.4 2007 67.9 87.9Western Sahara . . . . . . . . . . . . . . . . . . . . . . . . . . .Zambia 870 1,490 2006 0.55 . . . 2006 76.8 26.7 59.3 2006 68.5 82.6Zimbabwe . . . . . . 1995 0.50 . . . 20037 . . . . . . 72.0 . . . . . .
ASIAAfghanistan . . . 1,1404 2008 0.28 . . . 20087,8 37.5 29.0 36.0 . . . . . .Armenia 2,090 6,100 2008 0.31 . . . 20108 36.0 36.0 35.8 2008 <2 12.4Azerbaijan 2,090 8,960 2008 0.34 . . . 20088 18.5 14.8 15.8 2008 <2 2.8Bahrain 20,460 . . . . . . . . . . . . . . . . . . . . . . . .Bangladesh 890 1,940 2010 0.32 1996 0.62 2010 35.2 21.3 31.5 2010 43.3 76.5Bhutan 2,430 5,570 2007 0.38 . . . 20077 30.9 1.7 23.2 2007 10.2 29.8Brunei Darussalam 43,010 . . . . . . . . . . . . . . . . . . . . . . . .
continued . . .
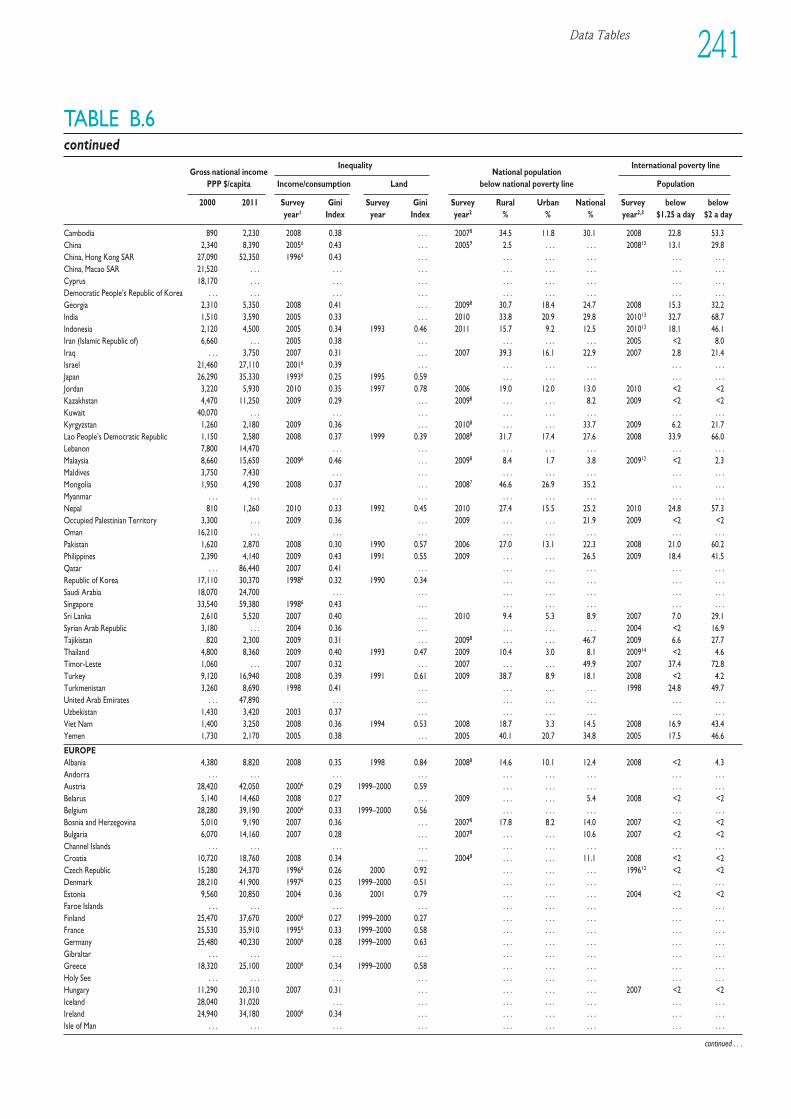
Data Tables 241
TABLE B.6continued
Gross national incomeInequality
National population International poverty line
PPP $/capita Income/consumption Land below national poverty line Population
2000 2011 Survey Gini Survey Gini Survey Rural Urban National Survey below belowyear1 Index year Index year2 % % % year2,3 $1.25 a day $2 a day
Cambodia 890 2,230 2008 0.38 . . . 20078 34.5 11.8 30.1 2008 22.8 53.3China 2,340 8,390 20056 0.43 . . . 20059 2.5 . . . . . . 200813 13.1 29.8China, Hong Kong SAR 27,090 52,350 19966 0.43 . . . . . . . . . . . . . . . . . .China, Macao SAR 21,520 . . . . . . . . . . . . . . . . . . . . . . . .Cyprus 18,170 . . . . . . . . . . . . . . . . . . . . . . . .Democratic People’s Republic of Korea . . . . . . . . . . . . . . . . . . . . . . . . . . .Georgia 2,310 5,350 2008 0.41 . . . 20098 30.7 18.4 24.7 2008 15.3 32.2India 1,510 3,590 2005 0.33 . . . 2010 33.8 20.9 29.8 201013 32.7 68.7Indonesia 2,120 4,500 2005 0.34 1993 0.46 2011 15.7 9.2 12.5 201013 18.1 46.1Iran (Islamic Republic of) 6,660 . . . 2005 0.38 . . . . . . . . . . . . 2005 <2 8.0Iraq . . . 3,750 2007 0.31 . . . 2007 39.3 16.1 22.9 2007 2.8 21.4Israel 21,460 27,110 20016 0.39 . . . . . . . . . . . . . . . . . .Japan 26,290 35,330 19936 0.25 1995 0.59 . . . . . . . . . . . . . . .Jordan 3,220 5,930 2010 0.35 1997 0.78 2006 19.0 12.0 13.0 2010 <2 <2Kazakhstan 4,470 11,250 2009 0.29 . . . 20098 . . . . . . 8.2 2009 <2 <2Kuwait 40,070 . . . . . . . . . . . . . . . . . . . . . . . .Kyrgyzstan 1,260 2,180 2009 0.36 . . . 20108 . . . . . . 33.7 2009 6.2 21.7Lao People’s Democratic Republic 1,150 2,580 2008 0.37 1999 0.39 20088 31.7 17.4 27.6 2008 33.9 66.0Lebanon 7,800 14,470 . . . . . . . . . . . . . . . . . . . . .Malaysia 8,660 15,650 20096 0.46 . . . 20098 8.4 1.7 3.8 200912 <2 2.3Maldives 3,750 7,430 . . . . . . . . . . . . . . . . . . . . .Mongolia 1,950 4,290 2008 0.37 . . . 20087 46.6 26.9 35.2 . . . . . .Myanmar . . . . . . . . . . . . . . . . . . . . . . . . . . .Nepal 810 1,260 2010 0.33 1992 0.45 2010 27.4 15.5 25.2 2010 24.8 57.3Occupied Palestinian Territory 3,300 . . . 2009 0.36 . . . 2009 . . . . . . 21.9 2009 <2 <2Oman 16,210 . . . . . . . . . . . . . . . . . . . . . . . .Pakistan 1,620 2,870 2008 0.30 1990 0.57 2006 27.0 13.1 22.3 2008 21.0 60.2Philippines 2,390 4,140 2009 0.43 1991 0.55 2009 . . . . . . 26.5 2009 18.4 41.5Qatar . . . 86,440 2007 0.41 . . . . . . . . . . . . . . . . . .Republic of Korea 17,110 30,370 19986 0.32 1990 0.34 . . . . . . . . . . . . . . .Saudi Arabia 18,070 24,700 . . . . . . . . . . . . . . . . . . . . .Singapore 33,540 59,380 19986 0.43 . . . . . . . . . . . . . . . . . .Sri Lanka 2,610 5,520 2007 0.40 . . . 2010 9.4 5.3 8.9 2007 7.0 29.1Syrian Arab Republic 3,180 . . . 2004 0.36 . . . . . . . . . . . . 2004 <2 16.9Tajikistan 820 2,300 2009 0.31 . . . 20098 . . . . . . 46.7 2009 6.6 27.7Thailand 4,800 8,360 2009 0.40 1993 0.47 2009 10.4 3.0 8.1 200914 <2 4.6Timor-Leste 1,060 . . . 2007 0.32 . . . 2007 . . . . . . 49.9 2007 37.4 72.8Turkey 9,120 16,940 2008 0.39 1991 0.61 2009 38.7 8.9 18.1 2008 <2 4.2Turkmenistan 3,260 8,690 1998 0.41 . . . . . . . . . . . . 1998 24.8 49.7United Arab Emirates . . . 47,890 . . . . . . . . . . . . . . . . . . . . .Uzbekistan 1,430 3,420 2003 0.37 . . . . . . . . . . . . . . . . . .Viet Nam 1,400 3,250 2008 0.36 1994 0.53 2008 18.7 3.3 14.5 2008 16.9 43.4Yemen 1,730 2,170 2005 0.38 . . . 2005 40.1 20.7 34.8 2005 17.5 46.6
EUROPEAlbania 4,380 8,820 2008 0.35 1998 0.84 20088 14.6 10.1 12.4 2008 <2 4.3Andorra . . . . . . . . . . . . . . . . . . . . . . . . . . .Austria 28,420 42,050 20006 0.29 1999–2000 0.59 . . . . . . . . . . . . . . .Belarus 5,140 14,460 2008 0.27 . . . 2009 . . . . . . 5.4 2008 <2 <2Belgium 28,280 39,190 20006 0.33 1999–2000 0.56 . . . . . . . . . . . . . . .Bosnia and Herzegovina 5,010 9,190 2007 0.36 . . . 20078 17.8 8.2 14.0 2007 <2 <2Bulgaria 6,070 14,160 2007 0.28 . . . 20078 . . . . . . 10.6 2007 <2 <2Channel Islands . . . . . . . . . . . . . . . . . . . . . . . . . . .Croatia 10,720 18,760 2008 0.34 . . . 20048 . . . . . . 11.1 2008 <2 <2Czech Republic 15,280 24,370 19966 0.26 2000 0.92 . . . . . . . . . 199612 <2 <2Denmark 28,210 41,900 19976 0.25 1999–2000 0.51 . . . . . . . . . . . . . . .Estonia 9,560 20,850 2004 0.36 2001 0.79 . . . . . . . . . 2004 <2 <2Faroe Islands . . . . . . . . . . . . . . . . . . . . . . . . . . .Finland 25,470 37,670 20006 0.27 1999–2000 0.27 . . . . . . . . . . . . . . .France 25,530 35,910 19956 0.33 1999–2000 0.58 . . . . . . . . . . . . . . .Germany 25,480 40,230 20006 0.28 1999–2000 0.63 . . . . . . . . . . . . . . .Gibraltar . . . . . . . . . . . . . . . . . . . . . . . . . . .Greece 18,320 25,100 20006 0.34 1999–2000 0.58 . . . . . . . . . . . . . . .Holy See . . . . . . . . . . . . . . . . . . . . . . . . . . .Hungary 11,290 20,310 2007 0.31 . . . . . . . . . . . . 2007 <2 <2Iceland 28,040 31,020 . . . . . . . . . . . . . . . . . . . . .Ireland 24,940 34,180 20006 0.34 . . . . . . . . . . . . . . . . . .Isle of Man . . . . . . . . . . . . . . . . . . . . . . . . . . .
continued . . .
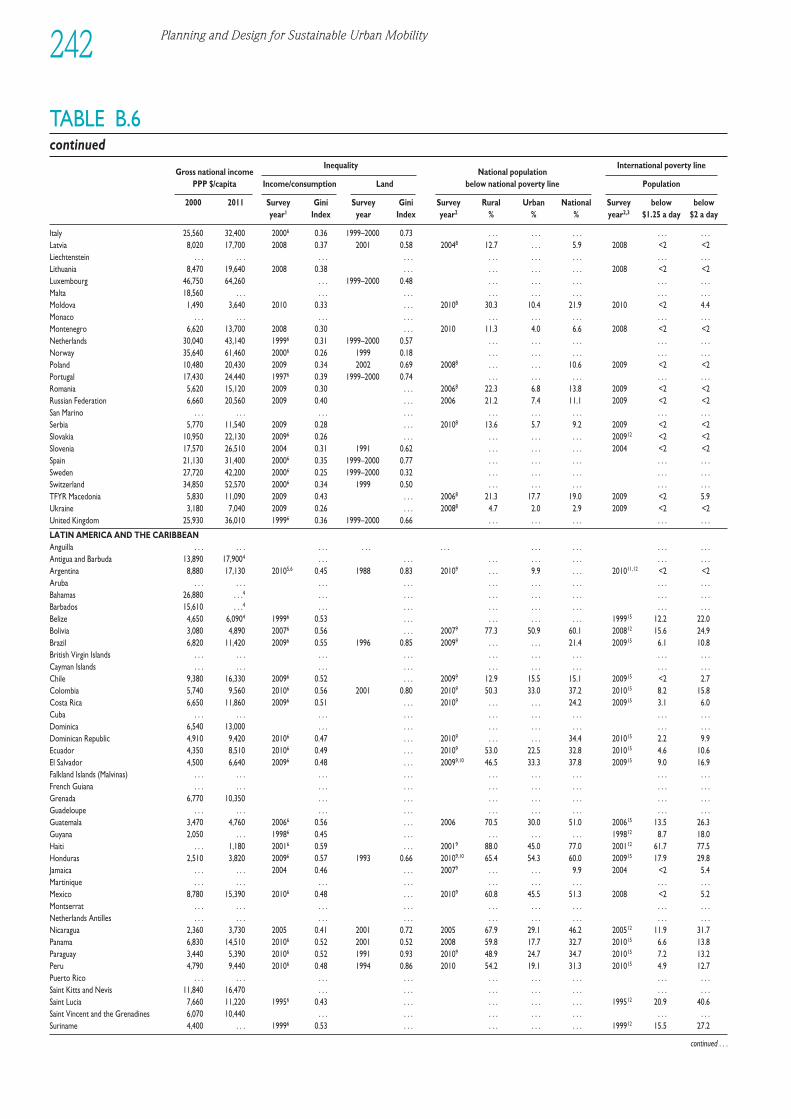
Planning and Design for Sustainable Urban Mobility242
TABLE B.6continued
Gross national incomeInequality
National population International poverty line
PPP $/capita Income/consumption Land below national poverty line Population
2000 2011 Survey Gini Survey Gini Survey Rural Urban National Survey below belowyear1 Index year Index year2 % % % year2,3 $1.25 a day $2 a day
Italy 25,560 32,400 20006 0.36 1999–2000 0.73 . . . . . . . . . . . . . . .Latvia 8,020 17,700 2008 0.37 2001 0.58 20048 12.7 . . . 5.9 2008 <2 <2Liechtenstein . . . . . . . . . . . . . . . . . . . . . . . . . . .Lithuania 8,470 19,640 2008 0.38 . . . . . . . . . . . . 2008 <2 <2Luxembourg 46,750 64,260 . . . 1999–2000 0.48 . . . . . . . . . . . . . . .Malta 18,560 . . . . . . . . . . . . . . . . . . . . . . . .Moldova 1,490 3,640 2010 0.33 . . . 20108 30.3 10.4 21.9 2010 <2 4.4Monaco . . . . . . . . . . . . . . . . . . . . . . . . . . .Montenegro 6,620 13,700 2008 0.30 . . . 2010 11.3 4.0 6.6 2008 <2 <2Netherlands 30,040 43,140 19996 0.31 1999–2000 0.57 . . . . . . . . . . . . . . .Norway 35,640 61,460 20006 0.26 1999 0.18 . . . . . . . . . . . . . . .Poland 10,480 20,430 2009 0.34 2002 0.69 20088 . . . . . . 10.6 2009 <2 <2Portugal 17,430 24,440 19976 0.39 1999–2000 0.74 . . . . . . . . . . . . . . .Romania 5,620 15,120 2009 0.30 . . . 20068 22.3 6.8 13.8 2009 <2 <2Russian Federation 6,660 20,560 2009 0.40 . . . 2006 21.2 7.4 11.1 2009 <2 <2San Marino . . . . . . . . . . . . . . . . . . . . . . . . . . .Serbia 5,770 11,540 2009 0.28 . . . 20108 13.6 5.7 9.2 2009 <2 <2Slovakia 10,950 22,130 20096 0.26 . . . . . . . . . . . . 200912 <2 <2Slovenia 17,570 26,510 2004 0.31 1991 0.62 . . . . . . . . . 2004 <2 <2Spain 21,130 31,400 20006 0.35 1999–2000 0.77 . . . . . . . . . . . . . . .Sweden 27,720 42,200 20006 0.25 1999–2000 0.32 . . . . . . . . . . . . . . .Switzerland 34,850 52,570 20006 0.34 1999 0.50 . . . . . . . . . . . . . . .TFYR Macedonia 5,830 11,090 2009 0.43 . . . 20068 21.3 17.7 19.0 2009 <2 5.9Ukraine 3,180 7,040 2009 0.26 . . . 20088 4.7 2.0 2.9 2009 <2 <2United Kingdom 25,930 36,010 19996 0.36 1999–2000 0.66 . . . . . . . . . . . . . . .
LATIN AMERICA AND THE CARIBBEANAnguilla . . . . . . . . . . . . . . . . . . . . . . . . . . .Antigua and Barbuda 13,890 17,9004 . . . . . . . . . . . . . . . . . . . . .Argentina 8,880 17,130 20105,6 0.45 1988 0.83 20109 . . . 9.9 . . . 201011,12 <2 <2Aruba . . . . . . . . . . . . . . . . . . . . . . . . . . .Bahamas 26,880 . . .4 . . . . . . . . . . . . . . . . . . . . .Barbados 15,610 . . .4 . . . . . . . . . . . . . . . . . . . . .Belize 4,650 6,0904 19996 0.53 . . . . . . . . . . . . 199915 12.2 22.0Bolivia 3,080 4,890 20076 0.56 . . . 20079 77.3 50.9 60.1 200812 15.6 24.9Brazil 6,820 11,420 20096 0.55 1996 0.85 20099 . . . . . . 21.4 200915 6.1 10.8British Virgin Islands . . . . . . . . . . . . . . . . . . . . . . . . . . .Cayman Islands . . . . . . . . . . . . . . . . . . . . . . . . . . .Chile 9,380 16,330 20096 0.52 . . . 20099 12.9 15.5 15.1 200915 <2 2.7Colombia 5,740 9,560 20106 0.56 2001 0.80 20109 50.3 33.0 37.2 201015 8.2 15.8Costa Rica 6,650 11,860 20096 0.51 . . . 20109 . . . . . . 24.2 200915 3.1 6.0Cuba . . . . . . . . . . . . . . . . . . . . . . . . . . .Dominica 6,540 13,000 . . . . . . . . . . . . . . . . . . . . .Dominican Republic 4,910 9,420 20106 0.47 . . . 20109 . . . . . . 34.4 201015 2.2 9.9Ecuador 4,350 8,510 20106 0.49 . . . 20109 53.0 22.5 32.8 201015 4.6 10.6El Salvador 4,500 6,640 20096 0.48 . . . 20099,10 46.5 33.3 37.8 200915 9.0 16.9Falkland Islands (Malvinas) . . . . . . . . . . . . . . . . . . . . . . . . . . .French Guiana . . . . . . . . . . . . . . . . . . . . . . . . . . .Grenada 6,770 10,350 . . . . . . . . . . . . . . . . . . . . .Guadeloupe . . . . . . . . . . . . . . . . . . . . . . . . . . .Guatemala 3,470 4,760 20066 0.56 . . . 2006 70.5 30.0 51.0 200615 13.5 26.3Guyana 2,050 . . . 19986 0.45 . . . . . . . . . . . . 199812 8.7 18.0Haiti . . . 1,180 20016 0.59 . . . 20019 88.0 45.0 77.0 200112 61.7 77.5Honduras 2,510 3,820 20096 0.57 1993 0.66 20109,10 65.4 54.3 60.0 200915 17.9 29.8Jamaica . . . . . . 2004 0.46 . . . 20079 . . . . . . 9.9 2004 <2 5.4Martinique . . . . . . . . . . . . . . . . . . . . . . . . . . .Mexico 8,780 15,390 20106 0.48 . . . 20109 60.8 45.5 51.3 2008 <2 5.2Montserrat . . . . . . . . . . . . . . . . . . . . . . . . . . .Netherlands Antilles . . . . . . . . . . . . . . . . . . . . . . . . . . .Nicaragua 2,360 3,730 2005 0.41 2001 0.72 2005 67.9 29.1 46.2 200512 11.9 31.7Panama 6,830 14,510 20106 0.52 2001 0.52 2008 59.8 17.7 32.7 201015 6.6 13.8Paraguay 3,440 5,390 20106 0.52 1991 0.93 20109 48.9 24.7 34.7 201015 7.2 13.2Peru 4,790 9,440 20106 0.48 1994 0.86 2010 54.2 19.1 31.3 201015 4.9 12.7Puerto Rico . . . . . . . . . . . . . . . . . . . . . . . . . . .Saint Kitts and Nevis 11,840 16,470 . . . . . . . . . . . . . . . . . . . . .Saint Lucia 7,660 11,220 19956 0.43 . . . . . . . . . . . . 199512 20.9 40.6Saint Vincent and the Grenadines 6,070 10,440 . . . . . . . . . . . . . . . . . . . . .Suriname 4,400 . . . 19996 0.53 . . . . . . . . . . . . 199912 15.5 27.2
continued . . .
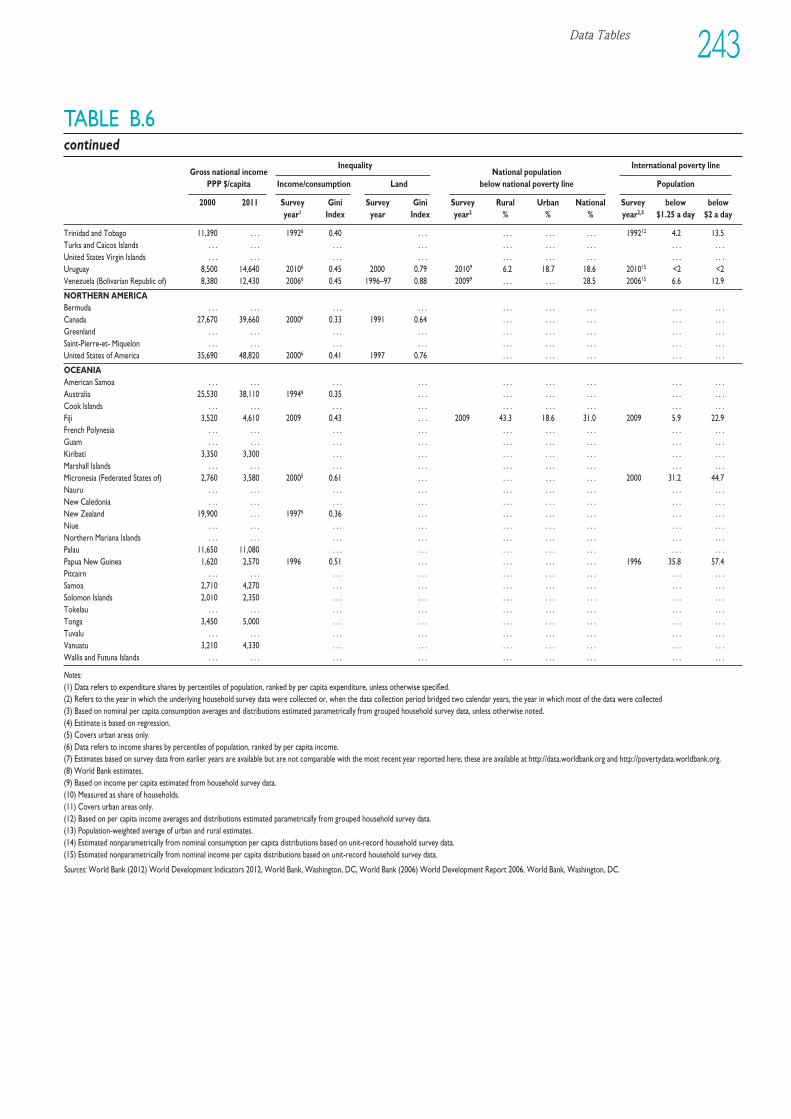
Data Tables 243
TABLE B.6continued
Gross national incomeInequality
National population International poverty line
PPP $/capita Income/consumption Land below national poverty line Population
2000 2011 Survey Gini Survey Gini Survey Rural Urban National Survey below belowyear1 Index year Index year2 % % % year2,3 $1.25 a day $2 a day
Trinidad and Tobago 11,390 . . . 19926 0.40 . . . . . . . . . . . . 199212 4.2 13.5Turks and Caicos Islands . . . . . . . . . . . . . . . . . . . . . . . . . . .United States Virgin Islands . . . . . . . . . . . . . . . . . . . . . . . . . . .Uruguay 8,500 14,640 20106 0.45 2000 0.79 20109 6.2 18.7 18.6 201015 <2 <2Venezuela (Bolivarian Republic of) 8,380 12,430 20066 0.45 1996–97 0.88 20099 . . . . . . 28.5 200615 6.6 12.9
NORTHERN AMERICABermuda . . . . . . . . . . . . . . . . . . . . . . . . . . .Canada 27,670 39,660 20006 0.33 1991 0.64 . . . . . . . . . . . . . . .Greenland . . . . . . . . . . . . . . . . . . . . . . . . . . .Saint-Pierre-et- Miquelon . . . . . . . . . . . . . . . . . . . . . . . . . . .United States of America 35,690 48,820 20006 0.41 1997 0.76 . . . . . . . . . . . . . . .
OCEANIAAmerican Samoa . . . . . . . . . . . . . . . . . . . . . . . . . . .Australia 25,530 38,110 19946 0.35 . . . . . . . . . . . . . . . . . .Cook Islands . . . . . . . . . . . . . . . . . . . . . . . . . . .Fiji 3,520 4,610 2009 0.43 . . . 2009 43.3 18.6 31.0 2009 5.9 22.9French Polynesia . . . . . . . . . . . . . . . . . . . . . . . . . . .Guam . . . . . . . . . . . . . . . . . . . . . . . . . . .Kiribati 3,350 3,300 . . . . . . . . . . . . . . . . . . . . .Marshall Islands . . . . . . . . . . . . . . . . . . . . . . . . . . .Micronesia (Federated States of) 2,760 3,580 20005 0.61 . . . . . . . . . . . . 2000 31.2 44.7Nauru . . . . . . . . . . . . . . . . . . . . . . . . . . .New Caledonia . . . . . . . . . . . . . . . . . . . . . . . . . . .New Zealand 19,900 . . . 19976 0.36 . . . . . . . . . . . . . . . . . .Niue . . . . . . . . . . . . . . . . . . . . . . . . . . .Northern Mariana Islands . . . . . . . . . . . . . . . . . . . . . . . . . . .Palau 11,650 11,080 . . . . . . . . . . . . . . . . . . . . .Papua New Guinea 1,620 2,570 1996 0.51 . . . . . . . . . . . . 1996 35.8 57.4Pitcairn . . . . . . . . . . . . . . . . . . . . . . . . . . .Samoa 2,710 4,270 . . . . . . . . . . . . . . . . . . . . .Solomon Islands 2,010 2,350 . . . . . . . . . . . . . . . . . . . . .Tokelau . . . . . . . . . . . . . . . . . . . . . . . . . . .Tonga 3,450 5,000 . . . . . . . . . . . . . . . . . . . . .Tuvalu . . . . . . . . . . . . . . . . . . . . . . . . . . .Vanuatu 3,210 4,330 . . . . . . . . . . . . . . . . . . . . .Wallis and Futuna Islands . . . . . . . . . . . . . . . . . . . . . . . . . . .
Notes:(1) Data refers to expenditure shares by percentiles of population, ranked by per capita expenditure, unless otherwise specified.(2) Refers to the year in which the underlying household survey data were collected or, when the data collection period bridged two calendar years, the year in which most of the data were collected(3) Based on nominal per capita consumption averages and distributions estimated parametrically from grouped household survey data, unless otherwise noted.(4) Estimate is based on regression.(5) Covers urban areas only.(6) Data refers to income shares by percentiles of population, ranked by per capita income.(7) Estimates based on survey data from earlier years are available but are not comparable with the most recent year reported here; these are available at http://data.worldbank.org and http://povertydata.worldbank.org. (8) World Bank estimates.(9) Based on income per capita estimated from household survey data.(10) Measured as share of households.(11) Covers urban areas only.(12) Based on per capita income averages and distributions estimated parametrically from grouped household survey data.(13) Population-weighted average of urban and rural estimates.(14) Estimated nonparametrically from nominal consumption per capita distributions based on unit-record household survey data.(15) Estimated nonparametrically from nominal income per capita distributions based on unit-record household survey data.
Sources: World Bank (2012) World Development Indicators 2012, World Bank, Washington, DC, World Bank (2006) World Development Report 2006, World Bank, Washington, DC.
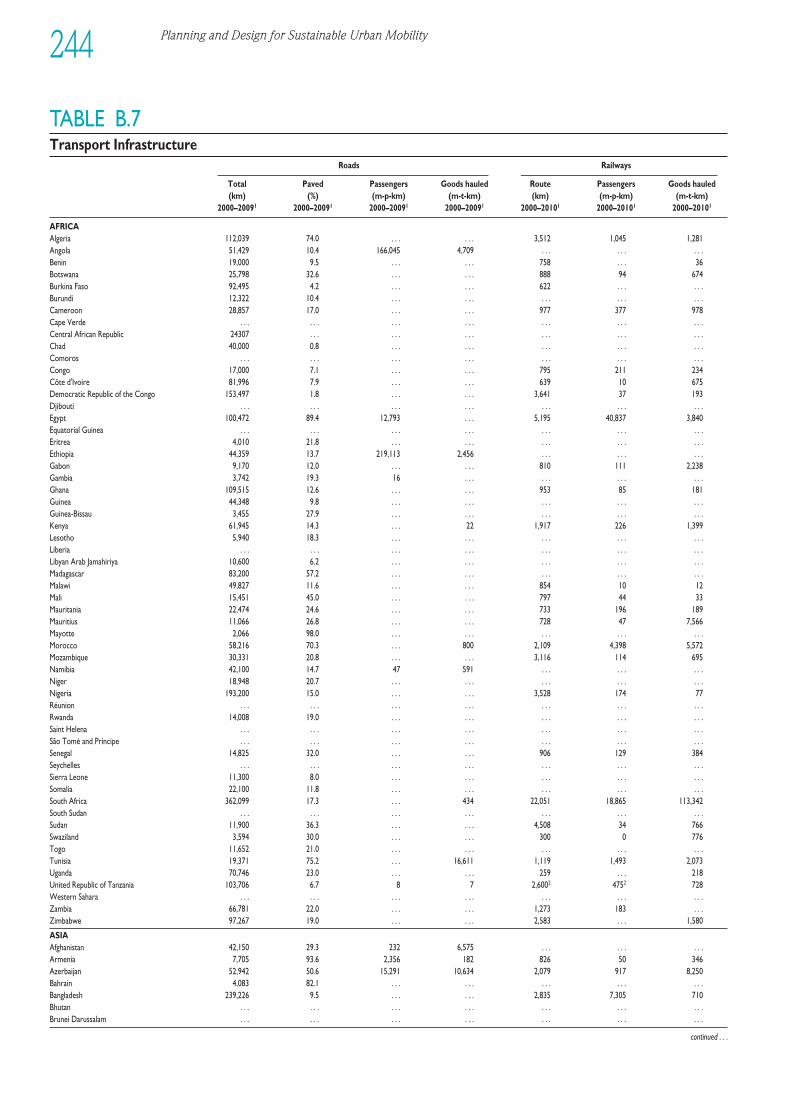
Planning and Design for Sustainable Urban Mobility244
TABLE B.7Transport Infrastructure
Roads Railways
Total Paved Passengers Goods hauled Route Passengers Goods hauled(km) (%) (m-p-km) (m-t-km) (km) (m-p-km) (m-t-km)
2000–20091 2000–20091 2000–20091 2000–20091 2000–20101 2000–20101 2000–20101
AFRICAAlgeria 112,039 74.0 . . . . . . 3,512 1,045 1,281Angola 51,429 10.4 166,045 4,709 . . . . . . . . .Benin 19,000 9.5 . . . . . . 758 . . . 36Botswana 25,798 32.6 . . . . . . 888 94 674Burkina Faso 92,495 4.2 . . . . . . 622 . . . . . .Burundi 12,322 10.4 . . . . . . . . . . . . . . .Cameroon 28,857 17.0 . . . . . . 977 377 978Cape Verde . . . . . . . . . . . . . . . . . . . . .Central African Republic 24307 . . . . . . . . . . . . . . . . . .Chad 40,000 0.8 . . . . . . . . . . . . . . .Comoros . . . . . . . . . . . . . . . . . . . . .Congo 17,000 7.1 . . . . . . 795 211 234Côte d'Ivoire 81,996 7.9 . . . . . . 639 10 675Democratic Republic of the Congo 153,497 1.8 . . . . . . 3,641 37 193Djibouti . . . . . . . . . . . . . . . . . . . . .Egypt 100,472 89.4 12,793 . . . 5,195 40,837 3,840Equatorial Guinea . . . . . . . . . . . . . . . . . . . . .Eritrea 4,010 21.8 . . . . . . . . . . . . . . .Ethiopia 44,359 13.7 219,113 2,456 . . . . . . . . .Gabon 9,170 12.0 . . . . . . 810 111 2,238Gambia 3,742 19.3 16 . . . . . . . . . . . .Ghana 109,515 12.6 . . . . . . 953 85 181Guinea 44,348 9.8 . . . . . . . . . . . . . . .Guinea-Bissau 3,455 27.9 . . . . . . . . . . . . . . .Kenya 61,945 14.3 . . . 22 1,917 226 1,399Lesotho 5,940 18.3 . . . . . . . . . . . . . . .Liberia . . . . . . . . . . . . . . . . . . . . .Libyan Arab Jamahiriya 10,600 6.2 . . . . . . . . . . . . . . .Madagascar 83,200 57.2 . . . . . . . . . . . . . . .Malawi 49,827 11.6 . . . . . . 854 10 12Mali 15,451 45.0 . . . . . . 797 44 33Mauritania 22,474 24.6 . . . . . . 733 196 189Mauritius 11,066 26.8 . . . . . . 728 47 7,566Mayotte 2,066 98.0 . . . . . . . . . . . . . . .Morocco 58,216 70.3 . . . 800 2,109 4,398 5,572Mozambique 30,331 20.8 . . . . . . 3,116 114 695Namibia 42,100 14.7 47 591 . . . . . . . . .Niger 18,948 20.7 . . . . . . . . . . . . . . .Nigeria 193,200 15.0 . . . . . . 3,528 174 77Réunion . . . . . . . . . . . . . . . . . . . . .Rwanda 14,008 19.0 . . . . . . . . . . . . . . .Saint Helena . . . . . . . . . . . . . . . . . . . . .São Tomé and Príncipe . . . . . . . . . . . . . . . . . . . . .Senegal 14,825 32.0 . . . . . . 906 129 384Seychelles . . . . . . . . . . . . . . . . . . . . .Sierra Leone 11,300 8.0 . . . . . . . . . . . . . . .Somalia 22,100 11.8 . . . . . . . . . . . . . . .South Africa 362,099 17.3 . . . 434 22,051 18,865 113,342South Sudan . . . . . . . . . . . . . . . . . . . . .Sudan 11,900 36.3 . . . . . . 4,508 34 766Swaziland 3,594 30.0 . . . . . . 300 0 776Togo 11,652 21.0 . . . . . . . . . . . . . . .Tunisia 19,371 75.2 . . . 16,611 1,119 1,493 2,073Uganda 70,746 23.0 . . . . . . 259 . . . 218United Republic of Tanzania 103,706 6.7 8 7 2,6002 4752 728Western Sahara . . . . . . . . . . . . . . . . . . . . .Zambia 66,781 22.0 . . . . . . 1,273 183 . . .Zimbabwe 97,267 19.0 . . . . . . 2,583 . . . 1,580
ASIAAfghanistan 42,150 29.3 232 6,575 . . . . . . . . .Armenia 7,705 93.6 2,356 182 826 50 346Azerbaijan 52,942 50.6 15,291 10,634 2,079 917 8,250Bahrain 4,083 82.1 . . . . . . . . . . . . . . .Bangladesh 239,226 9.5 . . . . . . 2,835 7,305 710Bhutan . . . . . . . . . . . . . . . . . . . . .Brunei Darussalam . . . . . . . . . . . . . . . . . . . . .
continued . . .
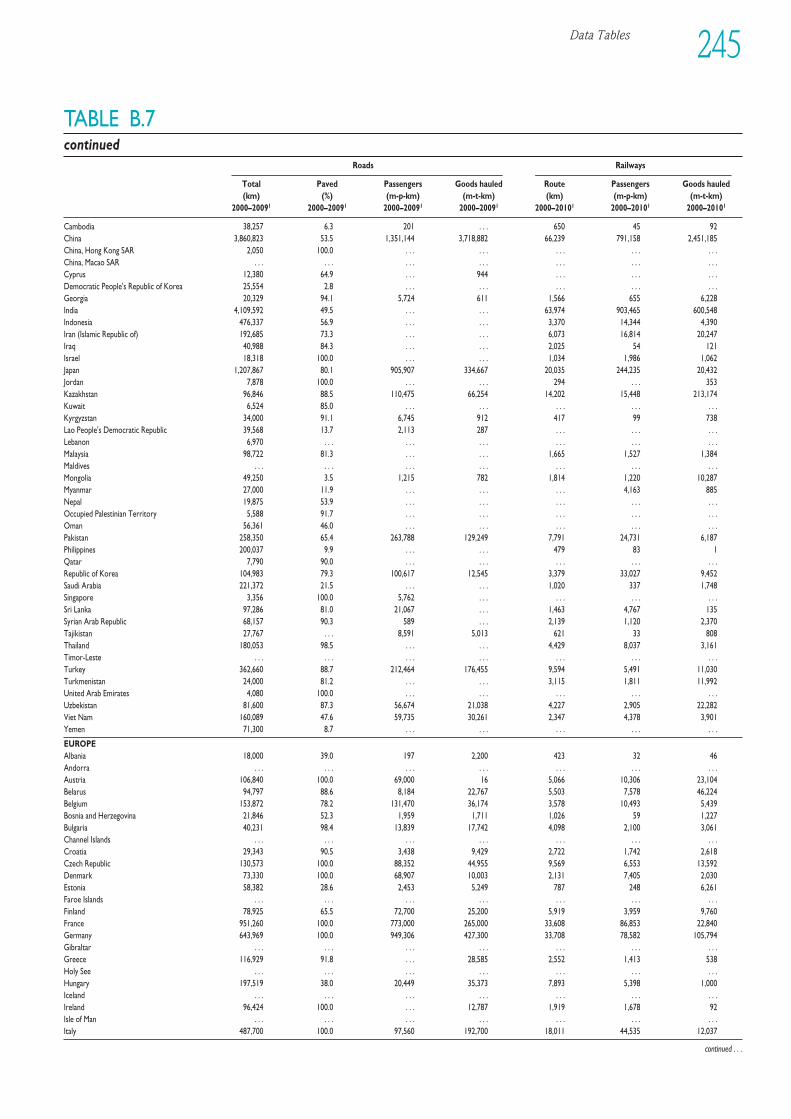
Data Tables 245
TABLE B.7continued
Roads Railways
Total Paved Passengers Goods hauled Route Passengers Goods hauled(km) (%) (m-p-km) (m-t-km) (km) (m-p-km) (m-t-km)
2000–20091 2000–20091 2000–20091 2000–20091 2000–20101 2000–20101 2000–20101
Cambodia 38,257 6.3 201 . . . 650 45 92China 3,860,823 53.5 1,351,144 3,718,882 66,239 791,158 2,451,185China, Hong Kong SAR 2,050 100.0 . . . . . . . . . . . . . . .China, Macao SAR . . . . . . . . . . . . . . . . . . . . .Cyprus 12,380 64.9 . . . 944 . . . . . . . . .Democratic People's Republic of Korea 25,554 2.8 . . . . . . . . . . . . . . . Georgia 20,329 94.1 5,724 611 1,566 655 6,228India 4,109,592 49.5 . . . . . . 63,974 903,465 600,548Indonesia 476,337 56.9 . . . . . . 3,370 14,344 4,390Iran (Islamic Republic of) 192,685 73.3 . . . . . . 6,073 16,814 20,247Iraq 40,988 84.3 . . . . . . 2,025 54 121Israel 18,318 100.0 . . . . . . 1,034 1,986 1,062Japan 1,207,867 80.1 905,907 334,667 20,035 244,235 20,432Jordan 7,878 100.0 . . . . . . 294 . . . 353Kazakhstan 96,846 88.5 110,475 66,254 14,202 15,448 213,174Kuwait 6,524 85.0 . . . . . . . . . . . . . . .Kyrgyzstan 34,000 91.1 6,745 912 417 99 738Lao People's Democratic Republic 39,568 13.7 2,113 287 . . . . . . . . .Lebanon 6,970 . . . . . . . . . . . . . . . . . .Malaysia 98,722 81.3 . . . . . . 1,665 1,527 1,384Maldives . . . . . . . . . . . . . . . . . . . . .Mongolia 49,250 3.5 1,215 782 1,814 1,220 10,287Myanmar 27,000 11.9 . . . . . . . . . 4,163 885Nepal 19,875 53.9 . . . . . . . . . . . . . . .Occupied Palestinian Territory 5,588 91.7 . . . . . . . . . . . . . . .Oman 56,361 46.0 . . . . . . . . . . . . . . .Pakistan 258,350 65.4 263,788 129,249 7,791 24,731 6,187Philippines 200,037 9.9 . . . . . . 479 83 1Qatar 7,790 90.0 . . . . . . . . . . . . . . .Republic of Korea 104,983 79.3 100,617 12,545 3,379 33,027 9,452Saudi Arabia 221,372 21.5 . . . . . . 1,020 337 1,748Singapore 3,356 100.0 5,762 . . . . . . . . . . . .Sri Lanka 97,286 81.0 21,067 . . . 1,463 4,767 135Syrian Arab Republic 68,157 90.3 589 . . . 2,139 1,120 2,370Tajikistan 27,767 . . . 8,591 5,013 621 33 808Thailand 180,053 98.5 . . . . . . 4,429 8,037 3,161Timor-Leste . . . . . . . . . . . . . . . . . . . . .Turkey 362,660 88.7 212,464 176,455 9,594 5,491 11,030Turkmenistan 24,000 81.2 . . . . . . 3,115 1,811 11,992United Arab Emirates 4,080 100.0 . . . . . . . . . . . . . . .Uzbekistan 81,600 87.3 56,674 21,038 4,227 2,905 22,282Viet Nam 160,089 47.6 59,735 30,261 2,347 4,378 3,901Yemen 71,300 8.7 . . . . . . . . . . . . . . .
EUROPEAlbania 18,000 39.0 197 2,200 423 32 46Andorra . . . . . . . . . . . . . . . . . . . . .Austria 106,840 100.0 69,000 16 5,066 10,306 23,104Belarus 94,797 88.6 8,184 22,767 5,503 7,578 46,224Belgium 153,872 78.2 131,470 36,174 3,578 10,493 5,439Bosnia and Herzegovina 21,846 52.3 1,959 1,711 1,026 59 1,227Bulgaria 40,231 98.4 13,839 17,742 4,098 2,100 3,061Channel Islands . . . . . . . . . . . . . . . . . . . . .Croatia 29,343 90.5 3,438 9,429 2,722 1,742 2,618Czech Republic 130,573 100.0 88,352 44,955 9,569 6,553 13,592Denmark 73,330 100.0 68,907 10,003 2,131 7,405 2,030Estonia 58,382 28.6 2,453 5,249 787 248 6,261Faroe Islands . . . . . . . . . . . . . . . . . . . . .Finland 78,925 65.5 72,700 25,200 5,919 3,959 9,760France 951,260 100.0 773,000 265,000 33,608 86,853 22,840Germany 643,969 100.0 949,306 427,300 33,708 78,582 105,794Gibraltar . . . . . . . . . . . . . . . . . . . . .Greece 116,929 91.8 . . . 28,585 2,552 1,413 538Holy See . . . . . . . . . . . . . . . . . . . . .Hungary 197,519 38.0 20,449 35,373 7,893 5,398 1,000Iceland . . . . . . . . . . . . . . . . . . . . .Ireland 96,424 100.0 . . . 12,787 1,919 1,678 92Isle of Man . . . . . . . . . . . . . . . . . . . . .Italy 487,700 100.0 97,560 192,700 18,011 44,535 12,037
continued . . .
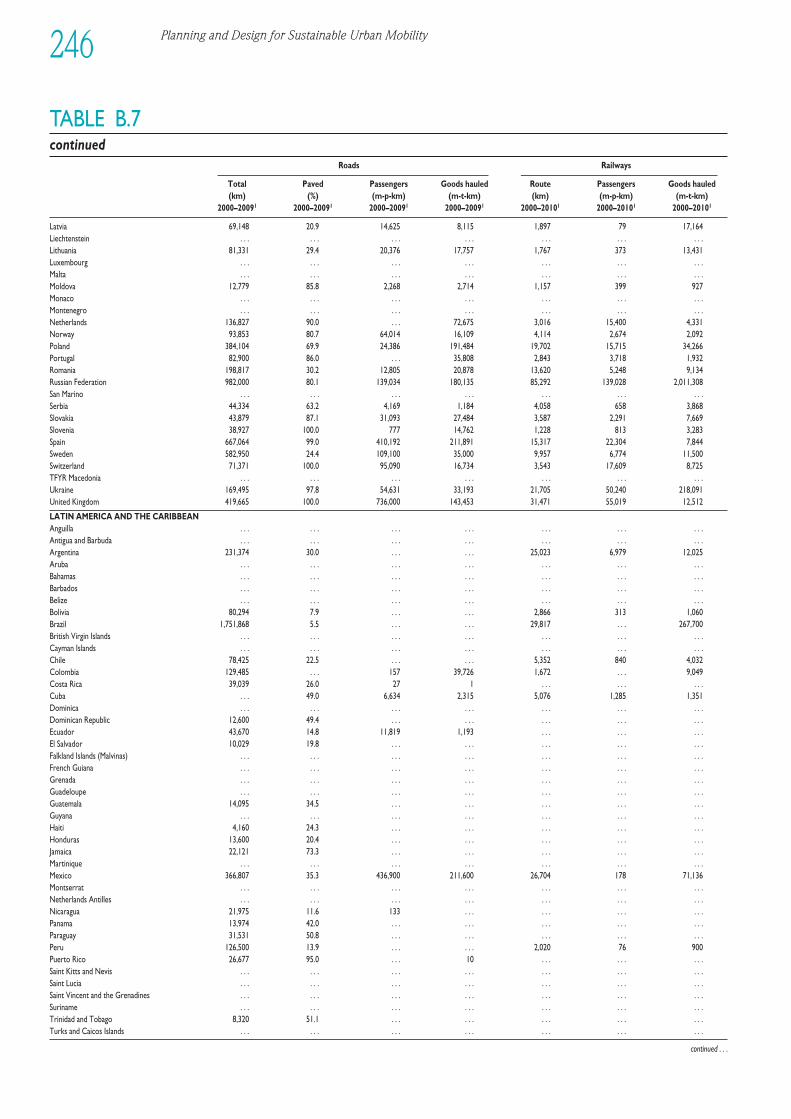
Planning and Design for Sustainable Urban Mobility246
TABLE B.7continued
Roads Railways
Total Paved Passengers Goods hauled Route Passengers Goods hauled(km) (%) (m-p-km) (m-t-km) (km) (m-p-km) (m-t-km)
2000–20091 2000–20091 2000–20091 2000–20091 2000–20101 2000–20101 2000–20101
Latvia 69,148 20.9 14,625 8,115 1,897 79 17,164Liechtenstein . . . . . . . . . . . . . . . . . . . . .Lithuania 81,331 29.4 20,376 17,757 1,767 373 13,431Luxembourg . . . . . . . . . . . . . . . . . . . . .Malta . . . . . . . . . . . . . . . . . . . . .Moldova 12,779 85.8 2,268 2,714 1,157 399 927Monaco . . . . . . . . . . . . . . . . . . . . .Montenegro . . . . . . . . . . . . . . . . . . . . .Netherlands 136,827 90.0 . . . 72,675 3,016 15,400 4,331Norway 93,853 80.7 64,014 16,109 4,114 2,674 2,092Poland 384,104 69.9 24,386 191,484 19,702 15,715 34,266Portugal 82,900 86.0 . . . 35,808 2,843 3,718 1,932Romania 198,817 30.2 12,805 20,878 13,620 5,248 9,134Russian Federation 982,000 80.1 139,034 180,135 85,292 139,028 2,011,308San Marino . . . . . . . . . . . . . . . . . . . . .Serbia 44,334 63.2 4,169 1,184 4,058 658 3,868Slovakia 43,879 87.1 31,093 27,484 3,587 2,291 7,669Slovenia 38,927 100.0 777 14,762 1,228 813 3,283Spain 667,064 99.0 410,192 211,891 15,317 22,304 7,844Sweden 582,950 24.4 109,100 35,000 9,957 6,774 11,500Switzerland 71,371 100.0 95,090 16,734 3,543 17,609 8,725TFYR Macedonia . . . . . . . . . . . . . . . . . . . . .Ukraine 169,495 97.8 54,631 33,193 21,705 50,240 218,091United Kingdom 419,665 100.0 736,000 143,453 31,471 55,019 12,512
LATIN AMERICA AND THE CARIBBEANAnguilla . . . . . . . . . . . . . . . . . . . . .Antigua and Barbuda . . . . . . . . . . . . . . . . . . . . .Argentina 231,374 30.0 . . . . . . 25,023 6,979 12,025Aruba . . . . . . . . . . . . . . . . . . . . .Bahamas . . . . . . . . . . . . . . . . . . . . .Barbados . . . . . . . . . . . . . . . . . . . . .Belize . . . . . . . . . . . . . . . . . . . . .Bolivia 80,294 7.9 . . . . . . 2,866 313 1,060Brazil 1,751,868 5.5 . . . . . . 29,817 . . . 267,700British Virgin Islands . . . . . . . . . . . . . . . . . . . . .Cayman Islands . . . . . . . . . . . . . . . . . . . . .Chile 78,425 22.5 . . . . . . 5,352 840 4,032Colombia 129,485 . . . 157 39,726 1,672 . . . 9,049Costa Rica 39,039 26.0 27 1 . . . . . . . . .Cuba . . . 49.0 6,634 2,315 5,076 1,285 1,351Dominica . . . . . . . . . . . . . . . . . . . . .Dominican Republic 12,600 49.4 . . . . . . . . . . . . . . .Ecuador 43,670 14.8 11,819 1,193 . . . . . . . . .El Salvador 10,029 19.8 . . . . . . . . . . . . . . .Falkland Islands (Malvinas) . . . . . . . . . . . . . . . . . . . . .French Guiana . . . . . . . . . . . . . . . . . . . . .Grenada . . . . . . . . . . . . . . . . . . . . .Guadeloupe . . . . . . . . . . . . . . . . . . . . .Guatemala 14,095 34.5 . . . . . . . . . . . . . . .Guyana . . . . . . . . . . . . . . . . . . . . .Haiti 4,160 24.3 . . . . . . . . . . . . . . .Honduras 13,600 20.4 . . . . . . . . . . . . . . .Jamaica 22,121 73.3 . . . . . . . . . . . . . . .Martinique . . . . . . . . . . . . . . . . . . . . .Mexico 366,807 35.3 436,900 211,600 26,704 178 71,136Montserrat . . . . . . . . . . . . . . . . . . . . .Netherlands Antilles . . . . . . . . . . . . . . . . . . . . .Nicaragua 21,975 11.6 133 . . . . . . . . . . . .Panama 13,974 42.0 . . . . . . . . . . . . . . .Paraguay 31,531 50.8 . . . . . . . . . . . . . . .Peru 126,500 13.9 . . . . . . 2,020 76 900Puerto Rico 26,677 95.0 . . . 10 . . . . . . . . .Saint Kitts and Nevis . . . . . . . . . . . . . . . . . . . . .Saint Lucia . . . . . . . . . . . . . . . . . . . . .Saint Vincent and the Grenadines . . . . . . . . . . . . . . . . . . . . .Suriname . . . . . . . . . . . . . . . . . . . . .Trinidad and Tobago 8,320 51.1 . . . . . . . . . . . . . . .Turks and Caicos Islands . . . . . . . . . . . . . . . . . . . . .
continued . . .
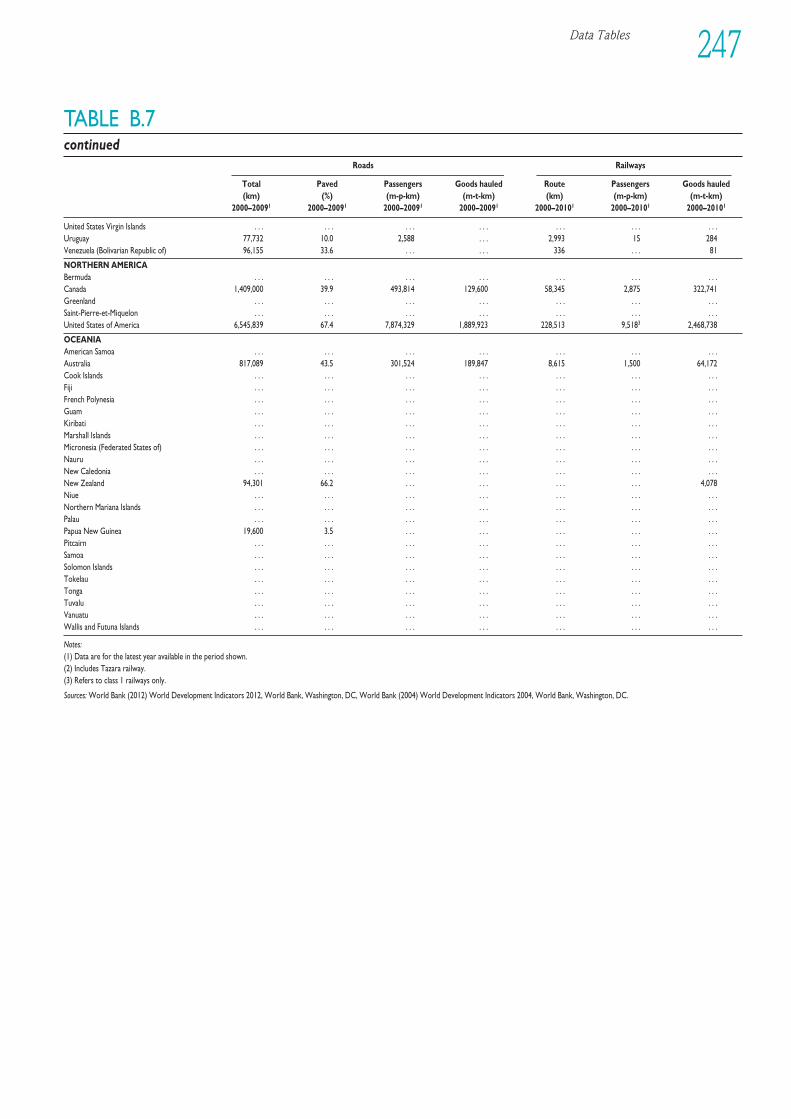
Data Tables 247
TABLE B.7continued
Roads Railways
Total Paved Passengers Goods hauled Route Passengers Goods hauled(km) (%) (m-p-km) (m-t-km) (km) (m-p-km) (m-t-km)
2000–20091 2000–20091 2000–20091 2000–20091 2000–20101 2000–20101 2000–20101
United States Virgin Islands . . . . . . . . . . . . . . . . . . . . .Uruguay 77,732 10.0 2,588 . . . 2,993 15 284Venezuela (Bolivarian Republic of) 96,155 33.6 . . . . . . 336 . . . 81
NORTHERN AMERICABermuda . . . . . . . . . . . . . . . . . . . . .Canada 1,409,000 39.9 493,814 129,600 58,345 2,875 322,741Greenland . . . . . . . . . . . . . . . . . . . . .Saint-Pierre-et-Miquelon . . . . . . . . . . . . . . . . . . . . .United States of America 6,545,839 67.4 7,874,329 1,889,923 228,513 9,5183 2,468,738
OCEANIAAmerican Samoa . . . . . . . . . . . . . . . . . . . . .Australia 817,089 43.5 301,524 189,847 8,615 1,500 64,172Cook Islands . . . . . . . . . . . . . . . . . . . . .Fiji . . . . . . . . . . . . . . . . . . . . .French Polynesia . . . . . . . . . . . . . . . . . . . . .Guam . . . . . . . . . . . . . . . . . . . . .Kiribati . . . . . . . . . . . . . . . . . . . . .Marshall Islands . . . . . . . . . . . . . . . . . . . . .Micronesia (Federated States of) . . . . . . . . . . . . . . . . . . . . .Nauru . . . . . . . . . . . . . . . . . . . . .New Caledonia . . . . . . . . . . . . . . . . . . . . .New Zealand 94,301 66.2 . . . . . . . . . . . . 4,078Niue . . . . . . . . . . . . . . . . . . . . .Northern Mariana Islands . . . . . . . . . . . . . . . . . . . . .Palau . . . . . . . . . . . . . . . . . . . . .Papua New Guinea 19,600 3.5 . . . . . . . . . . . . . . .Pitcairn . . . . . . . . . . . . . . . . . . . . .Samoa . . . . . . . . . . . . . . . . . . . . .Solomon Islands . . . . . . . . . . . . . . . . . . . . .Tokelau . . . . . . . . . . . . . . . . . . . . .Tonga . . . . . . . . . . . . . . . . . . . . .Tuvalu . . . . . . . . . . . . . . . . . . . . .Vanuatu . . . . . . . . . . . . . . . . . . . . .Wallis and Futuna Islands . . . . . . . . . . . . . . . . . . . . .
Notes:(1) Data are for the latest year available in the period shown.(2) Includes Tazara railway.(3) Refers to class 1 railways only.
Sources: World Bank (2012) World Development Indicators 2012, World Bank, Washington, DC, World Bank (2004) World Development Indicators 2004, World Bank, Washington, DC.
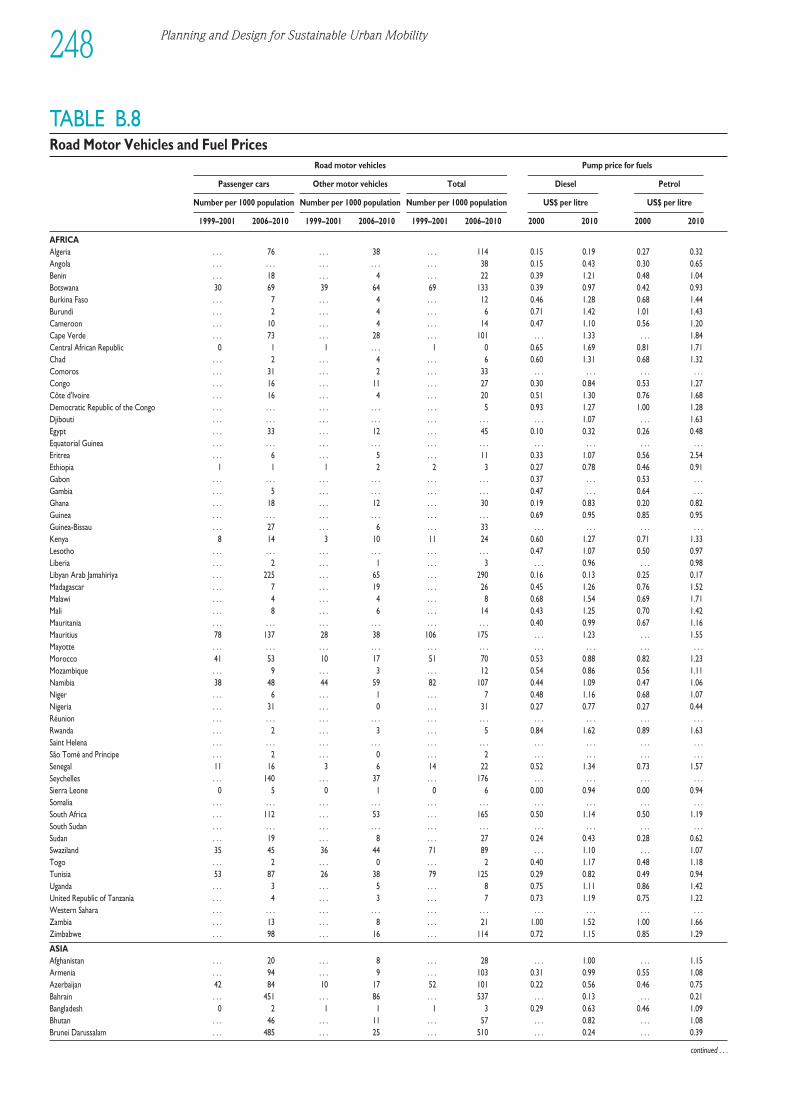
Planning and Design for Sustainable Urban Mobility248
TABLE B.8Road Motor Vehicles and Fuel Prices
Road motor vehicles Pump price for fuels
Passenger cars Other motor vehicles Total Diesel Petrol
Number per 1000 population Number per 1000 population Number per 1000 population US$ per litre US$ per litre
1999–2001 2006–2010 1999–2001 2006–2010 1999–2001 2006–2010 2000 2010 2000 2010
AFRICAAlgeria . . . 76 . . . 38 . . . 114 0.15 0.19 0.27 0.32Angola . . . . . . . . . . . . . . . 38 0.15 0.43 0.30 0.65Benin . . . 18 . . . 4 . . . 22 0.39 1.21 0.48 1.04Botswana 30 69 39 64 69 133 0.39 0.97 0.42 0.93Burkina Faso . . . 7 . . . 4 . . . 12 0.46 1.28 0.68 1.44Burundi . . . 2 . . . 4 . . . 6 0.71 1.42 1.01 1.43Cameroon . . . 10 . . . 4 . . . 14 0.47 1.10 0.56 1.20Cape Verde . . . 73 . . . 28 . . . 101 . . . 1.33 . . . 1.84Central African Republic 0 1 1 . . . 1 0 0.65 1.69 0.81 1.71Chad . . . 2 . . . 4 . . . 6 0.60 1.31 0.68 1.32Comoros . . . 31 . . . 2 . . . 33 . . . . . . . . . . . .Congo . . . 16 . . . 11 . . . 27 0.30 0.84 0.53 1.27Côte d'Ivoire . . . 16 . . . 4 . . . 20 0.51 1.30 0.76 1.68Democratic Republic of the Congo . . . . . . . . . . . . . . . 5 0.93 1.27 1.00 1.28Djibouti . . . . . . . . . . . . . . . . . . . . . 1.07 . . . 1.63Egypt . . . 33 . . . 12 . . . 45 0.10 0.32 0.26 0.48Equatorial Guinea . . . . . . . . . . . . . . . . . . . . . . . . . . . . . .Eritrea . . . 6 . . . 5 . . . 11 0.33 1.07 0.56 2.54Ethiopia 1 1 1 2 2 3 0.27 0.78 0.46 0.91Gabon . . . . . . . . . . . . . . . . . . 0.37 . . . 0.53 . . .Gambia . . . 5 . . . . . . . . . . . . 0.47 . . . 0.64 . . .Ghana . . . 18 . . . 12 . . . 30 0.19 0.83 0.20 0.82Guinea . . . . . . . . . . . . . . . . . . 0.69 0.95 0.85 0.95Guinea-Bissau . . . 27 . . . 6 . . . 33 . . . . . . . . . . . .Kenya 8 14 3 10 11 24 0.60 1.27 0.71 1.33Lesotho . . . . . . . . . . . . . . . . . . 0.47 1.07 0.50 0.97Liberia . . . 2 . . . 1 . . . 3 . . . 0.96 . . . 0.98Libyan Arab Jamahiriya . . . 225 . . . 65 . . . 290 0.16 0.13 0.25 0.17Madagascar . . . 7 . . . 19 . . . 26 0.45 1.26 0.76 1.52Malawi . . . 4 . . . 4 . . . 8 0.68 1.54 0.69 1.71Mali . . . 8 . . . 6 . . . 14 0.43 1.25 0.70 1.42Mauritania . . . . . . . . . . . . . . . . . . 0.40 0.99 0.67 1.16Mauritius 78 137 28 38 106 175 . . . 1.23 . . . 1.55Mayotte . . . . . . . . . . . . . . . . . . . . . . . . . . . . . .Morocco 41 53 10 17 51 70 0.53 0.88 0.82 1.23Mozambique . . . 9 . . . 3 . . . 12 0.54 0.86 0.56 1.11Namibia 38 48 44 59 82 107 0.44 1.09 0.47 1.06Niger . . . 6 . . . 1 . . . 7 0.48 1.16 0.68 1.07Nigeria . . . 31 . . . 0 . . . 31 0.27 0.77 0.27 0.44Réunion . . . . . . . . . . . . . . . . . . . . . . . . . . . . . .Rwanda . . . 2 . . . 3 . . . 5 0.84 1.62 0.89 1.63Saint Helena . . . . . . . . . . . . . . . . . . . . . . . . . . . . . .São Tomé and Príncipe . . . 2 . . . 0 . . . 2 . . . . . . . . . . . .Senegal 11 16 3 6 14 22 0.52 1.34 0.73 1.57Seychelles . . . 140 . . . 37 . . . 176 . . . . . . . . . . . .Sierra Leone 0 5 0 1 0 6 0.00 0.94 0.00 0.94Somalia . . . . . . . . . . . . . . . . . . . . . . . . . . . . . .South Africa . . . 112 . . . 53 . . . 165 0.50 1.14 0.50 1.19South Sudan . . . . . . . . . . . . . . . . . . . . . . . . . . . . . .Sudan . . . 19 . . . 8 . . . 27 0.24 0.43 0.28 0.62Swaziland 35 45 36 44 71 89 . . . 1.10 . . . 1.07Togo . . . 2 . . . 0 . . . 2 0.40 1.17 0.48 1.18Tunisia 53 87 26 38 79 125 0.29 0.82 0.49 0.94Uganda . . . 3 . . . 5 . . . 8 0.75 1.11 0.86 1.42United Republic of Tanzania . . . 4 . . . 3 . . . 7 0.73 1.19 0.75 1.22Western Sahara . . . . . . . . . . . . . . . . . . . . . . . . . . . . . .Zambia . . . 13 . . . 8 . . . 21 1.00 1.52 1.00 1.66Zimbabwe . . . 98 . . . 16 . . . 114 0.72 1.15 0.85 1.29
ASIAAfghanistan . . . 20 . . . 8 . . . 28 . . . 1.00 . . . 1.15Armenia . . . 94 . . . 9 . . . 103 0.31 0.99 0.55 1.08Azerbaijan 42 84 10 17 52 101 0.22 0.56 0.46 0.75Bahrain . . . 451 . . . 86 . . . 537 . . . 0.13 . . . 0.21Bangladesh 0 2 1 1 1 3 0.29 0.63 0.46 1.09Bhutan . . . 46 . . . 11 . . . 57 . . . 0.82 . . . 1.08Brunei Darussalam . . . 485 . . . 25 . . . 510 . . . 0.24 . . . 0.39
continued . . .
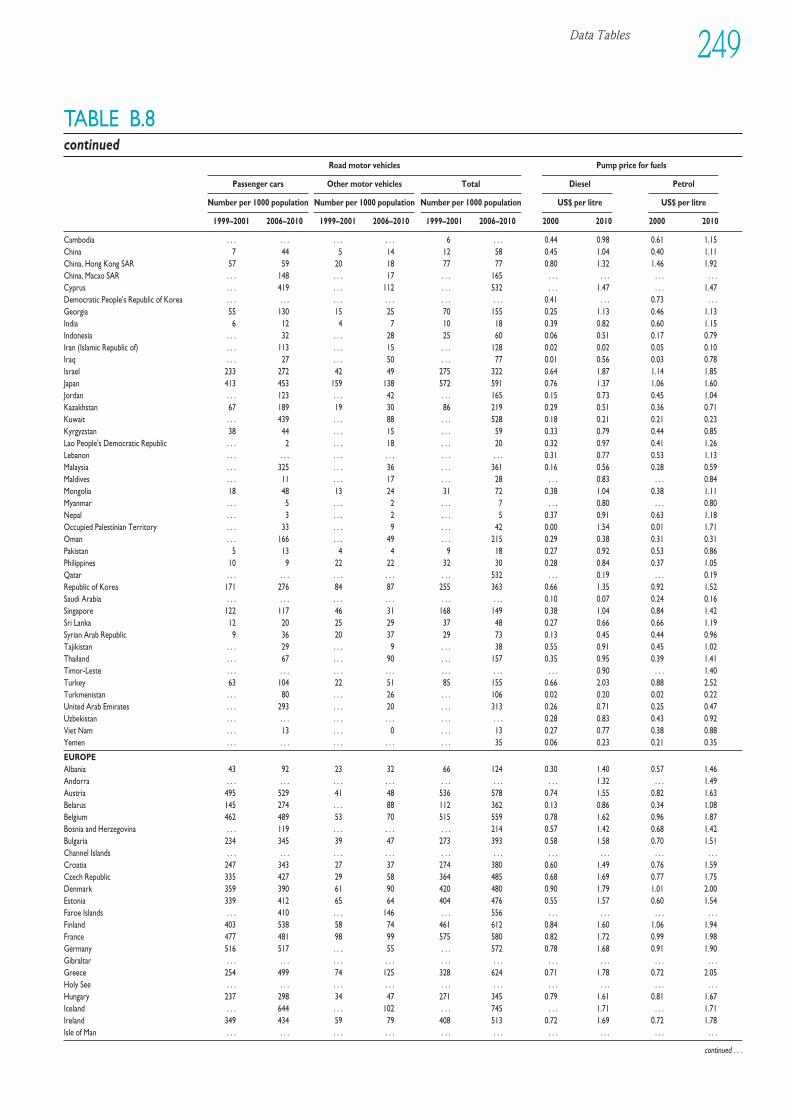
Data Tables 249
TABLE B.8continued
Road motor vehicles Pump price for fuels
Passenger cars Other motor vehicles Total Diesel Petrol
Number per 1000 population Number per 1000 population Number per 1000 population US$ per litre US$ per litre
1999–2001 2006–2010 1999–2001 2006–2010 1999–2001 2006–2010 2000 2010 2000 2010
Cambodia . . . . . . . . . . . . 6 . . . 0.44 0.98 0.61 1.15China 7 44 5 14 12 58 0.45 1.04 0.40 1.11China, Hong Kong SAR 57 59 20 18 77 77 0.80 1.32 1.46 1.92China, Macao SAR . . . 148 . . . 17 . . . 165 . . . . . . . . . . . .Cyprus . . . 419 . . . 112 . . . 532 . . . 1.47 . . . 1.47Democratic People's Republic of Korea . . . . . . . . . . . . . . . . . . 0.41 . . . 0.73 . . .Georgia 55 130 15 25 70 155 0.25 1.13 0.46 1.13India 6 12 4 7 10 18 0.39 0.82 0.60 1.15Indonesia . . . 32 . . . 28 25 60 0.06 0.51 0.17 0.79Iran (Islamic Republic of) . . . 113 . . . 15 . . . 128 0.02 0.02 0.05 0.10Iraq . . . 27 . . . 50 . . . 77 0.01 0.56 0.03 0.78Israel 233 272 42 49 275 322 0.64 1.87 1.14 1.85Japan 413 453 159 138 572 591 0.76 1.37 1.06 1.60Jordan . . . 123 . . . 42 . . . 165 0.15 0.73 0.45 1.04Kazakhstan 67 189 19 30 86 219 0.29 0.51 0.36 0.71Kuwait . . . 439 . . . 88 . . . 528 0.18 0.21 0.21 0.23Kyrgyzstan 38 44 . . . 15 . . . 59 0.33 0.79 0.44 0.85Lao People's Democratic Republic . . . 2 . . . 18 . . . 20 0.32 0.97 0.41 1.26Lebanon . . . . . . . . . . . . . . . . . . 0.31 0.77 0.53 1.13Malaysia . . . 325 . . . 36 . . . 361 0.16 0.56 0.28 0.59Maldives . . . 11 . . . 17 . . . 28 . . . 0.83 . . . 0.84Mongolia 18 48 13 24 31 72 0.38 1.04 0.38 1.11Myanmar . . . 5 . . . 2 . . . 7 . . . 0.80 . . . 0.80Nepal . . . 3 . . . 2 . . . 5 0.37 0.91 0.63 1.18Occupied Palestinian Territory . . . 33 . . . 9 . . . 42 0.00 1.54 0.01 1.71Oman . . . 166 . . . 49 . . . 215 0.29 0.38 0.31 0.31Pakistan 5 13 4 4 9 18 0.27 0.92 0.53 0.86Philippines 10 9 22 22 32 30 0.28 0.84 0.37 1.05Qatar . . . . . . . . . . . . . . . 532 . . . 0.19 . . . 0.19Republic of Korea 171 276 84 87 255 363 0.66 1.35 0.92 1.52Saudi Arabia . . . . . . . . . . . . . . . . . . 0.10 0.07 0.24 0.16Singapore 122 117 46 31 168 149 0.38 1.04 0.84 1.42Sri Lanka 12 20 25 29 37 48 0.27 0.66 0.66 1.19Syrian Arab Republic 9 36 20 37 29 73 0.13 0.45 0.44 0.96Tajikistan . . . 29 . . . 9 . . . 38 0.55 0.91 0.45 1.02Thailand . . . 67 . . . 90 . . . 157 0.35 0.95 0.39 1.41Timor-Leste . . . . . . . . . . . . . . . . . . . . . 0.90 . . . 1.40Turkey 63 104 22 51 85 155 0.66 2.03 0.88 2.52Turkmenistan . . . 80 . . . 26 . . . 106 0.02 0.20 0.02 0.22United Arab Emirates . . . 293 . . . 20 . . . 313 0.26 0.71 0.25 0.47Uzbekistan . . . . . . . . . . . . . . . . . . 0.28 0.83 0.43 0.92Viet Nam . . . 13 . . . 0 . . . 13 0.27 0.77 0.38 0.88Yemen . . . . . . . . . . . . . . . 35 0.06 0.23 0.21 0.35
EUROPEAlbania 43 92 23 32 66 124 0.30 1.40 0.57 1.46Andorra . . . . . . . . . . . . . . . . . . . . . 1.32 . . . 1.49Austria 495 529 41 48 536 578 0.74 1.55 0.82 1.63Belarus 145 274 . . . 88 112 362 0.13 0.86 0.34 1.08Belgium 462 489 53 70 515 559 0.78 1.62 0.96 1.87Bosnia and Herzegovina . . . 119 . . . . . . . . . 214 0.57 1.42 0.68 1.42Bulgaria 234 345 39 47 273 393 0.58 1.58 0.70 1.51Channel Islands . . . . . . . . . . . . . . . . . . . . . . . . . . . . . .Croatia 247 343 27 37 274 380 0.60 1.49 0.76 1.59Czech Republic 335 427 29 58 364 485 0.68 1.69 0.77 1.75Denmark 359 390 61 90 420 480 0.90 1.79 1.01 2.00Estonia 339 412 65 64 404 476 0.55 1.57 0.60 1.54Faroe Islands . . . 410 . . . 146 . . . 556 . . . . . . . . . . . .Finland 403 538 58 74 461 612 0.84 1.60 1.06 1.94France 477 481 98 99 575 580 0.82 1.72 0.99 1.98Germany 516 517 . . . 55 . . . 572 0.78 1.68 0.91 1.90Gibraltar . . . . . . . . . . . . . . . . . . . . . . . . . . . . . .Greece 254 499 74 125 328 624 0.71 1.78 0.72 2.05Holy See . . . . . . . . . . . . . . . . . . . . . . . . . . . . . .Hungary 237 298 34 47 271 345 0.79 1.61 0.81 1.67Iceland . . . 644 . . . 102 . . . 745 . . . 1.71 . . . 1.71Ireland 349 434 59 79 408 513 0.72 1.69 0.72 1.78Isle of Man . . . . . . . . . . . . . . . . . . . . . . . . . . . . . .
continued . . .
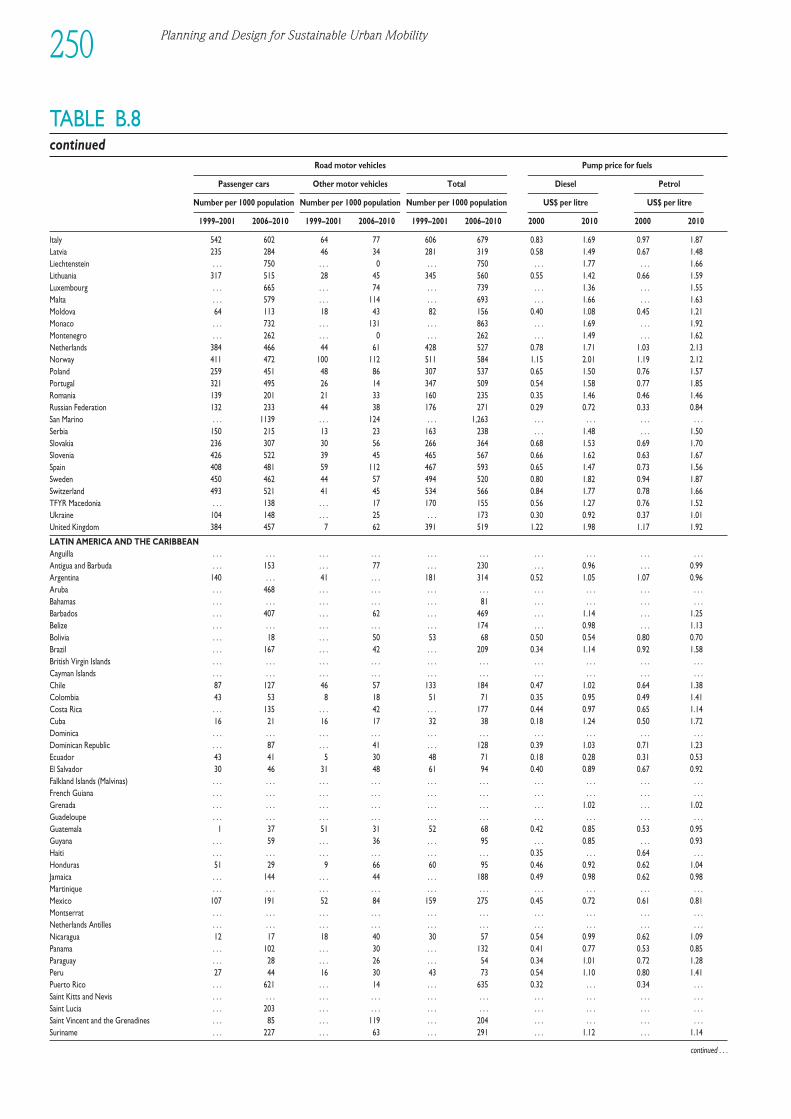
Planning and Design for Sustainable Urban Mobility250
TABLE B.8continued
Road motor vehicles Pump price for fuels
Passenger cars Other motor vehicles Total Diesel Petrol
Number per 1000 population Number per 1000 population Number per 1000 population US$ per litre US$ per litre
1999–2001 2006–2010 1999–2001 2006–2010 1999–2001 2006–2010 2000 2010 2000 2010
Italy 542 602 64 77 606 679 0.83 1.69 0.97 1.87Latvia 235 284 46 34 281 319 0.58 1.49 0.67 1.48Liechtenstein . . . 750 . . . 0 . . . 750 . . . 1.77 . . . 1.66Lithuania 317 515 28 45 345 560 0.55 1.42 0.66 1.59Luxembourg . . . 665 . . . 74 . . . 739 . . . 1.36 . . . 1.55Malta . . . 579 . . . 114 . . . 693 . . . 1.66 . . . 1.63Moldova 64 113 18 43 82 156 0.40 1.08 0.45 1.21Monaco . . . 732 . . . 131 . . . 863 . . . 1.69 . . . 1.92Montenegro . . . 262 . . . 0 . . . 262 . . . 1.49 . . . 1.62Netherlands 384 466 44 61 428 527 0.78 1.71 1.03 2.13Norway 411 472 100 112 511 584 1.15 2.01 1.19 2.12Poland 259 451 48 86 307 537 0.65 1.50 0.76 1.57Portugal 321 495 26 14 347 509 0.54 1.58 0.77 1.85Romania 139 201 21 33 160 235 0.35 1.46 0.46 1.46Russian Federation 132 233 44 38 176 271 0.29 0.72 0.33 0.84San Marino . . . 1139 . . . 124 . . . 1,263 . . . . . . . . . . . .Serbia 150 215 13 23 163 238 . . . 1.48 . . . 1.50Slovakia 236 307 30 56 266 364 0.68 1.53 0.69 1.70Slovenia 426 522 39 45 465 567 0.66 1.62 0.63 1.67Spain 408 481 59 112 467 593 0.65 1.47 0.73 1.56Sweden 450 462 44 57 494 520 0.80 1.82 0.94 1.87Switzerland 493 521 41 45 534 566 0.84 1.77 0.78 1.66TFYR Macedonia . . . 138 . . . 17 170 155 0.56 1.27 0.76 1.52Ukraine 104 148 . . . 25 . . . 173 0.30 0.92 0.37 1.01United Kingdom 384 457 7 62 391 519 1.22 1.98 1.17 1.92
LATIN AMERICA AND THE CARIBBEANAnguilla . . . . . . . . . . . . . . . . . . . . . . . . . . . . . .Antigua and Barbuda . . . 153 . . . 77 . . . 230 . . . 0.96 . . . 0.99Argentina 140 . . . 41 . . . 181 314 0.52 1.05 1.07 0.96Aruba . . . 468 . . . . . . . . . . . . . . . . . . . . . . . .Bahamas . . . . . . . . . . . . . . . 81 . . . . . . . . . . . .Barbados . . . 407 . . . 62 . . . 469 . . . 1.14 . . . 1.25Belize . . . . . . . . . . . . . . . 174 . . . 0.98 . . . 1.13Bolivia . . . 18 . . . 50 53 68 0.50 0.54 0.80 0.70Brazil . . . 167 . . . 42 . . . 209 0.34 1.14 0.92 1.58British Virgin Islands . . . . . . . . . . . . . . . . . . . . . . . . . . . . . .Cayman Islands . . . . . . . . . . . . . . . . . . . . . . . . . . . . . .Chile 87 127 46 57 133 184 0.47 1.02 0.64 1.38Colombia 43 53 8 18 51 71 0.35 0.95 0.49 1.41Costa Rica . . . 135 . . . 42 . . . 177 0.44 0.97 0.65 1.14Cuba 16 21 16 17 32 38 0.18 1.24 0.50 1.72Dominica . . . . . . . . . . . . . . . . . . . . . . . . . . . . . .Dominican Republic . . . 87 . . . 41 . . . 128 0.39 1.03 0.71 1.23Ecuador 43 41 5 30 48 71 0.18 0.28 0.31 0.53El Salvador 30 46 31 48 61 94 0.40 0.89 0.67 0.92Falkland Islands (Malvinas) . . . . . . . . . . . . . . . . . . . . . . . . . . . . . .French Guiana . . . . . . . . . . . . . . . . . . . . . . . . . . . . . .Grenada . . . . . . . . . . . . . . . . . . . . . 1.02 . . . 1.02Guadeloupe . . . . . . . . . . . . . . . . . . . . . . . . . . . . . .Guatemala 1 37 51 31 52 68 0.42 0.85 0.53 0.95Guyana . . . 59 . . . 36 . . . 95 . . . 0.85 . . . 0.93Haiti . . . . . . . . . . . . . . . . . . 0.35 . . . 0.64 . . .Honduras 51 29 9 66 60 95 0.46 0.92 0.62 1.04Jamaica . . . 144 . . . 44 . . . 188 0.49 0.98 0.62 0.98Martinique . . . . . . . . . . . . . . . . . . . . . . . . . . . . . .Mexico 107 191 52 84 159 275 0.45 0.72 0.61 0.81Montserrat . . . . . . . . . . . . . . . . . . . . . . . . . . . . . .Netherlands Antilles . . . . . . . . . . . . . . . . . . . . . . . . . . . . . .Nicaragua 12 17 18 40 30 57 0.54 0.99 0.62 1.09Panama . . . 102 . . . 30 . . . 132 0.41 0.77 0.53 0.85Paraguay . . . 28 . . . 26 . . . 54 0.34 1.01 0.72 1.28Peru 27 44 16 30 43 73 0.54 1.10 0.80 1.41Puerto Rico . . . 621 . . . 14 . . . 635 0.32 . . . 0.34 . . .Saint Kitts and Nevis . . . . . . . . . . . . . . . . . . . . . . . . . . . . . .Saint Lucia . . . 203 . . . . . . . . . . . . . . . . . . . . . . . .Saint Vincent and the Grenadines . . . 85 . . . 119 . . . 204 . . . . . . . . . . . .Suriname . . . 227 . . . 63 . . . 291 . . . 1.12 . . . 1.14
continued . . .
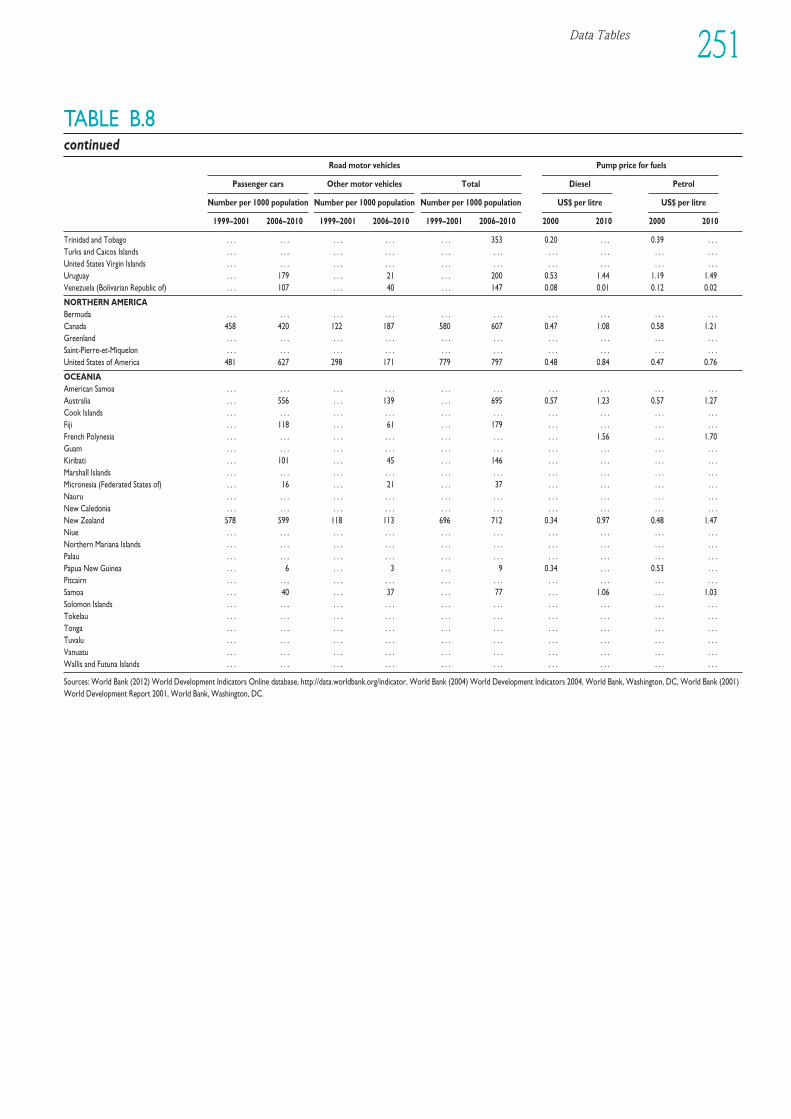
Data Tables 251
TABLE B.8continued
Road motor vehicles Pump price for fuels
Passenger cars Other motor vehicles Total Diesel Petrol
Number per 1000 population Number per 1000 population Number per 1000 population US$ per litre US$ per litre
1999–2001 2006–2010 1999–2001 2006–2010 1999–2001 2006–2010 2000 2010 2000 2010
Trinidad and Tobago . . . . . . . . . . . . . . . 353 0.20 . . . 0.39 . . .Turks and Caicos Islands . . . . . . . . . . . . . . . . . . . . . . . . . . . . . .United States Virgin Islands . . . . . . . . . . . . . . . . . . . . . . . . . . . . . .Uruguay . . . 179 . . . 21 . . . 200 0.53 1.44 1.19 1.49Venezuela (Bolivarian Republic of) . . . 107 . . . 40 . . . 147 0.08 0.01 0.12 0.02
NORTHERN AMERICABermuda . . . . . . . . . . . . . . . . . . . . . . . . . . . . . .Canada 458 420 122 187 580 607 0.47 1.08 0.58 1.21Greenland . . . . . . . . . . . . . . . . . . . . . . . . . . . . . .Saint-Pierre-et-Miquelon . . . . . . . . . . . . . . . . . . . . . . . . . . . . . .United States of America 481 627 298 171 779 797 0.48 0.84 0.47 0.76
OCEANIAAmerican Samoa . . . . . . . . . . . . . . . . . . . . . . . . . . . . . .Australia . . . 556 . . . 139 . . . 695 0.57 1.23 0.57 1.27Cook Islands . . . . . . . . . . . . . . . . . . . . . . . . . . . . . .Fiji . . . 118 . . . 61 . . . 179 . . . . . . . . . . . .French Polynesia . . . . . . . . . . . . . . . . . . . . . 1.56 . . . 1.70Guam . . . . . . . . . . . . . . . . . . . . . . . . . . . . . .Kiribati . . . 101 . . . 45 . . . 146 . . . . . . . . . . . .Marshall Islands . . . . . . . . . . . . . . . . . . . . . . . . . . . . . .Micronesia (Federated States of) . . . 16 . . . 21 . . . 37 . . . . . . . . . . . .Nauru . . . . . . . . . . . . . . . . . . . . . . . . . . . . . .New Caledonia . . . . . . . . . . . . . . . . . . . . . . . . . . . . . .New Zealand 578 599 118 113 696 712 0.34 0.97 0.48 1.47Niue . . . . . . . . . . . . . . . . . . . . . . . . . . . . . .Northern Mariana Islands . . . . . . . . . . . . . . . . . . . . . . . . . . . . . .Palau . . . . . . . . . . . . . . . . . . . . . . . . . . . . . .Papua New Guinea . . . 6 . . . 3 . . . 9 0.34 . . . 0.53 . . .Pitcairn . . . . . . . . . . . . . . . . . . . . . . . . . . . . . .Samoa . . . 40 . . . 37 . . . 77 . . . 1.06 . . . 1.03Solomon Islands . . . . . . . . . . . . . . . . . . . . . . . . . . . . . .Tokelau . . . . . . . . . . . . . . . . . . . . . . . . . . . . . .Tonga . . . . . . . . . . . . . . . . . . . . . . . . . . . . . .Tuvalu . . . . . . . . . . . . . . . . . . . . . . . . . . . . . .Vanuatu . . . . . . . . . . . . . . . . . . . . . . . . . . . . . .Wallis and Futuna Islands . . . . . . . . . . . . . . . . . . . . . . . . . . . . . .
Sources: World Bank (2012) World Development Indicators Online database, http://data.worldbank.org/indicator, World Bank (2004) World Development Indicators 2004, World Bank, Washington, DC, World Bank (2001)World Development Report 2001, World Bank, Washington, DC.
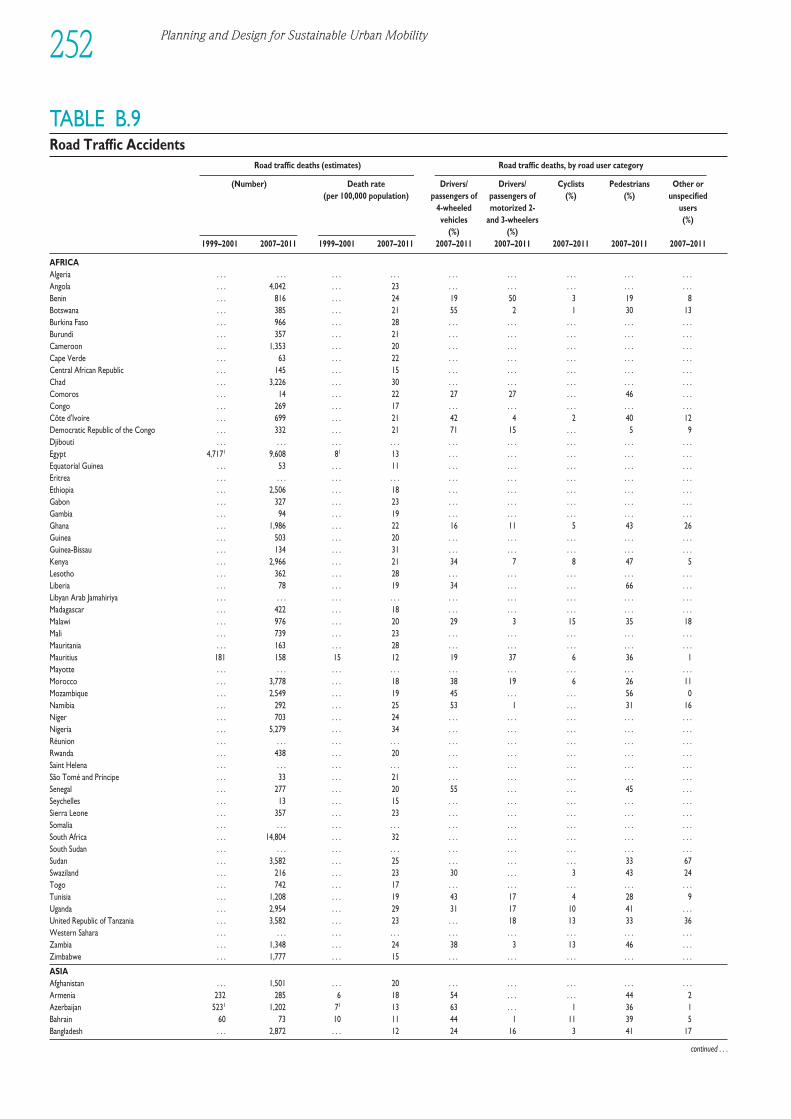
Planning and Design for Sustainable Urban Mobility252
TABLE B.9Road Traffic Accidents
Road traffic deaths (estimates) Road traffic deaths, by road user category
(Number) Death rate Drivers/ Drivers/ Cyclists Pedestrians Other or (per 100,000 population) passengers of passengers of (%) (%) unspecified
4-wheeled motorized 2- usersvehicles and 3-wheelers (%)
(%) (%)1999–2001 2007–2011 1999–2001 2007–2011 2007–2011 2007–2011 2007–2011 2007–2011 2007–2011
AFRICAAlgeria . . . . . . . . . . . . . . . . . . . . . . . . . . .Angola . . . 4,042 . . . 23 . . . . . . . . . . . . . . .Benin . . . 816 . . . 24 19 50 3 19 8Botswana . . . 385 . . . 21 55 2 1 30 13Burkina Faso . . . 966 . . . 28 . . . . . . . . . . . . . . .Burundi . . . 357 . . . 21 . . . . . . . . . . . . . . .Cameroon . . . 1,353 . . . 20 . . . . . . . . . . . . . . .Cape Verde . . . 63 . . . 22 . . . . . . . . . . . . . . .Central African Republic . . . 145 . . . 15 . . . . . . . . . . . . . . .Chad . . . 3,226 . . . 30 . . . . . . . . . . . . . . .Comoros . . . 14 . . . 22 27 27 . . . 46 . . .Congo . . . 269 . . . 17 . . . . . . . . . . . . . . .Côte d'Ivoire . . . 699 . . . 21 42 4 2 40 12Democratic Republic of the Congo . . . 332 . . . 21 71 15 . . . 5 9Djibouti . . . . . . . . . . . . . . . . . . . . . . . . . . .Egypt 4,7171 9,608 81 13 . . . . . . . . . . . . . . .Equatorial Guinea . . . 53 . . . 11 . . . . . . . . . . . . . . .Eritrea . . . . . . . . . . . . . . . . . . . . . . . . . . .Ethiopia . . . 2,506 . . . 18 . . . . . . . . . . . . . . .Gabon . . . 327 . . . 23 . . . . . . . . . . . . . . .Gambia . . . 94 . . . 19 . . . . . . . . . . . . . . .Ghana . . . 1,986 . . . 22 16 11 5 43 26Guinea . . . 503 . . . 20 . . . . . . . . . . . . . . .Guinea-Bissau . . . 134 . . . 31 . . . . . . . . . . . . . . .Kenya . . . 2,966 . . . 21 34 7 8 47 5Lesotho . . . 362 . . . 28 . . . . . . . . . . . . . . .Liberia . . . 78 . . . 19 34 . . . . . . 66 . . .Libyan Arab Jamahiriya . . . . . . . . . . . . . . . . . . . . . . . . . . .Madagascar . . . 422 . . . 18 . . . . . . . . . . . . . . .Malawi . . . 976 . . . 20 29 3 15 35 18Mali . . . 739 . . . 23 . . . . . . . . . . . . . . .Mauritania . . . 163 . . . 28 . . . . . . . . . . . . . . .Mauritius 181 158 15 12 19 37 6 36 1Mayotte . . . . . . . . . . . . . . . . . . . . . . . . . . .Morocco . . . 3,778 . . . 18 38 19 6 26 11Mozambique . . . 2,549 . . . 19 45 . . . . . . 56 0Namibia . . . 292 . . . 25 53 1 . . . 31 16Niger . . . 703 . . . 24 . . . . . . . . . . . . . . .Nigeria . . . 5,279 . . . 34 . . . . . . . . . . . . . . .Réunion . . . . . . . . . . . . . . . . . . . . . . . . . . .Rwanda . . . 438 . . . 20 . . . . . . . . . . . . . . .Saint Helena . . . . . . . . . . . . . . . . . . . . . . . . . . .São Tomé and Príncipe . . . 33 . . . 21 . . . . . . . . . . . . . . .Senegal . . . 277 . . . 20 55 . . . . . . 45 . . .Seychelles . . . 13 . . . 15 . . . . . . . . . . . . . . .Sierra Leone . . . 357 . . . 23 . . . . . . . . . . . . . . .Somalia . . . . . . . . . . . . . . . . . . . . . . . . . . .South Africa . . . 14,804 . . . 32 . . . . . . . . . . . . . . .South Sudan . . . . . . . . . . . . . . . . . . . . . . . . . . .Sudan . . . 3,582 . . . 25 . . . . . . . . . 33 67Swaziland . . . 216 . . . 23 30 . . . 3 43 24Togo . . . 742 . . . 17 . . . . . . . . . . . . . . .Tunisia . . . 1,208 . . . 19 43 17 4 28 9Uganda . . . 2,954 . . . 29 31 17 10 41 . . .United Republic of Tanzania . . . 3,582 . . . 23 . . . 18 13 33 36Western Sahara . . . . . . . . . . . . . . . . . . . . . . . . . . .Zambia . . . 1,348 . . . 24 38 3 13 46 . . .Zimbabwe . . . 1,777 . . . 15 . . . . . . . . . . . . . . .
ASIAAfghanistan . . . 1,501 . . . 20 . . . . . . . . . . . . . . .Armenia 232 285 6 18 54 . . . . . . 44 2Azerbaijan 5231 1,202 71 13 63 . . . 1 36 1Bahrain 60 73 10 11 44 1 11 39 5Bangladesh . . . 2,872 . . . 12 24 16 3 41 17
continued . . .
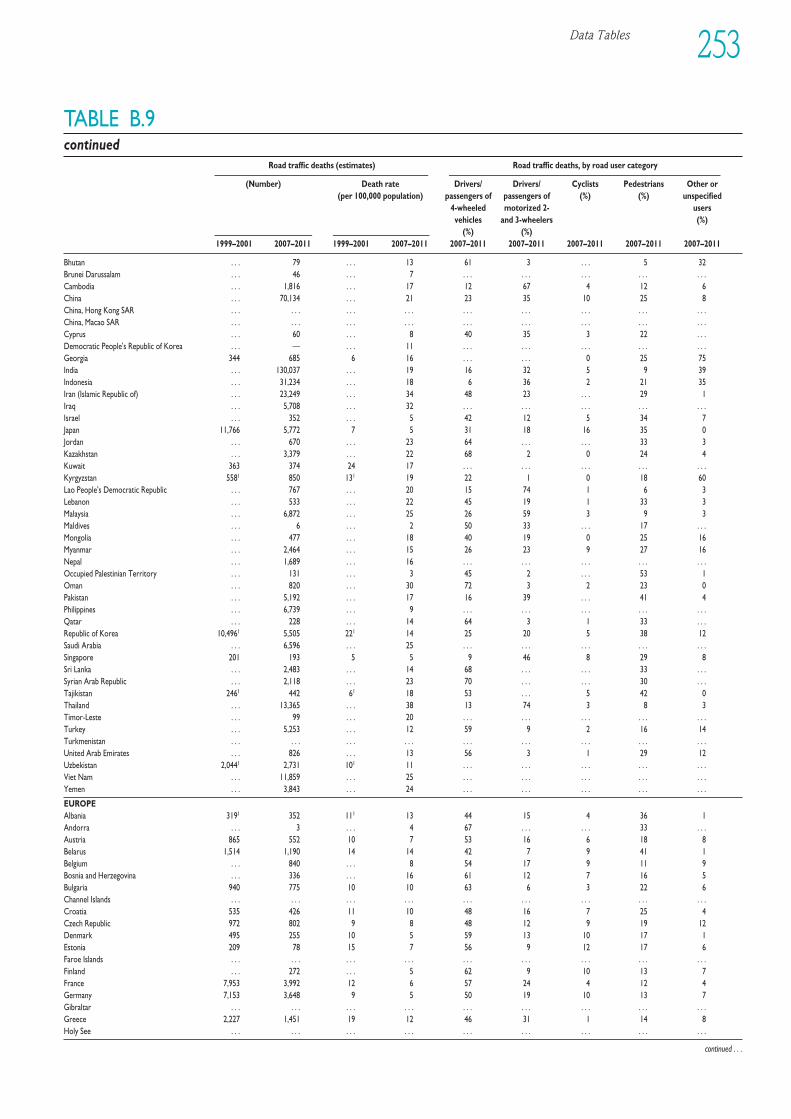
Data Tables 253
TABLE B.9continued
Road traffic deaths (estimates) Road traffic deaths, by road user category
(Number) Death rate Drivers/ Drivers/ Cyclists Pedestrians Other or (per 100,000 population) passengers of passengers of (%) (%) unspecified
4-wheeled motorized 2- usersvehicles and 3-wheelers (%)
(%) (%)1999–2001 2007–2011 1999–2001 2007–2011 2007–2011 2007–2011 2007–2011 2007–2011 2007–2011
Bhutan . . . 79 . . . 13 61 3 . . . 5 32Brunei Darussalam . . . 46 . . . 7 . . . . . . . . . . . . . . .Cambodia . . . 1,816 . . . 17 12 67 4 12 6China . . . 70,134 . . . 21 23 35 10 25 8China, Hong Kong SAR . . . . . . . . . . . . . . . . . . . . . . . . . . .China, Macao SAR . . . . . . . . . . . . . . . . . . . . . . . . . . .Cyprus . . . 60 . . . 8 40 35 3 22 . . .Democratic People's Republic of Korea . . . — . . . 11 . . . . . . . . . . . . . . .Georgia 344 685 6 16 . . . . . . 0 25 75India . . . 130,037 . . . 19 16 32 5 9 39Indonesia . . . 31,234 . . . 18 6 36 2 21 35Iran (Islamic Republic of) . . . 23,249 . . . 34 48 23 . . . 29 1Iraq . . . 5,708 . . . 32 . . . . . . . . . . . . . . .Israel . . . 352 . . . 5 42 12 5 34 7Japan 11,766 5,772 7 5 31 18 16 35 0Jordan . . . 670 . . . 23 64 . . . . . . 33 3Kazakhstan . . . 3,379 . . . 22 68 2 0 24 4Kuwait 363 374 24 17 . . . . . . . . . . . . . . .Kyrgyzstan 5581 850 131 19 22 1 0 18 60Lao People's Democratic Republic . . . 767 . . . 20 15 74 1 6 3Lebanon . . . 533 . . . 22 45 19 1 33 3Malaysia . . . 6,872 . . . 25 26 59 3 9 3Maldives . . . 6 . . . 2 50 33 . . . 17 . . .Mongolia . . . 477 . . . 18 40 19 0 25 16Myanmar . . . 2,464 . . . 15 26 23 9 27 16Nepal . . . 1,689 . . . 16 . . . . . . . . . . . . . . .Occupied Palestinian Territory . . . 131 . . . 3 45 2 . . . 53 1Oman . . . 820 . . . 30 72 3 2 23 0Pakistan . . . 5,192 . . . 17 16 39 . . . 41 4Philippines . . . 6,739 . . . 9 . . . . . . . . . . . . . . .Qatar . . . 228 . . . 14 64 3 1 33 . . .Republic of Korea 10,4961 5,505 221 14 25 20 5 38 12Saudi Arabia . . . 6,596 . . . 25 . . . . . . . . . . . . . . .Singapore 201 193 5 5 9 46 8 29 8Sri Lanka . . . 2,483 . . . 14 68 . . . . . . 33 . . .Syrian Arab Republic . . . 2,118 . . . 23 70 . . . . . . 30 . . .Tajikistan 2461 442 61 18 53 . . . 5 42 0Thailand . . . 13,365 . . . 38 13 74 3 8 3Timor-Leste . . . 99 . . . 20 . . . . . . . . . . . . . . .Turkey . . . 5,253 . . . 12 59 9 2 16 14Turkmenistan . . . . . . . . . . . . . . . . . . . . . . . . . . .United Arab Emirates . . . 826 . . . 13 56 3 1 29 12Uzbekistan 2,0441 2,731 101 11 . . . . . . . . . . . . . . .Viet Nam . . . 11,859 . . . 25 . . . . . . . . . . . . . . .Yemen . . . 3,843 . . . 24 . . . . . . . . . . . . . . .
EUROPEAlbania 3191 352 111 13 44 15 4 36 1Andorra . . . 3 . . . 4 67 . . . . . . 33 . . .Austria 865 552 10 7 53 16 6 18 8Belarus 1,514 1,190 14 14 42 7 9 41 1Belgium . . . 840 . . . 8 54 17 9 11 9Bosnia and Herzegovina . . . 336 . . . 16 61 12 7 16 5Bulgaria 940 775 10 10 63 6 3 22 6Channel Islands . . . . . . . . . . . . . . . . . . . . . . . . . . .Croatia 535 426 11 10 48 16 7 25 4Czech Republic 972 802 9 8 48 12 9 19 12Denmark 495 255 10 5 59 13 10 17 1Estonia 209 78 15 7 56 9 12 17 6Faroe Islands . . . . . . . . . . . . . . . . . . . . . . . . . . .Finland . . . 272 . . . 5 62 9 10 13 7France 7,953 3,992 12 6 57 24 4 12 4Germany 7,153 3,648 9 5 50 19 10 13 7Gibraltar . . . . . . . . . . . . . . . . . . . . . . . . . . .Greece 2,227 1,451 19 12 46 31 1 14 8Holy See . . . . . . . . . . . . . . . . . . . . . . . . . . .
continued . . .
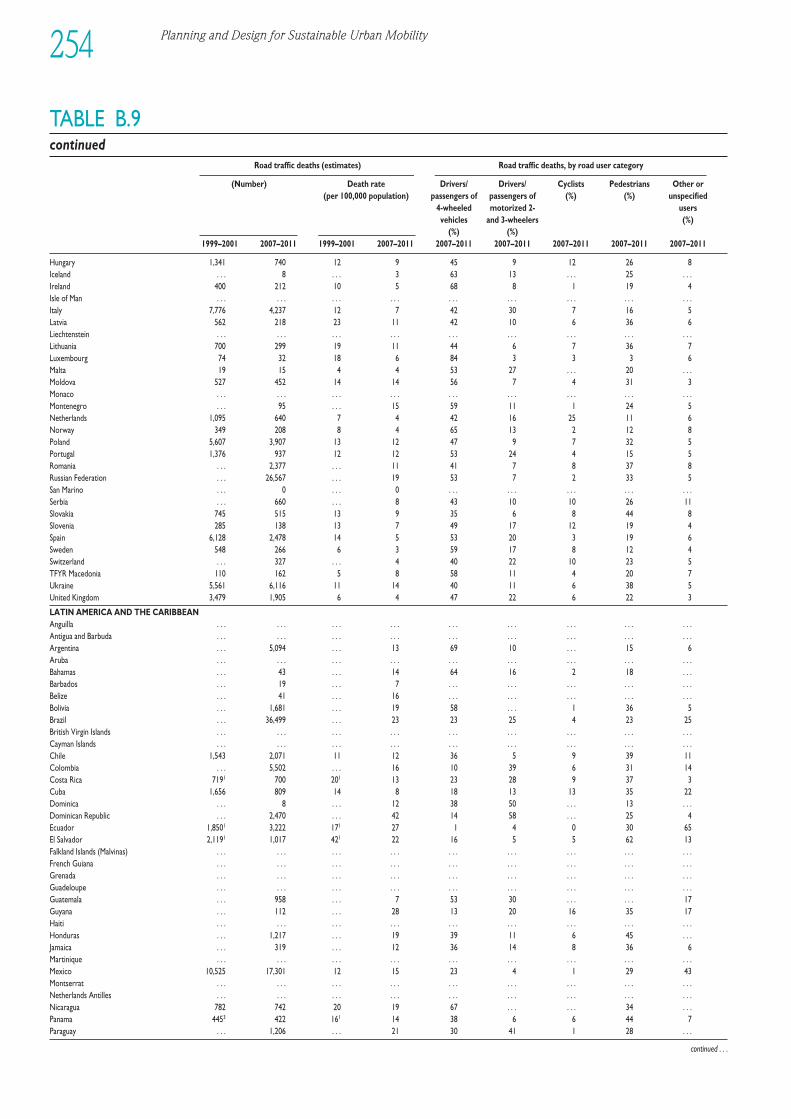
Planning and Design for Sustainable Urban Mobility254
TABLE B.9continued
Road traffic deaths (estimates) Road traffic deaths, by road user category
(Number) Death rate Drivers/ Drivers/ Cyclists Pedestrians Other or (per 100,000 population) passengers of passengers of (%) (%) unspecified
4-wheeled motorized 2- usersvehicles and 3-wheelers (%)
(%) (%)1999–2001 2007–2011 1999–2001 2007–2011 2007–2011 2007–2011 2007–2011 2007–2011 2007–2011
Hungary 1,341 740 12 9 45 9 12 26 8Iceland . . . 8 . . . 3 63 13 . . . 25 . . .Ireland 400 212 10 5 68 8 1 19 4Isle of Man . . . . . . . . . . . . . . . . . . . . . . . . . . .Italy 7,776 4,237 12 7 42 30 7 16 5Latvia 562 218 23 11 42 10 6 36 6Liechtenstein . . . . . . . . . . . . . . . . . . . . . . . . . . .Lithuania 700 299 19 11 44 6 7 36 7Luxembourg 74 32 18 6 84 3 3 3 6Malta 19 15 4 4 53 27 . . . 20 . . .Moldova 527 452 14 14 56 7 4 31 3Monaco . . . . . . . . . . . . . . . . . . . . . . . . . . .Montenegro . . . 95 . . . 15 59 11 1 24 5Netherlands 1,095 640 7 4 42 16 25 11 6Norway 349 208 8 4 65 13 2 12 8Poland 5,607 3,907 13 12 47 9 7 32 5Portugal 1,376 937 12 12 53 24 4 15 5Romania . . . 2,377 . . . 11 41 7 8 37 8Russian Federation . . . 26,567 . . . 19 53 7 2 33 5San Marino . . . 0 . . . 0 . . . . . . . . . . . . . . .Serbia . . . 660 . . . 8 43 10 10 26 11Slovakia 745 515 13 9 35 6 8 44 8Slovenia 285 138 13 7 49 17 12 19 4Spain 6,128 2,478 14 5 53 20 3 19 6Sweden 548 266 6 3 59 17 8 12 4Switzerland . . . 327 . . . 4 40 22 10 23 5TFYR Macedonia 110 162 5 8 58 11 4 20 7Ukraine 5,561 6,116 11 14 40 11 6 38 5United Kingdom 3,479 1,905 6 4 47 22 6 22 3
LATIN AMERICA AND THE CARIBBEANAnguilla . . . . . . . . . . . . . . . . . . . . . . . . . . .Antigua and Barbuda . . . . . . . . . . . . . . . . . . . . . . . . . . .Argentina . . . 5,094 . . . 13 69 10 . . . 15 6Aruba . . . . . . . . . . . . . . . . . . . . . . . . . . .Bahamas . . . 43 . . . 14 64 16 2 18 . . .Barbados . . . 19 . . . 7 . . . . . . . . . . . . . . .Belize . . . 41 . . . 16 . . . . . . . . . . . . . . .Bolivia . . . 1,681 . . . 19 58 . . . 1 36 5Brazil . . . 36,499 . . . 23 23 25 4 23 25British Virgin Islands . . . . . . . . . . . . . . . . . . . . . . . . . . .Cayman Islands . . . . . . . . . . . . . . . . . . . . . . . . . . .Chile 1,543 2,071 11 12 36 5 9 39 11Colombia . . . 5,502 . . . 16 10 39 6 31 14Costa Rica 7191 700 201 13 23 28 9 37 3Cuba 1,656 809 14 8 18 13 13 35 22Dominica . . . 8 . . . 12 38 50 . . . 13 . . .Dominican Republic . . . 2,470 . . . 42 14 58 . . . 25 4Ecuador 1,8501 3,222 171 27 1 4 0 30 65El Salvador 2,1191 1,017 421 22 16 5 5 62 13Falkland Islands (Malvinas) . . . . . . . . . . . . . . . . . . . . . . . . . . .French Guiana . . . . . . . . . . . . . . . . . . . . . . . . . . .Grenada . . . . . . . . . . . . . . . . . . . . . . . . . . .Guadeloupe . . . . . . . . . . . . . . . . . . . . . . . . . . .Guatemala . . . 958 . . . 7 53 30 . . . . . . 17Guyana . . . 112 . . . 28 13 20 16 35 17Haiti . . . . . . . . . . . . . . . . . . . . . . . . . . .Honduras . . . 1,217 . . . 19 39 11 6 45 . . .Jamaica . . . 319 . . . 12 36 14 8 36 6Martinique . . . . . . . . . . . . . . . . . . . . . . . . . . .Mexico 10,525 17,301 12 15 23 4 1 29 43Montserrat . . . . . . . . . . . . . . . . . . . . . . . . . . .Netherlands Antilles . . . . . . . . . . . . . . . . . . . . . . . . . . .Nicaragua 782 742 20 19 67 . . . . . . 34 . . .Panama 4453 422 161 14 38 6 6 44 7Paraguay . . . 1,206 . . . 21 30 41 1 28 . . .
continued . . .
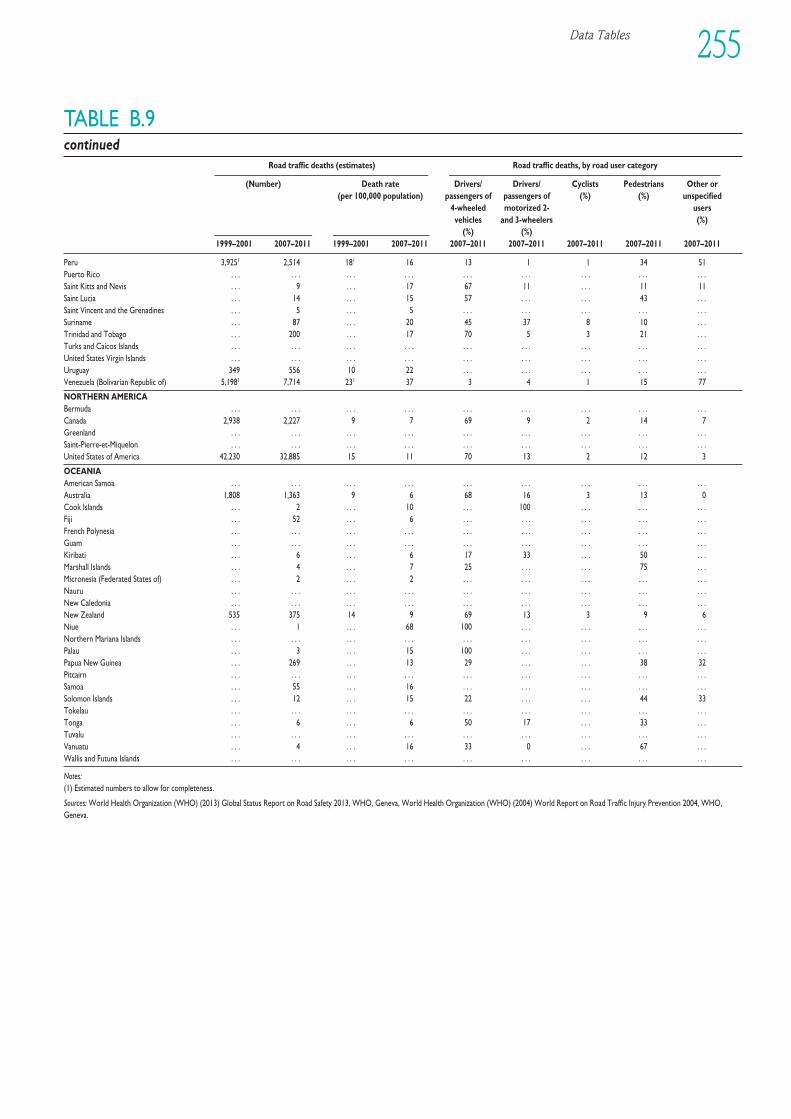
Data Tables 255
TABLE B.9continued
Road traffic deaths (estimates) Road traffic deaths, by road user category
(Number) Death rate Drivers/ Drivers/ Cyclists Pedestrians Other or (per 100,000 population) passengers of passengers of (%) (%) unspecified
4-wheeled motorized 2- usersvehicles and 3-wheelers (%)
(%) (%)1999–2001 2007–2011 1999–2001 2007–2011 2007–2011 2007–2011 2007–2011 2007–2011 2007–2011
Peru 3,9251 2,514 181 16 13 1 1 34 51Puerto Rico . . . . . . . . . . . . . . . . . . . . . . . . . . .Saint Kitts and Nevis . . . 9 . . . 17 67 11 . . . 11 11Saint Lucia . . . 14 . . . 15 57 . . . . . . 43 . . .Saint Vincent and the Grenadines . . . 5 . . . 5 . . . . . . . . . . . . . . .Suriname . . . 87 . . . 20 45 37 8 10 . . .Trinidad and Tobago . . . 200 . . . 17 70 5 3 21 . . .Turks and Caicos Islands . . . . . . . . . . . . . . . . . . . . . . . . . . .United States Virgin Islands . . . . . . . . . . . . . . . . . . . . . . . . . . .Uruguay 349 556 10 22 . . . . . . . . . . . . . . .Venezuela (Bolivarian Republic of) 5,1981 7,714 231 37 3 4 1 15 77
NORTHERN AMERICABermuda . . . . . . . . . . . . . . . . . . . . . . . . . . .Canada 2,938 2,227 9 7 69 9 2 14 7Greenland . . . . . . . . . . . . . . . . . . . . . . . . . . .Saint-Pierre-et-Miquelon . . . . . . . . . . . . . . . . . . . . . . . . . . .United States of America 42,230 32,885 15 11 70 13 2 12 3
OCEANIAAmerican Samoa . . . . . . . . . . . . . . . . . . . . . . . . . . .Australia 1,808 1,363 9 6 68 16 3 13 0Cook Islands . . . 2 . . . 10 . . . 100 . . . . . . . . .Fiji . . . 52 . . . 6 . . . . . . . . . . . . . . .French Polynesia . . . . . . . . . . . . . . . . . . . . . . . . . . .Guam . . . . . . . . . . . . . . . . . . . . . . . . . . .Kiribati . . . 6 . . . 6 17 33 . . . 50 . . .Marshall Islands . . . 4 . . . 7 25 . . . . . . 75 . . .Micronesia (Federated States of) . . . 2 . . . 2 . . . . . . . . . . . . . . .Nauru . . . . . . . . . . . . . . . . . . . . . . . . . . .New Caledonia . . . . . . . . . . . . . . . . . . . . . . . . . . .New Zealand 535 375 14 9 69 13 3 9 6Niue . . . 1 . . . 68 100 . . . . . . . . . . . .Northern Mariana Islands . . . . . . . . . . . . . . . . . . . . . . . . . . .Palau . . . 3 . . . 15 100 . . . . . . . . . . . .Papua New Guinea . . . 269 . . . 13 29 . . . . . . 38 32Pitcairn . . . . . . . . . . . . . . . . . . . . . . . . . . .Samoa . . . 55 . . . 16 . . . . . . . . . . . . . . .Solomon Islands . . . 12 . . . 15 22 . . . . . . 44 33Tokelau . . . . . . . . . . . . . . . . . . . . . . . . . . .Tonga . . . 6 . . . 6 50 17 . . . 33 . . .Tuvalu . . . . . . . . . . . . . . . . . . . . . . . . . . .Vanuatu . . . 4 . . . 16 33 0 . . . 67 . . .Wallis and Futuna Islands . . . . . . . . . . . . . . . . . . . . . . . . . . .
Notes:(1) Estimated numbers to allow for completeness.
Sources: World Health Organization (WHO) (2013) Global Status Report on Road Safety 2013, WHO, Geneva, World Health Organization (WHO) (2004) World Report on Road Traffic Injury Prevention 2004, WHO,Geneva.
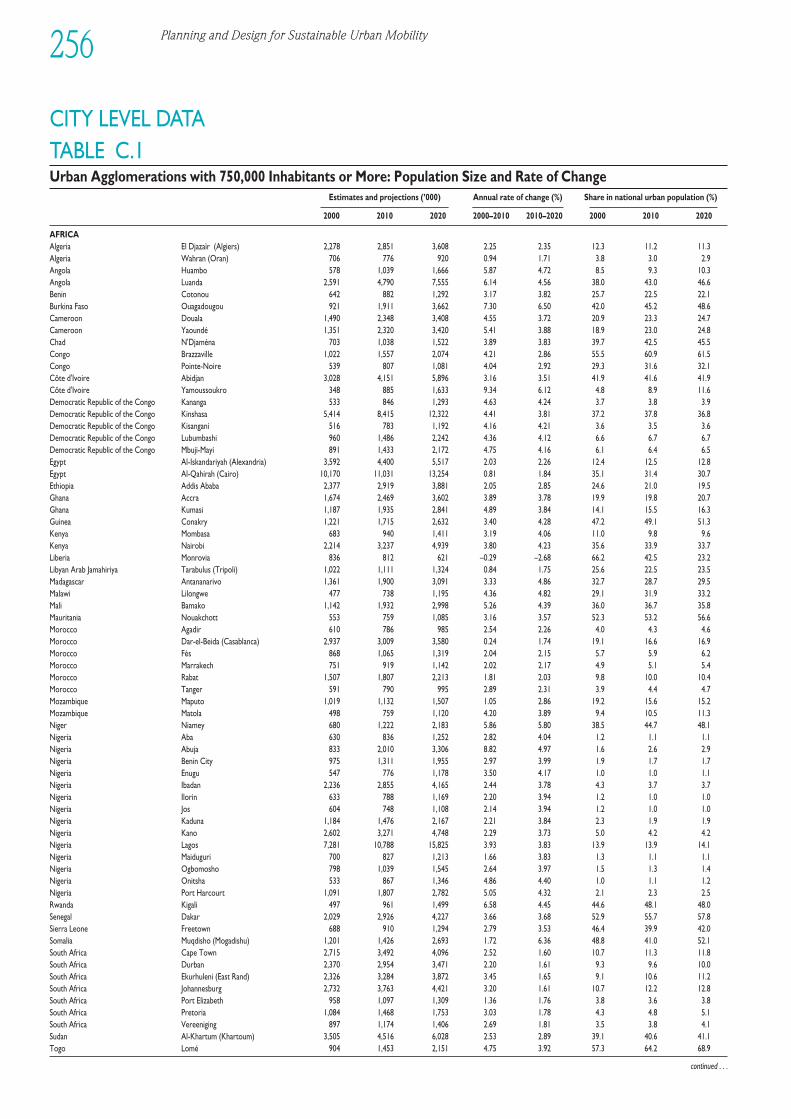
Planning and Design for Sustainable Urban Mobility256
CITY LEVEL DATATABLE C.1Urban Agglomerations with 750,000 Inhabitants or More: Population Size and Rate of Change
Estimates and projections (’000) Annual rate of change (%) Share in national urban population (%)
2000 2010 2020 2000–2010 2010–2020 2000 2010 2020
AFRICAAlgeria El Djazaïr (Algiers) 2,278 2,851 3,608 2.25 2.35 12.3 11.2 11.3Algeria Wahran (Oran) 706 776 920 0.94 1.71 3.8 3.0 2.9Angola Huambo 578 1,039 1,666 5.87 4.72 8.5 9.3 10.3Angola Luanda 2,591 4,790 7,555 6.14 4.56 38.0 43.0 46.6Benin Cotonou 642 882 1,292 3.17 3.82 25.7 22.5 22.1Burkina Faso Ouagadougou 921 1,911 3,662 7.30 6.50 42.0 45.2 48.6Cameroon Douala 1,490 2,348 3,408 4.55 3.72 20.9 23.3 24.7Cameroon Yaoundé 1,351 2,320 3,420 5.41 3.88 18.9 23.0 24.8Chad N'Djaména 703 1,038 1,522 3.89 3.83 39.7 42.5 45.5Congo Brazzaville 1,022 1,557 2,074 4.21 2.86 55.5 60.9 61.5Congo Pointe-Noire 539 807 1,081 4.04 2.92 29.3 31.6 32.1Côte d'Ivoire Abidjan 3,028 4,151 5,896 3.16 3.51 41.9 41.6 41.9Côte d'Ivoire Yamoussoukro 348 885 1,633 9.34 6.12 4.8 8.9 11.6Democratic Republic of the Congo Kananga 533 846 1,293 4.63 4.24 3.7 3.8 3.9Democratic Republic of the Congo Kinshasa 5,414 8,415 12,322 4.41 3.81 37.2 37.8 36.8Democratic Republic of the Congo Kisangani 516 783 1,192 4.16 4.21 3.6 3.5 3.6Democratic Republic of the Congo Lubumbashi 960 1,486 2,242 4.36 4.12 6.6 6.7 6.7Democratic Republic of the Congo Mbuji-Mayi 891 1,433 2,172 4.75 4.16 6.1 6.4 6.5Egypt Al-Iskandariyah (Alexandria) 3,592 4,400 5,517 2.03 2.26 12.4 12.5 12.8Egypt Al-Qahirah (Cairo) 10,170 11,031 13,254 0.81 1.84 35.1 31.4 30.7Ethiopia Addis Ababa 2,377 2,919 3,881 2.05 2.85 24.6 21.0 19.5Ghana Accra 1,674 2,469 3,602 3.89 3.78 19.9 19.8 20.7Ghana Kumasi 1,187 1,935 2,841 4.89 3.84 14.1 15.5 16.3Guinea Conakry 1,221 1,715 2,632 3.40 4.28 47.2 49.1 51.3Kenya Mombasa 683 940 1,411 3.19 4.06 11.0 9.8 9.6Kenya Nairobi 2,214 3,237 4,939 3.80 4.23 35.6 33.9 33.7Liberia Monrovia 836 812 621 –0.29 –2.68 66.2 42.5 23.2Libyan Arab Jamahiriya Tarabulus (Tripoli) 1,022 1,111 1,324 0.84 1.75 25.6 22.5 23.5Madagascar Antananarivo 1,361 1,900 3,091 3.33 4.86 32.7 28.7 29.5Malawi Lilongwe 477 738 1,195 4.36 4.82 29.1 31.9 33.2Mali Bamako 1,142 1,932 2,998 5.26 4.39 36.0 36.7 35.8Mauritania Nouakchott 553 759 1,085 3.16 3.57 52.3 53.2 56.6Morocco Agadir 610 786 985 2.54 2.26 4.0 4.3 4.6Morocco Dar-el-Beida (Casablanca) 2,937 3,009 3,580 0.24 1.74 19.1 16.6 16.9Morocco Fès 868 1,065 1,319 2.04 2.15 5.7 5.9 6.2Morocco Marrakech 751 919 1,142 2.02 2.17 4.9 5.1 5.4Morocco Rabat 1,507 1,807 2,213 1.81 2.03 9.8 10.0 10.4Morocco Tanger 591 790 995 2.89 2.31 3.9 4.4 4.7Mozambique Maputo 1,019 1,132 1,507 1.05 2.86 19.2 15.6 15.2Mozambique Matola 498 759 1,120 4.20 3.89 9.4 10.5 11.3Niger Niamey 680 1,222 2,183 5.86 5.80 38.5 44.7 48.1Nigeria Aba 630 836 1,252 2.82 4.04 1.2 1.1 1.1Nigeria Abuja 833 2,010 3,306 8.82 4.97 1.6 2.6 2.9Nigeria Benin City 975 1,311 1,955 2.97 3.99 1.9 1.7 1.7Nigeria Enugu 547 776 1,178 3.50 4.17 1.0 1.0 1.1Nigeria Ibadan 2,236 2,855 4,165 2.44 3.78 4.3 3.7 3.7Nigeria Ilorin 633 788 1,169 2.20 3.94 1.2 1.0 1.0Nigeria Jos 604 748 1,108 2.14 3.94 1.2 1.0 1.0Nigeria Kaduna 1,184 1,476 2,167 2.21 3.84 2.3 1.9 1.9Nigeria Kano 2,602 3,271 4,748 2.29 3.73 5.0 4.2 4.2Nigeria Lagos 7,281 10,788 15,825 3.93 3.83 13.9 13.9 14.1Nigeria Maiduguri 700 827 1,213 1.66 3.83 1.3 1.1 1.1Nigeria Ogbomosho 798 1,039 1,545 2.64 3.97 1.5 1.3 1.4Nigeria Onitsha 533 867 1,346 4.86 4.40 1.0 1.1 1.2Nigeria Port Harcourt 1,091 1,807 2,782 5.05 4.32 2.1 2.3 2.5Rwanda Kigali 497 961 1,499 6.58 4.45 44.6 48.1 48.0Senegal Dakar 2,029 2,926 4,227 3.66 3.68 52.9 55.7 57.8Sierra Leone Freetown 688 910 1,294 2.79 3.53 46.4 39.9 42.0Somalia Muqdisho (Mogadishu) 1,201 1,426 2,693 1.72 6.36 48.8 41.0 52.1South Africa Cape Town 2,715 3,492 4,096 2.52 1.60 10.7 11.3 11.8South Africa Durban 2,370 2,954 3,471 2.20 1.61 9.3 9.6 10.0South Africa Ekurhuleni (East Rand) 2,326 3,284 3,872 3.45 1.65 9.1 10.6 11.2South Africa Johannesburg 2,732 3,763 4,421 3.20 1.61 10.7 12.2 12.8South Africa Port Elizabeth 958 1,097 1,309 1.36 1.76 3.8 3.6 3.8South Africa Pretoria 1,084 1,468 1,753 3.03 1.78 4.3 4.8 5.1South Africa Vereeniging 897 1,174 1,406 2.69 1.81 3.5 3.8 4.1Sudan Al-Khartum (Khartoum) 3,505 4,516 6,028 2.53 2.89 39.1 40.6 41.1Togo Lomé 904 1,453 2,151 4.75 3.92 57.3 64.2 68.9
continued . . .
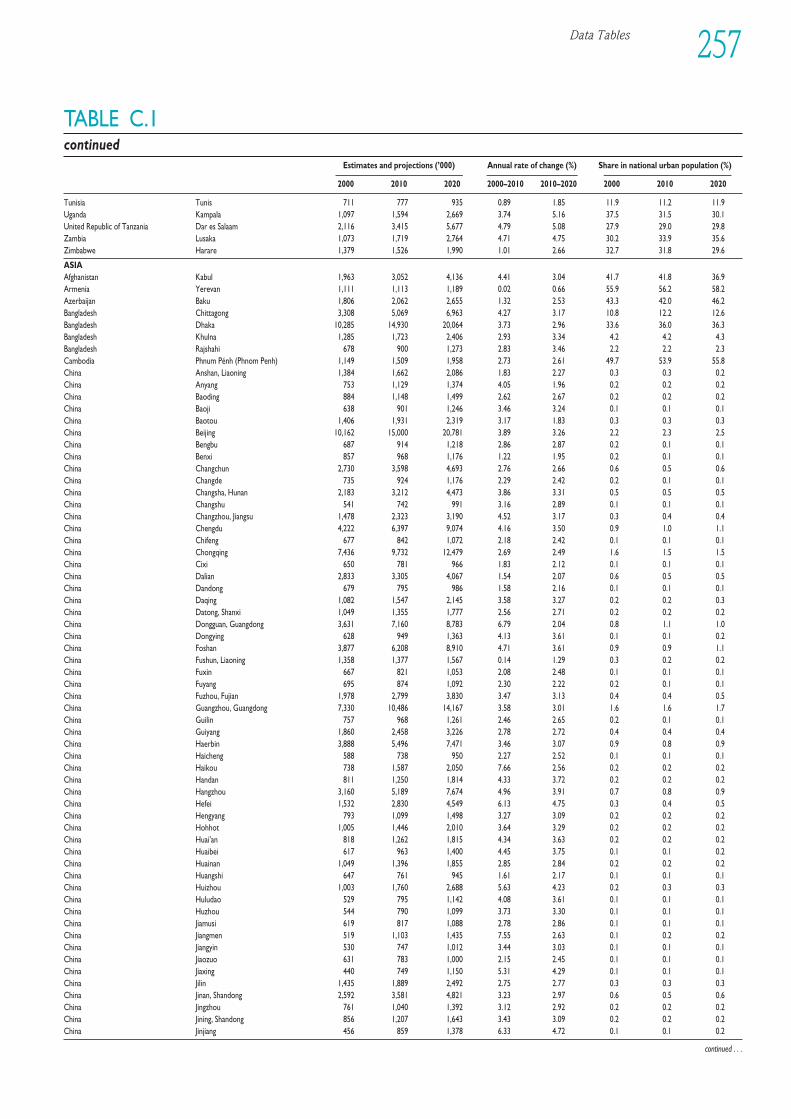
Data Tables 257
TABLE C.1continued
Estimates and projections (’000) Annual rate of change (%) Share in national urban population (%)
2000 2010 2020 2000–2010 2010–2020 2000 2010 2020
Tunisia Tunis 711 777 935 0.89 1.85 11.9 11.2 11.9Uganda Kampala 1,097 1,594 2,669 3.74 5.16 37.5 31.5 30.1United Republic of Tanzania Dar es Salaam 2,116 3,415 5,677 4.79 5.08 27.9 29.0 29.8Zambia Lusaka 1,073 1,719 2,764 4.71 4.75 30.2 33.9 35.6Zimbabwe Harare 1,379 1,526 1,990 1.01 2.66 32.7 31.8 29.6
ASIAAfghanistan Kabul 1,963 3,052 4,136 4.41 3.04 41.7 41.8 36.9Armenia Yerevan 1,111 1,113 1,189 0.02 0.66 55.9 56.2 58.2Azerbaijan Baku 1,806 2,062 2,655 1.32 2.53 43.3 42.0 46.2Bangladesh Chittagong 3,308 5,069 6,963 4.27 3.17 10.8 12.2 12.6Bangladesh Dhaka 10,285 14,930 20,064 3.73 2.96 33.6 36.0 36.3Bangladesh Khulna 1,285 1,723 2,406 2.93 3.34 4.2 4.2 4.3Bangladesh Rajshahi 678 900 1,273 2.83 3.46 2.2 2.2 2.3Cambodia Phnum Pénh (Phnom Penh) 1,149 1,509 1,958 2.73 2.61 49.7 53.9 55.8China Anshan, Liaoning 1,384 1,662 2,086 1.83 2.27 0.3 0.3 0.2China Anyang 753 1,129 1,374 4.05 1.96 0.2 0.2 0.2China Baoding 884 1,148 1,499 2.62 2.67 0.2 0.2 0.2China Baoji 638 901 1,246 3.46 3.24 0.1 0.1 0.1China Baotou 1,406 1,931 2,319 3.17 1.83 0.3 0.3 0.3China Beijing 10,162 15,000 20,781 3.89 3.26 2.2 2.3 2.5China Bengbu 687 914 1,218 2.86 2.87 0.2 0.1 0.1China Benxi 857 968 1,176 1.22 1.95 0.2 0.1 0.1China Changchun 2,730 3,598 4,693 2.76 2.66 0.6 0.5 0.6China Changde 735 924 1,176 2.29 2.42 0.2 0.1 0.1China Changsha, Hunan 2,183 3,212 4,473 3.86 3.31 0.5 0.5 0.5China Changshu 541 742 991 3.16 2.89 0.1 0.1 0.1China Changzhou, Jiangsu 1,478 2,323 3,190 4.52 3.17 0.3 0.4 0.4China Chengdu 4,222 6,397 9,074 4.16 3.50 0.9 1.0 1.1China Chifeng 677 842 1,072 2.18 2.42 0.1 0.1 0.1China Chongqing 7,436 9,732 12,479 2.69 2.49 1.6 1.5 1.5China Cixi 650 781 966 1.83 2.12 0.1 0.1 0.1China Dalian 2,833 3,305 4,067 1.54 2.07 0.6 0.5 0.5China Dandong 679 795 986 1.58 2.16 0.1 0.1 0.1China Daqing 1,082 1,547 2,145 3.58 3.27 0.2 0.2 0.3China Datong, Shanxi 1,049 1,355 1,777 2.56 2.71 0.2 0.2 0.2China Dongguan, Guangdong 3,631 7,160 8,783 6.79 2.04 0.8 1.1 1.0China Dongying 628 949 1,363 4.13 3.61 0.1 0.1 0.2China Foshan 3,877 6,208 8,910 4.71 3.61 0.9 0.9 1.1China Fushun, Liaoning 1,358 1,377 1,567 0.14 1.29 0.3 0.2 0.2China Fuxin 667 821 1,053 2.08 2.48 0.1 0.1 0.1China Fuyang 695 874 1,092 2.30 2.22 0.2 0.1 0.1China Fuzhou, Fujian 1,978 2,799 3,830 3.47 3.13 0.4 0.4 0.5China Guangzhou, Guangdong 7,330 10,486 14,167 3.58 3.01 1.6 1.6 1.7China Guilin 757 968 1,261 2.46 2.65 0.2 0.1 0.1China Guiyang 1,860 2,458 3,226 2.78 2.72 0.4 0.4 0.4China Haerbin 3,888 5,496 7,471 3.46 3.07 0.9 0.8 0.9China Haicheng 588 738 950 2.27 2.52 0.1 0.1 0.1China Haikou 738 1,587 2,050 7.66 2.56 0.2 0.2 0.2China Handan 811 1,250 1,814 4.33 3.72 0.2 0.2 0.2China Hangzhou 3,160 5,189 7,674 4.96 3.91 0.7 0.8 0.9China Hefei 1,532 2,830 4,549 6.13 4.75 0.3 0.4 0.5China Hengyang 793 1,099 1,498 3.27 3.09 0.2 0.2 0.2China Hohhot 1,005 1,446 2,010 3.64 3.29 0.2 0.2 0.2China Huai'an 818 1,262 1,815 4.34 3.63 0.2 0.2 0.2China Huaibei 617 963 1,400 4.45 3.75 0.1 0.1 0.2China Huainan 1,049 1,396 1,855 2.85 2.84 0.2 0.2 0.2China Huangshi 647 761 945 1.61 2.17 0.1 0.1 0.1China Huizhou 1,003 1,760 2,688 5.63 4.23 0.2 0.3 0.3China Huludao 529 795 1,142 4.08 3.61 0.1 0.1 0.1China Huzhou 544 790 1,099 3.73 3.30 0.1 0.1 0.1China Jiamusi 619 817 1,088 2.78 2.86 0.1 0.1 0.1China Jiangmen 519 1,103 1,435 7.55 2.63 0.1 0.2 0.2China Jiangyin 530 747 1,012 3.44 3.03 0.1 0.1 0.1China Jiaozuo 631 783 1,000 2.15 2.45 0.1 0.1 0.1China Jiaxing 440 749 1,150 5.31 4.29 0.1 0.1 0.1China Jilin 1,435 1,889 2,492 2.75 2.77 0.3 0.3 0.3China Jinan, Shandong 2,592 3,581 4,821 3.23 2.97 0.6 0.5 0.6China Jingzhou 761 1,040 1,392 3.12 2.92 0.2 0.2 0.2China Jining, Shandong 856 1,207 1,643 3.43 3.09 0.2 0.2 0.2China Jinjiang 456 859 1,378 6.33 4.72 0.1 0.1 0.2
continued . . .
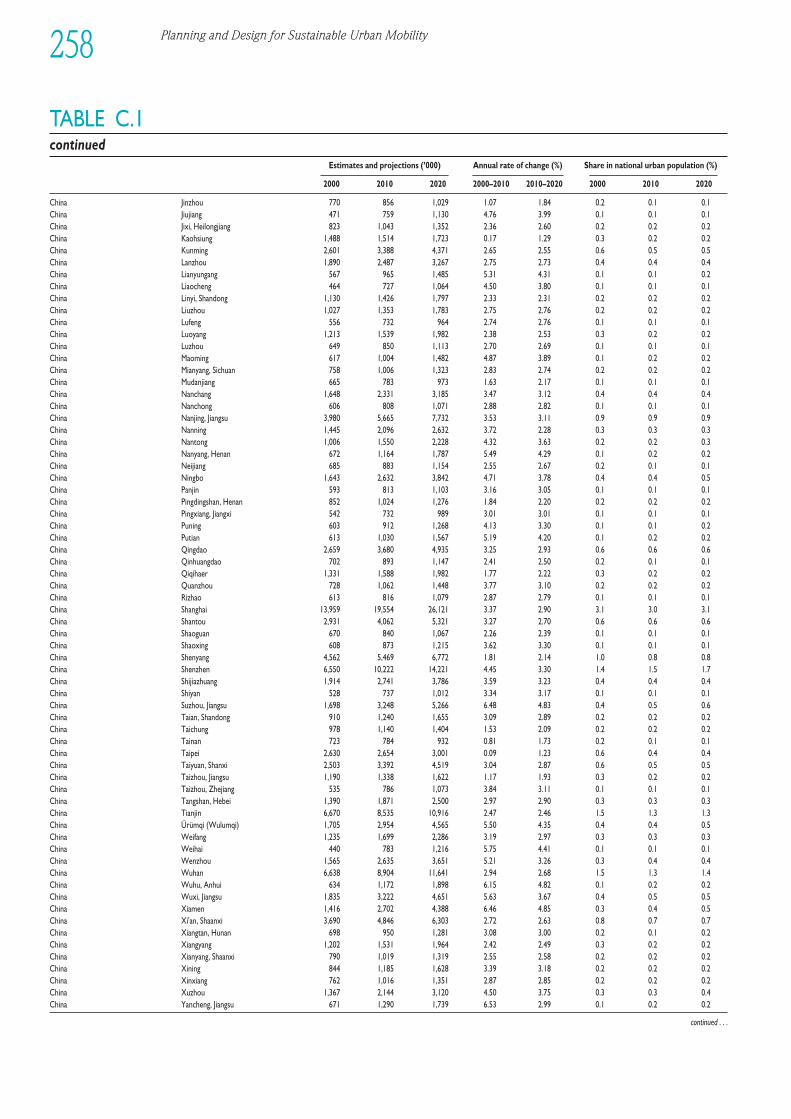
Planning and Design for Sustainable Urban Mobility258
TABLE C.1continued
Estimates and projections (’000) Annual rate of change (%) Share in national urban population (%)
2000 2010 2020 2000–2010 2010–2020 2000 2010 2020
China Jinzhou 770 856 1,029 1.07 1.84 0.2 0.1 0.1China Jiujiang 471 759 1,130 4.76 3.99 0.1 0.1 0.1China Jixi, Heilongjiang 823 1,043 1,352 2.36 2.60 0.2 0.2 0.2China Kaohsiung 1,488 1,514 1,723 0.17 1.29 0.3 0.2 0.2China Kunming 2,601 3,388 4,371 2.65 2.55 0.6 0.5 0.5China Lanzhou 1,890 2,487 3,267 2.75 2.73 0.4 0.4 0.4China Lianyungang 567 965 1,485 5.31 4.31 0.1 0.1 0.2China Liaocheng 464 727 1,064 4.50 3.80 0.1 0.1 0.1China Linyi, Shandong 1,130 1,426 1,797 2.33 2.31 0.2 0.2 0.2China Liuzhou 1,027 1,353 1,783 2.75 2.76 0.2 0.2 0.2China Lufeng 556 732 964 2.74 2.76 0.1 0.1 0.1China Luoyang 1,213 1,539 1,982 2.38 2.53 0.3 0.2 0.2China Luzhou 649 850 1,113 2.70 2.69 0.1 0.1 0.1China Maoming 617 1,004 1,482 4.87 3.89 0.1 0.2 0.2China Mianyang, Sichuan 758 1,006 1,323 2.83 2.74 0.2 0.2 0.2China Mudanjiang 665 783 973 1.63 2.17 0.1 0.1 0.1China Nanchang 1,648 2,331 3,185 3.47 3.12 0.4 0.4 0.4China Nanchong 606 808 1,071 2.88 2.82 0.1 0.1 0.1China Nanjing, Jiangsu 3,980 5,665 7,732 3.53 3.11 0.9 0.9 0.9China Nanning 1,445 2,096 2,632 3.72 2.28 0.3 0.3 0.3China Nantong 1,006 1,550 2,228 4.32 3.63 0.2 0.2 0.3China Nanyang, Henan 672 1,164 1,787 5.49 4.29 0.1 0.2 0.2China Neijiang 685 883 1,154 2.55 2.67 0.2 0.1 0.1China Ningbo 1,643 2,632 3,842 4.71 3.78 0.4 0.4 0.5China Panjin 593 813 1,103 3.16 3.05 0.1 0.1 0.1China Pingdingshan, Henan 852 1,024 1,276 1.84 2.20 0.2 0.2 0.2China Pingxiang, Jiangxi 542 732 989 3.01 3.01 0.1 0.1 0.1China Puning 603 912 1,268 4.13 3.30 0.1 0.1 0.2China Putian 613 1,030 1,567 5.19 4.20 0.1 0.2 0.2China Qingdao 2,659 3,680 4,935 3.25 2.93 0.6 0.6 0.6China Qinhuangdao 702 893 1,147 2.41 2.50 0.2 0.1 0.1China Qiqihaer 1,331 1,588 1,982 1.77 2.22 0.3 0.2 0.2China Quanzhou 728 1,062 1,448 3.77 3.10 0.2 0.2 0.2China Rizhao 613 816 1,079 2.87 2.79 0.1 0.1 0.1China Shanghai 13,959 19,554 26,121 3.37 2.90 3.1 3.0 3.1China Shantou 2,931 4,062 5,321 3.27 2.70 0.6 0.6 0.6China Shaoguan 670 840 1,067 2.26 2.39 0.1 0.1 0.1China Shaoxing 608 873 1,215 3.62 3.30 0.1 0.1 0.1China Shenyang 4,562 5,469 6,772 1.81 2.14 1.0 0.8 0.8China Shenzhen 6,550 10,222 14,221 4.45 3.30 1.4 1.5 1.7China Shijiazhuang 1,914 2,741 3,786 3.59 3.23 0.4 0.4 0.4China Shiyan 528 737 1,012 3.34 3.17 0.1 0.1 0.1China Suzhou, Jiangsu 1,698 3,248 5,266 6.48 4.83 0.4 0.5 0.6China Taian, Shandong 910 1,240 1,655 3.09 2.89 0.2 0.2 0.2China Taichung 978 1,140 1,404 1.53 2.09 0.2 0.2 0.2China Tainan 723 784 932 0.81 1.73 0.2 0.1 0.1China Taipei 2,630 2,654 3,001 0.09 1.23 0.6 0.4 0.4China Taiyuan, Shanxi 2,503 3,392 4,519 3.04 2.87 0.6 0.5 0.5China Taizhou, Jiangsu 1,190 1,338 1,622 1.17 1.93 0.3 0.2 0.2China Taizhou, Zhejiang 535 786 1,073 3.84 3.11 0.1 0.1 0.1China Tangshan, Hebei 1,390 1,871 2,500 2.97 2.90 0.3 0.3 0.3China Tianjin 6,670 8,535 10,916 2.47 2.46 1.5 1.3 1.3China Ürümqi (Wulumqi) 1,705 2,954 4,565 5.50 4.35 0.4 0.4 0.5China Weifang 1,235 1,699 2,286 3.19 2.97 0.3 0.3 0.3China Weihai 440 783 1,216 5.75 4.41 0.1 0.1 0.1China Wenzhou 1,565 2,635 3,651 5.21 3.26 0.3 0.4 0.4China Wuhan 6,638 8,904 11,641 2.94 2.68 1.5 1.3 1.4China Wuhu, Anhui 634 1,172 1,898 6.15 4.82 0.1 0.2 0.2China Wuxi, Jiangsu 1,835 3,222 4,651 5.63 3.67 0.4 0.5 0.5China Xiamen 1,416 2,702 4,388 6.46 4.85 0.3 0.4 0.5China Xi'an, Shaanxi 3,690 4,846 6,303 2.72 2.63 0.8 0.7 0.7China Xiangtan, Hunan 698 950 1,281 3.08 3.00 0.2 0.1 0.2China Xiangyang 1,202 1,531 1,964 2.42 2.49 0.3 0.2 0.2China Xianyang, Shaanxi 790 1,019 1,319 2.55 2.58 0.2 0.2 0.2China Xining 844 1,185 1,628 3.39 3.18 0.2 0.2 0.2China Xinxiang 762 1,016 1,351 2.87 2.85 0.2 0.2 0.2China Xuzhou 1,367 2,144 3,120 4.50 3.75 0.3 0.3 0.4China Yancheng, Jiangsu 671 1,290 1,739 6.53 2.99 0.1 0.2 0.2
continued . . .
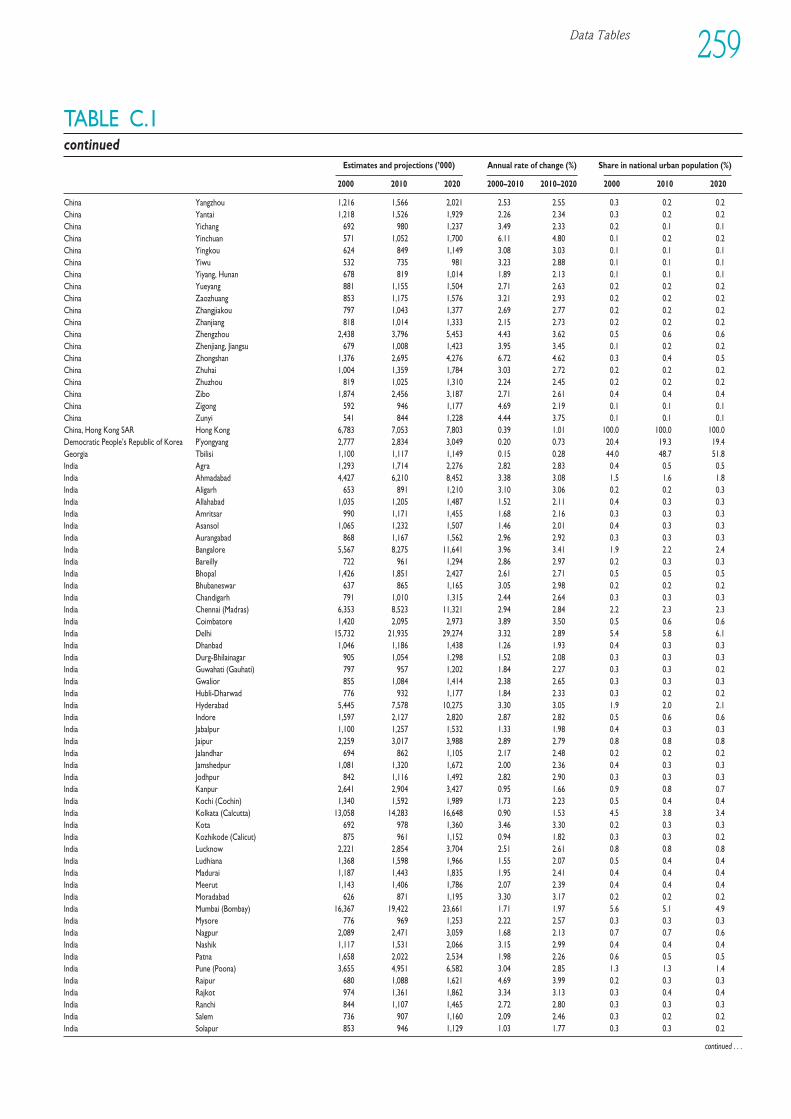
Data Tables 259
TABLE C.1continued
Estimates and projections (’000) Annual rate of change (%) Share in national urban population (%)
2000 2010 2020 2000–2010 2010–2020 2000 2010 2020
China Yangzhou 1,216 1,566 2,021 2.53 2.55 0.3 0.2 0.2China Yantai 1,218 1,526 1,929 2.26 2.34 0.3 0.2 0.2China Yichang 692 980 1,237 3.49 2.33 0.2 0.1 0.1China Yinchuan 571 1,052 1,700 6.11 4.80 0.1 0.2 0.2China Yingkou 624 849 1,149 3.08 3.03 0.1 0.1 0.1China Yiwu 532 735 981 3.23 2.88 0.1 0.1 0.1China Yiyang, Hunan 678 819 1,014 1.89 2.13 0.1 0.1 0.1China Yueyang 881 1,155 1,504 2.71 2.63 0.2 0.2 0.2China Zaozhuang 853 1,175 1,576 3.21 2.93 0.2 0.2 0.2China Zhangjiakou 797 1,043 1,377 2.69 2.77 0.2 0.2 0.2China Zhanjiang 818 1,014 1,333 2.15 2.73 0.2 0.2 0.2China Zhengzhou 2,438 3,796 5,453 4.43 3.62 0.5 0.6 0.6China Zhenjiang, Jiangsu 679 1,008 1,423 3.95 3.45 0.1 0.2 0.2China Zhongshan 1,376 2,695 4,276 6.72 4.62 0.3 0.4 0.5China Zhuhai 1,004 1,359 1,784 3.03 2.72 0.2 0.2 0.2China Zhuzhou 819 1,025 1,310 2.24 2.45 0.2 0.2 0.2China Zibo 1,874 2,456 3,187 2.71 2.61 0.4 0.4 0.4China Zigong 592 946 1,177 4.69 2.19 0.1 0.1 0.1China Zunyi 541 844 1,228 4.44 3.75 0.1 0.1 0.1China, Hong Kong SAR Hong Kong 6,783 7,053 7,803 0.39 1.01 100.0 100.0 100.0Democratic People’s Republic of Korea P'yongyang 2,777 2,834 3,049 0.20 0.73 20.4 19.3 19.4Georgia Tbilisi 1,100 1,117 1,149 0.15 0.28 44.0 48.7 51.8India Agra 1,293 1,714 2,276 2.82 2.83 0.4 0.5 0.5India Ahmadabad 4,427 6,210 8,452 3.38 3.08 1.5 1.6 1.8India Aligarh 653 891 1,210 3.10 3.06 0.2 0.2 0.3India Allahabad 1,035 1,205 1,487 1.52 2.11 0.4 0.3 0.3India Amritsar 990 1,171 1,455 1.68 2.16 0.3 0.3 0.3India Asansol 1,065 1,232 1,507 1.46 2.01 0.4 0.3 0.3India Aurangabad 868 1,167 1,562 2.96 2.92 0.3 0.3 0.3India Bangalore 5,567 8,275 11,641 3.96 3.41 1.9 2.2 2.4India Bareilly 722 961 1,294 2.86 2.97 0.2 0.3 0.3India Bhopal 1,426 1,851 2,427 2.61 2.71 0.5 0.5 0.5India Bhubaneswar 637 865 1,165 3.05 2.98 0.2 0.2 0.2India Chandigarh 791 1,010 1,315 2.44 2.64 0.3 0.3 0.3India Chennai (Madras) 6,353 8,523 11,321 2.94 2.84 2.2 2.3 2.3India Coimbatore 1,420 2,095 2,973 3.89 3.50 0.5 0.6 0.6India Delhi 15,732 21,935 29,274 3.32 2.89 5.4 5.8 6.1India Dhanbad 1,046 1,186 1,438 1.26 1.93 0.4 0.3 0.3India Durg-Bhilainagar 905 1,054 1,298 1.52 2.08 0.3 0.3 0.3India Guwahati (Gauhati) 797 957 1,202 1.84 2.27 0.3 0.3 0.2India Gwalior 855 1,084 1,414 2.38 2.65 0.3 0.3 0.3India Hubli-Dharwad 776 932 1,177 1.84 2.33 0.3 0.2 0.2India Hyderabad 5,445 7,578 10,275 3.30 3.05 1.9 2.0 2.1India Indore 1,597 2,127 2,820 2.87 2.82 0.5 0.6 0.6India Jabalpur 1,100 1,257 1,532 1.33 1.98 0.4 0.3 0.3India Jaipur 2,259 3,017 3,988 2.89 2.79 0.8 0.8 0.8India Jalandhar 694 862 1,105 2.17 2.48 0.2 0.2 0.2India Jamshedpur 1,081 1,320 1,672 2.00 2.36 0.4 0.3 0.3India Jodhpur 842 1,116 1,492 2.82 2.90 0.3 0.3 0.3India Kanpur 2,641 2,904 3,427 0.95 1.66 0.9 0.8 0.7India Kochi (Cochin) 1,340 1,592 1,989 1.73 2.23 0.5 0.4 0.4India Kolkata (Calcutta) 13,058 14,283 16,648 0.90 1.53 4.5 3.8 3.4India Kota 692 978 1,360 3.46 3.30 0.2 0.3 0.3India Kozhikode (Calicut) 875 961 1,152 0.94 1.82 0.3 0.3 0.2India Lucknow 2,221 2,854 3,704 2.51 2.61 0.8 0.8 0.8India Ludhiana 1,368 1,598 1,966 1.55 2.07 0.5 0.4 0.4India Madurai 1,187 1,443 1,835 1.95 2.41 0.4 0.4 0.4India Meerut 1,143 1,406 1,786 2.07 2.39 0.4 0.4 0.4India Moradabad 626 871 1,195 3.30 3.17 0.2 0.2 0.2India Mumbai (Bombay) 16,367 19,422 23,661 1.71 1.97 5.6 5.1 4.9India Mysore 776 969 1,253 2.22 2.57 0.3 0.3 0.3India Nagpur 2,089 2,471 3,059 1.68 2.13 0.7 0.7 0.6India Nashik 1,117 1,531 2,066 3.15 2.99 0.4 0.4 0.4India Patna 1,658 2,022 2,534 1.98 2.26 0.6 0.5 0.5India Pune (Poona) 3,655 4,951 6,582 3.04 2.85 1.3 1.3 1.4India Raipur 680 1,088 1,621 4.69 3.99 0.2 0.3 0.3India Rajkot 974 1,361 1,862 3.34 3.13 0.3 0.4 0.4India Ranchi 844 1,107 1,465 2.72 2.80 0.3 0.3 0.3India Salem 736 907 1,160 2.09 2.46 0.3 0.2 0.2India Solapur 853 946 1,129 1.03 1.77 0.3 0.3 0.2
continued . . .
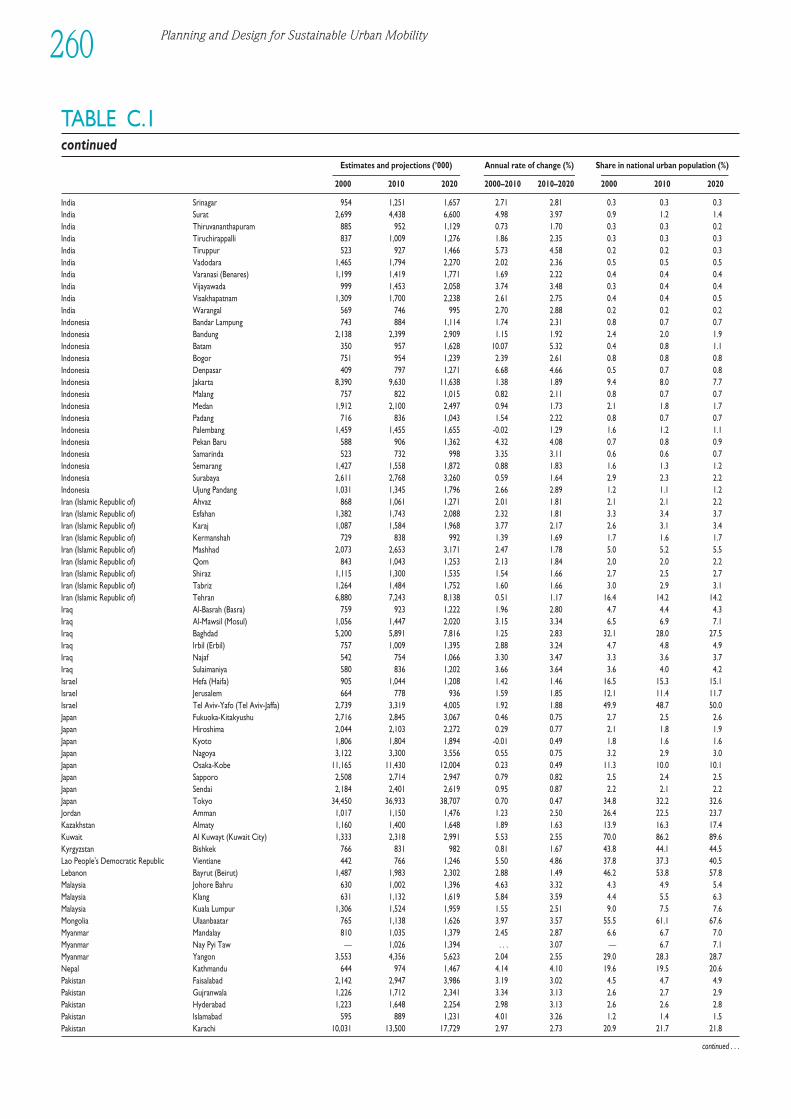
Planning and Design for Sustainable Urban Mobility260
TABLE C.1continued
Estimates and projections (’000) Annual rate of change (%) Share in national urban population (%)
2000 2010 2020 2000–2010 2010–2020 2000 2010 2020
India Srinagar 954 1,251 1,657 2.71 2.81 0.3 0.3 0.3India Surat 2,699 4,438 6,600 4.98 3.97 0.9 1.2 1.4India Thiruvananthapuram 885 952 1,129 0.73 1.70 0.3 0.3 0.2India Tiruchirappalli 837 1,009 1,276 1.86 2.35 0.3 0.3 0.3India Tiruppur 523 927 1,466 5.73 4.58 0.2 0.2 0.3India Vadodara 1,465 1,794 2,270 2.02 2.36 0.5 0.5 0.5India Varanasi (Benares) 1,199 1,419 1,771 1.69 2.22 0.4 0.4 0.4India Vijayawada 999 1,453 2,058 3.74 3.48 0.3 0.4 0.4India Visakhapatnam 1,309 1,700 2,238 2.61 2.75 0.4 0.4 0.5India Warangal 569 746 995 2.70 2.88 0.2 0.2 0.2Indonesia Bandar Lampung 743 884 1,114 1.74 2.31 0.8 0.7 0.7Indonesia Bandung 2,138 2,399 2,909 1.15 1.92 2.4 2.0 1.9Indonesia Batam 350 957 1,628 10.07 5.32 0.4 0.8 1.1Indonesia Bogor 751 954 1,239 2.39 2.61 0.8 0.8 0.8Indonesia Denpasar 409 797 1,271 6.68 4.66 0.5 0.7 0.8Indonesia Jakarta 8,390 9,630 11,638 1.38 1.89 9.4 8.0 7.7Indonesia Malang 757 822 1,015 0.82 2.11 0.8 0.7 0.7Indonesia Medan 1,912 2,100 2,497 0.94 1.73 2.1 1.8 1.7Indonesia Padang 716 836 1,043 1.54 2.22 0.8 0.7 0.7Indonesia Palembang 1,459 1,455 1,655 -0.02 1.29 1.6 1.2 1.1Indonesia Pekan Baru 588 906 1,362 4.32 4.08 0.7 0.8 0.9Indonesia Samarinda 523 732 998 3.35 3.11 0.6 0.6 0.7Indonesia Semarang 1,427 1,558 1,872 0.88 1.83 1.6 1.3 1.2Indonesia Surabaya 2,611 2,768 3,260 0.59 1.64 2.9 2.3 2.2Indonesia Ujung Pandang 1,031 1,345 1,796 2.66 2.89 1.2 1.1 1.2Iran (Islamic Republic of) Ahvaz 868 1,061 1,271 2.01 1.81 2.1 2.1 2.2Iran (Islamic Republic of) Esfahan 1,382 1,743 2,088 2.32 1.81 3.3 3.4 3.7Iran (Islamic Republic of) Karaj 1,087 1,584 1,968 3.77 2.17 2.6 3.1 3.4Iran (Islamic Republic of) Kermanshah 729 838 992 1.39 1.69 1.7 1.6 1.7Iran (Islamic Republic of) Mashhad 2,073 2,653 3,171 2.47 1.78 5.0 5.2 5.5Iran (Islamic Republic of) Qom 843 1,043 1,253 2.13 1.84 2.0 2.0 2.2Iran (Islamic Republic of) Shiraz 1,115 1,300 1,535 1.54 1.66 2.7 2.5 2.7Iran (Islamic Republic of) Tabriz 1,264 1,484 1,752 1.60 1.66 3.0 2.9 3.1Iran (Islamic Republic of) Tehran 6,880 7,243 8,138 0.51 1.17 16.4 14.2 14.2Iraq Al-Basrah (Basra) 759 923 1,222 1.96 2.80 4.7 4.4 4.3Iraq Al-Mawsil (Mosul) 1,056 1,447 2,020 3.15 3.34 6.5 6.9 7.1Iraq Baghdad 5,200 5,891 7,816 1.25 2.83 32.1 28.0 27.5Iraq Irbil (Erbil) 757 1,009 1,395 2.88 3.24 4.7 4.8 4.9Iraq Najaf 542 754 1,066 3.30 3.47 3.3 3.6 3.7Iraq Sulaimaniya 580 836 1,202 3.66 3.64 3.6 4.0 4.2Israel Hefa (Haifa) 905 1,044 1,208 1.42 1.46 16.5 15.3 15.1Israel Jerusalem 664 778 936 1.59 1.85 12.1 11.4 11.7Israel Tel Aviv-Yafo (Tel Aviv-Jaffa) 2,739 3,319 4,005 1.92 1.88 49.9 48.7 50.0Japan Fukuoka-Kitakyushu 2,716 2,845 3,067 0.46 0.75 2.7 2.5 2.6Japan Hiroshima 2,044 2,103 2,272 0.29 0.77 2.1 1.8 1.9Japan Kyoto 1,806 1,804 1,894 -0.01 0.49 1.8 1.6 1.6Japan Nagoya 3,122 3,300 3,556 0.55 0.75 3.2 2.9 3.0Japan Osaka-Kobe 11,165 11,430 12,004 0.23 0.49 11.3 10.0 10.1Japan Sapporo 2,508 2,714 2,947 0.79 0.82 2.5 2.4 2.5Japan Sendai 2,184 2,401 2,619 0.95 0.87 2.2 2.1 2.2Japan Tokyo 34,450 36,933 38,707 0.70 0.47 34.8 32.2 32.6Jordan Amman 1,017 1,150 1,476 1.23 2.50 26.4 22.5 23.7Kazakhstan Almaty 1,160 1,400 1,648 1.89 1.63 13.9 16.3 17.4Kuwait Al Kuwayt (Kuwait City) 1,333 2,318 2,991 5.53 2.55 70.0 86.2 89.6Kyrgyzstan Bishkek 766 831 982 0.81 1.67 43.8 44.1 44.5Lao People's Democratic Republic Vientiane 442 766 1,246 5.50 4.86 37.8 37.3 40.5Lebanon Bayrut (Beirut) 1,487 1,983 2,302 2.88 1.49 46.2 53.8 57.8Malaysia Johore Bahru 630 1,002 1,396 4.63 3.32 4.3 4.9 5.4Malaysia Klang 631 1,132 1,619 5.84 3.59 4.4 5.5 6.3Malaysia Kuala Lumpur 1,306 1,524 1,959 1.55 2.51 9.0 7.5 7.6Mongolia Ulaanbaatar 765 1,138 1,626 3.97 3.57 55.5 61.1 67.6Myanmar Mandalay 810 1,035 1,379 2.45 2.87 6.6 6.7 7.0Myanmar Nay Pyi Taw — 1,026 1,394 . . . 3.07 — 6.7 7.1Myanmar Yangon 3,553 4,356 5,623 2.04 2.55 29.0 28.3 28.7Nepal Kathmandu 644 974 1,467 4.14 4.10 19.6 19.5 20.6Pakistan Faisalabad 2,142 2,947 3,986 3.19 3.02 4.5 4.7 4.9Pakistan Gujranwala 1,226 1,712 2,341 3.34 3.13 2.6 2.7 2.9Pakistan Hyderabad 1,223 1,648 2,254 2.98 3.13 2.6 2.6 2.8Pakistan Islamabad 595 889 1,231 4.01 3.26 1.2 1.4 1.5Pakistan Karachi 10,031 13,500 17,729 2.97 2.73 20.9 21.7 21.8
continued . . .
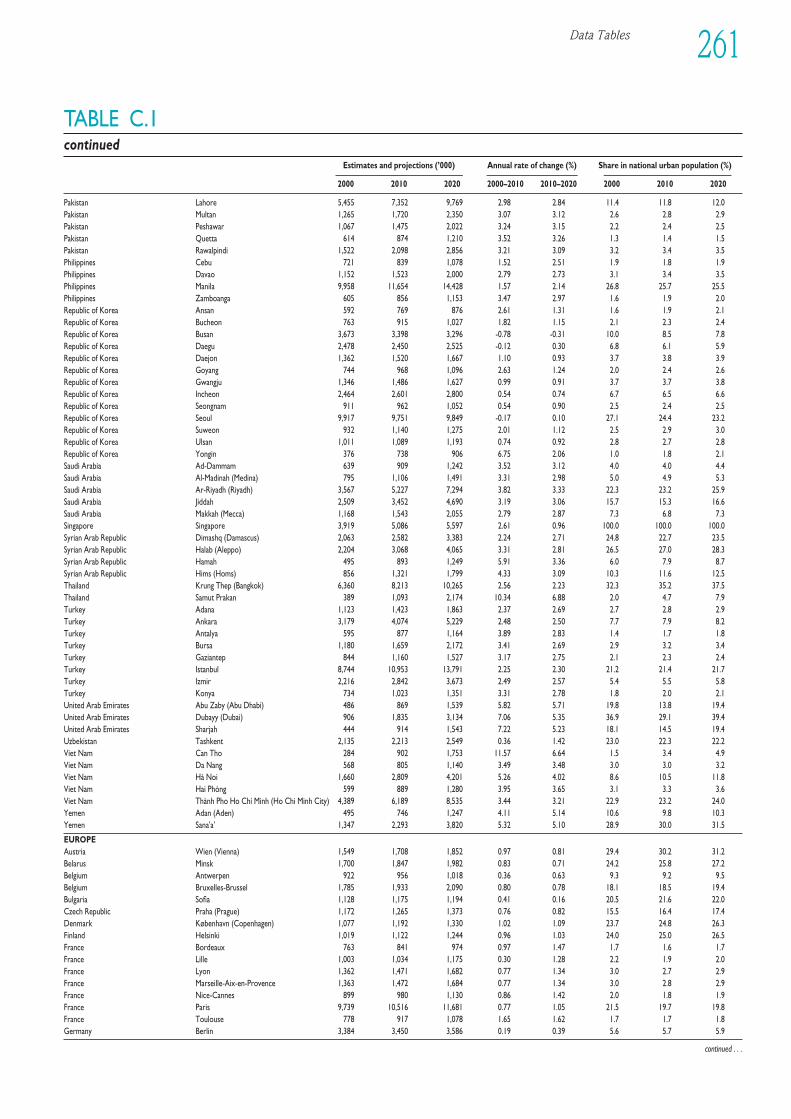
Data Tables 261
TABLE C.1continued
Estimates and projections (’000) Annual rate of change (%) Share in national urban population (%)
2000 2010 2020 2000–2010 2010–2020 2000 2010 2020
Pakistan Lahore 5,455 7,352 9,769 2.98 2.84 11.4 11.8 12.0Pakistan Multan 1,265 1,720 2,350 3.07 3.12 2.6 2.8 2.9Pakistan Peshawar 1,067 1,475 2,022 3.24 3.15 2.2 2.4 2.5Pakistan Quetta 614 874 1,210 3.52 3.26 1.3 1.4 1.5Pakistan Rawalpindi 1,522 2,098 2,856 3.21 3.09 3.2 3.4 3.5Philippines Cebu 721 839 1,078 1.52 2.51 1.9 1.8 1.9Philippines Davao 1,152 1,523 2,000 2.79 2.73 3.1 3.4 3.5Philippines Manila 9,958 11,654 14,428 1.57 2.14 26.8 25.7 25.5Philippines Zamboanga 605 856 1,153 3.47 2.97 1.6 1.9 2.0Republic of Korea Ansan 592 769 876 2.61 1.31 1.6 1.9 2.1Republic of Korea Bucheon 763 915 1,027 1.82 1.15 2.1 2.3 2.4Republic of Korea Busan 3,673 3,398 3,296 -0.78 -0.31 10.0 8.5 7.8Republic of Korea Daegu 2,478 2,450 2,525 -0.12 0.30 6.8 6.1 5.9Republic of Korea Daejon 1,362 1,520 1,667 1.10 0.93 3.7 3.8 3.9Republic of Korea Goyang 744 968 1,096 2.63 1.24 2.0 2.4 2.6Republic of Korea Gwangju 1,346 1,486 1,627 0.99 0.91 3.7 3.7 3.8Republic of Korea Incheon 2,464 2,601 2,800 0.54 0.74 6.7 6.5 6.6Republic of Korea Seongnam 911 962 1,052 0.54 0.90 2.5 2.4 2.5Republic of Korea Seoul 9,917 9,751 9,849 -0.17 0.10 27.1 24.4 23.2Republic of Korea Suweon 932 1,140 1,275 2.01 1.12 2.5 2.9 3.0Republic of Korea Ulsan 1,011 1,089 1,193 0.74 0.92 2.8 2.7 2.8Republic of Korea Yongin 376 738 906 6.75 2.06 1.0 1.8 2.1Saudi Arabia Ad-Dammam 639 909 1,242 3.52 3.12 4.0 4.0 4.4Saudi Arabia Al-Madinah (Medina) 795 1,106 1,491 3.31 2.98 5.0 4.9 5.3Saudi Arabia Ar-Riyadh (Riyadh) 3,567 5,227 7,294 3.82 3.33 22.3 23.2 25.9Saudi Arabia Jiddah 2,509 3,452 4,690 3.19 3.06 15.7 15.3 16.6Saudi Arabia Makkah (Mecca) 1,168 1,543 2,055 2.79 2.87 7.3 6.8 7.3Singapore Singapore 3,919 5,086 5,597 2.61 0.96 100.0 100.0 100.0Syrian Arab Republic Dimashq (Damascus) 2,063 2,582 3,383 2.24 2.71 24.8 22.7 23.5Syrian Arab Republic Halab (Aleppo) 2,204 3,068 4,065 3.31 2.81 26.5 27.0 28.3Syrian Arab Republic Hamah 495 893 1,249 5.91 3.36 6.0 7.9 8.7Syrian Arab Republic Hims (Homs) 856 1,321 1,799 4.33 3.09 10.3 11.6 12.5Thailand Krung Thep (Bangkok) 6,360 8,213 10,265 2.56 2.23 32.3 35.2 37.5Thailand Samut Prakan 389 1,093 2,174 10.34 6.88 2.0 4.7 7.9Turkey Adana 1,123 1,423 1,863 2.37 2.69 2.7 2.8 2.9Turkey Ankara 3,179 4,074 5,229 2.48 2.50 7.7 7.9 8.2Turkey Antalya 595 877 1,164 3.89 2.83 1.4 1.7 1.8Turkey Bursa 1,180 1,659 2,172 3.41 2.69 2.9 3.2 3.4Turkey Gaziantep 844 1,160 1,527 3.17 2.75 2.1 2.3 2.4Turkey Istanbul 8,744 10,953 13,791 2.25 2.30 21.2 21.4 21.7Turkey Izmir 2,216 2,842 3,673 2.49 2.57 5.4 5.5 5.8Turkey Konya 734 1,023 1,351 3.31 2.78 1.8 2.0 2.1United Arab Emirates Abu Zaby (Abu Dhabi) 486 869 1,539 5.82 5.71 19.8 13.8 19.4United Arab Emirates Dubayy (Dubai) 906 1,835 3,134 7.06 5.35 36.9 29.1 39.4United Arab Emirates Sharjah 444 914 1,543 7.22 5.23 18.1 14.5 19.4Uzbekistan Tashkent 2,135 2,213 2,549 0.36 1.42 23.0 22.3 22.2Viet Nam Can Tho 284 902 1,753 11.57 6.64 1.5 3.4 4.9Viet Nam Da Nang 568 805 1,140 3.49 3.48 3.0 3.0 3.2Viet Nam Hà Noi 1,660 2,809 4,201 5.26 4.02 8.6 10.5 11.8Viet Nam Hai Phòng 599 889 1,280 3.95 3.65 3.1 3.3 3.6Viet Nam Thành Pho Ho Chí Minh (Ho Chi Minh City) 4,389 6,189 8,535 3.44 3.21 22.9 23.2 24.0Yemen Adan (Aden) 495 746 1,247 4.11 5.14 10.6 9.8 10.3Yemen Sana'a' 1,347 2,293 3,820 5.32 5.10 28.9 30.0 31.5
EUROPEAustria Wien (Vienna) 1,549 1,708 1,852 0.97 0.81 29.4 30.2 31.2Belarus Minsk 1,700 1,847 1,982 0.83 0.71 24.2 25.8 27.2Belgium Antwerpen 922 956 1,018 0.36 0.63 9.3 9.2 9.5Belgium Bruxelles-Brussel 1,785 1,933 2,090 0.80 0.78 18.1 18.5 19.4Bulgaria Sofia 1,128 1,175 1,194 0.41 0.16 20.5 21.6 22.0Czech Republic Praha (Prague) 1,172 1,265 1,373 0.76 0.82 15.5 16.4 17.4Denmark København (Copenhagen) 1,077 1,192 1,330 1.02 1.09 23.7 24.8 26.3Finland Helsinki 1,019 1,122 1,244 0.96 1.03 24.0 25.0 26.5France Bordeaux 763 841 974 0.97 1.47 1.7 1.6 1.7France Lille 1,003 1,034 1,175 0.30 1.28 2.2 1.9 2.0France Lyon 1,362 1,471 1,682 0.77 1.34 3.0 2.7 2.9France Marseille-Aix-en-Provence 1,363 1,472 1,684 0.77 1.34 3.0 2.8 2.9France Nice-Cannes 899 980 1,130 0.86 1.42 2.0 1.8 1.9France Paris 9,739 10,516 11,681 0.77 1.05 21.5 19.7 19.8France Toulouse 778 917 1,078 1.65 1.62 1.7 1.7 1.8Germany Berlin 3,384 3,450 3,586 0.19 0.39 5.6 5.7 5.9
continued . . .
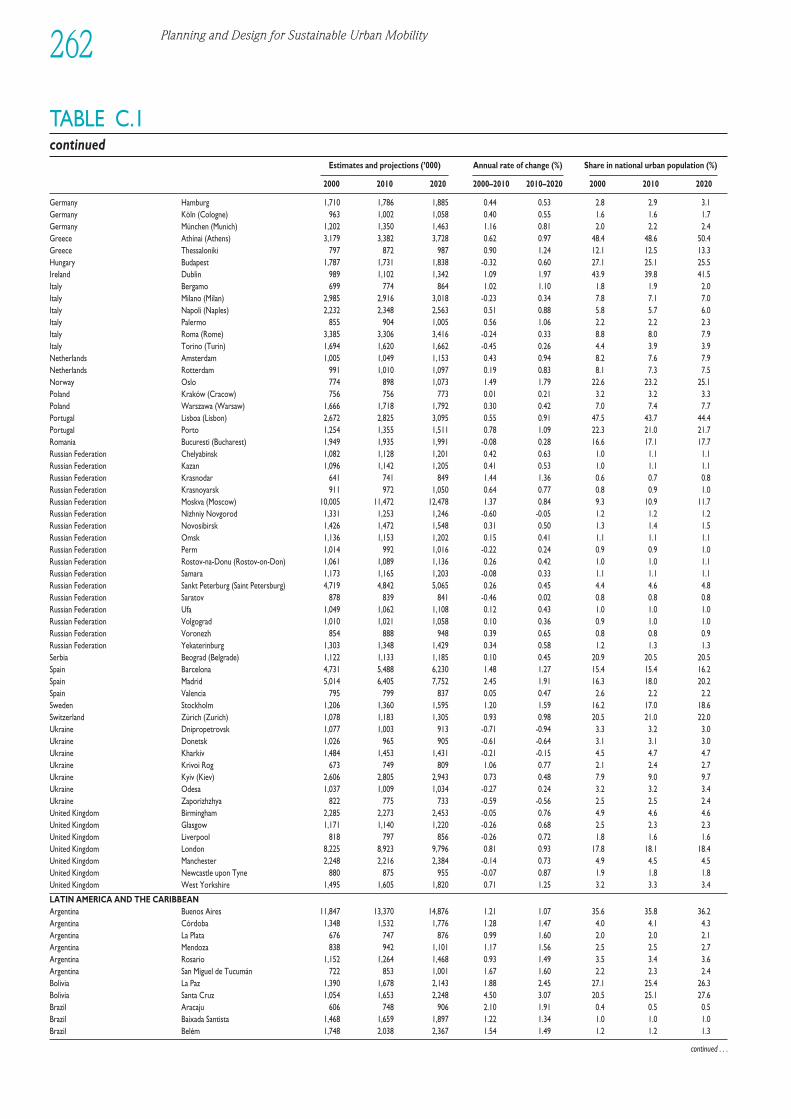
Planning and Design for Sustainable Urban Mobility262
TABLE C.1continued
Estimates and projections (’000) Annual rate of change (%) Share in national urban population (%)
2000 2010 2020 2000–2010 2010–2020 2000 2010 2020
Germany Hamburg 1,710 1,786 1,885 0.44 0.53 2.8 2.9 3.1Germany Köln (Cologne) 963 1,002 1,058 0.40 0.55 1.6 1.6 1.7Germany München (Munich) 1,202 1,350 1,463 1.16 0.81 2.0 2.2 2.4Greece Athínai (Athens) 3,179 3,382 3,728 0.62 0.97 48.4 48.6 50.4Greece Thessaloniki 797 872 987 0.90 1.24 12.1 12.5 13.3Hungary Budapest 1,787 1,731 1,838 -0.32 0.60 27.1 25.1 25.5Ireland Dublin 989 1,102 1,342 1.09 1.97 43.9 39.8 41.5Italy Bergamo 699 774 864 1.02 1.10 1.8 1.9 2.0Italy Milano (Milan) 2,985 2,916 3,018 -0.23 0.34 7.8 7.1 7.0Italy Napoli (Naples) 2,232 2,348 2,563 0.51 0.88 5.8 5.7 6.0Italy Palermo 855 904 1,005 0.56 1.06 2.2 2.2 2.3Italy Roma (Rome) 3,385 3,306 3,416 -0.24 0.33 8.8 8.0 7.9Italy Torino (Turin) 1,694 1,620 1,662 -0.45 0.26 4.4 3.9 3.9Netherlands Amsterdam 1,005 1,049 1,153 0.43 0.94 8.2 7.6 7.9Netherlands Rotterdam 991 1,010 1,097 0.19 0.83 8.1 7.3 7.5Norway Oslo 774 898 1,073 1.49 1.79 22.6 23.2 25.1Poland Kraków (Cracow) 756 756 773 0.01 0.21 3.2 3.2 3.3Poland Warszawa (Warsaw) 1,666 1,718 1,792 0.30 0.42 7.0 7.4 7.7Portugal Lisboa (Lisbon) 2,672 2,825 3,095 0.55 0.91 47.5 43.7 44.4Portugal Porto 1,254 1,355 1,511 0.78 1.09 22.3 21.0 21.7Romania Bucuresti (Bucharest) 1,949 1,935 1,991 -0.08 0.28 16.6 17.1 17.7Russian Federation Chelyabinsk 1,082 1,128 1,201 0.42 0.63 1.0 1.1 1.1Russian Federation Kazan 1,096 1,142 1,205 0.41 0.53 1.0 1.1 1.1Russian Federation Krasnodar 641 741 849 1.44 1.36 0.6 0.7 0.8Russian Federation Krasnoyarsk 911 972 1,050 0.64 0.77 0.8 0.9 1.0Russian Federation Moskva (Moscow) 10,005 11,472 12,478 1.37 0.84 9.3 10.9 11.7Russian Federation Nizhniy Novgorod 1,331 1,253 1,246 -0.60 -0.05 1.2 1.2 1.2Russian Federation Novosibirsk 1,426 1,472 1,548 0.31 0.50 1.3 1.4 1.5Russian Federation Omsk 1,136 1,153 1,202 0.15 0.41 1.1 1.1 1.1Russian Federation Perm 1,014 992 1,016 -0.22 0.24 0.9 0.9 1.0Russian Federation Rostov-na-Donu (Rostov-on-Don) 1,061 1,089 1,136 0.26 0.42 1.0 1.0 1.1Russian Federation Samara 1,173 1,165 1,203 -0.08 0.33 1.1 1.1 1.1Russian Federation Sankt Peterburg (Saint Petersburg) 4,719 4,842 5,065 0.26 0.45 4.4 4.6 4.8Russian Federation Saratov 878 839 841 -0.46 0.02 0.8 0.8 0.8Russian Federation Ufa 1,049 1,062 1,108 0.12 0.43 1.0 1.0 1.0Russian Federation Volgograd 1,010 1,021 1,058 0.10 0.36 0.9 1.0 1.0Russian Federation Voronezh 854 888 948 0.39 0.65 0.8 0.8 0.9Russian Federation Yekaterinburg 1,303 1,348 1,429 0.34 0.58 1.2 1.3 1.3Serbia Beograd (Belgrade) 1,122 1,133 1,185 0.10 0.45 20.9 20.5 20.5Spain Barcelona 4,731 5,488 6,230 1.48 1.27 15.4 15.4 16.2Spain Madrid 5,014 6,405 7,752 2.45 1.91 16.3 18.0 20.2Spain Valencia 795 799 837 0.05 0.47 2.6 2.2 2.2Sweden Stockholm 1,206 1,360 1,595 1.20 1.59 16.2 17.0 18.6Switzerland Zürich (Zurich) 1,078 1,183 1,305 0.93 0.98 20.5 21.0 22.0Ukraine Dnipropetrovsk 1,077 1,003 913 -0.71 -0.94 3.3 3.2 3.0Ukraine Donetsk 1,026 965 905 -0.61 -0.64 3.1 3.1 3.0Ukraine Kharkiv 1,484 1,453 1,431 -0.21 -0.15 4.5 4.7 4.7Ukraine Krivoi Rog 673 749 809 1.06 0.77 2.1 2.4 2.7Ukraine Kyiv (Kiev) 2,606 2,805 2,943 0.73 0.48 7.9 9.0 9.7Ukraine Odesa 1,037 1,009 1,034 -0.27 0.24 3.2 3.2 3.4Ukraine Zaporizhzhya 822 775 733 -0.59 -0.56 2.5 2.5 2.4United Kingdom Birmingham 2,285 2,273 2,453 -0.05 0.76 4.9 4.6 4.6United Kingdom Glasgow 1,171 1,140 1,220 -0.26 0.68 2.5 2.3 2.3United Kingdom Liverpool 818 797 856 -0.26 0.72 1.8 1.6 1.6United Kingdom London 8,225 8,923 9,796 0.81 0.93 17.8 18.1 18.4United Kingdom Manchester 2,248 2,216 2,384 -0.14 0.73 4.9 4.5 4.5United Kingdom Newcastle upon Tyne 880 875 955 -0.07 0.87 1.9 1.8 1.8United Kingdom West Yorkshire 1,495 1,605 1,820 0.71 1.25 3.2 3.3 3.4
LATIN AMERICA AND THE CARIBBEANArgentina Buenos Aires 11,847 13,370 14,876 1.21 1.07 35.6 35.8 36.2Argentina Córdoba 1,348 1,532 1,776 1.28 1.47 4.0 4.1 4.3Argentina La Plata 676 747 876 0.99 1.60 2.0 2.0 2.1Argentina Mendoza 838 942 1,101 1.17 1.56 2.5 2.5 2.7Argentina Rosario 1,152 1,264 1,468 0.93 1.49 3.5 3.4 3.6Argentina San Miguel de Tucumán 722 853 1,001 1.67 1.60 2.2 2.3 2.4Bolivia La Paz 1,390 1,678 2,143 1.88 2.45 27.1 25.4 26.3Bolivia Santa Cruz 1,054 1,653 2,248 4.50 3.07 20.5 25.1 27.6Brazil Aracaju 606 748 906 2.10 1.91 0.4 0.5 0.5Brazil Baixada Santista 1,468 1,659 1,897 1.22 1.34 1.0 1.0 1.0Brazil Belém 1,748 2,038 2,367 1.54 1.49 1.2 1.2 1.3
continued . . .
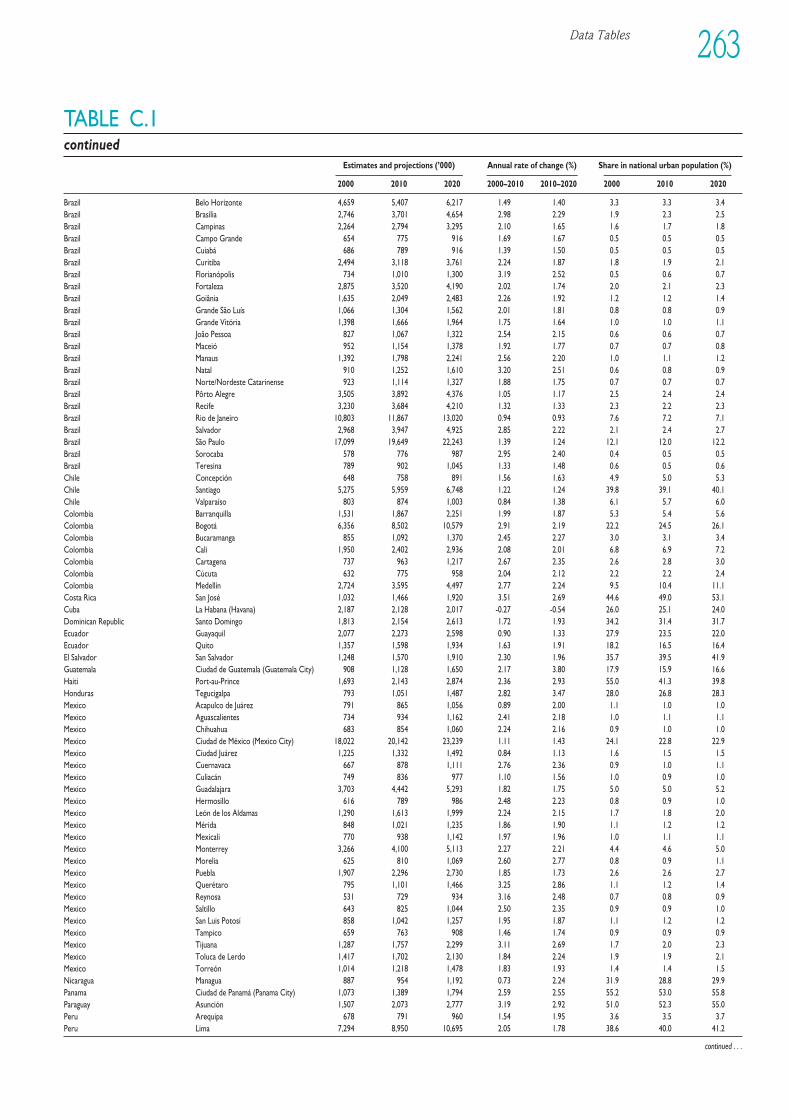
Data Tables 263
TABLE C.1continued
Estimates and projections (’000) Annual rate of change (%) Share in national urban population (%)
2000 2010 2020 2000–2010 2010–2020 2000 2010 2020
Brazil Belo Horizonte 4,659 5,407 6,217 1.49 1.40 3.3 3.3 3.4Brazil Brasília 2,746 3,701 4,654 2.98 2.29 1.9 2.3 2.5Brazil Campinas 2,264 2,794 3,295 2.10 1.65 1.6 1.7 1.8Brazil Campo Grande 654 775 916 1.69 1.67 0.5 0.5 0.5Brazil Cuiabá 686 789 916 1.39 1.50 0.5 0.5 0.5Brazil Curitiba 2,494 3,118 3,761 2.24 1.87 1.8 1.9 2.1Brazil Florianópolis 734 1,010 1,300 3.19 2.52 0.5 0.6 0.7Brazil Fortaleza 2,875 3,520 4,190 2.02 1.74 2.0 2.1 2.3Brazil Goiânia 1,635 2,049 2,483 2.26 1.92 1.2 1.2 1.4Brazil Grande São Luís 1,066 1,304 1,562 2.01 1.81 0.8 0.8 0.9Brazil Grande Vitória 1,398 1,666 1,964 1.75 1.64 1.0 1.0 1.1Brazil João Pessoa 827 1,067 1,322 2.54 2.15 0.6 0.6 0.7Brazil Maceió 952 1,154 1,378 1.92 1.77 0.7 0.7 0.8Brazil Manaus 1,392 1,798 2,241 2.56 2.20 1.0 1.1 1.2Brazil Natal 910 1,252 1,610 3.20 2.51 0.6 0.8 0.9Brazil Norte/Nordeste Catarinense 923 1,114 1,327 1.88 1.75 0.7 0.7 0.7Brazil Pôrto Alegre 3,505 3,892 4,376 1.05 1.17 2.5 2.4 2.4Brazil Recife 3,230 3,684 4,210 1.32 1.33 2.3 2.2 2.3Brazil Rio de Janeiro 10,803 11,867 13,020 0.94 0.93 7.6 7.2 7.1Brazil Salvador 2,968 3,947 4,925 2.85 2.22 2.1 2.4 2.7Brazil São Paulo 17,099 19,649 22,243 1.39 1.24 12.1 12.0 12.2Brazil Sorocaba 578 776 987 2.95 2.40 0.4 0.5 0.5Brazil Teresina 789 902 1,045 1.33 1.48 0.6 0.5 0.6Chile Concepción 648 758 891 1.56 1.63 4.9 5.0 5.3Chile Santiago 5,275 5,959 6,748 1.22 1.24 39.8 39.1 40.1Chile Valparaíso 803 874 1,003 0.84 1.38 6.1 5.7 6.0Colombia Barranquilla 1,531 1,867 2,251 1.99 1.87 5.3 5.4 5.6Colombia Bogotá 6,356 8,502 10,579 2.91 2.19 22.2 24.5 26.1Colombia Bucaramanga 855 1,092 1,370 2.45 2.27 3.0 3.1 3.4Colombia Cali 1,950 2,402 2,936 2.08 2.01 6.8 6.9 7.2Colombia Cartagena 737 963 1,217 2.67 2.35 2.6 2.8 3.0Colombia Cúcuta 632 775 958 2.04 2.12 2.2 2.2 2.4Colombia Medellín 2,724 3,595 4,497 2.77 2.24 9.5 10.4 11.1Costa Rica San José 1,032 1,466 1,920 3.51 2.69 44.6 49.0 53.1Cuba La Habana (Havana) 2,187 2,128 2,017 -0.27 -0.54 26.0 25.1 24.0Dominican Republic Santo Domingo 1,813 2,154 2,613 1.72 1.93 34.2 31.4 31.7Ecuador Guayaquil 2,077 2,273 2,598 0.90 1.33 27.9 23.5 22.0Ecuador Quito 1,357 1,598 1,934 1.63 1.91 18.2 16.5 16.4El Salvador San Salvador 1,248 1,570 1,910 2.30 1.96 35.7 39.5 41.9Guatemala Ciudad de Guatemala (Guatemala City) 908 1,128 1,650 2.17 3.80 17.9 15.9 16.6Haiti Port-au-Prince 1,693 2,143 2,874 2.36 2.93 55.0 41.3 39.8Honduras Tegucigalpa 793 1,051 1,487 2.82 3.47 28.0 26.8 28.3Mexico Acapulco de Juárez 791 865 1,056 0.89 2.00 1.1 1.0 1.0Mexico Aguascalientes 734 934 1,162 2.41 2.18 1.0 1.1 1.1Mexico Chihuahua 683 854 1,060 2.24 2.16 0.9 1.0 1.0Mexico Ciudad de México (Mexico City) 18,022 20,142 23,239 1.11 1.43 24.1 22.8 22.9Mexico Ciudad Juárez 1,225 1,332 1,492 0.84 1.13 1.6 1.5 1.5Mexico Cuernavaca 667 878 1,111 2.76 2.36 0.9 1.0 1.1Mexico Culiacán 749 836 977 1.10 1.56 1.0 0.9 1.0Mexico Guadalajara 3,703 4,442 5,293 1.82 1.75 5.0 5.0 5.2Mexico Hermosillo 616 789 986 2.48 2.23 0.8 0.9 1.0Mexico León de los Aldamas 1,290 1,613 1,999 2.24 2.15 1.7 1.8 2.0Mexico Mérida 848 1,021 1,235 1.86 1.90 1.1 1.2 1.2Mexico Mexicali 770 938 1,142 1.97 1.96 1.0 1.1 1.1Mexico Monterrey 3,266 4,100 5,113 2.27 2.21 4.4 4.6 5.0Mexico Morelia 625 810 1,069 2.60 2.77 0.8 0.9 1.1Mexico Puebla 1,907 2,296 2,730 1.85 1.73 2.6 2.6 2.7Mexico Querétaro 795 1,101 1,466 3.25 2.86 1.1 1.2 1.4Mexico Reynosa 531 729 934 3.16 2.48 0.7 0.8 0.9Mexico Saltillo 643 825 1,044 2.50 2.35 0.9 0.9 1.0Mexico San Luis Potosí 858 1,042 1,257 1.95 1.87 1.1 1.2 1.2Mexico Tampico 659 763 908 1.46 1.74 0.9 0.9 0.9Mexico Tijuana 1,287 1,757 2,299 3.11 2.69 1.7 2.0 2.3Mexico Toluca de Lerdo 1,417 1,702 2,130 1.84 2.24 1.9 1.9 2.1Mexico Torreón 1,014 1,218 1,478 1.83 1.93 1.4 1.4 1.5Nicaragua Managua 887 954 1,192 0.73 2.24 31.9 28.8 29.9Panama Ciudad de Panamá (Panama City) 1,073 1,389 1,794 2.59 2.55 55.2 53.0 55.8Paraguay Asunción 1,507 2,073 2,777 3.19 2.92 51.0 52.3 55.0Peru Arequipa 678 791 960 1.54 1.95 3.6 3.5 3.7Peru Lima 7,294 8,950 10,695 2.05 1.78 38.6 40.0 41.2
continued . . .
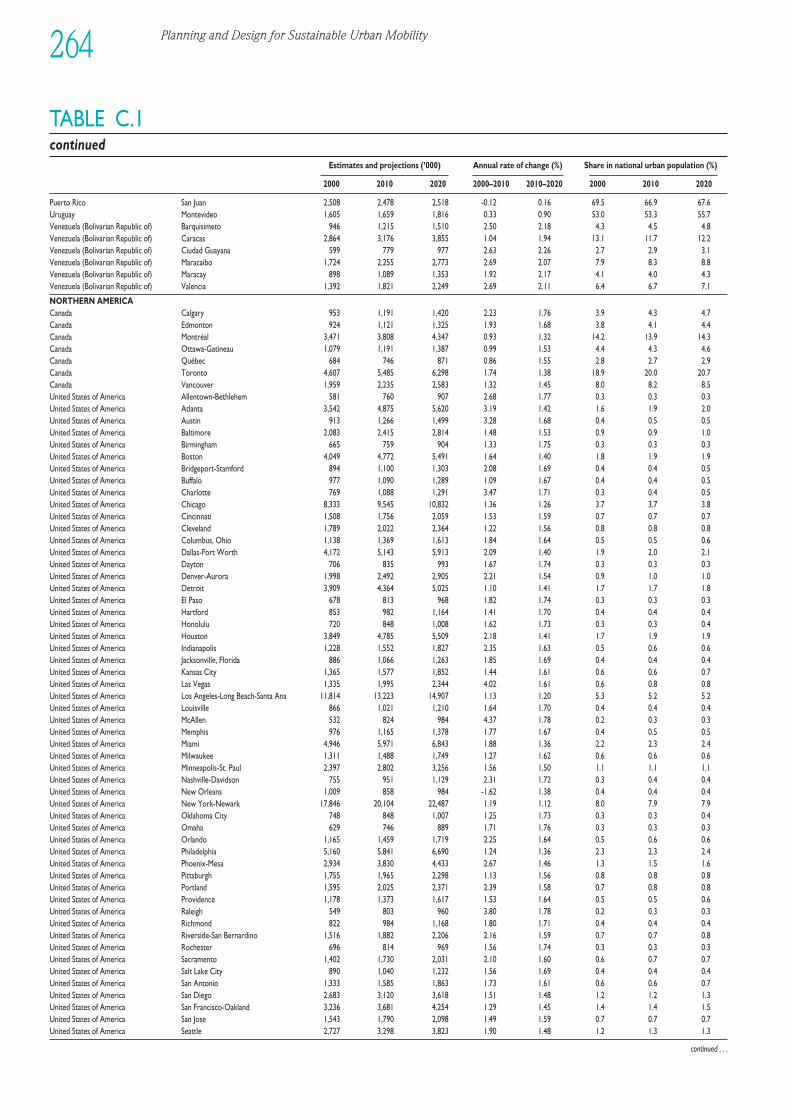
Planning and Design for Sustainable Urban Mobility264
TABLE C.1continued
Estimates and projections (’000) Annual rate of change (%) Share in national urban population (%)
2000 2010 2020 2000–2010 2010–2020 2000 2010 2020
Puerto Rico San Juan 2,508 2,478 2,518 -0.12 0.16 69.5 66.9 67.6Uruguay Montevideo 1,605 1,659 1,816 0.33 0.90 53.0 53.3 55.7Venezuela (Bolivarian Republic of) Barquisimeto 946 1,215 1,510 2.50 2.18 4.3 4.5 4.8Venezuela (Bolivarian Republic of) Caracas 2,864 3,176 3,855 1.04 1.94 13.1 11.7 12.2Venezuela (Bolivarian Republic of) Ciudad Guayana 599 779 977 2.63 2.26 2.7 2.9 3.1Venezuela (Bolivarian Republic of) Maracaibo 1,724 2,255 2,773 2.69 2.07 7.9 8.3 8.8Venezuela (Bolivarian Republic of) Maracay 898 1,089 1,353 1.92 2.17 4.1 4.0 4.3Venezuela (Bolivarian Republic of) Valencia 1,392 1,821 2,249 2.69 2.11 6.4 6.7 7.1
NORTHERN AMERICACanada Calgary 953 1,191 1,420 2.23 1.76 3.9 4.3 4.7Canada Edmonton 924 1,121 1,325 1.93 1.68 3.8 4.1 4.4Canada Montréal 3,471 3,808 4,347 0.93 1.32 14.2 13.9 14.3Canada Ottawa-Gatineau 1,079 1,191 1,387 0.99 1.53 4.4 4.3 4.6Canada Québec 684 746 871 0.86 1.55 2.8 2.7 2.9Canada Toronto 4,607 5,485 6,298 1.74 1.38 18.9 20.0 20.7Canada Vancouver 1,959 2,235 2,583 1.32 1.45 8.0 8.2 8.5United States of America Allentown-Bethlehem 581 760 907 2.68 1.77 0.3 0.3 0.3United States of America Atlanta 3,542 4,875 5,620 3.19 1.42 1.6 1.9 2.0United States of America Austin 913 1,266 1,499 3.28 1.68 0.4 0.5 0.5United States of America Baltimore 2,083 2,415 2,814 1.48 1.53 0.9 0.9 1.0United States of America Birmingham 665 759 904 1.33 1.75 0.3 0.3 0.3United States of America Boston 4,049 4,772 5,491 1.64 1.40 1.8 1.9 1.9United States of America Bridgeport-Stamford 894 1,100 1,303 2.08 1.69 0.4 0.4 0.5United States of America Buffalo 977 1,090 1,289 1.09 1.67 0.4 0.4 0.5United States of America Charlotte 769 1,088 1,291 3.47 1.71 0.3 0.4 0.5United States of America Chicago 8,333 9,545 10,832 1.36 1.26 3.7 3.7 3.8United States of America Cincinnati 1,508 1,756 2,059 1.53 1.59 0.7 0.7 0.7United States of America Cleveland 1,789 2,022 2,364 1.22 1.56 0.8 0.8 0.8United States of America Columbus, Ohio 1,138 1,369 1,613 1.84 1.64 0.5 0.5 0.6United States of America Dallas-Fort Worth 4,172 5,143 5,913 2.09 1.40 1.9 2.0 2.1United States of America Dayton 706 835 993 1.67 1.74 0.3 0.3 0.3United States of America Denver-Aurora 1,998 2,492 2,905 2.21 1.54 0.9 1.0 1.0United States of America Detroit 3,909 4,364 5,025 1.10 1.41 1.7 1.7 1.8United States of America El Paso 678 813 968 1.82 1.74 0.3 0.3 0.3United States of America Hartford 853 982 1,164 1.41 1.70 0.4 0.4 0.4United States of America Honolulu 720 848 1,008 1.62 1.73 0.3 0.3 0.4United States of America Houston 3,849 4,785 5,509 2.18 1.41 1.7 1.9 1.9United States of America Indianapolis 1,228 1,552 1,827 2.35 1.63 0.5 0.6 0.6United States of America Jacksonville, Florida 886 1,066 1,263 1.85 1.69 0.4 0.4 0.4United States of America Kansas City 1,365 1,577 1,852 1.44 1.61 0.6 0.6 0.7United States of America Las Vegas 1,335 1,995 2,344 4.02 1.61 0.6 0.8 0.8United States of America Los Angeles-Long Beach-Santa Ana 11,814 13,223 14,907 1.13 1.20 5.3 5.2 5.2United States of America Louisville 866 1,021 1,210 1.64 1.70 0.4 0.4 0.4United States of America McAllen 532 824 984 4.37 1.78 0.2 0.3 0.3United States of America Memphis 976 1,165 1,378 1.77 1.67 0.4 0.5 0.5United States of America Miami 4,946 5,971 6,843 1.88 1.36 2.2 2.3 2.4United States of America Milwaukee 1,311 1,488 1,749 1.27 1.62 0.6 0.6 0.6United States of America Minneapolis-St. Paul 2,397 2,802 3,256 1.56 1.50 1.1 1.1 1.1United States of America Nashville-Davidson 755 951 1,129 2.31 1.72 0.3 0.4 0.4United States of America New Orleans 1,009 858 984 -1.62 1.38 0.4 0.4 0.4United States of America New York-Newark 17,846 20,104 22,487 1.19 1.12 8.0 7.9 7.9United States of America Oklahoma City 748 848 1,007 1.25 1.73 0.3 0.3 0.4United States of America Omaha 629 746 889 1.71 1.76 0.3 0.3 0.3United States of America Orlando 1,165 1,459 1,719 2.25 1.64 0.5 0.6 0.6United States of America Philadelphia 5,160 5,841 6,690 1.24 1.36 2.3 2.3 2.4United States of America Phoenix-Mesa 2,934 3,830 4,433 2.67 1.46 1.3 1.5 1.6United States of America Pittsburgh 1,755 1,965 2,298 1.13 1.56 0.8 0.8 0.8United States of America Portland 1,595 2,025 2,371 2.39 1.58 0.7 0.8 0.8United States of America Providence 1,178 1,373 1,617 1.53 1.64 0.5 0.5 0.6United States of America Raleigh 549 803 960 3.80 1.78 0.2 0.3 0.3United States of America Richmond 822 984 1,168 1.80 1.71 0.4 0.4 0.4United States of America Riverside-San Bernardino 1,516 1,882 2,206 2.16 1.59 0.7 0.7 0.8United States of America Rochester 696 814 969 1.56 1.74 0.3 0.3 0.3United States of America Sacramento 1,402 1,730 2,031 2.10 1.60 0.6 0.7 0.7United States of America Salt Lake City 890 1,040 1,232 1.56 1.69 0.4 0.4 0.4United States of America San Antonio 1,333 1,585 1,863 1.73 1.61 0.6 0.6 0.7United States of America San Diego 2,683 3,120 3,618 1.51 1.48 1.2 1.2 1.3United States of America San Francisco-Oakland 3,236 3,681 4,254 1.29 1.45 1.4 1.4 1.5United States of America San Jose 1,543 1,790 2,098 1.49 1.59 0.7 0.7 0.7United States of America Seattle 2,727 3,298 3,823 1.90 1.48 1.2 1.3 1.3
continued . . .
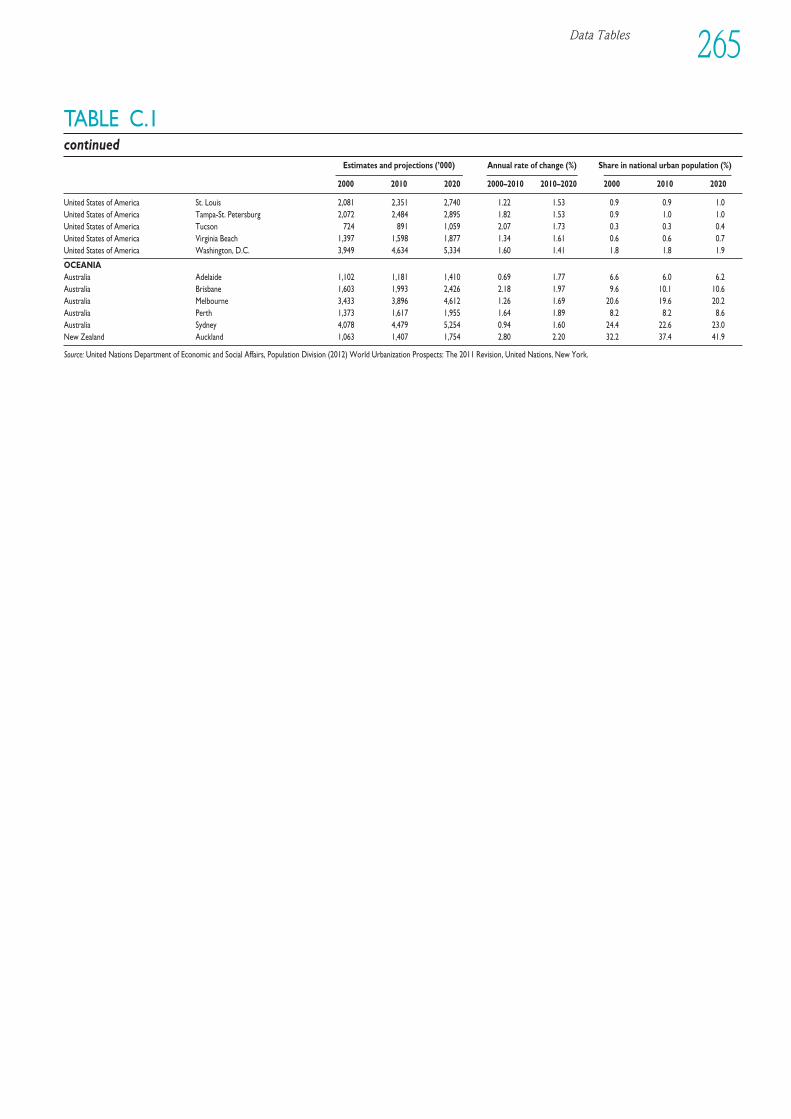
Data Tables 265
TABLE C.1continued
Estimates and projections (’000) Annual rate of change (%) Share in national urban population (%)
2000 2010 2020 2000–2010 2010–2020 2000 2010 2020
United States of America St. Louis 2,081 2,351 2,740 1.22 1.53 0.9 0.9 1.0United States of America Tampa-St. Petersburg 2,072 2,484 2,895 1.82 1.53 0.9 1.0 1.0United States of America Tucson 724 891 1,059 2.07 1.73 0.3 0.3 0.4United States of America Virginia Beach 1,397 1,598 1,877 1.34 1.61 0.6 0.6 0.7United States of America Washington, D.C. 3,949 4,634 5,334 1.60 1.41 1.8 1.8 1.9
OCEANIAAustralia Adelaide 1,102 1,181 1,410 0.69 1.77 6.6 6.0 6.2Australia Brisbane 1,603 1,993 2,426 2.18 1.97 9.6 10.1 10.6Australia Melbourne 3,433 3,896 4,612 1.26 1.69 20.6 19.6 20.2Australia Perth 1,373 1,617 1,955 1.64 1.89 8.2 8.2 8.6Australia Sydney 4,078 4,479 5,254 0.94 1.60 24.4 22.6 23.0New Zealand Auckland 1,063 1,407 1,754 2.80 2.20 32.2 37.4 41.9
Source: United Nations Department of Economic and Social Affairs, Population Division (2012) World Urbanization Prospects: The 2011 Revision, United Nations, New York.
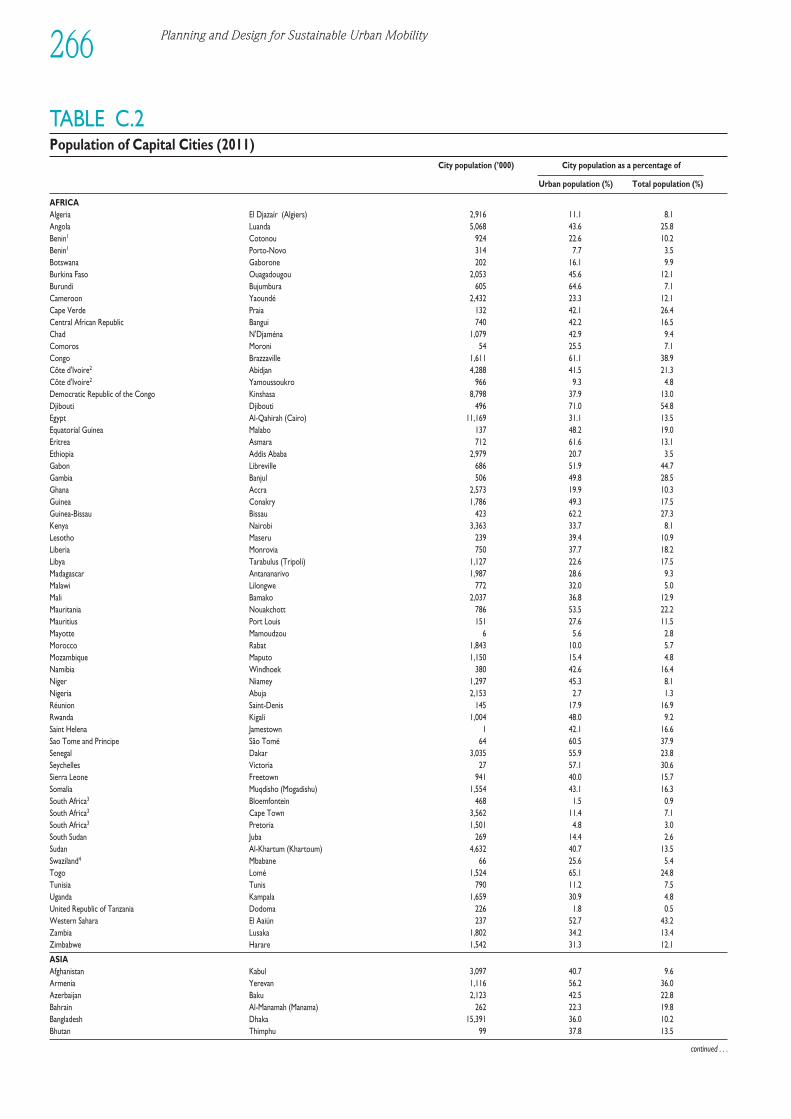
Planning and Design for Sustainable Urban Mobility266
TABLE C.2Population of Capital Cities (2011)
City population (’000) City population as a percentage of
Urban population (%) Total population (%)
AFRICAAlgeria El Djazaïr (Algiers) 2,916 11.1 8.1Angola Luanda 5,068 43.6 25.8Benin1 Cotonou 924 22.6 10.2Benin1 Porto-Novo 314 7.7 3.5Botswana Gaborone 202 16.1 9.9Burkina Faso Ouagadougou 2,053 45.6 12.1Burundi Bujumbura 605 64.6 7.1Cameroon Yaoundé 2,432 23.3 12.1Cape Verde Praia 132 42.1 26.4Central African Republic Bangui 740 42.2 16.5Chad N'Djaména 1,079 42.9 9.4Comoros Moroni 54 25.5 7.1Congo Brazzaville 1,611 61.1 38.9Côte d'Ivoire2 Abidjan 4,288 41.5 21.3Côte d'Ivoire2 Yamoussoukro 966 9.3 4.8Democratic Republic of the Congo Kinshasa 8,798 37.9 13.0Djibouti Djibouti 496 71.0 54.8Egypt Al-Qahirah (Cairo) 11,169 31.1 13.5Equatorial Guinea Malabo 137 48.2 19.0Eritrea Asmara 712 61.6 13.1Ethiopia Addis Ababa 2,979 20.7 3.5Gabon Libreville 686 51.9 44.7Gambia Banjul 506 49.8 28.5Ghana Accra 2,573 19.9 10.3Guinea Conakry 1,786 49.3 17.5Guinea-Bissau Bissau 423 62.2 27.3Kenya Nairobi 3,363 33.7 8.1Lesotho Maseru 239 39.4 10.9Liberia Monrovia 750 37.7 18.2Libya Tarabulus (Tripoli) 1,127 22.6 17.5Madagascar Antananarivo 1,987 28.6 9.3Malawi Lilongwe 772 32.0 5.0Mali Bamako 2,037 36.8 12.9Mauritania Nouakchott 786 53.5 22.2Mauritius Port Louis 151 27.6 11.5Mayotte Mamoudzou 6 5.6 2.8Morocco Rabat 1,843 10.0 5.7Mozambique Maputo 1,150 15.4 4.8Namibia Windhoek 380 42.6 16.4Niger Niamey 1,297 45.3 8.1Nigeria Abuja 2,153 2.7 1.3Réunion Saint-Denis 145 17.9 16.9Rwanda Kigali 1,004 48.0 9.2Saint Helena Jamestown 1 42.1 16.6Sao Tome and Principe São Tomé 64 60.5 37.9Senegal Dakar 3,035 55.9 23.8Seychelles Victoria 27 57.1 30.6Sierra Leone Freetown 941 40.0 15.7Somalia Muqdisho (Mogadishu) 1,554 43.1 16.3South Africa3 Bloemfontein 468 1.5 0.9South Africa3 Cape Town 3,562 11.4 7.1South Africa3 Pretoria 1,501 4.8 3.0South Sudan Juba 269 14.4 2.6Sudan Al-Khartum (Khartoum) 4,632 40.7 13.5Swaziland4 Mbabane 66 25.6 5.4Togo Lomé 1,524 65.1 24.8Tunisia Tunis 790 11.2 7.5Uganda Kampala 1,659 30.9 4.8United Republic of Tanzania Dodoma 226 1.8 0.5Western Sahara El Aaiún 237 52.7 43.2Zambia Lusaka 1,802 34.2 13.4Zimbabwe Harare 1,542 31.3 12.1
ASIAAfghanistan Kabul 3,097 40.7 9.6Armenia Yerevan 1,116 56.2 36.0Azerbaijan Baku 2,123 42.5 22.8Bahrain Al-Manamah (Manama) 262 22.3 19.8Bangladesh Dhaka 15,391 36.0 10.2Bhutan Thimphu 99 37.8 13.5
continued . . .
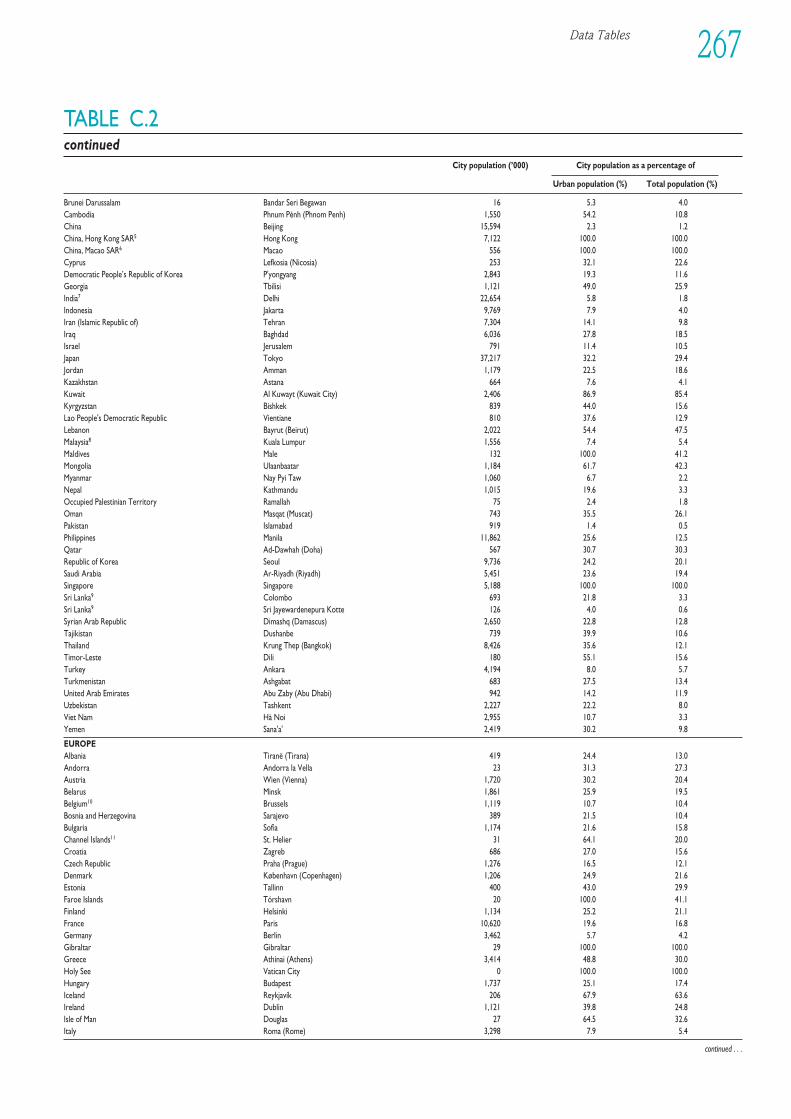
Data Tables 267
TABLE C.2continued
City population (’000) City population as a percentage of
Urban population (%) Total population (%)
Brunei Darussalam Bandar Seri Begawan 16 5.3 4.0Cambodia Phnum Pénh (Phnom Penh) 1,550 54.2 10.8China Beijing 15,594 2.3 1.2China, Hong Kong SAR5 Hong Kong 7,122 100.0 100.0China, Macao SAR6 Macao 556 100.0 100.0Cyprus Lefkosia (Nicosia) 253 32.1 22.6Democratic People’s Republic of Korea P'yongyang 2,843 19.3 11.6Georgia Tbilisi 1,121 49.0 25.9India7 Delhi 22,654 5.8 1.8Indonesia Jakarta 9,769 7.9 4.0Iran (Islamic Republic of) Tehran 7,304 14.1 9.8Iraq Baghdad 6,036 27.8 18.5Israel Jerusalem 791 11.4 10.5Japan Tokyo 37,217 32.2 29.4Jordan Amman 1,179 22.5 18.6Kazakhstan Astana 664 7.6 4.1Kuwait Al Kuwayt (Kuwait City) 2,406 86.9 85.4Kyrgyzstan Bishkek 839 44.0 15.6Lao People's Democratic Republic Vientiane 810 37.6 12.9Lebanon Bayrut (Beirut) 2,022 54.4 47.5Malaysia8 Kuala Lumpur 1,556 7.4 5.4Maldives Male 132 100.0 41.2Mongolia Ulaanbaatar 1,184 61.7 42.3Myanmar Nay Pyi Taw 1,060 6.7 2.2Nepal Kathmandu 1,015 19.6 3.3Occupied Palestinian Territory Ramallah 75 2.4 1.8Oman Masqat (Muscat) 743 35.5 26.1Pakistan Islamabad 919 1.4 0.5Philippines Manila 11,862 25.6 12.5Qatar Ad-Dawhah (Doha) 567 30.7 30.3Republic of Korea Seoul 9,736 24.2 20.1Saudi Arabia Ar-Riyadh (Riyadh) 5,451 23.6 19.4Singapore Singapore 5,188 100.0 100.0Sri Lanka9 Colombo 693 21.8 3.3Sri Lanka9 Sri Jayewardenepura Kotte 126 4.0 0.6Syrian Arab Republic Dimashq (Damascus) 2,650 22.8 12.8Tajikistan Dushanbe 739 39.9 10.6Thailand Krung Thep (Bangkok) 8,426 35.6 12.1Timor-Leste Dili 180 55.1 15.6Turkey Ankara 4,194 8.0 5.7Turkmenistan Ashgabat 683 27.5 13.4United Arab Emirates Abu Zaby (Abu Dhabi) 942 14.2 11.9Uzbekistan Tashkent 2,227 22.2 8.0Viet Nam Hà Noi 2,955 10.7 3.3Yemen Sana'a' 2,419 30.2 9.8
EUROPEAlbania Tiranë (Tirana) 419 24.4 13.0Andorra Andorra la Vella 23 31.3 27.3Austria Wien (Vienna) 1,720 30.2 20.4Belarus Minsk 1,861 25.9 19.5Belgium10 Brussels 1,119 10.7 10.4Bosnia and Herzegovina Sarajevo 389 21.5 10.4Bulgaria Sofia 1,174 21.6 15.8Channel Islands11 St. Helier 31 64.1 20.0Croatia Zagreb 686 27.0 15.6Czech Republic Praha (Prague) 1,276 16.5 12.1Denmark København (Copenhagen) 1,206 24.9 21.6Estonia Tallinn 400 43.0 29.9Faroe Islands Tórshavn 20 100.0 41.1Finland Helsinki 1,134 25.2 21.1France Paris 10,620 19.6 16.8Germany Berlin 3,462 5.7 4.2Gibraltar Gibraltar 29 100.0 100.0Greece Athínai (Athens) 3,414 48.8 30.0Holy See Vatican City 0 100.0 100.0Hungary Budapest 1,737 25.1 17.4Iceland Reykjavík 206 67.9 63.6Ireland Dublin 1,121 39.8 24.8Isle of Man Douglas 27 64.5 32.6Italy Roma (Rome) 3,298 7.9 5.4
continued . . .
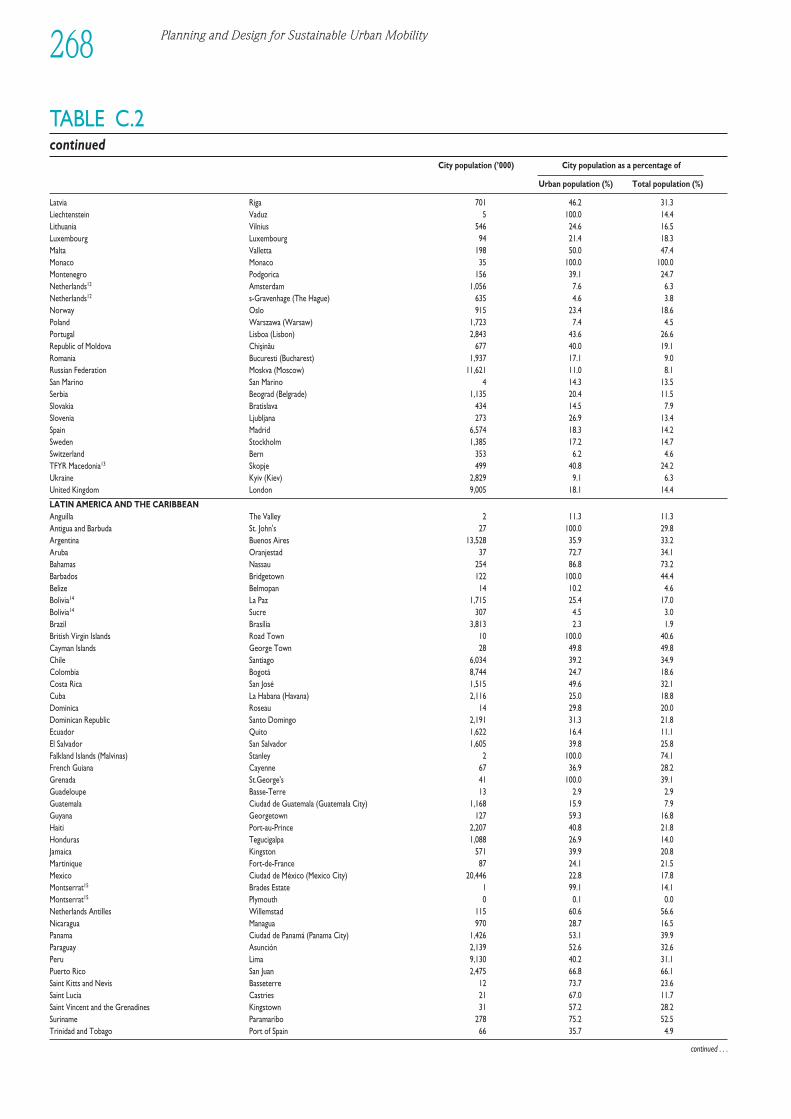
Planning and Design for Sustainable Urban Mobility268
TABLE C.2continued
City population (’000) City population as a percentage of
Urban population (%) Total population (%)
Latvia Riga 701 46.2 31.3Liechtenstein Vaduz 5 100.0 14.4Lithuania Vilnius 546 24.6 16.5Luxembourg Luxembourg 94 21.4 18.3Malta Valletta 198 50.0 47.4Monaco Monaco 35 100.0 100.0Montenegro Podgorica 156 39.1 24.7Netherlands12 Amsterdam 1,056 7.6 6.3Netherlands12 s-Gravenhage (The Hague) 635 4.6 3.8Norway Oslo 915 23.4 18.6Poland Warszawa (Warsaw) 1,723 7.4 4.5Portugal Lisboa (Lisbon) 2,843 43.6 26.6Republic of Moldova Chisinau 677 40.0 19.1Romania Bucuresti (Bucharest) 1,937 17.1 9.0Russian Federation Moskva (Moscow) 11,621 11.0 8.1San Marino San Marino 4 14.3 13.5Serbia Beograd (Belgrade) 1,135 20.4 11.5Slovakia Bratislava 434 14.5 7.9Slovenia Ljubljana 273 26.9 13.4Spain Madrid 6,574 18.3 14.2Sweden Stockholm 1,385 17.2 14.7Switzerland Bern 353 6.2 4.6TFYR Macedonia13 Skopje 499 40.8 24.2Ukraine Kyiv (Kiev) 2,829 9.1 6.3United Kingdom London 9,005 18.1 14.4
LATIN AMERICA AND THE CARIBBEANAnguilla The Valley 2 11.3 11.3Antigua and Barbuda St. John's 27 100.0 29.8Argentina Buenos Aires 13,528 35.9 33.2Aruba Oranjestad 37 72.7 34.1Bahamas Nassau 254 86.8 73.2Barbados Bridgetown 122 100.0 44.4Belize Belmopan 14 10.2 4.6Bolivia14 La Paz 1,715 25.4 17.0Bolivia14 Sucre 307 4.5 3.0Brazil Brasília 3,813 2.3 1.9British Virgin Islands Road Town 10 100.0 40.6Cayman Islands George Town 28 49.8 49.8Chile Santiago 6,034 39.2 34.9Colombia Bogotá 8,744 24.7 18.6Costa Rica San José 1,515 49.6 32.1Cuba La Habana (Havana) 2,116 25.0 18.8Dominica Roseau 14 29.8 20.0Dominican Republic Santo Domingo 2,191 31.3 21.8Ecuador Quito 1,622 16.4 11.1El Salvador San Salvador 1,605 39.8 25.8Falkland Islands (Malvinas) Stanley 2 100.0 74.1French Guiana Cayenne 67 36.9 28.2Grenada St.George's 41 100.0 39.1Guadeloupe Basse-Terre 13 2.9 2.9Guatemala Ciudad de Guatemala (Guatemala City) 1,168 15.9 7.9Guyana Georgetown 127 59.3 16.8Haiti Port-au-Prince 2,207 40.8 21.8Honduras Tegucigalpa 1,088 26.9 14.0Jamaica Kingston 571 39.9 20.8Martinique Fort-de-France 87 24.1 21.5Mexico Ciudad de México (Mexico City) 20,446 22.8 17.8Montserrat15 Brades Estate 1 99.1 14.1Montserrat15 Plymouth 0 0.1 0.0Netherlands Antilles Willemstad 115 60.6 56.6Nicaragua Managua 970 28.7 16.5Panama Ciudad de Panamá (Panama City) 1,426 53.1 39.9Paraguay Asunción 2,139 52.6 32.6Peru Lima 9,130 40.2 31.1Puerto Rico San Juan 2,475 66.8 66.1Saint Kitts and Nevis Basseterre 12 73.7 23.6Saint Lucia Castries 21 67.0 11.7Saint Vincent and the Grenadines Kingstown 31 57.2 28.2Suriname Paramaribo 278 75.2 52.5Trinidad and Tobago Port of Spain 66 35.7 4.9
continued . . .
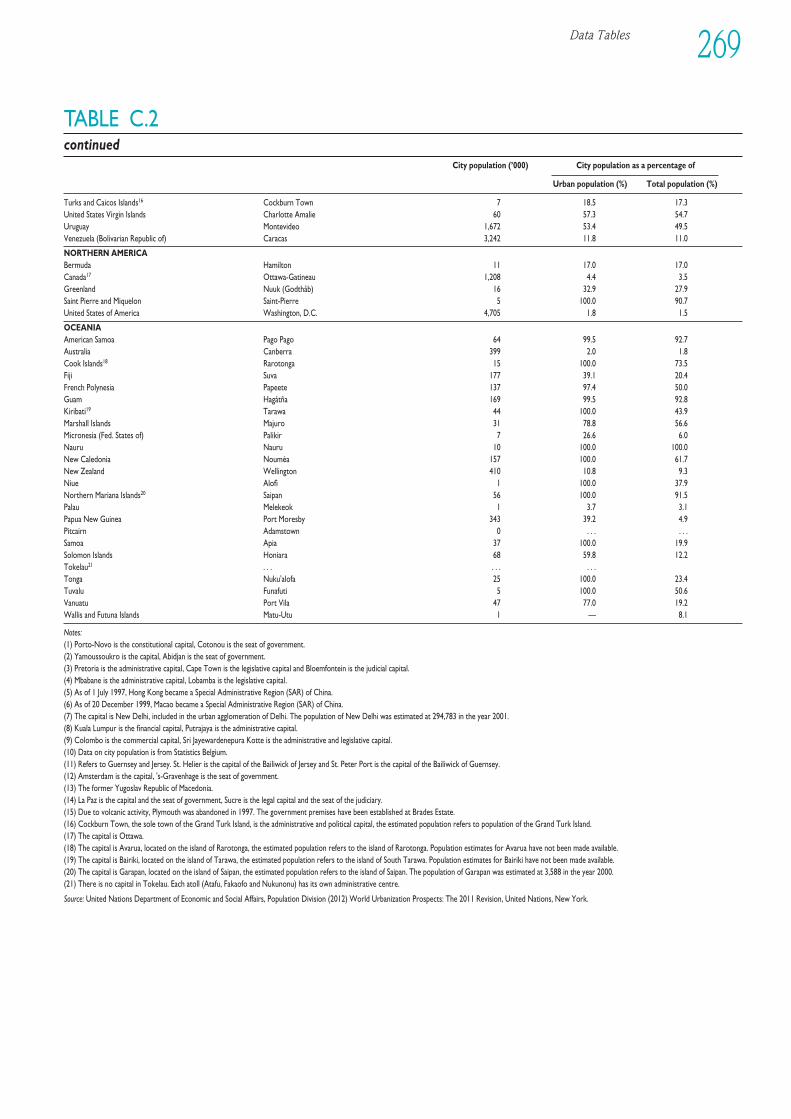
Data Tables 269
TABLE C.2continued
City population (’000) City population as a percentage of
Urban population (%) Total population (%)
Turks and Caicos Islands16 Cockburn Town 7 18.5 17.3United States Virgin Islands Charlotte Amalie 60 57.3 54.7Uruguay Montevideo 1,672 53.4 49.5Venezuela (Bolivarian Republic of) Caracas 3,242 11.8 11.0
NORTHERN AMERICABermuda Hamilton 11 17.0 17.0Canada17 Ottawa-Gatineau 1,208 4.4 3.5Greenland Nuuk (Godthåb) 16 32.9 27.9Saint Pierre and Miquelon Saint-Pierre 5 100.0 90.7United States of America Washington, D.C. 4,705 1.8 1.5
OCEANIAAmerican Samoa Pago Pago 64 99.5 92.7Australia Canberra 399 2.0 1.8Cook Islands18 Rarotonga 15 100.0 73.5Fiji Suva 177 39.1 20.4French Polynesia Papeete 137 97.4 50.0Guam Hagåtña 169 99.5 92.8Kiribati19 Tarawa 44 100.0 43.9Marshall Islands Majuro 31 78.8 56.6Micronesia (Fed. States of) Palikir 7 26.6 6.0Nauru Nauru 10 100.0 100.0New Caledonia Nouméa 157 100.0 61.7New Zealand Wellington 410 10.8 9.3Niue Alofi 1 100.0 37.9Northern Mariana Islands20 Saipan 56 100.0 91.5Palau Melekeok 1 3.7 3.1Papua New Guinea Port Moresby 343 39.2 4.9Pitcairn Adamstown 0 . . . . . .Samoa Apia 37 100.0 19.9Solomon Islands Honiara 68 59.8 12.2Tokelau21 . . . . . . . . .Tonga Nuku'alofa 25 100.0 23.4Tuvalu Funafuti 5 100.0 50.6Vanuatu Port Vila 47 77.0 19.2Wallis and Futuna Islands Matu-Utu 1 — 8.1
Notes:(1) Porto-Novo is the constitutional capital, Cotonou is the seat of government.(2) Yamoussoukro is the capital, Abidjan is the seat of government.(3) Pretoria is the administrative capital, Cape Town is the legislative capital and Bloemfontein is the judicial capital.(4) Mbabane is the administrative capital, Lobamba is the legislative capital.(5) As of 1 July 1997, Hong Kong became a Special Administrative Region (SAR) of China.(6) As of 20 December 1999, Macao became a Special Administrative Region (SAR) of China.(7) The capital is New Delhi, included in the urban agglomeration of Delhi. The population of New Delhi was estimated at 294,783 in the year 2001.(8) Kuala Lumpur is the financial capital, Putrajaya is the administrative capital.(9) Colombo is the commercial capital, Sri Jayewardenepura Kotte is the administrative and legislative capital.(10) Data on city population is from Statistics Belgium.(11) Refers to Guernsey and Jersey. St. Helier is the capital of the Bailiwick of Jersey and St. Peter Port is the capital of the Bailiwick of Guernsey.(12) Amsterdam is the capital, 's-Gravenhage is the seat of government.(13) The former Yugoslav Republic of Macedonia.(14) La Paz is the capital and the seat of government, Sucre is the legal capital and the seat of the judiciary.(15) Due to volcanic activity, Plymouth was abandoned in 1997. The government premises have been established at Brades Estate.(16) Cockburn Town, the sole town of the Grand Turk Island, is the administrative and political capital, the estimated population refers to population of the Grand Turk Island.(17) The capital is Ottawa.(18) The capital is Avarua, located on the island of Rarotonga, the estimated population refers to the island of Rarotonga. Population estimates for Avarua have not been made available.(19) The capital is Bairiki, located on the island of Tarawa, the estimated population refers to the island of South Tarawa. Population estimates for Bairiki have not been made available.(20) The capital is Garapan, located on the island of Saipan, the estimated population refers to the island of Saipan. The population of Garapan was estimated at 3,588 in the year 2000.(21) There is no capital in Tokelau. Each atoll (Atafu, Fakaofo and Nukunonu) has its own administrative centre.
Source: United Nations Department of Economic and Social Affairs, Population Division (2012) World Urbanization Prospects: The 2011 Revision, United Nations, New York.
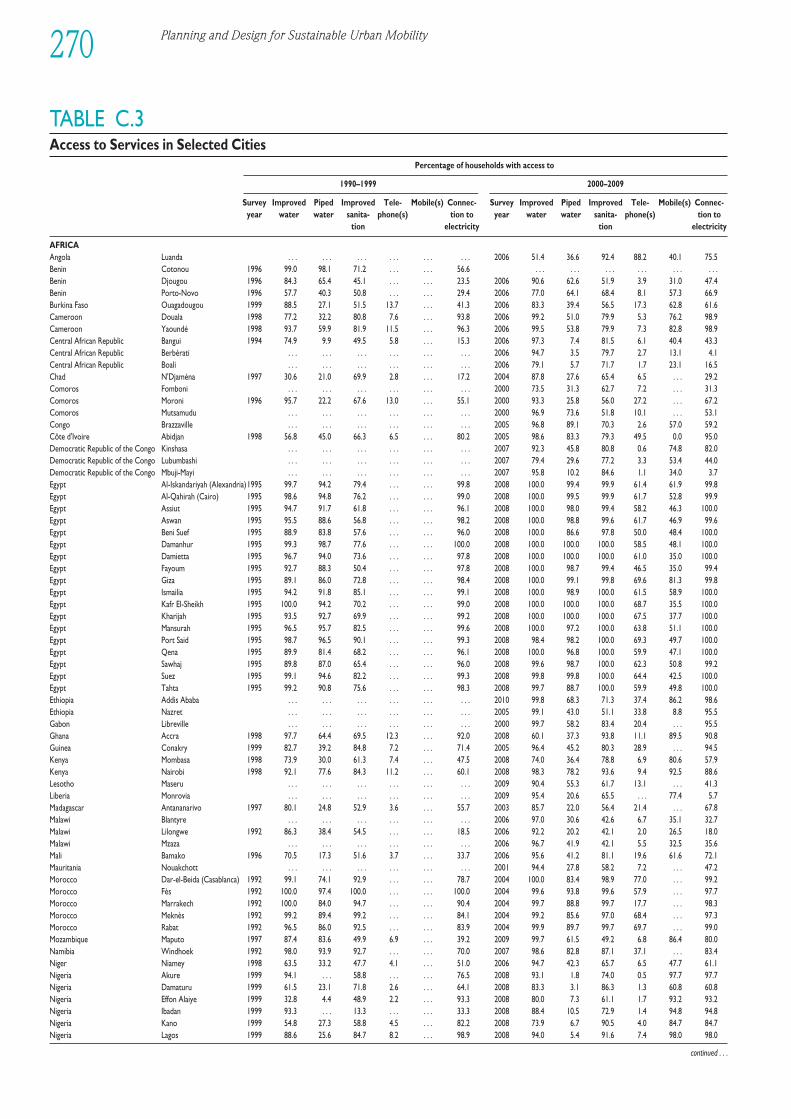
Planning and Design for Sustainable Urban Mobility270
TABLE C.3Access to Services in Selected Cities
Percentage of households with access to
1990–1999 2000–2009
Survey Improved Piped Improved Tele- Mobile(s) Connec- Survey Improved Piped Improved Tele- Mobile(s) Connec-year water water sanita- phone(s) tion to year water water sanita- phone(s) tion to
tion electricity tion electricity
AFRICAAngola Luanda . . . . . . . . . . . . . . . . . . 2006 51.4 36.6 92.4 88.2 40.1 75.5Benin Cotonou 1996 99.0 98.1 71.2 . . . . . . 56.6 . . . . . . . . . . . . . . . . . .Benin Djougou 1996 84.3 65.4 45.1 . . . . . . 23.5 2006 90.6 62.6 51.9 3.9 31.0 47.4Benin Porto-Novo 1996 57.7 40.3 50.8 . . . . . . 29.4 2006 77.0 64.1 68.4 8.1 57.3 66.9Burkina Faso Ouagadougou 1999 88.5 27.1 51.5 13.7 . . . 41.3 2006 83.3 39.4 56.5 17.3 62.8 61.6Cameroon Douala 1998 77.2 32.2 80.8 7.6 . . . 93.8 2006 99.2 51.0 79.9 5.3 76.2 98.9Cameroon Yaoundé 1998 93.7 59.9 81.9 11.5 . . . 96.3 2006 99.5 53.8 79.9 7.3 82.8 98.9Central African Republic Bangui 1994 74.9 9.9 49.5 5.8 . . . 15.3 2006 97.3 7.4 81.5 6.1 40.4 43.3Central African Republic Berbérati . . . . . . . . . . . . . . . . . . 2006 94.7 3.5 79.7 2.7 13.1 4.1Central African Republic Boali . . . . . . . . . . . . . . . . . . 2006 79.1 5.7 71.7 1.7 23.1 16.5Chad N'Djaména 1997 30.6 21.0 69.9 2.8 . . . 17.2 2004 87.8 27.6 65.4 6.5 . . . 29.2Comoros Fomboni . . . . . . . . . . . . . . . . . . 2000 73.5 31.3 62.7 7.2 . . . 31.3Comoros Moroni 1996 95.7 22.2 67.6 13.0 . . . 55.1 2000 93.3 25.8 56.0 27.2 . . . 67.2Comoros Mutsamudu . . . . . . . . . . . . . . . . . . 2000 96.9 73.6 51.8 10.1 . . . 53.1Congo Brazzaville . . . . . . . . . . . . . . . . . . 2005 96.8 89.1 70.3 2.6 57.0 59.2Côte d'Ivoire Abidjan 1998 56.8 45.0 66.3 6.5 . . . 80.2 2005 98.6 83.3 79.3 49.5 0.0 95.0Democratic Republic of the Congo Kinshasa . . . . . . . . . . . . . . . . . . 2007 92.3 45.8 80.8 0.6 74.8 82.0Democratic Republic of the Congo Lubumbashi . . . . . . . . . . . . . . . . . . 2007 79.4 29.6 77.2 3.3 53.4 44.0Democratic Republic of the Congo Mbuji-Mayi . . . . . . . . . . . . . . . . . . 2007 95.8 10.2 84.6 1.1 34.0 3.7Egypt Al-Iskandariyah (Alexandria)1995 99.7 94.2 79.4 . . . . . . 99.8 2008 100.0 99.4 99.9 61.4 61.9 99.8Egypt Al-Qahirah (Cairo) 1995 98.6 94.8 76.2 . . . . . . 99.0 2008 100.0 99.5 99.9 61.7 52.8 99.9Egypt Assiut 1995 94.7 91.7 61.8 . . . . . . 96.1 2008 100.0 98.0 99.4 58.2 46.3 100.0Egypt Aswan 1995 95.5 88.6 56.8 . . . . . . 98.2 2008 100.0 98.8 99.6 61.7 46.9 99.6Egypt Beni Suef 1995 88.9 83.8 57.6 . . . . . . 96.0 2008 100.0 86.6 97.8 50.0 48.4 100.0Egypt Damanhur 1995 99.3 98.7 77.6 . . . . . . 100.0 2008 100.0 100.0 100.0 58.5 48.1 100.0Egypt Damietta 1995 96.7 94.0 73.6 . . . . . . 97.8 2008 100.0 100.0 100.0 61.0 35.0 100.0Egypt Fayoum 1995 92.7 88.3 50.4 . . . . . . 97.8 2008 100.0 98.7 99.4 46.5 35.0 99.4Egypt Giza 1995 89.1 86.0 72.8 . . . . . . 98.4 2008 100.0 99.1 99.8 69.6 81.3 99.8Egypt Ismailia 1995 94.2 91.8 85.1 . . . . . . 99.1 2008 100.0 98.9 100.0 61.5 58.9 100.0Egypt Kafr El-Sheikh 1995 100.0 94.2 70.2 . . . . . . 99.0 2008 100.0 100.0 100.0 68.7 35.5 100.0Egypt Kharijah 1995 93.5 92.7 69.9 . . . . . . 99.2 2008 100.0 100.0 100.0 67.5 37.7 100.0Egypt Mansurah 1995 96.5 95.7 82.5 . . . . . . 99.6 2008 100.0 97.2 100.0 63.8 51.1 100.0Egypt Port Said 1995 98.7 96.5 90.1 . . . . . . 99.3 2008 98.4 98.2 100.0 69.3 49.7 100.0Egypt Qena 1995 89.9 81.4 68.2 . . . . . . 96.1 2008 100.0 96.8 100.0 59.9 47.1 100.0Egypt Sawhaj 1995 89.8 87.0 65.4 . . . . . . 96.0 2008 99.6 98.7 100.0 62.3 50.8 99.2Egypt Suez 1995 99.1 94.6 82.2 . . . . . . 99.3 2008 99.8 99.8 100.0 64.4 42.5 100.0Egypt Tahta 1995 99.2 90.8 75.6 . . . . . . 98.3 2008 99.7 88.7 100.0 59.9 49.8 100.0Ethiopia Addis Ababa . . . . . . . . . . . . . . . . . . 2010 99.8 68.3 71.3 37.4 86.2 98.6Ethiopia Nazret . . . . . . . . . . . . . . . . . . 2005 99.1 43.0 51.1 33.8 8.8 95.5Gabon Libreville . . . . . . . . . . . . . . . . . . 2000 99.7 58.2 83.4 20.4 . . . 95.5Ghana Accra 1998 97.7 64.4 69.5 12.3 . . . 92.0 2008 60.1 37.3 93.8 11.1 89.5 90.8Guinea Conakry 1999 82.7 39.2 84.8 7.2 . . . 71.4 2005 96.4 45.2 80.3 28.9 . . . 94.5Kenya Mombasa 1998 73.9 30.0 61.3 7.4 . . . 47.5 2008 74.0 36.4 78.8 6.9 80.6 57.9Kenya Nairobi 1998 92.1 77.6 84.3 11.2 . . . 60.1 2008 98.3 78.2 93.6 9.4 92.5 88.6Lesotho Maseru . . . . . . . . . . . . . . . . . . 2009 90.4 55.3 61.7 13.1 . . . 41.3Liberia Monrovia . . . . . . . . . . . . . . . . . . 2009 95.4 20.6 65.5 . . . 77.4 5.7Madagascar Antananarivo 1997 80.1 24.8 52.9 3.6 . . . 55.7 2003 85.7 22.0 56.4 21.4 . . . 67.8Malawi Blantyre . . . . . . . . . . . . . . . . . . 2006 97.0 30.6 42.6 6.7 35.1 32.7Malawi Lilongwe 1992 86.3 38.4 54.5 . . . . . . 18.5 2006 92.2 20.2 42.1 2.0 26.5 18.0Malawi Mzaza . . . . . . . . . . . . . . . . . . 2006 96.7 41.9 42.1 5.5 32.5 35.6Mali Bamako 1996 70.5 17.3 51.6 3.7 . . . 33.7 2006 95.6 41.2 81.1 19.6 61.6 72.1Mauritania Nouakchott . . . . . . . . . . . . . . . . . . 2001 94.4 27.8 58.2 7.2 . . . 47.2Morocco Dar-el-Beida (Casablanca) 1992 99.1 74.1 92.9 . . . . . . 78.7 2004 100.0 83.4 98.9 77.0 . . . 99.2Morocco Fès 1992 100.0 97.4 100.0 . . . . . . 100.0 2004 99.6 93.8 99.6 57.9 . . . 97.7Morocco Marrakech 1992 100.0 84.0 94.7 . . . . . . 90.4 2004 99.7 88.8 99.7 17.7 . . . 98.3Morocco Meknès 1992 99.2 89.4 99.2 . . . . . . 84.1 2004 99.2 85.6 97.0 68.4 . . . 97.3Morocco Rabat 1992 96.5 86.0 92.5 . . . . . . 83.9 2004 99.9 89.7 99.7 69.7 . . . 99.0Mozambique Maputo 1997 87.4 83.6 49.9 6.9 . . . 39.2 2009 99.7 61.5 49.2 6.8 86.4 80.0Namibia Windhoek 1992 98.0 93.9 92.7 . . . . . . 70.0 2007 98.6 82.8 87.1 37.1 . . . 83.4Niger Niamey 1998 63.5 33.2 47.7 4.1 . . . 51.0 2006 94.7 42.3 65.7 6.5 47.7 61.1Nigeria Akure 1999 94.1 . . . 58.8 . . . . . . 76.5 2008 93.1 1.8 74.0 0.5 97.7 97.7Nigeria Damaturu 1999 61.5 23.1 71.8 2.6 . . . 64.1 2008 83.3 3.1 86.3 1.3 60.8 60.8Nigeria Effon Alaiye 1999 32.8 4.4 48.9 2.2 . . . 93.3 2008 80.0 7.3 61.1 1.7 93.2 93.2Nigeria Ibadan 1999 93.3 . . . 13.3 . . . . . . 33.3 2008 88.4 10.5 72.9 1.4 94.8 94.8Nigeria Kano 1999 54.8 27.3 58.8 4.5 . . . 82.2 2008 73.9 6.7 90.5 4.0 84.7 84.7Nigeria Lagos 1999 88.6 25.6 84.7 8.2 . . . 98.9 2008 94.0 5.4 91.6 7.4 98.0 98.0
continued . . .
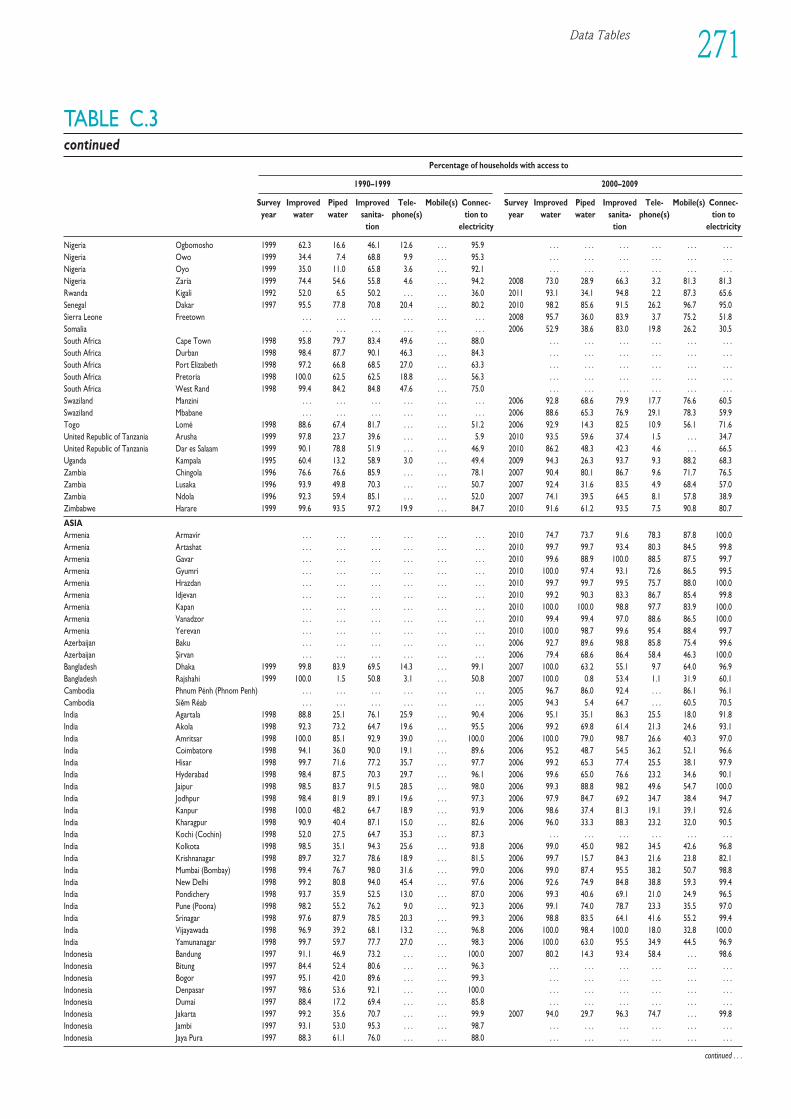
Data Tables 271
TABLE C.3continued
Percentage of households with access to
1990–1999 2000–2009
Survey Improved Piped Improved Tele- Mobile(s) Connec- Survey Improved Piped Improved Tele- Mobile(s) Connec-year water water sanita- phone(s) tion to year water water sanita- phone(s) tion to
tion electricity tion electricity
Nigeria Ogbomosho 1999 62.3 16.6 46.1 12.6 . . . 95.9 . . . . . . . . . . . . . . . . . .Nigeria Owo 1999 34.4 7.4 68.8 9.9 . . . 95.3 . . . . . . . . . . . . . . . . . .Nigeria Oyo 1999 35.0 11.0 65.8 3.6 . . . 92.1 . . . . . . . . . . . . . . . . . .Nigeria Zaria 1999 74.4 54.6 55.8 4.6 . . . 94.2 2008 73.0 28.9 66.3 3.2 81.3 81.3Rwanda Kigali 1992 52.0 6.5 50.2 . . . . . . 36.0 2011 93.1 34.1 94.8 2.2 87.3 65.6Senegal Dakar 1997 95.5 77.8 70.8 20.4 . . . 80.2 2010 98.2 85.6 91.5 26.2 96.7 95.0Sierra Leone Freetown . . . . . . . . . . . . . . . . . . 2008 95.7 36.0 83.9 3.7 75.2 51.8Somalia . . . . . . . . . . . . . . . . . . 2006 52.9 38.6 83.0 19.8 26.2 30.5South Africa Cape Town 1998 95.8 79.7 83.4 49.6 . . . 88.0 . . . . . . . . . . . . . . . . . .South Africa Durban 1998 98.4 87.7 90.1 46.3 . . . 84.3 . . . . . . . . . . . . . . . . . .South Africa Port Elizabeth 1998 97.2 66.8 68.5 27.0 . . . 63.3 . . . . . . . . . . . . . . . . . .South Africa Pretoria 1998 100.0 62.5 62.5 18.8 . . . 56.3 . . . . . . . . . . . . . . . . . .South Africa West Rand 1998 99.4 84.2 84.8 47.6 . . . 75.0 . . . . . . . . . . . . . . . . . .Swaziland Manzini . . . . . . . . . . . . . . . . . . 2006 92.8 68.6 79.9 17.7 76.6 60.5Swaziland Mbabane . . . . . . . . . . . . . . . . . . 2006 88.6 65.3 76.9 29.1 78.3 59.9Togo Lomé 1998 88.6 67.4 81.7 . . . . . . 51.2 2006 92.9 14.3 82.5 10.9 56.1 71.6United Republic of Tanzania Arusha 1999 97.8 23.7 39.6 . . . . . . 5.9 2010 93.5 59.6 37.4 1.5 . . . 34.7United Republic of Tanzania Dar es Salaam 1999 90.1 78.8 51.9 . . . . . . 46.9 2010 86.2 48.3 42.3 4.6 . . . 66.5Uganda Kampala 1995 60.4 13.2 58.9 3.0 . . . 49.4 2009 94.3 26.3 93.7 9.3 88.2 68.3Zambia Chingola 1996 76.6 76.6 85.9 . . . . . . 78.1 2007 90.4 80.1 86.7 9.6 71.7 76.5Zambia Lusaka 1996 93.9 49.8 70.3 . . . . . . 50.7 2007 92.4 31.6 83.5 4.9 68.4 57.0Zambia Ndola 1996 92.3 59.4 85.1 . . . . . . 52.0 2007 74.1 39.5 64.5 8.1 57.8 38.9Zimbabwe Harare 1999 99.6 93.5 97.2 19.9 . . . 84.7 2010 91.6 61.2 93.5 7.5 90.8 80.7
ASIAArmenia Armavir . . . . . . . . . . . . . . . . . . 2010 74.7 73.7 91.6 78.3 87.8 100.0Armenia Artashat . . . . . . . . . . . . . . . . . . 2010 99.7 99.7 93.4 80.3 84.5 99.8Armenia Gavar . . . . . . . . . . . . . . . . . . 2010 99.6 88.9 100.0 88.5 87.5 99.7Armenia Gyumri . . . . . . . . . . . . . . . . . . 2010 100.0 97.4 93.1 72.6 86.5 99.5Armenia Hrazdan . . . . . . . . . . . . . . . . . . 2010 99.7 99.7 99.5 75.7 88.0 100.0Armenia Idjevan . . . . . . . . . . . . . . . . . . 2010 99.2 90.3 83.3 86.7 85.4 99.8Armenia Kapan . . . . . . . . . . . . . . . . . . 2010 100.0 100.0 98.8 97.7 83.9 100.0Armenia Vanadzor . . . . . . . . . . . . . . . . . . 2010 99.4 99.4 97.0 88.6 86.5 100.0Armenia Yerevan . . . . . . . . . . . . . . . . . . 2010 100.0 98.7 99.6 95.4 88.4 99.7Azerbaijan Baku . . . . . . . . . . . . . . . . . . 2006 92.7 89.6 98.8 85.8 75.4 99.6Azerbaijan Sirvan . . . . . . . . . . . . . . . . . . 2006 79.4 68.6 86.4 58.4 46.3 100.0Bangladesh Dhaka 1999 99.8 83.9 69.5 14.3 . . . 99.1 2007 100.0 63.2 55.1 9.7 64.0 96.9Bangladesh Rajshahi 1999 100.0 1.5 50.8 3.1 . . . 50.8 2007 100.0 0.8 53.4 1.1 31.9 60.1Cambodia Phnum Pénh (Phnom Penh) . . . . . . . . . . . . . . . . . . 2005 96.7 86.0 92.4 . . . 86.1 96.1Cambodia Siem Réab . . . . . . . . . . . . . . . . . . 2005 94.3 5.4 64.7 . . . 60.5 70.5India Agartala 1998 88.8 25.1 76.1 25.9 . . . 90.4 2006 95.1 35.1 86.3 25.5 18.0 91.8India Akola 1998 92.3 73.2 64.7 19.6 . . . 95.5 2006 99.2 69.8 61.4 21.3 24.6 93.1India Amritsar 1998 100.0 85.1 92.9 39.0 . . . 100.0 2006 100.0 79.0 98.7 26.6 40.3 97.0India Coimbatore 1998 94.1 36.0 90.0 19.1 . . . 89.6 2006 95.2 48.7 54.5 36.2 52.1 96.6India Hisar 1998 99.7 71.6 77.2 35.7 . . . 97.7 2006 99.2 65.3 77.4 25.5 38.1 97.9India Hyderabad 1998 98.4 87.5 70.3 29.7 . . . 96.1 2006 99.6 65.0 76.6 23.2 34.6 90.1India Jaipur 1998 98.5 83.7 91.5 28.5 . . . 98.0 2006 99.3 88.8 98.2 49.6 54.7 100.0India Jodhpur 1998 98.4 81.9 89.1 19.6 . . . 97.3 2006 97.9 84.7 69.2 34.7 38.4 94.7India Kanpur 1998 100.0 48.2 64.7 18.9 . . . 93.9 2006 98.6 37.4 81.3 19.1 39.1 92.6India Kharagpur 1998 90.9 40.4 87.1 15.0 . . . 82.6 2006 96.0 33.3 88.3 23.2 32.0 90.5India Kochi (Cochin) 1998 52.0 27.5 64.7 35.3 . . . 87.3 . . . . . . . . . . . . . . . . . .India Kolkota 1998 98.5 35.1 94.3 25.6 . . . 93.8 2006 99.0 45.0 98.2 34.5 42.6 96.8India Krishnanagar 1998 89.7 32.7 78.6 18.9 . . . 81.5 2006 99.7 15.7 84.3 21.6 23.8 82.1India Mumbai (Bombay) 1998 99.4 76.7 98.0 31.6 . . . 99.0 2006 99.0 87.4 95.5 38.2 50.7 98.8India New Delhi 1998 99.2 80.8 94.0 45.4 . . . 97.6 2006 92.6 74.9 84.8 38.8 59.3 99.4India Pondichery 1998 93.7 35.9 52.5 13.0 . . . 87.0 2006 99.3 40.6 69.1 21.0 24.9 96.5India Pune (Poona) 1998 98.2 55.2 76.2 9.0 . . . 92.3 2006 99.1 74.0 78.7 23.3 35.5 97.0India Srinagar 1998 97.6 87.9 78.5 20.3 . . . 99.3 2006 98.8 83.5 64.1 41.6 55.2 99.4India Vijayawada 1998 96.9 39.2 68.1 13.2 . . . 96.8 2006 100.0 98.4 100.0 18.0 32.8 100.0India Yamunanagar 1998 99.7 59.7 77.7 27.0 . . . 98.3 2006 100.0 63.0 95.5 34.9 44.5 96.9Indonesia Bandung 1997 91.1 46.9 73.2 . . . . . . 100.0 2007 80.2 14.3 93.4 58.4 . . . 98.6Indonesia Bitung 1997 84.4 52.4 80.6 . . . . . . 96.3 . . . . . . . . . . . . . . . . . .Indonesia Bogor 1997 95.1 42.0 89.6 . . . . . . 99.3 . . . . . . . . . . . . . . . . . .Indonesia Denpasar 1997 98.6 53.6 92.1 . . . . . . 100.0 . . . . . . . . . . . . . . . . . .Indonesia Dumai 1997 88.4 17.2 69.4 . . . . . . 85.8 . . . . . . . . . . . . . . . . . .Indonesia Jakarta 1997 99.2 35.6 70.7 . . . . . . 99.9 2007 94.0 29.7 96.3 74.7 . . . 99.8Indonesia Jambi 1997 93.1 53.0 95.3 . . . . . . 98.7 . . . . . . . . . . . . . . . . . .Indonesia Jaya Pura 1997 88.3 61.1 76.0 . . . . . . 88.0 . . . . . . . . . . . . . . . . . .
continued . . .
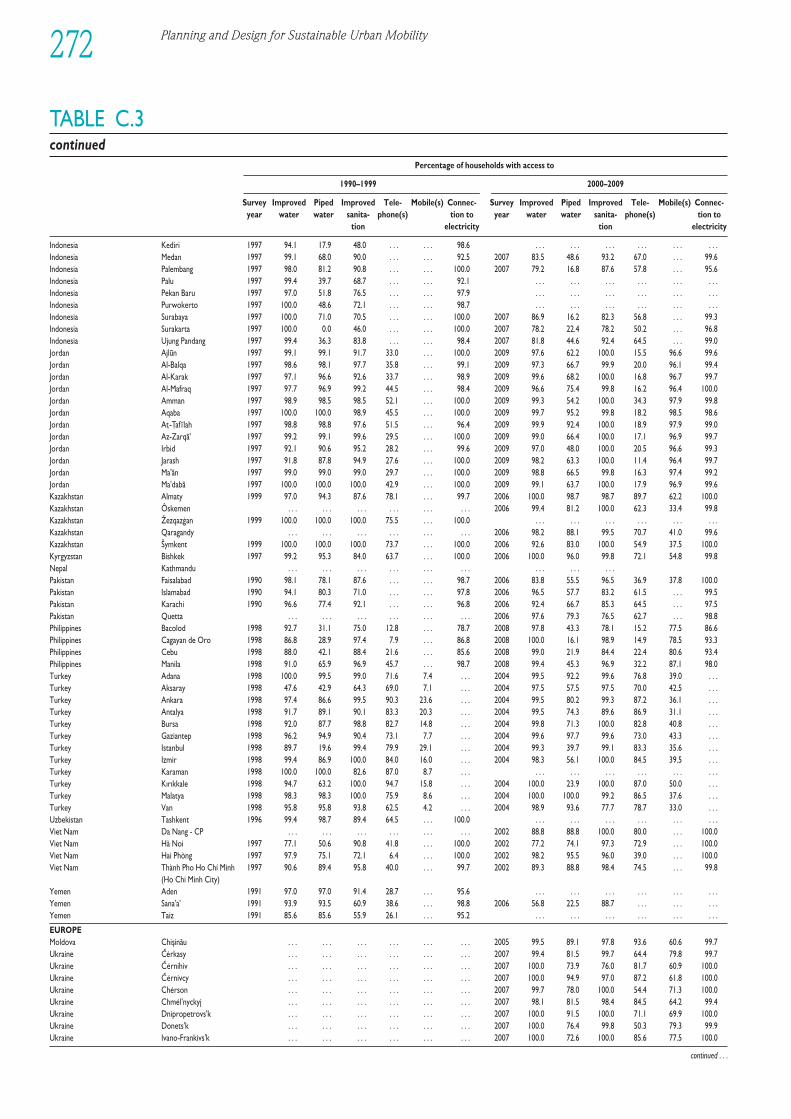
Planning and Design for Sustainable Urban Mobility272
TABLE C.3continued
Percentage of households with access to
1990–1999 2000–2009
Survey Improved Piped Improved Tele- Mobile(s) Connec- Survey Improved Piped Improved Tele- Mobile(s) Connec-year water water sanita- phone(s) tion to year water water sanita- phone(s) tion to
tion electricity tion electricity
Indonesia Kediri 1997 94.1 17.9 48.0 . . . . . . 98.6 . . . . . . . . . . . . . . . . . .Indonesia Medan 1997 99.1 68.0 90.0 . . . . . . 92.5 2007 83.5 48.6 93.2 67.0 . . . 99.6Indonesia Palembang 1997 98.0 81.2 90.8 . . . . . . 100.0 2007 79.2 16.8 87.6 57.8 . . . 95.6Indonesia Palu 1997 99.4 39.7 68.7 . . . . . . 92.1 . . . . . . . . . . . . . . . . . .Indonesia Pekan Baru 1997 97.0 51.8 76.5 . . . . . . 97.9 . . . . . . . . . . . . . . . . . .Indonesia Purwokerto 1997 100.0 48.6 72.1 . . . . . . 98.7 . . . . . . . . . . . . . . . . . .Indonesia Surabaya 1997 100.0 71.0 70.5 . . . . . . 100.0 2007 86.9 16.2 82.3 56.8 . . . 99.3Indonesia Surakarta 1997 100.0 0.0 46.0 . . . . . . 100.0 2007 78.2 22.4 78.2 50.2 . . . 96.8Indonesia Ujung Pandang 1997 99.4 36.3 83.8 . . . . . . 98.4 2007 81.8 44.6 92.4 64.5 . . . 99.0Jordan Ajlun 1997 99.1 99.1 91.7 33.0 . . . 100.0 2009 97.6 62.2 100.0 15.5 96.6 99.6Jordan Al-Balqa 1997 98.6 98.1 97.7 35.8 . . . 99.1 2009 97.3 66.7 99.9 20.0 96.1 99.4Jordan Al-Karak 1997 97.1 96.6 92.6 33.7 . . . 98.9 2009 99.6 68.2 100.0 16.8 96.7 99.7Jordan Al-Mafraq 1997 97.7 96.9 99.2 44.5 . . . 98.4 2009 96.6 75.4 99.8 16.2 96.4 100.0Jordan Amman 1997 98.9 98.5 98.5 52.1 . . . 100.0 2009 99.3 54.2 100.0 34.3 97.9 99.8Jordan Aqaba 1997 100.0 100.0 98.9 45.5 . . . 100.0 2009 99.7 95.2 99.8 18.2 98.5 98.6Jordan At
˙-T˙af ı lah 1997 98.8 98.8 97.6 51.5 . . . 96.4 2009 99.9 92.4 100.0 18.9 97.9 99.0
Jordan Az-Zarqa' 1997 99.2 99.1 99.6 29.5 . . . 100.0 2009 99.0 66.4 100.0 17.1 96.9 99.7Jordan Irbid 1997 92.1 90.6 95.2 28.2 . . . 99.6 2009 97.0 48.0 100.0 20.5 96.6 99.3Jordan Jarash 1997 91.8 87.8 94.9 27.6 . . . 100.0 2009 98.2 63.3 100.0 11.4 96.4 99.7Jordan Ma'an 1997 99.0 99.0 99.0 29.7 . . . 100.0 2009 98.8 66.5 99.8 16.3 97.4 99.2Jordan Ma'daba 1997 100.0 100.0 100.0 42.9 . . . 100.0 2009 99.1 63.7 100.0 17.9 96.9 99.6Kazakhstan Almaty 1999 97.0 94.3 87.6 78.1 . . . 99.7 2006 100.0 98.7 98.7 89.7 62.2 100.0Kazakhstan Ôskemen . . . . . . . . . . . . . . . . . . 2006 99.4 81.2 100.0 62.3 33.4 99.8Kazakhstan Žezqazgan 1999 100.0 100.0 100.0 75.5 . . . 100.0 . . . . . . . . . . . . . . . . . .Kazakhstan Qaragandy . . . . . . . . . . . . . . . . . . 2006 98.2 88.1 99.5 70.7 41.0 99.6Kazakhstan Šymkent 1999 100.0 100.0 100.0 73.7 . . . 100.0 2006 92.6 83.0 100.0 54.9 37.5 100.0Kyrgyzstan Bishkek 1997 99.2 95.3 84.0 63.7 . . . 100.0 2006 100.0 96.0 99.8 72.1 54.8 99.8Nepal Kathmandu . . . . . . . . . . . . . . . . . . . . . . . . . . .Pakistan Faisalabad 1990 98.1 78.1 87.6 . . . . . . 98.7 2006 83.8 55.5 96.5 36.9 37.8 100.0Pakistan Islamabad 1990 94.1 80.3 71.0 . . . . . . 97.8 2006 96.5 57.7 83.2 61.5 . . . 99.5Pakistan Karachi 1990 96.6 77.4 92.1 . . . . . . 96.8 2006 92.4 66.7 85.3 64.5 . . . 97.5Pakistan Quetta . . . . . . . . . . . . . . . . . . 2006 97.6 79.3 76.5 62.7 . . . 98.8Philippines Bacolod 1998 92.7 31.1 75.0 12.8 . . . 78.7 2008 97.8 43.3 78.1 15.2 77.5 86.6Philippines Cagayan de Oro 1998 86.8 28.9 97.4 7.9 . . . 86.8 2008 100.0 16.1 98.9 14.9 78.5 93.3Philippines Cebu 1998 88.0 42.1 88.4 21.6 . . . 85.6 2008 99.0 21.9 84.4 22.4 80.6 93.4Philippines Manila 1998 91.0 65.9 96.9 45.7 . . . 98.7 2008 99.4 45.3 96.9 32.2 87.1 98.0Turkey Adana 1998 100.0 99.5 99.0 71.6 7.4 . . . 2004 99.5 92.2 99.6 76.8 39.0 . . .Turkey Aksaray 1998 47.6 42.9 64.3 69.0 7.1 . . . 2004 97.5 57.5 97.5 70.0 42.5 . . .Turkey Ankara 1998 97.4 86.6 99.5 90.3 23.6 . . . 2004 99.5 80.2 99.3 87.2 36.1 . . .Turkey Antalya 1998 91.7 89.1 90.1 83.3 20.3 . . . 2004 99.5 74.3 89.6 86.9 31.1 . . .Turkey Bursa 1998 92.0 87.7 98.8 82.7 14.8 . . . 2004 99.8 71.3 100.0 82.8 40.8 . . .Turkey Gaziantep 1998 96.2 94.9 90.4 73.1 7.7 . . . 2004 99.6 97.7 99.6 73.0 43.3 . . .Turkey Istanbul 1998 89.7 19.6 99.4 79.9 29.1 . . . 2004 99.3 39.7 99.1 83.3 35.6 . . .Turkey Izmir 1998 99.4 86.9 100.0 84.0 16.0 . . . 2004 98.3 56.1 100.0 84.5 39.5 . . .Turkey Karaman 1998 100.0 100.0 82.6 87.0 8.7 . . . . . . . . . . . . . . . . . . . . .Turkey Kırıkkale 1998 94.7 63.2 100.0 94.7 15.8 . . . 2004 100.0 23.9 100.0 87.0 50.0 . . .Turkey Malatya 1998 98.3 98.3 100.0 75.9 8.6 . . . 2004 100.0 100.0 99.2 86.5 37.6 . . .Turkey Van 1998 95.8 95.8 93.8 62.5 4.2 . . . 2004 98.9 93.6 77.7 78.7 33.0 . . .Uzbekistan Tashkent 1996 99.4 98.7 89.4 64.5 . . . 100.0 . . . . . . . . . . . . . . . . . .Viet Nam Da Nang - CP . . . . . . . . . . . . . . . . . . 2002 88.8 88.8 100.0 80.0 . . . 100.0Viet Nam Hà Noi 1997 77.1 50.6 90.8 41.8 . . . 100.0 2002 77.2 74.1 97.3 72.9 . . . 100.0Viet Nam Hai Phòng 1997 97.9 75.1 72.1 6.4 . . . 100.0 2002 98.2 95.5 96.0 39.0 . . . 100.0Viet Nam Thành Pho Ho Chí Minh 1997 90.6 89.4 95.8 40.0 . . . 99.7 2002 89.3 88.8 98.4 74.5 . . . 99.8
(Ho Chi Minh City)Yemen Aden 1991 97.0 97.0 91.4 28.7 . . . 95.6 . . . . . . . . . . . . . . . . . .Yemen Sana'a' 1991 93.9 93.5 60.9 38.6 . . . 98.8 2006 56.8 22.5 88.7 . . . . . . . . .Yemen Taiz 1991 85.6 85.6 55.9 26.1 . . . 95.2 . . . . . . . . . . . . . . . . . .
EUROPEMoldova Chisinau . . . . . . . . . . . . . . . . . . 2005 99.5 89.1 97.8 93.6 60.6 99.7Ukraine Cerkasy . . . . . . . . . . . . . . . . . . 2007 99.4 81.5 99.7 64.4 79.8 99.7Ukraine Cernihiv . . . . . . . . . . . . . . . . . . 2007 100.0 73.9 76.0 81.7 60.9 100.0Ukraine Cernivcy . . . . . . . . . . . . . . . . . . 2007 100.0 94.9 97.0 87.2 61.8 100.0Ukraine Cherson . . . . . . . . . . . . . . . . . . 2007 99.7 78.0 100.0 54.4 71.3 100.0Ukraine Chmel'nyckyj . . . . . . . . . . . . . . . . . . 2007 98.1 81.5 98.4 84.5 64.2 99.4Ukraine Dnipropetrovs'k . . . . . . . . . . . . . . . . . . 2007 100.0 91.5 100.0 71.1 69.9 100.0Ukraine Donets'k . . . . . . . . . . . . . . . . . . 2007 100.0 76.4 99.8 50.3 79.3 99.9Ukraine Ivano-Frankivs'k . . . . . . . . . . . . . . . . . . 2007 100.0 72.6 100.0 85.6 77.5 100.0
continued . . .
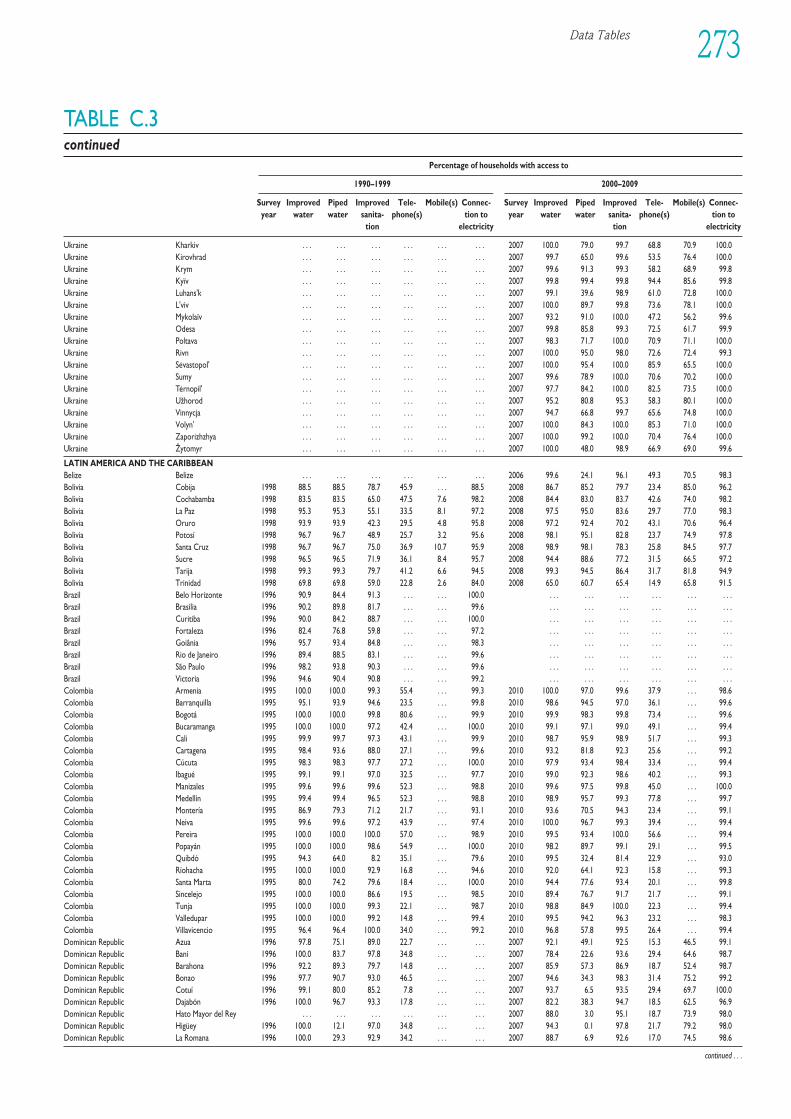
Data Tables 273
TABLE C.3continued
Percentage of households with access to
1990–1999 2000–2009
Survey Improved Piped Improved Tele- Mobile(s) Connec- Survey Improved Piped Improved Tele- Mobile(s) Connec-year water water sanita- phone(s) tion to year water water sanita- phone(s) tion to
tion electricity tion electricity
Ukraine Kharkiv . . . . . . . . . . . . . . . . . . 2007 100.0 79.0 99.7 68.8 70.9 100.0Ukraine Kirovhrad . . . . . . . . . . . . . . . . . . 2007 99.7 65.0 99.6 53.5 76.4 100.0Ukraine Krym . . . . . . . . . . . . . . . . . . 2007 99.6 91.3 99.3 58.2 68.9 99.8Ukraine Kyïv . . . . . . . . . . . . . . . . . . 2007 99.8 99.4 99.8 94.4 85.6 99.8Ukraine Luhans'k . . . . . . . . . . . . . . . . . . 2007 99.1 39.6 98.9 61.0 72.8 100.0Ukraine L'viv . . . . . . . . . . . . . . . . . . 2007 100.0 89.7 99.8 73.6 78.1 100.0Ukraine Mykolaïv . . . . . . . . . . . . . . . . . . 2007 93.2 91.0 100.0 47.2 56.2 99.6Ukraine Odesa . . . . . . . . . . . . . . . . . . 2007 99.8 85.8 99.3 72.5 61.7 99.9Ukraine Poltava . . . . . . . . . . . . . . . . . . 2007 98.3 71.7 100.0 70.9 71.1 100.0Ukraine Rivn . . . . . . . . . . . . . . . . . . 2007 100.0 95.0 98.0 72.6 72.4 99.3Ukraine Sevastopol' . . . . . . . . . . . . . . . . . . 2007 100.0 95.4 100.0 85.9 65.5 100.0Ukraine Sumy . . . . . . . . . . . . . . . . . . 2007 99.6 78.9 100.0 70.6 70.2 100.0Ukraine Ternopil' . . . . . . . . . . . . . . . . . . 2007 97.7 84.2 100.0 82.5 73.5 100.0Ukraine Užhorod . . . . . . . . . . . . . . . . . . 2007 95.2 80.8 95.3 58.3 80.1 100.0Ukraine Vinnycja . . . . . . . . . . . . . . . . . . 2007 94.7 66.8 99.7 65.6 74.8 100.0Ukraine Volyn' . . . . . . . . . . . . . . . . . . 2007 100.0 84.3 100.0 85.3 71.0 100.0Ukraine Zaporizhzhya . . . . . . . . . . . . . . . . . . 2007 100.0 99.2 100.0 70.4 76.4 100.0Ukraine Žytomyr . . . . . . . . . . . . . . . . . . 2007 100.0 48.0 98.9 66.9 69.0 99.6
LATIN AMERICA AND THE CARIBBEANBelize Belize . . . . . . . . . . . . . . . . . . 2006 99.6 24.1 96.1 49.3 70.5 98.3Bolivia Cobija 1998 88.5 88.5 78.7 45.9 . . . 88.5 2008 86.7 85.2 79.7 23.4 85.0 96.2Bolivia Cochabamba 1998 83.5 83.5 65.0 47.5 7.6 98.2 2008 84.4 83.0 83.7 42.6 74.0 98.2Bolivia La Paz 1998 95.3 95.3 55.1 33.5 8.1 97.2 2008 97.5 95.0 83.6 29.7 77.0 98.3Bolivia Oruro 1998 93.9 93.9 42.3 29.5 4.8 95.8 2008 97.2 92.4 70.2 43.1 70.6 96.4Bolivia Potosí 1998 96.7 96.7 48.9 25.7 3.2 95.6 2008 98.1 95.1 82.8 23.7 74.9 97.8Bolivia Santa Cruz 1998 96.7 96.7 75.0 36.9 10.7 95.9 2008 98.9 98.1 78.3 25.8 84.5 97.7Bolivia Sucre 1998 96.5 96.5 71.9 36.1 8.4 95.7 2008 94.4 88.6 77.2 31.5 66.5 97.2Bolivia Tarija 1998 99.3 99.3 79.7 41.2 6.6 94.5 2008 99.3 94.5 86.4 31.7 81.8 94.9Bolivia Trinidad 1998 69.8 69.8 59.0 22.8 2.6 84.0 2008 65.0 60.7 65.4 14.9 65.8 91.5Brazil Belo Horizonte 1996 90.9 84.4 91.3 . . . . . . 100.0 . . . . . . . . . . . . . . . . . .Brazil Brasília 1996 90.2 89.8 81.7 . . . . . . 99.6 . . . . . . . . . . . . . . . . . .Brazil Curitiba 1996 90.0 84.2 88.7 . . . . . . 100.0 . . . . . . . . . . . . . . . . . .Brazil Fortaleza 1996 82.4 76.8 59.8 . . . . . . 97.2 . . . . . . . . . . . . . . . . . .Brazil Goiânia 1996 95.7 93.4 84.8 . . . . . . 98.3 . . . . . . . . . . . . . . . . . .Brazil Rio de Janeiro 1996 89.4 88.5 83.1 . . . . . . 99.6 . . . . . . . . . . . . . . . . . .Brazil São Paulo 1996 98.2 93.8 90.3 . . . . . . 99.6 . . . . . . . . . . . . . . . . . .Brazil Victoria 1996 94.6 90.4 90.8 . . . . . . 99.2 . . . . . . . . . . . . . . . . . .Colombia Armenia 1995 100.0 100.0 99.3 55.4 . . . 99.3 2010 100.0 97.0 99.6 37.9 . . . 98.6Colombia Barranquilla 1995 95.1 93.9 94.6 23.5 . . . 99.8 2010 98.6 94.5 97.0 36.1 . . . 99.6Colombia Bogotá 1995 100.0 100.0 99.8 80.6 . . . 99.9 2010 99.9 98.3 99.8 73.4 . . . 99.6Colombia Bucaramanga 1995 100.0 100.0 97.2 42.4 . . . 100.0 2010 99.1 97.1 99.0 49.1 . . . 99.4Colombia Cali 1995 99.9 99.7 97.3 43.1 . . . 99.9 2010 98.7 95.9 98.9 51.7 . . . 99.3Colombia Cartagena 1995 98.4 93.6 88.0 27.1 . . . 99.6 2010 93.2 81.8 92.3 25.6 . . . 99.2Colombia Cúcuta 1995 98.3 98.3 97.7 27.2 . . . 100.0 2010 97.9 93.4 98.4 33.4 . . . 99.4Colombia Ibagué 1995 99.1 99.1 97.0 32.5 . . . 97.7 2010 99.0 92.3 98.6 40.2 . . . 99.3Colombia Manizales 1995 99.6 99.6 99.6 52.3 . . . 98.8 2010 99.6 97.5 99.8 45.0 . . . 100.0Colombia Medellín 1995 99.4 99.4 96.5 52.3 . . . 98.8 2010 98.9 95.7 99.3 77.8 . . . 99.7Colombia Montería 1995 86.9 79.3 71.2 21.7 . . . 93.1 2010 93.6 70.5 94.3 23.4 . . . 99.1Colombia Neiva 1995 99.6 99.6 97.2 43.9 . . . 97.4 2010 100.0 96.7 99.3 39.4 . . . 99.4Colombia Pereira 1995 100.0 100.0 100.0 57.0 . . . 98.9 2010 99.5 93.4 100.0 56.6 . . . 99.4Colombia Popayán 1995 100.0 100.0 98.6 54.9 . . . 100.0 2010 98.2 89.7 99.1 29.1 . . . 99.5Colombia Quibdó 1995 94.3 64.0 8.2 35.1 . . . 79.6 2010 99.5 32.4 81.4 22.9 . . . 93.0Colombia Ríohacha 1995 100.0 100.0 92.9 16.8 . . . 94.6 2010 92.0 64.1 92.3 15.8 . . . 99.3Colombia Santa Marta 1995 80.0 74.2 79.6 18.4 . . . 100.0 2010 94.4 77.6 93.4 20.1 . . . 99.8Colombia Sincelejo 1995 100.0 100.0 86.6 19.5 . . . 98.5 2010 89.4 76.7 91.7 21.7 . . . 99.1Colombia Tunja 1995 100.0 100.0 99.3 22.1 . . . 98.7 2010 98.8 84.9 100.0 22.3 . . . 99.4Colombia Valledupar 1995 100.0 100.0 99.2 14.8 . . . 99.4 2010 99.5 94.2 96.3 23.2 . . . 98.3Colombia Villavicencio 1995 96.4 96.4 100.0 34.0 . . . 99.2 2010 96.8 57.8 99.5 26.4 . . . 99.4Dominican Republic Azua 1996 97.8 75.1 89.0 22.7 . . . . . . 2007 92.1 49.1 92.5 15.3 46.5 99.1Dominican Republic Baní 1996 100.0 83.7 97.8 34.8 . . . . . . 2007 78.4 22.6 93.6 29.4 64.6 98.7Dominican Republic Barahona 1996 92.2 89.3 79.7 14.8 . . . . . . 2007 85.9 57.3 86.9 18.7 52.4 98.7Dominican Republic Bonao 1996 97.7 90.7 93.0 46.5 . . . . . . 2007 94.6 34.3 98.3 31.4 75.2 99.2Dominican Republic Cotuí 1996 99.1 80.0 85.2 7.8 . . . . . . 2007 93.7 6.5 93.5 29.4 69.7 100.0Dominican Republic Dajabón 1996 100.0 96.7 93.3 17.8 . . . . . . 2007 82.2 38.3 94.7 18.5 62.5 96.9Dominican Republic Hato Mayor del Rey . . . . . . . . . . . . . . . . . . 2007 88.0 3.0 95.1 18.7 73.9 98.0Dominican Republic Higüey 1996 100.0 12.1 97.0 34.8 . . . . . . 2007 94.3 0.1 97.8 21.7 79.2 98.0Dominican Republic La Romana 1996 100.0 29.3 92.9 34.2 . . . . . . 2007 88.7 6.9 92.6 17.0 74.5 98.6
continued . . .
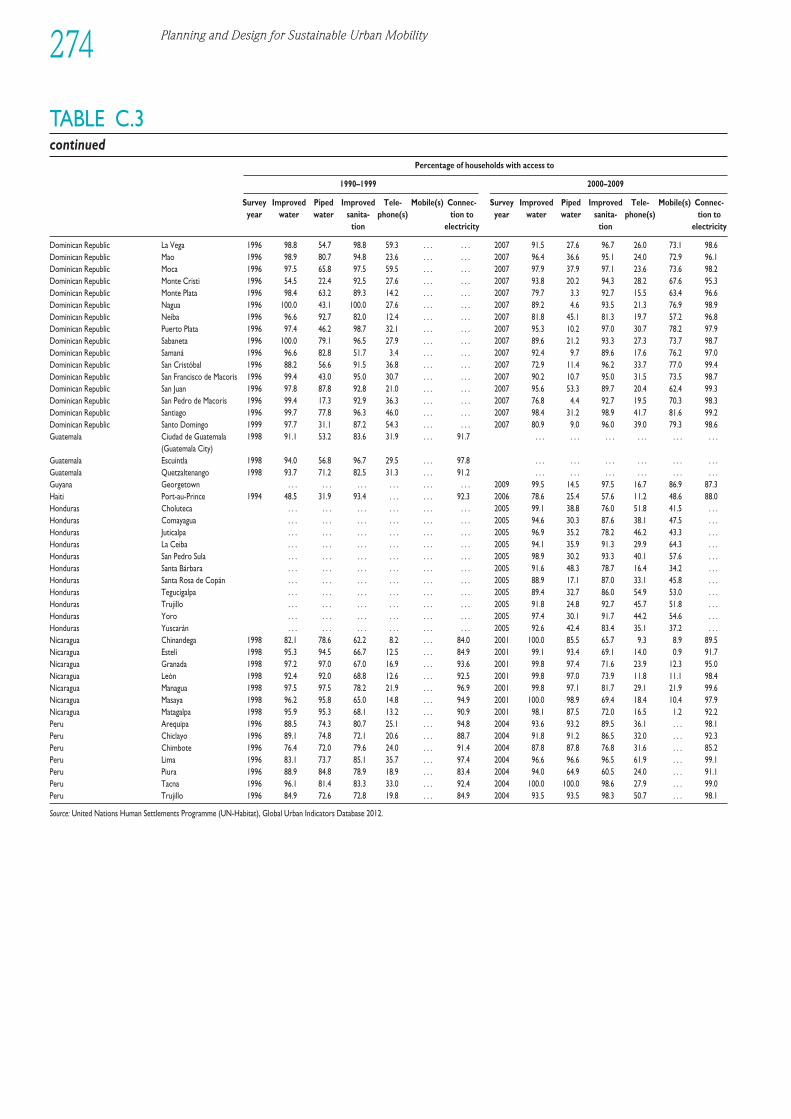
Planning and Design for Sustainable Urban Mobility274
TABLE C.3continued
Percentage of households with access to
1990–1999 2000–2009
Survey Improved Piped Improved Tele- Mobile(s) Connec- Survey Improved Piped Improved Tele- Mobile(s) Connec-year water water sanita- phone(s) tion to year water water sanita- phone(s) tion to
tion electricity tion electricity
Dominican Republic La Vega 1996 98.8 54.7 98.8 59.3 . . . . . . 2007 91.5 27.6 96.7 26.0 73.1 98.6Dominican Republic Mao 1996 98.9 80.7 94.8 23.6 . . . . . . 2007 96.4 36.6 95.1 24.0 72.9 96.1Dominican Republic Moca 1996 97.5 65.8 97.5 59.5 . . . . . . 2007 97.9 37.9 97.1 23.6 73.6 98.2Dominican Republic Monte Cristi 1996 54.5 22.4 92.5 27.6 . . . . . . 2007 93.8 20.2 94.3 28.2 67.6 95.3Dominican Republic Monte Plata 1996 98.4 63.2 89.3 14.2 . . . . . . 2007 79.7 3.3 92.7 15.5 63.4 96.6Dominican Republic Nagua 1996 100.0 43.1 100.0 27.6 . . . . . . 2007 89.2 4.6 93.5 21.3 76.9 98.9Dominican Republic Neiba 1996 96.6 92.7 82.0 12.4 . . . . . . 2007 81.8 45.1 81.3 19.7 57.2 96.8Dominican Republic Puerto Plata 1996 97.4 46.2 98.7 32.1 . . . . . . 2007 95.3 10.2 97.0 30.7 78.2 97.9Dominican Republic Sabaneta 1996 100.0 79.1 96.5 27.9 . . . . . . 2007 89.6 21.2 93.3 27.3 73.7 98.7Dominican Republic Samaná 1996 96.6 82.8 51.7 3.4 . . . . . . 2007 92.4 9.7 89.6 17.6 76.2 97.0Dominican Republic San Cristóbal 1996 88.2 56.6 91.5 36.8 . . . . . . 2007 72.9 11.4 96.2 33.7 77.0 99.4Dominican Republic San Francisco de Macorís 1996 99.4 43.0 95.0 30.7 . . . . . . 2007 90.2 10.7 95.0 31.5 73.5 98.7Dominican Republic San Juan 1996 97.8 87.8 92.8 21.0 . . . . . . 2007 95.6 53.3 89.7 20.4 62.4 99.3Dominican Republic San Pedro de Macorís 1996 99.4 17.3 92.9 36.3 . . . . . . 2007 76.8 4.4 92.7 19.5 70.3 98.3Dominican Republic Santiago 1996 99.7 77.8 96.3 46.0 . . . . . . 2007 98.4 31.2 98.9 41.7 81.6 99.2Dominican Republic Santo Domingo 1999 97.7 31.1 87.2 54.3 . . . . . . 2007 80.9 9.0 96.0 39.0 79.3 98.6Guatemala Ciudad de Guatemala 1998 91.1 53.2 83.6 31.9 . . . 91.7 . . . . . . . . . . . . . . . . . .
(Guatemala City)Guatemala Escuintla 1998 94.0 56.8 96.7 29.5 . . . 97.8 . . . . . . . . . . . . . . . . . .Guatemala Quetzaltenango 1998 93.7 71.2 82.5 31.3 . . . 91.2 . . . . . . . . . . . . . . . . . .Guyana Georgetown . . . . . . . . . . . . . . . . . . 2009 99.5 14.5 97.5 16.7 86.9 87.3Haiti Port-au-Prince 1994 48.5 31.9 93.4 . . . . . . 92.3 2006 78.6 25.4 57.6 11.2 48.6 88.0Honduras Choluteca . . . . . . . . . . . . . . . . . . 2005 99.1 38.8 76.0 51.8 41.5 . . .Honduras Comayagua . . . . . . . . . . . . . . . . . . 2005 94.6 30.3 87.6 38.1 47.5 . . .Honduras Juticalpa . . . . . . . . . . . . . . . . . . 2005 96.9 35.2 78.2 46.2 43.3 . . .Honduras La Ceiba . . . . . . . . . . . . . . . . . . 2005 94.1 35.9 91.3 29.9 64.3 . . .Honduras San Pedro Sula . . . . . . . . . . . . . . . . . . 2005 98.9 30.2 93.3 40.1 57.6 . . .Honduras Santa Bárbara . . . . . . . . . . . . . . . . . . 2005 91.6 48.3 78.7 16.4 34.2 . . .Honduras Santa Rosa de Copán . . . . . . . . . . . . . . . . . . 2005 88.9 17.1 87.0 33.1 45.8 . . .Honduras Tegucigalpa . . . . . . . . . . . . . . . . . . 2005 89.4 32.7 86.0 54.9 53.0 . . .Honduras Trujillo . . . . . . . . . . . . . . . . . . 2005 91.8 24.8 92.7 45.7 51.8 . . .Honduras Yoro . . . . . . . . . . . . . . . . . . 2005 97.4 30.1 91.7 44.2 54.6 . . .Honduras Yuscarán . . . . . . . . . . . . . . . . . . 2005 92.6 42.4 83.4 35.1 37.2 . . .Nicaragua Chinandega 1998 82.1 78.6 62.2 8.2 . . . 84.0 2001 100.0 85.5 65.7 9.3 8.9 89.5Nicaragua Estelí 1998 95.3 94.5 66.7 12.5 . . . 84.9 2001 99.1 93.4 69.1 14.0 0.9 91.7Nicaragua Granada 1998 97.2 97.0 67.0 16.9 . . . 93.6 2001 99.8 97.4 71.6 23.9 12.3 95.0Nicaragua León 1998 92.4 92.0 68.8 12.6 . . . 92.5 2001 99.8 97.0 73.9 11.8 11.1 98.4Nicaragua Managua 1998 97.5 97.5 78.2 21.9 . . . 96.9 2001 99.8 97.1 81.7 29.1 21.9 99.6Nicaragua Masaya 1998 96.2 95.8 65.0 14.8 . . . 94.9 2001 100.0 98.9 69.4 18.4 10.4 97.9Nicaragua Matagalpa 1998 95.9 95.3 68.1 13.2 . . . 90.9 2001 98.1 87.5 72.0 16.5 1.2 92.2Peru Arequipa 1996 88.5 74.3 80.7 25.1 . . . 94.8 2004 93.6 93.2 89.5 36.1 . . . 98.1Peru Chiclayo 1996 89.1 74.8 72.1 20.6 . . . 88.7 2004 91.8 91.2 86.5 32.0 . . . 92.3Peru Chimbote 1996 76.4 72.0 79.6 24.0 . . . 91.4 2004 87.8 87.8 76.8 31.6 . . . 85.2Peru Lima 1996 83.1 73.7 85.1 35.7 . . . 97.4 2004 96.6 96.6 96.5 61.9 . . . 99.1Peru Piura 1996 88.9 84.8 78.9 18.9 . . . 83.4 2004 94.0 64.9 60.5 24.0 . . . 91.1Peru Tacna 1996 96.1 81.4 83.3 33.0 . . . 92.4 2004 100.0 100.0 98.6 27.9 . . . 99.0Peru Trujillo 1996 84.9 72.6 72.8 19.8 . . . 84.9 2004 93.5 93.5 98.3 50.7 . . . 98.1
Source: United Nations Human Settlements Programme (UN-Habitat), Global Urban Indicators Database 2012.
1EEE234567891012311145678920123456789301234567894012345678950123456789EEEE
AASHTO (American Association of State Highway andTransportation Officials) (2012) ‘State/Local/MPOActivities’, AASHTO, Washington, DC, http://climatechange.transportation.org/state_local_mpo/, lastaccessed 25 February 2013
ACCA (Association of Chartered Certified Accountants)(2004) ‘Evaluating the operation of PFI in roads andhospitals,’ Certified Accountants Educational Trust,London, http://image.guardian.co.uk/sys-files/Society/documents/2004/11/24/PFI.pdf, last accessed 30 January2013
ACFA (Asian Clean Fuels Association) (2010) ‘India work-ing to improve its air and fuel quality’, ACFA News8(3): 1–4, http://www.acfa.org.sg/pdf/acfa0310.pdf,last accessed 30 January 2013
Adam Smith International (2005) ‘A study of institutional,finan cial and regulatory frameworks of urban trans portin large Sub-Saharan cities’, The Sub-Saharan AfricaTrans port Policy Program SSATP Working Paper No. 82,The World Bank, Washington, DC, http://www4.worldbank.org/afr/ssatp/Resources/SSATP-WorkingPapers/ssatpwp82.pdf, last accessed 18 April 2013
ADB (Asian Devel op ment Bank) (2010a) ‘Inception report:Sus tain able fuel partnership’, Regional and Sus tain ableDevel op ment Department, Manila, April
ADB (2010b) ‘Reducing carbon emissions from trans portprojects’, Evaluation Knowledge Brief, Ref. No. EKB:REG2010-16, http://www.oecd.org/derec/adb/47170274.pdf, last accessed 15 May 2013
ADB (2012a) ‘Astana light rail transit project’, http://www.adb.org/projects/45195-002/main, last accessed 15 May2013
ADB (2012b) ‘Billions benefit from the Rio+20 trans portcommitment’, http://www.adb.org/news/billions-benefit-rio20-transport-commitment, last accessed 15May 2013
ADB and CAI-Asia (Clean Air Initiative-Asia) (2009) Bicyclingin Asia, http://cleanairinitiative.org/portal/sites/default/files/BICYCLING_IN_ASIA_FINAL_26NOV.pdf, lastaccessed 18 April 2013
ADB and Ministry of Urban Devel op ment (India) (2008)Guidelines and Toolkits for Urban Transport Devel op mentin Medium Sized Cities in India, http://www2.adb.org/Documents/Produced-Under-TA/40006/40006-01-ind-dpta-04.pdf, last accessed 18 April 2013
ADEME (Agence de l’Environnement et de la Maîtrise del’Energie) (2010) ‘Logistique urbaine: agir ensemble’,France Nature Environnement(FNE)/ ADEME,Document 6849, http://www2.ademe.fr/servlet/getDoc?id=71973&p1=30&ref=12441, last accessed 15 May2013
ADONIS (Analysis and Devel op ment of New Insights intoSubstitution of Short Car Trips by Walking and Cycling)(1999) Best Practice to Promote Cycling and Walking,Road Directorate, Copenhagen, http://www.statensnet.dk/pligtarkiv/fremvis.pl?vaerkid=12587&reprid=0&filid=918&iarkiv=1, last accessed 30 January 2013
Aecom Consult (2006) ‘International urban road pricing’,Final report prepared for Office of Transportation PolicyStudies, Federal Highway Administration, US Depart -ment of Transportation, Fairfax, Virginia, http://www.ncppp.org/resources/papers/fhwainternationalcase606.pdf, last accessed 15 February 2013
Aeron-Thomas, A. and G. Jacobs (2011) ‘Road crashes andlow-income cities: Impacts and options’, in H. Dimitriouand R. Gakenheimer (eds) Urban Transport in the Devel -op ing World: A Handbook of Policy and Practice, EdwardElgar, Cheltenham, UK: 386–420
Aeron-Thomas, A., G. Jacobs, B. Sexton, G. Gururaj and F. Rahman (2004) ‘The involvement and impact of road crashes on the poor: Bangladesh and India casestudies’, TRL, Crowthorne, UK, http://www.dfid.gov.uk/r4d/pdf/outputs/R7780.pdf, last accessed 25 March2013
African Union and UNECA (United Nations EconomicCommission for Africa) (2005) ‘Transport and theMillennium Devel op ment Goals in Africa,’ http://www4.worldbank.org/afr/ssatp/Resources/PapersNotes/transport_mdg.pdf, last accessed 25 March 2013
Afrique en ligne (2011) ‘Kenya-Economy: Kenyan annualinflation rises to 19.72 pc in November’, 30 November,http://www.afriquejet.com/inflation-energy-prices-2011113028394.html, last accessed 17 April 2012
Afukaar, F.K., P. Antwi and S. Ofosu-Amah (2003) ‘Patternof road traffic injuries in Ghana: Implications for con-trol,’ Injury Control and Safety Promotion 10: 69–76,http://www.bvsde.paho.org/bvsacd/cd53/pattern.pdf,last accessed 25 March 2013
Ainsworth, B., R. Mannell, T. Behrens and L. Caldwell (2007)‘Perspectives of public health and leisure studies on
REFERENCES
determinants of physically active leisure’, Journal ofPhysical Activity and Health 4(S1):S24–S35
Ajuntament de Barcelona (not dated) ‘Mobility pact’,http://w3.bcn.cat/XMLServeis/XMLHomeLinkPl/0,4022,173124074_173389407_3,00.html, last accessed 25February 2013
Albalate, D., G. Bel and J. Calzada (2012) ‘Governance andregulation of urban bus transportation: Using partialprivatization to achieve the better of two worlds’,Regulation & Governance 6: 83–100
Alberta Health Services (2008) ‘Land use planning andhealth’, Healthy public policy information sheet,http://www.albertahealthservices.ca/poph/hi-poph-hpp-info-land-use.pdf, last accessed 25 March 2013
Alcazaren, P. (2004) ‘Blueprint for a city’s soul’, i-ReportPhilippines 2015: Glimpses of the Future, 2 October,http://pcij.org/stories/blueprint-for-a-citys-soul/, lastaccessed 15 May 2013
Allen, H. (2011a) ‘Africa’s first full rapid bus system: The Rea Vaya bus system in Johannesburg, Republic ofSouth Africa’, unpublished case study prepared for theGlobal Report on Human Settlements 2013, www.unhabitat.org/grhs/2013
Allen, H. (2011b) ‘Integrated public transport, Nantes,France’, unpublished case study prepared for the GlobalReport on Human Settlements 2013, www.unhabitat.org/grhs/2013
Allport, R. (2011) ‘Rail rapid transit advances’, in H.Dimitriou and R. Gakenheimer (eds) Urban Transport in the Devel op ing World, Edward Elgar, Cheltenham, UK:456–487
Altshuler, A. (1979) The Urban Transportation System:Politics and Policy Innovation, MIT Press, Cambridge,Massachusetts
Ambrosini, C. and J.L. Routhier (2004) ‘Objectives, methodsand results of surveys carried out in the field of urbanfreight transport: An international comparison’, Trans -port Reviews 24(1): 57–77
An, F., R. Earley, and L. Green-Weiskel (2011) ‘Globaloverview on fuel efficiency and motor vehicle emissionsstandards: Policy options and perspectives for inter -national cooperation’, United Nations Department forEconomic and Social Affairs, Background Paper No. 3(CSD19/2011/BP3), Commission on Sus tain able Devel op ment, Nineteenth Session, New York, 2–13 May 2011, http://www.pdfio.com/k-1908211.html#,last accessed 30 January 2013
Anand, A. and Tiwari, G. (2006) ‘A gendered perspec-tive of the shelter-transport-livelihood link: The case ofpoor women in Delhi’, Transport Reviews 26(1): 63–80
Anas, A. and Lindsay, R. (2011) ‘Reducing urban roadtransportation externalities: Road pricing in theory andin practice’, Review of Environ mental Economics andPolicy 5(1): 66–88
Anas, A., R. Arnott and K. Small (1998) ‘Urban spatialstructure’, Journal of Economic Literature 36:1426–1464
Andersen, L.B., P. Schnohr, M. Schroll and H.O. Hein (2000)‘All-cause mortality associated with physical activityduring leisure time, work, sports, and cycling to work’,Arch Intern Med 160(11):1621–1628, http://archinte.ama-assn.org/cgi/reprint/160/11/1621.pdf, last accessed30 January 2013
Anderson, S., J. Allen and M. Browne (2005) ‘Urbanlogistics: How can it meet policy makers’ sus tain abilityobjectives?’, Journal of Transport Geography 13(1):71–81
Andrews, J. (2010) ‘Looking out for road safety’, UrbanWorld: Urban Sus tain able Mobility 2(5): 11–14,http://www.unhabitat.org/pmss/listItemDetails.aspx?publicationID=3075, last accessed 25 March 2013
Angel, S. (2011) Making Room for a Planet of Cities,Lincoln Institute of Land Policy, Cambridge, MA
Angel, S., S. Sheppard and D. Civco (2005) ‘The dynamicsof global urban expansion’, Transport and Urban Devel op ment Department, The World Bank, Washington,DC
Angel, S., J. Parent and D. Civco (2010) ‘Ten compactnessproperties of circles: Measuring shape in geography’, TheCanadian Geographer 55(4): 441–461
Antún, J.P., A. Lozano, R. Alarcón, F. Granados and L. Guarneros (2010) ‘The physical distribution of goods in a megalopolis: Strategies for policies on thelocation of logistical facilities within the central regionof Mexico’, in E. Tanguchi and R.G. Thompson (eds)Procedia: Social and Behavioral Sciences, The SixthInternational Conference on City Logistics 2(3):6130–6140
Aoun, A. (2010) ‘Traffic and transit in Beirut, Lebanon’,unpublished Master’s thesis, Energy Resources Group,University of California, Berkeley
APTA (American Public Transport Association) (1994)Glossary of Transit Terminology, APTA, Washington, DC,http://www.apta.com/resources/reportsandpublications/Documents/Transit_Glossary_1994.pdf, last accessed 15May 2013
APTA (2010) Public Transportation: Moving AmericaForward, APTA, Washington, DC, http://www.apta.com/resources/reportsandpublications/Documents/APTABrochure_v28%20FINAL.pdf, last accessed 18 April2013
Archdeacon, K. (2008) ‘TransLink – Vancouver Trans portGovernance’, Sus tain able Cities Net, 5 December,http://www.sus tain ablecitiesnet.com/models/translink-vancouver-transport-governance/, last accessed 25February 2013
Ardila, A. and G. Menckhoff (2002) ‘Transportation policiesin Bogotá, Colombia: Building a transportation systemfor the people’, Journal of the Transportation ResearchBoard 1817: 130–136
Arnott, R., K. Arrow and A.B. Atkinson (eds) (1994) PublicEconomics: Selected Papers by William Vickrey,University of Cambridge Press, Cambridge
Arora, A. (2011) ‘Non-motorized trans port in peri-urbanareas of Delhi, India’, unpublished case study preparedfor the Global Report on Human Settlements 2013,www.unhabitat.org/grhs/2013
Arrington, G. and R. Cervero (2008) Effects of TOD onhousing, parking and travel, Transit Cooperative ResearchProgram, Report 128, Washington, DC, http://onlinepubs.trb.org/onlinepubs/tcrp/tcrp_rpt_128.pdf, lastaccessed 7 May 2013
Arvis, J.-F., M.A. Mustra, L. Ojala and D. Saslvasky (2010)‘Connecting to compete 2010: Trade logistics in theglobal economy’, The Logistics Performance Index andIts Indicators, World Bank, Washington, DC
Planning and Design for Sustainable Urban Mobility276
Asmaa, A.B., G. Brahim and A.-L. Esteve (2012) ‘Trans -portation planning: A comparison between Moroccanand Spanish decision making process’, The OpenTransportation Journal 6: 1–10, http://benthamscience.com/open/totj/article/V006/1TOTJ.pdf, last accessed22 May 2013
Astrop, A. (1996) ‘Urban travel behavior and constraints oflow-income households and females in Pune, India’,Proceedings from the Second National Conference onWomen’s Travel Issues, Baltimore, October, FederalHighway Administration, Washington, DC: 215–246,http://www.fhwa.dot.gov/ohim/womens/chap12.pdf,last accessed 25 March 2013
Auckland Transport (2012) ‘About us’, http://www.aucklandcouncil.govt.nz/EN/AboutCouncil/representativesbodies/CCO/Pages/auckland_transport.aspx, lastaccessed 25 February 2013
Aziakou, G. (2013) ‘Sao Paulo rich use choppers to beattraffic jams’, AFP, http://www.google.com/hostednews/afp/article/ALeqM5iw3-Eq-KS_qBHAOAlueBF-DK8JJA?docId=CNG.8d6a8c3ea29165d945bd0d17f7bfe46e.b31,last accessed 29 April 2013
Bailey, L. (2004) Aging Americans: Stranded withoutOptions, Surface Transportation Policy Project 2004,http://www.apta.com/resources/reportsandpublications/Documents/aging_stranded.pdf, last accessed 25 March2013
Baily, M.N., R.E. Litan and M.S. Johnson (2008) TheOrigins of the Finan cial Crisis, The Brookings Institution,Washington, DC
Balassiano, R. and R.W.C. Alexandre (2011) ‘Informalmotorized trans port in Rio de Janeiro, Brazil’, unpub -lished case study prepared for the Global Report onHuman Settlements 2013, www.unhabitat.org/grhs/2013
Bangkok Metropolitan Administration (2010) Bangkoktransportation over the next decade: 2010–2020, Trafficand Transportation Department
Banister, D. (1998) Transport Policy and the Environ ment,Spon, London
Banister, D. (2003) ‘Critical pragmatism and congestioncharging in London’, International Social Science Journal176: 249–264
Banister, D. (2005) Unsus tain able Transport: City Transportin the New Century, Routledge, London
Banister, D. (2007) ‘Cities, urban form and sprawl: AEuropean perspective’, in Transport, Urban Form andEconomic Growth, ECMT Round Table 137, Paris:113–142
Banister, D. (2008) ‘The sus tain able mobility paradigm’,Transport Policy 15(1): 73–80
Banister, D. and J. Berechman (2000) Transport Investmentand Economic Devel op ment, UCL Press, London
Banister, D. and E. Finch (2011) ‘Urban trans port and theenviron ment, London, UK’, unpublished case studyprepared for the Global Report on Human Settlements2013, www.unhabitat.org/grhs/2013
Banister, D. and J. Liu (2011) ‘Urban trans port and theenviron ment, Hangzhou, China’, unpublished casestudy prepared for the Global Report on Human Settle -ments 2013, www.unhabitat.org/grhs/2013
Banister, D. and S. Marshall (2000) Encouraging Trans portAlternatives: Good Practice in Reducing Travel, TheStationery Office, London
Banister, D. and D. Stead (2004) ‘Impact of information andcommunications technology on transport’, TransportReviews 24(5): 611–632
Banister, D., K. Anderton, D. Bonilla, M. Givoni and T.Schwanen (2011) ‘Transportation and the environ -ment’, Annual Review of Environ ment and Resources 36:247–270, DOI: 10.1146/annurev-environ-032310-112100
Barcelona City Council (2006) Barcelona StrategicMetropolitan Plan, Barcelona, Spain
Barker T., I. Bashmakov, L. Bernstein, J.E. Bogner, P.R. Bosch,R. Dave, O.R. Davidson, B.S. Fisher, S. Gupta, K.Halsnæs, G.J. Heij, S. Kahn Ribeiro, S. Kobayashi, M.D.Levine, D.L. Martino, O. Masera, B. Metz, L.A. Meyer,G.-J. Nabuurs, A. Najam, N. Nakicenovic, H.-H. Rogner,J. Roy, J. Sathaye, R. Schock, P. Shukla, R.E.H. Sims, P.Smith, D.A. Tirpak, D. Urge-Vorsatz and D. Zhou (2007)‘Technical summary’, in B. Metz, O.R. Davidson, P.R.Bosch, R. Dave and L.A. Meyer (eds) Climate Change2007: Mitigation, Contribution of Working Group III tothe Fourth Assessment Report of the Intergovern mentalPanel on Climate Change, Cambridge University Press,Cambridge and New York: 25–93, www.ipcc.ch/pdf/assessment-report/ar4/wg3/ar4-wg3-ts.pdf, last accessed30 January 2013
Barlow, J., R.S. Wall, D.H. Ashmead, and B.L. Bentzen (2004)‘Directional guidance from audible pedestrian signals for street crossing,’ Ergonomics 47(12): 1318–1338,http://www.mc.vanderbilt.edu/root/pdfs/pedauditory/directionalguidance.pdf, last accessed 25 March 2013
Barone, M. and J. Rebelo (2003) ‘Potential impact ofMetro’s Line 4 on poverty in the São Paulo MetropolitanRegion (SPMR)’, World Bank, Washington, DC, http://siteresources.worldbank.org/INTURBANTRANSPORT/Resources/poverty_14_sp.pdf, last accessed 25 March2013
Barter, P. (2002) ‘Transport and housing security in the Klang Valley, Malaysia, Singapore’, Journal of TropicalGeography 23(3): 268–287
Barter, P. and E. Dotson (2011) ‘Urban trans port institu-tions and governance and integrated land use andtransport, Singapore’, unpublished case study preparedfor the Global Report on Human Settlements 2013, www.unhabitat.org/grhs/2013
Barter, P.A. (2008) The Status of Bicycles in Singapore,Bicycling in Asia, Interface for Cycling Expertise, I-ce,the Netherlands
Barth, J.R., Tong Li, Wenling Lu, T. Phumiwasana and G. Yago (2009) The Rise and Fall of the U.S. Mortgageand Credit Markets, Milken Institute, Santa Monica, CA,http://www.milkeninstitute.org/pdf/Riseandfallexcerpt.pdf, last accessed 27 May 2013
Basterfield, S. (2011) Short History of Cargo Cycling,http://cyclelogistics.eu/index.php?id=39&folder_id=111, last accessed 15 May 2013
Bauer, M., A. Kandler and H. Weiss (2006) ‘Model of tramline operation’, in K. Gürlebeck and C. Könke (eds) 17th International Conference on the Applications ofComputer Science and Mathematics in Architectureand Civil Engineering, Weimar, Germany, 12–14 July,http://euklid.bauing.uni-weimar.de/ikm2006-cd/data/templates/papers/f59.pdf, last accessed 6 February2013
References 277
1EEE234567891012311145678920123456789301234567894012345678950123456789EEEE
278 Planning and Design for Sustainable Urban Mobility
Becker, H.-J., S. Stark and M. Abraham (2008) BicycleParking in Berlin – A Planning Guide, http://130.149.80.38/spicycles/dokumente/ws4/Guide%20BikeParking%20Berlin%20.pdf, last accessed 18 April 2013
Beesley, M.E. and C.D. Foster (1965) ‘The Victoria line:Social benefits and finances’, Journal of the RoyalStatistical Society, Series A (General) 128(1): 67–88
Beldean, V., A.S. Huzayyin, P. Laconte and H. Lauridsen(2007) ‘Statement of the External Advisory Panel’, inWorld Bank Independent Evaluation Group (2007) ADecade of Action in Transport: An Evaluation of WorldBank Assistance to the Transport Sector, 1995–2005,World Bank, Washington, DC: xxvii–xxxi, http://siteresources.worldbank.org/EXTTRANSPORTATION/Resources/transport_eval.pdf, last accessed 2 May 2013
Benjelloun, A., T.G. Crainic and Y. Bigras (2010) ‘Towardsa taxonomy of city logistics projects’, Procedia Social andBehavioral Sciences 2(3): 6217–6228
Berglund B., T. Lindvall and D.H. Schwela (1999) ‘Guidelinesfor community noise’, World Health Organization,http://www.who.int/docstore/peh/noise/guidelines2.html, last accessed 30 January 2013
Bernick, M. and R. Cervero (1997) Transit Villages for the21st Century, McGraw Hill, New York
Bertaud, A. (2001) ‘Metropolis: A measure of the spatialorganization of 7 large cities’, http://alain-bertaud.com,last accessed 14 February 2012
Bertaud, A. (2011) ‘Mumbai FAE/FSI Conundrum: Theperfect storm’, http://alain-bertaud.com/AB_Files/AB_Mumbai_FSI_Conundrum_Revised_sept_2011.pdf, lastaccessed 21 March 2012
Bertaud, A. and S. Malpezzi (2003) ‘The spatial distributionof population in 48 World Cities: Implications foreconomies in transition’, http://alain-bertaud.com/AB_Files/Spatia_%20Distribution_of_Pop_%2050_%20Cities.pdf, last accessed 19 January 2012
Bertaud, A. and H.W. Richardson (2004) ‘Transit anddensity: Atlanta, the United States and Western Europe’,in H.W. Harry Ward Richardson and C.-H. Bae (eds)Urban Sprawl in Western Europe and the United States,Ashgate, Aldershot, England: 293–310
Bertaud, A., B. Lefèvre and B. Yuen (2009) ‘GHG emissions,urban mobility and efficiency of urban morphology: A hypothesis’, Paper presented at the Urban ResearchSymposium, Cities and Climate Change: Respondingto an Urgent Agenda, 28–30 June, Marseilles, France,http://siteresources.worldbank.org/INTURBANDEVELOP MENT/Resources/336387-1256566800920/6505269-1268260567624/Bertaud.pdf, last accessed 30 January 2013
Bertolini, L. and T. Spit (1998) Cities on Rails: The Redevel -op ment of Railway Station Areas, Spon Press, London
BESTUFS (Best Urban Freight Solutions) (2005) ‘Urbanconsolidation centres, last mile solutions’, BESTUFS II,http://www.bestufs.net/download/BESTUFS_II/key_issuesII/BESTUFS_Recommendations.pdf, last accessed22 May 2013
Bettencourt, L., J. Lobo, D. Strumsky and G. West (2010)‘Urban scaling and its deviations: Revealing the struc-ture of wealth, innovation and crime across cities’, PLoSONE 5(11): e13541, http://www.plosone.org/article/info%3Adoi%2F10.1371%2Fjournal.pone.0013541, lastaccessed 7 May 2013
Bhalla, K., S. Shahraz, M. Naghavi and C. Murray (2008)‘Impact of safety policies on road traffic deaths in devel -op ing countries’, 9th World Conference on InjuryPrevention and Safety Promotion, Merida, Mexico
Bhatta, S. and M. Drennan (2003) ‘The economic benefitsof public investment in transportation: A review of recentliterature’, Journal of Planning Education and Research22(2): 288–296
Black, A. (1990) ‘The Chicago area transportation study: A case study of rational planning’, Journal of PlanningEducation and Research 10(1): 27–37
Black, W. (1996) ‘Sus tain able transportation: A USperspective’, Journal of Transportation Geography 4(3):151–159
Black, W. (2010) Sus tain able Transportation: Problems andSolutions, Guilford Press, New York
Blackden, C.M. and Q. Wodon (eds) (2006) Gender, TimeUse and Poverty in Sub-Saharan Africa, Working PaperNo. 73, World Bank, Washington, DC, http://siteresources.worldbank.org/INTAFRREGTOPGENDER/Resources/gender_time_use_pov.pdf, last accessed 25 March
Bleviss, D., J.-P. Orfeuil and R. Pischinger (1996) ‘Mitigationoptions in the transportation sector’, in R.T. Watson,R.T.M.C. Zinyowera and R.H. Moss (eds) ClimateChange 1995: Impacts, Adaptations and Mitigation ofClimate Change: Scientific-Technical Analyses, Con -tribution of Working Group II to the 2nd AssessmentReport of the Intergovern mental Panel on ClimateChange, Cambridge University Press, Cambridge:679–712, http://www.ipcc-wg2.gov/publications/SAR/SAR_Chapter%2021.pdf, last accessed 30 January 2013
Boarnet, M. (1997) ‘Infra struc ture services and the pro -ductivity of public capital: The case of streets andhighways’, National Tax Journal 50(1): 39–57
Boarnet, M. (1998) ‘Spillovers and locational effects of public infra struc ture’, Journal of Regional Science 38(3):381–400
Boarnet, M. and S. Chalermpong (2001) ‘New highways,house prices, and urban devel op ment: A case study oftoll roads in Orange County, CA’, Housing Policy Debate12(3): 575–605
Boarnet, M. and A.F. Haughwout (2000) Do HighwaysMatter? Evidence and Policy Implications of Highway’sInfluence on Metropolitan Devel op ment, BrookingsInstitution Press, Washington, DC
Bocarejo, J.B. and L.E. Tafur (2011) ‘Urban land usetransformation driven by an innovative transporta-tion project, Bogotá, Colombia’, unpublished case studyprepared for the Global Report on Human Settlements2013, www.unhabitat.org/grhs/2013
Bollinger, C. and K. Ihlandfelt (1997) ‘The impact of rapidrail transit on economic devel op ment: The case ofAtlanta’s MARTA’, Journal of Urban Economics 42(2):179–204
Booth, D., L. Hanmer and E. Lovell (2000) Poverty andTransport, Report prepared for the World Bank incollaboration with DFID Final Report, Overseas Devel -op ment Institute, London, http://www.odi.org.uk/resources/download/2689.pdf, last accessed 25 March2013
Boschmann, E. and M.P. Kwan (2008) ‘Toward socially sus -tain able urban transportation: Progress and potentials’,
International Journal of Sus tain able Transportation 2(3):138–157
Boudouin, D. (2006) Les espaces logistiques urbains, Ladocumentation française, Paris
Bouf, D. and Hensher, D.A. (2007) ‘The dark side ofmaking transit irresistible: The example of France’,Transport Policy 24(6): 523–532
Boupda, E. (2010) ‘Les gares routières dans la ville de Doualaet leurs effets induits’, Colloque International Transportet Développement des Territoires, Le Havre, 8–10September
BOVAG-RAI Mobility Foundation (2009) Mobility in Figures:Two-wheelers 2009/2010, BOVAG-RAI MobilityFoundation, Amsterdam, http://www.bovagrai.info/tweewieler/2009/images/MICtweewieler2009.pdf, lastaccessed 18 April 2013
BP plc (2012) BP Statistical Review of World Energy 2012,http://www.bp.com/assets/bp_internet/globalbp/globalbp_uk_english/reports_and_publications/statistical_energy_review_2011/STAGING/local_assets/pdf/statistical_review_of_world_energy_full_report_2012.pdf, last accessed 30 January 2013
Brand, P. and J. Davila (2011) ‘Aerial cable-car systems forpublic trans port in low-income urban areas: lessons from Medellin, Colombia’, Paper presented in Track 11(Transportation, Infra struc ture and Planning) at the 3rd World Planning Schools Congress, Perth, 4–8 July,http://r4d.dfid.gov.uk/pdf/outputs/esrc_dfid/60726_brand_aerial.pdf, last accessed 18 April 2013
Broaddus, A., T. Litman and G. Menon (2009) ‘Trans -portation demand management: Training document’,GTZ, Eschborn
Brown, H. (2007) ‘Rwanda’s road-safety transformation’,Bulletin of the World Health Organization 85(6):421–500, http://www.who.int/bulletin/volumes/85/6/07-010607/en/index.html, last accessed 25 March2013
Brown, J., D.B. Hess and D. Shoup (2001) ‘Unlimited access’,Transportation 28: 233–267
Browne, M., M. Sweet, A. Woodburn and J. Allen (2005)Urban Freight Consolidation Centres: Final Report,report for Department of Transport, UK
Browne, M., J. Allen and M. Attlassy (2007) ‘Comparingfreight trans port strategies and measures in London and Paris’, International Journal of Logistics Research andApplications 10(3): 205–219
Browne, W. and J. Allen (1999) ‘The impact of sus tain abilitypolicies on urban freight trans port and logistics systems’,in H. Meesman, E. Van De Voorde and W. Winkelmans(eds) World Transport Research, Vol. 1: TransportModes and Systems, Elsevier, Oxford: 505–518
Brownson, R., E. Baker, R. Housemann, L. Brennan and S. Bacak (2001) ‘Environ mental and policy determinantsof physical activity in the United States’, AmericanJournal of Public Health 91(12): 1995–2003
Buehler, R. and J. Pucher (2012a) ‘Walking and cycling inWestern Europe and the United States: Trends, policies,and lessons’, TR News 280(May-June): 34–42
Buehler, R. and J. Pucher (2012b) ‘Demand for public trans -port in Germany and the USA: An analysis of rider charac -teristics’, Transport Reviews 32(5): 541–567
Bull, F.C., T.P. Armstrong, T. Dixon, S. Ham, A. Neiman andM. Pratt (2004) ‘Physical inactivity’, in M. Ezzati, A. Lopez, A. Rodgers and C. Murray (eds) Comparative
Quantification of Health Risks, World Health Organ -ization, Geneva: 729–881, http://whqlibdoc.who.int/publications/2004/9241580348_eng_Volume1.pdf, lastaccessed 30 January 2013
Bullard, R. (2007) Growing Smarter: Achieving LivableCommunities, Environ mental Justice, and RegionalEquity, MIT Press, Cambridge, MA
Burchell, R. (2005) Sprawl Costs: Economic Impacts ofUnchecked Devel op ment, Island Press, Washington,DC
Burchell, R. and S. Mukherji (2003) ‘Conventional devel -op ment versus managed growth: The costs of sprawl’,American Journal of Public Health 93(9): 1534–1540
Bureau of Transport and Regional Economics (2007)Estimating urban traffic and congestion cost trends forAustralian cities, Working Paper 71, Canberra, http://www.bitre.gov.au/publications/2007/files/wp_071.pdf, last accessed 18 April 2013
Button, K. (2010) Transportation Economics, Edward Elgar,Cheltenham, UK
Buys, P., W. Deichmanna and D. Wheeler (2010) ‘Roadnetwork upgrading and overland trade expansion in Sub-Saharan Africa’, Journal of African Economics 19(3):399–432
Cabinet Alain Thomas (undated) ‘Versement transport’,http://www.cabinet-atec.com/_infos/dossiers/article.asp?rub=paie&sousrub=cotisations&art=paie10j, lastaccessed 17 January 2013
CAI-Asia (Clean Air Initiative-Asia) (2010) Non-MotorizedTransportation: Introduction to Cycling in Asia, CAI-Asia Factsheet No. 26, Metro Manila, http://cleanairinitiative.org/portal/sites/default/files/26_Introduction_to_Cycling_12_October_2010.pdf, last accessed 18April 2013
Calthorpe, P. (1993) The New American Metropolis:Ecology, Community, and the American Dream,Princeton Architectural Press, New York
Calthorpe, P. (2011) Urbanism in the Age of ClimateChange, Island Press, Washington, DC
Calthorpe, P. and W. Fulton (2001) The Regional City:Planning for the End of Sprawl, Island Press, Washington,DC
Cambridge Systematics (2002) ‘Working paper #3:Community and social benefits of transportationinvestment’, The Positive Impacts of TransportationInvestment: Compilation of Working Papers, NCHRP(National Cooperative Highway Research Program)Project 8-36, http://onlinepubs.trb.org/onlinepubs/archive/notesdocs/NCHRP08-36%2822%29_FR.pdf, lastaccessed 18 April 2013
Canadian Urban Transit Association (2010) Recent Devel -op ments in Transit in Canadian Cities, Report of theUrban Transit Task Force to Ministers of Transportation,Ottawa, http://www.comt.ca/english/recent-nov2010.pdf, last accessed 25 February 2013
Canary Wharf Group plc (undated) ‘Transport’, http://www.canarywharf.com/aboutus/Corporate—Social-Responsibility/Green-Canary-Wharf/Transport/, lastaccessed 30 January 2013
Cao, X., P. Mokhtarian and S. Handy (2009) ‘Examining theimpacts of residential self-selection on travel behaviour:A focus on empirical findings’, Transport Reviews 29(3):359–395
1EEE234567891012311145678920123456789301234567894012345678950123456789EEEE
279References
280 Planning and Design for Sustainable Urban Mobility
Carpenter, J.A., J. Gibbs, A.A. Pesaran, L.D. Marlino and K.Kelly (2008) ‘Road transportation vehicles’, MRS Bulletin33(4): 439–444, http://dx.doi.org/10.1557/mrs2008.86,last accessed 30 January 2013
Carruthers, R., M. Dick and A. Saurkar (2005) Afford-ability of Public Transport in Devel op ing Countries, World Bank Transport Paper, TP-3, World Bank,Washington, DC, http://siteresources.worldbank.org/INTTRANSPORT/214578-1099319223335/20460038/TP-3_affordability_final.pdf, last accessed 30 May 2013
Carter, M.R., M.P. Howard and N. Owens et al (2002)‘Effects of catastrophic events on transportation systemmanagement and operations, the Pentagon and theNational Capitol region – September 11, 2001’, Preparedby Science Applications International Corporation forthe Federal Highway Administration, ITS Joint ProgramOffice, Washington, DC, http://www.hsdl.org/?view&did=28270, last accessed 25 March 2013
Castells, M. (2000) End of Millennium, the Information Age:Economy, Society and Culture Vol. III, Blackwell, Oxford,UK
CBC News (2007) ‘Major TransLink overhaul going ahead’, 8 March, http://www.cbc.ca/news/canada/british-columbia/story/2007/03/08/bc-translink.html, lastaccessed 25 February 2013
CEMR (Council of European Municipalities and Regions)(2007) ‘Declaration of Stuttgart: On the role of Europeanlocal and regional govern ments regarding sus tain ablemobility’, Policy Committee of the CEMR, http://www.ccre.org/docs/stuttgart_urban_mobility_en.pdf, lastaccessed 30 May 2013
Center for Transit-Oriented Devel op ment (2008) Capturingthe Value of Transit, Federal Transit Administration, USDepartment of Transportation, Washington, DC
Central Bureau of Statistics, Netherlands (2010) ‘Meergesloopt, wagenpark toch ouder’ (‘More scrapped, yetan older fleet of cars’), Wemagazine, 26 April, http://www.cbs.nl/nl-NL/menu/themas/verkeer-vervoer/publicaties/artikelen/archief/2010/2010-3107-wm.htm,last accessed 30 January 2013
Central PPP Unit in the Department of Finance Govern mentof Ireland (2007) ‘Public private partnership: Value formoney and the public private partnership procurementprocess’, http://www.ppp.gov.ie/wp-content/uploads/file/Value%20for%20Money%20and%20the%20PPP%20Procurement%20Process.doc, last accessed 30 January2013
Centre of Excellence in Urban Transport (2012) Data fromIntegrated Spatial Devel op ment project, CEPT University,Ahmedabad, India, Urban Department of the World Bank,accessed 5 January 2012
CERTU (Centre d’études sur les réseaux, les transports,l’urbanisme et les constructions publiques) (2002)Coûts des dysfonctionnements du système des transportsurbains d’Abidjan, Report to Agence des TransportsUrbains (AGETU), Lyon
Cervero, R. (1988) ‘Land-use mixing and suburban mobility’,Transportation Quarterly 45(3): 479–491
Cervero, R. (1991) ‘Paratransit in Southeast Asia: A marketresponse to poor roads?’ Review of Urban and RegionalDevel op ment Studies 3(1): 3–27
Cervero, R. (1996) ‘Mixed land uses and commuting: Evi -dence from the American Housing Survey’, Transporta -tion Research A 30(5): 361–377
Cervero, R. (1997) ‘Paradigm shift: From automobility toaccessibility planning’, Urban Futures 22(1): 9–20
Cervero, R. (1998) The Transit Metropolis: A Global Inquiry,Island Press, Washington, DC
Cervero, R. (2000) Informal Transport in the Devel op ingWorld, UN-Habitat, Nairobi, http://www.unhabitat.org/pmss/getElectronicVersion.aspx?nr=1534&alt=1, last accessed 3 June 2013
Cervero, R. (2002) ‘Induced travel demand: Researchdesign, empirical evidence, and policy directions’,Journal of Planning Literature 17(1): 3–20
Cervero, R. (2004) ‘The property value case for transit’, in R. Dunphy, R. Cervero, F. Dock, M. McAvoy and D.R. Porter (eds) Devel op ing Around Transit: Strategiesand Solutions That Work, Urban Land Institute,Washington, DC: 31–49
Cervero, R. (2005a) Accessible Cities and Regions: AFramework for Sus tain able Transport and Urbanism inthe 21st Century, Institute of Transportation Studies,Berkeley Center for Future Urban Transport, WorkingPaper, UCB-ITS-VWP-2005-3, Berkley, http://www.its.berkeley.edu/publications/UCB/2005/VWP/UCB-ITS-VWP-2005-3.pdf, last accessed 25 March 2013
Cervero, R. (2005b) ‘Progressive trans port and the poor:Bogotá’s bold steps forward’, Access 27: 24–30,http://www.uctc.net/access/27/Access%2027%20-%2005%20-%20Progressive%20Transport%20and%20the%20Poor.pdf, last accessed 25 March 2013
Cervero, R. (2007) ‘Transit oriented devel op ment’s ridershipbonus: A product of self selection and public policies’,Environ ment and Planning A 39: 2068–2085
Cervero, R. (2008) ‘Transit-oriented devel op ment inAmerica: Strategies, issues, policy directions’, in T. Hass(ed) New Urbanism and Beyond: Designing Cities for theFuture, Rizzoli, New York: 124–129
Cervero, R. (2009) ‘Public trans port and sus tain ableurbanism: Global lessons’, in C. Curtis, J. Renne and L. Bertolini (eds) Transit Oriented Devel op ment: MakingIt Happen, Ashgate, Surrey, England: 23–35
Cervero, R. (2011) ‘State roles in providing affordable masstrans port services for low-income residents’, Organ -ization for Economic Devel op ment/International Trans -port Forum, Discussion Paper 2011-17, Paris, http://www.internationaltransportforum.org/jtrc/DiscussionPapers/DP201117.pdf, last accessed 25 March 2013
Cervero, R. (2013) ‘Linking urban trans port and land usein devel op ing countries’, Journal of Transport and LandUse 6(1): 7–24
Cervero, R. and A. Golub (2011) ‘Informal public trans-port: A global perspective’, in H. Dimitriou and R.Gakenheimer (eds) Urban Transport in the Devel op ingWorld: A Handbook of Policy and Practice, EdwardElgar, Cheltenham, UK: 488–518
Cervero, R. and J. Day (2008) ‘Suburbanization and transitoriented devel op ment in China’, Transport Policy 15:315–323
Cervero, R. and K. Kockelman (1997) ‘Travel demand andthe 3 Ds: Density, diversity, and design’, TransportationResearch D 2(3): 199–219
Cervero, R. and J. Landis (1997) ‘Twenty years of BART: Landuse and devel op ment impacts’, Transportation ResearchA 31(4): 309–333
Cervero, R. and J. Murakami (2008a) ‘Rail + property devel -op ment: A model of sus tain able transit finance and
1EEE234567891012311145678920123456789301234567894012345678950123456789EEEE
281References
urbanism’, Working paper, UC Berkley Center forFuture Urban Transport, http://www.its.berkeley.edu/publications/UCB/2008/VWP/UCB-ITS-VWP-2008-5.pdf,last accessed 8 May 2013
Cervero, R. and J. Murakami (2008b) ‘Rail and propertydevel op ment in Hong Kong: Experi ences, impacts, andextensions’, Working Paper, Lincoln Institute of LandPolicy, http://www.lincolninst.edu/pubs/dl/1388_706_Cervero Murakami Final.pdf, last accessed on 30 January2013
Cervero, R. and J. Murakami (2009) ‘Rail + property devel -op ment in Hong Kong: Experi ences and extensions’,Urban Studies 46(10): 2019–2043
Cervero, R. and S. Seskin (1995) ‘An evaluation of therelationship between transit and urban form’, ResearchResults Digest 7, Transit Cooperative Research Program,National Research Council, Washington, DC
Cervero, R., G. Arrington, J. Smith-Heimer and R. Dunphy(2005) Transit Oriented Devel op ment in America: Experi -ences, Challenges, and Prospects, Report 102, TransitCooperative Research Program, Washington, DC
Cervero, R., J. Kang and K. Shively (2009) ‘From elevatedfreeways to surface boulevards: Neighborhood andhousing price impacts in San Francisco’, Journal ofUrbanism 2(1): 31–50
Chan, P.L.P. (2010) ‘An overview of the provision of publictrans port for people with disabilities in Hong Kong’,http://www.transed2010.hk/front/upload/20100617CR-0OZtd27D16.doc, last accessed 25 March 2013
Chandran, R. (2010) ‘Urban trans port debate: Is BRTS theanswer?’, livemint.com, HT Media Limited, Ahmedabad,http://www.livemint.com/Politics/rmrv69KmokVhBrcyee7nHM/Urban-transport-debate-Is-BRTS-the-answer.html,last accessed 30 January 2013
Changwonderful (2012) ‘An introduction to Nubija’,http://www.changwonderful.com/an-introduction-to-nubija, last accessed 30 January 2013
Chew, T.C. (2011) ‘Sus tain able railway devel op mentthrough careful planning, design and implementation’,Journeys 6(May): 24–37, Land Transport AuthorityAcademy, Singapore, http://www.ltaacademy.gov.sg/doc/LTA_Journeys%20May%202011%20r2.pdf#page=26,last accessed 30 January 2013
Chiffi, C. (undated) ‘Goods delivery by cargo tram inAmsterdam (the Netherlands)’, Eltis, http://www.eltis.org/index.php?id=13&study_id=1547, last accessed 29 May 2013
Chin, H.-C. (2011) ‘Sus tain able urban mobility in South-Eastern Asia and the Pacific’, unpublished regionalstudy prepared for the Global Report on HumanSettlements 2013, www.unhabitat.org/grhs/2013
China Communications Press (2008) Sus tain able TransportDevel op ment in Chinese Cities: Challenges and Options,PRC Communications Press
China Daily (2010) ‘Beijing seeks to revive cycling’, ChinaDaily, 24 January, http://www.chinadaily.com.cn/china/2010-01/24/content_9368053.htm, last accessed18 April 2013
Chitere, P.O. and T.N. Kibua (2004) Efforts to Improve RoadSafety in Kenya: Achievements and Limitations of Reformsin the Matatu-Industry, Institute of Policy Analysis andResearch, Regal Press, Nairobi
Chorus, P. (2009) ‘Transit oriented devel op ment in Tokyo:The public sector shapes favourable conditions, the
private sector makes it happen’, in C. Curtis, J. Renneand L. Bertolini (eds) Transit Oriented Devel op ment:Making It Happen, Ashgate, Surrey, England: 225–238
Choudhry, R. (2013) ‘Urban Journal: The Trouble withDelhi’s Metro’, The Wall Street Journal, India, http://blogs.wsj.com/indiarealtime/2012/04/24/urban-journal-the-trouble-with-delhis-metro/?mod=google_news_blog,last accessed 5 April 2013
Chow, C.K. (2008) ‘2007 Annual Results’, 11 March,MTR Corporation, http://www.mtr.com.hk/eng/investrelation/annualresult2007/MTR_annual_2007_final_web.pdf, last accessed 30 January 2013
Churchman, C.W. (1967) ‘Guest editorial: “Wickedproblems” ’, Management Science 14(4): B-141–142
Cidell, J. (2010) ‘Concentration and decentralisation: Thenew geography of freight distribution in US metropolitanareas’, Journal of Transport Geography 18(3): 363–371
CIF (Climate Investment Funds) (2011) ‘Clean TechnologyFund (CTF)’, in CIF from the Ground Up: Investing inOur Green Future: 2011 Annual Report, the World Bank,Washington, DC, http://www.climateinvestmentfunds.org/cif/sites/climateinvestmentfunds.org/files/CIF_AR_2011_cleant_technology_fund_CTF.pdf, last accessed30 January 2013
City of Cape Town (2013) ‘Why MyCiTi?’, https://www.capetown.gov.za/EN/MYCITI/Pages/AboutMyCiTi2.aspx, last accessed 3 April 2013
City of Göteborg (2006) Calm, Safe and Secure in Göteborg:Positive Effects of Traffic-Calming Countermeasures,City of Göteborg, Göteborg, http://www2.trafikkontoret.goteborg.se/resourcelibrary/Trafiksakerhet/Calm%20in%20G%C3%B6teborg%202007%2003%2029.pdf, lastaccessed 25 March 2013
City of Seoul Govern ment (2009) ‘Organization’, http://english.Seoul.go.kr/gtk/cg/cityhall.php?pidx=1, lastaccessed 25 February 2013
City of Tshwane (undated) ‘Bus rapid transit’, http://www.tshwane.gov.za/Services/Transport/Bus%20Rapid%20Transit/Pages/default.aspx, last accessed 3 April2013
CODATU (Cooperation for Urban Mobility in the Devel opingWorld) (2009) Who Pays what for Urban Transport?Handbook of Good Practices, Agence Française deDéveloppement (AFD), Ministère de l’Ecologie, del’Energie, du Développement durbale et de la Mer France(MEEDDM) and CODATU, http://www.codatu.org/wp-content/uploads/handbook_good_practices.pdf, 16 May2013
Commission for Global Road Safety (2006) Make Roads Safe:A New Priority for Sus tain able Devel op ment, Commissionfor Global Road Safety, London, http://www.makeroadssafe.org/publications/Documents/mrs_report_2007.pdf, last accessed 25 March 2013
Condon, P. (2008) ‘Planning for climate change’, Land Lines20(1): 1–8
Cortright, J., Impresa and CEOs for Cities (2010) MeasuringUrban Transportation Performance: A Critique of MobilityMeasures and a Synthesis, http://www.rockefellerfoundation.org/uploads/files/bede002f-16bc-4557-aaeb-1fb97e8dc36f.pdf, last accessed 18 April 2013
Cosgrove, D.C (2011) ‘Long-term patterns of Australianpublic trans port use’, in 34th Australasian TransportResearch Forum, 28–30 September 2011, Adelaide,Australia
282 Planning and Design for Sustainable Urban Mobility
Cox, W. (2012) ‘The evolving urban form: Tokyo’, NewGeography, 20 June, http://www.newgeography.com/content/002923-the-evolving-urban-form-tokyo, lastaccessed 16 May 2013
Crain & Associates, Ricardo Byrd and Omniversed Inter -national (1999) Using Public Transportation to Reducethe Economic, Social, and Human Costs of PersonalImmobility, Transit Cooperative Research ProgramReport 49, Transportation Research Board, Washington,DC, http://onlinepubs.trb.org/onlinepubs/tcrp/tcrp_rpt_49.pdf, last accessed 18 April 2013
Crozet, Y. (2006) ‘Assessing the long-term outlook forcurrent business models in the construction andprovision of urban mass transit infra struc ture andservices’, Discussion paper for OECD Futures Projecton Global Infra struc ture Needs: Prospects andImplications for Public and Private Actors, June
Crozet, Y. (2007) ‘Strategic issues for the future fundingand operation of urban public trans port systems’, In Infra -struc ture to 2030: Mapping Policy for Electricity, Waterand Transport, Volume 2, Organisation for Economic Co-operation and Devel op ment, http://www.oecd.org/dataoecd/61/27/40953164.pdf, last accessed 30 January2013
Cullingworth, B. and R.W. Caves (2009) Planning in the USA:Policies, Issues and Process, Routledge, London
Cuomo, A. (2010) The New NY Agenda: A Plan for Action,http://www.andrewcuomo.com/system/storage/6/34/9/378/acbookfinal.pdf, last accessed 27 May 2013
Curtis, C., J. Renne and L. Bertolini (2009) Transit OrientedDevel op ment: Making it Happen, Ashgate, Surrey, UK
Cusset, J.M., B.Guiro, E. Ilboudo and G. Sirpé (1995) Les transports urbains non motorisés en Afrique sub-saharienne: Le cas du Burkina Faso, LET-INRETS-CEDRES, Lyon-Arcueil-Ouagadougou
D’Souza, C., E. Steinfield, V. Parquet and D. Feathers (2010)‘Space requirements for wheeled mobility devices inpublic transportation: Analysis of clear floor spacerequire ments’, 89th Transport Research Board Meeting,10–14 January, Hilton, Lincoln West
Dablanc, L. (2007) ‘Goods trans port in large European cities:Difficult to organize, difficult to modernize’, Trans -portation Research Part A 41: 280–285
Dablanc, L. (2008) ‘Urban goods trans port and air quality,policy and regulation issues in European cities’, Journalof Environ mental Law 20(2): 245–266
Dablanc, L. (2009) Freight Transport for Devel op mentToolkit: Urban Freight – Freight Transport, a Key for theNew Urban Economy, World Bank, Washington, DC
Dablanc, L. (2011) ‘Commercial goods transport, Paris,France’, Unpublished case study prepared for the GlobalReport on Human Settlements 2013, www.unhabitat.org/grhs/2013
Dablanc, L. and A. Lozano (2011) ‘Commercial goodstransport, Mexico City’, Unpublished case study pre -pared for the Global Report on Human Settlements 2013,www.unhabitat.org/grhs/2013
Dablanc, L. and D. Rakotonarivo (2010) ‘The impacts oflogistic sprawl: how does the location of parcel trans -port terminals affect the energy efficiency of goods’ trans port in Paris and what can we do about it?’, TheSixth International Conference on City Logistics; Procedia-Social and Behavioral Sciences 2(3): 6087–6096
Dalkmann, H. and C. Brannigan (2007) ‘Transport andclimate change’, in GTZ, Sus tain able Transport: ASource book for Policy-makers in Devel op ing Cities,Germany, http://www.transport2012.org/bridging/ressources/files/1/609,-dl_name-en-transport-and-climate-ch.pdf, last accessed 16 May 2013
Dargay, J., D. Gately and M. Sommer (2007) ‘Vehicleownership and income growth worldwide: 1960–2030’,Energy Journal 28(4): 143–170
Darido, G., T.M. Mariana and S. Mehndiratta (2009)‘Urban trans port and CO2 emissions: Some evidencefrom Chinese cities’, World Bank Working Paper, June,World Bank
Davis, B., T. Dutzik and P. Baxandall (2012) Transportationand the New Generation: Why Young People are DrivingLess and What it Means for Transportation Policy,Frontier Group, Washington, DC
Davis, L.W. and M.E. Kahn (2011) ‘Cash for clunkers? Theenviron mental impact of Mexico’s demand for usedvehicles’, Access 38(Spring): 15–21
Davis, O. and N. Johnson (1984) ‘The jitneys: A study ofgrassroots capitalism’, Journal of Contemporary Studies4(1): 81–102
De Vries, J.C., G. Bester and B. van Biljon (2010)‘Implementing high occupancy vehicle lanes in a free-way network environ ment’, Proceedings of the 29thSouthern African Transport Conference, 16–19 August,Pretoria, http://repository.up.ac.za/bitstream/handle/2263/14797/DeVries_Implementing%282010%29.pdf?sequence=1, last accessed 5 February 2013
de Wit, T. and H. Talens (undated) ‘Traffic calming in theNetherlands’, The Dutch Information and TechnologyCentre for Transport and Infra struc ture, CROW,http://www.ite.org/traffic/documents/AHA99B04.pdf,last accessed 25 March 2013
Deakin, E. (1989) ‘Land use and transportation planning inresponse to congestion problems: A review and critique’,Transportation Research Record 1237: 77–83
DeBlasio, A.J. (2004) ‘Effects of catastrophic events ontransportation system management and operations’,US Department of Transportation, John A. Volpe NationalTransportation Systems Center, Cambridge, MA, Paperprepared for workshop on ‘Optimizing resourceallocation for transportation infra struc ture protection’,University of Wisconsin-Madison, 20 May, http://www.chpra.wisc.edu/pdfs/talkdeblasio.pdf, last accessed 25March 2013
Dellinger, A.M. and C.E. Staunton (2002) ‘Barriers tochildren walking and bicycling to school, United States,1999’, Morbidity and Mortality Weekly 51(32): 701–704,http://www.cdc.gov/mmwr/preview/mmwrhtml/mm5132a1.htm, last accessed 25 March 2013
DeMaio, P. (2009) ‘Bike-sharing: History, impacts, modelsof provision, and future’, Journal of Public Transportation12(4): 41–56, http://www.nctr.usf.edu/jpt/pdf/JPT12-4DeMaio.pdf, last accessed 25 March 2013
Demographia (2005) ‘Greenhouse gas emissions per passen -ger mile public trans port and personal mobility USA:2005’, http://www.demographia.com/db-ghg-carstr.pdf,last accessed 16 May 2013
den Hartog, H. (2009) ‘Shanghai new towns – searching forcommunity and identity in a sprawling metropolis’, 4thInternational Conference of the International Forum on
1EEE234567891012311145678920123456789301234567894012345678950123456789EEEE
283References
Urbanism (IFoU): The New Urban Question – Urbanismbeyond Neo-Liberalism 1379, Amsterdam/Delft
Denver Urban Renewal Authority (undated) ‘How taxincrement financing (TIF) works’, http://www.renewdenver.org/redevel op ment/redevel op ment-sections/how-tax-increment-financing-tif-works.html, last accessed30 January 2013
Department for Transport, UK (2002) ‘Inclusive mobility’,https://www.gov.uk/govern ment/uploads/system/uploads/attachment_data/file/3695/inclusive-mobility.pdf, lastaccessed 25 March 2013
Department for Transport, UK (2010) ‘Number of disabilityaccessible or low-floor buses used as public servicevehicles: Great Britain 2004/05 to 2009/10’, http://www.dft.gov.uk/pgr/statistics/datatablespublications/public/bus/vehicles/bus0603.xls, last accessed 27 March 2013
Department for Transport, UK (2012) The Blue BadgeScheme Local Authority Guidance, http://www.gov.uk/govern ment/uploads/system/uploads/attachment_data/file/15319/blue-badge-scheme-local-authority-guidance.pdf, last accessed 25 March 2013
Department of Transport, South Africa (1996) ‘Whitepaper on national trans port policy’, Pretoria, http://www.info.gov.za/whitepapers/1996/transportpolicy.htm, 25March 2013
Deutsche Bahn (2012) ‘DB Arriva launches trans portoperations in Stockholm’, last modified: 22 August2012, http://www.deutschebahn.com/en/group/im_blickpunkt/2948114/arriva_stockholm_20120822.html,last accessed 15 April 2013
DieselNet.com (2012a) ‘Emission standards, EuropeanUnion’, http://www.dieselnet.com/standards/eu/, lastaccessed 30 January 2013
DieselNet.com (2012b) ‘Emission standards, EuropeanUnion: Cars and light trucks’, http://www.dieselnet.com/standards/eu/ld.php, last accessed 30 January 2013
Dijk, M. and C. Montalvo (2011) ‘Policy frames for park andride in Europe’, Journal of Transport Geography 19(6):1106–1119
Dimitriou, H. (2011) ‘Trans port and city devel op ment:understanding the fundamentals’, in H. Dimitriou andR. Gakenheimer (eds) Urban Transport in the Devel op -ing World: A Handbook of Policy and Practice, EdwardElgar, Cheltenham, UK: 8–39
Dings, D. and W. Dijkstra (1997) Specific EnergyConsumption and Emissions of Freight Transport,Centrum voor Energiebesparing en schone technologie,Delft
DMRC (Delhi Metro Rail Corporation) (undated) ‘Projectupdate’, http://www.delhimetrorail.com/project_updates.aspx, last accessed 16 May 2013
Doi, N. and K. Asano (2011) ‘Understanding the factorsaffecting the urban trans port energy in Asian cities –pathways of urban trans port indicators from 1995 to2009’, Environ mental Economics 2(2): 37–49, http://businessperspectives.org/journals_free/ee/2011/ee_2011_2_Doi.pdf, last accessed 22 May 2013
Dotson, E. (2011) ‘Institutional and political support forurban transport’, in H.T. Dimitriou and R. Gaken-heimer (eds) Urban Transport in the Devel op ing World:A Handbook of Policy and Practice, Edward Elgar,Cheltenham: 262–301
Downs, A. (1992) Stuck in Traffic: Coping with Peak-HourTraffic Congestion, Brookings Institution and LincolnInstitute of Land policy, Washington, DC
Downs, A. (2004) Still Stuck in Traffic: Coping with Peak-Hour Traffic Congestion, Brookings Institution Press,Washington, DC
Dresdner Verkehrsbetriebe AG (2011) ‘The tram rides awave of popularity’, Current Facts on Public trans-port 5, Dresdner Verkehrsbetriebe AG, Dresden, http://www.dvb.de/push.aspx?s=downloads/de/Download/Publikationen//DVB-Fakt/dvb_fakt_5_english_web.pdf,last accessed 18 April 2013
Drewry Shipping Consultants (2010) Annual Review ofGlobal Container Terminal Operators, Drewry MaritimeResearch, London
Duany, A., E. Plater-Zyberk and J. Speck (2000) SuburbanNation: The Rise of Sprawl and the Decline of theAmerican Dream, New York, North Point Press
Duarte, F. and F. Rojas (2012) ‘Intermodal connectivity toBRT: A comparative analysis of Bogotá and Curitiba’,Journal of Public Transportation 15(2): 1–18
Duarte, F. and C. Ultramari (2012) ‘Making public trans -port and housing match: Accomplishments and failuresof Curitiba’s BRT’, Journal of Urban Planning and Devel -op ment 138(2): 183–194
Duchène, C. (2011) ‘Gender and transport’, DiscussionPaper No. 2011-11, The International Transport Forumat the OECD, April, http://www.internationaltransportforum.org/jtrc/DiscussionPapers/DP201111.pdf, lastaccessed 25 March 2013
Dupuy, G (2011) Towards Sus tain able Transport: TheChallenge of Car Dependence, John Libbey Eurotext,Montrouge, France
Dye, R. and D. Merriman (2006) ‘Tax increment financing:A tool for local economic devel op ment’, Land Lines 18(1),http://www.lincolninst.edu/pubs/1078_Tax-Increment-Financing, last accessed 30 January 2013
EASHW (European Agency for Safety and Health at Work)(2011) Occupational Safety and Health in the TransportSector: An Overview, Publications Office of the EuropeanUnion, Luxembourg
EC (European Commission) (2001) European TransportPolicy for 2010: Time to Decide, White Paper, COM: 370final, European Commission, Brussels http://ec.europa.eu/transport/strategies/doc/2001_white_paper/lb_com_2001_0370_en.pdf, last accessed 25 February 2013
EC (2003) ‘Guidelines for successful public–privatepartnerships’, March, Directorate-General, RegionalPolicy, http://ec.europa.eu/regional_policy/sources/docgener/guides/ppp_en.pdf, last accessed 30 January2013
EC (2006) Keeping Europe Moving: Sus tain able Mobility for Our Continent, Midterm review of the Europeancommission’s 2001 Transport White Paper, COM (2006)314 Final, Brussels, 22 June, http://eur-lex.europa.eu/LexUriServ/LexUriServ.do?uri=COM:2006:0314:FIN:EN:PDF, last accessed 30 January 2013
EC (2011) ‘White paper: Roadmap to a single European trans port area – Towards a competitive and resourceefficient trans port system, COM(2011) 144 Final’,Brussels, http://ec.europa.eu/transport/strategies/doc/2011_white_paper/white_paper_2011_ia_full_en.pdf,last accessed 30 January 2013
284 Planning and Design for Sustainable Urban Mobility
EC (2012) Transport Infra struc tures – TEN-T, What Do weWant to Achieve? http://ec.europa.eu/transport/themes/infra struc ture/index_en.htm, downloaded the 20 March2013
EC–Environ ment (2011) ‘TREMOVE: An EU-wide Model’,European Commission – Environ ment, http://ec.europa.eu/environ ment/air/pollutants/models/tremove.htm, lastaccessed 17 July 2011
Echenique, M.H., A.J. Hargreaves, G. Mitchell and A.Namdeo (2012) ‘Growing cities sus tain ably: Does urbanform really matter?’, Journal of the American PlanningAssociation 78(2): 121–137
Economist, The (2009) ‘Mobile marvels’, The Economist,24 September, http://www.economist.com/node/14483896?story_id=14483896, last accessed 30 Janu -ary 2013
Economist (The) (2013) ‘Subways are spreading fast: Goingunderground’, The Economist, 5 January, http://www.economist.com/news/business/21569059-subways-are-spreading-fast-going-underground, last accessed 16 May2013
EcoPlan (2000) ‘Referendum results’, http://ecoplan.org/votebogota2000/general/results.htm, last accessed 25February 2013
Edel, M., E. Sclar and D. Luria (1984) Shaky Palaces:Homeownership and Social Mobility in the Suburban -ization of Boston, Columbia University Press, New York
EEA (European Environ ment Agency) (2001) ‘Traffic noise:Exposure and annoyance’, http://www.eea.europa.eu/data-and-maps/indicators/traffic-noise-exposure-and-annoyance, last accessed 30 January 2013
EEA (2011a) ‘Countries and Eionet’, http://www.eea.europa.eu/about-us/countries-and-eionet/intro, lastaccessed 30 January 2013
EEA (2011b) ‘Transport emissions of air pollutants, EEATERM 003’, Copenhagen, http://www.eea.europa.eu/data-and-maps/indicators/transport-emissions-of-air-pollutants-8/transport-emissions-of-air-pollutants-7,last accessed 30 January 2013
Efroymson, D. and M. Rahman (2005) ‘Transportationpolicy for poverty reduction and social equity’, WBBTrust, Dhaka, Bangladesh, http://www.wbbtrust.org/mediafile/Tp_Poverty%20reduction_2.pdf, last accessed27 March 2013
Eiden, E. (2005) ‘The worst of all worlds: Los Angeles,California, and the emerging reality of dense sprawl’,Transportation Research Record 1902: 1–9
EIU (Economist Intelligence Unit) and Siemens AG (2010)Latin American Green City Index: Assessing the envir -onmental performance of Latin America’s major cities,Siemens AG, Munich
EIU and Siemens AG (2011) Africa Green City Index:Assessing the environ mental performance of Africa’smajor cities, Siemens AG, Munich
El-Geneidy, A., E. Diab, C. Jacques and A. Mathez (2011)‘Sus tain able urban mobility in the Middle East and NorthAfrica’, unpublished regional study prepared for theGlobal Report on Human Settlements 2013, www.unhabitat.org/grhs/2013
Eliasson, J. and M. Lundberg (2002) ‘Road pricing in urban areas’, Swedish National Road Administration andT&E, http://www.transport-pricing.net/download/swedishreport.pdf, last accessed 7 February 2013
Elvik, R. (2010) Trafikksikkerhetshåndboken, Transport -økonomisk institutt, Oslo, http://tsh.toi.no/, last accessed25 March 2013
EPEC (European PPP Expertise Centre) (2012) The Guideto Guidance: How to Prepare, Procure and Deliver PPPProjects, EPEC, http://www.eib.org/epec/resources/guide-to-guidance-en.pdf, last accessed 30 January 2013(see also www.eib.org/epec/g2g/index.htm)
Ernst, J. (2011) ‘Environ mental challenges of urbantransport: The impacts of motorization’, in H. Dimitriou(ed) Urban Transport in the Devel op ing World: Perspec -tives from the First Decade of the New Millennium,Edward Elgar, Cheltenham: 137–173
ERRAC (European Rail Research Advisory Council) and UITP(International Association of Public Transport) (2009)Metro, Light Rail and Tram Systems in Europe, ERRACRoadmaps, http://www.uitp.org/files/ERRAC_MetroLR&TramSystemsinEurope.pdf, last accessed 16 May 2013
Estache, A. and A. Gómez-Lobo (2005) ‘Limits to com -petition in urban bus services in devel op ing countries’,Transport Reviews 25(2): 139–158
Estupiñán, N. and D. Rodriquez (2008) ‘The relationshipbetween urban form and station boardings for Bogotá’sBRT’, Transportation Research A 42: 296–306
Estupiñán, N., A. Gómez-Lobo, R. Muñoz-Raskin and T. Serebrisky (2007) Affordability and Subsidies inPublic Urban Transport: What Do We Mean, What CanBe Done?, World Bank Policy Research Working PaperNo. 4440, http://www-wds.worldbank.org/external/default/WDSContentServer/IW3P/IB/2007/12/13/000158349_20071213102316/Rendered/PDF/wps4440.pdf,last accessed 25 March 2013
Ethiopian Railways Corporation (2011) ‘Addis Ababa LightRail Transit (AA-LRT) project’, http://www.erc.gov.et/index.php/projects/addis-ababa-light-rail-transit-aa-lrt.html, last accessed 4 June 2013
Etzo, S. and G. Collender (2010) ‘The mobile phone “revo -lu tion” in Africa: Rhetoric or reality?’, African Affairs,September: 1–10
Evans, J., K. Bhatt and K. Turnbull (2003) ‘Road valuepricing’, in Traveler Response to Transportation SystemChanges: Chapter 14 – Road value pricing, TCRP Report95, Transportation Research Board of the NationalAcademies, Washington, DC: 14(1)–14(67)
Evenson W.E. (2004) ‘The potential for a hydrogen energyeconomy’, in IUPAP (International Union of Pure andApplied Physics, Energy Reports: Report on Research and Devel op ment of Energy Technologies, USA: 209–215, http://www.iupap.org/wg/energy/annex-1d.pdf,last accessed 30 January 2013
Ewing, R. (1995) ‘Measuring transportation performance’,Transportation Quarterly 49(1): 91–104
Ewing, R. (1997) ‘Is Los Angeles-style sprawl desirable?’,Journal of the American Planning Association 63(1):107–126
Ewing, R. and R. Cervero (2001) ‘Travel and the builtenviron ment: A synthesis’, Transportation ResearchRecord 1780: 87–113
Ewing, R. and R. Cervero (2010) ‘Travel and the builtenviron ment: A meta-analysis’, Journal of the AmericanPlanning Association 76(3): 265–294
Ewing, R., M. Greenwald, M. Zhang, J. Walters, M. Feldman,R. Cervero, L. Frank and J. Thomas (2011) ‘Trafficgenerated by mixed-use devel op ments: A six-region
1EEE234567891012311145678920123456789301234567894012345678950123456789EEEE
285References
study using consistent built environ mental measures’,Journal of Urban Planning and Devel op ment 137(3):248–261
Fasolo, B. (2009) From Describing to Nudging: Choice ofTransportation after Terrorist Attack in London, Researchproject summaries, http://research.create.usc.edu/cgi/viewcontent.cgi?article=1029&context=project_summaries, last accessed 25 March 2013
Federal Republic of Nigeria (2010) ‘Draft National Trans-port Policy’, http://www.accessbankplc.com/Library/Documents/2010%20Bankers%20Committee%20Conference%20Resources/Transportation%20Sector/Draft_National_Transport_Policy_Fed%20Rep%20of%20Nigeria.pdf, last accessed 3 April 2013
Federal Statistical Office, Switzerland (2012) ‘Road vehiclesin Switzerland: Stock’, Neuchâtel, http://www.bfs.admin.ch/bfs/portal/en/index/themen/11/03/blank/key/fahrzeuge_strasse/bestand.html, last updated 30 May2012, last accessed 30 January 2013
Federal Transit Administration (2009) Characteristics of Bus Rapid Transit for Decision-Making, Federal TransitAdministration, United States Department of Transporta -tion, Washington, DC
FedEx (undated) ‘FedEx adds new, environ mentally friendlytechnologies’, http://www.fedex.com/us/smallbusiness/updates/october2009/environ mental-technology.html,last accessed 30 January 2013
Ferrarazzo, A. and M. Arauz (2000) ‘Pobreza y transporte,Consultación con grupos de foco en Buenos Aires’,Informe Final, WB UTS Review, Santiago Conference,World Bank, Washington, DC
Ferreira, L.O., E.S. de Oliveira, H.F. Raymond, S.Y. Chenand W. McFarland (2008) ‘Use of time-location samplingfor systematic behavioral surveillance of truck driversin Brazil’, AIDS Behav 12: S32–S38
Ferrell, C., M. Carroll, B. Appleyard, D. Reinke, S. Ashiabor,R. Dowling, H. Levinson, E. Deakin and R. Cervero (2012)Reinventing the Interstate: A ‘New Paradigm’ for Multi -modal Transportation Corridors, Transit CooperativeResearch Report 145, Transportation Research Board,Washington, DC
FIA Foundation (undated) The Automobile and Society:Executive Summary, FIA Foundation, London, http://www.fiafoundation.org/publications/Documents/auto_society_exec_summary.pdf, last accessed 23 April 2013
Figueroa, O. (1990) Santiago Metro: Integration and PublicTransport: Rail Mass Transit for Devel op ing Coun-tries, Proceedings of the conference organized by theInstitution of Civil Engineers, London, 9–10 October,1989, Thomas Telford, London
Figueroa, O. and C. Rodriguez (2011) ‘Urban transport,urban expansion and institutions and governance inSantiago, Chile’, unpublished case study prepared forthe Global Report on Human Settlements 2013, www.unhabitat.org/grhs/2013
Flower, C. (2012) ‘Bogotá, Colombia’s Tranmilenio: Howpublic transportation can socially include and sociallyexclude’, Sus tain able Cities Collective, 30 November,http://sus tain ablecitiescollective.com/cflower/95236/bogota-colombias-tranmilenio-how-public-transportation-can-socially-include-and-exclud, last accessed 25 March2013
Flyvbjerg, N., M.K. Skamris Holm and S.L. Buhl (2003) ‘Howcommon and how large are cost overruns in trans port
infra struc ture projects?’, Transport Reviews 23(1):71–88, http://flyvbjerg.plan.aau.dk/COSTFREQ4.pdf,last accessed 22 May 2013
Flyvbjerg, B., N. Bruzelius and B. van Wee (2008) ‘Com -parison of capital costs per route-kilometre in urban rail’, European Journal of Transport and Infra struc tureResearch, 8(1): 17–30, http://vbn.aau.dk/files/14076659/Comparison_of_Capital_Costs.pdf, last accessed22 May 2013
Foletta, N. (2011) ‘Houten: Utrecht, the Netherlands’,Europe’s Vibrant New Low Car(bon) Communities,ITDP Publications, New York, http://www.itdp.org/documents/092211_ITDP_NED_Desktop_Houten.pdf,last accessed 26 April 2012
Foletta, N. and S. Field (2011) Europe’s Vibrant New Low Car(bon) Communities, ITDP (Institute for Trans -portation and Devel op ment Policy), New York
Forum Vauban (1999) ‘A journey through the model districtVauban: A vision taking shape’, http://www.forum-vauban.de/downloads/life-en.pdf, last accessed 30January 2013
Foster, C.D. and M.E. Beesley (1963) ‘Estimating thesocial benefit of constructing an underground railwayin London’, Journal of the Royal Statistical Society. SeriesA (General) 126(1): 46–93
Fouracre, P., C. Dunkerley and G. Gardner (2003) ‘Massrapid transit systems for cities in the devel op ing world’, Transport Reviews 23(3): 299–310
Freedonia Group (2009) World Motorcycles (includingElectric Bicycles and Mopeds) Industry Study withForecasts for 2013 and 2018, to 2013, Study 2537, TheFreedonia Group, Cleveland
Frye, A. (2011) ‘Disabled and older persons and sus tain ableurban mobility’, unpublished thematic study preparedfor the Global Report on Human Settlements 2013,www.unhabitat.org/grhs/2013
Fujita, M., P. Krugman and A. Venables (1999) The SpatialEconomy, MIT Press, Cambridge, MA
Fulton, L. and G. Eads (2004) ‘IEA/SMP model docu -mentation and reference projection’, http://www.wbcsd.org/web/publications/mobility/smp-model-document.pdf,for World Business Council for Sus tain able Devel op ment,last accessed 30 January 2013
Gajewski, G., M. Ihara and G. Tornieri (2007) SociallyInclusive and Gender Responsive Transport Projects: ACase Study of the Timor-Leste Road Sector ImprovementProject’, Asian Devel op ment Bank, Philippines, http://www.louisberger.com/Insights/~/media/Files/LBG/PDF/Insights/case_study_timor_leste.pdf, last accessed 26March 2013
Gakenheimer, R. (2011) ‘Land use and trans port in rapidlymotorizing cities: Contexts of controversy’, in H.Dimitriou and R. Gakenheimer (eds) Urban Transportin the Devel op ing World, Edward Elgar, Cheltenham, UK:40–71
Gakenheimer, R. and C. Zegras (2004) ‘Drivers of traveldemand in cities of the devel op ing world: A synthesisof eight case studies’, in Mobility 2030 – Meeting theChallenges to Sus tain ability. The Sus tain able MobilityProject, Full Report 2004, World Business Council forSus tain able Mobility, Geneva, http://www.wbcsd.org/web/publications/mobility/mobility-full.pdf, last accessed18 April 2013
286 Planning and Design for Sustainable Urban Mobility
Gallagher, J. (2012) ‘Diesel exhausts do cause cancer, saysWHO’, BBC News, 12 June, http://www.bbc.co.uk/news/health-18415532, last accessed 30 January 2013
Gallego, F., J.-P. Montero and C. Salas (2011) ‘The effectof trans port policies on car use: Theory and evidencefrom Latin American cities’, 6 October, http://econweb.umd.edu/~davis/eventpapers/GallegoEffect.pdf, lastaccessed 30 January 2013
Gannon, C. and Z. Liu (1997) ‘Poverty and transport’, TWU-30, World Bank, Washington, DC, http://siteresources.worldbank.org/INTURBANTRANSPORT/Resources/twu-30.pdf, last accessed 26 March 2013
Gauthier, A. and A. Weinstock (2010) ‘Africa transformingparatransit into BRT’, Built Environ ment 36 (3): 317–327
GEF (Global Environ ment Facility) (2011) ‘Report of theGlobal Environ ment Facility to the Seventeenth Sessionof the Conference of the Parties to the United NationsFramework Convention on Climate Change’, GEFCouncil, GEF/C.41/Inf.11, http://www.thegef.org/gef/sites/thegef.org/files/documents/C.41.Inf_.11_Report_of_the_GEF_to_the_17th_Session_of_the_COP_to_the_UNFCCC.pdf, last accessed 30 January 2013
GEF (2012) Greening Opportunities at World Events: GEFInvestment Experi ences, http://www.thegef.org/gef/sites/thegef.org/files/publication/GEF_Greening_Bro_Nov30-2012.pdf, last accessed 18 April 2013
Gehl, J. (1996) Life Between Buildings, 5th Edition, DanishArchitectural Press, Copenhagen
Gehl, J. and L. Gemzøe (2001) New City Spaces, DanishArchitectural Press, Copenhagen
Geroliminis, N. and C.F. Daganzo (2005) A Review of GreenLogistics Schemes Used in Cities Around the World,Institute of Transportation Studies, University of Cali -fornia, Berkeley
Gilbert, R. and A. Perl (2010) The Transformation of Traveland Freight Movement in a Post-Peak-Oil World, NewSociety Publishers, Vancouver
Gilbert, R., C. O’Brien, A. Orsini and S. Ramanathan (2009)‘Youth and sus tain able transportation: A review of theliterature’, Centre for Sus tain able Transport, Universityof Winnipeg, http://www.kidsonthemove.ca/uploads/Youth%20and%20Sus tain able%20Transportation,%20Review%20of%20the%20Literature.pdf , last accessed 26 March 2013
Giuliano, G. (2004) ‘Land use impacts of transportationinvestments: Highway and transit’, in S. Hanson and G. Giuliano (eds) The Geography of Urban Transporta -tion, Guilford Press, New York: 237–274
Givoni, M., J. Macmillen, D. Banister and E. Feitelson (2013) ‘From policy measures to policy packages’,Trans port Reviews 33(1): 1–20, http://dx.doi.org/10.1080/01441647.2012.744779, last accessed 26 February2013
GLA (Greater London Authority) (2010) The Mayor’s Trans -port Strategy, GLA, August, http://www.london.gov.uk/publication/mayors-transport-strategy, last accessed 25 February 2013
Glaeser, E. (2011) Triumph of the City, How Our GreatestInvention Makes Us Richer, Smarter, Greener, Healthier,and Happier, Penguin Press, London
GlaxoSmithKline (2011) Corporate Responsibility Report2010, http://www.gsk.com/content/dam/gsk/globals/documents/pdf/GSK-CR-2010-Report.pdf, last accessed5 February 2013
GlaxoSmithKline (2012) Corporate Responsibility Report2011, http://www.gsk.com/content/dam/gsk/globals/documents/pdf/GSK-CR-2011-Report.pdf, last accessed5 February 2013
Gleave, G., A. Marsden, T. Powell, S. Coetze, G. Fletcher,I. Barrett and D. Storer (2005) A Study of Institutional,Finan cial and Regulatory Frameworks of Urban Transportin Large Sub-Saharan African Cities, World Bank, SSATPWorking Paper 82, Washington, DC
Glover, L. and N. Low (2004) ‘Integrated management of sus tain able urban passen ger trans port systems indispersed cities: A review of successful institutionalinterventions’, Final Report prepared for Volvo Research& Education Foundations (VREF), Australian Centre forthe Governance and Management of Urban Transport(GAMUT), University of Melbourne, Melbourne,http://www.abp.unimelb.edu.au/files/miabp/ext-rep7integrated-transport-final.pdf, last accessed 25 February2013
Godard, X. (2006) ‘Coping with paratransit in devel op ingcities: A scheme of complementarity with institutionaltransport,’ Gothenburg, Sweden, Paper presented atFuture Urban Transport Conference, Volvo Foundationfor the Future of Urban Transport, April
Godard, X. (2011a) ‘Poverty and urban mobility: Diagnosistoward a new understanding’, in H. Dimitriou and R. Gakenheimer (eds) Urban Transport in the Devel op -ing World: A Handbook of Policy and Practice, EdwardElgar, Cheltenham, UK: 232–261
Godard, X. (2011b) ‘Sus tain able urban mobility in“Francophone” Sub-Saharan Africa’, unpublishedregional study prepared for the Global Report on HumanSettle ments 2013, www.unhabitat.org/grhs/2013
Goldman, T. and R. Gorham (2006) ‘Sus tain able urbantransport: Four innovative directions’, Technology inSociety 28(1–2): 261–273
Gómez-Ibañez, J., W.B. Tye and C. Winston (eds) (1999)Essays in Transportation Economics: A Handbook inHonor of John R. Meyer, Brookings, Washington, DC
Gonzales, E. J., C. Chavis, Y. Li and C.F. Daganzo (2009)‘Multimodal trans port modeling for Nairobi, Kenya:Insights and recommendations with an evidence-basedmodel’, Working Paper UCB-ITS-VWP-2009-5, Universityof California, Berkeley Center for Future UrbanTransport, Berkeley
Goodall, C. (2007) How to Live a Low Carbon Life, Earthscan,London
Goodman, J., M. Laube and J. Schwenk (2006) ‘Curitiba’sbus system is model for rapid transit’, Race, Poverty andEnviron ment Winter (2005/2006): 75–76, http://urbanhabitat.org/files/25.Curitiba.pdf, last accessed 22 May2013
Goodwin, P. (2012) Peak Travel, Peak Car and the Futureof Mobility: Evidence, Unresolved Issues, Policy Impli -cations, and a Research Agenda, Discussion Paper No. 2012-13, OECD/ International Transport Forum,Paris, http://www.internationaltransportforum.org/jtrc/DiscussionPapers/DP201213.pdf, last accessed 18 April2013
Goodwin, P., C. Haas-Klau and S. Cairns (1998) ‘Evidenceon the effects of road capacity reduction on traffic levels’,Journal of Transportation Engineering and Control39(6): 348–354
1EEE234567891012311145678920123456789301234567894012345678950123456789EEEE
287References
Gordon, D. and S.-P. Tsay (2013) ‘Unlikely allies? Urban -ization and unconventional oils’, Huffington Post, 13February, http://carnegieendowment.org/2013/02/13/unlikely-allies-urbanization-and-unconventional-oils/fg6f,last accessed 24 May 2013
Govern ment of India (2006) ‘National Urban Transport Policy(NUTP)’, Ministry of Transport, New Delhi, http://www.indiaenviron mentportal.org.in/files/TransportPolicy.pdf,last accessed 14 June 2013
Govern ment of Singapore (2011) ‘Annual Vehicle Statistics2011’, Customer Services Division, Land TransportAuthority, http://www.lta.gov.sg/content/dam/ltaweb/corp/PublicationsResearch/files/FactsandFigures/MVP01-3_(MVP_by_age).pdf, last accessed 30 January2013
Graham, I. (2010) The Global Economic Crisis – SectoralCoverage. Automotive Industry: Trends and reflections,Working Paper 278, International Labour Organization,Geneva
Graham, P.W. and L.J. Reedman (2010) ‘Peak oil andenergy security: Can alternative fuels and vehicles saveus?’ International Journal of Global Energy Issues 33(1–2):22–37
Greater Wellington Regional Council (2009) WellingtonRegional Rail Plan: 2010–2035 – A Better Rail Experi ence,Greater Wellington Regional Council and KiwiRail,Wellington, http://www.gw.govt.nz/assets/Transport/Public-Transport/Docs/RegionalRailPlan.pdf, last accessed25 February 2013
Grieving, S. and R. Kemper (1999) Integration of Transportand Land Use Policies: State of the Art, University ofDortmund, Germany, Deliverable 2b of the TRANSLANDProject, 4th RTD EC Project, European Commission,Brussels
Guerra, E. and R. Cervero (2011) ‘Cost of a ride: The effectsof densities on fixed-guideway transit ridership andcosts’, Journal of the American Planning Association77(3): 267–290
Guerra, E., R. Cervero and D. Tischler (2012) ‘The half-milecircle: Does it best represent transit station catchments?’,University of California Transportation Center, UCTC-FR-2011-09, Berkeley, California, http://www.uctc.net/research/papers/UCTC-FR-2011-09.pdf, last accessed 29 May 2012
Gullberg, A. and A. Kaijser (2004) ‘City-building regimesin post-war Stockholm’, Journal of Urban Technology11(2): 3–39
Guo, Q. and Y. Fang (2010) ‘Highway jam enters its 9thday, spans 100km’, Global Times, 23 August, http://english.sina.com/china/p/2010/0822/335293.html, last accessed 3 June 2013
Gwilliam, K. (2002) Cities on the Move: A World Bank UrbanTransport Strategy Review, World Bank, Washington, DC,http://siteresources.worldbank.org/INTURBANTRANSPORT/Resources/cities_on_the_move.pdf, lastaccessed 18 April 2013
Gwilliam, K. (2003) ‘Urban trans port in devel op ing coun -tries’, Transport Reviews 23(2): 197–216
Haas, T. (2008) ‘New urbanism and beyond’, in T. Haas (ed)New Urbanism and Beyond: Designing Cities for theFuture, Rizzoli, New York: 9–13
Hague, O. (2001) ‘Creation of express bus services toimprove competitive edge for competitive trans port in
Møre og Romsdal county’, International ConferenceSeries on Competition and Ownership in Land Passen -ger Transport, http://www.thredbo-conference-series.org/downloads/thredbo7_papers/thredbo7-workshopE-Hauge.pdf, last accessed 26 March 2013
Hajer, M. (1995) The Politics of Environ mental Discourse,Oxford University Press, Oxford
Halcrow Fox (in association with Traffic and TransportationConsultants) (2000) ‘Mass rapid transit in devel op ingcountries: Final report’, Department for InternationalDevel op ment, World Bank Urban Transport StrategyReview, http://siteresources.worldbank.org/INTURBANTRANSPORT/Resources/uk_mass_transit_halcrow.pdf,last accessed 21 May 2013
Hale, C. and P. Charles (2008) ‘Visions for a sus tain abletrans port future: A comparative analysis of trans portplanning approaches in Singapore, Vienna and Brisbane’,Centre for Transport Strategy, University of Queensland,in report of the 31st Australasian Transport ResearchForum: 17–37, http://www.patrec.org/web_docs/atrf/papers/2008/1703_ATRF08%201-2%20Hale.pdf, lastaccessed 30 January 2013
Hall, P. (1996) Cities of Tomorrow: An Intellectual Historyof Urban Planning and Design in the Twentieth Century,Blackwell, Oxford, UK
Hall, P. (1997) ‘Megacities, world cities and global cities’,The First Megacities Lecture, Rotterdam, February,http://www.megacities.nl/lecture_1/lecture.html, lastaccessed 28 May 2013
Hall, P. and C. Hass-Klau (1985) Can Rail Save the City? The Impacts of Rail Rapid Transit and Pedestrianisationon British and German Cities, Gower, Farnborough
Hampshire, K., A. Abane, A. Munthali, E. Robson, M. Mashiriand A. Tanle (2012) ‘Youth, mobility and mobile phonesin Africa: Findings from a three-country study’, Journalof Information Technology for Devel op ment 18(2):145–162
Hans, D.R. and J. Becker (2007) ‘Mobility and socialcohesion’, Background paper in preparation of theMetropolis Commission 4 Conference in Toronto, June2006, http://www.verkehrsplanung.tu-berlin.de/fileadmin/fg93/IVP-Schriften/IVP_17.pdf, last accessed 26 March 2013
Haq, G. (1997) Toward Sus tain able Transport Planning: A Comparison of Britain and the Netherlands, Aldershot,Avebury, UK
Hart, J. and G. Parkhurst (2011) ‘Driven to excess: Impactsof motor vehicles on the quality of life of residents ofthree streets in Bristol UK’, World Transport Policy andPractice 17(2): 12–30
Hass-Klau, C. (1990) The Pedestrian and City Traffic,Belhaven Press, London
Hass-Klau, C. (1993) ‘Impact of pedestrianisation andtraffic calming on retailing’, Transport Policy 1(1):21–31
Healey, J.R. (2011) ‘Obama administration floats 56.2 mpgtarget for vehicles’, USA Today, 28 June, http://www.usatoday.com/money/autos/2011-06-27-mpg-obama_n.htm,last accessed 30 January 2013
Hegger, R. (2007) ‘Public trans port and cycling: livingapart or together?’, Public Transport International 2:38–41, http://www.uitp.org/public-transport/urban/pics/ptcycling.pdf, last accessed 18 April 2013
288 Planning and Design for Sustainable Urban Mobility
Hensher, D.A. (2007) ‘Sus tain able public trans port systems:Moving towards a value for money and network-basedapproach and away from blind commitment’, Trans portPolicy 14(1): 98–102
Hepple, B. (2010) ‘The new single Equality Act in Britain’,The Equal Rights Review 5: 11–23, http://www.equalrightstrust.org/ertdocumentbank/bob%20hepple.pdf,last accessed 26 March 2013
Herring, H. and Sorrell, S. (eds) (2008) Energy Efficiencyand Sus tain able Consumption: Dealing with the ReboundEffect, Palgrave Macmillan, London
Hesse, M. (2008) The City as a Terminal: The UrbanContext of Logistics and Freight Transport, Ashgate,Aldershot, Hampshire
Hesse, M. and J.-P. Rodrigue (2004) ‘The trans port geog -raphy of logistics and freight distribution’, Journal ofTransport Geography 12(3): 171–184
Hidalgo, D. (2007) ‘High level bus rapid transit systems(HBRT): An option to consider even at high demandlevels’, Presentation in 5th International Bus ConferenceUITP Bogotá, Colombia, 14–16 February, http://www.8-80cities.org/Articles/ComparativeTransitSystems%20PP%20Hidalgo%20%20UITP.pdf, last accessed 21 May2013
Hidalgo, D. (2008) ‘Why is TransMilenio still so special?’The City Fix, 5 August, http://thecityfix.com/blog/why-is-transmilenio-still-so-special/, last accessed 17 May2013
Hidalgo, D. (2011) ‘Bus rapid transit BRT: Worldwidehistory, key systems and future directions’, Encyclopediaof Sus tain ability Science and Technology, http://www.springerreference.com/docs/html/chapterdbid/308766.html, last accessed 17 May 2013
Hidalgo, D. (2012) BRT Around the World: Update 2012and Future Evolution, EMBARQ/ALC-BRT (AcrossLatitudes and Cultures – Bus Rapid Transit Centre ofExcellence), http://www.slideshare.net/EMBARQNetwork/brt-status-webinar-113012-by-dario-hidalgo,last accessed 17 May<?>
Hidalgo, D. and A. Carrigan (2008) ‘Modernizing publictransportation: Lessons learned from major bus im -provements in Latin America and Asia’, World ResourceInstitute (WRI), Policy Paper, Washington, DC, http://pdf.wri.org/modernizing_public_transportation.pdf, lastaccessed 28 May 2013
Hidalgo, D. and C. Huizenga (2013) ‘Implementation of sus -tain able urban trans port in Latin America’, Research inTransportation Economics 40: 66–77, http://www.brt.cl/wp-content/uploads/2012/12/Hidalgo-Huizenga-2013.pdf, last accessed 18 April 2013
Hidalgo, D., P.S. Custodio and P. Graftieaux (2007)‘Planning, implementation and operation of BRT systems:The cases of Quito, Bogotá, Leon, Mexico City, Jakartaand Beijing’, Paper 07-0938, Preprints of the 86thAnnual Meeting of the Transportation Research Board,CD-ROM.
Hine, P., A. Marsay, J. Edge and K. Gal (2000) ‘Transportdevel op ment areas: a study into achieving higher densitydevel op ment around public trans port nodes’, RICSLondon
Hirota, K. and J. Poot (2005) ‘Taxes and the environ mentalimpact of private car use: Evidence from 68 cities’, inA. Reggiani and L. Schintler (eds) Methods and Models
in Transport and Telecommunications, Springer-Verlag,Berlin: 299–318
Hirt, S. and S. Stanilov (2009) Twenty Years of Transition:The Evolution of Urban Planning in Eastern Europe and the Former Soviet Union, 1989–2009, HumanSettlements Global Dialogue Series, No. 5, UN-Habitat,Nairobi, http://www.unhabitat.org/pmss/listItemDetails.aspx?publicationID=2841, last accessed 28 May 2013
Holeywell, R. (2011) ‘The Indiana toll road: A model forprivatization?’, Governing the States and Localities,October, http://www.governing.com/topics/mgmt/indiana-toll-road-model-privatization.html, last accessed30 January 2013
Holtzclaw, J., R. Clear, H. Dittmar, D. Goldstein and P. Haas(2002) ‘Location efficiency: Neighborhood and socio -economic characteristics determine auto ownershipand use-studies in Chicago, Los Angeles, and SanFrancisco’, Transportation Planning and Technology25(1): 1–27
Hong Kong Transport Department (2004) ‘Cycling study’,contract NO.TD 100/2002, final report, http://www.td.gov.hk/filemanager/en/publication/cyclingstudy.pdf, lastaccessed 19 April 2013
Hook, L., T. Johnston and B. Bland (2011) ‘Fuel subsidiesdrag on emerging economies’, Finan cial Times, 18April, http://www.ft.com/intl/cms/s/0/81a781a0-69d7-11e0-89db-00144feab49a.html, last accessed 30 January2013
Hook, W. (2001) ‘The over-devel op ment of real estate inCentral Europe and the risks of finan cial crisis’, PolicyPaper, International Transport Devel op ment Program,New York
Hook, W. (2003) Preserving and Expanding the Role of Non-motorised Transport, Module 3d of Sus tain ableTransport: A Sourcebook for Policy-makers in Devel-oping Cities, GTZ, Eschborn, http://www.itdp.org/documents/NMTmodule.pdf, last accessed 26 March2013
Hook, W. (2005) ‘Training course: Non-motorised trans-port’, Division 44, Environ ment and Infra struc tureSector Project, Deutsche Gesellschaft für TechnischeZusammen arbeit (GTZ) GmbH, http://www.itdp.org/documents/GTZ%20Training%20Course_Non%20Motorized%20Transportation.pdf, last accessed 30 January2013
Hook, W. (2006) ‘Urban transportation and the MillenniumDevel op ment Goals’, Global Urban Devel op ment 2(1):1–9, http://www.globalurban.org/GUDMag06Vol2Iss1/Hook%20PDF.pdf, last accessed 26 March 2013
Hook, W. and M. Replogle (1996) ‘Motorization and non-motorized trans port in Asia’, Land Use Policy 13(1):69–84
Houpin, S. (2011) Urban Mobility and Sus tain able Devel op -ment in the Mediterranean: Regional Diagnostic Outlook,Plan Blue Papers #9, UNEP/MAP Regional ActivityCentre, Sophia Antipolis, Valbonne, http://www.planbleu.org/publications/Synthese_moburb_Damas_EN.pdf,last accessed 26 February 2013
House of Commons Transport Committee (2008) TheLondon Underground and the Public–Private Partner-ship Agreements, Second Report of Session 2007–08, The Stationery Office Limited, London, http://www.publications.parliament.uk/pa/cm200708/cmselect/cmtran/45/45.pdf, last accessed 30 January 2013
1EEE234567891012311145678920123456789301234567894012345678950123456789EEEE
289References
Howard, E. (1898) Garden Cities of To-morrow, Swan-Sonnenschein, London
Howe, J. and D. Bryceson (2000) Poverty and UrbanTransport in East Africa: Review of Research and DutchDonor Experi ence, World Bank, Washington, DC
Hoyt, H. (1939) The Structure and Growth of ResidentialNeighborhoods in American Cities, Federal HousingAdministration, Washington, DC
Hu, P.S., J.R. Young and A. Lu (1993) Highway Crash Ratesand Age-Related Driver Limitations: Literature Review andEvaluation of Data Bases, Oak Ridge, Oak Ridge NationalLaboratory, Tennessee
Hudson, J. and S. Lowe (2004) Understanding the PolicyProcess: Analysing Welfare Policy and Practice, PolicyPress, Bristol
Huzayyin, A.S. (1995) ‘Realistic requirements of trans-port improvement for sus tain able urban devel op ment: key issues for Egypt and other devel op ing countries’,Report of HABITAT II Global Workshop on trans port and communications for urban devel op ment, UNCHS,Singapore, 1995, http://www.ucl.ac.uk/dpu-projects/drivers_urb_change/urb_infra struc ture/pdf_transport/HABITATII_Huzayyin_transport_improvement_egypt.pdf,last accessed 26 February 2013
Huzayyin, A.S. (2002) ‘Urban trans port institutional reformfor devel op ing countries, realistic views’, Paper presentedat Urban Research Symposium, World Bank, Washington,DC
Huzayyin, A.S. (2004) ‘Analysis of the evolution of travel,trans port system and urban activity for sus tain ableshort/long term trans port policies’, with reference toGreater Cairo, Official CD of WCTR-10, Istanbul,Elsevier Science Publishers, Amsterdam
Huzayyin, A.S. (2005) ‘Impeding the promotion of sus tain -able trans port in devel op ing countries; views on theconstraints’, Proceedings of the International Conferenceon Sus tain able Transportation in Devel op ing Countries,Abu Dhabi, UAE, 29 January–2 February: 456–474
Huzayyin, A.S. (2011) ‘Urban trans port and the environ-ment in devel op ing countries: Complexities and simpli -fications’, in W. Rothengatter, Y. Hayashi and W.K.E.Shade (eds) Moving to Climate Change Intelligence,Springer, New York: 95–109, http://books.google.co.ke/books?id=IkHwrDN6SwgC&printsec=frontcover&dq=Transport+Moving+to+Climate+Change+Intelligence&hl=en&sa=X&ei=FNRjUZGqLZGHhQeThIGoCg&ved=0CDAQ6AEwAA#v=onepage&q=Transport%20Moving%20to%20Climate%20Change%20Intelligence&f=false,last accessed 9 April 2013
Huzayyin, A.S. and H. Salem (2013) ‘Analysis of thirty yearsevolution of urban growth, trans port demand andsupply, energy consumption, greenhouse and pollutantsemissions in Greater Cairo’, Research in TransportationEconomics 40(1): 104–115
IBM Corporation (2010) The Globalization of TrafficCongestion: IBM 2010 Commuter Pain Survey, IBMCorporation, Armonk, New York
IBM Corporation (2011) Frustration Rising: IBM 2011Commuter Pain Survey, http://www-03.ibm.com/press/us/en/attachment/35314.wss?fileId=ATTACH_FILE1&fileName=Frustration%20Rising_IBM%202011%20Commuter Pain Report.pdf, last accessed 20 September2012
I-ce (Interface for Cycling Expertise) (2000) Significance ofNon-Motorised Transport for Devel op ing Countries:Strategies for Policy Devel op ment, Interface for CyclingExpertise, Utrecht, the Netherlands
ICLEI (Local Govern ments for Sus tain ability) (2010) ‘The nearby useful bike, interesting joyful attraction (NUBIJA) project’, ICLEI World Secretariat, Bonn, ICLEI Case Study 119, http://www.iclei.org/fileadmin/user_upload/documents/Global/case_studies/ICLEI_Case_Study_Changwon_119_October_2010.pdf, lastaccessed 30 January 2013
ICLEI and Changwon City (2011) ‘EcoMobility Changwon2011: World Congress on Mobility for the Future of Sus tain able Cities’, 22–24 October 2011, Changwon,Republic of Korea, http://www.unhabitat.org/downloads/docs/10091_1_594027.pdf, last accessed 30 January2013
IDFC (Infra struc ture Devel op ment Finance Company)(2010) India Infra struc ture Report 2010: Infra struc- ture Devel op ment in a Low Carbon Economy, OxfordUniversity Press, New Delhi, http://www.dimts.in/download/Multi_Modal_Transport_in_a_Low_Carbon_Future.pdf, last accessed 18 April 2013
IEA (International Energy Agency) (2006) World EnergyOutlook 2006, IEA, Paris, http://www.iea.org/publications/freepublications/publication/weo2006.pdf, last accessed30 January 2013
IEA (2009) ‘Transport, energy and CO2: Moving towardssus tain ability’, IEA, Paris, http://www.iea.org/publications/freepublications/publication/transport2009.pdf, lastaccessed 30 January 2013
IEA (2010) World Energy Outlook, IEA, Paris, http://www.worldenergyoutlook.org/media/weo2010.pdf, lastaccessed 30 May 2013
IEA (2011a) ‘CO2 Emissions from fuel combustion:Highlights’, IEA, Paris, http://www.iea.org/co2highlights/co2highlights.pdf, last accessed 30 January 2013
IEA (2011b) ‘Prospect of limiting the global increase intemperature to 2ºC is getting bleaker’, IEA, Paris, 30May, http://www.iea.org/newsroomandevents/news/2011/may/name,19839,en.html, last accessed 30January 2013
IEA (2011c) World Energy Outlook, Executive Summary, IEA,Paris http://www.worldenergyoutlook.org/media/weowebsite/2011/executive_summary.pdf, last accessed30 January 2013
IEA (2011d) World Energy Outlook, IEA, ParisIEA (2012a) World Energy Outlook: Executive Summary, IEA,
Paris, http://www.iea.org/Textbase/npsum/weo2012sum.pdf, last accessed 31 January 2013
IEA (2012b) Key World Energy Statistics, IEA, Paris,http://www.iea.org/publications/freepublications/publication/kwes.pdf, last accessed 31 January 2013
Imran, M. (2010) Institutional Barriers to Sus tain able UrbanTransport in Pakistan, Oxford University Press, Oxford
Infonavit (2011) ‘Plan Financiero 2011–2015’, Mexico City,Infonavit
Infra struc ture Australia (2011) ‘Infra struc ture Australiafunctions as set out in the Infra struc ture Australia Act2008’, http://www.infra struc tureaustralia.gov.au/about/functions.aspx, last accessed 25 February 2013
Ingo, S. and M. Viehhauser (eds) (2005) IntegratedPolycentric Land Use and Transportation Policy: Case Studies Review. Part II, November, http://www.
290 Planning and Design for Sustainable Urban Mobility
urbanistika.ru/international/projects/ORP_proekty/Part-II_final-report-policentrik.pdf, last accessed 25 February2013
Institution of Civil Engineers (1990) Rail Mass Transit forDevel op ing Countries, Thomas Telford, London
IntellAsia.Net (2011) ‘ADB proposes market in “fuel secur -ity” credits’, http://www.intellasia.net/adb-proposes-market-in-fuel-security-credits-178038, last accessed 5 February 2013
iRAP (International Road Assessment Programme) (2009a)‘Star rating roads for safety: iRAP methodology’, iRAP,Basingtoke, UK, http://www.irap.net/, last accessed 26 March 2013
iRAP (2009b) iRAP Kenya Report 2009, iRAP, London,www.irap.org/about-irap-3/assessment-reports?download=74:irap-kenya-report-2009, last accessed 13May 2013
iRAP (2011) ‘A world free of high risk roads: Star RatingImprovements, 2009 Malaysia Black Spot Programme’,iRAP, Basingtoke, UK
Irwin, N. (2003) ‘Urban transportation: An essential factor’,IBI Group Paper prepared for presentation at the open -ing session of the 2003 Annual Conference of the Trans -portation Association of Canada St John’s, Newfound landand Labrador, September, http://www.tac-atc.ca/english/resourcecentre/readingroom/conference/conf2003/pdfs/irwin.pdf, last accessed 25 February 2013
ISIS (Istituto di Studi per l’Integrazione dei Sistemi) (2003) Achieving Sus tain able Transport and Land Use with Integrated Policies, Final Report: TRANSPLUS, ECContract EVK4-CT-1999-00009, prepared by ISIS,European Commission, Brussels, www.eukn.org/dsresource?objectid=147915&type=org, last accessed 25 February 2013
Issam, K. (2011) ‘Tramway d’Alger: Inauguration du 1er tron -çon devant un parterre de responsables’, Le Financier,8 May, http://www.djazairess.com/fr/lefinancier/13815
ITDP (Institute for Transportation and Devel op ment Policy) (2007) Bus Rapid Transit Planning Guide, ITDP,New York, http://www.itdp.org/documents/Bus%20Rapid%20Transit%20Guide%20-%20complete%20guide.pdf,last accessed 17 May 2013
ITDP (2008) ‘Bus rapid transit’s new wave: Ahmedabad,Guangzhou, and Johannesburg’, Sus tain able Trans portWinter (20):12–13, http://www.itdp.org/documents/st_magazine/ITDP-ST_Magazine-%20V%2020.pdf, lastaccessed 22 May 2013
ITDP (undated) 2011 Winner: Guangzhou, China, http://www.itdp.org/get-involved/sus tain able-transport-award/previous-award-recipients/guangzhou-china-winner-2011, last accessed 18 April 2013
ITF (International Transport Forum) (2011) Trans portOutlook: Meeting the Needs of 9 Billion People,Organization for Economic Devel op ment/InternationalTransport Forum, Paris, http://www.internationaltransportforum.org/Pub/pdf/11Outlook.pdf, last accessed 28May 2013
ITF (2012) ‘Statistics Brief – Infra struc ture Investment’,June, Organization for Economic Development/International Transport Forum, Paris, http://www.internationaltransportforum.org/statistics/StatBrief/2012-06.pdf, last accessed 28 May 2013
Jackson, T. (2009) Prosperity without Growth: Economicsfor a Finite Planet, Earthscan London
Jacobs, J. (1961) The Death and Life of Great American Cities,Random House, New York
Jacobs, J. (1970) The Economy of Cities, Vintage Books, NewYork
Jacobs, J., E. Macdonald and Y. Rofé (2002) The BoulevardBook: History, Evolution, Design of Multi-Way Boulevards,MIT Press, Cambridge
Jain, A.K. (2011) ‘Sus tain able urban mobility in SouthernAsia’, unpublished regional study prepared for theGlobal Report on Human Settlements 2013, www.unhabitat.org/grhs/2013
Jain, A.K. (2012) Sus tain able Urban Transport and Systems,Khanna Publishers, Delhi
Jain, S.S., Sing, P.K. and Parida, M. (2011) ‘Road safety auditfor four lane national highways’, 3rd InternationalConference on Road Safety and Simulation, Indianapolis,USA, http://onlinepubs.trb.org/onlinepubs/conferences/2011/RSS/3/Jain,S.pdf, last accessed 26 March 2013
James, W.P.T., R. Jackson-Leach, C.N. Mhurchu, E. Kalamara,M. Shayeghi, N.J. Rigby, C. Nishida and A. Rodger (2004)‘Overweight and obesity (high body mass index)’, in M. Ezzati, A. Lopez, A. Rodgers and C. Murray (eds)Comparative quantification of health risks: Global andregional burden of disease attributable to selected major risk factors, World Health Organization, Geneva:497–596, http://whqlibdoc.who.int/publications/2004/9241580348_eng_Volume1.pdf, last accessed 30 Jan -uary 2013
Japan Probe (2008) ‘Elderly drivers in Japan’, http://www.japanprobe.com/2008/03/19/elderly-drivers-in-japan/,last accessed 26 March 2013
Japan Society of Traffic Engineers (2007) The Planning andDesign of At-Grade Intersections, Tokyo, Japan
Jenkins, J., M. Colella and F. Salvucci (2010) ‘Agglomera-tion benefits and transportation projects: a review oftheory, measurement, and application’, Paper preparedfor annual meeting of Transport Research Board, January2011, Washington, DC, ftp://ftp.hsrc.unc.edu/pub/TRB2011/data/papers/11-1858.pdf, last accessed 30January 2013
Jirón, P. (2008) ‘Mobility on the move; Examining the experi ence of urban daily mobility in Santiago de Chile’,PhD thesis presented at Geography and Environ mentDepartment, London School of Economics and PoliticalScience, London
Jirón, P. (2011) ‘Sus tain able urban mobility in Latin Americaand the Caribbean’, unpublished regional study preparedfor the Global Report on Human Settlements 2013,www.unhabitat.org/grhs/2013
Joewono, T.B. and H. Kubota (2005) ‘The characteristicsof paratransit and non-motorized trans port in Bandung,Indonesia’, Journal of the Eastern Asia Society forTransportation Studies 6: 262–277
Johnston, E. (2004) ‘Women flee Tokyo train gropers’, TheGuardian, 24 November, http://www.guardian.co.uk/world/2004/nov/24/japan, last accessed 26 March 2013
Kahn Ribeiro, S., S. Kobayashi, M. Beuthe, J. Gasca, D.Greene, D.S. Lee, Y. Muromachi, P.J. Newton, S.Plotkin, D. Sperling, R. Wit and P.J. Zhou (2007) ‘Trans -port and its infra struc ture’, in B. Metz, O.R. Davidson,P.R. Bosch, R. Dave and L.A. Meyer (eds) ClimateChange 2007: Mitigation. Contribution of WorkingGroup III to the Fourth Assessment Report of the
1EEE234567891012311145678920123456789301234567894012345678950123456789EEEE
291References
Intergovern mental Panel on Climate Change, CambridgeUniversity Press, Cambridge and New York, http://www.ipcc.ch/pdf/assessment-report/ar4/wg3/ar4-wg3-chapter5.pdf, last accessed 30 January 2013
Kaltheier, R. (2002) Urban Transport and Poverty in Devel -op ing Countries: Analysis and Options for Trans portPolicy and Planning, Deutsche Gesellschaft für Tech -nische Zusammenarbeit (GTZ) GmbH, Eschborn,Germany
Kamuhanda, R. and O. Schmidt (2009) ‘Matatu: A case studyof the core segment of the public trans port market ofKampala, Uganda’, Transport Reviews 29(1):129–142
Kane, L. (2002) ‘The urban trans port problem in South Africa and the devel op ing world: A focus on institutionalissues’, Urban Transport Research Group Working Paper3, Faculty of Engineering and the Built Environ ment,University of Cape Town, Cape Town, http://www.utrg.uct.ac.za/publications/downloads/kane2002b.pdf, lastaccessed 25 February 2013
Kang, C. and R. Cervero (2009) ‘From elevated freeway to urban greenway: Land value impacts of Seoul, Korea’sCGC project’, Urban Studies 46(13): 2771–2794
KARA (Kenya Alliance of Residents Associations) and CUSD (Centre for Sus tain able Urban Devel op ment)(2012) ‘Thika Highway Improvement Project: The social/community component of the analysis of the ThikaHighway Improvement Project’, Abridged Version,March 2012, http://csud.ei.columbia.edu/files/2012/08/Shortened-Kara-Thika-Report.pdf, last accessed 26March 2013
Kasarda, J.D. and G. Lindsey (2011) Aerotropolis: The WayWe’ll Live Next, Farrar, Straus and Giroux, New York
Kassi, I. (2007) Régulation des transports populaires et recomposition du territoire urbain d’Abidjan, Thèsede doctorat de Géographie, Université Bordeaux 3
Katz, P. (1994) The New Urbanism: Toward an Architectureof Community, McGraw-Hill, New York
Kaufmann, V., Bergman, M. and D. Joye (2004) ‘Motility:Mobility as capital’, International Journal of Urban andRegional Research 28(4): 745–756
Keirstead, J. and N. Brandon (2011) ‘Low carbon rush hoursummary report’, Research compiled by Imperial CollegeLondon for EDF Energy, June, http://www.businessgreen.com/digital_assets/3138/Low_Carbon_Rush_Hour_summary_report.pdf, last accessed 30 January 2013
Kenworthy, J. (2008) ‘Energy use and CO2 production inthe urban passen ger trans port systems of 84 internationalcities: Findings and policy implications’, in P. Droege (ed)Urban Energy Transition, Elsevier, Rotterdam: 211–237
Kenworthy, J. and F. Laube (1999) An International Source -book of Automobile Dependence in Cities: 1960–1990,University of Colorado Press, Boulder
Kenworthy, J.R. (2003) ‘Trans port energy use andgreenhouse gases in urban passen ger trans port systems:A study of 84 global cities’, Presented to the internationalThird Conference of the Regional Govern ment Networkfor Sus tain able Devel op ment, Notre Dame University,Fremantle, Western Australia, 17–19 September, http://cst.uwinnipeg.ca/documents/Transport_Greenhouse.pdf,last accessed 30 January 2013
Kenworthy, J.R. (2011) ‘An international comparativeperspective on fast rising motorization and automobiledependence’, in H. Dimitriou and R. Gakenheimer(eds) Urban Transport in the Devel op ing World:
Per spectives from the First Decade of the NewMillennium, Edward Elgar, Cheltenham, UK: 71–112
Kenya Ports Authority (2012) Kenya Ports AuthorityHandbook 2012–13, Land and Marine Publications Ltd,Colchester
Kenya Revenue Authority (undated) ‘The frequently askedquestions (FAQs)’, Customs Services Department,http://www.kra.go.ke/customs/faqcustoms2.html, lastaccessed 30 January 2013
Kessides, C. (1993) The Contributions of Infra struc ture toEconomic Devel op ment, A Review of Experi ence andPolicy Implications, World Bank Discussion Paper 213,The World Bank, Washington, DC
Khattak, A. and D. Rodriquez (2005) ‘Travel behavior inneotraditional neighborhood devel op ments: A casestudy in USA’, Transportation Research A 39(6):481–500
Kikoyo, O. (undated) ‘Regulatory framework: A solution fortrans port accessibility in Tanzania’, Surface and MarineTransport Consumer Consultative Council, Tanzania,http://www.transed2010.hk/front/upload/20100522CR-AAilpC3U4j.doc, last accessed 25 February 2013
King, D. (2011) ‘Exploring the perennial struggle for sus -tain able finance of the New York metropolitan transitauthority’, unpublished case study prepared for theGlobal Report on Human Settlements 2013, http://www.unhabitat.org/grhs/2013
Kingdom of Jordan (undated) ‘About us’, Ministry of Trans -port, http://www.mot.gov.jo/aboutus, last accessed 25February 2013
Kirby, R., K. Bhatt, M. Kemp, R. McGillivray and M. Wohl(1972) Paratransit: Neglected Options for Urban Mobility,Urban Institute, Washington, DC
Kliment, A. (2011) ‘Bigger, greener, and younger: Brazil’sbooming car fleet’, by Alexander, FT Tilt, 11 April, http://tilt.ft.com/#!posts/2011-04/17916/bigger-greener-younger-brazils-booming-car-fleet, last accessed 30January 2013
Knight, R. and L. Trygg (1977) ‘Evidence of land useimpacts of rapid transit systems’, Transportation 6(3):231–247
Kolko, J. (2011) ‘Making the most of transit: Density,employment growth, and ridership around new stations’,Public Policy Institute of California, San Francisco,http://www.ppic.org/content/pubs/report/R_211JKR.pdf,last accessed 5 July 2012
Kollamthodi, S., A. Hird, L. Elghali, K. Johnstone, M.Wayman and V. McColl (2003) ‘Data required to monitorcompliance with the End of Life Vehicles Directive’,Transport Research Laboratory, Project Report PRSE/483/02, TRL Limited, http://archive.defra.gov.uk/environment/waste/producer/vehicles/documents/trlstudy-one.pdf, last accessed 30 January 2013
Korea Transport Institute (2010) Toward an IntegratedGreen Transportation System in Korea, Korea TransportInstitute, Seoul
Krels, P. (2007) Planning Cities for the Future: The Successesand Failures of Urban Economic Strategies in Europe,Edward Edgar Publishing, Cheltenham UK
Krizek, K. (2003) ‘Residential relocation and changes inurban travel: Does neighborhood-scale urban formmatter?’, Journal of the American Planning Association69(3): 265–281
292 Planning and Design for Sustainable Urban Mobility
Krugman, P. (1991) ‘Increasing returns and economicgeography’, Journal of Political Economy 99(3): 483–499
Kunieda, M. and A. Gauthier (2007) Gender and UrbanTransport: Smart and Affordable, Module 7a, Sus tain -able Transport: A Sourcebook for Policy-makers inDevel op ing Cities, revised edition September 2007,http://www.itdp.org/documents/7aGenderUT(Sept)300.pdf, last accessed 26 March 2013
Kunstler, J. (1994) Geography of Nowhere: The Rise andDecline of America’s Man-Made Landscape, Simon andShuster, New York
Kunstler, J. (1998) Home from Nowhere: Remaking Our Everyday World for the Twenty-First Century, Simonand Shuster, New York
Kutzback, M. (2010) ‘Megacities and mega traffic’, Access37: 31–35
Lachapelle, U., L. Frank, B.E. Saelens, J.F. Sallis and T.L. Conway (2011) ‘Commuting by public transit andphysical activity: Where you live, where you work, andhow you get there’, Journal of Physical Activity and Health8 (Supplement 1): S72–S82
Lai, J. (2010) ‘Accessible trans port in Hong Kong’, Paperpresented at the 12th International Conference onMobility and Transport for Elderly and Disabled Persons(TRANSED 2010), June, Hong Kong, http://www.td.gov.hk/en/publications_and_press_releases/speeches/20100602/index.html, last accessed 25 February 2013
Langenhoven, B. and M. Dyssel (2007) ‘The recyclingindustry and subsistence waste collectors: A case studyof Mitchell’s Plain’, Urban Forum 18(1): 114–132
Larsen, J., J. Urry and K. Axhausen (2006) Mobilities,Networks, Geographies, Ashgate, Aldershot
Lasserre, J.-C. (2008) Stratégie de mobilité durable dans lesvilles des pays en développement, Centre d’études surles réseaux, les transports, l’urbanisme et les con -structions publiques (CERTU), Paris
Lauridsen, H. and T. Bjørnskau (2004) ‘Evaluation of theSida support to the Global Road Safety Partnership’, FinalReport, Swedish International Devel op ment Coopera-tion Agency (SIDA), https://www.toi.no/getfile.php/Publikasjoner/T%D8I%20rapporter/2004/724-2004/724-04-report.pdf, last accessed 26 March 2013
Lavadinho, S. (2010) ‘Walking as a lever towards themultimodal city: What are the roles that mobilityoperators can play?’, The 11th International WALK21Conference & 23rd International Workshop of theInternational Co-operation on Theories and Concepts inTraffic safety (ICTCT), 17–19 November, the Hague
LaVigne, N. (1997) ‘Safe transport: Security by design onthe Washington Metro’, In R.V. Clarke (ed) PreventingMass Transit Crime, Criminal Justice Press Monsey, NY:163–197
Leape, J. (2006) ‘The London congestion charge’, Journalof Economic Perspective 20(Fall): 157–176, http://classes.igpa.uiuc.edu/jgiertz/London-congestion.pdf, lastaccessed 25 February 2013
Lefèvre, B. (2009) ‘Urban trans port energy consump-tion: determinants and strategies for its reduction’,S.A.P.I.EN.S 2(3): 1–32, http://sapiens.revues.org/914,last accessed 9 May 2013
Levine, J. (2006) Zoned Out: Regulation, Markets, andChoices in Transportation and Metropolitan Land-Use,Resources for the Future, Washington, DC
Levinson, H., S. Zimmerman, J. Clinger, J. Gast, S. Rutherfordand E. Bruhn (2003) ‘Bus Rapid Transit, Volume 2: Imple -mentation Guidelines’, Transit Cooperative ResearchProgram – Report 90, Transportation Research Board,National Academies, Washington, DC, http://onlinepubs.trb.org/onlinepubs/tcrp/tcrp_rpt_90v2.pdf, last accessed22 May 2013
Lewyn, M. (2003) ‘Zoning without zoning, 24 November,http://www.planetizen.com/node/109, last accessed 15May 2013
Leyden, K.M. (2003) ‘Social capital and the built environ -ment: the importance of walkable neigh bour hoods’,American Journal of Public Health 93(9):1546–1551
Li, S.-M. and Y.-M. Siu (2001) ‘Residential mobility andurban restructure under market transition: A study ofGuangzhou, China’, Professional Geographer 53(2):219–229
Li, W.-L. and J. Huang (2010) ‘The conception of transitmetropolis in Guangzhou’, Proceedings of the 2010International Conference on Mechanics Automationand Control Engineering, Singapore, 26–28 June:817–820
Light Rail Now (2009) ‘Salt Lake: One-third of campus travelvia light rail’, Light Rail Now! NewsLog, 20 March,http://www.lightrailnow.org/news/n_newslog2009q1.htm#SLC_20090320, last accessed 18 April 2013
Lim, S.S., T. Vos, A.D. Flaxman, G. Danaei, K. Shibuya, et al (2012) ‘A comparative risk assessment of burdenof disease and injury attributable to 67 risk factors and risk factor clusters in 21 regions, 1990–2010: A systematic analysis for the Global Burden of DiseaseStudy 2010’, The Lancet 380: 2224–2260, http://download.thelancet.com/pdfs/journals/lancet/PIIS0140673612617668.pdf, last accessed 1 February2013
Lin, J. and A. Yang (2009) ‘Structural analysis of how urbanform impacts travel demand: Evidence from Taipei’,Urban Studies 46(9): 1951–1967
Lindau, L.A., D. Hidalgo and D. Facchini (2010) ‘Curitiba,the cradle of bus rapid transit’, Built Environ ment 36(3):274–282, http://www.sibrtonline.org/downloads/built-environ ment-curitiba-oct19-4db0b5ac230da.pdf, lastaccessed 22 May 2013
LINK (The European Forum on Intermodal Passen gerTravel) (undated) Intermodal Passen ger Transport inEurope: Passen ger Intermodality From A to Z, http://www.mobiel21.be/sites/default/files/publications/Brochure%20link%20kleiner.pdf, last accessed 18 April2013
Litman, T. (2006a) ‘Evaluating transportation equity:Guidance for incorporating distributional impacts intransportation planning’, Victoria Transport PolicyInstitute (VTPI), http://www.vtpi.org/equity.pdf, lastaccessed 26 March 2013
Litman, T. (2006b) ‘Parking management: Strategies, evalu -ation and planning’, Victoria Transport Policy Institute,http://www.vtpi.org/park_man.pdf, last accessed 18February 2013
Litman, T. (2007) ‘Evaluating rail transit benefits: Acomment’, Transport Policy 14(1): 94–97
Litman, T. (2008a) ‘Valuing transit service quality improve -ments’, Journal of Public Transportation 11(2): 55–58,http://www.nctr.usf.edu/jpt/pdf/JPT11-2Litman.pdf, lastaccessed 18 April 2013
1EEE234567891012311145678920123456789301234567894012345678950123456789EEEE
293References
Litman, T. (2008b) Build for Comfort, Not Just Speed:Valuing Service Quality Impacts in Transport Planning,Victoria Transport Policy Institute, Victoria, http://www.vtpi.org/quality.pdf, last accessed 18 April 2013
Litman, T. (2010) ‘Evaluating public transportation healthbenefits’, American Public Transportation Association,www.vtpi.org/tran_health.pdf, last accessed 18 April2013
Litman, T. (2012a) Community Cohesion as a TransportPlanning Objective, Victoria Transport Policy Institute,Victoria, http://www.vtpi.org/cohesion.pdf, last accessed18 April 2013
Litman, T. (2012b) Evaluating Public Transit Benefits andCosts: Best Practices Guide Book, Victoria TransportPolicy Institute, Victoria, http://www.vtpi.org/tranben.pdf, last accessed 18 April 2013
Litman, T. (2013) Evaluating Non-Motorized TransportationBenefits and Costs, Victoria Transport Policy Institute,Victoria, http://www.vtpi.org/nmt-tdm.pdf, last accessed18 April 2013
Liu, J. (2012) ‘Electric vehicle charging infra struc tureassignment and power grid impacts assessment inBeijing’, Energy Policy 51(December): 544–557
Liu, J. and Y. Zhang (2004) ‘Analysis of passen ger volumeeffect of land use along urban rail transit’, TransportForum 22: 54–57
Loewen, L.J., G.D. Steel and P. Suedfeld (1993) ‘Perceivedsafety from crime in the urban environ ment’, Journal ofEnviron mental Psychology 13(4): 323–331
London European Partnership for Transport (2011)‘Congestion costs billions in world economy’, LEPT, 2December, http://www.londoncouncils.gov.uk/services/lept/news/news.htm?pk=1414, last accessed 3 June2013
Lorenz, F. and S. Bufton (2012) ‘Beijing’s pedal-based liveli -hoods as a muse for bicycle urbanism’, Zoll 19, http://www.streetfoodaustralia.com.au/storage/zoll_no19_vol59_2012_urban_LorenzBufton.pdf, last accessed 18April 2013
Lotfi, S. and M. Koohsari (2011) ‘Neighborhood walkabilityin a city within a devel op ing country’, Journal of UrbanPlanning and Devel op ment 137(4): 402–408
Low, N., B. Glesson and E. Rush (2003) ‘Making believe:Institutional discursive barriers to sus tain able trans portin two Australian cities, International Planning Studies8(2): 93–114
LSE cities, ICLEI and Global Green Growth Institute (2013)Going Green: How cities are leading the next economy,http://www.lse.ac.uk/businessAndConsultancy/LSEConsulting/pdf/LSECities-GoingGreen-3GFedition.pdf,last accessed 17 July 2013
LTA (Land Transport Authority) Academy (2011) ‘Passen gertrans port mode shares in world cities’, Journeys 7: 60–70
LTA (2012) ‘Singapore Land Transport: Statistics in Brief2012’, http://www.lta.gov.sg/content/dam/ltaweb/corp/PublicationsResearch/files/FactsandFigures/Stats_in_Brief_2012.pdf, last accessed 20 May 2013
Lubow, A. (2007) ‘The road to Curitiba’, New York Times, 20 May, http://www.nytimes.com/2007/05/20/magazine/20Curitiba-t.html?ref=magazine&pagewanted=all&_r=0moc.semityn.www, last accessed 24 Sep -tember 2012
Lucas, K. (2004) Running on Empty: Transport, SocialExclusion and Environ mental Justice, Policy Press, Bristol
Lucas, K. (2009) ‘Actual and perceived car dependence:Likely implications for enforced reductions in car usefor livelihoods, lifestyles and well-being’, TransportationResearch Record 2118: 8–15
Lucas, K., T. Grosvenor and R. Simpson (2001) Transport,the Environ ment and Social Exclusion, Joseph RowntreeFoundation and York Publishing Ltd, York
Lund, H., R. Willson and R. Cervero (2006) ‘A re-evaluationof travel behavior in California TODs’, Journal ofArchitecture and Planning Research 23(3): 247–263
Lyons, G. and Kenyon, S. (2003) ‘Social participation,personal travel and Internet use’, Proceedings of the 10thInternational Conference on Travel Behaviour Research,August, Lucerne, http://www.ivt.ethz.ch/news/archive/20030810_IATBR/lyons.pdf, last accessed 30 January2013
Macaulay, J. and R. McInerney (2002) ‘Evaluation of theproposed actions emanating from road safety audits’,Austroads, Sydney, https://www.onlinepublications.austroads.com.au/items/AP-R209-02, last accessed 26March 2013
Macnamara, K. (2010) ‘Future looks sunny for Bangkok’stuk-tuks’, AFP, June 29, http://www.google.com/hostednews/afp/article/ALeqM5geXU5mLFBUHKkCMqtnDbAiFpA4Jw, last accessed 18 April 2013
Maddison, D., D. Pearce, O. Johansson, E. Calthrop, T.Litman and E. Verhoef (1996) The True Costs ofTransport, Earthscan, London
Manchala, R. and P.S. Vagvala (2012) Distortions in Infra -struc ture Devel op ment in Urban Transport in India: Howto Remedy it?, MPRA (Munich Personal RePEc Archive)Paper No. 22874, http://mpra.ub.uni-muenchen.de/22874/1/MPRA_paper_22874.pdf, last accessed 22April 2013
Marshall, S. and D. Banister (eds) (2007) Land Use andTransport: European Research Towards IntegratedPolicies, Elsevier, Amsterdam
Marshall, T. (2000) ‘Urban planning and governance: Is therea Barcelona model?’, International Planning Studies5(3): 299–219
Martin, B. (1993) In the Public Interest: Privatization andpublic sector reform, Zed Books, London
Martin, E. and S. Shaheen (2011) ‘The impact of carsharingon household vehicle ownership’, Access 38: 22–27,http://www.uctc.net/access/38/access38_carsharing_ownership.pdf, last accessed 26 March 2013
Matsuoka, M., A. Hricko, R. Gottlieb and J. De Lara (2009)Global Trade Impacts: Addressing the Health, Social andEnviron mental Consequences of Moving InternationalFreight through Our Communities, Occidental Collegeand University of Southern California, Los Angeles
Maunder, D., C. Venter, T. Rickert and J. Sentinella (2004)Improving Transport Access and Mobility for People withDisabilities, UK Department for International Devel op -ment (DFID), London
Mayor of London (2012) Community Infra struc ture LevyCharging Schedule, Greater London Authority, London,http://www.london.gov.uk/sites/default/files/CIL%20charging%20schedule%20April%202012.pdf, lastaccessed 25 February 2013
McCaul, C. (2009) ‘The introduction of the Rea Vaya BRTsystem in Johannesburg: devel op ments, achievementsand challenges’, Colleen McCaul Associates, South
294 Planning and Design for Sustainable Urban Mobility
Africa, www.unhabitat.org/downloads/docs/7997_81569_Rea_Vaya.pdf, last accessed 6 June 2013
McKinlay, P. (2011) ‘Integration of urban services and good governance: The Auckland Supercity Project’,Paper presented to Pacific Economic Cooperation Coun -cil (PECC) Seminar on Environ mental Sus tain ability in Urban Centres, Perth, Western Australia, 13 April,http://www.mdl.co.nz/site/mckinley/files/pdfs/PECC%20Urban%20Services%20and%20Good%20Governance.pdf,last accessed 25 February 2013
McKinnon, A. (2009) ‘The present and future land require -ments of logistical activities’, Land Use Policy 26(S):S293–S301
McKinsey and Company (2008) Sus tain able Urban Infra struc -ture: London Edition – A View of 2025, Siemens AG,Munich
McKinsey Global Institute (2010) Preparing for China’sUrban Billion, McKinsey and Company, http://www.mckinsey.com/insights/urbanization/preparing_for_urban_billion_in_china, last accessed 17 May 2013
McMillan, T. (2011) ‘Children and youth and sus tain ableurban mobility’, unpublished thematic study preparedfor the Global Report on Human Settlements 2013,www.unhabitat.org/grhs/2013
Meakin, R. (2002) Urban Transport Institutions, Sus tain ableTransport: A Sourcebook for Policy-Makers in Devel opingCountries, GTZ (Deutsche Gesellschaft für TechnischeZusammenarbeit), Eschborn, www.sutp.org/index.php/component/phocadownload/category/19-1b?download=9:1b-uti-en, last accessed 25 February 2013
Mees, P. (2009) Transport for Suburbia: Beyond theAutomobile Age, Earthscan, Oxford, UK
Meleis, A. (2011) ‘Introduction: Devel op ing urban areas asif gender matters’, in A. Meleis, E.L. Birch and S.Wachter (eds) Women’s Health and the World’s Cities,University of Pennsylvania Press, Philadelphia: 1–11
Melia, S. (2006) ‘On the road to sus tain ability – trans portand carfree living in Freiburg’, Report for WHO HealthyCities Collaborating Centre, University of the West ofEngland, http://www.stevemelia.co.uk/vauban.htm, lastaccessed 30 January 2013
Melia, S. (2010) ‘Carfree, low car – what’s the difference?’,Paper presented at the European Transport Conference,11–13 October 2010, Glasgow, UK, http://eprints.uwe.ac.uk/10558/2/melia_Carfree_Low_Car_[ETC_Paper].pdf, last accessed 30 January 2013
Metrobits (2012) ‘World metro database’, http://mic-ro.com/metro/table.html, last accessed 20 May 2013
Metrolinx (2008) The Big Move: Transforming Transporta -tion in the Greater Toronto and Hamilton Area, GreaterToronto Transportation Authority, http://www.metrolinx.com/thebigmove/Docs/big_move/TheBigMove_020109.pdf, last accessed 25 February 2013
Metropolis (2005) Commission 4: Urban MobilityManagement, Metropolis, Barcelona
Metropolis International Institute (2009) Climate Change:Cities in Action, http://www.metropolis.org/sites/default/files/publications/2009/Climate-Change-Cities-in-Action_0.pdf, last accessed 18 April 2013
Metz, D. (2008) ‘The myth of travel time savings’, Trans -port Reviews 28(3): 321–326, http://www.limitstotravel.org.uk/documents/Myth_TTS_printed.pdf, last accessed30 January 2013
Meyer, J., J. Kain and M. Wohl (1965) The UrbanTransportation Problem, Harvard University Press,Cambridge
Milakis, D., T. Vlastos and N. Barbopoulos (2008)‘Relationships between urban form and travel behavioursin Athens, Greece: A comparison with Western Europeanand North American results’, European Journal of Trans -port and Infra struc ture Research 8(3): 201–215
Millard-Ball, A. and L. Schipper (2010) ‘Are we reaching peak travel? Trends in passen ger trans port in eightindustrialized countries’, Transport Reviews 31(3):357–378
Minadali, O., A. Raveh and I. Salomon (2004) ‘Urbandensity and energy consumption: A new look at oldstatistics’, Transportation Research A 38(2): 143–162
Ministry of Transport (1999) Moving South Africa: TheAction Agenda, Govern ment of South Africa
Ministry of Transport, Ontario (2007) ‘Ontario’s greenplates’, http://www.mto.gov.on.ca/english/dandv/vehicle/electric/ev-green-plates.shtml, last accessed 30 January2013
Minteguiaga, J. (2010) ‘Modal integration of other modes’,Symposium on Public Transportation in Indian Cities withSpecial Focus on Bus Rapid Transit (BRT), UITP Asia-Pacific, 20–21 January 2010, New Delhi, http://www.dimts.in/pdf/Symposium-on-Publi-Transportation/Modal%20Integration%20with%20other%20modes-JMinteguiaga-DIMTSUITP-Symposium.pdf, last accessed 18April 2013
Mitchell, R.B. and C. Rapkin (1954) Urban Traffic: AFunction of Land Use, Columbia University Press, NewYork
Mitric, S. (2008) Urban Transport for Devel op ment: Towardsan Operationally-Orientated Strategy, Transport PapersTP-22 World Bank, Washington, DC, http://siteresources.worldbank.org/INTTRANSPORT/Resources/336291-1227561426235/5611053-1229359963828/tp_22_web.pdf, last accessed 25 February 2013
Mobereola, D. (2009) Lagos Bus Rapid Transit: Africa’s First BRT Scheme, Sub-Saharan Africa Trans port PolicyProgram, World Bank, Washington, DC, http://siteresources.worldbank.org/EXTAFRSUBSAHTRA/Resources/DP09-Lagos-BRT.pdf, last accessed 22 May 2013
Mohan, D. (2008) Mythologies, Metros and Future Urban Transport, Transportation Research and InjuryPrevention Program Report Series, Indian Institute ofTechnology Delhi, http://tripp.iitd.ernet.in/delhibrts/metro/Metro/Metro%20Mythology08.pdf, last accessed30 January 2013
Mohring, H. (1972) ‘Optimization and scale economies inurban bus transportation’, American Economic Review62: 591–604
Moller, R. (2006) Transporte urbano y desarrollo sostenibleen América Latina: el ejemplo de Santiago de Cali,Colombia, Universidad del Valle, Cali
Montgomery, B. and P. Roberts (2008) Walk Urban:Demand, Constraints and Measurement of the UrbanPedestrian Environ ment, Trans port Papers, TP-18, Trans -port Sector Board, World Bank, Washington, DC
Moore, M. and P. Foster (2011) ‘China to create largestmega city in the world with 42 million people’, ChinaDaily 24 January, http://www.telegraph.co.uk/news/worldnews/asia/china/8278315/China-to-create-largest-
1EEE234567891012311145678920123456789301234567894012345678950123456789EEEE
295References
mega-city-in-the-world-with-42-million-people.html, lastaccessed 8 May 2013.
Moore, T., P. Thornes and B. Appleyard (2007) TheTransportation/Land Use Connection, Planning AdvisoryService Report Number 546/547, Chicago
Morgan Stanley (2009) ‘The infra struc ture opportunity:Repair, build and stimulate’, Investment Focus, February,http://www.morganstanley.com/views/perspectives/files/THE_INFRA STRUC TURE%20OPPORTUNITY_JAN09.pdf, last accessed 30 January 2013
MoUD (Ministry of Urban Devel op ment) (2005) ‘JawaharlalNehru National Urban Renewal Mission: Overview’,http://jnnurm.nic.in/nurmudweb/toolkit/Overview.pdf,last accessed 17 May 2013
MTRC (Mass Transit Railway Corporation) (undated) ‘Shareinformation’, http://www.mtr.com.hk/eng/investrelation/shareservices.php#04, last accessed 30 January 2013
Mueller, B. (2011) ‘Economic and finan cial impact of urbanpublic transport: The example of Geneva’, Congress –Dubai 2011, Session 5, International Association of PublicTransport (UITP), Geneva
Muller, P. (2004) ‘Transportation and urban form: stages inthe spatial evolution of the American metropolis’, in S.Hanson and G. Giuliano (eds) The Geography of UrbanTransportation, Guilford Press, New York: 59–86
Municipality of Ottawa (2007) Transit-Oriented Devel op -ment Guidelines, Municipality of Ottawa, Ottawa,http://ottawa.ca/cs/groups/content/@webottawa/documents/pdf/mdaw/mdyx/~edisp/con029008.pdf, lastaccessed 23 March 2012
Municipality of Ottawa (2008) Transportation Master Plan November 2008, Publication 19–82, Municipality ofOttawa, Ottawa, http://ottawa.ca/city_hall/master_plans/tmp/tmp_en.pdf, last accessed 23 March 2012
Naess, P. (2001) ‘Urban planning and sus tain able devel op -ment’, European Planning Studies 9(4): 503–524
Nakicenovic, N. (1986) ‘The automobile road to techno logicalchange’, Technological Forecasting and Social Change 29:309–340
Nantulya, V.M. and F. Muli-Musiime (2001) ‘Uncovering thesocial determinants of road traffic accidents in Kenya’, inT. Evans, M. Whitehead, F. Diderischen, A. Bhinya andM.T. Wirth (eds) Challenging Inequities: From Ethics toAction, Oxford University Press, Oxford: 211–255
Nantulya, V.M. and M.P. Reich (2003) ‘Equity dimensionsof road traffic injuries in low and middle income coun -tries’, Injury Control and Safety Promotion 10(1–2):13–20, http://www.bvsde.paho.org/bvsacd/cd53/equity2.pdf, last accessed 26 March 2013
Nascu, I. (2009) ‘Terrorist threats and public transportation’,Theoretical and Empirical Researches in Urban Manage -ment 2(11): 80–87
National Audit Office (2004) London underground PPP:Were they good deals? Report by the Comptroller andAuditor General, HC 645 Session 2003–2004, 17 June
National Bureau of Statistics of China (2009) China StatisticalYearbook 2009, China Statistics Press, Beijing
National Research Council (2009) Driving and the BuiltEnviron ment: The Effects of Compact Devel op ment on Motorized Travel, Energy Use, and CO2 Emissions,Special Report 298, Transportation Research Board,National Academies, Washington, DC
Net Resources International (2012) ‘Rabat-Salé Tram-way, Morocco’, railway-technology.com, http://www.railway-technology.com/projects/rabat-sale-tramway/, lastaccessed 3 April 2013
New African (2012) ‘Nairobi breaks traffic shackles’, AfricanBusiness, 31 October 2012, http://africanbusinessmagazine.com/features/infra struc ture/nairobi-breaks-traffic-shackles, last accessed 27 May 2013
Newman, P. and J. Kenworthy (1999) Cities and AutomobileDependence: An International Sourcebook, Gower,Aldershot, UK
Newman, P. and J. Kenworthy (2011a) ‘Evaluating the trans -port sector’s contribution to greenhouse gas emissionsand energy consumption’, in R. Salter, S. Dhar and P. Newman (eds) Technologies for Climate ChangeMitigation – Trans port Sector, UNEP, Roskilde: 7–23,http://tech-action.org/Guidebooks/TNA_Guidebook_MitigationTransport.pdf, last accessed 30 January 2013
Newman, P. and J. Kenworthy (2011b) ‘Peak car use: Under -standing the demise of automobile dependence’, WorldTransport Policy and Practice 17(2): 31–42
Newman, P., T. Beatley and H. Boyer (2009) Resilient Cities:Responding to Peak Oil and Climate Change, Island Press,Washington, DC
Newmark, G., P. Plaut and Y. Garb (2004) ‘Shopping travelbehaviors in an era of rapid economic transition: Evidencefrom newly built malls in Prague, Czech Republic’,Transportation Research Record 1898: 165–174
Nicholls, R.J., S. Hanson, C. Herweijer, N. Patmore, S.Hallegatte, J. Corfee-Morlot, J. Chateau and R. Muir-Wood (2008) ‘Ranking port cities with high exposure andvulnerability to climate extremes’, OECD, Environ mentWorking Paper 1, ENV/WKP(2007), http://www.oecd-ilibrary.org/environ ment/ranking-port-cities-with-high-exposure-and-vulnerability-to-climate-extremes_011766488208, last accessed 30 January 2013
Nobis, C. (2003) ‘The impact of car-free housing districts onmobility behaviour – Case study’, in E. Beriatos, C.A.Brebbia, H. Coccossis and A. Kungolos (eds) InternationalConference on Sus tain able Planning and Devel op ment,WIT: 701–720, http://library.witpress.com/pages/PaperInfo.asp?PaperID=1979, last accessed 30 January 2013
O’Connor, K. (2010) ‘Global city regions and the location oflogistics activity’, Journal of Transport Geography 18(3):354–362, http://www.docentes.unal.edu.co/wadarmej/docs/LOGISTICA/LOGISTIC%20AND%20MOBILITY%20t2.pdf, last accessed 29 May 2013
O’Sullivan, A. (2008) Urban Economics, McGraw-Hill, NewYork
Obeng, K. (2012) ‘The deadweight costs of operating andcapital subsidies’, Journal of the Transportation ResearchForum 49(1): 37–57
OECD (Organisation for Economic Co-operation and Devel op ment) (1986) Trans port for Disabled People:Inter national Comparisons of Practice and PolicyRecommendations, OECD Publications, Paris
OECD (1991) The State of the Environ ment, OECDPublications, Paris
OECD (2001) Ageing and Transport: Mobility Needs andSafety Issues, OECD Publications, Paris, http://www.oecd.org/dataoecd/40/63/2675189.pdf, last accessed 26March 2013
OECD (2002) Road Travel Demand: Meeting the Challenge,OECD Publications, Paris, http://www.international
296 Planning and Design for Sustainable Urban Mobility
transportforum.org/pub/pdf/02RdTravDemE.pdf, lastaccessed 26 March 2013
OECD (2003) Delivering the Goods, 21st Century Challengesto Urban Good Transport, OECD Publications, Paris
OECD (2009) OECD in Figures, OECD Publications, Paris,http://www.oecd-ilibrary.org/economics/oecd-in-figures-2009_oif-2009-en, last accessed 28 May 2013
OECD (2010a) Cities and Climate Change, OECD Publications,Paris
OECD (2010b) ‘Cities and green growth’, Issues paper forthe 3rd Annual Meeting of the OECD Urban Roundtableof Mayors and Ministers, OECD Conference Centre,OECD Regional Policy Devel op ment Division, Paris
OECD/ITF (International Transportation Forum) (2008)Transport Outlook: Focusing on CO2 Emissions from Road, Joint Research Center of the OECD and the ITF,Discussion Paper, No. 2008-13, http://www.internationaltransportforum.org/jtrc/DiscussionPapers/DP200813.pdf, last accessed 22 May 2013
OECD/ITF (International Trans port Forum) (2011a)Pedestrian Safety, Urban Space and Health, InternationalTrans port Forum, Paris, http://www.internationaltransportforum.org/Pub/pdf/11PedestrianSum.pdf, lastaccessed 18 April 2013
OECD/ITF (International Trans port Forum) (2011b) ‘Trans -port outlook: Meeting the needs of 9 billion people’,Paper produced by the International Trans port Forum,Paris, http://www.internationaltransportforum.org/Pub/pdf/11Outlook.pdf, last accessed 30 January 2013
Office for Low Emissions Vehicles (2011) Making theConnection: The Plug in Vehicle Infra struc ture Strategy,Department of Transport, London, June, http://assets.dft.gov.uk/publications/making-the-connection-the-plug-in-vehicle-infra struc ture-strategy/plug-in-vehicle-infra struc ture-strategy.pdf, last accessed 30 January 2013
Office of the State Comptroller, New York State (2011)‘Controlling risk without gimmicks: New York’s infra -struc ture crisis and public–private partnerships’, January,http://osc.state.ny.us/reports/infra struc ture/pppjan61202.pdf, last accessed 30 January 2013
Offices of New Zealand Minister of Transport (2009)Auckland Governance: Regional Transport Authority,Chair Cabinet Committee on Implementation ofAuckland Governance Reforms, Auckland, http://www.transport.govt.nz/ourwork/Land/Documents/Auckland%20Governance%20Regional%20Transport%20Authority%20Cabinet%20Paper%20FINAL.pdf, last accessed 1March 2013
Olvera, L., D. Plat and P. Pochet (2003) ‘Transportationconditions and access to services in a context of urbansprawl and deregulations: The case of Dar es Salaam’,Transport Policy 10: 287–298
Omwenga, G. (2013) ‘“Last-mile” link buses to boost citycommuter train service’, Daily Nation, 27 April, http://www.nation.co.ke/business/news/Last-mile-link-buses-to-boost-city-commuter-train-service/-/1006/1760200/-/xv8nfj/-/index.html, last accessed 3 April 2013
Ong, G.P., K.C. Sinha and T.F. Fwa (2010) ‘Strategies forachieving sus tain ability through integrated transporta-tion and urban devel op ment in the USA and Asia’, AsianTrans port Studies 1(1): 89–104, http://www.easts.info/publications/journal_proceedings/ats/ATS_PDF/Vol-1-Issue-1/(7)ATS_Vol_1-Issue_1.pdf, last accessed 26March 2013
Ontario College of Family Physicians (2005) The HealthImpacts of Urban Sprawl, Volume 4: Social and Mental Health, http://www.ocfp.on.ca/docs/committee-documents/urban-sprawl---volume-4---social-and-mental-health.pdf?sfvrsn=5, last accessed 30 January 2013
Osborne, P. (2005) ‘Safe routes for children: What they wantand what works’, Children, Youth and Environ ments15(1): 234–239
Osman, S., A. Nawawi, J. Abdullah (2008) ‘Urban sprawl andits finan cial cost: A conceptual framework’, Asian SocialScience 4(10): 39–50
Owen, B., A. Carrigan and D. Hidalgo (2012) Evaluate,Enable, Engage: Principles to Support Effective DecisionMaking in Mass Transit Investment Programs, EMBARQ,Washington, DC, http://www.embarq.org/sites/default/files/EMB_Evaluate_Enable_Engage.pdf, last accessed 20 May 2013
Oxford University (2007) ‘At least half the UK’s populationwill be overweight by 2032’, press release, 17 October,http://www.ox.ac.uk/media/news_releases_for_journalists/overweight_by_2032.html, last accessed 30 January2013
Oyesiku, O. and O. Odufuwa (2002) ‘Gender perspectivesin travel behaviour of motorcycle passen gers in Nigerianintermediate cities’, in X. Godard and I. Fatonzoun (eds)Urban Mobility for All – La Mobilite Pour Tous, Swets andZeitlinger, Lisse: 13–19
Pai, M., and D. Hidalgo (2009) ‘Indian bus rapid transitsystems funded by the Jawaharlal Nehru National UrbanRenewal Mission’, Transportation Research Record 2114:10–18
Pan, H. (2011) ‘Implementing sus tain able urban travelpolicies in China’, Discussion paper 2011-05, Organ -ization for Economic Devel op ment/International Trans -port Forum, Paris, http://www.internationaltransportforum.org/jtrc/DiscussionPapers/DP201112.pdf, lastaccessed 28 May 2013
Pan, H., J. Zhuo and B. Liu (2008) Mobility for Devel op ment:Shanghai, China, Department of Urban Planning, TongjiUniversity, for World Business Council for Sus tain -able Devel op ment, Washington, DC, http://www.urba2000.com/club-ecomobilite-DUD/IMG/pdf/Shanghai_M4D_report_April08.pdf, last accessed 1 March 2013
Pan, H., Q. Shen and M. Zhang (2009) ‘Influence of urbanform on travel behaviour in four neigh bour hoods inShanghai’, Urban Studies 46(2): 275–295
Pan, H., W. Liu, K. Lo Hau Yan, M. Xu, S. Ye and P. Wei(2011) ‘Sus tain able urban mobility in Eastern Asia’,Unpublished regional study prepared for the GlobalReport on Human Settlements 2013, www.unhabitat.org/grhs/2013
Papagiannakis, A. and E. Masad (2008) Pavement Design andMaterials, Wiley & Sons, Hoboken, New Jersey
Parra, J.R. (2012) ‘Bogotá citizens take to Youtube to criticizethe Transmilenio BRT system’, ThisBigCity, 4 February,http://thisbigcity.net/bogota-citizens-youtube-criticize-transmilenio-brt/, last accessed 14 June 2013
Parry, I.W.H. and K.A. Small (2005) ‘Does Britain or theUnited States have the right gasoline tax?’, The AmericanEconomic Review 95(4): 1276–1289
Patel, S. and K. Sharma (1998) ‘One David and threeGoliaths: Avoiding anti-poor solutions to Mumbai’s trans -port problems’, Environ ment and Urbanization 10(2):
1EEE234567891012311145678920123456789301234567894012345678950123456789EEEE
297References
149–160Patier, D. (ed.) (2001) L’intégration des marchandises
dans le système des déplacements urbains, Etudes etRecherches, No. 15, Laboratoire d’économie destransports, Lyon
Patier, D. and J.L. Routhier (2008) ‘How to improve thecapture of urban goods trans port data’, in P. Bonnel, M. Lee-Gosselin, J. Zmud and J.L. Madre (eds) Trans portSurvey Methods, Keeping up with a Changing World,Emerald, Bingley, UK: 251–287
Peden, M., R. Scurfield, D. Sleet, D. Mohan, A. A. Hyder, E.Jarawan and C. Mathers (eds) (2004) World Report onRoad Traffic Injury Prevention, World Health Organ -ization, Geneva, http://whqlibdoc.who.int/publications/2004/9241562609.pdf, last accessed 26 March 2013
Peñalosa, E. (2002) ‘Urban trans port and urban devel op ment:Different model’, The Center for Latin American Studies,University of California, Berkeley
Pendakur, V. (2005) ‘Non-motorized trans port in Africancities: Lessons from experi ence in Kenya and Tanzania’,SSATP working paper no. 80, Sub-Saharan Africa Trans -port Policy Program, World Bank, Washington, DC,http://www4.worldbank.org/afr/ssatp/Resources/SSATP-WorkingPapers/ssatpwp80.pdf, last accessed 28 May2013
Pendakur, V. (2011) ‘Non-motorized urban trans port asneglected modes’, in H. Dimitriou and R. Gakenheimer(eds) Urban Transport in the Devel op ing World: AHandbook of Policy and Practice, Edward Elgar,Cheltenham, UK: 203–231
Perkins, A. and S. Hamnett (2002) ‘The full impact of trans -port and the built environ ment on greenhouse gasemissions and the influence of urban form’, Paperpresented at the 28th Australasian Transport ResearchForum, Canberra, October, http://www.atrf.info/papers/2005/2005_Perkins_Hamnett.pdf, last accessed 30January 2013
Perrels, A., V. Himanen and M. Lee-Gosselin (2008) (eds)Building Blocks for Sus tain able Transport: Obstacles,Trends, Solutions, Emerald, Bingley
Peters, D. (2001) ‘Gender and trans port in less developedcountries: A background paper in preparation for CSD-9’, Background Paper Commissioned by UNED forthe Expert Workshop ‘Gender Perspectives for EarthSummit 2002; Energy, Transport, Information forDecision-Making’, Berlin, Germany, 10–12 January,http://mediaresearchhub.ssrc.org/gender-and-transport-in-less-developed-countries-a-background-paper-in-preparation-for-csd-9/attachment, last accessed 26 March2013
Peters, D. (2011) ‘Gender and sus tain able urban mobility’,Unpublished thematic study prepared for the GlobalReport on Human Settlements 2013, www.unhabitat.org/grhs/2013
Phin, D.T. and E. Dotson (2011) ‘Urban trans port institutionsand governance and integrated land use and transport,Hanoi’, unpublished case study prepared for the GlobalReport on Human Settlements 2013, www.unhabitat.org/grhs/2013
Pichaironarongsongkram, S. (2012) Future Challenges ofRiver Trans port in Bangkok, Thailand, http://www.interferry.com/2012papers/11-3Presentation_Supapan_2.pdf,last accessed 18 April 2013
Pickrell, D. (1985) ‘Rising deficits and the uses of transit
subsidies in the United States’, Journal of TransportEconomics and Policy 19(3): 281–298, http://www.bath.ac.uk/e-journals/jtep/pdf/Volume_X1X_No_3_281-298.pdf, last accessed 28 May 2013
Pineau, E. (2010) ‘Paris: from tyranny of taxis to city of bikes’, The Globe and Mail 12 August, http://www.theglobeandmail.com/life/paris-from-tyranny-of-taxis-to-city-of-bikes/article1670498/, last accessed 6 February 2013
Pirie, G. (2011) ‘Sus tain able urban mobility in “Anglo-phone” Sub-Saharan Africa’, unpublished regional studyprepared for the Global Report on Human Settlements2013, www.unhabitat.org/grhs/2013
Pojani, D. (2010) ‘Public trans port and its privatization in EastEurope: The case of Tirana, Albania’, European Trans port/ Trasporti Europei 45: 64–82, http://www.openstarts.units.it/dspace/bitstream/10077/6159/1/45D_Pojani.pdf,last accessed 18 April 2013
Polèse, M. and R. Stren (eds) (2000) The Social Sus tain abilityof Cities, Diversity and the Management of Change,University of Toronto Press, Toronto
Politics.co.uk (undated) ‘Fuel duties’, http://www.politics.co.uk/reference/fuel-duties, last accessed 5 February2013
Poole, R. and C. Orski (2003) HOT Networks: A New Plan for Congestion Relief and Better Transit, Policy Study No.305, Reason Foundation, Los Angeles
Population Connection (2009) ‘Fact Sheet’, April, http://donation.populationconnection.org/Communications/FactSheets/sprawl.pdf, last accessed 15 May 2013
Porter, G. (2011) ‘Urban trans port in Cape Coast, Ghana: Asocial sus tain ability analysis’, unpublished case study prepared for the Global Report on HumanSettlements 2013, www.unhabitat.org/grhs/2013
Porter, G. (2012) ‘Mobile phones, livelihoods and the poorin sub-Saharan Africa: Review and prospect’, GeographyCompass 6: 241–259
Porter, G., K. Hampshire, A. Abane, A. Munthali, E. Robson,M. Mashiri and A. Tanle (2010) ‘Youth transport, mobilityand security in Sub-Saharan Africa: The gendered journeyto school’, World Transport Policy and Practice 16(1):51–71
Posada, F., F. Kamakate and A. Bandivadekar (2011) ‘Sus tain able management of two and three wheelers in Asia: Regulatory and institutional framework’, ESTConference, 5 December, New Delhi, InternationalCouncil on Clean Transportation, http://www.uncrd.or.jp/env/6th-regional-est-forum/doc/EST-5B_01_ICCT_Bandivadekar.pdf, last accessed 18 April 2013
Potter, S. (1984) Transport and New Towns, The OpenUniversity, New Towns Study Unit, Milton Keynes
Pourbaix, J. (2011) ‘Towards a smart future for cities: Urban trans port scenarios for 2025’, Public Trans portInternational 60(3): 8–10, http://ltaacademy.gov.sg/doc/J12%20May-p07Jerome_Towards%20a%20Smart%20Future%20for%20Cities.pdf, last accessed 28 May 2013
Pourbaix, J. (2012) ‘Towards a smart future for cities’,Journeys (May): 7–13, http://ltaacademy.gov.sg/doc/J12%20May-p07Jerome_Towards%20a%20Smart%20Future%20for%20Cities.pdf, last accessed 14 May 2013
PTUA (Victoria Public Transport Users Association) (2011)‘Governance models: Privatisation, contracts, franchisesand the rest’, PTUA, Melbourne, http://www.ptua.org.au/campaigns/govern/models/, last accessed 1 March2013
298 Planning and Design for Sustainable Urban Mobility
Pucher, J. and R. Buehler (2007) Cycling for Everyone:Lessons from Europe, Rutgers University, Newark, New Jersey, http://policy.rutgers.edu/faculty/pucher/Cycling%20for%20everyone%20TRB.pdf, last accessed 18April 2013
Pucher, J. and R. Buehler (2008) ‘Making cycling irresistible:Lessons from the Netherlands, Demark and Germany’,Transport Reviews 28(4): 495–528, http://policy.rutgers.edu/faculty/pucher/irresistible.pdf, last accessed 28 May2013
Pucher, J. and R. Buehler (2009) ‘Integrating bicycling andpublic trans port in North America’, Journal of PublicTransportation 12(3): 79–104, http://www.nctr.usf.edu/jpt/pdf/JPT12-3Pucher.pdf, last accessed 18 April 2013
Pucher, J. and L. Dijkstra (2000) ‘Making walking and cycling safer: lessons from Europe’, Transportation Quar -terly 54(3): 25–50, http://www.ta.org.br/site/Banco/7manuais/VTPIpuchertq.pdf, last accessed 18 April 2013
Pucher, J. and S. Kurth (1996) ‘Verkehrsverbund: Thesuccess of regional public trans port in Germany, Austriaand Switzerland’, Transport Policy 2(4): 279–291
Pucher, J. and C. Lefèvre (1996) The Urban Transport Crisisin Europe and North America, Macmillan, Houndmills,UK
Pucher, J. and J.L. Renne (2003) ‘Socioeconomics of urbantravel: Evidence from the 2001 NHTS’, TransportationQuarterly 57(3): 49–77
Pucher, J., N. Korattyswaroopam, N. Mittal and N. Ittyerah(2005) ‘Urban trans port crisis in India’, Trans port Policy12: 185–198
Pucher, J., Z.-R. Peng, N. Mittal, Y. Zhu and N.Korattyswaroopam (2007) ‘Urban trans port trends andpolicies in China and India: Impacts of rapid economicgrowth’, Trans port Reviews 27(4): 379–410, http://policy.rutgers.edu/faculty/pucher/PUCHER_China%20India_Urban%20Transport.pdf, last accessed 28 May 2013
Pulley, T., S. Lateef and F.S. Begum (2001) Making Infra -struc ture Work for Women in Bangladesh, Asian Devel -op ment Bank, Manila
Pushkarev, B. and J. Zupan (1977) Public Transportation andLand Use Policy, Indiana University Press, Blooming ton
Ragheb, K. (2010) ‘PM puts Cairo public trans port underministry jurisdiction’, Egypt Independent, 30 August,http://www.egyptindependent.com/news/pm-puts-cairo-public-transport-under-ministrys-jurisdiction, lastaccessed 1 March 2013
Rahman, M.M., G. D’Este, and J.M. Bunker (2010) ‘Non-motorised public transport: The past, the present, thefuture’, in 33rd Australasian Transport Research Forum,29 September–1 October, National Convention Centre,Canberra, Australia
Railway Gazette International (2012) ‘Royal opening launchesCasablanca trams’, http://www.railwaygazette.com/news/urban-rail/single-view/view/royal-opening-launches-casablanca-trams.html, last accessed 20 May 2013
Railway-technology.com (undated) ‘Santo Domingo Metro, Dominican Republic’, http://www.railway-technology.com/projects/santodomingo/, last accessed 30January 2013
Rea Vaya (2011a) ‘Rea Vaya boosts job creation’, 30 March,http://www.reavaya.org.za/news-archive/march-2011/673-rea-vaya-boosts-job-creation, last accessed 6June 2013
Rea Vaya (2011b) ‘Taxis scrapped in BRT milestone’, 8
February , h t tp : / /www.reavaya .o rg . za /news -archive/february-2011/649-taxis-scrapped-in-brt-milestone, last accessed 6 June 2013
Rea Vaya (undated) ‘Who we are’, http://www.reavaya.org.za/welcome, last accessed 3 April 2013
Regional Environ mental Centre for the Caucasus (2008)Fuel Quality and Vehicle Emissions Standards Overview,UNEP, Georgia, http://www.unep.org/transport/pcfv/PDF/FuelQuality_en.pdf, last accessed 30 January 2013
Renner, M., S. Sweeney, and J. Kubit (2008) Green Jobs:Working for People and the Environ ment, Worldwatchreport 177, Worldwatch Institute, Washington, DC,http://www.worldwatch.org/system/files/177%20Green%20Jobs.pdf, last accessed 26 March 2013
Replogle, M. and M. Kodransky (2010) ‘Bridging the urbantrans port divide in the US and Europe’, unpublishedpaper presented at Urban Researchers Roundtable:Bridging the Urban Transport Divide, UN-HabitatMeeting, Rio de Janeiro, March
Republic of Kenya (2009) Integrated National TransportPolicy: Moving a Working Nation, Ministry of Transport,http://www.krb.go.ke/images/company_doc/mot.pdf, lastaccessed 3 April 2013
Republic of Mauritius (2013) ‘Mauritius Light Rail TransitSystem works to start by October 2014’, http://www.gov.mu/English/News/Pages/Mauritius-Light-Rail-Transit-System-Works-to-Start-by-October-2014.aspx, lastaccessed 4 June 2013
Reuters (2010) ‘Landmark environ mental justice non-profit and $50 million mitigation fund approvedunanimously by Board of Harbor Commissioners’,Reuters, October 27, http://www.reuters.com/article/2010/10/27/idUS272010+27-Oct-2010+PRN20101027, last accessed 22 May 2013
Reuters (2013) ‘Beijing air pollution at “hazardous” levels’,CNews, 29 January, http://cnews.canoe.ca/CNEWS/Environ ment/2013/01/29/20534601.html, last accessed1 February 2013
Rhee, B. and S. Bae (2011) ‘How to build healthy and livable cities through safe and dedicated bicycle infra struc -tures: Case of Changwon’, presentation at EST Session 3B, 5 December, http://www.uncrd.or.jp/env/6th-regional-est-forum/doc/EST-3B_03_1_Changwon_Rhee.pdf, last accessed 30 January 2013
Rickert, T. (2001) ‘Mobility for the disabled poor’, for AccessExchange International, September, http://web.worldbank.org/WBSITE/EXTERNAL/TOPICS/EXTTRANSPORT/EXTTSR/0,,contentMDK:21268763~menuPK:2970912~pagePK:210058~piPK:210062~theSitePK:463716,00.html, last accessed 26 March 2013
RICS (Royal Institution of Chartered Surveyors) (2002) LandValue and Public Transport, RICS, London
Rimmer, P. (1982) ‘Urban public trans port in smallerMalaysian towns: Threat to the trishaw industry’,Malaysian Tropical Geography 5: 54–66
Rittel, H. and M. Webber (1973) ‘Dilemmas in a generaltheory of planning’, Policy Sciences 4: 155–169,http://www.uctc.net/mwebber/Rittel+Webber+Dilemmas+General_Theory_of_Planning.pdf, last accessed 1March 2013
Riverson, J., M. Kunieda, P. Roberts, N. Lewi and W.M.Walker (2005) ‘The challenges in addressing genderdimensions of trans port in devel op ing countries: Lessonsfrom World Bank’s projects’, Proceedings, Annual
1EEE234567891012311145678920123456789301234567894012345678950123456789EEEE
299Mobility and Urban Form
Meeting of the Transportation Research Board,Washington, DC
Rizvi, A. (2011) ‘Alternative approaches to economically sus tain able mobility in India: Comparing Ahmedabad bus rapid transit and Delhi metro systems’, Case studyprepared for the Global Report on Human Settlements2013, www.unhabitat.org/grhs/2013
Roberts, B. (2012) City Clusters: Engines of Global andRegional Economies, Paper Commissioned by UN-Habitatfor the State of the World’s Cities Report, Nairobi
Roberts, B. and T. Kanaley (eds) (2006) Urbanization and Sus -tain ability in Asia: Case Studies of Good Practice, Manila,Philippines, Asian Devel op ment Bank and Cities Alliance(World Bank)
Roberts, I. and P. Edwards (2010) The Energy Glut: ThePolitics of Fatness in an Overheating World, Zed Books,London
Robichand, K. and M. Gunter (2012) ‘Capital city pedestriancrossing study: City of Fredericton’, Opus International,http://www.fredericton.ca/en/transportation/resources/CCPedStudy_DraftReport_Apr-12.pdf, last accessed 26 March 2013
Rodgers, J. (2006) ‘Russia’s women drivers fight back’, BBCNews, 1 November, London
Rodrigue, J.-P. (2011) ‘Intermodal terminals, mega ports andmega logistics’, in S.D. Brunn (ed) Engineering Earth: TheImpacts of Mega-engineering Projects, Dordrecht, KluwerAcademic Publishers, The Netherlands: 851–866
Rodrigue, J.-P., B. Slack and C. Comtois (2009) The Geog -raphy of Transport Systems, Routledge, New York
Rodriquez, A. (2012) Study on Integrated Spatial Devel -opment: Bogotá, Colombia, World Bank, Washington, DC
Rodriquez, D. and C. Mojica (2009) ‘Capitalization of BRTnetwork expansion effects into prices of non-expansionareas’, Transportation Research A 43: 560–571
Rodriquez, D. and F. Targa (2004) ‘The value of accessibilityto Bogotá’s bus rapid transit system’, Trans port Reviews24(5): 587–610
Rodriquez, D., E. Brisson and N. Estuinan (2009) ‘Therelationship between segment-level built environ-ment attributes and pedestrian activity around Bogotá’s BRT stations’, Transportation Research D 14:470–478
Rogat, J., M. Hinostroza and E. Kamala (2009) ‘Promotingsus tain able trans port in Latin America through masstransit technologies’, in report of Colloque internationalEnvironnement et transports dans des contexts différents,Ghardaïa, Algérie, 16–18 February 2009, Alger: 83–92,http://www.inrets.fr/ur/lte/lesseminaires/ghardaia09/pdf/Ernest.pdf, last accessed 26 March 2013
Rosenbloom, S. (2005) ‘Understanding women’s and men’stravel patterns: The research challenge’, in Trans-porta tion Research Board of the National Academies,Conference Proceedings 45: Research on Women’s Issuesin Transportation: Report of a Conference; Volume 1:Conference Overview and Plenary Papers, Washington,DC: 7–28, http://onlinepubs.trb.org/onlinepubs/conf/CP35v1.pdf, last accessed 26 March 2013
Rosenbloom, S. and E. Burns (1993) ‘Gender differences incommuter travel in Tucson: Implications for traveldemand management programs’, Transportation ResearchRecord 1404: 82–90
Royal Institute of Technology (2012) Impacts of Free PT,
Tallinn – Evaluation Framework, http://www.tallinn.ee/eng/tasutauhistransport/g9616s62872, last accessed 18April 2013
Rudlin, D. and N. Falk (2009) Sus tain able Urban Neigh bour -hood: Building the 21st Century Home, ArchitecturalPress, Oxford, UK
Rusche, T. (2010) ‘The European climate change program:An evaluation of stakeholder involvement and policyachievements’, Energy Policy 38(10): 6349–6359
Sager, J., J. Apte, D. Lemoine and D. Kammen (2011) ‘Reducegrowth rate of light-duty vehicle travel to meet 2050global climate goals’, Environ mental Research Letters 6:1–6
Salanie, B. (2005) The Economics of Contracts: A Primer, 2ndEdition, MIT Press, Cambridge
Salon, D. and S. Shewmake (2011) ‘Opportunities for valuecapture to fund public transport: A comprehensive reviewof the literature with a focus on East Asia’,http://ssrn.com/abstract=1753302, last accessed 30January 2013
Salter, R., S. Dhar and P. Newman (eds) (2011) Technologiesfor Climate Change Mitigation – Transport Sector, TNAGuidebook Series, GEF/UNEP, http://tech-action.org/Guidebooks/TNA_Guidebook_MitigationTransport.pdf,last accessed 17 May 2013
Samarthyam (India National Centre for Accessible Environ -ments) (2010) ‘Accessibility of auto rickshaws’, http://www.samarthyam.org/accessibility-of-auto-rikshaws.html, last accessed 26 March 2013
Sandhu, R. and J. Sandhu (2007) Globalizing Cities: Inequalityand Segregation in Devel op ing Countries, Rawat Publica -tions, Jaipur, India
Sanger, T. and C. Crawley (2009) ‘The problem withpublic–private partnerships: Economic crisis exposes the high costs and risks of P3s’, The Monitor, 1 April,http://www.policyalternatives.ca/publications/monitor/problem-public-private-partnerships, last accessed 30January 2013
Santacana, F. (2000) El planejament strategic, Aula Barcelona,Quaderns de gestió, Barcelona, Spain
Santos, E. (2011) Curitiba, Brazil: Pioneering in Devel op ingBus Rapid Transit and Urban Planning Solutions, LambertAcademic Publishing, Saarbrücken
Sassen, S. (2007) ‘Urban sociology in the 21st century’, inC.D. Bryant and D.L. Peck (eds), 21st Century Sociology,Sage Publications: 476–486
Satoh, K. and L. Law (2009) ‘Editorial: Devel op ment anddeployment of sus tain able transportation’, InternationalJournal Sus tain able Transportation 1(2): 69–71
Satterthwaite, D., S. Huq, M. Pelling, H. Reid and P.R.Lankao (2007) Adapting to Climate Change in UrbanAreas: The Possibilities and Constraints in Low- andMiddle-income Nations, International Institute forEnviron ment and Devel op ment (IIED), HumanSettlements Discussion Paper Series, http://pubs.iied.org/pdfs/10549IIED.pdf, last accessed 22 May 2013
Savage, I. and K.A. Small (2010) ‘A comment on “Sub -sidization of Urban Public Trans port and the MohringEffect”’, Journal of Transport Economics and Policy 44(3):373–380
Savage, N. (2011) ‘Fuel options: The ideal biofuel’, Nature474: S9–S11 (23 June 2011), http://www.nature.com/nature/journal/v474/n7352_supp/full/474S09a.html, last
accessed 30 January 2013Sayeg, P. (2009) ‘Draft case study: Urban trans port
arrangements in Australia’, unpublished Report, WorldBank, Washington, DC
Schäfer A., J.B. Heywood, H.D. Jacoby and I.A. Waitz (2009)Transportation in a Climate-Constrained World, MITPress, Massachusetts
Schaeffer, K.H. and E. Sclar (1980) Access for All:Transportation and Urban Growth, Columbia UniversityPress, New York
Scheurer, J. (2001) ‘Urban ecology, innovations in housingpolicy and the future of cities: Towards sus tain ability in neigh bour hood communities’, PhD Thesis, MurdochUniversity Institute of Sus tain able Transport, Perth,http://www.istp.murdoch.edu.au/ISTP/publications/jscheurer/urbanecology/index.html, last accessed 30 January2013
Scheurer, J., P. Newman, J. Kenworthy and T. Gallagher(2000) Can Rail Pay? Light Rail Transit and Urban Redevel -op ment with Value Capture Funding and Joint Devel op -ment Mechanisms, ISTP, Perth
Schipper, L. (2011) ‘Automobile use, fuel economy and CO2 emissions in industrialised countries: Encouragingtrends through 2008?’, Transport Policy 18: 358–372
Schneider, A., M.A. Friedl and D. Potere (2009) ‘A new globalmap of global urban extent from MODIS satellite data’,Environ mental Research Letters 4: 1–11
Schrag, Z.M. (2000) ‘“The bus is young and honest”,Transportation politics, technical choice and themotorization of Manhattan surface transit, 1919–1936’,Technology and Culture 41(1): 51–79
Schrank, D. and T. Lomax (2007) The 2007 Urban MobilityReport, Transportation Institute, Texas A&M University,College Station, http://www.pagnet.org/documents/HumanServices/MobilityReport2007Wappx.pdf, lastaccessed 9 May 2013
Schrank, D., B. Eisele and T. Lomax (2012) 2012 AnnualUrban Mobility Report, Texas A&M TransportationInstitute, http://d2dtl5nnlpfr0r.cloudfront.net/tti.tamu.edu/documents/mobility-report-2012.pdf, last accessed18 April 2013
Schuster, C. and C. Perez Brito (2011) ‘Cutting costs, boost -ing quality and collecting data real-time – Lessons froma cell phone-based beneficiary survey to strengthenGuatemala’s conditional cash transfer program’, En Breve, February, No. 16, World Bank, http://siteresources.worldbank.org/INTLAC/Resources/257803-1269390034020/EnBreve_166_Printable.pdf, lastaccessed 14 February 2013
Sclar, E.D. (2000) You Don’t Always Get What You Pay For:The Economics of Privatization, Cornell University Pressand Century Foundation, Ithaca, NY
Scotiabank (2013) Global Auto Report, 6 March, Scotiabank,Toronto, http://www.gbm.scotiabank.com/English/bns_econ/bns_auto.pdf, last accessed 18 April 2013
Scottish Executive Central Research Unit (2000) ‘Womenand transport: Moving forward’, Report prepared by Reid-Howie Associates, http://www.scotland.gov.uk/Resource/Doc/156605/0042069.pdf, last accessed 26 March 2013
Sheehan, M.O. (2002) ‘What will it take to halt sprawl?’,World Watch 15: 12–23
Sheller, M. and J. Urry (2003) ‘Mobile transformations ofpublic and private life’, Theory, Culture and Society 20(3):
107–125Shin, H.C. (2007) ‘Korea bicycle transportation: Trends and
safety’, Presentation made at the Seminar on CyclingSafety, 7 April 2011, Seoul, Republic of Korea, organizedby the Organisation for Economic Co-operation andDevel op ment and the Korea Transport Institute, http://www.internationaltransportforum.org/Proceedings/Cycling2011/Shin.pdf, last accessed 2 July 2013
Shoiji, K. (2001) ‘Lessons from Japanese experi ence and rolesof public and private sector in urban transport’, JapanRailway and Transport Review 29: 12–18, http://www.jrtr.net/jrtr29/pdf/f12_sho.pdf, last accessed 30January 2013
Shoup, D. (2003) ‘Truth in transportation planning’, Journalof Transportation and Statistics 6(1): 1–16, http://apps.bts.gov/publications/journal_of_transportation_and_statistics/volume_06_number_01/html/paper_01/index.html, last accessed 1 March 2013
Shoup, D. (2005) ‘High cost of free parking’, University ofCalifornia, Transportation Center, Berkeley, http://www.uctc.net/papers/351.pdf, last accessed 21 February 2013
Shoup, D. (2011) The High Cost of Free Parking, RevisedEdition, Planners Press, Chicago
Silcock, D. (1981) ‘Urban paratransit in the devel op ingworld’, Transport Reviews 1(2): 151–168
Singh, S.K. (2012) ‘Urban trans port in India: Issues,challenges, and the way forward’, European Trans port52(5): 1–26
SMA-GDF (Secretaria del Medio Ambiente del Gobierno delDistrito Federal) (2008) ‘Inventario de emisionescontaminantes criterio de la ZMVM’, SMA-DF, http://www.sma.df.gob.mx/sma/index.php?opcion=26&id=689, last accessed 22 May 2013
Small, K.A. and E.T. Verhoef (2007) The Economics of UrbanTransportation, Routledge, London
SMART (Sustainable Mobility Accessibility Research andTransformation) (2008) Future Research Directions inSustainable Mobility and Accessibility, University ofMichigan Center for Advancing Research and Solutionsfor Society (CARSS), http://www.um-smart.org/project_research/Future_directions.pdf, last accessed 3 June2013
SmartGrowthAmerica (2010) ‘What we learned from the stimulus’, http://www.smartgrowthamerica.org/resources/what-we-learned-from-the-stimulus/, lastaccessed 30 January 2013
Smith, J. and T. Gihring (2006) ‘Financing transit systemsthrough value capture: an annotated bibliography’,American Journal of Economics and Sociology 65(3):751–786
Social Exclusion Unit (2003) Making the Connections: FinalReport on Transport and Social Exclusion, Office of theDeputy Prime Minister, UK, February, http://assets.dft.gov.uk/statistics/series/accessibility/making-the-connections.pdf, last accessed 26 March 2013
Sociecity (2011) ‘Changwon: High-tech Nubija bicycleshare system’, 23 October, http://sociecity.com/beat-on-the-street/changwon-high-tech-nubija-bicycle-share-system, last accessed 30 January 2013
Source London (undated) ‘Sainsbury’s’, https://www.sourcelondon.net/sainsburys, last accessed 30 January 2013
South African Govern ment Information (2012) ‘Bus Rapid Transit System (BRT)’, http://www.info.gov.za/aboutgovt/programmes/brt/index.html, last accessed
Planning and Design for Sustainable Urban Mobility300
3 April 2013Srinivasan, S. (2005) ‘Influence of residential location
on travel behaviour of women in Chennai, India’, In Trans -portation Research Board of the National Academies,Conference Proceedings 35: Research on Women’s Issuesin Transportation: Report of a Conference: Volume 2:Technical Papers, Washington, DC: 4–13, http://onlinepubs.trb.org/onlinepubs/conf/CP35v2.pdf, last accessed26 March 2013
Srivastava, R.K. and B. Anderson (2010) ‘Gender roles andfamily decision making: A study of Indian automobilepurchases’, International Journal of Services, Economicsand Management 2(2): 109–120
Stainburn, S. and J. Overdorf (2013) ‘New Delhi air pollutionworse than Beijing’s’, GlobalPost, 31 January,http://www.globalpost.com/dispatch/news/regions/asia-pacific/india/130131/new-delhi-air-pollution-worse-bejing, last accessed 1 February 2013
Starkey, P., S. Ellis, J. Hine, and A. Ternell (2002) ‘Improvingrural mobility: Options for devel op ing motorized and non-motorized trans port in rural areas’, World Bank,Washington, DC, http://www.pickar.caltech.edu/me105/materials/transportation/ImprovingRuralMobility.pdf, lastaccessed 26 March 2013
Stockholm County Council (2006) The Stockholm Region:Regional Planning and Devel op ment Overview, Office of Regional Planning and Urban Transportation, Stock-holm County Council, Stockholm, http://www.eurometrex.org/Docs/Moscow/Stockholm_Summary_and_Profile.pdf, last accessed 1 March 2013
Stockholm Municipality (2000) ‘Stockholms Stad: 1975–1990-tal, Tunnelbanestad’, Stockholm
Storeygard, A. (2011) ‘Farther on Down the Road: Trans portCosts, Trade and Urban Growth in Sub-Saharan Africa’,research paper, Brown University, Department ofEconomics, Providence
Suchorzewski, W. (2011) ‘Sus tain able urban mobility intransitional economies’, unpublished regional studyprepared for the Global Report on Human Settlements2013, www.unhabitat.org/grhs/2013
Sullivan, E. and M. Burris (2006) ‘Benefit–cost analysis ofvariable pricing projects: SR-91 express lanes’, Journal ofTransportation Engineering 132(3): 191–198
Susantono, B. (1998) ‘Transportation and land use dynamicsin Metropolitan Jakarta’, Berkeley Planning Journal 12:126–144, http://www.escholarship.org/uc/item/2g41499w#page-1, last accessed 1 March 2013
Sus tain able Transport Project for Egypt (2011) ‘Sus tain abletrans port project for Egypt’, http://www.stpegypt.org/, lastaccessed 9 April 2013
SUTP (Sus tain able Urban Transport Project) (2008) GTZ-SUTP Supports the Promotion of Cycle Rickshaws inUdon Thani, http://www.sutp.org/index.php?option=com_content&task=view&id=1101&Itemid=1, lastaccessed 18 April 2013
SUTP (2012) GEF-5: A Way Forward, http://www.sutpindia.com/docs/sumit_221112/SUTP_AM_GEF5.pdf, last accessed 18 April 2013
Suzuki, H., A. Dastur, S. Moffatt, N. Yabuki and H.Maruyama (2010) Eco2 Cities: Ecological Cities asEconomic Cities, The World Bank, Washington, DC
Suzuki, H., R. Cervero and K. Iuchi (2013) TransformingCities with Transit: Transit and Land-Use Integration for Sus tain able Urban Devel op ment, World Bank,
Washington, DCSwamy, H., S. Sinha, N. Bhakuni and S. Imchen (2012)
Integrated Spatial Devel op ment: Summary Report –Ahmedabad, Centre of Excellence in Urban Transport,CEPT University, Ahmedabad, India
Swilling, M. (2012) ‘Africa 2050: Growth, resourceproductivity and decoupling’, Sus tain ability Institute,School of Public Management and Planning, StellenboschUniversity, South Africa, http://www.learndev.org/dl/BtSM2011/Africa%20Policy%20Brief.pdf, last accessed27 May 2013
Syabri, I., D.M. Sebayang and B.T. Soegijanto (2011)‘Embracing paratransit in Bandung metropolitan area,West Java, Indonesia’, unpublished case study preparedfor the Global Report on Human Settlements 2013,www.unhabitat.org/grhs/2013
Systra (2008) Stratégie de mobilité durable dans les villes despays en développement: Guide pédagogique, MEEDDAT/CERTU, Lyon, France
Tagliaventi, G. and A. Bucci (2009) The Guide of Eco-EfficientCities, Avoe Publications, Bologna, Italy
Talen, E. (2005) The New Urbanism and American Planning:The Conflict of Cultures, Routledge, New York
Tanaka, D.F., H. Ishida, M. Tsutsumi and N. Okamoto (2005)‘Private finance for road projects in devel op ing countries:Improving transparency through VFM risk assessment’,Journal of the Eastern Asia Society for TransportationStudies 6: 3899–3914, http://www.easts.info/on-line/journal_06/3899.pdf, last accessed 18 February 2013
Taniguchi, E. and R.G. Thompson (eds) (2008) Innovationsin City Logistics, Nova Science Publishers, Hauppauge, NY
Tarazona, H. (2008) ‘Portales de Transmilenio: Revitalizaciónde espacios e integración social urbana’, EdicionesUniandes, Bogotá
Taylor, B., A. Loukaitou-Sideris, R. Liggett, C. Fink, M.Wachs, E. Cavanagh, C. Cherry and P.J. Haas (2005) ‘Al Qaeda attack on RENFE subway system Madrid’, in‘Designing and operating safe and secure transit systems:Assessing current practices in the United States andabroad’, MTI REPORT 04-05, November, MinetaTransportation Institute, College of Business, San JoséState University, San Jose, CA, http://transweb.sjsu.edu/MTIportal/research/publications/documents/04-05/MTI_04-03_Secure_Transi_Systems.htm#pgfId-1011243, last accessed 26 March 2013
Taylor, M.A.P. (2005) ‘The city logistics paradigm for urbanfreight transport’, Proceedings of the 2nd State ofAustralian Cities Conference, Urban Research Program,Griffith University, Brisbane
Teravaninthorn, S. and G. Raballand (2009) Transport Pricesand Costs in Africa: A Review of the Main Inter nationalCorridors, World Bank, African Infra struc ture CountryDiagnostic, Working Paper 14, Washington, DC
Texas Transportation Institute (2010) ‘The urban mobilityreport’, Texas Transportation Institute, Texas
Thomson, J. (1977) Great Cities and Their Traffic, Penguin,Harmondsworth, UK
Tiwari, G. (2011) ‘Key mobility challenges in Indian cities’,Discussion Paper 2011-18, Organization for EconomicDevel op ment/International Transport Forum, Paris,http://www.internationaltransportforum.org/jtrc/DiscussionPapers/DP201118.pdf, last accessed 28 May 2013
Tiwari, G. (2011) ‘Road safety: Decade of action withresearch’, International Journal of Injury Control and
Mobility and Urban Form 301
1EEE234567891012311145678920123456789301234567894012345678950123456789EEEE
Safety Promotion 18(1): 1–2Tiwari, G. (2012) ‘Public trans port accessibility feeder to
metro/BRT?’, 5th Urban Mobility Conference 2012,http://urbanmobilityindia.in/Upload/Conference/044e543d-2843-4c93-90da-4d1f8bcd99bd.pdf, last accessed18 April 2013
Todes, A., N. Malaza and A. Williamson (2009) ‘Goodpractice in planning with gender in the Common-wealth’, Paper for the Women in Planning (WiP) Networkof the Commonwealth Association of Planners, March,http://siteresources.worldbank.org/INTSOUTHAFRICA/Resources/Revised_CAP_paper_2_April_1.pdf, lastaccessed 26 March 2013
Trade Arabia (2013) ‘RATP launches new tramway in Algeria’, 13 May, http://www.tradearabia.com/news/MISC_235829.html, last accessed 6 June 2013
Trans port for London (2011) ‘Business plan: GLA budgetupdate 2011/12–2014/15’, http://www.tfl.gov.uk/assets/downloads/corporate/business-plan-gla-budget-update.pdf, last accessed 30 January 2013
Trans port for London (undated a) ‘History’, http://www.tfl.gov.uk/corporate/modesoftransport/londonunderground/1604.aspx, last accessed 20 May 2013
Trans port for London (undated b) ‘Hybrid buses’, http://www.tfl.gov.uk/corporate/projectsandschemes/2019.aspx, last accessed 30 January 2013
Transportation Research Board (2005) ‘ConferenceProceedings 34: International Perspective on RoadPricing’, Key Biscayne, Florida, 19–22 November 2003,http://www.trb.org/publications/conf/cp3roadpricing.pdf, last accessed 7 February 2013
TRB (Transportation Research Board) (1999) The Role ofTransit Amenities and Vehicle Characteristics in BuildingTransit Ridership: Amenities for Transit Handbook and theTransit Design Game Workbook, TCRP Report 46,National Academy Press, Washington, DC
TRB (2011) ‘Research Results Digest 102’, TransitCooperative Research Program (TCRP), TRB, http://onlinepubs.trb.org/onlinepubs/tcrp/tcrp_rrd_102.pdf, lastaccessed 21 May 2013
TRL Limited (Transport Research Laboratory Ltd) (2004)‘Overseas road note 22: A guide to pro-poor trans portappraisal’, TRL Limited, UK, http://www.transport-links.org/transport_links/filearea/documentstore/322_ORN22%20-%20Final.PDF, last accessed 26 March 2013
Tsai, Y. (2005) ‘Quantifying urban form: Compactness versus“sprawl”’, Urban Studies 42(1): 141–161
TUBITAK (Türkiye Bilimsel ve Teknolojik Arastırma Kurumu)(2007) The Regulation of Taxicab Markets and IstanbulExperi ence: Problems and Solutions, Scientific andTechnical Research Council of the Turkish Republic,Project No. 105K164, May, TUBITAK, Ankara
Turro, M. (2011) ‘A closer look at funding and financing forpublic transport’, Public Transport International (UITP) 2:20–24
UITP (International Association of Public Transport) (2001)Millennium Cities Database for Sustainable Transport, CD ROM, UITP, Brussels
UITP (2004) ‘The Dresden Declaration on the importanceof keeping and upgrading long established tramwaysystems’, http://www.uitp.org/news/details-news.cfm?&id=108&lg=en, last accessed 20 May 2013
UITP (2006) Mobility in Cities Database, CD Rom, UITP,Brussels
UITP (2009) Public Transport: The Smart Green Solution!Doubling Market Share Worldwide by 2025, UITP,Brussels, http://www.ptx2uitp.org/sites/default/files/UITP-PTstrategy_fullbrochure-EN.pdf, last accessed 30 January 2013
UITP (2010) ‘Public trans port in Sub-Saharan Africa: Majortrends and case studies’, Trans-African Consortium,Brussels, http://www.uitp.org/knowledge/pdf/PTinSSAfr-Majortrendsandcasestudies.pdf, last accessed 30January 2013
UITP (2011a) ‘Employment in public transport: 13 millionpeople worldwide!’, Observatory of employment inpublic transport, Report 1 April, Brussels, http://www . u i t p . o r g / p u b l i c - t r a n s p o r t / b u s i n e s s_human/pdf/observatoire_emploi.pdf, last accessed 30January 2013
UITP (2011b) Report on Statistical Indicators of Public Trans -port Performance in Africa, Version 1.3, Brussels,http://www.uitp.org/knowledge/pdf/Report_on_statistical_indicators_of_publictransportperformanceinS-SA.pdf,last accessed 28 May 2013
UITP (undated) ‘Public trans port A–Z’, http://www.uitp.org/Public-Transport/light-rail/index.cfm, last accessed 5June 2013
UITP and UATP (Union Africaine des Transports Publics)(2010) Report on Statistical Indicators of Public TransportPerformance in Africa, UITP and UATP, http://www.uitp.org/knowledge/pdf/Report_on_statistical_indicators_of_publictransportperformanceinS-SA.pdf, last accessed 18April 2013
UN (United Nations) (1997) ‘Road trans port and the environ -ment: Areas of concern for the Asian and Pacific region’,New York
UN (2008) World Urbanization Prospects: The 2007 Revision,Population Division, Department of Economic and SocialAffairs, New York
UN (2011a) World Population Prospects: The 2010 Revision,United Nations, Department of Economic and SocialAffairs, Population Division, New York, NY, http://esa.un.org/wpp/Excel-Data/population.htm, last accessed26 March 2013
UN (2011b) World Urbanization Prospects: The 2011Revision, http://esa.un.org/unup/pdf/FINALFINAL_REPORT%20WUP2011_Annextables_01Aug2012_Final.pdf, last accessed 20 May 2013
UN (2012a) World Urbanization Prospects: The 2011Revision, United Nations, Department of Economic andSocial Affairs, Population Division, New York, NY,http://esa.un.org/unpd/wup/index.htm, last accessed 31January 2013
UN (2012b) World Economic and Social Survey 2012: InSearch of New Devel op ment Finance, United Nations,Department of Economic and Social Affairs, PopulationDivision, New York, NY, E/2012/50/Rev. 1 (ST/ESA/341),http://www.un.org/en/devel op ment/desa/policy/wess/wess_current/2012wess.pdf, last accessed 18March 2013
UN System Task Team on the Post-2015 UN Devel op-ment Agenda (2013) A Renewed Global Partnership forDevel op ment, New York, March, http://www.un.org/en/devel opment/desa/policy/untaskteam_undf/glob_dev_rep_2013.pdf, last accessed 27 March 2013
UNCHS (United Nations Centre for Human Settlements)
Planning and Design for Sustainable Urban Mobility302
(1990) Report of the Ad Hoc Expert Committee Meet-ing on Trans port in Cities of One Million Plus, UNCHS,Nairobi
UNCHS (1993) ‘City of Ottawa: A case study’, in Improvingthe Quality of Life of the Elderly and Disabled People inHuman Settlements, UNCHS, Nairobi: 48–50
UNCHS (1997) The Istanbul Declaration and the HabitatAgenda, with subject index, UNCHS, Nairobi
UNCRD (United Nations Centre for Regional Devel op ment)(2008) ‘Sus tain able Transport: Myanmar’, 3rd RegionalEnviron mentally Sus tain able Transport (EST) Forum,Singapore, 17–19 March
UNEP (United Nations Environ ment Programme) (2007a)Beijing 2008 Olympic Games: An Environ mental Review,UNEP, Nairobi, http://www.unep.org/publications/ebooks/beijing-report/pdfs/BeijingReport.pdf, last accessed 30January 2013
UNEP (2007b) Opening the Door to Cleaner Vehicles inDevel op ing and Transition Countries: The Role of Lower Sulphur Fuels, Report of the Sulphur WorkingGroup of the Partnership for Clean Fuels and Vehicles (PCFV), Nairobi, http://www.unep.org/transport/pcfv/PDF/SulphurReport.pdf, last accessed 30 January 2013
UNEP (2008) Reforming Energy Subsidies: Opportunities toContribute to the Climate Change Agenda, Division ofTechnology, Industry and Economics, Paris, http://www.unep.org/pdf/pressreleases/reforming_energy_subsidies.pdf, last accessed 30 January 2013
UNEP (2009) Hybrid Electric Vehicles: An overview of currenttechnology and its application to devel op ing andtransitional countries, UNEP, Nairobi, http://www.unep.org/transport/pcfv/PDF/HEV_Report.pdf, last accessed 30January 2013
UNEP Risø Centre (2013) ‘CDM projects by type: Projecttypes breakdown into the sub-types’, http://cdmpipeline.org/cdm-projects-type.htm, last accessed 10 April 2013
UN-ESCAP (United Nations Economic and Social Com -mission for Asia and the Pacific) (2006a) Asian Highway:Priority Investment Needs for the Devel op ment of theAsian Highway Network, United Nations, New York
UN-ESCAP (United Nations Economic and Social Com -mission for Asia and the Pacific) (2006b) EnhancingRegional Cooperation in Infra struc ture Devel op mentIncluding that Related to Disaster Management, Macro -economic Policy and Devel op ment Division, UNESCAP,Bangkok, http://www.unescap.org/pdd/publications/themestudy2006/themestudy_2006_full.pdf, lastaccessed 30 January 2013
UN-Habitat (United Nations Human Settlements Pro gramme)(2004) The State of the World’s Cities 2004/2005:Globalization and Urban Culture, UN-Habitat andEarthscan, London
UN-Habitat (2007) Enhancing Urban Safety and Security:Global Report on Human Settlements 2007, Earthscan,London, http://www.unhabitat.org/grhs/2007, lastaccessed 26 March 2013
UN-Habitat (2008) Harmonious Cities: State of the World’sCities 2008/2009, Earthscan, London, www.unhabitat.org/pmss/getElectronicVersion.aspx?nr=2562&alt=1,last accessed 30 January 2013
UN-Habitat (2009) Planning Sus tain able Cities: Global Reporton Human Settlements 2009, Earthscan, London,http://www.unhabitat.org/downloads/docs/GRHS2011_
Full.pdf, last accessed 17 April 2013UN-Habitat (2010) Bridging the Urban Divide: State of the
World’s Cities 2010/2011, UN-Habitat, NairobiUN-Habitat (2011) Cities and Climate Change: Global Report
on Human Settlements 2011, Earthscan, London,http://www.unhabitat.org/grhs/2011, last accessed 28May 2013
UN-Habitat (2012) State of the World’s Cities Report:Prosperity of Cities, Earthscan, London
UN-Habitat (2013a) State of the World’s Cities 2012/2013:Prosperity of Cities, UN-Habitat and Earthscan, London,http://www.unhabitat.org/pmss/listItemDetails.aspx?publicationID=3387, last accessed 23 May 2013
UN-Habitat (2013b) ‘The relevance of street patterns andpublic space in urban areas’, UN-Habitat Working Paper,April, Nairobi, http://www.unhabitat.org/pmss/listItemDetails.aspx?publicationID=3465, last accessed 27 June2013
UNICEF (United Nations Children’s Fund) (1999) State ofthe World’s Children Report 1999: Education, UnitedNations, New York, http://www.unicef.org/sowc99/sowc99e.pdf, last accessed 26 March 2013
United States General Accounting Office (2001) ‘Masstransit: Bus rapid transit shows promise’, Report toCongressional Requesters, GAO-01-984, Washington,DC, http://www.gao.gov/new.items/d01984.pdf, lastaccessed 30 January 2013
University of California at Riverside (2002) ‘Nairobi, Kenyavehicle activity study’, Global Sus tain able SystemsResearch, http://www.issrc.org/ive/downloads/reports/NairobiKenya.pdf, last accessed 30 January 2013
UPI (United Press International) (2008) ‘French rediscoverlove for streetcars’, UPI.com, 18 July, http://www.upi.com/Top_News/2008/07/18/French-rediscover-love-for-streetcars/UPI-82771216410359, last accessed 20 May2013
Urban Transportation Task Force (2012) The High Cost ofCongestion in Canadian Cities, http://www.comt.ca/english/uttf-congestion-2012.pdf, last accessed 18 April2013
Urry, J. (2004) ‘The system of automobility’, Theory,Culture and Society 21(4–5): 25–39, http://www.lancs.ac.uk/fass/centres/cemore/word%20docs/urry-systemofautomobility.pdf, last accessed 28 May 2013
US Census Bureau (2012) Statistical Abstract of the UnitedStates: 2012, ‘Section 23: Transportation’, http://www.census.gov/prod/2011pubs/12statab/trans.pdf, lastaccessed 30 January 2013
US Department of Transportation (2006) CongestionPricing: A Primer, Federal Highway Administration,Office of Transportation Management, HOTM, Wash -ington, DC (Publication Number: FHWA-HOP-07-074),http://ops.fhwa.dot.gov/publications/congestionpricing/congestionpricing.pdf, last accessed 30 January 2013
US Department of Transportation (2009) ‘High-speed railstrategic plan: Press release and highlights’, http://www.fra.dot.gov/Downloads/RRdev/hsrpressrelease.pdf, lastaccessed 20 April 2009
Van Dender, K. and P. Crist (2011) ‘What does improved fueleconomy cost consumers and what does it cost tax -payers? Some illustrations’, Organization for EconomicDevel op ment/International Trans port Forum, DiscussionPaper 2011-16, Paris, http://www.internationaltransport
Mobility and Urban Form 303
1EEE234567891012311145678920123456789301234567894012345678950123456789EEEE
forum.org/jtrc/DiscussionPapers/DP201116.pdf, lastaccessed 28 May 2013
van Goeverden, C., P. Rietveld, J. Koelemeijer and P. Peeters(2006) ‘Subsidies in public transport’, European Trans -port 32: 5–25
Van Vliet, W. (1983) ‘Children’s travel behavior’, Ekistics50(298): 61–65, http://www.ucdenver.edu/academics/colleges/ArchitecturePlanning/discover/centers/CYE/Publications/Documents/van%20vliet%20-%20children’s%20travel%20behavior.pdf, last accessed 26 March 2013
Vasconcellos, E. (2001) Urban Transport, Environ ment andEquity: The case for devel op ing countries, Earthscan,London
Vasconcellos, E. (2011) ‘Equity evaluation of urban trans port’,in H. Dimitriou and R. Gakenheimer (eds) UrbanTransport in the Devel op ing World: A Handbook of Policyand Practice, Edward Elgar, Cheltenham: 332–358
Vedula, A. (2007) ‘Blueprint and reality: Navi Mumbai, thecity of the 21st century’, Habitat International 31(1):12–23
Venter, C., H. Bogopane, T. Rickert, J. Camba, A. Venkatesh,N. Mulikita, D. Maunder, T. Savill and J. Stone (undated)‘Improving accessibility for people with disabilities inurban areas’, http://www.transport-links.org/transport_links/filearea/publications/1_793_pa3832.pdf, lastaccessed 26 March 2013
Vickers, A. (2009) Visualising Landvaluescape: Devel op ing theConcept for Britain, unpublished PhD thesis, KingstonUniversity, London, http://www.landvaluescape.org/archives/2009/12/visualising-landvaluescape-for-britian-thesis-published.html, last accessed 6 March 2013
Victoria Transport Policy Institute (2011) Park Pricing: DirectCharges for Using Parking Facilities, Online TDMEncyclopedia, http://www.vtpi.org/tdm/tdm26.htm, lastaccessed 22 February 2013
Vidal, J. (2013) ‘Beijing is not the only Asian city with lethalair pollution’, The Guardian Environ ment Blog, 17 Janu ary, http://www.guardian.co.uk/environ ment/blog/2013/jan/17/lethal-air-pollution-asia-cities, last accessed 1February 2013
Visser, J. and T. Nemoto (2002) ‘E-commerce and theconsequences for freight transport’, in E. Taniguchi andR.G. Thompson (eds) Innovations in Freight Transport,WIT Press, Southampton
Vivier, J. and M. Mezghani (2001) ‘The Millennium CitiesDatabase: A tool for sus tain able mobility’, InternationalAssociation of Public Transport (UITP), Paper presentedat summer study, http://www.eceee.org/conference_proceedings/eceee/2001/Panel_3/p3_5/paper, lastaccessed on 30 January 2013
Von Winterfeldt, D. and Prager, F. (2010) ‘Estimatingbehavioural changes for transportation modes afterterrorist attacks in London, Madrid and Tokyo’, MetransTransportation Centre, University of Southern California,www.metrans.org/research/final/08-10%20Final%20Report.pdf, last accessed 26 March 2013
Vuchic, V.R. (2005) Urban Transit: Operations, Planning, andEconomics, John Wiley and Sons, Hoboken, NY
Vuchic, V.R. (2007) Urban Transit Systems and Technology,John Wiley and Sons, Hoboken, NJ
Vuri, D. (2008) ‘The effect of availability and distance toschool on children’s time allocation in Ghana andGuatemala’, Understanding Children’s Work, ProgrammeWorking Paper, http://papers.ssrn.com/sol3/papers.cfm?
abstract_id=1780142, last accessed 26 March 2013Walker, G. (2012) Environ mental Justice: Concepts, Evidence
and Politics, Routledge, LondonWalker, J. (2011) Human Transit: How Clearer Thinking
about Public Transit Can Enrich Our Communities andOur Lives, Island Press, Washington, DC
Warner, S. (1962) Street Car Suburbs, Harvard UniversityPress, Cambridge, Massachusetts
Wassenberg, F. and T. Lupi (2011) Sterke woonerfwijken:Voorkomen is beter dan herstructureren, Nicis Institute,Den Haag, http://g32.nl/dsresource?type=pdf&objectid=g32:2177&versionid=&subobjectname=, lastaccessed 26 March 2013
Watson, G., I. Bengley, S. Roaf and P. Smith (2004) ‘Learningfrom Poundbury, England’, West Dorset City Council,Oxford Brooks University
WBCSD (World Business Council for Sus tain able Devel op -ment) (2004) Mobility 2030 Report: Meeting theChallenges to Sus tain ability, WBCSD, Geneva, http://www.wbcsd.org/web/publications/mobility/mobility-full.pdf, last accessed 26 March 2013
WCED (World Commission on Environ ment and Devel -opment) (1987) Our Common Future, Oxford UniversityPress, Oxford, electronic version of text available athttp://www.un-documents.net/wced-ocf.htm, lastaccessed 3 June 2013
Weinstein, A. and P. Schimek (2005) ‘How much doAmericans walk? An analysis of the 2001 NHTS’,Transportation Research Board Annual Meeting, 9–13January, Washington, DC
Weisbrod, G. and A. Reno (2009) ‘Economic impact of publictransportation investment’, Paper prepared for theAmerican Public Transportation Association, October,http://www.apta.com/resources/reportsandpublications/Documents/economic_impact_of_public_transportation_investment.pdf, last accessed 30 January 2013
Wenhua, W. (2005) ‘Urban travel in China: Continuingchallenges with rapid urbanization and motorization’,Presentation at a Workshop on Implementing Sus tainableUrban Travel Policies in Japan and Other Asia-PacificCountries, 2–3 March, Tokyo, Japan, http://www.internationaltransportforum.org/IntOrg/ecmt/urban/Tokyo05/Wu.pdf, last accessed 28 May 2013
Wheeler, J. (2009) ‘First Gulf metro system to open’, BBCNews, 9 September, http://news.bbc.co.uk/2/hi/middle_east/8245408.stm, last accessed 18 April 2013
WHO (World Health Organization) (2004) World Report onRoad Traffic Injury Prevention, http://whqlibdoc.who.int/publications/2004/9241562609.pdf, last accessed 26March 2013
WHO (2008) ‘Global burden of disease: 2004 update’,WHO, Geneva, http://www.who.int/healthinfo/global_burden_disease/GBD_report_2004update_full.pdf, lastaccessed 3 June 2013
WHO (2009) Global Status Report on Road Safety, WHO, Geneva, http://whqlibdoc.who.int/publications/2009/9789241563840_eng.pdf, last accessed 3 June2013
WHO (2013) Global Status Report on Road Safety: Supportinga Decade of Action, WHO, Geneva
WHO and World Bank (2011) World Report on Disability,WHO, Geneva, http://whqlibdoc.who.int/publications/2011/9789240685215_eng.pdf, last accessed 26 March2013
Planning and Design for Sustainable Urban Mobility304
WHO Regional Office for Africa (2006) Health of the People(The): The African Regional Health Report, Brazzaville,Republic of Congo, http://whqlibdoc.who.int/afro/2006/9290231033_rev_eng.pdf, last accessed 26 March2013
Wiener Linien (2010) A Look at the Company, AbridgedAnnual Report 2010, Vienna, http://www.wienerlinien.at/media/files/2011/wl_annual_report_2010_55977.pdf,last accessed 18 April 2013
Williams, K. (2000) NCHRP Synthesis of Highway Practice289: Corridor Management, Transportation ResearchBoard, National Research Council, Washington, DC
Wipperman, T.E. and T. Sowula (2007) The Rationalisationof Non Motorised Public Trans port in Bangladesh,http://www.drishtipat.org/blog/wp-content/uploads/2007/08/rickshaw-devel op ment-proposal.pdf, lastaccessed 18 April 2013
Witting, R., J. Rijnsburger, D. Winjen and A. Pettinga (2006)‘Cycling, a smart way of moving’, Second Edition,Shimano/I-CE, Interfact for Cycling Expertise, Utrecht/Nunspeet, The Netherlands
Wolf, C. (2011) ‘The public–private Indiana toll road is introuble’, Bloomberg Businessweek, 7 July, http://www.businessweek.com/magazine/the-publicprivate-indiana-toll-road-is-in-trouble-07072011.html, last accessed 30January 2013
Wolmar, C. (2009) ‘PPP was fundamentally flawed saysdeparting tube boss’, Evening Standard, 17 April,http://www.christianwolmar.co.uk/2009/04/ppp-was-fundamentally-flawed-says-departing-tube-boss/, lastaccessed 30 January 2013
Wolmar, C. (2010) ‘Rail644: Why the PPP was doomed fromthe start’, Rail Magazine, 22 May, http://www.christianwolmar.co.uk/2010/05/rail-644-why-the-ppp-was-doomed-from-the-start/, last accessed 30 January2013
Woodcock, J., D. Banister, P. Edwards, A.M. Prentice and I.Roberts (2007) ‘Energy and transport’, The Lancet370(9592): 1078–1088
Woodcock, J., I. Roberts, P. Edwards, B. Armstrong, D.Banister, S. Beevers, Z. Chalabi, A. Cohen, O. Franco, A.Haines, R. Hickman, R. Lindsey, I. Mittal, D. Mohan, G.Tiwari, C. Tonne and A. Woodward (2009) ‘Impact onpublic health effects of strategies to reduce green housegas emissions: Urban land transport’, The Lancet374(9705): 1930–1943
World Bank (1994) World Devel op ment Report, Washington,DC
World Bank (1999a) ‘Managing the social dimensions oftransport: The role of social assessment’, Social Devel op -ment Department (ECSHD), Transport Division,Washington, DC, http://www4.worldbank.org/afr/ssatp/Resources/HTML/Gender-RG/Source%20%20documents/Tool%20Kits%20&%20Guides/Social%20Analysis/TLAN1%20SocialDimensionsofTransportSector%28429KbPDF%29.pdf, last accessed 26 March 2013
World Bank (1999b) Poland, Strategic Priorities for the Trans -port Sector, Report No. 19450-POL, Washington, DC,http://www-wds.worldbank.org/servlet/WDSContentServer/WDSP/IB/1999/09/28/000094946_99072307291550/Rendered/PDF/multi_page.pdf, last accessed 6March 2013
World Bank (2000) World Devel op ment Report 2000/2001:Attacking Poverty, World Bank, Washington, DC, http://
www-wds.worldbank.org/external/default/WDSContentServer/WDSP/IB/2013/03/04/000425962_20130304112816/Rendered/PDF/226840WDR00PUB0ng0poverty0200002001.pdf, last accessed 4 April 2013
World Bank (2002a) Cities on the Move: A World Bank Urban Transport Strategy Review, World Bank, Washing -ton, DC, http://siteresources.worldbank.org/INTURBANTRANSPORT/Resources/cities_on_the_move.pdf, last accessed 23 May 2013
World Bank (2002b) Urban Transport in the Europe andCentral Asia Region: World Bank Experi ence and Strategy,Infra struc ture and Energy Services Department, Europeand Central Asia Region, Washington, DC, December,http://www.thepep.org/ClearingHouse/docfiles/WorldBank_Urban.pdf, last accessed 6 March 2013
World Bank (2005) Environ mental Fiscal Reform: WhatShould Be Done and How to Achieve It, World Bank,Washington, DC, http://siteresources.worldbank.org/INTRANETENVIRONMENT/Publications/20712869/EnvFiscalReform.pdf, last accessed 30 January 2013
World Bank (2006a) ‘Urban bus toolkit: Tools and optionsfor reforming urban bus systems’, World Bank,Washington, DC, http://www.ppiaf.org/sites/ppiaf.org/files/documents/toolkits/UrbanBusToolkit/assets/1/1e/1e6.html, last accessed 26 March 2013
World Bank (2006b) Promoting Global Environ mentalPriorities in the Urban Transport Sector Experi ence fromWorld Bank Group–Global Environ ment Facility Projects,Global Environ ment Facilities Program, The World Bank,Washington, DC
World Bank (2007) World Devel op ment Indicators: 2007,World Bank, Washington, DC, http://www.scribd.com/doc/16060172/World-Devel op ment-Indicators-2007-, lastaccessed 30 January 2013
World Bank (2008a) Safe, Clean, and Affordable: Trans portfor Devel op ment – The World Bank Group’s Trans portBusiness Strategy for 2008–2012, Washington, DC
World Bank (2008b) Urban Poverty: A Global View, WorldBank, Washington, DC, http://siteresources.worldbank.org/INTURBANDEVEL OP MENT/Resources/336387-1169585750379/UP-5.pdf, last accessed 26 March 2013
World Bank (2009a) ‘Getting people and traffic moving againin Lagos’, http://web.worldbank.org/WBSITE/EXTERNAL/EXTABOUTUS/IDA/0,,contentMDK:22229765~menuPK:4754051~pagePK:51236175~piPK:437394~theSitePK:73154,00.html, last accessed 20 May 2013
World Bank (2009b) World Devel op ment Report: ReshapingEconomic Geography, Washington, DC
World Bank (2010a) Main streaming Gender in RoadTransport: Operational Guidance for World Bank Staff,Washington, DC, http://siteresources.worldbank.org/INTTRANSPORT/Resources/336291-1227561426235/5611053-1229359963828/tp-28-Gender.pdf, lastaccessed 26 March 2013
World Bank (2010b) Yemen, Republic of: Urban Transport inSana’a: Strategy Note, World Bank Report No. 49176-YE, https://openknowledge.worldbank.org/bitstream/handle/10986/2981/491760ESW0WHIT1n0Transport0in0Sanaa.pdf?sequence=1, last accessed 18 April 2013
World Bank (2011a) ‘Metropolitan transportation institu -tions; Six case studies: Australia, Brazil, Canada, France,Germany and the United States’, A South Asia Trans portWorking Paper, South Asia Region, Transport Unit,http://siteresources.worldbank.org/INTURBAN
Mobility and Urban Form 305
1EEE234567891012311145678920123456789301234567894012345678950123456789EEEE
TRANSPORT/Resources/Heanue-Salzberg-MTA-for-India-9Mar2011.pdf, last accessed 18 March 2013
World Bank (2011b) World Devel op ment Indicators 2011,Washington, DC
World Bank (2012a) ‘Cairo traffic is much more than anuisance’, News, August 21, http://www.worldbank.org/en/news/feature/2012/08/21/cairo-traffic-much-more-than-nuisance, last accessed 22 April 2013
World Bank (2012b) Maximizing Mobile: Information andCommunications for Devel op ment 2012. Overview,Washington, DC, http://ttarl.org/attachments/IC4D2012Overview.pdf, last accessed 26 March 2013
World Bank (2013) ‘Kenya: National Urban Trans portImprovement Project’, http://www.worldbank.org/projects/P126321/kenya-national-urban-transport-improvement-project?lang=en, last accessed 3 April2013
World Bank (undated a) ‘Gender and trans port resourceguide’, http:/www4.worldbank.org/afr/ssatp/Resources/HTML/Gender-RG/Index.html, last accessed 26 March2013
World Bank (undated b) ‘Transport and gender’, http://web.worldbank.org/WBSITE/EXTERNAL/TOPICS/EXTTRANSPORT/EXTTSR/0,,contentMDK:21246915~menuPK:2970901~pagePK:210058~piPK:210062~theSitePK:463716,00.html, last accessed 26 March 2013
World Bank and DfID (Department for International Devel op ment) (2009) Freight Trans port for Devel op-ment – Toolkit: Urban Freight, Washington, DC, http://siteresources.worldbank.org/INTTRANSPORT/Resources/336291-1239112757744/5997693-1266940498535/urban.pdf, last accessed 30 January 2013
World Bank Ghana Office (2010) World Bank ApprovesUS$228 Million for Abidjan-Lagos Transport Corridor,http://www.modernghana.com/news/269126/1/world-bank-approves-us228-million-for-abidjan-lago.html,retrieved the 25 March 2010
World Bank Independent Evaluation Group (2007) A Decadeof Action in Transport: An Evaluation of World BankAssistance to the Transport Sector, 1995–2005, WorldBank, Washington, DC, http://siteresources.worldbank.org/EXTTRANSPORTATION/Resources/transport_eval.pdf, last accessed 6 March 2013
World Economic Forum (2012) ‘Caracas, Venezuela: neigh -bour hood upgrading’, Urban Anthologies: Learning fromour Cities, World Economic Forum, New York
World Institute on Disability (2005) Technology andDisability: A Global Glimpse of the Future, Oakland, CA,for the International Disability Exchanges and Studies(IDEAS) Project, http://wid.org/publications/downloads/TECHNOLOGY%20-%20DISABILITY.pdf, last accessed26 March 2013
Worldwatch Institute (2008) Green Jobs: Towards DecentWork in a Sus tain able, Low-Carbon World, Washington,DC, for United Nations Environ ment Programme,International Labour Organization, International Organ -isation of Employers, International Trade Union Confed -eration, and Green Jobs Initiative, http://www.ilo.org/wcmsp5/groups/public/@ed_emp/@emp_ent/documents/publication/wcms_158727.pdf, last accessed 26 March2013
Wright, L. (2010) ‘Bus rapid transit: A public trans portrenaissance’, Built Environ ment 36(3): 269–273
Wright, L. (2011) ‘Bus rapid transit: A review of recentadvances’, in H. Dimitriou and R. Gakenheimer (eds)
Urban Transport in the Devel op ing World: A Handbookof Policy and Practice, Edward Elgar, Cheltenham, UK:421–455
Wright, L. and K. Fjellstrom (2003) Mass Transit Options,Module 3a of Sus tain able Transport: A Sourcebook forPolicymakers in Devel op ing Cities, GTZ, Frankfurt,http://www.itdp.org/documents/MTO.PDF, last accessed22 May 2013
Wright, L. and W. Hook (eds) (2007) Bus Rapid TransitPlanning Guide, 3rd Edition, Institute for Transportationand Devel op ment Policy, New York, http://www.itdp.org/microsites/bus-rapid-transit-planning-guide/brt-planning-guide-in-english/, last accessed 21 May 2013
Yang, J., Q. Shen, J. Shen, J. and C. He (2012) ‘Trans portimpacts of clustered devel op ment in Beijing: Compactdevel op ment versus overconcentration’, Urban Studies49(6): 1315–1331
Yang, P.-P. and S.-H. Lew (2009) ‘An Asian model of TOD:The planning integration in Singapore’, in C. Curtis,J. Renne and L. Bertolini (eds) Transit Oriented Devel op -ment: Making It Happen, Ashgate, Surrey, England:91–106
Yi, C. (2006) ‘The impact of public transit on employ-ment status: Disaggregate analysis of Houston, Texas’,Transportation Research Record 1986: 137–144,http://pubsindex.trb.org/view.aspx?id=776961, lastaccessed 18 April 2013
Zegras, C. (2010) ‘The built environ ment and motor vehicleownership and use: Evidence from Santiago de Chile’,Urban Studies 47(8): 1793–1817
Zegras, C. (2011) ‘Main streaming sus tain able urbantransport: Putting the pieces together’, in H.T. Dimitriouand R. Gakenheimer (eds) Urban Transport in the Devel -op ing World: A Handbook of Policy and Practice, EdwardElgar, Cheltenham: 548–555
Zegras, C. and V. Hannan (2011) ‘The dynamics of auto -mobile ownership under rapid growth: The Santiago deChile case’, http://web.mit.edu/czegras/www/Zegras andHannan_Revised2.pdf, last accessed 7 May 2013
Zeng, H. (2013) ‘China transportation briefing: 5 trends towatch in China’s urban trans port in 2013’, The City Fix,1 February, http://thecityfix.com//5-trends-watch-china-urban-transport-2013-2/, last accessed 18 April 2013
Zhang, M. (2004) ‘The role of land use in travel modechoice: Evidence from Boston and Hong Kong’, Journalof the American Planning Association 70(3): 344–360
Zhang, M. (2007) ‘Chinese edition of transit-oriented devel -op ment’, Transportation Research Record 2038:120–127
Zhao, J. (2011) ‘Land value capture China style: The good,the bad and the ugly’, Paper presented at University ofMinneapolis, August
Zhao, P. (2011) ‘Car use, commuting and urban form in arapidly growing city: Evidence from Beijing’, Transporta -tion Planning and Technology 34(6): 509–527
Zhou, W. and S. Szyliowicz (eds) (2005) Towards a Sus tain -able Future: Transportation Devel op ment Issues in China,Communications Press, Beijing
Planning and Design for Sustainable Urban Mobility306
Abidjan (Côte d’Ivoire), 28, 29, 101, 192Abidjan–Lagos coastal corridor, 101Abu Dhabi (United Arab Emirates), 45, 94Abuja (Nigeria), 99acceptability, 53, 60, 108, 150‘Access Advisr’ (pilot web application, UK), 126accessibility, 2–3, 10, 15–16, 33, 35, 36, 65, 75, 97,
102–104, 108, 114–122, 129, 138, 164, 193, 197, 198–200; economics of access, 159–161;equitable access to urban mobility, 107–128;measuring value of access, 159–160; pedestrianaccessibility and safety, improving, 120; planning,87–91, 126; private car vs. public transport,markets and modal choices, 160; road pricing,insufficient to improve, 160–161; time saving, 159
accountability, 193, 198, 203Accra (Ghana), 21, 24, 28, 51, 62, 79, 82, 99, 101, 123Acela Express (US), 101adaptation challenges, 181–182Addis Ababa (Ethiopia), 25, 28, 48, 139, 157add-on technology, 135, 144administrative and governance challenges, 178, 182–184‘aerotropolis,’ 65affordable urban mobility, 7, 10, 108–115, 171, 193,
199; challenges and impacts of poverty, 110–112;land-use, improving affordability through, 114–115;meaning of affordability, 108; non-motorizedtransport, supporting, 113–114; policy responsesand innovative practices, 113–117; publictransport, improving affordability and quality ofservice, 114; urban form, improving affordabilitythrough, 116
Afghanistan, 27Africa, 2, 5, 24–25, 28, 48, 62, 122, 178; bus rapid
transit, 49–50; density, urban, 77–78; non-motorized transport, 8, 62, 109, 111; passengertransport, 16, 18, 21, 24, 26, 32, 33; publictransport systems, 7, 8, 48, 49–51; urban form,77–78, 102; see also Eastern Africa; Middle Africa;Northern Africa; Southern Africa; Sub-SaharanAfrica; Western Africa; specific countries
African Development Bank, 54Agelada de Cima (Portugal), 93agency, single purpose, 170–171agglomeration, 39, 47, 55, 65, 84, 101, 198, 210Ahmedabad (India), 16, 17, 43, 89, 92, 105, 156, 171,
190
air pollution, 8, 19, 39, 41, 43, 62, 67, 70, 77, 84, 93,97, 110, 135, 137, 142
Algiers (Algeria), 26, 45, 48, 79American Public Transportation Association (US), 55Americans with Disabilities Act (US), 11Amman (Jordan), 186–187ammonia, 135Amsterdam (Netherlands), 61, 73, 94, 146; bicycle use,
20, 111; economic and financial issues, 157, 158animal-powered carts, 5Asia, 3, 5, 45, 48, 61, 62, 101; density, urban, 77–78;
metro systems, 44–45; passenger transport, 16, 24,31, 33, 33, 36; public transport systems, 7, 45, 48;road traffic accidents, 121, 122; urban form,77–78, 96; see also Central Asia; Eastern Asia;South-Eastern Asia; Southern Asia; Western Asia;specific countries
Asia-Pacific region, 148Asian Development Bank, 54, 141Aspen (US), 165Association for Car-free living (Vauban, Germany), 147Athens (Greece), 85, 95Atlanta (US), 12, 32, 114, 133; urban form, 79, 84, 85,
89Auckland (New Zealand), 187–188Australia, 85, 124, 133; institutions, and governance,
177, 188; passenger transport, 17, 23, 33, 34, 35;see also Brisbane (Australia); Canberra (Australia);Melbourne (Australia); Sydney (Australia); Victoria(Australia)
auto-rickshaws, 27, 119availability of transport, 108
Bahrain, 45bajas (three-wheeled motor-taxis), 26Bandung (Indonesia), 16, 82Bangalore (India), 16, 42, 99, 125, 179Bangkok (Thailand), 7, 9, 60, 65, 113; passenger
transport, 21, 27, 29, 33; public transport systems,51, 54; urban goods transport, 60, 65
Bangladesh, 8, 27; see also Dhaka (Bangladesh)banks, multilateral development, 54Barcelona (Spain), 55, 89, 89, 158, 165; mobility pact,
186, 187Bay Area Rapid Transit (BART) system, San Francisco
(US), 35becaks (pedicabs), 16–17, 72; see also non-motorized
transport (NMT)
1EEE234567891012311145678920123456789301234567894012345678950123456789EEEE
INDEX
References to Figures or Tables will be in italics.
Beijing (China), 8, 12, 16, 19, 24, 84; environment andurban mobility, 136, 139; metro system, 45, 46;public transport systems, 42, 45, 46, 47, 49, 55;urban form, 80, 84, 94, 101
Beijing–Guangzhou Railway (China), 101Beijing–Harbin Railway (China), 101Beirut (Lebanon), 94Belarus, 119, 142Belem (Brazil), 43Belfast (UK), 28Belgium, 58Belo Horizonte (Brazil), 43bemos (three-wheeled taxis), 26Berlin (Germany), 6, 55, 97; passenger transport, 18, 24,
35, 121Bhopal (India), 43bicycle lanes, 112, 137; see also bicycles; cyclingBicycle Master Plan, Republic of Korea, 19; see also
cyclingbicycles/bicycle use; see bicycle lanes; Bicycle Master
Plan, Republic of Korea; cycling; non-motorizedtransport (NMT); walking
bicycle-taxis, 8, 111; see also cyclingbiofuels, 144‘black cabs,’ 28; see also taxisblue badge disabled parking scheme, UK, 119Bogotá (Colombia), 19, 120, 125, 178, 190; equitable
access to urban mobility, 112, 120; passengertransport, 19, 20, 21, 27, 33, 36; private motorizedtransport, 154; public transport systems, 49, 53;TransMilenio BRT system, 45, 105, 112, 140, 166,186, 190; urban form, 92, 99, 102, 105
Bologna (Italy), 95Bordeaux (France), 48Boston (US), 101Brasilia (Brazil), 43, 99Brazil, 8, 12, 43, 113, 119; passenger transport, 21, 24,
35; see also Curitiba (Brazil); Rio de Janeiro (Brazil);São Paulo (Brazil)
Bremen (Germany), 95Brest (France), 48Brisbane (Australia), 104BRT see bus rapid transit (BRT)Bruges (Belgium), 95Brundtland Report (1987), 9Buenos Aires (Argentina), 7, 10, 16, 54, 137; urban
form, 94, 99built environment, 90; integration with high-capacity
public transport systems, 52–53; at neighbourhoodscale, 90–99, 95–98
Bulgaria, 77bus lanes, 43, 112bus rapid transit (BRT), 7, 13, 19, 21, 36, 39–44, 48–55,
85, 87, 89, 92, 94, 97–99, 103, 111, 118,139–141, 144–145, 155–156, 163, 171, 186,189–191, 198, 201–203; physical characteristics,outputs and requirements, 40, 40–41, 42; urbanform, 89, 94, 97–98, 99, 104–105; worldwide,trends and conditions, 48–51, 49–50; see also high-capacity public transport
Busan (Republic of Korea), 60bus-based public transport, 104busway system see bus rapid transit (BRT)
cable cars, 21Caen (France), 48Cairo (Egypt), 7, 77, 100, 113, 142, 178; passenger
transport, 21, 26, 35; public transport systems, 45,46, 142
Cambodia, 9, 16, 27, 29Cameroon, 7Canada, 133, 177; passenger transport, 21, 33, 34, 35,
121; see also Montreal (Canada); Ottawa (Canada);Toronto (Canada); Vancouver (Canada)
Canadian Urban Transit Association, 55Canary Wharf (London, UK), 138Canberra (Australia), 99capacity-building, 183–184Cape Town (South Africa), 44, 50capital cities, 47, 99, 100, 101Capital Region Board, Edmonton (Canada), 185captive walkers, 8, 20car access ramps, 19; see also carscar pooling schemes, 119; see also carsCaracas (Venezuela), 77, 92, 101carbon dioxide (CO2) emissions, 12, 89, 130, 133, 134,
142, 144carbon monoxide (CO), 135cargo-trams, 73Caribbean, 2, 29, 45, 101; institutions and governance,
178–179; public transport systems, 45, 49cars: car-free living, 146, 147; car-restricted and traffic-
calmed neighbourhoods, 95; dependence on, 4,77–80, 134–135; full cost pricing for, 172;ownership rates, 4, 31–22, 109, 154; parkingcharges, 165; passenger (definition), 210; privatecar vs. public transport, markets and modal choices, 161; private motorized transport, 30–35,30–31, 33
Casablanca (Morocco), 43, 44catalytic converters, 143, 144Central and Eastern Europe, 177; see also transitional
economiesCentral Asia, 48, 208centralization, 187Centres for Disease Control and Prevention (US), 125CETUD (Executive Council of Urban Transport) (Dakar,
Senegal), 178Changwon (Republic of Korea), 137Chao Phraya express-boat company (Bangkok, Thailand),
21Chengdu (China), 42Chennai (India), 5, 8, 11, 20, 32, 33, 42, 179Chicago (US), 5, 6, 22, 52; urban form, 79–80, 101;
urban goods transport, 62, 65children and youth, mobility needs, 11, 25, 29, 51, 55,
107, 109–110, 115, 116–117, 119, 125, 134, 166,182, 203
Chile, 8, 186; see also Santiago (Chile)China, 2, 3, 4, 5, 8, 11, 12, 47, 77, 132, 154; economic
zones, 64, 65; institutions, and governance,180–181; non-motorized transport, 8, 19;passenger transport, 16, 21, 32, 35; publictransport systems, 7, 42, 47; urban form, 92–93,99, 100; women’s participation in transport sector,118; see also specific cities, such as Beijing
Chongqing (China), 42cities, 69, 138; capital, 47, 99, 100, 101; city cluster
variances and transport responses, 101–102;‘compact’ 75, 88; energy use, 132, 133; gateway,61, 64; high-density 112; megacities, 84;monocentric cities, 82, 84, 85, 101; polycentric,84, 85; spread-out, 84; see also city logistics, urbangoods transport
city cluster variances, 101–102city logistics, urban goods transport, 57, 58, 59, 59, 60,
62, 67, 67, 71; logistics sprawl, 65–66, 66civil society, 13
Planning and Design for Sustainable Urban Mobility308
clean fuels, 144Clermont-Ferrand (France), 48climate change, 132–134, 188Climate Change Programme, EU, 75cognitive mapping, 118co-location, important urban activities, 172Cologne (Germany), 94Colombia, 21, 92, 125; see also Bogotá (Colombia)combustion engine car technology, 79CoMET (programme of international railway
benchmarking), 54–55community participation, 12–13; car free living, Vauban,
Germany 146–147; information networks 126;Lagos BRT system 50; ‘compact city’ principle 88,partnership campaigns 125; social participation,decision-making, 187; transit-orientateddevelopment (TOD) 93–94; women’s transportforum, China 118;
community severance, 136‘compact city’ policy, 52–3, 75, 88–89‘complete streets’ model, 202concept and land-use plans, Singapore, 180, 185congestion charging scheme (London, UK), 112, 140connectivity and large urban configurations, 99–101constrained mobility, 109consumerism, 5containerization, 58Convention on the Rights of Persons with Disabilities,
120cooperatives, 29Copenhagen (Denmark), 52, 111, 136; ‘Finger Plan,’ 88,
94; urban form, 88, 91, 94, 97, 104, 105core–periphery distinction, 6corridor contexts: mobility and development trade-offs,
95–96; public transport-oriented corridors, 96–99cost–benefit analysis, 159–161Cotonou (Benin), 26, 29, 157credit, access to, 21, 29, 43, 62, 76, 111, 141criminal gangs, 122–123Croatia, 4, 77cross agency committees, Singapore, 185cross-subsidies, 18, 120, 156–157, 160, 165, 170, 202Curitiba (Brazil): bus rapid transit, 40, 48–49, 163;
equitable access to urban mobility, 111, 114–115;institutions, and governance, 178; passengertransport, 33, 36; public transport systems, 40,48–49, 52; transit-oriented development, 94; urbanform, 87, 88, 90, 94, 95, 98–99, 104, 105
cycle rickshaws, 5, 8, 15, 16, 17, 111; see also cyclingcycling, bicycle sharing, 137; constrained mobility 109;
developed countries 17–18, 18; developingcountries 11, 16–17; health issues 136; integrationprojects 19–20; 35–36, 111–112, 136–137, 138,145, 189; integration requirements 51–52, 55,150, 202; low costs 109; multifunctional use 8;planning priority 91, 95, 146–147; road safety 124,125; road traffic deaths 122; women’s mobility 119;urban goods delivery 72; see also bicycle lanes;Bicycle Master Plan, Republic of Korea
Czech Republic, trucks 4
Dakar (Senegal), 29, 178Dalian (China), 42, 64Dallas (US), 101Dallas-Fort Worth (US), 65Dar es Salaam (Tanzania), 21, 29, 51, 111decentralization, 63, 100–104, 134, 177–178, 179,
182, 186–187, 203; urban form and mobility,76–84, 104
decision-making, 13, 54, 88, 127, 150, 175, 176,181–182, 185, 187, 188–189, 193, 198, 203
Delhi/New Delhi (India), 5, 8, 10, 135, 156; economicand financial issues, 171; equitable access to urbanmobility, 109, 111, 121; institutions, andgovernance, 179, 190–191; passenger transport,16, 19, 20, 24, 36; public transport systems, 42,43, 54, 62; urban form, 77, 99, 101
Denmark, 19, 120, 124, 125; see also Copenhagen(Denmark)
density, urban, 2, 63, 78–79, 80, 91; global patterns andtrends, 77–78; gradients, 81, 81; and publictransport thresholds, 84–87; and travel, 79–80, 80
derived demand, 2, 105, 126, 158, 198, 199destination accountability, 90, 91, 91developed countries: formal public transport, 21–23,
22; definition, 207; informal transport sector,27–28; institutions and governance, 176–177; non-motorized transport, 17–18; populationincrease, 2; private motorized transport, 31–32,33–34; social sustainability, 11; urban goodstransport, 61–62; urban land area, 9; see alsospecific countries
developing countries: car ownership, 109; economicgrowth and rising incomes, 4; education, andwalking distance, 116; financial considerations, 12; formal public transport, 21; freight facilities/vehicles, 4; high-capacity public transport, examplesof national policies, 42–44; high-density cities, 112;importation of used vehicles, 5; definition, 207;informal transport sector, 26–28; institutions andgovernance, 178–181; non-motorized transport, 5,21; passenger transport, 16–17, 24; privatemotorized transport, 32–33; public transportsystems, 6–7, 21, 42–44, 53; road traffic accidents,reducing, 123–124; sprawl, 10, 77; trafficcongestion, 8–9; urban goods transport, 62; urbanland area, 9; vehicle increase, 3; walking in, 8; see also specific countries
development: trade-offs, and mobility, 95–96; transit-oriented see transit-oriented development (TOD)
Development Bank of Latin America, 54Dhaka (Bangladesh), 8, 20, 115–116, 155‘Dial-a-ride’ service, 121diesel, 130, 143disability adjusted life years (DALYs), 136disabled people, mobility needs, 11, 55, 116–118,
119–120, 121, 126, 182dispersal metropolis, 77–78distance to transit, 90distribution facilities, 65diversity, 90, 91Dodoma (Tanzania), 99Doha (Qatar), 45Douala (Cameroon), 29Dubai (United Arab Emirates), 6, 45; passenger
transport, 21, 25; urban goods transport, 61, 64, 65
Eastern Africa, 101, 139, 155, 207Eastern Asia, 7, 180–181, 198, 202, 208Eastern Europe: passenger transport, 23, 28; public
transport systems, 5, 6, 7, 48; suburbanization, 77
Ecatepec (Mexico), 43e-commerce, 69; see also internet shoppingeconomic development zones, export-oriented, 64, 65economic issues see financial and economic issuesEcuador, 21
Index 309
1EEE234567891012311145678920123456789301234567894012345678950123456789EEEE
Edmonton (Canada), 21, 185efficiency see vehicle efficiencyEgypt, 27, 48, 119, 126; see also Cairo (Egypt)El Salvador, 125elderly people, mobility needs, 117–118, 119, 122electric bikes, 19electric vehicles, 72, 144, 145Ellis Park (Doornfontein, South Africa), 44employment densities, 80–81engineering, transport, 200environmental issues, 129–151; built environment,
52–3, 90–99, 95–98; carbon dioxide (CO2)missions, 12, 130, 133, 142, 144; climate change,132–134; composite solutions, 146–148;environmental challenges, 129–136; fundingmechanisms, environmentally sustainable urbanmobility systems, 148–149; greenhouse gasemissions, 4, 12, 68, 130, 133, 139, 143, 189;human health concerns, 135–136; mainstreamingenvironmental concerns, 183, 188–189;motorization and oil dependence, 130–132;motorized forms of transport, dependence on,134–135; pricing measures, 140–141, 149; quotasystem, registration of new vehicles, 139; reducingnumber of motorized trips, 136–137; regulatorymeasures, 139–140, 149; sprawl, 134–135;sustainability challenges, 11–12; technologicalinnovation and vehicle efficiency, 141–146, 148;urban goods transport, 67–68
equitable access to urban mobility, 76, 107–128;affordable urban mobility, 108–115; vulnerable and disadvantaged groups, 115–121
Eritrea, 131Estonia, 77Ethiopia, 27, 48Europe, 5, 9, 208European Bank for Reconstruction and Development, 54,
77European Commission, 189European Investment Bank, 54, 77European Union (EU), 23, 189; Climate Change
Programme, 75; fuel regulation, 142–143‘Eve teasing,’ 115eviction, 110Executive Council of Urban Transport (Dakar, Senegal),
178, 192express bus system see bus rapid transit (BRT)‘exurbia’ (new settlements), 5
fares, travel, 109, 120, 156, 157; subsidies, 140–141favelas (slums), 77Femmes en mouvement, les transports au féminin
(French association), 119financial and economic issues, 4, 12, 29, 138, 163;
access, economics of, 159–161; allocations of public funds, 164–165; challenges of urbanmobility, 154–157; combination models, 170–171;costs exceeding revenues, as perennial challenge,161–163; economic characteristics by mode andcontext, 155–157; economics and financing ofurban mobility, 153–173; expanding options forpublic and non-motorized transport, 163–172;funding mechanisms, environmentally sustainableurban mobility systems, 148–149; general revenuemodels, 163–164; good quality urban transport,162–163; high private cost of transport, 162; non-motorized transport, 155; public transportsystems, 25, 53–54, 155–157, 161–162, 164;public-private partnerships, 168–170; sustainable
funding, 192–193; transitional economies,177–178; urban goods transport, 68–9; valuecapture models, 156, 166–168, 172
floor space index (FSI), 82‘Fordist’ accumulation pattern, 6form see urban formformal public transport: defined, 15; developed
countries, 21–23, 22; developing countries, 21;economic value 158; impacts, 28–30;infrastructure, 24; overview, 23; subsidies 141
fossil-fuels, 8, 11, 20, 131, 132fragmentation, urban development, 5–6, 12–13Framework Convention on Climate Change (Climate
Convention), 132–133France: city logistics projects, 58; gender-sensitive
design, infrastructure and services, 119; passengertransport, 23, 31; public transport systems, 48;urban goods transport, 60, 72; see also Lyon(France); Nantes (France); Paris
Frankfurt (Germany), 138freeways, 3, 5, 96Freight Charter (Paris, France), 190freight facilities/vehicles, 5, 9, 71–72, 146, 183;
distribution, 59, 60, 63–64, 67, 67; see also trucks;urban goods transport
freight movement needs, 1, 9, 176, 183, 189, 190‘freight villages,’ 65frontage roads, 96fuel subsidies, 132funding sources, 54furgons (minivans), 28
‘Garden City’ concept, 99gated communities, 5gatetun (Norway), 125gateway cities, 61, 64Gauteng Provincial Government (South Africa), 44gender-sensitive design, infrastructure and services,
119–120geographic information system (GIS), 118geometry of transportation systems, 87Germany, 47, 58, 95, 114; passenger transport, 18, 19,
25, 31; see also Berlin (Germany); Frankfurt(Germany); Munich (Germany)
Global Burden of Disease Study, 136Global Environment Facility (GEF), 148global positioning systems (GPS), 12Global Road Safety Partnership, World Bank, 125globalization, 5, 65, 181goods transport see urban goods transportGreater London Authority (UK), Transport Strategy, 176Greater Toronto Transportation Agency (Canada), 177greenbelt wedges, 88greenhouse gas emissions, 4, 12, 68, 130, 133, 139,
143, 189Grenoble (France), 48gross domestic product (GDP), 4, 8, 32‘Growth Acceleration Programme,’ Brazil, 43growth triangles, 99Guadalajara (Mexico), 43, 94Guangdong Provincial Government (China), 100Guangfo (China), 42Guangzhou (China), 32, 111; public transport systems,
42, 55; urban form, 100, 101; urban goodstransport, 60, 61
Guatemala, 27, 94
Hangzhou (China), 19, 42, 45, 111Hanoi (Viet Nam), 99, 187
Planning and Design for Sustainable Urban Mobility310
Harare (Zimbabwe), 26, 33‘HarassMap’ (Egyptian website), 126Hardelot Plage (France), 93head-loading, 4health concerns, 12, 20, 24–26, 31, 3, 67, 69, 70, 75,
90, 135–136, 149hearing-impairment, 53, 117helmets, compulsory use, 124Helsinki (Finland), 6, 22, 97Heulebrug (Belgium), 93high-capacity bus system see bus rapid transit (BRT)high-capacity public transport, 8, 84; see also metro;
BRT; and light railhighways, 3, 6; Nairobi–Thika highway improvement
project (Kenya), 110; National Highway System, US 101; see also motorways; and freeways
Ho Chi Minh City (Viet Nam), 12, 32, 133home zones, 19–20; see also gatetun; and woonerfs
(‘living streets’)Hong Kong (China), 7, 61, 121, 138, 180, 189, 192;
economic and financial issues, 156–157, 163, 164,167, 168, 172; light rail system, 48; Mass TransitRailway Corporation, 165, 167, 192; passengertransport, 16, 23, 24; public transport systems, 6,7, 42, 47, 48, 55; sustainable funding, 192; urbanform, 79, 80, 85, 92, 99, 103, 104
Hong Kong–Shenzhen gateway region (China), 61housing policy, 3, 13, 76–78, 88, 89, 91, 93–95, 97–98,
102, 105, 115, 138, 176, 200Houston (US), 5, 12, 32, 158; urban form, 79, 80, 105Houten (Netherlands), 91, 95Howard, Ebenezer, 99human rights dimension of sustainable mobility, 3, 10,
107, 126Hungary, 17, 77Hybrid and Electric Bus Test Programme, Latin America,
145hybrid vehicles, 144–145, 146Hyderabad (India), 43, 179hydrogen, 144hyper-mobility, 1
import-liberalization policies, 5incremental implementation, 171India, 3, 5, 8, 11, 124, 143, 179, 180; dispersal/
dispersed growth in, 76, 77; Jawaharlal NehruNational Urban Mission, 18–19, 19, 24, 42;National Urban Transport Policy, 171, 172;passenger transport, 16, 19, 27, 32, 35; publictransport systems, 42–43; urban form and travel,82, 83; see also specific cities, such as Delhi
Indonesia, 72; see also Jakarta (Indonesia)Indore (India), 43industrial associations, 55informal transport sector, 7, 10, 157; benefits, 28–29;
corruption, 29; defined, 15; developed countries,28; developing countries, 26–28; impacts, 28–30
information and communications technologies, 58, 127,137, 167,183–184
infrastructure, 11, 24, 64, 141;non-motorized transport,18–21; private motorized transport, 33–34;realigning transport infrastructure investment anddevelopment, 200–201
Infrastructure Australia, 193innovative practices and policy responses: affordable
urban mobility, 113–117; institutions, andgovernance, 185–194; non-motorized transport,supporting, 111–112; public transport systems,improving affordability and quality of service,
112–114; safety and security, 123–126, 123;vulnerable and disadvantaged groups, 118–121
Institute for Transportation and Development Policy(ITDP), 111
institutions, and governance, 175–195; adaptationchallenges, 181–182; administrative andgovernance challenges, 182; centralization,186–187; challenges/underlying influences,181–184; decentralization, 186–187; developedcountries, 176–177; freight movement needs,addressing, 189; integrated urban land-use andmobility planning, 185; mainstreamingenvironmental concerns, 188–189; managementand regulatory changes, 182–183; mobility policy,182, 188; multi-modal integration, 191–192; plan-making, 182–183; policy responses and innovativepractices, 185–194; privatization, 186–187; publictransport systems, 54–55, 189–190; resources andcapacity-building challenges, 183–184; social mediaand open source material, 185; social participation,decision-making, 187; socially and economicallydisadvantaged, mainstreaming mobility needs, 189; sustainability challenges, 12–13; sustainablefunding, 192–193; trends and conditions, 176–181;urban boundary complications, addressing,187–188
Integrated National Transport Policy (Kenya), 43‘intelligent transport systems,’ China, 42inter-agency collaboration, 183Inter-American Development Bank, 54intermodality: multi-modal integration, 15, 19, 20, 43,
52, 54, 55, 57, 96, 99, 100, 103, 111, 112, 147,157, 162, 163, 165, 171, 177, 180, 183, 185, 188,191–192, 194, 198, 199, 201, 203; passengertransport, 2, 12, 35–37, 39, 40, 44, 47, 51, 109,120, 155, 170; urban goods transport, 58, 59, 62,64, 65, 71
International Association of Public Transport, 55International Bus Benchmarking Group (IBBG), 55International Road Assessment Programme (iRAP),
124Internet shopping, 137; see also e-commerceinvestments, transportation: bus-based public transport
and urban-form adjustments, 104–105; impacts onurban form, 102–104; motorways, 104; publictransport and land price appreciation, 103–104; public transport investments, 102
Iran, 124, 179Islamic Development Bank, 54Istanbul (Turkey), 26, 54, 55, 93, 179Italy: passenger transport, 31; public transport systems,
48; see also Rome (Italy)
Jahor Baru (Malaysia), 99Jaipur (India), 43, 179Jakarta (Indonesia), 12, 201, 203; economic and financial
issues, 154; environment and urban mobility, 140,145; equitable access to urban mobility, 111, 112,118, 125; institutions, and governance, 178, 180;passenger transport, 16–17, 26, 29, 32; publictransport systems, 45, 49; urban form, 79, 84, 99
Jaoshiung (China), 94Japan: city logistics projects, 58; gender-sensitive design,
infrastructure and services, 119; metro systems, 47;passenger transport, 31; public transport systems,7; see also Tokyo
Jawaharlal Nehru National Urban Mission (India), 18–19,19, 24, 42
jeepneys (converted jeep taxis), 7, 16, 26
Index 311
1EEE234567891012311145678920123456789301234567894012345678950123456789EEEE
Jiaxing (China), 94jitneys, 7Johannesburg (South Africa), 93; passenger transport,
21, 24, 29; public transport systems, 44, 50–51
Kampala (Uganda), 51, 115; passenger transport, 18, 21,26, 28
Kazakhstan, 114Kenya: bicycle use, 8; National Urban Transport
Improvement Project, 43; petrol shortage,130–131; public transport systems, 43; trafficcongestion, 8–9; vehicle stock, efficiency and age,142; see also Nairobi (Kenya)
Kenya Railways Corporation (Nairobi, Kenya), 52kerb ramps, 121Kingston (Jamaica), 28Kolkata (India), 42Korea, Republic of, 7, 19; see also Seoul (Republic of
Korea)Kuala Lumpur (Malaysia), 33, 65; urban form, 94, 99,
101Kunming (China), 42, 45Kuwait City, 45Kyoto Protocol on Climate Change, 133, 141
Lagos (Nigeria): bus rapid transit, 49–50, 51; LagosMetropolitan Area Transport Authority (LAMATA),50, 192; passenger transport, 18, 21, 26; urbanform, 79, 84, 99, 101
land cover, 76, 81–2land price appreciation, and public transport, 95–96,
103–104, 105, 111, 141, 167, 182, 183, 192; see also value capture
Land Transport Authority, Singapore, 180land-use, 2, 31, 32, 39, 58–60, 63–65, 73, 75, 77, 85,
89–98, 102–105, 114–115, 124, 126, 134, 137,172, 176–177, 179–180, 183, 190; affordability,improving through, 114–115; and city logistics, 67,67; diversity, 92–93; integration with transportplanning, 3, 7–10, 13, 25, 37, 52, 114, 138, 149,166, 175, 181–182, 185–188, 190–191, 194,197–200; see also density, urban; urban form
Laos, passenger transport, 27, 29last-mile link buses, 43, 52Latin America, 2, 8, 45, 49, 78, 94, 109, 145, 208;
dispersal, 76, 77; institutions and governance,178–179; passenger transport, 16, 21, 25, 33, 36;public transport systems, 6, 7, 45, 48, 49; SIBRT(Latin American Association of Integrated TransportSystems), 55; urban form, 76, 77, 78, 82, 94, 99,102
Latvia, 77lead, 135leadership, political, 50, 105, 112, 163, 165, 181, 185,
190, 193, 202leapfrog development, 77, 82Lebanon, 9Lerner, Jaime, 105liberalization, imports, 5light rail systems, 25, 40, 85; institutional and
governance framework, Portland (Oregon), 191;Nova (programme of international railwaybenchmarking), 54; physical characteristics, outputsand requirements, 40, 41, 42; worldwide, trendsand conditions, 47–48, 48; see also high-capacitypublic transport
light-duty motor vehicles, 3, 4, 30Likoni ferry (Mombasa, Kenya), 21Lille (France), 24, 48
limousine services, 28Lisbon (Portugal), 6, 24, 54, 55, 80, 95logistical performance, and cities, 69logistics sprawl, 65–66, 66, 189Lomé (Togo), 112London, 12; congestion charging scheme, 112, 140;
Crossrail project, 159, 160; economic and financialissues, 156, 157; environment and urban mobility,132, 133, 137, 138, 140, 145; equitable access tourban mobility, 112, 114, 122; Greater LondonAuthority, Transport Strategy, 176; institutions, andgovernance, 176, 189, 192; Low Emission Zones,146; ‘Oyster’ smartcard ticketing scheme, 114;passenger transport, 16, 18, 24; public transportsystems, 39, 49, 51, 55, 157, 160, 168–169, 170;terrorist attacks (2005), 122; Underground system,157, 160, 169–170; urban form, 79, 97, 103;urban goods transport, 60, 68
Longhai Railway (Lianyungang–Lanzhou, China), 101Los Angeles (US), 5, 79, 101; dysfunctional densities,
87; Port Community Mitigation Trust Fund, 71;urban form, 87, 104; urban goods transport, 61, 62,64, 71
Lübeck (Germany), 95Luxembourg, 58Lyon (France), 48, 163
Maasvlatke II port terminal (Rotterdam, Netherlands), 64Madrid (Spain), 24, 51, 55, 79, 120, 158; terrorist
attacks (2004), 122Mahindra World City (Chennai, India) 5Malawi, 29Mali, 11Manila (Philippines), 5, 8, 10, 16, 180; public transport
systems, 48, 51, 53; urban form, 84, 101Marseille (France), 48Maryland (US), 100Mass Transit Railway Corporation (MTRC) (Hong Kong,
China), 166, 167, 192mass transport/transit; see high-capacity public transportmatatu, 8, 26, 28, 62, 123, 158; see also minibus
servicesMauritius, 48Medellin (Colombia), 178megacities, 82, 84Melbourne (Australia), 6, 22, 26Melrose Arch (Johannesburg), 93mental health, 117, 136Metro Manila (Philippines), 5, 8, 180metro systems, 7, 21, 23, 47, 55, 89, 121; Canada 185;
China 45, 46; Japan 45, 46–47; maincharacteristics, 39; Philippines 5, 8, 180; physical characteristics, outputs and requirements,40, 41, 42; worldwide, trends and conditions,44–47, 45–46; see also high-capacity publictransport
metro-bus see bus rapid transit (BRT)Metrolinx, Greater Toronto and Hamilton Area (Canada),
185Metropolitan Transportation Authority (MTA), New York
(US), 171Mexico/Mexico City, 3, 5, 8, 12, 47, 111; dispersal, 77;
energy use, 132; formal vs. informal city logistics,63; gender-sensitive design, infrastructure andservices, 119; passenger transport, 25, 27, 35–36;pedestrian accessibility and safety, improving, 120;public transport systems, 43, 47; reduced fares,120; road safety procedures, 125; socialsustainability, 10, 11; urban form, 77, 84, 99;
Planning and Design for Sustainable Urban Mobility312
urban goods transport, 62, 63, 68; vulnerable anddisadvantaged groups, 119, 121
Miami (US), 28, 165microbus services, 7, 10, 26; see also matatu; minibus
servicesMiddle Africa, 101, 207Middle East, 29, 32Milton Keynes (UK), 91, 165minibus services, 7, 26, 28, 29Ministry of Transport, China, 42mini-vans, 3, 28, 30modal adaptation, 72–73, 100–101, 200; see also modal
splitmodal split, 6, 97, 98, 116, 154; changing, 129,
139–141, 149; pricing measures, 140–41, 149;regulatory measures, 139–140, 149
modes of transport, 15, 132, 153‘Mohring effect,’ 54Mombasa (Kenya), 21monocentric cities, 82, 84, 85, 101Monterrey (Mexico), 43Montevideo (Uruguay), 21Montreal (Canada), 35Morocco, 43–44Moscow (Russia), 6, 8, 55, 80, 101, 136motility, 108motorcycle rickshaws, 27motorcycle taxis, 7, 11, 26, 29, 30, 157motorization, 3–4, 5, 20, 30–37, 77–78, 105, 130–132,
176–178, 182motorized forms of transport, dependence on, 134–135;
car-free living, 146, 147; reducing number of trips,136–137; urban form, 76–84
motorways, 95, 104multi-modal integration, 13, 15, 17, 20, 35–37, 39–40,
43–44, 47, 51–55, 52, 62, 96, 100–101, 109, 112,114, 120–121, 141, 147, 155, 157, 162, 163,170–172, 177–180, 183, 185–188, 191–192
multi-tiered financing, 171Mumbai (India), 8, 45, 62, 122, 179; passenger
transport, 16, 32, 35; urban form, 77, 99, 100Mungiki (criminal youth gang), 122, 123Munich (Germany), 95, 96, 102, 103Municipal Transportation Agency (Nigeria), 44Myanmar, 16, 17MyCiTi (BRT system, Capetown), 44Myong Bak Lee, 105
Nairobi (Kenya), 4; criminal gangs, 122–123; passengertransport, 18, 26, 28; public transport systems, 52
Nairobi–Thika highway improvement project, 110Nancy (France), 48Nanjing (China), 42Nantes (France), 48, 185National Policy on Urban Mobility (Brazil), 43‘National Programme for Freight in Cities,’ French
Ministry of Transport, 189National Transport Policy (Nigeria), 44National Urban Transport Improvement Project
(NUTRIP), Kenya, 43National Urban Transport Policy (NUTP), India, 171necklace of pearl urban form, 90, 97neighbourhoods: built environment and travel,
neighbourhood scale, 90–99, 95–98; car-restrictedand traffic-calmed, 94–95; corridor contexts,96–99; traditional, and new urbanism, 93; transit-oriented development see transit-orienteddevelopment (TOD)
Netherlands: city logistics projects, 58; non-motorizedtransport, 8; passenger transport, 18, 19, 20;vulnerable and disadvantaged groups, improvingsafety of, 125
New Delhi (India), 99new towns movement, 99new urbanism, 90, 93New York/New York City, 12, 28, 32, 60, 81, 97,
101, 109, 156, 158; Metropolitan TransportationAuthority, 171; planning and developmentmeasures, 139; Port Authority Bus Terminal, 125; public transport systems, 47, 55
New Zealand, 34, 85, 124, 177; urban boundarycomplications, addressing, 187–188
NGOs (non-governmental organizations), 13, 125, 176,203
Nigeria, 30, 44, 192Ningbo (China), 64nitrogen oxides (NOx), 135NMT see non-motorized transport (NMT)noise pollution, 12, 20, 26, 39, 41, 42, 63, 68, 70, 71,
73, 110, 136, 140, 147, 149, 187non-motorized transport (NMT), 7–8; accident rates, 20;
benefits, 20, 36; defined, 15; developed countries,17–18; 18; developing countries, 5, 16–17, 21;economic characteristics, 155; financial support,163–172; funding, 163–164; impacts, 19–21;informal goods transport in Asia and Africa, 62;infrastructure, 18–20; supporting, 111–112
Northern Africa, 7, 21, 207Northern America, 6, 45, 62, 208; passenger transport,
21–22, 31, 35; urban form, 79, 81–82, 89–90;value capture models, 167; see also Canada; UnitedStates (US)
Norway, 125; see also Oslo (Norway)Nova (programme of international railway
benchmarking), 54
Occupancy, energy efficiency 132, 132; (load) factors,145–146; occupancy levels, 53, 202
Oceania, 78oil, 11, 130–132, 131open spaces, 136OR Tambo International Airport (South Africa), 44Oran tramway (Algeria), 48Orchid Bay (Belize), 93Oslo (Norway), 24, 164Ottawa (Canada), 88, 104, 120Ouagadougou (Burkina Faso), 18‘Oyster’ smartcard ticketing scheme (London, UK),
114
Pakistan, 8, 27Panama City, 77paratransit arrangements see informal transport sectorpardah institution, Islamic communities, 115Paris, 111, 137, 158, 189; environment and urban
mobility, 133, 137; Freight Charter, 190; publictransport systems, 51, 55; urban form, 82, 84, 103;urban goods transport, 60, 62, 66, 66; versementtransport,
parking, availability 33–34, 91; urban goods delivery 59, 68, 72; parking charges, cars, 88, 165; pricingmeasures 140, 202; subsidized parking, 119, 140
particulate matter, 68, 136; particulate traps, 70,135–136, 143
passenger transport: informal transport sector, 26–28;intermodality, 35–36, 37; modes, 15, 132, 153;
Index 313
1EEE234567891012311145678920123456789301234567894012345678950123456789EEEE
non-motorized, 16–21; trends and conditions,15–16; see also public transport systems
paved roads, 95, 120, 210pavements see sidewalks/pavementsPearl River Delta, mega-region (China), 100pedestrian accessibility and safety, improving, 120‘pedestrian refuges,’ 124pedestrian zones, 94–95pedestrianization, 94–95, 95, 111pedicabs, 16–17, 18; see also non-motorized transportPeñalosa, Enrique, 105, 112Peru, 21petrol, 11, 67, 79, 114, 130–132, 135, 140, 142–144,
171; see also fossil fuelsPhilippines, 5, 8, 27, 180; see also Manila (Philippines)Phoenix (US), 105physical activity and health; see health concernsPimpri-Chinchwad (India), 43pirate buses, 26Pitiuosa (Greece), 93Pittsburgh (US), 104Plusvalia programme, Bogotá (Colombia), 104Poland, 4, 77, 161; institutions, and governance, 177,
178policy responses and innovative practices see innovative
practices and policy responsespolluter pays principle, 131monocentric cities, 82, 84, 85, 101population: density, 210; increase, 2; rural, 209; spatial
distribution, 80–81, 81; total, 209–210; urban,78–79, 210; see also density, urban
Port Community Mitigation Trust Fund (Los Angeles,US), 71
Port Elizabeth (South Africa), 50Portland (US), 22, 89–90, 103, 163, 191Porto Alegre (Brazil), 43Portugal, 23, 48; see also Lisbon (Portugal)Poundbury (England), 93poverty, urban, 8, 108–110PPP (purchasing power parity), 32, 113, 154, 209Prague (Czech Republic), 24, 77, 79preferential parking, 119, 141; see also parkingPretoria (South Africa), 44, 120pricing measures, 140–141, 149, 160–161, 202private motorized transport, 30–35; defined, 15;
developed countries, 31–32, 33–34; developingcountries, 32–33; economic characteristics, 157;global dominance, 154–155; impacts, 34–35;infrastructure, 33–34; see also cars; public transportsystems; vehicles
privatization, 77, 177, 186–187project development (public transport), financial risks,
53–54, 168–170, 201PROTRAM (Federal Support Programme for Public
Transport) (Mexico), 43‘Protransporte’ programme (Brazil), 43Public Transport Authority (Perth), 177Public Transport Strategy (South Africa), 44public transport systems, 36, 51; affordability,
improving, 112–114, 113; average operating costs,156; bus-based, and urban-form adjustments,104–105; challenges facing high-capacity, 51–55;corridors, public transport-oriented, 96–99, 96;developing countries, 6–7, 21, 42–44, 53;economic characteristics, 155–157; employmentfigures 158; exclusion of women, in some Islamicsocieties, 115–116; financial considerations, 12,53–54, 156; financial support, 163–172; formal,21–26; and freight, 72–73; funding sources, 54;
gender-sensitive design, infrastructure and services,119–120; high-capacity, 42–44, 51–55;infrastructure, investment in, 141; institutions,54–55; integration with built environment, 52–53;integration with other elements of transport system,51–52; investments, impacts, 102–103, 141; andland price appreciation 103–104; nationalgovernments, 54; planning and service delivery,189–190; private car vs. public transport, marketsand modal choices, 161; private motorized, 30–35;project development, financial risks, 53–54; qualityof service, 53, 112–114; safety improvement, 125;sexual harassment, 115–116; subsidies, 54;technical inadequacies, 55; thresholds, and urbandensities, 84–87; urban form, 103; use of, risks andfears related to, 122–123; user charges neversufficient to finance, 161–162; varying butdeclining dominance of public transport, 6–7; seealso bus rapid transit (BRT); metro; non-motorizedtransport (NMT); private motorized transport
public-private partnerships, 157, 168–170Pudukkottai (India), bicycle-taxis, 111Pune (India), 43purchasing power parity; see PPP
Qingdao (China), 94
Rabat-Salé (Morocco), 43rail transport: costs, 156; Crossrail project, London, 159,
160; light rail systems, 39, 40, 41, 42, 47–48; Nova(programme of international railway benchmarking),54; railways, defined, 210; safety factors, 122;urban form, 96, 101, 103
Rajkot (India), 43Rea Vaya BRT (South Africa), 44, 50–51Recife (Brazil), 43regional context: city cluster variances and transport
responses, 101–102; connectivity and large urbanconfigurations, 99–101
regulatory measures, 7, 9, 10, 12, 13, 21, 23, 27–29,36–37, 43–44, 60, 63–64, 71–72, 77, 81, 88, 89,91, 102, 112, 123–125, 139–140, 143–144,146–147, 149, 167, 176, 180–182, 186–187, 189,190–193, 197–203
‘request stop’ bus service, 125Research Triangle area (North Carolina, US), 93resettlement, 110resources and capacity-building challenges, 183–184revenue models, general, 163–164, 164rickshaws, 7, 11, 20; auto-rickshaws, 27, 119; cycle
rickshaws, 4, 8, 15, 16, 17, 111; motorcyclerickshaws, 27
Rieselfeld (Germany), 94Rio de Janeiro (Brazil), 113, 120, 145; passenger
transport, 16, 21, 24, 26; pedestrian accessibilityand safety, improving, 120; public transportsystems, 43, 45, 54; urban form, 98, 99, 101
Riyadh (Saudi Arabia), 33, 45road pricing: insufficient to improve accessibility,
160–61; urban initiatives, 164, 165road traffic accidents (RTAs), 11, 121–122, 122; deaths
from, 210; reducing, 123–125roads: defined, 210; frontage, 96; infrastructure
investments, 5, 34; paved, 120, 210; trafficcongestion, 8–9; trinary road system, 97–98, 98;unpaved, 19; see also sidewalks/pavements
Rome (Italy), 98Rosetown (Jamaica), 93Rotterdam (Netherlands), 64
Planning and Design for Sustainable Urban Mobility314
route associations, 29rural population, 209Russian Federation, 178; see also Moscow (Russia)Rwanda, 16, 123
‘safe route to school’ programmes, 125safety and security, urban mobility systems, 11, 29,
121–126; global conditions, trends and challenges,121–123; policy responses and innovative practices,123–126, 123; road traffic accidents (RTAs),121–122, 122 123–125; transportation security,122–123; vulnerable groups, improving safety andsecurity of, 125–126
Sainsbury’s Online (UK), 137Salt Lake City (US), TRAX light rail system, 25Salvador (Brazil), 43San Diego (US), 86San Francisco (US), 5, 79, 101; San Francisco Bay Area,
35, 103Sana’a (Yemen), 26, 77Santiago (Chile), 7, 8, 145, 154; institutions, and
governance, 178–179, 186; passenger transport,16, 26–27, 36; private motorized transport, 154;public transport systems, 55; Transantiagoprogramme, 179, 186; transit-orienteddevelopment, 94; urban form, 80, 91, 94, 99, 102;urban mobility plan (2000–2010), 179
São Paulo (Brazil), 7, 8, 12, 113, 145, 154; IntegratedUrban Transport Plan, 47; passenger transport, 33,34, 35, 36; public transport systems, 43, 45, 49,53, 55; urban form, 79, 98, 99, 100, 101
Schiphol (Netherlands), 65Seaside (Florida, US), 93seatbelts, 28, 123sectoralization, urban development, 5–6, 198Senegal, 7, 8, 21, 28; Executive Council of Urban
Transport (Dakar), 178, 191Seoul (Republic of Korea), 45, 46, 114Seville (Spain), 94sexual harassment, on public transport, 11, 115–116,
122, 123Shanghai (China), 7, 12, 163; equitable access to urban
mobility, 109, 111; institutions, and governance,180–181; metro system, 47; passenger transport,24, 32, 33; public transport systems, 42, 46, 47,55; urban form, 84, 92, 99; urban goods transport,60, 62, 64; World Expo accommodation, 163
shared-ride taxis, 10, 28Shenyang (China), 42Shenzhen (China), 42, 65, 99SIBRT (Latin American Association of Integrated
Transport Systems), 55sidewalks/pavements, 19, 120; see also footpaths;
pedestrian pathways; pedestrian zonesSierra (Italy), 94Singapore, 16, 201; concept and land-use plans, 185;
economic and financial issues, 157, 161, 163, 164;environment and urban mobility, 138, 139, 140;equitable access to urban mobility, 115, 124;institutions, and governance, 185, 192; LandTransport Authority, 180; passenger transport, 24;planning and development measures, 139; publictransport systems, 47, 51–52, 54, 55; sustainablefunding, 192; urban form, 79, 82, 88, 94, 99, 104,105; urban goods transport, 61, 64
Slovakia, 77slums, 8, 16, 21, 27, 30, 68, 77, 92–93, 200‘smart growth’, 88social media and open source material, 185
South Africa: bus rapid transit, 44, 50–51; disabilitystrategy, 120; institutions, and governance, 189;passenger transport, 24, 29; road safety procedures,124
South America, 31, 208South-Central Asia, 208; see also Central Asia; Southern
AsiaSouth-Eastern Asia, 7, 101, 157, 208; institutions and
governance, 180Southern Africa, 102, 207Southern Asia, 7, 77, 101, 179, 207Spain, 23, 48; see also Barcelona (Spain); Madrid (Spain)special groups, private transport for, 119sports utility vehicles (SUVs), 3, 15, 30, 32, 121sprawl: defined, 77; and dependence on motorized
transport, 134–135; developing countries, 10,77–78; integration of land-use and transportplanning, 9, 10; logistics, 65–66; peripheral, 138;spread-out cities, 84; suburban, 10; urban,transport as factor increasing, 78–79
Sri Lanka, 8, 27staff training, 183–184Standard Rules on the Equalization of Opportunities for
Persons with Disabilities, UN (1994), 118Stockholm (Sweden), 140, 157, 188, 191; urban form,
84, 88, 94, 96–97, 103, 105strategic spatial plans, 89streetcars, 40, 78–79, 79streets, percentage of urban land allocated to, 10; street
design, 125; street hawkers, 9; street networks, 90,92; see also neighbourhoods
streetscapes, 92; see also streetsSub-Saharan Africa, 9, 11, 158, 162, 207; passenger
transport, 28, 29; public transport systems, 6–7,141; urban form, 77, 96
subsidies, 54, 113, 132, 156, 177; fares, 140–141subsidized parking, 119; see also parkingsuburbanization/suburban sprawl; see sprawlsubways; see metro systemsSudan, 27sulphur dioxide (SO2), 135‘supra-agglomerations,’ 100Surat (India), 43surface metro; see bus rapid transit (BRT)Sustainable Fuel Partnership, 148‘Sustainable Transport Solutions in East African Cities
project’ (SUSTRAN), 139sustainable urban mobility, 197–204; accessibility,
priority of, 199; Brundtland Report (1987), 9;challenges, 9–13; economic dimensions, 12;environmental dimensions, 11–12; fundingmechanisms, environmentally sustainable urbanmobility systems, 148–149; holistic and systemicthinking and action, 2, 198; human rightsdimension, 3; institutional and governancedimensions, 12–13; integrating urban transportfacilities and service operations, 201–202;integration of land-use and transport planning,9–10, 199–200; operational entry points and policy,199–203; pillars of sustainability, 9; policies andpractices reframing urban mobility, 198–199;readjusting legal and regulatory instruments, 203;realigning transport infrastructure investment anddevelopment, 200–201; social dimensions, 10–11;streamlining urban institutions and governanceframework, 202–203
Suzhou (China), 42, 45Sweden, 19; see also Stockholm (Sweden)Sydney (Australia), 54, 55
Index 315
1EEE234567891012311145678920123456789301234567894012345678950123456789EEEE
Syokimau Railway station (Nairobi, Kenya), 43, 52Sytral (Lyon, France), 163
Taipei (China), 7, 92Tanzania, 8, 21taxis: accessible, 121; bicycle-taxis, 111; ‘black cabs,’ 28;
in Egypt, 142; motorcycle, 7, 11, 26, 29, 30, 157;shared-ride, 10, 28; see also bicycle-taxis; jeepneys(converted jeep taxis)
technological innovation, and vehicle efficiency seevehicle efficiency
Tehran (Iran), 25telactivities, 137‘telebus’ (Berlin, Germany), 121teleconferencing, 137teleworking, 137Teresina (Brazil), 43terminal facilities, 57, 64–65terrorist attacks, 122Thailand, 124, 180; passenger transport, 16, 17, 27, 29;
see also Bangkok (Thailand)Thokoza Park (Soweto, South Africa), 44through-traffic, 125Tianjin (China), 42, 109time poverty, 109time saving, economics of access, 159Timphu (Bhutan), 93Tirana (Albania), 28Tokyo (Japan), 7, 24, 115, 120, 146; metro system, 45,
46–47; public transport systems, 45, 46–47; urbanform, 79, 94, 97, 103, 104; urban goods transport,60, 61
Tokyo–Singapore corridor, 61Toronto (Canada), 21, 35, 125; Greater Toronto
Transportation Agency, 177; urban form, 102, 105Toulon (France), 48traffic: congestion, 8–9, 35, 43, 84, 136; enforcement
policies, 33, 124–125; management, absence of insome developing countries, 9
tramways, 15, 23, 40, 43, 44, 48, 73, 155, 202Transantiago programme (Santiago, Chile), 179, 186Trans-European Transport Network (TEN-T), 100transitional economies, 5, 7, 13, 23, 30, 31, 77, 154,
158, 161, 176, 177–178transit-oriented development (TOD), 52, 76, 84, 85, 86,
93–94, 105TransLink (Vancouver, Canada), 163, 177, 185TransMilenio BRT system, Bogotá (Colombia), 45, 104,
112, 140, 166, 186, 190transparency, 193transport bias of mobility, 3–5; forces promoting, 5–6transport sector, economic value, 158–159transportation security, 122–123transportation vouchers system, Brazil, 113transport-oriented mobility systems: informality, 7; non-
motorized transport, 7–8; traffic congestion, 8–9;trends and conditions, 6–9; varying but decliningdominance of public transport, 6–7
travel: at neighbourhood scale, 90–99, 96–98; reducingtravel distances in cities, 138; and urban density,79–80; and urban form, 82, 83, 84
tricycles, 10, 16, 17, 27, 30, 62, 72, 119–120; see alsotuk-tuks
TriMet (Portland, US), 163trinary road system, 97–98, 98trip chaining, 137trolleycars, 40trucks, 3, 4, 9, 30, 135–136; hybrid, 146; urban goods
transport, 59, 62
Tshwane (South Africa), 44tugurios (slums), 77tuk-tuks, 29; see also tricyclesTunisia, 7, 48Turkey, 179
Uganda, 111, 124–125UITP (International Association of Public Transport),
Youth Project, 189United Arab Emirates (UAE), 6, 179; see also Abu Dhabi
(United Arab Emirates); Dubai (United ArabEmirates)
United Kingdom (UK): blue badge disabled parkingscheme, 119; city logistics projects, 58; new townsmovement, 99; passenger transport, 23, 35; publictransport systems, 48; reduced fares, 120; roadsafety procedures, 124; see also London
United Nations (UN): Framework Convention on ClimateChange (Climate Convention), 132–133; StandardRules on the Equalization of Opportunities forPersons with Disabilities (1994), 118
United States (US): bus rapid transit, origination of term,40; carbon dioxide (CO2) emissions, 133; catalyticconverters, 144; density gradients, 81; densitythresholds, 86, 87; government policies, 3;institutions, and governance, 177; mainstreamingenvironmental concerns, 188–189; passengertransport, 17, 18, 25, 33, 34, 35; WashingtonMetropolitan Area Transit Authority, 125; see alsoNorthern America
‘universal design’/‘access for all,’ 53, 120–121urban boundary complications, addressing, 187–188urban form: ‘aerotropolis,’ 65; affordability, improving
through, 114–115; bus rapid transit, 89, 90, 94,98, 99, 103–105; bus-based public transport andurban-form adjustments, 104–105; cardependence, 77–80; ‘compact city’ policy, 75, 88;corridor contexts, 96–99; decentralization,77–79, 104; densities see density, urban;dispersal metropolis, 77–78; land cover, 81–82,81; and mobility, 75–107; necklace of pearl, 90,97; neighbourhoods, 90–99, 95–98; planning ofaccessible city, 87–90; prerequisites to changes,103; proactive planning, necessity for, 103;purpose of systems, 107; regional context,99–101; self-selection bias, risk of, 80; spatialdistribution of population, 80–81, 81; sprawl,65–6, 78–79; transportation investments, impactson, 102–105, 102; and travel, 82–84, 82–83,86–87
urban freight distribution see urban goods transporturban goods transport, 57–73; actors and stakeholders,
59–60, 60, 64; cargo owners, 60; carriers, privateand common, 59; challenges, 67–71; city logisticssee city logistics, urban goods transport;compensation and resettlement mechanisms,70–71; competition, 60; components, 58–59;conflicts, 60; cooperation, 60; competition, 60;deliveries, rationalization, 71; delivery areas, 72;developed countries, 61–62; developing countries,62; distribution facilities, 65; economic challenges,68–69, 68; environmental challenges, 68, 68;existing policy responses, 71–73; freightdistribution, 61, 63–64; freight facilities, 71–72;freight movement needs, addressing, 189; globalnetworks, 59; global supply chains, 65; goodstransport in urban context, 63–66; intermodality,58, 65; key components/actors, 57–60; local freightstations, 72; logistics sprawl, 65–66; modal
Planning and Design for Sustainable Urban Mobility316
adaptation, 72–73; rationalization of deliveries, 71;safety considerations, 70; social and institutionalchallenges, 69–71, 70 ; spatial structure ofmetropolitan areas, 65–66; terminal facilities, 57,64–65; trends and conditions, 60–63; urbanplanning and freight distribution, 58
urban mobility: accessibility, 2–3, 107–128; affordable,108–115; challenge of, 1–14; and housing policy,115; institutions and governance, 175–195; asprivate and public good, 160, 172, 202; as socialand economic need, 107; sustainability challenges,9–13; transport bias, 3–5; vulnerable anddisadvantaged groups, 115–121, 116, 117
Urban Planning Council, United Arab Emirates, 179‘urban villages,’ 5urbanization, 1–2, 11, 88, 141, 198, 209used vehicles, importation, 5
value capture models, 156, 166–168, 172; see also landprice appreciation
value of access, measuring, 159–160Vancouver (Canada), 21, 35; TransLink, 163, 177,
185Vauban (Germany), 94; car-free living, 147vehicle efficiency, 2, 72; and age of vehicle stock,
141–142; alternative fuels, 144–145; occupancy(load) factors, 145–146; standards of fuelsused/emissions, 142–144; and technologicalinnovation, 141–146
vehicle quotas, 139vehicles: age, 68, 142; efficiency see vehicle efficiency;
electric, 72, 144, 145; light-duty motor vehicles, 3,4, 30; operating speeds and idling, 68; ownership,31–32, 109; size, 68; sports utility vehicles, 3, 30;used, importation of, 5; see also cars; freightfacilities/vehicles
Venezuela, 16, 21, 131; urban form, 77, 92, 101Verkehrsverbund (transport federation), Germany, 114Victoria (Australia), 188Vienna (Austria), 6, 22–23, 24, 95Viet Nam, 16, 187; see also Hanoi (Viet Nam); Ho Chi
Minh (Viet Nam)Virginia (US), 100Visakapatnam (India), 43vision-impairment, 117, 120
VKT (vehicle-kilometres travelled), 75, 79–80, 90–91,91, 92; Curitiba (Brazil), 98–99
volatile organic compounds, 135vulnerable and disadvantaged groups, 107, 115–121;
children and youth, 116; disabled people, 116–117,119, 121; elderly people, 117–118, 119; gender-sensitive design, infrastructure and services,119–120; global conditions, trends and challenges,115–118; mainstreaming mobility needs of sociallyand economically disadvantaged, 189; pedestrianaccessibility and safety, improving, 120; policyresponses and innovative practices, 118–121; safetyand security, improving, 125–126; special groups,private transport for, 119; ‘universal design’/‘accessfor all,’ 53, 120–121; and urban mobility, 115–121;women, needs of, 115–116
walking, 7, 8, 16; 18, 19, 25, 51, 92, 109, 155; see alsobicycles/bicycle use; cycling; non-motorizedtransport (NMT); pedestrianization
Warsaw (Poland), 100Washington (DC, US), 100; Washington Metropolitan
Area Transit Authority, 125Western Asia, 208; institutions and governance, 179Western Australian Department of Planning and
Infrastructure, 177Western Europe: city logistics projects, 58; light rail
systems, 48; passenger transport, 18, 19–20, 21,33, 34, 35; public transport systems, 5, 6, 48
wheelchair facilities, 120–121woonerfs (‘living streets’), 125World Bank, 54; Global Road Safety Partnership, 125World Health Organization (WHO), 11, 121, 123, 124,
143Wuhan (China), 19, 42
Xi’an (China), 42
Yangshan container port (Shanghai, China), 64Yola (Nigeria), 29Yopougon (Côte d’Ivoire), 29Youth for Public Transport Group, 189
zoning policies, 52, 60, 67, 70, 77, 81, 92, 97–98, 102,103, 105, 114, 139, 200, 202, 203
Index 317
1EEE234567891012311145678920123456789301234567894012345678950123456789EEEE