Embed Size (px)
Citation preview
HAL Id: hal-01059306https://hal.archives-ouvertes.fr/hal-01059306
Submitted on 29 Aug 2014
HAL is a multi-disciplinary open accessarchive for the deposit and dissemination of sci-entific research documents, whether they are pub-lished or not. The documents may come fromteaching and research institutions in France orabroad, or from public or private research centers.
L’archive ouverte pluridisciplinaire HAL, estdestinée au dépôt et à la diffusion de documentsscientifiques de niveau recherche, publiés ou non,émanant des établissements d’enseignement et derecherche français ou étrangers, des laboratoirespublics ou privés.
Plastisol Gelation and Fusion Rheological AspectsJacques Verdu, Agnes Zoller, Antonio Marcilla
To cite this version:Jacques Verdu, Agnes Zoller, Antonio Marcilla. Plastisol Gelation and Fusion Rheological Aspects.Journal of Applied Polymer Science, Wiley, 2013, 129, pp.2840-2847. �10.1002/app.39005�. �hal-01059306�
Science Arts & Métiers (SAM)is an open access repository that collects the work of Arts et Métiers ParisTech
researchers and makes it freely available over the web where possible.
This is an author-deposited version published in: http://sam.ensam.euHandle ID: .http://hdl.handle.net/10985/8419
To cite this version :
Jacques VERDU, Agnes ZOLLER, Antonio MARCILLA - Plastisol Gelation and FusionRheological Aspects - Journal of Applied Polymer Science - Vol. 129, p.2840–2847 - 2013
Any correspondence concerning this service should be sent to the repository
Administrator : [email protected]
Plastisol Gelation and Fusion Rheological Aspects
Jacques Verdu,1 Agnes Zoller,2 Antonio Marcilla2
1Arts et M�etiers ParisTech, 151 bd de l’HOPITAL, 75013 Paris, France2Department of Chemical Engineering of the University of Alicante, Apartado 99 Alicante, Spain
Correspondence to: A. Marcilla (E-mail: [email protected])
ABSTRACT: This study deals with the rheological aspects of poly-vinyl chloride (PVC) plastisol gelation and fusion processes in foam-
able formulations. Here, such processes are simulated by temperature-programmed experiment (5 K min�1) in which complex viscos-ity components are continuously recorded. Nineteen samples based on a PVC-VAC (vinyl acetate 95/5) copolymer with 100 phr plas-ticizer have been studied, differing only by the plasticizer structure. The sample shear modulus increases continuously with temperature until a maximum, long time after the end of the dissolution process as characterized by DSC. The temperature at the maximum varies between 345 and 428 K with a clear tendency to increase almost linearly with the plasticizer molar mass, and to vary with the flexibility and the degree of branching of the plasticizer molecule. The shear modulus increase is interpreted in terms of progressive ‘‘welding’’ of swelled particles by polymer chain reptation. The plasticizer nature would mainly affect the friction parame-ter of chain diffusion.
INTRODUCTION
There are many types of processing operations (foaming, roto-
molding, etc.) in which poly-vinyl chloride (PVC) plastisols are
heated from ambient temperature to about 200 6 20�C. An
interesting peculiarity of these materials is that their viscosity,
g�, and their shear modulus, G, vary in a nonmonotonic way
during such experiments.1,2 The viscosity first decreases until a
minimum located at a temperature Tmin of about 40–50�C.
Then both the modulus and the viscosity increase to reach a
maximum at the temperature Tmax. During this episode, the
material adopts a rubbery behavior.
In its initial state, the plastisol can be described as a suspension
of rigid PVC particles in a liquid plasticizer. It is thus expected
to behave as a molecular liquid, and its viscosity is expected to
be a decreasing function of temperature as effectively
observed.1–5 This state is characterized by two main features:
the existence of an aging process revealed by a viscosity increase
during isothermal exposure,1 and the fact that the duration of
the period to reach Tmin is an increasing function of the particle
size and depends of the plasticizer nature. For many authors, an
important property in this period is the plasticizer ‘‘compatibil-
ity,’’ in other words the reciprocal polymer–plasticizer solubility
as expressed for instance in terms of Flory’s interaction parame-
ter v1,6 or more complex structural factors.5 Surprisingly,
plasticizer diffusivity D in the polymer (which is not necessarily
correlated with solubility) is often ignored or just mentioned
among many other factors, whereas it seems to us the key
parameter in this context. As a matter of fact, plasticizer pene-
tration in PVC is expected to obey the ‘‘case II’’ diffusion7,8
according to which the plasticizer invades progressively PVC
particles with an abrupt diffusion front separating the fully plas-
ticized superficial layer and the unplasticized core. This front
moves progressively toward the particle center. In such process,
the kinetics of the solvation process is expected to depend more
on diffusion than on equilibrium (solubility) parameters. The
initial plastisol morphology is also characterized by the presence
of agglomerates and by the roughness of elementary particles. It
has been suggested that particle deagglomeration and plasticizer
penetration in particle anfractuosities may also play an impor-
tant role.1 These processes, whatever their mechanism is, justify
the number of articles reporting microscopic investiga-
tions.1,3,5,9–11
In this article, phenomena occurring at T < Tmin will not be
considered, which explains why, in the experiments, temperature
scans begin at 40�C rather than at ambient temperature.
Above Tmin (� 50�C), both the storage modulus G and the
viscosity g� increase more or less abruptly until a maximum
located at a temperature Tmax ranging between about 60 and
150�C depending of many factors among which is the plasticizer
nature. There is a wide consensus to call it ‘‘gelation’’ although
the nature of the physical crosslinking mechanism responsible
for this process is not clearly identified in most articles.
‘‘Gelation’’ could be first associated to the loss of tackiness,1 that
is, presumably to the disappearance of the liquid phase consti-
tuted of almost pure plasticizer. It is also possible to associate
‘‘gelation’’ to the disappearance of the granular morphology.1,11–13
However, rheological measurements of Tmin considered as the
temperature of the onset of ‘‘gelation’’ and Tmax where ‘‘gelation’’
is generally considered complete, are the most common ways
for characterizing this phenomenon.1–5,14,15. In most cases, the
curve G ¼ f(T) displays a shoulder in the vicinity of the
glass transition temperature (Tg) of the unplasticized polymer
(� 80�C), indicating that, at this temperature, the plasticizer
has not yet penetrated into the particle core. The system can be
thus described, in this intermediary state, as a suspension of
rigid particles having a soft, swollen skin16,17 in the liquid plas-
ticizer. The viscosity increase could be caused by the progressive
increase in particle size because of swelling.18 A very interesting
and complete description of the rheological changes experienced
by PVC plastisols at constant and at increasing temperatures
was presented by Boudhani et al.19 In this article, the evolution
of the complex viscosity with time was related to the solid
volume fraction of a system with swelling particles reaching the
percolation threshold.
Above Tmax, both the modulus and the viscosity decrease con-
tinuously with temperature and the material tends to adopt a
behavior characteristic of a macromolecular liquid. Here also,
there is a wide consensus to call this phenomenon ‘‘fusion.’’ Just
above Tmax, the granular morphology is no more observable. It
is necessary to reach temperatures Tfin of, typically, 200 6 20�C
to obtain acceptable tensile properties.9,20 If the material is not
treated at the adequate temperature and time, it may easily
break at ambient temperature. In their study of the PVC-epoxy-
ester systems, Fenollar et al.9 determined the curing time to
achieve the maximum sample ductility (ultimate elongation of
the order of 250% at ambient temperature), it was about 16
min at 180�C, 12 min at 200�C, and 5 min at 220�C. For many
authors,1,9,20 the ‘‘fusion’’ process is associated to the existence
of PVC micro-crystallites21 of which the melting would be
needed to allow complete material homogenization. To our
opinion, a similar behavior would be observed with a fully
amorphous polymer; this is the reason why we have chosen to
study a vinyl chloride–vinyl acetate copolymer of especially low
crystallinity. But the main objective of this article is to bring
new results on the effect of plasticizer structure on the
‘‘gelation-fusion’’ process. Some partial results have been
reported in literature, for instance on five plasticizers among
which were one phthalate, two sebacates, and two phosphates1;
four alkyl phthalates3; one adipate, one phthalate, and one
citrate5; three phthalates, one mellitate, and their mixtures;6 or
three alkyl phthalates10. As quoted above, these results were
generally interpreted in terms of solvent–polymer (equilibrium)
interactions. It seemed to us interesting to study a larger series
of 19 plasticizers (of distinct structures) in order to have a
more panoramic view of the influence of factors such as ali-
phatic/aromatic content (alkyl adipates and alkyl phthalates),
degree of branching (citrates and esters of erythritol), and
molecular or macromolecular (polyadipates) character on the
processes under study.
EXPERIMENTAL
Materials
The resin (ETINOX 400 supplied by ASCONDEL) was a vinyl
chloride–vinyl acetate copolymer (95/5). Its K-value was 70 and
its glass transition temperature Tgp measured by DSC was
81.4�C. It was stabilized by a Ca-Zn stearate (REAGENS) 2 phr
combined with epoxidized soybean oil (Lankroflex 2307 6
phr).The plasticizers under study are listed in Table I.
The polymer and stabilizers were thoroughly mixed with each
plasticizer (100 phr) at room temperature in a rapid mixer at
120 min�1 during 5 min of the series. Mixtures were then
degassed for 15 min under vacuum (pressure � 100 Pa).
Characterization
Both components of complex shear viscosity were measured in a
Bohlin CS 50 viscosimeter in temperature-programmed condi-
tions: from 40�C to 180�C at 5�C min�1, under nitrogen. This
range of temperature covers the main processes typically occurring
in PVC plastisol processing before decomposition starts. The
plane–plane configuration with plateau diameter of 20 mm and a
gap of 0.5 mm was used. The rheological properties were recorded
at constant 5 � 10�3 strain amplitude and 1 Hz frequency.
RESULTS
The variations of complex viscosity (g), storage shear modulus
(G0), and loss modulus (G00) are shown in Figures 1 and 2 for the
plastisols prepared with DEP, DOP, and DUP. For DOP all the three
quantities are very low at temperatures lower than 80�C. Then they
increase until a maximum located at around 130–140�C, to decrease
above this temperature. All the samples behave in the same way but
with maxima depending of the plasticizer nature, as illustrated by
the curves of complex viscosity (Figure 1) and storage and shear
modulus (Figure 2) against temperature for phthalates having the
lowest molar mass (DEP) and the highest molar mass (DUP) (note
the different values attained by the different plasticizers). The char-
acteristics of the curves maxima are given in Table II.
It clearly appears that all the samples behave as molecular
liquids (for the frequency under study: 1 Hz) below 80�C and
above 180�C. Between these limits they behave rather as a visco-
elastic fluid in a more or less sharp temperature interval, with a
maximum located at a temperature increasing with molar mass
and a maximum modulus value decreasing with molar mass, at
least in the phthalate series.
The coordinates of maximum of G0 are listed in Table III for all
plasticizers under study.
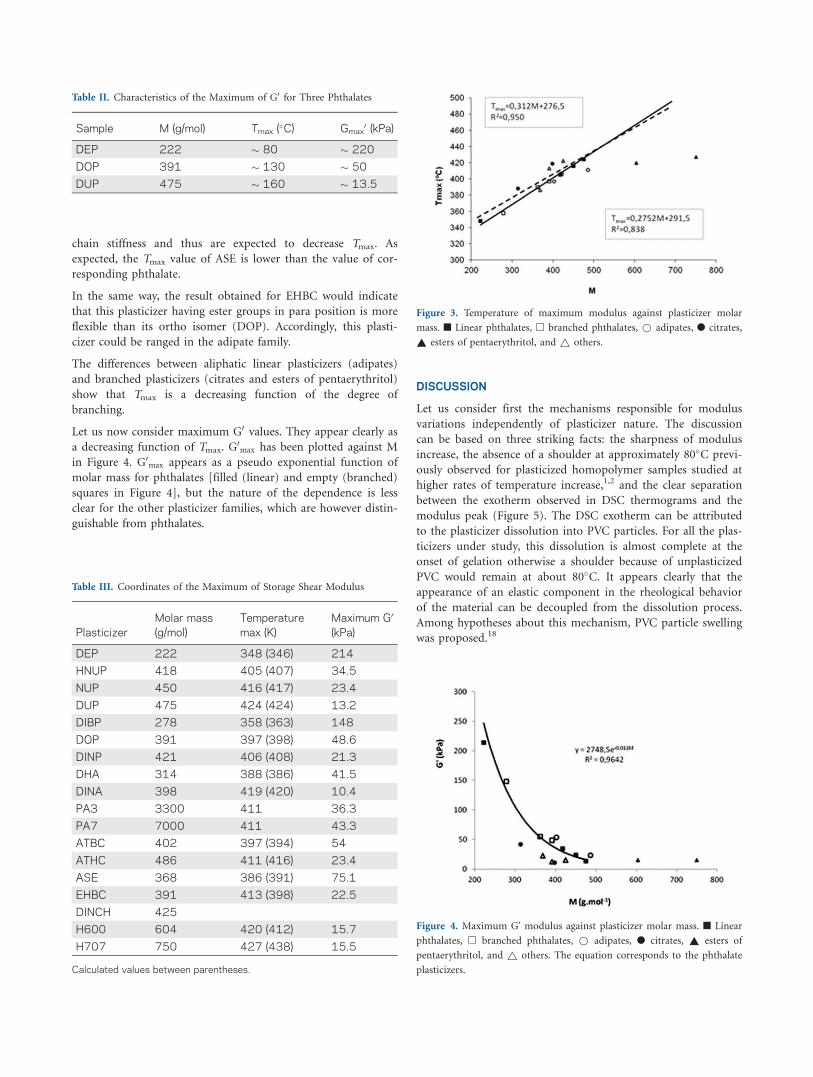
The temperature where the maximum value of the storage mod-
ulus was reached (Tmax) is plotted in Figure 3 for all plasticizers
except the polymeric ones.
In the phthalate family [filled (linear) and empty (branched)
squares in Figure 3], the dependence is not far from a straight
line of equation (in K):
Tmax ¼ 276:5þ 0:312 M (1)
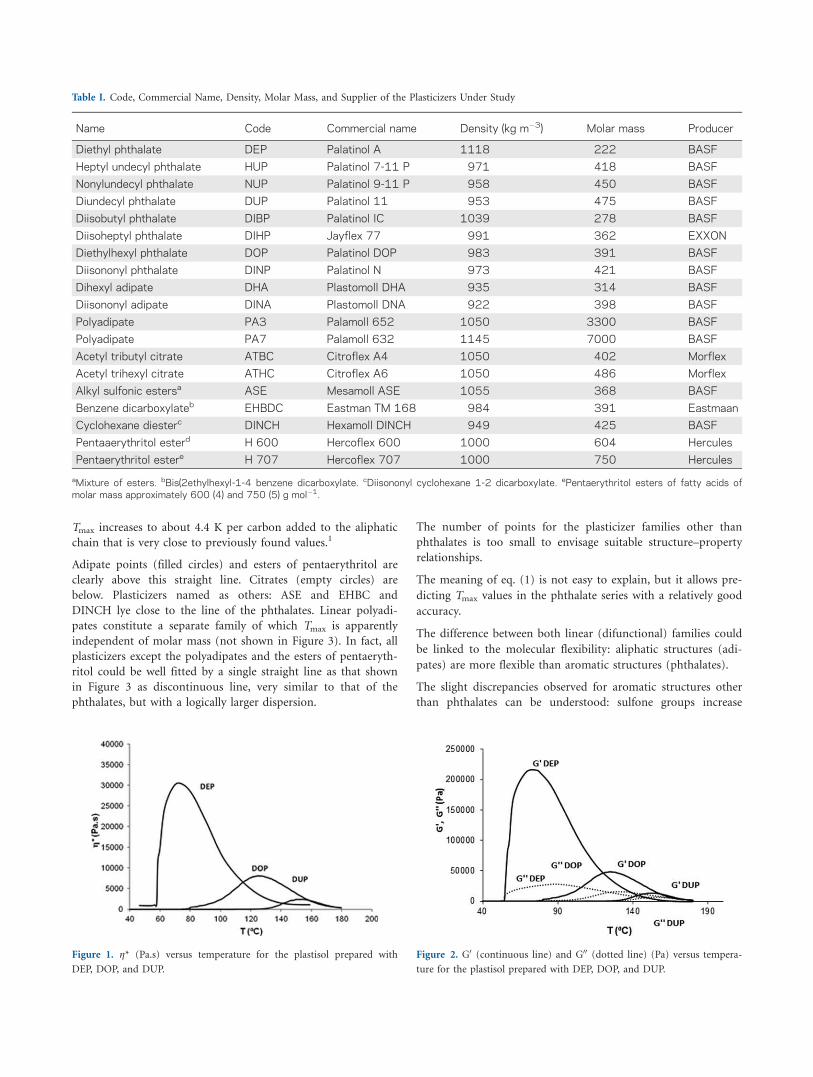
Tmax increases to about 4.4 K per carbon added to the aliphatic
chain that is very close to previously found values.1
Adipate points (filled circles) and esters of pentaerythritol are
clearly above this straight line. Citrates (empty circles) are
below. Plasticizers named as others: ASE and EHBC and
DINCH lye close to the line of the phthalates. Linear polyadi-
pates constitute a separate family of which Tmax is apparently
independent of molar mass (not shown in Figure 3). In fact, all
plasticizers except the polyadipates and the esters of pentaeryth-
ritol could be well fitted by a single straight line as that shown
in Figure 3 as discontinuous line, very similar to that of the
phthalates, but with a logically larger dispersion.
The number of points for the plasticizer families other than
phthalates is too small to envisage suitable structure–property
relationships.
The meaning of eq. (1) is not easy to explain, but it allows pre-
dicting Tmax values in the phthalate series with a relatively good
accuracy.
The difference between both linear (difunctional) families could
be linked to the molecular flexibility: aliphatic structures (adi-
pates) are more flexible than aromatic structures (phthalates).
The slight discrepancies observed for aromatic structures other
than phthalates can be understood: sulfone groups increase
Table I. Code, Commercial Name, Density, Molar Mass, and Supplier of the Plasticizers Under Study
Name Code Commercial name Density (kg m�3) Molar mass Producer
Diethyl phthalate DEP Palatinol A 1118 222 BASF
Heptyl undecyl phthalate HUP Palatinol 7-11 P 971 418 BASF
Nonylundecyl phthalate NUP Palatinol 9-11 P 958 450 BASF
Diundecyl phthalate DUP Palatinol 11 953 475 BASF
Diisobutyl phthalate DIBP Palatinol IC 1039 278 BASF
Diisoheptyl phthalate DIHP Jayflex 77 991 362 EXXON
Diethylhexyl phthalate DOP Palatinol DOP 983 391 BASF
Diisononyl phthalate DINP Palatinol N 973 421 BASF
Dihexyl adipate DHA Plastomoll DHA 935 314 BASF
Diisononyl adipate DINA Plastomoll DNA 922 398 BASF
Polyadipate PA3 Palamoll 652 1050 3300 BASF
Polyadipate PA7 Palamoll 632 1145 7000 BASF
Acetyl tributyl citrate ATBC Citroflex A4 1050 402 Morflex
Acetyl trihexyl citrate ATHC Citroflex A6 1050 486 Morflex
Alkyl sulfonic estersa ASE Mesamoll ASE 1055 368 BASF
Benzene dicarboxylateb EHBDC Eastman TM 168 984 391 Eastmaan
Cyclohexane diesterc DINCH Hexamoll DINCH 949 425 BASF
Pentaaerythritol esterd H 600 Hercoflex 600 1000 604 Hercules
Pentaerythritol estere H 707 Hercoflex 707 1000 750 Hercules
aMixture of esters. bBis(2ethylhexyl-1-4 benzene dicarboxylate. cDiisononyl cyclohexane 1-2 dicarboxylate. ePentaerythritol esters of fatty acids ofmolar mass approximately 600 (4) and 750 (5) g mol�1.
Figure 1. g* (Pa.s) versus temperature for the plastisol prepared with
DEP, DOP, and DUP.
Figure 2. G0 (continuous line) and G00 (dotted line) (Pa) versus tempera-
ture for the plastisol prepared with DEP, DOP, and DUP.
chain stiffness and thus are expected to decrease Tmax. As
expected, the Tmax value of ASE is lower than the value of cor-
responding phthalate.
In the same way, the result obtained for EHBC would indicate
that this plasticizer having ester groups in para position is more
flexible than its ortho isomer (DOP). Accordingly, this plasti-
cizer could be ranged in the adipate family.
The differences between aliphatic linear plasticizers (adipates)
and branched plasticizers (citrates and esters of pentaerythritol)
show that Tmax is a decreasing function of the degree of
branching.
Let us now consider maximum G0 values. They appear clearly as
a decreasing function of Tmax. G0max has been plotted against M
in Figure 4. G0max appears as a pseudo exponential function of
molar mass for phthalates [filled (linear) and empty (branched)
squares in Figure 4], but the nature of the dependence is less
clear for the other plasticizer families, which are however distin-
guishable from phthalates.
DISCUSSION
Let us consider first the mechanisms responsible for modulus
variations independently of plasticizer nature. The discussion
can be based on three striking facts: the sharpness of modulus
increase, the absence of a shoulder at approximately 80�C previ-
ously observed for plasticized homopolymer samples studied at
higher rates of temperature increase,1,2 and the clear separation
between the exotherm observed in DSC thermograms and the
modulus peak (Figure 5). The DSC exotherm can be attributed
to the plasticizer dissolution into PVC particles. For all the plas-
ticizers under study, this dissolution is almost complete at the
onset of gelation otherwise a shoulder because of unplasticized
PVC would remain at about 80�C. It appears clearly that the
appearance of an elastic component in the rheological behavior
of the material can be decoupled from the dissolution process.
Among hypotheses about this mechanism, PVC particle swelling
was proposed.18
Table III. Coordinates of the Maximum of Storage Shear Modulus
Plasticizer
Molar mass
(g/mol)
Temperature
max (K)
Maximum G0
(kPa)
DEP 222 348 (346) 214
HNUP 418 405 (407) 34.5
NUP 450 416 (417) 23.4
DUP 475 424 (424) 13.2
DIBP 278 358 (363) 148
DOP 391 397 (398) 48.6
DINP 421 406 (408) 21.3
DHA 314 388 (386) 41.5
DINA 398 419 (420) 10.4
PA3 3300 411 36.3
PA7 7000 411 43.3
ATBC 402 397 (394) 54
ATHC 486 411 (416) 23.4
ASE 368 386 (391) 75.1
EHBC 391 413 (398) 22.5
DINCH 425
H600 604 420 (412) 15.7
H707 750 427 (438) 15.5
Calculated values between parentheses.
Figure 3. Temperature of maximum modulus against plasticizer molar
mass. n Linear phthalates, h branched phthalates, * adipates, l citrates,
~ esters of pentaerythritol, and ~ others.
Table II. Characteristics of the Maximum of G0 for Three Phthalates
Sample M (g/mol) Tmax (�C) Gmax0 (kPa)
DEP 222 � 80 � 220
DOP 391 � 130 � 50
DUP 475 � 160 � 13.5
Figure 4. Maximum G’ modulus against plasticizer molar mass. n Linear
phthalates, h branched phthalates, * adipates, l citrates, ~ esters of
pentaerythritol, and ~ others. The equation corresponds to the phthalate
plasticizers.
The dissolution process has been described as a progressive
‘‘invasion’’ of polymer particles by the plasticizer, leading to a
swelling ratio presumably close to 2, assuming additivity of
polymer and plasticizer volumes at equilibrium. It is well
known that for a suspension of rigid spherical particles, viscos-
ity obeys Einstein law at high dilutions:
dg
dv¼
5gs2
(2)
where v is the solid volume fraction and gs is the solvent viscos-
ity. Here, however the volume fraction of swelled particles can
approach unity and Einstein law is no longer valid. For rigid
spherical particles, the viscosity diverges at a critical volume
fraction close of 0.6. Its variation can be represented by equa-
tions as the following one:
g
gs
¼1
1� v=v0ð Þ2(3)
where v0 is approximately 0.6. In this case, one would observe
the sudden appearance of elastic properties when v approaches
v0, which can be considered as a percolation threshold. Here,
however, the particles are neither spherical nor rigid in their su-
perficial layer. Little is known on elastic properties of such sys-
tems where viscosity probably increases continuously but does
not diverge.
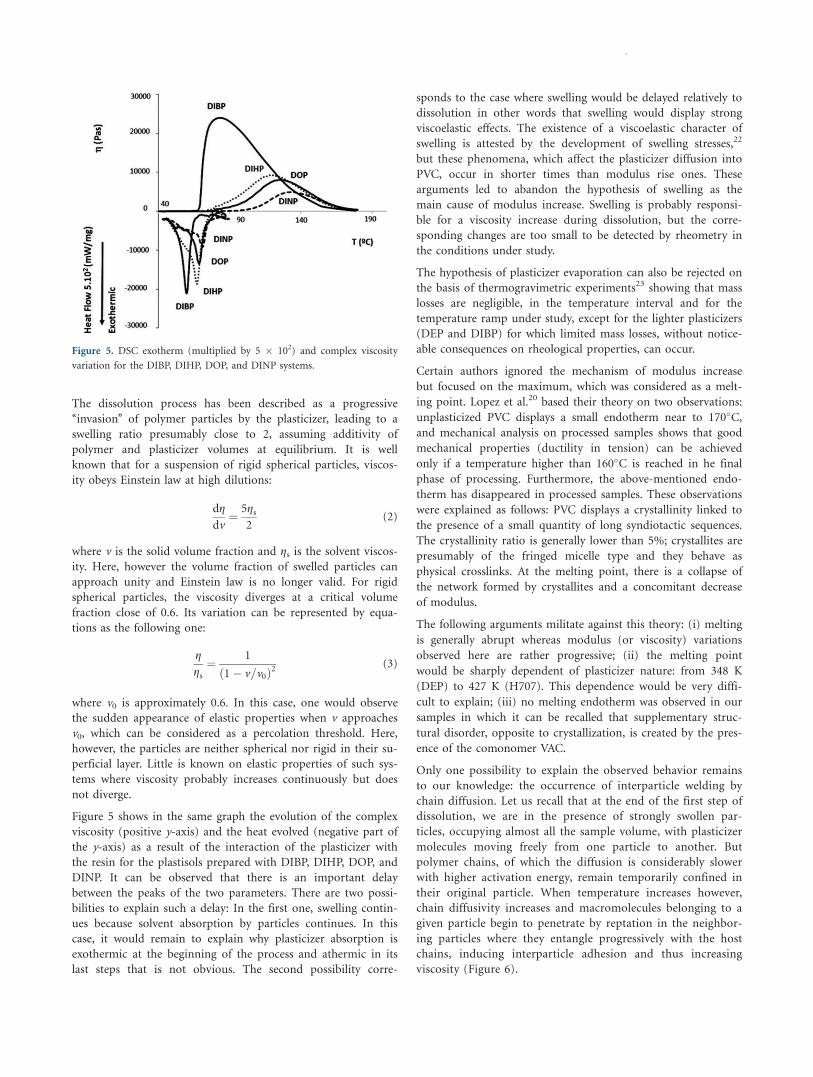
Figure 5 shows in the same graph the evolution of the complex
viscosity (positive y-axis) and the heat evolved (negative part of
the y-axis) as a result of the interaction of the plasticizer with
the resin for the plastisols prepared with DIBP, DIHP, DOP, and
DINP. It can be observed that there is an important delay
between the peaks of the two parameters. There are two possi-
bilities to explain such a delay: In the first one, swelling contin-
ues because solvent absorption by particles continues. In this
case, it would remain to explain why plasticizer absorption is
exothermic at the beginning of the process and athermic in its
last steps that is not obvious. The second possibility corre-
sponds to the case where swelling would be delayed relatively to
dissolution in other words that swelling would display strong
viscoelastic effects. The existence of a viscoelastic character of
swelling is attested by the development of swelling stresses,22
but these phenomena, which affect the plasticizer diffusion into
PVC, occur in shorter times than modulus rise ones. These
arguments led to abandon the hypothesis of swelling as the
main cause of modulus increase. Swelling is probably responsi-
ble for a viscosity increase during dissolution, but the corre-
sponding changes are too small to be detected by rheometry in
the conditions under study.
The hypothesis of plasticizer evaporation can also be rejected on
the basis of thermogravimetric experiments23 showing that mass
losses are negligible, in the temperature interval and for the
temperature ramp under study, except for the lighter plasticizers
(DEP and DIBP) for which limited mass losses, without notice-
able consequences on rheological properties, can occur.
Certain authors ignored the mechanism of modulus increase
but focused on the maximum, which was considered as a melt-
ing point. Lopez et al.20 based their theory on two observations:
unplasticized PVC displays a small endotherm near to 170�C,
and mechanical analysis on processed samples shows that good
mechanical properties (ductility in tension) can be achieved
only if a temperature higher than 160�C is reached in he final
phase of processing. Furthermore, the above-mentioned endo-
therm has disappeared in processed samples. These observations
were explained as follows: PVC displays a crystallinity linked to
the presence of a small quantity of long syndiotactic sequences.
The crystallinity ratio is generally lower than 5%; crystallites are
presumably of the fringed micelle type and they behave as
physical crosslinks. At the melting point, there is a collapse of
the network formed by crystallites and a concomitant decrease
of modulus.
The following arguments militate against this theory: (i) melting
is generally abrupt whereas modulus (or viscosity) variations
observed here are rather progressive; (ii) the melting point
would be sharply dependent of plasticizer nature: from 348 K
(DEP) to 427 K (H707). This dependence would be very diffi-
cult to explain; (iii) no melting endotherm was observed in our
samples in which it can be recalled that supplementary struc-
tural disorder, opposite to crystallization, is created by the pres-
ence of the comonomer VAC.
Only one possibility to explain the observed behavior remains
to our knowledge: the occurrence of interparticle welding by
chain diffusion. Let us recall that at the end of the first step of
dissolution, we are in the presence of strongly swollen par-
ticles, occupying almost all the sample volume, with plasticizer
molecules moving freely from one particle to another. But
polymer chains, of which the diffusion is considerably slower
with higher activation energy, remain temporarily confined in
their original particle. When temperature increases however,
chain diffusivity increases and macromolecules belonging to a
given particle begin to penetrate by reptation in the neighbor-
ing particles where they entangle progressively with the host
chains, inducing interparticle adhesion and thus increasing
viscosity (Figure 6).
Figure 5. DSC exotherm (multiplied by 5 � 102) and complex viscosity
variation for the DIBP, DIHP, DOP, and DINP systems.
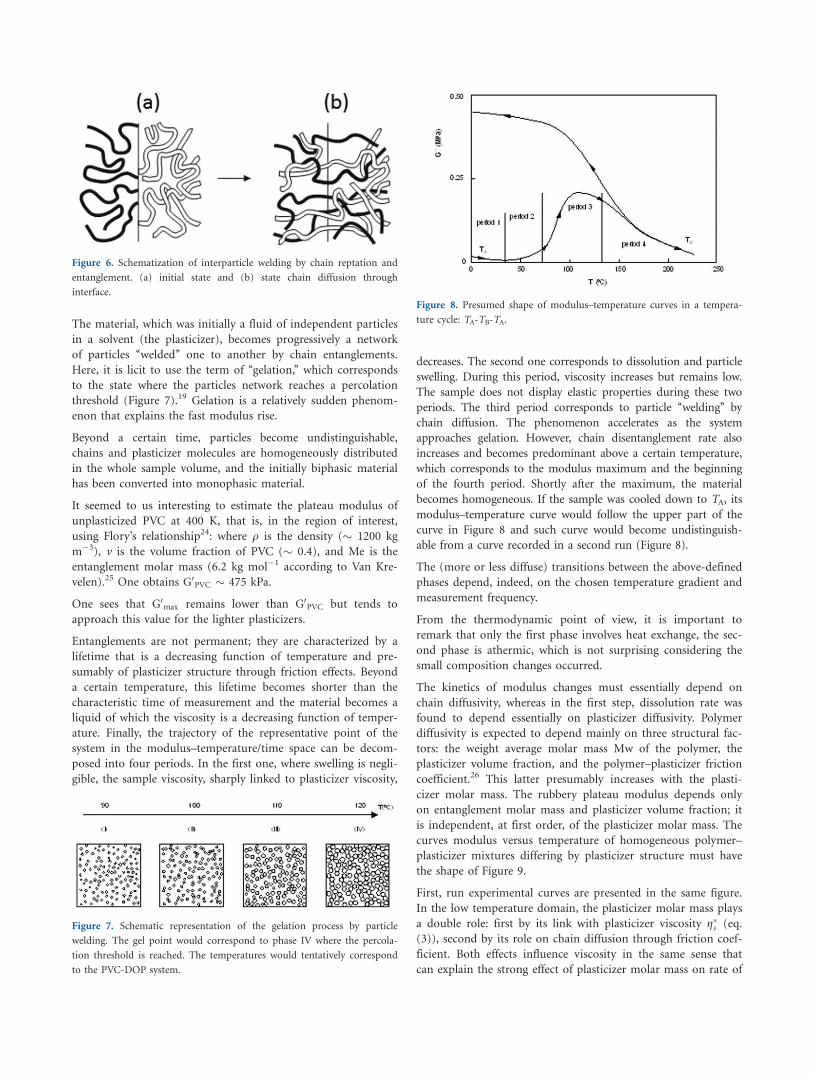
The material, which was initially a fluid of independent particles
in a solvent (the plasticizer), becomes progressively a network
of particles ‘‘welded’’ one to another by chain entanglements.
Here, it is licit to use the term of ‘‘gelation,’’ which corresponds
to the state where the particles network reaches a percolation
threshold (Figure 7).19 Gelation is a relatively sudden phenom-
enon that explains the fast modulus rise.
Beyond a certain time, particles become undistinguishable,
chains and plasticizer molecules are homogeneously distributed
in the whole sample volume, and the initially biphasic material
has been converted into monophasic material.
It seemed to us interesting to estimate the plateau modulus of
unplasticized PVC at 400 K, that is, in the region of interest,
using Flory’s relationship24: where q is the density (� 1200 kg
m�3), v is the volume fraction of PVC (� 0.4), and Me is the
entanglement molar mass (6.2 kg mol�1 according to Van Kre-
velen).25 One obtains G0PVC � 475 kPa.
One sees that G0max remains lower than G0
PVC but tends to
approach this value for the lighter plasticizers.
Entanglements are not permanent; they are characterized by a
lifetime that is a decreasing function of temperature and pre-
sumably of plasticizer structure through friction effects. Beyond
a certain temperature, this lifetime becomes shorter than the
characteristic time of measurement and the material becomes a
liquid of which the viscosity is a decreasing function of temper-
ature. Finally, the trajectory of the representative point of the
system in the modulus–temperature/time space can be decom-
posed into four periods. In the first one, where swelling is negli-
gible, the sample viscosity, sharply linked to plasticizer viscosity,
decreases. The second one corresponds to dissolution and particle
swelling. During this period, viscosity increases but remains low.
The sample does not display elastic properties during these two
periods. The third period corresponds to particle ‘‘welding’’ by
chain diffusion. The phenomenon accelerates as the system
approaches gelation. However, chain disentanglement rate also
increases and becomes predominant above a certain temperature,
which corresponds to the modulus maximum and the beginning
of the fourth period. Shortly after the maximum, the material
becomes homogeneous. If the sample was cooled down to TA, its
modulus–temperature curve would follow the upper part of the
curve in Figure 8 and such curve would become undistinguish-
able from a curve recorded in a second run (Figure 8).
The (more or less diffuse) transitions between the above-defined
phases depend, indeed, on the chosen temperature gradient and
measurement frequency.
From the thermodynamic point of view, it is important to
remark that only the first phase involves heat exchange, the sec-
ond phase is athermic, which is not surprising considering the
small composition changes occurred.
The kinetics of modulus changes must essentially depend on
chain diffusivity, whereas in the first step, dissolution rate was
found to depend essentially on plasticizer diffusivity. Polymer
diffusivity is expected to depend mainly on three structural fac-
tors: the weight average molar mass Mw of the polymer, the
plasticizer volume fraction, and the polymer–plasticizer friction
coefficient.26 This latter presumably increases with the plasti-
cizer molar mass. The rubbery plateau modulus depends only
on entanglement molar mass and plasticizer volume fraction; it
is independent, at first order, of the plasticizer molar mass. The
curves modulus versus temperature of homogeneous polymer–
plasticizer mixtures differing by plasticizer structure must have
the shape of Figure 9.
First, run experimental curves are presented in the same figure.
In the low temperature domain, the plasticizer molar mass plays
a double role: first by its link with plasticizer viscosity g�s (eq.
(3)), second by its role on chain diffusion through friction coef-
ficient. Both effects influence viscosity in the same sense that
can explain the strong effect of plasticizer molar mass on rate of
Figure 6. Schematization of interparticle welding by chain reptation and
entanglement. (a) initial state and (b) state chain diffusion through
interface.
Figure 7. Schematic representation of the gelation process by particle
welding. The gel point would correspond to phase IV where the percola-
tion threshold is reached. The temperatures would tentatively correspond
to the PVC-DOP system.
Figure 8. Presumed shape of modulus–temperature curves in a tempera-
ture cycle: TA-TB-TA.
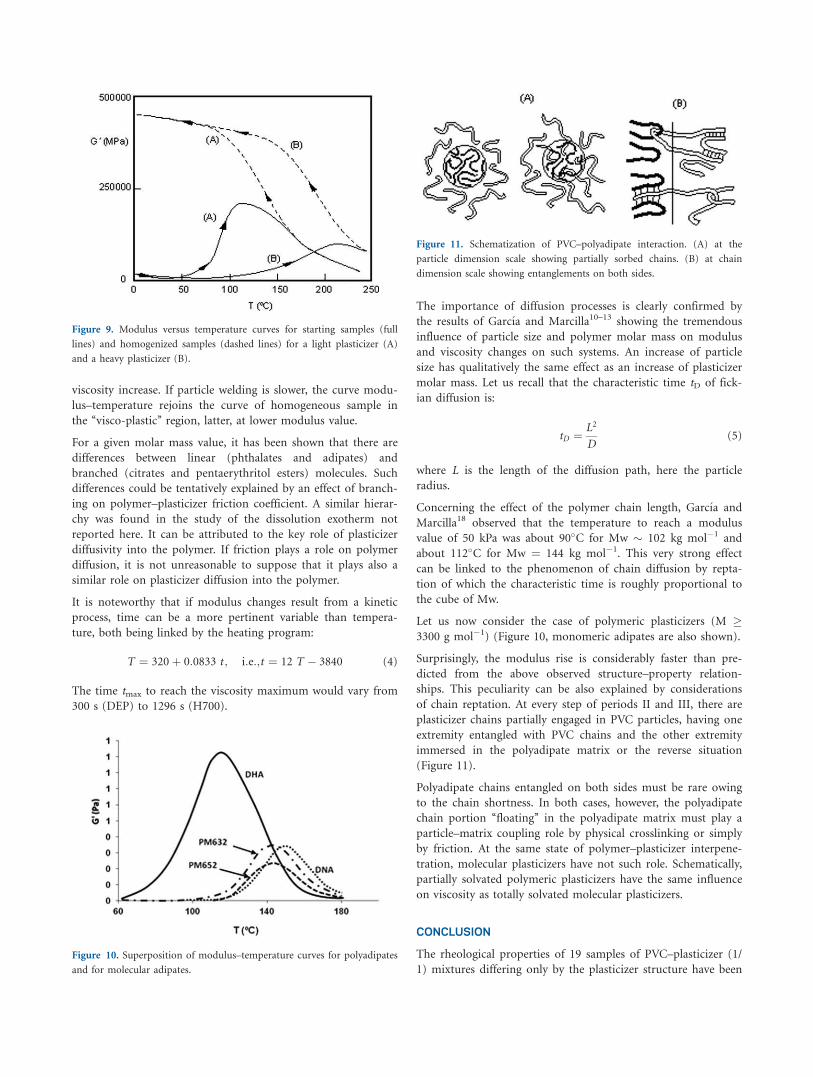
viscosity increase. If particle welding is slower, the curve modu-
lus–temperature rejoins the curve of homogeneous sample in
the ‘‘visco-plastic’’ region, latter, at lower modulus value.
For a given molar mass value, it has been shown that there are
differences between linear (phthalates and adipates) and
branched (citrates and pentaerythritol esters) molecules. Such
differences could be tentatively explained by an effect of branch-
ing on polymer–plasticizer friction coefficient. A similar hierar-
chy was found in the study of the dissolution exotherm not
reported here. It can be attributed to the key role of plasticizer
diffusivity into the polymer. If friction plays a role on polymer
diffusion, it is not unreasonable to suppose that it plays also a
similar role on plasticizer diffusion into the polymer.
It is noteworthy that if modulus changes result from a kinetic
process, time can be a more pertinent variable than tempera-
ture, both being linked by the heating program:
T ¼ 320þ 0:0833 t ; i:e:;t ¼ 12 T � 3840 (4)
The time tmax to reach the viscosity maximum would vary from
300 s (DEP) to 1296 s (H700).
The importance of diffusion processes is clearly confirmed by
the results of Garcı́a and Marcilla10–13 showing the tremendous
influence of particle size and polymer molar mass on modulus
and viscosity changes on such systems. An increase of particle
size has qualitatively the same effect as an increase of plasticizer
molar mass. Let us recall that the characteristic time tD of fick-
ian diffusion is:
tD ¼L2
D(5)
where L is the length of the diffusion path, here the particle
radius.
Concerning the effect of the polymer chain length, Garcı́a and
Marcilla18 observed that the temperature to reach a modulus
value of 50 kPa was about 90�C for Mw � 102 kg mol�1 and
about 112�C for Mw ¼ 144 kg mol�1. This very strong effect
can be linked to the phenomenon of chain diffusion by repta-
tion of which the characteristic time is roughly proportional to
the cube of Mw.
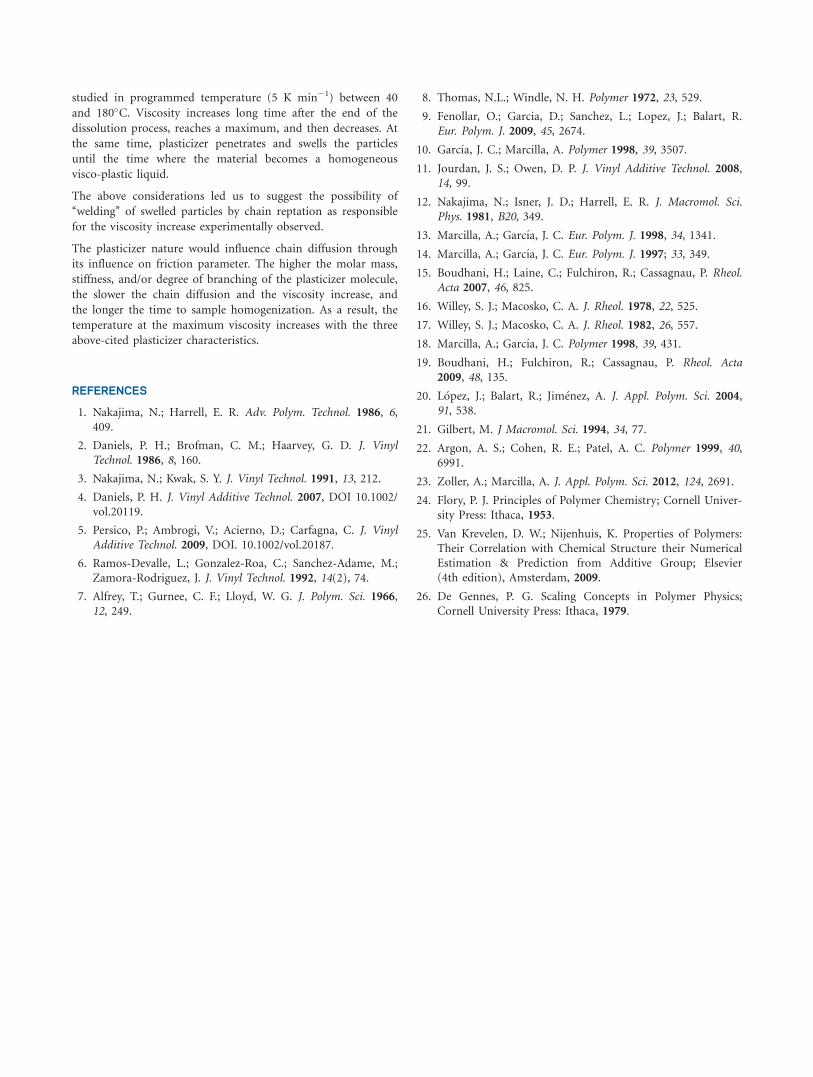
Let us now consider the case of polymeric plasticizers (M �3300 g mol�1) (Figure 10, monomeric adipates are also shown).
Surprisingly, the modulus rise is considerably faster than pre-
dicted from the above observed structure–property relation-
ships. This peculiarity can be also explained by considerations
of chain reptation. At every step of periods II and III, there are
plasticizer chains partially engaged in PVC particles, having one
extremity entangled with PVC chains and the other extremity
immersed in the polyadipate matrix or the reverse situation
(Figure 11).
Polyadipate chains entangled on both sides must be rare owing
to the chain shortness. In both cases, however, the polyadipate
chain portion ‘‘floating’’ in the polyadipate matrix must play a
particle–matrix coupling role by physical crosslinking or simply
by friction. At the same state of polymer–plasticizer interpene-
tration, molecular plasticizers have not such role. Schematically,
partially solvated polymeric plasticizers have the same influence
on viscosity as totally solvated molecular plasticizers.
CONCLUSION
The rheological properties of 19 samples of PVC–plasticizer (1/
1) mixtures differing only by the plasticizer structure have been
Figure 9. Modulus versus temperature curves for starting samples (full
lines) and homogenized samples (dashed lines) for a light plasticizer (A)
and a heavy plasticizer (B).
Figure 10. Superposition of modulus–temperature curves for polyadipates
and for molecular adipates.
Figure 11. Schematization of PVC–polyadipate interaction. (A) at the
particle dimension scale showing partially sorbed chains. (B) at chain
dimension scale showing entanglements on both sides.
studied in programmed temperature (5 K min�1) between 40
and 180�C. Viscosity increases long time after the end of the
dissolution process, reaches a maximum, and then decreases. At
the same time, plasticizer penetrates and swells the particles
until the time where the material becomes a homogeneous
visco-plastic liquid.
The above considerations led us to suggest the possibility of
‘‘welding’’ of swelled particles by chain reptation as responsible
for the viscosity increase experimentally observed.
The plasticizer nature would influence chain diffusion through
its influence on friction parameter. The higher the molar mass,
stiffness, and/or degree of branching of the plasticizer molecule,
the slower the chain diffusion and the viscosity increase, and
the longer the time to sample homogenization. As a result, the
temperature at the maximum viscosity increases with the three
above-cited plasticizer characteristics.
REFERENCES
1. Nakajima, N.; Harrell, E. R. Adv. Polym. Technol. 1986, 6,409.
2. Daniels, P. H.; Brofman, C. M.; Haarvey, G. D. J. Vinyl
Technol. 1986, 8, 160.
3. Nakajima, N.; Kwak, S. Y. J. Vinyl Technol. 1991, 13, 212.
4. Daniels, P. H. J. Vinyl Additive Technol. 2007, DOI 10.1002/vol.20119.
5. Persico, P.; Ambrogi, V.; Acierno, D.; Carfagna, C. J. VinylAdditive Technol. 2009, DOI. 10.1002/vol.20187.
6. Ramos-Devalle, L.; Gonzalez-Roa, C.; Sanchez-Adame, M.;Zamora-Rodriguez, J. J. Vinyl Technol. 1992, 14(2), 74.
7. Alfrey, T.; Gurnee, C. F.; Lloyd, W. G. J. Polym. Sci. 1966,12, 249.
8. Thomas, N.L.; Windle, N. H. Polymer 1972, 23, 529.
9. Fenollar, O.; Garcia, D.; Sanchez, L.; Lopez, J.; Balart, R.Eur. Polym. J. 2009, 45, 2674.
10. Garcı́a, J. C.; Marcilla, A. Polymer 1998, 39, 3507.
11. Jourdan, J. S.; Owen, D. P. J. Vinyl Additive Technol. 2008,14, 99.
12. Nakajima, N.; Isner, J. D.; Harrell, E. R. J. Macromol. Sci.
Phys. 1981, B20, 349.
13. Marcilla, A.; Garcı́a, J. C. Eur. Polym. J. 1998, 34, 1341.
14. Marcilla, A.; Garcı́a, J. C. Eur. Polym. J. 1997; 33, 349.
15. Boudhani, H.; Laine, C.; Fulchiron, R.; Cassagnau, P. Rheol.Acta 2007, 46, 825.
16. Willey, S. J.; Macosko, C. A. J. Rheol. 1978, 22, 525.
17. Willey, S. J.; Macosko, C. A. J. Rheol. 1982, 26, 557.
18. Marcilla, A.; Garcı́a, J. C. Polymer 1998, 39, 431.
19. Boudhani, H.; Fulchiron, R.; Cassagnau, P. Rheol. Acta
2009, 48, 135.
20. L�opez, J.; Balart, R.; Jim�enez, A. J. Appl. Polym. Sci. 2004,91, 538.
21. Gilbert, M. J Macromol. Sci. 1994, 34, 77.
22. Argon, A. S.; Cohen, R. E.; Patel, A. C. Polymer 1999, 40,6991.
23. Zoller, A.; Marcilla, A. J. Appl. Polym. Sci. 2012, 124, 2691.
24. Flory, P. J. Principles of Polymer Chemistry; Cornell Univer-sity Press: Ithaca, 1953.
25. Van Krevelen, D. W.; Nijenhuis, K. Properties of Polymers:Their Correlation with Chemical Structure their NumericalEstimation & Prediction from Additive Group; Elsevier(4th edition), Amsterdam, 2009.
26. De Gennes, P. G. Scaling Concepts in Polymer Physics;Cornell University Press: Ithaca, 1979.


