Embed Size (px)
Citation preview

at SciVerse ScienceDirect
Quaternary Science Reviews 34 (2012) 93e112
Contents lists available
Quaternary Science Reviews
journal homepage: www.elsevier .com/locate/quascirev
Pleistocene variability of Antarctic Ice Sheet extent in the Ross Embayment
Robert McKay a,*, Tim Naish a, Ross Powell b, Peter Barrett a, Reed Scherer b, Franco Talarico c, Philip Kyle d,Donata Monien e,1, Gerhard Kuhn e, Chris Jackolski b, Trevor Williams f
aAntarctic Research Centre, Victoria University of Wellington, PO Box 600, Wellington, New ZealandbDepartment of Geology and Environmental Geosciences, Northern Illinois University, USAcDipartimento di Scienze della Terra, Università di Siena, ItalydNew Mexico Institute of Mining and Technology, New Mexico, USAeAlfred Wegener Institute, Bremerhaven, Germanyf Lamont-Doherty Earth Observatory, New York, USA
a r t i c l e i n f o
Article history:Received 23 September 2011Received in revised form12 December 2011Accepted 14 December 2011Available online 28 January 2012
Keywords:PleistoceneWest Antarctic Ice SheetPalaeoclimatologySequence stratigraphy
* Corresponding author. Tel.: þ64 4 463 6836; fax:E-mail address: [email protected] (R. McKa
1 Current address: Institute for Chemistry and BiolGermany.
0277-3791/$ e see front matter � 2011 Elsevier Ltd.doi:10.1016/j.quascirev.2011.12.012
a b s t r a c t
Cores acquired by the ANDRILL McMurdo Ice Shelf Project (AND-1B) provide the basis for a new sedi-mentation model for glacimarine depositional sequences that reflect cyclic glacialeinterglacial fluctua-tions of a marine-based ice sheet in the western Ross Embayment over the past 2.0 Ma. Notwithstandingperiodic erosion during advances of the ice sheet, uncertainties inherent to the sedimentologicalinterpretation, and a limited number of chronological datums, it is clear that subglacial to grounding-zone sedimentation was dominant at the AND-1B site during the Late Pleistocene with interglacialsbeing represented only by thin intervals of ice-shelf sediment. Each sequence is characterised bysubglacial, massive diamictite that pass upwards into glacimarine diamictites and mudstones. Thisprovides the first direct evidence that the marine-based Antarctic Ice Sheet has oscillated betweena grounded and floating state at least 7 times in the Ross Embayment over the last 780ka, implyinga Milankovitch orbital influence. An unconformity in AND-1B, that spans most (w200 kyr) of the Mid-Pleistocene Transition is inferred to represent widespread expansion of a marine-based ice sheet in theRoss Embayment at 0.8 Ma. Prior to 1.0 Ma, interglacial periods are characterised by open-waterconditions at the drill site with high abundances of volcanoclastic deposits and occasional diatoma-ceous sediments. These may have responded to precession (w20-kyr) or obliquity (w40-kyr) orbitalcontrol. The occurrence of 6.7 m of phonolitic glass reworked from Mt Erebus in interglacial depositsbeneath Last Glacial Maximum till requires open ocean or ice shelf conditions in the western Ross Seaaround the drill site within the past 250 ka and implies a Ross Ice Shelf similar to or less extensive thantoday during Marine Isotope Stage 7 or 5.
� 2011 Elsevier Ltd. All rights reserved.
1. Introduction
The marine d18O isotope record provides arguably the mostdetailed proxy for past global ice volume and changes in oceanictemperature during the Pleistocene (Lisiecki and Raymo, 2005).However, uncertainties in the relative timing and extent ofNorthern Hemisphere versus Southern Hemisphere ice volumechanges during this time, as well as the timing and magnitude ofdeep-water cooling makes the interpretation of the d18O isotoperecord equivocal (e.g., Shackleton, 2000; Miller et al., 2005). Thishighlights the need for proximal records of past fluctuations in
þ64 4 463 5186.y).ogy, University of Oldenburg,
All rights reserved.
Antarctic ice sheet extent from the continental margin. Themarine sectors of the Antarctic ice sheets in particular arecommonly cited as being potentially unstable in response toclimate warming (Mercer, 1978; Joughin and Alley, 2011), yet littleis known of the past dynamic behaviour and response of themarine-based Antarctic during Pleistocene warm intervals(Vaughan and Arthern, 2007).
The sediment record obtained from the ANDRILL AND-1B drillcore (Fig. 1), collected from beneath the McMurdo Ice Shelf,provides an opportunity to correlate a direct record of marine-based ice sheet advance and retreat across the Ross Sea conti-nental shelf directly to far-field geological proxies of associatedoceanic and sea level change. Here, we use the AND-1B sedimentrecord to document the processes occurring at the grounding-linein the ancestral Antarctic Ice Sheet in the Ross Embayment,focussing on the record younger than 2.0 Ma. While the ice flowing

Fig. 1. Left) Map showing locations mentioned in text, the extent of Transantarctic Mountain and McMurdo Volcanic Group bedrock, and reconstruction glacial flowlines (dottedblack line) for the grounded Last Glacial Maximum ice sheet in McMurdo Region (after Denton and Hughes, 2000); Right) Modelled reconstructions (after Pollard and DeConto,2009) of Last Glacial Maximum, modern and Marine Isotope Stage 31 (1.07 Ma) suggest that the presence of grounded ice sheet, floating ice shelf, or open marine conditionsat the AND-1B are a good indicator of the general state of the West Antarctic Ice Sheet as a whole. The green to red colour fills represent ice sheet elevations at 500 m contourintervals. McMurdo region is indicated by black box. (For interpretation of the references to colour in this figure legend, the reader is referred to the web version of this article.)
R. McKay et al. / Quaternary Science Reviews 34 (2012) 93e11294
over the AND-1B site during glacial periods originates from EastAntarctica, previous studies have shown that the distal source ofthis East Antarctic ice, its reconstructed geometry and its thickness,grounded w835 m belowmodern sea level at the AND-1B drill sitein the Ross Embayment, requires a significant contribution of icefromWest Antarctica relative to the present-day (Fig. 1; Naish et al.,2009; Pollard and DeConto, 2009).
Last Glacial Maximum retreat reconstructions (Conway et al.,1999; Domack et al., 1999; Ship et al., 1999; Licht et al., 2005;Mosola and Anderson, 2006; McKay et al., 2008), mass balanceconsiderations (Pollard and DeConto, 2009), and the over-deepened/reverse slope nature of the Ross Sea continental shelfsince the Late Neogene (Weertman, 1974; De Santis et al., 1995)indicate that the record of grounded ice sheet deposition at theAND-1B drill site is expected to be intimately related to the overallstate of past marine-based ice sheets in the Ross Embayment. Thatis, an ice sheet that is fed by a contribution from both the East andWest Antarctic Ice Sheets, but subject to the same marine influ-ences on its mass balance as the wider West Antarctic Ice Sheetwhile the high-altitude regions of the East Antarctic Ice Sheetremain relatively stable. This is because air temperatures neverbecome warm enough to cause significant surface melting on theEast Antarctic Ice Sheet, whereas variations in ocean-induced melt
and sea level affect the marine-based West Antarctic Ice Sheetmuch more than the East Antarctic Ice Sheet.
This implies that once retreat was initiated for past configu-rations of these marine-based ice sheets, it was likely to haveoccurred within the deep basins across the Ross Embayment inpatterns similar to those hypothesized for the last glacial/inter-glacial cycle. (e.g. Conway et al., 1999; Denton and Hughes, 2000;Mosola and Anderson, 2006). The presence of open water depositsat the AND-1B drill site indicates the ice shelf calving-line wassouth of its present position, and therefore, the ice sheet was atleast partially reduced in extent, but this is not evidence ofcomplete collapse of the West Antarctic Ice Sheet. Nevertheless,well-dated periods of open water at the AND-1B drill site duringthe last 5 Ma (Naish et al., 2009) all correspond to times ofpartially to completely deglaciated West Antarctic Ice Sheet basedon model simulations (Pollard and DeConto, 2009). Therefore, inthe context of documenting past periods of partial or completecollapse of the West Antarctic Ice Sheet during the Pleistocene,open water conditions at the AND-1B drill site are required. In thispaper, we identify such deposits in AND-1B and examine these inthe context of the hypothesized collapses of the marine-basedsectors of the West Antarctic Ice Sheet, as inferred by far-fieldsea level records.

R. McKay et al. / Quaternary Science Reviews 34 (2012) 93e112 95
Here we address three questions: 1) to what extent did thevolume of the marine-based sector of the Antarctic Ice Sheets vary(if at all) in the Ross Embayment during Pleistocene interglacials?2) How did the ice sheets evolve through the onset of the 100-kyrcycles at the Mid-Pleistocene transition w1e0.8 Ma? 3) Whatconstraints can be placed on the Antarctica Ice Sheet contributionsto global sea level during “super interglacials” of the past 400 ka �e.g., Marine Isotope Stages (MIS) 11, 9, 7 and 5.
2. Near- and far-field evidence for West Antarctic Ice Sheet“collapse” events during the Pleistocene
The Western Ross Embayment is a critical location for under-standing sensitivity of the marine-based West Antarctic Ice Sheet,as the grounding line in this region has retreated w1300 km sincethe LGM. This retreat was relatively continuous throughout theHolocene, and may still be ongoing (Conway et al., 1999), sug-gesting that even in the absence of external (anthropengic) forc-ings, periods of prolonged or intense interglacial conditions mayeventually result in collapse of the West Antarctic Ice Sheet.
The presence of Quaternary diatoms and relatively highconcentrations of 10Be in tills recovered from beneath the WhillansIce Stream (83�290S, 138�060W) indicate that areas of WestAntarctic Ice Sheet now grounded were exposed to open marineconditions at some time(s) during the Middle to Late Pleistocene(Scherer et al., 1998). This evidence constrained the timing of atleast one marine ice sheet “collapse” event occurring within thepast 1.3 Myr in the Ross Embayment, based on the occurrence ofThalassiosira antarctica and other diatoms characteristic of the LatePleistocene in the tills, and a general absence of early Pleistocene orPliocene-aged diatoms (Kerr, 1998; Scherer et al., 1998).
Evidence of open marine conditions followed by ice shelfgrowth in McMurdo Sound during MIS 5e is provided by reworkedmarine sediments at Cape Barne on Ross Island (Stuiver et al., 1981;Bohaty et al., 1998). This deposit has been 230Th/234U dated at120,000 � 6000 yrs, and is composed of 20% biogenic material,including sponge spicules, fragmentary calcareous shells, diatomsand foraminifera (Ward and Webb, 1986). Stuiver et al. (1981)interpreted this marine deposit to be a glacial erratic that wasincorporated into the base of an ice shelf (as is happening today inthe western-most sector of the McMurdo Ice Shelf), and trans-ported to Cape Barne as the ice shelf grounded during the lastglacial advance. These marine deposits therefore provide an age forthe last period of open marine conditions in McMurdo Sound priorto the Last Glacial Maximum (Stuiver et al., 1981). Radiocarbonages of reworked molluscs in tills on Ross Island indicate thatduring the Last Glacial Maximum, a grounded ice sheet did notoccupy the McMurdo Sound region until 26,860 14C yr BP (Dentonand Hughes, 2000), leaving open the possibility of a prolonged(w100 kyr) period of ice shelf or open marine conditions near RossIsland between MIS 5e and the Last Glacial Maximum.
Coral reef studies indicate that sea levels were w4e6 m higherthanpresent day formost ofMIS 5e (Rostami et al., 2000;Muhs et al.,2001). However, a recent statistical reassessment of globally-distributed, local sea level records during MIS 5e concludedthere was a 95% probability that global sea levels exceeded 6.6 m,and a 67% probability that it exceed 8.0 m (Kopp et al., 2009).Estimates of Greenland’s contribution to the Stage 5e sea-levelhighstand are at most 4 m. Ice-core constraints for the presenceof Last Interglacial ice on southern Greenland remain equivocal(e.g., Andersen et al., 2004; Lhomme et al., 2005), whereasgeological data indicate that sufficient ice melted from southernGreenland to contribute 1.6 to 2.2 m of sea-level rise (Colville et al.,2011). Models of Greenland and other Arctic ice masses forced byclimatologies inferred from data or simulated by climate models
find a contribution of about 2e4 m of early Last Interglacial sea-level rise over several millennia (Robinson et al., 2011). If theseestimates of sea level are correct, then theWest Antarctic Ice Sheetmust have been a significant contributor to MIS 5e sea levels, withpotential contribution from the East Antarctic Ice Sheet.
Scherer et al. (1998) suggestedMIS 11, 430,000 years agowas themost probable candidate for a Late Pleistocene “collapse” event ofthe grounded portion of the West Antarctic Ice Sheet. This state-ment was based on the presence of beach deposits preserved at20 � 3 m above sea level on the coastlines of Barbardos and Ber-muda. These deposits were dated at between 390 and 550 kyr(Hearty et al., 1999), implying a contribution from a “collapsed”West Antarctic Ice Sheet. However, these sea level records arecomplicated by uncertainties associated with tectonics andambiguous chronologies. In addition, a recent correction of theseestimates using average uplift rates from MIS 5e shorelines indi-cates that sea level duringMIS 11was closer to present-day (Bowen,2010). Such an assessment is supported by the composite d18Oforaminifera sea level record from the Red Sea (Rohling et al., 2009),which suggests that MIS 11 may have had lower sea levels thanMIS 5e.
Hillenbrand et al. (2009) argued for a single prolonged inter-glacial period between 490,000 and 590,000 years ago, based onevidence from continental rise sediments recovered in theAmundsen Sea region that displayed a strong depositional cyclicityfor most of the Late Pleistocene with the exception of the periodspanning MIS 15e13 (Hillenbrand et al., 2009). They suggest thisdepositional anomaly may represent a period of West Antarctic IceSheet drawdown, with relatively limited ice advance occurringduring MIS 14.
The strongest case for a greatly reduced marine ice sheet in theRoss Embayment during the Pleistocene is MIS 31, centred at1.07 Ma, which stands out as significantly warmer than the otherLate Pliocene/Pleistocene interglacials (Lisiecki and Raymo, 2005).Scherer et al. (2008) reported on a relatively warm-water marinecarbonate unit deposited during MIS 31 recovered by the CapeRoberts Project (77�S). The age of this unit is well-constrained by87Sr/86Sr dating of carbonate shells, 40Ar/39Ar dating of volcanicashes, biostratigraphy, as well as coinciding with a paleomagneticreversal assigned to the base of the Jaramillo subchron (1.07 Ma).Diatoms indicated surfacewater conditions 4e5 �C degreeswarmerthan today. The authors also demonstrated from stable isotopemeasurements, calcareous nannofossils and diatom data that thepeak warmth for this deposit, and for ODP site 1094 in the SouthernOcean, occurred during a phase of peak Southern Hemisphereinsolation, prior to deglaciation in the Northern Hemisphere. Anincursion of calcareous nannofossils in the Site 1165 sediment coreoccurred atw1 Ma (Villa et al., 2007) and indicated that the MIS 31warming was also significant at the East Antarctic margin. Thislends support to the hypothesis of Raymo et al. (2006) that localinsolation may be a key control for determining ice volume in eachhemisphere e at least during the periods of extremely highintensity Southern Hemisphere insolation.
An alternative scenario is that the West Antarctic Ice Sheet maynot respond linearly to orbital-controlled variations in solar inso-lation, with MacAyeal (1992) hypothesizing that the distribution ofsoft, deformable till underlying theWest Antarctic Ice Sheet may bethe critical factor in determining its susceptibility to collapse,which in his model runs were irregularly timed. In contrast,a recent model simulation of the West Antarctic Ice Sheet for thepast 5 Myr shows sensitivity to marine mass balance controls andlocal insolation forcing (Pollard and DeConto, 2009) and recon-structs West Antarctic Ice Sheet collapses during Pleistoceneinterglacials coincident with strong austral summer insolationanomalies, most notably MIS 31 and MIS 7 (1.07 Ma and 225 ka).

R. McKay et al. / Quaternary Science Reviews 34 (2012) 93e11296
The varying results from ice sheet modelling experimentshighlights the need for further constraints from geological datasuch as the AND-1B record to assess the relative sensitivity of themarine-based ice sheets in Antarctica to various mass balancecontrols that are used to drive these models. These controls includeeustatic sea level change associated with Northern Hemisphere icesheet growth and decay (Denton et al., 1986), oceanic warming(Pollard and DeConto, 2009; Mackintosh et al., 2011), sedimentaryand hydrological processes at the base of ice sheets (MacAyeal,1992; Alley, 2000), and changes in solar insolation due to orbitalvariations (e.g. Huybers, 2006; Raymo et al., 2006).
3. Regional setting
The 1284.87-m-long AND-1B drill core (77.89�S, 167.09�E) wasrecovered in the austral summer of 2006e07. It records theclimate and glacial/marine history spanning the last 13 Myr, withw60 sequences recording advance and retreat of a grounded icemargin across the Ross Embayment (McKay et al., 2009; Naishet al., 2009). AND-1B was recovered from beneath the McMurdoIce Shelf, an extension of the present-day Ross Ice Shelf at itsnorth-western margin, at a water depth of 935 m. The easternsector of the present-day McMurdo Ice Shelf (i.e. at the AND-1Bdrill site) is fed mainly by glaciers flowing from the Trans-antarctic Mountains and Ross Island, and has surface accumulationof w0.3 m/year that must be balanced by basal ice shelf melting(McCrae, 1984).
Approximately two-thirds of the present day Ross Ice Shelf isnourished by ice streams that drain the West Antarctic Ice Sheet,yet its western margin is fed by East Antarctic Ice Sheet outletglaciers (Fahnestock et al., 2000). Glaciological reconstructions atthe Last Glacial Maximum indicates grounded ice within the RossEmbayment to near the edge of the Ross Sea continental shelf(Denton and Hughes, 2000) with an approximately equivalentcontribution from East and West Antarctic sourced ice (Licht et al.,2005). Previous studies of till provenance in the Ross Island regionindicate that glacial transport by ice sourced from distal EastAntarctic Ice Sheet outlet glaciers w200 km to the south of theAND-1B drill site occurred during the last period of grounded icedeposition at the Last Glacial Maximum (Denton and Hughes,2000; Licht et al., 2005; McKay et al., 2008; Fig. 1), as well asduring deposition of older Plio-Pleistocene tills sequences in AND-1B (Talarico and Sandroni, 2009). This distal provenance sourceindicates that a grounded ice event at the Last Glacial Maximum inthe Windless Bight region was the result of large-scale marine icesheet that was grounded in the Ross Embayment, rather thanlocalised glacial advance from Ross Island or outlet glaciers in theMcMurdo Sound region.
Volcanism and its influence on lithospheric flexure is impor-tant during the past 2.0 Myr (Horgan et al., 2005). Mt Terror,a large 3230 m high basalt shield formed between and 1 and 2 Ma.Overlapping the final phases of activity of Mt Terror, Mt. Erebusevolved in three phases 1) a shield-building phase of low-viscositymafic volcanism between 1.3 and 1.0 Ma; followed by 2) a cone-building phase, with more differentiated, higher-viscosity erup-tions of tephrites, basanites and phonotephrites (moderatelyhigher alkali and silica content) that continued between 1.0 Maand 250 ka; and 3) anorthoclase-phyric tephriphonolite andphonolite eruptions (i.e., much higher silica and alkali content)that have characterised Mt Erebus eruptions since 250 ka (Esseret al., 2004). This volcanic activity is important as crustal flexurefrom loading has provided accommodation space for the preser-vation of significant volumes of Pleistocene sediment at thelocation of AND-1B drill site (Stern et al., 1991; ten Brink et al.,1997; Horgan et al., 2005). The petrologic evolution of Mt Erebus
also provides some chronological constraints for volcanic materialpresent in the AND-1B drill core.
4. Material and methods
AND-1B was initially described at the Crary Science and Engi-neering Centre, in McMurdo Station, Antarctica using standardsedimentological techniques to produce detailed stratigraphiclogs. The logs were then used to develop a preliminary “on-ice”sequence stratigraphy (Krissek et al., 2007). Re-assessment of theinitial sequence stratigraphy for this time period was undertakenby visual inspection of the archive half of the drill core at theAntarctic Research Facility in Florida during June 2007 e with twosequence boundaries, representing ice grounding and erosionduring glacial advance, being removed from the preliminaryassessment (see Section 5.2.1 for details). The upper 125 mbsf ofthe AND-1B drill core has been x-rayed to examine subtle sedi-mentary features not observed in the cut core face. However, theselargely confirm the observation of stratification and other sedi-mentary structures that were originally noted during the coredescription.
We focus only on the polar glacial regime sequences in AND-1Bthat characterised the past 2.0 Ma, and apply a detailed faciesanalysis to this interval, consistent with those conducted on LastGlacial Maximum to Holocene subglacial/ice shelf and open marinesedimentary facies successions in the Ross Embayment (Andersonet al., 1980; Domack et al., 1999; Licht et al., 1999; McKay et al.,2008).
For poorly-sorted clastic sediments that contain any gravel, wefollow the textural classification scheme of Moncrieff (1989). Underthis scheme, diamictites are defined as having between 10 and 90%sand in the matrix, and between 1 and 30% gravel. A mudstonewith clasts has <10% sand and contains trace to 30% gravel, whileconglomerates have >30% gravel. If no gravel is present, thetextural classification of terrigenous sediment was based on thedominant grain size e i.e., mudstone or sandstone. Diatom oozesare classified as being composed of >50% diatoms from smear slideestimates, which were made by a single worker to ensure internalconsistency. A terrigenous lithology is classified as diatom-bearingif diatom estimates were between 10 and 25%, while they areclassified as diatom-rich if estimates were between 25 and 50% e
e.g. a diatom-bearing mudstone contains 10e25% diatoms.For grain-size analysis, between 10 and 30 g of sample was
dried and gently broken down into w2 mm-sized fragments. Theywere then tested for carbonate, and if present treated in 10% HCluntil the reaction was complete. The samples were then stirred insodium hexametaphosphate (1 g/L) in an ultrasonic bath untildisaggregated, a process that could take several hours. Once fullydisaggregated, the sample was wet-sieved into sand and mudfractions, for dry-sieving at 0.5ø intervals, and Sedigraph� 5100analysis, respectively. These datasets were subsequently mergedwith the gravel fraction (>2 mm) being excluded from thestatistical analysis. However, the abundance and composition ofgravel was recorded at 10-cm intervals by visual analysis of thesplit core face during core characterization (Talarico and Sandroni,2009). All quantitative particle size measurements in this studyconfirmed the initial visual estimates of texture during the visualcore description.
Total Organic Carbon measurements were carried out witha carbon-sulphur determinator LECO CS-125 (LECO InstrumenteGmbH, 20 Germany). Prior to Total Organic Carbon determinationthe samples were heated with 0.5 ml 10% HCl and 3 drops ofethanol to remove Total Inorganic Carbon. To assess lithologies inintervals where there was poor recovery, a downhole naturalgamma ray tool (Century Geophysical Corp. multifunction model

R. McKay et al. / Quaternary Science Reviews 34 (2012) 93e112 97
8144) was passed up through the well three times. Each pass wassmoothed with a 20-cm running mean (to minimize noise), depth-corrected to bring features in the log into line with the samefeatures in the XRF-core scanning potassium log, and corrected toaccount for attenuation of the natural gamma signal through thedrill pipes. The three passes were then averaged to increase signal-to-noise ratio.
5. Pleistocene glacial/interglacial facies analysis and sequencestratigraphy of the AND-1B drill core
The upper 146.79 m of AND-1B contains strata younger than2.0 Ma (Wilson et al., 2007). Above 82.74 metres below sea floor(mbsf), the AND-1B drill core can be generalised as “muddydiamictite with thin intervals of mudstone and sandstone” (Figs. 2and 3). Between 146.79 and 82.74 mbsf, AND-1B contains only 23%diamictite, which forms metre-scale interbeds with w10- to 20-mthick successions of basanitic tephra and volcanic sands, muds, andoccasionally diatomite (Figs. 3 and 4). The facies model is like thatdeveloped for AND-1B (McKay et al., 2009), but due to the higher-resolution, more-detailed nature of this study, additional facieshave been added (Table 1). These are consistent with previousstudies of Last Glacial Maximum to Holocene glacimarine deposits(e.g. Anderson, 1999; Domack et al., 1999; Hemer and Harris, 2003).
5.1. Lithofacies present in the upper 150 m of the AND-1B drill core
5.1.1. Massive diamictite (Facies Dm)Facies Dm is represented by clast-rich (5e30% gravel) to clast-
poor (1e5% gravel) muddy diamictite that displays no evidenceof stratification (e.g. Fig. 5) either in the cut core face or in x-rayimages, although in some intervals horizontal alignment of clastsalong the a-axis orientation is evident. Biogenic silica content isusually absent, but rare intervals have up to 10% in the matrix asdetermined by smear slides estimates. Grain size is characterised bya uniform, poorly sorted distribution. Clasts are angular to rounded,poorly sorted, and include a wide range of lithologies, such asmudstone intraclasts and volcanics, metasedimentary and sedi-mentary rocks, granites, dolerites, and marbles. Striated andfacetted clasts are also present.
5.1.2. Stratified diamictite (Facies Ds)Facies Ds is represented by clast-rich to clast-poor diamictite
that displays weak to well-defined stratification as defined bychanges in matrix colour or clast concentration (e.g. Fig. 5C and D).Horizontal alignment of clasts was not used as a criterion forstratification, although preferred a-axis orientation is common andpebble “nests” are present in some intervals. The matrix rangesfrom muddy to sandy, and the biogenic silica content is usuallyabsent, but rare intervals have up to 10% in the matrix as deter-mined by smear slides estimates. Grain size is characterised bya uniform distribution. Clasts are angular to rounded, poorly sor-ted, and contain a wide range of lithologies, including volcanics,metasedimentary and sedimentary rocks, granites, dolerites, andmarbles.
5.1.3. Granulated diamictite (Facies Dg)Facies Dg has a sandy mud matrix, and displays well-defined
stratification that is characterised by a high proportion (>10 clast-s per metre) of sedimentary (mudstone/diamictite) intraclasts orincreased abundance of coarse sands to granule-sized clasts, rela-tive to the stratified diamictites (e.g. Figs. 5 and 6). Facies Dg isa diamictite that is commonly well stratified (e.g. Fig. 5A), but isoccasional massive in structure (Fig. 6C). Grain-size distribution ischaracterised by a distinct silt mode relative to massive and
stratified diamictites (Fig. 7). Stratification is commonly defined bysubhorizontal mudstone laminae.
5.1.4. Sandstone (Facies S)Facies S is usually very fine- to medium-grained, but can reach
coarse sand grade. The sandstone beds are commonly graded, andassociated with a variety of sedimentary structures, notably planarand ripple lamination, and are typically less than <1 m thick. Thelower contacts of the sandstones usually are sharp, whereas theupper contacts are gradational. Some sandstone intervals aredominated by volcanic grains, whereas others contain a notablequartzo-feldspathic component and display planar and ripple-laminae (e.g., Fig. 6C and D).
5.1.5. Mudstone (Facies M)Facies M is represented by silty claystones to clayey siltstones
that may be massive or stratified. If present, stratification is iden-tified by a change in either colour or particle size, with localsandstone laminae (mm-scale). Bioturbation is variable, rangingfrom absent to intense (Fig. 6A and B, respectively). In someintervals dispersed (w1%) to common clasts (1e5% clasts) arepresent, and a separate facies is assigned to these intervals (FaciesMc; e.g. Fig. 6A). Biosiliceous debris is also highly variable rangingfrom absent, to diatom-bearing (10e25%) and diatom-rich(25e50%) mudstone.
5.1.6. Diatomite (Facies DO)Facies DO is lithified diatom ooze, defined by abundances of
>50% diatoms by visual estimate in smear slides analysis. They maybe either massive or stratified. The degree of bioturbation is vari-able and stratification, if present, is defined by colour changes orlaminae/thin beds of sandstone and gravel. Dispersed pebbles,granules and coarse sand are common throughout and may deformthe laminae beneath.
5.1.7. Volcanic debris (Facies V)This facies consists of primary tephra deposits and near-primary
volcanic deposits (including lapilli tuffs between 83 and 86 mbsf),and sandstone/mudstone intervals that are black in colour and arecomposed almost entirely of volcanic debris.
5.2. Sequence stratigraphic framework for Pleistocene Antarctic IceSheet oscillations in the Ross Embayment
5.2.1. Subglacial depositionMassive diamictites (Facies Dm) are difficult to interpret as they
can form in a subglacial, glacimarine, openmarine environments asa result of mass flow deposition (e.g., Anderson et al., 1980; Powelland Molnia, 1989; Domack et al., 1999), or arise from homogeni-sation of glacimarine sediment by iceberg-scouring (Dowdeswellet al., 1994). As the water depth at the AND-1B drill site isw935 m, iceberg-scouring is unlikely to occur. Clasts contained inAND-1B diamictites interpreted as glacigenic in origin havea notable Transantarctic Mountains component that indicatesa provenance from the Skelton/Mulock Glacier region 200 km tothe south of the drill site (Talarico et al., 2010) and thereforedeposition by a large, grounded (or nearly grounded) ice sheet inthe Ross Embayment. The mixed Transantarctic Mountains/McMurdo Volcanic Group provenance of most diamictites in AND-1B suggests that these large ice sheets had a similar configurationto that proposed for the Last Glacial Maximum, when AND-1B lay atthe approximate confluence of ice derived from Ross Island andfrom south of Minna Bluff (Denton and Hughes, 2000; Fig. 1). Thedistal provenance of the clast compositions within the massivediamictite facies can only be explained by large-scale grounded ice
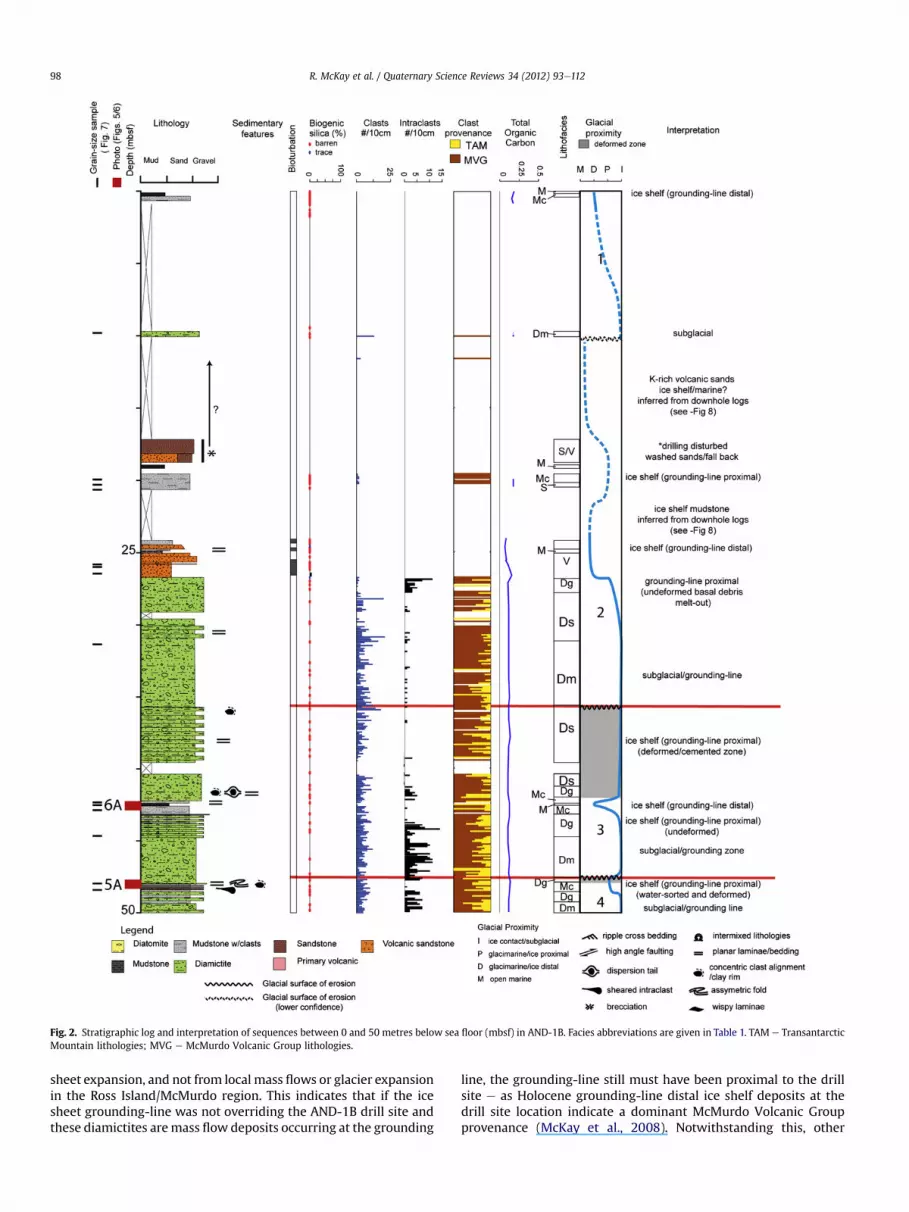
Fig. 2. Stratigraphic log and interpretation of sequences between 0 and 50 metres below sea floor (mbsf) in AND-1B. Facies abbreviations are given in Table 1. TAM e TransantarcticMountain lithologies; MVG e McMurdo Volcanic Group lithologies.
R. McKay et al. / Quaternary Science Reviews 34 (2012) 93e11298
sheet expansion, and not from local mass flows or glacier expansionin the Ross Island/McMurdo region. This indicates that if the icesheet grounding-line was not overriding the AND-1B drill site andthese diamictites aremass flow deposits occurring at the grounding
line, the grounding-line still must have been proximal to the drillsite e as Holocene grounding-line distal ice shelf deposits at thedrill site location indicate a dominant McMurdo Volcanic Groupprovenance (McKay et al., 2008). Notwithstanding this, other

Fig. 3. Stratigraphic log and interpretation of the 50e100 metres below sea floor (mbsf) interval in AND-1B. Key to symbols and lithologies is shown in Fig. 2. Facies abbreviationsare given in Table 1. TAM e Transantarctic Mountain lithologies; MVG e McMurdo Volcanic Group lithologies.
R. McKay et al. / Quaternary Science Reviews 34 (2012) 93e112 99
evidence described below supports ice contact deposition at thedrill site during the majority of Pleistocene glacial advances.
In the Pliocene interval of the AND-1B drill core, sharp faciesdislocations occur between subglacial (massive diamictites) and
open marine deposits (diatomites), and allow the stratigraphiccyclicity of grounding-line advance and retreat to be readily inter-preted (Naish et al., 2009). In the Pleistocene interval of AND-1B,the facies present are generally restricted to glacimarine or

Fig. 4. Stratigraphic log and interpretation of the 150e100 metres below sea floor (mbsf) interval in AND-1B. Key to symbols and lithologies is shown in Fig. 2. Facies abbreviationsare given in Table 1. TAM e Transantarctic Mountain lithologies; MVG e McMurdo Volcanic Group lithologies.
R. McKay et al. / Quaternary Science Reviews 34 (2012) 93e112100
subglacial facies, and changes in depositional environment arelithologically more subtle. As discussed above, massive diamictitefacies may represent more than one specific subglacial orgrounding-zone environment. Consequently, we have undertaken
a detailed assessment of the nature of the basal contact and thestyle of deformation of the underlying facies for each massivediamictite in the AND-1B drill core to determine the potentialinfluence of subglacial deposition at the drill site.

Table 1Lithofacies designations, paleoenvironmental interpretations of each facies, andrelationship with broader facies scheme for entire AND-1B core (detailed in McKayet al. (2009)).
Faciesabbrev.
Description Paleoenvironmentalinterpretation
Equivalent facies inMcKay et al. (2009)
Dm MassiveDiamictite
subglacial, proximalglacimarine, massflow
10
Ds StratifiedDiamictite
proximal glacimarine,mass flow
subdivisionof Facies 9
Dg GranulatedStratifiedDiamictite
proximal glacimarine,mass flow
subdivisionof Facies 9
S Sandstone proximal glacimarine,ice-rafted debris, massflow
sand beds inFacies 3,5
Mc Mudstone with>1% clasts
proximal to distalglacimarine
4
M Mudstone(<1% clasts)
distal glacimarine(sub ice shelf to openmarine)
2,mud beds inFacies 3
DO Diatomite open marine 1V Volcanic primary/near-primary
volcanics11
Vs Volcanicsandstone
mass flow, turbidities volcanic sands inFacies 6
R. McKay et al. / Quaternary Science Reviews 34 (2012) 93e112 101
As outlined in previous studies of drill core from the Antarcticcontinental margin, each glacimarine sequence contains a “glacialsurface of erosion” that marks the passage of grounded ice acrossthe site during glacial advance (Fielding et al., 2000; Dunbar et al.,2008; McKay et al., 2009). A glacial surface of erosion is identifiedby diamictite with a sharp basal contact that usually overliessheared or physically-intermixed facies of the underlying sequence.These sheared features provide evidence for overriding by groun-ded ice (Fig. 5). However, not all sequence boundaries representlarge-scale erosional events, as fluctuations in ice proximalgrounding-line facies are preserved within several sequences (e.g.Sequences 2e6; Fig. 2), representing smaller-scale fluctuations ofthe grounding line. Although for consistency in our terminology,we define each sequence boundary as a “surface of erosion”, theglacial deformation associated with each sequence boundaryusually occurs over a zone of 1e6 m and comprises deformedproglacial facies of stratified diamictite (Ds) and granulated facies(Dg) that pass upwards into massive diamictite (Dm) (Figs. 2e4). Inmost cases this zone represents a continuum from undeformedglacimarine/marine sediments, passing up into a glacimarine/marine facies that has increasing degrees of post-depositionaldisturbance up-section, before passing into the highly shearedand homogenized subglacial till.
Evidence of planar shearing, in these glacial deformation zonescommonly includes dispersion tails of clay around basement clasts(e.g. Fig. 5B and D) as well as soft-sediment intraclasts that displayhorizontally elongation characteristic of shearing (Fig. 5C). Theseare usually associated with intervals of wispy mudstone laminaeand lenses that also appear to be highly sheared (Fig. 5C and D).Also typically present in the deformation zones beneath themassive diamictites are well-defined clay rims that surroundlarger clasts (Fig. 5A), as well as small pebbles and granules clus-tering, commonly around the outer edge of larger pebbles andcobbles, displaying a-axis alignment in a concentric pattern(Fig. 5A and B). These concentric clast “clusterings” and clay rimsare interpreted as being the consequence of rotational processesoccurring within the deforming bed environment (Boyce andEyles, 2000), and are commonly associated with features indica-tive of planar shearing, such as dispersion tails and asymmetricalfolding (Fig. 5). This zone may overlie fine grain mudstone or
diatomite facies that contain evidence for brittle deformation suchas low-angle reverse faulting, brecciation, as well as load and fluidescape structures indicative of potential ice loading (Figs. 2e5).The distinct facies stacking pattern and associated styles ofdeformation in the “sequence boundary zone” underlying themassive diamictites (Figs. 2e5) is consistent with establishedmodels of a deforming bed due to overriding of a grounded icesheet (e.g. Krüger and Kjaer, 1998; Boyce and Eyles, 2000; Boultonet al., 2001; McCarroll and Rijsdijk, 2003; Evans and Benn, 2004). Athin section of the massive diamictite above the glacial surface oferosion at the base of sequence 9 (Fig. 8D) shows discrete parallelbands of high birefringence, and such microstructures in massivediamictites are commonly interpreted as representing shear zones(van der Meer, 1993; Carr, 2001; Hiemstra and Rijsdijk, 2003).Combined with the macroscopic evidence of shearing beneath theglacial surface of erosion, these features provide supportingevidence that the massive diamictite were deposited by an icesheet overriding at the base of this sequence (Fig. 5D). Thin sectionanalysis of the massive diamictite at the base of Sequence 4 showsthat the diamictite matrix has a patchy birefringence. However,distinct zones of high birefringence and clast alignments arewrapped around the surface of the larger sand grains, and formdistinct “comet” like structures around some of the larger sandgrains (Fig. 8B). Linear alignment of silt to fine sand grains alsooccurs (Fig. 8B). These micromorphological features are indicativeof grain rotation with influence of planar shearing (Hiemstraand Rijsdijk, 2003) and are interpreted as being subglaciallydeformed by an overriding ice sheet.
A critical criterion for assessing a subglacial/grounding lineorigin for Massive Diamictites (Dm) is the location of this facieswithin a glacimarine sequence stratigraphic framework. In partic-ular, whether or not the massive diamictites are underlain bydeformed grounding-line proximal glacimarine facies, and are alsooverlain by relatively undeformed grounding-line proximal glaci-marine facies (Figs. 2e4, 6). During the reassessment phase of thepreliminary “on-ice” sequence stratigraphy (Krissek et al., 2007)two sequence boundaries were removed as they did not meet theabove criteria for identifying erosion by glacial overriding. The firstof these, at w94.5 mbsf, was determined to be a volcanic debrisflow on account of the clast and sand content in the overlyingdiamictite being almost exclusively sourced from local Ross Islandvolcanic deposits (Fig. 3). The basal contact of this diamictite isextremely sharp and underlying laminae are undeformed, with theexception of mm-scale load structures with 2 cm of the contact. Thesecond sequence boundary removed, at 151 mbsf, was within 1 mof another sequence boundary and was interpreted to be part of thesingle overriding event, and represented part of the subglacialdeformation zone discussed above.
Total Organic Carbon content is also extremely low (<0.15%) inthese massive diamictites. Grain-size analysis of Facies Dm (Fig. 7)indicates a uniform distribution in the silt-to-sand range (i.e. verypoorly sorted) and very high clay contents (up to 70%), indicatinga lack of water-sorting. The massive diamictites in AND-1B havesignificantly higher clay proportions than other diamictites fromthe Ross Sea embayment and adjacent Transantarctic Mountains(Fig. 7). Oligocene diamictites from the Cape Roberts Project havea well-defined fine sand mode, which is absent in AND-1B dia-mictites (Fig. 7). We attribute this difference to the diamictites inthe Cape Roberts Project drill cores being deposited by expansion ofa piedmont glacier beyond the Transantarctic Mountain Front andfed by an ancestral Mackay Glacier (Barrett, 2007). Cape RobertsProject diamictites contain a high proportion of TransantarcticMountains bedrock (basement, Beacon Supergroup sediments andFerrar Group igneous rocks) as part of their basal bed load, whereasdiamictites deposited by an ice sheet in Ross Embayment at the

Fig. 5. Characteristic lithofacies and deformation features associated with subglacial deposition and deformation in Pleistocene sequences from AND-1B. A) Glacial advancesuccession at top of Sequence 4 is identified by strongly stratified, granulated diamictite with mudstone intraclasts passing sharply into a massive diamictite of the overlyingsequence. Within the granulated diamictite, the three clasts aligned beneath the large cobble have clay rims interpreted to rotation features (insert). B) Granulated diamictite passesupsection into a massive diamictite. Contact is interbedded, or may represent a fold feature. Dispersion tails occur around larger clasts in the granulated diamictite, and there isa concentric alignment of clast long axis along one edge of the clast and along the margins of the dispersion tail (insert). C) Glacial surface of erosion (wavy line) identified in a zoneof massive to weakly stratified diamictite separating Sequence 8 and 9. The weakly stratified diamictite displays thin lenses and wispy laminae (arrows) of diatom-bearingmudstone, interpreted to be deformed by subglacial shearing and erosion of pre-existing ice shelf deposits at the AND-1B drill site. D) Mudstone of Sequence 9 overlain byweakly stratified diamictites at the base of Sequence 9. The sharp contact (wavy line) is identified as a glacial surface of erosion as it overlies a zone physically-intermixed diamictiteand mudstone, with wispy laminae, dispersion tails around clasts, and an asymmetric fold within a brecciated mudstone.
R. McKay et al. / Quaternary Science Reviews 34 (2012) 93e112102

Fig. 6. Characteristic ice shelf lithofacies and sedimentary features from Pleistocene sequences in AND-1B. A) Mudstone with clasts (Facies Mc) interbedded by a massive mudstonelacking clasts (Facies M) of Sequence 3. The massive mudstone is interpreted as representing ice shelf environment distal to the calving line, based on the absence of bioturbationand diatoms, and low Total Organic Carbon content of w0.10%. B) Glacial retreat succession in Sequence 4 shows a granulated stratified diamictite (Dg) passing sharply into massivemudstones with a thin volcanic sandstone (Vs) bed. C) Glacial retreat succession in Sequence 11 contains a granulated stratified diamictite that passes sharply into cross-beddedwell-sorted, fine-medium grained sandstone. D) Glacial retreat succession in Sequence 14 shows a granulated stratified diamictite composed of mudstone intraclasts passingsharply into cross-bedded sandstone, also composed of fine-grained intraclasts.
R. McKay et al. / Quaternary Science Reviews 34 (2012) 93e112 103
AND-1B site are likely to have entrained older diamictite units asthe grounded ice sheet advanced across the sea floor of the RossEmbayment, thereby incorporating mud-rich sediments into theglacial bed load. The uniform distribution in AND-1B is slightlymore comparable to the average distribution for Whillans IceStream tills (Tulaczyk et al., 1998), but is notably finer grained.Although the processes at both sites are likely to be similar (i.e.,deposition beneath a marine-based ice sheet), the AND-1B dia-mictites have entrained/recycled (mud-rich) diamictites that arebelieved to blanket the floor of the Ross continental shelf (Webbet al., 1979; Bart, 2003), and may explain the finer-grained natureof the AND-1B diamictites. Differences in glacial processes couldalso explain some of the variance in grain-size distributions e e.g.:winnowing by subglacial meltwater currents associated withwarmer Oligocene glaciers in Cape Roberts Project diamictites.
The diamictites associated with Late Pleistocene groundingevents in AND-1B contain virtually no reworked diatom debris. Thisis puzzling, given that the matrix of diamictites recovered from thecentral Ross Sea incorporate a high proportion of Neogene marine-derived material (Sjunneskog and Scherer, 2005). The absence ofrecognizable diatom debris in AND-1B diamictites may be consis-tent with a till that has experienced very high shear strains; higherthan that of the Siple Coast ice streams or the central Ross Sea
where diatom remains occur in very low abundances (Tulaczyket al., 1998; Scherer et al., 2004), which may be explained by tillbeneath streaming ice experiencing relatively lower shear strainsdue to higher pore water pressures (Alley, 2000).
5.2.2. Grounding-line proximal depositionIn all sequences, massive diamictites (Facies Dm) pass upwards
into stratified and granulated diamictite (Facies Ds and Dg:Figs. 2e4). Weakly stratified diamictites can potentially be depos-ited or deformed in a subglacial environment (e.g. Bennett andGlasser, 2009). We attempt here to identify those intervals thathave been deposited through a water column. In AND-1B, mostexamples of Facies Ds and Dg have a similar clast composition to theunderlying massive diamictite (Dm), although have a higherproportion of sedimentary intraclasts. Such intraclasts are inferredto have formed within a deforming bed undergoing rotationalmovement (van der Meer, 1993), but these may subsequentlybecome incorporated into the basal debris layer of the ice sheet,and eventually melt out of a floating ice shelf at the grounding line.The presence of these intraclasts, combined with the presence ofmudstone/sand/gravel laminae, and dropstone features, indicatesthat most occurrences of Facies Ds and Dg were deposited bymeltout through a narrow water column directly from the basal
0
5
10
15
20
25
30
35
%fin
er=
22-6
5/2
0-52
siltsand clay
5
10
15
20
25
30
35
%fin
er=
0-32
/ 0-3
3
siltsand clay
Diamictite Facies (Dm, Ds, Dg)
0
5
10
15
20
30
35
-2 -1 0 1 2 3 4 5 6 7 8 9 10 >10
Mudstone Facies (M)
0
%fin
er=
10-5
2//
15-3
98-
302 5
/1-2
4
siltsand clayWhillians Ice Stream tills(25%clay)
AND-1B
massive
HWD03-1
Cape Roberts Project diamictite25 stratifiedgranulated
AND-1BHWD03-1,HWD03-2DF80-189
%
%
%
Sandstone Facies (S)
-2 -1 0 1 2 3 4 5 6 7 8 9 10 >10
-2 -1 0 1 2 3 4 5 6 7 8 9 10 >10
size (Ф)
size (Ф)
size (Ф)
Fig. 7. Grain-size distributions for facies in AND-1B: Top: Mudstones (M) in AND-1B compared to mudstone facies overlying Last Glacial Maximum diamicton in gravity cores in theimmediate vicinity of the AND-1B drill site (HWD03-1,2) and north of Ross Island (DF80-189). Middle: Sandstones (M) in AND-1B compared to sandstone facies immediatelyoverlying Last glacial Maximum diamicton in gravity cores beneath the modern McMurdo Ice Shelf (HWD03-1). HWD-03 and DF80-189 grain-size data is from McKay et al., 2008.Bottom: Diamictite facies in AND-1B compared with diamictite facies from Oligocene to Miocene diamictites in Cape Roberts Project cores (Dunbar and Barrett, 2004) and fromactively deforming tills collected from beneath Whillans Ice Stream (Tulaczyk et al., 1998).
R. McKay et al. / Quaternary Science Reviews 34 (2012) 93e112104
debris layer in an ice shelf environment proximal to the ice sheetgrounding-line.
Compared with the uniform grain-size distribution in Facies Dm,there is a distinct silt mode and reduced clay content in facies Dg(Fig. 7). This is suggestive of lateral transport andwinnowing of fine-grained clays by sub-ice shelf tidal currents near the grounding-line(Domack et al., 1999). In addition, Facies Ds and Dg generally have aslightly higher Total Organic Carbon content (0.15e0.2%) than FaciesDm, also indicative of a glacimarine depositional environment asopposed to subglacial (Domack et al., 1999; Licht et al., 1999). Weinterpret Facies Dg to be the equivalent to the muddy, granulatedfacies of Domack et al. (1999), who interpreted this facies to repre-sent proximal glacimarine sediments deposited by grounding-line
retreat following the Last Glacial Maximum in the Ross Sea.The preservation of intraclasts and the compositional similaritiesto the underlying massive diamictites suggests that the granulateddiamictites (Dg) were deposited by the passive undermelting of thebasal debris layer within the floating ice shelf (Domack et al., 1999).Such grounding-line proximal process would be expected to occurduring both the advance of an approaching grounded ice sheetas well as the retreat phase, and supports our interpretationthat granulated diamictites (Dg) underlying the glacial surfacesof erosion are proglacial deposits that have undergone post-depositional deformation by an overriding ice sheet.
The matrix of a granulated diamictite deposited during theretreat phase, i.e. underlying ice shelf distal mudstones at

Fig. 8. Photomicrographs of thin sections from granulated and massive diamictites. A) Granulated diamictite (26.68 mbsf) that directly underlies mudstone and overlies massivediamictite in Sequence 2. Note the well-defined interclasts with sharp boundaries, and the lack of birefringence in the diamictite matrix. B) Massive diamictite (35.82 mbsf) at baseof sequence 2, immediately above a glacial surface of erosion and stratified diamictite. Note the higher birefringence and clast alignment forming a comet like structure around thelarge clasts in the centre of the image. There is also a linear alignment of silt and fine sand grains in the lower half of the image. C) Granulated diamictite (48.03 mbsf) at top ofsequence 4 that directly underlies a glacial surface of erosion and massive diamictite. This interval has well-defined stratification and deformation features as shown in Fig. 5A. Notethe less well-defined boundaries of the interclasts compared with photo A, and the abundant turbate features. Sand grain in uppermost left-hand corner has a well-defined clay rim.There are also faint linear concentrations of clasts in bands running diagonally approximately 30� to the horizontal of the image. D) Massive diamictite (77.52 mbsf) at base ofsequence 9, above the glacial surface of erosion and stratified diamictite shown in Fig. 5D. Note the diagonal bands of high birefringence in the lower half of the image.
R. McKay et al. / Quaternary Science Reviews 34 (2012) 93e112 105
26.68 mbsf, display little evidence of clay alignment and containsintraclasts with sharply defined grain boundaries. This supports theinterpretation of passive melt out of the basal debris layer as anorigin of this facies, with limited evidence of deformation.However, this contrasts significantly with a granulated diamictite at48.03 mbsf, interpreted as being deposited during the glacialadvance phase, which in thin section displays abundant turbatestructures in the form of circular clast alignments, and a highbirefringence, but with a chaotic matrix fabric (Fig. 8C). Pervasiverotational structures, intraclasts with poorly defined grain bound-aries, and the absence of obvious planar shear features are char-acteristic of deposition by mass movement (Carr, 2001; Hiemstra,2001), likely at the grounding line on the basis of the macro-scopic stratification and very high abundance of mudstone intra-clasts (Fig. 5A). Faint linear concentrations of clasts may indicatea subsequent phase of planar deformation related to glacial over-riding, although this could also represent influence by glacimarinesedimentation.
No grounding-line facies were found that might representsignificant conduit or sediment-laden subglacial meltwater-plumedischarge. In several sequences (Sequences 3, 11 and 14; Figs. 2e4),the stratified and granulated diamictites (Ds, Dg) are sharplyoverlain by well-sorted cross-stratified sandstones (Fig. 6C and D),which suggests the influence of traction currents. The glacialretreat succession within Sequence 11 (100.69e100.08 mbsf) isa characteristic example. Sieve analysis of the >63 mm fractionindicates that this sandstone has a mean grain-size range of700e880 mm (Fig. 7). Currents of the order of 30e50 cm s�1 arerequired to move sand in this size range (Hjulstrom, 1939). The
sands are composed of the same Transantarctic Mountain lithol-ogies that are present in the underlying diamictites, and alsocommonly contain mudstone/diamictite intraclasts (e.g. Fig. 6Cand D). Sand deposits of this grain-size frequency and lithology area consistent facies associated with the initial retreat phase in LastGlacial Maximum to Holocene sediment cores collected from theRoss Sea (e.g., Domack et al., 1999), and from sub-ice shelf depositsbeneath the McMurdo (e.g. McKay et al., 2008) and Amery IceShelves (Hemer et al., 2007), as well as in the Antarctic Peninsula(Evans and Pudsey, 2002). In the absence of any evidence forsignificant subglacial meltwater discharge, previous workers havepostulated that these currents are the consequence of “pumpingmechanism” due to grounding-line migration through a tidal cycle(e.g., Alley et al., 1987; Domack and Williams, 1990) or long-periodwaves (Domack, 2007).
5.2.3. Grounding-line distal depositionAs the grounding-line continued to retreat upstream of the
AND-1B drill site, deposition of mudstones (Facies M) occurredbeneath a floating ice shelf relatively free of basal glacial debris, aswas the case for the McMurdo Ice Shelf during the Holocene(McKay et al., 2008). These mudstones usually sharply overliestratified diamictites (Facies Ds/Dg) or sandstones (Facies S). Wherebioturbation and diatom remains are absent (or rare) and dispersedclasts (i.e. <1%) occur we interpret limited sub-ice shelf oceaniccirculation and increased sedimentation rates, indicating a relativeproximity to the grounding line. However, where clasts are gener-ally absent, bioturbation is of moderate intensity, diatom remainsoccur in trace to 1% values (e.g. Sequences 6, 10) and Total Organic

R. McKay et al. / Quaternary Science Reviews 34 (2012) 93e112106
Carbon is in the range of 0.2e0.25% we interpret a more distalenvironment to the grounding-line. When the ice shelf calving-line was proximal to the drill site in these sequences, there wasan associated increase in benthic activity (bioturbation), and theincreased proximity to open-water zones of primary productivityresulted in an increase of Total Organic Carbon and diatom remainsadvected beneath the ice shelf.
The mudstones have a high clay content (up to 70%), andsupport an interpretation that deposition was by hemipelagic-suspension settling of fine-grained debris derived from winn-owed glacimarine diamictites, in an environment that was moredistal to the grounding-line than the diamictite and sandstonefacies. These observations are all consistent with models of sedi-mentation of modern and early Holocene ice shelves (Domack et al.,1999; Hemer and Harris, 2003; Sjunneskog and Scherer, 2005;McKay et al., 2008). The grain-size distribution of mudstones(Facies M) in AND-1B correlates well with post-Last GlacialMaximum mudstones documented in the HWD and DF-189 coresfrom around Ross Island (McKay et al., 2008; Fig. 7), in which themudstone facies are interpreted to have been deposited in a sedi-ment-starved environment beneath a floating ice shelf that isrelatively free of basal debris.
5.2.4. Open marine depositionDuring open marine conditions, volcanic sandstone, mudstone
and diatomite units were deposited, and Total Organic Carbon is inthe range of 0.25e0.45%. Two sequences (Sequences 10 and 13)contain diatomite intervals (Facies DO) with ice-rafted debris,indicative of an open marine environment. Although diatomremains can be advected beneath an ice shelf from open waters,diatom abundances from Holocene sub-ice shelf mudstones inter-preted as being deposited proximal to the ice shelf calving line, arebetween 10 and 50 � 106 diatom valves per gram (v/g), and areequivalent to 5e10% diatoms in smear slide estimates (Barrett et al.,2005). This is compared to 200e1200 � 106 v/g for diatom oozes(c.f. 50e80% diatoms in smear slides estimates) deposited in openwaters immediately to the north of Ross Island (McKay et al., 2008).Hemer and Harris (2003) report slightly higher diatoms abun-dances (averaging 80e100 � 106 v/g) for siliceous muds and oozesbeneath the Amery Ice Shelf. A peak in diatom abundances in therange of 200�106 v/g in the Amery Ice Shelf cores was attributed toa possible period of openwater conditions in the early Holocene, asthis peak also coincides with an IRD-rich interval (Hemer andHarris, 2003). As far as we are aware, there are no unequivocalreports of diatom ooze (>50% diatoms in smear slides in this study)being deposited beneath an expansive ice shelf.
Sequence 10 and 13 intervals also contain thick, continuoussuccessions (w5e12 m) of volcanoclastic diamictite, sandstones,and mudstone. Some of these volcanic intervals are physically-intermixed and are interpreted to be deposited by volcanic debrisflows; or where Bouma sequences (Bouma, 1962) are present,turbidity currents triggered by rapid redeposition of volcanic debrisinto the marine environment during significant eruptive episodes.Sequence 10 contains near-primary volcanic ash fall in the form oflapilli tuffs. The association of these volcaniclastic intervals withopen marine diatomite facies suggests a linkage between volcanic-rich sediments and an open marine environment. For sequenceswhere the glacial minima are most likely represented by a floatingice shelf above the drill site (i.e., Sequences 3e9 and 11e12), themaximum thickness of any volcanic-rich bed is 4 cm.
At face value, this observation suggests that Sequences 14 wasalso deposited in open water environments. The glacial retreat andminima facies in Sequence 14 consists of a black basanitic primarytephra-fall deposit from 146.47 to 134.77 mbsf, and are overlain byhighly-bioturbated mudstones (containing w1% diatoms), w7-m
thick. This mudstone is considerably thicker than the mudstonesfacies deposited in Sequences 9e3 and 12e11, or for mudstonesdeposited beneath Antarctic ice shelves in the Holocene (Hemerand Harris, 2003; McKay et al., 2008). The extremely well-preserved nature of delicate glass shard structures and gradedbed nature of the basanitic primary tephra fall deposit indicatesthat it was deposited extremely rapidly (potentially within<1 year)through open water, as opposed to mass flow processes (Pompilioet al., 2007). The complete absence of diatoms in this interval(Fig. 4) may be due to the rapid input of the volcanic tephra to thewater column restricting productivity, or the alkaline conditionsdissolving any biogenic opal that was deposited on the seafloor.Combined, the mudstone and tephra deposits point towards anopen marine setting for the glacial minima in Sequence 14.
5.3. Facies interpretation using the natural gamma ray well log
The top 24 m is the only interval of the AND-1B drill core thathas poor drilling recovery. Comparison of the natural gamma welllog to the potassium content measured by the XRF-core scanner(XRF-K) provides insight into the stratigraphy of the upper 24 m ofAND-1B. Natural gamma and XRF-K can be used to estimate claycontent because in many sediments, potassium is contained mostlyin clay minerals such as illite, and potassium is a gamma-rayemitter. In volcanic sediments, geochemical differences, ratherthan clay content, can dominate the natural gamma signal (Fig. 9).
The interval 24.2e22.0 mbsf is probably a continuation of thenon-volcanic mud found in the core from 24.5 to 24.2 mbsf, asboth intervals have the same natural gamma values. The consistentnatural gamma signal between 22 and 16.7 mbsf suggests that theunrecovered intervals consist of diamictite ormudstonewith clasts,as the gamma signal is identical to the values seen in these faciesbetween 82 and 27 mbsf. This interpretation is supported by therecovery of mudstones with dispersed clasts between 20.7 and19.6 mbsf. Between 16.7 and 11.0 mbsf, natural gamma jumps to180 counts per second (corrected for drill pipe attenuation),a similar level to that from a high-K volcanic tuff at 85.5 mbsf. The18.8e17.2 mbsf interval of AND-1B contained highly washedvolcanic sands, and is likely derived from slightly higher in the core,most likely from the 16.7 to 11.0 mbsf interval, due to the highnatural gamma signal at those depths. A volcanic glass sample inthis washed interval, at 18.60 mbsf, is phonolitic and contains5.53 � 0.02 wt.% K2O, 18.4 ppm Th and 5.5 ppm U (Table 2). Thephonolitic glass is similar to glass from recently erupted bombsfrom Erebus (Kelly et al., 2008) and is interpreted to be volcanicsediment shed fromMt. Erebus (Table 2). Glass sampled from 25.20to 26.13 mbsf contain much lower K2O, U and Th than the sample at18.60 mbsf.
At 10.0 mbsf, a massive diamictite is observed in the core, andnatural gamma returns to a lower value (110 counts per second),similar to those seen in the diamictites lower in the core (Fig. 9).This diamictite continues to at least 5 mbsf. Above 5 mbsf, naturalgamma counts reach above 150 counts per second in two intervals,which indicates the presence of more phonolitic Erebus glass,although this may constitute an increase in the volcanic componentwithin the matrix of a diamictite.
5.4. Sedimentary evidence for the degree of erosion represented byunconformities in AND-1B
The presence of mudstone facies consistent with depositionbeneath a grounding-line distal ice shelf in Sequences 1e3, 5 and 6suggests there are minimal periods of time missing betweensequences, despite the obvious potential for erosion by advance ofa grounded ice sheet. Grounding-line distal ice shelf facies

Fig. 9. Stratigraphic column, downhole log of Natural Gamma Ray (NGR) overlain on XRF-K counts (Monien et al., 2010), chronostratigraphic datums and sequence stratigraphicinterpretation correlated with benthic d18O and geomagnetic timescales (Ogg and Smith, 2004). Solid line correlations are based on chronostratigraphic datums (dashed grey linesare more tentative correlations based on cyclostratigaphy). Orbital Southern Hemisphere solstice insolation is also shown, with high insolation values coinciding with “collapse”events in modelled simulations of West Antarctic Ice Sheet extent (Pollard and DeConto, 2009). These collapse events are defined as having þ5 m equivalent sea-level contributionfrom West Antarctic Ice Sheet relative to present day. Key to symbols and lithologies is shown in Fig. 2.
R. McKay et al. / Quaternary Science Reviews 34 (2012) 93e112 107
deposited during Holocene around the Antarctic margin are char-acteristically thin and have lower sedimentation rates than theiropen marine counterparts (Evans and Pudsey, 2002; Hemer andHarris, 2003; Domack et al., 2005; McKay et al., 2008). Fine-grained ice shelf deposits are generally <1 m and if erosion ofopen marine sediments, which have higher sedimentation rateshad occurred, it is likely that the relatively thin ice shelf depositswould have also been eroded. In a scenario where the marinedeposits have been eroded while the thin ice shelf deposits arepreserved, there should be some evidence of recycling of themarine sediments within the basal section of the diamictite in theoverlying sequence. This is the case in the diamictites from the base
of Sequence 14 where a significant erosional unconformity over-lying diatomite is identified (Figs. 4 and 9). Sequences 2e6 are allunderlain by stratified or granulated diamictites (Facies Ds andDg) that pass upward into massive diamictites (Dm), and overliemudstones (Facies M, Mc) of the underlying sequences. Thatshearing by glacial overriding was not significant enough tohomogenise these proglacial ice sheet advance facies suggeststhat overriding of the ice sheet was relatively non-erosive inthese sequences, and peak interglacial conditions appear to bepreserved in the upper 60 m of the AND-1B core.
The upper w20 cm of Sequence 8 contain “wispy” laminae andintraclasts of mudstone that are highly sheared and contain w5%

Table
2Electron
microprobe
andLA
-ICP-MSan
alyses
ofglassfrom
AND-1Bdrillco
re.n
¼numbe
rof
analyses
(bold).Uncertainty
inthean
alyses
are1s.d.For
heterog
eneo
ussamplesindividual
analyses
arelis
tedby
increa
singSiO2an
dan
alysis
numbe
r.Allan
alyses
arerecalculatedto
100wt%
volatile
free
.Erebu
sdataarefrom
Kelly
etal.,20
08.
Dep
thn/Anal
#18
.60
25.20Ph
ono
25.20Other
26.13
Ereb
us
5sd
4sd
910
2026
829
164
730
3531
9sd
SiO2
55.65
0.29
55.66
0.07
42.95
43.92
44.77
45.32
45.90
45.41
45.88
45.64
46.27
49.55
53.76
55.12
44.44
0.28
55.35
0.38
TiO2
1.16
0.03
1.13
0.03
4.54
4.64
4.20
3.54
3.75
4.31
4.17
3.96
4.03
2.56
1.74
1.04
4.95
0.18
1.01
0.02
Al2O3
19.27
0.08
19.32
0.06
13.68
15.82
14.85
16.14
16.29
15.29
15.25
16.04
15.91
17.77
19.05
19.10
15.45
0.30
19.80
0.14
FeO
5.88
0.06
5.84
0.11
11.65
11.98
11.54
10.57
11.35
11.73
11.58
11.47
10.81
9.88
6.51
5.80
11.42
0.25
5.43
0.07
MnO
0.30
0.04
0.27
0.06
0.16
0.16
0.23
0.25
0.24
0.23
0.21
0.19
0.26
0.23
0.25
0.27
0.19
0.04
0.28
0.01
MgO
0.98
0.04
0.98
0.02
6.29
4.52
5.34
4.17
4.54
4.32
4.39
4.41
3.94
2.96
1.39
0.99
5.05
0.15
0.83
0.03
CaO
2.27
0.03
2.27
0.01
13.63
10.82
12.33
9.79
9.45
9.88
9.92
9.48
10.87
7.51
3.45
2.22
11.43
0.27
1.87
0.05
Na2
O8.19
0.23
8.27
0.08
3.39
4.35
3.59
5.29
4.52
4.53
4.55
4.43
4.38
5.27
7.69
9.02
3.87
0.11
9.04
0.14
K2O
5.53
0.02
5.51
0.03
1.76
2.34
1.88
2.76
2.18
2.36
2.42
2.43
1.95
2.71
5.21
5.73
1.90
0.06
5.64
0.10
P2O5
0.35
0.07
0.35
0.04
0.84
1.00
1.04
1.66
1.29
1.38
1.30
1.26
1.24
1.15
0.57
0.33
0.95
0.08
0.28
0.02
SO2
0.08
0.01
0.07
0.02
0.89
0.20
0.12
0.16
0.19
0.11
0.10
0.34
0.09
0.06
0.14
0.06
0.15
0.04
0.08
0.01
F0.18
0.02
0.19
0.11
0.14
0.18
0.05
0.21
0.19
0.34
0.14
0.27
0.18
0.24
0.12
0.18
0.13
0.11
0.23
0.04
Cl
0.14
0.01
0.13
0.00
0.08
0.08
0.06
0.13
0.12
0.11
0.09
0.08
0.06
0.12
0.11
0.12
0.08
0.02
0.15
0.01
Total
100.00
100.00
100.00
100.00
100.00
100.00
100.00
100.00
100.00
100.00
100.00
100.00
100.00
100.00
100.00
n7
sd4
sd
Thppm
18.4
1.0
17.5
0.5
7.3
5.2
4.6
8.3
5.8
6.3
5.6
5.5
7.0
6.1
16.6
8.3
4.2
0.4
30.4
1.2
Uppm
5.5
0.2
5.5
0.1
2.1
1.6
1.4
2.5
1.8
1.9
1.4
1.7
2.0
2.1
5.5
2.4
1.7
0.2
9.1
0.3
R. McKay et al. / Quaternary Science Reviews 34 (2012) 93e112108
diatom remains (Fig. 5C). These laminae have a similar style ofdeformation to those associated with the Glacial Surface of Erosionat the bases of Sequences 10 and 14 separating diatomite fromdiamictite (Fig. 4 and Fig. 5D), where our age-model suggestssignificant erosion occurred (see Section 6; Fig. 9). Trace amounts ofdiatoms are noted in the basal diamictite from Sequences 11 to 14(Fig. 4), and these sequences overlie marine sediments.
6. Chronostratigraphy and correlation to the marine oxygenisotope timescale
The age-model presented in Fig. 9 is developed from the chro-nostratigraphy of Wilson et al. (2007). It integrates 40Ar/39Ar datesfrom volcanic ashes and the magnetostratigraphy with thesequence stratigraphy detailed in this paper. Here, we first discussthe framework and then a more-detailed chronology is inferred forLate Pleistocene Sequences 1e9.
The first magnetic reversal downcore is encountered at80.03 mbsf and is identified as the Brunhes/Matuyama (0.781 Ma)boundary. This is followed by another polarity change at84.97 mbsf, recognised as the Matuyama/Jaramillo (0.988 Ma)boundary, (Wilson et al., 2007). These two age assignments areconfirmed by a 40Ar/39Ar date of 1.014 � 0.04 Ma from a felsictephra at 85.53 mbsf (Wilson et al., 2007). This age also givesconfidence in assigning a further polarity change at 91.13 mbsf(Fig. 9) to the base of Jaramillo subchron (1.072 Ma). These ageassignments, spanning the transition from 100 kyr to 40 kyrcyclicity in benthic d18O isotope records (Lisiecki and Raymo, 2005),allow confident correlation of the base of Sequence 9 with theGlacial Marine Isotope Stage (MIS) 20, and the base of Sequence 10with the cold MIS 32.
While the age of Sequence 10 is well constrained by two polaritychanges and an 40Ar/39Ar age, the internal chronology is morecomplex. The Matuyama/Jaramillo reversal occurs in a zone ofphysically-intermixed volcanic sandstone and diatomite, inter-preted as a volcanic debris flow interval (Fig. 3). This is separatedinto a (lower) zone of reversed polarity bioturbated ice shelf/gla-cimarine deposits and a (upper) zone of normal polarity laminateddiatomites. The absence of a glacial overriding event here togetherwith the intermixing of diatomite in the debris flow indicate openmarine or grounding-line distal ice shelf conditions early in MIS-31,when southern hemisphere insolation reached its peak intensity(1.08 Ma), as noted by Scherer et al. (2008). Facies in the upper partof Sequence 10 indicate open marine conditions persisted, at leastepisodically until the end of the Jaramillo subchron (0.988 Ma;Fig. 9).
Other key datums occur in Sequences 14 and 13, dated by40Ar/39Ar age of basaltic tephras at 1.67 � 0.03 Ma and1.65 � 0.03 Ma, respectively, (Wilson et al., 2007). This pair of agesbrackets the sequence boundary, suggesting the diamictite therecorresponds to the cold MIS 58 (Fig. 9). Using these constraints,Sequences 14, 13, 10 and 9 can be tied to excursions in the Lisieckiand Raymo (2005) deep ocean benthic d18O isotope curve (Fig. 9).Sequences 11 and 12 are not as well constrained, and weredeposited sometime between MIS 53 and 34. This implies uncon-formities totalling w0.5 Myr between the top of Sequence 13 andthe bottom of Sequence 10.
Sequences 1e9 have been tentatively correlated with the nineconsecutive Marine Isotope Stage interglacial events in the Lisieckiand Raymo (2005) d18O benthic stack (Fig. 9), with the caveat thatthe evidence for glacimarine deposition and glacial deformation atthe top of Sequences 9 and 7 is not as strong for these twosequences (Fig. 3), i.e. the distinct facies stacking patterns andassociated deformation features. Also, given the uncertaintysurrounding modern grounding-line and subglacial depositional

R. McKay et al. / Quaternary Science Reviews 34 (2012) 93e112 109
processes (Bennett and Glasser, 2009) it is not possible to infer ifthe subtle facies changes observed in the lower parts of these twosequences (e.g., alternations of stratified and massive diamictite)relate to an ice sheet retreat event, or result from shorter-termdepositional patterns as part of grounding-zone wedge sedimen-tation (Powell and Alley, 1997). Nevertheless, we speculate thesemay be “lift off/retreat” events and related to smaller amplitudeglacial/interglacial cycles (Figs. 3 and 9).
The diamicton at the base of Sequence 1 (atw10mbsf) is similarto those encountered in the lower part of gravity cores near theAND-1B site (McKay et al., 2008) in that is unlithified. Downholegamma log also indicates a relatively consistent lithology between10 and 1mbsf (Fig. 9), therefore this diamicton is likely to have beendeposited during the glacial advance (Last Glacial Maximum). Thepresence of potassium-rich muds and phonolitic volcanic sands inthe upper 6.7m of Sequence 2 indicates depositionwithin the latestphase of phonolitic eruptions of Mt Erebus during the past 250 ka,most likely duringMIS 5, although possibly MIS 7. The upper part ofSequence 2 suffers from poor recovery, but appears to containgrounding-line proximal ice shelf or subglacial deposits (i.e. dia-mictite), between 22 and 16.7 mbsf, that overlie grounding-linedistal ice shelf deposits between 26.7 and 22.0 mbsf. Althoughwe have not placed a sequence boundary here, the glacial read-vance between 22 and 16.7 mbsf may correspond to MIS 6, with theunderlying ice shelf deposits (26.7e22 mbsf) representing MIS 7.The diamictite at the base in Sequence 2 (35.9e26.7 mbsf), andall sequences below, lack phonolitic glass and anorthoclasephonolitic clasts indicating probable depositional ages of >250 ka(MIS 8 and prior).
The base of sequences 3, 4, 5, 7 and 9 that follow are correlatedwith intervening even-numbered cold MIS stages 10, 12, 14, 16 and20, respectively. Noteworthy, is the occurrence of two largeunconformities between w1.6 and 1.13 Ma and w0.99 and 0.8 Ma,which mark the onset of larger amplitude variations in global icevolumes after MIS 52 and the onset of the 100 kyr glacial cycles,respectively (Lisiecki and Raymo, 2005) (Fig. 9).
7. Discussion: periods of past retreat and expansion of theAntarctic Ice Sheet in the Ross Embayment during thePleistocene
7.1. The Middle to Late Pleistocene
Sequences 1e9 in AND-1B characterise 800,000 years of relativeice sheet stability in the Ross Embayment. The region was domi-nated by a grounded ice sheet whose grounding-line retreatedbriefly south during most, if not all, interglacial periods to leave thedrill site covered with a floating ice shelf. Today, the grounding lineof the outlet glacier that fed these ancestral grounded ice sheets is200 km to the south of the drill site, and for aw1 km-thick ice sheetto occupy the AND-1B site requires a significant marine ice sheetwithin the Ross Embayment (Pollard and DeConto, 2009). There isclear evidence of at least seven grounding-line migrations acrossthe drill site associated with oscillations between subglacial and iceshelf environments over the past 800,000 years. This impliesa sensitivity of past ice sheets in the Ross Embayment to orbitally-influenced surface temperature, oceanic temperature and sea levelvariations.
Throughout this period, only Sequence 2 and Sequence 8provide evidence of possible open water sedimentation. Anunequivocal interpretation for Sequence 2 is difficult becauseseveral metres of the upper part were not recovered. Diatomabundances are low (w1% of matrix from smear slide estimates)throughout the interglacial mudstone facies in Sequence 2, sug-gesting sub-ice shelf conditions more extensive than, or similar to
the present day. However, the presence of several metres ofphonolitic sands suggests a period of open marine conditions.While the timing of this open water cannot be distinguishedbetween MIS 7 or 5, support for a last interglaciation age comesfrom reworked marine shells dated as MIS 5e from Cape Barne,w45 km to the north of the drill site (Stuiver et al., 1981; Bohatyet al., 1998). The implied retreat of the marine based AntarcticIce Sheet in Ross Embayment at this time is also consistent withfar-field sea level records that indicates global sea levels were6e8 m higher than present during MIS 5e (e.g. Kopp et al., 2009)(Fig. 9), which cannot be accounted for by melting of the Green-land Ice Sheet alone. Intriguingly, however, is that the highestvalues for local summer insolation at 77�S in the Pleistocene occurduring MIS 7 (Fig. 9) making this an alternative candidate for theinterpretation of ice shelf/open-marine deposits within the past250 ka. A recent numerical ice sheet model predicted MIS 7 asa likely period of West Antarctic Ice Sheet retreat south of AND-1Bas a direct consequence of these high local insolation values, butonly minor melting during MIS 5e (Pollard and DeConto, 2009). Aninterpretation of either or MIS 7 and 5e is also consistent withdiatom and 10Be data from beneath the West Antarctic Ice Sheetinterior (Scherer et al., 1998).
Sequences 3e6 all contain diamictites with well-definedstratification and evidence of winnowing and current rework-ing. This provides direct evidence for a floating ice shelf over-lying the AND-1B drill site during glacial minima, but there is nocompelling evidence for open marine conditions. It is difficult togauge the duration of these periods of sub-ice shelf deposition atthe AND-1B drill site, but they are of similar thickness (<1 m) toHolocene grounding-line distal ice shelf sediments elsewhere(e.g., Evans and Pudsey, 2002; Hemer and Harris, 2003), implyinga similar duration (i.e., several thousand years during the peakof each interglacial). On the basis of an absence of phonoliticErebus debris, these periods of deposition beneath a debris-freeice shelf likely coincided with interglacials prior to 250 ka (e.g.,MIS 9, 11), These intervals of ice shelf conditions correspond toglobal sea-levels during peak interglacial conditions similar inamplitude, or less than the present day (Rohling et al., 2009).
The preservation of glacial readvance facies beneath the glacialsurfaces of erosion at the bases of Sequences 2e6 indicates thatglacial erosion reduced during the past 0.8 Ma. While this mayrepresent a climatic signal, such as a drier, less erosive ice polar iceglacial regime relative to the Pliocene (McKay et al., 2009), it mayalso have been the consequence of increased volcanic build up ofRoss Island, increasing accommodation space via rapid subsidenceof the flexural moat.
The relative lack of open-marine deposits, and the presenceof ice shelf deposits during interglacial periods, implies a coolingof the glacial regime at 0.8 Ma to the extent that an extensive iceshelf persisted across the Ross Embayment during most, if notall, of the interglacial periods in the past 0.8 Ma. Large iceshelves require cold ice in order to be sustained (Mercer, 1978;Alley et al., 1989). More extensive ice shelves during interglacialsin a cooler glacial regime may increase the buttressing effect onthe grounded ice sheet that feeds it (Mercer, 1978; Rignot et al.,2004) promoting further stability of West Antarctic Ice Sheet inthe Ross Embayment, with the notable exception of potentialretreat during periods of intense local summer insolation, i.e.MIS 7 or 5 (Fig. 9).
7.2. Mid-Pleistocene Transition
The unconformity at 82.6 mbsf coincides with the Mid-Pleistocene Transition (1e0.8 Ma) and is inferred to representlarge-scale expansion of an ice sheet in the Ross Embayment at

R. McKay et al. / Quaternary Science Reviews 34 (2012) 93e112110
w0.8 Ma, where sedimentation is characterised by subglacial orgrounding-line proximal diamictites. The Brunhes/Matuyamatransition (0.781 Ma) occurs within the diamictite, approximately2 m above the base of Sequence 9, indicating that this expansionoccurred just prior to 0.78 Ma. This time period corresponds to thetransition in benthic marine d18O isotope records from 40 kyr-duration glacial/interglacial cycles to 100 kyr-duration cycles(Lisiecki and Raymo, 2005).
The top of Sequence 8 contains highly-sheared diatom-bearingmudstone laminae and intraclasts (Fig. 5C), and provides compel-ling evidence for at least one period of extensive calving-lineproximal conditions, or even open marine conditions, at theAND-1B during the mid-Pleistocene. Assuming a linear correlationof the sequences to the Marine Isotope Stages, this is correlatedwith the glacial advance associated with MIS 17 (Fig. 9). Althoughthis correlation is subjective, it does correspond to period of highlocal summer insolation that is modelled by Pollard and DeConto(2009) as a West Antarctic Ice Sheet “collapse” event (Fig. 9). Thisperiod was followed by MIS 16 that was characterised a largepositive excursion (w3.5&), a significantly “cold” glacial period(Fig. 9). An alternative scenario is that it could be slightly youngerand correspond to the hypothesized West Antarctic Ice Sheetretreat in MIS 15e13 from Amundsen Sea sediment cores(Hillenbrand et al., 2009).
7.3. The Early to Middle Pleistocene
Prior to theMid-Pleistocene Transition, the ice sheets in the RossEmbayment were more dynamic, with several periods of openwater conditions in the McMurdo region. Sequence 10 is the lastperiod of prolonged open marine conditions recorded at the drillsite and its timing coincides with MIS 31e27. The magnetic reversalthat is correlated with the base of Jaramillo Subchron (1.072 Ma)occurs at 91.13 mbsf, within an interval of physically-intermixedvolcanic sandstone and diatomite. As such, the climatic signalassociated with the peak warmth during MIS 31 is not as well-preserved in AND-1B as it was in CRP-1 drill site, w150 km to thenorth of AND-1B (Scherer et al., 2008). This interval also containsrare calcareous nannofossils (Villa et al., 2010), further indicatingincursion of warm ocean waters to the site. However, the presenceof the intermixed diatomite at this time is clear evidence of open-water conditions at the drill site during MIS 31, while grounding-line distal ice shelf deposits indicate floating ice shelf conditionsoccurred just prior to MIS 31. The age of the overlying mudstoneprovided by the magnetic reversal at the top of Jaramillo Subchron(0.988 Ma), indicates that the sea floor was not eroded at the drillsite during the subsequent glacial maximum of MIS 30 (Fig. 9), andthat ice sheet withdrawal in the Ross Embayment was significantenough to allow open water to persist at the drill site throughMIS 31e27.
Micropaleontological and isotopic analysis of MIS 31 depositsat CRP-1 and Southern Ocean drill sites (Ocean Drilling ProgramSite 1094) indicate that ice-free conditions (and minimal sea ice)and high sea-surface temperatures occurred in phase with highvalues of southern latitude insolation, and preceded peakNorthern Hemisphere interglacial conditions e i.e. the peak ofMIS 31 (Scherer et al., 2008), and this is supported by the AND-1Brecord. Scherer et al. (2008) implied that, at least for the warmestSouthern Hemisphere orbital configurations, ice sheet growthand decay had an antiphased relationship between the northernand southern hemispheres, and that glacial cycles in each hemi-sphere could operate at 20-kyr cyclicity (c.f. Raymo et al., 2006).Sequences 14 and 13 may represent either 20 or 40-kyr cycles, asthe interglacial facies in Sequences 14 and 13 have 40Ar/39Ar agesof 1.67 (�0.03) Ma and 1.65 (�0.03) Ma, respectively. The
maximum range of the errors is separated by 80 kyr, but theoverlap could also allow for 20 kyr cyclicity. Naish et al. (2009)implied that the Antarctic Ice Sheet variability in the RossEmbayment had a 40 kyr response during the Pliocene-EarlyPleistocene due to the influence of obliquity on oceanic warm-ing. They noted that in general the surface of Antarctic Ice Sheet istoo cold to respond to local insolation driven ablation, but modelsindicate (Pollard and DeConto, 2009) that ablation may occurduring the warmest precession anomalies of the Pleistocene(such as MIS 31 and 7).
8. Conclusions
The upper 80 m of the AND-1B drill core contains muddy iceshelf and winnowed glacimarine deposits, separated by glacialdiamictites with deformation features at their bases that areindicative of ice sheet overriding. This provides the first directevidence that the marine ice sheet in the western Ross Embay-ment has oscillated between a grounded ice sheet and floatingice shelf at least seven times during the past 0.8 Ma. This isconsistent with orbitally-paced oscillations between a groundedice sheet and floating ice shelf in the Ross Embayment ata frequency of at least 100 kyr. Despite these oscillations, there islimited evidence of open marine conditions at the AND-1B drillsite during the past w1 Myr. Interglacials during this time in theRoss Sea were probably characterised by ice shelf conditionssimilar to, or more extensive than those of the present day.Evidence from AND-1B downhole logs, and pre-Last GlacialMaximum deposits (Stuiver et al., 1981; Bohaty et al., 1998)indicates that calving-line proximal/open marine conditions mayhave occurred in the Ross Island region during MIS 5e or 7, orpotentially both. The earlier scenario is consistent with far-fieldsea-level reconstructions that suggest MIS 5e probably hadglobal sea levels >6.6 m above present requiring a reduction inthe volume of the West Antarctic Ice Sheet relative to the presentday (Kopp et al., 2009).
The period 0.8e0.5 Ma is characterised by sequences mostlycontaining subglacial to glacimarine/grounding-line proximaldeposits (e.g., Sequences 9, 7 and 6). These sequences are moredifficult to interpret than the younger Pleistocene sequences,although one subtle contact between massive and stratified dia-mictite, at the boundary separating Sequence 8 from 7, containshighly sheared, diatom-bearing mudstone intraclasts that suggestssome erosion of calving-line proximal ice shelf or open marinedeposits. This indicates at least one period of reduced ice sheetextent during this interval.
For the period before 0.8 Ma, the AND-1B sequences recorddynamic ice sheet behaviour in the Ross Embayment, with severalsequences documenting subglacial deposition followed by periodsof open-marine sedimentation at the AND-1B drill site. Sequence10 spans at least two glacialeinterglacial cycles (MIS 31e27) withno evidence of a subglacial deposition associated with MIS 30 atAND-1B. This supports the hypothesis that ice sheet in the RossEmbayment was much smaller during MIS 31 (Scherer et al., 2008),and was not able to re-establish itself during the following glacialcycle. To date, MIS 31 provides the only conclusive evidence foraWest Antarctic Ice Sheet reduced in volume relative to the presentday.
The sequences deposited between w2 and 1.0 Ma in AND-1Bappear to represent 40-kyr cycles (obliquity), although 20-kyrprecessional-based pacing is not ruled out. Either way, the transi-tion from ice shelf/ice sheet sequences to ice shelf/open marinesequences at w1.0 Ma in AND-1B document a fundamental changein the past response of the marine-based ice sheet system in theRoss Embayment to orbital forcing.

R. McKay et al. / Quaternary Science Reviews 34 (2012) 93e112 111
Acknowledgements
The scientific studies for ANDRILL are jointly supported by theUS National Science Foundation, the NZ Foundation for ResearchScience and Technology and the Royal Society of New ZealandMarsden Fund, the Italian Antarctic Research Programme, theGerman Research Foundation and the Alfred Wegener Institute forPolar and Marine Research. We thank Michael Hambrey and JohnHiemstra for constructive reviews that helped significantly improvethis paper.
References
Alley, R.B., 2000. Continuity comes first: recent progress in understanding subgla-cial deformation. In: Maltman, A.J., Hubbard, B., Hambrey, M.J. (Eds.), Defor-mation of Glacial Materials. The Geological Society, London, pp. 171e179.
Alley, R.B., Blankenship, D.D., Bentley, C.R., Rooney, S.T., 1987. Till beneath ice streamB 3. Till deformation: evidence and implications. Journal of GeophysicalResearch 92, 8921e8929.
Alley, R.B., Blankenship, D.D., Rooney, S.T., 1989. Sedimentation beneath ice shelves;the view from ice stream B. Modern glacimarine environments; glacial andmarine controls of modern lithofacies and biofacies. Marine Geology 85,101e120.
Andersen, K.K., Azuma, N., Barnola, J.-M., Bigler, M., Biscaye, P., Caillon, N.,Chappellaz, J., Clausen, H.B., Dahl-Jensen, D., Fischer, H., Flückiger, J., Fritzsche, D.,Fujii, Y., Goto-Azuma, K., Grønvold, K., Gundestrup, N.S., Hansson, M., Huber, C.,Hvidberg, C.S., Johnsen, S.J., Jonsell, U., Jouzel, J., Kipfstuhl, S., Landais, A.,Leuenberger, M., Lorrain, R., Masson-Delmotte, V., Miller, H., Motoyama, H.,Narita, H., Popp, T., Rasmussen, S.O., Raynaud, D., Röthlisberger, R., Ruth, U.,Samyn, D., Schwander, J., Shoji, H., Siggard-Andersen, M.-L., Steffensen, J.P.,Stocker, T., Sveinbjörnsdottir, A.E., Svensson, A., Takata, M., Tison, J.-L.,Thorsteinsson, T., Watanabe, O., Wilhelms, F., White, J., 2004. High-resolutionrecord of the Northern Hemisphere climate extending into the last interglacialperiod. Nature 431, 147e151.
Anderson, J.B., 1999. Antarctic Marine Geology. Cambridge University Press, UK.Anderson, J.B., Kurtz, D., Domack, E.W., Balshaw, K., 1980. Glacial and glacial
marine sediments of the Antarctic continental shelf. Journal of Geology 88,399e414.
Barrett, P.J., 2007. Cenozoic climate and sea level history from glacimarine strata offthe Victoria Land Coast, Cape Roberts Project, Antarctica. In: Hambrey, M.J.,Christoffersen, P., Glasser, N.F., Hubbard, B. (Eds.), Glacial Processes and Prod-ucts. International Association of Sedimentologists Special Publication, vol. 39,pp. 259e287.
Barrett, P.J., Carter, L., Dunbar, G.B., Dunker, E., Giorgetti, G., Harper, M.A.,McKay, R.M., Niessen, F., Nixdorf, U., Pyne, A.R., Riesselmann, C., Robinson, N.,Hollis, C., Strong, P., 2005. Oceanography and Sedimentation Beneath theMcMurdo Ice Shelf in Windless Bight, Antarctica. In: Antarctic Data Series, vol.25. Victoria University of Wellington.
Bart, P.J., 2003. Were West Antarctic Ice Sheet grounding events in the Ross Seaa consequence of East Antarctic Ice Sheet expansion during the middleMiocene? Earth and Planetary Science Letters 216, 93e107.
Bennett, M.R., Glasser, N.F., 2009. Glacial Geology: Ice Sheets and Landforms, seconded. John Wiley, London. 400pp.
Bohaty, S.M., Scherer, R.P., Harwood, D.M., 1998. Quaternary diatom biostratigraphyand palaeoenvironments of the CRP-1 drillcore, Ross Sea, Antarctica. TerraAn-tartica 5, 431e454.
Bouma, A.H., 1962. Sedimentology of Some Flysch Deposits: A Graphic Approach toFacies Interpretation. Elsevier, Amsterdam.
Boulton, G.S., Dobbie, K.E., Zatsepin, S., 2001. Sediment deformation beneathglaciers and its coupling to the subglacial hydraulic system. Quaternary Inter-national 86, 3e28.
Bowen, D.Q., 2010. Sea levelw400 000 years ago (MIS 11): analogue for present andfuture sea-level? Climates of the Past 6, 19e29.
Boyce, J.I., Eyles, N., 2000. Architectural element analysis applied to glacial deposits:internal geometry of a late Pleistocene till sheet, Ontario, Canada. GeologicalSociety of America Bulletin 112, 98e118.
Carr, S., 2001. Micromorphological criteria for discriminating subglacial and glaci-marine sediments: evidence from a contemporary tidewater glacier, Spitsber-gen. Quaternary International 86, 71e79.
Colville, E.J., Carlson, A.E., Beard, B.L., Hatfield, R.G., Stoner, J.S., Reyes, A.V.,Ullman, D.J., 2011. SreNdePb isotope evidence for ice-sheet presence onSouthern Greenland during the last interglacial. Science 333, 620e623.
Conway, H., Hall, B.L., Denton, G.H., Gades, A.M., Waddington, E.D., 1999. Past andfuture grounding-line retreat of the West Antarctic ice sheet. Science 286,280e283.
De Santis, L., Anderson, J.B., Brancolini, G., Zayatz, I., 1995. Seismic record of lateOligocene through Miocene glaciation on the central and eastern continentalshelf of the Ross Sea. In: Cooper, A.K., Barker, P.F., Brancolini, G. (Eds.), Geologyand Seismic Stratigraphy of the Antarctic Margin. Antarctic Research Series 68.American Geophysical Union, pp. 235e260.
Denton, G.H., Hughes, T.J., 2000. Reconstruction of the Ross ice drainage system,Antarctica, at the last glacial maximum. Geografiska Annaler. Series A: PhysicalGeography 82, 143e166.
Denton, G.H., Hughes, T.J., Karlen, W., 1986. Global ice-sheet system interlocked bysea level. Quaternary Research 26, 3e26.
Domack, E., 2007. Recognition of long period waves in Antarctic glacial marine (iceshelf) sediments. Geophysical Research Abstracts 9, 04586, SRef-ID:1607e7962/gra/EGU2007-A-04586.
Domack, E.W., Williams, C.R., 1990. Fine structure and suspended sediment trans-port in three Antarctic fjords. Antarctic Research Series 50, 71e89.
Domack, E.W., Jacobson, E.A., Shipp, S., Anderson, J.B., 1999. Late Pleistocene-Holocene retreat of the West Antarctic ice-sheet system in the Ross Sea; Part2, Sedimentologic and stratigraphic signature. Geological Society of AmericaBulletin 111, 1517e1536.
Domack, E., Duran, D., Leventer, A., Ishman, S., Doane, S., McCallum, S., Amblas, D.,Ring, J., Gilbert, R., Prentice, M., 2005. Stability of the Larsen B ice shelf on theAntarctic Peninsula during the Holocene epoch. Nature 436, 681e685.
Dowdeswell, J.A., Whittington, R.J., Marienfeld, P., 1994. The origin of massive dia-micton facies by iceberg rafting and scouring, Scoresby Sund, East Greenland.Sedimentology 41, 21e35.
Dunbar, G.B., Barrett, P.J., 2004. A Compilation of Textural Data for Modern andAncient Sediments in the McMurdo Sound Area, Antarctica. In: Antarctic DataSeries 24. Victoria University of Wellington, New Zealand.
Dunbar, G.B., Naish, T.R., Barrett, P.J., Fielding, C.R., Powell, R.D., 2008. Constrainingthe amplitude of late Oligocene bathymetric changes in Western Ross Seaduring orbitally-induced oscillations in the East Antarctic Ice Sheet: (1) Impli-cations for glacimarine sequence stratigraphic models. Palaeogeography,Palaeoclimatology, Palaeoecology 260, 50e65.
Esser, R.P., Kyle, P.R., McIntosh, W.C., 2004. 40Ar/39Ar dating of the eruptive historyof Mount Erebus, Antarctica: volcano evolution. Bulletin of Volcanology 66,671e686.
Evans, J., Pudsey, C.J., 2002. Sedimentation associated with Antarctic Peninsula iceshelves: implications for palaeoenvironmental reconstructions of glacimarinesediments. Journal of the Geological Society 159, 233e237.
Evans, D.J.A., Benn, D.I.A., 2004. Practical Guide to the Study of Glacial Sediments.Arnold Publishers, Oxford, UK.
Fahnestock, M., Scambos, T., Bindschadler, R., Kvaran, G., 2000. A millennium ofvariable ice flow recorded by the Ross Ice Shelf, Antarctica. Journal of Glaciology46, 652e664.
Fielding, C.R., Naish, T.R., Woolfe, K.J., Lavelle, M.A., 2000. Facies analysis andsequence stratigraphy of CRP-2/2A, Victoria Land Basin, Antarctica. TerraAntartica 7, 323e338.
Hearty, P.J., Kindler, P., Cheng, H., Edwards, R.L., 1999. A þ20 m middle Pleistocenesea-level highstand (Bermuda and the Bahamas) due to partial collapse ofAntarctic ice. Geology 27, 375e378.
Hiemstra, J.F., 2001. Microscopic analyses of Quaternary glacigenic sediments ofMarguerite Bay, Antarctic Peninsula. Arctic, Antarctic, and Alpine Research 33,258e265.
Hiemstra, J.F., Rijsdijk, K.F., 2003. Observing artificially induced strain: implicationsfor subglacial deformation. Journal of Quaternary Science 18, 373e383.
Hemer, M.A., Harris, P.T., 2003. Sediment core from beneath the Amery Ice Shelf,East Antarctica, suggests mid-Holocene ice-shelf retreat. Geology 31,127e130.
Hemer, M.A., O’Brien, P.E., Post, A.L., Craven, M., Truswell, E.M., Roberts, D.,Harris, P.T., 2007. Sedimentological signatures of the sub-Amery Ice Shelfcirculation. Antarctic Science 19, 497e506.
Hillenbrand, C., Kuhn, G., Frederichs, T., 2009. Record of a Mid-Pleistocene depo-sitional anomaly in West Antarctic continental margin sediments: an indicatorfor ice-sheet collapse? Quaternary Science Reviews 28, 1147e1159.
Hjulstrom, F., 1939. Transportation of detritus by moving water. In: Trask, P.D. (Ed.),Recent Marine Sediments. Dover Publications Inc., New York, pp. 5e31.
Horgan, H., Naish, T., Bannister, S., Balfour, N., Wilson, G., 2005. Seismic stratigraphyof the Plio-Pleistocene Ross Island flexural moat-fill: a prognosis for ANDRILLProgram drilling beneath McMurdo-Ross Ice Shelf. Global and Planetary Change45, 83e97.
Huybers, P., 2006. Early Pleistocene glacial cycles and the integrated summerinsolation forcing. Science 313, 508e511.
Joughin, I., Alley, R.B., 2011. Stability of the West Antarctic ice sheet in a warmingworld. Nature Geoscience 4, 506e513.
Kelly, P.J., Kyle, P.R., Dunbar, N.W., Sims, K.W.W., 2008. Geochemistry and miner-alogy of the phonolite lava lake, Erebus volcano, Antarctica: 1972e2004 andcomparison with older lavas. Journal of Volcanology and Geothermal Research177, 589e605.
Kerr, R.A., 1998. Global change: signs of past collapse beneath Antarctic ice. Science281, 17.
Kopp, R.E., Simons, F.J., Mitrovica, J.X., Maloof, A.C., Oppenheimer, M., 2009. Prob-abilistic assessment of sea level during the last interglacial stage. Nature 462,863e867.
Krissek, L.A., Browne, G.H., Carter, L., Cowan, E.A., Dunbar, G.B., McKay, R.M.,Naish, T., Powell, R., Reed, J., Wilch, T.I., Andrill MIS Science Team, 2007. Sedi-mentology and stratigraphy of the AND-1B core, ANDRILL McMurdo Ice Shelfproject, Antarctica. Terra Antartica 14, 185e222.
Krüger, J., Kjaer, K.H., 1998. A data chart for field description and genetic inter-pretation of glacial diamicts and associated sediments with examples fromGreenland, Iceland, and Denmark. Boreas 28, 386e402.

R. McKay et al. / Quaternary Science Reviews 34 (2012) 93e112112
Lhomme, N., Clarke, G.K., Marshall, S.J., 2005. Tracer transport in the Greenland IceSheet: constraints on ice cores and glacial history. Quaternary Science Reviews24, 173e194.
Licht, K.J., Dunbar, N.W., Andrews, J.T., Jennings, A.E., 1999. Distinguishing subglacialtill and glacial marine diamictons in the western Ross Sea, Antarctica: impli-cations for a last glacial maximum grounding line. Geological Society ofAmerica Bulletin 111, 91e103.
Licht, K.J., Lederer, J.R., Jeffrey Swope, R., 2005. Provenance of LGM glacial till (sandfraction) across the Ross embayment, Antarctica. Quaternary Science Reviews24, 1499e1520.
Lisiecki, L.E., Raymo, M.E., 2005. A Pliocene-Pleistocene stack of 57 globallydistributed benthic d18O records. Paleoceanography 20, PA1003. doi:10.1029/2004PA001071.
MacAyeal, D.R., 1992. Irregular oscillation of the West Antarctic Ice Sheet. Nature359, 29e32.
Mackintosh, A., Golledge, N., Domack, E., Dunbar, R., Leventer, A., White, D.,Pollard, D., DeConto, R., Fink, D., Zwartz, D., Gore, D., Lavoie, C., 2011. Retreat ofthe East Antarctic ice sheet during the last glacial termination. Nature Geo-science 4, 195e202.
McCarroll, D., Rijsdijk, K., 2003. Deformation styles as a key for unlocking glacialdepositional environments. Journal of Quaternary Science 18, 473e489.
McCrae, I.R., 1984. A Summary of Glaciological Measurements Made Between 1960and 1984 on the McMurdo Ice Shelf, Antarctica. School of Engineering Report360. Department of Theoretical and Applied Mechanics, University of Auckland,Auckland.
McKay, R.M., Dunbar, G.B., Naish, T., Barrett, P.J., Carter, L., Harper, M., 2008. Retreathistory of the Ross Ice Sheet (Shelf) since the Last Glacial Maximum from deep-basin sediment cores around Ross Island. Palaeogeography, Palaeoclimatology,Palaeoecology 260, 168e183.
McKay, R., Browne, G., Carter, L., Cowan, E., Dunbar, G., Krissek, L., Naish, T.,Powell, R., Reed, J., Talarico, F., Wilch, T., 2009. The stratigraphic signature of thelate Cenozoic Antarctic Ice Sheets in the Ross Embayment. Geological Society ofAmerica Bulletin 121, 1537e1561.
Mercer, J.H., 1978. West Antarctic ice sheet and CO2 greenhouse effect; a threat ofdisaster. Nature 271, 321e325.
Miller, K.G., Kominz, M.A., Browning, J.V., Wright, J.D., Mountain, G.S., Katz, M.E.,Sugarman, P.J., Cramer, B.S., Christie-Blick, N., Pekar, S.F., 2005. The Phanerozoicrecord of global sea-level change. Science 312, 1293e1297.
Monien, D., Kuhn, G., von Eynatten, H., Talarico, F., 2010. Geochemical provenanceanalyses of fine-grained sediment revealing Late Miocene to recent paleo-environmental changes in the western Ross Sea, Antarctica. Global and Plane-tary Change. doi:10.1016/j.gloplacha.2010.05.001.
Moncrieff, A.C.M., 1989. Classification of poorly sorted sedimentary rocks. Sedi-mentary Geology 65, 191e194.
Mosola, A.B., Anderson, J.B., 2006. Expansion and rapid retreat of the West AntarcticIce Sheet in eastern Ross Sea: possible consequence of over-extended icestreams? Quaternary Science Reviews 25, 2177e2196.
Muhs, D.R., Ager, T.A., Beget, J.E., 2001. Vegetation and paleoclimate of the lastinterglacial period, central Alaska. Quaternary Science Reviews 20, 41e61.
Naish, T., Powell, R., Levy, R., Wilson, G., Scherer, R., Talarico, F., Krissek, L.,Niessen, F., Pompilio, M., Wilson, T., Carter, L., DeConto, R., Huybers, P.,McKay, R., Pollard, D., Ross, J., Winter, D., Barrett, P., Browne, G., Cody, R.,Cowan, E., Crampton, J., Dunbar, G., Dunbar, N., Florindo, F., Gebhardt, C.,Graham, I., Hannah, M., Hansaraj, D., Harwood, D., Helling, D., Henrys, S.,Hinnov, L., Kuhn, G., Kyle, P., Laufer, A., Maffioli, P., Magens, D.,Mandernack, K., McIntosh, W., Millan, C., Morin, R., Ohneiser, C., Paulsen, T.,Persico, D., Raine, I., Reed, J., Riesselman, C., Sagnotti, L., Schmitt, D.,Sjunneskog, C., Strong, P., Taviani, M., Vogel, S., Wilch, T., Williams, T., 2009.Obliquity-paced Pliocene West Antarctic ice sheet oscillations. Nature 458,322e328.
Ogg, J.G., Smith, A.G., 2004. The geomagnetic polarity timescale. In: Gradstein, F.M.,Ogg, J.G., Smith, A.G. (Eds.), A Geological Time Scale. Cambridge UniversityPress, Cambridge UK, pp. 63e95.
Pollard, D., DeConto, R.M., 2009. Modelling West Antarctic ice sheet growth andcollapse through the past five million years. Nature 458, 329e332.
Pompilio, M., Dunbar, N., Gebhardt, A.C., Helling, D., Kuhn, G., Kyle, P., McKay, R.,Talarico, F., Tulaczyk, S., Vogel, S., Wilch, T., 2007. Petrology and geochemistry ofAND-1B Core, ANDRILL McMurdo Ice Shelf Project, Antarctica. Terra Antartica14, 255e288.
Powell, R.D., Molnia, B., 1989. Glacimarine sedimentary processes, facies andmorphology of the south-southeast Alaska shelf and fjords. Marine Geology 85,359e390.
Powell, R.D., Alley, R.B., 1997. Grounding-line systems; processes, glaciologicalinferences and the stratigraphic record. In: Barker, P.F., Cooper, A.K. (Eds.),Geology and Seismic Stratigraphy of the Antarctic Margin 2. Antarctic ResearchSeries, vol. 71, pp. 169e187.
Raymo, M.E., Lisiecki, L.E., Nisancioglu, K.H., 2006. Plio-Pleistocene ice volume,Antarctic climate, and the global d18O record. Science 313, 492e495.
Rignot, E., Casassa, G., Gogineni, P., Krabill, W., Rivera, A., Thomas, R., 2004. Accel-erated ice discharge from the Antarctic Peninsula following the collapse ofLarsen B ice shelf. Geophysical Research Letters 31, L18401. doi:10.1029/2004GL020697.
Robinson, A., Calov, R., Ganopolski, A., 2011. Greenland ice sheet model parametersconstrained using simulations of the Eemian Interglacial. Climate of the Past 7,381e396.
Rohling, E.J., Grant, K., Bolshaw, M., Roberts, A.P., Siddall, M., Hemleben, C.,Kucera, M., 2009. Antarctic temperature and global sea level closely coupledover the past five glacial cycles. Nature Geoscience 2, 500e504.
Rostami, K., Peltier, W.R., Mangini, A., 2000. Quaternary marine terraces, sea-levelchanges and uplift history of Patagonia, Argentina. Comparisons with predic-tions of ICE-4G (VM2) model of the global process of glacial isostatic adjust-ment. Quaternary Science Reviews 19, 1495e1525.
Scherer, R.P., Aldahan, A.A., Tulaczyk, S., Possnert, G., Engelhardt, H., Kamb, B., 1998.Pleistocene collapse of the West Antarctic ice sheet. Science 281, 82e85.
Scherer, R.P., Sjunneskog, C.M., Iverson, N.R., Hooyer, T.S., 2004. Assessing subglacialprocesses from diatom fragmentation patterns. Geology 32, 557e560.
Scherer, R.P., Bohaty, S.M., Dunbar, R.B., Esper, O., Flores, J.-A., Gersonde, R.,Harwood, D.M., Roberts, A.P., Taviani, R., 2008. Antarctic records of precession-paced insolation-driven warming during early Pleistocene Marine Isotope Stage31. Geophysical Research Letters 35, L03505. doi:10.1029/2007GL032254.
Shackleton, N.J., 2000. The 100,000-year ice-age cycle identified and found to lagtemperature, carbon dioxide, and orbital eccentricity. Science 289, 1897e1902.
Ship, S., Anderson, J., Domack, E., 1999. Late Pleistocene-Holocene retreat of theWest Antarctic Ice-Sheet system in the Ross Sea: Part 1eGeophysical results.Geological Society of America Bulletin 111, 1486e1516.
Sjunneskog, C., Scherer, R.P., 2005. Mixed diatom assemblages in glacigenic sedi-ment from the central Ross Sea, Antarctica. Palaeogeography, Palae-oclimatology, Palaeoecology 218, 287e300.
Stern, T.A., Davey, F.J., Delisle, G., 1991. Lithospheric flexure induced by the load ofRoss Archipelago, southern Victoria Land, Antarctica. In: Thomson, M.R.A.,Crame, J.A., Thomson, J.W. (Eds.), Geological Evolution of Antarctica. CambridgeUniversity Press, pp. 323e328.
Stuiver, M., Denton, G.H., Hughes, T.J., Fastook, J.L., 1981. History of the marine icesheet in West Antarctica during the last glaciation; a working hypothesis. In:Denton, G.H., Hughes, T.J. (Eds.), The Last Great Ice Sheets, pp. 319e436.
Talarico, F., Sandroni, S., 2009. Provenance signatures of the Antarctic Ice Sheets inthe Ross Embayment during the Late Miocene to Early Pliocene: the ANDRILLAND-1B core record. Global and Planetary Change 69, 103e123.
Talarico, F., McKay, R., Powell, R., Sandroni, S., Naish, T., 2010. Late Cenozoic oscil-lations of Antarctic ice sheets revealed by provenance of basement clasts andgrain detrital modes in ANDRILL core AND-1B. Global and Planetary Change.doi:10.1016/j.gloplacha.2009.12.002.
ten Brink, U.S., Hackney, R.I., Bannister, S.C., Stern, T.A., Makovsky, Y., 1997. Uplift ofthe Transantarctic Mountains and the bedrock beneath the East Antarctic icesheet. Journal of Geophysical Research 102 (B), 27603e27621.
Tulaczyk, S., Kamb, B., Scherer, R.P., Engelhardt, H.F., 1998. Sedimentary processesat the base of a West Antarctic ice stream: constraints from textural andcompositional properties of subglacial debris. Journal of Sedimentary Research68, 487e496.
van der Meer, J., 1993. Microscopic evidence of subglacial deformation. QuaternaryScience Reviews 12, 553e587.
Vaughan, D.G., Arthern, R., 2007. Climate Change: why is it hard to predict thefuture of ice sheets? Science 315, 1503e1504.
Villa, G., Lupi, C., Cobianchi, M., Florindo, F., Pekar, S., 2007. A Pleistocene warmingevent at 1 Ma in Prydz Bay, East Antarctica: evidence from ODP Site 1165.Paleogeography, Paleoclimatology, Paleoecology 260, 230e255.
Villa, G., Persico, D., Wise, S., Gadaleta, A., 2010. Calcareous nannofossil evidencefor Marine Isotope Stage 31 (1 Ma) in Core AND-1B, ANDRILL McMurdoIce Shelf Project (Antarctica). Global and Planetary Change. doi:10.1016/j.gloplacha.2009.12.003.
Ward, B.L., Webb, P.N., 1986. Late Quaternary foraminifera from raised deposits ofthe Cape Royds-Cape Barne area, Ross Island, Antarctica. Journal of Foraminif-eral Research 16, 176e200.
Webb, P., Ronan, T., Lipps, J., DeLaca, T., 1979. Miocene glaciomarine sediments frombeneath the Southern Ross Ice Shelf, Antarctica. Science 203, 435e437.
Weertman, J., 1974. Stability of the junction of an ice sheet and an ice shelf. Journalof Glaciology 13, 3e13.
Wilson, G., Levy, R., Browne, G., Dunbar, N., Florindo, F., Henry, S., Graham, I.,McIntosh, W., McKay, R., Naish, T., Ohneiser, C., Powell, R., Ross, J., Sagnotti, L.,Scherer, R., Sjunneskog, C., Strong, C.P., Taviani, M., Winter, D., ANDRILL MISScience Team, 2007. Preliminary integrated chronostratigraphy of the AND-1Bcore, ANDRILLMcMurdo Ice Shelf Project, Antarctica. Terra Antartica 14, 297e316.