Embed Size (px)
Citation preview

Th
e P
NC
Fin
ancial S
ervices G
roup, In
c. 2012
An
nu
al R
ep
ort
PNC Financial Services Group2012 Annual Report
Corporate HeadquartersThe PNC Financial Services Group, Inc.
One PNC Plaza, 249 Fifth Avenue
Pittsburgh, PA 15222-2707
412-762-2000
8621_Cvr.indd 18621_Cvr.indd 1 2/27/13 8:59 AM2/27/13 8:59 AM

Stock Listing
The common stock of The PNC Financial
Services Group, Inc. is listed on the New York
Stock Exchange under the symbol PNC.
Stock Transfer Agent and Registrar
Computershare Trust Company, N. A.
250 RoyaII Street
Canton, MA 02021
800-982-7652
Dividend Reinvestment and Stock Purchase Plan
The PNC Financial Services Group, Inc. Dividend
Reinvestment and Stock Purchase Plan enables
holders of common and preferred Series B
stock to conveniently purchase additional shares
of common stock. Obtain a prospectus and
enrollment form at www.computershare.com/pnc
or by contacting Computershare at 800-982-7652.
“PNC is going to win in this environment because
we have the right people, the right culture and the
right business model to deliver for our shareholders,
customers, employees and communities.”
–Jim Rohr, chairman and chief executive offi cer
8621_Cvr.indd 28621_Cvr.indd 2 2/27/13 8:59 AM2/27/13 8:59 AM

From the ChairmanMarch 1, 2013
James E. Rohr
Chairman and Chief Executive Officer
To Our Shareholders,
In nearly every way, today’s banking industry is a world away from the one I joined nearly
41 years ago. New regulations, persistently low interest rates, evolving customer preferences
and stunning enhancements in technology are just some of the differences we see as we
begin 2013. Then as now, one attribute transcends the decades – trust.
Trust is the quality that people seek from a financial institution, and banks that can earn the
confidence of their customers are those that will have enduring success. We believe PNC
is such a bank.
We have strategies for growth, a business model and an approach to risk that drive our
performance. Our products are designed to provide customers with the level of safety and
liquidity they seek and to create opportunities for financial growth. But it is trust that creates
the loyalty necessary to sustain relationships, and that is why we believe customers are the
foundation for revenue potential.
PNC Chairman and Chief Executive Officer Jim Rohr celebrated the 25-year anniversary of PNC trading
on the New York Stock Exchange on October 22, 2012.

Our customer relationships drove PNC’s progress in 2012. By increasing customers – both
organically and through acquisition – we were able to grow full-year loans by $27 billion and
deposits by $25 billion compared to 2011. As a result, 2012 revenue increased $1.2 billion or
8 percent from the previous year.
Some of these gains were achieved through the very successful acquisition and integration of
RBC Bank (USA), which we completed in the first quarter of 2012.
With this transaction, we added nearly 1 million accounts and
gained access to markets in the Southeast, which are some of the
fastest growing in the U.S.
Our strong brand and expanded footprint drove customer growth
across our businesses. In Retail Banking, we added a total of
Growing Customers as Never Before
ToTal loans aT year end
Billions
$151 $159
2010 2011 2012
$186
PNC employees (from left) Dennis Morgan, Jessica Fabrizi, Jared Drummer and Jasmine Bennings show
their corporate colors. Through effective marketing communications initiatives in 2012, awareness of the
PNC brand grew to 69 percent in markets where PNC has a Retail Banking presence.
There were clearly some pluses and minuses for PNC in 2012.
In addition to our growth in customers and gains in loans,
deposits and revenue, other positives included:
• Our balance sheet liquidity remained strong as
evidenced by our loan-to-deposit ratio of 87 percent
as of December 31, 2012.
• We exceeded our full-year cost reduction target of $550 million.
• Our Tier 1 capital ratio increased following our cash acquisition of RBC Bank (USA)
in March 2012.
There were also a few minuses, some of which reflect the current operating environment.
• Developments in the residential mortgage banking industry required us to set aside
a provision of $761 million primarily for obligations to repurchase loans that were
acquired when we purchased National City. This had a negative impact on revenue.
• On the expense side, residential mortgage foreclosure-related expenses were
$225 million for the year.
• Other expenses included integration costs of RBC Bank (USA) and the noncash charges
related to the redemption of $2.3 billion in high-cost trust preferred securities. Both
provide PNC with benefits in the form of an expanded footprint and lower funding costs,
respectively.
On balance this was a good year for PNC but because of these minuses, our financial results
do not reflect the full potential of the investments we have made and the value we believe
PNC can create for shareholders.
Pluses and Minuses
714,000 net new checking relationships during the year. Of that amount, 254,000 were net
new organic relationships, growth of 4 percent from year-end 2011 or more than double the
population growth rate in our footprint. Over the last three years, from 2010 through 2012, we
acquired about 3,000 new Corporate Banking primary clients. In 2012 compared with 2011,
new primary client acquisitions for our Asset Management Group were 37 percent higher
and Residential Mortgage originations increased by $3.8 billion or 33 percent.
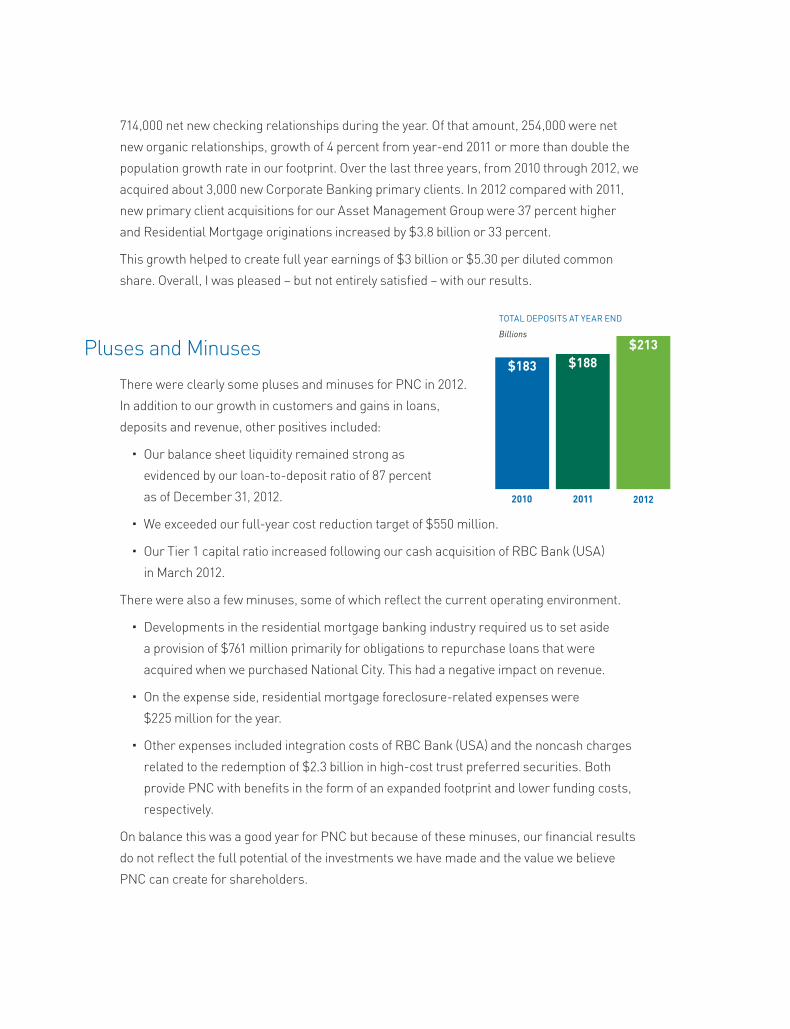
This growth helped to create full year earnings of $3 billion or $5.30 per diluted common
share. Overall, I was pleased – but not entirely satisfied – with our results.
ToTal deposiTs aT year end
Billions
$183 $188
2010 2011 2012
$213

Priorities for 2013
Building on the strong customer growth in our business segments – Retail Banking, Corporate &
Institutional Banking, Asset Management Group and Residential Mortgage – 2013 provides us with
greater opportunities to deepen relationships through cross selling and increase fee-based income,
while we also look to reduce expenses. Additionally, we have established several growth priorities
for 2013.
Across our industry, fewer customers are
regularly using retail branches. In fact 40
percent of PNC’s customers have not visited
a branch in the last three months as more
transactions are being conducted online, at
ATMs and through mobile devices. And the
number of checks deposited by mobile devices
grew from zero to nearly 15,000 per day at PNC
– all in 2012.
Evolving customer preferences along with
low interest rates and a dynamic regulatory
environment have created a new world for
retail banking. We are rethinking nearly
every aspect of this business with a focus on
enhancing customer loyalty by deepening
relationships while lowering costs.
For example, we plan to install nearly
2,500 multi-functional, check-cashing ATMs
this year in addition to the 1,100 we rolled out
in 2012. That would mean that by the end of
2013, approximately half of our ATM network
will allow customers to cash checks, receive
images of their deposits and withdraw cash.
Compared to a branch, these ATMs often
provide greater customer convenience and
have significantly lower transaction costs.
Our innovative Virtual Wallet® product, which
helps customers better manage their money,
now has approximately 1.3 million accounts. In
the fourth quarter of 2012, we became the first
U.S. bank to integrate with Visa’s new digital
wallet service – V.me – which should simplify
e-commerce for Virtual Wallet users.
We are applying this same innovative approach
to a new product that we will be launching
this year for our business banking customers.
It’s called Cash Flow Insight® and provides
business owners with an online tool to help
them better understand their cash flows and
forecast their cash position.
Reflecting customer trends, we also plan to
close more branches in 2013 than we have
in any year in our history. However, PNC will
continue to expand its branch presence in
underpenetrated markets.
As we look ahead, we envision technology-
centered branches that deliver products and
services such as business and commercial
banking, wealth management, investments
and mortgages. This approach should drive
customer loyalty while improving margins. At
the same time, we are looking to increase our
brand equity in the virtual space with the goal
of deeper relationships with our customers.
redefine The reTail banking experience.

CAPTURE MORE OF OUR CUSTOMERS’ INVESTABlE ASSETS.
We estimate that our current customers
have $1.9 trillion in personal investable assets,
but our percentage share of those dollars is
in the single digits, reflecting the fragmented
nature of this industry. With the long-term
goal of doubling the size of our investment and
retirement business, we plan to have annual
conversations with each of our customers.
At a time when many banks are looking to
the mass market, affluent, high net worth
and institutional markets as a source to
increase fee income, we believe PNC’s
highly collaborative culture gives us an
edge as referrals are one of our strengths.
For example, referral sales to our Asset
Management Group last year were up
more than 39 percent compared to 2011,
reflecting strong referral activity from Retail
and Corporate & Institutional Banking. This
helped to produce an increase in total net
inflows, bringing discretionary assets under
management to $112 billion at year-end 2012.
This year, we are looking to expand those
efforts. All of our client-facing employees now
have specific goals in support of our investing
and retirement initiative.
Our open architecture along with our
consultative approach is designed to provide
customers with solutions based on their
individualized needs. It’s our position that this
approach helps to drive our excellent levels of
client retention.
Recognizing that some clients like to manage
aspects of their portfolio on their own, last year
we established the PNC Investment Center and
we introduced brokerage capabilities for our
high net worth customers.
PNC Wealth Insight® was honored by both CIO
and InformationWeek magazines in 2012 as
an innovation that delivers a competitive
advantage. This tool allows wealth management
customers to aggregate their assets – even
those not managed by PNC – and view them
based on how they think about their money.
Given our culture, product and service
capabilities and larger customer base, we feel
this represents another opportunity to diversify
our revenue stream.
Moises Almonte (right), a senior relationship manager in Wealth Management, meets with Mark Nobile
(center), chief operating officer, and Ed Maier, president, of the Susquehanna Brewing Co., a family-owned
craft brewery located in northeastern Pennsylvania.

CONTINUE TO BUIlD OUR PRESENCE IN NEWly ACqUIRED MARkETS.
As this letter goes to press, we have been in
our new Southeastern markets about one year.
In that short space of time, we have established
our brand in highly attractive markets such as
Atlanta, Birmingham, Charlotte and Raleigh,
provided Retail customers with a robust
product set and, from a de novo position,
created an Asset Management and Corporate
& Institutional banking presence.
When we entered the market, we received
thousands of resumes, many from area
competitors. These new hires coupled with
a group of legacy employees who willingly
relocated to warmer climes have allowed
PNC to establish itself as a worthy banking
competitor with strong talent.
Despite a credit market that has become more
competitive for our Corporate & Institutional
Bank, we remain bullish on the opportunities,
and believe that over time, this area will
generate loan and fee income in line with our
more established markets such as Chicago,
Washington, D.C. and Philadelphia.
BUIlD A SUSTAINABlE RESIDENTIAl MORTGAGE BUSINESS.
For most customers, the single most important
financial transaction of their lives is the purchase
of a home. We are committed to investing in this
business to create a strong financial bond with
our customers while delivering bottom-line
returns and burnishing our already strong brand.
Today, we are building a viable, highly integrated
mortgage origination and servicing engine that
is cost efficient and reflects PNC’s business
practices, culture and commitment to customer
service. As refinancing activity eases, this should
drive longer term value for this business. We
are also looking to cross-sell our mortgage
products to existing clients across our footprint.
We are seeing an improving housing market,
something we haven’t experienced since 2008.
Taken together, we see our opportunities with
our residential mortgage business to enhance
customer relationships and help us capture a
greater share of wallet.
PNC’s expansion in the Southeast combined with a commitment to innovation, expense management and energy
efficiency led to the opening of a net-zero energy bank branch in Fort Lauderdale in January 2012.
These priorities along with our commitment to executing give us confidence that we can deliver
shareholder value in 2013.
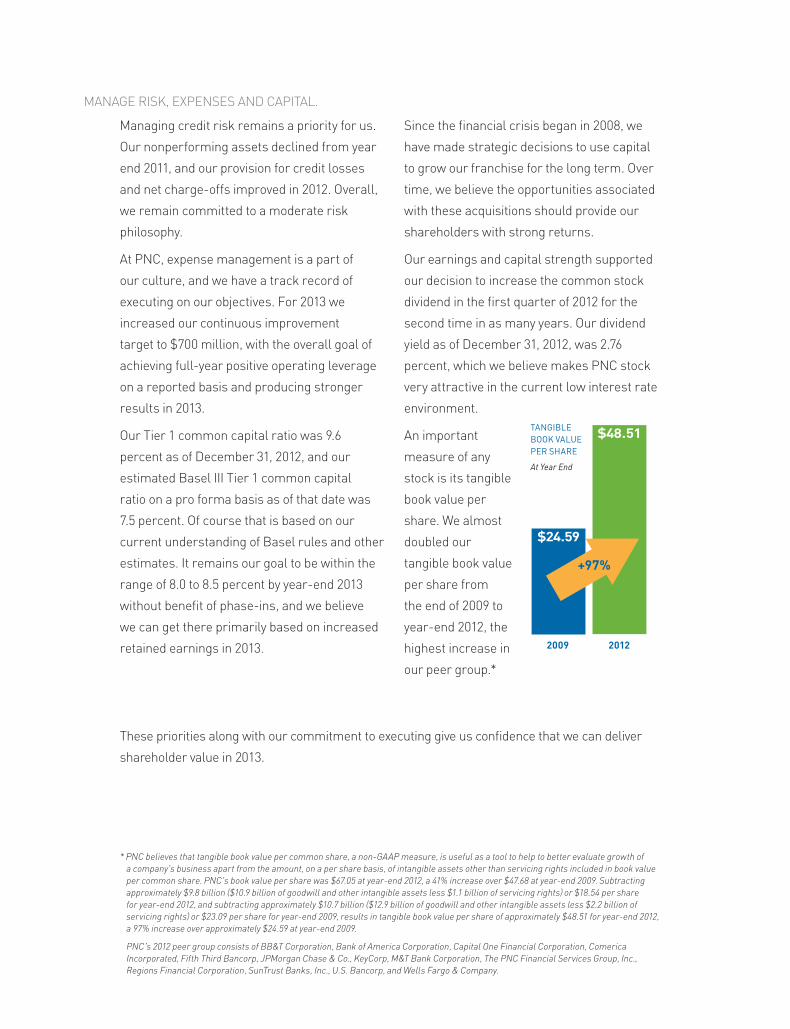
* PNC believes that tangible book value per common share, a non-GAAP measure, is useful as a tool to help to better evaluate growth of a company’s business apart from the amount, on a per share basis, of intangible assets other than servicing rights included in book value per common share. PNC’s book value per share was $67.05 at year-end 2012, a 41% increase over $47.68 at year-end 2009. Subtracting approximately $9.8 billion ($10.9 billion of goodwill and other intangible assets less $1.1 billion of servicing rights) or $18.54 per share for year-end 2012, and subtracting approximately $10.7 billion ($12.9 billion of goodwill and other intangible assets less $2.2 billion of servicing rights) or $23.09 per share for year-end 2009, results in tangible book value per share of approximately $48.51 for year-end 2012, a 97% increase over approximately $24.59 at year-end 2009.
PNC’s 2012 peer group consists of BB&T Corporation, Bank of America Corporation, Capital One Financial Corporation, Comerica Incorporated, Fifth Third Bancorp, JPMorgan Chase & Co., KeyCorp, M&T Bank Corporation, The PNC Financial Services Group, Inc., Regions Financial Corporation, SunTrust Banks, Inc., U.S. Bancorp, and Wells Fargo & Company.
MANAGE RISk, ExPENSES AND CAPITAl.
Managing credit risk remains a priority for us.
Our nonperforming assets declined from year
end 2011, and our provision for credit losses
and net charge-offs improved in 2012. Overall,
we remain committed to a moderate risk
philosophy.
At PNC, expense management is a part of
our culture, and we have a track record of
executing on our objectives. For 2013 we
increased our continuous improvement
target to $700 million, with the overall goal of
achieving full-year positive operating leverage
on a reported basis and producing stronger
results in 2013.
Our Tier 1 common capital ratio was 9.6
percent as of December 31, 2012, and our
estimated Basel III Tier 1 common capital
ratio on a pro forma basis as of that date was
7.5 percent. Of course that is based on our
current understanding of Basel rules and other
estimates. It remains our goal to be within the
range of 8.0 to 8.5 percent by year-end 2013
without benefit of phase-ins, and we believe
we can get there primarily based on increased
retained earnings in 2013.
Since the financial crisis began in 2008, we
have made strategic decisions to use capital
to grow our franchise for the long term. Over
time, we believe the opportunities associated
with these acquisitions should provide our
shareholders with strong returns.
Our earnings and capital strength supported
our decision to increase the common stock
dividend in the first quarter of 2012 for the
second time in as many years. Our dividend
yield as of December 31, 2012, was 2.76
percent, which we believe makes PNC stock
very attractive in the current low interest rate
environment.
An important
measure of any
stock is its tangible
book value per
share. We almost
doubled our
tangible book value
per share from
the end of 2009 to
year-end 2012, the
highest increase in
our peer group.*
2009 2012
$24.59
$48.51Tangible book Value per share
At Year End
+97%

Our ValuesPerformance
Customer Focus
Respect
Integrity
Diversity
Teamwork
Quality of Life
Employees accept the 2012 Gallup Great Workplace Award, which recognizes companies for excellence in
workforce engagement. This marked the fourth straight year PNC has received the award. From left are:
Sharon Lamcha, Bob Leininger, Mike Brundage, Rick Baumgartner and Debbie Campbell.
Achievement Through Teamwork
None of these accomplishments would have been possible without the hard work of our
more than 56,000 employees. In 2012, our employee engagement scores reached new highs,
and for the fourth straight year, PNC was named a Gallup Great Workplace Award winner.
Our Retail Bank won the award in 2009 and 2010 and the full company received the honor in
2011 and 2012, the only U.S.-based bank to do so.
There were other accolades as well: for the 10th straight year, we were a Training Top 125
company in recognition of our employee training and development programs; we were
named one of the nation’s 100 Best Companies by Working Mother magazine for the 11th
year; and U.S. Veterans Magazine said PNC was one of the top companies in the country
working to hire military veterans.
After some three decades of service, Vice Chairman Tom Whitford will retire in March 2013.
Among his many assignments, he led the successful integration of National City, which
doubled our size and ultimately became the industry model for large mergers. Succeeding
Tom as head of our operations and technology areas is Steve Van Wyk. We were pleased to
welcome him to PNC in January 2013.

Giving Back to the Community
At PNC, we have always believed that a company is only as strong as the community it serves. Overall,
we contributed more than $73 million to strengthen communities and enrich lives in the places where
we had a significant presence in 2012.
For example, in Cleveland’s historic Eastside community, PNC Fairfax Connection now provides educational
programs to local residents and business owners. In the headquarters city, the legacy Project opened as
a historical tribute to the transformation of Pittsburgh and PNC’s place in it. And in Philadelphia, a premier
PNC sponsorship of the Barnes Foundation is leading to an unprecedented increase in visibility for one of
the world’s finest collections of Impressionist, Post-Impressionist and early Modern paintings.
Grow Up Great, our signature philanthropic initiative in early childhood education, was introduced to
new Southeast markets in 2012. Our grant making is focused on science, math, the arts and financial
education, areas that should lay the foundation for tomorrow’s dynamic workforce. In almost eight years,
this $350 million, multi-year program has helped more than 1.7 million children under age 5 prepare for
school and life. In 2012, more than 35 percent of our employees participated in a Grow Up Great activity,
which helps to enhance overall engagement and retention.
Following the devastation of Hurricane Sandy, PNC donated $300,000 to relief efforts, matched
employee contributions up to $150,000, and supported customers by waiving a total of $7 million in
fees immediately following the storm. While as many as 1,000 branches along the East Coast were
affected, we are pleased that our employees rallied to restore services and serve customers.
These are just some of the ways that PNC and our employees support the communities where we
live and do business.
The PNC Fairfax Connection opened in September 2012 in Cleveland’s historic Eastside. It provides residents and
business owners a variety of resources: early childhood education classes for toddlers and caregivers, media training
for teens, financial education and job skill assistance for adults, and a historic preservation project for seniors.

New leadership
In February 2013, our Board of
Directors elected Bill Demchak
director and named him to
succeed me as PNC’s next chief
executive officer. Bill’s elevation
to CEO is a well deserved
promotion for one of the most
talented and insightful executives
with whom I have ever worked.
Bill also remains president of
the corporation and the bank,
and I will assume a new role as executive chairman to ensure a smooth transition.
The board’s action was in response to my desire to step down as chief executive officer
at the upcoming Annual Meeting of Shareholders on April 23, 2013, and retire the
following year.
Bill has demonstrated exceptional leadership since joining PNC in 2002. He was named
president in April 2012, and enhanced customer growth by successfully aligning our
businesses to deliver the entire company for our clients.
Since my election to CEO, PNC’s assets have increased from $70 billion at the end of 2000
to $305 billion as of December 31, 2012. Given our products, scale and recently expanded
footprint, your bank is poised for continued growth.
As new chapters are written in the PNC story, I believe many of our best qualities will
persevere: the importance we place on delivering value to our shareholders while serving
the needs of our customers, employees and communities, along with maintaining the
trust we have earned from those who do business with us.
Trust may not appear on our financial statements, but it underscores the values and
principles that have driven PNC’s successes and that will sustain us in the years to come
as we continue to build a great company.
Sincerely,
James e. rohr chairman and chief executive officer
For more information regarding certain factors that could cause future results to differ, possibly materially, from historical performance or from those anticipated in forward-looking statements, see the Cautionary Statement in Item 7 of our 2012 Annual Report on Form 10-K, which accompanies this letter.
UNITED STATESSECURITIES AND EXCHANGE COMMISSION
Washington, DC 20549
FORM 10-KAnnual Report Pursuant to Section 13 or 15(d) of the Securities Exchange Act of 1934
For the fiscal year ended December 31, 2012Commission file number 001-09718
THE PNC FINANCIAL SERVICES GROUP, INC.(Exact name of registrant as specified in its charter)
Pennsylvania 25-1435979
(State or other jurisdiction of incorporation or organization) (I.R.S. Employer Identification No.)
One PNC Plaza249 Fifth Avenue
Pittsburgh, Pennsylvania 15222-2707(Address of principal executive offices, including zip code)
Registrant’s telephone number, including area code - (412) 762-2000
Securities registered pursuant to Section 12(b) of the Act:
Title of Each ClassName of Each Exchange
on Which RegisteredCommon Stock, par value $5.00 New York Stock ExchangeDepositary Shares Each Representing 1/4,000 Interest in a Share of 9.875%
Fixed-to-Floating Rate Non-Cumulative Preferred Stock, Series L, par value $1.00New York Stock Exchange
Depositary Shares Each Representing a 1/4,000 Interest in a Share of Fixed-to-Floating Rate Non-Cumulative Perpetual Preferred Stock, Series P
New York Stock Exchange
Depositary Shares Each Representing a 1/4,000 Interest in a Share of 5.375% Non-Cumulative Perpetual Preferred Stock, Series Q
New York Stock Exchange
Warrants (expiring December 31, 2018) to purchase Common Stock New York Stock Exchange
Securities registered pursuant to Section 12(g) of the Act:$1.80 Cumulative Convertible Preferred Stock - Series B, par value $1.00
Indicate by check mark if the registrant is a well-known seasoned issuer, as defined in Rule 405 of the Securities Act. Yes X No
Indicate by check mark if the registrant is not required to file reports pursuant to Section 13 or Section 15(d) of the Act. Yes No X
Indicate by check mark whether the registrant: (1) has filed all reports required to be filed by Section 13 or 15(d) of the Securities Exchange Actof 1934 during the preceding 12 months (or for such shorter period that the registrant was required to file such reports), and (2) has been subjectto such filing requirements for the past 90 days. Yes X No
Indicate by check mark whether the registrant has submitted electronically and posted on its corporate Web site, if any, every Interactive Data Filerequired to be submitted and posted pursuant to Rule 405 of Regulation S-T (§232.405 of this chapter) during the preceding 12 months (or forsuch shorter period that the registrant was required to submit and post such files). Yes X No
Indicate by check mark if the disclosure of delinquent filers pursuant to Item 405 of Regulation S-K is not contained herein, and will not becontained, to the best of registrant’s knowledge, in definitive proxy or information statements incorporated by reference in Part III of thisForm 10-K or any amendment to this Form 10-K. X
Indicate by check mark whether the registrant is a large accelerated filer, an accelerated filer, a non-accelerated filer, or a smaller reportingcompany. See the definitions of “large accelerated filer”, “accelerated filer” and “smaller reporting company” in Rule 12b-2 of the Exchange Act.
Large accelerated filer X Accelerated filer Non-accelerated filer Smaller reporting company
Indicate by check mark whether the registrant is a shell company (as defined in Rule 12b-2 of the Act). Yes No X
The aggregate market value of the registrant’s outstanding voting common stock held by nonaffiliates on June 30, 2012, determined using the pershare closing price on that date on the New York Stock Exchange of $61.11, was approximately $32.2 billion. There is no non-voting commonequity of the registrant outstanding.
Number of shares of registrant’s common stock outstanding at February 15, 2013: 528,435,413
DOCUMENTS INCORPORATED BY REFERENCEPortions of the definitive Proxy Statement of The PNC Financial Services Group, Inc. to be filed pursuant to Regulation 14A for the 2013 annualmeeting of shareholders (Proxy Statement) are incorporated by reference into Part III of this Form 10-K.
THE PNC FINANCIAL SERVICES GROUP, INC.Cross-Reference Index to 2012 Form 10-K
TABLE OF CONTENTS
Page
PART I
Item 1 Business. 1
Item 1A Risk Factors. 12
Item 1B Unresolved Staff Comments. 24
Item 2 Properties. 24
Item 3 Legal Proceedings. 25
Item 4 Mine Safety Disclosures. 25
Executive Officers of the Registrant 25Directors of the Registrant 26
PART II
Item 5 Market for Registrant’s Common Equity, Related Stockholder Matters and Issuer Purchases of Equity Securities. 27
Common Stock Performance Graph 28
Item 6 Selected Financial Data. 29
Item 7 Management’s Discussion and Analysis of Financial Condition and Results of Operations. 31
Executive Summary 31
Consolidated Income Statement Review 39
Consolidated Balance Sheet Review 42
Off-Balance Sheet Arrangements And Variable Interest Entities 53
Fair Value Measurements 54
European Exposure 55
Business Segments Review 57
Critical Accounting Estimates And Judgments 71
Status Of Qualified Defined Benefit Pension Plan 76
Recourse And Repurchase Obligations 78
Risk Management 83
2011 Versus 2010 108
Glossary Of Terms 111
Cautionary Statement Regarding Forward-Looking Information 116
Item 7A Quantitative and Qualitative Disclosures About Market Risk. 117
Item 8 Financial Statements and Supplementary Data. 118
Report of Independent Registered Public Accounting Firm 118
Consolidated Income Statement 119
Consolidated Statement of Comprehensive Income 120
Consolidated Balance Sheet 121
Consolidated Statement Of Changes In Equity 122
Consolidated Statement Of Cash Flows 123
Notes To Consolidated Financial Statements 125
Note 1 Accounting Policies 125
Note 2 Acquisition and Divestiture Activity 137
THE PNC FINANCIAL SERVICES GROUP, INC.Cross-Reference Index to 2012 Form 10-K (continued)
TABLE OF CONTENTS (Continued)
Page
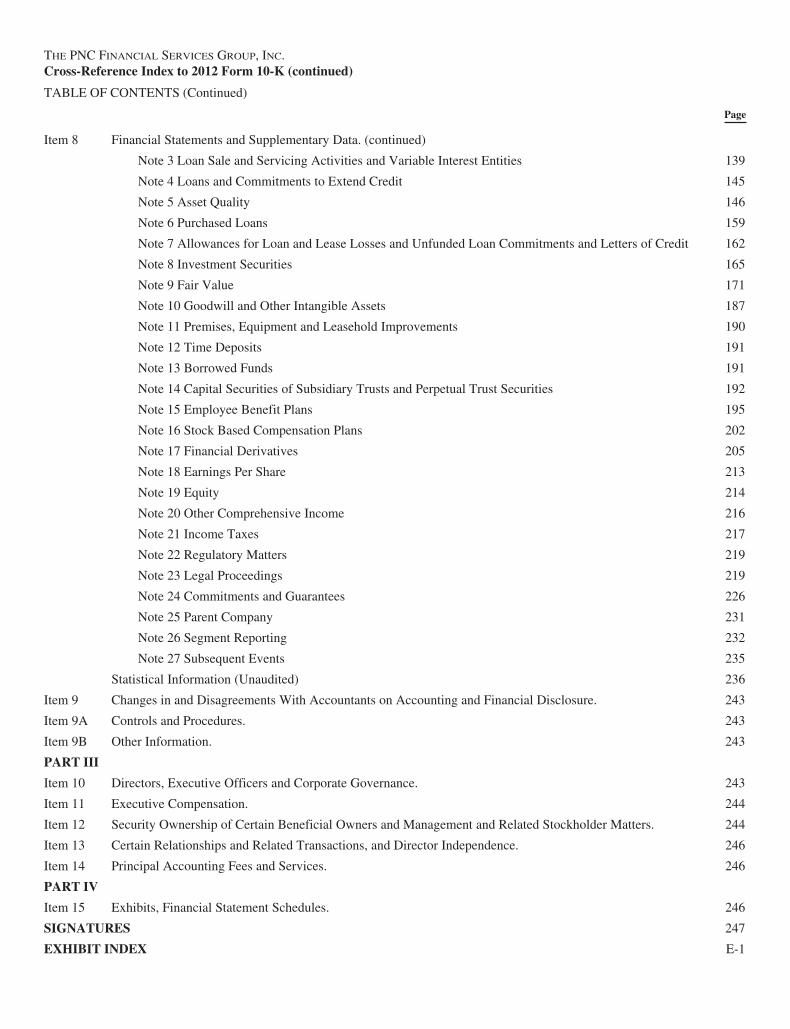
Item 8 Financial Statements and Supplementary Data. (continued)
Note 3 Loan Sale and Servicing Activities and Variable Interest Entities 139
Note 4 Loans and Commitments to Extend Credit 145
Note 5 Asset Quality 146
Note 6 Purchased Loans 159
Note 7 Allowances for Loan and Lease Losses and Unfunded Loan Commitments and Letters of Credit 162
Note 8 Investment Securities 165
Note 9 Fair Value 171
Note 10 Goodwill and Other Intangible Assets 187
Note 11 Premises, Equipment and Leasehold Improvements 190
Note 12 Time Deposits 191
Note 13 Borrowed Funds 191
Note 14 Capital Securities of Subsidiary Trusts and Perpetual Trust Securities 192
Note 15 Employee Benefit Plans 195
Note 16 Stock Based Compensation Plans 202
Note 17 Financial Derivatives 205
Note 18 Earnings Per Share 213
Note 19 Equity 214
Note 20 Other Comprehensive Income 216
Note 21 Income Taxes 217
Note 22 Regulatory Matters 219
Note 23 Legal Proceedings 219
Note 24 Commitments and Guarantees 226
Note 25 Parent Company 231
Note 26 Segment Reporting 232
Note 27 Subsequent Events 235
Statistical Information (Unaudited) 236
Item 9 Changes in and Disagreements With Accountants on Accounting and Financial Disclosure. 243
Item 9A Controls and Procedures. 243
Item 9B Other Information. 243
PART III
Item 10 Directors, Executive Officers and Corporate Governance. 243
Item 11 Executive Compensation. 244
Item 12 Security Ownership of Certain Beneficial Owners and Management and Related Stockholder Matters. 244
Item 13 Certain Relationships and Related Transactions, and Director Independence. 246
Item 14 Principal Accounting Fees and Services. 246
PART IV
Item 15 Exhibits, Financial Statement Schedules. 246
SIGNATURES 247
EXHIBIT INDEX E-1
THE PNC FINANCIAL SERVICES GROUP, INC.Cross-Reference Index to 2012 Form 10-K (continued)
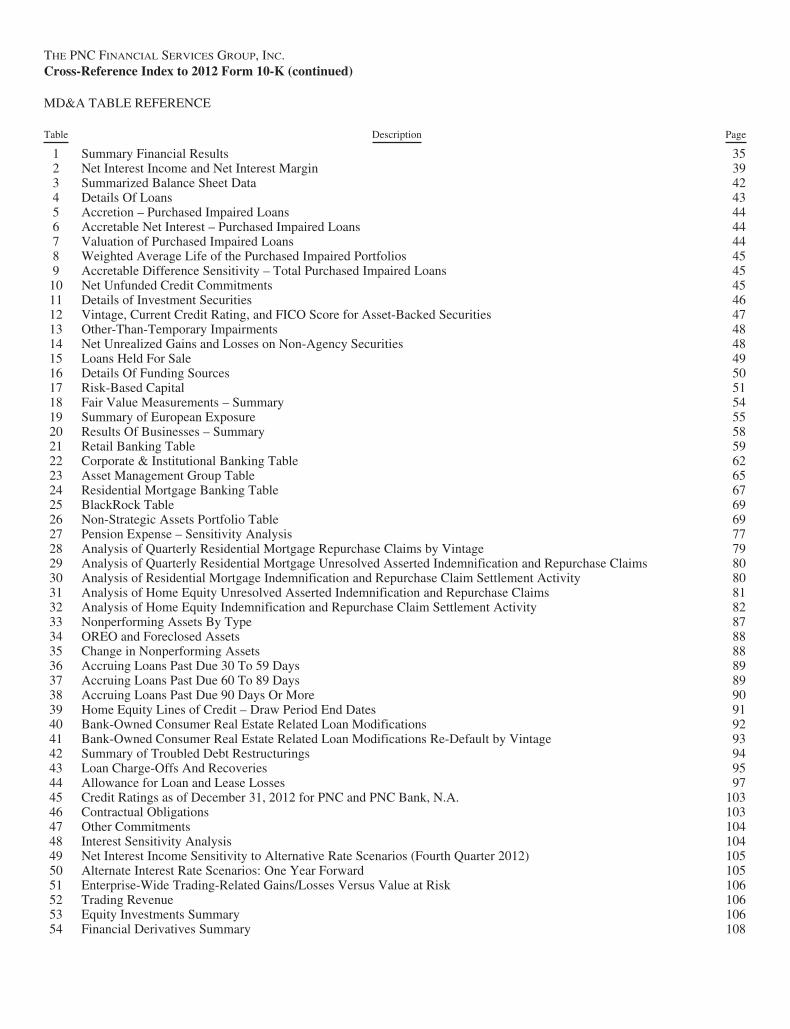
MD&A TABLE REFERENCE
Table Description Page
1 Summary Financial Results 352 Net Interest Income and Net Interest Margin 393 Summarized Balance Sheet Data 424 Details Of Loans 435 Accretion – Purchased Impaired Loans 446 Accretable Net Interest – Purchased Impaired Loans 447 Valuation of Purchased Impaired Loans 448 Weighted Average Life of the Purchased Impaired Portfolios 459 Accretable Difference Sensitivity – Total Purchased Impaired Loans 4510 Net Unfunded Credit Commitments 4511 Details of Investment Securities 4612 Vintage, Current Credit Rating, and FICO Score for Asset-Backed Securities 4713 Other-Than-Temporary Impairments 4814 Net Unrealized Gains and Losses on Non-Agency Securities 4815 Loans Held For Sale 4916 Details Of Funding Sources 5017 Risk-Based Capital 5118 Fair Value Measurements – Summary 5419 Summary of European Exposure 5520 Results Of Businesses – Summary 5821 Retail Banking Table 5922 Corporate & Institutional Banking Table 6223 Asset Management Group Table 6524 Residential Mortgage Banking Table 6725 BlackRock Table 6926 Non-Strategic Assets Portfolio Table 6927 Pension Expense – Sensitivity Analysis 7728 Analysis of Quarterly Residential Mortgage Repurchase Claims by Vintage 7929 Analysis of Quarterly Residential Mortgage Unresolved Asserted Indemnification and Repurchase Claims 8030 Analysis of Residential Mortgage Indemnification and Repurchase Claim Settlement Activity 8031 Analysis of Home Equity Unresolved Asserted Indemnification and Repurchase Claims 8132 Analysis of Home Equity Indemnification and Repurchase Claim Settlement Activity 8233 Nonperforming Assets By Type 8734 OREO and Foreclosed Assets 8835 Change in Nonperforming Assets 8836 Accruing Loans Past Due 30 To 59 Days 8937 Accruing Loans Past Due 60 To 89 Days 8938 Accruing Loans Past Due 90 Days Or More 9039 Home Equity Lines of Credit – Draw Period End Dates 9140 Bank-Owned Consumer Real Estate Related Loan Modifications 9241 Bank-Owned Consumer Real Estate Related Loan Modifications Re-Default by Vintage 9342 Summary of Troubled Debt Restructurings 9443 Loan Charge-Offs And Recoveries 9544 Allowance for Loan and Lease Losses 9745 Credit Ratings as of December 31, 2012 for PNC and PNC Bank, N.A. 10346 Contractual Obligations 10347 Other Commitments 10448 Interest Sensitivity Analysis 10449 Net Interest Income Sensitivity to Alternative Rate Scenarios (Fourth Quarter 2012) 10550 Alternate Interest Rate Scenarios: One Year Forward 10551 Enterprise-Wide Trading-Related Gains/Losses Versus Value at Risk 10652 Trading Revenue 10653 Equity Investments Summary 10654 Financial Derivatives Summary 108
THE PNC FINANCIAL SERVICES GROUP, INC.Cross-Reference Index to 2012 Form 10-K (continued)
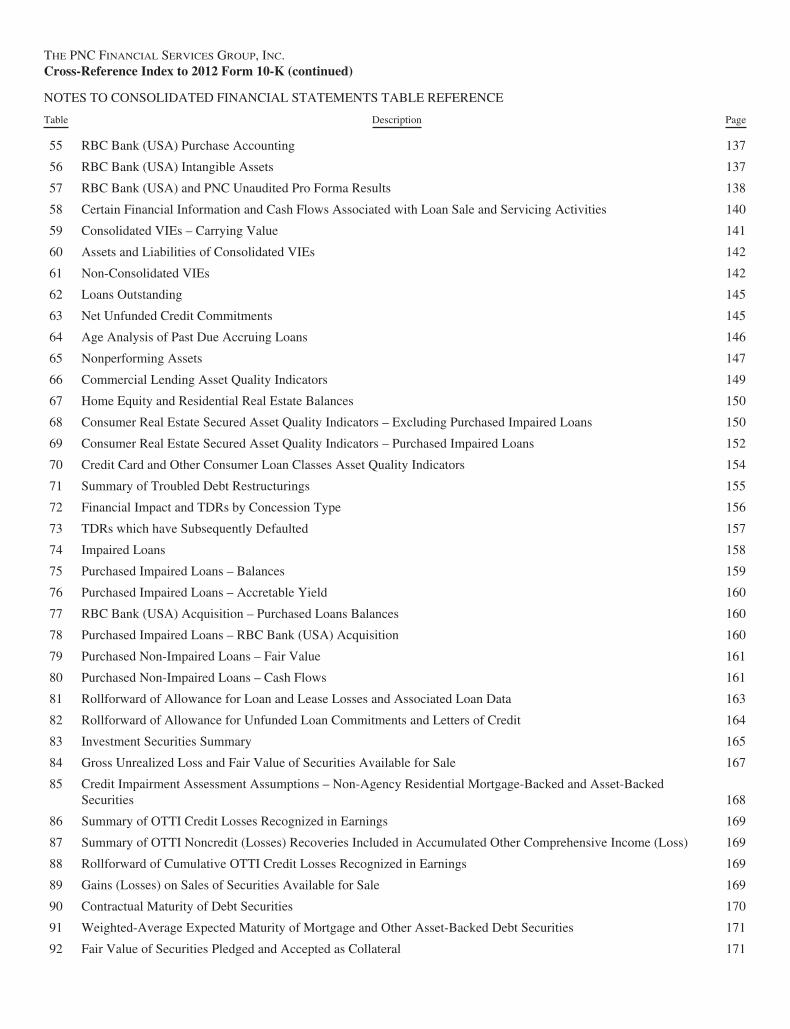
NOTES TO CONSOLIDATED FINANCIAL STATEMENTS TABLE REFERENCE
Table Description Page
55 RBC Bank (USA) Purchase Accounting 137
56 RBC Bank (USA) Intangible Assets 137
57 RBC Bank (USA) and PNC Unaudited Pro Forma Results 138
58 Certain Financial Information and Cash Flows Associated with Loan Sale and Servicing Activities 140
59 Consolidated VIEs – Carrying Value 141
60 Assets and Liabilities of Consolidated VIEs 142
61 Non-Consolidated VIEs 142
62 Loans Outstanding 145
63 Net Unfunded Credit Commitments 145
64 Age Analysis of Past Due Accruing Loans 146
65 Nonperforming Assets 147
66 Commercial Lending Asset Quality Indicators 149
67 Home Equity and Residential Real Estate Balances 150
68 Consumer Real Estate Secured Asset Quality Indicators – Excluding Purchased Impaired Loans 150
69 Consumer Real Estate Secured Asset Quality Indicators – Purchased Impaired Loans 152
70 Credit Card and Other Consumer Loan Classes Asset Quality Indicators 154
71 Summary of Troubled Debt Restructurings 155
72 Financial Impact and TDRs by Concession Type 156
73 TDRs which have Subsequently Defaulted 157
74 Impaired Loans 158
75 Purchased Impaired Loans – Balances 159
76 Purchased Impaired Loans – Accretable Yield 160
77 RBC Bank (USA) Acquisition – Purchased Loans Balances 160
78 Purchased Impaired Loans – RBC Bank (USA) Acquisition 160
79 Purchased Non-Impaired Loans – Fair Value 161
80 Purchased Non-Impaired Loans – Cash Flows 161
81 Rollforward of Allowance for Loan and Lease Losses and Associated Loan Data 163
82 Rollforward of Allowance for Unfunded Loan Commitments and Letters of Credit 164
83 Investment Securities Summary 165
84 Gross Unrealized Loss and Fair Value of Securities Available for Sale 167
85 Credit Impairment Assessment Assumptions – Non-Agency Residential Mortgage-Backed and Asset-BackedSecurities 168
86 Summary of OTTI Credit Losses Recognized in Earnings 169
87 Summary of OTTI Noncredit (Losses) Recoveries Included in Accumulated Other Comprehensive Income (Loss) 169
88 Rollforward of Cumulative OTTI Credit Losses Recognized in Earnings 169
89 Gains (Losses) on Sales of Securities Available for Sale 169
90 Contractual Maturity of Debt Securities 170
91 Weighted-Average Expected Maturity of Mortgage and Other Asset-Backed Debt Securities 171
92 Fair Value of Securities Pledged and Accepted as Collateral 171
THE PNC FINANCIAL SERVICES GROUP, INC.Cross-Reference Index to 2012 Form 10-K (continued)
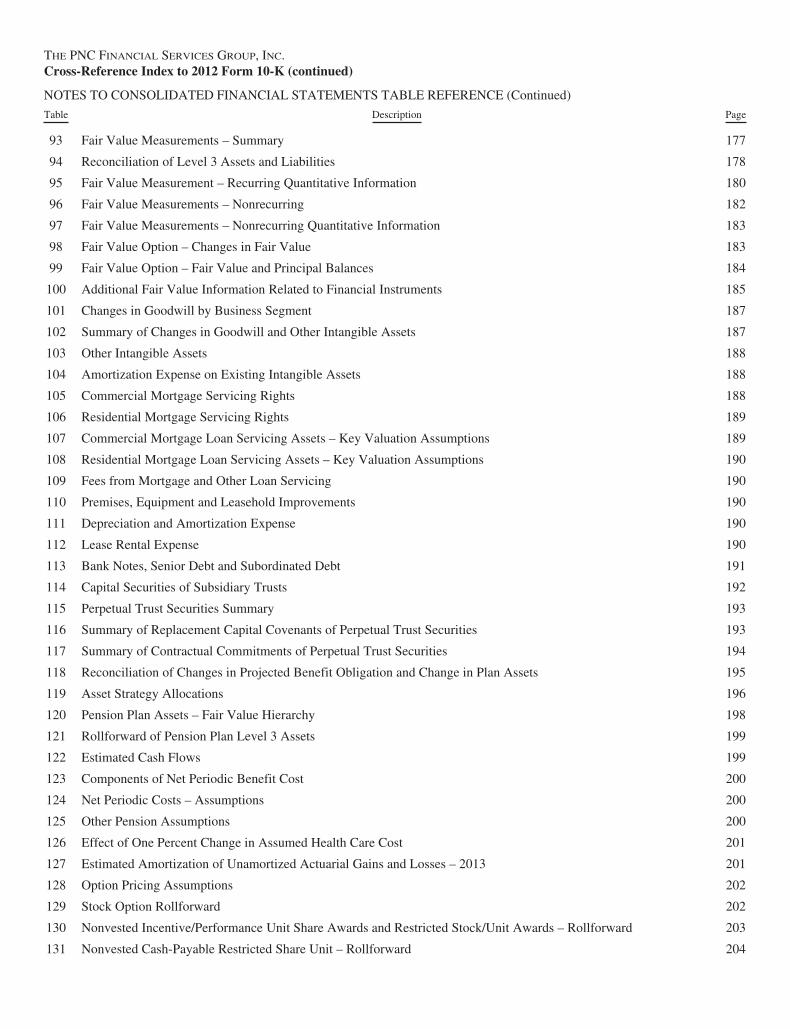
NOTES TO CONSOLIDATED FINANCIAL STATEMENTS TABLE REFERENCE (Continued)
Table Description Page
93 Fair Value Measurements – Summary 177
94 Reconciliation of Level 3 Assets and Liabilities 178
95 Fair Value Measurement – Recurring Quantitative Information 180
96 Fair Value Measurements – Nonrecurring 182
97 Fair Value Measurements – Nonrecurring Quantitative Information 183
98 Fair Value Option – Changes in Fair Value 183
99 Fair Value Option – Fair Value and Principal Balances 184
100 Additional Fair Value Information Related to Financial Instruments 185
101 Changes in Goodwill by Business Segment 187
102 Summary of Changes in Goodwill and Other Intangible Assets 187
103 Other Intangible Assets 188
104 Amortization Expense on Existing Intangible Assets 188
105 Commercial Mortgage Servicing Rights 188
106 Residential Mortgage Servicing Rights 189
107 Commercial Mortgage Loan Servicing Assets – Key Valuation Assumptions 189
108 Residential Mortgage Loan Servicing Assets – Key Valuation Assumptions 190
109 Fees from Mortgage and Other Loan Servicing 190
110 Premises, Equipment and Leasehold Improvements 190
111 Depreciation and Amortization Expense 190
112 Lease Rental Expense 190
113 Bank Notes, Senior Debt and Subordinated Debt 191
114 Capital Securities of Subsidiary Trusts 192
115 Perpetual Trust Securities Summary 193
116 Summary of Replacement Capital Covenants of Perpetual Trust Securities 193
117 Summary of Contractual Commitments of Perpetual Trust Securities 194
118 Reconciliation of Changes in Projected Benefit Obligation and Change in Plan Assets 195
119 Asset Strategy Allocations 196
120 Pension Plan Assets – Fair Value Hierarchy 198
121 Rollforward of Pension Plan Level 3 Assets 199
122 Estimated Cash Flows 199
123 Components of Net Periodic Benefit Cost 200
124 Net Periodic Costs – Assumptions 200
125 Other Pension Assumptions 200
126 Effect of One Percent Change in Assumed Health Care Cost 201
127 Estimated Amortization of Unamortized Actuarial Gains and Losses – 2013 201
128 Option Pricing Assumptions 202
129 Stock Option Rollforward 202
130 Nonvested Incentive/Performance Unit Share Awards and Restricted Stock/Unit Awards – Rollforward 203
131 Nonvested Cash-Payable Restricted Share Unit – Rollforward 204
THE PNC FINANCIAL SERVICES GROUP, INC.Cross-Reference Index to 2012 Form 10-K (continued)
NOTES TO CONSOLIDATED FINANCIAL STATEMENTS TABLE REFERENCE (Continued)
Table Description Page
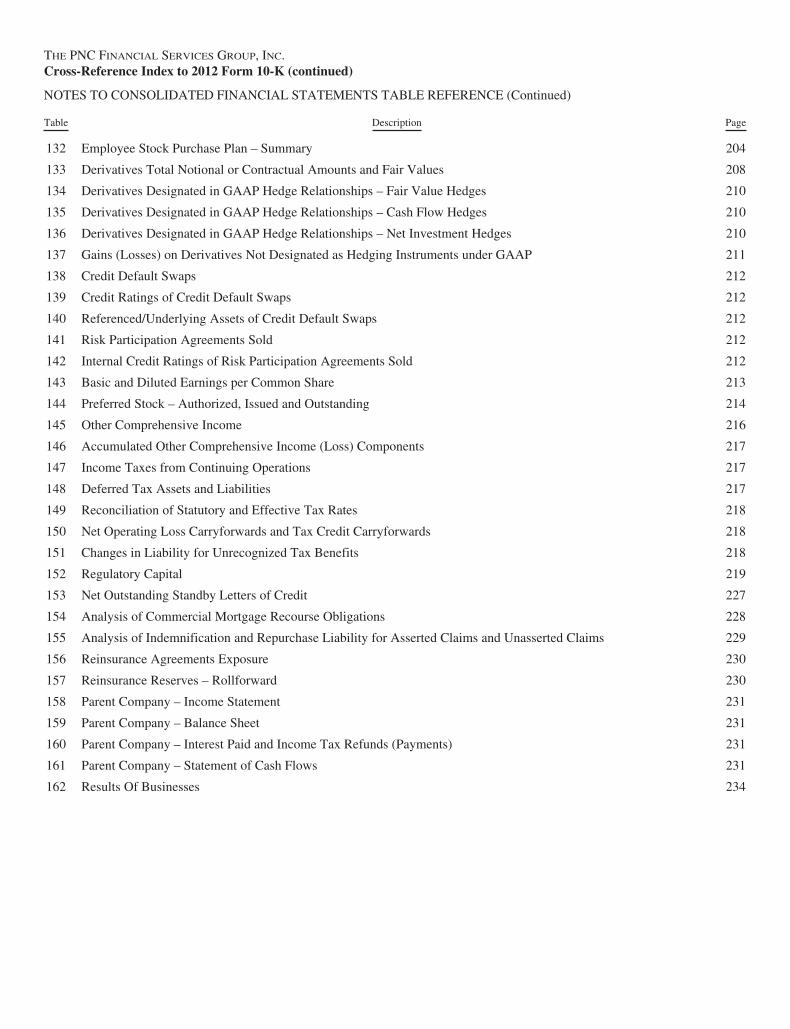
132 Employee Stock Purchase Plan – Summary 204
133 Derivatives Total Notional or Contractual Amounts and Fair Values 208
134 Derivatives Designated in GAAP Hedge Relationships – Fair Value Hedges 210
135 Derivatives Designated in GAAP Hedge Relationships – Cash Flow Hedges 210
136 Derivatives Designated in GAAP Hedge Relationships – Net Investment Hedges 210
137 Gains (Losses) on Derivatives Not Designated as Hedging Instruments under GAAP 211
138 Credit Default Swaps 212
139 Credit Ratings of Credit Default Swaps 212
140 Referenced/Underlying Assets of Credit Default Swaps 212
141 Risk Participation Agreements Sold 212
142 Internal Credit Ratings of Risk Participation Agreements Sold 212
143 Basic and Diluted Earnings per Common Share 213
144 Preferred Stock – Authorized, Issued and Outstanding 214
145 Other Comprehensive Income 216
146 Accumulated Other Comprehensive Income (Loss) Components 217
147 Income Taxes from Continuing Operations 217
148 Deferred Tax Assets and Liabilities 217
149 Reconciliation of Statutory and Effective Tax Rates 218
150 Net Operating Loss Carryforwards and Tax Credit Carryforwards 218
151 Changes in Liability for Unrecognized Tax Benefits 218
152 Regulatory Capital 219
153 Net Outstanding Standby Letters of Credit 227
154 Analysis of Commercial Mortgage Recourse Obligations 228
155 Analysis of Indemnification and Repurchase Liability for Asserted Claims and Unasserted Claims 229
156 Reinsurance Agreements Exposure 230
157 Reinsurance Reserves – Rollforward 230
158 Parent Company – Income Statement 231
159 Parent Company – Balance Sheet 231
160 Parent Company – Interest Paid and Income Tax Refunds (Payments) 231
161 Parent Company – Statement of Cash Flows 231
162 Results Of Businesses 234

PART IForward-Looking Statements: From time to time, The PNC Financial Services Group, Inc. (PNC or the Corporation) has madeand may continue to make written or oral forward-looking statements regarding our outlook for earnings, revenues, expenses,capital levels and ratios, liquidity levels, asset levels, asset quality, financial position and other matters regarding or affectingPNC and its future business and operations or the impact of legal, regulatory or supervisory matters on our business operations orperformance. This Annual Report on Form 10-K (the Report or Form 10-K) also includes forward-looking statements. With respectto all such forward-looking statements, you should review our Risk Factors discussion in Item 1A, our Risk Management, CriticalAccounting Estimates And Judgments, and Cautionary Statement Regarding Forward-Looking Information sections included inItem 7, and Note 23 Legal Proceedings and Note 24 Commitments and Guarantees in the Notes To Consolidated FinancialStatements included in Item 8 of this Report.
ITEM 1 – BUSINESS
BUSINESS OVERVIEW
Headquartered in Pittsburgh, Pennsylvania, we are one of thelargest diversified financial services companies in the UnitedStates. We have businesses engaged in retail banking,corporate and institutional banking, asset management, andresidential mortgage banking, providing many of our productsand services nationally, as well as products and services in ourprimary geographic markets located in Pennsylvania, Ohio,New Jersey, Michigan, Illinois, Maryland, Indiana, NorthCarolina, Florida, Kentucky, Washington, D.C., Delaware,Alabama, Virginia, Georgia, Missouri, Wisconsin and SouthCarolina. We also provide certain products and servicesinternationally. At December 31, 2012, our consolidated totalassets, total deposits and total shareholders’ equity were$305.1 billion, $213.1 billion and $39.0 billion, respectively.
We were incorporated under the laws of the Commonwealthof Pennsylvania in 1983 with the consolidation of PittsburghNational Corporation and Provident National Corporation.Since 1983, we have diversified our geographical presence,business mix and product capabilities through internal growth,strategic bank and non-bank acquisitions and equityinvestments, and the formation of various non-bankingsubsidiaries.
RBC BANK (USA) ACQUISITION
On March 2, 2012, we acquired 100% of the issued andoutstanding common stock of RBC Bank (USA), the U.S.retail banking subsidiary of Royal Bank of Canada. As part ofthe acquisition, PNC also purchased a credit card portfoliofrom RBC Bank (Georgia), National Association. PNC paid$3.6 billion in cash as the consideration for the acquisition ofboth RBC Bank (USA) and the credit card portfolio. Thetransaction added approximately $18.1 billion in deposits,$14.5 billion of loans and $1.1 billion of goodwill andintangible assets to PNC’s Consolidated Balance Sheet. OurConsolidated Income Statement includes the impact ofbusiness activity associated with the RBC Bank (USA)acquisition subsequent to March 2, 2012.
RBC Bank (USA), based in Raleigh, North Carolina, operatedmore than 400 branches in North Carolina, Florida, Alabama,Georgia, Virginia and South Carolina. The primary reasons forthe acquisition of RBC Bank (USA) were to enhance
shareholder value, to improve PNC’s competitive position inthe financial services industry, and to further expand PNC’sexisting branch network in the states where it currentlyoperates as well as expanding into new markets.
SALE OF SMARTSTREET
Effective October 26, 2012, PNC divested certain deposits andassets of the Smartstreet business unit, which was acquired byPNC as part of the RBC Bank (USA) acquisition, to UnionBank, N.A. Smartstreet is a nationwide business focused onhomeowner or community association managers and hadapproximately $1 billion of assets and deposits as ofSeptember 30, 2012. The gain on sale was immaterial and wereduced goodwill and core deposit intangibles of $46 millionand $13 million, respectively.
FLAGSTAR BRANCH ACQUISITION
Effective December 9, 2011, PNC acquired 27 branches in thenorthern metropolitan Atlanta, Georgia area from FlagstarBank, FSB, a subsidiary of Flagstar Bancorp, Inc. Weassumed approximately $210 million of deposits associatedwith these branches. No loans were acquired in thetransaction.
BANKATLANTIC BRANCH ACQUISITION
Effective June 6, 2011, PNC acquired 19 branches in thegreater Tampa, Florida area from BankAtlantic, a subsidiaryof BankAtlantic Bancorp, Inc. We assumed approximately$324 million of deposits associated with these branches. Noloans were acquired in the transaction.
REVIEW OF BUSINESS SEGMENTS
In addition to the following information relating to our lines ofbusiness, we incorporate the information under the captionsBusiness Segment Highlights, Product Revenue, and BusinessSegments Review in Item 7 of this Report here by reference.Also, we include the financial and other information bybusiness in Note 26 Segment Reporting in the Notes ToConsolidated Financial Statements in Item 8 of this Reporthere by reference.
Assets, revenue and earnings attributable to foreign activitieswere not material in the periods presented. Business segmentresults for periods prior to 2012 have been reclassified toreflect current methodologies and current business andmanagement structure and to present those periods on the
The PNC Financial Services Group, Inc. – Form 10-K 1

same basis. Business segment information does not includePNC Global Investment Servicing Inc. (GIS). Results ofoperations of GIS through June 30, 2010 and the related after-tax gain on its sale in the third quarter of 2010 are reflected indiscontinued operations.
Retail Banking provides deposit, lending, brokerage,investment management and cash management services toconsumer and small business customers within our primarygeographic markets. Our customers are serviced through ourbranch network, call centers, online banking and mobilechannels. The branch network is principally located in ourprimary geographical markets.
Our core strategy is to acquire and retain customers whomaintain their primary checking and transaction relationshipswith PNC. We also seek revenue growth by deepening ourshare of our customers’ financial assets, including savings andliquidity deposits, loans and investable assets, includingretirement assets. A key element of our strategy is to expandthe use of lower-cost alternative distribution channels whilecontinuing to optimize the traditional branch network. Inaddition, we have a disciplined process to continually improvethe engagement of both our employees and customers, whichis a strong indicator of customer growth, retention andrelationship expansion.
Corporate & Institutional Banking provides lending, treasurymanagement and capital markets-related products and servicesto mid-sized corporations, government and not-for-profitentities and selectively to large corporations. Lendingproducts include secured and unsecured loans, letters of creditand equipment leases. Treasury management services includecash and investment management, receivables management,disbursement services, funds transfer services, informationreporting and global trade services. Capital markets-relatedproducts and services include foreign exchange, derivatives,loan syndications, mergers and acquisitions advisory andrelated services to middle-market companies, our multi-sellerconduit, securities underwriting and securities sales andtrading. Corporate & Institutional Banking also providescommercial loan servicing, and real estate advisory andtechnology solutions for the commercial real estate financeindustry. Corporate & Institutional Banking provides productsand services generally within our primary geographic markets,with certain products and services offered nationally andinternationally.
Corporate & Institutional Banking is focused on becoming apremier provider of financial services in each of the markets itserves. The value proposition to our customers is driven byproviding a broad range of competitive and high qualityproducts and services by a team fully committed to deliveringthe comprehensive resources of PNC to help each clientsucceed. Corporate & Institutional Banking’s primary goalsare to achieve market share growth and enhanced returns bymeans of expansion and retention of customer relationshipsand prudent risk and expense management.
Asset Management Group includes personal wealthmanagement for high net worth and ultra high net worthclients and institutional asset management. Wealthmanagement products and services include investment andretirement planning, customized investment management,private banking, tailored credit solutions and trustmanagement and administration for individuals and theirfamilies. Institutional asset management provides investmentmanagement, custody and retirement administration services.Institutional clients include corporations, unions,municipalities, non-profits, foundations and endowments,primarily located in our geographic footprint.
Asset Management Group is focused on being one of thepremier bank-held individual and institutional asset managersin each of the markets it serves. The business seeks to deliverhigh quality banking advice and trust and investmentmanagement services to our high net worth, ultra high networth and institutional client sectors through a broad array ofproducts and services. Asset Management Group’s primarygoals are to service our clients, grow the business and deliversolid financial performance with prudent risk and expensemanagement.
Residential Mortgage Banking directly originates primarilyfirst lien residential mortgage loans on a nationwide basis witha significant presence within the retail banking footprint, andalso originates loans through majority owned affiliates.Mortgage loans represent loans collateralized by one-to-four-family residential real estate. These loans are typicallyunderwritten to government agency and/or third-partystandards, and sold, servicing retained, to secondary mortgageconduits of Federal National Mortgage Association (FNMA),Federal Home Loan Mortgage Corporation (FHLMC), FederalHome Loan Banks and third-party investors, or are securitizedand issued under the Government National MortgageAssociation (GNMA) program, as described in more detail inNote 3 Loan Sale and Servicing Activities and VariableInterest Entities in Item 8 of this Report and included here byreference. The mortgage servicing operation performs allfunctions related to servicing mortgage loans, primarily thosein first lien position, for various investors and for loans ownedby PNC. Certain loan applications are brokered by majorityowned affiliates to others.
Residential Mortgage Banking is focused on adding value tothe PNC franchise by building stronger customerrelationships, providing quality investment loans, anddelivering acceptable returns consistent with a moderate riskphilosophy. Our national distribution capability providesvolume that drives economies of scale, risk dispersion, andcost-effective extension of the retail banking footprint forcross-selling opportunities.
BlackRock is a leader in investment management, riskmanagement and advisory services for institutional and retailclients worldwide. BlackRock provides diversified investment
2 The PNC Financial Services Group, Inc. – Form 10-K
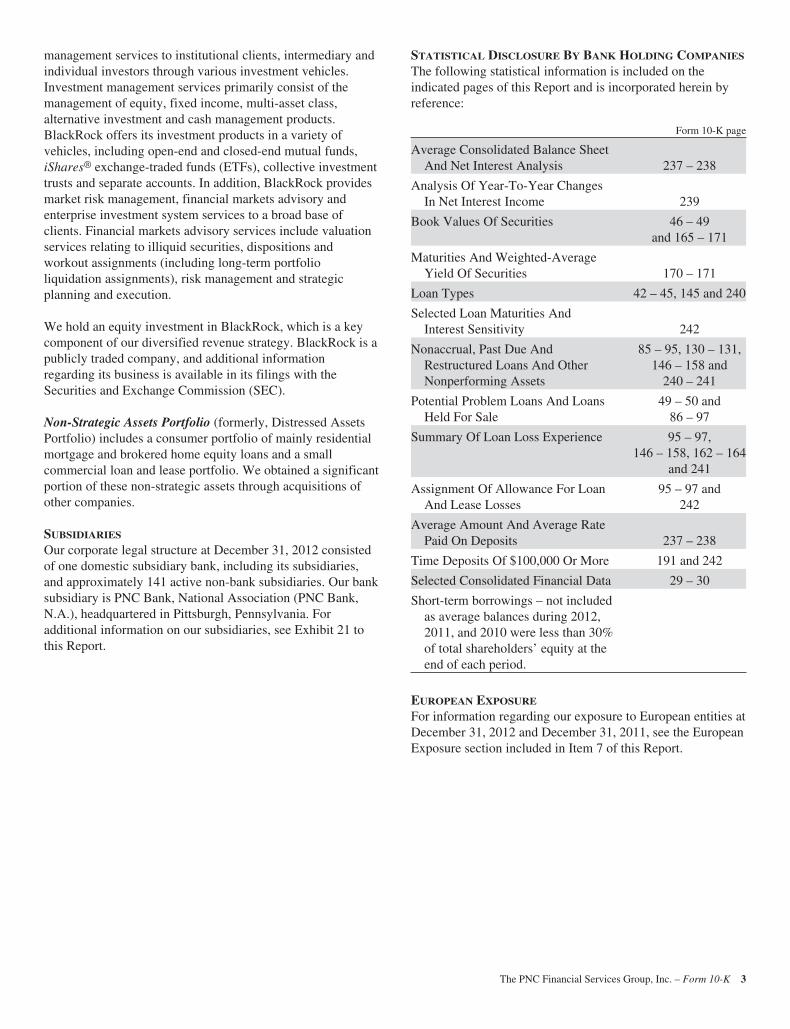
management services to institutional clients, intermediary andindividual investors through various investment vehicles.Investment management services primarily consist of themanagement of equity, fixed income, multi-asset class,alternative investment and cash management products.BlackRock offers its investment products in a variety ofvehicles, including open-end and closed-end mutual funds,iShares® exchange-traded funds (ETFs), collective investmenttrusts and separate accounts. In addition, BlackRock providesmarket risk management, financial markets advisory andenterprise investment system services to a broad base ofclients. Financial markets advisory services include valuationservices relating to illiquid securities, dispositions andworkout assignments (including long-term portfolioliquidation assignments), risk management and strategicplanning and execution.
We hold an equity investment in BlackRock, which is a keycomponent of our diversified revenue strategy. BlackRock is apublicly traded company, and additional informationregarding its business is available in its filings with theSecurities and Exchange Commission (SEC).
Non-Strategic Assets Portfolio (formerly, Distressed AssetsPortfolio) includes a consumer portfolio of mainly residentialmortgage and brokered home equity loans and a smallcommercial loan and lease portfolio. We obtained a significantportion of these non-strategic assets through acquisitions ofother companies.
SUBSIDIARIES
Our corporate legal structure at December 31, 2012 consistedof one domestic subsidiary bank, including its subsidiaries,and approximately 141 active non-bank subsidiaries. Our banksubsidiary is PNC Bank, National Association (PNC Bank,N.A.), headquartered in Pittsburgh, Pennsylvania. Foradditional information on our subsidiaries, see Exhibit 21 tothis Report.
STATISTICAL DISCLOSURE BY BANK HOLDING COMPANIES
The following statistical information is included on theindicated pages of this Report and is incorporated herein byreference:
Form 10-K page
Average Consolidated Balance SheetAnd Net Interest Analysis 237 – 238
Analysis Of Year-To-Year ChangesIn Net Interest Income 239
Book Values Of Securities 46 – 49and 165 – 171
Maturities And Weighted-AverageYield Of Securities 170 – 171
Loan Types 42 – 45, 145 and 240
Selected Loan Maturities AndInterest Sensitivity 242
Nonaccrual, Past Due AndRestructured Loans And OtherNonperforming Assets
85 – 95, 130 – 131,146 – 158 and
240 – 241
Potential Problem Loans And LoansHeld For Sale
49 – 50 and86 – 97
Summary Of Loan Loss Experience 95 – 97,146 – 158, 162 – 164
and 241
Assignment Of Allowance For LoanAnd Lease Losses
95 – 97 and242
Average Amount And Average RatePaid On Deposits 237 – 238
Time Deposits Of $100,000 Or More 191 and 242
Selected Consolidated Financial Data 29 – 30
Short-term borrowings – not includedas average balances during 2012,2011, and 2010 were less than 30%of total shareholders’ equity at theend of each period.
EUROPEAN EXPOSURE
For information regarding our exposure to European entities atDecember 31, 2012 and December 31, 2011, see the EuropeanExposure section included in Item 7 of this Report.
The PNC Financial Services Group, Inc. – Form 10-K 3
SUPERVISION AND REGULATION
OVERVIEW
PNC is a bank holding company registered under the BankHolding Company Act of 1956 as amended (BHC Act) and afinancial holding company under the Gramm-Leach-BlileyAct (GLB Act).
We are subject to numerous governmental regulations, someof which are highlighted below. See Note 22 RegulatoryMatters in the Notes To Consolidated Financial Statements inItem 8 of this Report, for additional information regarding ourregulatory matters. Applicable laws and regulations restrictour permissible activities and investments and requirecompliance with protections for loan, deposit, brokerage,fiduciary, investment management and other customers,among other things. They also restrict our ability torepurchase stock or pay dividends, or to receive dividendsfrom our bank subsidiary, and impose capital adequacyrequirements. The consequences of noncompliance caninclude substantial monetary and nonmonetary sanctions.
In addition, we are subject to comprehensive examination andsupervision by, among other regulatory bodies, the Board ofGovernors of the Federal Reserve System (Federal Reserve)and the Office of the Comptroller of the Currency (OCC),which result in examination reports and ratings (which are notpublicly available) that can impact the conduct and growth ofour businesses. These examinations consider not onlycompliance with applicable laws and regulations, but alsocapital levels, asset quality and risk, management ability andperformance, earnings, liquidity and various other factors. Theresults of examination activity by any of our federal bankregulators potentially can result in the imposition ofsignificant limitations on our activities and growth. Theseregulatory agencies generally have broad discretion to imposerestrictions and limitations on the operations of a regulatedentity where the relevant agency determines, among otherthings, that such operations are conducted in an unsafe orunsound manner, fail to comply with applicable law or areotherwise inconsistent with the regulations or supervisorypolicies of the agency. This supervisory framework couldmaterially impact the conduct, growth and profitability of ouroperations.
The Consumer Financial Protection Bureau (CFPB), a newagency established by the Dodd-Frank Wall Street Reform andConsumer Protection Act (Dodd-Frank), is responsible forexamining PNC Bank, N.A. and its affiliates (including PNC)for compliance with most consumer financial protection lawsand for enforcing such laws with respect to PNC Bank, N.A.and its affiliates. This authority previously was exercised bythe OCC and the Federal Reserve. The CFPB also now hasauthority for prescribing rules governing the provision ofconsumer financial products and services such as credit cards,student and other loans, deposits and residential mortgages.The agency has issued final regulations that impose broad new
requirements relating to our mortgage origination activitiesand the servicing activities we perform for residentialmortgage loans. These regulations include a requirement thatresidential mortgage lenders, like PNC Bank, make a “goodfaith and reasonable determination” at or before the time ofconsummation of a residential mortgage loan that theprospective borrower has a reasonable ability to repay thatloan. The new regulations also include broad newrequirements applicable to servicers of residential mortgageloans, like PNC, which include provisions requiring policiesand procedures relating to how servicers respond to andmanage loans of borrowers who are in default. Most of theseregulations are scheduled to take effect in January of 2014. Inaddition, the CFPB is now considering additional regulationsthat will modify the application and closing disclosures thatmust be provided to borrowers in connection with residentialmortgage loans.
As a result of Dodd-Frank, after July 21, 2011, subsidiaries ofPNC Bank, N.A. are subject to state law and regulation to thesame extent as if they were not subsidiaries of a national bank.Additionally, based on Dodd-Frank, state authorities mayassert that certain state consumer financial laws that providedifferent requirements or limitations than Federal law mayapply to national banks, including PNC Bank, N.A. Such statelaws may be preempted if they meet certain standards set forthin Dodd-Frank or other applicable law. We expect toexperience an increase in regulation of our Retail Banking,Asset Management Group and Residential Mortgage Bankingbusinesses and additional compliance obligations, revenue andcost impacts.
We also are subject to regulation by the SEC by virtue of ourstatus as a public company and by the SEC and theCommodity Futures Trading Commission (CFTC) due to thenature of some of our businesses. Our banking and securitiesbusinesses with operations outside the United States,including those conducted by BlackRock, are also subject toregulation by appropriate authorities in the foreignjurisdictions in which they do business.
As a regulated financial services firm, our relationships andgood standing with regulators are of fundamental importanceto the operation and growth of our businesses. The FederalReserve, OCC, CFPB, SEC, CFTC and other domestic andforeign regulators have broad enforcement powers, and certainof the regulators have the power to approve, deny, or refuse toact upon our applications or notices to conduct new activities,acquire or divest businesses or assets and deposits, orreconfigure existing operations.
We anticipate new legislative and regulatory initiatives overthe next several years, focused specifically on banking andother financial services in which we are engaged. Theseinitiatives would be in addition to the actions already taken byCongress and the regulators, including the Credit CardAccountability, Responsibility, and Disclosure Act of 2009
4 The PNC Financial Services Group, Inc. – Form 10-K
(Credit CARD Act), the Secure and Fair Enforcement forMortgage Licensing Act (the SAFE Act), and Dodd-Frank, aswell as changes to the regulations implementing the RealEstate Settlement Procedures Act, the Federal Truth inLending Act, and the Electronic Fund Transfer Act, includingthe new rules set forth in Regulation E related to overdraftcharges.
Dodd-Frank, which was signed into law on July 21, 2010,comprehensively reforms the regulation of financialinstitutions, products and services. Dodd-Frank requiresvarious federal regulatory agencies to implement numerousnew rules and regulations. Because the federal agencies aregranted broad discretion in drafting these rules andregulations, and many implementing rules either have not yetbeen issued or have only been issued in proposed form, manyof the details and much of the impact of Dodd-Frank may notbe known for many months or years. Among other things,Dodd-Frank provides for new capital standards that eliminatethe treatment of trust preferred securities as Tier 1 regulatorycapital; requires that deposit insurance assessments becalculated based on an insured depository institution’s assetsrather than its insured deposits; raises the minimumDesignated Reserve Ratio (the balance in the DepositInsurance Fund divided by estimated insured deposits) to1.35%; establishes a comprehensive regulatory regime for thederivatives activities of financial institutions; limitsproprietary trading and owning or sponsoring hedge funds andprivate equity funds by banking entities; requires the FederalReserve to establish a variety of enhanced prudentialstandards for bank holding companies with $50 billion ormore in total assets; places limitations on the interchange feescharged for debit card transactions; and establishes newminimum mortgage underwriting standards for residentialmortgages.
Dodd-Frank established the 10-member inter-agency FinancialStability Oversight Council (FSOC), which is charged withidentifying systemic risks and strengthening the regulation offinancial holding companies and certain non-bank companiesdeemed to be “systemically important” and could, inextraordinary cases and in conjunction with the FederalReserve, break up financial firms that are deemed to present agrave threat to the financial stability of the United States.Dodd-Frank also requires the Federal Reserve to establishprudential standards for bank holding companies with totalconsolidated assets equal to or greater than $50 billion that aremore stringent than the standards and requirements applicableto bank holding companies with assets below this threshold,and that increase in stringency for bank holding companiesthat present heightened risk to the financial system. Additionalinformation concerning these enhanced prudential standards isprovided in Item 1A – Risk Factors of this Report. The FSOCmay make recommendations to the Federal Reserveconcerning the establishment and refinement of theseprudential standards and reporting and disclosurerequirements.
Legislative and regulatory developments to date, as well asthose that come in the future, have had and are likely tocontinue to have an impact on the conduct of our business.The more detailed description of the significant regulations towhich we are subject included in this Report is based on thecurrent regulatory environment and is subject to potentiallymaterial change. See also the additional information includedin Item 1A of this Report under the risk factors discussing theimpact of financial regulatory reform initiatives, includingDodd-Frank and regulations promulgated to implement it, onthe regulatory environment for PNC and the financial servicesindustry.
Among other areas that have been receiving a high level ofregulatory focus over the last several years are compliancewith anti-money laundering laws and the protection ofconfidential customer information. In addition, at least in partdriven by the current economic and financial situation, there isan increased focus on fair lending and other issues related tothe mortgage industry. Ongoing mortgage-related regulatoryreforms include measures aimed at reducing mortgageforeclosures.
Additional legislation, changes in rules promulgated by theFederal Reserve, the OCC, the Federal Deposit InsuranceCorporation (FDIC), the CFPB, the SEC, the CFTC, otherfederal and state regulatory authorities and self-regulatoryorganizations, or changes in the interpretation or enforcementof existing laws and rules, may directly affect the method ofoperation and profitability of our businesses. The profitabilityof our businesses could also be affected by rules andregulations that impact the business and financial communitiesin general, including changes to the laws governing taxation,antitrust regulation and electronic commerce.
There are numerous rules governing the regulation of financialservices institutions and their holding companies.Accordingly, the following discussion is general in nature anddoes not purport to be complete or to describe all of the lawsand regulations that apply to us. To a substantial extent, thepurpose of the regulation and supervision of financial servicesinstitutions and their holding companies is not to protect ourshareholders and our non-customer creditors, but rather toprotect our customers (including depositors) and the financialmarkets in general.
The PNC Financial Services Group, Inc. – Form 10-K 5
BANKING REGULATION AND SUPERVISION
Capital Regulations. PNC and PNC Bank, N.A. are subject tothe regulatory capital requirements established by the FederalReserve and the OCC, respectively. In addition, PNC issubject to the Federal Reserve’s capital plan rule and annualcapital stress testing and Comprehensive Capital Analysis andReview (CCAR) process. As part of this annual capitalplanning process, the Federal Reserve undertakes asupervisory assessment of the capital adequacy of bankholding companies (BHCs), including PNC, that have $50billion or more in total consolidated assets. This capitaladequacy assessment is based on a review of a comprehensivecapital plan submitted by each participating BHC to theFederal Reserve that describes the company’s planned capitalactions during the nine quarter review period, as well as theresults of stress tests conducted by both the company and theFederal Reserve under different hypothetical macro-economicscenarios, including a severely stressed scenario provided bythe Federal Reserve (supervisory severely adverse scenario).In evaluating a BHC’s capital plan, the Federal Reserveconsiders a number of factors, including the company’s riskprofile, the strength of the company’s internal capitalassessment process, and whether the company’s projected proforma Basel I Tier 1 common capital ratio under thehypothetical supervisory severely adverse scenario wouldremain above 5 percent throughout the nine quarter planninghorizon even if the company continued with the capitaldistributions proposed under a baseline scenario. In addition,the Federal Reserve evaluates a company’s projected pathtowards compliance with the proposed Basel III regulatorycapital framework. After completing its review, the FederalReserve may object or not object to the firm’s proposedcapital actions, such as plans to pay or increase common stockdividends, reinstate or increase common stock repurchaseprograms, or redeem preferred stock or other regulatorycapital instruments.
In connection with the 2013 CCAR, PNC filed its capital planand stress testing results using financial data as ofSeptember 30, 2012 with the Federal Reserve on January 7,2013. PNC expects to receive the Federal Reserve’s response(either a non-objection or objection) to the capital plansubmitted as part of the 2013 CCAR by March 15, 2013. TheFederal Reserve also has announced that it intends to publishon this date the results of its assessments, including theFederal Reserve’s estimates of the Basel I capital ratios foreach of the largest 19 BHCs participating in the 2013 reviews,including PNC, during the review period under the FederalReserve’s severely adverse macro-economic scenario andapplying the firm’s proposed base case capital distributions.Prior to this release, the Federal Reserve will release onMarch 7, 2013 its estimate of the Basel I capital ratios, as wellas its estimate of certain revenue and loss information, forsuch BHCs under the same supervisory severely adversescenario but applying the common assumptions concerningcapital distributions by firms established by the FederalReserve for the stress tests required by Dodd-Frank (Dodd-
Frank capital action assumptions). PNC also is requiredto publicly disclose, in March 2013, its estimates of certaincapital, revenue and loss information under the samehypothetical supervisory severely adverse macro-economicscenario and applying the Dodd-Frank capital actionassumptions. Federal Reserve regulations also require thatPNC and other large bank holding companies conduct aseparate mid-year stress test using financial data as ofMarch 31st and three company-derived macro-economicscenarios (base, adverse and severely adverse) and publish asummary of the results under the severely adverse scenario inSeptember.
The Federal banking agencies have requested comment onproposed rules to implement the Basel III capital frameworkin the United States. These rules have not yet been finalizedand remain subject to change. For additional information onthese proposed rules, see Recent Market and IndustryDevelopments in Item 7 and Item 1A – Risk Factors in thisReport. PNC’s estimated pro forma Basel III Tier 1 commonratio was 7.5% at December 31, 2012, excluding the benefitsof the transitional phase-in periods provided by Basel III. Thisestimate is based on management’s understanding of theBasel III proposed rules issued by the U.S. banking agenciesin June 2012 and on available data and information as ofDecember 31, 2012. It also reflects our estimates of PNC’srisk-weighted assets under Basel II (with the modificationsproposed in June 2012) and application of the Basel II.5market risk rules that became effective on January 1, 2013.Both our Basel II and Basel III estimates are point in timeestimates and are subject to further regulatory guidance andclarity, as well as the development, refinement, validation andregulatory approval of internal models.
Parent Company Liquidity and Dividends. The principalsource of our liquidity at the parent company level isdividends from PNC Bank, N.A. PNC Bank, N.A. is subject tovarious federal restrictions on its ability to pay dividends toPNC Bancorp, Inc., its direct parent. PNC Bank, N.A. is alsosubject to federal laws limiting extensions of credit to itsparent holding company and non-bank affiliates as discussedin Note 22 Regulatory Matters in the Notes To ConsolidatedFinancial Statements in Item 8 of this Report. Furtherinformation on bank level liquidity and parent companyliquidity and on certain contractual restrictions is alsoavailable in the Liquidity Risk Management portion of theRisk Management section and the Trust Preferred Securitiesportion of the Off-Balance Sheet Arrangements And VariableInterest Entities section of Item 7 of this Report, and in Note14 Capital Securities of Subsidiary Trusts and Perpetual TrustSecurities in the Notes To Consolidated Financial Statementsin Item 8 of this Report.
Federal Reserve rules provide that a bank holding company isexpected to serve as a source of financial strength to itssubsidiary banks and to commit resources to support suchbanks if necessary. Consistent with the “source of strength”
6 The PNC Financial Services Group, Inc. – Form 10-K
policy for subsidiary banks, the Federal Reserve has statedthat, as a matter of prudent banking, a bank holding companygenerally should not maintain a rate of cash dividends unlessits net income available to common shareholders has beensufficient to fully fund the dividends and the prospective rateof earnings retention appears to be consistent with thecorporation’s capital needs, asset quality and overall financialcondition. Further, in providing guidance to the large BHCsparticipating in the 2013 CCAR, discussed above, the FederalReserve stated that it expects capital plans submitted in 2013will reflect conservative dividend payout ratios and net sharerepurchase programs, and that requests that imply commondividend payout ratios above 30% of projected after-tax netincome available to common shareholders will receiveparticularly close scrutiny. The Federal Reserve also hasstated that it expects BHCs that meet the minimum capitalratio requirements under Basel III during the transition periodsprovided by Basel III, but that do not meet the fully-phased inBasel III minimum plus capital conservation buffer ratio of 7percent Tier 1 common (plus any applicable capital surchargefor globally systemically important banks), to maintainprudent earnings retention policies with a view to meeting thisstandard in accordance with the phase-in schedule included inthe agencies’ proposed Basel III rules.
Additional Powers Under the GLB Act. The Gramm–Leach–Bliley Act (GLB Act) permits a qualifying bank holdingcompany to become a “financial holding company” andthereby engage in, or affiliate with financial companiesengaging in, a broader range of activities than wouldotherwise be permitted for a bank holding company. Permittedaffiliates include securities underwriters and dealers, insurancecompanies and companies engaged in other activities that aredetermined by the Federal Reserve, in consultation with theSecretary of the Treasury, to be “financial in nature orincidental thereto” or are determined by the Federal Reserveunilaterally to be “complementary” to financial activities. Webecame a financial holding company as of March 13, 2000. Inorder to be and remain a financial holding company, a bankholding company and its subsidiary depository institutionsmust be “well capitalized” and “well managed.” In addition, afinancial holding company generally may not engage in a newfinancial activity if any of its insured depository institutionsreceived a less than Satisfactory rating at its most recentevaluation under the Community Reinvestment Act (CRA).
The Federal Reserve is the “umbrella” regulator of a financialholding company, with its operating entities, such as itssubsidiary broker-dealers, investment advisers, insurancecompanies and banks, as well as investment companiesadvised by investment adviser subsidiaries of the financialholding company, also being subject to the jurisdiction ofvarious federal and state “functional” regulators with normalregulatory responsibility for companies in their lines ofbusiness.
As subsidiaries of a financial holding company under the GLBAct, our non-bank subsidiaries are generally allowed toconduct new financial activities, and PNC is generallypermitted to acquire non-bank financial companies that haveless than $10 billion in assets, with after-the-fact notice to theFederal Reserve. In addition, our non-bank subsidiaries (andany financial subsidiaries of subsidiary banks) are permitted toengage in certain activities that were not permitted for bankholding companies and banks prior to enactment of the GLBAct, and to engage on less restrictive terms in certain activitiesthat were previously permitted. Among other activities, wecurrently rely on our status as a financial holding company toconduct merchant banking activities and securitiesunderwriting and dealing activities.
In addition, the GLB Act permits national banks, such as PNCBank, N.A., to engage in expanded activities through theformation of a “financial subsidiary.” PNC Bank, N.A. hasfiled a financial subsidiary certification with the OCC andcurrently engages in insurance agency activities throughfinancial subsidiaries. PNC Bank, N.A. may also generallyengage through a financial subsidiary in any activity that isdetermined to be financial in nature or incidental to a financialactivity by the Secretary of the Treasury, in consultation withthe Federal Reserve. Certain activities, however, areimpermissible for a financial subsidiary of a national bank,including certain insurance underwriting activities, insurancecompany investment activities, real estate investment ordevelopment, and merchant banking.
Other Federal Reserve and OCC Regulation and Supervision.The federal banking agencies possess broad powers to takecorrective action as deemed appropriate for an insureddepository institution and its holding company. In some cases,the extent of these powers depends upon whether theinstitution in question is considered “well capitalized,”“adequately capitalized,” “undercapitalized,” “significantlyundercapitalized” or “critically undercapitalized.” Generally,the smaller an institution’s capital base in relation to its risk-weighted or total assets, the greater the scope and severity ofthe agencies’ powers, ultimately permitting the agencies toappoint a receiver for the institution. Business activities mayalso be influenced by an institution’s capital classification. Forinstance, only a “well capitalized” depository institution mayaccept brokered deposits without prior regulatory approvaland an “adequately capitalized” depository institution mayaccept brokered deposits only with prior regulatory approval.At December 31, 2012, PNC Bank, N.A. exceeded therequired ratios for classification as “well capitalized.” Foradditional discussion of capital adequacy requirements, werefer you to the Funding and Capital Sources portion of theConsolidated Balance Sheet Review section of Item 7 of thisReport and to Note 22 Regulatory Matters in the Notes ToConsolidated Financial Statements in Item 8 of this Report.
Laws and regulations limit the scope of our permittedactivities and investments. National banks (such as PNC Bank,
The PNC Financial Services Group, Inc. – Form 10-K 7
N.A.) and their operating subsidiaries generally may engageonly in any activities that are determined by the OCC to bepart of or incidental to the business of banking, although afinancial subsidiary may engage in a broader range ofactivities as described above.
Moreover, examination ratings of “3” or lower, lower capitalratios than peer group institutions, regulatory concernsregarding management, controls, assets, operations or otherfactors, can all potentially result in practical limitations on theability of a bank or bank holding company to engage in newactivities, grow, acquire new businesses, repurchase its stockor pay dividends, or to continue to conduct existing activities.
The Federal Reserve’s prior approval is required whenever wepropose to acquire all or substantially all of the assets of anybank or thrift, to acquire direct or indirect ownership orcontrol of more than 5% of any class of voting shares of anybank or thrift, or to merge or consolidate with any other bankholding company or thrift holding company. The BHC Actenumerates the factors the Federal Reserve must considerwhen reviewing the merger of bank holding companies or theacquisition of banks. These factors include the competitiveeffects of the proposal in the relevant geographic markets; thefinancial and managerial resources and future prospects of thecompanies and banks involved in the transaction; the effect ofthe transaction on financial stability of the United States; theorganizations’ compliance with anti-money laundering lawsand regulations; the convenience and needs of thecommunities to be served; and the records of performanceunder the CRA of the insured depository institutions involvedin the transaction. In cases involving interstate bankacquisitions, the Federal Reserve also must consider theconcentration of deposits nationwide and in certain individualstates. OCC prior approval is required for PNC Bank, N.A. toacquire another insured bank or thrift by merger. In decidingwhether to approve such a transaction, the OCC is required toconsider factors similar to those that must be considered bythe Federal Reserve. Our ability to grow through acquisitionscould be limited by these approval requirements.
At December 31, 2012, PNC Bank, N.A. was rated“Outstanding” with respect to CRA.
Because of PNC’s ownership interest in BlackRock,BlackRock is subject to the supervision and regulation of theFederal Reserve.
FDIC Insurance. PNC Bank, N.A. is insured by the FDIC andsubject to premium assessments. Regulatory matters couldincrease the cost of FDIC deposit insurance premiums to aninsured bank as FDIC deposit insurance premiums are “riskbased.” Therefore, higher fee percentages would be charged tobanks that have lower capital ratios or higher risk profiles.These risk profiles take into account weaknesses that arefound by the primary banking regulator through itsexamination and supervision of the bank. A negative
evaluation by the FDIC or a bank’s primary federal bankingregulator could increase the costs to a bank and result in anaggregate cost of deposit funds higher than that of competingbanks in a lower risk category. Under Dodd-Frank, in April2011, the deposit insurance base calculation shifted fromdeposits to average assets less Tier 1 capital. Thismethodology change did not materially impact the premiumsdue to the FDIC for PNC.
CFPB Regulation and Supervision. Dodd-Frank gives theCFPB authority to examine PNC and PNC Bank, N.A. forcompliance with a broad range of federal consumer financiallaws and regulations, including the laws and regulations thatrelate to credit card, deposit, mortgage and other consumerfinancial products and services we offer. In addition, Dodd-Frank gives the CFPB broad authority to take corrective actionagainst PNC Bank, N.A. and PNC as it deems appropriate.The CFPB also has powers that it was assigned in Dodd-Frankto issue regulations and take enforcement actions to preventand remedy acts and practices relating to consumer financialproducts and services that it deems to be unfair, deceptive orabusive. The agency also has authority to impose newdisclosure requirements for any consumer financial product orservice. These authorities are in addition to the authority theCFPB assumed on July 21, 2011 under existing consumerfinancial law governing the provision of consumer financialproducts and services.
SECURITIES AND DERIVATIVES REGULATION
Our registered broker-dealer and investment advisersubsidiaries are subject to rules and regulations promulgatedby the SEC.
Several of our subsidiaries are registered with the SEC asinvestment advisers and may provide investment advisoryservices to clients, other PNC affiliates or related entities,including registered investment companies. Certain of theseadvisers are registered as investment advisers to private equityfunds under rules adopted under Dodd-Frank.
Broker-dealer subsidiaries are subject to the requirements ofthe Securities Exchange Act of 1934, as amended, and theregulations promulgated thereunder. The Financial IndustryRegulatory Authority (FINRA) is the primary self-regulatoryorganization (SRO) for our registered broker-dealersubsidiaries. Investment adviser subsidiaries are subject to therequirements of the Investment Advisers Act of 1940, asamended, and the regulations thereunder. An investmentadviser to a registered investment company is also subject tothe requirements of the Investment Company Act of 1940, asamended, and the regulations thereunder. Our broker-dealerand investment adviser subsidiaries also are subject toadditional regulation by states or local jurisdictions.
Over the past several years, the SEC and other regulatoryagencies have increased their focus on the mutual fund andbroker-dealer industries. Congress and the SEC have adopted
8 The PNC Financial Services Group, Inc. – Form 10-K
regulatory reforms and are considering additional reforms thathave increased, and are likely to continue to increase, theextent of regulation of the mutual fund and broker-dealerindustries and impose additional compliance obligations andcosts on our subsidiaries involved with those industries. Underprovisions of the federal securities laws applicable to broker-dealers, investment advisers and registered investmentcompanies and their service providers, a determination by acourt or regulatory agency that certain violations haveoccurred at a company or its affiliates can result in fines,restitution, a limitation on permitted activities, disqualificationto continue to conduct certain activities and an inability to relyon certain favorable exemptions. Certain types of infractionsand violations can also affect a public company in its timingand ability to expeditiously issue new securities into thecapital markets. In addition, certain changes in the activities ofa broker-dealer require approval from FINRA, and FINRAtakes into account a variety of considerations in acting uponapplications for such approval, including internal controls,capital levels, management experience and quality, priorenforcement and disciplinary history and supervisoryconcerns.
Title VII of Dodd-Frank imposes new comprehensive andsignificant regulations on the activities of financial institutionsthat are active in the U.S. over-the-counter (“OTC”)derivatives and foreign exchange markets. Title VII wasenacted to (i) address systemic risk issues, (ii) bring greatertransparency to the derivatives markets, (iii) provide enhanceddisclosures and protection to customers, and (iv) promotemarket integrity. Among other things, Title VII: (i) requiresthe registration of both “swap dealers” and “major swapparticipants” with one or both of the Commodity FuturesTrading Commission (“CFTC”) (in the case of non security-based swaps) and the SEC (in the case of security-basedswaps); (ii) requires that most standardized swaps be centrallycleared through a regulated clearing house and traded on acentralized exchange or swap execution facility; (iii) subjectsswap dealers and major swap participants to capital andmargin requirements in excess of historical practice;(iv) subjects swap dealers and major swap participants tocomprehensive new recordkeeping and real-time publicreporting requirements; (v) subjects swap dealers and majorswap participants to new business conduct requirements(including the providing of daily marks to counterparties anddisclosing to counterparties (pre-execution) the material risksassociated with their swap and of material incentives and anyconflicts of interest associated with their swap); and(vi) imposes special duties on swap dealers and major swapparticipants when transacting a swap with a “special entity”(e.g., governmental agency (federal, state or local) or politicalsubdivision thereof, pension plan or endowment).
Based on the definition of a “swap dealer” under Title VII,PNC Bank, N.A. registered with the CFTC as a swap dealeron January 31, 2013. As a result thereof, PNC Bank, N.A. issubject to all of the above-described regulations and
requirements imposed on registered swap dealers, and theCFTC will have a meaningful supervisory role with respect toPNC Bank, N.A.’s derivatives and foreign exchangebusinesses. Because of the limited volume of our security-based swap activities, we have not registered with the SEC asa security-based swap dealer. The above describedrequirements will collectively impose implementation andongoing compliance burdens on PNC Bank, N.A. and willintroduce additional legal risks (including as a result of newlyapplicable antifraud and anti-manipulation provisions andprivate rights of action).
In addition, an investment adviser to private funds or toregistered investment companies may be required to registerwith the CFTC as a commodity pool operator. Registrationcould impose significant new regulatory compliance burdens.Presently, we expect our subsidiaries that serve as investmentadvisers to such entities to be eligible for exemptions fromregistration as a commodity pool operator.
BlackRock has subsidiaries in securities and relatedbusinesses subject to SEC, other governmental agencies, state,local and FINRA regulation, as described above, and afederally chartered nondepository trust company subsidiarysubject to supervision and regulation by the OCC. Foradditional information about the regulation of BlackRock bythese agencies and otherwise, we refer you to the discussionunder the “Regulation” section of Item 1 Business inBlackRock’s most recent Annual Report on Form 10-K, whichmay be obtained electronically at the SEC’s website atwww.sec.gov.
COMPETITION
We are subject to intense competition from various financialinstitutions and from non-bank entities that can offer a numberof similar products and services without being subject to bankregulatory supervision and restrictions.
In making loans, PNC Bank, N.A. competes with traditionalbanking institutions as well as consumer finance companies,leasing companies and other non-bank lenders, andinstitutional investors including collateralized loan obligation(CLO) managers, hedge funds, mutual fund complexes andprivate equity firms. Loan pricing, structure and creditstandards are extremely important in the current environmentas we seek to achieve appropriate risk-adjusted returns.Traditional deposit-taking activities are also subject to pricingpressures and to customer migration as a result of intensecompetition for consumer investment dollars.
PNC Bank, N.A. competes for deposits with:• Other commercial banks,• Savings banks,• Savings and loan associations,• Credit unions,• Treasury management service companies,• Insurance companies, and
The PNC Financial Services Group, Inc. – Form 10-K 9

• Issuers of commercial paper and other securities,including mutual funds.
Our various non-bank businesses engaged in investmentbanking and alternative investment activities compete with:
• Commercial banks,• Investment banking firms,• Merchant banks,• Insurance companies,• Private equity firms, and• Other investment vehicles.
In providing asset management services, our businessescompete with:
• Investment management firms,• Large banks and other financial institutions,• Brokerage firms,• Mutual fund complexes, and• Insurance companies.
We include here by reference the additional informationregarding competition included in the Item 1A Risk Factorssection of this Report.
EMPLOYEES
Employees totaled 56,285 at December 31, 2012. This totalincludes 50,947 full-time and 5,338 part-time employees, ofwhich 23,331 full-time and 4,563 part-time employees wereemployed by our Retail Banking business.
SEC REPORTS AND CORPORATE GOVERNANCE
INFORMATION
We are subject to the informational requirements of theSecurities Exchange Act of 1934, as amended (Exchange Act),and, in accordance with the Exchange Act, we file annual,quarterly and current reports, proxy statements, and otherinformation with the SEC. Our SEC File Number is 001-09718. You may read and copy this information at the SEC’sPublic Reference Room located at 100 F Street NE, Room1580, Washington, D.C. 20549. You can obtain informationon the operation of the Public Reference Room by calling theSEC at 1-800-SEC-0330.
You can also obtain copies of this information by mail fromthe Public Reference Section of the SEC, 100 F Street NE,Washington, D.C. 20549, at prescribed rates.
The SEC also maintains an internet website that containsreports, proxy and information statements, and otherinformation about issuers, like us, who file electronically withthe SEC. The address of that site is www.sec.gov. You canalso inspect reports, proxy statements and other informationabout us at the offices of the New York Stock Exchange, 20Broad Street, New York, New York 10005.
We also make our Annual Report on Form 10-K, QuarterlyReports on Form 10-Q, Current Reports on Form 8-K, andamendments to those reports filed with or furnished to the SECpursuant to Section 13(a) or 15(d) of the Exchange Actavailable free of charge on our internet website as soon as
reasonably practicable after we electronically file such materialwith, or furnish it to, the SEC. PNC’s corporate internet addressis www.pnc.com and you can find this informationat www.pnc.com/secfilings. Shareholders and bondholders mayalso obtain copies of these filings without charge by contactingShareholder Services at 800-982-7652 or via the online contactform at www.computershare.com/contactus for copies withoutexhibits, and by contacting Shareholder Relationsat 800-843-2206 or via e-mail at [email protected] copies of exhibits, including financial statement andschedule exhibits where applicable. The interactive data file(XBRL) exhibit is only available electronically.
Information about our Board of Directors and its committeesand corporate governance at PNC is available on PNC’scorporate website at www.pnc.com/corporategovernance. OurPNC Code of Business Conduct and Ethics is available on ourcorporate website at www.pnc.com/corporategovernance. Inaddition, any future amendments to, or waivers from, aprovision of the PNC Code of Business Conduct and Ethicsthat applies to our directors or executive officers (includingthe Chairman and Chief Executive Officer, the Chief FinancialOfficer and the Controller) will be posted at this internetaddress.
Shareholders who would like to request printed copies of thePNC Code of Business Conduct and Ethics or our CorporateGovernance Guidelines or the charters of our Board’s Audit,Nominating and Governance, Personnel and Compensation, orRisk Committees (all of which are posted on the PNCcorporate website) may do so by sending their requests toGeorge P. Long, III, Chief Governance Counsel and CorporateSecretary, at corporate headquarters at One PNC Plaza, 249Fifth Avenue, Pittsburgh, Pennsylvania 15222-2707. Copieswill be provided without charge to shareholders.
Our common stock is listed on the New York Stock Exchange(NYSE) under the symbol “PNC.”
INTERNET INFORMATION
The PNC Financial Services Group, Inc.’s financial reportsand information about its products and services are availableon the internet at www.pnc.com. We provide information forinvestors on our corporate website under “About PNC –Investor Relations,” such as Investor Events, QuarterlyEarnings, SEC Filings, Financial Information, Financial PressReleases and Message from the Chairman. Under “InvestorRelations,” we will from time to time post information that webelieve may be important or useful to investors. We generallypost the following shortly before or promptly following itsfirst use or release: financially-related press releases(including earnings releases), various SEC filings,presentation materials associated with earnings and otherinvestor conference calls or events, and access to live andreplay audio from such calls or events. When warranted, wewill also use our website to expedite public access to time-critical information regarding PNC in advance of distributionof a press release or a filing with the SEC disclosing the sameinformation.
10 The PNC Financial Services Group, Inc. – Form 10-K

Starting in 2013, PNC will be required to provide additionalpublic disclosure regarding estimated income, losses and proforma regulatory capital ratios under a supervisoryhypothetical severely adverse economic scenario in March ofeach year and under a PNC-developed hypothetical severelyadverse economic scenario in September of each year, as wellas information concerning its capital stress testing processes,pursuant to the stress testing regulations adopted by theFederal Reserve and the OCC. Under these regulations, PNCmay be able to satisfy at least a portion of these requirementsthrough postings on its website, and PNC may elect to do so
without also providing disclosure of this information throughfilings with the Securities and Exchange Commission.
You can also find the SEC reports and corporate governanceinformation described in the sections above in the InvestorRelations section of our website.
Where we have included web addresses in this Report, such asour web address and the web address of the SEC, we haveincluded those web addresses as inactive textual referencesonly. Except as specifically incorporated by reference into thisReport, information on those websites is not part hereof.
The PNC Financial Services Group, Inc. – Form 10-K 11
ITEM 1A – RISK FACTORSWe are subject to a number of risks potentially impacting ourbusiness, financial condition, results of operations and cashflows. As a financial services organization, certain elements ofrisk are inherent in our transactions and are present in thebusiness decisions we make. Thus, we encounter risk as partof the normal course of our business, and we design riskmanagement processes to help manage these risks.
There are risks that are known to exist at the outset of atransaction. For example, every loan transaction presentscredit risk (the risk that the borrower may not perform inaccordance with contractual terms) and market risk (apotential loss in earnings or economic value due to adversemovement in market interest rates or credit spreads), with thenature and extent of these risks principally depending on thefinancial profile of the borrower and overall economicconditions. We focus on lending that is within the boundariesof our risk framework, and manage these risks by adjustingthe terms and structure of the loans we make and through ouroversight of the borrower relationship, as well as throughmanagement of our deposits and other funding sources.
Risk management is an important part of our business model.The success of our business is dependent on our ability toidentify, understand and manage the risks presented by ourbusiness activities so that we can appropriately balancerevenue generation and profitability. These risks include, butare not limited to, credit risk, market risk, liquidity risk,operational risk, model risk, technology, compliance and legalrisk, and strategic and reputation risk. We discuss ourprincipal risk management processes and, in appropriateplaces, related historical performance in the Risk Managementsection included in Item 7 of this Report.
The following are the key risk factors that affect us. Any oneor more of these risk factors could have a material adverseimpact on our business, financial condition, results ofoperations or cash flows, in addition to presenting otherpossible adverse consequences, which are described below.These risk factors and other risks are also discussed further inother sections of this Report.
The possibility of the moderate economic recoveryreturning to recessionary conditions or of turmoil orvolatility in the financial markets would likely have anadverse effect on our business, financial position andresults of operations.
Although the United States economy has shown modestimprovement recently, economic conditions continue to pose arisk to financial institutions, including PNC. The economicrecovery, although continuing, did so only at a pace in 2012below trend for other recent recoveries from recessions. Jobgrowth has not yet been sufficient to significantly reduce highunemployment in the United States. Consumer and businessconfidence is improving but remains in the cautious zone.
There continues to be concern regarding the possibility of areturn to recessionary conditions, as well as regarding thepossibility of increased turmoil or volatility in financialmarkets.
The recent global recession and disruption of the financialmarkets has led to concerns over the solvency of certainEurozone states, including Greece, Ireland, Italy, Portugal andSpain, affecting these countries’ capital markets access, aswell as market perception of financial institutions that havesignificant direct or indirect exposure to these countries’creditworthiness. Certain of the major rating agencies havedowngraded the sovereign credit ratings of Greece, Portugaland Ireland to below investment grade. The sovereign creditratings of France, Italy and Spain have also been downgraded.These ratings downgrades, uncertainties surrounding theimplementation of reform programs, the effect of economiccontraction, and the Eurozone’s financial inter-linkagesincrease the risk of financial distress spreading to otherEurozone states. If measures to address sovereign debt andfinancial sector problems in Europe are inadequate, they mayresult in a delayed economic recovery, the exit of one or moremember states from the Eurozone, or more severerecessionary conditions. If realized, these risk scenarios couldcontribute to severe financial market stress or a globalrecession, likely affecting the economy and capital markets inthe United States as well.
Although the so-called “fiscal cliff” was averted in early 2013,Congress and the President still need to resolve issues withrespect to the U.S. government’s debt ceiling and otherbudgetary and spending matters. Uncertainty as to whetherthese issues can be resolved or how effective a resolutionmight be increases the risk of slower economic growth. Thenature and ultimate resolution of these issues, or a failure toachieve a timely and effective resolution, may furtheradversely affect the U.S. economy through possibleconsequences including downgrades in the ratings for U.S.Treasury securities, government shutdowns, or substantialspending cuts resulting from sequestration.
Current economic conditions have had an adverse effect onour business and financial performance and may not improvein the near future. We expect these conditions to continue tohave an ongoing negative impact on us and a worsening ofconditions would likely aggravate the adverse effects of thesedifficult economic and market conditions on us and on othersin the financial services industry.
In particular, we may face the following risks in connectionwith the current economic and market environment:
• Investors may have less confidence in the equitymarkets in general and in financial services industrystocks in particular, which could place downwardpressure on PNC’s stock price and resulting marketvaluation.
• Economic and market developments, in the UnitedStates, Europe or elsewhere, may further affect
12 The PNC Financial Services Group, Inc. – Form 10-K
consumer and business confidence levels and maycause declines in credit usage and adverse changes inpayment patterns, causing increases in delinquenciesand default rates.
• The continuation of the current very low interest rateenvironment, which is expected to continue at leastthrough mid-year 2015 based on statements by theChairman of the Federal Reserve Board, could affectconsumer and business behavior in ways that areadverse to us and could also hamper our ability toincrease our net interest income.
• Our ability to assess the creditworthiness of ourcustomers may be impaired if the models andapproaches we use to select, manage, and underwriteour customers become less predictive of futurebehaviors.
• The process we use to estimate losses in our creditexposures requires difficult, subjective and complexjudgments, including with respect to economicconditions and how economic conditions mightimpair the ability of our borrowers to repay theirloans. At any point in time or for any length of time,such losses may no longer be capable of accurateestimation, which may, in turn, adversely impact thereliability of the process for estimating losses and,therefore, the establishment of adequate reserves forthose losses.
• We could suffer decreases in customer desire to dobusiness with us, whether as a result of a decreaseddemand for loans or other financial products andservices or decreased deposits or other investments inaccounts with PNC.
• Competition in our industry could intensify as aresult of the increasing consolidation of financialservices companies in connection with current marketconditions, or otherwise.
• A continuation or deterioration of current economictrends may lead to declines in the values of ourbusinesses potentially resulting in goodwillimpairments.
• A lessening of confidence in the creditworthiness ofthe United States or other governments whosesecurities we hold could impact the value of thoseholdings.
• Increased regulation of compensation at financialservices companies as part of government efforts toreform the industry may hinder our ability to attract,retain and incentivize well-qualified individuals inkey positions.
• Investors in mortgage loans and other assets that wesell or sold are more likely to seek indemnificationfrom us against losses or otherwise seek to have usshare in such losses or to request us to repurchaseloans that they believe do not comply with applicablerepresentations and warranties or other contractualprovisions.
• We may be subject to additional fees and taxes as thegovernment seeks to recover some of the costs of itsrecovery efforts, reduce the national debt or pay foradditional government programs, in particular fromthe financial services industry.
The regulatory environment for the financial servicesindustry is being significantly impacted by financialregulatory reform initiatives in the United States andelsewhere, including Dodd-Frank and regulationspromulgated to implement it.
The United States and other governments have undertakenmajor reform of the regulatory oversight structure of thefinancial services industry, including engaging in new effortsto impose requirements designed to reduce systemic risks andprotect consumers and investors. We expect to face furtherincreased regulation of our industry as a result of current andfuture initiatives intended to provide economic stimulus,financial market stability and enhanced regulation of financialservices companies and to enhance the liquidity and solvencyof financial institutions and markets. We also expect in manycases more intense scrutiny from our bank supervisors in theexamination process and more aggressive enforcement of lawsand regulations on both the federal and state levels.Compliance with regulations and other supervisory initiativeswill likely increase our costs and reduce our revenue, and maylimit our ability to pursue certain desirable businessopportunities.
The Dodd-Frank Wall Street Reform and ConsumerProtection Act (Dodd-Frank) mandates the most wide-rangingoverhaul of financial industry regulation in decades. Dodd-Frank was signed into law on July 21, 2010. Many parts of thelaw are now in effect and others are now in theimplementation stage, which is likely to continue for severalyears. The law requires that regulators, some of which are newregulatory bodies created by Dodd-Frank, draft, review andapprove more than 300 implementing regulations and conductnumerous studies that are likely to lead to more regulations, aprocess that, while well underway, is proceeding somewhatslower than originally anticipated, thus extending theuncertainty surrounding the ultimate impact of Dodd-Frank onus.
A number of reform provisions are likely to significantlyimpact the ways in which banks and bank holding companies,including PNC, do business.
• Newly created regulatory bodies include theConsumer Financial Protection Bureau (CFPB) andthe Financial Stability Oversight Council (FSOC).The CFPB has been given authority to regulateconsumer financial products and services sold bybanks and non-bank companies and to supervisebanks with assets of more than $10 billion and theiraffiliates for compliance with Federal consumerprotection laws. The FSOC has been charged with
The PNC Financial Services Group, Inc. – Form 10-K 13
identifying systemic risks, promoting strongerfinancial regulation and identifying those non-bankcompanies that are “systemically important” and thusshould be subject to regulation by the FederalReserve. In addition, in extraordinary cases andtogether with the Federal Reserve, the FSOC couldbreak up financial firms that are deemed to present agrave threat to the financial stability of the UnitedStates.
• Dodd-Frank (through provisions commonly known asthe “Volcker Rule”) prohibits banks and their affiliatesfrom engaging in some types of proprietary trading andrestricts the ability of banks and their affiliates tosponsor, invest in or have other financial relationshipswith private equity or hedge funds. In October 2011,four of the five agencies with authority for rulemakingissued proposed rules to implement the Volcker Rule. InJanuary 2012, the fifth agency issued substantiallysimilar proposed rules. The rules set forth a complexand detailed compliance, reporting and monitoringprogram for large banks, and seek comments onnumerous questions. Although the comment deadlineexpired in February 2012 on the four agency proposals(and later in 2012 on the single agency proposal), theagencies have not yet issued final rules. The timing andcontent of the final rules remain uncertain. The mannerin which the questions posed by the proposed rules areaddressed by the agencies will have an importantinfluence on the impact of the final rules on PNC.
Although PNC no longer has a designated proprietarytrading operation, the proposed rules broadly definewhat constitutes potentially prohibited “proprietarytrading,” thereby making the scope of the statutoryand regulatory exemptions for trading activities,including the exemptions for hedging activities andcustomer trading, all the more important. Until moreis known about how the final rules will define“proprietary trading” and the scope of permissibletrading activities, it is not possible to determine theimpact to PNC of the proprietary trading prohibition.However, any meaningful limitation on PNC’s abilityto hedge its risks in the ordinary course or to trade onbehalf of customers would likely be adverse toPNC’s business and results of operations. In addition,the proposed rules contain extensive compliance andrecordkeeping requirements related to permissibletrading activities. Such requirements, if included in afinal rule, could increase the costs of hedging or othertypes of permissible transactions and potentiallyresult in PNC not engaging in certain transactions, ortypes of transactions, in which we would otherwiseengage.
With respect to the restrictions on private equity andhedge fund activities, as of December 31, 2012, PNCheld interests in such funds likely to be coveredtotaling approximately $859 million including three
sponsored funds with total invested capital ofapproximately $389 million. PNC expects that overtime it will need to eliminate these investments andcease sponsoring these funds, although it is likelythat at least some of these amounts will reduce overtime in the ordinary course before compliance isrequired, and the Volcker Rule also permitsextensions of the compliance date under somecircumstances. A forced sale of some of theseinvestments due to the Volcker Rule could result inPNC receiving less value than it would otherwisehave received. Depending on the provisions of thefinal rule, it is possible that other structures throughwhich PNC conducts business, such as operatingsubsidiaries, joint ventures or securitization vehicles,but that are not typically referred to as private equityor hedge funds, could be restricted, with an impactthat cannot now be evaluated.
• Pursuant to Dodd-Frank, in December 2011 theFederal Reserve requested comment on proposedrules that would establish enhanced prudentialstandards governing U.S. bank holding companieswith $50 billion or more in consolidated total assets(“covered companies”). The proposed enhancedprudential standards would include, among otherthings, heightened liquidity risk managementstandards; new standards governing oversight by acovered company’s board of directors and board-level risk committee; and new limits on the aggregateamount of credit exposure a covered company mayhave to any single customer or counterparty. Theseproposed rules also would establish an “earlyremediation” regime for covered companies, underwhich the Federal Reserve would be required to takeincreasingly stringent actions against a coveredcompany as its financial condition or riskmanagement deteriorated as reflected by thecompany’s current or projected post-stress capitallevels, compliance with supervisory liquidity and riskmanagement standards and, in some instances,market-based indicators, such as credit default swapspreads. The comment period on the proposed rulesclosed in March 2012. Final rules, however, have notbeen issued, and as such the impact of these rulescannot now be evaluated.
• In addition, the relevant regulatory agencies haveproposed rules to implement the Dodd-Frankprovisions requiring retention of risk by certainsecuritization participants through holding interestsin the securitization vehicles, but the rules are not yetfinalized or effective. As a result, the ultimate impactof these Dodd-Frank provisions on PNC remainsunpredictable. That impact on PNC could be direct,by requiring PNC to hold interests in a securitizationvehicle or other assets that represent a portion of thecredit risk of the assets held by the securitizationvehicle, or indirect, by impacting markets in which
14 The PNC Financial Services Group, Inc. – Form 10-K
PNC participates and increasing the costs associatedwith mortgage assets that we originate. Since thebeginning of the financial crisis, there has been andcontinues to be substantially less private (that is, non-government backed) securitization activity than hadpreviously been the case. It is unclear at presentwhether and to what extent the private securitizationmarkets will rebound. In recent years, PNC has onlyengaged to a limited extent in securitizationtransactions under circumstances where we mightexpect to be required to retain additional risk on ourbalance sheet as a result of implementation of theseDodd-Frank provisions. If the market for privatesecuritizations rebounds and PNC decides to increaseits participation in that market, we would likely berequired under the regulations to retain more riskthan would otherwise have been the case, and as aresult could be required to consolidate certainsecuritization vehicles on our balance sheet, withcurrently an uncertain financial impact.
• On the indirect impact side, PNC originates loans ofa variety of types, including residential andcommercial mortgages, credit card, auto, and student,that historically have commonly been securitized,and PNC is also a significant servicer of residentialand commercial mortgages held by others, includingsecuritization vehicles. PNC anticipates that the riskretention requirements will impact the market forloans of types that historically have been securitized,potentially affecting the volumes of loans securitized,the types of loan products made available, the termson which loans are offered, consumer and businessdemand for loans, and the need for third-party loanservicers. It should be noted that the risk retentionrules themselves could have the effect of slowing therebound in the securitization markets. One effect ofhaving substantially reduced opportunities tosecuritize loans would likely be a reduction in thewillingness of banks, including PNC, to make loansdue to balance sheet management requirements. Anyof these potential impacts of the Dodd-Frank riskretention rules could affect the way in which PNCconducts its business, including its product offerings,and could also affect PNC’s revenue andprofitability, although, as noted above, not in waysthat are currently predictable.
• Title VII of Dodd-Frank imposes new comprehensiveand significant restrictions on the activities offinancial institutions that are active in the U.S. over-the-counter (“OTC”) derivatives and foreignexchange markets. Title VII (i) requires theregistration of both “swap dealers” and “major swapparticipants” with one or both of the CommodityFutures Trading Commission (“CFTC”) (in the caseof non security-based swaps) and the SecuritiesExchange Commission (“SEC”) (in the case ofsecurity-based swaps); (ii) requires that most
standardized swaps be centrally cleared through aregulated clearing house and traded on a centralizedexchange or swap execution facility; (iii) subjectsswap dealers and major swap participants to capitaland margin requirements in excess of currentpractice; (iv) subjects swap dealers and major swapparticipants to comprehensive new recordkeepingand real-time public reporting requirements;(v) subjects swap dealers and major swap participantsto new business conduct requirements (including anobligation to provide daily marks to counterpartiesand to disclose to counterparties (pre-execution) thematerial risks associated with a swap and materialincentives and conflicts of interest associated withthe swap); and (vi) imposes special duties on swapdealers and major swap participants when transactinga swap with a “special entity” (e.g., governmentalagency (federal, state or local) or politicalsubdivision thereof, pension plan or endowment).Based on the definition of a “swap dealer” underTitle VII, PNC Bank, N.A. registered with the CFTCas a swap dealer effective January 31, 2013. As aresult, PNC Bank, N.A. will be subject to all of theabove-described restrictions and the CFTC will havea meaningful supervisory role with respect to PNCBank, N.A.’s derivatives and foreign exchangebusinesses.
The above described requirements will collectivelyimpose potentially significant implementation andongoing compliance burdens on PNC and willintroduce additional legal risk (including as a resultof newly applicable antifraud and anti-manipulationprovisions and private rights of action).
• New provisions under Dodd-Frank concerning theapplicability of state consumer protection laws tonational banks, such as PNC Bank, N.A., becameeffective in 2011. Questions may arise as to whethercertain state consumer financial laws that may havepreviously been preempted by federal law are nolonger preempted as a result of the effectiveness ofthese new provisions. Depending on how suchquestions are resolved, we may experience an increasein state-level regulation of our retail banking businessand additional compliance obligations, revenueimpacts and costs. In addition, provisions under Dodd-Frank that also took effect in 2011 permit stateattorneys general to bring civil actions against nationalbanks, such as PNC Bank, N.A., for violations of law,as well as regulations issued by the CFPB.
• Dodd-Frank requires bank holding companies thathave $50 billion or more in assets, such as PNC, toperiodically submit to the Federal Reserve, the FDICand the FSOC a resolution plan that includes, amongother things, an analysis of how the company couldbe resolved in a rapid and orderly fashion if thecompany were to fail or experience material financial
The PNC Financial Services Group, Inc. – Form 10-K 15
distress. The Federal Reserve and the FDIC mayjointly impose restrictions on PNC, includingadditional capital requirements or limitations ongrowth, if the agencies jointly determine that thecompany’s plan is not credible or would not facilitatea rapid and orderly resolution of PNC under the U.S.Bankruptcy Code, and additionally could requirePNC to divest assets or take other actions if we didnot submit an acceptable resolution plan within twoyears after any such restrictions were imposed. TheFDIC also has adopted a rule that requires largeinsured depository institutions, including PNC Bank,N.A., to periodically submit a resolution plan to theFDIC that includes, among other things, an analysisof how the institution could be resolved under theFederal Deposit Insurance Act (FDI Act) in a mannerthat protects depositors and limits losses or costs tocreditors of the bank in accordance with the FDI Act.PNC and PNC Bank, N.A. must file their first plansunder these rules by December 31, 2013. Dependingon how the agencies conduct their review of theresolution plans submitted by PNC and PNC Bank,N.A., it is possible that these requirements couldaffect the ways in which PNC structures andconducts its business and result in higher complianceand operating costs.
• Other provisions of Dodd-Frank will affectregulatory oversight, holding company capitalrequirements, and residential mortgage products.
While much of how the Dodd-Frank and other financialindustry reforms will change our current business operationsdepends on the specific regulatory promulgations andinterpretations, many of which have yet to be released orfinalized, it is clear that the reforms, both under Dodd-Frankand otherwise, will have a significant effect on our entireindustry. Although Dodd-Frank and other reforms will affect anumber of the areas in which we do business, it is not clear atthis time the full extent of the adjustments that will berequired and the extent to which we will be able to adjust ourbusinesses in response to the requirements. Although it isdifficult to predict the magnitude and extent of these effects atthis stage, we believe compliance with Dodd-Frank and itsimplementing regulations and other initiatives will continue tonegatively impact revenue, at least to some extent, andincrease the cost of doing business, both in terms of transitionexpenses and on an ongoing basis, and may also limit ourability to pursue certain desirable business opportunities.
New capital and liquidity standards will result in banksand bank holding companies needing to maintain moreand higher quality capital and greater liquidity than hashistorically been the case.
New and evolving capital and liquidity standards will have asignificant effect on banks and bank holding companies,including PNC. These evolving standards include the
proposals issued by the U.S. banking agencies in June 2012 toimplement the Basel III capital framework in the United Statesand revise the framework for the risk-weighting of assetsunder Basel I. The Basel III proposed rules would, amongother things, narrow the definition of regulatory capital,require the phase-out of trust preferred securities from Tier 1regulatory capital, establish a new Tier 1 common capitalrequirement for banking organizations and revise the capitallevels at which a bank would be subject to prompt correctiveaction. As of December 31, 2012, PNC had $331 million oftrust preferred securities included in Tier 1 capital which,under these rules and Dodd-Frank, will no longer qualify asTier 1 capital over time to the extent they remain outstanding.The proposed rules also would require that unconsolidatedinvestments in financial entities (potentially including PNC’sinvestment in BlackRock), as well as mortgage servicingrights and deferred tax assets, above certain thresholds bededucted from regulatory capital and significantly limit theextent to which minority interests in consolidated subsidiaries(including minority interests in the form of REIT preferredsecurities) may be included in regulatory capital. As ofDecember 31, 2012, PNC had approximately $1.4 billion ofREIT preferred securities outstanding. PNC has submitted thenecessary redemption notice to redeem $375 million of thisamount on March 15, 2013, as discussed further in the Capitaland Liquidity Actions portion of the Executive Summarysection in Item 7 of this Report. In addition, the proposed ruleswould remove the filter that currently excludes unrealizedgains and losses (other than those resulting from other-than-temporary impairments) on available for sale debt securitiesfrom affecting regulatory capital, which could increase thevolatility of regulatory capital of banking organizations,including PNC. When fully phased-in on January 1, 2019, theBasel III rules would require that banking organizationsmaintain a minimum Tier 1 common ratio of 4.5%, a Tier 1capital ratio of 6.0%, a total capital ratio of 8.0% and aleverage ratio of 4%. Moreover, the proposed rules, whenfully phased-in, would require banking organizations,including PNC, to maintain a minimum Tier 1 common ratioof 7.0%, a Tier 1 capital ratio of 8.5%, and a total capital ratioof 10.5% to avoid limitations on capital distributions(including common stock dividends and share repurchases)and certain discretionary incentive compensation payments.For banking organizations subject to the Basel II advancedapproaches (such as PNC), these levels could be supplementedby an additional countercyclical capital buffer of up to anadditional 2.5% during periods of excessive credit growth,although this buffer is proposed to initially be set at zero in theUnited States. Such organizations would also be subject to anew supplementary leverage ratio that would take into accountcertain off-balance sheet items.
The proposed rules issued in June 2012 that would revise theBasel I risk-weighting framework (referred to as thestandardized approach) and the Basel II risk-weightingframework (referred to as the advanced approaches) wouldreplace the use of credit ratings with alternative
16 The PNC Financial Services Group, Inc. – Form 10-K
methodologies for assessing creditworthiness and establish anew framework (referred to as the Simplified SupervisoryFramework Approach) for risk-weighting securitizationexposures (such as privately issued mortgage-backedsecurities and asset-backed securities). The standardizedapproach also would, among other things, significantly revisethe risk weight assigned to residential mortgages (with riskweights changing from between 50% to 100% to between35% and 200%) and increase the risk weight applicable tocertain types of commercial real estate loans under Basel I.The advanced approaches rule would, among other things,significantly alter the methodology for determiningcounterparty credit risk weights, including the establishmentof a credit valuation adjustment for counterparty risk in over-the-counter (OTC) derivative transactions, under Basel II.
The Basel III framework adopted by the Basel Committee alsoincludes new short-term liquidity standards (the LiquidityCoverage Ratio) and long-term funding standards (the NetStable Funding Ratio). The Liquidity Coverage Ratio, whichis scheduled to begin to take effect on January 1, 2015 and befully phased in by January 1, 2019, is designed to ensure thatbanking organizations maintain an adequate level of cash, orother high quality and unencumbered liquid assets that canreadily be converted to cash, to meet estimated liquidity needsin a stress scenario lasting 30 days. The Basel Committee hasdefined the types of assets that would qualify as high qualityliquid assets, and also has established various assumptionsregarding cash outflows and inflows during the 30-day stressperiod, for purposes of the Liquidity Coverage Ratio. The NetStable Funding Ratio is designed to promote a stable maturitystructure of assets and liabilities of banking organizations overa one-year time horizon. The Net Stable Funding Ratio isscheduled to take effect by January 1, 2018 but continues toundergo review by the Basel Committee.
In November 2011, the Basel Committee also adopted aframework that would require globally systemically importantbanks (“G-SIBs”) to maintain additional Tier 1 commoncapital ranging between 1.0% to 2.5% of risk-weighted assets,with the actual required amount varying based on the firm’sglobal systemic importance as determined using five criteria(size, interconnectedness, lack of substitutability, cross-jurisdictional activity, and complexity). The Federal Reservehas indicated that it expects to propose a capital surcharge inthe United States based on the Basel Committee’s G-SIBframework. While these rules have not yet been proposed, andthe identity of the banking organizations that would be subjectto a surcharge as a G-SIB definitively determined, PNCbelieves that it is unlikely to be deemed a G-SIB based on thecriteria included in the Basel Committee’s framework. Dodd-Frank directs the Federal Reserve to establish heightened risk-based and leverage capital requirements and liquidityrequirements for bank holding companies, like PNC, that have$50 billion or more in assets. The Basel Committee also hasadopted an analytical framework for national jurisdictions touse in determining whether to apply a capital surcharge to
firms that may be systemically important on a domestic basis(“D-SIBs”), but that are not G-SIBs. The Federal Reserve hasstated that it is still considering whether to impose anadditional capital surcharge on bank holding companies thathave $50 billion or more in consolidated total assets, but thatare not subject to a G-SIB surcharge.
Because proposals by the U.S. agencies to implement theBasel III capital standards and revise the Basel I risk-weighting framework have not been finalized, and anyadditional heightened capital or liquidity standards that maybe established by the Federal Reserve under Basel III orDodd-Frank (such as, for example, a D-SIB surcharge) remainsubject to rulemaking in the U.S., the full effect of thesestandards on PNC’s regulatory capital and liquidity, bothduring and after any applicable phase-in periods, is uncertainat this time.
The need to maintain more and higher quality capital, as wellas greater liquidity, going forward than historically has beenrequired could limit PNC’s business activities, includinglending, and its ability to expand, either organically or throughacquisitions. It could also result in PNC taking steps toincrease its capital that may be dilutive to shareholders orbeing limited in its ability to pay dividends or otherwise returncapital to shareholders, or selling or refraining from acquiringassets, the capital requirements for which are inconsistent withthe assets’ underlying risks. In addition, the new liquiditystandards could require PNC to increase its holdings of highlyliquid short-term investments, thereby reducing PNC’s abilityto invest in longer-term or less liquid assets even if moredesirable from a balance sheet management perspective.Moreover, although these new requirements are being phasedin over time, U.S. federal banking agencies have been takinginto account expectations regarding the ability of banks tomeet these new requirements, including under stressedconditions, in approving actions that represent uses of capital,such as dividend increases, share repurchases and acquisitions.
Our lending and servicing businesses and the value of theloans and debt securities we hold may be adverselyaffected by economic conditions, including a reversal orslowing of the current moderate recovery. Downwardvaluation of debt securities could also negatively impactour capital position.
Given the high percentage of our assets represented directly orindirectly by loans, and the importance of lending to ouroverall business, weak economic conditions are likely to havea negative impact on our business and our results ofoperations. This could adversely impact loan utilization ratesas well as delinquencies, defaults and customer ability to meetobligations under the loans. This is particularly the caseduring the period in which the aftermath of recessionaryconditions continues and the positive effects of economicrecovery appear to be slow to materialize and unevenly spreadamong our customers.
The PNC Financial Services Group, Inc. – Form 10-K 17
Further, weak economic conditions would likely have anegative impact on our business, our ability to serve ourcustomers, and our results of operations. Such conditions arelikely to lead to increases in the number of borrowers whobecome delinquent or default or otherwise demonstrate adecreased ability to meet their obligations under their loans.This would result in higher levels of nonperforming loans, netcharge-offs, provision for credit losses and valuationadjustments on loans held for sale. The value to us of otherassets such as investment securities, most of which are debtsecurities or other financial instruments supported by loans,similarly would be negatively impacted by widespreaddecreases in credit quality resulting from a weakening of theeconomy.
We have historically not considered government insured orguaranteed loans to be higher risk loans as defaults arematerially mitigated by payments of insurance or guaranteedamounts for approved claims by the applicable governmentagency. While the level of claim denials by governmentagencies, including the Department of Housing and UrbanDevelopment, has historically been low, if financial conditionsprompt government agencies to deny or curtail an increasingnumber of these claims, we could face additional losses in ourlending business. In addition, in the event that submittedclaims are denied or curtailed as a result of our failure as aservicer of the loan to adhere to applicable agency servicingguidelines, we will be required to remit the difference betweenthe claims proceeds that should have been received and theclaim amounts actually received to the holder of the loan.
A failure to sustain reduced amounts of the provision forcredit losses, which has benefitted results of operations inrecent periods, could result in decreases in net income.
As was typical in the banking industry, the economicdownturn that started in 2007 resulted in PNC experiencinghigh levels of provision for credit losses. In 2009, PNCreported provision for credit losses totaling $3.9 billion.Subsequently, in part due to improvement in economicconditions, as well as actions taken by PNC to manage itsportfolio, PNC’s provision for credit losses has declinedsubstantially, to $2.5 billion in 2010, $1.2 billion in 2011 and$1.0 billion in 2012. This decline in provision for credit losseshas been a major contributor to PNC’s ability to maintain andgrow its net income during this period. As the provision forcredit losses stabilizes, there may not be as much opportunityas there has been for declining provision to help PNCmaintain and grow net income. In addition, if PNC’s provisionfor credit losses were to rise back towards levels experiencedduring the height of the economic downturn, it would have anadverse effect on PNC’s net income and could result in lowerlevels of net income than PNC has reported in recent periods.
Our regional concentrations make us particularly at riskto adverse economic conditions in our primary retailbanking footprint.
Although many of our businesses are national in scope, ourretail banking business is concentrated within our retail branchnetwork footprint, located principally in our primarygeographic markets. Thus, we are particularly vulnerable toadverse changes in economic conditions in the Mid-Atlantic,Midwest, and Southeast regions.
Our business and performance are vulnerable to theimpact of volatility in debt and equity markets.
As most of our assets and liabilities are financial in nature, wetend to be particularly sensitive to the performance of thefinancial markets. Turmoil and volatility in U.S. and globalfinancial markets, such as that experienced during the recentfinancial crisis, can be a major contributory factor to overallweak economic conditions, leading to some of the risksdiscussed above, including the impaired ability of borrowersand other counterparties to meet obligations to us. Financialmarket volatility also can have some of the following adverseeffects on PNC and our business and financial performance.
• It can affect the value or liquidity of our on-balancesheet and off-balance sheet financial instruments.
• It can affect the value of servicing rights, includingthose we carry at fair value.
• It can affect our ability to access capital markets toraise funds necessary to support our businesses andmaintain our overall liquidity position. Inability toaccess capital markets as needed, or at cost effectiverates, could adversely affect our liquidity and resultsof operations.
• It can affect the value of the assets that we manage orotherwise administer for others or the assets forwhich we provide processing and informationservices. Although we are not directly impacted bychanges in the value of such assets, decreases in thevalue of those assets would affect related fee incomeand could result in decreased demand for ourservices.
• It can affect the required funding of our pensionobligations to the extent that the value of the assetssupporting those obligations drops below minimumlevels.
• In general, it can impact the nature, profitability orrisk profile of the financial transactions in which weengage.
Volatility in the markets for real estate and other assetscommonly securing financial products has been and is likelyto continue to be a significant contributor to overall volatilityin financial markets.
18 The PNC Financial Services Group, Inc. – Form 10-K
Our business and financial performance is impactedsignificantly by market interest rates and movements inthose rates. The monetary, tax and other policies ofgovernmental agencies, including the Federal Reserve,have a significant impact on interest rates and overallfinancial market performance over which we have nocontrol and which we may not be able to predictadequately.
As a result of the high percentage of our assets and liabilitiesthat are in the form of interest-bearing or interest-relatedinstruments, changes in interest rates, in the shape of the yieldcurve or in spreads between different market interest rates canhave a material effect on our business, our profitability and thevalue of our financial assets and liabilities. For example:
• Changes in interest rates or interest rate spreads canaffect the difference between the interest that we earnon assets and the interest that we pay on liabilities,which impacts our overall net interest income andprofitability.
• Such changes can affect the ability of borrowers tomeet obligations under variable or adjustable rateloans and other debt instruments, and can, in turn,affect our loss rates on those assets.
• Such changes may decrease the demand for interestrate-based products and services, including loans anddeposit accounts.
• Such changes can also affect our ability to hedgevarious forms of market and interest rate risk andmay decrease the profitability or increase the riskassociated with such hedges.
• Movements in interest rates also affect mortgageprepayment speeds and could result in impairmentsof mortgage servicing assets or otherwise affect theprofitability of such assets.
The monetary, tax and other policies of the government and itsagencies, including the Federal Reserve, have a significantimpact on interest rates and overall financial marketperformance. These governmental policies can thus affect theactivities and results of operations of banking companies suchas PNC. An important function of the Federal Reserve is toregulate the national supply of bank credit and certain interestrates. The actions of the Federal Reserve influence the rates ofinterest that we charge on loans and that we pay onborrowings and interest-bearing deposits and can also affectthe value of our on-balance sheet and off-balance sheetfinancial instruments. Both due to the impact on rates and bycontrolling access to direct funding from the Federal ReserveBanks, the Federal Reserve’s policies also influence, to asignificant extent, our cost of funding. We cannot predict thenature or timing of future changes in monetary, tax and otherpolicies or the effects that they may have on our activities andfinancial results.
PNC faces legal and regulatory risk arising out of itsresidential mortgage businesses.
Numerous federal and state governmental, legislative andregulatory authorities are investigating practices in thebusiness of mortgage and home equity loan lending andservicing and in the mortgage-related insurance andreinsurance industries. PNC has received inquiries fromgovernmental, legislative and regulatory authorities on thesetopics and is responding to these inquiries. These inquiries andinvestigations could lead to administrative, civil or criminalproceedings, possibly resulting in remedies including fines,penalties, restitution, alterations in our business practices andadditional expenses and collateral costs.
In addition to governmental or regulatory inquiries andinvestigations, PNC, like other companies with residentialmortgage and home equity loan origination and servicingoperations, faces the risk of class actions, other litigation andclaims from: the owners of, investors in, or purchasers of suchloans originated or serviced by PNC (or securities backed bysuch loans), homeowners involved in foreclosure proceedingsor various mortgage-related insurance programs, downstreampurchasers of homes sold after foreclosure, title insurers, andother potential claimants. Included among these claims areclaims from purchasers of mortgage and home equity loansseeking the repurchase of loans where the loans allegedlybreached origination covenants and representations andwarranties made to the purchasers in the purchase and saleagreements.
At this time PNC cannot predict the ultimate overall cost to oreffect upon PNC from governmental, legislative or regulatoryactions and private litigation or claims arising out ofresidential mortgage and home equity loan lending, servicingor reinsurance practices, although such actions, litigation andclaims could, individually or in the aggregate, result insignificant expense. See Note 23 Legal Proceedings and Note24 Commitments and Guarantees in the Notes ToConsolidated Financial Statements in Item 8 of this Report foradditional information regarding federal and stategovernmental, legislative and regulatory inquiries andinvestigations and additional information regarding potentialrepurchase obligations relating to mortgage and home equityloans.
Moreover, the CFPB recently issued final regulations thatimpose new requirements relating to our residential mortgageorigination practices and servicing practices. Theseregulations are not yet in effect, but we are in the processes ofimplementing them. We cannot predict at this time the overallcost of implementing these requirements, but implementationis likely to result in significant expense.
The PNC Financial Services Group, Inc. – Form 10-K 19
The issues described above may affect the value of ourownership interests, direct or indirect, in property subject toforeclosure. In addition, possible delays in the schedule forprocessing foreclosures may result in an increase innonperforming loans, additional servicing costs and possibledemands for contractual fees or penalties under servicingagreements.
There is also a continuing risk of incurring costs related tofurther remedial and related efforts required by the consentorders and related to repurchase requests arising out of eitherthe foreclosure process or origination issues. Reputationaldamage arising out of this industry-wide inquiry could alsohave an adverse effect upon our existing mortgage and homeequity loan business and could reduce future businessopportunities.
One or more of the foregoing could adversely affect PNC’sbusiness, financial condition, results of operations or cashflows.
We grow our business in part by acquiring other financialservices companies from time to time, and theseacquisitions present a number of risks and uncertaintiesrelated both to the acquisition transactions themselves andto the integration of the acquired businesses into PNCafter closing.
Acquisitions of other financial services companies, financialservices assets and related deposits and other liabilities presentrisks and uncertainties to PNC in addition to those presentedby the nature of the business acquired.
In general, acquisitions may be substantially more expensiveto complete than anticipated (including unanticipated costsincurred in connection with the integration of the acquiredcompany). Anticipated benefits (including anticipated costsavings and strategic gains) may be significantly harder ortake longer to achieve than expected or may not be achievedin their entirety as a result of unexpected factors or events.
Our ability to achieve anticipated results from acquisitions isoften dependent also on the extent of credit losses in theacquired loan portfolios and the extent of deposit attrition,which are, in part, related to the state of economic andfinancial markets. Also, litigation and governmentalinvestigations that may be filed or commenced, as a result ofan acquisition or otherwise, could impact the timing orrealization of anticipated benefits to PNC.
Integration of an acquired company’s business and operationsinto PNC, including conversion of the acquired company’sdifferent systems and procedures, may take longer thananticipated or be more costly than anticipated or haveunanticipated adverse results relating to the acquiredcompany’s or PNC’s existing businesses. In some cases,acquisitions involve our entry into new businesses or newgeographic or other markets, and these situations also presentrisks and uncertainties in instances where we may beinexperienced in these new areas.
Our ability to analyze the risks presented by prospectiveacquisitions, as well as our ability to prepare in advance ofclosing for integration, depends, in part, on the information wecan gather with respect to the target, which is more limitedthan the information we have regarding companies we alreadyown.
As a regulated financial institution, our ability to pursue orcomplete attractive acquisition opportunities could benegatively impacted by regulatory delays or other regulatoryissues. In addition, legal and regulatory or other governmentalproceedings, claims, investigations or inquiries relating to pre-acquisition business and activities of acquired companies mayresult in future monetary judgments or settlements or otherremedies, including damages, fines, penalties, restitution oralterations in our business practices, and in additionalexpenses and collateral costs, and may cause reputationalharm to PNC. The processes of integrating acquiredbusinesses, as well as the deconsolidation of divestedbusinesses, also pose many additional possible risks whichcould result in increased costs, liability or other adverseconsequences to PNC. Note 23 Legal Proceedings in the NotesTo Consolidated Financial Statements in Item 8 of this Reportdescribes several legal proceedings related to pre-acquisitionactivities of companies we have acquired, including NationalCity. Other such legal proceedings may be commenced in thefuture.
The soundness of other financial institutions couldadversely affect us.
Financial services institutions are interrelated as a result oftrading, clearing, counterparty, and other relationships. Wehave exposure to many different industries and counterparties,and we routinely execute transactions with counterparties inthe financial services industry, including brokers and dealers,commercial banks, investment banks, mutual and hedge funds,and other institutional clients. Many of these transactionsexpose us to credit risk in the event of default of ourcounterparty or client. In addition, our credit risk may beexacerbated when the collateral held by us cannot be realizedupon or is liquidated at prices that are not sufficient to recoverthe full amount of the loan or derivative exposure due us.
20 The PNC Financial Services Group, Inc. – Form 10-K
We operate in a highly competitive environment, in termsof the products and services we offer and the geographicmarkets in which we conduct business, as well as in ourlabor markets where we compete for talented employees.Competition could adversely impact our customeracquisition, growth and retention, as well as our creditspreads and product pricing, causing us to lose marketshare and deposits and revenues.
We are subject to intense competition from various financialinstitutions as well as from non-bank entities that engage inmany similar activities without being subject to bankregulatory supervision and restrictions. This competition isdescribed in Item 1 of this Report under “Competition.”
In all, the principal bases for competition are pricing(including the interest rates charged on loans or paid oninterest-bearing deposits), product structure, the range ofproducts and services offered, and the quality of customerservice (including convenience and responsiveness tocustomer needs and concerns). The ability to access and usetechnology is an increasingly important competitive factor inthe financial services industry, and it is a critically importantcomponent to customer satisfaction as it affects our ability todeliver the right products and services.
Another increasingly competitive factor in the financialservices industry is the competition to attract and retaintalented employees across many of our business and supportareas. This competition leads to increased expenses in manybusiness areas and can also cause us to not pursue certainbusiness opportunities.
A failure to adequately address the competitive pressures weface could make it harder for us to attract and retain customersacross our businesses. On the other hand, meeting thesecompetitive pressures could require us to incur significantadditional expense or to accept risk beyond what we wouldotherwise view as desirable under the circumstances. Inaddition, in our interest rate sensitive businesses, pressures toincrease rates on deposits or decrease rates on loans couldreduce our net interest margin with a resulting negative impacton our net interest income.
The performance of our asset management businesses maybe adversely impacted by overall economic and marketconditions as well as the relative performance of ourproducts compared with the offerings by competitors.
Asset management revenue is primarily based on a percentageof the value of the assets and thus is impacted by generalchanges in market valuations, customer preferences and needs.In addition, investment performance is an important factorinfluencing the level of assets. Poor investment performancecould impair revenue and growth as existing clients mightwithdraw funds in favor of better performing products.Additionally, the ability to attract funds from existing and newclients might diminish. Overall economic conditions may limit
the amount that customers are able or willing to invest as wellas the value of the assets they do invest.
The failure or negative performance of products of otherfinancial institutions could lead to a loss of confidence insimilar products offered by us without regard to theperformance of our products. Such a negative contagion couldlead to withdrawals, redemptions and liquidity issues in suchproducts and have a material adverse impact on our assetsunder management and asset management revenues andearnings.
As a regulated financial services firm, we are subject tonumerous governmental regulations and to comprehensiveexamination and supervision by regulators, which affectour business as well as our competitive position.
PNC is a bank holding company and a financial holdingcompany and is subject to numerous governmental regulationsinvolving both its business and organization.
Our businesses are subject to regulation by multiple bankregulatory bodies as well as multiple securities industryregulators. Applicable laws and regulations restrict our abilityto repurchase stock or to receive dividends from subsidiariesthat operate in the banking and securities businesses andimpose capital adequacy requirements. PNC’s ability toservice its obligations is dependent on the receipt of dividendsand advances from its subsidiaries. Applicable laws andregulations also restrict permissible activities and investmentsand require compliance with protections for loan, deposit,brokerage, fiduciary, mutual fund and other customers, and forthe protection of customer information, among other things.We are also subject to laws and regulations designed tocombat money laundering, terrorist financing, and transactionswith persons, companies or foreign governments designatedby U.S. authorities. The consequences of noncompliance caninclude substantial monetary and nonmonetary sanctions aswell as damage to our reputation and businesses.
In addition, we are subject to comprehensive examination andsupervision by banking and other regulatory bodies.Examination reports and ratings (which often are not publiclyavailable) and other aspects of this supervisory framework canmaterially impact the conduct, growth, and profitability of ourbusinesses.
Due to the current economic environment and issues facingthe financial services industry, we anticipate that there will benew legislative and regulatory initiatives over the next severalyears, including many focused specifically on banking andother financial services in which we are engaged. Theseinitiatives will be in addition to the actions already taken byCongress and the regulators, through enactment of the CreditCARD Act, the SAFE Act, and Dodd-Frank, as well aschanges to the regulations implementing the Real EstateSettlement Procedures Act, the Federal Truth in Lending Act,
The PNC Financial Services Group, Inc. – Form 10-K 21

and the Electronic Fund Transfer Act. Legislative andregulatory initiatives have had and are likely to continue tohave an impact on the conduct of our business. This impactcould include rules and regulations that affect the nature andprofitability of our business activities, how we use our capital,how we compensate and incent our employees, the type andamount of instruments we hold for liquidity purposes, andother matters potentially having a negative effect on ouroverall business results and prospects.
Under the regulations of the Federal Reserve, a bank holdingcompany is expected to act as a source of financial andmanagerial strength for its subsidiary banks. As a result, theFederal Reserve could require PNC to commit resources toPNC Bank, N.A. when doing so is not otherwise in theinterests of PNC or its shareholders or creditors.
Our ability to pay dividends to shareholders is largelydependent on dividends from our operating subsidiaries,principally PNC Bank, N.A. Banks are subject to regulationthat limits and governs the payout of dividends to theirholding companies.
We discuss these and other regulatory issues applicable toPNC, including some particular areas of current regulatoryfocus or concern, in the Supervision and Regulation sectionincluded in Item 1 of this Report and in Note 22 RegulatoryMatters in the Notes To Consolidated Financial Statements inItem 8 of this Report.
A failure to comply, or to have adequate policies andprocedures designed to comply, with regulatory requirementscould expose us to damages, fines and regulatory penaltiesand other regulatory actions, which could be significant, andcould also injure our reputation with customers and otherswith whom we do business.
We must comply with generally accepted accountingprinciples established by the Financial Accounting StandardsBoard, accounting, disclosure and other rules set forth by theSEC, income tax and other regulations established by the U.S.Treasury and state and local taxing authorities, and revenuerulings and other guidance issued by the Internal RevenueService, which affect our financial condition and results ofoperations.
Changes in accounting standards, or interpretations of thosestandards, can impact our revenue recognition and expensepolicies and affect our estimation methods used to prepare theconsolidated financial statements. Changes in income taxregulations, revenue rulings, revenue procedures, and otherguidance can impact our tax liability and alter the timing ofcash flows associated with tax deductions and payments. Newguidance often dictates how changes to standards andregulations are to be presented in our consolidated financialstatements, as either an adjustment to beginning retainedearnings for the period or as income or expense in current
period earnings. In some cases, changes may be applied topreviously reported disclosures.
The determination of the amount of loss allowances andimpairments taken on our assets is highly subjective, andinaccurate estimates could materially impact our results ofoperations or financial position.
The determination of the amount of loss allowances and assetimpairments varies by asset type and is based upon ourperiodic evaluation and assessment of known and inherentrisks associated with the respective asset class. Suchevaluations and assessments are revised as conditions changeand new information becomes available. Management updatesits evaluations regularly and reflects changes in allowancesand impairments in operations as such evaluations are revised.Although we have policies and procedures in place todetermine loss allowance and asset impairments, due to thesubstantial subjective nature of this area, there can be noassurance that our management has accurately assessed thelevel of impairments taken and allowances reflected in ourfinancial statements. Furthermore, additional impairmentsmay need to be taken or allowances provided for in the future.Historical trends may not be indicative of future impairmentsor allowances.
Our asset valuation may include methodologies,estimations and assumptions that are subject to differinginterpretations and this, along with market factors such asvolatility in one or more markets, could result in changesto asset valuations that may materially adversely affectour results of operations or financial condition.
We must use estimates, assumptions, and judgments whenassets and liabilities are measured and reported at fair value.Assets and liabilities carried at fair value inherently result in ahigher degree of financial statement volatility. Fair values andthe information used to record valuation adjustments forcertain assets and liabilities are based on quoted market pricesand/or other observable inputs provided by independent third-party sources, when available. When such third-partyinformation is not available, we estimate fair value primarilyby using cash flow and other financial modeling techniquesutilizing assumptions such as credit quality, liquidity, interestrates and other relevant inputs. Changes in underlying factorsor assumptions in any of the areas underlying our estimatescould materially impact our future financial condition andresults of operations.
During periods of market disruption, including periods ofsignificantly rising or high interest rates, rapidly wideningcredit spreads or illiquidity, it may be more difficult to valuecertain of our assets if trading becomes less frequent and/ormarket data becomes less observable. There may be certainasset classes that were historically in active markets withsignificant observable data that rapidly become illiquid due tomarket volatility, a loss in market confidence or other factors.In such cases, valuations in certain asset classes may require
22 The PNC Financial Services Group, Inc. – Form 10-K
more subjectivity and management judgment; valuations mayinclude inputs and assumptions that are less observable orrequire greater estimation. Further, rapidly changing andunprecedented market conditions in any particular market (e.g.credit, equity, fixed income, foreign exchange) couldmaterially impact the valuation of assets as reported withinour consolidated financial statements, and the period-to-periodchanges in value could vary significantly.
There are risks resulting from the extensive use of modelsin our business.
PNC relies on quantitative models to measure risks and toestimate certain financial values. Models may be used in suchprocesses as determining the pricing of various products,grading loans and extending credit, measuring interest rate andother market risks, predicting losses, assessing capitaladequacy, and calculating regulatory capital levels, as well asto estimate the value of financial instruments and balancesheets items. Poorly designed or implemented models presentthe risk that our business decisions based on informationincorporating models will be adversely affected due to theinadequacy of that information. Also, information we provideto the public or to our regulators based on poorly designed orimplemented models could be inaccurate or misleading. Someof the decisions that our regulators make, including thoserelated to capital distributions to our shareholders, could beaffected adversely due to their perception that the quality ofthe models used to generate the relevant information isinsufficient. See the Model Risk Management portion of theRisk Management section included in Item 7 of this Report.
We are subject to operational risk.
Like all businesses, we are subject to operational risk, whichrepresents the risk of loss resulting from inadequate or failedinternal processes and systems, human error and externalevents. Operational risk also encompasses technology,compliance and legal risk, which is the risk of loss fromviolations of, or noncompliance with, laws, rules, regulations,prescribed practices or ethical standards, as well as the risk ofour noncompliance with contractual and other obligations. Weare also exposed to operational risk through our outsourcingarrangements, and the effect that changes in circumstances orcapabilities of our outsourcing vendors can have on our abilityto continue to perform operational functions necessary to ourbusiness. Although we seek to mitigate operational riskthrough a system of internal controls which we review andupdate, no system of controls, however well designed andmaintained, is infallible. Control weaknesses or failures orother operational risks could result in charges, increasedoperational costs, harm to our reputation or foregone businessopportunities.
We continually encounter technological change and wecould falter in our ability to remain competitive in thisarena.
The financial services industry is continually undergoing rapidtechnological change with frequent introductions of newtechnology-driven products and services. The effective use oftechnology increases efficiency and enables financialinstitutions to better serve customers and to reduce costs. Ourcontinued success depends, in part, upon our ability to addressthe needs of our customers by using technology to provideproducts and services that satisfy customer demands andcreate efficiencies in our operations. We may not be able toeffectively implement new technology-driven products andservices that allow us to remain competitive or be successfulin marketing these products and services to our customers.
Our information systems may experience interruptions orbreaches in security.
We rely heavily on communications and information systemsto conduct our business. Any failure, interruption or breach insecurity of these systems could result in disruptions to ouraccounting, deposit, loan and other systems, and adverselyaffect our customer relationships. While we have policies,procedures and systems designed to prevent or limit the effectof these possible events, there remains the risk that such afailure, interruption or security breach might occur and, if itdoes occur, that it might not be sufficiently remediated.
Recently, there have been several well-publicized series ofapparently related denial of service attacks on large financialservices companies, including PNC. In a denial of serviceattack, hackers flood commercial websites withextraordinarily high volumes of traffic, with the goal ofdisrupting the ability of commercial enterprises to processtransactions and possibly making their websites unavailable tocustomers for extended periods of time. The recent attacksagainst PNC resulted in temporary disruptions in customers’ability to access the corporate website and to perform on-linebanking transactions, although no customer data was lost orcompromised. Furthermore, even if not directed at PNCspecifically, attacks on other entities with whom we dobusiness or on whom we otherwise rely or attacks on financialor other institutions important to the overall functioning of thefinancial system could adversely affect, directly or indirectly,aspects of PNC’s business.
In addition, there have been increasing efforts on the part ofthird parties to breach data security at financial institutions orwith respect to financial transactions, including through theuse of social engineering schemes such as “phishing.” Theability of our customers to bank remotely, including onlineand through mobile devices, requires secure transmission ofconfidential information and increases the risk of data securitybreaches.
The PNC Financial Services Group, Inc. – Form 10-K 23
Because the techniques used to attack financial servicescompany communications and information systems changefrequently (and generally increasing in sophistication), oftenare not recognized until launched against a target, may besupported by foreign governments or other well-financedentities, and may originate from less regulated and remoteareas around the world, we may be unable to address thesetechniques in advance of attacks, including by implementingadequate preventative measures.
Despite temporary disruptions in our ability to provideproducts and services to our customers, to date these effortshave not had a material impact on PNC. Nonetheless, theoccurrence of any such failure, interruption or security breachof our systems, particularly if widespread or resulting infinancial losses to our customers, could damage the reputationof PNC, result in a loss of customer business, subject us toadditional regulatory scrutiny, or expose us to civil litigationand financial liability. In addition, the increasing prevalenceof cyberattacks and other efforts to breach or disrupt oursystems has led, and we expect will continue to lead, toincreased costs to PNC with respect to prevention andmitigation of these risks, as well as costs reimbursingcustomers for losses suffered as a result of these actions.Successful attacks or systems failures at other large financialinstitutions, whether or not PNC is included, could lead to ageneral loss of customer confidence in financial institutionswith a potential negative impact on PNC’s business, additionaldemands on the part of our regulators, and increased costs todeal with risks identified as a result of the problems affectingothers.
Our business and financial results could be impactedmaterially by adverse results in legal proceedings.
Many aspects of our business involve substantial risk of legalliability. We have been named or threatened to be named asdefendants in various lawsuits arising from our businessactivities (and in some cases from the activities of companieswe have acquired). In addition, we are regularly the subject ofgovernmental investigations and other forms of regulatoryinquiry. We also are at risk when we have agreed to indemnifyothers for losses related to legal proceedings, includinglitigation and governmental investigations and inquiries, theyface, such as in connection with the sale of a business or assetsby us. The results of these legal proceedings could lead tosignificant monetary damages or penalties, restrictions on theway in which we conduct our business, or reputational harm.
Although we establish accruals for legal proceedings wheninformation related to the loss contingencies represented bythose matters indicates both that a loss is probable and that theamount of loss can be reasonably estimated, we do not haveaccruals for all legal proceedings where we face a risk of loss.In addition, due to the inherent subjectivity of the assessmentsand unpredictability of the outcome of legal proceedings,amounts accrued may not represent the ultimate loss to usfrom the legal proceedings in question. Thus, our ultimate
losses may be higher, and possibly significantly so, than theamounts accrued for legal loss contingencies.
We discuss further the unpredictability of legal proceedingsand describe some of our pending legal proceedings in Note23 Legal Proceedings in the Notes To Consolidated FinancialStatements in Item 8 of this Report.
Our business and financial performance could beadversely affected, directly or indirectly, by disasters,natural or otherwise, by terrorist activities or byinternational hostilities.
Neither the occurrence nor the potential impact of disasters(such as earthquakes, hurricanes, tornadoes, floods, fires,explosions, and other severe weather conditions orcatastrophic accidents), terrorist activities and internationalhostilities can be predicted. However, these occurrences couldimpact us directly (for example, by causing significantdamage to our facilities or preventing us from conducting ourbusiness in the ordinary course), or indirectly as a result oftheir impact on our borrowers, depositors, other customers,suppliers or other counterparties. We could also suffer adverseconsequences to the extent that disasters, terrorist activities orinternational hostilities affect the financial markets or theeconomy in general or in any particular region. These types ofimpacts could lead, for example, to an increase indelinquencies, bankruptcies or defaults that could result in ourexperiencing higher levels of nonperforming assets, netcharge-offs and provisions for credit losses.
Our ability to mitigate the adverse consequences of suchoccurrences is in part dependent on the quality of ourresiliency planning, and our ability, if any, to anticipate thenature of any such event that occurs. The adverse impact ofdisasters or terrorist activities or international hostilities alsocould be increased to the extent that there is a lack ofpreparedness on the part of national or regional emergencyresponders or on the part of other organizations and businessesthat we deal with, particularly those that we depend upon buthave no control over.
ITEM 1B – UNRESOLVED STAFF COMMENTSThere are no SEC staff comments regarding PNC’s periodic orcurrent reports under the Exchange Act that are pendingresolution.
ITEM 2 – PROPERTIESOur executive and primary administrative offices are currentlylocated at One PNC Plaza, Pittsburgh, Pennsylvania. The 30-story structure is owned by PNC Bank, N.A.
We own or lease numerous other premises for use inconducting business activities, including operations centers,offices, and branch and other facilities. We consider thefacilities owned or occupied under lease by our subsidiaries tobe adequate for the purposes of our business operations. Weinclude here by reference the additional information regardingour properties in Note 11 Premises, Equipment and Leasehold
24 The PNC Financial Services Group, Inc. – Form 10-K
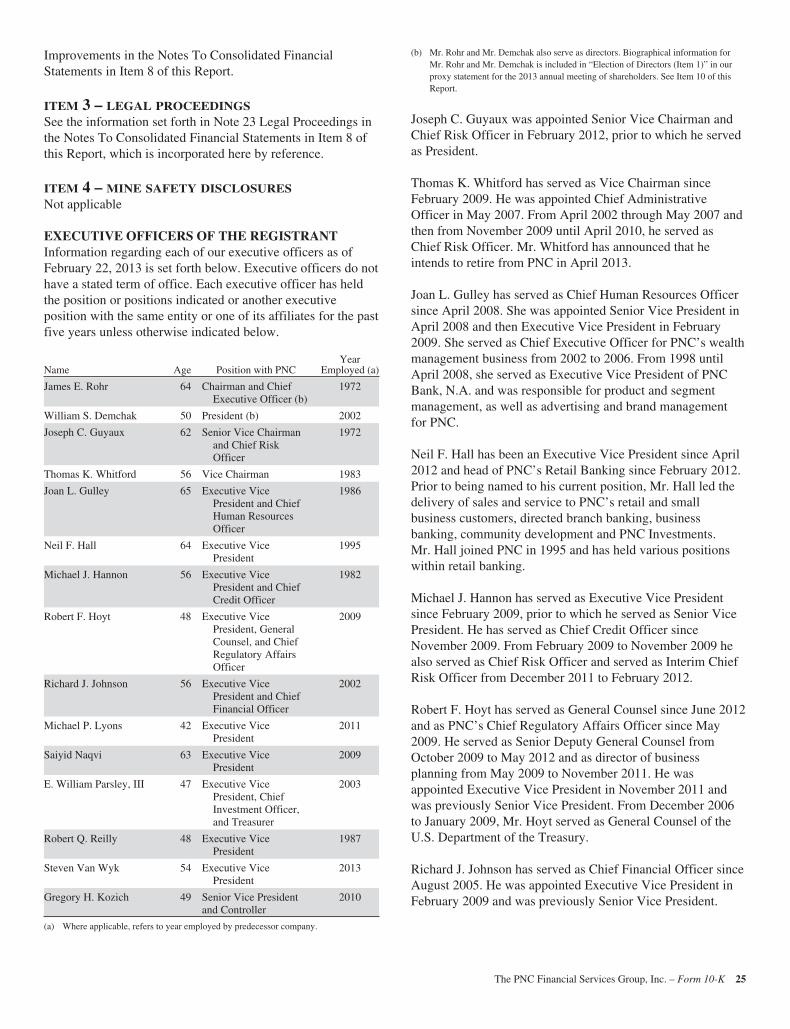
Improvements in the Notes To Consolidated FinancialStatements in Item 8 of this Report.
ITEM 3 – LEGAL PROCEEDINGSSee the information set forth in Note 23 Legal Proceedings inthe Notes To Consolidated Financial Statements in Item 8 ofthis Report, which is incorporated here by reference.
ITEM 4 – MINE SAFETY DISCLOSURESNot applicable
EXECUTIVE OFFICERS OF THE REGISTRANTInformation regarding each of our executive officers as ofFebruary 22, 2013 is set forth below. Executive officers do nothave a stated term of office. Each executive officer has heldthe position or positions indicated or another executiveposition with the same entity or one of its affiliates for the pastfive years unless otherwise indicated below.
Name Age Position with PNCYear
Employed (a)
James E. Rohr 64 Chairman and ChiefExecutive Officer (b)
1972
William S. Demchak 50 President (b) 2002
Joseph C. Guyaux 62 Senior Vice Chairmanand Chief RiskOfficer
1972
Thomas K. Whitford 56 Vice Chairman 1983
Joan L. Gulley 65 Executive VicePresident and ChiefHuman ResourcesOfficer
1986
Neil F. Hall 64 Executive VicePresident
1995
Michael J. Hannon 56 Executive VicePresident and ChiefCredit Officer
1982
Robert F. Hoyt 48 Executive VicePresident, GeneralCounsel, and ChiefRegulatory AffairsOfficer
2009
Richard J. Johnson 56 Executive VicePresident and ChiefFinancial Officer
2002
Michael P. Lyons 42 Executive VicePresident
2011
Saiyid Naqvi 63 Executive VicePresident
2009
E. William Parsley, III 47 Executive VicePresident, ChiefInvestment Officer,and Treasurer
2003
Robert Q. Reilly 48 Executive VicePresident
1987
Steven Van Wyk 54 Executive VicePresident
2013
Gregory H. Kozich 49 Senior Vice Presidentand Controller
2010
(a) Where applicable, refers to year employed by predecessor company.
(b) Mr. Rohr and Mr. Demchak also serve as directors. Biographical information forMr. Rohr and Mr. Demchak is included in “Election of Directors (Item 1)” in ourproxy statement for the 2013 annual meeting of shareholders. See Item 10 of thisReport.
Joseph C. Guyaux was appointed Senior Vice Chairman andChief Risk Officer in February 2012, prior to which he servedas President.
Thomas K. Whitford has served as Vice Chairman sinceFebruary 2009. He was appointed Chief AdministrativeOfficer in May 2007. From April 2002 through May 2007 andthen from November 2009 until April 2010, he served asChief Risk Officer. Mr. Whitford has announced that heintends to retire from PNC in April 2013.
Joan L. Gulley has served as Chief Human Resources Officersince April 2008. She was appointed Senior Vice President inApril 2008 and then Executive Vice President in February2009. She served as Chief Executive Officer for PNC’s wealthmanagement business from 2002 to 2006. From 1998 untilApril 2008, she served as Executive Vice President of PNCBank, N.A. and was responsible for product and segmentmanagement, as well as advertising and brand managementfor PNC.
Neil F. Hall has been an Executive Vice President since April2012 and head of PNC’s Retail Banking since February 2012.Prior to being named to his current position, Mr. Hall led thedelivery of sales and service to PNC’s retail and smallbusiness customers, directed branch banking, businessbanking, community development and PNC Investments.Mr. Hall joined PNC in 1995 and has held various positionswithin retail banking.
Michael J. Hannon has served as Executive Vice Presidentsince February 2009, prior to which he served as Senior VicePresident. He has served as Chief Credit Officer sinceNovember 2009. From February 2009 to November 2009 healso served as Chief Risk Officer and served as Interim ChiefRisk Officer from December 2011 to February 2012.
Robert F. Hoyt has served as General Counsel since June 2012and as PNC’s Chief Regulatory Affairs Officer since May2009. He served as Senior Deputy General Counsel fromOctober 2009 to May 2012 and as director of businessplanning from May 2009 to November 2011. He wasappointed Executive Vice President in November 2011 andwas previously Senior Vice President. From December 2006to January 2009, Mr. Hoyt served as General Counsel of theU.S. Department of the Treasury.
Richard J. Johnson has served as Chief Financial Officer sinceAugust 2005. He was appointed Executive Vice President inFebruary 2009 and was previously Senior Vice President.
The PNC Financial Services Group, Inc. – Form 10-K 25

Michael P. Lyons has been an Executive Vice President sinceNovember 2011 and is head of Corporate and InstitutionalBanking. Prior to joining PNC in October 2011, from May2010 until October 2011, Mr. Lyons was head of corporatedevelopment and strategic planning for Bank of America.Prior to joining Bank of America, from September 2004 toMay 2010, Mr. Lyons held various positions at MaverickCapital, most recently as a principal focused on financialinstitutions investments.
Saiyid Naqvi has been an Executive Vice President sinceApril 2012 and has served as Chief Executive Officer of PNCMortgage since he returned to PNC in 2009. Mr. Naqvi hadpreviously served as Chief Executive Officer of PNCMortgage from 1993 until its sale in 2001. Prior to returningto PNC in 2009, Mr. Naqvi served as president of HarleyDavidson Financial Services Inc.
E. William Parsley, III has served as Treasurer and ChiefInvestment Officer since January 2004. He was appointedExecutive Vice President of PNC in February 2009.
Robert Q. Reilly has served as the head of PNC’s AssetManagement Group since 2005. Previously, he held numerousmanagement roles in both Corporate Banking and AssetManagement. He was appointed Executive Vice President inFebruary 2009.
Steven Van Wyk joined PNC as head of Technology andOperations in January 2013. Prior to joining PNC, Mr. VanWyk served as Global Chief Operating Officer for ING. Hewas appointed Executive Vice President of PNC in February2013.
Gregory H. Kozich has served as a Senior Vice President andCorporate Controller of PNC since 2011. Mr. Kozich joinedPNC as Senior Vice President of PNC Bank, N.A. in October2010. Prior to joining PNC, Mr. Kozich was with Fannie Maefrom 2005 until late 2010, most recently serving as itscorporate controller.
DIRECTORS OF THE REGISTRANTThe name, age and principal occupation of each of ourdirectors as of February 22, 2013, and the year he or she firstbecame a director is set forth below:
• Richard O. Berndt, 70, Managing Partner ofGallagher, Evelius & Jones LLP (law firm) (2007)
• Charles E. Bunch, 63, Chairman and Chief ExecutiveOfficer of PPG Industries, Inc. (coatings, sealantsand glass products) (2007)
• Paul W. Chellgren, 70, Operating Partner, SnowPhipps Group, LLC (private equity) (1995)
• William S. Demchak, 50, President of PNC (2013)• Kay Coles James, 63, President and Founder of The
Gloucester Institute (non-profit) (2006)• Richard B. Kelson, 66, President and Chief Executive
Officer, ServCo, LLC (strategic sourcing, supplychain management) (2002)
• Bruce C. Lindsay, 71, Chairman and ManagingMember of 2117 Associates, LLC (businessconsulting firm) (1995)
• Anthony A. Massaro, 68, Retired Chairman andChief Executive Officer of Lincoln ElectricHoldings, Inc. (manufacturer of welding and cuttingproducts) (2002)
• Jane G. Pepper, 67, Retired President of thePennsylvania Horticultural Society (non-profit)(1997)
• James E. Rohr, 64, Chairman and Chief ExecutiveOfficer of PNC (1990)
• Donald J. Shepard, 66, Retired Chairman of theExecutive Board and Chief Executive Officer ofAEGON N.V. (insurance) (2007)
• Lorene K. Steffes, 67, Independent Business Advisor(technology and technical services) (2000)
• Dennis F. Strigl, 66, Retired President and ChiefOperating Officer of Verizon Communications Inc.(telecommunications) (2001)
• Thomas J. Usher, 70, Non-executive Chairman ofMarathon Petroleum Corporation (oil and gasindustry) (1992)
• George H. Walls, Jr., 70, former Chief DeputyAuditor for the State of North Carolina (2006)
• Helge H. Wehmeier, 70, Retired Vice Chairman ofBayer Corporation (healthcare, crop protection, andchemicals) (1992)
26 The PNC Financial Services Group, Inc. – Form 10-K
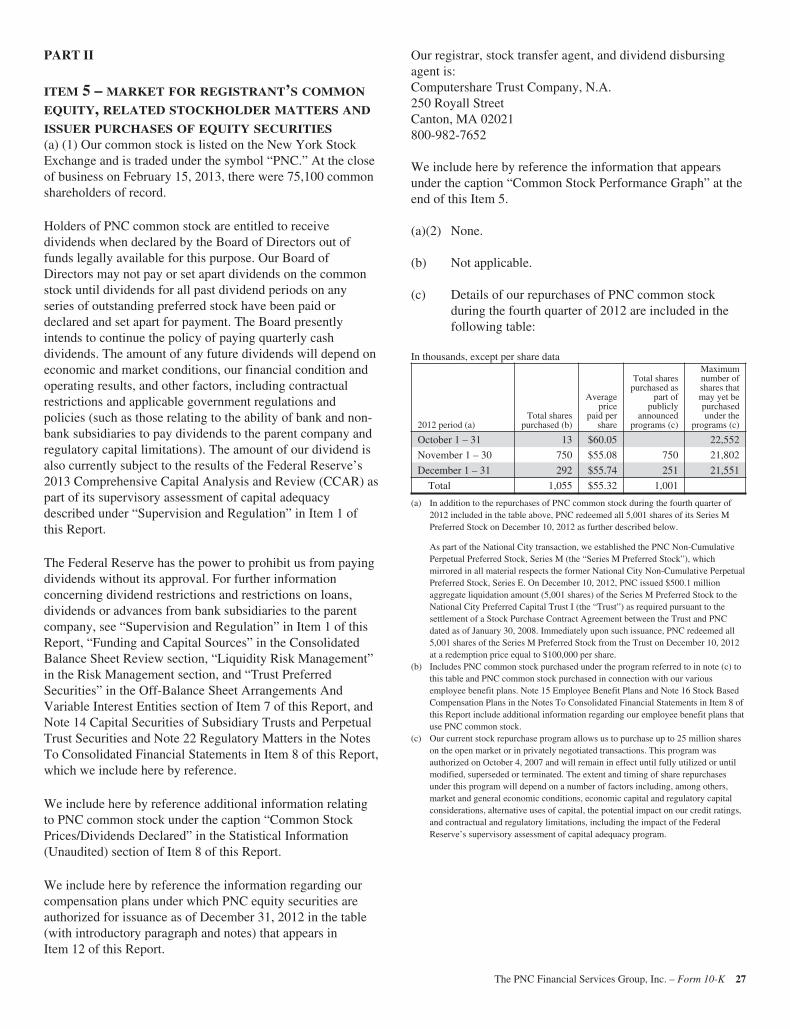
PART II
ITEM 5 – MARKET FOR REGISTRANT’S COMMON
EQUITY, RELATED STOCKHOLDER MATTERS AND
ISSUER PURCHASES OF EQUITY SECURITIES(a) (1) Our common stock is listed on the New York StockExchange and is traded under the symbol “PNC.” At the closeof business on February 15, 2013, there were 75,100 commonshareholders of record.
Holders of PNC common stock are entitled to receivedividends when declared by the Board of Directors out offunds legally available for this purpose. Our Board ofDirectors may not pay or set apart dividends on the commonstock until dividends for all past dividend periods on anyseries of outstanding preferred stock have been paid ordeclared and set apart for payment. The Board presentlyintends to continue the policy of paying quarterly cashdividends. The amount of any future dividends will depend oneconomic and market conditions, our financial condition andoperating results, and other factors, including contractualrestrictions and applicable government regulations andpolicies (such as those relating to the ability of bank and non-bank subsidiaries to pay dividends to the parent company andregulatory capital limitations). The amount of our dividend isalso currently subject to the results of the Federal Reserve’s2013 Comprehensive Capital Analysis and Review (CCAR) aspart of its supervisory assessment of capital adequacydescribed under “Supervision and Regulation” in Item 1 ofthis Report.
The Federal Reserve has the power to prohibit us from payingdividends without its approval. For further informationconcerning dividend restrictions and restrictions on loans,dividends or advances from bank subsidiaries to the parentcompany, see “Supervision and Regulation” in Item 1 of thisReport, “Funding and Capital Sources” in the ConsolidatedBalance Sheet Review section, “Liquidity Risk Management”in the Risk Management section, and “Trust PreferredSecurities” in the Off-Balance Sheet Arrangements AndVariable Interest Entities section of Item 7 of this Report, andNote 14 Capital Securities of Subsidiary Trusts and PerpetualTrust Securities and Note 22 Regulatory Matters in the NotesTo Consolidated Financial Statements in Item 8 of this Report,which we include here by reference.
We include here by reference additional information relatingto PNC common stock under the caption “Common StockPrices/Dividends Declared” in the Statistical Information(Unaudited) section of Item 8 of this Report.
We include here by reference the information regarding ourcompensation plans under which PNC equity securities areauthorized for issuance as of December 31, 2012 in the table(with introductory paragraph and notes) that appears inItem 12 of this Report.
Our registrar, stock transfer agent, and dividend disbursingagent is:Computershare Trust Company, N.A.250 Royall StreetCanton, MA 02021800-982-7652
We include here by reference the information that appearsunder the caption “Common Stock Performance Graph” at theend of this Item 5.
(a)(2) None.
(b) Not applicable.
(c) Details of our repurchases of PNC common stockduring the fourth quarter of 2012 are included in thefollowing table:
In thousands, except per share data
2012 period (a)Total shares
purchased (b)
Averageprice
paid pershare
Total sharespurchased as
part ofpublicly
announcedprograms (c)
Maximumnumber ofshares thatmay yet bepurchasedunder the
programs (c)
October 1 – 31 13 $60.05 22,552
November 1 – 30 750 $55.08 750 21,802
December 1 – 31 292 $55.74 251 21,551
Total 1,055 $55.32 1,001
(a) In addition to the repurchases of PNC common stock during the fourth quarter of2012 included in the table above, PNC redeemed all 5,001 shares of its Series MPreferred Stock on December 10, 2012 as further described below.
As part of the National City transaction, we established the PNC Non-CumulativePerpetual Preferred Stock, Series M (the “Series M Preferred Stock”), whichmirrored in all material respects the former National City Non-Cumulative PerpetualPreferred Stock, Series E. On December 10, 2012, PNC issued $500.1 millionaggregate liquidation amount (5,001 shares) of the Series M Preferred Stock to theNational City Preferred Capital Trust I (the “Trust”) as required pursuant to thesettlement of a Stock Purchase Contract Agreement between the Trust and PNCdated as of January 30, 2008. Immediately upon such issuance, PNC redeemed all5,001 shares of the Series M Preferred Stock from the Trust on December 10, 2012at a redemption price equal to $100,000 per share.
(b) Includes PNC common stock purchased under the program referred to in note (c) tothis table and PNC common stock purchased in connection with our variousemployee benefit plans. Note 15 Employee Benefit Plans and Note 16 Stock BasedCompensation Plans in the Notes To Consolidated Financial Statements in Item 8 ofthis Report include additional information regarding our employee benefit plans thatuse PNC common stock.
(c) Our current stock repurchase program allows us to purchase up to 25 million shareson the open market or in privately negotiated transactions. This program wasauthorized on October 4, 2007 and will remain in effect until fully utilized or untilmodified, superseded or terminated. The extent and timing of share repurchasesunder this program will depend on a number of factors including, among others,market and general economic conditions, economic capital and regulatory capitalconsiderations, alternative uses of capital, the potential impact on our credit ratings,and contractual and regulatory limitations, including the impact of the FederalReserve’s supervisory assessment of capital adequacy program.
The PNC Financial Services Group, Inc. – Form 10-K 27
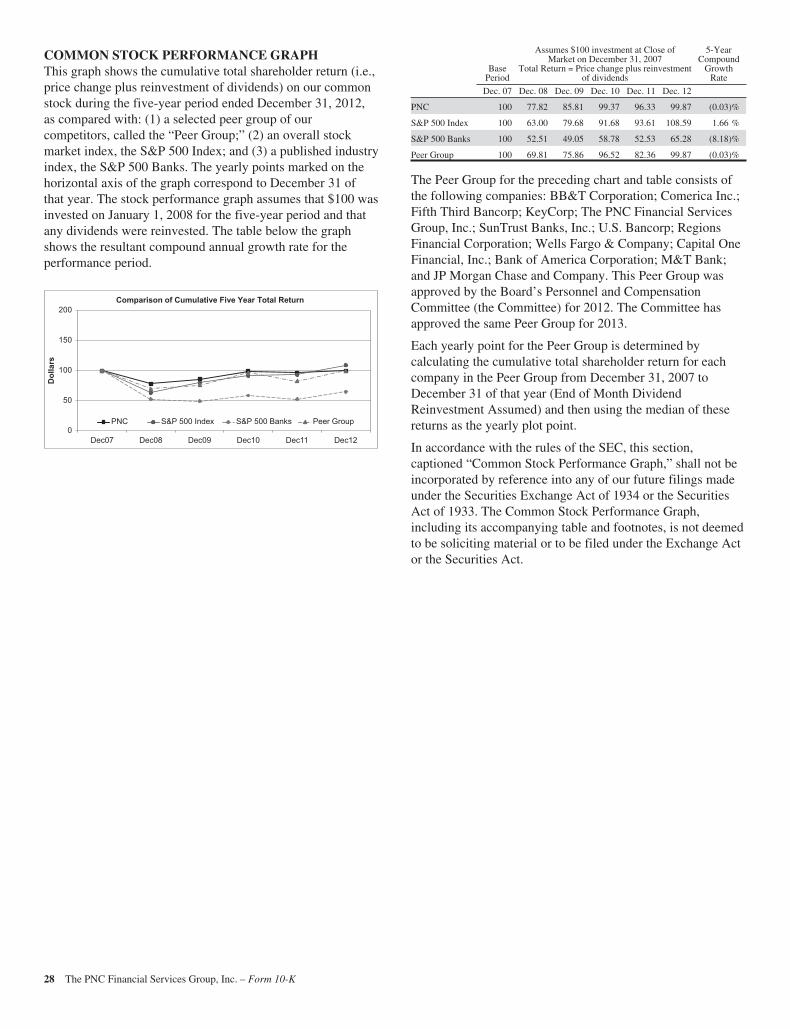
COMMON STOCK PERFORMANCE GRAPHThis graph shows the cumulative total shareholder return (i.e.,price change plus reinvestment of dividends) on our commonstock during the five-year period ended December 31, 2012,as compared with: (1) a selected peer group of ourcompetitors, called the “Peer Group;” (2) an overall stockmarket index, the S&P 500 Index; and (3) a published industryindex, the S&P 500 Banks. The yearly points marked on thehorizontal axis of the graph correspond to December 31 ofthat year. The stock performance graph assumes that $100 wasinvested on January 1, 2008 for the five-year period and thatany dividends were reinvested. The table below the graphshows the resultant compound annual growth rate for theperformance period.
0
50
100
150
200
Dec07 Dec08 Dec09 Dec10 Dec11 Dec12
Dol
lars
Comparison of Cumulative Five Year Total Return
PNC S&P 500 Index S&P 500 Banks Peer Group
BasePeriod
Assumes $100 investment at Close ofMarket on December 31, 2007
Total Return = Price change plus reinvestmentof dividends
5-YearCompound
GrowthRate
Dec. 07 Dec. 08 Dec. 09 Dec. 10 Dec. 11 Dec. 12
PNC 100 77.82 85.81 99.37 96.33 99.87 (0.03)%
S&P 500 Index 100 63.00 79.68 91.68 93.61 108.59 1.66 %
S&P 500 Banks 100 52.51 49.05 58.78 52.53 65.28 (8.18)%
Peer Group 100 69.81 75.86 96.52 82.36 99.87 (0.03)%
The Peer Group for the preceding chart and table consists ofthe following companies: BB&T Corporation; Comerica Inc.;Fifth Third Bancorp; KeyCorp; The PNC Financial ServicesGroup, Inc.; SunTrust Banks, Inc.; U.S. Bancorp; RegionsFinancial Corporation; Wells Fargo & Company; Capital OneFinancial, Inc.; Bank of America Corporation; M&T Bank;and JP Morgan Chase and Company. This Peer Group wasapproved by the Board’s Personnel and CompensationCommittee (the Committee) for 2012. The Committee hasapproved the same Peer Group for 2013.
Each yearly point for the Peer Group is determined bycalculating the cumulative total shareholder return for eachcompany in the Peer Group from December 31, 2007 toDecember 31 of that year (End of Month DividendReinvestment Assumed) and then using the median of thesereturns as the yearly plot point.
In accordance with the rules of the SEC, this section,captioned “Common Stock Performance Graph,” shall not beincorporated by reference into any of our future filings madeunder the Securities Exchange Act of 1934 or the SecuritiesAct of 1933. The Common Stock Performance Graph,including its accompanying table and footnotes, is not deemedto be soliciting material or to be filed under the Exchange Actor the Securities Act.
28 The PNC Financial Services Group, Inc. – Form 10-K
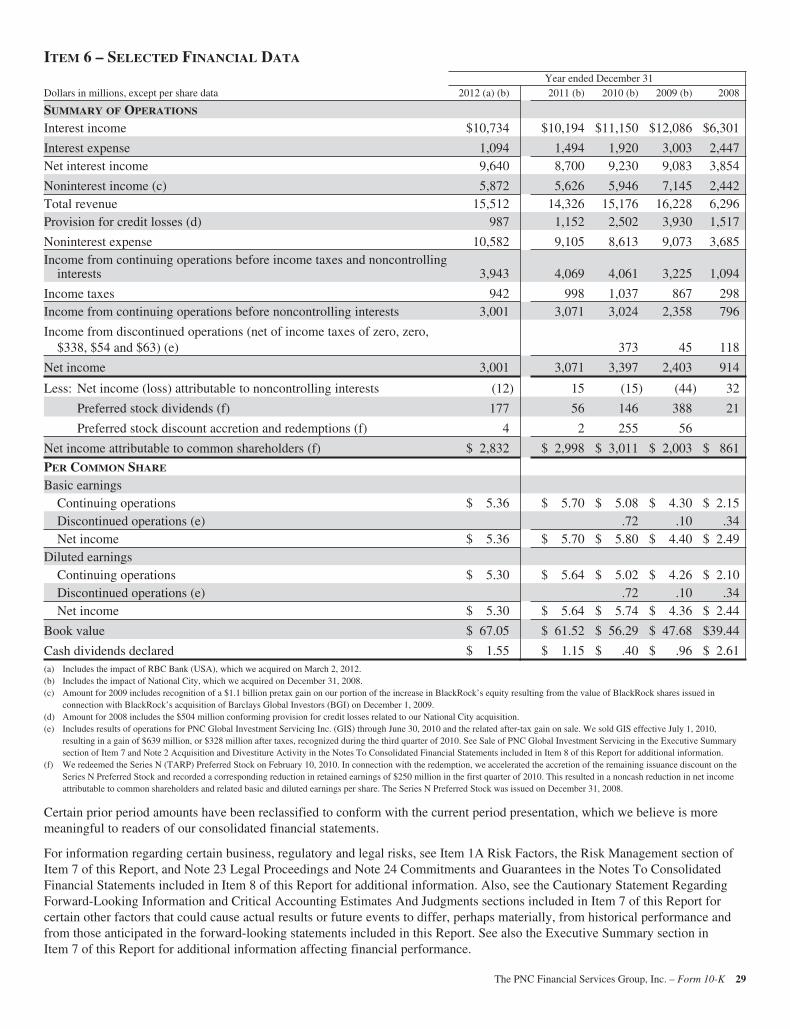
ITEM 6 – SELECTED FINANCIAL DATA
Year ended December 31Dollars in millions, except per share data 2012 (a) (b) 2011 (b) 2010 (b) 2009 (b) 2008
SUMMARY OF OPERATIONS
Interest income $10,734 $10,194 $11,150 $12,086 $6,301
Interest expense 1,094 1,494 1,920 3,003 2,447Net interest income 9,640 8,700 9,230 9,083 3,854
Noninterest income (c) 5,872 5,626 5,946 7,145 2,442Total revenue 15,512 14,326 15,176 16,228 6,296Provision for credit losses (d) 987 1,152 2,502 3,930 1,517
Noninterest expense 10,582 9,105 8,613 9,073 3,685Income from continuing operations before income taxes and noncontrolling
interests 3,943 4,069 4,061 3,225 1,094
Income taxes 942 998 1,037 867 298Income from continuing operations before noncontrolling interests 3,001 3,071 3,024 2,358 796
Income from discontinued operations (net of income taxes of zero, zero,$338, $54 and $63) (e) 373 45 118
Net income 3,001 3,071 3,397 2,403 914
Less: Net income (loss) attributable to noncontrolling interests (12) 15 (15) (44) 32
Preferred stock dividends (f) 177 56 146 388 21
Preferred stock discount accretion and redemptions (f) 4 2 255 56
Net income attributable to common shareholders (f) $ 2,832 $ 2,998 $ 3,011 $ 2,003 $ 861
PER COMMON SHARE
Basic earningsContinuing operations $ 5.36 $ 5.70 $ 5.08 $ 4.30 $ 2.15Discontinued operations (e) .72 .10 .34Net income $ 5.36 $ 5.70 $ 5.80 $ 4.40 $ 2.49
Diluted earningsContinuing operations $ 5.30 $ 5.64 $ 5.02 $ 4.26 $ 2.10Discontinued operations (e) .72 .10 .34Net income $ 5.30 $ 5.64 $ 5.74 $ 4.36 $ 2.44
Book value $ 67.05 $ 61.52 $ 56.29 $ 47.68 $39.44
Cash dividends declared $ 1.55 $ 1.15 $ .40 $ .96 $ 2.61(a) Includes the impact of RBC Bank (USA), which we acquired on March 2, 2012.(b) Includes the impact of National City, which we acquired on December 31, 2008.(c) Amount for 2009 includes recognition of a $1.1 billion pretax gain on our portion of the increase in BlackRock’s equity resulting from the value of BlackRock shares issued in
connection with BlackRock’s acquisition of Barclays Global Investors (BGI) on December 1, 2009.(d) Amount for 2008 includes the $504 million conforming provision for credit losses related to our National City acquisition.(e) Includes results of operations for PNC Global Investment Servicing Inc. (GIS) through June 30, 2010 and the related after-tax gain on sale. We sold GIS effective July 1, 2010,
resulting in a gain of $639 million, or $328 million after taxes, recognized during the third quarter of 2010. See Sale of PNC Global Investment Servicing in the Executive Summarysection of Item 7 and Note 2 Acquisition and Divestiture Activity in the Notes To Consolidated Financial Statements included in Item 8 of this Report for additional information.
(f) We redeemed the Series N (TARP) Preferred Stock on February 10, 2010. In connection with the redemption, we accelerated the accretion of the remaining issuance discount on theSeries N Preferred Stock and recorded a corresponding reduction in retained earnings of $250 million in the first quarter of 2010. This resulted in a noncash reduction in net incomeattributable to common shareholders and related basic and diluted earnings per share. The Series N Preferred Stock was issued on December 31, 2008.
Certain prior period amounts have been reclassified to conform with the current period presentation, which we believe is moremeaningful to readers of our consolidated financial statements.
For information regarding certain business, regulatory and legal risks, see Item 1A Risk Factors, the Risk Management section ofItem 7 of this Report, and Note 23 Legal Proceedings and Note 24 Commitments and Guarantees in the Notes To ConsolidatedFinancial Statements included in Item 8 of this Report for additional information. Also, see the Cautionary Statement RegardingForward-Looking Information and Critical Accounting Estimates And Judgments sections included in Item 7 of this Report forcertain other factors that could cause actual results or future events to differ, perhaps materially, from historical performance andfrom those anticipated in the forward-looking statements included in this Report. See also the Executive Summary section inItem 7 of this Report for additional information affecting financial performance.
The PNC Financial Services Group, Inc. – Form 10-K 29
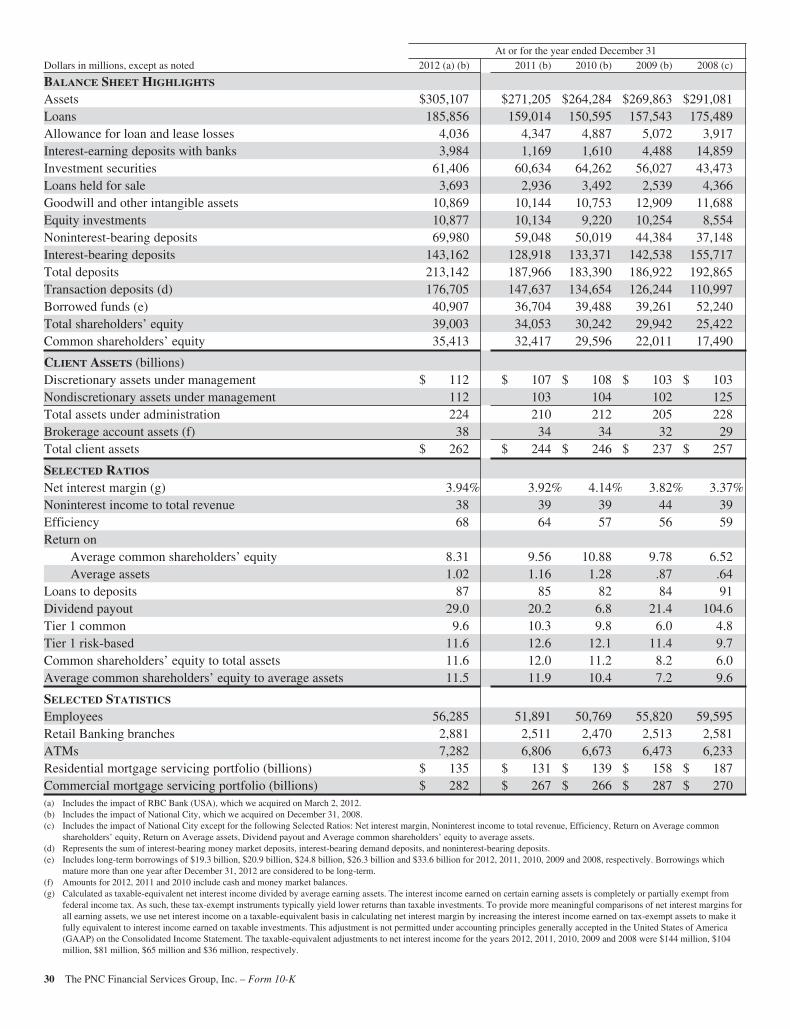
At or for the year ended December 31Dollars in millions, except as noted 2012 (a) (b) 2011 (b) 2010 (b) 2009 (b) 2008 (c)
BALANCE SHEET HIGHLIGHTS
Assets $305,107 $271,205 $264,284 $269,863 $291,081Loans 185,856 159,014 150,595 157,543 175,489Allowance for loan and lease losses 4,036 4,347 4,887 5,072 3,917Interest-earning deposits with banks 3,984 1,169 1,610 4,488 14,859Investment securities 61,406 60,634 64,262 56,027 43,473Loans held for sale 3,693 2,936 3,492 2,539 4,366Goodwill and other intangible assets 10,869 10,144 10,753 12,909 11,688Equity investments 10,877 10,134 9,220 10,254 8,554Noninterest-bearing deposits 69,980 59,048 50,019 44,384 37,148Interest-bearing deposits 143,162 128,918 133,371 142,538 155,717Total deposits 213,142 187,966 183,390 186,922 192,865Transaction deposits (d) 176,705 147,637 134,654 126,244 110,997Borrowed funds (e) 40,907 36,704 39,488 39,261 52,240Total shareholders’ equity 39,003 34,053 30,242 29,942 25,422Common shareholders’ equity 35,413 32,417 29,596 22,011 17,490
CLIENT ASSETS (billions)Discretionary assets under management $ 112 $ 107 $ 108 $ 103 $ 103Nondiscretionary assets under management 112 103 104 102 125Total assets under administration 224 210 212 205 228Brokerage account assets (f) 38 34 34 32 29Total client assets $ 262 $ 244 $ 246 $ 237 $ 257
SELECTED RATIOS
Net interest margin (g) 3.94% 3.92% 4.14% 3.82% 3.37%Noninterest income to total revenue 38 39 39 44 39Efficiency 68 64 57 56 59Return on
Average common shareholders’ equity 8.31 9.56 10.88 9.78 6.52Average assets 1.02 1.16 1.28 .87 .64
Loans to deposits 87 85 82 84 91Dividend payout 29.0 20.2 6.8 21.4 104.6Tier 1 common 9.6 10.3 9.8 6.0 4.8Tier 1 risk-based 11.6 12.6 12.1 11.4 9.7Common shareholders’ equity to total assets 11.6 12.0 11.2 8.2 6.0Average common shareholders’ equity to average assets 11.5 11.9 10.4 7.2 9.6
SELECTED STATISTICS
Employees 56,285 51,891 50,769 55,820 59,595Retail Banking branches 2,881 2,511 2,470 2,513 2,581ATMs 7,282 6,806 6,673 6,473 6,233Residential mortgage servicing portfolio (billions) $ 135 $ 131 $ 139 $ 158 $ 187Commercial mortgage servicing portfolio (billions) $ 282 $ 267 $ 266 $ 287 $ 270(a) Includes the impact of RBC Bank (USA), which we acquired on March 2, 2012.(b) Includes the impact of National City, which we acquired on December 31, 2008.(c) Includes the impact of National City except for the following Selected Ratios: Net interest margin, Noninterest income to total revenue, Efficiency, Return on Average common
shareholders’ equity, Return on Average assets, Dividend payout and Average common shareholders’ equity to average assets.(d) Represents the sum of interest-bearing money market deposits, interest-bearing demand deposits, and noninterest-bearing deposits.(e) Includes long-term borrowings of $19.3 billion, $20.9 billion, $24.8 billion, $26.3 billion and $33.6 billion for 2012, 2011, 2010, 2009 and 2008, respectively. Borrowings which
mature more than one year after December 31, 2012 are considered to be long-term.(f) Amounts for 2012, 2011 and 2010 include cash and money market balances.(g) Calculated as taxable-equivalent net interest income divided by average earning assets. The interest income earned on certain earning assets is completely or partially exempt from
federal income tax. As such, these tax-exempt instruments typically yield lower returns than taxable investments. To provide more meaningful comparisons of net interest margins forall earning assets, we use net interest income on a taxable-equivalent basis in calculating net interest margin by increasing the interest income earned on tax-exempt assets to make itfully equivalent to interest income earned on taxable investments. This adjustment is not permitted under accounting principles generally accepted in the United States of America(GAAP) on the Consolidated Income Statement. The taxable-equivalent adjustments to net interest income for the years 2012, 2011, 2010, 2009 and 2008 were $144 million, $104million, $81 million, $65 million and $36 million, respectively.
30 The PNC Financial Services Group, Inc. – Form 10-K
ITEM 7 – MANAGEMENT’S DISCUSSION AND
ANALYSIS OF FINANCIAL CONDITION AND
RESULTS OF OPERATIONS
EXECUTIVE SUMMARY
KEY STRATEGIC GOALS
At PNC we manage our company for the long term. We arefocused on revenue growth, with an emphasis on deepeningcustomer relationships and increasing fee income, whilereducing expenses. Our goal for 2013 is to deliver positiveoperating leverage and create momentum going into 2014,while investing for the future, and managing risk and capital.We continue to invest in our products, markets and brand, andembrace our corporate responsibility to the communitieswhere we do business.
The primary drivers of revenue are the acquisition, expansionand retention of customer relationships. We strive to expandand deepen customer relationships by offering convenientbanking options and innovative technology solutions,providing a broad range of fee-based and credit products andservices, focusing on customer service, and enhancing ourbrand. This strategy is designed to give our customers choicesbased on their needs. Our approach is focused on effectivelygrowing targeted market share and “share of wallet” ratherthan short term fee revenue optimization. We may also growrevenue through appropriate and targeted acquisitions and, incertain businesses, by expanding into new geographicalmarkets.
PNC faces a variety of risks that may impact various aspectsof our risk profile from time to time. The extent of suchimpacts may vary depending on factors such as the currenteconomic, political and regulatory environment, merger andacquisition activity, and operational challenges. Many of theserisks and our risk management strategies are described inmore detail elsewhere in this Report.
Our priorities for 2013 are to build capital to support clientgrowth and business investment, maintain appropriate capitalin light of economic uncertainty and the Basel III frameworkand return excess capital to shareholders, subject to regulatoryapproval. We continue to work to improve the quality of ourcapital and expect to build capital through retained earnings.PNC continues to maintain a strong bank holding companyliquidity position. See the Capital and Liquidity Actionssection of this Executive Summary, the Funding and CapitalSources section of the Consolidated Balance Sheet Reviewsection and the Liquidity Risk Management section of thisFinancial Review and the Supervision and Regulation sectionin Item 1 of this Report.
RBC BANK (USA) ACQUISITION
On March 2, 2012, we acquired 100% of the issued andoutstanding common stock of RBC Bank (USA), the U.S.retail banking subsidiary of Royal Bank of Canada. As part ofthe acquisition, PNC also purchased a credit card portfoliofrom RBC Bank (Georgia), National Association. PNC paid$3.6 billion in cash as the consideration for the acquisition ofboth RBC Bank (USA) and the credit card portfolio. Thetransaction added approximately $18.1 billion in deposits,$14.5 billion of loans and $1.1 billion of goodwill andintangible assets to PNC’s Consolidated Balance Sheet. OurConsolidated Income Statement includes the impact ofbusiness activity associated with the RBC Bank (USA)acquisition subsequent to March 2, 2012.
RBC Bank (USA), based in Raleigh, North Carolina, operatedmore than 400 branches in North Carolina, Florida, Alabama,Georgia, Virginia and South Carolina. The primary reasons forthe acquisition of RBC Bank (USA) were to enhanceshareholder value, to improve PNC’s competitive position inthe financial services industry, and to further expand PNC’sexisting branch network in the states where it currentlyoperates as well as expanding into new markets. Whencombined with PNC’s existing network, PNC now has 2,881branches across 17 states and the District of Columbia,ranking it fifth among U.S. banks in branches. See Note 2Acquisition and Divestiture Activity in the Notes ToConsolidated Financial Statements in Item 8 of this Report foradditional information regarding this acquisition and theSmartstreet divestiture and 2011 branch acquisitions describedbelow.
SALE OF SMARTSTREET
Effective October 26, 2012, PNC divested certain deposits andassets of the Smartstreet business unit, which was acquired byPNC as part of the RBC Bank (USA) acquisition, to UnionBank, N.A. Smartstreet is a nationwide business focused onhomeowner or community association managers and hadapproximately $1 billion of assets and deposits as ofSeptember 30, 2012. The gain on sale was immaterial andresulted in a reduction of goodwill and core depositintangibles of $46 million and $13 million, respectively.
BRANCH ACQUISITIONS
Effective December 9, 2011, PNC acquired 27 branches in thenorthern metropolitan Atlanta, Georgia area from FlagstarBank, FSB, a subsidiary of Flagstar Bancorp, Inc. EffectiveJune 6, 2011, PNC acquired 19 branches in the greater Tampa,Florida area from BankAtlantic, a subsidiary of BankAtlanticBancorp, Inc. Our Consolidated Income Statement includesthe impact of the branch activity subsequent to each date ofthe respective acquisitions.
The PNC Financial Services Group, Inc. – Form 10-K 31
SALE OF PNC GLOBAL INVESTMENT SERVICING
On July 1, 2010, we sold PNC Global Investment ServicingInc. (GIS), a leading provider of processing, technology andbusiness intelligence services to asset managers, broker-dealers and financial advisors worldwide, for $2.3 billion incash. The pretax gain in discontinued operations recorded inthe third quarter of 2010 related to this sale was $639 million,net of transaction costs, or $328 million after taxes.
Results of operations of GIS through June 30, 2010 arepresented as income from discontinued operations, net ofincome taxes, on our Consolidated Income Statement in thisReport. Once we entered into the sales agreement, GIS was nolonger a reportable business segment. See Note 2 Acquisitionand Divestiture Activity in the Notes To ConsolidatedFinancial Statements in Item 8 of this Report.
CAPITAL AND LIQUIDITY ACTIONS
Our ability to take certain capital actions, including plans topay or increase common stock dividends or to repurchaseshares under current or future programs, is subject to theresults of the supervisory assessment of capital adequacyundertaken by the Board of Governors of the Federal ReserveSystem (Federal Reserve) and our primary bank regulators aspart of the Comprehensive Capital Analysis and Review(CCAR) process. This capital adequacy assessment is basedon a review of a comprehensive capital plan submitted to theFederal Reserve. In connection with the 2013 CCAR, PNCfiled its capital plan and stress testing results with the FederalReserve on January 7, 2013. PNC expects to receive theFederal Reserve’s response (either a non-objection orobjection) to the capital plan submitted as part of the 2013CCAR by March 15, 2013. For additional informationconcerning the CCAR process and the factors the FederalReserve takes into consideration in evaluating capital plans,see Item 1 Business – Supervision and Regulation of thisReport.
A summary of 2012 capital and liquidity actions follows.
DEBT SECURITIES ISSUED
On March 8, 2012, PNC Funding Corp issued $1 billion ofsenior notes, unconditionally guaranteed by The PNCFinancial Services Group, Inc., due March 8, 2022. Interest ispaid semi-annually at a fixed rate of 3.30%. The offeringresulted in gross proceeds to us of $990 million beforeoffering related expenses. We used the net proceeds from thisoffering for general corporate purposes, which includedadvances to PNC and its subsidiaries to finance theiractivities, repayment of outstanding indebtedness, andrepurchases and redemptions of issued and outstandingsecurities of PNC and its subsidiaries.
On June 20, 2012, PNC Bank, N.A. issued $1.0 billion ofsenior extendible floating rate bank notes with an initialmaturity date of July 20, 2013, subject to the holder’s monthlyoption to extend, and a final maturity date of June 20, 2014.
Interest is paid at the 3-month LIBOR rate, reset quarterly,plus a spread of 22.5 basis points, which spread is subject tofour potential one basis point increases in the event of certainextensions of maturity by the holder.
On October 22, 2012, PNC Bank, N.A. issued $1.0 billion ofsubordinated notes with a maturity date of November 1, 2022.Interest is payable semi-annually, at a fixed rate of 2.70%, onMay 1 and November 1 of each year, beginning on May 1,2013.
TRUST PREFERRED SECURITIES REDEEMED
On April 25, 2012 we redeemed $300 million of trustpreferred securities issued by PNC Capital Trust D with acurrent distribution rate of 6.125% and $6 million of trustpreferred securities issued by Yardville Capital Trust III witha current distribution rate of 10.18%. In addition, on May 25,2012 we redeemed $500 million of trust preferred securitiesissued by National City Capital Trust III with a currentdistribution rate of 6.625%. These redemptions togetherresulted in a noncash charge for unamortized discounts ofapproximately $130 million in the second quarter of 2012.
On July 30, 2012 we redeemed $450 million of trust preferredsecurities issued by PNC Capital Trust E with a currentdistribution rate of 7.750% and $517.5 million of enhancedtrust preferred securities issued by National City Capital TrustIV with a current distribution rate of 8.000%. Theseredemptions together resulted in a noncash charge forunamortized discounts of approximately $95 million in thethird quarter of 2012.
PREFERRED STOCK ISSUED
On April 24, 2012, we issued 60 million depositary shares,each representing a 1/4,000th interest in a share of our Fixed-to-Floating Rate Non-Cumulative Perpetual Preferred Stock,Series P, in an underwritten public offering resulting in grossproceeds of $1.5 billion to us before commissions andexpenses. We used the net proceeds from the sale of thedepositary shares for general corporate purposes, whichincluded repurchases and redemptions of issued andoutstanding securities of PNC and its subsidiaries, includingtrust preferred securities.
On September 21, 2012 we issued 18 million depositaryshares, each representing a 1/4,000th interest in a share of our5.375% Non-Cumulative Perpetual Preferred Stock, Series Q,in an underwritten public offering resulting in gross proceedsof $450 million to us before commissions and expenses. OnOctober 9, 2012, pursuant to the underwriting agreement forthis offering, we issued an additional 1.2 million depositaryshares in satisfaction of an option granted to the underwritersin the underwriting agreement to cover over-allotments,resulting in additional gross proceeds of $30 million. We usedthe net proceeds from the sales of the depositary shares forgeneral corporate purposes, which included advances to oursubsidiaries to finance their activities, repayment of
32 The PNC Financial Services Group, Inc. – Form 10-K
outstanding indebtedness, and repurchases and redemptions ofissued and outstanding securities of PNC and its subsidiaries.
SENIOR DEBT ISSUED AND REDEMPTION OF NORMAL APEXOn November 9, 2012 PNC issued $500.1 million of its parentcompany Senior Notes due November 9, 2022 (the “SeniorNotes”) which were sold in a secondary public offering madein connection with the remarketing of PNC’s Remarketable8.729% Junior Subordinated Notes due 2043 (the“Subordinated Notes”) owned by the National City PreferredCapital Trust I (the “Trust”). In the remarketing the Trust soldthe Subordinated Notes and PNC exchanged the Senior Noteswith the purchasers of the Subordinated Notes. The SeniorNotes were then sold by the purchasers in the secondarypublic offering. The Senior Notes bore interest at 8.729%from and including June 10, 2012, to but excludingNovember 9, 2012 and thereafter bear interest at 2.854% perannum. The proceeds of the remarketing were ultimately usedby the Trust, after the completion of the Preferred Stocktransactions described below, to redeem all $500.0 millionoutstanding of its 12% Fixed-to-Floating Rate Normal APEXand $.1 million Common Securities of the Trust.
In the fourth quarter of 2012, PNC incurred noncash chargesfor unamortized discounts of $70 million related to thisredemption. After the closing of these transactions, includingthe redemption of the Normal APEX, only the Senior Notesdue November 9, 2022 remain outstanding.
As required under a stock purchase contract agreement, theTrust purchased $500.1 million of PNC’s Non-CumulativePerpetual Preferred Stock, Series M (the “Preferred Stock”).PNC then redeemed all of the Preferred Stock from the Trustimmediately upon its issuance. See Note 19 Equity in theNotes To Consolidated Financial Statements in Item 8 of thisReport for further detail.
A summary of 2013 capital and liquidity actions to datefollows.
On January 28, 2013, PNC Bank, N.A. issued:• $750 million of fixed rate senior notes with a
maturity date of January 28, 2016. Interest is payablesemi-annually, at a fixed rate of .80%, on January 28and July 28 of each year, beginning on July 28, 2013.
• $250 million of floating rate senior notes with amaturity date of January 28, 2016. Interest is payableat the 3-month LIBOR rate, reset quarterly, plus aspread of .31% on January 28, April 28, July 28, andOctober 28 of each year, beginning on April 28,2013.
• $750 million of subordinated notes with a maturitydate of January 30, 2023. Interest is payable semi-annually, at a fixed rate of 2.905%, on January 30and July 30 of each year, beginning on July 30, 2013.
On February 7, 2013, PNC announced that on March 15, 2013we will redeem all $375 million of REIT preferred securities
issued by PNC Preferred Funding Trust III. See Note 27Subsequent Events in the Notes To Consolidated FinancialStatements in Item 8 of this Report.
RECENT MARKET AND INDUSTRY DEVELOPMENTS
There have been numerous legislative and regulatorydevelopments and dramatic changes in the competitivelandscape of our industry over the last several years.
The United States and other governments have undertakenmajor reform of the regulation of the financial servicesindustry, including engaging in new efforts to imposerequirements designed to strengthen the stability of thefinancial system and protect consumers and investors. Weexpect to face further increased regulation of our industry as aresult of current and future initiatives intended to provideeconomic stimulus, financial market stability and enhancedregulation of financial services companies and to enhance theliquidity and solvency of financial institutions and markets.We also expect in many cases more intense scrutiny from ourbank supervisors in the examination process and moreaggressive enforcement of regulations on both the federal andstate levels. Compliance with new regulations will increaseour costs and reduce our revenue. Some new regulations maylimit our ability to pursue certain desirable businessopportunities.
The Dodd-Frank Wall Street Reform and ConsumerProtection Act (Dodd-Frank), enacted in July 2010, mandatesthe most wide-ranging overhaul of financial industryregulation in decades. Many parts of the law are now in effectand others are now in the implementation stage, which islikely to continue for several years.
Until such time as the regulatory agencies issue finalregulations implementing all of the numerous provisions ofDodd-Frank, PNC will not be able to fully assess the impactthe legislation will have on its businesses. However, webelieve that the expected changes will be manageable for PNCand will have an overall smaller impact on us than on ourlarger peers.
Included in these recent legislative and regulatorydevelopments are evolving regulatory capital standards forfinancial institutions. These evolving standards include thethree sets of proposed rules that the U.S. banking agenciesreleased in June 2012 to implement the Basel III regulatorycapital framework developed by the Basel Committee onBanking Supervision (Basel III) and also make other changesto U.S. regulatory capital standards for banking institutions.The Basel III proposed rules include heightened capitalrequirements for banking institutions in terms of both higherquality capital and higher regulatory capital ratios. Theproposed Basel III rules would become effective under aphase-in period and would be in full effect on January 1, 2019.
The capital rules issued by the Federal banking agencies inJune 2012 would also revise the manner in which a banking
The PNC Financial Services Group, Inc. – Form 10-K 33
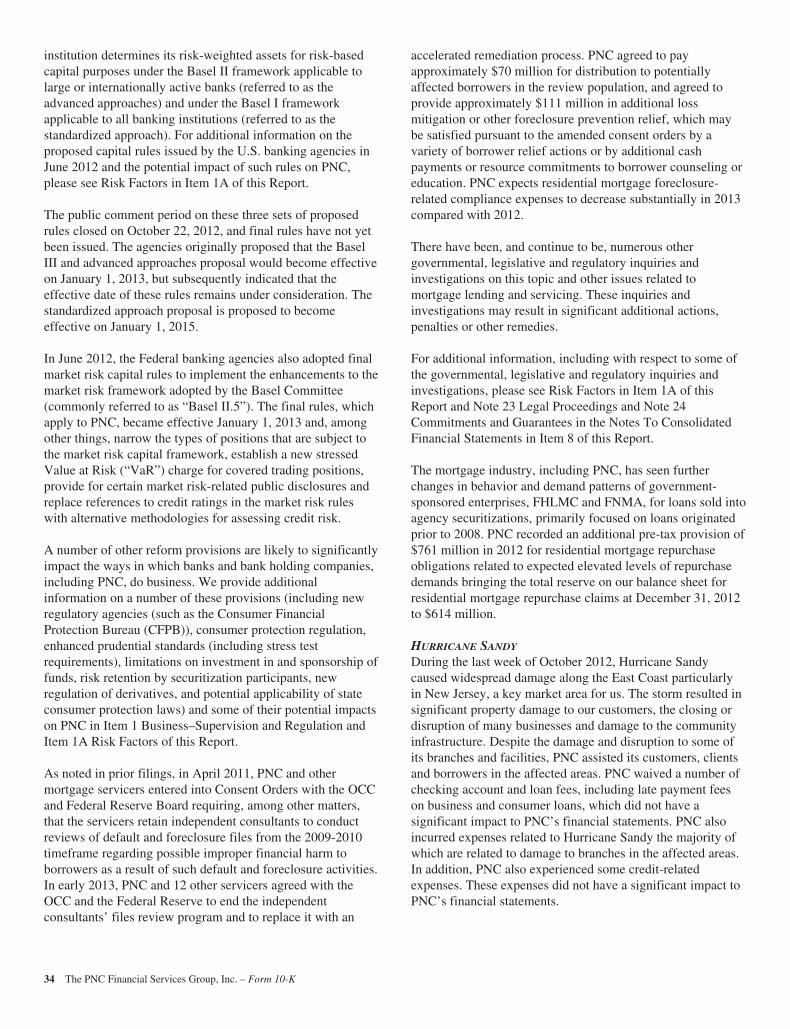
institution determines its risk-weighted assets for risk-basedcapital purposes under the Basel II framework applicable tolarge or internationally active banks (referred to as theadvanced approaches) and under the Basel I frameworkapplicable to all banking institutions (referred to as thestandardized approach). For additional information on theproposed capital rules issued by the U.S. banking agencies inJune 2012 and the potential impact of such rules on PNC,please see Risk Factors in Item 1A of this Report.
The public comment period on these three sets of proposedrules closed on October 22, 2012, and final rules have not yetbeen issued. The agencies originally proposed that the BaselIII and advanced approaches proposal would become effectiveon January 1, 2013, but subsequently indicated that theeffective date of these rules remains under consideration. Thestandardized approach proposal is proposed to becomeeffective on January 1, 2015.
In June 2012, the Federal banking agencies also adopted finalmarket risk capital rules to implement the enhancements to themarket risk framework adopted by the Basel Committee(commonly referred to as “Basel II.5”). The final rules, whichapply to PNC, became effective January 1, 2013 and, amongother things, narrow the types of positions that are subject tothe market risk capital framework, establish a new stressedValue at Risk (“VaR”) charge for covered trading positions,provide for certain market risk-related public disclosures andreplace references to credit ratings in the market risk ruleswith alternative methodologies for assessing credit risk.
A number of other reform provisions are likely to significantlyimpact the ways in which banks and bank holding companies,including PNC, do business. We provide additionalinformation on a number of these provisions (including newregulatory agencies (such as the Consumer FinancialProtection Bureau (CFPB)), consumer protection regulation,enhanced prudential standards (including stress testrequirements), limitations on investment in and sponsorship offunds, risk retention by securitization participants, newregulation of derivatives, and potential applicability of stateconsumer protection laws) and some of their potential impactson PNC in Item 1 Business–Supervision and Regulation andItem 1A Risk Factors of this Report.
As noted in prior filings, in April 2011, PNC and othermortgage servicers entered into Consent Orders with the OCCand Federal Reserve Board requiring, among other matters,that the servicers retain independent consultants to conductreviews of default and foreclosure files from the 2009-2010timeframe regarding possible improper financial harm toborrowers as a result of such default and foreclosure activities.In early 2013, PNC and 12 other servicers agreed with theOCC and the Federal Reserve to end the independentconsultants’ files review program and to replace it with an
accelerated remediation process. PNC agreed to payapproximately $70 million for distribution to potentiallyaffected borrowers in the review population, and agreed toprovide approximately $111 million in additional lossmitigation or other foreclosure prevention relief, which maybe satisfied pursuant to the amended consent orders by avariety of borrower relief actions or by additional cashpayments or resource commitments to borrower counseling oreducation. PNC expects residential mortgage foreclosure-related compliance expenses to decrease substantially in 2013compared with 2012.
There have been, and continue to be, numerous othergovernmental, legislative and regulatory inquiries andinvestigations on this topic and other issues related tomortgage lending and servicing. These inquiries andinvestigations may result in significant additional actions,penalties or other remedies.
For additional information, including with respect to some ofthe governmental, legislative and regulatory inquiries andinvestigations, please see Risk Factors in Item 1A of thisReport and Note 23 Legal Proceedings and Note 24Commitments and Guarantees in the Notes To ConsolidatedFinancial Statements in Item 8 of this Report.
The mortgage industry, including PNC, has seen furtherchanges in behavior and demand patterns of government-sponsored enterprises, FHLMC and FNMA, for loans sold intoagency securitizations, primarily focused on loans originatedprior to 2008. PNC recorded an additional pre-tax provision of$761 million in 2012 for residential mortgage repurchaseobligations related to expected elevated levels of repurchasedemands bringing the total reserve on our balance sheet forresidential mortgage repurchase claims at December 31, 2012to $614 million.
HURRICANE SANDY
During the last week of October 2012, Hurricane Sandycaused widespread damage along the East Coast particularlyin New Jersey, a key market area for us. The storm resulted insignificant property damage to our customers, the closing ordisruption of many businesses and damage to the communityinfrastructure. Despite the damage and disruption to some ofits branches and facilities, PNC assisted its customers, clientsand borrowers in the affected areas. PNC waived a number ofchecking account and loan fees, including late payment feeson business and consumer loans, which did not have asignificant impact to PNC’s financial statements. PNC alsoincurred expenses related to Hurricane Sandy the majority ofwhich are related to damage to branches in the affected areas.In addition, PNC also experienced some credit-relatedexpenses. These expenses did not have a significant impact toPNC’s financial statements.
34 The PNC Financial Services Group, Inc. – Form 10-K
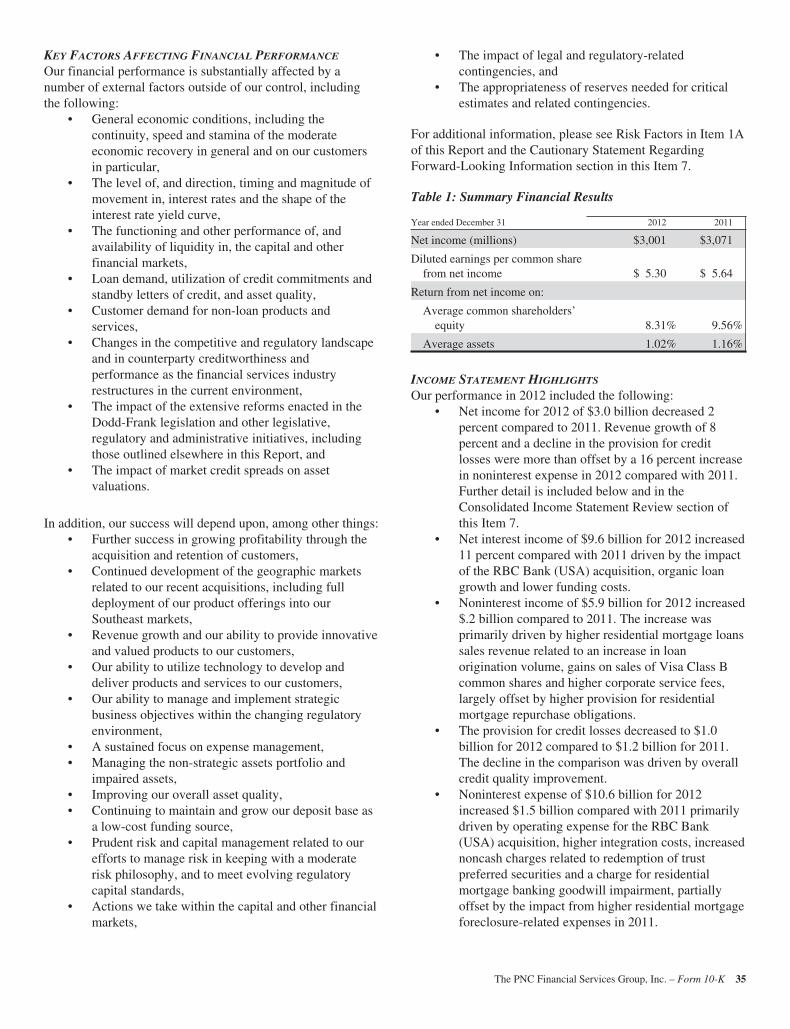
KEY FACTORS AFFECTING FINANCIAL PERFORMANCE
Our financial performance is substantially affected by anumber of external factors outside of our control, includingthe following:
• General economic conditions, including thecontinuity, speed and stamina of the moderateeconomic recovery in general and on our customersin particular,
• The level of, and direction, timing and magnitude ofmovement in, interest rates and the shape of theinterest rate yield curve,
• The functioning and other performance of, andavailability of liquidity in, the capital and otherfinancial markets,
• Loan demand, utilization of credit commitments andstandby letters of credit, and asset quality,
• Customer demand for non-loan products andservices,
• Changes in the competitive and regulatory landscapeand in counterparty creditworthiness andperformance as the financial services industryrestructures in the current environment,
• The impact of the extensive reforms enacted in theDodd-Frank legislation and other legislative,regulatory and administrative initiatives, includingthose outlined elsewhere in this Report, and
• The impact of market credit spreads on assetvaluations.
In addition, our success will depend upon, among other things:• Further success in growing profitability through the
acquisition and retention of customers,• Continued development of the geographic markets
related to our recent acquisitions, including fulldeployment of our product offerings into ourSoutheast markets,
• Revenue growth and our ability to provide innovativeand valued products to our customers,
• Our ability to utilize technology to develop anddeliver products and services to our customers,
• Our ability to manage and implement strategicbusiness objectives within the changing regulatoryenvironment,
• A sustained focus on expense management,• Managing the non-strategic assets portfolio and
impaired assets,• Improving our overall asset quality,• Continuing to maintain and grow our deposit base as
a low-cost funding source,• Prudent risk and capital management related to our
efforts to manage risk in keeping with a moderaterisk philosophy, and to meet evolving regulatorycapital standards,
• Actions we take within the capital and other financialmarkets,
• The impact of legal and regulatory-relatedcontingencies, and
• The appropriateness of reserves needed for criticalestimates and related contingencies.
For additional information, please see Risk Factors in Item 1Aof this Report and the Cautionary Statement RegardingForward-Looking Information section in this Item 7.
Table 1: Summary Financial Results
Year ended December 31 2012 2011
Net income (millions) $3,001 $3,071
Diluted earnings per common sharefrom net income $ 5.30 $ 5.64
Return from net income on:
Average common shareholders’equity 8.31% 9.56%
Average assets 1.02% 1.16%
INCOME STATEMENT HIGHLIGHTS
Our performance in 2012 included the following:• Net income for 2012 of $3.0 billion decreased 2
percent compared to 2011. Revenue growth of 8percent and a decline in the provision for creditlosses were more than offset by a 16 percent increasein noninterest expense in 2012 compared with 2011.Further detail is included below and in theConsolidated Income Statement Review section ofthis Item 7.
• Net interest income of $9.6 billion for 2012 increased11 percent compared with 2011 driven by the impactof the RBC Bank (USA) acquisition, organic loangrowth and lower funding costs.
• Noninterest income of $5.9 billion for 2012 increased$.2 billion compared to 2011. The increase wasprimarily driven by higher residential mortgage loanssales revenue related to an increase in loanorigination volume, gains on sales of Visa Class Bcommon shares and higher corporate service fees,largely offset by higher provision for residentialmortgage repurchase obligations.
• The provision for credit losses decreased to $1.0billion for 2012 compared to $1.2 billion for 2011.The decline in the comparison was driven by overallcredit quality improvement.
• Noninterest expense of $10.6 billion for 2012increased $1.5 billion compared with 2011 primarilydriven by operating expense for the RBC Bank(USA) acquisition, higher integration costs, increasednoncash charges related to redemption of trustpreferred securities and a charge for residentialmortgage banking goodwill impairment, partiallyoffset by the impact from higher residential mortgageforeclosure-related expenses in 2011.
The PNC Financial Services Group, Inc. – Form 10-K 35
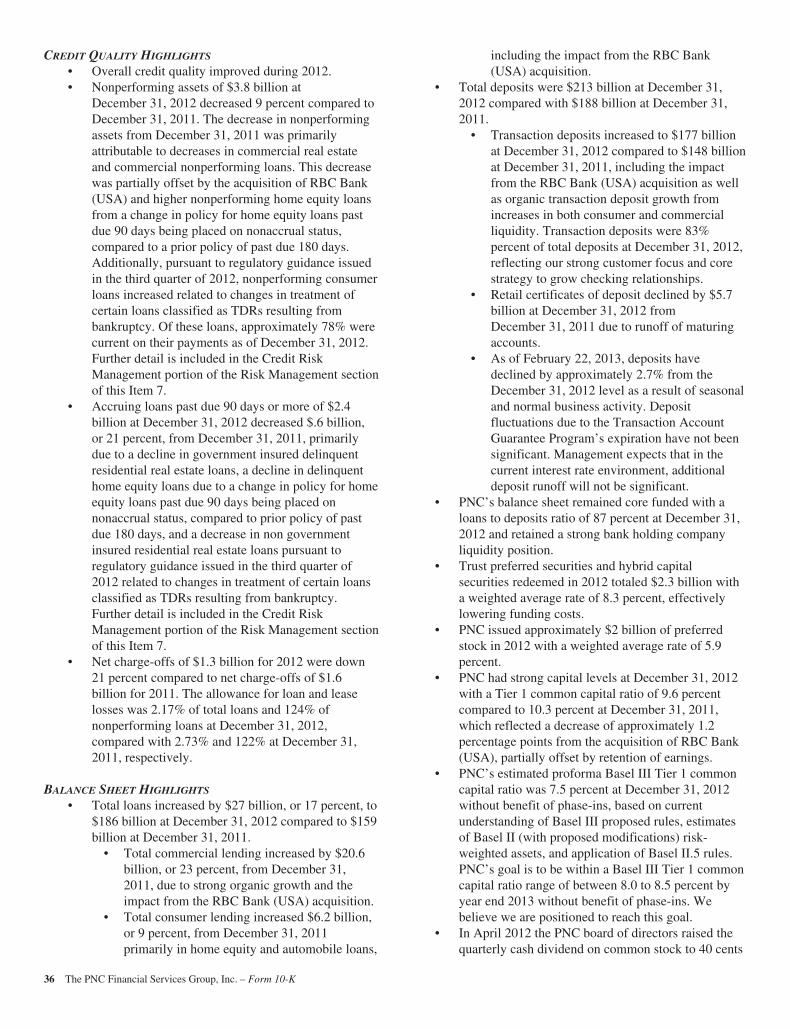
CREDIT QUALITY HIGHLIGHTS
• Overall credit quality improved during 2012.• Nonperforming assets of $3.8 billion at
December 31, 2012 decreased 9 percent compared toDecember 31, 2011. The decrease in nonperformingassets from December 31, 2011 was primarilyattributable to decreases in commercial real estateand commercial nonperforming loans. This decreasewas partially offset by the acquisition of RBC Bank(USA) and higher nonperforming home equity loansfrom a change in policy for home equity loans pastdue 90 days being placed on nonaccrual status,compared to a prior policy of past due 180 days.Additionally, pursuant to regulatory guidance issuedin the third quarter of 2012, nonperforming consumerloans increased related to changes in treatment ofcertain loans classified as TDRs resulting frombankruptcy. Of these loans, approximately 78% werecurrent on their payments as of December 31, 2012.Further detail is included in the Credit RiskManagement portion of the Risk Management sectionof this Item 7.
• Accruing loans past due 90 days or more of $2.4billion at December 31, 2012 decreased $.6 billion,or 21 percent, from December 31, 2011, primarilydue to a decline in government insured delinquentresidential real estate loans, a decline in delinquenthome equity loans due to a change in policy for homeequity loans past due 90 days being placed onnonaccrual status, compared to prior policy of pastdue 180 days, and a decrease in non governmentinsured residential real estate loans pursuant toregulatory guidance issued in the third quarter of2012 related to changes in treatment of certain loansclassified as TDRs resulting from bankruptcy.Further detail is included in the Credit RiskManagement portion of the Risk Management sectionof this Item 7.
• Net charge-offs of $1.3 billion for 2012 were down21 percent compared to net charge-offs of $1.6billion for 2011. The allowance for loan and leaselosses was 2.17% of total loans and 124% ofnonperforming loans at December 31, 2012,compared with 2.73% and 122% at December 31,2011, respectively.
BALANCE SHEET HIGHLIGHTS
• Total loans increased by $27 billion, or 17 percent, to$186 billion at December 31, 2012 compared to $159billion at December 31, 2011.
• Total commercial lending increased by $20.6billion, or 23 percent, from December 31,2011, due to strong organic growth and theimpact from the RBC Bank (USA) acquisition.
• Total consumer lending increased $6.2 billion,or 9 percent, from December 31, 2011primarily in home equity and automobile loans,
including the impact from the RBC Bank(USA) acquisition.
• Total deposits were $213 billion at December 31,2012 compared with $188 billion at December 31,2011.
• Transaction deposits increased to $177 billionat December 31, 2012 compared to $148 billionat December 31, 2011, including the impactfrom the RBC Bank (USA) acquisition as wellas organic transaction deposit growth fromincreases in both consumer and commercialliquidity. Transaction deposits were 83%percent of total deposits at December 31, 2012,reflecting our strong customer focus and corestrategy to grow checking relationships.
• Retail certificates of deposit declined by $5.7billion at December 31, 2012 fromDecember 31, 2011 due to runoff of maturingaccounts.
• As of February 22, 2013, deposits havedeclined by approximately 2.7% from theDecember 31, 2012 level as a result of seasonaland normal business activity. Depositfluctuations due to the Transaction AccountGuarantee Program’s expiration have not beensignificant. Management expects that in thecurrent interest rate environment, additionaldeposit runoff will not be significant.
• PNC’s balance sheet remained core funded with aloans to deposits ratio of 87 percent at December 31,2012 and retained a strong bank holding companyliquidity position.
• Trust preferred securities and hybrid capitalsecurities redeemed in 2012 totaled $2.3 billion witha weighted average rate of 8.3 percent, effectivelylowering funding costs.
• PNC issued approximately $2 billion of preferredstock in 2012 with a weighted average rate of 5.9percent.
• PNC had strong capital levels at December 31, 2012with a Tier 1 common capital ratio of 9.6 percentcompared to 10.3 percent at December 31, 2011,which reflected a decrease of approximately 1.2percentage points from the acquisition of RBC Bank(USA), partially offset by retention of earnings.
• PNC’s estimated proforma Basel III Tier 1 commoncapital ratio was 7.5 percent at December 31, 2012without benefit of phase-ins, based on currentunderstanding of Basel III proposed rules, estimatesof Basel II (with proposed modifications) risk-weighted assets, and application of Basel II.5 rules.PNC’s goal is to be within a Basel III Tier 1 commoncapital ratio range of between 8.0 to 8.5 percent byyear end 2013 without benefit of phase-ins. Webelieve we are positioned to reach this goal.
• In April 2012 the PNC board of directors raised thequarterly cash dividend on common stock to 40 cents
36 The PNC Financial Services Group, Inc. – Form 10-K
per share, an increase of 5 cents per share, or 14percent. PNC purchased $190 million of commonstock in 2012 under a $250 million authorization aspart of its existing 25 million share repurchaseprogram in open market or privately negotiatedtransactions.
Our Consolidated Income Statement Review section of thisItem 7 describes in greater detail the various items thatimpacted our results for 2012 and 2011.
AVERAGE CONSOLIDATED BALANCE SHEET HIGHLIGHTS
Total assets were $305.1 billion at December 31, 2012compared with $271.2 billion at December 31, 2011. Theincrease from year end 2011 was primarily due to the additionof assets from the RBC Bank (USA) acquisition and organicloan growth.
Various seasonal and other factors impact our period-endbalances whereas average balances are generally moreindicative of underlying business trends apart from the impactof acquisitions and divestitures. The Consolidated BalanceSheet Review section of this Item 7 provides information onchanges in selected Consolidated Balance Sheet categories atDecember 31, 2012 compared with December 31, 2011.
Total average assets increased to $295.0 billion for 2012compared with $265.3 billion for 2011, reflecting an increaseof $24.2 billion in average interest-earning assets to $248.6billion for 2012, compared with $224.3 billion in 2011. Theincrease in average interest-earning assets was primarilydriven by an increase in average total loans, including thoseacquired from the RBC Bank (USA) acquisition.
Total loans at December 31, 2012 increased $26.8 billion to$185.9 billion compared to December 31, 2011. Average totalloans increased by $24.6 billion to $176.6 billion for 2012compared with 2011, primarily due to increases in averagecommercial loans of $17.2 billion and in average consumerloans of $5.1 billion. Loans added from the RBC Bank (USA)acquisition contributed to the increase. In addition, averagecommercial loans increased from organic loan growthprimarily in corporate banking, real estate and asset-basedlending and average consumer loans increased due to growthin indirect auto loans. Loans represented 71 percent of averageinterest-earning assets for 2012 compared to 68 percent for2011.
Average investment securities increased $1.1 billion to $60.8billion in 2012 compared with 2011. Total investmentsecurities comprised 24 percent of average interest-earningassets for 2012 and 27 percent for 2011.
Average noninterest-earning assets totaled $46.5 billion in2012 compared with $41.0 billion in 2011. The increaseincluded the impact of higher adjustments for net unrealizedgains on securities, which are included in noninterest-earningassets for average balance sheet purposes, the impact of the
RBC Bank (USA) acquisition, including goodwill, and anincrease in equity investments.
Average total deposits increased by $18.5 billion to $201.6billion in 2012 compared with 2011. This increase primarilyresulted from an increase in average transaction deposits of$23.9 billion partially offset by a decrease of $7.4 billion inretail certificates of deposit attributable to runoff of maturingaccounts. Growth in average noninterest-bearing deposits,average money market deposits and average interest-bearingdemand deposits drove the increase in transaction deposits,which resulted from deposits added in the RBC Bank (USA)acquisition and organic growth. Average transaction depositswere $161.9 billion for 2012 compared with $138.0 billion for2011. Total deposits at December 31, 2012 were $213.1billion compared with $188.0 billion at December 31, 2011and are further discussed within the Consolidated BalanceSheet Review section of this Item 7.
Average total deposits represented 68 percent of average totalassets for 2012 and 69 percent for 2011.
Average borrowed funds increased to $41.8 billion for 2012compared with $35.7 billion for 2011. An increase incommercial paper and net issuances of Federal Home LoanBank (FHLB) borrowings during 2012 drove the increasecompared with 2011. Total borrowed funds at December 31,2012 were $40.9 billion compared with $36.7 billion atDecember 31, 2011 and are further discussed within theConsolidated Balance Sheet Review section of this Item 7. Inaddition, the Liquidity Risk Management portion of the RiskManagement section of this Item 7 includes additionalinformation regarding our sources and uses of borrowedfunds.
BUSINESS SEGMENT HIGHLIGHTS
Total business segment earnings were $3.4 billion for 2012and $3.1 billion for 2011. Highlights of results for 2012 and2011 are included below. Enhancements were made to theinternal funds transfer pricing methodology during the secondquarter of 2012. Retrospective application of our new fundstransfer pricing methodology has been made to the priorperiod reportable business segment results and disclosures tocreate comparability to the current period presentation, whichwe believe is more meaningful to readers of our financialstatements. Key reserve assumptions and estimation processesreact to and are influenced by observed changes in loanportfolio performance experience, the financial strength of theborrower, and economic conditions. Key reserve assumptionsare periodically updated. During the third quarter of 2012,PNC increased the amount of internally observed data used inestimating the key commercial lending assumptions ofProbabilities of Default (PDs) and Losses Given Default(LGDs). The estimated impact as of the beginning of the thirdquarter 2012 was approximately an increase of $41 millionand a decrease of $55 million to the provision for credit lossesof Retail Banking and Corporate & Institutional Banking,respectively. Prior periods are not presented on a comparablebasis as it is not practicable to do so.
The PNC Financial Services Group, Inc. – Form 10-K 37
We refer you to Item 1 of this Report under the captionsBusiness Overview and Review of Business Segments for anoverview of our business segments and to the BusinessSegments Review section of this Item 7 for the Results OfBusinesses – Summary table and further analysis of businesssegment results for 2012 and 2011, including presentationdifferences from Note 26 Segment Reporting in the Notes ToConsolidated Financial Statements in Item 8 of this Report.
We provide a reconciliation of total business segment earningsto PNC consolidated income from continuing operationsbefore noncontrolling interests as reported according toaccounting principles generally accepted in the United Statesof America (GAAP) in Note 26 Segment Reporting in ourNotes To Consolidated Financial Statements of Item 8 of thisReport.
RETAIL BANKING
Retail Banking earned $596 million in 2012 compared with$371 million in 2011. The increase in earnings resulted fromorganic growth in transaction deposit balances, gains on salesof Visa Class B common shares, lower rates paid on deposits,higher levels of customer-initiated transactions, a lowerprovision for credit losses, and the impact of the RBC Bank(USA) acquisition, partially offset by the regulatory impact oflower interchange fees on debit card transactions and higheradditions to legal reserves.
CORPORATE & INSTITUTIONAL BANKING
Corporate & Institutional Banking earned $2.3 billion in 2012compared with $1.9 billion in 2011. The increase in earningswas primarily due to higher revenue partially offset by highernoninterest expense and a provision for credit losses of zero in2012 compared with a benefit of $124 million in 2011. Wecontinued to focus on building client relationships includingincreasing cross sales and adding new clients where the risk-return profile was attractive.
ASSET MANAGEMENT GROUP
Asset Management Group earned $145 million in 2012compared with $168 million in 2011. Assets underadministration increased to $224 billion at December 31, 2012from $210 billion at December 31, 2011 driven by strongeraverage equity markets. Revenue increased $44 million in theyear over year comparison as strong sales and higher averageequity markets increased noninterest income by 4% andhigher average deposit balances increased net interest incomeby 6%. The revenue increase was offset by higher noninterestexpense from strategic business investments and higherprovision for credit losses.
RESIDENTIAL MORTGAGE BANKING
Residential Mortgage Banking reported a loss of $308 millionin 2012 compared with earnings of $89 million in 2011.Earnings declined from the prior year primarily as a result ofhigher provision for residential mortgage repurchaseobligations, higher noninterest expense, including goodwillimpairment, and lower net hedging gains on mortgageservicing rights, partially offset by increased loan salesrevenue driven by higher loan origination volume.
BLACKROCK
Our BlackRock business segment earned $395 million in 2012and $361 million in 2011. We hold an equity investment inBlackRock, which is a key component of our diversifiedrevenue strategy. BlackRock is a publicly traded company,and additional information regarding its business is availablein its filings with the SEC.
NON-STRATEGIC ASSETS PORTFOLIO
This business segment consists primarily of non-strategicassets obtained through acquisitions of other companies. Non-Strategic Assets Portfolio had earnings of $237 million for2012 compared with $200 million in 2011. The increase wasprimarily attributable to a lower provision for credit losses,partially offset by lower net interest income driven by declinesin loan balances and purchase accounting accretion.
OTHER
“Other” had a loss of $392 million in 2012 compared with aloss of $58 million in 2011. The increase in loss in the 2012period was primarily due to higher integration costs andnoncash charges related to redemption of trust preferredsecurities.
38 The PNC Financial Services Group, Inc. – Form 10-K
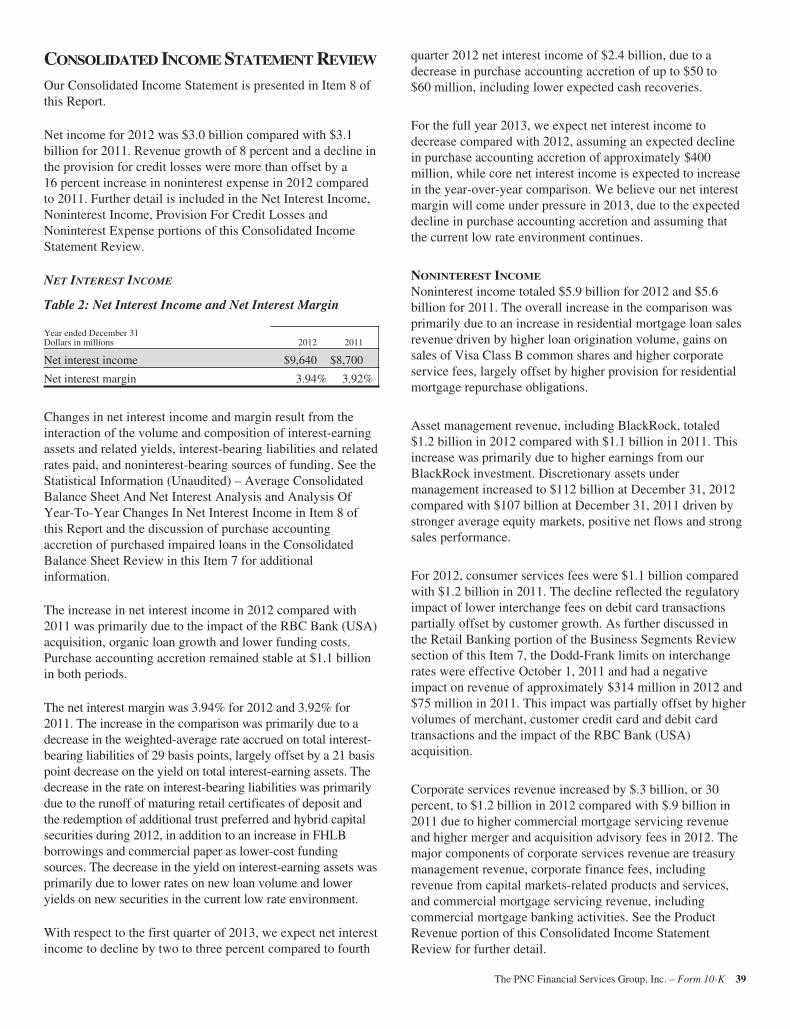
CONSOLIDATED INCOME STATEMENT REVIEW
Our Consolidated Income Statement is presented in Item 8 ofthis Report.
Net income for 2012 was $3.0 billion compared with $3.1billion for 2011. Revenue growth of 8 percent and a decline inthe provision for credit losses were more than offset by a16 percent increase in noninterest expense in 2012 comparedto 2011. Further detail is included in the Net Interest Income,Noninterest Income, Provision For Credit Losses andNoninterest Expense portions of this Consolidated IncomeStatement Review.
NET INTEREST INCOME
Table 2: Net Interest Income and Net Interest Margin
Year ended December 31Dollars in millions 2012 2011
Net interest income $9,640 $8,700
Net interest margin 3.94% 3.92%
Changes in net interest income and margin result from theinteraction of the volume and composition of interest-earningassets and related yields, interest-bearing liabilities and relatedrates paid, and noninterest-bearing sources of funding. See theStatistical Information (Unaudited) – Average ConsolidatedBalance Sheet And Net Interest Analysis and Analysis OfYear-To-Year Changes In Net Interest Income in Item 8 ofthis Report and the discussion of purchase accountingaccretion of purchased impaired loans in the ConsolidatedBalance Sheet Review in this Item 7 for additionalinformation.
The increase in net interest income in 2012 compared with2011 was primarily due to the impact of the RBC Bank (USA)acquisition, organic loan growth and lower funding costs.Purchase accounting accretion remained stable at $1.1 billionin both periods.
The net interest margin was 3.94% for 2012 and 3.92% for2011. The increase in the comparison was primarily due to adecrease in the weighted-average rate accrued on total interest-bearing liabilities of 29 basis points, largely offset by a 21 basispoint decrease on the yield on total interest-earning assets. Thedecrease in the rate on interest-bearing liabilities was primarilydue to the runoff of maturing retail certificates of deposit andthe redemption of additional trust preferred and hybrid capitalsecurities during 2012, in addition to an increase in FHLBborrowings and commercial paper as lower-cost fundingsources. The decrease in the yield on interest-earning assets wasprimarily due to lower rates on new loan volume and loweryields on new securities in the current low rate environment.
With respect to the first quarter of 2013, we expect net interestincome to decline by two to three percent compared to fourth
quarter 2012 net interest income of $2.4 billion, due to adecrease in purchase accounting accretion of up to $50 to$60 million, including lower expected cash recoveries.
For the full year 2013, we expect net interest income todecrease compared with 2012, assuming an expected declinein purchase accounting accretion of approximately $400million, while core net interest income is expected to increasein the year-over-year comparison. We believe our net interestmargin will come under pressure in 2013, due to the expecteddecline in purchase accounting accretion and assuming thatthe current low rate environment continues.
NONINTEREST INCOME
Noninterest income totaled $5.9 billion for 2012 and $5.6billion for 2011. The overall increase in the comparison wasprimarily due to an increase in residential mortgage loan salesrevenue driven by higher loan origination volume, gains onsales of Visa Class B common shares and higher corporateservice fees, largely offset by higher provision for residentialmortgage repurchase obligations.
Asset management revenue, including BlackRock, totaled$1.2 billion in 2012 compared with $1.1 billion in 2011. Thisincrease was primarily due to higher earnings from ourBlackRock investment. Discretionary assets undermanagement increased to $112 billion at December 31, 2012compared with $107 billion at December 31, 2011 driven bystronger average equity markets, positive net flows and strongsales performance.
For 2012, consumer services fees were $1.1 billion comparedwith $1.2 billion in 2011. The decline reflected the regulatoryimpact of lower interchange fees on debit card transactionspartially offset by customer growth. As further discussed inthe Retail Banking portion of the Business Segments Reviewsection of this Item 7, the Dodd-Frank limits on interchangerates were effective October 1, 2011 and had a negativeimpact on revenue of approximately $314 million in 2012 and$75 million in 2011. This impact was partially offset by highervolumes of merchant, customer credit card and debit cardtransactions and the impact of the RBC Bank (USA)acquisition.
Corporate services revenue increased by $.3 billion, or 30percent, to $1.2 billion in 2012 compared with $.9 billion in2011 due to higher commercial mortgage servicing revenueand higher merger and acquisition advisory fees in 2012. Themajor components of corporate services revenue are treasurymanagement revenue, corporate finance fees, includingrevenue from capital markets-related products and services,and commercial mortgage servicing revenue, includingcommercial mortgage banking activities. See the ProductRevenue portion of this Consolidated Income StatementReview for further detail.
The PNC Financial Services Group, Inc. – Form 10-K 39
Residential mortgage revenue decreased to $284 million in2012 from $713 million in 2011. This decrease of $429million, or 60 percent, was largely due to a higher provisionfor residential mortgage repurchase obligations of $761million in 2012 compared with $102 million in 2011, partiallyoffset by an increase in loan sales revenue driven by higherloan origination volume.
The higher provision for residential mortgage repurchaseobligations in 2012 reflected expected further elevated levelsof repurchase demands primarily as a result of changes inbehaviors and demand patterns of two government-sponsoredenterprises, FHLMC and FNMA, for loans sold into agencysecuritizations. The recorded liability for residential mortgageindemnification and repurchase claims was $614 million atDecember 31, 2012. See the Recourse And RepurchaseObligations section of this Item 7 for more detail.
Service charges on deposits grew to $573 million in 2012compared with $534 million in 2011. This increase reflectedcontinued success in growing customers, including throughthe RBC Bank (USA) acquisition.
Net gains on sales of securities totaled $204 million for 2012and $249 million for 2011. The net credit component of other-than-temporary impairment (OTTI) of securities recognized inearnings was $111 million in 2012 compared with $152million for 2011.
Other noninterest income increased by $.4 billion, or 38percent, to $1.5 billion for 2012 compared with $1.1 billionfor 2011. This increase was primarily due to $267 million ofgains on sales of approximately 9 million Visa Class Bcommon shares during the third and fourth quarters of 2012,as well as higher revenue associated with private equityinvestments. We continue to hold approximately 14.4 millionVisa Class B common shares with an estimated fair value ofapproximately $916 million as of December 31, 2012. Ourrecorded investment in these remaining shares wasapproximately $251 million at December 31, 2012.
Other noninterest income typically fluctuates from period toperiod depending on the nature and magnitude of transactionscompleted. Further details regarding our trading activities areincluded in the Market Risk Management – Trading Riskportion of the Risk Management section of this Item 7. Furtherdetails regarding private and other equity investments areincluded in the Market Risk Management – Equity And OtherInvestment Risk portion of the Risk Management section ofthis Item 7, and further details regarding gains or lossesrelated to our equity investment in BlackRock are included inthe Business Segments Review section of this Item 7.
For 2013, we currently expect both noninterest income andtotal revenue to increase compared with 2012.
PRODUCT REVENUE
In addition to credit and deposit products for commercialcustomers, Corporate & Institutional Banking offers otherservices, including treasury management, capital markets-related products and services, and commercial mortgagebanking activities for customers of all our business segments.A portion of the revenue and expense related to these productsis reflected in the Corporate & Institutional Banking segmentresults and the remainder is reflected in the results of otherbusinesses. The Other Information section in the Corporate &Institutional Banking table in the Business Segments Reviewsection of this Item 7 includes the consolidated revenue toPNC for these services. A discussion of the consolidatedrevenue from these services follows.
Treasury management revenue, comprised of fees and netinterest income from customer deposit balances, totaled $1.4billion for 2012 and $1.3 billion for 2011. Higher depositbalances along with strong growth in commercial card,lockbox and traditional products, including DDA, wire andACH, led to the favorable results.
Revenue from capital markets-related products and servicestotaled $710 million in 2012 compared with $622 million in2011. The comparison reflects higher merger and acquisitionadvisory fees and strong customer driven capital marketsactivity.
Commercial mortgage banking activities include revenuederived from commercial mortgage servicing (including netinterest income and noninterest income from loan servicingand ancillary services, net of commercial mortgage servicingrights amortization, and commercial mortgage servicing rightsvaluations net of economic hedge), and revenue derived fromcommercial mortgage loans intended for sale and relatedhedges (including loan origination fees, net interest income,valuation adjustments and gains or losses on sales).
Commercial mortgage banking activities resulted in revenueof $330 million in 2012 compared with $136 million in 2011.The increase in the comparison was mainly due to the impactof recoveries on commercial mortgage servicing rights in2012 compared to impairments taken during 2011.
40 The PNC Financial Services Group, Inc. – Form 10-K
PROVISION FOR CREDIT LOSSES
The provision for credit losses totaled $1.0 billion for 2012, adecrease of $.2 billion, or 14 percent, compared with $1.2billion for 2011. The decline in the comparison was driven byoverall credit quality improvement.
We currently expect our provision for credit losses in the firstquarter of 2013 to be between $200 and $300 million, as weexpect the benefit of commercial loan reserve releases to belower in 2013 compared to 2012.
The Credit Risk Management portion of the Risk Managementsection of this Item 7 includes additional informationregarding factors impacting the provision for credit losses. Seealso Item 1A Risk Factors and the Cautionary StatementRegarding Forward-Looking Information section of Item 7 ofthis Report.
NONINTEREST EXPENSE
Noninterest expense was $10.6 billion for 2012 and $9.1billion for 2011. Noninterest expense for 2012 includednoncash charges of $295 million related to redemption of trustpreferred securities, integration costs of $267 million, $225million of residential mortgage foreclosure-related expenses,and a noncash charge of $45 million for residential mortgagebanking goodwill impairment. Noninterest expense for 2011included $324 million of residential mortgage foreclosure-related expenses, $198 million of noncash charges related toredemption of trust preferred securities and $42 million ofintegration costs. The increase in noninterest expense in 2012compared with 2011 also reflected operating expense for theRBC Bank (USA) acquisition, higher personnel expense,higher settlements for other litigation and increased expensesfor other real estate owned.
In the first quarter of 2013, we expect noninterest expense todecrease by at least $300 million compared to noninterestexpense in fourth quarter 2012 of $2.8 billion. This expecteddecline is primarily due to our expectations for a significantreduction in residential mortgage foreclosure-relatedcompliance expenses, which were $91 million in the fourthquarter and included the impact of a charge of approximately$70 million for the early 2013 amendment to our foreclosureconsent orders, and for no anticipated noncash charges relatedto redemption of trust preferred securities and goodwillimpairment, and integration costs, which were $70 million,$45 million and $35 million in the fourth quarter of 2012,respectively.
For full year 2013, we have increased our continuousimprovement expense savings goal to $700 million, whichrepresents approximately 7 percent of our noninterest expensein 2012 and reflects an expected decline in residentialmortgage foreclosure-related compliance expenses. We expectthat amount to be offset by investments in our businesses andinfrastructure, including the full year impact of investing inthe Southeast. However, we are not expecting to incurintegration costs in 2013 and anticipate the charges for anynoncash charges related to redemption of trust preferredsecurities to be approximately $60 million or less in 2013.
As a result, we currently expect total noninterest expense for2013 to decline by mid-single digits on a percentage basiscompared with 2012.
EFFECTIVE INCOME TAX RATE
The effective income tax rate was 23.9% in 2012 comparedwith 24.5% in 2011. The effective tax rate is generally lowerthan the statutory rate primarily due to tax credits PNCreceives from our investments in low income housingpartnerships and other tax exempt investments.
We expect our 2013 full year effective tax rate to be between25 to 26 percent, reflecting expected higher pre-tax income.
The PNC Financial Services Group, Inc. – Form 10-K 41
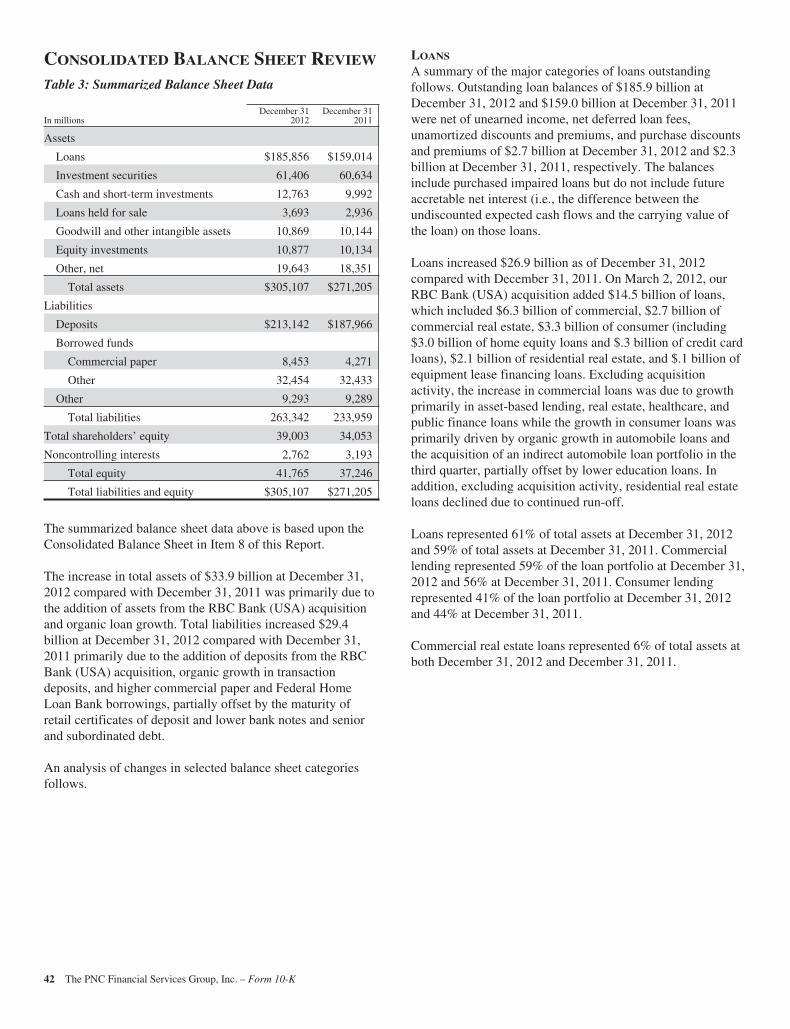
CONSOLIDATED BALANCE SHEET REVIEW
Table 3: Summarized Balance Sheet Data
In millionsDecember 31
2012December 31
2011
Assets
Loans $185,856 $159,014
Investment securities 61,406 60,634
Cash and short-term investments 12,763 9,992
Loans held for sale 3,693 2,936
Goodwill and other intangible assets 10,869 10,144
Equity investments 10,877 10,134
Other, net 19,643 18,351
Total assets $305,107 $271,205
Liabilities
Deposits $213,142 $187,966
Borrowed funds
Commercial paper 8,453 4,271
Other 32,454 32,433
Other 9,293 9,289
Total liabilities 263,342 233,959
Total shareholders’ equity 39,003 34,053
Noncontrolling interests 2,762 3,193
Total equity 41,765 37,246
Total liabilities and equity $305,107 $271,205
The summarized balance sheet data above is based upon theConsolidated Balance Sheet in Item 8 of this Report.
The increase in total assets of $33.9 billion at December 31,2012 compared with December 31, 2011 was primarily due tothe addition of assets from the RBC Bank (USA) acquisitionand organic loan growth. Total liabilities increased $29.4billion at December 31, 2012 compared with December 31,2011 primarily due to the addition of deposits from the RBCBank (USA) acquisition, organic growth in transactiondeposits, and higher commercial paper and Federal HomeLoan Bank borrowings, partially offset by the maturity ofretail certificates of deposit and lower bank notes and seniorand subordinated debt.
An analysis of changes in selected balance sheet categoriesfollows.
LOANS
A summary of the major categories of loans outstandingfollows. Outstanding loan balances of $185.9 billion atDecember 31, 2012 and $159.0 billion at December 31, 2011were net of unearned income, net deferred loan fees,unamortized discounts and premiums, and purchase discountsand premiums of $2.7 billion at December 31, 2012 and $2.3billion at December 31, 2011, respectively. The balancesinclude purchased impaired loans but do not include futureaccretable net interest (i.e., the difference between theundiscounted expected cash flows and the carrying value ofthe loan) on those loans.
Loans increased $26.9 billion as of December 31, 2012compared with December 31, 2011. On March 2, 2012, ourRBC Bank (USA) acquisition added $14.5 billion of loans,which included $6.3 billion of commercial, $2.7 billion ofcommercial real estate, $3.3 billion of consumer (including$3.0 billion of home equity loans and $.3 billion of credit cardloans), $2.1 billion of residential real estate, and $.1 billion ofequipment lease financing loans. Excluding acquisitionactivity, the increase in commercial loans was due to growthprimarily in asset-based lending, real estate, healthcare, andpublic finance loans while the growth in consumer loans wasprimarily driven by organic growth in automobile loans andthe acquisition of an indirect automobile loan portfolio in thethird quarter, partially offset by lower education loans. Inaddition, excluding acquisition activity, residential real estateloans declined due to continued run-off.
Loans represented 61% of total assets at December 31, 2012and 59% of total assets at December 31, 2011. Commerciallending represented 59% of the loan portfolio at December 31,2012 and 56% at December 31, 2011. Consumer lendingrepresented 41% of the loan portfolio at December 31, 2012and 44% at December 31, 2011.
Commercial real estate loans represented 6% of total assets atboth December 31, 2012 and December 31, 2011.
42 The PNC Financial Services Group, Inc. – Form 10-K
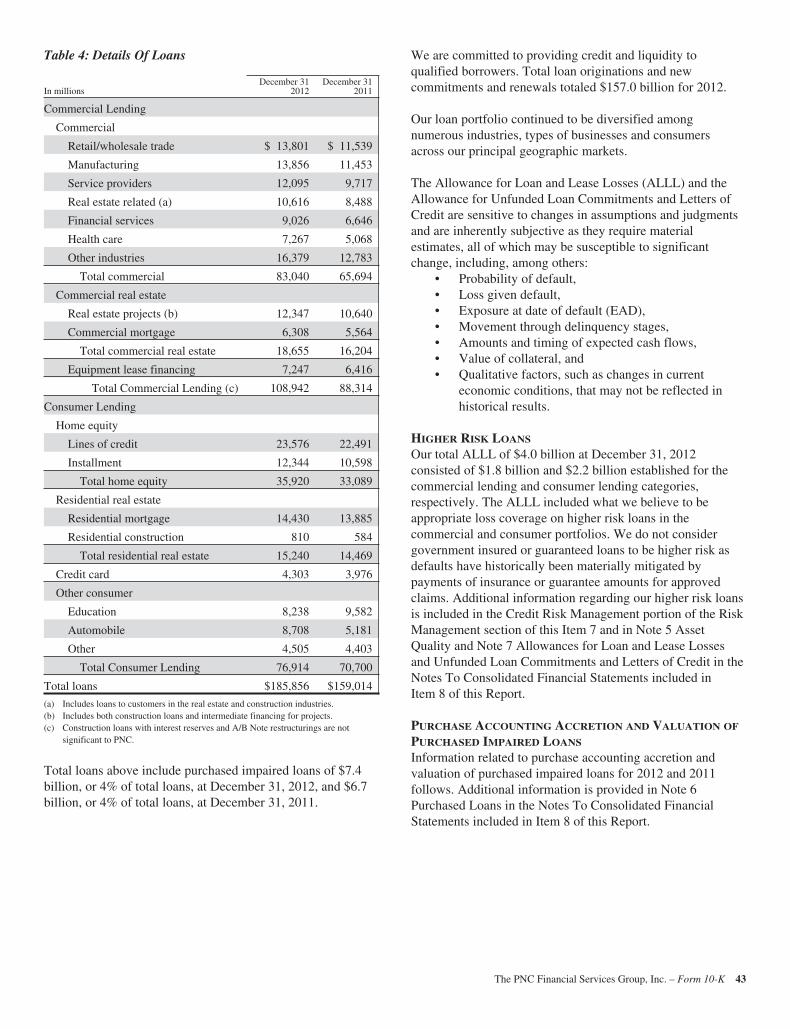
Table 4: Details Of Loans
In millionsDecember 31
2012December 31
2011
Commercial Lending
Commercial
Retail/wholesale trade $ 13,801 $ 11,539
Manufacturing 13,856 11,453
Service providers 12,095 9,717
Real estate related (a) 10,616 8,488
Financial services 9,026 6,646
Health care 7,267 5,068
Other industries 16,379 12,783
Total commercial 83,040 65,694
Commercial real estate
Real estate projects (b) 12,347 10,640
Commercial mortgage 6,308 5,564
Total commercial real estate 18,655 16,204
Equipment lease financing 7,247 6,416
Total Commercial Lending (c) 108,942 88,314
Consumer Lending
Home equity
Lines of credit 23,576 22,491
Installment 12,344 10,598
Total home equity 35,920 33,089
Residential real estate
Residential mortgage 14,430 13,885
Residential construction 810 584
Total residential real estate 15,240 14,469
Credit card 4,303 3,976
Other consumer
Education 8,238 9,582
Automobile 8,708 5,181
Other 4,505 4,403
Total Consumer Lending 76,914 70,700
Total loans $185,856 $159,014
(a) Includes loans to customers in the real estate and construction industries.(b) Includes both construction loans and intermediate financing for projects.(c) Construction loans with interest reserves and A/B Note restructurings are not
significant to PNC.
Total loans above include purchased impaired loans of $7.4billion, or 4% of total loans, at December 31, 2012, and $6.7billion, or 4% of total loans, at December 31, 2011.
We are committed to providing credit and liquidity toqualified borrowers. Total loan originations and newcommitments and renewals totaled $157.0 billion for 2012.
Our loan portfolio continued to be diversified amongnumerous industries, types of businesses and consumersacross our principal geographic markets.
The Allowance for Loan and Lease Losses (ALLL) and theAllowance for Unfunded Loan Commitments and Letters ofCredit are sensitive to changes in assumptions and judgmentsand are inherently subjective as they require materialestimates, all of which may be susceptible to significantchange, including, among others:
• Probability of default,• Loss given default,• Exposure at date of default (EAD),• Movement through delinquency stages,• Amounts and timing of expected cash flows,• Value of collateral, and• Qualitative factors, such as changes in current
economic conditions, that may not be reflected inhistorical results.
HIGHER RISK LOANS
Our total ALLL of $4.0 billion at December 31, 2012consisted of $1.8 billion and $2.2 billion established for thecommercial lending and consumer lending categories,respectively. The ALLL included what we believe to beappropriate loss coverage on higher risk loans in thecommercial and consumer portfolios. We do not considergovernment insured or guaranteed loans to be higher risk asdefaults have historically been materially mitigated bypayments of insurance or guarantee amounts for approvedclaims. Additional information regarding our higher risk loansis included in the Credit Risk Management portion of the RiskManagement section of this Item 7 and in Note 5 AssetQuality and Note 7 Allowances for Loan and Lease Lossesand Unfunded Loan Commitments and Letters of Credit in theNotes To Consolidated Financial Statements included inItem 8 of this Report.
PURCHASE ACCOUNTING ACCRETION AND VALUATION OF
PURCHASED IMPAIRED LOANS
Information related to purchase accounting accretion andvaluation of purchased impaired loans for 2012 and 2011follows. Additional information is provided in Note 6Purchased Loans in the Notes To Consolidated FinancialStatements included in Item 8 of this Report.
The PNC Financial Services Group, Inc. – Form 10-K 43
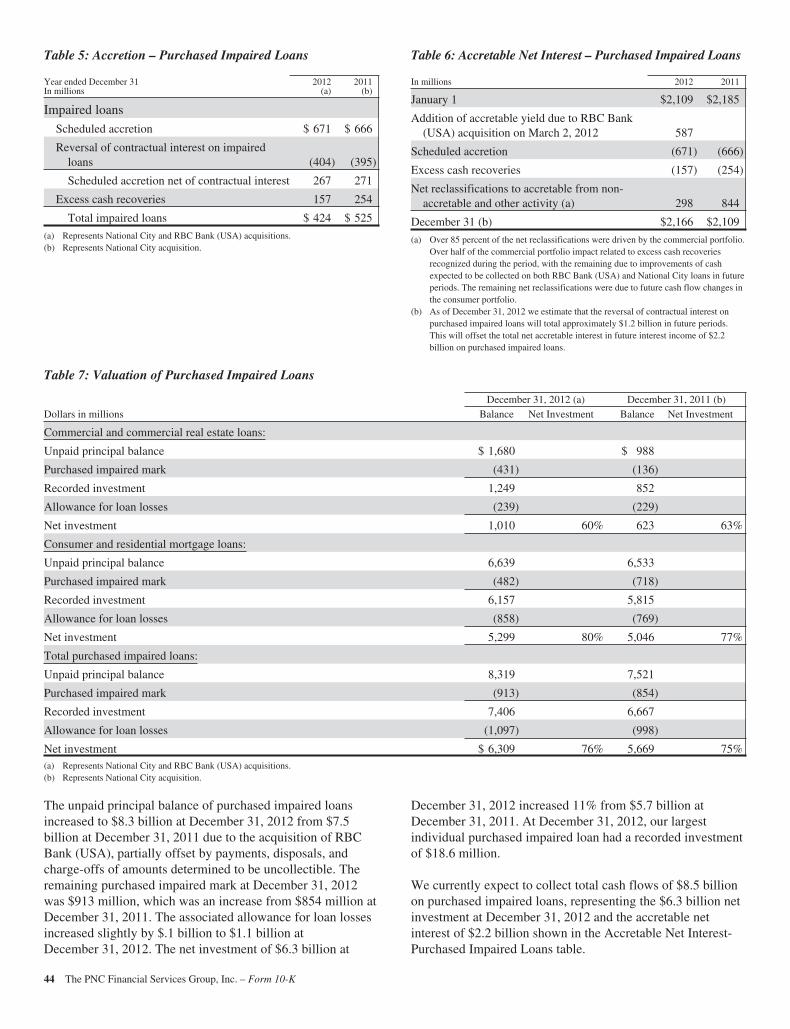
Table 5: Accretion – Purchased Impaired Loans
Year ended December 31In millions
2012(a)
2011(b)
Impaired loans
Scheduled accretion $ 671 $ 666
Reversal of contractual interest on impairedloans (404) (395)
Scheduled accretion net of contractual interest 267 271
Excess cash recoveries 157 254
Total impaired loans $ 424 $ 525
(a) Represents National City and RBC Bank (USA) acquisitions.(b) Represents National City acquisition.
Table 6: Accretable Net Interest – Purchased Impaired Loans
In millions 2012 2011
January 1 $2,109 $2,185
Addition of accretable yield due to RBC Bank(USA) acquisition on March 2, 2012 587
Scheduled accretion (671) (666)
Excess cash recoveries (157) (254)
Net reclassifications to accretable from non-accretable and other activity (a) 298 844
December 31 (b) $2,166 $2,109
(a) Over 85 percent of the net reclassifications were driven by the commercial portfolio.Over half of the commercial portfolio impact related to excess cash recoveriesrecognized during the period, with the remaining due to improvements of cashexpected to be collected on both RBC Bank (USA) and National City loans in futureperiods. The remaining net reclassifications were due to future cash flow changes inthe consumer portfolio.
(b) As of December 31, 2012 we estimate that the reversal of contractual interest onpurchased impaired loans will total approximately $1.2 billion in future periods.This will offset the total net accretable interest in future interest income of $2.2billion on purchased impaired loans.
Table 7: Valuation of Purchased Impaired Loans
December 31, 2012 (a) December 31, 2011 (b)Dollars in millions Balance Net Investment Balance Net Investment
Commercial and commercial real estate loans:
Unpaid principal balance $ 1,680 $ 988
Purchased impaired mark (431) (136)
Recorded investment 1,249 852
Allowance for loan losses (239) (229)
Net investment 1,010 60% 623 63%
Consumer and residential mortgage loans:
Unpaid principal balance 6,639 6,533
Purchased impaired mark (482) (718)
Recorded investment 6,157 5,815
Allowance for loan losses (858) (769)
Net investment 5,299 80% 5,046 77%
Total purchased impaired loans:
Unpaid principal balance 8,319 7,521
Purchased impaired mark (913) (854)
Recorded investment 7,406 6,667
Allowance for loan losses (1,097) (998)
Net investment $ 6,309 76% 5,669 75%(a) Represents National City and RBC Bank (USA) acquisitions.(b) Represents National City acquisition.
The unpaid principal balance of purchased impaired loansincreased to $8.3 billion at December 31, 2012 from $7.5billion at December 31, 2011 due to the acquisition of RBCBank (USA), partially offset by payments, disposals, andcharge-offs of amounts determined to be uncollectible. Theremaining purchased impaired mark at December 31, 2012was $913 million, which was an increase from $854 million atDecember 31, 2011. The associated allowance for loan lossesincreased slightly by $.1 billion to $1.1 billion atDecember 31, 2012. The net investment of $6.3 billion at
December 31, 2012 increased 11% from $5.7 billion atDecember 31, 2011. At December 31, 2012, our largestindividual purchased impaired loan had a recorded investmentof $18.6 million.
We currently expect to collect total cash flows of $8.5 billionon purchased impaired loans, representing the $6.3 billion netinvestment at December 31, 2012 and the accretable netinterest of $2.2 billion shown in the Accretable Net Interest-Purchased Impaired Loans table.
44 The PNC Financial Services Group, Inc. – Form 10-K
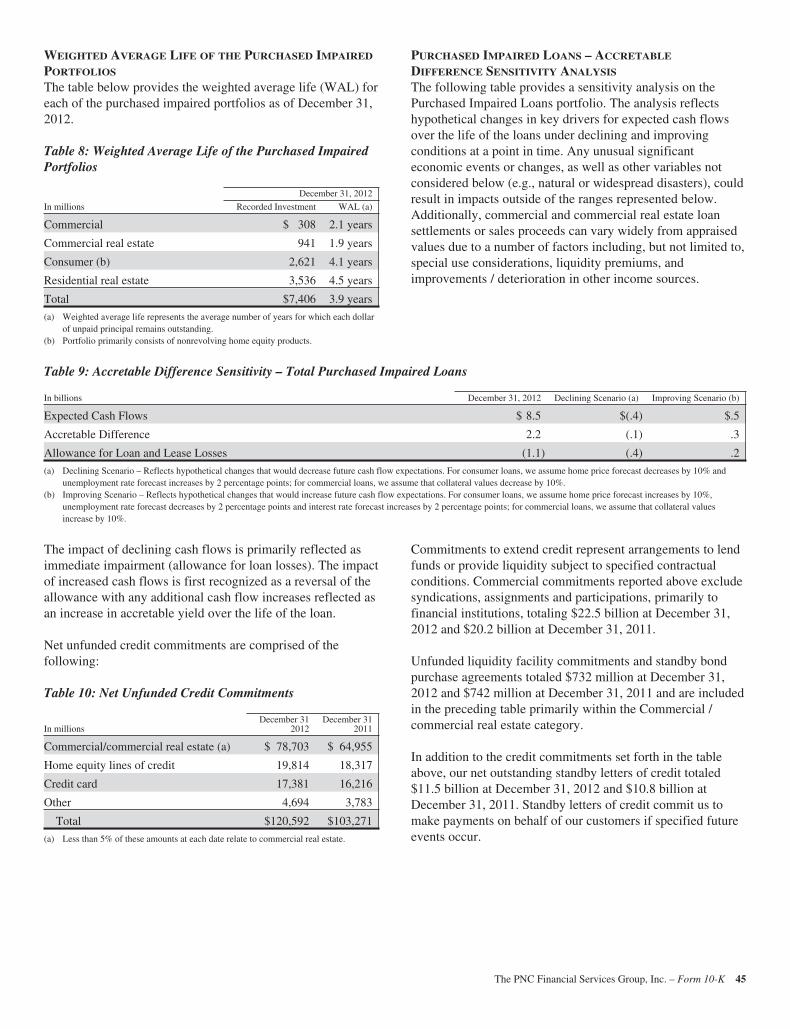
WEIGHTED AVERAGE LIFE OF THE PURCHASED IMPAIRED
PORTFOLIOS
The table below provides the weighted average life (WAL) foreach of the purchased impaired portfolios as of December 31,2012.
Table 8: Weighted Average Life of the Purchased ImpairedPortfolios
December 31, 2012
In millions Recorded Investment WAL (a)
Commercial $ 308 2.1 years
Commercial real estate 941 1.9 years
Consumer (b) 2,621 4.1 years
Residential real estate 3,536 4.5 years
Total $7,406 3.9 years
(a) Weighted average life represents the average number of years for which each dollarof unpaid principal remains outstanding.
(b) Portfolio primarily consists of nonrevolving home equity products.
PURCHASED IMPAIRED LOANS – ACCRETABLE
DIFFERENCE SENSITIVITY ANALYSIS
The following table provides a sensitivity analysis on thePurchased Impaired Loans portfolio. The analysis reflectshypothetical changes in key drivers for expected cash flowsover the life of the loans under declining and improvingconditions at a point in time. Any unusual significanteconomic events or changes, as well as other variables notconsidered below (e.g., natural or widespread disasters), couldresult in impacts outside of the ranges represented below.Additionally, commercial and commercial real estate loansettlements or sales proceeds can vary widely from appraisedvalues due to a number of factors including, but not limited to,special use considerations, liquidity premiums, andimprovements / deterioration in other income sources.
Table 9: Accretable Difference Sensitivity – Total Purchased Impaired Loans
In billions December 31, 2012 Declining Scenario (a) Improving Scenario (b)
Expected Cash Flows $ 8.5 $(.4) $.5
Accretable Difference 2.2 (.1) .3
Allowance for Loan and Lease Losses (1.1) (.4) .2
(a) Declining Scenario – Reflects hypothetical changes that would decrease future cash flow expectations. For consumer loans, we assume home price forecast decreases by 10% andunemployment rate forecast increases by 2 percentage points; for commercial loans, we assume that collateral values decrease by 10%.
(b) Improving Scenario – Reflects hypothetical changes that would increase future cash flow expectations. For consumer loans, we assume home price forecast increases by 10%,unemployment rate forecast decreases by 2 percentage points and interest rate forecast increases by 2 percentage points; for commercial loans, we assume that collateral valuesincrease by 10%.
The impact of declining cash flows is primarily reflected asimmediate impairment (allowance for loan losses). The impactof increased cash flows is first recognized as a reversal of theallowance with any additional cash flow increases reflected asan increase in accretable yield over the life of the loan.
Net unfunded credit commitments are comprised of thefollowing:
Table 10: Net Unfunded Credit Commitments
In millionsDecember 31
2012December 31
2011
Commercial/commercial real estate (a) $ 78,703 $ 64,955
Home equity lines of credit 19,814 18,317
Credit card 17,381 16,216
Other 4,694 3,783
Total $120,592 $103,271
(a) Less than 5% of these amounts at each date relate to commercial real estate.
Commitments to extend credit represent arrangements to lendfunds or provide liquidity subject to specified contractualconditions. Commercial commitments reported above excludesyndications, assignments and participations, primarily tofinancial institutions, totaling $22.5 billion at December 31,2012 and $20.2 billion at December 31, 2011.
Unfunded liquidity facility commitments and standby bondpurchase agreements totaled $732 million at December 31,2012 and $742 million at December 31, 2011 and are includedin the preceding table primarily within the Commercial /commercial real estate category.
In addition to the credit commitments set forth in the tableabove, our net outstanding standby letters of credit totaled$11.5 billion at December 31, 2012 and $10.8 billion atDecember 31, 2011. Standby letters of credit commit us tomake payments on behalf of our customers if specified futureevents occur.
The PNC Financial Services Group, Inc. – Form 10-K 45
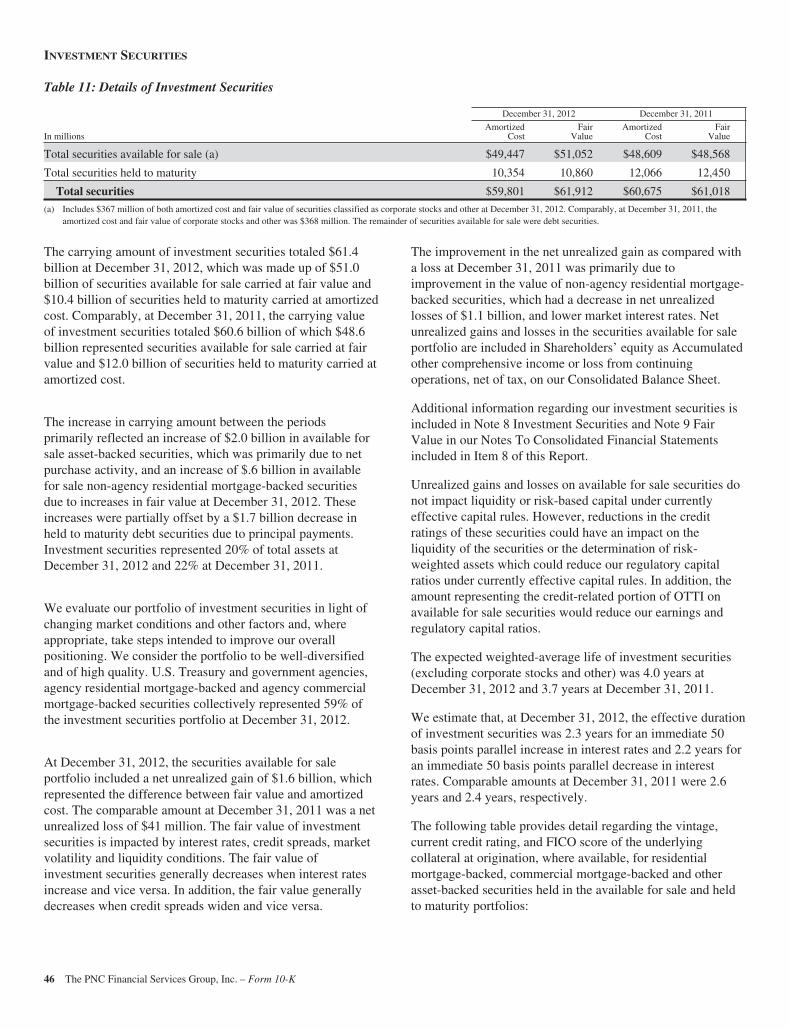
INVESTMENT SECURITIES
Table 11: Details of Investment Securities
December 31, 2012 December 31, 2011
In millionsAmortized
CostFair
ValueAmortized
CostFair
Value
Total securities available for sale (a) $49,447 $51,052 $48,609 $48,568
Total securities held to maturity 10,354 10,860 12,066 12,450
Total securities $59,801 $61,912 $60,675 $61,018
(a) Includes $367 million of both amortized cost and fair value of securities classified as corporate stocks and other at December 31, 2012. Comparably, at December 31, 2011, theamortized cost and fair value of corporate stocks and other was $368 million. The remainder of securities available for sale were debt securities.
The carrying amount of investment securities totaled $61.4billion at December 31, 2012, which was made up of $51.0billion of securities available for sale carried at fair value and$10.4 billion of securities held to maturity carried at amortizedcost. Comparably, at December 31, 2011, the carrying valueof investment securities totaled $60.6 billion of which $48.6billion represented securities available for sale carried at fairvalue and $12.0 billion of securities held to maturity carried atamortized cost.
The increase in carrying amount between the periodsprimarily reflected an increase of $2.0 billion in available forsale asset-backed securities, which was primarily due to netpurchase activity, and an increase of $.6 billion in availablefor sale non-agency residential mortgage-backed securitiesdue to increases in fair value at December 31, 2012. Theseincreases were partially offset by a $1.7 billion decrease inheld to maturity debt securities due to principal payments.Investment securities represented 20% of total assets atDecember 31, 2012 and 22% at December 31, 2011.
We evaluate our portfolio of investment securities in light ofchanging market conditions and other factors and, whereappropriate, take steps intended to improve our overallpositioning. We consider the portfolio to be well-diversifiedand of high quality. U.S. Treasury and government agencies,agency residential mortgage-backed and agency commercialmortgage-backed securities collectively represented 59% ofthe investment securities portfolio at December 31, 2012.
At December 31, 2012, the securities available for saleportfolio included a net unrealized gain of $1.6 billion, whichrepresented the difference between fair value and amortizedcost. The comparable amount at December 31, 2011 was a netunrealized loss of $41 million. The fair value of investmentsecurities is impacted by interest rates, credit spreads, marketvolatility and liquidity conditions. The fair value ofinvestment securities generally decreases when interest ratesincrease and vice versa. In addition, the fair value generallydecreases when credit spreads widen and vice versa.
The improvement in the net unrealized gain as compared witha loss at December 31, 2011 was primarily due toimprovement in the value of non-agency residential mortgage-backed securities, which had a decrease in net unrealizedlosses of $1.1 billion, and lower market interest rates. Netunrealized gains and losses in the securities available for saleportfolio are included in Shareholders’ equity as Accumulatedother comprehensive income or loss from continuingoperations, net of tax, on our Consolidated Balance Sheet.
Additional information regarding our investment securities isincluded in Note 8 Investment Securities and Note 9 FairValue in our Notes To Consolidated Financial Statementsincluded in Item 8 of this Report.
Unrealized gains and losses on available for sale securities donot impact liquidity or risk-based capital under currentlyeffective capital rules. However, reductions in the creditratings of these securities could have an impact on theliquidity of the securities or the determination of risk-weighted assets which could reduce our regulatory capitalratios under currently effective capital rules. In addition, theamount representing the credit-related portion of OTTI onavailable for sale securities would reduce our earnings andregulatory capital ratios.
The expected weighted-average life of investment securities(excluding corporate stocks and other) was 4.0 years atDecember 31, 2012 and 3.7 years at December 31, 2011.
We estimate that, at December 31, 2012, the effective durationof investment securities was 2.3 years for an immediate 50basis points parallel increase in interest rates and 2.2 years foran immediate 50 basis points parallel decrease in interestrates. Comparable amounts at December 31, 2011 were 2.6years and 2.4 years, respectively.
The following table provides detail regarding the vintage,current credit rating, and FICO score of the underlyingcollateral at origination, where available, for residentialmortgage-backed, commercial mortgage-backed and otherasset-backed securities held in the available for sale and heldto maturity portfolios:
46 The PNC Financial Services Group, Inc. – Form 10-K
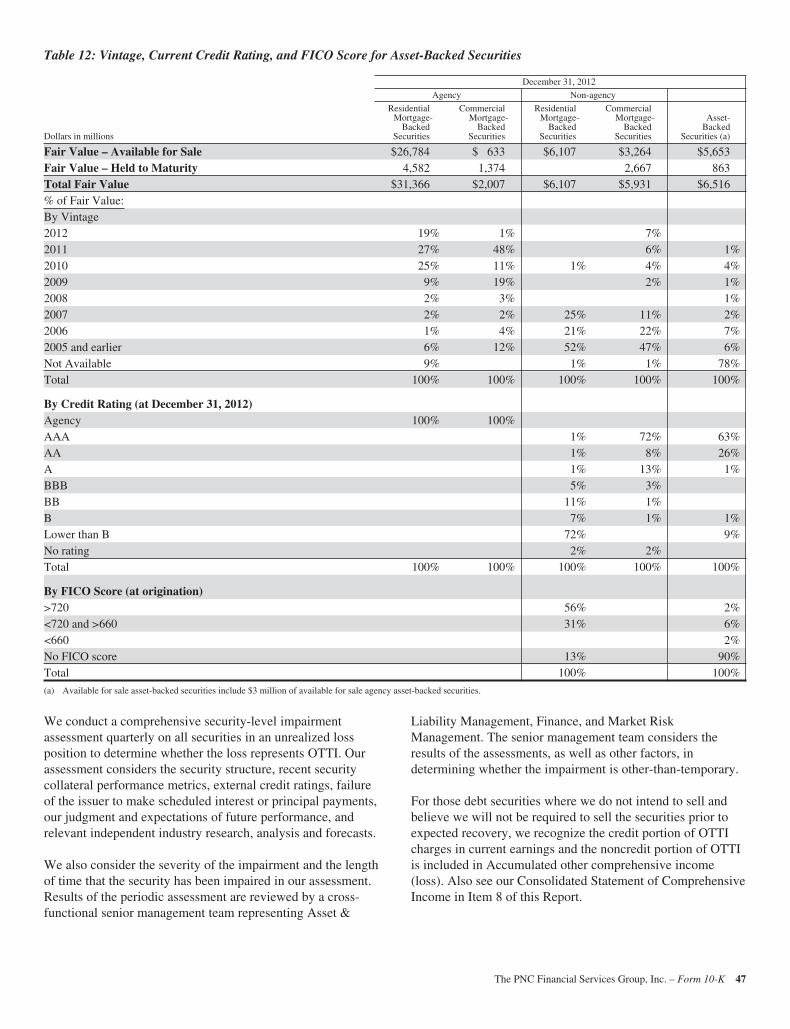
Table 12: Vintage, Current Credit Rating, and FICO Score for Asset-Backed Securities
December 31, 2012
Agency Non-agency
Dollars in millions
ResidentialMortgage-
BackedSecurities
CommercialMortgage-
BackedSecurities
ResidentialMortgage-
BackedSecurities
CommercialMortgage-
BackedSecurities
Asset-Backed
Securities (a)
Fair Value – Available for Sale $26,784 $ 633 $6,107 $3,264 $5,653Fair Value – Held to Maturity 4,582 1,374 2,667 863Total Fair Value $31,366 $2,007 $6,107 $5,931 $6,516% of Fair Value:By Vintage2012 19% 1% 7%2011 27% 48% 6% 1%2010 25% 11% 1% 4% 4%2009 9% 19% 2% 1%2008 2% 3% 1%2007 2% 2% 25% 11% 2%2006 1% 4% 21% 22% 7%2005 and earlier 6% 12% 52% 47% 6%Not Available 9% 1% 1% 78%Total 100% 100% 100% 100% 100%
By Credit Rating (at December 31, 2012)Agency 100% 100%AAA 1% 72% 63%AA 1% 8% 26%A 1% 13% 1%BBB 5% 3%BB 11% 1%B 7% 1% 1%Lower than B 72% 9%No rating 2% 2%Total 100% 100% 100% 100% 100%
By FICO Score (at origination)>720 56% 2%<720 and >660 31% 6%<660 2%No FICO score 13% 90%Total 100% 100%
(a) Available for sale asset-backed securities include $3 million of available for sale agency asset-backed securities.
We conduct a comprehensive security-level impairmentassessment quarterly on all securities in an unrealized lossposition to determine whether the loss represents OTTI. Ourassessment considers the security structure, recent securitycollateral performance metrics, external credit ratings, failureof the issuer to make scheduled interest or principal payments,our judgment and expectations of future performance, andrelevant independent industry research, analysis and forecasts.
We also consider the severity of the impairment and the lengthof time that the security has been impaired in our assessment.Results of the periodic assessment are reviewed by a cross-functional senior management team representing Asset &
Liability Management, Finance, and Market RiskManagement. The senior management team considers theresults of the assessments, as well as other factors, indetermining whether the impairment is other-than-temporary.
For those debt securities where we do not intend to sell andbelieve we will not be required to sell the securities prior toexpected recovery, we recognize the credit portion of OTTIcharges in current earnings and the noncredit portion of OTTIis included in Accumulated other comprehensive income(loss). Also see our Consolidated Statement of ComprehensiveIncome in Item 8 of this Report.
The PNC Financial Services Group, Inc. – Form 10-K 47
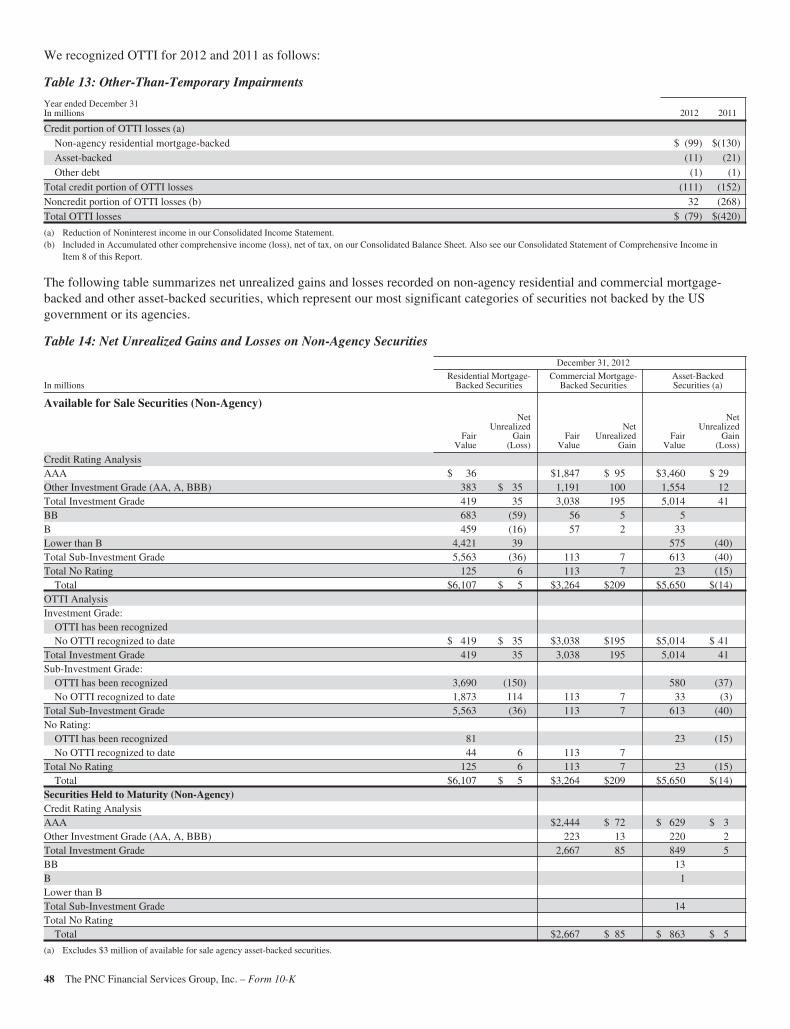
We recognized OTTI for 2012 and 2011 as follows:
Table 13: Other-Than-Temporary Impairments
Year ended December 31In millions 2012 2011
Credit portion of OTTI losses (a)Non-agency residential mortgage-backed $ (99) $(130)Asset-backed (11) (21)Other debt (1) (1)
Total credit portion of OTTI losses (111) (152)Noncredit portion of OTTI losses (b) 32 (268)Total OTTI losses $ (79) $(420)
(a) Reduction of Noninterest income in our Consolidated Income Statement.(b) Included in Accumulated other comprehensive income (loss), net of tax, on our Consolidated Balance Sheet. Also see our Consolidated Statement of Comprehensive Income in
Item 8 of this Report.
The following table summarizes net unrealized gains and losses recorded on non-agency residential and commercial mortgage-backed and other asset-backed securities, which represent our most significant categories of securities not backed by the USgovernment or its agencies.
Table 14: Net Unrealized Gains and Losses on Non-Agency Securities
December 31, 2012
In millionsResidential Mortgage-
Backed SecuritiesCommercial Mortgage-
Backed SecuritiesAsset-BackedSecurities (a)
Available for Sale Securities (Non-Agency)
FairValue
NetUnrealized
Gain(Loss)
FairValue
NetUnrealized
GainFair
Value
NetUnrealized
Gain(Loss)
Credit Rating AnalysisAAA $ 36 $1,847 $ 95 $3,460 $ 29Other Investment Grade (AA, A, BBB) 383 $ 35 1,191 100 1,554 12Total Investment Grade 419 35 3,038 195 5,014 41BB 683 (59) 56 5 5B 459 (16) 57 2 33Lower than B 4,421 39 575 (40)Total Sub-Investment Grade 5,563 (36) 113 7 613 (40)Total No Rating 125 6 113 7 23 (15)
Total $6,107 $ 5 $3,264 $209 $5,650 $(14)OTTI AnalysisInvestment Grade:
OTTI has been recognizedNo OTTI recognized to date $ 419 $ 35 $3,038 $195 $5,014 $ 41
Total Investment Grade 419 35 3,038 195 5,014 41Sub-Investment Grade:
OTTI has been recognized 3,690 (150) 580 (37)No OTTI recognized to date 1,873 114 113 7 33 (3)
Total Sub-Investment Grade 5,563 (36) 113 7 613 (40)No Rating:
OTTI has been recognized 81 23 (15)No OTTI recognized to date 44 6 113 7
Total No Rating 125 6 113 7 23 (15)Total $6,107 $ 5 $3,264 $209 $5,650 $(14)
Securities Held to Maturity (Non-Agency)Credit Rating AnalysisAAA $2,444 $ 72 $ 629 $ 3Other Investment Grade (AA, A, BBB) 223 13 220 2Total Investment Grade 2,667 85 849 5BB 13B 1Lower than BTotal Sub-Investment Grade 14Total No Rating
Total $2,667 $ 85 $ 863 $ 5
(a) Excludes $3 million of available for sale agency asset-backed securities.
48 The PNC Financial Services Group, Inc. – Form 10-K
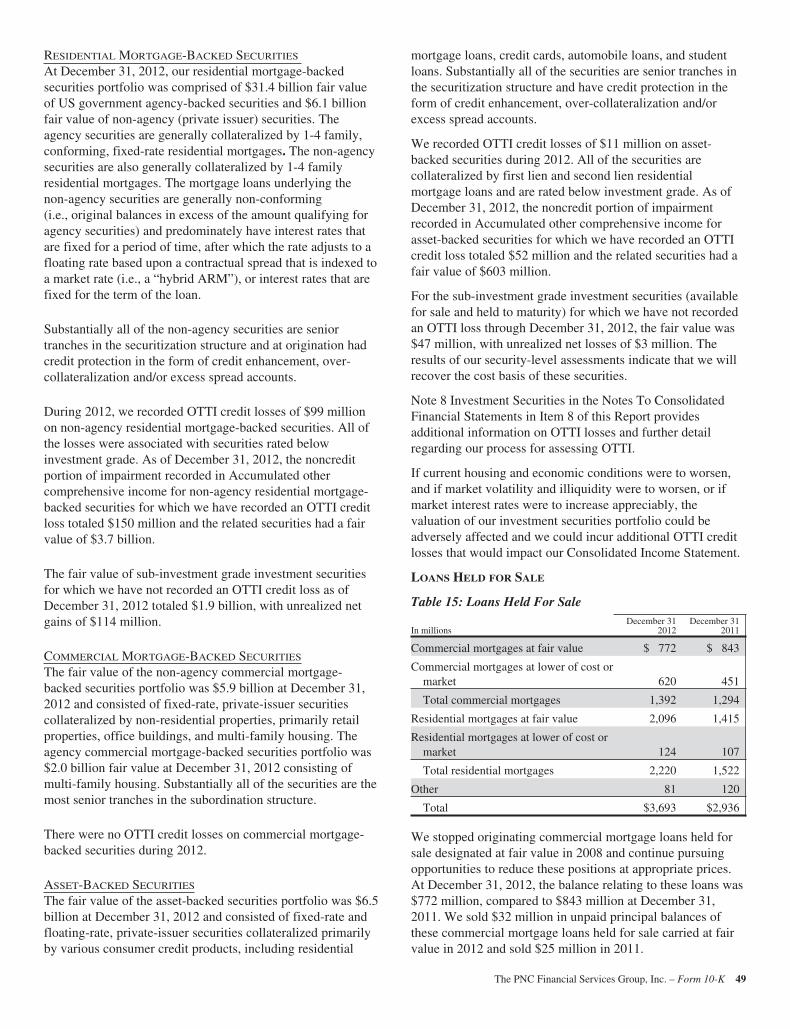
RESIDENTIAL MORTGAGE-BACKED SECURITIES
At December 31, 2012, our residential mortgage-backedsecurities portfolio was comprised of $31.4 billion fair valueof US government agency-backed securities and $6.1 billionfair value of non-agency (private issuer) securities. Theagency securities are generally collateralized by 1-4 family,conforming, fixed-rate residential mortgages. The non-agencysecurities are also generally collateralized by 1-4 familyresidential mortgages. The mortgage loans underlying thenon-agency securities are generally non-conforming(i.e., original balances in excess of the amount qualifying foragency securities) and predominately have interest rates thatare fixed for a period of time, after which the rate adjusts to afloating rate based upon a contractual spread that is indexed toa market rate (i.e., a “hybrid ARM”), or interest rates that arefixed for the term of the loan.
Substantially all of the non-agency securities are seniortranches in the securitization structure and at origination hadcredit protection in the form of credit enhancement, over-collateralization and/or excess spread accounts.
During 2012, we recorded OTTI credit losses of $99 millionon non-agency residential mortgage-backed securities. All ofthe losses were associated with securities rated belowinvestment grade. As of December 31, 2012, the noncreditportion of impairment recorded in Accumulated othercomprehensive income for non-agency residential mortgage-backed securities for which we have recorded an OTTI creditloss totaled $150 million and the related securities had a fairvalue of $3.7 billion.
The fair value of sub-investment grade investment securitiesfor which we have not recorded an OTTI credit loss as ofDecember 31, 2012 totaled $1.9 billion, with unrealized netgains of $114 million.
COMMERCIAL MORTGAGE-BACKED SECURITIES
The fair value of the non-agency commercial mortgage-backed securities portfolio was $5.9 billion at December 31,2012 and consisted of fixed-rate, private-issuer securitiescollateralized by non-residential properties, primarily retailproperties, office buildings, and multi-family housing. Theagency commercial mortgage-backed securities portfolio was$2.0 billion fair value at December 31, 2012 consisting ofmulti-family housing. Substantially all of the securities are themost senior tranches in the subordination structure.
There were no OTTI credit losses on commercial mortgage-backed securities during 2012.
ASSET-BACKED SECURITIES
The fair value of the asset-backed securities portfolio was $6.5billion at December 31, 2012 and consisted of fixed-rate andfloating-rate, private-issuer securities collateralized primarilyby various consumer credit products, including residential
mortgage loans, credit cards, automobile loans, and studentloans. Substantially all of the securities are senior tranches inthe securitization structure and have credit protection in theform of credit enhancement, over-collateralization and/orexcess spread accounts.
We recorded OTTI credit losses of $11 million on asset-backed securities during 2012. All of the securities arecollateralized by first lien and second lien residentialmortgage loans and are rated below investment grade. As ofDecember 31, 2012, the noncredit portion of impairmentrecorded in Accumulated other comprehensive income forasset-backed securities for which we have recorded an OTTIcredit loss totaled $52 million and the related securities had afair value of $603 million.
For the sub-investment grade investment securities (availablefor sale and held to maturity) for which we have not recordedan OTTI loss through December 31, 2012, the fair value was$47 million, with unrealized net losses of $3 million. Theresults of our security-level assessments indicate that we willrecover the cost basis of these securities.
Note 8 Investment Securities in the Notes To ConsolidatedFinancial Statements in Item 8 of this Report providesadditional information on OTTI losses and further detailregarding our process for assessing OTTI.
If current housing and economic conditions were to worsen,and if market volatility and illiquidity were to worsen, or ifmarket interest rates were to increase appreciably, thevaluation of our investment securities portfolio could beadversely affected and we could incur additional OTTI creditlosses that would impact our Consolidated Income Statement.
LOANS HELD FOR SALE
Table 15: Loans Held For Sale
In millionsDecember 31
2012December 31
2011
Commercial mortgages at fair value $ 772 $ 843
Commercial mortgages at lower of cost ormarket 620 451
Total commercial mortgages 1,392 1,294
Residential mortgages at fair value 2,096 1,415
Residential mortgages at lower of cost ormarket 124 107
Total residential mortgages 2,220 1,522
Other 81 120
Total $3,693 $2,936
We stopped originating commercial mortgage loans held forsale designated at fair value in 2008 and continue pursuingopportunities to reduce these positions at appropriate prices.At December 31, 2012, the balance relating to these loans was$772 million, compared to $843 million at December 31,2011. We sold $32 million in unpaid principal balances ofthese commercial mortgage loans held for sale carried at fairvalue in 2012 and sold $25 million in 2011.
The PNC Financial Services Group, Inc. – Form 10-K 49
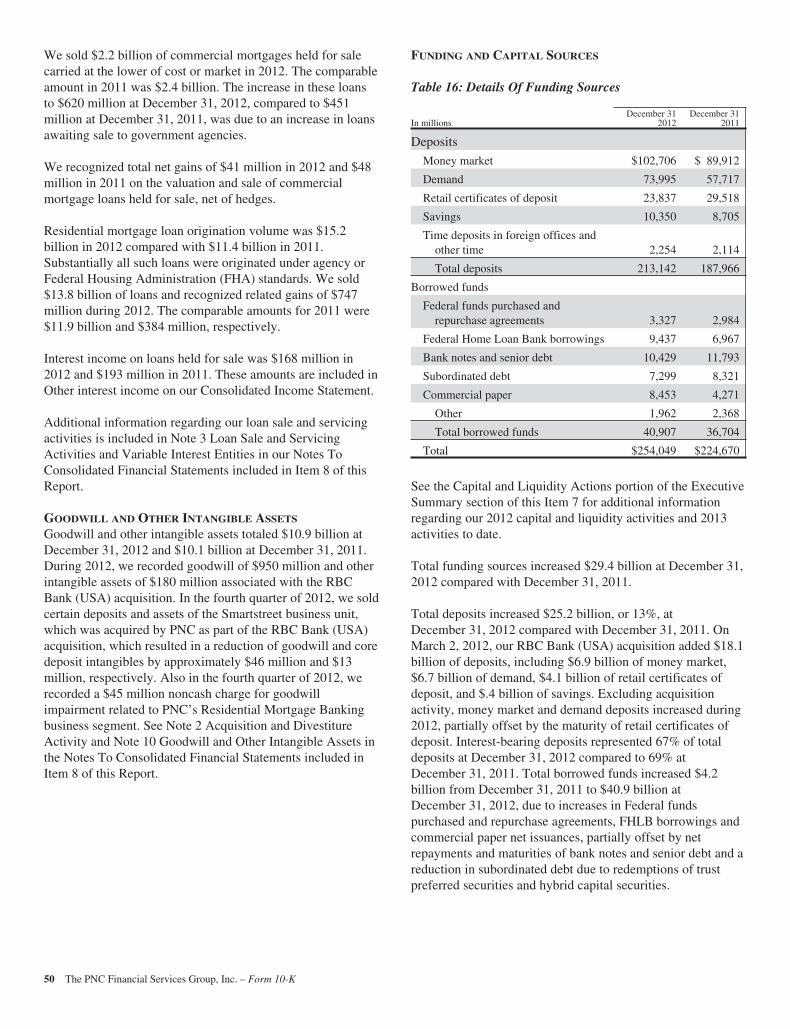
We sold $2.2 billion of commercial mortgages held for salecarried at the lower of cost or market in 2012. The comparableamount in 2011 was $2.4 billion. The increase in these loansto $620 million at December 31, 2012, compared to $451million at December 31, 2011, was due to an increase in loansawaiting sale to government agencies.
We recognized total net gains of $41 million in 2012 and $48million in 2011 on the valuation and sale of commercialmortgage loans held for sale, net of hedges.
Residential mortgage loan origination volume was $15.2billion in 2012 compared with $11.4 billion in 2011.Substantially all such loans were originated under agency orFederal Housing Administration (FHA) standards. We sold$13.8 billion of loans and recognized related gains of $747million during 2012. The comparable amounts for 2011 were$11.9 billion and $384 million, respectively.
Interest income on loans held for sale was $168 million in2012 and $193 million in 2011. These amounts are included inOther interest income on our Consolidated Income Statement.
Additional information regarding our loan sale and servicingactivities is included in Note 3 Loan Sale and ServicingActivities and Variable Interest Entities in our Notes ToConsolidated Financial Statements included in Item 8 of thisReport.
GOODWILL AND OTHER INTANGIBLE ASSETS
Goodwill and other intangible assets totaled $10.9 billion atDecember 31, 2012 and $10.1 billion at December 31, 2011.During 2012, we recorded goodwill of $950 million and otherintangible assets of $180 million associated with the RBCBank (USA) acquisition. In the fourth quarter of 2012, we soldcertain deposits and assets of the Smartstreet business unit,which was acquired by PNC as part of the RBC Bank (USA)acquisition, which resulted in a reduction of goodwill and coredeposit intangibles by approximately $46 million and $13million, respectively. Also in the fourth quarter of 2012, werecorded a $45 million noncash charge for goodwillimpairment related to PNC’s Residential Mortgage Bankingbusiness segment. See Note 2 Acquisition and DivestitureActivity and Note 10 Goodwill and Other Intangible Assets inthe Notes To Consolidated Financial Statements included inItem 8 of this Report.
FUNDING AND CAPITAL SOURCES
Table 16: Details Of Funding Sources
In millionsDecember 31
2012December 31
2011
Deposits
Money market $102,706 $ 89,912
Demand 73,995 57,717
Retail certificates of deposit 23,837 29,518
Savings 10,350 8,705
Time deposits in foreign offices andother time 2,254 2,114
Total deposits 213,142 187,966
Borrowed funds
Federal funds purchased andrepurchase agreements 3,327 2,984
Federal Home Loan Bank borrowings 9,437 6,967
Bank notes and senior debt 10,429 11,793
Subordinated debt 7,299 8,321
Commercial paper 8,453 4,271
Other 1,962 2,368
Total borrowed funds 40,907 36,704
Total $254,049 $224,670
See the Capital and Liquidity Actions portion of the ExecutiveSummary section of this Item 7 for additional informationregarding our 2012 capital and liquidity activities and 2013activities to date.
Total funding sources increased $29.4 billion at December 31,2012 compared with December 31, 2011.
Total deposits increased $25.2 billion, or 13%, atDecember 31, 2012 compared with December 31, 2011. OnMarch 2, 2012, our RBC Bank (USA) acquisition added $18.1billion of deposits, including $6.9 billion of money market,$6.7 billion of demand, $4.1 billion of retail certificates ofdeposit, and $.4 billion of savings. Excluding acquisitionactivity, money market and demand deposits increased during2012, partially offset by the maturity of retail certificates ofdeposit. Interest-bearing deposits represented 67% of totaldeposits at December 31, 2012 compared to 69% atDecember 31, 2011. Total borrowed funds increased $4.2billion from December 31, 2011 to $40.9 billion atDecember 31, 2012, due to increases in Federal fundspurchased and repurchase agreements, FHLB borrowings andcommercial paper net issuances, partially offset by netrepayments and maturities of bank notes and senior debt and areduction in subordinated debt due to redemptions of trustpreferred securities and hybrid capital securities.
50 The PNC Financial Services Group, Inc. – Form 10-K
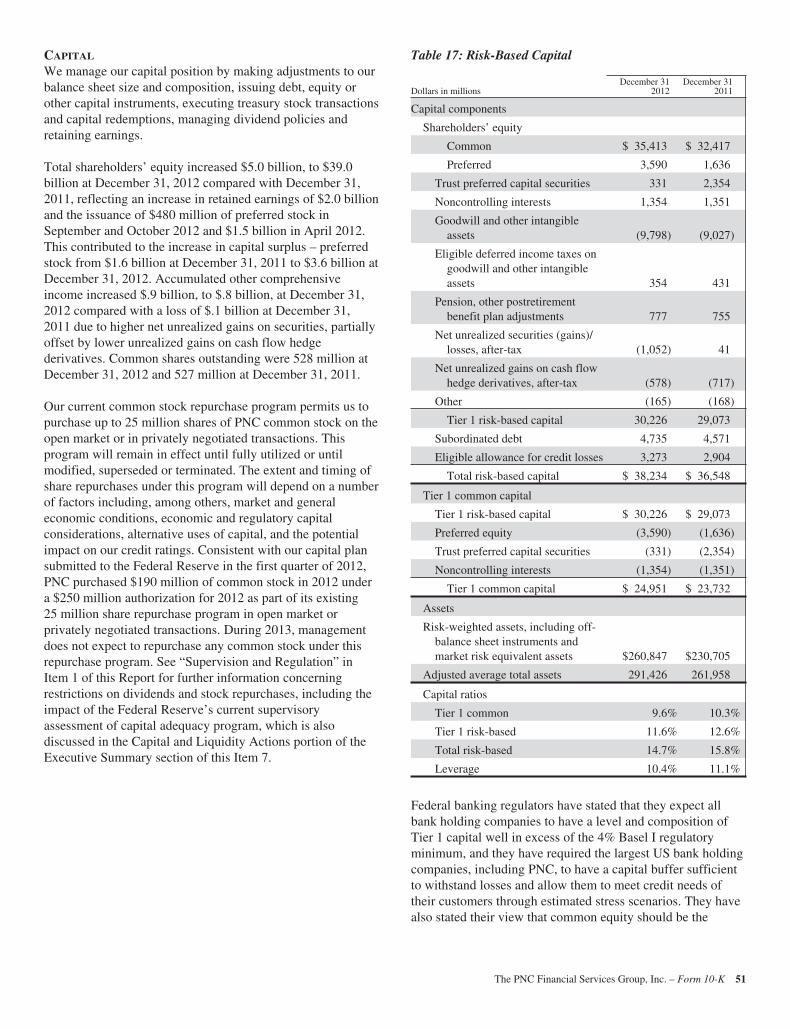
CAPITAL
We manage our capital position by making adjustments to ourbalance sheet size and composition, issuing debt, equity orother capital instruments, executing treasury stock transactionsand capital redemptions, managing dividend policies andretaining earnings.
Total shareholders’ equity increased $5.0 billion, to $39.0billion at December 31, 2012 compared with December 31,2011, reflecting an increase in retained earnings of $2.0 billionand the issuance of $480 million of preferred stock inSeptember and October 2012 and $1.5 billion in April 2012.This contributed to the increase in capital surplus – preferredstock from $1.6 billion at December 31, 2011 to $3.6 billion atDecember 31, 2012. Accumulated other comprehensiveincome increased $.9 billion, to $.8 billion, at December 31,2012 compared with a loss of $.1 billion at December 31,2011 due to higher net unrealized gains on securities, partiallyoffset by lower unrealized gains on cash flow hedgederivatives. Common shares outstanding were 528 million atDecember 31, 2012 and 527 million at December 31, 2011.
Our current common stock repurchase program permits us topurchase up to 25 million shares of PNC common stock on theopen market or in privately negotiated transactions. Thisprogram will remain in effect until fully utilized or untilmodified, superseded or terminated. The extent and timing ofshare repurchases under this program will depend on a numberof factors including, among others, market and generaleconomic conditions, economic and regulatory capitalconsiderations, alternative uses of capital, and the potentialimpact on our credit ratings. Consistent with our capital plansubmitted to the Federal Reserve in the first quarter of 2012,PNC purchased $190 million of common stock in 2012 undera $250 million authorization for 2012 as part of its existing25 million share repurchase program in open market orprivately negotiated transactions. During 2013, managementdoes not expect to repurchase any common stock under thisrepurchase program. See “Supervision and Regulation” inItem 1 of this Report for further information concerningrestrictions on dividends and stock repurchases, including theimpact of the Federal Reserve’s current supervisoryassessment of capital adequacy program, which is alsodiscussed in the Capital and Liquidity Actions portion of theExecutive Summary section of this Item 7.
Table 17: Risk-Based Capital
Dollars in millionsDecember 31
2012December 31
2011
Capital components
Shareholders’ equity
Common $ 35,413 $ 32,417
Preferred 3,590 1,636
Trust preferred capital securities 331 2,354
Noncontrolling interests 1,354 1,351
Goodwill and other intangibleassets (9,798) (9,027)
Eligible deferred income taxes ongoodwill and other intangibleassets 354 431
Pension, other postretirementbenefit plan adjustments 777 755
Net unrealized securities (gains)/losses, after-tax (1,052) 41
Net unrealized gains on cash flowhedge derivatives, after-tax (578) (717)
Other (165) (168)
Tier 1 risk-based capital 30,226 29,073
Subordinated debt 4,735 4,571
Eligible allowance for credit losses 3,273 2,904
Total risk-based capital $ 38,234 $ 36,548
Tier 1 common capital
Tier 1 risk-based capital $ 30,226 $ 29,073
Preferred equity (3,590) (1,636)
Trust preferred capital securities (331) (2,354)
Noncontrolling interests (1,354) (1,351)
Tier 1 common capital $ 24,951 $ 23,732
Assets
Risk-weighted assets, including off-balance sheet instruments andmarket risk equivalent assets $260,847 $230,705
Adjusted average total assets 291,426 261,958
Capital ratios
Tier 1 common 9.6% 10.3%
Tier 1 risk-based 11.6% 12.6%
Total risk-based 14.7% 15.8%
Leverage 10.4% 11.1%
Federal banking regulators have stated that they expect allbank holding companies to have a level and composition ofTier 1 capital well in excess of the 4% Basel I regulatoryminimum, and they have required the largest US bank holdingcompanies, including PNC, to have a capital buffer sufficientto withstand losses and allow them to meet credit needs oftheir customers through estimated stress scenarios. They havealso stated their view that common equity should be the
The PNC Financial Services Group, Inc. – Form 10-K 51
dominant form of Tier 1 capital. As a result, regulators arenow emphasizing the Tier 1 common capital ratio in theirevaluation of bank holding company capital levels, although aformal ratio for this metric is not provided for in currentregulations. We seek to manage our capital consistent withthese regulatory principles, and believe that our December 31,2012 capital levels were aligned with them.
Dodd-Frank requires the Federal Reserve Board to establishcapital requirements that would, among other things, eliminatethe Tier 1 treatment of trust preferred securities following aphase-in period expected to begin in 2013. Accordingly, PNChas redeemed some of its trust preferred securities and willconsider redeeming others on or after their first call date,based on such considerations as dividend rates, future capitalrequirements, capital market conditions and other factors. Seethe Capital and Liquidity Actions portion of the ExecutiveSummary section of this Item 7 for additional informationregarding our April 2012, May 2012, July 2012, andNovember 2012 redemptions of trust preferred securities andhybrid capital securities. See Note 14 Capital Securities ofSubsidiary Trusts and Perpetual Trust Securities in the NotesTo Consolidated Financial Statements in Item 8 of this Reportfor additional information on trust preferred securities.
Our Tier 1 common capital ratio was 9.6% at December 31,2012, compared with 10.3% at December 31, 2011. Our Tier 1risk-based capital ratio decreased 100 basis points to 11.6% atDecember 31, 2012 from 12.6% at December 31, 2011. Ourtotal risk-based capital ratio declined 110 basis points to14.7% at December 31, 2012 from 15.8% at December 31,2011. The decline in these ratios was primarily due to theRBC Bank (USA) acquisition, which resulted in highergoodwill and risk-weighted assets, partially offset by retentionof earnings which more than offset organic asset growth. OurTier 1 risk-based capital ratio reflected our 2012 capitalactions of issuing approximately $2.0 billion of preferredstock and redeeming approximately $2.3 billion of trustpreferred securities and hybrid capital securities. Basel I risk-weighted assets increased $30.1 billion from $230.7 billion atDecember 31, 2011 to $260.8 billion at December 31, 2012due to the RBC Bank (USA) acquisition and organic loangrowth for 2012.
At December 31, 2012, PNC Bank, N.A., our domestic banksubsidiary, was considered “well capitalized” based on U.S.regulatory capital ratio requirements under Basel I. To qualifyas “well-capitalized”, regulators currently require banks tomaintain capital ratios of at least 6% for Tier 1 risk-based,10% for total risk-based, and 5% for leverage. See the“Supervision and Regulation” section of Item 1 and Note 22Regulatory Matters in the Notes To Consolidated FinancialStatements in Item 8 of this Report for additional information.We believe PNC Bank, N.A. will continue to meet theserequirements during 2013.
PNC and PNC Bank, N.A. entered the “parallel run”qualification phase under the Basel II capital framework onJanuary 1, 2013. The Basel II framework, which was adoptedby the Basel Committee on Banking Supervision in 2004,seeks to provide more risk-sensitive regulatory capitalcalculations and promote enhanced risk management practicesamong large, internationally active banking organizations. TheU.S. banking agencies adopted final rules to implement theBasel II capital framework in December 2007 and in June2012 requested comment on proposed modifications to theserules (collectively referred to as the “advanced approaches”).See Recent Market and Industry Developments in theExecutive Summary section of this Financial Review. Prior tofully implementing the advanced approaches to calculate risk-weighted assets, PNC and PNC Bank, N.A. must successfullycomplete a “parallel run” qualification phase. This phase mustlast at least four consecutive quarters, although, consistentwith the experience of other U.S. banks, we currentlyanticipate a multi-year parallel run period.
The access to and cost of funding for new business initiatives,the ability to undertake new business initiatives includingacquisitions, the ability to engage in expanded businessactivities, the ability to pay dividends or repurchase shares orother capital instruments, the level of deposit insurance costs,and the level and nature of regulatory oversight depend, inlarge part, on a financial institution’s capital strength.
We provide additional information regarding enhanced capitalrequirements and some of their potential impacts on PNC inItem 1A Risk Factors of this Report.
52 The PNC Financial Services Group, Inc. – Form 10-K
OFF-BALANCE SHEET ARRANGEMENTS
AND VARIABLE INTEREST ENTITIES
We engage in a variety of activities that involveunconsolidated entities or that are otherwise not reflected inour Consolidated Balance Sheet that are generally referred toas “off-balance sheet arrangements.” Additional informationon these types of activities is included in the followingsections of this Report:
• Commitments, including contractual obligations andother commitments, included within the RiskManagement section of this Item 7,
• Note 3 Loan Sale and Servicing Activities andVariable Interest Entities in the Notes ToConsolidated Financial Statements included in Item 8of this Report,
• Note 14 Capital Securities of Subsidiary Trusts andPerpetual Trust Securities in the Notes ToConsolidated Financial Statements included in Item 8of this Report, and
• Note 24 Commitments and Guarantees in the NotesTo Consolidated Financial Statements included inItem 8 of this Report.
PNC consolidates variable interest entities (VIEs) when weare deemed to be the primary beneficiary. The primarybeneficiary of a VIE is determined to be the party that meetsboth of the following criteria: (i) has the power to makedecisions that most significantly affect the economicperformance of the VIE; and (ii) has the obligation to absorblosses or the right to receive benefits that in either case couldpotentially be significant to the VIE.
A summary of VIEs, including those that we haveconsolidated and those in which we hold variable interests buthave not consolidated into our financial statements, as ofDecember 31, 2012 and December 31, 2011 is included inNote 3 in the Notes To Consolidated Financial Statementsincluded in Item 8 of this Report.
Trust Preferred Securities and REIT Preferred SecuritiesIn connection with $402 million in principal amount ofoutstanding junior subordinated debentures associated with$390 million of trust preferred securities as of December 31,2012 that were issued by various subsidiary statutory trusts,we are subject to certain restrictions, including restrictions ondividend payments. Generally, if (i) there is an event ofdefault under the debentures, (ii) PNC elects to defer intereston the debentures, (iii) PNC exercises its right to deferpayments on the related trust preferred securities issued by thestatutory trusts, or (iv) there is a default under PNC’sguarantee of such payment obligations, as specified in theapplicable governing documents, then PNC would be subjectduring the period of such default or deferral to restrictions ondividends and other provisions protecting the status of thedebenture holders similar to or in some ways more restrictivethan those potentially imposed under the ExchangeAgreements with PNC Preferred Funding Trust II and TrustIII, as described in Note 14 Capital Securities of SubsidiaryTrusts and Perpetual Trust Securities in the Notes ToConsolidated Financial Statements in Item 8 of this Report.See the Capital and Liquidity Actions portion of the ExecutiveSummary section of this Item 7 for additional informationregarding our redemptions of trust preferred securities andhybrid capital securities during 2012 and announcedredemption of the REIT Preferred Securities issued by PNCPreferred Funding Trust III.
The PNC Financial Services Group, Inc. – Form 10-K 53
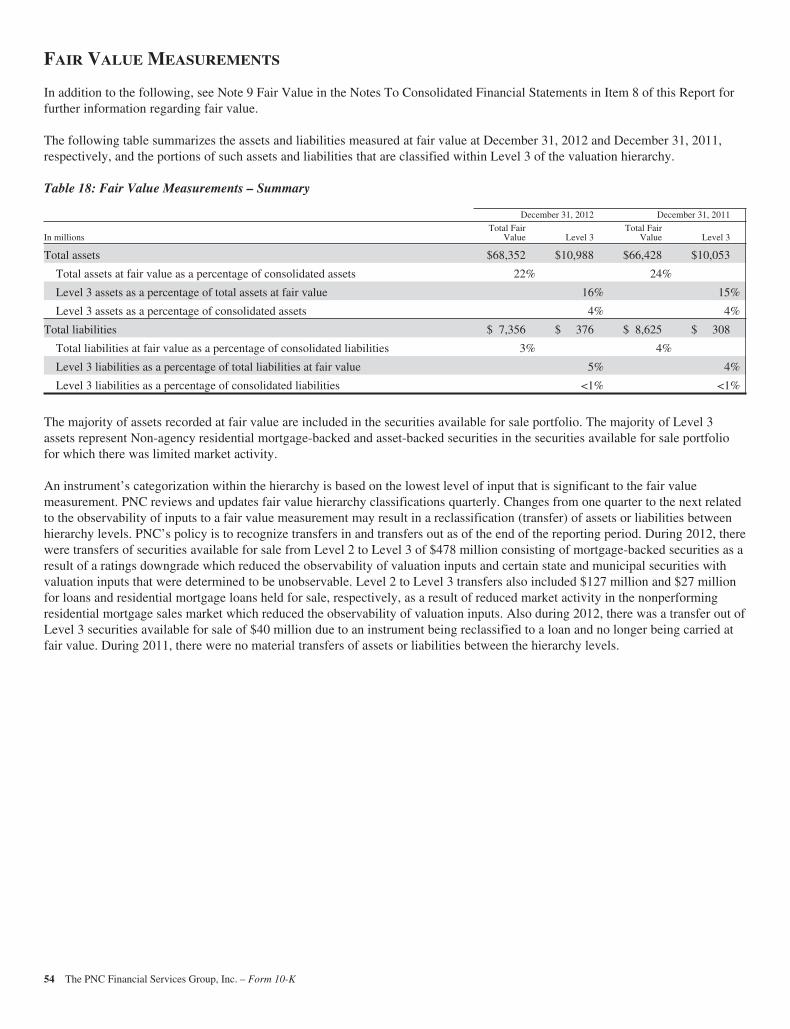
FAIR VALUE MEASUREMENTS
In addition to the following, see Note 9 Fair Value in the Notes To Consolidated Financial Statements in Item 8 of this Report forfurther information regarding fair value.
The following table summarizes the assets and liabilities measured at fair value at December 31, 2012 and December 31, 2011,respectively, and the portions of such assets and liabilities that are classified within Level 3 of the valuation hierarchy.
Table 18: Fair Value Measurements – Summary
December 31, 2012 December 31, 2011
In millionsTotal Fair
Value Level 3Total Fair
Value Level 3
Total assets $68,352 $10,988 $66,428 $10,053
Total assets at fair value as a percentage of consolidated assets 22% 24%
Level 3 assets as a percentage of total assets at fair value 16% 15%
Level 3 assets as a percentage of consolidated assets 4% 4%
Total liabilities $ 7,356 $ 376 $ 8,625 $ 308
Total liabilities at fair value as a percentage of consolidated liabilities 3% 4%
Level 3 liabilities as a percentage of total liabilities at fair value 5% 4%
Level 3 liabilities as a percentage of consolidated liabilities <1% <1%
The majority of assets recorded at fair value are included in the securities available for sale portfolio. The majority of Level 3assets represent Non-agency residential mortgage-backed and asset-backed securities in the securities available for sale portfoliofor which there was limited market activity.
An instrument’s categorization within the hierarchy is based on the lowest level of input that is significant to the fair valuemeasurement. PNC reviews and updates fair value hierarchy classifications quarterly. Changes from one quarter to the next relatedto the observability of inputs to a fair value measurement may result in a reclassification (transfer) of assets or liabilities betweenhierarchy levels. PNC’s policy is to recognize transfers in and transfers out as of the end of the reporting period. During 2012, therewere transfers of securities available for sale from Level 2 to Level 3 of $478 million consisting of mortgage-backed securities as aresult of a ratings downgrade which reduced the observability of valuation inputs and certain state and municipal securities withvaluation inputs that were determined to be unobservable. Level 2 to Level 3 transfers also included $127 million and $27 millionfor loans and residential mortgage loans held for sale, respectively, as a result of reduced market activity in the nonperformingresidential mortgage sales market which reduced the observability of valuation inputs. Also during 2012, there was a transfer out ofLevel 3 securities available for sale of $40 million due to an instrument being reclassified to a loan and no longer being carried atfair value. During 2011, there were no material transfers of assets or liabilities between the hierarchy levels.
54 The PNC Financial Services Group, Inc. – Form 10-K
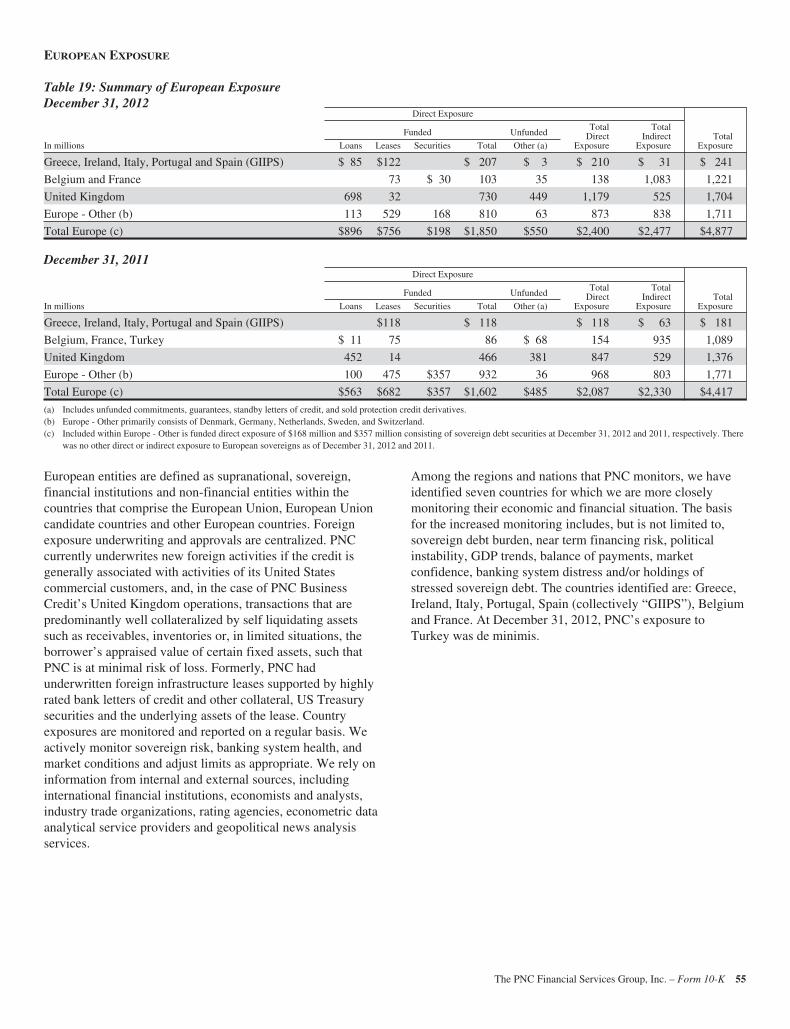
EUROPEAN EXPOSURE
Table 19: Summary of European ExposureDecember 31, 2012
Direct Exposure
TotalExposure
Funded UnfundedTotal
DirectExposure
TotalIndirect
ExposureIn millions Loans Leases Securities Total Other (a)
Greece, Ireland, Italy, Portugal and Spain (GIIPS) $ 85 $122 $ 207 $ 3 $ 210 $ 31 $ 241
Belgium and France 73 $ 30 103 35 138 1,083 1,221
United Kingdom 698 32 730 449 1,179 525 1,704
Europe - Other (b) 113 529 168 810 63 873 838 1,711
Total Europe (c) $896 $756 $198 $1,850 $550 $2,400 $2,477 $4,877
December 31, 2011Direct Exposure
TotalExposure
Funded UnfundedTotal
DirectExposure
TotalIndirect
ExposureIn millions Loans Leases Securities Total Other (a)
Greece, Ireland, Italy, Portugal and Spain (GIIPS) $118 $ 118 $ 118 $ 63 $ 181
Belgium, France, Turkey $ 11 75 86 $ 68 154 935 1,089
United Kingdom 452 14 466 381 847 529 1,376
Europe - Other (b) 100 475 $357 932 36 968 803 1,771
Total Europe (c) $563 $682 $357 $1,602 $485 $2,087 $2,330 $4,417
(a) Includes unfunded commitments, guarantees, standby letters of credit, and sold protection credit derivatives.(b) Europe - Other primarily consists of Denmark, Germany, Netherlands, Sweden, and Switzerland.(c) Included within Europe - Other is funded direct exposure of $168 million and $357 million consisting of sovereign debt securities at December 31, 2012 and 2011, respectively. There
was no other direct or indirect exposure to European sovereigns as of December 31, 2012 and 2011.
European entities are defined as supranational, sovereign,financial institutions and non-financial entities within thecountries that comprise the European Union, European Unioncandidate countries and other European countries. Foreignexposure underwriting and approvals are centralized. PNCcurrently underwrites new foreign activities if the credit isgenerally associated with activities of its United Statescommercial customers, and, in the case of PNC BusinessCredit’s United Kingdom operations, transactions that arepredominantly well collateralized by self liquidating assetssuch as receivables, inventories or, in limited situations, theborrower’s appraised value of certain fixed assets, such thatPNC is at minimal risk of loss. Formerly, PNC hadunderwritten foreign infrastructure leases supported by highlyrated bank letters of credit and other collateral, US Treasurysecurities and the underlying assets of the lease. Countryexposures are monitored and reported on a regular basis. Weactively monitor sovereign risk, banking system health, andmarket conditions and adjust limits as appropriate. We rely oninformation from internal and external sources, includinginternational financial institutions, economists and analysts,industry trade organizations, rating agencies, econometric dataanalytical service providers and geopolitical news analysisservices.
Among the regions and nations that PNC monitors, we haveidentified seven countries for which we are more closelymonitoring their economic and financial situation. The basisfor the increased monitoring includes, but is not limited to,sovereign debt burden, near term financing risk, politicalinstability, GDP trends, balance of payments, marketconfidence, banking system distress and/or holdings ofstressed sovereign debt. The countries identified are: Greece,Ireland, Italy, Portugal, Spain (collectively “GIIPS”), Belgiumand France. At December 31, 2012, PNC’s exposure toTurkey was de minimis.
The PNC Financial Services Group, Inc. – Form 10-K 55
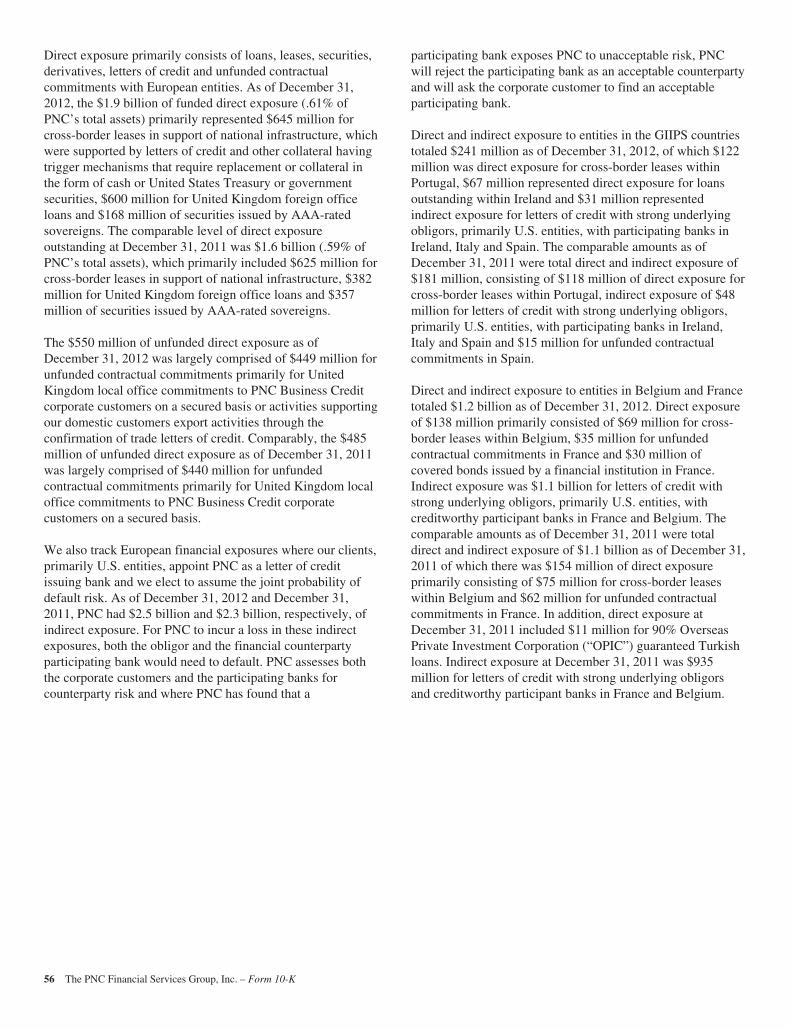
Direct exposure primarily consists of loans, leases, securities,derivatives, letters of credit and unfunded contractualcommitments with European entities. As of December 31,2012, the $1.9 billion of funded direct exposure (.61% ofPNC’s total assets) primarily represented $645 million forcross-border leases in support of national infrastructure, whichwere supported by letters of credit and other collateral havingtrigger mechanisms that require replacement or collateral inthe form of cash or United States Treasury or governmentsecurities, $600 million for United Kingdom foreign officeloans and $168 million of securities issued by AAA-ratedsovereigns. The comparable level of direct exposureoutstanding at December 31, 2011 was $1.6 billion (.59% ofPNC’s total assets), which primarily included $625 million forcross-border leases in support of national infrastructure, $382million for United Kingdom foreign office loans and $357million of securities issued by AAA-rated sovereigns.
The $550 million of unfunded direct exposure as ofDecember 31, 2012 was largely comprised of $449 million forunfunded contractual commitments primarily for UnitedKingdom local office commitments to PNC Business Creditcorporate customers on a secured basis or activities supportingour domestic customers export activities through theconfirmation of trade letters of credit. Comparably, the $485million of unfunded direct exposure as of December 31, 2011was largely comprised of $440 million for unfundedcontractual commitments primarily for United Kingdom localoffice commitments to PNC Business Credit corporatecustomers on a secured basis.
We also track European financial exposures where our clients,primarily U.S. entities, appoint PNC as a letter of creditissuing bank and we elect to assume the joint probability ofdefault risk. As of December 31, 2012 and December 31,2011, PNC had $2.5 billion and $2.3 billion, respectively, ofindirect exposure. For PNC to incur a loss in these indirectexposures, both the obligor and the financial counterpartyparticipating bank would need to default. PNC assesses boththe corporate customers and the participating banks forcounterparty risk and where PNC has found that a
participating bank exposes PNC to unacceptable risk, PNCwill reject the participating bank as an acceptable counterpartyand will ask the corporate customer to find an acceptableparticipating bank.
Direct and indirect exposure to entities in the GIIPS countriestotaled $241 million as of December 31, 2012, of which $122million was direct exposure for cross-border leases withinPortugal, $67 million represented direct exposure for loansoutstanding within Ireland and $31 million representedindirect exposure for letters of credit with strong underlyingobligors, primarily U.S. entities, with participating banks inIreland, Italy and Spain. The comparable amounts as ofDecember 31, 2011 were total direct and indirect exposure of$181 million, consisting of $118 million of direct exposure forcross-border leases within Portugal, indirect exposure of $48million for letters of credit with strong underlying obligors,primarily U.S. entities, with participating banks in Ireland,Italy and Spain and $15 million for unfunded contractualcommitments in Spain.
Direct and indirect exposure to entities in Belgium and Francetotaled $1.2 billion as of December 31, 2012. Direct exposureof $138 million primarily consisted of $69 million for cross-border leases within Belgium, $35 million for unfundedcontractual commitments in France and $30 million ofcovered bonds issued by a financial institution in France.Indirect exposure was $1.1 billion for letters of credit withstrong underlying obligors, primarily U.S. entities, withcreditworthy participant banks in France and Belgium. Thecomparable amounts as of December 31, 2011 were totaldirect and indirect exposure of $1.1 billion as of December 31,2011 of which there was $154 million of direct exposureprimarily consisting of $75 million for cross-border leaseswithin Belgium and $62 million for unfunded contractualcommitments in France. In addition, direct exposure atDecember 31, 2011 included $11 million for 90% OverseasPrivate Investment Corporation (“OPIC”) guaranteed Turkishloans. Indirect exposure at December 31, 2011 was $935million for letters of credit with strong underlying obligorsand creditworthy participant banks in France and Belgium.
56 The PNC Financial Services Group, Inc. – Form 10-K

BUSINESS SEGMENTS REVIEW
We have six reportable business segments:• Retail Banking• Corporate & Institutional Banking• Asset Management Group• Residential Mortgage Banking• BlackRock• Non-Strategic Assets Portfolio
Business segment results, including inter-segment revenues,and a description of each business are included in Note 26Segment Reporting included in the Notes To ConsolidatedFinancial Statements in Item 8 of this Report. Certain amountsincluded in this Item 7 differ from those amounts shown inNote 26 primarily due to the presentation in this BusinessSegments Review of business net interest revenue on ataxable-equivalent basis.
Results of individual businesses are presented based on ourinternal management reporting practices. There is nocomprehensive, authoritative body of guidance formanagement accounting equivalent to GAAP; therefore, thefinancial results of our individual businesses are notnecessarily comparable with similar information for any othercompany. We periodically refine our internal methodologiesas management reporting practices are enhanced. To theextent practicable, retrospective application of newmethodologies is made to prior period reportable businesssegment results and disclosures to create comparability to thecurrent period presentation to reflect any such refinements.Financial results are presented, to the extent practicable, as ifeach business operated on a stand-alone basis. We haveaggregated the business results for certain similar operatingsegments for financial reporting purposes.
Assets receive a funding charge and liabilities and capitalreceive a funding credit based on a transfer pricingmethodology that incorporates product maturities, durationand other factors. During the second quarter of 2012,enhancements were made to the funds transfer pricingmethodology. Retrospective application of our new fundstransfer pricing methodology has been made to the priorperiod reportable business segment results and disclosures tocreate comparability to the current period presentation, whichwe believe is more meaningful to readers of our financialstatements.
A portion of capital is intended to cover unexpected losses andis assigned to our business segments using our risk-basedeconomic capital model, including consideration of thegoodwill and other intangible assets at those businesssegments, as well as the diversification of risk among thebusiness segments.
We have allocated the allowances for loan and lease lossesand for unfunded loan commitments and letters of credit basedon our assessment of risk in the business segment loanportfolios. Our allocation of the costs incurred by operationsand other shared support areas not directly aligned with thebusinesses is primarily based on the use of services. Keyreserve assumptions and estimation processes react to and areinfluenced by observed changes in loan portfolio performanceexperience, the financial strength of the borrower, andeconomic conditions. Key reserve assumptions areperiodically updated. During the third quarter of 2012, PNCincreased the amount of internally observed data used inestimating the key commercial lending assumptions of PDsand LGDs. The estimated impact as of the beginning of thethird quarter 2012 was approximately an increase of $41million and a decrease of $55 million to the provision forcredit losses of Retail Banking and Corporate & InstitutionalBanking, respectively. Prior periods are not presented on acomparable basis as it is not practicable to do so.
Total business segment financial results differ fromconsolidated income from continuing operations beforenoncontrolling interests. The impact of these differences isreflected in the “Other” category. “Other” for purposes of thisBusiness Segments Review and the Business SegmentHighlights in the Executive Summary includes residualactivities that do not meet the criteria for disclosure as aseparate reportable business, such as gains or losses related toBlackRock transactions, integration costs, asset and liabilitymanagement activities including net securities gains or losses,other-than-temporary impairment of investment securities andcertain trading activities, exited businesses, alternativeinvestments including private equity, intercompanyeliminations, most corporate overhead, tax adjustments thatare not allocated to business segments and differencesbetween business segment performance reporting andfinancial statement reporting (GAAP), including thepresentation of net income attributable to noncontrollinginterests as the segments’ results exclude their portion of netincome attributable to noncontrolling interests.
The PNC Financial Services Group, Inc. – Form 10-K 57
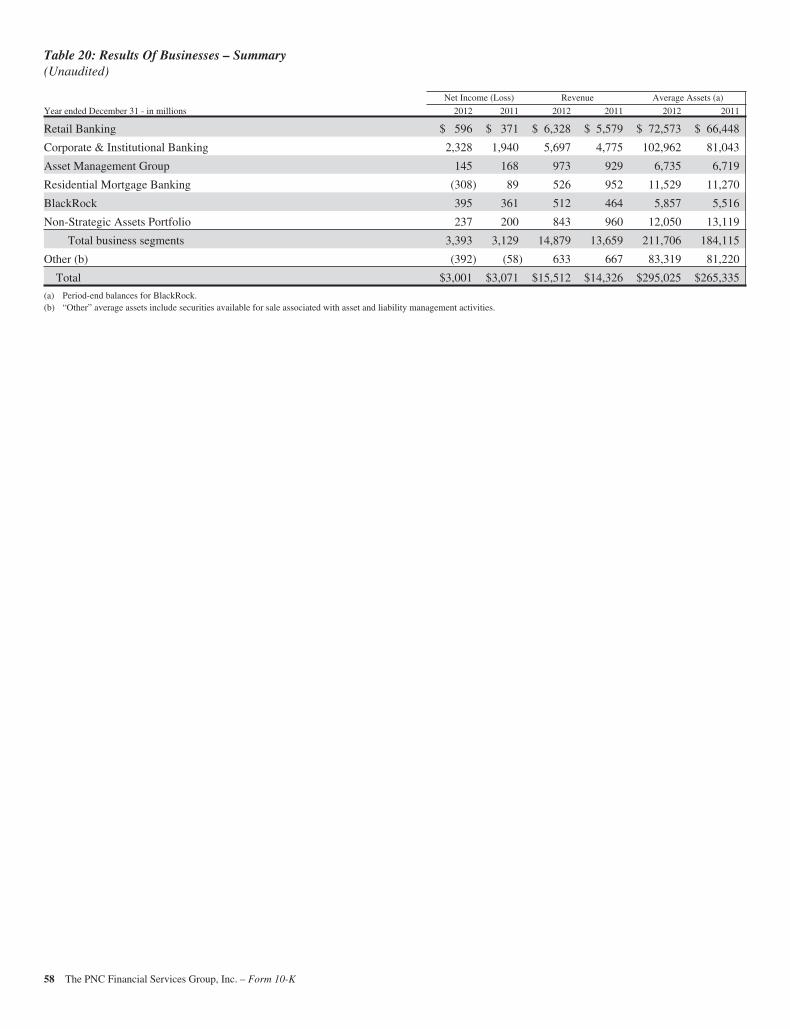
Table 20: Results Of Businesses – Summary(Unaudited)
Net Income (Loss) Revenue Average Assets (a)
Year ended December 31 - in millions 2012 2011 2012 2011 2012 2011
Retail Banking $ 596 $ 371 $ 6,328 $ 5,579 $ 72,573 $ 66,448
Corporate & Institutional Banking 2,328 1,940 5,697 4,775 102,962 81,043
Asset Management Group 145 168 973 929 6,735 6,719
Residential Mortgage Banking (308) 89 526 952 11,529 11,270
BlackRock 395 361 512 464 5,857 5,516
Non-Strategic Assets Portfolio 237 200 843 960 12,050 13,119
Total business segments 3,393 3,129 14,879 13,659 211,706 184,115
Other (b) (392) (58) 633 667 83,319 81,220
Total $3,001 $3,071 $15,512 $14,326 $295,025 $265,335
(a) Period-end balances for BlackRock.(b) “Other” average assets include securities available for sale associated with asset and liability management activities.
58 The PNC Financial Services Group, Inc. – Form 10-K
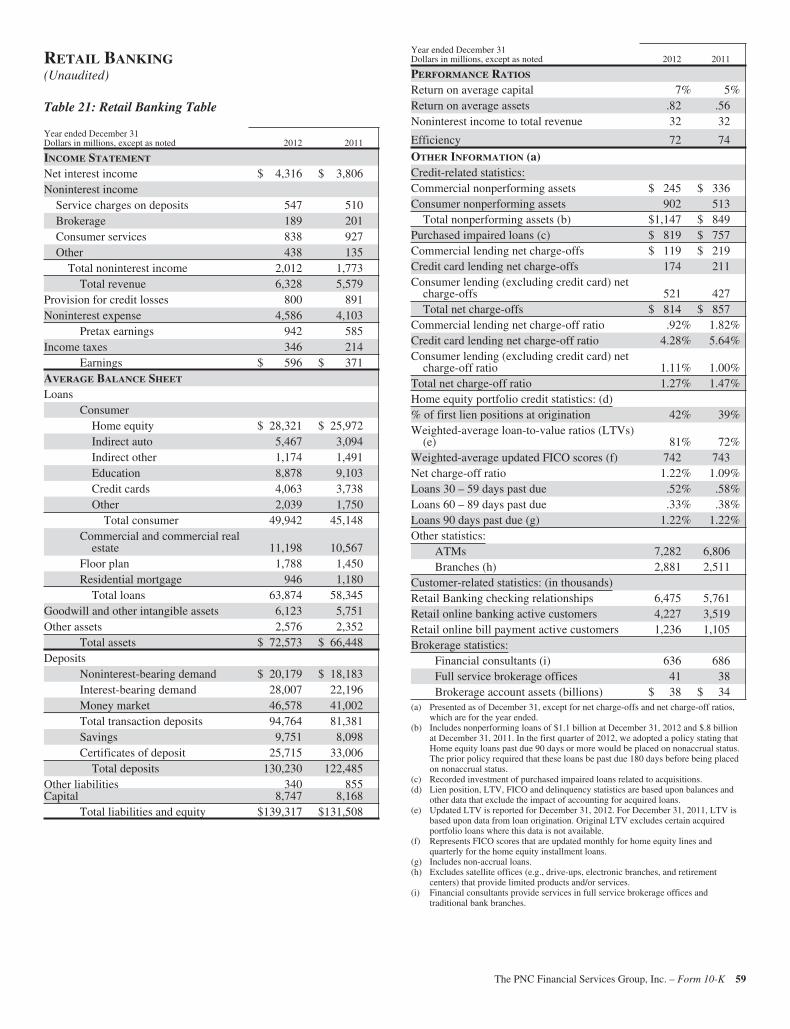
RETAIL BANKING(Unaudited)
Table 21: Retail Banking Table
Year ended December 31Dollars in millions, except as noted 2012 2011
INCOME STATEMENT
Net interest income $ 4,316 $ 3,806Noninterest income
Service charges on deposits 547 510Brokerage 189 201Consumer services 838 927Other 438 135
Total noninterest income 2,012 1,773Total revenue 6,328 5,579
Provision for credit losses 800 891Noninterest expense 4,586 4,103
Pretax earnings 942 585Income taxes 346 214
Earnings $ 596 $ 371AVERAGE BALANCE SHEET
LoansConsumer
Home equity $ 28,321 $ 25,972Indirect auto 5,467 3,094Indirect other 1,174 1,491Education 8,878 9,103Credit cards 4,063 3,738Other 2,039 1,750
Total consumer 49,942 45,148Commercial and commercial real
estate 11,198 10,567Floor plan 1,788 1,450Residential mortgage 946 1,180
Total loans 63,874 58,345Goodwill and other intangible assets 6,123 5,751Other assets 2,576 2,352
Total assets $ 72,573 $ 66,448Deposits
Noninterest-bearing demand $ 20,179 $ 18,183Interest-bearing demand 28,007 22,196Money market 46,578 41,002Total transaction deposits 94,764 81,381Savings 9,751 8,098Certificates of deposit 25,715 33,006
Total deposits 130,230 122,485Other liabilities 340 855Capital 8,747 8,168
Total liabilities and equity $139,317 $131,508
Year ended December 31Dollars in millions, except as noted 2012 2011
PERFORMANCE RATIOS
Return on average capital 7% 5%Return on average assets .82 .56Noninterest income to total revenue 32 32
Efficiency 72 74
OTHER INFORMATION (a)Credit-related statistics:Commercial nonperforming assets $ 245 $ 336Consumer nonperforming assets 902 513
Total nonperforming assets (b) $1,147 $ 849Purchased impaired loans (c) $ 819 $ 757Commercial lending net charge-offs $ 119 $ 219Credit card lending net charge-offs 174 211Consumer lending (excluding credit card) net
charge-offs 521 427Total net charge-offs $ 814 $ 857
Commercial lending net charge-off ratio .92% 1.82%Credit card lending net charge-off ratio 4.28% 5.64%Consumer lending (excluding credit card) net
charge-off ratio 1.11% 1.00%Total net charge-off ratio 1.27% 1.47%Home equity portfolio credit statistics: (d)% of first lien positions at origination 42% 39%Weighted-average loan-to-value ratios (LTVs)
(e) 81% 72%Weighted-average updated FICO scores (f) 742 743Net charge-off ratio 1.22% 1.09%Loans 30 – 59 days past due .52% .58%Loans 60 – 89 days past due .33% .38%Loans 90 days past due (g) 1.22% 1.22%Other statistics:
ATMs 7,282 6,806Branches (h) 2,881 2,511
Customer-related statistics: (in thousands)Retail Banking checking relationships 6,475 5,761Retail online banking active customers 4,227 3,519Retail online bill payment active customers 1,236 1,105Brokerage statistics:
Financial consultants (i) 636 686Full service brokerage offices 41 38Brokerage account assets (billions) $ 38 $ 34
(a) Presented as of December 31, except for net charge-offs and net charge-off ratios,which are for the year ended.
(b) Includes nonperforming loans of $1.1 billion at December 31, 2012 and $.8 billionat December 31, 2011. In the first quarter of 2012, we adopted a policy stating thatHome equity loans past due 90 days or more would be placed on nonaccrual status.The prior policy required that these loans be past due 180 days before being placedon nonaccrual status.
(c) Recorded investment of purchased impaired loans related to acquisitions.(d) Lien position, LTV, FICO and delinquency statistics are based upon balances and
other data that exclude the impact of accounting for acquired loans.(e) Updated LTV is reported for December 31, 2012. For December 31, 2011, LTV is
based upon data from loan origination. Original LTV excludes certain acquiredportfolio loans where this data is not available.
(f) Represents FICO scores that are updated monthly for home equity lines andquarterly for the home equity installment loans.
(g) Includes non-accrual loans.(h) Excludes satellite offices (e.g., drive-ups, electronic branches, and retirement
centers) that provide limited products and/or services.(i) Financial consultants provide services in full service brokerage offices and
traditional bank branches.
The PNC Financial Services Group, Inc. – Form 10-K 59
Retail Banking earned $596 million for 2012 compared withearnings of $371 million in 2011. The increase in earningsresulted from organic growth in transaction deposit balances,gains on sales of Visa Class B common shares, lower ratespaid on deposits, higher levels of customer-initiatedtransactions, a lower provision for credit losses, and theimpact of the RBC Bank (USA) acquisition, partially offset bythe regulatory impact of lower interchange fees on debit cardtransactions and higher additions to legal reserves.
The results for 2012 include the impact of the retail businessassociated with the acquisition of RBC Bank (USA) and thecredit card portfolio purchase from RBC Bank (Georgia),National Association in March 2012. Retail Banking addedapproximately $12.1 billion in deposits, $4.9 billion in loans,460,000 checking relationships, over 400 branches, and over400 ATMs through this acquisition. Retail Banking’s footprintextends across 17 states and Washington, D.C., coveringnearly half the US population and serving 5,733,000consumers and 742,000 small businesses with 2,881 branchesand 7,282 ATMs.
Retail Banking’s core strategy is to grow consumer and smallbusiness checking households profitably by providing anexperience that builds customer loyalty and createsopportunities to sell other products and services, includingloans, savings accounts, investment products and moneymanagement services. Net checking relationships grew714,000 in 2012, including 460,000 from the RBC Bank(USA) acquisition. Organic net checking relationships grewby 4% in 2012 from year end 2011. The growth reflects strongresults and gains in all of our markets as well as strongcustomer retention in the overall network. Active onlinebanking customers and active online bill payment customersincreased by 20% and 12%, respectively, from year end 2011.The business is also focused on expanding the use oftechnology, using services such as online banking and mobiledeposit taking to improve customer service convenience andlower our service delivery costs.
Total revenue for 2012 was $6.3 billion compared with $5.6billion in 2011. Net interest income of $4.3 billion increased$510 million compared with 2011. The increase resulted fromhigher organic transaction deposit balances, lower rates paidon deposits, and the impact of the RBC Bank (USA)acquisition.
Noninterest income increased $239 million compared to 2011.The increase was driven by the $267 million gain on the saleof 9 million Visa Class B common shares. Noninterest incomehas been adversely affected by Dodd-Frank limits related tointerchange rates that became effective in October 2011. Thenegative impact of these limits was approximately $314million in 2012 and approximately $75 million in 2011. Thisimpact has been partially offset by higher volumes ofmerchant, customer credit card and debit card transactions andthe RBC Bank (USA) acquisition.
The provision for credit losses was $800 million in 2012compared with $891 million in the prior year. Net charge-offswere $814 million for 2012 compared with $857 million for2011. Improvements in credit quality over the prior year wereevident in the small business and credit card portfolios.Pursuant to regulatory guidance issued in the third quarter of2012, consumer charge-offs were taken in 2012 related totroubled debt restructurings resulting from bankruptcy. Suchloans have been classified as troubled debt restructurings andhave been measured at the fair value of the collateral less coststo sell.
Noninterest expense increased $483 million in 2012 comparedto 2011. The increase was primarily attributable to theoperating expenses associated with RBC Bank (USA) andhigher additions to legal reserves.
Growing core checking deposits is key to Retail Banking’sgrowth and to providing a source of low-cost funding to PNC.The deposit product strategy of Retail Banking is to remaindisciplined on pricing, target specific products and markets forgrowth, and focus on the retention and growth of balances forrelationship customers. In 2012, average total deposits of$130.2 billion increased $7.7 billion, or 6%, compared with2011.
• Average transaction deposits grew $13.4 billion, or16%, and average savings deposit balances grew $1.7billion, or 20%, year over year as a result of organicdeposit growth, continued customer preference forliquidity, and the RBC Bank (USA) acquisition. In2012, average demand deposits increased $7.8billion, or 19%, to $48.2 billion; average moneymarket deposits increased $5.6 billion, or 14%, to$46.6 billion.
• Total average certificates of deposit decreased $7.3billion, or 22%, compared to 2011. This decline wasin support of our low-cost funding strategy and wasdue to the run-off of maturing accounts partiallyoffset by the impact of the RBC Bank (USA)acquisition.
Retail Banking continues to focus primarily on a relationship-based lending strategy that targets specific customer sectors,including mass and mass affluent consumers, small businessesand auto dealerships. In 2012, average total loans were $63.9billion, an increase of $5.5 billion, or 9%, of which $4.0billion was attributable to the RBC Bank (USA) acquisition,primarily in the home equity portfolio.
• Average indirect auto loans increased $2.4 billion, or77%, over 2011. The increase was due to theexpansion of our indirect sales force and productintroduction to acquired markets, as well as overallincreases in auto sales. An indirect auto portfolio of$522 million was purchased in September 2012.
• Average home equity loans increased $2.3 billion, or9%, in 2012. The increase was due to the RBC Bank(USA) acquisition. The remainder of the portfolio
60 The PNC Financial Services Group, Inc. – Form 10-K
showed a decline as loan demand was outpaced bypaydowns, refinancing and charge-offs. RetailBanking’s home equity loan portfolio is relationshipbased, with 97% of the portfolio attributable toborrowers in our primary geographic footprint.
• Average commercial and commercial real estateloans increased $631 million, or 6%, over 2011. Theincrease was due to the acquisition of RBC Bank(USA). The remainder of the portfolio showed adecline as loan demand was outpaced by paydowns,refinancing and charge-offs.
• Average auto dealer floor plan loans grew $338million, or 23%, in 2012, primarily resulting fromdealer line utilization and additional dealerrelationships.
• Average credit card balances increased $325 million,or 9%, over 2011 as a result of the portfolio purchasefrom RBC Bank (Georgia), National Association inMarch 2012 and organic customer growth.
• Average education loans were down $225 million, or2%, from 2011 as paydowns and charge-offs in thediscontinued government guaranteed portfoliooutpaced growth in the private portfolio.
• Average indirect other and residential mortgages inthis segment are primarily run-off portfolios anddeclined $317 million and $234 million, respectively,in 2012. The indirect other portfolio is comprised ofmarine, RV, and other indirect loan products.
Nonperforming assets increased $298 million to $1.1 billiondue to a change in policy on home equity loans, implementedin the first quarter of 2012, which places these loans onnonaccrual status at 90 days past due (versus the prior policyof 180 days) as well as the implementation of regulatoryguidance issued in the third quarter of 2012 related to troubleddebt restructurings resulting from bankruptcy. These increaseswere partially offset by a decline in the level of commercialnonperforming assets.
The PNC Financial Services Group, Inc. – Form 10-K 61
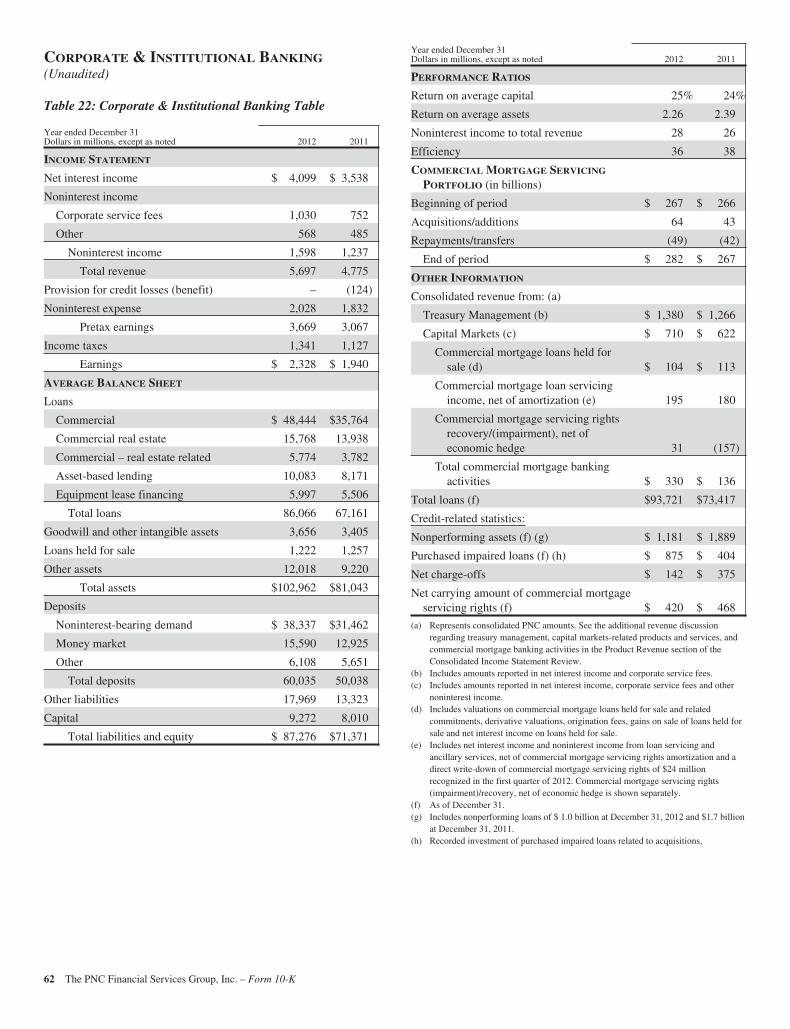
CORPORATE & INSTITUTIONAL BANKING(Unaudited)
Table 22: Corporate & Institutional Banking Table
Year ended December 31Dollars in millions, except as noted 2012 2011
INCOME STATEMENT
Net interest income $ 4,099 $ 3,538
Noninterest income
Corporate service fees 1,030 752
Other 568 485
Noninterest income 1,598 1,237
Total revenue 5,697 4,775
Provision for credit losses (benefit) – (124)
Noninterest expense 2,028 1,832
Pretax earnings 3,669 3,067
Income taxes 1,341 1,127
Earnings $ 2,328 $ 1,940
AVERAGE BALANCE SHEET
Loans
Commercial $ 48,444 $35,764
Commercial real estate 15,768 13,938
Commercial – real estate related 5,774 3,782
Asset-based lending 10,083 8,171
Equipment lease financing 5,997 5,506
Total loans 86,066 67,161
Goodwill and other intangible assets 3,656 3,405
Loans held for sale 1,222 1,257
Other assets 12,018 9,220
Total assets $102,962 $81,043
Deposits
Noninterest-bearing demand $ 38,337 $31,462
Money market 15,590 12,925
Other 6,108 5,651
Total deposits 60,035 50,038
Other liabilities 17,969 13,323
Capital 9,272 8,010
Total liabilities and equity $ 87,276 $71,371
Year ended December 31Dollars in millions, except as noted 2012 2011
PERFORMANCE RATIOS
Return on average capital 25% 24%
Return on average assets 2.26 2.39
Noninterest income to total revenue 28 26
Efficiency 36 38
COMMERCIAL MORTGAGE SERVICING
PORTFOLIO (in billions)
Beginning of period $ 267 $ 266
Acquisitions/additions 64 43
Repayments/transfers (49) (42)
End of period $ 282 $ 267
OTHER INFORMATION
Consolidated revenue from: (a)
Treasury Management (b) $ 1,380 $ 1,266
Capital Markets (c) $ 710 $ 622
Commercial mortgage loans held forsale (d) $ 104 $ 113
Commercial mortgage loan servicingincome, net of amortization (e) 195 180
Commercial mortgage servicing rightsrecovery/(impairment), net ofeconomic hedge 31 (157)
Total commercial mortgage bankingactivities $ 330 $ 136
Total loans (f) $93,721 $73,417
Credit-related statistics:
Nonperforming assets (f) (g) $ 1,181 $ 1,889
Purchased impaired loans (f) (h) $ 875 $ 404
Net charge-offs $ 142 $ 375
Net carrying amount of commercial mortgageservicing rights (f) $ 420 $ 468
(a) Represents consolidated PNC amounts. See the additional revenue discussionregarding treasury management, capital markets-related products and services, andcommercial mortgage banking activities in the Product Revenue section of theConsolidated Income Statement Review.
(b) Includes amounts reported in net interest income and corporate service fees.(c) Includes amounts reported in net interest income, corporate service fees and other
noninterest income.(d) Includes valuations on commercial mortgage loans held for sale and related
commitments, derivative valuations, origination fees, gains on sale of loans held forsale and net interest income on loans held for sale.
(e) Includes net interest income and noninterest income from loan servicing andancillary services, net of commercial mortgage servicing rights amortization and adirect write-down of commercial mortgage servicing rights of $24 millionrecognized in the first quarter of 2012. Commercial mortgage servicing rights(impairment)/recovery, net of economic hedge is shown separately.
(f) As of December 31.(g) Includes nonperforming loans of $ 1.0 billion at December 31, 2012 and $1.7 billion
at December 31, 2011.(h) Recorded investment of purchased impaired loans related to acquisitions.
62 The PNC Financial Services Group, Inc. – Form 10-K
Corporate & Institutional Banking earned $2.3 billion in 2012,compared with $1.9 billion in 2011. The increase in earningswas primarily due to higher revenue partially offset by highernoninterest expense and a provision for credit losses of zero in2012 compared with a benefit of $124 million in 2011. Wecontinued to focus on building client relationships includingincreasing cross sales and adding new clients where the risk-return profile was attractive.
Results in 2012 include the impact of the RBC Bank (USA)acquisition in March 2012, which added approximately $7.5billion of loans and $4.8 billion of deposits at acquisition date.
Highlights of Corporate & Institutional Banking’sperformance throughout 2012 include the following:
• Corporate & Institutional Banking continued toexecute on strategic initiatives, including in theSoutheast, by organically growing and deepeningclient relationships that meet our risk/returnmeasures. Approximately 1,100 new primaryCorporate Banking clients were added in 2012.
• Loan commitments increased 24% to $181 billion atDecember 31, 2012 compared to December 31, 2011,primarily due to the RBC Bank (USA) acquisitionand growth in our Corporate Banking (CorporateFinance, Financial Services Advisory and Banking,Public Finance and Healthcare businesses), RealEstate and Business Credit (asset-based lending)businesses.
• Period-end loan balances have increased for the ninthconsecutive quarter, including an increase of 4% atDecember 31, 2012 compared with September 30,2012 and 22% compared with December 31, 2011.
• Our Treasury Management business, which ranksamong the top providers in the country, continued toinvest in markets, products and infrastructure as wellas major initiatives such as healthcare.
• Cross sales of treasury management and capitalmarkets-related products and services to customers inPNC’s markets continued to be successful and wereahead of 2011.
• Midland Loan Services was the number one servicerof Fannie Mae and Freddie Mac multifamily andhealthcare loans and was the second leading servicerof commercial and multifamily loans by volume as ofJune 30, 2012 according to Mortgage BankersAssociation. Midland is the only U.S. commercialmortgage servicer to receive the highest primary,master and special servicer ratings from FitchRatings, Standard & Poor’s and Morningstar.
Net interest income in 2012 was $4.1 billion, a 16% increasefrom 2011, reflecting higher average loans and deposits,partially offset by lower spreads on loans and deposits.
Corporate service fees were $1.0 billion in 2012, an increaseof $278 million from 2011, primarily due to higher
commercial mortgage servicing revenue and merger andacquisition advisory fees. The major components of corporateservice fees are treasury management, corporate finance feesand commercial mortgage servicing revenue.
Other noninterest income was $568 million in 2012 comparedwith $485 million in 2011. The increase of $83 million wasprimarily due to gains on asset sales and the impact ofcustomer driven capital markets activity.
The provision for credit losses was zero in 2012 comparedwith a benefit of $124 million in 2011. The increase reflectshigher loan and commitment levels offset by positive creditmigration. Despite the increase, the overall credit qualityremains strong. Net charge-offs were $142 million in 2012,which decreased $233 million, or 62%, compared with 2011.The decline was attributable primarily to the commercial realestate portfolio.
Nonperforming assets declined for the eleventh consecutivequarter, and at $1.2 billion, represented a 37% decrease fromDecember 31, 2011.
Noninterest expense was $2.0 billion in 2012, an increase of$196 million from 2011. Higher compensation-related costswere driven by improved performance and higher staffing,including the impact of the RBC Bank (USA) acquisition.
Average loans were $86.1 billion in 2012 compared with$67.2 billion in 2011, an increase of 28%. Organically,average loans grew 20% in the comparison.
• The Corporate Banking business provides lending,treasury management, and capital markets-relatedproducts and services to mid-sized corporations,government and not-for-profit entities, andselectively to large corporations. Average loans forthis business increased $11.0 billion, or 33%, in 2012compared with 2011, primarily due to an increase inloan commitments from new customers. Organically,average loans for this business grew 22% in thecomparison.
• PNC Real Estate provides commercial real estate andreal estate-related lending and is one of the industry’stop providers of both conventional and affordablemultifamily financing. Average loans for thisbusiness increased $2.7 billion, or 17%, in 2012compared with 2011 due to increased originations.
• PNC Business Credit is one of the top five asset-based lenders in the country with increasing marketshare according to the Commercial FinanceAssociation. The loan portfolio is relatively highyielding, with moderate risk as the loans are mainlysecured by short-term assets. Average loansincreased $1.9 billion, or 23%, in 2012 comparedwith 2011 due to customers seeking stable lendingsources, loan usage rates, and market shareexpansion.
The PNC Financial Services Group, Inc. – Form 10-K 63

• PNC Equipment Finance is the 4th largest bank-affiliated leasing company with over $11 billion inequipment finance assets.
Average deposits were $60.0 billion in 2012, an increase of$10.0 billion, or 20%, compared with 2011.
• Deposit growth has been very strong, consistent withthe industry-wide trend, as clients hold record levelsof cash.
• Deposit inflows into noninterest-bearing demanddeposits continued as FDIC insurance has been anattraction for customers maintaining liquidity duringthis prolonged period of low interest rates.
• The repeal of Regulation Q limitations on interest-bearing commercial demand deposit accountsbecame effective in the third quarter of 2011. Interestin this product has been muted due to the current rateenvironment.
• As of February 22, 2013, commercial deposits havedeclined by $3.6 billion from the December 31, 2012level as a result of seasonal and normal businessactivity. Deposit fluctuations due to the TransactionAccount Guarantee Program’s expiration have notbeen significant. Management expects that in thecurrent interest rate environment, additional runoff ofcommercial deposits will not be significant.
The commercial mortgage servicing portfolio was $282 billionat December 31, 2012 compared with $267 billion atDecember 31, 2011. Servicing additions exceeded portfoliorun-off.
See the additional revenue discussion regarding treasurymanagement, capital markets-related products and services,and commercial mortgage banking activities in the ProductRevenue section of the Consolidated Income StatementReview.
64 The PNC Financial Services Group, Inc. – Form 10-K
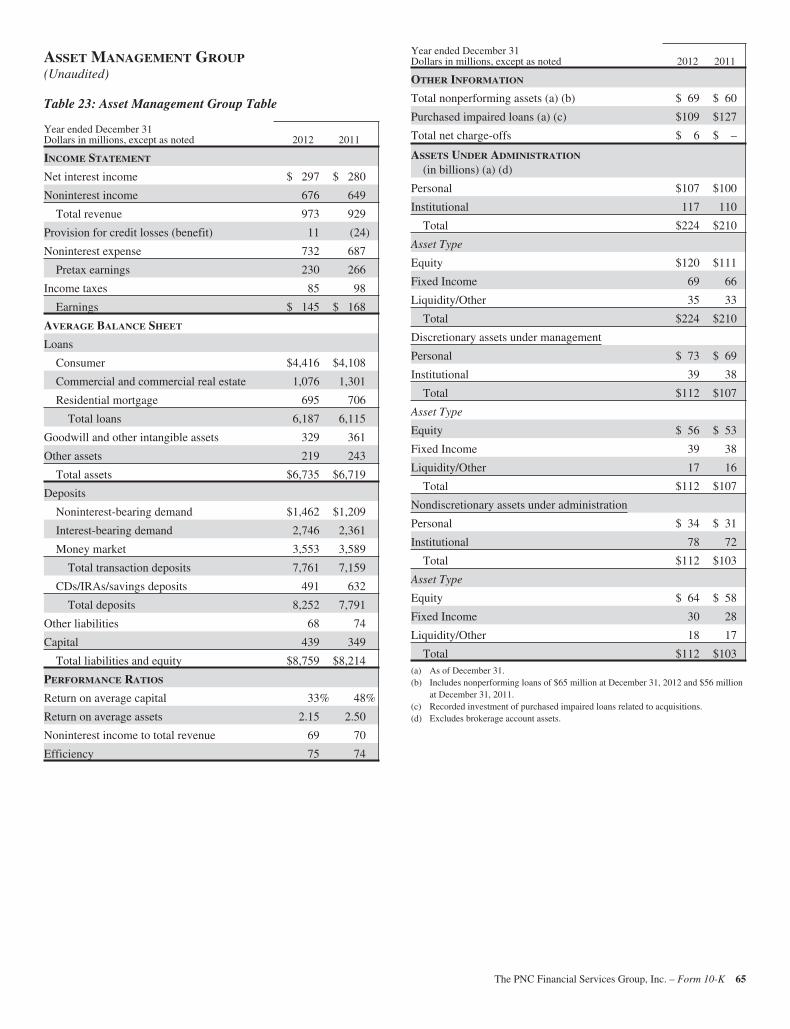
ASSET MANAGEMENT GROUP(Unaudited)
Table 23: Asset Management Group Table
Year ended December 31Dollars in millions, except as noted 2012 2011
INCOME STATEMENT
Net interest income $ 297 $ 280
Noninterest income 676 649
Total revenue 973 929
Provision for credit losses (benefit) 11 (24)
Noninterest expense 732 687
Pretax earnings 230 266
Income taxes 85 98
Earnings $ 145 $ 168
AVERAGE BALANCE SHEET
Loans
Consumer $4,416 $4,108
Commercial and commercial real estate 1,076 1,301
Residential mortgage 695 706
Total loans 6,187 6,115
Goodwill and other intangible assets 329 361
Other assets 219 243
Total assets $6,735 $6,719
Deposits
Noninterest-bearing demand $1,462 $1,209
Interest-bearing demand 2,746 2,361
Money market 3,553 3,589
Total transaction deposits 7,761 7,159
CDs/IRAs/savings deposits 491 632
Total deposits 8,252 7,791
Other liabilities 68 74
Capital 439 349
Total liabilities and equity $8,759 $8,214
PERFORMANCE RATIOS
Return on average capital 33% 48%
Return on average assets 2.15 2.50
Noninterest income to total revenue 69 70
Efficiency 75 74
Year ended December 31Dollars in millions, except as noted 2012 2011
OTHER INFORMATION
Total nonperforming assets (a) (b) $ 69 $ 60
Purchased impaired loans (a) (c) $109 $127
Total net charge-offs $ 6 $ –
ASSETS UNDER ADMINISTRATION
(in billions) (a) (d)
Personal $107 $100
Institutional 117 110
Total $224 $210
Asset Type
Equity $120 $111
Fixed Income 69 66
Liquidity/Other 35 33
Total $224 $210
Discretionary assets under management
Personal $ 73 $ 69
Institutional 39 38
Total $112 $107
Asset Type
Equity $ 56 $ 53
Fixed Income 39 38
Liquidity/Other 17 16
Total $112 $107
Nondiscretionary assets under administration
Personal $ 34 $ 31
Institutional 78 72
Total $112 $103
Asset Type
Equity $ 64 $ 58
Fixed Income 30 28
Liquidity/Other 18 17
Total $112 $103(a) As of December 31.(b) Includes nonperforming loans of $65 million at December 31, 2012 and $56 million
at December 31, 2011.(c) Recorded investment of purchased impaired loans related to acquisitions.(d) Excludes brokerage account assets.
The PNC Financial Services Group, Inc. – Form 10-K 65
Asset Management Group earned $145 million in 2012compared with $168 million in 2011. Revenue increased $44million in the year over year comparison as strong sales andhigher average equity markets increased noninterest incomeby 4% and higher average deposit balances increased netinterest income by 6%. The revenue increase was offset byhigher noninterest expense from strategic businessinvestments and higher provision for credit losses. During2012 the business continued to focus on client acquisition andasset and revenue growth.
The core growth strategies for the business continue toinclude: investing in higher growth geographies including theSoutheast region, increasing internal referral sales and addingnew front line sales staff throughout our footprint. For 2012,the business delivered strong sales production, grew highvalue clients and benefited from significant referrals fromother PNC lines of business. Over time, the successfulexecution of these strategies and the accumulation of ourstrong sales performance are expected to create meaningfulgrowth in assets under management and noninterest income.Highlights of Asset Management Group’s performance during2012 include the following:
• Assets under administration of $224 billion withpositive net flows of $2.5 billion in discretionaryassets under management after adjustments to totalnet flows for cyclical client activities,
• Strong sales production, up 32% over the prior yearincluding a 37% increase in the acquisition of newprimary clients,
• Significant referrals from other PNC lines ofbusiness, reflecting an increase of approximately39% over 2011,
• Continuing levels of new business investment andfocused hiring to drive growth, with over 360external new hires, and
• PNC Wealth Insight® was awarded a “2012 CIO 100Award” by CIO Magazine. The online clientreporting tool now enables clients to view their PNCInvestments brokerage accounts and access all client
information through a mobile application thatsupports a number of smartphone platforms.
Assets under administration increased to $224 billion atDecember 31, 2012 from $210 billion at December 31, 2011.Discretionary assets under management were $112 billion atDecember 31, 2012 compared with $107 billion atDecember 31, 2011. The increase in the comparisons wasdriven by stronger average equity markets, positive net flows,and strong sales performance.
Total revenue for 2012 was $973 million compared with $929million for 2011. Noninterest income was $676 million for2012, an increase of $27 million from the prior yearattributable to stronger average equity markets, increased salesand new client acquisition. Net interest income was $297million for 2012 compared with $280 million for 2011. Theincrease was primarily a result of growth in transactiondeposit balances.
Provision for credit losses of $11 million in 2012 increased$35 million compared to a benefit of $24 million for 2011.Noninterest expense was $732 million in 2012, an increase of$45 million, or 7%, from the prior year. The increase wasattributable to investments in the business including theSoutheast region and higher compensation-related costs. AssetManagement Group remains focused on disciplined expensemanagement as it invests in these strategic growthopportunities.
Average deposits of $8.3 billion for 2012 increased $461million, or 6%, over the prior year. Average transactiondeposits grew 8% compared with 2011 and were partiallyoffset by the strategic run-off of maturing certificates ofdeposit in the comparison.
Average loan balances of $6.2 billion increased $72 million,or 1%, from the prior year primarily due to increasedconsumer loan activity partially offset by decreases incommercial and commercial real estate loans.
66 The PNC Financial Services Group, Inc. – Form 10-K
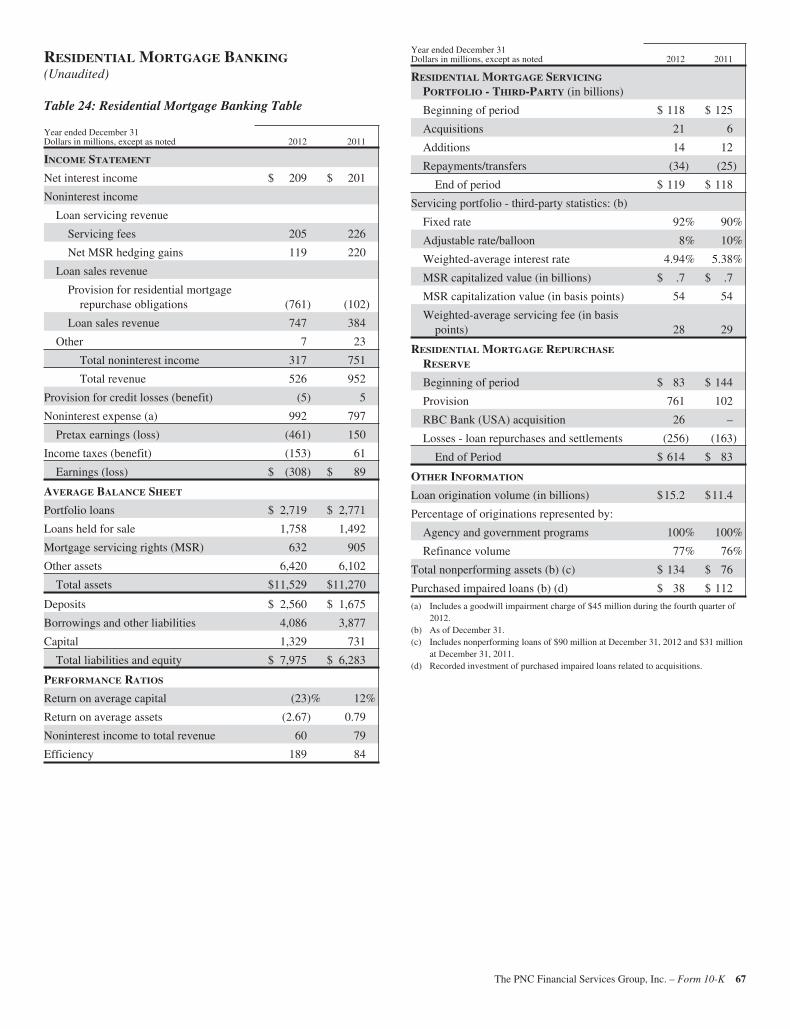
RESIDENTIAL MORTGAGE BANKING(Unaudited)
Table 24: Residential Mortgage Banking Table
Year ended December 31Dollars in millions, except as noted 2012 2011
INCOME STATEMENT
Net interest income $ 209 $ 201
Noninterest income
Loan servicing revenue
Servicing fees 205 226
Net MSR hedging gains 119 220
Loan sales revenue
Provision for residential mortgagerepurchase obligations (761) (102)
Loan sales revenue 747 384
Other 7 23
Total noninterest income 317 751
Total revenue 526 952
Provision for credit losses (benefit) (5) 5
Noninterest expense (a) 992 797
Pretax earnings (loss) (461) 150
Income taxes (benefit) (153) 61
Earnings (loss) $ (308) $ 89
AVERAGE BALANCE SHEET
Portfolio loans $ 2,719 $ 2,771
Loans held for sale 1,758 1,492
Mortgage servicing rights (MSR) 632 905
Other assets 6,420 6,102
Total assets $11,529 $11,270
Deposits $ 2,560 $ 1,675
Borrowings and other liabilities 4,086 3,877
Capital 1,329 731
Total liabilities and equity $ 7,975 $ 6,283
PERFORMANCE RATIOS
Return on average capital (23)% 12%
Return on average assets (2.67) 0.79
Noninterest income to total revenue 60 79
Efficiency 189 84
Year ended December 31Dollars in millions, except as noted 2012 2011
RESIDENTIAL MORTGAGE SERVICING
PORTFOLIO - THIRD-PARTY (in billions)
Beginning of period $ 118 $ 125
Acquisitions 21 6
Additions 14 12
Repayments/transfers (34) (25)
End of period $ 119 $ 118
Servicing portfolio - third-party statistics: (b)
Fixed rate 92% 90%
Adjustable rate/balloon 8% 10%
Weighted-average interest rate 4.94% 5.38%
MSR capitalized value (in billions) $ .7 $ .7
MSR capitalization value (in basis points) 54 54
Weighted-average servicing fee (in basispoints) 28 29
RESIDENTIAL MORTGAGE REPURCHASE
RESERVE
Beginning of period $ 83 $ 144
Provision 761 102
RBC Bank (USA) acquisition 26 –
Losses - loan repurchases and settlements (256) (163)
End of Period $ 614 $ 83
OTHER INFORMATION
Loan origination volume (in billions) $15.2 $11.4
Percentage of originations represented by:
Agency and government programs 100% 100%
Refinance volume 77% 76%
Total nonperforming assets (b) (c) $ 134 $ 76
Purchased impaired loans (b) (d) $ 38 $ 112
(a) Includes a goodwill impairment charge of $45 million during the fourth quarter of2012.
(b) As of December 31.(c) Includes nonperforming loans of $90 million at December 31, 2012 and $31 million
at December 31, 2011.(d) Recorded investment of purchased impaired loans related to acquisitions.
The PNC Financial Services Group, Inc. – Form 10-K 67
Residential Mortgage Banking reported a loss of $308 millionin 2012 compared with earnings of $89 million in 2011.Earnings declined from the prior year primarily as a result ofhigher provision for residential mortgage repurchaseobligations, higher noninterest expense, including goodwillimpairment, and lower net hedging gains on mortgageservicing rights, partially offset by increased loan salesrevenue driven by higher loan origination volume.
The strategic focus of the business is the acquisition of newcustomers through a retail loan officer sales force with anemphasis on home purchase transactions. Two key aspects ofthis strategy are: (i) competing on the basis of superior serviceto new and existing customers in serving their home purchaseand refinancing needs; and (ii) pursuing strategic partnershipswith reputable residential real estate franchises to acquire newcustomers. A key consideration in pursuing this approach isthe cross-sell opportunity, especially in the bank footprintmarkets.
Residential Mortgage Banking overview:• Total loan originations were $15.2 billion for 2012
compared with $11.4 billion in 2011. Loans continueto be originated primarily through direct channelsunder FNMA, FHLMC and FHA/VA agencyguidelines. Refinancings were 77% of originationsfor 2012 and 76% in 2011. During 2012, 30% of loanoriginations were under the original or revised HomeAffordable Refinance Program (HARP or HARP 2).
• Investors having purchased mortgage loans mayrequest PNC to indemnify them against losses oncertain loans or to repurchase loans that they believedo not comply with applicable contractual loanorigination covenants and representations andwarranties we have made. At December 31, 2012, theliability for estimated losses on repurchase andindemnification claims for the Residential MortgageBanking business segment was $614 millioncompared with $83 million at December 31, 2011.See the Recourse And Repurchase Obligationssection of this Item 7 and Note 24 Commitments andGuarantees in the Notes To Consolidated Financial
Statements in Item 8 of this Report for additionalinformation.– PNC has experienced and expects to experience
further elevated levels of residential mortgageloan repurchase demands reflecting changes inbehavior and demand patterns of twogovernment-sponsored enterprises, FHLMCand FNMA, primarily related to loans sold in2004 through 2008 into agency securitizations.
• Residential mortgage loans serviced for others totaled$119 billion at December 31, 2012 compared with$118 billion at December 31, 2011. Payoff volumesremained high, but new direct loan originationvolume and servicing portfolio acquisitions offset thedecline.
• Noninterest income was $317 million in 2012compared with $751 million in 2011. The decreaseresulted from current year additions to reserves of$761 million for residential mortgage loan repurchaseobligations as compared to $102 million in 2011 andlower net hedging gains on mortgage servicing rights,partially offset by increased loan sales revenue drivenby higher loan origination volume.
• Net interest income was $209 million in 2012compared with $201 million in 2011.
• Noninterest expense was $992 million in 2012compared with $797 million in 2011. The increasefrom the prior year was primarily driven by increasedresidential mortgage origination volumes, servicingcosts, a goodwill impairment charge and higheradditions to legal reserves. Included in noninterestexpense in the fourth quarter of 2012 was anapproximately $70 million charge resulting from anagreement to amend consent orders previouslyentered into by PNC with its banking regulators. Theagreement ends the independent foreclosure reviewprogram under the consent orders and replaces it withan accelerated remediation process.
• The fair value of mortgage servicing rights was $.7billion at both December 31, 2012 and December 31,2011.
68 The PNC Financial Services Group, Inc. – Form 10-K
BLACKROCK(Unaudited)
Table 25: BlackRock Table
Information related to our equity investment in BlackRockfollows:
Year ended December 31Dollars in millions 2012 2011
Business segment earnings (a) $395 $361
PNC’s economic interest in BlackRock (b) 22 % 21%
(a) Includes PNC’s share of BlackRock’s reported GAAP earnings net of additionalincome taxes on those earnings incurred by PNC.
(b) At December 31
In billionsDec. 31
2012Dec. 31
2011
Carrying value of PNC’s investment inBlackRock (c) $5.6 $5.3
Market value of PNC’s investment inBlackRock (d) 7.4 6.4
(c) PNC accounts for its investment in BlackRock under the equity method ofaccounting, exclusive of a related deferred tax liability of $1.9 billion atDecember 31, 2012 and $1.7 billion at December 31, 2011. In May 2012, weexchanged 2 million shares of BlackRock Series B Preferred Stock for an equalnumber of shares of BlackRock common stock. The exchange transaction had noimpact on the carrying value of our investment in BlackRock nor on our use of theequity method of accounting. Our voting interest in BlackRock common stock wasapproximately 21% at December 31, 2012.
(d) Does not include liquidity discount.
PNC accounts for its shares of BlackRock Series C PreferredStock at fair value, which offsets the impact of marking-to-market the obligation to deliver these shares to BlackRock topartially fund BlackRock long-term incentive plan (LTIP)programs. The fair value amount of the BlackRock Series CPreferred Stock is included on our Consolidated Balance Sheetin the caption Other assets. Additional information regardingthe valuation of the BlackRock Series C Preferred Stock isincluded in Note 9 Fair Value in the Notes To ConsolidatedFinancial Statements in Item 8 of this Report.
On September 29, 2011, PNC transferred 1.3 million shares ofBlackRock Series C Preferred Stock to BlackRock to satisfy aportion of our LTIP obligation. Upon transfer, Other assetsand Other liabilities on our Consolidated Balance Sheet werereduced by $172 million, representing the fair value of theshares transferred. On January 31, 2013, we transferred anadditional 205,350 shares to BlackRock in connection withour obligation. The transfer reduced Other assets and Otherliabilities on our Consolidated Balance Sheet by $33 million.After this transfer, we hold approximately 1.3 million sharesof BlackRock Series C Preferred Stock which are available tofund our obligation in connection with the BlackRock LTIPprograms. Additional information regarding our BlackRockLTIP shares obligation is included in Note 16 Stock BasedCompensation Plans in the Notes To Consolidated FinancialStatements in Item 8 of this Report.
NON-STRATEGIC ASSETS PORTFOLIO(Unaudited)
Table 26: Non-Strategic Assets Portfolio Table
Year ended December 31Dollars in millions 2012 2011
INCOME STATEMENT
Net interest income $ 830 $ 913Noninterest income 13 47
Total revenue 843 960Provision for credit losses 181 366Noninterest expense 287 275
Pretax earnings 375 319Income taxes 138 119
Earnings $ 237 $ 200AVERAGE BALANCE SHEET
Commercial Lending:Commercial/Commercial real estate $ 894 $ 1,277Lease financing 677 712
Total commercial lending 1,571 1,989Consumer Lending:
Home equity 4,584 5,257Residential real estate 6,259 6,161
Total consumer lending 10,843 11,418Total portfolio loans 12,414 13,407Other assets (a) (364) (288)Total assets $12,050 $13,119Deposits and other liabilities $ 183 $ 111Capital 1,238 1,319
Total liabilities and equity $ 1,421 $ 1,430PERFORMANCE RATIOS
Return on average capital 19% 15%Return on average assets 1.97 1.52Noninterest income to total revenue 2 5Efficiency 34 29OTHER INFORMATION
Nonperforming assets (b) (c) $ 999 $ 1,024Purchased impaired loans (b) (d) $ 5,547 $ 5,251Net charge-offs (e) $ 299 $ 370Net charge-off ratio (e) 2.41% 2.76%Loans (b)Commercial Lending
Commercial/Commercial real estate $ 665 $ 976Lease financing 686 670Total commercial lending 1,351 1,646
Consumer LendingHome equity 4,237 4,930Residential real estate 6,093 5,840Total consumer lending 10,330 10,770
Total loans $11,681 $12,416
(a) Other assets includes deferred taxes, ALLL and OREO. Other assets were negativein both periods due to the ALLL.
(b) As of December 31.(c) Includes nonperforming loans of $.7 billion at both December 31, 2012 and
December 31, 2011.(d) Recorded investment of purchased impaired loans related to acquisitions. At
December 31, 2012, this segment contained 75% of PNC’s purchased impairedloans.
(e) For the year ended December 31.
The PNC Financial Services Group, Inc. – Form 10-K 69
This business segment consists primarily of non-strategicassets obtained through acquisitions of other companies. Non-Strategic Assets Portfolio had earnings of $237 million in2012 compared with $200 million in 2011. The increase wasprimarily attributable to a lower provision for credit losses,partially offset by lower net interest income driven by declinesin loan balances and purchase accounting accretion.
2012 included the impact of the RBC Bank (USA) acquisition,which added approximately $1.0 billion of residential realestate loans, $.2 billion of commercial/commercial real estateloans and $.2 billion of OREO assets. Of these assets, $1.0billion were deemed purchased impaired loans.
Non-Strategic Assets Portfolio overview:• Net interest income was $830 million in 2012
compared with $913 million 2011. The decrease wasdriven by lower purchase accounting accretion andloan balances.
• Noninterest income was $13 million in 2012compared with $47 million 2011. The decline wasdriven mainly by larger valuation adjustments toliabilities for estimated repurchase losses on homeequity loans sold.
• The provision for credit losses was $181 million in2012 compared with $366 million in 2011. Thedecrease in the provision for credit losses reflected adeclining loan portfolio and improvement in assetquality.
• Noninterest expense in 2012 was $287 millioncompared with $275 million in 2011. The increasewas primarily due to higher other real estate ownedexpenses.
• Average portfolio loans declined to $12.4 billion in2012 compared with $13.4 billion in 2011. Theoverall decline was driven by customer paymentactivity and portfolio management activities toreduce under-performing assets partially offset by theaddition of loans from the RBC Bank (USA)acquisition.
• Nonperforming loans were $.7 billion as ofDecember 31, 2012 and December 31, 2011. Theconsumer lending portfolio comprised 80% ofnonperforming loans at December 31, 2012.Nonperforming consumer loans increased $83million from December 31, 2011 as a result of achange in the nonaccrual policy for home equityloans requiring loans to be placed on nonaccrual at90 days past due compared to the prior policy of 180days. Also contributing to the increase was a changein the treatment of certain consumer loans classifiedas TDRs, pursuant to regulatory guidance issued inthe third quarter of 2012. These TDRs resulted frombankruptcy where no formal reaffirmation wasprovided by the borrower thereby granting aconcession upon discharge from personal liability.
• Net charge-offs were $299 million in 2012 and $370million in 2011. Net charge-offs declined 17% on theconsumer lending portfolio and 23% on thecommercial lending portfolio.
The business activity of this segment is to manage the wind-down of the portfolio assigned to it while maximizing thevalue and mitigating risk. The fair value marks taken uponacquisition of the assets, the team we have in place, andtargeted asset resolution strategies help us to manage theseassets.
• The Commercial Lending portfolio declined 18% to$1.35 billion at December 31, 2012 compared toDecember 31, 2011. Loans to residential developersdeclined 32% to $.7 billion while the lease financingportfolio remained relatively flat at $.7 billion. Theleases are long-term with relatively low credit risk.
• The Consumer Lending portfolio declined $.4 billion,or 4%, when compared to the same period last year.Excluding $.9 billion of residential mortgage loansfrom the RBC Bank (USA) acquisition, the portfoliodecreased 13%. The portfolio’s credit quality hasstabilized through actions taken by management. Wehave implemented various refinance programs, linemanagement programs, and loss mitigation programsto mitigate risks within this portfolio while assistingborrowers to maintain homeownership whenpossible.
• When loans are sold, we may assume certain loanrepurchase obligations to indemnify investors againstlosses or to repurchase loans that they believe do notcomply with applicable contractual loan originationcovenants and representations and warranties wehave made. From 2005 to 2007, home equity loanswere sold with such contractual provisions. AtDecember 31, 2012, the liability for estimated losseson repurchase and indemnification claims for theNon-Strategic Assets Portfolio was $58 millioncompared to $47 million at December 31, 2011. Seethe Recourse And Repurchase Obligations section ofthis Item 7 and Note 24 Commitments andGuarantees in the Notes To Consolidated FinancialStatements included in Item 8 of this Report foradditional information.
70 The PNC Financial Services Group, Inc. – Form 10-K
CRITICAL ACCOUNTING ESTIMATES
AND JUDGMENTS
Our consolidated financial statements are prepared byapplying certain accounting policies. Note 1 AccountingPolicies in the Notes To Consolidated Financial Statements inItem 8 of this Report describes the most significant accountingpolicies that we use. Certain of these policies require us tomake estimates or economic assumptions that may vary underdifferent assumptions or conditions and such variations maysignificantly affect our reported results and financial positionfor the period or in future periods.
Fair Value MeasurementsWe must use estimates, assumptions, and judgments whenassets and liabilities are required to be recorded at, or adjustedto reflect, fair value.
Assets and liabilities carried at fair value inherently result in ahigher degree of financial statement volatility. Fair values andthe information used to record valuation adjustments forcertain assets and liabilities are based on either quoted marketprices or are provided by independent third-party sources,including appraisers and valuation specialists, when available.When such third-party information is not available, weestimate fair value primarily by using cash flow and otherfinancial modeling techniques. Changes in underlying factors,assumptions, or estimates in any of these areas couldmaterially impact our future financial condition and results ofoperations.
PNC applies ASC 820 Fair Value Measurements andDisclosures. This guidance defines fair value as the price thatwould be received to sell a financial asset or paid to transfer afinancial liability in an orderly transaction between marketparticipants at the measurement date. This guidance requires athree level hierarchy for disclosure of assets and liabilitiesrecorded at fair value. The classification of assets andliabilities within the hierarchy is based on whether the inputsto the valuation methodology used in the measurement areobservable or unobservable.
The following sections of this Report provide furtherinformation on this type of activity:
• Fair Value Measurements included within thisItem 7, and
• Note 9 Fair Value included in the Notes ToConsolidated Financial Statements in Item 8 of thisReport.
Allowances For Loan And Lease Losses And UnfundedLoan Commitments And Letters Of CreditWe maintain the ALLL and the Allowance For UnfundedLoan Commitments And Letters Of Credit at levels that webelieve to be appropriate to absorb estimated probable creditlosses incurred in the loan portfolio and on these unfundedcredit facilities as of the balance sheet date. Our determinationof the allowances is based on periodic evaluations of the loanand lease portfolios and unfunded credit facilities and otherrelevant factors. This evaluation is inherently subjective as itrequires material estimates, all of which may be susceptible tosignificant change, including, among others:
• Probability of default (PD),• Loss given default (LGD),• Exposure at date of default (EAD),• Movement through delinquency stages,• Amounts and timing of expected future cash flows,• Value of collateral, and• Qualitative factors, such as changes in current
economic conditions, that may not be reflected inhistorical results.
In determining the appropriateness of the ALLL, we makespecific allocations to impaired loans and allocations toportfolios of commercial and consumer loans. We alsoallocate reserves to provide coverage for probable lossesincurred in the portfolio at the balance sheet date based uponcurrent market conditions, which may not be reflected inhistorical loss data. Commercial lending is the largest categoryof credits and is sensitive to changes in assumptions andjudgments underlying the determination of the ALLL. Wehave allocated approximately $1.8 billion, or 44%, of theALLL at December 31, 2012 to the commercial lendingcategory. Consumer lending allocations are made based onhistorical loss experience adjusted for recent activity.Approximately $2.2 billion, or 56%, of the ALLL atDecember 31, 2012 have been allocated to these consumerlending categories.
During the third quarter of 2012, PNC increased the amount ofinternally observed data used in estimating the keycommercial lending assumptions of PD and LGD.
The PNC Financial Services Group, Inc. – Form 10-K 71
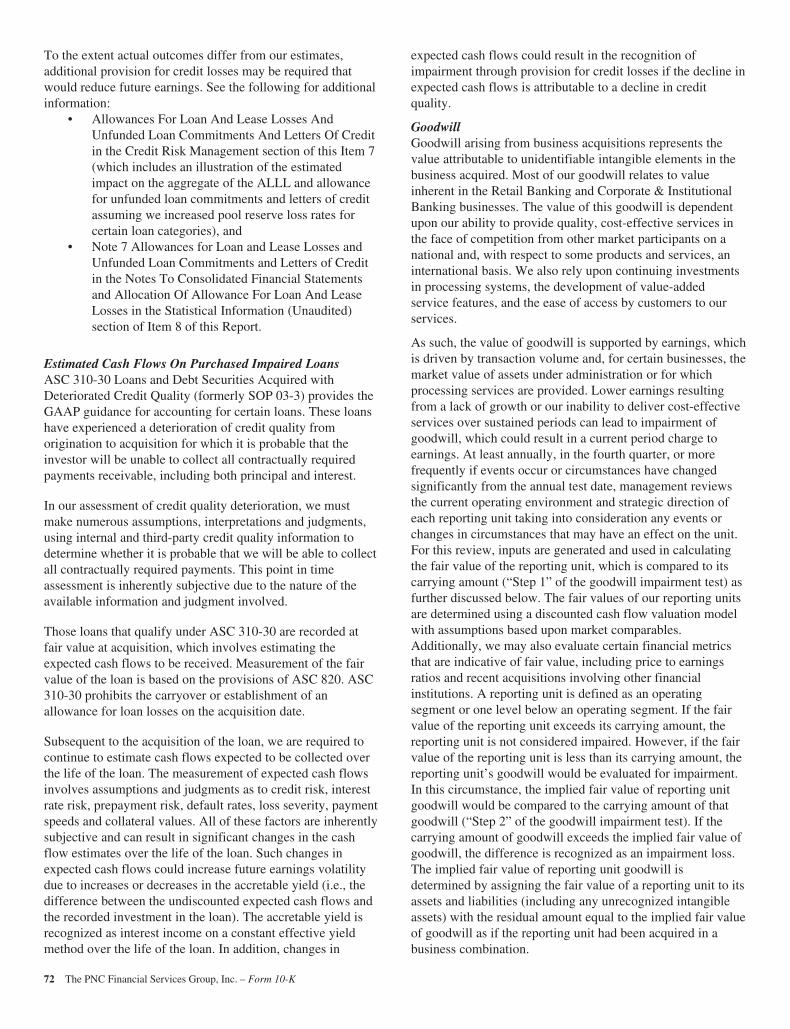
To the extent actual outcomes differ from our estimates,additional provision for credit losses may be required thatwould reduce future earnings. See the following for additionalinformation:
• Allowances For Loan And Lease Losses AndUnfunded Loan Commitments And Letters Of Creditin the Credit Risk Management section of this Item 7(which includes an illustration of the estimatedimpact on the aggregate of the ALLL and allowancefor unfunded loan commitments and letters of creditassuming we increased pool reserve loss rates forcertain loan categories), and
• Note 7 Allowances for Loan and Lease Losses andUnfunded Loan Commitments and Letters of Creditin the Notes To Consolidated Financial Statementsand Allocation Of Allowance For Loan And LeaseLosses in the Statistical Information (Unaudited)section of Item 8 of this Report.
Estimated Cash Flows On Purchased Impaired LoansASC 310-30 Loans and Debt Securities Acquired withDeteriorated Credit Quality (formerly SOP 03-3) provides theGAAP guidance for accounting for certain loans. These loanshave experienced a deterioration of credit quality fromorigination to acquisition for which it is probable that theinvestor will be unable to collect all contractually requiredpayments receivable, including both principal and interest.
In our assessment of credit quality deterioration, we mustmake numerous assumptions, interpretations and judgments,using internal and third-party credit quality information todetermine whether it is probable that we will be able to collectall contractually required payments. This point in timeassessment is inherently subjective due to the nature of theavailable information and judgment involved.
Those loans that qualify under ASC 310-30 are recorded atfair value at acquisition, which involves estimating theexpected cash flows to be received. Measurement of the fairvalue of the loan is based on the provisions of ASC 820. ASC310-30 prohibits the carryover or establishment of anallowance for loan losses on the acquisition date.
Subsequent to the acquisition of the loan, we are required tocontinue to estimate cash flows expected to be collected overthe life of the loan. The measurement of expected cash flowsinvolves assumptions and judgments as to credit risk, interestrate risk, prepayment risk, default rates, loss severity, paymentspeeds and collateral values. All of these factors are inherentlysubjective and can result in significant changes in the cashflow estimates over the life of the loan. Such changes inexpected cash flows could increase future earnings volatilitydue to increases or decreases in the accretable yield (i.e., thedifference between the undiscounted expected cash flows andthe recorded investment in the loan). The accretable yield isrecognized as interest income on a constant effective yieldmethod over the life of the loan. In addition, changes in
expected cash flows could result in the recognition ofimpairment through provision for credit losses if the decline inexpected cash flows is attributable to a decline in creditquality.
GoodwillGoodwill arising from business acquisitions represents thevalue attributable to unidentifiable intangible elements in thebusiness acquired. Most of our goodwill relates to valueinherent in the Retail Banking and Corporate & InstitutionalBanking businesses. The value of this goodwill is dependentupon our ability to provide quality, cost-effective services inthe face of competition from other market participants on anational and, with respect to some products and services, aninternational basis. We also rely upon continuing investmentsin processing systems, the development of value-addedservice features, and the ease of access by customers to ourservices.
As such, the value of goodwill is supported by earnings, whichis driven by transaction volume and, for certain businesses, themarket value of assets under administration or for whichprocessing services are provided. Lower earnings resultingfrom a lack of growth or our inability to deliver cost-effectiveservices over sustained periods can lead to impairment ofgoodwill, which could result in a current period charge toearnings. At least annually, in the fourth quarter, or morefrequently if events occur or circumstances have changedsignificantly from the annual test date, management reviewsthe current operating environment and strategic direction ofeach reporting unit taking into consideration any events orchanges in circumstances that may have an effect on the unit.For this review, inputs are generated and used in calculatingthe fair value of the reporting unit, which is compared to itscarrying amount (“Step 1” of the goodwill impairment test) asfurther discussed below. The fair values of our reporting unitsare determined using a discounted cash flow valuation modelwith assumptions based upon market comparables.Additionally, we may also evaluate certain financial metricsthat are indicative of fair value, including price to earningsratios and recent acquisitions involving other financialinstitutions. A reporting unit is defined as an operatingsegment or one level below an operating segment. If the fairvalue of the reporting unit exceeds its carrying amount, thereporting unit is not considered impaired. However, if the fairvalue of the reporting unit is less than its carrying amount, thereporting unit’s goodwill would be evaluated for impairment.In this circumstance, the implied fair value of reporting unitgoodwill would be compared to the carrying amount of thatgoodwill (“Step 2” of the goodwill impairment test). If thecarrying amount of goodwill exceeds the implied fair value ofgoodwill, the difference is recognized as an impairment loss.The implied fair value of reporting unit goodwill isdetermined by assigning the fair value of a reporting unit to itsassets and liabilities (including any unrecognized intangibleassets) with the residual amount equal to the implied fair valueof goodwill as if the reporting unit had been acquired in abusiness combination.
72 The PNC Financial Services Group, Inc. – Form 10-K
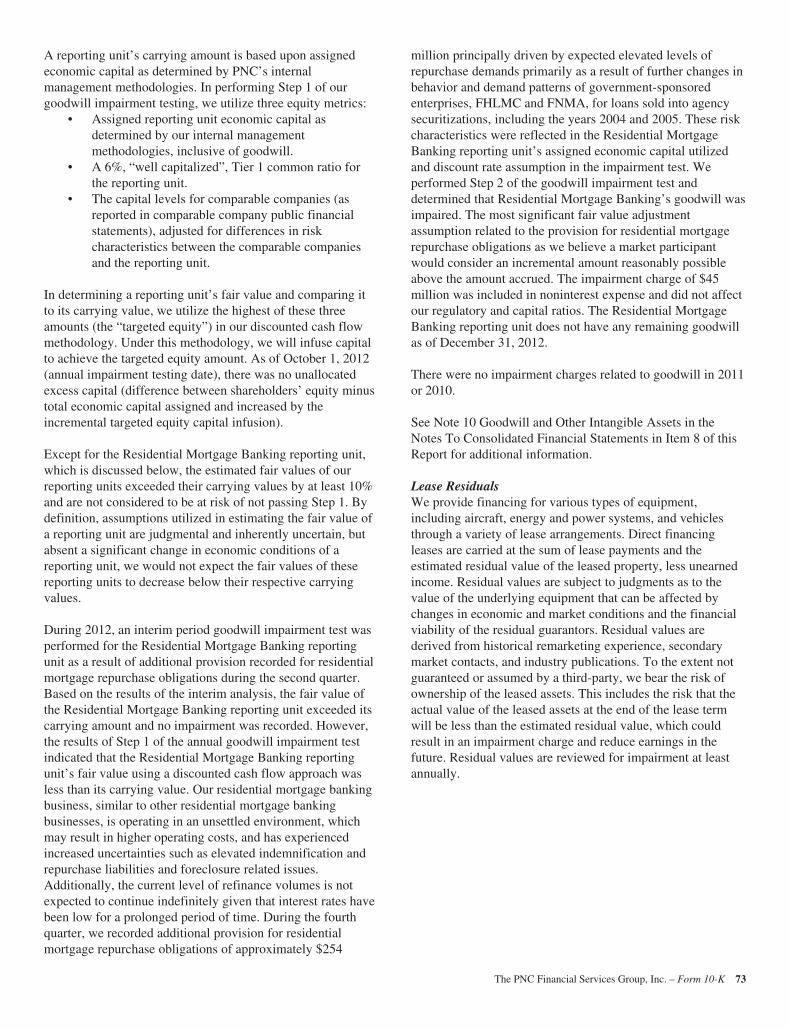
A reporting unit’s carrying amount is based upon assignedeconomic capital as determined by PNC’s internalmanagement methodologies. In performing Step 1 of ourgoodwill impairment testing, we utilize three equity metrics:
• Assigned reporting unit economic capital asdetermined by our internal managementmethodologies, inclusive of goodwill.
• A 6%, “well capitalized”, Tier 1 common ratio forthe reporting unit.
• The capital levels for comparable companies (asreported in comparable company public financialstatements), adjusted for differences in riskcharacteristics between the comparable companiesand the reporting unit.
In determining a reporting unit’s fair value and comparing itto its carrying value, we utilize the highest of these threeamounts (the “targeted equity”) in our discounted cash flowmethodology. Under this methodology, we will infuse capitalto achieve the targeted equity amount. As of October 1, 2012(annual impairment testing date), there was no unallocatedexcess capital (difference between shareholders’ equity minustotal economic capital assigned and increased by theincremental targeted equity capital infusion).
Except for the Residential Mortgage Banking reporting unit,which is discussed below, the estimated fair values of ourreporting units exceeded their carrying values by at least 10%and are not considered to be at risk of not passing Step 1. Bydefinition, assumptions utilized in estimating the fair value ofa reporting unit are judgmental and inherently uncertain, butabsent a significant change in economic conditions of areporting unit, we would not expect the fair values of thesereporting units to decrease below their respective carryingvalues.
During 2012, an interim period goodwill impairment test wasperformed for the Residential Mortgage Banking reportingunit as a result of additional provision recorded for residentialmortgage repurchase obligations during the second quarter.Based on the results of the interim analysis, the fair value ofthe Residential Mortgage Banking reporting unit exceeded itscarrying amount and no impairment was recorded. However,the results of Step 1 of the annual goodwill impairment testindicated that the Residential Mortgage Banking reportingunit’s fair value using a discounted cash flow approach wasless than its carrying value. Our residential mortgage bankingbusiness, similar to other residential mortgage bankingbusinesses, is operating in an unsettled environment, whichmay result in higher operating costs, and has experiencedincreased uncertainties such as elevated indemnification andrepurchase liabilities and foreclosure related issues.Additionally, the current level of refinance volumes is notexpected to continue indefinitely given that interest rates havebeen low for a prolonged period of time. During the fourthquarter, we recorded additional provision for residentialmortgage repurchase obligations of approximately $254
million principally driven by expected elevated levels ofrepurchase demands primarily as a result of further changes inbehavior and demand patterns of government-sponsoredenterprises, FHLMC and FNMA, for loans sold into agencysecuritizations, including the years 2004 and 2005. These riskcharacteristics were reflected in the Residential MortgageBanking reporting unit’s assigned economic capital utilizedand discount rate assumption in the impairment test. Weperformed Step 2 of the goodwill impairment test anddetermined that Residential Mortgage Banking’s goodwill wasimpaired. The most significant fair value adjustmentassumption related to the provision for residential mortgagerepurchase obligations as we believe a market participantwould consider an incremental amount reasonably possibleabove the amount accrued. The impairment charge of $45million was included in noninterest expense and did not affectour regulatory and capital ratios. The Residential MortgageBanking reporting unit does not have any remaining goodwillas of December 31, 2012.
There were no impairment charges related to goodwill in 2011or 2010.
See Note 10 Goodwill and Other Intangible Assets in theNotes To Consolidated Financial Statements in Item 8 of thisReport for additional information.
Lease ResidualsWe provide financing for various types of equipment,including aircraft, energy and power systems, and vehiclesthrough a variety of lease arrangements. Direct financingleases are carried at the sum of lease payments and theestimated residual value of the leased property, less unearnedincome. Residual values are subject to judgments as to thevalue of the underlying equipment that can be affected bychanges in economic and market conditions and the financialviability of the residual guarantors. Residual values arederived from historical remarketing experience, secondarymarket contacts, and industry publications. To the extent notguaranteed or assumed by a third-party, we bear the risk ofownership of the leased assets. This includes the risk that theactual value of the leased assets at the end of the lease termwill be less than the estimated residual value, which couldresult in an impairment charge and reduce earnings in thefuture. Residual values are reviewed for impairment at leastannually.
The PNC Financial Services Group, Inc. – Form 10-K 73
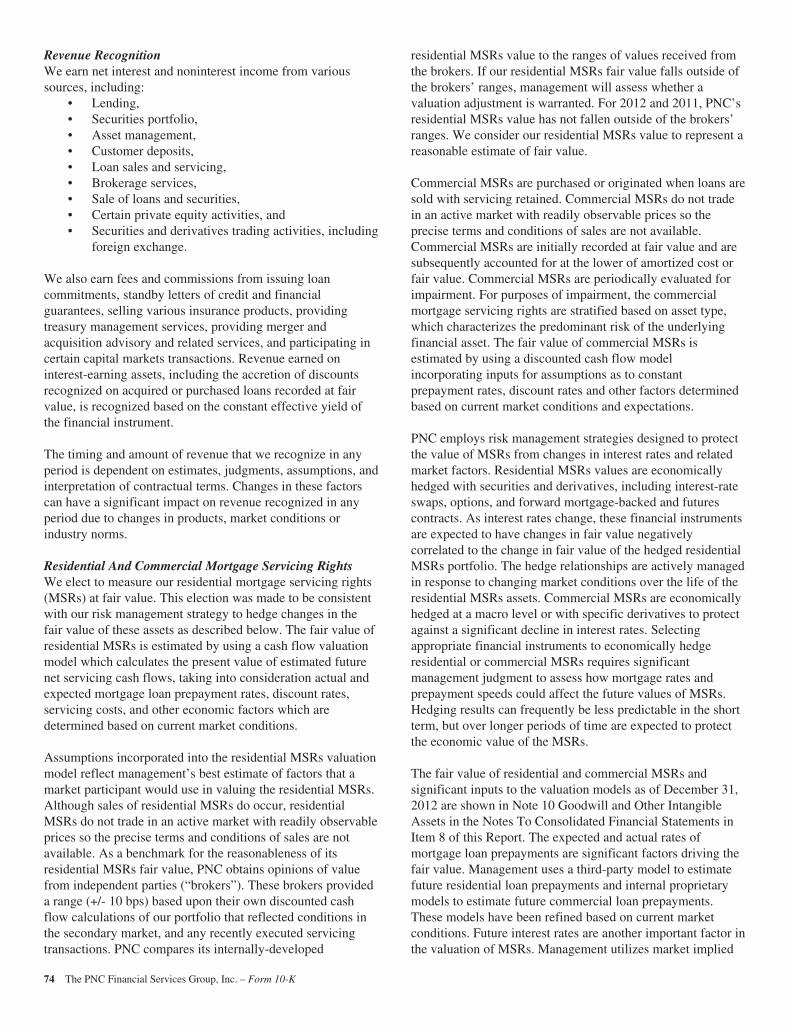
Revenue RecognitionWe earn net interest and noninterest income from varioussources, including:
• Lending,• Securities portfolio,• Asset management,• Customer deposits,• Loan sales and servicing,• Brokerage services,• Sale of loans and securities,• Certain private equity activities, and• Securities and derivatives trading activities, including
foreign exchange.
We also earn fees and commissions from issuing loancommitments, standby letters of credit and financialguarantees, selling various insurance products, providingtreasury management services, providing merger andacquisition advisory and related services, and participating incertain capital markets transactions. Revenue earned oninterest-earning assets, including the accretion of discountsrecognized on acquired or purchased loans recorded at fairvalue, is recognized based on the constant effective yield ofthe financial instrument.
The timing and amount of revenue that we recognize in anyperiod is dependent on estimates, judgments, assumptions, andinterpretation of contractual terms. Changes in these factorscan have a significant impact on revenue recognized in anyperiod due to changes in products, market conditions orindustry norms.
Residential And Commercial Mortgage Servicing RightsWe elect to measure our residential mortgage servicing rights(MSRs) at fair value. This election was made to be consistentwith our risk management strategy to hedge changes in thefair value of these assets as described below. The fair value ofresidential MSRs is estimated by using a cash flow valuationmodel which calculates the present value of estimated futurenet servicing cash flows, taking into consideration actual andexpected mortgage loan prepayment rates, discount rates,servicing costs, and other economic factors which aredetermined based on current market conditions.
Assumptions incorporated into the residential MSRs valuationmodel reflect management’s best estimate of factors that amarket participant would use in valuing the residential MSRs.Although sales of residential MSRs do occur, residentialMSRs do not trade in an active market with readily observableprices so the precise terms and conditions of sales are notavailable. As a benchmark for the reasonableness of itsresidential MSRs fair value, PNC obtains opinions of valuefrom independent parties (“brokers”). These brokers provideda range (+/- 10 bps) based upon their own discounted cashflow calculations of our portfolio that reflected conditions inthe secondary market, and any recently executed servicingtransactions. PNC compares its internally-developed
residential MSRs value to the ranges of values received fromthe brokers. If our residential MSRs fair value falls outside ofthe brokers’ ranges, management will assess whether avaluation adjustment is warranted. For 2012 and 2011, PNC’sresidential MSRs value has not fallen outside of the brokers’ranges. We consider our residential MSRs value to represent areasonable estimate of fair value.
Commercial MSRs are purchased or originated when loans aresold with servicing retained. Commercial MSRs do not tradein an active market with readily observable prices so theprecise terms and conditions of sales are not available.Commercial MSRs are initially recorded at fair value and aresubsequently accounted for at the lower of amortized cost orfair value. Commercial MSRs are periodically evaluated forimpairment. For purposes of impairment, the commercialmortgage servicing rights are stratified based on asset type,which characterizes the predominant risk of the underlyingfinancial asset. The fair value of commercial MSRs isestimated by using a discounted cash flow modelincorporating inputs for assumptions as to constantprepayment rates, discount rates and other factors determinedbased on current market conditions and expectations.
PNC employs risk management strategies designed to protectthe value of MSRs from changes in interest rates and relatedmarket factors. Residential MSRs values are economicallyhedged with securities and derivatives, including interest-rateswaps, options, and forward mortgage-backed and futurescontracts. As interest rates change, these financial instrumentsare expected to have changes in fair value negativelycorrelated to the change in fair value of the hedged residentialMSRs portfolio. The hedge relationships are actively managedin response to changing market conditions over the life of theresidential MSRs assets. Commercial MSRs are economicallyhedged at a macro level or with specific derivatives to protectagainst a significant decline in interest rates. Selectingappropriate financial instruments to economically hedgeresidential or commercial MSRs requires significantmanagement judgment to assess how mortgage rates andprepayment speeds could affect the future values of MSRs.Hedging results can frequently be less predictable in the shortterm, but over longer periods of time are expected to protectthe economic value of the MSRs.
The fair value of residential and commercial MSRs andsignificant inputs to the valuation models as of December 31,2012 are shown in Note 10 Goodwill and Other IntangibleAssets in the Notes To Consolidated Financial Statements inItem 8 of this Report. The expected and actual rates ofmortgage loan prepayments are significant factors driving thefair value. Management uses a third-party model to estimatefuture residential loan prepayments and internal proprietarymodels to estimate future commercial loan prepayments.These models have been refined based on current marketconditions. Future interest rates are another important factor inthe valuation of MSRs. Management utilizes market implied
74 The PNC Financial Services Group, Inc. – Form 10-K
forward interest rates to estimate the future direction ofmortgage and discount rates. The forward rates utilized arederived from the current yield curve for U.S. dollar interestrate swaps and are consistent with pricing of capital marketsinstruments. Changes in the shape and slope of the forwardcurve in future periods may result in volatility in the fair valueestimate.
A sensitivity analysis of the hypothetical effect on the fairvalue of MSRs to adverse changes in key assumptions ispresented in Note 10 Goodwill and Other Intangible Assets inthe Notes To Consolidated Financial Statements in Item 8 ofthis Report. These sensitivities do not include the impact ofthe related hedging activities. Changes in fair value generallycannot be extrapolated because the relationship of the changein the assumption to the change in fair value may not belinear. Also, the effect of a variation in a particular assumptionon the fair value of the MSRs is calculated independentlywithout changing any other assumption. In reality, changes inone factor may result in changes in another (for example,changes in mortgage interest rates, which drive changes inprepayment rate estimates, could result in changes in theinterest rate spread), which could either magnify or counteractthe sensitivities.
Income TaxesIn the normal course of business, we and our subsidiaries enterinto transactions for which the tax treatment is unclear orsubject to varying interpretations. In addition, filingrequirements, methods of filing and the calculation of taxableincome in various state and local jurisdictions are subject todiffering interpretations.
We evaluate and assess the relative risks and merits of the taxtreatment of transactions, filing positions, filing methods andtaxable income calculations after considering statutes,regulations, judicial precedent, and other information, andmaintain tax accruals consistent with our evaluation of theserelative risks and merits. The result of our evaluation andassessment is by its nature an estimate. We and oursubsidiaries are routinely subject to audit and challenges fromtaxing authorities. In the event we resolve a challenge for anamount different than amounts previously accrued, we willaccount for the difference in the period in which we resolvethe matter.
Proposed Accounting StandardsThe Financial Accounting Standards Board (FASB) issuedseveral Exposure Drafts for comment during 2012 as well asthe beginning of 2013.
In January 2013, the FASB issued Proposed AccountingStandards Update (ASU) Transfers and Servicing (Topic 860):Effective Control for Transfers with Forward Agreements toRepurchase Assets and Accounting for RepurchaseFinancings. This exposure draft would change the accountingfor repurchase-to-maturity agreements (“repos-to-maturity”).
Under the existing guidance, repos-to-maturity may meet thecriteria to be accounted for as sales, but the proposed guidancewould require them to be accounted for as securedborrowings. It would also clarify the evaluation of whetherfinancial assets that will be repurchased are “substantially thesame” as those transferred. Additionally, the exposure draftproposes a change to the accounting for repurchases that arepart of repurchase financings, such that the initial transfer andrepurchase are evaluated as two separate transactions. Theeffective date has not yet been determined. We are evaluatingthe impact of this proposal on our financial statements.
In December 2012, the FASB issued Proposed ASU FinancialInstruments – Credit Losses (Subtopic 825-15). The FASB hasexposed a single-model approach which would apply to allfinancial instruments carried at amortized cost or at fair-valuethrough other comprehensive income (replacing the currentASC 450, Contingencies, ASC 310-10, Receivables – Overall,ASC 310-30, Receivables – Loans and Debt SecuritiesAcquired with Deteriorated Credit Quality and ASC 320,Investments – Debt and Equity Securities approaches). Thismodel would require reserves for all expected credit lossesover the life of the instrument. Under the proposal,retrospective application with cumulative adjustment toretained earnings will be required and early adoption wouldnot be permitted. The effective date has not yet beendetermined. We are evaluating the impact of this proposal onour financial statements.
In October 2012, the FASB issued Proposed ASUConsolidation (Topic 810): Accounting for the Differencebetween the Fair Value of the Assets and the Fair Value of theLiabilities of a Consolidated Collateralized Financing Entity.This exposure draft would define “collateralized financingentity” and require a reporting entity that consolidates acollateralized financing entity and measures the associatedfinancial assets and financial liabilities at fair value, tomeasure that fair value consistently with how a marketparticipant would price the reporting entity’s net exposure.The reporting entity would allocate portfolio-leveladjustments to the individual assets and liabilities on areasonable and consistent basis. The exposure draft wouldrequire a modified retrospective approach to be applied atadoption for only those collateralized financing entities thatexist at the date of adoption. Early adoption would bepermitted. An effective date has not yet been determined. Weare evaluating the impact of this proposal on our financialstatements.
In October 2012, the FASB issued Proposed ASU ForeignCurrency Matters (Topic 830): Parent’s Accounting for theCumulative Translation Adjustment upon Derecognition ofCertain Subsidiaries or Groups of Assets within a ForeignEntity or of an Investment in a Foreign Entity. This exposuredraft would clarify the timing of release of CurrencyTranslation Adjustments (CTA) from Accumulated OtherComprehensive Income (AOCI) upon deconsolidation or
The PNC Financial Services Group, Inc. – Form 10-K 75
derecognition of a foreign entity, subsidiary or a group ofassets within a foreign entity and in step acquisitions.Specifically, 1) Upon deconsolidation or derecognition of aforeign entity, CTA would be released; 2) Upon sale of asubsidiary or a group of assets within a foreign entity, CTAwould not be released, unless it also represents the completeor substantially complete liquidation of the foreign entity inwhich it resides; and 3) In a step acquisition, the AOCI relatedto the previously held investment would be included in thecalculation of gain or loss upon change in control. Theproposed standard would be applied prospectively from thedate of adoption with early adoption permitted. An effectivedate has not yet been determined. We are evaluating theimpact of this proposal on our financial statements.
In July 2012, the FASB issued Proposed ASU Liabilities(Topic 405): Obligations Resulting from Joint and SeveralLiability Arrangements. This exposure draft would require anentity to measure obligations resulting from joint and severalliability arrangements for which the total amount under thearrangement is fixed at the reporting date per ASC 450-20,Contingencies—Loss Contingencies. This exposure draftwould also require an entity to disclose the nature and amountof the obligation as well as information about the risks thatsuch obligations pose to an entity’s future cash flows. If theprimary role of a reporting entity in the joint and severalliability arrangement is that of a guarantor, then it shouldaccount for the obligation under ASC 460, Guarantees. Thisguidance would be applied retrospectively to all prior periodspresented for those obligations resulting from joint and severalliability arrangements that exist at the beginning of an entity’sfiscal year of adoption. The effective date has not yet beendetermined. The comment period ended September 20, 2012.We are evaluating the impact of this proposal on our financialstatements.
Recent Accounting PronouncementsSee Note 1 Accounting Policies in the Notes To theConsolidated Financial Statements in Item 8 of this Reportregarding the impact of new accounting pronouncements.
STATUS OF QUALIFIED DEFINED
BENEFIT PENSION PLAN
We have a noncontributory, qualified defined benefit pensionplan (plan or pension plan) covering eligible employees.Benefits are determined using a cash balance formula whereearnings credits are applied as a percentage of eligiblecompensation. Pension contributions are based on anactuarially determined amount necessary to fund total benefitspayable to plan participants. Consistent with our investmentstrategy, plan assets are primarily invested in equityinvestments and fixed income instruments. Plan fiduciariesdetermine and review the plan’s investment policy, which isdescribed more fully in Note 15 Employee Benefit Plans inthe Notes To Consolidated Financial Statements in Item 8 ofthis Report.
We calculate the expense associated with the pension plan andthe assumptions and methods that we use include a policy ofreflecting trust assets at their fair market value. On an annualbasis, we review the actuarial assumptions related to thepension plan. The primary assumptions used to measurepension obligations and costs are the discount rate,compensation increase and expected long-term return onassets. Among these, the compensation increase assumptiondoes not significantly affect pension expense.
The discount rate used to measure pension obligations isdetermined by comparing the expected future benefits thatwill be paid under the plan with yields available on highquality corporate bonds of similar duration. The impact onpension expense of a 0.5% decrease in discount rate in thecurrent environment is $21 million per year. In contrast, thesensitivity to the same change in discount rate in a higherinterest rate environment is less significant.
The expected long-term return on assets assumption also has asignificant effect on pension expense. The expected return onplan assets is a long-term assumption established byconsidering historical and anticipated returns of the assetclasses invested in by the pension plan and the asset allocationpolicy currently in place. For purposes of setting andreviewing this assumption, “long term” refers to the periodover which the plan’s projected benefit obligations will bedisbursed. We review this assumption at each measurementdate and adjust it if warranted. Our selection processreferences certain historical data and the current environment,but primarily utilizes qualitative judgment regarding futurereturn expectations. Accordingly, we generally do not changethe assumption unless we modify our investment strategy oridentify events that would alter our expectations of futurereturns.
To evaluate the continued reasonableness of our assumption,we examine a variety of viewpoints and data. Various studieshave shown that portfolios comprised primarily of U.S. equity
76 The PNC Financial Services Group, Inc. – Form 10-K
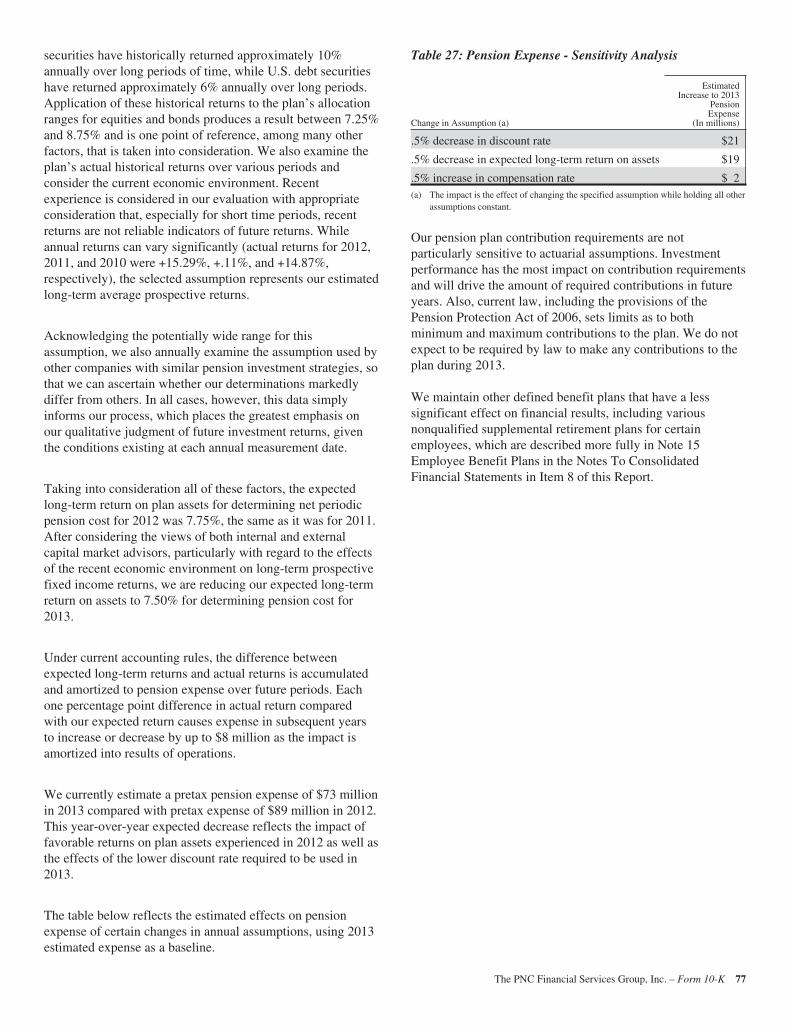
securities have historically returned approximately 10%annually over long periods of time, while U.S. debt securitieshave returned approximately 6% annually over long periods.Application of these historical returns to the plan’s allocationranges for equities and bonds produces a result between 7.25%and 8.75% and is one point of reference, among many otherfactors, that is taken into consideration. We also examine theplan’s actual historical returns over various periods andconsider the current economic environment. Recentexperience is considered in our evaluation with appropriateconsideration that, especially for short time periods, recentreturns are not reliable indicators of future returns. Whileannual returns can vary significantly (actual returns for 2012,2011, and 2010 were +15.29%, +.11%, and +14.87%,respectively), the selected assumption represents our estimatedlong-term average prospective returns.
Acknowledging the potentially wide range for thisassumption, we also annually examine the assumption used byother companies with similar pension investment strategies, sothat we can ascertain whether our determinations markedlydiffer from others. In all cases, however, this data simplyinforms our process, which places the greatest emphasis onour qualitative judgment of future investment returns, giventhe conditions existing at each annual measurement date.
Taking into consideration all of these factors, the expectedlong-term return on plan assets for determining net periodicpension cost for 2012 was 7.75%, the same as it was for 2011.After considering the views of both internal and externalcapital market advisors, particularly with regard to the effectsof the recent economic environment on long-term prospectivefixed income returns, we are reducing our expected long-termreturn on assets to 7.50% for determining pension cost for2013.
Under current accounting rules, the difference betweenexpected long-term returns and actual returns is accumulatedand amortized to pension expense over future periods. Eachone percentage point difference in actual return comparedwith our expected return causes expense in subsequent yearsto increase or decrease by up to $8 million as the impact isamortized into results of operations.
We currently estimate a pretax pension expense of $73 millionin 2013 compared with pretax expense of $89 million in 2012.This year-over-year expected decrease reflects the impact offavorable returns on plan assets experienced in 2012 as well asthe effects of the lower discount rate required to be used in2013.
The table below reflects the estimated effects on pensionexpense of certain changes in annual assumptions, using 2013estimated expense as a baseline.
Table 27: Pension Expense - Sensitivity Analysis
Change in Assumption (a)
EstimatedIncrease to 2013
PensionExpense
(In millions)
.5% decrease in discount rate $21
.5% decrease in expected long-term return on assets $19
.5% increase in compensation rate $ 2(a) The impact is the effect of changing the specified assumption while holding all other
assumptions constant.
Our pension plan contribution requirements are notparticularly sensitive to actuarial assumptions. Investmentperformance has the most impact on contribution requirementsand will drive the amount of required contributions in futureyears. Also, current law, including the provisions of thePension Protection Act of 2006, sets limits as to bothminimum and maximum contributions to the plan. We do notexpect to be required by law to make any contributions to theplan during 2013.
We maintain other defined benefit plans that have a lesssignificant effect on financial results, including variousnonqualified supplemental retirement plans for certainemployees, which are described more fully in Note 15Employee Benefit Plans in the Notes To ConsolidatedFinancial Statements in Item 8 of this Report.
The PNC Financial Services Group, Inc. – Form 10-K 77
RECOURSE AND REPURCHASE
OBLIGATIONS
As discussed in Note 3 Loan Sale and Servicing Activities andVariable Interest Entities in the Notes To ConsolidatedFinancial Statements in Item 8 of this Report, PNC has soldcommercial mortgage, residential mortgage and home equityloans directly or indirectly through securitization and loan saletransactions in which we have continuing involvement. Oneform of continuing involvement includes certain recourse andloan repurchase obligations associated with the transferredassets.
COMMERCIAL MORTGAGE LOAN RECOURSE OBLIGATIONS
We originate, close, and service certain multi-familycommercial mortgage loans which are sold to FNMA underFNMA’s Delegated Underwriting and Servicing (DUS)program. We participated in a similar program with theFHLMC.
Under these programs, we generally assume up to a one-thirdpari passu risk of loss on unpaid principal balances through aloss share arrangement. At December 31, 2012 andDecember 31, 2011, the unpaid principal balance outstandingof loans sold as a participant in these programs was $12.8billion and $13.0 billion, respectively. The potential maximumexposure under the loss share arrangements was $3.9 billion atDecember 31, 2012 and $4.0 billion at December 31, 2011.
We maintain a reserve for estimated losses based on ourexposure. The reserve for losses under these programs totaled$43 million and $47 million as of December 31, 2012 andDecember 31, 2011, respectively, and is included in Otherliabilities on our Consolidated Balance Sheet. If payment isrequired under these programs, we would not have acontractual interest in the collateral underlying the mortgageloans on which losses occurred, although the value of thecollateral is taken into account in determining our share ofsuch losses. Our exposure and activity associated with theserecourse obligations are reported in the Corporate &Institutional Banking segment.
RESIDENTIAL MORTGAGE REPURCHASE OBLIGATIONS
While residential mortgage loans are sold on a non-recoursebasis, we assume certain loan repurchase obligationsassociated with mortgage loans we have sold to investors.These loan repurchase obligations primarily relate tosituations where PNC is alleged to have breached certainorigination covenants and representations and warrantiesmade to purchasers of the loans in the respective purchase andsale agreements. Residential mortgage loans covered by theseloan repurchase obligations include first and second-lienmortgage loans we have sold through Agency securitizations,Non-agency securitizations, and loan sale transactions. As
discussed in Note 3 Loan Sale and Servicing Activities andVariable Interest Entities in the Notes To ConsolidatedFinancial Statements in Item 8 of this Report, Agencysecuritizations consist of mortgage loan sale transactions withFNMA, FHLMC, and the Government National MortgageAssociation (GNMA) program, while Non-agencysecuritizations consist of mortgage loan sale transactions withprivate investors. Mortgage loan sale transactions that are notpart of a securitization may involve FNMA, FHLMC orprivate investors. Our historical exposure and activityassociated with Agency securitization repurchase obligationshas primarily been related to transactions with FNMA andFHLMC, as indemnification and repurchase losses associatedwith Federal Housing Agency (FHA) and Department ofVeterans Affairs (VA)-insured and uninsured loans pooled inGNMA securitizations historically have been minimal.Repurchase obligation activity associated with residentialmortgages is reported in the Residential Mortgage Bankingsegment.
Loan covenants and representations and warranties areestablished through loan sale agreements with variousinvestors to provide assurance that PNC has sold loans that areof sufficient investment quality. Key aspects of suchcovenants and representations and warranties include theloan’s compliance with any applicable loan criteria establishedfor the transaction, including underwriting standards, deliveryof all required loan documents to the investor or its designatedparty, sufficient collateral valuation, and the validity of thelien securing the loan. As a result of alleged breaches of thesecontractual obligations, investors may request PNC toindemnify them against losses on certain loans or torepurchase loans.
We investigate every investor claim on a loan by loan basis todetermine the existence of a legitimate claim, and that allother conditions for indemnification or repurchase have beenmet prior to the settlement with that investor. Indemnificationsfor loss or loan repurchases typically occur when, after reviewof the claim, we agree insufficient evidence exists to disputethe investor’s claim that a breach of a loan covenant andrepresentation and warranty has occurred, such breach has notbeen cured, and the effect of such breach is deemed to havehad a material and adverse effect on the value of thetransferred loan. Depending on the sale agreement and uponproper notice from the investor, we typically respond to suchindemnification and repurchase requests within 90 days,although final resolution of the claim may take a longer periodof time. With the exception of the sales agreements associatedwith the Agency securitizations, most sale agreements do notprovide for penalties or other remedies if we do not respondtimely to investor indemnification or repurchase requests.
78 The PNC Financial Services Group, Inc. – Form 10-K
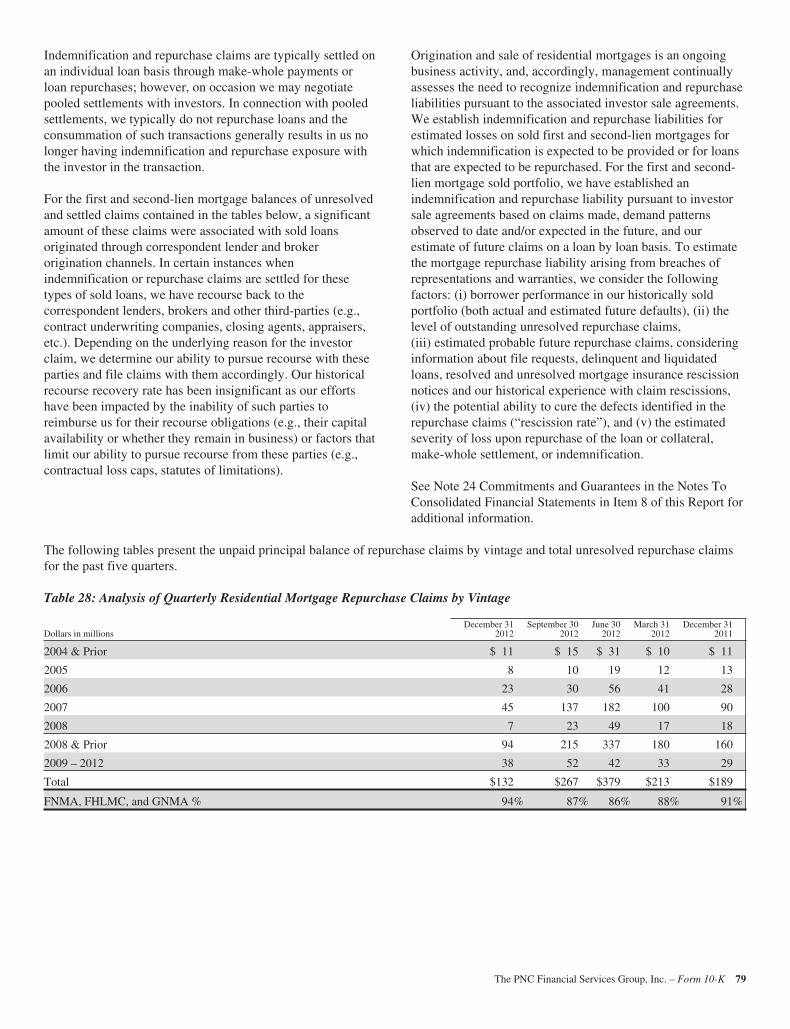
Indemnification and repurchase claims are typically settled onan individual loan basis through make-whole payments orloan repurchases; however, on occasion we may negotiatepooled settlements with investors. In connection with pooledsettlements, we typically do not repurchase loans and theconsummation of such transactions generally results in us nolonger having indemnification and repurchase exposure withthe investor in the transaction.
For the first and second-lien mortgage balances of unresolvedand settled claims contained in the tables below, a significantamount of these claims were associated with sold loansoriginated through correspondent lender and brokerorigination channels. In certain instances whenindemnification or repurchase claims are settled for thesetypes of sold loans, we have recourse back to thecorrespondent lenders, brokers and other third-parties (e.g.,contract underwriting companies, closing agents, appraisers,etc.). Depending on the underlying reason for the investorclaim, we determine our ability to pursue recourse with theseparties and file claims with them accordingly. Our historicalrecourse recovery rate has been insignificant as our effortshave been impacted by the inability of such parties toreimburse us for their recourse obligations (e.g., their capitalavailability or whether they remain in business) or factors thatlimit our ability to pursue recourse from these parties (e.g.,contractual loss caps, statutes of limitations).
Origination and sale of residential mortgages is an ongoingbusiness activity, and, accordingly, management continuallyassesses the need to recognize indemnification and repurchaseliabilities pursuant to the associated investor sale agreements.We establish indemnification and repurchase liabilities forestimated losses on sold first and second-lien mortgages forwhich indemnification is expected to be provided or for loansthat are expected to be repurchased. For the first and second-lien mortgage sold portfolio, we have established anindemnification and repurchase liability pursuant to investorsale agreements based on claims made, demand patternsobserved to date and/or expected in the future, and ourestimate of future claims on a loan by loan basis. To estimatethe mortgage repurchase liability arising from breaches ofrepresentations and warranties, we consider the followingfactors: (i) borrower performance in our historically soldportfolio (both actual and estimated future defaults), (ii) thelevel of outstanding unresolved repurchase claims,(iii) estimated probable future repurchase claims, consideringinformation about file requests, delinquent and liquidatedloans, resolved and unresolved mortgage insurance rescissionnotices and our historical experience with claim rescissions,(iv) the potential ability to cure the defects identified in therepurchase claims (“rescission rate”), and (v) the estimatedseverity of loss upon repurchase of the loan or collateral,make-whole settlement, or indemnification.
See Note 24 Commitments and Guarantees in the Notes ToConsolidated Financial Statements in Item 8 of this Report foradditional information.
The following tables present the unpaid principal balance of repurchase claims by vintage and total unresolved repurchase claimsfor the past five quarters.
Table 28: Analysis of Quarterly Residential Mortgage Repurchase Claims by Vintage
Dollars in millionsDecember 31
2012September 30
2012June 30
2012March 31
2012December 31
2011
2004 & Prior $ 11 $ 15 $ 31 $ 10 $ 11
2005 8 10 19 12 13
2006 23 30 56 41 28
2007 45 137 182 100 90
2008 7 23 49 17 18
2008 & Prior 94 215 337 180 160
2009 – 2012 38 52 42 33 29
Total $132 $267 $379 $213 $189
FNMA, FHLMC, and GNMA % 94% 87% 86% 88% 91%
The PNC Financial Services Group, Inc. – Form 10-K 79
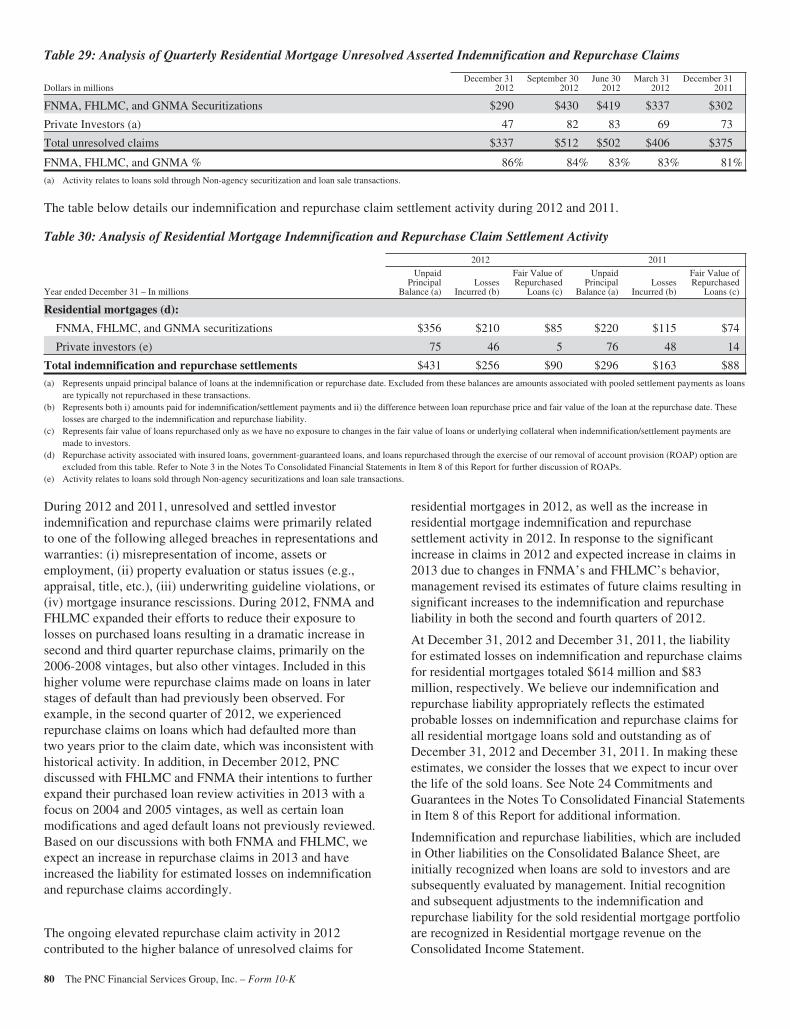
Table 29: Analysis of Quarterly Residential Mortgage Unresolved Asserted Indemnification and Repurchase Claims
Dollars in millionsDecember 31
2012September 30
2012June 30
2012March 31
2012December 31
2011
FNMA, FHLMC, and GNMA Securitizations $290 $430 $419 $337 $302
Private Investors (a) 47 82 83 69 73
Total unresolved claims $337 $512 $502 $406 $375
FNMA, FHLMC, and GNMA % 86% 84% 83% 83% 81%
(a) Activity relates to loans sold through Non-agency securitization and loan sale transactions.
The table below details our indemnification and repurchase claim settlement activity during 2012 and 2011.
Table 30: Analysis of Residential Mortgage Indemnification and Repurchase Claim Settlement Activity
2012 2011
Year ended December 31 – In millions
UnpaidPrincipal
Balance (a)Losses
Incurred (b)
Fair Value ofRepurchased
Loans (c)
UnpaidPrincipal
Balance (a)Losses
Incurred (b)
Fair Value ofRepurchased
Loans (c)
Residential mortgages (d):
FNMA, FHLMC, and GNMA securitizations $356 $210 $85 $220 $115 $74
Private investors (e) 75 46 5 76 48 14
Total indemnification and repurchase settlements $431 $256 $90 $296 $163 $88
(a) Represents unpaid principal balance of loans at the indemnification or repurchase date. Excluded from these balances are amounts associated with pooled settlement payments as loansare typically not repurchased in these transactions.
(b) Represents both i) amounts paid for indemnification/settlement payments and ii) the difference between loan repurchase price and fair value of the loan at the repurchase date. Theselosses are charged to the indemnification and repurchase liability.
(c) Represents fair value of loans repurchased only as we have no exposure to changes in the fair value of loans or underlying collateral when indemnification/settlement payments aremade to investors.
(d) Repurchase activity associated with insured loans, government-guaranteed loans, and loans repurchased through the exercise of our removal of account provision (ROAP) option areexcluded from this table. Refer to Note 3 in the Notes To Consolidated Financial Statements in Item 8 of this Report for further discussion of ROAPs.
(e) Activity relates to loans sold through Non-agency securitizations and loan sale transactions.
During 2012 and 2011, unresolved and settled investorindemnification and repurchase claims were primarily relatedto one of the following alleged breaches in representations andwarranties: (i) misrepresentation of income, assets oremployment, (ii) property evaluation or status issues (e.g.,appraisal, title, etc.), (iii) underwriting guideline violations, or(iv) mortgage insurance rescissions. During 2012, FNMA andFHLMC expanded their efforts to reduce their exposure tolosses on purchased loans resulting in a dramatic increase insecond and third quarter repurchase claims, primarily on the2006-2008 vintages, but also other vintages. Included in thishigher volume were repurchase claims made on loans in laterstages of default than had previously been observed. Forexample, in the second quarter of 2012, we experiencedrepurchase claims on loans which had defaulted more thantwo years prior to the claim date, which was inconsistent withhistorical activity. In addition, in December 2012, PNCdiscussed with FHLMC and FNMA their intentions to furtherexpand their purchased loan review activities in 2013 with afocus on 2004 and 2005 vintages, as well as certain loanmodifications and aged default loans not previously reviewed.Based on our discussions with both FNMA and FHLMC, weexpect an increase in repurchase claims in 2013 and haveincreased the liability for estimated losses on indemnificationand repurchase claims accordingly.
The ongoing elevated repurchase claim activity in 2012contributed to the higher balance of unresolved claims for
residential mortgages in 2012, as well as the increase inresidential mortgage indemnification and repurchasesettlement activity in 2012. In response to the significantincrease in claims in 2012 and expected increase in claims in2013 due to changes in FNMA’s and FHLMC’s behavior,management revised its estimates of future claims resulting insignificant increases to the indemnification and repurchaseliability in both the second and fourth quarters of 2012.
At December 31, 2012 and December 31, 2011, the liabilityfor estimated losses on indemnification and repurchase claimsfor residential mortgages totaled $614 million and $83million, respectively. We believe our indemnification andrepurchase liability appropriately reflects the estimatedprobable losses on indemnification and repurchase claims forall residential mortgage loans sold and outstanding as ofDecember 31, 2012 and December 31, 2011. In making theseestimates, we consider the losses that we expect to incur overthe life of the sold loans. See Note 24 Commitments andGuarantees in the Notes To Consolidated Financial Statementsin Item 8 of this Report for additional information.
Indemnification and repurchase liabilities, which are includedin Other liabilities on the Consolidated Balance Sheet, areinitially recognized when loans are sold to investors and aresubsequently evaluated by management. Initial recognitionand subsequent adjustments to the indemnification andrepurchase liability for the sold residential mortgage portfolioare recognized in Residential mortgage revenue on theConsolidated Income Statement.
80 The PNC Financial Services Group, Inc. – Form 10-K
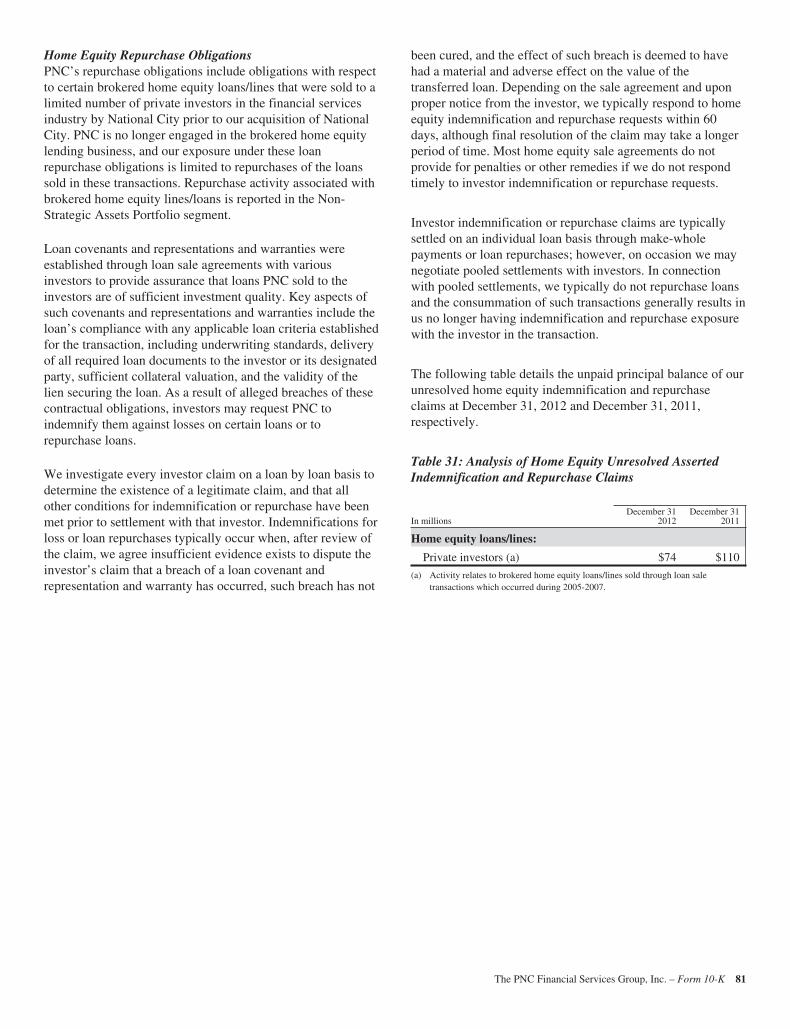
Home Equity Repurchase ObligationsPNC’s repurchase obligations include obligations with respectto certain brokered home equity loans/lines that were sold to alimited number of private investors in the financial servicesindustry by National City prior to our acquisition of NationalCity. PNC is no longer engaged in the brokered home equitylending business, and our exposure under these loanrepurchase obligations is limited to repurchases of the loanssold in these transactions. Repurchase activity associated withbrokered home equity lines/loans is reported in the Non-Strategic Assets Portfolio segment.
Loan covenants and representations and warranties wereestablished through loan sale agreements with variousinvestors to provide assurance that loans PNC sold to theinvestors are of sufficient investment quality. Key aspects ofsuch covenants and representations and warranties include theloan’s compliance with any applicable loan criteria establishedfor the transaction, including underwriting standards, deliveryof all required loan documents to the investor or its designatedparty, sufficient collateral valuation, and the validity of thelien securing the loan. As a result of alleged breaches of thesecontractual obligations, investors may request PNC toindemnify them against losses on certain loans or torepurchase loans.
We investigate every investor claim on a loan by loan basis todetermine the existence of a legitimate claim, and that allother conditions for indemnification or repurchase have beenmet prior to settlement with that investor. Indemnifications forloss or loan repurchases typically occur when, after review ofthe claim, we agree insufficient evidence exists to dispute theinvestor’s claim that a breach of a loan covenant andrepresentation and warranty has occurred, such breach has not
been cured, and the effect of such breach is deemed to havehad a material and adverse effect on the value of thetransferred loan. Depending on the sale agreement and uponproper notice from the investor, we typically respond to homeequity indemnification and repurchase requests within 60days, although final resolution of the claim may take a longerperiod of time. Most home equity sale agreements do notprovide for penalties or other remedies if we do not respondtimely to investor indemnification or repurchase requests.
Investor indemnification or repurchase claims are typicallysettled on an individual loan basis through make-wholepayments or loan repurchases; however, on occasion we maynegotiate pooled settlements with investors. In connectionwith pooled settlements, we typically do not repurchase loansand the consummation of such transactions generally results inus no longer having indemnification and repurchase exposurewith the investor in the transaction.
The following table details the unpaid principal balance of ourunresolved home equity indemnification and repurchaseclaims at December 31, 2012 and December 31, 2011,respectively.
Table 31: Analysis of Home Equity Unresolved AssertedIndemnification and Repurchase Claims
In millionsDecember 31
2012December 31
2011
Home equity loans/lines:
Private investors (a) $74 $110
(a) Activity relates to brokered home equity loans/lines sold through loan saletransactions which occurred during 2005-2007.
The PNC Financial Services Group, Inc. – Form 10-K 81
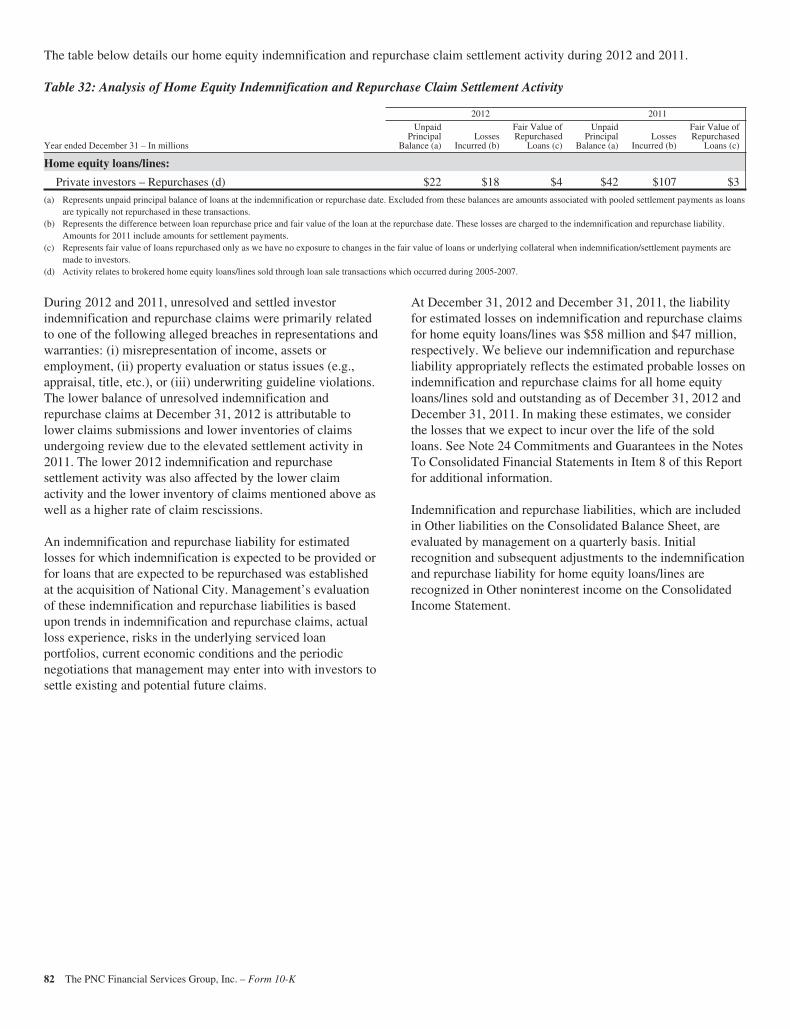
The table below details our home equity indemnification and repurchase claim settlement activity during 2012 and 2011.
Table 32: Analysis of Home Equity Indemnification and Repurchase Claim Settlement Activity
2012 2011
Year ended December 31 – In millions
UnpaidPrincipal
Balance (a)Losses
Incurred (b)
Fair Value ofRepurchased
Loans (c)
UnpaidPrincipal
Balance (a)Losses
Incurred (b)
Fair Value ofRepurchased
Loans (c)
Home equity loans/lines:
Private investors – Repurchases (d) $22 $18 $4 $42 $107 $3
(a) Represents unpaid principal balance of loans at the indemnification or repurchase date. Excluded from these balances are amounts associated with pooled settlement payments as loansare typically not repurchased in these transactions.
(b) Represents the difference between loan repurchase price and fair value of the loan at the repurchase date. These losses are charged to the indemnification and repurchase liability.Amounts for 2011 include amounts for settlement payments.
(c) Represents fair value of loans repurchased only as we have no exposure to changes in the fair value of loans or underlying collateral when indemnification/settlement payments aremade to investors.
(d) Activity relates to brokered home equity loans/lines sold through loan sale transactions which occurred during 2005-2007.
During 2012 and 2011, unresolved and settled investorindemnification and repurchase claims were primarily relatedto one of the following alleged breaches in representations andwarranties: (i) misrepresentation of income, assets oremployment, (ii) property evaluation or status issues (e.g.,appraisal, title, etc.), or (iii) underwriting guideline violations.The lower balance of unresolved indemnification andrepurchase claims at December 31, 2012 is attributable tolower claims submissions and lower inventories of claimsundergoing review due to the elevated settlement activity in2011. The lower 2012 indemnification and repurchasesettlement activity was also affected by the lower claimactivity and the lower inventory of claims mentioned above aswell as a higher rate of claim rescissions.
An indemnification and repurchase liability for estimatedlosses for which indemnification is expected to be provided orfor loans that are expected to be repurchased was establishedat the acquisition of National City. Management’s evaluationof these indemnification and repurchase liabilities is basedupon trends in indemnification and repurchase claims, actualloss experience, risks in the underlying serviced loanportfolios, current economic conditions and the periodicnegotiations that management may enter into with investors tosettle existing and potential future claims.
At December 31, 2012 and December 31, 2011, the liabilityfor estimated losses on indemnification and repurchase claimsfor home equity loans/lines was $58 million and $47 million,respectively. We believe our indemnification and repurchaseliability appropriately reflects the estimated probable losses onindemnification and repurchase claims for all home equityloans/lines sold and outstanding as of December 31, 2012 andDecember 31, 2011. In making these estimates, we considerthe losses that we expect to incur over the life of the soldloans. See Note 24 Commitments and Guarantees in the NotesTo Consolidated Financial Statements in Item 8 of this Reportfor additional information.
Indemnification and repurchase liabilities, which are includedin Other liabilities on the Consolidated Balance Sheet, areevaluated by management on a quarterly basis. Initialrecognition and subsequent adjustments to the indemnificationand repurchase liability for home equity loans/lines arerecognized in Other noninterest income on the ConsolidatedIncome Statement.
82 The PNC Financial Services Group, Inc. – Form 10-K
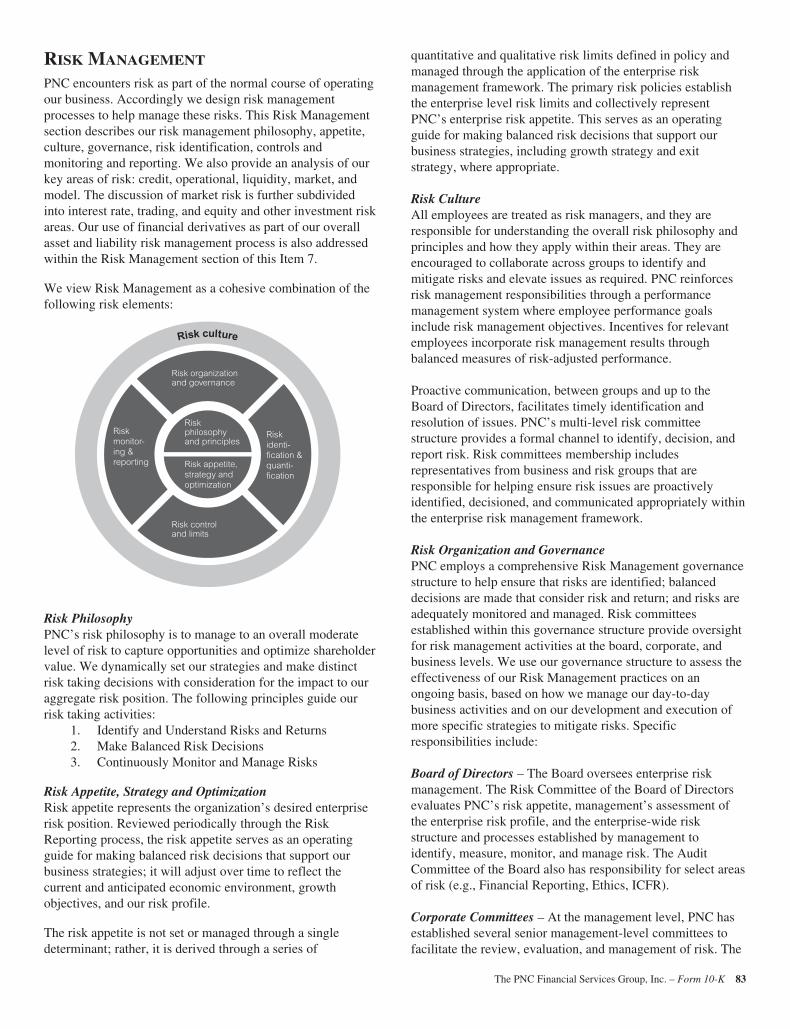
RISK MANAGEMENT
PNC encounters risk as part of the normal course of operatingour business. Accordingly we design risk managementprocesses to help manage these risks. This Risk Managementsection describes our risk management philosophy, appetite,culture, governance, risk identification, controls andmonitoring and reporting. We also provide an analysis of ourkey areas of risk: credit, operational, liquidity, market, andmodel. The discussion of market risk is further subdividedinto interest rate, trading, and equity and other investment riskareas. Our use of financial derivatives as part of our overallasset and liability risk management process is also addressedwithin the Risk Management section of this Item 7.
We view Risk Management as a cohesive combination of thefollowing risk elements:
Risk organizationand governance
Riskmonitor-ing &reporting
Riskidenti-fication &quanti-fication
Risk controland limits
Riskphilosophyand principles
Risk appetite,strategy andoptimization
Risk culture
Risk PhilosophyPNC’s risk philosophy is to manage to an overall moderatelevel of risk to capture opportunities and optimize shareholdervalue. We dynamically set our strategies and make distinctrisk taking decisions with consideration for the impact to ouraggregate risk position. The following principles guide ourrisk taking activities:
1. Identify and Understand Risks and Returns2. Make Balanced Risk Decisions3. Continuously Monitor and Manage Risks
Risk Appetite, Strategy and OptimizationRisk appetite represents the organization’s desired enterpriserisk position. Reviewed periodically through the RiskReporting process, the risk appetite serves as an operatingguide for making balanced risk decisions that support ourbusiness strategies; it will adjust over time to reflect thecurrent and anticipated economic environment, growthobjectives, and our risk profile.
The risk appetite is not set or managed through a singledeterminant; rather, it is derived through a series of
quantitative and qualitative risk limits defined in policy andmanaged through the application of the enterprise riskmanagement framework. The primary risk policies establishthe enterprise level risk limits and collectively representPNC’s enterprise risk appetite. This serves as an operatingguide for making balanced risk decisions that support ourbusiness strategies, including growth strategy and exitstrategy, where appropriate.
Risk CultureAll employees are treated as risk managers, and they areresponsible for understanding the overall risk philosophy andprinciples and how they apply within their areas. They areencouraged to collaborate across groups to identify andmitigate risks and elevate issues as required. PNC reinforcesrisk management responsibilities through a performancemanagement system where employee performance goalsinclude risk management objectives. Incentives for relevantemployees incorporate risk management results throughbalanced measures of risk-adjusted performance.
Proactive communication, between groups and up to theBoard of Directors, facilitates timely identification andresolution of issues. PNC’s multi-level risk committeestructure provides a formal channel to identify, decision, andreport risk. Risk committees membership includesrepresentatives from business and risk groups that areresponsible for helping ensure risk issues are proactivelyidentified, decisioned, and communicated appropriately withinthe enterprise risk management framework.
Risk Organization and GovernancePNC employs a comprehensive Risk Management governancestructure to help ensure that risks are identified; balanceddecisions are made that consider risk and return; and risks areadequately monitored and managed. Risk committeesestablished within this governance structure provide oversightfor risk management activities at the board, corporate, andbusiness levels. We use our governance structure to assess theeffectiveness of our Risk Management practices on anongoing basis, based on how we manage our day-to-daybusiness activities and on our development and execution ofmore specific strategies to mitigate risks. Specificresponsibilities include:
Board of Directors – The Board oversees enterprise riskmanagement. The Risk Committee of the Board of Directorsevaluates PNC’s risk appetite, management’s assessment ofthe enterprise risk profile, and the enterprise-wide riskstructure and processes established by management toidentify, measure, monitor, and manage risk. The AuditCommittee of the Board also has responsibility for select areasof risk (e.g., Financial Reporting, Ethics, ICFR).
Corporate Committees – At the management level, PNC hasestablished several senior management-level committees tofacilitate the review, evaluation, and management of risk. The
The PNC Financial Services Group, Inc. – Form 10-K 83
management-level Executive Committee (EC) is the corporatecommittee that is responsible for developing enterprise-widestrategy and achieving PNC’s strategic objectives. The ECevaluates risk management, in part, by monitoring riskreporting from the other corporate committees, which are thesupporting committees for EC. The corporate committees areresponsible for overseeing risk standards and strategies,recommending risk limits, policies, and metrics, monitoringrisk exposures, reviewing risk profiles and key risk issues, andapproving significant transactions and initiatives.
Working Committees – The working committees are generallysubcommittees of the corporate committees and include riskmanagement committees for each of PNC’s major businessesor functions. Working committees are intended to define,design and develop the risk management framework at thebusiness or function level. The working committees help toimplement key enterprise-level activities within a business orfunction. These committees recommend risk managementpolicies for the business or function that are consistent withthe enterprise-wide risk management objectives and policies.The business level committees are also responsible forapproving significant initiatives under a certain threshold.
Working Groups – Where appropriate, management will alsoform ad hoc groups (working groups) to address specific risktopics and report to a working committee or corporatecommittee. These working groups generally have a narrowerscope and may be limited in their duration.
Policies and Procedures – PNC uses various risk managementpolicies and procedures to provide direction and guidance tomanagement and the Board of Directors. These policies andprocedures are organized in a framework of different levelsrequiring review and approval at varying committees withinthe governance structure.
Business Activities – Our businesses strive to enhance riskmanagement and internal control processes. Integrated andcomprehensive processes are designed to adequately identify,measure, manage, monitor, and report risks which maysignificantly impact each business.
Risk Identification and QuantificationRisk identification takes place across a variety of different risktypes throughout the organization. These risk types consist of,but are not limited to, Credit Risk, Market Risk, OperationalRisk, Model Risk and Liquidity Risk. Risks are identifiedbased on a balanced use of analytical tools and managementjudgment for both on- and off-balance sheet exposures. Ourgovernance structure supports risk identification byfacilitating that issues of the risk types, both existing andemerging, are assessed and mitigation strategies implemented.These risks are prioritized based on quantitative andqualitative analysis and assessed against the risk appetite.
Multiple tools and approaches are used to help identify andprioritize risks, including Key Risk Indicators (KRIs), KeyPerformance Indicators (KPIs), Risk Control and SelfAssessments (RCSAs), scenario analysis, stress testing, andspecial investigations.
Risks are aggregated and assessed within and across riskfunctions or businesses. The aggregated risk information isreviewed and reported at an enterprise level for adherence tothe risk appetite and tolerances as established through thepolicy framework and approved by the Board of Directors orby appropriate managing committees. This enterpriseaggregation and reporting approach promotes theidentification and appropriate escalation of material risksacross the organization and supports an understanding of thecumulative impact of risk in relation to our risk appetite.
Risk Control and LimitsPNC uses a multi-tiered risk policy, procedure, and committeecharter framework to provide direction and guidance foridentifying, decisioning, and managing risk, includingappropriate processes to escalate control parameter exceptionswhen applicable.
Risk limits, defined quantitatively and qualitatively, areestablished within policy across risk categories. When settingrisk limits, PNC considers major risks, aligns with establishedrisk appetite, balances risk-reward, leverages analytics, andadjusts limits timely in response to changes in external andinternal environments.
Quantitative and qualitative operating guidelines support risklimits and serve as an early warning system for potentialviolations of the limits. These operating guidelines triggermitigation strategies and management escalation protocols iflimits are breached.
Risk Monitoring and ReportingPNC uses similar tools to monitor and report risk as to performRisk Identification. These tools include KRIs, KPIs, RCSAs,scenario analysis, stress testing, and special investigations.
The risk identification and quantification processes, the riskcontrol and limits reviews, and the tools used for riskmonitoring provide the basis for risk reporting. The objectiveof risk reporting is comprehensive risk aggregation andtransparent communication of aggregated risks. Risk reportsare produced at the line of business level, the functional level(credit, market, operational) and the enterprise level. Theenterprise level report aggregates the risks identified in thefunctional and business reports. The enterprise level report isprovided through the governance structure to the Board ofDirectors.
84 The PNC Financial Services Group, Inc. – Form 10-K
CREDIT RISK MANAGEMENT
Credit risk represents the possibility that a customer,counterparty or issuer may not perform in accordance withcontractual terms. Credit risk is inherent in the financialservices business and results from extending credit tocustomers, purchasing securities, and entering into financialderivative transactions and certain guarantee contracts. Creditrisk is one of our most significant risks. Our processes formanaging credit risk are embedded in PNC’s risk culture andin our decision-making processes using a systematic approachwhereby credit risks and related exposures are: identified andassessed; managed through specific policies and processes;measured and evaluated against our risk tolerance limits; andreported, along with specific mitigation activities, tomanagement and the board through our governance structure.
Asset Quality OverviewOverall asset quality trends in 2012 improved fromDecember 31, 2011 and included the following:
• Nonperforming loans decreased $306 million, or 9%,to $3.3 billion as of December 31, 2012 comparedwith $3.6 billion as of December 31, 2011. Thisdecrease was mainly attributable to decreases incommercial real estate and commercialnonperforming loans, which were partially offset bythe acquisition of RBC Bank (USA) and highernonperforming consumer loans. Pursuant toregulatory guidance issued in the third quarter of2012, nonperforming consumer loans, primarilyhome equity and residential mortgage, increased$288 million in 2012 related to changes in treatmentof certain loans classified as TDRs, net of charge-offs, resulting from bankruptcy where no formalreaffirmation was provided by the borrower andtherefore a concession has been granted based upondischarge from personal liability. Of these loans,approximately 78% were current on their payments atDecember 31, 2012. Additionally, nonperforminghome equity loans increased due to a change inpolicy made in the first quarter of 2012 which placeshome equity loans on nonaccrual status when pastdue 90 days or more compared with 180 days underthe prior policy.
• Overall loan delinquencies decreased $797 million,or 18%, from year-end 2011. The reduction wasmainly due to a decline in government insuredresidential real estate loans in addition to a firstquarter of 2012 policy change for home equity loanswhereby loans are placed on nonaccrual status whenpast due 90 days compared to prior policy of placingloans on nonaccrual status when past due 180 days.In addition, consumer loan delinquencies, primarilyresidential real estate delinquencies, decreasedpursuant to regulatory guidance issued in the thirdquarter of 2012 related to treatment of certain loansclassified as TDRs resulting from bankruptcy asdiscussed above. These decreases were partiallyoffset by an increase in commercial real estatedelinquencies.
• Net charge-offs were $1.3 billion in 2012, down 21%from 2011 net charge-offs of $1.6 billion. Pursuant toregulatory guidance issued in the third quarter of2012, additional consumer charge-offs of $128.1million have been taken in 2012 related to changes intreatment of certain loans where borrowers have beendischarged from personal liability under bankruptcyprotection where no formal reaffirmation wasprovided by the borrower. Such loans have beenclassified as TDRs and have been measured at thefair value of the collateral less costs to sell.
• The provision for credit losses declined 14% to $1.0billion for 2012 compared with $1.2 billion for 2011.
• The level of ALLL decreased 7% to $4.0 billion atDecember 31, 2012 from $4.3 billion atDecember 31, 2011.
The PNC Financial Services Group, Inc. – Form 10-K 85
NONPERFORMING ASSETS AND LOAN DELINQUENCIES
Nonperforming Assets, including OREO and ForeclosedAssetsNonperforming assets include nonaccrual loans and leases forwhich ultimate collectability of the full amount of contractualprincipal and interest is not probable and includenonperforming TDRs, OREO and foreclosed assets. Loansheld for sale, certain government insured or guaranteed loans,purchased impaired loans and loans accounted for under thefair value option are excluded from nonperforming loans.Additional information regarding our nonaccrual policies isincluded in Note 1 Accounting Policies in the Notes ToConsolidated Financial Statements in Item 8 of this Report.The major categories of nonperforming assets are presented inthe table below.
Nonperforming assets decreased $362 million fromDecember 31, 2011, to $3.8 billion at December 31, 2012, asdiscussed above. Nonperforming loans decreased $306 millionto $3.3 billion and OREO and foreclosed assets decreased $56million to $540 million. The ratio of nonperforming assets tototal loans, OREO and foreclosed assets decreased to 2.04% atDecember 31, 2012 from 2.60% at December 31, 2011. Theratio of nonperforming loans to total loans declined to 1.75%at December 31, 2012, compared to 2.24% at December 31,2011. Total nonperforming assets have declined $2.6 billion,or 41%, from their peak of $6.4 billion at March 31, 2010.
Management continues to evaluate nonaccrual and charge-offpolicies for second-lien consumer loans (residential mortgagesand home equity loans and lines) pursuant to interagencysupervisory guidance on practices for loans and lines of creditsecured by junior liens on 1-4 family residential properties.This will result in future classification of performing second-lien consumer loans as nonperforming where the first-lienloan is 90 days or more past due. Pursuant to the guidance, theCompany will adopt a policy in the first quarter of 2013,subsequent to operationalizing related procedures, to charge-
off a portion of certain second-lien consumer loans(residential mortgage and home equity lines of credit) wherethe first-lien loan is 90 days or more past due. Additionally,given these operational enhancements and pursuant tointeragency supervisory guidance, the company will updatecertain additional nonaccrual and charge-off policies. Weestimate adding approximately $350 million to $450 millionto the nonaccrual consumer loan population in the first quarterof 2013. If these policies had been in effect as ofDecember 31, 2012, there would have been an estimatedcumulative charge-off of approximately $140 million. Thecredit loss policies for these loans are considered in ourreserving process and the risk of loss associated with theseloans was considered in the determination of our ALLL atDecember 31, 2012.
At December 31, 2012, TDRs included in nonperformingloans were $1.6 billion or 49% of total nonperforming loanscompared to $1.1 billion or 32% of nonperforming loans as ofDecember 31, 2011. Within consumer nonperforming loans,residential real estate TDRs comprise 64% of total residentialreal estate nonperforming loans at December 31, 2012, upfrom 51% at December 31, 2011. Home equity TDRscomprise 70% of home equity nonperforming loans atDecember 31, 2012, down from 77% at December 31, 2011.The level of TDRs in these portfolios is expected to result inelevated nonperforming loan levels because TDRs remain innonperforming status until a borrower has made at least sixconsecutive months of payments under the modified terms orultimate resolution occurs.
At December 31, 2012, our largest nonperforming asset was$38 million and in the Real Estate Rental and LeasingIndustry. Our average nonperforming loans associated withcommercial lending were under $1 million. Eight of our tenlargest outstanding nonperforming assets are from thecommercial lending portfolio and represent 11% and 4% oftotal commercial lending nonperforming loans and totalnonperforming assets, respectively, as of December 31, 2012.
86 The PNC Financial Services Group, Inc. – Form 10-K
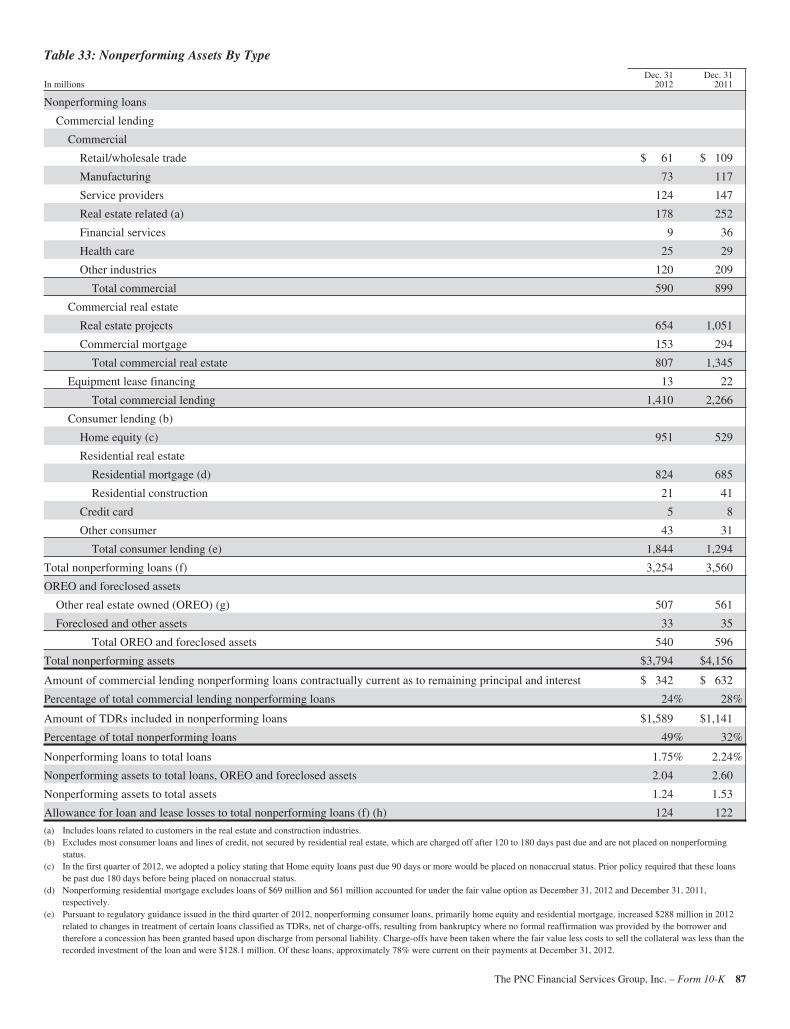
Table 33: Nonperforming Assets By Type
In millionsDec. 31
2012Dec. 31
2011
Nonperforming loans
Commercial lending
Commercial
Retail/wholesale trade $ 61 $ 109
Manufacturing 73 117
Service providers 124 147
Real estate related (a) 178 252
Financial services 9 36
Health care 25 29
Other industries 120 209
Total commercial 590 899
Commercial real estate
Real estate projects 654 1,051
Commercial mortgage 153 294
Total commercial real estate 807 1,345
Equipment lease financing 13 22
Total commercial lending 1,410 2,266
Consumer lending (b)
Home equity (c) 951 529
Residential real estate
Residential mortgage (d) 824 685
Residential construction 21 41
Credit card 5 8
Other consumer 43 31
Total consumer lending (e) 1,844 1,294
Total nonperforming loans (f) 3,254 3,560
OREO and foreclosed assets
Other real estate owned (OREO) (g) 507 561
Foreclosed and other assets 33 35
Total OREO and foreclosed assets 540 596
Total nonperforming assets $3,794 $4,156
Amount of commercial lending nonperforming loans contractually current as to remaining principal and interest $ 342 $ 632
Percentage of total commercial lending nonperforming loans 24% 28%
Amount of TDRs included in nonperforming loans $1,589 $1,141
Percentage of total nonperforming loans 49% 32%
Nonperforming loans to total loans 1.75% 2.24%
Nonperforming assets to total loans, OREO and foreclosed assets 2.04 2.60
Nonperforming assets to total assets 1.24 1.53
Allowance for loan and lease losses to total nonperforming loans (f) (h) 124 122
(a) Includes loans related to customers in the real estate and construction industries.(b) Excludes most consumer loans and lines of credit, not secured by residential real estate, which are charged off after 120 to 180 days past due and are not placed on nonperforming
status.(c) In the first quarter of 2012, we adopted a policy stating that Home equity loans past due 90 days or more would be placed on nonaccrual status. Prior policy required that these loans
be past due 180 days before being placed on nonaccrual status.(d) Nonperforming residential mortgage excludes loans of $69 million and $61 million accounted for under the fair value option as December 31, 2012 and December 31, 2011,
respectively.(e) Pursuant to regulatory guidance issued in the third quarter of 2012, nonperforming consumer loans, primarily home equity and residential mortgage, increased $288 million in 2012
related to changes in treatment of certain loans classified as TDRs, net of charge-offs, resulting from bankruptcy where no formal reaffirmation was provided by the borrower andtherefore a concession has been granted based upon discharge from personal liability. Charge-offs have been taken where the fair value less costs to sell the collateral was less than therecorded investment of the loan and were $128.1 million. Of these loans, approximately 78% were current on their payments at December 31, 2012.
The PNC Financial Services Group, Inc. – Form 10-K 87
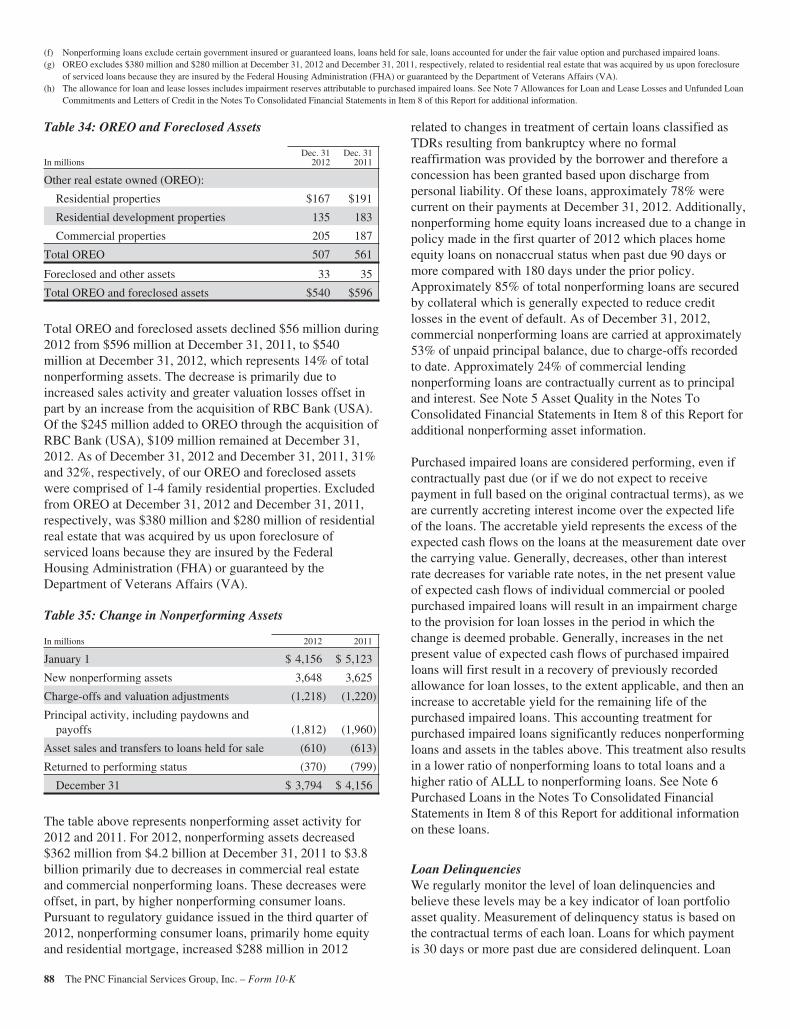
(f) Nonperforming loans exclude certain government insured or guaranteed loans, loans held for sale, loans accounted for under the fair value option and purchased impaired loans.(g) OREO excludes $380 million and $280 million at December 31, 2012 and December 31, 2011, respectively, related to residential real estate that was acquired by us upon foreclosure
of serviced loans because they are insured by the Federal Housing Administration (FHA) or guaranteed by the Department of Veterans Affairs (VA).(h) The allowance for loan and lease losses includes impairment reserves attributable to purchased impaired loans. See Note 7 Allowances for Loan and Lease Losses and Unfunded Loan
Commitments and Letters of Credit in the Notes To Consolidated Financial Statements in Item 8 of this Report for additional information.
Table 34: OREO and Foreclosed Assets
In millionsDec. 31
2012Dec. 31
2011
Other real estate owned (OREO):
Residential properties $167 $191
Residential development properties 135 183
Commercial properties 205 187
Total OREO 507 561
Foreclosed and other assets 33 35
Total OREO and foreclosed assets $540 $596
Total OREO and foreclosed assets declined $56 million during2012 from $596 million at December 31, 2011, to $540million at December 31, 2012, which represents 14% of totalnonperforming assets. The decrease is primarily due toincreased sales activity and greater valuation losses offset inpart by an increase from the acquisition of RBC Bank (USA).Of the $245 million added to OREO through the acquisition ofRBC Bank (USA), $109 million remained at December 31,2012. As of December 31, 2012 and December 31, 2011, 31%and 32%, respectively, of our OREO and foreclosed assetswere comprised of 1-4 family residential properties. Excludedfrom OREO at December 31, 2012 and December 31, 2011,respectively, was $380 million and $280 million of residentialreal estate that was acquired by us upon foreclosure ofserviced loans because they are insured by the FederalHousing Administration (FHA) or guaranteed by theDepartment of Veterans Affairs (VA).
Table 35: Change in Nonperforming Assets
In millions 2012 2011
January 1 $ 4,156 $ 5,123
New nonperforming assets 3,648 3,625
Charge-offs and valuation adjustments (1,218) (1,220)
Principal activity, including paydowns andpayoffs (1,812) (1,960)
Asset sales and transfers to loans held for sale (610) (613)
Returned to performing status (370) (799)
December 31 $ 3,794 $ 4,156
The table above represents nonperforming asset activity for2012 and 2011. For 2012, nonperforming assets decreased$362 million from $4.2 billion at December 31, 2011 to $3.8billion primarily due to decreases in commercial real estateand commercial nonperforming loans. These decreases wereoffset, in part, by higher nonperforming consumer loans.Pursuant to regulatory guidance issued in the third quarter of2012, nonperforming consumer loans, primarily home equityand residential mortgage, increased $288 million in 2012
related to changes in treatment of certain loans classified asTDRs resulting from bankruptcy where no formalreaffirmation was provided by the borrower and therefore aconcession has been granted based upon discharge frompersonal liability. Of these loans, approximately 78% werecurrent on their payments at December 31, 2012. Additionally,nonperforming home equity loans increased due to a change inpolicy made in the first quarter of 2012 which places homeequity loans on nonaccrual status when past due 90 days ormore compared with 180 days under the prior policy.Approximately 85% of total nonperforming loans are securedby collateral which is generally expected to reduce creditlosses in the event of default. As of December 31, 2012,commercial nonperforming loans are carried at approximately53% of unpaid principal balance, due to charge-offs recordedto date. Approximately 24% of commercial lendingnonperforming loans are contractually current as to principaland interest. See Note 5 Asset Quality in the Notes ToConsolidated Financial Statements in Item 8 of this Report foradditional nonperforming asset information.
Purchased impaired loans are considered performing, even ifcontractually past due (or if we do not expect to receivepayment in full based on the original contractual terms), as weare currently accreting interest income over the expected lifeof the loans. The accretable yield represents the excess of theexpected cash flows on the loans at the measurement date overthe carrying value. Generally, decreases, other than interestrate decreases for variable rate notes, in the net present valueof expected cash flows of individual commercial or pooledpurchased impaired loans will result in an impairment chargeto the provision for loan losses in the period in which thechange is deemed probable. Generally, increases in the netpresent value of expected cash flows of purchased impairedloans will first result in a recovery of previously recordedallowance for loan losses, to the extent applicable, and then anincrease to accretable yield for the remaining life of thepurchased impaired loans. This accounting treatment forpurchased impaired loans significantly reduces nonperformingloans and assets in the tables above. This treatment also resultsin a lower ratio of nonperforming loans to total loans and ahigher ratio of ALLL to nonperforming loans. See Note 6Purchased Loans in the Notes To Consolidated FinancialStatements in Item 8 of this Report for additional informationon these loans.
Loan DelinquenciesWe regularly monitor the level of loan delinquencies andbelieve these levels may be a key indicator of loan portfolioasset quality. Measurement of delinquency status is based onthe contractual terms of each loan. Loans for which paymentis 30 days or more past due are considered delinquent. Loan
88 The PNC Financial Services Group, Inc. – Form 10-K
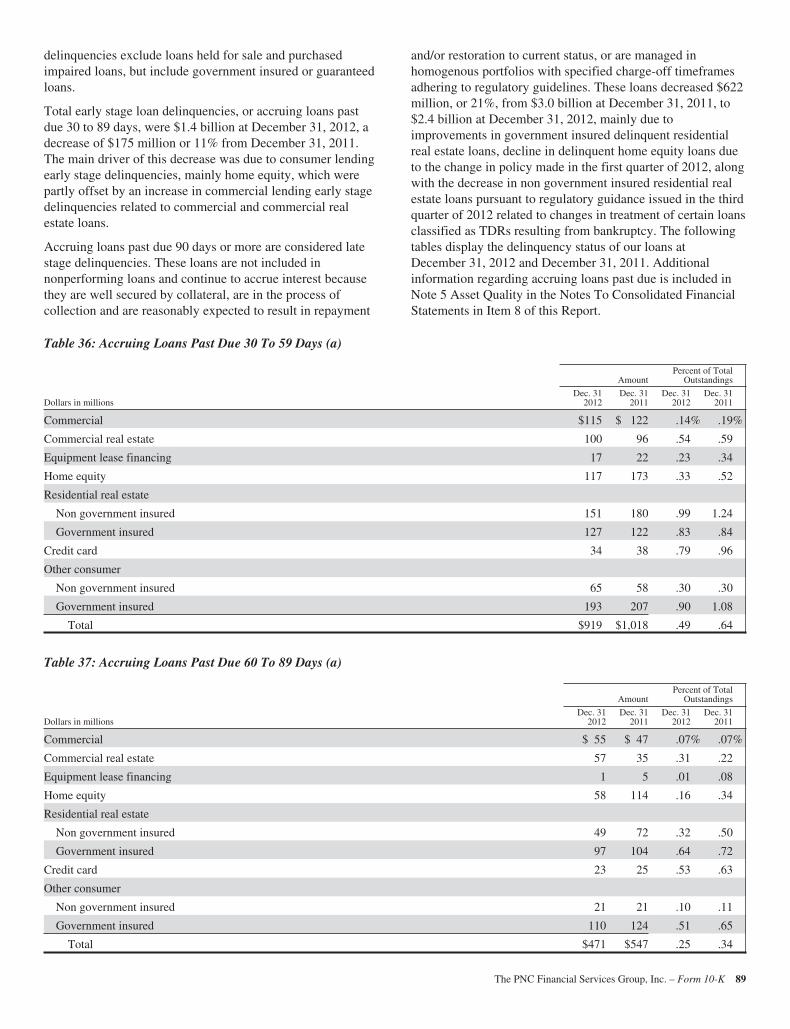
delinquencies exclude loans held for sale and purchasedimpaired loans, but include government insured or guaranteedloans.
Total early stage loan delinquencies, or accruing loans pastdue 30 to 89 days, were $1.4 billion at December 31, 2012, adecrease of $175 million or 11% from December 31, 2011.The main driver of this decrease was due to consumer lendingearly stage delinquencies, mainly home equity, which werepartly offset by an increase in commercial lending early stagedelinquencies related to commercial and commercial realestate loans.
Accruing loans past due 90 days or more are considered latestage delinquencies. These loans are not included innonperforming loans and continue to accrue interest becausethey are well secured by collateral, are in the process ofcollection and are reasonably expected to result in repayment
and/or restoration to current status, or are managed inhomogenous portfolios with specified charge-off timeframesadhering to regulatory guidelines. These loans decreased $622million, or 21%, from $3.0 billion at December 31, 2011, to$2.4 billion at December 31, 2012, mainly due toimprovements in government insured delinquent residentialreal estate loans, decline in delinquent home equity loans dueto the change in policy made in the first quarter of 2012, alongwith the decrease in non government insured residential realestate loans pursuant to regulatory guidance issued in the thirdquarter of 2012 related to changes in treatment of certain loansclassified as TDRs resulting from bankruptcy. The followingtables display the delinquency status of our loans atDecember 31, 2012 and December 31, 2011. Additionalinformation regarding accruing loans past due is included inNote 5 Asset Quality in the Notes To Consolidated FinancialStatements in Item 8 of this Report.
Table 36: Accruing Loans Past Due 30 To 59 Days (a)
AmountPercent of Total
Outstandings
Dollars in millionsDec. 31
2012Dec. 31
2011Dec. 31
2012Dec. 31
2011
Commercial $115 $ 122 .14% .19%
Commercial real estate 100 96 .54 .59
Equipment lease financing 17 22 .23 .34
Home equity 117 173 .33 .52
Residential real estate
Non government insured 151 180 .99 1.24
Government insured 127 122 .83 .84
Credit card 34 38 .79 .96
Other consumer
Non government insured 65 58 .30 .30
Government insured 193 207 .90 1.08
Total $919 $1,018 .49 .64
Table 37: Accruing Loans Past Due 60 To 89 Days (a)
AmountPercent of Total
Outstandings
Dollars in millionsDec. 31
2012Dec. 31
2011Dec. 31
2012Dec. 31
2011
Commercial $ 55 $ 47 .07% .07%
Commercial real estate 57 35 .31 .22
Equipment lease financing 1 5 .01 .08
Home equity 58 114 .16 .34
Residential real estate
Non government insured 49 72 .32 .50
Government insured 97 104 .64 .72
Credit card 23 25 .53 .63
Other consumer
Non government insured 21 21 .10 .11
Government insured 110 124 .51 .65
Total $471 $547 .25 .34
The PNC Financial Services Group, Inc. – Form 10-K 89
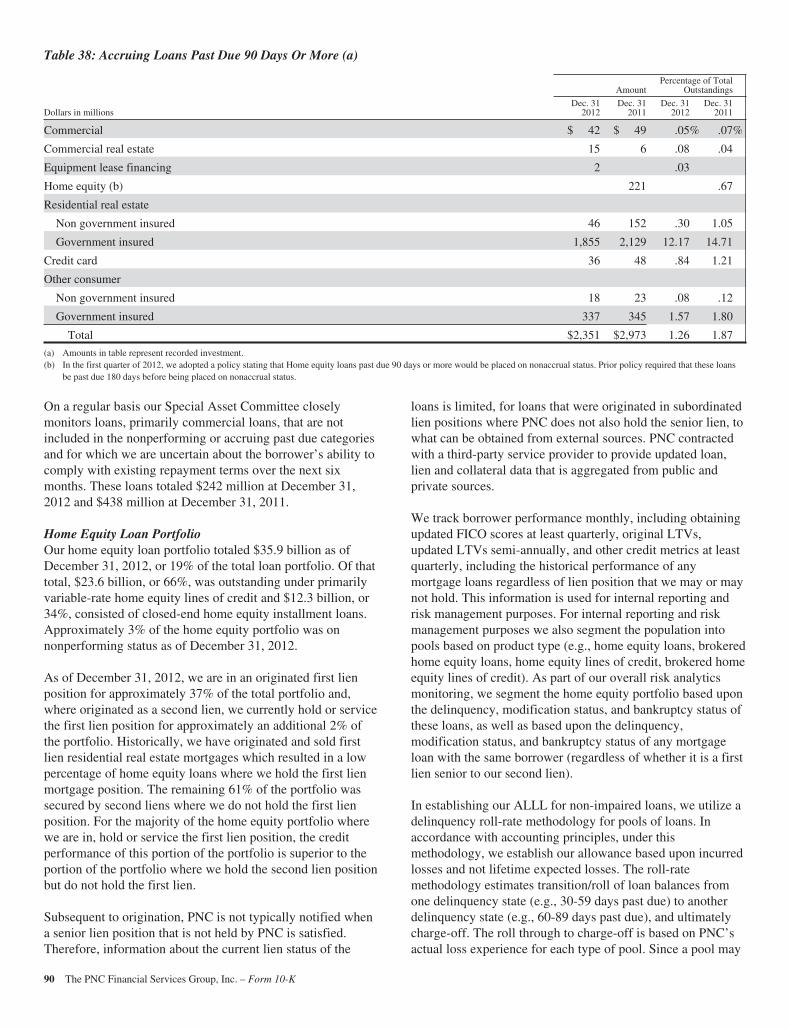
Table 38: Accruing Loans Past Due 90 Days Or More (a)
AmountPercentage of Total
Outstandings
Dollars in millionsDec. 31
2012Dec. 31
2011Dec. 31
2012Dec. 31
2011
Commercial $ 42 $ 49 .05% .07%
Commercial real estate 15 6 .08 .04
Equipment lease financing 2 .03
Home equity (b) 221 .67
Residential real estate
Non government insured 46 152 .30 1.05
Government insured 1,855 2,129 12.17 14.71
Credit card 36 48 .84 1.21
Other consumer
Non government insured 18 23 .08 .12
Government insured 337 345 1.57 1.80
Total $2,351 $2,973 1.26 1.87
(a) Amounts in table represent recorded investment.(b) In the first quarter of 2012, we adopted a policy stating that Home equity loans past due 90 days or more would be placed on nonaccrual status. Prior policy required that these loans
be past due 180 days before being placed on nonaccrual status.
On a regular basis our Special Asset Committee closelymonitors loans, primarily commercial loans, that are notincluded in the nonperforming or accruing past due categoriesand for which we are uncertain about the borrower’s ability tocomply with existing repayment terms over the next sixmonths. These loans totaled $242 million at December 31,2012 and $438 million at December 31, 2011.
Home Equity Loan PortfolioOur home equity loan portfolio totaled $35.9 billion as ofDecember 31, 2012, or 19% of the total loan portfolio. Of thattotal, $23.6 billion, or 66%, was outstanding under primarilyvariable-rate home equity lines of credit and $12.3 billion, or34%, consisted of closed-end home equity installment loans.Approximately 3% of the home equity portfolio was onnonperforming status as of December 31, 2012.
As of December 31, 2012, we are in an originated first lienposition for approximately 37% of the total portfolio and,where originated as a second lien, we currently hold or servicethe first lien position for approximately an additional 2% ofthe portfolio. Historically, we have originated and sold firstlien residential real estate mortgages which resulted in a lowpercentage of home equity loans where we hold the first lienmortgage position. The remaining 61% of the portfolio wassecured by second liens where we do not hold the first lienposition. For the majority of the home equity portfolio wherewe are in, hold or service the first lien position, the creditperformance of this portion of the portfolio is superior to theportion of the portfolio where we hold the second lien positionbut do not hold the first lien.
Subsequent to origination, PNC is not typically notified whena senior lien position that is not held by PNC is satisfied.Therefore, information about the current lien status of the
loans is limited, for loans that were originated in subordinatedlien positions where PNC does not also hold the senior lien, towhat can be obtained from external sources. PNC contractedwith a third-party service provider to provide updated loan,lien and collateral data that is aggregated from public andprivate sources.
We track borrower performance monthly, including obtainingupdated FICO scores at least quarterly, original LTVs,updated LTVs semi-annually, and other credit metrics at leastquarterly, including the historical performance of anymortgage loans regardless of lien position that we may or maynot hold. This information is used for internal reporting andrisk management purposes. For internal reporting and riskmanagement purposes we also segment the population intopools based on product type (e.g., home equity loans, brokeredhome equity loans, home equity lines of credit, brokered homeequity lines of credit). As part of our overall risk analyticsmonitoring, we segment the home equity portfolio based uponthe delinquency, modification status, and bankruptcy status ofthese loans, as well as based upon the delinquency,modification status, and bankruptcy status of any mortgageloan with the same borrower (regardless of whether it is a firstlien senior to our second lien).
In establishing our ALLL for non-impaired loans, we utilize adelinquency roll-rate methodology for pools of loans. Inaccordance with accounting principles, under thismethodology, we establish our allowance based upon incurredlosses and not lifetime expected losses. The roll-ratemethodology estimates transition/roll of loan balances fromone delinquency state (e.g., 30-59 days past due) to anotherdelinquency state (e.g., 60-89 days past due), and ultimatelycharge-off. The roll through to charge-off is based on PNC’sactual loss experience for each type of pool. Since a pool may
90 The PNC Financial Services Group, Inc. – Form 10-K
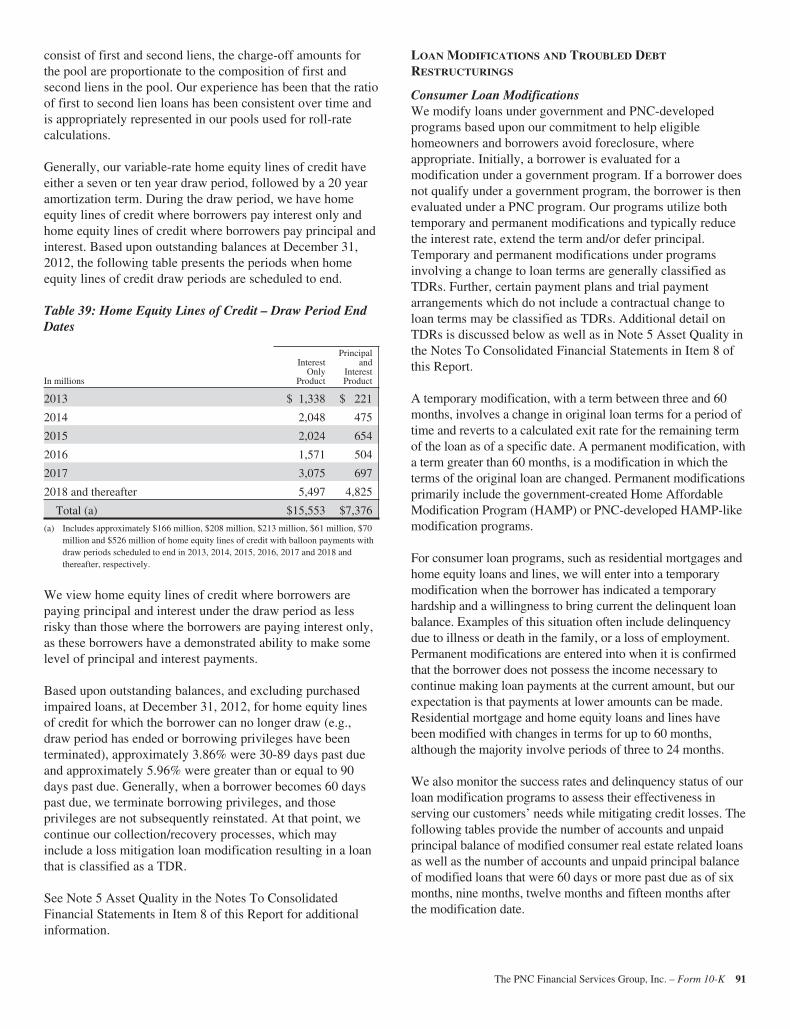
consist of first and second liens, the charge-off amounts forthe pool are proportionate to the composition of first andsecond liens in the pool. Our experience has been that the ratioof first to second lien loans has been consistent over time andis appropriately represented in our pools used for roll-ratecalculations.
Generally, our variable-rate home equity lines of credit haveeither a seven or ten year draw period, followed by a 20 yearamortization term. During the draw period, we have homeequity lines of credit where borrowers pay interest only andhome equity lines of credit where borrowers pay principal andinterest. Based upon outstanding balances at December 31,2012, the following table presents the periods when homeequity lines of credit draw periods are scheduled to end.
Table 39: Home Equity Lines of Credit – Draw Period EndDates
In millions
InterestOnly
Product
Principaland
InterestProduct
2013 $ 1,338 $ 221
2014 2,048 475
2015 2,024 654
2016 1,571 504
2017 3,075 697
2018 and thereafter 5,497 4,825
Total (a) $15,553 $7,376
(a) Includes approximately $166 million, $208 million, $213 million, $61 million, $70million and $526 million of home equity lines of credit with balloon payments withdraw periods scheduled to end in 2013, 2014, 2015, 2016, 2017 and 2018 andthereafter, respectively.
We view home equity lines of credit where borrowers arepaying principal and interest under the draw period as lessrisky than those where the borrowers are paying interest only,as these borrowers have a demonstrated ability to make somelevel of principal and interest payments.
Based upon outstanding balances, and excluding purchasedimpaired loans, at December 31, 2012, for home equity linesof credit for which the borrower can no longer draw (e.g.,draw period has ended or borrowing privileges have beenterminated), approximately 3.86% were 30-89 days past dueand approximately 5.96% were greater than or equal to 90days past due. Generally, when a borrower becomes 60 dayspast due, we terminate borrowing privileges, and thoseprivileges are not subsequently reinstated. At that point, wecontinue our collection/recovery processes, which mayinclude a loss mitigation loan modification resulting in a loanthat is classified as a TDR.
See Note 5 Asset Quality in the Notes To ConsolidatedFinancial Statements in Item 8 of this Report for additionalinformation.
LOAN MODIFICATIONS AND TROUBLED DEBT
RESTRUCTURINGS
Consumer Loan ModificationsWe modify loans under government and PNC-developedprograms based upon our commitment to help eligiblehomeowners and borrowers avoid foreclosure, whereappropriate. Initially, a borrower is evaluated for amodification under a government program. If a borrower doesnot qualify under a government program, the borrower is thenevaluated under a PNC program. Our programs utilize bothtemporary and permanent modifications and typically reducethe interest rate, extend the term and/or defer principal.Temporary and permanent modifications under programsinvolving a change to loan terms are generally classified asTDRs. Further, certain payment plans and trial paymentarrangements which do not include a contractual change toloan terms may be classified as TDRs. Additional detail onTDRs is discussed below as well as in Note 5 Asset Quality inthe Notes To Consolidated Financial Statements in Item 8 ofthis Report.
A temporary modification, with a term between three and 60months, involves a change in original loan terms for a period oftime and reverts to a calculated exit rate for the remaining termof the loan as of a specific date. A permanent modification, witha term greater than 60 months, is a modification in which theterms of the original loan are changed. Permanent modificationsprimarily include the government-created Home AffordableModification Program (HAMP) or PNC-developed HAMP-likemodification programs.
For consumer loan programs, such as residential mortgages andhome equity loans and lines, we will enter into a temporarymodification when the borrower has indicated a temporaryhardship and a willingness to bring current the delinquent loanbalance. Examples of this situation often include delinquencydue to illness or death in the family, or a loss of employment.Permanent modifications are entered into when it is confirmedthat the borrower does not possess the income necessary tocontinue making loan payments at the current amount, but ourexpectation is that payments at lower amounts can be made.Residential mortgage and home equity loans and lines havebeen modified with changes in terms for up to 60 months,although the majority involve periods of three to 24 months.
We also monitor the success rates and delinquency status of ourloan modification programs to assess their effectiveness inserving our customers’ needs while mitigating credit losses. Thefollowing tables provide the number of accounts and unpaidprincipal balance of modified consumer real estate related loansas well as the number of accounts and unpaid principal balanceof modified loans that were 60 days or more past due as of sixmonths, nine months, twelve months and fifteen months afterthe modification date.
The PNC Financial Services Group, Inc. – Form 10-K 91
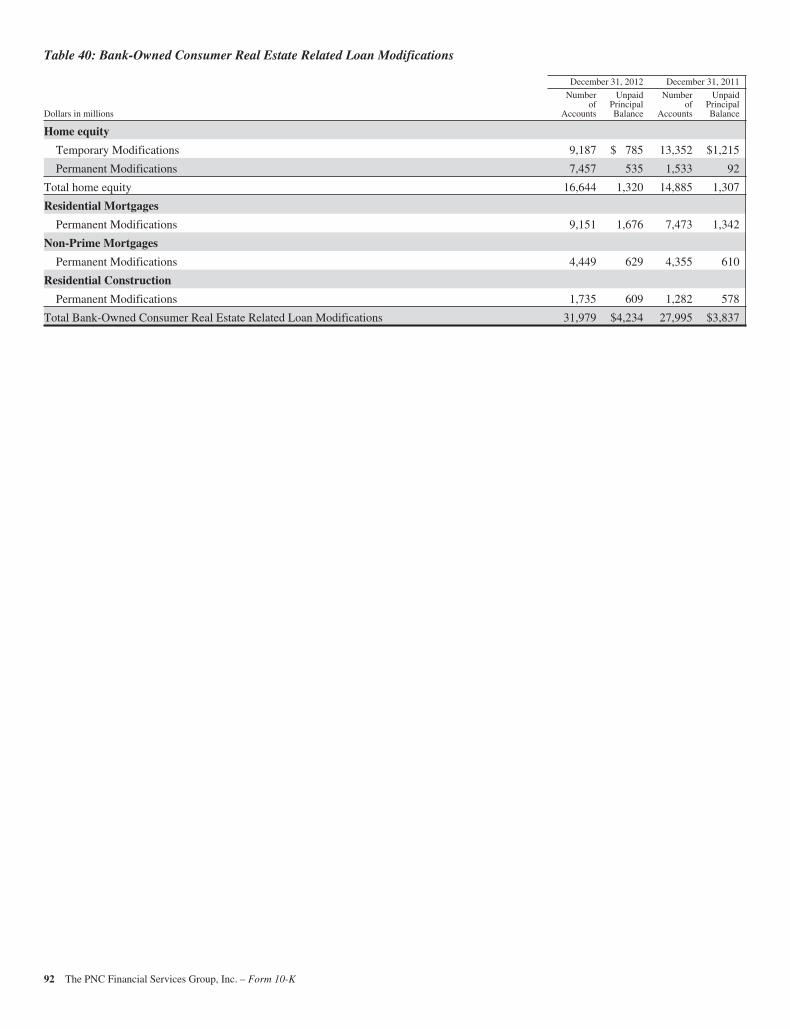
Table 40: Bank-Owned Consumer Real Estate Related Loan Modifications
December 31, 2012 December 31, 2011
Dollars in millions
Numberof
Accounts
UnpaidPrincipalBalance
Numberof
Accounts
UnpaidPrincipalBalance
Home equity
Temporary Modifications 9,187 $ 785 13,352 $1,215
Permanent Modifications 7,457 535 1,533 92
Total home equity 16,644 1,320 14,885 1,307
Residential Mortgages
Permanent Modifications 9,151 1,676 7,473 1,342
Non-Prime Mortgages
Permanent Modifications 4,449 629 4,355 610
Residential Construction
Permanent Modifications 1,735 609 1,282 578
Total Bank-Owned Consumer Real Estate Related Loan Modifications 31,979 $4,234 27,995 $3,837
92 The PNC Financial Services Group, Inc. – Form 10-K
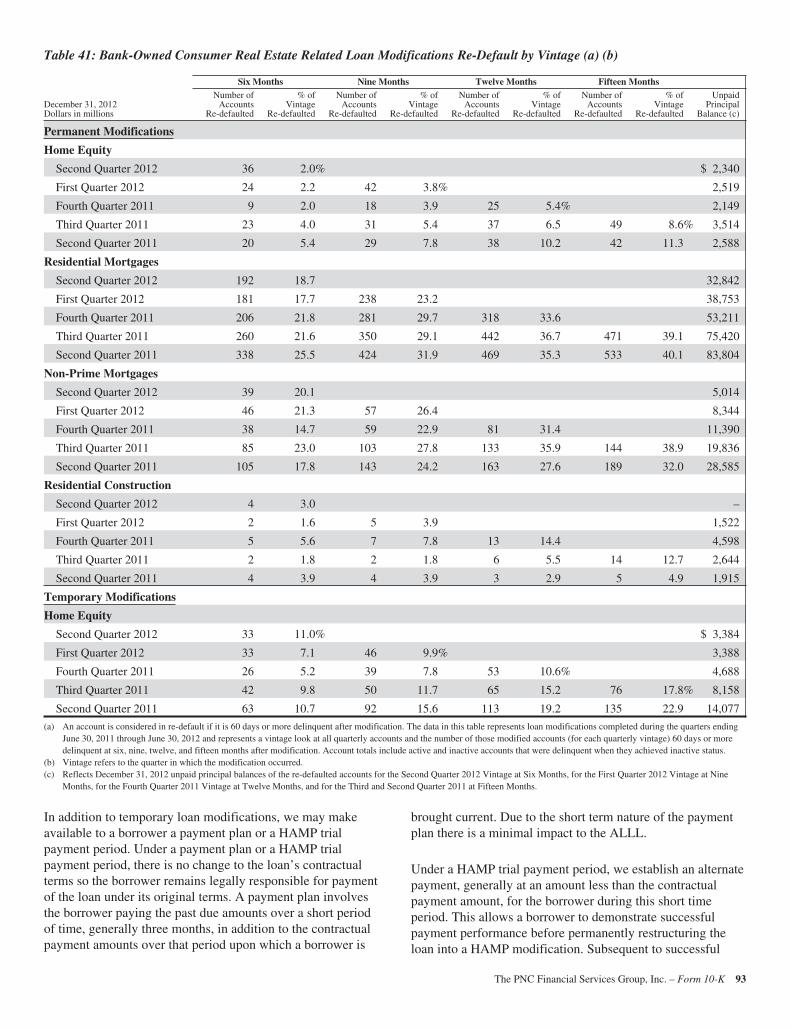
Table 41: Bank-Owned Consumer Real Estate Related Loan Modifications Re-Default by Vintage (a) (b)
Six Months Nine Months Twelve Months Fifteen Months
December 31, 2012Dollars in millions
Number ofAccounts
Re-defaulted
% ofVintage
Re-defaulted
Number ofAccounts
Re-defaulted
% ofVintage
Re-defaulted
Number ofAccounts
Re-defaulted
% ofVintage
Re-defaulted
Number ofAccounts
Re-defaulted
% ofVintage
Re-defaulted
UnpaidPrincipal
Balance (c)
Permanent Modifications
Home Equity
Second Quarter 2012 36 2.0% $ 2,340
First Quarter 2012 24 2.2 42 3.8% 2,519
Fourth Quarter 2011 9 2.0 18 3.9 25 5.4% 2,149
Third Quarter 2011 23 4.0 31 5.4 37 6.5 49 8.6% 3,514
Second Quarter 2011 20 5.4 29 7.8 38 10.2 42 11.3 2,588
Residential Mortgages
Second Quarter 2012 192 18.7 32,842
First Quarter 2012 181 17.7 238 23.2 38,753
Fourth Quarter 2011 206 21.8 281 29.7 318 33.6 53,211
Third Quarter 2011 260 21.6 350 29.1 442 36.7 471 39.1 75,420
Second Quarter 2011 338 25.5 424 31.9 469 35.3 533 40.1 83,804
Non-Prime Mortgages
Second Quarter 2012 39 20.1 5,014
First Quarter 2012 46 21.3 57 26.4 8,344
Fourth Quarter 2011 38 14.7 59 22.9 81 31.4 11,390
Third Quarter 2011 85 23.0 103 27.8 133 35.9 144 38.9 19,836
Second Quarter 2011 105 17.8 143 24.2 163 27.6 189 32.0 28,585
Residential Construction
Second Quarter 2012 4 3.0 –
First Quarter 2012 2 1.6 5 3.9 1,522
Fourth Quarter 2011 5 5.6 7 7.8 13 14.4 4,598
Third Quarter 2011 2 1.8 2 1.8 6 5.5 14 12.7 2,644
Second Quarter 2011 4 3.9 4 3.9 3 2.9 5 4.9 1,915
Temporary Modifications
Home Equity
Second Quarter 2012 33 11.0% $ 3,384
First Quarter 2012 33 7.1 46 9.9% 3,388
Fourth Quarter 2011 26 5.2 39 7.8 53 10.6% 4,688
Third Quarter 2011 42 9.8 50 11.7 65 15.2 76 17.8% 8,158
Second Quarter 2011 63 10.7 92 15.6 113 19.2 135 22.9 14,077
(a) An account is considered in re-default if it is 60 days or more delinquent after modification. The data in this table represents loan modifications completed during the quarters endingJune 30, 2011 through June 30, 2012 and represents a vintage look at all quarterly accounts and the number of those modified accounts (for each quarterly vintage) 60 days or moredelinquent at six, nine, twelve, and fifteen months after modification. Account totals include active and inactive accounts that were delinquent when they achieved inactive status.
(b) Vintage refers to the quarter in which the modification occurred.(c) Reflects December 31, 2012 unpaid principal balances of the re-defaulted accounts for the Second Quarter 2012 Vintage at Six Months, for the First Quarter 2012 Vintage at Nine
Months, for the Fourth Quarter 2011 Vintage at Twelve Months, and for the Third and Second Quarter 2011 at Fifteen Months.
In addition to temporary loan modifications, we may makeavailable to a borrower a payment plan or a HAMP trialpayment period. Under a payment plan or a HAMP trialpayment period, there is no change to the loan’s contractualterms so the borrower remains legally responsible for paymentof the loan under its original terms. A payment plan involvesthe borrower paying the past due amounts over a short periodof time, generally three months, in addition to the contractualpayment amounts over that period upon which a borrower is
brought current. Due to the short term nature of the paymentplan there is a minimal impact to the ALLL.
Under a HAMP trial payment period, we establish an alternatepayment, generally at an amount less than the contractualpayment amount, for the borrower during this short timeperiod. This allows a borrower to demonstrate successfulpayment performance before permanently restructuring theloan into a HAMP modification. Subsequent to successful
The PNC Financial Services Group, Inc. – Form 10-K 93
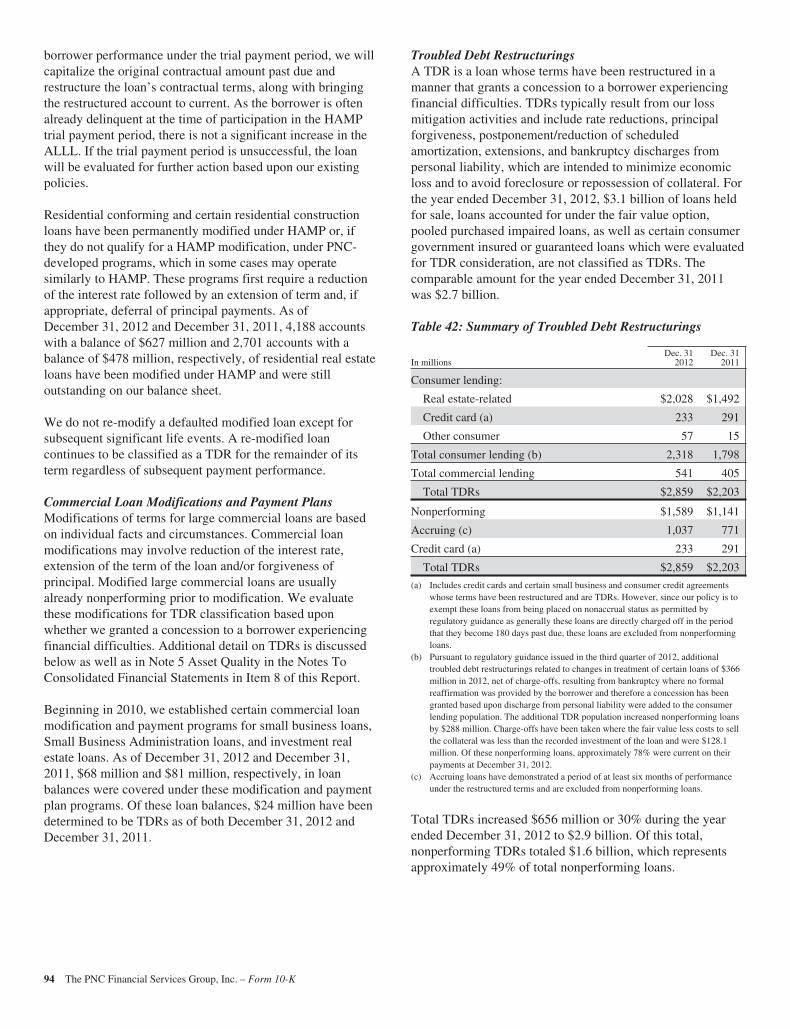
borrower performance under the trial payment period, we willcapitalize the original contractual amount past due andrestructure the loan’s contractual terms, along with bringingthe restructured account to current. As the borrower is oftenalready delinquent at the time of participation in the HAMPtrial payment period, there is not a significant increase in theALLL. If the trial payment period is unsuccessful, the loanwill be evaluated for further action based upon our existingpolicies.
Residential conforming and certain residential constructionloans have been permanently modified under HAMP or, ifthey do not qualify for a HAMP modification, under PNC-developed programs, which in some cases may operatesimilarly to HAMP. These programs first require a reductionof the interest rate followed by an extension of term and, ifappropriate, deferral of principal payments. As ofDecember 31, 2012 and December 31, 2011, 4,188 accountswith a balance of $627 million and 2,701 accounts with abalance of $478 million, respectively, of residential real estateloans have been modified under HAMP and were stilloutstanding on our balance sheet.
We do not re-modify a defaulted modified loan except forsubsequent significant life events. A re-modified loancontinues to be classified as a TDR for the remainder of itsterm regardless of subsequent payment performance.
Commercial Loan Modifications and Payment PlansModifications of terms for large commercial loans are basedon individual facts and circumstances. Commercial loanmodifications may involve reduction of the interest rate,extension of the term of the loan and/or forgiveness ofprincipal. Modified large commercial loans are usuallyalready nonperforming prior to modification. We evaluatethese modifications for TDR classification based uponwhether we granted a concession to a borrower experiencingfinancial difficulties. Additional detail on TDRs is discussedbelow as well as in Note 5 Asset Quality in the Notes ToConsolidated Financial Statements in Item 8 of this Report.
Beginning in 2010, we established certain commercial loanmodification and payment programs for small business loans,Small Business Administration loans, and investment realestate loans. As of December 31, 2012 and December 31,2011, $68 million and $81 million, respectively, in loanbalances were covered under these modification and paymentplan programs. Of these loan balances, $24 million have beendetermined to be TDRs as of both December 31, 2012 andDecember 31, 2011.
Troubled Debt RestructuringsA TDR is a loan whose terms have been restructured in amanner that grants a concession to a borrower experiencingfinancial difficulties. TDRs typically result from our lossmitigation activities and include rate reductions, principalforgiveness, postponement/reduction of scheduledamortization, extensions, and bankruptcy discharges frompersonal liability, which are intended to minimize economicloss and to avoid foreclosure or repossession of collateral. Forthe year ended December 31, 2012, $3.1 billion of loans heldfor sale, loans accounted for under the fair value option,pooled purchased impaired loans, as well as certain consumergovernment insured or guaranteed loans which were evaluatedfor TDR consideration, are not classified as TDRs. Thecomparable amount for the year ended December 31, 2011was $2.7 billion.
Table 42: Summary of Troubled Debt Restructurings
In millionsDec. 31
2012Dec. 31
2011
Consumer lending:
Real estate-related $2,028 $1,492
Credit card (a) 233 291
Other consumer 57 15
Total consumer lending (b) 2,318 1,798
Total commercial lending 541 405
Total TDRs $2,859 $2,203
Nonperforming $1,589 $1,141
Accruing (c) 1,037 771
Credit card (a) 233 291
Total TDRs $2,859 $2,203
(a) Includes credit cards and certain small business and consumer credit agreementswhose terms have been restructured and are TDRs. However, since our policy is toexempt these loans from being placed on nonaccrual status as permitted byregulatory guidance as generally these loans are directly charged off in the periodthat they become 180 days past due, these loans are excluded from nonperformingloans.
(b) Pursuant to regulatory guidance issued in the third quarter of 2012, additionaltroubled debt restructurings related to changes in treatment of certain loans of $366million in 2012, net of charge-offs, resulting from bankruptcy where no formalreaffirmation was provided by the borrower and therefore a concession has beengranted based upon discharge from personal liability were added to the consumerlending population. The additional TDR population increased nonperforming loansby $288 million. Charge-offs have been taken where the fair value less costs to sellthe collateral was less than the recorded investment of the loan and were $128.1million. Of these nonperforming loans, approximately 78% were current on theirpayments at December 31, 2012.
(c) Accruing loans have demonstrated a period of at least six months of performanceunder the restructured terms and are excluded from nonperforming loans.
Total TDRs increased $656 million or 30% during the yearended December 31, 2012 to $2.9 billion. Of this total,nonperforming TDRs totaled $1.6 billion, which representsapproximately 49% of total nonperforming loans.
94 The PNC Financial Services Group, Inc. – Form 10-K
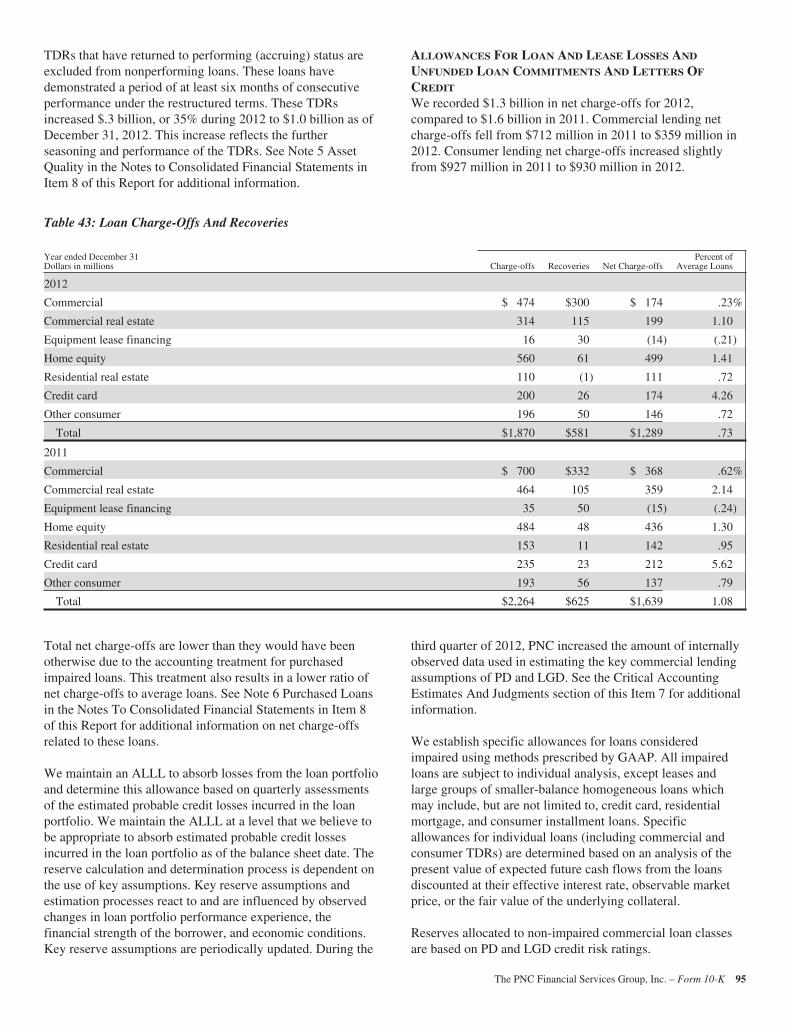
TDRs that have returned to performing (accruing) status areexcluded from nonperforming loans. These loans havedemonstrated a period of at least six months of consecutiveperformance under the restructured terms. These TDRsincreased $.3 billion, or 35% during 2012 to $1.0 billion as ofDecember 31, 2012. This increase reflects the furtherseasoning and performance of the TDRs. See Note 5 AssetQuality in the Notes to Consolidated Financial Statements inItem 8 of this Report for additional information.
ALLOWANCES FOR LOAN AND LEASE LOSSES AND
UNFUNDED LOAN COMMITMENTS AND LETTERS OF
CREDIT
We recorded $1.3 billion in net charge-offs for 2012,compared to $1.6 billion in 2011. Commercial lending netcharge-offs fell from $712 million in 2011 to $359 million in2012. Consumer lending net charge-offs increased slightlyfrom $927 million in 2011 to $930 million in 2012.
Table 43: Loan Charge-Offs And Recoveries
Year ended December 31Dollars in millions Charge-offs Recoveries Net Charge-offs
Percent ofAverage Loans
2012
Commercial $ 474 $300 $ 174 .23%
Commercial real estate 314 115 199 1.10
Equipment lease financing 16 30 (14) (.21)
Home equity 560 61 499 1.41
Residential real estate 110 (1) 111 .72
Credit card 200 26 174 4.26
Other consumer 196 50 146 .72
Total $1,870 $581 $1,289 .73
2011
Commercial $ 700 $332 $ 368 .62%
Commercial real estate 464 105 359 2.14
Equipment lease financing 35 50 (15) (.24)
Home equity 484 48 436 1.30
Residential real estate 153 11 142 .95
Credit card 235 23 212 5.62
Other consumer 193 56 137 .79
Total $2,264 $625 $1,639 1.08
Total net charge-offs are lower than they would have beenotherwise due to the accounting treatment for purchasedimpaired loans. This treatment also results in a lower ratio ofnet charge-offs to average loans. See Note 6 Purchased Loansin the Notes To Consolidated Financial Statements in Item 8of this Report for additional information on net charge-offsrelated to these loans.
We maintain an ALLL to absorb losses from the loan portfolioand determine this allowance based on quarterly assessmentsof the estimated probable credit losses incurred in the loanportfolio. We maintain the ALLL at a level that we believe tobe appropriate to absorb estimated probable credit lossesincurred in the loan portfolio as of the balance sheet date. Thereserve calculation and determination process is dependent onthe use of key assumptions. Key reserve assumptions andestimation processes react to and are influenced by observedchanges in loan portfolio performance experience, thefinancial strength of the borrower, and economic conditions.Key reserve assumptions are periodically updated. During the
third quarter of 2012, PNC increased the amount of internallyobserved data used in estimating the key commercial lendingassumptions of PD and LGD. See the Critical AccountingEstimates And Judgments section of this Item 7 for additionalinformation.
We establish specific allowances for loans consideredimpaired using methods prescribed by GAAP. All impairedloans are subject to individual analysis, except leases andlarge groups of smaller-balance homogeneous loans whichmay include, but are not limited to, credit card, residentialmortgage, and consumer installment loans. Specificallowances for individual loans (including commercial andconsumer TDRs) are determined based on an analysis of thepresent value of expected future cash flows from the loansdiscounted at their effective interest rate, observable marketprice, or the fair value of the underlying collateral.
Reserves allocated to non-impaired commercial loan classesare based on PD and LGD credit risk ratings.
The PNC Financial Services Group, Inc. – Form 10-K 95
Our commercial pool reserve methodology is sensitive tochanges in key risk parameters such as PD and LGD; theresults of these parameters are then applied to the loan balanceto determine the amount of the reserve. In general, a givenchange in any of the major risk parameters will have acorresponding change in the pool reserve allocations for non-impaired commercial loans. To illustrate, if we increase thepool reserve LGD by 5% for all categories of non-impairedcommercial loans at December 31, 2012, then the aggregate ofthe ALLL and allowance for unfunded loan commitments andletters of credit would increase by $74 million.
The majority of the commercial portfolio is secured bycollateral, including loans to asset-based lending customersthat continue to show demonstrably lower LGD. Further, thelarge investment grade or equivalent portion of the loanportfolio has performed well and has not been subject tosignificant deterioration. Additionally, guarantees on loansgreater than $1 million and owner guarantees for smallbusiness loans do not significantly impact our ALLL.
Allocations to non-impaired consumer loan classes are basedupon a roll-rate model which uses statistical relationships,calculated from historical data that estimate the movement ofloan outstandings through the various stages of delinquencyand ultimately charge-off.
A portion of the ALLL related to qualitative and measurementfactors has been assigned to loan categories. These factorsinclude, but are not limited to, the following:
• Industry concentrations and conditions,• Recent credit quality trends,• Recent loss experience in particular portfolios,• Recent macro-economic factors,• Changes in risk selection and underwriting standards,
and• Timing of available information, including the
performance of first lien positions.
Purchased impaired loans are initially recorded at fair valueand applicable accounting guidance prohibits the carry over orcreation of valuation allowances at acquisition. Because theinitial fair values of these loans already reflect a creditcomponent, additional reserves are established whenperformance is expected to be worse than our expectations asof the acquisition date. At December 31, 2012, we hadestablished reserves of $1.1 billion for purchased impairedloans. In addition, all loans (purchased impaired and non-impaired) acquired in the RBC Bank (USA) acquisition wererecorded at fair value. No allowance for loan losses wascarried over and no allowance was created at acquisition. SeeNote 6 Purchased Loans in the Notes To ConsolidatedFinancial Statements in Item 8 of this Report for additionalinformation.
In addition to the ALLL, we maintain an allowance forunfunded loan commitments and letters of credit. We reportthis allowance as a liability on our Consolidated BalanceSheet. We maintain the allowance for unfunded loancommitments and letters of credit at a level we believe isappropriate to absorb estimated probable losses on theseunfunded credit facilities. We determine this amount usingestimates of the probability of the ultimate funding and lossesrelated to those credit exposures. Other than the estimation ofthe probability of funding, this methodology is similar to theone we use for determining our ALLL.
We refer you to Note 5 Asset Quality and Note 7 Allowancesfor Loan and Lease Losses and Unfunded Loan Commitmentsand Letters of Credit in the Notes To Consolidated FinancialStatements in Item 8 of this Report for further information onkey asset quality indicators that we use to evaluate ourportfolio and establish the allowances.
96 The PNC Financial Services Group, Inc. – Form 10-K
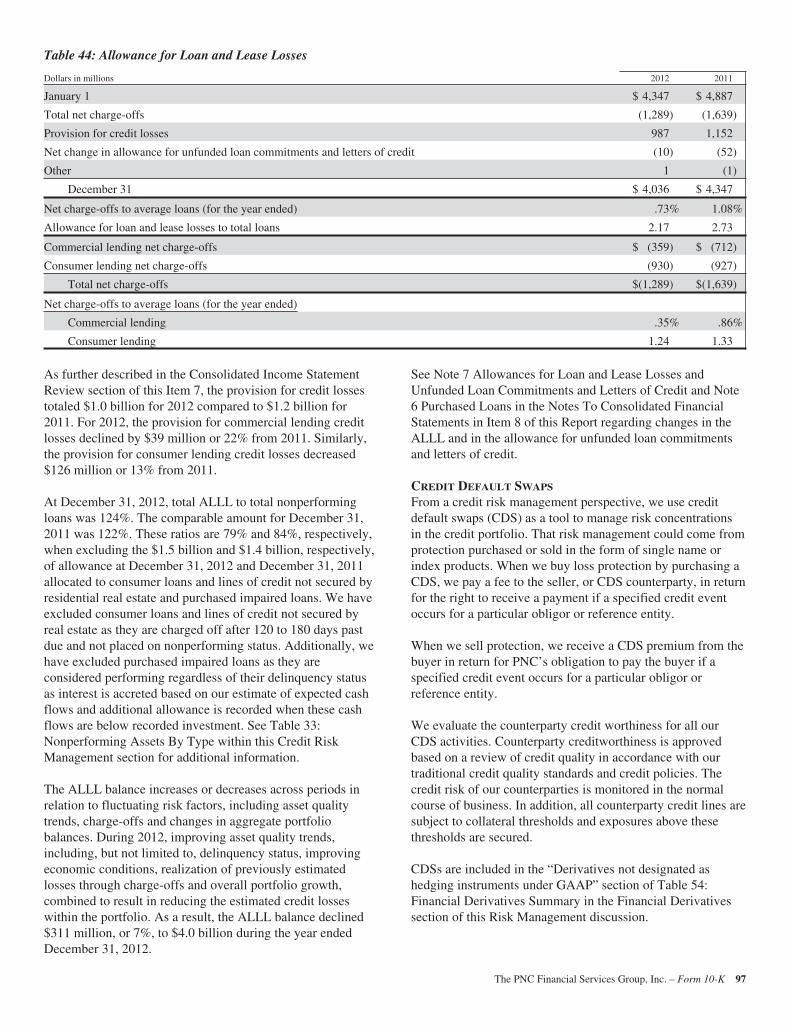
Table 44: Allowance for Loan and Lease Losses
Dollars in millions 2012 2011
January 1 $ 4,347 $ 4,887
Total net charge-offs (1,289) (1,639)
Provision for credit losses 987 1,152
Net change in allowance for unfunded loan commitments and letters of credit (10) (52)
Other 1 (1)
December 31 $ 4,036 $ 4,347
Net charge-offs to average loans (for the year ended) .73% 1.08%
Allowance for loan and lease losses to total loans 2.17 2.73
Commercial lending net charge-offs $ (359) $ (712)
Consumer lending net charge-offs (930) (927)
Total net charge-offs $(1,289) $(1,639)
Net charge-offs to average loans (for the year ended)
Commercial lending .35% .86%
Consumer lending 1.24 1.33
As further described in the Consolidated Income StatementReview section of this Item 7, the provision for credit lossestotaled $1.0 billion for 2012 compared to $1.2 billion for2011. For 2012, the provision for commercial lending creditlosses declined by $39 million or 22% from 2011. Similarly,the provision for consumer lending credit losses decreased$126 million or 13% from 2011.
At December 31, 2012, total ALLL to total nonperformingloans was 124%. The comparable amount for December 31,2011 was 122%. These ratios are 79% and 84%, respectively,when excluding the $1.5 billion and $1.4 billion, respectively,of allowance at December 31, 2012 and December 31, 2011allocated to consumer loans and lines of credit not secured byresidential real estate and purchased impaired loans. We haveexcluded consumer loans and lines of credit not secured byreal estate as they are charged off after 120 to 180 days pastdue and not placed on nonperforming status. Additionally, wehave excluded purchased impaired loans as they areconsidered performing regardless of their delinquency statusas interest is accreted based on our estimate of expected cashflows and additional allowance is recorded when these cashflows are below recorded investment. See Table 33:Nonperforming Assets By Type within this Credit RiskManagement section for additional information.
The ALLL balance increases or decreases across periods inrelation to fluctuating risk factors, including asset qualitytrends, charge-offs and changes in aggregate portfoliobalances. During 2012, improving asset quality trends,including, but not limited to, delinquency status, improvingeconomic conditions, realization of previously estimatedlosses through charge-offs and overall portfolio growth,combined to result in reducing the estimated credit losseswithin the portfolio. As a result, the ALLL balance declined$311 million, or 7%, to $4.0 billion during the year endedDecember 31, 2012.
See Note 7 Allowances for Loan and Lease Losses andUnfunded Loan Commitments and Letters of Credit and Note6 Purchased Loans in the Notes To Consolidated FinancialStatements in Item 8 of this Report regarding changes in theALLL and in the allowance for unfunded loan commitmentsand letters of credit.
CREDIT DEFAULT SWAPS
From a credit risk management perspective, we use creditdefault swaps (CDS) as a tool to manage risk concentrationsin the credit portfolio. That risk management could come fromprotection purchased or sold in the form of single name orindex products. When we buy loss protection by purchasing aCDS, we pay a fee to the seller, or CDS counterparty, in returnfor the right to receive a payment if a specified credit eventoccurs for a particular obligor or reference entity.
When we sell protection, we receive a CDS premium from thebuyer in return for PNC’s obligation to pay the buyer if aspecified credit event occurs for a particular obligor orreference entity.
We evaluate the counterparty credit worthiness for all ourCDS activities. Counterparty creditworthiness is approvedbased on a review of credit quality in accordance with ourtraditional credit quality standards and credit policies. Thecredit risk of our counterparties is monitored in the normalcourse of business. In addition, all counterparty credit lines aresubject to collateral thresholds and exposures above thesethresholds are secured.
CDSs are included in the “Derivatives not designated ashedging instruments under GAAP” section of Table 54:Financial Derivatives Summary in the Financial Derivativessection of this Risk Management discussion.
The PNC Financial Services Group, Inc. – Form 10-K 97
Operational Risk ManagementOperational risk is the risk of loss resulting from inadequate orfailed internal processes or systems, human factors, orexternal events. This includes losses that may arise as a resultof non-compliance with laws or regulations, failure to fulfillfiduciary responsibilities, as well as litigation or other legalactions. Operational risk may occur in any of our businessactivities and manifests itself in various ways, including butnot limited to:
• Transaction processing errors,• Unauthorized transactions and fraud by employees or
third parties,• Material disruption in business activities,• System breaches and misuse of sensitive information,• Regulatory or governmental actions, fines or
penalties, and• Significant legal expenses, judgments or settlements.
PNC’s Operational Risk Management is inclusive ofTechnology Risk Management, Compliance, and BusinessResiliency. Operational Risk Management focuses onbalancing business needs, regulatory expectations and riskmanagement priorities through an adaptive and proactiveprogram that is designed to provide a strong governancemodel, sound and consistent risk management processes andtransparent operational risk reporting across the enterprise.
The PNC Board determines the strategic approach tooperational risk via establishment of the operational riskappetite and appropriate risk management structure. Thisincludes establishment of risk metrics and limits and areporting structure to identify, understand and manageoperational risks.
Executive Management has responsibility for operational riskmanagement. The executive management team is responsiblefor monitoring risk issues through management reporting anda governance structure of risk committees and sub-committees.
Within Risk Management, Operational Risk Managementfunctions are responsible for developing and maintaining thepolicies, methodologies, tools, and technology utilized acrossthe enterprise to identify, assess, monitor, and reportoperational risks, including compliance risk. A key function ofOperational Risk Management is to help ensure businessunits’ alignment with the Operational Risk Managementframework and to validate results and overall programeffectiveness.
Business Unit management is responsible for the day-to-daymanagement of operational risks inherent in the products,services, and activities for which they are responsible.Business Unit management is also responsible for adhering toPNC’s enterprise-wide operational risk management policies
and procedures; including regularly identifying, measuring,and monitoring operational risks in their respective area, aswell as capturing, analyzing and reporting operational lossevents.
Management of operational risk is based upon acomprehensive framework designed to enable the company todetermine the enterprise and individual business unit’soperational risk profile in comparison to the established riskappetite and identify operational risks that may require furthermitigation. This framework is established around a set ofenterprise-wide policies and a system of internal controls thatare designed to manage risk and to provide management withtimely and accurate information about the operations of PNC.This framework employs a number of techniques to manageoperational risk, including:
• Risk and Control Self-Assessments (RCSAs) areperformed at least annually across PNC’s businesses,processes, systems and products. RCSA methodologyis a standard process for management to self assessoperational risks, evaluate control effectiveness, anddetermine if risk exposure is within establishedtolerances,
• Scenario Analysis is leveraged to proactivelyevaluate operational loss events with the potential forsevere business, financial, operational or regulatoryimpact on the company or a major business unit. Thismethodology leverages standard processes and toolsto evaluate a wide range of business and operationalrisks encompassing both external and internal eventsrelevant to the company. Based upon scenarioanalysis conclusions, management may implementadditional controls or risk management activities toreduce exposure to an acceptable level,
• A Key Risk Indicator (KRI) framework allowsmanagement to assess actual operational risk resultscompared to expectations and thresholds, as well asproactively identify unexpected shifts in operationalrisk exposure or control effectiveness. Enterprise-level KRIs are designed to monitor exposure acrossthe different inherent operational risk types,including compliance risk. Business-specific KRIsare established in support of the individual risk andcontrol self assessments, and
• Operational loss events across the enterprise arecontinuously captured and maintained in a centralrepository. This information is analyzed and used tohelp determine the root causes of these events and toidentify trends that could indicate changes in thecompany’s risk exposure or control effectiveness.PNC utilizes a number of sources to identify externalloss events occurring across the financial servicesindustry. These events are evaluated to determinewhether PNC is exposed to similar events, and if so,whether appropriate controls are in place.
98 The PNC Financial Services Group, Inc. – Form 10-K
We continue to enhance our methodology to estimate capitalrequirements for Operational Risk using a proprietary versionof an Advanced Measurement Approach (AMA). Under theAMA approach, the results of the program elements describedabove are key inputs directly incorporated into the capitalcalculation methodology.
Risk professionals from Operational Risk Management,Technology Risk Management, Business Resiliency,Compliance, and Legal work closely with business areas toevaluate risks and help ensure that appropriate controls areestablished prior to the introduction of new or enhancedproducts, services, and technologies. These risk professionalsalso consult with business areas in the design andimplementation of mitigation strategies to address risks andissues identified through ongoing assessment and monitoringactivities.
PNC’s technology risk management program is aligned withthe operational risk framework. Management of technologyrisk is embedded into the culture and decision makingprocesses of PNC through an information and technology riskmanagement framework designed to help ensure secure,sound, and compliant IT systems and infrastructure in supportof business strategies and goals. PNC’s Technology RiskManagement (TRM) function supports enterprise managementof technology risk by independently assessing technology andinformation security risks, and by serving in an oversight roleby measuring, monitoring, and challenging enterprisetechnology capabilities.
Our business resiliency program manages the organization’scapabilities to provide services in the case of an event thatresults in material disruption of business activities.Prioritization of investments in people, processes, technologyand facilities is based on different types of events, businessrisk and criticality. A testing program validates our resiliencycapabilities on an ongoing basis, and an integrated governancemodel is designed to help assure appropriate managementreporting.
Enterprise Compliance is responsible for coordinating thecompliance risk component of PNC’s Operational Riskframework. Compliance issues are identified and trackedthrough enterprise-wide monitoring and tracking programs.Key compliance risk issues are escalated through acomprehensive risk reporting process at both a business andenterprise level and incorporated, as appropriate, into thedevelopment and assessment of the firm’s operational riskprofile. The Compliance, Conflicts & Ethics PolicyCommittee, chaired by the Chief Compliance Officer,provides oversight for compliance, conflicts and ethicsprograms and strategies across PNC. This committee alsooversees the compliance processes related to fiduciary andinvestment risk. In order to help understand and whereappropriate proactively address emerging regulatory issues,Enterprise Compliance communicates regularly with various
regulators with supervisory or regulatory responsibilities withrespect to PNC, its subsidiaries or businesses and participatesin forums focused on regulatory and compliance matters in thefinancial services industry.
PNC uses insurance where appropriate to help mitigate theeffects of operational risk events. In 2012, PNC implementeda Network Security & Privacy Liability program to addressassociated risks. The purchase of insurance protects againstaccidental losses, which, in the aggregate, may affectpersonnel, financial objectives, or our ability to meetresponsibilities to various stakeholder groups. While certaincorporate risks are retained through a subsidiary, variousinsurers provide the balance of coverage. Uncertainty, relatedto insurer coverage determinations, may result in reducedbenefit received from insurance mitigation. Oversight ofinsurance purchased is provided by Risk committees withinthe governance structure.
On a quarterly basis, an enterprise operational risk report isdeveloped to report key operational risks to seniormanagement and the Board of Directors. The reportencompasses key operational risk management conclusions,including the overall operational risk level, risk managementeffectiveness and outlook, grounded in quantitative measuresand qualitative factors. Key enterprise operational risks arealso included in the enterprise risk report. In addition,operational risk is an integrated part of the quarterly business-specific risk reports.
Model Risk ManagementPNC relies on quantitative models to measure risks and toestimate certain financial values. Models may be used in suchprocesses as determining the pricing of various products,grading and granting loans, measuring interest rate risks andother market risks, predicting losses, and assessing capitaladequacy, as well as to estimate the value of financialinstruments and balance sheet items. There are risks involvedin the use of models as they have the potential to provideinaccurate output or results, could be used for purposes otherthan those for which they have been designed, or may beoperated in an uncontrolled environment where unauthorizedchanges can take place and where other control risks exist.Model Risk Management is responsible for policies andprocedures describing how model risk is evaluated andmanaged, and the application of the governance process toimplement these practices throughout the enterprise. TheModel Risk Management Committee, a subcommittee of theEnterprise Risk Management Committee, oversees all aspectsof model risk, including PNC’s compliance with regulatoryrequirements, and approves exceptions to policy whenappropriate.
To better manage our business, our practices around the use ofmodels, and to comply with regulatory guidance andrequirements, we have in place policies and procedures thatdefine our governance processes for assessing and controlling
The PNC Financial Services Group, Inc. – Form 10-K 99

model risk. These processes focus on identifying, reporting,and remediating any problems with the soundness, accuracy,improper use, or operating environment of our models. Werecognize that models must be monitored over time to ensuretheir continued accuracy and functioning, and our policies alsoaddress the type and frequency of monitoring that isappropriate according to the importance of each model.
There are a number of practices we undertake to identify andcontrol model risk. A primary consideration is that models bewell understood by those who use them as well as by otherparties. Our policies require detailed written modeldocumentation for significant models to assist in making theiruse transparent and understood by users, independentreviewers, and regulatory and auditing bodies. Thedocumentation must include details on the data and methodsused to develop each model, assumptions utilized within themodel, and a description of model limitations andcircumstances in which a model should not be relied upon.
Our modeling methods and data are reviewed by independentmodel reviewers not involved in the development of the modelto identify possible errors or areas where the soundness of themodel could be in question. Issues identified by theindependent reviewer are tracked and reported using ourexisting governance structure until the issue has been fullyremediated. It is important that models operate in a controlledenvironment where access to code or the ability to makechanges is limited to those so authorized. Additionally, properback-up and recovery mechanisms are needed for the ongoingfunctioning of models. Our use of independent model controlreviewers aids in the evaluation of the existing controlmechanisms to help ensure that controls are appropriate andare functioning properly.
Liquidity Risk ManagementLiquidity risk has two fundamental components. The first ispotential loss assuming we were unable to meet our fundingrequirements at a reasonable cost. The second is the potentialinability to operate our businesses because adequatecontingent liquidity is not available in a stressed environment.We manage liquidity risk at the consolidated company level(bank, parent company, and nonbank subsidiaries combined)to help ensure that we can obtain cost-effective funding tomeet current and future obligations under both normal“business as usual” and stressful circumstances, and to helpensure that we maintain an appropriate level of contingentliquidity.
Spot and forward funding gap analyses are used to measureand monitor consolidated liquidity risk. Funding gapsrepresent the difference in projected sources of liquidityavailable to offset projected uses. We calculate funding gapsfor the overnight, thirty-day, ninety-day, one hundred eighty-day and one-year time intervals. Management also monitorsliquidity through a series of early warning indicators that mayindicate a potential market, or PNC-specific, liquidity stress
event. Finally, management performs a set of liquidity stresstests and maintains a contingency funding plan to address apotential liquidity crisis. In the most severe liquidity stresssimulation, we assume that PNC’s liquidity position is underpressure, while the market in general is under systemicpressure. The simulation considers, among other things, theimpact of restricted access to both secured and unsecuredexternal sources of funding, accelerated run-off of customerdeposits, valuation pressure on assets, and heavy demand tofund contingent obligations. Risk limits are established withinour Liquidity Risk Policy. Management’s Asset and LiabilityCommittee regularly reviews compliance with the establishedlimits.
Parent company liquidity guidelines are designed to helpensure that sufficient liquidity is available to meet our parentcompany obligations over the succeeding 24-month period.Risk limits for parent company liquidity are established withinour Enterprise Capital and Liquidity Management Policy. TheBoard of Directors’ Risk Committee regularly reviewscompliance with the established limits.
Bank Level Liquidity – UsesObligations requiring the use of liquidity can generally becharacterized as either contractual or discretionary. At thebank level, primary contractual obligations include fundingloan commitments, satisfying deposit withdrawal requests andmaturities and debt service related to bank borrowings. As ofDecember 31, 2012, there were approximately $17.2 billion ofbank borrowings with contractual maturities of less than oneyear. We also maintain adequate bank liquidity to meet futurepotential loan demand and provide for other business needs, asnecessary. See the Bank Level Liquidity – Sources sectionbelow.
Bank Level Liquidity – SourcesOur largest source of bank liquidity on a consolidated basis isthe deposit base that comes from our retail and commercialbusinesses. Total deposits increased to $213.1 billion atDecember 31, 2012 from $188.0 billion at December 31,2011, primarily due to the RBC Bank (USA) acquisition.Liquid assets and unused borrowing capacity from a numberof sources are also available to maintain our liquidity position.Borrowed funds come from a diverse mix of short and long-term funding sources.
At December 31, 2012, our liquid assets consisted of short-term investments (Federal funds sold, resale agreements,trading securities, and interest-earning deposits with banks)totaling $7.5 billion and securities available for sale totaling$51.1 billion. Of our total liquid assets of $58.6 billion, wehad $25.6 billion pledged as collateral for borrowings, trust,and other commitments. The level of liquid assets fluctuatesover time based on many factors, including market conditions,loan and deposit growth and active balance sheetmanagement, including securities purchases to manageduration.
100 The PNC Financial Services Group, Inc. – Form 10-K
In addition to the customer deposit base, which hashistorically provided the single largest source of relativelystable and low-cost funding, the bank also obtains liquiditythrough the issuance of traditional forms of funding includinglong-term debt (senior notes and subordinated debt and FHLBadvances) and short-term borrowings (Federal fundspurchased, securities sold under repurchase agreements,commercial paper issuances, and other short-termborrowings).
PNC Bank, N.A. is authorized by its board to offer up to $20billion in senior and subordinated unsecured debt obligations withmaturities of more than nine months. Through December 31,2012, PNC Bank, N.A. had issued $10.4 billion of debt under thisprogram, including the following during 2012:
• $100 million of senior bank notes issued March 8,2012 and due April 8, 2015. Interest is paid semi-annually at a fixed rate of 1.07%,
• $1.0 billion of senior extendible floating rate banknotes issued June 20, 2012 with an initial maturitydate of July 20, 2013, subject to the holder’s monthlyoption to extend, and a final maturity date of June 20,2014. Interest is paid at the 3-month LIBOR rate,reset quarterly, plus a spread of 22.5 basis points,which spread is subject to four potential one basispoint increases in the event of certain extensions ofmaturity by the holder,
• $900 million of senior extendible floating rate banknotes issued to an affiliate on June 27, 2012 with aninitial maturity date of July 27, 2013, subject to theholder’s monthly option to extend, and a finalmaturity date of April 27, 2014. Interest is paid at the3-month LIBOR rate, reset quarterly, plus a spread of22.5 basis points,
• $500 million of senior extendible floating rate banknotes issued to an affiliate on June 27, 2012 with aninitial maturity date of July 27, 2013, subject to theholder’s monthly option to extend, and a finalmaturity date of January 27, 2014. Interest is paid atthe 3-month LIBOR rate, reset quarterly, plus aspread of 22.5 basis points, and
• $1.0 billion of subordinated notes issued October 22,2012 and due November 1, 2022. Interest is paidsemi-annually at a fixed rate of 2.70%.
See Capital and Liquidity Actions in the Executive Summarysection of this Item 7 for additional information regarding our2013 issuances under this program, which totaled $1.8 billion.
Total senior and subordinated debt increased to $7.6 billion atDecember 31, 2012 from $4.1 billion at December 31, 2011due to issuances.
PNC Bank, N.A. is a member of the FHLB-Pittsburgh and assuch has access to advances from FHLB-Pittsburgh securedgenerally by residential mortgage and other mortgage-related
loans. At December 31, 2012, our unused secured borrowingcapacity was $10.5 billion with FHLB-Pittsburgh. TotalFHLB borrowings increased to $9.4 billion at December 31,2012 from $7.0 billion at December 31, 2011 due to $13.5billion in new borrowings partially offset by $11.0 billion inmaturities.
PNC Bank, N.A. has the ability to offer up to $10.0 billion ofits commercial paper to provide additional liquidity. As ofDecember 31, 2012, there was $2.4 billion outstanding underthis program. Commercial paper on our Consolidated BalanceSheet also includes $6.1 billion of commercial paper issued byMarket Street Funding LLC, a consolidated VIE.
PNC Bank, N.A. can also borrow from the Federal ReserveBank of Cleveland’s (Federal Reserve Bank) discount windowto meet short-term liquidity requirements. The FederalReserve Bank, however, is not viewed as the primary meansof funding our routine business activities, but rather as apotential source of liquidity in a stressed environment orduring a market disruption. These potential borrowings aresecured by securities and commercial loans. At December 31,2012, our unused secured borrowing capacity was $28.6billion with the Federal Reserve Bank.
Parent Company Liquidity – UsesObligations requiring the use of liquidity can generally becharacterized as either contractual or discretionary. The parentcompany’s contractual obligations consist primarily of debtservice related to parent company borrowings and fundingnon-bank affiliates. As of December 31, 2012, there wereapproximately $300 million of parent company borrowingswith maturities of less than one year.
Additionally, the parent company maintains adequate liquidityto fund discretionary activities such as paying dividends toPNC shareholders, share repurchases, and acquisitions. Seethe Parent Company Liquidity – Sources section below. InMarch 2012, we used approximately $3.6 billion of parentcompany cash to acquire both RBC Bank (USA) and a creditcard portfolio from RBC Bank (Georgia), NationalAssociation. Additionally, in June 2012, we used $1.4 billionof parent company cash to purchase senior extendible floatingrate bank notes issued by PNC Bank, N.A noted above.
See Supervision and Regulation in Item 1 of this Report forinformation regarding the Federal Reserve’s CCAR process,including its impact on our ability to take certain capitalactions, including plans to pay or increase common stockdividends, reinstate or increase common stock repurchaseprograms, or redeem preferred stock or other regulatorycapital instruments.
See Capital and Liquidity Actions in the Executive Summarysection of this Item 7 for additional information regarding our2012 and 2013 capital activities.
The PNC Financial Services Group, Inc. – Form 10-K 101
Parent Company Liquidity – SourcesThe principal source of parent company liquidity is thedividends it receives from its subsidiary bank, which may beimpacted by the following:
• Bank-level capital needs,• Laws and regulations,• Corporate policies,• Contractual restrictions, and• Other factors.
The amount available for dividend payments by PNC Bank,N.A. to the parent company without prior regulatory approvalwas approximately $1.5 billion at December 31, 2012. Thereare statutory and regulatory limitations on the ability ofnational banks to pay dividends or make other capitaldistributions or to extend credit to the parent company or itsnon-bank subsidiaries. See Note 22 Regulatory Matters in theNotes To Consolidated Financial Statements in Item 8 of thisReport for a further discussion of these limitations. Dividendsmay also be impacted by the bank’s capital needs and bycontractual restrictions. We provide additional information oncertain contractual restrictions under the “Trust PreferredSecurities” section of the Off-Balance Sheet ArrangementsAnd Variable Interest Entities section of this Item 7 and inNote 14 Capital Securities of Subsidiary Trusts and PerpetualTrust Securities in the Notes To Consolidated FinancialStatements in Item 8 of this Report.
In addition to dividends from PNC Bank, N.A., other sourcesof parent company liquidity include cash and investments, aswell as dividends and loan repayments from other subsidiariesand dividends or distributions from equity investments. As ofDecember 31, 2012, the parent company had approximately$3.4 billion in funds available from its cash and investments.
We can also generate liquidity for the parent company andPNC’s non-bank subsidiaries through the issuance of debtsecurities and equity securities, including certain capitalsecurities, in public or private markets and commercial paper.We have an effective shelf registration statement pursuant towhich we can issue additional debt, equity and other capitalinstruments. Total senior and subordinated debt and hybridcapital instruments decreased to $11.5 billion at December 31,2012 from $16.0 billion at December 31, 2011 primarily dueto $4.0 billion in maturities and $2.3 billion in redemptionspartially offset by $1.5 billion in new borrowings.
During 2012 we issued the following securities under ourshelf registration statement:
• $1.0 billion of senior notes issued March 8, 2012 anddue March 8, 2022. Interest is paid semi-annually at afixed rate of 3.30%. The offering resulted in grossproceeds to us, before offering related expenses, of$990 million,
• Sixty million depositary shares, each representing a1/4,000th interest in a share of our Fixed-to-FloatingRate Non-Cumulative Perpetual Preferred Stock,
Series P, issued April 24, 2012, resulting in grossproceeds to us, before commissions and expenses, of$1.5 billion,
• Eighteen million depositary shares, each representinga 1/4,000th interest in a share of our 5.375% Non-Cumulative Perpetual Preferred Stock, Series Q,issued September 21, 2012, resulting in grossproceeds to us, before commissions and expenses, of$450 million. On October 9, 2012, pursuant to theunderwriting agreement for this offering, we issuedan additional 1.2 million depositary shares insatisfaction of an option granted to the underwritersin the agreement to cover over-allotments, resultingin additional gross proceeds of $30 million, and
• On November 9, 2012, PNC issued $500.1 million ofits parent company Senior Notes due November 9,2022 (the “Senior Notes”), which were sold in asecondary public offering made in connection with theremarketing of PNC’s Remarketable 8.729% JuniorSubordinated Notes due 2043 (the “SubordinatedNotes”) owned by the National City Preferred CapitalTrust I (the “Trust”). In the remarketing, the Trust soldthe Subordinated Notes and PNC exchanged with thepurchasers of the Subordinated Notes the SeniorNotes. The Senior Notes were then sold by thepurchasers in the secondary public offering. TheSenior Notes bore interest at 8.729% from andincluding June 10, 2012, to but excluding November 9,2012, and thereafter bear interest at 2.854% perannum. The proceeds of the remarketing were used bythe Trust to purchase $500.1 million of PNC’s Non-Cumulative Perpetual Preferred Stock, Series M (the“Preferred Stock”) on December 10, 2012. PNCredeemed all of the Preferred Stock from the Trustimmediately upon its issuance, and the Trust in turnredeemed all $500.0 million outstanding of its 12%Fixed-to-Floating Rate Normal APEX and $.1 millionCommon Securities of the Trust. After the closing ofthese transactions, including the redemption of theNormal APEX, only the Senior Notes dueNovember 9, 2022 remain outstanding.
The parent company, through its subsidiary PNC FundingCorp, has the ability to offer up to $3.0 billion of commercialpaper to provide additional liquidity. As of December 31,2012, there were no issuances outstanding under this program.
Note 19 Equity in the Notes To Consolidated FinancialStatements in Item 8 of this Report describes our February2010 redemption of all 75,792 shares of our Fixed RateCumulative Perpetual Preferred Shares, Series N (Series NPreferred Stock) that had been issued on December 31, 2008to the US Treasury under the Troubled Asset Relief Program(TARP) Capital Purchase Program, the acceleration of theaccretion of the remaining issuance discount on the Series NPreferred Stock in the first quarter of 2010 (and acorresponding reduction in retained earnings of $250 million
102 The PNC Financial Services Group, Inc. – Form 10-K
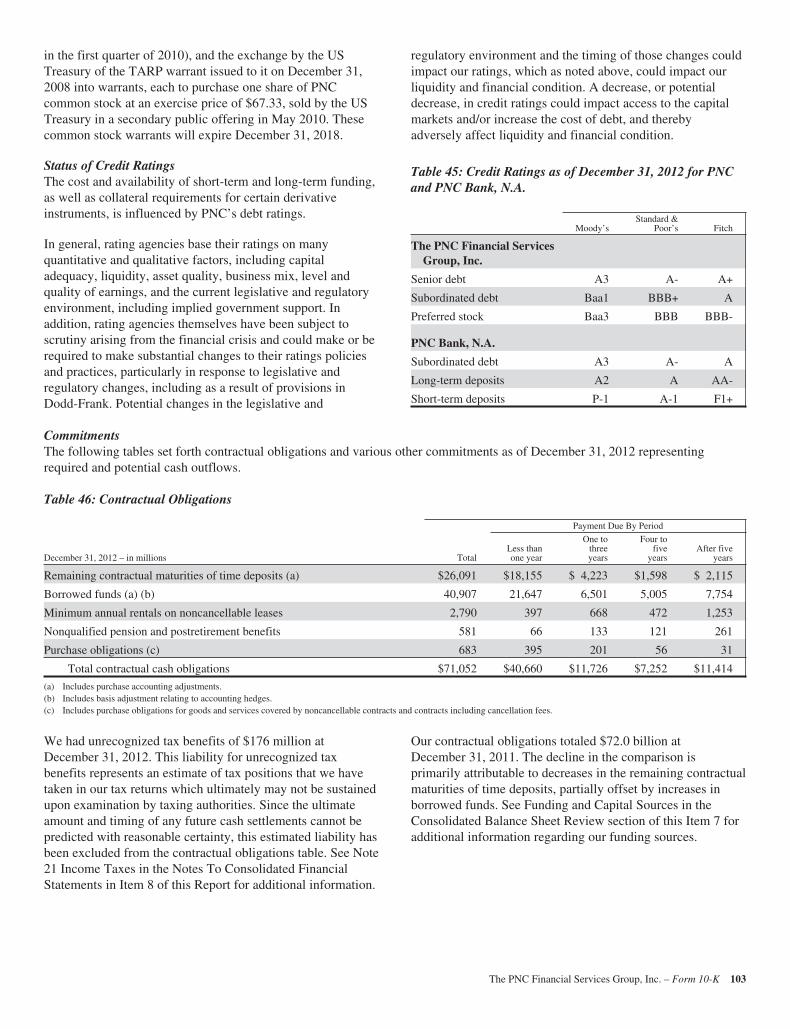
in the first quarter of 2010), and the exchange by the USTreasury of the TARP warrant issued to it on December 31,2008 into warrants, each to purchase one share of PNCcommon stock at an exercise price of $67.33, sold by the USTreasury in a secondary public offering in May 2010. Thesecommon stock warrants will expire December 31, 2018.
Status of Credit RatingsThe cost and availability of short-term and long-term funding,as well as collateral requirements for certain derivativeinstruments, is influenced by PNC’s debt ratings.
In general, rating agencies base their ratings on manyquantitative and qualitative factors, including capitaladequacy, liquidity, asset quality, business mix, level andquality of earnings, and the current legislative and regulatoryenvironment, including implied government support. Inaddition, rating agencies themselves have been subject toscrutiny arising from the financial crisis and could make or berequired to make substantial changes to their ratings policiesand practices, particularly in response to legislative andregulatory changes, including as a result of provisions inDodd-Frank. Potential changes in the legislative and
regulatory environment and the timing of those changes couldimpact our ratings, which as noted above, could impact ourliquidity and financial condition. A decrease, or potentialdecrease, in credit ratings could impact access to the capitalmarkets and/or increase the cost of debt, and therebyadversely affect liquidity and financial condition.
Table 45: Credit Ratings as of December 31, 2012 for PNCand PNC Bank, N.A.
Moody’sStandard &
Poor’s Fitch
The PNC Financial ServicesGroup, Inc.
Senior debt A3 A- A+
Subordinated debt Baa1 BBB+ A
Preferred stock Baa3 BBB BBB-
PNC Bank, N.A.
Subordinated debt A3 A- A
Long-term deposits A2 A AA-
Short-term deposits P-1 A-1 F1+
CommitmentsThe following tables set forth contractual obligations and various other commitments as of December 31, 2012 representingrequired and potential cash outflows.
Table 46: Contractual Obligations
Payment Due By Period
December 31, 2012 – in millions TotalLess thanone year
One tothreeyears
Four tofive
yearsAfter five
years
Remaining contractual maturities of time deposits (a) $26,091 $18,155 $ 4,223 $1,598 $ 2,115
Borrowed funds (a) (b) 40,907 21,647 6,501 5,005 7,754
Minimum annual rentals on noncancellable leases 2,790 397 668 472 1,253
Nonqualified pension and postretirement benefits 581 66 133 121 261
Purchase obligations (c) 683 395 201 56 31
Total contractual cash obligations $71,052 $40,660 $11,726 $7,252 $11,414
(a) Includes purchase accounting adjustments.(b) Includes basis adjustment relating to accounting hedges.(c) Includes purchase obligations for goods and services covered by noncancellable contracts and contracts including cancellation fees.
We had unrecognized tax benefits of $176 million atDecember 31, 2012. This liability for unrecognized taxbenefits represents an estimate of tax positions that we havetaken in our tax returns which ultimately may not be sustainedupon examination by taxing authorities. Since the ultimateamount and timing of any future cash settlements cannot bepredicted with reasonable certainty, this estimated liability hasbeen excluded from the contractual obligations table. See Note21 Income Taxes in the Notes To Consolidated FinancialStatements in Item 8 of this Report for additional information.
Our contractual obligations totaled $72.0 billion atDecember 31, 2011. The decline in the comparison isprimarily attributable to decreases in the remaining contractualmaturities of time deposits, partially offset by increases inborrowed funds. See Funding and Capital Sources in theConsolidated Balance Sheet Review section of this Item 7 foradditional information regarding our funding sources.
The PNC Financial Services Group, Inc. – Form 10-K 103
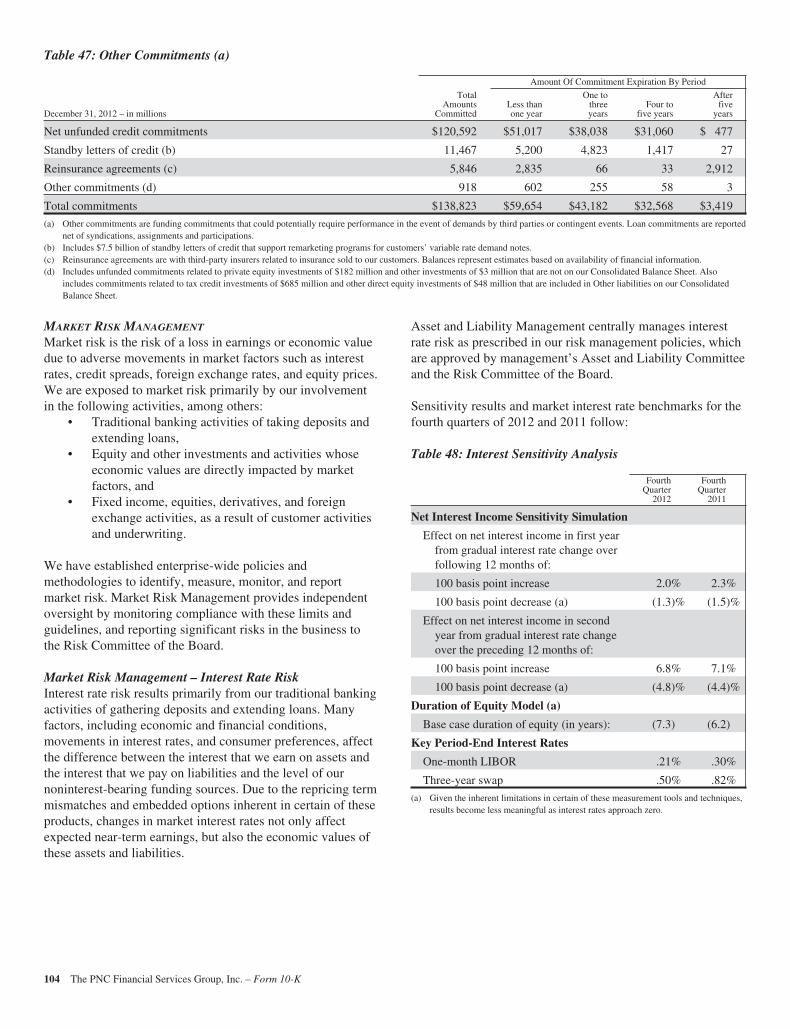
Table 47: Other Commitments (a)
Amount Of Commitment Expiration By Period
December 31, 2012 – in millions
TotalAmounts
CommittedLess thanone year
One tothreeyears
Four tofive years
Afterfive
years
Net unfunded credit commitments $120,592 $51,017 $38,038 $31,060 $ 477
Standby letters of credit (b) 11,467 5,200 4,823 1,417 27
Reinsurance agreements (c) 5,846 2,835 66 33 2,912
Other commitments (d) 918 602 255 58 3
Total commitments $138,823 $59,654 $43,182 $32,568 $3,419
(a) Other commitments are funding commitments that could potentially require performance in the event of demands by third parties or contingent events. Loan commitments are reportednet of syndications, assignments and participations.
(b) Includes $7.5 billion of standby letters of credit that support remarketing programs for customers’ variable rate demand notes.(c) Reinsurance agreements are with third-party insurers related to insurance sold to our customers. Balances represent estimates based on availability of financial information.(d) Includes unfunded commitments related to private equity investments of $182 million and other investments of $3 million that are not on our Consolidated Balance Sheet. Also
includes commitments related to tax credit investments of $685 million and other direct equity investments of $48 million that are included in Other liabilities on our ConsolidatedBalance Sheet.
MARKET RISK MANAGEMENT
Market risk is the risk of a loss in earnings or economic valuedue to adverse movements in market factors such as interestrates, credit spreads, foreign exchange rates, and equity prices.We are exposed to market risk primarily by our involvementin the following activities, among others:
• Traditional banking activities of taking deposits andextending loans,
• Equity and other investments and activities whoseeconomic values are directly impacted by marketfactors, and
• Fixed income, equities, derivatives, and foreignexchange activities, as a result of customer activitiesand underwriting.
We have established enterprise-wide policies andmethodologies to identify, measure, monitor, and reportmarket risk. Market Risk Management provides independentoversight by monitoring compliance with these limits andguidelines, and reporting significant risks in the business tothe Risk Committee of the Board.
Market Risk Management – Interest Rate RiskInterest rate risk results primarily from our traditional bankingactivities of gathering deposits and extending loans. Manyfactors, including economic and financial conditions,movements in interest rates, and consumer preferences, affectthe difference between the interest that we earn on assets andthe interest that we pay on liabilities and the level of ournoninterest-bearing funding sources. Due to the repricing termmismatches and embedded options inherent in certain of theseproducts, changes in market interest rates not only affectexpected near-term earnings, but also the economic values ofthese assets and liabilities.
Asset and Liability Management centrally manages interestrate risk as prescribed in our risk management policies, whichare approved by management’s Asset and Liability Committeeand the Risk Committee of the Board.
Sensitivity results and market interest rate benchmarks for thefourth quarters of 2012 and 2011 follow:
Table 48: Interest Sensitivity Analysis
FourthQuarter
2012
FourthQuarter
2011
Net Interest Income Sensitivity Simulation
Effect on net interest income in first yearfrom gradual interest rate change overfollowing 12 months of:
100 basis point increase 2.0% 2.3%
100 basis point decrease (a) (1.3)% (1.5)%
Effect on net interest income in secondyear from gradual interest rate changeover the preceding 12 months of:
100 basis point increase 6.8% 7.1%
100 basis point decrease (a) (4.8)% (4.4)%
Duration of Equity Model (a)
Base case duration of equity (in years): (7.3) (6.2)
Key Period-End Interest Rates
One-month LIBOR .21% .30%
Three-year swap .50% .82%
(a) Given the inherent limitations in certain of these measurement tools and techniques,results become less meaningful as interest rates approach zero.
104 The PNC Financial Services Group, Inc. – Form 10-K
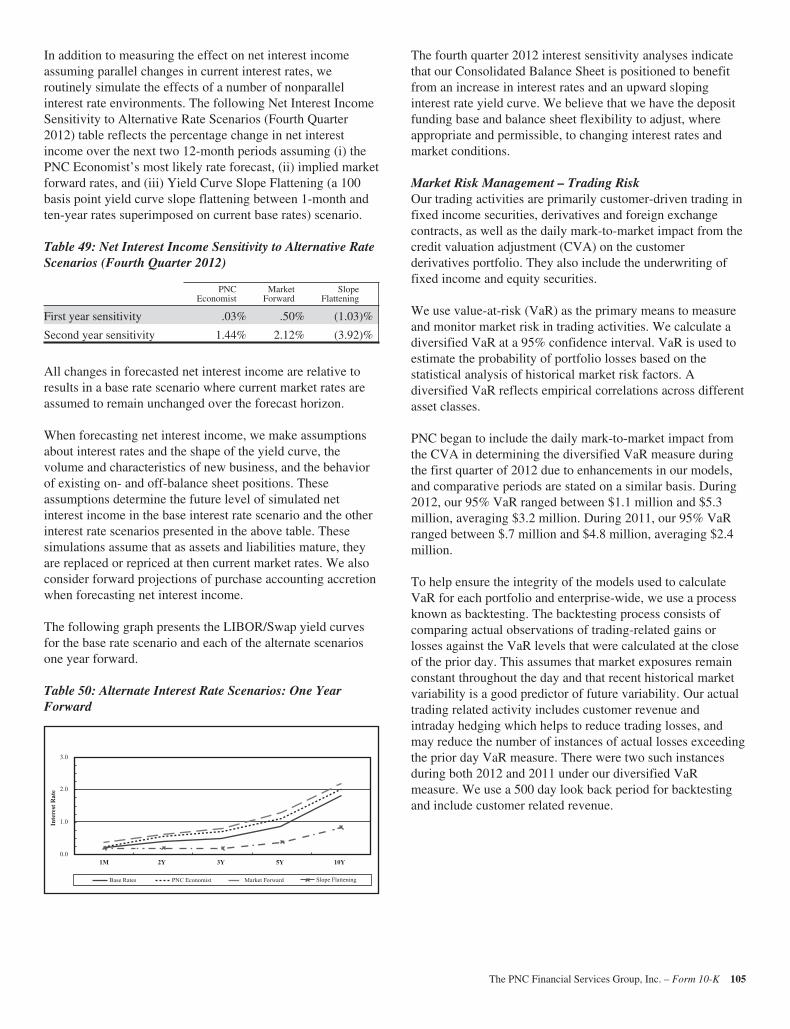
In addition to measuring the effect on net interest incomeassuming parallel changes in current interest rates, weroutinely simulate the effects of a number of nonparallelinterest rate environments. The following Net Interest IncomeSensitivity to Alternative Rate Scenarios (Fourth Quarter2012) table reflects the percentage change in net interestincome over the next two 12-month periods assuming (i) thePNC Economist’s most likely rate forecast, (ii) implied marketforward rates, and (iii) Yield Curve Slope Flattening (a 100basis point yield curve slope flattening between 1-month andten-year rates superimposed on current base rates) scenario.
Table 49: Net Interest Income Sensitivity to Alternative RateScenarios (Fourth Quarter 2012)
PNCEconomist
MarketForward
SlopeFlattening
First year sensitivity .03% .50% (1.03)%
Second year sensitivity 1.44% 2.12% (3.92)%
All changes in forecasted net interest income are relative toresults in a base rate scenario where current market rates areassumed to remain unchanged over the forecast horizon.
When forecasting net interest income, we make assumptionsabout interest rates and the shape of the yield curve, thevolume and characteristics of new business, and the behaviorof existing on- and off-balance sheet positions. Theseassumptions determine the future level of simulated netinterest income in the base interest rate scenario and the otherinterest rate scenarios presented in the above table. Thesesimulations assume that as assets and liabilities mature, theyare replaced or repriced at then current market rates. We alsoconsider forward projections of purchase accounting accretionwhen forecasting net interest income.
The following graph presents the LIBOR/Swap yield curvesfor the base rate scenario and each of the alternate scenariosone year forward.
Table 50: Alternate Interest Rate Scenarios: One YearForward
1M
Inte
rest
Rat
e
0.0
Base Rates PNC Economist Market Forward Slope Flattening
1.0
2.0
3.0
2Y 3Y 5Y 10Y
The fourth quarter 2012 interest sensitivity analyses indicatethat our Consolidated Balance Sheet is positioned to benefitfrom an increase in interest rates and an upward slopinginterest rate yield curve. We believe that we have the depositfunding base and balance sheet flexibility to adjust, whereappropriate and permissible, to changing interest rates andmarket conditions.
Market Risk Management – Trading RiskOur trading activities are primarily customer-driven trading infixed income securities, derivatives and foreign exchangecontracts, as well as the daily mark-to-market impact from thecredit valuation adjustment (CVA) on the customerderivatives portfolio. They also include the underwriting offixed income and equity securities.
We use value-at-risk (VaR) as the primary means to measureand monitor market risk in trading activities. We calculate adiversified VaR at a 95% confidence interval. VaR is used toestimate the probability of portfolio losses based on thestatistical analysis of historical market risk factors. Adiversified VaR reflects empirical correlations across differentasset classes.
PNC began to include the daily mark-to-market impact fromthe CVA in determining the diversified VaR measure duringthe first quarter of 2012 due to enhancements in our models,and comparative periods are stated on a similar basis. During2012, our 95% VaR ranged between $1.1 million and $5.3million, averaging $3.2 million. During 2011, our 95% VaRranged between $.7 million and $4.8 million, averaging $2.4million.
To help ensure the integrity of the models used to calculateVaR for each portfolio and enterprise-wide, we use a processknown as backtesting. The backtesting process consists ofcomparing actual observations of trading-related gains orlosses against the VaR levels that were calculated at the closeof the prior day. This assumes that market exposures remainconstant throughout the day and that recent historical marketvariability is a good predictor of future variability. Our actualtrading related activity includes customer revenue andintraday hedging which helps to reduce trading losses, andmay reduce the number of instances of actual losses exceedingthe prior day VaR measure. There were two such instancesduring both 2012 and 2011 under our diversified VaRmeasure. We use a 500 day look back period for backtestingand include customer related revenue.
The PNC Financial Services Group, Inc. – Form 10-K 105
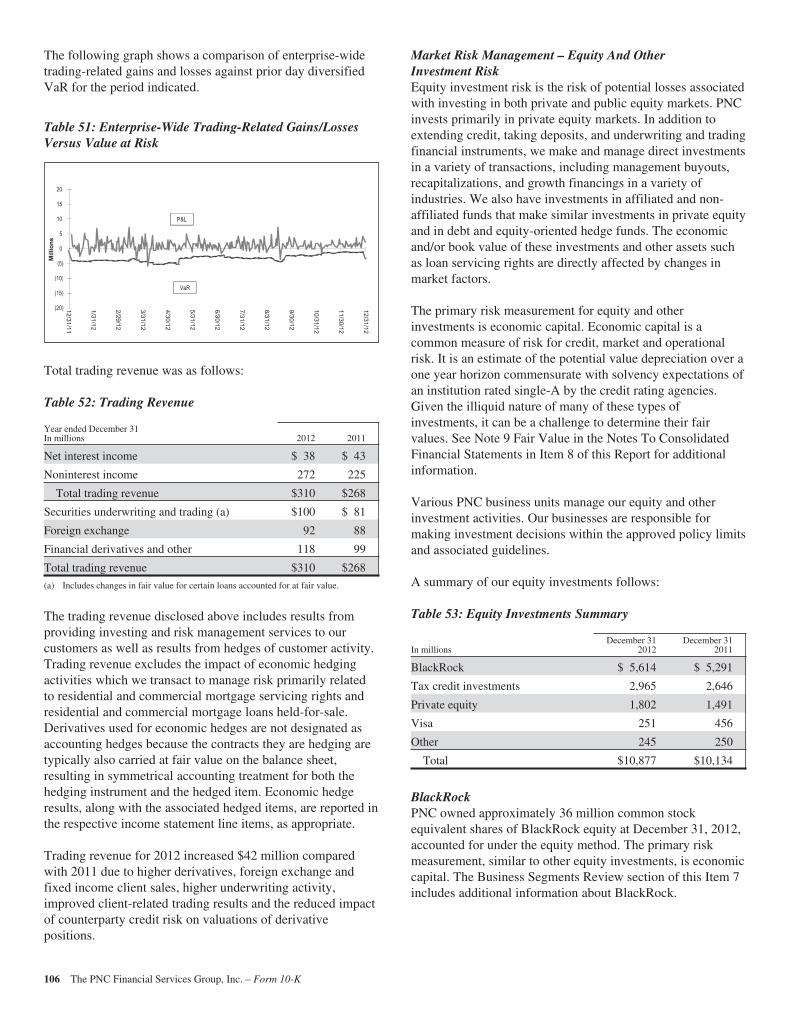
The following graph shows a comparison of enterprise-widetrading-related gains and losses against prior day diversifiedVaR for the period indicated.
Table 51: Enterprise-Wide Trading-Related Gains/LossesVersus Value at Risk
(10)
(5)
0
5
10
15
20
Mill
ions
P&L
(20)
(15)
(10)VaR
12/31/11
1/31/12
2/29/12
3/31/12
4/30/12
5/31/12
6/30/12
7/31/12
8/31/12
9/30/12
10/31/12
11/30/12
12/31/12
Total trading revenue was as follows:
Table 52: Trading Revenue
Year ended December 31In millions 2012 2011
Net interest income $ 38 $ 43
Noninterest income 272 225
Total trading revenue $310 $268
Securities underwriting and trading (a) $100 $ 81
Foreign exchange 92 88
Financial derivatives and other 118 99
Total trading revenue $310 $268
(a) Includes changes in fair value for certain loans accounted for at fair value.
The trading revenue disclosed above includes results fromproviding investing and risk management services to ourcustomers as well as results from hedges of customer activity.Trading revenue excludes the impact of economic hedgingactivities which we transact to manage risk primarily relatedto residential and commercial mortgage servicing rights andresidential and commercial mortgage loans held-for-sale.Derivatives used for economic hedges are not designated asaccounting hedges because the contracts they are hedging aretypically also carried at fair value on the balance sheet,resulting in symmetrical accounting treatment for both thehedging instrument and the hedged item. Economic hedgeresults, along with the associated hedged items, are reported inthe respective income statement line items, as appropriate.
Trading revenue for 2012 increased $42 million comparedwith 2011 due to higher derivatives, foreign exchange andfixed income client sales, higher underwriting activity,improved client-related trading results and the reduced impactof counterparty credit risk on valuations of derivativepositions.
Market Risk Management – Equity And OtherInvestment RiskEquity investment risk is the risk of potential losses associatedwith investing in both private and public equity markets. PNCinvests primarily in private equity markets. In addition toextending credit, taking deposits, and underwriting and tradingfinancial instruments, we make and manage direct investmentsin a variety of transactions, including management buyouts,recapitalizations, and growth financings in a variety ofindustries. We also have investments in affiliated and non-affiliated funds that make similar investments in private equityand in debt and equity-oriented hedge funds. The economicand/or book value of these investments and other assets suchas loan servicing rights are directly affected by changes inmarket factors.
The primary risk measurement for equity and otherinvestments is economic capital. Economic capital is acommon measure of risk for credit, market and operationalrisk. It is an estimate of the potential value depreciation over aone year horizon commensurate with solvency expectations ofan institution rated single-A by the credit rating agencies.Given the illiquid nature of many of these types ofinvestments, it can be a challenge to determine their fairvalues. See Note 9 Fair Value in the Notes To ConsolidatedFinancial Statements in Item 8 of this Report for additionalinformation.
Various PNC business units manage our equity and otherinvestment activities. Our businesses are responsible formaking investment decisions within the approved policy limitsand associated guidelines.
A summary of our equity investments follows:
Table 53: Equity Investments Summary
In millionsDecember 31
2012December 31
2011
BlackRock $ 5,614 $ 5,291
Tax credit investments 2,965 2,646
Private equity 1,802 1,491
Visa 251 456
Other 245 250
Total $10,877 $10,134
BlackRockPNC owned approximately 36 million common stockequivalent shares of BlackRock equity at December 31, 2012,accounted for under the equity method. The primary riskmeasurement, similar to other equity investments, is economiccapital. The Business Segments Review section of this Item 7includes additional information about BlackRock.
106 The PNC Financial Services Group, Inc. – Form 10-K
Tax Credit InvestmentsIncluded in our equity investments are tax credit investmentswhich are accounted for under the equity method. Theseinvestments, as well as equity investments held byconsolidated partnerships, totaled $3.0 billion at December 31,2012 and $2.6 billion at December 31, 2011. These equityinvestment balances include unfunded commitments totaling$685 million and $420 million, respectively. These unfundedcommitments are included in Other Liabilities on ourConsolidated Balance Sheet.
Note 3 Loan Sale and Servicing Activities and VariableInterest Entities in the Notes To Consolidated FinancialStatements in Item 8 of this Report has further information onTax Credit Investments.
Private EquityThe private equity portfolio is an illiquid portfolio comprisedof mezzanine and equity investments that vary by industry,stage and type of investment.
Private equity investments carried at estimated fair valuetotaled $1.8 billion at December 31, 2012 and $1.5 billion atDecember 31, 2011. As of December 31, 2012, $1.2 billionwas invested directly in a variety of companies and $.6 billionwas invested indirectly through various private equity funds.Included in direct investments are investment activities of twoprivate equity funds that are consolidated for financialreporting purposes. The noncontrolling interests of these fundstotaled $266 million as of December 31, 2012. The indirectprivate equity funds are not redeemable, but PNC receivesdistributions over the life of the partnership from liquidationof the underlying investments by the investee. See Item 1Business – Supervision and Regulation and Item 1A RiskFactors of this Report for discussion of potential impacts ofthe Volcker Rule provisions of Dodd-Frank on our holdinginterests in and sponsorship of private equity or hedge funds.
Our unfunded commitments related to private equity totaled$182 million at December 31, 2012 compared with $247million at December 31, 2011.
VisaIn 2012, we sold 9 million of Visa Class B common sharesand entered into swap agreements with the purchaser of theshares. See Note 9 Fair Value and Note 17 FinancialDerivatives in the Notes To Consolidated FinancialStatements in Item 8 of this Report for additional information.At December 31, 2012, our investment in Visa Class Bcommon shares totaled approximately 14 million shares andwas recorded at $251 million. Based on the December 31,2012 closing price of $151.58 for the Visa Class A commonshares, the fair value of our total investment wasapproximately $916 million at the current conversion ratewhich reflects adjustments in respect of all litigation fundingby Visa to date. The Visa Class B common shares that we ownare transferable only under limited circumstances (including
those applicable to the sales in 2012) until they can beconverted into shares of the publicly traded class of stock,which cannot happen until the settlement of all of thespecified litigation. It is expected that Visa will continue toadjust the conversion rate of Visa Class B common shares toClass A common shares in connection with any settlements ofthe specified litigation in excess of any amounts then inescrow for that purpose and will also reduce the conversionrate to the extent that it adds any funds to the escrow in thefuture.
Note 24 Commitments and Guarantees in the Notes ToConsolidated Financial Statements in Item 8 of this Report hasfurther information on our Visa indemnification obligation.
Other InvestmentsWe also make investments in affiliated and non-affiliatedfunds with both traditional and alternative investmentstrategies. The economic values could be driven by either thefixed-income market or the equity markets, or both. AtDecember 31, 2012, other investments totaled $245 millioncompared with $250 million at December 31, 2011. Werecognized net gains related to these investments of $55million during 2012, compared with $1 million during 2011.
Given the nature of these investments, if market conditionsaffecting their valuation were to worsen, we could incur futurelosses.
Our unfunded commitments related to other investmentstotaled $3 million at both December 31, 2012 andDecember 31, 2011.
Impact of InflationOur assets and liabilities are primarily financial in nature andtypically have varying maturity dates. Accordingly, futurechanges in prices do not affect the obligations to pay orreceive fixed and determinable amounts of money. However,during periods of inflation, there may be a subsequent impactaffecting certain fixed costs or expenses, an erosion ofconsumer and customer purchasing power, and fluctuations inthe need or demand for our products and services. Shouldsignificant levels of inflation occur, our business couldpotentially be impacted by, among other things, reducing ourtolerance for extending credit or causing us to incur additionalcredit losses resulting from possible increased default rates.
Financial DerivativesWe use a variety of financial derivatives as part of the overallasset and liability risk management process to help manageexposure to interest rate, market and credit risk inherent in ourbusiness activities. Substantially all such instruments are usedto manage risk related to changes in interest rates. Interest rateand total return swaps, interest rate caps and floors, swaptions,options, forwards and futures contracts are the primaryinstruments we use for interest rate risk management. We alsoenter into derivatives with customers to facilitate their riskmanagement activities.
The PNC Financial Services Group, Inc. – Form 10-K 107
Financial derivatives involve, to varying degrees, interest rate,market and credit risk. For interest rate swaps and total returnswaps, options and futures contracts, only periodic cashpayments and, with respect to options, premiums areexchanged. Therefore, cash requirements and exposure tocredit risk are significantly less than the notional amount onthese instruments.
Further information on our financial derivatives is presentedin Note 1 Accounting Policies and Note 17 FinancialDerivatives in the Notes To Consolidated Financial
Statements in Item 8 of this Report, which is incorporated hereby reference.
Not all elements of interest rate, market and credit risk areaddressed through the use of financial or other derivatives,and such instruments may be ineffective for their intendedpurposes due to unanticipated market changes, among otherreasons.
The following table summarizes the notional or contractual amounts and net fair value of financial derivatives at December 31,2012 and December 31, 2011.
Table 54: Financial Derivatives Summary
December 31, 2012 December 31, 2011
In millions
Notional/Contractual
Amount
Net FairValue
(a)
Notional/Contractual
Amount
Net FairValue
(a)
Derivatives designated as hedging instruments under GAAP
Total derivatives designated as hedging instruments $ 29,270 $1,720 $ 29,234 $1,772
Derivatives not designated as hedging instruments under GAAP
Total derivatives used for residential mortgage banking activities $166,819 $ 588 $196,991 $ 565
Total derivatives used for commercial mortgage banking activities 4,606 (23) 2,720 (21)
Total derivatives used for customer-related activities 163,848 30 158,095 (132)
Total derivatives used for other risk management activities 1,813 (357) 4,289 (327)
Total derivatives not designated as hedging instruments $337,086 $ 238 $362,095 $ 85
Total Derivatives $366,356 $1,958 $391,329 $1,857
(a) Represents the net fair value of assets and liabilities.
2011 VERSUS 2010
CONSOLIDATED INCOME STATEMENT REVIEW
Summary ResultsNet income for 2011 was $3.1 billion, or $5.64 per dilutedcommon share, compared with $3.4 billion, or $5.74 perdiluted common share, for 2010. The decrease from 2010 wasprimarily due to an $850 million, or 6%, reduction in totalrevenue, a $492 million, or 6%, increase in noninterestexpense and the impact of the $328 million after-tax gain onthe sale of GIS recognized in 2010, partially offset by a $1.3billion, or 54%, decrease in the provision for credit losses in2011. In addition, 2010 net income attributable to commonshareholders was also impacted by a noncash reduction of$250 million in connection with the redemption of TARPpreferred stock.
Net Interest IncomeNet interest income was $8.7 billion for 2011 down from $9.2billion in 2010. The net interest margin decreased to 3.92% in2011 compared with 4.14% for 2010, primarily due to theimpact of lower purchase accounting accretion, a decline inthe rate on average loan balances and the low interest rateenvironment partially offset by lower funding costs.
Noninterest IncomeNoninterest income was $5.6 billion for 2011 and $5.9 billionfor 2010. Noninterest income for 2011 reflected higher assetmanagement fees and other income, higher residentialmortgage banking revenue, and lower net other-than-temporary impairments (OTTI), that were offset by a decreasein corporate service fees primarily due to a reduction in thevalue of commercial mortgage servicing rights, lower servicecharges on deposits from the impact of Regulation E rulespertaining to overdraft fees, a decrease in net gains on sales ofsecurities and lower consumer services fees due, in part, to adecline in interchange fees on individual debit cardtransactions in the fourth quarter partially offset by highertransaction volumes throughout 2011.
Asset management revenue, including BlackRock, increased$34 million to $1.1 billion in 2011 compared to 2010. Theincrease was driven by strong sales performance by our AssetManagement Group and somewhat higher equity earningsfrom our BlackRock investment. Discretionary assets undermanagement at December 31, 2011 totaled $107 billioncompared with $108 billion at December 31, 2010.
108 The PNC Financial Services Group, Inc. – Form 10-K
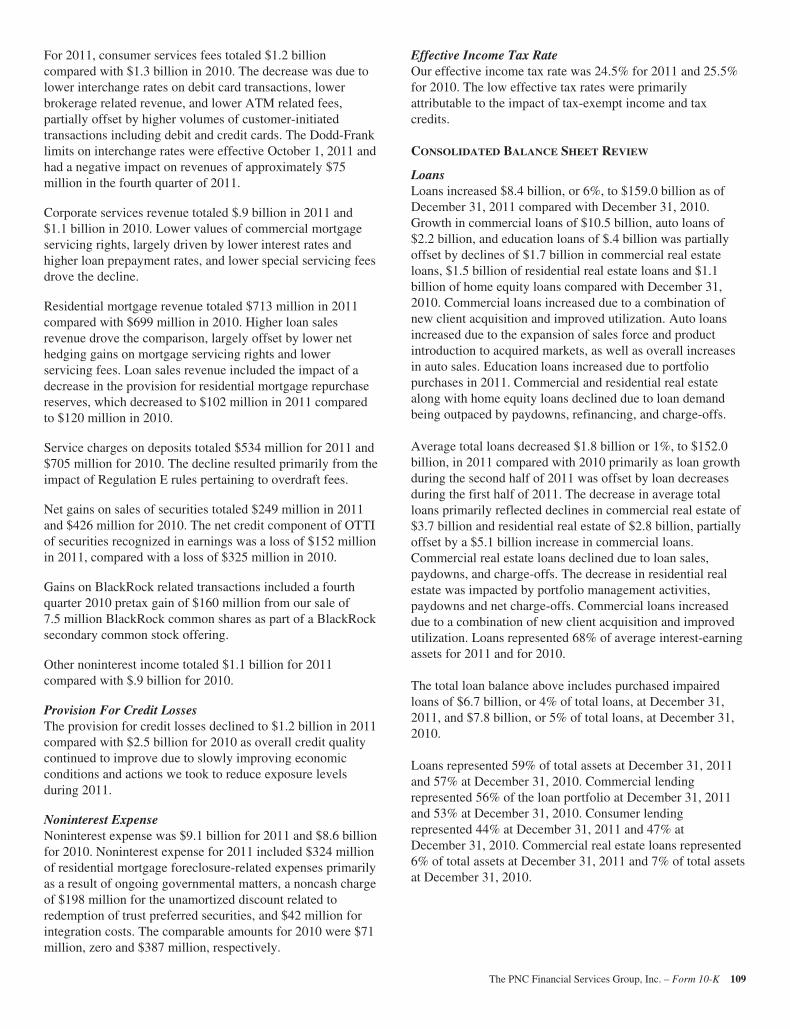
For 2011, consumer services fees totaled $1.2 billioncompared with $1.3 billion in 2010. The decrease was due tolower interchange rates on debit card transactions, lowerbrokerage related revenue, and lower ATM related fees,partially offset by higher volumes of customer-initiatedtransactions including debit and credit cards. The Dodd-Franklimits on interchange rates were effective October 1, 2011 andhad a negative impact on revenues of approximately $75million in the fourth quarter of 2011.
Corporate services revenue totaled $.9 billion in 2011 and$1.1 billion in 2010. Lower values of commercial mortgageservicing rights, largely driven by lower interest rates andhigher loan prepayment rates, and lower special servicing feesdrove the decline.
Residential mortgage revenue totaled $713 million in 2011compared with $699 million in 2010. Higher loan salesrevenue drove the comparison, largely offset by lower nethedging gains on mortgage servicing rights and lowerservicing fees. Loan sales revenue included the impact of adecrease in the provision for residential mortgage repurchasereserves, which decreased to $102 million in 2011 comparedto $120 million in 2010.
Service charges on deposits totaled $534 million for 2011 and$705 million for 2010. The decline resulted primarily from theimpact of Regulation E rules pertaining to overdraft fees.
Net gains on sales of securities totaled $249 million in 2011and $426 million for 2010. The net credit component of OTTIof securities recognized in earnings was a loss of $152 millionin 2011, compared with a loss of $325 million in 2010.
Gains on BlackRock related transactions included a fourthquarter 2010 pretax gain of $160 million from our sale of7.5 million BlackRock common shares as part of a BlackRocksecondary common stock offering.
Other noninterest income totaled $1.1 billion for 2011compared with $.9 billion for 2010.
Provision For Credit LossesThe provision for credit losses declined to $1.2 billion in 2011compared with $2.5 billion for 2010 as overall credit qualitycontinued to improve due to slowly improving economicconditions and actions we took to reduce exposure levelsduring 2011.
Noninterest ExpenseNoninterest expense was $9.1 billion for 2011 and $8.6 billionfor 2010. Noninterest expense for 2011 included $324 millionof residential mortgage foreclosure-related expenses primarilyas a result of ongoing governmental matters, a noncash chargeof $198 million for the unamortized discount related toredemption of trust preferred securities, and $42 million forintegration costs. The comparable amounts for 2010 were $71million, zero and $387 million, respectively.
Effective Income Tax RateOur effective income tax rate was 24.5% for 2011 and 25.5%for 2010. The low effective tax rates were primarilyattributable to the impact of tax-exempt income and taxcredits.
CONSOLIDATED BALANCE SHEET REVIEW
LoansLoans increased $8.4 billion, or 6%, to $159.0 billion as ofDecember 31, 2011 compared with December 31, 2010.Growth in commercial loans of $10.5 billion, auto loans of$2.2 billion, and education loans of $.4 billion was partiallyoffset by declines of $1.7 billion in commercial real estateloans, $1.5 billion of residential real estate loans and $1.1billion of home equity loans compared with December 31,2010. Commercial loans increased due to a combination ofnew client acquisition and improved utilization. Auto loansincreased due to the expansion of sales force and productintroduction to acquired markets, as well as overall increasesin auto sales. Education loans increased due to portfoliopurchases in 2011. Commercial and residential real estatealong with home equity loans declined due to loan demandbeing outpaced by paydowns, refinancing, and charge-offs.
Average total loans decreased $1.8 billion or 1%, to $152.0billion, in 2011 compared with 2010 primarily as loan growthduring the second half of 2011 was offset by loan decreasesduring the first half of 2011. The decrease in average totalloans primarily reflected declines in commercial real estate of$3.7 billion and residential real estate of $2.8 billion, partiallyoffset by a $5.1 billion increase in commercial loans.Commercial real estate loans declined due to loan sales,paydowns, and charge-offs. The decrease in residential realestate was impacted by portfolio management activities,paydowns and net charge-offs. Commercial loans increaseddue to a combination of new client acquisition and improvedutilization. Loans represented 68% of average interest-earningassets for 2011 and for 2010.
The total loan balance above includes purchased impairedloans of $6.7 billion, or 4% of total loans, at December 31,2011, and $7.8 billion, or 5% of total loans, at December 31,2010.
Loans represented 59% of total assets at December 31, 2011and 57% at December 31, 2010. Commercial lendingrepresented 56% of the loan portfolio at December 31, 2011and 53% at December 31, 2010. Consumer lendingrepresented 44% at December 31, 2011 and 47% atDecember 31, 2010. Commercial real estate loans represented6% of total assets at December 31, 2011 and 7% of total assetsat December 31, 2010.
The PNC Financial Services Group, Inc. – Form 10-K 109

Investment SecuritiesThe carrying amount of investment securities totaled $60.6billion at December 31, 2011, a decrease of $3.6 billion, or6%, from $64.3 billion at December 31, 2010. The declineresulted from principal payments and net sales activity relatedto US Treasury and government agency and non-agencyresidential mortgage-backed securities. Investment securitiesrepresented 22% of total assets at December 31, 2011 and24% of total assets at December 31, 2010.
Average investment securities increased $1.7 billion, to $59.7billion, in 2011 compared with 2010. Average securities heldto maturity increased $2.3 billion, to $9.4 billion, in 2011compared to 2010. This increase was partially offset by thedecrease in average securities available for sale of $.6 billion,to $50.3 billion, in 2011 compared with 2010. The increase inaverage securities held to maturity was primarily a result oftransfers totaling $6.3 billion from securities available for saleto securities held to maturity during the second and thirdquarters of 2011. The transfers were completed in order toreduce the impact of price volatility on accumulated othercomprehensive income and certain capital measures, andconsidered potential changes to regulatory capitalrequirements under the proposed Basel III capital standards.
At December 31, 2011, the securities available for saleportfolio included a net unrealized loss of $41 million, whichrepresented the difference between fair value and amortizedcost. The comparable amount at December 31, 2010 was a netunrealized loss of $861 million. The expected weighted-average life of investment securities (excluding corporatestocks and other) was 3.7 years at December 31, 2011 and 4.7years at December 31, 2010.
Loans Held For SaleLoans held for sale totaled $2.9 billion at December 31, 2011compared with $3.5 billion at December 31, 2010. We stoppedoriginating commercial mortgage loans held for saledesignated at fair value in 2008 and have pursuedopportunities to reduce these positions at appropriate prices.At December 31, 2011, the balance relating to these loans was$843 million, compared to $877 million at December 31,2010. We sold $25 million in unpaid principal balances ofthese commercial mortgage loans held for sale carried at fairvalue in 2011 and sold $241 million in 2010.
We sold $2.4 billion of commercial mortgages held for salecarried at the lower of cost or market to government agenciesin 2011 compared to $2.1 billion in 2010. The increase inthese loans to $451 million at December 31, 2011, comparedto $330 million at December 31, 2010, was due to an increasein loans awaiting sales to government agencies.
Residential mortgage loan origination volume was $11.4billion in 2011. Substantially all such loans were originatedunder agency or FHA standards. We sold $11.9 billion ofloans and recognized related gains of $282 million during2011. The comparable amounts for 2010 were $10.0 billionand $231 million, respectively.
Asset QualityOverall credit quality continued to improve during 2011.Nonperforming assets declined $967 million, or 19%, to $4.2billion as of December 31, 2011 from December 31, 2010.Accruing loans past due increased $12 million, or less than1%, during 2011 to $4.5 billion at year end primarilyattributable to government insured or guaranteed loans. Netcharge-offs declined significantly to $1.6 billion atDecember 31, 2011, down 44% from 2010 net charge-offs of$2.9 billion.
The ALLL was $4.3 billion, or 2.73% of total loans and 122%of nonperforming loans, as of December 31, 2011.
At December 31, 2011, our largest nonperforming asset was$28 million in the Accommodation and Food ServicesIndustry and our average nonperforming loan associated withcommercial lending was under $1 million.
Goodwill and Other Intangible AssetsGoodwill and other intangible assets totaled $10.1 billion atDecember 31, 2011 and $10.8 billion at December, 31, 2010.Goodwill increased $.1 billion, to $8.3 billion, atDecember 31, 2011 compared with the December 31, 2010balance primarily due to the BankAtlantic and Flagstar branchacquisitions and the correction of amounts for an acquisitionaffecting prior periods. The $.7 billion decline in otherintangible assets from December 31, 2010 included $.2 billionand $.4 billion declines in commercial and residentialmortgage servicing rights, respectively.
Funding SourcesTotal funding sources were $224.7 billion at December 31,2011 and $222.9 billion at December 31, 2010.
Total deposits increased $4.6 billion, or 2%, at December 31,2011 compared with December 31, 2010 due to an increase inmoney market and demand deposits, partially offset by netredemptions of retail certificates of deposit.
Average total deposits were $183.0 billion for 2011 comparedwith $181.9 billion for 2010. Average deposits remainedessentially flat from 2010 primarily as a result of decreases of$8.9 billion in average retail certificates of deposit and $.8billion in average time deposits in foreign offices and othertime, which were offset by increases of $6.6 billion in averagenoninterest-bearing deposits, $2.5 billion in average interest-bearing demand deposits and $1.2 billion in average savingsdeposits.
Total borrowed funds decreased $2.8 billion to $36.7 billion atDecember 31, 2011 compared to December 31, 2010. Thedecline from December 31, 2010 was primarily due tomaturities of federal funds purchased and repurchaseagreements, bank notes and senior debt, and subordinated debtpartially offset by issuances of FHLB borrowings and seniornotes.
110 The PNC Financial Services Group, Inc. – Form 10-K
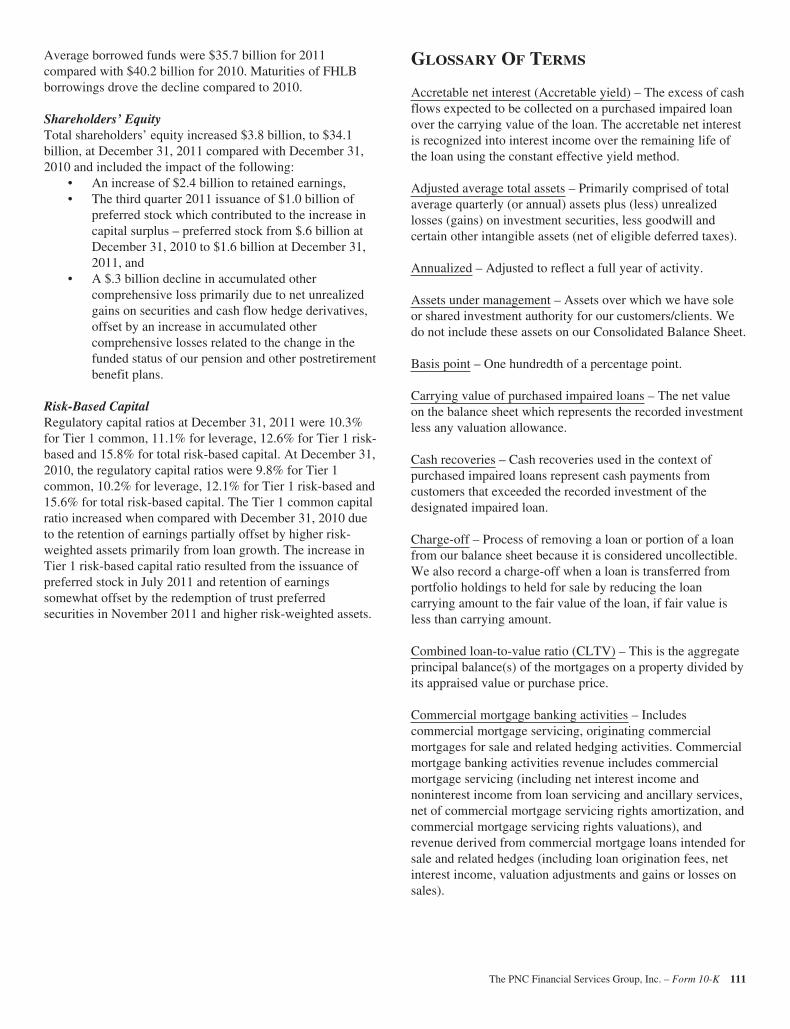
Average borrowed funds were $35.7 billion for 2011compared with $40.2 billion for 2010. Maturities of FHLBborrowings drove the decline compared to 2010.
Shareholders’ EquityTotal shareholders’ equity increased $3.8 billion, to $34.1billion, at December 31, 2011 compared with December 31,2010 and included the impact of the following:
• An increase of $2.4 billion to retained earnings,• The third quarter 2011 issuance of $1.0 billion of
preferred stock which contributed to the increase incapital surplus – preferred stock from $.6 billion atDecember 31, 2010 to $1.6 billion at December 31,2011, and
• A $.3 billion decline in accumulated othercomprehensive loss primarily due to net unrealizedgains on securities and cash flow hedge derivatives,offset by an increase in accumulated othercomprehensive losses related to the change in thefunded status of our pension and other postretirementbenefit plans.
Risk-Based CapitalRegulatory capital ratios at December 31, 2011 were 10.3%for Tier 1 common, 11.1% for leverage, 12.6% for Tier 1 risk-based and 15.8% for total risk-based capital. At December 31,2010, the regulatory capital ratios were 9.8% for Tier 1common, 10.2% for leverage, 12.1% for Tier 1 risk-based and15.6% for total risk-based capital. The Tier 1 common capitalratio increased when compared with December 31, 2010 dueto the retention of earnings partially offset by higher risk-weighted assets primarily from loan growth. The increase inTier 1 risk-based capital ratio resulted from the issuance ofpreferred stock in July 2011 and retention of earningssomewhat offset by the redemption of trust preferredsecurities in November 2011 and higher risk-weighted assets.
GLOSSARY OF TERMS
Accretable net interest (Accretable yield) – The excess of cashflows expected to be collected on a purchased impaired loanover the carrying value of the loan. The accretable net interestis recognized into interest income over the remaining life ofthe loan using the constant effective yield method.
Adjusted average total assets – Primarily comprised of totalaverage quarterly (or annual) assets plus (less) unrealizedlosses (gains) on investment securities, less goodwill andcertain other intangible assets (net of eligible deferred taxes).
Annualized – Adjusted to reflect a full year of activity.
Assets under management – Assets over which we have soleor shared investment authority for our customers/clients. Wedo not include these assets on our Consolidated Balance Sheet.
Basis point – One hundredth of a percentage point.
Carrying value of purchased impaired loans – The net valueon the balance sheet which represents the recorded investmentless any valuation allowance.
Cash recoveries – Cash recoveries used in the context ofpurchased impaired loans represent cash payments fromcustomers that exceeded the recorded investment of thedesignated impaired loan.
Charge-off – Process of removing a loan or portion of a loanfrom our balance sheet because it is considered uncollectible.We also record a charge-off when a loan is transferred fromportfolio holdings to held for sale by reducing the loancarrying amount to the fair value of the loan, if fair value isless than carrying amount.
Combined loan-to-value ratio (CLTV) – This is the aggregateprincipal balance(s) of the mortgages on a property divided byits appraised value or purchase price.
Commercial mortgage banking activities – Includescommercial mortgage servicing, originating commercialmortgages for sale and related hedging activities. Commercialmortgage banking activities revenue includes commercialmortgage servicing (including net interest income andnoninterest income from loan servicing and ancillary services,net of commercial mortgage servicing rights amortization, andcommercial mortgage servicing rights valuations), andrevenue derived from commercial mortgage loans intended forsale and related hedges (including loan origination fees, netinterest income, valuation adjustments and gains or losses onsales).
The PNC Financial Services Group, Inc. – Form 10-K 111

Common shareholders’ equity to total assets – Commonshareholders’ equity divided by total assets. Commonshareholders’ equity equals total shareholders’ equity less theliquidation value of preferred stock.
Core net interest income – Total net interest income lesspurchase accounting accretion.
Credit derivatives – Contractual agreements, primarily creditdefault swaps, that provide protection against a credit event ofone or more referenced credits. The nature of a credit event isestablished by the protection buyer and protection seller at theinception of a transaction, and such events includebankruptcy, insolvency and failure to meet paymentobligations when due. The buyer of the credit derivative paysa periodic fee in return for a payment by the protection sellerupon the occurrence, if any, of a credit event.
Credit spread – The difference in yield between debt issues ofsimilar maturity. The excess of yield attributable to creditspread is often used as a measure of relative creditworthiness,with a reduction in the credit spread reflecting animprovement in the borrower’s perceived creditworthiness.
Derivatives – Financial contracts whose value is derived fromchanges in publicly traded securities, interest rates, currencyexchange rates or market indices. Derivatives cover a wideassortment of financial contracts, including but not limited toforward contracts, futures, options and swaps.
Duration of equity – An estimate of the rate sensitivity of oureconomic value of equity. A negative duration of equity isassociated with asset sensitivity (i.e., positioned for risinginterest rates), while a positive value implies liabilitysensitivity (i.e., positioned for declining interest rates). Forexample, if the duration of equity is +1.5 years, the economicvalue of equity declines by 1.5% for each 100 basis pointincrease in interest rates.
Earning assets – Assets that generate income, which include:Federal funds sold; resale agreements; trading securities;interest-earning deposits with banks; loans held for sale;loans; investment securities; and certain other assets.
Economic capital – Represents the amount of resources that abusiness or business segment should hold to guard againstpotentially large losses that could cause insolvency and isbased on a measurement of economic risk. The economiccapital measurement process involves converting a riskdistribution to the capital that is required to support the risk,consistent with our target credit rating. As such, economic riskserves as a “common currency” of risk that allows us tocompare different risks on a similar basis.
Effective duration – A measurement, expressed in years, that,when multiplied by a change in interest rates, wouldapproximate the percentage change in value of on- and off-balance sheet positions.
Efficiency – Noninterest expense divided by total revenue.
Fair value – The price that would be received to sell an assetor paid to transfer a liability in an orderly transaction betweenmarket participants at the measurement date.
FICO score – A credit bureau-based industry standard scorecreated by Fair Isaac Co. which predicts the likelihood ofborrower default. We use FICO scores both in underwritingand assessing credit risk in our consumer lending portfolio.Lower FICO scores indicate likely higher risk of default,while higher FICO scores indicate likely lower risk of default.FICO scores are updated on a periodic basis.
Foreign exchange contracts – Contracts that provide for thefuture receipt and delivery of foreign currency at previouslyagreed-upon terms.
Funds transfer pricing – A management accountingmethodology designed to recognize the net interest incomeeffects of sources and uses of funds provided by the assets andliabilities of a business segment. We assign these balancesLIBOR-based funding rates at origination that represent theinterest cost for us to raise/invest funds with similar maturityand repricing structures.
Futures and forward contracts – Contracts in which the buyeragrees to purchase and the seller agrees to deliver a specificfinancial instrument at a predetermined price or yield. May besettled either in cash or by delivery of the underlying financialinstrument.
GAAP – Accounting principles generally accepted in theUnited States of America.
Home price index (HPI) – A broad measure of the movementof single-family house prices in the U.S.
Interest rate floors and caps – Interest rate protectioninstruments that involve payment from the protection seller tothe protection buyer of an interest differential, whichrepresents the difference between a short-term rate (e.g., three-month LIBOR) and an agreed-upon rate (the strike rate)applied to a notional principal amount.
Interest rate swap contracts – Contracts that are entered intoprimarily as an asset/liability management strategy to reduceinterest rate risk. Interest rate swap contracts are exchanges ofinterest rate payments, such as fixed-rate payments forfloating-rate payments, based on notional principal amounts.
112 The PNC Financial Services Group, Inc. – Form 10-K
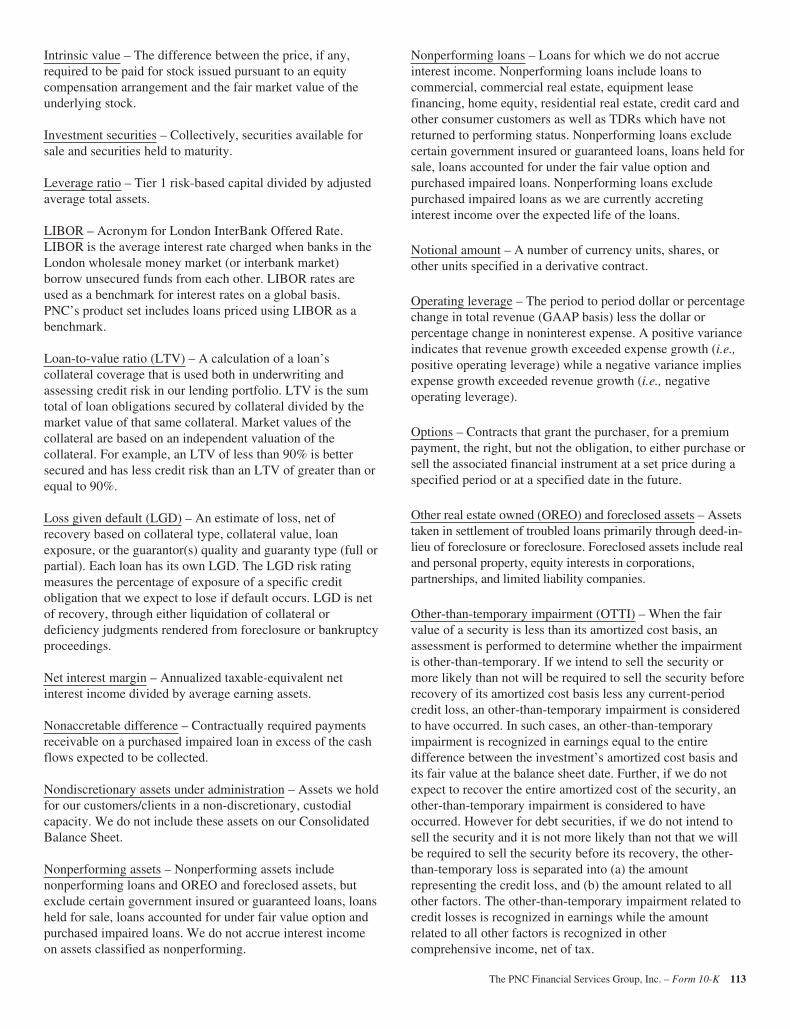
Intrinsic value – The difference between the price, if any,required to be paid for stock issued pursuant to an equitycompensation arrangement and the fair market value of theunderlying stock.
Investment securities – Collectively, securities available forsale and securities held to maturity.
Leverage ratio – Tier 1 risk-based capital divided by adjustedaverage total assets.
LIBOR – Acronym for London InterBank Offered Rate.LIBOR is the average interest rate charged when banks in theLondon wholesale money market (or interbank market)borrow unsecured funds from each other. LIBOR rates areused as a benchmark for interest rates on a global basis.PNC’s product set includes loans priced using LIBOR as abenchmark.
Loan-to-value ratio (LTV) – A calculation of a loan’scollateral coverage that is used both in underwriting andassessing credit risk in our lending portfolio. LTV is the sumtotal of loan obligations secured by collateral divided by themarket value of that same collateral. Market values of thecollateral are based on an independent valuation of thecollateral. For example, an LTV of less than 90% is bettersecured and has less credit risk than an LTV of greater than orequal to 90%.
Loss given default (LGD) – An estimate of loss, net ofrecovery based on collateral type, collateral value, loanexposure, or the guarantor(s) quality and guaranty type (full orpartial). Each loan has its own LGD. The LGD risk ratingmeasures the percentage of exposure of a specific creditobligation that we expect to lose if default occurs. LGD is netof recovery, through either liquidation of collateral ordeficiency judgments rendered from foreclosure or bankruptcyproceedings.
Net interest margin – Annualized taxable-equivalent netinterest income divided by average earning assets.
Nonaccretable difference – Contractually required paymentsreceivable on a purchased impaired loan in excess of the cashflows expected to be collected.
Nondiscretionary assets under administration – Assets we holdfor our customers/clients in a non-discretionary, custodialcapacity. We do not include these assets on our ConsolidatedBalance Sheet.
Nonperforming assets – Nonperforming assets includenonperforming loans and OREO and foreclosed assets, butexclude certain government insured or guaranteed loans, loansheld for sale, loans accounted for under fair value option andpurchased impaired loans. We do not accrue interest incomeon assets classified as nonperforming.
Nonperforming loans – Loans for which we do not accrueinterest income. Nonperforming loans include loans tocommercial, commercial real estate, equipment leasefinancing, home equity, residential real estate, credit card andother consumer customers as well as TDRs which have notreturned to performing status. Nonperforming loans excludecertain government insured or guaranteed loans, loans held forsale, loans accounted for under the fair value option andpurchased impaired loans. Nonperforming loans excludepurchased impaired loans as we are currently accretinginterest income over the expected life of the loans.
Notional amount – A number of currency units, shares, orother units specified in a derivative contract.
Operating leverage – The period to period dollar or percentagechange in total revenue (GAAP basis) less the dollar orpercentage change in noninterest expense. A positive varianceindicates that revenue growth exceeded expense growth (i.e.,positive operating leverage) while a negative variance impliesexpense growth exceeded revenue growth (i.e., negativeoperating leverage).
Options – Contracts that grant the purchaser, for a premiumpayment, the right, but not the obligation, to either purchase orsell the associated financial instrument at a set price during aspecified period or at a specified date in the future.
Other real estate owned (OREO) and foreclosed assets – Assetstaken in settlement of troubled loans primarily through deed-in-lieu of foreclosure or foreclosure. Foreclosed assets include realand personal property, equity interests in corporations,partnerships, and limited liability companies.
Other-than-temporary impairment (OTTI) – When the fairvalue of a security is less than its amortized cost basis, anassessment is performed to determine whether the impairmentis other-than-temporary. If we intend to sell the security ormore likely than not will be required to sell the security beforerecovery of its amortized cost basis less any current-periodcredit loss, an other-than-temporary impairment is consideredto have occurred. In such cases, an other-than-temporaryimpairment is recognized in earnings equal to the entiredifference between the investment’s amortized cost basis andits fair value at the balance sheet date. Further, if we do notexpect to recover the entire amortized cost of the security, another-than-temporary impairment is considered to haveoccurred. However for debt securities, if we do not intend tosell the security and it is not more likely than not that we willbe required to sell the security before its recovery, the other-than-temporary loss is separated into (a) the amountrepresenting the credit loss, and (b) the amount related to allother factors. The other-than-temporary impairment related tocredit losses is recognized in earnings while the amountrelated to all other factors is recognized in othercomprehensive income, net of tax.
The PNC Financial Services Group, Inc. – Form 10-K 113

Parent company liquidity coverage – Liquid assets divided byfunding obligations within a two year period.
Pretax earnings – Income from continuing operations beforeincome taxes and noncontrolling interests.
Pretax, pre-provision earnings from continuing operations –Total revenue less noninterest expense, both from continuingoperations.
Primary client relationship – A corporate banking clientrelationship with annual revenue generation of $10,000 to$50,000 or more, and for Asset Management Group, a clientrelationship with annual revenue generation of $10,000 ormore.
Probability of default (PD) – An internal risk rating thatindicates the likelihood that a credit obligor will enter intodefault status.
Purchase accounting accretion – Accretion of the discountsand premiums on acquired assets and liabilities. The purchaseaccounting accretion is recognized in net interest income overthe weighted-average life of the financial instruments usingthe constant effective yield method. Accretion for purchasedimpaired loans includes any cash recoveries received in excessof the recorded investment.
Purchased impaired loans – Acquired loans determined to becredit impaired under FASB ASC 310-30 (AICPA SOP 03-3).Loans are determined to be impaired if there is evidence ofcredit deterioration since origination and for which it isprobable that all contractually required payments will not becollected.
Recorded investment (purchased impaired loans) – The initialinvestment of a purchased impaired loan plus interestaccretion and less any cash payments and writedowns to date.The recorded investment excludes any valuation allowancewhich is included in our allowance for loan and lease losses.
Recovery – Cash proceeds received on a loan that we hadpreviously charged off. We credit the amount received to theallowance for loan and lease losses.
Residential development loans – Project-specific loans tocommercial customers for the construction or development ofresidential real estate including land, single family homes,condominiums and other residential properties.
Residential mortgage servicing rights hedge gains/(losses),net – We have elected to measure acquired or originatedresidential mortgage servicing rights (MSRs) at fair valueunder GAAP. We employ a risk management strategydesigned to protect the economic value of MSRs from changesin interest rates. This strategy utilizes securities and a portfolioof derivative instruments to hedge changes in the fair value of
MSRs arising from changes in interest rates. These financialinstruments are expected to have changes in fair value whichare negatively correlated to the change in fair value of theMSR portfolio. Net MSR hedge gains/(losses) represent thechange in the fair value of MSRs, exclusive of changes due totime decay and payoffs, combined with the change in the fairvalue of the associated securities and derivative instruments.
Return on average assets – Annualized net income divided byaverage assets.
Return on average capital – Annualized net income divided byaverage capital.
Return on average common shareholders’ equity – Annualizednet income attributable to common shareholders, divided byaverage common shareholders’ equity.
Risk-weighted assets – Computed by the assignment ofspecific risk-weights (as defined by the Board of Governors ofthe Federal Reserve System) to assets and off-balance sheetinstruments.
Securitization – The process of legally transforming financialassets into securities.
Servicing rights – An intangible asset or liability created by anobligation to service assets for others. Typical servicing rightsinclude the right to receive a fee for collecting and forwardingpayments on loans and related taxes and insurance premiumsheld in escrow.
Swaptions – Contracts that grant the purchaser, for a premiumpayment, the right, but not the obligation, to enter into aninterest rate swap agreement during a specified period or at aspecified date in the future.
Taxable-equivalent interest – The interest income earned oncertain assets is completely or partially exempt from Federalincome tax. As such, these tax-exempt instruments typicallyyield lower returns than taxable investments. To provide moremeaningful comparisons of yields and margins for all interest-earning assets, we use interest income on a taxable-equivalentbasis in calculating average yields and net interest margins byincreasing the interest income earned on tax-exempt assets tomake it fully equivalent to interest income earned on othertaxable investments. This adjustment is not permitted underGAAP on the Consolidated Income Statement.
Tier 1 common capital – Tier 1 risk-based capital, lesspreferred equity, less trust preferred capital securities, and lessnoncontrolling interests.
Tier 1 common capital ratio – Tier 1 common capital dividedby period-end risk-weighted assets.
114 The PNC Financial Services Group, Inc. – Form 10-K

Tier 1 risk-based capital – Total shareholders’ equity, plustrust preferred capital securities, plus certain noncontrollinginterests that are held by others; less goodwill and certainother intangible assets (net of eligible deferred taxes relatingto taxable and nontaxable combinations), less equityinvestments in nonfinancial companies less ineligibleservicing assets and less net unrealized holding losses onavailable for sale equity securities. Net unrealized holdinggains on available for sale equity securities, net unrealizedholding gains (losses) on available for sale debt securities andnet unrealized holding gains (losses) on cash flow hedgederivatives are excluded from total shareholders’ equity forTier 1 risk-based capital purposes.
Tier 1 risk-based capital ratio – Tier 1 risk-based capitaldivided by period-end risk-weighted assets.
Total equity – Total shareholders’ equity plus noncontrollinginterests.
Total return swap – A non-traditional swap where one partyagrees to pay the other the “total return” of a definedunderlying asset (e.g., a loan), usually in return for receiving astream of LIBOR-based cash flows. The total returns of theasset, including interest and any default shortfall, are passedthrough to the counterparty. The counterparty is thereforeassuming the credit and economic risk of the underlying asset.
Total risk-based capital – Tier 1 risk-based capital plusqualifying subordinated debt and trust preferred securities,other noncontrolling interest not qualified as Tier 1, eligiblegains on available for sale equity securities and the allowancefor loan and lease losses, subject to certain limitations.
Total risk-based capital ratio – Total risk-based capital dividedby period-end risk-weighted assets.
Transaction deposits – The sum of interest-bearing moneymarket deposits, interest-bearing demand deposits, andnoninterest-bearing deposits.
Troubled debt restructuring (TDR) – A loan whose terms havebeen restructured in a manner that grants a concession to aborrower experiencing financial difficulties.
Value-at-risk (VaR) – A statistically-based measure of riskthat describes the amount of potential loss which may beincurred due to severe and adverse market movements. Themeasure is of the maximum loss which should not beexceeded on 95 out of 100 days for a 95% VaR.
Watchlist – A list of criticized loans, credit exposure or otherassets compiled for internal monitoring purposes. We definecriticized exposure for this purpose as exposure with aninternal risk rating of other assets especially mentioned,substandard, doubtful or loss.
Yield curve – A graph showing the relationship between theyields on financial instruments or market indices of the samecredit quality with different maturities. For example, a“normal” or “positive” yield curve exists when long-termbonds have higher yields than short-term bonds. A “flat” yieldcurve exists when yields are the same for short-term and long-term bonds. A “steep” yield curve exists when yields on long-term bonds are significantly higher than on short-term bonds.An “inverted” or “negative” yield curve exists when short-term bonds have higher yields than long-term bonds.
The PNC Financial Services Group, Inc. – Form 10-K 115
CAUTIONARY STATEMENT REGARDING
FORWARD-LOOKING INFORMATION
We make statements in this Report, and we may from time totime make other statements, regarding our outlook forearnings, revenues, expenses, capital levels and ratios,liquidity levels, asset levels, asset quality, financial position,and other matters regarding or affecting PNC and its futurebusiness and operations that are forward-looking statementswithin the meaning of the Private Securities Litigation ReformAct. Forward-looking statements are typically identified bywords such as “believe,” “plan,” “expect,” “anticipate,” “see,”“look,” “intend,” “outlook,” “project,” “forecast,” “estimate,”“goal,” “will,” “should” and other similar words andexpressions. Forward-looking statements are subject tonumerous assumptions, risks and uncertainties, which changeover time.
Forward-looking statements speak only as of the date made.We do not assume any duty and do not undertake to updateforward-looking statements. Actual results or future eventscould differ, possibly materially, from those anticipated inforward-looking statements, as well as from historicalperformance.
Our forward-looking statements are subject to the followingprincipal risks and uncertainties.
• Our businesses, financial results and balance sheet valuesare affected by business and economic conditions,including the following:– Changes in interest rates and valuations in debt,
equity and other financial markets.– Disruptions in the liquidity and other functioning of
U.S. and global financial markets.– The impact on financial markets and the economy of
any changes in the credit ratings of U.S. Treasuryobligations and other U.S. government-backed debt,as well as issues surrounding the level of U.S. andEuropean government debt and concerns regardingthe creditworthiness of certain sovereigngovernments, supranationals and financialinstitutions in Europe.
– Actions by Federal Reserve, U.S. Treasury and othergovernment agencies, including those that impactmoney supply and market interest rates.
– Changes in customers’, suppliers’ and othercounterparties’ performance and creditworthiness.
– Slowing or failure of the current moderate economicexpansion.
– Continued effects of aftermath of recessionaryconditions and uneven spread of positive impacts ofrecovery on the economy and our counterparties,including adverse impacts on levels ofunemployment, loan utilization rates, delinquencies,defaults and counterparty ability to meet credit andother obligations.
– Changes in customer preferences and behavior,whether due to changing business and economicconditions, legislative and regulatory initiatives, orother factors.
• Our forward-looking financial statements are subject tothe risk that economic and financial market conditionswill be substantially different than we are currentlyexpecting. These statements are based on our current viewthat the moderate economic expansion will persist andinterest rates will remain very low in 2013, despite dragsfrom Federal fiscal restraint and a European recession.These forward-looking statements also do not, unlessotherwise indicated, take into account the impact ofpotential legal and regulatory contingencies.
• PNC’s regulatory capital ratios in the future will dependon, among other things, the company’s financialperformance, the scope and terms of final capitalregulations then in effect (particularly those implementingthe Basel Capital Accords), and management actionsaffecting the composition of PNC’s balance sheet. Inaddition, PNC’s ability to determine, evaluate andforecast regulatory capital ratios, and to take actions (suchas capital distributions) based on actual or forecastedcapital ratios, will be dependent on the ongoingdevelopment, validation and regulatory approval ofrelated models.
• Legal and regulatory developments could have an impacton our ability to operate our businesses, financialcondition, results of operations, competitive position,reputation, or pursuit of attractive acquisitionopportunities. Reputational impacts could affect matterssuch as business generation and retention, liquidity,funding, and ability to attract and retain management.These developments could include:– Changes resulting from legislative and regulatory
reforms, including major reform of the regulatoryoversight structure of the financial services industryand changes to laws and regulations involving tax,pension, bankruptcy, consumer protection, and otherindustry aspects, and changes in accounting policiesand principles. We will be impacted by extensivereforms provided for in the Dodd-Frank Wall StreetReform and Consumer Protection Act (the “Dodd-Frank Act”) and otherwise growing out of the recentfinancial crisis, the precise nature, extent and timingof which, and their impact on us, remains uncertain.
– Changes to regulations governing bank capital andliquidity standards, including due to the Dodd-FrankAct and to Basel-related initiatives.
– Unfavorable resolution of legal proceedings or otherclaims and regulatory and other governmentalinvestigations or other inquiries. In addition tomatters relating to PNC’s business and activities,such matters may include proceedings, claims,investigations, or inquiries relating to pre-acquisitionbusiness and activities of acquired companies, suchas National City. These matters may result in
116 The PNC Financial Services Group, Inc. – Form 10-K
monetary judgments or settlements or other remedies,including fines, penalties, restitution or alterations inour business practices, and in additional expenses andcollateral costs, and may cause reputational harm toPNC.
– Results of the regulatory examination andsupervision process, including our failure to satisfyrequirements of agreements with governmentalagencies.
– Impact on business and operating results of any costsassociated with obtaining rights in intellectualproperty claimed by others and of adequacy of ourintellectual property protection in general.
• Business and operating results are affected by our abilityto identify and effectively manage risks inherent in ourbusinesses, including, where appropriate, througheffective use of third-party insurance, derivatives, andcapital management techniques, and to meet evolvingregulatory capital standards. In particular, our resultscurrently depend on our ability to manage elevated levelsof impaired assets.
• Business and operating results also include impactsrelating to our equity interest in BlackRock, Inc. and relyto a significant extent on information provided to us byBlackRock. Risks and uncertainties that could affectBlackRock are discussed in more detail by BlackRock inits SEC filings.
• Our 2012 acquisition of RBC Bank (USA) presents uswith risks and uncertainties related to the integration ofthe acquired businesses into PNC, including:– Anticipated benefits of the transaction, including cost
savings and strategic gains, may be significantlyharder or take longer to achieve than expected or maynot be achieved in their entirety as a result ofunexpected factors or events.
– Our ability to achieve anticipated results from thistransaction is dependent also on the extent of creditlosses in the acquired loan portfolios and the extentof deposit attrition, in part related to the state ofeconomic and financial markets. Also, litigation andregulatory and other governmental investigations thatmay be filed or commenced relating to thepre-acquisition business and activities of RBC Bank(USA) could impact the timing or realization ofanticipated benefits to PNC.
– Integration of RBC Bank (USA)’s business andoperations into PNC may take longer than anticipatedor be substantially more costly than anticipated orhave unanticipated adverse results relating to RBCBank (USA)’s or PNC’s existing businesses. PNC’sability to integrate RBC Bank (USA) successfullymay be adversely affected by the fact that thistransaction results in PNC entering severalgeographic markets where PNC did not previouslyhave any meaningful retail presence.
• In addition to the RBC Bank (USA) transaction, we growour business in part by acquiring from time to time other
financial services companies, financial services assets andrelated deposits and other liabilities. These otheracquisitions often present risks and uncertaintiesanalogous to those presented by the RBC Bank (USA)transaction. Acquisition risks include those presented bythe nature of the business acquired as well as risks anduncertainties related to the acquisition transactionsthemselves, regulatory issues, and the integration of theacquired businesses into PNC after closing.
• Competition can have an impact on customer acquisition,growth and retention and on credit spreads and productpricing, which can affect market share, deposits andrevenues. Industry restructuring in the currentenvironment could also impact our business and financialperformance through changes in counterpartycreditworthiness and performance and in the competitiveand regulatory landscape. Our ability to anticipate andrespond to technological changes can also impact ourability to respond to customer needs and meet competitivedemands.
• Business and operating results can also be affected bywidespread natural and other disasters, dislocations,terrorist activities or international hostilities throughimpacts on the economy and financial markets generallyor on us or our counterparties specifically.
We provide greater detail regarding these as well as otherfactors elsewhere in this Report, including in the Risk Factorsand Risk Management sections and the Legal Proceedings andCommitments and Guarantees Notes of the Notes ToConsolidated Financial Statements in this Report. Ourforward-looking statements may also be subject to other risksand uncertainties, including those discussed elsewhere in thisReport or in our other filings with the SEC.
ITEM 7A – QUANTITATIVE AND QUALITATIVE
DISCLOSURES ABOUT MARKET RISKThis information is set forth in the Risk Management sectionof Item 7 and in Note 1 Accounting Policies, Note 9 FairValue, and Note 17 Financial Derivatives in the Notes ToConsolidated Financial Statements in Item 8 of this Report.
The PNC Financial Services Group, Inc. – Form 10-K 117
ITEM 8 – FINANCIAL STATEMENTS AND
SUPPLEMENTARY DATA
REPORT OF INDEPENDENT REGISTERED PUBLIC
ACCOUNTING FIRM
To the Board of Directors and Shareholders of The PNCFinancial Services Group, Inc.
In our opinion, the accompanying consolidated balance sheetsand the related consolidated statements of income andcomprehensive income, of changes in equity, and of cashflows present fairly, in all material respects, the financialposition of The PNC Financial Services Group, Inc. and itssubsidiaries at December 31, 2012 and December 31, 2011,and the results of their operations and their cash flows for eachof the three years in the period ended December 31, 2012 inconformity with accounting principles generally accepted inthe United States of America. Also in our opinion, theCompany maintained, in all material respects, effectiveinternal control over financial reporting as of December 31,2012, based on criteria established in Internal Control –Integrated Framework issued by the Committee of SponsoringOrganizations of the Treadway Commission (COSO). TheCompany’s management is responsible for these financialstatements, for maintaining effective internal control overfinancial reporting and for its assessment of the effectivenessof internal control over financial reporting, included inManagement’s Report on Internal Control over FinancialReporting under Item 9A. Our responsibility is to expressopinions on these financial statements and on the Company’sinternal control over financial reporting based on ourintegrated audits. We conducted our audits in accordance withthe standards of the Public Company Accounting OversightBoard (United States). Those standards require that we planand perform the audits to obtain reasonable assurance aboutwhether the financial statements are free of materialmisstatement and whether effective internal control overfinancial reporting was maintained in all material respects.Our audits of the financial statements included examining, ona test basis, evidence supporting the amounts and disclosuresin the financial statements, assessing the accounting principlesused and significant estimates made by management, and
evaluating the overall financial statement presentation. Ouraudit of internal control over financial reporting includedobtaining an understanding of internal control over financialreporting, assessing the risk that a material weakness exists,and testing and evaluating the design and operatingeffectiveness of internal control based on the assessed risk.Our audits also included performing such other procedures aswe considered necessary in the circumstances. We believe thatour audits provide a reasonable basis for our opinions.
A company’s internal control over financial reporting is aprocess designed to provide reasonable assurance regardingthe reliability of financial reporting and the preparation offinancial statements for external purposes in accordance withgenerally accepted accounting principles. A company’sinternal control over financial reporting includes those policiesand procedures that (i) pertain to the maintenance of recordsthat, in reasonable detail, accurately and fairly reflect thetransactions and dispositions of the assets of the company;(ii) provide reasonable assurance that transactions arerecorded as necessary to permit preparation of financialstatements in accordance with generally accepted accountingprinciples, and that receipts and expenditures of the companyare being made only in accordance with authorizations ofmanagement and directors of the company; and (iii) providereasonable assurance regarding prevention or timely detectionof unauthorized acquisition, use, or disposition of thecompany’s assets that could have a material effect on thefinancial statements.
Because of its inherent limitations, internal control overfinancial reporting may not prevent or detect misstatements.Also, projections of any evaluation of effectiveness to futureperiods are subject to the risk that controls may becomeinadequate because of changes in conditions, or that thedegree of compliance with the policies or procedures maydeteriorate.
/s/ PricewaterhouseCoopers LLP
Pittsburgh, PennsylvaniaFebruary 28, 2013
118 The PNC Financial Services Group, Inc. – Form 10-K
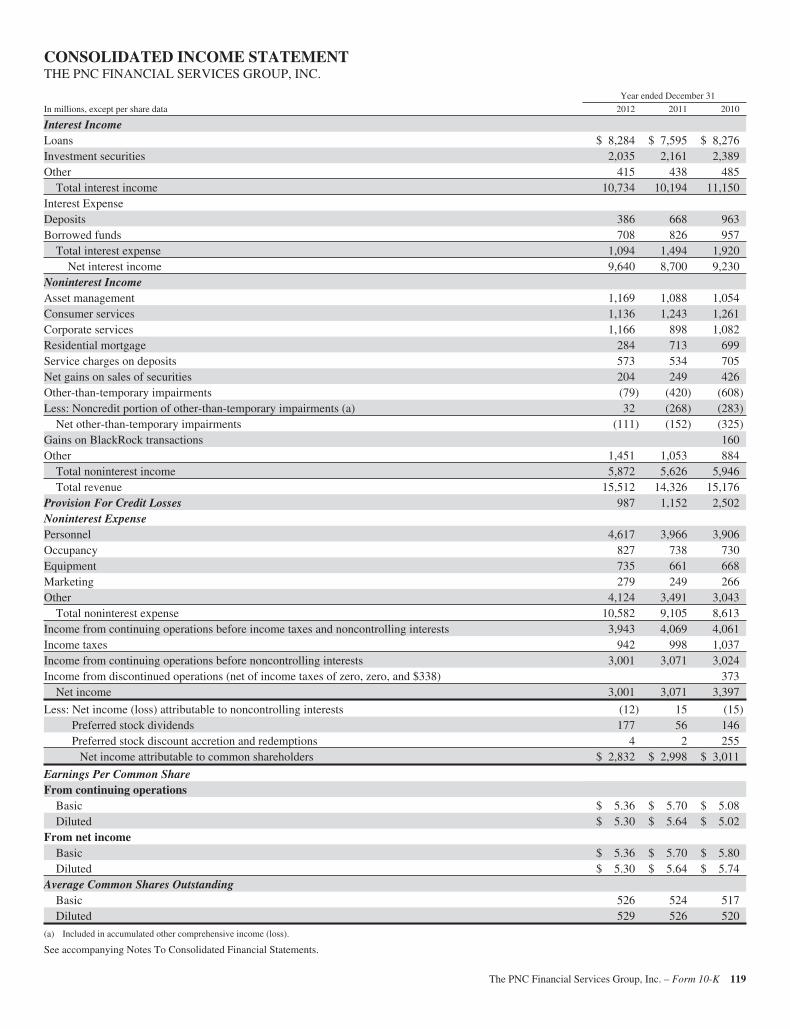
CONSOLIDATED INCOME STATEMENTTHE PNC FINANCIAL SERVICES GROUP, INC.
Year ended December 31
In millions, except per share data 2012 2011 2010
Interest IncomeLoans $ 8,284 $ 7,595 $ 8,276Investment securities 2,035 2,161 2,389Other 415 438 485
Total interest income 10,734 10,194 11,150Interest ExpenseDeposits 386 668 963Borrowed funds 708 826 957
Total interest expense 1,094 1,494 1,920Net interest income 9,640 8,700 9,230
Noninterest IncomeAsset management 1,169 1,088 1,054Consumer services 1,136 1,243 1,261Corporate services 1,166 898 1,082Residential mortgage 284 713 699Service charges on deposits 573 534 705Net gains on sales of securities 204 249 426Other-than-temporary impairments (79) (420) (608)Less: Noncredit portion of other-than-temporary impairments (a) 32 (268) (283)
Net other-than-temporary impairments (111) (152) (325)Gains on BlackRock transactions 160Other 1,451 1,053 884
Total noninterest income 5,872 5,626 5,946Total revenue 15,512 14,326 15,176
Provision For Credit Losses 987 1,152 2,502Noninterest ExpensePersonnel 4,617 3,966 3,906Occupancy 827 738 730Equipment 735 661 668Marketing 279 249 266Other 4,124 3,491 3,043
Total noninterest expense 10,582 9,105 8,613Income from continuing operations before income taxes and noncontrolling interests 3,943 4,069 4,061Income taxes 942 998 1,037Income from continuing operations before noncontrolling interests 3,001 3,071 3,024Income from discontinued operations (net of income taxes of zero, zero, and $338) 373
Net income 3,001 3,071 3,397
Less: Net income (loss) attributable to noncontrolling interests (12) 15 (15)Preferred stock dividends 177 56 146Preferred stock discount accretion and redemptions 4 2 255
Net income attributable to common shareholders $ 2,832 $ 2,998 $ 3,011
Earnings Per Common ShareFrom continuing operations
Basic $ 5.36 $ 5.70 $ 5.08Diluted $ 5.30 $ 5.64 $ 5.02
From net incomeBasic $ 5.36 $ 5.70 $ 5.80Diluted $ 5.30 $ 5.64 $ 5.74
Average Common Shares OutstandingBasic 526 524 517Diluted 529 526 520
(a) Included in accumulated other comprehensive income (loss).
See accompanying Notes To Consolidated Financial Statements.
The PNC Financial Services Group, Inc. – Form 10-K 119
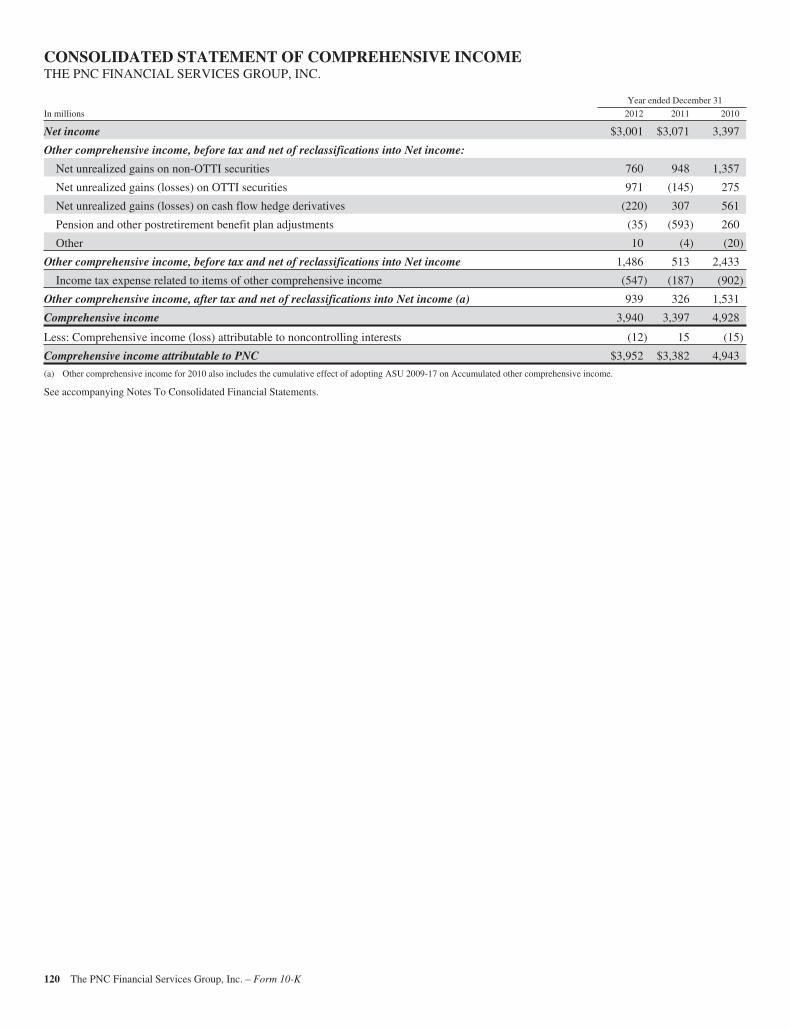
CONSOLIDATED STATEMENT OF COMPREHENSIVE INCOMETHE PNC FINANCIAL SERVICES GROUP, INC.
Year ended December 31
In millions 2012 2011 2010
Net income $3,001 $3,071 3,397
Other comprehensive income, before tax and net of reclassifications into Net income:
Net unrealized gains on non-OTTI securities 760 948 1,357
Net unrealized gains (losses) on OTTI securities 971 (145) 275
Net unrealized gains (losses) on cash flow hedge derivatives (220) 307 561
Pension and other postretirement benefit plan adjustments (35) (593) 260
Other 10 (4) (20)
Other comprehensive income, before tax and net of reclassifications into Net income 1,486 513 2,433
Income tax expense related to items of other comprehensive income (547) (187) (902)
Other comprehensive income, after tax and net of reclassifications into Net income (a) 939 326 1,531
Comprehensive income 3,940 3,397 4,928
Less: Comprehensive income (loss) attributable to noncontrolling interests (12) 15 (15)
Comprehensive income attributable to PNC $3,952 $3,382 4,943
(a) Other comprehensive income for 2010 also includes the cumulative effect of adopting ASU 2009-17 on Accumulated other comprehensive income.
See accompanying Notes To Consolidated Financial Statements.
120 The PNC Financial Services Group, Inc. – Form 10-K
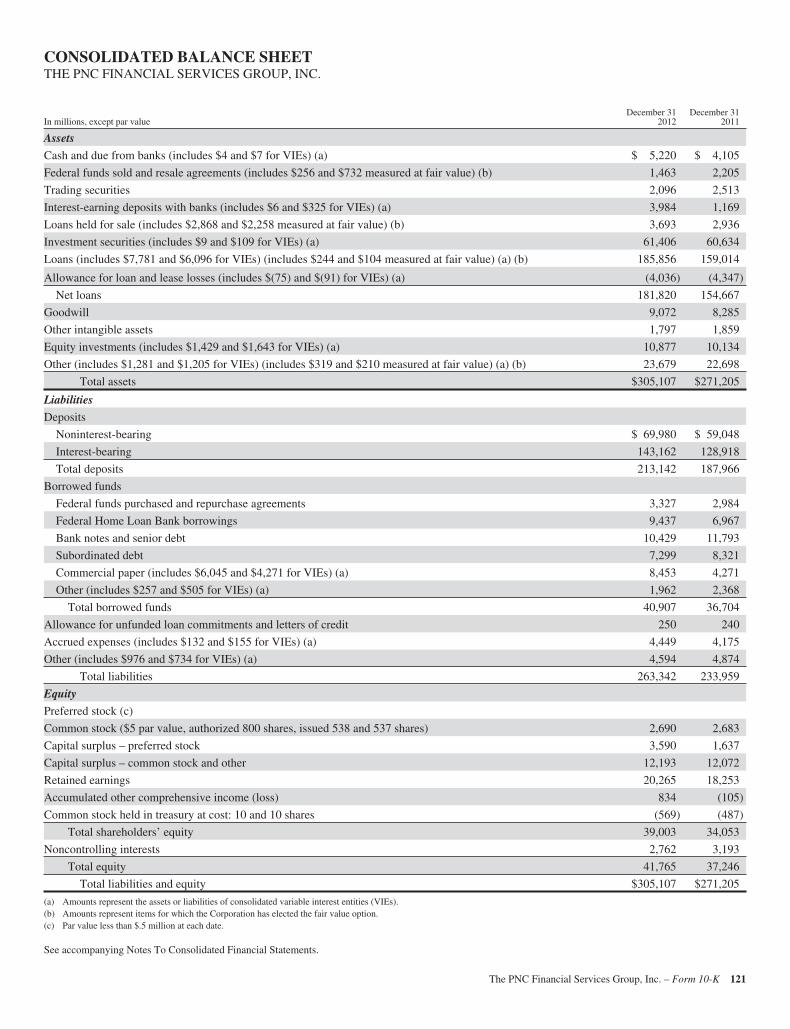
CONSOLIDATED BALANCE SHEETTHE PNC FINANCIAL SERVICES GROUP, INC.
In millions, except par valueDecember 31
2012December 31
2011
Assets
Cash and due from banks (includes $4 and $7 for VIEs) (a) $ 5,220 $ 4,105
Federal funds sold and resale agreements (includes $256 and $732 measured at fair value) (b) 1,463 2,205
Trading securities 2,096 2,513
Interest-earning deposits with banks (includes $6 and $325 for VIEs) (a) 3,984 1,169
Loans held for sale (includes $2,868 and $2,258 measured at fair value) (b) 3,693 2,936
Investment securities (includes $9 and $109 for VIEs) (a) 61,406 60,634
Loans (includes $7,781 and $6,096 for VIEs) (includes $244 and $104 measured at fair value) (a) (b) 185,856 159,014
Allowance for loan and lease losses (includes $(75) and $(91) for VIEs) (a) (4,036) (4,347)
Net loans 181,820 154,667
Goodwill 9,072 8,285
Other intangible assets 1,797 1,859
Equity investments (includes $1,429 and $1,643 for VIEs) (a) 10,877 10,134
Other (includes $1,281 and $1,205 for VIEs) (includes $319 and $210 measured at fair value) (a) (b) 23,679 22,698
Total assets $305,107 $271,205
Liabilities
Deposits
Noninterest-bearing $ 69,980 $ 59,048
Interest-bearing 143,162 128,918
Total deposits 213,142 187,966
Borrowed funds
Federal funds purchased and repurchase agreements 3,327 2,984
Federal Home Loan Bank borrowings 9,437 6,967
Bank notes and senior debt 10,429 11,793
Subordinated debt 7,299 8,321
Commercial paper (includes $6,045 and $4,271 for VIEs) (a) 8,453 4,271
Other (includes $257 and $505 for VIEs) (a) 1,962 2,368
Total borrowed funds 40,907 36,704
Allowance for unfunded loan commitments and letters of credit 250 240
Accrued expenses (includes $132 and $155 for VIEs) (a) 4,449 4,175
Other (includes $976 and $734 for VIEs) (a) 4,594 4,874
Total liabilities 263,342 233,959
Equity
Preferred stock (c)
Common stock ($5 par value, authorized 800 shares, issued 538 and 537 shares) 2,690 2,683
Capital surplus – preferred stock 3,590 1,637
Capital surplus – common stock and other 12,193 12,072
Retained earnings 20,265 18,253
Accumulated other comprehensive income (loss) 834 (105)
Common stock held in treasury at cost: 10 and 10 shares (569) (487)
Total shareholders’ equity 39,003 34,053
Noncontrolling interests 2,762 3,193
Total equity 41,765 37,246
Total liabilities and equity $305,107 $271,205
(a) Amounts represent the assets or liabilities of consolidated variable interest entities (VIEs).(b) Amounts represent items for which the Corporation has elected the fair value option.(c) Par value less than $.5 million at each date.
See accompanying Notes To Consolidated Financial Statements.
The PNC Financial Services Group, Inc. – Form 10-K 121
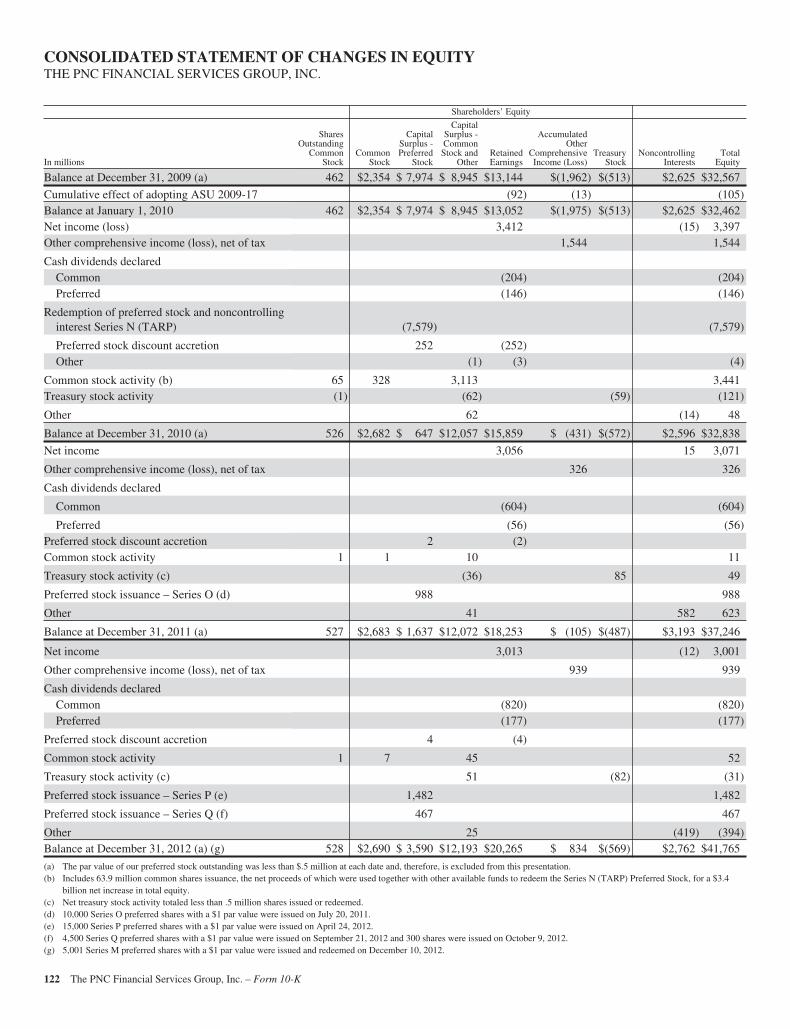
CONSOLIDATED STATEMENT OF CHANGES IN EQUITYTHE PNC FINANCIAL SERVICES GROUP, INC.
Shareholders’ Equity
In millions
SharesOutstanding
CommonStock
CommonStock
CapitalSurplus -Preferred
Stock
CapitalSurplus -CommonStock and
OtherRetainedEarnings
AccumulatedOther
ComprehensiveIncome (Loss)
TreasuryStock
NoncontrollingInterests
TotalEquity
Balance at December 31, 2009 (a) 462 $2,354 $ 7,974 $ 8,945 $13,144 $(1,962) $(513) $2,625 $32,567
Cumulative effect of adopting ASU 2009-17 (92) (13) (105)Balance at January 1, 2010 462 $2,354 $ 7,974 $ 8,945 $13,052 $(1,975) $(513) $2,625 $32,462Net income (loss) 3,412 (15) 3,397Other comprehensive income (loss), net of tax 1,544 1,544
Cash dividends declaredCommon (204) (204)Preferred (146) (146)
Redemption of preferred stock and noncontrollinginterest Series N (TARP) (7,579) (7,579)
Preferred stock discount accretion 252 (252)Other (1) (3) (4)
Common stock activity (b) 65 328 3,113 3,441Treasury stock activity (1) (62) (59) (121)
Other 62 (14) 48
Balance at December 31, 2010 (a) 526 $2,682 $ 647 $12,057 $15,859 $ (431) $(572) $2,596 $32,838
Net income 3,056 15 3,071
Other comprehensive income (loss), net of tax 326 326
Cash dividends declared
Common (604) (604)
Preferred (56) (56)Preferred stock discount accretion 2 (2)Common stock activity 1 1 10 11
Treasury stock activity (c) (36) 85 49
Preferred stock issuance – Series O (d) 988 988
Other 41 582 623
Balance at December 31, 2011 (a) 527 $2,683 $ 1,637 $12,072 $18,253 $ (105) $(487) $3,193 $37,246
Net income 3,013 (12) 3,001
Other comprehensive income (loss), net of tax 939 939
Cash dividends declaredCommon (820) (820)Preferred (177) (177)
Preferred stock discount accretion 4 (4)
Common stock activity 1 7 45 52
Treasury stock activity (c) 51 (82) (31)
Preferred stock issuance – Series P (e) 1,482 1,482
Preferred stock issuance – Series Q (f) 467 467
Other 25 (419) (394)Balance at December 31, 2012 (a) (g) 528 $2,690 $ 3,590 $12,193 $20,265 $ 834 $(569) $2,762 $41,765
(a) The par value of our preferred stock outstanding was less than $.5 million at each date and, therefore, is excluded from this presentation.(b) Includes 63.9 million common shares issuance, the net proceeds of which were used together with other available funds to redeem the Series N (TARP) Preferred Stock, for a $3.4
billion net increase in total equity.(c) Net treasury stock activity totaled less than .5 million shares issued or redeemed.(d) 10,000 Series O preferred shares with a $1 par value were issued on July 20, 2011.(e) 15,000 Series P preferred shares with a $1 par value were issued on April 24, 2012.(f) 4,500 Series Q preferred shares with a $1 par value were issued on September 21, 2012 and 300 shares were issued on October 9, 2012.(g) 5,001 Series M preferred shares with a $1 par value were issued and redeemed on December 10, 2012.
122 The PNC Financial Services Group, Inc. – Form 10-K
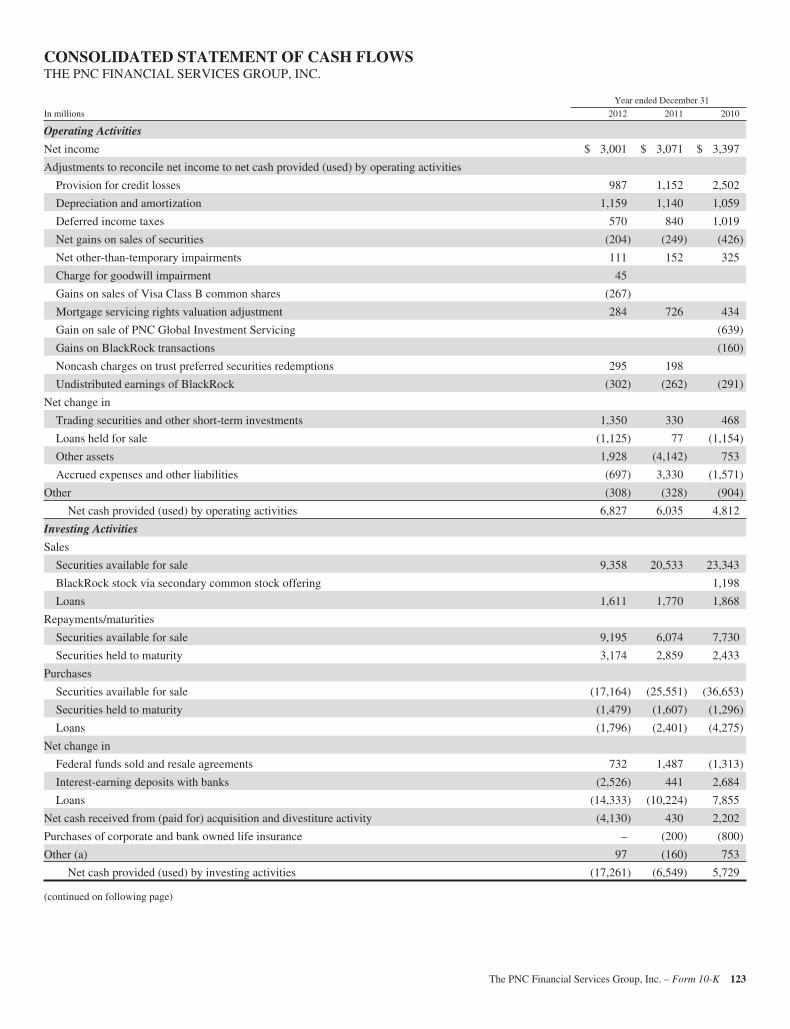
CONSOLIDATED STATEMENT OF CASH FLOWSTHE PNC FINANCIAL SERVICES GROUP, INC.
Year ended December 31
In millions 2012 2011 2010
Operating Activities
Net income $ 3,001 $ 3,071 $ 3,397
Adjustments to reconcile net income to net cash provided (used) by operating activities
Provision for credit losses 987 1,152 2,502
Depreciation and amortization 1,159 1,140 1,059
Deferred income taxes 570 840 1,019
Net gains on sales of securities (204) (249) (426)
Net other-than-temporary impairments 111 152 325
Charge for goodwill impairment 45
Gains on sales of Visa Class B common shares (267)
Mortgage servicing rights valuation adjustment 284 726 434
Gain on sale of PNC Global Investment Servicing (639)
Gains on BlackRock transactions (160)
Noncash charges on trust preferred securities redemptions 295 198
Undistributed earnings of BlackRock (302) (262) (291)
Net change in
Trading securities and other short-term investments 1,350 330 468
Loans held for sale (1,125) 77 (1,154)
Other assets 1,928 (4,142) 753
Accrued expenses and other liabilities (697) 3,330 (1,571)
Other (308) (328) (904)
Net cash provided (used) by operating activities 6,827 6,035 4,812
Investing Activities
Sales
Securities available for sale 9,358 20,533 23,343
BlackRock stock via secondary common stock offering 1,198
Loans 1,611 1,770 1,868
Repayments/maturities
Securities available for sale 9,195 6,074 7,730
Securities held to maturity 3,174 2,859 2,433
Purchases
Securities available for sale (17,164) (25,551) (36,653)
Securities held to maturity (1,479) (1,607) (1,296)
Loans (1,796) (2,401) (4,275)
Net change in
Federal funds sold and resale agreements 732 1,487 (1,313)
Interest-earning deposits with banks (2,526) 441 2,684
Loans (14,333) (10,224) 7,855
Net cash received from (paid for) acquisition and divestiture activity (4,130) 430 2,202
Purchases of corporate and bank owned life insurance – (200) (800)
Other (a) 97 (160) 753
Net cash provided (used) by investing activities (17,261) (6,549) 5,729
(continued on following page)
The PNC Financial Services Group, Inc. – Form 10-K 123
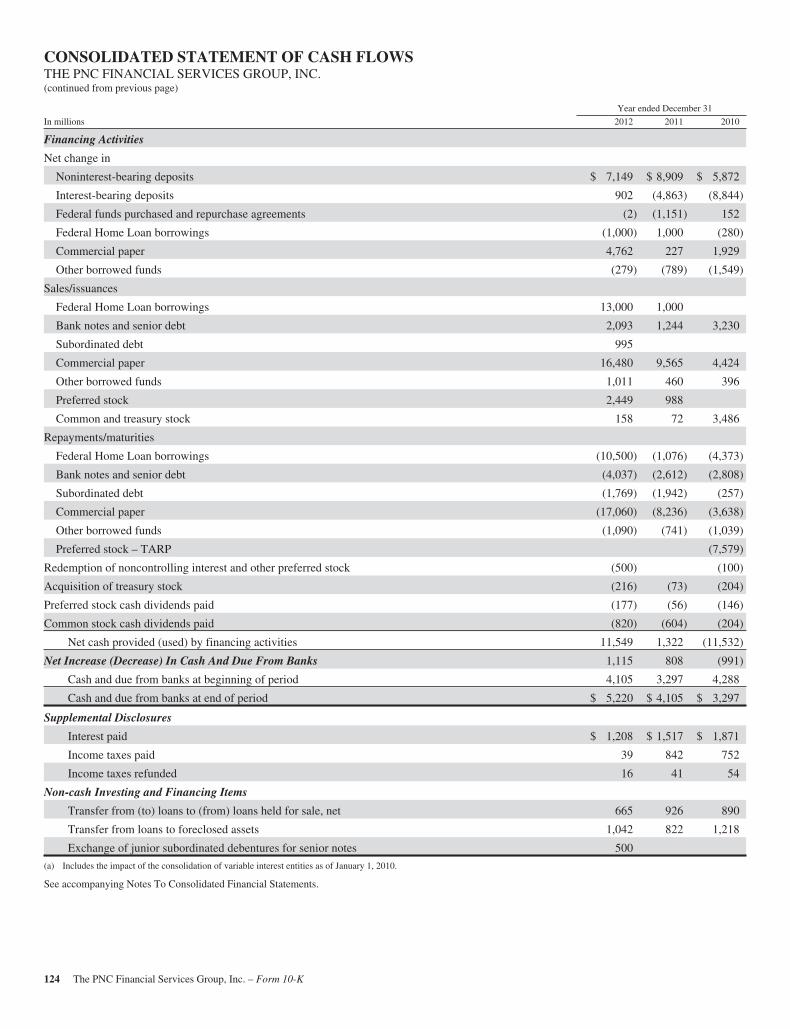
CONSOLIDATED STATEMENT OF CASH FLOWSTHE PNC FINANCIAL SERVICES GROUP, INC.(continued from previous page)
Year ended December 31
In millions 2012 2011 2010
Financing Activities
Net change in
Noninterest-bearing deposits $ 7,149 $ 8,909 $ 5,872
Interest-bearing deposits 902 (4,863) (8,844)
Federal funds purchased and repurchase agreements (2) (1,151) 152
Federal Home Loan borrowings (1,000) 1,000 (280)
Commercial paper 4,762 227 1,929
Other borrowed funds (279) (789) (1,549)
Sales/issuances
Federal Home Loan borrowings 13,000 1,000
Bank notes and senior debt 2,093 1,244 3,230
Subordinated debt 995
Commercial paper 16,480 9,565 4,424
Other borrowed funds 1,011 460 396
Preferred stock 2,449 988
Common and treasury stock 158 72 3,486
Repayments/maturities
Federal Home Loan borrowings (10,500) (1,076) (4,373)
Bank notes and senior debt (4,037) (2,612) (2,808)
Subordinated debt (1,769) (1,942) (257)
Commercial paper (17,060) (8,236) (3,638)
Other borrowed funds (1,090) (741) (1,039)
Preferred stock – TARP (7,579)
Redemption of noncontrolling interest and other preferred stock (500) (100)
Acquisition of treasury stock (216) (73) (204)
Preferred stock cash dividends paid (177) (56) (146)
Common stock cash dividends paid (820) (604) (204)
Net cash provided (used) by financing activities 11,549 1,322 (11,532)
Net Increase (Decrease) In Cash And Due From Banks 1,115 808 (991)
Cash and due from banks at beginning of period 4,105 3,297 4,288
Cash and due from banks at end of period $ 5,220 $ 4,105 $ 3,297
Supplemental Disclosures
Interest paid $ 1,208 $ 1,517 $ 1,871
Income taxes paid 39 842 752
Income taxes refunded 16 41 54
Non-cash Investing and Financing Items
Transfer from (to) loans to (from) loans held for sale, net 665 926 890
Transfer from loans to foreclosed assets 1,042 822 1,218
Exchange of junior subordinated debentures for senior notes 500
(a) Includes the impact of the consolidation of variable interest entities as of January 1, 2010.
See accompanying Notes To Consolidated Financial Statements.
124 The PNC Financial Services Group, Inc. – Form 10-K
NOTES TO CONSOLIDATED FINANCIAL STATEMENTSTHE PNC FINANCIAL SERVICES GROUP, INC.
BUSINESS
PNC is one of the largest diversified financial servicescompanies in the United States and is headquartered inPittsburgh, Pennsylvania.
PNC has businesses engaged in retail banking, corporate andinstitutional banking, asset management, and residentialmortgage banking, providing many of its products andservices nationally, as well as, products and services in PNC’sprimary geographic markets located in Pennsylvania, Ohio,New Jersey, Michigan, Illinois, Maryland, Indiana, NorthCarolina, Florida, Kentucky, Washington, D.C., Delaware,Alabama, Virginia, Georgia, Missouri, Wisconsin and SouthCarolina. PNC also provides certain products and servicesinternationally.
NOTE 1 ACCOUNTING POLICIES
BASIS OF FINANCIAL STATEMENT PRESENTATION
Our consolidated financial statements include the accounts ofthe parent company and its subsidiaries, most of which arewholly owned, and certain partnership interests and variableinterest entities.
We prepared these consolidated financial statements inaccordance with accounting principles generally accepted inthe United States of America (GAAP). We have eliminatedintercompany accounts and transactions. We have alsoreclassified certain prior year amounts to conform to the 2012presentation. These reclassifications did not have a materialimpact on our consolidated financial condition or results ofoperations. We evaluate the materiality of identified errors inthe financial statements using both an income statement and abalance sheet approach, based on relevant quantitative andqualitative factors. Net income includes certain adjustments tocorrect immaterial errors related to previously reportedperiods.
As described in Note 2 Acquisition and Divestiture Activity,on March 2, 2012, PNC acquired 100% of the issued andoutstanding common stock of RBC Bank (USA), the US retailbanking subsidiary of Royal Bank of Canada. As part of theacquisition, PNC also purchased a credit card portfolio fromRBC Bank (Georgia), National Association. The transactionsadded approximately $18.1 billion of deposits and $14.5billion of loans to PNC’s Consolidated Balance Sheet. Inaddition, see discussion of the July 1, 2010 sale of PNCGlobal Investment Servicing Inc. The Consolidated IncomeStatement and related Notes To Consolidated FinancialStatements reflect the global investment servicing business asdiscontinued operations for 2010.
We have considered the impact on these consolidatedfinancial statements of subsequent events.
USE OF ESTIMATES
We prepared these consolidated financial statements usingfinancial information available at the time, which requires usto make estimates and assumptions that affect the amountsreported. Our most significant estimates pertain to our fairvalue measurements, allowances for loan and lease losses andunfunded loan commitments and letters of credit, andaccretion on purchased impaired loans. Actual results maydiffer from the estimates and the differences may be materialto the consolidated financial statements.
INVESTMENT IN BLACKROCK, INC.We account for our investment in the common stock andSeries B Preferred Stock of BlackRock (deemed to be in-substance common stock) under the equity method ofaccounting. In May 2012, we exchanged 2 million shares ofSeries B Preferred Stock of BlackRock for an equal number ofshares of BlackRock common stock. The exchange transactionhad no impact on the carrying value of our investment inBlackRock or our use of the equity method of accounting. Theinvestment in BlackRock is reflected on our ConsolidatedBalance Sheet in Equity investments, while our equity inearnings of BlackRock is reported on our ConsolidatedIncome Statement in Asset management revenue.
As described in Note 16 Stock Based Compensation Plans, wealso hold shares of BlackRock Series C Preferred Stockpursuant to our obligation to partially fund a portion of certainBlackRock long-term incentive plan (LTIP) programs. Sincethese preferred shares are not deemed to be in substancecommon stock, we have elected to account for these preferredshares at fair value and the changes in fair value will offset theimpact of marking-to-market the obligation to deliver theseshares to BlackRock. Our investment in the BlackRock SeriesC Preferred Stock is included on our Consolidated BalanceSheet in Other assets. Our obligation to transfer these shares toBlackRock is classified as a derivative not designated as ahedging instrument under GAAP as disclosed in Note 17Financial Derivatives.
In September 2011, we delivered approximately 1.3 millionshares of the BlackRock Series C Preferred Stock toBlackRock in connection with our obligation.
On January 31, 2013, we transferred an additional 205,350shares to BlackRock in connection with our obligation. Afterthis transfer, we hold approximately 1.3 million shares ofBlackRock Series C Preferred Stock which are available tofund our obligation in connection with the BlackRock LTIPprograms.
The PNC Financial Services Group, Inc. – Form 10-K 125

BUSINESS COMBINATIONS
We record the net assets of companies that we acquire at theirestimated fair value at the date of acquisition and we includethe results of operations of the acquired companies on ourConsolidated Income Statement from the date of acquisition.We recognize, as goodwill, the excess of the acquisition priceover the estimated fair value of the net assets acquired.
SPECIAL PURPOSE ENTITIES
Special purpose entities (SPEs) are defined as legal entitiesstructured for a particular purpose. We use special purposeentities in various legal forms to conduct normal businessactivities. We review the structure and activities of specialpurpose entities for possible consolidation under theapplicable GAAP guidance.
A variable interest entity (VIE) is a corporation, partnership,limited liability company, or any other legal structure used toconduct activities or hold assets that either:
• Does not have equity investors with voting rights thatcan directly or indirectly make decisions about theentity’s activities through those voting rights orsimilar rights, or
• Has equity investors that do not provide sufficientequity for the entity to finance its activities withoutadditional subordinated financial support.
A VIE often holds financial assets, including loans orreceivables, real estate or other property.
VIEs are assessed for consolidation under ASC 810Consolidations when we hold a variable interest in theseentities. We consolidate a VIE if we are its primarybeneficiary. The primary beneficiary of a VIE is determined tobe the party that meets both of the following criteria: (i) hasthe power to make decisions that most significantly affect theeconomic performance of the VIE; and (ii) has the obligationto absorb losses or the right to receive benefits that in eithercase could potentially be significant to the VIE. Uponconsolidation of a VIE, we recognize all of the VIE’s assets,liabilities and noncontrolling interests on our ConsolidatedBalance Sheet. See Note 3 Loan Sale and Servicing Activitiesand Variable Interest Entities for information about VIEs thatwe do not consolidate but in which we hold a significantvariable interest.
On January 1, 2010, we adopted Accounting Standard Update(ASU) 2009-17, Consolidations (Topic 810): Improvements toFinancial Reporting by Enterprises Involved with VariableInterest Entities. This guidance replaces previous guidance byrequiring an enterprise to perform a qualitative analysis asopposed to a quantitative analysis to determine if it is theprimary beneficiary of a VIE. The qualitative analysisconsiders the purpose and the design of the VIE as well as therisks that the VIE was designed to either create or passthrough to variable interest holders. This guidance also
removed the former scope exception for qualifying special-purpose entities, contained new criteria for determining theprimary beneficiary of a VIE, and increased the frequency ofrequired reassessments to determine whether an entity is theprimary beneficiary of a VIE. As a result of the adoption ofASU 2009-17, we consolidated Market Street Funding LLC(Market Street), a credit card securitization trust, and certainLow Income Housing Tax Credit (LIHTC) investments.
REVENUE RECOGNITION
We earn interest and noninterest income from various sources,including:
• Lending,• Securities portfolio,• Asset management,• Customer deposits,• Loan sales and servicing,• Brokerage services,• Sale of loans and securities,• Certain private equity activities, and• Securities and derivatives trading activities, including
foreign exchange.
We earn fees and commissions from:• Issuing loan commitments, standby letters of credit
and financial guarantees,• Selling various insurance products,• Providing treasury management services,• Providing merger and acquisition advisory and
related services, and• Participating in certain capital markets transactions.
Revenue earned on interest-earning assets including unearnedincome and the amortization/accretion of premiums ordiscounts recognized on acquired loans is recognized based onthe constant effective yield of the financial instrument, orbased on other applicable accounting guidance.
Asset management fees are generally based on a percentage ofthe fair value of the assets under management. The captionAsset management also includes our share of the earnings ofBlackRock recognized under the equity method of accounting.This caption also includes any performance fees which aregenerally based on a percentage of the returns on such assetsand are recorded as earned.
Service charges on deposit accounts are recognized whenearned. Brokerage fees and gains and losses on the sale ofsecurities and certain derivatives are recognized on a trade-date basis.
We record private equity income or loss based on changes inthe valuation of the underlying investments or when wedispose of our interest.
We recognize gain/(loss) on changes in the fair value ofcertain financial instruments where we have elected the fair
126 The PNC Financial Services Group, Inc. – Form 10-K

value option. These financial instruments include certaincommercial and residential mortgage loans originated for sale,certain residential mortgage portfolio loans, resale agreementsand our investment in BlackRock Series C preferred stock. Wealso recognize gain/(loss) on changes in the fair value ofresidential mortgage servicing rights (MSRs), which aremeasured at fair value.
We recognize revenue from servicing residential mortgages,commercial mortgages and other consumer loans as earnedbased on the specific contractual terms. These revenues, aswell as impairment on servicing rights, are reported on theConsolidated Income Statement in the line items Residentialmortgage, Corporate services and Consumer services. Werecognize revenue from securities, derivatives and foreignexchange trading, as well as securities underwriting activities,as these transactions occur or as services are provided. Werecognize gains from the sale of loans upon receipt of cash.
When appropriate, revenue is reported net of associatedexpenses in accordance with GAAP.
CASH AND CASH EQUIVALENTS
Cash and due from banks are considered “cash and cashequivalents” for financial reporting purposes.
INVESTMENTS
We hold interests in various types of investments. Theaccounting for these investments is dependent on a number offactors including, but not limited to, items such as:
• Ownership interest,• Our plans for the investment, and• The nature of the investment.
DEBT SECURITIES
Debt securities are recorded on a trade-date basis. We classifydebt securities as held to maturity and carry them at amortizedcost if we have the positive intent and ability to hold thesecurities to maturity. Debt securities that we purchase forshort-term appreciation, trading purposes or those with non-bifurcated embedded derivatives are carried at fair value andclassified as Trading securities on our Consolidated BalanceSheet. Realized and unrealized gains and losses on tradingsecurities are included in Other noninterest income.
Debt securities not classified as held to maturity or trading aredesignated as securities available for sale and carried at fairvalue with unrealized gains and losses, net of income taxes,reflected in Accumulated other comprehensive income (loss).
On at least a quarterly basis, we review all debt securities thatare in an unrealized loss position for other than temporaryimpairment (OTTI). An investment security is deemedimpaired if the fair value of the investment is less than itsamortized cost. Amortized cost includes adjustments (if any)made to the cost basis of an investment for accretion,amortization, previous other-than-temporary impairments and
hedging gains and losses. After an investment security isdetermined to be impaired, we evaluate whether the decline invalue is other-than-temporary. As part of this evaluation, wetake into consideration whether we intend to sell the securityor whether it is more likely than not that we will be required tosell the security before expected recovery of its amortizedcost. We also consider whether or not we expect to receive allof the contractual cash flows from the investment based onfactors that include, but are not limited to: thecreditworthiness of the issuer and, in the case of securitiescollateralized by consumer and commercial loan assets, thehistorical and projected performance of the underlyingcollateral. In addition, we may also evaluate the business andfinancial outlook of the issuer, as well as broader industry andsector performance indicators. Declines in the fair value ofavailable for sale debt securities that are deemed other-than-temporary and are attributable to credit deterioration arerecognized on our Consolidated Income Statement in theperiod in which the determination is made. Declines in fairvalue which are deemed other-than-temporary and attributableto factors other than credit deterioration are recognized inAccumulated other comprehensive income (loss) on ourConsolidated Balance Sheet.
We include all interest on debt securities, includingamortization of premiums and accretion of discounts oninvestment securities, in net interest income using the constanteffective yield method. Effective yields reflect either theeffective interest rate implicit in the security at the date ofacquisition or the effective interest rate determined based onsignificantly improved cash flows subsequent to impairment.We compute gains and losses realized on the sale of availablefor sale debt securities on a specific security basis. Thesesecurities gains/(losses) are included in the caption Net gainson sales of securities on the Consolidated Income Statement.
In certain situations, management may elect to transfer certaindebt securities from the securities available for sale to the heldto maturity classification. In such cases, any unrealized gain orloss included in Accumulated other comprehensive income(loss) at the time of transfer is amortized over the remaininglife of the security as a yield adjustment such that only theremaining initial discount/premium from the purchase date isrecognized in income.
EQUITY SECURITIES AND PARTNERSHIP INTERESTS
We account for equity securities and equity investments otherthan BlackRock and private equity investments under one ofthe following methods:
• Marketable equity securities are recorded on a trade-date basis and are accounted for based on thesecurities’ quoted market prices from a nationalsecurities exchange. Those purchased with theintention of recognizing short-term profits areclassified as trading and included in trading securitieson our Consolidated Balance Sheet. Both realizedand unrealized gains and losses on trading securities
The PNC Financial Services Group, Inc. – Form 10-K 127
are included in Noninterest income. Marketableequity securities not classified as trading aredesignated as securities available for sale withunrealized gains and losses, net of income taxes,reflected in Accumulated other comprehensiveincome (loss). Any unrealized losses that we havedetermined to be other-than-temporary on securitiesclassified as available for sale are recognized incurrent period earnings.
• For investments in limited partnerships, limitedliability companies and other investments that are notrequired to be consolidated, we use either the equitymethod or the cost method of accounting. We use theequity method for general and limited partnerownership interests and limited liability companies inwhich we are considered to have significant influenceover the operations of the investee and when the netasset value of our investment reflects our economicinterest in the underlying investment. Under theequity method, we record our equity ownership shareof net income or loss of the investee in Noninterestincome. We use the cost method for all otherinvestments. Under the cost method, there is nochange to the cost basis unless there is an other-than-temporary decline in value or dividends are received.If the decline is determined to be other-than-temporary, we write down the cost basis of theinvestment to a new cost basis that representsrealizable value. The amount of the write-down isaccounted for as a loss included in Other noninterestincome. Distributions received from the income of aninvestee on cost method investments are included inNoninterest income. Investments described above areincluded in the caption Equity investments on theConsolidated Balance Sheet.
PRIVATE EQUITY INVESTMENTS
We report private equity investments, which include directinvestments in companies, affiliated partnership interests andindirect investments in private equity funds, at estimated fairvalue. These estimates are based on available information andmay not necessarily represent amounts that we will ultimatelyrealize through distribution, sale or liquidation of theinvestments. Fair value of publicly traded direct investmentsare determined using quoted market prices and are subject tovarious discount factors for legal or contractual salesrestrictions, when appropriate. The valuation proceduresapplied to direct investments in private companies includetechniques such as multiples of adjusted earnings of the entity,independent appraisals, anticipated financing and saletransactions with third parties, or the pricing used to value theentity in a recent financing transaction. We value affiliatedpartnership interests based on the underlying investments ofthe partnership using procedures consistent with those appliedto direct investments. We value indirect investments in privateequity funds based on net asset value as provided in the
financial statements that we receive from their managers. Dueto the time lag in our receipt of the financial information andbased on a review of investments and valuation techniquesapplied, adjustments to the manager-provided values are madewhen available recent portfolio company information ormarket information indicates significant changes in value fromthat provided by the manager of the fund. We include allprivate equity investments on the Consolidated Balance Sheetin the caption Equity investments. Changes in the fair value ofprivate equity investments are recognized in noninterestincome.
We consolidate affiliated partnerships when we are thegeneral partner and have determined that we have control ofthe partnership or are the primary beneficiary if the entity is aVIE. The portion we do not own is reflected in the captionNoncontrolling interests on the Consolidated Balance Sheet.
LOANS
Loans are classified as held for investment when managementhas both the intent and ability to hold the loan for theforeseeable future, or until maturity or payoff. Management’sintent and view of the foreseeable future may change based onchanges in business strategies, the economic environment,market conditions and the availability of governmentprograms.
Measurement of delinquency status is based on the contractualterms of each loan. Loans that are 30 days or more past due interms of payment are considered delinquent.
Except as described below, loans held for investment arestated at the principal amounts outstanding, net of unearnedincome, unamortized deferred fees and costs on originatedloans, and premiums or discounts on purchased loans. Intereston performing loans (excluding purchased impaired loans,which is further discussed below) is accrued based on theprincipal amount outstanding and recorded in interest incomeas earned using the constant effective yield method. Loanorigination fees, direct loan origination costs, and loanpremiums and discounts are deferred and accreted oramortized into net interest income, over periods not exceedingthe contractual life of the loan.
When loans are redesignated from held for investment to heldfor sale, specific reserves and allocated pooled reservesincluded in the allowance for loan and lease losses (ALLL) arecharged-off to reduce the basis of the loans to the lower ofcost or estimated fair value less cost to sell.
In addition to originating loans, we also acquire loans throughportfolio purchases or acquisitions of other financial servicescompanies. For certain acquired loans that have experienced adeterioration of credit quality, we follow the guidancecontained in ASC 310-30 Loans and Debt Securities Acquiredwith Deteriorated Credit Quality. Under this guidance,acquired purchased impaired loans are to be recorded at fair
128 The PNC Financial Services Group, Inc. – Form 10-K
value without the carryover of any existing valuationallowances. Evidence of credit quality deterioration mayinclude information and statistics regarding bankruptcyevents, updated borrower credit scores, such as Fair IsaacCorporation scores (FICO), past due status, and updated loan-to-value (LTV) ratios. We review the loans acquired forevidence of credit quality deterioration and determine if it isprobable that we will be unable to collect all contractualamounts due, including both principal and interest. When bothconditions exist, we estimate the amount and timing ofundiscounted expected cash flows at acquisition for each loaneither individually or on a pool basis. We estimate the cashflows expected to be collected using internal models thatincorporate management’s best estimate of current keyassumptions, such as default rates, loss severity and paymentspeeds. Collateral values are also incorporated into cash flowestimates. Late fees, which are contractual but not expected tobe collected, are excluded from expected future cash flows.
The accretable yield is calculated based upon the differencebetween the undiscounted expected future cash flows of theloans and the recorded investment in the loans. This amount isaccreted into income over the life of the loan or pool using theconstant effective yield method. Subsequent decreases inexpected cash flows that are attributable, at least in part, tocredit quality are recognized as impairments through a chargeto the provision for credit losses resulting in an increase in theALLL. Subsequent increases in expected cash flows arerecognized as a recovery of previously recorded ALLL orprospectively through an adjustment of the loan’s or pool’syield over its remaining life.
The nonaccretable yield represents the difference between theexpected undiscounted cash flows of the loans and the totalcontractual cash flows (including principal and future interestpayments) at acquisition and throughout the remaining lives ofthe loans.
LEASES
We provide financing for various types of equipmentincluding aircraft, energy and power systems and vehiclesthrough a variety of lease arrangements. Direct financingleases are carried at the aggregate of lease payments plusestimated residual value of the leased property, less unearnedincome. Leveraged leases, a form of financing lease, arecarried net of nonrecourse debt. We recognize income overthe term of the lease using the constant effective yield method.Lease residual values are reviewed for other-than-temporaryimpairment at least annually. Gains or losses on the sale ofleased assets are included in Other noninterest income whilevaluation adjustments on lease residuals are included in Othernoninterest expense.
LOAN SALES, LOAN SECURITIZATIONS AND RETAINED
INTERESTS
We recognize the sale of loans or other financial assets whenthe transferred assets are legally isolated from our creditorsand the appropriate accounting criteria are met. We have soldmortgage, credit card and other loans through securitizationtransactions. In a securitization, financial assets are transferredinto trusts or to SPEs in transactions to effectively legallyisolate the assets from PNC. Where the transferor is adepository institution, legal isolation is accomplished throughcompliance with specific rules and regulations of the relevantregulatory authorities. Where the transferor is not a depositoryinstitution, legal isolation is accomplished through utilizationof a two-step securitization structure.
ASC Topic 860 Accounting For Transfers of Financial Assetsrequires a true sale legal analysis to address several relevantfactors, such as the nature and level of recourse to thetransferor, and the amount and nature of retained interests inthe loans sold. The analytical conclusion as to a true sale isnever absolute and unconditional, but contains qualificationsbased on the inherent equitable powers of a bankruptcy court,as well as the unsettled state of the common law, or powers ofthe FDIC as a conservator or receiver. Once the legal isolationtest has been met, other factors concerning the nature andextent of the transferor’s control and the rights of thetransferee over the transferred assets are taken into account inorder to determine whether derecognition of assets iswarranted.
In a securitization, the trust or SPE issues beneficial interestsin the form of senior and subordinated securities backed orcollateralized by the assets sold to the trust. The senior classesof the asset-backed securities typically receive investmentgrade credit ratings at the time of issuance. These ratings aregenerally achieved through the creation of lower-ratedsubordinated classes of asset-backed securities, as well assubordinated or residual interests. In certain cases, we mayretain a portion or all of the securities issued, interest-onlystrips, one or more subordinated tranches, servicing rights and,in some cases, cash reserve accounts. Securitized loans areremoved from the balance sheet and a net gain or loss isrecognized in noninterest income at the time of initial sale.Gains or losses recognized on the sale of the loans depend onthe fair value of the loans sold and the retained interests at thedate of sale. We generally estimate the fair value of theretained interests based on the present value of future expectedcash flows using assumptions as to discount rates, interestrates, prepayment speeds, credit losses and servicing costs, ifapplicable.
With the exception of loan sales to certain US governmentchartered entities, our loan sales and securitizations aregenerally structured without recourse to us except forrepresentations and warranties and with no restrictions on theretained interests. We originate, sell and service mortgage
The PNC Financial Services Group, Inc. – Form 10-K 129

loans under the Federal National Mortgage Association(FNMA) Delegated Underwriting and Servicing (DUS)program. Under the provisions of the DUS program, weparticipate in a loss-sharing arrangement with FNMA. Weparticipated in a similar program with the Federal Home LoanMortgage Corporation (FHLMC). When we are obligated forloss-sharing or recourse, our policy is to record such liabilitiesinitially at fair value and subsequently reserve for estimatedlosses in accordance with guidance contained in applicableGAAP. Refer to Note 24 Commitments and Guarantees formore information about our obligations related to sales ofloans under these programs.
On January 1, 2010, we adopted ASU 2009-16 Transfers andServicing (Topic 860): Accounting For Transfers of FinancialAssets. This guidance removed the concept of a qualifyingspecial-purpose entity under previous GAAP. The guidancefurther clarified that an entity must consider all arrangementsor agreements made contemporaneously with or incontemplation of a transfer even if not entered into at the timeof the transfer when applying surrender of control conditions.Additionally, this guidance established conditions foraccounting and reporting for transfer of a portion of afinancial asset, modified the asset sale/derecognition criteria,and changed how retained interests are initially measured.
LOANS HELD FOR SALE
We designate loans as held for sale when we have the intent tosell them. We transfer loans to the Loans held for salecategory at the lower of cost or estimated fair value less costto sell. At the time of transfer, write-downs on the loans arerecorded as charge-offs. We establish a new cost basis upontransfer. Any subsequent lower-of-cost-or-market adjustmentis determined on an individual loan basis and is recognized asa valuation allowance with any charges included in Othernoninterest income. Gains or losses on the sale of these loansare included in Other noninterest income when realized.
We have elected to account for certain commercial mortgageloans held for sale at fair value. The changes in the fair valueof these loans are measured and recorded in Other noninterestincome each period. See Note 9 Fair Value for additionalinformation. Also, we elected to account for residential realestate loans held for sale, which were not purchased impairedloans, at fair value.
Interest income with respect to loans held for sale classified asperforming is accrued based on the principal amountoutstanding and the loan’s contractual interest rate.
In certain circumstances, loans designated as held for sale maybe transferred to held for investment based on a change instrategy. We transfer these loans at the lower of cost orestimated fair value; however, any loans held for sale anddesignated at fair value will remain at fair value for the life ofthe loan.
NONPERFORMING ASSETS
Nonperforming assets include nonaccrual loans and leases,including nonperforming troubled debt restructurings (TDRs)and other real estate owned and foreclosed assets.
Nonperforming loans are those loans that have deteriorated incredit quality to the extent that full collection of contractualprincipal and interest is not probable. When a loan isdetermined to be nonperforming (and as a result is impaired),the accrual of interest is ceased and the loan is classified asnonaccrual. The current year accrued and uncollected interestis reversed out of net interest income.
Additionally, any prior year accrued and uncollected interestis charged-off.
A loan acquired and accounted for under ASC 310-30 Loansand Debt Securities Acquired with Deteriorated Credit Qualityis reported as an accruing loan and a performing asset due tothe accretion of interest income.
We generally classify Commercial Lending (Commercial,Commercial Real Estate, and Equipment Lease Financing)loans as nonaccrual (and therefore nonperforming) when wedetermine that the collection of interest or principal is notprobable or when delinquency of interest or principalpayments has existed for 90 days or more and the loans arenot well-secured and/or in the process of collection. A loan isconsidered well-secured when the collateral in the form ofliens on (or pledges of) real or personal property, includingmarketable securities, has a realizable value sufficient todischarge the debt in full, including accrued interest. Suchfactors that would lead to nonperforming status would include,but are not limited to, the following:
• Deterioration in the financial position of the borrowerresulting in the loan moving from accrual to cashbasis accounting,
• The collection of principal or interest is 90 days ormore past due unless the asset is well-secured and/orin the process of collection,
• Reasonable doubt exists as to the certainty of theborrower’s future debt service ability, whether 90days have passed or not,
• The borrower has filed or will likely file forbankruptcy,
• The bank advances additional funds to coverprincipal or interest,
• We are in the process of liquidating the assets of acommercial borrower, or
• We are pursuing remedies under a guarantee.
We charge-off commercial nonaccrual loans when wedetermine that a specific loan, or portion thereof, isuncollectible. This determination is based on the specific factsand circumstances of the individual loan. In making thisdetermination, we consider the viability of the business orproject as a going concern, the past due status when the assetis not well-secured, the expected cash flows to repay the loan,the value of the collateral, and the ability and willingness ofany guarantors to perform.
130 The PNC Financial Services Group, Inc. – Form 10-K
Effective in the second quarter of 2011, the commercialnonaccrual policy was applied to certain small business creditcard balances. This change resulted in loans being placed onnonaccrual status when they become 90 days or more pastdue. We continue to charge-off these loans at 180 days pastdue.
Additionally, in general, for smaller dollar commercial loansof $1 million or less, a partial or full charge-off will occur at120 days past due for term loans and 180 days past due forrevolvers.
Home equity installment loans, lines of credit, and residentialreal estate loans that are not well-secured and/or not in theprocess of collection are charged-off at 180 days past due tothe estimated fair value of the collateral less costs to sell.
A consumer loan is considered well-secured when thecollateral in the form of liens on (or pledges of) real orpersonal property, including marketable securities, has arealizable value sufficient to discharge the debt in full,including accrued interest. Starting in the first quarter of 2012,home equity installment loans and lines of credit, whetherwell-secured or not, are classified as nonaccrual at 90 dayspast due instead of the prior policy of nonaccrual classificationat 180 days past due. Well-secured residential real estate loansare classified as nonaccrual at 180 days past due.
Most consumer loans and lines of credit, not secured byresidential real estate, are charged off after 120 to 180 dayspast due. Generally, they are not placed on nonaccrual statusas permitted by regulatory guidance.
If payment is received while a loan is nonperforming,generally the payment is first applied to the recordedinvestment; once this principal obligation has been fulfilled,payments are applied to recover any charged-off amountsrelated to the impaired loan that might exist. Finally, if bothprincipal and any charge-offs have been recovered, then thepayment will be recorded as interest income.
A TDR is a loan whose terms have been restructured in amanner that grants a concession to a borrower experiencingfinancial difficulty. TDRs may include restructuring certainterms of loans, receipts of assets from debtors in partialsatisfaction of loans, or a combination thereof.
In April 2011, the FASB issued ASU 2011-02 Receivables(Topic 310): A Creditor’s Determination of Whether aRestructuring Is a Troubled Debt Restructuring. The ASUclarifies when a loan restructuring constitutes a troubled debtrestructuring (TDR). This ASU (i) eliminates the sole use ofthe borrowers’ effective interest rate test to determine if aconcession has occurred on the part of the creditor,(ii) requires a restructuring with below market terms to beconsidered in determining classification as a TDR,(iii) specifies that a borrower not currently in default may still
be experiencing financial difficulty when payment default is“probable in the foreseeable future,” and (iv) specifies that adelay in payment should be considered along with all otherfactors in determining classification as a TDR. We identifiedas TDRs certain loans for which the allowance for creditlosses had previously been measured under a generalallowance for credit losses methodology. Upon identifyingthose loans as TDRs, we accounted for them as impairedunder the guidance in ASC 310-10-35.
See Note 5 Asset Quality and Note 7 Allowances for Loan andLease Losses and Unfunded Loan Commitments and Lettersof Credit for additional TDR information.
Nonaccrual loans are generally not returned to accrual statusuntil the obligation is brought current and the borrower hasperformed in accordance with the contractual terms for areasonable period of time and collection of the contractualprincipal and interest is no longer in doubt.
Foreclosed assets are comprised of any asset seized orproperty acquired through a foreclosure proceeding oracceptance of a deed-in-lieu of foreclosure. Other real estateowned is comprised principally of commercial real estate andresidential real estate properties obtained in partial or totalsatisfaction of loan obligations. After obtaining a foreclosurejudgment, or in some jurisdictions the initiation ofproceedings under a power of sale in the loan instruments, theproperty will be sold. When we are awarded title, we transferthe loan to foreclosed assets included in Other assets on ourConsolidated Balance Sheet. Property obtained in satisfactionof a loan is initially recorded at estimated fair value less costto sell. Based upon the estimated fair value less cost to sell,the recorded investment of the loan is adjusted and, typically,a charge-off or recovery is recognized to the Allowance forLoan and Lease Losses (ALLL). We estimate fair valuesprimarily based on appraisals, or sales agreements with thirdparties. Anticipated recoveries and government guarantees arealso considered in evaluating the potential impairment ofloans at the date of transfer.
Subsequently, foreclosed assets are valued at the lower of theamount recorded at acquisition date or estimated fair valueless cost to sell. Valuation adjustments on these assets andgains or losses realized from disposition of such property arereflected in Other noninterest expense.
See Note 5 Asset Quality and Note 7 Allowances for Loan andLease Losses and Unfunded Loan Commitments and Lettersof Credit for additional information.
The PNC Financial Services Group, Inc. – Form 10-K 131
ALLOWANCE FOR LOAN AND LEASE LOSSES
We maintain the ALLL at a level that we believe to beappropriate to absorb estimated probable credit losses incurredin the loan and lease portfolios as of the balance sheet date.Our determination of the allowance is based on periodicevaluations of these loan and lease portfolios and otherrelevant factors. This evaluation is inherently subjective as itrequires material estimates, all of which may be susceptible tosignificant change, including, among others:
• Probability of default (PD),• Loss given default (LGD),• Outstanding balance of the loan,• Movement through delinquency stages,• Amounts and timing of expected future cash flows,• Value of collateral, and• Qualitative factors, such as changes in current
economic conditions, that may not be reflected inhistorical results.
While our reserve methodologies strive to reflect all relevantrisk factors, there continues to be uncertainty associated with,but not limited to, potential imprecision in the estimationprocess due to the inherent time lag of obtaining informationand normal variations between estimates and actual outcomes.We provide additional reserves that are designed to providecoverage for losses attributable to such risks. The ALLL alsoincludes factors which may not be directly measured in thedetermination of specific or pooled reserves. Such qualitativefactors may include:
• Industry concentrations and conditions,• Recent credit quality trends,• Recent loss experience in particular portfolios,• Recent macro-economic factors,• Changes in risk selection and underwriting
standards, and• Timing of available information, including the
performance of first lien positions.
In determining the appropriateness of the ALLL, we makespecific allocations to impaired loans and allocations toportfolios of commercial and consumer loans.
Nonperforming loans are considered impaired under ASC 310,Receivables and are evaluated for a specific reserve. Specificreserve allocations are determined as follows:
• For commercial nonperforming loans and TDRsgreater than or equal to a defined dollar threshold,specific reserves are based on an analysis of thepresent value of the loan’s expected future cashflows, the loan’s observable market price or the fairvalue of the collateral.
• For commercial nonperforming loans and TDRsbelow the defined dollar threshold, the loans areaggregated for purposes of measuring specificreserve impairment using the applicable loan’s LGDpercentage multiplied by the balance of the loan.
• Consumer nonperforming loans are collectivelyreserved for unless classified as TDRs, for whichspecific reserves are based on an analysis of thepresent value of the loan’s expected future cashflows.
• For purchased impaired loans, subsequent decreasesto the net present value of expected cash flows willgenerally result in an impairment charge to theprovision for credit losses, resulting in an increase tothe ALLL.
When applicable, this process is applied across all the loanclasses in a similar manner. However, as previously discussed,certain consumer loans and lines of credit, not secured byresidential real estate, are charged off instead of beingclassified as nonperforming.
Our credit risk management policies, procedures and practicesare designed to promote sound lending standards and prudentcredit risk management. We have policies, procedures andpractices that address financial statement requirements,collateral review and appraisal requirements, advance ratesbased upon collateral types, appropriate levels of exposure,cross-border risk, lending to specialized industries or borrowertype, guarantor requirements, and regulatory compliance.
See Note 5 Asset Quality and Note 7 Allowances for Loan andLease Losses and Unfunded Loan Commitments and Lettersof Credit for additional information.
ALLOWANCE FOR UNFUNDED LOAN COMMITMENTS AND
LETTERS OF CREDIT
We maintain the allowance for unfunded loan commitmentsand letters of credit at a level we believe is appropriate toabsorb estimated probable credit losses on these unfundedcredit facilities as of the balance sheet date. We determine theallowance based on periodic evaluations of the unfundedcredit facilities, including an assessment of the probability ofcommitment usage, credit risk factors, and, solely forcommercial lending, the terms and expiration dates of theunfunded credit facilities. The reserve for unfunded loancommitments is estimated in a manner similar to themethodology used for determining reserves for fundedexposures. The allowance for unfunded loan commitments andletters of credit is recorded as a liability on the ConsolidatedBalance Sheet. Net adjustments to the allowance for unfundedloan commitments and letters of credit are included in theprovision for credit losses.
See Note 5 Asset Quality and Note 7 Allowances for Loan andLease Losses and Unfunded Loan Commitments and Lettersof Credit for additional information.
132 The PNC Financial Services Group, Inc. – Form 10-K
MORTGAGE AND OTHER SERVICING RIGHTS
We provide servicing under various loan servicing contractsfor commercial, residential and other consumer loans. Thesecontracts are either purchased in the open market or retainedas part of a loan securitization or loan sale. All newly acquiredor originated servicing rights are initially measured at fairvalue. Fair value is based on the present value of the expectedfuture cash flows, including assumptions as to:
• Deposit balances and interest rates for escrow andcommercial reserve earnings,
• Discount rates,• Stated note rates,• Estimated prepayment speeds, and• Estimated servicing costs.
For subsequent measurements of these assets, we have electedto utilize either the amortization method or fair valuemeasurement based upon the asset class and our riskmanagement strategy for managing these assets. Forcommercial mortgage loan servicing rights, we use theamortization method. This election was made based on theunique characteristics of the commercial mortgage loansunderlying these servicing rights with regard to market inputsused in determining fair value and how we manage the risksinherent in the commercial mortgage servicing rights assets.Specific risk characteristics of commercial mortgages includeloan type, currency or exchange rate, interest rates, expectedcash flows and changes in the cost of servicing. We recordthese servicing assets as Other intangible assets and amortizethem over their estimated lives based on estimated netservicing income. On a quarterly basis, we test the assets forimpairment by categorizing the pools of assets underlying theservicing rights into various strata. If the estimated fair valueof the assets is less than the carrying value, an impairment lossis recognized and a valuation reserve is established.
For servicing rights related to residential real estate loans, weapply the fair value method. This election was made to beconsistent with our risk management strategy to hedgechanges in the fair value of these assets. We manage this riskby hedging the fair value of this asset with derivatives andsecurities which are expected to increase in value when thevalue of the servicing right declines. The fair value of theseservicing rights is estimated by using a cash flow valuationmodel which calculates the present value of estimated futurenet servicing cash flows, taking into consideration actual andexpected mortgage loan prepayment rates, discount rates,servicing costs, and other economic factors which aredetermined based on current market conditions.
Revenue from the various loan servicing contracts forcommercial, residential and other consumer loans is reportedon the Consolidated Income Statement in line items Corporateservices, Residential mortgage and Consumer services.
FAIR VALUE OF FINANCIAL INSTRUMENTS
The fair value of financial instruments and the methods andassumptions used in estimating fair value amounts andfinancial assets and liabilities for which fair value was electedare detailed in Note 9 Fair Value.
GOODWILL AND OTHER INTANGIBLE ASSETS
We assess goodwill for impairment at least annually, in thefourth quarter, or when events or changes in circumstancesindicate the assets might be impaired. Finite-lived intangibleassets are amortized to expense using accelerated or straight-line methods over their respective estimated useful lives. Wereview finite-lived intangible assets for impairment whenevents or changes in circumstances indicate that the asset’scarrying amount may not be recoverable from undiscountedfuture cash flows or that it may exceed its fair value.
DEPRECIATION AND AMORTIZATION
For financial reporting purposes, we depreciate premises andequipment, net of salvage value, principally using the straight-line method over their estimated useful lives.
We use estimated useful lives for furniture and equipmentranging from one to 10 years, and depreciate buildings over anestimated useful life of up to 40 years. We amortize leaseholdimprovements over their estimated useful lives of up to 15years or the respective lease terms, whichever is shorter.
We purchase, as well as internally develop and customize,certain software to enhance or perform internal businessfunctions. Software development costs incurred in theplanning and post-development project stages are charged toNoninterest expense. Costs associated with designing softwareconfiguration and interfaces, installation, coding programs andtesting systems are capitalized and amortized using thestraight-line method over periods ranging from one to sevenyears.
REPURCHASE AND RESALE AGREEMENTS
Repurchase and resale agreements are treated as collateralizedfinancing transactions and are carried at the amounts at whichthe securities will be subsequently reacquired or resold,including accrued interest, as specified in the respectiveagreements. Our policy is to take possession of securitiespurchased under agreements to resell. We monitor the marketvalue of securities to be repurchased and resold and additionalcollateral may be obtained where considered appropriate toprotect against credit exposure. We have elected to accountfor structured resale agreements at fair value.
OTHER COMPREHENSIVE INCOME
Other comprehensive income consists, on an after-tax basis,primarily of unrealized gains or losses, excluding OTTIattributable to credit deterioration, on investment securitiesclassified as available for sale, unrealized gains or losses onderivatives designated as cash flow hedges, and changes inpension and other postretirement benefit plan liabilityadjustments. Details of each component are included in Note20 Other Comprehensive Income.
The PNC Financial Services Group, Inc. – Form 10-K 133
TREASURY STOCK
We record common stock purchased for treasury at cost. Atthe date of subsequent reissue, the treasury stock account isreduced by the cost of such stock on the first-in, first-outbasis.
DERIVATIVE INSTRUMENTS AND HEDGING ACTIVITIES
We use a variety of financial derivatives as part of our overallasset and liability risk management process to help manageinterest rate, market and credit risk inherent in our businessactivities. Interest rate and total return swaps, swaptions,interest rate caps and floors and futures contracts are theprimary instruments we use for interest rate risk management.
Financial derivatives involve, to varying degrees, interest rate,market and credit risk. We manage these risks as part of ourasset and liability management process and through creditpolicies and procedures. We seek to minimize counterpartycredit risk by entering into transactions with only high-qualityinstitutions, establishing credit limits, and generally requiringbilateral netting and collateral agreements.
We recognize all derivative instruments at fair value as eitherOther assets or Other liabilities on the Consolidated BalanceSheet and the related cash flows in the Operating Activitiessection of the Consolidated Statement Of Cash Flows.Adjustments for counterparty credit risk are included in thedetermination of fair value. The accounting for changes in thefair value of a derivative instrument depends on whether it hasbeen designated and qualifies as part of a hedgingrelationship. For derivatives not designated as an accountinghedge, changes in fair value are recognized in Noninterestincome.
We utilize a net presentation for derivative instruments on theConsolidated Balance Sheet taking into consideration theeffects of legally enforceable master netting agreements. Cashcollateral exchanged with counterparties is also netted againstthe applicable derivative exposures by offsetting obligations toreturn, or rights to reclaim, cash collateral against the fairvalues of the net derivatives being collateralized.
For those derivative instruments that are designated andqualify as accounting hedges, we designate the hedginginstrument, based on the exposure being hedged, as a fairvalue hedge, a cash flow hedge or a hedge of the netinvestment in a foreign operation.
We formally document the relationship between the hedginginstruments and hedged items, as well as the risk managementobjective and strategy, before undertaking an accountinghedge. To qualify for hedge accounting, the derivatives andrelated hedged items must be designated as a hedge atinception of the hedge relationship. For accounting hedgerelationships, we formally assess, both at the inception of thehedge and on an ongoing basis, if the derivatives are highlyeffective in offsetting designated changes in the fair value orcash flows of the hedged item. If it is determined that thederivative instrument is not highly effective, hedge accountingis discontinued.
For derivatives that are designated as fair value hedges (i.e.,hedging the exposure to changes in the fair value of an assetor a liability attributable to a particular risk, such as changesin LIBOR), changes in the fair value of the hedginginstrument are recognized in earnings and offset by alsorecognizing in earnings the changes in the fair value of thehedged item attributable to the hedged risk. To the extent thechange in fair value of the derivative does not offset thechange in fair value of the hedged item, the difference orineffectiveness is reflected in the Consolidated IncomeStatement in the same financial statement category as thehedged item.
For derivatives designated as cash flow hedges (i.e., hedgingthe exposure to variability in expected future cash flows), theeffective portions of the gain or loss on derivatives arereported as a component of Accumulated other comprehensiveincome (loss) and subsequently reclassified to interest incomein the same period or periods during which the hedgedtransaction affects earnings. The change in fair valueattributable to the ineffective portion of the hedginginstrument is recognized immediately in Noninterest income.
For derivatives designated as a hedge of net investment in aforeign operation, the effective portions of the gain or loss onthe derivatives are reported as a component of Accumulatedother comprehensive income (loss). The change in fair valueof any ineffectiveness of the hedging instrument is recognizedimmediately in Noninterest income.
We discontinue hedge accounting when it is determined thatthe derivative no longer qualifies as an effective hedge; thederivative expires or is sold, terminated or exercised; or thederivative is de-designated as a fair value or cash flow hedgeor, for a cash flow hedge, it is no longer probable that theforecasted transaction will occur by the end of the originallyspecified time period. If we determine that the derivative nolonger qualifies as a fair value or cash flow hedge and hedgeaccounting is discontinued, the derivative will continue to berecorded on the balance sheet at its fair value with changes infair value included in current earnings. For a discontinued fairvalue hedge, the previously hedged item is no longer adjustedfor changes in fair value.
When hedge accounting is discontinued because it is no longerprobable that a forecasted transaction will occur, thederivative will continue to be recorded on the balance sheet atits fair value with changes in fair value included in currentearnings, and the gains and losses in Accumulated othercomprehensive income (loss) will be recognized immediatelyinto earnings. When we discontinue hedge accounting becausethe hedging instrument is sold, terminated or no longerdesignated, the amount reported in Accumulated othercomprehensive income (loss) up to the date of sale,termination or de-designation continues to be reported inOther comprehensive income or loss until the forecastedtransaction affects earnings. We did not terminate any cashflow hedges in 2012, 2011 or 2010 due to a determination thata forecasted transaction was no longer probable of occurring.
134 The PNC Financial Services Group, Inc. – Form 10-K

We purchase or originate financial instruments that contain anembedded derivative. At the inception of the transaction, weassess if the economic characteristics of the embeddedderivative are clearly and closely related to the economiccharacteristics of the host contract, whether the hybridfinancial instrument is measured at fair value with changes infair value reported in earnings, and whether a separateinstrument with the same terms as the embedded derivativewould be a derivative. If the embedded derivative does notmeet all of these conditions, the embedded derivative isrecorded separately from the host contract with changes in fairvalue recorded in earnings, unless we elect to account for thehybrid instrument at fair value.
We have elected on an instrument-by-instrument basis, fairvalue measurement for certain financial instruments withembedded derivatives.
We enter into commitments to originate residential andcommercial mortgage loans for sale. We also enter intocommitments to purchase or sell commercial and residentialreal estate loans. These commitments are accounted for asfree-standing derivatives which are recorded at fair value inOther assets or Other liabilities on the Consolidated BalanceSheet. Any gain or loss from the change in fair value after theinception of the commitment is recognized in noninterestincome.
INCOME TAXES
We account for income taxes under the asset and liabilitymethod. Deferred tax assets and liabilities are determinedbased on differences between the financial reporting and taxbases of assets and liabilities and are measured using theenacted tax rates and laws that we expect will apply at thetime when we believe the differences will reverse. Therecognition of deferred tax assets requires an assessment todetermine the realization of such assets. Realization refers tothe incremental benefit achieved through the reduction infuture taxes payable or refunds receivable from the deferredtax assets, assuming that the underlying deductible differencesand carryforwards are the last items to enter into thedetermination of future taxable income. We establish avaluation allowance for tax assets when it is more likely thannot that they will not be realized, based upon all availablepositive and negative evidence.
EARNINGS PER COMMON SHARE
Basic earnings per common share is calculated using the two-class method to determine income attributable to commonshareholders. Unvested share-based payment awards thatcontain nonforfeitable rights to dividends or dividendequivalents are considered participating securities under thetwo-class method. Income attributable to commonshareholders is then divided by the weighted-average commonshares outstanding for the period.
Diluted earnings per common share is calculated under themore dilutive of either the treasury method or the two-class
method. For the diluted calculation, we increase the weighted-average number of shares of common stock outstanding by theassumed conversion of outstanding convertible preferred stockand debentures from the beginning of the year or date ofissuance, if later, and the number of shares of common stockthat would be issued assuming the exercise of stock optionsand warrants and the issuance of incentive shares using thetreasury stock method. These adjustments to the weighted-average number of shares of common stock outstanding aremade only when such adjustments will dilute earnings percommon share. See Note 18 Earnings Per Share for additionalinformation.
RECENT ACCOUNTING PRONOUNCEMENTS
In October 2012, the Financial Accounting Standards Board(FASB) issued Accounting Standards Update (ASU) 2012-06,Business Combinations (Topic 805): Subsequent Accountingfor an Indemnification Asset Recognized at the AcquisitionDate as a Result of a Government-Assisted Acquisition of aFinancial Institution. This ASU impacts all entities thatrecognize an indemnification asset in purchase accounting fora government-assisted acquisition of a financial institution.The effective date of ASU 2012-06 was January 1, 2013.However, since we currently do not have any of these assets,this ASU did not have an effect on our results of operations orfinancial position.
In July 2012, the FASB issued ASU 2012-02, Intangibles—Goodwill and Other (Topic 350): Testing Indefinite-LivedIntangible Assets for Impairment. This ASU simplifies thetesting for indefinite lived intangible assets impairment byallowing an entity to first assess qualitative factors todetermine whether it is more likely than not that the fair valueof an indefinite lived intangible asset is less than its carryingamount before proceeding to the quantitative impairment test.The effective date of this ASU was January 1, 2013. However,since we currently do not have any indefinite livedintangibles, this ASU did not have an effect on our results ofoperations or financial position.
In December 2011, the FASB issued ASU 2011-11, BalanceSheet (Topic 210): Disclosures about Offsetting Assets andLiabilities and then amended the scope of ASU 2011-11 inJanuary 2013 through the issuance of ASU 2013-01, BalanceSheet (Topic 210): Clarifying the Scope of Disclosures aboutOffsetting Assets and Liabilities. This guidance applies to allentities that have derivative instruments, repurchaseagreements and reverse repurchase agreements, or securitieslending agreements that are either (i) offset in accordance witheither ASC 210-20-45 or ASC 815-10-45 or (ii) subject to anenforceable master netting arrangement or similar agreement,and requires an entity to disclose information about offsettingto enable users of its financial statements to understand theeffect of those arrangements on its financial position. Thedisclosures are required for quarterly and annual reportingperiods beginning on or after January 1, 2013, are to beapplied retrospectively for all comparative periods presented,
The PNC Financial Services Group, Inc. – Form 10-K 135
and will be provided in the first quarter 2013. We adoptedASU 2011-11 on January 1, 2013 for our derivatives that weoffset in accordance with ASC 815-10-45 and for ourrepurchase/resale arrangements under enforceable masternetting arrangements, which we do not currently offset on ourConsolidated Balance Sheet. The new guidance did notchange the accounting for these arrangements or require themto be offset and thus had no impact on our statement offinancial position.
In December 2011, the FASB also finalized ASU 2011-10,Property, Plant, and Equipment (Topic 360) – Derecognitionof in Substance Real Estate – a Scope Clarification (aconsensus of the FASB Emerging Issues Task Force). ThisASU clarified that the guidance in ASC 360-20 applies to aparent that ceases to have a controlling financial interest (asdescribed in ASC 810-10) in a subsidiary that is in substancereal estate as a result of default on the subsidiary’snonrecourse debt. The amendments within this update shouldbe applied on a prospective basis and are effective for fiscalyears, and interim periods within those years, beginning on orafter June 15, 2012. We adopted ASU 2011-10 on January 1,2013. There was no material impact to our results ofoperations or financial position upon adoption of ASU 2011-10 on January 1, 2013.
In September 2011, the FASB issued ASU 2011-08,Intangibles – Goodwill and Other (Topic 350) : TestingGoodwill for Impairment. The ASU permits an entity to firstassess qualitative factors to determine whether it is morelikely than not that the fair value of a reporting unit is lessthan its carrying amount. If an entity qualitatively determinesthe fair value of a reporting unit is greater than its carryingamount, it is not required to perform the Step 1 quantitativegoodwill impairment test for the reporting unit. ASU 2011-08is effective for annual and interim goodwill impairment testsperformed for fiscal years beginning after December 15, 2011.We did not utilize this guidance in our 2012 annual goodwillimpairment test. The adoption of this ASU did not have afinancial impact since the method for determining the amountof impairment (Step 2) remained unchanged.
In June 2011, the FASB issued ASU 2011-05 ComprehensiveIncome (Topic 220): Presentation of Comprehensive Income.This ASU required an entity to present each component of netincome along with total net income, each component of othercomprehensive income along with total other comprehensiveincome, and a total amount for comprehensive income eitherin a single continuous statement of comprehensive income orin two separate but consecutive statements. In bothpresentation options, the tax effect for each component mustbe presented in the statement in which other comprehensiveincome is presented or disclosed in the notes to the financialstatements. This ASU did not change the items that must bereported in other comprehensive income or when an item ofother comprehensive income must be reclassified to netincome. In December 2011, the FASB issued ASU 2011-12,
Comprehensive Income (Topic 220): Deferral of the EffectiveDate for Amendments to the Presentation of Reclassificationsof Items Out of Accumulated Other Comprehensive Income inASU 2011-05. This ASU deferred those changes in ASU2011-05 that relate to the presentation of reclassificationadjustments pending further Board deliberation. We adoptedASU 2011-05 and ASU 2011-12 on January 1, 2012. Our2012 financial statements and disclosures continue to reportreclassifications out of accumulated other comprehensiveincome consistent with the presentation requirements in effectbefore ASU 2011-05. See the Consolidated Statement ofComprehensive Income, Consolidated Statement of Changesin Equity and Note 20 Other Comprehensive Income foradditional information. In February 2013, the FASB issuedASU 2013-02, Comprehensive Income (Topic 220): Reportingof Amounts Reclassified Out of Accumulated OtherComprehensive Income. This ASU requires companies topresent information about reclassification adjustments fromaccumulated other comprehensive income in a single note oron the face of the financial statements. Additionally,companies are to disclose by component reclassifications outof accumulated other comprehensive income and their effectson the respective line items on net income and otherdisclosures currently required under U.S. GAAP. ASU 2013-02 is effective for annual and interim reporting periodsbeginning after December 15, 2012 and we will present thesedisclosures in the first quarter of 2013.
In May 2011, the FASB issued ASU 2011-04 Fair ValueMeasurement (Topic 820), Amendments to Achieve CommonFair Value Measurement and Disclosure Requirements in U.S.GAAP and International Financial Reporting Standards(IFRS). This ASU provides guidance to clarify the concept ofhighest and best use valuation premise, how a principalmarket is determined, and the application of the fair valuemeasurement for instruments with offsetting market orcounterparty credit risks. It also extends the prohibition onblockage factors to all fair value hierarchy levels. This ASUrequired additional disclosures for the following:(i) quantitative information about the significant unobservableinputs used in all Level 3 financial instruments, (ii) thevaluation processes used by the reporting entity as well as anarrative description of the sensitivity of the fair valuemeasurement to changes in unobservable inputs, (iii) areporting entity’s use of a nonfinancial asset in a way thatdiffers from the asset’s highest and best use if the fair value ofthe asset is reported, (iv) the categorization by level of the fairvalue hierarchy for items that are not measured at fair value infinancial statements, and (v) any transfers between Level 1and 2 and the reason for those transfers. The adoption of thisnew guidance did not have a material effect on our results ofoperations or financial position. We adopted ASU 2011-04 onJanuary 1, 2012. See Note 9 Fair Value for additionalinformation.
136 The PNC Financial Services Group, Inc. – Form 10-K
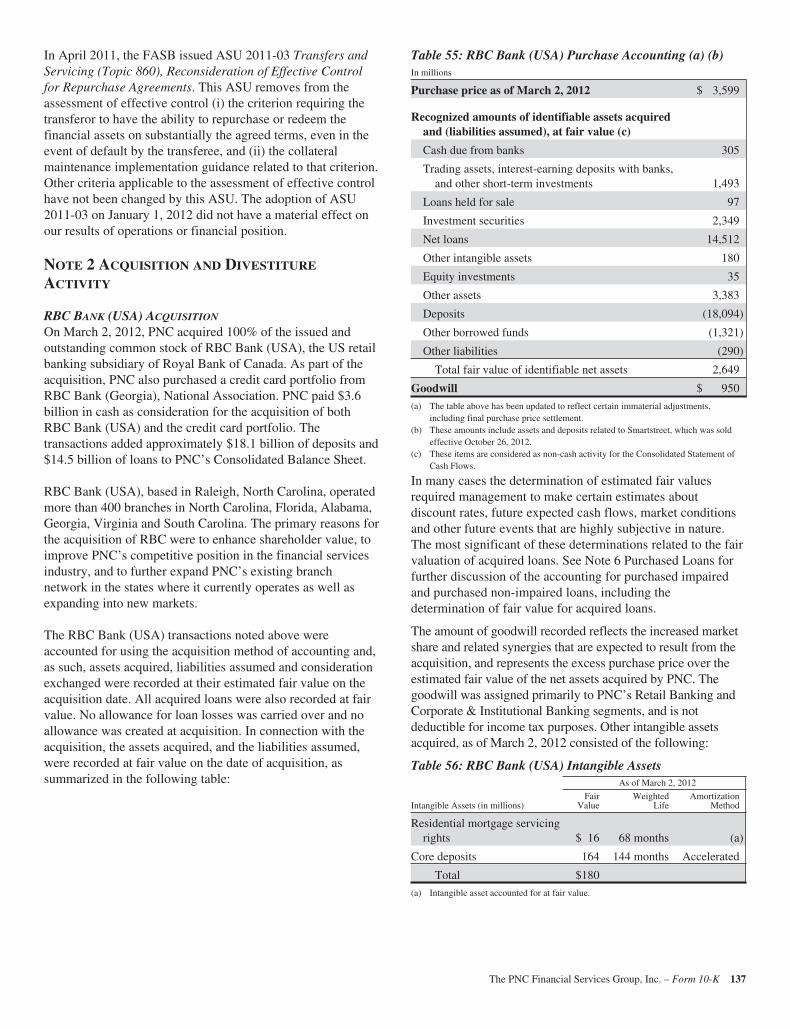
In April 2011, the FASB issued ASU 2011-03 Transfers andServicing (Topic 860), Reconsideration of Effective Controlfor Repurchase Agreements. This ASU removes from theassessment of effective control (i) the criterion requiring thetransferor to have the ability to repurchase or redeem thefinancial assets on substantially the agreed terms, even in theevent of default by the transferee, and (ii) the collateralmaintenance implementation guidance related to that criterion.Other criteria applicable to the assessment of effective controlhave not been changed by this ASU. The adoption of ASU2011-03 on January 1, 2012 did not have a material effect onour results of operations or financial position.
NOTE 2 ACQUISITION AND DIVESTITURE
ACTIVITY
RBC BANK (USA) ACQUISITION
On March 2, 2012, PNC acquired 100% of the issued andoutstanding common stock of RBC Bank (USA), the US retailbanking subsidiary of Royal Bank of Canada. As part of theacquisition, PNC also purchased a credit card portfolio fromRBC Bank (Georgia), National Association. PNC paid $3.6billion in cash as consideration for the acquisition of bothRBC Bank (USA) and the credit card portfolio. Thetransactions added approximately $18.1 billion of deposits and$14.5 billion of loans to PNC’s Consolidated Balance Sheet.
RBC Bank (USA), based in Raleigh, North Carolina, operatedmore than 400 branches in North Carolina, Florida, Alabama,Georgia, Virginia and South Carolina. The primary reasons forthe acquisition of RBC were to enhance shareholder value, toimprove PNC’s competitive position in the financial servicesindustry, and to further expand PNC’s existing branchnetwork in the states where it currently operates as well asexpanding into new markets.
The RBC Bank (USA) transactions noted above wereaccounted for using the acquisition method of accounting and,as such, assets acquired, liabilities assumed and considerationexchanged were recorded at their estimated fair value on theacquisition date. All acquired loans were also recorded at fairvalue. No allowance for loan losses was carried over and noallowance was created at acquisition. In connection with theacquisition, the assets acquired, and the liabilities assumed,were recorded at fair value on the date of acquisition, assummarized in the following table:
Table 55: RBC Bank (USA) Purchase Accounting (a) (b)In millions
Purchase price as of March 2, 2012 $ 3,599
Recognized amounts of identifiable assets acquiredand (liabilities assumed), at fair value (c)
Cash due from banks 305
Trading assets, interest-earning deposits with banks,and other short-term investments 1,493
Loans held for sale 97
Investment securities 2,349
Net loans 14,512
Other intangible assets 180
Equity investments 35
Other assets 3,383
Deposits (18,094)
Other borrowed funds (1,321)
Other liabilities (290)
Total fair value of identifiable net assets 2,649
Goodwill $ 950
(a) The table above has been updated to reflect certain immaterial adjustments,including final purchase price settlement.
(b) These amounts include assets and deposits related to Smartstreet, which was soldeffective October 26, 2012.
(c) These items are considered as non-cash activity for the Consolidated Statement ofCash Flows.
In many cases the determination of estimated fair valuesrequired management to make certain estimates aboutdiscount rates, future expected cash flows, market conditionsand other future events that are highly subjective in nature.The most significant of these determinations related to the fairvaluation of acquired loans. See Note 6 Purchased Loans forfurther discussion of the accounting for purchased impairedand purchased non-impaired loans, including thedetermination of fair value for acquired loans.
The amount of goodwill recorded reflects the increased marketshare and related synergies that are expected to result from theacquisition, and represents the excess purchase price over theestimated fair value of the net assets acquired by PNC. Thegoodwill was assigned primarily to PNC’s Retail Banking andCorporate & Institutional Banking segments, and is notdeductible for income tax purposes. Other intangible assetsacquired, as of March 2, 2012 consisted of the following:
Table 56: RBC Bank (USA) Intangible AssetsAs of March 2, 2012
Intangible Assets (in millions)Fair
ValueWeighted
LifeAmortization
Method
Residential mortgage servicingrights $ 16 68 months (a)
Core deposits 164 144 months Accelerated
Total $180
(a) Intangible asset accounted for at fair value.
The PNC Financial Services Group, Inc. – Form 10-K 137
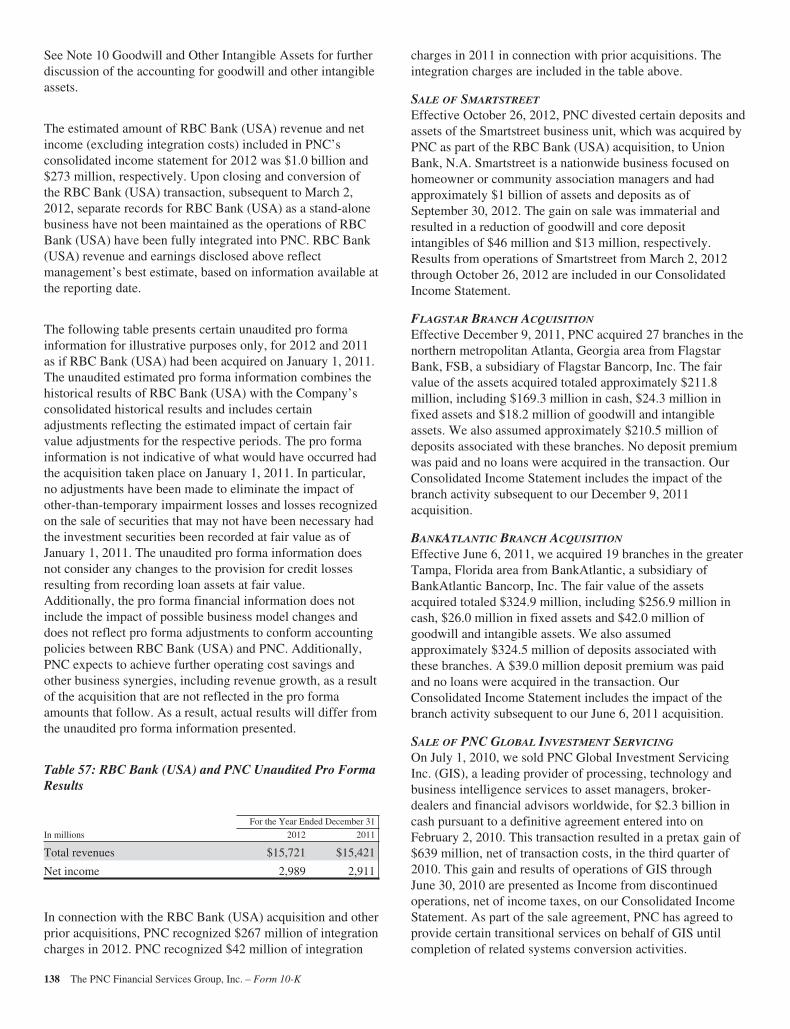
See Note 10 Goodwill and Other Intangible Assets for furtherdiscussion of the accounting for goodwill and other intangibleassets.
The estimated amount of RBC Bank (USA) revenue and netincome (excluding integration costs) included in PNC’sconsolidated income statement for 2012 was $1.0 billion and$273 million, respectively. Upon closing and conversion ofthe RBC Bank (USA) transaction, subsequent to March 2,2012, separate records for RBC Bank (USA) as a stand-alonebusiness have not been maintained as the operations of RBCBank (USA) have been fully integrated into PNC. RBC Bank(USA) revenue and earnings disclosed above reflectmanagement’s best estimate, based on information available atthe reporting date.
The following table presents certain unaudited pro formainformation for illustrative purposes only, for 2012 and 2011as if RBC Bank (USA) had been acquired on January 1, 2011.The unaudited estimated pro forma information combines thehistorical results of RBC Bank (USA) with the Company’sconsolidated historical results and includes certainadjustments reflecting the estimated impact of certain fairvalue adjustments for the respective periods. The pro formainformation is not indicative of what would have occurred hadthe acquisition taken place on January 1, 2011. In particular,no adjustments have been made to eliminate the impact ofother-than-temporary impairment losses and losses recognizedon the sale of securities that may not have been necessary hadthe investment securities been recorded at fair value as ofJanuary 1, 2011. The unaudited pro forma information doesnot consider any changes to the provision for credit lossesresulting from recording loan assets at fair value.Additionally, the pro forma financial information does notinclude the impact of possible business model changes anddoes not reflect pro forma adjustments to conform accountingpolicies between RBC Bank (USA) and PNC. Additionally,PNC expects to achieve further operating cost savings andother business synergies, including revenue growth, as a resultof the acquisition that are not reflected in the pro formaamounts that follow. As a result, actual results will differ fromthe unaudited pro forma information presented.
Table 57: RBC Bank (USA) and PNC Unaudited Pro FormaResults
For the Year Ended December 31
In millions 2012 2011
Total revenues $15,721 $15,421
Net income 2,989 2,911
In connection with the RBC Bank (USA) acquisition and otherprior acquisitions, PNC recognized $267 million of integrationcharges in 2012. PNC recognized $42 million of integration
charges in 2011 in connection with prior acquisitions. Theintegration charges are included in the table above.
SALE OF SMARTSTREET
Effective October 26, 2012, PNC divested certain deposits andassets of the Smartstreet business unit, which was acquired byPNC as part of the RBC Bank (USA) acquisition, to UnionBank, N.A. Smartstreet is a nationwide business focused onhomeowner or community association managers and hadapproximately $1 billion of assets and deposits as ofSeptember 30, 2012. The gain on sale was immaterial andresulted in a reduction of goodwill and core depositintangibles of $46 million and $13 million, respectively.Results from operations of Smartstreet from March 2, 2012through October 26, 2012 are included in our ConsolidatedIncome Statement.
FLAGSTAR BRANCH ACQUISITION
Effective December 9, 2011, PNC acquired 27 branches in thenorthern metropolitan Atlanta, Georgia area from FlagstarBank, FSB, a subsidiary of Flagstar Bancorp, Inc. The fairvalue of the assets acquired totaled approximately $211.8million, including $169.3 million in cash, $24.3 million infixed assets and $18.2 million of goodwill and intangibleassets. We also assumed approximately $210.5 million ofdeposits associated with these branches. No deposit premiumwas paid and no loans were acquired in the transaction. OurConsolidated Income Statement includes the impact of thebranch activity subsequent to our December 9, 2011acquisition.
BANKATLANTIC BRANCH ACQUISITION
Effective June 6, 2011, we acquired 19 branches in the greaterTampa, Florida area from BankAtlantic, a subsidiary ofBankAtlantic Bancorp, Inc. The fair value of the assetsacquired totaled $324.9 million, including $256.9 million incash, $26.0 million in fixed assets and $42.0 million ofgoodwill and intangible assets. We also assumedapproximately $324.5 million of deposits associated withthese branches. A $39.0 million deposit premium was paidand no loans were acquired in the transaction. OurConsolidated Income Statement includes the impact of thebranch activity subsequent to our June 6, 2011 acquisition.
SALE OF PNC GLOBAL INVESTMENT SERVICING
On July 1, 2010, we sold PNC Global Investment ServicingInc. (GIS), a leading provider of processing, technology andbusiness intelligence services to asset managers, broker-dealers and financial advisors worldwide, for $2.3 billion incash pursuant to a definitive agreement entered into onFebruary 2, 2010. This transaction resulted in a pretax gain of$639 million, net of transaction costs, in the third quarter of2010. This gain and results of operations of GIS throughJune 30, 2010 are presented as Income from discontinuedoperations, net of income taxes, on our Consolidated IncomeStatement. As part of the sale agreement, PNC has agreed toprovide certain transitional services on behalf of GIS untilcompletion of related systems conversion activities.
138 The PNC Financial Services Group, Inc. – Form 10-K
NOTE 3 LOAN SALE AND SERVICING ACTIVITIES
AND VARIABLE INTEREST ENTITIES
LOAN SALE AND SERVICING ACTIVITIES
We have transferred residential and commercial mortgageloans in securitization or sales transactions in which we havecontinuing involvement. These transfers have occurredthrough Agency securitization, Non-agency securitization, andloan sale transactions. Agency securitizations consist ofsecuritization transactions with Federal National MortgageAssociation (FNMA), Federal Home Loan MortgageCorporation (FHLMC), and Government National MortgageAssociation (GNMA) (collectively, the Agencies). FNMA andFHLMC generally securitize our transferred loans intomortgage-backed securities for sale into the secondary marketthrough special purpose entities (SPEs) that they sponsor. We,as an authorized GNMA issuer/servicer, pool Federal HousingAdministration (FHA) and Department of Veterans Affairs(VA) insured loans into mortgage-backed securities for saleinto the secondary market. In Non-agency securitizations, wehave transferred loans into securitization SPEs. In otherinstances, third-party investors have also purchased our loansin loan sale transactions and in certain instances havesubsequently sold these loans into securitization SPEs.Securitization SPEs utilized in the Agency and Non-agencysecuritization transactions are variable interest entities (VIEs).
Our continuing involvement in the FNMA, FHLMC, andGNMA securitizations, Non-agency securitizations, and loansale transactions generally consists of servicing, repurchasesof previously transferred loans under certain conditions andloss share arrangements, and, in limited circumstances,holding of mortgage-backed securities issued by thesecuritization SPEs.
Depending on the transaction, we may act as the master,primary, and/or special servicer to the securitization SPEs orthird-party investors. Servicing responsibilities typically consistof collecting and remitting monthly borrower principal andinterest payments, maintaining escrow deposits, performing lossmitigation and foreclosure activities, and, in certain instances,funding of servicing advances. Servicing advances, which arereimbursable, are recognized in Other assets at cost and aremade for principal and interest and collateral protection.
We earn servicing and other ancillary fees for our role asservicer and, depending on the contractual terms of theservicing arrangement, we can be terminated as servicer withor without cause. At the consummation date of each type ofloan transfer, we recognize a servicing asset at fair value.Servicing assets are recognized in Other intangible assets onour Consolidated Balance Sheet and when subsequentlyaccounted for at fair value are classified within Level 3 of thefair value hierarchy. See Note 9 Fair Value and Note 10Goodwill and Other Intangible Assets for further discussion ofour residential and commercial servicing assets.
Certain loans transferred to the Agencies contain removal ofaccount provisions (ROAPs). Under these ROAPs, we hold anoption to repurchase at par individual delinquent loans thatmeet certain criteria. When we have the unilateral ability torepurchase a delinquent loan, effective control over the loanhas been regained and we recognize an asset (in either Loansor Loans held for sale) and a corresponding liability (in Otherborrowed funds) on the balance sheet regardless of our intentto repurchase the loan. At December 31, 2012 andDecember 31, 2011, the balance of our ROAP asset andliability totaled $190 million and $265 million, respectively.
The Agency and Non-agency mortgage-backed securitiesissued by the securitization SPEs that are purchased and heldon our balance sheet are typically purchased in the secondarymarket. PNC does not retain any credit risk on its Agencymortgage-backed security positions as FNMA, FHLMC, andthe US Government (for GNMA) guarantee losses of principaland interest. Substantially all of the Non-agency mortgage-backed securities acquired and held on our balance sheet aresenior tranches in the securitization structure.
We also have involvement with certain Agency and Non-agencycommercial securitization SPEs where we have not transferredcommercial mortgage loans. These SPEs were sponsored byindependent third-parties and the loans held by these entitieswere purchased exclusively from other third-parties. Generally,our involvement with these SPEs is as servicer with servicingactivities consistent with those described above.
We recognize a liability for our loss exposure associated withcontractual obligations to repurchase previously transferredloans due to breaches of representations and warranties andalso for loss sharing arrangements (recourse obligations) withthe Agencies. Other than providing temporary liquidity underservicing advances and our loss exposure associated with ourrepurchase and recourse obligations, we have not provided norare we required to provide any type of credit support,guarantees, or commitments to the securitization SPEs orthird-party investors in these transactions. See Note 24Commitments and Guarantees for further discussion of ourrepurchase and recourse obligations.
The PNC Financial Services Group, Inc. – Form 10-K 139
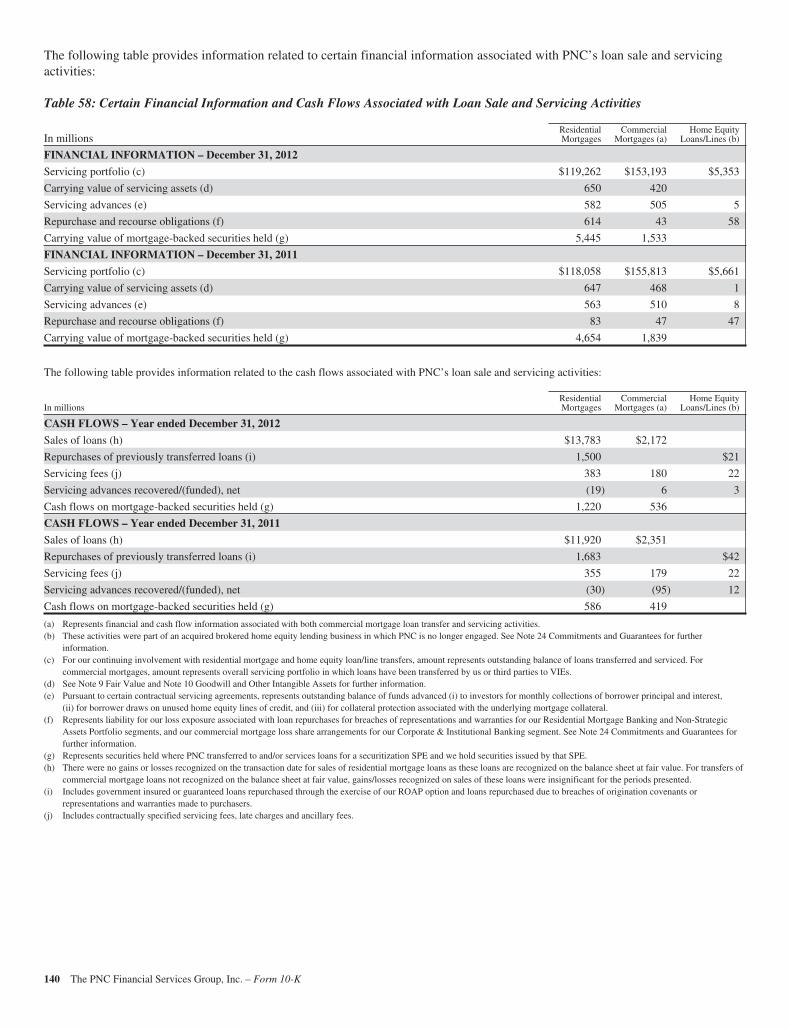
The following table provides information related to certain financial information associated with PNC’s loan sale and servicingactivities:
Table 58: Certain Financial Information and Cash Flows Associated with Loan Sale and Servicing Activities
In millionsResidentialMortgages
CommercialMortgages (a)
Home EquityLoans/Lines (b)
FINANCIAL INFORMATION – December 31, 2012
Servicing portfolio (c) $119,262 $153,193 $5,353
Carrying value of servicing assets (d) 650 420
Servicing advances (e) 582 505 5
Repurchase and recourse obligations (f) 614 43 58
Carrying value of mortgage-backed securities held (g) 5,445 1,533
FINANCIAL INFORMATION – December 31, 2011
Servicing portfolio (c) $118,058 $155,813 $5,661
Carrying value of servicing assets (d) 647 468 1
Servicing advances (e) 563 510 8
Repurchase and recourse obligations (f) 83 47 47
Carrying value of mortgage-backed securities held (g) 4,654 1,839
The following table provides information related to the cash flows associated with PNC’s loan sale and servicing activities:
In millionsResidentialMortgages
CommercialMortgages (a)
Home EquityLoans/Lines (b)
CASH FLOWS – Year ended December 31, 2012
Sales of loans (h) $13,783 $2,172
Repurchases of previously transferred loans (i) 1,500 $21
Servicing fees (j) 383 180 22
Servicing advances recovered/(funded), net (19) 6 3
Cash flows on mortgage-backed securities held (g) 1,220 536
CASH FLOWS – Year ended December 31, 2011
Sales of loans (h) $11,920 $2,351
Repurchases of previously transferred loans (i) 1,683 $42
Servicing fees (j) 355 179 22
Servicing advances recovered/(funded), net (30) (95) 12
Cash flows on mortgage-backed securities held (g) 586 419
(a) Represents financial and cash flow information associated with both commercial mortgage loan transfer and servicing activities.(b) These activities were part of an acquired brokered home equity lending business in which PNC is no longer engaged. See Note 24 Commitments and Guarantees for further
information.(c) For our continuing involvement with residential mortgage and home equity loan/line transfers, amount represents outstanding balance of loans transferred and serviced. For
commercial mortgages, amount represents overall servicing portfolio in which loans have been transferred by us or third parties to VIEs.(d) See Note 9 Fair Value and Note 10 Goodwill and Other Intangible Assets for further information.(e) Pursuant to certain contractual servicing agreements, represents outstanding balance of funds advanced (i) to investors for monthly collections of borrower principal and interest,
(ii) for borrower draws on unused home equity lines of credit, and (iii) for collateral protection associated with the underlying mortgage collateral.(f) Represents liability for our loss exposure associated with loan repurchases for breaches of representations and warranties for our Residential Mortgage Banking and Non-Strategic
Assets Portfolio segments, and our commercial mortgage loss share arrangements for our Corporate & Institutional Banking segment. See Note 24 Commitments and Guarantees forfurther information.
(g) Represents securities held where PNC transferred to and/or services loans for a securitization SPE and we hold securities issued by that SPE.(h) There were no gains or losses recognized on the transaction date for sales of residential mortgage loans as these loans are recognized on the balance sheet at fair value. For transfers of
commercial mortgage loans not recognized on the balance sheet at fair value, gains/losses recognized on sales of these loans were insignificant for the periods presented.(i) Includes government insured or guaranteed loans repurchased through the exercise of our ROAP option and loans repurchased due to breaches of origination covenants or
representations and warranties made to purchasers.(j) Includes contractually specified servicing fees, late charges and ancillary fees.
140 The PNC Financial Services Group, Inc. – Form 10-K
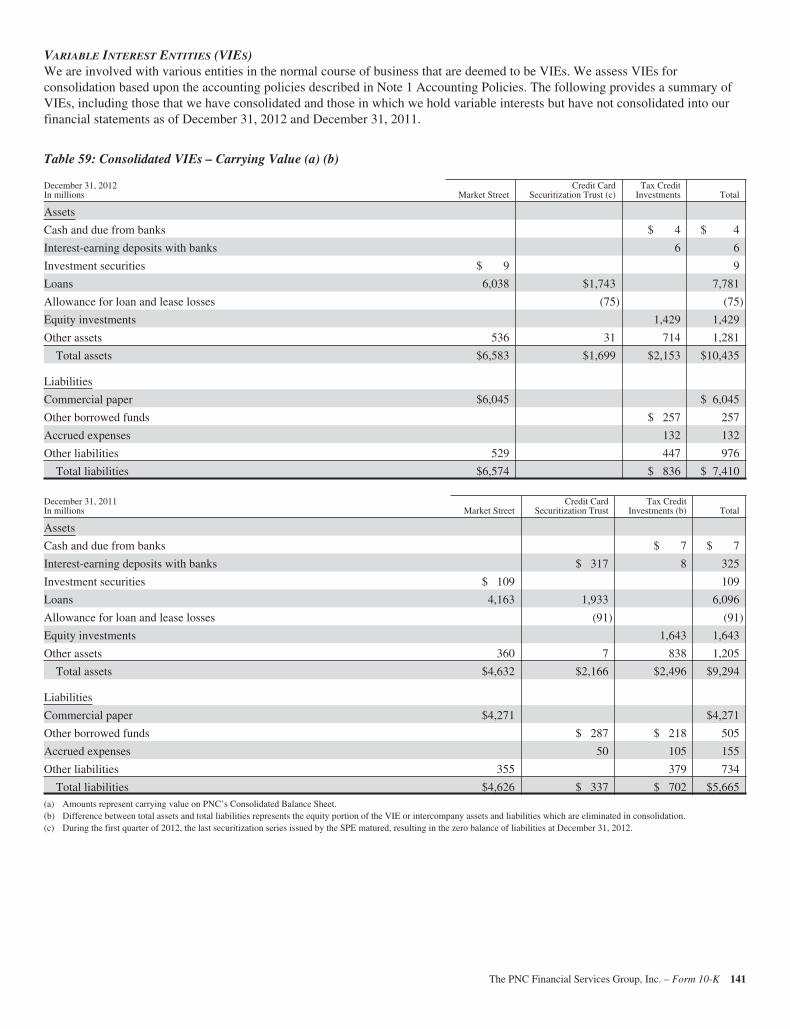
VARIABLE INTEREST ENTITIES (VIES)We are involved with various entities in the normal course of business that are deemed to be VIEs. We assess VIEs forconsolidation based upon the accounting policies described in Note 1 Accounting Policies. The following provides a summary ofVIEs, including those that we have consolidated and those in which we hold variable interests but have not consolidated into ourfinancial statements as of December 31, 2012 and December 31, 2011.
Table 59: Consolidated VIEs – Carrying Value (a) (b)
December 31, 2012In millions Market Street
Credit CardSecuritization Trust (c)
Tax CreditInvestments Total
Assets
Cash and due from banks $ 4 $ 4
Interest-earning deposits with banks 6 6
Investment securities $ 9 9
Loans 6,038 $1,743 7,781
Allowance for loan and lease losses (75) (75)
Equity investments 1,429 1,429
Other assets 536 31 714 1,281
Total assets $6,583 $1,699 $2,153 $10,435
Liabilities
Commercial paper $6,045 $ 6,045
Other borrowed funds $ 257 257
Accrued expenses 132 132
Other liabilities 529 447 976
Total liabilities $6,574 $ 836 $ 7,410
December 31, 2011In millions Market Street
Credit CardSecuritization Trust
Tax CreditInvestments (b) Total
Assets
Cash and due from banks $ 7 $ 7
Interest-earning deposits with banks $ 317 8 325
Investment securities $ 109 109
Loans 4,163 1,933 6,096
Allowance for loan and lease losses (91) (91)
Equity investments 1,643 1,643
Other assets 360 7 838 1,205
Total assets $4,632 $2,166 $2,496 $9,294
Liabilities
Commercial paper $4,271 $4,271
Other borrowed funds $ 287 $ 218 505
Accrued expenses 50 105 155
Other liabilities 355 379 734
Total liabilities $4,626 $ 337 $ 702 $5,665(a) Amounts represent carrying value on PNC’s Consolidated Balance Sheet.(b) Difference between total assets and total liabilities represents the equity portion of the VIE or intercompany assets and liabilities which are eliminated in consolidation.(c) During the first quarter of 2012, the last securitization series issued by the SPE matured, resulting in the zero balance of liabilities at December 31, 2012.
The PNC Financial Services Group, Inc. – Form 10-K 141
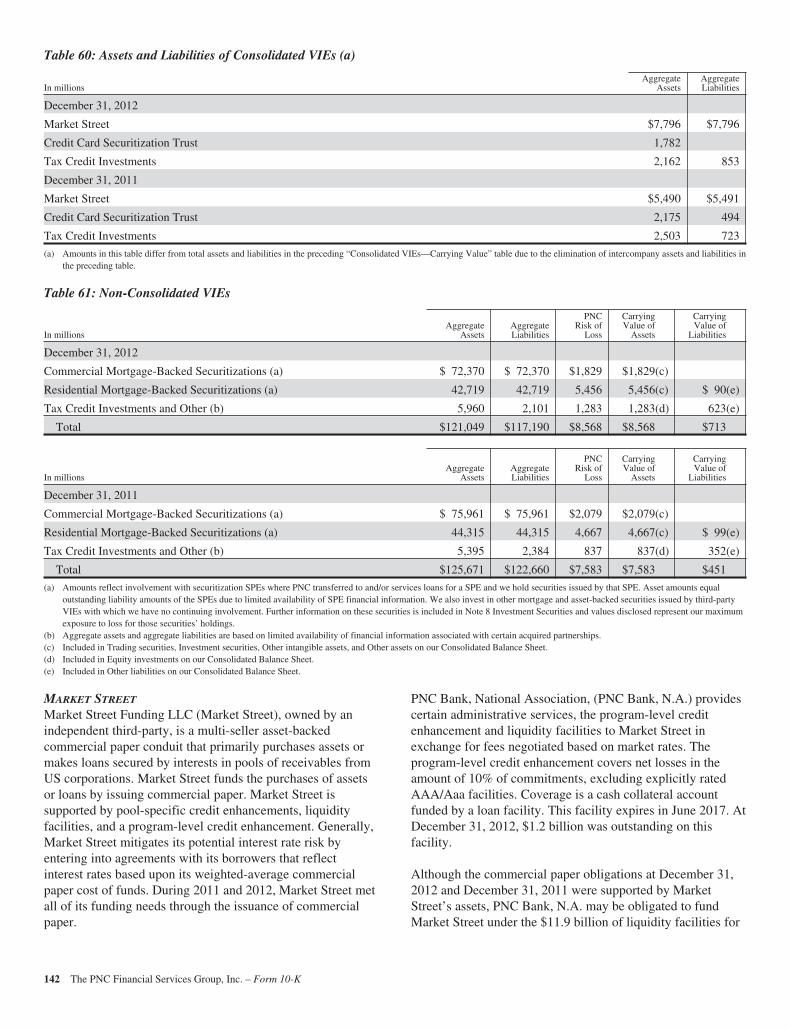
Table 60: Assets and Liabilities of Consolidated VIEs (a)
In millionsAggregate
AssetsAggregateLiabilities
December 31, 2012
Market Street $7,796 $7,796
Credit Card Securitization Trust 1,782
Tax Credit Investments 2,162 853
December 31, 2011
Market Street $5,490 $5,491
Credit Card Securitization Trust 2,175 494
Tax Credit Investments 2,503 723
(a) Amounts in this table differ from total assets and liabilities in the preceding “Consolidated VIEs—Carrying Value” table due to the elimination of intercompany assets and liabilities inthe preceding table.
Table 61: Non-Consolidated VIEs
In millionsAggregate
AssetsAggregateLiabilities
PNCRisk of
Loss
CarryingValue of
Assets
CarryingValue of
Liabilities
December 31, 2012
Commercial Mortgage-Backed Securitizations (a) $ 72,370 $ 72,370 $1,829 $1,829(c)
Residential Mortgage-Backed Securitizations (a) 42,719 42,719 5,456 5,456(c) $ 90(e)
Tax Credit Investments and Other (b) 5,960 2,101 1,283 1,283(d) 623(e)
Total $121,049 $117,190 $8,568 $8,568 $713
In millionsAggregate
AssetsAggregateLiabilities
PNCRisk of
Loss
CarryingValue of
Assets
CarryingValue of
Liabilities
December 31, 2011
Commercial Mortgage-Backed Securitizations (a) $ 75,961 $ 75,961 $2,079 $2,079(c)
Residential Mortgage-Backed Securitizations (a) 44,315 44,315 4,667 4,667(c) $ 99(e)
Tax Credit Investments and Other (b) 5,395 2,384 837 837(d) 352(e)
Total $125,671 $122,660 $7,583 $7,583 $451
(a) Amounts reflect involvement with securitization SPEs where PNC transferred to and/or services loans for a SPE and we hold securities issued by that SPE. Asset amounts equaloutstanding liability amounts of the SPEs due to limited availability of SPE financial information. We also invest in other mortgage and asset-backed securities issued by third-partyVIEs with which we have no continuing involvement. Further information on these securities is included in Note 8 Investment Securities and values disclosed represent our maximumexposure to loss for those securities’ holdings.
(b) Aggregate assets and aggregate liabilities are based on limited availability of financial information associated with certain acquired partnerships.(c) Included in Trading securities, Investment securities, Other intangible assets, and Other assets on our Consolidated Balance Sheet.(d) Included in Equity investments on our Consolidated Balance Sheet.(e) Included in Other liabilities on our Consolidated Balance Sheet.
MARKET STREET
Market Street Funding LLC (Market Street), owned by anindependent third-party, is a multi-seller asset-backedcommercial paper conduit that primarily purchases assets ormakes loans secured by interests in pools of receivables fromUS corporations. Market Street funds the purchases of assetsor loans by issuing commercial paper. Market Street issupported by pool-specific credit enhancements, liquidityfacilities, and a program-level credit enhancement. Generally,Market Street mitigates its potential interest rate risk byentering into agreements with its borrowers that reflectinterest rates based upon its weighted-average commercialpaper cost of funds. During 2011 and 2012, Market Street metall of its funding needs through the issuance of commercialpaper.
PNC Bank, National Association, (PNC Bank, N.A.) providescertain administrative services, the program-level creditenhancement and liquidity facilities to Market Street inexchange for fees negotiated based on market rates. Theprogram-level credit enhancement covers net losses in theamount of 10% of commitments, excluding explicitly ratedAAA/Aaa facilities. Coverage is a cash collateral accountfunded by a loan facility. This facility expires in June 2017. AtDecember 31, 2012, $1.2 billion was outstanding on thisfacility.
Although the commercial paper obligations at December 31,2012 and December 31, 2011 were supported by MarketStreet’s assets, PNC Bank, N.A. may be obligated to fundMarket Street under the $11.9 billion of liquidity facilities for
142 The PNC Financial Services Group, Inc. – Form 10-K
events such as commercial paper market disruptions, borrowerbankruptcies, collateral deficiencies or covenant violations.Our credit risk under the liquidity facilities is secondary to therisk of first loss absorbed by Market Street borrowers throughover-collateralization of assets and losses absorbed by deal-specific credit enhancement provided by a third party. Thedeal-specific credit enhancement is generally structured tocover a multiple of expected losses for the pool of assets andis sized to meet rating agency standards for comparablystructured transactions.
Through the credit enhancement and liquidity facilityarrangements, PNC Bank, N.A. has the power to direct theactivities of Market Street that most significantly affect itseconomic performance and these arrangements expose PNCBank, N.A. to expected losses or residual returns that arepotentially significant to Market Street. Therefore, PNC Bank,N.A. consolidates Market Street. PNC Bank, N.A. is notrequired to nor have we provided additional financial supportto Market Street, and Market Street creditors have no directrecourse to PNC Bank, N.A.
CREDIT CARD SECURITIZATION TRUST
We were the sponsor of several credit card securitizationsfacilitated through a trust. This bankruptcy-remote SPE wasestablished to purchase credit card receivables from thesponsor and to issue and sell asset-backed securities createdby it to independent third-parties. The SPE was financedprimarily through the sale of these asset-backed securities.These transactions were originally structured to provideliquidity and to afford favorable capital treatment.
Our continuing involvement in these securitizationtransactions consisted primarily of holding certain retainedinterests and acting as the primary servicer. For eachsecuritization series that was outstanding, our retainedinterests held were in the form of a pro-rata undivided interest,or sellers’ interest, in the transferred receivables, subordinatedtranches of asset-backed securities, interest-only strips,discount receivables, and subordinated interests in accruedinterest and fees in securitized receivables. We consolidatedthe SPE as we were deemed the primary beneficiary of theentity based upon our level of continuing involvement. Ourrole as primary servicer gave us the power to direct theactivities of the SPE that most significantly affect itseconomic performance and our holding of retained interestsgave us the obligation to absorb expected losses, or the abilityto receive residual returns that could be potentially significantto the SPE. The underlying assets of the consolidated SPEwere restricted only for payment of the beneficial interestsissued by the SPE. We were not required to nor did weprovide additional financial support to the SPE. Additionally,creditors of the SPE have no direct recourse to PNC.
During the first quarter of 2012, the last series issued by theSPE, Series 2007-1, matured. At December 31, 2012, the SPEcontinued to exist and we consolidated the entity as we
continued to be the primary beneficiary of the SPE throughour holding of seller’s interest and our role as the primaryservicer.
TAX CREDIT INVESTMENTS
We make certain equity investments in various tax creditlimited partnerships or limited liability companies (LLCs).The purpose of these investments is to achieve a satisfactoryreturn on capital and to assist us in achieving goals associatedwith the Community Reinvestment Act.
Also, we are a national syndicator of affordable housingequity. In these syndication transactions, we create funds inwhich our subsidiaries are the general partner or managingmember and sell limited partnership or non-managing memberinterests to third parties. In some cases PNC may alsopurchase a limited partnership or non-managing memberinterest in the fund. The purpose of this business is to generateincome from the syndication of these funds, generate servicingfees by managing the funds, and earn tax credits to reduce ourtax liability. General partner or managing member activitiesinclude selecting, evaluating, structuring, negotiating, andclosing the fund investments in operating limited partnershipsor LLCs, as well as oversight of the ongoing operations of thefund portfolio.
Typically, the general partner or managing member will be theparty that has the right to make decisions that will mostsignificantly impact the economic performance of the entity.However, certain partnership or LLC agreements provide thelimited partner or non-managing member the ability to removethe general partner or managing member without cause. Thisresults in the limited partner or non-managing member beingthe party that has the right to make decisions that will mostsignificantly impact the economic performance of the entity.The primary sources of losses and benefits for theseinvestments are the tax credits, tax benefits due to passivelosses on the investments, and development and operatingcash flows. We have consolidated investments in which weare the general partner or managing member and have alimited partnership interest or non-managing member interestthat provides us the power to direct the activities that mostsignificantly impact the entity’s performance and have alimited partnership interest or non-managing member interestthat could absorb losses or receive benefits that could bepotentially significant. The assets are primarily included inEquity investments and Other assets on our ConsolidatedBalance Sheet with the liabilities classified in Other borrowedfunds, Accrued expenses, and Other liabilities and the thirdparty investors’ interests included in the Equity section asNoncontrolling interests. Neither creditors nor equity investorsin these investments have any recourse to our general credit.We have not provided financial or other support to the limitedpartnership or LLC that we are not contractually obligated toprovide. The consolidated aggregate assets and liabilities ofthese investments are provided in the Consolidated VIEs tableand reflected in the “Other” business segment.
The PNC Financial Services Group, Inc. – Form 10-K 143
For tax credit investments in which we do not have the right tomake decisions that will most significantly impact theeconomic performance of the entity, we are not the primarybeneficiary and thus they are not consolidated. Theseinvestments are disclosed in the Non-Consolidated VIEs table.The table also reflects our maximum exposure to loss. Ourmaximum exposure to loss is equal to our legally bindingequity commitments adjusted for recorded impairment andpartnership results. We use the equity method to account forour investment in these entities with the investments reflectedin Equity investments on our Consolidated Balance Sheet. Inaddition, we increase our recognized investments andrecognize a liability for all legally binding unfunded equitycommitments. These liabilities are reflected in Other liabilitieson our Consolidated Balance Sheet.
RESIDENTIAL AND COMMERCIAL MORTGAGE-BACKED
SECURITIZATIONS
In connection with each Agency and Non-agencysecuritization discussed above, we evaluate each SPE utilizedin these transactions for consolidation. In performing theseassessments, we evaluate our level of continuing involvementin these transactions as the nature of our involvementultimately determines whether or not we hold a variableinterest and/or are the primary beneficiary of the SPE. Factorswe consider in our consolidation assessment include thesignificance of (i) our role as servicer, (ii) our holdings ofmortgage-backed securities issued by the securitization SPE,and (iii) the rights of third-party variable interest holders.
The first step in our assessment is to determine whether wehold a variable interest in the securitization SPE. We holdvariable interests in Agency and Non-agency securitizationSPEs through our holding of mortgage-backed securitiesissued by the SPEs and/or our recourse obligations. Each SPEin which we hold a variable interest is evaluated to determinewhether we are the primary beneficiary of the entity. ForAgency securitization transactions, our contractual role asservicer does not give us the power to direct the activities thatmost significantly affect the economic performance of theSPEs. Thus, we are not the primary beneficiary of theseentities. For Non-agency securitization transactions, we wouldbe the primary beneficiary to the extent our servicing activitiesgive us the power to direct the activities that mostsignificantly affect the economic performance of the SPE andwe hold a more than insignificant variable interest in theentity. At December 31, 2012, our level of continuinginvolvement in Non-agency securitization SPEs did not resultin PNC being deemed the primary beneficiary of any of theseentities. Details about the Agency and Non-agencysecuritization SPEs where we hold a variable interest and arenot the primary beneficiary are included in the Non-Consolidated VIEs table. Our maximum exposure to loss as aresult of our involvement with these SPEs is the carryingvalue of the mortgage-backed securities, servicing assets,servicing advances, and our liabilities associated with ourrecourse obligations. Creditors of the securitization SPEs haveno recourse to PNC’s assets or general credit.
144 The PNC Financial Services Group, Inc. – Form 10-K
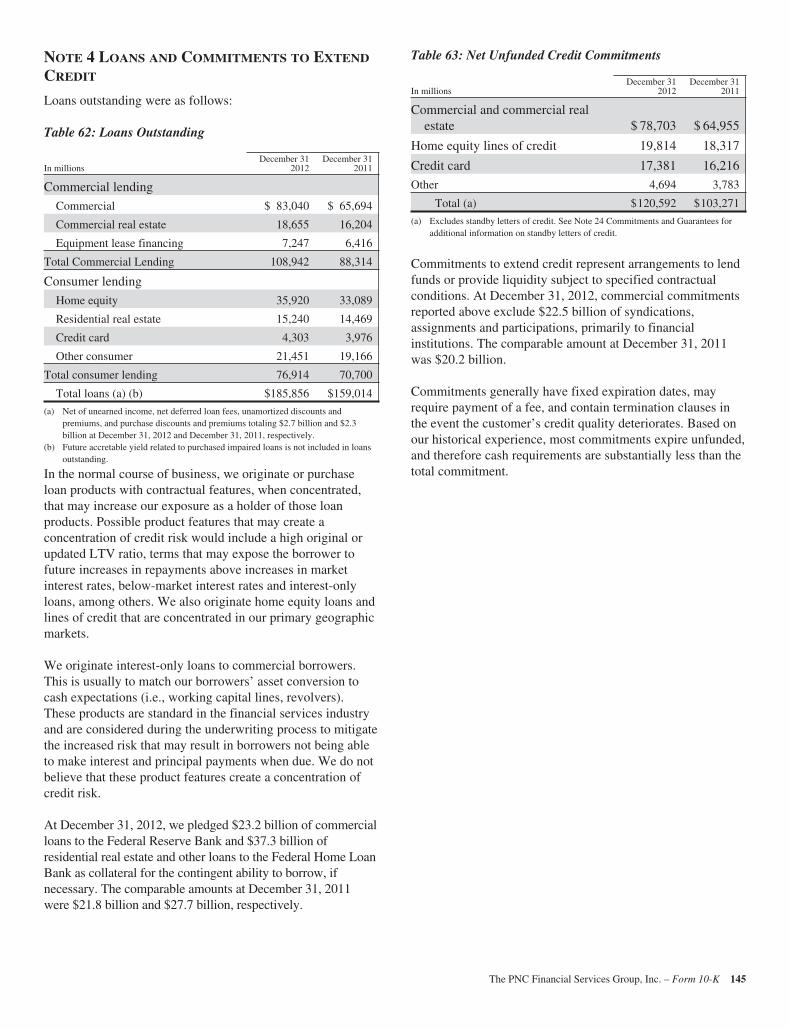
NOTE 4 LOANS AND COMMITMENTS TO EXTEND
CREDIT
Loans outstanding were as follows:
Table 62: Loans Outstanding
In millionsDecember 31
2012December 31
2011
Commercial lending
Commercial $ 83,040 $ 65,694
Commercial real estate 18,655 16,204
Equipment lease financing 7,247 6,416
Total Commercial Lending 108,942 88,314
Consumer lending
Home equity 35,920 33,089
Residential real estate 15,240 14,469
Credit card 4,303 3,976
Other consumer 21,451 19,166
Total consumer lending 76,914 70,700
Total loans (a) (b) $185,856 $159,014
(a) Net of unearned income, net deferred loan fees, unamortized discounts andpremiums, and purchase discounts and premiums totaling $2.7 billion and $2.3billion at December 31, 2012 and December 31, 2011, respectively.
(b) Future accretable yield related to purchased impaired loans is not included in loansoutstanding.
In the normal course of business, we originate or purchaseloan products with contractual features, when concentrated,that may increase our exposure as a holder of those loanproducts. Possible product features that may create aconcentration of credit risk would include a high original orupdated LTV ratio, terms that may expose the borrower tofuture increases in repayments above increases in marketinterest rates, below-market interest rates and interest-onlyloans, among others. We also originate home equity loans andlines of credit that are concentrated in our primary geographicmarkets.
We originate interest-only loans to commercial borrowers.This is usually to match our borrowers’ asset conversion tocash expectations (i.e., working capital lines, revolvers).These products are standard in the financial services industryand are considered during the underwriting process to mitigatethe increased risk that may result in borrowers not being ableto make interest and principal payments when due. We do notbelieve that these product features create a concentration ofcredit risk.
At December 31, 2012, we pledged $23.2 billion of commercialloans to the Federal Reserve Bank and $37.3 billion ofresidential real estate and other loans to the Federal Home LoanBank as collateral for the contingent ability to borrow, ifnecessary. The comparable amounts at December 31, 2011were $21.8 billion and $27.7 billion, respectively.
Table 63: Net Unfunded Credit Commitments
In millionsDecember 31
2012December 31
2011
Commercial and commercial realestate $ 78,703 $ 64,955
Home equity lines of credit 19,814 18,317
Credit card 17,381 16,216
Other 4,694 3,783
Total (a) $120,592 $103,271
(a) Excludes standby letters of credit. See Note 24 Commitments and Guarantees foradditional information on standby letters of credit.
Commitments to extend credit represent arrangements to lendfunds or provide liquidity subject to specified contractualconditions. At December 31, 2012, commercial commitmentsreported above exclude $22.5 billion of syndications,assignments and participations, primarily to financialinstitutions. The comparable amount at December 31, 2011was $20.2 billion.
Commitments generally have fixed expiration dates, mayrequire payment of a fee, and contain termination clauses inthe event the customer’s credit quality deteriorates. Based onour historical experience, most commitments expire unfunded,and therefore cash requirements are substantially less than thetotal commitment.
The PNC Financial Services Group, Inc. – Form 10-K 145
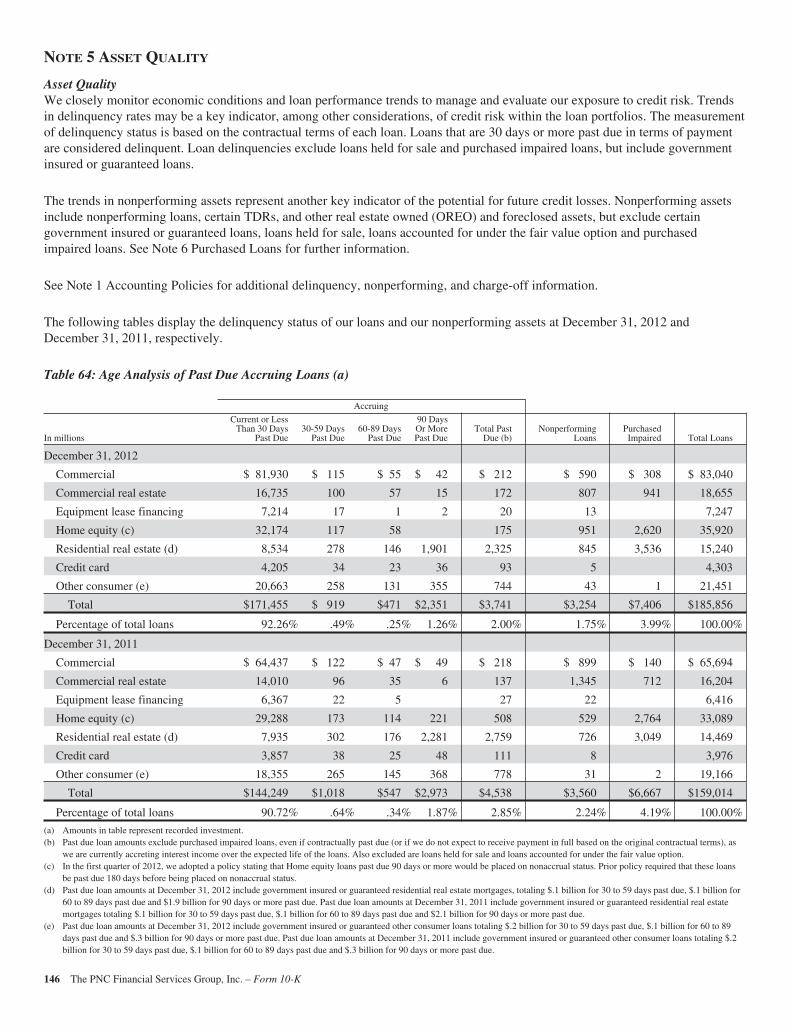
NOTE 5 ASSET QUALITY
Asset QualityWe closely monitor economic conditions and loan performance trends to manage and evaluate our exposure to credit risk. Trendsin delinquency rates may be a key indicator, among other considerations, of credit risk within the loan portfolios. The measurementof delinquency status is based on the contractual terms of each loan. Loans that are 30 days or more past due in terms of paymentare considered delinquent. Loan delinquencies exclude loans held for sale and purchased impaired loans, but include governmentinsured or guaranteed loans.
The trends in nonperforming assets represent another key indicator of the potential for future credit losses. Nonperforming assetsinclude nonperforming loans, certain TDRs, and other real estate owned (OREO) and foreclosed assets, but exclude certaingovernment insured or guaranteed loans, loans held for sale, loans accounted for under the fair value option and purchasedimpaired loans. See Note 6 Purchased Loans for further information.
See Note 1 Accounting Policies for additional delinquency, nonperforming, and charge-off information.
The following tables display the delinquency status of our loans and our nonperforming assets at December 31, 2012 andDecember 31, 2011, respectively.
Table 64: Age Analysis of Past Due Accruing Loans (a)
Accruing
In millions
Current or LessThan 30 Days
Past Due30-59 Days
Past Due60-89 Days
Past Due
90 DaysOr MorePast Due
Total PastDue (b)
NonperformingLoans
PurchasedImpaired Total Loans
December 31, 2012
Commercial $ 81,930 $ 115 $ 55 $ 42 $ 212 $ 590 $ 308 $ 83,040
Commercial real estate 16,735 100 57 15 172 807 941 18,655
Equipment lease financing 7,214 17 1 2 20 13 7,247
Home equity (c) 32,174 117 58 175 951 2,620 35,920
Residential real estate (d) 8,534 278 146 1,901 2,325 845 3,536 15,240
Credit card 4,205 34 23 36 93 5 4,303
Other consumer (e) 20,663 258 131 355 744 43 1 21,451
Total $171,455 $ 919 $471 $2,351 $3,741 $3,254 $7,406 $185,856
Percentage of total loans 92.26% .49% .25% 1.26% 2.00% 1.75% 3.99% 100.00%
December 31, 2011
Commercial $ 64,437 $ 122 $ 47 $ 49 $ 218 $ 899 $ 140 $ 65,694
Commercial real estate 14,010 96 35 6 137 1,345 712 16,204
Equipment lease financing 6,367 22 5 27 22 6,416
Home equity (c) 29,288 173 114 221 508 529 2,764 33,089
Residential real estate (d) 7,935 302 176 2,281 2,759 726 3,049 14,469
Credit card 3,857 38 25 48 111 8 3,976
Other consumer (e) 18,355 265 145 368 778 31 2 19,166
Total $144,249 $1,018 $547 $2,973 $4,538 $3,560 $6,667 $159,014
Percentage of total loans 90.72% .64% .34% 1.87% 2.85% 2.24% 4.19% 100.00%
(a) Amounts in table represent recorded investment.(b) Past due loan amounts exclude purchased impaired loans, even if contractually past due (or if we do not expect to receive payment in full based on the original contractual terms), as
we are currently accreting interest income over the expected life of the loans. Also excluded are loans held for sale and loans accounted for under the fair value option.(c) In the first quarter of 2012, we adopted a policy stating that Home equity loans past due 90 days or more would be placed on nonaccrual status. Prior policy required that these loans
be past due 180 days before being placed on nonaccrual status.(d) Past due loan amounts at December 31, 2012 include government insured or guaranteed residential real estate mortgages, totaling $.1 billion for 30 to 59 days past due, $.1 billion for
60 to 89 days past due and $1.9 billion for 90 days or more past due. Past due loan amounts at December 31, 2011 include government insured or guaranteed residential real estatemortgages totaling $.1 billion for 30 to 59 days past due, $.1 billion for 60 to 89 days past due and $2.1 billion for 90 days or more past due.
(e) Past due loan amounts at December 31, 2012 include government insured or guaranteed other consumer loans totaling $.2 billion for 30 to 59 days past due, $.1 billion for 60 to 89days past due and $.3 billion for 90 days or more past due. Past due loan amounts at December 31, 2011 include government insured or guaranteed other consumer loans totaling $.2billion for 30 to 59 days past due, $.1 billion for 60 to 89 days past due and $.3 billion for 90 days or more past due.
146 The PNC Financial Services Group, Inc. – Form 10-K
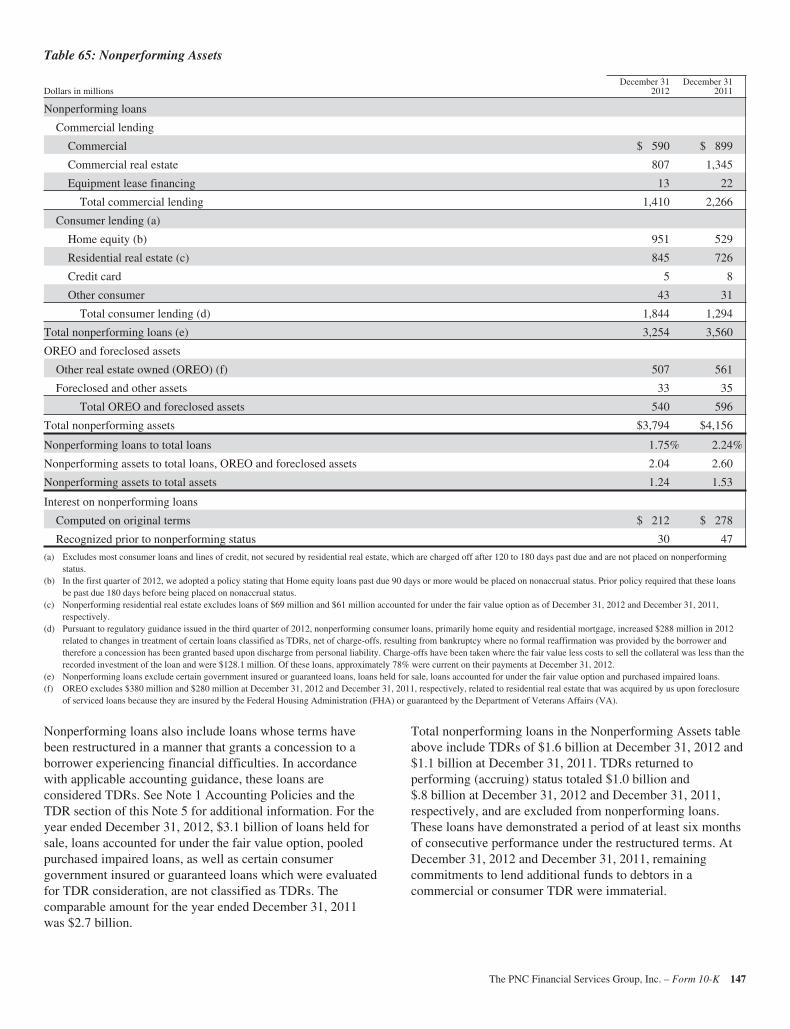
Table 65: Nonperforming Assets
Dollars in millionsDecember 31
2012December 31
2011
Nonperforming loans
Commercial lending
Commercial $ 590 $ 899
Commercial real estate 807 1,345
Equipment lease financing 13 22
Total commercial lending 1,410 2,266
Consumer lending (a)
Home equity (b) 951 529
Residential real estate (c) 845 726
Credit card 5 8
Other consumer 43 31
Total consumer lending (d) 1,844 1,294
Total nonperforming loans (e) 3,254 3,560
OREO and foreclosed assets
Other real estate owned (OREO) (f) 507 561
Foreclosed and other assets 33 35
Total OREO and foreclosed assets 540 596
Total nonperforming assets $3,794 $4,156
Nonperforming loans to total loans 1.75% 2.24%
Nonperforming assets to total loans, OREO and foreclosed assets 2.04 2.60
Nonperforming assets to total assets 1.24 1.53
Interest on nonperforming loans
Computed on original terms $ 212 $ 278
Recognized prior to nonperforming status 30 47
(a) Excludes most consumer loans and lines of credit, not secured by residential real estate, which are charged off after 120 to 180 days past due and are not placed on nonperformingstatus.
(b) In the first quarter of 2012, we adopted a policy stating that Home equity loans past due 90 days or more would be placed on nonaccrual status. Prior policy required that these loansbe past due 180 days before being placed on nonaccrual status.
(c) Nonperforming residential real estate excludes loans of $69 million and $61 million accounted for under the fair value option as of December 31, 2012 and December 31, 2011,respectively.
(d) Pursuant to regulatory guidance issued in the third quarter of 2012, nonperforming consumer loans, primarily home equity and residential mortgage, increased $288 million in 2012related to changes in treatment of certain loans classified as TDRs, net of charge-offs, resulting from bankruptcy where no formal reaffirmation was provided by the borrower andtherefore a concession has been granted based upon discharge from personal liability. Charge-offs have been taken where the fair value less costs to sell the collateral was less than therecorded investment of the loan and were $128.1 million. Of these loans, approximately 78% were current on their payments at December 31, 2012.
(e) Nonperforming loans exclude certain government insured or guaranteed loans, loans held for sale, loans accounted for under the fair value option and purchased impaired loans.(f) OREO excludes $380 million and $280 million at December 31, 2012 and December 31, 2011, respectively, related to residential real estate that was acquired by us upon foreclosure
of serviced loans because they are insured by the Federal Housing Administration (FHA) or guaranteed by the Department of Veterans Affairs (VA).
Nonperforming loans also include loans whose terms havebeen restructured in a manner that grants a concession to aborrower experiencing financial difficulties. In accordancewith applicable accounting guidance, these loans areconsidered TDRs. See Note 1 Accounting Policies and theTDR section of this Note 5 for additional information. For theyear ended December 31, 2012, $3.1 billion of loans held forsale, loans accounted for under the fair value option, pooledpurchased impaired loans, as well as certain consumergovernment insured or guaranteed loans which were evaluatedfor TDR consideration, are not classified as TDRs. Thecomparable amount for the year ended December 31, 2011was $2.7 billion.
Total nonperforming loans in the Nonperforming Assets tableabove include TDRs of $1.6 billion at December 31, 2012 and$1.1 billion at December 31, 2011. TDRs returned toperforming (accruing) status totaled $1.0 billion and$.8 billion at December 31, 2012 and December 31, 2011,respectively, and are excluded from nonperforming loans.These loans have demonstrated a period of at least six monthsof consecutive performance under the restructured terms. AtDecember 31, 2012 and December 31, 2011, remainingcommitments to lend additional funds to debtors in acommercial or consumer TDR were immaterial.
The PNC Financial Services Group, Inc. – Form 10-K 147
Additional Asset Quality IndicatorsWe have two overall portfolio segments – CommercialLending and Consumer Lending. Each of these two segmentsis comprised of one or more loan classes. Classes arecharacterized by similarities in initial measurement, riskattributes and the manner in which we monitor and assesscredit risk. The commercial segment is comprised of thecommercial, commercial real estate, equipment leasefinancing, and commercial purchased impaired loan classes.The consumer segment is comprised of the home equity,residential real estate, credit card, other consumer, andconsumer purchased impaired loan classes. Asset qualityindicators for each of these loan classes are discussed in moredetail below.
COMMERCIAL LENDING ASSET CLASSES
Commercial Loan ClassFor commercial loans, we monitor the performance of theborrower in a disciplined and regular manner based upon thelevel of credit risk inherent in the loan. To evaluate the levelof credit risk, we assign internal risk ratings reflecting theborrower’s PD and LGD. This two-dimensional credit riskrating methodology provides risk granularity in the monitoringprocess on an ongoing basis. These ratings are reviewed andupdated on a risk-adjusted basis, generally at least once peryear. Additionally, on an annual basis, we update PD ratesrelated to each rating grade based upon internal historical data,augmented by market data. For small balance homogenouspools of commercial loans, mortgages and leases, we applystatistical modeling to assist in determining the probability ofdefault within these pools. Further, on a periodic basis, weupdate our LGD estimates associated with each rating gradebased on historical data. The combination of the PD and LGDratings assigned to a commercial loan, capturing both theexpectations of default and loss severity in event of default,reflects the relative estimated likelihood of loss for that loan atthe reporting date. In general, loans with better PD and LGDhave a lower likelihood of loss. Conversely, loans with worsePD and LGD have a higher likelihood of loss. The lossamount also considers exposure at date of default (EAD),which we also periodically update based on historical data.
Based upon the amount of exposure and our risk ratings, wefollow a formal schedule of written periodic review. On aquarterly basis, we conduct formal reviews of a market orbusiness unit’s loan portfolio, focusing on those loans whichwe perceive to be of higher risk, based upon PDs and LGDs,or weakening credit quality. If circumstances warrant, it is ourpractice to review any customer obligation and its level ofcredit risk more frequently. We attempt to proactively manageour loans by using various procedures that are customized tothe risk of a given loan, including ongoing outreach, contact,and assessment of obligor financial conditions, collateralinspection and appraisal.
Commercial Real Estate Loan ClassWe manage credit risk associated with our commercial realestate projects and commercial mortgage activities similar tocommercial loans by analyzing PD and LGD. Additionally,risks connected with commercial real estate projects andcommercial mortgage activities tend to be correlated to theloan structure and collateral location, project progress andbusiness environment. As a result, these attributes are alsomonitored and utilized in assessing credit risk.
As with the commercial class, a formal schedule of periodicreview is performed to also assess market/geographic risk andbusiness unit/industry risk. Often as a result of theseoverviews, more in-depth reviews and increased scrutiny areplaced on areas of higher risk, including adverse changes inrisk ratings, deteriorating operating trends, and/or areas thatconcern management. The goal of these reviews is to assessrisk and take actions to mitigate our exposure to such risks.
Equipment Lease Financing Loan ClassWe manage credit risk associated with our equipment leasefinancing class similar to commercial loans by analyzing PDand LGD.
Based upon the dollar amount of the lease and of the level ofcredit risk, we follow a formal schedule of periodic review.Generally, this occurs on a quarterly basis, although we haveestablished practices to review such credit risk morefrequently, if circumstances warrant. Our review processentails analysis of the following factors: equipment value/residual value, exposure levels, jurisdiction risk, industry risk,and guarantor requirements.
Commercial Purchased Impaired Loans ClassThe credit impacts of purchased impaired loans are primarilydetermined through the estimation of expected cash flows.Commercial cash flow estimates are influenced by a numberof credit related items, which include but are not limited to:estimated collateral values, receipt of additional collateral,secondary trading prices, circumstances of possible and/orongoing liquidation, capital availability, business operationsand payment patterns.
We attempt to proactively manage these factors by usingvarious procedures that are customized to the risk of a givenloan. These procedures include a review by our Special AssetCommittee (SAC), ongoing outreach, contact, and assessmentof obligor financial conditions, collateral inspection andappraisal.
See Note 6 Purchased Loans for additional information.
148 The PNC Financial Services Group, Inc. – Form 10-K
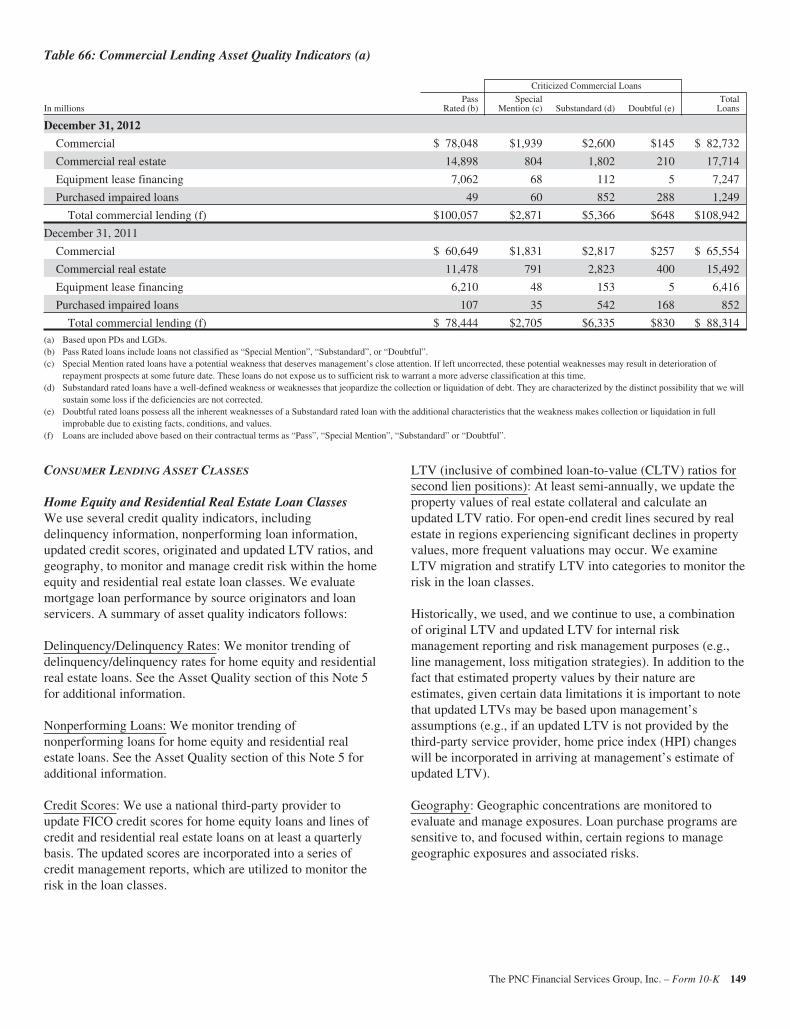
Table 66: Commercial Lending Asset Quality Indicators (a)
Criticized Commercial Loans
In millionsPass
Rated (b)Special
Mention (c) Substandard (d) Doubtful (e)Total
Loans
December 31, 2012
Commercial $ 78,048 $1,939 $2,600 $145 $ 82,732
Commercial real estate 14,898 804 1,802 210 17,714
Equipment lease financing 7,062 68 112 5 7,247
Purchased impaired loans 49 60 852 288 1,249
Total commercial lending (f) $100,057 $2,871 $5,366 $648 $108,942
December 31, 2011
Commercial $ 60,649 $1,831 $2,817 $257 $ 65,554
Commercial real estate 11,478 791 2,823 400 15,492
Equipment lease financing 6,210 48 153 5 6,416
Purchased impaired loans 107 35 542 168 852
Total commercial lending (f) $ 78,444 $2,705 $6,335 $830 $ 88,314(a) Based upon PDs and LGDs.(b) Pass Rated loans include loans not classified as “Special Mention”, “Substandard”, or “Doubtful”.(c) Special Mention rated loans have a potential weakness that deserves management’s close attention. If left uncorrected, these potential weaknesses may result in deterioration of
repayment prospects at some future date. These loans do not expose us to sufficient risk to warrant a more adverse classification at this time.(d) Substandard rated loans have a well-defined weakness or weaknesses that jeopardize the collection or liquidation of debt. They are characterized by the distinct possibility that we will
sustain some loss if the deficiencies are not corrected.(e) Doubtful rated loans possess all the inherent weaknesses of a Substandard rated loan with the additional characteristics that the weakness makes collection or liquidation in full
improbable due to existing facts, conditions, and values.(f) Loans are included above based on their contractual terms as “Pass”, “Special Mention”, “Substandard” or “Doubtful”.
CONSUMER LENDING ASSET CLASSES
Home Equity and Residential Real Estate Loan ClassesWe use several credit quality indicators, includingdelinquency information, nonperforming loan information,updated credit scores, originated and updated LTV ratios, andgeography, to monitor and manage credit risk within the homeequity and residential real estate loan classes. We evaluatemortgage loan performance by source originators and loanservicers. A summary of asset quality indicators follows:
Delinquency/Delinquency Rates: We monitor trending ofdelinquency/delinquency rates for home equity and residentialreal estate loans. See the Asset Quality section of this Note 5for additional information.
Nonperforming Loans: We monitor trending ofnonperforming loans for home equity and residential realestate loans. See the Asset Quality section of this Note 5 foradditional information.
Credit Scores: We use a national third-party provider toupdate FICO credit scores for home equity loans and lines ofcredit and residential real estate loans on at least a quarterlybasis. The updated scores are incorporated into a series ofcredit management reports, which are utilized to monitor therisk in the loan classes.
LTV (inclusive of combined loan-to-value (CLTV) ratios forsecond lien positions): At least semi-annually, we update theproperty values of real estate collateral and calculate anupdated LTV ratio. For open-end credit lines secured by realestate in regions experiencing significant declines in propertyvalues, more frequent valuations may occur. We examineLTV migration and stratify LTV into categories to monitor therisk in the loan classes.
Historically, we used, and we continue to use, a combinationof original LTV and updated LTV for internal riskmanagement reporting and risk management purposes (e.g.,line management, loss mitigation strategies). In addition to thefact that estimated property values by their nature areestimates, given certain data limitations it is important to notethat updated LTVs may be based upon management’sassumptions (e.g., if an updated LTV is not provided by thethird-party service provider, home price index (HPI) changeswill be incorporated in arriving at management’s estimate ofupdated LTV).
Geography: Geographic concentrations are monitored toevaluate and manage exposures. Loan purchase programs aresensitive to, and focused within, certain regions to managegeographic exposures and associated risks.
The PNC Financial Services Group, Inc. – Form 10-K 149
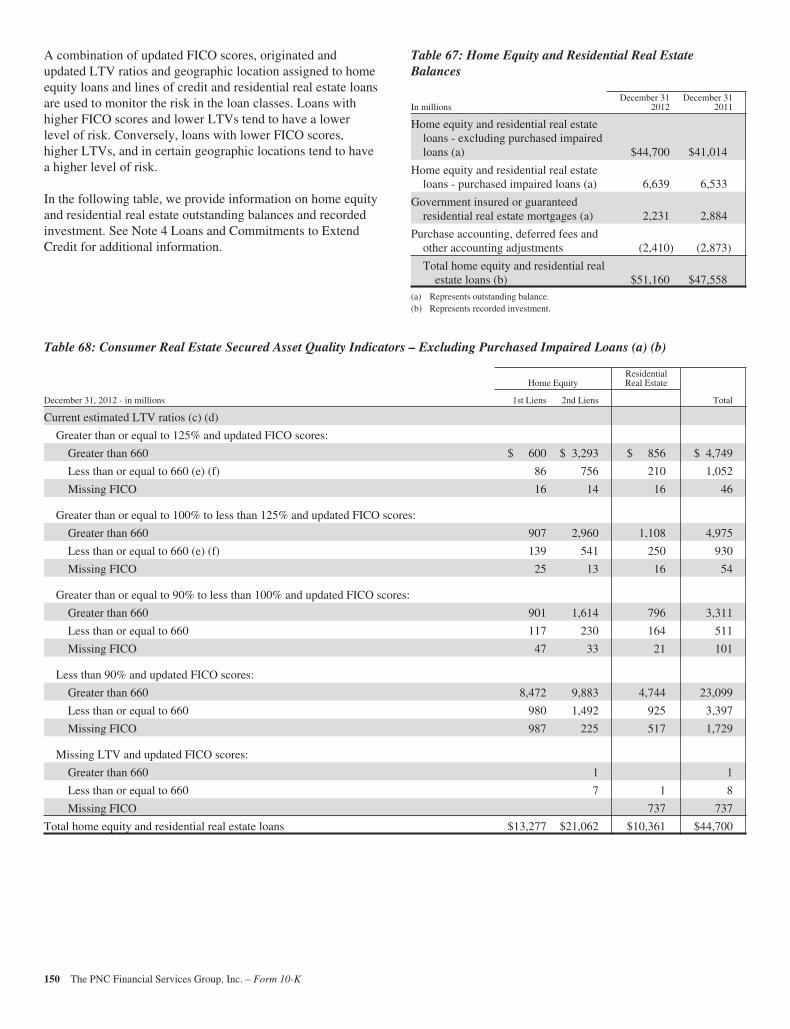
A combination of updated FICO scores, originated andupdated LTV ratios and geographic location assigned to homeequity loans and lines of credit and residential real estate loansare used to monitor the risk in the loan classes. Loans withhigher FICO scores and lower LTVs tend to have a lowerlevel of risk. Conversely, loans with lower FICO scores,higher LTVs, and in certain geographic locations tend to havea higher level of risk.
In the following table, we provide information on home equityand residential real estate outstanding balances and recordedinvestment. See Note 4 Loans and Commitments to ExtendCredit for additional information.
Table 67: Home Equity and Residential Real EstateBalances
In millionsDecember 31
2012December 31
2011
Home equity and residential real estateloans - excluding purchased impairedloans (a) $44,700 $41,014
Home equity and residential real estateloans - purchased impaired loans (a) 6,639 6,533
Government insured or guaranteedresidential real estate mortgages (a) 2,231 2,884
Purchase accounting, deferred fees andother accounting adjustments (2,410) (2,873)
Total home equity and residential realestate loans (b) $51,160 $47,558
(a) Represents outstanding balance.(b) Represents recorded investment.
Table 68: Consumer Real Estate Secured Asset Quality Indicators – Excluding Purchased Impaired Loans (a) (b)
Home EquityResidentialReal Estate
December 31, 2012 - in millions 1st Liens 2nd Liens Total
Current estimated LTV ratios (c) (d)
Greater than or equal to 125% and updated FICO scores:
Greater than 660 $ 600 $ 3,293 $ 856 $ 4,749
Less than or equal to 660 (e) (f) 86 756 210 1,052
Missing FICO 16 14 16 46
Greater than or equal to 100% to less than 125% and updated FICO scores:
Greater than 660 907 2,960 1,108 4,975
Less than or equal to 660 (e) (f) 139 541 250 930
Missing FICO 25 13 16 54
Greater than or equal to 90% to less than 100% and updated FICO scores:
Greater than 660 901 1,614 796 3,311
Less than or equal to 660 117 230 164 511
Missing FICO 47 33 21 101
Less than 90% and updated FICO scores:
Greater than 660 8,472 9,883 4,744 23,099
Less than or equal to 660 980 1,492 925 3,397
Missing FICO 987 225 517 1,729
Missing LTV and updated FICO scores:
Greater than 660 1 1
Less than or equal to 660 7 1 8
Missing FICO 737 737
Total home equity and residential real estate loans $13,277 $21,062 $10,361 $44,700
150 The PNC Financial Services Group, Inc. – Form 10-K
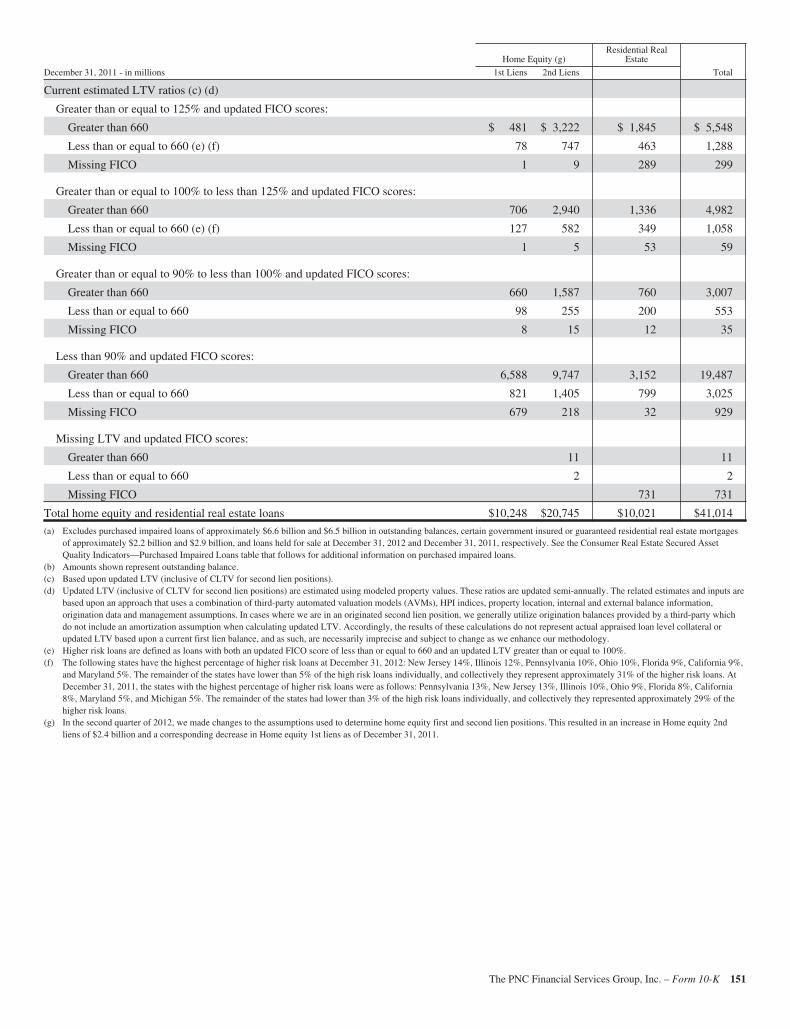
Home Equity (g)Residential Real
Estate
December 31, 2011 - in millions 1st Liens 2nd Liens Total
Current estimated LTV ratios (c) (d)
Greater than or equal to 125% and updated FICO scores:
Greater than 660 $ 481 $ 3,222 $ 1,845 $ 5,548
Less than or equal to 660 (e) (f) 78 747 463 1,288
Missing FICO 1 9 289 299
Greater than or equal to 100% to less than 125% and updated FICO scores:
Greater than 660 706 2,940 1,336 4,982
Less than or equal to 660 (e) (f) 127 582 349 1,058
Missing FICO 1 5 53 59
Greater than or equal to 90% to less than 100% and updated FICO scores:
Greater than 660 660 1,587 760 3,007
Less than or equal to 660 98 255 200 553
Missing FICO 8 15 12 35
Less than 90% and updated FICO scores:
Greater than 660 6,588 9,747 3,152 19,487
Less than or equal to 660 821 1,405 799 3,025
Missing FICO 679 218 32 929
Missing LTV and updated FICO scores:
Greater than 660 11 11
Less than or equal to 660 2 2
Missing FICO 731 731
Total home equity and residential real estate loans $10,248 $20,745 $10,021 $41,014
(a) Excludes purchased impaired loans of approximately $6.6 billion and $6.5 billion in outstanding balances, certain government insured or guaranteed residential real estate mortgagesof approximately $2.2 billion and $2.9 billion, and loans held for sale at December 31, 2012 and December 31, 2011, respectively. See the Consumer Real Estate Secured AssetQuality Indicators—Purchased Impaired Loans table that follows for additional information on purchased impaired loans.
(b) Amounts shown represent outstanding balance.(c) Based upon updated LTV (inclusive of CLTV for second lien positions).(d) Updated LTV (inclusive of CLTV for second lien positions) are estimated using modeled property values. These ratios are updated semi-annually. The related estimates and inputs are
based upon an approach that uses a combination of third-party automated valuation models (AVMs), HPI indices, property location, internal and external balance information,origination data and management assumptions. In cases where we are in an originated second lien position, we generally utilize origination balances provided by a third-party whichdo not include an amortization assumption when calculating updated LTV. Accordingly, the results of these calculations do not represent actual appraised loan level collateral orupdated LTV based upon a current first lien balance, and as such, are necessarily imprecise and subject to change as we enhance our methodology.
(e) Higher risk loans are defined as loans with both an updated FICO score of less than or equal to 660 and an updated LTV greater than or equal to 100%.(f) The following states have the highest percentage of higher risk loans at December 31, 2012: New Jersey 14%, Illinois 12%, Pennsylvania 10%, Ohio 10%, Florida 9%, California 9%,
and Maryland 5%. The remainder of the states have lower than 5% of the high risk loans individually, and collectively they represent approximately 31% of the higher risk loans. AtDecember 31, 2011, the states with the highest percentage of higher risk loans were as follows: Pennsylvania 13%, New Jersey 13%, Illinois 10%, Ohio 9%, Florida 8%, California8%, Maryland 5%, and Michigan 5%. The remainder of the states had lower than 3% of the high risk loans individually, and collectively they represented approximately 29% of thehigher risk loans.
(g) In the second quarter of 2012, we made changes to the assumptions used to determine home equity first and second lien positions. This resulted in an increase in Home equity 2ndliens of $2.4 billion and a corresponding decrease in Home equity 1st liens as of December 31, 2011.
The PNC Financial Services Group, Inc. – Form 10-K 151
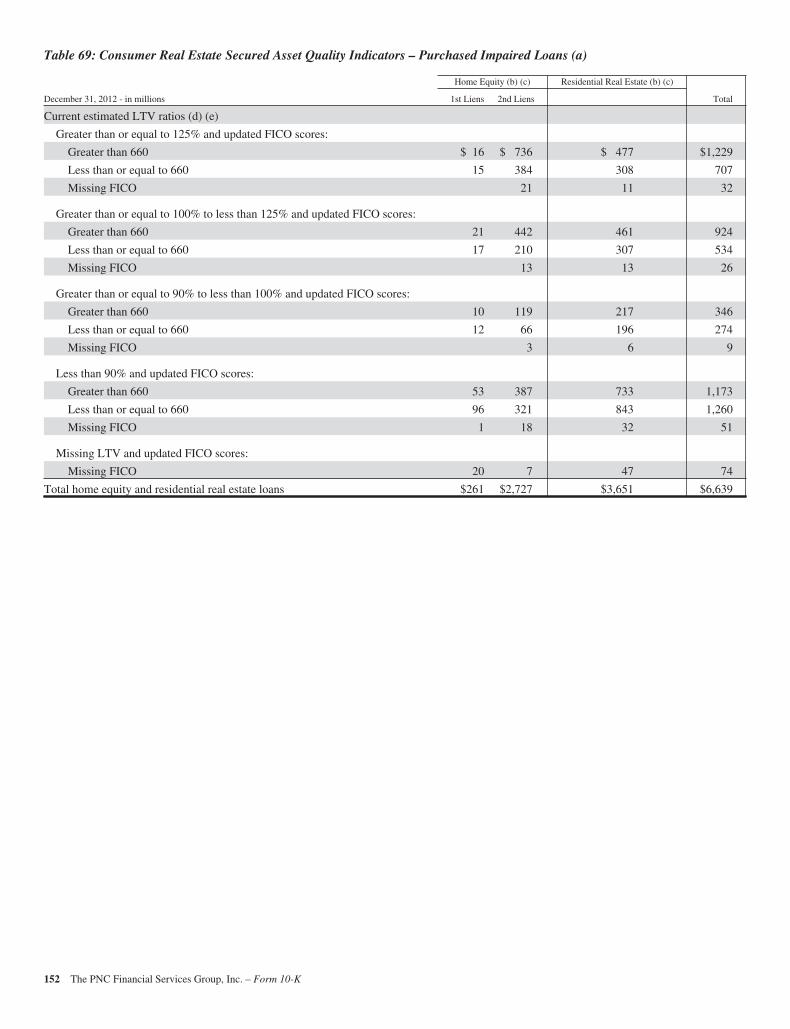
Table 69: Consumer Real Estate Secured Asset Quality Indicators – Purchased Impaired Loans (a)
Home Equity (b) (c) Residential Real Estate (b) (c)
December 31, 2012 - in millions 1st Liens 2nd Liens Total
Current estimated LTV ratios (d) (e)
Greater than or equal to 125% and updated FICO scores:
Greater than 660 $ 16 $ 736 $ 477 $1,229
Less than or equal to 660 15 384 308 707
Missing FICO 21 11 32
Greater than or equal to 100% to less than 125% and updated FICO scores:
Greater than 660 21 442 461 924
Less than or equal to 660 17 210 307 534
Missing FICO 13 13 26
Greater than or equal to 90% to less than 100% and updated FICO scores:
Greater than 660 10 119 217 346
Less than or equal to 660 12 66 196 274
Missing FICO 3 6 9
Less than 90% and updated FICO scores:
Greater than 660 53 387 733 1,173
Less than or equal to 660 96 321 843 1,260
Missing FICO 1 18 32 51
Missing LTV and updated FICO scores:
Missing FICO 20 7 47 74
Total home equity and residential real estate loans $261 $2,727 $3,651 $6,639
152 The PNC Financial Services Group, Inc. – Form 10-K
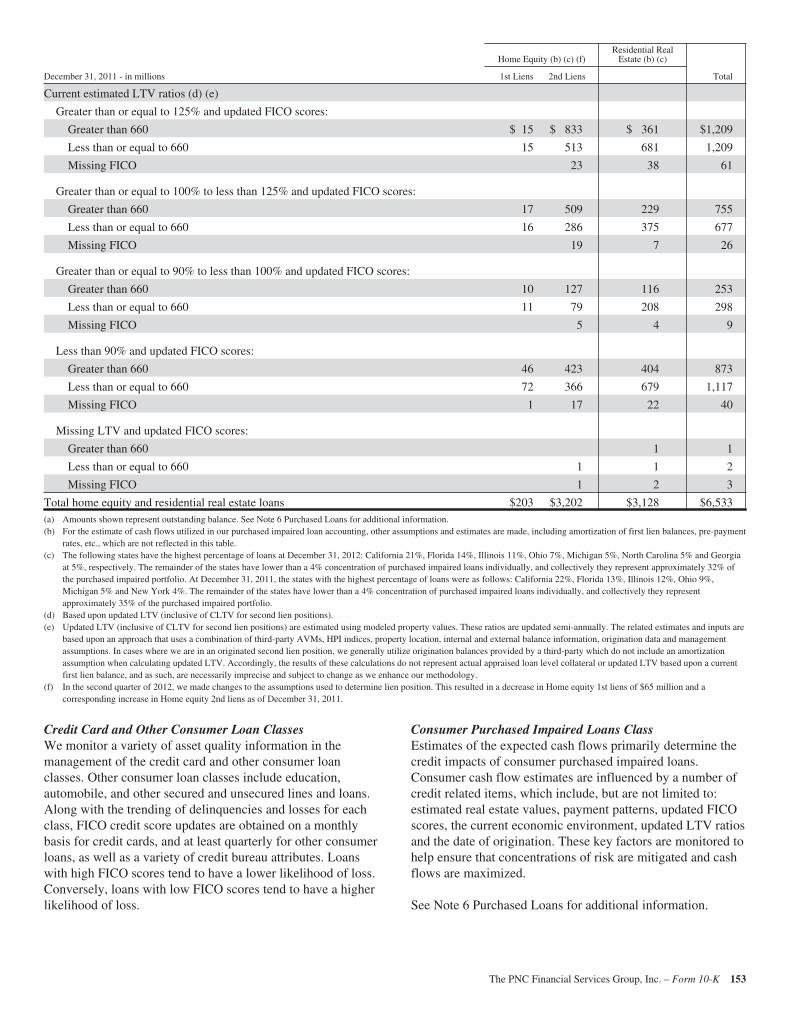
Home Equity (b) (c) (f)Residential Real
Estate (b) (c)
December 31, 2011 - in millions 1st Liens 2nd Liens Total
Current estimated LTV ratios (d) (e)
Greater than or equal to 125% and updated FICO scores:
Greater than 660 $ 15 $ 833 $ 361 $1,209
Less than or equal to 660 15 513 681 1,209
Missing FICO 23 38 61
Greater than or equal to 100% to less than 125% and updated FICO scores:
Greater than 660 17 509 229 755
Less than or equal to 660 16 286 375 677
Missing FICO 19 7 26
Greater than or equal to 90% to less than 100% and updated FICO scores:
Greater than 660 10 127 116 253
Less than or equal to 660 11 79 208 298
Missing FICO 5 4 9
Less than 90% and updated FICO scores:
Greater than 660 46 423 404 873
Less than or equal to 660 72 366 679 1,117
Missing FICO 1 17 22 40
Missing LTV and updated FICO scores:
Greater than 660 1 1
Less than or equal to 660 1 1 2
Missing FICO 1 2 3
Total home equity and residential real estate loans $203 $3,202 $3,128 $6,533(a) Amounts shown represent outstanding balance. See Note 6 Purchased Loans for additional information.(b) For the estimate of cash flows utilized in our purchased impaired loan accounting, other assumptions and estimates are made, including amortization of first lien balances, pre-payment
rates, etc., which are not reflected in this table.(c) The following states have the highest percentage of loans at December 31, 2012: California 21%, Florida 14%, Illinois 11%, Ohio 7%, Michigan 5%, North Carolina 5% and Georgia
at 5%, respectively. The remainder of the states have lower than a 4% concentration of purchased impaired loans individually, and collectively they represent approximately 32% ofthe purchased impaired portfolio. At December 31, 2011, the states with the highest percentage of loans were as follows: California 22%, Florida 13%, Illinois 12%, Ohio 9%,Michigan 5% and New York 4%. The remainder of the states have lower than a 4% concentration of purchased impaired loans individually, and collectively they representapproximately 35% of the purchased impaired portfolio.
(d) Based upon updated LTV (inclusive of CLTV for second lien positions).(e) Updated LTV (inclusive of CLTV for second lien positions) are estimated using modeled property values. These ratios are updated semi-annually. The related estimates and inputs are
based upon an approach that uses a combination of third-party AVMs, HPI indices, property location, internal and external balance information, origination data and managementassumptions. In cases where we are in an originated second lien position, we generally utilize origination balances provided by a third-party which do not include an amortizationassumption when calculating updated LTV. Accordingly, the results of these calculations do not represent actual appraised loan level collateral or updated LTV based upon a currentfirst lien balance, and as such, are necessarily imprecise and subject to change as we enhance our methodology.
(f) In the second quarter of 2012, we made changes to the assumptions used to determine lien position. This resulted in a decrease in Home equity 1st liens of $65 million and acorresponding increase in Home equity 2nd liens as of December 31, 2011.
Credit Card and Other Consumer Loan ClassesWe monitor a variety of asset quality information in themanagement of the credit card and other consumer loanclasses. Other consumer loan classes include education,automobile, and other secured and unsecured lines and loans.Along with the trending of delinquencies and losses for eachclass, FICO credit score updates are obtained on a monthlybasis for credit cards, and at least quarterly for other consumerloans, as well as a variety of credit bureau attributes. Loanswith high FICO scores tend to have a lower likelihood of loss.Conversely, loans with low FICO scores tend to have a higherlikelihood of loss.
Consumer Purchased Impaired Loans ClassEstimates of the expected cash flows primarily determine thecredit impacts of consumer purchased impaired loans.Consumer cash flow estimates are influenced by a number ofcredit related items, which include, but are not limited to:estimated real estate values, payment patterns, updated FICOscores, the current economic environment, updated LTV ratiosand the date of origination. These key factors are monitored tohelp ensure that concentrations of risk are mitigated and cashflows are maximized.
See Note 6 Purchased Loans for additional information.
The PNC Financial Services Group, Inc. – Form 10-K 153
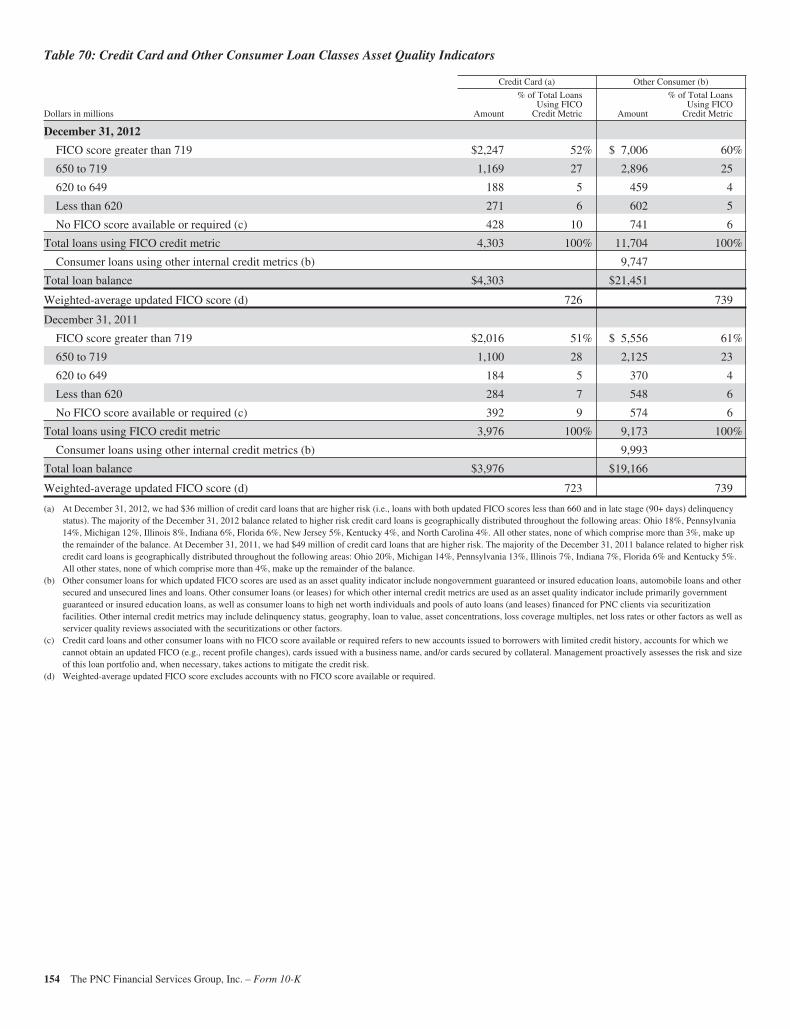
Table 70: Credit Card and Other Consumer Loan Classes Asset Quality Indicators
Credit Card (a) Other Consumer (b)
Dollars in millions Amount
% of Total LoansUsing FICO
Credit Metric Amount
% of Total LoansUsing FICO
Credit Metric
December 31, 2012
FICO score greater than 719 $2,247 52% $ 7,006 60%
650 to 719 1,169 27 2,896 25
620 to 649 188 5 459 4
Less than 620 271 6 602 5
No FICO score available or required (c) 428 10 741 6
Total loans using FICO credit metric 4,303 100% 11,704 100%
Consumer loans using other internal credit metrics (b) 9,747
Total loan balance $4,303 $21,451
Weighted-average updated FICO score (d) 726 739
December 31, 2011
FICO score greater than 719 $2,016 51% $ 5,556 61%
650 to 719 1,100 28 2,125 23
620 to 649 184 5 370 4
Less than 620 284 7 548 6
No FICO score available or required (c) 392 9 574 6
Total loans using FICO credit metric 3,976 100% 9,173 100%
Consumer loans using other internal credit metrics (b) 9,993
Total loan balance $3,976 $19,166
Weighted-average updated FICO score (d) 723 739
(a) At December 31, 2012, we had $36 million of credit card loans that are higher risk (i.e., loans with both updated FICO scores less than 660 and in late stage (90+ days) delinquencystatus). The majority of the December 31, 2012 balance related to higher risk credit card loans is geographically distributed throughout the following areas: Ohio 18%, Pennsylvania14%, Michigan 12%, Illinois 8%, Indiana 6%, Florida 6%, New Jersey 5%, Kentucky 4%, and North Carolina 4%. All other states, none of which comprise more than 3%, make upthe remainder of the balance. At December 31, 2011, we had $49 million of credit card loans that are higher risk. The majority of the December 31, 2011 balance related to higher riskcredit card loans is geographically distributed throughout the following areas: Ohio 20%, Michigan 14%, Pennsylvania 13%, Illinois 7%, Indiana 7%, Florida 6% and Kentucky 5%.All other states, none of which comprise more than 4%, make up the remainder of the balance.
(b) Other consumer loans for which updated FICO scores are used as an asset quality indicator include nongovernment guaranteed or insured education loans, automobile loans and othersecured and unsecured lines and loans. Other consumer loans (or leases) for which other internal credit metrics are used as an asset quality indicator include primarily governmentguaranteed or insured education loans, as well as consumer loans to high net worth individuals and pools of auto loans (and leases) financed for PNC clients via securitizationfacilities. Other internal credit metrics may include delinquency status, geography, loan to value, asset concentrations, loss coverage multiples, net loss rates or other factors as well asservicer quality reviews associated with the securitizations or other factors.
(c) Credit card loans and other consumer loans with no FICO score available or required refers to new accounts issued to borrowers with limited credit history, accounts for which wecannot obtain an updated FICO (e.g., recent profile changes), cards issued with a business name, and/or cards secured by collateral. Management proactively assesses the risk and sizeof this loan portfolio and, when necessary, takes actions to mitigate the credit risk.
(d) Weighted-average updated FICO score excludes accounts with no FICO score available or required.
154 The PNC Financial Services Group, Inc. – Form 10-K
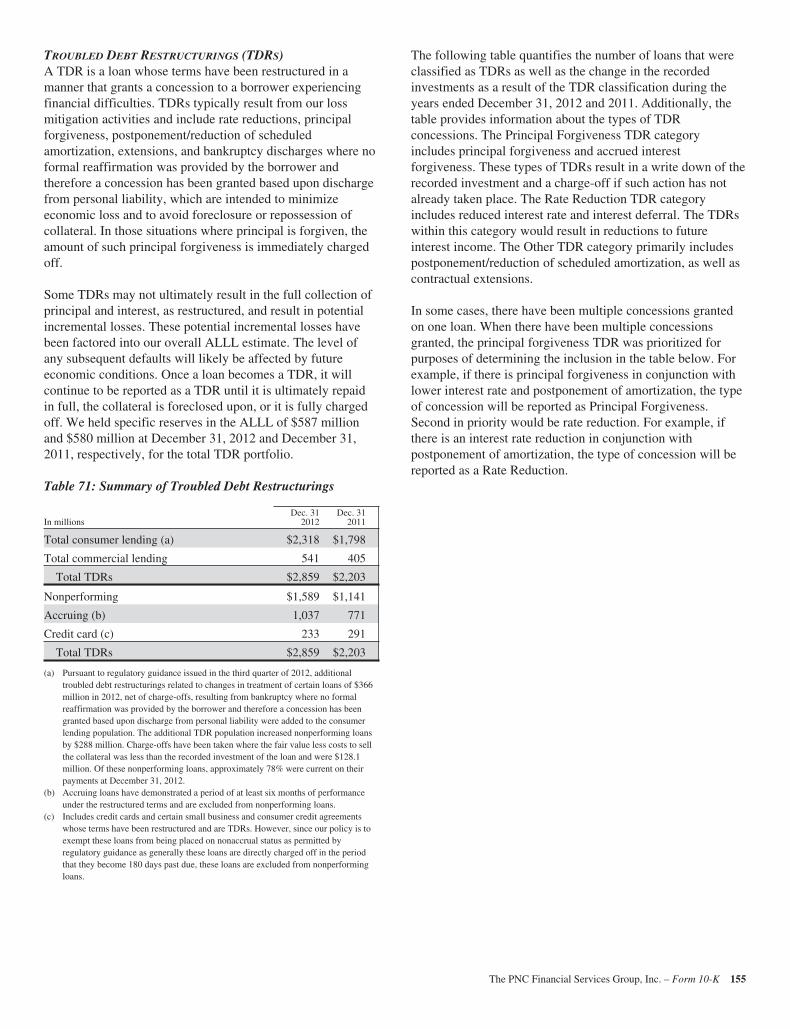
TROUBLED DEBT RESTRUCTURINGS (TDRS)A TDR is a loan whose terms have been restructured in amanner that grants a concession to a borrower experiencingfinancial difficulties. TDRs typically result from our lossmitigation activities and include rate reductions, principalforgiveness, postponement/reduction of scheduledamortization, extensions, and bankruptcy discharges where noformal reaffirmation was provided by the borrower andtherefore a concession has been granted based upon dischargefrom personal liability, which are intended to minimizeeconomic loss and to avoid foreclosure or repossession ofcollateral. In those situations where principal is forgiven, theamount of such principal forgiveness is immediately chargedoff.
Some TDRs may not ultimately result in the full collection ofprincipal and interest, as restructured, and result in potentialincremental losses. These potential incremental losses havebeen factored into our overall ALLL estimate. The level ofany subsequent defaults will likely be affected by futureeconomic conditions. Once a loan becomes a TDR, it willcontinue to be reported as a TDR until it is ultimately repaidin full, the collateral is foreclosed upon, or it is fully chargedoff. We held specific reserves in the ALLL of $587 millionand $580 million at December 31, 2012 and December 31,2011, respectively, for the total TDR portfolio.
Table 71: Summary of Troubled Debt Restructurings
In millionsDec. 31
2012Dec. 31
2011
Total consumer lending (a) $2,318 $1,798
Total commercial lending 541 405
Total TDRs $2,859 $2,203
Nonperforming $1,589 $1,141
Accruing (b) 1,037 771
Credit card (c) 233 291
Total TDRs $2,859 $2,203
(a) Pursuant to regulatory guidance issued in the third quarter of 2012, additionaltroubled debt restructurings related to changes in treatment of certain loans of $366million in 2012, net of charge-offs, resulting from bankruptcy where no formalreaffirmation was provided by the borrower and therefore a concession has beengranted based upon discharge from personal liability were added to the consumerlending population. The additional TDR population increased nonperforming loansby $288 million. Charge-offs have been taken where the fair value less costs to sellthe collateral was less than the recorded investment of the loan and were $128.1million. Of these nonperforming loans, approximately 78% were current on theirpayments at December 31, 2012.
(b) Accruing loans have demonstrated a period of at least six months of performanceunder the restructured terms and are excluded from nonperforming loans.
(c) Includes credit cards and certain small business and consumer credit agreementswhose terms have been restructured and are TDRs. However, since our policy is toexempt these loans from being placed on nonaccrual status as permitted byregulatory guidance as generally these loans are directly charged off in the periodthat they become 180 days past due, these loans are excluded from nonperformingloans.
The following table quantifies the number of loans that wereclassified as TDRs as well as the change in the recordedinvestments as a result of the TDR classification during theyears ended December 31, 2012 and 2011. Additionally, thetable provides information about the types of TDRconcessions. The Principal Forgiveness TDR categoryincludes principal forgiveness and accrued interestforgiveness. These types of TDRs result in a write down of therecorded investment and a charge-off if such action has notalready taken place. The Rate Reduction TDR categoryincludes reduced interest rate and interest deferral. The TDRswithin this category would result in reductions to futureinterest income. The Other TDR category primarily includespostponement/reduction of scheduled amortization, as well ascontractual extensions.
In some cases, there have been multiple concessions grantedon one loan. When there have been multiple concessionsgranted, the principal forgiveness TDR was prioritized forpurposes of determining the inclusion in the table below. Forexample, if there is principal forgiveness in conjunction withlower interest rate and postponement of amortization, the typeof concession will be reported as Principal Forgiveness.Second in priority would be rate reduction. For example, ifthere is an interest rate reduction in conjunction withpostponement of amortization, the type of concession will bereported as a Rate Reduction.
The PNC Financial Services Group, Inc. – Form 10-K 155
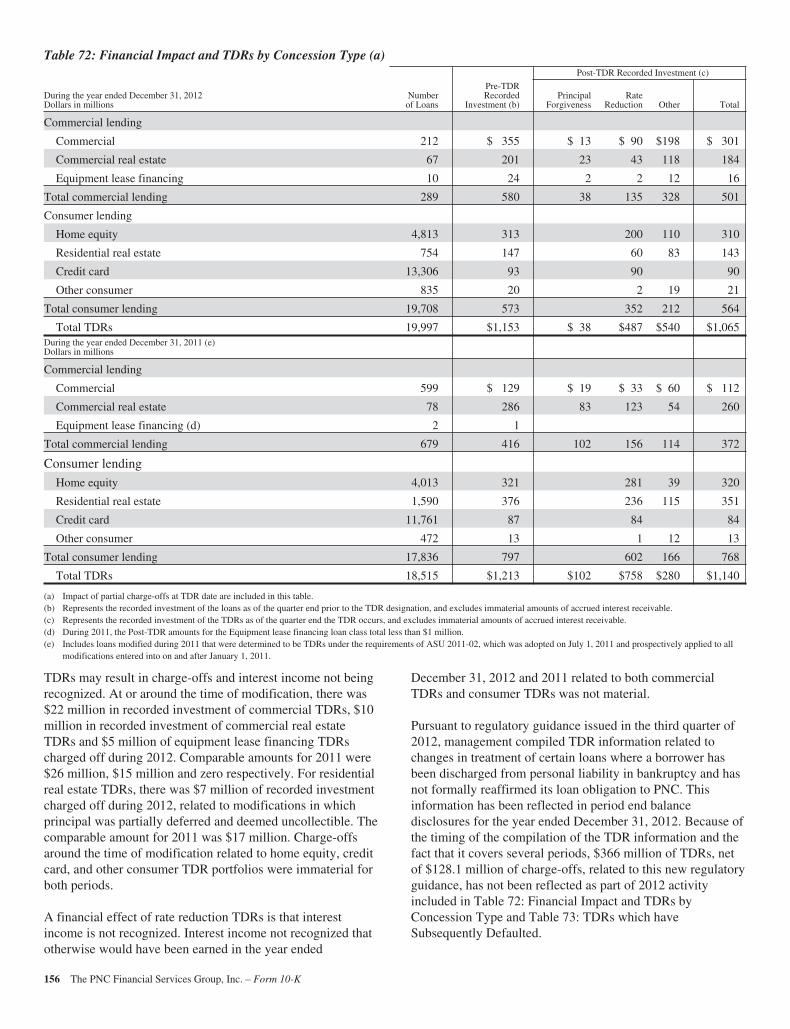
Table 72: Financial Impact and TDRs by Concession Type (a)Post-TDR Recorded Investment (c)
During the year ended December 31, 2012Dollars in millions
Numberof Loans
Pre-TDRRecorded
Investment (b)Principal
ForgivenessRate
Reduction Other Total
Commercial lending
Commercial 212 $ 355 $ 13 $ 90 $198 $ 301
Commercial real estate 67 201 23 43 118 184
Equipment lease financing 10 24 2 2 12 16
Total commercial lending 289 580 38 135 328 501
Consumer lending
Home equity 4,813 313 200 110 310
Residential real estate 754 147 60 83 143
Credit card 13,306 93 90 90
Other consumer 835 20 2 19 21
Total consumer lending 19,708 573 352 212 564
Total TDRs 19,997 $1,153 $ 38 $487 $540 $1,065During the year ended December 31, 2011 (e)Dollars in millions
Commercial lending
Commercial 599 $ 129 $ 19 $ 33 $ 60 $ 112
Commercial real estate 78 286 83 123 54 260
Equipment lease financing (d) 2 1
Total commercial lending 679 416 102 156 114 372
Consumer lending
Home equity 4,013 321 281 39 320
Residential real estate 1,590 376 236 115 351
Credit card 11,761 87 84 84
Other consumer 472 13 1 12 13
Total consumer lending 17,836 797 602 166 768
Total TDRs 18,515 $1,213 $102 $758 $280 $1,140
(a) Impact of partial charge-offs at TDR date are included in this table.(b) Represents the recorded investment of the loans as of the quarter end prior to the TDR designation, and excludes immaterial amounts of accrued interest receivable.(c) Represents the recorded investment of the TDRs as of the quarter end the TDR occurs, and excludes immaterial amounts of accrued interest receivable.(d) During 2011, the Post-TDR amounts for the Equipment lease financing loan class total less than $1 million.(e) Includes loans modified during 2011 that were determined to be TDRs under the requirements of ASU 2011-02, which was adopted on July 1, 2011 and prospectively applied to all
modifications entered into on and after January 1, 2011.
TDRs may result in charge-offs and interest income not beingrecognized. At or around the time of modification, there was$22 million in recorded investment of commercial TDRs, $10million in recorded investment of commercial real estateTDRs and $5 million of equipment lease financing TDRscharged off during 2012. Comparable amounts for 2011 were$26 million, $15 million and zero respectively. For residentialreal estate TDRs, there was $7 million of recorded investmentcharged off during 2012, related to modifications in whichprincipal was partially deferred and deemed uncollectible. Thecomparable amount for 2011 was $17 million. Charge-offsaround the time of modification related to home equity, creditcard, and other consumer TDR portfolios were immaterial forboth periods.
A financial effect of rate reduction TDRs is that interestincome is not recognized. Interest income not recognized thatotherwise would have been earned in the year ended
December 31, 2012 and 2011 related to both commercialTDRs and consumer TDRs was not material.
Pursuant to regulatory guidance issued in the third quarter of2012, management compiled TDR information related tochanges in treatment of certain loans where a borrower hasbeen discharged from personal liability in bankruptcy and hasnot formally reaffirmed its loan obligation to PNC. Thisinformation has been reflected in period end balancedisclosures for the year ended December 31, 2012. Because ofthe timing of the compilation of the TDR information and thefact that it covers several periods, $366 million of TDRs, netof $128.1 million of charge-offs, related to this new regulatoryguidance, has not been reflected as part of 2012 activityincluded in Table 72: Financial Impact and TDRs byConcession Type and Table 73: TDRs which haveSubsequently Defaulted.
156 The PNC Financial Services Group, Inc. – Form 10-K
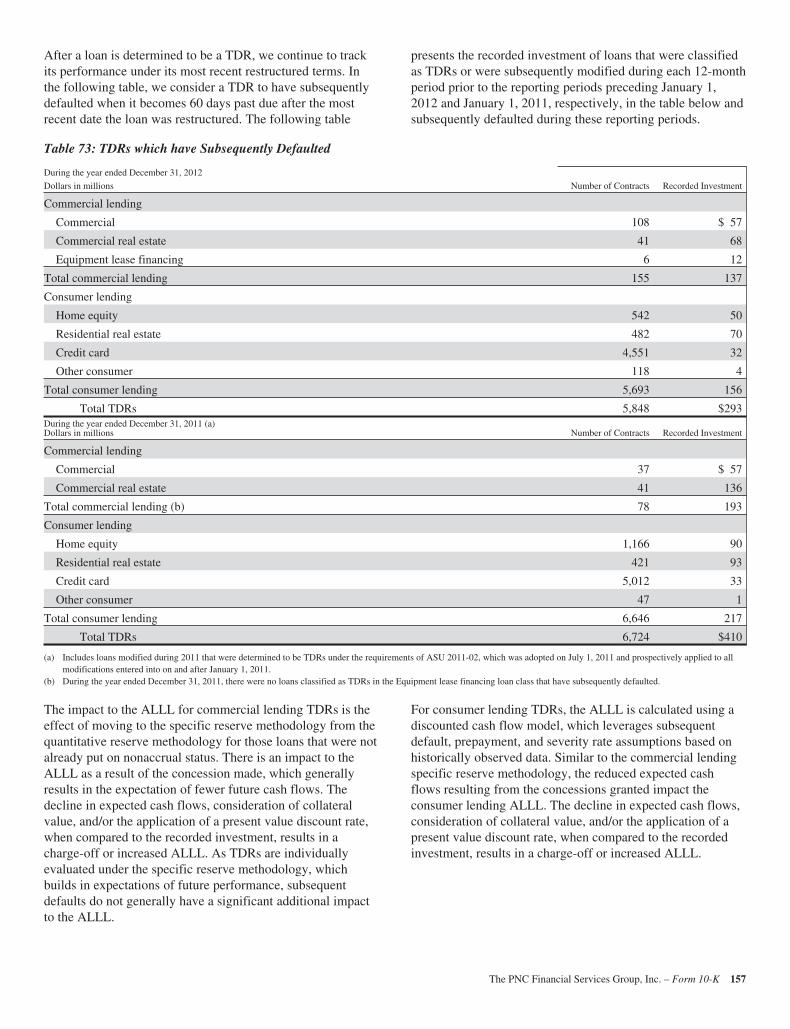
After a loan is determined to be a TDR, we continue to trackits performance under its most recent restructured terms. Inthe following table, we consider a TDR to have subsequentlydefaulted when it becomes 60 days past due after the mostrecent date the loan was restructured. The following table
presents the recorded investment of loans that were classifiedas TDRs or were subsequently modified during each 12-monthperiod prior to the reporting periods preceding January 1,2012 and January 1, 2011, respectively, in the table below andsubsequently defaulted during these reporting periods.
Table 73: TDRs which have Subsequently Defaulted
During the year ended December 31, 2012
Dollars in millions Number of Contracts Recorded Investment
Commercial lending
Commercial 108 $ 57
Commercial real estate 41 68
Equipment lease financing 6 12
Total commercial lending 155 137
Consumer lending
Home equity 542 50
Residential real estate 482 70
Credit card 4,551 32
Other consumer 118 4
Total consumer lending 5,693 156
Total TDRs 5,848 $293During the year ended December 31, 2011 (a)Dollars in millions Number of Contracts Recorded Investment
Commercial lending
Commercial 37 $ 57
Commercial real estate 41 136
Total commercial lending (b) 78 193
Consumer lending
Home equity 1,166 90
Residential real estate 421 93
Credit card 5,012 33
Other consumer 47 1
Total consumer lending 6,646 217
Total TDRs 6,724 $410
(a) Includes loans modified during 2011 that were determined to be TDRs under the requirements of ASU 2011-02, which was adopted on July 1, 2011 and prospectively applied to allmodifications entered into on and after January 1, 2011.
(b) During the year ended December 31, 2011, there were no loans classified as TDRs in the Equipment lease financing loan class that have subsequently defaulted.
The impact to the ALLL for commercial lending TDRs is theeffect of moving to the specific reserve methodology from thequantitative reserve methodology for those loans that were notalready put on nonaccrual status. There is an impact to theALLL as a result of the concession made, which generallyresults in the expectation of fewer future cash flows. Thedecline in expected cash flows, consideration of collateralvalue, and/or the application of a present value discount rate,when compared to the recorded investment, results in acharge-off or increased ALLL. As TDRs are individuallyevaluated under the specific reserve methodology, whichbuilds in expectations of future performance, subsequentdefaults do not generally have a significant additional impactto the ALLL.
For consumer lending TDRs, the ALLL is calculated using adiscounted cash flow model, which leverages subsequentdefault, prepayment, and severity rate assumptions based onhistorically observed data. Similar to the commercial lendingspecific reserve methodology, the reduced expected cashflows resulting from the concessions granted impact theconsumer lending ALLL. The decline in expected cash flows,consideration of collateral value, and/or the application of apresent value discount rate, when compared to the recordedinvestment, results in a charge-off or increased ALLL.
The PNC Financial Services Group, Inc. – Form 10-K 157
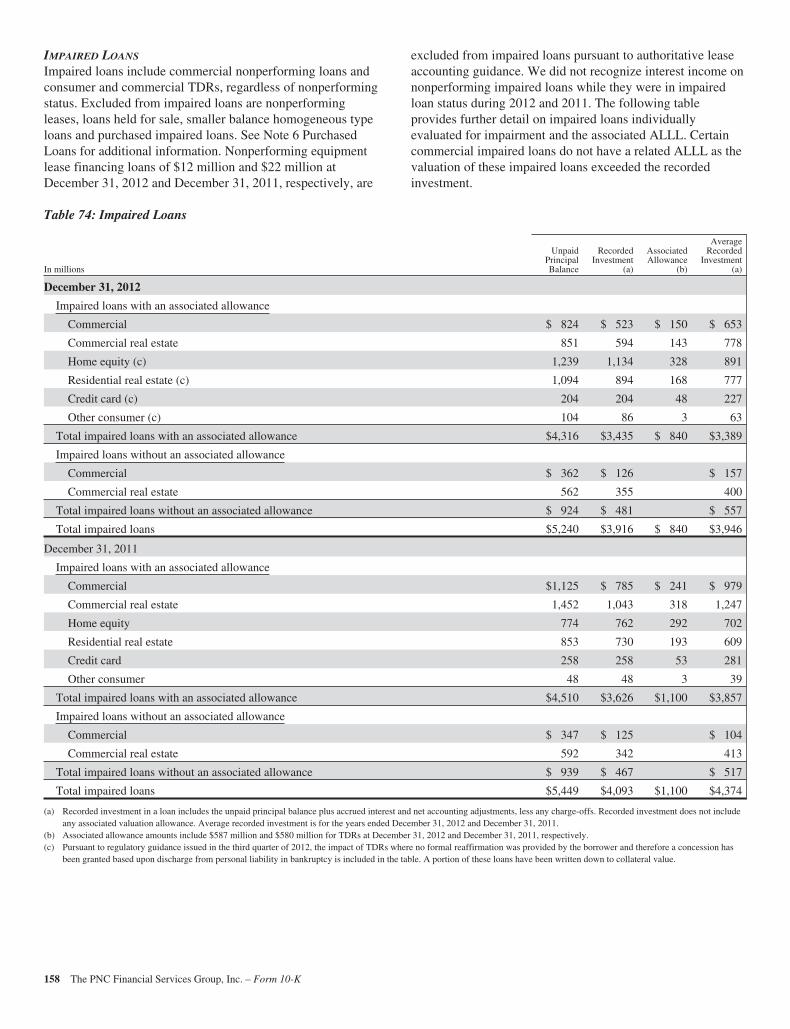
IMPAIRED LOANS
Impaired loans include commercial nonperforming loans andconsumer and commercial TDRs, regardless of nonperformingstatus. Excluded from impaired loans are nonperformingleases, loans held for sale, smaller balance homogeneous typeloans and purchased impaired loans. See Note 6 PurchasedLoans for additional information. Nonperforming equipmentlease financing loans of $12 million and $22 million atDecember 31, 2012 and December 31, 2011, respectively, are
excluded from impaired loans pursuant to authoritative leaseaccounting guidance. We did not recognize interest income onnonperforming impaired loans while they were in impairedloan status during 2012 and 2011. The following tableprovides further detail on impaired loans individuallyevaluated for impairment and the associated ALLL. Certaincommercial impaired loans do not have a related ALLL as thevaluation of these impaired loans exceeded the recordedinvestment.
Table 74: Impaired Loans
In millions
UnpaidPrincipalBalance
RecordedInvestment
(a)
AssociatedAllowance
(b)
AverageRecorded
Investment(a)
December 31, 2012
Impaired loans with an associated allowance
Commercial $ 824 $ 523 $ 150 $ 653
Commercial real estate 851 594 143 778
Home equity (c) 1,239 1,134 328 891
Residential real estate (c) 1,094 894 168 777
Credit card (c) 204 204 48 227
Other consumer (c) 104 86 3 63
Total impaired loans with an associated allowance $4,316 $3,435 $ 840 $3,389
Impaired loans without an associated allowance
Commercial $ 362 $ 126 $ 157
Commercial real estate 562 355 400
Total impaired loans without an associated allowance $ 924 $ 481 $ 557
Total impaired loans $5,240 $3,916 $ 840 $3,946
December 31, 2011
Impaired loans with an associated allowance
Commercial $1,125 $ 785 $ 241 $ 979
Commercial real estate 1,452 1,043 318 1,247
Home equity 774 762 292 702
Residential real estate 853 730 193 609
Credit card 258 258 53 281
Other consumer 48 48 3 39
Total impaired loans with an associated allowance $4,510 $3,626 $1,100 $3,857
Impaired loans without an associated allowance
Commercial $ 347 $ 125 $ 104
Commercial real estate 592 342 413
Total impaired loans without an associated allowance $ 939 $ 467 $ 517
Total impaired loans $5,449 $4,093 $1,100 $4,374
(a) Recorded investment in a loan includes the unpaid principal balance plus accrued interest and net accounting adjustments, less any charge-offs. Recorded investment does not includeany associated valuation allowance. Average recorded investment is for the years ended December 31, 2012 and December 31, 2011.
(b) Associated allowance amounts include $587 million and $580 million for TDRs at December 31, 2012 and December 31, 2011, respectively.(c) Pursuant to regulatory guidance issued in the third quarter of 2012, the impact of TDRs where no formal reaffirmation was provided by the borrower and therefore a concession has
been granted based upon discharge from personal liability in bankruptcy is included in the table. A portion of these loans have been written down to collateral value.
158 The PNC Financial Services Group, Inc. – Form 10-K
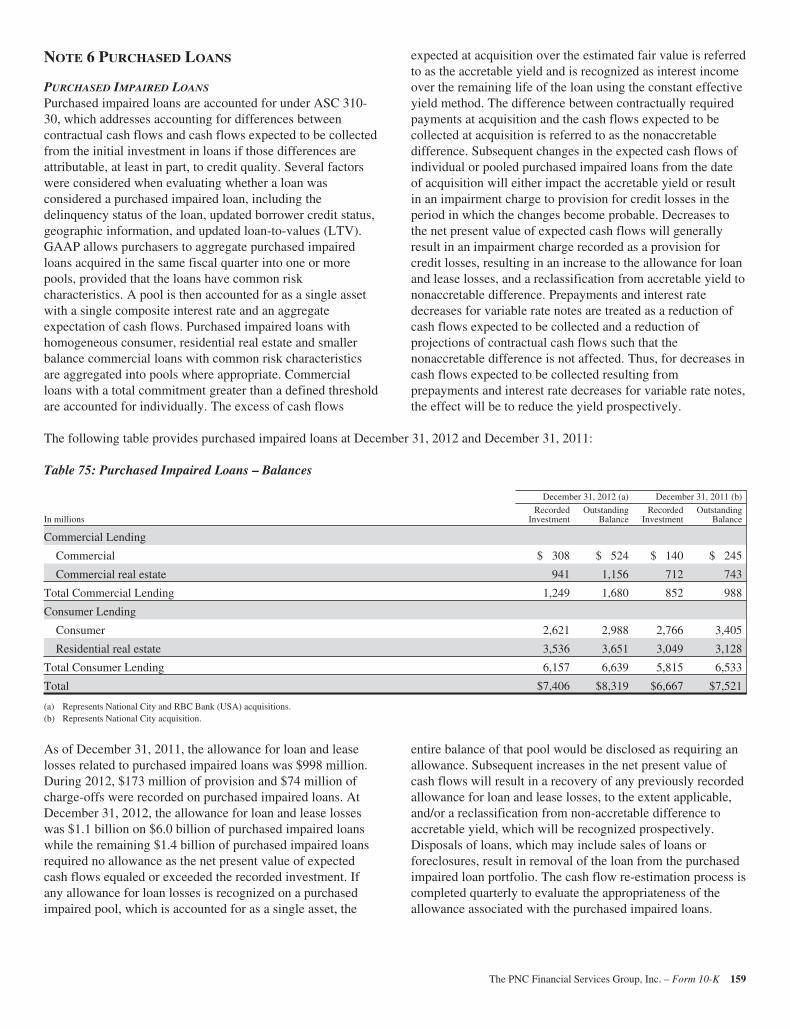
NOTE 6 PURCHASED LOANS
PURCHASED IMPAIRED LOANS
Purchased impaired loans are accounted for under ASC 310-30, which addresses accounting for differences betweencontractual cash flows and cash flows expected to be collectedfrom the initial investment in loans if those differences areattributable, at least in part, to credit quality. Several factorswere considered when evaluating whether a loan wasconsidered a purchased impaired loan, including thedelinquency status of the loan, updated borrower credit status,geographic information, and updated loan-to-values (LTV).GAAP allows purchasers to aggregate purchased impairedloans acquired in the same fiscal quarter into one or morepools, provided that the loans have common riskcharacteristics. A pool is then accounted for as a single assetwith a single composite interest rate and an aggregateexpectation of cash flows. Purchased impaired loans withhomogeneous consumer, residential real estate and smallerbalance commercial loans with common risk characteristicsare aggregated into pools where appropriate. Commercialloans with a total commitment greater than a defined thresholdare accounted for individually. The excess of cash flows
expected at acquisition over the estimated fair value is referredto as the accretable yield and is recognized as interest incomeover the remaining life of the loan using the constant effectiveyield method. The difference between contractually requiredpayments at acquisition and the cash flows expected to becollected at acquisition is referred to as the nonaccretabledifference. Subsequent changes in the expected cash flows ofindividual or pooled purchased impaired loans from the dateof acquisition will either impact the accretable yield or resultin an impairment charge to provision for credit losses in theperiod in which the changes become probable. Decreases tothe net present value of expected cash flows will generallyresult in an impairment charge recorded as a provision forcredit losses, resulting in an increase to the allowance for loanand lease losses, and a reclassification from accretable yield tononaccretable difference. Prepayments and interest ratedecreases for variable rate notes are treated as a reduction ofcash flows expected to be collected and a reduction ofprojections of contractual cash flows such that thenonaccretable difference is not affected. Thus, for decreases incash flows expected to be collected resulting fromprepayments and interest rate decreases for variable rate notes,the effect will be to reduce the yield prospectively.
The following table provides purchased impaired loans at December 31, 2012 and December 31, 2011:
Table 75: Purchased Impaired Loans – Balances
December 31, 2012 (a) December 31, 2011 (b)
In millionsRecorded
InvestmentOutstanding
BalanceRecorded
InvestmentOutstanding
Balance
Commercial Lending
Commercial $ 308 $ 524 $ 140 $ 245
Commercial real estate 941 1,156 712 743
Total Commercial Lending 1,249 1,680 852 988
Consumer Lending
Consumer 2,621 2,988 2,766 3,405
Residential real estate 3,536 3,651 3,049 3,128
Total Consumer Lending 6,157 6,639 5,815 6,533
Total $7,406 $8,319 $6,667 $7,521
(a) Represents National City and RBC Bank (USA) acquisitions.(b) Represents National City acquisition.
As of December 31, 2011, the allowance for loan and leaselosses related to purchased impaired loans was $998 million.During 2012, $173 million of provision and $74 million ofcharge-offs were recorded on purchased impaired loans. AtDecember 31, 2012, the allowance for loan and lease losseswas $1.1 billion on $6.0 billion of purchased impaired loanswhile the remaining $1.4 billion of purchased impaired loansrequired no allowance as the net present value of expectedcash flows equaled or exceeded the recorded investment. Ifany allowance for loan losses is recognized on a purchasedimpaired pool, which is accounted for as a single asset, the
entire balance of that pool would be disclosed as requiring anallowance. Subsequent increases in the net present value ofcash flows will result in a recovery of any previously recordedallowance for loan and lease losses, to the extent applicable,and/or a reclassification from non-accretable difference toaccretable yield, which will be recognized prospectively.Disposals of loans, which may include sales of loans orforeclosures, result in removal of the loan from the purchasedimpaired loan portfolio. The cash flow re-estimation process iscompleted quarterly to evaluate the appropriateness of theallowance associated with the purchased impaired loans.
The PNC Financial Services Group, Inc. – Form 10-K 159
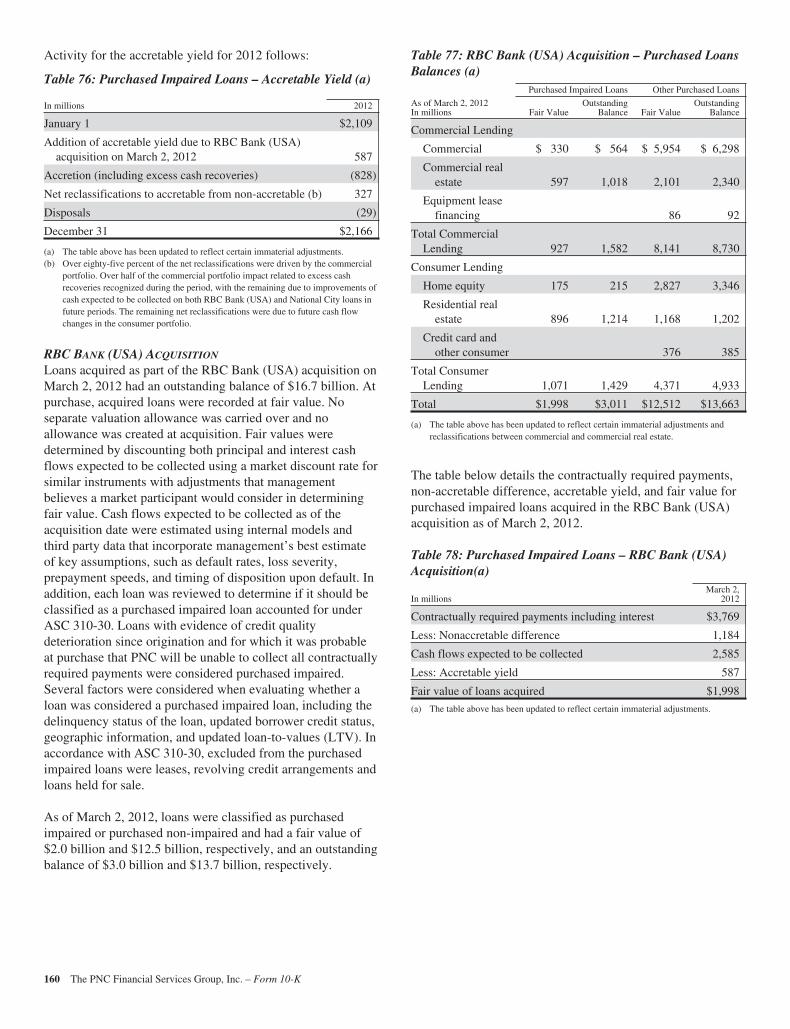
Activity for the accretable yield for 2012 follows:
Table 76: Purchased Impaired Loans – Accretable Yield (a)
In millions 2012
January 1 $2,109
Addition of accretable yield due to RBC Bank (USA)acquisition on March 2, 2012 587
Accretion (including excess cash recoveries) (828)
Net reclassifications to accretable from non-accretable (b) 327
Disposals (29)
December 31 $2,166
(a) The table above has been updated to reflect certain immaterial adjustments.(b) Over eighty-five percent of the net reclassifications were driven by the commercial
portfolio. Over half of the commercial portfolio impact related to excess cashrecoveries recognized during the period, with the remaining due to improvements ofcash expected to be collected on both RBC Bank (USA) and National City loans infuture periods. The remaining net reclassifications were due to future cash flowchanges in the consumer portfolio.
RBC BANK (USA) ACQUISITION
Loans acquired as part of the RBC Bank (USA) acquisition onMarch 2, 2012 had an outstanding balance of $16.7 billion. Atpurchase, acquired loans were recorded at fair value. Noseparate valuation allowance was carried over and noallowance was created at acquisition. Fair values weredetermined by discounting both principal and interest cashflows expected to be collected using a market discount rate forsimilar instruments with adjustments that managementbelieves a market participant would consider in determiningfair value. Cash flows expected to be collected as of theacquisition date were estimated using internal models andthird party data that incorporate management’s best estimateof key assumptions, such as default rates, loss severity,prepayment speeds, and timing of disposition upon default. Inaddition, each loan was reviewed to determine if it should beclassified as a purchased impaired loan accounted for underASC 310-30. Loans with evidence of credit qualitydeterioration since origination and for which it was probableat purchase that PNC will be unable to collect all contractuallyrequired payments were considered purchased impaired.Several factors were considered when evaluating whether aloan was considered a purchased impaired loan, including thedelinquency status of the loan, updated borrower credit status,geographic information, and updated loan-to-values (LTV). Inaccordance with ASC 310-30, excluded from the purchasedimpaired loans were leases, revolving credit arrangements andloans held for sale.
As of March 2, 2012, loans were classified as purchasedimpaired or purchased non-impaired and had a fair value of$2.0 billion and $12.5 billion, respectively, and an outstandingbalance of $3.0 billion and $13.7 billion, respectively.
Table 77: RBC Bank (USA) Acquisition – Purchased LoansBalances (a)
Purchased Impaired Loans Other Purchased Loans
As of March 2, 2012In millions Fair Value
OutstandingBalance Fair Value
OutstandingBalance
Commercial Lending
Commercial $ 330 $ 564 $ 5,954 $ 6,298
Commercial realestate 597 1,018 2,101 2,340
Equipment leasefinancing 86 92
Total CommercialLending 927 1,582 8,141 8,730
Consumer Lending
Home equity 175 215 2,827 3,346
Residential realestate 896 1,214 1,168 1,202
Credit card andother consumer 376 385
Total ConsumerLending 1,071 1,429 4,371 4,933
Total $1,998 $3,011 $12,512 $13,663
(a) The table above has been updated to reflect certain immaterial adjustments andreclassifications between commercial and commercial real estate.
The table below details the contractually required payments,non-accretable difference, accretable yield, and fair value forpurchased impaired loans acquired in the RBC Bank (USA)acquisition as of March 2, 2012.
Table 78: Purchased Impaired Loans – RBC Bank (USA)Acquisition(a)
In millionsMarch 2,
2012
Contractually required payments including interest $3,769
Less: Nonaccretable difference 1,184
Cash flows expected to be collected 2,585
Less: Accretable yield 587
Fair value of loans acquired $1,998
(a) The table above has been updated to reflect certain immaterial adjustments.
160 The PNC Financial Services Group, Inc. – Form 10-K
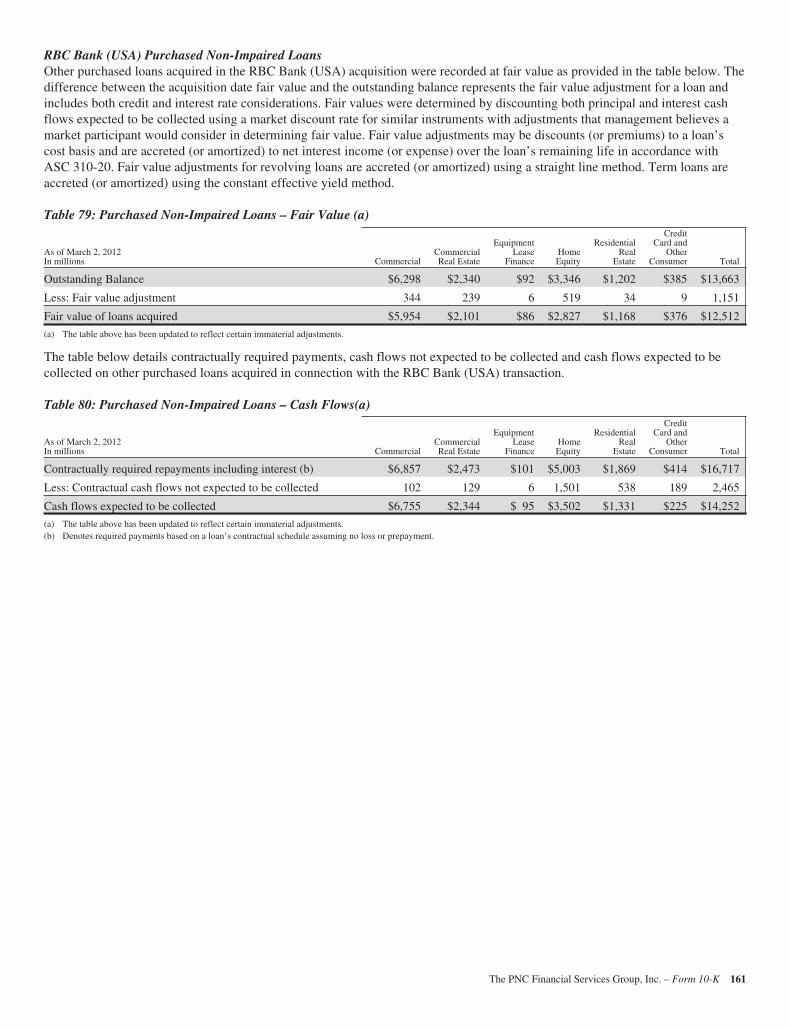
RBC Bank (USA) Purchased Non-Impaired LoansOther purchased loans acquired in the RBC Bank (USA) acquisition were recorded at fair value as provided in the table below. Thedifference between the acquisition date fair value and the outstanding balance represents the fair value adjustment for a loan andincludes both credit and interest rate considerations. Fair values were determined by discounting both principal and interest cashflows expected to be collected using a market discount rate for similar instruments with adjustments that management believes amarket participant would consider in determining fair value. Fair value adjustments may be discounts (or premiums) to a loan’scost basis and are accreted (or amortized) to net interest income (or expense) over the loan’s remaining life in accordance withASC 310-20. Fair value adjustments for revolving loans are accreted (or amortized) using a straight line method. Term loans areaccreted (or amortized) using the constant effective yield method.
Table 79: Purchased Non-Impaired Loans – Fair Value (a)
As of March 2, 2012In millions Commercial
CommercialReal Estate
EquipmentLease
FinanceHomeEquity
ResidentialReal
Estate
CreditCard and
OtherConsumer Total
Outstanding Balance $6,298 $2,340 $92 $3,346 $1,202 $385 $13,663
Less: Fair value adjustment 344 239 6 519 34 9 1,151
Fair value of loans acquired $5,954 $2,101 $86 $2,827 $1,168 $376 $12,512
(a) The table above has been updated to reflect certain immaterial adjustments.
The table below details contractually required payments, cash flows not expected to be collected and cash flows expected to becollected on other purchased loans acquired in connection with the RBC Bank (USA) transaction.
Table 80: Purchased Non-Impaired Loans – Cash Flows(a)
As of March 2, 2012In millions Commercial
CommercialReal Estate
EquipmentLease
FinanceHomeEquity
ResidentialReal
Estate
CreditCard and
OtherConsumer Total
Contractually required repayments including interest (b) $6,857 $2,473 $101 $5,003 $1,869 $414 $16,717
Less: Contractual cash flows not expected to be collected 102 129 6 1,501 538 189 2,465
Cash flows expected to be collected $6,755 $2,344 $ 95 $3,502 $1,331 $225 $14,252
(a) The table above has been updated to reflect certain immaterial adjustments.(b) Denotes required payments based on a loan’s contractual schedule assuming no loss or prepayment.
The PNC Financial Services Group, Inc. – Form 10-K 161
NOTE 7 ALLOWANCES FOR LOAN AND LEASE
LOSSES AND UNFUNDED LOAN COMMITMENTS
AND LETTERS OF CREDIT
We maintain the ALLL and the Allowance for Unfunded LoanCommitments and Letters of Credit at levels that we believe tobe appropriate to absorb estimated probable credit lossesincurred in the portfolios as of the balance sheet date. We usethe two main portfolio segments – Commercial Lending andConsumer Lending – and we develop and document the ALLLunder separate methodologies for each of these segments asfurther discussed and presented below.
ALLOWANCE FOR LOAN AND LEASE LOSSES COMPONENTS
For all loans, except purchased impaired loans, the ALLL isthe sum of three components: (i) asset specific/individualimpaired reserves, (ii) quantitative (formulaic or pooled)reserves, and (iii) qualitative (judgmental) reserves. See Note6 Purchased Loans for additional ALLL information. Thereserve calculation and determination process is dependent onthe use of key assumptions. Key reserve assumptions andestimation processes react to and are influenced by observedchanges in loan portfolio performance experience, thefinancial strength of the borrower, and economic conditions.Key reserve assumptions are periodically updated. During thethird quarter of 2012, PNC increased the amount of internallyobserved data used in estimating the key commercial lendingassumptions of PD and LGD.
ASSET SPECIFIC/INDIVIDUAL COMPONENT
Commercial nonperforming loans and all TDRs areconsidered impaired and are evaluated for a specific reserve.See Note 1 Accounting Policies for additional information.
COMMERCIAL LENDING QUANTITATIVE COMPONENT
The estimates of the quantitative component of ALLL forincurred losses within the commercial lending portfoliosegment are determined through statistical loss modelingutilizing PD, LGD, and outstanding balance of the loan. Basedupon loan risk ratings we assign PDs and LGDs. Each of thesestatistical parameters is determined based on internalhistorical data and market data. PD is influenced by suchfactors as liquidity, industry, obligor financial structure,access to capital, and cash flow. LGD is influenced bycollateral type, original and/or updated LTV, and guaranteesby related parties.
CONSUMER LENDING QUANTITATIVE COMPONENT
Quantitative estimates within the consumer lending portfoliosegment are calculated using a roll-rate model based onstatistical relationships, calculated from historical data thatestimate the movement of loan outstandings through thevarious stages of delinquency and ultimately charge-off.
Qualitative ComponentWhile our reserve methodologies strive to reflect all relevantrisk factors, there continues to be uncertainty associated with,but not limited to, potential imprecision in the estimationprocess due to the inherent time lag of obtaining informationand normal variations between estimates and actual outcomes.We provide additional reserves that are designed to providecoverage for losses attributable to such risks. The ALLL alsoincludes factors which may not be directly measured in thedetermination of specific or pooled reserves. Such qualitativefactors include:
• Industry concentrations and conditions,• Recent credit quality trends,• Recent loss experience in particular portfolios,• Recent macro-economic factors,• Changes in risk selection and underwriting standards,
and• Timing of available information, including the
performance of first lien positions.
ALLOWANCE FOR RBC BANK (USA) PURCHASED
NON-IMPAIRED LOANS
ALLL for RBC Bank (USA) purchased non-impaired loans isdetermined based upon the methodologies described abovecompared to the remaining acquisition date fair value discountthat has yet to be accreted into interest income. After makingthe comparison, an ALLL is recorded for the amount greaterthan the discount, or no ALLL is recorded if the discount isgreater.
ALLOWANCE FOR PURCHASED IMPAIRED LOANS
ALLL for purchased impaired loans is determined inaccordance with ASC 310-30 by comparing the net presentvalue of the cash flows expected to be collected to theRecorded Investment for a given loan (or pool of loans). Incases where the net present value of expected cash flows islower than Recorded Investment, ALLL is established. Cashflows expected to be collected represent management’s bestestimate of the cash flows expected over the life of a loan (orpool of loans). For large balance commercial loans, cash flowsare separately estimated and compared to the RecordedInvestment at the loan level. For smaller balance pooled loans,cash flows are estimated using cash flow models andcompared at the risk pool level, which was defined atacquisition based on risk characteristics of the loan. Our cashflow models use loan data including, but not limited to,delinquency status of the loan, updated borrower FICO creditscores, geographic information, historical loss experience, andupdated LTVs, as well as estimates for unemployment rates,home prices and other economic factors to determineestimated cash flows.
162 The PNC Financial Services Group, Inc. – Form 10-K
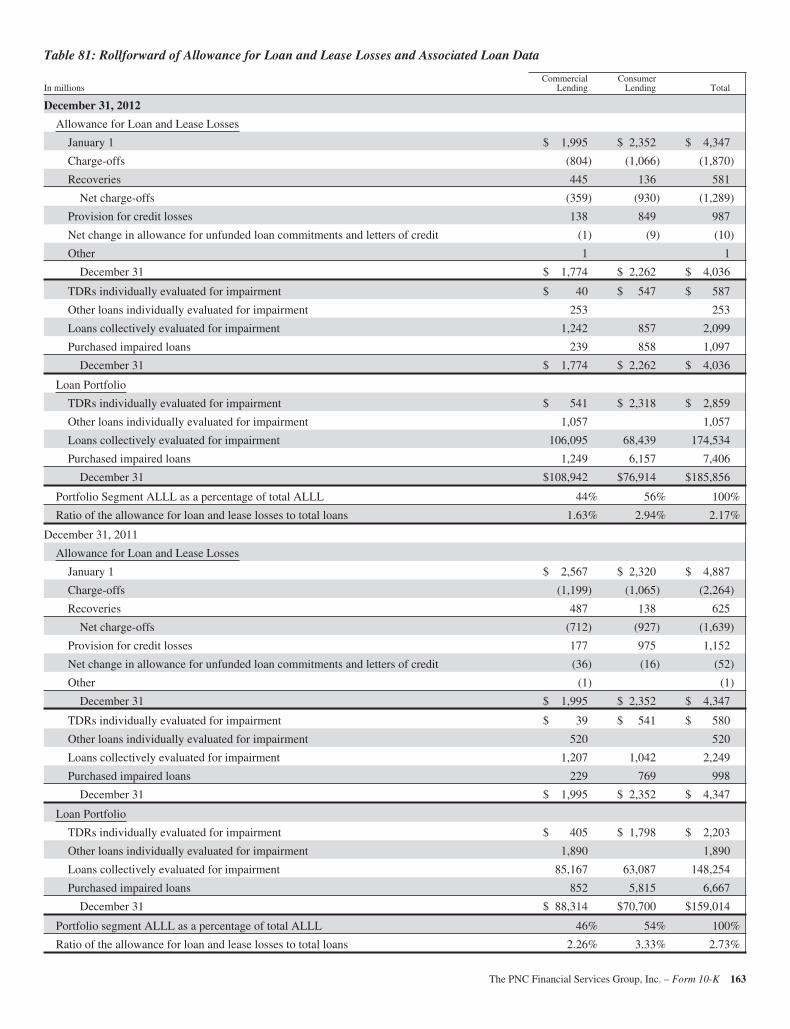
Table 81: Rollforward of Allowance for Loan and Lease Losses and Associated Loan Data
In millionsCommercial
LendingConsumer
Lending Total
December 31, 2012
Allowance for Loan and Lease Losses
January 1 $ 1,995 $ 2,352 $ 4,347
Charge-offs (804) (1,066) (1,870)
Recoveries 445 136 581
Net charge-offs (359) (930) (1,289)
Provision for credit losses 138 849 987
Net change in allowance for unfunded loan commitments and letters of credit (1) (9) (10)
Other 1 1
December 31 $ 1,774 $ 2,262 $ 4,036
TDRs individually evaluated for impairment $ 40 $ 547 $ 587
Other loans individually evaluated for impairment 253 253
Loans collectively evaluated for impairment 1,242 857 2,099
Purchased impaired loans 239 858 1,097
December 31 $ 1,774 $ 2,262 $ 4,036
Loan Portfolio
TDRs individually evaluated for impairment $ 541 $ 2,318 $ 2,859
Other loans individually evaluated for impairment 1,057 1,057
Loans collectively evaluated for impairment 106,095 68,439 174,534
Purchased impaired loans 1,249 6,157 7,406
December 31 $108,942 $76,914 $185,856
Portfolio Segment ALLL as a percentage of total ALLL 44% 56% 100%
Ratio of the allowance for loan and lease losses to total loans 1.63% 2.94% 2.17%
December 31, 2011
Allowance for Loan and Lease Losses
January 1 $ 2,567 $ 2,320 $ 4,887
Charge-offs (1,199) (1,065) (2,264)
Recoveries 487 138 625
Net charge-offs (712) (927) (1,639)
Provision for credit losses 177 975 1,152
Net change in allowance for unfunded loan commitments and letters of credit (36) (16) (52)
Other (1) (1)
December 31 $ 1,995 $ 2,352 $ 4,347
TDRs individually evaluated for impairment $ 39 $ 541 $ 580
Other loans individually evaluated for impairment 520 520
Loans collectively evaluated for impairment 1,207 1,042 2,249
Purchased impaired loans 229 769 998
December 31 $ 1,995 $ 2,352 $ 4,347
Loan Portfolio
TDRs individually evaluated for impairment $ 405 $ 1,798 $ 2,203
Other loans individually evaluated for impairment 1,890 1,890
Loans collectively evaluated for impairment 85,167 63,087 148,254
Purchased impaired loans 852 5,815 6,667
December 31 $ 88,314 $70,700 $159,014
Portfolio segment ALLL as a percentage of total ALLL 46% 54% 100%
Ratio of the allowance for loan and lease losses to total loans 2.26% 3.33% 2.73%
The PNC Financial Services Group, Inc. – Form 10-K 163
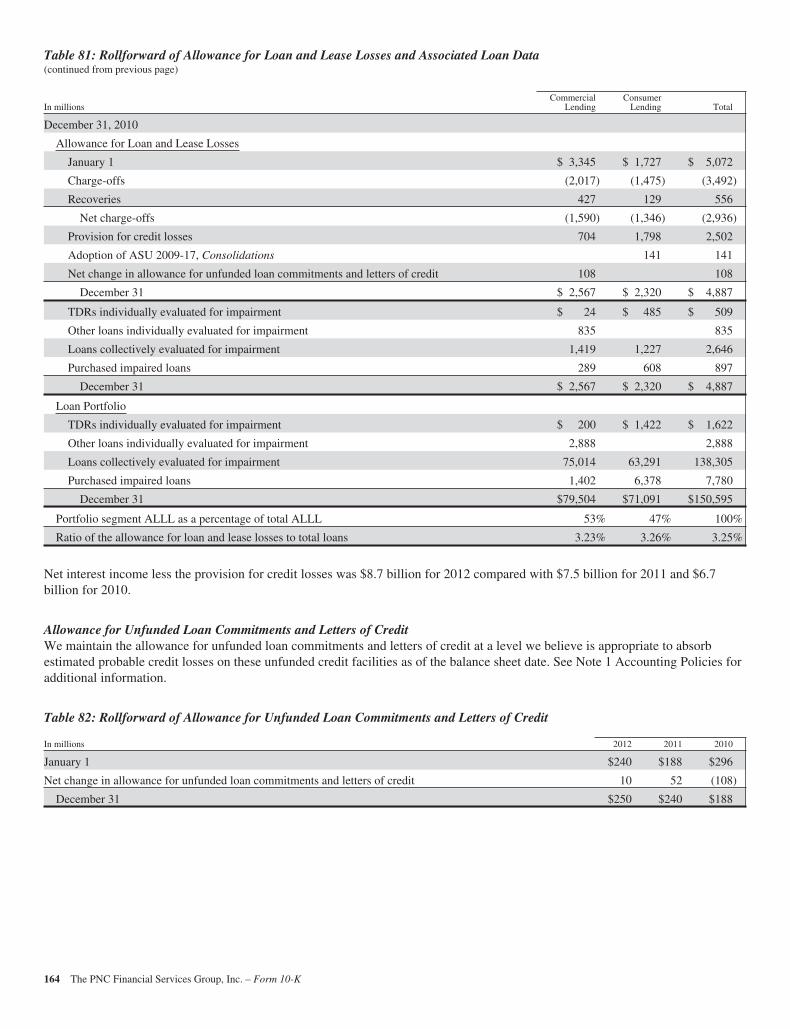
Table 81: Rollforward of Allowance for Loan and Lease Losses and Associated Loan Data(continued from previous page)
In millionsCommercial
LendingConsumer
Lending Total
December 31, 2010
Allowance for Loan and Lease Losses
January 1 $ 3,345 $ 1,727 $ 5,072
Charge-offs (2,017) (1,475) (3,492)
Recoveries 427 129 556
Net charge-offs (1,590) (1,346) (2,936)
Provision for credit losses 704 1,798 2,502
Adoption of ASU 2009-17, Consolidations 141 141
Net change in allowance for unfunded loan commitments and letters of credit 108 108
December 31 $ 2,567 $ 2,320 $ 4,887
TDRs individually evaluated for impairment $ 24 $ 485 $ 509
Other loans individually evaluated for impairment 835 835
Loans collectively evaluated for impairment 1,419 1,227 2,646
Purchased impaired loans 289 608 897
December 31 $ 2,567 $ 2,320 $ 4,887
Loan Portfolio
TDRs individually evaluated for impairment $ 200 $ 1,422 $ 1,622
Other loans individually evaluated for impairment 2,888 2,888
Loans collectively evaluated for impairment 75,014 63,291 138,305
Purchased impaired loans 1,402 6,378 7,780
December 31 $79,504 $71,091 $150,595
Portfolio segment ALLL as a percentage of total ALLL 53% 47% 100%
Ratio of the allowance for loan and lease losses to total loans 3.23% 3.26% 3.25%
Net interest income less the provision for credit losses was $8.7 billion for 2012 compared with $7.5 billion for 2011 and $6.7billion for 2010.
Allowance for Unfunded Loan Commitments and Letters of CreditWe maintain the allowance for unfunded loan commitments and letters of credit at a level we believe is appropriate to absorbestimated probable credit losses on these unfunded credit facilities as of the balance sheet date. See Note 1 Accounting Policies foradditional information.
Table 82: Rollforward of Allowance for Unfunded Loan Commitments and Letters of Credit
In millions 2012 2011 2010
January 1 $240 $188 $296
Net change in allowance for unfunded loan commitments and letters of credit 10 52 (108)
December 31 $250 $240 $188
164 The PNC Financial Services Group, Inc. – Form 10-K
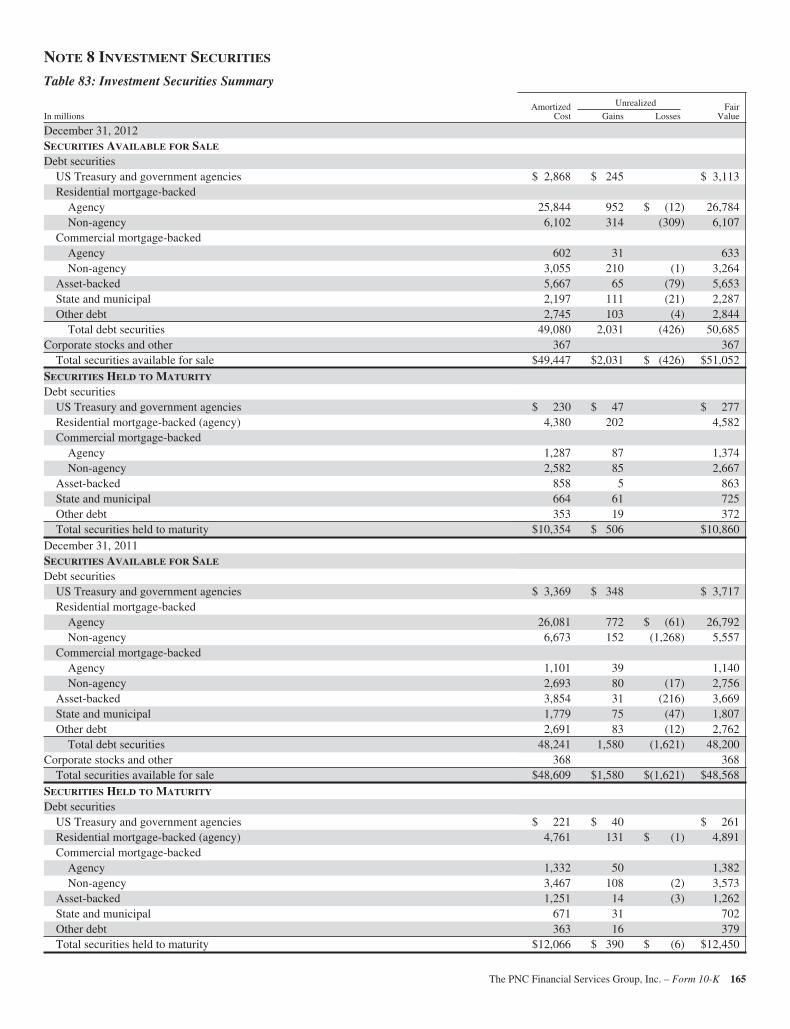
NOTE 8 INVESTMENT SECURITIES
Table 83: Investment Securities Summary
AmortizedCost
Unrealized FairValueIn millions Gains Losses
December 31, 2012SECURITIES AVAILABLE FOR SALE
Debt securitiesUS Treasury and government agencies $ 2,868 $ 245 $ 3,113Residential mortgage-backed
Agency 25,844 952 $ (12) 26,784Non-agency 6,102 314 (309) 6,107
Commercial mortgage-backedAgency 602 31 633Non-agency 3,055 210 (1) 3,264
Asset-backed 5,667 65 (79) 5,653State and municipal 2,197 111 (21) 2,287Other debt 2,745 103 (4) 2,844
Total debt securities 49,080 2,031 (426) 50,685Corporate stocks and other 367 367
Total securities available for sale $49,447 $2,031 $ (426) $51,052SECURITIES HELD TO MATURITY
Debt securitiesUS Treasury and government agencies $ 230 $ 47 $ 277Residential mortgage-backed (agency) 4,380 202 4,582Commercial mortgage-backed
Agency 1,287 87 1,374Non-agency 2,582 85 2,667
Asset-backed 858 5 863State and municipal 664 61 725Other debt 353 19 372Total securities held to maturity $10,354 $ 506 $10,860
December 31, 2011SECURITIES AVAILABLE FOR SALE
Debt securitiesUS Treasury and government agencies $ 3,369 $ 348 $ 3,717Residential mortgage-backed
Agency 26,081 772 $ (61) 26,792Non-agency 6,673 152 (1,268) 5,557
Commercial mortgage-backedAgency 1,101 39 1,140Non-agency 2,693 80 (17) 2,756
Asset-backed 3,854 31 (216) 3,669State and municipal 1,779 75 (47) 1,807Other debt 2,691 83 (12) 2,762
Total debt securities 48,241 1,580 (1,621) 48,200Corporate stocks and other 368 368
Total securities available for sale $48,609 $1,580 $(1,621) $48,568SECURITIES HELD TO MATURITY
Debt securitiesUS Treasury and government agencies $ 221 $ 40 $ 261Residential mortgage-backed (agency) 4,761 131 $ (1) 4,891Commercial mortgage-backed
Agency 1,332 50 1,382Non-agency 3,467 108 (2) 3,573
Asset-backed 1,251 14 (3) 1,262State and municipal 671 31 702Other debt 363 16 379Total securities held to maturity $12,066 $ 390 $ (6) $12,450
The PNC Financial Services Group, Inc. – Form 10-K 165
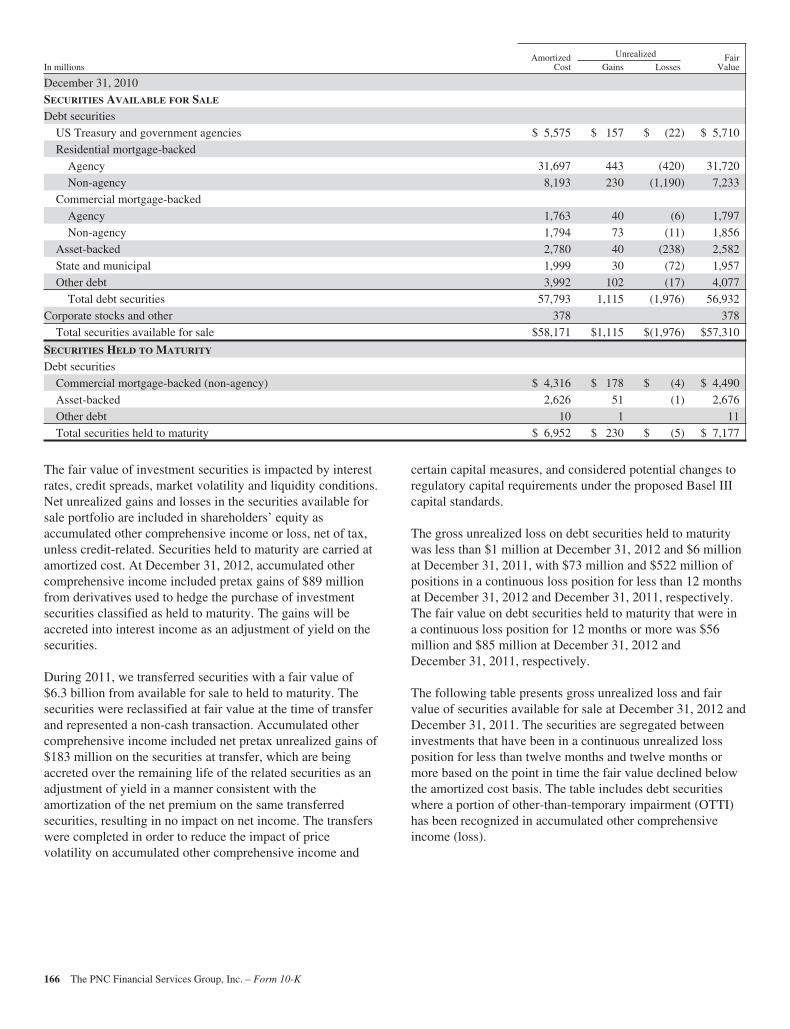
AmortizedCost
Unrealized FairValueIn millions Gains Losses
December 31, 2010SECURITIES AVAILABLE FOR SALE
Debt securitiesUS Treasury and government agencies $ 5,575 $ 157 $ (22) $ 5,710Residential mortgage-backed
Agency 31,697 443 (420) 31,720Non-agency 8,193 230 (1,190) 7,233
Commercial mortgage-backedAgency 1,763 40 (6) 1,797Non-agency 1,794 73 (11) 1,856
Asset-backed 2,780 40 (238) 2,582State and municipal 1,999 30 (72) 1,957Other debt 3,992 102 (17) 4,077
Total debt securities 57,793 1,115 (1,976) 56,932Corporate stocks and other 378 378
Total securities available for sale $58,171 $1,115 $(1,976) $57,310
SECURITIES HELD TO MATURITY
Debt securitiesCommercial mortgage-backed (non-agency) $ 4,316 $ 178 $ (4) $ 4,490Asset-backed 2,626 51 (1) 2,676Other debt 10 1 11Total securities held to maturity $ 6,952 $ 230 $ (5) $ 7,177
The fair value of investment securities is impacted by interestrates, credit spreads, market volatility and liquidity conditions.Net unrealized gains and losses in the securities available forsale portfolio are included in shareholders’ equity asaccumulated other comprehensive income or loss, net of tax,unless credit-related. Securities held to maturity are carried atamortized cost. At December 31, 2012, accumulated othercomprehensive income included pretax gains of $89 millionfrom derivatives used to hedge the purchase of investmentsecurities classified as held to maturity. The gains will beaccreted into interest income as an adjustment of yield on thesecurities.
During 2011, we transferred securities with a fair value of$6.3 billion from available for sale to held to maturity. Thesecurities were reclassified at fair value at the time of transferand represented a non-cash transaction. Accumulated othercomprehensive income included net pretax unrealized gains of$183 million on the securities at transfer, which are beingaccreted over the remaining life of the related securities as anadjustment of yield in a manner consistent with theamortization of the net premium on the same transferredsecurities, resulting in no impact on net income. The transferswere completed in order to reduce the impact of pricevolatility on accumulated other comprehensive income and
certain capital measures, and considered potential changes toregulatory capital requirements under the proposed Basel IIIcapital standards.
The gross unrealized loss on debt securities held to maturitywas less than $1 million at December 31, 2012 and $6 millionat December 31, 2011, with $73 million and $522 million ofpositions in a continuous loss position for less than 12 monthsat December 31, 2012 and December 31, 2011, respectively.The fair value on debt securities held to maturity that were ina continuous loss position for 12 months or more was $56million and $85 million at December 31, 2012 andDecember 31, 2011, respectively.
The following table presents gross unrealized loss and fairvalue of securities available for sale at December 31, 2012 andDecember 31, 2011. The securities are segregated betweeninvestments that have been in a continuous unrealized lossposition for less than twelve months and twelve months ormore based on the point in time the fair value declined belowthe amortized cost basis. The table includes debt securitieswhere a portion of other-than-temporary impairment (OTTI)has been recognized in accumulated other comprehensiveincome (loss).
166 The PNC Financial Services Group, Inc. – Form 10-K
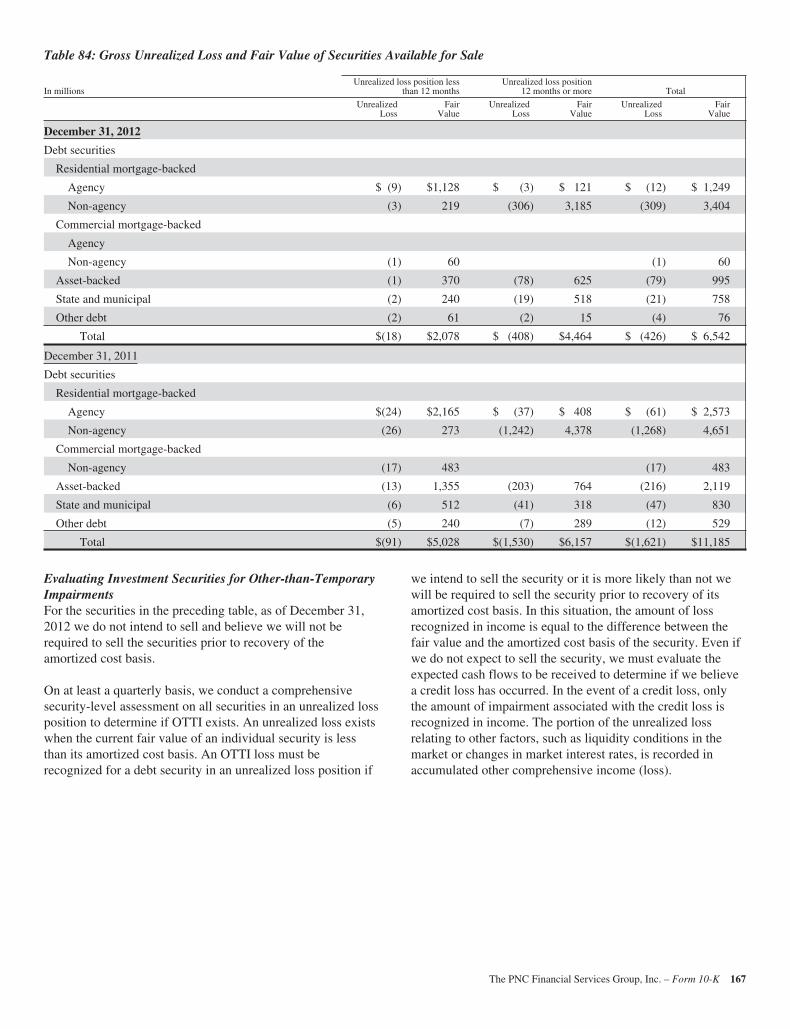
Table 84: Gross Unrealized Loss and Fair Value of Securities Available for Sale
In millionsUnrealized loss position less
than 12 monthsUnrealized loss position
12 months or more Total
UnrealizedLoss
FairValue
UnrealizedLoss
FairValue
UnrealizedLoss
FairValue
December 31, 2012
Debt securities
Residential mortgage-backed
Agency $ (9) $1,128 $ (3) $ 121 $ (12) $ 1,249
Non-agency (3) 219 (306) 3,185 (309) 3,404
Commercial mortgage-backed
Agency
Non-agency (1) 60 (1) 60
Asset-backed (1) 370 (78) 625 (79) 995
State and municipal (2) 240 (19) 518 (21) 758
Other debt (2) 61 (2) 15 (4) 76
Total $(18) $2,078 $ (408) $4,464 $ (426) $ 6,542
December 31, 2011
Debt securities
Residential mortgage-backed
Agency $(24) $2,165 $ (37) $ 408 $ (61) $ 2,573
Non-agency (26) 273 (1,242) 4,378 (1,268) 4,651
Commercial mortgage-backed
Non-agency (17) 483 (17) 483
Asset-backed (13) 1,355 (203) 764 (216) 2,119
State and municipal (6) 512 (41) 318 (47) 830
Other debt (5) 240 (7) 289 (12) 529
Total $(91) $5,028 $(1,530) $6,157 $(1,621) $11,185
Evaluating Investment Securities for Other-than-TemporaryImpairmentsFor the securities in the preceding table, as of December 31,2012 we do not intend to sell and believe we will not berequired to sell the securities prior to recovery of theamortized cost basis.
On at least a quarterly basis, we conduct a comprehensivesecurity-level assessment on all securities in an unrealized lossposition to determine if OTTI exists. An unrealized loss existswhen the current fair value of an individual security is lessthan its amortized cost basis. An OTTI loss must berecognized for a debt security in an unrealized loss position if
we intend to sell the security or it is more likely than not wewill be required to sell the security prior to recovery of itsamortized cost basis. In this situation, the amount of lossrecognized in income is equal to the difference between thefair value and the amortized cost basis of the security. Even ifwe do not expect to sell the security, we must evaluate theexpected cash flows to be received to determine if we believea credit loss has occurred. In the event of a credit loss, onlythe amount of impairment associated with the credit loss isrecognized in income. The portion of the unrealized lossrelating to other factors, such as liquidity conditions in themarket or changes in market interest rates, is recorded inaccumulated other comprehensive income (loss).
The PNC Financial Services Group, Inc. – Form 10-K 167
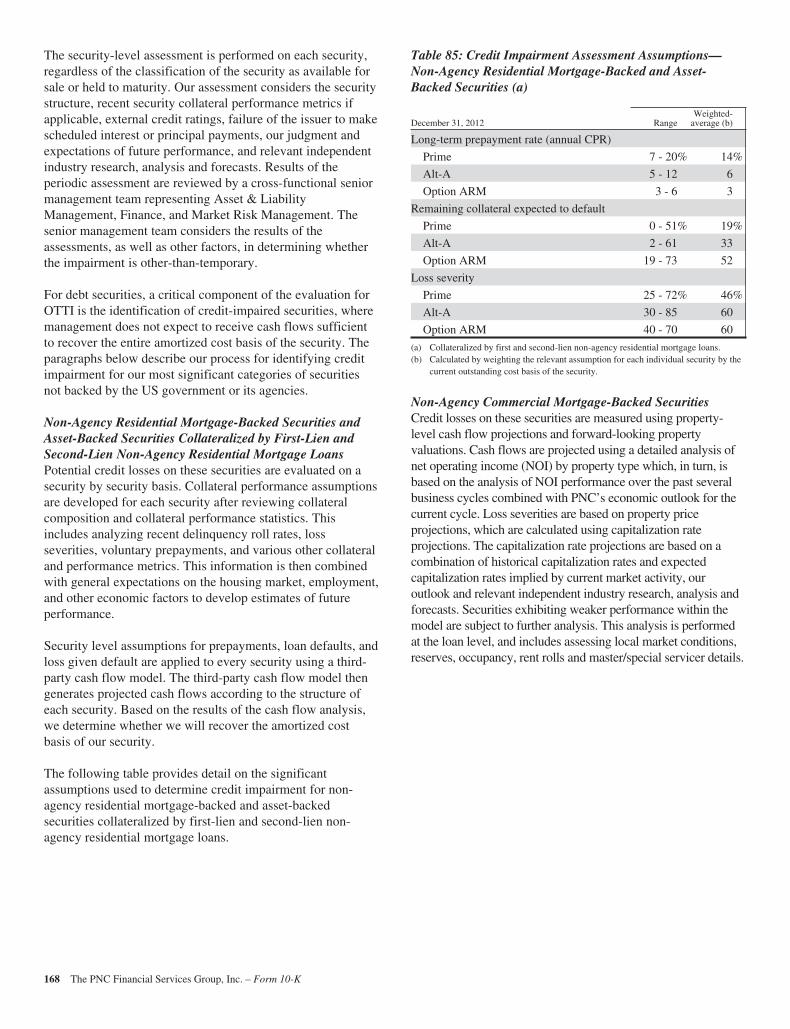
The security-level assessment is performed on each security,regardless of the classification of the security as available forsale or held to maturity. Our assessment considers the securitystructure, recent security collateral performance metrics ifapplicable, external credit ratings, failure of the issuer to makescheduled interest or principal payments, our judgment andexpectations of future performance, and relevant independentindustry research, analysis and forecasts. Results of theperiodic assessment are reviewed by a cross-functional seniormanagement team representing Asset & LiabilityManagement, Finance, and Market Risk Management. Thesenior management team considers the results of theassessments, as well as other factors, in determining whetherthe impairment is other-than-temporary.
For debt securities, a critical component of the evaluation forOTTI is the identification of credit-impaired securities, wheremanagement does not expect to receive cash flows sufficientto recover the entire amortized cost basis of the security. Theparagraphs below describe our process for identifying creditimpairment for our most significant categories of securitiesnot backed by the US government or its agencies.
Non-Agency Residential Mortgage-Backed Securities andAsset-Backed Securities Collateralized by First-Lien andSecond-Lien Non-Agency Residential Mortgage LoansPotential credit losses on these securities are evaluated on asecurity by security basis. Collateral performance assumptionsare developed for each security after reviewing collateralcomposition and collateral performance statistics. Thisincludes analyzing recent delinquency roll rates, lossseverities, voluntary prepayments, and various other collateraland performance metrics. This information is then combinedwith general expectations on the housing market, employment,and other economic factors to develop estimates of futureperformance.
Security level assumptions for prepayments, loan defaults, andloss given default are applied to every security using a third-party cash flow model. The third-party cash flow model thengenerates projected cash flows according to the structure ofeach security. Based on the results of the cash flow analysis,we determine whether we will recover the amortized costbasis of our security.
The following table provides detail on the significantassumptions used to determine credit impairment for non-agency residential mortgage-backed and asset-backedsecurities collateralized by first-lien and second-lien non-agency residential mortgage loans.
Table 85: Credit Impairment Assessment Assumptions—Non-Agency Residential Mortgage-Backed and Asset-Backed Securities (a)
December 31, 2012 RangeWeighted-
average (b)
Long-term prepayment rate (annual CPR)
Prime 7 - 20% 14%
Alt-A 5 - 12 6
Option ARM 3 - 6 3
Remaining collateral expected to default
Prime 0 - 51% 19%
Alt-A 2 - 61 33
Option ARM 19 - 73 52
Loss severity
Prime 25 - 72% 46%
Alt-A 30 - 85 60
Option ARM 40 - 70 60
(a) Collateralized by first and second-lien non-agency residential mortgage loans.(b) Calculated by weighting the relevant assumption for each individual security by the
current outstanding cost basis of the security.
Non-Agency Commercial Mortgage-Backed SecuritiesCredit losses on these securities are measured using property-level cash flow projections and forward-looking propertyvaluations. Cash flows are projected using a detailed analysis ofnet operating income (NOI) by property type which, in turn, isbased on the analysis of NOI performance over the past severalbusiness cycles combined with PNC’s economic outlook for thecurrent cycle. Loss severities are based on property priceprojections, which are calculated using capitalization rateprojections. The capitalization rate projections are based on acombination of historical capitalization rates and expectedcapitalization rates implied by current market activity, ouroutlook and relevant independent industry research, analysis andforecasts. Securities exhibiting weaker performance within themodel are subject to further analysis. This analysis is performedat the loan level, and includes assessing local market conditions,reserves, occupancy, rent rolls and master/special servicer details.
168 The PNC Financial Services Group, Inc. – Form 10-K
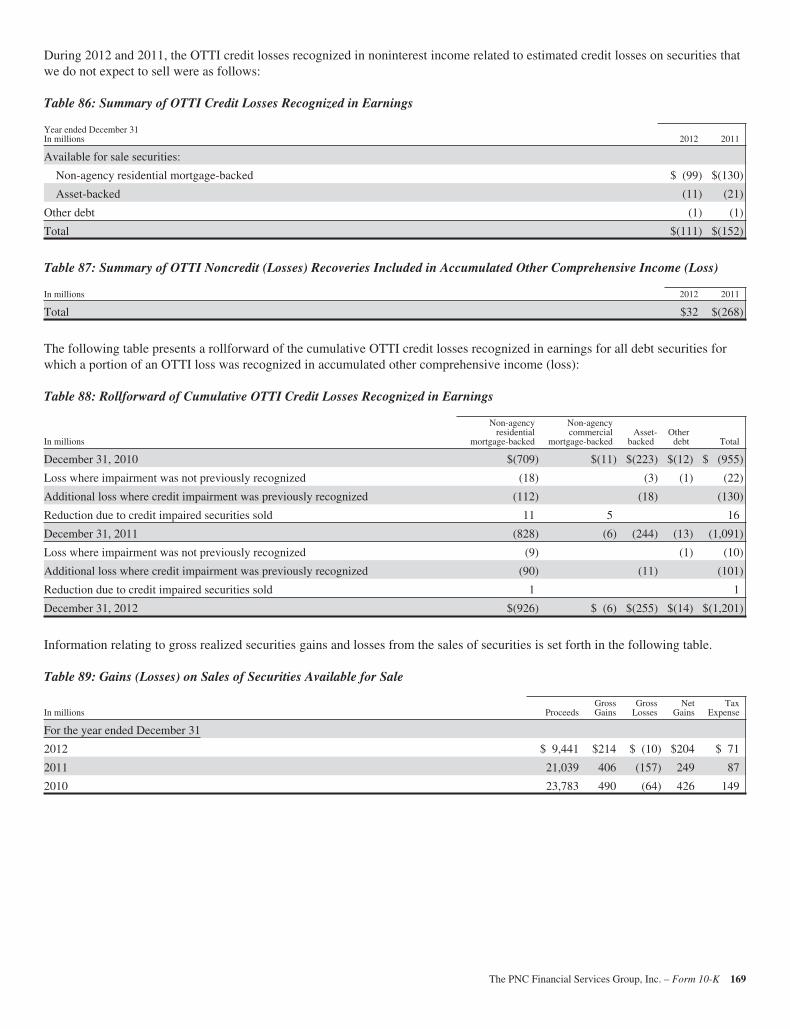
During 2012 and 2011, the OTTI credit losses recognized in noninterest income related to estimated credit losses on securities thatwe do not expect to sell were as follows:
Table 86: Summary of OTTI Credit Losses Recognized in Earnings
Year ended December 31In millions 2012 2011
Available for sale securities:
Non-agency residential mortgage-backed $ (99) $(130)
Asset-backed (11) (21)
Other debt (1) (1)
Total $(111) $(152)
Table 87: Summary of OTTI Noncredit (Losses) Recoveries Included in Accumulated Other Comprehensive Income (Loss)
In millions 2012 2011
Total $32 $(268)
The following table presents a rollforward of the cumulative OTTI credit losses recognized in earnings for all debt securities forwhich a portion of an OTTI loss was recognized in accumulated other comprehensive income (loss):
Table 88: Rollforward of Cumulative OTTI Credit Losses Recognized in Earnings
In millions
Non-agencyresidential
mortgage-backed
Non-agencycommercial
mortgage-backedAsset-
backedOther
debt Total
December 31, 2010 $(709) $(11) $(223) $(12) $ (955)
Loss where impairment was not previously recognized (18) (3) (1) (22)
Additional loss where credit impairment was previously recognized (112) (18) (130)
Reduction due to credit impaired securities sold 11 5 16
December 31, 2011 (828) (6) (244) (13) (1,091)
Loss where impairment was not previously recognized (9) (1) (10)
Additional loss where credit impairment was previously recognized (90) (11) (101)
Reduction due to credit impaired securities sold 1 1
December 31, 2012 $(926) $ (6) $(255) $(14) $(1,201)
Information relating to gross realized securities gains and losses from the sales of securities is set forth in the following table.
Table 89: Gains (Losses) on Sales of Securities Available for Sale
In millions ProceedsGrossGains
GrossLosses
NetGains
TaxExpense
For the year ended December 31
2012 $ 9,441 $214 $ (10) $204 $ 71
2011 21,039 406 (157) 249 87
2010 23,783 490 (64) 426 149
The PNC Financial Services Group, Inc. – Form 10-K 169
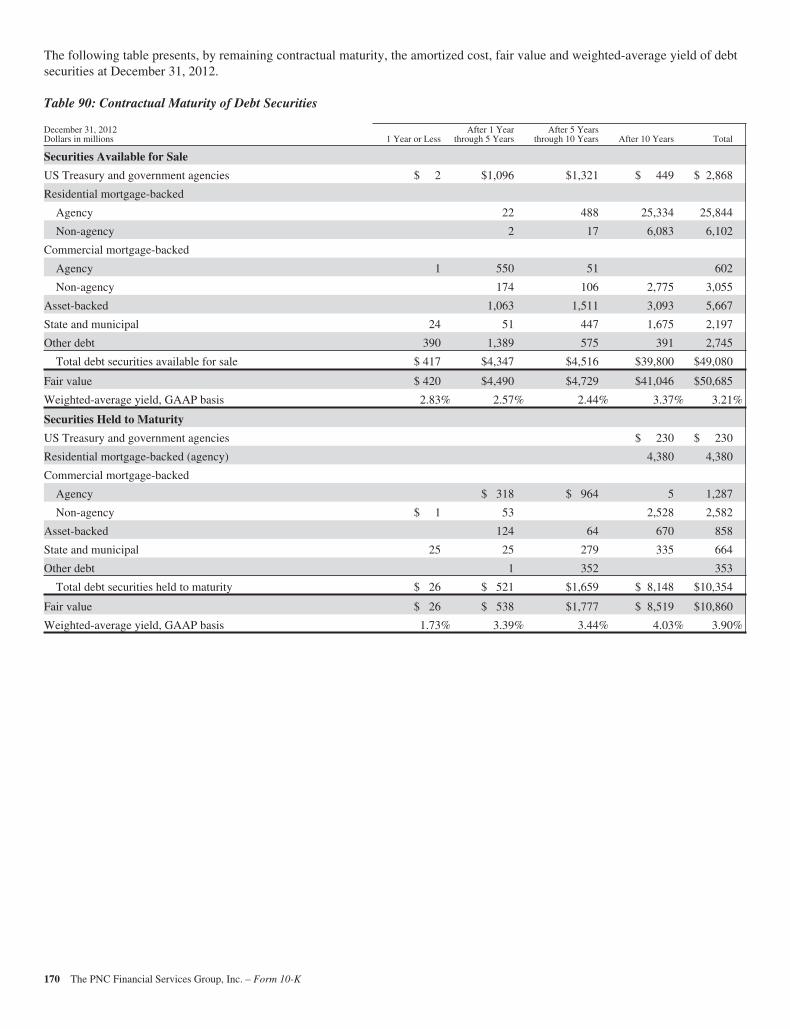
The following table presents, by remaining contractual maturity, the amortized cost, fair value and weighted-average yield of debtsecurities at December 31, 2012.
Table 90: Contractual Maturity of Debt Securities
December 31, 2012Dollars in millions 1 Year or Less
After 1 Yearthrough 5 Years
After 5 Yearsthrough 10 Years After 10 Years Total
Securities Available for Sale
US Treasury and government agencies $ 2 $1,096 $1,321 $ 449 $ 2,868
Residential mortgage-backed
Agency 22 488 25,334 25,844
Non-agency 2 17 6,083 6,102
Commercial mortgage-backed
Agency 1 550 51 602
Non-agency 174 106 2,775 3,055
Asset-backed 1,063 1,511 3,093 5,667
State and municipal 24 51 447 1,675 2,197
Other debt 390 1,389 575 391 2,745
Total debt securities available for sale $ 417 $4,347 $4,516 $39,800 $49,080
Fair value $ 420 $4,490 $4,729 $41,046 $50,685
Weighted-average yield, GAAP basis 2.83% 2.57% 2.44% 3.37% 3.21%
Securities Held to Maturity
US Treasury and government agencies $ 230 $ 230
Residential mortgage-backed (agency) 4,380 4,380
Commercial mortgage-backed
Agency $ 318 $ 964 5 1,287
Non-agency $ 1 53 2,528 2,582
Asset-backed 124 64 670 858
State and municipal 25 25 279 335 664
Other debt 1 352 353
Total debt securities held to maturity $ 26 $ 521 $1,659 $ 8,148 $10,354
Fair value $ 26 $ 538 $1,777 $ 8,519 $10,860
Weighted-average yield, GAAP basis 1.73% 3.39% 3.44% 4.03% 3.90%
170 The PNC Financial Services Group, Inc. – Form 10-K
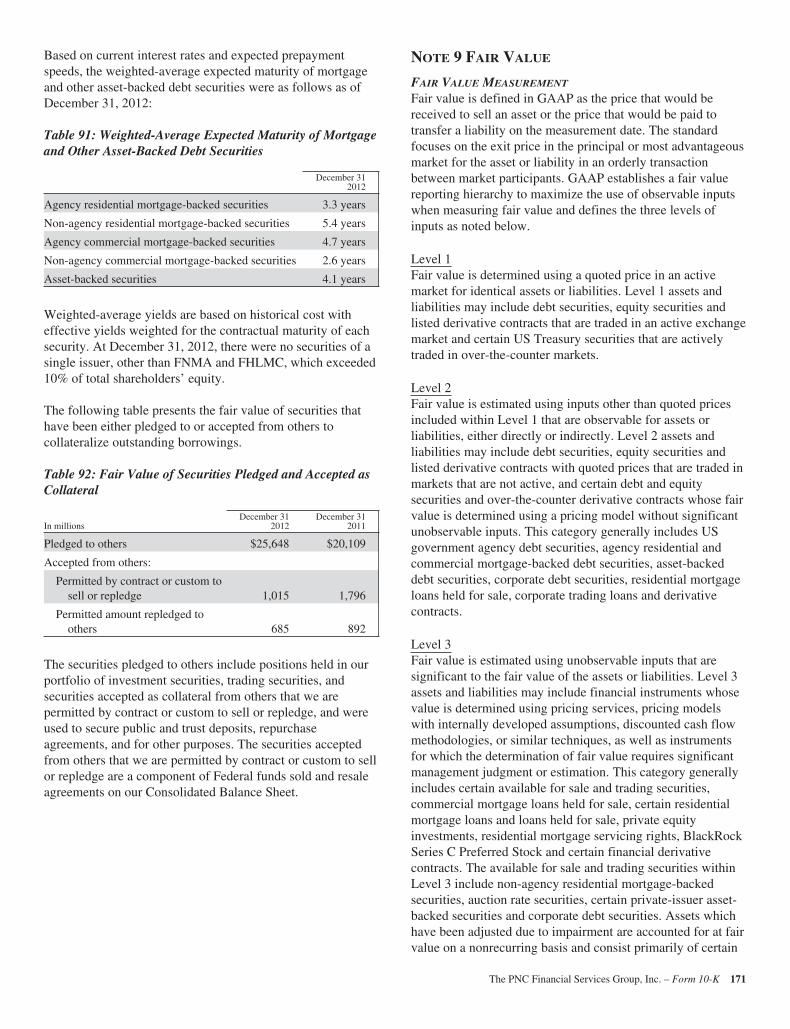
Based on current interest rates and expected prepaymentspeeds, the weighted-average expected maturity of mortgageand other asset-backed debt securities were as follows as ofDecember 31, 2012:
Table 91: Weighted-Average Expected Maturity of Mortgageand Other Asset-Backed Debt Securities
December 312012
Agency residential mortgage-backed securities 3.3 years
Non-agency residential mortgage-backed securities 5.4 years
Agency commercial mortgage-backed securities 4.7 years
Non-agency commercial mortgage-backed securities 2.6 years
Asset-backed securities 4.1 years
Weighted-average yields are based on historical cost witheffective yields weighted for the contractual maturity of eachsecurity. At December 31, 2012, there were no securities of asingle issuer, other than FNMA and FHLMC, which exceeded10% of total shareholders’ equity.
The following table presents the fair value of securities thathave been either pledged to or accepted from others tocollateralize outstanding borrowings.
Table 92: Fair Value of Securities Pledged and Accepted asCollateral
In millionsDecember 31
2012December 31
2011
Pledged to others $25,648 $20,109
Accepted from others:
Permitted by contract or custom tosell or repledge 1,015 1,796
Permitted amount repledged toothers 685 892
The securities pledged to others include positions held in ourportfolio of investment securities, trading securities, andsecurities accepted as collateral from others that we arepermitted by contract or custom to sell or repledge, and wereused to secure public and trust deposits, repurchaseagreements, and for other purposes. The securities acceptedfrom others that we are permitted by contract or custom to sellor repledge are a component of Federal funds sold and resaleagreements on our Consolidated Balance Sheet.
NOTE 9 FAIR VALUE
FAIR VALUE MEASUREMENT
Fair value is defined in GAAP as the price that would bereceived to sell an asset or the price that would be paid totransfer a liability on the measurement date. The standardfocuses on the exit price in the principal or most advantageousmarket for the asset or liability in an orderly transactionbetween market participants. GAAP establishes a fair valuereporting hierarchy to maximize the use of observable inputswhen measuring fair value and defines the three levels ofinputs as noted below.
Level 1Fair value is determined using a quoted price in an activemarket for identical assets or liabilities. Level 1 assets andliabilities may include debt securities, equity securities andlisted derivative contracts that are traded in an active exchangemarket and certain US Treasury securities that are activelytraded in over-the-counter markets.
Level 2Fair value is estimated using inputs other than quoted pricesincluded within Level 1 that are observable for assets orliabilities, either directly or indirectly. Level 2 assets andliabilities may include debt securities, equity securities andlisted derivative contracts with quoted prices that are traded inmarkets that are not active, and certain debt and equitysecurities and over-the-counter derivative contracts whose fairvalue is determined using a pricing model without significantunobservable inputs. This category generally includes USgovernment agency debt securities, agency residential andcommercial mortgage-backed debt securities, asset-backeddebt securities, corporate debt securities, residential mortgageloans held for sale, corporate trading loans and derivativecontracts.
Level 3Fair value is estimated using unobservable inputs that aresignificant to the fair value of the assets or liabilities. Level 3assets and liabilities may include financial instruments whosevalue is determined using pricing services, pricing modelswith internally developed assumptions, discounted cash flowmethodologies, or similar techniques, as well as instrumentsfor which the determination of fair value requires significantmanagement judgment or estimation. This category generallyincludes certain available for sale and trading securities,commercial mortgage loans held for sale, certain residentialmortgage loans and loans held for sale, private equityinvestments, residential mortgage servicing rights, BlackRockSeries C Preferred Stock and certain financial derivativecontracts. The available for sale and trading securities withinLevel 3 include non-agency residential mortgage-backedsecurities, auction rate securities, certain private-issuer asset-backed securities and corporate debt securities. Assets whichhave been adjusted due to impairment are accounted for at fairvalue on a nonrecurring basis and consist primarily of certain
The PNC Financial Services Group, Inc. – Form 10-K 171
nonaccrual loans, loans held for sale, commercial mortgageservicing rights, equity investments and other assets.
We characterize active markets as those where transactionvolumes are sufficient to provide objective pricinginformation, with reasonably narrow bid/ask spreads andwhere dealer quotes received do not vary widely and are basedon current information. Inactive markets are typicallycharacterized by low transaction volumes, price quotationsthat vary substantially among market participants or are notbased on current information, wide bid/ask spreads, asignificant increase in implied liquidity risk premiums, yields,or performance indicators for observed transactions or quotedprices compared to historical periods, a significant decline orabsence of a market for new issuance, or any combination ofthe above factors. We also consider nonperformance risksincluding credit risk as part of our valuation methodology forall assets and liabilities measured at fair value.
Any models used to determine fair values or to validate dealerquotes based on the descriptions below are subject to reviewand independent testing as part of our model validation andinternal control testing processes. Our Model RiskManagement Committee reviews significant models on atleast an annual basis. In addition, we have teams, independentof the traders, which verify marks and assumptions used forvaluations at each period end.
Assets and liabilities measured at fair value, by their nature,result in a higher degree of financial statement volatility.Assets and liabilities classified within Level 3 inherentlyrequire the use of various assumptions, estimates andjudgments when measuring their fair value. As observablemarket activity is commonly not available to use whenestimating the fair value of Level 3 assets and liabilities, wemust estimate fair value using various modeling techniques.These techniques include the use of a variety of inputs/assumptions including credit quality, liquidity, interest rates orother relevant inputs across the entire population of our Level3 assets and liabilities. Changes in the significant underlyingfactors or assumptions (either an increase or a decrease) in anyof these areas underlying our estimates may result in asignificant increase/decrease in the Level 3 fair valuemeasurement of a particular asset and/or liability from periodto period.
FINANCIAL INSTRUMENTS ACCOUNTED FOR AT FAIR VALUE
ON A RECURRING BASIS
Securities Available for Sale and Trading SecuritiesSecurities accounted for at fair value include both theavailable for sale and trading portfolios. We primarily useprices obtained from pricing services, dealer quotes, or recenttrades to determine the fair value of securities. As ofDecember 31, 2012, 84% of the positions in these portfolioswere priced by using pricing services provided by third-partyvendors. The third-party vendors use a variety of methodswhen pricing securities that incorporate relevant market datato arrive at an estimate of what a buyer in the marketplacewould pay for a security under current market conditions. Oneof the vendor’s prices are set with reference to market activityfor highly liquid assets such as U.S. Treasury and agencysecurities and agency residential mortgage-backed securities,and matrix pricing for other asset classes, such as commercialmortgage and other asset-backed securities. Another vendorprimarily uses discounted cash flow pricing modelsconsidering adjustments for spreads and prepayments for theinstruments we value using this service, such as non-agencyresidential mortgage-backed securities, agency adjustable ratemortgage securities, agency collateralized mortgageobligations (CMOs), commercial mortgage-backed securitiesand municipal bonds. The vendors we use provide pricingservices on a global basis and have quality managementprocesses in place to monitor the integrity of the valuationinputs and the prices provided to users, including proceduresto consider and incorporate information received from pricingservice users who may challenge a price. We monitor andvalidate the reliability of vendor pricing on an ongoing basisthrough pricing methodology reviews, by performing detailedreviews of the assumptions and inputs used by the vendor toprice individual securities, and through price validationtesting. Price validation testing is performed independent ofthe risk-taking function and involves corroborating the pricesreceived from third-party vendors with prices from anotherthird-party source, by reviewing valuations of comparableinstruments, by comparison to internal valuations, or byreference to recent sales of similar securities. Securities notpriced by one of our pricing vendors may be valued using adealer quote. Dealer quotes received are typically non-binding. Securities priced using a dealer quote are subject tocorroboration either with another dealer quote, by comparisonto similar securities priced by either a third-party vendor oranother dealer, or through internal valuation in order tovalidate that the quote is representative of the market. Securityprices are also validated through actual cash settlement uponsale of a security.
A cross-functional team comprised of representatives fromAsset & Liability Management, Finance, and Market RiskManagement oversees the governance of the processes andmethodologies used to estimate the fair value of securities andthe price validation testing that is performed. Thismanagement team reviews pricing sources and trends and theresults of validation testing.
172 The PNC Financial Services Group, Inc. – Form 10-K
Securities are classified within the fair value hierarchy aftergiving consideration to the activity level in the market for thesecurity type and the observability of the inputs used todetermine the fair value. When a quoted price in an activemarket exists for the identical security, this price is used todetermine fair value and the security is classified within Level1 of the hierarchy. Level 1 securities include certain U.S.Treasury securities and exchange traded equities. When aquoted price in an active market for the identical security isnot available, fair value is estimated using either an alternativemarket approach, such as a recent trade or matrix pricing, oran income approach, such as a discounted cash flow pricingmodel. If the inputs to the valuation are based primarily onmarket observable information, then the security is classifiedwithin Level 2 of the hierarchy. Level 2 securities includeagency debt securities, agency residential mortgage-backedsecurities, agency and non-agency commercial mortgage-backed securities, asset-backed securities collateralized bynon-mortgage-related consumer loans, municipal securities,and other debt securities. Level 2 securities are predominantlypriced by third parties, either a pricing vendor or dealer.
In certain cases where there is limited activity or lesstransparency around the inputs to the valuation, securities areclassified within Level 3 of the hierarchy. Securities classifiedas Level 3 consist primarily of non-agency residentialmortgage-backed and asset-backed securities collateralized byfirst- and second-lien residential mortgage loans. Fair valuefor these securities is primarily estimated using pricingobtained from third-party vendors. In some cases, fair value isestimated using a dealer quote, by reference to prices ofsecurities of a similar vintage and collateral type or byreference to recent sales of similar securities. Market activityfor these security types is limited with little pricetransparency. As a result, these securities are generally valuedby the third-party vendor using a discounted cash flowapproach that incorporates observable market activity whereavailable. Significant inputs to the valuation includeprepayment projections and credit loss assumptions (defaultrate and loss severity) and discount rates that are deemedrepresentative of current market conditions. The discount ratesused incorporate a spread over the benchmark curve that takesinto consideration liquidity risk and potential credit risk notalready included in the credit loss assumptions. Significantincreases (decreases) in any of those assumptions in isolationwould result in a significantly lower (higher) fair valuemeasurement. Prepayment estimates generally increase whenmarket interest rates decline and decrease when marketinterest rates rise. Credit loss estimates are driven by theability of borrowers to pay their loans and housing marketprices and are impacted by changes in overall macroeconomicconditions, typically increasing when economic conditionsworsen and decreasing when conditions improve. An increasein the estimated prepayment rate typically results in a decreasein estimated credit losses and vice versa. Discount ratestypically increase when market interest rates increase and/orcredit and liquidity risks increase and decrease when market
interest rates decline and/or credit and liquidity conditionsimprove. Price validation procedures are performed and theresults are reviewed for these Level 3 securities by a cross-functional Asset & Liability Management, Finance, andMarket Risk Management team. Specific price validationprocedures performed for these securities include comparingcurrent prices to historical pricing trends by collateral type andvintage, comparing prices by product type to indicativepricing grids published by market makers, and by obtainingcorroborating prices from another third-party source.
Certain infrequently traded debt securities within the State andmunicipal and Other debt securities available-for-sale andTrading securities categories are also classified in Level 3.The significant unobservable inputs used to estimate the fairvalue of these securities include an estimate of expected creditlosses and a discount for liquidity risk. These inputs areincorporated into the fair value measurement by eitherincreasing the spread over the benchmark curve or byapplying a credit and liquidity discount to the par value of thesecurity. Significant increases (decreases) in credit and/orliquidity risk could result in a significantly lower (higher) fairvalue estimate.
Financial DerivativesExchange-traded derivatives are valued using quoted marketprices and are classified as Level 1. However, the majority ofderivatives that we enter into are executed over-the-counterand are valued using internal models. These derivatives areprimarily classified as Level 2 as the readily observablemarket inputs to these models are validated to externalsources. The external sources for these inputs include industrypricing services, or are corroborated through recent trades,dealer quotes, yield curves, implied volatility or other market-related data. Level 2 financial derivatives are primarilyestimated using a combination of Eurodollar future prices andobservable benchmark interest rate swaps to constructprojected discounted cash flows. Financial derivatives that arepriced using significant management judgment or assumptionsare classified as Level 3.
Fair value information for Level 3 financial derivatives ispresented separately for interest rate contracts and othercontracts. Interest rate contracts include residential andcommercial mortgage interest rate lock commitments andcertain interest rate options. Other contracts include riskparticipation agreements, certain equity options and othertypes of contracts.
Significant unobservable inputs for residential mortgage loancommitments include the probability of funding andembedded servicing. The probability of funding for residentialmortgage loan commitments represents the expectedproportion of loan commitments in the pipeline that will fund.Additionally, embedded in the market price of the underlyingloan is a value for retaining servicing of the loan once it issold. Significant increases (decreases) in the fair value of a
The PNC Financial Services Group, Inc. – Form 10-K 173
residential mortgage loan commitment asset (liability) resultwhen the probability of funding increases (decreases) andwhen the embedded servicing value increases (decreases).
The fair value of commercial mortgage loan commitmentassets and liabilities as of December 31, 2012 are included inthe Insignificant Level 3 assets, net of liabilities line item inTable 95: Fair Value Measurement – Recurring QuantitativeInformation in this Note 9. Significant unobservable inputs forcommercial mortgage loan commitments include spread overthe benchmark U.S. Treasury interest rate and the embeddedservicing value. The spread over the benchmark curve reflectsmanagement assumptions regarding credit and liquidity risks.Embedded servicing value reflects the estimated value forretaining the right to service the underlying loan once it issold. Significant increases (decreases) in the fair value ofcommercial mortgage loan commitments result when thespread over the benchmark curve decreases (increases) or theembedded servicing value increases (decreases).
The fair value of interest rate option assets and liabilities as ofDecember 31, 2012 are included in the Insignificant Level 3assets, net of liabilities line item in Table 95: Fair ValueMeasurement – Recurring Quantitative Information in thisNote 9. The significant unobservable input used in the fairvalue measurement of the interest rate options is expectedinterest rate volatility. Significant increases (decreases) ininterest rate volatility would result in a significantly higher(lower) fair value measurement.
The fair value of risk participation agreement assets andliabilities as of December 31, 2012 are included in theInsignificant Level 3 assets, net of liabilities line item in Table95: Fair Value Measurement – Recurring QuantitativeInformation in this Note 9. The significant unobservableinputs used in the fair value measurement of risk participationagreements are probability of default and loss severity.Significant increases (decreases) in probability of default andloss severity would result in a significantly higher (lower) fairvalue measurement.
Significant unobservable inputs for the other contracts forderivative liabilities include credit and liquidity discount andspread over the benchmark curve that are deemedrepresentative of current market conditions. Significantincreases (decreases) in these assumptions would result insignificantly lower (higher) fair value measurement.
In connection with the sales of certain Visa Class B commonshares in 2012, we entered into swap agreements with thepurchaser of the shares to account for future changes in thevalue of the Class B common shares resulting from changes inthe settlement of certain specified litigation and its effect onthe conversion rate of Class B common shares into VisaClass A common shares and to make payments calculated byreference to the market price of the Class A common shares.At December 31, 2012, the estimated fair values of the swap
liabilities are classified as Level 3 instruments and included inTable 95: Fair Value Measurement – Recurring QuantitativeInformation in this Note 9. The fair values of the swapagreements are determined using a discounted cash flowmethodology. The significant unobservable inputs to thevaluations are estimated changes in the conversion rate of theClass B shares into Class A shares and the estimated futureprice of the Class A shares. A decrease in the conversion ratewill have a negative impact on the fair value of the swaps andvice versa. Independent of changes in the conversion rate, anincrease in the future Class A share price will have a negativeimpact on the fair value of the swaps and vice versa, throughits impact on periodic payments due to the counterparty untilthe maturity dates of the swaps.
The fair values of our derivatives are adjusted fornonperformance risk through the calculation of our CreditValuation Adjustment (CVA). Our CVA is computed usingnew loan pricing and considers externally available bondspreads, in conjunction with internal historical recoveryobservations.
Residential Mortgage Loans Held for SaleWe account for certain residential mortgage loans originatedfor sale at fair value on a recurring basis. We have elected toaccount for certain RBC Bank (USA) residential mortgageloans held for sale at fair value. The election of the fair valueoption aligns the accounting for the residential mortgages withthe related hedges. Additionally, with the exception ofrepurchased FHA insured loans which are accounted for atamortized cost, we have elected to account for loansrepurchased due to breaches of representations and warrantiesat fair value.
Residential mortgage loans are valued based on quoted marketprices, where available, prices for other traded mortgage loanswith similar characteristics, and purchase commitments andbid information received from market participants. Theseloans are regularly traded in active markets and observablepricing information is available from market participants. Theprices are adjusted as necessary to include the embeddedservicing value in the loans and to take into consideration thespecific characteristics of certain loans that are priced basedon the pricing of similar loans. These adjustments representunobservable inputs to the valuation but are not consideredsignificant given the relative insensitivity of the value tochanges in these inputs to the fair value of the loans.Accordingly, the majority of residential mortgage loans heldfor sale are classified as Level 2. This category also includesrepurchased and temporarily unsalable residential mortgageloans. These loans are repurchased due to a breach ofrepresentations and warranties in the loan sales agreement andtypically occur after the loan is in default. The temporarilyunsalable loans have an origination defect that makes themcurrently unable to be sold into the performing loan salesmarket. Because transaction details regarding sales of this typeof loan are often unavailable, unobservable bid information
174 The PNC Financial Services Group, Inc. – Form 10-K
from brokers and investors is heavily relied upon.Accordingly, based on the significance of unobservableinputs, these loans are classified as Level 3.
Residential Mortgage Servicing RightsResidential mortgage servicing rights (MSRs) are carried atfair value on a recurring basis. Assumptions incorporated intothe residential MSRs valuation model reflect management’sbest estimate of factors that a market participant would use invaluing the residential MSRs. Although sales of residentialMSRs do occur, residential MSRs do not trade in an active,open market with readily observable prices so the preciseterms and conditions of sales are not available. As abenchmark for the reasonableness of its residential MSRs fairvalue, PNC obtained opinions of value from independentparties (“brokers”). These brokers provided a range (+/- 10bps) based upon their own discounted cash flow calculationsof our portfolio that reflect conditions in the secondary marketand any recently executed servicing transactions. PNCcompares its internally-developed residential MSRs value tothe ranges of values received from the brokers. If ourresidential MSRs fair value falls outside of the brokers’ranges, management will assess whether a valuationadjustment is warranted. For the periods presented, PNC’sresidential MSRs value did not fall outside of the brokers’ranges. We consider our residential MSRs value to represent areasonable estimate of fair value. Due to the nature of thevaluation inputs, residential MSRs are classified as Level 3.
The significant unobservable inputs used in the fair valuemeasurement of residential MSRs are constant prepaymentrates and spread over the benchmark curve. Significantincreases (decreases) in prepayment rates and spread over thebenchmark curve would result in lower (higher) fair marketvalue of residential MSRs.
Commercial Mortgage Loans Held for SaleWe account for certain commercial mortgage loans classifiedas held for sale at fair value. The election of the fair valueoption aligns the accounting for the commercial mortgageswith the related hedges.
We determine the fair value of commercial mortgage loansheld for sale by using a discounted cash flow model. Fairvalue is determined using sale valuation assumptions thatmanagement believes a market participant would use inpricing the loans. When available, valuation assumptionsinclude observable inputs based on the benchmark LIBORinterest rate swap curve and whole loan sales. The significantunobservable input is management’s assumption of the spreadapplied to the benchmark rate. The spread over the benchmarkcurve includes management’s assumptions of the impact ofcredit and liquidity risk. Significant increases (decreases) inthe spread applied to the benchmark would result in asignificantly lower (higher) asset value. The wide range of thespread over the benchmark curve is due to the varying risk andunderlying property characteristics within our portfolio. Basedon the significance of unobservable inputs, we classified thisportfolio as Level 3.
Equity InvestmentsThe valuation of direct and indirect private equity investmentsrequires significant management judgment due to the absenceof quoted market prices, inherent lack of liquidity and thelong-term nature of such investments. The carrying values ofdirect and affiliated partnership interests reflect the expectedexit price and are based on various techniques includingmultiples of adjusted earnings of the entity, independentappraisals, anticipated financing and sale transactions withthird parties, or the pricing used to value the entity in a recentfinancing transaction. A multiple of adjusted earningscalculation is the valuation technique utilized most frequentlyand the multiple of earnings is the primary and mostsignificant unobservable input used in such calculation. Themultiple of earnings is utilized in conjunction with portfoliocompany financial results and our ownership interest inportfolio company securities to determine PNC’s interest inthe enterprise value of the portfolio company. Significantdecreases (increases) in the multiple of earnings could resultin a significantly lower (higher) fair value measurement. Themagnitude of the change in fair value is dependent on thesignificance of the change in the multiple of earnings and thesignificance of portfolio company adjusted earnings.Valuation inputs or analysis are supported by portfoliocompany or market documentation. Due to the size, privateand unique nature of each portfolio company, lack of liquidityand the long-term nature of investments, relevantbenchmarking is not always feasible. A valuation committeereviews the portfolio company valuations on a quarterly basisand oversight is provided by senior management of thebusiness.
We value indirect investments in private equity funds basedon net asset value as provided in the financial statements thatwe receive from their managers. Due to the time lag in ourreceipt of the financial information and based on a review ofinvestments and valuation techniques applied, adjustments tothe manager-provided value are made when available recentportfolio company information or market informationindicates a significant change in value from that provided bythe manager of the fund. These investments are classified asLevel 3.
Customer Resale AgreementsWe have elected to account for structured resale agreements,which are economically hedged using free-standing financialderivatives, at fair value. The fair value for structured resaleagreements is determined using a model that includesobservable market data such as interest rates as inputs.Readily observable market inputs to this model can bevalidated to external sources, including yield curves, impliedvolatility or other market-related data. These instruments areclassified as Level 2.
The PNC Financial Services Group, Inc. – Form 10-K 175
LoansLoans accounted for at fair value consist primarily ofresidential mortgage loans. These loans are generally valuedsimilarly to residential mortgage loans held for sale and areclassified as Level 2. However, similar to residential mortgageloans held for sale, if these loans are repurchased andunsalable, they are classified as Level 3. This category alsoincludes repurchased brokered home equity loans. These loansare repurchased due to a breach of representations orwarranties in the loan sales agreements and occur typicallyafter the loan is in default. The fair value price is based onbids and market observations of transactions of similarvintage. Because transaction details regarding the credit andunderwriting quality are often unavailable, unobservable bidinformation from brokers and investors is heavily relied upon.Accordingly, based on the significance of unobservableinputs, these loans are classified as Level 3. The fair value ofthese loans as of December 31, 2012 is included in theInsignificant Level 3 assets, net of liabilities line item in Table95: Fair Value Measurement – Recurring QuantitativeInformation in this Note 9. A significant input to the valuationincludes a credit and liquidity discount that is deemedrepresentative of current market conditions. Significantincreases (decreases) in this assumption would result in asignificantly lower (higher) fair value measurement.
BlackRock Series C Preferred StockWe have elected to account for the shares of BlackRock SeriesC Preferred Stock received in a stock exchange withBlackRock at fair value. In September 2011, we deliveredapproximately 1.3 million shares of BlackRock Series CPreferred Stock pursuant to our obligation to partially fund aportion of certain BlackRock LTIP programs. On January 31,2013, we transferred an additional 205,350 shares toBlackRock in connection with our obligation. After thistransfer, we hold approximately 1.3 million shares ofBlackRock Series C Preferred Stock which are available tofund our obligation in connection with the BlackRock LTIPprograms. The Series C Preferred Stock economically hedgesthe BlackRock LTIP liability that is accounted for as aderivative. The fair value of the Series C Preferred Stock is
determined using a third-party modeling approach, whichincludes both observable and unobservable inputs. Thisapproach considers expectations of a default/liquidation eventand the use of liquidity discounts based on our inability to sellthe security at a fair, open market price in a timely manner.Although dividends are equal to common shares and otherpreferred series, significant transfer restrictions exist on ourSeries C shares for any purpose other than to satisfy the LTIPobligation. Due to the significance of unobservable inputs, thissecurity is classified as Level 3. Significant increases(decreases) in the liquidity discount would result in asignificantly lower (higher) asset value for the BlackRockSeries C and vice versa for the BlackRock LTIP liability.
Other Assets and LiabilitiesWe have entered into a prepaid forward contract with afinancial institution to mitigate the risk on a portion of theCompany’s deferred compensation, supplemental incentivesavings plan liabilities and certain stock based compensationawards that are based on the Company’s stock price and aresubject to market risk. The prepaid forward contract is initiallyvalued at the transaction price and is subsequently valued byreference to the market price of the Company’s stock and isrecorded in either Other Assets or Other Liabilities at fairvalue. In addition, deferred compensation and supplementalincentive savings plan participants may also invest based onfixed income and equity-based funds. The Company utilizes aRabbi Trust to hedge the returns by purchasing the same fundson which the participant returns are based. The Rabbi Trustbalances are recorded in Other Assets at fair value using thequoted market price. These assets are primarily beingclassified in Levels 1 and 2. The other asset category alsoincludes FHLB interests and the retained interests related tothe Small Business Administration (SBA) securitizationswhich are classified as Level 3. All Level 3 other assets areincluded in the Insignificant Level 3 assets, net of liabilitiesline item in Table 95: Fair Value Measurement – RecurringQuantitative Information in this Note 9.
176 The PNC Financial Services Group, Inc. – Form 10-K
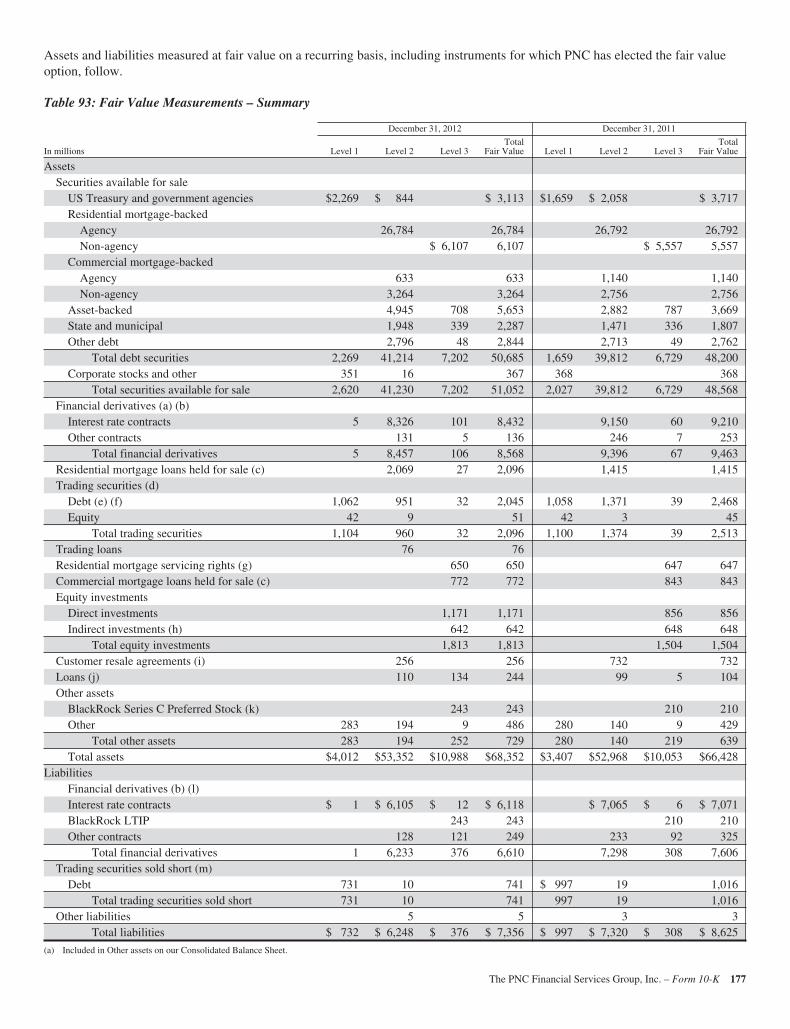
Assets and liabilities measured at fair value on a recurring basis, including instruments for which PNC has elected the fair valueoption, follow.
Table 93: Fair Value Measurements – Summary
December 31, 2012 December 31, 2011
In millions Level 1 Level 2 Level 3Total
Fair Value Level 1 Level 2 Level 3Total
Fair Value
AssetsSecurities available for sale
US Treasury and government agencies $2,269 $ 844 $ 3,113 $1,659 $ 2,058 $ 3,717Residential mortgage-backed
Agency 26,784 26,784 26,792 26,792Non-agency $ 6,107 6,107 $ 5,557 5,557
Commercial mortgage-backedAgency 633 633 1,140 1,140Non-agency 3,264 3,264 2,756 2,756
Asset-backed 4,945 708 5,653 2,882 787 3,669State and municipal 1,948 339 2,287 1,471 336 1,807Other debt 2,796 48 2,844 2,713 49 2,762
Total debt securities 2,269 41,214 7,202 50,685 1,659 39,812 6,729 48,200Corporate stocks and other 351 16 367 368 368
Total securities available for sale 2,620 41,230 7,202 51,052 2,027 39,812 6,729 48,568Financial derivatives (a) (b)
Interest rate contracts 5 8,326 101 8,432 9,150 60 9,210Other contracts 131 5 136 246 7 253
Total financial derivatives 5 8,457 106 8,568 9,396 67 9,463Residential mortgage loans held for sale (c) 2,069 27 2,096 1,415 1,415Trading securities (d)
Debt (e) (f) 1,062 951 32 2,045 1,058 1,371 39 2,468Equity 42 9 51 42 3 45
Total trading securities 1,104 960 32 2,096 1,100 1,374 39 2,513Trading loans 76 76Residential mortgage servicing rights (g) 650 650 647 647Commercial mortgage loans held for sale (c) 772 772 843 843Equity investments
Direct investments 1,171 1,171 856 856Indirect investments (h) 642 642 648 648
Total equity investments 1,813 1,813 1,504 1,504Customer resale agreements (i) 256 256 732 732Loans (j) 110 134 244 99 5 104Other assets
BlackRock Series C Preferred Stock (k) 243 243 210 210Other 283 194 9 486 280 140 9 429
Total other assets 283 194 252 729 280 140 219 639Total assets $4,012 $53,352 $10,988 $68,352 $3,407 $52,968 $10,053 $66,428
LiabilitiesFinancial derivatives (b) (l)Interest rate contracts $ 1 $ 6,105 $ 12 $ 6,118 $ 7,065 $ 6 $ 7,071BlackRock LTIP 243 243 210 210Other contracts 128 121 249 233 92 325
Total financial derivatives 1 6,233 376 6,610 7,298 308 7,606Trading securities sold short (m)
Debt 731 10 741 $ 997 19 1,016Total trading securities sold short 731 10 741 997 19 1,016
Other liabilities 5 5 3 3Total liabilities $ 732 $ 6,248 $ 376 $ 7,356 $ 997 $ 7,320 $ 308 $ 8,625
(a) Included in Other assets on our Consolidated Balance Sheet.
The PNC Financial Services Group, Inc. – Form 10-K 177
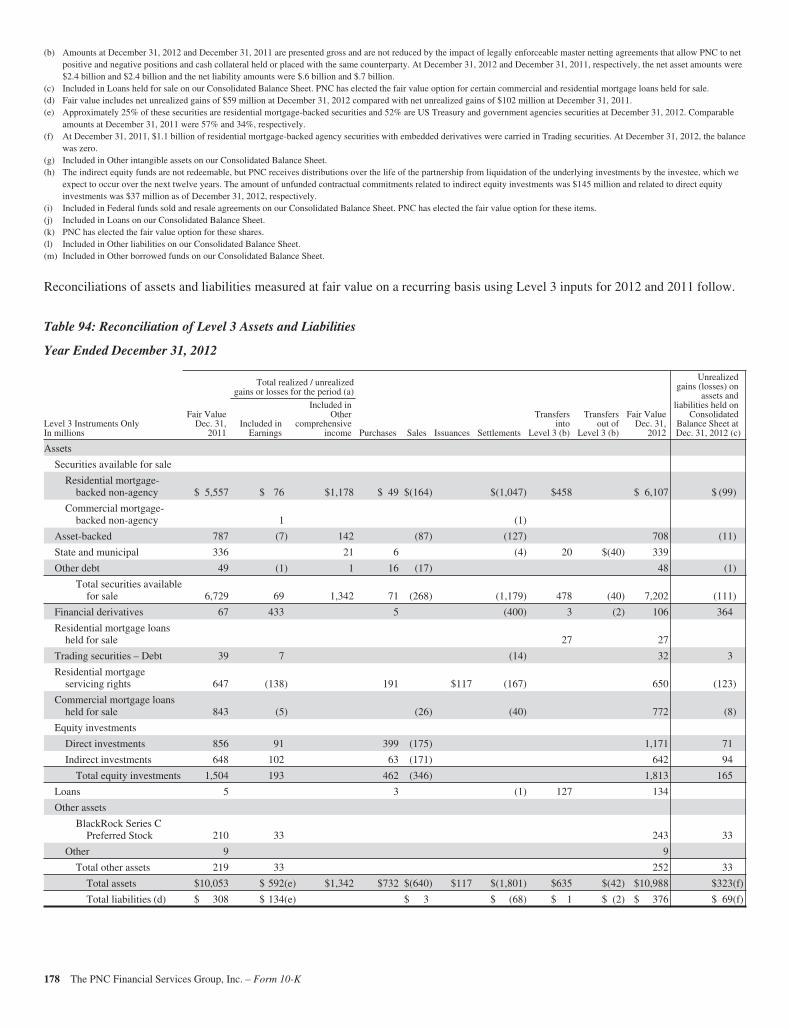
(b) Amounts at December 31, 2012 and December 31, 2011 are presented gross and are not reduced by the impact of legally enforceable master netting agreements that allow PNC to netpositive and negative positions and cash collateral held or placed with the same counterparty. At December 31, 2012 and December 31, 2011, respectively, the net asset amounts were$2.4 billion and $2.4 billion and the net liability amounts were $.6 billion and $.7 billion.
(c) Included in Loans held for sale on our Consolidated Balance Sheet. PNC has elected the fair value option for certain commercial and residential mortgage loans held for sale.(d) Fair value includes net unrealized gains of $59 million at December 31, 2012 compared with net unrealized gains of $102 million at December 31, 2011.(e) Approximately 25% of these securities are residential mortgage-backed securities and 52% are US Treasury and government agencies securities at December 31, 2012. Comparable
amounts at December 31, 2011 were 57% and 34%, respectively.(f) At December 31, 2011, $1.1 billion of residential mortgage-backed agency securities with embedded derivatives were carried in Trading securities. At December 31, 2012, the balance
was zero.(g) Included in Other intangible assets on our Consolidated Balance Sheet.(h) The indirect equity funds are not redeemable, but PNC receives distributions over the life of the partnership from liquidation of the underlying investments by the investee, which we
expect to occur over the next twelve years. The amount of unfunded contractual commitments related to indirect equity investments was $145 million and related to direct equityinvestments was $37 million as of December 31, 2012, respectively.
(i) Included in Federal funds sold and resale agreements on our Consolidated Balance Sheet. PNC has elected the fair value option for these items.(j) Included in Loans on our Consolidated Balance Sheet.(k) PNC has elected the fair value option for these shares.(l) Included in Other liabilities on our Consolidated Balance Sheet.(m) Included in Other borrowed funds on our Consolidated Balance Sheet.
Reconciliations of assets and liabilities measured at fair value on a recurring basis using Level 3 inputs for 2012 and 2011 follow.
Table 94: Reconciliation of Level 3 Assets and Liabilities
Year Ended December 31, 2012
Total realized / unrealizedgains or losses for the period (a)
Unrealizedgains (losses) on
assets andliabilities held on
ConsolidatedBalance Sheet atDec. 31, 2012 (c)
Level 3 Instruments OnlyIn millions
Fair ValueDec. 31,
2011Included in
Earnings
Included inOther
comprehensiveincome Purchases Sales Issuances Settlements
Transfersinto
Level 3 (b)
Transfersout of
Level 3 (b)
Fair ValueDec. 31,
2012
Assets
Securities available for sale
Residential mortgage-backed non-agency $ 5,557 $ 76 $1,178 $ 49 $(164) $(1,047) $458 $ 6,107 $ (99)
Commercial mortgage-backed non-agency 1 (1)
Asset-backed 787 (7) 142 (87) (127) 708 (11)
State and municipal 336 21 6 (4) 20 $(40) 339
Other debt 49 (1) 1 16 (17) 48 (1)
Total securities availablefor sale 6,729 69 1,342 71 (268) (1,179) 478 (40) 7,202 (111)
Financial derivatives 67 433 5 (400) 3 (2) 106 364
Residential mortgage loansheld for sale 27 27
Trading securities – Debt 39 7 (14) 32 3
Residential mortgageservicing rights 647 (138) 191 $117 (167) 650 (123)
Commercial mortgage loansheld for sale 843 (5) (26) (40) 772 (8)
Equity investments
Direct investments 856 91 399 (175) 1,171 71
Indirect investments 648 102 63 (171) 642 94
Total equity investments 1,504 193 462 (346) 1,813 165
Loans 5 3 (1) 127 134
Other assets
BlackRock Series CPreferred Stock 210 33 243 33
Other 9 9
Total other assets 219 33 252 33
Total assets $10,053 $ 592(e) $1,342 $732 $(640) $117 $(1,801) $635 $(42) $10,988 $323(f)
Total liabilities (d) $ 308 $ 134(e) $ 3 $ (68) $ 1 $ (2) $ 376 $ 69(f)
178 The PNC Financial Services Group, Inc. – Form 10-K
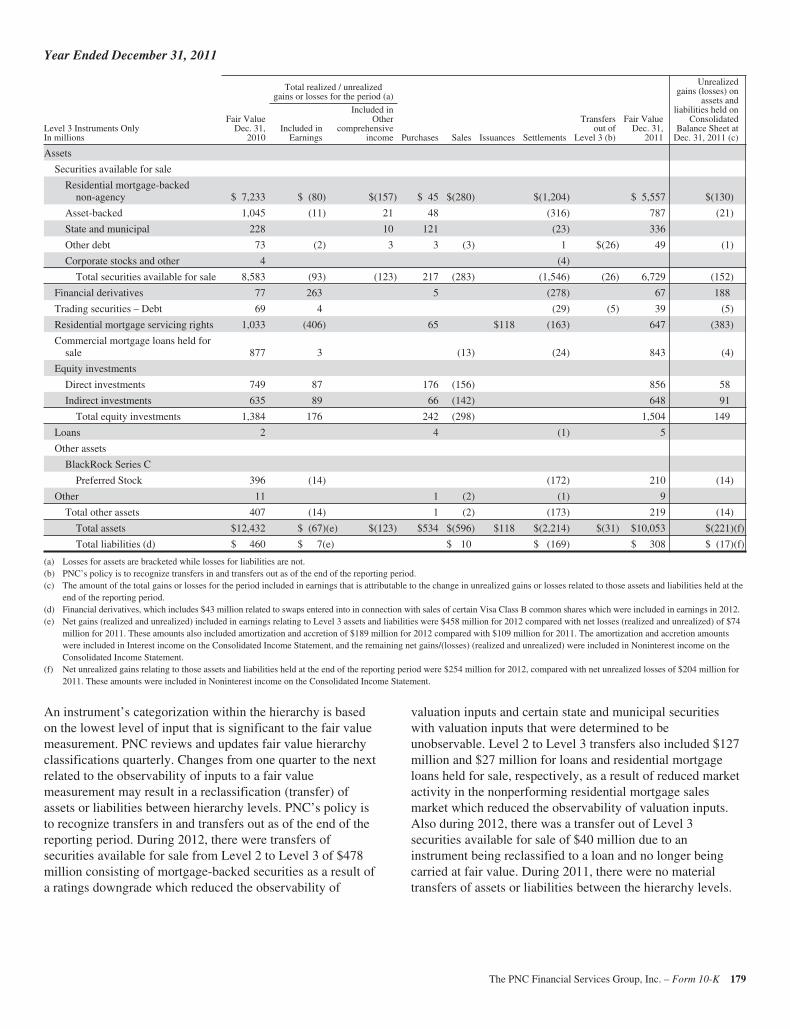
Year Ended December 31, 2011
Total realized / unrealizedgains or losses for the period (a)
Unrealizedgains (losses) on
assets andliabilities held on
ConsolidatedBalance Sheet at
Dec. 31, 2011 (c)Level 3 Instruments OnlyIn millions
Fair ValueDec. 31,
2010Included in
Earnings
Included inOther
comprehensiveincome Purchases Sales Issuances Settlements
Transfersout of
Level 3 (b)
Fair ValueDec. 31,
2011
Assets
Securities available for sale
Residential mortgage-backednon-agency $ 7,233 $ (80) $(157) $ 45 $(280) $(1,204) $ 5,557 $(130)
Asset-backed 1,045 (11) 21 48 (316) 787 (21)
State and municipal 228 10 121 (23) 336
Other debt 73 (2) 3 3 (3) 1 $(26) 49 (1)
Corporate stocks and other 4 (4)
Total securities available for sale 8,583 (93) (123) 217 (283) (1,546) (26) 6,729 (152)
Financial derivatives 77 263 5 (278) 67 188
Trading securities – Debt 69 4 (29) (5) 39 (5)
Residential mortgage servicing rights 1,033 (406) 65 $118 (163) 647 (383)
Commercial mortgage loans held forsale 877 3 (13) (24) 843 (4)
Equity investments
Direct investments 749 87 176 (156) 856 58
Indirect investments 635 89 66 (142) 648 91
Total equity investments 1,384 176 242 (298) 1,504 149
Loans 2 4 (1) 5
Other assets
BlackRock Series C
Preferred Stock 396 (14) (172) 210 (14)
Other 11 1 (2) (1) 9
Total other assets 407 (14) 1 (2) (173) 219 (14)
Total assets $12,432 $ (67)(e) $(123) $534 $(596) $118 $(2,214) $(31) $10,053 $(221)(f)
Total liabilities (d) $ 460 $ 7(e) $ 10 $ (169) $ 308 $ (17)(f)
(a) Losses for assets are bracketed while losses for liabilities are not.(b) PNC’s policy is to recognize transfers in and transfers out as of the end of the reporting period.(c) The amount of the total gains or losses for the period included in earnings that is attributable to the change in unrealized gains or losses related to those assets and liabilities held at the
end of the reporting period.(d) Financial derivatives, which includes $43 million related to swaps entered into in connection with sales of certain Visa Class B common shares which were included in earnings in 2012.(e) Net gains (realized and unrealized) included in earnings relating to Level 3 assets and liabilities were $458 million for 2012 compared with net losses (realized and unrealized) of $74
million for 2011. These amounts also included amortization and accretion of $189 million for 2012 compared with $109 million for 2011. The amortization and accretion amountswere included in Interest income on the Consolidated Income Statement, and the remaining net gains/(losses) (realized and unrealized) were included in Noninterest income on theConsolidated Income Statement.
(f) Net unrealized gains relating to those assets and liabilities held at the end of the reporting period were $254 million for 2012, compared with net unrealized losses of $204 million for2011. These amounts were included in Noninterest income on the Consolidated Income Statement.
An instrument’s categorization within the hierarchy is basedon the lowest level of input that is significant to the fair valuemeasurement. PNC reviews and updates fair value hierarchyclassifications quarterly. Changes from one quarter to the nextrelated to the observability of inputs to a fair valuemeasurement may result in a reclassification (transfer) ofassets or liabilities between hierarchy levels. PNC’s policy isto recognize transfers in and transfers out as of the end of thereporting period. During 2012, there were transfers ofsecurities available for sale from Level 2 to Level 3 of $478million consisting of mortgage-backed securities as a result ofa ratings downgrade which reduced the observability of
valuation inputs and certain state and municipal securitieswith valuation inputs that were determined to beunobservable. Level 2 to Level 3 transfers also included $127million and $27 million for loans and residential mortgageloans held for sale, respectively, as a result of reduced marketactivity in the nonperforming residential mortgage salesmarket which reduced the observability of valuation inputs.Also during 2012, there was a transfer out of Level 3securities available for sale of $40 million due to aninstrument being reclassified to a loan and no longer beingcarried at fair value. During 2011, there were no materialtransfers of assets or liabilities between the hierarchy levels.
The PNC Financial Services Group, Inc. – Form 10-K 179
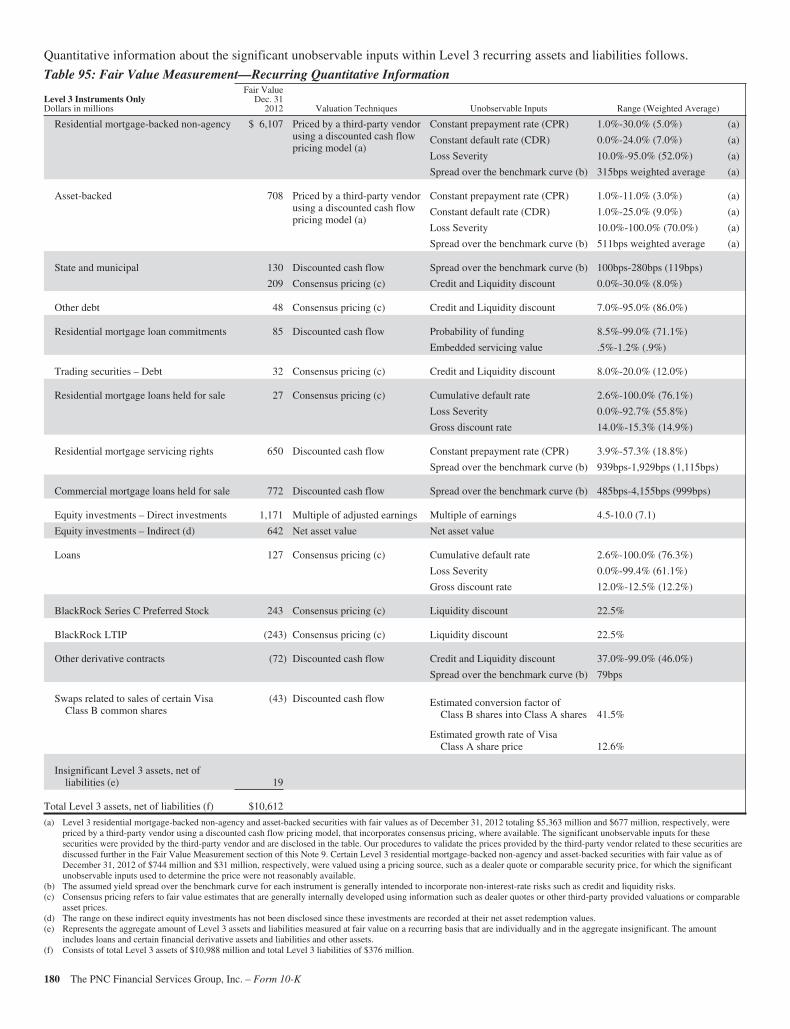
Quantitative information about the significant unobservable inputs within Level 3 recurring assets and liabilities follows.
Table 95: Fair Value Measurement—Recurring Quantitative Information
Level 3 Instruments OnlyDollars in millions
Fair ValueDec. 31
2012 Valuation Techniques Unobservable Inputs Range (Weighted Average)
Residential mortgage-backed non-agency $ 6,107 Priced by a third-party vendorusing a discounted cash flowpricing model (a)
Constant prepayment rate (CPR) 1.0%-30.0% (5.0%) (a)
Constant default rate (CDR) 0.0%-24.0% (7.0%) (a)
Loss Severity 10.0%-95.0% (52.0%) (a)
Spread over the benchmark curve (b) 315bps weighted average (a)
Asset-backed 708 Priced by a third-party vendorusing a discounted cash flowpricing model (a)
Constant prepayment rate (CPR) 1.0%-11.0% (3.0%) (a)
Constant default rate (CDR) 1.0%-25.0% (9.0%) (a)
Loss Severity 10.0%-100.0% (70.0%) (a)
Spread over the benchmark curve (b) 511bps weighted average (a)
State and municipal 130 Discounted cash flow Spread over the benchmark curve (b) 100bps-280bps (119bps)
209 Consensus pricing (c) Credit and Liquidity discount 0.0%-30.0% (8.0%)
Other debt 48 Consensus pricing (c) Credit and Liquidity discount 7.0%-95.0% (86.0%)
Residential mortgage loan commitments 85 Discounted cash flow Probability of funding 8.5%-99.0% (71.1%)
Embedded servicing value .5%-1.2% (.9%)
Trading securities – Debt 32 Consensus pricing (c) Credit and Liquidity discount 8.0%-20.0% (12.0%)
Residential mortgage loans held for sale 27 Consensus pricing (c) Cumulative default rate 2.6%-100.0% (76.1%)
Loss Severity 0.0%-92.7% (55.8%)
Gross discount rate 14.0%-15.3% (14.9%)
Residential mortgage servicing rights 650 Discounted cash flow Constant prepayment rate (CPR) 3.9%-57.3% (18.8%)
Spread over the benchmark curve (b) 939bps-1,929bps (1,115bps)
Commercial mortgage loans held for sale 772 Discounted cash flow Spread over the benchmark curve (b) 485bps-4,155bps (999bps)
Equity investments – Direct investments 1,171 Multiple of adjusted earnings Multiple of earnings 4.5-10.0 (7.1)
Equity investments – Indirect (d) 642 Net asset value Net asset value
Loans 127 Consensus pricing (c) Cumulative default rate 2.6%-100.0% (76.3%)
Loss Severity 0.0%-99.4% (61.1%)
Gross discount rate 12.0%-12.5% (12.2%)
BlackRock Series C Preferred Stock 243 Consensus pricing (c) Liquidity discount 22.5%
BlackRock LTIP (243) Consensus pricing (c) Liquidity discount 22.5%
Other derivative contracts (72) Discounted cash flow Credit and Liquidity discount 37.0%-99.0% (46.0%)
Spread over the benchmark curve (b) 79bps
Swaps related to sales of certain VisaClass B common shares
(43) Discounted cash flow Estimated conversion factor ofClass B shares into Class A shares 41.5%
Estimated growth rate of VisaClass A share price 12.6%
Insignificant Level 3 assets, net ofliabilities (e) 19
Total Level 3 assets, net of liabilities (f) $10,612
(a) Level 3 residential mortgage-backed non-agency and asset-backed securities with fair values as of December 31, 2012 totaling $5,363 million and $677 million, respectively, werepriced by a third-party vendor using a discounted cash flow pricing model, that incorporates consensus pricing, where available. The significant unobservable inputs for thesesecurities were provided by the third-party vendor and are disclosed in the table. Our procedures to validate the prices provided by the third-party vendor related to these securities arediscussed further in the Fair Value Measurement section of this Note 9. Certain Level 3 residential mortgage-backed non-agency and asset-backed securities with fair value as ofDecember 31, 2012 of $744 million and $31 million, respectively, were valued using a pricing source, such as a dealer quote or comparable security price, for which the significantunobservable inputs used to determine the price were not reasonably available.
(b) The assumed yield spread over the benchmark curve for each instrument is generally intended to incorporate non-interest-rate risks such as credit and liquidity risks.(c) Consensus pricing refers to fair value estimates that are generally internally developed using information such as dealer quotes or other third-party provided valuations or comparable
asset prices.(d) The range on these indirect equity investments has not been disclosed since these investments are recorded at their net asset redemption values.(e) Represents the aggregate amount of Level 3 assets and liabilities measured at fair value on a recurring basis that are individually and in the aggregate insignificant. The amount
includes loans and certain financial derivative assets and liabilities and other assets.(f) Consists of total Level 3 assets of $10,988 million and total Level 3 liabilities of $376 million.
180 The PNC Financial Services Group, Inc. – Form 10-K
OTHER FINANCIAL ASSETS ACCOUNTED FOR AT FAIR VALUE
ON A NONRECURRING BASIS
We may be required to measure certain other financial assetsat fair value on a nonrecurring basis. These adjustments to fairvalue usually result from the application of lower-of-cost-or-fair value accounting or write-downs of individual assets dueto impairment and are included in Table 96: Fair ValueMeasurements – Nonrecurring and Table 97: Fair ValueMeasurements – Nonrecurring Quantitative Information.
Nonaccrual LoansThe amounts below for nonaccrual loans represent the fairvalue of those loans which have been adjusted due toimpairment. The impairment is primarily based on theappraised value of the collateral or LGD percentage. The LGDpercentage is used to determine the weighted average lossseverity of the nonaccrual loans.
As part of the appraisal process, persons ordering or reviewingappraisals are independent of the asset manager. Appraisalsmust be provided by licensed or certified appraisers andconform to the Uniform Standards of Professional AppraisalPractice. For loans secured by commercial properties wherethe underlying collateral is in excess of $250,000, appraisalsare obtained at least annually. In certain instances (e.g.,physical changes in the property), a more recent appraisal isobtained. Additionally, borrower ordered appraisals are notpermitted, and PNC ordered appraisals are regularly reviewed.For loans secured by commercial properties where theunderlying collateral is $250,000 and less, there is norequirement to obtain an appraisal. In instances where anappraisal is not obtained, the collateral value is determinedconsistent with external third-party appraisal standards by aninternal person independent of the asset manager. PNC has areal estate valuation services group whose sole function is tomanage the real estate appraisal solicitation and evaluationprocess for commercial loans. All third-party appraisals arereviewed by this group, including consideration of comments/questions on the appraisal by the reviewer, customerrelationship manager, credit officer, and underwriter. Uponresolving these comments/questions through discussions withthe third-party appraiser, adjustments to the initial appraisalmay occur and be incorporated into the final issued appraisalreport.
If an appraisal is outdated due to changed project or marketconditions, or if the net book value is utilized, managementuses an LGD percentage which represents the exposure PNCexpects to lose in the event a borrower defaults on anobligation. Accordingly, LGD, which represents the lossseverity, is a function of collateral recovery rates and loan-to-value. Those rates are established based upon actual PNC lossexperience and external market data. In instances where wehave agreed to sell the property to a third party, the fair valueis based on the contractual sales price adjusted for costs tosell. In these instances, the most significant unobservableinput is the appraised value or the sales price. The estimated
costs to sell are incremental direct costs to transact a sale suchas broker commissions, legal, closing costs and title transferfees. The costs must be essential to the sale and would nothave been incurred if the decision to sell had not been made.The costs to sell are based on costs associated with our actualsales of commercial and residential OREO and foreclosedassets, which are assessed annually.
Loans Held for SaleThe amounts below for loans held for sale include the carryingvalue of commercial mortgage loans which are intended to besold with servicing retained. The fair value of the commercialmortgage loans is determined using discounted cash flows.Significant observable market data includes the applicablebenchmark U.S. Treasury interest rates. These instruments areclassified within Level 3. Significant unobservable inputsinclude a spread over the benchmark curve and the embeddedservicing value. Significant increases (decreases) to the spreadover the benchmark curve would result in a significantly lower(higher) carrying value of the assets. Significant increases(decreases) in the embedded servicing value would result insignificantly higher (lower) carrying value.
Loans held for sale also includes syndicated commercial loaninventory. The fair value of the syndicated commercial loaninventory is primarily determined based on prices provided bya third-party vendor. The third-party vendor prices are basedupon dealer quotes. These instruments are classified withinLevel 2. There were no loans held for sale categorized asLevel 2 at December 31, 2012.
Equity InvestmentsThe amounts below for equity investments represent thecarrying value of Low Income Housing Tax Credit (LIHTC)investments held for sale calculated using a discounted cashflow model. The significant unobservable input ismanagement’s estimate of required market rate of return. Themarket rate of return is based on comparison to recent LIHTCsales in the market. Significant increases (decreases) in thisinput would result in a significantly lower (higher) carryingvalue of the investments.
Commercial Mortgage Servicing RightsCommercial MSRs are periodically evaluated for impairmentand the amounts below reflect an impairment of two strata atDecember 31, 2012 and three strata at December 31, 2011,respectively. For purposes of impairment, the commercialMSRs are stratified based on asset type, which characterizesthe predominant risk of the underlying financial asset. The fairvalue of commercial MSRs is estimated by using a discountedcash flow model incorporating unobservable inputs forassumptions as to constant prepayment rates, discount ratesand other factors. Significant increases (decreases) in constantprepayment rates and discount rates would result insignificantly lower (higher) commercial MSR valuedetermined based on current market conditions andexpectations.
The PNC Financial Services Group, Inc. – Form 10-K 181
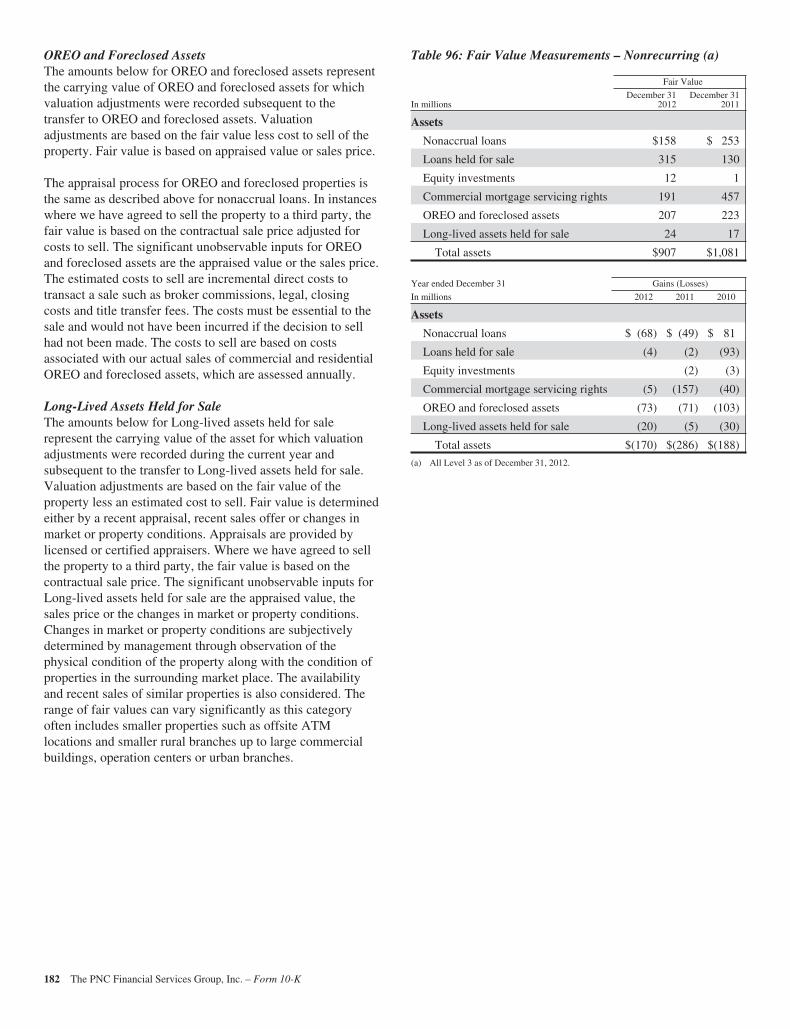
OREO and Foreclosed AssetsThe amounts below for OREO and foreclosed assets representthe carrying value of OREO and foreclosed assets for whichvaluation adjustments were recorded subsequent to thetransfer to OREO and foreclosed assets. Valuationadjustments are based on the fair value less cost to sell of theproperty. Fair value is based on appraised value or sales price.
The appraisal process for OREO and foreclosed properties isthe same as described above for nonaccrual loans. In instanceswhere we have agreed to sell the property to a third party, thefair value is based on the contractual sale price adjusted forcosts to sell. The significant unobservable inputs for OREOand foreclosed assets are the appraised value or the sales price.The estimated costs to sell are incremental direct costs totransact a sale such as broker commissions, legal, closingcosts and title transfer fees. The costs must be essential to thesale and would not have been incurred if the decision to sellhad not been made. The costs to sell are based on costsassociated with our actual sales of commercial and residentialOREO and foreclosed assets, which are assessed annually.
Long-Lived Assets Held for SaleThe amounts below for Long-lived assets held for salerepresent the carrying value of the asset for which valuationadjustments were recorded during the current year andsubsequent to the transfer to Long-lived assets held for sale.Valuation adjustments are based on the fair value of theproperty less an estimated cost to sell. Fair value is determinedeither by a recent appraisal, recent sales offer or changes inmarket or property conditions. Appraisals are provided bylicensed or certified appraisers. Where we have agreed to sellthe property to a third party, the fair value is based on thecontractual sale price. The significant unobservable inputs forLong-lived assets held for sale are the appraised value, thesales price or the changes in market or property conditions.Changes in market or property conditions are subjectivelydetermined by management through observation of thephysical condition of the property along with the condition ofproperties in the surrounding market place. The availabilityand recent sales of similar properties is also considered. Therange of fair values can vary significantly as this categoryoften includes smaller properties such as offsite ATMlocations and smaller rural branches up to large commercialbuildings, operation centers or urban branches.
Table 96: Fair Value Measurements – Nonrecurring (a)
Fair Value
In millionsDecember 31
2012December 31
2011
Assets
Nonaccrual loans $158 $ 253
Loans held for sale 315 130
Equity investments 12 1
Commercial mortgage servicing rights 191 457
OREO and foreclosed assets 207 223
Long-lived assets held for sale 24 17
Total assets $907 $1,081
Year ended December 31 Gains (Losses)
In millions 2012 2011 2010
Assets
Nonaccrual loans $ (68) $ (49) $ 81
Loans held for sale (4) (2) (93)
Equity investments (2) (3)
Commercial mortgage servicing rights (5) (157) (40)
OREO and foreclosed assets (73) (71) (103)
Long-lived assets held for sale (20) (5) (30)
Total assets $(170) $(286) $(188)
(a) All Level 3 as of December 31, 2012.
182 The PNC Financial Services Group, Inc. – Form 10-K
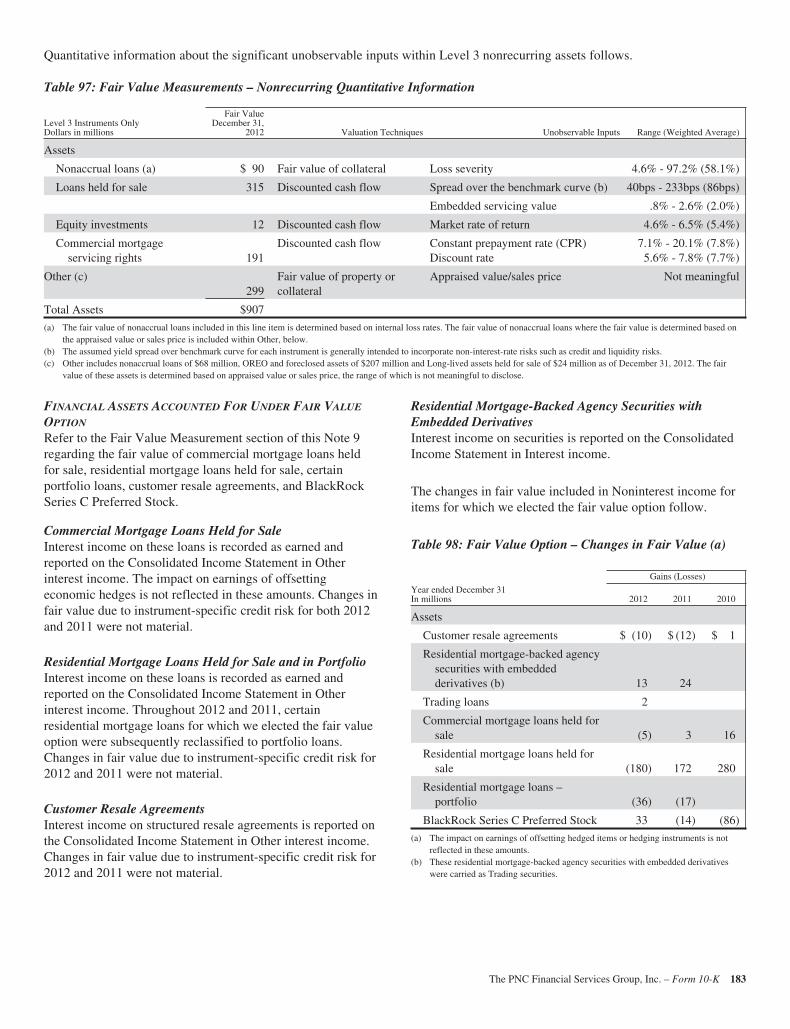
Quantitative information about the significant unobservable inputs within Level 3 nonrecurring assets follows.
Table 97: Fair Value Measurements – Nonrecurring Quantitative Information
Level 3 Instruments OnlyDollars in millions
Fair ValueDecember 31,
2012 Valuation Techniques Unobservable Inputs Range (Weighted Average)
Assets
Nonaccrual loans (a) $ 90 Fair value of collateral Loss severity 4.6% - 97.2% (58.1%)
Loans held for sale 315 Discounted cash flow Spread over the benchmark curve (b) 40bps - 233bps (86bps)
Embedded servicing value .8% - 2.6% (2.0%)
Equity investments 12 Discounted cash flow Market rate of return 4.6% - 6.5% (5.4%)
Commercial mortgageservicing rights 191
Discounted cash flow Constant prepayment rate (CPR)Discount rate
7.1% - 20.1% (7.8%)5.6% - 7.8% (7.7%)
Other (c)299
Fair value of property orcollateral
Appraised value/sales price Not meaningful
Total Assets $907
(a) The fair value of nonaccrual loans included in this line item is determined based on internal loss rates. The fair value of nonaccrual loans where the fair value is determined based onthe appraised value or sales price is included within Other, below.
(b) The assumed yield spread over benchmark curve for each instrument is generally intended to incorporate non-interest-rate risks such as credit and liquidity risks.(c) Other includes nonaccrual loans of $68 million, OREO and foreclosed assets of $207 million and Long-lived assets held for sale of $24 million as of December 31, 2012. The fair
value of these assets is determined based on appraised value or sales price, the range of which is not meaningful to disclose.
FINANCIAL ASSETS ACCOUNTED FOR UNDER FAIR VALUE
OPTION
Refer to the Fair Value Measurement section of this Note 9regarding the fair value of commercial mortgage loans heldfor sale, residential mortgage loans held for sale, certainportfolio loans, customer resale agreements, and BlackRockSeries C Preferred Stock.
Commercial Mortgage Loans Held for SaleInterest income on these loans is recorded as earned andreported on the Consolidated Income Statement in Otherinterest income. The impact on earnings of offsettingeconomic hedges is not reflected in these amounts. Changes infair value due to instrument-specific credit risk for both 2012and 2011 were not material.
Residential Mortgage Loans Held for Sale and in PortfolioInterest income on these loans is recorded as earned andreported on the Consolidated Income Statement in Otherinterest income. Throughout 2012 and 2011, certainresidential mortgage loans for which we elected the fair valueoption were subsequently reclassified to portfolio loans.Changes in fair value due to instrument-specific credit risk for2012 and 2011 were not material.
Customer Resale AgreementsInterest income on structured resale agreements is reported onthe Consolidated Income Statement in Other interest income.Changes in fair value due to instrument-specific credit risk for2012 and 2011 were not material.
Residential Mortgage-Backed Agency Securities withEmbedded DerivativesInterest income on securities is reported on the ConsolidatedIncome Statement in Interest income.
The changes in fair value included in Noninterest income foritems for which we elected the fair value option follow.
Table 98: Fair Value Option – Changes in Fair Value (a)
Gains (Losses)
Year ended December 31In millions 2012 2011 2010
Assets
Customer resale agreements $ (10) $ (12) $ 1
Residential mortgage-backed agencysecurities with embeddedderivatives (b) 13 24
Trading loans 2
Commercial mortgage loans held forsale (5) 3 16
Residential mortgage loans held forsale (180) 172 280
Residential mortgage loans –portfolio (36) (17)
BlackRock Series C Preferred Stock 33 (14) (86)
(a) The impact on earnings of offsetting hedged items or hedging instruments is notreflected in these amounts.
(b) These residential mortgage-backed agency securities with embedded derivativeswere carried as Trading securities.
The PNC Financial Services Group, Inc. – Form 10-K 183
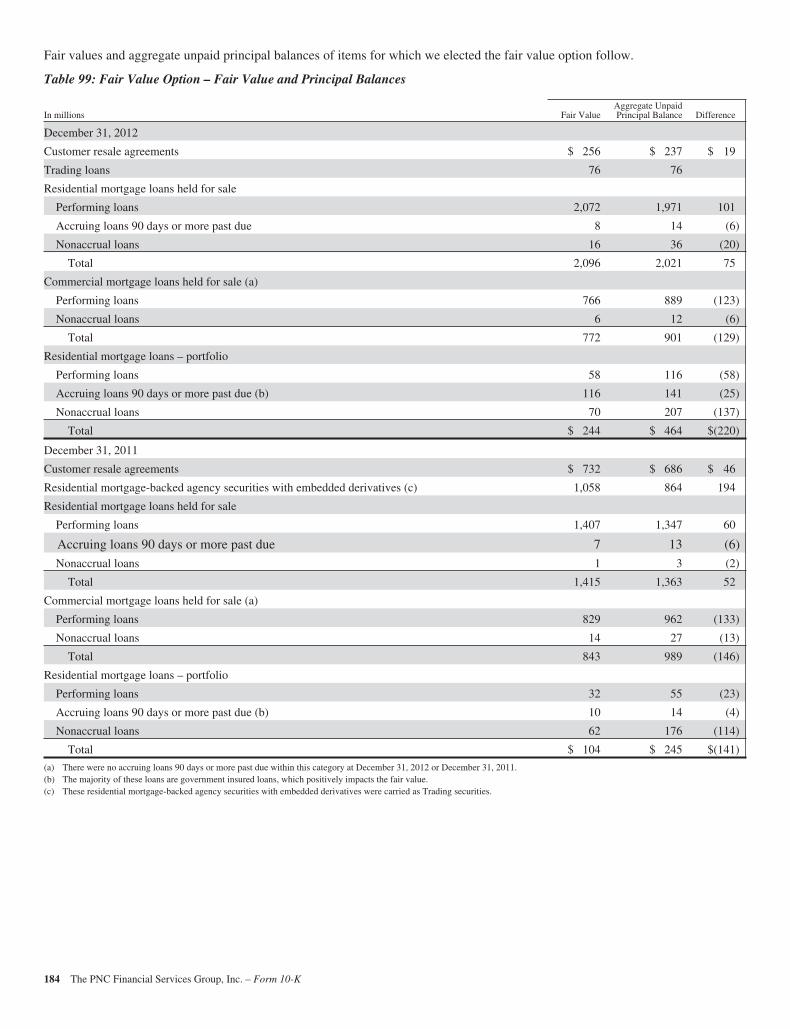
Fair values and aggregate unpaid principal balances of items for which we elected the fair value option follow.
Table 99: Fair Value Option – Fair Value and Principal Balances
In millions Fair ValueAggregate UnpaidPrincipal Balance Difference
December 31, 2012
Customer resale agreements $ 256 $ 237 $ 19
Trading loans 76 76
Residential mortgage loans held for sale
Performing loans 2,072 1,971 101
Accruing loans 90 days or more past due 8 14 (6)
Nonaccrual loans 16 36 (20)
Total 2,096 2,021 75
Commercial mortgage loans held for sale (a)
Performing loans 766 889 (123)
Nonaccrual loans 6 12 (6)
Total 772 901 (129)
Residential mortgage loans – portfolio
Performing loans 58 116 (58)
Accruing loans 90 days or more past due (b) 116 141 (25)
Nonaccrual loans 70 207 (137)
Total $ 244 $ 464 $(220)
December 31, 2011
Customer resale agreements $ 732 $ 686 $ 46
Residential mortgage-backed agency securities with embedded derivatives (c) 1,058 864 194
Residential mortgage loans held for sale
Performing loans 1,407 1,347 60
Accruing loans 90 days or more past due 7 13 (6)
Nonaccrual loans 1 3 (2)
Total 1,415 1,363 52
Commercial mortgage loans held for sale (a)
Performing loans 829 962 (133)
Nonaccrual loans 14 27 (13)
Total 843 989 (146)
Residential mortgage loans – portfolio
Performing loans 32 55 (23)
Accruing loans 90 days or more past due (b) 10 14 (4)
Nonaccrual loans 62 176 (114)
Total $ 104 $ 245 $(141)
(a) There were no accruing loans 90 days or more past due within this category at December 31, 2012 or December 31, 2011.(b) The majority of these loans are government insured loans, which positively impacts the fair value.(c) These residential mortgage-backed agency securities with embedded derivatives were carried as Trading securities.
184 The PNC Financial Services Group, Inc. – Form 10-K
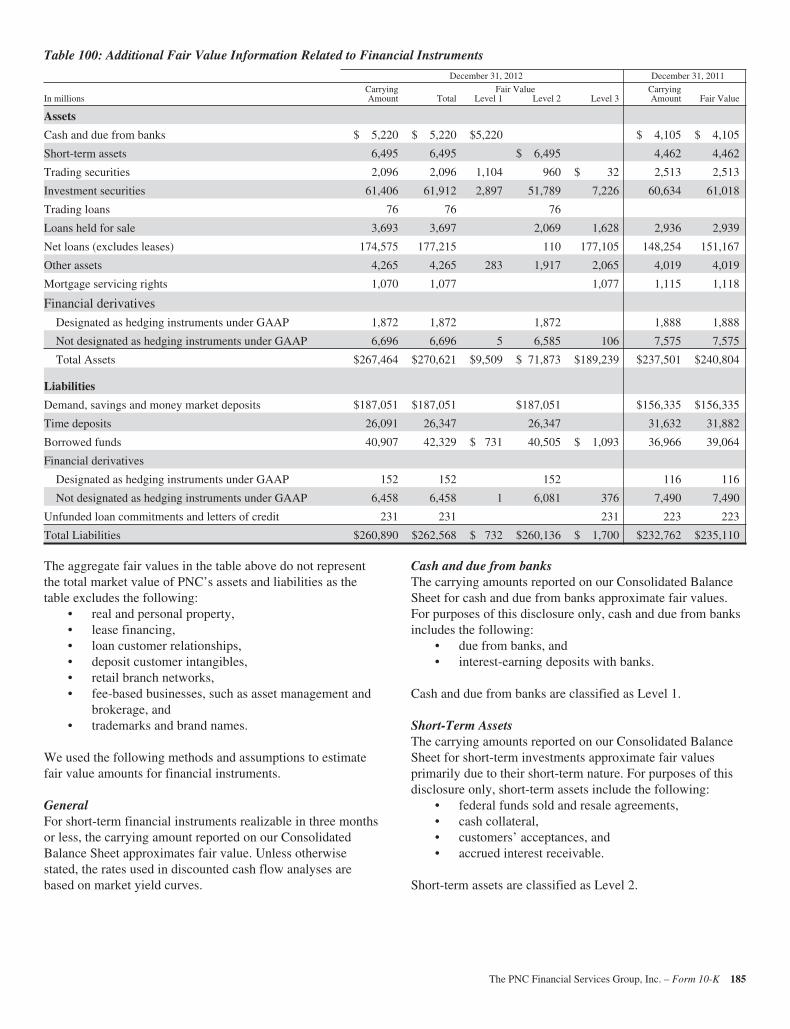
Table 100: Additional Fair Value Information Related to Financial Instruments
December 31, 2012 December 31, 2011
Carrying Fair Value CarryingIn millions Amount Total Level 1 Level 2 Level 3 Amount Fair Value
Assets
Cash and due from banks $ 5,220 $ 5,220 $5,220 $ 4,105 $ 4,105
Short-term assets 6,495 6,495 $ 6,495 4,462 4,462
Trading securities 2,096 2,096 1,104 960 $ 32 2,513 2,513
Investment securities 61,406 61,912 2,897 51,789 7,226 60,634 61,018
Trading loans 76 76 76
Loans held for sale 3,693 3,697 2,069 1,628 2,936 2,939
Net loans (excludes leases) 174,575 177,215 110 177,105 148,254 151,167
Other assets 4,265 4,265 283 1,917 2,065 4,019 4,019
Mortgage servicing rights 1,070 1,077 1,077 1,115 1,118
Financial derivatives
Designated as hedging instruments under GAAP 1,872 1,872 1,872 1,888 1,888
Not designated as hedging instruments under GAAP 6,696 6,696 5 6,585 106 7,575 7,575
Total Assets $267,464 $270,621 $9,509 $ 71,873 $189,239 $237,501 $240,804
Liabilities
Demand, savings and money market deposits $187,051 $187,051 $187,051 $156,335 $156,335
Time deposits 26,091 26,347 26,347 31,632 31,882
Borrowed funds 40,907 42,329 $ 731 40,505 $ 1,093 36,966 39,064
Financial derivatives
Designated as hedging instruments under GAAP 152 152 152 116 116
Not designated as hedging instruments under GAAP 6,458 6,458 1 6,081 376 7,490 7,490
Unfunded loan commitments and letters of credit 231 231 231 223 223
Total Liabilities $260,890 $262,568 $ 732 $260,136 $ 1,700 $232,762 $235,110
The aggregate fair values in the table above do not representthe total market value of PNC’s assets and liabilities as thetable excludes the following:
• real and personal property,• lease financing,• loan customer relationships,• deposit customer intangibles,• retail branch networks,• fee-based businesses, such as asset management and
brokerage, and• trademarks and brand names.
We used the following methods and assumptions to estimatefair value amounts for financial instruments.
GeneralFor short-term financial instruments realizable in three monthsor less, the carrying amount reported on our ConsolidatedBalance Sheet approximates fair value. Unless otherwisestated, the rates used in discounted cash flow analyses arebased on market yield curves.
Cash and due from banksThe carrying amounts reported on our Consolidated BalanceSheet for cash and due from banks approximate fair values.For purposes of this disclosure only, cash and due from banksincludes the following:
• due from banks, and• interest-earning deposits with banks.
Cash and due from banks are classified as Level 1.
Short-Term AssetsThe carrying amounts reported on our Consolidated BalanceSheet for short-term investments approximate fair valuesprimarily due to their short-term nature. For purposes of thisdisclosure only, short-term assets include the following:
• federal funds sold and resale agreements,• cash collateral,• customers’ acceptances, and• accrued interest receivable.
Short-term assets are classified as Level 2.
The PNC Financial Services Group, Inc. – Form 10-K 185
SecuritiesSecurities include both the investment securities (comprised ofavailable for sale and held to maturity securities) and tradingsecurities portfolios. We primarily use prices obtained frompricing services, dealer quotes or recent trades to determinethe fair value of securities. As of December 31, 2012, 86% ofthe positions in these portfolios were priced by pricingservices provided by third-party vendors. The third-partyvendors use a variety of methods when pricing securities thatincorporate relevant market data to arrive at an estimate ofwhat a buyer in the marketplace would pay for a securityunder current market conditions. One of the vendor’s prices isset with reference to market activity for highly liquid assets,such as U.S. Treasury and agency securities and agencymortgage-backed securities, and matrix pricing for other assetclasses, such as commercial mortgage and other asset-backedsecurities. Another vendor primarily uses pricing modelsconsidering adjustments for ratings, spreads, matrix pricingand prepayments for the instruments we value using thisservice, such as non-agency residential mortgage-backedsecurities, agency adjustable rate mortgage securities, agencyCMOs, commercial mortgage-backed securities, andmunicipal bonds. Management uses various methods andtechniques to validate prices obtained from pricing servicesand dealers, including reference to another third-party source,by reviewing valuations of comparable instruments, or bycomparison to internal valuations.
Net Loans And Loans Held For SaleFair values are estimated based on the discounted value ofexpected net cash flows incorporating assumptions aboutprepayment rates, net credit losses and servicing fees. Forpurchased impaired loans, fair value is assumed to equalPNC’s carrying value, which represents the present value ofexpected future principal and interest cash flows, as adjustedfor any ALLL recorded for these loans. See Note 6 PurchasedLoans for additional information. For revolving home equityloans and commercial credit lines, this fair value does notinclude any amount for new loans or the related fees that willbe generated from the existing customer relationships.Nonaccrual loans are valued at their estimated recovery value.Also refer to the Fair Value Measurement and Fair ValueOption sections of this Note 9 regarding the fair value ofcommercial and residential mortgage loans held for sale.Loans are presented net of the ALLL and do not include futureaccretable discounts related to purchased impaired loans.
Other AssetsOther assets as shown in the preceding table includes thefollowing:
• FHLB and FRB stock,• equity investments carried at cost and fair value, and• BlackRock Series C Preferred Stock.
Investments accounted for under the equity method, includingour investment in BlackRock, are not included in thepreceding Table 100: Additional Fair Value InformationRelated to Financial Instruments.
Refer to the Fair Value Measurement section of this Note 9regarding the fair value of equity investments.
The aggregate carrying value of our investments that arecarried at cost and FHLB and FRB stock was $1.7 billion atDecember 31, 2012 and was $1.9 billion at December 31,2011, which approximates fair value at each date.
Mortgage Servicing AssetsFair value is based on the present value of the estimated futurecash flows, incorporating assumptions as to prepayment rates,discount rates, default rates, escrow balances, interest rates,cost to service and other factors.
The key valuation assumptions for commercial and residentialmortgage loan servicing assets at December 31, 2012 andDecember 31, 2011 are included in Note 10 Goodwill andOther Intangible Assets.
Customer Resale AgreementsRefer to the Fair Value Measurement section of this Note 9regarding the fair value of customer resale agreements.
DepositsThe carrying amounts of noninterest-bearing and interest-bearing demand, interest-bearing money market and savingsdeposits approximate fair values. For time deposits, whichinclude foreign deposits, fair values are estimated based on thediscounted value of expected net cash flows assuming currentinterest rates. All deposits are classified as Level 2.
Borrowed FundsThe carrying amounts of Federal funds purchased, commercialpaper, repurchase agreements, trading securities sold short,cash collateral, other short-term borrowings, acceptancesoutstanding and accrued interest payable are considered to betheir fair value because of their short-term nature. For all otherborrowed funds, fair values are estimated using either pricesobtained from third-party vendors or an internally developeddiscounted cash flow approach taking into consideration ourcurrent incremental borrowing rates for similar instruments.
Unfunded Loan Commitments And Letters of CreditThe fair value of unfunded loan commitments and letters ofcredit is determined from a market participant’s viewincluding the impact of changes in interest rates, credit andother factors. Because our obligation on substantially allunfunded loan commitments and letters of credit varies withchanges in interest rates, these instruments are subject to littlefluctuation in fair value due to changes in interest rates. Weestablish a liability on these facilities related to thecreditworthiness of our counterparty. These instruments areclassified as Level 3.
FINANCIAL DERIVATIVES
Refer to the Fair Value Measurement section of this Note 9regarding the fair value of financial derivatives.
186 The PNC Financial Services Group, Inc. – Form 10-K
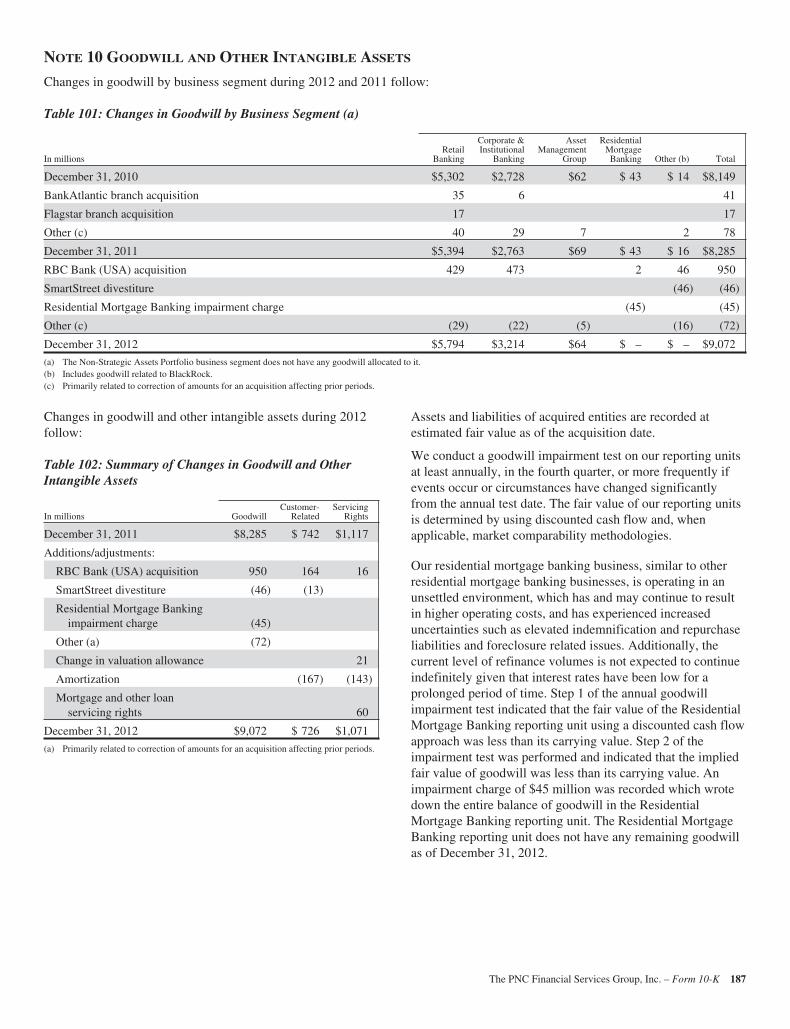
NOTE 10 GOODWILL AND OTHER INTANGIBLE ASSETS
Changes in goodwill by business segment during 2012 and 2011 follow:
Table 101: Changes in Goodwill by Business Segment (a)
In millionsRetail
Banking
Corporate &Institutional
Banking
AssetManagement
Group
ResidentialMortgageBanking Other (b) Total
December 31, 2010 $5,302 $2,728 $62 $ 43 $ 14 $8,149
BankAtlantic branch acquisition 35 6 41
Flagstar branch acquisition 17 17
Other (c) 40 29 7 2 78
December 31, 2011 $5,394 $2,763 $69 $ 43 $ 16 $8,285
RBC Bank (USA) acquisition 429 473 2 46 950
SmartStreet divestiture (46) (46)
Residential Mortgage Banking impairment charge (45) (45)
Other (c) (29) (22) (5) (16) (72)
December 31, 2012 $5,794 $3,214 $64 $ – $ – $9,072
(a) The Non-Strategic Assets Portfolio business segment does not have any goodwill allocated to it.(b) Includes goodwill related to BlackRock.(c) Primarily related to correction of amounts for an acquisition affecting prior periods.
Changes in goodwill and other intangible assets during 2012follow:
Table 102: Summary of Changes in Goodwill and OtherIntangible Assets
In millions GoodwillCustomer-
RelatedServicing
Rights
December 31, 2011 $8,285 $ 742 $1,117
Additions/adjustments:
RBC Bank (USA) acquisition 950 164 16
SmartStreet divestiture (46) (13)
Residential Mortgage Bankingimpairment charge (45)
Other (a) (72)
Change in valuation allowance 21
Amortization (167) (143)
Mortgage and other loanservicing rights 60
December 31, 2012 $9,072 $ 726 $1,071
(a) Primarily related to correction of amounts for an acquisition affecting prior periods.
Assets and liabilities of acquired entities are recorded atestimated fair value as of the acquisition date.
We conduct a goodwill impairment test on our reporting unitsat least annually, in the fourth quarter, or more frequently ifevents occur or circumstances have changed significantlyfrom the annual test date. The fair value of our reporting unitsis determined by using discounted cash flow and, whenapplicable, market comparability methodologies.
Our residential mortgage banking business, similar to otherresidential mortgage banking businesses, is operating in anunsettled environment, which has and may continue to resultin higher operating costs, and has experienced increaseduncertainties such as elevated indemnification and repurchaseliabilities and foreclosure related issues. Additionally, thecurrent level of refinance volumes is not expected to continueindefinitely given that interest rates have been low for aprolonged period of time. Step 1 of the annual goodwillimpairment test indicated that the fair value of the ResidentialMortgage Banking reporting unit using a discounted cash flowapproach was less than its carrying value. Step 2 of theimpairment test was performed and indicated that the impliedfair value of goodwill was less than its carrying value. Animpairment charge of $45 million was recorded which wrotedown the entire balance of goodwill in the ResidentialMortgage Banking reporting unit. The Residential MortgageBanking reporting unit does not have any remaining goodwillas of December 31, 2012.
The PNC Financial Services Group, Inc. – Form 10-K 187
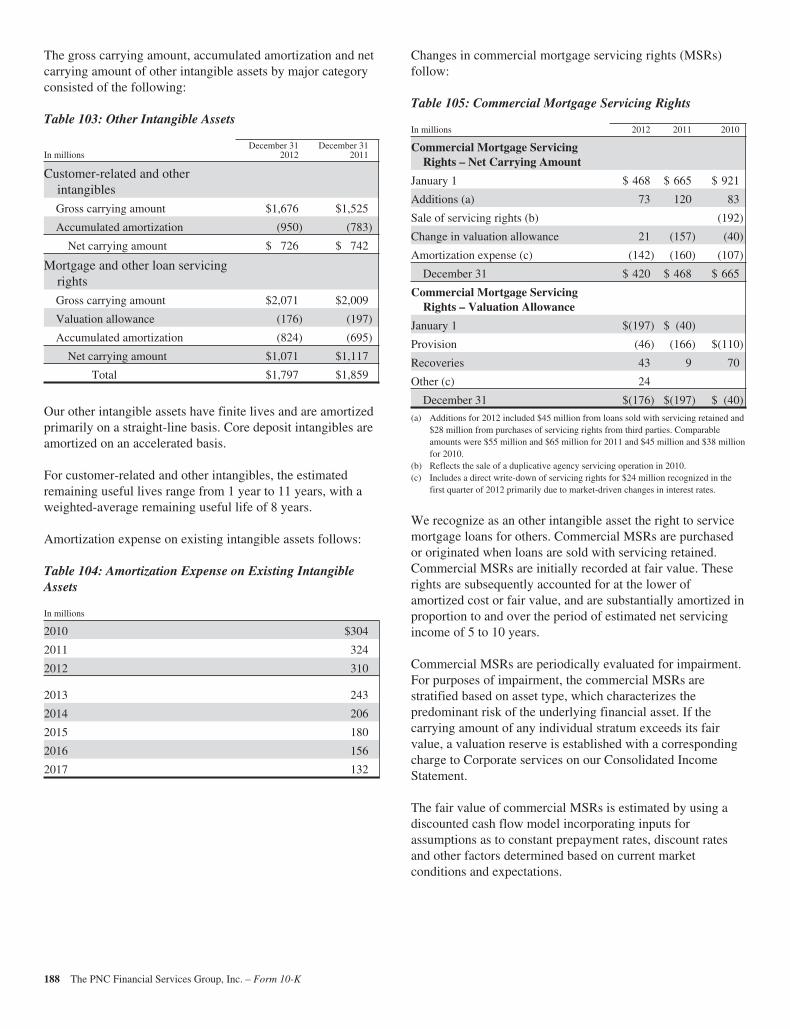
The gross carrying amount, accumulated amortization and netcarrying amount of other intangible assets by major categoryconsisted of the following:
Table 103: Other Intangible Assets
In millionsDecember 31
2012December 31
2011
Customer-related and otherintangibles
Gross carrying amount $1,676 $1,525
Accumulated amortization (950) (783)
Net carrying amount $ 726 $ 742
Mortgage and other loan servicingrights
Gross carrying amount $2,071 $2,009
Valuation allowance (176) (197)
Accumulated amortization (824) (695)
Net carrying amount $1,071 $1,117
Total $1,797 $1,859
Our other intangible assets have finite lives and are amortizedprimarily on a straight-line basis. Core deposit intangibles areamortized on an accelerated basis.
For customer-related and other intangibles, the estimatedremaining useful lives range from 1 year to 11 years, with aweighted-average remaining useful life of 8 years.
Amortization expense on existing intangible assets follows:
Table 104: Amortization Expense on Existing IntangibleAssets
In millions
2010 $304
2011 324
2012 310
2013 243
2014 206
2015 180
2016 156
2017 132
Changes in commercial mortgage servicing rights (MSRs)follow:
Table 105: Commercial Mortgage Servicing Rights
In millions 2012 2011 2010
Commercial Mortgage ServicingRights – Net Carrying Amount
January 1 $ 468 $ 665 $ 921
Additions (a) 73 120 83
Sale of servicing rights (b) (192)
Change in valuation allowance 21 (157) (40)
Amortization expense (c) (142) (160) (107)
December 31 $ 420 $ 468 $ 665
Commercial Mortgage ServicingRights – Valuation Allowance
January 1 $(197) $ (40)
Provision (46) (166) $(110)
Recoveries 43 9 70
Other (c) 24
December 31 $(176) $(197) $ (40)
(a) Additions for 2012 included $45 million from loans sold with servicing retained and$28 million from purchases of servicing rights from third parties. Comparableamounts were $55 million and $65 million for 2011 and $45 million and $38 millionfor 2010.
(b) Reflects the sale of a duplicative agency servicing operation in 2010.(c) Includes a direct write-down of servicing rights for $24 million recognized in the
first quarter of 2012 primarily due to market-driven changes in interest rates.
We recognize as an other intangible asset the right to servicemortgage loans for others. Commercial MSRs are purchasedor originated when loans are sold with servicing retained.Commercial MSRs are initially recorded at fair value. Theserights are subsequently accounted for at the lower ofamortized cost or fair value, and are substantially amortized inproportion to and over the period of estimated net servicingincome of 5 to 10 years.
Commercial MSRs are periodically evaluated for impairment.For purposes of impairment, the commercial MSRs arestratified based on asset type, which characterizes thepredominant risk of the underlying financial asset. If thecarrying amount of any individual stratum exceeds its fairvalue, a valuation reserve is established with a correspondingcharge to Corporate services on our Consolidated IncomeStatement.
The fair value of commercial MSRs is estimated by using adiscounted cash flow model incorporating inputs forassumptions as to constant prepayment rates, discount ratesand other factors determined based on current marketconditions and expectations.
188 The PNC Financial Services Group, Inc. – Form 10-K
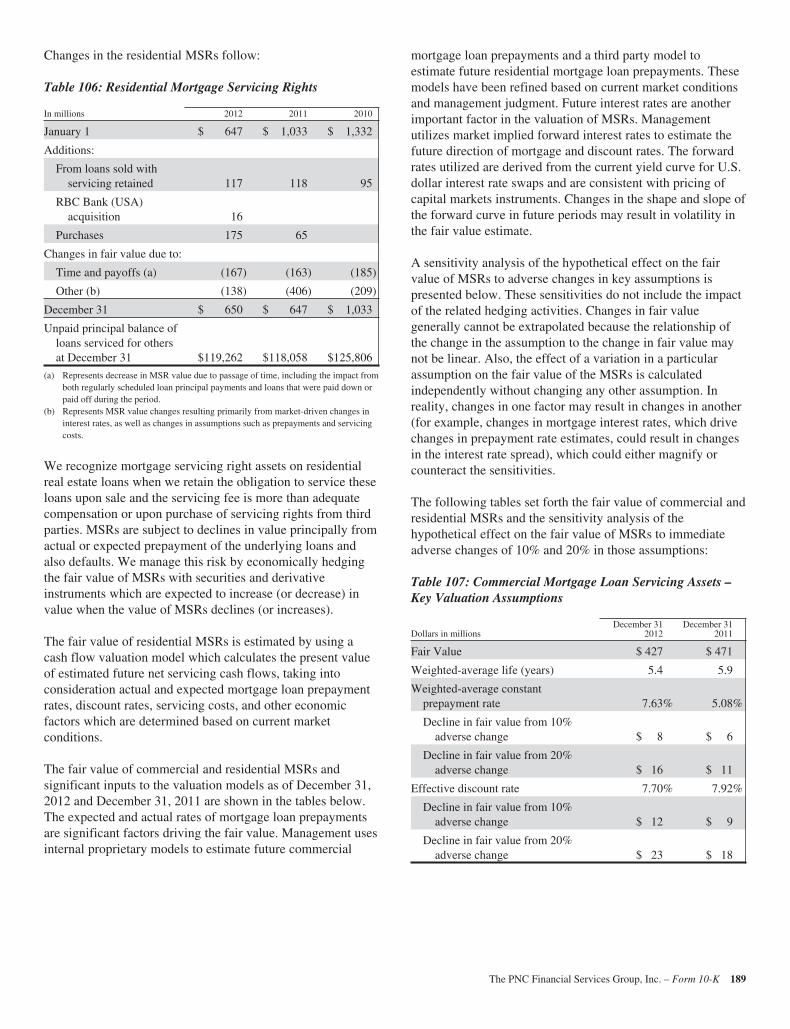
Changes in the residential MSRs follow:
Table 106: Residential Mortgage Servicing Rights
In millions 2012 2011 2010
January 1 $ 647 $ 1,033 $ 1,332
Additions:
From loans sold withservicing retained 117 118 95
RBC Bank (USA)acquisition 16
Purchases 175 65
Changes in fair value due to:
Time and payoffs (a) (167) (163) (185)
Other (b) (138) (406) (209)
December 31 $ 650 $ 647 $ 1,033
Unpaid principal balance ofloans serviced for othersat December 31 $119,262 $118,058 $125,806
(a) Represents decrease in MSR value due to passage of time, including the impact fromboth regularly scheduled loan principal payments and loans that were paid down orpaid off during the period.
(b) Represents MSR value changes resulting primarily from market-driven changes ininterest rates, as well as changes in assumptions such as prepayments and servicingcosts.
We recognize mortgage servicing right assets on residentialreal estate loans when we retain the obligation to service theseloans upon sale and the servicing fee is more than adequatecompensation or upon purchase of servicing rights from thirdparties. MSRs are subject to declines in value principally fromactual or expected prepayment of the underlying loans andalso defaults. We manage this risk by economically hedgingthe fair value of MSRs with securities and derivativeinstruments which are expected to increase (or decrease) invalue when the value of MSRs declines (or increases).
The fair value of residential MSRs is estimated by using acash flow valuation model which calculates the present valueof estimated future net servicing cash flows, taking intoconsideration actual and expected mortgage loan prepaymentrates, discount rates, servicing costs, and other economicfactors which are determined based on current marketconditions.
The fair value of commercial and residential MSRs andsignificant inputs to the valuation models as of December 31,2012 and December 31, 2011 are shown in the tables below.The expected and actual rates of mortgage loan prepaymentsare significant factors driving the fair value. Management usesinternal proprietary models to estimate future commercial
mortgage loan prepayments and a third party model toestimate future residential mortgage loan prepayments. Thesemodels have been refined based on current market conditionsand management judgment. Future interest rates are anotherimportant factor in the valuation of MSRs. Managementutilizes market implied forward interest rates to estimate thefuture direction of mortgage and discount rates. The forwardrates utilized are derived from the current yield curve for U.S.dollar interest rate swaps and are consistent with pricing ofcapital markets instruments. Changes in the shape and slope ofthe forward curve in future periods may result in volatility inthe fair value estimate.
A sensitivity analysis of the hypothetical effect on the fairvalue of MSRs to adverse changes in key assumptions ispresented below. These sensitivities do not include the impactof the related hedging activities. Changes in fair valuegenerally cannot be extrapolated because the relationship ofthe change in the assumption to the change in fair value maynot be linear. Also, the effect of a variation in a particularassumption on the fair value of the MSRs is calculatedindependently without changing any other assumption. Inreality, changes in one factor may result in changes in another(for example, changes in mortgage interest rates, which drivechanges in prepayment rate estimates, could result in changesin the interest rate spread), which could either magnify orcounteract the sensitivities.
The following tables set forth the fair value of commercial andresidential MSRs and the sensitivity analysis of thehypothetical effect on the fair value of MSRs to immediateadverse changes of 10% and 20% in those assumptions:
Table 107: Commercial Mortgage Loan Servicing Assets –Key Valuation Assumptions
Dollars in millionsDecember 31
2012December 31
2011
Fair Value $ 427 $ 471
Weighted-average life (years) 5.4 5.9
Weighted-average constantprepayment rate 7.63% 5.08%
Decline in fair value from 10%adverse change $ 8 $ 6
Decline in fair value from 20%adverse change $ 16 $ 11
Effective discount rate 7.70% 7.92%
Decline in fair value from 10%adverse change $ 12 $ 9
Decline in fair value from 20%adverse change $ 23 $ 18
The PNC Financial Services Group, Inc. – Form 10-K 189
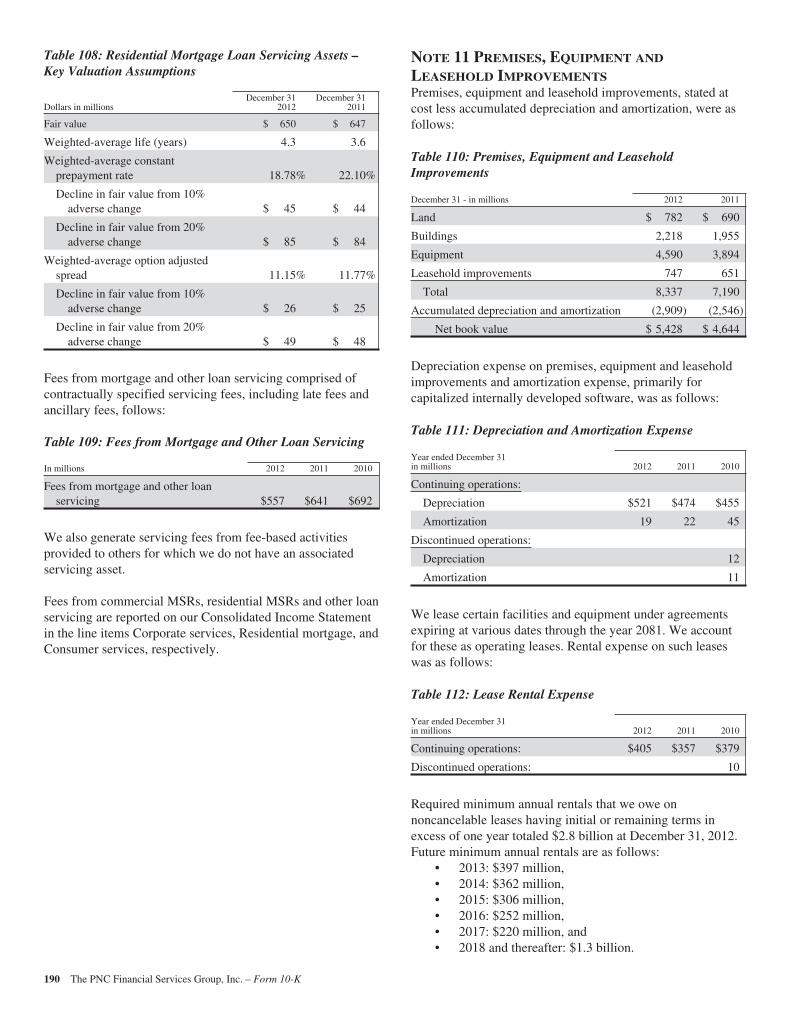
Table 108: Residential Mortgage Loan Servicing Assets –Key Valuation Assumptions
Dollars in millionsDecember 31
2012December 31
2011
Fair value $ 650 $ 647
Weighted-average life (years) 4.3 3.6
Weighted-average constantprepayment rate 18.78% 22.10%
Decline in fair value from 10%adverse change $ 45 $ 44
Decline in fair value from 20%adverse change $ 85 $ 84
Weighted-average option adjustedspread 11.15% 11.77%
Decline in fair value from 10%adverse change $ 26 $ 25
Decline in fair value from 20%adverse change $ 49 $ 48
Fees from mortgage and other loan servicing comprised ofcontractually specified servicing fees, including late fees andancillary fees, follows:
Table 109: Fees from Mortgage and Other Loan Servicing
In millions 2012 2011 2010
Fees from mortgage and other loanservicing $557 $641 $692
We also generate servicing fees from fee-based activitiesprovided to others for which we do not have an associatedservicing asset.
Fees from commercial MSRs, residential MSRs and other loanservicing are reported on our Consolidated Income Statementin the line items Corporate services, Residential mortgage, andConsumer services, respectively.
NOTE 11 PREMISES, EQUIPMENT AND
LEASEHOLD IMPROVEMENTSPremises, equipment and leasehold improvements, stated atcost less accumulated depreciation and amortization, were asfollows:
Table 110: Premises, Equipment and LeaseholdImprovements
December 31 - in millions 2012 2011
Land $ 782 $ 690
Buildings 2,218 1,955
Equipment 4,590 3,894
Leasehold improvements 747 651
Total 8,337 7,190
Accumulated depreciation and amortization (2,909) (2,546)
Net book value $ 5,428 $ 4,644
Depreciation expense on premises, equipment and leaseholdimprovements and amortization expense, primarily forcapitalized internally developed software, was as follows:
Table 111: Depreciation and Amortization Expense
Year ended December 31in millions 2012 2011 2010
Continuing operations:
Depreciation $521 $474 $455
Amortization 19 22 45
Discontinued operations:
Depreciation 12
Amortization 11
We lease certain facilities and equipment under agreementsexpiring at various dates through the year 2081. We accountfor these as operating leases. Rental expense on such leaseswas as follows:
Table 112: Lease Rental Expense
Year ended December 31in millions 2012 2011 2010
Continuing operations: $405 $357 $379
Discontinued operations: 10
Required minimum annual rentals that we owe onnoncancelable leases having initial or remaining terms inexcess of one year totaled $2.8 billion at December 31, 2012.Future minimum annual rentals are as follows:
• 2013: $397 million,• 2014: $362 million,• 2015: $306 million,• 2016: $252 million,• 2017: $220 million, and• 2018 and thereafter: $1.3 billion.
190 The PNC Financial Services Group, Inc. – Form 10-K
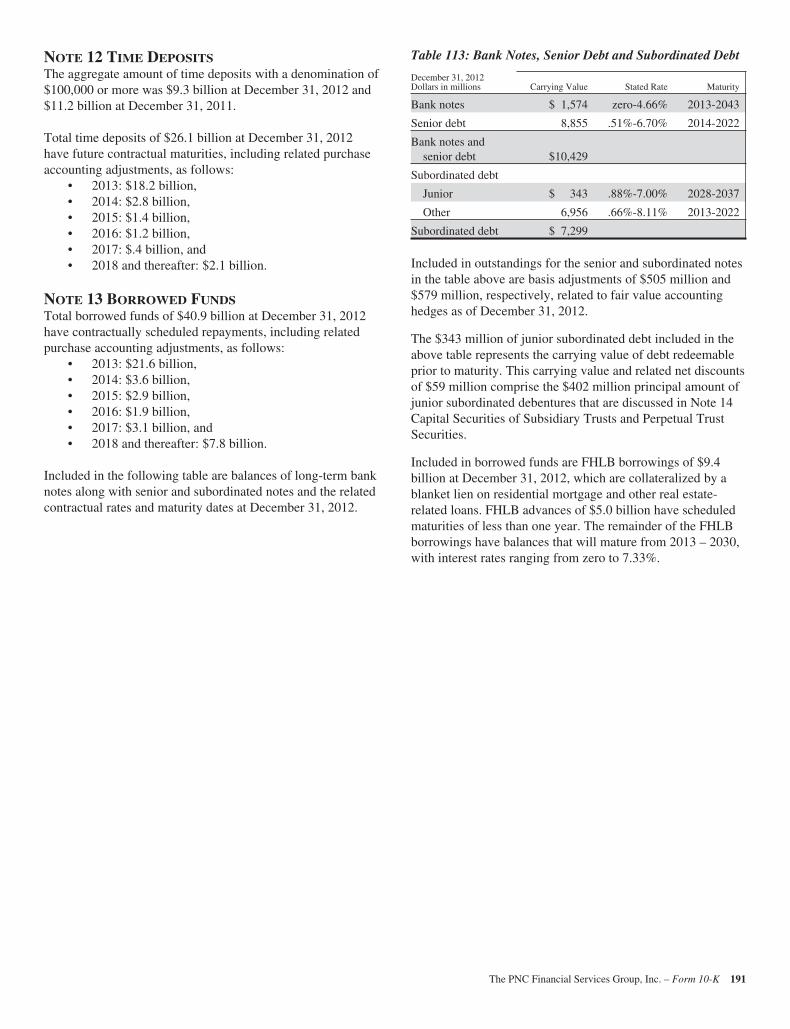
NOTE 12 TIME DEPOSITSThe aggregate amount of time deposits with a denomination of$100,000 or more was $9.3 billion at December 31, 2012 and$11.2 billion at December 31, 2011.
Total time deposits of $26.1 billion at December 31, 2012have future contractual maturities, including related purchaseaccounting adjustments, as follows:
• 2013: $18.2 billion,• 2014: $2.8 billion,• 2015: $1.4 billion,• 2016: $1.2 billion,• 2017: $.4 billion, and• 2018 and thereafter: $2.1 billion.
NOTE 13 BORROWED FUNDSTotal borrowed funds of $40.9 billion at December 31, 2012have contractually scheduled repayments, including relatedpurchase accounting adjustments, as follows:
• 2013: $21.6 billion,• 2014: $3.6 billion,• 2015: $2.9 billion,• 2016: $1.9 billion,• 2017: $3.1 billion, and• 2018 and thereafter: $7.8 billion.
Included in the following table are balances of long-term banknotes along with senior and subordinated notes and the relatedcontractual rates and maturity dates at December 31, 2012.
Table 113: Bank Notes, Senior Debt and Subordinated Debt
December 31, 2012Dollars in millions Carrying Value Stated Rate Maturity
Bank notes $ 1,574 zero-4.66% 2013-2043
Senior debt 8,855 .51%-6.70% 2014-2022
Bank notes andsenior debt $10,429
Subordinated debt
Junior $ 343 .88%-7.00% 2028-2037
Other 6,956 .66%-8.11% 2013-2022
Subordinated debt $ 7,299
Included in outstandings for the senior and subordinated notesin the table above are basis adjustments of $505 million and$579 million, respectively, related to fair value accountinghedges as of December 31, 2012.
The $343 million of junior subordinated debt included in theabove table represents the carrying value of debt redeemableprior to maturity. This carrying value and related net discountsof $59 million comprise the $402 million principal amount ofjunior subordinated debentures that are discussed in Note 14Capital Securities of Subsidiary Trusts and Perpetual TrustSecurities.
Included in borrowed funds are FHLB borrowings of $9.4billion at December 31, 2012, which are collateralized by ablanket lien on residential mortgage and other real estate-related loans. FHLB advances of $5.0 billion have scheduledmaturities of less than one year. The remainder of the FHLBborrowings have balances that will mature from 2013 – 2030,with interest rates ranging from zero to 7.33%.
The PNC Financial Services Group, Inc. – Form 10-K 191

NOTE 14 CAPITAL SECURITIES OF SUBSIDIARY TRUSTS AND PERPETUAL TRUST SECURITIES
At December 31, 2012, PNC had $402 million in principal amount of outstanding junior subordinated debentures associated with$390 million of trust preferred securities that were issued by various subsidiary statutory trusts. These trust preferred securitiesrepresented non-voting preferred beneficial interests in the assets of the following Trusts:
Table 114: Capital Securities of Subsidiary Trusts
Trust Date Formed Description of Capital Securities Redeemable
PNC Capital Trust C June 1998 $200 million due June 1, 2028, bearinginterest at a floating rate per annum equal to3-month LIBOR plus 57 basis points. Therate in effect at December 31, 2012 was.881%.
On or after June 1, 2008 at par.
Fidelity Capital Trust II December 2003 $22 million due January 23, 2034 bearing aninterest rate of 3-month LIBOR plus 285basis points. The rate in effect at December31, 2012 was 3.163%.
On or after January 23, 2009 at par.
Yardville Capital Trust VI June 2004 $15 million due July 23, 2034, bearing aninterest rate equal to 3-month LIBOR plus270 basis points. The rate in effect atDecember 31, 2012 was 3.017%.
On or after July 23, 2009 at par.
Fidelity Capital Trust III October 2004 $30 million due November 23, 2034 bearingan interest rate of 3-month LIBOR plus 197basis points. The rate in effect at December31, 2012 was 2.282%.
On or after November 23, 2009 at par.
Sterling Financial Statutory Trust III December 2004 $15 million due December 15, 2034 at afixed rate of 6%. The fixed rate remained ineffect until December 15, 2009 at whichtime the securities began paying a floatingrate of 3-month LIBOR plus 189 basispoints. The rate in effect at December 31,2012 was 2.198%.
On or after December 15, 2009 at par.
Sterling Financial Statutory Trust IV February 2005 $15 million due March 15, 2035 at a fixedrate of 6.19%. The fixed rate remained ineffect until March 15, 2010 at which timethe securities began paying a floating rate of3-month LIBOR plus 187 basis points. Therate in effect at December 31, 2012 was2.178%.
On or after March 15, 2010 at par.
MAF Bancorp Capital Trust I April 2005 $30 million due June 15, 2035 bearing aninterest rate of 3-month LIBOR plus 175basis points. The rate in effect at December31, 2012 was 2.058%.
On or after June 15, 2010 at par.
MAF Bancorp Capital Trust II August 2005 $35 million due September 15, 2035 bearingan interest rate of 3-month LIBOR plus 140basis points. The rate in effect at December31, 2012 was 1.708%.
On or after September 15, 2010 at par.
James Monroe Statutory Trust III September 2005 $8 million due December 15, 2035 at afixed rate of 6.253%. The fixed rateremained in effect until September 15, 2010at which time the securities began paying afloating rate of LIBOR plus 155 basispoints. The rate in effect at December 31,2012 was 1.858%.
On or after December 15, 2010 at par.
Sterling Financial Statutory Trust V March 2007 $20 million due March 15, 2037 at a fixedrate of 7%. The fixed rate remained in effectuntil June 15, 2007 at which time thesecurities began paying a floating rate of3-month LIBOR plus 165 basis points. Therate in effect at December 31, 2012 was1.958%.
March 15, 2012 at par.
192 The PNC Financial Services Group, Inc. – Form 10-K
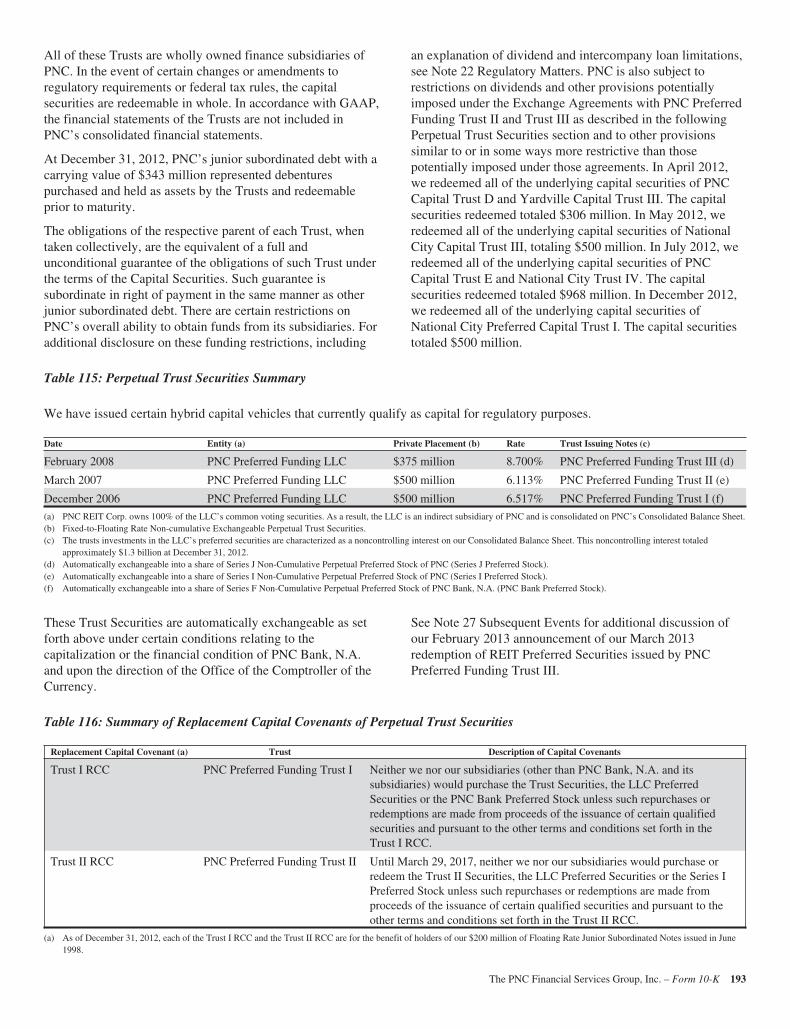
All of these Trusts are wholly owned finance subsidiaries ofPNC. In the event of certain changes or amendments toregulatory requirements or federal tax rules, the capitalsecurities are redeemable in whole. In accordance with GAAP,the financial statements of the Trusts are not included inPNC’s consolidated financial statements.
At December 31, 2012, PNC’s junior subordinated debt with acarrying value of $343 million represented debenturespurchased and held as assets by the Trusts and redeemableprior to maturity.
The obligations of the respective parent of each Trust, whentaken collectively, are the equivalent of a full andunconditional guarantee of the obligations of such Trust underthe terms of the Capital Securities. Such guarantee issubordinate in right of payment in the same manner as otherjunior subordinated debt. There are certain restrictions onPNC’s overall ability to obtain funds from its subsidiaries. Foradditional disclosure on these funding restrictions, including
an explanation of dividend and intercompany loan limitations,see Note 22 Regulatory Matters. PNC is also subject torestrictions on dividends and other provisions potentiallyimposed under the Exchange Agreements with PNC PreferredFunding Trust II and Trust III as described in the followingPerpetual Trust Securities section and to other provisionssimilar to or in some ways more restrictive than thosepotentially imposed under those agreements. In April 2012,we redeemed all of the underlying capital securities of PNCCapital Trust D and Yardville Capital Trust III. The capitalsecurities redeemed totaled $306 million. In May 2012, weredeemed all of the underlying capital securities of NationalCity Capital Trust III, totaling $500 million. In July 2012, weredeemed all of the underlying capital securities of PNCCapital Trust E and National City Trust IV. The capitalsecurities redeemed totaled $968 million. In December 2012,we redeemed all of the underlying capital securities ofNational City Preferred Capital Trust I. The capital securitiestotaled $500 million.
Table 115: Perpetual Trust Securities Summary
We have issued certain hybrid capital vehicles that currently qualify as capital for regulatory purposes.
Date Entity (a) Private Placement (b) Rate Trust Issuing Notes (c)
February 2008 PNC Preferred Funding LLC $375 million 8.700% PNC Preferred Funding Trust III (d)
March 2007 PNC Preferred Funding LLC $500 million 6.113% PNC Preferred Funding Trust II (e)
December 2006 PNC Preferred Funding LLC $500 million 6.517% PNC Preferred Funding Trust I (f)
(a) PNC REIT Corp. owns 100% of the LLC’s common voting securities. As a result, the LLC is an indirect subsidiary of PNC and is consolidated on PNC’s Consolidated Balance Sheet.(b) Fixed-to-Floating Rate Non-cumulative Exchangeable Perpetual Trust Securities.(c) The trusts investments in the LLC’s preferred securities are characterized as a noncontrolling interest on our Consolidated Balance Sheet. This noncontrolling interest totaled
approximately $1.3 billion at December 31, 2012.(d) Automatically exchangeable into a share of Series J Non-Cumulative Perpetual Preferred Stock of PNC (Series J Preferred Stock).(e) Automatically exchangeable into a share of Series I Non-Cumulative Perpetual Preferred Stock of PNC (Series I Preferred Stock).(f) Automatically exchangeable into a share of Series F Non-Cumulative Perpetual Preferred Stock of PNC Bank, N.A. (PNC Bank Preferred Stock).
These Trust Securities are automatically exchangeable as setforth above under certain conditions relating to thecapitalization or the financial condition of PNC Bank, N.A.and upon the direction of the Office of the Comptroller of theCurrency.
See Note 27 Subsequent Events for additional discussion ofour February 2013 announcement of our March 2013redemption of REIT Preferred Securities issued by PNCPreferred Funding Trust III.
Table 116: Summary of Replacement Capital Covenants of Perpetual Trust Securities
Replacement Capital Covenant (a) Trust Description of Capital Covenants
Trust I RCC PNC Preferred Funding Trust I Neither we nor our subsidiaries (other than PNC Bank, N.A. and itssubsidiaries) would purchase the Trust Securities, the LLC PreferredSecurities or the PNC Bank Preferred Stock unless such repurchases orredemptions are made from proceeds of the issuance of certain qualifiedsecurities and pursuant to the other terms and conditions set forth in theTrust I RCC.
Trust II RCC PNC Preferred Funding Trust II Until March 29, 2017, neither we nor our subsidiaries would purchase orredeem the Trust II Securities, the LLC Preferred Securities or the Series IPreferred Stock unless such repurchases or redemptions are made fromproceeds of the issuance of certain qualified securities and pursuant to theother terms and conditions set forth in the Trust II RCC.
(a) As of December 31, 2012, each of the Trust I RCC and the Trust II RCC are for the benefit of holders of our $200 million of Floating Rate Junior Subordinated Notes issued in June1998.
The PNC Financial Services Group, Inc. – Form 10-K 193
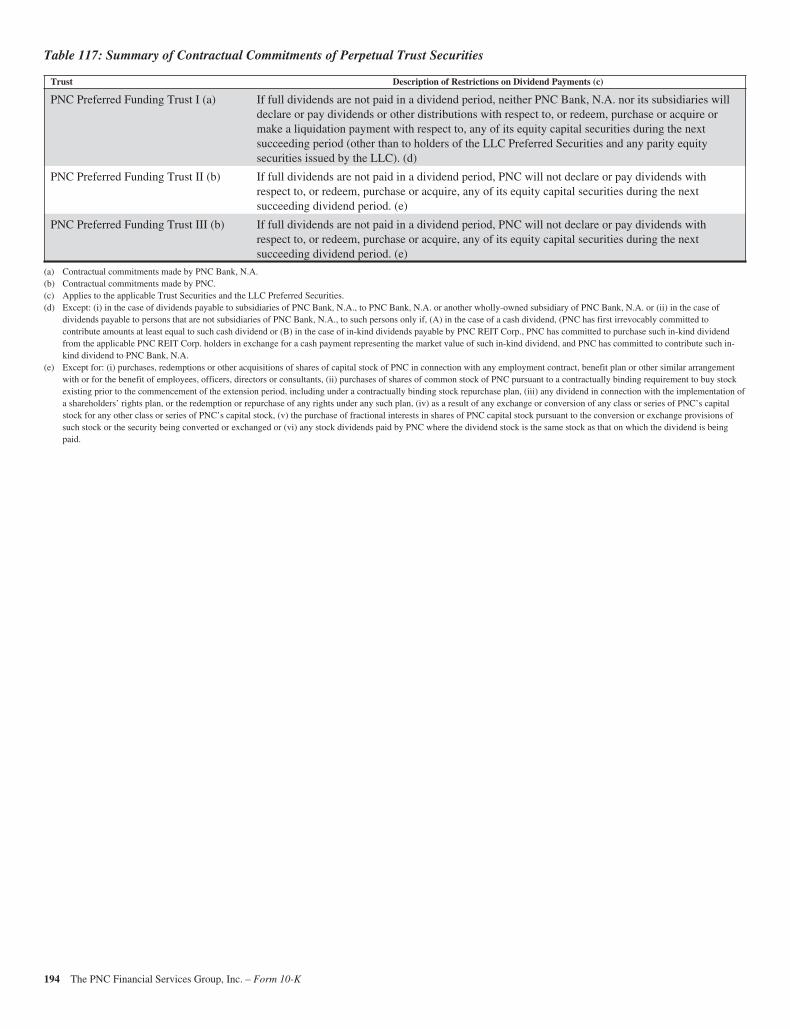
Table 117: Summary of Contractual Commitments of Perpetual Trust Securities
Trust Description of Restrictions on Dividend Payments (c)
PNC Preferred Funding Trust I (a) If full dividends are not paid in a dividend period, neither PNC Bank, N.A. nor its subsidiaries willdeclare or pay dividends or other distributions with respect to, or redeem, purchase or acquire ormake a liquidation payment with respect to, any of its equity capital securities during the nextsucceeding period (other than to holders of the LLC Preferred Securities and any parity equitysecurities issued by the LLC). (d)
PNC Preferred Funding Trust II (b) If full dividends are not paid in a dividend period, PNC will not declare or pay dividends withrespect to, or redeem, purchase or acquire, any of its equity capital securities during the nextsucceeding dividend period. (e)
PNC Preferred Funding Trust III (b) If full dividends are not paid in a dividend period, PNC will not declare or pay dividends withrespect to, or redeem, purchase or acquire, any of its equity capital securities during the nextsucceeding dividend period. (e)
(a) Contractual commitments made by PNC Bank, N.A.(b) Contractual commitments made by PNC.(c) Applies to the applicable Trust Securities and the LLC Preferred Securities.(d) Except: (i) in the case of dividends payable to subsidiaries of PNC Bank, N.A., to PNC Bank, N.A. or another wholly-owned subsidiary of PNC Bank, N.A. or (ii) in the case of
dividends payable to persons that are not subsidiaries of PNC Bank, N.A., to such persons only if, (A) in the case of a cash dividend, (PNC has first irrevocably committed tocontribute amounts at least equal to such cash dividend or (B) in the case of in-kind dividends payable by PNC REIT Corp., PNC has committed to purchase such in-kind dividendfrom the applicable PNC REIT Corp. holders in exchange for a cash payment representing the market value of such in-kind dividend, and PNC has committed to contribute such in-kind dividend to PNC Bank, N.A.
(e) Except for: (i) purchases, redemptions or other acquisitions of shares of capital stock of PNC in connection with any employment contract, benefit plan or other similar arrangementwith or for the benefit of employees, officers, directors or consultants, (ii) purchases of shares of common stock of PNC pursuant to a contractually binding requirement to buy stockexisting prior to the commencement of the extension period, including under a contractually binding stock repurchase plan, (iii) any dividend in connection with the implementation ofa shareholders’ rights plan, or the redemption or repurchase of any rights under any such plan, (iv) as a result of any exchange or conversion of any class or series of PNC’s capitalstock for any other class or series of PNC’s capital stock, (v) the purchase of fractional interests in shares of PNC capital stock pursuant to the conversion or exchange provisions ofsuch stock or the security being converted or exchanged or (vi) any stock dividends paid by PNC where the dividend stock is the same stock as that on which the dividend is beingpaid.
194 The PNC Financial Services Group, Inc. – Form 10-K
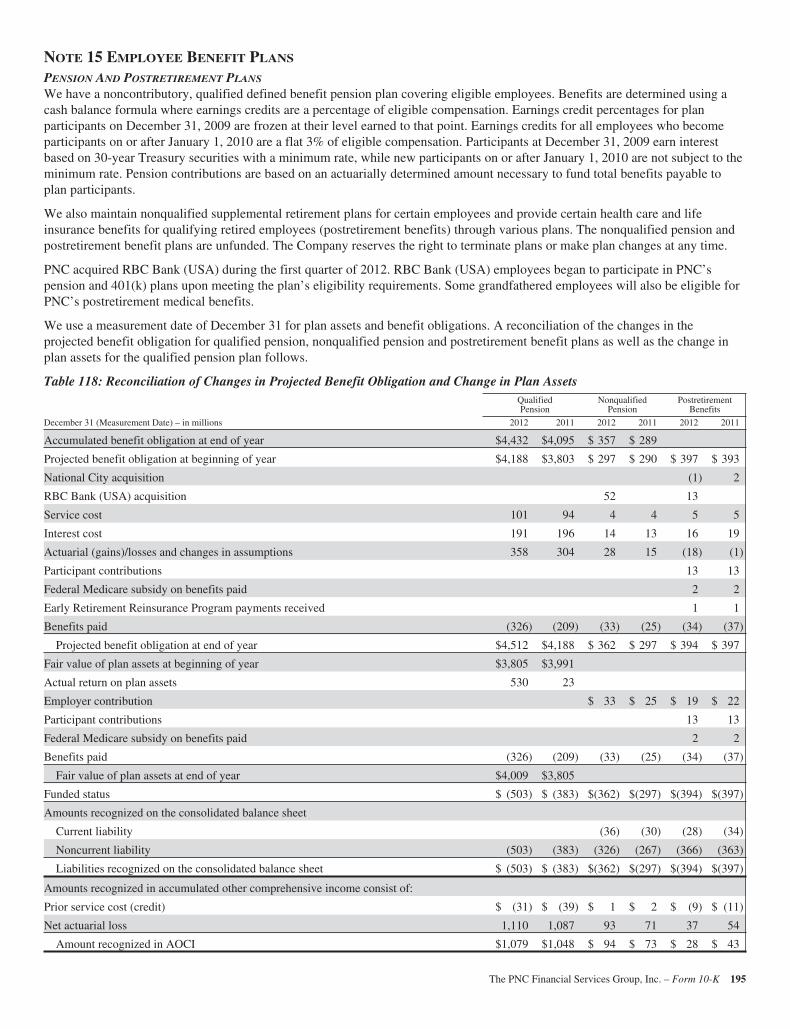
NOTE 15 EMPLOYEE BENEFIT PLANS
PENSION AND POSTRETIREMENT PLANS
We have a noncontributory, qualified defined benefit pension plan covering eligible employees. Benefits are determined using acash balance formula where earnings credits are a percentage of eligible compensation. Earnings credit percentages for planparticipants on December 31, 2009 are frozen at their level earned to that point. Earnings credits for all employees who becomeparticipants on or after January 1, 2010 are a flat 3% of eligible compensation. Participants at December 31, 2009 earn interestbased on 30-year Treasury securities with a minimum rate, while new participants on or after January 1, 2010 are not subject to theminimum rate. Pension contributions are based on an actuarially determined amount necessary to fund total benefits payable toplan participants.
We also maintain nonqualified supplemental retirement plans for certain employees and provide certain health care and lifeinsurance benefits for qualifying retired employees (postretirement benefits) through various plans. The nonqualified pension andpostretirement benefit plans are unfunded. The Company reserves the right to terminate plans or make plan changes at any time.
PNC acquired RBC Bank (USA) during the first quarter of 2012. RBC Bank (USA) employees began to participate in PNC’spension and 401(k) plans upon meeting the plan’s eligibility requirements. Some grandfathered employees will also be eligible forPNC’s postretirement medical benefits.
We use a measurement date of December 31 for plan assets and benefit obligations. A reconciliation of the changes in theprojected benefit obligation for qualified pension, nonqualified pension and postretirement benefit plans as well as the change inplan assets for the qualified pension plan follows.
Table 118: Reconciliation of Changes in Projected Benefit Obligation and Change in Plan AssetsQualifiedPension
NonqualifiedPension
PostretirementBenefits
December 31 (Measurement Date) – in millions 2012 2011 2012 2011 2012 2011
Accumulated benefit obligation at end of year $4,432 $4,095 $ 357 $ 289
Projected benefit obligation at beginning of year $4,188 $3,803 $ 297 $ 290 $ 397 $ 393
National City acquisition (1) 2
RBC Bank (USA) acquisition 52 13
Service cost 101 94 4 4 5 5
Interest cost 191 196 14 13 16 19
Actuarial (gains)/losses and changes in assumptions 358 304 28 15 (18) (1)
Participant contributions 13 13
Federal Medicare subsidy on benefits paid 2 2
Early Retirement Reinsurance Program payments received 1 1
Benefits paid (326) (209) (33) (25) (34) (37)
Projected benefit obligation at end of year $4,512 $4,188 $ 362 $ 297 $ 394 $ 397
Fair value of plan assets at beginning of year $3,805 $3,991
Actual return on plan assets 530 23
Employer contribution $ 33 $ 25 $ 19 $ 22
Participant contributions 13 13
Federal Medicare subsidy on benefits paid 2 2
Benefits paid (326) (209) (33) (25) (34) (37)
Fair value of plan assets at end of year $4,009 $3,805
Funded status $ (503) $ (383) $(362) $(297) $(394) $(397)
Amounts recognized on the consolidated balance sheet
Current liability (36) (30) (28) (34)
Noncurrent liability (503) (383) (326) (267) (366) (363)
Liabilities recognized on the consolidated balance sheet $ (503) $ (383) $(362) $(297) $(394) $(397)
Amounts recognized in accumulated other comprehensive income consist of:
Prior service cost (credit) $ (31) $ (39) $ 1 $ 2 $ (9) $ (11)
Net actuarial loss 1,110 1,087 93 71 37 54
Amount recognized in AOCI $1,079 $1,048 $ 94 $ 73 $ 28 $ 43
The PNC Financial Services Group, Inc. – Form 10-K 195
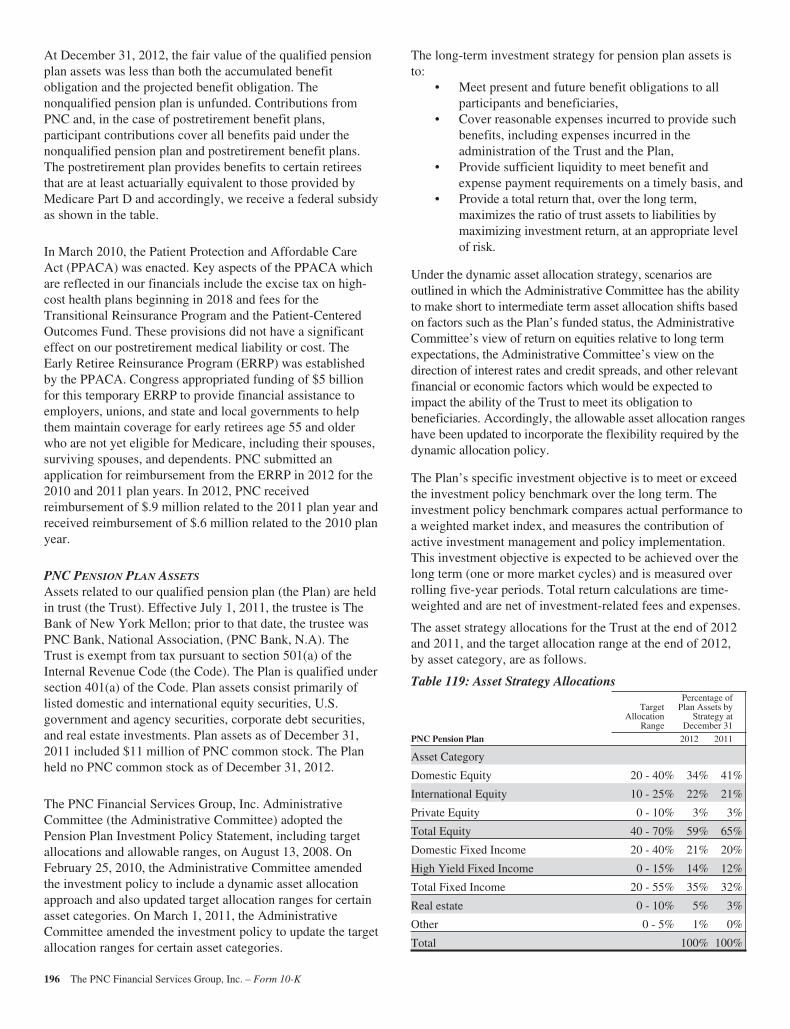
At December 31, 2012, the fair value of the qualified pensionplan assets was less than both the accumulated benefitobligation and the projected benefit obligation. Thenonqualified pension plan is unfunded. Contributions fromPNC and, in the case of postretirement benefit plans,participant contributions cover all benefits paid under thenonqualified pension plan and postretirement benefit plans.The postretirement plan provides benefits to certain retireesthat are at least actuarially equivalent to those provided byMedicare Part D and accordingly, we receive a federal subsidyas shown in the table.
In March 2010, the Patient Protection and Affordable CareAct (PPACA) was enacted. Key aspects of the PPACA whichare reflected in our financials include the excise tax on high-cost health plans beginning in 2018 and fees for theTransitional Reinsurance Program and the Patient-CenteredOutcomes Fund. These provisions did not have a significanteffect on our postretirement medical liability or cost. TheEarly Retiree Reinsurance Program (ERRP) was establishedby the PPACA. Congress appropriated funding of $5 billionfor this temporary ERRP to provide financial assistance toemployers, unions, and state and local governments to helpthem maintain coverage for early retirees age 55 and olderwho are not yet eligible for Medicare, including their spouses,surviving spouses, and dependents. PNC submitted anapplication for reimbursement from the ERRP in 2012 for the2010 and 2011 plan years. In 2012, PNC receivedreimbursement of $.9 million related to the 2011 plan year andreceived reimbursement of $.6 million related to the 2010 planyear.
PNC PENSION PLAN ASSETS
Assets related to our qualified pension plan (the Plan) are heldin trust (the Trust). Effective July 1, 2011, the trustee is TheBank of New York Mellon; prior to that date, the trustee wasPNC Bank, National Association, (PNC Bank, N.A). TheTrust is exempt from tax pursuant to section 501(a) of theInternal Revenue Code (the Code). The Plan is qualified undersection 401(a) of the Code. Plan assets consist primarily oflisted domestic and international equity securities, U.S.government and agency securities, corporate debt securities,and real estate investments. Plan assets as of December 31,2011 included $11 million of PNC common stock. The Planheld no PNC common stock as of December 31, 2012.
The PNC Financial Services Group, Inc. AdministrativeCommittee (the Administrative Committee) adopted thePension Plan Investment Policy Statement, including targetallocations and allowable ranges, on August 13, 2008. OnFebruary 25, 2010, the Administrative Committee amendedthe investment policy to include a dynamic asset allocationapproach and also updated target allocation ranges for certainasset categories. On March 1, 2011, the AdministrativeCommittee amended the investment policy to update the targetallocation ranges for certain asset categories.
The long-term investment strategy for pension plan assets isto:
• Meet present and future benefit obligations to allparticipants and beneficiaries,
• Cover reasonable expenses incurred to provide suchbenefits, including expenses incurred in theadministration of the Trust and the Plan,
• Provide sufficient liquidity to meet benefit andexpense payment requirements on a timely basis, and
• Provide a total return that, over the long term,maximizes the ratio of trust assets to liabilities bymaximizing investment return, at an appropriate levelof risk.
Under the dynamic asset allocation strategy, scenarios areoutlined in which the Administrative Committee has the abilityto make short to intermediate term asset allocation shifts basedon factors such as the Plan’s funded status, the AdministrativeCommittee’s view of return on equities relative to long termexpectations, the Administrative Committee’s view on thedirection of interest rates and credit spreads, and other relevantfinancial or economic factors which would be expected toimpact the ability of the Trust to meet its obligation tobeneficiaries. Accordingly, the allowable asset allocation rangeshave been updated to incorporate the flexibility required by thedynamic allocation policy.
The Plan’s specific investment objective is to meet or exceedthe investment policy benchmark over the long term. Theinvestment policy benchmark compares actual performance toa weighted market index, and measures the contribution ofactive investment management and policy implementation.This investment objective is expected to be achieved over thelong term (one or more market cycles) and is measured overrolling five-year periods. Total return calculations are time-weighted and are net of investment-related fees and expenses.
The asset strategy allocations for the Trust at the end of 2012and 2011, and the target allocation range at the end of 2012,by asset category, are as follows.
Table 119: Asset Strategy Allocations
TargetAllocation
Range
Percentage ofPlan Assets by
Strategy atDecember 31
PNC Pension Plan 2012 2011
Asset Category
Domestic Equity 20 - 40% 34% 41%
International Equity 10 - 25% 22% 21%
Private Equity 0 - 10% 3% 3%
Total Equity 40 - 70% 59% 65%
Domestic Fixed Income 20 - 40% 21% 20%
High Yield Fixed Income 0 - 15% 14% 12%
Total Fixed Income 20 - 55% 35% 32%
Real estate 0 - 10% 5% 3%
Other 0 - 5% 1% 0%
Total 100% 100%
196 The PNC Financial Services Group, Inc. – Form 10-K
The asset category represents the allocation of Plan assets inaccordance with the investment objective of each of the Plan’sinvestment managers. Certain domestic equity investmentmanagers utilize derivatives and fixed income securities asdescribed in their Investment Management Agreements toachieve their investment objective under the InvestmentPolicy Statement. Other investment managers may invest ineligible securities outside of their assigned asset category tomeet their investment objectives. The actual percentage of thefair value of total Plan assets held as of December 31, 2012for equity securities, fixed income securities, real estate andall other assets are 59%, 33%, 5%, and 3%, respectively.
We believe that, over the long term, asset allocation is thesingle greatest determinant of risk. Asset allocation willdeviate from the target percentages due to market movement,cash flows, investment manager performance andimplementation of shifts under the dynamic allocation policy.Material deviations from the asset allocation targets can alterthe expected return and risk of the Trust. On the other hand,frequent rebalancing to the asset allocation targets may resultin significant transaction costs, which can impair the Trust’sability to meet its investment objective. Accordingly, the Trustportfolio is periodically rebalanced to maintain assetallocation within the target ranges described above.
In addition to being diversified across asset classes, the Trustis diversified within each asset class. Secondarydiversification provides a reasonable basis for the expectationthat no single security or class of securities will have adisproportionate impact on the total risk and return of theTrust.
The Administrative Committee selects investment managersfor the Trust based on the contributions that their respectiveinvestment styles and processes are expected to make to theinvestment performance of the overall portfolio. Themanagers’ Investment Objectives and Guidelines, which are apart of each manager’s Investment Management Agreement,document performance expectations and each manager’s rolein the portfolio. The Administrative Committee uses theInvestment Objectives and Guidelines to establish, guide,control and measure the strategy and performance for eachmanager.
The purpose of investment manager guidelines is to:• Establish the investment objective and performance
standards for each manager,• Provide the manager with the capability to evaluate
the risks of all financial instruments or other assets inwhich the manager’s account is invested, and
• Prevent the manager from exposing its account toexcessive levels of risk, undesired or inappropriaterisk, or disproportionate concentration of risk.
The guidelines also indicate which investments and strategiesthe manager is permitted to use to achieve its performanceobjectives, and which investments and strategies it isprohibited from using.
Where public market investment strategies may include theuse of derivatives and/or currency management, language isincorporated in the managers’ guidelines to define allowableand prohibited transactions and/or strategies. Derivatives aretypically employed by investment managers to modify risk/return characteristics of their portfolio(s), implement assetallocation changes in a cost-effective manner, or reducetransaction costs. Under the managers’ investment guidelines,derivatives may not be used solely for speculation or leverage.Derivatives are to be used only in circumstances where theyoffer the most efficient economic means of improving the risk/reward profile of the portfolio.
BlackRock receives compensation for providing investmentmanagement services. The Asset Management Group businesssegment also receives compensation for payor-relatedservices, and received compensation for providing trustee/custodian services prior to July 1, 2011. Compensation forsuch services is paid by PNC and was not significant for 2012,2011 or 2010. Non-affiliate service providers for the Trust arecompensated from plan assets.
FAIR VALUE MEASUREMENTS
As further described in Note 9 Fair Value, GAAP establishesthe framework for measuring fair value, including a hierarchyused to classify the inputs used in measuring fair value.
A description of the valuation methodologies used for assetsmeasured at fair value follows. There have been no significantchanges in the valuation methodologies used at December 31,2012 compared with those in place at December 31, 2011:
• Money market and mutual funds are valued at the netasset value of the shares held by the pension plan atyear end.
• U.S. government and agency securities, corporatedebt, common stock and preferred stock are valued atthe closing price reported on the active market onwhich the individual securities are traded. If quotedmarket prices are not available for the specificsecurity, then fair values are estimated by usingpricing models or quoted prices of securities withsimilar characteristics. Such securities are generallyclassified within level 2 of the valuation hierarchybut may be a level 3 depending on the level ofliquidity and activity in the market for the security.
• The collective trust fund investments are valuedbased upon the units of such collective trust fundheld by the plan at year end multiplied by therespective unit value. The unit value of the collectivetrust fund is based upon significant observable inputs,although it is not based upon quoted marked prices inan active market. The underlying investments of thecollective trust funds consist primarily of equitysecurities, debt obligations, short-term investments,and other marketable securities. Due to the nature ofthese securities, there are no unfunded commitmentsor redemption restrictions.
The PNC Financial Services Group, Inc. – Form 10-K 197
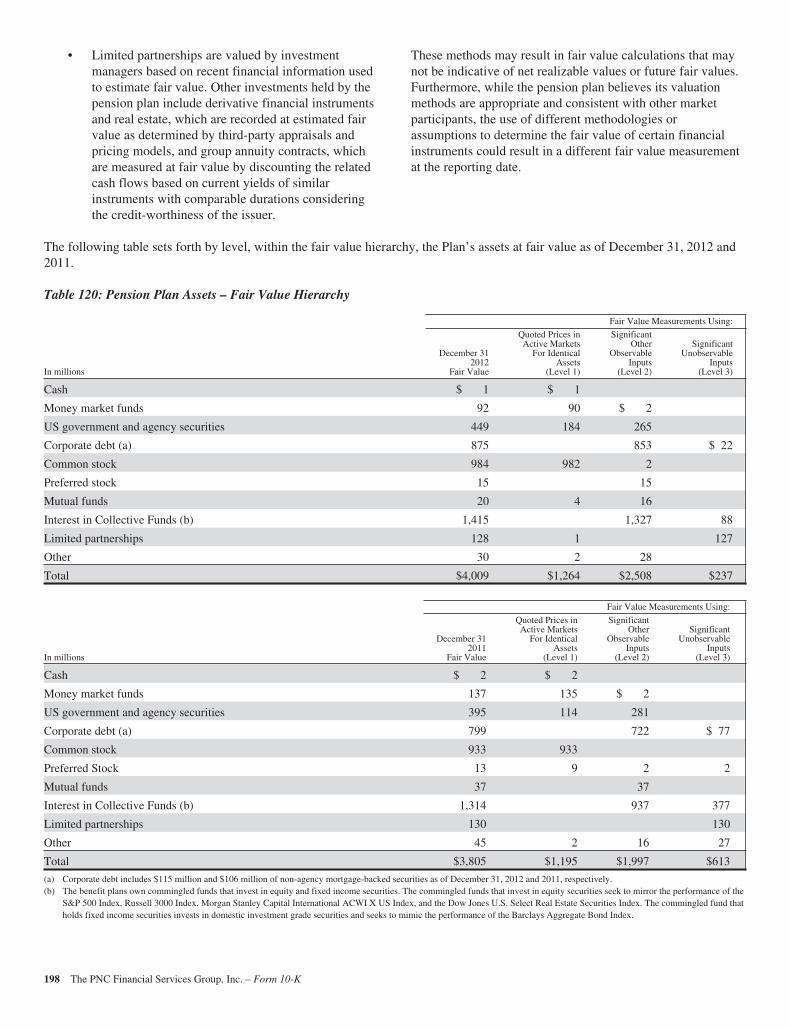
• Limited partnerships are valued by investmentmanagers based on recent financial information usedto estimate fair value. Other investments held by thepension plan include derivative financial instrumentsand real estate, which are recorded at estimated fairvalue as determined by third-party appraisals andpricing models, and group annuity contracts, whichare measured at fair value by discounting the relatedcash flows based on current yields of similarinstruments with comparable durations consideringthe credit-worthiness of the issuer.
These methods may result in fair value calculations that maynot be indicative of net realizable values or future fair values.Furthermore, while the pension plan believes its valuationmethods are appropriate and consistent with other marketparticipants, the use of different methodologies orassumptions to determine the fair value of certain financialinstruments could result in a different fair value measurementat the reporting date.
The following table sets forth by level, within the fair value hierarchy, the Plan’s assets at fair value as of December 31, 2012 and2011.
Table 120: Pension Plan Assets – Fair Value Hierarchy
Fair Value Measurements Using:
In millions
December 312012
Fair Value
Quoted Prices inActive Markets
For IdenticalAssets
(Level 1)
SignificantOther
ObservableInputs
(Level 2)
SignificantUnobservable
Inputs(Level 3)
Cash $ 1 $ 1
Money market funds 92 90 $ 2
US government and agency securities 449 184 265
Corporate debt (a) 875 853 $ 22
Common stock 984 982 2
Preferred stock 15 15
Mutual funds 20 4 16
Interest in Collective Funds (b) 1,415 1,327 88
Limited partnerships 128 1 127
Other 30 2 28
Total $4,009 $1,264 $2,508 $237
Fair Value Measurements Using:
In millions
December 312011
Fair Value
Quoted Prices inActive Markets
For IdenticalAssets
(Level 1)
SignificantOther
ObservableInputs
(Level 2)
SignificantUnobservable
Inputs(Level 3)
Cash $ 2 $ 2
Money market funds 137 135 $ 2
US government and agency securities 395 114 281
Corporate debt (a) 799 722 $ 77
Common stock 933 933
Preferred Stock 13 9 2 2
Mutual funds 37 37
Interest in Collective Funds (b) 1,314 937 377
Limited partnerships 130 130
Other 45 2 16 27
Total $3,805 $1,195 $1,997 $613
(a) Corporate debt includes $115 million and $106 million of non-agency mortgage-backed securities as of December 31, 2012 and 2011, respectively.(b) The benefit plans own commingled funds that invest in equity and fixed income securities. The commingled funds that invest in equity securities seek to mirror the performance of the
S&P 500 Index, Russell 3000 Index, Morgan Stanley Capital International ACWI X US Index, and the Dow Jones U.S. Select Real Estate Securities Index. The commingled fund thatholds fixed income securities invests in domestic investment grade securities and seeks to mimic the performance of the Barclays Aggregate Bond Index.
198 The PNC Financial Services Group, Inc. – Form 10-K
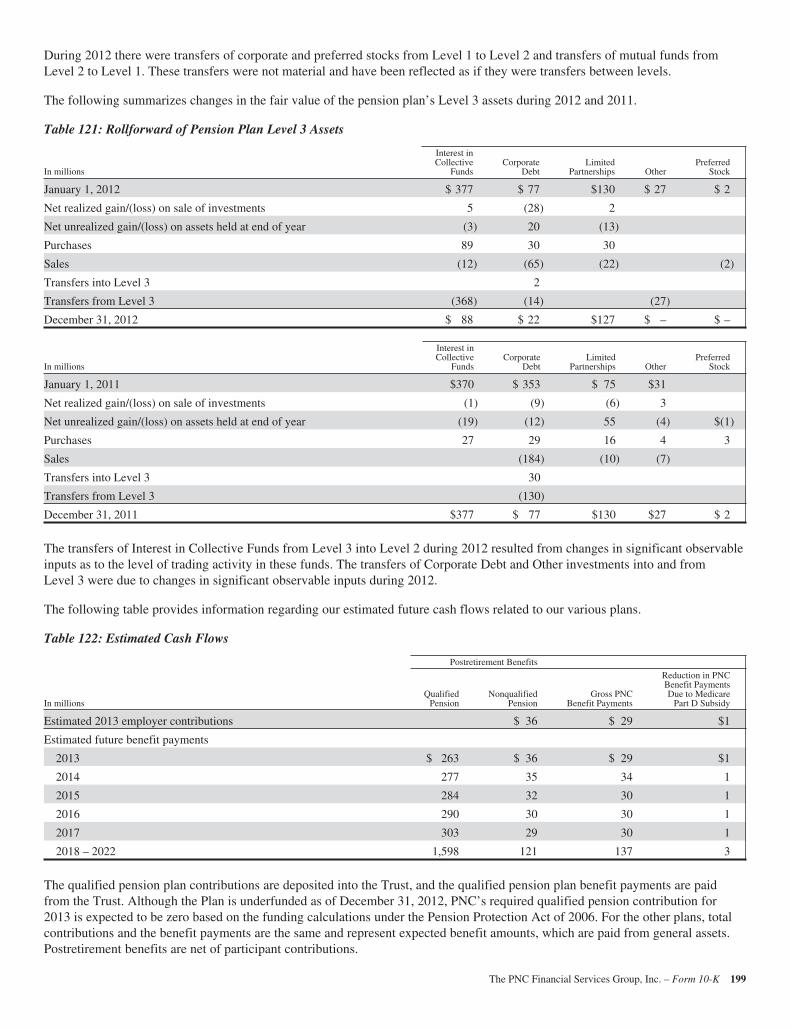
During 2012 there were transfers of corporate and preferred stocks from Level 1 to Level 2 and transfers of mutual funds fromLevel 2 to Level 1. These transfers were not material and have been reflected as if they were transfers between levels.
The following summarizes changes in the fair value of the pension plan’s Level 3 assets during 2012 and 2011.
Table 121: Rollforward of Pension Plan Level 3 Assets
In millions
Interest inCollective
FundsCorporate
DebtLimited
Partnerships OtherPreferred
Stock
January 1, 2012 $ 377 $ 77 $130 $ 27 $ 2
Net realized gain/(loss) on sale of investments 5 (28) 2
Net unrealized gain/(loss) on assets held at end of year (3) 20 (13)
Purchases 89 30 30
Sales (12) (65) (22) (2)
Transfers into Level 3 2
Transfers from Level 3 (368) (14) (27)
December 31, 2012 $ 88 $ 22 $127 $ – $ –
In millions
Interest inCollective
FundsCorporate
DebtLimited
Partnerships OtherPreferred
Stock
January 1, 2011 $370 $ 353 $ 75 $31
Net realized gain/(loss) on sale of investments (1) (9) (6) 3
Net unrealized gain/(loss) on assets held at end of year (19) (12) 55 (4) $(1)
Purchases 27 29 16 4 3
Sales (184) (10) (7)
Transfers into Level 3 30
Transfers from Level 3 (130)
December 31, 2011 $377 $ 77 $130 $27 $ 2
The transfers of Interest in Collective Funds from Level 3 into Level 2 during 2012 resulted from changes in significant observableinputs as to the level of trading activity in these funds. The transfers of Corporate Debt and Other investments into and fromLevel 3 were due to changes in significant observable inputs during 2012.
The following table provides information regarding our estimated future cash flows related to our various plans.
Table 122: Estimated Cash Flows
Postretirement Benefits
In millionsQualified
PensionNonqualified
PensionGross PNC
Benefit Payments
Reduction in PNCBenefit PaymentsDue to Medicare
Part D Subsidy
Estimated 2013 employer contributions $ 36 $ 29 $1
Estimated future benefit payments
2013 $ 263 $ 36 $ 29 $1
2014 277 35 34 1
2015 284 32 30 1
2016 290 30 30 1
2017 303 29 30 1
2018 – 2022 1,598 121 137 3
The qualified pension plan contributions are deposited into the Trust, and the qualified pension plan benefit payments are paidfrom the Trust. Although the Plan is underfunded as of December 31, 2012, PNC’s required qualified pension contribution for2013 is expected to be zero based on the funding calculations under the Pension Protection Act of 2006. For the other plans, totalcontributions and the benefit payments are the same and represent expected benefit amounts, which are paid from general assets.Postretirement benefits are net of participant contributions.
The PNC Financial Services Group, Inc. – Form 10-K 199
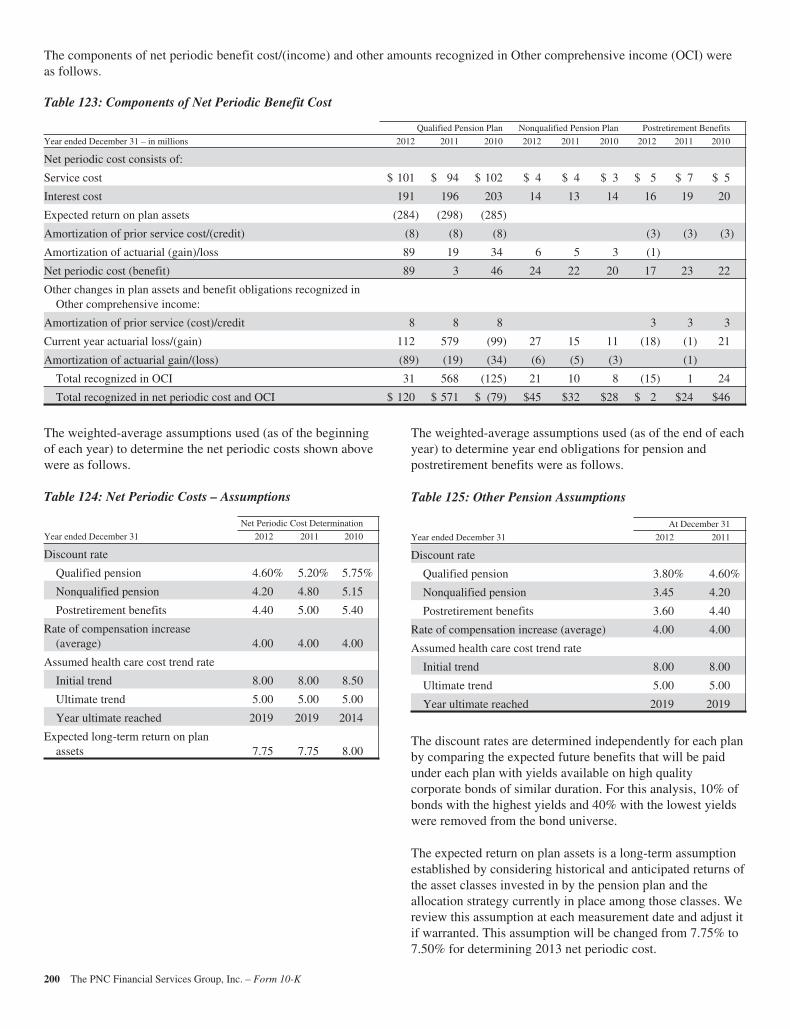
The components of net periodic benefit cost/(income) and other amounts recognized in Other comprehensive income (OCI) wereas follows.
Table 123: Components of Net Periodic Benefit Cost
Qualified Pension Plan Nonqualified Pension Plan Postretirement Benefits
Year ended December 31 – in millions 2012 2011 2010 2012 2011 2010 2012 2011 2010
Net periodic cost consists of:
Service cost $ 101 $ 94 $ 102 $ 4 $ 4 $ 3 $ 5 $ 7 $ 5
Interest cost 191 196 203 14 13 14 16 19 20
Expected return on plan assets (284) (298) (285)
Amortization of prior service cost/(credit) (8) (8) (8) (3) (3) (3)
Amortization of actuarial (gain)/loss 89 19 34 6 5 3 (1)
Net periodic cost (benefit) 89 3 46 24 22 20 17 23 22
Other changes in plan assets and benefit obligations recognized inOther comprehensive income:
Amortization of prior service (cost)/credit 8 8 8 3 3 3
Current year actuarial loss/(gain) 112 579 (99) 27 15 11 (18) (1) 21
Amortization of actuarial gain/(loss) (89) (19) (34) (6) (5) (3) (1)
Total recognized in OCI 31 568 (125) 21 10 8 (15) 1 24
Total recognized in net periodic cost and OCI $ 120 $ 571 $ (79) $45 $32 $28 $ 2 $24 $46
The weighted-average assumptions used (as of the beginningof each year) to determine the net periodic costs shown abovewere as follows.
Table 124: Net Periodic Costs – Assumptions
Net Periodic Cost Determination
Year ended December 31 2012 2011 2010
Discount rate
Qualified pension 4.60% 5.20% 5.75%
Nonqualified pension 4.20 4.80 5.15
Postretirement benefits 4.40 5.00 5.40
Rate of compensation increase(average) 4.00 4.00 4.00
Assumed health care cost trend rate
Initial trend 8.00 8.00 8.50
Ultimate trend 5.00 5.00 5.00
Year ultimate reached 2019 2019 2014
Expected long-term return on planassets 7.75 7.75 8.00
The weighted-average assumptions used (as of the end of eachyear) to determine year end obligations for pension andpostretirement benefits were as follows.
Table 125: Other Pension Assumptions
At December 31
Year ended December 31 2012 2011
Discount rate
Qualified pension 3.80% 4.60%
Nonqualified pension 3.45 4.20
Postretirement benefits 3.60 4.40
Rate of compensation increase (average) 4.00 4.00
Assumed health care cost trend rate
Initial trend 8.00 8.00
Ultimate trend 5.00 5.00
Year ultimate reached 2019 2019
The discount rates are determined independently for each planby comparing the expected future benefits that will be paidunder each plan with yields available on high qualitycorporate bonds of similar duration. For this analysis, 10% ofbonds with the highest yields and 40% with the lowest yieldswere removed from the bond universe.
The expected return on plan assets is a long-term assumptionestablished by considering historical and anticipated returns ofthe asset classes invested in by the pension plan and theallocation strategy currently in place among those classes. Wereview this assumption at each measurement date and adjust itif warranted. This assumption will be changed from 7.75% to7.50% for determining 2013 net periodic cost.
200 The PNC Financial Services Group, Inc. – Form 10-K
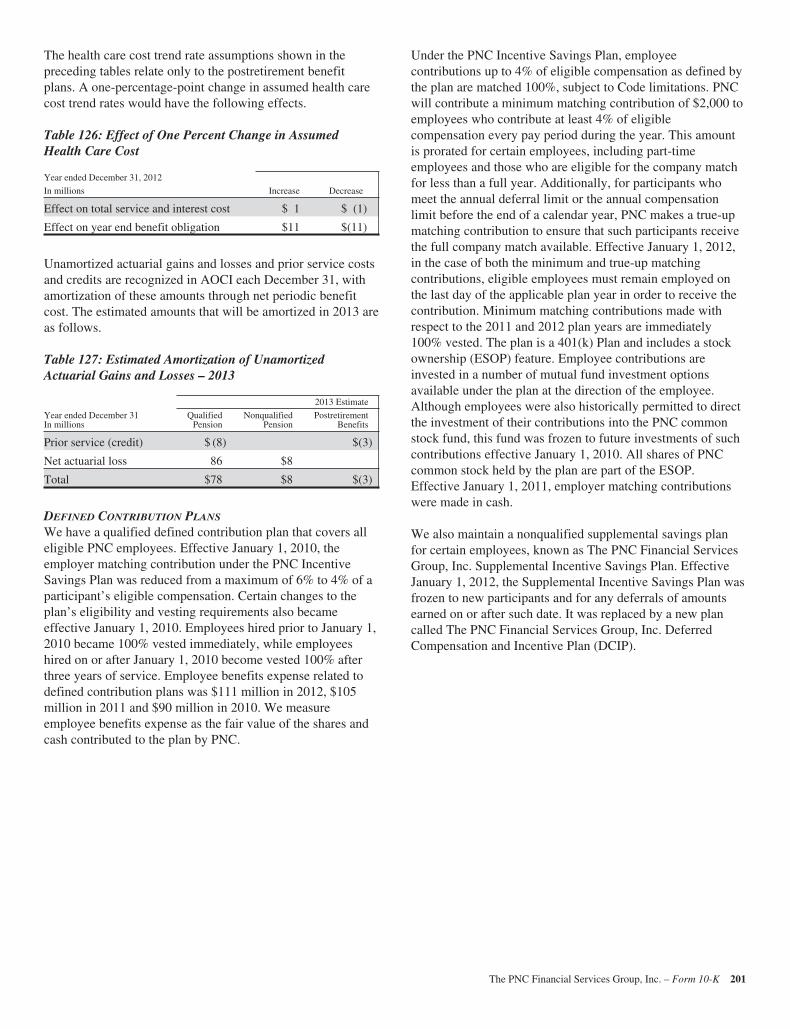
The health care cost trend rate assumptions shown in thepreceding tables relate only to the postretirement benefitplans. A one-percentage-point change in assumed health carecost trend rates would have the following effects.
Table 126: Effect of One Percent Change in AssumedHealth Care Cost
Year ended December 31, 2012
In millions Increase Decrease
Effect on total service and interest cost $ 1 $ (1)
Effect on year end benefit obligation $11 $(11)
Unamortized actuarial gains and losses and prior service costsand credits are recognized in AOCI each December 31, withamortization of these amounts through net periodic benefitcost. The estimated amounts that will be amortized in 2013 areas follows.
Table 127: Estimated Amortization of UnamortizedActuarial Gains and Losses – 2013
2013 Estimate
Year ended December 31In millions
QualifiedPension
NonqualifiedPension
PostretirementBenefits
Prior service (credit) $ (8) $(3)
Net actuarial loss 86 $8
Total $78 $8 $(3)
DEFINED CONTRIBUTION PLANS
We have a qualified defined contribution plan that covers alleligible PNC employees. Effective January 1, 2010, theemployer matching contribution under the PNC IncentiveSavings Plan was reduced from a maximum of 6% to 4% of aparticipant’s eligible compensation. Certain changes to theplan’s eligibility and vesting requirements also becameeffective January 1, 2010. Employees hired prior to January 1,2010 became 100% vested immediately, while employeeshired on or after January 1, 2010 become vested 100% afterthree years of service. Employee benefits expense related todefined contribution plans was $111 million in 2012, $105million in 2011 and $90 million in 2010. We measureemployee benefits expense as the fair value of the shares andcash contributed to the plan by PNC.
Under the PNC Incentive Savings Plan, employeecontributions up to 4% of eligible compensation as defined bythe plan are matched 100%, subject to Code limitations. PNCwill contribute a minimum matching contribution of $2,000 toemployees who contribute at least 4% of eligiblecompensation every pay period during the year. This amountis prorated for certain employees, including part-timeemployees and those who are eligible for the company matchfor less than a full year. Additionally, for participants whomeet the annual deferral limit or the annual compensationlimit before the end of a calendar year, PNC makes a true-upmatching contribution to ensure that such participants receivethe full company match available. Effective January 1, 2012,in the case of both the minimum and true-up matchingcontributions, eligible employees must remain employed onthe last day of the applicable plan year in order to receive thecontribution. Minimum matching contributions made withrespect to the 2011 and 2012 plan years are immediately100% vested. The plan is a 401(k) Plan and includes a stockownership (ESOP) feature. Employee contributions areinvested in a number of mutual fund investment optionsavailable under the plan at the direction of the employee.Although employees were also historically permitted to directthe investment of their contributions into the PNC commonstock fund, this fund was frozen to future investments of suchcontributions effective January 1, 2010. All shares of PNCcommon stock held by the plan are part of the ESOP.Effective January 1, 2011, employer matching contributionswere made in cash.
We also maintain a nonqualified supplemental savings planfor certain employees, known as The PNC Financial ServicesGroup, Inc. Supplemental Incentive Savings Plan. EffectiveJanuary 1, 2012, the Supplemental Incentive Savings Plan wasfrozen to new participants and for any deferrals of amountsearned on or after such date. It was replaced by a new plancalled The PNC Financial Services Group, Inc. DeferredCompensation and Incentive Plan (DCIP).
The PNC Financial Services Group, Inc. – Form 10-K 201
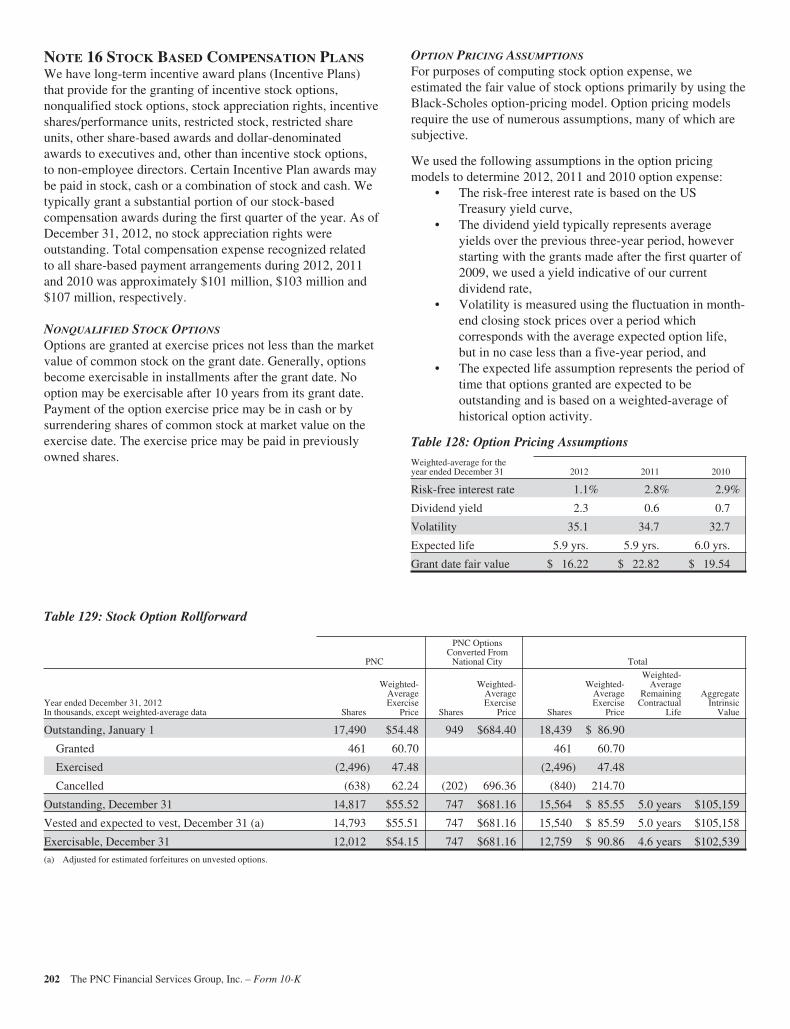
NOTE 16 STOCK BASED COMPENSATION PLANSWe have long-term incentive award plans (Incentive Plans)that provide for the granting of incentive stock options,nonqualified stock options, stock appreciation rights, incentiveshares/performance units, restricted stock, restricted shareunits, other share-based awards and dollar-denominatedawards to executives and, other than incentive stock options,to non-employee directors. Certain Incentive Plan awards maybe paid in stock, cash or a combination of stock and cash. Wetypically grant a substantial portion of our stock-basedcompensation awards during the first quarter of the year. As ofDecember 31, 2012, no stock appreciation rights wereoutstanding. Total compensation expense recognized relatedto all share-based payment arrangements during 2012, 2011and 2010 was approximately $101 million, $103 million and$107 million, respectively.
NONQUALIFIED STOCK OPTIONS
Options are granted at exercise prices not less than the marketvalue of common stock on the grant date. Generally, optionsbecome exercisable in installments after the grant date. Nooption may be exercisable after 10 years from its grant date.Payment of the option exercise price may be in cash or bysurrendering shares of common stock at market value on theexercise date. The exercise price may be paid in previouslyowned shares.
OPTION PRICING ASSUMPTIONS
For purposes of computing stock option expense, weestimated the fair value of stock options primarily by using theBlack-Scholes option-pricing model. Option pricing modelsrequire the use of numerous assumptions, many of which aresubjective.
We used the following assumptions in the option pricingmodels to determine 2012, 2011 and 2010 option expense:
• The risk-free interest rate is based on the USTreasury yield curve,
• The dividend yield typically represents averageyields over the previous three-year period, howeverstarting with the grants made after the first quarter of2009, we used a yield indicative of our currentdividend rate,
• Volatility is measured using the fluctuation in month-end closing stock prices over a period whichcorresponds with the average expected option life,but in no case less than a five-year period, and
• The expected life assumption represents the period oftime that options granted are expected to beoutstanding and is based on a weighted-average ofhistorical option activity.
Table 128: Option Pricing Assumptions
Weighted-average for theyear ended December 31 2012 2011 2010
Risk-free interest rate 1.1% 2.8% 2.9%
Dividend yield 2.3 0.6 0.7
Volatility 35.1 34.7 32.7
Expected life 5.9 yrs. 5.9 yrs. 6.0 yrs.
Grant date fair value $ 16.22 $ 22.82 $ 19.54
Table 129: Stock Option Rollforward
PNC
PNC OptionsConverted From
National City Total
Year ended December 31, 2012In thousands, except weighted-average data Shares
Weighted-AverageExercise
Price Shares
Weighted-AverageExercise
Price Shares
Weighted-AverageExercise
Price
Weighted-Average
RemainingContractual
Life
AggregateIntrinsic
Value
Outstanding, January 1 17,490 $54.48 949 $684.40 18,439 $ 86.90
Granted 461 60.70 461 60.70
Exercised (2,496) 47.48 (2,496) 47.48
Cancelled (638) 62.24 (202) 696.36 (840) 214.70
Outstanding, December 31 14,817 $55.52 747 $681.16 15,564 $ 85.55 5.0 years $105,159
Vested and expected to vest, December 31 (a) 14,793 $55.51 747 $681.16 15,540 $ 85.59 5.0 years $105,158
Exercisable, December 31 12,012 $54.15 747 $681.16 12,759 $ 90.86 4.6 years $102,539
(a) Adjusted for estimated forfeitures on unvested options.
202 The PNC Financial Services Group, Inc. – Form 10-K
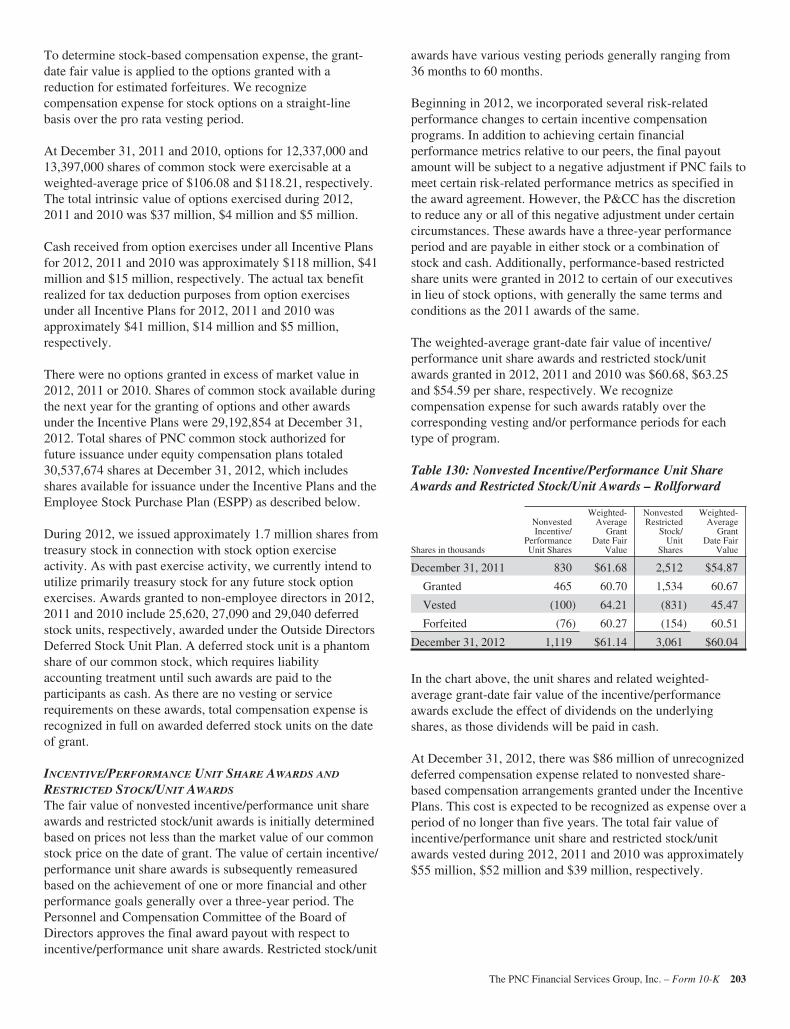
To determine stock-based compensation expense, the grant-date fair value is applied to the options granted with areduction for estimated forfeitures. We recognizecompensation expense for stock options on a straight-linebasis over the pro rata vesting period.
At December 31, 2011 and 2010, options for 12,337,000 and13,397,000 shares of common stock were exercisable at aweighted-average price of $106.08 and $118.21, respectively.The total intrinsic value of options exercised during 2012,2011 and 2010 was $37 million, $4 million and $5 million.
Cash received from option exercises under all Incentive Plansfor 2012, 2011 and 2010 was approximately $118 million, $41million and $15 million, respectively. The actual tax benefitrealized for tax deduction purposes from option exercisesunder all Incentive Plans for 2012, 2011 and 2010 wasapproximately $41 million, $14 million and $5 million,respectively.
There were no options granted in excess of market value in2012, 2011 or 2010. Shares of common stock available duringthe next year for the granting of options and other awardsunder the Incentive Plans were 29,192,854 at December 31,2012. Total shares of PNC common stock authorized forfuture issuance under equity compensation plans totaled30,537,674 shares at December 31, 2012, which includesshares available for issuance under the Incentive Plans and theEmployee Stock Purchase Plan (ESPP) as described below.
During 2012, we issued approximately 1.7 million shares fromtreasury stock in connection with stock option exerciseactivity. As with past exercise activity, we currently intend toutilize primarily treasury stock for any future stock optionexercises. Awards granted to non-employee directors in 2012,2011 and 2010 include 25,620, 27,090 and 29,040 deferredstock units, respectively, awarded under the Outside DirectorsDeferred Stock Unit Plan. A deferred stock unit is a phantomshare of our common stock, which requires liabilityaccounting treatment until such awards are paid to theparticipants as cash. As there are no vesting or servicerequirements on these awards, total compensation expense isrecognized in full on awarded deferred stock units on the dateof grant.
INCENTIVE/PERFORMANCE UNIT SHARE AWARDS AND
RESTRICTED STOCK/UNIT AWARDS
The fair value of nonvested incentive/performance unit shareawards and restricted stock/unit awards is initially determinedbased on prices not less than the market value of our commonstock price on the date of grant. The value of certain incentive/performance unit share awards is subsequently remeasuredbased on the achievement of one or more financial and otherperformance goals generally over a three-year period. ThePersonnel and Compensation Committee of the Board ofDirectors approves the final award payout with respect toincentive/performance unit share awards. Restricted stock/unit
awards have various vesting periods generally ranging from36 months to 60 months.
Beginning in 2012, we incorporated several risk-relatedperformance changes to certain incentive compensationprograms. In addition to achieving certain financialperformance metrics relative to our peers, the final payoutamount will be subject to a negative adjustment if PNC fails tomeet certain risk-related performance metrics as specified inthe award agreement. However, the P&CC has the discretionto reduce any or all of this negative adjustment under certaincircumstances. These awards have a three-year performanceperiod and are payable in either stock or a combination ofstock and cash. Additionally, performance-based restrictedshare units were granted in 2012 to certain of our executivesin lieu of stock options, with generally the same terms andconditions as the 2011 awards of the same.
The weighted-average grant-date fair value of incentive/performance unit share awards and restricted stock/unitawards granted in 2012, 2011 and 2010 was $60.68, $63.25and $54.59 per share, respectively. We recognizecompensation expense for such awards ratably over thecorresponding vesting and/or performance periods for eachtype of program.
Table 130: Nonvested Incentive/Performance Unit ShareAwards and Restricted Stock/Unit Awards – Rollforward
Shares in thousands
NonvestedIncentive/
PerformanceUnit Shares
Weighted-Average
GrantDate Fair
Value
NonvestedRestricted
Stock/Unit
Shares
Weighted-Average
GrantDate Fair
Value
December 31, 2011 830 $61.68 2,512 $54.87
Granted 465 60.70 1,534 60.67
Vested (100) 64.21 (831) 45.47
Forfeited (76) 60.27 (154) 60.51
December 31, 2012 1,119 $61.14 3,061 $60.04
In the chart above, the unit shares and related weighted-average grant-date fair value of the incentive/performanceawards exclude the effect of dividends on the underlyingshares, as those dividends will be paid in cash.
At December 31, 2012, there was $86 million of unrecognizeddeferred compensation expense related to nonvested share-based compensation arrangements granted under the IncentivePlans. This cost is expected to be recognized as expense over aperiod of no longer than five years. The total fair value ofincentive/performance unit share and restricted stock/unitawards vested during 2012, 2011 and 2010 was approximately$55 million, $52 million and $39 million, respectively.
The PNC Financial Services Group, Inc. – Form 10-K 203
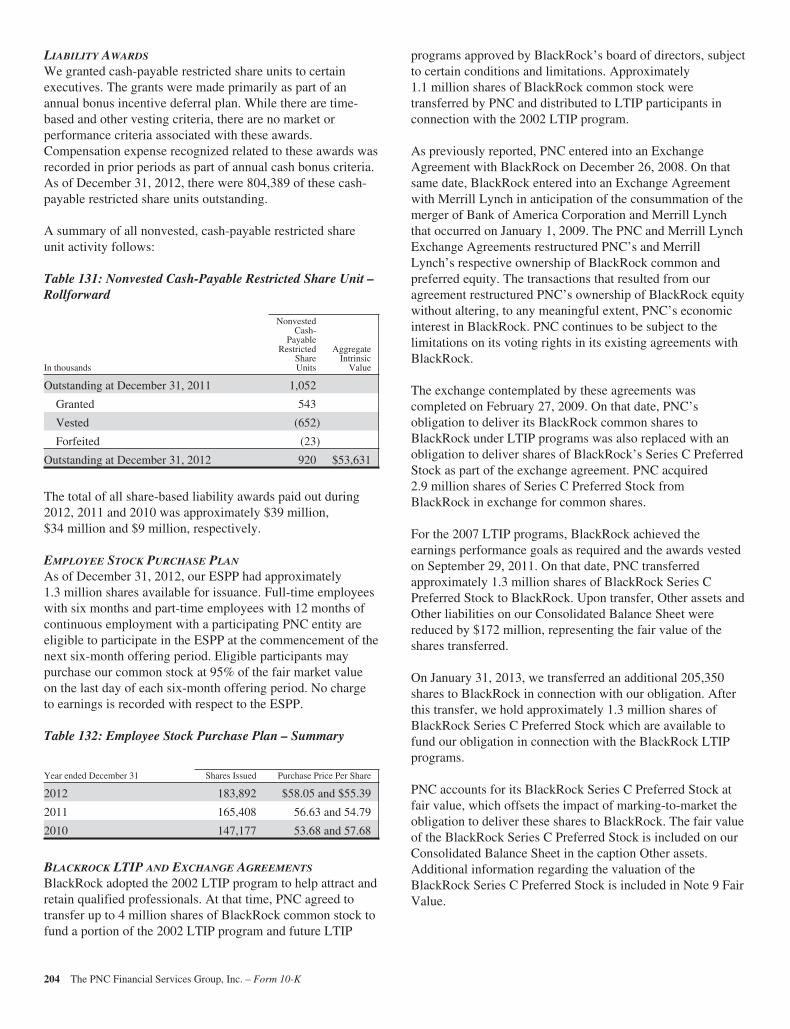
LIABILITY AWARDS
We granted cash-payable restricted share units to certainexecutives. The grants were made primarily as part of anannual bonus incentive deferral plan. While there are time-based and other vesting criteria, there are no market orperformance criteria associated with these awards.Compensation expense recognized related to these awards wasrecorded in prior periods as part of annual cash bonus criteria.As of December 31, 2012, there were 804,389 of these cash-payable restricted share units outstanding.
A summary of all nonvested, cash-payable restricted shareunit activity follows:
Table 131: Nonvested Cash-Payable Restricted Share Unit –Rollforward
In thousands
NonvestedCash-
PayableRestricted
ShareUnits
AggregateIntrinsic
Value
Outstanding at December 31, 2011 1,052
Granted 543
Vested (652)
Forfeited (23)
Outstanding at December 31, 2012 920 $53,631
The total of all share-based liability awards paid out during2012, 2011 and 2010 was approximately $39 million,$34 million and $9 million, respectively.
EMPLOYEE STOCK PURCHASE PLAN
As of December 31, 2012, our ESPP had approximately1.3 million shares available for issuance. Full-time employeeswith six months and part-time employees with 12 months ofcontinuous employment with a participating PNC entity areeligible to participate in the ESPP at the commencement of thenext six-month offering period. Eligible participants maypurchase our common stock at 95% of the fair market valueon the last day of each six-month offering period. No chargeto earnings is recorded with respect to the ESPP.
Table 132: Employee Stock Purchase Plan – Summary
Year ended December 31 Shares Issued Purchase Price Per Share
2012 183,892 $58.05 and $55.39
2011 165,408 56.63 and 54.79
2010 147,177 53.68 and 57.68
BLACKROCK LTIP AND EXCHANGE AGREEMENTS
BlackRock adopted the 2002 LTIP program to help attract andretain qualified professionals. At that time, PNC agreed totransfer up to 4 million shares of BlackRock common stock tofund a portion of the 2002 LTIP program and future LTIP
programs approved by BlackRock’s board of directors, subjectto certain conditions and limitations. Approximately1.1 million shares of BlackRock common stock weretransferred by PNC and distributed to LTIP participants inconnection with the 2002 LTIP program.
As previously reported, PNC entered into an ExchangeAgreement with BlackRock on December 26, 2008. On thatsame date, BlackRock entered into an Exchange Agreementwith Merrill Lynch in anticipation of the consummation of themerger of Bank of America Corporation and Merrill Lynchthat occurred on January 1, 2009. The PNC and Merrill LynchExchange Agreements restructured PNC’s and MerrillLynch’s respective ownership of BlackRock common andpreferred equity. The transactions that resulted from ouragreement restructured PNC’s ownership of BlackRock equitywithout altering, to any meaningful extent, PNC’s economicinterest in BlackRock. PNC continues to be subject to thelimitations on its voting rights in its existing agreements withBlackRock.
The exchange contemplated by these agreements wascompleted on February 27, 2009. On that date, PNC’sobligation to deliver its BlackRock common shares toBlackRock under LTIP programs was also replaced with anobligation to deliver shares of BlackRock’s Series C PreferredStock as part of the exchange agreement. PNC acquired2.9 million shares of Series C Preferred Stock fromBlackRock in exchange for common shares.
For the 2007 LTIP programs, BlackRock achieved theearnings performance goals as required and the awards vestedon September 29, 2011. On that date, PNC transferredapproximately 1.3 million shares of BlackRock Series CPreferred Stock to BlackRock. Upon transfer, Other assets andOther liabilities on our Consolidated Balance Sheet werereduced by $172 million, representing the fair value of theshares transferred.
On January 31, 2013, we transferred an additional 205,350shares to BlackRock in connection with our obligation. Afterthis transfer, we hold approximately 1.3 million shares ofBlackRock Series C Preferred Stock which are available tofund our obligation in connection with the BlackRock LTIPprograms.
PNC accounts for its BlackRock Series C Preferred Stock atfair value, which offsets the impact of marking-to-market theobligation to deliver these shares to BlackRock. The fair valueof the BlackRock Series C Preferred Stock is included on ourConsolidated Balance Sheet in the caption Other assets.Additional information regarding the valuation of theBlackRock Series C Preferred Stock is included in Note 9 FairValue.
204 The PNC Financial Services Group, Inc. – Form 10-K
NOTE 17 FINANCIAL DERIVATIVESWe use derivative financial instruments (derivatives)primarily to help manage exposure to interest rate, market andcredit risk and reduce the effects that changes in interest ratesmay have on net income, fair value of assets and liabilities,and cash flows. We also enter into derivatives with customersto facilitate their risk management activities.
Derivatives represent contracts between parties that usuallyrequire little or no initial net investment and result in one partydelivering cash or another type of asset to the other partybased on a notional amount and an underlying as specified inthe contract. Derivative transactions are often measured interms of notional amount, but this amount is generally notexchanged and it is not recorded on the balance sheet. Thenotional amount is the basis to which the underlying is appliedto determine required payments under the derivative contract.The underlying is a referenced interest rate (commonlyLIBOR), security price, credit spread or other index.Residential and commercial real estate loan commitmentsassociated with loans to be sold also qualify as derivativeinstruments.
All derivatives are carried on our Consolidated Balance Sheetat fair value. Derivative balances are presented on a net basistaking into consideration the effects of legally enforceablemaster netting agreements. Cash collateral exchanged withcounterparties is also netted against the applicable derivativefair values.
Further discussion on how derivatives are accounted for isincluded in Note 1 Accounting Policies.
DERIVATIVES DESIGNATED IN HEDGE RELATIONSHIPS
Certain derivatives used to manage interest rate risk as part ofour asset and liability risk management activities aredesignated as accounting hedges under GAAP. Derivativeshedging the risks associated with changes in the fair value ofassets or liabilities are considered fair value hedges,derivatives hedging the variability of expected future cashflows are considered cash flow hedges, and derivativeshedging a net investment in a foreign subsidiary areconsidered net investment hedges. Designating derivatives asaccounting hedges allows for gains and losses on thosederivatives, to the extent effective, to be recognized in theincome statement in the same period the hedged items affectearnings.
Fair Value HedgesWe enter into receive-fixed, pay-variable interest rate swaps tohedge changes in the fair value of outstanding fixed-rate debtand borrowings caused by fluctuations in market interest rates.The specific products hedged may include bank notes, FederalHome Loan Bank borrowings, and senior and subordinateddebt. We also enter into pay-fixed, receive-variable interestrate swaps, and zero-coupon swaps to hedge changes in the
fair value of fixed rate and zero-coupon investment securitiescaused by fluctuations in market interest rates. The specificproducts hedged include US Treasury, government agency andother debt securities. For these hedge relationships, we usestatistical regression analysis to assess hedge effectiveness atboth the inception of the hedge relationship and on an ongoingbasis. There were no components of derivative gains or lossesexcluded from the assessment of hedge effectiveness.
The ineffective portion of the change in value of our fair valuehedge derivatives resulted in net losses of $54 million for2012 compared with net losses of $17 million for 2011 and netlosses of $31 million for 2010.
Cash Flow HedgesWe enter into receive-fixed, pay-variable interest rate swaps tomodify the interest rate characteristics of designatedcommercial loans from variable to fixed in order to reduce theimpact of changes in future cash flows due to market interestrate changes. For these cash flow hedges, any changes in thefair value of the derivatives that are effective in offsettingchanges in the forecasted interest cash flows are recorded inAccumulated other comprehensive income and are reclassifiedto interest income in conjunction with the recognition ofinterest receipts on the loans. In the 12 months that followDecember 31, 2012, we expect to reclassify from the amountcurrently reported in Accumulated other comprehensiveincome net derivative gains of $264 million pretax, or $171million after-tax, in association with interest receipts on thehedged loans. This amount could differ from amounts actuallyrecognized due to changes in interest rates, hedge de-designations, and the addition of other hedges subsequent toDecember 31, 2012. The maximum length of time over whichforecasted loan cash flows are hedged is 8 years. We usestatistical regression analysis to assess the effectiveness ofthese hedge relationships at both the inception of the hedgerelationship and on an ongoing basis.
We also periodically enter into forward purchase and salecontracts to hedge the variability of the consideration that willbe paid or received related to the purchase or sale ofinvestment securities. The forecasted purchase or sale isconsummated upon gross settlement of the forward contractitself. As a result, hedge ineffectiveness, if any, is typicallyminimal. Gains and losses on these forward contracts arerecorded in Accumulated other comprehensive income and arerecognized in earnings when the hedged cash flows affectearnings. In the 12 months that follow December 31, 2012, weexpect to reclassify from the amount currently reported inAccumulated other comprehensive income, net derivativegains of $78 million pretax, or $51 million after-tax, asadjustments of yield on investment securities. The maximumlength of time we are hedging forecasted purchases is threemonths. With respect to forecasted sale of securities, therewere no amounts in Accumulated other comprehensiveincome at December 31, 2012.
The PNC Financial Services Group, Inc. – Form 10-K 205

There were no components of derivative gains or lossesexcluded from the assessment of hedge effectiveness relatedto either cash flow hedge strategy.
During 2012 and 2011, there were no gains or losses fromcash flow hedge derivatives reclassified to earnings because itbecame probable that the original forecasted transaction wouldnot occur. The amount of cash flow hedge ineffectivenessrecognized in income for 2012 and 2011 was not material toPNC’s results of operations.
Net Investment HedgesWe enter into foreign currency forward contracts to hedgenon-U.S. Dollar (USD) net investments in foreign subsidiariesagainst adverse changes in foreign exchange rates. We assesswhether the hedging relationship is highly effective inachieving offsetting changes in the value of the hedge andhedged item by qualitatively verifying that the critical terms ofthe hedge and hedged item match at the inception of thehedging relationship and on an ongoing basis. There were nocomponents of derivative gains or losses excluded from theassessment of the hedge effectiveness.
During 2012 and 2011, there was no net investment hedgeineffectiveness.
Further detail regarding the notional amounts, fair values andgains and losses recognized related to derivatives used in fairvalue, cash flow, and net investment hedge strategies ispresented in the tables that follow.
DERIVATIVES NOT DESIGNATED IN HEDGE RELATIONSHIPS
We also enter into derivatives that are not designated asaccounting hedges under GAAP.
The majority of these derivatives are used to manage riskrelated to residential and commercial mortgage bankingactivities and are considered economic hedges. Although thesederivatives are used to hedge risk, they are not designated asaccounting hedges because the contracts they are hedging aretypically also carried at fair value on the balance sheet,resulting in symmetrical accounting treatment for both thehedging instrument and the hedged item.
Our residential mortgage banking activities consist oforiginating, selling and servicing mortgage loans. Residentialmortgage loans that will be sold in the secondary market, andthe related loan commitments, which are consideredderivatives, are accounted for at fair value. Changes in the fairvalue of the loans and commitments due to interest rate riskare hedged with forward contracts to sell mortgage-backedsecurities, as well as US Treasury and Eurodollar futures andoptions. Gains and losses on the loans and commitments heldfor sale and the derivatives used to economically hedge themare included in Residential mortgage noninterest income onthe Consolidated Income Statement.
We typically retain the servicing rights related to residentialmortgage loans that we sell. Residential mortgage servicingrights are accounted for at fair value with changes in fair valueinfluenced primarily by changes in interest rates. Derivativesused to hedge the fair value of residential mortgage servicingrights include interest rate futures, swaps, options (includingcaps, floors, and swaptions), and forward contracts topurchase mortgage-backed securities. Gains and losses onresidential mortgage servicing rights and the relatedderivatives used for hedging are included in Residentialmortgage noninterest income.
Certain commercial mortgage loans held for sale areaccounted for at fair value. These loans, and the related loancommitments, which are considered derivatives, are accountedfor at fair value. In addition we originate loans for sale into thesecondary market that are carried at the lower of cost or fairvalue. Derivatives used to economically hedge these loans andcommitments from changes in fair value due to interest raterisk and credit risk include forward loan sale contracts,interest rate swaps, and credit default swaps. Gains and losseson the commitments, loans and derivatives are included inOther noninterest income. Derivatives used to economicallyhedge the change in value of commercial mortgage servicingrights include interest rate swaps and futures. Gains or losseson these derivatives are included in Corporate Servicesnoninterest income.
The residential and commercial mortgage loan commitmentsassociated with loans to be sold which are accounted for asderivatives are valued based on the estimated fair value of theunderlying loan and the probability that the loan will fundwithin the terms of the commitment. The fair value also takesinto account the fair value of the embedded servicing right.
We offer derivatives to our customers in connection with theirrisk management needs. These derivatives primarily consist ofinterest rate swaps, interest rate caps, floors, swaptions,foreign exchange contracts, and equity contracts. Weprimarily manage our market risk exposure from customertransactions by entering into a variety of hedging transactionswith third-party dealers. Gains and losses on customer-relatedderivatives are included in Other noninterest income.
The derivatives portfolio also includes derivatives used forother risk management activities. These derivatives areentered into based on stated risk management objectives andinclude credit default swaps (CDS) used to mitigate the risk ofeconomic loss on a portion of our loan exposure. We also soldloss protection to mitigate the net premium cost and theimpact of mark-to-market accounting on CDS purchases tohedge the loan portfolio. The fair values of these derivativestypically are based on related credit spreads. Gains and losseson the derivatives entered into for other risk management areincluded in Other noninterest income.
206 The PNC Financial Services Group, Inc. – Form 10-K
Included in the customer, mortgage banking risk management,and other risk management portfolios are written interest-ratecaps and floors entered into with customers and for riskmanagement purposes. We receive an upfront premium fromthe counterparty and are obligated to make payments to thecounterparty if the underlying market interest rate rises aboveor falls below a certain level designated in the contract. Ourultimate obligation under written options is based on futuremarket conditions and is only quantifiable at settlement.
In connection with sales of a portion of our Visa Class Bcommon shares in 2012, we entered into swap agreementswith the purchaser in which we will make or receive paymentsbased on subsequent changes in the conversion rate of Class Binto Class A common shares and to make payments calculatedby reference to the market price of the Class A commonshares. The fair value of the swaps, included in Otherliabilities on our Consolidated Balance Sheet, was $43 millionat December 31, 2012.
Further detail regarding the derivatives not designated inhedging relationships is presented in the tables that follow.
DERIVATIVE COUNTERPARTY CREDIT RISK
By entering into derivative contracts we are exposed to creditrisk. We seek to minimize credit risk through internal creditapprovals, limits, monitoring procedures, executing masternetting agreements and collateral requirements. We generallyenter into transactions with counterparties that carry highquality credit ratings. Nonperformance risk including creditrisk is included in the determination of the estimated net fairvalue.
We generally have established agreements with our majorderivative dealer counterparties that provide for exchanges ofmarketable securities or cash to collateralize either party’spositions. At December 31, 2012, we held cash, U.S.government securities and mortgage-backed securities totaling$1.2 billion under these agreements. We pledged cash andU.S. government securities of $978 million under theseagreements. To the extent not netted against derivative fairvalues under a master netting agreement, the receivable forcash pledged is included in Other assets and the obligation forcash held is included in Other borrowed funds on ourConsolidated Balance Sheet.
The credit risk associated with derivatives executed withcustomers is essentially the same as that involved in extendingloans and is subject to normal credit policies. We may obtaincollateral based on our assessment of the customer’s creditquality.
We periodically enter into risk participation agreements toshare some of the credit exposure with other counterpartiesrelated to interest rate derivative contracts or to take on creditexposure to generate revenue. We will make/receive paymentsunder these agreements if a customer defaults on its obligationto perform under certain derivative swap contracts. Riskparticipation agreements are included in the derivatives tablethat follows. Our exposure related to risk participations wherewe sold protection is discussed in the Credit Derivativessection below.
CONTINGENT FEATURES
Some of PNC’s derivative instruments contain provisions thatrequire PNC’s debt to maintain an investment grade creditrating from each of the major credit rating agencies. If PNC’sdebt ratings were to fall below investment grade, it would bein violation of these provisions, and the counterparties to thederivative instruments could request immediate payment ordemand immediate and ongoing full overnightcollateralization on derivative instruments in net liabilitypositions.
The aggregate fair value of all derivative instruments withcredit-risk-related contingent features that were in a netliability position on December 31, 2012 was $1.1 billion forwhich PNC had posted collateral of $942 million in thenormal course of business. The maximum amount of collateralPNC would have been required to post if the credit-risk-related contingent features underlying these agreements hadbeen triggered on December 31, 2012, would be an additional$139 million.
The PNC Financial Services Group, Inc. – Form 10-K 207
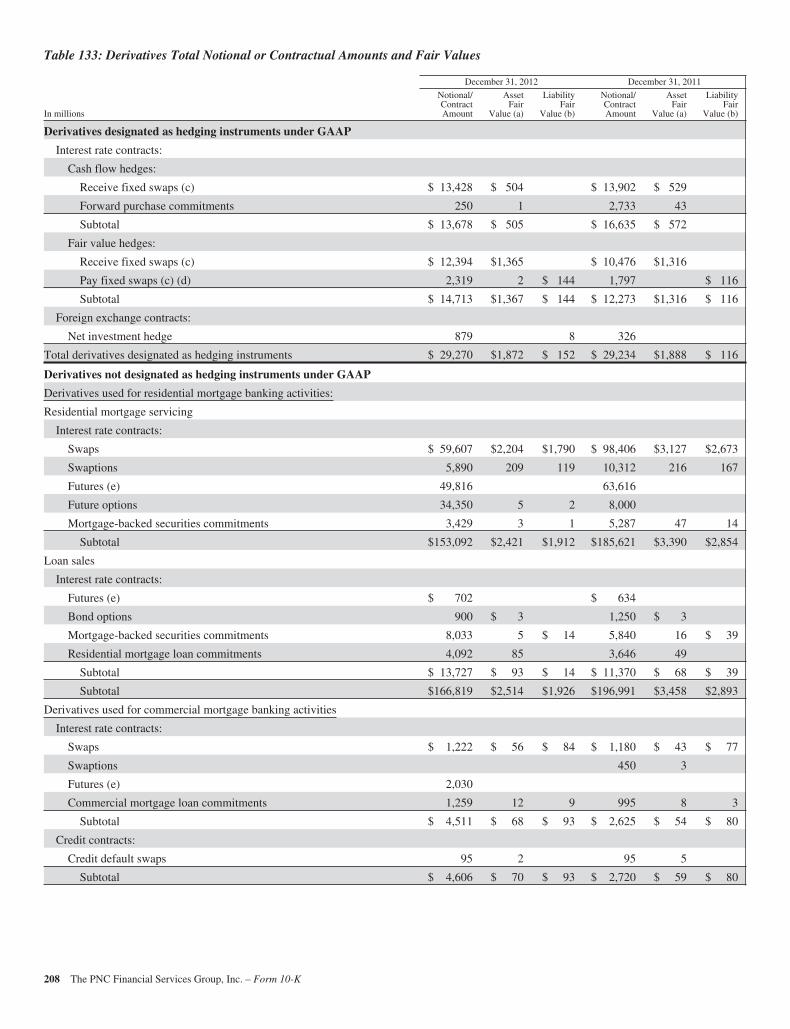
Table 133: Derivatives Total Notional or Contractual Amounts and Fair Values
December 31, 2012 December 31, 2011
In millions
Notional/ContractAmount
AssetFair
Value (a)
LiabilityFair
Value (b)
Notional/ContractAmount
AssetFair
Value (a)
LiabilityFair
Value (b)
Derivatives designated as hedging instruments under GAAP
Interest rate contracts:
Cash flow hedges:
Receive fixed swaps (c) $ 13,428 $ 504 $ 13,902 $ 529
Forward purchase commitments 250 1 2,733 43
Subtotal $ 13,678 $ 505 $ 16,635 $ 572
Fair value hedges:
Receive fixed swaps (c) $ 12,394 $1,365 $ 10,476 $1,316
Pay fixed swaps (c) (d) 2,319 2 $ 144 1,797 $ 116
Subtotal $ 14,713 $1,367 $ 144 $ 12,273 $1,316 $ 116
Foreign exchange contracts:
Net investment hedge 879 8 326
Total derivatives designated as hedging instruments $ 29,270 $1,872 $ 152 $ 29,234 $1,888 $ 116
Derivatives not designated as hedging instruments under GAAP
Derivatives used for residential mortgage banking activities:
Residential mortgage servicing
Interest rate contracts:
Swaps $ 59,607 $2,204 $1,790 $ 98,406 $3,127 $2,673
Swaptions 5,890 209 119 10,312 216 167
Futures (e) 49,816 63,616
Future options 34,350 5 2 8,000
Mortgage-backed securities commitments 3,429 3 1 5,287 47 14
Subtotal $153,092 $2,421 $1,912 $185,621 $3,390 $2,854
Loan sales
Interest rate contracts:
Futures (e) $ 702 $ 634
Bond options 900 $ 3 1,250 $ 3
Mortgage-backed securities commitments 8,033 5 $ 14 5,840 16 $ 39
Residential mortgage loan commitments 4,092 85 3,646 49
Subtotal $ 13,727 $ 93 $ 14 $ 11,370 $ 68 $ 39
Subtotal $166,819 $2,514 $1,926 $196,991 $3,458 $2,893
Derivatives used for commercial mortgage banking activities
Interest rate contracts:
Swaps $ 1,222 $ 56 $ 84 $ 1,180 $ 43 $ 77
Swaptions 450 3
Futures (e) 2,030
Commercial mortgage loan commitments 1,259 12 9 995 8 3
Subtotal $ 4,511 $ 68 $ 93 $ 2,625 $ 54 $ 80
Credit contracts:
Credit default swaps 95 2 95 5
Subtotal $ 4,606 $ 70 $ 93 $ 2,720 $ 59 $ 80
208 The PNC Financial Services Group, Inc. – Form 10-K
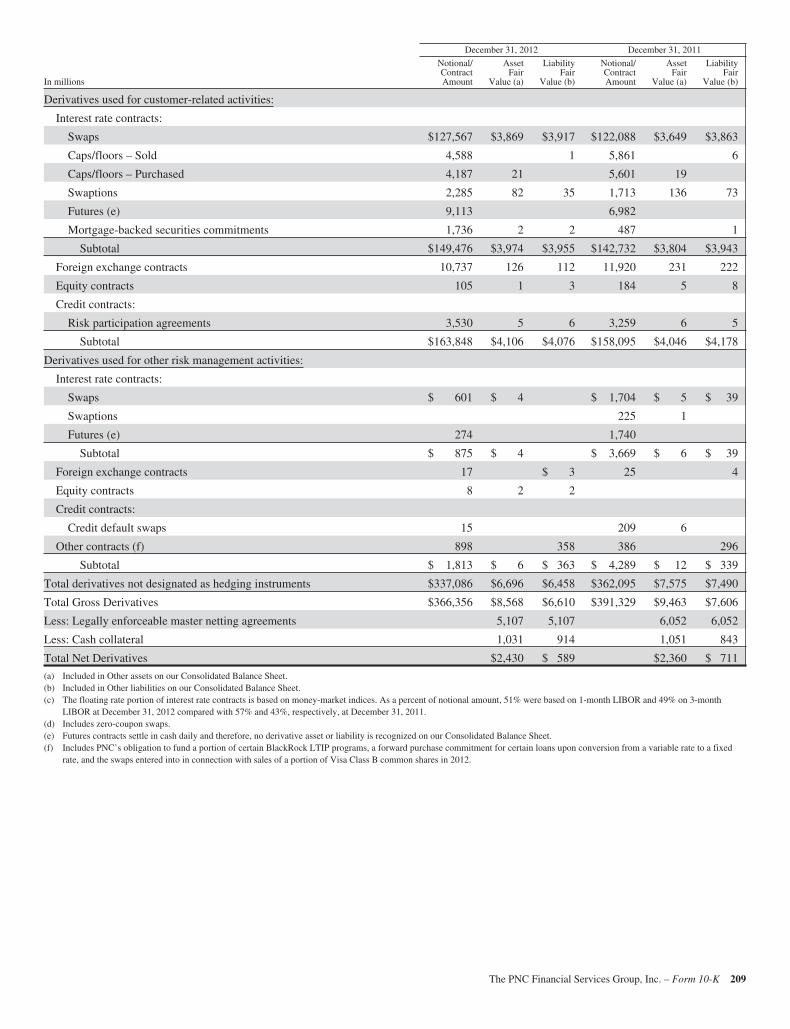
December 31, 2012 December 31, 2011
In millions
Notional/ContractAmount
AssetFair
Value (a)
LiabilityFair
Value (b)
Notional/ContractAmount
AssetFair
Value (a)
LiabilityFair
Value (b)
Derivatives used for customer-related activities:
Interest rate contracts:
Swaps $127,567 $3,869 $3,917 $122,088 $3,649 $3,863
Caps/floors – Sold 4,588 1 5,861 6
Caps/floors – Purchased 4,187 21 5,601 19
Swaptions 2,285 82 35 1,713 136 73
Futures (e) 9,113 6,982
Mortgage-backed securities commitments 1,736 2 2 487 1
Subtotal $149,476 $3,974 $3,955 $142,732 $3,804 $3,943
Foreign exchange contracts 10,737 126 112 11,920 231 222
Equity contracts 105 1 3 184 5 8
Credit contracts:
Risk participation agreements 3,530 5 6 3,259 6 5
Subtotal $163,848 $4,106 $4,076 $158,095 $4,046 $4,178
Derivatives used for other risk management activities:
Interest rate contracts:
Swaps $ 601 $ 4 $ 1,704 $ 5 $ 39
Swaptions 225 1
Futures (e) 274 1,740
Subtotal $ 875 $ 4 $ 3,669 $ 6 $ 39
Foreign exchange contracts 17 $ 3 25 4
Equity contracts 8 2 2
Credit contracts:
Credit default swaps 15 209 6
Other contracts (f) 898 358 386 296
Subtotal $ 1,813 $ 6 $ 363 $ 4,289 $ 12 $ 339
Total derivatives not designated as hedging instruments $337,086 $6,696 $6,458 $362,095 $7,575 $7,490
Total Gross Derivatives $366,356 $8,568 $6,610 $391,329 $9,463 $7,606
Less: Legally enforceable master netting agreements 5,107 5,107 6,052 6,052
Less: Cash collateral 1,031 914 1,051 843
Total Net Derivatives $2,430 $ 589 $2,360 $ 711
(a) Included in Other assets on our Consolidated Balance Sheet.(b) Included in Other liabilities on our Consolidated Balance Sheet.(c) The floating rate portion of interest rate contracts is based on money-market indices. As a percent of notional amount, 51% were based on 1-month LIBOR and 49% on 3-month
LIBOR at December 31, 2012 compared with 57% and 43%, respectively, at December 31, 2011.(d) Includes zero-coupon swaps.(e) Futures contracts settle in cash daily and therefore, no derivative asset or liability is recognized on our Consolidated Balance Sheet.(f) Includes PNC’s obligation to fund a portion of certain BlackRock LTIP programs, a forward purchase commitment for certain loans upon conversion from a variable rate to a fixed
rate, and the swaps entered into in connection with sales of a portion of Visa Class B common shares in 2012.
The PNC Financial Services Group, Inc. – Form 10-K 209
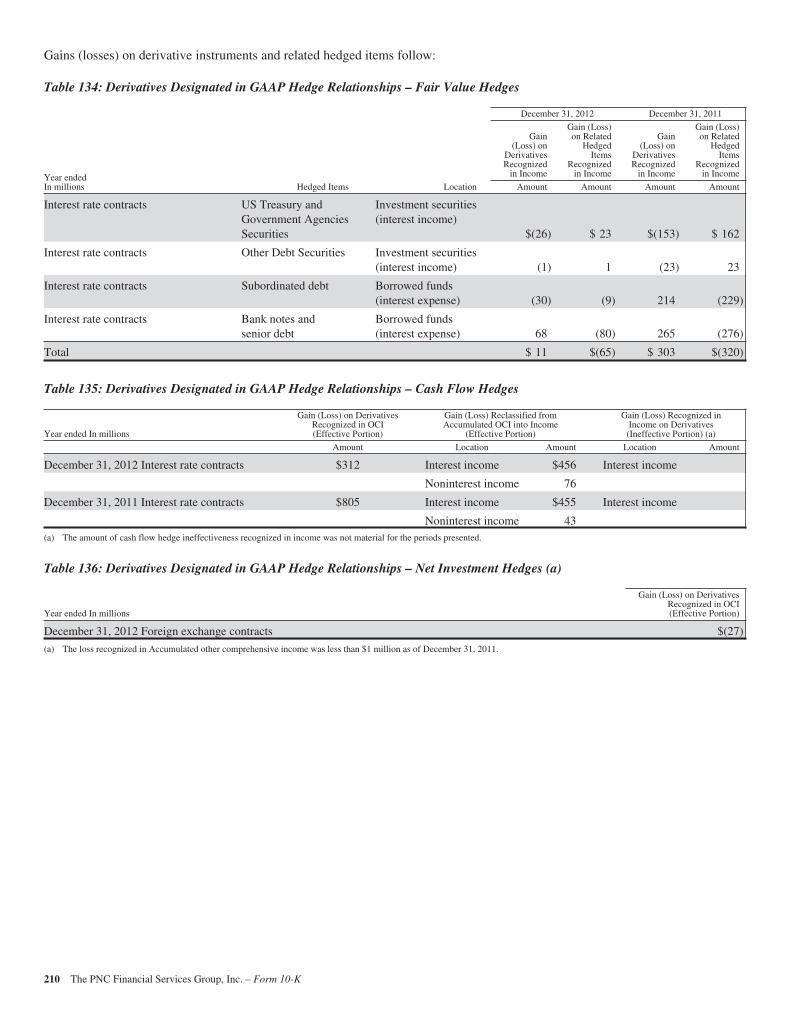
Gains (losses) on derivative instruments and related hedged items follow:
Table 134: Derivatives Designated in GAAP Hedge Relationships – Fair Value Hedges
December 31, 2012 December 31, 2011
Year endedIn millions
Gain(Loss) on
DerivativesRecognized
in Income
Gain (Loss)on Related
HedgedItems
Recognizedin Income
Gain(Loss) on
DerivativesRecognized
in Income
Gain (Loss)on Related
HedgedItems
Recognizedin Income
Hedged Items Location Amount Amount Amount Amount
Interest rate contracts US Treasury andGovernment AgenciesSecurities
Investment securities(interest income)
$(26) $ 23 $(153) $ 162
Interest rate contracts Other Debt Securities Investment securities(interest income) (1) 1 (23) 23
Interest rate contracts Subordinated debt Borrowed funds(interest expense) (30) (9) 214 (229)
Interest rate contracts Bank notes andsenior debt
Borrowed funds(interest expense) 68 (80) 265 (276)
Total $ 11 $(65) $ 303 $(320)
Table 135: Derivatives Designated in GAAP Hedge Relationships – Cash Flow Hedges
Year ended In millions
Gain (Loss) on DerivativesRecognized in OCI(Effective Portion)
Gain (Loss) Reclassified fromAccumulated OCI into Income
(Effective Portion)
Gain (Loss) Recognized inIncome on Derivatives(Ineffective Portion) (a)
Amount Location Amount Location Amount
December 31, 2012 Interest rate contracts $312 Interest income $456 Interest income
Noninterest income 76
December 31, 2011 Interest rate contracts $805 Interest income $455 Interest income
Noninterest income 43(a) The amount of cash flow hedge ineffectiveness recognized in income was not material for the periods presented.
Table 136: Derivatives Designated in GAAP Hedge Relationships – Net Investment Hedges (a)
Year ended In millions
Gain (Loss) on DerivativesRecognized in OCI(Effective Portion)
December 31, 2012 Foreign exchange contracts $(27)
(a) The loss recognized in Accumulated other comprehensive income was less than $1 million as of December 31, 2011.
210 The PNC Financial Services Group, Inc. – Form 10-K
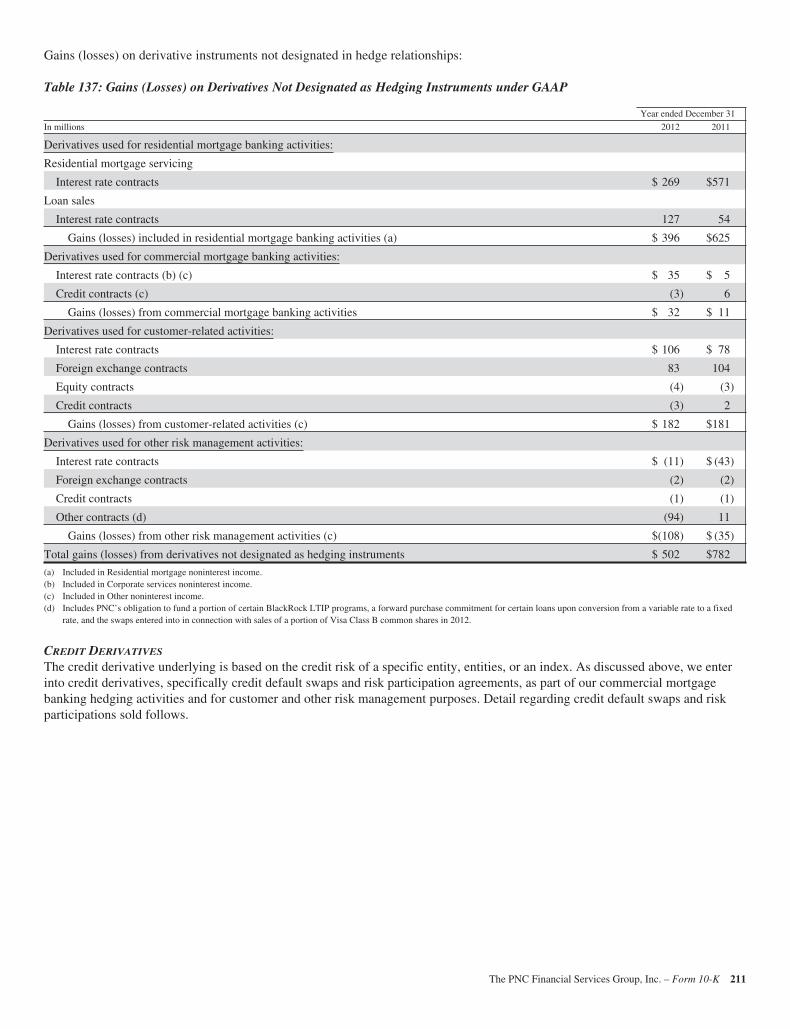
Gains (losses) on derivative instruments not designated in hedge relationships:
Table 137: Gains (Losses) on Derivatives Not Designated as Hedging Instruments under GAAP
Year ended December 31
In millions 2012 2011
Derivatives used for residential mortgage banking activities:
Residential mortgage servicing
Interest rate contracts $ 269 $571
Loan sales
Interest rate contracts 127 54
Gains (losses) included in residential mortgage banking activities (a) $ 396 $625
Derivatives used for commercial mortgage banking activities:
Interest rate contracts (b) (c) $ 35 $ 5
Credit contracts (c) (3) 6
Gains (losses) from commercial mortgage banking activities $ 32 $ 11
Derivatives used for customer-related activities:
Interest rate contracts $ 106 $ 78
Foreign exchange contracts 83 104
Equity contracts (4) (3)
Credit contracts (3) 2
Gains (losses) from customer-related activities (c) $ 182 $181
Derivatives used for other risk management activities:
Interest rate contracts $ (11) $ (43)
Foreign exchange contracts (2) (2)
Credit contracts (1) (1)
Other contracts (d) (94) 11
Gains (losses) from other risk management activities (c) $(108) $ (35)
Total gains (losses) from derivatives not designated as hedging instruments $ 502 $782
(a) Included in Residential mortgage noninterest income.(b) Included in Corporate services noninterest income.(c) Included in Other noninterest income.(d) Includes PNC’s obligation to fund a portion of certain BlackRock LTIP programs, a forward purchase commitment for certain loans upon conversion from a variable rate to a fixed
rate, and the swaps entered into in connection with sales of a portion of Visa Class B common shares in 2012.
CREDIT DERIVATIVES
The credit derivative underlying is based on the credit risk of a specific entity, entities, or an index. As discussed above, we enterinto credit derivatives, specifically credit default swaps and risk participation agreements, as part of our commercial mortgagebanking hedging activities and for customer and other risk management purposes. Detail regarding credit default swaps and riskparticipations sold follows.
The PNC Financial Services Group, Inc. – Form 10-K 211
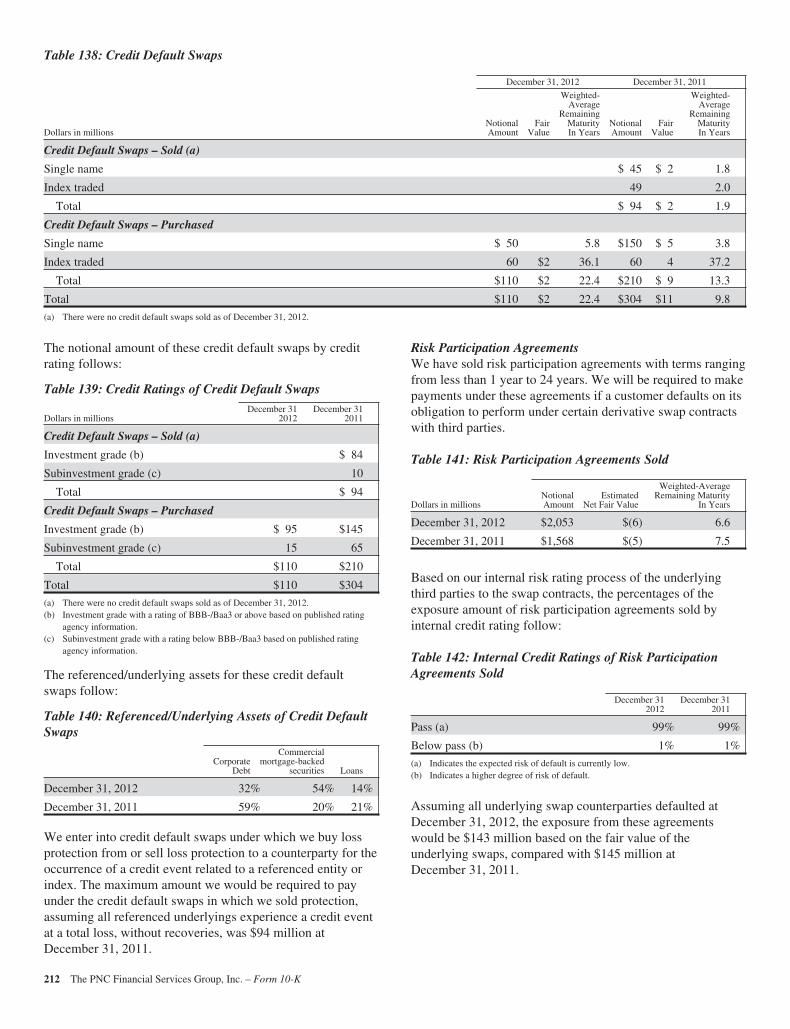
Table 138: Credit Default Swaps
December 31, 2012 December 31, 2011
Dollars in millionsNotionalAmount
FairValue
Weighted-Average
RemainingMaturityIn Years
NotionalAmount
FairValue
Weighted-Average
RemainingMaturityIn Years
Credit Default Swaps – Sold (a)
Single name $ 45 $ 2 1.8
Index traded 49 2.0
Total $ 94 $ 2 1.9
Credit Default Swaps – Purchased
Single name $ 50 5.8 $150 $ 5 3.8
Index traded 60 $2 36.1 60 4 37.2
Total $110 $2 22.4 $210 $ 9 13.3
Total $110 $2 22.4 $304 $11 9.8
(a) There were no credit default swaps sold as of December 31, 2012.
The notional amount of these credit default swaps by creditrating follows:
Table 139: Credit Ratings of Credit Default Swaps
Dollars in millionsDecember 31
2012December 31
2011
Credit Default Swaps – Sold (a)
Investment grade (b) $ 84
Subinvestment grade (c) 10
Total $ 94
Credit Default Swaps – Purchased
Investment grade (b) $ 95 $145
Subinvestment grade (c) 15 65
Total $110 $210
Total $110 $304
(a) There were no credit default swaps sold as of December 31, 2012.(b) Investment grade with a rating of BBB-/Baa3 or above based on published rating
agency information.(c) Subinvestment grade with a rating below BBB-/Baa3 based on published rating
agency information.
The referenced/underlying assets for these credit defaultswaps follow:
Table 140: Referenced/Underlying Assets of Credit DefaultSwaps
CorporateDebt
Commercialmortgage-backed
securities Loans
December 31, 2012 32% 54% 14%
December 31, 2011 59% 20% 21%
We enter into credit default swaps under which we buy lossprotection from or sell loss protection to a counterparty for theoccurrence of a credit event related to a referenced entity orindex. The maximum amount we would be required to payunder the credit default swaps in which we sold protection,assuming all referenced underlyings experience a credit eventat a total loss, without recoveries, was $94 million atDecember 31, 2011.
Risk Participation AgreementsWe have sold risk participation agreements with terms rangingfrom less than 1 year to 24 years. We will be required to makepayments under these agreements if a customer defaults on itsobligation to perform under certain derivative swap contractswith third parties.
Table 141: Risk Participation Agreements Sold
Dollars in millionsNotionalAmount
EstimatedNet Fair Value
Weighted-AverageRemaining Maturity
In Years
December 31, 2012 $2,053 $(6) 6.6
December 31, 2011 $1,568 $(5) 7.5
Based on our internal risk rating process of the underlyingthird parties to the swap contracts, the percentages of theexposure amount of risk participation agreements sold byinternal credit rating follow:
Table 142: Internal Credit Ratings of Risk ParticipationAgreements Sold
December 312012
December 312011
Pass (a) 99% 99%
Below pass (b) 1% 1%
(a) Indicates the expected risk of default is currently low.(b) Indicates a higher degree of risk of default.
Assuming all underlying swap counterparties defaulted atDecember 31, 2012, the exposure from these agreementswould be $143 million based on the fair value of theunderlying swaps, compared with $145 million atDecember 31, 2011.
212 The PNC Financial Services Group, Inc. – Form 10-K
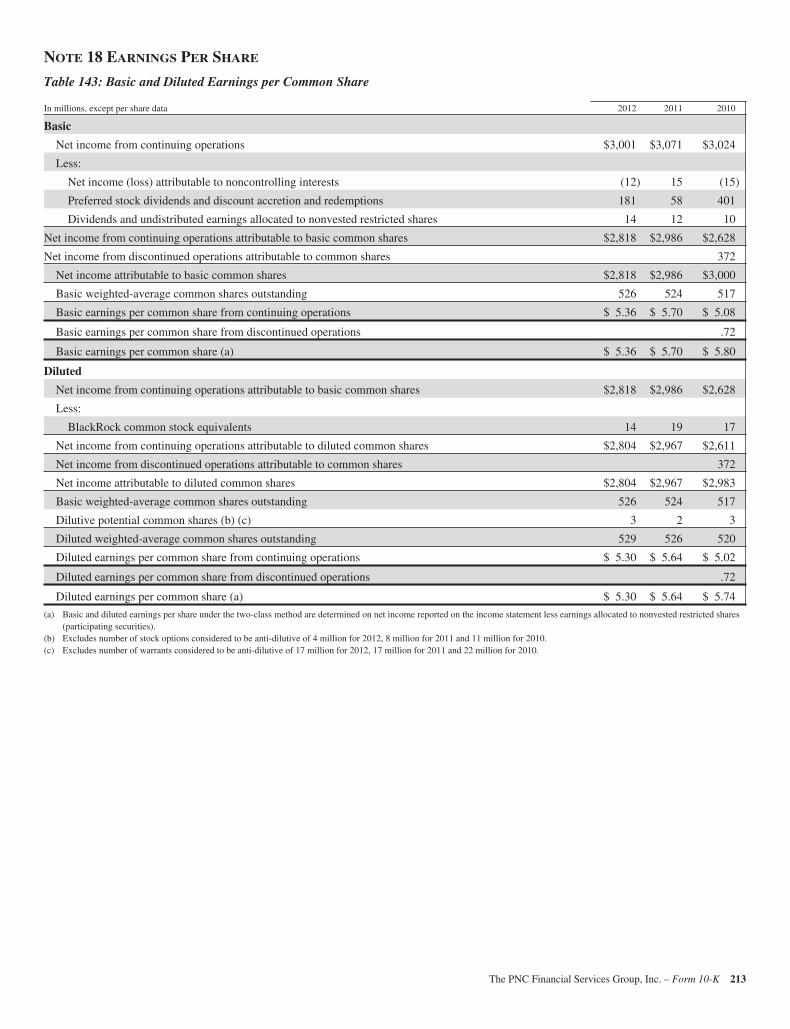
NOTE 18 EARNINGS PER SHARE
Table 143: Basic and Diluted Earnings per Common Share
In millions, except per share data 2012 2011 2010
Basic
Net income from continuing operations $3,001 $3,071 $3,024
Less:
Net income (loss) attributable to noncontrolling interests (12) 15 (15)
Preferred stock dividends and discount accretion and redemptions 181 58 401
Dividends and undistributed earnings allocated to nonvested restricted shares 14 12 10
Net income from continuing operations attributable to basic common shares $2,818 $2,986 $2,628
Net income from discontinued operations attributable to common shares 372
Net income attributable to basic common shares $2,818 $2,986 $3,000
Basic weighted-average common shares outstanding 526 524 517
Basic earnings per common share from continuing operations $ 5.36 $ 5.70 $ 5.08
Basic earnings per common share from discontinued operations .72
Basic earnings per common share (a) $ 5.36 $ 5.70 $ 5.80
Diluted
Net income from continuing operations attributable to basic common shares $2,818 $2,986 $2,628
Less:
BlackRock common stock equivalents 14 19 17
Net income from continuing operations attributable to diluted common shares $2,804 $2,967 $2,611
Net income from discontinued operations attributable to common shares 372
Net income attributable to diluted common shares $2,804 $2,967 $2,983
Basic weighted-average common shares outstanding 526 524 517
Dilutive potential common shares (b) (c) 3 2 3
Diluted weighted-average common shares outstanding 529 526 520
Diluted earnings per common share from continuing operations $ 5.30 $ 5.64 $ 5.02
Diluted earnings per common share from discontinued operations .72
Diluted earnings per common share (a) $ 5.30 $ 5.64 $ 5.74
(a) Basic and diluted earnings per share under the two-class method are determined on net income reported on the income statement less earnings allocated to nonvested restricted shares(participating securities).
(b) Excludes number of stock options considered to be anti-dilutive of 4 million for 2012, 8 million for 2011 and 11 million for 2010.(c) Excludes number of warrants considered to be anti-dilutive of 17 million for 2012, 17 million for 2011 and 22 million for 2010.
The PNC Financial Services Group, Inc. – Form 10-K 213
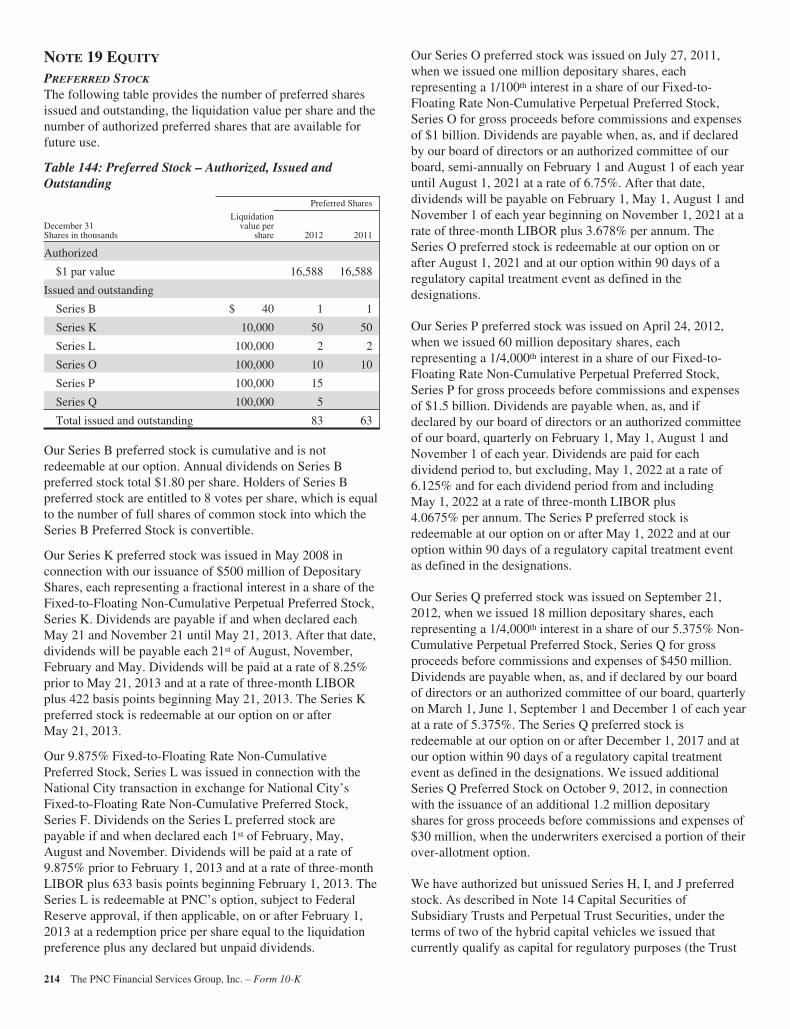
NOTE 19 EQUITY
PREFERRED STOCK
The following table provides the number of preferred sharesissued and outstanding, the liquidation value per share and thenumber of authorized preferred shares that are available forfuture use.
Table 144: Preferred Stock – Authorized, Issued andOutstanding
Preferred Shares
December 31Shares in thousands
Liquidationvalue per
share 2012 2011
Authorized
$1 par value 16,588 16,588
Issued and outstanding
Series B $ 40 1 1
Series K 10,000 50 50
Series L 100,000 2 2
Series O 100,000 10 10
Series P 100,000 15
Series Q 100,000 5
Total issued and outstanding 83 63
Our Series B preferred stock is cumulative and is notredeemable at our option. Annual dividends on Series Bpreferred stock total $1.80 per share. Holders of Series Bpreferred stock are entitled to 8 votes per share, which is equalto the number of full shares of common stock into which theSeries B Preferred Stock is convertible.
Our Series K preferred stock was issued in May 2008 inconnection with our issuance of $500 million of DepositaryShares, each representing a fractional interest in a share of theFixed-to-Floating Non-Cumulative Perpetual Preferred Stock,Series K. Dividends are payable if and when declared eachMay 21 and November 21 until May 21, 2013. After that date,dividends will be payable each 21st of August, November,February and May. Dividends will be paid at a rate of 8.25%prior to May 21, 2013 and at a rate of three-month LIBORplus 422 basis points beginning May 21, 2013. The Series Kpreferred stock is redeemable at our option on or afterMay 21, 2013.
Our 9.875% Fixed-to-Floating Rate Non-CumulativePreferred Stock, Series L was issued in connection with theNational City transaction in exchange for National City’sFixed-to-Floating Rate Non-Cumulative Preferred Stock,Series F. Dividends on the Series L preferred stock arepayable if and when declared each 1st of February, May,August and November. Dividends will be paid at a rate of9.875% prior to February 1, 2013 and at a rate of three-monthLIBOR plus 633 basis points beginning February 1, 2013. TheSeries L is redeemable at PNC’s option, subject to FederalReserve approval, if then applicable, on or after February 1,2013 at a redemption price per share equal to the liquidationpreference plus any declared but unpaid dividends.
Our Series O preferred stock was issued on July 27, 2011,when we issued one million depositary shares, eachrepresenting a 1/100th interest in a share of our Fixed-to-Floating Rate Non-Cumulative Perpetual Preferred Stock,Series O for gross proceeds before commissions and expensesof $1 billion. Dividends are payable when, as, and if declaredby our board of directors or an authorized committee of ourboard, semi-annually on February 1 and August 1 of each yearuntil August 1, 2021 at a rate of 6.75%. After that date,dividends will be payable on February 1, May 1, August 1 andNovember 1 of each year beginning on November 1, 2021 at arate of three-month LIBOR plus 3.678% per annum. TheSeries O preferred stock is redeemable at our option on orafter August 1, 2021 and at our option within 90 days of aregulatory capital treatment event as defined in thedesignations.
Our Series P preferred stock was issued on April 24, 2012,when we issued 60 million depositary shares, eachrepresenting a 1/4,000th interest in a share of our Fixed-to-Floating Rate Non-Cumulative Perpetual Preferred Stock,Series P for gross proceeds before commissions and expensesof $1.5 billion. Dividends are payable when, as, and ifdeclared by our board of directors or an authorized committeeof our board, quarterly on February 1, May 1, August 1 andNovember 1 of each year. Dividends are paid for eachdividend period to, but excluding, May 1, 2022 at a rate of6.125% and for each dividend period from and includingMay 1, 2022 at a rate of three-month LIBOR plus4.0675% per annum. The Series P preferred stock isredeemable at our option on or after May 1, 2022 and at ouroption within 90 days of a regulatory capital treatment eventas defined in the designations.
Our Series Q preferred stock was issued on September 21,2012, when we issued 18 million depositary shares, eachrepresenting a 1/4,000th interest in a share of our 5.375% Non-Cumulative Perpetual Preferred Stock, Series Q for grossproceeds before commissions and expenses of $450 million.Dividends are payable when, as, and if declared by our boardof directors or an authorized committee of our board, quarterlyon March 1, June 1, September 1 and December 1 of each yearat a rate of 5.375%. The Series Q preferred stock isredeemable at our option on or after December 1, 2017 and atour option within 90 days of a regulatory capital treatmentevent as defined in the designations. We issued additionalSeries Q Preferred Stock on October 9, 2012, in connectionwith the issuance of an additional 1.2 million depositaryshares for gross proceeds before commissions and expenses of$30 million, when the underwriters exercised a portion of theirover-allotment option.
We have authorized but unissued Series H, I, and J preferredstock. As described in Note 14 Capital Securities ofSubsidiary Trusts and Perpetual Trust Securities, under theterms of two of the hybrid capital vehicles we issued thatcurrently qualify as capital for regulatory purposes (the Trust
214 The PNC Financial Services Group, Inc. – Form 10-K

II Securities and the Trust III Securities), these TrustSecurities are automatically exchangeable into shares of PNCpreferred stock (Series I and Series J, respectively) in eachcase under certain conditions relating to the capitalization orthe financial condition of PNC Bank, N.A. and upon thedirection of the Office of the Comptroller of the Currency.The Series preferred stock of PNC REIT Corp. is alsoautomatically exchangeable under similar conditions intoshares of PNC Series H preferred stock.
As a part of the National City transaction, we established thePNC Non-Cumulative Perpetual Preferred Stock, Series M(the Series M Preferred Stock), which mirrored in all materialrespects the former National City Non-Cumulative PerpetualPreferred Stock, Series E. On December 10, 2012, PNC issued$500.1 million (5,001 shares) of the Series M Preferred Stockas required under a Stock Purchase Contract Agreementbetween PNC and National City Preferred Capital Trust I (the“Trust”) dated January 30, 2008. PNC immediately redeemedall $500.1 million of the Series M Preferred Stock from theTrust and the Trust in turn redeemed all $500.0 millionoutstanding of its 12% Fixed-to-Floating Rate Normal APEXand all $.1 million of its Common Securities.
The replacement capital covenants with respect to the NormalAPEX Securities, our Series M shares and our 6,000,000 ofDepositary Shares (each representing 1/4,000th of an interestin a share of our 9.875% Fixed-to-Floating Rate Non-Cumulative Preferred Stock, Series L) were terminated onNovember 5, 2010 as a result of a successful consentsolicitation.
In connection with the redemption of the Series N PreferredStock, we accelerated the accretion of the remaining issuancediscount on the Series N Preferred Stock, recorded acorresponding reduction in retained earnings of $250 millionduring the first quarter of 2010 and paid dividends of $89million to the US Treasury. This resulted in a noncashreduction in net income attributable to common shareholdersand related basic and diluted earnings per share.
WARRANTS
We have outstanding 16,885,192 warrants, each to purchaseone share of PNC common stock at an exercise price of$67.33 per share. These warrants were sold by the USTreasury in a secondary public offering that closed on May 5,2010 after the US Treasury exchanged its TARP Warrant(issued on December 31, 2008 under the TARP CapitalPurchase Program in relation to the Series N preferred stockreferred to above) for 16,885,192 warrants. These warrantsexpire December 31, 2018.
OTHER SHAREHOLDERS’ EQUITY MATTERS
We have a dividend reinvestment and stock purchase plan.Holders of preferred stock and PNC common stock mayparticipate in the plan, which provides that additional sharesof common stock may be purchased at market value withreinvested dividends and voluntary cash payments. Commonshares issued pursuant to this plan were: 422,642 shares in2012, 379,459 shares in 2011 and 149,088 shares in 2010.
At December 31, 2012, we had reserved approximately108.4 million common shares to be issued in connection withcertain stock plans and the conversion of certain debt andequity securities.
Effective October 4, 2007, our Board of Directors approved astock repurchase program to purchase up to 25 million sharesof PNC common stock on the open market or in privatelynegotiated transactions. A maximum of 21.551 million sharesremained available for repurchase under this program atDecember 31, 2012. This program will remain in effect untilfully utilized or until modified, superseded or terminated. Werepurchased 3.2 million shares in 2012 and did not repurchaseany shares during 2011 or 2010 under this program.
The PNC Financial Services Group, Inc. – Form 10-K 215
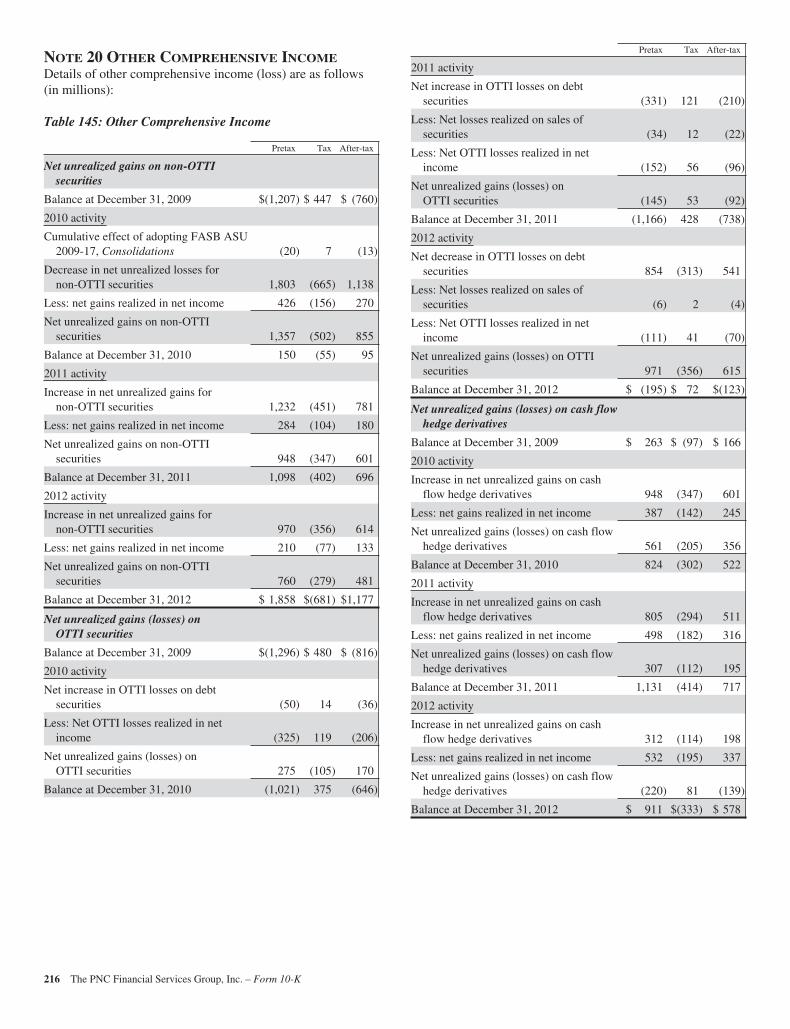
NOTE 20 OTHER COMPREHENSIVE INCOMEDetails of other comprehensive income (loss) are as follows(in millions):
Table 145: Other Comprehensive Income
Pretax Tax After-tax
Net unrealized gains on non-OTTIsecurities
Balance at December 31, 2009 $(1,207) $ 447 $ (760)
2010 activity
Cumulative effect of adopting FASB ASU2009-17, Consolidations (20) 7 (13)
Decrease in net unrealized losses fornon-OTTI securities 1,803 (665) 1,138
Less: net gains realized in net income 426 (156) 270
Net unrealized gains on non-OTTIsecurities 1,357 (502) 855
Balance at December 31, 2010 150 (55) 95
2011 activity
Increase in net unrealized gains fornon-OTTI securities 1,232 (451) 781
Less: net gains realized in net income 284 (104) 180
Net unrealized gains on non-OTTIsecurities 948 (347) 601
Balance at December 31, 2011 1,098 (402) 696
2012 activity
Increase in net unrealized gains fornon-OTTI securities 970 (356) 614
Less: net gains realized in net income 210 (77) 133
Net unrealized gains on non-OTTIsecurities 760 (279) 481
Balance at December 31, 2012 $ 1,858 $(681) $1,177
Net unrealized gains (losses) onOTTI securities
Balance at December 31, 2009 $(1,296) $ 480 $ (816)
2010 activity
Net increase in OTTI losses on debtsecurities (50) 14 (36)
Less: Net OTTI losses realized in netincome (325) 119 (206)
Net unrealized gains (losses) onOTTI securities 275 (105) 170
Balance at December 31, 2010 (1,021) 375 (646)
Pretax Tax After-tax
2011 activity
Net increase in OTTI losses on debtsecurities (331) 121 (210)
Less: Net losses realized on sales ofsecurities (34) 12 (22)
Less: Net OTTI losses realized in netincome (152) 56 (96)
Net unrealized gains (losses) onOTTI securities (145) 53 (92)
Balance at December 31, 2011 (1,166) 428 (738)
2012 activity
Net decrease in OTTI losses on debtsecurities 854 (313) 541
Less: Net losses realized on sales ofsecurities (6) 2 (4)
Less: Net OTTI losses realized in netincome (111) 41 (70)
Net unrealized gains (losses) on OTTIsecurities 971 (356) 615
Balance at December 31, 2012 $ (195) $ 72 $(123)
Net unrealized gains (losses) on cash flowhedge derivatives
Balance at December 31, 2009 $ 263 $ (97) $ 166
2010 activity
Increase in net unrealized gains on cashflow hedge derivatives 948 (347) 601
Less: net gains realized in net income 387 (142) 245
Net unrealized gains (losses) on cash flowhedge derivatives 561 (205) 356
Balance at December 31, 2010 824 (302) 522
2011 activity
Increase in net unrealized gains on cashflow hedge derivatives 805 (294) 511
Less: net gains realized in net income 498 (182) 316
Net unrealized gains (losses) on cash flowhedge derivatives 307 (112) 195
Balance at December 31, 2011 1,131 (414) 717
2012 activity
Increase in net unrealized gains on cashflow hedge derivatives 312 (114) 198
Less: net gains realized in net income 532 (195) 337
Net unrealized gains (losses) on cash flowhedge derivatives (220) 81 (139)
Balance at December 31, 2012 $ 911 $(333) $ 578
216 The PNC Financial Services Group, Inc. – Form 10-K
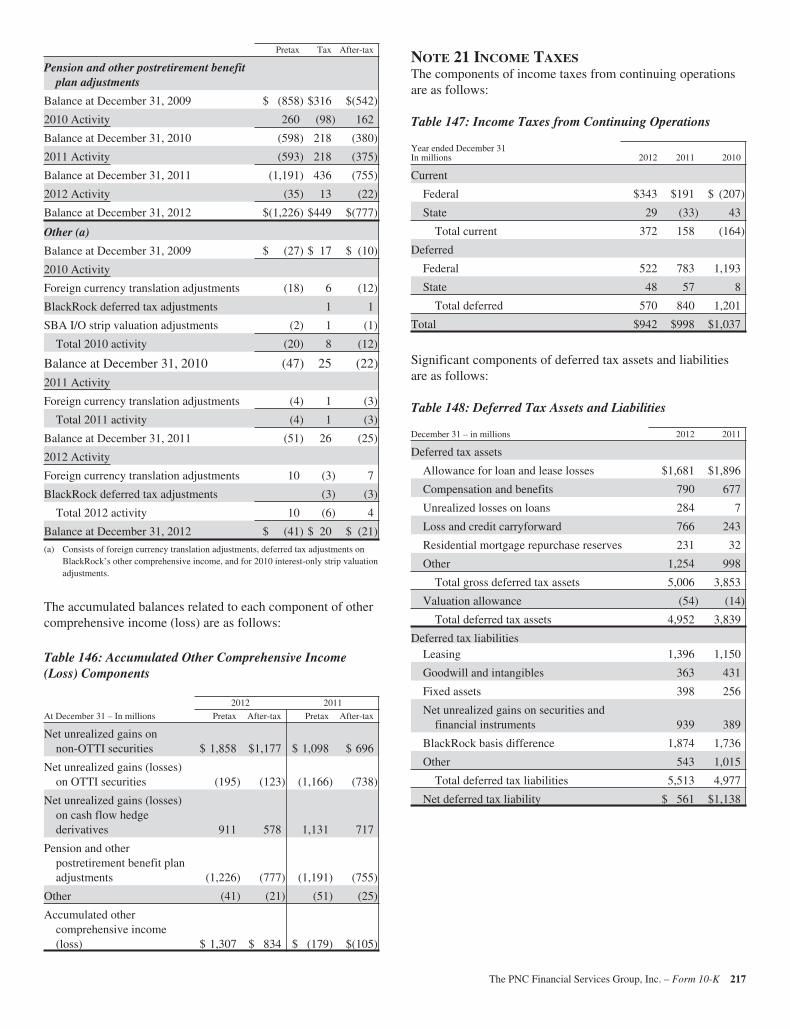
Pretax Tax After-tax
Pension and other postretirement benefitplan adjustments
Balance at December 31, 2009 $ (858) $316 $(542)
2010 Activity 260 (98) 162
Balance at December 31, 2010 (598) 218 (380)
2011 Activity (593) 218 (375)
Balance at December 31, 2011 (1,191) 436 (755)
2012 Activity (35) 13 (22)
Balance at December 31, 2012 $(1,226) $449 $(777)
Other (a)
Balance at December 31, 2009 $ (27) $ 17 $ (10)
2010 Activity
Foreign currency translation adjustments (18) 6 (12)
BlackRock deferred tax adjustments 1 1
SBA I/O strip valuation adjustments (2) 1 (1)
Total 2010 activity (20) 8 (12)
Balance at December 31, 2010 (47) 25 (22)
2011 Activity
Foreign currency translation adjustments (4) 1 (3)
Total 2011 activity (4) 1 (3)
Balance at December 31, 2011 (51) 26 (25)
2012 Activity
Foreign currency translation adjustments 10 (3) 7
BlackRock deferred tax adjustments (3) (3)
Total 2012 activity 10 (6) 4
Balance at December 31, 2012 $ (41) $ 20 $ (21)
(a) Consists of foreign currency translation adjustments, deferred tax adjustments onBlackRock’s other comprehensive income, and for 2010 interest-only strip valuationadjustments.
The accumulated balances related to each component of othercomprehensive income (loss) are as follows:
Table 146: Accumulated Other Comprehensive Income(Loss) Components
2012 2011
At December 31 – In millions Pretax After-tax Pretax After-tax
Net unrealized gains onnon-OTTI securities $ 1,858 $1,177 $ 1,098 $ 696
Net unrealized gains (losses)on OTTI securities (195) (123) (1,166) (738)
Net unrealized gains (losses)on cash flow hedgederivatives 911 578 1,131 717
Pension and otherpostretirement benefit planadjustments (1,226) (777) (1,191) (755)
Other (41) (21) (51) (25)
Accumulated othercomprehensive income(loss) $ 1,307 $ 834 $ (179) $(105)
NOTE 21 INCOME TAXESThe components of income taxes from continuing operationsare as follows:
Table 147: Income Taxes from Continuing Operations
Year ended December 31In millions 2012 2011 2010
Current
Federal $343 $191 $ (207)
State 29 (33) 43
Total current 372 158 (164)
Deferred
Federal 522 783 1,193
State 48 57 8
Total deferred 570 840 1,201
Total $942 $998 $1,037
Significant components of deferred tax assets and liabilitiesare as follows:
Table 148: Deferred Tax Assets and Liabilities
December 31 – in millions 2012 2011
Deferred tax assets
Allowance for loan and lease losses $1,681 $1,896
Compensation and benefits 790 677
Unrealized losses on loans 284 7
Loss and credit carryforward 766 243
Residential mortgage repurchase reserves 231 32
Other 1,254 998
Total gross deferred tax assets 5,006 3,853
Valuation allowance (54) (14)
Total deferred tax assets 4,952 3,839
Deferred tax liabilitiesLeasing 1,396 1,150
Goodwill and intangibles 363 431
Fixed assets 398 256
Net unrealized gains on securities andfinancial instruments 939 389
BlackRock basis difference 1,874 1,736
Other 543 1,015
Total deferred tax liabilities 5,513 4,977
Net deferred tax liability $ 561 $1,138
The PNC Financial Services Group, Inc. – Form 10-K 217
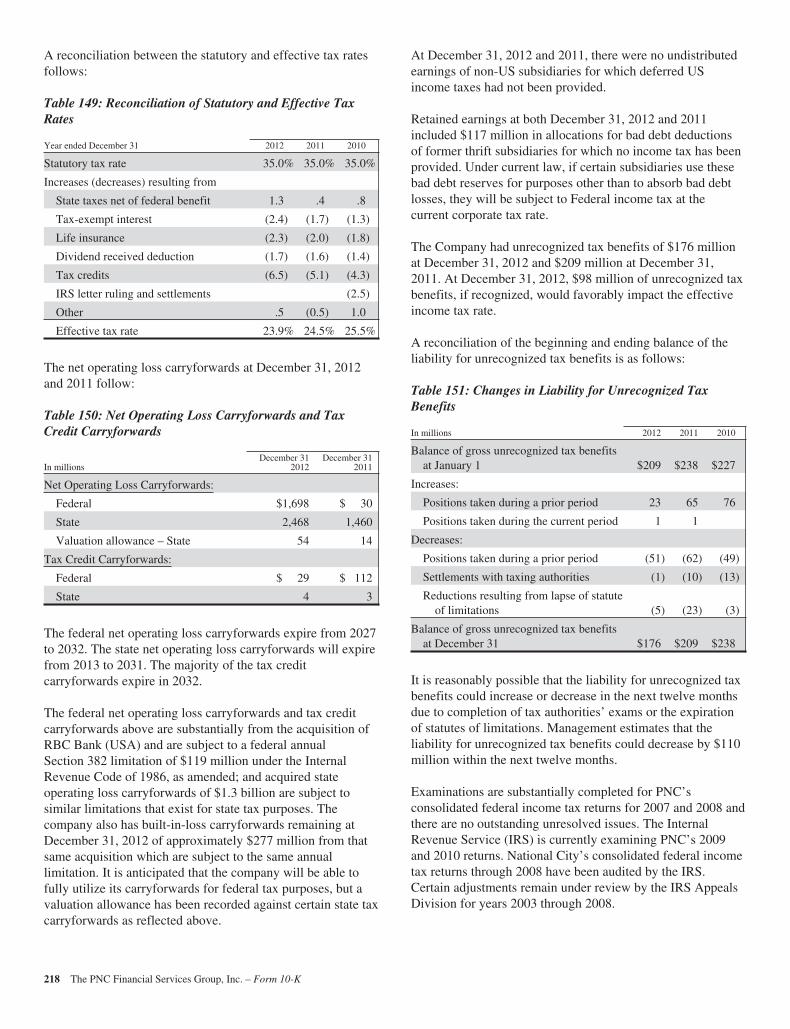
A reconciliation between the statutory and effective tax ratesfollows:
Table 149: Reconciliation of Statutory and Effective TaxRates
Year ended December 31 2012 2011 2010
Statutory tax rate 35.0% 35.0% 35.0%
Increases (decreases) resulting from
State taxes net of federal benefit 1.3 .4 .8
Tax-exempt interest (2.4) (1.7) (1.3)
Life insurance (2.3) (2.0) (1.8)
Dividend received deduction (1.7) (1.6) (1.4)
Tax credits (6.5) (5.1) (4.3)
IRS letter ruling and settlements (2.5)
Other .5 (0.5) 1.0
Effective tax rate 23.9% 24.5% 25.5%
The net operating loss carryforwards at December 31, 2012and 2011 follow:
Table 150: Net Operating Loss Carryforwards and TaxCredit Carryforwards
In millionsDecember 31
2012December 31
2011
Net Operating Loss Carryforwards:
Federal $1,698 $ 30
State 2,468 1,460
Valuation allowance – State 54 14
Tax Credit Carryforwards:
Federal $ 29 $ 112
State 4 3
The federal net operating loss carryforwards expire from 2027to 2032. The state net operating loss carryforwards will expirefrom 2013 to 2031. The majority of the tax creditcarryforwards expire in 2032.
The federal net operating loss carryforwards and tax creditcarryforwards above are substantially from the acquisition ofRBC Bank (USA) and are subject to a federal annualSection 382 limitation of $119 million under the InternalRevenue Code of 1986, as amended; and acquired stateoperating loss carryforwards of $1.3 billion are subject tosimilar limitations that exist for state tax purposes. Thecompany also has built-in-loss carryforwards remaining atDecember 31, 2012 of approximately $277 million from thatsame acquisition which are subject to the same annuallimitation. It is anticipated that the company will be able tofully utilize its carryforwards for federal tax purposes, but avaluation allowance has been recorded against certain state taxcarryforwards as reflected above.
At December 31, 2012 and 2011, there were no undistributedearnings of non-US subsidiaries for which deferred USincome taxes had not been provided.
Retained earnings at both December 31, 2012 and 2011included $117 million in allocations for bad debt deductionsof former thrift subsidiaries for which no income tax has beenprovided. Under current law, if certain subsidiaries use thesebad debt reserves for purposes other than to absorb bad debtlosses, they will be subject to Federal income tax at thecurrent corporate tax rate.
The Company had unrecognized tax benefits of $176 millionat December 31, 2012 and $209 million at December 31,2011. At December 31, 2012, $98 million of unrecognized taxbenefits, if recognized, would favorably impact the effectiveincome tax rate.
A reconciliation of the beginning and ending balance of theliability for unrecognized tax benefits is as follows:
Table 151: Changes in Liability for Unrecognized TaxBenefits
In millions 2012 2011 2010
Balance of gross unrecognized tax benefitsat January 1 $209 $238 $227
Increases:
Positions taken during a prior period 23 65 76
Positions taken during the current period 1 1
Decreases:
Positions taken during a prior period (51) (62) (49)
Settlements with taxing authorities (1) (10) (13)
Reductions resulting from lapse of statuteof limitations (5) (23) (3)
Balance of gross unrecognized tax benefitsat December 31 $176 $209 $238
It is reasonably possible that the liability for unrecognized taxbenefits could increase or decrease in the next twelve monthsdue to completion of tax authorities’ exams or the expirationof statutes of limitations. Management estimates that theliability for unrecognized tax benefits could decrease by $110million within the next twelve months.
Examinations are substantially completed for PNC’sconsolidated federal income tax returns for 2007 and 2008 andthere are no outstanding unresolved issues. The InternalRevenue Service (IRS) is currently examining PNC’s 2009and 2010 returns. National City’s consolidated federal incometax returns through 2008 have been audited by the IRS.Certain adjustments remain under review by the IRS AppealsDivision for years 2003 through 2008.
218 The PNC Financial Services Group, Inc. – Form 10-K
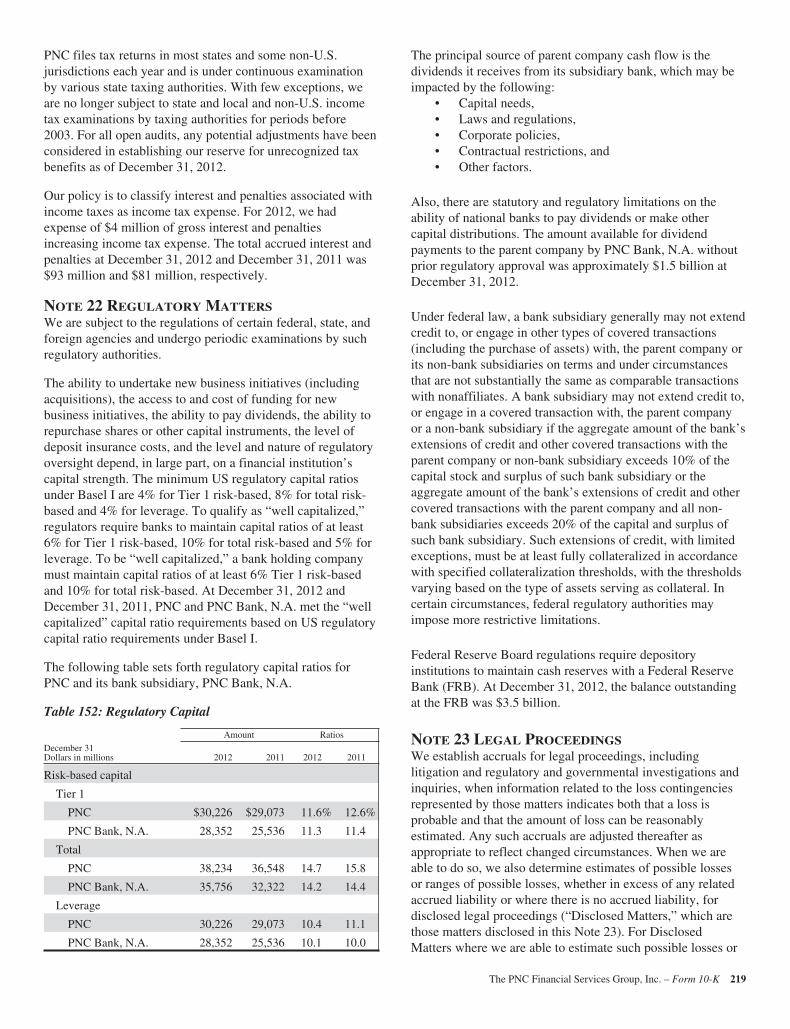
PNC files tax returns in most states and some non-U.S.jurisdictions each year and is under continuous examinationby various state taxing authorities. With few exceptions, weare no longer subject to state and local and non-U.S. incometax examinations by taxing authorities for periods before2003. For all open audits, any potential adjustments have beenconsidered in establishing our reserve for unrecognized taxbenefits as of December 31, 2012.
Our policy is to classify interest and penalties associated withincome taxes as income tax expense. For 2012, we hadexpense of $4 million of gross interest and penaltiesincreasing income tax expense. The total accrued interest andpenalties at December 31, 2012 and December 31, 2011 was$93 million and $81 million, respectively.
NOTE 22 REGULATORY MATTERSWe are subject to the regulations of certain federal, state, andforeign agencies and undergo periodic examinations by suchregulatory authorities.
The ability to undertake new business initiatives (includingacquisitions), the access to and cost of funding for newbusiness initiatives, the ability to pay dividends, the ability torepurchase shares or other capital instruments, the level ofdeposit insurance costs, and the level and nature of regulatoryoversight depend, in large part, on a financial institution’scapital strength. The minimum US regulatory capital ratiosunder Basel I are 4% for Tier 1 risk-based, 8% for total risk-based and 4% for leverage. To qualify as “well capitalized,”regulators require banks to maintain capital ratios of at least6% for Tier 1 risk-based, 10% for total risk-based and 5% forleverage. To be “well capitalized,” a bank holding companymust maintain capital ratios of at least 6% Tier 1 risk-basedand 10% for total risk-based. At December 31, 2012 andDecember 31, 2011, PNC and PNC Bank, N.A. met the “wellcapitalized” capital ratio requirements based on US regulatorycapital ratio requirements under Basel I.
The following table sets forth regulatory capital ratios forPNC and its bank subsidiary, PNC Bank, N.A.
Table 152: Regulatory Capital
Amount Ratios
December 31Dollars in millions 2012 2011 2012 2011
Risk-based capital
Tier 1
PNC $30,226 $29,073 11.6% 12.6%
PNC Bank, N.A. 28,352 25,536 11.3 11.4
Total
PNC 38,234 36,548 14.7 15.8
PNC Bank, N.A. 35,756 32,322 14.2 14.4
Leverage
PNC 30,226 29,073 10.4 11.1
PNC Bank, N.A. 28,352 25,536 10.1 10.0
The principal source of parent company cash flow is thedividends it receives from its subsidiary bank, which may beimpacted by the following:
• Capital needs,• Laws and regulations,• Corporate policies,• Contractual restrictions, and• Other factors.
Also, there are statutory and regulatory limitations on theability of national banks to pay dividends or make othercapital distributions. The amount available for dividendpayments to the parent company by PNC Bank, N.A. withoutprior regulatory approval was approximately $1.5 billion atDecember 31, 2012.
Under federal law, a bank subsidiary generally may not extendcredit to, or engage in other types of covered transactions(including the purchase of assets) with, the parent company orits non-bank subsidiaries on terms and under circumstancesthat are not substantially the same as comparable transactionswith nonaffiliates. A bank subsidiary may not extend credit to,or engage in a covered transaction with, the parent companyor a non-bank subsidiary if the aggregate amount of the bank’sextensions of credit and other covered transactions with theparent company or non-bank subsidiary exceeds 10% of thecapital stock and surplus of such bank subsidiary or theaggregate amount of the bank’s extensions of credit and othercovered transactions with the parent company and all non-bank subsidiaries exceeds 20% of the capital and surplus ofsuch bank subsidiary. Such extensions of credit, with limitedexceptions, must be at least fully collateralized in accordancewith specified collateralization thresholds, with the thresholdsvarying based on the type of assets serving as collateral. Incertain circumstances, federal regulatory authorities mayimpose more restrictive limitations.
Federal Reserve Board regulations require depositoryinstitutions to maintain cash reserves with a Federal ReserveBank (FRB). At December 31, 2012, the balance outstandingat the FRB was $3.5 billion.
NOTE 23 LEGAL PROCEEDINGSWe establish accruals for legal proceedings, includinglitigation and regulatory and governmental investigations andinquiries, when information related to the loss contingenciesrepresented by those matters indicates both that a loss isprobable and that the amount of loss can be reasonablyestimated. Any such accruals are adjusted thereafter asappropriate to reflect changed circumstances. When we areable to do so, we also determine estimates of possible lossesor ranges of possible losses, whether in excess of any relatedaccrued liability or where there is no accrued liability, fordisclosed legal proceedings (“Disclosed Matters,” which arethose matters disclosed in this Note 23). For DisclosedMatters where we are able to estimate such possible losses or
The PNC Financial Services Group, Inc. – Form 10-K 219
ranges of possible losses, as of December 31, 2012, weestimate that it is reasonably possible that we could incurlosses in an aggregate amount of up to approximately $450million. The estimates included in this amount are based onour analysis of currently available information and are subjectto significant judgment and a variety of assumptions anduncertainties. As new information is obtained we may changeour estimates. Due to the inherent subjectivity of theassessments and unpredictability of outcomes of legalproceedings, any amounts accrued or included in thisaggregate amount may not represent the ultimate loss to usfrom the legal proceedings in question. Thus, our exposureand ultimate losses may be higher, and possibly significantlyso, than the amounts accrued or this aggregate amount.
The aggregate estimated amount provided above does notinclude an estimate for every Disclosed Matter, as we areunable, at this time, to estimate the losses that it is reasonablypossible that we could incur or ranges of such losses withrespect to some of the matters disclosed for one or more of thefollowing reasons. In our experience, legal proceedings areinherently unpredictable. In many legal proceedings, variousfactors exacerbate this inherent unpredictability, including,among others, one or more of the following: the proceeding isin its early stages; the damages sought are unspecified,unsupported or uncertain; it is unclear whether a case broughtas a class action will be allowed to proceed on that basis or, ifpermitted to proceed as a class action, how the class will bedefined; the plaintiff is seeking relief other than or in additionto compensatory damages; the matter presents meaningfullegal uncertainties, including novel issues of law; we have notengaged in meaningful settlement discussions; discovery hasnot started or is not complete; there are significant facts indispute; and there are a large number of parties named asdefendants (including where it is uncertain how damages orliability, if any, will be shared among multiple defendants).Generally, the less progress that has been made in theproceedings or the broader the range of potential results, theharder it is for us to estimate losses or ranges of losses that itis reasonably possible we could incur. Therefore, as theestimated aggregate amount disclosed above does not includeall of the Disclosed Matters, the amount disclosed above doesnot represent our maximum reasonably possible loss exposurefor all of the Disclosed Matters. The estimated aggregateamount also does not reflect any of our exposure to mattersnot so disclosed, as discussed below under “Other.”
We include in some of the descriptions of individualDisclosed Matters certain quantitative information related tothe plaintiff’s claim against us as alleged in the plaintiff’spleadings or other public filings or otherwise publiclyavailable information. While information of this type mayprovide insight into the potential magnitude of a matter, itdoes not necessarily represent our estimate of reasonablypossible loss or our judgment as to any currently appropriateaccrual.
Some of our exposure in Disclosed Matters may be offset byapplicable insurance coverage. We do not consider thepossible availability of insurance coverage in determining theamounts of any accruals (although we record the amount ofrelated insurance recoveries that are deemed probable up tothe amount of the accrual) or in determining any estimates ofpossible losses or ranges of possible losses.
Interchange LitigationBeginning in June 2005, a series of antitrust lawsuits werefiled against Visa®, MasterCard®, and several major financialinstitutions, including cases naming National City (sincemerged into PNC) and its subsidiary, National City Bank ofKentucky (since merged into National City Bank which inturn was merged into PNC Bank, N.A.). The cases have beenconsolidated for pretrial proceedings in the United StatesDistrict Court for the Eastern District of New York under thecaption In re Payment Card Interchange Fee and Merchant-Discount Antitrust Litigation (Master File No. 1:05-md-1720-JG-JO). Those cases naming National City were brought asclass actions on behalf of all persons or business entities whohave accepted Visa® or Master Card®. The plaintiffs,merchants operating commercial businesses throughout theU.S. and trade associations, allege, among other things, thatthe defendants conspired to fix the prices for general purposecard network services and otherwise imposed unreasonablerestraints on trade, resulting in the payment of inflatedinterchange fees, in violation of the antitrust laws. In January2009, the plaintiffs filed amended and supplementalcomplaints adding, among other things, allegations that therestructuring of Visa and MasterCard, each of which includedan initial public offering, violated the antitrust laws. In theircomplaints, the plaintiffs seek, among other things, injunctiverelief, unspecified damages (trebled under the antitrust laws)and attorneys’ fees.
In July 2012, the parties entered into a memorandum ofunderstanding with the class plaintiffs and an agreement inprinciple with certain individual plaintiffs with respect to asettlement of these cases, under which the defendants willcollectively pay approximately $6.6 billion to the class andindividual settling plaintiffs and have agreed to changes in theterms applicable to their respective card networks (includingan eight-month reduction in default credit interchange rates).The parties entered into a definitive agreement with respect tothis settlement in October 2012. The court granted preliminaryapproval of this settlement in November 2012. The settlementremains subject to, among other things, final court approval.As a result of the previously funded litigation escrow(described in Note 24 Commitments and Guarantees), whichwill cover substantially all of our share of the Visa portion, weanticipate no material financial impact from the monetaryamount of this settlement.
National City and National City Bank entered into judgmentand loss sharing agreements with Visa and certain other bankswith respect to all of the above referenced litigation. All of the
220 The PNC Financial Services Group, Inc. – Form 10-K
litigation against Visa is also subject to the indemnificationobligations described in Note 24 Commitments andGuarantees. PNC Bank, N.A. is not named a defendant in anyof the Visa or MasterCard related antitrust litigation nor was itinitially a party to the judgment or loss sharing agreements,but it has been subject to these indemnification obligationsand became responsible for National City Bank’s position inthe litigation and responsibilities under the agreements uponcompletion of the merger of National City Bank into PNCBank, N.A. In March 2011, we entered into a MasterCardSettlement and Judgment Sharing Agreement withMasterCard and other financial institution defendants and anOmnibus Agreement Regarding Interchange LitigationSharing and Settlement Sharing with Visa, MasterCard andother financial institution defendants. If there is a resolution ofall claims against all defendants, the Omnibus Agreement, insubstance, apportions that resolution into a Visa portion and aMasterCard portion, with the Visa portion being two-thirdsand the MasterCard portion being one-third. Thisapportionment only applies in the case of either a globalsettlement involving all defendants or an adverse judgmentagainst the defendants, to the extent that damages either arerelated to the merchants’ inter-network conspiracy claims orare otherwise not attributed to specific MasterCard or Visaconduct or damages. The MasterCard portion (or anyMasterCard-related liability not subject to the OmnibusAgreement) will then be apportioned under the MasterCardSettlement and Judgment Sharing Agreement amongMasterCard and PNC and the other financial institutiondefendants that are parties to this agreement. Theresponsibility for the Visa portion (or any Visa-relatedliability not subject to the Omnibus Agreement) will beapportioned under the pre-existing indemnificationresponsibilities and judgment and loss sharing agreements.
CBNV Mortgage LitigationBetween 2001 and 2003, on behalf of either individualplaintiffs or proposed classes of plaintiffs, several separatelawsuits were filed in state and federal courts againstCommunity Bank of Northern Virginia (CBNV) and otherdefendants asserting claims arising from second mortgageloans made to the plaintiffs. CBNV was merged into one ofMercantile Bankshares Corporation’s banks before PNCacquired Mercantile in 2007. The state lawsuits were removedto federal court and, with the lawsuits that had been filed infederal court, were consolidated for pre-trial proceedings in amultidistrict litigation (MDL) proceeding in the United StatesDistrict Court for the Western District of Pennsylvania,currently under the caption In re: Community Bank ofNorthern Virginia Lending Practices Litigation (No. 03-0425(W.D. Pa.), MDL No. 1674). In January 2008, thePennsylvania district court issued an order sending back to theGeneral Court of Justice, Superior Court Division, for WakeCounty, North Carolina the claims of two proposed classmembers. These claims are asserted in a case originally filedin 2001 and captioned Bumpers, et al. v. Community Bank ofNorthern Virginia (01-CVS-011342).
MDL Proceedings in Pennsylvania. In October 2011, theplaintiffs filed a joint consolidated amended class actioncomplaint covering all of the class action lawsuits pending inthis proceeding. The amended complaint names CBNV,another bank, and purchasers of loans originated by CBNVand the other bank (including the Residential FundingCompany, LLC) as defendants. (In May 2012, the ResidentialFunding Company, LLC filed for bankruptcy protection underChapter 11.) The principal allegations in the amendedcomplaint are that a group of persons and entities collectivelycharacterized as the “Shumway/Bapst Organization” referredprospective second residential mortgage loan borrowers toCBNV and the other bank, that CBNV and the other bankcharged these borrowers improper title and loan fees at loanclosings, that the disclosures provided to the borrowers at loanclosings were inaccurate, and that CBNV and the other bankpaid some of the loan fees to the Shumway/BapstOrganization as purported “kickbacks” for the referrals. Theamended complaint asserts claims for violations of the RealEstate Settlement Procedures Act (RESPA), the Truth inLending Act (TILA), as amended by the Home Ownership andEquity Protection Act (HOEPA), and the Racketeer Influencedand Corrupt Organizations Act (RICO).
The amended complaint seeks to certify a class of allborrowers who obtained a second residential non-purchasemoney mortgage loan, secured by their principal dwelling,from either CBNV or the other defendant bank, the terms ofwhich made the loan subject to HOEPA. The plaintiffs allegethat there are approximately 50,000 members of this class.They seek, among other things, unspecified damages(including treble damages under RICO and RESPA),rescission of loans, declaratory and injunctive relief, interest,and attorneys’ fees. In November 2011, the defendants filed amotion to dismiss the amended complaint, which was arguedin October 2012. The court has not yet ruled on this motion.
North Carolina Proceedings. The plaintiffs in Bumpers makesimilar allegations to those included in the amended complaintin the MDL proceedings. Following the remand to NorthCarolina state court, the plaintiffs in Bumpers sought torepresent a class of North Carolina borrowers in state courtproceedings in North Carolina. The plaintiffs claim that thisclass consists of approximately 650 borrowers. The districtcourt in Pennsylvania handling the MDL proceedings enjoinedclass proceedings in Bumpers in March 2008. In April 2008,the North Carolina superior court granted the Bumpersplaintiffs’ motion for summary judgment on their individualclaims and awarded them approximately $11,000 each plusinterest. CBNV appealed the grant of the motion for summaryjudgment. In September 2011, the North Carolina Court ofAppeals affirmed in part and reversed in part the granting ofthe plaintiffs’ motion for summary judgment. The courtaffirmed the judgment on the plaintiffs’ claim that they paid aloan discount fee but were not provided a loan discount. Itreversed the judgment on the plaintiffs’ claim that they wereovercharged for settlement services and remanded that claim
The PNC Financial Services Group, Inc. – Form 10-K 221
for trial. The court also held that, in light of the Pennsylvaniadistrict court’s injunction against class proceedings havingbeen vacated in September 2010, the trial court may onremand consider the issue of class certification. In August2012, the North Carolina Supreme Court granted our petitionfor discretionary review of the decision of the North CarolinaCourt of Appeals. The appeal was argued in January 2013.The court has not yet decided the appeal.
Overdraft LitigationBeginning in October 2009, PNC Bank, National City Bankand RBC Bank (USA) have been named in lawsuits brought asclass actions relating to the manner in which they chargedoverdraft fees on ATM and debit transactions to customersand related matters.
Status of MDL Cases. Three pending lawsuits naming PNCBank, one naming National City Bank and two naming RBCBank (USA), along with similar lawsuits against numerousother banks, have been consolidated for pre-trial proceedingsin the United States District Court for the Southern District ofFlorida (the “MDL Court”) under the caption In re CheckingAccount Overdraft Litigation (MDL No. 2036, CaseNo. 1:09-MD-02036-JLK ). A consolidated amendedcomplaint was filed in December 2010 that consolidated all ofthe claims in these four MDL Court cases. The first caseagainst RBC Bank (USA) pending in the MDL Court (Dasherv. RBC Bank (10-cv-22190-JLK)) was filed in July 2010 in theUnited States District Court for the Southern District ofFlorida. The other case against RBC Bank (USA) (Avery v.RBC Bank (Case No. 10-cv-329)) was originally filed in NorthCarolina state court in July 2010 and was removed to theUnited States District Court for the Eastern District of NorthCarolina before being transferred to the MDL Court. Anamended complaint was filed in Avery in August 2010.
All of the cases now pending in the MDL Court seek to certifymulti-state classes of customers for the common law claimsdescribed below (covering all states in which PNC Bank,National City Bank and RBC Bank (USA) had retail branchoperations during the class periods), and subclasses of PNCBank customers with accounts in Pennsylvania and NewJersey branches, of National City Bank customers withaccounts in Illinois branches, and of RBC Bank (USA)customers with accounts in North Carolina branches, witheach subclass being asserted for purposes of claims underthose states’ consumer protection statutes. No class periodsare stated in any of the complaints, other than for theapplicable statutes of limitations, which vary by state andclaim.
PNC Bank’s motion to dismiss the consolidated amendedcomplaint with respect to the cases pending against it andNational City Bank in the MDL Court was denied in March2011. In December 2011, the plaintiffs in cases pendingagainst PNC Bank and National City Bank in the MDL Courtmoved for class certification. In light of the settlement of a
separate lawsuit on behalf of National City Bank customers,the National City Bank plaintiffs did not move for classcertification on behalf of National City Bank customers. As toPNC Bank, the plaintiffs moved for class certification inaccordance with their consolidated amended complaint, exceptthat they did not seek a class as to the conversion claimsdescribed below. In May 2012, the court granted plaintiffs’motion for class certification.
In June 2012, PNC Bank reached an agreement to settle thethree cases pending against it in the MDL Court for $90million. This settlement received preliminary approval of thecourt in January 2013, and remains subject to, among otherthings, notice to the class and final court approval.
The customer agreements with the RBC Bank (USA) plaintiffscontain arbitration provisions. RBC Bank (USA)’s originalmotion in Dasher to compel arbitration under these provisionswas denied by the MDL Court. This denial was appealed tothe United States Court of Appeals for the Eleventh Circuit.While this appeal was pending, the United States SupremeCourt issued its decision in AT&T Mobility v. Concepcion,following which the court of appeals vacated the MDLCourt’s denial of the arbitration motion and remanded to theMDL Court for further consideration in light of theConcepcion decision. RBC Bank (USA)’s motion to compelarbitration, now covering both Dasher and Avery, was deniedin January 2013. We have appealed the denial of the motion tothe United States Court of Appeals for the Eleventh Circuit.
Status of Non-MDL Case. In December 2010, an additionallawsuit (Henry v. PNC Bank, National Association(No. GD-10-022974)) was filed in the Court of Common Pleasof Allegheny County, Pennsylvania on behalf of all currentcitizens of Pennsylvania who are domiciled in Pennsylvaniawho had or have a PNC checking or debit account usedprimarily for personal, family or household purposes and whoincurred overdraft and related fees on transactions resultingfrom the methodology of posting transactions fromDecember 8, 2004 through August 14, 2010. We filedpreliminary objections seeking dismissal of each of the claimsin this lawsuit in March 2011. In January 2012, the court ruledon our preliminary objections, dismissing several claims butoverruling our objections with respect to claims for breach ofcontract and the duty of good faith and fair dealing and forviolation of Pennsylvania’s consumer protection statute.
Nature of Claims. The complaints in each of these lawsuitsallege that the banks engaged in unlawful practices inassessing overdraft fees arising from electronic point-of-saleand ATM debits. The principal practice challenged in theselawsuits is the banks’ purportedly common policy of postingdebit transactions on a daily basis from highest amount tolowest amount, thereby allegedly inflating the number ofoverdraft fees assessed. Other practices challenged include thefailure to decline to honor debit card transactions where theaccount has insufficient funds to cover the transactions.
222 The PNC Financial Services Group, Inc. – Form 10-K
In the consolidated amended complaint against PNC Bank inthe MDL Court, the plaintiffs asserted claims for breach of thecovenant of good faith and fair dealing; unconscionability;conversion; unjust enrichment; and violation of the consumerprotection statutes of Pennsylvania, Illinois and New Jersey.In the Dasher and Avery complaints, the plaintiffs assert thesame claims, except the state consumer protection statutoryclaims relate to the North Carolina statute and the Averycomplaint does not make claims for breach of the covenant ofgood faith and fair dealing or for conversion. In the Henrycase, the remaining claims are for breach of contract and theduty of good faith and fair dealing and for violation ofPennsylvania’s consumer protection statute. In theircomplaints, the plaintiffs seek, among other things, restitutionof overdraft fees paid, unspecified actual and punitivedamages (with actual damages, in some cases, trebled understate law), pre-judgment interest, attorneys’ fees, anddeclaratory relief finding the overdraft policies to be unfairand unconscionable.
Fulton FinancialIn 2009, Fulton Financial Advisors, N.A. filed lawsuits againstPNC Capital Markets, LLC and NatCity Investments, Inc. inthe Court of Common Pleas of Lancaster County,Pennsylvania arising out of Fulton’s purchase of auction ratecertificates (ARCs) through PNC and NatCity. Each of thelawsuits alleges violations of the Pennsylvania Securities Act,negligent misrepresentation, negligence, breach of fiduciaryduty, common law fraud, and aiding and abetting common lawfraud in connection with the purchase of the ARCs by Fulton.Specifically, Fulton alleges that, as a result of the decline offinancial markets in 2007 and 2008, the market for ARCsbecame illiquid; that PNC and NatCity knew or should haveknown of the increasing threat of the ARC market becomingilliquid; and that PNC and NatCity did not inform Fulton ofthis increasing threat, but allowed Fulton to continue topurchase ARCs, to Fulton’s detriment. In its complaints,Fulton alleges that it then held ARCs purchased through PNCfor a price of more than $123 million and purchased throughNatCity for a price of more than $175 million. In eachcomplaint, Fulton seeks, among other things, unspecifiedactual and punitive damages, rescission, attorneys’ fees andinterest.
In the case against PNC (Fulton Financial Advisors, N.A. v.PNC Capital Markets, LLC (CI 09-10838)), PNC filedpreliminary objections to Fulton’s complaint, which weredenied. NatCity removed the case against it to the UnitedStates District Court for the Eastern District of Pennsylvania(Fulton Financial Advisors, N.A. v. NatCity Investments, Inc.(No. 5:09-cv-04855)), and in November 2009 filed a motionto dismiss the complaint. The court has not yet ruled on thismotion.
FHLBIn October 2010, the Federal Home Loan Bank of Chicagobrought a lawsuit in the Circuit Court of Cook County,
Illinois, against numerous financial companies, including ThePNC Financial Services Group, Inc., as successor in interest toNational City Corporation, and PNC Investments LLC, assuccessor in interest to NatCity Investments, Inc. (FederalHome Loan Bank of Chicago v. Bank of America FundingCorp., et al. (Case No. 10CH45033)). The complaint allegesthat the defendants have liability to the Federal Home LoanBank of Chicago in a variety of capacities (in the case of theNational City entities, as underwriters) under Illinois statesecurities law and common law in connection with the allegedpurchase of private-label mortgage-backed securities by theFederal Home Loan Bank. According to the complaint, theFederal Home Loan Bank purchased approximately $3.3billion in mortgage-backed securities in total in transactionsaddressed by the complaint, approximately $345 million ofwhich was allegedly in transactions involving the NationalCity entities. The complaint alleges misrepresentations andomissions in connection with the sales of the mortgage-backedsecurities in question. In its complaint, the Federal HomeLoan Bank seeks, among other things, rescission, unspecifieddamages, interest, and attorneys’ fees. In November 2010, thedefendants removed the case to the United States DistrictCourt for the Northern District of Illinois. In January 2011, thedistrict court remanded the case to the Circuit Court of CookCounty. The plaintiff amended its complaint in March 2011and filed a corrected amended complaint in April 2011. Thecorrected amended complaint does not identify any additionaltransaction for which the plaintiff seeks recovery from PNCnor does it add any additional substantive allegations. In May2011, the defendants filed a motion to dismiss the correctedamended complaint. The motion was denied in September2012.
Weavering Macro Fixed Income FundIn July 2010, PNC completed the sale of PNC GlobalInvestment Servicing (“PNC GIS”) to The Bank of New YorkMellon Corporation (“BNY Mellon”), pursuant to a stockpurchase agreement dated February 1, 2010. In July 2009, theliquidators of the Weavering Macro Fixed Income FundLimited (“Weavering”) issued a Plenary Summons in the HighCourt, Dublin, Ireland, in connection with a Europeansubsidiary of PNC GIS’s provision of administration servicesto Weavering. The Plenary Summons was served on the PNCGIS subsidiary (GIS Europe) on or about June 30, 2010. InMay 2011, the liquidator served a Notice of Intention toProceed and Statement of Claim, which alleges, among otherthings, that GIS Europe breached its contractual duties toWeavering as well as an alleged duty of care to Weavering,and investors in Weavering, and makes claims of breach of theadministration and accounting services agreement, negligence,gross negligence, breach of duty, misrepresentation andnegligent misstatement. The statement of claim further allegesthat investors in Weavering lost approximately €282,000,000and that, in addition, expended approximately €98,000,000 inbrokerage and exchange commissions, interest, and fees as aresult of the transactions at issue. The statement of claimseeks, among other things, damages, costs, and interest. In
The PNC Financial Services Group, Inc. – Form 10-K 223
January 2012, upon application by GIS Europe, the courtissued a judgment ordering a hearing on certain preliminaryissues (a “modular trial”). In March 2012, the plaintiffappealed this judgment to the Supreme Court of Ireland. InDecember 2012, the Supreme Court reversed the order of theHigh Court and directed that no modular trial take place at thisstage of the proceedings. We now expect that the matter willproceed with full discovery and various pre-trial steps, afterwhich it will be set for trial.
In May 2011, BNY Mellon provided notice to PNC of anindemnification claim pursuant to the stock purchaseagreement related to this litigation. PNC’s responsibility forthis litigation is subject to the terms and limitations includedin the indemnification provisions of the stock purchaseagreement.
365/360 LitigationIn December 2008, a lawsuit was filed as a class actionagainst National City Bank in the Court of Common Pleas ofCuyahoga County, Ohio (DK&D Properties, LLC v. NationalCity Bank (Case no. 08 cv 680078)) alleging breach ofcontract arising from the use of the 365/360 method of interestcomputation in certain commercial promissory notes. Theplaintiffs sought to certify a class consisting of certain Ohiocommercial borrowers of National City Bank. The plaintiffsalleged that they obtained fixed or variable rate commercialloans from National City Bank pursuant to promissory notesor loan agreements setting forth annual or per annum interestrates, that the bank’s use of the 365/360 method of calculationof interest caused the borrower to pay interest over a calendaryear at a higher rate than the per annum rate stated in thepromissory notes, and that this was a breach of the terms ofthe promissory notes. The plaintiffs sought declaratory andinjunctive relief, compensatory damages, prejudgmentinterest, and attorneys’ fees.
In December 2011, the court granted National City Bank’smotion to stay the case pending the decision of the OhioSupreme Court in JNT Properties, LLC v. KeyBank NationalAssociation (Case No. 11-1392), which, although neither PNCBank nor National City Bank were parties, presented many ofthe same issues as those in DK&D Properties. In November2012, following the decision of the Ohio Supreme Court inJNT Properties, the plaintiffs voluntarily dismissed theircomplaint without prejudice.
False Claims Act LawsuitPNC Bank was named as a defendant, along with otherlenders, in a qui tam lawsuit brought in the U.S. District Courtfor the Northern District of Georgia by two individuals onbehalf of the United States under the federal False Claims Act(United States ex rel. Bibby & Donnelly v. Wells Fargo, et al.(1:06-CV-0547-AT)). The lawsuit was originally filed underseal, with a second amended complaint filed in June 2011. Thesecond amended complaint was unsealed by the district courtin October 2011. In the second amended complaint, the
plaintiffs, who alleged that they are officers of a mortgagebroker, allege that several mortgage originators, includingentities affiliated with PNC Bank’s predecessor, National CityBank, made false statements to the U.S. Department ofVeterans Affairs in order to obtain loan guarantees by the VAunder its Interest Rate Reduction Refinancing Loans (IRRRL)program. Under that program, the VA guarantees refinancingloans made to veterans if the loans meet programrequirements, one of which limits the type and amount of feesthat can be charged to borrowers by lenders. The plaintiffsalleged, among other things, that the defendants chargedimpermissible fees to borrowers under the VA program andthen made false statements to the VA concerning such fees inviolation of the civil False Claims Act. The plaintiffs allegedthat, by doing so, National City Bank and the other defendantscaused the VA to pay, among other costs, amounts in respectof the loan guarantees to which the defendants were notentitled. On their behalf and on behalf of the United States, theplaintiffs sought, among other things, unspecified damagesequal to the loss the defendants allegedly caused the UnitedStates (including treble damages under the False Claims Act),statutory civil penalties between $5,500 and $11,000 per falseclaim made by the defendants, injunctive relief againstsubmission of false claims to the United States and imposingunallowable charges against veterans participating in theIRRRL program, and attorneys’ fees. In April 2012, PNCBank reached an agreement with the plaintiffs to settle thislawsuit. In October 2012, the United States provided itsconsent to the settlement. The settlement became final inDecember 2012. The amount of the settlement was notmaterial to PNC and had been previously fully accrued.
Captive Mortgage Reinsurance LitigationIn December 2011, a lawsuit (White, et al. v. The PNCFinancial Services Group, Inc., et al. (Civil Action No. 11-7928)) was filed against PNC (as successor in interest toNational City Corporation and several of its subsidiaries) andseveral mortgage insurance companies in the United StatesDistrict Court for the Eastern District of Pennsylvania. Thislawsuit, which was brought as a class action, alleges thatNational City structured its program of reinsurance of privatemortgage insurance in such a way as to avoid a true transfer ofrisk from the mortgage insurers to National City’s captivereinsurer. The plaintiffs allege that the payments from themortgage insurers to the captive reinsurer constitutekickbacks, referral payments, or unearned fee splits prohibitedunder the Real Estate Settlement Procedures Act (RESPA), aswell as common law unjust enrichment. The plaintiffs claim,among other things, that from the beginning of 2004 until theend of 2010 National City’s captive reinsurer collected fromthe mortgage insurance company defendants at least $219million as its share of borrowers’ private mortgage insurancepremiums and that its share of paid claims during this periodwas approximately $12 million. The plaintiffs seek to certify anationwide class of all persons who obtained residentialmortgage loans originated, funded or originated throughcorrespondent lending by National City or any of its
224 The PNC Financial Services Group, Inc. – Form 10-K
subsidiaries or affiliates between January 1, 2004 and thepresent and, in connection with these mortgage loans,purchased private mortgage insurance and whose residentialmortgage loans were included within National City’s captivemortgage reinsurance arrangements. Plaintiffs seek, amongother things, statutory damages under RESPA (which includetreble damages), restitution of reinsurance premiumscollected, disgorgement of profits, and attorneys’ fees. InAugust 2012, the district court directed the plaintiffs to file anamended complaint, which the plaintiffs filed in September2012. In November 2012, we filed a motion to dismiss theamended complaint.
Residential Mortgage-Backed Securities IndemnificationDemandsWe have received indemnification demands from severalentities sponsoring residential mortgage-backed securities andtheir affiliates where purchasers of the securities have broughtlitigation against the sponsors and other parties involved in thesecuritization transactions. National City Mortgage had soldwhole loans to the sponsors or their affiliates that wereallegedly included in certain of these securitizationtransactions. According to the indemnification demands, theplaintiffs’ claims in these lawsuits are based on allegedmisstatements and omissions in the offering documents forthese transactions. The indemnification demands assert thatagreements governing the sale of these loans or thesecuritization transactions to which National City Mortgage isa party require us to indemnify the sponsors and their affiliatesfor losses suffered in connection with these lawsuits. Atpresent, there has been no determination that the partiesseeking indemnification have any liability to the plaintiffs inthese lawsuits.
Other Regulatory and Governmental InquiriesPNC is the subject of investigations, audits and other forms ofregulatory and governmental inquiry covering a broad rangeof issues in our banking, securities and other financial servicesbusinesses, in some cases as part of reviews of specifiedactivities at multiple industry participants. Over the last fewyears, we have experienced an increase in regulatory andgovernmental investigations, audits and other inquiries. Areasof current regulatory or governmental inquiry with respect toPNC include consumer financial protection, fair lending,mortgage origination and servicing, mortgage-relatedinsurance and reinsurance, municipal finance activities, andparticipation in government insurance or guarantee programs,some of which are described below. These inquiries, includingthose described below, may lead to administrative, civil orcriminal proceedings, and possibly result in remediesincluding fines, penalties, restitution, or alterations in ourbusiness practices, and in additional expenses and collateralcosts.
• One area of significant regulatory and governmentalfocus has been mortgage lending and servicing.Numerous federal and state governmental, legislative
and regulatory authorities are investigating practicesin this area. PNC has received inquiries from, or isthe subject of investigations by, a broad range ofgovernmental, legislative and regulatory authoritiesrelating to our activities in this area and iscooperating with these investigations and inquiries.As a result of the number and range of authoritiesconducting the investigations and inquiries, as well asthe nature of these types of investigations andinquiries, among other factors, PNC cannot at thistime predict the ultimate overall cost to or effect onPNC from potential governmental, legislative orregulatory actions arising out of these investigationsand inquiries.
• In April 2011, as a result of a publicly-disclosed interagency horizontal review ofresidential mortgage servicing operations atfourteen federally regulated mortgageservicers, PNC entered into a consent orderwith the Board of Governors of the FederalReserve System and PNC Bank entered into aconsent order with the Office of theComptroller of the Currency. Collectively,these consent orders describe certainforeclosure-related practices and controls thatthe regulators found to be deficient and requirePNC and PNC Bank to, among other things,develop and implement plans and programs toenhance PNC’s residential mortgage servicingand foreclosure processes, retain anindependent consultant to review certainresidential mortgage foreclosure actions, takecertain remedial actions, and overseecompliance with the orders and the new plansand programs. The two orders do not foreclosethe potential for civil money penalties fromeither of these regulators, although the range ofpotential penalties communicated to PNC bythe regulators in connection with theagreements described below is not material toPNC.
In connection with these orders, PNCestablished a Compliance Committee of theBoards of PNC and PNC Bank to monitor andcoordinate PNC’s and PNC Bank’simplementation of the commitments under theorders. PNC and PNC Bank are executingAction Plans designed to meet the requirementsof the orders. Consistent with the orders, PNCalso engaged an independent consultant toconduct a review of certain residentialforeclosure actions, including those identifiedthrough borrower complaints, and identifywhether any remedial actions for borrowers arenecessary. This review was on-goingthroughout 2012.
The PNC Financial Services Group, Inc. – Form 10-K 225
In early 2013, PNC and PNC Bank, along withtwelve other residential mortgage servicers,reached agreements with the OCC and theFederal Reserve to amend these consent orders.Pursuant to the amended consent orders, inorder to accelerate the remediation process,PNC agreed to make a payment ofapproximately $70 million for distribution topotentially affected borrowers in the reviewpopulation and to provide approximately$111 million in additional loss mitigation orother foreclosure prevention relief, which maybe satisfied pursuant to the amended consentorders by a variety of borrower relief actions orby additional cash payments or resourcecommitments to borrower counseling oreducation. Fulfillment of these commitmentswill satisfy all of PNC’s and PNC Bank’sobligations under the consent orders inconnection with the independent foreclosurereview. We do not expect any additionalfinancial charges related to the amendment tothe consent orders to be material. PNC’s andPNC Bank’s obligations to comply with theremaining provisions of the consent ordersremain.
• On February 9, 2012, the Department of Justice,other federal regulators and 49 state attorneys generalannounced agreements with the five largest mortgageservicers. Written agreements were filed with theU.S. District Court for the Southern District of NewYork in March 2012. Under these agreements, themortgage servicers will make cash payments tofederal and state governments, provide various formsof financial relief to borrowers, and implement newmortgage servicing standards. These governmentalauthorities are continuing their review of, and haveengaged in discussions with, other mortgageservicers, including PNC, that were subject to theinteragency horizontal review, which could result inthe imposition of substantial payments and otherforms of relief (similar to that agreed to by the fivelargest servicers) on some or all of these mortgageservicers, including PNC. Whether and to whatextent any such relief may be imposed on PNC andother smaller servicers is not yet known.
• PNC has received subpoenas from the U.S.Attorney’s Office for the Southern District of NewYork concerning National City Bank’s lendingpractices in connection with loans insured by theFederal Housing Administration (FHA) as well ascertain non-FHA-insured loan origination, sale andsecuritization practices. The U.S. Attorney’s Officeinquiry is in its early stage and PNC is cooperatingwith the investigation.
• The SEC previously commenced investigations ofactivities of National City prior to its acquisition by PNC.The SEC has requested, and we have provided to theSEC, documents concerning, among other things,National City’s capital-raising activities, loanunderwriting experience, allowance for loan losses,marketing practices, dividends, bank regulatory mattersand the sale of First Franklin Financial Corporation. InFebruary 2013, the SEC staff informed PNC that it hadcompleted its investigation and does not intend torecommend enforcement action.
Our practice is to cooperate fully with regulatory andgovernmental investigations, audits and other inquiries,including those described in this Note 23.
OtherIn addition to the proceedings or other matters describedabove, PNC and persons to whom we may haveindemnification obligations, in the normal course of business,are subject to various other pending and threatened legalproceedings in which claims for monetary damages and otherrelief are asserted. We do not anticipate, at the present time,that the ultimate aggregate liability, if any, arising out of suchother legal proceedings will have a material adverse effect onour financial position. However, we cannot now determinewhether or not any claims asserted against us or others towhom we may have indemnification obligations, whether inthe proceedings or other matters described above or otherwise,will have a material adverse effect on our results of operationsin any future reporting period, which will depend on, amongother things, the amount of the loss resulting from the claimand the amount of income otherwise reported for the reportingperiod.
See Note 24 Commitments and Guarantees for additionalinformation regarding the Visa indemnification and our otherobligations to provide indemnification, including to currentand former officers, directors, employees and agents of PNCand companies we have acquired, including National City.
NOTE 24 COMMITMENTS AND GUARANTEES
EQUITY FUNDING AND OTHER COMMITMENTS
Our unfunded commitments at December 31, 2012 includedprivate equity investments of $182 million, and otherinvestments of $3 million.
STANDBY LETTERS OF CREDIT
We issue standby letters of credit and have risk participationsin standby letters of credit issued by other financialinstitutions, in each case to support obligations of ourcustomers to third parties, such as insurance requirements andthe facilitation of transactions involving capital marketsproduct execution. Net outstanding standby letters of creditand internal credit ratings were as follows:
226 The PNC Financial Services Group, Inc. – Form 10-K
Table 153: Net Outstanding Standby Letters of Credit
Dollars in billionsDecember 31
2012December 31
2011
Net outstanding standby letters of credit $11.5 $10.8
Internal credit ratings (as a percentageof portfolio):
Pass (a) 95% 94%
Below pass (b) 5% 6%
(a) Indicates that expected risk of loss is currently low.(b) Indicates a higher degree of risk of default.
If the customer fails to meet its financial or performanceobligation to the third party under the terms of the contract orthere is a need to support a remarketing program, then uponthe request of the guaranteed party, subject to the terms of theletter of credit, we would be obligated to make payment tothem. The standby letters of credit and risk participations instandby letters of credit and bankers’ acceptances outstandingon December 31, 2012 had terms ranging from less than 1year to 7 years. The aggregate maximum amount of futurepayments PNC could be required to make under outstandingstandby letters of credit and risk participations in standbyletters of credit and bankers’ acceptances was $14.7 billion atDecember 31, 2012, of which $7.5 billion support remarketingprograms.
As of December 31, 2012, assets of $1.8 billion securedcertain specifically identified standby letters of credit.Recourse provisions from third parties of $3.2 billion werealso available for this purpose as of December 31, 2012. Inaddition, a portion of the remaining standby letters of creditand letter of credit risk participations issued on behalf ofspecific customers is also secured by collateral or guaranteesthat secure the customers’ other obligations to us. Thecarrying amount of the liability for our obligations related tostandby letters of credit and risk participations in standbyletters of credit and bankers’ acceptances was $247 million atDecember 31, 2012.
STANDBY BOND PURCHASE AGREEMENTS AND OTHER
LIQUIDITY FACILITIES
We enter into standby bond purchase agreements to supportmunicipal bond obligations. At December 31, 2012, theaggregate of our commitments under these facilities was $587million. We also enter into certain other liquidity facilities tosupport individual pools of receivables acquired bycommercial paper conduits. At December 31, 2012, our totalcommitments under these facilities were $145 million.
INDEMNIFICATIONS
We are a party to numerous acquisition or divestitureagreements under which we have purchased or sold, or agreedto purchase or sell, various types of assets. These agreementscan cover the purchase or sale of:
• Entire businesses,• Loan portfolios,
• Branch banks,• Partial interests in companies, or• Other types of assets.
These agreements generally include indemnificationprovisions under which we indemnify the third parties to theseagreements against a variety of risks to the indemnified partiesas a result of the transaction in question. When PNC is theseller, the indemnification provisions will generally alsoprovide the buyer with protection relating to the quality of theassets we are selling and the extent of any liabilities beingassumed by the buyer. Due to the nature of theseindemnification provisions, we cannot quantify the totalpotential exposure to us resulting from them.
We provide indemnification in connection with securitiesoffering transactions in which we are involved. When we arethe issuer of the securities, we provide indemnification to theunderwriters or placement agents analogous to theindemnification provided to the purchasers of businesses fromus, as described above. When we are an underwriter orplacement agent, we provide a limited indemnification to theissuer related to our actions in connection with the offeringand, if there are other underwriters, indemnification to theother underwriters intended to result in an appropriate sharingof the risk of participating in the offering. Due to the nature ofthese indemnification provisions, we cannot quantify the totalpotential exposure to us resulting from them.
In the ordinary course of business, we enter into certain typesof agreements that include provisions for indemnifying thirdparties. We also enter into certain types of agreements,including leases, assignments of leases, and subleases, inwhich we agree to indemnify third parties for acts by ouragents, assignees and/or sublessees, and employees. We alsoenter into contracts for the delivery of technology service inwhich we indemnify the other party against claims of patentand copyright infringement by third parties. Due to the natureof these indemnification provisions, we cannot calculate ouraggregate potential exposure under them.
In the ordinary course of business, we enter into contracts withthird parties under which the third parties provide services onbehalf of PNC. In many of these contracts, we agree toindemnify the third party service provider under certaincircumstances. The terms of the indemnity vary from contractto contract and the amount of the indemnification liability, ifany, cannot be determined.
We are a general or limited partner in certain assetmanagement and investment limited partnerships, many ofwhich contain indemnification provisions that would requireus to make payments in excess of our remaining unfundedcommitments. While in certain of these partnerships themaximum liability to us is limited to the sum of our unfundedcommitments and partnership distributions received by us, inthe others the indemnification liability is unlimited. As aresult, we cannot determine our aggregate potential exposurefor these indemnifications.
The PNC Financial Services Group, Inc. – Form 10-K 227
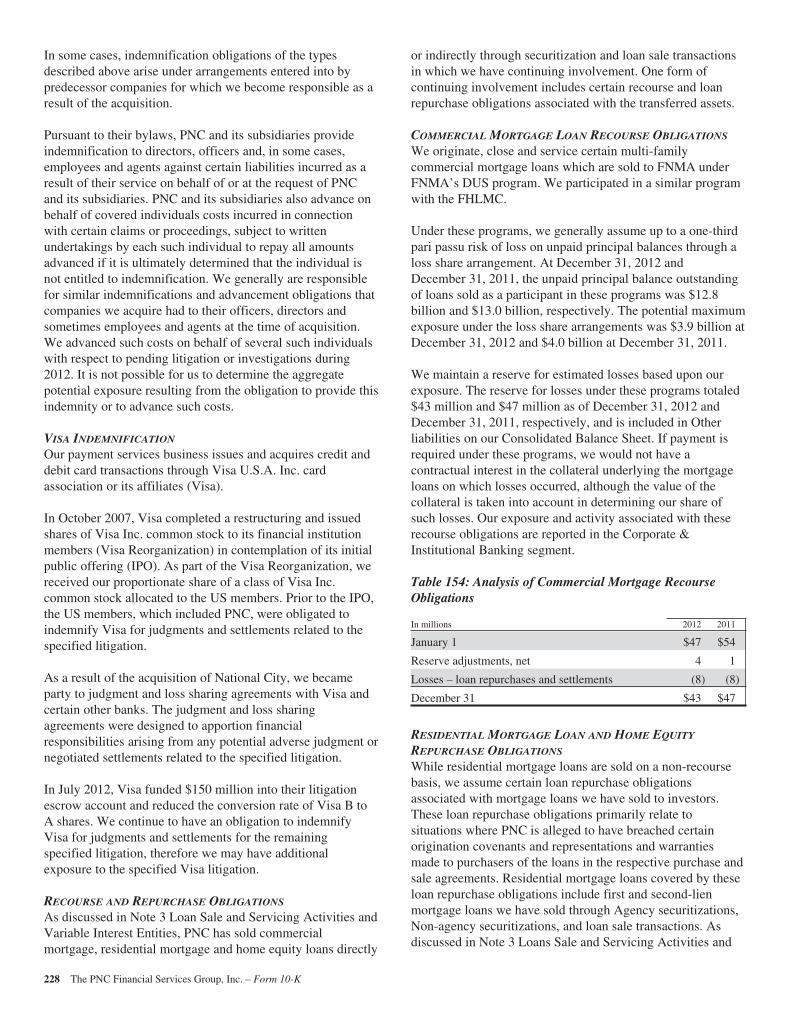
In some cases, indemnification obligations of the typesdescribed above arise under arrangements entered into bypredecessor companies for which we become responsible as aresult of the acquisition.
Pursuant to their bylaws, PNC and its subsidiaries provideindemnification to directors, officers and, in some cases,employees and agents against certain liabilities incurred as aresult of their service on behalf of or at the request of PNCand its subsidiaries. PNC and its subsidiaries also advance onbehalf of covered individuals costs incurred in connectionwith certain claims or proceedings, subject to writtenundertakings by each such individual to repay all amountsadvanced if it is ultimately determined that the individual isnot entitled to indemnification. We generally are responsiblefor similar indemnifications and advancement obligations thatcompanies we acquire had to their officers, directors andsometimes employees and agents at the time of acquisition.We advanced such costs on behalf of several such individualswith respect to pending litigation or investigations during2012. It is not possible for us to determine the aggregatepotential exposure resulting from the obligation to provide thisindemnity or to advance such costs.
VISA INDEMNIFICATION
Our payment services business issues and acquires credit anddebit card transactions through Visa U.S.A. Inc. cardassociation or its affiliates (Visa).
In October 2007, Visa completed a restructuring and issuedshares of Visa Inc. common stock to its financial institutionmembers (Visa Reorganization) in contemplation of its initialpublic offering (IPO). As part of the Visa Reorganization, wereceived our proportionate share of a class of Visa Inc.common stock allocated to the US members. Prior to the IPO,the US members, which included PNC, were obligated toindemnify Visa for judgments and settlements related to thespecified litigation.
As a result of the acquisition of National City, we becameparty to judgment and loss sharing agreements with Visa andcertain other banks. The judgment and loss sharingagreements were designed to apportion financialresponsibilities arising from any potential adverse judgment ornegotiated settlements related to the specified litigation.
In July 2012, Visa funded $150 million into their litigationescrow account and reduced the conversion rate of Visa B toA shares. We continue to have an obligation to indemnifyVisa for judgments and settlements for the remainingspecified litigation, therefore we may have additionalexposure to the specified Visa litigation.
RECOURSE AND REPURCHASE OBLIGATIONS
As discussed in Note 3 Loan Sale and Servicing Activities andVariable Interest Entities, PNC has sold commercialmortgage, residential mortgage and home equity loans directly
or indirectly through securitization and loan sale transactionsin which we have continuing involvement. One form ofcontinuing involvement includes certain recourse and loanrepurchase obligations associated with the transferred assets.
COMMERCIAL MORTGAGE LOAN RECOURSE OBLIGATIONS
We originate, close and service certain multi-familycommercial mortgage loans which are sold to FNMA underFNMA’s DUS program. We participated in a similar programwith the FHLMC.
Under these programs, we generally assume up to a one-thirdpari passu risk of loss on unpaid principal balances through aloss share arrangement. At December 31, 2012 andDecember 31, 2011, the unpaid principal balance outstandingof loans sold as a participant in these programs was $12.8billion and $13.0 billion, respectively. The potential maximumexposure under the loss share arrangements was $3.9 billion atDecember 31, 2012 and $4.0 billion at December 31, 2011.
We maintain a reserve for estimated losses based upon ourexposure. The reserve for losses under these programs totaled$43 million and $47 million as of December 31, 2012 andDecember 31, 2011, respectively, and is included in Otherliabilities on our Consolidated Balance Sheet. If payment isrequired under these programs, we would not have acontractual interest in the collateral underlying the mortgageloans on which losses occurred, although the value of thecollateral is taken into account in determining our share ofsuch losses. Our exposure and activity associated with theserecourse obligations are reported in the Corporate &Institutional Banking segment.
Table 154: Analysis of Commercial Mortgage RecourseObligations
In millions 2012 2011
January 1 $47 $54
Reserve adjustments, net 4 1
Losses – loan repurchases and settlements (8) (8)
December 31 $43 $47
RESIDENTIAL MORTGAGE LOAN AND HOME EQUITY
REPURCHASE OBLIGATIONS
While residential mortgage loans are sold on a non-recoursebasis, we assume certain loan repurchase obligationsassociated with mortgage loans we have sold to investors.These loan repurchase obligations primarily relate tosituations where PNC is alleged to have breached certainorigination covenants and representations and warrantiesmade to purchasers of the loans in the respective purchase andsale agreements. Residential mortgage loans covered by theseloan repurchase obligations include first and second-lienmortgage loans we have sold through Agency securitizations,Non-agency securitizations, and loan sale transactions. Asdiscussed in Note 3 Loans Sale and Servicing Activities and
228 The PNC Financial Services Group, Inc. – Form 10-K
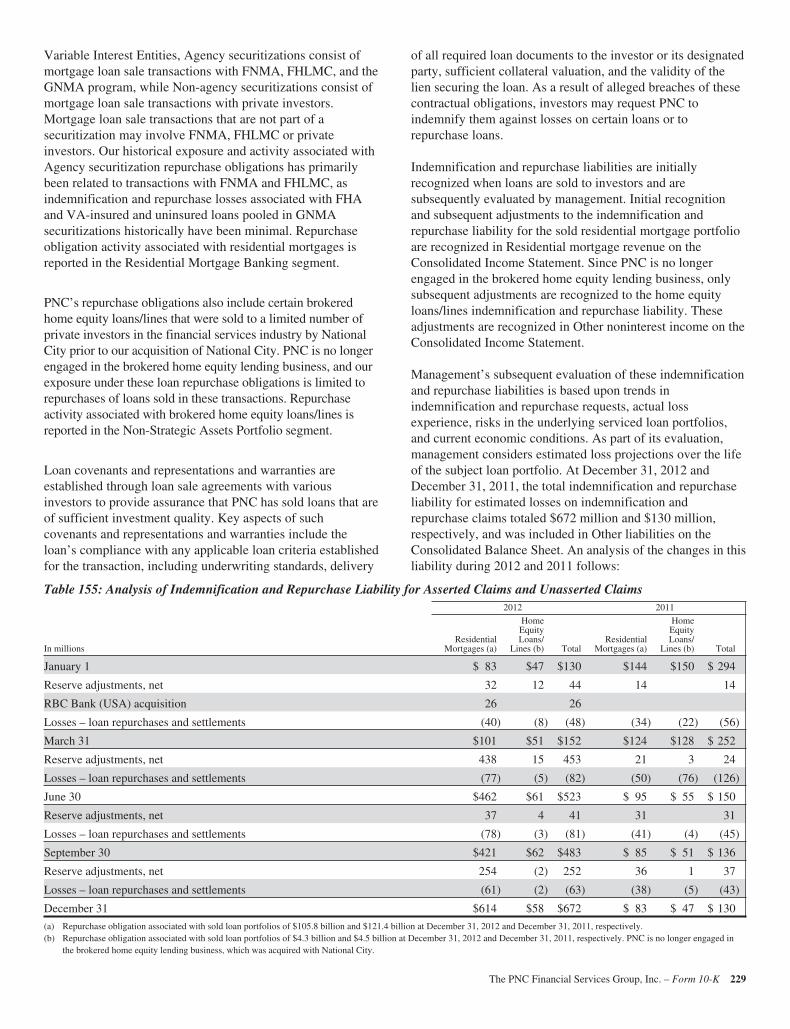
Variable Interest Entities, Agency securitizations consist ofmortgage loan sale transactions with FNMA, FHLMC, and theGNMA program, while Non-agency securitizations consist ofmortgage loan sale transactions with private investors.Mortgage loan sale transactions that are not part of asecuritization may involve FNMA, FHLMC or privateinvestors. Our historical exposure and activity associated withAgency securitization repurchase obligations has primarilybeen related to transactions with FNMA and FHLMC, asindemnification and repurchase losses associated with FHAand VA-insured and uninsured loans pooled in GNMAsecuritizations historically have been minimal. Repurchaseobligation activity associated with residential mortgages isreported in the Residential Mortgage Banking segment.
PNC’s repurchase obligations also include certain brokeredhome equity loans/lines that were sold to a limited number ofprivate investors in the financial services industry by NationalCity prior to our acquisition of National City. PNC is no longerengaged in the brokered home equity lending business, and ourexposure under these loan repurchase obligations is limited torepurchases of loans sold in these transactions. Repurchaseactivity associated with brokered home equity loans/lines isreported in the Non-Strategic Assets Portfolio segment.
Loan covenants and representations and warranties areestablished through loan sale agreements with variousinvestors to provide assurance that PNC has sold loans that areof sufficient investment quality. Key aspects of suchcovenants and representations and warranties include theloan’s compliance with any applicable loan criteria establishedfor the transaction, including underwriting standards, delivery
of all required loan documents to the investor or its designatedparty, sufficient collateral valuation, and the validity of thelien securing the loan. As a result of alleged breaches of thesecontractual obligations, investors may request PNC toindemnify them against losses on certain loans or torepurchase loans.
Indemnification and repurchase liabilities are initiallyrecognized when loans are sold to investors and aresubsequently evaluated by management. Initial recognitionand subsequent adjustments to the indemnification andrepurchase liability for the sold residential mortgage portfolioare recognized in Residential mortgage revenue on theConsolidated Income Statement. Since PNC is no longerengaged in the brokered home equity lending business, onlysubsequent adjustments are recognized to the home equityloans/lines indemnification and repurchase liability. Theseadjustments are recognized in Other noninterest income on theConsolidated Income Statement.
Management’s subsequent evaluation of these indemnificationand repurchase liabilities is based upon trends inindemnification and repurchase requests, actual lossexperience, risks in the underlying serviced loan portfolios,and current economic conditions. As part of its evaluation,management considers estimated loss projections over the lifeof the subject loan portfolio. At December 31, 2012 andDecember 31, 2011, the total indemnification and repurchaseliability for estimated losses on indemnification andrepurchase claims totaled $672 million and $130 million,respectively, and was included in Other liabilities on theConsolidated Balance Sheet. An analysis of the changes in thisliability during 2012 and 2011 follows:
Table 155: Analysis of Indemnification and Repurchase Liability for Asserted Claims and Unasserted Claims2012 2011
In millionsResidential
Mortgages (a)
HomeEquityLoans/
Lines (b) TotalResidential
Mortgages (a)
HomeEquityLoans/
Lines (b) Total
January 1 $ 83 $47 $130 $144 $150 $ 294
Reserve adjustments, net 32 12 44 14 14
RBC Bank (USA) acquisition 26 26
Losses – loan repurchases and settlements (40) (8) (48) (34) (22) (56)
March 31 $101 $51 $152 $124 $128 $ 252
Reserve adjustments, net 438 15 453 21 3 24
Losses – loan repurchases and settlements (77) (5) (82) (50) (76) (126)
June 30 $462 $61 $523 $ 95 $ 55 $ 150
Reserve adjustments, net 37 4 41 31 31
Losses – loan repurchases and settlements (78) (3) (81) (41) (4) (45)
September 30 $421 $62 $483 $ 85 $ 51 $ 136
Reserve adjustments, net 254 (2) 252 36 1 37
Losses – loan repurchases and settlements (61) (2) (63) (38) (5) (43)
December 31 $614 $58 $672 $ 83 $ 47 $ 130
(a) Repurchase obligation associated with sold loan portfolios of $105.8 billion and $121.4 billion at December 31, 2012 and December 31, 2011, respectively.(b) Repurchase obligation associated with sold loan portfolios of $4.3 billion and $4.5 billion at December 31, 2012 and December 31, 2011, respectively. PNC is no longer engaged in
the brokered home equity lending business, which was acquired with National City.
The PNC Financial Services Group, Inc. – Form 10-K 229
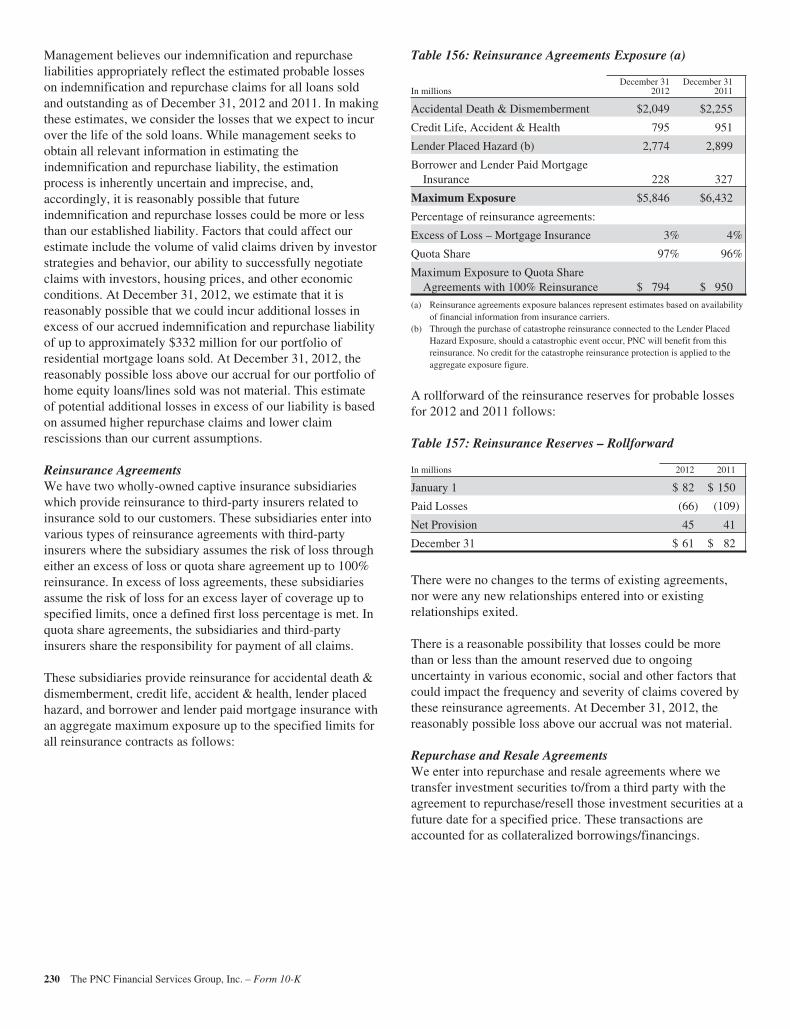
Management believes our indemnification and repurchaseliabilities appropriately reflect the estimated probable losseson indemnification and repurchase claims for all loans soldand outstanding as of December 31, 2012 and 2011. In makingthese estimates, we consider the losses that we expect to incurover the life of the sold loans. While management seeks toobtain all relevant information in estimating theindemnification and repurchase liability, the estimationprocess is inherently uncertain and imprecise, and,accordingly, it is reasonably possible that futureindemnification and repurchase losses could be more or lessthan our established liability. Factors that could affect ourestimate include the volume of valid claims driven by investorstrategies and behavior, our ability to successfully negotiateclaims with investors, housing prices, and other economicconditions. At December 31, 2012, we estimate that it isreasonably possible that we could incur additional losses inexcess of our accrued indemnification and repurchase liabilityof up to approximately $332 million for our portfolio ofresidential mortgage loans sold. At December 31, 2012, thereasonably possible loss above our accrual for our portfolio ofhome equity loans/lines sold was not material. This estimateof potential additional losses in excess of our liability is basedon assumed higher repurchase claims and lower claimrescissions than our current assumptions.
Reinsurance AgreementsWe have two wholly-owned captive insurance subsidiarieswhich provide reinsurance to third-party insurers related toinsurance sold to our customers. These subsidiaries enter intovarious types of reinsurance agreements with third-partyinsurers where the subsidiary assumes the risk of loss througheither an excess of loss or quota share agreement up to 100%reinsurance. In excess of loss agreements, these subsidiariesassume the risk of loss for an excess layer of coverage up tospecified limits, once a defined first loss percentage is met. Inquota share agreements, the subsidiaries and third-partyinsurers share the responsibility for payment of all claims.
These subsidiaries provide reinsurance for accidental death &dismemberment, credit life, accident & health, lender placedhazard, and borrower and lender paid mortgage insurance withan aggregate maximum exposure up to the specified limits forall reinsurance contracts as follows:
Table 156: Reinsurance Agreements Exposure (a)
In millionsDecember 31
2012December 31
2011
Accidental Death & Dismemberment $2,049 $2,255
Credit Life, Accident & Health 795 951
Lender Placed Hazard (b) 2,774 2,899
Borrower and Lender Paid MortgageInsurance 228 327
Maximum Exposure $5,846 $6,432
Percentage of reinsurance agreements:
Excess of Loss – Mortgage Insurance 3% 4%
Quota Share 97% 96%
Maximum Exposure to Quota ShareAgreements with 100% Reinsurance $ 794 $ 950
(a) Reinsurance agreements exposure balances represent estimates based on availabilityof financial information from insurance carriers.
(b) Through the purchase of catastrophe reinsurance connected to the Lender PlacedHazard Exposure, should a catastrophic event occur, PNC will benefit from thisreinsurance. No credit for the catastrophe reinsurance protection is applied to theaggregate exposure figure.
A rollforward of the reinsurance reserves for probable lossesfor 2012 and 2011 follows:
Table 157: Reinsurance Reserves – Rollforward
In millions 2012 2011
January 1 $ 82 $ 150
Paid Losses (66) (109)
Net Provision 45 41
December 31 $ 61 $ 82
There were no changes to the terms of existing agreements,nor were any new relationships entered into or existingrelationships exited.
There is a reasonable possibility that losses could be morethan or less than the amount reserved due to ongoinguncertainty in various economic, social and other factors thatcould impact the frequency and severity of claims covered bythese reinsurance agreements. At December 31, 2012, thereasonably possible loss above our accrual was not material.
Repurchase and Resale AgreementsWe enter into repurchase and resale agreements where wetransfer investment securities to/from a third party with theagreement to repurchase/resell those investment securities at afuture date for a specified price. These transactions areaccounted for as collateralized borrowings/financings.
230 The PNC Financial Services Group, Inc. – Form 10-K
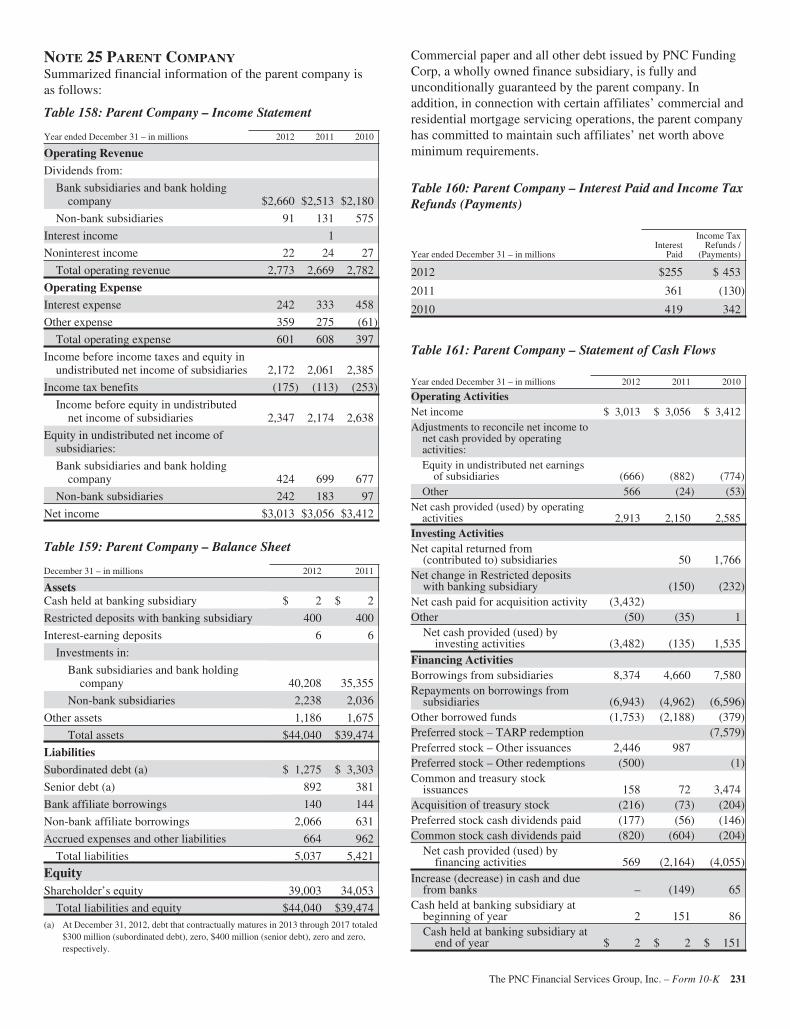
NOTE 25 PARENT COMPANYSummarized financial information of the parent company isas follows:
Table 158: Parent Company – Income Statement
Year ended December 31 – in millions 2012 2011 2010
Operating Revenue
Dividends from:
Bank subsidiaries and bank holdingcompany $2,660 $2,513 $2,180
Non-bank subsidiaries 91 131 575
Interest income 1
Noninterest income 22 24 27
Total operating revenue 2,773 2,669 2,782
Operating Expense
Interest expense 242 333 458
Other expense 359 275 (61)
Total operating expense 601 608 397
Income before income taxes and equity inundistributed net income of subsidiaries 2,172 2,061 2,385
Income tax benefits (175) (113) (253)
Income before equity in undistributednet income of subsidiaries 2,347 2,174 2,638
Equity in undistributed net income ofsubsidiaries:
Bank subsidiaries and bank holdingcompany 424 699 677
Non-bank subsidiaries 242 183 97
Net income $3,013 $3,056 $3,412
Table 159: Parent Company – Balance Sheet
December 31 – in millions 2012 2011
AssetsCash held at banking subsidiary $ 2 $ 2
Restricted deposits with banking subsidiary 400 400
Interest-earning deposits 6 6
Investments in:
Bank subsidiaries and bank holdingcompany 40,208 35,355
Non-bank subsidiaries 2,238 2,036
Other assets 1,186 1,675
Total assets $44,040 $39,474
Liabilities
Subordinated debt (a) $ 1,275 $ 3,303
Senior debt (a) 892 381
Bank affiliate borrowings 140 144
Non-bank affiliate borrowings 2,066 631
Accrued expenses and other liabilities 664 962
Total liabilities 5,037 5,421
EquityShareholder’s equity 39,003 34,053
Total liabilities and equity $44,040 $39,474(a) At December 31, 2012, debt that contractually matures in 2013 through 2017 totaled
$300 million (subordinated debt), zero, $400 million (senior debt), zero and zero,respectively.
Commercial paper and all other debt issued by PNC FundingCorp, a wholly owned finance subsidiary, is fully andunconditionally guaranteed by the parent company. Inaddition, in connection with certain affiliates’ commercial andresidential mortgage servicing operations, the parent companyhas committed to maintain such affiliates’ net worth aboveminimum requirements.
Table 160: Parent Company – Interest Paid and Income TaxRefunds (Payments)
Year ended December 31 – in millionsInterest
Paid
Income TaxRefunds /
(Payments)
2012 $255 $ 453
2011 361 (130)
2010 419 342
Table 161: Parent Company – Statement of Cash Flows
Year ended December 31 – in millions 2012 2011 2010
Operating ActivitiesNet income $ 3,013 $ 3,056 $ 3,412Adjustments to reconcile net income to
net cash provided by operatingactivities:Equity in undistributed net earnings
of subsidiaries (666) (882) (774)Other 566 (24) (53)
Net cash provided (used) by operatingactivities 2,913 2,150 2,585
Investing ActivitiesNet capital returned from
(contributed to) subsidiaries 50 1,766Net change in Restricted deposits
with banking subsidiary (150) (232)Net cash paid for acquisition activity (3,432)Other (50) (35) 1
Net cash provided (used) byinvesting activities (3,482) (135) 1,535
Financing ActivitiesBorrowings from subsidiaries 8,374 4,660 7,580Repayments on borrowings from
subsidiaries (6,943) (4,962) (6,596)Other borrowed funds (1,753) (2,188) (379)Preferred stock – TARP redemption (7,579)Preferred stock – Other issuances 2,446 987Preferred stock – Other redemptions (500) (1)Common and treasury stock
issuances 158 72 3,474Acquisition of treasury stock (216) (73) (204)Preferred stock cash dividends paid (177) (56) (146)Common stock cash dividends paid (820) (604) (204)
Net cash provided (used) byfinancing activities 569 (2,164) (4,055)
Increase (decrease) in cash and duefrom banks – (149) 65
Cash held at banking subsidiary atbeginning of year 2 151 86Cash held at banking subsidiary at
end of year $ 2 $ 2 $ 151
The PNC Financial Services Group, Inc. – Form 10-K 231

NOTE 26 SEGMENT REPORTINGWe have six reportable business segments:
• Retail Banking• Corporate & Institutional Banking• Asset Management Group• Residential Mortgage Banking• BlackRock• Non-Strategic Assets Portfolio
Results of individual businesses are presented based on ourinternal management reporting practices. There is nocomprehensive, authoritative body of guidance formanagement accounting equivalent to GAAP; therefore, thefinancial results of our individual businesses are notnecessarily comparable with similar information for any othercompany. We periodically refine our internal methodologiesas management reporting practices are enhanced. To theextent practicable, retrospective application of newmethodologies is made to prior period reportable businesssegment results and disclosures to create comparability to thecurrent period presentation to reflect any such refinements.
Financial results are presented, to the extent practicable, as ifeach business operated on a stand-alone basis. Additionally,we have aggregated the results for corporate support functionswithin “Other” for financial reporting purposes.
Assets receive a funding charge and liabilities and capitalreceive a funding credit based on a transfer pricingmethodology that incorporates product maturities, durationand other factors. During the second quarter of 2012,enhancements were made to the funds transfer pricingmethodology. Retrospective application of our new fundstransfer pricing methodology has been made to the priorperiod reportable business segment results and disclosures tocreate comparability to the current period presentation, whichwe believe is more meaningful to readers of our financialstatements.
A portion of capital is intended to cover unexpected losses andis assigned to our business segments using our risk-basedeconomic capital model, including consideration of thegoodwill and other intangible assets at those businesssegments, as well as the diversification of risk among thebusiness segments.
We have allocated the allowances for loan and lease lossesand for unfunded loan commitments and letters of credit basedon our assessment of risk in each business segment’s loanportfolio. Our allocation of the costs incurred by operationsand other shared support areas not directly aligned with thebusinesses is primarily based on the use of services. Keyreserve assumptions and estimation processes react to and areinfluenced by observed changes in loan portfolio performanceexperience, the financial strength of the borrower, andeconomic conditions. Key reserve assumptions areperiodically updated. During the third quarter of 2012, PNC
increased the amount of internally observed data used inestimating the key commercial lending assumptions of PDsand LGDs. Prior periods are not presented on a comparablebasis as it is not practicable to do so.
Total business segment financial results differ fromconsolidated income from continuing operations beforenoncontrolling interests, which itself excludes the earningsand revenue attributable to GIS through June 30, 2010 and therelated third quarter 2010 after-tax gain on the sale of GIS thatare reflected in discontinued operations. The impact of thesedifferences is reflected in the “Other” category in the businesssegment tables. “Other” includes residual activities that do notmeet the criteria for disclosure as a separate reportablebusiness, such as gains or losses related to BlackRocktransactions, integration costs, asset and liability managementactivities including net securities gains or losses, other-than-temporary impairment of investment securities and certaintrading activities, exited businesses, alternative investmentsincluding private equity, intercompany eliminations, mostcorporate overhead, tax adjustments that are not allocated tobusiness segments and differences between business segmentperformance reporting and financial statement reporting(GAAP), including the presentation of net income attributableto noncontrolling interests as the segments’ results excludetheir portion of net income attributable to noncontrollinginterests. Assets, revenue and earnings attributable to foreignactivities were not material in the periods presented forcomparative purposes.
BUSINESS SEGMENT PRODUCTS AND SERVICES
Retail Banking provides deposit, lending, brokerage,investment management, and cash management services toconsumer and small business customers within our primarygeographic markets. Our customers are serviced through ourbranch network, call centers, online banking and mobilechannels. The branch network is located primarily inPennsylvania, Ohio, New Jersey, Michigan, Illinois,Maryland, Indiana, North Carolina, Florida, Kentucky,Washington, D.C., Delaware, Alabama, Virginia, Georgia,Missouri, Wisconsin and South Carolina.
Corporate & Institutional Banking provides lending, treasurymanagement and capital markets-related products and servicesto mid-sized corporations, government and not-for-profitentities and selectively to large corporations. Lendingproducts include secured and unsecured loans, letters of creditand equipment leases. Treasury management services includecash and investment management, receivables management,disbursement services, funds transfer services, informationreporting and global trade services. Capital markets-relatedproducts and services include foreign exchange, derivatives,loan syndications, mergers and acquisitions advisory andrelated services to middle-market companies, our multi-sellerconduit, securities underwriting and securities sales andtrading. Corporate & Institutional Banking also providescommercial loan servicing, and real estate advisory and
232 The PNC Financial Services Group, Inc. – Form 10-K

technology solutions for the commercial real estate financeindustry. Corporate & Institutional Banking provides productsand services generally within our primary geographic markets,with certain products and services offered nationally andinternationally.
Asset Management Group includes personal wealthmanagement for high net worth and ultra high net worthclients and institutional asset management. Wealthmanagement products and services include investment andretirement planning, customized investment management,private banking, tailored credit solutions and trustmanagement and administration for individuals and theirfamilies. Institutional asset management provides investmentmanagement, custody and retirement administration services.Institutional clients include corporations, unions,municipalities, non-profits, foundations and endowments,primarily located in our geographic footprint.
Residential Mortgage Banking directly originates primarilyfirst lien residential mortgage loans on a nationwide basis witha significant presence within the retail banking footprint, andalso originates loans through majority owned affiliates.Mortgage loans represent loans collateralized by one-to-four-family residential real estate. These loans are typicallyunderwritten to government agency and/or third-partystandards, and sold, servicing retained, to secondary mortgageconduits of FNMA, FHLMC, Federal Home Loan Banks andthird-party investors, or are securitized and issued under theGNMA program. The mortgage servicing operation performsall functions related to servicing mortgage loans, primarilythose in first lien position, for various investors and for loansowned by PNC. Certain loan applications are brokered bymajority owned affiliates to others.
BlackRock is a leader in investment management, riskmanagement and advisory services for institutional and retailclients worldwide. BlackRock provides diversified investmentmanagement services to institutional clients, intermediary andindividual investors through various investment vehicles.Investment management services primarily consist of themanagement of equity, fixed income, multi-asset class,alternative investment and cash management products.BlackRock offers its investment products in a variety ofvehicles, including open-end and closed-end mutual funds,iShares® exchange-traded funds (ETFs), collective investmenttrusts and separate accounts. In addition, BlackRock providesmarket risk management, financial markets advisory andenterprise investment system services to a broad base ofclients. Financial markets advisory services include valuationservices relating to illiquid securities, dispositions andworkout assignments (including long-term portfolioliquidation assignments), risk management and strategicplanning and execution.
We hold an equity investment in BlackRock, which is a keycomponent of our diversified revenue strategy. BlackRock is apublicly traded company, and additional information regardingits business is available in its filings with the Securities andExchange Commission (SEC). At December 31, 2012, oureconomic interest in BlackRock was 22%.
PNC received cash dividends from BlackRock of $225 millionduring 2012, $212 million during 2011, and $178 millionduring 2010.
Non-Strategic Assets Portfolio (formerly, Distressed AssetsPortfolio) includes a consumer portfolio of mainly residentialmortgage and brokered home equity loans and a smallcommercial loan and lease portfolio. We obtained a significantportion of these non-strategic assets through acquisitions ofother companies.
The PNC Financial Services Group, Inc. – Form 10-K 233
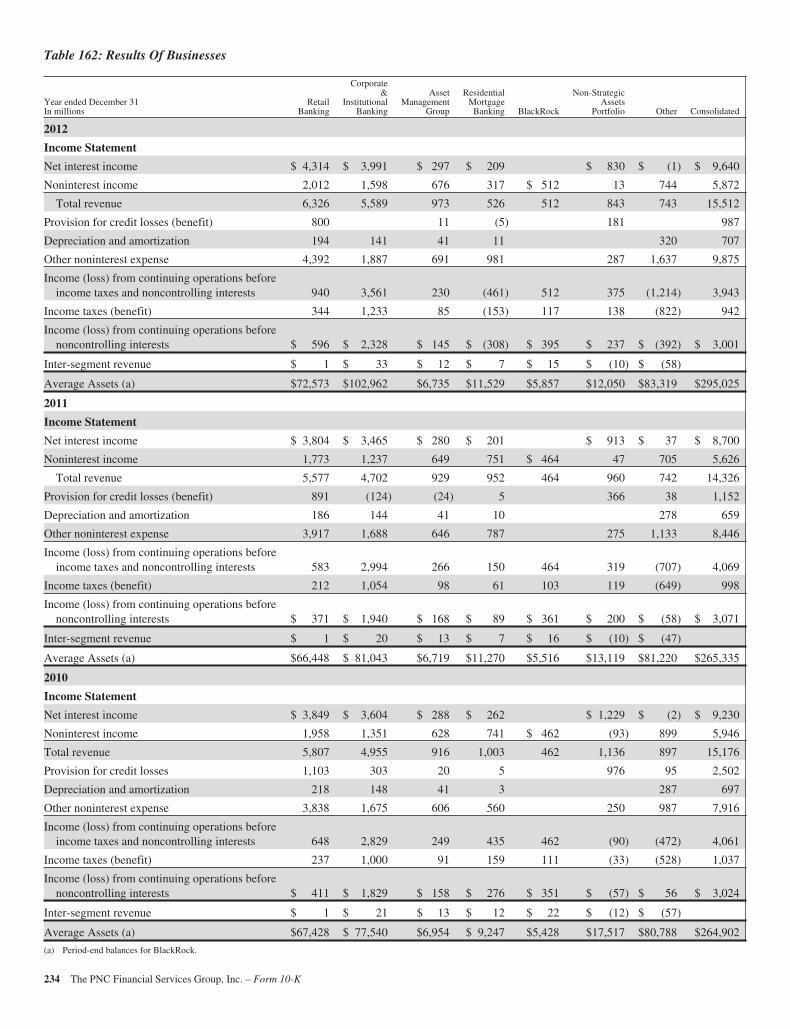
Table 162: Results Of Businesses
Year ended December 31In millions
RetailBanking
Corporate&
InstitutionalBanking
AssetManagement
Group
ResidentialMortgageBanking BlackRock
Non-StrategicAssets
Portfolio Other Consolidated
2012
Income Statement
Net interest income $ 4,314 $ 3,991 $ 297 $ 209 $ 830 $ (1) $ 9,640
Noninterest income 2,012 1,598 676 317 $ 512 13 744 5,872
Total revenue 6,326 5,589 973 526 512 843 743 15,512
Provision for credit losses (benefit) 800 11 (5) 181 987
Depreciation and amortization 194 141 41 11 320 707
Other noninterest expense 4,392 1,887 691 981 287 1,637 9,875
Income (loss) from continuing operations beforeincome taxes and noncontrolling interests 940 3,561 230 (461) 512 375 (1,214) 3,943
Income taxes (benefit) 344 1,233 85 (153) 117 138 (822) 942
Income (loss) from continuing operations beforenoncontrolling interests $ 596 $ 2,328 $ 145 $ (308) $ 395 $ 237 $ (392) $ 3,001
Inter-segment revenue $ 1 $ 33 $ 12 $ 7 $ 15 $ (10) $ (58)
Average Assets (a) $72,573 $102,962 $6,735 $11,529 $5,857 $12,050 $83,319 $295,025
2011
Income Statement
Net interest income $ 3,804 $ 3,465 $ 280 $ 201 $ 913 $ 37 $ 8,700
Noninterest income 1,773 1,237 649 751 $ 464 47 705 5,626
Total revenue 5,577 4,702 929 952 464 960 742 14,326
Provision for credit losses (benefit) 891 (124) (24) 5 366 38 1,152
Depreciation and amortization 186 144 41 10 278 659
Other noninterest expense 3,917 1,688 646 787 275 1,133 8,446
Income (loss) from continuing operations beforeincome taxes and noncontrolling interests 583 2,994 266 150 464 319 (707) 4,069
Income taxes (benefit) 212 1,054 98 61 103 119 (649) 998
Income (loss) from continuing operations beforenoncontrolling interests $ 371 $ 1,940 $ 168 $ 89 $ 361 $ 200 $ (58) $ 3,071
Inter-segment revenue $ 1 $ 20 $ 13 $ 7 $ 16 $ (10) $ (47)
Average Assets (a) $66,448 $ 81,043 $6,719 $11,270 $5,516 $13,119 $81,220 $265,335
2010
Income Statement
Net interest income $ 3,849 $ 3,604 $ 288 $ 262 $ 1,229 $ (2) $ 9,230
Noninterest income 1,958 1,351 628 741 $ 462 (93) 899 5,946
Total revenue 5,807 4,955 916 1,003 462 1,136 897 15,176
Provision for credit losses 1,103 303 20 5 976 95 2,502
Depreciation and amortization 218 148 41 3 287 697
Other noninterest expense 3,838 1,675 606 560 250 987 7,916
Income (loss) from continuing operations beforeincome taxes and noncontrolling interests 648 2,829 249 435 462 (90) (472) 4,061
Income taxes (benefit) 237 1,000 91 159 111 (33) (528) 1,037
Income (loss) from continuing operations beforenoncontrolling interests $ 411 $ 1,829 $ 158 $ 276 $ 351 $ (57) $ 56 $ 3,024
Inter-segment revenue $ 1 $ 21 $ 13 $ 12 $ 22 $ (12) $ (57)
Average Assets (a) $67,428 $ 77,540 $6,954 $ 9,247 $5,428 $17,517 $80,788 $264,902
(a) Period-end balances for BlackRock.
234 The PNC Financial Services Group, Inc. – Form 10-K

NOTE 27 SUBSEQUENT EVENTS
On January 28, 2013, PNC Bank, N.A. issued:
• $750 million of fixed rate senior notes with a maturity date of January 28, 2016. Interest is payable semi-annually, at afixed rate of .80%, on January 28 and July 28 of each year, beginning on July 28, 2013.
• $250 million of floating rate senior notes with a maturity date of January 28, 2016. Interest is payable at the 3-monthLIBOR rate, reset quarterly, plus a spread of .31% on January 28, April 28, July 28, and October 28 of each year,beginning on April 28, 2013.
• $750 million of subordinated notes with a maturity date of January 30, 2023. Interest is payable semi-annually, at a fixedrate of 2.950%, on January 30 and July 30 of each year, beginning on July 30, 2013.
On January 31, 2013, we transferred 205,350 shares of BlackRock Series C Preferred Stock to BlackRock in connection with ourLTIP obligation. After this transfer, we hold approximately 1.3 million shares of BlackRock Series C Preferred Stock which areavailable to fund a portion of awards under the BlackRock LTIP programs.
On February 7, 2013, we announced that on March 15, 2013 we will redeem all $375 million of Fixed-To-Floating Rate Non-cumulative Exchangeable Perpetual Trust Securities issued by PNC Preferred Funding Trust III (REIT Preferred Securities) with acurrent distribution rate of 8.7%. The redemption price will be $100,000 per security. The previously declared regular first quarterdistribution on the securities is payable on March 15, 2013 to holders of record on March 1, 2013.
The PNC Financial Services Group, Inc. – Form 10-K 235
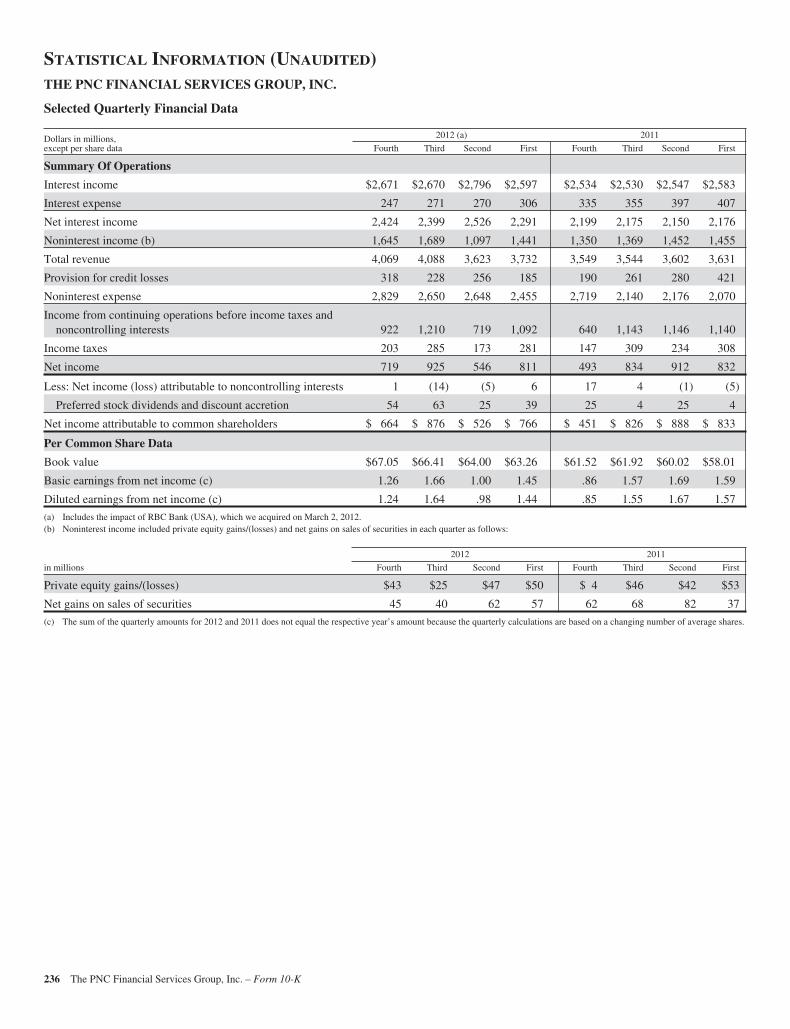
STATISTICAL INFORMATION (UNAUDITED)THE PNC FINANCIAL SERVICES GROUP, INC.
Selected Quarterly Financial Data
Dollars in millions,except per share data
2012 (a) 2011
Fourth Third Second First Fourth Third Second First
Summary Of Operations
Interest income $2,671 $2,670 $2,796 $2,597 $2,534 $2,530 $2,547 $2,583
Interest expense 247 271 270 306 335 355 397 407
Net interest income 2,424 2,399 2,526 2,291 2,199 2,175 2,150 2,176
Noninterest income (b) 1,645 1,689 1,097 1,441 1,350 1,369 1,452 1,455
Total revenue 4,069 4,088 3,623 3,732 3,549 3,544 3,602 3,631
Provision for credit losses 318 228 256 185 190 261 280 421
Noninterest expense 2,829 2,650 2,648 2,455 2,719 2,140 2,176 2,070
Income from continuing operations before income taxes andnoncontrolling interests 922 1,210 719 1,092 640 1,143 1,146 1,140
Income taxes 203 285 173 281 147 309 234 308
Net income 719 925 546 811 493 834 912 832
Less: Net income (loss) attributable to noncontrolling interests 1 (14) (5) 6 17 4 (1) (5)
Preferred stock dividends and discount accretion 54 63 25 39 25 4 25 4
Net income attributable to common shareholders $ 664 $ 876 $ 526 $ 766 $ 451 $ 826 $ 888 $ 833
Per Common Share Data
Book value $67.05 $66.41 $64.00 $63.26 $61.52 $61.92 $60.02 $58.01
Basic earnings from net income (c) 1.26 1.66 1.00 1.45 .86 1.57 1.69 1.59
Diluted earnings from net income (c) 1.24 1.64 .98 1.44 .85 1.55 1.67 1.57
(a) Includes the impact of RBC Bank (USA), which we acquired on March 2, 2012.(b) Noninterest income included private equity gains/(losses) and net gains on sales of securities in each quarter as follows:
2012 2011
in millions Fourth Third Second First Fourth Third Second First
Private equity gains/(losses) $43 $25 $47 $50 $ 4 $46 $42 $53
Net gains on sales of securities 45 40 62 57 62 68 82 37
(c) The sum of the quarterly amounts for 2012 and 2011 does not equal the respective year’s amount because the quarterly calculations are based on a changing number of average shares.
236 The PNC Financial Services Group, Inc. – Form 10-K
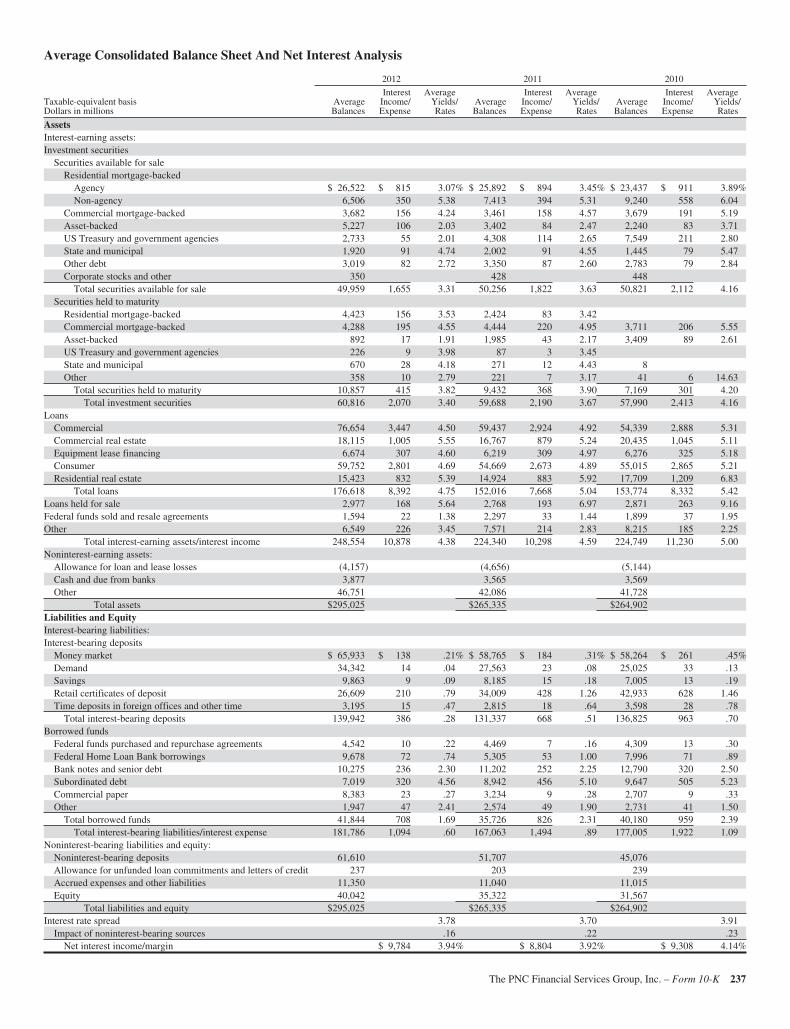
Average Consolidated Balance Sheet And Net Interest Analysis
2012 2011 2010
Taxable-equivalent basisDollars in millions
AverageBalances
InterestIncome/Expense
AverageYields/Rates
AverageBalances
InterestIncome/Expense
AverageYields/Rates
AverageBalances
InterestIncome/Expense
AverageYields/Rates
AssetsInterest-earning assets:Investment securities
Securities available for saleResidential mortgage-backed
Agency $ 26,522 $ 815 3.07% $ 25,892 $ 894 3.45% $ 23,437 $ 911 3.89%Non-agency 6,506 350 5.38 7,413 394 5.31 9,240 558 6.04
Commercial mortgage-backed 3,682 156 4.24 3,461 158 4.57 3,679 191 5.19Asset-backed 5,227 106 2.03 3,402 84 2.47 2,240 83 3.71US Treasury and government agencies 2,733 55 2.01 4,308 114 2.65 7,549 211 2.80State and municipal 1,920 91 4.74 2,002 91 4.55 1,445 79 5.47Other debt 3,019 82 2.72 3,350 87 2.60 2,783 79 2.84Corporate stocks and other 350 428 448
Total securities available for sale 49,959 1,655 3.31 50,256 1,822 3.63 50,821 2,112 4.16Securities held to maturity
Residential mortgage-backed 4,423 156 3.53 2,424 83 3.42Commercial mortgage-backed 4,288 195 4.55 4,444 220 4.95 3,711 206 5.55Asset-backed 892 17 1.91 1,985 43 2.17 3,409 89 2.61US Treasury and government agencies 226 9 3.98 87 3 3.45State and municipal 670 28 4.18 271 12 4.43 8Other 358 10 2.79 221 7 3.17 41 6 14.63
Total securities held to maturity 10,857 415 3.82 9,432 368 3.90 7,169 301 4.20Total investment securities 60,816 2,070 3.40 59,688 2,190 3.67 57,990 2,413 4.16
LoansCommercial 76,654 3,447 4.50 59,437 2,924 4.92 54,339 2,888 5.31Commercial real estate 18,115 1,005 5.55 16,767 879 5.24 20,435 1,045 5.11Equipment lease financing 6,674 307 4.60 6,219 309 4.97 6,276 325 5.18Consumer 59,752 2,801 4.69 54,669 2,673 4.89 55,015 2,865 5.21Residential real estate 15,423 832 5.39 14,924 883 5.92 17,709 1,209 6.83
Total loans 176,618 8,392 4.75 152,016 7,668 5.04 153,774 8,332 5.42Loans held for sale 2,977 168 5.64 2,768 193 6.97 2,871 263 9.16Federal funds sold and resale agreements 1,594 22 1.38 2,297 33 1.44 1,899 37 1.95Other 6,549 226 3.45 7,571 214 2.83 8,215 185 2.25
Total interest-earning assets/interest income 248,554 10,878 4.38 224,340 10,298 4.59 224,749 11,230 5.00Noninterest-earning assets:
Allowance for loan and lease losses (4,157) (4,656) (5,144)Cash and due from banks 3,877 3,565 3,569Other 46,751 42,086 41,728
Total assets $295,025 $265,335 $264,902Liabilities and EquityInterest-bearing liabilities:Interest-bearing deposits
Money market $ 65,933 $ 138 .21% $ 58,765 $ 184 .31% $ 58,264 $ 261 .45%Demand 34,342 14 .04 27,563 23 .08 25,025 33 .13Savings 9,863 9 .09 8,185 15 .18 7,005 13 .19Retail certificates of deposit 26,609 210 .79 34,009 428 1.26 42,933 628 1.46Time deposits in foreign offices and other time 3,195 15 .47 2,815 18 .64 3,598 28 .78
Total interest-bearing deposits 139,942 386 .28 131,337 668 .51 136,825 963 .70Borrowed funds
Federal funds purchased and repurchase agreements 4,542 10 .22 4,469 7 .16 4,309 13 .30Federal Home Loan Bank borrowings 9,678 72 .74 5,305 53 1.00 7,996 71 .89Bank notes and senior debt 10,275 236 2.30 11,202 252 2.25 12,790 320 2.50Subordinated debt 7,019 320 4.56 8,942 456 5.10 9,647 505 5.23Commercial paper 8,383 23 .27 3,234 9 .28 2,707 9 .33Other 1,947 47 2.41 2,574 49 1.90 2,731 41 1.50
Total borrowed funds 41,844 708 1.69 35,726 826 2.31 40,180 959 2.39Total interest-bearing liabilities/interest expense 181,786 1,094 .60 167,063 1,494 .89 177,005 1,922 1.09
Noninterest-bearing liabilities and equity:Noninterest-bearing deposits 61,610 51,707 45,076Allowance for unfunded loan commitments and letters of credit 237 203 239Accrued expenses and other liabilities 11,350 11,040 11,015Equity 40,042 35,322 31,567
Total liabilities and equity $295,025 $265,335 $264,902Interest rate spread 3.78 3.70 3.91
Impact of noninterest-bearing sources .16 .22 .23Net interest income/margin $ 9,784 3.94% $ 8,804 3.92% $ 9,308 4.14%
The PNC Financial Services Group, Inc. – Form 10-K 237

Nonaccrual loans are included in loans, net of unearned income. The impact of financial derivatives used in interest rate risk management is included in the interestincome/expense and average yields/rates of the related assets and liabilities. Basis adjustments related to hedged items are included in noninterest-earning assets andnoninterest-bearing liabilities. Average balances of securities are based on amortized historical cost (excluding adjustments to fair value, which are included in otherassets). Average balances for certain loans and borrowed funds accounted for at fair value, with changes in fair value recorded in trading noninterest income, areincluded in noninterest-earning assets and noninterest-bearing liabilities. The interest-earning deposits with the Federal Reserve are included in the “Other” interest-earning assets category.
Loan fees for the years ended December 31, 2012, 2011, and 2010 were $217 million, $175 million, and $154 million, respectively.
Interest income includes the effects of taxable-equivalent adjustments using a marginal federal income tax rate of 35% to increase tax-exempt interest income to ataxable-equivalent basis. The taxable-equivalent adjustments to interest income for the years ended December 31, 2012, 2011, and 2010 were $144 million, $104million, and $81 million, respectively.
238 The PNC Financial Services Group, Inc. – Form 10-K
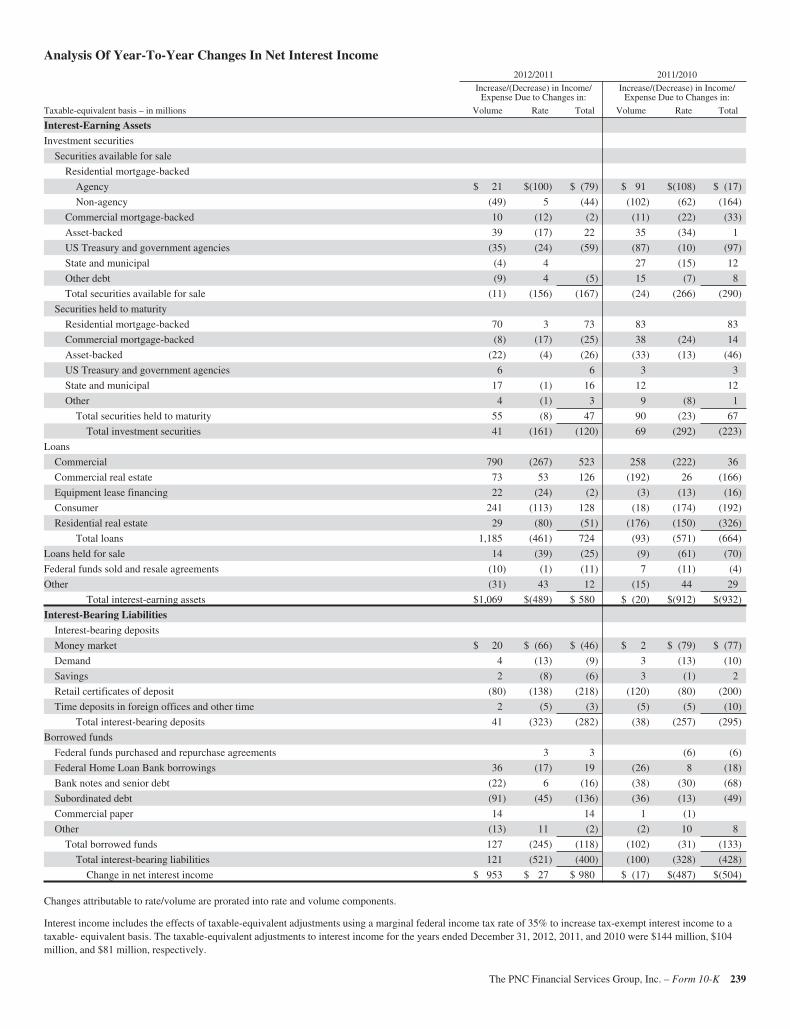
Analysis Of Year-To-Year Changes In Net Interest Income2012/2011 2011/2010
Increase/(Decrease) in Income/Expense Due to Changes in:
Increase/(Decrease) in Income/Expense Due to Changes in:
Taxable-equivalent basis – in millions Volume Rate Total Volume Rate Total
Interest-Earning AssetsInvestment securities
Securities available for sale
Residential mortgage-backed
Agency $ 21 $(100) $ (79) $ 91 $(108) $ (17)
Non-agency (49) 5 (44) (102) (62) (164)
Commercial mortgage-backed 10 (12) (2) (11) (22) (33)
Asset-backed 39 (17) 22 35 (34) 1
US Treasury and government agencies (35) (24) (59) (87) (10) (97)
State and municipal (4) 4 27 (15) 12
Other debt (9) 4 (5) 15 (7) 8
Total securities available for sale (11) (156) (167) (24) (266) (290)
Securities held to maturity
Residential mortgage-backed 70 3 73 83 83
Commercial mortgage-backed (8) (17) (25) 38 (24) 14
Asset-backed (22) (4) (26) (33) (13) (46)
US Treasury and government agencies 6 6 3 3
State and municipal 17 (1) 16 12 12
Other 4 (1) 3 9 (8) 1
Total securities held to maturity 55 (8) 47 90 (23) 67
Total investment securities 41 (161) (120) 69 (292) (223)
Loans
Commercial 790 (267) 523 258 (222) 36
Commercial real estate 73 53 126 (192) 26 (166)
Equipment lease financing 22 (24) (2) (3) (13) (16)
Consumer 241 (113) 128 (18) (174) (192)
Residential real estate 29 (80) (51) (176) (150) (326)
Total loans 1,185 (461) 724 (93) (571) (664)
Loans held for sale 14 (39) (25) (9) (61) (70)
Federal funds sold and resale agreements (10) (1) (11) 7 (11) (4)
Other (31) 43 12 (15) 44 29
Total interest-earning assets $1,069 $(489) $ 580 $ (20) $(912) $(932)
Interest-Bearing LiabilitiesInterest-bearing deposits
Money market $ 20 $ (66) $ (46) $ 2 $ (79) $ (77)
Demand 4 (13) (9) 3 (13) (10)
Savings 2 (8) (6) 3 (1) 2
Retail certificates of deposit (80) (138) (218) (120) (80) (200)
Time deposits in foreign offices and other time 2 (5) (3) (5) (5) (10)
Total interest-bearing deposits 41 (323) (282) (38) (257) (295)
Borrowed funds
Federal funds purchased and repurchase agreements 3 3 (6) (6)
Federal Home Loan Bank borrowings 36 (17) 19 (26) 8 (18)
Bank notes and senior debt (22) 6 (16) (38) (30) (68)
Subordinated debt (91) (45) (136) (36) (13) (49)
Commercial paper 14 14 1 (1)
Other (13) 11 (2) (2) 10 8
Total borrowed funds 127 (245) (118) (102) (31) (133)
Total interest-bearing liabilities 121 (521) (400) (100) (328) (428)
Change in net interest income $ 953 $ 27 $ 980 $ (17) $(487) $(504)
Changes attributable to rate/volume are prorated into rate and volume components.
Interest income includes the effects of taxable-equivalent adjustments using a marginal federal income tax rate of 35% to increase tax-exempt interest income to ataxable- equivalent basis. The taxable-equivalent adjustments to interest income for the years ended December 31, 2012, 2011, and 2010 were $144 million, $104million, and $81 million, respectively.
The PNC Financial Services Group, Inc. – Form 10-K 239
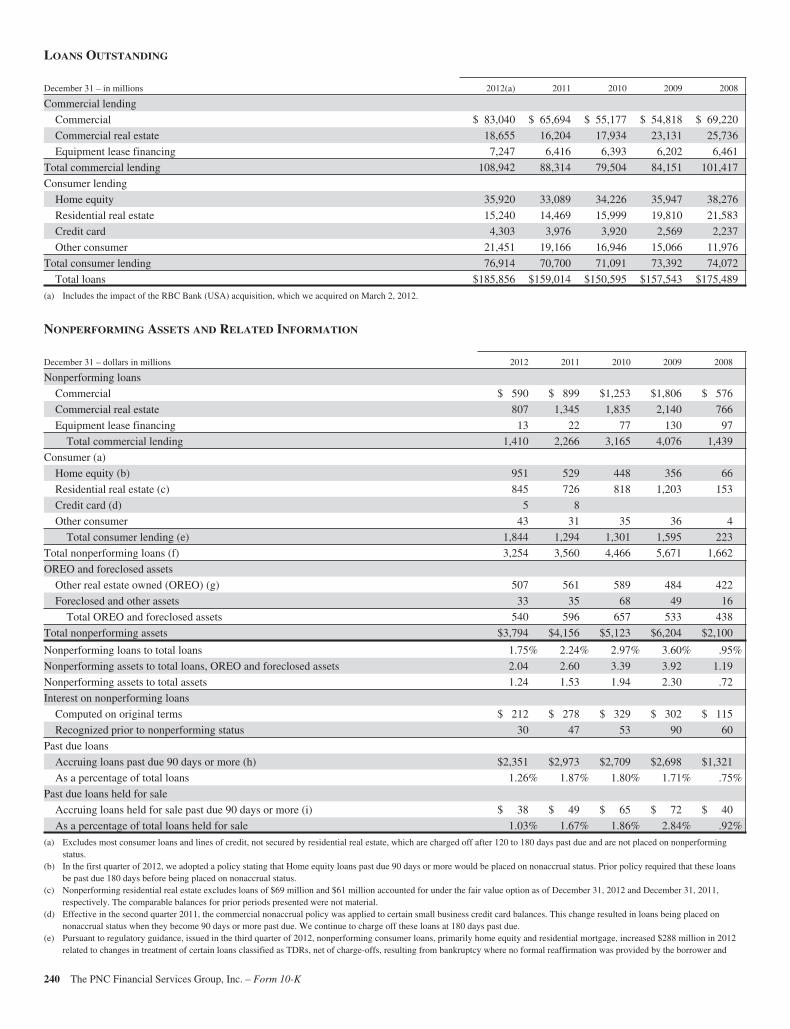
LOANS OUTSTANDING
December 31 – in millions 2012(a) 2011 2010 2009 2008
Commercial lending
Commercial $ 83,040 $ 65,694 $ 55,177 $ 54,818 $ 69,220
Commercial real estate 18,655 16,204 17,934 23,131 25,736
Equipment lease financing 7,247 6,416 6,393 6,202 6,461
Total commercial lending 108,942 88,314 79,504 84,151 101,417
Consumer lending
Home equity 35,920 33,089 34,226 35,947 38,276
Residential real estate 15,240 14,469 15,999 19,810 21,583
Credit card 4,303 3,976 3,920 2,569 2,237
Other consumer 21,451 19,166 16,946 15,066 11,976
Total consumer lending 76,914 70,700 71,091 73,392 74,072
Total loans $185,856 $159,014 $150,595 $157,543 $175,489
(a) Includes the impact of the RBC Bank (USA) acquisition, which we acquired on March 2, 2012.
NONPERFORMING ASSETS AND RELATED INFORMATION
December 31 – dollars in millions 2012 2011 2010 2009 2008
Nonperforming loans
Commercial $ 590 $ 899 $1,253 $1,806 $ 576
Commercial real estate 807 1,345 1,835 2,140 766
Equipment lease financing 13 22 77 130 97
Total commercial lending 1,410 2,266 3,165 4,076 1,439
Consumer (a)
Home equity (b) 951 529 448 356 66
Residential real estate (c) 845 726 818 1,203 153
Credit card (d) 5 8
Other consumer 43 31 35 36 4
Total consumer lending (e) 1,844 1,294 1,301 1,595 223
Total nonperforming loans (f) 3,254 3,560 4,466 5,671 1,662
OREO and foreclosed assets
Other real estate owned (OREO) (g) 507 561 589 484 422
Foreclosed and other assets 33 35 68 49 16
Total OREO and foreclosed assets 540 596 657 533 438
Total nonperforming assets $3,794 $4,156 $5,123 $6,204 $2,100
Nonperforming loans to total loans 1.75% 2.24% 2.97% 3.60% .95%
Nonperforming assets to total loans, OREO and foreclosed assets 2.04 2.60 3.39 3.92 1.19
Nonperforming assets to total assets 1.24 1.53 1.94 2.30 .72
Interest on nonperforming loans
Computed on original terms $ 212 $ 278 $ 329 $ 302 $ 115
Recognized prior to nonperforming status 30 47 53 90 60
Past due loans
Accruing loans past due 90 days or more (h) $2,351 $2,973 $2,709 $2,698 $1,321
As a percentage of total loans 1.26% 1.87% 1.80% 1.71% .75%
Past due loans held for sale
Accruing loans held for sale past due 90 days or more (i) $ 38 $ 49 $ 65 $ 72 $ 40
As a percentage of total loans held for sale 1.03% 1.67% 1.86% 2.84% .92%
(a) Excludes most consumer loans and lines of credit, not secured by residential real estate, which are charged off after 120 to 180 days past due and are not placed on nonperformingstatus.
(b) In the first quarter of 2012, we adopted a policy stating that Home equity loans past due 90 days or more would be placed on nonaccrual status. Prior policy required that these loansbe past due 180 days before being placed on nonaccrual status.
(c) Nonperforming residential real estate excludes loans of $69 million and $61 million accounted for under the fair value option as of December 31, 2012 and December 31, 2011,respectively. The comparable balances for prior periods presented were not material.
(d) Effective in the second quarter 2011, the commercial nonaccrual policy was applied to certain small business credit card balances. This change resulted in loans being placed onnonaccrual status when they become 90 days or more past due. We continue to charge off these loans at 180 days past due.
(e) Pursuant to regulatory guidance, issued in the third quarter of 2012, nonperforming consumer loans, primarily home equity and residential mortgage, increased $288 million in 2012related to changes in treatment of certain loans classified as TDRs, net of charge-offs, resulting from bankruptcy where no formal reaffirmation was provided by the borrower and
240 The PNC Financial Services Group, Inc. – Form 10-K
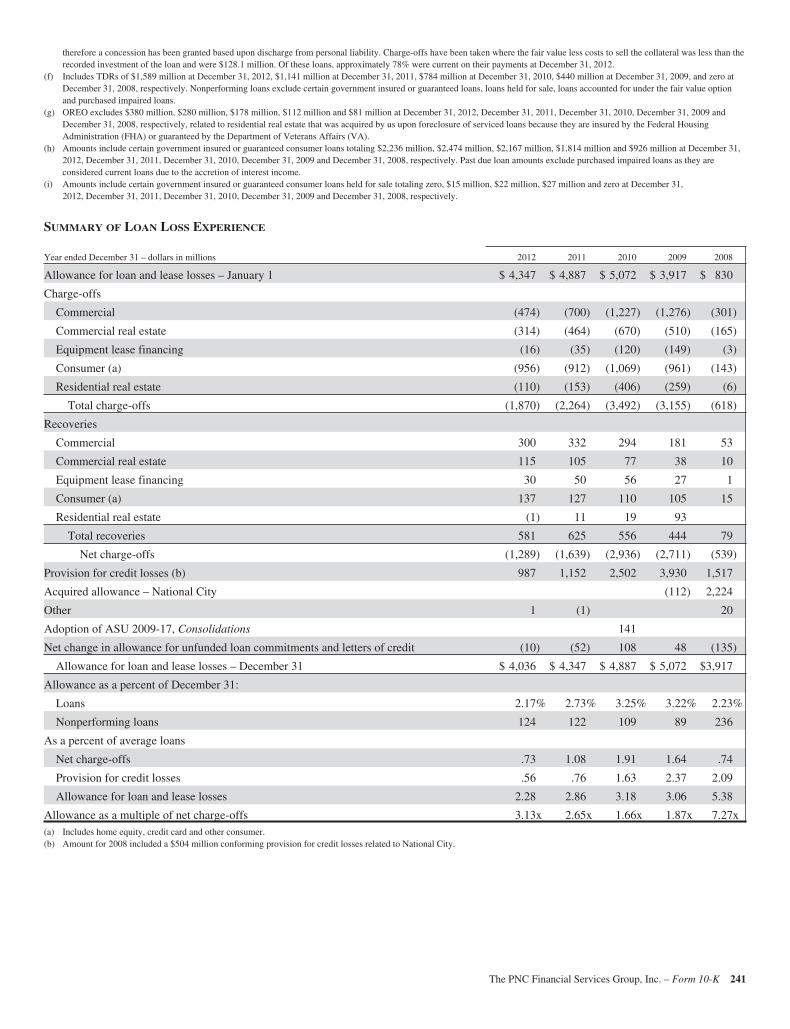
therefore a concession has been granted based upon discharge from personal liability. Charge-offs have been taken where the fair value less costs to sell the collateral was less than therecorded investment of the loan and were $128.1 million. Of these loans, approximately 78% were current on their payments at December 31, 2012.
(f) Includes TDRs of $1,589 million at December 31, 2012, $1,141 million at December 31, 2011, $784 million at December 31, 2010, $440 million at December 31, 2009, and zero atDecember 31, 2008, respectively. Nonperforming loans exclude certain government insured or guaranteed loans, loans held for sale, loans accounted for under the fair value optionand purchased impaired loans.
(g) OREO excludes $380 million, $280 million, $178 million, $112 million and $81 million at December 31, 2012, December 31, 2011, December 31, 2010, December 31, 2009 andDecember 31, 2008, respectively, related to residential real estate that was acquired by us upon foreclosure of serviced loans because they are insured by the Federal HousingAdministration (FHA) or guaranteed by the Department of Veterans Affairs (VA).
(h) Amounts include certain government insured or guaranteed consumer loans totaling $2,236 million, $2,474 million, $2,167 million, $1,814 million and $926 million at December 31,2012, December 31, 2011, December 31, 2010, December 31, 2009 and December 31, 2008, respectively. Past due loan amounts exclude purchased impaired loans as they areconsidered current loans due to the accretion of interest income.
(i) Amounts include certain government insured or guaranteed consumer loans held for sale totaling zero, $15 million, $22 million, $27 million and zero at December 31,2012, December 31, 2011, December 31, 2010, December 31, 2009 and December 31, 2008, respectively.
SUMMARY OF LOAN LOSS EXPERIENCE
Year ended December 31 – dollars in millions 2012 2011 2010 2009 2008
Allowance for loan and lease losses – January 1 $ 4,347 $ 4,887 $ 5,072 $ 3,917 $ 830
Charge-offs
Commercial (474) (700) (1,227) (1,276) (301)
Commercial real estate (314) (464) (670) (510) (165)
Equipment lease financing (16) (35) (120) (149) (3)
Consumer (a) (956) (912) (1,069) (961) (143)
Residential real estate (110) (153) (406) (259) (6)
Total charge-offs (1,870) (2,264) (3,492) (3,155) (618)
Recoveries
Commercial 300 332 294 181 53
Commercial real estate 115 105 77 38 10
Equipment lease financing 30 50 56 27 1
Consumer (a) 137 127 110 105 15
Residential real estate (1) 11 19 93
Total recoveries 581 625 556 444 79
Net charge-offs (1,289) (1,639) (2,936) (2,711) (539)
Provision for credit losses (b) 987 1,152 2,502 3,930 1,517
Acquired allowance – National City (112) 2,224
Other 1 (1) 20
Adoption of ASU 2009-17, Consolidations 141
Net change in allowance for unfunded loan commitments and letters of credit (10) (52) 108 48 (135)
Allowance for loan and lease losses – December 31 $ 4,036 $ 4,347 $ 4,887 $ 5,072 $3,917
Allowance as a percent of December 31:
Loans 2.17% 2.73% 3.25% 3.22% 2.23%
Nonperforming loans 124 122 109 89 236
As a percent of average loans
Net charge-offs .73 1.08 1.91 1.64 .74
Provision for credit losses .56 .76 1.63 2.37 2.09
Allowance for loan and lease losses 2.28 2.86 3.18 3.06 5.38
Allowance as a multiple of net charge-offs 3.13x 2.65x 1.66x 1.87x 7.27x(a) Includes home equity, credit card and other consumer.(b) Amount for 2008 included a $504 million conforming provision for credit losses related to National City.
The PNC Financial Services Group, Inc. – Form 10-K 241
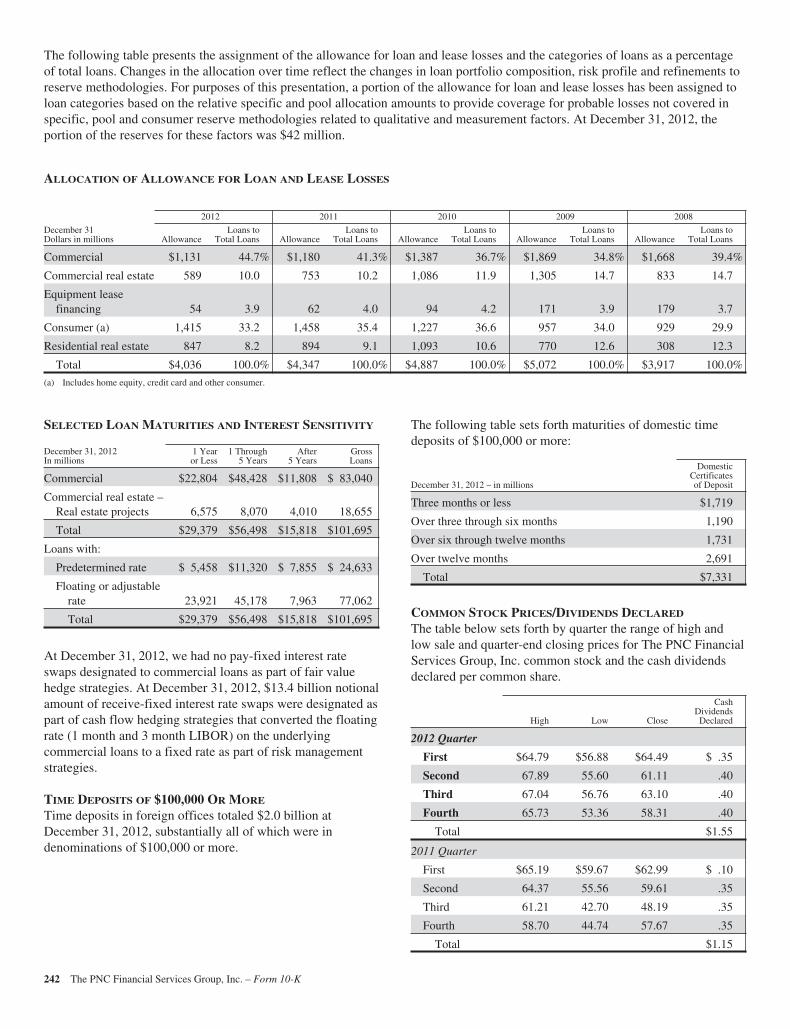
The following table presents the assignment of the allowance for loan and lease losses and the categories of loans as a percentageof total loans. Changes in the allocation over time reflect the changes in loan portfolio composition, risk profile and refinements toreserve methodologies. For purposes of this presentation, a portion of the allowance for loan and lease losses has been assigned toloan categories based on the relative specific and pool allocation amounts to provide coverage for probable losses not covered inspecific, pool and consumer reserve methodologies related to qualitative and measurement factors. At December 31, 2012, theportion of the reserves for these factors was $42 million.
ALLOCATION OF ALLOWANCE FOR LOAN AND LEASE LOSSES
2012 2011 2010 2009 2008
December 31Dollars in millions Allowance
Loans toTotal Loans Allowance
Loans toTotal Loans Allowance
Loans toTotal Loans Allowance
Loans toTotal Loans Allowance
Loans toTotal Loans
Commercial $1,131 44.7% $1,180 41.3% $1,387 36.7% $1,869 34.8% $1,668 39.4%
Commercial real estate 589 10.0 753 10.2 1,086 11.9 1,305 14.7 833 14.7
Equipment leasefinancing 54 3.9 62 4.0 94 4.2 171 3.9 179 3.7
Consumer (a) 1,415 33.2 1,458 35.4 1,227 36.6 957 34.0 929 29.9
Residential real estate 847 8.2 894 9.1 1,093 10.6 770 12.6 308 12.3
Total $4,036 100.0% $4,347 100.0% $4,887 100.0% $5,072 100.0% $3,917 100.0%
(a) Includes home equity, credit card and other consumer.
SELECTED LOAN MATURITIES AND INTEREST SENSITIVITY
December 31, 2012In millions
1 Yearor Less
1 Through5 Years
After5 Years
GrossLoans
Commercial $22,804 $48,428 $11,808 $ 83,040
Commercial real estate –Real estate projects 6,575 8,070 4,010 18,655
Total $29,379 $56,498 $15,818 $101,695
Loans with:
Predetermined rate $ 5,458 $11,320 $ 7,855 $ 24,633
Floating or adjustablerate 23,921 45,178 7,963 77,062
Total $29,379 $56,498 $15,818 $101,695
At December 31, 2012, we had no pay-fixed interest rateswaps designated to commercial loans as part of fair valuehedge strategies. At December 31, 2012, $13.4 billion notionalamount of receive-fixed interest rate swaps were designated aspart of cash flow hedging strategies that converted the floatingrate (1 month and 3 month LIBOR) on the underlyingcommercial loans to a fixed rate as part of risk managementstrategies.
TIME DEPOSITS OF $100,000 OR MORE
Time deposits in foreign offices totaled $2.0 billion atDecember 31, 2012, substantially all of which were indenominations of $100,000 or more.
The following table sets forth maturities of domestic timedeposits of $100,000 or more:
December 31, 2012 – in millions
DomesticCertificatesof Deposit
Three months or less $1,719
Over three through six months 1,190
Over six through twelve months 1,731
Over twelve months 2,691
Total $7,331
COMMON STOCK PRICES/DIVIDENDS DECLARED
The table below sets forth by quarter the range of high andlow sale and quarter-end closing prices for The PNC FinancialServices Group, Inc. common stock and the cash dividendsdeclared per common share.
High Low Close
CashDividendsDeclared
2012 Quarter
First $64.79 $56.88 $64.49 $ .35
Second 67.89 55.60 61.11 .40
Third 67.04 56.76 63.10 .40
Fourth 65.73 53.36 58.31 .40
Total $1.55
2011 Quarter
First $65.19 $59.67 $62.99 $ .10
Second 64.37 55.56 59.61 .35
Third 61.21 42.70 48.19 .35
Fourth 58.70 44.74 57.67 .35
Total $1.15
242 The PNC Financial Services Group, Inc. – Form 10-K
ITEM 9 – CHANGES IN AND DISAGREEMENTS
WITH ACCOUNTANTS ON ACCOUNTING AND
FINANCIAL DISCLOSURE
(a) None.
(b) None.
ITEM 9A – CONTROLS AND PROCEDURES
(a) Management’s Report on Internal Control overFinancial Reporting
The management of The PNC Financial Services Group,Inc. and subsidiaries (PNC) is responsible forestablishing and maintaining adequate internal controlover financial reporting, as such term is defined in theExchange Act Rule 13a-15(f).
Because of inherent limitations, internal control overfinancial reporting may not prevent or detectmisstatements. Also, projections of any evaluation ofeffectiveness to future periods are subject to the risk thatcontrols may become inadequate because of changes inconditions, or that the degree of compliance with thepolicies or procedures may deteriorate.
We performed an evaluation under the supervision andwith the participation of our management, including theChairman and Chief Executive Officer and the ExecutiveVice President and Chief Financial Officer, of theeffectiveness of PNC’s internal control over financialreporting as of December 31, 2012. This assessment wasbased on criteria for effective internal control overfinancial reporting described in Internal Control-Integrated Framework issued by the Committee ofSponsoring Organizations of the Treadway Commission.Based on this assessment, management concluded thatPNC maintained effective internal control over financialreporting as of December 31, 2012.
PricewaterhouseCoopers LLP, the independent registeredpublic accounting firm that audited our consolidatedfinancial statements as of and for the year endedDecember 31, 2012 included in this Report, has alsoaudited the effectiveness of PNC’s internal control overfinancial reporting as of December 31, 2012. The reportof PricewaterhouseCoopers LLP is included under Item 8of this Annual Report on Form 10-K.
(b) Disclosure Controls and Procedures and Changes inInternal Control over Financial Reporting
As of December 31, 2012, we performed an evaluationunder the supervision and with the participation of ourmanagement, including the Chairman and ChiefExecutive Officer and the Executive Vice President andChief Financial Officer, of the effectiveness of the design
and operation of our disclosure controls and proceduresand of changes in our internal control over financialreporting.
Based on that evaluation, our Chairman and ChiefExecutive Officer and our Executive Vice President andChief Financial Officer concluded that our disclosurecontrols and procedures (as defined in Rule 13a-15(e)under the Securities and Exchange Act of 1934, asamended) were effective as of December 31, 2012, andthat there has been no change in PNC’s internal controlover financial reporting that occurred during the fourthquarter of 2012 that has materially affected, or isreasonably likely to materially affect, our internal controlover financial reporting.
ITEM 9B – OTHER INFORMATION
None.
Part III
ITEM 10 – DIRECTORS, EXECUTIVE OFFICERS
AND CORPORATE GOVERNANCE
Certain of the information regarding our directors (ornominees for director), executive officers and AuditCommittee (and Audit Committee financial experts), requiredby this item is included under the captions “Election ofDirectors (Item 1),” and “Corporate Governance – Boardcommittees – Audit Committee,” and “Director and ExecutiveOfficer Relationships – Family relationships” in our ProxyStatement to be filed for the 2013 annual meeting ofshareholders and is incorporated herein by reference.
Information regarding our compliance with Section 16(a) ofthe Securities Exchange Act of 1934 is included under thecaption “Director and Executive Officer Relationships –Section 16(a) beneficial ownership reporting compliance” inour Proxy Statement to be filed for the 2013 annual meeting ofshareholders and is incorporated herein by reference.
Additional information regarding our executive officers andour directors is included in Part I of this Report under thecaptions “Executive Officers of the Registrant” and “Directorsof the Registrant.”
Certain information regarding our PNC Code of BusinessConduct and Ethics required by this item is included under thecaption “Corporate Governance – Our code of ethics” in ourProxy Statement to be filed for the 2013 annual meeting ofshareholders and is incorporated herein by reference. OurPNC Code of Business Conduct and Ethics is available on ourcorporate website at www.pnc.com/corporate governance. Inaddition, any future amendments to, or waivers from, aprovision of the PNC Code of Business Conduct and Ethicsthat applies to our directors or executive officers (includingthe Chairman and Chief Executive Officer, the Chief FinancialOfficer and the Controller) will be posted at this internetaddress.
The PNC Financial Services Group, Inc. – Form 10-K 243
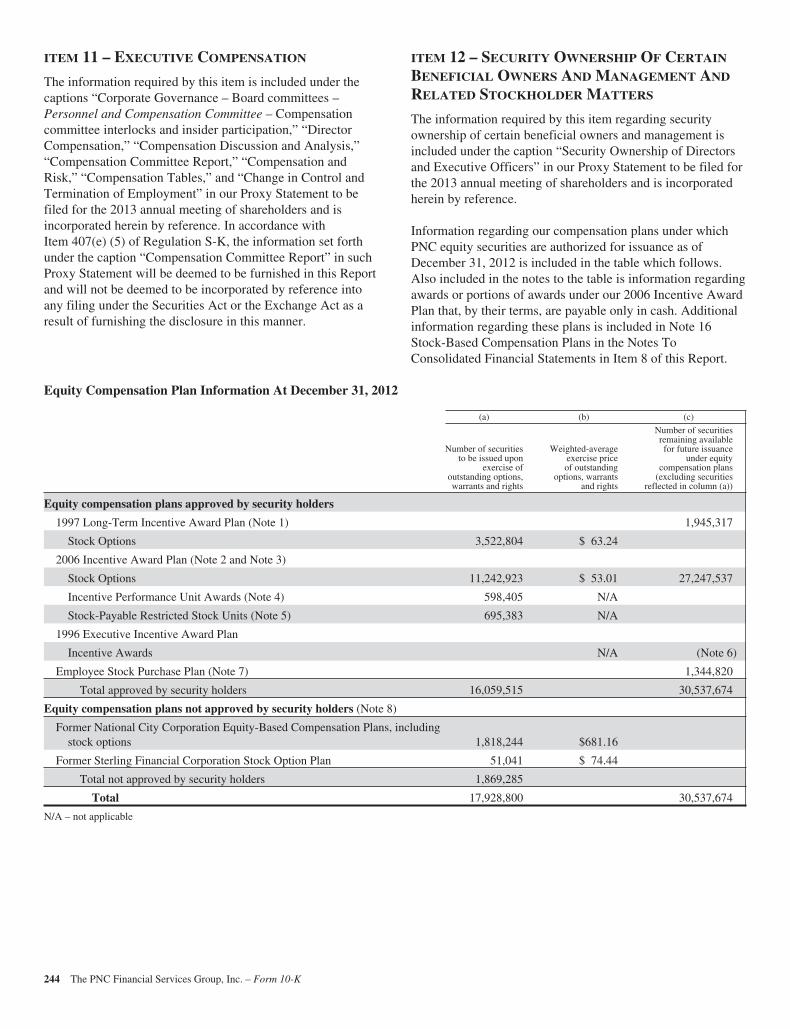
ITEM 11 – EXECUTIVE COMPENSATION
The information required by this item is included under thecaptions “Corporate Governance – Board committees –Personnel and Compensation Committee – Compensationcommittee interlocks and insider participation,” “DirectorCompensation,” “Compensation Discussion and Analysis,”“Compensation Committee Report,” “Compensation andRisk,” “Compensation Tables,” and “Change in Control andTermination of Employment” in our Proxy Statement to befiled for the 2013 annual meeting of shareholders and isincorporated herein by reference. In accordance withItem 407(e) (5) of Regulation S-K, the information set forthunder the caption “Compensation Committee Report” in suchProxy Statement will be deemed to be furnished in this Reportand will not be deemed to be incorporated by reference intoany filing under the Securities Act or the Exchange Act as aresult of furnishing the disclosure in this manner.
ITEM 12 – SECURITY OWNERSHIP OF CERTAIN
BENEFICIAL OWNERS AND MANAGEMENT AND
RELATED STOCKHOLDER MATTERS
The information required by this item regarding securityownership of certain beneficial owners and management isincluded under the caption “Security Ownership of Directorsand Executive Officers” in our Proxy Statement to be filed forthe 2013 annual meeting of shareholders and is incorporatedherein by reference.
Information regarding our compensation plans under whichPNC equity securities are authorized for issuance as ofDecember 31, 2012 is included in the table which follows.Also included in the notes to the table is information regardingawards or portions of awards under our 2006 Incentive AwardPlan that, by their terms, are payable only in cash. Additionalinformation regarding these plans is included in Note 16Stock-Based Compensation Plans in the Notes ToConsolidated Financial Statements in Item 8 of this Report.
Equity Compensation Plan Information At December 31, 2012
(a) (b) (c)
Number of securitiesto be issued upon
exercise ofoutstanding options,warrants and rights
Weighted-averageexercise priceof outstanding
options, warrantsand rights
Number of securitiesremaining availablefor future issuance
under equitycompensation plans
(excluding securitiesreflected in column (a))
Equity compensation plans approved by security holders
1997 Long-Term Incentive Award Plan (Note 1) 1,945,317
Stock Options 3,522,804 $ 63.24
2006 Incentive Award Plan (Note 2 and Note 3)
Stock Options 11,242,923 $ 53.01 27,247,537
Incentive Performance Unit Awards (Note 4) 598,405 N/A
Stock-Payable Restricted Stock Units (Note 5) 695,383 N/A
1996 Executive Incentive Award Plan
Incentive Awards N/A (Note 6)
Employee Stock Purchase Plan (Note 7) 1,344,820
Total approved by security holders 16,059,515 30,537,674
Equity compensation plans not approved by security holders (Note 8)
Former National City Corporation Equity-Based Compensation Plans, includingstock options 1,818,244 $681.16
Former Sterling Financial Corporation Stock Option Plan 51,041 $ 74.44
Total not approved by security holders 1,869,285
Total 17,928,800 30,537,674
N/A – not applicable
244 The PNC Financial Services Group, Inc. – Form 10-K

Note 1 – After shareholder approval of the 2006 IncentiveAward Plan at the 2006 annual meeting of PNC’s shareholderson April 25, 2006 (see Note 2 below), no further grants werepermitted under the 1997 Long-Term Incentive Award Plan,other than for the exercise of options still subject to a reloadfeature. As of December 31, 2012, the number of remainingshares reserved under this plan for that purpose was1,945,317.
Note 2 – The 2006 Incentive Award Plan was adopted by theBoard on February 15, 2006 and approved by the PNCshareholders at the 2006 annual meeting on April 25, 2006.The plan initially authorized up to 40,000,000 shares ofcommon stock for issuance under the plan, subject toadjustment in certain circumstances. If and to the extent thatstock options and stock appreciation rights (“SARs”) grantedunder the plan, or granted under the prior plan and outstandingon the approval date of the plan, terminate, expire or arecancelled, forfeited, exchanged or surrendered after theeffective date of the plan without being exercised or if anyshare awards, share units, dividend equivalents or other share-based awards are forfeited or terminated, or otherwise not paidin full, after the effective date of the plan, the shares subject tosuch grants become available again for purposes of the plan.Shares available for issuance under this plan are also reducedby the number of any shares used in payment of bonusesunder the 1996 Executive Incentive Award Plan.
The plan was most recently amended and restatedincorporating amendments adopted by the Board andapproved by PNC’s shareholders at the 2011 annual meetingof shareholders, effective as of March 11, 2011. Theseamendments incorporate, among other things, an increase tothe overall limit on the number of shares that may be awardedunder the plan to 46,000,000, and a new requirement that eachaward of a share (other than pursuant to a stock option orSAR) granted after that effective date will reduce theaggregate plan limit by 2.5 shares, while each award of a sharepursuant to a stock option or SAR will reduce the aggregateplan limit by one share.
Note 3 – Under the 2006 Incentive Award Plan, awards orportions of awards that, by their terms, are payable only incash do not reduce the number of shares that remain availablefor issuance under the plan (the number in column (c)).During 2012, a total of 543,959 cash-payable share units pluscash-payable dividend equivalents with respect to 418,665 ofthose share units were granted under the plan. This numberincludes an incremental change in the cash-payable portion ofthe 2010, 2011 and 2012 incentive performance unit awardgrants described in Note 4 below (net of forfeitures), aseparate 2012 incentive performance unit award grant payablesolely in cash, and 2012 grants of share units (all of whichinclude rights to cash dividend equivalents) payable solely incash. Payments are subject to the conditions of the individualgrants, including, where applicable, the achievement of anyperformance goals or service requirement established for such
grants. The comparable amount for 2010 was 367,365 cash-payable share units plus cash-payable dividend equivalentswith respect to 211,573 cash-payable restricted share units,and the comparable amount for 2011 was 560,544 cash-payable share units plus cash-payable dividend equivalentswith respect to 505,866 cash-payable restricted share units.
Note 4 – These incentive performance unit awards provide forthe issuance of shares of common stock (up to a target numberof shares) based on the degree to which corporate performancegoals established by the Personnel and CompensationCommittee have been achieved, subject to potential negativeadjustment based on certain risk-related performance metrics,and, if a premium level of such performance is achieved, forfurther payment in cash. The numbers in column (a) of thistable for these awards reflect the maximum number of sharesthat could be issued pursuant to grants outstanding atDecember 31, 2012 upon achievement of the performancegoals and other conditions of the grants. At the premium levelof performance, a further maximum payout of cashequivalents for the same number of share units, plus theincremental change described in Note 3, could also be payablesubject to the other conditions of the grants. Grants under the2006 Incentive Award Plan were made in the first quarter of2010, 2011, and 2012.
Note 5 – These stock-payable restricted stock units include2011 and 2012 grants of performance-based restricted shareunits (with the units payable solely in stock and relateddividend equivalents payable solely in cash) that have aservice condition, an internal risk-related performancecondition and a market condition and also include grants ofother stock-payable restricted share units, some of which aretime-based and some of which also include related dividendequivalents payable solely in cash. The number in column(a) includes the maximum number of shares that could beissued pursuant to grants of this type of award outstanding atDecember 31, 2012 upon achievement of the performance andmarket conditions, where applicable, and other conditions ofthe grants. Cash-payable dividend equivalents were grantedwith respect to most of these stock-payable restricted stockunits. Where stock-payable restricted share units include afractional share interest, such fractional share interest ispayable only in cash share equivalents. During 2012, a total of21 cash share equivalents were paid in the aggregate forfractional share interests.
Note 6 – The 1996 Executive Incentive Award Plan is ashareholder-approved plan that enables PNC to pay annualbonuses to its senior executive officers based upon theachievement of specified levels of performance. The plan asamended and restated as of January 1, 2007 was adopted bythe Board on February 14, 2007 and approved by the PNCshareholders at the 2007 annual meeting on April 24, 2007.The plan does not specify a fixed share amount for awardsunder the plan. Rather, it provides for maximum bonus awards
The PNC Financial Services Group, Inc. – Form 10-K 245

for a given period (generally a year) for each individual planparticipant of 0.2% of incentive income for that period.Incentive income is based on PNC’s consolidated pre-tax netincome as further adjusted for the impact of changes in taxlaw, extraordinary items, discontinued operations, acquisitionand merger integration costs, and for the impact of PNC’sobligation to fund certain BlackRock long-term incentiveprograms. Although the size of awards under the plan isdollar-denominated, payment may be made in cash, in stock,or in a combination of cash and stock.
Note 7 – The purchase price for shares sold under the planrepresents 95% of the fair market value on the last day of eachsix-month offering period.
Note 8 – The plans in this section of the table reflect awardsunder pre-acquisition plans of National City Corporation andSterling Financial Corporation, respectively. National Citywas merged into PNC on December 31, 2008 and Sterling wasmerged into PNC on April 4, 2008. Pursuant to the respectivemerger agreements for these acquisitions, common shares ofNational City or Sterling, as the case may be, issuable uponthe exercise or settlement of various equity awards grantedunder the National City or Sterling plans were converted intocorresponding awards covering PNC common stock.Additional information is included in Note 16 Stock-BasedCompensation Plans in the Notes To Consolidated FinancialStatements in Item 8 of this Report and in Note 16 Stock-Based Compensation Plans in the Notes To ConsolidatedFinancial Statements in Item 8 of our 2008 10-K.
ITEM 13 – CERTAIN RELATIONSHIPS AND
RELATED TRANSACTIONS, AND DIRECTOR
INDEPENDENCE
The information required by this item is included under thecaptions “Director and Executive Officer Relationships –Director independence, – Transactions with directors, –Indemnification and advancement of costs, and – Related
person transactions policies and procedures” in our ProxyStatement to be filed for the 2013 annual meeting ofshareholders and is incorporated herein by reference.
ITEM 14 – PRINCIPAL ACCOUNTING FEES AND
SERVICES
The information required by this item is included under thecaption “Ratification of Independent Registered PublicAccounting Firm (Item 2) – Audit and non-audit fees” in ourProxy Statement to be filed for the 2013 annual meeting ofshareholders and is incorporated herein by reference.
PART IV
ITEM 15 – EXHIBITS, FINANCIAL STATEMENT
SCHEDULES
Financial Statements, Financial Statement Schedules
Our consolidated financial statements required in response tothis Item are incorporated by reference from Item 8 of thisReport.
Audited consolidated financial statements of BlackRock, Inc.as of December 31, 2012 and 2011 and for each of the threeyears in the period ended December 31, 2012 are filed withthis Report as Exhibit 99.2 and incorporated herein byreference.
Exhibits
Our exhibits listed on the Exhibit Index on pages E-1 throughE-8 of this Form 10-K are filed with this Report or areincorporated herein by reference.
246 The PNC Financial Services Group, Inc. – Form 10-K

SIGNATURES
Pursuant to the requirements of Section 13 or 15(d) of the Securities Exchange Act of 1934, the registrant has duly caused thisreport to be signed on its behalf by the undersigned, thereunto duly authorized.
The PNC Financial Services Group, Inc.(Registrant)
By: /s/ Richard J. Johnson
Richard J. JohnsonExecutive Vice President and Chief Financial OfficerFebruary 28, 2013
Pursuant to the requirements of the Securities Exchange Act of 1934, this report has been signed below by the following persons onbehalf of The PNC Financial Services Group, Inc. and in the capacities indicated on February 28, 2013.
Signature Capacities
/s/ James E. Rohr
James E. Rohr
Chairman, Chief Executive Officer and Director(Principal Executive Officer)
/s/ Richard J. Johnson
Richard J. Johnson
Executive Vice President and Chief Financial Officer(Principal Financial Officer)
/s/ Gregory H. Kozich
Gregory H. Kozich
Senior Vice President and Controller(Principal Accounting Officer)
/s/ William S. Demchak
William S. Demchak
Director
* Richard O. Berndt; Charles E. Bunch; Paul W. Chellgren; KayColes James; Richard B. Kelson; Bruce C. Lindsay; Anthony A.Massaro; Jane G. Pepper; Donald J. Shepard; Lorene K. Steffes;Dennis F. Strigl; Thomas J. Usher; George H. Walls, Jr.; andHelge H. Wehmeier
Directors
*By: /s/ George P. Long, III
George P. Long, III, Attorney-in-Fact,pursuant to Powers of Attorney filedherewith
The PNC Financial Services Group, Inc. – Form 10-K 247
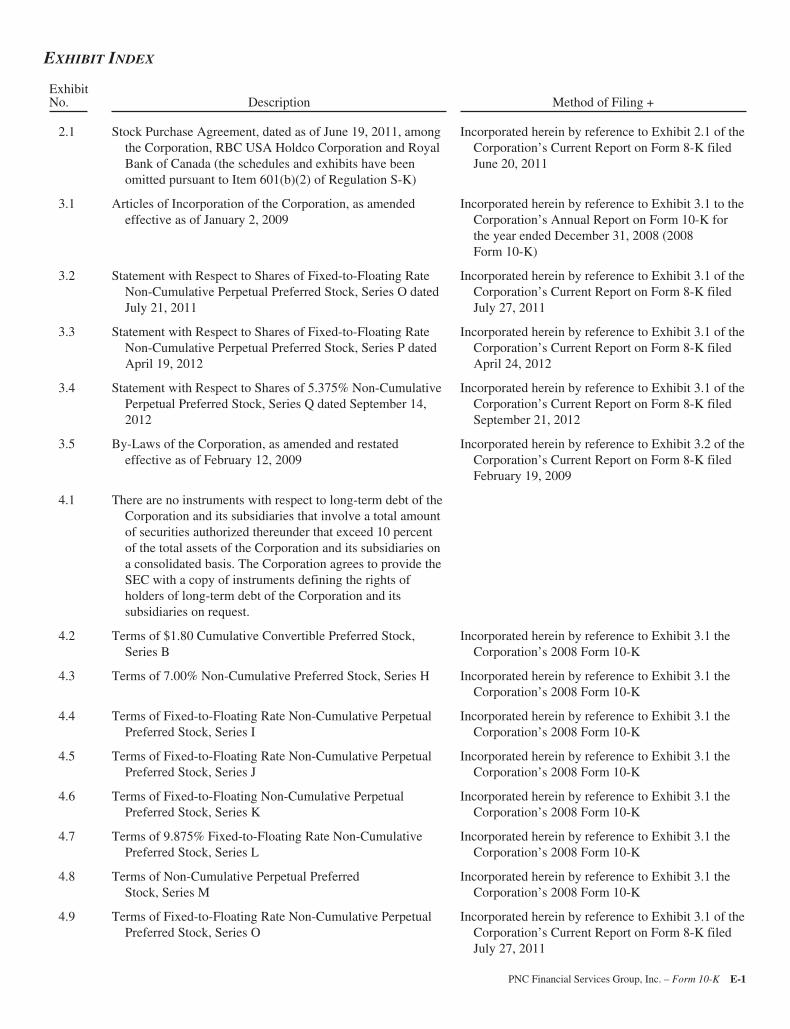
EXHIBIT INDEX
ExhibitNo. Description Method of Filing +
2.1 Stock Purchase Agreement, dated as of June 19, 2011, amongthe Corporation, RBC USA Holdco Corporation and RoyalBank of Canada (the schedules and exhibits have beenomitted pursuant to Item 601(b)(2) of Regulation S-K)
Incorporated herein by reference to Exhibit 2.1 of theCorporation’s Current Report on Form 8-K filedJune 20, 2011
3.1 Articles of Incorporation of the Corporation, as amendedeffective as of January 2, 2009
Incorporated herein by reference to Exhibit 3.1 to theCorporation’s Annual Report on Form 10-K forthe year ended December 31, 2008 (2008Form 10-K)
3.2 Statement with Respect to Shares of Fixed-to-Floating RateNon-Cumulative Perpetual Preferred Stock, Series O datedJuly 21, 2011
Incorporated herein by reference to Exhibit 3.1 of theCorporation’s Current Report on Form 8-K filedJuly 27, 2011
3.3 Statement with Respect to Shares of Fixed-to-Floating RateNon-Cumulative Perpetual Preferred Stock, Series P datedApril 19, 2012
Incorporated herein by reference to Exhibit 3.1 of theCorporation’s Current Report on Form 8-K filedApril 24, 2012
3.4 Statement with Respect to Shares of 5.375% Non-CumulativePerpetual Preferred Stock, Series Q dated September 14,2012
Incorporated herein by reference to Exhibit 3.1 of theCorporation’s Current Report on Form 8-K filedSeptember 21, 2012
3.5 By-Laws of the Corporation, as amended and restatedeffective as of February 12, 2009
Incorporated herein by reference to Exhibit 3.2 of theCorporation’s Current Report on Form 8-K filedFebruary 19, 2009
4.1 There are no instruments with respect to long-term debt of theCorporation and its subsidiaries that involve a total amountof securities authorized thereunder that exceed 10 percentof the total assets of the Corporation and its subsidiaries ona consolidated basis. The Corporation agrees to provide theSEC with a copy of instruments defining the rights ofholders of long-term debt of the Corporation and itssubsidiaries on request.
4.2 Terms of $1.80 Cumulative Convertible Preferred Stock,Series B
Incorporated herein by reference to Exhibit 3.1 theCorporation’s 2008 Form 10-K
4.3 Terms of 7.00% Non-Cumulative Preferred Stock, Series H Incorporated herein by reference to Exhibit 3.1 theCorporation’s 2008 Form 10-K
4.4 Terms of Fixed-to-Floating Rate Non-Cumulative PerpetualPreferred Stock, Series I
Incorporated herein by reference to Exhibit 3.1 theCorporation’s 2008 Form 10-K
4.5 Terms of Fixed-to-Floating Rate Non-Cumulative PerpetualPreferred Stock, Series J
Incorporated herein by reference to Exhibit 3.1 theCorporation’s 2008 Form 10-K
4.6 Terms of Fixed-to-Floating Non-Cumulative PerpetualPreferred Stock, Series K
Incorporated herein by reference to Exhibit 3.1 theCorporation’s 2008 Form 10-K
4.7 Terms of 9.875% Fixed-to-Floating Rate Non-CumulativePreferred Stock, Series L
Incorporated herein by reference to Exhibit 3.1 theCorporation’s 2008 Form 10-K
4.8 Terms of Non-Cumulative Perpetual PreferredStock, Series M
Incorporated herein by reference to Exhibit 3.1 theCorporation’s 2008 Form 10-K
4.9 Terms of Fixed-to-Floating Rate Non-Cumulative PerpetualPreferred Stock, Series O
Incorporated herein by reference to Exhibit 3.1 of theCorporation’s Current Report on Form 8-K filedJuly 27, 2011
PNC Financial Services Group, Inc. – Form 10-K E-1
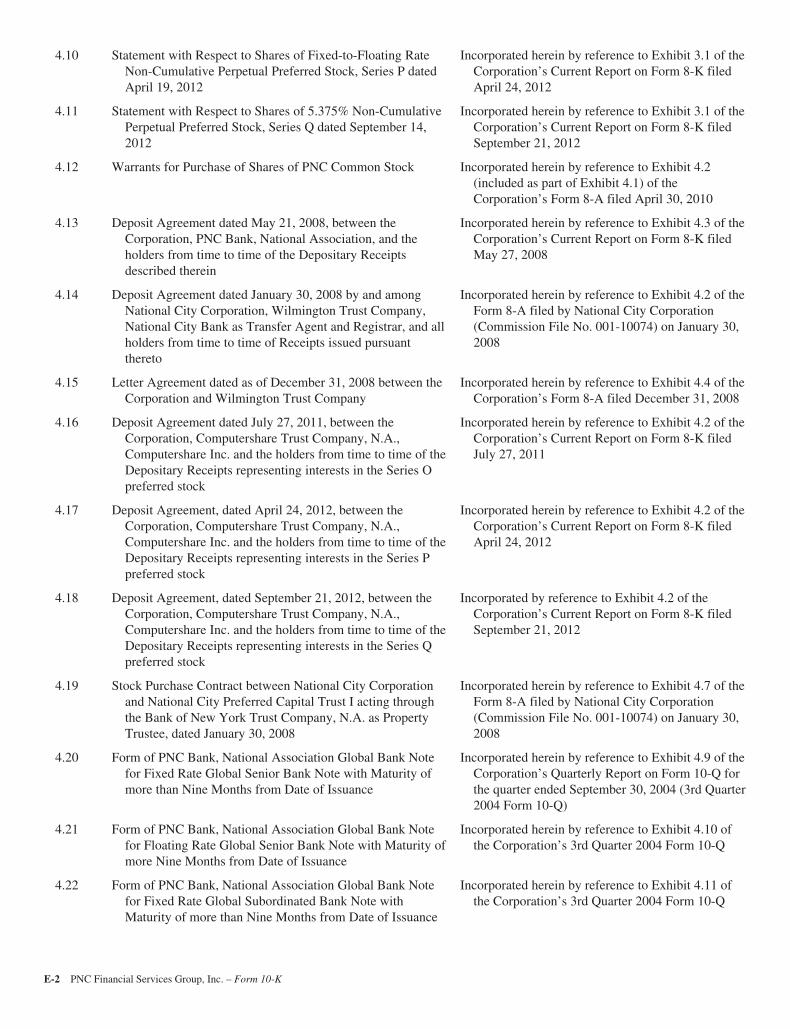
4.10 Statement with Respect to Shares of Fixed-to-Floating RateNon-Cumulative Perpetual Preferred Stock, Series P datedApril 19, 2012
Incorporated herein by reference to Exhibit 3.1 of theCorporation’s Current Report on Form 8-K filedApril 24, 2012
4.11 Statement with Respect to Shares of 5.375% Non-CumulativePerpetual Preferred Stock, Series Q dated September 14,2012
Incorporated herein by reference to Exhibit 3.1 of theCorporation’s Current Report on Form 8-K filedSeptember 21, 2012
4.12 Warrants for Purchase of Shares of PNC Common Stock Incorporated herein by reference to Exhibit 4.2(included as part of Exhibit 4.1) of theCorporation’s Form 8-A filed April 30, 2010
4.13 Deposit Agreement dated May 21, 2008, between theCorporation, PNC Bank, National Association, and theholders from time to time of the Depositary Receiptsdescribed therein
Incorporated herein by reference to Exhibit 4.3 of theCorporation’s Current Report on Form 8-K filedMay 27, 2008
4.14 Deposit Agreement dated January 30, 2008 by and amongNational City Corporation, Wilmington Trust Company,National City Bank as Transfer Agent and Registrar, and allholders from time to time of Receipts issued pursuantthereto
Incorporated herein by reference to Exhibit 4.2 of theForm 8-A filed by National City Corporation(Commission File No. 001-10074) on January 30,2008
4.15 Letter Agreement dated as of December 31, 2008 between theCorporation and Wilmington Trust Company
Incorporated herein by reference to Exhibit 4.4 of theCorporation’s Form 8-A filed December 31, 2008
4.16 Deposit Agreement dated July 27, 2011, between theCorporation, Computershare Trust Company, N.A.,Computershare Inc. and the holders from time to time of theDepositary Receipts representing interests in the Series Opreferred stock
Incorporated herein by reference to Exhibit 4.2 of theCorporation’s Current Report on Form 8-K filedJuly 27, 2011
4.17 Deposit Agreement, dated April 24, 2012, between theCorporation, Computershare Trust Company, N.A.,Computershare Inc. and the holders from time to time of theDepositary Receipts representing interests in the Series Ppreferred stock
Incorporated herein by reference to Exhibit 4.2 of theCorporation’s Current Report on Form 8-K filedApril 24, 2012
4.18 Deposit Agreement, dated September 21, 2012, between theCorporation, Computershare Trust Company, N.A.,Computershare Inc. and the holders from time to time of theDepositary Receipts representing interests in the Series Qpreferred stock
Incorporated by reference to Exhibit 4.2 of theCorporation’s Current Report on Form 8-K filedSeptember 21, 2012
4.19 Stock Purchase Contract between National City Corporationand National City Preferred Capital Trust I acting throughthe Bank of New York Trust Company, N.A. as PropertyTrustee, dated January 30, 2008
Incorporated herein by reference to Exhibit 4.7 of theForm 8-A filed by National City Corporation(Commission File No. 001-10074) on January 30,2008
4.20 Form of PNC Bank, National Association Global Bank Notefor Fixed Rate Global Senior Bank Note with Maturity ofmore than Nine Months from Date of Issuance
Incorporated herein by reference to Exhibit 4.9 of theCorporation’s Quarterly Report on Form 10-Q forthe quarter ended September 30, 2004 (3rd Quarter2004 Form 10-Q)
4.21 Form of PNC Bank, National Association Global Bank Notefor Floating Rate Global Senior Bank Note with Maturity ofmore Nine Months from Date of Issuance
Incorporated herein by reference to Exhibit 4.10 ofthe Corporation’s 3rd Quarter 2004 Form 10-Q
4.22 Form of PNC Bank, National Association Global Bank Notefor Fixed Rate Global Subordinated Bank Note withMaturity of more than Nine Months from Date of Issuance
Incorporated herein by reference to Exhibit 4.11 ofthe Corporation’s 3rd Quarter 2004 Form 10-Q
E-2 PNC Financial Services Group, Inc. – Form 10-K
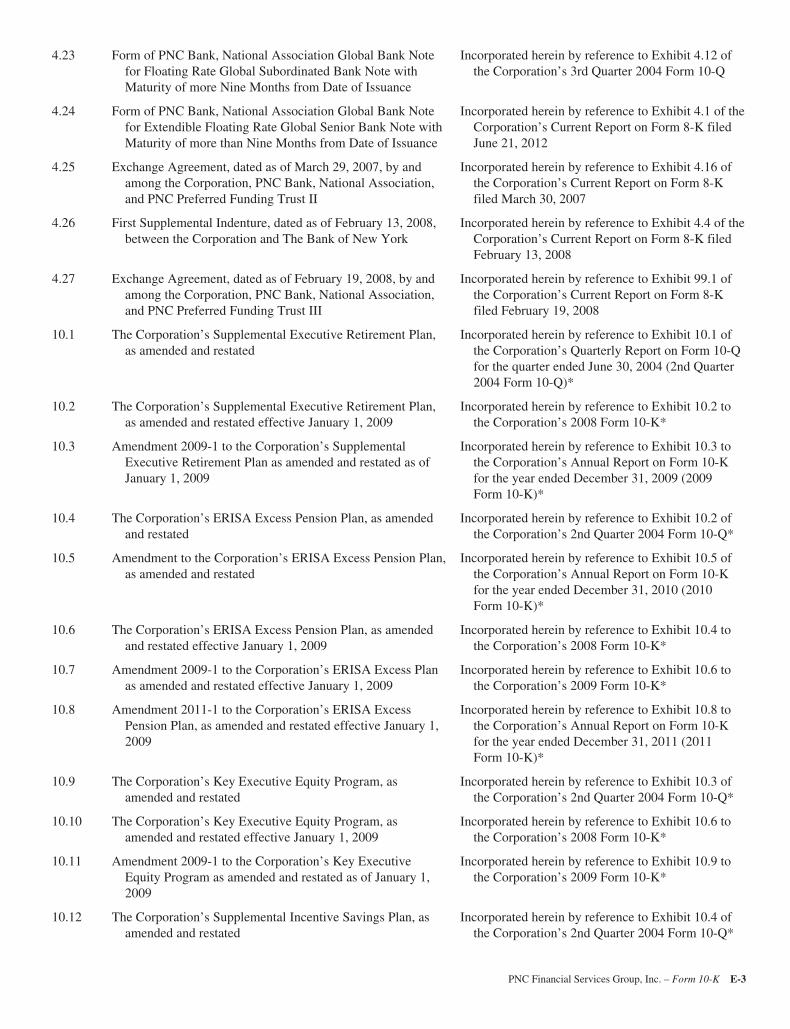
4.23 Form of PNC Bank, National Association Global Bank Notefor Floating Rate Global Subordinated Bank Note withMaturity of more Nine Months from Date of Issuance
Incorporated herein by reference to Exhibit 4.12 ofthe Corporation’s 3rd Quarter 2004 Form 10-Q
4.24 Form of PNC Bank, National Association Global Bank Notefor Extendible Floating Rate Global Senior Bank Note withMaturity of more than Nine Months from Date of Issuance
Incorporated herein by reference to Exhibit 4.1 of theCorporation’s Current Report on Form 8-K filedJune 21, 2012
4.25 Exchange Agreement, dated as of March 29, 2007, by andamong the Corporation, PNC Bank, National Association,and PNC Preferred Funding Trust II
Incorporated herein by reference to Exhibit 4.16 ofthe Corporation’s Current Report on Form 8-Kfiled March 30, 2007
4.26 First Supplemental Indenture, dated as of February 13, 2008,between the Corporation and The Bank of New York
Incorporated herein by reference to Exhibit 4.4 of theCorporation’s Current Report on Form 8-K filedFebruary 13, 2008
4.27 Exchange Agreement, dated as of February 19, 2008, by andamong the Corporation, PNC Bank, National Association,and PNC Preferred Funding Trust III
Incorporated herein by reference to Exhibit 99.1 ofthe Corporation’s Current Report on Form 8-Kfiled February 19, 2008
10.1 The Corporation’s Supplemental Executive Retirement Plan,as amended and restated
Incorporated herein by reference to Exhibit 10.1 ofthe Corporation’s Quarterly Report on Form 10-Qfor the quarter ended June 30, 2004 (2nd Quarter2004 Form 10-Q)*
10.2 The Corporation’s Supplemental Executive Retirement Plan,as amended and restated effective January 1, 2009
Incorporated herein by reference to Exhibit 10.2 tothe Corporation’s 2008 Form 10-K*
10.3 Amendment 2009-1 to the Corporation’s SupplementalExecutive Retirement Plan as amended and restated as ofJanuary 1, 2009
Incorporated herein by reference to Exhibit 10.3 tothe Corporation’s Annual Report on Form 10-Kfor the year ended December 31, 2009 (2009Form 10-K)*
10.4 The Corporation’s ERISA Excess Pension Plan, as amendedand restated
Incorporated herein by reference to Exhibit 10.2 ofthe Corporation’s 2nd Quarter 2004 Form 10-Q*
10.5 Amendment to the Corporation’s ERISA Excess Pension Plan,as amended and restated
Incorporated herein by reference to Exhibit 10.5 ofthe Corporation’s Annual Report on Form 10-Kfor the year ended December 31, 2010 (2010Form 10-K)*
10.6 The Corporation’s ERISA Excess Pension Plan, as amendedand restated effective January 1, 2009
Incorporated herein by reference to Exhibit 10.4 tothe Corporation’s 2008 Form 10-K*
10.7 Amendment 2009-1 to the Corporation’s ERISA Excess Planas amended and restated effective January 1, 2009
Incorporated herein by reference to Exhibit 10.6 tothe Corporation’s 2009 Form 10-K*
10.8 Amendment 2011-1 to the Corporation’s ERISA ExcessPension Plan, as amended and restated effective January 1,2009
Incorporated herein by reference to Exhibit 10.8 tothe Corporation’s Annual Report on Form 10-Kfor the year ended December 31, 2011 (2011Form 10-K)*
10.9 The Corporation’s Key Executive Equity Program, asamended and restated
Incorporated herein by reference to Exhibit 10.3 ofthe Corporation’s 2nd Quarter 2004 Form 10-Q*
10.10 The Corporation’s Key Executive Equity Program, asamended and restated effective January 1, 2009
Incorporated herein by reference to Exhibit 10.6 tothe Corporation’s 2008 Form 10-K*
10.11 Amendment 2009-1 to the Corporation’s Key ExecutiveEquity Program as amended and restated as of January 1,2009
Incorporated herein by reference to Exhibit 10.9 tothe Corporation’s 2009 Form 10-K*
10.12 The Corporation’s Supplemental Incentive Savings Plan, asamended and restated
Incorporated herein by reference to Exhibit 10.4 ofthe Corporation’s 2nd Quarter 2004 Form 10-Q*
PNC Financial Services Group, Inc. – Form 10-K E-3
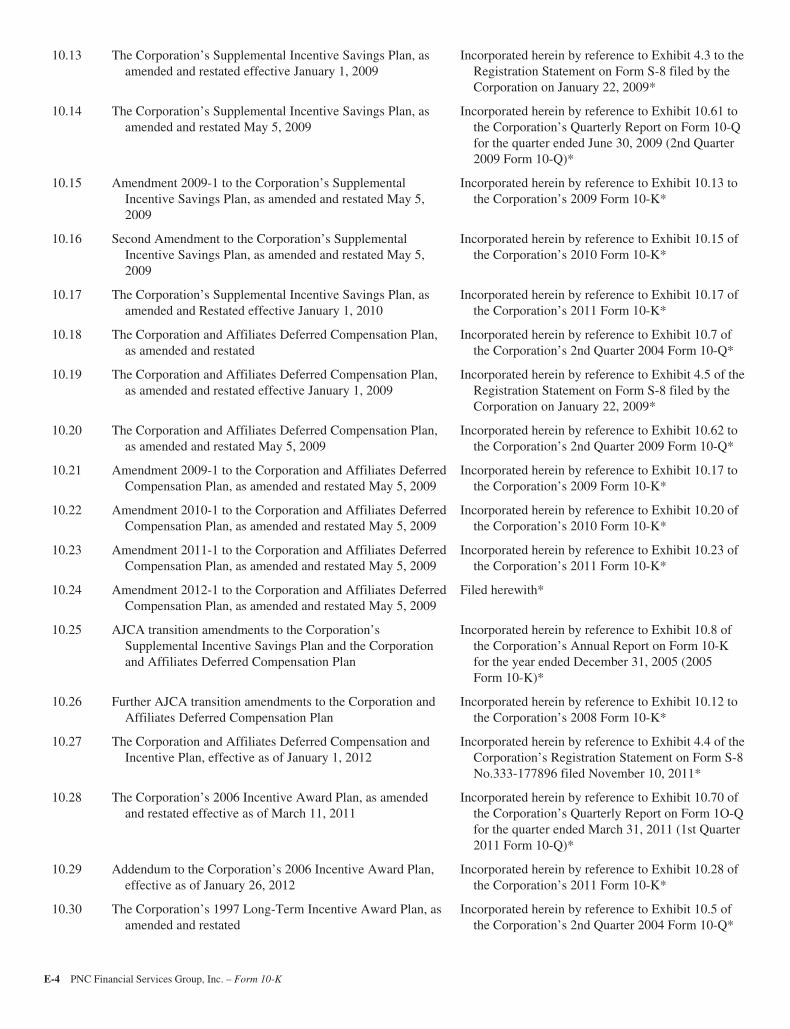
10.13 The Corporation’s Supplemental Incentive Savings Plan, asamended and restated effective January 1, 2009
Incorporated herein by reference to Exhibit 4.3 to theRegistration Statement on Form S-8 filed by theCorporation on January 22, 2009*
10.14 The Corporation’s Supplemental Incentive Savings Plan, asamended and restated May 5, 2009
Incorporated herein by reference to Exhibit 10.61 tothe Corporation’s Quarterly Report on Form 10-Qfor the quarter ended June 30, 2009 (2nd Quarter2009 Form 10-Q)*
10.15 Amendment 2009-1 to the Corporation’s SupplementalIncentive Savings Plan, as amended and restated May 5,2009
Incorporated herein by reference to Exhibit 10.13 tothe Corporation’s 2009 Form 10-K*
10.16 Second Amendment to the Corporation’s SupplementalIncentive Savings Plan, as amended and restated May 5,2009
Incorporated herein by reference to Exhibit 10.15 ofthe Corporation’s 2010 Form 10-K*
10.17 The Corporation’s Supplemental Incentive Savings Plan, asamended and Restated effective January 1, 2010
Incorporated herein by reference to Exhibit 10.17 ofthe Corporation’s 2011 Form 10-K*
10.18 The Corporation and Affiliates Deferred Compensation Plan,as amended and restated
Incorporated herein by reference to Exhibit 10.7 ofthe Corporation’s 2nd Quarter 2004 Form 10-Q*
10.19 The Corporation and Affiliates Deferred Compensation Plan,as amended and restated effective January 1, 2009
Incorporated herein by reference to Exhibit 4.5 of theRegistration Statement on Form S-8 filed by theCorporation on January 22, 2009*
10.20 The Corporation and Affiliates Deferred Compensation Plan,as amended and restated May 5, 2009
Incorporated herein by reference to Exhibit 10.62 tothe Corporation’s 2nd Quarter 2009 Form 10-Q*
10.21 Amendment 2009-1 to the Corporation and Affiliates DeferredCompensation Plan, as amended and restated May 5, 2009
Incorporated herein by reference to Exhibit 10.17 tothe Corporation’s 2009 Form 10-K*
10.22 Amendment 2010-1 to the Corporation and Affiliates DeferredCompensation Plan, as amended and restated May 5, 2009
Incorporated herein by reference to Exhibit 10.20 ofthe Corporation’s 2010 Form 10-K*
10.23 Amendment 2011-1 to the Corporation and Affiliates DeferredCompensation Plan, as amended and restated May 5, 2009
Incorporated herein by reference to Exhibit 10.23 ofthe Corporation’s 2011 Form 10-K*
10.24 Amendment 2012-1 to the Corporation and Affiliates DeferredCompensation Plan, as amended and restated May 5, 2009
Filed herewith*
10.25 AJCA transition amendments to the Corporation’sSupplemental Incentive Savings Plan and the Corporationand Affiliates Deferred Compensation Plan
Incorporated herein by reference to Exhibit 10.8 ofthe Corporation’s Annual Report on Form 10-Kfor the year ended December 31, 2005 (2005Form 10-K)*
10.26 Further AJCA transition amendments to the Corporation andAffiliates Deferred Compensation Plan
Incorporated herein by reference to Exhibit 10.12 tothe Corporation’s 2008 Form 10-K*
10.27 The Corporation and Affiliates Deferred Compensation andIncentive Plan, effective as of January 1, 2012
Incorporated herein by reference to Exhibit 4.4 of theCorporation’s Registration Statement on Form S-8No.333-177896 filed November 10, 2011*
10.28 The Corporation’s 2006 Incentive Award Plan, as amendedand restated effective as of March 11, 2011
Incorporated herein by reference to Exhibit 10.70 ofthe Corporation’s Quarterly Report on Form 1O-Qfor the quarter ended March 31, 2011 (1st Quarter2011 Form 10-Q)*
10.29 Addendum to the Corporation’s 2006 Incentive Award Plan,effective as of January 26, 2012
Incorporated herein by reference to Exhibit 10.28 ofthe Corporation’s 2011 Form 10-K*
10.30 The Corporation’s 1997 Long-Term Incentive Award Plan, asamended and restated
Incorporated herein by reference to Exhibit 10.5 ofthe Corporation’s 2nd Quarter 2004 Form 10-Q*
E-4 PNC Financial Services Group, Inc. – Form 10-K

10.31 The Corporation’s 1996 Executive Incentive Award Plan, asamended and restated effective as of January 1, 2007
Incorporated herein by reference to Exhibit 10.10 ofthe Corporation’s Annual Report on Form 10-Kfor the year ended December 31, 2007 (2007Form 10-K)*
10.32 The Corporation’s Directors Deferred Compensation Plan, asamended and restated
Incorporated herein by reference to Exhibit 10.12 ofthe Corporation’s Quarterly Report on Form 10-Qfor the quarter ended March 31, 2004 (1st Quarter2004 Form 10-Q)*
10.33 The Corporation’s Directors Deferred Compensation Plan, asamended and restated effective January 1, 2012
Incorporated herein by reference to Exhibit 10.32 ofthe Corporation’s 2011 Form 10-K*
10.34 The Corporation’s Outside Directors Deferred Stock UnitPlan, as amended and restated
Incorporated herein by reference to Exhibit 10.13 ofthe Corporation’s 1st Quarter 2004 Form 10-Q*
10.35 The Corporation’s Outside Directors Deferred Stock UnitPlan, as amended and restated effective January 1, 2012
Incorporated herein by reference to Exhibit 10.34 ofthe Corporation’s 2011 Form 10-K*
10.36 Amended and Restated Trust Agreement between PNCInvestment Corp., as settlor, and Hershey Trust Company,as trustee
Incorporated herein by reference to Exhibit 10.35 ofthe Corporation’s Quarterly Report on Form 10-Qfor the quarter ended September 30, 2005 (3rdQuarter 2005 Form 10-Q)*
10.37 Trust Agreement between PNC Investment Corp., as settlor,and PNC Bank, National Association, as trustee
Incorporated herein by reference to Exhibit 10.34 ofthe Corporation’s 3rd Quarter 2005 Form 10-Q*
10.38 Certificate of Corporate Action for Grantor Trusts effectiveJanuary 1, 2012
Incorporated herein by reference to Exhibit 10.37 ofthe Corporation’s 2011 Form 10-K*
10.39 The Corporation’s Employee Stock Purchase Plan, asamended and restated as of January 1, 2009
Incorporated herein by reference to Exhibit 99.1 tothe Registration Statement on Form S-8 filed bythe Corporation on December 31, 2008
10.40 Amendment 2011-1 to the Corporation’s Employee StockPurchase Plan, as amended and restated effective January 1,2009
Incorporated herein by reference to Exhibit 10.39 ofthe Corporation’s 2011 Form 10-K
10.41 Amendment 2012-1 to the Corporation’s Employee StockPurchase Plan, as amended and restated effective January 1,2009
Filed herewith
10.42 Forms of employee stock option, restricted stock, restricteddeferral, and incentive share agreements
Incorporated herein by reference to Exhibit 10.30 ofthe Corporation’s 3rd Quarter 2004 Form 10-Q*
10.43 2005 forms of employee stock option, restricted stock andrestricted deferral agreements
Incorporated herein by reference to Exhibit 10.28 ofthe Corporation’s Annual Report on Form 10-Kfor the year ended December 31, 2004 (2004Form 10-K)*
10.44 2006 forms of employee stock option, restricted stock andrestricted deferral agreements
Incorporated herein by reference to Exhibit 10.17 ofthe Corporation’s 2005 Form 10-K*
10.45 Forms of employee stock option and restricted stockagreements under 2006 Incentive Award Plan
Incorporated by reference to Exhibit 10.40 of theCorporation’s Quarterly Report on Form 10-Q forthe quarter ended June 30, 2006*
10.46 2006 forms of employee incentive performance unit andsenior officer change in control severance agreements
Incorporated herein by reference to Exhibit 10.20 ofthe Corporation’s Annual Report on Form 10-Kfor the year ended December 31, 2006 as filed onMarch 1, 2007 (2006 Form 10-K)*
10.47 2007 forms of employee stock option and restricted stockagreements
Incorporated herein by reference to Exhibit 10.21 ofthe Corporation’s 2006 Form 10-K*
PNC Financial Services Group, Inc. – Form 10-K E-5

10.48 2006-2007 forms of employee incentive performance unitsagreements
Incorporated herein by reference to Exhibit 10.51 ofthe Corporation’s Quarterly Report on Form 10-Qfor the quarter ended June 30, 2007 (2nd Quarter2007 Form 10-Q)*
10.49 2008 forms of employee stock option and restricted stock/share unit agreements
Incorporated herein by reference to Exhibit 10.26 ofthe Corporation’s 2007 Form 10-K*
10.50 2008 forms of employee performance units agreements Incorporated herein by reference to Exhibit 10.33 tothe Corporation’s 2008 Form 10-K*
10.51 Form of employee stock option agreement with varied vestingschedule or circumstances
Incorporated herein by reference to Exhibit 10.50 ofthe Corporation’s Current Report on Form 8-Kfiled April 18, 2008*
10.52 Form of employee restricted stock agreement with variedvesting schedule or circumstances
Incorporated herein by reference to Exhibit 10.51 ofthe Corporation’s Current Report on Form 8-Kfiled April 18, 2008*
10.53 Form of employee stock option agreement with performancevesting schedule
Incorporated herein by reference to Exhibit 10.54 ofthe Corporation’s Quarterly Report on Form 10-Qfor the quarter ended June 30, 2008*
10.54 2009 forms of employee stock option, restricted stock,restricted share unit and performance unit agreements
Incorporated by reference to Exhibit 10.61 to theCorporation’s Quarterly Report on Form 10-Q forthe quarter ended March 31, 2009*
10.55 Form of agreement regarding portion of salary payable instock units
Incorporated by reference to Exhibit 10.63 to theCorporation’s Current Report on Form 8-K filedAugust 21, 2009*
10.56 Form of agreement for long-term restricted stock Incorporated by reference to Exhibit 10.64 to theCorporation’s Current Report on Form 8-K filedDecember 23, 2009*
10.57 Form of agreement for long-term stock Incorporated by reference to Exhibit 10.65 to theCorporation’s Current Report on Form 8-K filedDecember 23, 2009*
10.58 2010 forms of employee stock option, restricted stock, andrestricted share unit agreements
Incorporated herein by reference to Exhibit 10.48 tothe Corporation’s 2009 Form 10-K*
10.59 2010 forms of employee performance units agreements Incorporated herein by reference to Exhibit 10.75 ofthe Corporation’s Quarterly Report on Form 10-Qfor the quarter ended September 30, 2010*
10.60 2011 forms of employee stock option, restricted stock,restricted share unit and performance unit agreements
Incorporated herein by reference to Exhibit 10.71 ofthe Corporation’s 1st Quarter 2011 Form 10-Q*
10.61 2012 forms of employee stock option, restricted stock andrestricted share unit agreements
Incorporated herein by reference to Exhibit 10.77 ofthe Corporation’s Quarterly Report on Form 10-Qfor the quarter ended March 31, 2012 (1st Quarter2012 Form 10-Q)*
10.62 Forms of employee stock option, restricted stock andrestricted share unit agreements with varied vesting,payment and other circumstances
Incorporated herein by reference to Exhibit 10.78 ofthe Corporation’s 1st Quarter 2012 Form 10-Q*
10.63 Additional 2012 forms of employee performance unit,restricted stock and restricted share unit agreements
Incorporated herein by reference to Exhibit 10.79 ofthe Corporation’s Quarterly Report on Form 10-Qfor the quarter ended June 30, 2012 (2nd Quarter2012 Form 10-Q)*
E-6 PNC Financial Services Group, Inc. – Form 10-K
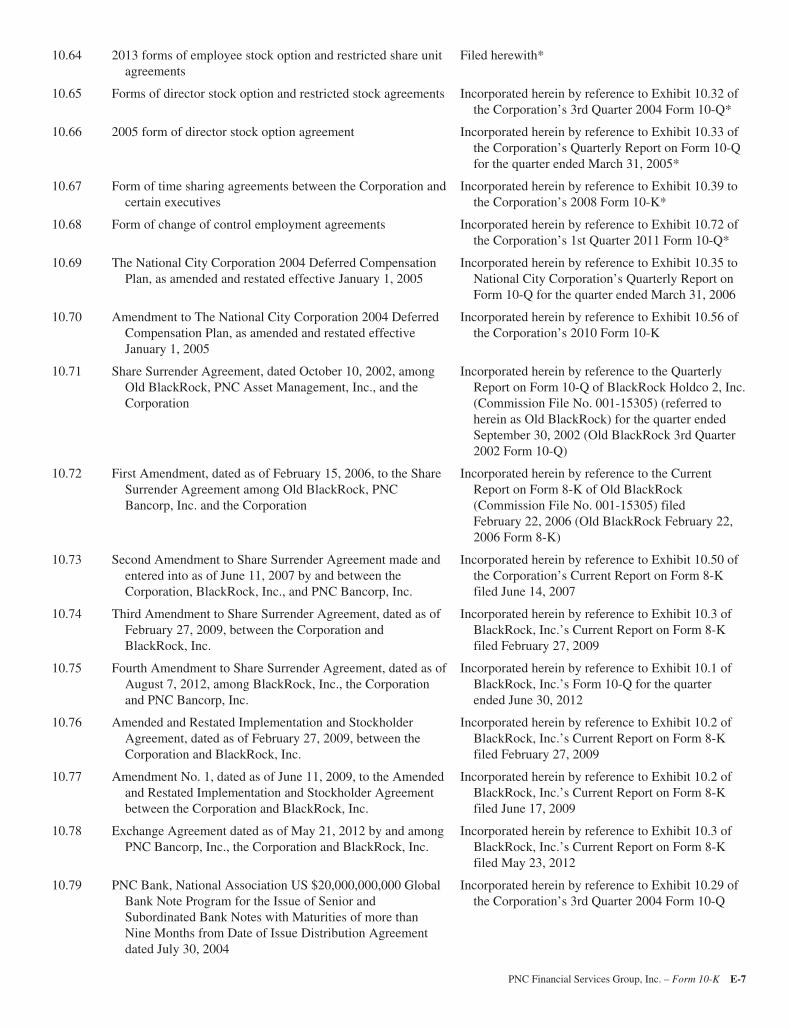
10.64 2013 forms of employee stock option and restricted share unitagreements
Filed herewith*
10.65 Forms of director stock option and restricted stock agreements Incorporated herein by reference to Exhibit 10.32 ofthe Corporation’s 3rd Quarter 2004 Form 10-Q*
10.66 2005 form of director stock option agreement Incorporated herein by reference to Exhibit 10.33 ofthe Corporation’s Quarterly Report on Form 10-Qfor the quarter ended March 31, 2005*
10.67 Form of time sharing agreements between the Corporation andcertain executives
Incorporated herein by reference to Exhibit 10.39 tothe Corporation’s 2008 Form 10-K*
10.68 Form of change of control employment agreements Incorporated herein by reference to Exhibit 10.72 ofthe Corporation’s 1st Quarter 2011 Form 10-Q*
10.69 The National City Corporation 2004 Deferred CompensationPlan, as amended and restated effective January 1, 2005
Incorporated herein by reference to Exhibit 10.35 toNational City Corporation’s Quarterly Report onForm 10-Q for the quarter ended March 31, 2006
10.70 Amendment to The National City Corporation 2004 DeferredCompensation Plan, as amended and restated effectiveJanuary 1, 2005
Incorporated herein by reference to Exhibit 10.56 ofthe Corporation’s 2010 Form 10-K
10.71 Share Surrender Agreement, dated October 10, 2002, amongOld BlackRock, PNC Asset Management, Inc., and theCorporation
Incorporated herein by reference to the QuarterlyReport on Form 10-Q of BlackRock Holdco 2, Inc.(Commission File No. 001-15305) (referred toherein as Old BlackRock) for the quarter endedSeptember 30, 2002 (Old BlackRock 3rd Quarter2002 Form 10-Q)
10.72 First Amendment, dated as of February 15, 2006, to the ShareSurrender Agreement among Old BlackRock, PNCBancorp, Inc. and the Corporation
Incorporated herein by reference to the CurrentReport on Form 8-K of Old BlackRock(Commission File No. 001-15305) filedFebruary 22, 2006 (Old BlackRock February 22,2006 Form 8-K)
10.73 Second Amendment to Share Surrender Agreement made andentered into as of June 11, 2007 by and between theCorporation, BlackRock, Inc., and PNC Bancorp, Inc.
Incorporated herein by reference to Exhibit 10.50 ofthe Corporation’s Current Report on Form 8-Kfiled June 14, 2007
10.74 Third Amendment to Share Surrender Agreement, dated as ofFebruary 27, 2009, between the Corporation andBlackRock, Inc.
Incorporated herein by reference to Exhibit 10.3 ofBlackRock, Inc.’s Current Report on Form 8-Kfiled February 27, 2009
10.75 Fourth Amendment to Share Surrender Agreement, dated as ofAugust 7, 2012, among BlackRock, Inc., the Corporationand PNC Bancorp, Inc.
Incorporated herein by reference to Exhibit 10.1 ofBlackRock, Inc.’s Form 10-Q for the quarterended June 30, 2012
10.76 Amended and Restated Implementation and StockholderAgreement, dated as of February 27, 2009, between theCorporation and BlackRock, Inc.
Incorporated herein by reference to Exhibit 10.2 ofBlackRock, Inc.’s Current Report on Form 8-Kfiled February 27, 2009
10.77 Amendment No. 1, dated as of June 11, 2009, to the Amendedand Restated Implementation and Stockholder Agreementbetween the Corporation and BlackRock, Inc.
Incorporated herein by reference to Exhibit 10.2 ofBlackRock, Inc.’s Current Report on Form 8-Kfiled June 17, 2009
10.78 Exchange Agreement dated as of May 21, 2012 by and amongPNC Bancorp, Inc., the Corporation and BlackRock, Inc.
Incorporated herein by reference to Exhibit 10.3 ofBlackRock, Inc.’s Current Report on Form 8-Kfiled May 23, 2012
10.79 PNC Bank, National Association US $20,000,000,000 GlobalBank Note Program for the Issue of Senior andSubordinated Bank Notes with Maturities of more thanNine Months from Date of Issue Distribution Agreementdated July 30, 2004
Incorporated herein by reference to Exhibit 10.29 ofthe Corporation’s 3rd Quarter 2004 Form 10-Q
PNC Financial Services Group, Inc. – Form 10-K E-7
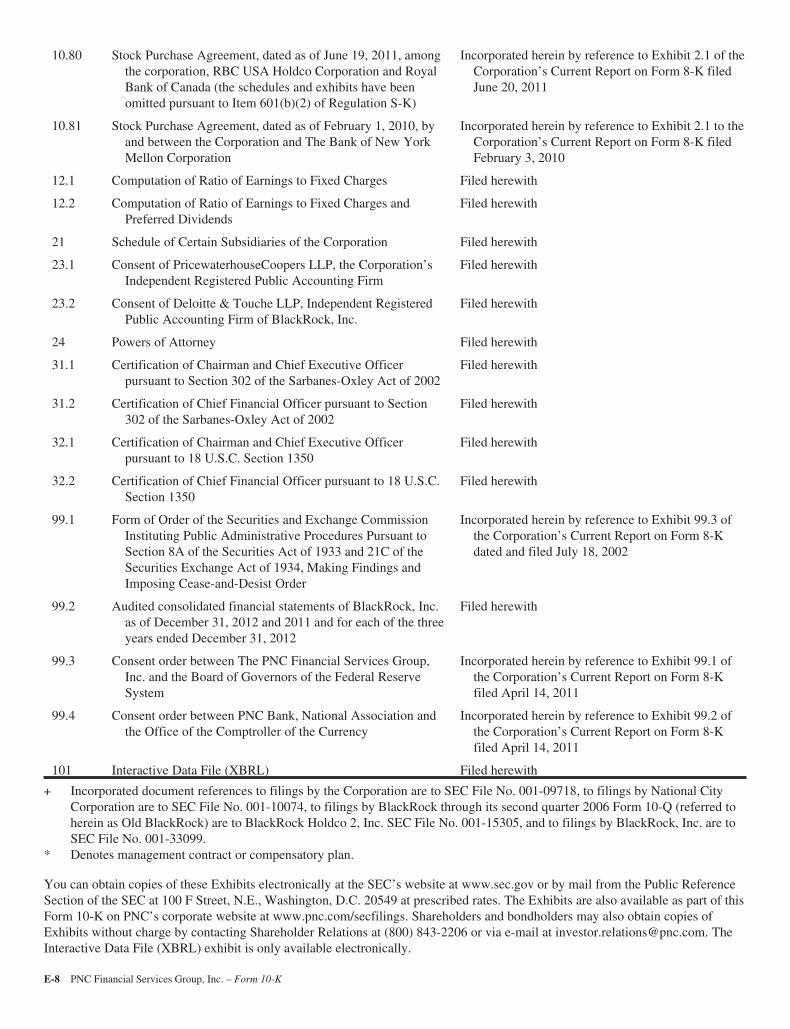
10.80 Stock Purchase Agreement, dated as of June 19, 2011, amongthe corporation, RBC USA Holdco Corporation and RoyalBank of Canada (the schedules and exhibits have beenomitted pursuant to Item 601(b)(2) of Regulation S-K)
Incorporated herein by reference to Exhibit 2.1 of theCorporation’s Current Report on Form 8-K filedJune 20, 2011
10.81 Stock Purchase Agreement, dated as of February 1, 2010, byand between the Corporation and The Bank of New YorkMellon Corporation
Incorporated herein by reference to Exhibit 2.1 to theCorporation’s Current Report on Form 8-K filedFebruary 3, 2010
12.1 Computation of Ratio of Earnings to Fixed Charges Filed herewith
12.2 Computation of Ratio of Earnings to Fixed Charges andPreferred Dividends
Filed herewith
21 Schedule of Certain Subsidiaries of the Corporation Filed herewith
23.1 Consent of PricewaterhouseCoopers LLP, the Corporation’sIndependent Registered Public Accounting Firm
Filed herewith
23.2 Consent of Deloitte & Touche LLP, Independent RegisteredPublic Accounting Firm of BlackRock, Inc.
Filed herewith
24 Powers of Attorney Filed herewith
31.1 Certification of Chairman and Chief Executive Officerpursuant to Section 302 of the Sarbanes-Oxley Act of 2002
Filed herewith
31.2 Certification of Chief Financial Officer pursuant to Section302 of the Sarbanes-Oxley Act of 2002
Filed herewith
32.1 Certification of Chairman and Chief Executive Officerpursuant to 18 U.S.C. Section 1350
Filed herewith
32.2 Certification of Chief Financial Officer pursuant to 18 U.S.C.Section 1350
Filed herewith
99.1 Form of Order of the Securities and Exchange CommissionInstituting Public Administrative Procedures Pursuant toSection 8A of the Securities Act of 1933 and 21C of theSecurities Exchange Act of 1934, Making Findings andImposing Cease-and-Desist Order
Incorporated herein by reference to Exhibit 99.3 ofthe Corporation’s Current Report on Form 8-Kdated and filed July 18, 2002
99.2 Audited consolidated financial statements of BlackRock, Inc.as of December 31, 2012 and 2011 and for each of the threeyears ended December 31, 2012
Filed herewith
99.3 Consent order between The PNC Financial Services Group,Inc. and the Board of Governors of the Federal ReserveSystem
Incorporated herein by reference to Exhibit 99.1 ofthe Corporation’s Current Report on Form 8-Kfiled April 14, 2011
99.4 Consent order between PNC Bank, National Association andthe Office of the Comptroller of the Currency
Incorporated herein by reference to Exhibit 99.2 ofthe Corporation’s Current Report on Form 8-Kfiled April 14, 2011
101 Interactive Data File (XBRL) Filed herewith
+ Incorporated document references to filings by the Corporation are to SEC File No. 001-09718, to filings by National CityCorporation are to SEC File No. 001-10074, to filings by BlackRock through its second quarter 2006 Form 10-Q (referred toherein as Old BlackRock) are to BlackRock Holdco 2, Inc. SEC File No. 001-15305, and to filings by BlackRock, Inc. are toSEC File No. 001-33099.
* Denotes management contract or compensatory plan.
You can obtain copies of these Exhibits electronically at the SEC’s website at www.sec.gov or by mail from the Public ReferenceSection of the SEC at 100 F Street, N.E., Washington, D.C. 20549 at prescribed rates. The Exhibits are also available as part of thisForm 10-K on PNC’s corporate website at www.pnc.com/secfilings. Shareholders and bondholders may also obtain copies ofExhibits without charge by contacting Shareholder Relations at (800) 843-2206 or via e-mail at [email protected]. TheInteractive Data File (XBRL) exhibit is only available electronically.
E-8 PNC Financial Services Group, Inc. – Form 10-K
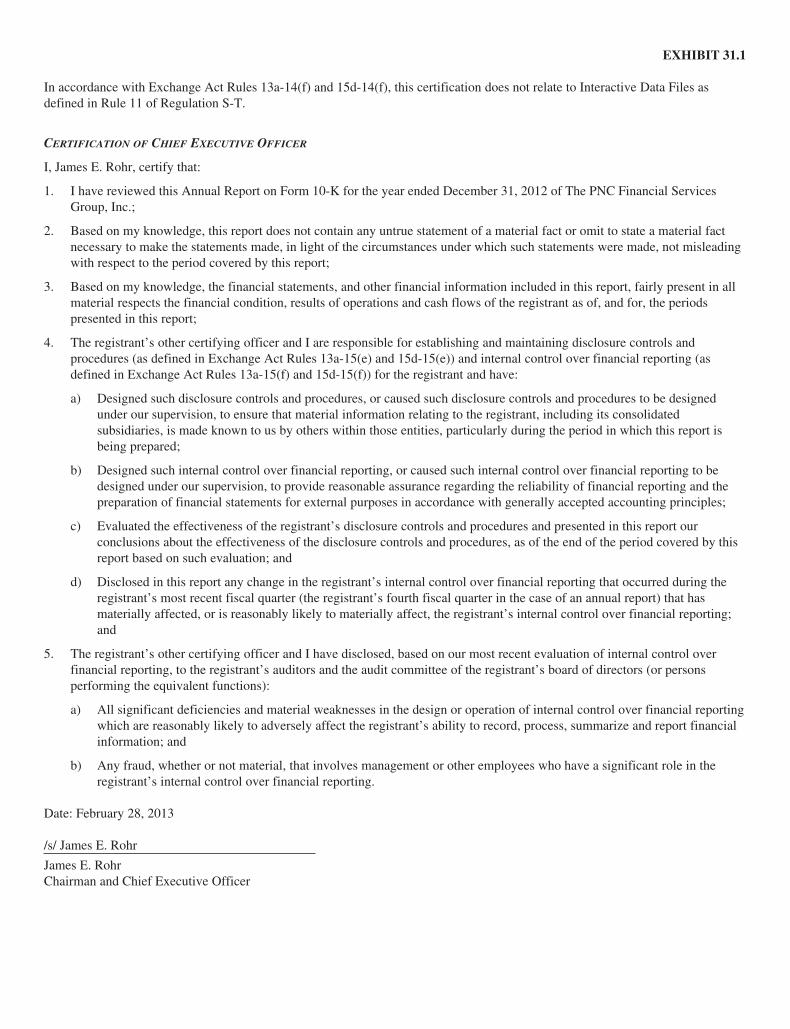
EXHIBIT 31.1
In accordance with Exchange Act Rules 13a-14(f) and 15d-14(f), this certification does not relate to Interactive Data Files asdefined in Rule 11 of Regulation S-T.
CERTIFICATION OF CHIEF EXECUTIVE OFFICER
I, James E. Rohr, certify that:
1. I have reviewed this Annual Report on Form 10-K for the year ended December 31, 2012 of The PNC Financial ServicesGroup, Inc.;
2. Based on my knowledge, this report does not contain any untrue statement of a material fact or omit to state a material factnecessary to make the statements made, in light of the circumstances under which such statements were made, not misleadingwith respect to the period covered by this report;
3. Based on my knowledge, the financial statements, and other financial information included in this report, fairly present in allmaterial respects the financial condition, results of operations and cash flows of the registrant as of, and for, the periodspresented in this report;
4. The registrant’s other certifying officer and I are responsible for establishing and maintaining disclosure controls andprocedures (as defined in Exchange Act Rules 13a-15(e) and 15d-15(e)) and internal control over financial reporting (asdefined in Exchange Act Rules 13a-15(f) and 15d-15(f)) for the registrant and have:
a) Designed such disclosure controls and procedures, or caused such disclosure controls and procedures to be designedunder our supervision, to ensure that material information relating to the registrant, including its consolidatedsubsidiaries, is made known to us by others within those entities, particularly during the period in which this report isbeing prepared;
b) Designed such internal control over financial reporting, or caused such internal control over financial reporting to bedesigned under our supervision, to provide reasonable assurance regarding the reliability of financial reporting and thepreparation of financial statements for external purposes in accordance with generally accepted accounting principles;
c) Evaluated the effectiveness of the registrant’s disclosure controls and procedures and presented in this report ourconclusions about the effectiveness of the disclosure controls and procedures, as of the end of the period covered by thisreport based on such evaluation; and
d) Disclosed in this report any change in the registrant’s internal control over financial reporting that occurred during theregistrant’s most recent fiscal quarter (the registrant’s fourth fiscal quarter in the case of an annual report) that hasmaterially affected, or is reasonably likely to materially affect, the registrant’s internal control over financial reporting;and
5. The registrant’s other certifying officer and I have disclosed, based on our most recent evaluation of internal control overfinancial reporting, to the registrant’s auditors and the audit committee of the registrant’s board of directors (or personsperforming the equivalent functions):
a) All significant deficiencies and material weaknesses in the design or operation of internal control over financial reportingwhich are reasonably likely to adversely affect the registrant’s ability to record, process, summarize and report financialinformation; and
b) Any fraud, whether or not material, that involves management or other employees who have a significant role in theregistrant’s internal control over financial reporting.
Date: February 28, 2013
/s/ James E. Rohr
James E. RohrChairman and Chief Executive Officer
EXHIBIT 31.2
In accordance with Exchange Act Rules 13a-14(f) and 15d-14(f), this certification does not relate to Interactive Data Files asdefined in Rule 11 of Regulation S-T.
CERTIFICATION OF CHIEF FINANCIAL OFFICER
I, Richard J. Johnson, certify that:
1. I have reviewed this Annual Report on Form 10-K for the year ended December 31, 2012 of The PNC Financial ServicesGroup, Inc.;
2. Based on my knowledge, this report does not contain any untrue statement of a material fact or omit to state a material factnecessary to make the statements made, in light of the circumstances under which such statements were made, not misleadingwith respect to the period covered by this report;
3. Based on my knowledge, the financial statements, and other financial information included in this report, fairly present in allmaterial respects the financial condition, results of operations and cash flows of the registrant as of, and for, the periodspresented in this report;
4. The registrant’s other certifying officer and I are responsible for establishing and maintaining disclosure controls andprocedures (as defined in Exchange Act Rules 13a-15(e) and 15d-15(e)) and internal control over financial reporting (asdefined in Exchange Act Rules 13a-15(f) and 15d-15(f)) for the registrant and have:
a) Designed such disclosure controls and procedures, or caused such disclosure controls and procedures to be designedunder our supervision, to ensure that material information relating to the registrant, including its consolidatedsubsidiaries, is made known to us by others within those entities, particularly during the period in which this report isbeing prepared;
b) Designed such internal control over financial reporting, or caused such internal control over financial reporting to bedesigned under our supervision, to provide reasonable assurance regarding the reliability of financial reporting and thepreparation of financial statements for external purposes in accordance with generally accepted accounting principles;
c) Evaluated the effectiveness of the registrant’s disclosure controls and procedures and presented in this report ourconclusions about the effectiveness of the disclosure controls and procedures, as of the end of the period covered by thisreport based on such evaluation; and
d) Disclosed in this report any change in the registrant’s internal control over financial reporting that occurred during theregistrant’s most recent fiscal quarter (the registrant’s fourth fiscal quarter in the case of an annual report) that hasmaterially affected, or is reasonably likely to materially affect, the registrant’s internal control over financial reporting;and
5. The registrant’s other certifying officer and I have disclosed, based on our most recent evaluation of internal control overfinancial reporting, to the registrant’s auditors and the audit committee of the registrant’s board of directors (or personsperforming the equivalent functions):
a) All significant deficiencies and material weaknesses in the design or operation of internal control over financial reportingwhich are reasonably likely to adversely affect the registrant’s ability to record, process, summarize and report financialinformation; and
b) Any fraud, whether or not material, that involves management or other employees who have a significant role in theregistrant’s internal control over financial reporting.
Date: February 28, 2013
/s/ Richard J. Johnson
Richard J. JohnsonExecutive Vice President and Chief FinancialOfficer

EXHIBIT 32.1
In accordance with Exchange Act Rules 13a-14(f) and 15d-14(f), this certification does not relate to Interactive Data Files asdefined in Rule 11 of Regulation S-T.
CERTIFICATION BY CHIEF EXECUTIVE OFFICERPURSUANT TO 18 U.S.C. SECTION 1350,
AS ADOPTED PURSUANT TOSECTION 906 OF THE SARBANES-OXLEY ACT OF 2002
In connection with the Annual Report on Form 10-K for the year ended December 31, 2012 of The PNC Financial Services Group,Inc. (Corporation) as filed with the Securities and Exchange Commission on the date hereof (Report), I, James E. Rohr, Chairmanand Chief Executive Officer of the Corporation, hereby certify, pursuant to 18 U.S.C. Section 1350, as adopted pursuant toSection 906 of the Sarbanes-Oxley Act of 2002, to the best of my knowledge, that:
(1) The Report fully complies with the requirements of Section 13(a) of the Securities Exchange Act of 1934; and
(2) The information contained in the Report fairly presents, in all material respects, the financial condition and results ofoperations of the Corporation for the dates and periods covered by the Report.
This certificate is being made for the exclusive purpose of compliance by the Chief Executive Officer of the Corporation with therequirements of Section 906 of the Sarbanes-Oxley Act of 2002, and may not be used by any person or for any reason other than asspecifically required by law.
/s/ James E. Rohr
James E. RohrChairman and Chief Executive Officer
February 28, 2013

EXHIBIT 32.2
In accordance with Exchange Act Rules 13a-14(f) and 15d-14(f), this certification does not relate to Interactive Data Files asdefined in Rule 11 of Regulation S-T.
CERTIFICATION BY CHIEF FINANCIAL OFFICERPURSUANT TO 18 U.S.C. SECTION 1350,
AS ADOPTED PURSUANT TOSECTION 906 OF THE SARBANES-OXLEY ACT OF 2002
In connection with the Annual Report on Form 10-K for the year ended December 31, 2012 of The PNC Financial Services Group,Inc. (Corporation) as filed with the Securities and Exchange Commission on the date hereof (Report), I, Richard J. Johnson,Executive Vice President and Chief Financial Officer of the Corporation, hereby certify, pursuant to 18 U.S.C. Section 1350, asadopted pursuant to Section 906 of the Sarbanes-Oxley Act of 2002, to the best of my knowledge, that:
(1) The Report fully complies with the requirements of Section 13(a) of the Securities Exchange Act of 1934; and
(2) The information contained in the Report fairly presents, in all material respects, the financial condition and results ofoperations of the Corporation for the dates and periods covered by the Report.
This certificate is being made for the exclusive purpose of compliance by the Chief Financial Officer of the Corporation with therequirements of Section 906 of the Sarbanes-Oxley Act of 2002, and may not be used by any person or for any reason other than asspecifically required by law.
/s/ Richard J. Johnson
Richard J. JohnsonExecutive Vice President and Chief FinancialOfficer
February 28, 2013
Stock Listing
The common stock of The PNC Financial
Services Group, Inc. is listed on the New York
Stock Exchange under the symbol PNC.
Stock Transfer Agent and Registrar
Computershare Trust Company, N. A.
250 RoyaII Street
Canton, MA 02021
800-982-7652
Dividend Reinvestment and Stock Purchase Plan
The PNC Financial Services Group, Inc. Dividend
Reinvestment and Stock Purchase Plan enables
holders of common and preferred Series B
stock to conveniently purchase additional shares
of common stock. Obtain a prospectus and
enrollment form at www.computershare.com/pnc
or by contacting Computershare at 800-982-7652.
8621.indd 13 3/1/13 9:16 AM

Corporate HeadquartersThe PNC Financial Services Group, Inc.
One PNC Plaza, 249 Fifth Avenue
Pittsburgh, PA 15222-2707
412-762-2000
8621.indd 14 3/1/13 9:16 AM