Embed Size (px)
Citation preview
INSTITUT FOR MARKET, CONSUMPTION AND BUSINESS CYCLES RESEARCH
Marzenna Błaszczuk, Ewa Kaliszuk
POLAND’S ACCESSION TO THE EU AND ITS EFFECTS ON TRADE WITH RUSSIA AND UKRAINE
No 93
The paper was prepared within the framework of “Industrial Restructuring in the NIS. Experience of and lessons from the new EU Member States” (INDEUNIS project),
an international research project (No 516751) funded by the EU Sixth Framework Programme (http://indeunis.wiiw.ac.at)
Warsaw, January 2008

This is one of the papers prepared within the framework of the INDEUNIS project and released in “Discussion Papers” series. The entire series comprise:
• Janusz Chojna, Krzysztof Marczewski, FIEs and SEZs as driving forces of export growth and industrial restructuring in Poland, No 90.
• Wojciech Burzyński, Urszula Kopeć, Industrial restructuring and changes in competitive position of Polish economy in the transition period, No 91.
• Marzenna Błaszczuk, Włodzimierz Kamiński, Ryszard Michalski, Poland’s transborder co-operation with Eastern neighbours, No 92.
• Marzenna Błaszczuk, Ewa Kaliszuk, Poland’s accession to the EU and its effects on trade with Russia and Ukraine, No 93.
• Józef Niemczyk, Impact of WTO membership of CIS countries on Polish trade – Agriculture (on example of Russia and Ukraine), No 94.
• Janusz Chojna, Krzysztof Marczewski, Position of exporters and foreign-owned companies in economic opening in Poland in light of trade flows and business survey analyses, No 95.
• Industrial Restructuring in the NIS. Experience of and lessons from the new EU Member States – Polish Experience to share, No 96.
© Copyright by Instytut Badań Rynku, Konsumpcji i Koniunktur, Warszawa 2008
Institute for Market, Consumption and Business Cycles Research Instytut Badań Rynku, Konsumpcji i Koniunktur Al. Jerozolimskie 87, 02-001 Warszawa, Poland phone: 48(22) 813-46-50, 813-51-86, fax: 48(22) 628-24-79 e-mail: [email protected] http://www.ibrkk.pl
ISSN 1898-8407

Since the 1st April 2005, the Foreign Trade Research Institute (since 1st January 2007, as the Institute for Market, Consumption and Business Cycles Research) had been participating in the INDEUNIS research project.
INDEUNIS stands for “Industrial Restructuring in the NIS: experience of and lessons from the new EU Member States”, an international research project based on the co-operation of ten research institutes from Austria, Poland, Hungary, Estonia, Finland, Russia, Belarus and Ukraine:
• The Vienna Institute for International Economic Studies (WIIW), Austria – coordinator;
• Foreign Trade Research Institute (IKCHZ), Poland (since 1 January 2007, as the Institute for Market, Consumption and Business Cycles Research (IBRKK), Poland;
• Institute of Economics, Hungarian Academy of Sciences (IE HAS), Hungary;
• Institute of Baltic Studies (IBS), Estonia;
• Pan-European Institute, Turku School of Economics and Business Administration (TSEBA), Finland;
• Institute for International Economic and Political Studies, Russian Academy of Sciences (IIEPS), Russia;
• Development Center (DC), Russia;
• The Center of World Economy and International Economic Relations, Institute of Economy, Belarus Academy of Sciences (CIES), Belarus;
• International Centre for Policy Studies (ICPS), Ukraine;
• Olga Pindyuk (OP UA) – private researcher, Ukraine.
INDEUNIS lasted from 2005 to 2007 and was funded by the European Union’s 6th Framework Programme.
The principal aim of INDEUNIS was to provide a comprehensive and up-to-date analysis of the recent experience with economic transition, industrial restructuring and integration in both EU New Member States from Central and Eastern Europe (NMS) and the selected Newly Independent States (NIS: Russia, Ukraine, Belarus, Kazakhstan and Moldova), in particular with respect to the role played by trade integration, Foreign Direct Investments (FDI) and European integration (institutional aspects). It drew policy conclusions related to restructuring in the NIS, addressed the challenges of their WTO accession and evaluated prospects for a closer integration between the enlarged EU and NIS neighbour states, as well as for a regional integration in the NIS. The additional aims were to intensify the cross-border research co-operation and the knowledge transfer between partners from the EU and NIS. By disseminating the research results to both scientific community, policy makers and to a broader public, the project stimulated expert discussions and helped to raise the general understanding of the topics concerned.
Within 6 scientific work packages, the research consortium investigated the following key topics: Patterns of industrial restructuring and trade specialisation in the NMS and the role played by Foreign Direct Investments (FDI) and EU integration. Are there any country- or industry-specific features of NMS’ restructuring and what are their key determinants? How has restructuring in the NIS proceeded and what are the reasons for differences compared to NMS? What are the emerging industry, employment and trade specialisation patterns of NIS? What are the obstacles and prospects for the future EU-NIS trade? What lessons can be drawn from the experience of NMS regarding restructuring, trade specialisation, FDI and integration for the NIS? Are there specific innovation strategies of firms in the NMS and NIS? What are the social impacts of FDI, especially in terms of know-how transfer and employment? How is the EU integration affecting EU-NIS economic relations and what are the prospects and policies regarding the regional integration of the NIS and between the enlarged EU and NIS?


5
CONTENTS
Page
Summary .............................................................................................................................................................. 7
1. Objectives of the study.................................................................................................................................. 8
2. Remarks concerning methodology .............................................................................................................. 8
3. The role of mutual trade for Poland, Ukraine and Russia ....................................................................... 9
4. Changes in conditions of Poland’s trade with Russia and Ukraine ...................................................... 10
4.1. Tariffs...................................................................................................................................................... 10
4.2. Non-tariff barriers (NTB).................................................................................................................... 12
4.2.1. Trade defence measures applicable by Poland before accession ...................................... 12
4.2.2. Trade defence measures applicable by Russia and Ukraine on imports originating, inter alia, in Poland.............................................................................................. 12
4.2.3. EU anti-dumping duties extended to Poland........................................................................ 14
4.2.4. Quantitative restrictions ........................................................................................................... 16
4.2.5. Other barriers............................................................................................................................. 16
5. Impact of the adoption by Poland of the Common Commercial Policy instruments on trade with Russia and Ukraine........................................................................................ 17
6. Changes in the commodity composition of Polish foreign trade after EU accession....................... 22
6.1. Poland’s exports to Russia and Ukraine ............................................................................................ 22
6.2. Poland’s imports from Russia and Ukraine ...................................................................................... 24
7. Conclusions ................................................................................................................................................... 25
Statistical Annex................................................................................................................................................ 27


INDEUNIS paper
7
Summary
Accession to the European Union has brought about essential changes in Poland’s commercial policy applying to trade with non-EU countries, including Poland’s eastern neighbours: Russia and Ukraine. The significance of these changes in relation to the countries in question arises from their importance for the Polish economy (it mainly concerns Russia) or its particular sectors (the case of Ukraine). Russia has been one of Poland’s major trading partners since the beginning of transition, and the role of Ukraine in Polish foreign trade has been gradually increasing (although it is still substantially smaller than Russia’s share in imports and slightly smaller in exports).
The adoption of the Common Commercial Policy has had some impact on access to the Polish market for goods originating in Russia and Ukraine (related to the adoption of all measures and rules of the Common Commercial Policy as well as requirements of the Single European Market) and a very limited impact on access to the markets of both countries for Polish exports (with the exception of stricter control of Polish agri-food exports on the Russian side). The study concentrates on questions concerning the adoption of the Common External Tariff (CET) and EU’s preferences for imports from Russian and Ukraine, as well as the abolishment of Polish autonomous measures and the imposition of the EU trade defence instruments (anti-dumping measures and quantitative restrictions on steel products).
Due to the specific composition of Poland’s imports from both countries, trade effects of the liberalisation of border protection of industrial products resulting from the adoption of the CET have been limited. On 1 May 2004, the customs duties on goods representing 83.5% of the value of Polish imports from Russia and 47% of imports from Ukraine were unaffected. The increase in duties affected 5% of Russian exports and 9% of Ukrainian exports to Poland.
On the other hand, the adoption of the EU trade defence instruments has had a greater impact, especially on Polish imports of steel (first of all from Ukraine) and fertilisers (mostly from Russia). Other factors (growth in domestic demand, fluctuations in exchange rates and world prices of minerals, consumer protection, diversification and better quality of Polish exports, the system of refunds in case of agricultural products, and “the 1st May syndrome”) have affected trade relations between Russia, Ukraine and Poland to a greater extent.
Work on this paper was completed in September 2006.

INDEUNIS paper
8
1. Objectives of the study
Accession to the European Union has brought about essential changes in Poland’s commercial policy, both in the area of law and institutional order, and in business activity. Considering that the commercial policy with non-EU countries (the so-called third countries) pursuant to Article 133 of the Treaty establishing the European Community falls within the exclusive competence of the Community, the domestic provisions regulating foreign trade were repealed and Poland adopted the acquis communautaire in the area of commercial policy1. The commercial policy is set out and implemented by the Community institutions – the European Commission and the Council – acting in the name of and on behalf of individual Member States.
On the day of accession, Poland had to automatically adopt all the measures and rules of the Common Commercial Policy (CCP) applying to trade with third countries, including the Common External Tariff and non-tariff measures, as well as an extensive system of preferential agreements with non-EU trading partners. The adoption of the measures and rules of the Common Commercial Policy produced vital changes in imports from third countries, although the domestic provisions regulating Poland’s foreign trade had, to a substantial degree, been brought into compliance with the CCP requirements even prior to EU accession (also as a consequence of adopting the principles of the World Trade Organisation, WTO, and concluding free-trade agreements with trading partners that had signed similar agreements with the Community before). At the same time, there were minor changes in access to the markets of non-EU countries for Polish goods.
Poland’s trade with the other twenty-four EU Member States became subject to the rules of the Single European Market. The changes which occurred on the day of accession primarily concerned the conditions of trade in agricultural goods as trade in manufactured products had in fact been fully liberalised since as early as 2002 (both with the EU-15 and with other acceding countries). The last barriers to trade in the form of anti-dumping duties and safeguard measures were abolished and border controls were eliminated.
The aim of this paper is to conduct a complex analysis of the impact of Poland’s accession to the EU on its trade with Russia and Ukraine, particularly in relation to non-tariff barriers and trade in sensitive products.
2. Remarks concerning methodology
Methodical remarks concerning the analysis of Poland’s foreign trade (Section 6 of this paper) are as follows:
• The analysis will cover the period after the year 2000, when Polish exports to Russia and Ukraine began to recover after the breakdown caused by the financial crisis in Russia; another reason for choosing that period is the fact that the commodity pattern of Polish exports to the countries in question has changed significantly after 1999;
• The analysis will cover twelve-month periods from 1 May till 30 April in 2000/2001 – 2004/2005 – which is connected with the date of Poland’s accession to the EU (1 May 2004);
• The analysis will be conducted mainly on the basis of Comext data (in euro, the commodity structure on 2-digit HS codes) as well as of Poland’s Central Statistical Office (CSO) data.
• The role of Poland in Russian and Ukrainian foreign trade will be examined based on GTK Rossii statistical data and data from the Ukrainian statistical office.
1 For details on the scope of applicability of uniform principles of the common commercial policy see: E. Synowiec,
Ogólne zasady wspólnej polityki handlowej (in:) Unia Europejska, E. Synowiec, E. Kawecka-Wyrzykowska (eds.), Vol. I, IKCHZ, Warsaw 2004.

INDEUNIS paper
9
3. The role of mutual trade for Poland, Ukraine and Russia
Poland. Since the beginning of transition, Russia has been one of Poland’s major trading partners, mostly due to its high share in Polish imports (ranging from 5 per cent in 1998 to 9.4 per cent in 2000)2. With the exception of the period of 1998-1999, Russia was among the three countries with the greatest shares in Polish imports (alongside with Germany and Italy). Ukraine with its share in Polish imports ranging from 0.7 to 1.2 per cent only ranked 20th-24th among major trading partners in Polish imports (see Table A in Annex).
As far as Poland’s exports are concerned, the analysed countries are involved to a lesser extent. Russia’s share in Polish exports is half of that of imports and much closer to the Ukraine’s one compared to imports. Till 1997, the Russian and Ukrainian shares in Polish exports saw a stable growth (to 8.4 per cent and 4.7 per cent, respectively), which was hampered by the Russian crisis in 1998-1999. In the period of 1999-2005 (with the exception of 2003), the Russian share was gradually growing from 2.6 per cent to 4.4 per cent. Ukraine with its share of 2.7-2.9 per cent in Polish exports in 1999-2005 ranked 9th or 10th.
It is rather difficult to link the changes in Russia’s and Ukraine’s position in Polish foreign trade with Poland’s accession to the EU. Positive changes observed in case of Poland’s exports to Russia should be rather perceived as a result of changes in the routes for commodity transport to Russia (see Section 6.1.), a favourable economic situation, a rise in real income and the appreciation of the Russian rouble, which had stimulated investment and consumer demand for imported goods, as well as the liberalisation of the Russian customs code in order to increase stability and transparency of the rules governing customs clearance. In case of Ukraine, as in Russia, a favourable economic situation, an increase in real income of the population and enterprises caused a relatively strong demand for imported products – both investment and consumer goods. The position of both countries in Polish imports mainly depends on the world prices of raw materials, which constitute the bulk of their exports to Poland. Nevertheless, EU accession influenced trade flows of particular commodities (see Section 6 of this paper).
Russia and Ukraine. Poland’s accession to the EU did not have a marked impact on its position in Russian and Ukrainian foreign trade (see Figure 1). In 2000-2005, Poland was a relatively important trading partner of the countries in question, especially Ukraine. Poland’s share in Ukrainian exports ranged from 2.9 to 3.3 per cent, while in imports it grew from 2.2 per cent to almost 4 per cent. Poland is one of the most important trading partners of Ukraine, both in exports (5th to 7th position) and imports (among the 5 major partners in the last four consecutive years).
The Polish share in Russian exports also fluctuated at about 3 per cent, but it was decreasing gradually from 4.3 per cent in 2000. As a result, Poland’s position in Russian exports deteriorated – it dropped from 8th to 11th position, but then upgraded to 9th position in 2005. The Polish share in Russian imports increased from 2.1 per cent in 2000 to 2.8 per cent in 2005, but it was not a stable growth. In general, Poland did not improve its position in Russian imports, remaining on 11th position for four consecutive years, and in 2005 it was placed only 13th.
2 It is worth stressing that the value of Polish imports from Russia is strongly affected by world prices of raw
materials.

INDEUNIS paper
10
Figure 1
Poland's share in Russian and Ukrainian foreign trade in 2000-2005 (%)
0
0,5
1
1,5
2
2,5
3
3,5
4
4,5
5
2000 2001 2002
Russia
2003 2004 2005 2000 2001 2002 2003
Ukraine
2004 2005
exports
imports
Source: Own calculations based on Russian (GTK) and Ukrainian (Statistical Office) data.
4. Changes in conditions of Poland’s trade with Russia and Ukraine
4.1. Tariffs
Since 1 May 2004, Poland’s trade with Russia and Ukraine has been regulated by the rules established in the Partnership and Co-operation Agreements (PCA) between the EU and these countries3. Despite changes in the legal basis of Polish foreign trade with the countries in question, access for Polish commodities to the Ukrainian and Russian markets, as far as tariffs are concerned, has not changed. Prior to 1 May 2004, products originating in Poland enjoyed the same status (MFN) as commodities from the old EU Member States.
In imports, on the other hand, the adoption by Poland of the EU Common External Tariff has generally caused a reduction in customs duties on the majority of manufactured goods, as prior to the date of accession Polish duties on these commodities were higher than the corresponding EU tariffs (see Table 1). Changes in customs duties on agricultural goods went in most cases in different directions4. On average, they decreased from 33.8% to 16.2%5. Moreover, as since 1993 Russia and Ukraine have benefited from the EU Generalised System of Preferences, their access to the Polish market for some products has been further facilitated. It should be stressed, however, that in the years 2002-2005 the preferences excluded certain steel products and fisheries, fertilisers, mineral products and selected base metals and articles thereof originating in Russia and oil seeds and oleaginous fruits originating in Ukraine6.
The bilateral agreements regulating trade relations between Poland and these countries prior to accession provided for no preferences in market access.
3 They were signed in June 1994 and entered into force on 1 December 1997 and 1 March 1998, respectively. 4 E. Kawecka-Wyrzykowska, Changes of conditions for carrying out trade resulting from the adoption of Common Customs Tariff
(in:) Poland in the European Union, Foreign Trade Research Institute, Warsaw 2004. 5 See: WTO Trade Policy Review – European Communities 2004, Report by the Secretariat, WT/TPR/S/136, 23 June
2004 and Poland’s Ministry of Economy. 6 See: M. Błaszczuk, U. Kopeć, Economic situation in the new EU Member States, Russia and other Central and Eastern
European countries and their relations with Poland (in:) Economic policy of Poland in the integrating Europe 2004-2005. Annual report, Foreign Trade Research Institute, Warsaw 2005, p. 53.

INDEUNIS paper
11
Table 1
Polish tariff rates and EU Common External Tariff (industrial products, HS codes 25-97)
Polish Customs Tariff
EU Customs External Tariff
2003 2004 2004 2005
Average tariff rate (per cent) 10.0 10.0 3.7* 3.7*
Zero duties (as per cent of tariff lines) 7.0 7.1 24.4 24.3
Non ad valorem tariff (number of tariff lines) 95 93 46 45
Tariff peaks** (as per cent of tariff lines) 1.7 1.7 3.1 3.2
Tariff peaks (def. 2)*** (as per cent of tariff lines) 12.8 12.9 0.4 0.4
Negligible duties (lower than or equal to 2 per cent, but not 0 per cent) 0.1 0.1 7.8 7.7
* Calculations do not include non ad valorem tariffs. ** Tariff peaks (def. 1): tariff rates higher than triple average tariff rate. *** Tariff peaks (def. 2): tariff rates higher than 15 per cent.
Source: Calculations based on customs tariffs prepared by A. Bujnowska. See also: WTO Trade Policy Review – European Communities…, op. cit.
Figure 2
Tariff duties on industrial goods in Poland (2003) and in the EU (CET for 2004)
7,0 7,1
54,8
18,4
8,4
2,5 1,90,0
24,4
40,9
31,4
0,2 0,2 0,0 0,0 0,00,0
10,0
20,0
30,0
40,0
50,0
60,0
0 >0-5 >5-10 >10-15 >15-20 >20-25 >25-50 >50
PL
EU
Source: As in Table 1.
Taking into account the structure of Polish imports from the countries in question, the change in the level of tariff protection has had a relatively small impact on deliveries from Russia. Following Poland’s accession to the EU7:
7 See the results of the analysis conducted by Poland’s Ministry of Economy and Labour published in: Ogłoszenie w
sprawie zmian zasad wymiany handlowej z Rosją od 1 maja 2004 r. and Ogłoszenie w sprawie zmian zasad wymiany handlowej z Ukrainą od 1 maja 2004 r., http://www.mgip.gov.pl/Clo/SrodkiTaryfowe/

INDEUNIS paper
12
• tariffs on some 83.5% of the value of Polish imports from Russia and about 47% of Polish imports from Ukraine have been unaffected8;
• the reduction in customs duties covered nearly 11.5% of imports from Russia and nearly 44% from Ukraine; lower tariffs are applicable, among others, to automobile vehicles, lubricating oils, some hydrocarbons, casein, non-alloy pig iron and aluminium powders originating in Russia as well as natural honey, rolled products and seam tubes from Ukraine;
• customs duties on the rest of goods increased; the largest growth in tariff burden in imports from Russia concerned frozen cod and non-alloy aluminium. In case of Ukraine, higher tariffs are applicable, among others, to non-alloy aluminium, frozen fish, milk and cream powder as well as to selected cereals.
4.2. Non-tariff barriers (NTB)
4.2.1. Trade defence measures applicable by Poland before accession
On the day of accession, Poland abolished all applied trade defence policy measures, including anti-dumping duties on styrene-butadiene rubber imported from Russia. Poland can no longer apply those measures autonomously. Unlike the EU, Poland used anti-dumping for protection of the domestic producers rather rarely. In fact, safeguard measures against excessive imports were preferred (Table 2). They were applied especially towards the neighbouring states and Asian countries.
Table 2
Safeguard measures affecting Ukrainian and Russian exports abolished by Poland prior to accession
No Commodities Geographical scope
Safeguard measure
1. Calcium carbide Erga omnes Additional customs duty in excess of tariff quota
2. Steel products Erga omnes Additional customs duty in excess of tariff quota
3. Water heaters Erga omnes Additional customs duty in excess of tariff quota
4. Matches Erga omnes Additional customs duty in excess of tariff quota
5. Ammonium nitrate Ukraine Ban on imports except for the volume indicated by Ukrainian authorities in export license (40,000 tons)
Source: Prepared on the basis of Polish Journals of Law of 2004.
Quantitative restrictions on coal imports from Russia, which had been in force from July 1998, were lifted on 1 January 2004, which could be associated with the forthcoming accession. Safeguard measures (quotas) on ammonium nitrate originating in Russia imposed in 1999 expired in February 2004.
4.2.2. Trade defence measures applicable by Russia and Ukraine on imports originating, inter alia, in Poland
Both before 1 May 2004 and after that date, Polish exports were affected by safeguard measures imposed by the Russian authorities. In the analysed period, Russia and Ukraine both intensified their trade defence activity. In the first year of Poland’s membership in the EU, Russia initiated one anti-dumping (EU-wide) and two safeguard investigations (erga omnes). Ukraine initiated one safeguard investigation on the erga omnes basis (Table 3). Safeguard measures were imposed in the first quarter of 2005. Due to their character, they also apply to Polish exports.
8 In case of Russia, this was related to the high share of crude oil and natural gas in imports (some 80%).
INDEUNIS paper
13
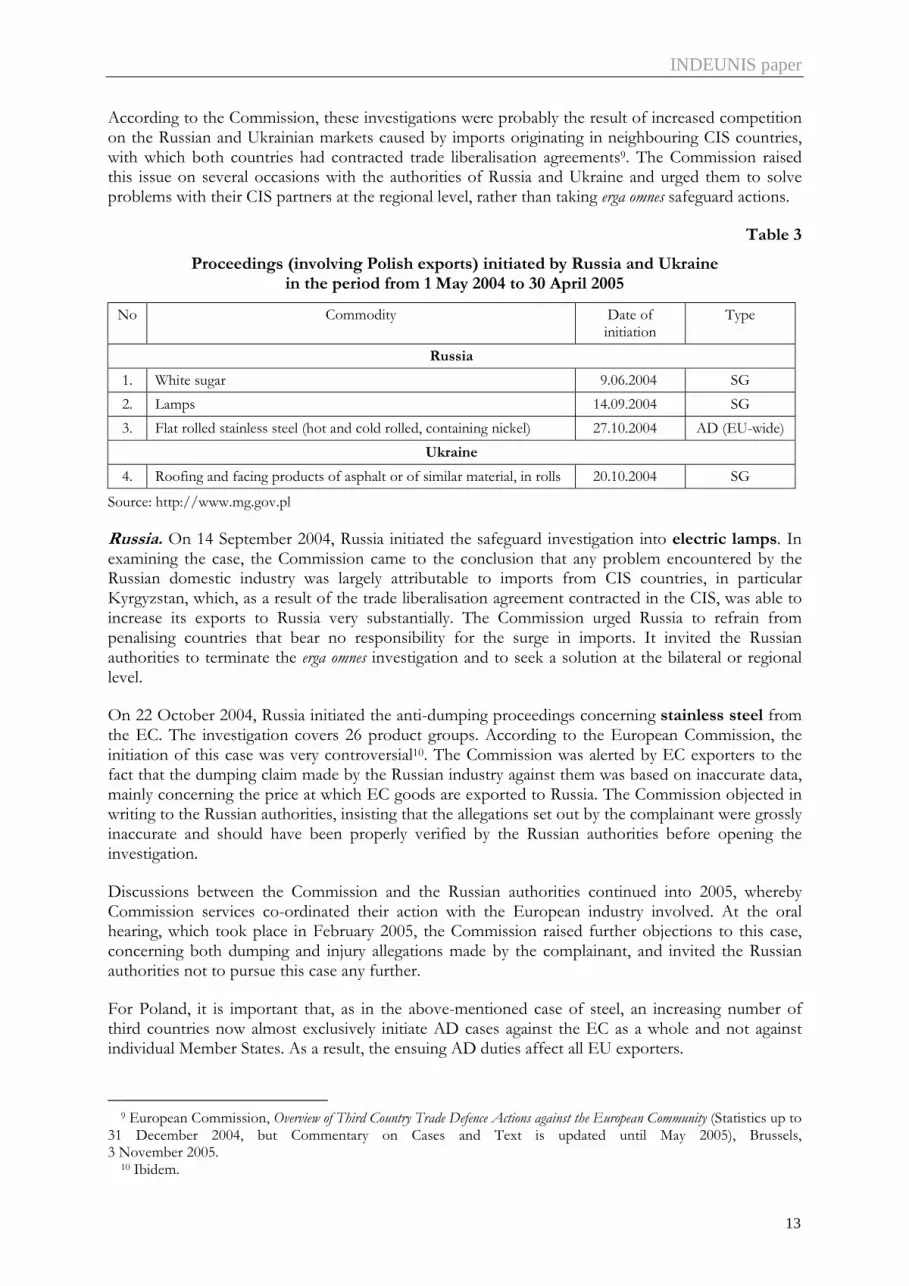
According to the Commission, these investigations were probably the result of increased competition on the Russian and Ukrainian markets caused by imports originating in neighbouring CIS countries, with which both countries had contracted trade liberalisation agreements9. The Commission raised this issue on several occasions with the authorities of Russia and Ukraine and urged them to solve problems with their CIS partners at the regional level, rather than taking erga omnes safeguard actions.
Table 3
Proceedings (involving Polish exports) initiated by Russia and Ukraine in the period from 1 May 2004 to 30 April 2005
No Commodity Date of initiation
Type
Russia
1. White sugar 9.06.2004 SG
2. Lamps 14.09.2004 SG
3. Flat rolled stainless steel (hot and cold rolled, containing nickel) 27.10.2004 AD (EU-wide)
Ukraine
4. Roofing and facing products of asphalt or of similar material, in rolls 20.10.2004 SG
Source: http://www.mg.gov.pl
Russia. On 14 September 2004, Russia initiated the safeguard investigation into electric lamps. In examining the case, the Commission came to the conclusion that any problem encountered by the Russian domestic industry was largely attributable to imports from CIS countries, in particular Kyrgyzstan, which, as a result of the trade liberalisation agreement contracted in the CIS, was able to increase its exports to Russia very substantially. The Commission urged Russia to refrain from penalising countries that bear no responsibility for the surge in imports. It invited the Russian authorities to terminate the erga omnes investigation and to seek a solution at the bilateral or regional level.
On 22 October 2004, Russia initiated the anti-dumping proceedings concerning stainless steel from the EC. The investigation covers 26 product groups. According to the European Commission, the initiation of this case was very controversial10. The Commission was alerted by EC exporters to the fact that the dumping claim made by the Russian industry against them was based on inaccurate data, mainly concerning the price at which EC goods are exported to Russia. The Commission objected in writing to the Russian authorities, insisting that the allegations set out by the complainant were grossly inaccurate and should have been properly verified by the Russian authorities before opening the investigation.
Discussions between the Commission and the Russian authorities continued into 2005, whereby Commission services co-ordinated their action with the European industry involved. At the oral hearing, which took place in February 2005, the Commission raised further objections to this case, concerning both dumping and injury allegations made by the complainant, and invited the Russian authorities not to pursue this case any further.
For Poland, it is important that, as in the above-mentioned case of steel, an increasing number of third countries now almost exclusively initiate AD cases against the EC as a whole and not against individual Member States. As a result, the ensuing AD duties affect all EU exporters.
9 European Commission, Overview of Third Country Trade Defence Actions against the European Community (Statistics up to
31 December 2004, but Commentary on Cases and Text is updated until May 2005), Brussels, 3 November 2005.
10 Ibidem.

INDEUNIS paper
14
In early 2004, Ukraine imposed AD measures on Polish exports of hardboard and laminated chipboard. Investigations concerning those goods had been launched before Poland’s accession (laminated chipboards – 2003, hardboard – 2002). In 2005, Ukraine imposed safeguard measures on imports of millstones, grindstones, grinding wheels and the like of artificial abrasives, with binder, of synthetic or artificial resin, reinforced (code 6804 22 18 00).
4.2.3. EU anti-dumping duties extended to Poland
On joining the European Union, Poland had to automatically adopt the anti-dumping and anti-subsidy (countervailing) measures applied by the Union on the accession day. This widened the scope of contingent protection, because the EU is among the biggest “users” of anti-dumping measures (countervailing duties are of a minor importance as the EU does not initiate anti-subsidy investigations vis-à-vis the CIS countries). Anti-dumping duties are a very sensitive issue of Russia’s and Ukraine’s trade relations with the EU.
On the day of accession, the EU applied 137 anti-dumping measures imposed on 57 products, including 11 from Russia and 8 from Ukraine. In the analysed period, the EU activity in this area did not expand; after a year, 136 anti-dumping measures were applicable to fifty-six items11, two thirds of which were chemical and steel products. Geographically, the imposition of EU anti-dumping duties primarily affected Poland’s imports from China, Russia, Belarus and Ukraine.
Taking into account the value of imports from Ukraine and Russia covered by the anti-dumping duty, serious consequences for Polish trade surfaced only in case of potassium salts necessary for the production of mineral fertilisers, nitrate fertilisers and iron and steel products.
Table 4
The EU anti-dumping measures in force in imports from Russia during the period 1 May 2004-30 April 2005
No Commodity Date of imposition/expiry Min-max level of the AD duty
1. Potassium chloride 24.10.92/13.04.06 (expiry review)
26.01 EUR/T
2. Ammonium nitrate 23.08.95/19.04.07 47.07 EUR/T
3. Urea 4.03.95/4.11.06 (expiry review)
7.81 EUR/T
4. Aluminium foil 17.05.01/17.05.06 14.9%
5. Seamless steel tubes and pipes 25.11.97 (expiry review)
0-26.8%
6. Grain-oriented electrical sheets 31.01.03/28.08.10 14.7%-40.1%
7. Steel ropes and cables 4.01.01/5.06.08 36.1%-50.7%
8. Tube and pipe fittings, of iron or steel 24.08.02/25.08.07 43.30%
9. Silicon 24.12.03/25.12.08 22.7%-23.6%
10. Silicon carbide 13.04.94 (expiry review)
0%; 23.30%
11. Urea and ammonium nitrate solutions (UAN) 22.09.00/23.09.05 (expiry review)
17.80-20.11 EUR/T
Source: The European Commission http://www.europa.eu.int
11 The European Commission data as of 31 March 2004, http://www.europa.eu.int

INDEUNIS paper
15
Table 5
The EU anti-dumping measures in force in imports from Ukraine during the period 1 May 2004-30 April 2005
No Commodity Date of imposition/expiry Min-max level of the duty
Reference country
1. Ammonium nitrate 25.01.01/26.01.06 (prolonged due to expiry review)
29.26-33.25 EUR/T Poland
2. Urea 19.01.02/20.01.07 8.85-16.84 EUR/T USA
3. UAN 22.09.00/22.09.07 26.7 EUR/T USA
4. Potassium chloride 11.05.00/12.05.05 19.61-48.19 EUR/T Canada
5. Seamless pipes and tubes of non-alloy steel
17.02.00/18.02.10 suspended till 18.11.06
51,.9-64.1% Croatia
6. Welded tubes and pipes, of iron or non-alloy steel
27.09.02/28.09.07 30.9%-44.1% Turkey
7. Steel ropes and cables 17.08.99/17.11.10 51.8% Poland
8. Silicon carbide 13.04.94 (expiry review)
24% Brazil
Source: The European Commission http://www.europa.eu.int
In order to reduce the consequences of the extension of anti-dumping duties for the new Member States, the Commission decided to launch ex officio the so-called enlargement reviews. As a result of the investigation, in May 2004, special transitional measures were introduced, inter alia, for 4 products subject to anti-dumping measures: potassium chloride from Russia (also from Belarus), ammonium nitrate (Russia and Ukraine), grain-oriented electrical sheets (GOES) from Russia and silicon carbide from Ukraine (Table 6). The transitional measures took the form of price and/or quantitative undertakings limited to the traditional export flows to the new Member States for a limited period (potassium chloride – 12 months, the rest – 6 months, later extended to 12 months). Although the Commission stressed that those measures were not equivalent to anti-dumping duties, but merely special measures pursuant to Article 22 paragraph c of Council Regulation (EC) 384/96 (the EU anti-dumping regulation), their economic meaning was the same.
Table 6
Commodities imported from the CIS countries subject to “enlargement” review in the EU
No Commodities Country of origin Adopted solution
1. Potassium chloride Russia, Belarus A-D duty-free quota, minimum price (12 months)
2. Silicon carbide Russia, Ukraine Ukraine: A-D duty-free quota (for 6 months with the possibility of extension for next 6 months)
Russia: increased A-D duty-free quota, exporter’s undertaking not to exceed ceiling
3. Aluminium foil Russia Increased A-D duty-free quota, exporter’s undertaking to observe minimum price
4. Ammonium nitrate Russia, Ukraine A-D duty-free quota, Russian and Ukrainian exporters’ undertaking to observe minimum price (for 6 months)
5. Grain-oriented electrical steel sheets
Russia A-D duty-free quota (for 6 months with the possibility of extension for next 6 months)
Source: Based on: Council Regulation (EC) No. 989-993 of 17.05.2004 (OJ EU L 182 of 19.05.2004), Council Regulation (EC) No. 997-1002 of 17.05.2004 (OJ EU L 183 of 20.05.2004).

INDEUNIS paper
16
In April 2004, in the Official Journal, the Commission published the Notice regarding the application of anti-dumping and anti-subsidy measures in force in the Community following enlargement. The Notice reiterated the EU readiness to review the measures in force, where interested parties submitted a request for a review supported by evidence that the measures would have been significantly different if they had been based on information including the new Member States. In fact, no such requests were submitted by Polish entities.
It was important to Ukrainian companies that from October 2000 till December 2005 Ukraine – for the purpose of anti-dumping investigations – was treated by the EU as a country in transition to the market economy. That status meant that – in order to be treated as operators dealing in the market economy – Ukrainian companies had to claim such status and submit evidence that market economy conditions prevailed in respect of the manufacture and sale of the like product concerned. If not, the normal value of the exported goods could be based on data from market economy third-country producers, which usually meant higher dumping margins and, consequently, higher dumping duties12.
4.2.4. Quantitative restrictions
Since the day of accession, Poland has been also covered by the EU system of quantitative quotas applicable to imports of steel products from Russia, Ukraine and Kazakhstan. Due to the EU enlargement, the EU quotas for 2004 were increased so as to take account of traditional trade flows between the new Member States and the countries subject to restrictions, in accordance with relevant clauses contained in steel agreements signed by the European Coal and Steel Community (after the expiration of the ECSC Treaty in July 2002, the European Community took over the ECSC international obligations). The extension of limits was one of the 14 conditions, which Russia recognised as indispensable for safeguarding its economic interests in the countries of Central and Eastern Europe that joined the European Union. In effect, the EU – independently of increasing the limits in January 2004 as stipulated in the steel agreement – additionally increased them as of 1 May 2004 (the increased quota was equal to the average of imports of the relevant steel products of the new Member States over the last three years adjusted pro rata). Higher limits for imports from Ukraine were only a compensation for the enlargement. Initially, the EU did not agree to an increase of quotas for 2004 (resulting from steel agreement), because Ukraine had not lifted limits in ferrous scrap export.
The quotas on steel are Community-wide, therefore they are not allocated to individual Member States. They are allocated in chronological order of applications and import licences are required. Quotas are likely to remain applicable until the accession of Russia and Ukraine to the WTO.
4.2.5. Other barriers
Moreover, from September 2004, exports of Poland’s animal products (meat and preparations, milk and dairy products, birds’ eggs, fish and preparations thereof) were negatively affected by the new certification requirements on the part of Russia13. In accordance to the new rules14, Polish animal products could be exported to Russia only if they fulfilled the following conditions: (1) production plants must be authorised to sell their products on the EU market and (2) pass a Russian veterinary inspection. To some extent, it could be perceived as a result of Poland’s accession to the EU. Before
12 Having eliminated distorting state interference in the pricing of goods, especially in the metalworking sector, and
adopting bankruptcy law to the EU standards, Ukraine was granted a country-wide MES by the Council on 30 November 2005.
13 As a consequence of these restrictions, deliveries of meat from Poland to Russia decreased by nearly 50% in 2004. ”Biuletyn Ekonomiczny” 2005, no 1, Economic and Commercial Section of the Embassy of the Republic of Poland (WEH), Moscow, March 2005.
14 Previous rules had been in force till 31 August 2004. As a result of Russian inspections, only 19 meat processing plants obtained permission to export their products to Russia.

INDEUNIS paper
17
1 May 2004, the issues related to sanitary certificates in imports to Russia had been settled on the bilateral basis. After the big bang, Russia decided to strengthen control on imported animal products.
5. Impact of the adoption by Poland of the Common Commercial Policy instruments on trade with Russia and Ukraine
In November 2004, having conducted a review, the European Commission agreed to extend the solutions applied to ammonium nitrate, steel sheets and silicon carbide by six months, i.e. until 20 May 2005. Despite the implemented alleviating measures, the import volume of nitrogenous fertilisers, sheets and silicon carbide showed a substantial decline following the accession. According to the Commission, this was mostly due to a considerable increase in imports of these products at the end of 2003 and during the first four months of 2004.15 The anti-dumping duty on potassium chloride, the fourth item covered by the transitional arrangements, was supposed to expire as of 12 May 200516. In fact, only the duty applicable to imports originating in Ukraine expired at that date. As regards imports from Belarus and Russia, the main suppliers of potassium salts to the European market, the Commission initiated a review investigation in April 2005.
During the review proceedings, anti-dumping duties continue to be applicable. Potassium chloride is not produced in Poland, so the anti-dumping duty offers no protection to the domestic industry, but entails higher costs for producers of fertilisers and, consequently, higher prices for farmers.
Although the special measures taken by the European Commission, to some extent, alleviated the consequences of additional protection, they did not prevent an increase in prices for imported goods. In most cases, establishing a certain quantitative ceiling free from anti-dumping duty was accompanied by an undertaking to follow a specified price level. The minimum import prices for fertilisers were established at a high level, difficult to accept for end users in Poland17. In case of ammonium nitrate, the Commission also took into account the fact that prior to the accession Poland (as well as Hungary and the Czech Republic) had applied safeguard measures with additional duties on imports of these fertilisers from Russia and Ukraine. As a result, the transitional arrangements covered only 50% of the import volume from the previous years, corresponding to the proportion not affected by the safeguard pre-enlargement measures.
The imposition of anti-dumping duties on mineral fertilisers had a significant impact on the rise in prices for these products in 2004 (by 29.4% for nitrogenous fertilisers, by 41.5% for potassium salt)18. Since Poland has no raw materials for the production of potassium fertilisers, anti-dumping duties on potassium salt forced Polish producers to increase purchases on the German market.
As a consequence of Poland’s accession (anticipation of unfavourable changes), imports of potassium chloride to Poland increased rapidly in 2003/2004 (May-April). The volume of imports from Belarus and Russia grew by 240% in comparison to the previous 12 months. After 1 May 2004, imports decreased (in 2004/2005 as compared to 2003/2004 by a total of 19%, while those from Russia by 60%). As a result, there were changes in the pattern of trade (see Figure 3). The share of Belarus remained unchanged (65%), but the share of Russia fell from 21.1% to 12%, and that of Germany increased from 9% to 24%. A drop of Russia’s position may have been related to a sharp increase in prices from this direction in the first year of Poland’s membership in the EU (by 173%).
15 Cf. Commission Decision of 19 November 2004 on imports of silicon carbide originating in Ukraine and
Commission Regulations No 1995/2004 and 1996/2004 of 19 November 2004 on imports of ammonium nitrate and electrical sheets (OJ L 344 of 20.11.2004).
16 Cf. Commission notice in October 2004, OJ C 249 of 8.10.2004. 17 Council Regulations (CE) no 992/2004 and 993/2004 of 17.05.2004, OJ L 182, 19.05.2004, pp. 25 and 31. 18 Rynek Rolny, “Biuletyn Miesięczny” 2005, no 2(168), Institute of Agricultural and Food Economics − PIB.

INDEUNIS paper
18
Figure 3
Polish imports of potassium chloride in 2002-2005 (May-April), 1,000 tonnes
0
100
200
300
400
500
600
700
800
Belarus 220,1 746,9 612,4
Russia 83,4 283,6 114,1
Germany 98,8 104,1 197,2
Other 386,1 104,2 11,9
2002/2003 2003/2004 2004/2005
Source. CSO data.
A different situation occurred in the market for nitrogenous fertilisers, Poland being a major producer of these commodities in the European market. Despite a high anti-dumping duty on imports from Russia and Ukraine, due to insufficient supply and higher prices for nitrogenous fertilisers in the EU market there was no shift in demand toward the EU-15 countries. Limited supply from the EU sources and restrictions on imports from third countries brought about increased demand for nitrogenous fertilisers of domestic origin (also favoured by an improved relation between wheat prices and fertiliser prices). However, inadequate supply caused by more expensive imports from the East was but one of the factors contributing to a rise in prices for mineral fertilisers in the domestic market. Other important factors affecting prices, which added to an upward trend as early as autumn 2003, included growing prices for gas (a significant component of production costs in case of nitrogenous fertilisers), the announcement of raising the VAT rate from 7% to 22% and high prices for ammonium on the international market (improved profitability of exports of nitrogenous fertilisers). According to some commentators, increased prices for fertilisers may have also resulted from an intentional action on the part of dealers exploiting improved financial situation of farmers receiving direct payments19.
Due to increased purchases of fertilisers before the accession and adoption of anti-dumping duties, in 2004/2005, the volume of Polish imports fell by 46% compared to the previous 12 months, entirely due to the fall in deliveries from Russia. Although Russia remained the main supplier of nitrogenous fertilisers to Poland, its share, both in the value and volume, diminished from 51% to 38% (Figures 4 and 5). But compared with the period before accession when Polish autonomous safeguard measures had been in force, Russia’s share increased substantially (in 2002/2003 it accounted for 12% of imports in value terms and 14% of imports in volume terms).
The quantitative quotas applicable to Polish imports on steel in practice constituted an obstacle only to trade with Ukraine and mainly in flat products (in 2003, imports of long products from this country were insignificant, in 2004 there were no such imports) – see Table 7. Although in the first months following the accession some problems were also noted in trade with Russia and Kazakhstan,
19 Ibidem.

INDEUNIS paper
19
generally the quotas imposed on imports from Russia fully met the demand of Polish enterprises (see Table 8), while imports from Kazakhstan were minor.
Figure 4
Polish imports of nitrogenous fertilisers in 2002-2005 (May-April), 1,000 tonnes
0
100
200
300
400
500
600
700
800
2002/2003 2003/2004 2004/2005
Other
Ukraine
Lithuania
Germany
Russia
Source: CSO data.
Figure 5
Polish imports of nitrogenous fertilisers in 2002-2005 (May-April), USD 1,000
0
20000
40000
60000
80000
100000
120000
2002/2003 2003/2004 2004/2005
Other
Ukraine
Lithuania
Germany
Russia
Source: CSO data.

INDEUNIS paper
20
In 2003, Polish imports of steel from Ukraine (CN chapters 72 and 73) constituted 3.9% of Poland’s total imports. Among the 68 positions (CN lines) subject to the EU limits in imports from Ukraine, in 2003 Polish imports comprised only 6 positions (but accounting for 66% in value terms).
After 1 May 2004, it appeared that the quotas on imports from Ukraine had been allocated to the EU-15 countries with no quantities left for the new Member States. It resulted in a substantial decrease in imports from this country (see Figures 6 and 7). Only the signing of a new agreement in June 2004 resulted in a substantial increase in the quota and subsequently in a rise in imports in subsequent months. Furthermore, the limits granted by the EU did not actually match the composition of Polish imports, therefore in respect of some items they were not exhausted, while in others – the demand substantially exceeded the quotas. In this connection, Poland submitted a request to the European Commission concerning the possibility of shifts within quotas.
Although the quotas on imports originating in Russia were established at higher levels, also on items of interest to Poland, due to a late decision on the quantities (taken on 27 April 2004) they were unavailable for Polish companies during the first three months following the accession. Therefore, importers of these products, also from Poland, were forced to exploit quotas originally intended for the EU-15. New rules allowing the new Member States to exploit the increased Community limits entered into force only in early August 200420.
In late November 2004, the EU extended the quota for steel imported from Russia, and in late December – for steel from Ukraine. It was indispensable due to the rising demand for certain steel products. The quotas for 2005 were established at a higher level; the steel agreements with both countries were signed in June 2005 (Russia) and July 2005 (Ukraine).
Figure 6
Polish imports from Ukraine of certain steel products (SA.1 coils) subject to EU quantitative quotas in 2003-2005 (April) in USD
0
2000
4000
6000
8000
10000
12000
14000
I II III IV V VI VII VIII IX X XI XII
2003 2004 2005
Source: CSO data.
20 Council Regulation (EC) No 1386/2004 of 26 July 2004 amending Commission Decision 2002/602/ECSC on
administering certain restrictions on imports of certain steel products from the Russian Federation, OJ L 255 of 31.07.2004.

INDEUNIS paper
21
Figure 7
Polish imports from Ukraine of certain steel products (SA.3 Other flat rolled products) subject to EU quantitative quotas in 2003-2005 (April) in USD
0
2000
4000
6000
8000
10000
12000
14000
16000
I II III IV V VI VII VIII IX X XI XII
2003 2004 2005
Source: CSO data.
Table 7
Comparison of EU quantitative quotas in force in imports from Ukraine in 2004 and 2005 and Polish imports from Ukraine in 2003 (tonnes)
EU quantitative limits Products Polish imports of steel products from Ukraine in 2003 2004 2005
SA. Flat-rolled products
SA1. Coils 178 966 62 037 150 000
SA2. Heavy plate 83 035 200 104 348 000
SA.3 Other flat rolled products 47 534 66 608 97 000
SB. Longs
SB1. Beams 0 12 481 30 000
SB2. Wire rod 14 091 66 828 125 000
SB3. Other long 7 597 122 170 230 000
Total 331 223 530 228 870 000
Source: CSO data. Council Regulation (EC) No 1440/2005 of 12 July 2005 on administering certain restrictions on imports of certain steel products from Ukraine and repealing Regulation (EC) No 2266/2004 (OJ L232, 8.09.2005), Communication from the Council of 26 June 2004 (OJ C 167, 26.06.2004).

INDEUNIS paper
22
Table 8
Comparison of EU quantitative quotas imposed on imports from Russia in 2004 and 2005 and Polish imports from Russia in 2003 (tonnes)
EU quantitative limits Products Polish imports of steel products from Russia in 2003 2004 2005
SA. Flat-rolled products
SA1. Coils 10 154 310 767 908 268
SA2. Heavy plate 0 558 839 190 593
SA3. Other flat rolled products 29 933 143 654 389 741
SB4. Alloyed products 30 482 250 148 97 080
SB5. Alloyed quarto plates 0 101 120 21 509
SA6. Alloyed cold-rolled and coated sheets 22 208 100 095
SB. Longs
SB1. Beams 0 31 440 44 948
SB2. Wire rod 0 121 783 172 676
SB3. Other long) 1 499 232 102 292 376
Total 72 068 1 869 622 2 120 206
Source: CSO data, Council Regulation (EC) No 1386/2004 of 26 July 2004 amending Commission Decision 2002/602/ECSC on administering certain restrictions on imports of certain steel products from the Russian Federation, OJ L 255 of 31.07.2004; Council Regulation (EC) No 1899/2005 of 27 June 2005 on administering certain restrictions on imports of certain steel products from the Russian Federation (OJ L 303, 22.11.2005); Communication from the Council of 26 June 2004 (OJ C 167, 26.06.2004).
6. Changes in the commodity composition of Polish foreign trade after EU accession
6.1. Poland’s exports to Russia and Ukraine
The period May 2004 – April 2005 saw significant changes in Poland’s trade with Russia, especially in exports. While Poland was increasing its exports during the whole period in question (more than 170 per cent from 2000/2001 to 2004/2005), the most dynamic growth – 99 per cent – was observed in the first year of Poland’s membership in the EU21. The growth in the export value was accompanied by a weaker increase in the volume, suggesting a rise in prices for exported goods.
The rise in Polish exports to Ukraine was not as significant as in case of Russia. During the period in question, it increased by some 85% and the most dynamic growth was noted from May 2001 to April 2002. In the first year of Poland’s membership in the EU, Polish exports to Ukraine increased by one fifth – the same growth rate as in the year preceding the accession.
In case of both Russia and Ukraine, the first year of Poland’s membership in the EU brought few changes in the commodity composition of exports. Due to the rapid growth in the value of exported manufactured products, their share in Polish exports increased. To a relatively large extent, the increased share of exports of manufactured goods could be related to changes in transport routes to Russia22.
21 Not only Poland, but also some other new EU Member States noted a rapid increase in their trade with Russia
and Ukraine. However, other countries (Estonia, Slovenia, Hungary and Lithuania) observed a significant drop in their imports from Ukraine.
22 Prior to the enlargement, certain Polish commodities were shipped to Lithuania and then re-exported to Russia.

INDEUNIS paper
23
On the other hand, the share of exported agri-food products decreased, even considerably after 1 May 2004. It is worth mentioning that whilst the position of agricultural products in Polish exports to Ukraine (measured by their share in total exports) was diminishing during the whole period in question, in case of Russia their share dropped below 20 per cent of the level noted in several consecutive years before the accession (see Table B in Annex).
The share of mineral products, especially in Polish exports to Russia, is marginal and has decreased after Poland’s accession to the EU. The most important commodity groups in Polish exports to Russia (with the exception of meat and edible meat offal and dairy products) saw a significant acceleration of growth after accession to the EU. A similar trend was observed in case of Polish exports to Ukraine.
Changes in the commodity composition could also be observed in case of major commodity groups that accounted for about ¾ of Polish exports to Russia in the year 2003/2004 (see Table C in Annex). Some of them saw growth well above the average and improved their position in the ranking. This applies particularly to 6 commodity groups: edible vegetables and certain roots and tubers (HS 07), plastics and articles thereof (HS 39), articles of iron or steel (HS 73), machinery (HS 84), electrical and electronic equipment (HS 85) and vehicles other than railway, tramway (HS 87).
An acceleration of growth in some commodity groups such as machinery, electrical, electronic and transport equipment may be partly related to an increased engagement of foreign investors’ enterprises (FIEs) in Polish-Russian trade23. Furthermore, a strong rise in exports of machinery and equipment as well as of edible vegetables, plastics and articles thereof could be connected to the above-mentioned changes in transport routes to Russia, as the commodity groups in question were among those characterised by the sharpest decrease in Polish exports to Lithuania.
Significant positive changes were also observed in case of three other commodity groups: miscellaneous edible preparations (HS 21), soaps, lubricants, waxes, candles, modelling pastes (HS 34) and miscellaneous articles of base metal (HS 83). After the first year of Poland’s membership in the EU, they considerably improved their position and ranked among the 20 main groups of Polish exports to Russia.
On the other hand, there were some groups of products suffering a significant breakdown – it mainly refers to meat and edible meat offal (HS 02), dairy products, eggs, honey, edible animal products n.e.s. (HS 04) as well as ships, boats and other floating structures (HS 89).
The worst situation was observed in exports of meat – after EU accession, the value of Polish exports decreased by some two-thirds. A drop in exports of meat and dairy products was observed after September 2004 and was attributed mainly to changes in conditions of imports to Russia. But one should also take into account that the value of exports of meat and dairy products in the whole period in question was strongly connected with the level of export subsidies transferred by the Agricultural Market Agency. In case of exports of ships, boats and other floating structures, the decline stemmed from the termination of the contract to supply ships for the Russian fleet in Vladivostok. Therefore, it could not be related to EU accession.
As in Polish exports to Russia, also in case of Ukraine the first year of Poland’s membership in the EU caused significant changes in the commodity composition. Some of them were the continuation of trends observed prior to 1 May 2004 – this applies, inter alia, to rubber and articles thereof (HS 40), footwear, gaiters and the like, parts thereof (HS 64), miscellaneous articles of base metal (HS 83) and furniture, lighting, signs, prefabricated buildings (HS 94). Some commodities saw unusual growth well above the average – essential oils, perfumes, cosmetics, toiletries (HS 33), plastics and articles thereof
23 Foreign investors’ enterprises have pushed up Poland’s exports to Russia since 2000. But in 2004 the value of
goods exported by FIEs to Russia increased by some 72 per cent.
INDEUNIS paper
24
(HS 39), paper and paperboard, articles of pulp, paper and board (HS 48), articles of iron and steel (HS 73), machinery (HS 84) and electrical and electronic equipment (HS 85).
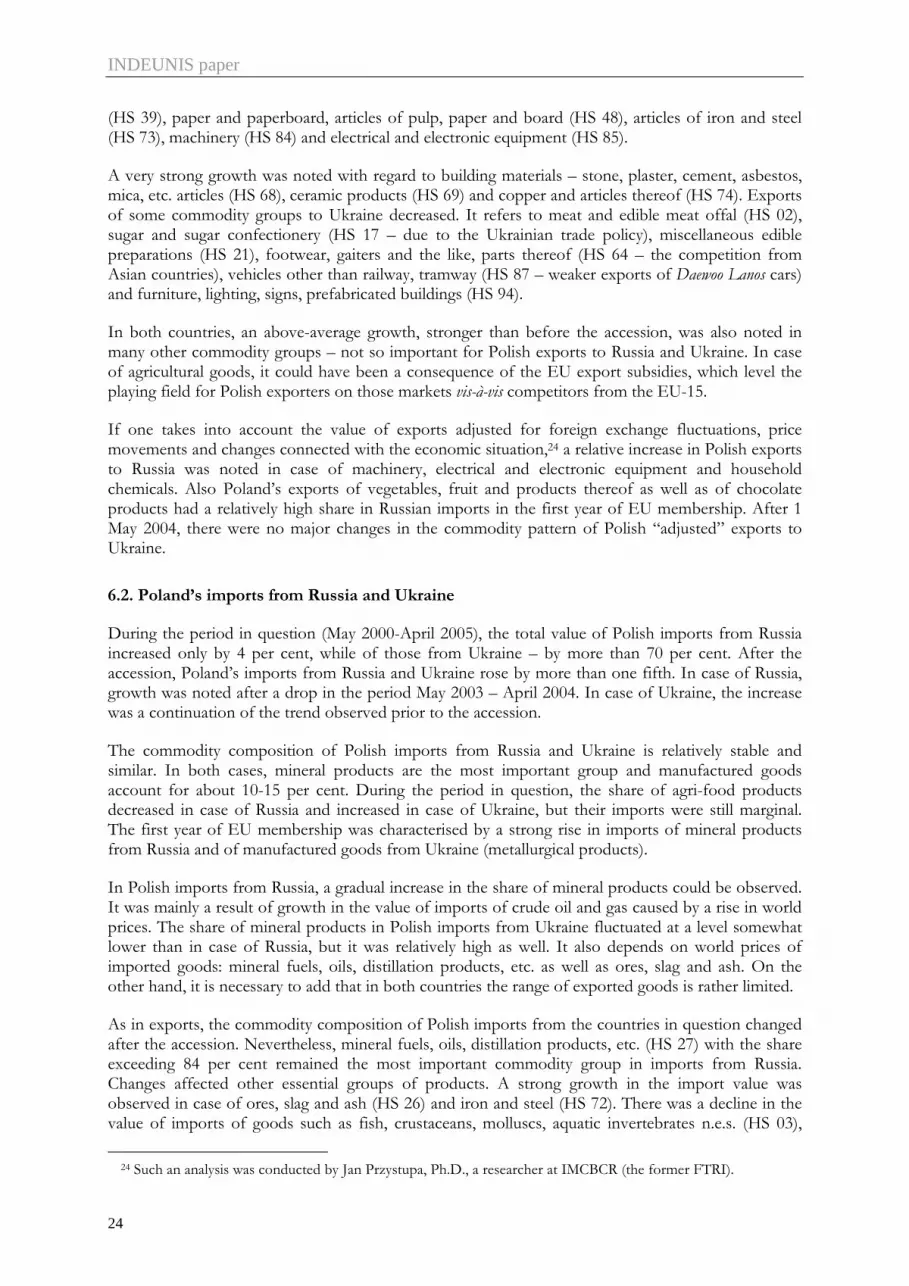
A very strong growth was noted with regard to building materials – stone, plaster, cement, asbestos, mica, etc. articles (HS 68), ceramic products (HS 69) and copper and articles thereof (HS 74). Exports of some commodity groups to Ukraine decreased. It refers to meat and edible meat offal (HS 02), sugar and sugar confectionery (HS 17 – due to the Ukrainian trade policy), miscellaneous edible preparations (HS 21), footwear, gaiters and the like, parts thereof (HS 64 – the competition from Asian countries), vehicles other than railway, tramway (HS 87 – weaker exports of Daewoo Lanos cars) and furniture, lighting, signs, prefabricated buildings (HS 94).
In both countries, an above-average growth, stronger than before the accession, was also noted in many other commodity groups – not so important for Polish exports to Russia and Ukraine. In case of agricultural goods, it could have been a consequence of the EU export subsidies, which level the playing field for Polish exporters on those markets vis-à-vis competitors from the EU-15.
If one takes into account the value of exports adjusted for foreign exchange fluctuations, price movements and changes connected with the economic situation,24 a relative increase in Polish exports to Russia was noted in case of machinery, electrical and electronic equipment and household chemicals. Also Poland’s exports of vegetables, fruit and products thereof as well as of chocolate products had a relatively high share in Russian imports in the first year of EU membership. After 1 May 2004, there were no major changes in the commodity pattern of Polish “adjusted” exports to Ukraine.
6.2. Poland’s imports from Russia and Ukraine
During the period in question (May 2000-April 2005), the total value of Polish imports from Russia increased only by 4 per cent, while of those from Ukraine – by more than 70 per cent. After the accession, Poland’s imports from Russia and Ukraine rose by more than one fifth. In case of Russia, growth was noted after a drop in the period May 2003 – April 2004. In case of Ukraine, the increase was a continuation of the trend observed prior to the accession.
The commodity composition of Polish imports from Russia and Ukraine is relatively stable and similar. In both cases, mineral products are the most important group and manufactured goods account for about 10-15 per cent. During the period in question, the share of agri-food products decreased in case of Russia and increased in case of Ukraine, but their imports were still marginal. The first year of EU membership was characterised by a strong rise in imports of mineral products from Russia and of manufactured goods from Ukraine (metallurgical products).
In Polish imports from Russia, a gradual increase in the share of mineral products could be observed. It was mainly a result of growth in the value of imports of crude oil and gas caused by a rise in world prices. The share of mineral products in Polish imports from Ukraine fluctuated at a level somewhat lower than in case of Russia, but it was relatively high as well. It also depends on world prices of imported goods: mineral fuels, oils, distillation products, etc. as well as ores, slag and ash. On the other hand, it is necessary to add that in both countries the range of exported goods is rather limited.
As in exports, the commodity composition of Polish imports from the countries in question changed after the accession. Nevertheless, mineral fuels, oils, distillation products, etc. (HS 27) with the share exceeding 84 per cent remained the most important commodity group in imports from Russia. Changes affected other essential groups of products. A strong growth in the import value was observed in case of ores, slag and ash (HS 26) and iron and steel (HS 72). There was a decline in the value of imports of goods such as fish, crustaceans, molluscs, aquatic invertebrates n.e.s. (HS 03),
24 Such an analysis was conducted by Jan Przystupa, Ph.D., a researcher at IMCBCR (the former FTRI).

INDEUNIS paper
25
organic chemicals (HS 29), fertilisers (HS 31), aluminium and articles thereof (HS 76) and ships, boats and other floating structures (HS 89). In case of fish and boats, the drop was a continuation of the previous trends. In case of some goods, e.g. base metals (mainly aluminium and articles thereof) and chemical products (fertilisers), the fall was preceded by a strong growth in imports in the pre-accession period (due to the expected changes in customs and tax procedures from 1 May 2004 – “the 1st May syndrome”).
In the whole period after Poland’s accession to the EU, imports of rubber and articles thereof (HS 40) as well as of wood and articles of wood, wood charcoal (HS 44) from Russia recorded a steady growth.
In case of Ukraine, the share of the main commodity groups remained unchanged, but some changes were observed within these groups. After 1 May 2004, the most significant growth was noted in imports of iron and steel (HS 72 – as in case of Russia), and this group of products became the most important in Polish imports from Ukraine. An above-average growth was also noted in case of organic chemicals (HS 29 – unlike imports from Russia), but the position of this commodity group did not change.
If one takes into account the value of imports adjusted for foreign exchange fluctuations, price movements and changes related to the economic situation25, it is evident that the position of Russian and Ukrainian imports on the Polish market deteriorated after 1 May 2004. The rise in imports from the countries in question was relatively weaker than in case of other countries, with the exception of iron ore and steel products. In case of Ukraine, it additionally concerned aluminium and articles thereof.
7. Conclusions
1. Poland’s accession to the EU had some impact on access to the Polish market for goods originating in Russia and Ukraine and a very limited effect on access to the markets of both countries for Polish exports. Other factors affected trade relations between Russia, Ukraine and Poland to a greater extent. They include, among others, growing domestic demand in Russia and Ukraine, exchange rate fluctuations, world prices of minerals, consumer protection, diversification and better quality of Polish exports, the system of refunds in case of agricultural products and, last but not least, the “1st May syndrome”.
2. Trade effects of liberalisation of border protection of industrial products resulting from Poland’s adoption of the CET (a general reduction in customs duties on an MFN basis and within the EU system of tariff preferences) were limited due to a high share of duty-free imports.
3. The adoption of EU trade defence instruments had a greater impact, especially on Polish imports of steel (first of all from Ukraine) and fertilisers (mostly from Russia). The temporary mechanism introduced by the European Commission reduced negative effects of the higher level of protection, but it did not prevent an increase in retail prices of commodities subject to anti-dumping measures.
4. The steel industry is among the branches particularly affected by changes in the commercial policy. The multitude of instruments for the protection of that industry against foreign competition stems from its particular sensitivity to shifts in trade flows. Although the general level of customs protection of steel products in Poland’s relations with Russia and Ukraine declined (a reduction in the average customs duty by more than 10 percentage points – plus the abolition of safeguard measures), in relation to certain items, the level went up notably, primarily because of the imposition of anti-dumping duties on imports of numerous products and the imposition of quantitative restrictions. The latter had a limited impact on Russian exports and a greater effect on Ukrainian. In both cases,
25 Such an analysis was conducted by Jan Przystupa, Ph.D., a researcher at IMCBCR (the former FTRI).

INDEUNIS paper
26
restrictions constituted a burden for economic operators (licences, problems with access to the quotas).
5. As a result of the extension of EU anti-dumping duties on fertilisers, some trade effects occurred: trade diversion (the fall in Russian exports to Poland in favour of Germany) and trade deflection (increased exports from countries not subject to anti-dumping duties). In case of nitrogen fertilisers, one can speak of some substitution of trade policy instruments: anti-dumping duties on ammonium nitrate from Russia and Ukraine imposed as a result of the enlargement constituted, to a certain extent, compensation for Polish producers for the lack of possibility to apply autonomous restrictions in imports.

INDEUNIS paper
27
STATISTICAL ANNEX
Table A
Russia and Ukraine in Polish foreign trade in 1992-2005
Polish imports Polish exports
Russia Ukraine Russia Ukraine Year
Share (in %) Position Share (in %) Position Share (in %) Position Share (in %) Position
1992 8.5 2 1.0 20 5.5 4 1.4 14
1993 6.8 3 1.1 20 4.6 4 1.3 15
1994 6.7 3 1.0 21 5.4 3 1.6 14
1995 6.7 3 1.0 21 5.6 3 3.2 7
1996 6.8 3 1.1 21 6.8 2 4.0 6
1997 6.3 3 1.0 23 8.4 2 4.7 4
1998 5.0 4 0.8 23 5.7 3 3.8 7
1999 5.9 6 0.7 23 2.6 11 2.6 11
2000 9.4 2 1.0 21 2.7 9 2.5 12
2001 8.8 2 0.9 23 2.9 8 2.8 9
2002 8.0 3 0.9 24 3.2 7 2.9 10
2003 7.7 3 1.1 22 2.8 10 2.9 9
2004 7.2 3 1.2 21 3.8 7 2.7 10
2005 8.9 2 1.0 23 4.4 6 2.9 10
Source: Own calculations based on CSO data.
Table B
Poland’s trade with Russia and Ukraine by product type (agri-food products – HS 01-HS24, mineral products – HS 25-HS 27 and manufactured products – HS 28-HS 99)
(%)
2000/2001 2001/2002 2002/2003 2003/2004 2004/2005
Russia Ukraine Russia Ukraine Russia Ukraine Russia Ukraine Russia Ukraine
Agri-food products
25.2 16.3 21.4 11.4 21.9 10.3 23.8 10.6 16.7 7.8
Mineral products
0.3 5.2 0.3 4.5 0.3 3.1 0.5 1.6 0.4 0.6
Exp
ort
s
Manufactured products
74.5 78.5 78.3 84.2 77.7 86.6 75.8 87.7 82.9 91.6
Agri-food products
1.1 1.9 1.2 2.2 0.7 1.7 0.8 2.7 0.3 2.5
Mineral products
89.2 87.1 88.5 83.1 89.1 69.6 86.0 86.6 89.5 82.4
Imp
ort
s
Manufactured products
9.6 11.1 10.4 14.6 10.1 28.6 13.3 10.7 10.2 15.1
Source: Own calculations based on Comext data.

INDEUNIS paper
28
Table C
Changes in Poland’s exports to Russia in the periods May 2003-April 2004 and May 2004-April 2005 – main commodity groups
Period prior to accession (May 2003-April 2004)
Period after accession (May 2004-April 2005)
2 digit HS
code
Code description
Position in exports to Russia
Share (%)
Value (EUR
million)
Changes in value
(%)
Position in
exports to
Russia
Share (%)
48* Paper and paperboard, articles of pulp, paper and paperboard 1 11.8 164.6 +40 2 8.3
84* Nuclear reactors, boilers, machinery, etc. 2 7.8 108.5 +236 1 13.2
33* Essentials oils, perfumes, cosmetics, toiletries 3 7.1 98.6 +82.6 5 6.5
02 Meat and edible meat offal 4 5.0 70.2 -63.1 24 0.9
39* Plastics and articles thereof 5 4.9 68.8 +171.5 4 6.7
85* Electrical, electronic equipment 6 4.1 56.5 +278.9 3 7.7
87* Vehicles other than railway, tramway 7 4.0 55.5 +110.3 7 4.2
94* Furniture, lighting, signs, prefabricated buildings 8 3.8 53.4 +74.2 8 3.4
08 Edible fruit, nuts, peel of citrus fruit, melons 9 3.2 44.5 +78.6 9 2.9
20* Preparations of vegetables, fruit, nut, etc. 10 3.2 44.1 +42.7 12 2.3
30* Pharmaceutical products 11 3.1 43.3 +82.3 10 2.9
44* Wood and articles of wood, wood charcoal 12 2.7 37.3 +32.9 14 1.8
73* Articles of iron or steel 13 2.5 34.5 +275.9 6 4.7
68 Articles of stone, plaster, cement, asbestos, mica, etc. 14 2.2 30.4 +42.2 18 1.6
89 Ships, boats and other floating structures 15 2.1 29.0 -40.8 33 0.6
07 Edible vegetables and certain roots and tubers 16 2.0 28.2 +139.2 11 2.4
70* Glass and glassware 17 2.0 27.9 +61.0 16 1.6
32 Tanning, dyeing extracts, tannins, derivatives, pigments etc. 18 2.0 27.3 +75.3 15 1.7
49 Printed books, newspapers, pictures etc. 19 1.8 25.0 +52.7 20 1.4
04 Dairy products, eggs, honey, edible animal product n.e.s. 20 1.8 24.5 -4.5 27 0.9
POLAND’S EXPORTS TO RUSSIA x 100.0 1,390.8 +99.2 x 100.0
* 2-digit HS groups included in main commodity groups during the whole period in question.
Source: Own calculations based on Comext data.
INDEUNIS paper
29
Table D
Changes in Poland’s exports to Ukraine in the periods May 2003-April 2004 and May 2004-April 2005 – main commodity groups
Period prior to accession
(May 2003-April 2004)
Period after accession
(May 2004-April 2005)
2-digit HS
code
Code description
Position in exports to Ukraine
Share (%)
Value (EUR
million)
Changes in value
(%)
Position in exports to Ukraine
Share (%)
87* Vehicles other than railway, tramway 1 14.9 217.3 -9.6 2 11.5
84* Nuclear reactors, boilers, machinery, etc 2 8.9 129.4 +63.4 1 12.3
39* Plastics and articles thereof 3 8.0 116.5 +22.2 3 8.3
48* Paper and paperboard, articles of pulp, paper and paperboard 4 5.7 83.0 +20.1 4 5.8
94* Furniture, lighting, signs, prefabricated buildings 5 4.4 63.7 -14.2 7 3.2
85* Electrical, electronic equipment 6 4.3 62.3 +31.9 5 4.8
44* Wood and articles of wood, wood charcoal 7 3.0 43.9 +12.9 9 2.9
73* Articles of iron or steel 8 2.9 41.9 +78.5 6 4.4
33* Essentials oils, perfumes, cosmetics, toiletries 9 2.7 39.4 +34.7 8 3.1
76* Aluminium and articles thereof 10 2.7 38.8 +11.5 11 2.5
40* Rubber and articles thereof 11 2.6 38.0 +28.7 10 2.9
64* Footwear, gaiters and the like, parts thereof 12 2.4 35.5 -13.7 16 1.8
17 Sugars and sugar confectionery 13 2.3 33.9 -86.2 48 0.3
32* Tanning, dyeing extracts, tannins, derivatives, pigments etc 14 2.2 31.6 +4.5 14 1.9
83 Miscellaneous articles of base metal 15 1.9 27.6 +42.3 12 2.3
02 Meat and edible meat offal 16 1.8 26.3 -34.2 25 1.0
21 Miscellaneous edible preparations 17 1.8 26.1 -15.6 20 1.3
POLAND’S EXPORTS TO UKRAINE x 100.0 1454.8 +18.0 x 100.0
* 2-digit HS groups included in main commodity groups during the whole period in question.
Source: Own calculations based on Comext data.

INDEUNIS paper
30
Table E
Changes in Poland’s imports from Russia in the periods May 2003-April 2004 and May 2004-April 2005 – main commodity groups
Period prior to accession (May 2003-April 2004)
Period after accession (May 2004-April 2005)
2-digit HS
code
Code description
Position in imports
from Russia
Share (%)
Value (EUR
million)
Changes in value
(%)
Position in imports
from Russia
Share (%)
27* Mineral fuels, oils, distillation products, etc. 1 84.1 3801.0 +21.7 1 84.1
76* Aluminium and articles thereof 2 3.9 175.1 -57.6 4 1.4
26* Ores, slag and ash 3 1.7 75.0 +284.1 2 5.2
29* Organic chemicals 4 1.6 69.9 -12.2 5 1.1
31* Fertilisers 5 1.4 64.4 -8.6 6 1.1
72* Iron and steel 6 0.9 39.0 +143.4 3 1.7
28 Inorganic chemicals, precious metal compound, isotopes 7 0.7 31.5 +115.4 7 0.7
03 Fish, crustaceans, molluscs, aquatic invertebrates n.e.s. 8 0.6 26.4 -62.9 15 0.2
89 Ships, boats and other floating structures 9 0.6 24.7 -21.1 13 0.4
POLAND’S IMPORTS FROM RUSSIA x 100.0 4519 +21.8 x 100.0
* 2-digit HS groups included in main commodity groups during the whole period in question.
Source: Own calculations based on Comext data.
Table F
Changes in Poland’s imports from Ukraine in the periods May 2003-April 2004 and May 2004-April 2005 – main commodity groups
Period prior to accession (May 2003-April 2004)
Period after accession (May 2004-April 2005)
2-digit HS code
Code description
Position in imports
from Ukraine
Share (%)
Value (EUR
million)
Changes in value
(%)
Position in imports
from Ukraine
Share (%)
27* Mineral fuels, oils, distillation products, etc. 1 24.6 172.9 +12.1 2 22.3
26* Ores, slag and ash 2 22.2 156.3 +18.7 3 21.4
72* Iron and steel 3 20.7 145.6 +38.6 1 23.3
29 Organic chemicals 4 5.5 38.7 +34.4 4 6.0
POLAND’S IMPORTS FROM UKRAINE x 100.0 702.8 +23.5 x 100.0
* 2-digit HS groups included in main commodity groups during the whole period in question.
Source: Own calculations based on Comext data.


![Cuba and Poland's Development Aid: the Activity of Polish NGOs in Cuba [Polish]](https://img.pdfslide.net/doc/110x75/631600c585333559270d664d/cuba-and-polands-development-aid-the-activity-of-polish-ngos-in-cuba-polish.jpg)


