Embed Size (px)
Citation preview

Polen Capital Investment Funds plc
(an open-ended umbrella investment company with variable capital and segregated liability between
Funds incorporated with limited liability in Ireland under the Companies Act 2014 as amended with
registration number 522617 and established as Undertakings for Collective Investment in Transferable Securities pursuant to
the European Communities (Undertakings for Collective Investment in
Transferable Securities) Regulations, 2011 (S.I. No. 352 of 2011), as amended and Central Bank (Supervision and
Enforcement) Act 2013 (Section 48(1)) (Undertakings for Collective Investment in Transferable Securities)
Regulations, 2019
CONDENSED INTERIM REPORT AND
UNAUDITED FINANCIAL STATEMENTS
For the financial period ended
30 June 2022

Polen Capital Investment Funds plc
1
2022 Condensed Interim Report &
Unaudited Financial Statements
Information Only for German Investors
No notification pursuant to Sec. 310 of the German Capital Investment Code (Kapitalanlagegesetzbuch) has been filed for the
following sub-funds and the shares in these sub-funds may not be marketed to investors in the Federal Republic of Germany:
Polen Capital International Growth Fund
Polen Capital Global Emerging Markets Growth Fund
Polen Capital Global SMID Company Growth Fund
Information Only For Swiss Investors
The state of the origin of the fund is Ireland. The representative is ACOLIN Fund Services AG, Leutschenbachstrasse 50, CH-8050
Zurich. The paying agent is NPB Neue Privat Bank AG, Limmatquai 1 / am Bellevue, CH-8024 Zurich. The prospectus, the Key
Investor Information Documents, the articles of association, the list of purchases and sales as well as the annual and semi-annual
reports may be obtained free of charge from the representative. In respect of the units distributed in and from Switzerland, the place of
performance and jurisdiction is at the registered office of the representative.
The total expense ratio (TER) was calculated based on the version currently applicable of the “Guidelines on the calculation and
disclosure of the Total Expense Ratio (TER) of collective investment schemes” of the Swiss Funds & Asset Management Association
(SFAMA).
For the period from 01 July 2021 to 30 June 2022:
Sub-fund(s) Share class(es) TER (%)
Polen Capital Focus U.S.
Growth Fund
CHF Class (Institutional) 0.80
CHF Class (Retail) 1.55
EUR Class (Institutional) 0.80
EUR Class (Institutional Unhedged) 0.80
EUR Class (Retail) 1.55
EUR Class (Retail Unhedged) 1.55
EUR D Class (Institutional Unhedged Distributing) 0.70
GBP Class (Institutional) 0.79
GBP Class (Institutional Unhedged) 0.80
GBP Class (Institutional Unhedged Distributing) 0.80
GBP Class (Retail) 1.55
GBP D Class (Institutional Unhedged Distributing) 0.70
U.S. Dollar A Class (Retail) 1.55
U.S. Dollar C Class (Retail) 1.80
U.S. Dollar Class (Institutional) 0.80
U.S. Dollar Class (Retail) 1.55
U.S. Dollar D Class (Institutional Unhedged) 0.69
U.S. Dollar E Class (Retail) 1.55
U.S. Dollar N Class (Retail) 1.95
Sub-fund(s) Share class(es) TER (%)
Polen Capital U.S. Small
Company Growth Fund
U.S. Dollar Class (Institutional) 1.25
U.S. Dollar A Class (Retail) 2.01
U.S. Dollar C Class (Retail) 2.26

Polen Capital Investment Funds plc
2
2022 Condensed Interim Report &
Unaudited Financial Statements
Contents
Page
Information Only For German Investors 1
Information Only For Swiss Investors 1
Organisation 3
Background to Company 4 - 6
Investment Manager’s Report 7 - 21
Statement of Financial Position 22 - 24
Statement of Comprehensive Income 25 - 27
Statement of Changes in Net Assets Attributable to Holders of Redeemable Participating Shares 28 - 30
Statement of Cash Flows 31 - 36
Notes to the Condensed Financial Statements 37 - 62
Schedule of Investments
Polen Capital Focus U.S. Growth Fund 63 - 65
Polen Capital U.S. Small Company Growth Fund 66 - 67
Polen Capital International Growth Fund 68 - 70
Polen Capital Global Emerging Markets Growth Fund 71 - 74
Polen Capital Global SMID Company Growth Fund 75 - 77
Schedule of Significant Portfolio Changes
Polen Capital Focus U.S. Growth Fund 78 - 79
Polen Capital U.S. Small Company Growth Fund 80 - 81
Polen Capital International Growth Fund 82 - 83
Polen Capital Global Emerging Markets Growth Fund 84 - 85
Polen Capital Global SMID Company Growth Fund 86 - 87
Appendix
Securities Financing Transactions Regulation 88

Polen Capital Investment Funds plc
3
2022 Condensed Interim Report &
Unaudited Financial Statements
Organisation
Directors
Bronwyn Wright (Irish)3
Brian Goldberg (U.S.)1
Kevin O'Neill (Irish)2
Mike Guarasci (U.S.)1
Jason Mullins (Irish)1
Registered Office of the Company
Polen Capital Investment Funds plc
4th Floor,
One George's Quay Plaza,
George's Quay, Dublin 2
Ireland
Investment Manager and Distributor
Polen Capital Management, LLC
1825 NW Corporate Blvd
Suite 300
Boca Raton
FL 33431
USA
Manager
Amundi Ireland Limited
1 George's Quay Plaza
George's Quay
Dublin 2
Ireland
Sub-Investment Manager
For Polen Capital Global Emerging Markets Growth Fund
Polen Capital UK LLP
1st Floor
15-18 Austin Friars
London
EC2N 2HE
United Kingdom
Depositary
RBC Investor Services Bank S.A., Dublin Branch
4th Floor,
One George's Quay Plaza,
George's Quay, Dublin 2
Ireland
Company Secretary
Tudor Trust Limited
33 Sir John Rogerson’s Quay
Dublin 2
Ireland
Administrator
RBC Investor Services Ireland Limited 4th Floor,
One George's Quay Plaza,
George's Quay, Dublin 2
Ireland
Independent Auditor
PricewaterhouseCoopers
Chartered Accountants and Statutory Audit Firm
One Spencer Dock
North Wall Quay
Dublin 1
Ireland
Legal Advisers
Dillon Eustace
33 Sir John Rogerson’s Quay
Dublin 2
Ireland
Sponsoring Broker
Dillon Eustace
33 Sir John Rogerson’s Quay
Dublin 2
Ireland
1 Non-Executive Director. 2 Independent Non-Executive Director. 3 Independent Non-Executive Director and Chairman.

Polen Capital Investment Funds plc
4
2022 Condensed Interim Report &
Unaudited Financial Statements
Background to Company
Polen Capital Investment Funds plc (the “Company”) is an open-ended umbrella investment company with variable capital and with
limited liability. The Company is structured as an umbrella fund and may comprise several portfolios of assets. The share capital of
the Company may be divided into different sub-funds (the “Funds”) each representing a separate portfolio of assets and further sub-
divided, to denote differing characteristics attributable to particular Shares, into “Classes”. The functional currency of the Funds is
U.S. Dollar.
At the financial period end there were five Funds which had been launched in the umbrella.
Launch Date Polen Capital Focus U.S. Growth Fund 8 March 2013
Polen Capital International Growth Fund 31 December 2018
Polen Capital U.S. Small Company Growth Fund 31 December 2018
Polen Capital Global Emerging Markets Growth Fund 16 October 2020
Polen Capital Global SMID Company Growth Fund 31 January 2022
Investment Objective and Policy
Polen Capital Focus U.S. Growth Fund
The investment objective of the Fund is to seek long-term growth of capital. The Fund seeks to achieve its investment objective by
investing typically in a focused portfolio of high quality common stocks of large capitalization companies (market capitalisations
greater than $10 billion at time of purchase) which are listed or traded on Recognised Exchanges in the United States of America
and which, in the view of the Investment Manager, have a sustainable competitive advantage. The Fund may from time to time also
purchase the common stock of companies whose shares are listed or traded on Recognised Markets in the United States of America
which have a market capitalisation of less than $10 billion at the time of purchase if the Investment Manager is of the opinion that
the stock represents a particularly attractive investment opportunity.
The Fund will measure its performance against the Russell 1000 Growth Index and the S&P 500 Index (the “Benchmarks”). The
Russell 1000 Growth Index measures the performance of the large-cap growth segment of the U.S. equity universe. It includes
those Russell 1000 companies with higher price-to-book ratios and higher forecasted growth values. The Russell 1000 Growth
Index is constructed to provide a comprehensive and unbiased barometer for the large-cap growth segment. The index is completely
reconstituted annually to ensure new and growing equities are included and that the represented companies continue to reflect
growth characteristics. The S&P 500 Index measures the performance of the top 500 large-cap companies listed on stock exchanges
in the U.S. The Fund is considered to be actively managed in reference to the Benchmarks by virtue of the fact that it uses the
Benchmarks for performance comparison purposes. Certain of the Fund’s securities may be components of and may have similar
weightings to the Benchmarks. However, the Benchmarks are not used to define the portfolio composition of the Fund or as a
performance target and the Fund may be wholly invested in securities which are not constituents of the Benchmarks. Any change to
the indices against which the performance of the Fund is measured will be disclosed in the annual or half-yearly report of the
Company issued subsequent to such change being effected.
For this Fund of the Company, underlying investments do not take into account the EU criteria for environmentally sustainable
economic activities.
Polen Capital International Growth Fund
The investment objective of the Fund is to seek long-term growth of capital. The Fund seeks to achieve its investment objective by
investing typically in a focused portfolio of high quality common stocks of large capitalization companies (market capitalisations
greater than $5 billion at time of purchase) which are listed or traded on Recognised Exchanges globally (including those domiciled
in emerging markets) and which, in the view of the Investment Manager, have a sustainable competitive advantage. Investment in
emerging market securities will comprise no more than the greater of 35% of the Fund’s Net Asset Value or 150% of the
Benchmark’s emerging market weighting as of the latest calendar quarter-end. The Fund may from time to time also purchase the
common stock of companies whose shares are listed or traded on Recognised Markets globally which have a market capitalisation
of less than $5 billion at the time of purchase if the Investment Manager is of the opinion that the stock represents a particularly
attractive investment opportunity. The Fund may also invest in Global Depositary Receipts, American Depositary Receipts,
European Depositary Receipts, and International Depositary Receipts where deemed appropriate by the Investment Manager in
order to achieve the investment objective of the Fund.

Polen Capital Investment Funds plc
5
2022 Condensed Interim Report &
Unaudited Financial Statements
Background to Company (continued)
Investment Objective and Policy (continued)
Polen Capital International Growth Fund (continued)
The Fund will measure its performance against the MSCI All Country World Index (“ACWI”) (ex-USA) (the “Benchmark”). The
MSCI ACWI (ex-USA) captures large and mid-cap companies across 22 of 23 Developed Markets countries (excluding the U.S.)
and 24 Emerging Markets countries. The index covers approximately 85% of the global investable equity opportunity set outside
the U.S. The Fund is considered to be actively managed in reference to the Benchmark by virtue of the fact that it uses the
Benchmark to define the maximum emerging market exposure of the Fund but the Benchmark is not used to define the portfolio
composition of the Fund. Certain of the Fund’s securities may be components of and may have similar weightings to the
Benchmark. However, the Fund may be wholly invested in securities which are not constituents of the Benchmark. The Fund may
also use the Benchmark for performance comparison purposes, however it is not used as a performance target. Any change to the
index against which the performance of the Fund is measured will be disclosed in the annual or half-yearly report of the Company
issued subsequent to such change being effected.
For this Fund of the Company, underlying investments do not take into account the EU criteria for environmentally sustainable
economic activities.
Polen Capital U.S. Small Company Growth Fund
The investment objective of the Fund is to seek long-term growth of capital. The Fund seeks to achieve its investment objective by
investing typically in a focused portfolio of high quality common stocks of small companies (market capitalisations within the
range of the market capitalizations of companies in the Russell 2000 Index and the S&P Small Cap 600 Index on a rolling three
year basis at time of purchase) which are listed or traded on Recognised Exchanges in the United States of America and which, in
the view of the Investment Manager, have a sustainable competitive advantage. The Fund may from time to time also purchase the
common stock of companies whose shares are listed or traded on Recognised Markets in the United States of America which have a
market capitalisation outside of the small company definition described in the preceding paragraph at the time of purchase if the
Investment Manager is of the opinion that the stock represents a particularly attractive investment opportunity. The Fund may also
invest in American Depositary Receipts where deemed appropriate by the Investment Manager in order to achieve the investment
objective of the Fund.
The Fund will measure its performance against the Russell 2000 Growth Index. The Russell 2000 Growth Index measures the
performance of those Russell 2000 companies with higher price-to-book ratios and higher forecasted growth values. The Fund is
considered to be actively managed in reference to the Russell 2000 Growth Index and the S&P Small Cap 600 Index (the
“Benchmarks”) by virtue of the fact that it uses each of the Benchmarks to define the characteristics of the securities held by the
Fund. Certain of the Fund’s securities may be components of and may have similar weightings to the Benchmarks. However, the
Fund may be wholly invested in securities which are not constituents of the Benchmarks. The Fund may also use the Russell 2000
Growth Index for performance comparison purposes, however it is not used as a performance target. Any change to the index
against which the performance of the Fund is measured will be disclosed in the annual or half-yearly report of the Company issued
subsequent to such change being effected.
For this Fund of the Company, underlying investments do not take into account the EU criteria for environmentally sustainable
economic activities.
Polen Capital Global Emerging Markets Growth Fund
The investment objective of the Fund is to seek long-term growth of capital. The Fund seeks to achieve the investment objective
through investment in a well-diversified portfolio of equity securities of issuers in the Emerging Markets or of issuers established
outside of the Emerging Markets, which have a predominant proportion of their assets or business operations in the Emerging
Markets and which are listed, traded or dealt in or on Recognised Exchanges worldwide. It is not proposed to concentrate
investments in any one industry or sector. The Fund may from time to time also purchase the common stock of companies whose
shares are listed or traded on Recognised Exchanges globally which have substantial business in, or revenues from Emerging
Markets if the Investment Manager is of the opinion that the stock represents a particularly attractive investment opportunity in
accordance with its Investment strategy. The Fund may invest up to 20% of net assets in securities which are listed or traded on the
Moscow Exchange. The Fund may also invest in Global Depositary Receipts, American Depositary Receipts, European Depositary
Receipts, and International Depositary Receipts where deemed appropriate by the Investment Manager in order to gain exposure to
international stocks rather than purchasing the stock directly from the underlying company in order to achieve the investment
objective of the Fund. Investment by the Fund in these instruments will limit the need for the Fund to transact in foreign currencies
to achieve the investment objective of the Fund.

Polen Capital Investment Funds plc
6
2022 Condensed Interim Report &
Unaudited Financial Statements
Background to Company (continued)
Investment Objective and Policy (continued)
Polen Capital Global Emerging Markets Growth Fund (continued)
The Fund is considered to be actively managed in reference to MSCI Emerging Markets Index (the “Benchmark”) by virtue of the
fact that it uses the Benchmark for performance comparison purposes. The Benchmark is a free float-adjusted market capitalization
weighted index that is designed to measure the equity market performance of emerging markets. Certain of the Fund’s securities
may be components of and may have similar weightings to the Benchmark. However, the Benchmark is not used to define the
portfolio composition of the Fund or as a performance target and the Fund may be wholly invested in securities which are not
constituents of the Benchmark.
For this Fund of the Company, underlying investments do not take into account the EU criteria for environmentally sustainable
economic activities.
Polen Capital Global SMID Company Growth Fund
The investment objective of the Fund is to seek long-term growth of capital. The Fund seeks to achieve its investment objective
through investment in a well-diversified portfolio of global equity securities of small and mid cap companies (market capitalisations
within the range of the market capitalisations of companies in the MSCI ACWI SMID Cap Index (the “Benchmark”) at the time of
purchase) which are listed, traded or dealt in or on Recognised Exchanges worldwide. While the Investment Manager will monitor
position size, country and sector weightings, it is not proposed to concentrate investments in any one country, industry or sector.
The Fund is considered to be actively managed in reference to the Benchmark by virtue of the fact that it uses the Benchmark to
define the characteristics of the securities held by the Fund. Certain of the Fund’s securities may be components of and may have
similar weightings to the Benchmark. However, the Fund may be wholly invested in securities which are not constituents of the
Benchmark. The Fund may also use the Benchmark for performance comparison purposes, however it is not used as a performance
target.
For this Fund of the Company, underlying investments do not take into account the EU criteria for environmentally sustainable
economic activities.

Polen Capital Investment Funds plc
7
2022 Condensed Interim Report &
Unaudited Financial Statements
Investment Manager’s Report
For the financial period ended 30 June 2022
Polen Capital Focus U.S. Growth Fund
The sell-off that began in 4Q'21 and continued into 1Q'22 accelerated this past quarter. Using the S&P 500 as a proxy for the U.S.
market, the current magnitude of the downdraft has been 3x faster than the bursting of the tech bubble in 2000-02. Concerns about
inflation—recently running above 8%—and rising interest rates continued, especially as the Federal Reserve began raising rates by
25, 50, and 75 basis points in March, May, and June, respectively. The Federal Reserve is clearly trying to clamp down on inflation
by raising the cost of borrowing, and the central bank expects to continue with aggressive rate hikes through the rest of this year.
As we exited the first half of the year, the bigger concern seemed to be about the possibility and severity of a looming recession,
which would not be surprising after a period of high inflation and higher interest rates. Indeed, the yield on the 10-year Treasury
note hit a high of nearly 3.5% in mid-June (up from about 1.5% only a few months ago) but has since retreated below 3% at the
time of this writing. It appears, at least when looking at the bond market, that inflation and higher rates may cause less demand for
products and services. If this does occur, inflation itself would likely begin to ease, and interest rates might stay relatively low.
We previously discussed the negative impact on the share prices of "long-duration equities" from the quick rise in interest rates.
Companies with more of their market value derived from future free cash flows are most susceptible to valuation impacts from an
abrupt change in interest rates. Many of these companies, particularly those that are digitally focused, such as digital advertising
businesses like Alphabet and Meta and e-commerce businesses like Amazon, have been robust stock market outperformers for
years. During the pandemic, they saw their revenue growth accelerate, and as the world reopened, their revenue growth slowed
considerably. The rate-induced selling that we have seen in these types of businesses seems to have been magnified by the shorter-
term revenue growth slowdown these companies are experiencing in 2022.
In hindsight, it seems clear that many digitally focused businesses that were driving secular growth trends pre-COVID had a bigger
pull forward in demand in 2020 and the first half of 2021 than we had expected. Though many of them, including Alphabet, Meta,
and Align Technology, are growing slower than we would have expected this year, which has affected share prices in the short-
term, we do not see a substantial change in the longer-term growth rates, market opportunity or earnings power for most of them
We still anticipate nearly 20% annualized earnings per share growth from the Polen Capital Focus U.S. Growth Fund (the “Fund”)
over the coming five years.
It is possible that the U.S. has already entered a recession. Recessions are normal. Economies don't grow all the time. The U.S.
economy has strong underlying foundational properties that have allowed it to grow at an incredible rate for almost two and a half
centuries. Still, there have been and will continue to be periods of negative GDP growth from time to time. Many companies must
retreat and cut investments in talent, product development, marketing, and other areas during periods of economic weakness. Most
companies either have little product/service differentiation versus competitors, in our view, or offer products and services that their
customers do not deem as essential. As a result, demand for their products and services tends to be tied closely to the health of the
overall economy. These types of businesses need to conserve cash when times are tough because their revenue and margins contract
when the economy contracts.
In our experience though, there is a much smaller group of companies—the companies we look for and seek to invest in—that are
typically far more resilient. We believe they can continue to grow revenue and earnings even when economic growth pauses or
temporarily contracts. These are companies that, according to our research, have strong competitive advantages, differentiated
products and services, secular growth prospects, and cash-rich balance sheets. These characteristics generally allow our Fund’s
companies to continue to invest during these tougher times, further widening their competitive advantages while most others are
conserving and contracting.
Most of the market sell-off we have witnessed over the last nine months has more to do with a re-setting of valuations based on
interest rate expectations, in our view.
Going forward, particularly if we remain in a more difficult economic environment, we expect to see the resilience of revenue and
earnings growth rise in importance in a more growth-challenged world.
All businesses will be affected by recessions to some degree. Still, based on our past experience and the high hurdles we hold our
companies to, we expect that the growth in our Fund portfolio companies' earnings, vis-à-vis the market, will compare quite
favourably as they have in other recessions.

Polen Capital Investment Funds plc
8
2022 Condensed Interim Report &
Unaudited Financial Statements
Investment Manager’s Report (continued)
For the financial period ended 30 June 2022
Polen Capital Focus U.S. Growth Fund (continued)
Fund Activity
Most of our holdings had double-digit stock price declines during the most recent quarter, but we've seen very little change in the
long-term competitive positions or growth prospects of these companies. As such, we have begun to shift weightings a bit within
the Fund. We have sold our position in MSCI outright in the second quarter. We have redeployed the cash from these sales into
existing holdings where we see more compelling values.
Many of these are in our fastest growing and most competitively advantaged businesses, like Adobe. We are currently witnessing
what we see as large dislocations in valuations, especially in companies commonly classified as faster-growing technology and
internet businesses. We are already taking advantage of these dislocations.
As an example of a valuation dislocation, we've recently taken advantage of, we added to our position in Adobe in the second
quarter. It is now one of our top three holdings at just under 7% of the Fund. According to our research, Adobe has a near monopoly
on digital content creation software globally and is a highly advantaged digital marketing and analytics business. The business
continues to grow revenues and profits robustly, even in the face of large currency headwinds and macroeconomic weakness in
parts of Europe.
We expect the company to continue to grow earnings at a high-teens or better rate for the foreseeable future on the back of robust
secular growth tailwinds in digital content creation and consumption. Adobe's tools are the de facto standards for various
applications such as graphics and video editing. In addition, Adobe stands to be a leader in providing tools for creators to develop
aspects of the immersive internet (metaverse) as that develops as well.
Adobe's share price has sold off considerably despite its healthy ongoing growth, similar to certain other companies commonly
classified as technology businesses. It is now valued at less than 23x consensus 2023 earnings estimates. This is a discount to
companies like Coca-Cola, Colgate, Clorox, McDonald's, and Proctor & Gamble. Each of these consumer staples companies could
be considered a good business by any unbiased observer. Yet, our research tells us that each one is also likely to only grow earnings
at a single-digit pace because they face more competition and sell into more mature markets than Adobe. The last time we saw
dominant, faster-growing businesses like Adobe trading at discounts to more challenged, slower-growing consumer staples
businesses like Coca-Cola was in late 2008/early 2009 during the Financial Crisis. We are not making a market call, but we are
starting to see valuation discrepancies that we can take advantage of for our Fund.
Fund Performance
Airbnb was one of our largest detractors from performance in the second quarter. Airbnb is the clear market leader in private rental
bookings globally, according to market research firm Euromonitor. The business is currently firing on all cylinders, with revenue
and earnings growth well above our expectations and long-term estimates. It would be easy to say that it is because as the world
reopens, people are traveling for the first time in two years, providing a short-term benefit to the company. But, Airbnb also grew
quickly in 2021 when people were still hesitant to travel and preferred staying close to home. The company's growth in 2022 is not
an easy comparison like it is for online travel agencies (which are more hotel-oriented), airlines, and hotels. In fact, Airbnb's
business has outpaced the hotel industry growth by more than 1,250 basis points per year since 2019, showing far more resilience
than hotels and online travel agencies.
Airbnb didn't invent the private rental market, but it developed a better offering and helped it scale with robust network effects and
a system of trust protecting travellers and hosts alike. It has diligently removed friction from the marketplace to catalyze demand.
The business model has very high incremental profit margins. When the company went public only a year and a half ago, it had
pretax profit margins on a non-GAAP3basis of approximately 5% by our calculations. This year, those margins should approach
30%. In addition, the company has generated approximately $3 billion in free cash flow over the last 12 months. The runway for
growth in private rental is very long, especially considering that hybrid work will likely remain for the long-term, allowing for more
business/leisure trips that work better in Airbnbs than hotels, in our view.
At the same time, Airbnb's network effect of more property listings drives more travellers to make more bookings, which again
drives more listings. This virtuous cycle helps to create the potential for huge barriers to entry for its competitors. As we see it, the
decline in the stock price year-to-date seems to have little to do with the long-term fundamentals of the business. Instead, it has
more to do with the general sell-off in faster-growing technology and internet businesses and short-term concerns around how travel
might fare in 2023 following a solid 2022.

Polen Capital Investment Funds plc
9
2022 Condensed Interim Report &
Unaudited Financial Statements
Investment Manager’s Report (continued)
For the financial period ended 30 June 2022
Polen Capital Focus U.S. Growth Fund (continued)
We agree that Airbnb will have a very tough growth comparison in 2023, especially if a recession is in store. But, we see many
years of double-digit growth ahead driven by durable competitive advantages and management's persistent investment to make
booking on Airbnb the first place travellers go for unique and differentiated stays. Indiscriminate selling due to macroeconomic
fears and how they might impact Airbnb's business over the next year rather than focusing on the next 5-10 years is the definition of
missing the forest for the trees, in our view.
Revisiting Netflix –We See Light in the Darkness, but Still Much Wood to Chop
We believed that the slowdown in Netflix's subscriber growth was most likely due to the reopening of the economy post-COVID-19
and not a competitive or maturation issue. We came to this conclusion because churn remained quite low (which was unlikely if
there was a competitive problem), and the slowdown was broad-based by geography. To us, this likely meant that maturation was
unlikely as even countries with low streaming penetration were seeing the same slowness in new users as those that were more
mature.
Earlier this quarter, Netflix again warned that net new subscriber additions would be negative (fewer new subscribers than those
churning off). They also disclosed for the first time that there are over 100 million households globally (including 30 million in the
U.S. and Canada) that use Netflix but don't pay for it by sharing someone else's password. This is a much larger number than we
expected and indicates that maturation is a real issue, especially in the U.S. and Western Europe.
In the intermediate term, we believe that the addressable market for Netflix is the roughly 450 million homes with smart TVs, often
the preferred method for watching long-form video. In the longer term, the market could be closer to the one billion households
with broadband internet access (excluding China). Watching on laptops and mobile devices can also be a good experience for many,
and over a long enough period, we would expect these households without smart TVs today will eventually own at least one. With
the new disclosure though, Netflix is already reaching roughly 320 million of the 450 million smart TV households (220 million
paying households plus 100 million non-paying password borrowers), which is the better metric for the medium-term addressable
market.
While we are not enthusiastic about the company being much further along in its subscriber adoption journey than we previously
thought due to excessive password-sharing, the potential for monetizing these users remains intriguing. An obvious positive is that
these 100 million households already use and seem to enjoy Netflix. But the big question is, how can you extract value out of them
if they have been unwilling to pay for a subscription? Certainly, there are many reasons why people borrow subscription passwords.
Netflix, in response to the slowdown in growth, has said it will embark on two new strategies. First, it intends to stop allowing
account holders to share their passwords without some payment. Second, the company plans to introduce a lower-cost subscription
that also presents users with advertisements to extract value for the company while offering a more cost-effective plan for
consumers. It remains unclear just how effective these two strategies will be as the details of both have not yet been articulated. But,
interpreting the thoughts management has provided thus far, we expect a few different options are on the table and that this will
involve a good amount of trial and error.
Netflix doesn't want to cut off people that are borrowing someone's password. They want to be able to keep them viewing and allow
for passwords to be shared for a fee (likely well below a full subscription fee). The ad-supported model could be free with ads or a
low-cost subscription with ads. And, it may be different by geography as some markets are far more price sensitive than others. It
will be very important that Netflix thread the needle properly to not alienate users and not incentivize too many of them to trade
down to cheaper subscriptions.
In our view, we'd like to see the company use advertising not only to bring new subscribers to the service but also to monetize
shared passwords. Forcing new fees on subscribers to pay for password sharing is likely to introduce friction and negative brand
equity at a time when consumers' wallets are already stretched. But, introducing ads to those who are borrowing passwords and not
paying does not financially burden the subscription owner and still allows the borrower to watch Netflix without an out-of-pocket
expense. This could be a win-win that should also provide significant incremental revenue to Netflix.
While advertisements can feel inconvenient for some, we think most people accept the trade-off between lower out-of-pocket costs
and seeing ads, particularly as ads become more relevant and engaging over time. The vast majority of linear T.V. and almost all
streaming companies now offer ad-supported models that most consumers accept. If someone does not like seeing ads, the full
subscription price option without ads will remain. The advertising model can be lucrative. Hulu alone generated over $2 billion in
advertising revenue in 2021 with a much smaller and less engaged user base than Netflix.

Polen Capital Investment Funds plc
10
2022 Condensed Interim Report &
Unaudited Financial Statements
Investment Manager’s Report (continued)
For the financial period ended 30 June 2022
Polen Capital Focus U.S. Growth Fund (continued)
We believe that as we exit 2022, Netflix will likely be growing its user base again on the back of a new, rich content slate and easy
comparisons with the tough 2022 period. They will also be launching new monetization schemes, especially advertising plans that
could open incremental revenue opportunities. That said, there is still much work to be done, and it's not as if competition is getting
any less intense. We still need more information from the company to better understand their new monetization strategies, but we
feel that the market has already priced in a dire situation when there is potentially light at the end of the tunnel.
There is much wood to chop for Netflix management, but we are being patient as we see opportunity. Most importantly, we
continue to see a service enjoyed by over 300 million people worldwide that is difficult for competitors to match on a global scale.
This is especially true for the large and important original programming category, an area where Netflix still has a clear lead in
viewership time versus all competitors, including in the U.S., where competition is the fiercest. We have seen plenty of examples of
weak products and services failing to monetize, but we have not seen many examples of unique products and services that are
globally scaled with hundreds of millions of engaged users failing to receive fair value from those who consume, even if it takes
longer than expected to get there.
Outlook
We have seen unusual volatility and surprising downside performance in share prices of many of our holdings despite what we
believe are businesses with strong competitive advantages and growth prospects. The confluence of macroeconomic issues
(inflation, interest rates, recession risks, etc.) and the post-COVID-19 reverberations across industries (difficult comparisons and
capacity utilization after large investments) have made for a challenging year so far. That said, our team has been methodically
examining each of our holdings, assessing the durability of competitive advantages and growth prospects.
We are disciplined in adhering to our investment philosophy but also dispassionate when it comes to stock price movements.
Our research indicates that the vast majority of our holdings are executing well on their strategic paths and growth initiatives, and
we feel confident in the ability to generate mid-teens or better earnings per share growth over the coming five years. We are also
evaluating new potential investments as valuation dislocations are occurring across our investible universe.
Thank you for your interest in Polen Capital and the Polen Capital Focus U.S. Growth Fund. Please feel free to contact us with any
questions or comments.
Sincerely,
Dan Davidowitz and Brandon Ladoff
11 August 2022

Polen Capital Investment Funds plc
11
2022 Condensed Interim Report &
Unaudited Financial Statements
Investment Manager’s Report (continued)
For the financial period ended 30 June 2022
Polen Capital International Growth Fund
International equities broadly declined in the first half of 2022. The Russia-Ukraine conflict, stubbornly high inflation, aggressive
central bank measures, and supply chain challenges all contributed to asset valuation reductions. A clear tightening bias from
central banks dampened some speculative fire that characterized markets in recent years. Liquidity conditions added to the multiple
compression that hit growth stocks. Overall, the markets on June 30 paid significantly less for a dollar's worth of earnings than they
did on January 1.
Many of our steady and stable holdings, including those we believe provide ballast for the Polen Capital International Growth Fund
(the “Fund”), were down in step with the broader market.
Despite share price movements, most of these companies reported robust results, with long-term growth initiatives continuing
briskly and management teams expressing confidence about their business trajectories.
Fund Performance & Attribution
The Fund's exposure to companies within the consumer discretionary, health care, and information technology sectors detracted
from performance in the most recent quarter. Risk-off sentiment has punished these sectors while favouring those in safe havens
like consumer staples. Materials, an area to which we typically carry little exposure, also benefitted the Index in the quarter. The
Fund style was challenged by growth and quality underperforming the benchmark.
Our most significant contributors to performance on an absolute basis over the second quarter were Unilever, Walmart de México,
and Tencent Holdings Ltd.
Multinational consumer goods company Unilever showed robust price increases overall, with minimal impact on volume, resulting
in faster-than-expected sales growth during the quarter. Indeed, higher inflation can be a positive change for companies with
favourable brands like Unilever as these conditions make it easier for the biggest brands to raise prices, continue spending on
advertising, and take share. We believe the appointment of an activist investor to Unilever's board in June will help spur additional
growth.
Walmart de México, Central America's leading retailer, sustained momentum in e-commerce, marketplace, connectivity solutions,
financial services, and advertising, which helped support its ongoing growth.
Our most significant absolute detractors from performance over the quarter were adidas AG, Siemens Healthineers, and
MercadoLibre. With no changes to their underlying businesses during the quarter, we strongly believe these companies were swept
up in indiscriminate selling unrelated to business fundamentals. Our view on the long-term prospects of all three remains positive.
Fund Activity
We increased our position in Globant S.A. during the quarter and exited Walmart de México. We reduced our position in Experian
and Dassault Systèmes SE.
Globant is a leading technology consulting company based in Argentina. As many businesses seek help with digital transformation,
Globant is seeing strong demand for its services that we expect will persist for years to come and drive earnings growth above 25%.
Since our initial purchase in January at a 1% weight, Globant's valuation has become more attractive, providing an opportunity to
add to our position incrementally.
While Walmart de México's business continues to perform as we expected, its stock valuation has crept higher. Over the more than
five years that we have owned the company, it delivered persistent net income growth and dividends. A surprisingly strengthening
peso further aided our compounded total returns. We believe the business is less likely to deliver on our future return expectations
based on valuations, so we decided to take profits and redeploy the proceeds to more favourable opportunities.
Multinational consumer credit reporting company Experian continues to execute well, and shares reflect a positive outlook for its
core Credit Bureau services and success in the consumer services segment. Given Experian's full but fair valuation and the rising
interest rate environment, we felt it prudent to trim our weighting in the company.
France-based Dassault Systèmes is a leading provider of enterprise software solutions in the computer-aided design industry.
Dassault has shown remarkable resilience in its growth and earnings in recent quarters; however, we again trimmed our position to
use the proceeds to add to a faster-growing business trading for the same valuation multiple (Globant).

Polen Capital Investment Funds plc
12
2022 Condensed Interim Report &
Unaudited Financial Statements
Investment Manager’s Report (continued)
For the financial period ended 30 June 2022
Polen Capital International Growth Fund (continued)
Outlook
We continue to run the Fund with a focus on robust and profitable businesses poised to grow their earnings at above- market rates
over the next five years.
Our optimism also stems from competitively advantaged companies on our watch list that we currently do not own but could
become more compelling options as valuations come in.
While uncertain and volatile markets can signal slower near-term economic growth, the divergence between business fundamentals
and stock prices has created attractive entry points for investment in companies with outsized long-term return potential.
As ever, we are confident in the time-tested philosophy driving our growth investing approach. Thank you for your interest in Polen
Capital and the Polen Capital International Growth Fund. Please contact us with any questions.
Sincerely,
Todd Morris and Daniel Fields
11 August 2022

Polen Capital Investment Funds plc
13
2022 Condensed Interim Report &
Unaudited Financial Statements
Investment Manager’s Report (continued)
For the financial period ended 30 June 2022
Polen Capital U.S. Small Company Growth Fund
The Polen Capital U.S. Small Company Growth Fund (the “Fund”) performance was disappointing in the second quarter and full
first half of the year, on both an absolute and relative basis. Amidst higher inflation, slowing economic growth, tightening monetary
policy, and widespread uncertainty, the Russell Growth 2000 Index delivered its worst first-half performance in its more than 40-
year history. There was nowhere to hide with most of the Index constituents delivering negative returns. Growth stocks faced the
greatest pressure. While we own a range of businesses on a growth-to-safety spectrum within an overall growth-oriented
framework, our longer duration, higher multiple investments along with our consumer discretionary holdings were particularly hard
hit. We generally avoid cyclical and commodity businesses like energy for several reasons including our core Flywheel investment
criteria, ESG (Environmental, Social, and Governance) considerations, and our need for strong balance sheets. It is important to
acknowledge that this under-exposure hurt us while still being clear that we do not intend to change our core discipline.
The underlying health of our businesses remains robust, even amidst a worsening economic outlook. As a reminder, in good times
and in bad, one of the key tenants of our Flywheel is investing in businesses with strong balance sheets that can self- fund growth.
We believe this allows them to invest, grow, and emerge stronger in and following challenging economic or funding environments.
However, this does not mean we sit idle. We have been working hard all year to leverage our distinctive collaborative team
approach to look at our investments from all angles and perspectives. As we promise, we are unafraid to update our views. We’ve
made some adjustments to manage the evolving risk landscape as detailed later in this note. We are still pleased with the balance
and ballast in our Fund as it stands today.
While we believe our clients are aligned with our long-term investment horizon, we never like to underperform for any period as
has been the case so far this year. We recognize that sometimes macroeconomic factors weigh more heavily on stock prices than
fundamental company results, and, there are some steps we could have taken to buffer the impact such as reducing some exposure
to consumer discretionary. However, our North Star is to remain focused on long-term intrinsic value creation, and we believe our
ability to see through the noise and act with the conviction of our disciplined research process will ultimately drive significant long-
term returns.
There remains a lot of uncertainty around how long high inflation will last, whether it will trigger a recession, how bad it will be,
and how high rates will need to go. While it’s tempting to make predictions, it’s far more prudent to recognize that the answers are
unknowable.
Instead, we stay focused on what we can understand: the quality of a business, the robustness, and repeatability of the business
model, the quality of a management team, and the team’s experience navigating difficult environments, and the investments a
company can make to solidify and expand its competitive advantages. Changing macroeconomic and pandemic conditions have the
biggest impact on stock prices over the short term.
However, over the long term, the value of a business is a function of the compounding of earnings, free cash flow, and high returns
on capital. By these metrics, we believe opportunities in our investment universe are better than they’ve been in several years and
offer attractive prospects for long-term investors. We are using the factor driven stock market volatility to our advantage, adding
new opportunities in companies in our library that previously did not meet our expected IRR hurdles. We are selling or trimming
companies that have held up well but may be more vulnerable to the changing market conditions. With respect to risk management,
we have been selling companies with less financial flexibility and focusing on adding more sector breadth where applicable.
We are mindful that in more challenging environments, it can be tempting to sell investments that aren’t working and assume
continued weakness.
Sometimes this is the best time to own these investments or buy more from a fundamental perspective.
With any changes that we make, our goal is to enhance quality and expected risk-adjusted returns.
It is often good to buy small-cap growth stocks during challenging times like these. Our focus continues to be on finding what we
believe to be high-quality companies that benefit from long-term secular trends; are well-positioned in their respective markets;
have robust, cash-generative business models; and are run by talented management teams. We believe these qualities provide
businesses with the ability to grow in any market environment and are important drivers of long-term performance. We have not
changed our view that the stocks in our Fund have the potential to at least double in value over a five-year period, with some
offering far more upside especially after the recent drawdown. We believe that maintaining our focus high-quality growth
companies with the best risk-reward tradeoff that are well positioned to drive cash flow and earnings growth over the next 5 years
will generate long-term performance for the Portfolio, regardless of volatility in the underlying economy and shorter-term rotations
in the market.

Polen Capital Investment Funds plc
14
2022 Condensed Interim Report &
Unaudited Financial Statements
Investment Manager’s Report (continued)
For the financial period ended 30 June 2022
Polen Capital U.S. Small Company Growth Fund (continued)
Fund Performance & Attribution Challenging stock selection in consumer discretionary and financials, where we believe there is a disconnect between the
performance of the underlying businesses and their stock prices, drove Fund underperformance. Cyclical sectors (energy, materials)
on one end of the spectrum and defensives (consumer staples, utilities) on the other were the only sectors that materially
outperformed the benchmark.
Except for consumer staples, our focus on high-quality, sustainable growth makes it easier to steer away from most of these sectors.
Our above-benchmark exposure to growth also detracted from performance over the quarter, as did our below- benchmark
exposures to the value and dividend yield factors.
The top absolute contributors to the Fund’s performance over the most recent quarter included AMN Healthcare, Bumble, and
Azenta.
AMN Healthcare is a provider of temporary health care staffing in the U.S. A tightened labour market and higher-than-average
turnover in the health care industry precipitated by the pandemic are helping to drive pricing and volume growth for the company.
We do not believe the company’s current results are sustainable, especially the well above average pricing the company is currently
benefitting from. Given its relative performance and the wide range of outcomes over the next few years as health care starts to
normalize, we trimmed our position in the company.
Online dating company Bumble has been successfully executing its core strategic priorities focused on driving scale and
engagement, monetization, and profitability. We are excited about the market potential for online dating and believe Bumble can
take share and leverage its brand in adjacent categories. This is a category we believe should be resilient no matter what happens
with the economy.
Azenta is a health care company that focuses on biological sample management. The company, previously known as Brooks
Automation, re-branded as Azenta after selling its semiconductor business earlier this year. The company is the only end-to-end
provider of reliable cold-chain sample management solutions and genomic services and benefits from the trend towards sample
outsourcing by pharmaceutical and diagnostic companies.
The most significant absolute detractors from the Fund’s performance over the most recent quarter included Warby Parker,
Revolve, and Progyny.
Warby Parker is an omnichannel retailer of prescription glasses, contacts, and sunglasses. The market’s rapid shift toward favouring
profitable companies posed challenges for the company in the quarter as did weaker results which were pandemic-related. Warby
Parker is less profitable at this stage of its lifecycle as it invests in building out its retail footprint. We expect the company to be
cash-flow positive within a year as it continues to benefit from scale and as retail foot traffic and productivity of the company’s
retail stores return to normal as pandemic conditions ease. We may have had the opportunity to add this holding at a more ideal
price. However, we remain excited about the long-term growth potential of the business, and the expected IRR.
Revolve is an e-commerce fashion company we believe is executing well. The stock weakness during the period was more
sentiment-driven as the market grew increasingly concerned about consumer spending in a recession. We acknowledge that there
could be some softness in the company’s near-term results as consumers tighten their purse strings, but we believe there remains
tremendous long-term potential for this business. We have also observed that Revolve’s management team is exceptional when it
comes to navigating unprecedented challenges, as they did during the pandemic and have a long history of doing so since being
founded in 2003 and bootstrapped by their founders. Management preparedness is an important marker we are looking for during
this challenging time and Revolve’s management team is unquestionably in this area. We added to our position on this weakness.
Progyny is a fertility benefits manager for self-insured companies and their employees. Like Revolve, the underlying fundamentals
of the business remain robust, and we believe the outsized weakness during the quarter was sentiment-driven based on investors’
recessionary fears. In our view, this is a short-sighted concern that overlooks Progyny’s nascent opportunity to penetrate a large and
rapidly growing market with an advantaged, “patient-first” business model. Progyny’s comprehensive fertility solutions are top of
mind for employers looking to drive better diversity, equity and inclusion efforts and it’s also a way for companies to stay
competitive in attracting and retaining talent. As a medical benefits provider, they should be relatively insulated should economic
conditions worsen, especially compared to more "nice to have" employee benefits.
Polen Capital Investment Funds plc
15
2022 Condensed Interim Report &
Unaudited Financial Statements
Investment Manager’s Report (continued)
For the financial period ended 30 June 2022
Polen Capital U.S. Small Company Growth Fund (continued)
Fund Activity
We had more trading activity than usual in recent months.
We are using the stock market volatility to enhance the Fund’s quality and expected risk- adjusted returns while remaining well
positioned for the long term.
We took advantage of drawdowns in existing holdings’ stock prices over the second quarter to add to our positions in cloud-based,
e- commerce restaurant brand platform Olo, e-commerce fashion company Revolve, and insurance brokerage company Goosehead
Insurance. We also added to our position in investment management services firm Hamilton Lane after initiating a smaller position
in the company earlier this year.
We have taken advantage of new opportunities in companies in our library that previously didn’t meet our expected IRR hurdles,
initiating new positions in Five Below Inc., Azenta Life Sciences Inc., Doximity, Inc., and SiteOne Landscape Supply, Inc.
Five Below is a leading, high-growth, value retailer in the U.S. with a differentiated and durable customer value proposition. This is
a company we had previously owned in the Fund but sold it during the pandemic as we were concerned about the company's ability
to thrive during the pandemic with a business model reliant on physical storefronts and foot-traffic.
With more comfort that the economy is reopening and considering the stock's big pullback over the past several months, Five
Below is a compelling investment once again. The things that have us most excited are the company's potential to grow its store
base, its compelling store economics, the investments the company is making to remodel its stores, and its value orientation in a
potentially difficult economy. We are excited about the company's plans to triple its store base by 2030 and double its top and
bottom line by 2025. Based on expectations of 15% square footage growth annually, modest store comps, and limited margin
improvement over the next eight years as the company grows its store base as planned, we believe there is significant upside from
current levels.
Azenta is the only end-to-end global provider of reliable cold-chain life science sample management solutions and genomic
services. The company is competitively advantaged in a very attractive industry that is growing 10 - 12% as more and more drugs
are developed in an increasingly complex environment. Due to the nature of its business, its customer relationships are often
enduring. The average sample is stored for three years, with some stored for over a decade. Long term, we believe the company will
deliver attractive growth, margin expansion, continued mergers and acquisition opportunities, and the potential for share buybacks
over time. From a portfolio management perspective, Azenta gives us exposure to the robust research and development trends in
biotechnology and pharma without concentrated FDA risk or earnings losses.
Doximity is a productivity and professional network app for doctors that derives its revenues primarily from advertising dollars
spent by biopharma companies on its platform. Its unique value proposition lies in its targeted physician list desired by drug
companies. Doximity is an attractive alternative or supplement to an industry that has historically focused its ad spend on sales reps.
Doximity is uniquely high growth and already a very profitable business with a 33% operating margin. It has attractive software-
like economics without having to spend much to acquire users or customers. While the company clearly had some benefit from the
pandemic, it is still early in tapping into a growing, $8B market with multiple avenues for growth. The sell-off in recent IPOs has
created an attractive risk-reward opportunity to start a position.
SiteOne is the largest and only nation-wide wholesale distributor of landscape products in the U.S. Given its scale, SiteOne offers
an accessible network for suppliers with limited distribution resources. The company’s landscaping focus, which is more recurring
in nature than other consumer markets, gives it a resilient earnings profile even in the event of an economic downturn. SiteOne has
also demonstrated success through highly accretive acquisitions of small local players. Given its industry’s fragmentation, we
believe the company has a long runway for growth. Going forward, we expect earnings per share to compound at a low double-digit
rate for the next five years, driven again by +5% organic same store sales growth, +5% growth from acquisitions, flat to expanding
margins, and potential returns of capital in the form of share repurchases or dividends. We recognize that some recent margin gains
may revert in the near- term, but believe this is a rock-solid, high-quality company that can compound earnings for many years and
that the current valuation sufficiently discounts near-term uncertainty.
In the most recent quarter, we reduced our positions in a few existing holdings. This included Endava, AMN Healthcare, and
AppFolio.
Our reduced position in IT consulting company Endava reflects the above-average risk related to the Russia-Ukraine conflict and
the possibility that it extends to Moldova, which represents 9% of Endava’s revenues and where 12% of the company's employees
are based.

Polen Capital Investment Funds plc
16
2022 Condensed Interim Report &
Unaudited Financial Statements
Investment Manager’s Report (continued)
For the financial period ended 30 June 2022
Polen Capital U.S. Small Company Growth Fund (continued)
We trimmed our position in property management software company AppFolio to redeploy the capital into what we believe to be
superior alternatives. The stock held up relatively well this year, and it was a source of funds for adding to new and existing
positions.
As referenced above, AMN Healthcare, performed well during the period. We reduced our position size on the margin due to risk
management given a widening range of outcomes over the next few years as the healthcare system returns to a new normal. AMN
remains a top holding.
We’ve completely sold companies that we believe may be more vulnerable to the changing market conditions and those with less
financial flexibility including Malibu Boats LLC., Trupanion, and BigCommerce Holding Inc.
On Malibu Boats LLC we are concerned about the considerable demand pull-forward during the pandemic combined with the rise
in interest rates and inflationary pressures the consumer is currently facing. The business continues to perform well but we know
from past downturns that this is an industry that is more vulnerable to these types of pressures, and that the environment can change
quickly. The company's stock has held up better than most companies in our Fund in the YTD period, making it a good source of
funds to redeploy into companies with less vulnerability to the changing economic conditions and more compelling risk reward
profiles.
We sold Trupanion because we are concerned about the deteriorating unit economics of the business. Changes in how vets operated
during COVID disrupted Trupanion’s strategic advantage for onboarding new pets at vet offices.
This forced Trupanion to compete in undifferentiated DTC (direct-To-consumer) sales channels with other pet insurers and increase
experimentation for pet acquisition. This significantly increasing per pet acquisition cost and moving away from the discipline we
had seen from management historically.
This is a key variable in the unit economics and free cash flow (FCF) generation that Trupanion would be able to earn from each of
its covered pets. While the veterinary community has largely overcome the challenges of COVID-19, we lack confidence that
management can curb pet acquisition spend in the intermediate term while also investing in future growth channels. This can both
hamper growth and is a major obstacle to generating free cash flow FCF. This is a clear and likely persistent Flywheel violation.
Management may be making correct and rational decisions to ensure the multi-decade success of the business, but the declining unit
economics of the business and lack of FCF makes it less compelling in the current environment and over our investment horizon.
Finally, we sold BigCommerce due to clear Flywheel violations. We are concerned about the company's deteriorating profitability
and reliance on external sources of capital. BigCommerce is facing numerous challenges including developer resources in Ukraine
and the potential for staffing challenges in a still challenging labour market for engineers.
Outlook The macroeconomic environment is complex and unpredictable. This unpredictability stems from interplay between
macroeconomic data points, external shocks or their reversal, the Fed’s actions, and how consumers and businesses react. This
creates a series of junctures in which multiple scenarios are possible. What we are observing in many companies we follow is a
natural reaction to uncertainty, which is a slowdown in the front edge of consumer discretionary, a lengthening of sales cycles, and
more caution around building inventory. There may be tougher times ahead, and we are prepared for it. We are expecting growth to
slow in the face of difficult comparisons and the weakening outlook. This compounds uncertainty around near-term predictions and
valuation multiples. Companies that benefited from the pandemic may look particularly volatile with a short-term view.
This is exactly why we stay focused on the long-term. While it may be hard to believe with short-term lens influenced by fear and
uncertainty, the long-term picture is far clearer than the market would suggest, and by and large, our long-term view and conviction
in our portfolio companies is unchanged. This allows us to confidently sift through the noise and take advantage of price
dislocation. This also highlights the benefit of owning Flywheel companies as we define them. These are long-term secular winners,
still in the early innings of their growth, with durable businesses models and balance sheets that are built to keep them robust when
others are weak. Time and patience are required for the fundamentals to play out. We cannot predict the short-term even though we
believe significant bad news is priced in.
Despite all the challenges, the opportunity set in small-cap is attractive. High-quality, small-cap companies have greater latent
potential for growth relative to more mature businesses. The best small cap growth companies can quickly reduce spending and
inflect profitability if needed given their high starting levels of investment. We believe the best-of-the-best small-cap companies
will take advantage of adjacencies and have a better potential opportunity set for value-added acquisitions.

Polen Capital Investment Funds plc
17
2022 Condensed Interim Report &
Unaudited Financial Statements
Investment Manager’s Report (continued)
For the financial period ended 30 June 2022
Polen Capital U.S. Small Company Growth Fund (continued)
Of course, many companies do not meet this high hurdle, which is why we hold a concentrated portfolio of companies that do not
just offer growth and high returns, but also durability, robust financial models, the ability to self-fund growth, and what we believe
to be superior management teams.
We believe great investing requires a clear and proven philosophy, a disciplined process and conviction. It also requires great
humility and a willingness to change your view when the evidence requires it. We look forward to keeping you updated on our
views in future commentary.
Thank you for your interest in Polen Capital and the Polen Capital U.S. Small Company Growth Fund. Please contact us with any
questions.
Sincerely,
Rayna Lesser Hannaway
11 August 2022

Polen Capital Investment Funds plc
18
2022 Condensed Interim Report &
Unaudited Financial Statements
Investment Manager’s Report (continued)
For the financial period ended 30 June 2022
Polen Capital Global Emerging Markets Growth Fund
Share prices globally—including those in emerging markets— remained under pressure in the second quarter of 2022, adding to an
already challenging start to the year. In our view, some of the reasons for the declines this year have been very rational. With
inflation moving higher globally and interest rates following suit, markets are naturally baking in higher discount rates, and some of
the frothy valuations of the past years have come home to roost.
We have been concerned for a while about the number of companies in the market with unprofitable business models raising capital
on the promise of significant returns tomorrow.
There was no way of knowing when this would unwind; however, history has shown that no matter how painful it can be – and
sometimes for a long time – fundamentals tend to win out in the end.
In such unwinding environments, it is not uncommon for markets to throw the proverbial "baby out with the bathwater." We believe
this is playing out now. Companies we regard as high quality are selling off as much if not more than those with significantly less
solid fundamental underpinnings simply because of the industry they operate in.
Going forward, we have no idea how much further markets can or will fall. However, it looks likely that global interest rates and
funding sources will get tighter from here on. This is probably not good news for companies with weak fundamental underpinnings
or cash flows to support valuations. Nevertheless, in our opinion, it is a good time to be an active investor. We feel very confident
in the companies we own in the Polen Capital Global Emerging Markets Growth Fund (the “Fund”), their robust business models,
and the valuations many of them are now trading on.
Emerging markets were not exempt from global pressures in the second quarter. Yet, the drawdown was less severe than across
their developed counterparts. This was partly because China, the largest emerging market, had already been heavily punished
during the previous twelve months. It was also probably a reflection of the emerging market asset class as a whole having missed
out on some of the exuberance that found its way into global markets in recent years.
Chinese equities closed the period higher after the world's second-largest economy relaxed some of its COVID-19-related
lockdowns and showed early signs of easing tensions on the regulatory front, particularly within the technology sector.
While easing lockdowns are a favourable tailwind in the short term, we would be cautious in cheering too early as the Chinese
government remains committed, albeit in an increasingly isolated way, to a zero COVID-19 policy. Despite the government's
efforts, achieving this goal is something that, at least as we stand today, looks unlikely to succeed over the long term.
Fund Performance & Attribution From an absolute perspective, our most significant contributors to performance over the most recent quarter were Autohome, Phu
Nhuan Jewelry, and Prosus.
Autohome is China's leading online car classified company and one company that, in our view, was unfairly punished in reaction to
China's regulatory crackdown last year. Autohome saw a steep decline in its share price in 2021 as most tech-related companies
sold off, irrespective of the actual direct impact of regulatory changes or how cash-generative their businesses were.
While earnings of Autohome did soften during the year as the global chip shortage weighed on new car sales, we expect the
company to return to the earnings growth levels it has historically delivered. The company's 70% share price decline in 2021 left it
trading on levels we considered very attractive, and we took the opportunity to increase our position earlier in the year. Despite the
bounce during the quarter, we still view the company as materially undervalued.
Headquartered in Vietnam, Phu Nhuan Jewelry produces, sells, and trades jewellery and related products. PNJ is the leading
formalized jewellery retailer in a growing industry (and country) still primarily dominated by "Mom and Pop" stores. Year to date,
profits are up about 50% year-over-year, which in our view, represents solid growth for a company trading at less than 20x forward
earnings. As PNJ rolls out new stores and customers continue to be attracted to purchasing from a brand they trust, we expect PNJ
will continue compounding at high rates of return.
Prosus is a Netherlands-headquartered holding company with a 30% stake in Tencent Holdings Ltd. We have historically viewed
Prosus as an attractive vehicle for investing in Tencent, given that Prosus's market cap—including several other promising
businesses—is significantly lower than its direct stake in Tencent.
After trying multiple times to close the discount without much success, the firm's management announced that it would begin to
gradually sell down some of its Tencent holdings and use the proceeds to buy back shares, leading to a jump in Prosus's share price.

Polen Capital Investment Funds plc
19
2022 Condensed Interim Report &
Unaudited Financial Statements
Investment Manager’s Report (continued)
For the financial period ended 30 June 2022
Polen Capital Global Emerging Markets Growth Fund (continued)
The most significant absolute detractors from performance over the quarter were MercadoLibre, Karoooo, and Titan.
As written in our Q4 2021 commentary, some significant differences exist between the underlying profitability of e- commerce
companies in emerging markets. However, MercadoLibre was punished during the quarter in part because of the sector it happens
to operate in. Given its robust cash flow generation, we believe MercadoLibre is well-poised to continue delivering solid cash flows
that will enable it to support its operations fully. Going forward, we expect the business to continue growing and providing value-
added services to its customers across the continent. In turn, we capitalized on the weakness during the quarter to opportunistically
increase our position in MercadoLibre.
Karoooo is a leading South African and Southeast Asian provider of highly precise vehicle tracking services that help its customers
improve their logistics operations' efficiency, safety, and security. Despite the price weakness during the quarter and year-to-date,
the company continues to deliver solid operating results, with subscribers and revenues for the full year ending February 2021
increasing by 17% and 20%, respectively. During the quarter, we spoke with Zak Calisto, CEO of Karoooo, about the business and
its plans for the future. Following our discussion, we remain very impressed with the company's strategy, quality of management,
and ability to continue compounding cash flows for many years.
Titan is the leading jewellery retailer in India. While it has made a solid recovery operationally since the early days of the
pandemic, so has its share price. With valuations under the limelight, it is not surprising to see some profit-taking action. Though
our team remains confident in the company's long-term structural growth story, we reduced our holding late last year to reflect more
demanding near-term valuations.
Fund Activity
During the most recent quarter, we increased our positions in Momo.com, Wizz Air, MercadoLibre, Tencent Music Entertainment
Group, and Alibaba Group Holding and exited President Chain Store. We also reduced our positions in Raia Drogasil SA, United
Spirits Limited, and Colgate-Palmolive (India) Ltd.
We used share-price weakness over the quarter to increase our positions in Taiwan-based e-commerce company Momo.com, low-
cost airline Wizz Air and online marketplace MercadoLibre. We have discussed these three businesses in recent quarterly
commentaries, and we believe in each case that the share price movements we have seen this year are not reflective of their
underlying solid fundamentals. We also added to our position online music platform Tencent Music Entertainment Group and
Chinese e-commerce company Alibaba.
To fund some of these additions, we reduced our position in Raia Drogasil. Raia had performed very well due to the robust year-to-
date performance of the Brazilian Real. While we still think this is a very good business, we didn't believe the growth/valuation
trade-off was sufficient to justify a top ten position in the fund.
We also reduced our positions in beverage company United Spirits and oral-care company Colgate-Palmolive as the slower growth
levels we have been seeing are not reflected in current valuations.
Finally, we exited President Chain Store entirely. Given some of the price dislocations, we see better opportunities for capital to be
invested elsewhere within the fund.
Outlook
As investors, we focus our attention on long-term fundamentals rather than market gyrations which can either work for or against
the Fund in the short term. This is particularly true in emerging markets, where unique risks arise from time to time that can create
bumps in the road. These headwinds are often difficult to predict in both timing and scale, so we focus our research on long- term
structural themes that have the potential to prevail over multiple years regardless of the near-term backdrop.
Our conviction in our businesses' competitive advantages, sustainability, and durability remains high, and we believe the Fund is
well-positioned to navigate the future. Looking ahead, we remain dedicated to finding companies with competitive advantages that
we believe can compound earnings and cash flows over the long term, independent of commodity swings or economic cycles.
Given the power of compounding over time, we think that once we invest in great businesses, the best path forward is to stay the
course through a long-term approach.
Thank you for your interest in Polen Capital and the Polen Capital Global Emerging Markets Growth Fund. Please contact us with
any questions you might have.
Sincerely,
Damian Bird and Dafydd Lewis
11 August 2022

Polen Capital Investment Funds plc
20
2022 Condensed Interim Report &
Unaudited Financial Statements
Investment Manager’s Report (continued)
For the financial period ended 30 June 2022
Polen Capital Global SMID Company Growth Fund
The Polen Capital Global SMID Company Growth Fund’s (the “Fund”) companies’ fundamentals continue to do well, but high
inflation, rising interest rates, and a general “risk- off” mentality have created some difficulty for our investing style. In response to
surging inflation, the U.S. Federal Reserve Board (the “Fed”) continued to tighten interest rates, trying to balance the need to curtail
rising prices and avoid the risk of tipping the economy into a recession. Whether the Fed’s strategy proves successful remains to be
seen, and in the meantime, rumblings about inflation and a potential recession are getting louder.
Among other macro developments, the absence of a quick and peaceful resolution to the Ukraine-Russia conflict as well as China’s
COVID-zero policy contributed to persistent inflation, which the market may not have fully appreciated. Investor sentiment became
increasingly negative as a result and multiples have continued to compress despite underlying fundamentals remaining solid.
Certain market segments, including consumer discretionary, are under more acute selling pressure given fears about consumer
weakness in recessionary periods. Another notable feature of the investment backdrop has been the outperformance of cyclical
sectors, energy being the best example. With our focus on what we believe to be high-quality compounders over the long term,
companies in this space tend not to fit our investment criteria.
As expected, during periods of heightened volatility and a shifting economic environment, we are refining the Fund
opportunistically.
We are taking advantage of new opportunities in companies that we believe are superior alternatives but did not previously meet
our expected internal rate-of- return (IRR) hurdle.
This includes some health care companies that have been on our watch list for years. We are also taking profits by selling or
trimming companies that have held up well that we believe have lower return expectations going forward.
Fund Performance & Attribution
Fund underperformance was driven primarily by security selection, as positive selection in financials and real estate was
outweighed by negative selection in consumer discretionary and consumer staples.
Sector allocation also detracted from relative performance due to our significant overweight in information technology. The Fund
style was challenged by growth and quality underperforming the benchmark.
Market sectors we typically have less exposure to, including value and cyclical stocks such as energy, have continued to perform
relatively well. We remain focused on finding companies with competitive advantages that we believe can compound earnings and
cash flows over the long-term independent of commodity swings or economic cycles.
Our most significant absolute contributors to performance over the second quarter were Azenta, Dechra Pharmaceuticals, and TMX
Group Limited.
Azenta is a life science sample management business. We initiated a position very late in the quarter and given that the Index was
down more than 16% over the period and the stock was up over our short holding period, it appears as a top contributor to absolute
returns.
Dechra Pharmaceuticals was another new position over the quarter. It is a U.K.-based animal health care company that we have
followed for many years. We took advantage of share-price weakness to initiate a position in the stock. Like Azenta, the reason it
appears as a top contributor over the quarter is a function of timing.
TMX Group Limited, the company that operates the Toronto stock exchange, posted robust results indicative of the business’s
overall stability. Earnings were ahead of consensus, revenues were up compared to last year, and we believe this is a high-quality,
high- returns business that can perform well in nearly any market environment.
Our most significant absolute detractors from performance included Globant, Revolve Group, and Endava.
Digitally native information technology (IT) service business Globant posted first-quarter revenue growth ahead of consensus, yet
the stock has been weak with expectations of slowing growth and rising wage costs. We believe valuation has become considerably
more attractive. While there may be some short- term volatility, we believe Globant remains a great value, high- quality business
with substantial growth potential.
Revolve Group is an e-commerce fashion company that we believe is executing well. We also believe the stock weakness during
the period was more sentiment-driven as the market grew increasingly concerned about consumer spending in a recession.

Polen Capital Investment Funds plc
21
2022 Condensed Interim Report &
Unaudited Financial Statements
Investment Manager’s Report (continued)
For the financial period ended 30 June 2022
Polen Capital Global SMID Company Growth Fund (continued)
Endava, a leading global IT consulting business, experienced stock price weakness. Similar to Globant, this was not a function of
any slowdown in demand or change to its core business but rather a reflection of the market’s broader concerns around future IT
investment and spending.
Fund Activity We initiated new positions in Tecan Group, Five Below, Dechra Pharmaceuticals, Azenta, and Keyword Studios. We increased our
position in Euronext while exiting RH, Etsy, and Thule. We reduced our position in CTS Eventim AG during the second quarter.
Tecan Group is a Swiss-based health care technology company that has seen consistent customer demand driven by the high quality
of its products and solutions, continuous innovation, and impressive underlying growth in genetic research, drug discovery, and
detecting and treating cancer. We believe this is a high- quality company with a favourable growth outlook and a narrow range of
outcomes that was trading at an attractive valuation after a drawdown in its stock price.
Five Below is a leading, high-growth, value retailer in the U.S. with a differentiated and durable customer value proposition. We
believe the company can compound its value at a high-teens rate over the next five years driven by a combination of mid-teens new
store expansion, mid- to low-single digit comparable store growth, and modest margin expansion off its fixed-cost leverage.
Having followed U.K.-based animal health care company Dechra Pharmaceuticals for years, we took advantage of recent share-
price weakness as our entry point for owning the business. Dechra excels in niche segments of the animal health care industry and
supplements its organic earnings growth with thoughtful mergers and acquisitions (M&A) and margin expansion. We believe its
competitive advantages will lead to durable and profitable long- term growth.
Azenta is a health care company that focuses on biological sample management. Previously known as Brooks Automation, the
company re-branded as Azenta after selling its semiconductor business earlier this year. Azenta is the only end-to-end provider of
reliable cold-chain sample management solutions and genomic services and benefits from the trend toward sample outsourcing by
pharmaceutical and diagnostic companies.
Keyword Studios is the global leader in outsourced video game production services and enjoys relationships with nearly all leading
game development companies worldwide. We believe the business has a long runaway of attractive growth opportunities ahead.
Given its attractive risk-reward profile and valuation, we increased the Fund’s position in Amsterdam-based Euronext, a leading
exchange operator with exposure to European capital markets.
We also exited the Fund’s positions in RH and Etsy. While remaining two of the highest-quality companies in our investable
universe, the discretionary nature of their products means that the range of outcomes has widened and recent shifts in the market
presented us with what we believe to be superior alternatives.
We reduced the Fund’s outsized position in CTS Eventim to redeploy the capital to Euronext.
Outlook We continue to stay focused on the long-term value propositions, competitive advantages, ongoing initiatives, growth opportunities,
and potential earnings power of our Fund’s portfolio companies. In challenging periods like these, we believe the strong get
stronger. In other words, we believe businesses with robust balance sheets that can self-fund growth are poised to withstand a
potential recession, maintain resilience, and gain market share while their competition retreats. We believe the opportunity for long-
term investors like us is more favourable than it has been in years.
Thank you for your interest in Polen Capital and the Polen Capital Global SMID Company Growth Fund. Please contact us with
any questions.
Sincerely,
Rob Forker
11 August 2022

Polen Capital Investment Funds plc
22
2022 Condensed Interim Report &
Unaudited Financial Statements
Statement of Financial Position
As at 30 June 2022
Polen Capital
Focus U.S.
Growth Fund
Polen Capital
Focus U.S.
Growth Fund
Polen Capital
U.S. Small
Company
Growth Fund
Polen Capital
U.S. Small
Company
Growth Fund
30 June
2022
31 December
2021
30 June
2022
31 December
2021
Notes USD USD USD USD
Assets
Financial assets at fair value through profit or loss:
Investment in transferable securities 3 3,111,610,526 5,363,582,808 8,735,292 16,351,269
Investment in financial derivative instruments 3 9,036 737,362 - -
Cash and cash equivalents 4 63,028,726 43,104,821 790,967 375,377
Amount receivable on subscriptions 2,240,080 42,518,013 - 642,568
Investment manager reimbursement receivable 8 2,299 58,830 2,459 10,121
Interest and dividends receivable, Net 197,819 - 1,227 -
Other receivables 30,675 - 20,355 -
Total assets 3,177,119,161 5,450,001,834 9,550,300 17,379,335
Liabilities
Financial liabilities at fair value through profit or loss:
Investment in financial derivative instruments 3 235,459 50,917 - -
Bank overdraft 4 56,930 - 1 -
Amount payable on purchase of securities - 46,322,390 296,600 660,324
Redemptions payable 4,656,729 10,944,148 - 11,907
Directors fees payable 5 7,654 7,026 123 91
Legal fees payable 65,002 55,595 - 121
Other accrued expenses and liabilities 6 149,604 123,925 8,063 5,724
Investment management fees payable 5 2,761,653 4,424,776 9,720 16,096
Administration fees payable 5 37,391 53,845 1,250 1,581
Audit fees payable 8,408 18,076 4,648 13,287
Depositary fees payable 5 53,224 93,117 1,183 3,050
Transfer agency fees payable 5 6,667 107,174 - 122
Taxation consultant fees payable 32,202 17,822 - 2,482
Payable to investors - 159,033 - -
Total liabilities (excluding amounts attributable
to holders of redeemable participating shares) 8,070,923 62,377,844 321,588 714,785
Net assets attributable to holders of redeemable
shares 3,169,048,238 5,387,623,990 9,228,712 16,664,550
The accompanying notes form an integral part of these financial statements.

Polen Capital Investment Funds plc
23
2022 Condensed Interim Report &
Unaudited Financial Statements
Statement of Financial Position (continued)
As at 30 June 2022
Polen Capital
International
Growth Fund
Polen Capital
International
Growth Fund
Polen Capital
Global
Emerging
Markets
Growth Fund
Polen Capital
Global
Emerging
Markets
Growth Fund
30 June
2022
31 December
2021
30 June
2022
31 December
2021
Notes USD USD USD USD
Assets
Financial assets at fair value through profit or loss:
Investment in transferable securities 3 23,703,562 38,581,367 2,228,377 3,071,368
Investment in financial derivative instruments 3 - - - 2,806
Cash and cash equivalents 4 719,194 939,582 75,279 81,653
Amount receivable on sale of securities 91,578 - - -
Amount receivable on subscriptions - 320,625 - -
Investment manager reimbursement receivable 8 - 8,293 3,323 8,496
Interest and dividends receivable 19,855 12,547 11,926 1,012
Other receivables 21,941 6,036 9,244 304
Total assets 24,556,130 39,868,450 2,328,149 3,165,639
Liabilities
Financial Liabilities at fair value through profit or
loss:
Investment in financial derivative instruments
liabilities 3 - - 1,997 -
Amount payable on purchase of securities - - 86 -
Redemptions payable 20,000 52,119 - -
Directors fees payable 5 36 17 137 103
Legal fees payable - 588 - 588
Other accrued expenses and liabilities 6 11,016 8,651 8,730 6,025
Investment management fees payable 5 25,171 39,185 1,915 2,603
Administration fees payable 5 400 1,031 1,350 1,681
Audit fees payable 4,577 13,216 389 9,027
Depositary fees payable 5 1,179 5,043 1,122 2,135
Transfer agency fees payable 5 - 285 - 1,036
Taxation consultant fees payable 4,404 3,218 - 2,088
Total liabilities (excluding amounts attributable
to holders of redeemable participating shares) 66,783 123,353 15,726 25,286
Net assets attributable to holders of redeemable
shares 24,489,347 39,745,097 2,312,423 3,140,353
The accompanying notes form an integral part of these financial statements.

Polen Capital Investment Funds plc
24
2022 Condensed Interim Report &
Unaudited Financial Statements
Statement of Financial Position (continued)
As at 30 June 2022
Polen Capital
Global SMID
Company
Growth Fund1 Total Total
30 June
2022
30 June
2022
31 December
2021
Notes USD USD USD
Assets
Financial assets at fair value through profit or loss:
Investment in transferable securities 3 915,516 3,147,193,273 5,421,586,812
Investment in financial derivative instruments 3 2 9,038 740,168
Cash and cash equivalents 4 19,775 64,633,941 44,501,433
Amount receivable on sale of securities 12,435 104,013 - Amount receivable on subscriptions 3,041 2,243,121 43,481,206 Investment manager reimbursement receivable 8 3,738 11,819 85,740
Interest and dividends receivable 63 230,890 13,559
Other receivables 12,075 94,290 6,340
Total assets 966,645 3,214,520,385 5,510,415,258
Liabilities
Financial liabilities at fair value through profit or loss:
Investment in financial derivative instruments 3 283 237,739 50,917
Bank overdraft 4 8,567 65,498 -
Amount payable on purchase of securities 25,386 322,072 46,982,714
Redemptions payable - 4,676,729 11,008,174
Directors fees payable 5 42 7,992 7,237
Legal fees payable - 65,002 56,892
Other accrued expenses and liabilities 6 948 178,361 144,325
Investment management fees payable 5 823 2,799,282 4,482,660
Administration fees payable 5 987 41,378 58,138
Audit fees payable 6,688 24,710 53,606
Depositary fees payable 5 1,123 57,831 103,345
Transfer agency fees payable 5 1,216 7,883 108,617
Taxation consultant fees payable 802 37,408 25,610
Payable to investors - - 159,033
Total liabilities (excluding amounts attributable
to holders of redeemable participating shares) 46,865 8,521,885 63,241,268
Net assets attributable to holders of redeemable
participating shares
919,780 3,205,998,500 5,447,173,990
1Fund was launched on 31 January 2022 therefore comparatives are not available.
The accompanying notes form an integral part of these financial statements.
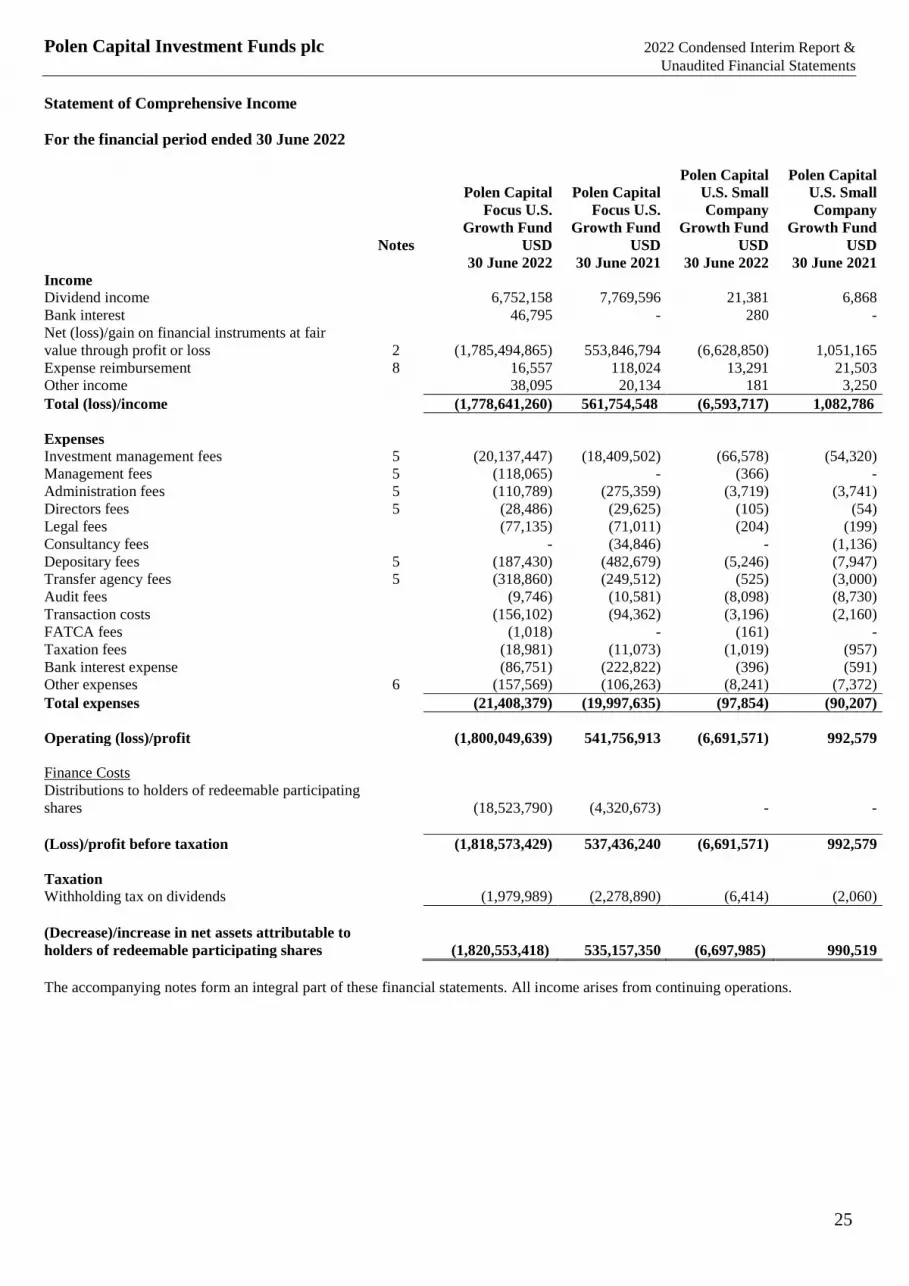
Polen Capital Investment Funds plc
25
2022 Condensed Interim Report &
Unaudited Financial Statements
Statement of Comprehensive Income
For the financial period ended 30 June 2022
Polen Capital
Focus U.S.
Growth Fund
Polen Capital
Focus U.S.
Growth Fund
Polen Capital
U.S. Small
Company
Growth Fund
Polen Capital
U.S. Small
Company
Growth Fund
Notes USD USD USD USD
30 June 2022 30 June 2021 30 June 2022 30 June 2021
Income
Dividend income 6,752,158 7,769,596 21,381 6,868
Bank interest 46,795 - 280 -
Net (loss)/gain on financial instruments at fair
value through profit or loss 2
(1,785,494,865) 553,846,794
(6,628,850) 1,051,165
Expense reimbursement 8 16,557 118,024 13,291 21,503
Other income 38,095 20,134 181 3,250
Total (loss)/income (1,778,641,260) 561,754,548 (6,593,717) 1,082,786
Expenses
Investment management fees 5 (20,137,447) (18,409,502) (66,578) (54,320)
Management fees 5 (118,065) - (366) -
Administration fees 5 (110,789) (275,359) (3,719) (3,741)
Directors fees 5 (28,486) (29,625) (105) (54)
Legal fees (77,135) (71,011) (204) (199)
Consultancy fees - (34,846) - (1,136)
Depositary fees 5 (187,430) (482,679) (5,246) (7,947)
Transfer agency fees 5 (318,860) (249,512) (525) (3,000)
Audit fees (9,746) (10,581) (8,098) (8,730)
Transaction costs (156,102) (94,362) (3,196) (2,160)
FATCA fees (1,018) - (161) -
Taxation fees (18,981) (11,073) (1,019) (957)
Bank interest expense (86,751) (222,822) (396) (591)
Other expenses 6 (157,569) (106,263) (8,241) (7,372)
Total expenses (21,408,379) (19,997,635) (97,854) (90,207)
Operating (loss)/profit (1,800,049,639) 541,756,913 (6,691,571) 992,579
Finance Costs
Distributions to holders of redeemable participating
shares
(18,523,790) (4,320,673)
- -
(Loss)/profit before taxation (1,818,573,429) 537,436,240 (6,691,571) 992,579
Taxation
Withholding tax on dividends (1,979,989) (2,278,890) (6,414) (2,060)
(Decrease)/increase in net assets attributable to
holders of redeemable participating shares (1,820,553,418) 535,157,350 (6,697,985) 990,519
The accompanying notes form an integral part of these financial statements. All income arises from continuing operations.

Polen Capital Investment Funds plc
26
2022 Condensed Interim Report &
Unaudited Financial Statements
Statement of Comprehensive Income (continued)
For the financial period ended 30 June 2022
Polen Capital
International
Growth Fund
Polen Capital
International
Growth Fund
Polen Capital
Global
Emerging
Markets
Growth Fund
Polen Capital
Global
Emerging
Markets
Growth Fund
Notes USD USD USD USD
30 June 2022 30 June 2021 30 June 2022 30 June 2021
Income
Dividend income 293,486 301,432 25,347 21,594
Bank interest 330 - 56 -
Net (loss)/gain on financial instruments at fair value
through profit or loss 2
(11,255,868) 1,222,614
(805,635) 15,492
Expense reimbursement 8 - 3,810 19,883 19,093
Other income 216 1,809 144 1,914
Total income (10,961,836) 1,529,665 (760,205) 58,093
Expenses
Investment management fees 5 (187,533) (247,159) (12,955) (15,007)
Management fees 5 (936) - (51) -
Administration fees 5 (3,719) (3,991) (3,719) (3,795)
Directors fees 5 (271) (309) (54) (64)
Legal fees (704) (995) (989) (199)
Consultancy fees - (1,195) - (1,001)
Depositary fees 5 (5,490) (11,362) (5,246) (6,674)
Transfer agency fees 5 (2,769) (7,406) (525) (937)
Audit fees (8,098) (8,730) (8,098) (7,743)
Transaction costs (8,175) (21,248) (1,123) (1,188)
FATCA fees (161) - (161) -
Taxation fees (1,235) (1,181) (1,019) (960)
Bank interest expense (1,416) (4,324) (100) (171)
Other expenses 6 (3,259) (3,353) (3,053) (2,810)
Total expenses (223,766) (311,253) (37,093) (40,549)
Operating (loss)/profit (11,185,602) 1,218,412 (797,298) 17,544
Finance Costs
Distributions to holders of redeemable participating
shares
-
-
-
-
(Loss)/profit before taxation (11,185,602) 1,218,412 (797,298) 17,544
Taxation
Withholding tax on dividends (38,549) (37,191) (1,284) (1,384)
(Decrease)/increase in net assets attributable to
holders of redeemable participating shares (11,224,151) 1,181,221 (798,582) 16,160
The accompanying notes form an integral part of these financial statements. All income arises from continuing operations.

Polen Capital Investment Funds plc
27
2022 Condensed Interim Report &
Unaudited Financial Statements
Statement of Comprehensive Income (continued)
For the financial period ended 30 June 2022
Polen
Capital Global
SMID
Company
Growth Fund1 Total Total
Notes USD USD USD
30 June 2022 30 June 2022 30 June 2021
Income
Dividend income 5,296 7,097,668 8,099,490
Bank interest 23 47,484 -
Net (loss)/gain on financial instruments at fair value
through profit or loss 2
(382,070)
(1,804,567,288) 556,136,065
Expense reimbursement 8 18,882 68,613 162,430
Other income 1 38,637 27,107
Total (loss)/income (357,868) (1,797,314,886) 564,425,092
Expenses
Investment management fees 5 (4,330) (20,408,843) (18,725,988)
Management fees 5 (41) (119,459) -
Administration fees 5 (3,082) (125,028) (286,886)
Directors fees 5 (44) (28,960) (30,052)
Legal fees (223) (79,255) (72,404)
Consultancy fees - - (38,178)
Depositary fees 5 (4,348) (207,760) (508,662)
Transfer agency fees 5 (2,308) (324,987) (260,855)
Audit fees (6,688) (40,728) (35,784)
Transaction costs (499) (169,095) (118,958)
FATCA fees - (1,501) -
Taxation fees (802) (23,056) (14,171)
Bank interest expense (273) (88,936) (227,908)
Other expenses 6 (2,211) (174,333) (119,798)
Total expenses (24,849) (21,791,941) (20,439,644)
Operating (loss)/profit (382,717) (1,819,106,827) 543,985,448
Finance Costs
Distributions to holders of redeemable participating
shares
- (18,523,790) (4,320,673)
(Loss)/profit before taxation (382,717) (1,837,630,617) 539,664,775
Taxation
Withholding tax on dividends (702) (2,026,938) (2,319,525)
(Decrease)/increase in net assets attributable to
holders of redeemable participating shares (383,419) (1,839,657,555) 537,345,250
1Fund was launched on 31 January 2022 therefore comparatives are not available.
The accompanying notes form an integral part of these financial statements. All income arises from continuing operations.

Polen Capital Investment Funds plc
28
2022 Condensed Interim Report &
Unaudited Financial Statements
Statement of Changes in Net Assets Attributable to Holders of Redeemable Participating Shares
For the financial period ended 30 June 2022
Polen Capital
Focus U.S.
Growth Fund
Polen Capital
Focus U.S.
Growth Fund
Polen Capital U.S.
Small Company
Growth Fund
Polen Capital U.S.
Small Company
Growth Fund
USD USD USD USD
Notes 30 June 2022 30 June 2021 30 June 2022 30 June 2021
Net Assets attributable to holders of redeemable
participating shares at beginning of the financial period 5,387,623,990 3,594,255,180 16,664,550 5,106,022
(Decrease)/increase in net assets attributable to holders of
redeemable participating shares
(1,820,553,418) 535,157,350 (6,697,985) 990,519
Change due to subscriptions and redemptions of
redeemable participating shares
Subscriptions* 7 683,300,094 898,860,409 2,908,528 6,104,331
Redemptions* 7 (1,081,322,428) (767,359,866) (3,646,381) (385,356)
Net (decrease)/increase in net assets resulting from
redeemable participating share transactions (398,022,334) 131,500,543 (737,853) 5,718,975
Net Assets attributable to holders of redeemable
participating shares at the end of the financial period 3,169,048,238 4,260,913,073 9,228,712 11,815,516
*excludes transfers between share classes within the same sub-fund.
The accompanying notes form an integral part of these financial statements.
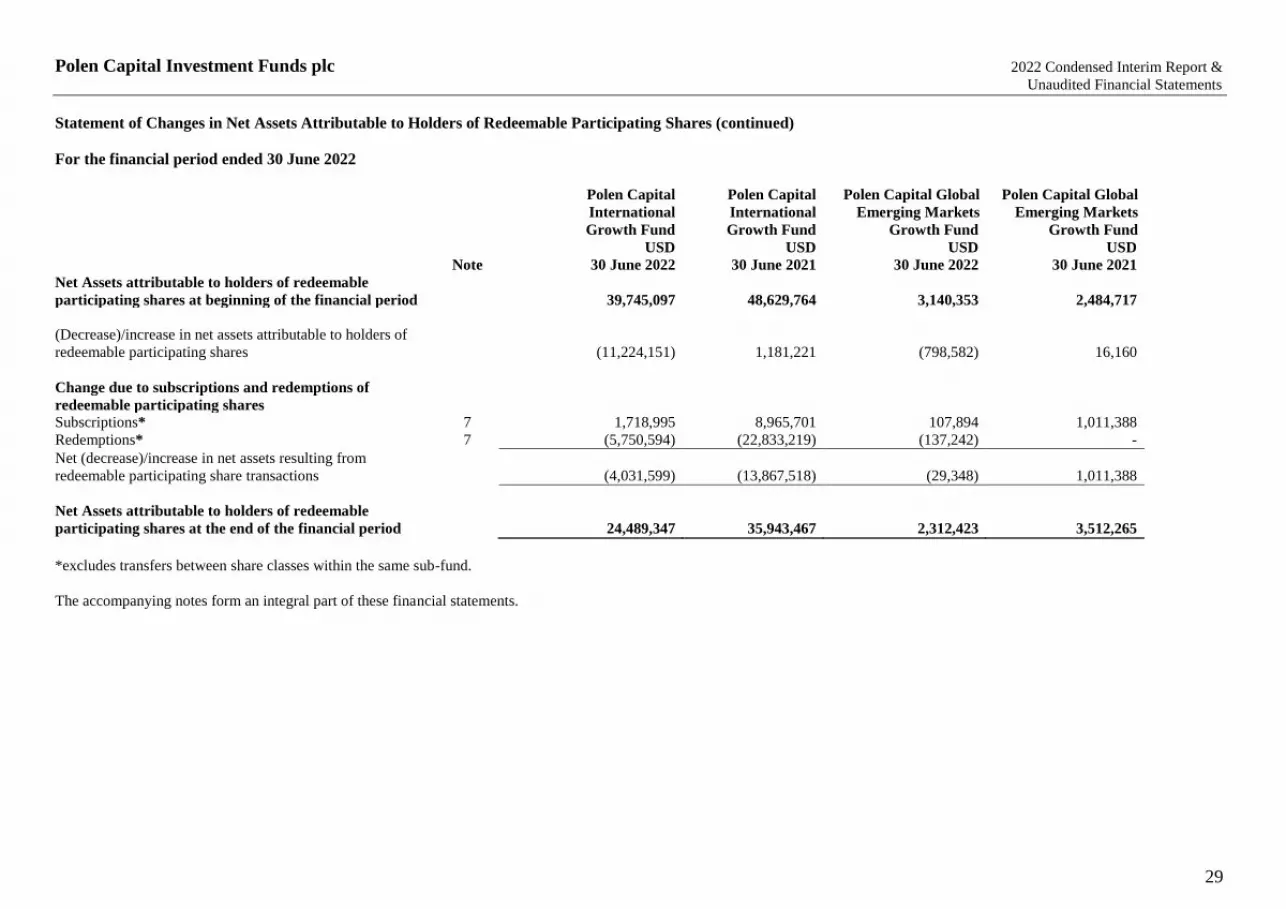
Polen Capital Investment Funds plc
29
2022 Condensed Interim Report &
Unaudited Financial Statements
Statement of Changes in Net Assets Attributable to Holders of Redeemable Participating Shares (continued)
For the financial period ended 30 June 2022
Polen Capital
International
Growth Fund
Polen Capital
International
Growth Fund
Polen Capital Global
Emerging Markets
Growth Fund
Polen Capital Global
Emerging Markets
Growth Fund
USD USD USD USD
Note 30 June 2022 30 June 2021 30 June 2022 30 June 2021
Net Assets attributable to holders of redeemable
participating shares at beginning of the financial period 39,745,097 48,629,764 3,140,353 2,484,717
(Decrease)/increase in net assets attributable to holders of
redeemable participating shares
(11,224,151) 1,181,221 (798,582) 16,160
Change due to subscriptions and redemptions of
redeemable participating shares
Subscriptions* 7 1,718,995 8,965,701 107,894 1,011,388
Redemptions* 7 (5,750,594) (22,833,219) (137,242) -
Net (decrease)/increase in net assets resulting from
redeemable participating share transactions (4,031,599) (13,867,518) (29,348) 1,011,388
Net Assets attributable to holders of redeemable
participating shares at the end of the financial period 24,489,347 35,943,467 2,312,423 3,512,265
*excludes transfers between share classes within the same sub-fund.
The accompanying notes form an integral part of these financial statements.

Polen Capital Investment Funds plc
30
2022 Condensed Interim Report &
Unaudited Financial Statements
Statement of Changes in Net Assets Attributable to Holders of Redeemable Participating Shares (continued)
For the financial period ended 30 June 2022
Polen Capital
Global SMID
Company Growth
Fund1 Total Total
USD USD USD
Note
30 June 2022 30 June 2022 30 June 2021
Net Assets attributable to holders of redeemable
participating shares at beginning of the financial period - 5,447,173,990 3,650,475,683
(Decrease)/increase in net assets attributable to holders of
redeemable participating shares
(383,419) (1,839,657,555) 537,345,250
Change due to subscriptions and redemptions of
redeemable participating shares
Subscriptions* 7 1,303,325 689,338,836 914,941,829
Redemptions* 7 (126) (1,090,856,771) (790,578,441)
Net increase/(decrease) in net assets resulting from
redeemable participating share transactions 1,303,199 (401,517,935) 124,363,388
Net Assets attributable to holders of redeemable
participating shares at the end of the financial period 919,780 3,205,998,500 4,312,184,321
1Fund was launched on 31 January 2022 therefore comparatives are not available.
*excludes transfers between share classes within the same sub-fund.
The accompanying notes form an integral part of these financial statements.

Polen Capital Investment Funds plc
31
2022 Condensed Interim Report &
Unaudited Financial Statements
Statement of Cash Flows
For the financial period ended 30 June 2022
Polen Capital
Focus U.S.
Growth Fund
Polen Capital
Focus U.S.
Growth Fund
Polen Capital U.S.
Small Company
Growth Fund
Polen Capital U.S.
Small Company
Growth Fund
USD USD USD USD
30 June 2022 30 June 2021 30 June 2022 30 June 2021
Cash flows from operating activities
(Decrease)/Increase in net assets attributable to holders of
redeemable participating shares from operations (1,820,553,418) 535,157,350 (6,697,985) 990,519
Adjustments to reconcile (loss)/profit attributable to holders of redeemable
participating shares to cash provided by/(used in) operating activities
Interest income (46,795) - (280) -
Dividend income (6,752,158) (7,769,596) (21,381) (6,868)
Tax expense 1,979,989 2,278,890 6,414 2,060
Distributions to holders of redeemable participating shares 18,523,790 4,320,673 - -
Operating (loss)/profit before working capital changes (1,806,848,592) 533,987,317 (6,713,232) 985,711
Changes in operating assets and liabilities
Decrease/(Increase) in investments in securities and financial derivative
instruments 2,252,885,150 (546,180,354) 7,615,977 (6,586,589)
Increase in other receivables (30,675) (4,779) (20,355) (130)
Decrease/(Increase) in investment manager reimbursement receivable 56,531 (20,716) 7,662 3,085
Decrease in amount payable on purchase of securities (46,322,390) (28,763,207) (363,724) (320,025)
(Decrease)/Increase in investment management fees payable (1,663,123) 754,664 (6,376) 7,845
(Decrease)/Increase in administration fees payable (16,454) 193,208 (331) 617
(Decrease)/Increase in transfer agency fees payable (100,507) (14,863) (122) 87
Increase in directors fees payable 628 17,506 32 48
Increase/(decrease) in legal fees payable 9,407 - (121) -
Decrease in consultancy fees payable - (602) - (115)
(Decrease)/Increase in depositary fees payable (39,893) 326,326 (1,867) 872
Decrease in audit fees payable (9,668) (11,100) (8,639) (9,212)
Increase/(Decrease) in taxation consultant fees payable 14,380 8,919 (2,482) 957
Decrease in payable to investment manager - (7,402) - -
Decrease in payable to investors (159,033) (54,550) - -
Increase/(Decrease) in other accrued expenses and liabilities 25,679 (57,594) 2,339 1,897
Cash provided by/(used in) operating activities 397,801,440 (39,827,227) 508,761 (5,914,952)

Polen Capital Investment Funds plc
32
2022 Condensed Interim Report &
Unaudited Financial Statements
Statement of Cash Flows (continued)
For the financial period ended 30 June 2022
Polen Capital
Focus U.S.
Growth Fund
Polen Capital
Focus U.S.
Growth Fund
Polen Capital U.S.
Small Company
Growth Fund
Polen Capital U.S.
Small Company
Growth Fund
USD USD USD USD
30 June 2022 30 June 2021 30 June 2022 30 June 2021
Interest received 46,795 - 280 -
Dividends received 6,554,339 7,599,532 20,154 6,868
Taxation (1,979,989) (2,278,890) (6,414) (2,060)
Net cash provided by/(used in) operating activities 402,422,585 (34,506,585) 522,781 (5,910,144)
Financing activities
Proceeds from issue of redeemable participating shares 723,578,027 914,288,949 3,551,096 6,162,673
Payments on redemption of redeemable participating shares (1,087,609,847) (761,643,087) (3,658,288) (385,356)
Distributions to holders of redeemable participating shares (18,523,790) (4,320,673) - -
Net cash inflow (used in)/provided by financing activities (382,555,610) 148,325,189 (107,192) 5,777,317
Net increase/(decrease) in cash and cash equivalents 19,866,975 113,818,604 415,589 (132,827)
Cash and cash equivalents at the beginning of the financial period 43,104,821 34,627,067 375,377 373,111
Cash at cash equivalents at the end of the financial period 62,971,796 148,445,671 790,966 240,284
Analysis of cash and cash equivalents
Cash and cash equivalents at the start of the financial period 43,104,821 35,201,753 375,377 373,111
Overdraft at the start of the financial period - (574,686) - -
Cash and cash equivalents at the end of the financial period 63,028,726 149,128,835 790,967 240,284
Overdraft at the end of the financial period (56,930) (683,164) (1) -
The accompanying notes form an integral part of these financial statements.

Polen Capital Investment Funds plc
33
2022 Condensed Interim Report &
Unaudited Financial Statements
Statement of Cash Flows (continued)
For the financial period ended 30 June 2022
Polen Capital
International
Growth Fund
Polen Capital
International
Growth Fund
Polen Capital Global
Emerging Markets
Growth Fund
Polen Capital Global
Emerging Markets
Growth Fund
USD USD USD USD 30 June 2022 30 June 2021 30 June 2022 30 June 2021
Cash flows from operating activities
(Decrease)/Increase in net assets attributable to holders of
redeemable participating shares from operations (11,224,151) 1,181,221 (798,582) 16,160
Adjustments to reconcile (loss)/profit attributable to holders of redeemable
participating shares to cash provided by/(used in) operating activities
Interest income (330) - (56) -
Dividend income (293,486) (301,432) (25,347) (21,594)
Tax expense 38,549 37,191 1,284 1,384
Distributions to holders of redeemable participating shares - - - -
Operating (loss)/profit before working capital changes (11,479,418) 916,980 (822,701) (4,050)
Changes in operating assets and liabilities
Decrease/(Increase) in investments in securities and financial derivative
instruments 14,877,805 11,364,282 847,794 (989,554)
(Increase)/Decrease in amount receivable on sale of securities (91,578) 71,211 - -
Increase in other receivables (15,905) (6,042) (8,940) (3,736)
Decrease/(Increase) in investment manager reimbursement receivable 8,293 946 5,173 (6,683)
Increase in amount payable on purchase of securities - - 86 164,566
(Decrease)/Increase in investment management fees payable (14,014) (2,044) (688) 3,397
(Decrease)/Increase in administration fees payable (631) 619 (331) 620
(Decrease)/Increase in transfer agency fees payable (285) (1,037) (1,036) 87
Increase in directors fees payable 19 152 34 52
Decrease in legal fees payable (588) - (588) -
(Decrease)/Increase in consultancy fees payable - (56) - 44
(Decrease)/Increase in depositary fees payable (3,864) 307 (1,013) 874
Decrease in audit fees payable (8,639) (9,212) (8,638) (480)
Increase/(Decrease) in taxation consultant fees payable 1,186 1,153 (2,088) 958
Increase in other accrued expenses and liabilities 2,365 1,651 2,705 2,521
Cash provided by/(used in) operating activities 3,274,746 12,338,910 9,769 (831,384)

Polen Capital Investment Funds plc
34
2022 Condensed Interim Report &
Unaudited Financial Statements
Statement of Cash Flows (continued)
For the financial period ended 30 June 2022
Polen Capital
International
Growth Fund
Polen Capital
International
Growth Fund
Polen Capital Global
Emerging Markets
Growth Fund
Polen Capital Global
Emerging Markets
Growth Fund
USD USD USD USD
30 June 2022 30 June 2021 30 June 2022 30 June 2021
Interest received 330 - 54 (2)
Dividends received 286,178 287,737 14,435 13,652
Taxation (38,549) (37,191) (1,284) (1,384)
Net cash provided by/(used in) operating activities 3,522,705 12,589,456 22,974 (819,118)
Financing activities
Proceeds from issue of redeemable participating shares 2,039,620 9,054,225 107,894 835,665
Payments on redemption of redeemable participating shares (5,782,713) (22,923,219) (137,242) -
Net cash inflow (used in)/provided by financing activities (3,743,093) (13,868,994) (29,348) 835,665
Net (decrease)/increase in cash and cash equivalents (220,388) (1,279,538) (6,374) 16,547
Cash and cash equivalents at the beginning of the financial period 939,582 2,232,317 81,653 93,577
Cash and cash equivalents at the end of the financial period 719,194 952,779 75,279 110,124
Analysis of cash and cash equivalents
Cash and cash equivalents at the start of the financial period 939,582 2,232,317 81,653 93,577
Overdraft at the start of the financial period - - - -
Cash and cash equivalents at the end of the financial period 719,194 952,779 75,279 110,124
Overdraft at the end of the financial period - - - -
The accompanying notes form an integral part of these financial statements.

Polen Capital Investment Funds plc
35
2022 Condensed Interim Report &
Unaudited Financial Statements
Statement of Cash Flows (continued)
For the financial period ended 30 June 2022
Polen Capital Global
SMID Company
Growth Fund1 Total Total
USD USD USD 30 June 2022 30 June 2022 30 June 2021 Cash flows from operating activities
(Decrease)/Increase in net assets attributable to holders of
redeemable participating shares from operations (383,419) (1,839,657,555) 537,345,250
Adjustments to reconcile (loss)/profit attributable to holders of redeemable
participating shares to cash (used in)/provided by operating activities
Interest income (23) (47,484) -
Dividend income (5,296) (7,097,668) (8,099,490)
Tax expense 702 2,026,938 2,319,525
Distributions to holders of redeemable participating shares - 18,523,790 4,320,673
Operating (loss)/profit before working capital changes (388,036) (1,826,251,979) 535,885,958
Changes in operating assets and liabilities
(Increase)/Decrease in investments in securities and financial derivative
instruments (915,235) 2,275,311,491 (542,392,215)
(Increase)/Decrease in amount receivable on sale of securities (12,435) (104,013) 71,211
Increase in other receivables (12,075) (87,950) (14,687)
(Increase)/Decrease in investment manager reimbursement receivable (3,738) 73,921 (23,368)
Increase/(Decrease) in amount payable on purchase of securities 25,386 (46,660,642) (28,918,666)
Increase/(Decrease) in investment management fees payable 823 (1,683,378) 763,862
Increase/(Decrease) in administration fees payable 987 (16,760) 195,064
Increase/(Decrease) in transfer agency fees payable 1,216 (100,734) (15,726)
Increase in directors fees payable 42 755 17,758
Increase in legal fees payable - 8,110 -
Decrease in consultancy fees payable - - (729)
Increase/(Decrease) in depositary fees payable 1,123 (45,514) 328,379
Increase/(Decrease) in audit fees payable 6,688 (28,896) (30,004)
Increase in taxation consultant fees payable 802 11,798 11,987
Decrease in payable to investment manager - - (7,402)
Decrease in payable to investors - (159,033) (54,550)
Increase/(Decrease) in other accrued expenses and liabilities 948 34,036 (51,525)
Cash (used in)/provided by operating activities (1,293,504) 400,301,212 (34,234,653)
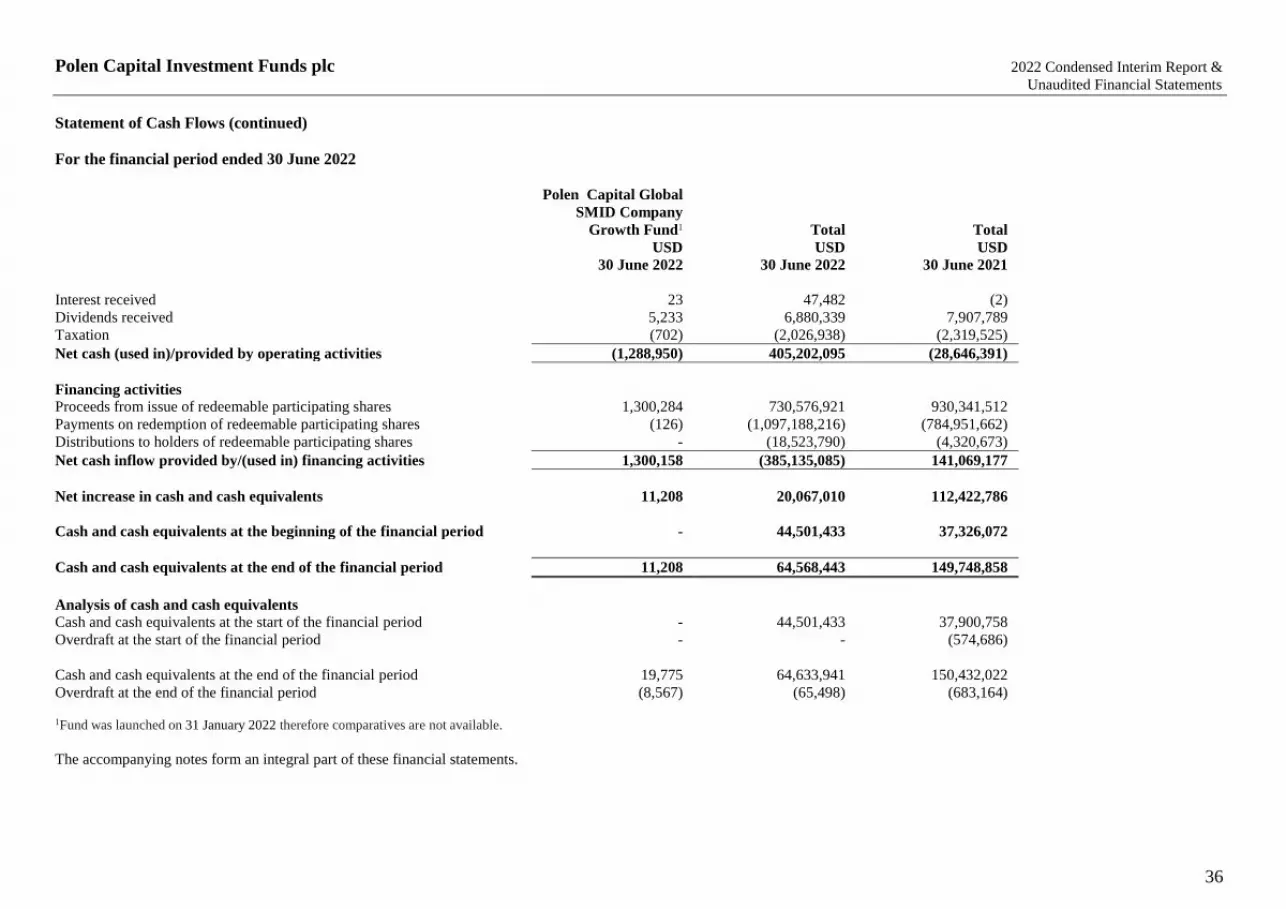
Polen Capital Investment Funds plc
36
2022 Condensed Interim Report &
Unaudited Financial Statements
Statement of Cash Flows (continued)
For the financial period ended 30 June 2022
Polen Capital Global
SMID Company
Growth Fund1 Total Total
USD USD USD
30 June 2022 30 June 2022 30 June 2021
Interest received 23 47,482 (2)
Dividends received 5,233 6,880,339 7,907,789
Taxation (702) (2,026,938) (2,319,525)
Net cash (used in)/provided by operating activities (1,288,950) 405,202,095 (28,646,391)
Financing activities
Proceeds from issue of redeemable participating shares 1,300,284 730,576,921 930,341,512
Payments on redemption of redeemable participating shares (126) (1,097,188,216) (784,951,662)
Distributions to holders of redeemable participating shares - (18,523,790) (4,320,673)
Net cash inflow provided by/(used in) financing activities 1,300,158 (385,135,085) 141,069,177
Net increase in cash and cash equivalents 11,208 20,067,010 112,422,786
Cash and cash equivalents at the beginning of the financial period - 44,501,433 37,326,072
Cash and cash equivalents at the end of the financial period 11,208 64,568,443 149,748,858
Analysis of cash and cash equivalents
Cash and cash equivalents at the start of the financial period - 44,501,433 37,900,758
Overdraft at the start of the financial period - - (574,686)
Cash and cash equivalents at the end of the financial period 19,775 64,633,941 150,432,022
Overdraft at the end of the financial period (8,567) (65,498) (683,164)
1Fund was launched on 31 January 2022 therefore comparatives are not available.
The accompanying notes form an integral part of these financial statements.

Polen Capital Investment Funds plc
Notes to the Financial Statements
For the financial period ended 30 June 2022
37
2022 Condensed Interim Report &
Unaudited Financial Statements
1. Significant Accounting Policies
a) Basis of Preparation
Polen Capital Investment Funds plc (the “Company”) is an open-ended umbrella investment company with variable capital and with
limited liability. At the financial year end there were four Funds (the "Funds") which had been launched in the umbrella. The financial
statements are prepared in accordance with International Financial Reporting Standards (“IFRS”) as adopted by the European Union,
the European Communities (Undertakings for Collective Investment in Transferable Securities) Regulations, 2011 (S.I. No. 352 of
2011), as amended and the Central Bank (Supervision and Enforcement) Act 2013 (Section 48(1)) (Undertakings for Collective
Investment in Transferable Securities) Regulations, 2019 (the “UCITS Regulations”), and the requirements of the Companies Act
2014.
The same accounting policies and methods of computation are followed in the preparation of these condensed interim financial
statements as were followed in the preparation of the audited annual financial statements prepared for the financial year ended 31
December 2021, with the exception of those noted below. The condensed interim financial statements should be read in conjunction
with audited financial statements.
The condensed financial statements have been prepared under the historical cost convention as modified by the revaluation of
financial assets and financial liabilities at fair value through profit or loss.
The Company’s management has made an assessment of the Company’s ability to continue as a going concern and is satisfied that the
Company has the resources to continue in business for the foreseeable future. Furthermore, management is not aware of any material
uncertainties that may cast significant doubt upon the Company’s ability to continue as a going concern. Therefore, the financial
statements continue to be prepared on the going concern basis.
The preparation of condensed financial statements requires the Directors to make judgments, estimates and assumptions that affect the
application of policies and the reported amounts of assets, liabilities, income and expenses. The estimates and associated assumptions
are based on historical experience and various other factors that are believed to be reasonable under the circumstances, the results of
which form the basis of making the judgments about carrying values of assets and liabilities that are not readily apparent from other
sources. Actual results may differ from these estimates. The accounting policies have been applied consistently by the Company.
b) New Accounting Pronouncements Amendments and Interpretations
A number of new standards, amendments to standards and interpretations are effective for annual periods beginning on or after 1
January 2022. None of these have had a material effect on the financial statements of the Company.
There are no other standards, interpretations or amendments to existing standards that are not yet effective and are expected to have a
significant impact on the financial statements of the Company and the Funds.
c) Foreign Currency
The functional currency of the Funds is U.S. Dollar (USD). This is representative of the primary economic environment in which
these Funds operate.
Assets and liabilities denominated in currencies other than the functional currency of the Funds are translated at the rate of exchange
ruling at the financial period end date. Transactions in foreign currencies are translated into U.S. Dollars at the exchange rate ruling at
the date of the transaction. Gains and losses on foreign exchange transactions are recognised in the Statement of Comprehensive
Income in determining the result for the financial period.

Polen Capital Investment Funds plc
Notes to the Financial Statements (continued)
For the financial period ended 30 June 2022
38
2022 Condensed Interim Report &
Unaudited Financial Statements
1. Significant Accounting Policies (continued)
c) Foreign Currency (continued)
Foreign exchange gains and losses on financial assets and financial liabilities at fair value through profit or loss are recognised
together with other changes in fair value.
The following exchange rates were used to convert assets and liabilities to the functional currency of the Funds at financial period
end:
As at As at
30 June 2022 31 December 2021
Australian Dollar 1.4488 1.3745
Brazilian Real 5.2334 5.5700
Canadian Dollar 1.2872 -
Chinese Yuan 6.6943 6.3734
Danish Krone 7.0975 6.5321
Euro 0.9542 0.8783
Hong Kong Dollar 7.8468 7.7976
Indian Rupee 78.9702 74.3384
Japanese Yen 135.6801 -
South Korean Won 1,298.7013 -
Mexican Peso 20.1094 20.4754
Philippine Peso - 50.9918
Pound Sterling 0.8215 0.7388
South African Rand 16.2686 15.9350
Swedish Krona 10.2298 9.0362
Swiss Franc 0.9547 0.9112
Taiwan Dollar 29.7336 27.6671
Thai Baht 35.3544 33.4046
Vietnamese Dong 23,265.0117 22,789.9451
2. Net Gain/(Loss) on Financial Assets and Liabilities at Fair Value Through Profit or Loss
Polen Capital Focus Polen Capital Focus Polen Capital Polen Capital
U.S. Growth Fund U.S. Growth Fund U.S. Small Company U.S. Small Company
Financial period
ended
Financial period
ended
Financial period
ended
Financial period
ended
30 June 2022 30 June 2021 30 June 2022 30 June 2021
USD USD USD USD
Net currency gains/(losses) 14,453 (19,071) 79 (58)
Net realised gains/(losses) on sale
of investments 185,357,782 273,166,051 (1,116,341) 234,934
Net realised (losses)/gains on
forward foreign exchange
contracts (9,554,598) (5,551,822) 74 110
Net change in unrealised losses
on forward foreign exchange
contracts (912,868) (571,132) - -
Net change in unrealised
(losses)/gains on investments (1,960,399,634) 286,822,768 (5,512,662) 816,179
Net (losses)/gains on financial
assets at fair value through
profit or loss (1,785,494,865) 553,846,794 (6,628,850) 1,051,165
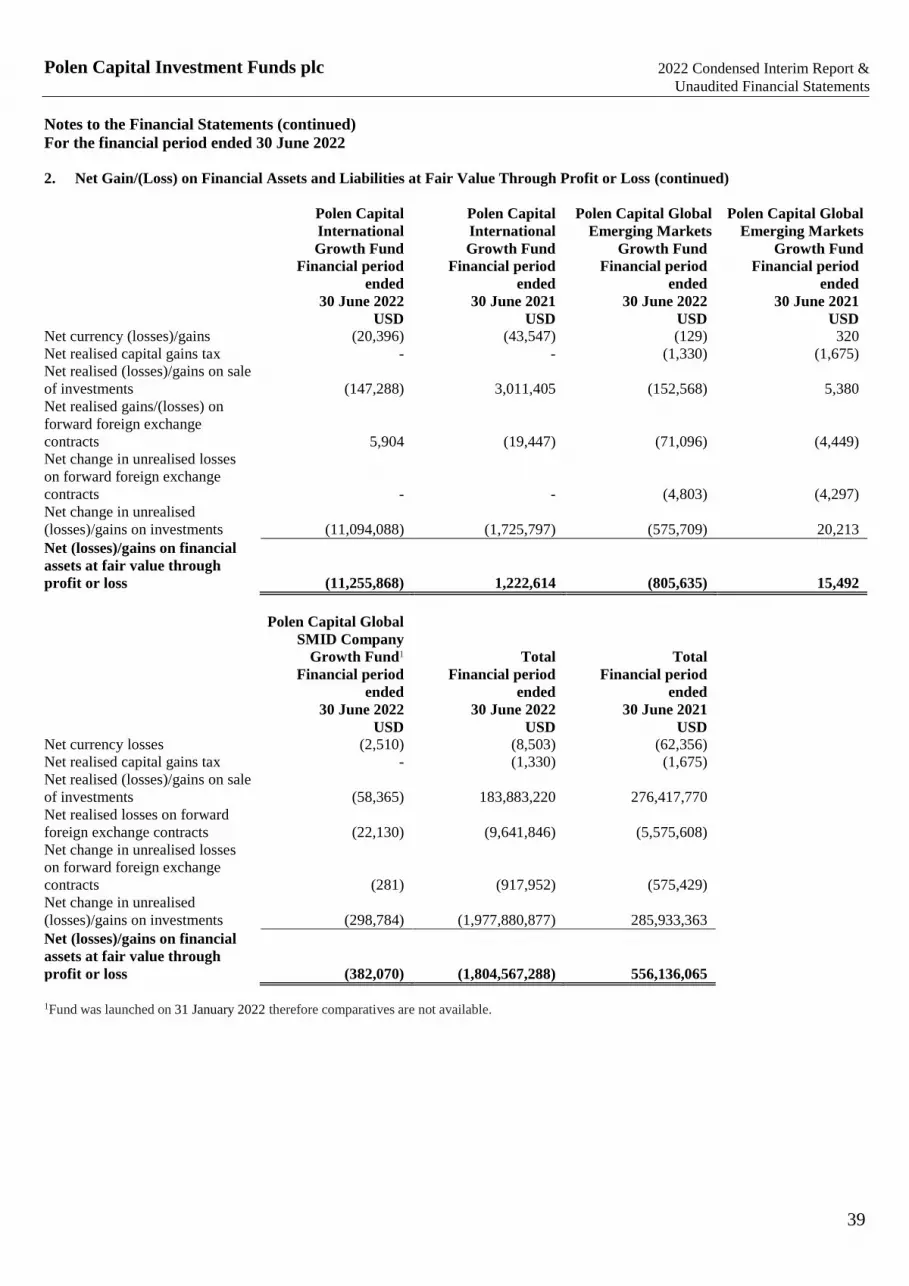
Polen Capital Investment Funds plc
Notes to the Financial Statements (continued)
For the financial period ended 30 June 2022
39
2022 Condensed Interim Report &
Unaudited Financial Statements
2. Net Gain/(Loss) on Financial Assets and Liabilities at Fair Value Through Profit or Loss (continued)
Polen Capital Polen Capital Polen Capital Global Polen Capital Global
International
Growth Fund
International
Growth Fund
Emerging Markets
Growth Fund
Emerging Markets
Growth Fund
Financial period
ended
Financial period
ended
Financial period
ended
Financial period
ended
30 June 2022 30 June 2021 30 June 2022 30 June 2021
USD USD USD USD
Net currency (losses)/gains (20,396) (43,547) (129) 320
Net realised capital gains tax - - (1,330) (1,675)
Net realised (losses)/gains on sale
of investments (147,288) 3,011,405 (152,568) 5,380
Net realised gains/(losses) on
forward foreign exchange
contracts 5,904 (19,447) (71,096) (4,449)
Net change in unrealised losses
on forward foreign exchange
contracts - - (4,803) (4,297)
Net change in unrealised
(losses)/gains on investments (11,094,088) (1,725,797) (575,709) 20,213
Net (losses)/gains on financial
assets at fair value through
profit or loss (11,255,868) 1,222,614 (805,635) 15,492
Polen Capital Global
SMID Company
Growth Fund1 Total Total
Financial period
ended
Financial period
ended
Financial period
ended
30 June 2022 30 June 2022 30 June 2021
USD USD USD
Net currency losses (2,510) (8,503) (62,356)
Net realised capital gains tax - (1,330) (1,675)
Net realised (losses)/gains on sale
of investments (58,365) 183,883,220 276,417,770
Net realised losses on forward
foreign exchange contracts (22,130) (9,641,846) (5,575,608)
Net change in unrealised losses
on forward foreign exchange
contracts (281) (917,952) (575,429)
Net change in unrealised
(losses)/gains on investments (298,784) (1,977,880,877) 285,933,363
Net (losses)/gains on financial
assets at fair value through
profit or loss (382,070) (1,804,567,288) 556,136,065
1Fund was launched on 31 January 2022 therefore comparatives are not available.

Polen Capital Investment Funds plc
Notes to the Financial Statements (continued)
For the financial period ended 30 June 2022
40
2022 Condensed Interim Report &
Unaudited Financial Statements
3. Fair Value Measurements
Valuation Techniques
The fair value hierarchy is categorised into three levels based on the inputs as follows:
Level 1 – Valuations based on quoted prices in active markets for identical assets or liabilities;
Level 2 - Valuations based on quoted prices in markets that are not active or inputs other than level one for which all significant
inputs are observable, either directly (as prices) or indirectly (derived from prices); and
Level 3 - Valuations based on inputs that are unobservable and significant to the overall fair value measurement.
Inputs are used in applying the various valuation techniques and broadly refer to the assumptions that market participants use to make
valuation decisions, including assumptions about risk. Inputs may include price information, volatility statistics, specific and broad
credit data, liquidity statistics, and other factors. A financial instrument’s level within the fair value hierarchy is based on the lowest
level of any input that is significant to the fair value measurement.
Observable inputs are those that market participants would use in pricing the asset or liability based on market data obtained from
sources independent of the Company. Unobservable inputs reflect the Company’s assumptions, made in good faith, about the inputs
market participants would use in pricing the asset or liability developed based on the best information available in the circumstances.
However, the determination of what constitutes “observable” requires significant judgment by the Company. The Company considers
observable data to be that market data which is readily available, regularly distributed or updated, reliable and verifiable, not
proprietary, and provided by independent sources that are actively involved in the relevant market. The categorisation of a financial
instrument within the hierarchy is based upon the pricing transparency of the instrument and does not necessarily correspond to the
Company’s perceived risk of that instrument.
Fair value is a market-based measure considered from the perspective of a market participant rather than an entity-specific measure.
Therefore, even when market assumptions are not readily available, the Investment Manager’s own assumptions are set to reflect
those that market participants would use in pricing the asset or liability at the measurement date. The Investment Manager uses prices
and inputs that are current as of the measurement date, including periods of market dislocation. In periods of market dislocation, the
transparency of prices and inputs may be reduced for many securities. This condition could cause a security to be reclassified to a
lower level within the fair value hierarchy.
The following is a summary of the inputs used to value the Funds’ financial assets and liabilities measured at fair value on a recurring
basis as of 30 June 2022 and of 31 December 2021:
Polen Capital Focus U.S. Growth Fund
Balance at 30 Quoted prices in Significant other Significant
Assets and Liabilities June 2022 active markets observable inputs unobservable inputs
Total (Level 1) (Level 2) (Level 3)
USD USD USD USD
Financial assets at fair value
through profit or loss
Quoted equity securities
at fair value 3,111,610,526 3,111,610,526 - -
Forward foreign currency contracts 9,036 - 9,036 -
3,111,619,562 3,111,610,526 9,036 -
Financial liabilities at fair value
through profit or loss
Forward foreign currency contracts 235,459 - 235,459 -
235,459 - 235,459 -

Polen Capital Investment Funds plc
Notes to the Financial Statements (continued)
For the financial period ended 30 June 2022
41
2022 Condensed Interim Report &
Unaudited Financial Statements
3. Fair Value Measurements (continued)
Valuation Techniques (continued)
Polen Capital U.S. Small Company Growth Fund
Balance at 30 Quoted prices in Significant other Significant
Assets and Liabilities June 2022 active markets observable inputs unobservable inputs
Total (Level 1) (Level 2) (Level 3)
USD USD USD USD
Financial assets at fair value
through profit or loss
Quoted equity securities
at fair value 8,735,292 8,735,292 - -
8,735,292 8,735,292 - -
Polen Capital International Growth Fund
Balance at 30 Quoted prices in Significant other Significant
Assets and Liabilities June 2022 active markets observable inputs unobservable inputs
Total (Level 1) (Level 2) (Level 3)
USD USD USD USD
Financial assets at fair value
through profit or loss
Quoted equity securities
at fair value 23,703,562 23,703,562 - -
23,703,562 23,703,562 - -
Polen Capital Global Emerging Markets Growth Fund
Balance at 30 Quoted prices in Significant other Significant
Assets and Liabilities June 2022 active markets observable inputs unobservable inputs
Total (Level 1) (Level 2) (Level 3)
USD USD USD USD
Financial assets at fair value
through profit or loss
Quoted equity securities
at fair value 2,228,377 2,228,292 - 85
2,228,377 2,228,292 - 85
Financial liabilities at fair value
through profit or loss
Forward foreign currency contracts 1,997 - 1,997 -
1,997 - 1,997 -

Polen Capital Investment Funds plc
Notes to the Financial Statements (continued)
For the financial period ended 30 June 2022
42
2022 Condensed Interim Report &
Unaudited Financial Statements
3. Fair Value Measurements (continued)
Valuation Techniques (continued)
Polen Capital Global SMID Company Growth Fund1
Balance at 30 Quoted prices in Significant other Significant
Assets and Liabilities June 2022 active markets observable inputs unobservable inputs
Total (Level 1) (Level 2) (Level 3)
USD USD USD USD
Financial assets at fair value
through profit or loss
Quoted equity securities
at fair value 915,516 915,516 - -
Forward foreign currency contracts 2 - 2 -
915,518 915,516 2 -
Financial liabilities at fair value
through profit or loss
Forward foreign currency contracts 283 - 283 -
283 - 283 - 1Fund was launched on 31 January 2022.
Polen Capital Focus U.S. Growth Fund
Balance at 31 Quoted prices in Significant other Significant
Assets and Liabilities December 2021 active markets observable inputs unobservable inputs
Total (Level 1) (Level 2) (Level 3)
USD USD USD USD
Financial assets at fair value
through profit or loss
Quoted equity securities
at fair value 5,363,582,808 5,363,582,808 - -
Forward foreign currency contracts 737,362 - 737,362 -
5,364,320,170 5,363,582,808 737,362 -
Financial liabilities at fair value
through profit or loss
Forward foreign currency contracts 50,917 - 50,917 -
50,917 - 50,917 -
Polen Capital U.S. Small Company Growth Fund
Balance at 31 Quoted prices in Significant other Significant
Assets and Liabilities December 2021 active markets observable inputs unobservable inputs
Total (Level 1) (Level 2) (Level 3)
USD USD USD USD
Financial assets at fair value
through profit or loss
Quoted equity securities
at fair value 16,351,269 16,351,269 - -
16,351,269 16,351,269 - -

Polen Capital Investment Funds plc
Notes to the Financial Statements (continued)
For the financial period ended 30 June 2022
43
2022 Condensed Interim Report &
Unaudited Financial Statements
3. Fair Value Measurements (continued)
Valuation Techniques (continued)
Polen Capital International Growth Fund
Balance at 31 Quoted prices in Significant other Significant
Assets and Liabilities December 2021 active markets observable inputs unobservable inputs
Total (Level 1) (Level 2) (Level 3)
USD USD USD USD
Financial assets at fair value
through profit or loss
Quoted equity securities
at fair value 38,581,367 38,581,367 - -
38,581,367 38,581,367 - -
Polen Capital Global Emerging Markets Growth Fund
Balance at 31 Quoted prices in Significant other Significant
Assets and Liabilities December 2021 active markets observable inputs unobservable inputs
Total (Level 1) (Level 2) (Level 3)
USD USD USD USD
Financial assets at fair value
through profit or loss
Quoted equity securities
at fair value 3,071,368 3,071,368 - -
Forward foreign currency contracts 2,806 - 2,806 -
3,074,174 3,071,368 2,806 -
Level 3 reconciliation
Transfers are deemed to occur from the start to the end of the current accounting period. The following table presents the movement
in level 3 instruments for the period ended 30 June 2022 by class of financial instrument.
Polen Capital Global Emerging Markets Unquoted securities at fair
Growth Fund value through profit or loss
EUR
Opening balance -
Total gains and losses recognised in profit or loss -
Purchases -
Sales -
Transfers into or out of Level 3 85
Closing balance 85
During the period two securities held by Polen Capital Global Emerging Markets Growth Fund were identified as Russian Securities.
As result, due to removal of companies from the Russian ETFs/indices and the overall uncertainty and volatility, those securities were
classified as Level 3 securities. The Investment Manager continues to monitor the situation to determine whether any further changes
are warranted.
There were no transfers between Level 1, Level 2 and Level 3 during the period for the Funds not disclosed in the above tables.
When fair values of listed equity at the reporting date are based on quoted market prices or binding dealer price quotations without
any deduction for transaction costs, the instruments are included within Level 1 of the hierarchy.
Assets and liabilities not carried at fair value (30 June 2022 and 31 December 2021)
Cash and cash equivalents are classified as Level 1 and all other assets and liabilities not carried at fair value are classified as Level 2
for the Funds. The assets and liabilities are carried at amortised cost; their carrying values are a reasonable approximation of fair
value.

Polen Capital Investment Funds plc
Notes to the Financial Statements (continued)
For the financial period ended 30 June 2022
44
2022 Condensed Interim Report &
Unaudited Financial Statements
4. Cash and Cash Equivalents
Polen Capital Focus Polen Capital Focus
Polen Capital U.S.
Small Company
Polen Capital U.S.
Small Company
U.S. Growth Fund U.S. Growth Fund Growth Fund Growth Fund
As at As at As at As at
30 June 2022 31 December 2021 30 June 2022 31 December 2021
USD USD USD USD
RBC Investor Services Bank
S.A., Dublin Branch
Cash and cash equivalents 63,028,726 43,104,821 790,967 375,377
Bank overdraft (56,930) - (1) -
62,971,796 43,104,821 790,966 375,377
Polen Capital
International
Polen Capital
International
Polen Capital
Global Emerging
Markets Growth
Fund
Polen Capital Global
Emerging Markets
Growth Fund
Growth Fund Growth Fund
As at As at As at As at
30 June 2022 31 December 2021 30 June 2022 31 December 2021
USD USD USD USD
RBC Investor Services Bank
S.A., Dublin Branch
Cash and cash equivalents 719,194 939,582 75,279 81,653
719,194 939,582 75,279 81,653
Polen Capital
Global SMID
Company
Growth Fund1 Total Total
As at As at As at
30 June 2022 30 June 2022 31 December 2022
USD USD USD
RBC Investor Services Bank
S.A., Dublin Branch
Cash and cash equivalents 19,775 64,633,941 44,501,433
Bank overdraft (8,567) (65,498) -
11,208 64,568,443 44,501,433
1Fund was launched on 31 January 2022 therefore comparatives are not available.

Polen Capital Investment Funds plc
Notes to the Financial Statements (continued)
For the financial period ended 30 June 2022
45
2022 Condensed Interim Report &
Unaudited Financial Statements
5. Fees
Investment Management Fee
Pursuant to the Investment Management Agreement, the Investment Manager shall be entitled to a maximum annual investment
management and distribution fee equal to a percentage of the Net Asset Value of the relevant Class as outlined in the table below.
Such fee shall be calculated and accrued at each Valuation Point and payable quarterly in arrears.
Fund Share class Annual percentage Polen Capital Focus U.S. Growth Fund CHF Class (Institutional) 0.75%
CHF Class (Retail) 1.50%
EUR Class (Institutional) 0.75%
EUR Class (Institutional Unhedged) 0.75%
EUR Class (Retail) 1.50%
EUR Class (Retail Unhedged) 1.50%
EUR D Class (Institutional Unhedged) 0.65%
GBP Class (Institutional) 0.75%
GBP Class (Institutional Unhedged) 0.75%
GBP Class (Institutional Unhedged Distributing) 0.75%
GBP Class (Retail) 1.50%
GBP D Class (Institutional Unhedged Distributing) 0.65%
U.S. Dollar A Class (Retail) 1.50%
U.S. Dollar C Class (Retail) 1.75%
U.S. Dollar Class (Institutional) 0.75%
U.S. Dollar Class (Retail) 1.50%
U.S. Dollar D Class (Institutional Unhedged) 0.65%
U.S. Dollar E Class (Retail) 1.50%
U.S. Dollar N Class (Retail) 1.90%
Fund Share class Annual percentage Polen Capital U.S. Small Company Growth Fund CHF Class (Institutional) 1.00%
CHF Class (Retail) 1.75%
EUR Class (Institutional) 1.00%
EUR Class (Retail) 1.75%
GBP Class (Institutional) 1.00%
GBP Class (Institutional Unhedged) 1.00%
GBP Class (Institutional Unhedged Distributing) 1.00%
GBP Class (Retail) 1.75%
U.S. Dollar A Class (Retail) 1.75%
U.S. Dollar C Class (Retail) 2.00%
U.S. Dollar Class (Institutional) 1.00%
U.S. Dollar Class (Retail) 1.75%

Polen Capital Investment Funds plc
Notes to the Financial Statements (continued)
For the financial period ended 30 June 2022
46
2022 Condensed Interim Report &
Unaudited Financial Statements
5. Fees (continued)
Investment Management Fee (continued)
1Fund was launched on 31 January 2022.
Fund Share class Annual percentage Polen Capital International Growth Fund CHF Class (Institutional) 0.85%
CHF Class (Retail) 1.60%
EUR Class (Institutional) 0.85%
EUR Class (Retail) 1.60%
GBP Class (Institutional) 0.85%
GBP Class (Institutional Unhedged) 0.85%
GBP Class (Institutional Unhedged Distributing) 0.85%
GBP Class (Retail) 1.60%
U.S. Dollar A Class (Retail) 1.60%
U.S. Dollar C Class (Retail) 1.85%
U.S. Dollar Class (Institutional) 0.85%
U.S. Dollar Class (Retail) 1.60%
Fund Share class Annual percentage Polen Capital Global Emerging Markets Growth CHF Class (Institutional) 1.00%
Fund CHF Class (Retail) 1.75%
EUR Class (Institutional) 1.00%
EUR Class (Retail) 1.75%
GBP Class (Institutional) 1.00%
GBP Class (Institutional Unhedged) 1.00%
GBP Class (Institutional Unhedged Distributing) 1.00%
GBP Class (Retail) 1.75%
U.S. Dollar A Class (Retail) 1.75%
U.S. Dollar C Class (Retail) 2.00%
U.S. Dollar Class (Institutional) 1.00%
U.S. Dollar Class (Retail) 1.75%
Fund Share class Annual percentage
Polen Capital Global SMID Company Growth USD Class (Institutional) 1.00%
Fund1 USD Class (Retail) 1.75%
EUR Class (Institutional) 1.00%
EUR Class (Retail) 1.75%
GBP Class (Institutional) 1.00%
GBP Class (Retail) 1.75%
CHF Class (Institutional) 1.00%
CHF Class (Retail) 1.75%
A Class (Retail) 1.75%
C Class (Retail) 2.00%
GBP Class (Institutional Unhedged) 1.00%
GBP Class (Institutional Unhedged Distributing) 1.00%

Polen Capital Investment Funds plc
Notes to the Financial Statements (continued)
For the financial period ended 30 June 2022
47
2022 Condensed Interim Report &
Unaudited Financial Statements
5. Fees (continued)
Investment Management Fee (continued)
In addition, the Investment Manager shall be entitled to be reimbursed for reasonable out of pocket expenses incurred by it and any
VAT on fees and expenses payable to or by it.
During the financial period Investment Management fees amounted to USD 20,408,843 (30 June 2021: USD 18,725,988) and
Investment Management fees payable at 30 June 2022 amounted to USD 2,799,282 (31 December 2021: USD 4,482,660).
Administration and Transfer Agency Fees
The Administrator, in relation to the calculation of the Net Asset Value of the Fund, shall be entitled to a fee payable out of the assets
of the Funds accruing at each Valuation Point and payable monthly in arrears at the end of each calendar month at a maximum rate of
up to 0.010% of the Net Asset Value of the Funds per annum subject to a minimum annual fee of USD 7,500 for the Fund. These
charges are inclusive of two Share Classes. Thereafter, an additional fee of $600 per annum will apply per each additional Share
Class.
The Funds shall also be subject to transaction charges, which shall not exceed normal commercial rates. The Administrator shall also
be entitled to reimbursement of all reasonable out-of-pocket expenses incurred for the benefit of the Funds out of the assets of the
Funds.
In addition, the Administrator shall be entitled to charge the Fund for transfer agency services such as maintenance and servicing,
processing payments (such as dividends), ad-hoc reporting (where the Administrator is required to report on matters to the Directors
outside of the standard quarterly reporting topics) and other similar services. These Transfer Agency fees shall vary in proportion to
the level of transaction activity of the Fund. Notwithstanding this, Transfer Agency fees are payable by the Fund monthly in arrears at
the end of each calendar month at an annual rate of up to 0.15% of the Net Asset Value of the Fund, subject to a minimum monthly
fee of $300. In addition, each Share Class will be charged $1,000 per annum payable in arrears at the end of each calendar month in
respect of shareholder services.
The Administration and Transfer Agency fees charged during the financial period amounted to USD 125,028 (30 June 2021: USD
286,886) and USD 324,987 (30 June 2021: USD 260,855) respectively. The Administration and Transfer Agency fees payable at 30
June 2022 amounted to USD 41,378 (31 December 2021: USD 58,138) and USD 7,883 (30 December 2021: USD 108,617)
respectively.
Depositary Fees
Safekeeping fees are based on the Net Asset Value of the Funds and vary, from 0.002% to 0.80%, depending on the country in which
the security is traded and held, exclusive of transaction charges and out-of-pocket expenses, subject to a minimum annual fee of USD
3,480 in respect of the Fund per annum. The Funds shall also bear the cost of all relevant sub-custodian transaction charges incurred
by the Depositary, or any sub-custodian, which shall not exceed normal commercial rates. The Depositary shall also be entitled to
reimbursement of reasonable out-of-pocket expenses incurred by the Depositary, or any sub-custodian, for the benefit of the Fund.
The Depositary shall also be entitled to a fee payable out of the assets of the Funds accruing at each Valuation Point and payable
monthly in arrears at the end of each calendar month at an annual rate of up to 0.175% of the Net Asset Value of the Funds, subject to
a minimum annual fee per Fund, exclusive of out-of-pocket expenses, of USD 7,100.
Depositary fees charged during the financial period amounted to USD 207,760 (30 June 2021: USD 508,662) of which USD 57,831
was payable at 30 June 2022 (31 December 2021: USD 103,345).
Directors Fees
Each Director shall receive a fee for their services. Jason Mullins, Brian Goldberg and Mike Guarasci have waived their entitlement to
receive directors fees. Each Director may be entitled to special remuneration if called upon to perform any special or extra services to
the Company. All Directors will be entitled to reimbursement by the Company of expenses properly incurred in connection with the
business of the Company or the discharge of their duties.
During the financial period Directors fees amounted to USD 28,960 (30 June 2021: USD 30,052) and Directors’ fees payable at 30
June 2022 amounted to USD 7,992 (31 December 2021: USD 7,237).

Polen Capital Investment Funds plc
Notes to the Financial Statements (continued)
For the financial period ended 30 June 2022
48
2022 Condensed Interim Report &
Unaudited Financial Statements
5. Fees (continued)
Management Fees
Pursuant to the Management Agreement, the Manager shall be entitled to a maximum annual management fee equal to 0.012% of the
Net Asset Value of each Share Class. The Manager is also entitled to a minimum annual fee for the Company of €40,000 per Fund .
Such fee shall be calculated and accrued at each Valuation Point and payable monthly in arrears.
During the financial period Management fees amounted to USD 119,459 (30 June 2021: USD NIL) and Management fees payable at
30 June 2022 amounted to USD NIL (31 December 2021: USD NIL).
6. Other Accrued Expenses and Liabilities and Other Expenses
Other Accrued Expenses and Liabilities
Below is the breakdown for other accrued expenses and liabilities as at 30 June 2022.
Polen Capital
Focus U.S.
Growth Fund
30 June 2022
Polen Capital
Focus U.S.
Growth Fund
31 December 2021
Polen Capital U.S.
Small Company
Growth Fund
30 June 2022
Polen Capital U.S.
Small Company
Growth Fund
31 December 2021
Description USD USD USD USD
Consulting fees payable - - 51 -
Insurance fees payable 14,012 13,396 41 36
Consultancy fees payable 14,580 14,580 327 327
Listing fees payable 20,196 20,963 6,220 4,974
Regulatory fees payable 12,069 6,842 94 113
Secretarial fees payable 6,647 3,459 23 34
Payable on currencies sold 3,746 - - -
Registration fees payable 78,354 63,182 1,307 205
Other payable - 1,503 - 35
Total other accrued expenses and
liabilities 149,604 123,925
8,063 5,724
Polen Capital
International
Growth Fund
30 June 2022
Polen Capital
International
Growth Fund
31 December 2021
Polen Capital Global
Emerging Markets
Growth Fund
30 June 2022
Polen Capital Global
Emerging Markets
Growth Fund
31 December 2021
Description USD USD USD USD
Insurance fees payable 41 36 21 15
Consultancy fees payable 339 339 111 111
Listing fees payable 6,745 5,532 3,953 2,711
Regulatory fees payable 157 103 53 44
Secretarial fees payable 531 469 62 49
Registration fees payable 3,203 2,133 4,530 3,092
Other payable - 39 - 3
Total other accrued expenses and
liabilities 11,016 8,651 8,730 6,025
Polen Capital
Global SMID
Company Growth
Fund1
Description USD
Insurance fees payable 4
Listing fees payable 891
Regulatory fees payable 8
Secretarial fees payable 12
Payable on currencies sold 33
Total other accrued expenses and
liabilities 948 1Fund was launched on 31 January 2022 therefore comparatives are not available.

Polen Capital Investment Funds plc
Notes to the Financial Statements (continued)
For the financial period ended 30 June 2022
49
2022 Condensed Interim Report &
Unaudited Financial Statements
6. Other Accrued Expenses and Liabilities and Other Expenses (continued)
Other Expenses (continued)
Below is the breakdown for other expenses during the financial period ended 30 June 2022.
Polen Capital
Focus U.S.
Growth Fund
30 June 2022
Polen Capital
Focus U.S.
Growth Fund
30 June 2021
Polen Capital U.S.
Small Company
Growth Fund
30 June 2022
Polen Capital U.S.
Small Company
Growth Fund
30 June 2021
Description USD USD USD USD
Listing fees 3,567 3,924 1,257 1,345
Registration fees 133,245 83,068 6,792 5,977
Insurance fees 616 677 5 7
Secretarial fees 13,383 8,682 16 19
Regulatory fees 5,225 9,372 10 24
Other expenses 515 540 - -
CRS Reporting fees 1,018 - 161 -
Total other expenses 157,569 106,263 8,241 7,372
Polen Capital
International
Growth Fund
30 June 2022
Polen Capital
International
Growth Fund
30 June 2021
Polen Capital Global
Emerging Markets
Growth Fund
30 June 2022
Polen Capital Global
Emerging Markets
Growth Fund
30 June 2021
Description USD USD USD USD
Listing fees 1,257 1,394 1,246 1,212
Registration fees 1,626 1,600 1,541 1,527
Insurance fees 5 7 5 7
Secretarial fees 156 173 21 27
Regulatory fees 54 179 10 27
Other expenses - - 35 10
CRS Reporting fees 161 - 161 -
Tax fees - - 34 -
Total other expenses 3,259 3,353 3,053 2,810
Polen Capital
Global SMID
Company Growth
Fund1
30 June 2022
Description USD
Listing fees 892
Registration fees 1,294
Insurance fees 4
Secretarial fees 13
Regulatory fees 8
Total other expenses 2,211
1Fund was launched on 31 January 2022 therefore comparatives are not available.
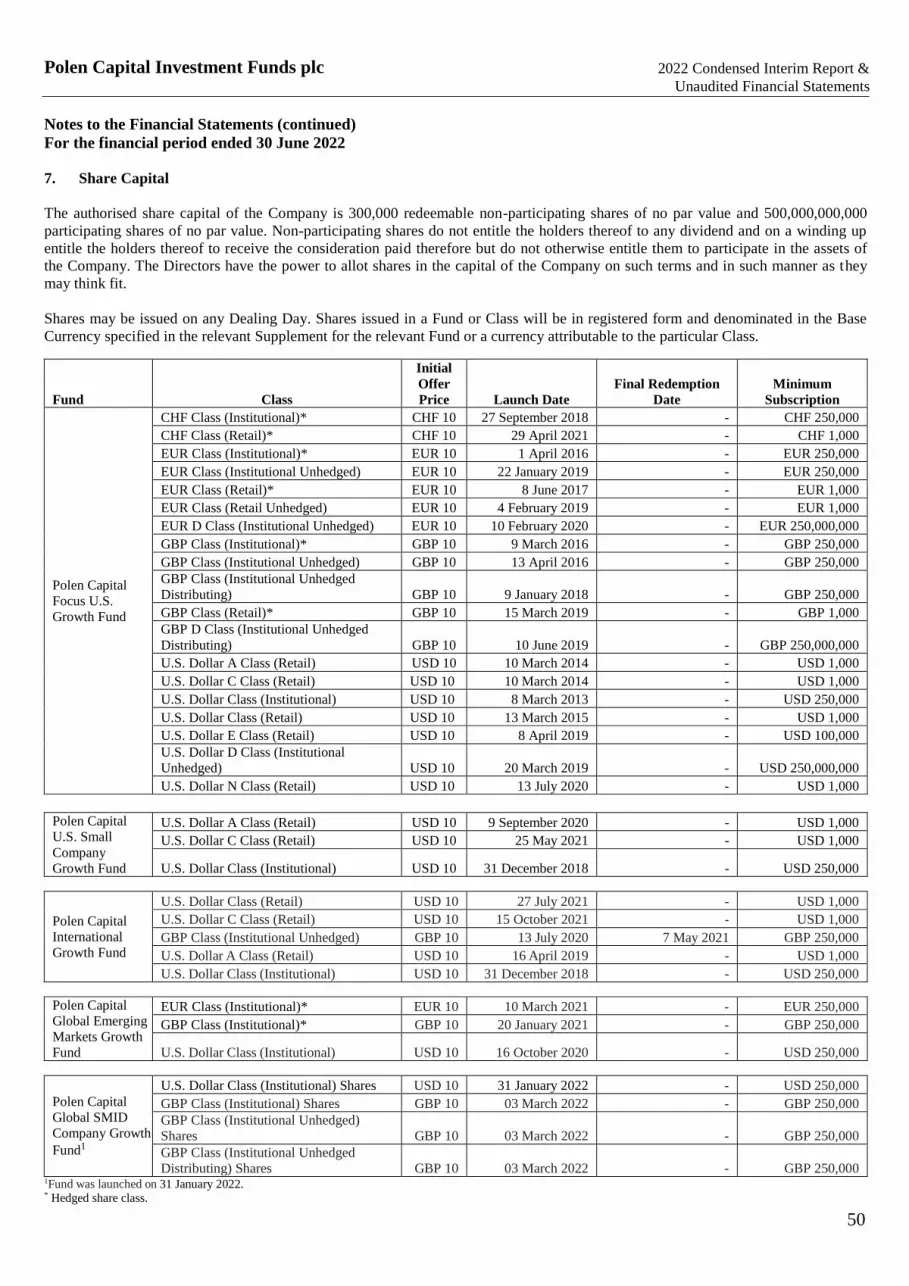
Polen Capital Investment Funds plc
Notes to the Financial Statements (continued)
For the financial period ended 30 June 2022
50
2022 Condensed Interim Report &
Unaudited Financial Statements
7. Share Capital
The authorised share capital of the Company is 300,000 redeemable non-participating shares of no par value and 500,000,000,000
participating shares of no par value. Non-participating shares do not entitle the holders thereof to any dividend and on a winding up
entitle the holders thereof to receive the consideration paid therefore but do not otherwise entitle them to participate in the assets of
the Company. The Directors have the power to allot shares in the capital of the Company on such terms and in such manner as they
may think fit.
Shares may be issued on any Dealing Day. Shares issued in a Fund or Class will be in registered form and denominated in the Base
Currency specified in the relevant Supplement for the relevant Fund or a currency attributable to the particular Class.
Fund Class
Initial
Offer
Price Launch Date
Final Redemption
Date
Minimum
Subscription
Polen Capital
Focus U.S.
Growth Fund
CHF Class (Institutional)* CHF 10 27 September 2018 - CHF 250,000
CHF Class (Retail)* CHF 10 29 April 2021 - CHF 1,000
EUR Class (Institutional)* EUR 10 1 April 2016 - EUR 250,000
EUR Class (Institutional Unhedged) EUR 10 22 January 2019 - EUR 250,000
EUR Class (Retail)* EUR 10 8 June 2017 - EUR 1,000
EUR Class (Retail Unhedged) EUR 10 4 February 2019 - EUR 1,000
EUR D Class (Institutional Unhedged) EUR 10 10 February 2020 - EUR 250,000,000
GBP Class (Institutional)* GBP 10 9 March 2016 - GBP 250,000
GBP Class (Institutional Unhedged) GBP 10 13 April 2016 - GBP 250,000
GBP Class (Institutional Unhedged
Distributing) GBP 10 9 January 2018 - GBP 250,000
GBP Class (Retail)* GBP 10 15 March 2019 - GBP 1,000
GBP D Class (Institutional Unhedged
Distributing) GBP 10 10 June 2019 - GBP 250,000,000
U.S. Dollar A Class (Retail) USD 10 10 March 2014 - USD 1,000
U.S. Dollar C Class (Retail) USD 10 10 March 2014 - USD 1,000
U.S. Dollar Class (Institutional) USD 10 8 March 2013 - USD 250,000
U.S. Dollar Class (Retail) USD 10 13 March 2015 - USD 1,000
U.S. Dollar E Class (Retail) USD 10 8 April 2019 - USD 100,000
U.S. Dollar D Class (Institutional
Unhedged) USD 10 20 March 2019 - USD 250,000,000
U.S. Dollar N Class (Retail) USD 10 13 July 2020 - USD 1,000
Polen Capital
U.S. Small
Company
Growth Fund
U.S. Dollar A Class (Retail) USD 10 9 September 2020 - USD 1,000
U.S. Dollar C Class (Retail) USD 10 25 May 2021 - USD 1,000
U.S. Dollar Class (Institutional) USD 10 31 December 2018 - USD 250,000
Polen Capital
International
Growth Fund
U.S. Dollar Class (Retail) USD 10 27 July 2021 - USD 1,000
U.S. Dollar C Class (Retail) USD 10 15 October 2021 - USD 1,000
GBP Class (Institutional Unhedged) GBP 10 13 July 2020 7 May 2021 GBP 250,000
U.S. Dollar A Class (Retail) USD 10 16 April 2019 - USD 1,000
U.S. Dollar Class (Institutional) USD 10 31 December 2018 - USD 250,000
Polen Capital
Global Emerging
Markets Growth
Fund
EUR Class (Institutional)* EUR 10 10 March 2021 - EUR 250,000
GBP Class (Institutional)* GBP 10 20 January 2021 - GBP 250,000
U.S. Dollar Class (Institutional) USD 10 16 October 2020 - USD 250,000
Polen Capital
Global SMID
Company Growth
Fund1
U.S. Dollar Class (Institutional) Shares USD 10 31 January 2022 - USD 250,000
GBP Class (Institutional) Shares GBP 10 03 March 2022 - GBP 250,000
GBP Class (Institutional Unhedged)
Shares GBP 10 03 March 2022 - GBP 250,000
GBP Class (Institutional Unhedged
Distributing) Shares GBP 10 03 March 2022 - GBP 250,000 1Fund was launched on 31 January 2022. * Hedged share class.

Polen Capital Investment Funds plc
Notes to the Financial Statements (continued)
For the financial period ended 30 June 2022
51
2022 Condensed Interim Report &
Unaudited Financial Statements
7. Share Capital (continued)
Shares will have no par value and will first be issued on the first Dealing Day after expiry of the initial offer year specified in the
relevant Supplement at the Initial Price as specified in the relevant Supplement. Thereafter, Shares shall be issued at the Net Asset
Value per Share.
Redemption of Shares
Shareholders may redeem their Shares on and with effect from any Dealing Day at the Net Asset Value per Share for that Class
calculated on or with respect to the relevant Dealing Day in accordance with the procedures described below (save during any
financial year when the calculation of Net Asset Value is suspended).
The minimum value of Shares which a Shareholder may redeem in any one redemption transaction is the Minimum Transaction Size
as specified in the relevant Supplement. If the redemption of only part of a Shareholder’s shareholding would leave the Shareholder
holding less than the Minimum Holding for the relevant Fund, the Company or its delegate may, if it thinks fit, redeem the whole of
that Shareholder's holding.
Minimum Initial Subscription, Minimum Holding and Minimum Transaction Size
Each investor must satisfy the Minimum Initial Subscription requirements applicable to the relevant Class as outlined above and must
retain Shares having a Net Asset Value of the Minimum Holding applicable to the relevant Class as outlined above. A Shareholder
may make subsequent subscriptions, conversions and redemptions, each subject to a Minimum Transaction Size applicable to the
relevant Class as outlined above.
The below table represents the movements in units for the financial period 30 June 2022 and 30 June 2021.
Fund Share Class
Financial
period
ended
Redeemable
participating
shares in issue
at beginning of
the financial
period
Shares issued
during the
financial period
Shares redeemed
during the
financial period
Redeemable
participating
shares in issue at
the end of the
financial period
Polen Capital
Focus U.S.
Growth Fund
CHF Class (Institutional)
Shares 30-Jun-22 144,720.150
14,048.000
(14,227.642)
144,540.508
30-Jun-21 49,717.130 73,442.000 (30,341.660) 92,817.470
CHF Class (Retail) Shares1 30-Jun-22 12,677.160 13,587.000 - 26,264.160
30-Jun-21 - 12,122.650 - 12,122.650
EUR Class (Institutional)
Shares 30-Jun-22 983,711.670
284,436.599
(378,147.701)
890,000.568
30-Jun-21 3,103,545.773 1,118,743.597 (3,455,473.404) 766,815.966
EUR Class (Institutional
Unhedged) Shares 30-Jun-22 9,637,894.693
1,700,307.106
(1,177,751.213)
10,160,450.586
30-Jun-21 6,910,737.511 2,351,659.170 (2,130,634.742) 7,131,761.939
EUR Class (Retail) Shares 30-Jun-22 6,014,537.573 803,552.699 (4,896,918.182) 1,921,172.090
30-Jun-21 4,731,056.248 1,371,196.584 (830,848.700) 5,271,404.132
EUR Class (Retail
Unhedged) Shares 30-Jun-22 882,305.729
228,485.767
(235,774.756)
875,016.740
30-Jun-21 639,014.287 213,740.441 (141,980.121) 710,774.607
EUR D Class (Institutional
Unhedged) Shares 30-Jun-22 206,748.358
2,435,932.511
(12,405.496)
2,630,275.373
30-Jun-21 73,567.000 103,557.614 - 177,124.614
1 Launched on 29 April 2021.

Polen Capital Investment Funds plc
Notes to the Financial Statements (continued)
For the financial period ended 30 June 2022
52
2022 Condensed Interim Report &
Unaudited Financial Statements
7. Share Capital (continued)
Fund Share Class
Financial
period
ended
Redeemable
participating
shares in issue at
beginning of the
financial period
Shares issued
during the
financial
period
Shares redeemed
during the
financial period
Redeemable
participating
shares in issue at
the end of the
financial period
Polen Capital
Focus U.S.
Growth Fund
(continued)
GBP Class (Institutional)
Shares 30-Jun-22 1,625,440.803 209,822.100 (1,357,292.930) 477,969.973
30-Jun-21 368,918.920 263,126.470 (55,002.790) 577,042.600
GBP Class (Institutional
Unhedged) Shares 30-Jun-22 2,438,241.816 480,228.954 (666,215.488) 2,252,255.282
30-Jun-21 4,076,277.006 222,779.160 (1,157,728.774) 3,141,327.392
GBP Class (Institutional
Unhedged Distributing)
Shares 30-Jun-22 635,349.350 18,224.730 (42,491.750) 611,082.330
30-Jun-21 83,642.660 405,605.840 - 489,248.500
GBP Class (Retail) Shares 30-Jun-22 32,174.660 13,857.210 - 46,031.870
30-Jun-21 29,341.270 5,826.630 (16,303.320) 18,864.580
GBP D Class (Institutional
Unhedged Distributing)
Shares 30-Jun-22 6,935,656.009 6,343,676.289 (1,183,515.818)
12,095,816.480
30-Jun-21 4,204,044.011 2,225,591.544 (1,655,040.372) 4,774,595.183
U.S. Dollar A Class (Retail)
Shares 30-Jun-22 26,442,323.366 3,713,996.737 (2,988,476.776) 27,167,843.327
30-Jun-21 20,613,731.161 3,903,986.804 (2,199,503.164) 22,318,214.801
U.S. Dollar C Class (Retail)
Shares 30-Jun-22 3,612,381.669 278,653.310 (334,721.188) 3,556,313.791
30-Jun-21 3,390,872.933 326,718.110 (467,032.931) 3,250,558.112
U.S. Dollar Class
(Institutional) Shares 30-Jun-22 44,805,667.307 6,029,652.201 (9,481,216.927) 41,354,102.581
30-Jun-21 38,027,495.371 6,211,975.200 (7,449,610.822) 36,789,859.749
U.S. Dollar Class (Retail)
Shares 30-Jun-22 2,192,823.262 462,220.334 (326,934.456) 2,328,109.140
30-Jun-21 1,948,482.500 379,976.100 (402,929.358) 1,925,529.242
U.S. Dollar D Class
(Institutional Unhedged)
Shares 30-Jun-22 38,548,475.795 3,521,163.594 (17,979,290.238) 24,090,349.151
30-Jun-21 30,968,305.456 16,330,427.270 (10,309,416.213) 36,989,316.513
U.S. Dollar E Class (Retail)
Shares 30-Jun-22 15,636,029.666 1,319,669.419 (3,352,506.007) 13,603,193.078
30-Jun-21 11,443,635.220 3,160,438.818 (983,662.562) 13,620,411.476
U.S. Dollar N Class (Retail)
Shares1 30-Jun-22 4,804,829.114 833,525.549 (1,359,388.052) 4,278,966.611
30-Jun-21 1,728,950.351 1,817,328.150 (337,685.384) 3,208,593.117
1 Launched on 13 July 2020.

Polen Capital Investment Funds plc
Notes to the Financial Statements (continued)
For the financial period ended 30 June 2022
53
2022 Condensed Interim Report &
Unaudited Financial Statements
7. Share Capital (continued)
Fund Share Class
Financial
period
ended
Redeemable
participating
shares in issue
at beginning of
the financial
period
Shares issued
during the
financial period
Shares redeemed
during the
financial period
Redeemable
participating
shares in issue at
the end of the
financial period
Polen Capital
U.S. Small
Company
Growth
U.S. Dollar A Class (Retail)
Shares 30-Jun-22
228,839.600
16,702.01
(9,775.540)
235,766.070
30-Jun-21 105,573.220 74,806.490 (7,140.930) 173,238.780
U.S. Dollar C Class (Retail)
Shares1 30-Jun-22
55,360.860
30,654.20
(4,074.980)
81,940.080
30-Jun-21 - 29,227.170 - 29,227.170
U.S. Dollar Class
(Institutional) Shares 30-Jun-22
588,758.490
151,699.59
(202,621.050)
537,837.030
30-Jun-21 205,147.050 239,540.240 (15,428.710) 429,258.580
1 Launched on 25 May 2021.
Fund Share Class
Financial
period
ended
Redeemable
participating
shares in issue
at beginning of
the financial
period
Shares issued
during the
financial period
Shares redeemed
during the
financial period
Redeemable
participating
shares in issue at
the end of the
financial period
Polen Capital
International
Growth Fund
GBP Class (Institutional
Unhedged) Shares1 30-Jun-22 - - - -
30-Jun-21 58,471.560 - (58,471.560) -
U.S. Dollar A Class (Retail)
Shares 30-Jun-22 1,498,586.606 56,633.760 (285,033.660) 1,270,186.706
30-Jun-21 1,263,542.254 360,384.800 (101,555.740) 1,522,371.314
U.S. Dollar Class
(Institutional) Shares 30-Jun-22 1,435,702.470 89,853.240 (250,938.190) 1,274,617.520
30-Jun-21 2,338,202.870 317,751.250 (1,475,532.260) 1,180,421.860
U.S Dollar (Retail) Shares2 30-Jun-22 17,000.000 - - 17,000.000
30-Jun-21 - - - -
U.S. Dollar C Class (Retail)
Shares3 30-Jun-22 27,800 2,994.350 - 30,794.350
30-Jun-21 - - - -
1 Launched on 13 July 2020 and terminated on 7 May 2021.
2 Launched on 27 July 2021. 3 Launched on 15 October 2021.
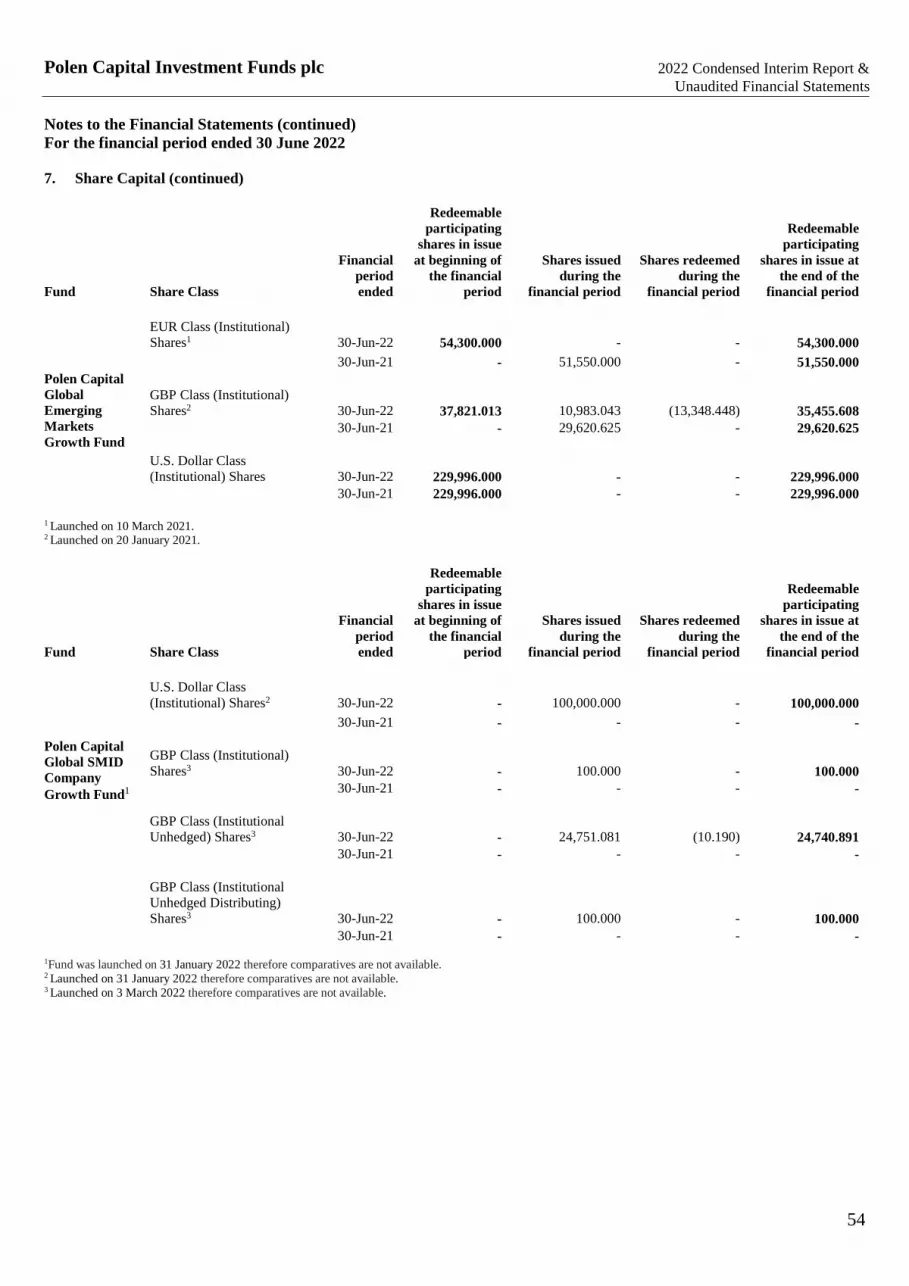
Polen Capital Investment Funds plc
Notes to the Financial Statements (continued)
For the financial period ended 30 June 2022
54
2022 Condensed Interim Report &
Unaudited Financial Statements
7. Share Capital (continued)
Fund Share Class
Financial
period
ended
Redeemable
participating
shares in issue
at beginning of
the financial
period
Shares issued
during the
financial period
Shares redeemed
during the
financial period
Redeemable
participating
shares in issue at
the end of the
financial period
Polen Capital
Global
Emerging
Markets
Growth Fund
EUR Class (Institutional)
Shares1 30-Jun-22
54,300.000
-
- 54,300.000 30-Jun-21 - 51,550.000 - 51,550.000
GBP Class (Institutional)
Shares2 30-Jun-22 37,821.013
10,983.043
(13,348.448) 35,455.608
30-Jun-21 - 29,620.625 - 29,620.625
U.S. Dollar Class
(Institutional) Shares 30-Jun-22
229,996.000
-
- 229,996.000
30-Jun-21 229,996.000 - - 229,996.000
1 Launched on 10 March 2021. 2 Launched on 20 January 2021.
Fund Share Class
Financial
period
ended
Redeemable
participating
shares in issue
at beginning of
the financial
period
Shares issued
during the
financial period
Shares redeemed
during the
financial period
Redeemable
participating
shares in issue at
the end of the
financial period
Polen Capital
Global SMID
Company
Growth Fund1
U.S. Dollar Class
(Institutional) Shares2 30-Jun-22
-
100,000.000
-
100,000.000 30-Jun-21 - - - -
GBP Class (Institutional)
Shares3 30-Jun-22 - 100.000
- 100.000
30-Jun-21 - - - -
GBP Class (Institutional
Unhedged) Shares3 30-Jun-22 - 24,751.081
(10.190) 24,740.891
30-Jun-21 - - - -
GBP Class (Institutional
Unhedged Distributing)
Shares3 30-Jun-22 - 100.000
- 100.000
30-Jun-21 - - - -
1Fund was launched on 31 January 2022 therefore comparatives are not available. 2 Launched on 31 January 2022 therefore comparatives are not available. 3 Launched on 3 March 2022 therefore comparatives are not available.

Polen Capital Investment Funds plc
Notes to the Financial Statements (continued)
For the financial period ended 30 June 2022
55
2022 Condensed Interim Report &
Unaudited Financial Statements
7. Share Capital (continued)
Investor Concentration
Below is a breakdown of the number of Shareholders who held greater than 10% of the total shares in issue per share class as at the
financial period end 30 June 2022 and 31 December 2021.
Polen Capital Focus Polen Capital Focus
Number of U.S. Growth Fund Number of U.S. Growth Fund
Share Class Shareholders Financial period ended Shareholders Financial year ended
30 June 2022 31 December 2021
CHF Class (Institutional) Shares 2 66.55% 2 64.37%
CHF Class (Retail) Shares 3 100.00% 2 100.00%
EUR Class (Institutional) Shares 3 69.01% 2 50.82%
EUR Class (Institutional Unhedged) Shares 3 79.59% 3 78.50%
EUR Class (Retail) Shares 2 61.78% 2 85.68%
EUR Class (Retail Unhedged) Shares 2 83.06% 2 83.01%
EUR D Class (Institutional Unhedged) Shares 1 84.29% 3 96.77%
GBP Class (Institutional) Shares 4 76.56% 3 44.80%
GBP Class (Institutional Unhedged) Shares 4 62.87% 4 72.71%
GBP Class (Institutional Unhedged Distributing) Shares 4 92.32% 4 93.32%
GBP Class (Retail) Shares 3 84.76% 3 89.09%
GBP D Class (Institutional Unhedged Distributing) Shares 4 77.09% 3 57.28%
U.S. Dollar Class (Institutional) Shares 2 23.59% 2 23.04%
U.S. Dollar A Class (Retail) Shares 1 16.56% 1 16.42%
U.S. Dollar C Class (Retail) Shares 1 20.56% 1 21.09%
U.S. Dollar Class (Retail) Shares 2 74.55% 2 67.22%
U.S. Dollar E Class (Retail) Shares 1 87.94% 2 97.87%
U.S. Dollar D Class (Institutional Unhedged) Shares 1 42.27% 2 36.32%
Polen Capital U.S.
Small Company
Polen Capital U.S.
Small Company
Number of Growth Fund Number of Growth Fund
Share Class Shareholders Financial period ended Shareholders Financial year ended
30 June 2022 31 December 2021
U.S. Dollar A Class (Retail) Shares 1 17.82% 1 14.04%
U.S. Dollar C Class (Retail) Shares 3 68.67% 2 46.27%
U.S. Dollar Class (Institutional) Shares 3 65.57% 3 62.49%
Polen Capital
International
Polen Capital
International
Number of Growth Fund Number of Growth Fund
Share Class Shareholders Financial period ended Shareholders Financial year ended
30 June 2022 31 December 2021
U.S. Dollar C Class (Retail) Shares 3 90.28% 1 100.00%
U.S. Dollar Class (Institutional) Shares 1 19.83% 1 20.69%
U.S. Dollar (Retail) Shares 3 90.28% 1 100.00%

Polen Capital Investment Funds plc
Notes to the Financial Statements (continued)
For the financial period ended 30 June 2022
56
2022 Condensed Interim Report &
Unaudited Financial Statements
7. Share Capital (continued)
Investor Concentration (continued)
1Fund was launched on 31 January 2022 therefore comparatives are not available.
Net Asset Values and Shares in Issue
The Net Assets included in the table below are the Net Asset Values calculated for share dealing purposes.
Polen Capital Focus U.S. Growth Fund
30 June 2022 31 December 2021 31 December 2020
Net Assets for Shareholder dealing/prospectus USD 3,169,048,238 USD 5,387,623,990 USD 3,594,255,180
CHF Class (Institutional) Shares
Reported NAV USD 1,794,708 USD 2,937,247 USD 850,548
Shares In Issue 144,540.508 144,720.150 49,717.130
Net Asset Value per Share CHF 11.86 CHF 18.50 CHF 15.15
CHF Class (Retail) Shares1
Reported NAV USD 194,796 USD 154,288 -
Shares In Issue 26,264.160 12,677.160 -
Net Asset Value per Share CHF 7.08 CHF 11.09 -
EUR Class (Institutional) Shares
Reported NAV USD 13,031,882 USD 24,456,972 USD 67,710,004
Shares In Issue 890,000.568 983,711.670 3,103,545.773
Net Asset Value per Share EUR 13.97 EUR 21.84 EUR 17.86
Polen Capital Global Polen Capital Global
Number of
Emerging Markets
Growth Fund Number of
Emerging Markets
Growth Fund
Share Class Shareholders Financial period ended Shareholders Financial year ended
30 June 2022 31 December 2021
EUR Class (Institutional) Shares 1 100.00% 1 100.00%
GBP Class (Institutional) Shares 1 100.00% 1 100.00%
U.S. Dollar Class (Institutional) Shares 1 100.00% 1 100.00%
Polen Capital Global Polen Capital Global
Number of
SMID Company
Growth Fund1 Number of
SMID Company
Growth Fund
Share Class Shareholders Financial period ended Shareholders Financial year ended
30 June 2022 31 December 2021
U.S. Dollar Class (Institutional) Shares 1 100.00% - -
GBP Class (Institutional) Shares 1 99.60% - -
GBP Class (Institutional Unhedged) Shares 1 100.00% - -
GBP Class (Institutional Unhedged Distributing) Shares 1 100.00% - -

Polen Capital Investment Funds plc
Notes to the Financial Statements (continued)
For the financial period ended 30 June 2022
57
2022 Condensed Interim Report &
Unaudited Financial Statements
7. Share Capital (continued)
Net Asset Values and Shares in Issue (continued)
Polen Capital Focus U.S. Growth Fund
30 June 2022 31 December 2021 31 December 2020
EUR Class (Institutional Unhedged) Shares
Reported NAV USD 165,976,220 USD 241,989,808 USD 140,034,415
Shares In Issue 10,160,450.586 9,637,894.693 6,910,737.511
Net Asset Value per Share EUR 15.59 EUR 22.06 EUR 16.58
EUR Class (Retail) Shares
Reported NAV USD 30,167,091 USD 160,746,615 USD 111,600,204
Shares In Issue 1,921,172.090 6,014,537.573 4,731,056.248
Net Asset Value per Shares EUR 14.98 EUR 23.48 EUR 19.31
EUR Class (Retail Unhedged) Shares
Reported NAV USD 13,387,377 USD 20,825,104 USD 12,263,365
Shares In Issue 875,016.740 882,305.729 639,014.287
Net Asset Value per Share EUR 14.60 EUR 20.73 EUR 15.71
EUR D Class (Institutional Unhedged) Shares2
Reported NAV USD 29,955,811 USD 3,618,148 USD 1,037,632
Shares In Issue 2,630,275.373 206,748.358 73,567.000
Net Asset Value per Share EUR 10.87 EUR 15.37 EUR 11.54
GBP Class (Institutional) Shares
Reported NAV USD 11,289,808 USD 66,458,003 USD 12,374,044
Shares In Issue 477,969.973 1,625,440.803 368,918.920
Net Asset Value per Share GBP 19.40 GBP 30.21 GBP 24.53
GBP Class (Institutional Unhedged) Shares
Reported NAV USD 66,901,757 USD 111,321,273 USD 150,191,630
Shares In Issue 2,252,255.282 2,438,241.816 4,076,277.006
Net Asset Value per Share GBP 24.40 GBP 33.73 GBP 26.95
GBP Class (Institutional Unhedged Distributing) Shares
Reported NAV USD 10,379,541 USD 18,553,534 USD 2,079,774
Shares In Issue 611,082.330 635,349.350 83,642.660
Net Asset Value per Share GBP 13.96 GBP 21.57 GBP 18.18
GBP Class (Retail) Shares
Reported NAV USD 670,627 USD 814,147 USD 613,995
Shares In Issue 46,031.870 32,174.660 29,341.270
Net Asset Value per Share GBP 11.97 GBP 18.69 GBP 15.31
1 Launched on 29 April 2021. 2 Launched on 10 February 2020.

Polen Capital Investment Funds plc
Notes to the Financial Statements (continued)
For the financial period ended 30 June 2022
58
2022 Condensed Interim Report &
Unaudited Financial Statements
7. Share Capital (continued)
Net Asset Values and Shares in Issue (continued)
Polen Capital Focus U.S. Growth Fund
30 June 2022 31 December 2021 31 December 2020
GBP D Class (Institutional Unhedged Distributing) Shares
Reported NAV USD 158,553,725 USD 156,414,043 USD 80,673,894
Shares In Issue 12,095,816.480 6,935,656.009 4,204,044.011
Net Asset Value per Share GBP 10.77 GBP 16.66 GBP 14.03
U.S. Dollar A Class (Retail) Shares
Reported NAV USD 685,775,417 USD 1,029,737,529 USD 652,711,841
Shares In Issue 27,167,843.327 26,442,323.366 20,613,731.161
Net Asset Value per Share USD 25.24 USD 38.94 USD 31.66
U.S. Dollar C Class (Retail) Shares
Reported NAV USD 87,958,385 USD 138,010,563 USD 105,597,728
Shares In Issue 3,556,313.791 3,612,381.669 3,390,872.933
Net Asset Value per Share USD 24.73 USD 38.20 USD 31.14
U.S. Dollar Class (Institutional) Shares
Reported NAV USD 1,319,641,252 USD 2,197,611,551 USD 1,505,211,541
Shares In Issue 41,354,102.581 44,805,667.307 38,027,495.371
Net Asset Value per Share USD 31.91 USD 49.05 USD 39.58
U.S. Dollar Class (Retail) Shares
Reported NAV USD 51,451,149 USD 74,763,299 USD 54,015,831
Shares In Issue 2,328,109.140 2,192,823.262 1,948,482.500
Net Asset Value per Share USD 22.10 USD 34.09 USD 27.72
U.S. Dollar D Class (Institutional Unhedged) Shares
Reported NAV USD 314,323,230 USD 772,595,001 USD 500,269,221
Shares In Issue 24,090,349.151 38,548,475.795 30,968,305.456
Net Asset Value per Share USD 13.05 USD 20.04 USD 16.15
U.S. Dollar E Class (Retail) Shares
Reported NAV USD 167,265,075 USD 296,609,045 USD 176,454,899
Shares In Issue 13,603,193.078 15,636,029.666 11,443,635.220
Net Asset Value per Share USD 12.30 USD 18.97 USD 15.42
U.S. Dollar N Class (Retail) Shares1
Reported NAV USD 40,330,387 EUR 70,007,821 USD 20,564,614
Shares In Issue 4,278,966.611 4,804,829.114 1,728,950.351
Net Asset Value per Share USD 9.43 USD 14.57 USD 11.89
1 Launched on 13 July 2020.

Polen Capital Investment Funds plc
Notes to the Financial Statements (continued)
For the financial period ended 30 June 2022
59
2022 Condensed Interim Report &
Unaudited Financial Statements
7. Share Capital (continued)
Net Asset Values and Shares in Issue (continued)
Polen Capital U.S. Small Company Growth Fund
30 June 2022 31 December 2021 31 December 2020
Net Assets for Shareholder dealing/prospectus USD 9,228,712 USD 16,664,550 USD 5,106,022
U.S. Dollar A Class (Retail) Shares1
Reported NAV USD 1,986,816 USD 3,345,491 USD 1,328,274
Shares In Issue 235,766.070 228,839.600 105,573.220
Net Asset Value per Share USD 8.43 USD 14.62 USD 12.58
U.S. Dollar C Class (Retail) Shares2
Reported NAV USD 532,680 USD 625,211 -
Shares In Issue 81,940.080 55,360.860 -
Net Asset Value per Share USD 6.50 USD 11.29 -
U.S. Dollar Class (Institutional) Shares
Reported NAV USD 6,709,216 USD 12,693,848 USD 3,777,748
Shares In Issue 537,837.030 588,758.490 205,147.050
Net Asset Value per Share USD 12.47 USD 21.56 USD 18.41
1 Launched on 9 September 2020. 2 Launched on 25 May 2021.
Polen Capital International Growth Fund
30 June 2022 31 December 2021 31 December 2020
Net Assets for Shareholder dealing/prospectus USD 24,489,347 USD 39,745,097 USD 48,629,764
GBP Class (Institutional Unhedged) Shares1
Reported NAV - - USD 811,479
Shares In Issue - - 58,471.560
Net Asset Value per Share - - GBP 10.15
U.S. Dollar A Class (Retail) Shares
Reported NAV USD 11,174,327 USD 18,672,325 USD 15,343,299
Shares In Issue 1,270,186.706 1,498,586.606 1,263,542.254
Net Asset Value per Share USD 8.80 USD 12.46 USD 12.14
U.S. Dollar Class (Institutional) Shares
Reported NAV USD 12,971,085 USD 20,615,806 USD 32,474,985
Shares In Issue 1,274,617.520 1,435,702.470 2,338,202.870
Net Asset Value per Share USD 10.18 USD 14.36 USD 13.89
U.S. Dollar C Class (Retail) Shares3
Reported NAV USD 221,415 USD 283,441 -
Shares In Issue 30,794.350 27,800.000 -
Net Asset Value per Share USD 7.19 USD 10.20 -
U.S. Dollar (Retail) Shares2
Reported NAV USD 122,520 USD 173,525 -
Shares In Issue 17,000.000 17,000.000 -
Net Asset Value per Share USD 7.21 USD 10.21 - 1 Launched on 13 July 2020 and terminated on 7 May 2021. 2 Launched on 27 July 2021. 3 Launched on 15 October 2021.

Polen Capital Investment Funds plc
Notes to the Financial Statements (continued)
For the financial period ended 30 June 2022
60
2022 Condensed Interim Report &
Unaudited Financial Statements
7. Share Capital (continued)
Net Asset Values and Shares in Issue (continued)
Polen Capital Global Emerging Markets Growth Fund
30 June 2022 31 December 2021 31 December 2020
Net Assets for Shareholder dealing/prospectus USD 2,312,423 USD 3,140,353 USD 2,484,717
EUR Class (Institutional) Shares1
Reported NAV USD 374,814 USD 538,062 -
Shares In Issue 54,300.000 54,300.000 -
Net Asset Value per Share EUR 6.58 EUR 8.70 -
GBP Class (Institutional) Shares2
Reported NAV USD 273,220 USD 427,062 -
Shares In Issue 35,455.608 37,821.013 -
Net Asset Value per Share GBP 6.33 GBP 8.34 -
U.S. Dollar Class (Institutional) Shares3
Reported NAV USD 1,664,389 USD 2,175,228 USD 2,484,717
Shares In Issue 229,996.000 229,996.000 229,996.000
Net Asset Value per Share USD 7.24 USD 9.46 USD 10.80
1 Launched on 10 March 2021. 2 Launched on 20 January 2021. 3 Launched on 16 October 2020.
Polen Capital Global SMID Company Growth Fund1
30 June 2022 31 December 2021 31 December 2020
Net Assets for Shareholder dealing/prospectus USD 919,780 - -
U.S. Dollar Class (Institutional) Shares2
Reported NAV USD 695,174 - -
Shares In Issue 100,000.000 - -
Net Asset Value per Share USD 6.95 - -
GBP Class (Institutional) Shares3
Reported NAV USD 222,604 - -
Shares In Issue 24,740.891 - -
Net Asset Value per Share GBP 7.39 - -
GBP Class (Institutional Unhedged) Shares3
Reported NAV USD 1,001 - -
Shares In Issue 100.000 - -
Net Asset Value per Share USD 8.22 - -
GBP Class (Institutional Unhedged Distributing) Shares3
Reported NAV USD 1,001 - -
Shares In Issue 100.000 - -
Net Asset Value per Share USD 8.22 - -
1Fund was launched on 31 January 2022. 2 Launched on 31 January 2022. 3 Launched on 3 March 2022.

Polen Capital Investment Funds plc
Notes to the Financial Statements (continued)
For the financial period ended 30 June 2022
61
2022 Condensed Interim Report &
Unaudited Financial Statements
8. Related Party Transaction
IAS 24 Related Party Disclosures requires the disclosure of information relating to material transactions with parties who are deemed
to be related to the reporting entity.
Brian Goldberg is General Counsel and Chief Compliance Officer of the Investment Manager and Director of the Company. Mike
Guarasci is Chief Operating Officer of the Investment Manager and Director of the Company. Jason Mullins was appointed as
Director of the Company effective from 8 October 2021. Mr Mullins is Head of Operations of the Manager. During the financial
period, the Investment Manager earned fees of USD 20,408,843 (30 June 2021: USD 18,725,988) of which USD 2,799,282 (31
December 2021: USD 4,482,660) was payable at 30 June 2022.
As at 30 June 2022 the Investment Manager holds 50,000 shares (31 December 2021: 50,000 shares) in the US Dollar Class
(Institutional) Shares of the Polen Capital U.S. Small Company Growth Fund, 229,996 shares (31 December 2021: 229,996 shares) in
the US Dollar Class (Institutional) Shares of the Polen Capital Global Emerging Markets Fund, 100,000 shares (31 December 2021:
nil shares) in U.S. Dollar Class (Institutional) Shares of the Polen Capital Global SMID Company Growth Fund, 100 shares (31
December 2021: nil shares) in GBP Class (Institutional Unhedged) Shares of the Polen Capital Global SMID Company Growth Fund,
100 shares (31 December 2021: nil shares) in GBP Class (Institutional) Shares of the Polen Capital Global SMID Company Growth
Fund and 100 shares (31 December 2021: nil shares) in GBP Class (Institutional Unhedged Distributing) Shares of the Polen Capital
Global SMID Company Growth Fund.
The Management and Director fees are disclosed in Note 5.
The total expenses ratios (TER) for all share classes of the Company are voluntarily capped. Polen Capital Management, LLC has
agreed to pay any expenses above the capped threshold back to the Company. Polen Capital Management, LLC has no intention to re-
coup this amount from the Company at a later date. Polen Capital Management, LLC has agreed to pay an amount of USD 68,613 (30
June 2021: USD 162,430) to the Company in relation to the capped TER fee agreement of which USD 11,819 (31 December 2021:
USD 85,740) was receivable at 30 June 2022.
Connected Persons
Regulation 43 of the Central Bank UCITS Regulations ‘Restrictions of transactions with connected persons” states that ‘A responsible
person shall ensure that any transaction between a UCITS and a connected person is conducted a) at arm’s length; and b) in the best
interest of the unitholders of the UCITS”.
As required under Central Bank UCITS Regulation 81(4), the Directors, as responsible persons are satisfied that there are in place
arrangements, evidenced by written procedures, to ensure that the obligations that are prescribed by Regulation 42 and 43(1) are
applied to all transactions with a connected party; and all transactions with connected parties that were entered into during the period
to which the report relates complied with the obligations that are prescribed by Regulation 42 and 43(l).
The following were connected persons of the Funds during the financial period ended 30 June 2022:
Connected Person Name
Investment Manager and Distributor Polen Capital Management, LLC
Sub-Investment Manager Polen Capital UK LLP
Depositary RBC Investor Services Bank S.A., Dublin Branch
Administrator RBC Investor Services Ireland Limited
Manager Amundi Ireland Limited

Polen Capital Investment Funds plc
Notes to the Financial Statements (continued)
For the financial period ended 30 June 2022
62
2022 Condensed Interim Report &
Unaudited Financial Statements
8. Related Party Transaction (continued)
Directors’ and Secretary’s Interests
Except as disclosed in Note 8 to the financial statements, at the reporting date neither the directors nor any associated person have any
other beneficial interest in the share capital of the Company or held any options in respect of such capital.
9. Soft Commission Arrangements
There are no soft commission arrangements affecting the Funds during the financial period (31 December 2021: none).
10. Securities Lending
As at 30 June 2022, the Funds had not entered into any securities lending transactions (31 December 2021: none).
11. Significant Events During the Financial Period End
The Polen Capital Focus U.S. Growth Fund GBP Class (Institutional Unhedged Distributing) declared a distribution of GBP
1,436,511 (USD 1,944,390) with record date 31 December 2021 and ex date of 4 January 2022, at the dividend rate 2.260979. The
Polen Capital Focus U.S. Growth Fund GBP D Class (Institutional Unhedged Distributing) declared a distribution of GBP 12,248,827
(USD 16,579,400) with record date 31 December 2021 and ex date of 4 January 2022, at the dividend rate 1.764360. Distributions
were paid on 18 January 2022.
The COVID-19 outbreak has caused extensive disruption to businesses and economic activities globally. The pandemic and the
measures taken to tackle COVID-19, including the development and roll out of vaccines globally, continue to affect economies and
public equity markets globally. The success of vaccine programs are expected to have a major impact on the speed and nature of
economic recovery but the timing and form of the recovery remains uncertain.
Polen Capital Global SMID Company Growth Fund was launched on 31 January 2022.
The following are share classes of the Funds that have been launched:
Fund Class Launch Date
Polen Capital Global SMID Company Growth Fund U.S. Dollar Class (Institutional) Shares 31 January 2022
Polen Capital Global SMID Company Growth Fund GBP Class (Institutional) Shares 03 March 2022
Polen Capital Global SMID Company Growth Fund GBP Class (Institutional Unhedged) Shares 03 March 2022
Polen Capital Global SMID Company Growth Fund GBP Class (Institutional Unhedged Distributing) Shares 03 March 2022
Events arising in Ukraine, as a result of military action being undertaken by Russia in Ukraine, may impact on securities related to
companies domiciled in Russia and/or listed on exchanges located in Russia, including the Moscow Exchange, and/or headquartered
in Russia (“Russian Securities”). None of the Funds, other than Polen Capital Global Emerging Markets Growth Fund (which had
exposure to Russian Securities of approximately 8.46% of its NAV at 31 December 2021), had exposure to Russian Securities. The
Manager continues to monitor the valuation of these assets which have been priced at fair value.
The main body Prospectus was not updated in 2022. However, two new Funds were established on 11 March 2022 namely, Polen
Capital Global Emerging Markets ex China Growth Fund and Polen Capital China Growth Fund. As a result, two new Supplements
were created and the List of Funds Supplement was updated to reference these new Funds.
12. Significant Events Since the Financial Period End
There were no other significant events since the financial year end.
13. Material Changes to Prospectus
There were no other changes to the Prospectus during the financial period.
14. Approval of Financial Statements
The financial statements were approved by the Directors on 25 August 2022.

Polen Capital Investment Funds plc
Polen Capital Focus U.S. Growth Fund
Schedule of Investments
As at 30 June 2022
63
2022 Condensed Interim Report &
Unaudited Financial Statements
(expressed in USD) Nominal Acquisition Fair % net
Description Holdings Currency cost Value assets
A) TRANSFERABLE SECURITIES ADMITTED TO AN OFFICIAL STOCK EXCHANGE LISTING
LISTED SECURITIES: SHARES (31 December 2021: 99.55%)
IRELAND (31 December 2021: 3.70%)
Accenture Plc 413,001 USD 81,823,986 114,669,728 3.62
81,823,986 114,669,728 3.62
UNITED STATES (U.S.A.) (31 December 2021: 95.85%)
Abbott Laboratories 1,381,878 USD 140,377,656 150,141,045 4.73
Adobe Systems Inc 600,589 USD 240,524,684 219,851,609 6.94
Airbnb Inc 1,381,209 USD 199,544,582 123,038,098 3.88
Align Technology Inc 278,244 USD 95,229,905 65,852,007 2.08
Alphabet Inc Class C 129,252 USD 200,192,059 282,732,287 8.92
Amazon.com Inc 2,609,180 USD 412,006,959 277,121,008 8.74
Autodesk Inc 786,796 USD 180,032,417 135,297,440 4.27
DocuSign Inc 817,030 USD 98,785,403 46,881,181 1.48
Gartner Inc 284,411 USD 40,866,271 68,779,112 2.17
Illumina Inc 479,173 USD 139,286,063 88,340,334 2.79
Intuitive Surgical Inc 426,376 USD 110,182,655 85,577,927 2.70
Mastercard Inc 433,734 USD 129,926,884 136,834,402 4.32
Meta Platforms Inc Class A 1,422,074 USD 322,810,104 229,309,433 7.24
Microsoft Corp 564,207 USD 95,393,524 144,905,284 4.57
Netflix Inc 490,398 USD 240,206,551 85,755,898 2.71
NIKE Inc Class B 926,551 USD 106,380,573 94,693,512 2.99
PayPal Holdings Inc 1,277,784 USD 206,296,942 89,240,435 2.82
Salesforce Inc 833,511 USD 174,839,219 137,562,655 4.34
ServiceNow Inc 298,168 USD 124,222,876 141,784,847 4.47
UnitedHealth Group Inc 263,076 USD 88,733,195 135,123,726 4.26
Visa Inc Class A 893,413 USD 171,741,705 175,904,086 5.55
Zoetis Inc 478,297 USD 61,766,690 82,214,472 2.59
3,579,346,917 2,996,940,798 94.56
TOTAL LISTED SECURITIES: SHARES (31 December 2021:
5,363,582,808) 3,661,170,903 3,111,610,526 98.18
TOTAL TRANSFERABLE SECURITIES ADMITTED TO AN
OFFICIAL STOCK EXCHANGE LISTING 3,661,170,903 3,111,610,526 98.18
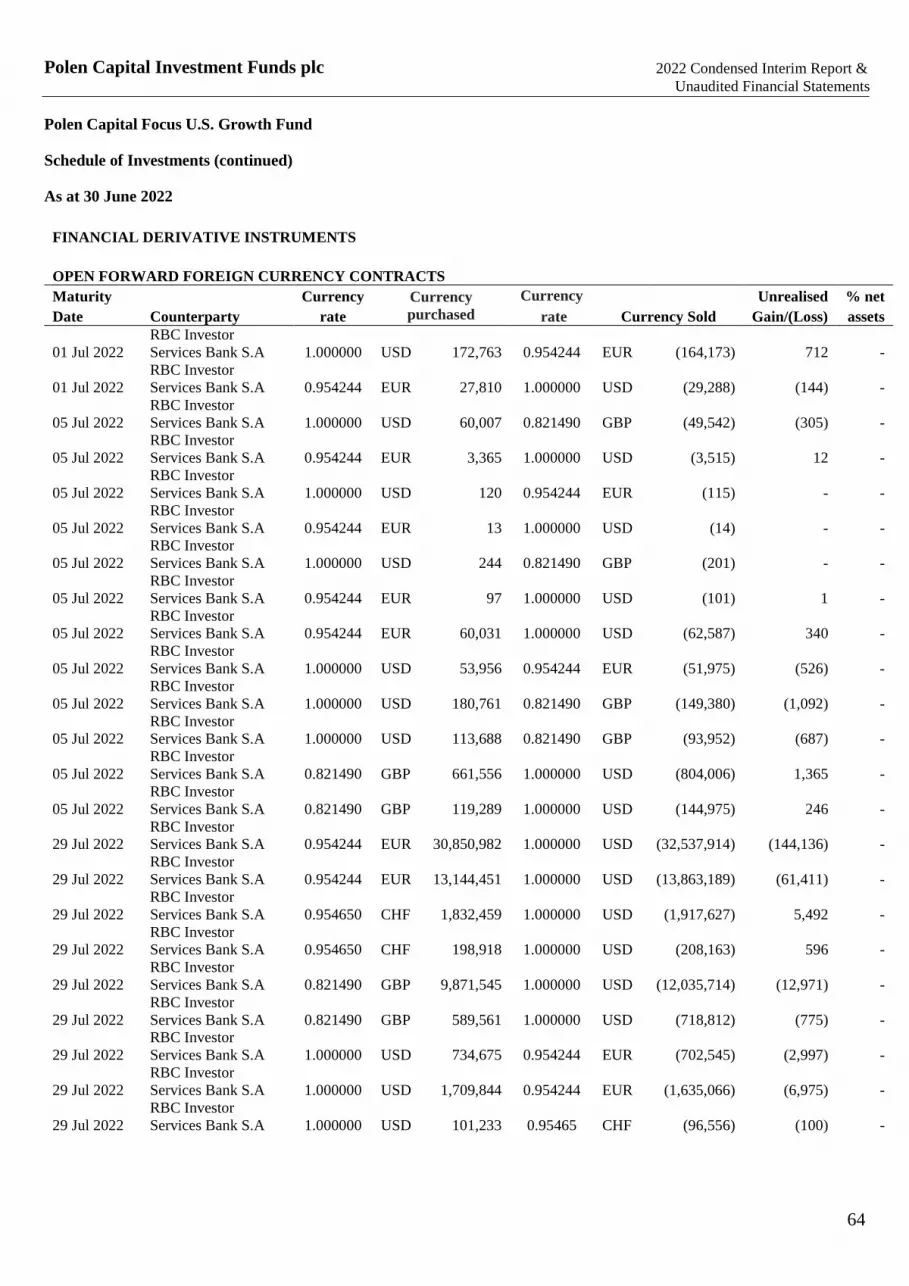
Polen Capital Investment Funds plc
Polen Capital Focus U.S. Growth Fund
Schedule of Investments (continued)
As at 30 June 2022
64
2022 Condensed Interim Report &
Unaudited Financial Statements
FINANCIAL DERIVATIVE INSTRUMENTS
OPEN FORWARD FOREIGN CURRENCY CONTRACTS Maturity Currency Currency
purchased
Currency Unrealised % net
Date Counterparty rate rate Currency Sold Gain/(Loss) assets
01 Jul 2022
RBC Investor
Services Bank S.A 1.000000 USD 172,763 0.954244 EUR (164,173) 712 -
01 Jul 2022
RBC Investor
Services Bank S.A 0.954244 EUR 27,810 1.000000 USD (29,288) (144) -
05 Jul 2022
RBC Investor
Services Bank S.A 1.000000 USD 60,007 0.821490 GBP (49,542) (305) -
05 Jul 2022
RBC Investor
Services Bank S.A 0.954244 EUR 3,365 1.000000 USD (3,515) 12 -
05 Jul 2022
RBC Investor
Services Bank S.A 1.000000 USD 120 0.954244 EUR (115) - -
05 Jul 2022
RBC Investor
Services Bank S.A 0.954244 EUR 13 1.000000 USD (14) - -
05 Jul 2022
RBC Investor
Services Bank S.A 1.000000 USD 244 0.821490 GBP (201) - -
05 Jul 2022
RBC Investor
Services Bank S.A 0.954244 EUR 97 1.000000 USD (101) 1 -
05 Jul 2022
RBC Investor
Services Bank S.A 0.954244 EUR 60,031 1.000000 USD (62,587) 340 -
05 Jul 2022
RBC Investor
Services Bank S.A 1.000000 USD 53,956 0.954244 EUR (51,975) (526) -
05 Jul 2022
RBC Investor
Services Bank S.A 1.000000 USD 180,761 0.821490 GBP (149,380) (1,092) -
05 Jul 2022
RBC Investor
Services Bank S.A 1.000000 USD 113,688 0.821490 GBP (93,952) (687) -
05 Jul 2022
RBC Investor
Services Bank S.A 0.821490 GBP 661,556 1.000000 USD (804,006) 1,365 -
05 Jul 2022
RBC Investor
Services Bank S.A 0.821490 GBP 119,289 1.000000 USD (144,975) 246 -
29 Jul 2022
RBC Investor
Services Bank S.A 0.954244 EUR 30,850,982 1.000000 USD (32,537,914) (144,136) -
29 Jul 2022
RBC Investor
Services Bank S.A 0.954244 EUR 13,144,451 1.000000 USD (13,863,189) (61,411) -
29 Jul 2022
RBC Investor
Services Bank S.A 0.954650 CHF 1,832,459 1.000000 USD (1,917,627) 5,492 -
29 Jul 2022
RBC Investor
Services Bank S.A 0.954650 CHF 198,918 1.000000 USD (208,163) 596 -
29 Jul 2022
RBC Investor
Services Bank S.A 0.821490 GBP 9,871,545 1.000000 USD (12,035,714) (12,971) -
29 Jul 2022
RBC Investor
Services Bank S.A 0.821490 GBP 589,561 1.000000 USD (718,812) (775) -
29 Jul 2022
RBC Investor
Services Bank S.A 1.000000 USD 734,675 0.954244 EUR (702,545) (2,997) -
29 Jul 2022
RBC Investor
Services Bank S.A 1.000000 USD 1,709,844 0.954244 EUR (1,635,066) (6,975) -
29 Jul 2022
RBC Investor
Services Bank S.A 1.000000 USD 101,233 0.95465 CHF (96,556) (100) -

Polen Capital Investment Funds plc
Polen Capital Focus U.S. Growth Fund
Schedule of Investments (continued)
As at 30 June 2022
65
2022 Condensed Interim Report &
Unaudited Financial Statements
Maturity Currency Currency
purchased
Currency Unrealised % net
Date Counterparty rate rate Currency Sold Gain/(Loss) assets
29 Jul 2022
RBC Investor
Services Bank S.A 1.000000 USD 37,758 0.821490 GBP (31,156) (187) -
29 Jul 2022
RBC Investor
Services Bank S.A 1.000000 USD 11,006 0.95465 CHF (10,497) (11) -
29 Jul 2022
RBC Investor
Services Bank S.A 1.000000 USD 631,268 0.821490 GBP (520,887) (3,128) -
29 Jul 2022
RBC Investor
Services Bank S.A 0.954244 EUR 115 1.000000 USD (121) - -
29 Jul 2022
RBC Investor
Services Bank S.A 1.000000 USD 3,519 0.954244 EUR (3,365) (14) -
29 Jul 2022
RBC Investor
Services Bank S.A 0.821490 GBP 49,542 1.000000 USD (60,066) 272 -
NET LOSS ON OPEN FORWARD AND FOREIGN EXCHANGE CONTRACTS (226,423) -
TOTAL FINANCIAL ASSETS AND LIABILITIES AT FAIR VALUE THROUGH PROFIT AND
LOSS 3,111,384,103 98.18
CASH AND CASH EQUIVALENTS
62,971,796 1.99
OTHER ASSETS LESS LIABILITIES
(5,307,661) (0.17)
NET ASSET ATTRIBUTABLE TO HOLDERS OF REDEEMABLE PARTICIPATING SHARES 3,169,048,238 100.00
Assets
% of Total Assets
Financial assets at fair value through profit or loss:
Investment in transferable securities
97.94
Investment in financial derivative instruments assets
0.00
Cash and cash equivalents
1.98
Amount receivable on subscriptions
0.07
Investment manager reimbursement receivable
0.00
Interest and dividends receivable
0.01
Other receivables
0.00
100.00

Polen Capital Investment Funds plc
Polen Capital U.S. Small Company Growth Fund
Schedule of Investments
As at 30 June 2022
66
2022 Condensed Interim Report &
Unaudited Financial Statements
(expressed in USD) Nominal Acquisition Fair % net
Description Holdings Currency cost Value assets
A) TRANSFERABLE SECURITIES ADMITTED TO AN OFFICIAL STOCK EXCHANGE LISTING
LISTED SECURITIES: SHARES (31 December 2021: 98.12%)
BERMUDA ISLANDS (31 December 2021: 2.77%)
Helen of Troy Ltd 1,207 USD 254,537 196,029 2.12
254,537 196,029 2.12
CAYMAN ISLANDS (31 December 2021: Nil)
Farfetch Ltd 19,373 USD 272,455 138,711 1.50
272,455 138,711 1.50
GREAT BRITAIN (31 December 2021: 5.32%)
Endava Plc 2,400 USD 249,263 211,848 2.30
249,263 211,848 2.30
LUXEMBOURG (31 December 2021: 5.29%)
Globant SA 2,380 USD 537,875 414,120 4.49
537,875 414,120 4.49
UNITED STATES (U.S.A.) (31 December 2021:84.74 %)
Alarm.com Holdings Inc 6,169 USD 491,721 381,613 4.14
Altair Engineering Inc 5,759 USD 352,879 302,348 3.28
AMN Healthcare Services Inc 4,348 USD 374,033 477,019 5.16
Appfolio Inc 2,956 USD 395,426 267,932 2.90
Azenta Inc 2,698 USD 193,113 194,526 2.11
Blackline Inc 6,352 USD 664,050 423,043 4.58
Bumble Inc 10,875 USD 294,043 306,131 3.32
Doximity Inc 5,117 USD 206,030 178,174 1.93
Duck Creek Technologies Inc 20,034 USD 707,660 297,505 3.22
Five Below Inc 2,991 USD 353,147 339,269 3.68
Fox Factory Holding Corp 6,515 USD 750,708 524,718 5.69
Goosehead Insurance Inc 8,676 USD 828,808 396,233 4.29
Hamilton Lane Inc 4,984 USD 376,126 334,825 3.63
Houlihan Lokey Inc 6,190 USD 503,450 488,577 5.29

Polen Capital Investment Funds plc
Polen Capital U.S. Small Company Growth Fund
Schedule of Investments (continued)
As at 30 June 2022
67
2022 Condensed Interim Report &
Unaudited Financial Statements
(expressed in USD) Nominal Acquisition Fair % net
Description Holdings Currency cost Value assets
Olo Inc 30,349 USD 772,000 299,545 3.25
Paylocity Holding Corp 1,228 USD 245,081 214,188 2.32
Progyny Inc 12,096 USD 612,575 351,389 3.81
Qualys Inc 4,716 USD 561,795 594,876 6.45
Revolve Group Inc 13,924 USD 600,426 360,771 3.91
SiteOne Landscape Supply Inc 1,618 USD 199,758 192,332 2.08
Warby Parker Inc 14,077 USD 635,147 158,507 1.72
Wingstop Inc 3,511 USD 483,944 262,517 2.84
YETI Holdings Inc 9,904 USD 664,844 428,546 4.64
11,266,764 7,774,584 84.24
TOTAL LISTED SECURITIES: SHARES (31 December 2021: 16,351,269) 12,580,894 8,735,292 94.65
TOTAL TRANSFERABLE SECURITIES ADMITTED TO AN OFFICIAL
STOCK EXCHANGE LISTING 12,580,894 8,735,292 94.65
TOTAL FINANCIAL ASSETS AT FAIR VALUE THROUGH PROFIT AND LOSS 8,735,292 94.65
CASH AND CASH EQUIVALENTS
790,966 8.57
OTHER ASSETS LESS LIABILITIES
(297,546) (3.22)
NET ASSET ATTRIBUTABLE TO HOLDERS OF REDEEMABLE PARTICIPATING SHARES 9,228,712 100.00
Assets
% of Total Assets
Financial assets at fair value through profit or loss:
Investment in transferable securities
91.47
Cash and cash equivalents
8.28
Investment manager reimbursement receivable
0.03
Interest and dividends receivable
0.01
Other receivables
0.21
100.00

Polen Capital Investment Funds plc
Polen Capital International Growth Fund
Schedule of Investments
As at 30 June 2022
68
2022 Condensed Interim Report &
Unaudited Financial Statements
(expressed in USD) Nominal Acquisition Fair % net
Description Holdings Currency cost Value assets
A) TRANSFERABLE SECURITIES ADMITTED TO AN OFFICIAL STOCK EXCHANGE LISTING
LISTED SECURITIES: SHARES (31 December 2021: 97.08%)
AUSTRALIA (31 December 2021: 3.31%)
CSL Ltd 4,721 AUD 937,236 876,778 3.58
937,236 876,778 3.58
CANADA (31 December 2021: 1.35%)
Shopify Inc 13,800 USD 950,328 431,112 1.76
950,328 431,112 1.76
CAYMAN ISLANDS (31 December 2021: 3.75%)
Shenzhou International Group Holdings
Ltd 42,188 HKD 740,286 511,031 2.09
Tencent Holdings Ltd 20,318 HKD 1,141,248 917,657 3.75
1,881,534 1,428,688 5.84
FRANCE (31 December 2021: 8.90%)
Dassault Systemes SE 6,448 EUR 262,828 237,278 0.97
Kering SA 1,441 EUR 1,086,419 740,098 3.02
LVMH Moet Hennessy Louis Vuitton SE 1,743 EUR 1,072,990 1,062,520 4.34
2,422,237 2,039,896 8.33
GERMANY (31 December 2021: 17.75%)
adidas AG 7,359 EUR 2,221,453 1,301,454 5.31
SAP SE 11,992 EUR 1,558,791 1,092,451 4.46
Siemens Healthineers AG 35,812 EUR 1,932,654 1,819,790 7.43
5,712,898 4,213,695 17.20
GREAT BRITAIN (31 December 2021: 8.70%)
Bunzl Plc 14,491 GBP 431,816 479,629 1.96
Sage Group Plc 142,637 GBP 1,244,708 1,102,216 4.50
Unilever Plc 11,456 GBP 661,193 518,908 2.12
2,337,717 2,100,753 8.58

Polen Capital Investment Funds plc
Polen Capital International Growth Fund
Schedule of Investments (continued)
As at 30 June 2022
69
2022 Condensed Interim Report &
Unaudited Financial Statements
(expressed in USD) Nominal Acquisition Fair % net
Description Holdings Currency cost Value assets
IRELAND (31 December 2021: 25.44%)
Accenture Plc 3,921 USD 939,224 1,088,666 4.45
Aon Plc 8,461 USD 2,331,356 2,281,762 9.32
ICON Plc 10,654 USD 2,187,648 2,308,721 9.43
Medtronic Plc 12,269 USD 1,333,144 1,101,143 4.49
6,791,372 6,780,292 27.69
JERSEY (31 December 2021: 3.94%)
Experian Plc 23,871 GBP 846,337 699,140 2.85
846,337 699,140 2.85
LUXEMBOURG (31 December 2021: 0.99%)
Globant SA 2,988 USD 760,745 519,912 2.12
760,745 519,912 2.12
NETHERLANDS (31 December 2021: 3.96%)
ASML Holding NV 1,928 EUR 1,376,472 921,021 3.76
1,376,472 921,021 3.76
SPAIN (31 December 2021: 2.57%)
Amadeus IT Group SA 10,603 EUR 703,478 590,683 2.41
703,478 590,683 2.41
SWEDEN (31 December 2021: 6.53%)
Evolution AB 15,964 SEK 2,106,461 1,451,463 5.93
2,106,461 1,451,463 5.93
SWITZERLAND (31 December 2021: 6.12%)
Temenos AG 12,708 CHF 1,466,886 1,086,499 4.44
1,466,886 1,086,499 4.44
UNITED STATES (U.S.A.) (31 December 2021: 2.74%)
MercadoLibre Inc 885 USD 1,052,895 563,630 2.30
1,052,895 563,630 2.30
TOTAL LISTED SECURITIES: SHARES (31 December 2021: 38,581,367) 29,346,596 23,703,562 96.79

Polen Capital Investment Funds plc
Polen Capital International Growth Fund
Schedule of Investments (continued)
As at 30 June 2022
70
2022 Condensed Interim Report &
Unaudited Financial Statements
(expressed in USD) Acquisition Fair % net
Description cost Value assets
TOTAL TRANSFERABLE SECURITIES ADMITTED TO AN OFFICIAL
STOCK EXCHANGE LISTING 29,346,596 23,703,562 96.79
TOTAL FINANCIAL ASSETS AT FAIR VALUE THROUGH PROFIT AND LOSS 23,703,562 96.79
CASH AND CASH EQUIVALENTS
719,194 2.94
OTHER ASSETS LESS LIABILITIES
66,591 0.27
NET ASSET ATTRIBUTABLE TO HOLDERS OF REDEEMABLE PARTICIPATING
SHARES 24,489,347 100.00
Assets
% of Total Assets
Financial assets at fair value through profit or loss:
Investment in transferable securities
96.53
Cash and cash equivalents
2.93
Amount receivable on sale of securities
0.37
Interest and dividends receivable
0.08
Other receivables
0.09
100.00

Polen Capital Investment Funds plc
Polen Capital Global Emerging Markets Growth Fund
Schedule of Investments
As at 30 June 2022
71
2022 Condensed Interim Report &
Unaudited Financial Statements
(expressed in USD) Nominal Acquisition Fair % net
Description Holdings Currency cost Value assets
A) TRANSFERABLE SECURITIES ADMITTED TO AN OFFICIAL STOCK EXCHANGE LISTING
LISTED SECURITIES: SHARES (31 December 2021: 86.41%)
BRAZIL (31 December 2021: 2.97%)
Raia Drogasil SA
13,200 BRL 59,821 48,427 2.09
59,821 48,427 2.09
CAYMAN ISLANDS (31 December 2021: 22.71%)
Alibaba Group Holding Ltd
6,200 HKD 196,654 88,415 3.82
ANTA Sports Products Ltd
4,600 HKD 50,768 56,512 2.44
NagaCorp Ltd
180,000 HKD 170,040 147,269 6.37
NetEase Inc
3,900 HKD 71,989 71,620 3.10
Tencent Music Entertainment
Group
23,307 USD 208,989 117,001 5.06
Tingyi Cayman Islands
Holding Corp
40,000 HKD 76,044 68,512 2.96
774,484 549,329 23.75
CHINA (31 December 2021: 5.89%)
Inner Mongolia Yili Industrial
Group Co Ltd
18,383 CNY 109,776 106,959 4.63
Zhejiang Supor Co Ltd
6,700 CNY 72,520 56,388 2.44
182,296 163,347 7.07
INDIA (31 December 2021: 19.97%)
Bajaj Auto Ltd
1,620 INR 76,826 76,037 3.29
Colgate-Palmolive India Ltd
1,250 INR 25,673 23,535 1.02
HDFC Bank Ltd
7,540 INR 150,635 128,706 5.57
Titan Co Ltd
3,470 INR 62,108 85,300 3.68
United Spirits Ltd
3,700 INR 29,494 35,597 1.54
344,736 349,175 15.10
JERSEY (31 December 2021: Nil)
Wizz Air Holdings Plc
1,830 GBP 93,354 39,073 1.69
93,354 39,073 1.69
MEXICO (31 December 2021: 4.08%)
Fomento Economico
Mexicano SAB de CV
9,880 MXN 62,369 66,686 2.88
62,369 66,686 2.88

Polen Capital Investment Funds plc
Polen Capital Global Emerging Markets Growth Fund
Schedule of Investments (continued)
As at 30 June 2022
72
2022 Condensed Interim Report &
Unaudited Financial Statements
(expressed in USD) Nominal Acquisition Fair % net
Description Holdings Currency cost Value assets
NETHERLANDS (31 December 2021: 10.23%)
Prosus NV
1,312 EUR 129,520 85,904 3.71
Yandex NV
3,775 USD 235,868 38 0.00
365,388 85,942 3.71
SINGAPORE (31 December 2021: 5.49%)
Karooooo Ltd
4,339 USD 123,520 94,807 4.10
123,520 94,807 4.10
SOUTH AFRICA (31 December 2021: 3.93%)
Discovery Ltd
5,580 ZAR 47,003 43,937 1.90
Mr Price Group Ltd
5,850 ZAR 59,252 63,780 2.76
106,255 107,717 4.66
TAIWAN (31 December 2021: 5.33%)
momo.com Inc
3,000 TWD 107,716 64,372 2.78
Taiwan Semiconductor
Manufacturing Co Ltd
3,000 TWD 69,524 48,027 2.08
177,240 112,399 4.86
THAILAND (31 December 2021: 0.99%)
Home Product Center PCL
71,300 THB 32,200 25,612 1.11
32,200 25,612 1.11
UNITED STATES (U.S.A.) (31 December 2021: 2.19%)
MercadoLibre Inc
73 USD 86,222 46,492 2.01
86,222 46,492 2.01
VIRGIN ISLANDS (UK) (31 December 2021: Nil)
VK Co Ltd
4,680 USD 134,225 47 0.00
134,225 47 0.00
TOTAL LISTED SECURITIES: SHARES (31 December 2021:
2,713,068)
2,542,110 1,689,053 73.03
TOTAL TRANSFERABLE SECURITIES ADMITTED TO AN
OFFICIAL STOCK EXCHANGE LISTING
2,542,110 1,689,053 73.03

Polen Capital Investment Funds plc
Polen Capital Global Emerging Markets Growth Fund
Schedule of Investments (continued)
As at 30 June 2022
73
2022 Condensed Interim Report &
Unaudited Financial Statements
(expressed in USD) Nominal Acquisition Fair % net
Description Holdings Currency cost Value assets
B) OTHER TRANSFERABLE SECURITIES DEALT ON ANOTHER REGULATED MARKET
OTHER ORGANISED MARKET: SHARES (31 December 2021:11.40%)
VIETNAM (31 December 2021: 11.40%)
Mobile World Investment
Corp
69,000 VND 152,309 212,056 9.17
Phu Nhuan Jewelry JSC
28,600 VND 96,470 157,967 6.83
Vietnam Dairy Products JSC
16,800 VND 70,173 53,149 2.30
318,952 423,172 18.30
TOTAL OTHER ORGANISED MARKET: SHARES (31 December 2021:
358,300) 318,952 423,172 18.30
TOTAL OTHER TRANSFERABLE SECURITIES DEALT ON
ANOTHER REGULATED MARKET
318,952 423,172 18.30
C) OTHER TRANSFERABLE SECURITIES
OTHER TRANSFERABLE SECURITIES : SHARES (31 December 2021: nil)
CAYMAN ISLANDS (31 December 2021: nil)
Autohome Inc
11,700 HKD 169,670 116,152 5.02
169,670 116,152 5.02
TOTAL OTHER TRANSFERABLE SECURITIES : SHARES (31
December 2021: nil)
169,670 116,152 5.02
TOTAL OTHER TRANSFERABLE SECURITIES 169,670 116,152 5.02

Polen Capital Investment Funds plc
Polen Capital Global Emerging Markets Growth Fund
Schedule of Investments (continued)
As at 30 June 2022
74
2022 Condensed Interim Report &
Unaudited Financial Statements
FINANCIAL DERIVATIVE INSTRUMENTS
OPEN FORWARD FOREIGN CURRENCY CONTRACTS
Currency Currency
Purchased
Currency Currency
Sold
Unrealised % net
Maturity Counterparty rate rate Gain/(Loss) assets
29 Jul 2022
RBC Investor
Services Bank
S.A 0.954244 EUR 349,763 1.000000 USD (368,888) (1,634) (0.07)
29 Jul 2022
RBC Investor
Services Bank
S.A 0.821490 GBP 8,240 1.000000 USD (10,048) (13) -
29 Jul 2022
RBC Investor
Services Bank
S.A 0.954244 EUR 13,079 1.000000 USD (13,795) (62) -
29 Jul 2022
RBC Investor
Services Bank
S.A 0.821490 GBP 219,414 1.000000 USD (267,516) (288) (0.01)
NET LOSS ON OPEN FORWARD AND FOREIGN EXCHANGE CONTRACTS
(1,997)
(0.08)
TOTAL FINANCIAL ASSETS AND LIABILITIES AT FAIR VALUE THROUGH PROFIT AND
LOSS 2,226,380 96.27
CASH AND CASH EQUIVALENTS 75,279 3.26
OTHER ASSETS LESS LIABILITIES 10,764 0.47
NET ASSET ATTRIBUTABLE TO HOLDERS OF REDEEMABLE PARTICIPATING SHARES 2,312,423 100.00
Assets
% of Total Assets
Financial assets at fair value through profit or loss:
Investment in transferable securities
95.72
Cash and cash equivalents
3.23
Investment manager reimbursement receivable
0.14
Interest and dividends receivable
0.51
Other receivables
0.40
100.00
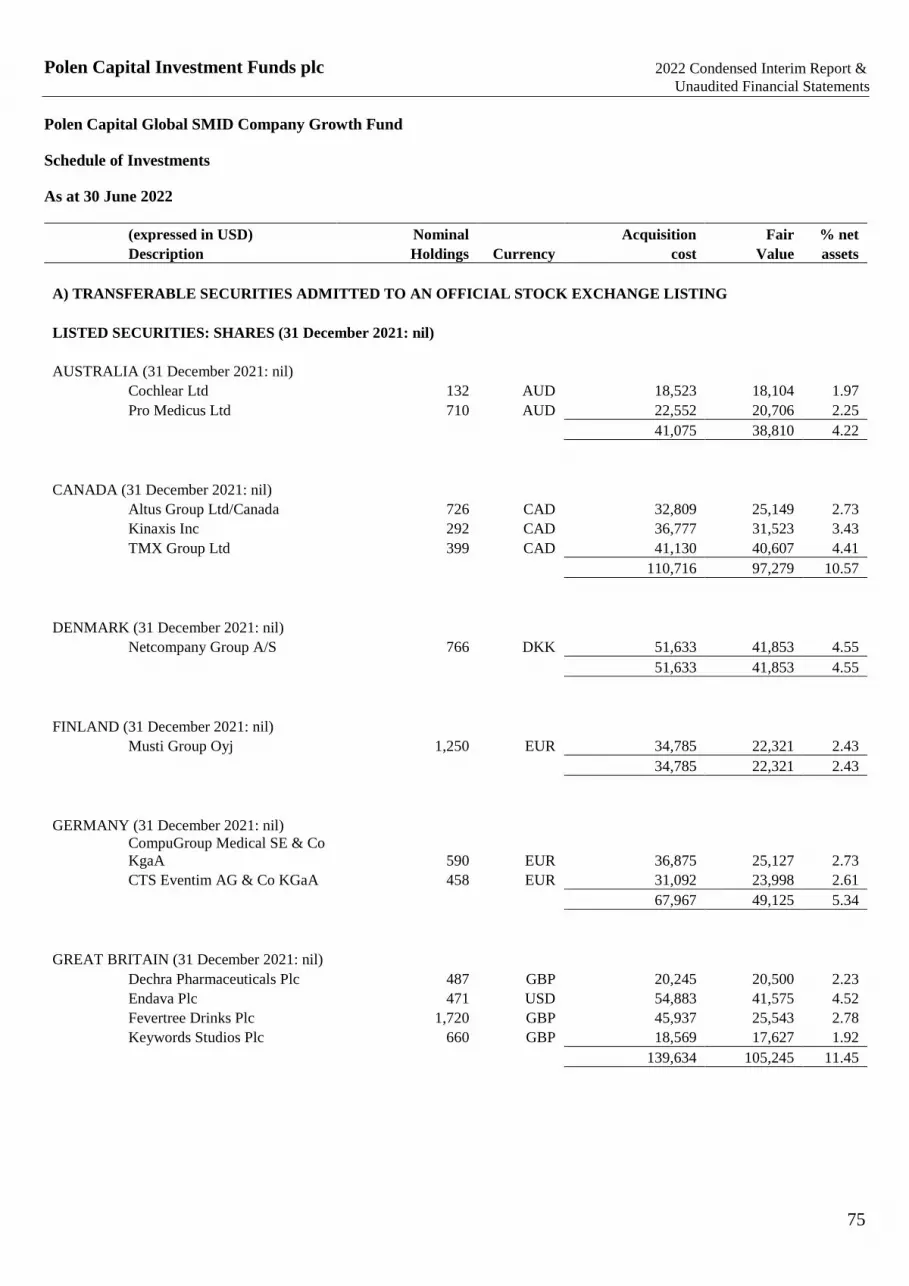
Polen Capital Investment Funds plc
Polen Capital Global SMID Company Growth Fund
Schedule of Investments
As at 30 June 2022
75
2022 Condensed Interim Report &
Unaudited Financial Statements
(expressed in USD) Nominal Acquisition Fair % net
Description Holdings Currency cost Value assets
A) TRANSFERABLE SECURITIES ADMITTED TO AN OFFICIAL STOCK EXCHANGE LISTING
LISTED SECURITIES: SHARES (31 December 2021: nil)
AUSTRALIA (31 December 2021: nil)
Cochlear Ltd 132 AUD 18,523 18,104 1.97
Pro Medicus Ltd 710 AUD 22,552 20,706 2.25
41,075 38,810 4.22
CANADA (31 December 2021: nil)
Altus Group Ltd/Canada 726 CAD 32,809 25,149 2.73
Kinaxis Inc 292 CAD 36,777 31,523 3.43
TMX Group Ltd 399 CAD 41,130 40,607 4.41
110,716 97,279 10.57
DENMARK (31 December 2021: nil)
Netcompany Group A/S 766 DKK 51,633 41,853 4.55
51,633 41,853 4.55
FINLAND (31 December 2021: nil)
Musti Group Oyj 1,250 EUR 34,785 22,321 2.43
34,785 22,321 2.43
GERMANY (31 December 2021: nil)
CompuGroup Medical SE & Co
KgaA 590 EUR 36,875 25,127 2.73
CTS Eventim AG & Co KGaA 458 EUR 31,092 23,998 2.61
67,967 49,125 5.34
GREAT BRITAIN (31 December 2021: nil)
Dechra Pharmaceuticals Plc 487 GBP 20,245 20,500 2.23
Endava Plc 471 USD 54,883 41,575 4.52
Fevertree Drinks Plc 1,720 GBP 45,937 25,543 2.78
Keywords Studios Plc 660 GBP 18,569 17,627 1.92
139,634 105,245 11.45

Polen Capital Investment Funds plc
Polen Capital Global SMID Company Growth Fund
Schedule of Investments (continued)
As at 30 June 2022
76
2022 Condensed Interim Report &
Unaudited Financial Statements
(expressed in USD) Nominal Acquisition Fair % net
Description Holdings Currency cost Value assets
JAPAN (31 December 2021: nil)
Benefit One Inc 1,100 JPY 31,183 14,788 1.61
Kakaku.com Inc 1,500 JPY 30,546 24,742 2.69
61,729 39,530 4.30
LUXEMBOURG (31 December 2021: nil)
Globant SA 284 USD 70,608 49,416 5.37
70,608 49,416 5.37
NETHERLANDS (31 December 2021: nil)
Euronext NV 604 EUR 50,722 49,308 5.36
50,722 49,308 5.36
SOUTH KOREA (31 December 2021: nil)
Douzone Bizon Co Ltd 630 KRW 26,440 17,706 1.93
Koh Young Technology Inc 2,570 KRW 42,354 27,902 3.03
68,794 45,608 4.96
SWEDEN (31 December 2021: nil)
Thule Group AB 562 SEK 25,053 13,806 1.50
25,053 13,806 1.50
SWITZERLAND (31 December 2021: nil)
Tecan Group AG 136 CHF 46,641 39,490 4.29
Temenos AG 430 CHF 47,703 36,764 4.00
94,344 76,254 8.29
UNITED STATES (U.S.A.) (31 December 2021: nil)
Azenta Inc 359 USD 25,386 25,884 2.81
Dynatrace Inc 783 USD 40,200 30,882 3.35
Fair Isaac Corp 105 USD 51,767 42,095 4.58
Five Below Inc 240 USD 38,004 27,223 2.95

Polen Capital Investment Funds plc
Polen Capital Global SMID Company Growth Fund
Schedule of Investments (continued)
As at 30 June 2022
77
2022 Condensed Interim Report &
Unaudited Financial Statements
(expressed in USD) Nominal Acquisition Fair % net
Description Holdings Currency cost Value assets
Floor & Decor Holdings Inc 556 USD 57,243 35,006 3.81
Goosehead Insurance Inc 364 USD 32,743 16,624 1.81
Paycom Software Inc 165 USD 54,301 46,220 5.03
Revolve Group Inc 771 USD 36,347 19,976 2.17
Tyler Technologies Inc 54 USD 24,802 17,954 1.95
YETI Holdings Inc 580 USD 36,887 25,097 2.73
397,680 286,961 31.19
TOTAL LISTED SECURITIES: SHARES (31 December 2021: nil) 1,214,740 915,516 99.53
TOTAL TRANSFERABLE SECURITIES ADMITTED TO
AN OFFICIAL STOCK EXCHANGE LISTING
1,214,740 915,516 99.53
FINANCIAL DERIVATIVE INSTRUMENTS
OPEN FORWARD FOREIGN CURRENCY CONTRACTS
Currency Currency
Purchased
Currency Unrealised % net
Maturity Counterparty rate rate Currency Sold Gain/(Loss) assets
01 Jul 2022
RBC Investor
Services Bank S.A 1.000000 USD 3,043 0.821490 GBP (2,499) 2 -
29 Jul 2022
RBC Investor
Services Bank S.A 0.821490 GBP 191,037 1.000000 USD (232,918) (251) (0.03)
29 Jul 2022
RBC Investor
Services Bank S.A 0.821490 GBP 2,499 1.000000 USD (3,047) (3) -
29 Jul 2022
RBC Investor
Services Bank S.A 1.000000 USD 5,770 0.821490 GBP (4,761) (29) -
NET LOSS ON OPEN FORWARD AND FOREIGN EXCHANGE CONTRACTS
(281) (0.03)
TOTAL FINANCIAL ASSETS AND LIABILITIES AT FAIR VALUE THROUGH PROFIT AND
LOSS 915,235 99.50
CASH AND CASH EQUIVALENTS 11,208 1.22
OTHER ASSETS LESS LIABILITIES (6,663) (0.72)
NET ASSET ATTRIBUTABLE TO HOLDERS OF REDEEMABLE PARTICIPATING SHARES 919,780 100.00
Assets
% of Total Assets
Financial assets at fair value through profit or loss:
Investment in transferable securities
94.70
Investment in financial derivative instruments assets 0.00
Cash and cash equivalents
2.05
Amount receivable on sale of securities
1.29
Amount receivable on subscriptions
0.31
Investment manager reimbursement receivable
0.39
Interest and dividends receivable
0.01
Other receivables
1.25
100.00

Polen Capital Investment Funds plc
Polen Capital Focus U.S. Growth Fund
Schedule of Significant Portfolio Changes
For the financial period ended 30 June 2022
78
2022 Condensed Interim Report &
Unaudited Financial Statements
Significant Purchases*
Quantity Cost % of Total
Security Name USD Purchases
Meta Platforms Inc Class A 830,042 168,825,961 18.77
Netflix Inc 227,500 86,537,631 9.62
Amazon.com Inc 2,657,267 84,154,253 9.36
Adobe Systems Inc 185,409 80,288,820 8.93
Airbnb Inc 532,350 66,617,919 7.41
DocuSign Inc 501,460 52,408,480 5.83
Illumina Inc 229,546 52,040,365 5.79
Intuitive Surgical Inc 179,000 50,453,587 5.61
Align Technology Inc 140,500 49,332,122 5.49
Alphabet Inc Class C 17,900 45,041,362 5.01
Salesforce Inc 199,900 42,037,102 4.67
ServiceNow Inc 43,200 26,016,116 2.89
PayPal Holdings Inc 308,400 24,953,676 2.77
Visa Inc Class A 93,000 18,859,127 2.10
Autodesk Inc 85,700 15,970,884 1.78
Mastercard Inc 42,380 14,767,370 1.64
NIKE Inc Class B 106,000 12,515,323 1.39
MSCI Inc 8,000 4,465,167 0.50
Abbott Laboratories 34,100 3,985,465 0.44 *In accordance with the UCITS regulations this schedule presents the aggregate purchases and aggregate sales of a security exceeding 1.00% of the total value of
purchases or sales for the period or at least the top 20 purchases and sales. The full list of purchases and sales for the period ended 30 June 2022 is available on request
from the Administrator.

Polen Capital Investment Funds plc
Polen Capital Focus U.S. Growth Fund
Schedule of Significant Portfolio Changes (continued)
For the financial period ended 30 June2022
79
2022 Condensed Interim Report &
Unaudited Financial Statements
Significant Sales*
Quantity Proceeds % of Total
Security Name USD Sales
Visa Inc Class A 610,200 132,726,768 9.65
Alphabet Inc Class C 50,900 132,680,926 9.64
Starbucks Corp 1,315,207 128,786,949 9.36
Amazon.com Inc 185,600 124,786,890 9.07
Mastercard Inc 255,000 94,006,355 6.83
UnitedHealth Group Inc 191,500 92,556,011 6.73
MSCI Inc 167,743 84,892,524 6.17
Meta Platforms Inc Class A 365,100 82,158,424 5.97
Airbnb Inc 468,021 80,563,272 5.85
Zoetis Inc 363,035 67,929,659 4.94
Salesforce Inc 252,937 51,338,805 3.73
Microsoft Corp 164,100 46,602,538 3.39
Abbott Laboratories 343,400 40,804,489 2.97
Netflix Inc 105,800 35,061,007 2.55
Adobe Systems Inc 61,200 28,758,556 2.09
NIKE Inc Class B 183,800 25,589,297 1.86
Accenture Plc 68,400 20,824,233 1.51
Autodesk Inc 95,000 19,459,505 1.41
Intuitive Surgical Inc 64,600 19,244,614 1.40
Align Technology Inc 27,000 14,349,987 1.04
*In accordance with the UCITS regulations this schedule presents the aggregate purchases and aggregate sales of a security exceeding 1.00% of the total value of
purchases or sales for the period or at least the top 20 purchases and sales. The full list of purchases and sales for the period ended 30 June 2022 is available on request
from the Administrator.

Polen Capital Investment Funds plc
Polen Capital U.S. Small Company Growth Fund
Schedule of Significant Portfolio Changes
For the financial period ended 30 June 2022
80
2022 Condensed Interim Report &
Unaudited Financial Statements
Significant Purchases*
Quantity Cost % of Total
Security Name USD Purchases Hamilton Lane Inc 5,218 394,244 7.52 Five Below Inc 2,991 353,147 6.74 Bumble Inc 11,811 319,792 6.10 Goosehead Insurance Inc 4,671 302,397 5.77 Farfetch Ltd 20,502 288,583 5.51 Fox Factory Holding Corp 2,620 258,274 4.93 YETI Holdings Inc 4,291 258,225 4.93 Qualys Inc 1,861 250,276 4.78 Revolve Group Inc 5,103 226,065 4.31 Warby Parker Inc 6,621 216,401 4.13 Doximity Inc 5,117 206,030 3.93 SiteOne Landscape Supply Inc 1,618 199,758 3.81 Azenta Inc 2,698 193,113 3.69 Globant SA 541 136,113 2.60 Blackline Inc 1,793 131,569 2.51 Olo Inc 10,832 130,093 2.48 Endava Plc 1,000 129,055 2.46 Houlihan Lokey Inc 1,380 125,729 2.40 AMN Healthcare Services Inc 1,238 125,690 2.40 Progyny Inc 2,705 123,832 2.36 Trupanion Inc 1,375 119,956 2.29 Appfolio Inc 1,066 116,263 2.22 Duck Creek Technologies Inc 4,467 96,559 1.84 Alarm.com Holdings Inc 1,379 91,420 1.74 Malibu Boats Inc 1,530 89,809 1.71 Wingstop Inc 796 88,585 1.69 Altair Engineering Inc 1,279 78,923 1.51 Helen of Troy Ltd 287 56,340 1.08 Paylocity Holding Corp 280 55,758 1.06 BigCommerce Holdings Inc 2,483 55,296 1.06 *In accordance with the UCITS regulations this schedule presents the aggregate purchases and aggregate sales of a security exceeding 1.00% of the total value of
purchases or sales for the period or at least the top 20 purchases and sales. The full list of purchases and sales for the period ended 30 June 2022 is available on request from the Administrator.

Polen Capital Investment Funds plc
Polen Capital U.S. Small Company Growth Fund
Schedule of Significant Portfolio Changes (continued)
For the financial period ended 30 June 2022
81
2022 Condensed Interim Report &
Unaudited Financial Statements
Significant Sales*
Quantity Proceeds % of Total
Security Name USD Sales
Exponent Inc 6,567 590,438 9.49
Medpace Holdings Inc 3,908 581,656 9.35
Trupanion Inc 7,862 484,505 7.78
Malibu Boats Inc 8,746 484,326 7.78
Endava Plc 3,875 443,996 7.13
Appfolio Inc 3,135 332,611 5.34
Wingstop Inc 2,117 308,732 4.96
BigCommerce Holdings Inc 15,129 300,012 4.82
AMN Healthcare Services Inc 2,695 283,539 4.56
Globant SA 967 236,320 3.80
Helen of Troy Ltd 970 206,586 3.32
Fox Factory Holding Corp 1,532 190,557 3.06
Houlihan Lokey Inc 1,712 171,976 2.76
Revolve Group Inc 3,394 159,522 2.56
Paylocity Holding Corp 722 143,305 2.30
Qualys Inc 1,092 139,171 2.24
Progyny Inc 3,349 139,118 2.24
YETI Holdings Inc 2,150 137,917 2.22
Goosehead Insurance Inc 1,560 136,266 2.19
Blackline Inc 1,612 132,527 2.13
Duck Creek Technologies Inc 5,547 128,385 2.06
Alarm.com Holdings Inc 1,713 122,847 1.97
Warby Parker Inc 3,386 110,833 1.78
Olo Inc 7,014 108,360 1.74
Altair Engineering Inc 1,590 97,508 1.57 *In accordance with the UCITS regulations this schedule presents the aggregate purchases and aggregate sales of a security exceeding 1.00% of the total value of
purchases or sales for the period or at least the top 20 purchases and sales. The full list of purchases and sales for the period ended 30 June 2022 is available on request
from the Administrator.

Polen Capital Investment Funds plc
Polen Capital International Growth Fund
Schedule of Significant Portfolio Changes
For the financial period ended 30 June 2022
82
2022 Condensed Interim Report &
Unaudited Financial Statements
Significant Purchases*
Quantity Cost % of Total
Security Name USD Purchases
Aon Plc 7,690 2,297,267 24.23
Shenzhou International Group Holdings Ltd 52,988 929,797 9.81
ICON Plc 3,160 787,776 8.31
Shopify Inc 1,390 737,092 7.77
Temenos AG 7,410 660,999 6.97
Evolution AB 6,275 636,151 6.71
Siemens Healthineers AG 10,300 557,783 5.88
Globant SA 2,029 445,543 4.70
adidas AG 1,800 393,380 4.15
MercadoLibre Inc 320 276,567 2.92
Tencent Holdings Ltd 6,100 249,304 2.63
ASML Holding NV 300 200,074 2.11
Medtronic Plc 1,660 165,572 1.75
Experian Plc 4,080 164,935 1.74
LVMH Moet Hennessy Louis Vuitton SE 250 160,583 1.69 CSL Ltd 830 153,201 1.62
Kering SA 250 140,878 1.49
SAP SE 1,230 134,466 1.42
Accenture Plc 360 127,761 1.35
Sage Group Plc 11,390 99,083 1.05 *In accordance with the UCITS regulations this schedule presents the aggregate purchases and aggregate sales of a security exceeding 1.00% of the total value of
purchases or sales for the period or at least the top 20 purchases and sales. The full list of purchases and sales for the period ended 30 June 2022 is available on request
from the Administrator.

Polen Capital Investment Funds plc
Polen Capital International Growth Fund
Schedule of Significant Portfolio Changes (continued)
For the financial period ended 30 June 2022
83
2022 Condensed Interim Report &
Unaudited Financial Statements
Significant Sales*
Quantity Proceeds % of Total
Security Name USD Sales
Aon Plc 8,970 2,730,972 20.91
ICON Plc 4,309 1,016,619 7.78
Evolution AB 8,540 967,940 7.41
adidas AG 3,270 747,530 5.72
Temenos AG 7,570 738,374 5.65
Siemens Healthineers AG 11,180 641,488 4.91
Nestle SA 4,658 620,762 4.75
Medtronic Plc 5,800 616,962 4.72
Tencent Holdings Ltd 11,200 562,668 4.31
CSL Ltd 2,320 446,400 3.42
Experian Plc 12,086 427,587 3.27
Wal-Mart de Mexico SAB de CV 110,057 415,277 3.18
Dassault Systemes SE 7,357 322,741 2.47
Sage Group Plc 32,450 311,177 2.38
Amadeus IT Group SA 4,540 295,252 2.26
LVMH Moet Hennessy Louis Vuitton SE 420 291,718 2.23
MercadoLibre Inc 244 286,761 2.20
Accenture Plc 840 255,712 1.96
Bunzl Plc 5,490 211,402 1.62
ASML Holding NV 330 205,551 1.57
Unilever Plc 4,310 203,322 1.56
Shopify Inc 400 174,223 1.33
Kering SA 300 170,284 1.30
SAP SE 1,630 158,959 1.22
Shenzhou International Group Holdings Ltd 10,800 146,768 1.12 *In accordance with the UCITS regulations this schedule presents the aggregate purchases and aggregate sales of a security exceeding 1.00% of the total value of
purchases or sales for the period or at least the top 20 purchases and sales. The full list of purchases and sales for the period ended 30 June 2022 is available on request
from the Administrator.

Polen Capital Investment Funds plc
Polen Capital Global Emerging Markets Growth Fund
Schedule of Significant Portfolio Changes
For the financial period ended 30 June 2022
84
2022 Condensed Interim Report &
Unaudited Financial Statements
Significant Purchases*
Quantity Cost % of Total
Security Name USD Purchases
Wizz Air Holdings Plc 1,830 93,354 20.32
Taiwan Semiconductor Manufacturing Co Ltd 3,000 69,524 15.13
HDFC Bank Ltd 3,250 66,509 14.47
Tencent Music Entertainment Group 9,880 57,525 12.51
momo.com Inc 1,750 48,317 10.52
Autohome Inc 1,320 43,063 9.37
Vietnam Dairy Products JSC 8,400 31,136 6.78
MercadoLibre Inc 22 18,270 3.98
Alibaba Group Holding Ltd 1,000 14,832 3.22
Yandex NV 280 14,733 3.21
Karooooo Ltd 111 2,232 0.49 *In accordance with the UCITS regulations this schedule presents the aggregate purchases and aggregate sales of a security exceeding 1.00% of the total value of
purchases or sales for the period or at least the top 20 purchases and sales. The full list of purchases and sales for the period ended 30 June 2022 is available on request
from the Administrator.

Polen Capital Investment Funds plc
Polen Capital Global Emerging Markets Growth Fund
Schedule of Significant Portfolio Changes (continued)
For the financial period ended 30 June 2022
85
2022 Condensed Interim Report &
Unaudited Financial Statements
Significant Sales*
Quantity Proceeds % of Total
Security Name USD Sales
Colgate-Palmolive India Ltd 7,130 136,409 23.79
President Chain Store Corp 11,000 105,493 18.40
Britannia Industries Ltd 1,450 66,572 11.61
United Spirits Ltd 5,870 57,939 10.11
Fomento Economico Mexicano SAB de CV 6,560 51,670 9.01
Raia Drogasil SA 8,200 40,480 7.06
Tingyi Cayman Islands Holding Corp 16,000 29,131 5.08
Ping An Healthcare and Technology Co Ltd 8,500 27,573 4.81
Vitasoy International Holdings Ltd 14,000 27,517 4.80
ANTA Sports Products Ltd 2,400 23,728 4.14
TAL Education Group 1,940 6,830 1.19
*In accordance with the UCITS regulations this schedule presents the aggregate purchases and aggregate sales of a security exceeding 1.00% of the total value of purchases or sales for the period or at least the top 20 purchases and sales. The full list of purchases and sales for the period ended 30 June 2022 is available on request
from the Administrator.

Polen Capital Investment Funds plc
Polen Capital Global SMID Company Growth Fund
Schedule of Significant Portfolio Changes
For the financial period ended 30 June 2022
86
2022 Condensed Interim Report &
Unaudited Financial Statements
Significant Purchases*
Quantity Cost % of Total
Security Name USD Purchases
Globant SA 287 71,374 4.90
Kinaxis Inc 464 58,439 4.01
Floor & Decor Holdings Inc 562 57,895 3.97
Endava Plc 477 55,613 3.82
Paycom Software Inc 165 54,301 3.73
Fair Isaac Corp 105 51,767 3.55
Netcompany Group A/S 766 51,633 3.54
Euronext NV 604 50,722 3.48
Etsy Inc 336 50,450 3.46
CTS Eventim AG & Co KGaA 720 48,884 3.35
Temenos AG 430 47,703 3.27
Tyler Technologies Inc 102 46,877 3.22
Tecan Group AG 136 46,734 3.21
Thule Group AB 1,040 46,362 3.18
Fevertree Drinks Plc 1,720 45,937 3.15
Koh Young Technology Inc 2,570 42,354 2.91
RH 108 41,142 2.82
TMX Group Ltd 399 41,130 2.82
Dynatrace Inc 783 40,200 2.76
Five Below Inc 240 38,004 2.61
YETI Holdings Inc 580 36,887 2.53
CompuGroup Medical SE & Co KgaA 590 36,875 2.53
Revolve Group Inc 771 36,347 2.49
Musti Group Oyj 1,250 34,785 2.39
Cochlear Ltd 244 34,239 2.35
Altus Group Ltd/Canada 726 32,809 2.25
Goosehead Insurance Inc 364 32,743 2.25
Benefit One Inc 1,100 31,183 2.14
Kakaku.com Inc 1,500 30,546 2.10
Blackline Inc 343 29,700 2.04
Douzone Bizon Co Ltd 630 26,440 1.81
Azenta Inc 359 25,386 1.74
Pro Medicus Ltd 710 22,552 1.55
Cybozu Inc 1,700 20,794 1.43
Dechra Pharmaceuticals Plc 487 20,245 1.39
Keywords Studios Plc 660 18,569 1.27 *In accordance with the UCITS regulations this schedule presents the aggregate purchases and aggregate sales of a security exceeding 1.00% of the total value of
purchases or sales for the period or at least the top 20 purchases and sales. The full list of purchases and sales for the period ended 30 June 2022 is available on request from the Administrator.
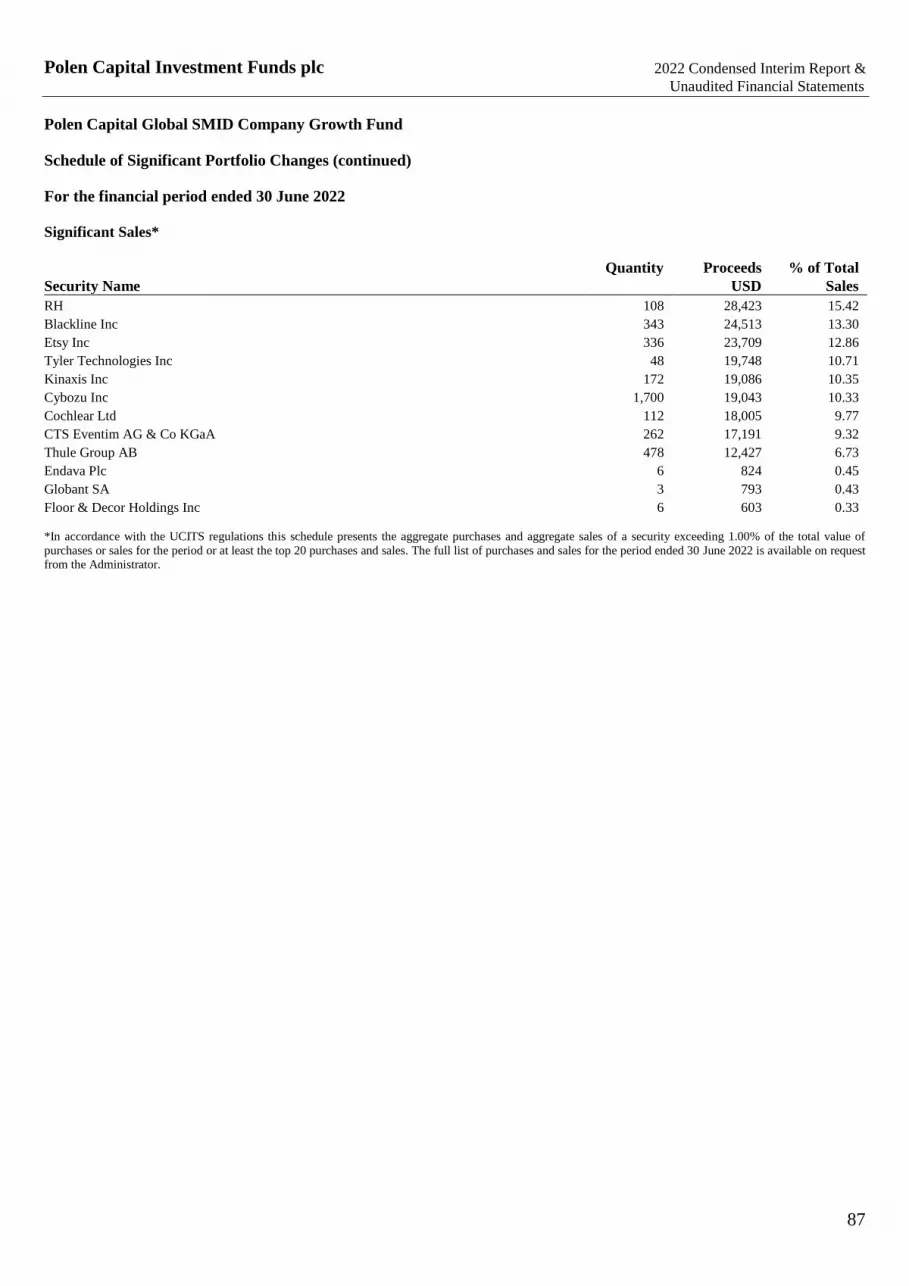
Polen Capital Investment Funds plc
Polen Capital Global SMID Company Growth Fund
Schedule of Significant Portfolio Changes (continued)
For the financial period ended 30 June 2022
87
2022 Condensed Interim Report &
Unaudited Financial Statements
Significant Sales*
Quantity Proceeds % of Total
Security Name USD Sales
RH 108 28,423 15.42
Blackline Inc 343 24,513 13.30
Etsy Inc 336 23,709 12.86
Tyler Technologies Inc 48 19,748 10.71
Kinaxis Inc 172 19,086 10.35
Cybozu Inc 1,700 19,043 10.33
Cochlear Ltd 112 18,005 9.77
CTS Eventim AG & Co KGaA 262 17,191 9.32
Thule Group AB 478 12,427 6.73
Endava Plc 6 824 0.45
Globant SA 3 793 0.43
Floor & Decor Holdings Inc 6 603 0.33
*In accordance with the UCITS regulations this schedule presents the aggregate purchases and aggregate sales of a security exceeding 1.00% of the total value of
purchases or sales for the period or at least the top 20 purchases and sales. The full list of purchases and sales for the period ended 30 June 2022 is available on request from the Administrator.

Polen Capital Investment Funds plc
88
2022 Condensed Interim Report &
Unaudited Financial Statements
Appendix
Securities Financing Transactions Regulation
The Securities Financing Transactions Regulation, as published by the European Securities and Markets Authority, aims to improve
the transparency of the securities financing markets. Disclosures regarding exposure to Securities Financing Transactions (SFTs) will
be required on all report and accounts published after 13 January 2017. During the financial year ended 30 June 2022 none of the
Funds entered into any Securities Financing Transactions.


