Embed Size (px)
Citation preview
P O L S K I E T O WA R Z Y S T W O M I K R O B I O L O G Ó WP O L I S H S O C I E T Y O F M I C R O B I O L O G I S T S
Polish Journal of Microbiology
2017
INSTRUCTIONS FOR AUTHORSSubmission of manuscripts: http://www.pjm.indexcopernicus.com/
Instructions for authors: http://www.pjmonline.org
CONTENTS
IMPORTANT INFORMATION ABOUT PUBLICATION FEES ANNOUNCEMENTS . . . . . . . . . . . . . . . . . . . . . . . . . . . . . . . . . . . . . . . . . . . . . . . . . . 3
MINIREVIEW
From latent tuberculosis infection to tuberculosis. News in diagnostics (QuantiFERON-Plus) BORKOWSKA D.I., NAPIÓRKOWSKA A.M., BRZEZIŃSKA S.A., KOZIŃSKA M., ZABOST A.T., AUGUSTYNOWICZ-KOPEĆ E.M. . . . . . . . . . . . . . . . . . . . . . . . . . . . . . . . . . . . . . . . . . . . . . . . . . . . . . . . . . . . . . . . . . . . . . . . . . . . . . . . . . . . . . . . . . . . . 5Application of metagenomic analyses in dentistry as a novel strategy enabling complex insight into microbial diversity of the oral cavity BURCZYNSKA A., DZIEWIT L, DECEWICZ P., STRUZYCKA I., WROBLEWSKA M. . . . . . . . . . . . . . . . . . . . . . . . . . . . . . . . . . . . . . . . . . . . . . 9
ORIGINAL PAPERS
Deletion of atoR from Streptococcus pyogenes results in hypervirulence in a mouse model of sepsis and is LuxS independent SITKIEWICZ I., MUSSER J.M. . . . . . . . . . . . . . . . . . . . . . . . . . . . . . . . . . . . . . . . . . . . . . . . . . . . . . . . . . . . . . . . . . . . . . . . . . . . . . . . . . . . . . . . . . . . . . . . . . 17Expression of the fluoroquinolones efflux pump genes acrA and mdfA in urinary Escherichia coli isolates ABDELHAMID S.M., ABOZAHRA R.R. . . . . . . . . . . . . . . . . . . . . . . . . . . . . . . . . . . . . . . . . . . . . . . . . . . . . . . . . . . . . . . . . . . . . . . . . . . . . . . . . . . . . . . . . 25Antimicrobial effects of platelet-rich plasma against selected oral and periodontal pathogens
AGGOUR R.L., GAMIL L. . . . . . . . . . . . . . . . . . . . . . . . . . . . . . . . . . . . . . . . . . . . . . . . . . . . . . . . . . . . . . . . . . . . . . . . . . . . . . . . . . . . . . . . . . . . . . . . . . . . . . 31A comparative study: taxonomic grouping of alkaline protease producing bacilli TEKIN N., CIHAN A.C., BASAR KARACA B., COKMUS C. . . . . . . . . . . . . . . . . . . . . . . . . . . . . . . . . . . . . . . . . . . . . . . . . . . . . . . . . . . . . . . . . . . . . . 39Isolation and characterization of phosphate-solubilizing bacteria from mushroom residues and their effect on tomato plant growth promotion ZHANG J., WANG P., FANG L., ZHANG Q.-A., YAN C., CHEN J. . . . . . . . . . . . . . . . . . . . . . . . . . . . . . . . . . . . . . . . . . . . . . . . . . . . . . . . . . . . . . . . . 57Dipicolinic acid release and the germination of Alicyclobacillus acidoterrestris spores under nutrient germinants PORĘBSKA I., SOKOŁOWSKA B., WOŹNIAK Ł. . . . . . . . . . . . . . . . . . . . . . . . . . . . . . . . . . . . . . . . . . . . . . . . . . . . . . . . . . . . . . . . . . . . . . . . . . . . . . . . 67Microbial biomass and enzymatic activity of the surface microlayer and subsurface water in two dystrophic lakes KOSTRZEWSKA-SZLAKOWSKA I., KIERSZTYN B. . . . . . . . . . . . . . . . . . . . . . . . . . . . . . . . . . . . . . . . . . . . . . . . . . . . . . . . . . . . . . . . . . . . . . . . . . . . . 75Suppressive effect of Trichoderma spp. on toxigenic Fusarium species
BŁASZCZYK L., BASIŃSKA-BARCZAK A., ĆWIEK-KUPCZYŃSKA H., GROMADZKA K., POPIEL D., STĘPIEŃ Ł. . . . . . . . . . . . . . . . 85
SHORT COMMUNICATIONS
Screening and identification of yeasts antagonistic to pathogenic fungi show a narrow optimal pH range for antagonistic activityCHEN P.-H., CHOU J.Y. . . . . . . . . . . . . . . . . . . . . . . . . . . . . . . . . . . . . . . . . . . . . . . . . . . . . . . . . . . . . . . . . . . . . . . . . . . . . . . . . . . . . . . . . . . . . . . . . . . . . . . . 101
Use of amplification fragment length polymorphism to genotype Pseudomonas stutzeri strains following exposure to ultraviolet light A LOMBARDI L., ZOPPO M., RIZZATO C., EGAN C.G., SCARPATO R., TAVANTI A. . . . . . . . . . . . . . . . . . . . . . . . . . . . . . . . . . . . . . . . . . . . . . . 107Vital staining of bacteria by sunset yellow pigment
GAO P., SUN C., LI Y., ZOU X., WU X., LING Y., LUAN C., CHEN H. . . . . . . . . . . . . . . . . . . . . . . . . . . . . . . . . . . . . . . . . . . . . . . . . . . . . . . . . . . . . 113Outpatient antibiotic consumption fluctuations in a view of unreasonable antibacterial therapy
CISZEWSKI M., CZEKAJ T., SZEWCZYK E.M. . . . . . . . . . . . . . . . . . . . . . . . . . . . . . . . . . . . . . . . . . . . . . . . . . . . . . . . . . . . . . . . . . . . . . . . . . . . . . . . . . 119Susceptibility of vascular implants to colonization in vitro by Staphylococcus aureus, Staphylococcus epidermidis, Enterococcus faecalis and Pseudomonas aeruginosa
WOŹNIAK W., KOZIŃSKA A., CIOSTEK P., SITKIEWICZ I. . . . . . . . . . . . . . . . . . . . . . . . . . . . . . . . . . . . . . . . . . . . . . . . . . . . . . . . . . . . . . . . . . . . . 125Antiviral resistance of splenocytes in aged mice
ZACZYŃSKA E., ARTYM J., KOCIĘBA M., BURSTER T., KRUZEL M., PAPROCKA M., ZIMECKI M. . . . . . . . . . . . . . . . . . . . . . . . . . . . . . 131
INFORMATION AND ANNOUNCEMENTS. . . . . . . . . . . . . . . . . . . . . . . . . . . . . . . . . . . . . . . . . . . . . . . . . . . . . . . . . . . . . . . . . . . . . . . . . . . . . . . . . . . . . . . . . . 135INSTRUCTION FOR AUTHORS . . . . . . . . . . . . . . . . . . . . . . . . . . . . . . . . . . . . . . . . . . . . . . . . . . . . . . . . . . . . . . . . . . . . . . . . . . . . . . . . . . . . . . . . . . . . . . . . . . . . . 145
Polish Journal of Microbiologyformerly Acta Microbiologica Polonica
2017, Vol. 66, No 1
Polish Journal of Microbiology2017, Vol. 66, No 1, 3
Dear Authors,
Presidium of the Main Board of the Polish Society of Microbiologists voted on 9.03.2017 to add 23% VAT to the publication fee. Therefore, the fee is 250 USD + 23% VAT for non-members of Polish Society of Microbiologists and 125 USD + 23% VAT for corresponding authors who are PTM members.
New payment rules apply for manuscripts printed in issue 1/2018 and onwards, including all manuscripts accepted in 2017, scheduled to be published in 2018.
Polish Society of Microbiologists
President prof. dr hab. Stefan TyskiVice Presidents prof. dr hab. Ewa Augustynowicz-Kopeć prof dr hab. Jacek MiędzobrodzkiMembers prof. dr hab. ElżbietaTrafny dr hab. Beata Sadowska dr Joanna Jursa-KuleszaSecretary dr Agnieszka E. Laudy

Polish Journal of Microbiology2017, Vol. 66, No 1, 5–8
MINIREVIEW
* Corresponding author: D.I. Borkowska, National Tuberculosis and Lung Diseases Research Institute, Department of Microbiology, Warsaw, Poland; e-mail: [email protected]
Introduction
The World Health Organization estimated that one third of the world’s population has latent tuberculosis infection (LTBI) and the risk of progressing to TB is very heterogeneous (WHO, 2008). LTBI provides a poten-tial reservoir for the reactivation and future develop-ment of active TB (Rangaka et al., 2012; Turetz and Ma, 2016). The active disease develops in 5–10% of those with LTBI over the course of their lifetimes (Turetz and Ma, 2016; Salgame et al., 2015). The highest risk of the progression from LTBI declines exponentially. Most TB cases occur within the first two years after a person has been infected (Mack et al., 2009; Salgame et al., 2015). In countries with intermediate (for example Poland) and high incidence of TB it is not practical to provide mass treatment for LTBI (Salgame et al., 2015; Korzeniewska-Koseła, 2016). It is well established that only a minor-ity of patients with LTBI will develop TB (Mack et al., 2009). However, among children, immunocompromised individuals and patients receiving biological treatment, the risk of the progression to TB is significantly higher (Salgame et al., 2015). A major component of TB con-trol is the identification of patients with LTBI in risk groups and the provision of chemoprophylaxis to pre-
vent the development of active TB in those infected (Turetz and Ma, 2016; Uplekar et al., 2016). In Poland, prior to biological treatment, children and older patients are treated prophylactically. LTBI is a state of persistent T-cell responses to Mycobacterium tuberculosis antigens without clinical symptoms or signs of active TB, such as cough, hemoptysis, fever, night sweats, weight loss and opacity in chest radiographs (Mack et al., 2009; Lim, 2016; Getahun et al., 2015). There is no diagnos-tic gold standard for LTBI and direct identification of LTBI is not possible. Diagnostic tests are designed to identify the immune response against M. tuberculosis. Currently, there are two accepted methods for LTBI identification: the in vivo tuberculin skin test (TST) and ex-vivo interferon-gamma release assays (IGRAs). Two IGRAs are commercially available: QuantiFERON-TB Gold Plus (Qiagen, Germany) and T-SPOT.TB (Oxford Immunotec, UK). Both IGRAs are approved by the U.S. Food and Drug Administration and Conformité Euro-péenne (Rangaka et al., 2012; Turetz and Ma, 2016; Salgame et al., 2015, Pai et al., 2014). However, none of the assays mentioned above, can distinguish between LTBI and active TB and none can identify which patients with LTBI will develop active TB (Rangaka et al., 2012; Turetz and Ma, 2016; Lim, 2016).
From Latent Tuberculosis Infection to Tuberculosis. News in Diagnostics(QuantiFERON-Plus)
DAGMARA I. BORKOWSKA*, AGNIESZKA M. NAPIÓRKOWSKA, SYLWIA A. BRZEZIŃSKA,MONIKA KOZIŃSKA, ANNA T. ZABOST and EWA M. AUGUSTYNOWICZ-KOPEĆ
National Tuberculosis and Lung Diseases Research Institute, Department of Microbiology,Warsaw, Poland
Submitted 19 August 2016, accepted 27 January 2017
A b s t r a c t
It is estimated that one third of the world’s population have latent tuberculosis infection and that this is a significant reservoir for future tuberculosis cases. Most cases occur within two years following initial infection. The identification of individuals with latent tuberculosis infection is difficult due to the lack of an ideal diagnostic assay and incomplete understanding of latent infection. Currently, there are three tests: the oldest tuberculin skin test, T-SPOT.TB and the latest QuantiFERON-Plus for the detection of Mycobacterium tuberculosis infec-tion. The interpretation of the test results must be used in the conjunction with a patient’s epidemiological history, risk assessment, current clinical status, radiography and microbiological methods to ensure accurate diagnosis.
K e y w o r d s: Mycobacterium tuberculosis, interferon-gamma release assays, latent tuberculosis infection, tuberculin skin test, tuberculosis
Borkowska D.I. et al. 16
Tuberculin Skin Test
The TST has been continuously in use for 100 years in clinical medicine and has been used to identify peo-ple with latent M. tuberculosis infection (Mack et al., 2009). A TST is performed by intradermal injection of a purified protein derivative (PPD) of tuberculin, on the palmar surface of the forearm, at a volume of 2 units. The induration at the injection site is measured after 48–72 hours, by measuring the diameter of the area of induration, transversely to the long axis of the forearm (Borkowska et al., 2011; Kruczak et al., 2009; Kang et al., 2005). In the case of patients who are latently infected with TB, tuberculin will stimulate a delayed type hyper-sensitivity (DTH) response via T lymphocytes. Tuber-culin induces DTH where T cells and macrophages produce lymphokines that cause oedema, fibrin depo-sition, and inflow of other inflammatory cells (Turetz and Ma, 2016; Borkowska et al., 2011; Kruczak et al., 2009; Lalvani, 2007). In Poland, a RT23 type (renset tuberculin, 23 series) of PPD tuberculin has been used since 1966, produced at the Institute of Serum and Vaccine in Copenhagen (Borkowska et al., 2011). TST is interpreted on the basis of the diameter and the clinical characteristics of a patient (Turetz and Ma, 2016). The TST has limitations, however. False positive and nega-tive results can occur. There are 2 causes of false positive results: Bacillus-Calmette-Guerin (BCG) vaccination and nontuberculous mycobacterial infections (Rangaka et al., 2012; Turetz and Ma, 2016; Pai et al., 2014). In populations vaccinated with BCG, the skin reaction may be positive in some individuals even after 15 years following vaccination (Borkowska et al., 2011). The specificity of the test is low because tuberculin contains more than 200 different antigens from micro organisms other than M. tuberculosis. In addition, false negative responses can occur if the patient is too young or too old, in immunocompromised patients (HIV infection), as well as in cases of those taking immunosuppressive medications or in those with active TB (Turetz and Ma, 2016; Pai et al., 2014; Borkowska et al., 2011). In Poland, where the whole population is vaccinated with BCG, it is important to establish whether the positive result of the TST is connected with a previous vaccination or with ongoing M. tuberculosis infection (Borkowska et al., 2011).
Interferon Gamma Release Assays
The IGRAs are an alternative to the TST for the diagnosis of LTBI. These assays identify cellular immune responses to M. tuberculosis by measuring inter feron- gamma (IFN-γ) after stimulation of T cells with M. tuber culosis-specific antigens (Turetz and Ma, 2016;
Diel et al., 2011). Two tests are available: T-SPOT.TB is based on the Elispot-enzyme-linked immunospot and QuantiFeron TB Gold Plus on the enzyme-linked immunosorbent assays (ELISA) technique. In the case of the T-SPOT.TB, whole blood is used and the test is based on measurement of the number of peripheral mononuclear cells that produce IFN-γ after stimula-tion with two antigens: early secreted antigenic tar-get 6 (ESAT-6) and culture filtrate protein 10 (CFP 10). Both antigens are encoded in the region of difference 1 (RD1) (Trajman et al., 2016; van Ingen et al., 2009). The second test, QFT-Plus, uses specialized whole blood collection tubes. The antigens used in this test are a peptide cocktail simulating the ESAT-6 and CFP 10. QFT-Plus comprises two distinct TB antigen tubes and both tubes contain ESAT-6 and CFP 10. TB1 tube is designed to elicit cell mediated immunity (CMI) responses from CD4+ T-helper lymphocytes and the TB2 tube contains an additional set of peptides targeted to the induction of CMI responses from CD8+cytotoxic T lymphocytes (2015b). The QFT-Plus measures the level of IFN-γ in the peripheral blood by the ELISA technique (Trajman et al., 2016). The antigens used in the IGRAs do not cross-react with the vaccination strain Mycobacterium bovis BCG and with most species of nontuberculous mycobacteria (NTM). However, the RD1-coding region of antigens ESAT-6 and CFP 10, similar to that of M. tuberculosis, is present in Mycobac-terium kansasii, Mycobacterium szulgai, Mycobacterium marinum, and Mycobacterium riyadhense (Diel et al., 2011; van Ingen et al., 2009; Hermansen et al., 2016). The presence of similar antigens in NTM theoretically lowers the specificity of the IGRAs in diagnosing LTBI (van Ingen et al., 2009). Compared to TST, IGRAs have better specificity, positive and negative controls, clear interpretation criteria and require only one visit in the clinic (Pai et al., 2014).
Sensitivity and specificity TST, QFT, T-SPOT.TB
There is no method to truly confirm the diagnosis of LTBI, because we do not have a gold standard for diag-nosing LTBI. The sensitivity of IGRAs or TST for LTBI diagnosis is typically assessed in patients with active TB, treating this group as a surrogate for LTBI (ECDC, 2011). The specificity of TST and IGRAs reflects the true negative rate of patients tested for LTBI. Popula-tions with a recognizable low risk of M. tuberculosis infection introduce a surrogate for a group, free of M. tuberculosis infection (ECDC, 2011). Menzies et al. (2007) calculated the sensitivity and specificity of 3 tests based on 56 studies. Pooled sensitivity was lowest for the TST (70%), higher for QFT (76%) and the highest for T-SPOT.TB (88%). Pooled specificity was the lowest
From latent tuberculosis infection to tuberculosis1 7
for the TST (66%), higher for T-SPOT.TB (92%) and the highest for QFT (97%). The meta-analysis proved that no tests had high sensitivity. IGRAs were more specific than the TST in populations vaccinated with BCG (Menzies et al., 2007). The meta-analysis of Diel et al. (2010) showed that the pooled sensitivity of TST was 70% compared to 81% for the QFT and 88% for the T-SPOT.TB. The specificity of the QFT was 99% and 86% for the T-SPOT.TB. This meta-analysis included 25 studies (Diel et al., 2010). Both meta-analyses had similar results. Hoffman et al. (2016) prepared the first evaluation of the new test generation called Quanti- Feron TB Gold Plus (QFT-Plus) in comparison with the older version of QuantiFeron TB Gold In Tube (QFT). QFT analyses IFN-γ released only by CD4+ T-helper cells after stimulation with M. tuberculo-sis antigens while QFT-Plus analyses the response of CD8+ cytotoxic T lymphocytes. Hoffman et al. (2016) counted the sensitivity of the new method based on data from 163 patients, including 77 health care work-ers and 86 suspected cases of TB. QFT-Plus produced 87.9% true-positive results, which was interpreted as demonstrating increased sensitivity compared to 80% for QFT in the meta-analysis (Hoffmann et al., 2016; Sester et al., 2011; Barcellini et al., 2016). This is one of the first such studies and therefore has some limita-tions, so further studies are needed to confirm these findings (Hoffmann et al., 2016).
Predictive value of IGRAs
A clear understanding of the predictive value of IGRAs for the development of active TB disease is neces sary (Lim, 2016). The positive predictive value (PPV) for the progression of LTBI is the probability that in the case of an individual with a positive test, there is real a risk of developing active TB disease later in their life. The negative predictive value (NPV) is the probability that a patient with a negative test does not have LTBI and therefore will not develop active TB (Hermansen et al., 2016). The NPV is high in low-endemic countries, whereas the PPV of both the TST and IGRAs is low in these countries. Therefore, cur-rently, only targeted testing in specific high-risk groups is recommended. Studies assessing the PPV of IGRAs show heterogeneous results (Hermansen et al., 2016). In 2015, Tuberculosis Network European Trials Group (TBNET) calculated the PPV and NPV of the QFT test, noting results of 1.9% and 99.9%, respectively (Zellweger et al., 2015) while Hermansen et al. (2016) in Denmark, a TB low endemic country, showed a high NPV (99.85%) and a low PPV (1.32%) for the same test. Their study included a 5-year retrospective cohort study assessing the risk of TB among patients with positive
and negative QFT results (Hermansen et al., 2016). Lim (2016) analysed 3 studies in a low-TB- incidence coun-tries and confirmed that IGRA has a very high NPV (99.5%) and a low PPV (about 4%) for future active TB (Lim, 2016; Hermansen et al., 2016; Zellweger et al., 2015; Sloot et al., 2014). Detecting LTBI and the need for treatment in specific cases should focus on patients with the highest risk of reactivation of TB. Current diagnostics of LTBI are deficient with limited PPV for the development of active TB (Turetz and Ma, 2016). There are a limited number of studies of the predictive value of IGRAs in countries with intermediate or high incidence of TB.
Summary
Standard diagnostic methods for an active TB diag-nosis are known and have clear guidelines. A number of studies concerning the issue have been published. The diagnosis of LTBI however lacks gold standard. There are indirect tests: TST, QFT and T-SPOT.TB for detec-tion of M. tuberculosis infection that must be used in conjunction with the patient’s epidemiological history, risk assessment, current medical status, radiography and microbiological methods. The sensitivity, specific-ity and predictive values of IGRAs for the diagnosis of LTBI in low, intermediate and high-TB incidence settings should be the subject of further studies. New studies are also needed to explore the use of the new generation assay of QFT-Plus for the diagnosis of LTBI and active TB in various populations. QuantiFERON – Plus can be used as an adjunct tool in the diagnosis of active TB, but certainly cannot be used solely and indiscriminately, separate from other clinical epidemio-logical and radiological factors.
Financial resources:The statutory activity of National Tuberculosis and Lung Dis-
eases Research Institute. Task No.1.20.
Literature
Barcellini L., E. Borroni, J. Brown, E. Brunetti, L. Codecasa, F. Cugnata, P.D. Monte, C.D. Serio, D. Goletti and others. 2016. First independent evaluation of QuantiFERON-TB Plus perfor-mance. Eur. Respir. J. http://erj.ersjournals.com/content/47/5/1587.long, 2016.04.30.Borkowska D., Z. Zwolska, D. Michałowska-Mitczuk, M. Korze-niewska-Koseła, A. Zabost, A. Napiórkowska, M. Kozińska, S. Krze zińska and E. Augustynowicz-Kopeć. 2011. Interferon-gamma assay T-SPOT.TB in the diagnostics of latent tuberculosis infection. Pneumonol. Alergol. Pol. 79: 264–271. Diel R, R. Loddenkemper and A. Nienhaus. 2010. Evidence-based comparison of commercial interferon-γ release assays for detecting active TB. Chest 137: 952–968.
Borkowska D.I. et al. 18
Diel R., D. Goletti, G. Ferrara, G. Bothamley, D. Cirillo, B. Kamp-mann, C. Lange, M. Losi, R. Markova, G.B. Migliori and others. 2011. Interferon-gamma release assays for the diagnosis of latent Mycobacterium tuberculosis infection: a systematic review and meta-analysis. Eur. Respir. J. 37: 88–99. European Centre for Disease Prevention and Control (ECDC). 2011. Use of interferon-gamma release assays in support of TB diag-nosis, pp. 1–32. ECDC. Stockholm. Getahun H., R.E. Chaisson and M. Raviglione. 2015. Latent Myco-bacterium tuberculosis infection. N. Engl. J. Med. 373: 1179–1180. Hermansen T.S., T. Lillebaek, K.L. Kristensen, P.H. Andersen and P. Ravn. 2016. Prognostic value of interferon-γ release assays, a population-based study from a TB low-incidence country. Thorax. 71: 652–658.Hoffmann H, K. Avsar, R. Göres, S.C. Mavi and S. Hofmann-Thiel. 2016. Equal sensitivity of the new generation QuantiFERON-TB Gold plus in direct comparison with the previous test version QuantiFERON-TB Gold IT. Clin. Microbiol. Infect. http://www.ncbi.nlm.nih.gov/pubmed/27184875, 2016.04.30.van Ingen J., R. de Zwaan, R. Dekhuijzen, M. Boeree and D. van Soolingen. 2009. Region of difference 1 in nontuberculous Myco-bacterium species adds a phylogenetic and taxonomical character. J. Bacteriol. 191: 5865–5867. Kang Y.A., H.W. Lee, H.I. Yoon, B. Cho, S.K. Han, Y.S. Shim and J.J. Jim. 2005. Discrepancy between the tuberculin skin test and the whole-blood interferon gamma assay for the diagnosis of latent tuberculosis infection in an intermediate tuberculosis-burden country. JAMA 293: 2756–2785.Korzeniewska-Koseła M. 2016. Tuberculosis and lung diseases in Poland in 2015. (In Polish). Institute Tuberculosis and Lung Diseases, Warsaw. Kruczak K., W. Skucha, M. Duplaga, M. Sanak and E. Niżan-kow ska-Mogilnicka. 2009. Assessment of the latent tuberculosis infection (LTBI) with QuantiFERON-GIT (QFT-GIT) assay in selected risk groups in Krakow. (In Polish) Borgis – Nowa Medy-cyna 1: 37–42. Lalvani A. 2007. Diagnosing tuberculosis infection in the 21st cen-tury. New tools to tackle an old enemy. Chest 131: 1898–1906.Lim W.S. 2016. From latent to active TB: are IGRAs of any use? Thorax. 71: 585–586.Mack U., G.B. Migliori, M. Sester, H.L. Rieder, S. Ehlers, D. Go letti, A. Bossink, K. Magdorf, C. Hölscher, B. Kampmann and others. 2009. LTBI: latent tuberculosis infection or lasting immune responses to Mycobacterium tuberculosis? A TBNET con-sensus statement. Eur. Respir. J. 33: 956–973.
Menzies D., M. Pai and G. Comstock. 2007. Meta-analysis: new tests in the diagnosis of latent tuberculosis infection: areas of uncertainty and recommendations for research. Ann. Intern. Med. 146: 340–354. Pai M., C.M. Denkinger, S.V. Kik, M.X. Rangaka, A. Zwerling, O. Oxlade, J.Z. Metcalfe, A. Cattamanchi, D.W. Dowdy, K. Dheda and others. 2014. Gamma interferon release assays for detection of Mycobacterium tuberculosis infection. Clin. Microbiol. Rev. 27: 3–20. QuantiFeron-TB Gold Plus (QFT-Plus) ELISA package insert. http://www.quantiferon.com/irm/content/PI/QFT/PLUS/2PK-Elisa/UK.pdf, 2016.04.30.Rangaka M.X., K.A. Wilkinson, J.R. Glynn, D. Ling, D. Menzies, J. Mwansa-Kambafwile, K. Fielding, R.J. Wilkinson and M. Pai. 2012. Predictive value of interferon-γ release assays for incident active tuberculosis: a systematic review and meta analysis. Lancet Infect. Dis. 12: 45–55. Salgame P., C. Geadas, L. Collins, E. Jones-Lopez, J.J. Ellner. 2015. Latent tuberculosis infection – Revisiting and revising concepts. Tuberculosis. 95: 373–384.Sester M., G. Sotgiu, C. Lange, C. Giehl, E. Girardi, G.B. Migliori, A. Bossink, K. Dheda, R. Diel, J. Dominguez and others. 2011. Interferon-γ release assays for the diagnosis of active tuberculosis: a systematic review and meta-analysis. Eur. Respir. J. 37: 100–111. Sloot R., M.F. Schim van der Loeff, P.M. Kouw and M.W. Borg-dorff. 2014. Risk of tuberculosis after recent exposure. A 10-year follow-up study of contacts in Amsterdam. Am. J. Respir. Crit. Care Med. 190: 1044–1052.Trajman A., R.E. Steffen and D. Menzies. 2013. Interferon-gamma release assays versus tuberculin skin testing for the diagnosis of latent tuberculosis infection: An overview of the evidence. Pulm. Med. 601737. http://dx.doi.org/10.1155/2013/601737, 2016.04.30.T-SPOT.TB packane insert. 2013. http://www.oxfordimmunotec.com/north-america/wp-content/uploads/sites/2/T-SPOT-PI-TB-US-v4.pdf, 2016.04.30.Turetz M.L. and K.C. Ma. 2016. Diagnosis and management of latent tuberculosis. Curr. Opin. Infect. Dis. 29: 205–211.Uplekar M., D. Weil, K. Lonnroth, E. Jaramillo, C. Lienhardt, H.M. Dias, D. Falzon, K. Floyd, G. Gargioni, H. Getahun and others. 2016. WHO’s new end TB strategy. Lancet 385: 1799–1801. World Health Organization (WHO). 2008. Global tuberculosis control: surveillance, planning, financing, pp. 1–294. WHO. Geneva. Zellweger J.P., G. Sotgiu, M. Block, S. Dore, N. Altet, R. Blunschi, M. Bogyi, G. Bothamley, C. Bothe, L. Codecasa and others. 2015. Risk assessment of tuberculosis in contacts by IFN-γ release assays. A tuberculosis network European Trial Group Study. Am. J. Respir. Crit. Care Med. 191: 1176–1184.
Polish Journal of Microbiology2017, Vol. 66, No 1, 9–15
MINIREVIEW
* Corresponding author: M. Wroblewska, Department of Dental Microbiology, Medical University of Warsaw, Poland; e-mail: [email protected]
Introduction
The oral microbiome plays a very important role both in health as well as in disease (Duran-Pinedo and Frias-Lopez, 2015; Strużycka, 2014; Xu and Gunsol-ley, 2014). It is now known – based on 16S rRNA gene sequence analyses – that the bacterial flora of the oral cavity exceeds 1000 taxa (Dewhirst et al., 2010; Zehnder et al., 2015). It consists of “protective” bacteria, transient invaders and opportunistic microflora of specific niches in the oral cavity (Zehnder et al., 2015).
Even in healthy individuals the composition of the oral microbiome is complex and dynamic, depend-ing on many factors, such as anatomical location in the oral cavity (supragingival or subgingival plaque, tongue, mucous membrane lining the oral cavity), diet, oral hygiene habits or host immune responses (Xu and Gunsolley, 2014). Disruption of a symbiotic relation-ship between the oral microbiome and the host results in dysbiosis, which may cause overgrowth of patho-genic microflora and diseases of the oral cavity (Beli-
basakis and Mylonakis, 2015). Furthermore, oral health may affect the health status of the host leading to sys-temic infections.
It is now estimated that about 2 billion people suf-fer from oral diseases, such as periodontal disease and dental caries. They are therefore some of the most preva-lent infectious diseases of humans (Xu and Gunsolley, 2014; He et al., 2015). Importantly, the oral microflora may cause not only local infections, but contributes also to the pathogenesis of systemic – even life-threatening infec tions – such as infective endocarditis, bacterial menin gitis or brain abscess (Hsiao et al., 2012; Mau-rer et al., 2009; Mang-de la Rosa et al., 2014). However, microbial composition in different conditions affecting the oral cavity remains unknown. The use of traditional microbiological methods (culturing and identification of microorganisms) is unsatisfactory, as it is known at present that at least 50% of the oral microflora cannot be cultured, as revealed by genetic studies, including metagenomic strategies. Furthermore, microbial popu-lations may be studied with the use of modern “omics”
Application of Metagenomic Analyses in Dentistryas a Novel Strategy Enabling Complex Insight into Microbial Diversity
of the Oral Cavity
ALEKSANDRA BURCZYNSKA1, LUKASZ DZIEWIT2, PRZEMYSLAW DECEWICZ2, 3,IZABELA STRUZYCKA4 and MARTA WROBLEWSKA1, 5*
1 Department of Dental Microbiology, Medical University of Warsaw, Poland2 Department of Bacterial Genetics, Institute of Microbiology, Faculty of Biology, University of Warsaw, Poland
3 Research and Development for Life Sciences Ltd., Poland 4 Department of Comprehensive Dental Care, Medical University of Warsaw, Poland
5 Department of Microbiology, Central Clinical Hospital in Warsaw, Poland
Submitted 8 November 2016, revised 12 November 2016, accepted 12 January 2016
A b s t r a c t
The composition of the oral microbiome in healthy individuals is complex and dynamic, and depends on many factors, such as anatomi-cal location in the oral cavity, diet, oral hygiene habits or host immune responses. It is estimated at present that worldwide about 2 billion people suffer from diseases of the oral cavity, mainly periodontal disease and dental caries. Importantly, the oral microflora involved in local infections may spread and cause systemic, even life-threatening infections. In search for etiological agents of infections in dentistry, traditional approaches are not sufficient, as about 50% of oral bacteria are not cultivable. Instead, metagenomic analyses are particularly useful for studies of the complex oral microbiome – both in healthy individuals, and in patients with oral and dental diseases. In this paper we review the current and future applications of metagenomic studies in evaluation of both the composition of the oral microbiome as well as its potential pathogenic role in infections in dentistry.
K e y w o r d s: dental caries, endodontics, metagenomics, periapical abscess, periodontitis
Burczyńska A. et al. 110
techniques combined with thorough bioinformatics analyses, detecting not only metagenome (DNA-based analysis), but also metatranscriptome (RNA level), meta- proteome (protein composition of the oral microbiome) and metabolome (functional activity of a studied micro-bial population) (Duran-Pinedo and Frias-Lopez, 2015).
Amongst the above mentioned analytical strategies, metagenomic analyses are particularly useful for studies of the oral microbiome. They allow not only evalua-tion of bacterial composition in different locations and conditions in the oral cavity, but also contribute to the detection of novel, not yet described, but potentially pathogenic species. Furthermore, they allow detection of even non-viable bacteria (Belda-Ferre et al., 2012).
Metagenomics strategies
Metagenomics – while being still a relatively novel science – has already helped to disclose many com-plicated, and often unexpected, relationships between the human microbiome and diseases it may cause (PadmanabHan and Wang, 2013; Alcaraz et al., 2012; Xu and Gunsolley, 2014). Originally, metagenomics mostly found application in ecological analyses, and it was called environmental genomics or ecogenomics. However, currently it finds a broad application also in
medical sciences, as clinical metagenomics revealed to be useful in detection and analysis of non-cultivable microorganisms (both commensal and pathogenic) and their mutual relationships in the community which they form within the host or in the particular ana to-mical location.
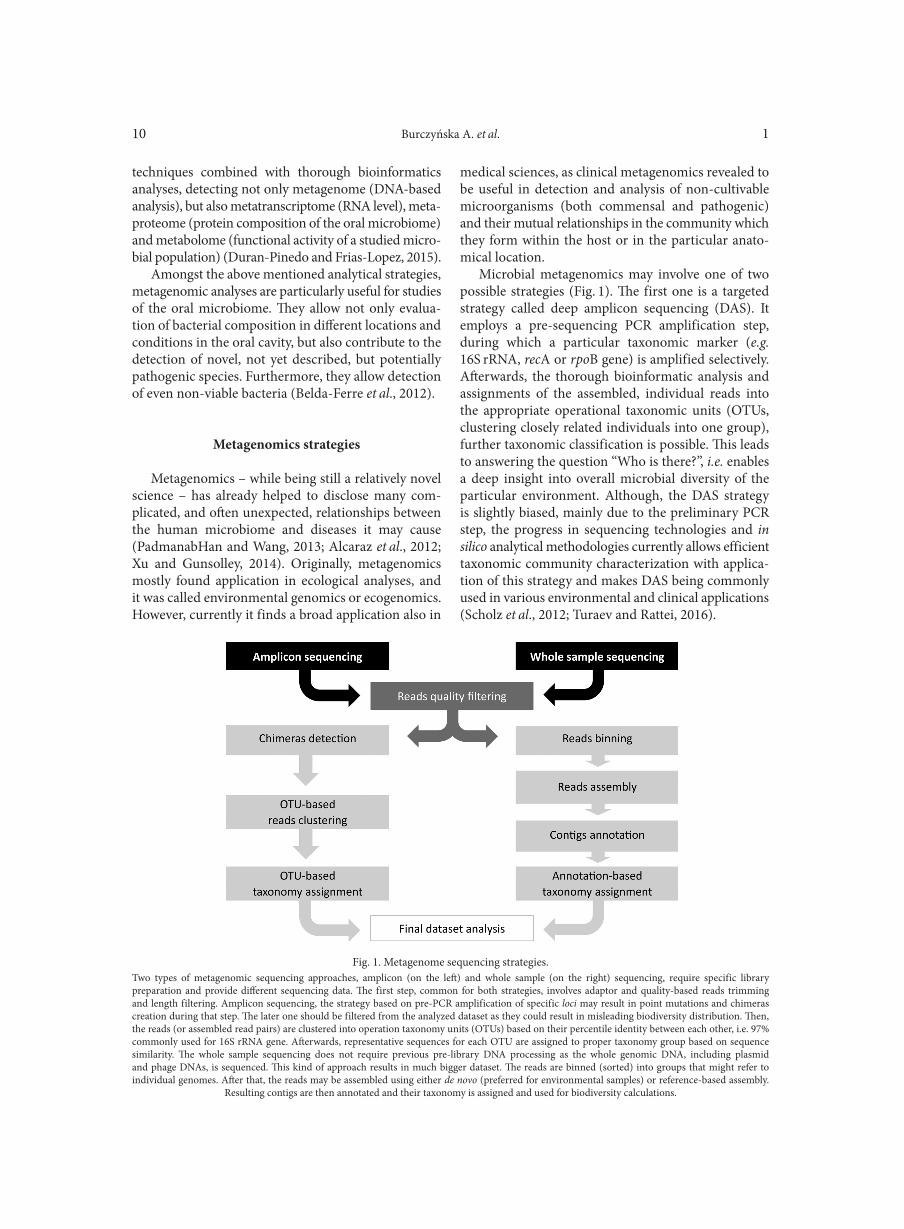
Microbial metagenomics may involve one of two possible strategies (Fig. 1). The first one is a targeted strategy called deep amplicon sequencing (DAS). It employs a pre-sequencing PCR amplification step, during which a particular taxonomic marker (e.g. 16S rRNA, recA or rpoB gene) is amplified selectively. Afterwards, the thorough bioinformatic analysis and assignments of the assembled, individual reads into the appropriate operational taxonomic units (OTUs, clustering closely related individuals into one group), further taxonomic classification is possible. This leads to answering the question “Who is there?”, i.e. enables a deep insight into overall microbial diversity of the particular environment. Although, the DAS strategy is slightly biased, mainly due to the preliminary PCR step, the progress in sequencing technologies and in silico analytical methodologies currently allows efficient taxonomic community characterization with applica-tion of this strategy and makes DAS being commonly used in various environmental and clinical applications (Scholz et al., 2012; Turaev and Rattei, 2016).
Fig. 1. Metagenome sequencing strategies.Two types of metagenomic sequencing approaches, amplicon (on the left) and whole sample (on the right) sequencing, require specific library preparation and provide different sequencing data. The first step, common for both strategies, involves adaptor and quality-based reads trimming and length filtering. Amplicon sequencing, the strategy based on pre-PCR amplification of specific loci may result in point mutations and chimeras creation during that step. The later one should be filtered from the analyzed dataset as they could result in misleading biodiversity distribution. Then, the reads (or assembled read pairs) are clustered into operation taxonomy units (OTUs) based on their percentile identity between each other, i.e. 97% commonly used for 16S rRNA gene. Afterwards, representative sequences for each OTU are assigned to proper taxonomy group based on sequence similarity. The whole sample sequencing does not require previous pre-library DNA processing as the whole genomic DNA, including plasmid and phage DNAs, is sequenced. This kind of approach results in much bigger dataset. The reads are binned (sorted) into groups that might refer to individual genomes. After that, the reads may be assembled using either de novo (preferred for environmental samples) or reference-based assembly.
Resulting contigs are then annotated and their taxonomy is assigned and used for biodiversity calculations.
Metagenomic studies in dentistry1 11
The second metagenomics strategy is much broader, as it leads to answering not only the question “Who is there?”, but also “What are they doing?”. This strategy is known as shotgun metagenomics. According to this approach after the isolation of the total DNA from a par-ticular sample, the total nucleic acid content of a sample is sequenced either directly or after applying an enrich-ment step, which might be a capture-based approach or subtraction prior to sequencing. The application of the high-throughput sequencing leads to generation of enormous number of short reads, which in the first step of bioinformatic analysis have to be assembled into con-tigs. Then, their taxonomic classification and functional assignments may be performed (Scholz et al., 2012).
Both above mentioned strategies find application in analyses of the oral cavity microbiomes. However, many researchers underline the need for standardized sampling methods for metagenomic studies of the oral microbiome. This would ensure reliable results, which will make it possible to compare the microbiome in dif-ferent intraoral locations and in diverse clinical condi-tions of health and disease. Bacterial flora composition may be influenced by many factors, such as anatomical location (e.g. soft palate, hard palate, tongue, tooth sur-face, supra- or subgingival sample) or other factors (e.g. diet, smoking and oral hygiene habits) (Xu and Gunsol-ley, 2014; Wu et al., 2016). Xu and Gunsolley (2014) also indicate that sampling methods differ significantly. In dental caries specimens should be taken precisely from the affected tooth, avoiding contamination from subgin-gival sites. On the other hand, there is a risk of human DNA contamination of the samples taken from perio-dontitis lesions (Xu and Gunsolley, 2014). Even differ-ent tools for supragingival sample collection (e.g. cotton swabs vs loop-like devices) may influence the results of metagenomic studies (Xu and Gunsolley, 2014).
Bacterial metagenome in dental caries
Dental caries is one of the most common diseases in many parts of the world despite a decline in its rate in some regions due to prevention programmes (Beli-basakis and Mylonakis, 2015; Gross et al., 2012; Gooch et al., 2009; Edelstein, 2006; Petersen et al., 2005). It may affect even very young children shortly after the erup-tion of their milk teeth. It is estimated by the WHO, that worldwide 60–90% of school children and nearly 100% of adults have dental caries (WHO, 2012). As indicated above, clinically it can have a severe course, which may even require hospitalization, with some fatal cases (Gross et al., 2012; Colak et al., 2013). Similarly, in adults dental caries may cause severe, even life-thre-atening complications. Most authors believe that den-tal caries constitutes an infectious, transmissible and
poly microbial disease, which results from a shift within the biofilm community of the oral cavity, however its etio logy and pathogenesis remain unsolved (Gross et al., 2012; Simon-Sorro et al., 2014; Belibasakis and Mylonakis, 2015).
At present there are three major hypotheses of the etiology of dental caries: the specific, the non-specific, and the ecological plaque hypothesis (Aas et al., 2008; Xu and Gunsolley, 2014). Therefore, verification of these hypotheses is urgently needed and possible with the use of modern molecular techniques comprising metagenomic analyses of the oral microbiome. This would contribute to an improvement in diagnosis, treatment and prevention of caries and its compli-cations, such as dental pulp necrosis and periapical abscess (Alcaraz et al., 2012; Belda-Ferre et al., 2012).
According to the specific plaque hypothesis, only a few bacterial species, such as Streptococcus mutans and Streptococcus sobrinus, are actively involved in the initiation of dental caries (Alcaraz et al., 2012; Xu and Gunsolley, 2014; Karpinski and Szkaradkiewicz, 2013; Kuramitsu and Wang, 2011). Apart from mutans streptococci, also lactobacilli and Actinomyces spp. may contribute to the development of dental caries (Beighton, 2005). There is, however, a conflicting opin-ion for and against this hypothesis as some authors claim that 10% of subjects with rampant caries in per-manent teeth do not have detectable levels of S. mutans (Aas et al., 2008). It is even postulated by some research-ers that the association of mutans streptococci and car-ies is weak and no greater than for other bacteria, and that the mere presence of S. mutans and S. sobrinus in dental plaque does not account alone for the cario-genic potential of such biofilms, as caries occurs in the absence of these species and their presence does not necessarily indicate caries activity (Gross et al., 2012; Beighton, 2005; Belda-Ferre et al., 2012; Kuramitsu and Wang, 2011; Simon-Sorro et al., 2014).
The non-specific plaque hypothesis maintains that caries is caused by a heterogenous mixture of many bac-terial species and results from the overall activity of the total plaque microflora (Aas et al., 2008). Other den-tal plaque bacteria – apart from mutans streptococci, lactobacilli and Actinomyces spp. – also possess some characteristics thought to be important in cariogenicity. It seems likely that interaction of different bacteria may cause initiation of caries, and therefore the plaque flora may be non-specific in nature.
The ecological plaque hypothesis suggests that cario genic flora of the oral microbiome constitutes only a minority of the total community and caries results from an imbalance of the metabolic activity of the resi-dent microflora in the dental biofilm, due to changes in local environmental conditions (Astorga et al., 2015). A diet rich in carbohydrates causes prolonged pH
Burczyńska A. et al. 112
change, which promotes tooth demineralisation and the growth of acid-tolerant and acid-producing bac-teria (e.g. mutans streptococci and lactobacilli), while eliminating acid-labile species (Astorga et al., 2015).
In a recent study Zhou et al. (2016) applying high-throughput metagenomic sequencing reported that in dental caries a synergistic effect may influence microbial community assembly and the co-prevalence of the patho- genic genera. In contrast to these findings, in caries-free individuals the authors found that the function of clus-tered genera was more random and competition appears to play a more significant role in the oral microbiome. They also found, that the following genera were more abundant in the caries group in comparison to healthy subjects: Veillonella, Bifidobacterium, Selenomonas, Olsenella, Parascardovia, Scardovia, Chryseobacterium, Terrimonas, Burkholderia and Sporobacter.
Metagenomic studies help to elucidate the potential role of oral bacteria in the initiation and establishment of a dental plaque. Many authors report that S. mutans is not present in all patients with dental caries (Gross et al., 2012). Instead, in these individuals other strep-tococci are predominant (e.g. Streptococcus salivarius, S. sobrinus, and Streptococcus parasanguinis) as well as strains of Veillonella spp. Detailed metagenomic analy-sis may therefore contribute to modification of current treatment of this disease and establishment of effective prophylactic measures.
Bacterial diversity in endodonticsand purulent complications of severe dental caries
Progression of dental caries may cause pulpitis, infec tion of the root canal and tooth necrosis (Beli-basakis and Mylonakis, 2015; Zehnder et al., 2015). Further expansion of the infection may lead to peri-apical abscess and apical periodontitis (Narayanan and Vaishnavi, 2010). The course of disease appears to depend on the interaction between the microbial flora and the host’s immune system (Zehnder et al., 2015).
It is estimated that periapical abscesses and accompa-nying pain (which can be excruciating) constitute about 56% of all non-traumatic dental emergencies (Hsiao et al., 2012). Infection may complicate the outcome of endodontic treatment and the survival of the tooth (Hsiao et al., 2012). Furthermore, pathogens involved in purulent complications may spread to the circulation, causing systemic diseases and infections in anatomi-cally distant organs and sites (Pappa and Jones, 2005; Sequeira and Rocas, 2013; Robertson, 2015). However, despite major progress in endodontic techniques and many chemicals being available for root canal treatment, periapical abscesses remain the main cause of tooth loss and severe, even life-threatening complications.
Periapical abscesses constitute an enclosed environ-ment, separated from the oral cavity. Indeed, recent metagenomic analyses revealed that bacterial compo-sition in the root canal and abscess samples differs sig-nificantly from the microflora present in the oral cavity (Hsiao et al., 2012; Tavares et al., 2010). Metagenomic studies are therefore needed to characterize bacterial flora present in the endodontic system and in periapi-cal abscesses in order to establish their etiology and proper treatment (Ribeiro et al., 2011). This can be done by 16S rDNA sequence analysis. Using this approach Ribeiro et al. (2011) were able to detect in samples from root canals of 12 untreated asymptomatic teeth, on average 10 different bacterial taxa per root canal (range: 3–21), out of which as many as almost 66% represented non-cultivable bacteria. Earlier, Siqueira et al., (2000) identified up to 17 taxa in a single root canal.
Molecular studies made it possible to detect uncul-tivable bacteria present in root canals of teeth with apical periodontitis, such as Spirochaetes, Synergistetes and Dialister (Munson et al., 2002; Zehnder et al., 2015). Recent approaches using 16S rRNA gene pyrosequenc-ing revealed high diversity of bacteria in the apical por-tion of infected root canals (Siqueira and Rocas, 2009; Siqueira et al., 2011). It now appears that bacterial flora present in different types of endodontic infections comprises as many as > 460 bacterial taxa, classified in 100 genera and 9 phyla (Siqueira and Rocas, 2009). Most of them represent Firmicutes, Bacteroidetes, Acti-nobacteria, and Proteobacteria. Tavares et al. (2011) evaluated the microbiota of 32 samples obtained from the root canal system of deciduous teeth with pulp necrosis. In their study the mean number of species detected was 19 per sample, with a range from 3 to 66.
Santos et al. (2011) examined the root canal con-tent of 8 teeth with chronic apical periodontitis and compared it with the aspirate from 9 abscesses of endo-dontic origin. They found, using a high-throughput multiplexed 16S rRNA gene pyrosequencing analysis that bacteria from the genus Peptostreptococcus, but also Fusobacterium, Atopobium, Parvimonas, Dialister, Por-phyromonas and Prevotella were much more common in abscesses as compared to chronic root canal infec-tions. It stands in agreement with a study by Sequeira and Rocas (2009), who found that the most prevalent species in apical abscess aspirates from 42 patients were Fusobacterium nucleatum, Parvimonas micra and Por-phyromonas endodontalis. Other common taxa were Olsenella uli, streptococci and Eikenella corrodens. In another study Sequeira and Rocas (2013) confirmed that the most common genera found in acute api-cal abscesses are Fusobacterium, Parvimonas, Prevo-tella, Porphyromonas, Dialister, Streptococcus, and Treponema. On the other hand, Hsiao et al. (2012) found in 8 patients that although strains of Prevotella spp. and
Metagenomic studies in dentistry1 13
Fusobacterium spp. were most prevalent in samples taken from the diseased endodontic sites, Streptococ-cus spp. were not common in these specimens. In this study, using next-generation sequencing of 16S rDNA amplicons, they found that the most common micro-bial species present in the samples from endodontic lesions were Granulicatella adiacens, Eubacterium yurii, Prevotella melaninogenica, Prevotella salivae, Streptococ-cus mitis, and Atopobium rimae (Hsiao et al., 2012). In a study by Ribeiro et al. (2011) in 12 samples from root canals the most prevalent bacterial species identified by metagenomic investigations were Atopobium rimae, Dialister invisus, Prevotella oris, Pseudoramibacter alac-tolyticus, and Tannerella forsythia. In a study of 32 root canal samples from deciduous teeth with pulp necro-sis, the most prevalent taxa were Prevotella intermedia (96.9%), Neisseria mucosa (65.6%), Prevotella nigrescens (56.2%) and Tannerella forsythia (56.2%), while Aggre-gatibacter (Haemophilus) aphrophilus and Helicobacter pylori were not detected (Tavares et al., 2011).
It remains to be evaluated on a larger group of patients what is the etiological role of particular bacteria – or their specific compositions – in endodontic infec-tions. Multiple species present in the root canals and/or periapical abscesses may result in network of inter-actions, which may affect their pathogenicity (Siqueira and Rocas, 2013). Understanding of the microflora asso-ciated with different forms of endodontic infections is necessary for improvement of the success of endodontic treatment (Narayanan and Vaishnavi, 2010).
Metagenomic studies in periodontal diseases
Periodontal disease may be defined as a cluster of infectious inflammatory conditions (gingivitis and dif-ferent forms of periodontitis) which in a severe form may affect even 10–15% of the global population and is the major cause of tooth loss in adults (Belibasakis and Mylonakis, 2015). Apart from genetic factors, its devel-opment is strongly related to the polymicrobial biofilm formed by oral bacteria on the tooth surface, which stimulates pro-inflammatory responses in the sur-rounding tissues and their destruction (Liu et al., 2012; Belibasakis and Mylonakis, 2015). It can often resolve by good oral hygiene which eliminates the biofilm formed by bacteria (Xu and Gunsolley, 2014). On the contrary, built-up of bacteria may contribute to development of severe periodontitis, which may lead to systemic compli-cations, such as infective endocarditis as well as diabetes, pneumonia, low birth weight in infants, inflammatory bowel disease, systemic autoimmune disease and colon cancer, to name a few (Xu and Gunsolley, 2014; Han and Wang, 2013; Moodley et al., 2013; Zarco et al., 2012; He et al., 2015; Liu et al., 2012). Apart from insufficient
oral hygiene, other modifiable risk factors have been identified, such as tobacco use, excessive alcohol con-sumption, poor diet and nutrition, obesity and psycho-logical stress, which contribute to periodontal disease prevalence (Petersen and Baehni, 2012).
Several metagenomic studies have indicated that sam- ples of subgingival plaque from periodontitis patients contained different flora than in healthy subjects (Liu et al., 2012; Xu and Gunsolley, 2014; Griffen et al., 2012). Furthermore, a shift has been demonstrated in the oral microbiome from Gram-positive bacteria predominant in healthy individuals to Gram-negative microflora in patients suffering from periodontal disease. Indeed, Wang et al. (2013) observed that strains of Streptococ-cus spp. (13.7–41.3%), Haemophilus spp. (2.0–25.8%), Rothia spp. (0.9–16.7%), and Capnocytophaga spp. (3.1–13.0%) predominated in samples from individu-als without periodontitis, while other genera comprised less than 10.0% of the microflora. In contrast, in speci-mens from individuals with periodontal disease the most prevalent were strains of Prevotella spp., which amounted to 14.4–44.7% of the bacterial communities.
The predominant species isolated from dental pla- ques from patients with periodontal disease are Porphy-romonas gingivalis (which has many virulence factors and an ability to evade the host’s immune response), Aggregatibacter actinomycetemcomitans (causing aggres-sive periodontitis), Treponema denticola, and Tannerella forsythia (which may have invasive properties). Simi-larly, Wang et al. (2013) showed a higher proportion of anaerobic Gram-negative bacteria classified in the gen-era Prevotella, Leptotrichia, Veillonella, Porphyromonas, and Treponema, in samples from periodontitis patients in comparison to microflora in samples from healthy individuals. Therefore, these species were considered by many authors as specific pathogens of periodontal disease. It should be noted, that further microbiologi-cal studies revealed a strong correlation between perio-dontal disease and the proportions of some bacteria cultured from dental plaques, e.g. Prevotella interme-dia, Fusobacterium nucleatum, Selenomonas noxia, Aggregatibacter actinomycetemcomitans, and Eubacte-rium nodatum (Slots and Genco, 1984; Tanner, 2015). However, the use of culture-independent molecular techniques allowed to identify other groups of bacte-ria prevalent in samples from patients with periodontal disease, including the following genera: Megasphaera, Parvimonas, Desulfobulbus, and Filifactor (Kumar et al., 2005; Colombo et al., 2009).
Elucidation of pathogenesis of periodontitis and an association between its progression and specific patho-gens – or their composition – require further studies, particularly metagenomic analyses (Wang et al., 2013; Jorth et al., 2014). Wang et al. (2013) used metagenomic sequencing of 16 samples from patients with 4 different
Burczyńska A. et al. 114
clinical forms of periodontal disease to evaluate func-tional potential of detected bacterial microflora. They observed a strong correlation between the composition of identified microflora and periodontal disease status. They also claim that they were successful in identifying an essential (“core”) disease-associated set of bacterial taxa. Jorth et al. (2014) confirmed a high diversity of microbial flora composition in patients with perio-dontits, however they found that disease-associated communities exhibit conserved changes in metabolic profiles and virulence gene expression.
Surprisingly, recent studies suggest that bacterial spe cies present in low quantities in oral samples can-not be ignored as they may play a significant role in the oral microbiota, including inflammatory processes observed in periodontitis (Kawamura and Kamiya, 2012; Hajishengallis et al., 2011; Wang et al., 2013). Using a metagenomic approach, Wang et al. (2013) identified low-abundance genera, which were associa-ted with periodontitis, including Alistipes, Bulleidia, Butyrivibrio, and Parabacteroides. They also claim that several functional genes and metabolic pathways (e.g. bacterial chemotaxis, flagellar assembly, and toxin bio-synthesis) were over-represented in the micro biomes in periodontal disease, in comparison to the oral micro-flora in healthy individuals (Wang et al., 2013). Further-more, they found a large number of phages in samples from both healthy individuals and patients with perio-dontal disease. They postulate that phages may modify the oral microflora and therefore may also play an indi-rect role in the pathogenesis of oral diseases.
The future of metagenomics in dentistry
Metagenomics has the potential to revolutionize clinical diagnostics (Miller et al., 2013). It enables simul-taneous detection of all microorganisms in a clinical sample, including uncultivable, rare and novel patho-gens. Furthermore, metagenomic techniques may help explain the role of variability in microbiome composi-tion and function in relation to pathogenesis of infec-tious diseases.
Metagenomic analyses have been done so far on a relatively small number of dental patients and healthy individuals. Further studies are therefore urgently needed to establish true composition of the oral micro-biome in health and disease. Metagenomic and related molecular techniques also offer perspectives for evalu-ation of pathomechanism of different dental infections and subsequently proper management of them. Func-tion-based metagenomic analyses have already helped to discover new resistance mechanisms and potential targets for antimicrobial therapy, therefore evaluation of the oral resistome is very important (Sukumar et al.,
2016; Tansirichaiya et al., 2016). As Zarco et al. (2012) stated, metagenomics may contribute not only to more effective diagnostic and therapeutic techniques, but also to personalized dental medicine. This may help to develop effective prophylaxis of oral diseases, such as dental caries and periodontitis, which according to the recent estimates affect as much as a quarter of the world’s human population.
Conflict of interestThe authors dec0lare that there are no conflicts of interest.
Literature
Aas J.A., A.L. Griffen, S.R. Dardis, A.M. Lee, I. Olsen, F.E. Dew-hirst, E.J. Leys and Paster B.J. 2008. Bacteria of dental caries in primary and permanent teeth in children and young adults. J. Clin. Microbiol. 46(4): 1407–1417.Alcaraz L.D., P. Belda-Ferre, R. Cabrera-Rubio, H. Romero, A. Simon-Soro, M. Pignatelli and A. Mira. 2012. Identifying a healthy oral microbiome through metagenomics. Clin. Microbiol. Infect. 18(Suppl. 4): 54–57.Astorga B., C. Barraza, J.M. Casals, M.J. Cisterna, D. Mena, F. Morales, S. González, O. de Oliveira Jnr. and G. Moncada. 2015. Advances in the study of oral bacterial diversity associated with dental caries by genomic study. Int. J. Odontostomat. 9(3): 349–356.Beighton D. 2005. The complex oral microflora of high-risk indi-viduals and groups and its role in the caries process. Comm. Dent. Oral Epidemiol. 33(4): 248–255.Belda-Ferre P., L.D. Alcaraz, R. Cabrera, H. Romero, A. Simon, M. Pignatelli and A. Mira. 2012. The oral metagenome in health and disease. ISME J. 6(1): 46–56.Belibasakis G.N. and E. Mylonakis. 2015. Oral infections: clinical and biological perspectives. Virulence 6(3): 173–176.Colak H., C.T. Dülgergil, M. Dalli and M.M. Hamidi. 2013. Early childhood caries update: A review of causes, diagnoses, and treat-ments. J. Nat. Sci. Biol. Med. 4(1): 29–38. Colombo A.P., S.K. Boches, S.L. Cotton, J.M. Goodson, R. Kent, A.D. Haffajee, S.S. Socransky, H. Hasturk, T.E. Van Dyke, F. Dewhirst and others. 2009. Comparisons of subgingival micro-bial profiles of refractory periodontitis, severe periodontitis, and periodontal health using the human oral microbe identification microarray. J. Periodontol. 80(9): 1421–1432. Dewhirst F.E., T. Chen, J. Izard, B.J. Paster, A.C. Tanner, W.H. Yu, A. Lakshmanan and W.G. Wade. 2010. The human oral micro-biome. J. Bacteriol. 192: 5002–5017.Duran-Pinedo A.E. and J. Frias-Lopez. 2015. Beyond microbial community composition: functional activities of the oral micro-biome in health and disease. Microbes Infect. 17: 505e516.Edelstein B.L. 2006. The dental caries pandemic and disparities problem. BMC Oral Health. 6(Suppl 1): S2. Gooch B.F., S.O. Griffin, S.K. Gray, W.G. Kohn, R.G. Rozier, M. Siegal, M. Fontana, D. Brunson, N. Carter, D.K. Curtis and others; Centers for Disease Control and Prevention. 2009. Pre-venting dental caries through school-based sealant programs: updated recommendations and reviews of evidence. J. Am. Dent. Assoc. 140(11): 1356–1365.Griffen A.L., C.J. Beall, J.H. Campbell, N.D. Firestone, P.S. Kumar, Z.K. Yang, M. Podar and E.J. Leys. 2012. Distinct and complex bacterial profiles in human periodontitis and health revealed by 16S pyrosequencing. ISME J. 6: 1176–1185.
Metagenomic studies in dentistry1 15
Gross E.L., C.J. Beall, S.R. Kutsch, N.D. Firestone, E.J. Leys and A.L. Griffen. 2012. Beyond Streptococcus mutans: dental caries onset linked to multiple species by 16S rRNA community analysis. PLoS ONE. 7(10): e47722.Hajishengallis G., S. Liang, M.A. Payne, A. Hashim, R. Jotwani, M.A. Eskan, M.L. McIntosh, A. Alsam, K.L. Kirkwood, J.D. Lam-bris and others. 2011. Low-abundance biofilm species orchestrates inflammatory periodontal disease through the commensal micro-biota and complement. Cell Host Microbe. 10: 497–506.Han Y.W. and X. Wang. 2013. Mobile microbiome: oral bacteria in extra-oral infections and inflammation. J. Dent. Res. 92: 485–491.He J., Y. Li, Y. Cao, J. Xue and X. Zhou. 2015. The oral microbiome diversity and its relation to human diseases. Folia Microbiol. 60: 69. Hsiao W.W.L., K.L. Li, Z. Liu, C. Jones, C.M. Fraser-Liggett and A.F. Fouad. 2012. Microbial transformation from normal oral microbiota to acute endodontic infections. BMC Genomics. 13: 345.Jorth P., K.H. Turner, P. Gumus, N. Nizam, N. Buduneli and M. Whiteley. 2014. Metatranscriptomics of the human oral micro-biome during health and disease. mBio. 5(2): e01012–14.Karpinski T.M. and A.K. Szkaradkiewicz. 2013. Microbiology of dental caries. J. Biol. Earth Sci. 3(1): M21–M24.Kawamura Y. and Y. Kamiya. 2012. Metagenomic analysis permit-ting identification of the minority bacterial populations in the oral microbiota. J. Oral Biosci. 54: 132–137.Kumar P.S., A.L. Griffen, M.L. Moeschberger and E.J. Leys. 2005. Identification of candidate periodontal pathogens and beneficial spe-cies by quantitative 16S clonal analysis. J. Clin. Microbiol. 43: 3944–3955.Kuramitsu H.K. and B.Y. Wang. 2011. The whole is greater than the sum of its parts: dental plaque bacterial interactions can affect the virulence properties of cariogenic Streptococcus mutans. Am. J. Dent. 24(3): 153–154.Liu B., L.L. Faller, N. Klitgord, V. Mazumdar, M. Ghodsi, D.D. Sommer, T.R. Gibbons, T.J. Treangen, Y.C. Chang, S. Li and others. 2012. Deep sequencing of the oral microbiome reveals sig-natures of periodontal disease. PLoS One 7: e37919. Mang-de la Rosa M.R., L. Castellanos-Cosano, M.J. Romero-Perez and A. Cutando. 2014. The bacteremia of dental origin and its implications in the appearance of bacterial endocarditis. Med. Oral Patol. Oral Cir. Bucal. 19(1): e67–e73.Maurer P., E. Hoffman and H. Mast. 2009. Bacterial meningitis after tooth extraction. Br. Dent. J. 206: 69–71. Miller R.R., V. Montoya, J.L. Gardy, D.M. Patrick and P. Tang. 2013. Metagenomics for pathogen detection in public health. Genome Med. 5(9): 81. Moodley A., N.H. Wood and S.L. Shangase. 2013. The relationship between periodontitis and diabetes: a brief review. SADJ 68(260): 262–264.Munson M.A., T. Pitt-Ford, B. Chong, A. Weightman and W.G. Wade. 2002. Molecular and cultural analysis of the microflora associated with endodontic infections. J. Dent. Res. 81: 761–766.Narayanan L.L. and C. Vaishnavi. 2010. Endodontic microbiology. J. Conserv. Dent. 13(4): 233–239.Padmanabhan R., A.K. Mishra, D. Raoult and P.E. Fournier. 2013. Genomics and metagenomics in medical microbiology. J. Microbiol. Methods. 95(3): 415–424. Pappa H. and D.C. Jones. 2005. Mediastinitis from odontogenic infection. A case report. Br. Dent. J. 198: 547–548.Petersen P.E. and P.C. Baehni. 2012. Periodontal health and global public health. Periodontol. 2000. 60(1): 7–14. Petersen P.E., D. Bourgeois, H. Ogawa, S. Estupinan-Day and C. Ndiaye. 2005. The global burden of oral diseases and risks to oral health. Bull. World Health Org. 83(9): 661–669.Ribeiro A.C., F. Matarazzo, M. Faveri, D.M. Zezell and M.P.A. Mayer. 2011. Exploring bacterial diversity of endodontic micro-biota by cloning and sequencing 16S rRNA. J. Endod. 37: 922–926.
Robertson D.P. 2015. Management of severe acute dental infections. Br. Med. J. 350: h1300.Santos A.L., J.F.J. Siqueira, I.N. Rocas, E.C. Jesus, A.S. Rosado and J.M. Tiedje. 2011. Comparing the bacterial diversity of acute and chronic dental root canal infections. PLoS One 6: e28088.Scholtz M.B., C.C. Lo and P.S. Chain. 2012. Next generation sequencing and bioinformatic bottlenecks: the current state of metagenomic data analysis. Curr. Opin. Biotechnol. 23(1): 9–15.Simon-Soro A., M. Guillen-Navarro and A. Mira. 2014. Metatran-scriptomics reveals overall active bacterial composition in caries lesions. J. Oral Microbiol. 6: 25443.Siqueira J.F.J., I.N. Rocas, R. Souto, M. de Uzeda and A.P. Colombo. 2000. Checkerboard DNA-DNA hybridization analysis of endodontic infections. Oral Surg. Oral Med. Oral Pathol. Oral Radiol. Endod. 89: 744–748.Siqueira J.F.J. and I.N. Rocas. 2009. Diversity of endodontic micro-biota revisited. J. Dent. Res. 88: 969–981.Siqueira J.F.J., F.R. Alves and I.N. Rocas. 2011. Pyrosequenc-ing analysis of the apical root canal microbiota. J. Endod. 37: 1499–1503.Sequeira J.F.J. and I.N. Rocas. 2013. Microbiology and treatment of acute apical abscesses. Clin. Microbiol. Rev. 26(2): 255–273. Slots J. and R.J. Genco. 1984. Black-pigmented Bacteroides species, Capnocytophaga species, and Actinobacillus actinomycetemcomitans in human periodontal disease: virulence factors in colonization, sur-vival, and tissue destruction. J. Dent. Res. 63: 412–421.Struzycka I. 2014. The oral microbiome in dental caries. Pol. J. Microbiol. 63(2): 127–135.Sukumar S., A.P. Roberts, F.E. Martin and C.J. Adler. 2016. Metagenomic insights into transferable antibiotic resistance in oral bacteria. J. Dent. Res. 95(9): 969–76.Tanner A.C.R. 2015. Anaerobic culture to detect periodontal and caries pathogens. J. Oral. Biosci. 57(1): 18–26. Tansirichaiya S., M.A. Rahman, A. Antepowicz, P. Mullany and A.P. Roberts. 2016. Detection of novel integrons in the metagenome of human saliva. PLoS One 11(6): 0157605.Tavares W.L.F., L.C. Neves de Brito, R.P. Teles, M.L.A. Mas-sara, A.P. Ribeiro Sobrinho, A.D. Haffajee, S.S. Socransky and F.R. Teles. 2011. Microbiota of deciduous endodontic infections analyzed by MDA and Checkerboard DNA-DNA hybridization. Int. Endod. J. 44(3): 225–235. Turaev D. and T. Rattei. 2016. High definition for systems biology of microbial communities: metagenomics gets genome-centric and strain-resolved. Curr. Opin. Biotechnol. 39: 174–181.Wang J., J. Qi, H. Zhao, S. He, Y. Zhang, S. Wei and F. Zhao. 2013. Metagenomic sequencing reveals microbiota and its functional potential associated with periodontal disease. Sci. Rep. 3: 1843.World Health Organization (WHO). 2012. Oral health. Fact sheet. http://www.who.int/mediacentre/factsheets/fs318/en, 2016.10.30.Wu J., B.A. Peters, C. Dominianni, Y. Zhang, Z. Pei, L. Yang, Y. Ma, M.P. Purdue, E.J. Jacobs, S.M. Gapstur and others. 2016. Cigarette smoking and the oral microbiome in a large study of American adults. ISME J. 10(10): 2435–2446.Xu P. and J. Gunsolley. 2014. Application of metagenomics in understanding oral health and disease. Virulence 5(3): 424–432.Zarco M.F., T.J. Vess and G.S. Ginsburg. 2012. The oral micro- biome in health and disease and the potential impact on personal-ized dental medicine. Oral Dis. 18(2): 109–120. Zehnder M. and G.N. Belibasakis. 2015. On the dynamics of root canal infections – what we understand and what we don’t. Virulence 6(3): 216–222.Zhou J., N. Jiang, S. Wang, X. Hu, K. Jiao, X. He, Z. Li and J. Wang. 2016. Exploration of human salivary microbiomes – insights into the novel characteristics of microbial community structure in caries and caries-free subjects. PLoS One 11(1): e0147039.

Polish Journal of Microbiology2017, Vol. 66, No 1, 17–24
ORIGINAL PAPER
* Corresponding author: I. Sitkiewicz, Department of Molecular Microbiology, National Medicines Institute, Chełmska 30/34, 00-725 Warsaw, Poland; e-mail: [email protected]
Introduction
Group A Streptococcus (GAS) is a Gram-positive human bacterial pathogen that causes a variety of diseases ranging from pharyngitis to life-threatening strepto- coccal toxic shock syndrome (Sitkiewicz and Hrynie-wicz, 2010). The molecular mechanisms responsible for these different diseases are an intense area of GAS research. Several studies have examined the global gene expression changes in GAS occurring as it encounters distinct niches within the host (Graham et al., 2002; 2005; Klenk et al., 2005; Shelburne et al., 2005; Sitkiewicz and Musser, 2006; Virtaneva et al., 2005; Voyich et al., 2004; Voyich et al., 2003; Musser and DeLeo, 2005). For example, an expression microarray analysis examined the transcriptional response of GAS to interaction with human polymorphonuclear leukocytes (PMNs) (Voyich et al., 2003). An important discovery was that transcrip-tion of the M5005_Spy_1343 gene (spy1343) was up-regulated two-fold 60 min post-PMN contact. Spy1343 encodes an inferred 298-amino acid protein that belongs to the LysR family of transcriptional regulators.
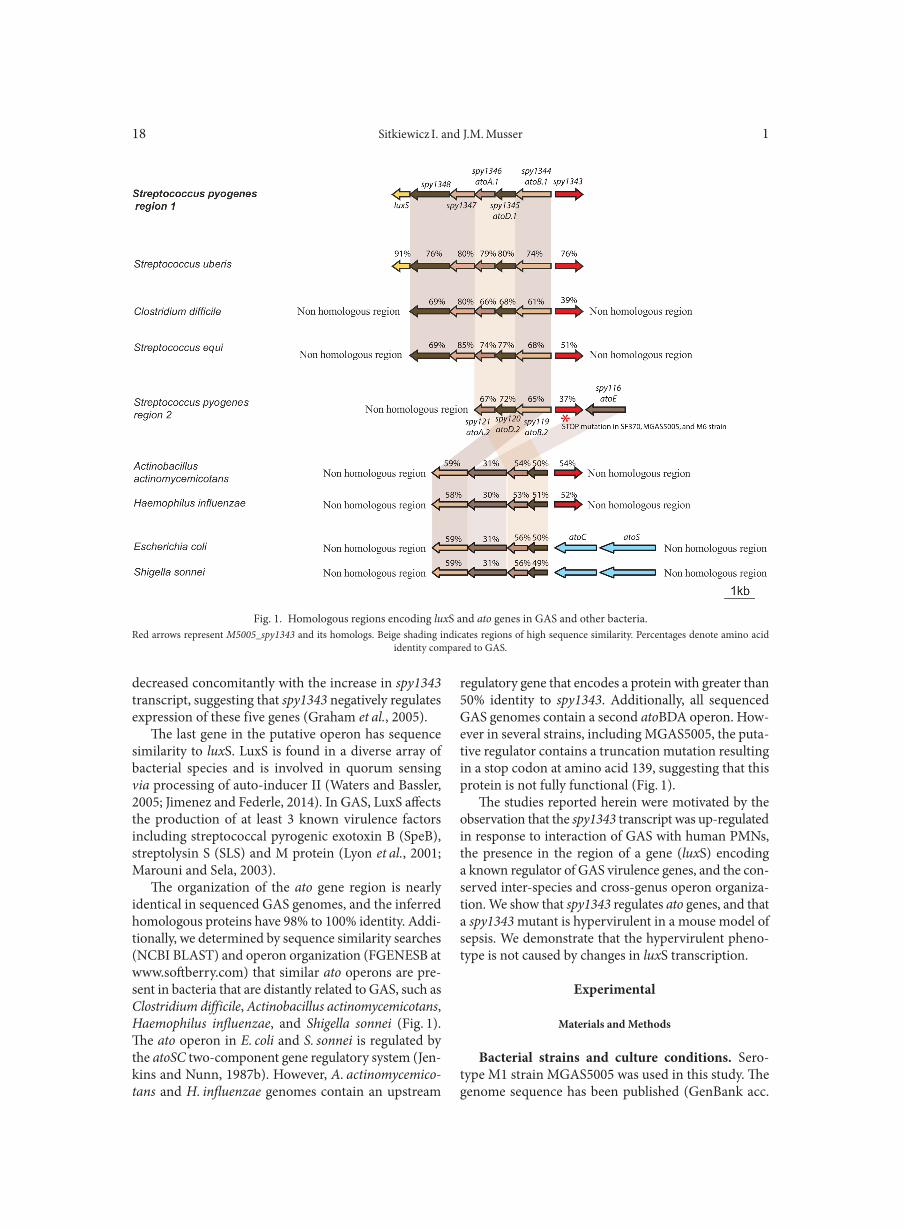
The spy1343 open reading frame (ORF) is located downstream and is divergently transcribed from a puta-tive operon containing six genes (Lyon et al., 2001) (Fig. 1). The first three genes (atoBDA) share sequence similarity with the atoBDA operon in Esherichia coli (Jenkins and Nunn, 1987a) that encodes enzymes involved in short-chain fatty acid (SCFA) degradation. In E. coli, AtoB is an acetoacetyl-CoA acetyltransferase (thiolase II), and AtoA and AtoD form the two subunits of acetate CoA-transferase. These enzymes also can par-ticipate in metabolic pathways other than SCFA degra-dation, such as butanoate metabolism, synthesis and degradation of ketone bodies, and fatty acid biosynthesis via pathway 2 (www.brenda.uni-koeln.de). Two other genes present in the putative GAS operon (M5005_Spy_1347 and M5005_Spy_1348) encode proteins with sequence similarity to 3-hydroxybutyrate dehydro-genase and 3-hydroxybutyrate permease, respectively. These enzymes are involved in butanoate metabolism and synthesis and degradation of ketone bodies. Inter-estingly, upon exposure of GAS to human blood, the transcript level of all 5 genes (M5005_Spy_1344-1348)
Deletion of atoR from Streptococcus pyogenes Results in Hypervirulencein a Mouse Model of Sepsis and is LuxS Independent
IZABELA SITKIEWICZ1* and JAMES M. MUSSER2
1 Department of Molecular Microbiology, National Medicines Institute, Warsaw, Poland2 Center for Molecular and Translational Human Infectious Diseases Research,
Houston Methodist Research Institute, and Department of Pathology and Genomic Medicine,Houston Methodist Hospital, Houston, Texas, USA
Submitted 17 November 2016, accepted 27 January 2016
A b s t r a c t
Group A Streptococcus (GAS) is a Gram-positive human pathogen that causes a variety of diseases ranging from pharyngitis to life-threaten-ing streptococcal toxic shock syndrome. Recently, several global gene expression analyses have yielded extensive new information regarding the regulation of genes encoding known and putative virulence factors in GAS. A microarray analysis found that transcription of the GAS gene M5005_Spy_1343 was significantly increased in response to interaction with human polymorphonuclear leukocytes. M5005_Spy_1343 is predicted to encode a member of the LysR family of transcriptional regulators and is located upstream of a putative operon containing six genes. Five of these genes have sequence similarity to genes involved in short-chain fatty acid metabolism, whereas the sixth gene (luxS) is found in many bacterial species and is involved in quorum sensing. Unexpectedly, inactivation of the M5005_Spy_1343 gene resulted in hypervirulence in an intraperitoneal mouse model of infection. Increased virulence was not due to changes in luxS gene expression. We postulate that short-chain fatty acid metabolism is involved in GAS pathogenesis.
Key words: Streptococcus pyogenes, ato, host-pathogen interactions, short chain fatty acid synthesis, virulence factors
Sitkiewicz I. and J.M. Musser 118
decreased concomitantly with the increase in spy1343 transcript, suggesting that spy1343 negatively regulates expression of these five genes (Graham et al., 2005).
The last gene in the putative operon has sequence similarity to luxS. LuxS is found in a diverse array of bacterial species and is involved in quorum sensing via processing of auto-inducer II (Waters and Bassler, 2005; Jimenez and Federle, 2014). In GAS, LuxS affects the production of at least 3 known virulence factors including streptococcal pyrogenic exotoxin B (SpeB), streptolysin S (SLS) and M protein (Lyon et al., 2001; Marouni and Sela, 2003).
The organization of the ato gene region is nearly identical in sequenced GAS genomes, and the inferred homologous proteins have 98% to 100% identity. Addi-tionally, we determined by sequence similarity searches (NCBI BLAST) and operon organization (FGENESB at www.softberry.com) that similar ato operons are pre-sent in bacteria that are distantly related to GAS, such as Clostridium difficile, Actinobacillus actinomycemicotans, Haemophilus influenzae, and Shigella sonnei (Fig. 1). The ato operon in E. coli and S. sonnei is regulated by the atoSC two-component gene regulatory system (Jen-kins and Nunn, 1987b). However, A. actinomycemico-tans and H. influenzae genomes contain an upstream
regulatory gene that encodes a protein with greater than 50% identity to spy1343. Additionally, all sequenced GAS genomes contain a second atoBDA operon. How-ever in several strains, including MGAS5005, the puta-tive regulator contains a truncation mutation resulting in a stop codon at amino acid 139, suggesting that this protein is not fully functional (Fig. 1).
The studies reported herein were motivated by the observation that the spy1343 transcript was up-regulated in response to interaction of GAS with human PMNs, the presence in the region of a gene (luxS) encoding a known regulator of GAS virulence genes, and the con-served inter-species and cross-genus operon organiza-tion. We show that spy1343 regulates ato genes, and that a spy1343 mutant is hypervirulent in a mouse model of sepsis. We demonstrate that the hypervirulent pheno-type is not caused by changes in luxS transcription.
Experimental
Materials and Methods
Bacterial strains and culture conditions. Sero-type M1 strain MGAS5005 was used in this study. The genome sequence has been published (GenBank acc.
Fig. 1. Homologous regions encoding luxS and ato genes in GAS and other bacteria.Red arrows represent M5005_spy1343 and its homologs. Beige shading indicates regions of high sequence similarity. Percentages denote amino acid
identity compared to GAS.
Deletion of atoR results in hypervirulence in mice1 19
No. CP000017), and MGAS5005 is representative of contemporary clinical M1 isolates (Sumby et al., 2005). GAS were grown in Todd-Hewitt broth (Difco Labo-ratories) supplemented with 0.2% yeast extract (THY medium) at 37°C in an atmosphere of 5% CO2, 20% O2. THY medium or tryptose agar with 5% sheep blood (Becton Dickinson) was used as solid media. THY agar supplemented with spectinomycin (150 µg/ml) was used for selection of the antibiotic-resistant mutant derivative strain. Cloning experiments were performed with E. coli DH10B (Invitrogen). Ampicillin (100 µg/ml) or spectinomycin (150 µg/ml) was used for selection of E. coli clones when required.
DNA techniques. Restriction and modification enzymes were purchased from New England BioLabs or ThermoFisher. Plasmid DNA from E. coli was iso-lated with a QIAprep Spin Miniprep Kit (Qiagen). Chromosomal DNA was isolated from GAS using the DNeasy Tissue Kit (Qiagen) as described by the manufacturer, with slight modification (Sitkiewicz and Musser, 2006). Southern hybridization was performed
with the ECL system according to the manufacturer’s instructions (Amersham).
Transformation of GAS. GAS was transformed as described previously (Sitkiewicz and Musser, 2006). Briefly, cells were grown to an OD600 of 0.2–0.25 in medium containing L-threonine and sucrose, washed, and frozen in aliquots. The GAS-DNA mixture was sub-jected to a pulse of 1.8 kV, 25 µF, 400 Ohms, and trans-formed cells were incubated 2–3 hours at 37°C without antibiotics and plated onto selective media.
Construction of the Δspy1343 mutant strain. The coding sequence of spy1343 was replaced with a spec-tinomycin-resistance cassette (spc) by a double cros-sover strategy. Upstream and downstream sequences of spy1343 were amplified in PCR reactions with primer pairs 1343 5’F/1343 5’R and 1343 3’F/1343 3’R (Table I). The PCR products were cloned into pUC19 (Fermentas) and pSTblue-1 (Novagen) vectors to generate plasmids p1343-5’ and p1343-3’, respectively. The spc contain-ing the add9 gene was excised from plasmid pSL60-2 (Lukomski et al., 2000) with SmaI and cloned into the
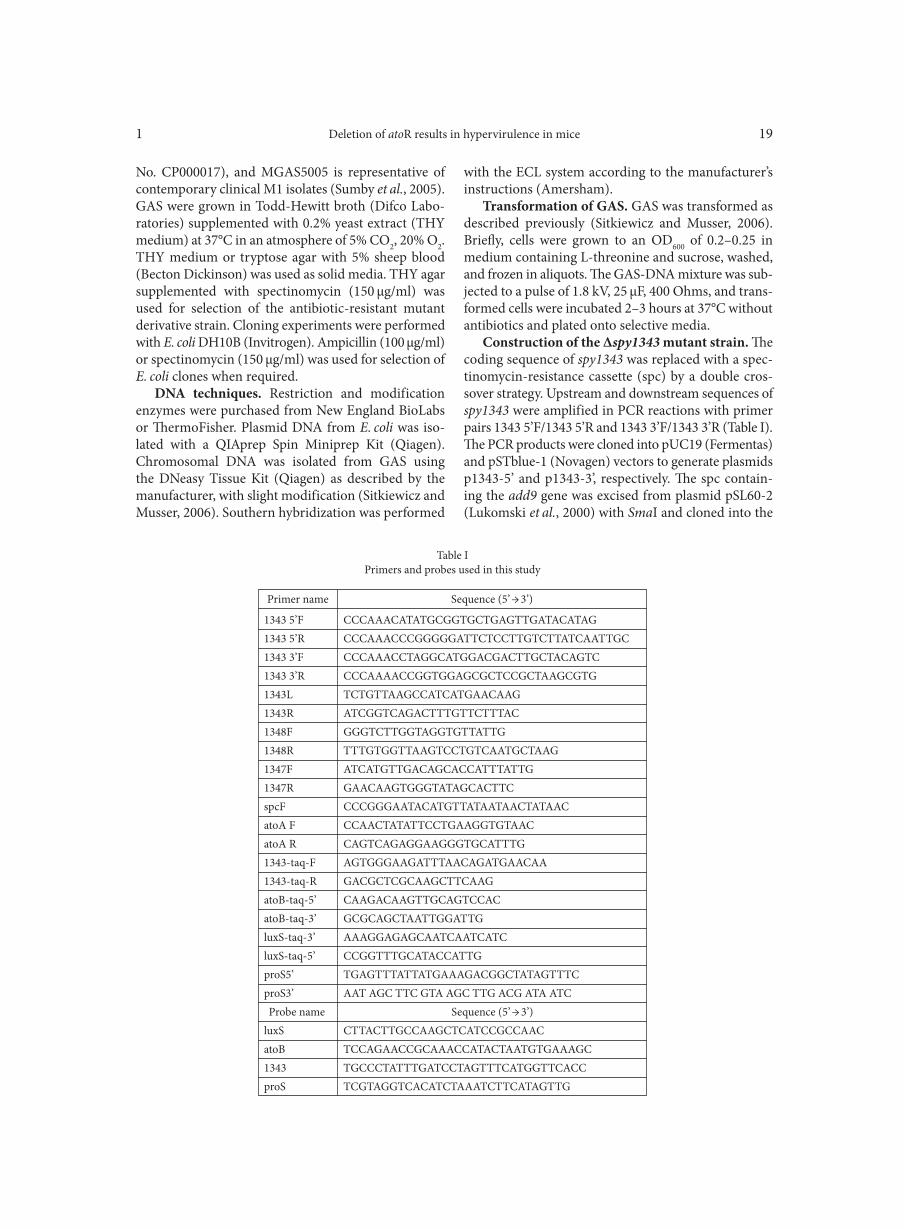
1343 5’F CCCAAACATATGCGGTGCTGAGTTGATACATAG1343 5’R CCCAAACCCGGGGGATTCTCCTTGTCTTATCAATTGC1343 3’F CCCAAACCTAGGCATGGACGACTTGCTACAGTC1343 3’R CCCAAAACCGGTGGAGCGCTCCGCTAAGCGTG1343L TCTGTTAAGCCATCATGAACAAG1343R ATCGGTCAGACTTTGTTCTTTAC1348F GGGTCTTGGTAGGTGTTATTG1348R TTTGTGGTTAAGTCCTGTCAATGCTAAG1347F ATCATGTTGACAGCACCATTTATTG1347R GAACAAGTGGGTATAGCACTTCspcF CCCGGGAATACATGTTATAATAACTATAACatoA F CCAACTATATTCCTGAAGGTGTAACatoA R CAGTCAGAGGAAGGGTGCATTTG1343-taq-F AGTGGGAAGATTTAACAGATGAACAA1343-taq-R GACGCTCGCAAGCTTCAAGatoB-taq-5’ CAAGACAAGTTGCAGTCCACatoB-taq-3’ GCGCAGCTAATTGGATTGluxS-taq-3’ AAAGGAGAGCAATCAATCATCluxS-taq-5’ CCGGTTTGCATACCATTGproS5’ TGAGTTTATTATGAAAGACGGCTATAGTTTCproS3’ AAT AGC TTC GTA AGC TTG ACG ATA ATC Probe name Sequence (5’ → 3’)luxS CTTACTTGCCAAGCTCATCCGCCAACatoB TCCAGAACCGCAAACCATACTAATGTGAAAGC1343 TGCCCTATTTGATCCTAGTTTCATGGTTCACCproS TCGTAGGTCACATCTAAATCTTCATAGTTG
Table IPrimers and probes used in this study
Primer name Sequence (5’ → 3’)
Sitkiewicz I. and J.M. Musser 120
PmlI site of p1343-3’ to generate plasmid p1343-3’spc. The orientation of the spc was determined by PCR with primers spcF/1343 3’R. The spy1343 fragment and spc from p1343-3’spc were cloned into p1343-5’ to generate a plasmid with a DNA cassette containing the upstream and downstream fragments of spy1343 flanking the add9 gene. The entire fragment was ampli-fied using PCR primers 1343 5’F and1343 3’R and puri-fied product was transformed into strain MGAS5005. Transformants were selected on THY medium contain-ing spectinomycin. Chromosomal DNA isolated from spectinomycin-resistant colonies was screened by PCR using primers 1343L/1343R, which annealed outside of the targeted integration site, thereby amplifying dif-ferent-size products in mutant versus wild-type clones. Inactivation of the target gene was further confirmed by sequencing of the appropriate chromosomal region, and single integration was confirmed by Southern hybridization using a probe that annealed to the spc.
Mouse infection experiments. GAS strains used for mouse infection studies were grown in THY medium to exponential phase (OD600 ~ 0.5), harvested, washed twice with cold PBS, and frozen at –70°C in aliquots. The number of CFUs used to inoculate mice was determined by plating GAS on sheep blood agar. Thawed aliquots of wild-type strain MGAS5005 and the isogenic mutant strain were adjusted to the same CFU/ml by diluting with PBS prior to injection. Outbred CD-1 Swiss male mice (4–6 weeks old) (Harlan) were used for intraperi-toneal inoculation with a dose of 1 × 10⁷ CFUs. Mortality and morbidity were monitored every 2 h for the first 48 h after infection, and every 6 h for the next 5 days.
TaqMan analysis of gene transcription. MGAS5005 and the Δspy1343 mutant strain were grown in THY medium to an OD600 of 0.2 (early-exponential), 0.5 (mid-exponential), 1.2 (late-exponential), or 1.8 (stationary phase). Two independent cultures for each strain rep-resented two biological replicates. RNA was isolated as described previously (Sitkiewicz and Musser, 2006). cDNA was generated using SuperScript III reverse transcriptase (RT) and random hexamers (Invitrogen), and TaqMan reactions were performed in quadrupli-cate using Platinum Quantitative PCR SuperMix (Invi-trogen). Primer/probe sets (Table I) used for Taqman reactions were: atoB-taq-5’/atoB-taq-3’/atoB probe for atoB (M5005_Spy_1344); luxS-taq-5’/luxS-taq-3’/luxS probe for luxS; 1343-taq-F/1343-taq-R/1343 probe for spy1343 and proS5’/proS3’/proS probe for internal proS standard. The transcript level of the genes of inter-est was normalized to proS transcript and compared between the wild-type and Δspy1343 mutant strains using ΔΔCT method (ABI, 2005).
RT-PCR. cDNA was generated using SuperScript III RT (Invitrogen) from RNA collected for TaqMan analysis with primers luxS-taq 3’, 1348R and atoA-R
according to the manufacturer’s instructions. First-strand cDNA was purified using S.N.A.P. columns (Invitrogen) and amplified in PCR reactions with primer pairs luxS-taq-3’/luxS-taq-5’, luxS-taq-3’/1348F and luxS-taq-3’/1347F (luxS transcript); 1348R/1638F, 1348R/1347F and 1347R/1347R (M5005_Spy_1348 transcript); atoAR/atoB-taq-5’ (atoA transcript). MGAS5005 genomic DNA served as a positive control for PCR, while the negative control used template gene-rated in the absence of RT.
Results
Construction and characterization of the Δspy1343 isogenic mutant strain. To determine if spy1343 is involved in regulation of the putative ato operon, we inactivated the gene by allelic replacement using stand-ard methods (Sitkiewicz and Musser, 2006). The mutant strain was confirmed to have the correct construction by PCR and DNA sequence analysis (data not shown) and gene transcript studies (see below). The Δspy1343 isogenic mutant strain had no observed phenotypic difference from the parent strain during growth in laboratory media. For example, the growth of the wild-type and mutant strains was identical in THY medium (Fig. 2), and colony morphology was identical on blood agar plates (data not shown).
spy1343 regulates transcription of the putative ato operon. To test the hypothesis that spy1343 regulates transcription of the genes in the putative ato operon, we compared transcript levels of spy1343 and the atoB gene in the wild-type and Δspy1343 mutant strains during early-, mid-, late-exponential, and stationary growth phases. TaqMan analysis indicated that the level of spy1343 transcript was constant throughout growth in the wild-type strain, and as expected, transcript was not detected in the Δspy1343 mutant strain (Fig. 3A). Interestingly, the atoB transcript level was decreased two-fold in the Δspy1343 mutant compared to wild-type in early-exponential phase, and then gradually attained wild-type transcript levels by stationary phase (Fig. 3B, red bars). This result indicates that spy1343 is not a direct negative regulator of the ato genes.
Deletion of spy1343 results in hypervirulence in mice. Because the level of spy1343 transcript increased when GAS interacted with human PMN ex vivo (Graham et al., 2005), we hypothesized that this gene played a role in GAS-host interactions. To test this hypothesis, we compared the virulence for mice of the wild-type and Δspy1343 mutant strains after intraperi-toneal ino cu lation, as described previously (Sitkiewicz and Musser, 2006). Unexpectedly, mice infected with the Δspy1343 mutant strain died significantly more rap-
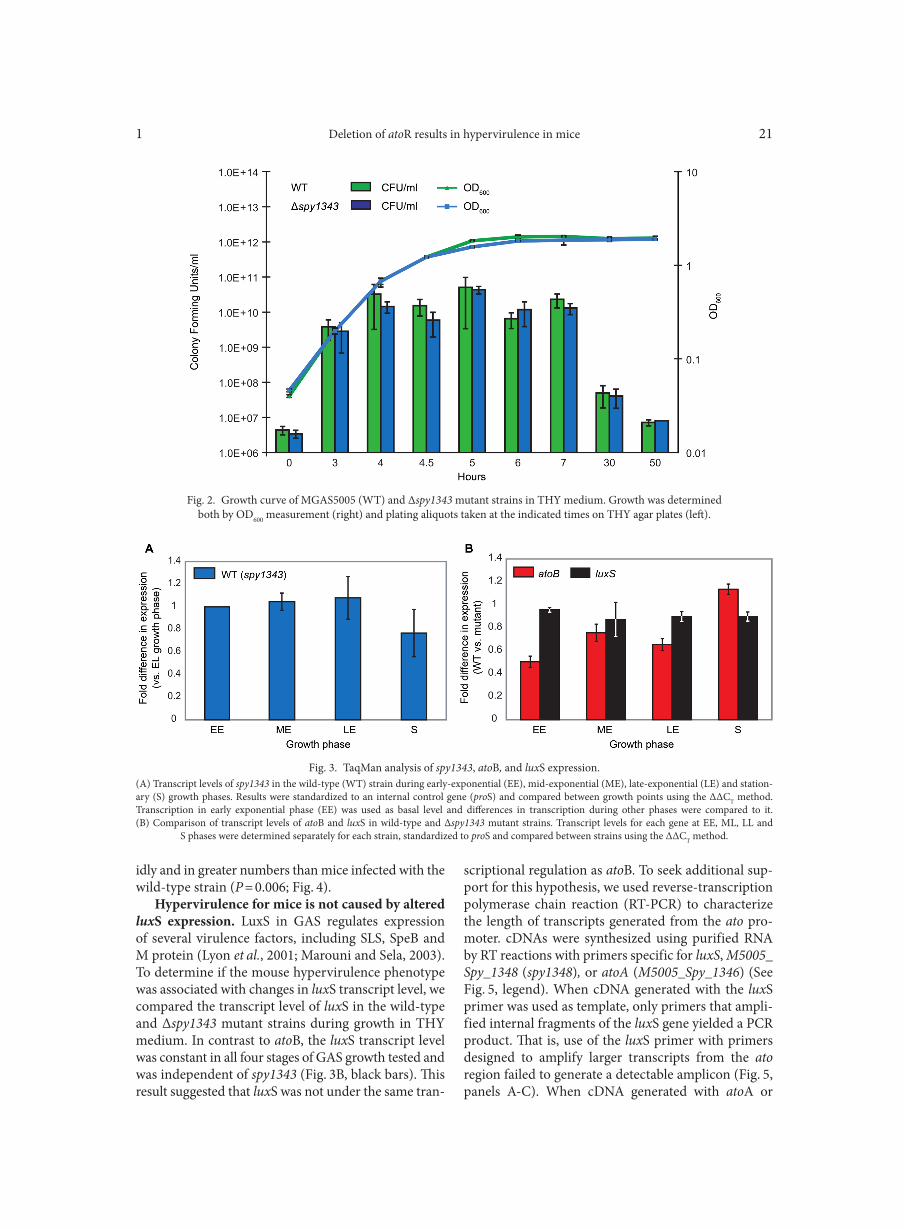
Deletion of atoR results in hypervirulence in mice1 21
idly and in greater numbers than mice infected with the wild-type strain (P = 0.006; Fig. 4).
Hypervirulence for mice is not caused by altered luxS expression. LuxS in GAS regulates expression of several virulence factors, including SLS, SpeB and M protein (Lyon et al., 2001; Marouni and Sela, 2003). To determine if the mouse hypervirulence phenotype was associated with changes in luxS transcript level, we compared the transcript level of luxS in the wild-type and Δspy1343 mutant strains during growth in THY medium. In contrast to atoB, the luxS transcript level was constant in all four stages of GAS growth tested and was independent of spy1343 (Fig. 3B, black bars). This result suggested that luxS was not under the same tran-
scriptional regulation as atoB. To seek additional sup-port for this hypothesis, we used reverse-transcription polymerase chain reaction (RT-PCR) to characterize the length of transcripts generated from the ato pro-moter. cDNAs were synthesized using purified RNA by RT reactions with primers specific for luxS, M5005_Spy_1348 (spy1348), or atoA (M5005_Spy_1346) (See Fig. 5, legend). When cDNA generated with the luxS primer was used as template, only primers that ampli-fied internal fragments of the luxS gene yielded a PCR product. That is, use of the luxS primer with primers designed to amplify larger transcripts from the ato region failed to generate a detectable amplicon (Fig. 5, panels A-C). When cDNA generated with atoA or
Fig. 2. Growth curve of MGAS5005 (WT) and Δspy1343 mutant strains in THY medium. Growth was determinedboth by OD600 measurement (right) and plating aliquots taken at the indicated times on THY agar plates (left).
Fig. 3. TaqMan analysis of spy1343, atoB, and luxS expression.(A) Transcript levels of spy1343 in the wild-type (WT) strain during early-exponential (EE), mid-exponential (ME), late-exponential (LE) and station-ary (S) growth phases. Results were standardized to an internal control gene (proS) and compared between growth points using the ΔΔCT method. Transcription in early exponential phase (EE) was used as basal level and differences in transcription during other phases were compared to it. (B) Comparison of transcript levels of atoB and luxS in wild-type and Δspy1343 mutant strains. Transcript levels for each gene at EE, ML, LL and
S phases were determined separately for each strain, standardized to proS and compared between strains using the ΔΔCT method.
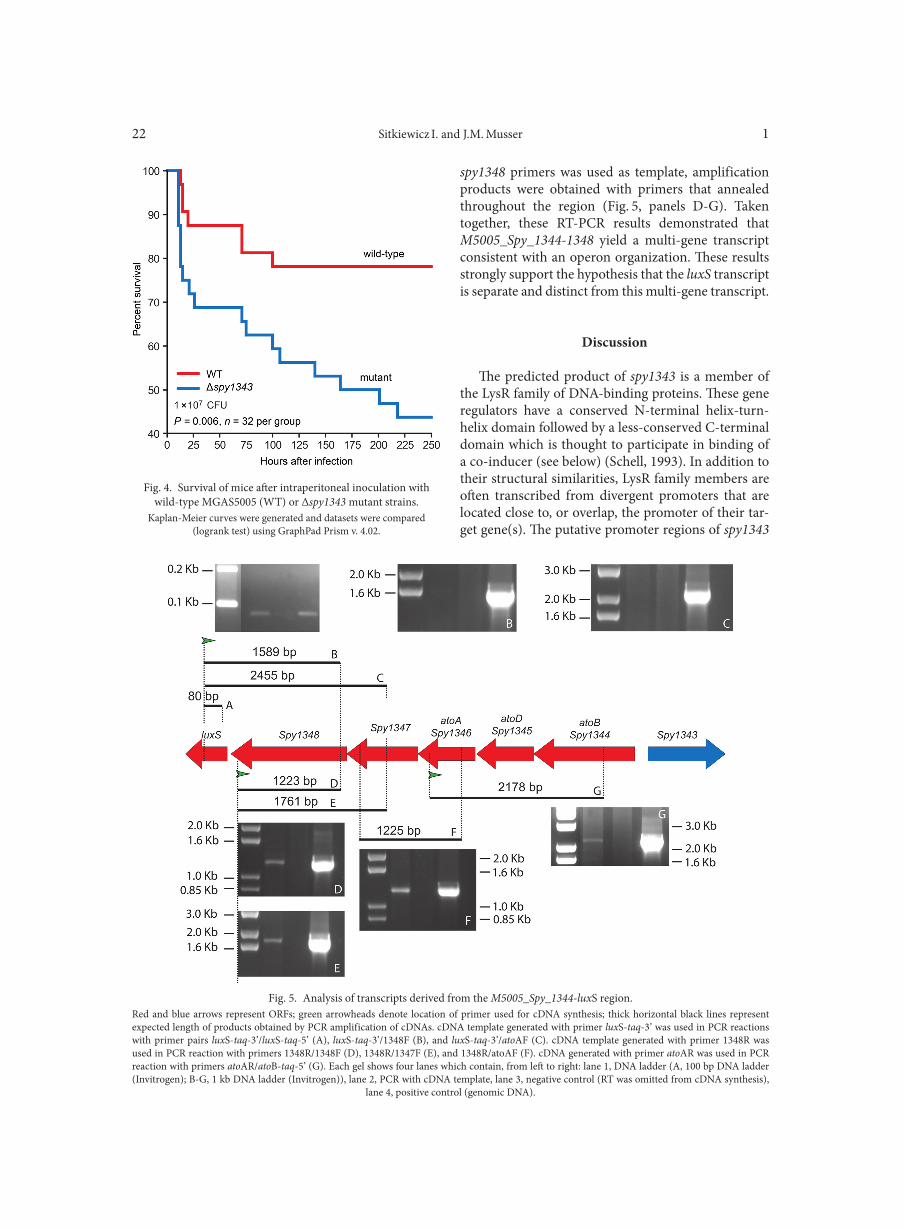
Sitkiewicz I. and J.M. Musser 122
spy1348 primers was used as template, amplification products were obtained with primers that annealed throughout the region (Fig. 5, panels D-G). Taken together, these RT-PCR results demonstrated that M5005_Spy_1344-1348 yield a multi-gene transcript consistent with an operon organization. These results strongly support the hypothesis that the luxS transcript is separate and distinct from this multi-gene transcript.
Discussion
The predicted product of spy1343 is a member of the LysR family of DNA-binding proteins. These gene regulators have a conserved N-terminal helix-turn-helix domain followed by a less-conserved C-terminal domain which is thought to participate in binding of a co-inducer (see below) (Schell, 1993). In addition to their structural similarities, LysR family members are often transcribed from divergent promoters that are located close to, or overlap, the promoter of their tar-get gene(s). The putative promoter regions of spy1343
Fig. 4. Survival of mice after intraperitoneal inoculation withwild-type MGAS5005 (WT) or Δspy1343 mutant strains.
Kaplan-Meier curves were generated and datasets were compared(logrank test) using GraphPad Prism v. 4.02.
Fig. 5. Analysis of transcripts derived from the M5005_Spy_1344-luxS region.Red and blue arrows represent ORFs; green arrowheads denote location of primer used for cDNA synthesis; thick horizontal black lines represent expected length of products obtained by PCR amplification of cDNAs. cDNA template generated with primer luxS-taq-3’ was used in PCR reactions with primer pairs luxS-taq-3’/luxS-taq-5’ (A), luxS-taq-3’/1348F (B), and luxS-taq-3’/atoAF (C). cDNA template generated with primer 1348R was used in PCR reaction with primers 1348R/1348F (D), 1348R/1347F (E), and 1348R/atoAF (F). cDNA generated with primer atoAR was used in PCR reaction with primers atoAR/atoB-taq-5’ (G). Each gel shows four lanes which contain, from left to right: lane 1, DNA ladder (A, 100 bp DNA ladder (Invitrogen); B-G, 1 kb DNA ladder (Invitrogen)), lane 2, PCR with cDNA template, lane 3, negative control (RT was omitted from cDNA synthesis),
lane 4, positive control (genomic DNA).
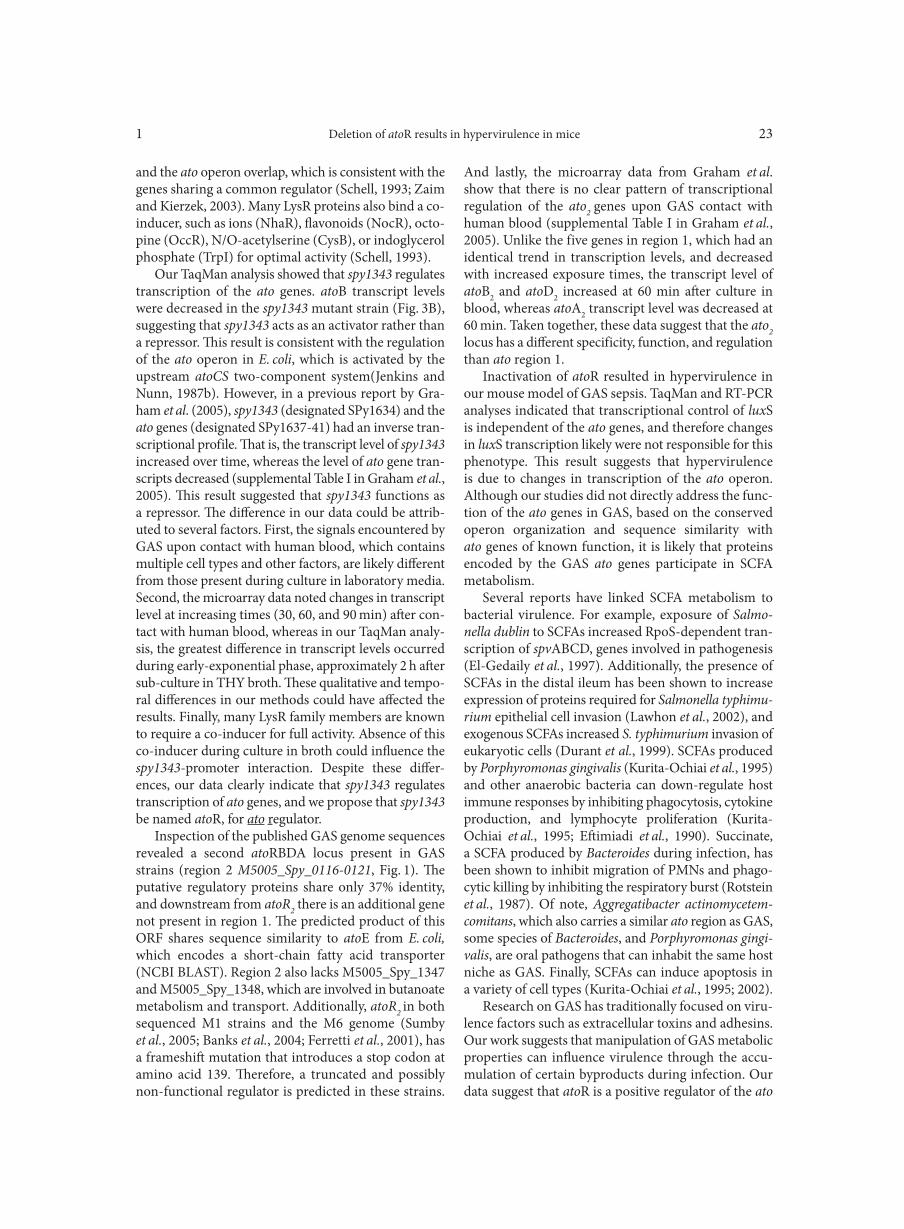
Deletion of atoR results in hypervirulence in mice1 23
and the ato operon overlap, which is consistent with the genes sharing a common regulator (Schell, 1993; Zaim and Kierzek, 2003). Many LysR proteins also bind a co-inducer, such as ions (NhaR), flavonoids (NocR), octo-pine (OccR), N/O-acetylserine (CysB), or indoglycerol phosphate (TrpI) for optimal activity (Schell, 1993).
Our TaqMan analysis showed that spy1343 regulates transcription of the ato genes. atoB transcript levels were decreased in the spy1343 mutant strain (Fig. 3B), suggesting that spy1343 acts as an activator rather than a repressor. This result is consistent with the regulation of the ato operon in E. coli, which is activated by the upstream atoCS two-component system(Jenkins and Nunn, 1987b). However, in a previous report by Gra-ham et al. (2005), spy1343 (designated SPy1634) and the ato genes (designated SPy1637-41) had an inverse tran-scriptional profile. That is, the transcript level of spy1343 increased over time, whereas the level of ato gene tran-scripts decreased (supplemental Table I in Graham et al., 2005). This result suggested that spy1343 functions as a repressor. The difference in our data could be attrib-uted to several factors. First, the signals encountered by GAS upon contact with human blood, which contains multiple cell types and other factors, are likely different from those present during culture in laboratory media. Second, the microarray data noted changes in transcript level at increasing times (30, 60, and 90 min) after con-tact with human blood, whereas in our TaqMan analy-sis, the greatest difference in transcript levels occurred during early-exponential phase, approximately 2 h after sub-culture in THY broth. These qualitative and tempo-ral differences in our methods could have affected the results. Finally, many LysR family members are known to require a co-inducer for full activity. Absence of this co-inducer during culture in broth could influence the spy1343-promoter interaction. Despite these differ-ences, our data clearly indicate that spy1343 regulates transcription of ato genes, and we propose that spy1343 be named atoR, for ato regulator.
Inspection of the published GAS genome sequences revealed a second atoRBDA locus present in GAS strains (region 2 M5005_Spy_0116-0121, Fig. 1). The putative regulatory proteins share only 37% identity, and downstream from atoR2 there is an additional gene not present in region 1. The predicted product of this ORF shares sequence similarity to atoE from E. coli, which encodes a short-chain fatty acid transporter (NCBI BLAST). Region 2 also lacks M5005_Spy_1347 and M5005_Spy_1348, which are involved in butanoate metabolism and transport. Additionally, atoR2 in both sequenced M1 strains and the M6 genome (Sumby et al., 2005; Banks et al., 2004; Ferretti et al., 2001), has a frameshift mutation that introduces a stop codon at amino acid 139. Therefore, a truncated and possibly non-functional regulator is predicted in these strains.
And lastly, the microarray data from Graham et al. show that there is no clear pattern of transcriptional regulation of the ato2 genes upon GAS contact with human blood (supplemental Table I in Graham et al., 2005). Unlike the five genes in region 1, which had an identical trend in transcription levels, and decreased with increased exposure times, the transcript level of atoB2 and atoD2 increased at 60 min after culture in blood, whereas atoA2 transcript level was decreased at 60 min. Taken together, these data suggest that the ato2 locus has a different specificity, function, and regulation than ato region 1.
Inactivation of atoR resulted in hypervirulence in our mouse model of GAS sepsis. TaqMan and RT-PCR analyses indicated that transcriptional control of luxS is independent of the ato genes, and therefore changes in luxS transcription likely were not responsible for this phenotype. This result suggests that hypervirulence is due to changes in transcription of the ato operon. Although our studies did not directly address the func-tion of the ato genes in GAS, based on the conserved operon organization and sequence similarity with ato genes of known function, it is likely that proteins encoded by the GAS ato genes participate in SCFA metabolism.
Several reports have linked SCFA metabolism to bacterial virulence. For example, exposure of Salmo-nella dublin to SCFAs increased RpoS-dependent tran-scription of spvABCD, genes involved in pathogenesis (El-Gedaily et al., 1997). Additionally, the presence of SCFAs in the distal ileum has been shown to increase expression of proteins required for Salmonella typhimu-rium epithelial cell invasion (Lawhon et al., 2002), and exogenous SCFAs increased S. typhimurium invasion of eukaryotic cells (Durant et al., 1999). SCFAs produced by Porphyromonas gingivalis (Kurita-Ochiai et al., 1995) and other anaerobic bacteria can down-regulate host immune responses by inhibiting phagocytosis, cytokine production, and lymphocyte proliferation (Kurita-Ochiai et al., 1995; Eftimiadi et al., 1990). Succinate, a SCFA produced by Bacteroides during infection, has been shown to inhibit migration of PMNs and phago-cytic killing by inhibiting the respiratory burst (Rotstein et al., 1987). Of note, Aggregatibacter actinomycetem-comitans, which also carries a similar ato region as GAS, some species of Bacteroides, and Porphyromonas gingi-valis, are oral pathogens that can inhabit the same host niche as GAS. Finally, SCFAs can induce apoptosis in a variety of cell types (Kurita-Ochiai et al., 1995; 2002).
Research on GAS has traditionally focused on viru-lence factors such as extracellular toxins and adhesins. Our work suggests that manipulation of GAS metabolic properties can influence virulence through the accu-mulation of certain byproducts during infection. Our data suggest that atoR is a positive regulator of the ato
Sitkiewicz I. and J.M. Musser 124
operon, and therefore the ΔatoR mutant strain could be impaired in degrading SCFA in vivo. An increase in the local concentration of SCFA could inhibit the host immune system and account for the observed hypervirulence.
Acknowledgments This work was supported by N N303 822240 grant to I.S. and
funds from the Fondren Foundation to J.M.M.
Literature
Banks D.J., S.F. Porcella, K.D. Barbian, S.B. Beres, L.E. Philips, J.M. Voyich, F.R. DeLeo, J.M. Martin, G.A. Somerville and J.M. Musser. 2004. Progress toward characterization of the group A Streptococcus metagenome: complete genome sequence of a macro-lide-resistant serotype M6 strain. J. Infect. Dis. 190: 727–738.Durant J.A., V.K. Lowry, D.J. Nisbet, L.H. Stanker, D.E. Corrier and S.C. Ricke. 1999. Short-chain fatty acids affect cell-association and invasion of HEp-2 cells by Salmonella typhimurium. J. Environ. Sci. Health. B. 34: 1083–1099.Eftimiadi C., M. Tonetti, A. Cavallero, O. Sacco and G.A. Rossi. 1990. Short-chain fatty acids produced by anaerobic bacteria inhibit phagocytosis by human lung phagocytes. J. Infect. Dis. 161: 138–142.El-Gedaily A., G. Paesold, C.Y. Chen, D.G. Guiney and M. Krause. 1997. Plasmid virulence gene expression induced by short-chain fatty acids in Salmonella dublin: identification of rpoS-dependent and rpo-S-independent mechanisms. J. Bacteriol. 179: 1409–1412.Ferretti J.J., W.M. McShan, D. Ajdic, D.J. Savic, G. Savic, K. Lyon, C. Primeaux, S. Sezate, A.N. Suvorov, S. Kenton and others. 2001. Complete genome sequence of an M1 strain of Streptococcus pyo-genes. Proc. Natl. Acad. Sci. USA 98: 4658–4663.Graham M.R., L.M. Smoot, C.A. Migliaccio, K. Virtaneva, D.E. Sturdevant, S.F. Porcella, M.J. Federle, G.J. Adams, J.R. Scott and J.M. Musser. 2002. Virulence control in group A Streptococ-cus by a two-component gene regulatory system: global expression profiling and in vivo infection modeling. Proc. Natl. Acad. Sci. USA 99: 13855–13860.Graham M.R., K. Virtaneva, S.F. Porcella, W.T. Barry, B.B. Gowen, C.R. Johnson, F.A. Wright and J.M. Musser. 2005. Group A Strepto-coccus transcriptome dynamics during growth in human blood reveals bacterial adaptive and survival strategies. Am. J. Pathol. 166: 455–465.Jenkins L.S. and W.D. Nunn. 1987a. Genetic and molecular charac-terization of the genes involved in short-chain fatty acid degradation in Escherichia coli: the ato system. J. Bacteriol. 169: 42–52.Jenkins L.S. and W.D. Nunn. 1987b. Regulation of the ato operon by the atoC gene in Escherichia coli. J. Bacteriol. 169: 2096–2102.Jimenez J.C. and M.J. Federle. 2014. Quorum sensing in group A Streptococcus. Front. Cell Infect. Microbiol. 4: 127.Klenk M., D. Koczan, R. Guthke, M. Nakata, H.J. Thiesen, A. Podbielski and B. Kreikemeyer. 2005. Global epithelial cell transcriptional responses reveal Streptococcus pyogenes Fas regula-tor activity association with bacterial aggressiveness. Cell Microbiol. 7: 1237–1250.Kurita-Ochiai T., K. Fukushima and K. Ochiai. 1995. Volatile fatty acids, metabolic by-products of periodontopathic bacteria, inhibit lymphocyte proliferation and cytokine production. J. Dent. Res. 74: 1367–1373.
Kurita-Ochiai T., K. Ochiai, N. Suzuki, K. Otsuka and K. Fuku-shima. 2002. Human gingival fibroblasts rescue butyric acid-indu-ced T-cell apoptosis. Infect. Immun. 70: 2361–2367.Lawhon S.D., R. Maurer, M. Suyemoto and C. Altier. 2002. Intes-tinal short-chain fatty acids alter Salmonella typhimurium invasion gene expression and virulence through BarA/SirA. Mol. Microbiol. 46: 1451–1464.Lukomski S., N.P. Hoe, I. Abdi, J. Rurangirwa, P. Kordari, M. Liu, S.J. Dou, G.G. Adams and J.M. Musser. 2000. Nonpolar inacti-vation of the hypervariable streptococcal inhibitor of complement gene (sic) in serotype M1 Streptococcus pyogenes significantly decreases mouse mucosal colonization. Infect. Immun. 68: 535–542.Lyon W.R., J.C. Madden, J.C. Levin, J.L. Stein and M.G. Caparon. 2001. Mutation of luxS affects growth and virulence factor expres-sion in Streptococcus pyogenes. Mol. Microbiol. 42: 145–157.Marouni M.J. and S. Sela. 2003. The luxS gene of Streptococcus pyogenes regulates expression of genes that affect internalization by epithelial cells. Infect. Immun. 71: 5633–5639.Musser J.M. and F.R. DeLeo. 2005. Toward a genome-wide systems biology analysis of host-pathogen interactions in group A Strepto-coccus. Am. J. Pathol. 167: 1461–1472.Rotstein O.D., P.E. Nasmith and S. Grinstein. 1987. The Bacteroi-des by-product succinic acid inhibits neutrophil respiratory burst by reducing intracellular pH. Infect. Immun. 55: 864–870.Schell M.A. 1993. Molecular biology of the LysR family of transcrip-tional regulators. Annu. Rev. Microbiol. 47: 597–626.Shelburne S.A., P. Sumby, I. Sitkiewicz, C. Granville, F.R. DeLeo and J.M. Musser. 2005. Central role of a bacterial two-component gene regulatory system of previously unknown function in patho-gen persistence in human saliva. Proc. Natl. Acad. Sci. USA 102: 16037–16042.Sitkiewicz I. and J.M. Musser. 2006. Expression microarray and mouse virulence analysis of four conserved two-component gene regulatory systems in group A Streptococcus. Infect. Immun. 74: 1339–1351.Sitkiewicz I. and W. Hryniewicz. 2010. Pyogenic streptococci – dan-ger of re-emerging pathogens. Pol. J. Microbiol. 59: 219–226.Sumby P., S.F. Porcella, A.G. Madrigal, K.D. Barbian, K. Virta-neva, S.M. Ricklefs, D.E. Sturdevant, M.R. Graham, J. Vuopio-Varkila, N.P. Hoe and others. 2005. Evolutionary origin and emergence of a highly successful clone of serotype M1 group A Streptococcus involved multiple horizontal gene transfer events. J. Infect. Dis. 192: 771–782.Waters C.M. and B.L. Bassler. 2005. Quorum sensing: cell-to-cell communication in bacteria. Annu. Rev. Cell Dev. Biol. 21: 319–346.Virtaneva K., S.F. Porcella, M.R. Graham, R.M. Ireland, C.A. Johnson, S.M. Ricklefs, I. Babar, L.D. Parkins, R.A. Romero, G.J. Corn and others. 2005. Longitudinal analysis of the group A Streptococcus transcriptome in experimental pharyngitis in cyno-molgus macaques. Proc. Natl. Acad. Sci. USA 102: 9014–9019.Voyich J.M., D.E. Sturdevant, K.R. Braughton, S.D. Kobayashi, B. Lei, K. Virtaneva, D.W. Dorward, J.M. Musser and F.R. DeLeo. 2003. Genome-wide protective response used by group A Streptococ-cus to evade destruction by human polymorphonuclear leukocytes. Proc. Natl. Acad. Sci. USA 100: 1996–2001.Voyich J.M., K.R. Braughton, D.E. Sturdevant, C. Vuong, S.D. Kobayashi, S.F. Porcella, M. Otto, J.M. Musser and F.R. DeLeo. 2004. Engagement of the pathogen survival response used by group A Streptococcus to avert destruction by innate host defense. J. Immu-nol. 173: 1194–1201.Zaim J. and A.M. Kierzek. 2003. The structure of full-length LysR-type transcriptional regulators. Modeling of the full-length OxyR transcription factor dimer. Nucleic Acids Res. 31: 1444–1454.
Polish Journal of Microbiology2017, Vol. 66, No 1, 25–30
ORIGINAL PAPER
* Corresponding author: R.R. Abozahra, Faculty of Pharmacy, Damanhour University, Damanhour, Egypt;e-mail: [email protected]
Introduction
Antimicrobial abuse is one of the major factors contributing to the development and maintenance of antimicrobial resistance in bacteria. The issue is of utmost importance in many developing countries, where the sale of antimicrobials is often unrestricted (Okeke et al., 2005).
In Egypt, Escherichia coli is among the most com-mon pathogens isolated from patients with urinary tract infections and it has a high prevalence of resist-ance to antibiotics (Shaheen et al., 2004; Mohamed Al-Agamy et al., 2006).
Bacterial resistance to antimicrobial agents is a threat to public health in Egypt. The consequences of resist-ance affect not only the ability to treat the infection, but also the cost and duration of treatment (Shaheen et al., 2004; Mohamed Al-Agamy et al., 2006).
Fluoroquinolone resistance is on the rise. The emer-gence of this resistance in nearly all species of bacteria was documented soon after the introduction of these compounds for clinical use (Acar and Goldstein, 1997).
Levofloxacin resistance has been shown to increase more than 5-fold in 6 years. Rapid emergence of resist-ance may have been fuelled by the increase in the rate of
levofloxacin prescribing (Johnson et al., 2008). A study showed that the annual rates of levofloxacin resist-ance of E. coli were 29.49% in 2005, 26.51% in 2006, 40.21% in 2007, 43.20% in 2008, and 31.75% in 2009 (Jang et al., 2011). The persistent increase in fluoroqui-nolone resistance rates influences patient management and demands a change in some existing guidelines for the treatment (Paterson, 2004; Wagenlehner et al., 2011; Han et al., 2012).
The overexpression of efflux pumps contributes to multidrug resistance (MDR) in E. coli. Almost all Gram-negative bacteria have genes for efflux pumps. Two transporters, AcrAB and MdfA, which belong to two distinct families of efflux pumps, have the ability to efflux quinolones in E. coli. Most of these efflux genes are either underexpressed or not expressed at all. When they are overexpressed, they are associated with MDR in E. coli (Yang, 2003; Yasufuku et al., 2011).
The AcrAB-TolC system of E. coli is among the better characterized resistance-nodulation-cell division superfamily (RND) systems. In addition to recognizing many fluoroquinolones, this system exports a diversity of agents including tetracycline, β-lactams, chloram-phenicol, erythromycin, rifampicin, disinfectants, dyes, and organic solvents. AcrA is a lipoprotein situated in
Expression of the Fluoroquinolones Efflux Pump Genes acrA and mdfAin Urinary Escherichia coli Isolates
SARAH M. ABDELHAMID1 and RANIA R. ABOZAHRA1*
1 Faculty of Pharmacy, Damanhour University, Damanhour, Egypt
Submitted 19 February 2016, revised 25 May 2016, accepted 2 June 2016
A b s t r a c t
Escherichia coli is one of the most frequent causes of urinary tract infections. Efflux system overexpression is reported to contribute to E. coli resistance to several antibiotics. Our aim in this study was to investigate the relation between antibiotic resistance and the expres-sion of the efflux pump genes acrA and mdfA in E. coli by real-time reverse transcription-PCR. We tested the in vitro susceptibilities to 12 antibiotics in 28 clinical isolates of E. coli obtained from urine samples. We also determined the minimum inhibitory concentrations of levofloxacin to these samples. We then revealed significant correlations between the overexpression of both mdfA and acrA and MICs of levofloxacin. In conclusion, we demonstrated that the increased expression of efflux pump genes such as mdfA and acrA can lead to levofloxacin resistance in E. coli. These findings contribute to further understanding of the molecular mechanisms of efflux pump systems and how they contribute to antibiotic resistance.
K e y w o r d s: Escherichia coli, acrA and mdfA genes, efflux pump, levofloxacin, overexpression
Abdelhamid S.M. and R.R. Abozahra 126
the periplasm; the inner membrane protein, AcrB, is a proton-motive-force transporter of the RND type. Strains lacking in the AcrAB proteins are hypersuscep-tible to many quinolones; on the other hand, fluoroqui-nolone-resistant efflux mutants frequently overproduce the periplasmic protein AcrA. Such mutants display decreased susceptibility to ciprofloxacin, tetracycline, ampicillin, and chloramphenicol. Removal or inacti-vation of proteins that suppress expression of AcrAB (AcrR and AcrS) reduces fluoroquinolone susceptibility (Drlica et al., 2012).
MdfA is a paradigm of multidrug-resistance anti-porters. It is a member of the major facilitator super-family (MFS) and is a transmembrane-spanning inte-gral inner membrane protein (Edgar and Bibi, 1997).
In laboratory-generated mutants, overexpression of the efflux pumps AcrAB or MdfA have been shown to cause three to six fold increase in fluoroquinolone resistance (Yang, 2003). The simultaneous overexpres-sion of AcrAB and MdfA results in synergistic increases in resistance to fluoroquinolones (Yang, 2003).
The overexpression of AcrA and MdfA in quinolone resistance in E. coli has been thoroughly investigated, yet data about it in Egypt, up until the date this paper has been written, has been really scarce.
Our aim in this study was to investigate the relation between antibiotic resistance and the expression of the efflux pump genes in E. coli by real-time quantitative polymerase chain reaction (RT-qPCR).
Experimental
Material and Methods
E. coli strains and growth conditions. A total of 28 non-duplicate E. coli isolates were used in this study obtained from patients with urinary tract infec-tion (UTI) treated in Damanhour General Hospi-tal, Damanhour, Egypt between the years 2013 and 2014. Post treatment isolates were excluded from this study. The isolates were identified with conventional bioche mical tests. All isolates were deemed to be clini-cally significant (> 105 CFU/ml). They were selected according to their sensitivity to levofloxacin in order to correlate their sensitivity profile with the over-expression of efflux pump genes. E. coli isolates with intermediate susceptibility were not classified as being resistant. The strains were propagated at 37°C in Luria- Bertani (LB) broth.
Susceptibility testing. The following 12 antimicro-bial discs were selected according to CLSI guidelines (CLSI, 2015): amoxicillin (AML), amoxicillin-clavu-lanic acid (AMC), cefuroxim (CMX), cefalexin (CL), cefepime (FEP), ceftriaxone (CRO), chloramphenicol
(C), gentamycin (CN) tetracycline (TE), levofloxacin (LVX), meropenem (MEM), azithromycin (AZM) (Oxoid Ltd., Basingstoke, United Kingdom) on Mueller- Hinton agar (Oxoid Ltd., Basingstoke, United King-dom). Zone sizes were measured to the nearest milli-metre. Using the published CLSI guidelines, the sus-ceptibility or resistance of the organism to each drug tested were then determined. E. coli ATCC 25922 (LGC Standards GmbH, Wesel, Germany) was used as a con-trol (CLSI, 2015).
Determination of the minimum inhibitory con-centration (MIC) to levofloxacin. Determination of the MIC of levofloxacin was done by using the two-fold dilution method according to CLSI guidelines (CLSI, 2015). MICs were performed in 96-well microplates (Greiner, Wemmel, Belgium). Briefly, serial two fold dilutions of 2x strength antibiotic were performed in sterile distilled water. An overnight culture of the tested isolate in Mueller-Hinton Broth (MHB) was diluted in fresh double strength MHB till it reaches the con-centration of 105 CFU/ml.
Fifty µl suspension of the organism in double strength MHB was added to the well with 0.05 ml of the antibiotic solution, and the microtiter plates were incu-bated aerobically at 35°C. The MIC was then defined as the lowest concentration of the antibiotic in which there is no visible growth after overnight incubation. Results were recorded in μg/ml after incubation at 35°C for 18 hours (CLSI breakpoints for levofloxacin are ≤ 2 µg/ml for susceptibility and ≥ 8 µg/ml for resistance).
RNA extraction and quantification of RNA expres- sion using RT-qPCR (Taylor et al., 2010). All E. coli isolates were cultured at 37°C for 14 h on MacConkey agar plates (Oxoid Ltd., Basingstoke, United Kingdom), then cultured in 4 ml of Luria-Bertani medium (Oxoid Ltd., Basingstoke, United Kingdom) for 8 h. Total RNA was obtained from mid-logarithmic growth-phase bac-terial cultures with Isolate II RNA Micro Kit (Bioline, Michigan, USA) (Pfaffl et al., 2002; Keeney et al., 2008). Genomic DNA contamination was removed by an on-column RNase-free DNase I digestion. RNA purity was assessed spectrophotometrically by measuring the OD260/280 ratio by NanoDrop™ 8000 Spectrophoto - meter (Thermo Fisher Scientific – Delaware, USA). RNA integrity was assessed by visualization of one large and one small band of RNA after electrophoresis (Fleige and Pfaffl, 2006).
The quantification protocol was performed immedi-ately following the quality control assessment. The acrA and mdfA genes were quantified by RT-qPCR using a SensiFAST™ SYBR No-ROX One-Step Kit (2x) (Bio-line, United Kingdom) in a StepOne™ Real-Time PCR System (StepOne™ system, Applied biosystems, USA). The reaction mixture was prepared in a total volume of 20 µl dispensed in MicroAmp® optical microplates
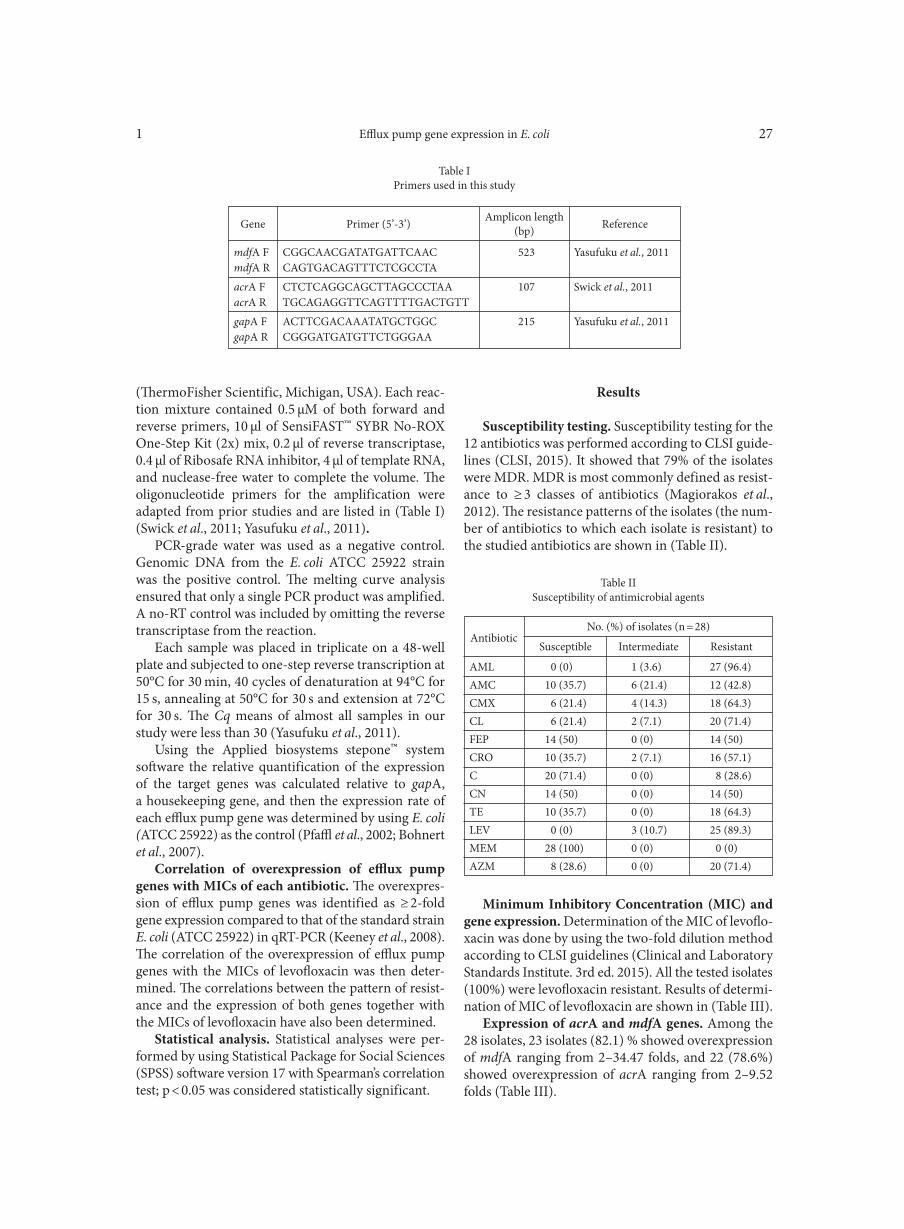
Efflux pump gene expression in E. coli1 27
(ThermoFisher Scientific, Michigan, USA). Each reac-tion mixture contained 0.5 µM of both forward and reverse primers, 10 µl of SensiFAST™ SYBR No-ROX One-Step Kit (2x) mix, 0.2 µl of reverse transcriptase, 0.4 µl of Ribosafe RNA inhibitor, 4 µl of template RNA, and nuclease-free water to complete the volume. The oligonucleotide primers for the amplification were adapted from prior studies and are listed in (Table I) (Swick et al., 2011; Yasufuku et al., 2011).
PCR-grade water was used as a negative control. Genomic DNA from the E. coli ATCC 25922 strain was the positive control. The melting curve analysis ensured that only a single PCR product was amplified. A no-RT control was included by omitting the reverse transcriptase from the reaction.
Each sample was placed in triplicate on a 48-well plate and subjected to one-step reverse transcription at 50°C for 30 min, 40 cycles of denaturation at 94°C for 15 s, annealing at 50°C for 30 s and extension at 72°C for 30 s. The Cq means of almost all samples in our study were less than 30 (Yasufuku et al., 2011).
Using the Applied biosystems stepone™ system software the relative quantification of the expression of the target genes was calculated relative to gapA, a housekeeping gene, and then the expression rate of each efflux pump gene was determined by using E. coli (ATCC 25922) as the control (Pfaffl et al., 2002; Bohnert et al., 2007).
Correlation of overexpression of efflux pump genes with MICs of each antibiotic. The overexpres-sion of efflux pump genes was identified as ≥ 2-fold gene expression compared to that of the standard strain E. coli (ATCC 25922) in qRT-PCR (Keeney et al., 2008). The correlation of the overexpression of efflux pump genes with the MICs of levofloxacin was then deter-mined. The correlations between the pattern of resist-ance and the expression of both genes together with the MICs of levofloxacin have also been determined.
Statistical analysis. Statistical analyses were per-formed by using Statistical Package for Social Sciences (SPSS) software version 17 with Spearman’s correlation test; p < 0.05 was considered statistically significant.
Results
Susceptibility testing. Susceptibility testing for the 12 antibiotics was performed according to CLSI guide-lines (CLSI, 2015). It showed that 79% of the isolates were MDR. MDR is most commonly defined as resist-ance to ≥ 3 classes of antibiotics (Magiorakos et al., 2012). The resistance patterns of the isolates (the num-ber of antibiotics to which each isolate is resistant) to the studied antibiotics are shown in (Table II).
mdfA F CGGCAACGATATGATTCAAC 523 Yasufuku et al., 2011mdfA R CAGTGACAGTTTCTCGCCTA
acrA F CTCTCAGGCAGCTTAGCCCTAA 107 Swick et al., 2011acrA R TGCAGAGGTTCAGTTTTGACTGTT
gapA F ACTTCGACAAATATGCTGGC 215 Yasufuku et al., 2011gapA R CGGGATGATGTTCTGGGAA
Table IPrimers used in this study
Gene Primer (5’-3’) ReferenceAmplicon length(bp)
AML 0 (0) 1 (3.6) 27 (96.4)AMC 10 (35.7) 6 (21.4) 12 (42.8)CMX 6 (21.4) 4 (14.3) 18 (64.3)CL 6 (21.4) 2 (7.1) 20 (71.4)FEP 14 (50) 0 (0) 14 (50)CRO 10 (35.7) 2 (7.1) 16 (57.1)C 20 (71.4) 0 (0) 8 (28.6)CN 14 (50) 0 (0) 14 (50)TE 10 (35.7) 0 (0) 18 (64.3)LEV 0 (0) 3 (10.7) 25 (89.3)MEM 28 (100) 0 (0) 0 (0)AZM 8 (28.6) 0 (0) 20 (71.4)
Table II Susceptibility of antimicrobial agents
AntibioticNo. (%) of isolates (n = 28)
Susceptible Intermediate Resistant
Minimum Inhibitory Concentration (MIC) and gene expression. Determination of the MIC of levoflo-xacin was done by using the two-fold dilution method according to CLSI guidelines (Clinical and Laboratory Standards Institute. 3rd ed. 2015). All the tested isolates (100%) were levofloxacin resistant. Results of determi-nation of MIC of levofloxacin are shown in (Table III).
Expression of acrA and mdfA genes. Among the 28 isolates, 23 isolates (82.1) % showed overexpression of mdfA ranging from 2–34.47 folds, and 22 (78.6%) showed overexpression of acrA ranging from 2–9.52 folds (Table III).
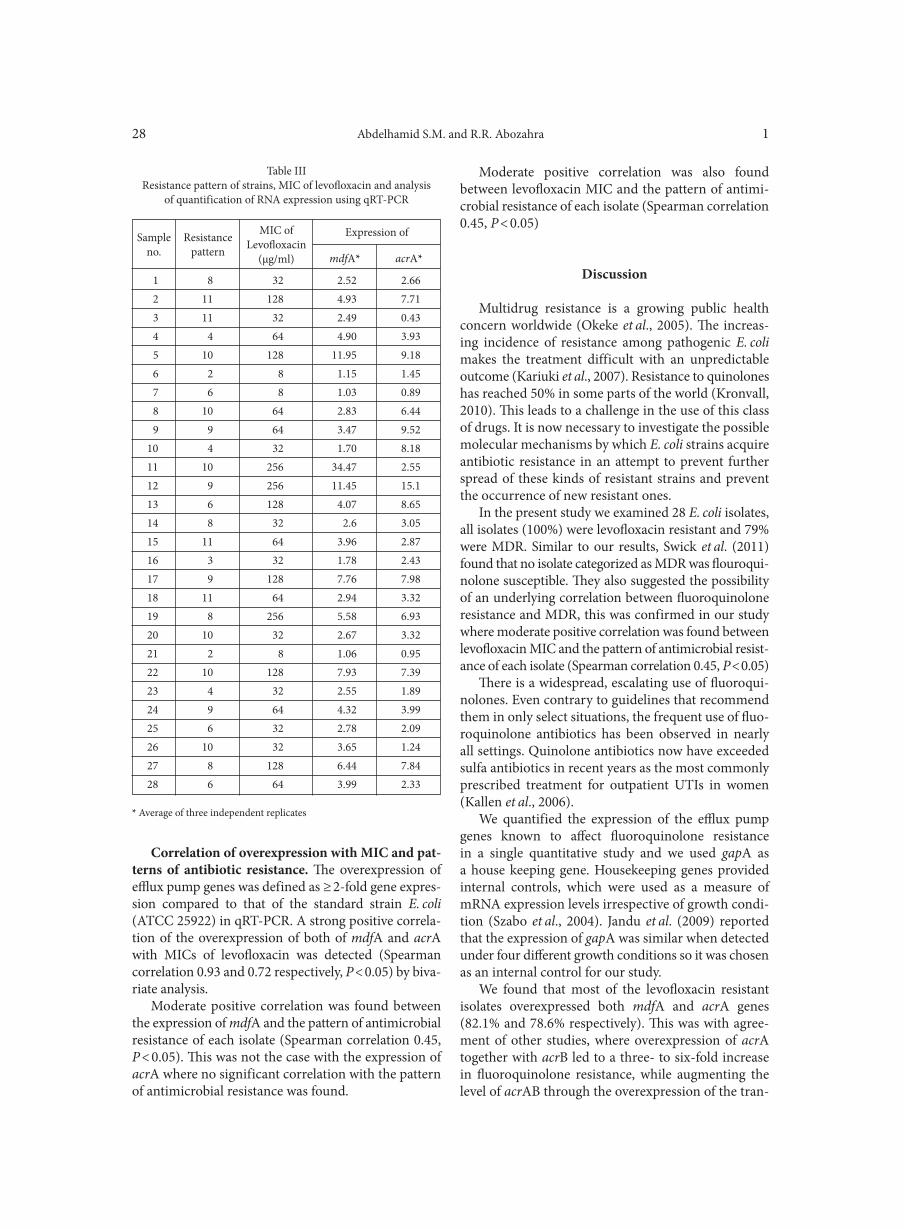
Abdelhamid S.M. and R.R. Abozahra 128
Correlation of overexpression with MIC and pat-terns of antibiotic resistance. The overexpression of efflux pump genes was defined as ≥ 2-fold gene expres-sion compared to that of the standard strain E. coli (ATCC 25922) in qRT-PCR. A strong positive correla-tion of the overexpression of both of mdfA and acrA with MICs of levofloxacin was detected (Spearman correlation 0.93 and 0.72 respectively, P < 0.05) by biva-riate analysis.
Moderate positive correlation was found between the expression of mdfA and the pattern of antimicrobial resistance of each isolate (Spearman correlation 0.45, P < 0.05). This was not the case with the expression of acrA where no significant correlation with the pattern of antimicrobial resistance was found.
Moderate positive correlation was also found between levofloxacin MIC and the pattern of antimi-crobial resistance of each isolate (Spearman correlation 0.45, P < 0.05)
Discussion
Multidrug resistance is a growing public health concern worldwide (Okeke et al., 2005). The increas-ing incidence of resistance among pathogenic E. coli makes the treatment difficult with an unpredictable outcome (Kariuki et al., 2007). Resistance to quinolones has reached 50% in some parts of the world (Kronvall, 2010). This leads to a challenge in the use of this class of drugs. It is now necessary to investigate the possible molecular mechanisms by which E. coli strains acquire antibiotic resistance in an attempt to prevent further spread of these kinds of resistant strains and prevent the occurrence of new resistant ones.
In the present study we examined 28 E. coli isolates, all isolates (100%) were levofloxacin resistant and 79% were MDR. Similar to our results, Swick et al. (2011) found that no isolate categorized as MDR was flouroqui-nolone susceptible. They also suggested the possibility of an underlying correlation between fluoroquinolone resistance and MDR, this was confirmed in our study where moderate positive correlation was found between levofloxacin MIC and the pattern of antimicrobial resist-ance of each isolate (Spearman correlation 0.45, P < 0.05)
There is a widespread, escalating use of fluoroqui-nolones. Even contrary to guidelines that recommend them in only select situations, the frequent use of fluo-roquinolone antibiotics has been observed in nearly all settings. Quinolone antibiotics now have exceeded sulfa antibiotics in recent years as the most commonly prescribed treatment for outpatient UTIs in women (Kallen et al., 2006).
We quantified the expression of the efflux pump genes known to affect fluoroquinolone resistance in a single quantitative study and we used gapA as a house keeping gene. Housekeeping genes provided internal controls, which were used as a measure of mRNA expression levels irrespective of growth condi-tion (Szabo et al., 2004). Jandu et al. (2009) reported that the expression of gapA was similar when detected under four different growth conditions so it was chosen as an internal control for our study.
We found that most of the levofloxacin resistant isolates overexpressed both mdfA and acrA genes (82.1% and 78.6% respectively). This was with agree-ment of other studies, where overexpression of acrA together with acrB led to a three- to six-fold increase in fluoroquinolone resistance, while augmenting the level of acrAB through the overexpression of the tran-
1 8 32 2.52 2.66 2 11 128 4.93 7.71 3 11 32 2.49 0.43 4 4 64 4.90 3.93 5 10 128 11.95 9.18 6 2 8 1.15 1.45 7 6 8 1.03 0.89 8 10 64 2.83 6.44 9 9 64 3.47 9.5210 4 32 1.70 8.1811 10 256 34.47 2.5512 9 256 11.45 15.113 6 128 4.07 8.6514 8 32 2.6 3.0515 11 64 3.96 2.8716 3 32 1.78 2.4317 9 128 7.76 7.9818 11 64 2.94 3.3219 8 256 5.58 6.9320 10 32 2.67 3.3221 2 8 1.06 0.9522 10 128 7.93 7.3923 4 32 2.55 1.8924 9 64 4.32 3.9925 6 32 2.78 2.0926 10 32 3.65 1.2427 8 128 6.44 7.8428 6 64 3.99 2.33
Table IIIResistance pattern of strains, MIC of levofloxacin and analysis
of quantification of RNA expression using qRT-PCR
* Average of three independent replicates
Sampleno.
Resistancepattern
MIC ofLevofloxacin
(μg/ml)
Expression of
mdfA* acrA*
Efflux pump gene expression in E. coli1 29
scriptional regulator, sdiA, resulted in about the same (approximately six-fold) increase in drug resistance. Yasufuku et al. (2011) revealed a significant correla-tion of the overexpression of mdfA with higher MICs of levofloxacin (Rahmati et al., 2002; Yang, 2003).
In general the more severe the MDR phenotype, the higher the likelihood that the isolate also overex-pressed acrAB (Nikaido and Pagès, 2012). Han et al. (2012) found that out of 89 patients with fluoroqui-nolone resistant isolates, 49.4% overexpressed acrAB.
A synergy in quinolone resistance was shown when acrAB was overexpressed simultaneously with norE or mdfA. Deletion of acrAB alone and all of the three pumps together had the same effect on the susceptibil-ity of fluoroquinolones. The authors also found that the strain with acrAB deletion were the most susceptible when compared to mutants strains with deletion in norE and/or mdfA. The maximum quinolone resistance mediated by efflux pumps was suggested to be ~10-fold, irrespective of any increase in production of these pumps (Yang, 2003).
Studies conducted with efflux pump deleted (ΔAcrAB) strain delayed the emergence of resistance suggesting that the inhibition of AcrAB efflux pump could be a strong strategy for slowing the development of resistance in clinically important Gram-negative bac-teria (Singh et al., 2012)
In our study 17.9% and 21.4% of the levofloxacin resistant isolates didn’t show over expression of mdfA and acrA respectively, thus flouroquinolone resistance may be contributed to other mechanisms such as gyrase or topoisomerase IV mutations. Morgan-Linnell et al. (2009) reported mutations in gyrase and/topoisomerase IV in 100% of the high-level-resistant E. coli clinical iso-lates, while over production of the efflux pump (AcrA) contributed approximately 33% to the overall quinolone resistance. As to the mdfA gene, one of the levofloxacin susceptible isolates showed very slight overexpression.
It should be noted that expression of pump genes can be induced by natural substrates encountered during infection. For example, indole and bile, which would be encountered in the mammalian gut, induce expression of acrAB in E. coli and Salmonella (Sun et al., 2014).
Though increased efflux pump expression correlates with increase in levofloxacin MIC, we did not compare expression of efflux pumps in levofloxacin sensitive strains. Thus, this has to be investigated as efflux pump expression might be high in these strains too if they are resistant to other antibiotics since both pumps are broad spectrum. Some studies have found that resist-ance to antibiotics through the same efflux pump is common (Poole, 2005).
An approach of blocking the efflux pump protein or gene has been studied. This falls under the class of biological inhibition of efflux pumps. The efflux pumps
could be switched off with the means of specific anti-bodies (Yoshihara and Inoko, 2011). The genes encod-ing these pumps or their regulators could be blocked by means of the antisense strategies. The antisense approach has been revealed to work for AcrAB efflux pump in E. coli and has also been patented (Oethinger and Levy, 2001; 2011).
Efflux pump inhibitors can also be used for the eva luation of the effect of efflux pumps on resistance emergence, however there are two major concerns with such inhibitors. First, some of these inhibitors have been found to be substrates of efflux pumps themselves, thus questioning their credibility (Lomovskaya and Bostian, 2006). Second, the concentrations required for efflux pump inhibitory activity are often associa-ted with toxicity and hence, are not clinically relevant (Schmitz et al., 1998).
While, only one Gram-negative bacterial species has been evaluated in our study, it is imperative to investi-gate other bacterial species to increase the clinical rele-vance of our results. Different inhibitory techniques can be utilized to study the different efflux pumps. These should not only be effective against multiple efflux pumps in one bacterial species but also against efflux pumps in more than one bacterial species.
In conclusion, we demonstrated a significant posi-tive correlation between the overexpression of AcrA and MdfA efflux pumps and the resistance to levofloxa-cin in E. coli clinical isolates. These findings contribute to further understanding of the molecular mechanisms of efflux pump systems and how they contribute to antibiotic resistance and suggest that developing new EPI could lead to treatments for flouroquinolones resistant bacteria.
Resistance emergence presents a debilitating chal-lenge in the management of infectious diseases. Data from this study might add to our understanding of resistance development. Our findings suggest that the inhibition of efflux pumps could be a potential strategy to thwart the problem of antibiotic resistance. Consid-ering the genetic plasticity in the bacteria, these find-ings just seem to be the tip of the iceberg and much needs to be unravelled in the future.
Literature
Acar J.F. and F.W. Goldstein. 1997. Trends in bacterial resistance to fluoroquinolones. Clin. Infect. Dis. 24(Suppl 1): S67–S73.Bohnert J.A., S. Schuster, E. Fahnrich, R. Trittler, and W.V. Kern. 2007. Altered spectrum of multidrug resistance associated with a single point mutation in the Escherichia coli RND type MDR efflux pump YhiV (MdtF). J. Antimicrob. Chemother. 59: 1216–1222.Clinical and Laboratory Standards Institute (CLSI). 2015. Perfor-mance standards for antimicrobial disk and dilution susceptibility tests for bacteria isolated from animals, 3rd ed. CLSI document M31-A3. Clinical and Laboratory Standards.
Abdelhamid S.M. and R.R. Abozahra 130
Drlica K., X. Zhao, M. Malik and T.K.R. Salz. 2012. Fluoro-quinolone resistance: mechanisms, restrictive dosing, and anti-mutant screening strategies for new compounds, pp. 485–514. In: Dougherty T.J. and M.J. Pucci (eds). Antibiotic Discovery and Devel-opment. 1st ed. Springer, US.Edgar R. and E. Bibi. 1997. MdfA, an Escherichia coli multidrug resistance protein with an extraordinarily broad spectrum of drug recognition. J. Bacteriol. 179: 2274–2280.Fleige S. and M.W. Pfaffl. 2006. RNA integrity and the effect on the real-time qRT-PCR performance. Mol. Aspects Med. 27: 126–139.Han J.H., I. Nachamkin, P. Tolomeo, X. Mao, W.B. Bilker and E. Lautenbach. 2012. Risk factors for efflux pump overexpression in fluoroquinolone-resistant Escherichia coli. J. Infect. Dis. 206: 1597–1603.Jandu N., N.K.L. Ho, K.A. Donato, M.A. Karmali, M. Mas-carenhas, S.P. Duffy, C. Tailor and P.M. Sherman. 2009. Entero-hemorrhagic Escherichia coli O157:H7 gene expression profiling in response to growth in the presence of host epithelia. PLoS One 4: e4889.Jang W.H., D.H. Yoo and S.W. Park. 2011. Prevalence of and risk factors for levofloxacin-resistant E. coli isolated from outpatients with urinary tract infection. Korean J. Urol. 52: 554–559.Johnson L., A. Sabel, W.J. Burman, R.M. Everhart, M. Rome, T.D. MacKenzie, J. Rozwadowski, P.S. Mehler and C.S. Price. 2008. Emergence of fluoroquinolone resistance in outpatient urinary Escherichia coli isolates. Am. J. Med. 121: 876–884.Kallen A.J., H.G. Welch and B.E. Sirovich. 2006. Current antibiotic therapy for isolated urinary tract infections in women. Arch. Intern. Med. 166: 635–639.Kariuki S., G. Revathi, J. Corkill, J. Kiiru, J. Mwituria, N. Mirza and C.A. Hart. 2007. Escherichia coli from community-acquired urinary tract infections resistant to fluoroquinolones and extended-spectrum beta-lactams. J. Infect. Dev. Ctries. 1: 257–262.Keeney D., A. Ruzin, F. McAleese, E. Murphy and P.A. Bradford. 2008. MarA-mediated overexpression of the AcrAB efflux pump results in decreased susceptibility to tigecycline in Escherichia coli. J. Antimicrob. Chemother. 61: 46–53Kronvall G. 2010. Antimicrobial resistance 1979–2009 at Karolin-ska hospital, Sweden: normalized resistance interpretation during a 30-year follow-up on Staphylococcus aureus and Escherichia coli resistance development. APMIS 118: 621–639.Lomovskaya O. and K.A. Bostian. 2006. Practical applications and feasibility of efflux pump inhibitors in the clinic – a vision for applied use. Biochem. Pharmacol. 71: 910–918.Magiorakos A.P., A. Srinivasan, R.B. Carey, Y. Carmeli, M.E. Fala-gas, C.G. Giske, S. Harbarth, J.F. Hindler, G. Kahlmeter and others. 2012. Multidrug-resistant, extensively drug-resistant and pandrug-resistant bacteria: an international expert proposal for interim standard definitions for acquired resistance. Clin. Micro-biol. Infect. 18: 268–281.Mohamed Al-Agamy M.H., M.S. El-Din Ashour and I. Wiegand. 2006. First description of CTX-M beta-lactamase-producing clini-cal Escherichia coli isolates from Egypt. Int. J. Antimicrob. Agents 27: 545–548.Morgan-Linnell S.K., L. Becnel Boyd, D. Steffen and L. Zechied-rich. 2009. Mechanisms accounting for fluoroquinolone resistance in Escherichia coli clinical isolates. Antimicrob. Agents Chemother. 53: 235–241.Nikaido H. and J.M. Pagès. 2012. Broad-specificity efflux pumps and their role in multidrug resistance of Gram-negative bacteria. FEMS Microbiol. Rev. 36: 340–363.Oethinger M. and S.B. Levy. 2001. Methods of reducing microbial resistance to drugs. Retrieved from http://www.google.com/patents/CA2378883A1?cl=en, 2016.02.10.
Oethinger M. and S.B. Levy. 2011. Methods of screening for com- pounds that reduce microbial resistance to fluoroquinolones. Retrie - ved from https://www.google.com.ar/patents/US8012711, 2016.02.10.Okeke I.N., R. Laxminarayan, Z. a Bhutta, A.G. Duse, P. Jenkins, T.F. O’Brien, A. Pablos-Mendez and K.P. Klugman. 2005. Anti-microbial resistance in developing countries. Part I: Recent trends and current status. Lancet Infect. Dis. 5: 481–493.Paterson D.L. 2004. “Collateral damage” from cephalosporin or qui-nolone antibiotic therapy. Clin. Infect. Dis. 38(Suppl 4):S341–S345.Pfaffl M.W., G.W. Horgan and L. Dempfle. 2002. Relative expres-sion software tool (REST) for group-wise comparison and statisti-cal analysis of relative expression results in real-time PCR. Nucleic Acids Res. 30: e36Poole K. 2005. Efflux-mediated antimicrobial resistance. J. Anti-microb. Chemother. 56: 20–51Rahmati S., S. Yang, A.L. Davidson and E.L. Zechiedrich. 2002. Control of the AcrAB multidrug efflux pump by quorum-sensing regulator SdiA. Mol. Microbiol. 43: 677–685.Schmitz F.J., A.C. Fluit, M. Lückefahr, B. Engler, B. Hofmann, J. Verhoef, H.P. Heinz, U. Hadding and M.E. Jones. 1998. The effect of reserpine, an inhibitor of multidrug efflux pumps, on the in vitro activities of ciprofloxacin, sparfloxacin and moxifloxacin against clinical isolates of Staphylococcus aureus. J. Antimicrob. Chemother. 42: 807–810. Shaheen H.I., S.B. Khalil, M.R. Rao, R. Abu Elyazeed, T.F. Wierzba, L.F. Peruski Jr., S. Putnam, A. Navarro, B.Z. Morsy and others. 2004. Phenotypic profiles of enterotoxigenic Escherichia coli associated with early childhood diarrhea in rural Egypt. J. Clin. Microbiol. 42: 5588–5595.Singh R., M.C. Swick, K.R. Ledesma, Z. Yang, M. Hu, L. Zechied-rich and V.H. Tam. 2012. Temporal interplay between efflux pumps and target mutations in development of antibiotic resistance in Esche richia coli. Antimicrob. Agents Chemother. 56: 1680–1685.Sun J., Z. Deng and A. Yan. 2014. Bacterial multidrug efflux pumps: Mechanisms, physiology and pharmacological exploitations. Bio-chem. Biophys. Res. Commun. 453: 254–267.Swick M.C., S.K. Morgan-Linnell, K.M. Carlson and L. Zechied-rich. 2011. Expression of multidrug efflux pump genes acrAB-tolC, mdfA, and norE in Escherichia coli clinical isolates as a function of fluoroquinolone and multidrug resistance. Antimicrob. Agents Che-mother. 55: 921–924.Szabo A., C.M. Perou, M. Karaca, L. Perreard, R. Palais, J.F. Quackenbush and P.S. Bernard. 2004. Statistical modeling for selecting housekeeper genes. Genome Biol. 5: R59.Taylor S., M. Wakem, G. Dijkman, M. Alsarraj and M. Nguyen. 2010. A practical approach to RT-qPCR-Publishing data that con-form to the MIQE guidelines. Methods 50: S1–S5.Wagenlehner F.M.E., G. Schmiemann, U. Hoyme, R. Fünfstück, E. Hummers-Pradier, M. Kaase, E. Kniehl, I. Selbach, U. Sester and others. 2011. National S3 guideline on uncomplicated urinary tract infection: recommendations for treatment and management of uncomplicated community-acquired bacterial urinary tract infec-tions in adult patients. Urologe. A. 50: 153–169.Yang S. 2003. Relative contributions of the AcrAB, MdfA and NorE efflux pumps to quinolone resistance in Escherichia coli. J. Antimi-crob. Chemother. 51: 545–556.Yasufuku T., K. Shigemura, T. Shirakawa, M. Matsumoto, Y. Nakano, K. Tanaka, S. Arakawa, S. Kinoshita, M. Kawabata and others. 2011. Correlation of overexpression of efflux pump genes with antibiotic resistance in Escherichia coli strains clinically isolated from urinary tract infection patients. J. Clin. Microbiol. 49: 189–194.Yoshihara E. and H. Inoko. 2011. Method or agent for inhibiting the function of efflux pump Pseudomonas aeruginosa. http://www.google.com/patents/US7985410, 2016.02.10.
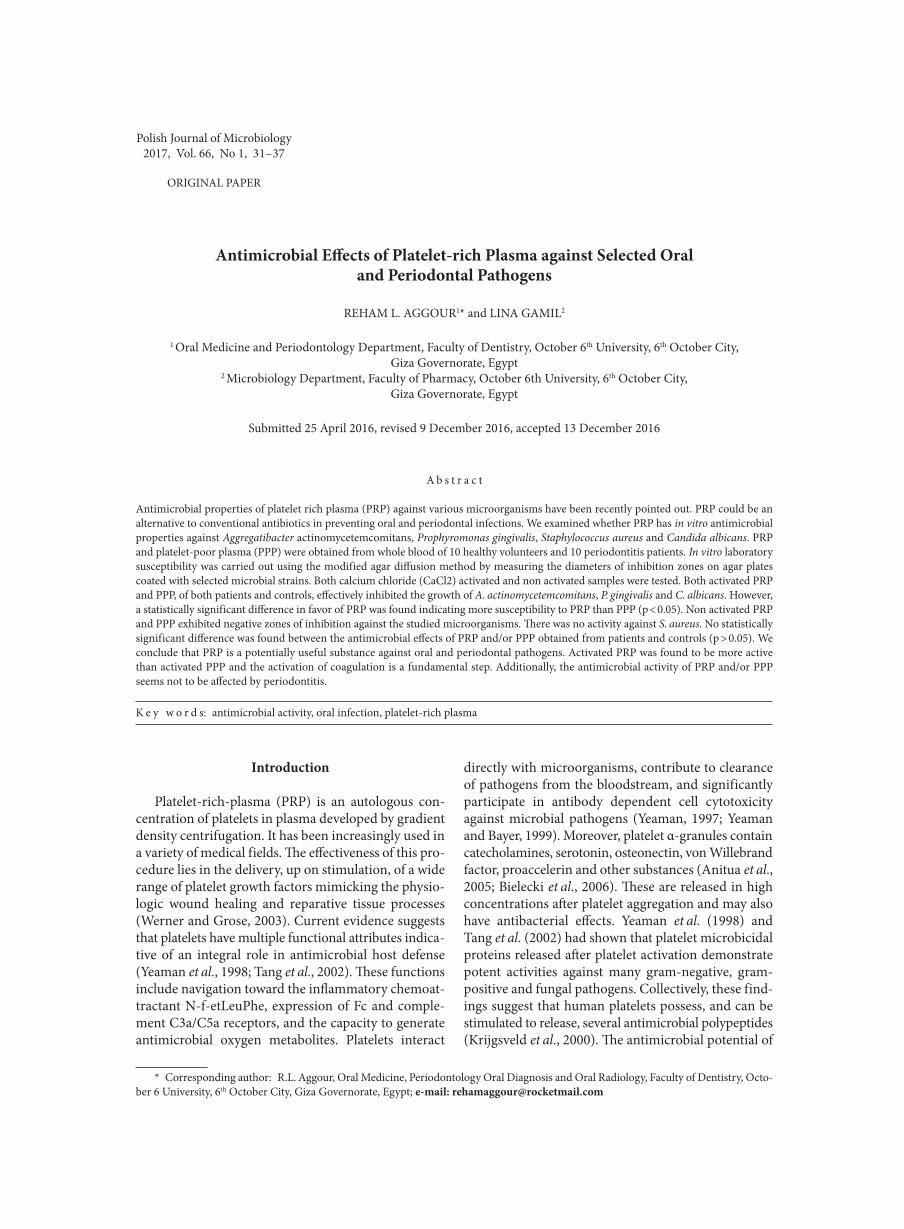
Polish Journal of Microbiology2017, Vol. 66, No 1, 31–37
ORIGINAL PAPER
* Corresponding author: R.L. Aggour, Oral Medicine, Periodontology Oral Diagnosis and Oral Radiology, Faculty of Dentistry, Octo-ber 6 University, 6th October City, Giza Governorate, Egypt; e-mail: [email protected]
Introduction
Platelet-rich-plasma (PRP) is an autologous con-centration of platelets in plasma developed by gradient density centrifugation. It has been increasingly used in a variety of medical fields. The effectiveness of this pro-cedure lies in the delivery, up on stimulation, of a wide range of platelet growth factors mimicking the physio-logic wound healing and reparative tissue processes (Werner and Grose, 2003). Current evidence suggests that platelets have multiple functional attributes indica-tive of an integral role in antimicrobial host defense (Yeaman et al., 1998; Tang et al., 2002). These functions include navigation toward the inflammatory chemoat-tractant N-f-etLeuPhe, expression of Fc and comple-ment C3a/C5a receptors, and the capacity to generate antimicrobial oxygen metabolites. Platelets interact
directly with microorganisms, contribute to clearance of pathogens from the bloodstream, and significantly participate in antibody dependent cell cytotoxicity against microbial pathogens (Yeaman, 1997; Yeaman and Bayer, 1999). Moreover, platelet α-granules contain catecholamines, serotonin, osteonectin, von Willebrand factor, proaccelerin and other substances (Anitua et al., 2005; Bielecki et al., 2006). These are released in high concentrations after platelet aggregation and may also have antibacterial effects. Yeaman et al. (1998) and Tang et al. (2002) had shown that platelet microbicidal proteins released after platelet activation demonstrate potent activities against many gram-negative, gram-posi tive and fungal pathogens. Collectively, these find-ings suggest that human platelets possess, and can be stimu lated to release, several antimicrobial polypeptides (Krijgsveld et al., 2000). The antimicrobial potential of
Antimicrobial Effects of Platelet-rich Plasma against Selected Oraland Periodontal Pathogens
REHAM L. AGGOUR1* and LINA GAMIL2
1 Oral Medicine and Periodontology Department, Faculty of Dentistry, October 6th University, 6th October City,Giza Governorate, Egypt
2 Microbiology Department, Faculty of Pharmacy, October 6th University, 6th October City,Giza Governorate, Egypt
Submitted 25 April 2016, revised 9 December 2016, accepted 13 December 2016
A b s t r a c t
Antimicrobial properties of platelet rich plasma (PRP) against various microorganisms have been recently pointed out. PRP could be an alternative to conventional antibiotics in preventing oral and periodontal infections. We examined whether PRP has in vitro antimicrobial properties against Aggregatibacter actinomycetemcomitans, Prophyromonas gingivalis, Staphylococcus aureus and Candida albicans. PRP and platelet-poor plasma (PPP) were obtained from whole blood of 10 healthy volunteers and 10 periodontitis patients. In vitro laboratory susceptibility was carried out using the modified agar diffusion method by measuring the diameters of inhibition zones on agar plates coated with selected microbial strains. Both calcium chloride (CaCl2) activated and non activated samples were tested. Both activated PRP and PPP, of both patients and controls, effectively inhibited the growth of A. actinomycetemcomitans, P. gingivalis and C. albicans. However, a statistically significant difference in favor of PRP was found indicating more susceptibility to PRP than PPP (p < 0.05). Non activated PRP and PPP exhibited negative zones of inhibition against the studied microorganisms. There was no activity against S. aureus. No statistically significant difference was found between the antimicrobial effects of PRP and/or PPP obtained from patients and controls (p > 0.05). We conclude that PRP is a potentially useful substance against oral and periodontal pathogens. Activated PRP was found to be more active than activated PPP and the activation of coagulation is a fundamental step. Additionally, the antimicrobial activity of PRP and/or PPP seems not to be affected by periodontitis.
K e y w o r d s: antimicrobial activity, oral infection, platelet-rich plasma
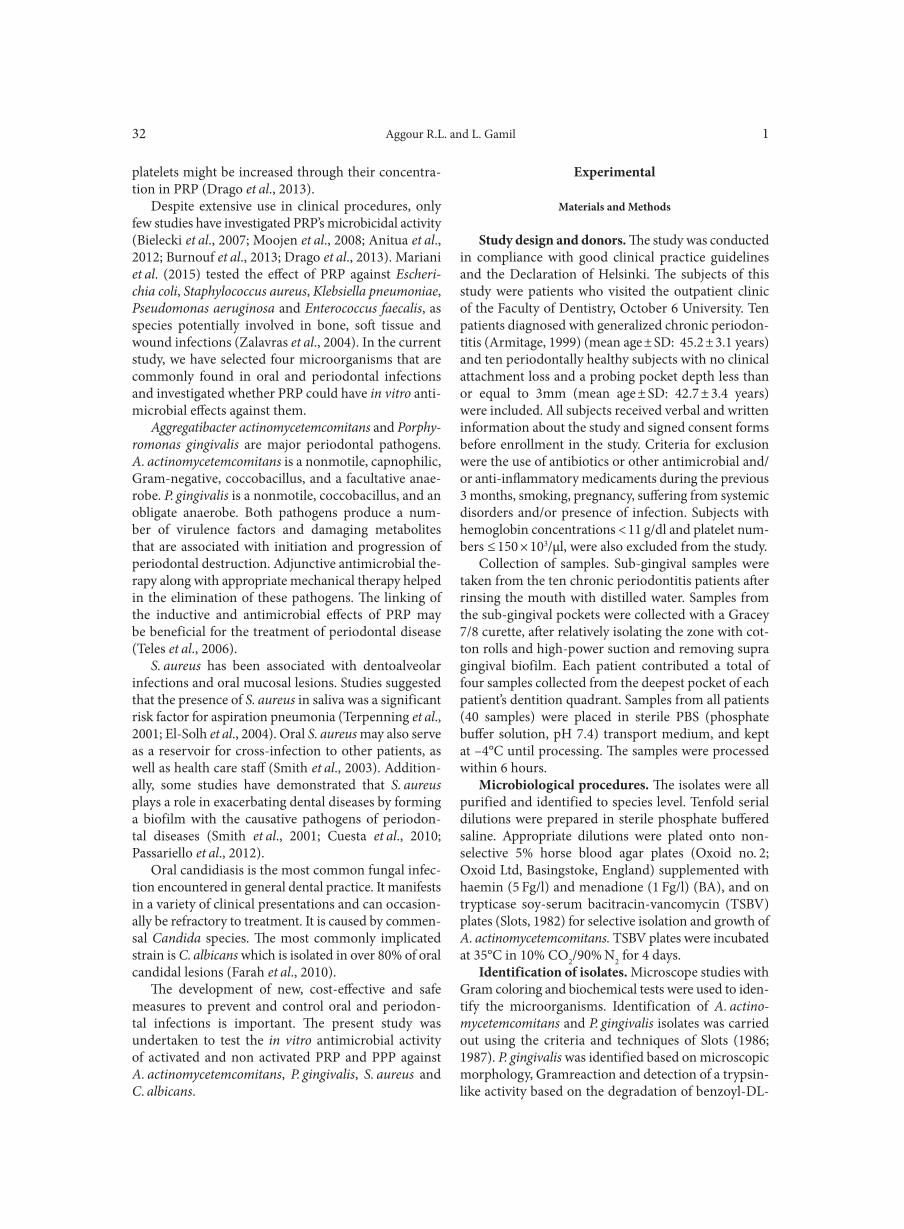
Aggour R.L. and L. Gamil 132
platelets might be increased through their concentra-tion in PRP (Drago et al., 2013).
Despite extensive use in clinical procedures, only few studies have investigated PRP’s microbicidal activity (Bielecki et al., 2007; Moojen et al., 2008; Anitua et al., 2012; Burnouf et al., 2013; Drago et al., 2013). Mariani et al. (2015) tested the effect of PRP against Escheri-chia coli, Staphylococcus aureus, Klebsiella pneumoniae, Pseudomonas aeruginosa and Enterococcus faecalis, as species potentially involved in bone, soft tissue and wound infections (Zalavras et al., 2004). In the current study, we have selected four microorga nisms that are commonly found in oral and periodontal infections and investigated whether PRP could have in vitro anti-microbial effects against them.
Aggregatibacter actinomycetemcomitans and Porphy-romonas gingivalis are major periodontal pathogens. A. actinomycetemcomitans is a nonmotile, capnophilic, Gram-negative, coccobacillus, and a facultative anae-robe. P. gingivalis is a nonmotile, coccobacillus, and an obligate anaerobe. Both pathogens produce a num-ber of virulence factors and damaging metabolites that are associated with initiation and progression of periodontal destruction. Adjunctive antimicrobial the- rapy along with appropriate mechanical therapy helped in the elimi nation of these pathogens. The linking of the inductive and antimicrobial effects of PRP may be beneficial for the treatment of periodontal disease (Teles et al., 2006).
S. aureus has been associated with dentoalveolar infections and oral mucosal lesions. Studies suggested that the presence of S. aureus in saliva was a significant risk factor for aspiration pneumonia (Terpenning et al., 2001; El-Solh et al., 2004). Oral S. aureus may also serve as a reservoir for cross-infection to other patients, as well as health care staff (Smith et al., 2003). Addition-ally, some studies have demonstrated that S. aureus plays a role in exacerbating dental diseases by forming a biofilm with the causative pathogens of periodon- tal diseases (Smith et al., 2001; Cuesta et al., 2010; Passa riello et al., 2012).
Oral candidiasis is the most common fungal infec-tion encountered in general dental practice. It manifests in a variety of clinical presentations and can occasion-ally be refractory to treatment. It is caused by commen-sal Candida species. The most commonly implicated strain is C. albicans which is isolated in over 80% of oral candidal lesions (Farah et al., 2010).
The development of new, cost-effective and safe measures to prevent and control oral and periodon- tal infections is important. The present study was undertaken to test the in vitro antimicrobial activity of activated and non activated PRP and PPP against A. actinomycetemcomitans, P. gingivalis, S. aureus and C. albicans.
Experimental
Materials and Methods
Study design and donors. The study was conducted in compliance with good clinical practice guidelines and the Declaration of Helsinki. The subjects of this study were pa tients who visited the outpatient clinic of the Faculty of Dentistry, October 6 University. Ten patients diagnosed with generalized chronic periodon-titis (Armitage, 1999) (mean age ± SD: 45.2 ± 3.1 years) and ten periodontally healthy subjects with no clinical attachment loss and a probing pocket depth less than or equal to 3mm (mean age ± SD: 42.7 ± 3.4 years) were included. All subjects received verbal and written information about the study and signed consent forms before enrollment in the study. Criteria for exclusion were the use of antibiotics or other antimicrobial and/ or anti-inflammatory medicaments during the previous 3 months, smoking, pregnancy, suffering from systemic disorders and/or presence of infection. Subjects with hemoglobin concentrations < 11 g/dl and platelet num-bers ≤ 150 × 103/μl, were also excluded from the study.
Collection of samples. Sub-gingival samples were taken from the ten chronic periodontitis patients after rinsing the mouth with distilled water. Samples from the sub-gingival pockets were collected with a Gracey 7/8 curette, after relatively isolating the zone with cot-ton rolls and high-power suction and removing supra gingival biofilm. Each patient contributed a total of four samples collected from the deepest pocket of each patient’s dentition quadrant. Samples from all patients (40 samples) were placed in sterile PBS (phosphate buffer solution, pH 7.4) transport medium, and kept at –4°C until processing. The samples were processed within 6 hours.
Microbiological procedures. The isolates were all purified and identified to species level. Tenfold serial dilutions were prepared in sterile phosphate buffered saline. Appropriate dilutions were plated onto non-selective 5% horse blood agar plates (Oxoid no. 2; Oxoid Ltd, Basingstoke, England) supplemented with haemin (5 Fg/l) and menadione (1 Fg/l) (BA), and on trypticase soy-serum bacitracin-vancomycin (TSBV) plates (Slots, 1982) for selective isolation and growth of A. actinomycetemcomitans. TSBV plates were incubated at 35°C in 10% CO2/90% N2 for 4 days.
Identification of isolates. Microscope studies with Gram coloring and biochemical tests were used to iden-tify the microorganisms. Identification of A. actino-mycetemcomitans and P. gingivalis isolates was carried out using the criteria and techniques of Slots (1986; 1987). P. gingivalis was identified based on microscopic morphology, Gramreaction and detection of a trypsin-like activity based on the degradation of benzoyl-DL-
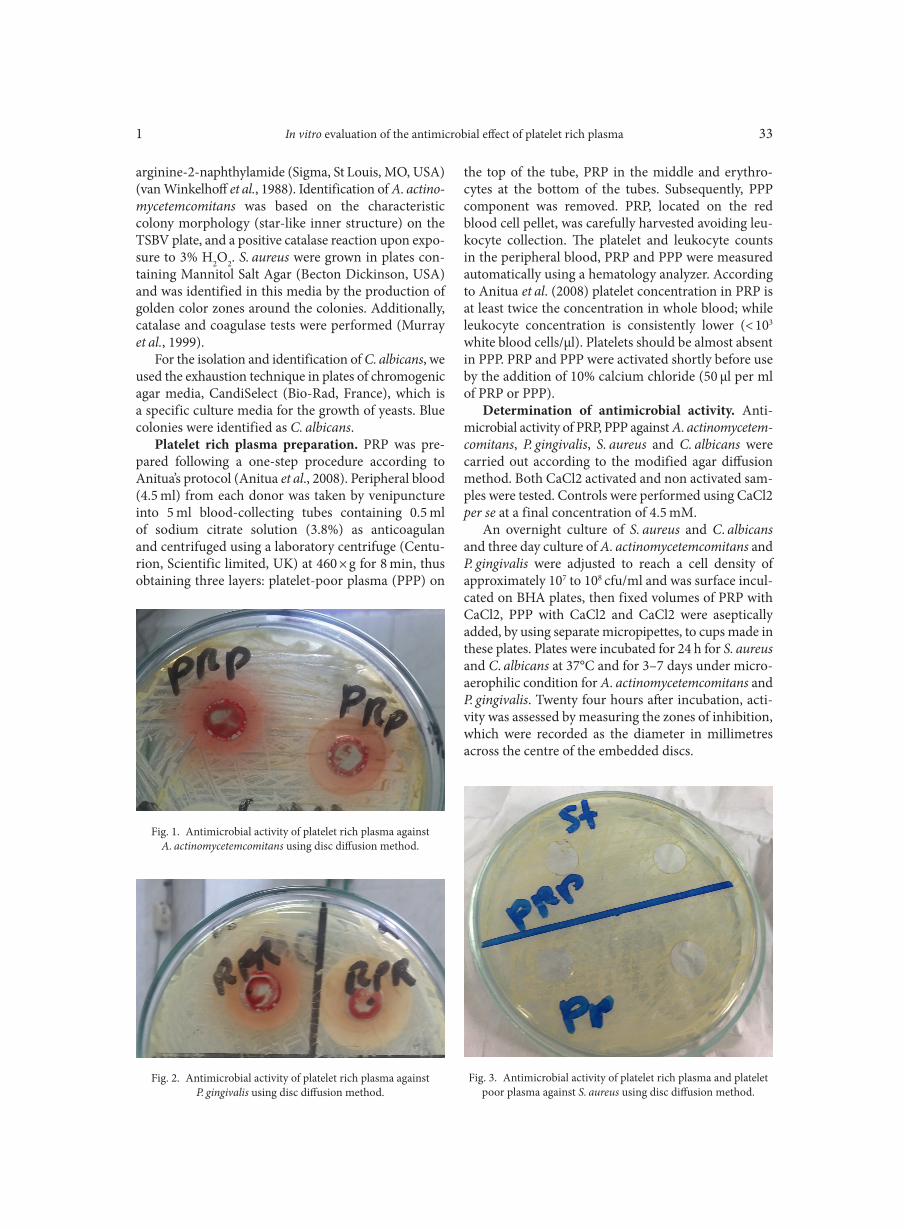
In vitro evaluation of the antimicrobial effect of platelet rich plasma1 33
arginine-2-naphthylamide (Sigma, St Louis, MO, USA) (van Winkelhoff et al., 1988). Identification of A. actino-mycetemcomitans was based on the characteristic colony morphology (star-like inner structure) on the TSBV plate, and a positive catalase reaction upon expo-sure to 3% H2O2. S. aureus were grown in plates con-taining Mannitol Salt Agar (Becton Dickinson, USA) and was identified in this media by the production of golden color zones around the colonies. Additionally, catalase and coagulase tests were performed (Murray et al., 1999).
For the isolation and identification of C. albicans, we used the exhaustion technique in plates of chromogenic agar media, CandiSelect (Bio-Rad, France), which is a specific culture media for the growth of yeasts. Blue colonies were identified as C. albicans.
Platelet rich plasma preparation. PRP was pre-pared following a one-step procedure according to Anitua’s protocol (Anitua et al., 2008). Peripheral blood (4.5 ml) from each donor was taken by venipuncture into 5 ml blood-collecting tubes containing 0.5 ml of sodium citrate solution (3.8%) as anticoagulan and centrifuged using a laboratory centrifuge (Centu-rion, Scientific limited, UK) at 460 × g for 8 min, thus obtaining three layers: platelet-poor plasma (PPP) on
the top of the tube, PRP in the middle and erythro- cytes at the bottom of the tubes. Subsequently, PPP component was removed. PRP, located on the red blood cell pellet, was carefully harvested avoiding leu-kocyte collection. The platelet and leukocyte counts in the peripheral blood, PRP and PPP were measured automatically using a hematology analyzer. According to Anitua et al. (2008) platelet concentration in PRP is at least twice the concentration in whole blood; while leukocyte concentration is consistently lower (< 103
white blood cells/μl). Platelets should be almost absent in PPP. PRP and PPP were activated shortly before use by the addition of 10% calcium chloride (50 μl per ml of PRP or PPP).
Determination of antimicrobial activity. Anti-micro bial activity of PRP, PPP against A. actinomycetem-comitans, P. gingivalis, S. aureus and C. albicans were carried out according to the modified agar diffusion method. Both CaCl2 activated and non activated sam-ples were tested. Controls were performed using CaCl2 per se at a final concentration of 4.5 mM.
An overnight culture of S. aureus and C. albicans and three day culture of A. actinomycetemcomitans and P. gingivalis were adjusted to reach a cell density of approximately 107 to 108 cfu/ml and was surface incul-cated on BHA plates, then fixed volumes of PRP with CaCl2, PPP with CaCl2 and CaCl2 were aseptically added, by using separate micropipettes, to cups made in these plates. Plates were incubated for 24 h for S. aureus and C. albicans at 37°C and for 3–7 days under micro-aerophilic condition for A. actinomycetemcomitans and P. gingivalis. Twenty four hours after incubation, acti-vity was assessed by measuring the zones of inhibition, which were recorded as the diameter in millimetres across the centre of the embedded discs.
Fig. 1. Antimicrobial activity of platelet rich plasma againstA. actinomycetemcomitans using disc diffusion method.
Fig. 2. Antimicrobial activity of platelet rich plasma againstP. gingivalis using disc diffusion method.
Fig. 3. Antimicrobial activity of platelet rich plasma and plateletpoor plasma against S. aureus using disc diffusion method.
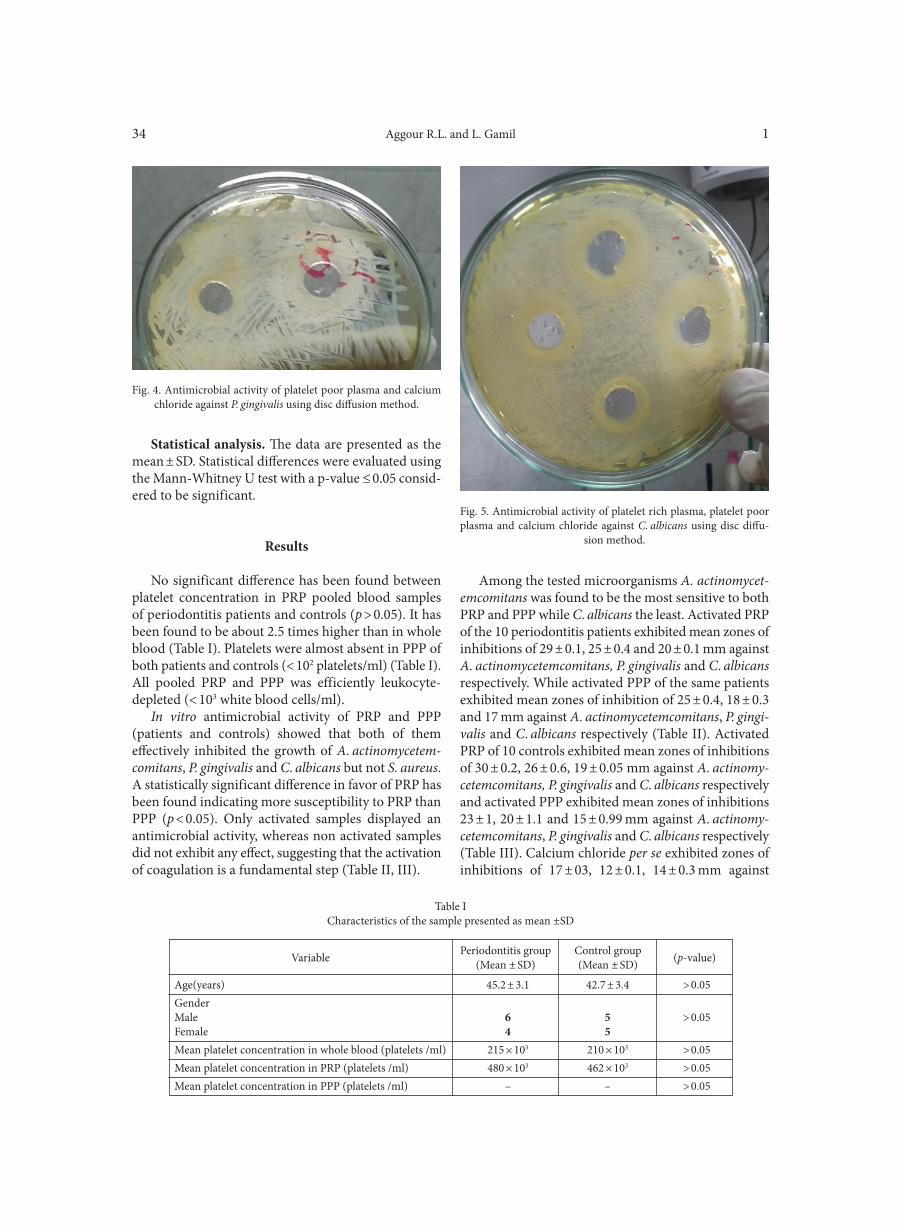
Aggour R.L. and L. Gamil 134
Statistical analysis. The data are presented as the mean ± SD. Statistical differences were evaluated using the Mann-Whitney U test with a p-value ≤ 0.05 consid-ered to be significant.
Results
No significant difference has been found between platelet concentration in PRP pooled blood samples of periodontitis patients and controls (p > 0.05). It has been found to be about 2.5 times higher than in whole blood (Table I). Platelets were almost absent in PPP of both patients and controls (< 102 platelets/ml) (Table I). All pooled PRP and PPP was efficiently leukocyte-depleted (< 103 white blood cells/ml).
In vitro antimicrobial activity of PRP and PPP (patients and controls) showed that both of them effectively inhibited the growth of A. actinomycetem-comitans, P. gingivalis and C. albicans but not S. aureus. A statistically significant difference in favor of PRP has been found indicating more susceptibility to PRP than PPP (p < 0.05). Only activated samples displayed an antimicrobial activity, whereas non activated samples did not exhibit any effect, suggesting that the activation of coagulation is a fundamental step (Table II, III).
Among the tested microorganisms A. actinomycet-emcomitans was found to be the most sensitive to both PRP and PPP while C. albicans the least. Activated PRP of the 10 periodontitis patients exhibited mean zones of inhibitions of 29 ± 0.1, 25 ± 0.4 and 20 ± 0.1 mm against A. actinomycetemcomitans, P. gingivalis and C. albicans respectively. While activated PPP of the same patients exhibited mean zones of inhibition of 25 ± 0.4, 18 ± 0.3 and 17 mm against A. actinomycetemcomitans, P. gingi-valis and C. albicans respectively (Table II). Activated PRP of 10 controls exhibited mean zones of inhibitions of 30 ± 0.2, 26 ± 0.6, 19 ± 0.05 mm against A. actinomy-cetemcomitans, P. gingivalis and C. albicans respectively and activated PPP exhibited mean zones of inhibitions 23 ± 1, 20 ± 1.1 and 15 ± 0.99 mm against A. actinomy-cetemcomitans, P. gingivalis and C. albicans respectively (Table III). Calcium chloride per se exhibited zones of inhibitions of 17 ± 03, 12 ± 0.1, 14 ± 0.3 mm against
Age(years) 45.2 ± 3.1 42.7 ± 3.4 > 0.05GenderMale 6 5 > 0.05Female 4 5Mean platelet concentration in whole blood (platelets /ml) 215 × 103 210 × 103 > 0.05Mean platelet concentration in PRP (platelets /ml) 480 × 103 462 × 103 > 0.05Mean platelet concentration in PPP (platelets /ml) – – > 0.05
Table ICharacteristics of the sample presented as mean ±SD
Variable Periodontitis group(Mean ± SD)
Control group(Mean ± SD) (p-value)
Fig. 4. Antimicrobial activity of platelet poor plasma and calcium chloride against P. gingivalis using disc diffusion method.
Fig. 5. Antimicrobial activity of platelet rich plasma, platelet poor plasma and calcium chloride against C. albicans using disc diffu-
sion method.
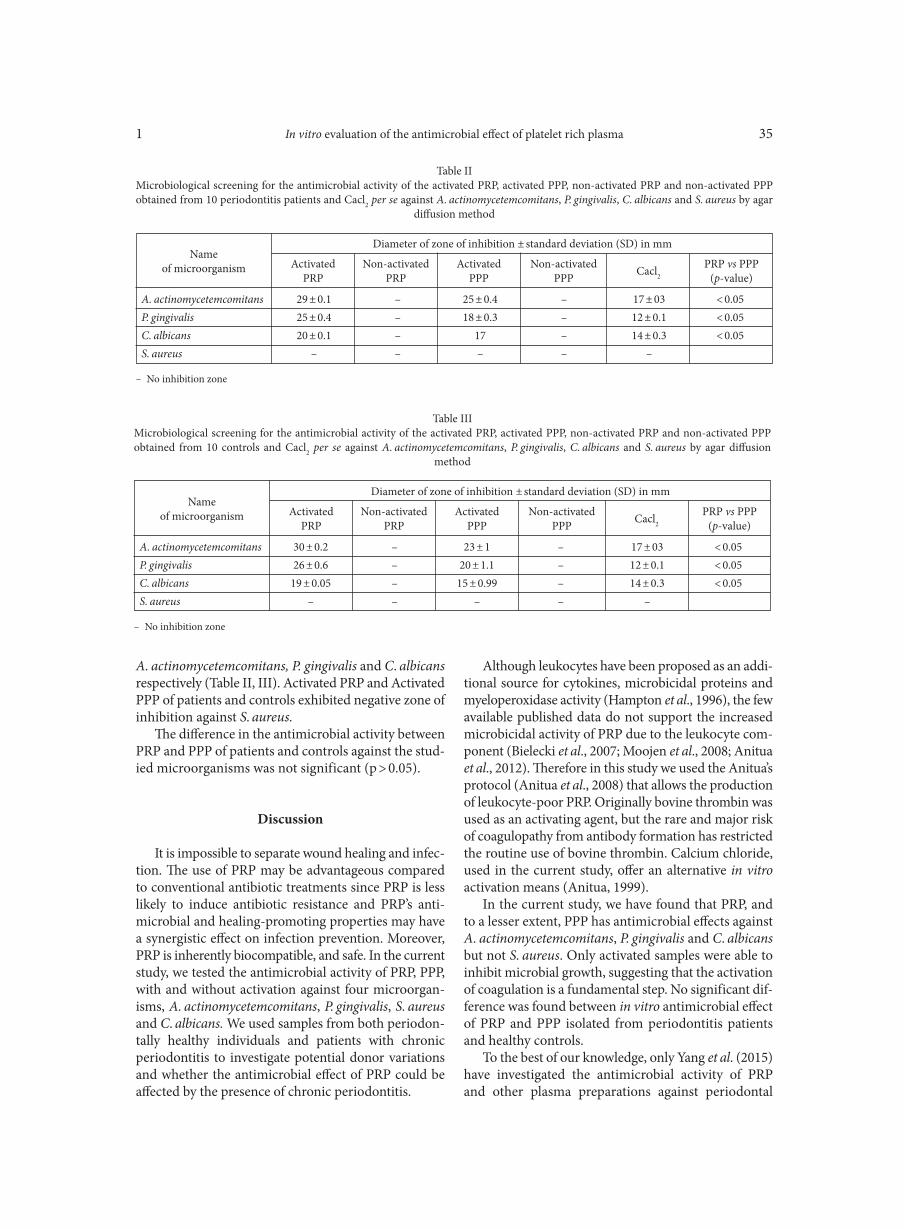
In vitro evaluation of the antimicrobial effect of platelet rich plasma1 35
A. actinomycetemcomitans, P. gingivalis and C. albicans respectively (Table II, III). Activated PRP and Activated PPP of patients and controls exhibited negative zone of inhibition against S. aureus.
The difference in the antimicrobial activity between PRP and PPP of patients and controls against the stud-ied microorganisms was not significant (p > 0.05).
Discussion
It is impossible to separate wound healing and infec-tion. The use of PRP may be advantageous compared to conventional antibiotic treatments since PRP is less likely to induce antibiotic resistance and PRP’s anti- microbial and healing-promoting properties may have a synergistic effect on infection prevention. Moreover, PRP is inherently biocompatible, and safe. In the current study, we tested the antimicrobial activity of PRP, PPP, with and without activation against four microorgan-isms, A. actinomycetemcomitans, P. gingivalis, S. aureus and C. albicans. We used samples from both periodon-tally healthy individuals and patients with chronic periodontitis to investigate potential donor variations and whether the antimicrobial effect of PRP could be affected by the presence of chronic periodontitis.
Although leukocytes have been proposed as an addi-tional source for cytokines, microbicidal proteins and myeloperoxidase activity (Hampton et al., 1996), the few available published data do not support the increased microbicidal activity of PRP due to the leukocyte com-ponent (Bielecki et al., 2007; Moojen et al., 2008; Anitua et al., 2012). Therefore in this study we used the Anitua’s protocol (Anitua et al., 2008) that allows the production of leukocyte-poor PRP. Originally bovine thrombin was used as an activating agent, but the rare and major risk of coagulopathy from antibody formation has restricted the routine use of bovine thrombin. Calcium chloride, used in the current study, offer an alternative in vitro activation means (Anitua, 1999).
In the current study, we have found that PRP, and to a lesser extent, PPP has antimicrobial effects against A. actinomycetemcomitans, P. gingivalis and C. albicans but not S. aureus. Only activated samples were able to inhibit microbial growth, suggesting that the activation of coagulation is a fundamental step. No significant dif-ference was found between in vitro antimicrobial effect of PRP and PPP isolated from periodontitis patients and healthy controls.
To the best of our knowledge, only Yang et al. (2015)
have investigated the antimicrobial activity of PRP and other plasma preparations against periodontal
A. actinomycetemcomitans 29 ± 0.1 – 25 ± 0.4 – 17 ± 03 < 0.05P. gingivalis 25 ± 0.4 – 18 ± 0.3 – 12 ± 0.1 < 0.05C. albicans 20 ± 0.1 – 17 – 14 ± 0.3 < 0.05S. aureus – – – – –
Table IIMicrobiological screening for the antimicrobial activity of the activated PRP, activated PPP, non-activated PRP and non-activated PPP obtained from 10 periodontitis patients and Cacl2 per se against A. actinomycetemcomitans, P. gingivalis, C. albicans and S. aureus by agar
diffusion method
– No inhibition zone
Nameof microorganism
Diameter of zone of inhibition ± standard deviation (SD) in mm
ActivatedPRP
Non-activatedPRP
ActivatedPPP
Non-activatedPPP Cacl2
PRP vs PPP(p-value)
A. actinomycetemcomitans 30 ± 0.2 – 23 ± 1 – 17 ± 03 < 0.05P. gingivalis 26 ± 0.6 – 20 ± 1.1 – 12 ± 0.1 < 0.05C. albicans 19 ± 0.05 – 15 ± 0.99 – 14 ± 0.3 < 0.05S. aureus – – – – –
Table IIIMicrobiological screening for the antimicrobial activity of the activated PRP, activated PPP, non-activated PRP and non-activated PPP obtained from 10 controls and Cacl2 per se against A. actinomycetemcomitans, P. gingivalis, C. albicans and S. aureus by agar diffusion
method
– No inhibition zone
Nameof microorganism
Diameter of zone of inhibition ± standard deviation (SD) in mm
ActivatedPRP
Non-activatedPRP
ActivatedPPP
Non-activatedPPP Cacl2
PRP vs PPP(p-value)
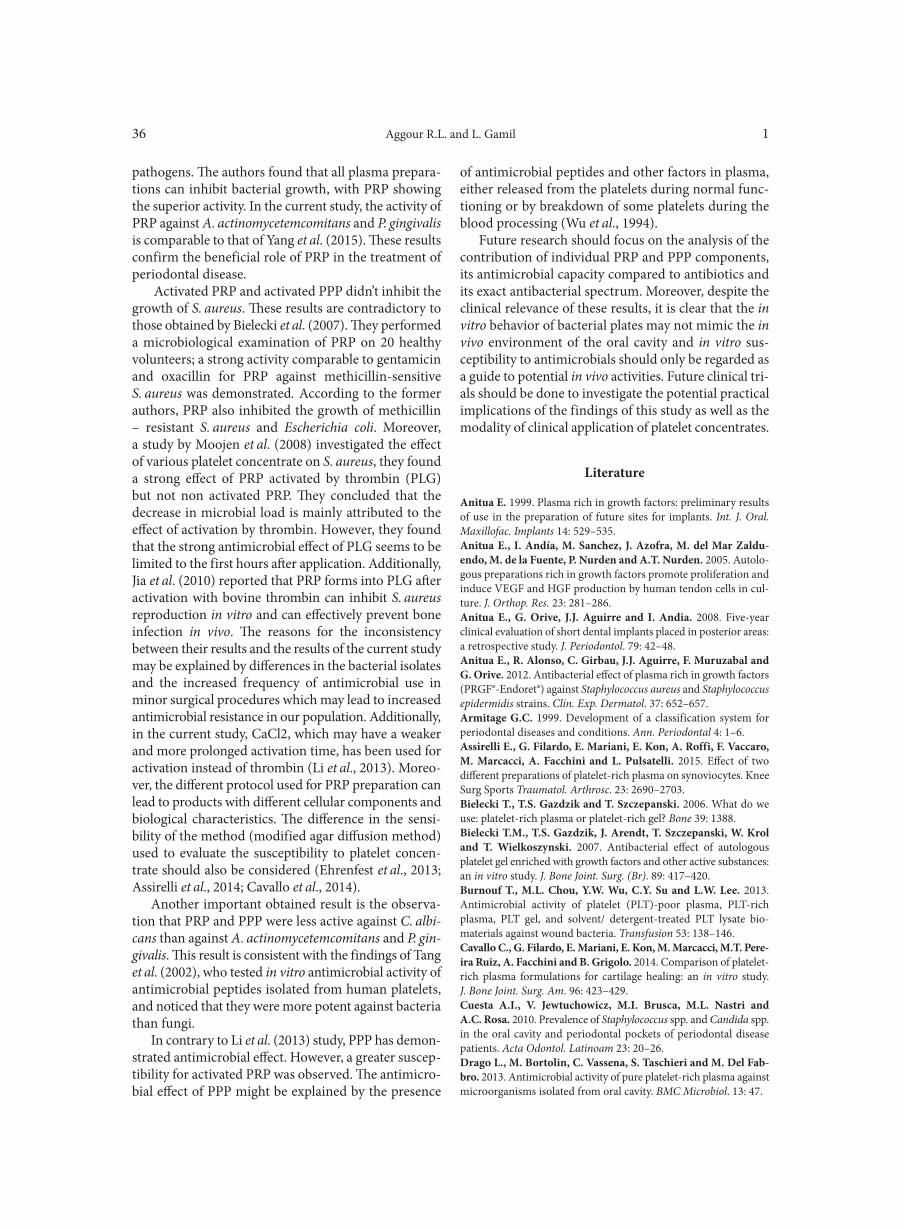
Aggour R.L. and L. Gamil 136
pathogens. The authors found that all plasma prepara-tions can inhibit bacterial growth, with PRP showing the superior activity. In the current study, the activity of PRP against A. actinomycetemcomitans and P. gingivalis is comparable to that of Yang et al. (2015). These results confirm the beneficial role of PRP in the treatment of periodontal disease.
Activated PRP and activated PPP didn’t inhibit the growth of S. aureus. These results are contradictory to those obtained by Bielecki et al. (2007). They performed a microbiological examination of PRP on 20 healthy volunteers; a strong activity comparable to gentamicin and oxacillin for PRP against methicillin-sensitive S. aureus was demonstrated. According to the former authors, PRP also inhibited the growth of methicillin – resistant S. aureus and Escherichia coli. Moreover, a study by Moojen et al. (2008) investigated the effect of various platelet concentrate on S. aureus, they found a strong effect of PRP activated by thrombin (PLG) but not non activated PRP. They concluded that the decrease in microbial load is mainly attributed to the effect of activation by thrombin. However, they found that the strong antimicrobial effect of PLG seems to be limited to the first hours after application. Additionally, Jia et al. (2010) reported that PRP forms into PLG after activation with bovine thrombin can inhibit S. aureus reproduction in vitro and can effectively prevent bone infection in vivo. The reasons for the inconsistency between their results and the results of the current study may be explained by differences in the bacterial isolates and the increased frequency of antimicrobial use in mi nor surgical procedures which may lead to increased antimicrobial resistance in our population. Additionally, in the current study, CaCl2, which may have a weaker and more prolonged activation time, has been used for activation instead of thrombin (Li et al., 2013). Moreo-ver, the different protocol used for PRP preparation can lead to products with different cellular components and biological characteristics. The difference in the sensi-bility of the method (modified agar diffusion method) used to evaluate the susceptibility to platelet concen- trate should also be considered (Ehrenfest et al., 2013; Assirelli et al., 2014; Cavallo et al., 2014).
Another important obtained result is the observa-tion that PRP and PPP were less active against C. albi-cans than against A. actinomycetemcomitans and P. gin-givalis. This result is consistent with the findings of Tang et al. (2002), who tested in vitro antimicrobial activity of antimicrobial peptides isolated from human platelets, and noticed that they were more potent against bacteria than fungi.
In contrary to Li et al. (2013) study, PPP has demon-strated antimicrobial effect. However, a greater suscep-tibility for activated PRP was observed. The antimicro-bial effect of PPP might be explained by the presence
of antimicrobial peptides and other factors in plasma, either released from the platelets during normal func-tioning or by breakdown of some platelets during the blood processing (Wu et al., 1994).
Future research should focus on the analysis of the contribution of individual PRP and PPP components, its antimicrobial capacity compared to antibiotics and its exact antibacterial spectrum. Moreover, despite the clinical relevance of these results, it is clear that the in vitro behavior of bacterial plates may not mimic the in vivo environment of the oral cavity and in vitro sus-ceptibility to antimicrobials should only be regarded as a guide to potential in vivo activities. Future clinical tri-als should be done to investigate the potential practical implications of the findings of this study as well as the modality of clinical application of platelet concentrates.
Literature
Anitua E. 1999. Plasma rich in growth factors: preliminary results of use in the preparation of future sites for implants. Int. J. Oral. Maxillofac. Implants 14: 529–535.Anitua E., I. Andía, M. Sanchez, J. Azofra, M. del Mar Zaldu-endo, M. de la Fuente, P. Nurden and A.T. Nurden. 2005. Autolo-gous preparations rich in growth factors promote proliferation and induce VEGF and HGF production by human tendon cells in cul-ture. J. Orthop. Res. 23: 281–286.Anitua E., G. Orive, J.J. Aguirre and I. Andia. 2008. Five-year clinical evaluation of short dental implants placed in posterior areas: a retrospective study. J. Periodontol. 79: 42–48.Anitua E., R. Alonso, C. Girbau, J.J. Aguirre, F. Muruzabal and G. Orive. 2012. Antibacterial effect of plasma rich in growth factors (PRGF®-Endoret®) against Staphylococcus aureus and Staphylococcus epidermidis strains. Clin. Exp. Dermatol. 37: 652–657.Armitage G.C. 1999. Development of a classification system for periodontal diseases and conditions. Ann. Periodontal 4: 1–6.Assirelli E., G. Filardo, E. Mariani, E. Kon, A. Roffi, F. Vaccaro, M. Marcacci, A. Facchini and L. Pulsatelli. 2015. Effect of two different preparations of platelet-rich plasma on synoviocytes. Knee Surg Sports Traumatol. Arthrosc. 23: 2690–2703.Bielecki T., T.S. Gazdzik and T. Szczepanski. 2006. What do we use: platelet-rich plasma or platelet-rich gel? Bone 39: 1388.Bielecki T.M., T.S. Gazdzik, J. Arendt, T. Szczepanski, W. Krol and T. Wielkoszynski. 2007. Antibacterial effect of autologous platelet gel enriched with growth factors and other active substances: an in vitro study. J. Bone Joint. Surg. (Br). 89: 417–420.Burnouf T., M.L. Chou, Y.W. Wu, C.Y. Su and L.W. Lee. 2013. Antimicrobial activity of platelet (PLT)-poor plasma, PLT-rich plasma, PLT gel, and solvent/ detergent-treated PLT lysate bio-materials against wound bacteria. Transfusion 53: 138–146.Cavallo C., G. Filardo, E. Mariani, E. Kon, M. Marcacci, M.T. Pere-ira Ruiz, A. Facchini and B. Grigolo. 2014. Comparison of platelet-rich plasma formulations for cartilage healing: an in vitro study. J. Bone Joint. Surg. Am. 96: 423–429.Cuesta A.I., V. Jewtuchowicz, M.I. Brusca, M.L. Nastri and A.C. Rosa. 2010. Prev alence of Staphylococcus spp. and Candida spp. in the oral cavity and periodontal pockets of periodontal disease patients. Acta Odontol. Latinoam 23: 20–26.Drago L., M. Bortolin, C. Vassena, S. Taschieri and M. Del Fab-bro. 2013. Antimicrobial activity of pure platelet-rich plasma against microorganisms isolated from oral cavity. BMC Microbiol. 13: 47.
In vitro evaluation of the antimicrobial effect of platelet rich plasma1 37
Ehrenfest D.M.D., G. Sammartino, J.A. Shibli, H. Wang, D. Zou and J. Bernard. 2013. Guidelines for the publication of articles related to platelet concentrates (Platelet-Rich Plasma – PRP, or Platelet-Rich Fibrin – PRF): the international classification of the POSEIDO. Poseido J. 1: 17–28.El-Solh A.A., C. Pietrantoni, A. Bhat, M. Okada, J. Zambon, A.A. Quilina and E. Berbary. 2004. Colonization of dental plaques: a reservoir of respiratory pathogens for hospital acquired pneumo-nia in institutionalized elders. Chest 126: 1575–1582.Farah C.S., N. Lynch and M.J. McCullough. 2010. Oral fungal infec-tions: an update for the general practitioner. Aust. Dent. J. 55: 48–54.Hampton M.B., A.J. Kettle and C.C. Winterbourn. 1996. Involve-ment of superoxide and myeloperoxidase in oxygen-dependent killing of Staphylococcus aureus by neutrophils. Infect. Immun. 64: 3512–3517.Jia W., C. Zhang, J. Wang, J. Chen and Y. Jiang. 2010. An experi-mental study on antimicrobial efficacy of platelet-rich plasma for bone infection prophylaxis. Zhongguo Xiu Fu Chong Jian Wai Ke Za Zhi. 24: 964–870.Krijgsveld J., S.A. Zaat, J. Meeldijk, P.A. van Veelen, G. Fang, B. Poolman, E. Brandt, J.E. Ehlert, A.J. Kuijpers, G.H. Engbers and others. 2000. Thrombocidins, microbicidal proteins fromhu-man blood platelets, are c-terminal deletion products of CXC che-mokines. J. Biol. Chem. 275: 20374–20381.Li H., T. Hamza, J.E Tidwell, N. Clovis and B. Li. 2013. Unique antimicrobial effects of platelet-rich plasma and its efficacy as a prophylaxis to prevent implant-associated spinal infection. Adv. Healthc. Mater. 2: 1277–1284. Mariani E., V. Canella, A. Berlingeri, A. Bielli, L. Cattini, M.P. Landini, E. Kon, M. Marcacci, B. Di Matteo and G. Filardo. 2015. Leukocyte presence does not increase microbicidal activity of platelet-rich plasma in vitro. BMC Microbiology 15: 149. Moojen D.J., P.A. Everts, R.M. Schure, E.P. Overdevest, Z.A. Van, J.T. Knape, R.M. Castelein, L.B. Creemers and W.J. Dhert. 2008. Antimicrobial activity of platelet-leukocyte gel against Staphylococ-cus aureus. J. Orthop. Re. 26: 404–10.Murray P.R., E.J. Baron, M.A. Pfaller, F.C. Tenover, R.H. Yolken (eds). 1999. Manual of clinical microbiology, 7th ed. American Society for Microbiology, Washington, DC.Passariello C., M. Puttini, V. Iebba, P. Pera and P. Gigola. 2012. Influence of oral conditions on colonization by highly toxigenic Staphylococ cus aureus strains. Oral Dis. 18: 402–409.Slots J. 1982. Selective medium for isolation of A. actinomycetem-comitans. J. Clin. Microbiol. 15: 606–609.
Slots J. 1986. Rapid identification of important periodontal micro-organisms by cultivation. Oral Microbiol. Immunol. 1: 49–55.Slots J. 1987. Detection of colonies of Bacteroides gingivalis by a rapid fluorescence assay for trypsin-like activity. Oral Microbiol. Immunol. 2: 139–141.Smith A.J., M.S. Jackson and J. Bagg. 2001. The ecology of Staphy-lococcus species in the oral cavity. J. Med. Microbiol. 50: 940–946.Smith A.J., D. Robertson, M.K. Tang, M.S. Jackson, D. MacKenzie and J. Bagg. 2003. Staphylococcus aureus in the oral cavity: a three-year retrospective analysis of clinical laboratory data. Br. Dent. J. 195: 701–703.Tang Y.-Q., M.R. Yeaman and M.E. Selsted. 2002. Antimicrobial peptides from human platelets. Infect. Immun. 70: 6524–6533.Teles R.P., A.D., Haffajee and S.S. Socransky. 2006. Microbiological goals of periodontal therapy. Periodontology 42: 180–218. Terpenning M.S., G.W. Taylor, D.E. Lopatin, C.K. Kerr, B.L. Domi n - guez and W.J. Loesche. 2001. Aspiration pneumonia: dental and oral risk factors in an older veteran population. J. Am. Geriatr. Soc. 49: 557–563.van Winkelhoff A. J., M. Clement and J. de Graaff. 1988. rapid characterization of oral and non-oral pigmented Bacteroides spe-cies with the ATB Anaerobes ID system. J. Clin. Microbiol. 26: 1063–1065.Werner S. and R. Grose. 2003. Regulation of wound healing by growth factors and cytokines. Physiol. Rev. 83: 835–870Wu T., M.R. Yeaman and A.S Bayer. 1994. In vitro resistance to platelet microbicidal protein correlates with endocarditis source among bacteremic staphylococcal and streptococcal isolates. Anti-microb. Agents Chemother. 38(4): 729–732.Yang L.C., S.W. Hu, M. Yan, J.J. Yang, S.H. Tsou and Y.Y. Lin. 2015. Antimicrobial activity of platelet-rich plasma and other plasma preparations against periodontal pathogens. J. Periodontol. 86(2): 310–318.Yeaman M.R., A.S. Bayer, S.-P. Koo, W. Foss and P.M. Sullam. 1998. Platelet microbicidal proteins and neutrophil defensin dis-rupt the Staphylococcus aureus cytoplasmic membrane by distinct mechanisms of action. J. Clin. Invest. 101: 178–187.Yeaman M.R. and A.S. Bayer. 1999. Antimicrobial peptides from plateletsYeaman M.R. 1997. The role of platelets in antimicrobial host defense. Clin. Infect. Dis. 25: 951–970.Zalavras C.G., M.J. Patzakis and P. Holtom. 2004. Local antibiotic therapy in the treatment of open fractures and osteomyelitis. Clin. Orthop. Relat. Res. 427: 86–93.

Polish Journal of Microbiology2017, Vol. 66, No 1, 39–56
ORIGINAL PAPER
* Corresponding author: C. Cokmus, Konya Food and Agriculture University, Dede Korkut Mahallesi, Beyşehir, Meram, Konya, Turkey; e-mail: [email protected]
Introduction
Alkaliphilic bacteria, which are also called as extre-mophiles, can grow at high pH conditions. They split into two groups as alkaliphiles and alkalitolerants. While alkaliphiles grow optimally at pH 9.0 and also at higher alkaline conditions like pH 10.0, they cannot grow at or below pH 7.0. On the other hand, alkalotolerants can grow both at high (like pH 10.0) and neutral pH values. The enzymes of these alkaliphilic bacteria have a high demand for many industrial branches due to their sta-bility at high pH values (Horikoshi, 1999; Kumar and Takagi, 1999). Of these enzymes, alkaline proteases take the lead and have been used in many areas such as deter-gent, medicine, food, leather, pharmaceuticals, biologi-cal waste elimination and textile industry. Alkaliphilic Bacillus strains, which are one of the well-known and well-studied alkaline protease producers, secrete very stable alkaline proteases against pH, temperature, and detergent additives (Ito et al., 1998; Horikoshi, 1999). In many countries, obtaining legal permission is necessary
in order to produce industrial enzymes and the types of microorganisms that produce enzymes with industrial importance should be identified to use the enzymes commercially (Arellano-Carbajal and Olmos-Soto, 2002). Several PCR based nucleic acid fingerprinting methods have been used to characterize and differen-tiate Bacillus strains when 16S rRNA gene sequencing failed to give the information at subspecies and strain level. 16S-23S intergenic transcribed spacer region PCR (ITS-PCR), BOX and (GTG)5-PCR as repetitive element sequence-based PCR (rep-PCR) which are pow-erful methods to screen the several parts of bacterial genome, have been used to identification, differentiation and comparing the bacterial genome diversity (Freitas et al., 2008; Cihan, 2013). In the present study, 56 rod shaped bacteria, capable of growing under highly alka-line conditions were isolated from different regions of Turkey. Carbon sources as a nutrient factor and the pH of the culture medium have a critical importance in the alkaline protease production. As a primary purpose of this study, we aimed to determine the optimal alkaline
A Comparative Study:Taxonomic Grouping of Alkaline Protease Producing Bacilli
NILGUN TEKIN1, ARZU COLERI CIHAN2, BASAR KARACA2 and CUMHUR COKMUS3*
1 Biotechnology Institute, Ankara University, Besevler, Ankara, Turkey2 Faculty of Science, Biology Department, Ankara University, Tandogan, Ankara, Turkey
3 Konya Food and Agriculture University, Dede Korkut Mahallesi, Beyşehir, Meram, Konya, Turkey
Submitted 5 November 2015, revised 17 February 2016, accepted 19 February 2016
A b s t r a c t
Alkaline proteases have biotechnological importance due to their activity and stability at alkaline pH. 56 bacteria, capable of growing under alkaline conditions were isolated and their alkaline protease activities were carried out at different parameters to determine their optimum alkaline protease production conditions. Seven isolates were showed higher alkaline protease production capacity than the reference strains. The highest alkaline protease producing isolates (103125 U/g), E114 and C265, were identified as Bacillus licheniformis with 99.4% and Bacillus mojavensis 99.8% based on 16S rRNA gene sequence similarities, respectively. Interestingly, the isolates identified as Bacillus safensis were also found to be high alkaline protease producing strains. Genotypic characterizations of the isolates were also determined by using a wide range of molecular techniques (ARDRA, ITS-PCR, (GTG)5-PCR, BOX-PCR). These different techniques allowed us to differentiate the alkaliphilic isolates and the results were in concurrence with phylogenetic analyses of the 16S rRNA genes. While ITS-PCR provided the highest correlation with 16S rRNA groups, (GTG)5-PCR showed the highest differentiation at species and intra-species level. In this study, each of the biotechnologically valuable alkaline protease producing isolates was grouped into their taxonomic positions with multi-genotypic analyses.
K e y w o r d s: 16S rRNA gene sequence, alkaline protease, alkaliphilic Bacillus, ARDRA, ITS-PCR, rep-PCR
Tekin N. et al. 140
production and enzyme activity conditions by using dif-ferent growth parameters in order to cover the needs for determining different alkaliphilic and alkalotoler-ant bacterial strains. Thus, two different culture media having two different pH values were used for cultivation and the enzyme activity experiments were carried with a buffer having two different pH. In addition, we aimed to compare and combine the alkaline protease produc-tion capacities of the isolates with their phylogenetic data. In this context, besides 16S rRNA gene sequence similarities, amplified rDNA (Ribosomal DNA) restric-tion analysis (ARDRA), internal transcribed spacer (ITS)-PCR, (GTG)5 and BOX-PCR as a repetitive extra-genic palindromic (Rep-PCR) were applied as nucleic acid fingerprinting techniques to obtain detailed infor-mation about the taxonomic position of the isolates at the subspecies and strain level.
Experimental
Materials and Methods
Strains. In this study, water and soil samples were collected from different areas of Turkey. The isolates used in this study, their origins and their isolation sources are presented in Table I. In order to isolate new alkaliphilic bacilli having alkaline protease activities, samples were mostly collected from extreme environ-ments having alkaline and saline conditions or contain-ing sulfur and soda. For the bacterial isolation, the soil (0.2–0.4 g) and the water samples (0.5 ml) were inocu-lated in to Nutrient Broth (pH 9.0) and were cultivated at 37°C by shaking at 200 rpm for 48 h. The turbid cultures were diluted with sterile saline solution and transferred onto Skim Milk Agar plates, which include 0.1% glucose, 2% peptone, 0.5% yeast extract, 0.1% K2HPO4, 0.02% MgSO47H2O, 0.5% skim milk (steri-lized separately) (Denizci et al., 2004). After steriliza-tion, the pH of the medium was adjusted to 9.0 by add-ing 10% Na2CO3. The isolates, which gave a clear zone around the colonies due to the hydrolysis of skim milk were selected as an alkaline protease producing strains (Denizci et al., 2004; Tekin et al., 2012).
Following Bacillus strains were also used as ref-erence strains; Bacillus licheniformis DSM 13, Bacil-lus coagulans DSM 1T, Bacillus subtilis ATCC 6633T, Bacillus alcalophilus DSM 485T, Bacillus subtilis DSM 1971, Bacillus clausii DSM 8716T, Bacillus cohnii DSM 6307T, Bacillus horikoshii DSM 8719T, Bacillus gibsonii 8722T, Bacillus agaradhaerens DSM 8721T, Bacillus halo-durans DSM 497T and Bacillus pseudalcaliphilus DSM 8725T. The alkaline protease production capacities of all the isolates and reference strains were qualitatively screened on Skim Milk Agar medium.
Alkaline protease production and quantita-tive determination of enzyme activity. Two differ-ent medium was used for enzyme production. The first medium, which contains casein was prepared according to Gessesse and Gashe (1997) (0.5% Casein, 0.5% Peptone, 0.2% Yeast extract, 0.5% NaCl, 0.02% MgSO47H2O, 0.01% CaCl22H2O, 0.1% K2HPO4). The second medium, which contains starch, was prepared according to Denizci et al. (2004) (1.0% starch, 0.5% yeast extract, 0.1% K2HPO4 and 0.02% MgSO4.7H2O). The pH of the media was adjusted to pH 7.5 (for alkali-tolerant and facultative alkaliphiles) and 9.5 (for alkaliphiles and obligate alkaliphiles) and the incuba-tion was carried out for 48 h and 72 h. The extracel-lular alkaline proteases were obtained from the culture supernatant as described by Tekin et al. (2012) and the same procedures were applied for the determination of alkaline protease activity. All enzyme activity assays were carried out in triplicate (technical replica) from triplicate cultivations (biological replica) and the results were calculated as mean standard values. Analysis of variance with repeated measures was performed using the Software IBM SPSS Statistics (Version 22, USA). Enzymatic activity means and standard deviation were calculated. Univariate analysis of variance was employed on the data with nutritional supplements (casein or starch)-alkaline protease activity, pH-alkaline protease activity, incubation period-alkaline protease activity, and enzyme reaction buffers having different pH values-alkaline protease activity were tested for sig-nificance. Main effects and interaction were also tested for significance.
The parameters for alkaline protease production and activity were summarized at Fig. 1. While determining the alkaline protease production capacities of the iso-lates, the enzyme activity values per pellet-wet weight (U/g) were determined. The micro molar extinction value of tyrosine, used at enzyme activity formula, was determined by measuring the optic densities of differ-ent concentration of tyrosine dilutions at spectropho-tometry (660 nm). Tyrosine micro molar extinction value was calculated as 0.0011 µM/ml. One unit of alkaline protease activity was defined as the amount of the enzyme capable of producing 1 μg of tyrosine in 1 min under standard assay conditions.
Morphologic and physiologic characterization of the isolates. Actively growing cells on Nutrient Agar plates (pH 7.0 and 9.0) at 37°C were used for cell and colony morphology analyses. The formation of the spores (spore shape, position in vegetative cell and swell-ing property) and motility were tested by using 18–24 h Nutrient Broth cultures supplemented with 5 mg/l MnSO4 . 4H2O and observed on the phase-contrast microscope (Suzuki et al., 1976). Colony morpho logy of the isolates determined by using 18 h-old cultures
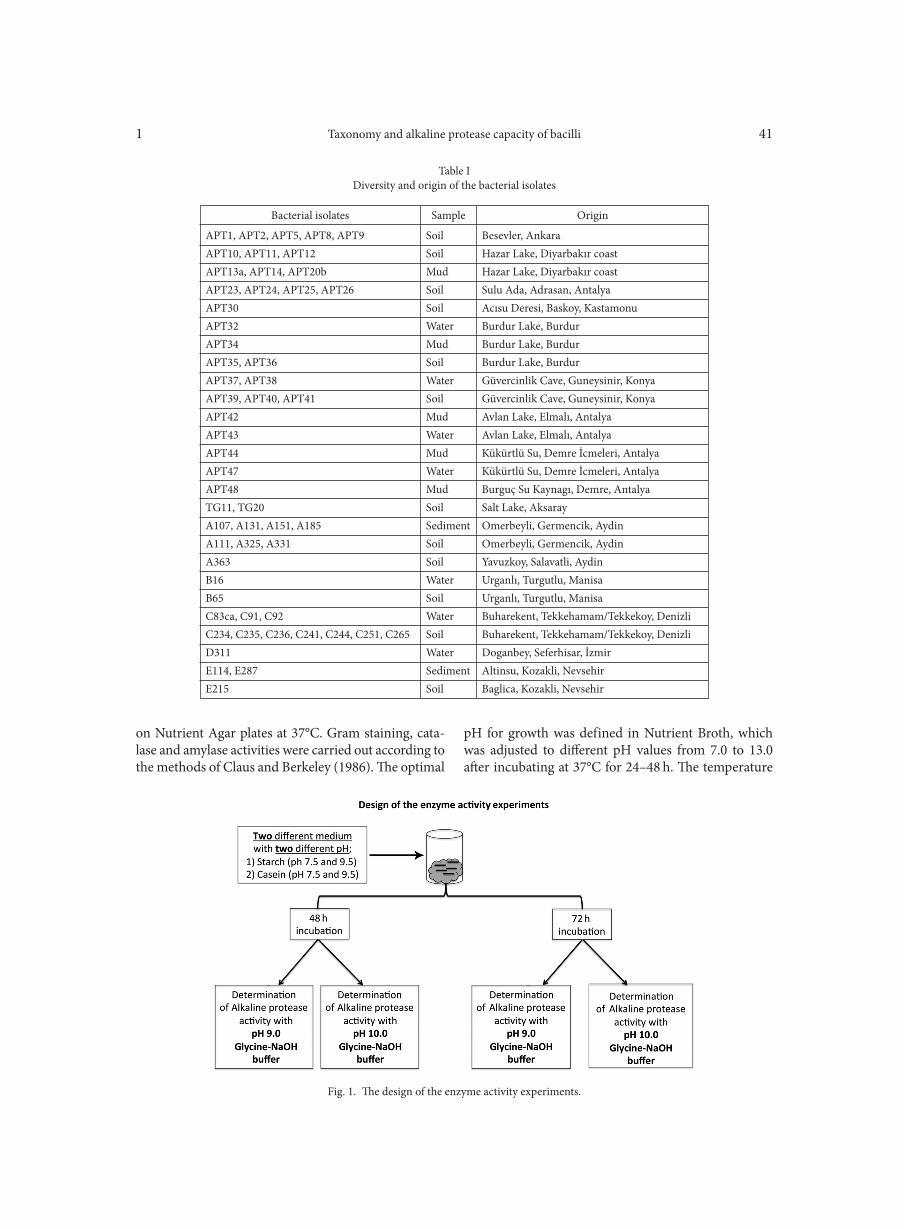
Taxonomy and alkaline protease capacity of bacilli1 41
on Nutrient Agar plates at 37°C. Gram staining, cata-lase and amylase activities were carried out according to the methods of Claus and Berkeley (1986). The optimal
pH for growth was defined in Nutrient Broth, which was adjusted to different pH values from 7.0 to 13.0 after incubating at 37°C for 24–48 h. The temperature
APT1, APT2, APT5, APT8, APT9 Soil Besevler, AnkaraAPT10, APT11, APT12 Soil Hazar Lake, Diyarbakır coastAPT13a, APT14, APT20b Mud Hazar Lake, Diyarbakır coastAPT23, APT24, APT25, APT26 Soil Sulu Ada, Adrasan, AntalyaAPT30 Soil Acısu Deresi, Baskoy, KastamonuAPT32 Water Burdur Lake, BurdurAPT34 Mud Burdur Lake, BurdurAPT35, APT36 Soil Burdur Lake, BurdurAPT37, APT38 Water Güvercinlik Cave, Guneysinir, KonyaAPT39, APT40, APT41 Soil Güvercinlik Cave, Guneysinir, KonyaAPT42 Mud Avlan Lake, Elmalı, AntalyaAPT43 Water Avlan Lake, Elmalı, AntalyaAPT44 Mud Kükürtlü Su, Demre İcmeleri, AntalyaAPT47 Water Kükürtlü Su, Demre İcmeleri, AntalyaAPT48 Mud Burguç Su Kaynagı, Demre, AntalyaTG11, TG20 Soil Salt Lake, AksarayA107, A131, A151, A185 Sediment Omerbeyli, Germencik, AydinA111, A325, A331 Soil Omerbeyli, Germencik, AydinA363 Soil Yavuzkoy, Salavatli, AydinB16 Water Urganlı, Turgutlu, ManisaB65 Soil Urganlı, Turgutlu, ManisaC83ca, C91, C92 Water Buharekent, Tekkehamam/Tekkekoy, DenizliC234, C235, C236, C241, C244, C251, C265 Soil Buharekent, Tekkehamam/Tekkekoy, DenizliD311 Water Doganbey, Seferhisar, İzmirE114, E287 Sediment Altinsu, Kozakli, NevsehirE215 Soil Baglica, Kozakli, Nevsehir
Table IDiversity and origin of the bacterial isolates
Bacterial isolates Sample Origin
Fig. 1. The design of the enzyme activity experiments.
Tekin N. et al. 142
requirements were tested in Nutrient Broth at pH 10.0 after 24–48 h incubation at different temperatures (5–70°C). The salinity (0–10% NaCl) tolerance for growth was tested in Nutrient Broth and after 24–48 h incubation at 37°C (Nielsen et al., 1995). The growth properties of the isolates were determined according to their optic density at 660 nm. All characterization assays were performed with monocultures in triplicates.
Amplification and sequencing of 16S rRNA gene. Genomic DNA extraction, 16S rRNA gene amplifica-tion, purification of the PCR products and sequenc-ing reactions were carried out as previously described (Tekin et al., 2012). In phylogenetic analyses, the evolu-tionary distances were computed using the Maximum Composite Likelihood method (Tamura et al., 2004) and the evolutionary history was derived using the Neighbor-Joining method (Saitou and Nei, 1987) with the bootstrap values based on 1000 replicates (Felsen-stein, 1985). The phylogenetic tree was constructed with the MEGA package version 4 (Tamura et al., 2007).
Amplified ribosomal DNA restriction analysis (ARDRA) of 16S rRNA gene. The same PCR ampli-cons that used for sequencing reactions were taken into ARDRA analysis of the 16S rRNA gene primed by 27F/1492R (Tekin et al., 2012). The PCR prod-ucts were digested with the restriction enzymes with Fast digest AluI, HaeIII and TaqI restriction enzymes (MBI Fermentas). ARDRA profiles were detected and statistically analyzed as previously described (Cihan et al., 2011). Finally, the individually examined all the ARDRA analyses were then taken into a cumulative cluster analysis which combined all these tests in a den-drogram by using the GelCompar II software pack-ages (Applied Maths, Belgium). In clustering analyses, according to the presence or absence of DNA bands and also to their densities, the similarity shade limits of 16.66, 33.33, 49.99, 66.66 and 83.3% values were used with GelCompar II software (Applied Maths, Belgium). In this context, the bacteria displaying lower similarities than 97% were denoted as having unique distinctive profiles; the ones having similarities between 97.0% and 100% were determined as sharing similar profiles and then were implied as displaying the same profiles.
PCR based fingerprinting analyses of Rep ele-ments and intergenic 16S-23S rRNA gene. Repetitive elements (Rep-PCR) genomic fingerprintings (BOXA1- and (GTG)5-PCR) and intergenic transcribed spacers (ITS) between 16S and 23S rRNA genes were performed according to Cihan (2013). Distinctive ITS-PCR, BOXA1 and (GTG)5-PCR fingerprintings were ana-lyzed by the GelCompar II software packages (Applied Maths, Belgium). Similarities of the digitized profiles were calculated using Dice correlation and an aver-age linkage (UPGMA) dendrogram was obtained. The individually examined all the ITS-, (GTG)5- and BOX-
PCR fingerprintings were then taken into a cumula-tive cluster analysis which combined all these tests in a dendrogram by using the GelCompar II software packages (Applied Maths, Belgium). This combined results containing dendrogram was presented in this paper, instead of showing all the three individual cluster analyses of these fingerprinting tests. In clustering anal-yses according to the presence or absence of DNA bands and also to their densities, the similarity shade limits of 16.66, 33.33, 49.99, 66.66 and 83.3% values were used in GelCompar II software. In this context, the bacteria displaying lower similarities than 83 % were denoted as having unique distinctive profiles, the ones having simi- larities between 83.3.0% and 99.9% were determined as showing similar profiles and the ones with 100% similarity were implied as displaying the same profiles.
For the all PCR based reactions, the DNA templates were analyzed spectrophotometrically on Nanodrop (NanoDrop 1000 Spectrophotometer V3.7, Thermo Fisher Scientific Inc, Wilmington, DE, USA). Then the concentrations of genomic DNA samples were diluted to 200 ng/µl as stock DNA. For the each PCR based experiment same amount of DNA was used from 200 ng/µl stocks to standardize the band density.
Results
Alkaline protease producing isolates. All of the 56 isolates determined as alkaline protease produ cers due to growing and producing proteolytic zone on skim milk agar plates at different pH values (7.0, 9.0 and 10.0) as reference Bacillus strains. Qualitative pro-teolytic activity was expressed as a diameter of clear zones in mm (data not shown).
Quantitative alkaline protease production. Enzyme activity values of the isolates and reference strains per pellet-wet weight (U/g) generally were differed between 353-103125 U/g. Isolates E114 and C265 were produced the highest amounts of alkaline protease (103125 U/g) when compared with the other isolates and reference strains. Besides these two isolates APT11, B65, APT43, C251 and C234 were also showed higher alkaline pro-tease production than the reference strains at the dif-ferent parameters which were summarized in Fig. 1. Alkaline protease production capacities of the seven highest enzyme producing strains and the reference strains were showed in graphs on Fig. 2. Prominently, it’s assessed that 70% of the bacteria showed high alka-line protease activity after 48 h incubation. In addi-tion, 76% of the isolates displayed high enzyme activ-ity after incubating at the casein containing medium. Also, 73% of the isolates were carried out the highest enzyme activity measurements at the Glycine-NaOH reaction buffer at pH 9.0. However, it’s revealed that
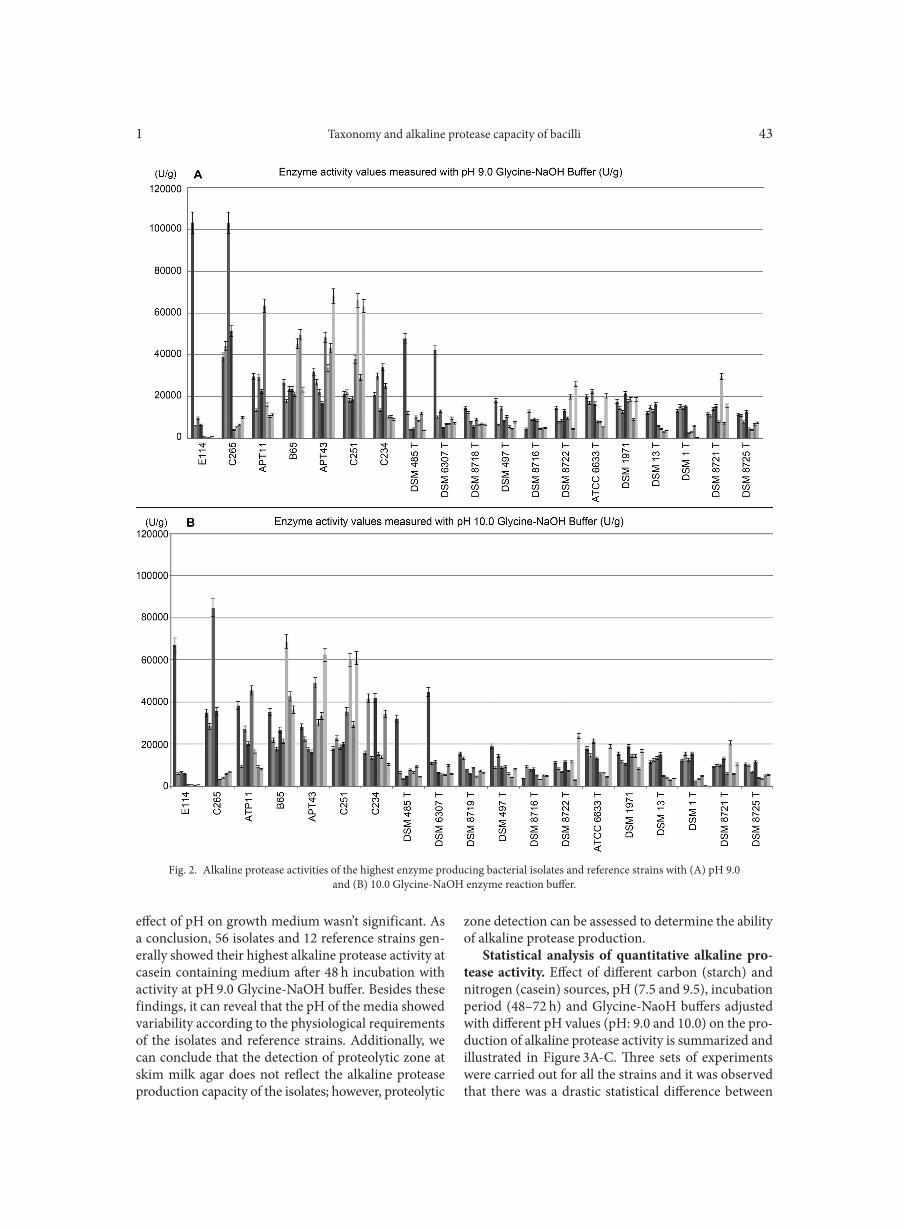
Taxonomy and alkaline protease capacity of bacilli1 43
effect of pH on growth medium wasn’t significant. As a conclusion, 56 isolates and 12 reference strains gen-erally showed their highest alkaline protease activity at casein containing medium after 48 h incubation with activity at pH 9.0 Glycine-NaOH buffer. Besides these findings, it can reveal that the pH of the media showed variability according to the physiological requirements of the isolates and reference strains. Additionally, we can conclude that the detection of proteolytic zone at skim milk agar does not reflect the alkaline protease production capacity of the isolates; however, proteolytic
zone detection can be assessed to determine the ability of alkaline protease production.
Statistical analysis of quantitative alkaline pro-tease activity. Effect of different carbon (starch) and nitrogen (casein) sources, pH (7.5 and 9.5), incubation period (48–72 h) and Glycine-NaoH buffers adjusted with different pH values (pH: 9.0 and 10.0) on the pro-duction of alkaline protease activity is summarized and illustrated in Figure 3A-C. Three sets of experiments were carried out for all the strains and it was observed that there was a drastic statistical difference between
Fig. 2. Alkaline protease activities of the highest enzyme producing bacterial isolates and reference strains with (A) pH 9.0and (B) 10.0 Glycine-NaOH enzyme reaction buffer.
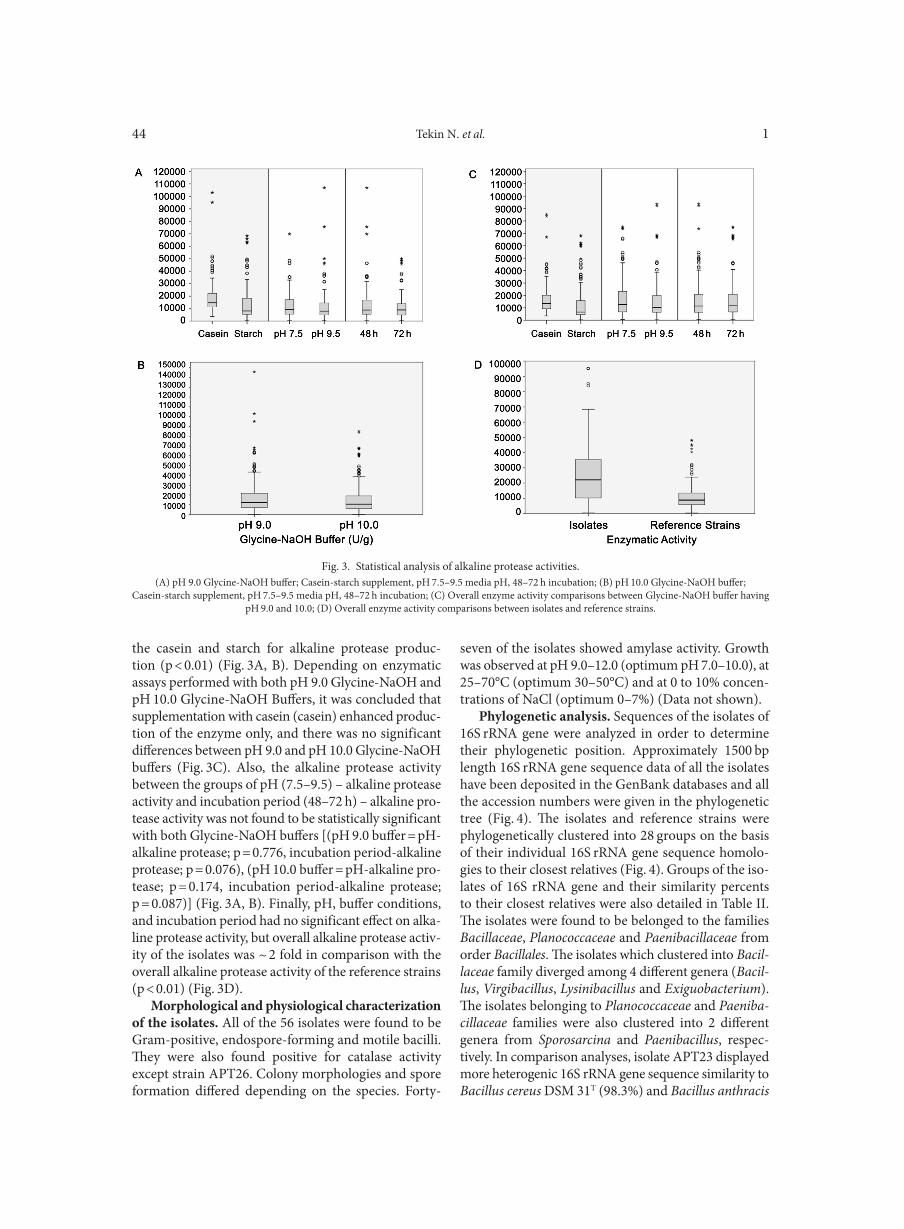
Tekin N. et al. 144
the casein and starch for alkaline protease produc-tion (p < 0.01) (Fig. 3A, B). Depending on enzymatic assays performed with both pH 9.0 Glycine-NaOH and pH 10.0 Glycine-NaOH Buffers, it was concluded that supplementation with casein (casein) enhanced produc-tion of the enzyme only, and there was no significant differences between pH 9.0 and pH 10.0 Glycine-NaOH buffers (Fig. 3C). Also, the alkaline protease activity between the groups of pH (7.5–9.5) – alkaline protease activity and incubation period (48–72 h) – alkaline pro-tease activity was not found to be statistically significant with both Glycine-NaOH buffers [(pH 9.0 buffer = pH-alkaline protease; p = 0.776, incubation period-alkaline protease; p = 0.076), (pH 10.0 buffer = pH-alkaline pro-tease; p = 0.174, incubation period-alkaline protease; p = 0.087)] (Fig. 3A, B). Finally, pH, buffer conditions, and incubation period had no significant effect on alka-line protease activity, but overall alkaline protease activ-ity of the isolates was ~ 2 fold in comparison with the overall alkaline protease activity of the reference strains (p < 0.01) (Fig. 3D).
Morphological and physiological characterization of the isolates. All of the 56 isolates were found to be Gram-positive, endospore-forming and motile bacilli. They were also found positive for catalase activity except strain APT26. Colony morphologies and spore formation differed depending on the species. Forty-
seven of the isolates showed amylase activity. Growth was observed at pH 9.0–12.0 (optimum pH 7.0–10.0), at 25–70°C (optimum 30–50°C) and at 0 to 10% concen-trations of NaCl (optimum 0–7%) (Data not shown).
Phylogenetic analysis. Sequences of the isolates of 16S rRNA gene were analyzed in order to determine their phylogenetic position. Approximately 1500 bp length 16S rRNA gene sequence data of all the isolates have been deposited in the GenBank databases and all the accession numbers were given in the phylogenetic tree (Fig. 4). The isolates and reference strains were phylogenetically clustered into 28 groups on the basis of their individual 16S rRNA gene sequence homolo-gies to their closest relatives (Fig. 4). Groups of the iso-lates of 16S rRNA gene and their similarity percents to their closest relatives were also detailed in Table II. The isolates were found to be belonged to the families Bacillaceae, Planococcaceae and Paenibacillaceae from order Bacillales. The isolates which clustered into Bacil-laceae family diverged among 4 different genera (Bacil-lus, Virgibacillus, Lysinibacillus and Exiguobacterium). The isolates belonging to Planococcaceae and Paeniba- cillaceae families were also clustered into 2 different genera from Sporosarcina and Paenibacillus, respec-tively. In comparison analyses, isolate APT23 displayed more heterogenic 16S rRNA gene sequence similarity to Bacillus cereus DSM 31T (98.3%) and Bacillus anthracis
Fig. 3. Statistical analysis of alkaline protease activities.(A) pH 9.0 Glycine-NaOH buffer; Casein-starch supplement, pH 7.5–9.5 media pH, 48–72 h incubation; (B) pH 10.0 Glycine-NaOH buffer;
Casein-starch supplement, pH 7.5–9.5 media pH, 48–72 h incubation; (C) Overall enzyme activity comparisons between Glycine-NaOH buffer having pH 9.0 and 10.0; (D) Overall enzyme activity comparisons between isolates and reference strains.
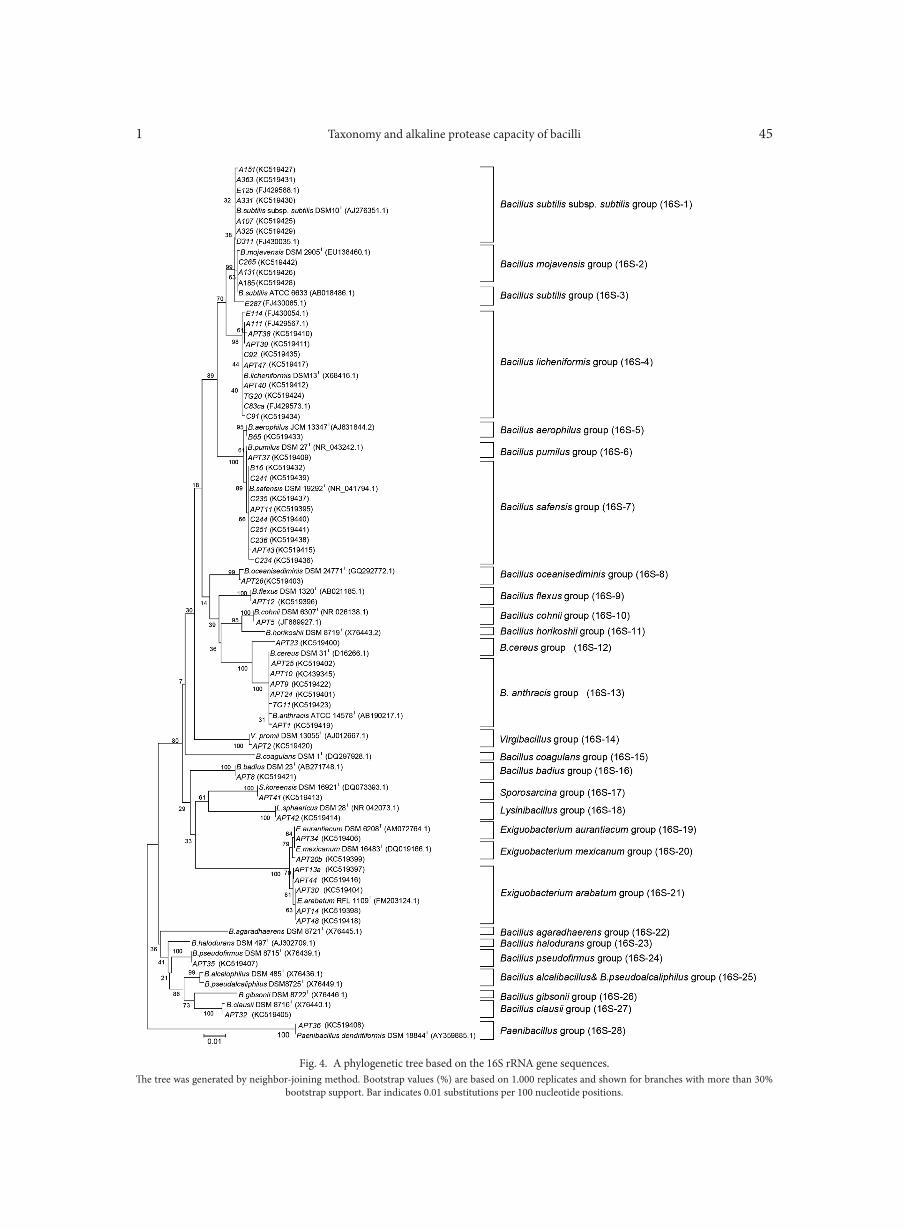
Taxonomy and alkaline protease capacity of bacilli1 45
Fig. 4. A phylogenetic tree based on the 16S rRNA gene sequences.The tree was generated by neighbor-joining method. Bootstrap values (%) are based on 1.000 replicates and shown for branches with more than 30%
bootstrap support. Bar indicates 0.01 substitutions per 100 nucleotide positions.
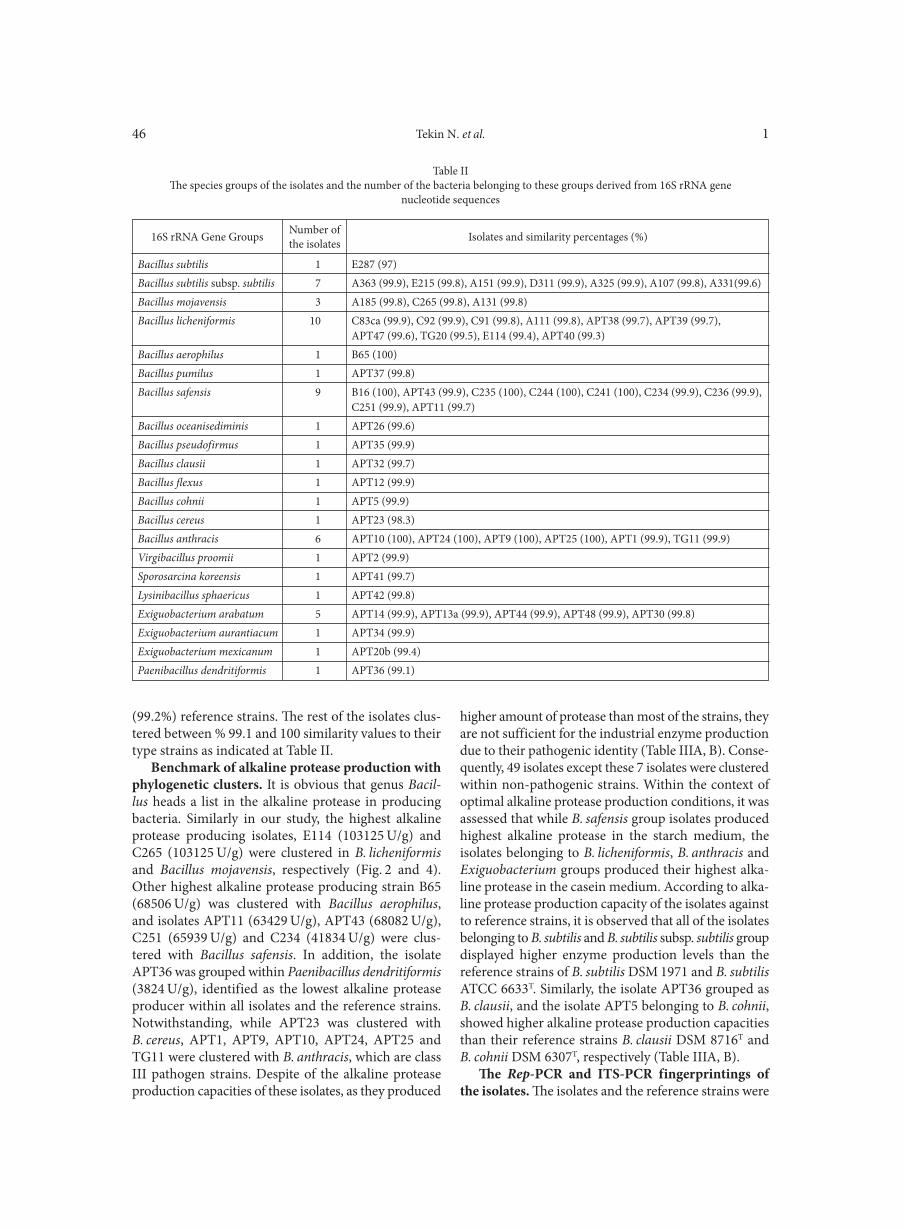
Tekin N. et al. 146
(99.2%) reference strains. The rest of the isolates clus-tered between % 99.1 and 100 similarity values to their type strains as indicated at Table II.
Benchmark of alkaline protease production with phylogenetic clusters. It is obvious that genus Bacil-lus heads a list in the alkaline protease in producing bacteria. Similarly in our study, the highest alkaline protease producing isolates, E114 (103125 U/g) and C265 (103125 U/g) were clustered in B. licheniformis and Bacillus mojavensis, respectively (Fig. 2 and 4). Other highest alkaline protease producing strain B65 (68506 U/g) was clustered with Bacillus aerophilus, and isolates APT11 (63429 U/g), APT43 (68082 U/g), C251 (65939 U/g) and C234 (41834 U/g) were clus-tered with Bacillus safensis. In addition, the isolate APT36 was grouped within Paenibacillus dendritiformis (3824 U/g), identified as the lowest alkaline protease producer within all isolates and the reference strains. Notwithstanding, while APT23 was clustered with B. cereus, APT1, APT9, APT10, APT24, APT25 and TG11 were clustered with B. anthracis, which are class III pathogen strains. Despite of the alkaline protease production capacities of these isolates, as they produced
higher amount of protease than most of the strains, they are not sufficient for the industrial enzyme production due to their pathogenic identity (Table IIIA, B). Conse-quently, 49 isolates except these 7 isolates were clustered within non-pathogenic strains. Within the context of optimal alkaline protease production conditions, it was assessed that while B. safensis group isolates produced highest alkaline protease in the starch medium, the isolates belonging to B. licheniformis, B. anthracis and Exiguobacterium groups produced their highest alka-line protease in the casein medium. According to alka-line protease production capacity of the isolates against to reference strains, it is observed that all of the isolates belonging to B. subtilis and B. subtilis subsp. subtilis group displayed higher enzyme production levels than the reference strains of B. subtilis DSM 1971 and B. subtilis ATCC 6633T. Similarly, the isolate APT36 grouped as B. clausii, and the isolate APT5 belonging to B. cohnii, showed higher alkaline protease production capacities than their reference strains B. clausii DSM 8716T and B. cohnii DSM 6307T, respectively (Table IIIA, B).
The Rep-PCR and ITS-PCR fingerprintings of the isolates. The isolates and the reference strains were
Bacillus subtilis 1 E287 (97)Bacillus subtilis subsp. subtilis 7 A363 (99.9), E215 (99.8), A151 (99.9), D311 (99.9), A325 (99.9), A107 (99.8), A331(99.6)Bacillus mojavensis 3 A185 (99.8), C265 (99.8), A131 (99.8)Bacillus licheniformis 10 C83ca (99.9), C92 (99.9), C91 (99.8), A111 (99.8), APT38 (99.7), APT39 (99.7), APT47 (99.6), TG20 (99.5), E114 (99.4), APT40 (99.3)Bacillus aerophilus 1 B65 (100)Bacillus pumilus 1 APT37 (99.8)Bacillus safensis 9 B16 (100), APT43 (99.9), C235 (100), C244 (100), C241 (100), C234 (99.9), C236 (99.9), C251 (99.9), APT11 (99.7)Bacillus oceanisediminis 1 APT26 (99.6)Bacillus pseudofirmus 1 APT35 (99.9)Bacillus clausii 1 APT32 (99.7)Bacillus flexus 1 APT12 (99.9)Bacillus cohnii 1 APT5 (99.9)Bacillus cereus 1 APT23 (98.3)Bacillus anthracis 6 APT10 (100), APT24 (100), APT9 (100), APT25 (100), APT1 (99.9), TG11 (99.9)Virgibacillus proomii 1 APT2 (99.9)Sporosarcina koreensis 1 APT41 (99.7)Lysinibacillus sphaericus 1 APT42 (99.8)Exiguobacterium arabatum 5 APT14 (99.9), APT13a (99.9), APT44 (99.9), APT48 (99.9), APT30 (99.8)Exiguobacterium aurantiacum 1 APT34 (99.9)Exiguobacterium mexicanum 1 APT20b (99.4)Paenibacillus dendritiformis 1 APT36 (99.1)
Table IIThe species groups of the isolates and the number of the bacteria belonging to these groups derived from 16S rRNA gene
nucleotide sequences
16S rRNA Gene Groups Number ofthe isolates Isolates and similarity percentages (%)
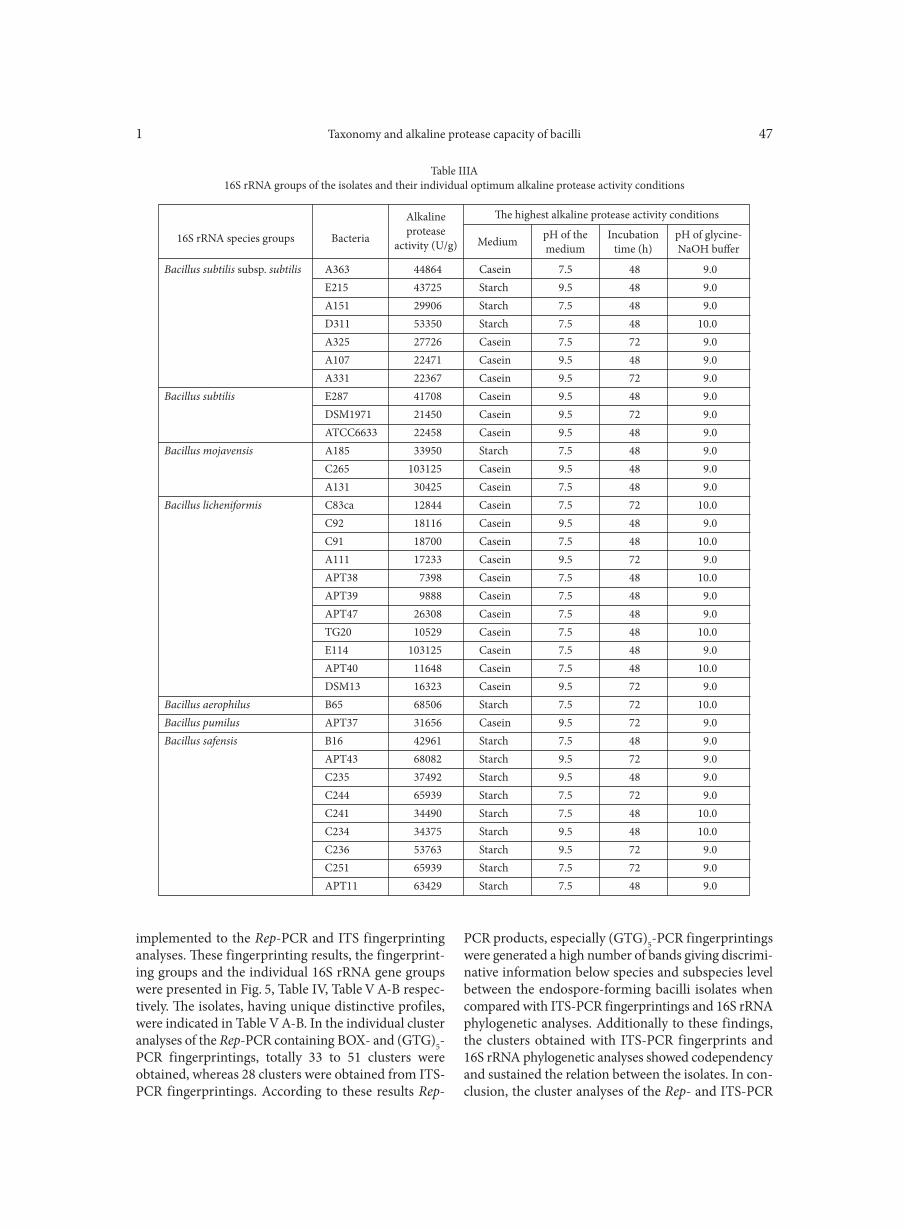
Taxonomy and alkaline protease capacity of bacilli1 47
implemented to the Rep-PCR and ITS fingerprinting analyses. These fingerprinting results, the fingerprint-ing groups and the individual 16S rRNA gene groups were presented in Fig. 5, Table IV, Table V A-B respec-tively. The isolates, having unique distinctive profiles, were indicated in Table V A-B. In the individual cluster analyses of the Rep-PCR containing BOX- and (GTG)5-PCR fingerprintings, totally 33 to 51 clusters were obtained, whereas 28 clusters were obtained from ITS-PCR fingerprintings. According to these results Rep-
PCR products, especially (GTG)5-PCR fingerprintings were generated a high number of bands giving discrimi-native information below species and subspecies level between the endospore-forming bacilli isolates when compared with ITS-PCR fingerprintings and 16S rRNA phylogenetic analyses. Additionally to these findings, the clusters obtained with ITS-PCR fingerprints and 16S rRNA phylogenetic analyses showed codependency and sustained the relation between the isolates. In con-clusion, the cluster analyses of the Rep- and ITS-PCR
Bacillus subtilis subsp. subtilis A363 44864 Casein 7.5 48 9.0 E215 43725 Starch 9.5 48 9.0 A151 29906 Starch 7.5 48 9.0 D311 53350 Starch 7.5 48 10.0 A325 27726 Casein 7.5 72 9.0 A107 22471 Casein 9.5 48 9.0 A331 22367 Casein 9.5 72 9.0Bacillus subtilis E287 41708 Casein 9.5 48 9.0 DSM1971 21450 Casein 9.5 72 9.0 ATCC6633 22458 Casein 9.5 48 9.0Bacillus mojavensis A185 33950 Starch 7.5 48 9.0 C265 103125 Casein 9.5 48 9.0 A131 30425 Casein 7.5 48 9.0Bacillus licheniformis C83ca 12844 Casein 7.5 72 10.0 C92 18116 Casein 9.5 48 9.0 C91 18700 Casein 7.5 48 10.0 A111 17233 Casein 9.5 72 9.0 APT38 7398 Casein 7.5 48 10.0 APT39 9888 Casein 7.5 48 9.0 APT47 26308 Casein 7.5 48 9.0 TG20 10529 Casein 7.5 48 10.0 E114 103125 Casein 7.5 48 9.0 APT40 11648 Casein 7.5 48 10.0 DSM13 16323 Casein 9.5 72 9.0Bacillus aerophilus B65 68506 Starch 7.5 72 10.0Bacillus pumilus APT37 31656 Casein 9.5 72 9.0Bacillus safensis B16 42961 Starch 7.5 48 9.0 APT43 68082 Starch 9.5 72 9.0 C235 37492 Starch 9.5 48 9.0 C244 65939 Starch 7.5 72 9.0 C241 34490 Starch 7.5 48 10.0 C234 34375 Starch 9.5 48 10.0 C236 53763 Starch 9.5 72 9.0 C251 65939 Starch 7.5 72 9.0 APT11 63429 Starch 7.5 48 9.0
Table IIIA16S rRNA groups of the isolates and their individual optimum alkaline protease activity conditions
16S rRNA species groups Bacteria
Alkalineprotease
activity (U/g)
The highest alkaline protease activity conditions
Medium pH of themedium
Incubationtime (h)
pH of glycine-NaOH buffer
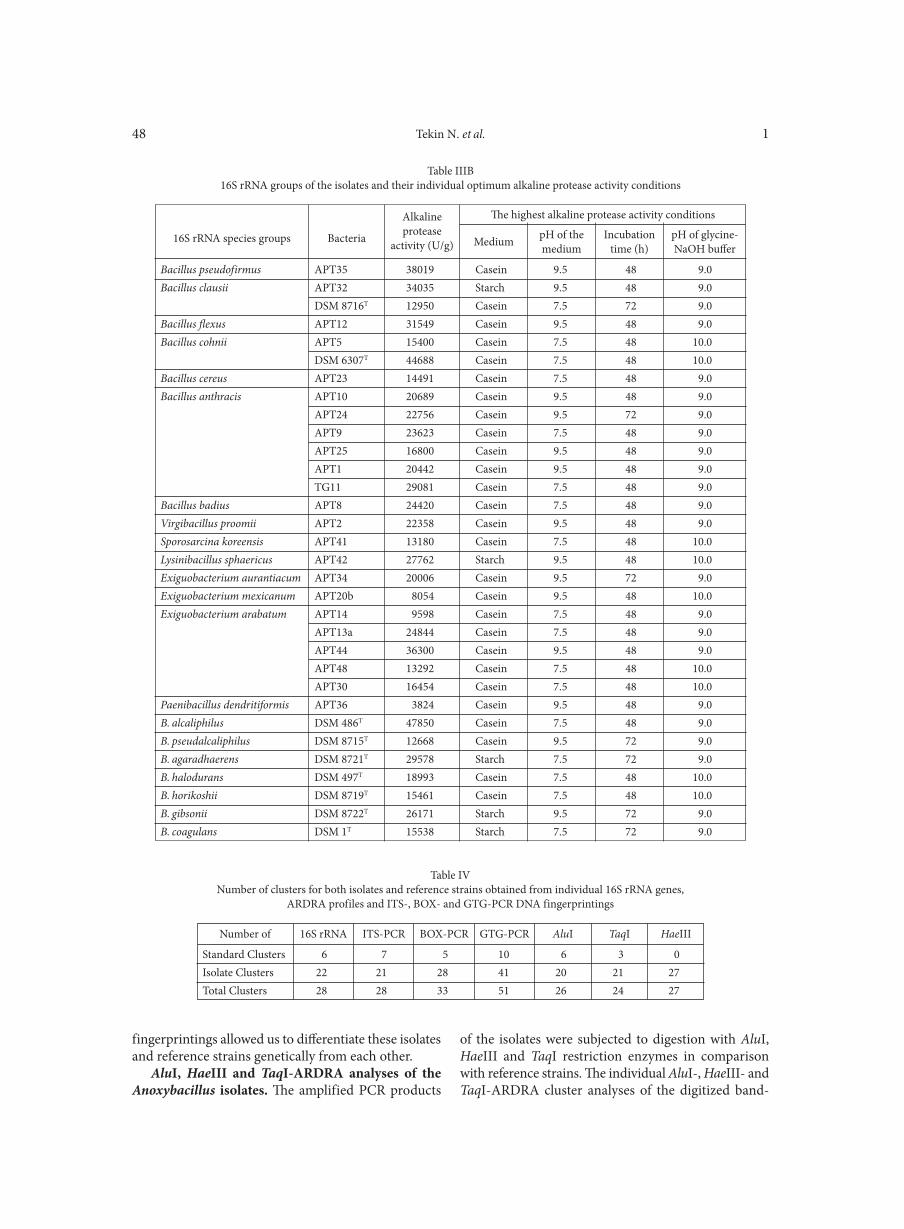
Tekin N. et al. 148
Table IIIB16S rRNA groups of the isolates and their individual optimum alkaline protease activity conditions
16S rRNA species groups Bacteria
Alkalineprotease
activity (U/g)
The highest alkaline protease activity conditions
Medium pH of themedium
Incubationtime (h)
pH of glycine-NaOH buffer
Bacillus pseudofirmus APT35 38019 Casein 9.5 48 9.0Bacillus clausii APT32 34035 Starch 9.5 48 9.0 DSM 8716T 12950 Casein 7.5 72 9.0Bacillus flexus APT12 31549 Casein 9.5 48 9.0Bacillus cohnii APT5 15400 Casein 7.5 48 10.0 DSM 6307T 44688 Casein 7.5 48 10.0Bacillus cereus APT23 14491 Casein 7.5 48 9.0Bacillus anthracis APT10 20689 Casein 9.5 48 9.0 APT24 22756 Casein 9.5 72 9.0 APT9 23623 Casein 7.5 48 9.0 APT25 16800 Casein 9.5 48 9.0 APT1 20442 Casein 9.5 48 9.0 TG11 29081 Casein 7.5 48 9.0Bacillus badius APT8 24420 Casein 7.5 48 9.0Virgibacillus proomii APT2 22358 Casein 9.5 48 9.0Sporosarcina koreensis APT41 13180 Casein 7.5 48 10.0Lysinibacillus sphaericus APT42 27762 Starch 9.5 48 10.0Exiguobacterium aurantiacum APT34 20006 Casein 9.5 72 9.0Exiguobacterium mexicanum APT20b 8054 Casein 9.5 48 10.0Exiguobacterium arabatum APT14 9598 Casein 7.5 48 9.0 APT13a 24844 Casein 7.5 48 9.0 APT44 36300 Casein 9.5 48 9.0 APT48 13292 Casein 7.5 48 10.0 APT30 16454 Casein 7.5 48 10.0Paenibacillus dendritiformis APT36 3824 Casein 9.5 48 9.0B. alcaliphilus DSM 486T 47850 Casein 7.5 48 9.0B. pseudalcaliphilus DSM 8715T 12668 Casein 9.5 72 9.0B. agaradhaerens DSM 8721T 29578 Starch 7.5 72 9.0B. halodurans DSM 497T 18993 Casein 7.5 48 10.0B. horikoshii DSM 8719T 15461 Casein 7.5 48 10.0B. gibsonii DSM 8722T 26171 Starch 9.5 72 9.0B. coagulans DSM 1T 15538 Starch 7.5 72 9.0
Standard Clusters 6 7 5 10 6 3 0Isolate Clusters 22 21 28 41 20 21 27Total Clusters 28 28 33 51 26 24 27
Table IVNumber of clusters for both isolates and reference strains obtained from individual 16S rRNA genes,
ARDRA profiles and ITS-, BOX- and GTG-PCR DNA fingerprintings
Number of 16S rRNA ITS-PCR BOX-PCR GTG-PCR AluI TaqI HaeIII
fingerprintings allowed us to differentiate these isolates and reference strains genetically from each other.
AluI, HaeIII and TaqI-ARDRA analyses of the Anoxybacillus isolates. The amplified PCR products
of the isolates were subjected to digestion with AluI, HaeIII and TaqI restriction enzymes in comparison with reference strains. The individual AluI-, HaeIII- and TaqI-ARDRA cluster analyses of the digitized band-
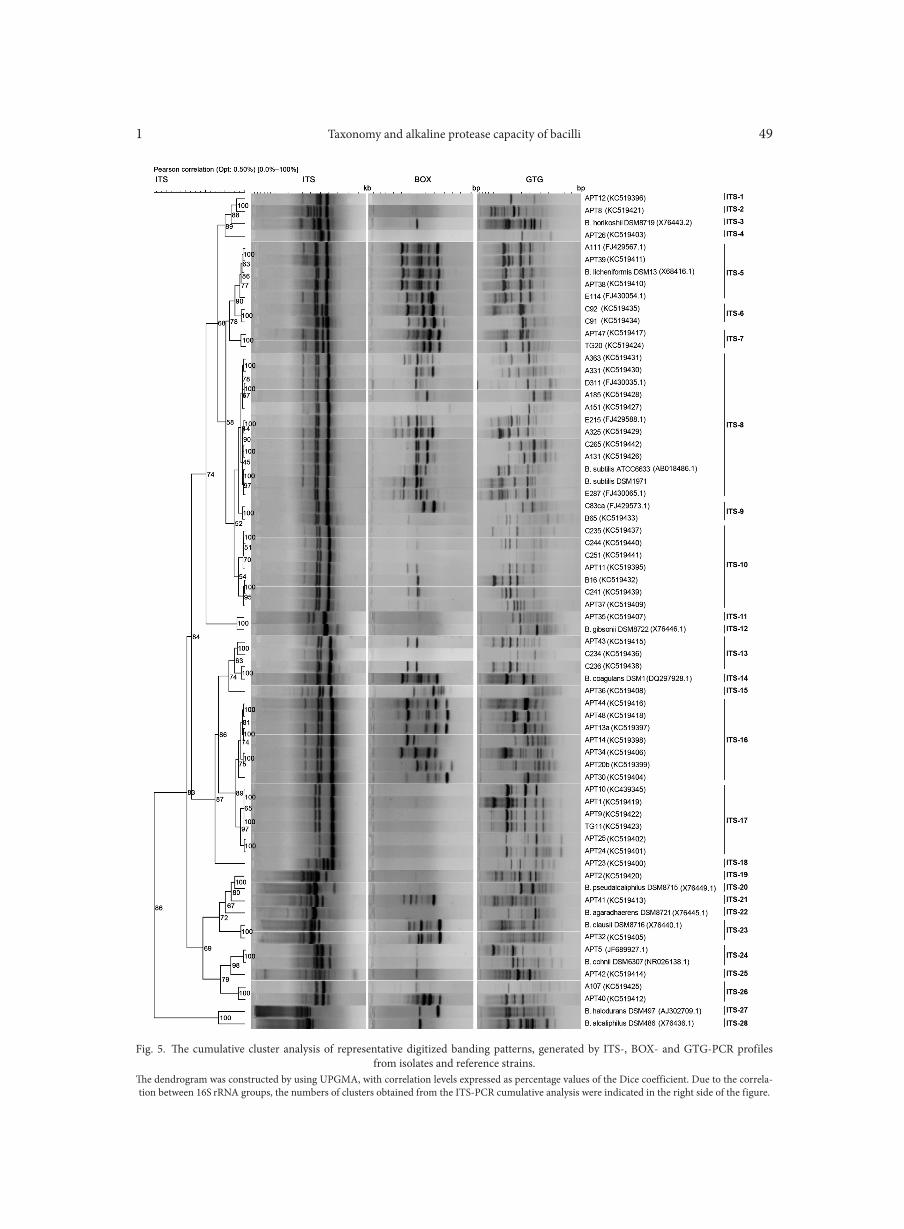
Taxonomy and alkaline protease capacity of bacilli1 49
Fig. 5. The cumulative cluster analysis of representative digitized banding patterns, generated by ITS-, BOX- and GTG-PCR profiles from isolates and reference strains.
The dendrogram was constructed by using UPGMA, with correlation levels expressed as percentage values of the Dice coefficient. Due to the correla-tion between 16S rRNA groups, the numbers of clusters obtained from the ITS-PCR cumulative analysis were indicated in the right side of the figure.
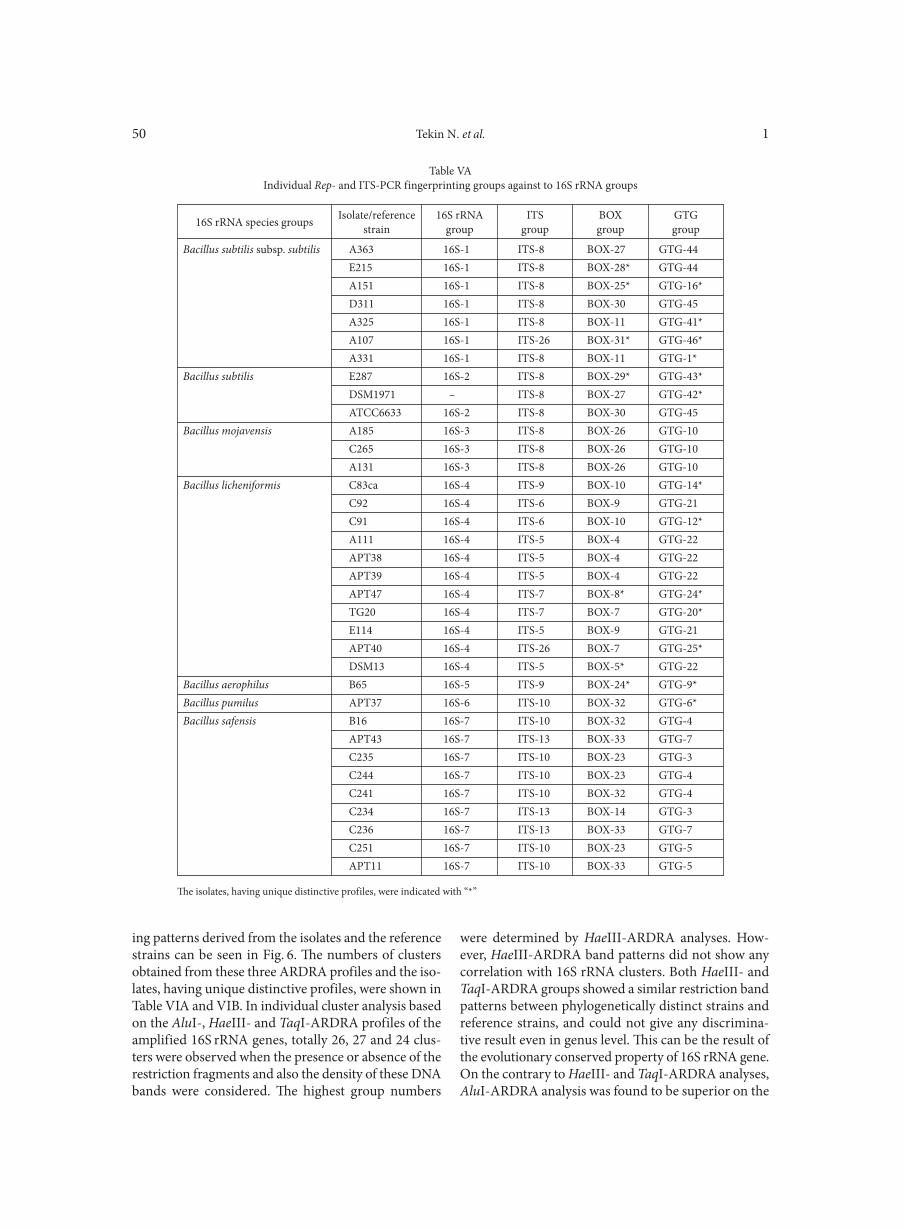
Tekin N. et al. 150
ing patterns derived from the isolates and the reference strains can be seen in Fig. 6. The numbers of clusters obtained from these three ARDRA profiles and the iso-lates, having unique distinctive profiles, were shown in Table VIA and VIB. In individual cluster analysis based on the AluI-, HaeIII- and TaqI-ARDRA profiles of the amplified 16S rRNA genes, totally 26, 27 and 24 clus-ters were observed when the presence or absence of the restriction fragments and also the density of these DNA bands were considered. The highest group numbers
were determined by HaeIII-ARDRA analyses. How-ever, HaeIII-ARDRA band patterns did not show any correlation with 16S rRNA clusters. Both HaeIII- and TaqI-ARDRA groups showed a similar restriction band patterns between phylogenetically distinct strains and reference strains, and could not give any discrimina-tive result even in genus level. This can be the result of the evolutionary conserved property of 16S rRNA gene. On the contrary to HaeIII- and TaqI-ARDRA analyses, AluI-ARDRA analysis was found to be superior on the
Bacillus subtilis subsp. subtilis A363 16S-1 ITS-8 BOX-27 GTG-44 E215 16S-1 ITS-8 BOX-28* GTG-44 A151 16S-1 ITS-8 BOX-25* GTG-16* D311 16S-1 ITS-8 BOX-30 GTG-45 A325 16S-1 ITS-8 BOX-11 GTG-41* A107 16S-1 ITS-26 BOX-31* GTG-46* A331 16S-1 ITS-8 BOX-11 GTG-1*Bacillus subtilis E287 16S-2 ITS-8 BOX-29* GTG-43* DSM1971 – ITS-8 BOX-27 GTG-42* ATCC6633 16S-2 ITS-8 BOX-30 GTG-45Bacillus mojavensis A185 16S-3 ITS-8 BOX-26 GTG-10 C265 16S-3 ITS-8 BOX-26 GTG-10 A131 16S-3 ITS-8 BOX-26 GTG-10Bacillus licheniformis C83ca 16S-4 ITS-9 BOX-10 GTG-14* C92 16S-4 ITS-6 BOX-9 GTG-21 C91 16S-4 ITS-6 BOX-10 GTG-12* A111 16S-4 ITS-5 BOX-4 GTG-22 APT38 16S-4 ITS-5 BOX-4 GTG-22 APT39 16S-4 ITS-5 BOX-4 GTG-22 APT47 16S-4 ITS-7 BOX-8* GTG-24* TG20 16S-4 ITS-7 BOX-7 GTG-20* E114 16S-4 ITS-5 BOX-9 GTG-21 APT40 16S-4 ITS-26 BOX-7 GTG-25* DSM13 16S-4 ITS-5 BOX-5* GTG-22Bacillus aerophilus B65 16S-5 ITS-9 BOX-24* GTG-9*Bacillus pumilus APT37 16S-6 ITS-10 BOX-32 GTG-6*Bacillus safensis B16 16S-7 ITS-10 BOX-32 GTG-4 APT43 16S-7 ITS-13 BOX-33 GTG-7 C235 16S-7 ITS-10 BOX-23 GTG-3 C244 16S-7 ITS-10 BOX-23 GTG-4 C241 16S-7 ITS-10 BOX-32 GTG-4 C234 16S-7 ITS-13 BOX-14 GTG-3 C236 16S-7 ITS-13 BOX-33 GTG-7 C251 16S-7 ITS-10 BOX-23 GTG-5 APT11 16S-7 ITS-10 BOX-33 GTG-5
Table VAIndividual Rep- and ITS-PCR fingerprinting groups against to 16S rRNA groups
The isolates, having unique distinctive profiles, were indicated with “*”
16S rRNA species groups Isolate/referencestrain
16S rRNAgroup
ITSgroup
BOXgroup
GTGgroup
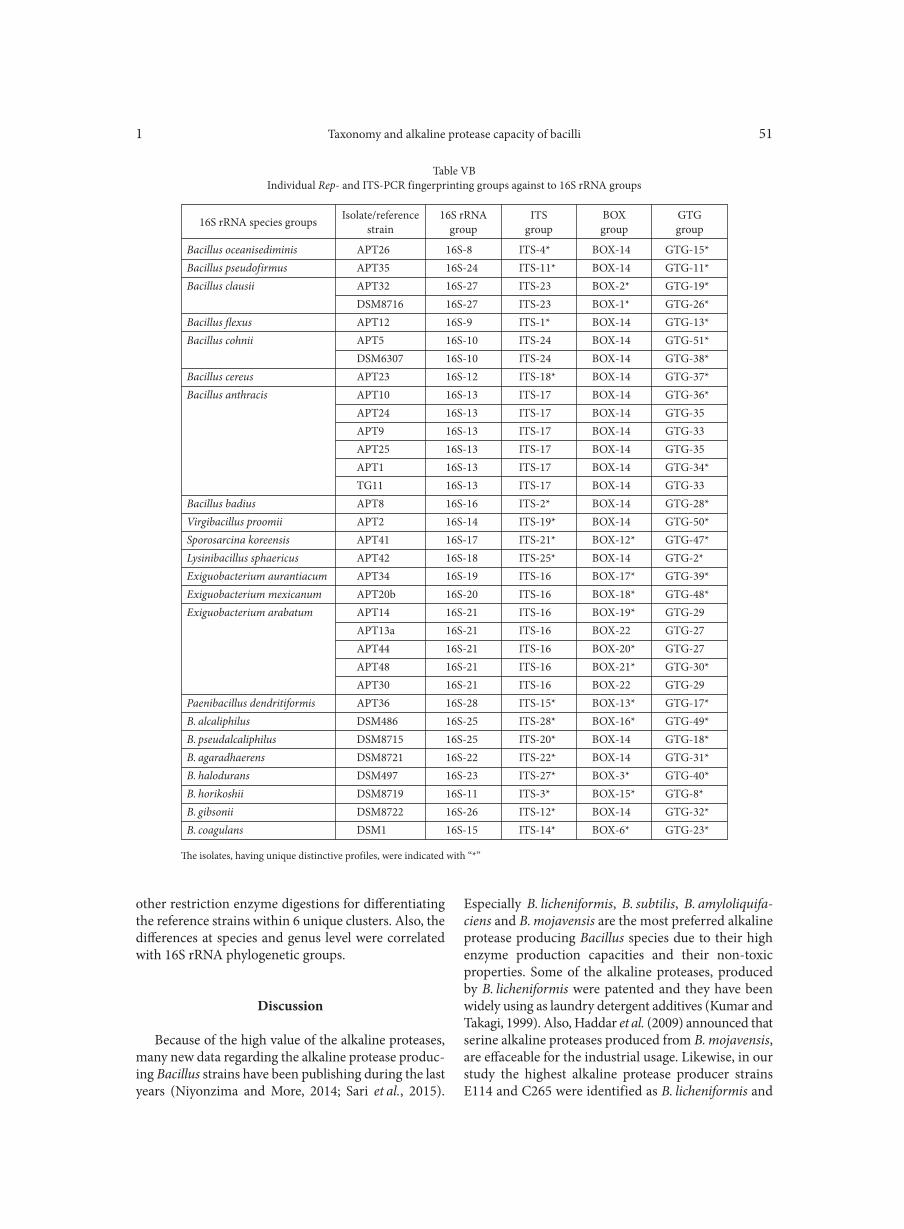
Taxonomy and alkaline protease capacity of bacilli1 51
other restriction enzyme digestions for differentiating the reference strains within 6 unique clusters. Also, the differences at species and genus level were correlated with 16S rRNA phylogenetic groups.
Discussion
Because of the high value of the alkaline proteases, many new data regarding the alkaline protease produc-ing Bacillus strains have been publishing during the last years (Niyonzima and More, 2014; Sari et al., 2015).
Especially B. licheniformis, B. subtilis, B. amyloliquifa-ciens and B. mojavensis are the most preferred alkaline protease producing Bacillus species due to their high enzyme production capacities and their non-toxic properties. Some of the alkaline proteases, produced by B. licheniformis were patented and they have been widely using as laundry detergent additives (Kumar and Takagi, 1999). Also, Haddar et al. (2009) announced that serine alkaline proteases produced from B. mojavensis, are effaceable for the industrial usage. Likewise, in our study the highest alkaline protease producer strains E114 and C265 were identified as B. licheniformis and
Table VBIndividual Rep- and ITS-PCR fingerprinting groups against to 16S rRNA groups
The isolates, having unique distinctive profiles, were indicated with “*”
16S rRNA species groups Isolate/referencestrain
16S rRNAgroup
ITSgroup
BOXgroup
GTGgroup
Bacillus oceanisediminis APT26 16S-8 ITS-4* BOX-14 GTG-15*Bacillus pseudofirmus APT35 16S-24 ITS-11* BOX-14 GTG-11*Bacillus clausii APT32 16S-27 ITS-23 BOX-2* GTG-19* DSM8716 16S-27 ITS-23 BOX-1* GTG-26*Bacillus flexus APT12 16S-9 ITS-1* BOX-14 GTG-13*Bacillus cohnii APT5 16S-10 ITS-24 BOX-14 GTG-51* DSM6307 16S-10 ITS-24 BOX-14 GTG-38*Bacillus cereus APT23 16S-12 ITS-18* BOX-14 GTG-37*Bacillus anthracis APT10 16S-13 ITS-17 BOX-14 GTG-36* APT24 16S-13 ITS-17 BOX-14 GTG-35 APT9 16S-13 ITS-17 BOX-14 GTG-33 APT25 16S-13 ITS-17 BOX-14 GTG-35 APT1 16S-13 ITS-17 BOX-14 GTG-34* TG11 16S-13 ITS-17 BOX-14 GTG-33Bacillus badius APT8 16S-16 ITS-2* BOX-14 GTG-28*Virgibacillus proomii APT2 16S-14 ITS-19* BOX-14 GTG-50*Sporosarcina koreensis APT41 16S-17 ITS-21* BOX-12* GTG-47*Lysinibacillus sphaericus APT42 16S-18 ITS-25* BOX-14 GTG-2*Exiguobacterium aurantiacum APT34 16S-19 ITS-16 BOX-17* GTG-39*Exiguobacterium mexicanum APT20b 16S-20 ITS-16 BOX-18* GTG-48*Exiguobacterium arabatum APT14 16S-21 ITS-16 BOX-19* GTG-29 APT13a 16S-21 ITS-16 BOX-22 GTG-27 APT44 16S-21 ITS-16 BOX-20* GTG-27 APT48 16S-21 ITS-16 BOX-21* GTG-30* APT30 16S-21 ITS-16 BOX-22 GTG-29Paenibacillus dendritiformis APT36 16S-28 ITS-15* BOX-13* GTG-17*B. alcaliphilus DSM486 16S-25 ITS-28* BOX-16* GTG-49*B. pseudalcaliphilus DSM8715 16S-25 ITS-20* BOX-14 GTG-18*B. agaradhaerens DSM8721 16S-22 ITS-22* BOX-14 GTG-31*B. halodurans DSM497 16S-23 ITS-27* BOX-3* GTG-40*B. horikoshii DSM8719 16S-11 ITS-3* BOX-15* GTG-8*B. gibsonii DSM8722 16S-26 ITS-12* BOX-14 GTG-32*B. coagulans DSM1 16S-15 ITS-14* BOX-6* GTG-23*
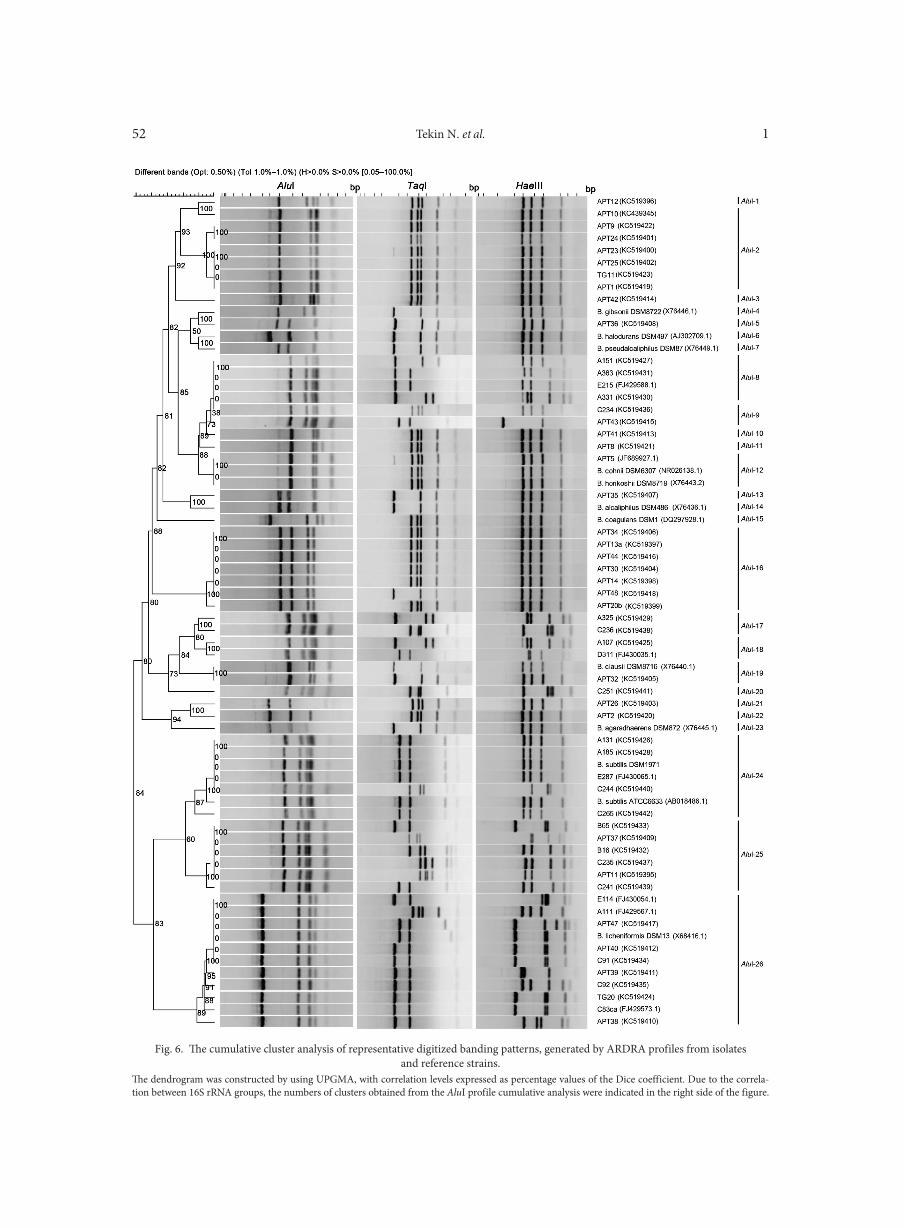
Tekin N. et al. 152
Fig. 6. The cumulative cluster analysis of representative digitized banding patterns, generated by ARDRA profiles from isolatesand reference strains.
The dendrogram was constructed by using UPGMA, with correlation levels expressed as percentage values of the Dice coefficient. Due to the correla-tion between 16S rRNA groups, the numbers of clusters obtained from the AluI profile cumulative analysis were indicated in the right side of the figure.
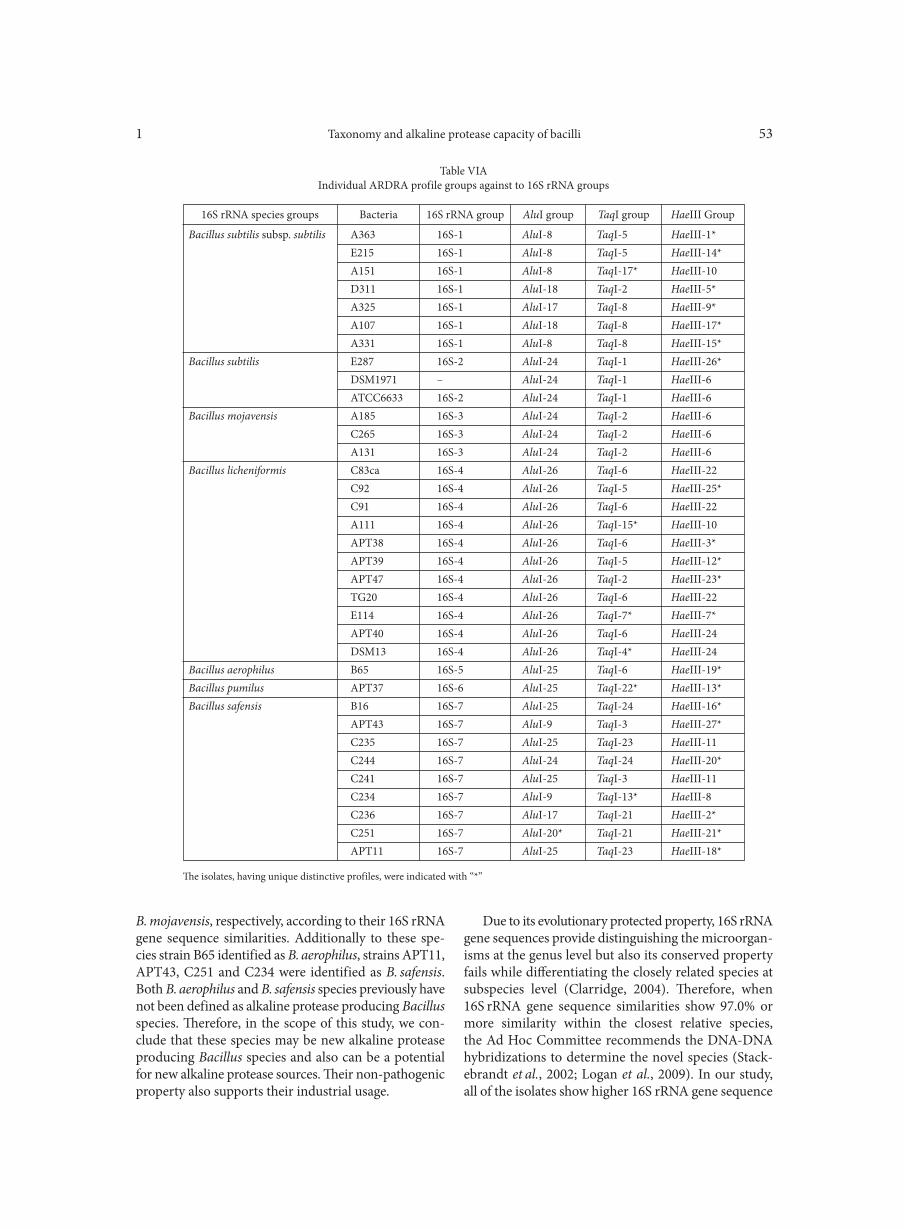
Taxonomy and alkaline protease capacity of bacilli1 53
B. mojavensis, respectively, according to their 16S rRNA gene sequence similarities. Additionally to these spe-cies strain B65 identified as B. aerophilus, strains APT11, APT43, C251 and C234 were identified as B. safensis. Both B. aerophilus and B. safensis species previously have not been defined as alkaline protease producing Bacillus species. Therefore, in the scope of this study, we con-clude that these species may be new alkaline protease producing Bacillus species and also can be a potential for new alkaline protease sources. Their non-pathogenic property also supports their industrial usage.
Due to its evolutionary protected property, 16S rRNA gene sequences provide distinguishing the microorgan-isms at the genus level but also its conserved property fails while differentiating the closely related species at subspecies level (Clarridge, 2004). Therefore, when 16S rRNA gene sequence similarities show 97.0% or more similarity within the closest relative species, the Ad Hoc Committee recommends the DNA-DNA hybridizations to determine the novel species (Stack-ebrandt et al., 2002; Logan et al., 2009). In our study, all of the isolates show higher 16S rRNA gene sequence
Bacillus subtilis subsp. subtilis A363 16S-1 AluI-8 TaqI-5 HaeIII-1* E215 16S-1 AluI-8 TaqI-5 HaeIII-14* A151 16S-1 AluI-8 TaqI-17* HaeIII-10 D311 16S-1 AluI-18 TaqI-2 HaeIII-5* A325 16S-1 AluI-17 TaqI-8 HaeIII-9* A107 16S-1 AluI-18 TaqI-8 HaeIII-17* A331 16S-1 AluI-8 TaqI-8 HaeIII-15*Bacillus subtilis E287 16S-2 AluI-24 TaqI-1 HaeIII-26* DSM1971 – AluI-24 TaqI-1 HaeIII-6 ATCC6633 16S-2 AluI-24 TaqI-1 HaeIII-6Bacillus mojavensis A185 16S-3 AluI-24 TaqI-2 HaeIII-6 C265 16S-3 AluI-24 TaqI-2 HaeIII-6 A131 16S-3 AluI-24 TaqI-2 HaeIII-6Bacillus licheniformis C83ca 16S-4 AluI-26 TaqI-6 HaeIII-22 C92 16S-4 AluI-26 TaqI-5 HaeIII-25* C91 16S-4 AluI-26 TaqI-6 HaeIII-22 A111 16S-4 AluI-26 TaqI-15* HaeIII-10 APT38 16S-4 AluI-26 TaqI-6 HaeIII-3* APT39 16S-4 AluI-26 TaqI-5 HaeIII-12* APT47 16S-4 AluI-26 TaqI-2 HaeIII-23* TG20 16S-4 AluI-26 TaqI-6 HaeIII-22 E114 16S-4 AluI-26 TaqI-7* HaeIII-7* APT40 16S-4 AluI-26 TaqI-6 HaeIII-24 DSM13 16S-4 AluI-26 TaqI-4* HaeIII-24Bacillus aerophilus B65 16S-5 AluI-25 TaqI-6 HaeIII-19*Bacillus pumilus APT37 16S-6 AluI-25 TaqI-22* HaeIII-13*Bacillus safensis B16 16S-7 AluI-25 TaqI-24 HaeIII-16* APT43 16S-7 AluI-9 TaqI-3 HaeIII-27* C235 16S-7 AluI-25 TaqI-23 HaeIII-11 C244 16S-7 AluI-24 TaqI-24 HaeIII-20* C241 16S-7 AluI-25 TaqI-3 HaeIII-11 C234 16S-7 AluI-9 TaqI-13* HaeIII-8 C236 16S-7 AluI-17 TaqI-21 HaeIII-2* C251 16S-7 AluI-20* TaqI-21 HaeIII-21* APT11 16S-7 AluI-25 TaqI-23 HaeIII-18*
Table VIAIndividual ARDRA profile groups against to 16S rRNA groups
The isolates, having unique distinctive profiles, were indicated with “*”
16S rRNA species groups Bacteria 16S rRNA group AluI group TaqI group HaeIII Group
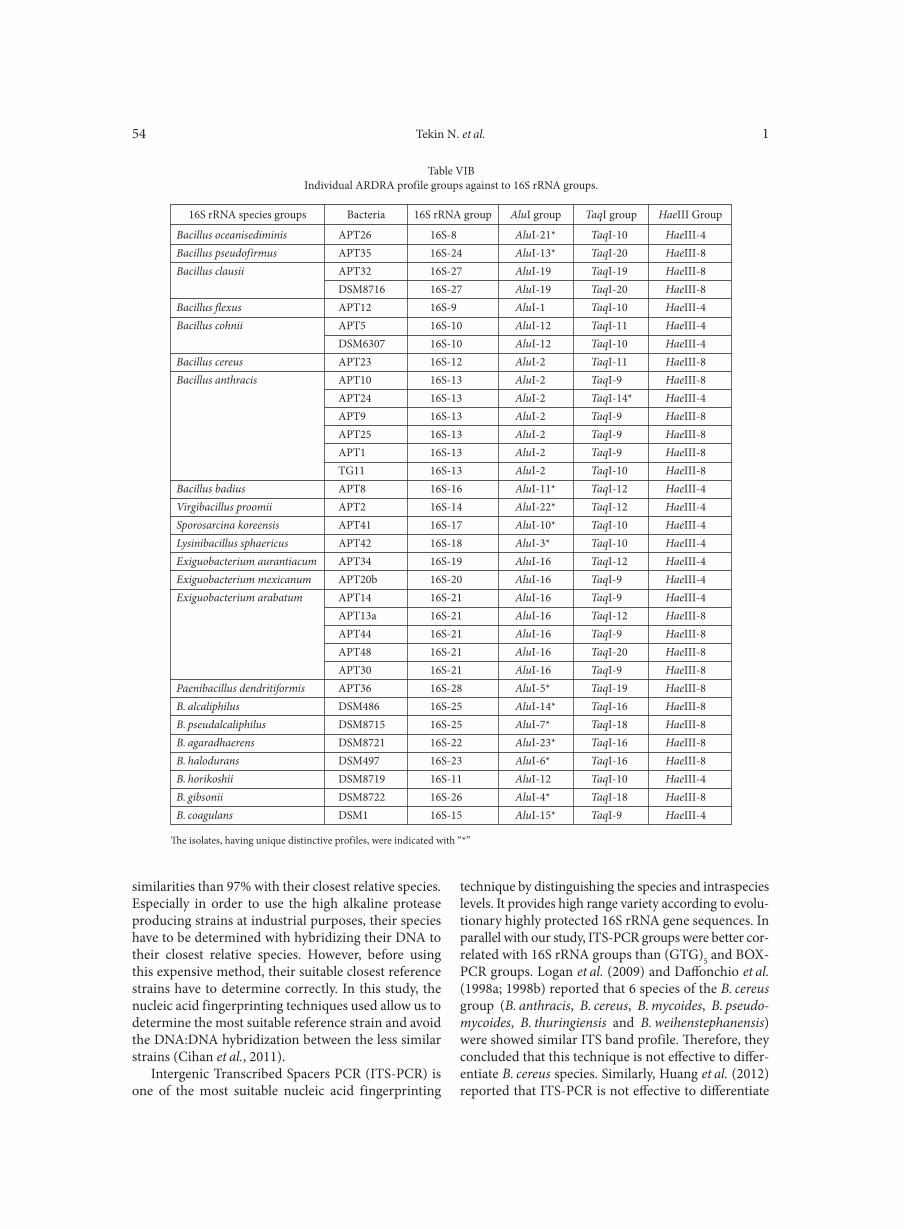
Tekin N. et al. 154
similarities than 97% with their closest relative species. Especially in order to use the high alkaline protease producing strains at industrial purposes, their species have to be determined with hybridizing their DNA to their closest relative species. However, before using this expensive method, their suitable closest reference strains have to determine correctly. In this study, the nucleic acid fingerprinting techniques used allow us to determine the most suitable reference strain and avoid the DNA:DNA hybridization between the less similar strains (Cihan et al., 2011).
Intergenic Transcribed Spacers PCR (ITS-PCR) is one of the most suitable nucleic acid fingerprinting
technique by distinguishing the species and intraspecies levels. It provides high range variety according to evolu-tionary highly protected 16S rRNA gene sequences. In parallel with our study, ITS-PCR groups were better cor-related with 16S rRNA groups than (GTG)5 and BOX-PCR groups. Logan et al. (2009) and Daffonchio et al. (1998a; 1998b) reported that 6 species of the B. cereus group (B. anthracis, B. cereus, B. mycoides, B. pseudo-mycoides, B. thuringiensis and B. weihenstephanensis) were showed similar ITS band profile. Therefore, they concluded that this technique is not effective to differ-entiate B. cereus species. Similarly, Huang et al. (2012) reported that ITS-PCR is not effective to differentiate
Table VIBIndividual ARDRA profile groups against to 16S rRNA groups.
The isolates, having unique distinctive profiles, were indicated with “*”
16S rRNA species groups Bacteria 16S rRNA group AluI group TaqI group HaeIII Group
Bacillus oceanisediminis APT26 16S-8 AluI-21* TaqI-10 HaeIII-4Bacillus pseudofirmus APT35 16S-24 AluI-13* TaqI-20 HaeIII-8Bacillus clausii APT32 16S-27 AluI-19 TaqI-19 HaeIII-8 DSM8716 16S-27 AluI-19 TaqI-20 HaeIII-8Bacillus flexus APT12 16S-9 AluI-1 TaqI-10 HaeIII-4Bacillus cohnii APT5 16S-10 AluI-12 TaqI-11 HaeIII-4 DSM6307 16S-10 AluI-12 TaqI-10 HaeIII-4Bacillus cereus APT23 16S-12 AluI-2 TaqI-11 HaeIII-8Bacillus anthracis APT10 16S-13 AluI-2 TaqI-9 HaeIII-8 APT24 16S-13 AluI-2 TaqI-14* HaeIII-4 APT9 16S-13 AluI-2 TaqI-9 HaeIII-8 APT25 16S-13 AluI-2 TaqI-9 HaeIII-8 APT1 16S-13 AluI-2 TaqI-9 HaeIII-8 TG11 16S-13 AluI-2 TaqI-10 HaeIII-8Bacillus badius APT8 16S-16 AluI-11* TaqI-12 HaeIII-4Virgibacillus proomii APT2 16S-14 AluI-22* TaqI-12 HaeIII-4Sporosarcina koreensis APT41 16S-17 AluI-10* TaqI-10 HaeIII-4Lysinibacillus sphaericus APT42 16S-18 AluI-3* TaqI-10 HaeIII-4Exiguobacterium aurantiacum APT34 16S-19 AluI-16 TaqI-12 HaeIII-4Exiguobacterium mexicanum APT20b 16S-20 AluI-16 TaqI-9 HaeIII-4Exiguobacterium arabatum APT14 16S-21 AluI-16 TaqI-9 HaeIII-4 APT13a 16S-21 AluI-16 TaqI-12 HaeIII-8 APT44 16S-21 AluI-16 TaqI-9 HaeIII-8 APT48 16S-21 AluI-16 TaqI-20 HaeIII-8 APT30 16S-21 AluI-16 TaqI-9 HaeIII-8Paenibacillus dendritiformis APT36 16S-28 AluI-5* TaqI-19 HaeIII-8B. alcaliphilus DSM486 16S-25 AluI-14* TaqI-16 HaeIII-8B. pseudalcaliphilus DSM8715 16S-25 AluI-7* TaqI-18 HaeIII-8B. agaradhaerens DSM8721 16S-22 AluI-23* TaqI-16 HaeIII-8B. halodurans DSM497 16S-23 AluI-6* TaqI-16 HaeIII-8B. horikoshii DSM8719 16S-11 AluI-12 TaqI-10 HaeIII-4B. gibsonii DSM8722 16S-26 AluI-4* TaqI-18 HaeIII-8B. coagulans DSM1 16S-15 AluI-15* TaqI-9 HaeIII-4
Taxonomy and alkaline protease capacity of bacilli1 55
B. cereus and B. subtilis specie. However, contrary to these studies B. cereus, B. anthracis and B. subtilis species showed different ITS band profiles and distinguished from each other successfully in this study (Fig. 5). Our results also showed that ITS-PCR was not discrimina-tive for B. subtilis and B. mojavensis species, which were identified by 16S rRNA gene sequences. However, it obviously illuminated the diversity for B. licheniformis and B. safensis groups at intraspecies level.
The main difference of Rep-PCR from the other fin-gerprinting techniques is that it provides scanning of the repetitive sequences on complete bacterial genomes (Versalovic et al., 1994). The discriminative efficacy of BOX and (GTG)5 elements on taxonomic classification of endospore forming bacilli were showed at various studies (Freitas et al., 2008; Logan et al., 2009; Cihan et al., 2011). According to our results, BOX-PCR pro-files correlated with 16S rRNA groups. Especially the species of B. subtilis, B. subtilis subsp. subtilis, B. licheni-formis, B. safensis and the species of genus Exiguobac-terium discriminated at intraspecies level. However, BOX elements of B. anthracis and B. cereus could not amplified with the same PCR conditions of other sam-ples. Similarly Freitas et al. (2008) reported that BOX elements of some samples were not amplified while the reactions were successful for the other isolates. We con-cluded that new PCR conditions have to be determined for B. anthracis and B. cereus species when BOX-PCR was used as a discriminative fingerprinting method. Contrary to the BOX-PCR, (GTG)5-PCR efficiently distinguished the isolates at species and intraspecies level. Especially B. cohnii, B. anthracis and Exiguobac-terium groups, which were not discriminated by ITS and BOX-PCR, were distinguished at intraspecies level with a higher resolution. Similarly, Freitas et al. (2008) reported that they were carried genomic fingerprint analysis with (GTG)5, BOXA1R and ERIC (Enterobac-terial Repetitive Intergenic Consensus) PCR primers on many different Bacillus isolates and of these tech-niques (GTG)5-PCR provided a wide variety of band profiles. Again similarly, at their study (GTG)5-PCR was not efficient grouping the microorganism accord-ing to BOX and ERIC-PCRs. Also, De Clerck and De Vos (2004) highlighted the efficiency of (GTG)5-PCR when distinguishing the intraspecies level. ARDRA analyses are carried on evolutionarily highly conserved 16S rRNA gene. Despite the conserved property of 16S rRNA gene, AluI restriction fragments correlated with 16S rRNA gene sequence analyses and the isolates partly distinguished at species and intraspecies level. rRNA genes are organized as multiple gene families and it is known that they express from 1 to 15, different copy numbers (Klappenbach and Dunbar, 2000). The mixed groups obtained by HaeIII and TaqI ARDRA analysis may occur because of the different copy num-
bers of 16S rRNA gene. Many studies were carried out on ARDRA analysis of 16S rRNA gene with different restriction enzymes. But, according to our knowledge this is the first study analyzing the ARDRA profiles of alkaline protease producing strains belonging to the Bacillaceae family. In conclusion, by this study, we determined the alkaline protease production capaci-ties of the each isolates and reference strains according to; their carbon source requirements (casein or starch containing growth media), the effect of growth time on enzyme activities (48 and 72 h incubation) and also the effect of pH on enzyme activities (Glycine-NaOH buffer at pH 9.0 and 10.0) by applying various param-eters. Moreover, we identified the taxonomic positions of these numerous endospore-forming bacilli, alkaline protease producing isolates in a polyphasic approach which leads to determine their appropriate taxonomic levels by investigating their phenotypic and genotypic diversity (White et al., 1993; Mora et al., 1998). Accord-ing to the literature, this is the first report that compares many DNA fingerprint techniques with on alkaline protease production capacities of the Bacillus strains. Moreover, many novel Bacillus species were introduced as alkaline protease producers and enumerated accord-ing to their enzyme production capacities.
AcknowledgementsThe Scientific Research Project Office of Ankara University was
supported this research with the project number 11B4240003. DNA sequencing and PCR experiments were carried out at Ankara Uni-versity Biotechnology Institute Central Laboratory Genomics Unit. We would like to thank to Prof. Hilal Ozdag (Ankara University Biotechnology Institute) for her contributions and supports.
Literature
Arellano-Carbajal F. and J. Olmos-Soto. 2002. Thermostable α-1, 4-and α-1, 6-glucosidase enzymes from Bacillus sp. isolated from a marine environment. World J. Microb. Biot. 18: 791–795. Cihan A.C. 2013. Taxonomic classification of Anoxybacillus iso- lates from geothermal regions in Turkey by 16S rRNA gene sequences and ARDRA, ITS-PCR, Rep-PCR analyses. Pol. J. Microbiol. 62: 149–163.Cihan A.C., B. Ozcan, N. Tekin and C. Cokmus. 2011. Phylo-genetic diversity of isolates belonging to genera Geobacillus and Aeribacillus isolated from different geothermal regions of Turkey. World J. Microb. Biot. 27: 2683–2696.Clarridge J.E. 2004. Impact of 16S rRNA gene sequence analysis for identification of bacteria on clinical microbiology and infectious diseases. Clin. Microbiol. Rev. 17: 840–62. Claus D. and C.W. Berkeley. 1986. The genus Bacillus, pp. 1105–1139. In: Sneath pHA (eds). Bergey’s Manual of Systematic Bacterio-logy. Volume 2. Williams, Wilkins, Baltimore. Daffonchio D, S. Borin, A.D. Consolandi, D. Mora, P.L. Manachini and C. Sorlini. 1998a. 16S–23S rRNA internal transcribed spacers as molecular markers for the species of the 16S rRNA group I of the genus Bacillus. FEMS Microbiol. Lett. 163: 229–236.
Tekin N. et al. 156
Daffonchio D., S. Borin, G. Frova, P.L. Manachini and C. Sorlini. 1998b. PCR fingerprinting of whole genomes: the spacers between the 16S and 23S rRNA genes and of intergenic tRNA gene regions reveal a different intraspecific genomic variability of Bacillus cereus and Bacillus licheniformis. Int. J. Syst. Bacteriol. 48: 107–116.De Clerck E. and P. De Vos. 2004. Genotypic diversity among Bacil-lus licheniformis strains from various sources. FEMS Microbiol. Lett. 231: 91–98. Denizci A.A., D. Kazan, E.C.A Abeln and A. Erarslan. 2004. Newly isolated Bacillus clausii GMBAE 42: an alkaline protease producer capable to grow under higly alkaline conditions. J. Appl. Microbiol. 96: 320–327. Felsenstein J. 1985. Confidence-limits on phylogenies – an approach using the bootstrap. Evolution. 39: 783–791.Freitas D.B., M.P. Reis, C.I. Lima-Bittencourt, P.S. Costa, P.S. Assis, E. Chartone-Souza and A.M.A. Nascimento. 2008. Geno- typic and phenotypic diversity of Bacillus spp. isolated from steel plant waste. BMC Res. Notes. 1: 92. Gessesse A. and B.A. Gashe BA. 1997. Production of alkaline pro-tease by an alkaliphilic bacteria isolated from an alkaline soda lake. Biotechnol. Lett. 19: 479–481.Haddar A., R. Agrebi, A. Bougatef, N. Hmidet, A. Sellami-Kamoun and M. Nasri. 2009. Two detergent stable alkaline serine-proteases from Bacillus mojavensis A21: purification, characte ri-za tion and potential application as a laundry detergent additive. Bioresour. Technol. 100: 3366–3373. Horikoshi K. 1999. Alkaliphiles: some applications of their products for biotechnology. Microbiol. Mol. Biol. Rev. 63: 735–50.Huang T.-P., D.D.-S. Tzeng, A.C.L. Wong, C.-H. Chen, K.-M. Lu. Y.-H. Lee, W.-D. Huang, B.-F. Hwang and K.-C. Tzeng. 2012. DNA polymorphisms and biocontrol of Bacillus antagonistic to citrus bacterial canker with indication of the interference of phyllosphere biofilms. PLoS ONE. 7: 421–424.Ito S., T. Kobayashi, K. Ara, K. Ozaki, S. Kawai and Y. Hatada. 1998. Alkaline detergent enzymes from alkaliphiles: enzymatic properties, genetics, and structures. Extremophiles 2: 185–190.Klappenbach J.A. and J.M. Dunbar. 2000. rRNA operon copy num-ber reflects ecological strategies of bacteria. Appl. Environ. Microb. 66: 1328–1333Kumar C.G. and H. Takagi. 1999. Microbial alkaline proteases: from a bioindustrial viewpoint. Biotechnol. Adv. 17: 561–594Logan N.A., O. Berge, A.H. Bishop, H.J. Busse, P. De Vos, D. Fritze, M. Heyndrickx, P. Kämpfer, L. Rabinovitch, M.S. Salkinoja-
Salonen and others. 2009. Proposed minimal standards for describ-ing new taxa of aerobic, endospore-forming bacteria. Int. J. Syst. Evol. Microbiol. 59: 2114–2121. Mora D., M.G. Fortina, G. Nicastro, C. Parini and P.L. Manachini. 1998. Genotypic characterization of thermophilic bacilli: a study on new soil isolates and several reference strains. Res. Microbiol. 149: 711–722.Nielsen P., D. Fritze and F.G. Priest. 1995. Phenetic diversity of alkaliphilic Bacillus strains: proposal for nine new species. Micro-biology 141: 1745–1761. Niyonzima F.N. and S.S. More. 2014. Concomitant production of detergent compatible enzymes by Bacillus flexus XJU-1. Braz. J. Microbiol. 45: 903–910.Saitou N. and M. Nei. 1987. The neighbor-joining method: a new method for reconstructing phylogenetic trees. Mol. Biol. Evol. 4: 406–425.Sari E., E. Loğoğlu and A. Öktemer. 2015. Purification and char-acterization of organic solvent stable serine alkaline protease from newly isolated Bacillus circulans M34. Biomed. Chromatogr. 29: 1356–1363.Stackebrandt E., W. Frederiksen, G.M. Garrity, P.A Grimont, P. Kämpfer, M.C. Maiden, X. Nesme, R. Rosselló-Mora, J. Swings, H.G. Trüper and others. 2002. Report of the ad hoc committee for the re-evaluation of the species definition in bacteriology. Int. J. Syst. Evol. Microbiol. 52: 1043–1047.Suzuki Y., T. Kishigami and S. Abe. 1976. Production of extra-cellular alpha-glucosidase by a thermophilic Bacillus species. Appl. Environ. Microbiol. 31: 807–812.Tamura K., M. Nei and S. Kumar. 2004. Prospects for inferring very large phylogenies by using the neighbor-joining method. Proc. Natl. Acad. Sci. USA 101: 11030–11035. Tamura K., J. Dudley, M. Nei and S. Kumar. 2007. MEGA4: Mole-cular evolutionary genetics analysis (MEGA) software version 4.0. Mol. Biol. Evol. 24: 1596–1599. Tekin N., A.C. Cihan, Z.S. Takaç, C. Yagci, K. Tunc and C. Cok-mus. 2012. Alkaline protease production of Bacillus cohnii APT5. Turk. J. Biol. 36: 430–440. Versalovic J., M. Schneider and F.J. De Bruijn. 1994. Genomic finger printing of bacteria using repetitive sequence-based poly-merase chain reaction. Method. Mol. Cell. Biol. 5: 25–40.White D., R.J. Sharpand and F.G. Priest. 1993. A polyphasic taxo-nomic study of thermophilic bacilli from a wide geographical area. Antonie Van Leeuwenhoek. 64: 357–386.
Polish Journal of Microbiology2017, Vol. 66, No 1, 57–65
ORIGINAL PAPER
* Corresponding author: J. Zhang and Q.-A. Zhang, Institute of Horticulture, Anhui Academy of Agricultural Sciences, Hefei, Anhui Province, P.R. China; e-mail: [email protected] and [email protected]
Introduction
In a terrestrial ecosystem, soil microorganisms are important players in the rhizosphere of plants involved in the recycling of nutrients and crucial for long-term soil sustainability (Grönemeyer et al., 2011). After nitrogen, phosphorus (P) is the second major essential macronutrient for plant development in soil, and the lack of P limits plant growth (Nautiyal, 1999; Yu et al., 2011). However, most agricultural soils contain large reserves of total P, which is typically within the range of 0.2–5 g P/kg and with an average of 0.6 g P/kg; moreo-ver, P accumulation partly depends on regular chemical fertilizer application (Fernández et al., 2007). Neverthe-less, many soils throughout the world are P-deficient because most of P in nature exists in various organic and inorganic forms; in addition, the concentration of free phosphorus available to plants in fertile soils is generally not higher than 10 μM, even at pH 6.5 at which P is most soluble (Rodríguez and Fraga, 1999; Gyaneshwar et al., 2002).
Although chemical fertilizers are added to the soils, plants can only utilize few amounts of phosphatic ferti-lizers that are often continuously applied; the remaining amount, which is almost 75–90% of added P fertilizer, is rapidly converted into insoluble complexes, such as cal-cium phosphate, aluminum phosphate, and iron phos-phate in the soil (Gyaneshwar et al., 2002; Vassilev and Vassileva, 2003; Alam and Ladha, 2004). Consequently, chemical fertilizers are frequently applied during crop planting, but its regular use is costly and produces undesirable environmental impacts, such as soil and water contamination. Therefore, P is often regarded a limiting nutrient in agricultural soils (Guiñazú et al., 2010; Yu et al., 2011).
Given the negative environmental impacts of che-mical fertilizers and increasing costs, the utilization of phosphate-solubilizing bacteria (PSB) is advantageous for sustainable agricultural practices (Gyaneshwar et al., 2002). PSB could convert these insoluble phosphates into available forms for plant via acidification, chela-tion, exchange reactions, and production of gluconic
Isolation and Characterization of Phosphate-Solubilizing Bacteriafrom Mushroom Residues and their Effect on Tomato Plant Growth Promotion
JIAN ZHANG1, 2*, PENGCHENG WANG1, 2, LING FANG1, 2, QI-AN ZHANG1, 2*, CONGSHENG YAN1, 2
and JINGYI CHEN1, 3
1 Institute of Horticulture, Anhui Academy of Agricultural Sciences, Hefei, Anhui Province, P.R. China2 Key Laboratory of Genetic Improvement and Ecophysiology of Horticultural Crop in Anhui Province,
Hefei, Anhui Province, P.R. China3 School of Horticulture, Anhui Agricultural University, Hefei, Anhui Province, P.R. China
Submitted 24 December 2015, revised 29 March 2016, accepted 12 April 2016
A b s t r a c t
Phosphorus is a major essential macronutrient for plant growth, and most of the phosphorus in soil remains in insoluble form. Highly efficient phosphate-solubilizing bacteria can be used to increase phosphorus in the plant rhizosphere. In this study, 13 isolates were obtained from waste mushroom residues, which were composed of cotton seed hulls, corn cob, biogas residues, and wood flour. NBRIP solid medium was used for isolation according to the dissolved phosphorus halo. Eight isolates produced indole acetic acid (61.5%), and six isolates produced siderophores (46.2%). Three highest phosphate-dissolving bacterial isolates, namely, M01, M04, and M11, were evalu-ated for their beneficial effects on the early growth of tomato plants (Solanum lycopersicum L. Wanza 15). Strains M01, M04, and M11 significantly increased the shoot dry weight by 30.5%, 32.6%, and 26.2%, and root dry weight by 27.1%, 33.1%, and 25.6%, respectively. Based on 16S rRNA gene sequence comparisons and phylogenetic positions, strains M01 and M04 belonged to the genus Acinetobacter, and strain M11 belonged to the genus Ochrobactrum. The findings suggest that waste mushroom residues are a potential resource of plant growth-promoting bacteria exhibiting satisfactory phosphate-solubilizing for sustainable agriculture.
K e y w o r d s: 16S rRNA, mushroom residues, phosphate solubilizing bacteria, tomato plant growth
Zhang J. et al. 158
acid (Chung et al., 2005; Gulati et al., 2010). They may also promote plant growth by secreting plant hormones, such as indole acetic acid and cytokinin (Poongu-zhali et al., 2008). Currently, many PSB belonging to Pseudo monas, Bacillus, Rhizobium, Agrobacterium, Burkholderia, Achromobacter, Microccocus, Aerobac-ter, Enterobacter, Flavobacterium, and Erwinia have been isolated from soils (Rodríguez and Fraga, 1999). These bacteria can grow in media containing calcium-phosphate complexes as the sole source of P, solubilize and assimilate a large proportion of P, and release P in high amounts. Phosphate is solubilized via organic acid synthesis and released by microorganisms (Puente et al., 2004). This reaction, appearing as a halo or clear zone on the plate, is used to assess the P-solubilizing activity of these bacteria. Undoubtedly, the selection of considerably efficient PSB strains as possible inocu-lants will be a promising way to release large amount of P from soil to improve the current status of extensive chemical fertilizer usage.
Currently, China has become the largest mushroom consuming country; accordingly, a large amount of mushroom residues, which are a kind of solid organic wastes, have been produced annually (Li et al., 2015). Thus, the ecological environment of the planting area is suffering from large mushroom residues character-ized by soil pollution and difficult degradation. Never-theless, mushroom composting has recently attracted significant attention and been regarded an environ-mentally friendly and sustainable alternative for the management and recycling of organic wastes (Sæbø and Ferrini, 2006; Liu et al., 2015). For instance, mush-room residues can be fermented for use as growing substrates in vegetable seedling breeding. In addition, mushroom compost is an artificial ecosystem that har-bors a complete spectrum of microbial diversity (Johri, 2011); thus, isolating PSB from mushroom compost is significant. To date, rare information is available for the screening of PSB from wasted mushroom residues. Therefore, the present work mainly aimed to isolate and characterize native PSB from waste mushroom residues. Their effect on promoting growth of tomato seedlings were also evaluated under greenhouse condition.
Experimental
Materials and Methods
Collection of mushroom residues. In this study, mushroom residues were collected from the experi-mental basements in Hefei city (117.27°E, 31.85°N). These residues were composed of cotton seed hulls mixed with corn cob (CC), cotton seed hulls mixed with wood flour (CW), cotton seed hulls mixed with
biogas residues (CB), and wood flour (WF). All samples were stored at 4°C until analysis and isolation.
Isolation of phosphate solubilizing bacteria. The serially dilution from 10–3 to 10–5 was achieved by trans-ferring 1 ml of mushroom residue solution from each preceding attenuation stage to the next. Approximately 0.1 ml volume of the resulting solution was then placed on the National Botanical Research Institute’s Phosphate growth medium (NBRIP) contained g/l: glucose, 10.0; Ca3(PO4)2, 5.0; MgCl2 · 6H2O, 5.0; MgSO4 · 7H2O, 0.25; KCl, 0.2 and (NH4)2SO4, 0.1, including 0.5% Ca3(PO4)2 as an insoluble P source for selectively screening the bacteria capable of releasing inorganic phosphate from tricalcium phosphate (TCP) (Nautiyal, 1999). Sterile medium served as a control. The PSB were identified by clear halo zones around their colonies after 3 days of incubation at 30°C. Experiments were performed in triplicate. Furthermore, the colonies that had larger solubilization zones were further purified. Thirteen PSB strains thus screened were selected for further analysis. All the isolates were designated as M01-13.
Phenotypic characterization of PSB isolates. Phy-s io logical and biochemical characteristics of the bacte-rial isolates were examined according to the methods described in Bergey’s Manual of Determinative Bacte-riology Edition 8.0 (Holt et al., 1994). All strains were characterized by Gram staining and light microscopy. The direct observation of isolated colonies was served as the first characterization comprising the color, shape, elevation, margins, diameter, and texture. Such traits as endospore, catalase, and starch hydrolysis were charac-terized (Yu et al., 2011).
Assay of phosphate solubilizing ability. As the plate assay is not considered a reliable method in deter-mining a strain as phosphate solubilizer (Johri et al., 1999), the pure cultures were further screened in liq-uid medium containing Ca3(PO4)2 at a concentration of 5 g · l−1 as insoluble P source. Strains were grown in 30 ml liquid medium shaken (190 × g) at 30 ± 1°C for 20 h. One milliliter culture was then transferred to a 300-ml flask containing 80 ml medium previously. Sterile water-inoculated medium was treated as a con-trol. Three Erlenmeyer flasks for statistical replication were used to incubate in the dark on a gyratory shaker (190 × g) at 30 ± 1°C for 3 days. The supernatant of the medium was used to assess P released into the solu-tion. Phosphorus in the culture was determined by the molybdenium blue method with a spectrophotometer at a wavelength of 700 nm (Watanabe and Olsen, 1965).
Characterization of plant growth promoting traits. Indole acetic acid (IAA) production was measured by the colorimetric method (Gordon and Weber, 1951). The isolates were cultivated in a minimal medium (Park et al., 2011) at 25°C for 7 days in a shaking incubator at 120 × g. Bacterial cells were removed from the culture
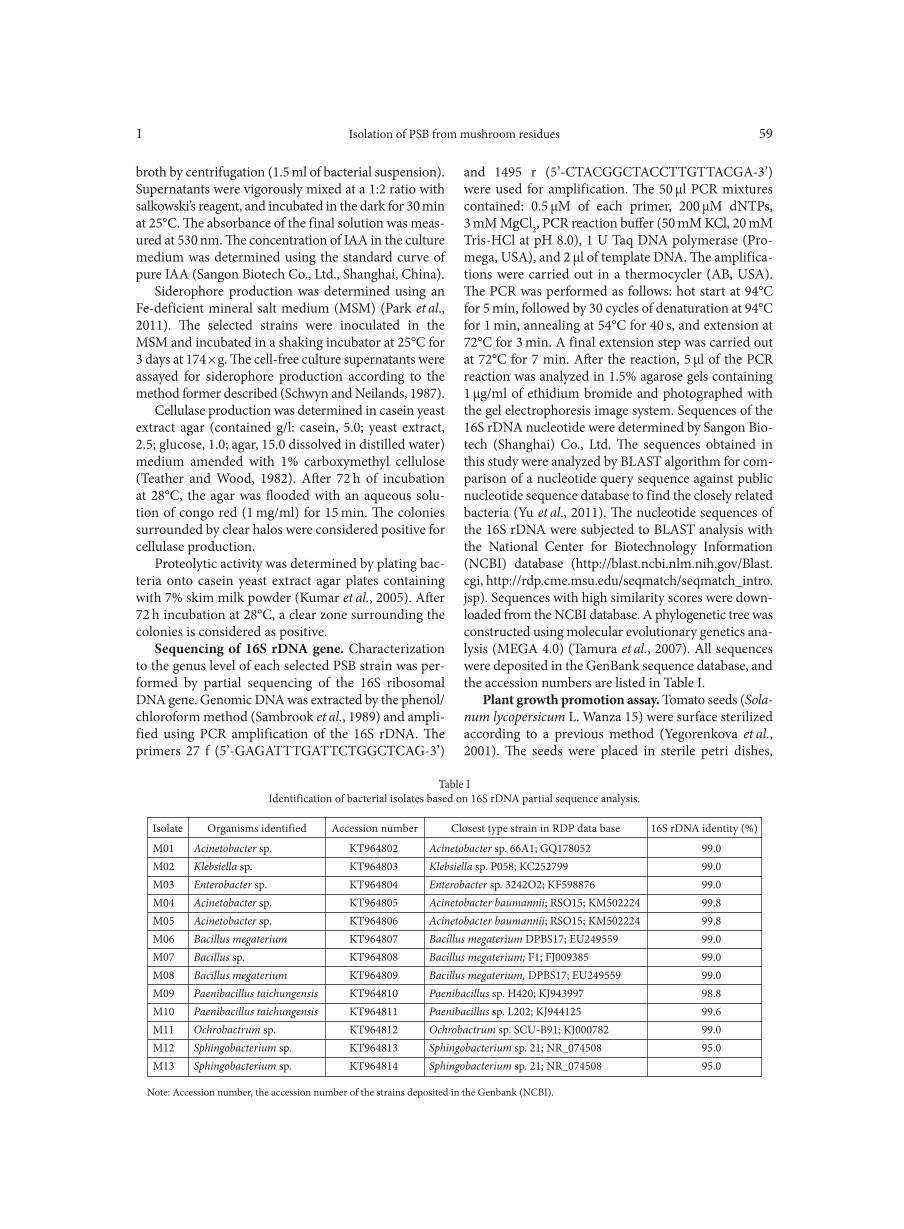
Isolation of PSB from mushroom residues1 59
broth by centrifugation (1.5 ml of bacterial suspension). Supernatants were vigorously mixed at a 1:2 ratio with salkowski’s reagent, and incubated in the dark for 30 min at 25°C. The absorbance of the final solution was meas-ured at 530 nm. The concentration of IAA in the culture medium was determined using the standard curve of pure IAA (Sangon Biotech Co., Ltd., Shanghai, China).
Siderophore production was determined using an Fe-deficient mineral salt medium (MSM) (Park et al., 2011). The selected strains were inoculated in the MSM and incubated in a shaking incubator at 25°C for 3 days at 174 × g. The cell-free culture supernatants were assayed for siderophore production according to the method former described (Schwyn and Neilands, 1987).
Cellulase production was determined in casein yeast extract agar (contained g/l: casein, 5.0; yeast extract, 2.5; glucose, 1.0; agar, 15.0 dissolved in distilled water) medium amended with 1% carboxymethyl cellulose (Teather and Wood, 1982). After 72 h of incubation at 28°C, the agar was flooded with an aqueous solu-tion of congo red (1 mg/ml) for 15 min. The colonies surrounded by clear halos were considered positive for cellulase production.
Proteolytic activity was determined by plating bac-teria onto casein yeast extract agar plates containing with 7% skim milk powder (Kumar et al., 2005). After 72 h incubation at 28°C, a clear zone surrounding the colonies is considered as positive.
Sequencing of 16S rDNA gene. Characterization to the genus level of each selected PSB strain was per-formed by partial sequencing of the 16S ribosomal DNA gene. Genomic DNA was extracted by the phenol/chloroform method (Sambrook et al., 1989) and ampli-fied using PCR amplification of the 16S rDNA. The primers 27 f (5’-GAGATTTGATTCTGGCTCAG-3’)
and 1495 r (5’-CTACGGCTACCTTGTTACGA-3’) were used for amplification. The 50 μl PCR mixtures contained: 0.5 μM of each primer, 200 μM dNTPs, 3 mM MgCl2, PCR reaction buffer (50 mM KCl, 20 mM Tris-HCl at pH 8.0), 1 U Taq DNA polymerase (Pro-mega, USA), and 2 μl of template DNA. The amplifica-tions were carried out in a thermocycler (AB, USA). The PCR was performed as follows: hot start at 94°C for 5 min, followed by 30 cycles of denaturation at 94°C for 1 min, annealing at 54°C for 40 s, and extension at 72°C for 3 min. A final extension step was carried out at 72°C for 7 min. After the reaction, 5 μl of the PCR reaction was analyzed in 1.5% agarose gels containing 1 μg/ml of ethidium bromide and photographed with the gel electrophoresis image system. Sequences of the 16S rDNA nucleotide were determined by Sangon Bio-tech (Shanghai) Co., Ltd. The sequences obtained in this study were analyzed by BLAST algorithm for com-parison of a nucleotide query sequence against public nucleotide sequence database to find the closely related bacteria (Yu et al., 2011). The nucleotide sequences of the 16S rDNA were subjected to BLAST analysis with the National Center for Biotechnology Information (NCBI) database (http://blast.ncbi.nlm.nih.gov/Blast.cgi, http://rdp.cme.msu.edu/seqmatch/seqmatch_intro.jsp). Sequences with high similarity scores were down-loaded from the NCBI database. A phylogenetic tree was constructed using molecular evolutionary genetics ana-lysis (MEGA 4.0) (Tamura et al., 2007). All sequences were deposited in the GenBank sequence database, and the accession numbers are listed in Table I.
Plant growth promotion assay. Tomato seeds (Sola-num lycopersicum L. Wanza 15) were surface sterilized according to a previous method (Yegorenkova et al., 2001). The seeds were placed in sterile petri dishes,
M01 Acinetobacter sp. KT964802 Acinetobacter sp. 66A1; GQ178052 99.0M02 Klebsiella sp. KT964803 Klebsiella sp. P058; KC252799 99.0M03 Enterobacter sp. KT964804 Enterobacter sp. 3242O2; KF598876 99.0M04 Acinetobacter sp. KT964805 Acinetobacter baumannii; RSO15; KM502224 99.8M05 Acinetobacter sp. KT964806 Acinetobacter baumannii; RSO15; KM502224 99.8M06 Bacillus megaterium KT964807 Bacillus megaterium DPBS17; EU249559 99.0M07 Bacillus sp. KT964808 Bacillus megaterium; F1; FJ009385 99.0M08 Bacillus megaterium KT964809 Bacillus megaterium, DPBS17; EU249559 99.0M09 Paenibacillus taichungensis KT964810 Paenibacillus sp. H420; KJ943997 98.8M10 Paenibacillus taichungensis KT964811 Paenibacillus sp. L202; KJ944125 99.6M11 Ochrobactrum sp. KT964812 Ochrobactrum sp. SCU-B91; KJ000782 99.0M12 Sphingobacterium sp. KT964813 Sphingobacterium sp. 21; NR_074508 95.0M13 Sphingobacterium sp. KT964814 Sphingobacterium sp. 21; NR_074508 95.0
Table IIdentification of bacterial isolates based on 16S rDNA partial sequence analysis.
Note: Accession number, the accession number of the strains deposited in the Genbank (NCBI).
Isolate Organisms identified Accession number Closest type strain in RDP data base 16S rDNA identity (%)
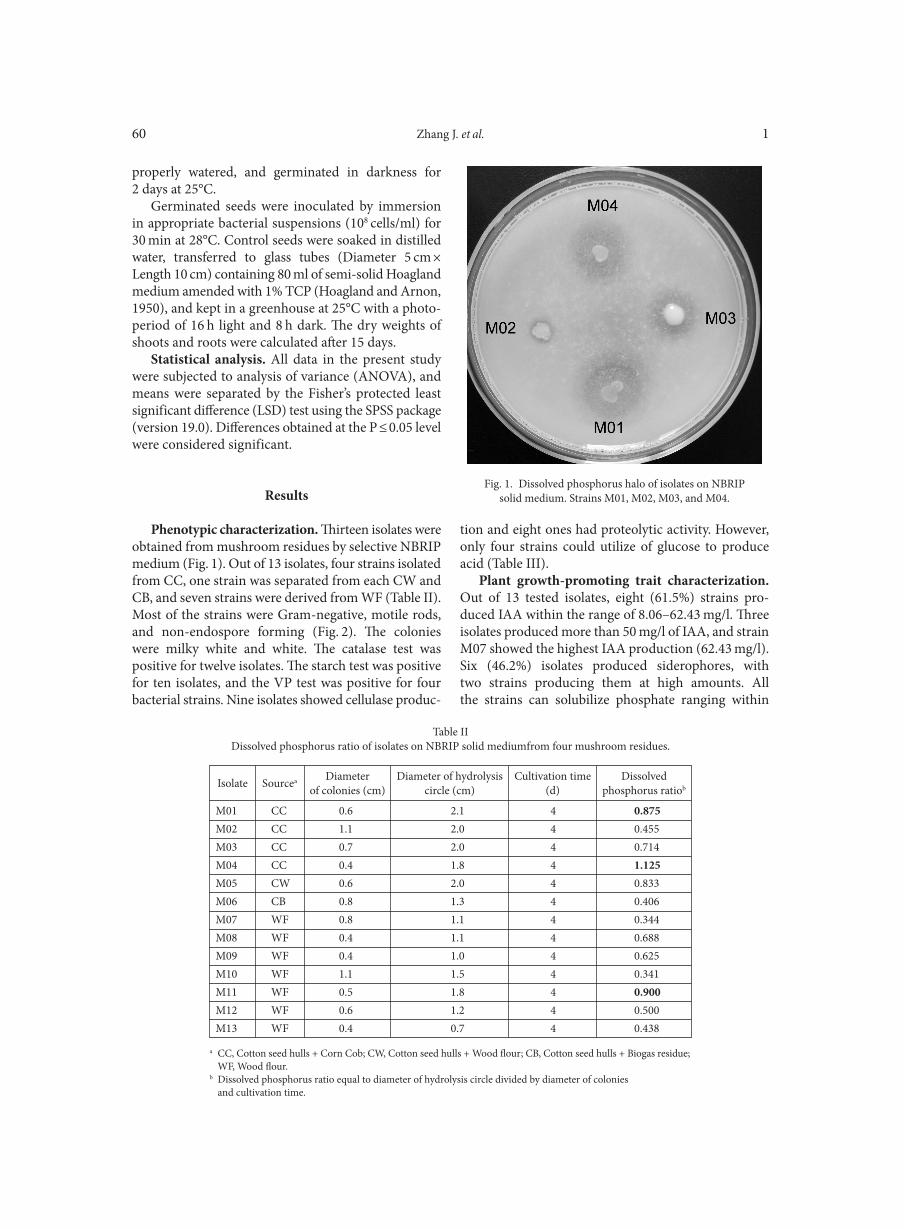
Zhang J. et al. 160
properly watered, and germinated in darkness for 2 days at 25°C.
Germinated seeds were inoculated by immersion in appropriate bacterial suspensions (108 cells/ml) for 30 min at 28°C. Control seeds were soaked in distilled water, transferred to glass tubes (Diameter 5 cm × Length 10 cm) containing 80 ml of semi-solid Hoagland medium amended with 1% TCP (Hoagland and Arnon, 1950), and kept in a greenhouse at 25°C with a photo-period of 16 h light and 8 h dark. The dry weights of shoots and roots were calculated after 15 days.
Statistical analysis. All data in the present study were subjected to analysis of variance (ANOVA), and means were separated by the Fisher’s protected least significant difference (LSD) test using the SPSS package (version 19.0). Differences obtained at the P ≤ 0.05 level were considered significant.
Results
Phenotypic characterization. Thirteen isolates were obtained from mushroom residues by selective NBRIP medium (Fig. 1). Out of 13 isolates, four strains isolated from CC, one strain was separated from each CW and CB, and seven strains were derived from WF (Table II). Most of the strains were Gram-negative, motile rods, and non-endospore forming (Fig. 2). The colonies were milky white and white. The catalase test was positive for twelve isolates. The starch test was positive for ten isolates, and the VP test was positive for four bacterial strains. Nine isolates showed cellulase produc-
tion and eight ones had proteolytic activity. However, only four strains could utilize of glucose to produce acid (Table III).
Plant growth-promoting trait characterization. Out of 13 tested isolates, eight (61.5%) strains pro-duced IAA within the range of 8.06–62.43 mg/l. Three isolates produced more than 50 mg/l of IAA, and strain M07 showed the highest IAA production (62.43 mg/l). Six (46.2%) isolates produced siderophores, with two strains producing them at high amounts. All the strains can solubilize phosphate ranging within
Fig. 1. Dissolved phosphorus halo of isolates on NBRIPsolid medium. Strains M01, M02, M03, and M04.
M01 CC 0.6 2.1 4 0.875M02 CC 1.1 2.0 4 0.455M03 CC 0.7 2.0 4 0.714M04 CC 0.4 1.8 4 1.125M05 CW 0.6 2.0 4 0.833M06 CB 0.8 1.3 4 0.406M07 WF 0.8 1.1 4 0.344M08 WF 0.4 1.1 4 0.688M09 WF 0.4 1.0 4 0.625M10 WF 1.1 1.5 4 0.341M11 WF 0.5 1.8 4 0.900M12 WF 0.6 1.2 4 0.500M13 WF 0.4 0.7 4 0.438
Table IIDissolved phosphorus ratio of isolates on NBRIP solid mediumfrom four mushroom residues.
a CC, Cotton seed hulls + Corn Cob; CW, Cotton seed hulls + Wood flour; CB, Cotton seed hulls + Biogas residue; WF, Wood flour.b Dissolved phosphorus ratio equal to diameter of hydrolysis circle divided by diameter of colonies and cultivation time.
Isolate Sourcea Diameterof colonies (cm)
Diameter of hydrolysiscircle (cm)
Cultivation time(d)
Dissolvedphosphorus ratiob
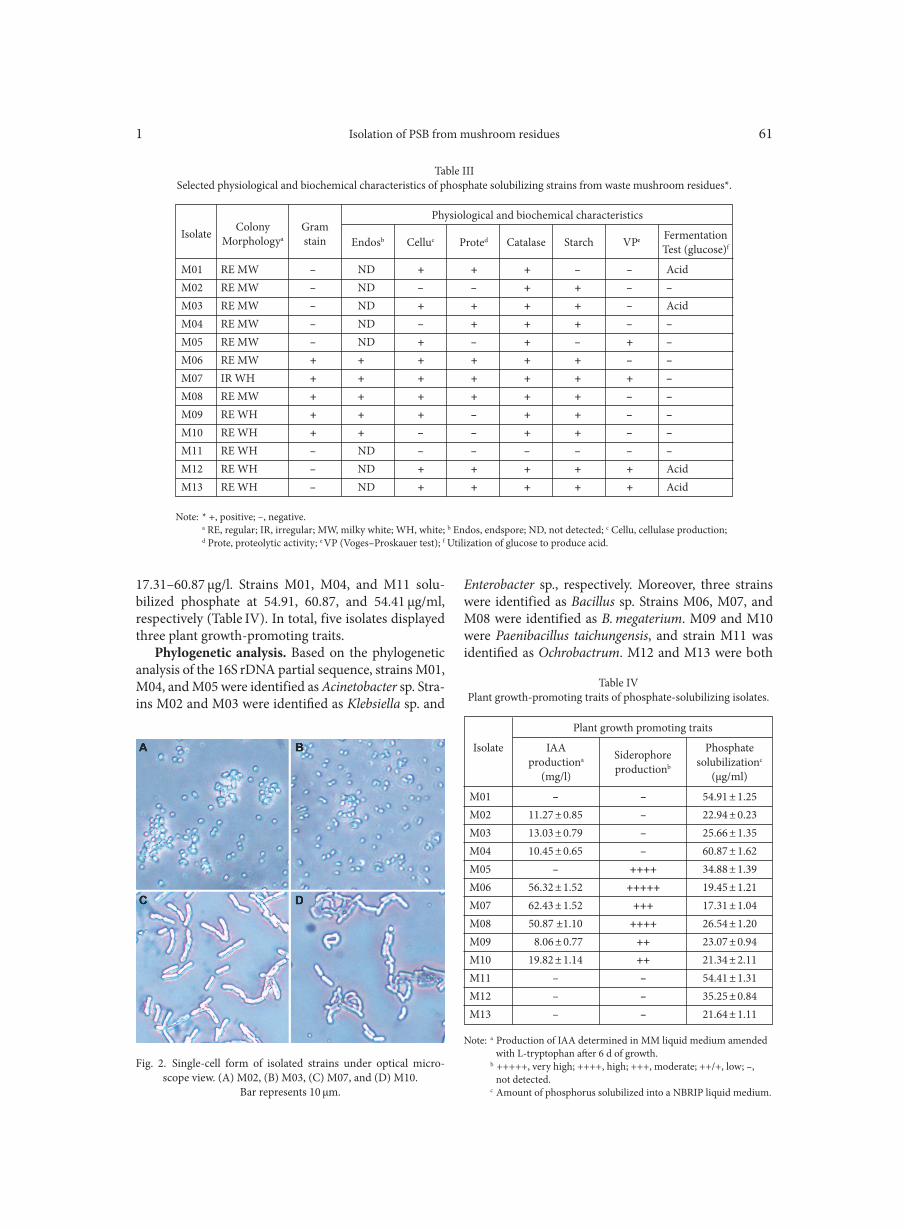
Isolation of PSB from mushroom residues1 61
17.31–60.87 μg/l. Strains M01, M04, and M11 solu-bilized phosphate at 54.91, 60.87, and 54.41 μg/ml, respectively (Table IV). In total, five isolates displayed three plant growth-promoting traits.
Phylogenetic analysis. Based on the phylogenetic analysis of the 16S rDNA partial sequence, strains M01, M04, and M05 were identified as Acinetobacter sp. Stra- ins M02 and M03 were identified as Klebsiella sp. and
Enterobacter sp., respectively. Moreover, three strains were identified as Bacillus sp. Strains M06, M07, and M08 were identified as B. megaterium. M09 and M10 were Paenibacillus taichungensis, and strain M11 was identified as Ochrobactrum. M12 and M13 were both
M01 RE MW – ND + + + – – AcidM02 RE MW – ND – – + + – –M03 RE MW – ND + + + + – AcidM04 RE MW – ND – + + + – –M05 RE MW – ND + – + – + –M06 RE MW + + + + + + – –M07 IR WH + + + + + + + –M08 RE MW + + + + + + – –M09 RE WH + + + – + + – –M10 RE WH + + – – + + – –M11 RE WH – ND – – – – – –M12 RE WH – ND + + + + + AcidM13 RE WH – ND + + + + + Acid
Table IIISelected physiological and biochemical characteristics of phosphate solubilizing strains from waste mushroom residues*.
Note: * +, positive; –, negative. a RE, regular; IR, irregular; MW, milky white; WH, white; b Endos, endspore; ND, not detected; c Cellu, cellulase production; d Prote, proteolytic activity; e VP (Voges–Proskauer test); f Utilization of glucose to produce acid.
IsolatePhysiological and biochemical characteristics
ColonyMorphologya
Gramstain Endosb Celluc Proted Catalase Starch VPe Fermentation
Test (glucose)f
Fig. 2. Single-cell form of isolated strains under optical micro-scope view. (A) M02, (B) M03, (C) M07, and (D) M10.
Bar represents 10 μm.
M01 – – 54.91 ± 1.25M02 11.27 ± 0.85 – 22.94 ± 0.23M03 13.03 ± 0.79 – 25.66 ± 1.35M04 10.45 ± 0.65 – 60.87 ± 1.62M05 – ++++ 34.88 ± 1.39M06 56.32 ± 1.52 +++++ 19.45 ± 1.21M07 62.43 ± 1.52 +++ 17.31 ± 1.04M08 50.87 ±1.10 ++++ 26.54 ± 1.20M09 8.06 ± 0.77 ++ 23.07 ± 0.94M10 19.82 ± 1.14 ++ 21.34 ± 2.11M11 – – 54.41 ± 1.31M12 – – 35.25 ± 0.84M13 – – 21.64 ± 1.11
Table IVPlant growth-promoting traits of phosphate-solubilizing isolates.
Note: a Production of IAA determined in MM liquid medium amended with L-tryptophan after 6 d of growth. b +++++, very high; ++++, high; +++, moderate; ++/+, low; –, not detected. c Amount of phosphorus solubilized into a NBRIP liquid medium.
Isolate
Plant growth promoting traits
IAAproductiona
(mg/l)
Siderophoreproductionb
Phosphatesolubilizationc
(μg/ml)
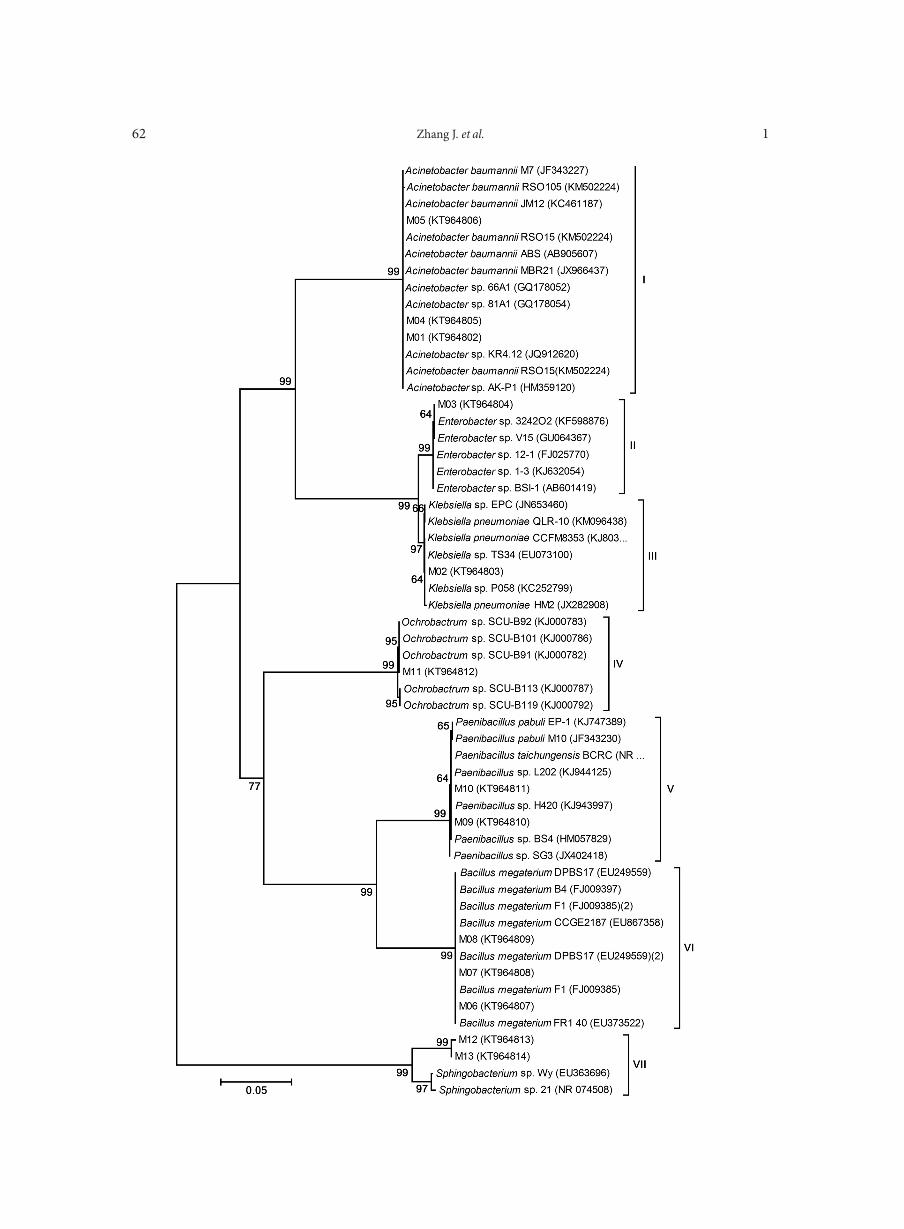
Zhang J. et al. 162
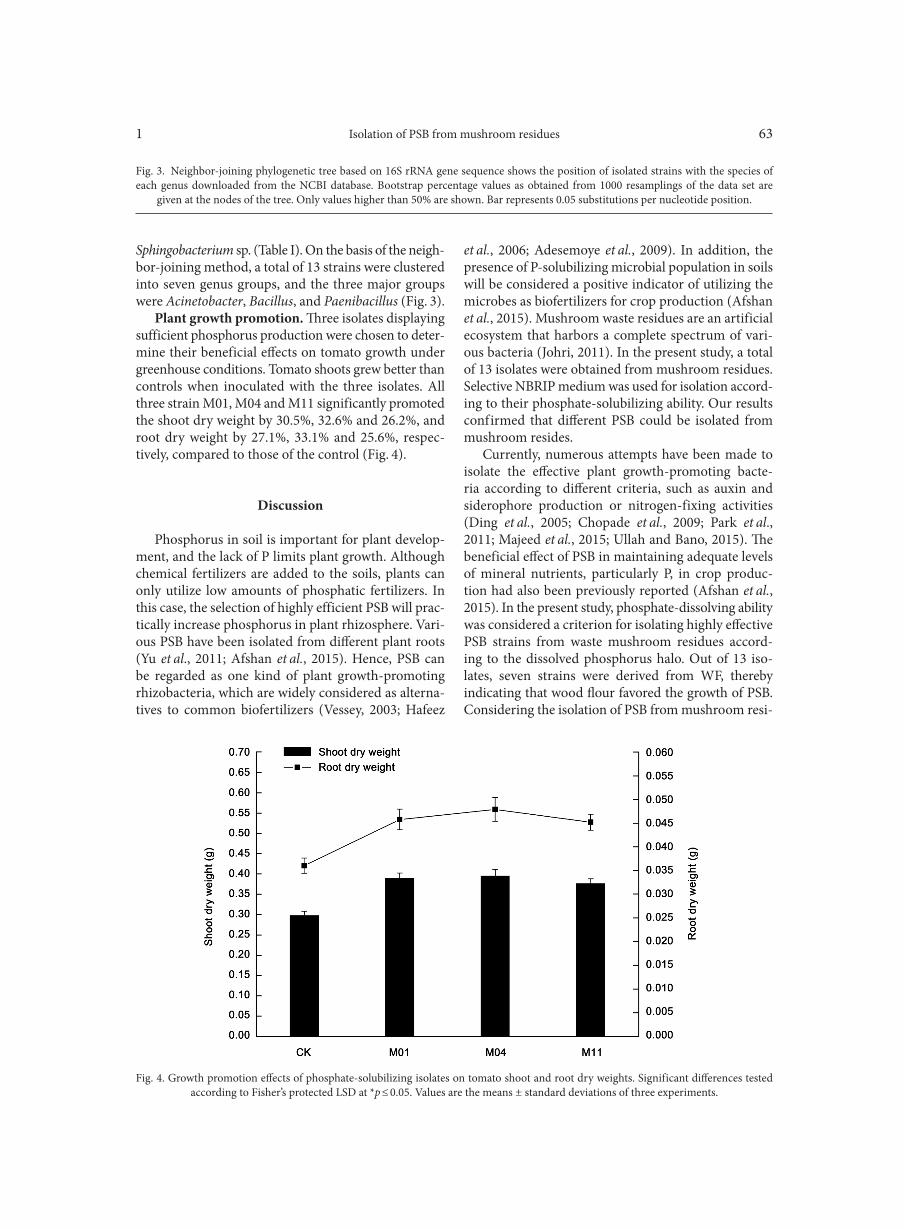
Isolation of PSB from mushroom residues1 63
Sphingobacterium sp. (Table I). On the basis of the neigh- bor-joining method, a total of 13 strains were clustered into seven genus groups, and the three major groups were Acinetobacter, Bacillus, and Paenibacillus (Fig. 3).
Plant growth promotion. Three isolates displaying sufficient phosphorus production were chosen to deter-mine their beneficial effects on tomato growth under greenhouse conditions. Tomato shoots grew better than controls when inoculated with the three isolates. All three strain M01, M04 and M11 significantly promoted the shoot dry weight by 30.5%, 32.6% and 26.2%, and root dry weight by 27.1%, 33.1% and 25.6%, respec-tively, compared to those of the control (Fig. 4).
Discussion
Phosphorus in soil is important for plant develop-ment, and the lack of P limits plant growth. Although chemical fertilizers are added to the soils, plants can only utilize low amounts of phosphatic fertilizers. In this case, the selection of highly efficient PSB will prac-tically increase phosphorus in plant rhizosphere. Vari-ous PSB have been isolated from different plant roots (Yu et al., 2011; Afshan et al., 2015). Hence, PSB can be regarded as one kind of plant growth-promoting rhizobacteria, which are widely considered as alterna-tives to common biofertilizers (Vessey, 2003; Hafeez
et al., 2006; Adesemoye et al., 2009). In addition, the presence of P-solubilizing microbial population in soils will be considered a positive indicator of utilizing the microbes as biofertilizers for crop production (Afshan et al., 2015). Mushroom waste residues are an artificial ecosystem that harbors a complete spectrum of vari-ous bacteria (Johri, 2011). In the present study, a total of 13 isolates were obtained from mushroom residues. Selective NBRIP medium was used for isolation accord-ing to their phosphate-solubilizing ability. Our results confirmed that different PSB could be isolated from mushroom resides.
Currently, numerous attempts have been made to isolate the effective plant growth-promoting bacte-ria according to different criteria, such as auxin and siderophore production or nitrogen-fixing activities (Ding et al., 2005; Chopade et al., 2009; Park et al., 2011; Majeed et al., 2015; Ullah and Bano, 2015). The beneficial effect of PSB in maintaining adequate levels of mineral nutrients, particularly P, in crop produc-tion had also been previously reported (Afshan et al., 2015). In the present study, phosphate-dissolving ability was considered a criterion for isolating highly effective PSB strains from waste mushroom residues accord-ing to the dissolved phosphorus halo. Out of 13 iso-lates, seven strains were derived from WF, thereby indicating that wood flour favored the growth of PSB. Considering the isolation of PSB from mushroom resi-
Fig. 3. Neighbor-joining phylogenetic tree based on 16S rRNA gene sequence shows the position of isolated strains with the species of each genus downloaded from the NCBI database. Bootstrap percentage values as obtained from 1000 resamplings of the data set are
given at the nodes of the tree. Only values higher than 50% are shown. Bar represents 0.05 substitutions per nucleotide position.
Fig. 4. Growth promotion effects of phosphate-solubilizing isolates on tomato shoot and root dry weights. Significant differences tested according to Fisher’s protected LSD at *p ≤ 0.05. Values are the means ± standard deviations of three experiments.
Zhang J. et al. 164
dues, the amount of isolates in the current study was lower than that reported by Yu et al. (2011), but higher than in other reports (Afshan et al., 2015). However, bacteria are considerably diverse because of differ-ent crops and soil types. To our knowledge, only few reports have identified the bacterial species in mush-room compost.
IAA production by bacteria isolated from different crops, such as wheat and rice, had already been reported (Park et al., 2005; Afshan et al., 2015). In the current study, about 61.5% of the isolates produced IAA within the range of 8.06–62.43 mg/l, which indicated a sub-stantial variability among isolates for IAA production. Furthermore, approximately 46.2% of strains produced siderophores, and all the strains solubilized tricalcium phosphate. The amount of IAA detected in the present study is close to that reported by Afshan et al. (2015), but lower than that reported earlier (Park et al., 2005). These differences may be attributed to the different sources and substantial variability among bacteria. IAA production is also an indicator of plant growth-promot-ing rhizobacteria (Chopade et al., 2009), thus indicat-ing that the mushroom residues under investigation have bacteria that can enhance plant growth. Previous reports showed that the phosphate solubilization ability of Pseudomonas sp. and Bacillus sp. is 90 and 60 μg/ml, respectively (Nautiyal, 1999). The same amount of phosphate solubilization abilities were obtained from the mushroom residues in the present study. However, the soluble phosphate released was also lower than that reported by Hafeez et al. (2006) and Yu et al. (2011). Considering the genus and sources, bacteria may show different phosphate solubilization abilities. In total, about 38.5% of isolates displayed three types of plant growth-promoting traits, hence suggesting the possibil-ity to isolate PSB from mushroom resides.
All the strains displaying phosphate-solubilizing traits were identified based on a 16S rDNA partial sequence. Out of 13 sequenced isolates, 3, 3, and 2 isolates belonged to the cluster of Acinetobacter sp., Bacillus, and Paenibacillus sp., respectively. One isolate belonged to each of the genera Klebsiella sp., Enterobac-ter sp., and Ochrobactrum sp. Two strains belonged to Sphingobacterium sp. The number of isolates belong-ing to the genera Acinetobacter and Bacillus was higher than those from other groups, which mean that these two genera are dominant in mushroom waste residues. In addition, Bacillus spp. is dominant in root-adhering soil (Laguerre et al., 1994). Based on the neighbor-join-ing phylogenetic tree constructed from 16S rRNA gene sequences, a total of seven genera were identified in the present study. Therefore, these bacterial strains exhib-iting phosphate-solubilizing activity presented large spectrum of microbial diversity, and the present results were consistent with previous findings (Johri, 2011).
Notably, strain M11 belonged to genus Ochrobactrum, which will help us further understand this genus.
Considering the low solubility of phosphorus in plant rhizosphere soil, three highest phosphorus-dis-solving isolates were used to determine their beneficial effects on tomato growth under greenhouse conditions. The inoculation of three isolates M01, M04, and M11 significantly increased the tomato’s shoot and root dry weight. This finding indicated that PSB could stimu-late early root growth in tomato seedling. Simultane-ous growth promotion as the result of PSB inoculations leads to an increase in the yield of maize and other cere-als (Ullah and Bano, 2015). The significant increase in plant dry weight caused by the inoculation with PSB strains has also been reported in other plants, such as walnut plant seedlings and wheat (Yu et al., 2011; Afshan et al., 2015). The present results were in agree-ment with those reported for greenhouse experiments. Hence, inoculation with PSB might have released con-siderable amount of available P in plant root, which were utilized by plants in the pot experiment. Based on 16S rRNA gene sequence comparisons and phyloge-netic positions, isolates M01 and M04 belonged to the genus Acinetobacter, and M11 belonged to the genus Ochrobactrum sp. To date, few reports have revealed that genus Ochrobactrum possesses phosphate-dis-solving ability. The use of PSB as inoculants would minimize the negative impact of chemical fertilizers on the environment and promote plant growth. Taken together, the selection of an efficient PSB strain as pos-sible inoculants should be based not only on the labo-ratory assays and greenhouse trails, but also in field experiments. Further studies should be focused on the practical applications in the field.
Conclusion
A total of 13 strains were isolated in this study. Most of the isolates displayed plant growth-promoting traits, thereby indicating that they have doable function for enhancing plant growth. The present findings suggest that waste mushroom residues are a potential resource of plant growth-promoting bacteria. Furthermore, the obtained isolates exhibited satisfactory phosphate-solu-bilizing activity for application in sustainable agriculture.
Disclosure statementThe authors declare that they have no competing interests.
AcknowledgmentsWe thank two anonymous reviewers for their constructive
comments. We also thank Xueliang Sun and Shaojun Ma for their assistance in the experiment. This work was supported by the Dean’s Youth Innovation Fund from Anhui Academy of Agricultural Sciences (15B0331), and the Fund of Innovation Team from Anhui Academy of Agricultural Sciences (14C0314).
Isolation of PSB from mushroom residues1 65
Literature
Adesemoye A.O., H.A. Torbert and J.W. Kloepper. 2009. Plant growth-promoting rhizobacteria allow reduced application rates of chemical fertilizers. Microbial Ecol. 58: 921–929.Afshan M., M. Kaleem, A. Sohail, H. Asma and I. Nasir. 2015. Iso-lation and characterization of plant growth-promoting rhizobacteria from wheat rhizosphere and their effect on plant growth promotion. Front. Microbiol. 1: 6.Alam M.M. and J.K. Ladha. 2004. Optimizing phosphorus ferti-lization in an intensive vegetable-rice cropping system. Biol. Fert. Soils. 40: 277–283.Chopade B.A., D.P. Sachdev, H.G. Chaudhari, V.M. Kasture and D.D. Dhavale. 2009. Isolation and characterization of indole acetic acid (IAA) producing Klebsiella pneumoniae strains from rhizo-sphere of wheat (Triticum aestivum) and their effect on plant growth. In. J. Exp. Biol. 47: 993–1000.Chung H., M. Park, M. Madhaiyan, S. Seshadri, J. Song, H. Cho and T. Sa. 2005. Isolation and characterization of phosphate solu-bilizing bacteria from the rhizosphere of crop plants of Korea. Soil Biol. Biochem. 37: 1970–1974.Ding Y., J. Wang, Y. Liu and S. Chen. 2005. Isolation and identifi-cation of nitrogen-fixing bacilli from plant rhizospheres in Beijing region. J. Appl. Microbiol. 99: 1271–1281.Fernández L., P. Zalba, M. Gómez and M. Sagardoy. 2007. Phos-phate-solubilization activity of bacterial strains in soil and their effect on soybean growth under greenhouse conditions. Biol. Fert. Soils. 43: 805–809.Gordon S.A. and R.P. Weber. 1951. Colorimetric estimation of indoleacetic acid. Plant Physiol. 26: 192.Grönemeyer J., C. Burbano, T. Hurek and B. Reinhold-Hurek. 2011. Isolation and characterization of root-associated bacteria from agricultural crops in the Kavango region of Namibia. Plant and Soil. 356: 67–82.Guiñazú L.B., J.A. Andrés, M.F. Del Papa, M. Pistorio and S.B. Rosas. 2010. Response of alfalfa (Medicago sativa L.) to single and mixed inoculation with phosphate-solubilizing bacteria and Sinorhizobium meliloti. Biol. Fert. Soils. 46:185–190.Gulati A., N. Sharma, P. Vyas, S. Sood, P. Rahi, V. Pathania and R. Prasad. 2010. Organic acid production and plant growth pro-motion as a function of phosphate solubilization by Acinetobacter rhizosphaerae strain BIHB 723 isolated from the cold deserts of the trans-Himalayas. Arch. Microbiol. 192: 975–983.Gyaneshwar P., G. Naresh Kumar, L.J. Parekh and P.S. Poole. 2002. Role of soil microorganisms in improving P nutrition of plants. Plant and Soil 245: 83–93.Hafeez F.Y., S. Yasmin, D. Ariani, U.R. Mehboob, R.Y. Zafar and K.A. Malik. 2006. Plant growth-promoting bacteria as biofertilizer. Agron. Sust. Develop. 26: 143–150.Hoagland D.R. and D.I. Arnon. 1950. The water-culture method for growing plants without soil. Circ. Calif. Agric. Exp. Stn. 347: 4–31.Holt J.G., N.R. Kreig, P.H.A. Sneath, J.T. Staley and S.T. Williams. 1994. Bergey’s manual of determinative bacteriology. Williams and Wilkins, Baltimore, USA.Johri B. 2011. Bacterial diversity in a bagasse-based compost pre-pared for the cultivation of edible mushrooms Agaricus bisporus. J. Agr. Technol. 7: 1303–1311.Johri J.K., S. Surange and C.S. Nautiyal. 1999. Occurrence of salt, pH, and temperature-tolerant, phosphate-solubilizing bacteria in alkaline soils. Curr. Microbiol. 39: 89–93.Kumar R.S., N. Ayyadurai, P. Pandiaraja, A.V. Reddy, Y. Ven-kateswarlu, O. Prakash and N. Sakthivel. 2005. Characterization of antifungal metabolite produced by a new strain Pseudomonas aeruginosa PUPa3 that exhibits broad-spectrum antifungal activity and biofertilizing traits. J. Appl. Microbiol. 98: 145–154.
Laguerre G., M.R. Allard, F. Revoy and N. Amarger. 1994. Rapid identification of rhizobia by restriction fragment length polymor-phism analysis of PCR-amplified 16S rRNA genes. Appl. Environ. Microbiol. 60: 56–63.Li H.J., H.Y. Chen, L.L. Fan, Z.H. Jiao, Q.H. Chen and Y.C. Jiao. 2015. In vitro antioxidant activities and in vivo anti-hypoxic activity of the edible mushroom Agaricus bisporus (lange) sing. chaidam. Molecules. 20: 17775.Liu X., L. Wang, C. Zhang, H. Wang, X. Zhang and Y. Li. 2015. Structure characterization and antitumor activity of a polysaccha-ride from the alkaline extract of king oyster mushroom. Carbohy. Poly. 118: 101–106.Nautiyal C.S. 1999. An efficient microbiological growth medium for screening phosphate solubilizing microorganisms. FEMS Microbiol. Lett. 170: 265–270.Park J.H., N. Bolan, M. Megharaj and R. Naidu. 2011, Isolation of phosphate solubilizing bacteria and their potential for lead immo-bilization in soil. J. Hazard. Mater. 185: 829–836.Park M., C. Kim, J. Yang, H. Lee, W. Shin, S. Kim and T. Sa. 2005. Isolation and characterization of diazotrophic growth promoting bacteria from rhizosphere of agricultural crops of Korea. Microbiol. Res. 160: 127–133.Poonguzhali S., M. Madhaiyan and T. Sa. 2008. Isolation and iden-tification of phosphate solubilizing bacteria from chinese cabbage and their effect on growth and phosphorus utilization of plants. J. Microbiol. Biotechnol. 18: 773–777.Puente M., C. Li and Y. Bashan. 2004. Microbial populations and activities in the rhizoplane of rock-weathering desert plants. II. Growth promotion of cactus seedlings. Plant Biol. 6: 643–650.Rodríguez H. and R. Fraga. 1999. Phosphate solubilizing bacteria and their role in plant growth promotion. Biotechnol. Adv. 17: 319–339.Sæbø A. and F. Ferrini. 2006. The use of compost in urban green areas-A review for practical application. Urban. Urban. Greening. 4: 159–169.Sambrook J., E.F. Fritsch and T. Maniatis. 1989. Molecular cloning: a laboratory manual. Cold Spring Harbor Press, New York.Schwyn B. and J.B. Neilands. 1987. Universal chemical assay for the detection and determination of siderophores. Analy. Biochem. 160: 47–56.Tamura K., J. Dudley, M. Nei and S. Kumar. 2007. MEGA4: Mole-cular Evolutionary Genetics Analysis (MEGA) software version 4.0. Mol. Biol. Evol. 24: 1596–1599.Teather R.M. and P.J. Wood. 1982. Use of congo red-polysaccharide interactions in enumeration and characterization of cellulolytic bac-teria from the bovine rumen. Appl. Environ. Microbiol. 43: 777–780.Ullah S. and A. Bano. 2015. Isolation of plant-growth-promoting rhizobacteria from rhizospheric soil of halophytes and their impact on maize (Zea mays L.) under induced soil salinity. Can. J. Microbiol. 61: 307–313.Vassilev N. and M. Vassileva. 2003. Biotechnological solubilization of rock phosphate on media containing agroindustrial wastes. Appl. Environ. Microbiol. 61: 435–440.Vessey J.K. 2003. Plant growth promoting rhizobacteria as bio-fertilizers. Plant and Soil 255: 571–586.Watanabe F. and S. Olsen. 1965. Test of an ascorbic acid method for determining phosphorus in water and NaHCO3 extracts from soil. Soil Sci. Soci. Ame. J. 29: 677–678.Yegorenkova I.V., S.A. Konnova, V.N. Sachuk and V.V. Ignatov. 2001. Azospirillum brasilense colonisation of wheat roots and the role of lectin-carbohydrate interactions in bacterial adsorption and root-hair deformation. Plant and Soil 231: 275–282.Yu X., X. Liu, T. Zhu, G. Liu and C. Mao. 2011. Isolation and characterization of phosphate-solubilizing bacteria from walnut and their effect on growth and phosphorus mobilization. Biol. Fert. Soils. 47: 437–446.

Polish Journal of Microbiology2017, Vol. 66, No 1, 67–74
ORIGINAL PAPER
* Corresponding author: I. Porębska, Prof. Wacław Dąbrowski Institute of Agricultural and Food Biotechnology, Department of Fruit and Vegetable Product Technology, Warsaw, Poland; e-mail: [email protected]
Introduction
Alicyclobacillus acidoterrestris, a gram-positive, ther-moacidophilic, spore forming bacterium, is a frequent contaminant of juices and is a common spoilage micro-organism in the processing industry. Due to its ability to undergo sporulation in an acidic environment, and to spoil juices by producing undesirable off-flavours (Sokołowska, 2014; Tianli et al., 2014), comprehen-sive knowledge about the germination of A. acidoter-restris spores is of general interest. The germination of A. acido terrestris spores, and their subsequent out-growth or inactivation, can be induced by external fac-tors such as high hydrostatic pressure (Wuytack et al., 2000; Vercammen et al., 2012; Sokołowska et al., 2013; 2015; Porębska et al., 2015a) or supercritical carbon dioxide (Bae et al., 2009; Porębska et al., 2016). The data indicate that within Bacillus species, the germination of spores can also be induced by various nutrients: amino acids, purine nucleosides, sugars (Lovdal et al., 2012), L-alanine (Parades-Sabja et al., 2011; Kuwana and Taka-
matsu, 2013; Cruz-Mora et al., 2015), ions and combi-nations of these, and a mixture of asparagine, glucose, fructose and potassium ions (AGFK) (Gosh et al., 2012; Stewart et al., 2012).
The mechanism of spore germination is very com-plex and has been the subject of many studies (Setlow et al., 2008; Parades-Sabja et al., 2011; Luu and Setlow, 2014; Bevilacqua et al., 2015; Luu et al., 20 15; Troiano et al., 2015). Nutrients initiate spore germination by binding to the germination receptors (GRs), located in the spore’s inner membrane which rapidly degrades the cortex peptidoglycan. Water is taken up, calcium dipico-linate (Ca-DPA) is released and a variety of spore con-stituents are degraded by hydrolytic enzymes. Although proteins which are likely candidates for DPA channels in the spore membranes have been identified, as yet there is no understanding of how the Ger receptors interacti on triggers the earliest events in spore germination, includ-ing the release of DPA and cations (Setlow et al., 2006).
Each Ger receptor can detect a specific germinant, including amino acids, nucleosides, sugars and cations.
Dipicolinic Acid Release and the Germinationof Alicyclobacillus acidoterrestris Spores under Nutrient Germinants
IZABELA PORĘBSKA1*, BARBARA SOKOŁOWSKA1, 2 and ŁUKASZ WOŹNIAK1
1 Prof. Wacław Dąbrowski Institute of Agriculture and Food Biotechnology, Department of Fruitand Vegetable Product Technology, Warsaw, Poland
2 Institute of High Pressure Physic of Polish Academy of Sciences, Laboratory of Biomaterials, Warsaw, Poland
Submitted 29 April 2016, accepted 30 July 2016
A b s t r a c t
The presence of Alicyclobacillus, a thermoacidophilic and spore-forming bacterium, in acidic fruit juices poses a serious problem for the processing industry. A typical sign of spoilage in contaminated juices is a characteristic phenolic off-flavour associated with the produc-tion of guaiacol. Spores are formed in response to starvation and in a natural environment re-access the nutrients, e.g.: L-alanine and AGFK – a mixture of asparagine, glucose, fructose and potassium, triggers germination. The aim of this study was to estimate the impact of L-alanine and AGFK on the germination of the spores of two Alicyclobacillus acidoterrestris strains and to evaluate the relationship of the germination rate with dipicolinic acid (DPA) release. The spores were suspended in apple juice or in buffers at pH 4 and pH 7, followed by the addition of L-alanine and AGFK. Suspensions were or were not subjected, to a temperature of 80°C/10 min and incubated for various periods of time at 45°C. Optical density (OD660) was used to estimate the number of germinated spores. The amount of DPA released was determined using HPLC. The results indicate that the degree of germination of A. acidoterrestris spores depended on the strain and time of incubation and the nutritious compounds used. The data obtained show that the amount of DPA released correlated to the number of A. acidoterrestris spores germinated.
K e y w o r d s: Alicyclobacillus acidoterrestris, AGFK mixture, dipicolinic acid, L-alanine, spore germination
Porębska I. et al. 168
Thus, expressing multiple Ger receptor operons allows spores to respond to structurally diverse compounds. Different Ger receptors can cooperate to recognize a single germinant or multiple germinants (Moir et al., 2002; Moir, 2006; Ross and Abel-Santos, 2010; Mong-kolthanaruk et al., 2013).
The mechanism whereby individual GRs can cooper-ate to recognize a single germinant or multiple germi-nants to allow or accelerate germination is not known. However, it has been suggested that either various individual GRs form complexes in the spore’s inner membrane or there is a mechanism which integrates signals from various individual GRs or GR complexes and that this integration determines the ultimate rate of germination (Yi et al., 2011). For example L-alanine and AGFK mixture as the nutrient germinants in the spore germination process may be involved in integrat-ing signals from different GRs (Parades-Sabja et al., 2011; Wang et al., 2015). During spore germination, Ca-DPA release is preceded by the loss of resistance to heat, the release of Na+, K+, H+, and Zn2+, and a signifi-cant change in the elastic light-scattering intensity from individual spores (Luu and Setlow, 2014).
In the case of Bacillus subtilis, the GRs are encoded by homologous tricistronic GerA, GerB and GerK oper-ons. Each of these GRs contains A, B and C sub-units, all of which are required for the function of the individ-ual GR. The GerA receptor responds to either L-alanine or valine, while the GerB and GerK receptors together are essential for germination in a AGFK mixture (Yi et al., 2011; Stewart et al., 2012; Chen et al., 2014).
In general, the model for bacterial spore germi-nation for Bacillus and Clostridium is known, and is associated with the expression of Ger proteins. The Ger family germination protein can also be found in Alicyclobacillus [http://www.ncbi.nlm.nih.gov/protein/YP_003184683.1?report=genpept].
L-alanine is a common germinant for both Bacillus and Clostridia species. L-alanine-mediated germina-tion has been characterized mostly in B. subtilis spores (McCann et al., 1996; Ramirez-Peralta et al., 2012). However, L-alanine can also induce the germination of B. cereus (Barlass et al., 2002), B. anthracis (Fisher and Hanna, 2005), B. megaterium (Christie and Lowel, 2007), B. lichenoformis (Lovdal et al., 2012), C. botuli-num (Broussolle et al., 2002), C. sporogenes (Broussolle et al., 2002), C. perfringes (Parades-Sabja et al., 2008) and C. sordellii (Ramirez and Abel-Santos, 2010). In fact L-alanine seems to be the most ubiquitous germi-nant for bacterial spores. There are data indicating that high hydrostatic pressures of 200 MPa – 400 MPa also trigger germination through the GerA, GerB and GerK receptors (Parades-Sabja et al., 2011).
To understand the molecular determinants of Ger receptor interactions and their effect on germinant
recognition, the kinetic method can be used to study bacterial spore germination (Abel-Santos and Dodatko, 2007; Akoachere et al., 2007; Ramirez and Abel-Santos, 2010; Zhang J. et al., 2011; Zhang P. et al., 2010; 2014; Brunt et al., 2014). Spore germination can be ana-lysed by optical density decreases (Terano et al., 2005; Akoachere et al., 2007; Brunt et al., 2014; Nagler et al., 2015; Porębska et al., 2015a).
The aim of this study was to characterize the process of spore germination in two A. acidoterrestris strains, initiated by L-alanine and AGFK, and to evaluate the relationship between DPA release and the germination of A. acidoterrestris spores induced by these biochemi-cal substances. This study is an attempt to expand the current state of knowledge concerning the mechanism of the A. acidoterrestris spore germination process, the variations in spore population and the factors stimulat-ing this process.
Experimental
Materials and Methods
Tested organisms. The A. acidoterrestris strains TO-169/06 and TO-117/02 used in this study were isolated from Polish concentrated apple juice, using the International Federation of Fruit Juice Producers’ method (2004/2007). These strains were selected from among eight wild strains tested previously (Skąpska et al., 2012; Porębska et al., 2015a; 2015b; 2016). TO-117/02 was the strain highly resistant to tempera-ture and HHP and TO-169/06 was the sensitive one.
Spore production. Spores were produced based on a method described by Sokołowska et al. (2012). Just before the experiments, the spores (> 95% phase bright – ungerminated) were suspended in apple juice (11.2 Bx, pH 3.4) or in a McIlvain buffer solution of pH 4.0 and pH 7.0. L-alanine (50 mM) or AGFK (50 mM) were then added to the samples, which were afterwards subjected, or not subjected, to a temperature of 80°C/10 min and incubated at 45°C (Bevilacqua et al., 2014). The number of spores in the suspensions was approximately 6 log cfu/ml for determining spore germination using the drop in optical density, and approximately 9 log cfu/ml for determining the release of dipicolinic acid.
Optical density measurement. The optical den-sity (OD660) of the spore suspensions was measured at a wavelength of 660 nm in a UV/Visible spectro-photometer Ultrospec 2000 (Pharmacia Biotech Ltd., England). To estimate the effect of the process param-eters on the dynamics of spore germination, the drop in optical density was expressed as the ratio (OD660 dur-ing germination/OD660 before germination) × 100% (Terano et al., 2005; Kato et al., 2009; Pandey et al., 2013;
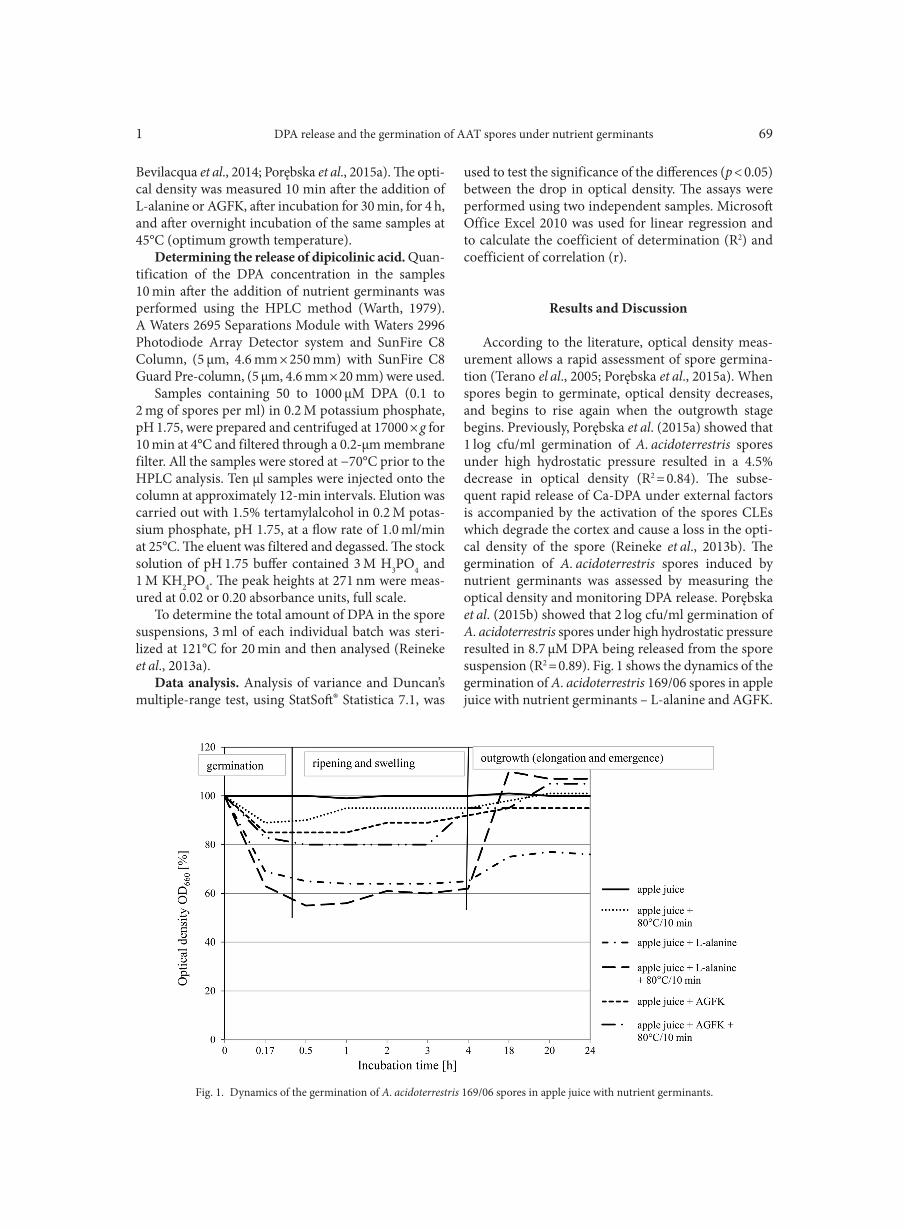
DPA release and the germination of AAT spores under nutrient germinants1 69
Bevilacqua et al., 2014; Porębska et al., 2015a). The opti-cal density was measured 10 min after the addition of L-alanine or AGFK, after incubation for 30 min, for 4 h, and after overnight incubation of the same samples at 45°C (optimum growth temperature).
Determining the release of dipicolinic acid. Quan-ti fication of the DPA concentration in the samples 10 min after the addition of nutrient germinants was performed using the HPLC method (Warth, 1979). A Waters 2695 Separations Module with Waters 2996 Photodiode Array Detector system and SunFire C8 Column, (5 µm, 4.6 mm × 250 mm) with SunFire C8 Guard Pre-column, (5 µm, 4.6 mm × 20 mm) were used.
Samples containing 50 to 1000 µM DPA (0.1 to 2 mg of spores per ml) in 0.2 M potassium phosphate, pH 1.75, were prepared and centrifuged at 17000 × g for 10 min at 4°C and filtered through a 0.2-µm membrane filter. All the samples were stored at −70°C prior to the HPLC analysis. Ten µl samples were injected onto the column at approximately 12-min intervals. Elution was carried out with 1.5% tertamylalcohol in 0.2 M potas-sium phosphate, pH 1.75, at a flow rate of 1.0 ml/min at 25°C. The eluent was filtered and degassed. The stock solution of pH 1.75 buffer contained 3 M H3PO4 and 1 M KH2PO4. The peak heights at 271 nm were meas-ured at 0.02 or 0.20 absorbance units, full scale.
To determine the total amount of DPA in the spore suspensions, 3 ml of each individual batch was steri-lized at 121°C for 20 min and then analysed (Reineke et al., 2013a).
Data analysis. Analysis of variance and Duncan’s multiple-range test, using StatSoft® Statistica 7.1, was
used to test the significance of the differences (p < 0.05) between the drop in optical density. The assays were performed using two independent samples. Microsoft Office Excel 2010 was used for linear regression and to calculate the coefficient of determination (R2) and coefficient of correlation (r).
Results and Discussion
According to the literature, optical density meas-urement allows a rapid assessment of spore germina-tion (Terano el al., 2005; Porębska et al., 2015a). When spores begin to germinate, optical density decreases, and begins to rise again when the outgrowth stage begins. Previously, Porębska et al. (2015a) showed that 1 log cfu/ml germination of A. acidoterrestris spores under high hydrostatic pressure resulted in a 4.5% decrease in optical density (R2 = 0.84). The subse-quent rapid release of Ca-DPA under external factors is accompanied by the activation of the spores CLEs which degrade the cortex and cause a loss in the opti-cal density of the spore (Reineke et al., 2013b). The germination of A. acidoterrestris spores induced by nutrient germinants was assessed by measuring the optical density and monitoring DPA release. Porębska et al. (2015b) showed that 2 log cfu/ml germination of A. acidoterrestris spores under high hydrostatic pressure resulted in 8.7 μM DPA being released from the spore suspension (R2 = 0.89). Fig. 1 shows the dynamics of the germination of A. acidoterrestris 169/06 spores in apple juice with nutrient germinants – L-alanine and AGFK.
Fig. 1. Dynamics of the germination of A. acidoterrestris 169/06 spores in apple juice with nutrient germinants.
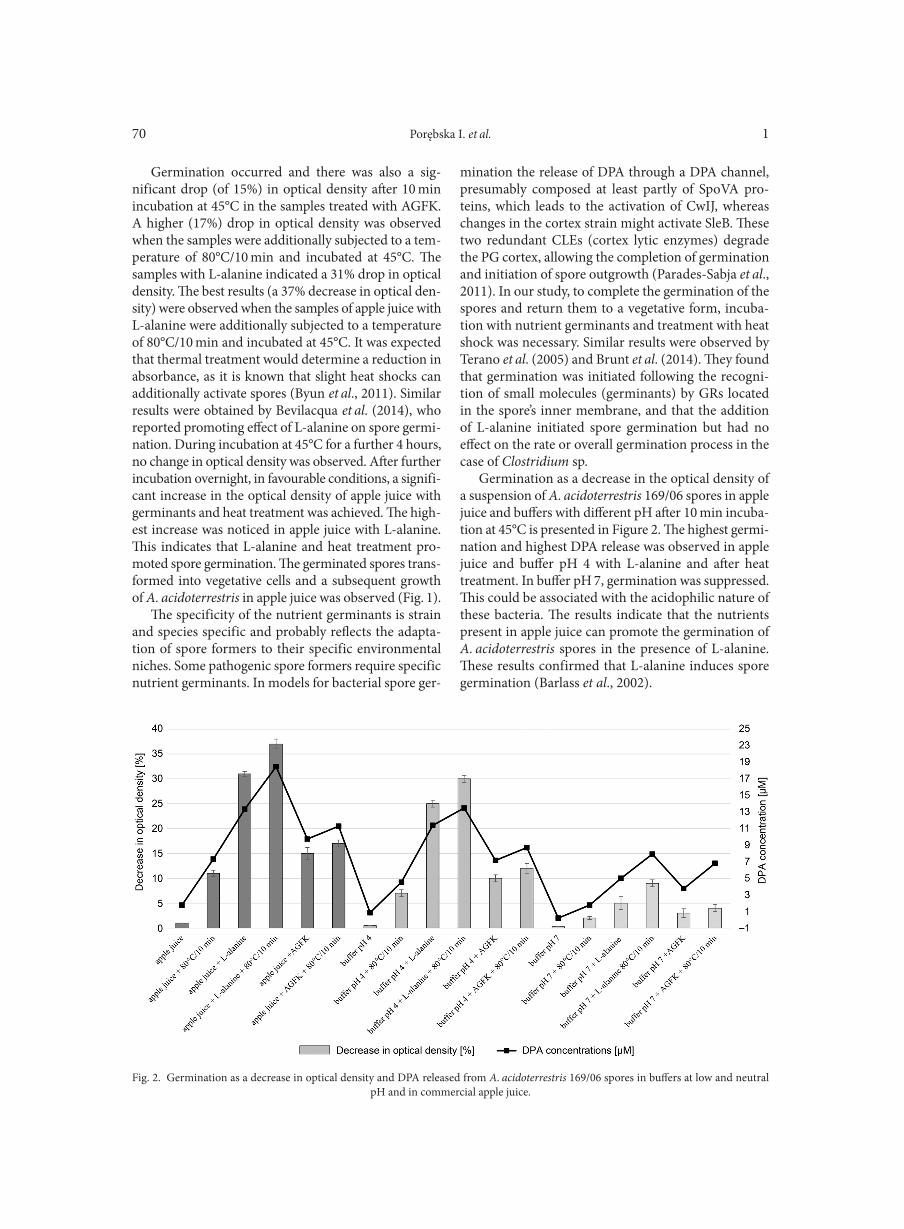
Porębska I. et al. 170
Germination occurred and there was also a sig-nificant drop (of 15%) in optical density after 10 min incubation at 45°C in the samples treated with AGFK. A higher (17%) drop in optical density was observed when the samples were additionally subjected to a tem-perature of 80°C/10 min and incubated at 45°C. The samples with L-alanine indicated a 31% drop in optical density. The best results (a 37% decrease in optical den-sity) were observed when the samples of apple juice with L-alanine were additionally subjected to a temperature of 80°C/10 min and incubated at 45°C. It was expected that thermal treatment would determine a reduction in absorbance, as it is known that slight heat shocks can additionally activate spores (Byun et al., 2011). Similar results were obtained by Bevilacqua et al. (2014), who reported promoting effect of L-alanine on spore germi-nation. During incubation at 45°C for a further 4 hours, no change in optical density was observed. After further incubation overnight, in favourable conditions, a signifi-cant increase in the optical density of apple juice with germinants and heat treatment was achieved. The high-est increase was noticed in apple juice with L-alanine. This indicates that L-alanine and heat treatment pro-moted spore germination. The germinated spores trans-formed into vegetative cells and a subsequent growth of A. acidoterrestris in apple juice was observed (Fig. 1).
The specificity of the nutrient germinants is strain and species specific and probably reflects the adapta-tion of spore formers to their specific environmental niches. Some pathogenic spore formers require specific nutrient germinants. In models for bacterial spore ger-
mination the release of DPA through a DPA channel, presumably composed at least partly of SpoVA pro-teins, which leads to the activation of CwIJ, whereas changes in the cortex strain might activate SleB. These two redundant CLEs (cortex lytic enzymes) degrade the PG cortex, allowing the completion of germination and initiation of spore outgrowth (Parades-Sabja et al., 2011). In our study, to complete the germination of the spores and return them to a vegetative form, incuba-tion with nutrient germinants and treatment with heat shock was necessary. Similar results were observed by Terano et al. (2005) and Brunt et al. (2014). They found that germination was initiated following the recogni-tion of small molecules (germinants) by GRs located in the spore’s inner membrane, and that the addition of L-alanine initiated spore germination but had no effect on the rate or overall germination process in the case of Clostridium sp.
Germination as a decrease in the optical density of a suspension of A. acidoterrestris 169/06 spores in apple juice and buffers with different pH after 10 min incuba-tion at 45°C is presented in Figure 2. The highest germi-nation and highest DPA release was observed in apple juice and buffer pH 4 with L-alanine and after heat treatment. In buffer pH 7, germination was suppressed. This could be associated with the acidophilic nature of these bacteria. The results indicate that the nutrients present in apple juice can promote the germination of A. acidoterrestris spores in the presence of L-alanine. These results confirmed that L-alanine induces spore germination (Barlass et al., 2002).
Fig. 2. Germination as a decrease in optical density and DPA released from A. acidoterrestris 169/06 spores in buffers at low and neutral pH and in commercial apple juice.
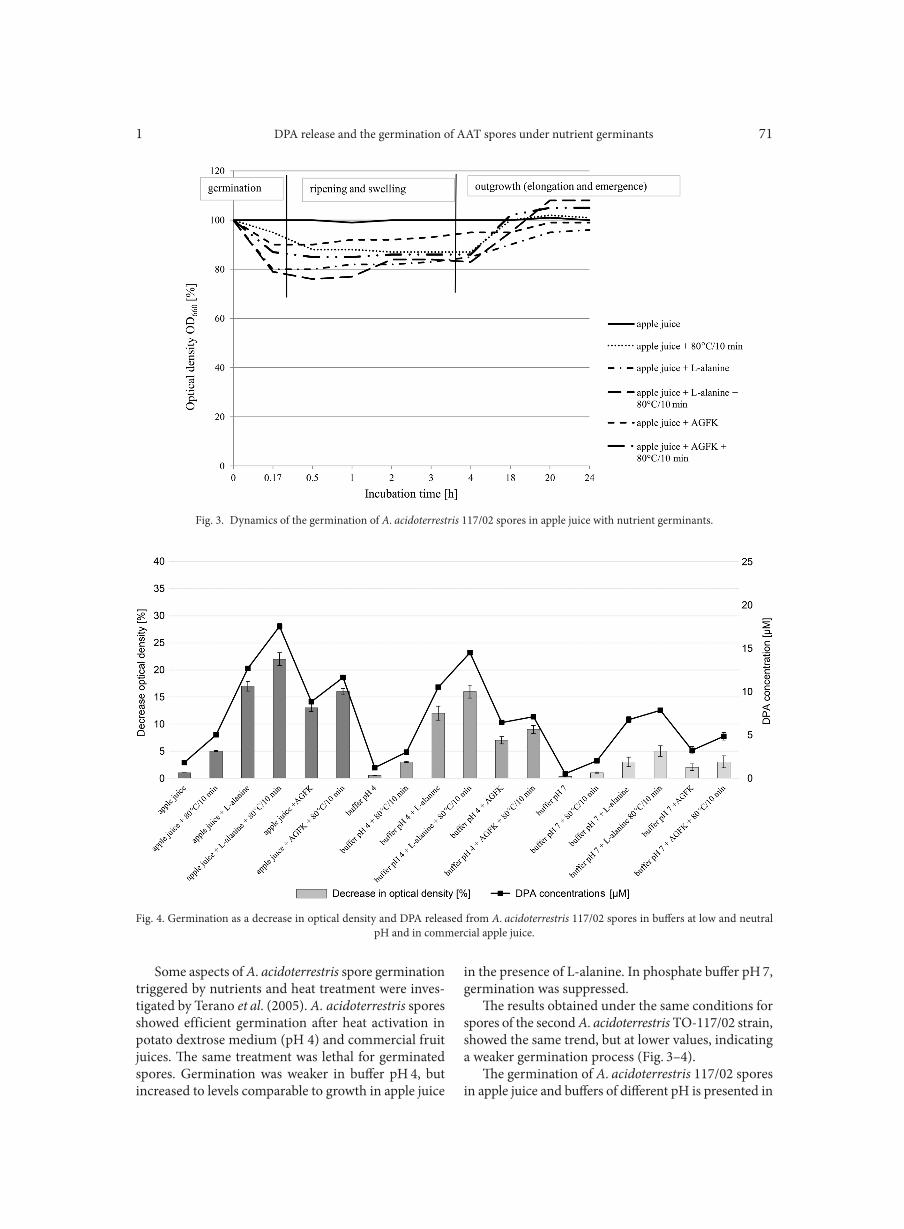
DPA release and the germination of AAT spores under nutrient germinants1 71
Some aspects of A. acidoterrestris spore germination triggered by nutrients and heat treatment were inves-tigated by Terano et al. (2005). A. acidoterrestris spores showed efficient germination after heat activation in potato dextrose medium (pH 4) and commercial fruit juices. The same treatment was lethal for germinated spores. Germination was weaker in buffer pH 4, but increased to levels comparable to growth in apple juice
in the presence of L-alanine. In phosphate buffer pH 7, germination was suppressed.
The results obtained under the same conditions for spores of the second A. acidoterrestris TO-117/02 strain, showed the same trend, but at lower values, indicating a weaker germination process (Fig. 3–4).
The germination of A. acidoterrestris 117/02 spores in apple juice and buffers of different pH is presented in
Fig. 3. Dynamics of the germination of A. acidoterrestris 117/02 spores in apple juice with nutrient germinants.
Fig. 4. Germination as a decrease in optical density and DPA released from A. acidoterrestris 117/02 spores in buffers at low and neutral pH and in commercial apple juice.
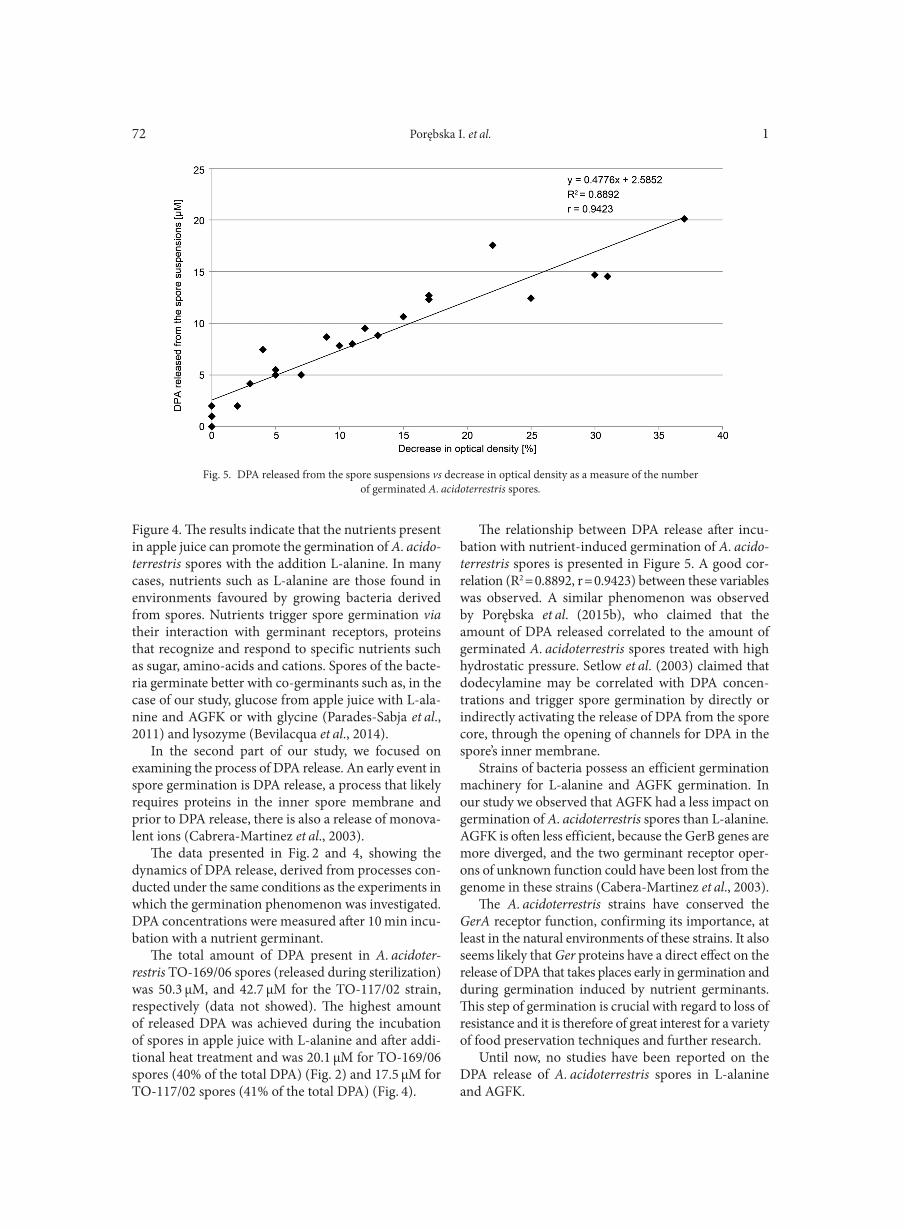
Porębska I. et al. 172
Figure 4. The results indicate that the nutrients present in apple juice can promote the germination of A. acido-terrestris spores with the addition L-alanine. In many cases, nutrients such as L-alanine are those found in environments favoured by growing bacteria derived from spores. Nutrients trigger spore germination via their interaction with germinant receptors, proteins that recognize and respond to specific nutrients such as sugar, amino-acids and cations. Spores of the bacte-ria germinate better with co-germinants such as, in the case of our study, glucose from apple juice with L-ala-nine and AGFK or with glycine (Parades-Sabja et al., 2011) and lysozyme (Bevilacqua et al., 2014).
In the second part of our study, we focused on examining the process of DPA release. An early event in spore germination is DPA release, a process that likely requires proteins in the inner spore membrane and prior to DPA release, there is also a release of monova-lent ions (Cabrera-Martinez et al., 2003).
The data presented in Fig. 2 and 4, showing the dynamics of DPA release, derived from processes con-ducted under the same conditions as the experiments in which the germination phenomenon was investigated. DPA concentrations were measured after 10 min incu-bation with a nutrient germinant.
The total amount of DPA present in A. acidoter-restris TO-169/06 spores (released during sterilization) was 50.3 µM, and 42.7 μM for the TO-117/02 strain, respectively (data not showed). The highest amount of released DPA was achieved during the incubation of spores in apple juice with L-alanine and after addi-tional heat treatment and was 20.1 µM for TO-169/06 spores (40% of the total DPA) (Fig. 2) and 17.5 µM for TO-117/02 spores (41% of the total DPA) (Fig. 4).
The relationship between DPA release after incu-bation with nutrient-induced germination of A. acido-terrestris spores is presented in Figure 5. A good cor-relation (R2 = 0.8892, r = 0.9423) between these variables was observed. A similar phenomenon was observed by Porębska et al. (2015b), who claimed that the amount of DPA released correlated to the amount of germinated A. acidoterrestris spores treated with high hydrostatic pressure. Setlow et al. (2003) claimed that dodecylamine may be correlated with DPA concen-trations and trigger spore germination by directly or indirectly activating the release of DPA from the spore core, through the opening of channels for DPA in the spore’s inner membrane.
Strains of bacteria possess an efficient germination machinery for L-alanine and AGFK germination. In our study we observed that AGFK had a less impact on germination of A. acidoterrestris spores than L-alanine. AGFK is often less efficient, because the GerB genes are more diverged, and the two germinant receptor oper-ons of unknown function could have been lost from the genome in these strains (Cabera-Martinez et al., 2003).
The A. acidoterrestris strains have conserved the GerA receptor function, confirming its importance, at least in the natural environments of these strains. It also seems likely that Ger proteins have a direct effect on the release of DPA that takes places early in germination and during germination induced by nutrient germinants. This step of germination is crucial with regard to loss of resistance and it is therefore of great interest for a variety of food preservation techniques and further research.
Until now, no studies have been reported on the DPA release of A. acidoterrestris spores in L-alanine and AGFK.
Fig. 5. DPA released from the spore suspensions vs decrease in optical density as a measure of the numberof germinated A. acidoterrestris spores.
DPA release and the germination of AAT spores under nutrient germinants1 73
Conclusions
The presence of L-alanine and AGFK in the environ-ment stimulated spore germination. The results indi-cate that the degree of germination of A. acidoterrestris spores depended on the strain and medium. Optical density is a fast and effective method for estimating the dynamics of spore germination. The results showed a greater decrease in optical density after incubation with L-alanine than with AGFK, and a subsequent increase of this parameter after overnight incubation at 45°C. It is worth noting that heat treatment addi-tionally stimulated the increase in the rate of germina-tion of spores. This indicates the start of the next phase, outgrowth. These results may show that the strains of A. acidoterrestris tested are dominated by the presence of GerA receptors. A slight decrease in the germina-tion of spores was observed with an increase in the pH, while a lower pH was conducive to germination. The nutrients in apple juice also can stimulate A. acidoter-restris spores to germinate. The process of DPA release from the spores depended on the strain and biochemi-cal substances. The amount of DPA released correlated to the amount of A. acidoterrestris spores germinated.
Literature
Abel-Santos E. and T. Dodatko. 2007. Differential nucleoside recog nition during Bacillus cereus 569 (ATCC 10876) spore germi-nation. New J. Chem. 31: 748–755.Akoachere M., R.C. Squires, A.M. Nour, L. Angelov, J. Brojatsch and E.V. Abel-Santos. 2007. Identification of an in vivo inhibitor of Bacillus anthracis Sterne spore germination. J. Biol. Chem. 282: 12112–12118. Bae Y.Y., H.J. Lee, S.A. Kim and M.S. Rhee. 2009. Inactivation of Alicyclobacillus acidoterrestris spores in apple juice by supercritical carbon dioxide. Int. J. Food Microbiol. 136(1): 95–100.Barlass P.J., C.W. Houston, M.O. Clements and A. Moir. 2002. Germination of Bacillus cereus spores in response to L-alanine and to nosine: the roles of gerL and gerQ operons. Microbiol. 148: 2089–2095.Bevilacqua A., E. Ciuffreda, M. Sinigaglia and M.R. Corbo. 2014. Effects of lysozyme on Alicyclobacillus acidoterrestris under labora-tory conditions. Int. J. Food Sci. Technol. 49: 224–229.Bevilacqua A., E. Ciufureda, M. Sinigaglia and M. Rosario Corbo. 2015. Spore inactivation and DPA release in Alicyclobacillus acidoterrestris under stress conditions. Food Microbiol. 46: 299–306.Broussolle V., F. Alberto, C.A. Shearman, D.R. Mason, L. Botella, C. Nguyen, M.W. Peck and F. Carlin. 2002. Molecular and physi-ological characterisation of spore germination in Clostridium botu-linum and Clostridium sporogenes. Anaerobe 8:89–100.Brunt J., J. Plowman, D.K. Gaskin, M. Itchner, A.T. Carter and M.W. Peck. 2014. Functional characterisation of germinant recep-tors in Clostridium botulinum and Clostridium sporogenes pres-ent novel insights into spore germination system. Plos One 10(9): e1004382.Byun B.Y., Y. Liu and J. Tang. 2011. Optimization and evaluation of heat-shock condition for spore enumeration being used in thermal-process verification: differentaial responses of spores and vegetative
cells of Clostridium sporogenes to heat shock. Food Sci. Biotechnol. 20: 751–757.Cabera-Martinez R.M., F. Tovar-Rojo, V.R. Vepachedu and P. Set-low. 2003. Effect of overexpressiom of nutrient receptors on gemi-nation of spores of Bacilus subtilis. J. Bacteriol. 185(8): 2457–2464.Chen Y., W.K. Ray, R.F. Helm, S.B. Melville and D.L. Popham. 2014. Levels of germination proteins in Bacilluis subtilis dormant, superdormant, and germinating spores. Plos One 9(4): e95781. Christie G. and C.R. Lowel. 2008. Amino acid substitutions in trans- membrane domains 9 and 10 of GerVB that affect the germination properties of Bacillus megaterium spores. J. Bacteriol. 190: 8009–8017. Cruz-Mora J., A. Pérez-Valdespino, S. Gupta, N. Withange, R. Kuwana, H. Takamatsu, G. Christie and P. Setlow. 2015. The GerW protein is not involved in the germination of spores of Bacil-lus species. PLoS One 10(3): e0119125. Dodatko T., M. Akoachere, S.M. Muehlbauer, F. Helfrich, A. How-erton, C. Ross, V. Wysocki, J. Brojatsch and E. Abel-Santos. 2009. Bacillus cereus spores release alanine that synergizes with inosine to promote germination. PloS One 4(7): e6398.Fisher N. and P. Hanna. 2005. Characterization of Bacillus anthracis germinant receptors in vitro. J. Bacteriol. 187: 8055–8062. Ghosh S., M. Scotland and P. Setlow. 2012. Levels of germination proteins in dormant and superdormant spores of Bacillus subtilis. J. Bacteriol. 194(9):2221–2227.Kato S., A. Masayama, T. Yoshimura, H. Hemmi, H. Tsunoda, T. Kihara and R. Moriyama. 2009. Physiological role of carbon dioxide in spore germination of Clostridium perfringens S40. J. Biosci. Bioeng. 108(6): 477–483.Kuwana R. and H. Takamatsu. 2013. The GerW protein is essen-tial for L-alanine-stimulated germination of Bacillus subtilis spores. J. Biochem. 154(5): 409–417.Lovdal I.S., C. From, E.H. Madslien, K.C. Romundset, E. Kluf-terud, J.T. Rosnes and P.E. Granum. 2012. Role of the gerA operon in L-alanine germination of Bacillus lichenoformis spores. BMC Microbiol. 12: 34.Luu S. and P. Setlow. 2014. Analysis of the loss in heat and acid resistance during germination of spores of Bacillus species. J. Bac-teriol. 196(9): 1733–1740.Luu S., J. Cruz-Mora, B. Setlow, F.E. Feeherry, C.J. Doona and P. Setlow. 2015. The effects of heat activation on Bacillus spore ger-mination, with nutrients or under pressure, with or without various germination proteins. Appl. Env. Microbiol. 81(8): 2927–2938McCann K.P., C. Robinson, R.L. Sammons, D.A. Smith and B.M. Corfe. 1996. Alanine germination receptors of Bacillus subti-lis. Lett. Appl. Microbiol. 23: 290–294. Moir A., B.M. Corfe and J. Behravan. 2002. Spore germination. Cell Mol. Life Sci. 59: 403–409. Moir A. 2006. How do spores germinate? J. Appl. Microbiol. 101: 526–530. Mongkolthanaruk W., C. Robinson and A. Moir. 2013. Localiza-tion of the GerD spore germination protein in the Bacillus subtilis spore. Mocrobiol. 155: 1146–1151.Nagler K., P. Setlow, K. Reineke, A. Driks and R. Moleller. 2015. Involvment of coat proteins in Bacillus subtilis spore germination in high salinity environments. Appl. Env. Microbiol. 81(19): 6725–6735.Pandey R., A.T. Beek, N.O. Vischer, J.P. Smelt, S. Brul and E.M. Manders. 2013. Live cell imaging of germination and out-growth of individual Bacillus subtilis spores; the effect of heat stress quantitatively analyzed with SporeTracker. PLoS One 8(3): 1–10. Paredes-Sabja D., J.A. Torres, P. Setlow and M.R. Sarker. 2008. Clostridium perfringens spore germination: characterization of ger-minants and their receptors. J. Bacteriol. 190: 1190–1201. Parades-Sabja D., P. Setlow and M.R. Sarker. 2011. Germination of spores of Bacillus and Clostridiales species: mechanisms and proteins involved. Trends Microbiol. 19(2): 85–94.
Porębska I. et al. 174
Porębska I., M. Rutkowska and B Sokołowska. 2015a. Decrease in optical density as a results of germination of Alicyclobacillus acidoterrestris spores under high hydrostatic pressure. High Press. Res. 35(1): 89–97.Porębska I., B. Sokołowska, Ł. Woźniak, Skąpska. S., M. Fonberg-Broczek, S.J. Rzoska. 2015b. DPA release and germination of Alicy-clobacillus acidoterrestris under HHP. J. Nutr. Food Sci. 5: 6.Porębska I., B. Sokołowska and Ł. Łaniewska-Trokenheim. 2016. Effect of supercritical carbon dioxide on inactivation and germina-tion of Alicyclobacillus acidoterrestris spores) (in Polish). Żywność. Nauka. Technol. 1(104).Ramirez N. and E. Abel-Santos. 2010. Requirements for germina-tion of Clostridium sordellii spores in vitro. J. Bacteriol. 192: 418–425. Ramirez-Peralta A., P. Zhang and P. Setlow. 2012. Effect of sporu-lation conditions on the germination and germinations protein lev-els of Bacillus subtilis spores. Appl. Env. Microbiol. 78(8): 2689–2697.Reineke K., K. Schlumbach, D. Baier, A. Mathys and D. Knorr. 2013a. The release of dipicolinic acid – the rate-limiting step of Bacillus endospore inactivation during the high pressure thermal sterilization process. Int. J. Food Microbiol. 162: 55–63.Reineke K., A. Mathys, V. Heinz and D. Knorr. 2013b. Mechanisms of endospore inavtivation under high pressure. Trends Microbiol. 21(8): 296–304.Ross C. and E. Abel-Santos. 2010. The ger receptor family from sporulating bacteria. Curr. Issues Mol. Biol. 12(3): 147–158. Setlow B., A.E. Cowan and P. Setlow. 2003. Germination of spores of Bacillus subtilis with dodecylamine. J. Appl. Microbiol. 95: 637–645.Setlow B., S. Atluri, R. Kitchel, K. Koziol-Dube and P. Setlow. 2006. Role of dipicolinic acid in resistance and stability of spores of Bacillus subtilis with or without DNA-protective α/β-type small acid-soluble proteins. J. Bacteriol. 188(11): 3740–3747.Setlow B., P.G. Wahome and P. Setlow. 2008. Release of small mol-ecules during germinations of spores of Bacillus species. J. Bacteriol. 190(13): 4759–4763.Skąpska S., B. Sokołowska, A. Dekowska, M. Chotkiewicz and M. Fonberg-Broczek. 2012. Application of high pressure pasteuriza-tion to inactivate spores of Alicyclobacillus acidoterrestris in apple juice(in Polish). Żywność Nauka Technol. Jakość 3(82): 187–196.Sokołowska B., S. Skąpska, M. Fonberg-Broczek, J. Niezgoda, M. Chotkiewicz, A. Dekowska and S.J. Rzoska. 2012. The com-bined effect of high pressure and nisin or lysosyme on the inac-tivation Alicyclobacillus acidoterrestris spores in apple juice. High Pressure Res. 32(1): 119–127.Sokołowska B., S. Skąpska, M. Fonberg-Broczek, J. Niezgoda, M. Chotkiewicz, A. Dekowska and S.J. Rzoska. 2013. Factors influencing the inactivation of Alicyclobacillus acidoterrestris spores exposed to high hydrostatic pressure in apple juice. High Pressure Res. 33(1): 73–82.
Sokołowska B. 2014. Alicyclobacillus – thermophilic acidophilic spore-forming bacteria – profile and prevalence (in Polish). Żywność Nauka Technol. Jakość 4(95): 5–17Sokołowska B., S. Skąpska, M. Fonberg-Broczek, J. Niezgoda, I. Porębska, A. Dekowska and S.J. Rzoska. 2015. Germination and inactivation of Alicyclobacillus acidoterrestris spores induced by moderate hydrostatic pressure. Pol. J. Microbiol. 64(4): 351–359Stewart K.A., X. Yi, S. Ghosh and P. Setlow. 2012. Germination protein levels and rates of germination of spores of Bacillus subtilis with overexpressed or deleted genes encoding germination proteins. J. Bacteriol. 194(12): 3156–3164.Terano H., K. Takahashi and Y. Sakakibara. 2005. Characterization of spore germination of a thermoacidophilic spore-forming bac-terium, Alicyclobacillus acidoterrestris. Biosci. Biotechnol. Biochem. 69(6): 1217–1220.Tianli Y., Z. Jiangbo and Y. Yahong. 2014. Spoilage by Alicyclobacil-lus bacteria in juice and beverage products: chemical, physical, and combined control methods. Compr. Rev. Food Sci. 13(5): 771–797.Troiano A.J., J. Zhang, A.E. Cowan, J. Yu and P. Setlow. 2015. Analysis of the dynamics of a Bacillus subtilis spore germination protein complex during spore germination and outgrowth. J. Bac-teriol. 197(2): 252–261.Vercammen A., B. Vivijs, I. Lurquin and C.W. Michiels. 2012. Germination and inactivation of Bacillus coagulans and Alicycloba-cillus acidoterrestris spores by high hydrostatic pressure treatment in buffer and tomato sauce. Int. J. Food Microbiol. 152(3): 162–167.Wang S., P. Setlow and Y. Li. 2015. Slow leakage of Ca-dipicolinic acid from individual Bacillus spores during initiation of spore ger-mination. J. Bacteriol. 197(6): 1095–1103.Warth A.D. 1979. Liquid chromatographic determination of dipi-colinic acid from bacterial spores. Appl. Environ. Microbiol. 38(6): 1029–1033. Wuytack E.Y., J. Soons, F. Pochet and C.W. Michiels. 2000. Com-parative study of pressure and nutrient induced germination of Bacillus subtilis spores. Appl. Env. Microbiol. 666(1): 257–261.Yi X., J. Liu, J.R. Faeder and P. Setlow. 2011. Synergism between different germinant receptors in the germination of Bacillus subtilis spores. J. Bacteriol. 190(18): 4664–4671.Zhnag P., W. Garner, X. Yi, J. Yu, Y. Li and P. Setlow. 2010. Factors affecting variability in time between addition of nutrient germinants and rapid dipicolinic acid release during germination of spores of Bacillus species. J Bacteriol. 192(14): 3608–3619.Zhang J., W. Garner, P. Setlow and J. Yu. 2011. Quantitative analy-sis of spatial-temporal correlations during germination of spores of Bacilus species. J. Bacteriol. 193(15): 3765–3772.Zhang P., J. Liang, X. Yi, P. Setlow and Y. Li. 2014. Monitoring of commitment, blocking and continuation of nutrient germinations of individual Bacillus subtilis spores. J. Bacteriol. 196(13): 2443–2454.

Polish Journal of Microbiology2017, Vol. 66, No 1, 75–84
ORIGINAL PAPER
* Corresponding author: I. Kostrzewska-Szlakowska, Faculty of Biology, University of Warsaw, Warszawa, Poland; e-mail: [email protected]
Introduction
At the air-water interface, the surface microlayer (SML) is physico-chemically distinct compared to the subsurface water (SSW) and is characteristically enriched with nutrients and organic matter (Dietz et al., 1976; Södergren, 1993; Hunter, 1997; Münster et al., 1998; Franklin et al., 2005; Stolle et al., 2009). The pres-ence of the surface film and surface tension properties causes the SML to be a unique ecotone inhabited by microorganisms called neuston to distinguish from the subsurface plankton (term first used by Nauman 1917 and cited in Cunliffe et al., 2011). For bacterio neuston, it is considered to be a stressful habitat on the one hand, but on the other – it might favour bacterial hetero-trophic activity through the accumulation of organic matter (OM) (Cunliffe et al., 2011). Most organic mat-ter inputs into water bodies are not directly utilisable by bacteria, which cannot access organic material that is larger than 600 Da (Weiss et al., 1991). Therefore, bacteria induce extracellular enzymes that hydrolyse
polymers and oligomers into labile monomers that can pass through cell membranes (Chróst, 1991; Weiss et al., 1991; Hoppe et al., 1991 cited in Williams and Jochem, 2006). Upon exposure to solar radiation, which takes place more intensively in the SML and in the photic zone, active enzymes can be released (Boavida and Wetzel, 1998). The SML is a challenging habitat in which neustonic microbial communities must rapidly respond, with possible effects on the overall bacterial metabolism (Santos et al., 2009).
However, our knowledge of the biology of the SML in humic lakes is still insufficient (Södergren, 1993; Münster et al., 1998; Hillbricht-Ilkowska and Kostrzew-ska-Szlakowska, 2004; Kostrzewska-Szlakowska, 2005). Much more work has been done in oceans (Dietz et al., 1976; Hermansson and Dahlbäck, 1983; Hunter, 1997; Stolle et al., 2009; Cunliffe et al., 2011). It is believed that these processes that cause enrichment in the SML are very similar in marine and freshwaters (Hardy, 1997).
In this study, we quantitatively characterise the activ-ity of bacteria living in the SML and simultaneously
Microbial Biomass and Enzymatic Activity of the Surface Microlayerand Subsurface Water in Two Dystrophic Lakes
IWONA KOSTRZEWSKA-SZLAKOWSKA1* and BARTOSZ KIERSZTYN2
1 Faculty of Biology, University of Warsaw, Warszawa, Poland2 Department of Microbial Ecology and Environmental Biotechnology, Institute of Botany,
University of Warsaw; Biological and Chemical Research Centre, Warszawa, Poland
Submitted 24 June 2014, revised 25 May 2016, accepted 23 August 2016
A b s t r a c t
Nutrient and organic matter concentration, microbial biomass and activities were studied at the surface microlayers (SML) and subsurface waters (SSW) in two small forest lakes of different water colour. The SML in polyhumic lake is more enriched with dissolved inorganic nitro-gen (0.141 mg l–1) than that of oligohumic lake (0.124 mg l–1), the former also contains higher levels of total nitrogen (2.66 mg l–1). Higher activities of lipase (Vmax 2290 nmol l–1 h–1 in oligo- and 6098 in polyhumic) and glucosidase (Vmax 41 nmol l–1 h–1 in oligo- and 49 in poly-humic) were in the SMLs in both lakes. Phosphatase activity was higher in the oligohumic SML than in SSW (Vmax 632 vs. 339 nmol l–1 h–1) while in polyhumic lake was higher in SSW (Vmax 2258 nmol l–1 h–1 vs. 1908 nmol l–1 h–1). Aminopeptidase activity in the SSW in both lakes was higher than in SMLs (Vmax 2117 in oligo- and 1213 nmol l–1 h–1 in polyhumic). It seems that solar radiation does inhibit neuston micro-bial community as a whole because secondary production and the share of active bacteria in total bacteria number were higher in SSW. However, in the oligohumic lake the abundance of bacteria in the SML was always higher than in the SSW (4.07 vs. 2.69 × 10⁶ cells ml–1) while in the polyhumic lake was roughly equal (4.48 vs. 4.33 × 10⁶ cells ml–1) in both layers. Results may also suggest that surface communi-ties are not supplemented by immigration from bulk communities. The SML of humic lakes may act as important sinks for allochthonous nutrient resources and may then generate considerable energy pools for microbial food webs.
K e y w o r d s: dystrophic lakes, enzymatic activity in lakes, neuston, bacteria in surface microlayer
Kostrzewska-Szlakowska I. and B. Kiersztyn 176
those living in the SSW, in two humic lakes of differ-ent water colours and assessed the relationship between bacterial activities and various environmental param-eters of these lakes. We try to answer the following questions: (1) how do SMLs in lakes of different trophy state behave; (2) does the solar radiation inhibit bacte-rioneuston activities; (3) are SMLs directly supported from the underlying waters; (4) may SML act as sinks for allochthonous nutrient resources and thus may generate new energy pools for microbial food webs.
Experimental
Materials and Methods
Sampling. Two dystrophic, humic lakes (Kruczy Staw 53°39’42”N, 21°24’21”E and Smolak 53°43’29”N, 21°36’09”E) from north-eastern Poland were sampled monthly from April to October 2008 and some analyses in 2009. SML samples were collected by using Larsson plate. This method was chosen as fast and appropriate for sampling bacteria, microalgae and chemical com-pounds (Larsson et al., 1974; Hillbricht-Ilkowska and Kostrzewska-Szlakowska, 2004). Considering the great dynamics of SML, we sampled the lakes during calm weather (wind speed under 0.3 m s–1) to minimize this variability. This procedure collected volumes of water corresponding to the layer thickness of 0.61 ± 0.13 mm in oligo- and 0.50 ± 0.15 mm in the polyhumic lakes. SSW samples (from 0.5 m depth) were collected using a Limnos apparatus. To compare the concentration of variables in the SML versus SSW, the enrichment factor (Ef = SML/SSW) was calculated (Hunter, 1997). Mean enrichment factors (Table I) were estimated as the average from monthly data. Water samples were kept
in dark bottles at ambient temperature until laboratory processing within a few hours.
Physico-chemical analyses. During each sampling period, physical conditions (temperature, pH, which were recorded electronically OXI 195 in situ), inorganic and organic nutrients, chlorophyll a concentrations, bacterial abundance, and ectoenzyme kinetics were determined at each lake and in each water layer. Photo-synthetically active radiation (PAR) was measured with a light meter [LI-COR Biosciences (LI-250A), USA] very closely over the surface of the water and a few mm below. Water colour was measured in portable photo-meter (Hanna Instruments HI93727) in 0-500 Platinum Cobalt Units range.
The chemical analyses were measured in unfil-tered (total) and filtered (GF/F – dissolved) samples. The total and dissolved phosphorus (TP and DP), orthophosphates (PO4-P), ammonia (NH4-N), nitrate (NO3-N) and nitrite (NO2-N) were analysed according to Golterman and Clymo (1978) and total and dissolved nitrogen (TN and DN) according to Dowgiałło (1984). Dissolved inorganic nitrogen (DIN) was calculated as a sum of ammonium, nitrate and nitrite (Williams and Jochem, 2006). Direct determination of calcium (Ca), iron (Fe), magnesium (Mg) and manganese (Mn) in aqueous matrices by atomic absorption spectrometry were analysed according to Flame Atomic Absorption Spectrometry (FAAS, 2007) in Schimadzu AA 660. Total and dissolved organic carbon (TOC and DOC) were determined by high temperature catalytic com-bustion (Schimadzu TOC 5050A). Specific ultraviolet absorbance at 254 nm (SUVA) was defined as the UV absorbance at 254 nm divided by the DOC concentra-tion (Chow et al., 2003).
Chlorophyll a concentration (chl a) as a proxy for phytoplankton biomass was analysed spectrophotomet-rically after extraction with 96% hot ethanol (Marker et al., 1980). Samples of 0.2–0.75 ml volume of water were concentrated on glass fibre filters GF/F (What-man, 25 mm).
Bacterial analyses. The number of DAPI (4’,6-diami-dino-2-phenylindole) stainable bacteria (BN) was determined by direct counting of cells suspended on 0.2 µm, black polycarbonate membrane filters (Milli-pore) under epifluorescence microscope according to Porter and Feig (1980). For bacteria counting, a com-puter image analyzing system composed of a Nikon epi-fluorescence E450 microscope, Nikon Digital Camera DXM 1200F and NIS elements software (Nikon) was used. Bacterial biomass (BB) was calculated from the biovolume and content of C per µm–3 360 fg C accord-ing to Arvola et al. (1996) and Tulonen (1993).
Secondary production (BP) was measured by the incorporation of 3H-thymidine (3H-TdR according to Chróst et al., 1988).
TN 0.97 0.72 1.4 2.66 2.43 1.1DIN 0.124 0.103 1.2 0.141 0.087 1.5TP 60.5 86.3 0.8 106.7 110.2 1.0PO4-P 3.1 13.5 0.9 17.6 34.6 0.7TOC 15.1 13.5 1.1 54.1 52.9 1.1DOC 13.7 12.3 1.1 47.2 48.0 1.0SUVA 8.6 9.2 1.0 31.7 32.5 1.0chl a 11.1 10.4 1.2 39.3 75.0 0.5BN 4.07 2.69 1.7 4.48 4.33 1.1
Table IMean values for total nitrogen (TN; mg l–1), dissolved inorganic nitrogen (DIN; mg l–1); total phosphorus (TP; µg l–1), orthophos-phates (PO4-P; µg l–1), total and dissolved carbon (TOC, DOC; µg l–1), SUVA, chlorophyll a (chl a; µg l–1), bacterial numbers (BN; 106 cell ml–1). Mean enrichment factors (Ef) were estimated as
averages from monthly calculated enrichment factors.
Oligohumic Polyhumic
SML SSW EfEfSSWSML
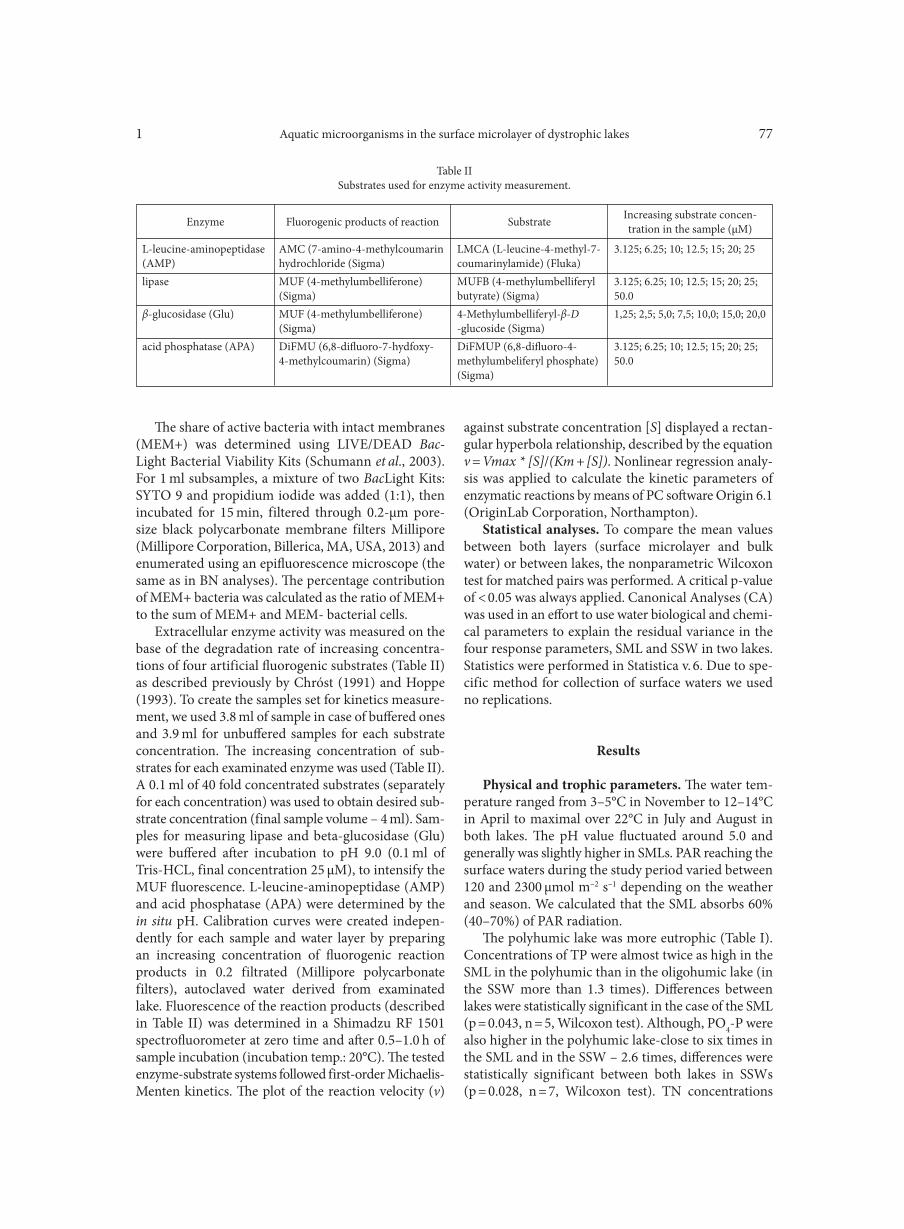
Aquatic microorganisms in the surface microlayer of dystrophic lakes1 77
The share of active bacteria with intact membranes (MEM+) was determined using LIVE/DEAD Bac-Light Bacterial Viability Kits (Schumann et al., 2003). For 1 ml subsamples, a mixture of two BacLight Kits: SYTO 9 and propidium iodide was added (1:1), then incubated for 15 min, filtered through 0.2-µm pore-size black polycarbonate membrane filters Millipore (Milli pore Corporation, Billerica, MA, USA, 2013) and enumerated using an epifluorescence microscope (the same as in BN analyses). The percentage contribution of MEM+ bacteria was calculated as the ratio of MEM+ to the sum of MEM+ and MEM- bacterial cells.
Extracellular enzyme activity was measured on the base of the degradation rate of increasing concentra-tions of four artificial fluorogenic substrates (Table II) as described previously by Chróst (1991) and Hoppe (1993). To create the samples set for kinetics measure-ment, we used 3.8 ml of sample in case of buffered ones and 3.9 ml for unbuffered samples for each substrate concentration. The increasing concentration of sub-strates for each examinated enzyme was used (Table II). A 0.1 ml of 40 fold concentrated substrates (separately for each concentration) was used to obtain desired sub-strate concentration (final sample volume – 4 ml). Sam-ples for measuring lipase and beta-glucosidase (Glu) were buffered after incubation to pH 9.0 (0.1 ml of Tris-HCL, final concentration 25 µM), to intensify the MUF fluorescence. L-leucine-aminopeptidase (AMP) and acid phosphatase (APA) were determined by the in situ pH. Calibration curves were created indepen-dently for each sample and water layer by preparing an increasing concentration of fluorogenic reaction products in 0.2 filtrated (Millipore polycarbonate filters), autoclaved water derived from examinated lake. Fluorescence of the reaction products (described in Table II) was determined in a Shimadzu RF 1501 spectrofluorometer at zero time and after 0.5–1.0 h of sample incubation (incubation temp.: 20°C). The tested enzyme-substrate systems followed first-order Michaelis- Menten kinetics. The plot of the reaction velocity (v)
against substrate concentration [S] displayed a rectan-gular hyperbola relationship, described by the equation v = Vmax * [S]/(Km + [S]). Nonlinear regression analy-sis was applied to calculate the kinetic parameters of enzymatic reactions by means of PC software Origin 6.1 (OriginLab Corporation, Northampton).
Statistical analyses. To compare the mean values between both layers (surface microlayer and bulk water) or between lakes, the nonparametric Wilcoxon test for matched pairs was performed. A critical p-value of < 0.05 was always applied. Canonical Analyses (CA) was used in an effort to use water biological and chemi-cal parameters to explain the residual variance in the four response parameters, SML and SSW in two lakes. Statistics were performed in Statistica v. 6. Due to spe-cific method for collection of surface waters we used no replications.
Results
Physical and trophic parameters. The water tem-perature ranged from 3–5°C in November to 12–14°C in April to maximal over 22°C in July and August in both lakes. The pH value fluctuated around 5.0 and generally was slightly higher in SMLs. PAR reaching the surface waters during the study period varied between 120 and 2300 µmol m–2 s–1 depending on the weather and season. We calculated that the SML absorbs 60% (40–70%) of PAR radiation.
The polyhumic lake was more eutrophic (Table I). Concentrations of TP were almost twice as high in the SML in the polyhumic than in the oligohumic lake (in the SSW more than 1.3 times). Differences between lakes were statistically significant in the case of the SML (p = 0.043, n = 5, Wilcoxon test). Although, PO4-P were also higher in the polyhumic lake-close to six times in the SML and in the SSW – 2.6 times, differences were statistically significant between both lakes in SSWs (p = 0.028, n = 7, Wilcoxon test). TN concentrations
L-leucine-aminopeptidase AMC (7-amino-4-methylcoumarin LMCA (L-leucine-4-methyl-7- 3.125; 6.25; 10; 12.5; 15; 20; 25(AMP) hydrochloride (Sigma) coumarinylamide) (Fluka)lipase MUF (4-methylumbelliferone) MUFB (4-methylumbelliferyl 3.125; 6.25; 10; 12.5; 15; 20; 25; (Sigma) butyrate) (Sigma) 50.0β-glucosidase (Glu) MUF (4-methylumbelliferone) 4-Methylumbelliferyl-β-D 1,25; 2,5; 5,0; 7,5; 10,0; 15,0; 20,0 (Sigma) -glucoside (Sigma)acid phosphatase (APA) DiFMU (6,8-difluoro-7-hydfoxy- DiFMUP (6,8-difluoro-4- 3.125; 6.25; 10; 12.5; 15; 20; 25; 4-methylcoumarin) (Sigma) methylumbeliferyl phosphate) 50.0 (Sigma)
Table IISubstrates used for enzyme activity measurement.
Enzyme Fluorogenic products of reaction Substrate Increasing substrate concen-tration in the sample (µM)
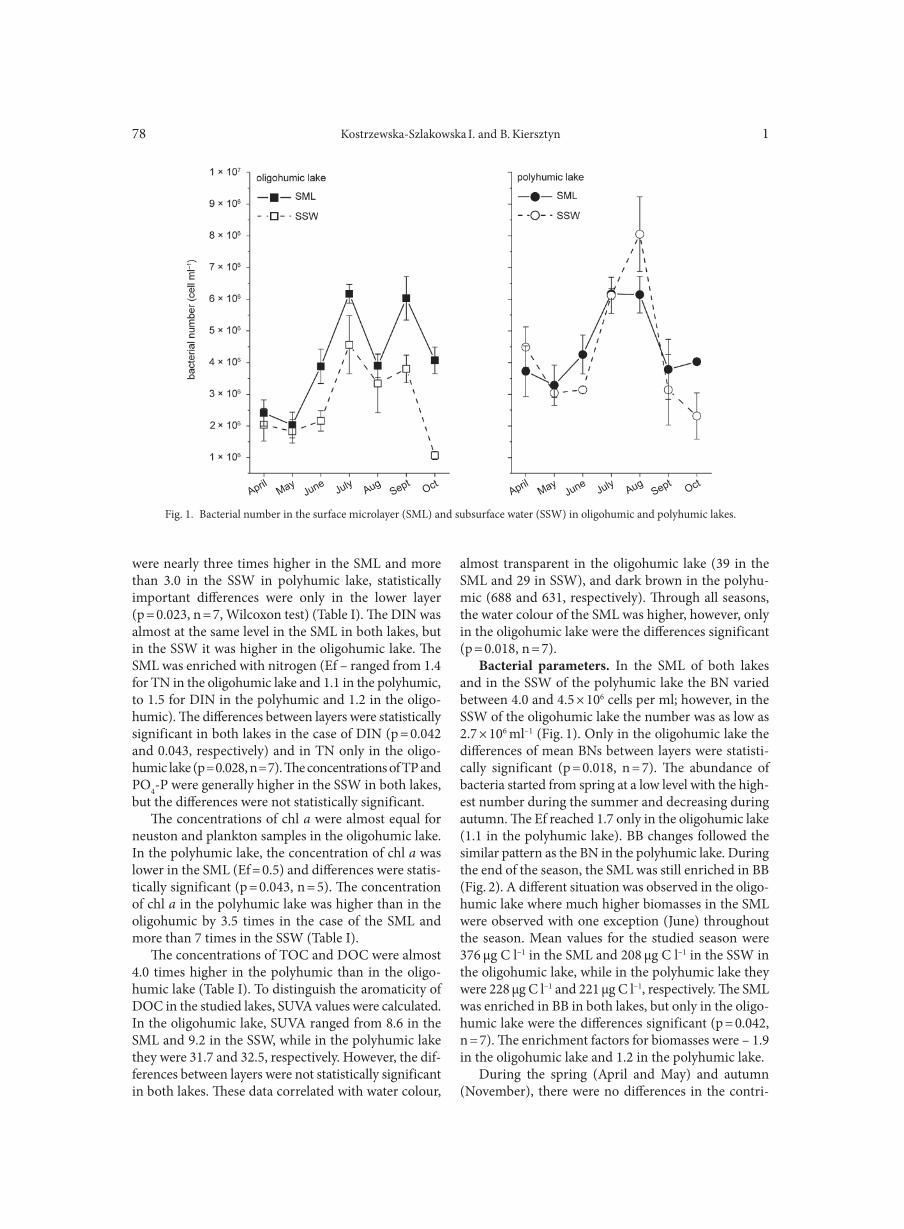
Kostrzewska-Szlakowska I. and B. Kiersztyn 178
were nearly three times higher in the SML and more than 3.0 in the SSW in polyhumic lake, statistically important differences were only in the lower layer (p = 0.023, n = 7, Wilcoxon test) (Table I). The DIN was almost at the same level in the SML in both lakes, but in the SSW it was higher in the oligohumic lake. The SML was enriched with nitrogen (Ef – ranged from 1.4 for TN in the oligohumic lake and 1.1 in the polyhumic, to 1.5 for DIN in the polyhumic and 1.2 in the oligo-humic). The differences between layers were statistically significant in both lakes in the case of DIN (p = 0.042 and 0.043, respectively) and in TN only in the oligo- humic lake (p = 0.028, n = 7). The concentrations of TP and PO4-P were generally higher in the SSW in both lakes, but the differences were not statistically significant.
The concentrations of chl a were almost equal for neuston and plankton samples in the oligohumic lake. In the polyhumic lake, the concentration of chl a was lower in the SML (Ef = 0.5) and differences were statis-tically significant (p = 0.043, n = 5). The concentration of chl a in the polyhumic lake was higher than in the oligohumic by 3.5 times in the case of the SML and more than 7 times in the SSW (Table I).
The concentrations of TOC and DOC were almost 4.0 times higher in the polyhumic than in the oligo-humic lake (Table I). To distinguish the aromaticity of DOC in the studied lakes, SUVA values were calculated. In the oligohumic lake, SUVA ranged from 8.6 in the SML and 9.2 in the SSW, while in the polyhumic lake they were 31.7 and 32.5, respectively. However, the dif-ferences between layers were not statistically significant in both lakes. These data correlated with water colour,
almost transparent in the oligohumic lake (39 in the SML and 29 in SSW), and dark brown in the polyhu-mic (688 and 631, respectively). Through all seasons, the water colour of the SML was higher, however, only in the oligohumic lake were the differences significant (p = 0.018, n = 7).
Bacterial parameters. In the SML of both lakes and in the SSW of the polyhumic lake the BN varied between 4.0 and 4.5 × 10⁶ cells per ml; however, in the SSW of the oligohumic lake the number was as low as 2.7 × 10⁶ ml–1 (Fig. 1). Only in the oligohumic lake the differences of mean BNs between layers were statisti-cally significant (p = 0.018, n = 7). The abundance of bacteria started from spring at a low level with the high-est number during the summer and decreasing during autumn. The Ef reached 1.7 only in the oligohumic lake (1.1 in the polyhumic lake). BB changes followed the similar pattern as the BN in the polyhumic lake. During the end of the season, the SML was still enriched in BB (Fig. 2). A different situation was observed in the oligo-humic lake where much higher biomasses in the SML were observed with one exception (June) throughout the season. Mean values for the studied season were 376 µg C l–1 in the SML and 208 µg C l–1 in the SSW in the oligohumic lake, while in the polyhumic lake they were 228 µg C l–1 and 221 µg C l–1, respectively. The SML was enriched in BB in both lakes, but only in the oligo-humic lake were the differences significant (p = 0.042, n = 7). The enrichment factors for biomasses were – 1.9 in the oligohumic lake and 1.2 in the polyhumic lake.
During the spring (April and May) and autumn (November), there were no differences in the contri-
Fig. 1. Bacterial number in the surface microlayer (SML) and subsurface water (SSW) in oligohumic and polyhumic lakes.
April MayJune July Aug
SeptOct
April MayJune July Aug
Sept Oct
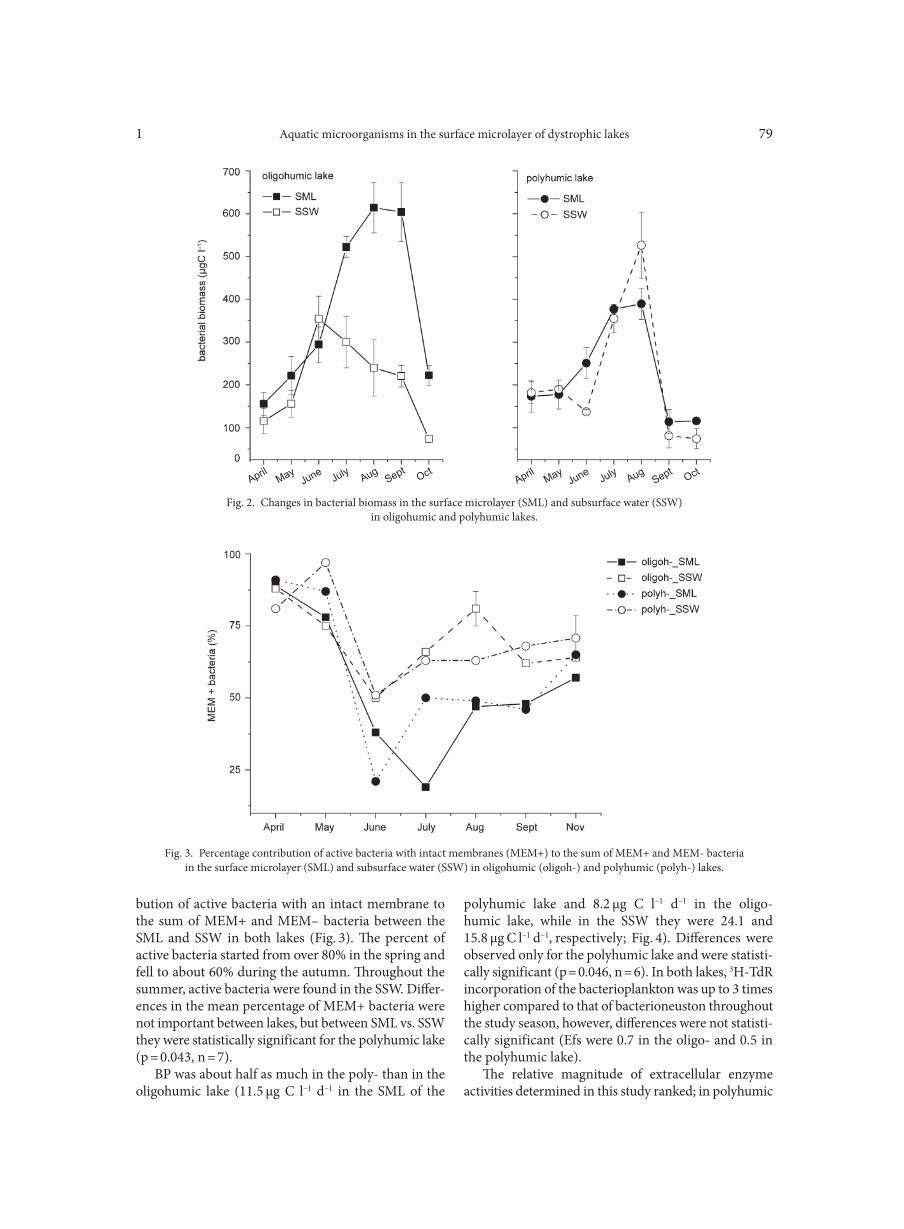
Aquatic microorganisms in the surface microlayer of dystrophic lakes1 79
bution of active bacteria with an intact membrane to the sum of MEM+ and MEM– bacteria between the SML and SSW in both lakes (Fig. 3). The percent of active bacteria started from over 80% in the spring and fell to about 60% during the autumn. Throughout the summer, active bacteria were found in the SSW. Differ-ences in the mean percentage of MEM+ bacteria were not important between lakes, but between SML vs. SSW they were statistically significant for the polyhumic lake (p = 0.043, n = 7).
BP was about half as much in the poly- than in the oligohumic lake (11.5 µg C l–1 d–1 in the SML of the
polyhumic lake and 8.2 µg C l–1 d–1 in the oligo- humic lake, while in the SSW they were 24.1 and 15.8 µg C l–1 d–1, respectively; Fig. 4). Differences were observed only for the polyhumic lake and were statisti-cally significant (p = 0.046, n = 6). In both lakes, 3H-TdR incorporation of the bacterioplankton was up to 3 times higher compared to that of bacterioneuston throughout the study season, however, differences were not statisti-cally significant (Efs were 0.7 in the oligo- and 0.5 in the polyhumic lake).
The relative magnitude of extracellular enzyme activities determined in this study ranked; in polyhumic
Fig. 2. Changes in bacterial biomass in the surface microlayer (SML) and subsurface water (SSW)in oligohumic and polyhumic lakes.
Fig. 3. Percentage contribution of active bacteria with intact membranes (MEM+) to the sum of MEM+ and MEM- bacteriain the surface microlayer (SML) and subsurface water (SSW) in oligohumic (oligoh-) and polyhumic (polyh-) lakes.
April MayJune July Aug
SeptOct
April MayJune July Aug
Sept Oct
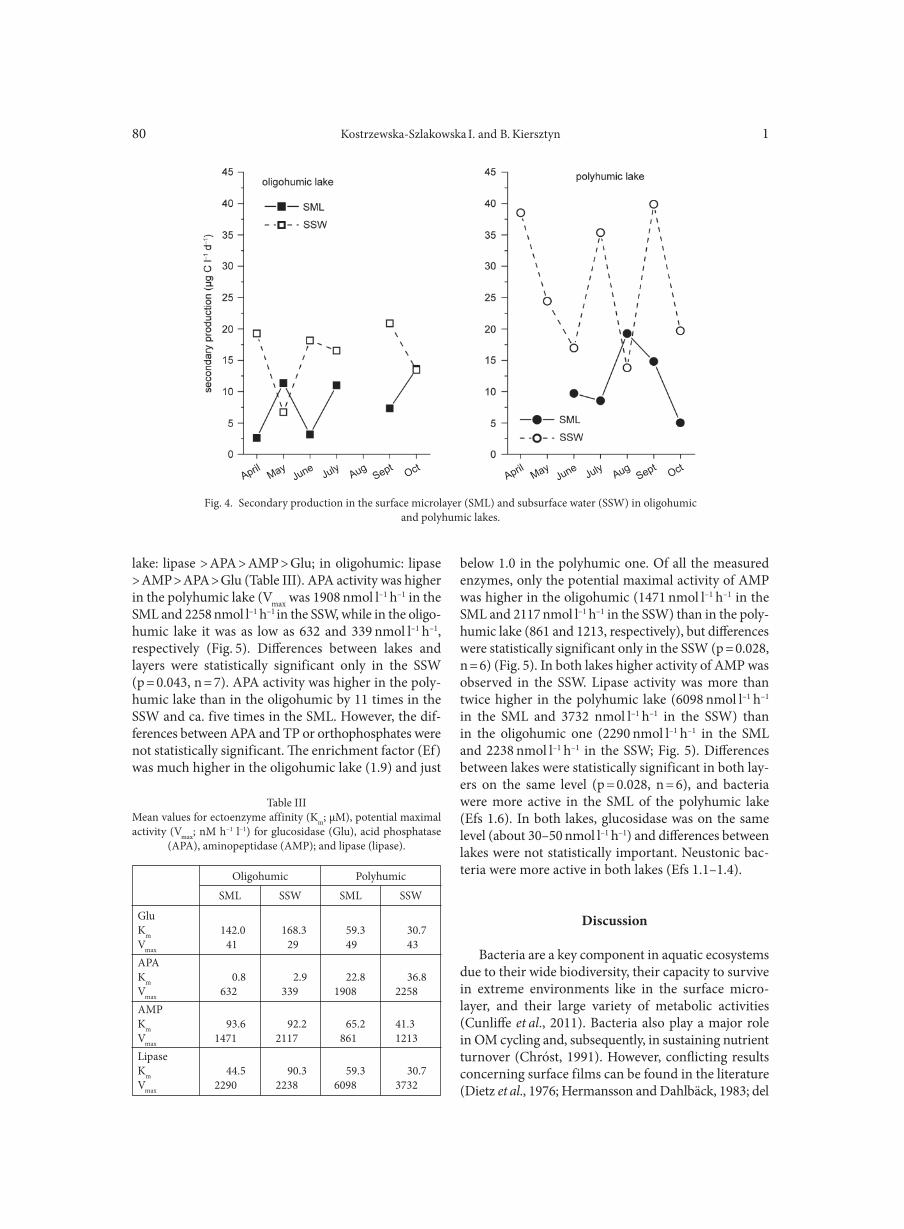
Kostrzewska-Szlakowska I. and B. Kiersztyn 180
lake: lipase > APA > AMP > Glu; in oligohumic: lipase > AMP > APA > Glu (Table III). APA activity was higher in the polyhumic lake (Vmax was 1908 nmol l–1 h–1 in the SML and 2258 nmol l–1 h–1 in the SSW, while in the oligo- humic lake it was as low as 632 and 339 nmol l–1 h–1,
respectively (Fig. 5). Differences between lakes and layers were statistically significant only in the SSW (p = 0.043, n = 7). APA activity was higher in the poly-humic lake than in the oligohumic by 11 times in the SSW and ca. five times in the SML. However, the dif-ferences between APA and TP or orthophosphates were not statistically significant. The enrichment factor (Ef) was much higher in the oligohumic lake (1.9) and just
below 1.0 in the polyhumic one. Of all the measured enzymes, only the potential maximal activity of AMP was higher in the oligohumic (1471 nmol l–1 h–1 in the SML and 2117 nmol l–1 h–1 in the SSW) than in the poly-humic lake (861 and 1213, respectively), but differences were statistically significant only in the SSW (p = 0.028, n = 6) (Fig. 5). In both lakes higher activity of AMP was observed in the SSW. Lipase activity was more than twice higher in the polyhumic lake (6098 nmol l–1 h–1 in the SML and 3732 nmol l–1 h–1 in the SSW) than in the oligohumic one (2290 nmol l–1 h–1 in the SML and 2238 nmol l–1 h–1 in the SSW; Fig. 5). Differences between lakes were statistically significant in both lay-ers on the same level (p = 0.028, n = 6), and bacteria were more active in the SML of the polyhumic lake (Efs 1.6). In both lakes, glucosidase was on the same level (about 30–50 nmol l–1 h–1) and differences between lakes were not statistically important. Neustonic bac-teria were more active in both lakes (Efs 1.1–1.4).
Discussion
Bacteria are a key component in aquatic ecosystems due to their wide biodiversity, their capacity to survive in extreme environments like in the surface micro-layer, and their large variety of metabolic activities (Cunliffe et al., 2011). Bacteria also play a major role in OM cycling and, subsequently, in sustaining nutrient turnover (Chróst, 1991). However, conflicting results concerning surface films can be found in the literature (Dietz et al., 1976; Hermansson and Dahlbäck, 1983; del
GluKm 142.0 168.3 59.3 30.7Vmax 41 29 49 43APAKm 0.8 2.9 22.8 36.8Vmax 632 339 1908 2258AMPKm 93.6 92.2 65.2 41.3Vmax 1471 2117 861 1213LipaseKm 44.5 90.3 59.3 30.7Vmax 2290 2238 6098 3732
Table IIIMean values for ectoenzyme affinity (Km; µM), potential maximal activity (Vmax; nM h–1 l–1) for glucosidase (Glu), acid phosphatase
(APA), aminopeptidase (AMP); and lipase (lipase).
Oligohumic Polyhumic
SML SSW SSWSML
Fig. 4. Secondary production in the surface microlayer (SML) and subsurface water (SSW) in oligohumicand polyhumic lakes.
April MayJune July Aug
Sept OctApril May
June July AugSept Oct
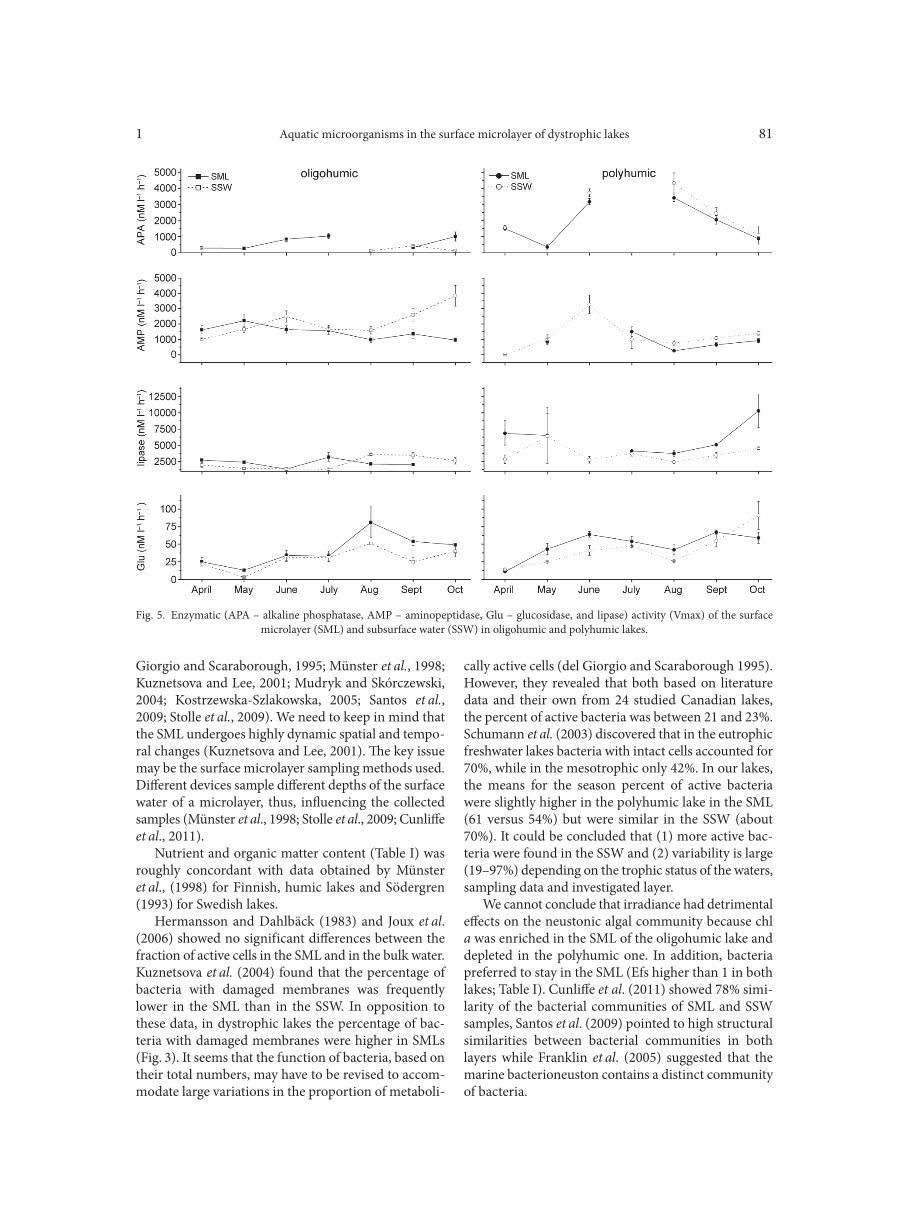
Aquatic microorganisms in the surface microlayer of dystrophic lakes1 81
Giorgio and Scaraborough, 1995; Münster et al., 1998; Kuznetsova and Lee, 2001; Mudryk and Skórczewski, 2004; Kostrzewska-Szlakowska, 2005; Santos et al., 2009; Stolle et al., 2009). We need to keep in mind that the SML undergoes highly dynamic spatial and tempo-ral changes (Kuznetsova and Lee, 2001). The key issue may be the surface microlayer sampling methods used. Different devices sample different depths of the surface water of a microlayer, thus, influencing the collected samples (Münster et al., 1998; Stolle et al., 2009; Cunliffe et al., 2011).
Nutrient and organic matter content (Table I) was roughly concordant with data obtained by Münster et al., (1998) for Finnish, humic lakes and Södergren (1993) for Swedish lakes.
Hermansson and Dahlbäck (1983) and Joux et al. (2006) showed no significant differences between the fraction of active cells in the SML and in the bulk water. Kuznetsova et al. (2004) found that the percentage of bacteria with damaged membranes was frequently lower in the SML than in the SSW. In opposition to these data, in dystrophic lakes the percentage of bac-teria with damaged membranes were higher in SMLs (Fig. 3). It seems that the function of bacteria, based on their total numbers, may have to be revised to accom-modate large variations in the proportion of metaboli-
cally active cells (del Giorgio and Scaraborough 1995). However, they revealed that both based on literature data and their own from 24 studied Canadian lakes, the percent of active bacteria was between 21 and 23%. Schumann et al. (2003) discovered that in the eutrophic freshwater lakes bacteria with intact cells accounted for 70%, while in the mesotrophic only 42%. In our lakes, the means for the season percent of active bacteria were slightly higher in the polyhumic lake in the SML (61 versus 54%) but were similar in the SSW (about 70%). It could be concluded that (1) more active bac-teria were found in the SSW and (2) variability is large (19–97%) depending on the trophic status of the waters, sampling data and investigated layer.
We cannot conclude that irradiance had detrimental effects on the neustonic algal community because chl a was enriched in the SML of the oligohumic lake and depleted in the polyhumic one. In addition, bacteria preferred to stay in the SML (Efs higher than 1 in both lakes; Table I). Cunliffe et al. (2011) showed 78% simi-larity of the bacterial communities of SML and SSW samples, Santos et al. (2009) pointed to high structural similarities between bacterial communities in both layers while Franklin et al. (2005) suggested that the marine bacterioneuston contains a distinct community of bacteria.
Fig. 5. Enzymatic (APA – alkaline phosphatase, AMP – aminopeptidase, Glu – glucosidase, and lipase) activity (Vmax) of the surface microlayer (SML) and subsurface water (SSW) in oligohumic and polyhumic lakes.
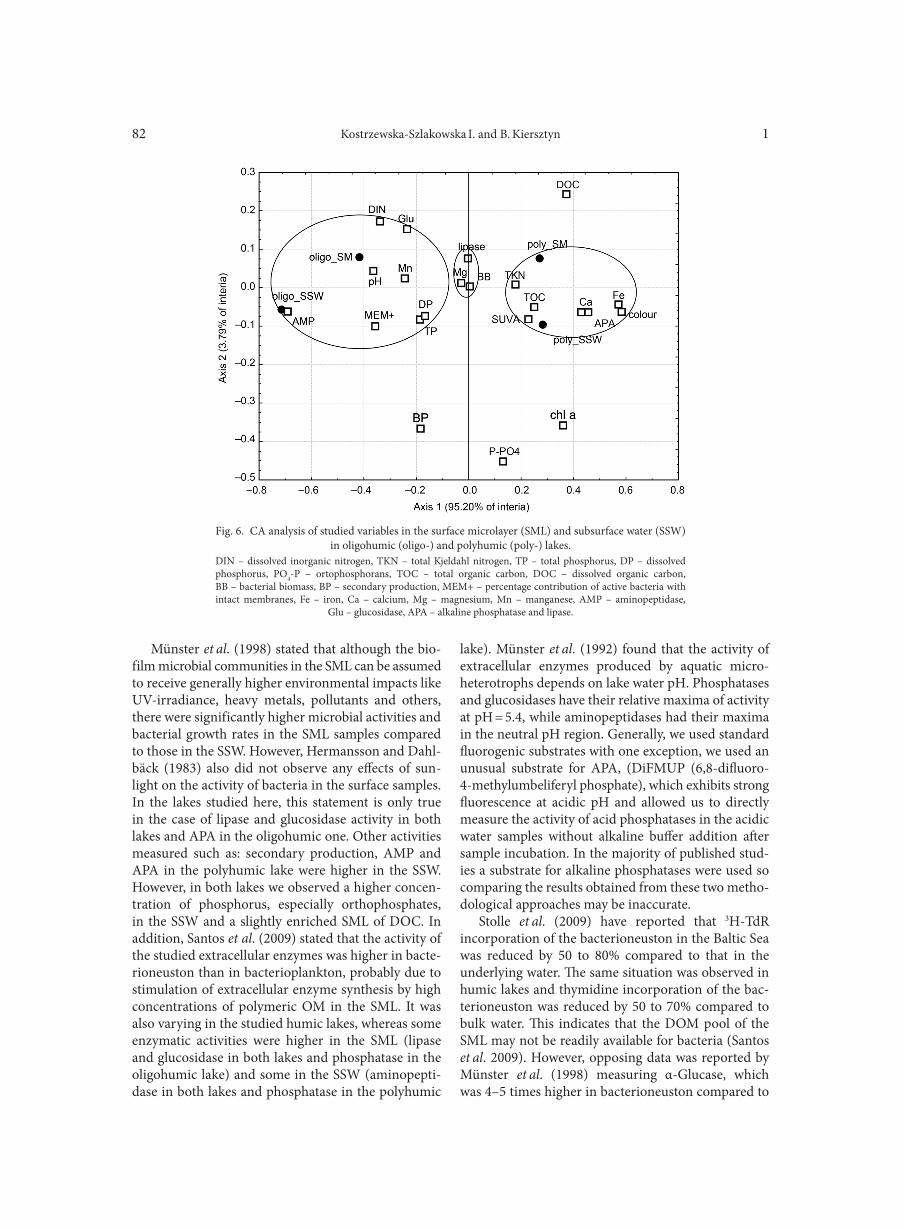
Kostrzewska-Szlakowska I. and B. Kiersztyn 182
Münster et al. (1998) stated that although the bio-film microbial communities in the SML can be assumed to receive generally higher environmental impacts like UV-irradiance, heavy metals, pollutants and others, there were significantly higher microbial activities and bacterial growth rates in the SML samples compared to those in the SSW. However, Hermansson and Dahl-bäck (1983) also did not observe any effects of sun-light on the activity of bacteria in the surface samples. In the lakes studied here, this statement is only true in the case of lipase and glucosidase activity in both lakes and APA in the oligohumic one. Other activities measured such as: secondary production, AMP and APA in the polyhumic lake were higher in the SSW. However, in both lakes we observed a higher concen-tration of phosphorus, especially orthophosphates, in the SSW and a slightly enriched SML of DOC. In addition, Santos et al. (2009) stated that the activity of the studied extracellular enzymes was higher in bacte-rioneuston than in bacterioplankton, probably due to stimulation of extracellular enzyme synthesis by high concentrations of polymeric OM in the SML. It was also varying in the studied humic lakes, whereas some enzymatic activities were higher in the SML (lipase and glucosidase in both lakes and phosphatase in the oligohumic lake) and some in the SSW (aminopepti-dase in both lakes and phosphatase in the polyhumic
lake). Münster et al. (1992) found that the activity of extracellular enzymes produced by aquatic micro- heterotrophs depends on lake water pH. Phosphatases and glucosidases have their relative maxima of activity at pH = 5.4, while aminopeptidases had their maxima in the neutral pH region. Generally, we used standard fluorogenic substrates with one exception, we used an unusual substrate for APA, (DiFMUP (6,8-difluoro-4-methylumbeliferyl phosphate), which exhibits strong fluorescence at acidic pH and allowed us to directly measure the activity of acid phosphatases in the acidic water samples without alkaline buffer addition after sample incubation. In the majority of published stud-ies a substrate for alkaline phosphatases were used so comparing the results obtained from these two metho-dological approaches may be inaccurate.
Stolle et al. (2009) have reported that 3H-TdR incorporation of the bacterioneuston in the Baltic Sea was reduced by 50 to 80% compared to that in the underlying water. The same situation was observed in humic lakes and thymidine incorporation of the bac-terioneuston was reduced by 50 to 70% compared to bulk water. This indicates that the DOM pool of the SML may not be readily available for bacteria (Santos et al. 2009). However, opposing data was reported by Münster et al. (1998) measuring α-Glucase, which was 4–5 times higher in bacterioneuston compared to
Fig. 6. CA analysis of studied variables in the surface microlayer (SML) and subsurface water (SSW) in oligohumic (oligo-) and polyhumic (poly-) lakes.
DIN – dissolved inorganic nitrogen, TKN – total Kjeldahl nitrogen, TP – total phosphorus, DP – dissolved phosphorus, PO4-P – ortophosphorans, TOC – total organic carbon, DOC – dissolved organic carbon, BB – bacterial biomass, BP – secondary production, MEM+ – percentage contribution of active bacteria with intact membranes, Fe – iron, Ca – calcium, Mg – magnesium, Mn – manganese, AMP – aminopeptidase,
Glu – glucosidase, APA – alkaline phosphatase and lipase.
Aquatic microorganisms in the surface microlayer of dystrophic lakes1 83
bacterioplankton. Joux et al. (2006) observed that the intensity of bacterial production in the Mediterranean Sea was highly variable.
CA analysis was used to investigate the relation between water biology and chemistry variables in two layers-SML and SSW of two humic lakes with differ-ent water colours (Fig. 6). For layers in both types of lakes, almost all of the explained variables were due to the first axis (95.20% of inertia) with a negligible influence from the second axis (3.79% of inertia). Concentrations of iron, calcium, orthophosphates, total nitrogen, total and dissolved carbon and water colour, SUVA, and some biological aspects like APA and chlo-rophyll a were positively related to both analysed lay-ers of the polyhumic lake. Concentrations of total and dissolved phosphorus, DIN, Mn, pH and some bio-logical elements connected with bacteria like second-ary production, percent of active bacteria with intact membranes, Glu, AMP correlated with both layers in the oligohumic lake. On the contrary, the model could not explain BB, Mg or potential activity of lipase. In addition, the results suggest that inherent properties of organic matter as indicated by TOC and DOC, SUVA, Fe were related to chl a in the polyhumic lake and were negatively related with most attributes of bacteria like production, MEM+ and some enzymatic activity. APA, which was used as an indicator of P deficiency, cor-related negatively with concentrations of phosphorus but positively with orthophosphates. Nonetheless, the low percentage of second axis (however both explain-ing almost 99% of cases) if we put ‘0’ line – two layers of two lakes are placed in each quadripartite. Thus, it seems that SML and SSW showed lake-specific differ-ences in all studied parameters and that was SML is generally supported from the underlying waters.
It could be stated that: (1) Polyhumic lake are char-acterised as more eutrophic with higher concentrations of organic matter and nutrients compared to oligohu-mic lake, then the surface microlayer of the polyhumic lake was enriched in forms of phosphorus and ammo-nium, while enrichments in nitrogen and bacterial abundance were higher in the oligohumic one. (2) The bacteria activity pattern in the SML versus SSW was variable. Activities expressed as lipase and glucosidase Vmax were higher in the SMLs in both studied lakes and as phosphatase Vmax just in the oligohumic lake. The aminopeptidase Vmax were higher in the SSW in both lakes and phosphatase Vmax only in the polyhumic lake. (3) Solar radiation does inhibit neuston microbial community as a whole; it has a pronounced inhibitory effect on the surface microbial activity characteristics as an bacterial production and share of active bacteria with intact membranes, however, in the oligohumic lake, we noticed stable higher total abundance of bac-teria in SML. (4) SML and SSW showed lake-specific
differences in all studied parameters and SMLs are not directly supported from the underlying waters (SSWs). (5) The SMLs of small humic lakes is an inhospitable microhabitat in the same way as in other water bodies (controlled by dynamic physical processes like intense solar radiation, wind, changing temperature, waves, etc.) but to a larger extent may act as an important sinks for allochthonous nutrient resources and may then gen-erate significant energy pools for microbial food webs.
AcknowledgmentsWe acknowledge the support of the Polish Ministry of Science
and Higher Education (N N304 415633). The authors are also grate-ful to prof. Uwe Münster and anonymous reviewers for valuable comments on the earlier draft of the manuscript.
Literature
Arvola L., P. Kankaala, T. Tulonen and A. Ojala. 1996. Effects of phosphorus and allochthonous humic matter enrichment on the metabolic processes and community structure of plankton boreal lake (Lake Pääjärvi). Can. J. Fish Aquatic Sci. 53: 1646–1662.Boavida M.J. and R.G. Wetzel. 1998. Inhibition of phosphatase activity by dissolved humic substances and hydrolytic reactivation by natural ultraviolet light. Freshwater Biolology 40: 285–293.Chow A.T., K.K. Tanji and S. Gao. 2003. Production of dissolved organic carbon (DOC) and trihalomethane (THM) precursor from peat soils. Water Res. 37: 4475–4485.Chróst R.J., J. Overbeck and R. Wcisło. 1988. Evaluation of the [3H] Thymidyne method for estimating bacterial growth rates and production in lake water: re-examination and methodological com-ments. Acta Microbiol. Pol. 37: 95–112.Chróst R.J. 1991. Environmental control of synthesis and activity of aquatic microbial ectoenzymes, pp. 29–59. In: Chróst R.J. (ed). Microbial enzymes in aquatic environments, Springer-Verlag, New York.Cunliffe M., Upstill-Goddard R.C. and J.C. Murrell. 2011. Micro-biology of aquatic surface microlayers. FEMS Microbiol. Rev. 35: 233–246.del Giorgio P.A. and G. Scaraborough. 1995. Increase in propor-tion of metabolically active bacteria along gradients of enrichment in freshwater and marine plankton: implications for estimates of bacterial growth and production rates. J. Plankton Res. 1: 1905–1924.Dietz A.S., L.J. Albright and T. Tuominen. 1976. Heterotrophic activities of bacterioneuston and bacterioplankton. Can. J. Microbiol. 22: 1699–1709.Dowgiałło A. 1984. Simplified photometric methods of determi-nation of ammonia and Kjeldahl nitrogen in biological materials. Polskie Archiwum Hydrobiologii 31: 317–339.Franklin M.P., I.R. McDonald, D.G. Bourne, N.J.P. Owens, R. Upstill-Goddard and J.C. Murrell. 2005. Bacterial diversity in the bacterioneuston (sea surface microlayer): the bacterioneuston through the looking glass. Env. Microbiol. 7: 723–736.Flame Atomic Absorption Spectrometry (FAAS). 2007. Analyti-cal Methods, ed. 11th. Agilent Technologies, Australia (M) Pty, Ltd.Golterman H.L. and R.S. Clymo. 1978. Methods for physical & chemical analysis of fresh waters. IBP Handbook No 8. Blackwell Scientific Publications, Oxford, Edinburgh, London, Melbourne.Hardy J.T. 1997. Biological effects of chemicals in the sea surface microlayer. In: Liss P.S. and R.A. Duce (eds). The Sea Surface and Global Change. Cambridge University Press, Cambridge.
Kostrzewska-Szlakowska I. and B. Kiersztyn 184
Hermansson M. and B. Dahlbäck. 1983. Bacterial activity at the air/water interface. Microb. Ecol. 9: 317–328.Hillbricht-Ilkowska A. and I. Kostrzewska-Szlakowska. 2004. Sur-face microlayer in lakes of different trophic status: nutrient concen-tration and accumulation. Pol. J. Ecol. 52: 461–478.Hoppe H.G. 1993. Use of fluorogenic model substrate for extracel-lular enzyme activity (EEA) measurements of bacteria, pp. 423–431. In: Kemp P.F., B.F. Sherr, E.B. Sherr and I.J. Cole (eds). Handbook of methods in aquatic microbial ecology. Lewis Publishers. Hunter K.A. 1997. Chemistry of the sea-surface microlayer, pp. 287–320. In: Liss P.S. and R.A. Duce (eds). The sea surface and global change. Cambridge University Press.Joux F., H. Agogue, I. Obernosterer, C. Dupuy, T. Reinthaler, G.J. Herndl and P. Lebaron. 2006. Microbial community structure in the sea surface microlayer at two contrasting coastal sites in the northwestern Mediterranean Sea. Aquatic Microbial Ecology 42: 91–104.Kostrzewska-Szlakowska I. 2005. Surface microlayer in lakes of different trophic status: dissolved organic matter and microbial com-munity. Pol. J. Ecol. 53: 341–351.Kuznetsova M. and C. Lee. 2001. Enhanced extracellular enzymatic peptide hydrolysis in the sea-surface microlayer. Marine Chemistry 73: 319–332.Kuznetsova M., C. Lee and J. Aller. 2004. Enrichment of amino acids in the sea surface microlayer at coastal and open sea sites in the North Atlantic Ocean. Limnology and Oceanography 49: 1605–1619.Larsson K., G. Odham and A. Södergren. 1974. On lipid surface films on the sea. I. A simple method for sampling and studies of composition. Marine Chemistry 2: 49–57.Marker A.F.H., E.A. Nush, H. Rai and B. Riemann. 1980. The measurement of photosynthetic pigments in freshwaters and stan-dardization of methods: conclusions and recommendations of the workshop. In: Proceedings of the workshop on the measurement of photosynthetic pigments in freshwaters and standardization of methods. Archiv fur Hydrobiologie – Beiheft Ergebnisse der Limno-logie 14: 91–106.
Mudryk Z. and P. Skórczewski. 2004. Extracellular enzyme activity at the air-water interface of an estuarine lake. Estuarine, Coastal and Shelf Sciences 59: 59–67.Münster U., P. Einiö, J. Nurminen and J. Overbeck. 1992. Extracel-lular enzymes in a polyhumic lake: important regulators in detritus processing. Hydrobiologia 229: 225–238.Münster U., E. Heillinen and J. Knulst. 1998. Nutrient composi-tion, microbial biomass and activity at the air-water interface of small boreal forest lakes. Hydrobiologia 363: 261–270.Porter K.G. and Y.S. Feig. 1980. The use of DAPI for indentifying and counting aquatic microflora. Limnology and Oceanography 25: 943–948.Santos A.L., C. Mendes, N.C.M. Gomes, I. Henriques, A. Cor-reia, A. Almeida and A. Cuhna. 2009. Short-term variability of abundance, diversity and activity of estuarine bacterioneuston and bacterioplankton. J. Plankton Res. 31: 1545–1555.Schumann R., U. Schiewer, U. Karoten and T. Rieling. 2003. Via-bility of bacteria from different aquatic habitats. II. Cellular fluores-cent markers for membrane integrity and metabolic activity. Aqua. Microb. Ecol. 32: 137–150.Södergren A. 1993. Role of aquatic surface microlayer in the dynamics of nutrients and organic compounds in lakes, with impli-cations for their ecotones. Hydrobiologia 251: 217–225.Stolle C., K. Nagel, M. Labrenz and K. Jürgens. 2009. Bacterial activity in the sea-surface microlayer: in situ investigations in the Baltic Sea and the influence of sampling devices. Aquatic Microbial Ecology 58: 67–78.Tulonen T. 1993. Bacterial production in a mesohumic lakes esti-mated from [14C]Leucine incorporation ratio. Microb. Ecol. 26: 201–217.Weiss M., U. Abele, J. Weckesser, W. Welte, E. Schiltz E. and G.E. Schultz. 1991. Molecular architecture and electrostatic proper-ties of bacterial porin. Science 254: 1627–1630.Williams C.J. and F.J. Jochem. 2006. Ectoenzyme kinetics in Flo-rida Bay: implications for bacterial carbon source and nutrient sta-tus. Hydrobiologia 569: 113–127.
Polish Journal of Microbiology2017, Vol. 66, No 1, 85–100
ORIGINAL PAPER
* Corresponding author: L. Błaszczyk, Institute of Plant Genetics of the Polish Academy of Sciences, Poznań, Poland; e-mail: [email protected]
Introduction
Fusarium species are considered to be some of the most important plant pathogens, causing head blight in small grain cereals and ear rot in maize. These patho-genic species produce a wide range of mycotoxins, such as trichothecenes (TCTs), fumonisins (FBs), zearale-none (ZEN), beauvericin (BEA) and moniliformin (MON), which have been determined to be common contaminants of cereal grains and derived products (Bottalico and Perrone, 2002; Jestoi et al., 2008; Goetz et al., 2010). Among the toxigenic Fusarium species that have been associated with infected grain are Fusarium graminearum, Fusarium culmorum, Fusarium ave-naceum, Fusarium cerealis, and Fusarium temperatum (Bottalico and Perrone, 2002; Logrieco et al., 2002a; 2002b; Goetz et al., 2010; Amarasinghe et al., 2014; Czembor et al., 2014). F. graminearum is capable of producing two major types of mycotoxins: estrogenic ZEN and type B trichothecenes, such as deoxyniva-
lenol (DON) and, depending on the chemotype, its acetylated forms 3-acetyl-deoxynivalenol (3-AcDON) or 15-acetyl-deoxynivalenol (15-AcDON), as well as nivalenol (NIV) (Bily et al., 2004; Glenn, 2007). The main mycotoxins biosynthesized by F. culmorum include DON, 3-AcDON, NIV, fusarenone X (FUS) and ZEN (Glenn, 2007; Wagacha and Muthomi, 2007). NIV, FUS and ZEN are also formed in cereals by F. cerea-lis strains (Logrieco et al., 2003; Amarasinghe et al., 2014). However, F. avenaceum and F. temperatum do not produce TCTs or ZEN, but they do produce other mycotoxins such as enniatins (ENs), BEA and MON (Logrieco et al., 2002b; Jestoi et al., 2008; Scauflaire et al., 2012). F. temperatum additionally produces FB1 (Scauflaire et al., 2012).
As has been repeatedly demonstrated, Fusarium mycotoxins pose a significant health risk for humans and animals through food and feed prepared from con-taminated cereal crops (Bennet and Klich, 2003; Glenn, 2007). Therefore, different strategies have been adopted
Suppressive Effect of Trichoderma spp. on toxigenic Fusarium species
LIDIA BŁASZCZYK1*, ANETA BASIŃSKA-BARCZAK1, HANNA ĆWIEK-KUPCZYŃSKA1,KAROLINA GROMADZKA2, DELFINA POPIEL1 and ŁUKASZ STĘPIEŃ1
1 Institute of Plant Genetics, Polish Academy of Sciences, Poznań, Poland2 Department of Chemistry, University of Life Sciences, Poznań, Poland
Submitted 25 February 2016, revised 11 July 2016, accepted 5 December 2016
A b s t r a c t
The aim of the present study was to examine the abilities of twenty-four isolates belonging to ten different Trichoderma species (i.e., Trichoderma atroviride, Trichoderma citrinoviride, Trichoderma cremeum, Trichoderma hamatum, Trichoderma harzianum, Trichoderma koningiopsis, Trichoderma longibrachiatum, Trichoderma longipile, Trichoderma viride and Trichoderma viridescens) to inhibit the mycelial growth and mycotoxin production by five Fusarium strains (i.e., Fusarium avenaceum, Fusarium cerealis, Fusarium culmorum, Fusarium graminearum and Fusarium temperatum). Dual-culture bioassay on potato dextrose agar (PDA) medium clearly documented that all of the Trichoderma strains used in the study were capable of influencing the mycelial growth of at least four of all five Fusarium species on the fourth day after co-inoculation, when there was the first apparent physical contact between antagonist and pathogen. The qualitative evalu-ation of the interaction between the colonies after 14 days of co-culturing on PDA medium showed that ten Trichoderma strains completely overgrew and sporulated on the colony at least one of the tested Fusarium species. Whereas, the microscopic assay provided evidence that only T. atroviride AN240 and T. viride AN255 formed dense coils around the hyphae of the pathogen from where penetration took place. Of all screened Trichoderma strains, T. atroviride AN240 was also found to be the most efficient (69–100% toxin reduction) suppressors of mycotoxins (deoxynivalenol, 3-acetyl-deoxynivalenol, 15-acetyl-deoxynivalenol, nivalenol, zearalenone, beauvericin, moniliformin) production by all five Fusarium species on solid substrates. This research suggests that T. atroviride AN240 can be a promising candidate for the biological control of toxigenic Fusarium species.
K e y w o r d s: antagonism, dual culture bioassays, fungal interactions, microscopic observations, mycotoxins
Błaszczyk L. et al. 186
to reduce Fusarium mycotoxin contamination in cereals (Palazzini et al., 2007). One of the more economically and environmentally attractive options is considered to be the use of biological control agents (BCAs) acting as natural antagonists to Fusarium.
Trichoderma spp. are among the most studied and promising microorganisms used in a biocontrol system (Benitez et al., 2004; Woo et al., 2014). Species of the ascomycete genus Trichoderma (teleomorph Hypocrea) are found in many ecosystems of all climatic zones, but the most common and natural habitat of these fungi is known to be soil and wood with symptoms of decay (Samuels, 2006; Kubicek et al., 2008; Druzhinina et al., 2011; Strakowska et al., 2014). These species succeed in various heterotrophic interactions, exhibiting sap-rotrophic and mycoparasitic (necrotrophic hyperpara-sitic, mycotrophic) lifestyles (Druzhinina et al., 2011). Their antagonistic abilities i.e. activities towards plant pathogens, such as Botrytis cinerea, Fusarium spp., Pythium spp., Rhizoctonia solani, Verticillium dahilae, and Sclerotinia spp. (Harman et al., 2004; Verma et al., 2007; Druzhinina et al., 2011) are a combination of several mechanisms, including nutrient and/or space competitions, antibiosis associated with the secretion of antibiotic metabolites and direct mycoparasitism, which involves the production of cell-wall-degrading enzymes (Vinale et al., 2008a; 2008b; Druzhinina et al., 2011). In addition, Trichoderma strains used as bio-control agents are able to induce plant defense against patho gens and to promote plant growth (Hermosa, 2012; Nawrocka and Małolepsza, 2014).
Several studies indicate that Trichoderma species are effective biocontrol agents for phytopathogenic Fusarium. Although, particular attention has been paid to Trichoderma harzianum strains. It has been shown that seed treatment of maize with T. harzianum T22 and Th-8 strains reduces Fusarium verticillioides kernel colonization and FBs contamination under controlled and natural conditions as well as induces systemic resistance in maize against this pathogens (Nayaka et al., 2008; Ferriego et al., 2014a; 2014b). T. harzianum T16 and T23 strains have been found to be effective antagonists towards F. verticillioides and FBs produc-tion in maize kernels in liquid as well as agar medium (Altinok, 2009). Furthermore, T. harzianum isolate THF2/3 has been reported to reduce DON production by F. graminearum in agar medium bioassays (Cooney et al., 2001). Recently, it has been documented that Trichoderma gamsii 6085 and Trichoderma atroviride AN35 strains are able to suppress TCTs production by F. graminearum and F. culmorum species on natural substrates (Buśko et al., 2008; Matarese et al., 2012). In addition, T. atroviride AN35 grown in dual cul-ture bioassays on rice (in a competition assay system) with F. graminearum and F. culmorum strains has also
been found to substantially inhibit ZEN production (Gromadzka et al., 2009; Popiel et al., 2008). However, very little is known on the impact of the various Tri-choderma species on the phytopathogenic Fusarium and their capacity to inhibit mycotoxin production on solid substrates.
Therefore, the aim of this study was to examine the antagonistic ability of twenty-four isolates belonging to ten different Trichoderma species, including species that are not yet fully recognized as important biological con-trol agents (BCA), against mycotoxigenic F. avenaceum, F. cerealis, F. culmorum, F. graminearum and F. tempe-ratum species.
Experimental
Materials and Methods
Fungal isolates. The twenty-four Trichoderma iso-lates and five Fusarium strains investigated in this study were selected from the culture collection of the Insti- tute of Plant Genetics, Polish Academy of Sciences, Poznań, Poland and are listed in Table I. Four selected Trichoderma strains (Table I) are deposited in the culture collection of the CBS-KNAW Fungal Biodiver-sity Centre, Utrecht, the Netherlands (CBS). All the studied Trichoderma strains sourced from different eco-logical niches in Poland had previously been identified to the species level by sequence analysis of the inter-nal transcribed spacer regions ITS-1 and ITS-2 of the nuclear rDNA and a fragment of the translation-elonga-tion factor 1-alpha (tef1) gene by Błaszczyk et al. (2011) and Jeleń et al. (2014). Fusarium strains of five species (F. avenaceum KF 2818, F. cerealis KF 1157, F. culmorum KF 2795, F. graminearum KF 2870 and F. temperatum KF 506) were identified using species-specific mark-ers validated during earlier studies (Stępień et al., 2011; Wiśniewska et al., 2014).
Dual culture bioassay. Antagonistic activities of all Trichoderma isolates towards Fusarium species were assessed in dual cultures on potato dextrose agar (PDA) medium. Pure cultures of Trichoderma and Fusarium were re-cultured aseptically from stock slants onto 8.5 cm diameter Petri dishes. They were grown on PDA for 7 days at 25 ± 2°C and were subsequently used as inoculum. Mycelial disks of 3 mm diameter from colony margins of each pathogen-antagonist combination were placed in Petri dishes containing 15 ml of PDA medium, 8.0 cm apart and diametrically opposed to each other. Each dual culture was set up in triplicate. The control consisted of individual cultures of the pathogen and antagonist. Plates were incubated at 25 ± 2°C, 12 h/12 h darkness/light. The radial growth of each fungus was measured daily with a ruler for
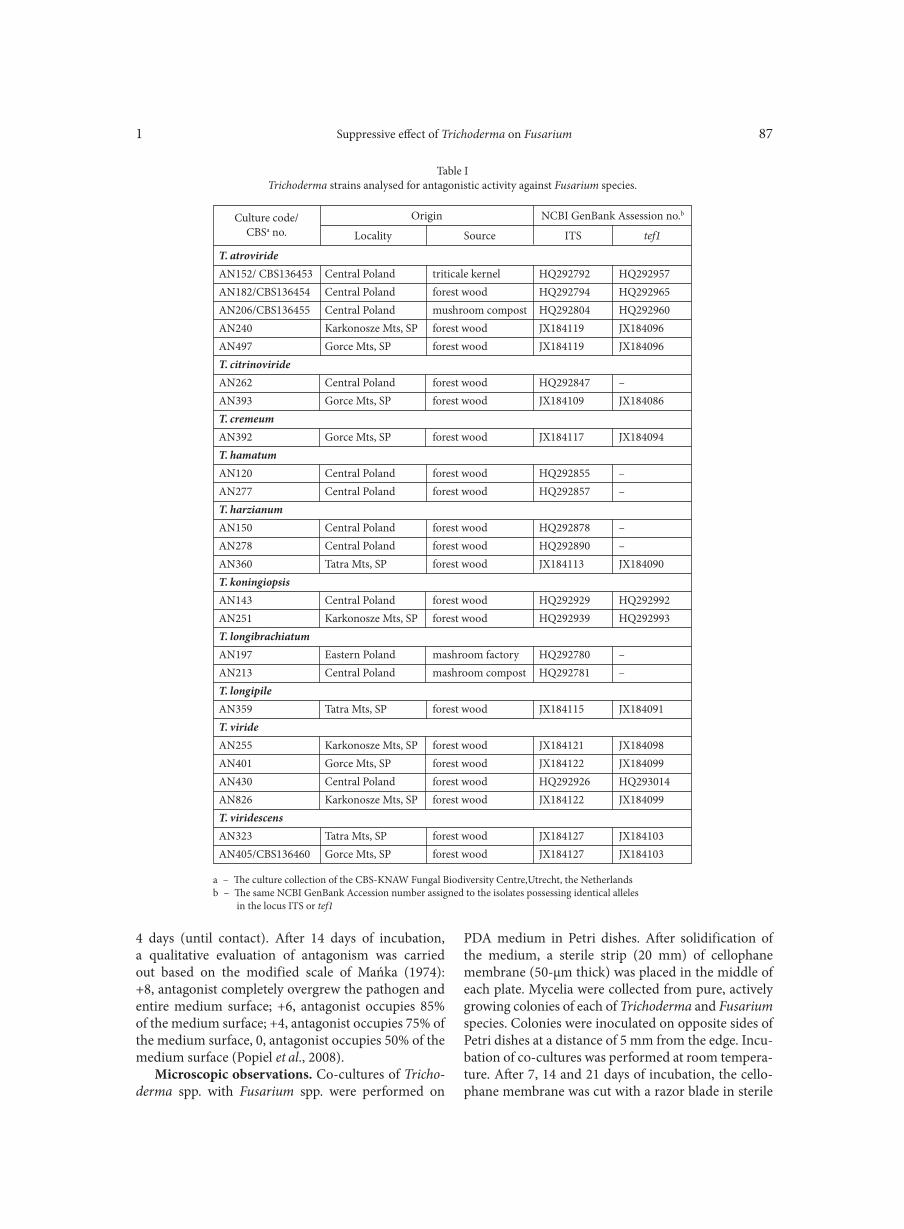
Suppressive effect of Trichoderma on Fusarium1 87
4 days (until contact). After 14 days of incubation, a qualitative evaluation of antagonism was carried out based on the modified scale of Mańka (1974): +8, antagonist completely overgrew the pathogen and entire medium surface; +6, antagonist occupies 85% of the medium surface; +4, antagonist occupies 75% of the medium surface, 0, antagonist occupies 50% of the medium surface (Popiel et al., 2008).
Microscopic observations. Co-cultures of Tricho-derma spp. with Fusarium spp. were performed on
PDA medium in Petri dishes. After solidification of the medium, a sterile strip (20 mm) of cellophane mem brane (50-μm thick) was placed in the middle of each plate. Mycelia were collected from pure, actively growing colonies of each of Trichoderma and Fusarium species. Colonies were inoculated on opposite sides of Petri dishes at a distance of 5 mm from the edge. Incu-bation of co-cultures was performed at room tempera-ture. After 7, 14 and 21 days of incubation, the cello-phane membrane was cut with a razor blade in sterile
T. atrovirideAN152/ CBS136453 Central Poland triticale kernel HQ292792 HQ292957AN182/CBS136454 Central Poland forest wood HQ292794 HQ292965AN206/CBS136455 Central Poland mushroom compost HQ292804 HQ292960AN240 Karkonosze Mts, SP forest wood JX184119 JX184096AN497 Gorce Mts, SP forest wood JX184119 JX184096T. citrinovirideAN262 Central Poland forest wood HQ292847 –AN393 Gorce Mts, SP forest wood JX184109 JX184086T. cremeumAN392 Gorce Mts, SP forest wood JX184117 JX184094T. hamatumAN120 Central Poland forest wood HQ292855 –AN277 Central Poland forest wood HQ292857 –T. harzianumAN150 Central Poland forest wood HQ292878 –AN278 Central Poland forest wood HQ292890 –AN360 Tatra Mts, SP forest wood JX184113 JX184090T. koningiopsisAN143 Central Poland forest wood HQ292929 HQ292992AN251 Karkonosze Mts, SP forest wood HQ292939 HQ292993T. longibrachiatumAN197 Eastern Poland mashroom factory HQ292780 –AN213 Central Poland mashroom compost HQ292781 –T. longipileAN359 Tatra Mts, SP forest wood JX184115 JX184091T. virideAN255 Karkonosze Mts, SP forest wood JX184121 JX184098AN401 Gorce Mts, SP forest wood JX184122 JX184099AN430 Central Poland forest wood HQ292926 HQ293014AN826 Karkonosze Mts, SP forest wood JX184122 JX184099T. viridescensAN323 Tatra Mts, SP forest wood JX184127 JX184103AN405/CBS136460 Gorce Mts, SP forest wood JX184127 JX184103
Table ITrichoderma strains analysed for antagonistic activity against Fusarium species.
a – The culture collection of the CBS-KNAW Fungal Biodiversity Centre,Utrecht, the Netherlands b – The same NCBI GenBank Accession number assigned to the isolates possessing identical alleles in the locus ITS or tef1
Culture code/CBSa no.
Origin NCBI GenBank Assession no.b
Locality Source ITS tef1
Błaszczyk L. et al. 188
conditions and the mycelia were placed onto a drop of distilled water on a microscope slide and examined. Observations were carried out using a light microscope (Olympus CX-41-1 with UC-30 camera, Olympus, Japan). After the first 7 days, the samples were screened mainly for loops of the Trichoderma around Fusarium hyphae. After the following days of incubation the samples were screened for the anatomical damage of the Fusarium and other structures indicating potential mycoparasitism.
Solid substrate bioassay. In order to evaluate the ability of Trichoderma to inhibit mycotoxin produc-tion by Fusarium species, dual cultures were estab-lished on solid substrates (rice kernels) following the methods described by Buśko et al. (2008). The assay was performed using all of the Fusarium strains and five selected Trichoderma isolates characterized by the highest antagonistic potential against Fusarium species in dual cultures on PDA medium. Rice kernels (50 g) were added to 15 ml distilled water, left overnight and autoclaved at 121°C for 30 min in a 300 ml Erlenmeyer flask. The flasks were inoculated with four disks (4 mm in diameter) cut from the advancing edge of 7-day PDA culture of pathogen and/or antagonist. Three replicates for each experimental set (antagonist, pathogen and antagonist/pathogen variants) were performed. Un-inoculated rice was used as negative controls. The incu-bation was carried out at 25 ± 2°C 12 h/12 h of darkness/light for 21 days. Flasks were shaken daily to prevent clumping and provide aeration.
Mycotoxin extraction and analysisChemicals and reagents. Mycotoxin standards
(ZEN, DON and its derivatives 15-AcDON and 3-AcDON, NIV, MON and BEA) were supplied by Sigma-Aldrich (Steinheim, Germany). Acetonitrile and methanol (HPLC grade), disodium tetraborate, 2-mercaptoethanol, potassium hydroxide, sodium dihydrophosphate and o-phosphoric acid were also purchased from Sigma-Aldrich. Potassium chloride, dipotassium phosphate, n-hexane and t-butyl-ammo-nium hydroxide were purchased from POCh (Poland). Water of HPLC grade from Merck Millipore water puri-fication system was used for analyses.
Sample preparation. Rice culture samples were powder-ground in a WŻ-1 laboratory mill (the Research Institute of Baking Industry Ltd., Bydgoszcz, Poland). ZEN, DON, NIV, 3-Ac-DON and 15-Ac-DON were extracted with acetonitrile:water (90:10, v/v) solution. MON and BEA were extracted with acetonitrile:methanol:water (16:3:1, v/v/v). A solvent mixture was used at a ratio of 2.5 ml of solvent per 1 g of ground samples. Extractions were performed by blending the samples with the solvents at high speed for 2 min in an H 500 blender jar (POL-EKO, Poland). The
extract was filtered through filter paper (No. 5, What-man), a glass microfiber filter (GF/B, Whatman) and a syringe filter (CHROMAFIL PET-45/15MS) and then the filtrate was collected. Where the toxin content in the sample was below the detection limit, the sample was purified by immunoaffinity columns (ZearalaTest, WB) according to the method of Visconti and Pascale (1998) for ZEN, and by using carbon columns for the deter-mination of DON, MON, 3-Ac-DON and 15-Ac-DON by the method of Tomczak et al. (2002), Kostecki et al. (1999) and Yang et al. (2013) respectively. The filtrate was analyzed by HPLC chromatography according to the methodology described below.
HPLC analysis. The chromatographic system con-sisted of a Waters 2695 high-performance liquid chro-matograph (Waters, Milford, USA), a Waters 2475 Multi λ Fluorescence Detector and a Waters 2996 Pho-todiode Array Detector. Millenium software was used for data processing. DON, NIV and MON analyses were performed according to the method described by Kostecki et al. (1999) and Tomczak et al. (2002) while 3-AcDON, 15-AcDON was detected by the method of Yang et al. (2013). Analysis of ZEN and BEA was performed according to Visconti and Pascale (1998) and Jestoi et al. (2008), respectively. The detection limit for DON, NIV, BEA and MON was 0.01 g kg −1, for 3-AcDON, 15-AcDON was 1.0 g kg−1 and for ZEN was 0.3 g kg−1. Recovery rates for NIV, DON, 3-AcDON, 15-AcDON, BEA and MON were 75, 87, 76, 75, 85, 90%, respectively. ZEN recovery was in a range from 97 to 99%. Relative standard deviation (R.S.D.) was below 1% for ZEN, below 5% for DON, 3-AcDON, 15-AcDON, NIV and BEA, and below 7% for MON. The recovery of mycotoxins were measured in tripli-cates by extracting toxins from solid substrates spiked with 1.0–100 g kg−1 of compounds. In order to confirm the presence of ZEN, a Photodiode Array Detector was used. Mycotoxin was identified by comparing reten-tion times and UV spectra of purified extracted samples with pure standards. Quantification of mycotoxins was carried out by comparing peak areas of the analyzed samples to the calibration curve of peak areas obtained with authentic mycotoxin standards.
Statistical analysis. To analyse the inhibition (%) of pathogen growth on the fourth day after co-inocu-lation, inhibition coefficients and their standard errors were calculated according to the formula: (Rc-R) / Rc × 100, where Rc, R are the estimates of radial growth of a pathogen in control and dual culture, respectively (Edington et al. 1971). The same procedure was also applied to calculate relative toxin reduction (%), based on estimated toxin production level. The final assess-ment of inhibitory effectiveness of the antagonists was based on observations from visual assessment of colony state at day 14 of co-incubation. To identify the most
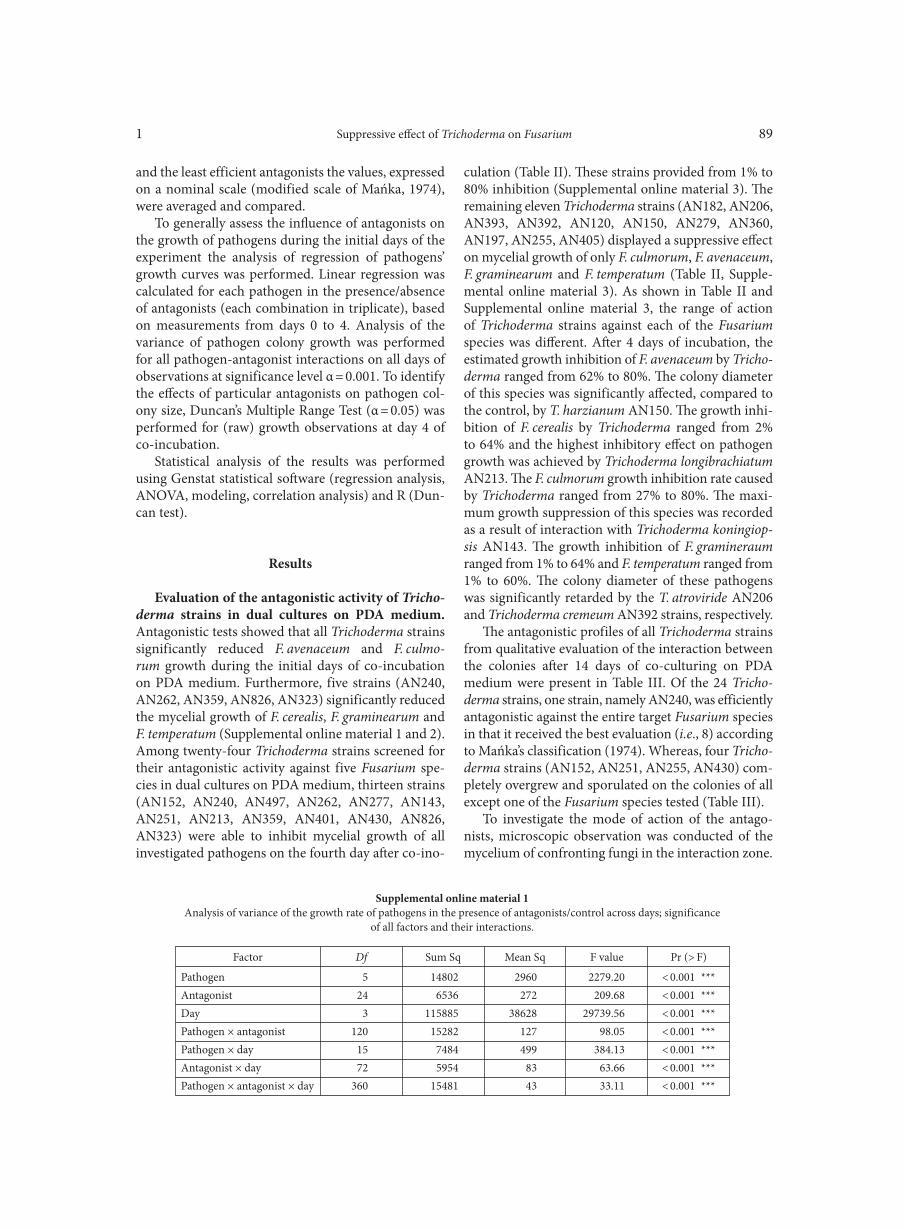
Suppressive effect of Trichoderma on Fusarium1 89
and the least efficient antagonists the values, expressed on a nominal scale (modified scale of Mańka, 1974), were averaged and compared.
To generally assess the influence of antagonists on the growth of pathogens during the initial days of the experiment the analysis of regression of pathogens’ growth curves was performed. Linear regression was calculated for each pathogen in the presence/absence of antagonists (each combination in triplicate), based on measurements from days 0 to 4. Analysis of the variance of pathogen colony growth was performed for all pathogen-antagonist interactions on all days of observations at significance level α = 0.001. To identify the effects of particular antagonists on pathogen col-ony size, Duncan’s Multiple Range Test (α = 0.05) was performed for (raw) growth observations at day 4 of co-incubation.
Statistical analysis of the results was performed using Genstat statistical software (regression analysis, ANOVA, modeling, correlation analysis) and R (Dun-can test).
Results
Evaluation of the antagonistic activity of Tricho-derma strains in dual cultures on PDA medium. Antagonistic tests showed that all Trichoderma strains significantly reduced F. avenaceum and F. culmo-rum growth during the initial days of co-incubation on PDA medium. Furthermore, five strains (AN240, AN262, AN359, AN826, AN323) significantly reduced the mycelial growth of F. cerealis, F. graminearum and F. temperatum (Supplemental online material 1 and 2). Among twenty-four Trichoderma strains screened for their antagonistic activity against five Fusarium spe-cies in dual cultures on PDA medium, thirteen strains (AN152, AN240, AN497, AN262, AN277, AN143, AN251, AN213, AN359, AN401, AN430, AN826, AN323) were able to inhibit mycelial growth of all investigated pathogens on the fourth day after co-ino-
culation (Table II). These strains provided from 1% to 80% inhibition (Supplemental online material 3). The remaining eleven Trichoderma strains (AN182, AN206, AN393, AN392, AN120, AN150, AN279, AN360, AN197, AN255, AN405) displayed a suppressive effect on mycelial growth of only F. culmorum, F. avenaceum, F. graminearum and F. temperatum (Table II, Supple-mental online material 3). As shown in Table II and Supplemental online material 3, the range of action of Trichoderma strains against each of the Fusarium species was different. After 4 days of incubation, the estimated growth inhibition of F. avenaceum by Tricho-derma ranged from 62% to 80%. The colony diameter of this species was significantly affected, compared to the control, by T. harzianum AN150. The growth inhi-bition of F. cerealis by Trichoderma ranged from 2% to 64% and the highest inhibitory effect on pathogen growth was achieved by Trichoderma longibrachiatum AN213. The F. culmorum growth inhibition rate caused by Trichoderma ranged from 27% to 80%. The maxi-mum growth suppression of this species was recorded as a result of interaction with Trichoderma koningiop-sis AN143. The growth inhibition of F. gramineraum ranged from 1% to 64% and F. temperatum ranged from 1% to 60%. The colony diameter of these pathogens was significantly retarded by the T. atroviride AN206 and Trichoderma cremeum AN392 strains, respectively.
The antagonistic profiles of all Trichoderma strains from qualitative evaluation of the interaction between the colonies after 14 days of co-culturing on PDA medium were present in Table III. Of the 24 Tricho-derma strains, one strain, namely AN240, was efficiently antagonistic against the entire target Fusarium species in that it received the best evaluation (i.e., 8) according to Mańka’s classification (1974). Whereas, four Tricho-derma strains (AN152, AN251, AN255, AN430) com-pletely overgrew and sporulated on the colonies of all except one of the Fusarium species tested (Table III).
To investigate the mode of action of the antago- nists, microscopic observation was conducted of the mycelium of confronting fungi in the interaction zone.
Pathogen 5 14802 2960 2279.20 < 0.001 ***Antagonist 24 6536 272 209.68 < 0.001 ***Day 3 115885 38628 29739.56 < 0.001 ***Pathogen × antagonist 120 15282 127 98.05 < 0.001 ***Pathogen × day 15 7484 499 384.13 < 0.001 ***Antagonist × day 72 5954 83 63.66 < 0.001 ***Pathogen × antagonist × day 360 15481 43 33.11 < 0.001 ***
Supplemental online material 1Analysis of variance of the growth rate of pathogens in the presence of antagonists/control across days; significance
of all factors and their interactions.
Factor Df Sum Sq Mean Sq F value Pr (> F)
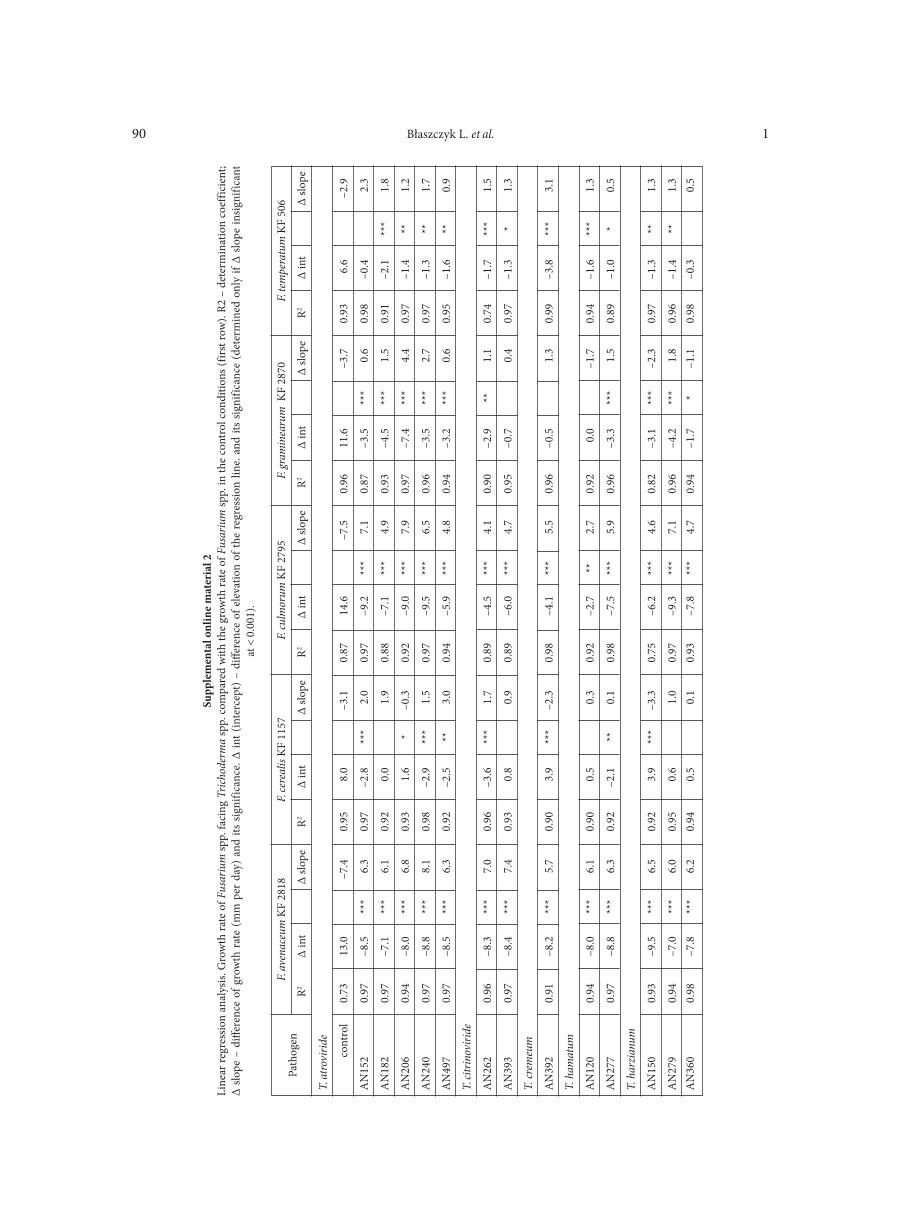
Błaszczyk L. et al. 190
T. at
rovi
ride
co
ntro
l 0.
73
13.0
–7.4
0.
95
8.0
–3
.1
0.87
14
.6
–7
.5
0.96
11
.6
–3
.7
0.93
6.
6
–2.9
AN
152
0.97
–8
.5
***
6.3
0.97
–2
.8
***
2.0
0.97
–9
.2
***
7.1
0.87
–3
.5
***
0.6
0.98
–0
.4
2.
3
AN
182
0.97
–7
.1
***
6.1
0.92
0.
0
1.9
0.88
–7
.1
***
4.9
0.93
–4
.5
***
1.5
0.91
–2
.1
***
1.8
AN
206
0.94
–8
.0
***
6.8
0.93
1.
6 *
–0.3
0.
92
–9.0
**
* 7.
9 0.
97
–7.4
**
* 4.
4 0.
97
–1.4
**
1.
2
AN
240
0.97
–8
.8
***
8.1
0.98
–2
.9
***
1.5
0.97
–9
.5
***
6.5
0.96
–3
.5
***
2.7
0.97
–1
.3
**
1.7
AN
497
0.97
–8
.5
***
6.3
0.92
–2
.5
**
3.0
0.94
–5
.9
***
4.8
0.94
–3
.2
***
0.6
0.95
–1
.6
**
0.9
T. ci
trin
oviri
de
AN
262
0.96
–8
.3
***
7.0
0.96
–3
.6
***
1.7
0.89
–4
.5
***
4.1
0.90
–2
.9
**
1.1
0.74
–1
.7
***
1.5
AN
393
0.97
–8
.4
***
7.4
0.93
0.
8
0.9
0.89
–6
.0
***
4.7
0.95
–0
.7
0.
4 0.
97
–1.3
*
1.3
T. cr
emeu
m
AN
392
0.91
–8
.2
***
5.7
0.90
3.
9 **
* –2
.3
0.98
–4
.1
***
5.5
0.96
–0
.5
1.
3 0.
99
–3.8
**
* 3.
1
T. h
amat
um
AN
120
0.94
–8
.0
***
6.1
0.90
0.
5
0.3
0.92
–2
.7
**
2.7
0.92
0.
0
–1.7
0.
94
–1.6
**
* 1.
3
AN
277
0.97
–8
.8
***
6.3
0.92
–2
.1
**
0.1
0.98
–7
.5
***
5.9
0.96
–3
.3
***
1.5
0.89
–1
.0
* 0.
5
T. h
arzi
anum
AN
150
0.93
–9
.5
***
6.5
0.92
3.
9 **
* –3
.3
0.75
–6
.2
***
4.6
0.82
–3
.1
***
–2.3
0.
97
–1.3
**
1.
3
AN
279
0.94
–7
.0
***
6.0
0.95
0.
6
1.0
0.97
–9
.3
***
7.1
0.96
–4
.2
***
1.8
0.96
–1
.4
**
1.3
AN
360
0.
98
–7.8
**
* 6.
2 0.
94
0.5
0.
1 0.
93
–7.8
**
* 4.
7 0.
94
–1.7
*
–1.1
0.
98
–0.3
0.5
Supp
lem
enta
l onl
ine
mat
eria
l 2Li
near
regr
essio
n an
alys
is. G
row
th ra
te o
f Fus
ariu
m sp
p. fa
cing
Tric
hode
rma
spp.
com
pare
d w
ith th
e gr
owth
rate
of F
usar
ium
spp.
in th
e co
ntro
l con
ditio
ns (f
irst r
ow).
R2 –
det
erm
inat
ion
coef
ficie
nt;
Δ slo
pe –
diff
eren
ce o
f gro
wth
rat
e (m
m p
er d
ay) a
nd it
s sig
nific
ance
. Δ in
t (in
terc
ept)
– di
ffere
nce
of e
leva
tion
of th
e re
gres
sion
line.
and
its s
igni
fican
ce (d
eter
min
ed o
nly
if Δ
slope
insig
nific
ant
at <
0.00
1).
Path
ogen
F. av
enac
eum
KF
2818
R2
F. te
mpe
ratu
m K
F 50
6F.
gram
inea
rum
KF
2870
F. cu
lmor
um K
F 27
95F.
cere
alis
KF
1157
Δ slo
peΔ
int
R2Δ
slope
Δ in
tR2
Δ slo
peΔ
int
R2Δ
slope
Δ in
tR2
Δ slo
peΔ
int
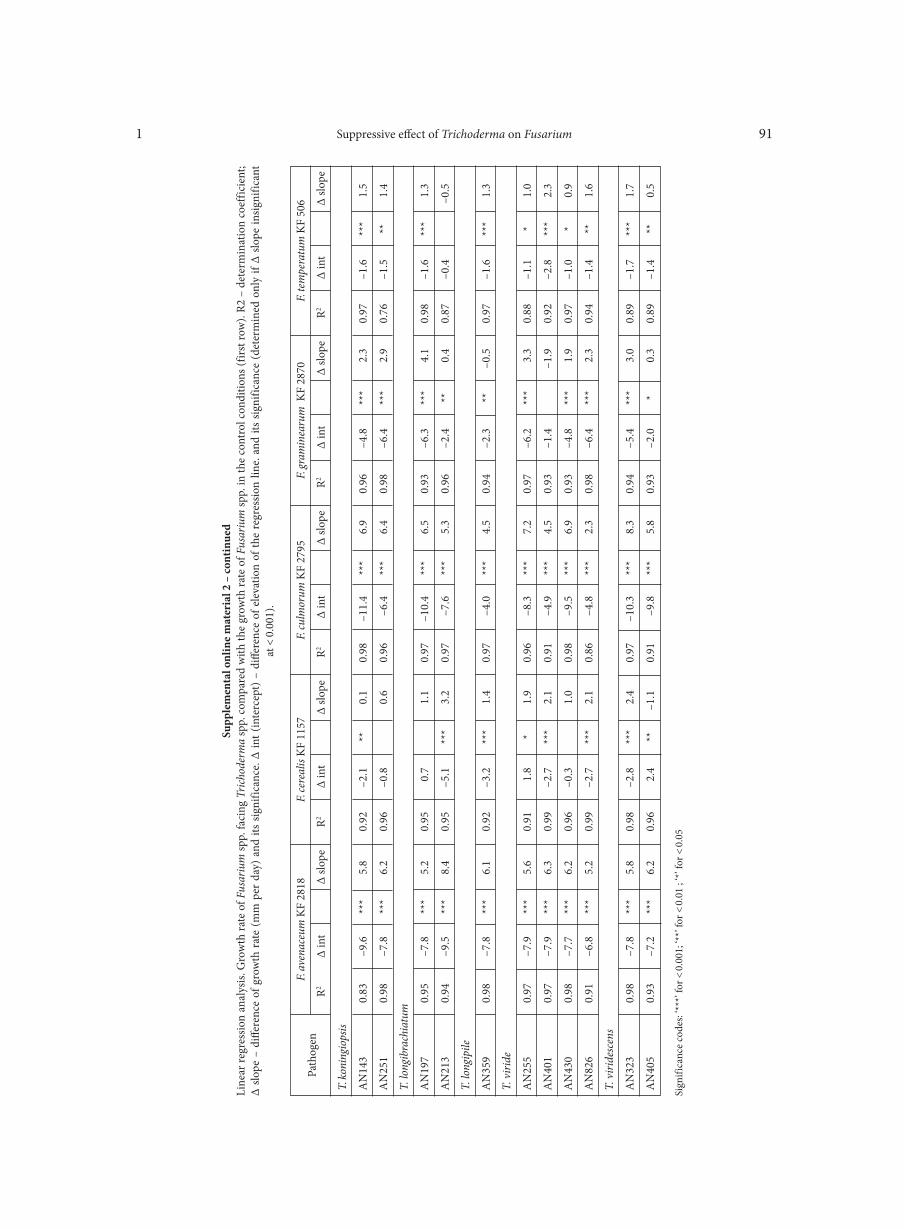
Suppressive effect of Trichoderma on Fusarium1 91
Sign
ifica
nce
code
s: ‘**
*’ fo
r < 0.
001;
‘**’
for <
0.01
; ‘*’
for <
0.05
T. ko
ning
iops
is
AN
143
0.83
–9
.6
***
5.8
0.92
–2
.1
**
0.1
0.98
–1
1.4
***
6.9
0.96
–4
.8
***
2.3
0.97
–1
.6
***
1.5
AN
251
0.98
–7
.8
***
6.2
0.96
–0
.8
0.
6 0.
96
–6.4
**
* 6.
4 0.
98
–6.4
**
* 2.
9 0.
76
–1.5
**
1.
4
T. lo
ngib
rach
iatu
m
AN
197
0.95
–7
.8
***
5.2
0.95
0.
7
1.1
0.97
–1
0.4
***
6.5
0.93
–6
.3
***
4.1
0.98
–1
.6
***
1.3
AN
213
0.94
–9
.5
***
8.4
0.95
–5
.1
***
3.2
0.97
–7
.6
***
5.3
0.96
–2
.4
**
0.4
0.87
–0
.4
–0
.5
T. lo
ngip
ile
AN
359
0.98
–7
.8
***
6.1
0.92
–3
.2
***
1.4
0.97
–4
.0
***
4.5
0.94
–2
.3
**
–0.5
0.
97
–1.6
**
* 1.
3
T. v
iride
AN
255
0.97
–7
.9
***
5.6
0.91
1.
8 *
1.9
0.96
–8
.3
***
7.2
0.97
–6
.2
***
3.3
0.88
–1
.1
* 1.
0
AN
401
0.
97
–7.9
**
* 6.
3 0.
99
–2.7
**
* 2.
1 0.
91
–4.9
**
* 4.
5 0.
93
–1.4
–1.9
0.
92
–2.8
**
* 2.
3
AN
430
0.
98
–7.7
**
* 6.
2 0.
96
–0.3
1.0
0.98
–9
.5
***
6.9
0.93
–4
.8
***
1.9
0.97
–1
.0
* 0.
9
AN
826
0.91
–6
.8
***
5.2
0.99
–2
.7
***
2.1
0.86
–4
.8
***
2.3
0.98
–6
.4
***
2.3
0.94
–1
.4
**
1.6
T. v
iride
scen
s
AN
323
0.
98
–7.8
**
* 5.
8 0.
98
–2.8
**
* 2.
4 0.
97
–10.
3 **
* 8.
3 0.
94
–5.4
**
* 3.
0 0.
89
–1.7
**
* 1.
7
AN
405
0.93
–7
.2
***
6.2
0.96
2.
4 **
–1
.1
0.91
–9
.8
***
5.8
0.93
–2
.0
* 0.
3 0.
89
–1.4
**
0.
5
Supp
lem
enta
l onl
ine
mat
eria
l 2 –
cont
inue
dLi
near
regr
essio
n an
alys
is. G
row
th ra
te o
f Fus
ariu
m sp
p. fa
cing
Tric
hode
rma
spp.
com
pare
d w
ith th
e gr
owth
rate
of F
usar
ium
spp.
in th
e co
ntro
l con
ditio
ns (f
irst r
ow).
R2 –
det
erm
inat
ion
coef
ficie
nt;
Δ slo
pe –
diff
eren
ce o
f gro
wth
rat
e (m
m p
er d
ay) a
nd it
s sig
nific
ance
. Δ in
t (in
terc
ept)
– di
ffere
nce
of e
leva
tion
of th
e re
gres
sion
line.
and
its s
igni
fican
ce (d
eter
min
ed o
nly
if Δ
slope
insig
nific
ant
at <
0.00
1).
Path
ogen
F. av
enac
eum
KF
2818
R2
F. te
mpe
ratu
m K
F 50
6F.
gram
inea
rum
KF
2870
F. cu
lmor
um K
F 27
95F.
cere
alis
KF
1157
Δ slo
peΔ
int
R2Δ
slope
Δ in
tR2
Δ slo
peΔ
int
R2Δ
slope
Δ in
tR2
Δ slo
peΔ
int
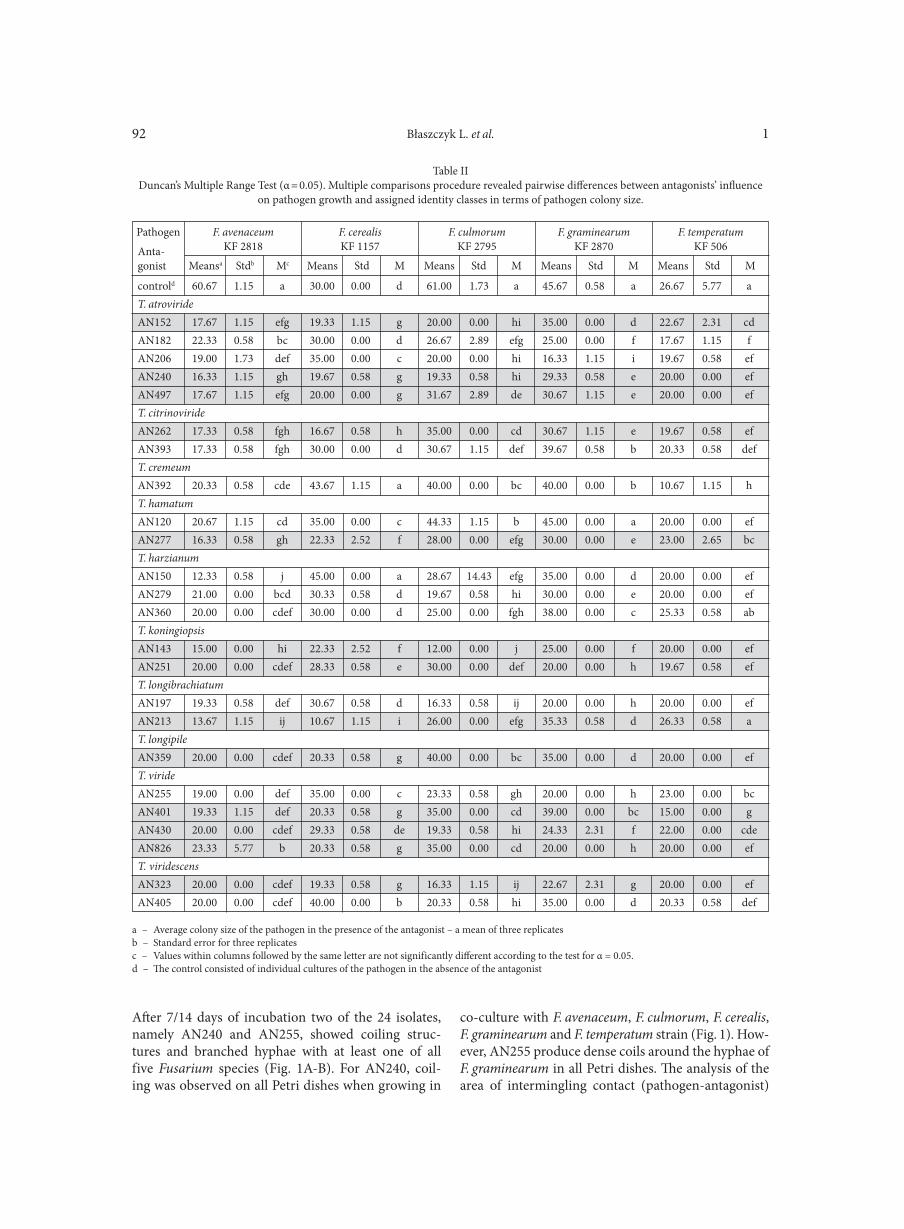
Błaszczyk L. et al. 192
After 7/14 days of incubation two of the 24 isolates, namely AN240 and AN255, showed coiling struc-tures and branched hyphae with at least one of all five Fusarium species (Fig. 1A-B). For AN240, coil-ing was observed on all Petri dishes when growing in
co-culture with F. avenaceum, F. culmorum, F. cerealis, F. graminearum and F. temperatum strain (Fig. 1). How-ever, AN255 produce dense coils around the hyphae of F. graminearum in all Petri dishes. The analysis of the area of intermingling contact (pathogen-antagonist)
controld 60.67 1.15 a 30.00 0.00 d 61.00 1.73 a 45.67 0.58 a 26.67 5.77 aT. atrovirideAN152 17.67 1.15 efg 19.33 1.15 g 20.00 0.00 hi 35.00 0.00 d 22.67 2.31 cdAN182 22.33 0.58 bc 30.00 0.00 d 26.67 2.89 efg 25.00 0.00 f 17.67 1.15 fAN206 19.00 1.73 def 35.00 0.00 c 20.00 0.00 hi 16.33 1.15 i 19.67 0.58 efAN240 16.33 1.15 gh 19.67 0.58 g 19.33 0.58 hi 29.33 0.58 e 20.00 0.00 efAN497 17.67 1.15 efg 20.00 0.00 g 31.67 2.89 de 30.67 1.15 e 20.00 0.00 efT. citrinovirideAN262 17.33 0.58 fgh 16.67 0.58 h 35.00 0.00 cd 30.67 1.15 e 19.67 0.58 efAN393 17.33 0.58 fgh 30.00 0.00 d 30.67 1.15 def 39.67 0.58 b 20.33 0.58 defT. cremeumAN392 20.33 0.58 cde 43.67 1.15 a 40.00 0.00 bc 40.00 0.00 b 10.67 1.15 hT. hamatumAN120 20.67 1.15 cd 35.00 0.00 c 44.33 1.15 b 45.00 0.00 a 20.00 0.00 efAN277 16.33 0.58 gh 22.33 2.52 f 28.00 0.00 efg 30.00 0.00 e 23.00 2.65 bcT. harzianumAN150 12.33 0.58 j 45.00 0.00 a 28.67 14.43 efg 35.00 0.00 d 20.00 0.00 efAN279 21.00 0.00 bcd 30.33 0.58 d 19.67 0.58 hi 30.00 0.00 e 20.00 0.00 efAN360 20.00 0.00 cdef 30.00 0.00 d 25.00 0.00 fgh 38.00 0.00 c 25.33 0.58 abT. koningiopsisAN143 15.00 0.00 hi 22.33 2.52 f 12.00 0.00 j 25.00 0.00 f 20.00 0.00 efAN251 20.00 0.00 cdef 28.33 0.58 e 30.00 0.00 def 20.00 0.00 h 19.67 0.58 efT. longibrachiatumAN197 19.33 0.58 def 30.67 0.58 d 16.33 0.58 ij 20.00 0.00 h 20.00 0.00 efAN213 13.67 1.15 ij 10.67 1.15 i 26.00 0.00 efg 35.33 0.58 d 26.33 0.58 aT. longipileAN359 20.00 0.00 cdef 20.33 0.58 g 40.00 0.00 bc 35.00 0.00 d 20.00 0.00 efT. virideAN255 19.00 0.00 def 35.00 0.00 c 23.33 0.58 gh 20.00 0.00 h 23.00 0.00 bcAN401 19.33 1.15 def 20.33 0.58 g 35.00 0.00 cd 39.00 0.00 bc 15.00 0.00 gAN430 20.00 0.00 cdef 29.33 0.58 de 19.33 0.58 hi 24.33 2.31 f 22.00 0.00 cdeAN826 23.33 5.77 b 20.33 0.58 g 35.00 0.00 cd 20.00 0.00 h 20.00 0.00 efT. viridescensAN323 20.00 0.00 cdef 19.33 0.58 g 16.33 1.15 ij 22.67 2.31 g 20.00 0.00 efAN405 20.00 0.00 cdef 40.00 0.00 b 20.33 0.58 hi 35.00 0.00 d 20.33 0.58 def
Table IIDuncan’s Multiple Range Test (α = 0.05). Multiple comparisons procedure revealed pairwise differences between antagonists’ influence
on pathogen growth and assigned identity classes in terms of pathogen colony size.
a – Average colony size of the pathogen in the presence of the antagonist – a mean of three replicatesb – Standard error for three replicatesc – Values within columns followed by the same letter are not significantly different according to the test for α = 0.05. d – The control consisted of individual cultures of the pathogen in the absence of the antagonist
Pathogen F. avenaceumKF 2818
F. cerealisKF 1157
F. culmorumKF 2795
F. graminearumKF 2870
F. temperatumKF 506Anta-
gonist Meansa Stdb Mc Means MStdMeans MStdMeans MStdMeans MStd
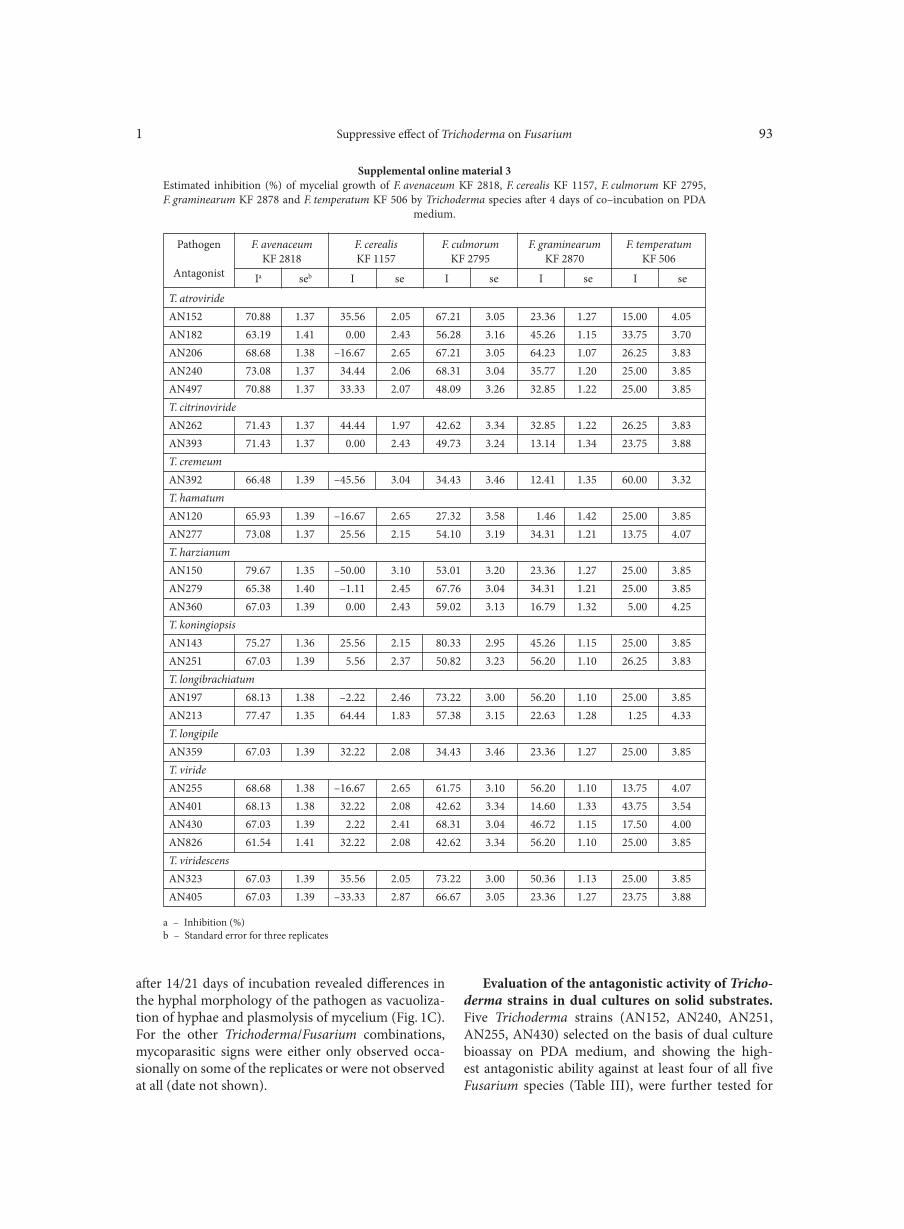
Suppressive effect of Trichoderma on Fusarium1 93
after 14/21 days of incubation revealed differences in the hyphal morphology of the pathogen as vacuoliza-tion of hyphae and plasmolysis of mycelium (Fig. 1C). For the other Trichoderma/Fusarium combinations, mycoparasitic signs were either only observed occa-sionally on some of the replicates or were not observed at all (date not shown).
Evaluation of the antagonistic activity of Tricho-derma strains in dual cultures on solid substrates. Five Trichoderma strains (AN152, AN240, AN251, AN255, AN430) selected on the basis of dual culture bioassay on PDA medium, and showing the high-est antagonistic ability against at least four of all five Fusarium species (Table III), were further tested for
T. atrovirideAN152 70.88 1.37 35.56 2.05 67.21 3.05 23.36 1.27 15.00 4.05AN182 63.19 1.41 0.00 2.43 56.28 3.16 45.26 1.15 33.75 3.70AN206 68.68 1.38 –16.67 2.65 67.21 3.05 64.23 1.07 26.25 3.83AN240 73.08 1.37 34.44 2.06 68.31 3.04 35.77 1.20 25.00 3.85AN497 70.88 1.37 33.33 2.07 48.09 3.26 32.85 1.22 25.00 3.85T. citrinovirideAN262 71.43 1.37 44.44 1.97 42.62 3.34 32.85 1.22 26.25 3.83AN393 71.43 1.37 0.00 2.43 49.73 3.24 13.14 1.34 23.75 3.88T. cremeumAN392 66.48 1.39 –45.56 3.04 34.43 3.46 12.41 1.35 60.00 3.32T. hamatumAN120 65.93 1.39 –16.67 2.65 27.32 3.58 1.46 1.42 25.00 3.85AN277 73.08 1.37 25.56 2.15 54.10 3.19 34.31 1.21 13.75 4.07T. harzianumAN150 79.67 1.35 –50.00 3.10 53.01 3.20 23.36 1.27 25.00 3.85AN279 65.38 1.40 –1.11 2.45 67.76 3.04 34.31 1.21 25.00 3.85AN360 67.03 1.39 0.00 2.43 59.02 3.13 16.79 1.32 5.00 4.25T. koningiopsisAN143 75.27 1.36 25.56 2.15 80.33 2.95 45.26 1.15 25.00 3.85AN251 67.03 1.39 5.56 2.37 50.82 3.23 56.20 1.10 26.25 3.83T. longibrachiatumAN197 68.13 1.38 –2.22 2.46 73.22 3.00 56.20 1.10 25.00 3.85AN213 77.47 1.35 64.44 1.83 57.38 3.15 22.63 1.28 1.25 4.33T. longipileAN359 67.03 1.39 32.22 2.08 34.43 3.46 23.36 1.27 25.00 3.85T. virideAN255 68.68 1.38 –16.67 2.65 61.75 3.10 56.20 1.10 13.75 4.07AN401 68.13 1.38 32.22 2.08 42.62 3.34 14.60 1.33 43.75 3.54AN430 67.03 1.39 2.22 2.41 68.31 3.04 46.72 1.15 17.50 4.00AN826 61.54 1.41 32.22 2.08 42.62 3.34 56.20 1.10 25.00 3.85T. viridescensAN323 67.03 1.39 35.56 2.05 73.22 3.00 50.36 1.13 25.00 3.85AN405 67.03 1.39 –33.33 2.87 66.67 3.05 23.36 1.27 23.75 3.88
Supplemental online material 3Estimated inhibition (%) of mycelial growth of F. avenaceum KF 2818, F. cerealis KF 1157, F. culmorum KF 2795, F. graminearum KF 2878 and F. temperatum KF 506 by Trichoderma species after 4 days of co–incubation on PDA
medium.
a – Inhibition (%)b – Standard error for three replicates
Pathogen
Antagonist
F. avenaceumKF 2818
F. cerealisKF 1157
F. culmorumKF 2795
F. graminearumKF 2870
F. temperatumKF 506
I seI seI seI seIa seb
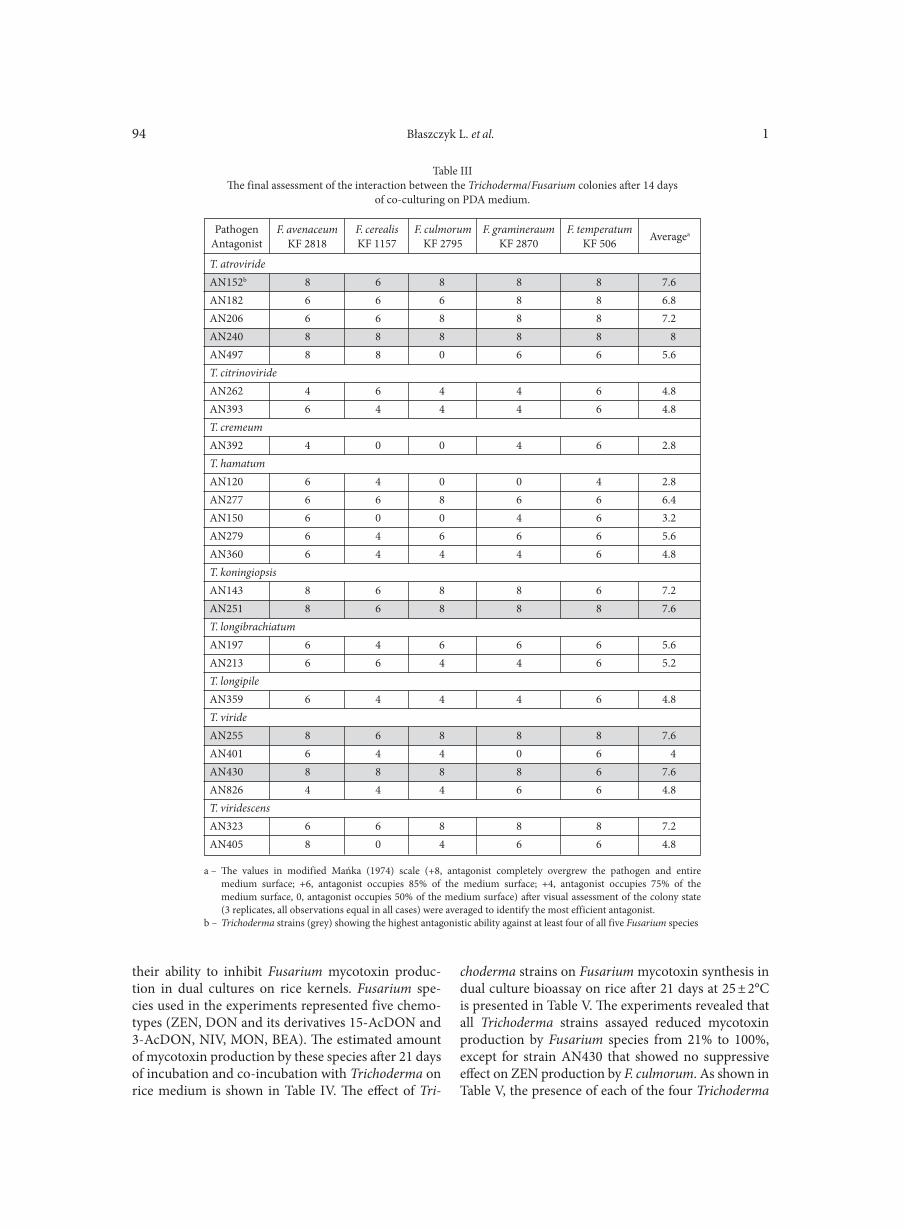
Błaszczyk L. et al. 194
their ability to inhibit Fusarium mycotoxin produc-tion in dual cultures on rice kernels. Fusarium spe-cies used in the experiments represented five chemo-types (ZEN, DON and its derivatives 15-AcDON and 3-AcDON, NIV, MON, BEA). The estimated amount of mycotoxin production by these species after 21 days of incubation and co-incubation with Trichoderma on rice medium is shown in Table IV. The effect of Tri-
choderma strains on Fusarium mycotoxin synthesis in dual culture bioassay on rice after 21 days at 25 ± 2°C is presented in Table V. The experiments revealed that all Trichoderma strains assayed reduced mycotoxin production by Fusarium species from 21% to 100%, except for strain AN430 that showed no suppressive effect on ZEN production by F. culmorum. As shown in Table V, the presence of each of the four Trichoderma
T. atrovirideAN152b 8 6 8 8 8 7.6AN182 6 6 6 8 8 6.8AN206 6 6 8 8 8 7.2AN240 8 8 8 8 8 8AN497 8 8 0 6 6 5.6T. citrinovirideAN262 4 6 4 4 6 4.8AN393 6 4 4 4 6 4.8T. cremeumAN392 4 0 0 4 6 2.8T. hamatumAN120 6 4 0 0 4 2.8AN277 6 6 8 6 6 6.4AN150 6 0 0 4 6 3.2AN279 6 4 6 6 6 5.6AN360 6 4 4 4 6 4.8T. koningiopsisAN143 8 6 8 8 6 7.2AN251 8 6 8 8 8 7.6T. longibrachiatumAN197 6 4 6 6 6 5.6AN213 6 6 4 4 6 5.2T. longipileAN359 6 4 4 4 6 4.8T. virideAN255 8 6 8 8 8 7.6AN401 6 4 4 0 6 4AN430 8 8 8 8 6 7.6AN826 4 4 4 6 6 4.8T. viridescensAN323 6 6 8 8 8 7.2AN405 8 0 4 6 6 4.8
Table IIIThe final assessment of the interaction between the Trichoderma/Fusarium colonies after 14 days
of co-culturing on PDA medium.
a – The values in modified Mańka (1974) scale (+8, antagonist completely overgrew the pathogen and entire medium surface; +6, antagonist occupies 85% of the medium surface; +4, antagonist occupies 75% of the medium surface, 0, antagonist occupies 50% of the medium surface) after visual assessment of the colony state (3 replicates, all observations equal in all cases) were averaged to identify the most efficient antagonist.
b – Trichoderma strains (grey) showing the highest antagonistic ability against at least four of all five Fusarium species
F. avenaceumKF 2818
PathogenAntagonist
F. cerealisKF 1157
F. culmorumKF 2795
F. gramineraumKF 2870
F. temperatumKF 506 Averagea
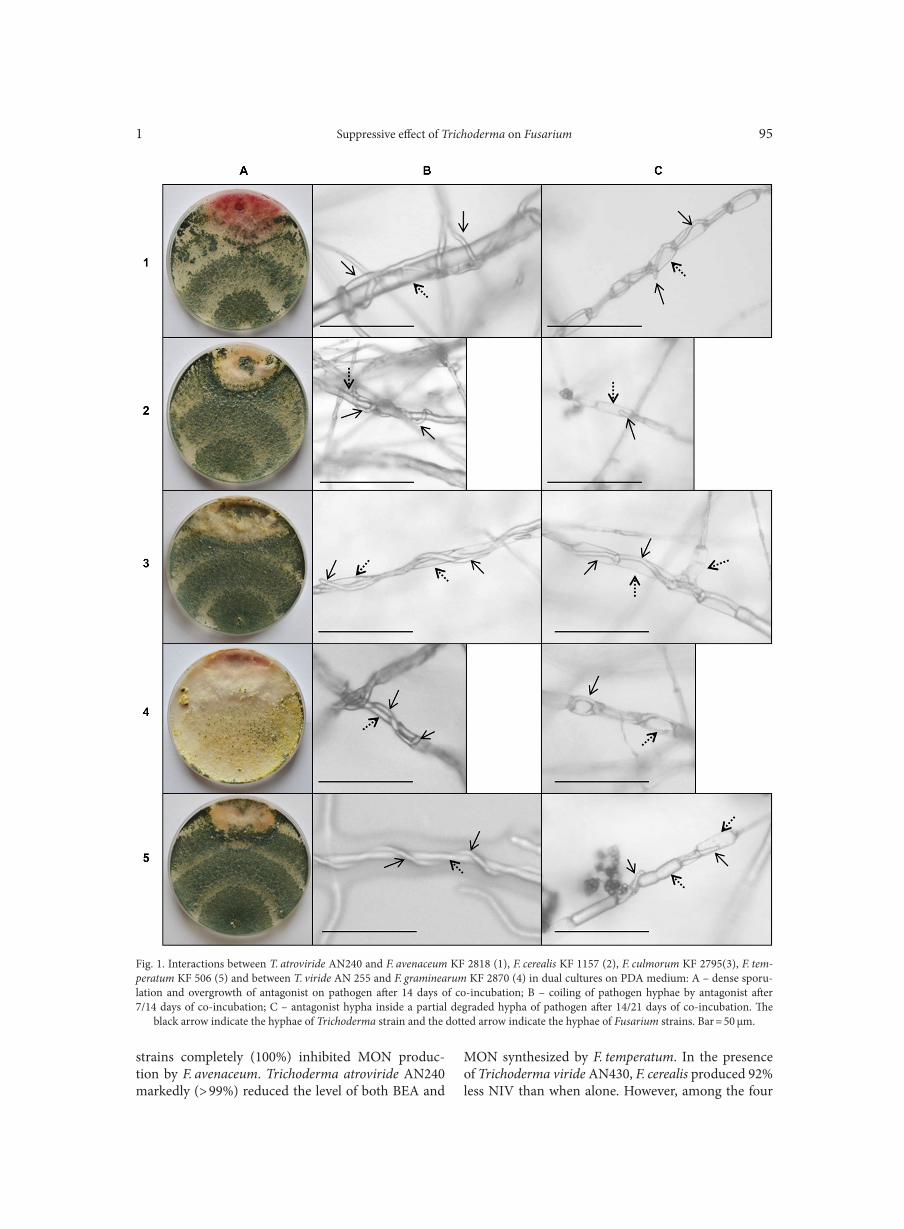
Suppressive effect of Trichoderma on Fusarium1 95
strains completely (100%) inhibited MON produc-tion by F. avenaceum. Trichoderma atroviride AN240 markedly (> 99%) reduced the level of both BEA and
Fig. 1. Interactions between T. atroviride AN240 and F. avenaceum KF 2818 (1), F. cerealis KF 1157 (2), F. culmorum KF 2795(3), F. tem-peratum KF 506 (5) and between T. viride AN 255 and F. graminearum KF 2870 (4) in dual cultures on PDA medium: A – dense sporu-lation and overgrowth of antagonist on pathogen after 14 days of co-incubation; B – coiling of pathogen hyphae by antagonist after 7/14 days of co-incubation; C – antagonist hypha inside a partial degraded hypha of pathogen after 14/21 days of co-incubation. The
black arrow indicate the hyphae of Trichoderma strain and the dotted arrow indicate the hyphae of Fusarium strains. Bar = 50 µm.
MON synthesized by F. temperatum. In the presence of Trichoderma viride AN430, F. cerealis produced 92% less NIV than when alone. However, among the four
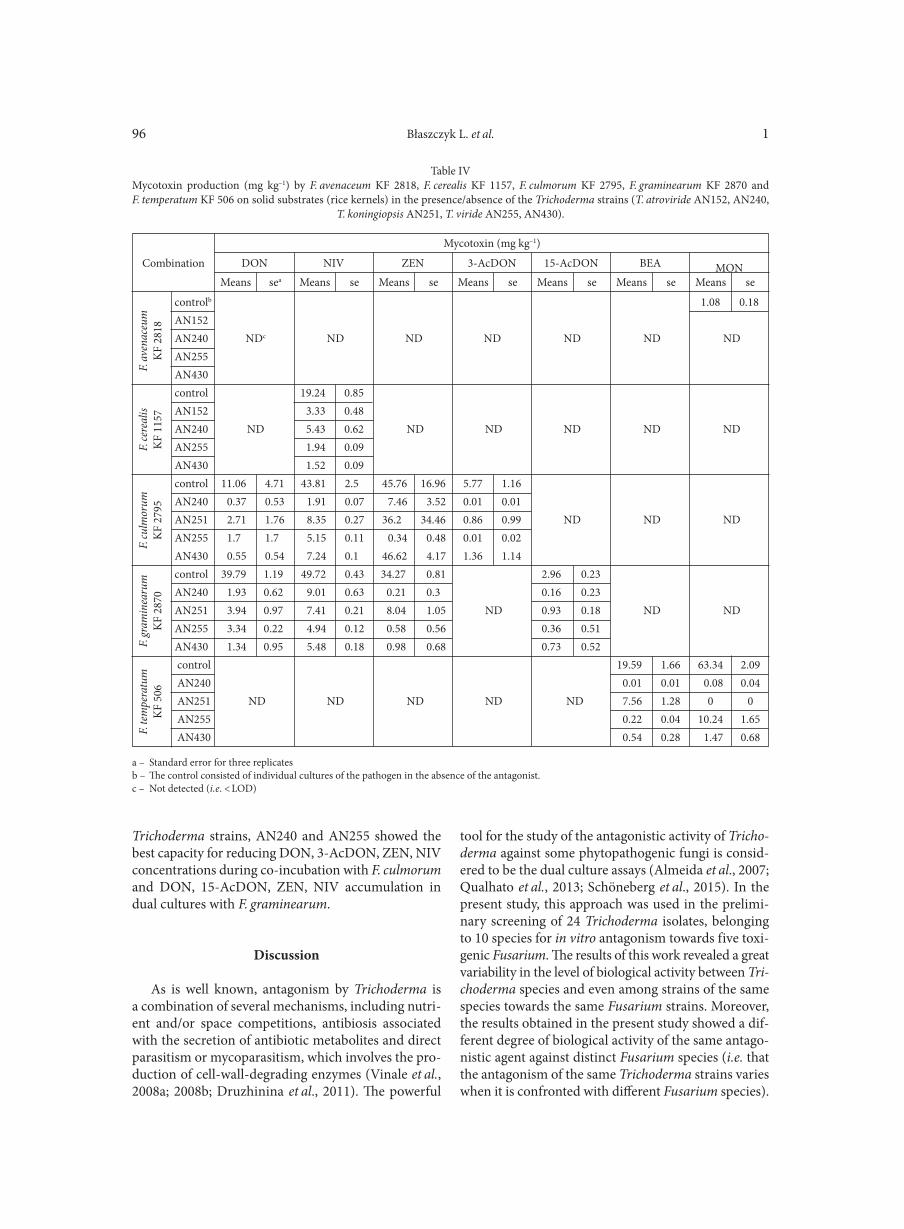
Błaszczyk L. et al. 196
Trichoderma strains, AN240 and AN255 showed the best capacity for reducing DON, 3-AcDON, ZEN, NIV concentrations during co-incubation with F. culmorum and DON, 15-AcDON, ZEN, NIV accumulation in dual cultures with F. graminearum.
Discussion
As is well known, antagonism by Trichoderma is a combination of several mechanisms, including nutri-ent and/or space competitions, antibiosis associated with the secretion of antibiotic metabolites and direct parasitism or mycoparasitism, which involves the pro-duction of cell-wall-degrading enzymes (Vinale et al., 2008a; 2008b; Druzhinina et al., 2011). The powerful
tool for the study of the antagonistic activity of Tricho-derma against some phytopathogenic fungi is consid-ered to be the dual culture assays (Almeida et al., 2007; Qualhato et al., 2013; Schöneberg et al., 2015). In the present study, this approach was used in the prelimi-nary screening of 24 Trichoderma isolates, belonging to 10 species for in vitro antagonism towards five toxi-genic Fusarium. The results of this work revealed a great variability in the level of biological activity between Tri-choderma species and even among strains of the same species towards the same Fusarium strains. Moreover, the results obtained in the present study showed a dif-ferent degree of biological activity of the same antago-nistic agent against distinct Fusarium species (i.e. that the antagonism of the same Trichoderma strains varies when it is confronted with different Fusarium species).
controlb 1.08 0.18 AN152 AN240 NDc ND ND ND ND ND ND AN255 AN430 control 19.24 0.85 AN152 3.33 0.48 AN240 ND 5.43 0.62 ND ND ND ND ND AN255 1.94 0.09 AN430 1.52 0.09 control 11.06 4.71 43.81 2.5 45.76 16.96 5.77 1.16 AN240 0.37 0.53 1.91 0.07 7.46 3.52 0.01 0.01 AN251 2.71 1.76 8.35 0.27 36.2 34.46 0.86 0.99 ND ND ND AN255 1.7 1.7 5.15 0.11 0.34 0.48 0.01 0.02 AN430 0.55 0.54 7.24 0.1 46.62 4.17 1.36 1.14 control 39.79 1.19 49.72 0.43 34.27 0.81 2.96 0.23 AN240 1.93 0.62 9.01 0.63 0.21 0.3 0.16 0.23 AN251 3.94 0.97 7.41 0.21 8.04 1.05 ND 0.93 0.18 ND ND AN255 3.34 0.22 4.94 0.12 0.58 0.56 0.36 0.51 AN430 1.34 0.95 5.48 0.18 0.98 0.68 0.73 0.52 control 19.59 1.66 63.34 2.09 AN240 0.01 0.01 0.08 0.04 AN251 ND ND ND ND ND 7.56 1.28 0 0 AN255 0.22 0.04 10.24 1.65 AN430 0.54 0.28 1.47 0.68
Table IVMycotoxin production (mg kg–1) by F. avenaceum KF 2818, F. cerealis KF 1157, F. culmorum KF 2795, F. graminearum KF 2870 and F. temperatum KF 506 on solid substrates (rice kernels) in the presence/absence of the Trichoderma strains (T. atroviride AN152, AN240,
T. koningiopsis AN251, T. viride AN255, AN430).
a – Standard error for three replicatesb – The control consisted of individual cultures of the pathogen in the absence of the antagonist.c – Not detected (i.e. < LOD)
Combination
Mycotoxin (mg kg–1)
ZEN 3-AcDON 15-AcDON BEA MONNIVDON
Means sea seMeansseMeansseMeansseMeansseMeansseMeans
F. av
enac
eum
KF
2818
F. ce
real
isK
F 11
57F.
culm
orum
KF
2795
F. gr
amin
earu
mK
F 28
70F.
tem
pera
tum
KF
506
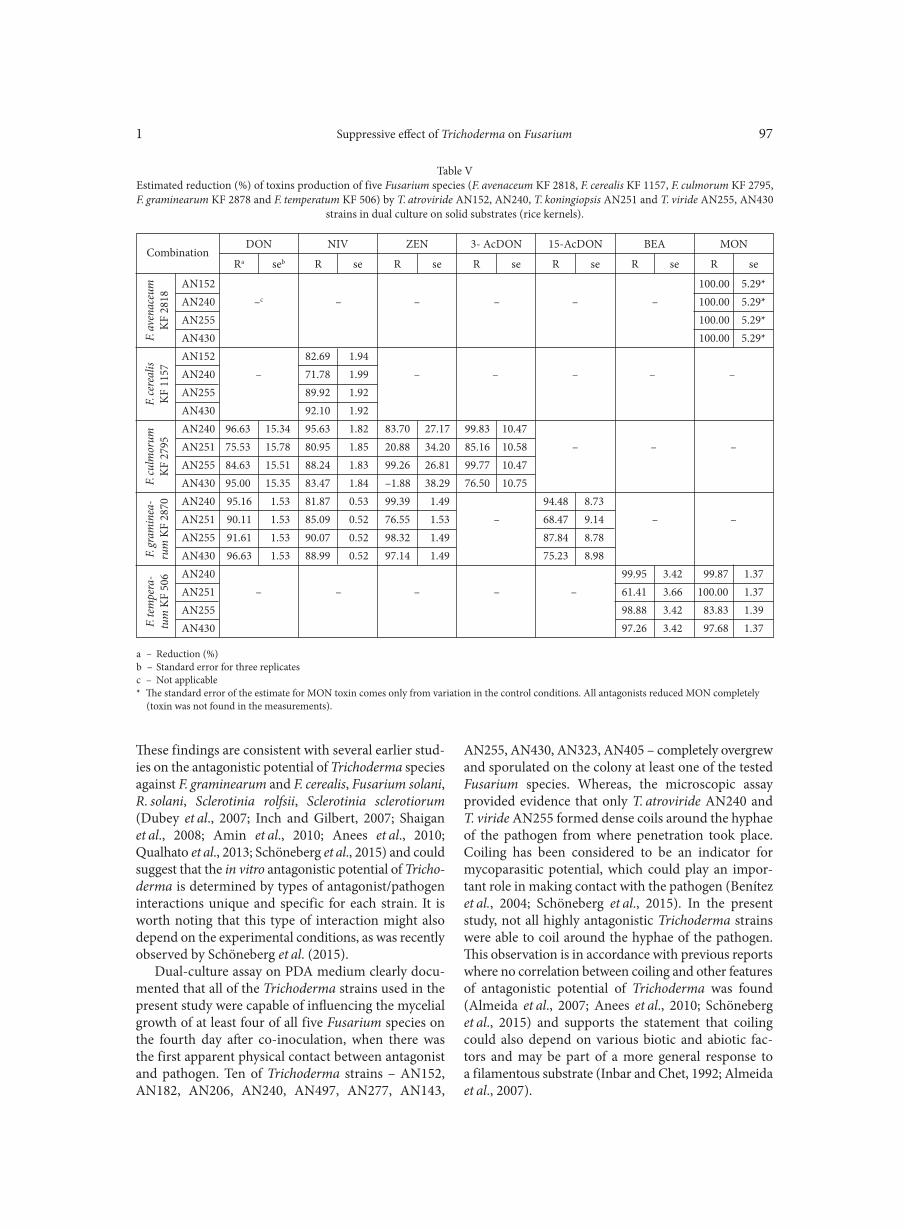
Suppressive effect of Trichoderma on Fusarium1 97
These findings are consistent with several earlier stud-ies on the antagonistic potential of Trichoderma species against F. graminearum and F. cerealis, Fusarium solani, R. solani, Sclerotinia rolfsii, Sclerotinia sclerotiorum (Dubey et al., 2007; Inch and Gilbert, 2007; Shaigan et al., 2008; Amin et al., 2010; Anees et al., 2010; Qualhato et al., 2013; Schöneberg et al., 2015) and could suggest that the in vitro antagonistic potential of Tricho-derma is determined by types of antagonist/pathogen interactions unique and specific for each strain. It is worth noting that this type of interaction might also depend on the experimental conditions, as was recently observed by Schöneberg et al. (2015).
Dual-culture assay on PDA medium clearly docu-mented that all of the Trichoderma strains used in the present study were capable of influencing the mycelial growth of at least four of all five Fusarium species on the fourth day after co-inoculation, when there was the first apparent physical contact between ant a gonist and pathogen. Ten of Trichoderma strains – AN152, AN182, AN206, AN240, AN497, AN277, AN143,
AN255, AN430, AN323, AN405 – completely overgrew and sporulated on the colony at least one of the tested Fusa rium species. Whereas, the microscopic assay provided evidence that only T. atroviride AN240 and T. viride AN255 formed dense coils around the hyphae of the pathogen from where penetration took place. Coiling has been considered to be an indicator for mycoparasitic potential, which could play an impor- tant role in making contact with the pathogen (Benítez et al., 2004; Schöneberg et al., 2015). In the present study, not all highly antagonistic Trichoderma strains were able to coil around the hyphae of the pathogen. This observation is in accordance with previous reports where no correlation between coiling and other features of anta gonistic potential of Trichoderma was found (Almeida et al., 2007; Anees et al., 2010; Schöneberg et al., 2015) and supports the statement that coiling could also depend on various biotic and abiotic fac-tors and may be part of a more general response to a filamentous substrate (Inbar and Chet, 1992; Almeida et al., 2007).
AN152 100.00 5.29* AN240 –c – – – – – 100.00 5.29* AN255 100.00 5.29* AN430 100.00 5.29* AN152 82.69 1.94 AN240 – 71.78 1.99 – – – – – AN255 89.92 1.92 AN430 92.10 1.92 AN240 96.63 15.34 95.63 1.82 83.70 27.17 99.83 10.47 AN251 75.53 15.78 80.95 1.85 20.88 34.20 85.16 10.58 – – – AN255 84.63 15.51 88.24 1.83 99.26 26.81 99.77 10.47 AN430 95.00 15.35 83.47 1.84 –1.88 38.29 76.50 10.75 AN240 95.16 1.53 81.87 0.53 99.39 1.49 94.48 8.73 AN251 90.11 1.53 85.09 0.52 76.55 1.53 – 68.47 9.14 – – AN255 91.61 1.53 90.07 0.52 98.32 1.49 87.84 8.78 AN430 96.63 1.53 88.99 0.52 97.14 1.49 75.23 8.98 AN240 99.95 3.42 99.87 1.37 AN251 – – – – – 61.41 3.66 100.00 1.37 AN255 98.88 3.42 83.83 1.39 AN430 97.26 3.42 97.68 1.37
Table VEstimated reduction (%) of toxins production of five Fusarium species (F. avenaceum KF 2818, F. cerealis KF 1157, F. culmorum KF 2795, F. graminearum KF 2878 and F. temperatum KF 506) by T. atroviride AN152, AN240, T. koningiopsis AN251 and T. viride AN255, AN430
strains in dual culture on solid substrates (rice kernels).
a – Reduction (%)b – Standard error for three replicatesc – Not applicable* The standard error of the estimate for MON toxin comes only from variation in the control conditions. All antagonists reduced MON completely (toxin was not found in the measurements).
MONBEA15-AcDON3- AcDONZENNIVDONCombination
seRseRseRseRseRseRsebRa
F. av
enac
eum
KF
2818
F. ce
real
isK
F 11
57F.
culm
orum
KF
2795
F. gr
amin
ea-
rum
KF
2870
F. te
mpe
ra-
tum
KF
506
Błaszczyk L. et al. 198
As observed here, those Trichoderma strains which displayed the highest antagonistic activity against at least four Fusarium species in co-culturing on PDA medium, namely AN152, AN240, AN255, AN430 and AN251, were also found to be effective suppressors of mycotoxin production by these pathogens on solid substrates. A similar study performed by Cooney et al. (2001) showed that T. harzianum isolate THF2/3 grown in a competition assay system with F. graminearum displayed an inhibitory effect on mycelial growth and trichothecene mycotoxin (DON) production by Fusar-ium. The capacity of highly antagonistic T. gamsii and T. atroviride strains to inhibit trichothecene and ZEN production by F. graminearum and F. culmorum on rice kernels was also described by Buśko et al. (2008), Popiel et al. (2008) and Matarese et al. (2012). Furthermore, Matarese et al. (2012) clearly demonstrated that the reduction of DON production by Fusarium species is correlated with the reduction of the pathogen biomass by Trichoderma. This finding could suggest that the ability all of the Trichoderma strains tested in the pre-sent study to suppress mycotoxin synthesis by Fusarium species on solid substrates was also the result of their high activity related to pathogen growth inhibition. The only exception is T. viride AN430. As was shown here, this strain was not able to reduce ZEN produc-tion by F. culmorum KF 2795, whereas the level of the other mycotoxins synthesized by KF 2795 was markedly reduced by AN430. Thus, the cause could not be as that described by Matarese et al. (2012). It is supposed that the presence of AN430 could stimulate the pathogen to selectively overproduce ZEN (Elmholt, 2008). However, the explanation of this aspect requires further studies.
In the present work, the most efficient strain over-all was T. atroviride AN240 which was able to reduce mycelial growth and mycotoxins production of F. ave-naceum, F. culmorum, F. cerealis, F. graminearum and F. temperatum species. To the best of our knowledge, this is the first report of the suppressive effect of T. atro-viride on five toxigenic Fusarium species. The only reports of an efficient antagonistic strain of T. atro viride towards F. avenaceum, F. culmorum and F. graminearum were available from Buśko et al. (2008) and Popiel et al. (2008). The results of present study indicate that T. atroviride AN240 strain was able both to inhibit the pathogen’s growth before the contact in confrontation plates and to overgrow and sporulate on the pathogen’s colony. Moreover, the microscopic observation revealed a direct development of AN240 on the mycelium of Fusarium species. This research has suggested a pos-sible antibiosis and mycoparasitism of AN240 and the production of antifungal components and extracellular metabolites by this antagonist (Druzhinina et al., 2011; Verma et al., 2007). Many studies of the in vitro biologi-cal activity of Trichoderma against fungal plant patho-
gens demonstrated the involvement of cell-wall degrad-ing enzymes (CWDEs), which are also capable of acting synergistically with diffusible, volatile and non-vola-tile secondary metabolites and a complex system for fungal prey detection (Almeida et al., 2007; Qualhato et al., 2013). It is significant to note that our associated studies (unpublished data) on the examination of the 186 Trichoderma strains originating from wood with decay symptoms and analyses of their ability to produce hydrolytic enzymes have shown T. atroviride AN240 as the best producer of β-1,3-glucanase – an enzyme which have been found to be directly involved in the hydrolysis of the fungal pathogen’s cell walls (Druzhi - nina et al., 2011). Furthermore, in our previous study on the formation of the 6-n-pentyl-2H-pyran-2-one and other volatile compounds by different Trichoderma spe-cies grown on PDA medium, T. atroviride was found to be the most efficient species in this respect (Jeleń et al., 2014). In the light of this and our previous findings, it can be assumed that T. atroviride AN240 represents a good candidate for the biological control of toxigenic F. avenaceum, F. culmorum, F. cerealis, F. graminearum and F. temperatum. However, it will be necessary to verified the reproducibility of the suppressive effect of AN240 also on Fusarium species (i.e., F. avenaceum, F. culmorum, F. cerealis, F. graminearum and F. tempera-tum) originating from other fungal collections and to undertake the field trials in order to determine the abil-ity of these strains to control of mycotoxin production in grain as well as to reduce toxigenic Fusarium inocu-lum levels in cereal debris under natural conditions.
Conclusion
The present survey has led to the emergence of the most efficient antagonist – T. atroviride AN240, able to inhibit the mycelial growth, completely overgrown and sporulated on the pathogen’s colony, as well as to reduce the level of mycotoxins produced by F. ave-naceum KF 2818, F. cerealis KF 1157, F. culmorum KF 2795, F. graminearum KF 2870 and F. temperatum KF 506. Considering the biological activity of this strain, being the synergistic effect of the several factors, it can be concluded that AN240 is a candidate fungus for the biological control of toxigenic Fusarium spe-cies by reducing their inoculum, as well as preventing mycotoxin accumulation in plant tissues.
Acknowledgments This work was supported by the Ministry of Science and Higher
Education in Poland, Project No. NN310 203037. The authors would like to thank Professor Jerzy Chełkowski for its helpful comments on the mycotoxins production by Fusarium species and on the antagonist-pathogen interactions in in vitro tests.
Suppressive effect of Trichoderma on Fusarium1 99
Literature
Almeida F.B., F.M. Cerqueira, N. Silva Rdo, C.J. Ulhoa and A.L. Lima. 2007. Mycoparasitism studies of Trichoderma harzianum strains against Rhizoctonia solani: evaluation of coiling and hydro-lytic enzyme production. Biotechnol. Lett. 29: 1189–1193. Altinok H.H. 2009. In vitro production of fumonisin B1 and B2 by Fusarium moniliforme and the biocontrol activity of Trichoderma harzianum. Ann. Microbiol. 59: 509–516.Amarasinghe C.C., S.A. Tittlemier and W.G.D. Fernando. 2014. Nivalenol-producing Fusarium cerealis associated with fusarium head blight in winter wheat in Manitoba, Canada. Plant Pathol. 64: 988–995.Amin F., V.K. Razdanm, F.A. Mohidm, K.A. Bhat and S. Ban-daym. 2010. Potential of Trichoderma species as biocontrol agents of soil borne fungal propagules. J. Phytopathol. 10: 38–41.Anees M., A. Tronsmo, V. Edel-Hermann, L.G. Hjeljord, C. Héraud and C. Steinberg. 2010. Characterization of field iso-lates of Trichoderma antagonistic against Rhizoctonia solani. Fungal Biol. 141: 691–701.Benítez T., A.M. Ricón, C.M Limón and A.C. Codón. 2004. Biocon-trol mechanisms of Trichoderma strains. Int. Microbiol. 7: 249–260.Bennett J.W. and M. Klich. 2003. Mycotoxins. Clin. Microbiol. Rev. 16: 497–516.Bily A.C., L.M. Reid, M.E. Savard, R. Reddy, B.A. Blackwell, C.M. Campbell, A. Krantis, T. Durst, B.J. Philogène, J.T. Arnason and others. 2004. Analysis of Fusarium graminearum mycotoxins in different biological matrices by LC/MS. Mycopathologia 157: 117–126.Błaszczyk L., D. Popiel, J. Chełkowski, G. Koczyk, G.J. Samuels, K. Sobieralski and M. Siwulski. 2011. Species diversity of Tricho-derma in Poland. J. Appl. Genet. 52: 233–243.Bottalico A. and G. Perrone. 2002. Toxigenic Fusarium species and mycotoxins associated with head blight in small-grain cereals in Europe. Eur. J. Plant Pathol. 108: 611–624.Buśko M., J. Chełkowski, D. Popiel and J. Perkowsk. 2008. Solid substrate bioassay to evaluate impact of Trichoderma on tri-chothecene mycotoxin production by Fusarium species. J. Sci. Food Agr. 88: 536–541.Cooney J.M., D.R. Lauren and M.E. Menna. 2001. Impact of com-petitive fungi on trichothecene production by Fusarium gramine-arum. J. Agric. Food Chem. 49: 522–526.Czembor E., Ł. Stępień and A. Waśkiewicz. 2014. Fusarium tem-peratum as a new species causing ear rot on maize in Poland. Plant Dis. 98: 1001.Druzhinina I.S., V. Seidl-Seiboth, A. Herrera-Estrella, B.A. Hor- witz, C.M. Kenerley, E. Monte, P.K. Mukherjee, S. Zeilinger, I.V. Grigoriev and C.P. Kubicek. 2011. Trichoderma: the genomics of opportunistic success. Nat. Rev. Microbiol. 16: 749–759.Dubey S., M. Suresh and B. Singh. 2007. Evaluation of Trichoderma species against Fusarium oxysporum f. sp. ciceris for integrated man-agement of chickpea wilt. Biol. Control 40: 118–127.Edington L.V., K.L. Khew and G. Barron. 1971. Fungitoxic spec-trum of benzimidazole compounds. Phytopathol. 61: 42–44. Elmholt S. 2008. Mycotoxins in the soil environment, pp. 167–203. In: P. Karlovsky (ed.). Secondary metabolites in soil ecology. Springer-Verlag, Heidelberg, Berlin.Ferrigo D., A. Raiola, E. Piccolo, C. Scopel and R. Causin. 2014a. Trichoderma harzianum T22 induces in maize systemic resistance against Fusarium verticillioides. J. Plant Pathol. 96: 133–142.Ferrigo D., A. Raiola, R. Rasera and R. Causin. 2014b. Tricho-derma harzianum seed treatment controls Fusarium verticillioides colonization and fumonisin contamination in maize under field conditions. Crop Prot. 65: 51–56.
Glenn A.E. 2007. Mycotoxigenic Fusarium species in animal feed. Anim. Feed Sci. Tech. 137: 213–240. Goertz A., S. Zühlke, M. Spiteller, U. Steiner, H.W. Dehne, C. Waalwijk, P.M. de Vries and E.C. Oerke. 2010. Fusarium species and mycotoxin profiles on commercial maize hybrids in Germany. Eur. J. Plant Pathol. 128: 101–111.Gromadzka K., J. Chełkowski, D. Popiel, P. Kachlicki, M. Kostecki and P. Goliński. 2009. Solid substrate bioassay to evaluate the effect of Trichoderma and Clonostachys on the production of zearalenone by Fusarium species. World Mycotoxin J. 2: 45–52.Harman G.E., C.R. Howell, A. Viterbo, I. Chet and M. Lorito. 2004. Trichoderma species–opportunistic, avirulent plant symbionts. Nat. Rev. Microbiol. 2: 43–56.Hermosa R., A. Viterbo, I. Chet and E. Monte. 2012. Plantbenefi-cial effects of Trichoderma and of its genes. Microbiology 158: 17–25.Inbar J. and I. Chet. 1992. Biomimics of fungal cell-cell recognition by use of lectin–coated nylon fibers. J. Bacteriol. 174: 1055–1059.Inch S. and J. Gilbert. 2007. Effect of Trichoderma harzianum on perithecial production of Gibberella zeae on wheat straw. Biocontrol Sci. Techn. 17: 635–646.Jeleń H., L. Błaszczyk, J. Chełkowski, K. Rogowicz and J. Stra-kowska. 2014. Formation of 6-n-pentyl-2H-pyran-2-one (6-PAP) and other volatiles by different Trichoderma species. Mycol. Prog. 13: 589–600.Jestoi M., M. Rokka, T. Yli-Mattila, P. Parikka, A. Rizzo and K. Peltonen. 2004. Presence and concentrations of the Fusarium-related mycotoxins beauvericin, eniatins and moniliformin in Fin-nish grain samples. Food Addit. Contam. 21: 794–802.Jestoi M.N., S. Paavanen-Huhtala, P. Parikka and T. Yli-Mattila. 2008. In vitro and in vivo mycotoxin production of Fusarium species isolated from Finnish grains. Arch. Phytopathology Plant Protect. 41: 545–558.Kostecki M., H. Wiśniewska, G. Perrone, A. Ritieni, P. Golinski, J. Chełkowski and A. Logrieco. 1999. The effects of cereal substrate and temperature on production of beauvericin, moniliformin and fusaproliferin by Fusarium subglutinans ITEM – 1434. Food Addit. Contam. 16: 361–365.Kubicek C.P., M. Komon-Żelazowska and I.S. Druzhinina. 2008. Fungal genus Hypocrea/Trichoderma: from barcodes to biodiversity. J. Zhejiang Univ. Sci. B. 9: 753–763.Logrieco A., G. Mulè, A. Moretti and A. Bottalico. 2002a. Toxi-genic Fusarium species and mycotoxins associated with maize ear rot in Europe. Eur. J. Plant Pathol. 108: 597–609.Logrieco A., A. Rizzo, R. Ferracane and A. Ritieni. 2002b. Occur-rence of beauvericin and enniatins in wheat affected by Fusarium avenaceum head blight. Appl. Environ. Microbiol. 68: 82–85.Logrieco A., A. Bottalico, G. Mule, A. Moretti and G. Perrone. 2003. Epidemiology of toxigenic fungi and their associated mycotox-ins for some Mediterranean crops. Eur. J. Plant Pathol. 109: 645–667.Mańka K. 1974. Fungal communities as criterion for estimating the effect of the environment of plant diseases in Poland. ZPPNR, PAN. 160: 9–23.Matarese F., S. Sarrocco, S. Gruber, V. Seidl-Seiboth and G. Van-nacci. 2012. Biocontrol of Fusarium head blight: interactions between Trichoderma and mycotoxigenic Fusarium. Microbiology 158: 98–106.Nawrocka J. and U. Małolepsza. 2013. Diversity in plant systemic resistance induced by Trichoderma. Biol. Control 67: 149–156. Nayakaa S.C, S.R. Niranjanaa, A.C. Uday, S. Shankara, R. Niran-jan, M.S. Reddyb, H.S. Prakasha and C.N. Mortensenc. 2008. Seed biopriming with novel strain of Trichoderma harzianum for the con-trol of toxigenic Fusarium verticillioides and fumonisins in maize. Arch Phytopathology Plant Protect 43:1–19.Qualhato T.F., F.A.C. Lopes, A.S. Steindorff R.S. Brandão, R.S. Jesuino and C.J. Ulhoa. 2013. Mycoparasitism studies of
Błaszczyk L. et al. 1100
Trichoderma species against three phytopathogenic fungi: evalua-tion of antagonism and hydrolytic enzyme production. Biotechnol. Lett. 35: 1461–1468. Palazzini J.M., M.L. Ramirez, A.M. Torres and S.N. Chulze. 2007. Potential biocontrol agents for Fusarium head blight and deoxyni-valenol production in wheat. Crop Prot. 26: 1702–1710.Popiel D., H. Kwaśna, J. Chełkowski, Ł. Stępień and M. Laskowska. 2008. Impact of selected antagonistic fungi on Fusarium species – toxigenic cereal pathogens. Acta Mycol. 43: 29–40.Samuels G.J. 2006. Trichoderma: systematics, the sexual state, and ecology. Phytopathology 96: 95–206.Scauflaire J., M. Gourgue, A. Callebaut and F. Munaut. 2012. Fusarium temperatum, a mycotoxin-producing pathogen of maize. Eur. J. Plant Pathol. 133: 911–922.Schöneberg A., T. Musa, R.T. Voegele and S. Vogelgsang. 2015. The potential of antagonistic fungi for control of Fusarium gramine-arum and Fusarium crookwellense varies depending on the experi-mental approach. J. Appl. Microbiol. 118: 1165–1179. Shaigan S., A. Seraji and S.A.M. Moghaddam. 2008. Identification and investigation on antagonistic effect of Trichoderma spp on tea seedlings white foot and root rot (Sclerotium rolfsii Sacc.) in vitro condition. Pak. J. Biol. Sci. 19:2346–2350.Stępień Ł., G. Koczyk and A. Waśkiewicz. 2011. FUM cluster diver-gence in fumonisins-producing Fusarium species. Fungal Biol. 115: 112–123.Strakowska J., L. Błaszczyk and J. Chełkowski. 2014. The signifi-cance of cellulolytic enzymes produced by Trichoderma in oppor-tunistic lifestyle of this fungus. J. Basic. Microbiol. 54: S2–S13.Tomczak M., H. Wiśniewska, L. Stępień, M. Kostecki, J. Cheł-kowski and P. Goliński. 2002. Deoxynivalenol, nivalenol and mon-
iliformin in wheat samples with head blight (scab) symptoms in Poland (1998–2000). Eur. J. Plant Pathol. 108: 625–630.Verma M., S.K. Brar, R.D. Tyagi, R.Y. Surampalli and J.R. Valéro. 2007. Antagonistic fungi, Trichoderma spp.: panoply of biological control. Biochem. Eng. J. 37:1–20.Vinale F., K. Sivasithamparam, E.L. Ghisalberti, R. Marra, M.J. Barbetti, H. Li, S.L. Woo and M. Lorito. 2008a. A novel role for Trichoderma secondary metabolites in the interactions with plants. Physiol. Mol. Plant. Path. 72: 80–86.Vinale F., K. Sivasithamparam, E.L. Ghisalberti, R. Marra, S.L. Woo and M. Lorito. 2008b. Trichoderma–plant–pathogen interactions. Soil Biol. Biochem. 40: 1–10.Visconti A. and M. Pascale. 1998. Determination of zearalenone in corn by means of immunoaffinity clean-up and high-performance liquid chromatography with fluorescence detector. J. Chromatogr. A. 815: 133–140.Wagacha J. and Muthomi J. 2007. Fusarium culmorum: infection process, mechanisms of mycotoxin production and their role in pathogenesis in wheat. Crop Prot. 26: 877–885.Wiśniewska H., Ł. Stępień, A. Waśkiewicz, M. Beszterda, T. Góral and J. Belter. 2014. Toxigenic Fusarium species infecting wheat heads in Poland. Cent. Eur. J. Biol. 9: 163–172.Woo S.L., M. Ruocco, F. Vinale, M. Nigro, R. Marra, N. Lombardi, A. Pascale, S. Lanzuise, G. Manganiello and M. Lorito. 2014. Tri-choderma-based products and their widespread use in agriculture. TOMYCJ. 8: 71–126.Yang D., Z.M. Geng, J.B. Yao, X. Zhang, P.P. Zhang and H.X. Ma. 2013. Simultaneous determination of deoxynivalenol, and 15- and 3-acetyldeoxynivalenol in cereals by HPLC-UV detection. World Mycotoxin J. 6: 117–125.
Polish Journal of Microbiology2017, Vol. 66, No 1, 101–106
ORIGINAL PAPER
* Corresponding author: J.-Y. Chou, Department of Biology, National Changhua University of Education, Changhua, Taiwan; e-mail: [email protected]
Introduction
Two broad types of competition are generally rec-ognized: interference and exploitative. Interference competition is a direct form of competition in which an organism actively interferes with another organ-ism’s ability to obtain resources. A common strategy for interference competition is the production of anti-biotic compounds or toxins, by which cells inhibit the growth of sensitive competitors (Cornforth and Foster, 2013). The use of secreted antagonistic compounds by microbes is one prominent example (Burgess et al., 1999; Jousset et al., 2014; Schmitt and Breinig, 2002).
The most common method for selecting probiotic microbes involves testing the inhibition potential of the antagonistic compounds produced by candidate strains against known pathogens. Biological control using microbial agents has been suggested as an effective approach against pathogens, and antibiotics produced by microorganisms have garnered particular attention in research (Kohanski et al., 2010; Mathur and Singh, 2005). Bacterial species producing antibiotics have been used as biocontrol agents against pathogenic fungi (Gebreel et al., 2008; Yilmaz et al., 2006). In addition, because antagonistic yeasts produce toxic secondary metabolites (antibiotics), they have been used in com-
mercial-scale yeast production including fermentation, formulation, storage, and handling (Wisniewski et al., 2007; Wisniewski and Wilson, 1992).
Based on the aforementioned literature, this study investigated antagonistic activity against these human pathogenic fungi. We used single killer-toxin-sensitive strain of Saccharomyces cerevisiae (Chang et al., 2015) and three pathogenic yeasts identified by the large subu-nit (LSU) of ribosomal DNA (rDNA) sequences isolated from the little black biting midge (Forcipomyia taiwana) (Chou et al., 2015): Aureobasidium pullulans JYC1003, Pseudozyma aphidis JYC1050, and Trichosporon asahii JYC1040. To confirm these species, the ITS1-5.8S-ITS2 regions of their rDNA were also sequenced. These yeasts are emergent opportunistic pathogens that cause infections in immune-compromised individuals.
A. pullulans is classified as a dematiaceous fungus, commonly known as black yeast because of its mela-nin production. A. pullulans can cause corneal and dermal infections in immunocompromised patients (Girardi et al., 1993). Despite the importance of A. pul-lulans in biotechnology (Molina-Leyva et al., 2013), and although it rarely causes cutaneous infections in humans, several recent studies have reported its patholo gical significance (Molina-Leyva et al., 2013; Vlchkova‐Lashkoska et al., 2004). P. aphidis is rarely
Screening and Identification of Yeasts Antagonistic to Pathogenic Fungi Showa Narrow Optimal pH Range for Antagonistic Activity
PEI-HUA CHEN and JUI-YU CHOU*
Department of Biology, National Changhua University of Education, Changhua, Taiwan
Submitted 25 February 2016, revised 11 July 2016, accepted 5 December 2016
A b s t r a c t
Microbes have evolved ways of interference competition to gain advantage over their ecological competitors. The use of secreted antagonistic compounds by yeast cells is one of the prominent examples. Although this killer behavior has been thoroughly studied in laboratory yeast strains, our knowledge of the antagonistic specificity of killer effects in nature remains limited. In this study, yeast strains were collected from various niches and screened for antagonistic activity against one toxin-sensitive strain of Saccharomyces cerevisiae and three pathogenic fungi. We demonstrate that some strains with antagonistic activity against these pathogenic fungi can be found in antagonist culture tests. These yeasts were identified as members of Trichosporon asahii, Candida stellimalicola, Wickerhamomyces anomalus, Ustilago esculenta, Aureobasidium pullulans, and Pichia kluyveri. The results indicated that the antagonistic activity of these killer yeasts has a narrow optimal pH range. Furthermore, we found that the antagonistic activity of some species is strain-dependent.
K e y w o r d s: antagonistic yeasts, interference competition, pathogenic fungi
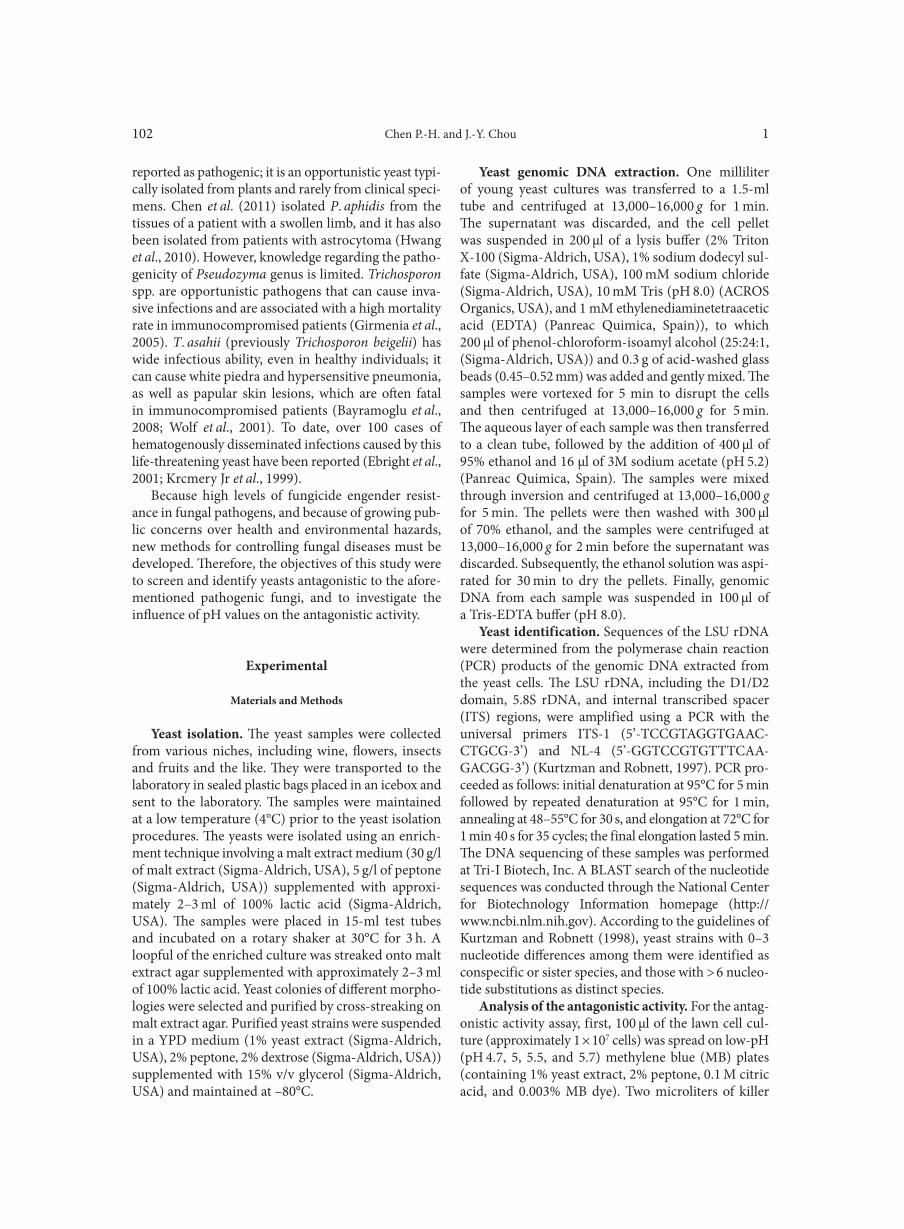
Chen P.-H. and J.-Y. Chou 1102
reported as pathogenic; it is an opportunistic yeast typi-cally isolated from plants and rarely from clinical speci-mens. Chen et al. (2011) isolated P. aphidis from the tissues of a patient with a swollen limb, and it has also been isolated from patients with astrocytoma (Hwang et al., 2010). However, knowledge regarding the patho-genicity of Pseudozyma genus is limited. Trichosporon spp. are opportunistic pathogens that can cause inva-sive infections and are associated with a high mortality rate in immunocompromised patients (Girmenia et al., 2005). T. asahii (previously Trichosporon beigelii) has wide infectious ability, even in healthy individuals; it can cause white piedra and hypersensitive pneumonia, as well as papular skin lesions, which are often fatal in immunocompromised patients (Bayramoglu et al., 2008; Wolf et al., 2001). To date, over 100 cases of hematogenously disseminated infections caused by this life-threatening yeast have been reported (Ebright et al., 2001; Krcmery Jr et al., 1999).
Because high levels of fungicide engender resist-ance in fungal pathogens, and because of growing pub-lic concerns over health and environmental hazards, new methods for controlling fungal diseases must be developed. Therefore, the objectives of this study were to screen and identify yeasts antagonistic to the afore-mentioned pathogenic fungi, and to investigate the influence of pH values on the antagonistic activity.
Experimental
Materials and Methods
Yeast isolation. The yeast samples were collected from various niches, including wine, flowers, insects and fruits and the like. They were transported to the laboratory in sealed plastic bags placed in an icebox and sent to the laboratory. The samples were maintained at a low temperature (4°C) prior to the yeast isolation procedures. The yeasts were isolated using an enrich-ment technique involving a malt extract medium (30 g/l of malt extract (Sigma-Aldrich, USA), 5 g/l of peptone (Sigma-Aldrich, USA)) supplemented with approxi-mately 2–3 ml of 100% lactic acid (Sigma-Aldrich, USA). The samples were placed in 15-ml test tubes and incubated on a rotary shaker at 30°C for 3 h. A loopful of the enriched culture was streaked onto malt extract agar supplemented with approximately 2–3 ml of 100% lactic acid. Yeast colonies of different morpho-logies were selected and purified by cross-streaking on malt extract agar. Purified yeast strains were suspended in a YPD medium (1% yeast extract (Sigma-Aldrich, USA), 2% peptone, 2% dextrose (Sigma-Aldrich, USA)) supplemented with 15% v/v glycerol (Sigma-Aldrich, USA) and maintained at –80°C.
Yeast genomic DNA extraction. One milliliter of young yeast cultures was transferred to a 1.5-ml tube and centrifuged at 13,000–16,000 g for 1 min. The supernatant was discarded, and the cell pellet was suspended in 200 µl of a lysis buffer (2% Triton X-100 (Sigma-Aldrich, USA), 1% sodium dodecyl sul-fate (Sigma-Aldrich, USA), 100 mM sodium chloride (Sigma-Aldrich, USA), 10 mM Tris (pH 8.0) (ACROS Organics, USA), and 1 mM ethylenediaminetetraacetic acid (EDTA) (Panreac Quimica, Spain)), to which 200 µl of phenol-chloroform-isoamyl alcohol (25:24:1, (Sigma-Aldrich, USA)) and 0.3 g of acid-washed glass beads (0.45–0.52 mm) was added and gently mixed. The samples were vortexed for 5 min to disrupt the cells and then centrifuged at 13,000–16,000 g for 5 min. The aqueous layer of each sample was then transferred to a clean tube, followed by the addition of 400 µl of 95% ethanol and 16 µl of 3M sodium acetate (pH 5.2) (Panreac Quimica, Spain). The samples were mixed through inversion and centrifuged at 13,000–16,000 g for 5 min. The pellets were then washed with 300 µl of 70% ethanol, and the samples were centrifuged at 13,000–16,000 g for 2 min before the supernatant was discarded. Subsequently, the ethanol solution was aspi-rated for 30 min to dry the pellets. Finally, genomic DNA from each sample was suspended in 100 µl of a Tris-EDTA buffer (pH 8.0).
Yeast identification. Sequences of the LSU rDNA were determined from the polymerase chain reaction (PCR) products of the genomic DNA extracted from the yeast cells. The LSU rDNA, including the D1/D2 domain, 5.8S rDNA, and internal transcribed spacer (ITS) regions, were amplified using a PCR with the universal primers ITS-1 (5’-TCCGTAGGTGAAC-CTGCG-3’) and NL-4 (5’-GGTCCGTGTTTCAA-GACGG-3’) (Kurtzman and Robnett, 1997). PCR pro-ceeded as follows: initial denaturation at 95°C for 5 min followed by repeated denaturation at 95°C for 1 min, annealing at 48–55°C for 30 s, and elongation at 72°C for 1 min 40 s for 35 cycles; the final elongation lasted 5 min. The DNA sequencing of these samples was performed at Tri-I Biotech, Inc. A BLAST search of the nucleotide sequences was conducted through the National Center for Biotechnology Information homepage (http://www.ncbi.nlm.nih.gov). According to the guidelines of Kurtzman and Robnett (1998), yeast strains with 0–3 nucleotide differences among them were identified as conspecific or sister species, and those with > 6 nucleo-tide substitutions as distinct species.
Analysis of the antagonistic activity. For the antag-onistic activity assay, first, 100 µl of the lawn cell cul-ture (approximately 1 × 10⁷ cells) was spread on low-pH (pH 4.7, 5, 5.5, and 5.7) methylene blue (MB) plates (containing 1% yeast extract, 2% peptone, 0.1 M citric acid, and 0.003% MB dye). Two microliters of killer
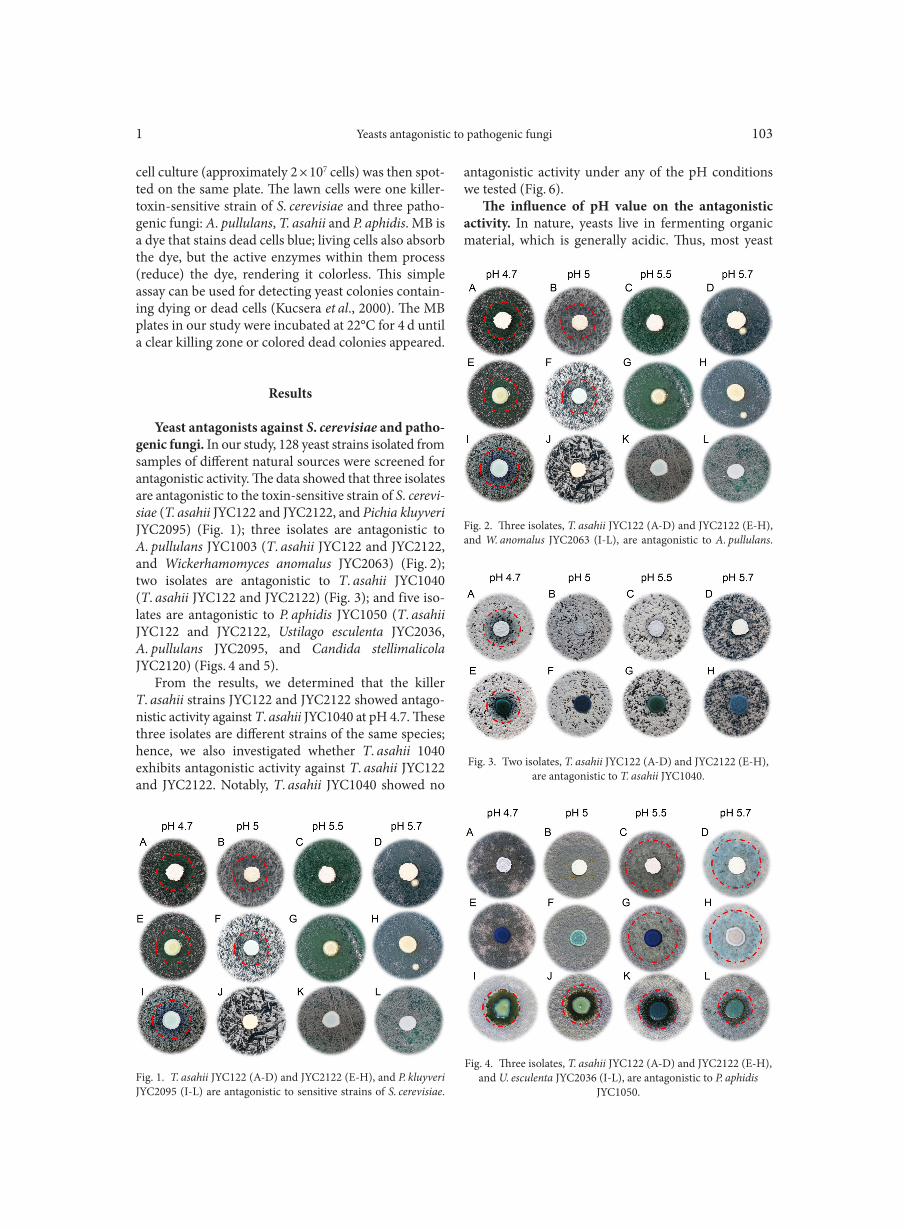
Yeasts antagonistic to pathogenic fungi1 103
cell culture (approximately 2 × 10⁷ cells) was then spot-ted on the same plate. The lawn cells were one killer-toxin-sensitive strain of S. cerevisiae and three patho-genic fungi: A. pullulans, T. asahii and P. aphidis. MB is a dye that stains dead cells blue; living cells also absorb the dye, but the active enzymes within them process (reduce) the dye, rendering it colorless. This simple assay can be used for detecting yeast colonies contain-ing dying or dead cells (Kucsera et al., 2000). The MB plates in our study were incubated at 22°C for 4 d until a clear killing zone or colored dead colonies appeared.
Results
Yeast antagonists against S. cerevisiae and patho-genic fungi. In our study, 128 yeast strains isolated from samples of different natural sources were screened for antagonistic activity. The data showed that three isolates are antagonistic to the toxin-sensitive strain of S. cerevi-siae (T. asahii JYC122 and JYC2122, and Pichia kluyveri JYC2095) (Fig. 1); three isolates are antagonistic to A. pullulans JYC1003 (T. asahii JYC122 and JYC2122, and Wickerhamomyces anomalus JYC2063) (Fig. 2); two isolates are antagonistic to T. asahii JYC1040 (T. asahii JYC122 and JYC2122) (Fig. 3); and five iso-lates are antagonistic to P. aphidis JYC1050 (T. asahii JYC122 and JYC2122, Ustilago esculenta JYC2036, A. pullulans JYC2095, and Candida stellimalicola JYC2120) (Figs. 4 and 5).
From the results, we determined that the killer T. asahii strains JYC122 and JYC2122 showed antago-nistic activity against T. asahii JYC1040 at pH 4.7. These three isolates are different strains of the same species; hence, we also investigated whether T. asahii 1040 exhibits antagonistic activity against T. asahii JYC122 and JYC2122. Notably, T. asahii JYC1040 showed no
antagonistic activity under any of the pH conditions we tested (Fig. 6).
The influence of pH value on the antagonistic activity. In nature, yeasts live in fermenting organic material, which is generally acidic. Thus, most yeast
Fig. 1. T. asahii JYC122 (A-D) and JYC2122 (E-H), and P. kluyveri JYC2095 (I-L) are antagonistic to sensitive strains of S. cerevisiae.
Fig. 2. Three isolates, T. asahii JYC122 (A-D) and JYC2122 (E-H), and W. anomalus JYC2063 (I-L), are antagonistic to A. pullulans.
Fig. 3. Two isolates, T. asahii JYC122 (A-D) and JYC2122 (E-H), are antagonistic to T. asahii JYC1040.
Fig. 4. Three isolates, T. asahii JYC122 (A-D) and JYC2122 (E-H), and U. esculenta JYC2036 (I-L), are antagonistic to P. aphidis
JYC1050.
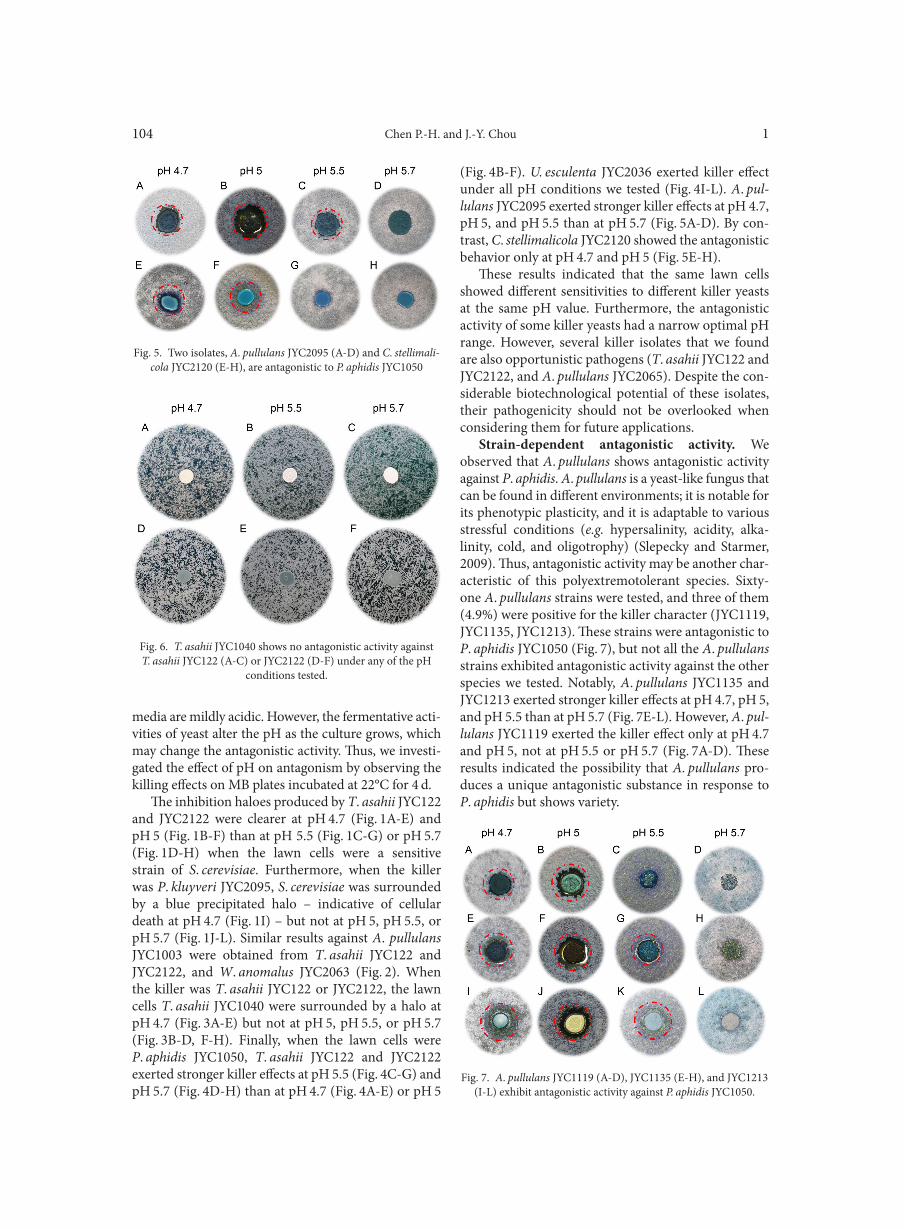
Chen P.-H. and J.-Y. Chou 1104
media are mildly acidic. However, the fermentative acti- vities of yeast alter the pH as the culture grows, which may change the antagonistic activity. Thus, we investi-gated the effect of pH on antagonism by observing the killing effects on MB plates incubated at 22°C for 4 d.
The inhibition haloes produced by T. asahii JYC122 and JYC2122 were clearer at pH 4.7 (Fig. 1A-E) and pH 5 (Fig. 1B-F) than at pH 5.5 (Fig. 1C-G) or pH 5.7 (Fig. 1D-H) when the lawn cells were a sensitive strain of S. cerevisiae. Furthermore, when the killer was P. kluyveri JYC2095, S. cerevisiae was surrounded by a blue precipitated halo – indicative of cellular death at pH 4.7 (Fig. 1I) – but not at pH 5, pH 5.5, or pH 5.7 (Fig. 1J-L). Similar results against A. pullulans JYC1003 were obtained from T. asahii JYC122 and JYC2122, and W. anomalus JYC2063 (Fig. 2). When the killer was T. asahii JYC122 or JYC2122, the lawn cells T. asahii JYC1040 were surrounded by a halo at pH 4.7 (Fig. 3A-E) but not at pH 5, pH 5.5, or pH 5.7 (Fig. 3B-D, F-H). Finally, when the lawn cells were P. aphidis JYC1050, T. asahii JYC122 and JYC2122 exerted stronger killer effects at pH 5.5 (Fig. 4C-G) and pH 5.7 (Fig. 4D-H) than at pH 4.7 (Fig. 4A-E) or pH 5
(Fig. 4B-F). U. esculenta JYC2036 exerted killer effect under all pH conditions we tested (Fig. 4I-L). A. pul-lulans JYC2095 exerted stronger killer effects at pH 4.7, pH 5, and pH 5.5 than at pH 5.7 (Fig. 5A-D). By con-trast, C. stellimalicola JYC2120 showed the antagonistic behavior only at pH 4.7 and pH 5 (Fig. 5E-H).
These results indicated that the same lawn cells showed different sensitivities to different killer yeasts at the same pH value. Furthermore, the antagonistic activity of some killer yeasts had a narrow optimal pH range. However, several killer isolates that we found are also opportunistic pathogens (T. asahii JYC122 and JYC2122, and A. pullulans JYC2065). Despite the con-siderable biotechnological potential of these isolates, their pathogenicity should not be overlooked when considering them for future applications.
Strain-dependent antagonistic activity. We observed that A. pullulans shows antagonistic activity against P. aphidis. A. pullulans is a yeast-like fungus that can be found in different environments; it is notable for its phenotypic plasticity, and it is adaptable to various stressful conditions (e.g. hypersalinity, acidity, alka-linity, cold, and oligotrophy) (Slepecky and Starmer, 2009). Thus, antagonistic activity may be another char-acteristic of this polyextremotolerant species. Sixty-one A. pullulans strains were tested, and three of them (4.9%) were positive for the killer character (JYC1119, JYC1135, JYC1213). These strains were antagonistic to P. aphidis JYC1050 (Fig. 7), but not all the A. pullulans strains exhibited antagonistic activity against the other species we tested. Notably, A. pullulans JYC1135 and JYC1213 exerted stronger killer effects at pH 4.7, pH 5, and pH 5.5 than at pH 5.7 (Fig. 7E-L). However, A. pul-lulans JYC1119 exerted the killer effect only at pH 4.7 and pH 5, not at pH 5.5 or pH 5.7 (Fig. 7A-D). These results indicated the possibility that A. pullulans pro-duces a unique antagonistic substance in response to P. aphidis but shows variety.
Fig. 7. A. pullulans JYC1119 (A-D), JYC1135 (E-H), and JYC1213 (I-L) exhibit antagonistic activity against P. aphidis JYC1050.
Fig. 5. Two isolates, A. pullulans JYC2095 (A-D) and C. stellimali-cola JYC2120 (E-H), are antagonistic to P. aphidis JYC1050
Fig. 6. T. asahii JYC1040 shows no antagonistic activity against T. asahii JYC122 (A-C) or JYC2122 (D-F) under any of the pH
conditions tested.
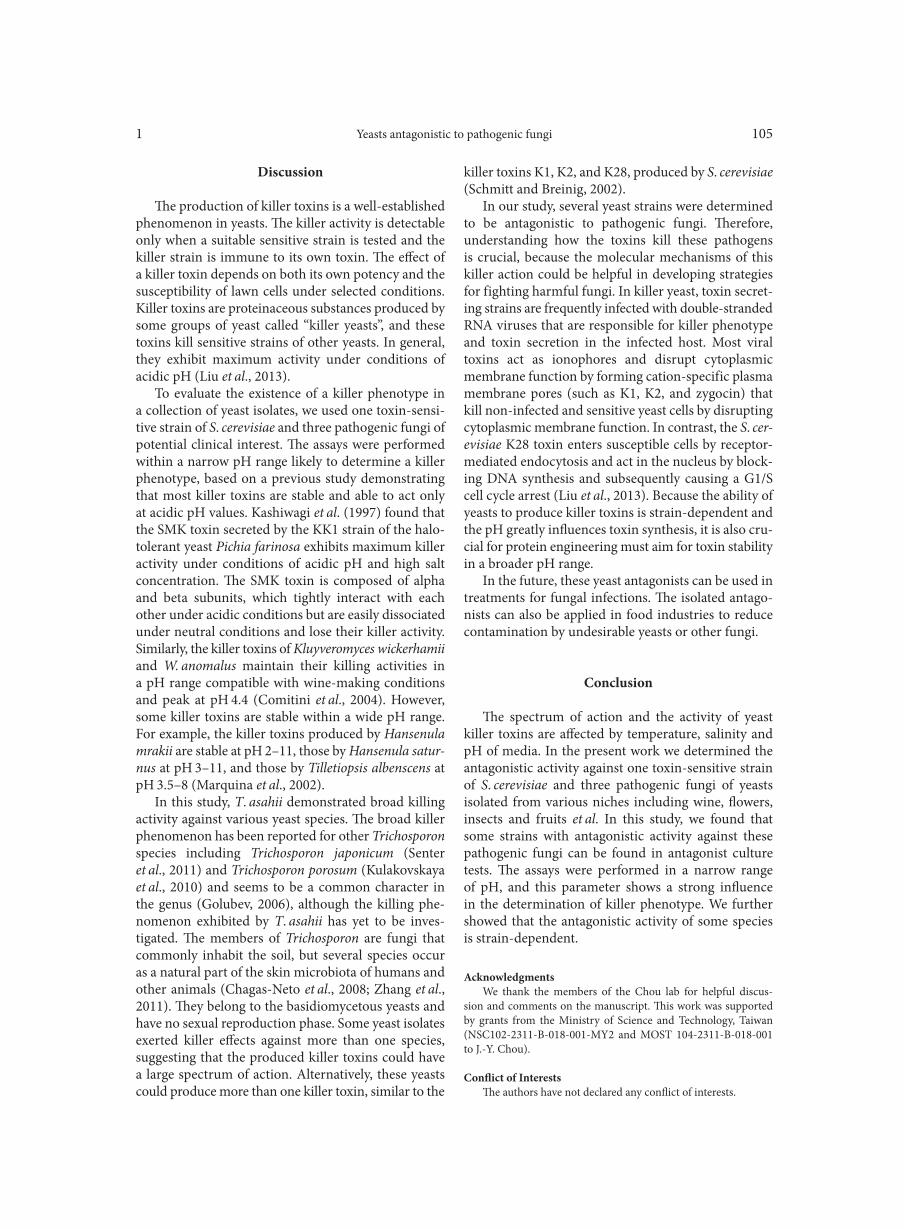
Yeasts antagonistic to pathogenic fungi1 105
Discussion
The production of killer toxins is a well-established phenomenon in yeasts. The killer activity is detectable only when a suitable sensitive strain is tested and the killer strain is immune to its own toxin. The effect of a killer toxin depends on both its own potency and the susceptibility of lawn cells under selected conditions. Killer toxins are proteinaceous substances produced by some groups of yeast called “killer yeasts”, and these toxins kill sensitive strains of other yeasts. In general, they exhibit maximum activity under conditions of acidic pH (Liu et al., 2013).
To evaluate the existence of a killer phenotype in a collection of yeast isolates, we used one toxin-sensi-tive strain of S. cerevisiae and three pathogenic fungi of potential clinical interest. The assays were performed within a narrow pH range likely to determine a killer phenotype, based on a previous study demonstrating that most killer toxins are stable and able to act only at acidic pH values. Kashiwagi et al. (1997) found that the SMK toxin secreted by the KK1 strain of the halo-tolerant yeast Pichia farinosa exhibits maximum killer activity under conditions of acidic pH and high salt concentration. The SMK toxin is composed of alpha and beta subunits, which tightly interact with each other under acidic conditions but are easily dissociated under neutral conditions and lose their killer activity. Similarly, the killer toxins of Kluyveromyces wickerhamii and W. anomalus maintain their killing activities in a pH range compatible with wine-making conditions and peak at pH 4.4 (Comitini et al., 2004). However, some killer toxins are stable within a wide pH range. For example, the killer toxins produced by Hansenula mrakii are stable at pH 2–11, those by Hansenula satur-nus at pH 3–11, and those by Tilletiopsis albenscens at pH 3.5–8 (Marquina et al., 2002).
In this study, T. asahii demonstrated broad killing activity against various yeast species. The broad killer phenomenon has been reported for other Trichosporon species including Trichosporon japonicum (Senter et al., 2011) and Trichosporon porosum (Kulakovskaya et al., 2010) and seems to be a common character in the genus (Golubev, 2006), although the killing phe-nomenon exhibited by T. asahii has yet to be inves-tigated. The members of Trichosporon are fungi that commonly inhabit the soil, but several species occur as a natural part of the skin microbiota of humans and other animals (Chagas-Neto et al., 2008; Zhang et al., 2011). They belong to the basidiomycetous yeasts and have no sexual reproduction phase. Some yeast isolates exerted killer effects against more than one species, suggesting that the produced killer toxins could have a large spectrum of action. Alternatively, these yeasts could produce more than one killer toxin, similar to the
killer toxins K1, K2, and K28, produced by S. cerevisiae (Schmitt and Breinig, 2002).
In our study, several yeast strains were determined to be antagonistic to pathogenic fungi. Therefore, understanding how the toxins kill these pathogens is crucial, because the molecular mechanisms of this killer action could be helpful in developing strategies for fighting harmful fungi. In killer yeast, toxin secret-ing strains are frequently infected with double-stranded RNA viruses that are responsible for killer phenotype and toxin secretion in the infected host. Most viral to xins act as ionophores and disrupt cytoplasmic membrane function by forming cation-specific plasma membrane pores (such as K1, K2, and zygocin) that kill non-infected and sensitive yeast cells by disrupting cytoplasmic membrane function. In contrast, the S. cer-evisiae K28 toxin enters susceptible cells by receptor-mediated endocytosis and act in the nucleus by block-ing DNA synthesis and subsequently causing a G1/S cell cycle arrest (Liu et al., 2013). Because the ability of yeasts to produce killer toxins is strain-dependent and the pH greatly influences toxin synthesis, it is also cru-cial for protein engineering must aim for toxin stability in a broader pH range.
In the future, these yeast antagonists can be used in treatments for fungal infections. The isolated antago-nists can also be applied in food industries to reduce contamination by undesirable yeasts or other fungi.
Conclusion
The spectrum of action and the activity of yeast killer toxins are affected by temperature, salinity and pH of media. In the present work we determined the antagonistic activity against one toxin-sensitive strain of S. cerevisiae and three pathogenic fungi of yeasts isolated from various niches including wine, flowers, insects and fruits et al. In this study, we found that some strains with antagonistic activity against these pathogenic fungi can be found in antagonist culture tests. The assays were performed in a narrow range of pH, and this parameter shows a strong influence in the determination of killer phenotype. We further showed that the antagonistic activity of some species is strain-dependent.
AcknowledgmentsWe thank the members of the Chou lab for helpful discus-
sion and comments on the manuscript. This work was supported by grants from the Ministry of Science and Technology, Taiwan (NSC102-2311-B-018-001-MY2 and MOST 104-2311-B-018-001 to J.-Y. Chou).
Conflict of InterestsThe authors have not declared any conflict of interests.
Chen P.-H. and J.-Y. Chou 1106
Literature
Bayramoglu G., M. Sonmez, I. Tosun, K. Aydin and F. Aydin. 2008. Breakthrough Trichosporon asahii fungemia in neutropenic patient with acute leukemia while receiving caspofungin. Infection 36(1): 68–70.Burgess J.G., E.M. Jordan, M. Bregu, A. Mearns-Spragg and K.G. Boyd. 1999. Microbial antagonism: a neglected avenue of natu-ral products research. J. Biotechnol. 70(1): 27–32.Chagas-Neto T.C., G.M. Chaves and A.L. Colombo. 2008. Update on the genus Trichosporon. Mycopathologia 166(3): 121–132. Chang S.L., J.Y. Leu, and T.H. Chang. 2015. A population study of killer viruses reveals different evolutionary histories of two closely related Saccharomyces sensu stricto yeasts. Mol. Ecol. 24(16): 4312–22.Chen B., L.Y. Zhu, X. Xuan, L.J. Wu, T.L. Zhou, X.Q. Zhang and B.X. Li. 2011. Isolation of both Pseudozyma aphidis and Nocardia otitidiscaviarum from a mycetoma on the leg. Int. J. Dermatol. 50(6): 714–719.Chou J.Y., H.W. Chen, C.C. Lin, Y.D. Wen and W.L. Wang. 2015. Yeast diversity associated with the biting midge Forcipomyia taiwana in Taiwan. Nova Hedwigia 101(3–4): 519–527.Comitini F., N. Di Pietro, L. Zacchi, I. Mannazzu and M. Ciani. 2004. Kluyveromyces phaffii killer toxin active against wine spoil-age yeasts: purification and characterization. Microbiology 150(Pt 8): 2535–2541.Cornforth D.M. and K.R. Foster. 2013. Competition sensing: the social side of bacterial stress responses. Nat. Rev. Microbiol. 11(4): 285–293. Ebright J.R., M.R. Fairfax and J.A. Vazquez. 2001. Trichosporon asahii, a non-Candida yeast that caused fatal septic shock in a patient without cancer or neutropenia. Clin. Infect. Dis. 33(5): e28–e30.Gebreel H., A. El-Mehalawy, I. El-Kholy, H. Rifaat and A. Humid. 2008. Antimicrobial activities of certain bacteria isolated from egyptian soil against pathogenic fungi. Res. J. Agric. Biol. Sci. 4(4): 331–339.Girardi L., R. Malowitz, G. Tortora, and E. Spitzer. 1993. Aureo-basidium pullulans septicemia. Clin. Infect. Dis. 16(2): 338–339.Girmenia C., L. Pagano, B. Martino, D. D’Antonio, R. Fanci, G. Specchia, L. Melillo, M. Buelli, G. Pizzarelli and M. Venditti. 2005. Invasive infections caused by Trichosporon species and Geot-richum capitatum in patients with hematological malignancies: a retro spective multicenter study from Italy and review of the litera-ture. J. Clin. Microbiol. 43(4): 1818–1828.Golubev W. 2006. Antagonistic interactions among yeasts, pp. 197–219. In: Biodiversity and ecophysiology of yeasts. Springer.Hwang S., J. Kim, S. Yoon, Y. Cha, M. Kim, D. Yong, J.H. Chang, S.H. Jeong, Y. Uh and K. Lee. 2010. First report of brain abscess associated with Pseudozyma species in a patient with astrocytoma. Korean J. Lab. Med. 30(3): 284–288.Jousset A., J. Becker, S. Chatterjee, P. Karlovsky, S. Scheu and N. Eisenhauer. 2014. Biodiversity and species identity shape the anti-fungal activity of bacterial communities. Ecology 95(5): 1184–1190.Kashiwagi T., N. Kunishima, C. Suzuki, F. Tsuchiya, S. Nikkuni, Y. Arata and K. Morikawa. 1997. The novel acidophilic struc- ture of the killer toxin from halotolerant yeast demonstrates remark-able folding similarity with a fungal killer toxin. Structure 5(1): 81–94.Kohanski M.A., D.J. Dwyer and J.J. Collins. 2010. How antibiot-ics kill bacteria: from targets to networks. Nat. Rev. Microbiol. 8(6): 423–435.Krcmery Jr. V., F. Mateička, A. Kunová, S. Špánik, J. Gyarfáš, Z. Syčová and J. Trupl. 1999. Hematogenous trichosporonosis in
cancer patients: report of 12 cases including 5 during prophylaxis with itraconazol. Support Care Cancer 7(1): 39–43.Kucsera J., K. Yarita and K. Takeo. 2000. Simple detection method for distinguishing dead and living yeast colonies. J. Microbiol. Meth-ods 41(1): 19–21.Kulakovskaya T.V., W.I. Golubev, M.A. Tomashevskaya, E.V. Kula- kovskaya, A.S. Shashkov, A.A. Grachev, A.S. Chizhov and N.E. Nifantiev. 2010. Production of antifungal cellobiose lipids by Trichosporon porosum. Mycopathologia 169(2): 117–123. Kurtzman C.P. and C.J. Robnett. 1997. Identification of clinically important ascomycetous yeasts based on nucleotide divergence in the 5’ end of the large-subunit (26S) ribosomal DNA gene. J. Clin. Microbiol. 35(5): 1216–1223.Kurtzman C.P. and C.J. Robnett. 1998. Identification and phylog-eny of ascomycetous yeasts from analysis of nuclear large subunit (26S) ribosomal DNA partial sequences. Antonie van Leeuwenhoek 73(4): 331–371.Liu G.L., Z. Chi, G.Y. Wang, Z.P. Wang, Y. Li and Z.M. Chi. 2013. Yeast killer toxins, molecular mechanisms of their action and their applications. Crit. Rev. Biotechnol. (0): 1–13.Marquina D., A. Santos, and J.M. Peinado. 2002. Biology of killer yeasts. Int. Microbiol. 5(2): 65–71. Mathur S. and R. Singh. 2005. Antibiotic resistance in food lactic acid bacteria – a review. Int. J. Food Microbiol. 105(3): 281–295.Molina-Leyva A., J.C. Ruiz-Carrascosa, A. Leyva-Garcia and H. Husein-Elahmed. 2013. Cutaneous Cryptococcus laurentii infection in an immunocompetent child. Int. J. Infect. Dis. 17(12): e1232–e1233.Schmitt M.J. and F. Breinig. 2002. The viral killer system in yeast: from molecular biology to application. FEMS Microbiol. Rev. 26(3): 257–276.Senter L., R.K.d.C. Ribas and P. Valente. 2011. Optimization of the cultivation conditions for the production of an antimicrobial compound by Trichosporon japonicum QU139. Rev. Bras. Biocienc. 9(1): 72–76.Slepecky R.A. and W.T. Starmer. 2009. Phenotypic plasticity in fungi: a review with observations on Aureobasidium pullulans. Myco-logia 101(6): 823–832.Vlchkova‐Lashkoska M., S. Kamberova, A. Starova, L. Goleva‐Mishevska, N. Tsatsa‐Biljanovska, V. Janevska and M. Petro-vska. 2004. Cutaneous Cryptococcus laurentii infection in a human immunodeficiency virus‐negative subject. J. Eur. Acad. Dermatol. Venereol. 18(1): 99–100.Wisniewski M., C. Wilson, S. Droby, E. Chalutz, A. El-Ghaouth, C. Stevens, C. Vincent, M. Goettel and G. Lazarovits. 2007. Post-harvest biocontrol: new concepts and applications, pp. 262–273. In: Biological control: a global perspective. CABI.Wisniewski M.E. and C.L. Wilson 1992. Biological control of postharvest diseases of fruits and vegetables: recent advances. Hort. Science 27(2): 94–98.Wolf D.G., R. Falk, M. Hacham, B. Theelen, T. Boekhout, G. Scor-zetti, M. Shapiro, C. Block, I.F. Salkin and I. Polacheck. 2001. Multidrug-resistant Trichosporon asahii infection of nongranulo-cytopenic patients in three intensive care units. J. Clin. Microbiol. 39(12): 4420–4425.Yilmaz M., H. Soran and Y. Beyatli. 2006. Antimicrobial activities of some Bacillus spp. strains isolated from the soil. Microbiol. Res. 161(2): 127–131.Zhang E., T. Sugita, R. Tsuboi, T. Yamazaki and K. Makimura. 2011. The opportunistic yeast pathogen Trichosporon asahii colo-nizes the skin of healthy individuals: analysis of 380 healthy indi-viduals by age and gender using a nested polymerase chain reaction assay. Microbiol. Immunol. 55(7): 483–488.
Polish Journal of Microbiology2017, Vol. 66, No 1, 107–111
SHORT COMMUNICATION
* Corresponding author: A. Tavanti, Department of Biology, University of Pisa, Pisa, Italy; e-mail: [email protected]
Microorganisms play a pivotal role in regulating fundamental biogeochemical processes in terrestrial and marine systems. Changes in ultraviolet light (UV) radiation, soil warming and desiccation may be strong selective forces acting on the phylogenetic and physio-logical composition of microorganisms. We chose to focus on Pseudomonas stutzeri since it is a non-fluores-cent denitrifying bacterium with a wide distributional range and it occurs as an opportunistic pathogen in humans (Lalucat et al., 2006). P. stutzeri is a Gram- -negative bacterium known for its high propensity nitrogen fixation and opportunistic pathogenicity. In addition, P. stutzeri strains have also been described to exert xenobiotic degradation capacity, mainly naph tha lene and other similar aromatic compounds (Brunet-Galmés et al., 2012). In fact, several strains of this species are involved in nitrogen fixation, whilst others participate in the degradation of pollutants or interact with toxic metals, processes that could be influ-enced by environmental factors (Lalucat et al., 2006). This species was also recently isolated from the oral cav-ity of asymptomatic health care workers, suggesting the possibility that P. stutzeri may behave as a commensal strain occasionally tuning pathogenic in immunocom-promised patients (Lima et al., 2015).
In this study, two P. stutzeri strains with different origins and optimal growth temperatures were used to assess bacterial viability following exposure to UV radiation.
In addition, we evaluated the applicability of ampli-fication length polymorphism analysis (AFLP) as a tool for genotyping P. stutzeri strains.
P. stutzeri DSM 7136, isolated from aquifer cores and with an optimum growth temperature of 30°C, and type strain DSM 5190, isolated from human spinal fluid, with an optimum growth temperature of 37°C were obtained from the Leibniz Institute DSMZ-German Collection of Microorganisms and Cell Cultures (Germany).
Bacterial cultures were grown in Nutrient Broth (Liofilchem S.r.L., Teramo, Italy) and incubated with shaking at their optimal temperatures until the exponen-tial growth phase was reached (O.D.λ600 nm 0.7). Strains were maintained on Nutrient Agar at 4°C (Liofilchem S.r.L., Teramo, Italy) for the duration of the study.
The effect of ultraviolet light B (UVB) (280–315 nm) and ultraviolet light A (UVA) (315–400 nm) radiation was evaluated by P. stutzeri survival following different exposure lengths and periods. The UV-light-generat-ing lamps consisted of two fluorescent narrowband tubes emitting in the 340 nm band (UV-A TLD 15 W,
Use of Amplification Fragment Length Polymorphismto Genotype Pseudomonas stutzeri Strains Following Exposure
to Ultraviolet Light A
LISA LOMBARDI1, MARINA ZOPPO1, COSMERI RIZZATO1, COLIN GERARD EGAN2,ROBERTO SCARPATO1 and ARIANNA TAVANTI1*
1 Department of Biology, Genetic Unit, University of Pisa, Italy2 Primula Multimedia S.r.L., Pisa, Italy
Submitted 23 December 2015, revised 27 April 2016, accepted 10 May 2016
A b s t r a c t
Changes in ultraviolet light radiation can act as a selective force on the genetic and physiological traits of a microbial community. Two strains of the common soil bacterium Pseudomonas stutzeri, isolated from aquifer cores and from human spinal fluid were exposed to ultraviolet light. Amplification length polymorphism analysis (AFLP) was used to genotype this bacterial species and evaluate the effect of UVA-exposure on genomic DNA extracted from 18 survival colonies of the two strains compared to unexposed controls. AFLP showed a high discriminatory power, confirming the existence of different genotypes within the species and presence of DNA polymorphisms in UVA-exposed colonies.
K e y w o r d s: Pseudomonas stutzeri, AFLP, polymorphisms, UVA exposure
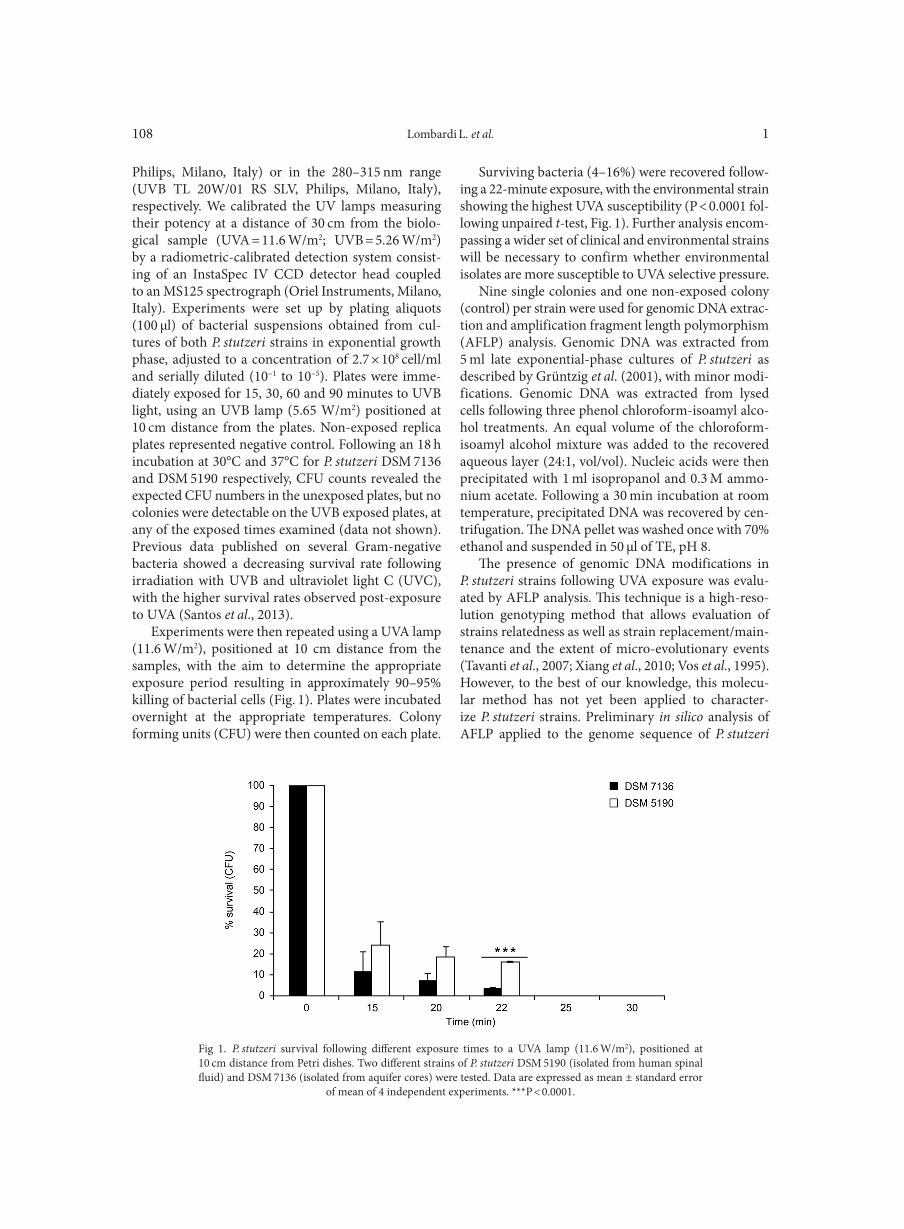
Lombardi L. et al. 1108
Philips, Milano, Italy) or in the 280–315 nm range (UVB TL 20W/01 RS SLV, Philips, Milano, Italy), respectively. We calibrated the UV lamps measuring their potency at a distance of 30 cm from the biolo-gical sample (UVA = 11.6 W/m2; UVB = 5.26 W/m2) by a radiometric-calibrated detection system consist-ing of an InstaSpec IV CCD detector head coupled to an MS125 spectrograph (Oriel Instruments, Milano, Italy). Experiments were set up by plating aliquots (100 µl) of bacterial suspensions obtained from cul-tures of both P. stutzeri strains in exponential growth phase, adjusted to a concentration of 2.7 × 10⁸ cell/ml and serially diluted (10–1 to 10–5). Plates were imme-diately exposed for 15, 30, 60 and 90 minutes to UVB light, using an UVB lamp (5.65 W/m2) positioned at 10 cm distance from the plates. Non-exposed replica plates represented negative control. Following an 18 h incubation at 30°C and 37°C for P. stutzeri DSM 7136 and DSM 5190 respectively, CFU counts revealed the expected CFU numbers in the unexposed plates, but no colonies were detectable on the UVB exposed plates, at any of the exposed times examined (data not shown). Previous data published on several Gram-negative bacteria showed a decreasing survival rate following irradiation with UVB and ultraviolet light C (UVC), with the higher survival rates observed post-exposure to UVA (Santos et al., 2013).
Experiments were then repeated using a UVA lamp (11.6 W/m2), positioned at 10 cm distance from the samples, with the aim to determine the appropriate exposure period resulting in approximately 90–95% killing of bacterial cells (Fig. 1). Plates were incubated overnight at the appropriate temperatures. Colony forming units (CFU) were then counted on each plate.
Surviving bacteria (4–16%) were recovered follow-ing a 22-minute exposure, with the environmental strain showing the highest UVA susceptibility (P < 0.0001 fol-lowing unpaired t-test, Fig. 1). Further analysis encom-passing a wider set of clinical and environmental strains will be necessary to confirm whether environmental isolates are more susceptible to UVA selective pressure.
Nine single colonies and one non-exposed colony (control) per strain were used for genomic DNA extrac-tion and amplification fragment length polymorphism (AFLP) analysis. Genomic DNA was extracted from 5 ml late exponential-phase cultures of P. stutzeri as described by Grüntzig et al. (2001), with minor modi-fications. Genomic DNA was extracted from lysed cells following three phenol chloroform-isoamyl alco-hol treatments. An equal volume of the chloroform-isoamyl alcohol mixture was added to the recovered aqueous layer (24:1, vol/vol). Nucleic acids were then precipitated with 1 ml isopropanol and 0.3 M ammo-nium acetate. Following a 30 min incubation at room temperature, precipitated DNA was recovered by cen-trifugation. The DNA pellet was washed once with 70% ethanol and suspended in 50 µl of TE, pH 8.
The presence of genomic DNA modifications in P. stutzeri strains following UVA exposure was evalu-ated by AFLP analysis. This technique is a high-reso-lution genotyping method that allows evaluation of strains relatedness as well as strain replacement/main-tenance and the extent of micro-evolutionary events (Tavanti et al., 2007; Xiang et al., 2010; Vos et al., 1995). However, to the best of our knowledge, this molecu-lar method has not yet been applied to character-ize P. stutzeri strains. Preliminary in silico analysis of AFLP applied to the genome sequence of P. stutzeri
Fig 1. P. stutzeri survival following different exposure times to a UVA lamp (11.6 W/m2), positioned at 10 cm distance from Petri dishes. Two different strains of P. stutzeri DSM 5190 (isolated from human spinal fluid) and DSM 7136 (isolated from aquifer cores) were tested. Data are expressed as mean ± standard error
of mean of 4 independent experiments. ***P < 0.0001.
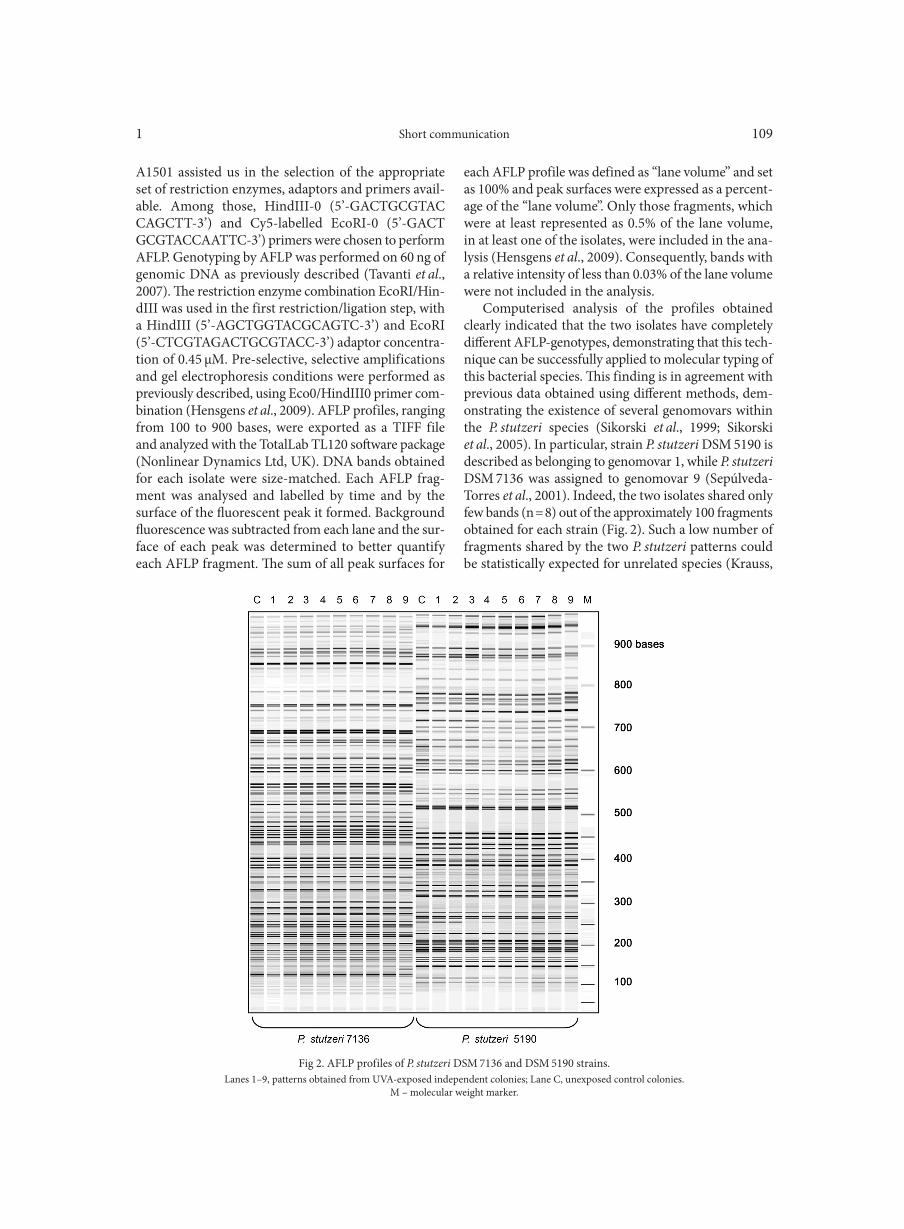
Short communication1 109
A1501 assisted us in the selection of the appropriate set of restriction enzymes, adaptors and primers avail-able. Among those, HindIII-0 (5’-GACTGCGTAC CAGCTT-3’) and Cy5-labelled EcoRI-0 (5’-GACT GCGTACCAATTC-3’) primers were chosen to perform AFLP. Genotyping by AFLP was performed on 60 ng of genomic DNA as previously described (Tavanti et al., 2007). The restriction enzyme combination EcoRI/Hin-dIII was used in the first restriction/ligation step, with a HindIII (5’-AGCTGGTACGCAGTC-3’) and EcoRI (5’-CTCGTAGACTGCGTACC-3’) adaptor concentra-tion of 0.45 µM. Pre-selective, selective amplifications and gel electrophoresis conditions were performed as previously described, using Eco0/HindIII0 primer com-bination (Hensgens et al., 2009). AFLP profiles, ranging from 100 to 900 bases, were exported as a TIFF file and analyzed with the TotalLab TL120 software package (Nonlinear Dynamics Ltd, UK). DNA bands obtained for each isolate were size-matched. Each AFLP frag-ment was analysed and labelled by time and by the surface of the fluorescent peak it formed. Background fluorescence was subtracted from each lane and the sur-face of each peak was determined to better quantify each AFLP fragment. The sum of all peak surfaces for
each AFLP profile was defined as “lane volume” and set as 100% and peak surfaces were expressed as a percent-age of the “lane volume”. Only those fragments, which were at least represented as 0.5% of the lane volume, in at least one of the isolates, were included in the ana-lysis (Hensgens et al., 2009). Consequently, bands with a relative intensity of less than 0.03% of the lane volume were not included in the analysis.
Computerised analysis of the profiles obtained clearly indicated that the two isolates have completely different AFLP-genotypes, demonstrating that this tech-nique can be successfully applied to molecular typing of this bacterial species. This finding is in agreement with previous data obtained using different methods, dem-onstrating the existence of several genomovars within the P. stutzeri species (Sikorski et al., 1999; Sikorski et al., 2005). In particular, strain P. stutzeri DSM 5190 is described as belonging to genomovar 1, while P. stutzeri DSM 7136 was assigned to genomovar 9 (Sepúlveda-Torres et al., 2001). Indeed, the two isolates shared only few bands (n = 8) out of the approximately 100 fragments obtained for each strain (Fig. 2). Such a low number of fragments shared by the two P. stutzeri patterns could be statistically expected for unrelated species (Krauss,
Fig 2. AFLP profiles of P. stutzeri DSM 7136 and DSM 5190 strains.Lanes 1–9, patterns obtained from UVA-exposed independent colonies; Lane C, unexposed control colonies.
M – molecular weight marker.
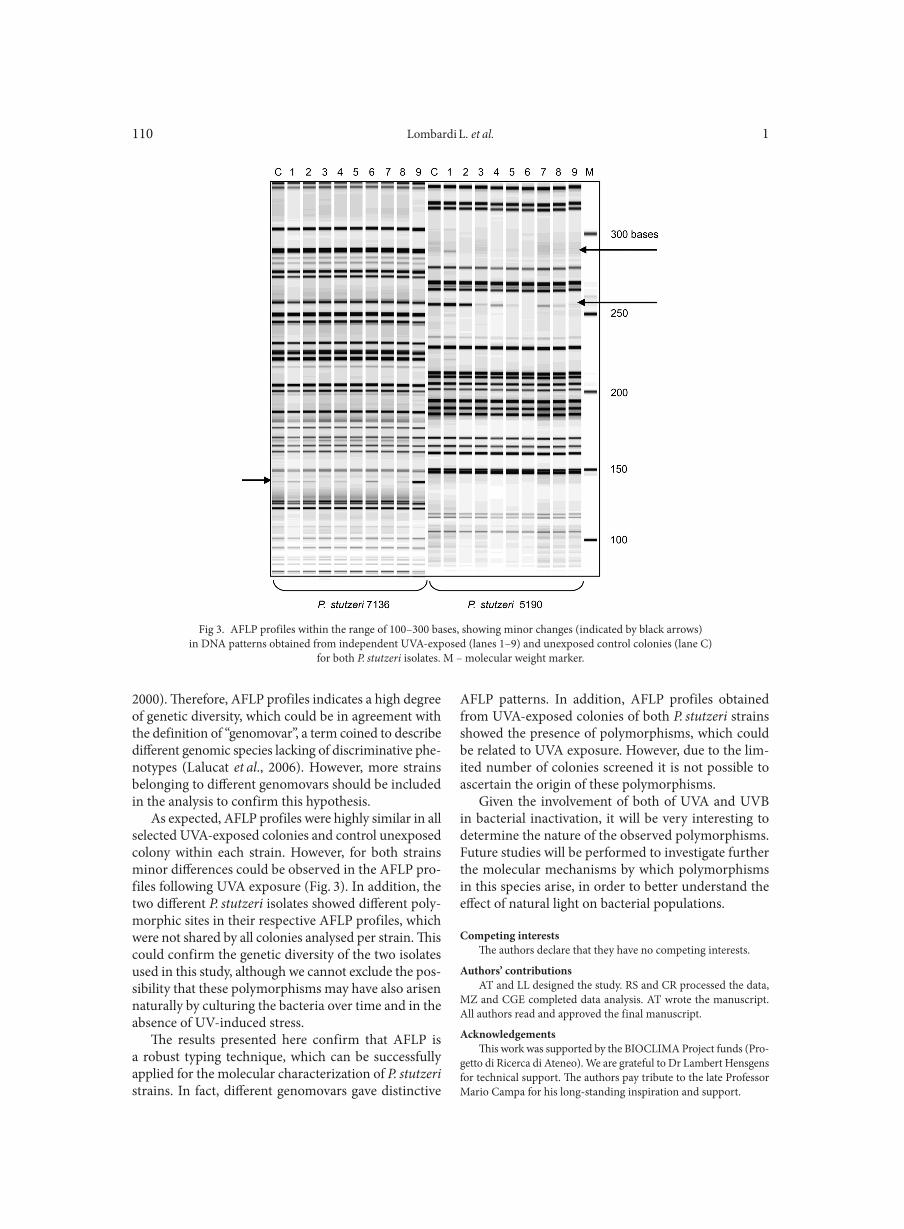
Lombardi L. et al. 1110
2000). Therefore, AFLP profiles indicates a high degree of genetic diversity, which could be in agreement with the definition of “genomovar”, a term coined to describe different genomic species lacking of discriminative phe-notypes (Lalucat et al., 2006). However, more strains belonging to different genomovars should be included in the analysis to confirm this hypothesis.
As expected, AFLP profiles were highly similar in all selected UVA-exposed colonies and control unexposed colony within each strain. However, for both strains minor differences could be observed in the AFLP pro-files following UVA exposure (Fig. 3). In addition, the two different P. stutzeri isolates showed different poly-morphic sites in their respective AFLP profiles, which were not shared by all colonies analysed per strain. This could confirm the genetic diversity of the two isolates used in this study, although we cannot exclude the pos-sibility that these polymorphisms may have also arisen naturally by culturing the bacteria over time and in the absence of UV-induced stress.
The results presented here confirm that AFLP is a robust typing technique, which can be successfully applied for the molecular characterization of P. stutzeri strains. In fact, different genomovars gave distinctive
AFLP patterns. In addition, AFLP profiles obtained from UVA-exposed colonies of both P. stutzeri strains showed the presence of polymorphisms, which could be related to UVA exposure. However, due to the lim-ited number of colonies screened it is not possible to ascertain the origin of these polymorphisms.
Given the involvement of both of UVA and UVB in bacterial inactivation, it will be very interesting to determine the nature of the observed polymorphisms. Future studies will be performed to investigate further the molecular mechanisms by which polymorphisms in this species arise, in order to better understand the effect of natural light on bacterial populations.
Competing interests The authors declare that they have no competing interests.
Authors’ contributionsAT and LL designed the study. RS and CR processed the data,
MZ and CGE completed data analysis. AT wrote the manuscript. All authors read and approved the final manuscript.
AcknowledgementsThis work was supported by the BIOCLIMA Project funds (Pro-
getto di Ricerca di Ateneo). We are grateful to Dr Lambert Hensgens for technical support. The authors pay tribute to the late Professor Mario Campa for his long-standing inspiration and support.
Fig 3. AFLP profiles within the range of 100–300 bases, showing minor changes (indicated by black arrows)in DNA patterns obtained from independent UVA-exposed (lanes 1–9) and unexposed control colonies (lane C)
for both P. stutzeri isolates. M – molecular weight marker.
Short communication1 111
Literature
Brunet-Galmés I., A. Busquets, A. Peña, M. Gomila, B. Nogales, E. García-Valdés, J. Lalucat, A. Bennasar and R. Bosch. 2012. Complete genome sequence of the naphthalene-degrading bacte-rium Pseudomonas stutzeri AN10 (CCUG 29243). J. Bacteriol. 194: 6642–6643.Hensgens L.A., A. Tavanti, S. Mogavero, E. Ghelardi and S. Senesi. 2009. AFLP genotyping of Candida metapsilosis clinical isolates: evi-dence for recombination. Fungal Gen. Biol. 46: 750–758.Grüntzig V., S.C. Nold, J. Zhou and J.M. Tiedje. 2001. Pseudomonas stutzeri nitrite reductase gene abundance in environmental samples measured by real-time PCR. Appl. Environ. Microbiol. 67: 760–768.Krauss S.L. 2000. Accurate gene diversity estimates from amplified fragment length by polymorphism (AFLP) markers. Mol. Ecol. 9: 1241–1245. Lalucat J., A. Bennasar, R. Bosch, E. García-Valdés and N.J. Pal-leroni. 2006. Biology of Pseudomonas stutzeri. Microbiol. Mol. Biol. Rev. 70: 510–547. Lima A.B., L.S. Leão-Vasconcelos, M. Costa de, L.O. Vilefort, M.C. André, M.A. Barbosa and M.A. Prado-Palos. 2015. Pseudo-monas spp. isolated from the oral cavity of healthcare workers from an oncology hospital in Midwestern Brazil. Rev Inst Med Trop Sao Paulo. 57: 513–514.Santos A.L., V. Oliveira, I. Baptista, I. Henriques, N.C. Gomes, A. Almeida, A. Correia and A. Cunha. 2013. Wavelength depen-
dence of biological damage induced by UV radiation on bacteria. Arch. Microbiol. 195: 63–74.Sepúlveda-Torres L.C., J. Zhou, C. Guasp, J. Lalucat, D. Knaebel, J.L. Plank and C. Criddle. 2001. Pseudomonas sp. strain KC repre-sents a new genomovar within Pseudomonas stutzeri. Int. J. Syst. Evol. Microbiol. 51: 2013–2019.Sikorski J., J. Lalucat and W. Wackernagel. 2005. Genomovars 11 to 18 of Pseudomonas stutzeri, identified among isolates from soil and marine sediment. Intern. J. Syst. Evol. Microbiol. 55: 1767–1770.Sikorski J., R. Rosselló-Mora and M.G. Lorenz. 1999. Analysis of genotypic diversity and relationships among Pseudomonas stutzeri strains by PCR-based genomic fingerprinting and multilocus enzyme electrophoresis. Syst. Appl. Microbiol. 22: 393–402.Tavanti A., L.A. Hensgens, E. Ghelardi, M. Campa and S. Senesi. 2007. Genotyping of Candida orthopsilosis by AFLP reveals genetic diversity among independent isolates and strain maintenance within the same patient. J. Clin. Microbiol. 45: 1455–1462.Vos P., R. Hogers, M. Bleeker, M. Reijans, T. van de Lee, M. Hornes, A. Frijters, J. Pot, J. Peleman and M. Kuiper. 1995. AFLP: a new technique for DNA fingerprinting. Nucleic Acids Res. 23: 4407–4414.Xiang S.R., M. Cook, S. Saucier, P. Gillespie, R. Socha, R. Scrog-gins and L.A. Beaudette. 2010. Development of amplified fragment length polymorphism-derived functional strain-specific markers to assess the persistence of 10 bacterial strains in soil microcosms. Appl. Environ. Microbiol. 76: 7126–7135.

Polish Journal of Microbiology2017, Vol. 66, No 1, 113–117
SHORT COMMUNICATION
In the global effort to cure many human diseases, a large number of pathogenic bacteria is cultured for different types of experiments (Jünger et al., 2012). However, numerous accidents have been reported when laboratories mishandled deadly germs (Cohen et al., 2004; Tucker, 2003). Moreover, leaks of contaminated waste, spilled bacterial or viral cultures, and defective airtight seals remain common occurrences in many laboratory settings. Accordingly, to improve the level of biological safety, an indicator that can detect spilled pathogenic bacteria is needed. There are numerous methods to stain bacteria in order to characterize and discriminate between them (Salleh et al., 2012); however, most dyes have been found to be toxic and inhibit bacte-rial growth (Salleh et al., 2011). To date, only few stud-ies have investigated non-poisonous methods of dye-ing cells in culture (Pérez-Díaz and McFeeters, 2009), therefore, a more effective staining method is needed.
Here, we present a convenient and safe method of microbial staining with the sunset yellow food dye. Using this food dye, we were able to trace the source of the leak or pathogenic microorganism without affecting bacterial growth, which we believe is necessary to allow for further characterization.
First, we investigated the ability of several pigments, such as coccinellin, erythrosine and FD&C Yellow No. 6 (sunset yellow, C16H10N2Na2O7S2), to dye bacteria, and found the pigment sunset yellow to be the most potent dye. Furthermore, previous studies have shown that sunset yellow is a synthetic dye and a small molecule that can easily dissolve in water. Accordingly, these characteristics allow sunset yellow to affix to bacteria when the dye is added to the nutrient medium. The ability of sunset yellow to colour bacteria offers a new way to indicate the trail of microorganisms, allowing researchers to physically monitor their spread. Accord-ingly, based on these characteristics, we believe this dye may become a good candidate for colouring bacteria and monitoring their spread.
Escherichia coli strain DH5α, E. coli O157:H7, Shi-gella flexneri O301, Staphylococcus aureus and Bacillus subtilis were used in this study. E. coli was grown in Luria Bertani (LB) medium aerobically at 37°C, while other strains were grown in LB medium in both liq-uid broth and on agar plates. We utilized coccinellin, erythrosine and FD&C Yellow No. 6 (sunset yellow, C16H10N2Na2O7S2) dyes in this study. A coloured LB cul-ture media with the addition of sunset yellow was used
Vital Staining of Bacteria by Sunset Yellow Pigment
PENG GAO1,2, CHENGMING SUN3, YUXIA LI1, 4, XIAOHUA ZOU1, XUN WU1,2, YAN LING1*,CAIFU LUAN3 and HUIPENG CHEN1, 2*
1 Beijing Institute of Biotechnology, Beijing, PR China2 School of Life Sciences, AnHui University, AnHui, PR China
3 Departments of Laboratory, Yuhuangding Hospital, Shandong, PR China4 Institute of Health Service and Medical Information, Academy of Military Medical Sciences,
Beijing, PR China
Peng Gao and Chengming Sun contributed equally to this work
Submitted 24 March 2016, revised 2 August 2016, accepted 7 August 2016
A b s t r a c t
In this study, we describe a method for discriminating pathogenic bacteria with a dye. First, we determined that among several colours tested, the sunset yellow pigment easily coloured Escherichia coli bacteria yellow. Next, we demonstrated that E. coli O157:H7, Shigella flexneri O301, Staphylococcus aureus and Bacillus subtilis could all be well marked by sunset yellow pigment. Finally, we performed bacterial viability assays and found there was no effect on bacterial growth when in co-culture with sunset yellow. Our results suggest that sunset yellow is suitable pigment to dye microorganisms.
K e y w o r d s: bio-safety, pathogenic bacteria detection, sunset yellow, vital staining
* Corresponding author: H. Chen, Beijing Institute of Biotechnology, Beijing, China or School of Life Sciences, AnHui University, AnHui, China; e-mail: [email protected]
Gao P. et al. 1114
to culture E. coli strain DH5α, thereby colouring the bacteria (De Mey et al., 2008). The pigment doses used in all experiments ranged from 0.05 g/ml to 5 g/ml. All cultures were put into 5 ml eppendorf tubes and centrifuged at 10.000 × g for 5 min to allow for bacte-rial collection (Ngwa et al., 2013). Sunset yellow plating medium was used to grow E. coli at 37°C for 24–48 h. To test the ability of sunset yellow to dye pathogenic bacteria, E. coli O157:H7 and S. flexneri O301 were cul-tured in media containing sunset yellow. Again, diffe-rent dilutions of sunset yellow pigment were used to culture S. aureus and B. subtilis.
Colony count assays were performed to determine the effect of sunset yellow on bacterial viability. E. coli DH5α cells were serially diluted (10–5, 10–6 or 10–7). Sub-sequently, 50 µl of diluted E. coli DH5α cells were added to 5 ml of a 43°C solution of 1% agarose in 100 mM NaCl, 10 mM sodium phosphate and 1% trypticase soy broth. Next, the entire 5-ml sample was poured over a conventional trypticase soy agar underlay. After incubating overnight, the colonies in the overlay were counted (Ferreira et al., 2010). Using the results of the plate counts, a growth curve was created to determine the incubation time and amount of E. coli required for the coloured culture.
Alternatively, turbidity readings of a 10-hour E. coli DH5α culture were taken every hour and PD was meas-ured at a wavelength of 600 nm (Choi et al., 2010). Different inoculum sizes were set to 1% and 0.1% of the bulk volume. A growth curve was plotted using the results of the changes in OD values during the 10-hour growth. All the data were statistically evaluated with SPSS/13.0 software (SPSS Inc., Chicago, IL). Val-ues of P < 0.05 were considered statistically significant. All the results are expressed as the mean ± standard deviation (SD).
During the E. coli culture, we could easily observe the turbidity of the media in each tube after 5 hours. We noted that sunset yellow was easily able to colour the bacteria yellow (Fig. 1A). The collected precipitate showed the coloured culture and the pigment success-fully turned the bacteria yellow (Fig. 1B). More impor-tantly, if some pathogenic bacteria had spilled out dur-ing the process, we would have been able to find them and promptly decontaminate the area. After culturing with the dye, we were able to observe the shape, size and traits of the bacteria (Fig. 1C).
When the sunset yellow plating medium was used, the E. coli bacterial colonies were coloured after growth at 37°C for 24–48 h. These methods were similar to those used by Zimmermann et al. (1978). Those col-onies were adhered on the surface of the filter paper and were coloured yellow when compared with the control group colonies, which possessed sunset yellow staining that was not well adhered on the surface of
the bacterial cells. More importantly, it could colour these cells. Thus, the prediction regarding the sunset yellow colouring mechanism proved to be correct. In Fig. 1D, tubes 1 and 3 are the cultures of O157:H7 and S. flexneri O301, respectively, in LB culture medium. It was apparent that O157:H7 in tube 2 and S. flexneri O301 in tube 4 were well labelled. The same phenom-enon appeared in the groups of S. aureus and B. subtilis in Fig. 1E and 1F, respectively. In this way, the spillage of pathogenic bacteria could easily be detected. The patho-genic bacterial colonies of S. aureus and S. flexneri O301 in Fig. 1G show the clearly coloured cells. Compared with the uncoloured bacterial cells in Fig. 1A and B, S. flexneri O301 germinated and was marked well, as shown in images (Fig. 1C and D). The same results were found for E. coli O157:H7, as shown in images (Fig. 1E and F). Pathogenic bacteria are only a small portion of all bacterial families; however, the vital staining method is universal.
We performed colony counting and determined that sunset yellow dye did not inhibit bacterial growth. E. coli was cultured for 12–16 hours in coloured LB before being spread onto solid LB. Sunset yellow was shown to be an ideal dye that had little influence on bacterial growth (Fig. 2A). E. coli strain DH5α was cultured overnight and then diluted (10–5, 10–6, 10–7 or 10–8). One hundred microliters of the diluted sample was then plated on solid LB with and without sunset yellow. These solid LB cultures were placed into a 37°C incubator and cultured overnight (Adler et al., 2011). Bacteria cultured in these coloured media were then sub-cultured in media without dye. Next, we chose the 5th culture generation and applied the same methods of examination. As shown in Fig. 2B, those bacteria grew well and exhibited little difference compared with the control groups. Fig. 2C and D showed that at different bacterial loads (1% or 0.1%), the bacteria could grow in both normal LB and media containing sunset yel-low LB. The E. coli cultured with sunset yellow added to the LB appeared to grow slightly slower than E. coli in normal LB between 1 and 4 hours. The growth was identical at 4 to 10 hours (Conrad et al., 2010; Cox et al., 2000). These results showed that there was no difference in bacterial growth and we concluded that sunset yellow pigment had no effect on bacterial growth.
Previously, rats were given FD&C Yellow No. 6 by gavage at 0, 60, 100, 200, 400, 600 or 1000 mg/kg body weight/day on days 0–19 of gestation. At the doses given, FD&C Yellow No. 6 was neither toxic nor tera-togenic (Poul et al., 2009; Sasaki et al., 2002). The stabil-ity of this dye had been shown by Nevado et al. (1998). This method of staining with sunset yellow was a com-prehensive, effective, stable, straightforward and safe way to stain some types of microorganisms. Although several studies have provided unequivocal evidence that
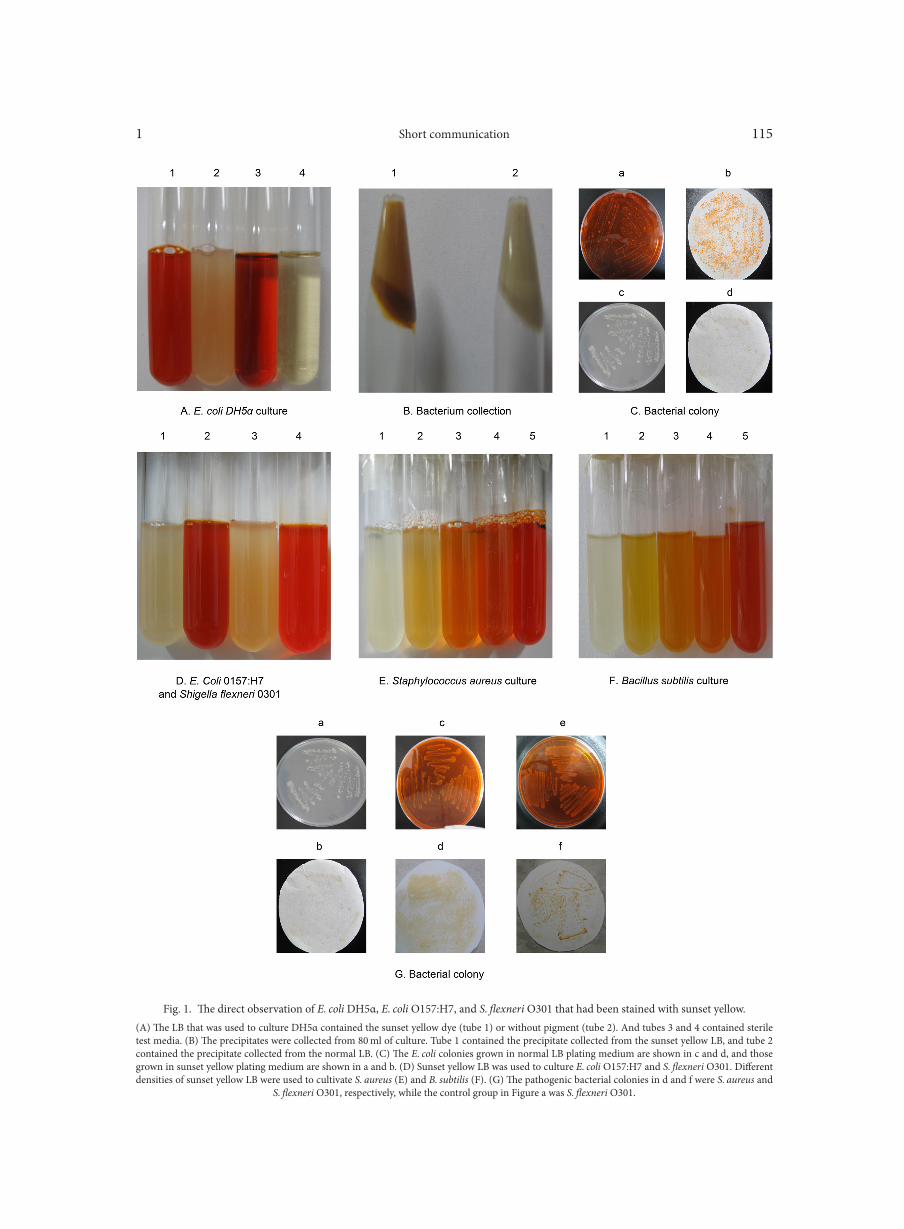
Short communication1 115
Fig. 1. The direct observation of E. coli DH5α, E. coli O157:H7, and S. flexneri O301 that had been stained with sunset yellow.(A) The LB that was used to culture DH5α contained the sunset yellow dye (tube 1) or without pigment (tube 2). And tubes 3 and 4 contained sterile test media. (B) The precipitates were collected from 80 ml of culture. Tube 1 contained the precipitate collected from the sunset yellow LB, and tube 2 contained the precipitate collected from the normal LB. (C) The E. coli colonies grown in normal LB plating medium are shown in c and d, and those grown in sunset yellow plating medium are shown in a and b. (D) Sunset yellow LB was used to culture E. coli O157:H7 and S. flexneri O301. Different densities of sunset yellow LB were used to cultivate S. aureus (E) and B. subtilis (F). (G) The pathogenic bacterial colonies in d and f were S. aureus and
S. flexneri O301, respectively, while the control group in Figure a was S. flexneri O301.
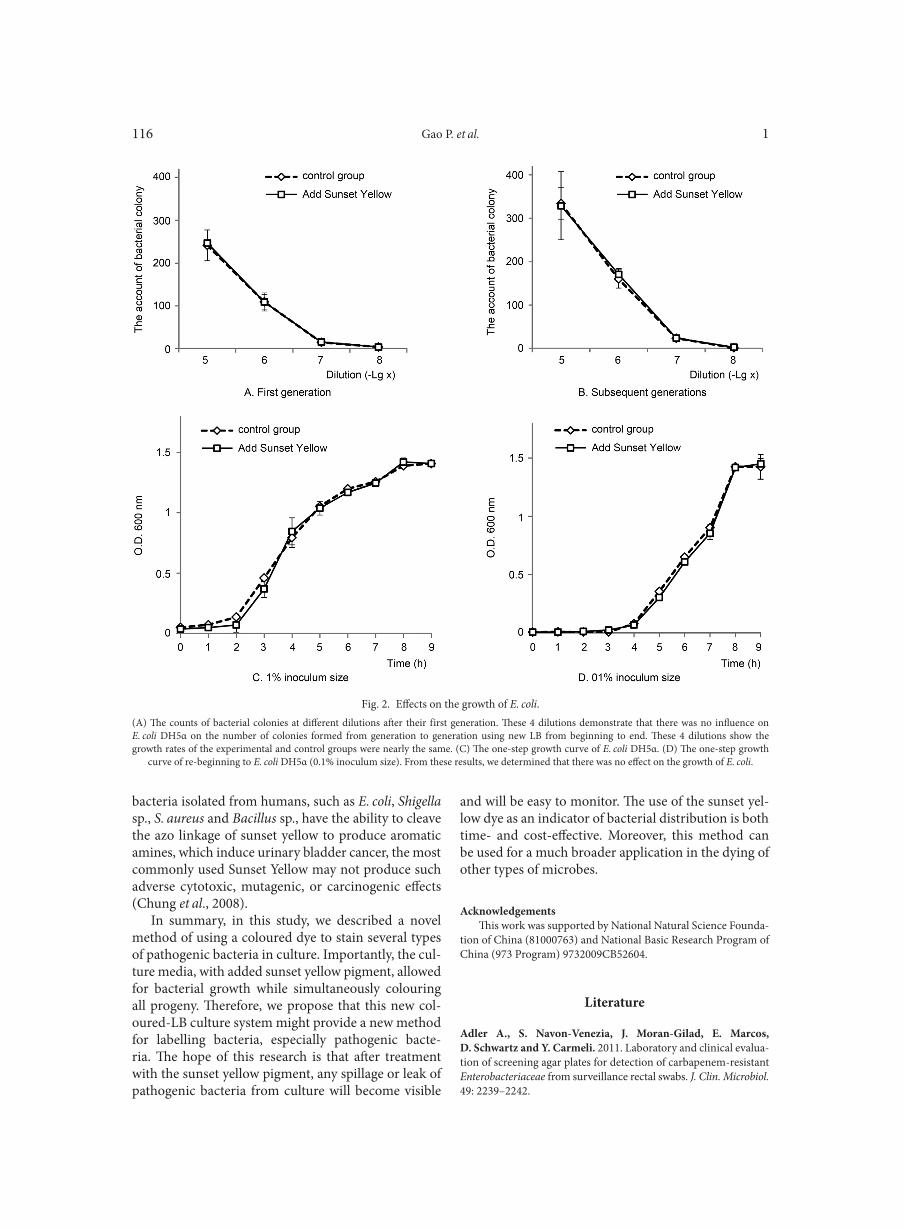
Gao P. et al. 1116
bacteria isolated from humans, such as E. coli, Shigella sp., S. aureus and Bacillus sp., have the ability to cleave the azo linkage of sunset yellow to produce aromatic amines, which induce urinary bladder cancer, the most commonly used Sunset Yellow may not produce such adverse cytotoxic, mutagenic, or carcinogenic effects (Chung et al., 2008).
In summary, in this study, we described a novel method of using a coloured dye to stain several types of pathogenic bacteria in culture. Importantly, the cul-ture media, with added sunset yellow pigment, allowed for bacterial growth while simultaneously colouring all progeny. Therefore, we propose that this new col-oured-LB culture system might provide a new method for labelling bacteria, especially pathogenic bacte-ria. The hope of this research is that after treatment with the sunset yellow pigment, any spillage or leak of pathogenic bacteria from culture will become visible
and will be easy to monitor. The use of the sunset yel-low dye as an indicator of bacterial distribution is both time- and cost-effective. Moreover, this method can be used for a much broader application in the dying of other types of microbes.
AcknowledgementsThis work was supported by National Natural Science Founda-
tion of China (81000763) and National Basic Research Program of China (973 Program) 9732009CB52604.
Literature
Adler A., S. Navon-Venezia, J. Moran-Gilad, E. Marcos, D. Schwartz and Y. Carmeli. 2011. Laboratory and clinical evalua-tion of screening agar plates for detection of carbapenem-resistant Enterobacteriaceae from surveillance rectal swabs. J. Clin. Microbiol. 49: 2239–2242.
Fig. 2. Effects on the growth of E. coli.(A) The counts of bacterial colonies at different dilutions after their first generation. These 4 dilutions demonstrate that there was no influence on E. coli DH5α on the number of colonies formed from generation to generation using new LB from beginning to end. These 4 dilutions show the growth rates of the experimental and control groups were nearly the same. (C) The one-step growth curve of E. coli DH5α. (D) The one-step growth
curve of re-beginning to E. coli DH5α (0.1% inoculum size). From these results, we determined that there was no effect on the growth of E. coli.
Short communication1 117
Choi C., E. Kuatsjah, E. Wu and S. Yuan. 2010. The effect of cell size on the burst size of T4 bacteriophage infections of Escherichia coli B23. J. Exp. Microbiol. Immun. 14: 85–91.Chung K.T., S.E. Stevens and C.E. Cerniglia. 2008. The reduc-tion of azo dyes by the intestinal microflora. Crit. Rev. Microbiol. 18: 175–190Cohen H.W., R.M. Gould and V.W. Sidel. 2004. The pitfalls of bio-terrorism preparedness: the anthrax and smallpox experiences. Am. J. Pub. Health. 94: 1667–1671.Conrad T.M., M. Frazier, A.R. Joyce, B.-K. Cho, E.M. Knight, N.E. Lewis, R. Landick and B.Ø. Palsson. 2010. RNA polymerase mutants found through adaptive evolution reprogram Escherichia coli for optimal growth in minimal media. Proceedings of the National Academy of Sciences. 107: 20500–20505.Cox S., C. Mann, J. Markham, H. Bell, J. Gustafson, J. Warming-ton and S. Wyllie. 2000. The mode of antimicrobial action of the essential oil of Melaleuca alternifolia (tea tree oil). J. Appl. Microbiol. 88: 170–175.De Mey M., G.J. Lequeux, J. Maertens, C.I. De Muynck, W.K. Soetaert and E.J. Vandamme. 2008. Comparison of protein quan-tification and extraction methods suitable for E. coli cultures. Bio-logicals 36: 198–202.Ferreira L., F. Sánchez-Juanes, M. González-Ávila, D. Cembrero-Fuciños, A. Herrero-Hernández, J.M. González-Buitrago and J.L. Muñoz-Bellido. 2010. Direct identification of urinary tract pathogens from urine samples by matrix-assisted laser desorption ionization-time of flight mass spectrometry. J. Clin. Microbiol. 48: 2110–2115.Jünger M., W. Vautz, M. Kuhns, L. Hofmann, S. Ulbricht, J.L. Baumbach, M. Quintel and T. Perl. 2012. Ion mobility spec-trometry for microbial volatile organic compounds: a new identi-fication tool for human pathogenic bacteria. Appl. Microbiol. Bio-technol. 93: 2603–2614.
Nevado J.B., J.R. Flores, C.G. Cabanillas, M.V. Llerena and A.C. Salcedo. 1998. Resolution of ternary mixtures of Tartrazine, Sunset Yellow and Ponceau 4R by derivative spectrophotometric ratio spectrum-zero crossing method in commercial foods. Talanta 46: 933–942.Ngwa G., R. Schop, S. Weir, C. León-Velarde and J. Odumeru. 2013. Detection and enumeration of E. coli O157: H7 in water samples by culture and molecular methods. J. Microbiol. Meth. 92: 164–172.Pérez-Díaz I. and R. McFeeters. 2009. Modification of azo dyes by lactic acid bacteria. J. Appl. Microbiol. 107: 584–589.Poul M., G. Jarry, M.O. Elhkim and J.-M. Poul. 2009. Lack of geno-toxic effect of food dyes amaranth, Sunset Yellow and tartrazine and their metabolites in the gut micronucleus assay in mice. Food Chem. Tox. 47: 443–448.Salleh F.M., A.M. Al-Mekhlafi, A. Nordin, A.M. Yasin, H.M. Al-Mekhlafi and N. Moktar. 2011. Evaluation of gram-chromotrope kinyoun staining technique: its effectiveness in detecting micro-sporidial spores in fecal specimens. Diagn. Microbiol. Infect. Dis. 69:82–85.Salleh F.M., T.S. Anuar, A.M.Yasin and N. Moktar. 2012. Winter-green oil: a novel method in Wheatley’s trichrome staining tech-nique. J. Microbiol. Meth. 91: 174–178.Sasaki Y.F., S. Kawaguchi, A. Kamaya, M. Ohshita, K. Kabasawa, K. Iwama, K. Taniguchi and S. Tsuda. 2002. The comet assay with 8 mouse organs: results with 39 currently used food additives. Muta-tion Research/Genetic Toxicology and Environmental Mutagenesis. 519: 103–119.Tucker J.B. 2003. Biosecurity: limiting terrorist access.Zimmermann R., R. Iturriaga and J. Becker-Birck. 1978. Simul-taneous determination of the total number of aquatic bacteria and the number thereof involved in respiration. Appl. Env. Microbiol. 36: 926–935.

Polish Journal of Microbiology2017, Vol. 66, No 1, 119–123
SHORT COMMUNICATION
* Corresponding author: M. Ciszewski, Department of Pharmaceutical Microbiology and Microbiological Diagnostics, Medical Uni-versity of Łódź, Łódź, Poland; e-mail: [email protected]
The attitude to antibacterial therapy needs to be fun-damentally changed. After the period of indisputable efficient outcomes of treatment (Aminov, 2010) and intensive search for new substances with a wide spec-trum activity and better pharmacological characteris-tics, a crisis in antibiotic therapy has emerged (Davies, 2014). This situation results from the underestimated plasticity of bacterial genomes and ability to accumulate features, which allow bacteria to endure environment which is hostile and rich in antibacterial substances. A vital example of this kind of environment is an organ-ism of a person treated with antibiotics (Ambur et al., 2009). Increasing frequency of multi-drug resistance hinders the ability to treat patients in life-threatening conditions. Unreasonable antibacterial therapy is sus-pected to be the main reason of the problem.
The most common causes of the community acqui-red respiratory infections in children over 3 years old and adults are viruses (respectively up to 85% and 95%): respiratory syncytial virus (RSV), influenza and parain-fluenza viruses, adenoviruses and even rhinoviruses (Korppi et al., 2004; Macfarlane et al., 2001). According to Jennings et al. (2008), bacterial pathogens isolated from adults were Streptococcus pneumoniae, Haemo-philus influenzae, Mycoplasma pneumoniae, Legionella pneumophila and Staphylococcus aureus.
Large national, European and worldwide programs have been started in order to improve the situation (WHO, 2014a; National Institute of Allergy and Infec-tious Diseases, 2014; National Medicines Institute, 2014; ECDC, 2014). In the presented study the rele-vance between the number of doses of different antibi-otic types prescribed for patients and autumn-winter season with the increased number of viral infections was examined.
Data on the number of systemic-use antibiotics pre-scribed between July 2009 and June 2014 was obtained from a leading twenty-four-hour pharmacy located in the city center of Szczecin, Poland, and was grouped according to the drug’s active substance. Due to its location and local conditions, for most of the analyzed period, the pharmacy, aside from its regular activ-ity, was the only one to serve patients at night and on public holidays. Data obtained from an internal phar-macy system have been converted into the consumed DDDs (defined daily doses) according to WHO guide-lines and ATC/DDD Index 2014 (WHO, 2014b) and divided according to a month of prescription. Months from October to March were classified as viral infec-tions “season”, which correlates with autumn/winter period in the Polish climate zone. Months from April to September were classified as “out of season”, which
Outpatient Antibiotic Consumption Fluctuations in a Viewof Unreasonable Antibacterial Therapy
MARCIN CISZEWSKI*, TOMASZ CZEKAJ and ELIGIA M. SZEWCZYK
Department of Pharmaceutical Microbiology and Microbiological Diagnostics,Medical University of Łódź, Łódź, Poland
Submitted 8 August 2016, accepted 12 January 2017
A b s t r a c t
Unreasonable antibacterial therapy is suspected to be the main reason of emergence of multi-resistant bacteria. The connection between seasonal variability of antibiotic use and reasonable antibacterial therapy has been described. We examined the issue basing on the data obtained from the primary care system in Szczecin (Poland) in order to verify the situation in this region of Central Europe. Increase in antibiotic consumption in a viral infection season was proved to be statistically significant. Statistically significant differences in various drug forms dispensation were also observed. Increased consumption of antibiotics in seasons of influenza-like illnesses might be connected with a lack of proper diagnostics or numerous cases of bacterial co-infections.
K e y w o r d s: antibacterial agents, drug resistance, drug usage fluctuations, outpatient infection treatment, unreasonable antibacterial therapy
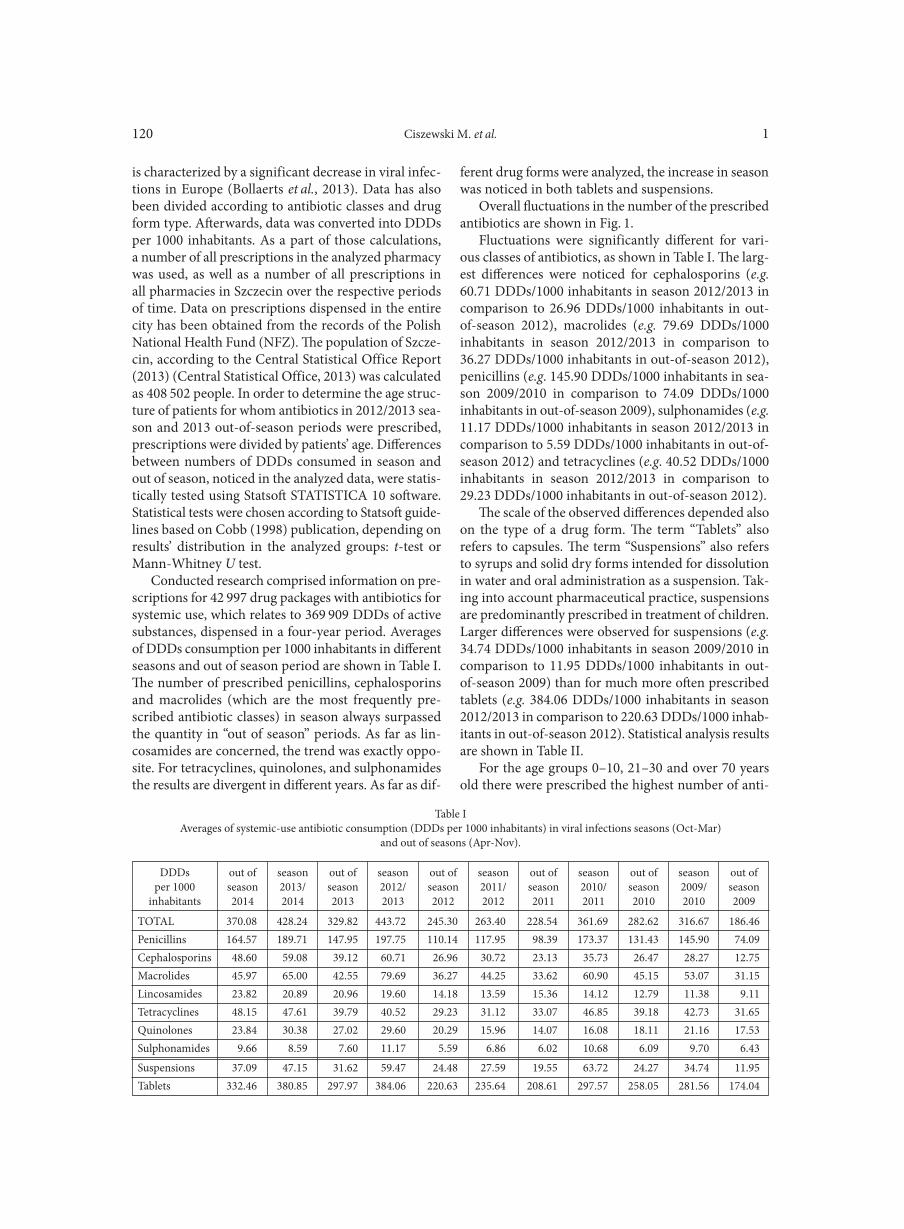
Ciszewski M. et al. 1120
is characterized by a significant decrease in viral infec-tions in Europe (Bollaerts et al., 2013). Data has also been divided according to antibiotic classes and drug form type. Afterwards, data was converted into DDDs per 1000 inhabitants. As a part of those calculations, a number of all prescriptions in the analyzed pharmacy was used, as well as a number of all prescriptions in all pharmacies in Szczecin over the respective periods of time. Data on prescriptions dispensed in the entire city has been obtained from the records of the Polish National Health Fund (NFZ). The population of Szcze-cin, according to the Central Statistical Office Report (2013) (Central Statistical Office, 2013) was calculated as 408 502 people. In order to determine the age struc-ture of patients for whom antibiotics in 2012/2013 sea-son and 2013 out-of-season periods were prescribed, prescriptions were divided by patients’ age. Differences between numbers of DDDs consumed in season and out of season, noticed in the analyzed data, were statis-tically tested using Statsoft STATISTICA 10 software. Statistical tests were chosen according to Statsoft guide-lines based on Cobb (1998) publication, depending on results’ distribution in the analyzed groups: t-test or Mann-Whitney U test.
Conducted research comprised information on pre-scriptions for 42 997 drug packages with antibiotics for systemic use, which relates to 369 909 DDDs of active substances, dispensed in a four-year period. Averages of DDDs consumption per 1000 inhabitants in different seasons and out of season period are shown in Table I. The number of prescribed penicillins, cephalosporins and macrolides (which are the most frequently pre-scribed antibiotic classes) in season always surpassed the quantity in “out of season” periods. As far as lin-cosamides are concerned, the trend was exactly oppo-site. For tetracyclines, quinolones, and sulphonamides the results are divergent in different years. As far as dif-
ferent drug forms were analyzed, the increase in season was noticed in both tablets and suspensions.
Overall fluctuations in the number of the prescribed antibiotics are shown in Fig. 1.
Fluctuations were significantly different for vari-ous classes of antibiotics, as shown in Table I. The larg-est differences were noticed for cephalosporins (e.g. 60.71 DDDs/1000 inhabitants in season 2012/2013 in comparison to 26.96 DDDs/1000 inhabitants in out-of-season 2012), macrolides (e.g. 79.69 DDDs/1000 inhabitants in season 2012/2013 in comparison to 36.27 DDDs/1000 inhabitants in out-of-season 2012), penicillins (e.g. 145.90 DDDs/1000 inhabitants in sea-son 2009/2010 in comparison to 74.09 DDDs/1000 inhabitants in out-of-season 2009), sulphonamides (e.g. 11.17 DDDs/1000 inhabitants in season 2012/2013 in comparison to 5.59 DDDs/1000 inhabitants in out-of-season 2012) and tetracyclines (e.g. 40.52 DDDs/1000 inhabitants in season 2012/2013 in comparison to 29.23 DDDs/1000 inhabitants in out-of-season 2012).
The scale of the observed differences depended also on the type of a drug form. The term “Tablets” also refers to capsules. The term “Suspensions” also refers to syrups and solid dry forms intended for dissolution in water and oral administration as a suspension. Tak-ing into account pharmaceutical practice, suspensions are predominantly prescribed in treatment of children. Larger differences were observed for suspensions (e.g. 34.74 DDDs/1000 inhabitants in season 2009/2010 in comparison to 11.95 DDDs/1000 inhabitants in out-of-season 2009) than for much more often prescribed tablets (e.g. 384.06 DDDs/1000 inhabitants in season 2012/2013 in comparison to 220.63 DDDs/1000 inhab-itants in out-of-season 2012). Statistical analysis results are shown in Table II.
For the age groups 0–10, 21–30 and over 70 years old there were prescribed the highest number of anti-
TOTAL 370.08 428.24 329.82 443.72 245.30 263.40 228.54 361.69 282.62 316.67 186.46Penicillins 164.57 189.71 147.95 197.75 110.14 117.95 98.39 173.37 131.43 145.90 74.09Cephalosporins 48.60 59.08 39.12 60.71 26.96 30.72 23.13 35.73 26.47 28.27 12.75Macrolides 45.97 65.00 42.55 79.69 36.27 44.25 33.62 60.90 45.15 53.07 31.15Lincosamides 23.82 20.89 20.96 19.60 14.18 13.59 15.36 14.12 12.79 11.38 9.11Tetracyclines 48.15 47.61 39.79 40.52 29.23 31.12 33.07 46.85 39.18 42.73 31.65Quinolones 23.84 30.38 27.02 29.60 20.29 15.96 14.07 16.08 18.11 21.16 17.53Sulphonamides 9.66 8.59 7.60 11.17 5.59 6.86 6.02 10.68 6.09 9.70 6.43
Suspensions 37.09 47.15 31.62 59.47 24.48 27.59 19.55 63.72 24.27 34.74 11.95Tablets 332.46 380.85 297.97 384.06 220.63 235.64 208.61 297.57 258.05 281.56 174.04
Table IAverages of systemic-use antibiotic consumption (DDDs per 1000 inhabitants) in viral infections seasons (Oct-Mar)
and out of seasons (Apr-Nov).
DDDsper 1000
inhabitants
out ofseason 2014
season2013/2014
out ofseason2013
season2012/2013
out ofseason2012
season2011/2012
out ofseason2011
season2010/2011
out ofseason2010
season2009/2010
out ofseason2009
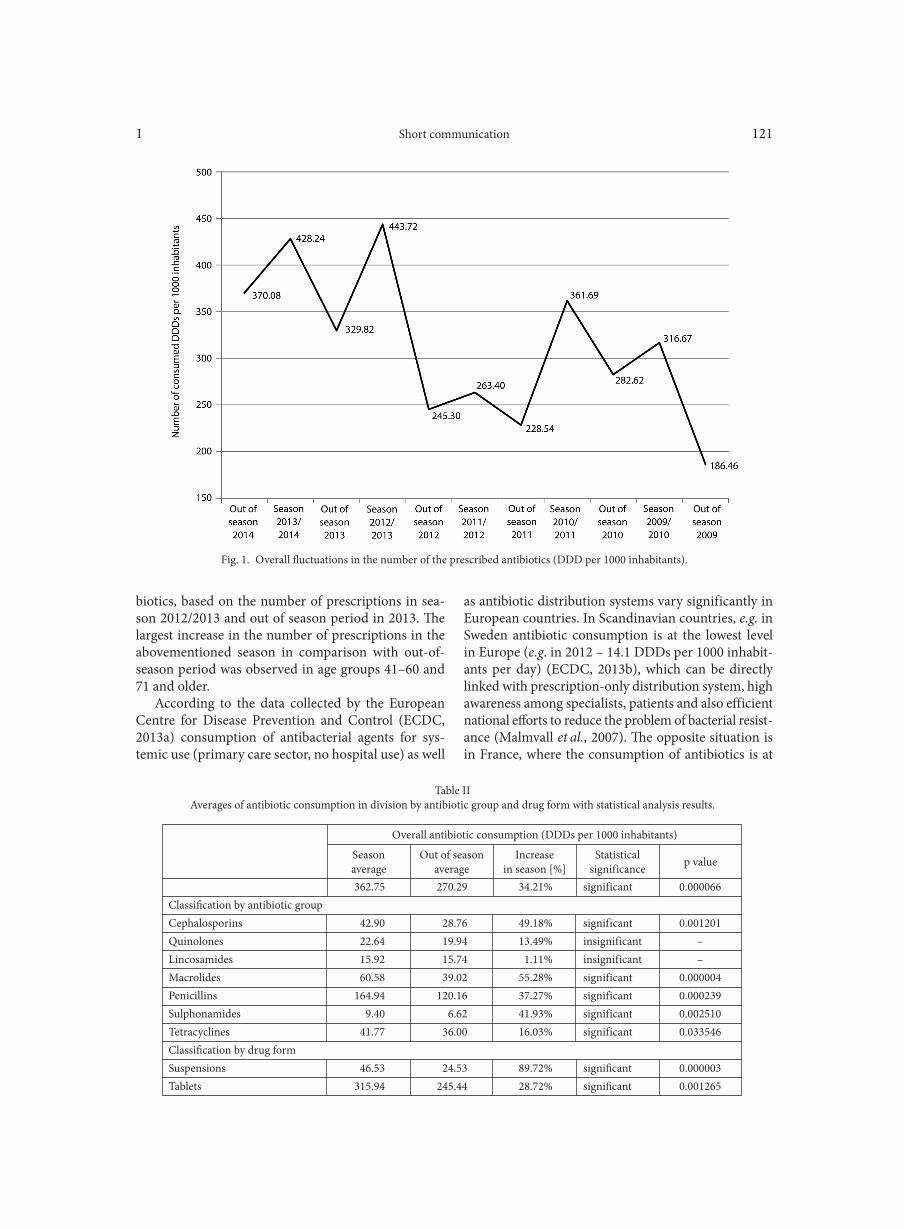
Short communication1 121
bio tics, based on the number of prescriptions in sea-son 2012/2013 and out of season period in 2013. The largest increase in the number of prescriptions in the abovemen tioned season in comparison with out-of-season period was observed in age groups 41–60 and 71 and older.
According to the data collected by the European Centre for Disease Prevention and Control (ECDC, 2013a) consumption of antibacterial agents for sys-temic use (primary care sector, no hospital use) as well
as antibiotic distribution systems vary significantly in European countries. In Scandinavian countries, e.g. in Sweden antibiotic consumption is at the lowest level in Europe (e.g. in 2012 – 14.1 DDDs per 1000 inhabit-ants per day) (ECDC, 2013b), which can be directly linked with prescription-only distribution system, high awareness among specialists, patients and also efficient national efforts to reduce the problem of bacterial resist-ance (Malmvall et al., 2007). The opposite situation is in France, where the consumption of antibiotics is at
362.75 270.29 34.21% significant 0.000066Classification by antibiotic groupCephalosporins 42.90 28.76 49.18% significant 0.001201Quinolones 22.64 19.94 13.49% insignificant –Lincosamides 15.92 15.74 1.11% insignificant –Macrolides 60.58 39.02 55.28% significant 0.000004Penicillins 164.94 120.16 37.27% significant 0.000239Sulphonamides 9.40 6.62 41.93% significant 0.002510Tetracyclines 41.77 36.00 16.03% significant 0.033546Classification by drug formSuspensions 46.53 24.53 89.72% significant 0.000003Tablets 315.94 245.44 28.72% significant 0.001265
Table IIAverages of antibiotic consumption in division by antibiotic group and drug form with statistical analysis results.
Overall antibiotic consumption (DDDs per 1000 inhabitants)
Seasonaverage
Out of seasonaverage
Increasein season [%]
Statisticalsignificance p value
Fig. 1. Overall fluctuations in the number of the prescribed antibiotics (DDD per 1000 inhabitants).
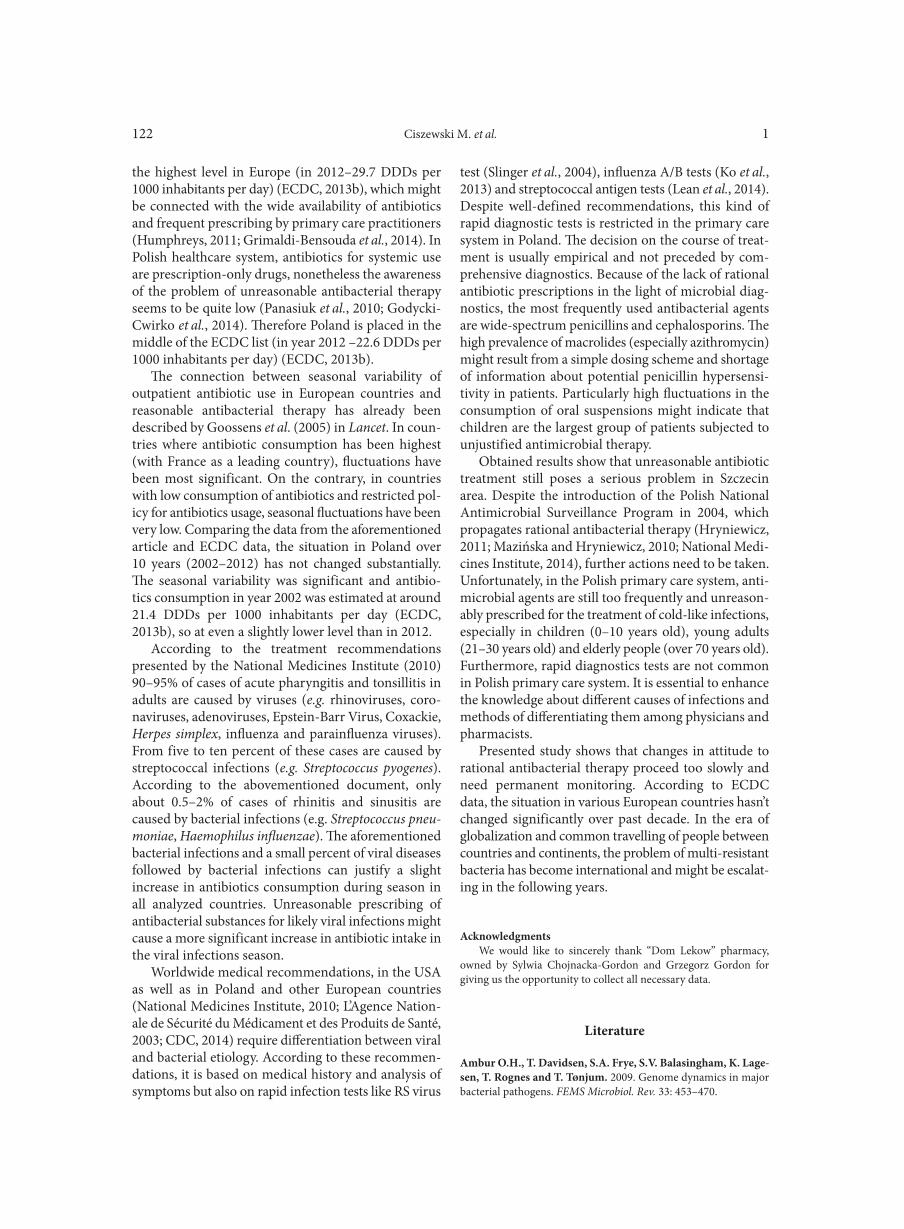
Ciszewski M. et al. 1122
the highest level in Europe (in 2012–29.7 DDDs per 1000 inhabitants per day) (ECDC, 2013b), which might be connected with the wide availability of antibiotics and frequent prescribing by primary care practitioners (Humphreys, 2011; Grimaldi-Bensouda et al., 2014). In Polish healthcare system, antibiotics for systemic use are prescription-only drugs, nonetheless the awareness of the problem of unreasonable antibacterial therapy seems to be quite low (Panasiuk et al., 2010; Godycki-Cwirko et al., 2014). Therefore Poland is placed in the middle of the ECDC list (in year 2012 –22.6 DDDs per 1000 inhabitants per day) (ECDC, 2013b).
The connection between seasonal variability of outpatient antibiotic use in European countries and reasonable antibacterial therapy has already been described by Goossens et al. (2005) in Lancet. In coun-tries where antibiotic consumption has been highest (with France as a leading country), fluctuations have been most significant. On the contrary, in countries with low consumption of antibiotics and restricted pol-icy for antibiotics usage, seasonal fluctuations have been very low. Comparing the data from the aforementioned article and ECDC data, the situation in Poland over 10 years (2002–2012) has not changed substantially. The seasonal variability was significant and antibio - tics consumption in year 2002 was estimated at around 21.4 DDDs per 1000 inhabitants per day (ECDC, 2013b), so at even a slightly lower level than in 2012.
According to the treatment recommendations presented by the National Medicines Institute (2010) 90–95% of cases of acute pharyngitis and tonsillitis in adults are caused by viruses (e.g. rhinoviruses, coro-naviruses, adenoviruses, Epstein-Barr Virus, Coxackie, Herpes simplex, influenza and parainfluenza viruses). From five to ten percent of these cases are caused by streptococcal infections (e.g. Streptococcus pyogenes). According to the abovementioned document, only about 0.5–2% of cases of rhinitis and sinusitis are caused by bacterial infections (e.g. Streptococcus pneu-moniae, Haemophilus influenzae). The aforementioned bacterial infections and a small percent of viral diseases followed by bacterial infections can justify a slight increase in antibiotics consumption during season in all analyzed countries. Unreasonable prescribing of antibacterial substances for likely viral infections might cause a more significant increase in antibiotic intake in the viral infections season.
Worldwide medical recommendations, in the USA as well as in Poland and other European countries (National Medicines Institute, 2010; L’Agence Nation-ale de Sécurité du Médicament et des Produits de Santé, 2003; CDC, 2014) require differentiation between viral and bacterial etiology. According to these recommen-dations, it is based on medical history and analysis of symptoms but also on rapid infection tests like RS virus
test (Slinger et al., 2004), influenza A/B tests (Ko et al., 2013) and streptococcal antigen tests (Lean et al., 2014). Despite well-defined recommendations, this kind of rapid diagnostic tests is restricted in the primary care system in Poland. The decision on the course of treat-ment is usually empirical and not preceded by com-prehensive diagnostics. Because of the lack of rational antibiotic prescriptions in the light of microbial diag-nostics, the most frequently used antibacterial agents are wide-spectrum penicillins and cephalosporins. The high prevalence of macrolides (especially azithromycin) might result from a simple dosing scheme and shortage of information about potential penicillin hypersensi-tivity in patients. Particularly high fluctuations in the consumption of oral suspensions might indicate that children are the largest group of patients subjected to unjustified antimicrobial therapy.
Obtained results show that unreasonable antibiotic treatment still poses a serious problem in Szczecin area. Despite the introduction of the Polish National Antimicrobial Surveillance Program in 2004, which propagates rational antibacterial therapy (Hryniewicz, 2011; Mazińska and Hryniewicz, 2010; National Medi-cines Institute, 2014), further actions need to be taken. Unfortunately, in the Polish primary care system, anti-microbial agents are still too frequently and unreason-ably prescribed for the treatment of cold-like infections, especially in children (0–10 years old), young adults (21–30 years old) and elderly people (over 70 years old). Furthermore, rapid diagnostics tests are not common in Polish primary care system. It is essential to enhance the knowledge about different causes of infections and methods of differentiating them among physicians and pharmacists.
Presented study shows that changes in attitude to rational antibacterial therapy proceed too slowly and need permanent monitoring. According to ECDC data, the situation in various European countries hasn’t changed significantly over past decade. In the era of globalization and common travelling of people between countries and continents, the problem of multi-resistant bacteria has become international and might be escalat-ing in the following years.
AcknowledgmentsWe would like to sincerely thank “Dom Lekow” pharmacy,
owned by Sylwia Chojnacka-Gordon and Grzegorz Gordon for giving us the opportunity to collect all necessary data.
Literature
Ambur O.H., T. Davidsen, S.A. Frye, S.V. Balasingham, K. Lage-sen, T. Rognes and T. Tønjum. 2009. Genome dynamics in major bacterial pathogens. FEMS Microbiol. Rev. 33: 453–470.
Short communication1 123
Aminov R.I. 2010. A brief history of the antibiotic era: lessons learned and challenges for the future. Front. Microbiol. 1: 134. Bollaerts K., J. Antoine, V. Van Casteren, G. Ducoffre, N. Hens and S. Quoilin. 2013. Contribution of respiratory pathogens to influenza-like illness consultations. Epidemiology and Infection 141: 2196–2204. Centers for Disease Control and Prevention (CDC). 2014. Get smart: know when antibiotics work. http://www.cdc.gov/getsmart/campaign-materials/adult-treatment.html, 2016.07.01.Central Statistical Office. 2013. Population in Poland. Size and structure by territorial division. As of June 30, 2013. Warsaw.Cobb G.W. 1998. Introduction to design and analysis of experiments. 1st ed. Springer-Verlag, New York.Davies J. 2014. Antibiotic resistance and the golden age of micro-biology. Upsala Journal of Medical Sciences 119: 65–67.European Centre for Disease Prevention and Control (ECDC). 2013a. Geographical distribution of antimicrobial consumption of antibacterials for systemic use (ATC Group J01) in the community (Primary Care Sector) in Europe, reporting year 2012. http://www.ecdc.europa.eu/en/healthtopics/antimicrobial_resistance/esac-net-database/Pages/geo-distribution-consumption.aspx, 2016.07.01.European Centre for Disease Prevention and Control (ECDC). 2013b. Consumption of antimicrobials of antibacterials for systemic use (ATC Group J01) in the community (Primary Care Sector) in Europe, reporting year 2012. http://www.ecdc.europa.eu/en/health-topics/antimicrobial_resistance/esac-net-database/Pages/Anti-microbial-consumption-rates-by-country.aspx, 2016.07.01European Centre for Disease Prevention and Control (ECDC). 2014. Antimicrobial Resistance and Healthcare-Associated Infec-tions Programme. http://www.ecdc.europa.eu/en/activities/disease-programmes/ARHAI/Pages/index.aspx, 2016.07.01Godycki-Cwirko M., J.W. Cals, N. Francis, T. Verheij, C.C. Butler, H. Goossens, I. Zakowska and L. Panasiuk. 2014. Public beliefs on antibiotics and symptoms of respiratory tract infections among rural and urban population in Poland: a questionnaire study. PloS One 9: e109248. Goossens H., M. Ferech, R.V. Stichele and M. Elseviers. 2005. Outpatient antibiotic use in Europe and association with resistance: a cross-national database study. Lancet 365: 579–587.Grimaldi-Bensouda L., B. Bégaud, M. Rossignol, B. Avouac, F. Lert, F. Rouillon, J. Bénichou, J. Massol, G. Duru, A.M. Magnier and others. 2014. Management of upper respiratory tract infections by different medical practices, including homeopathy, and consump-tion of antibiotics in Primary Care: The EPI3 cohort study in France 2007–2008. PloS One 9: e89990. Hryniewicz W. 2011. Antibiotic resistance – What We have to do now? (in Polish). Polski Merkuriusz Lekarski 30: 305–309.Humphreys G. 2011. Are antibiotics still ‘automatic’ in France? Bul-letin of the World Health Organization 89:8–9.Jennings L.C., T.P. Anderson, K.A. Beynon, A. Chua, R.T. Laing, A.M. Werno, S.A. Young, S.T. Chambers and D.R. Murdoch. 2008. Incidence and characteristics of viral community-acquired Pneumo-nia in adults. Thorax 63: 42–48.
Ko S., J.W. Jang, D.J. Song, C.S. Lim and W.J. Kim. 2013. Evalua-tion of the Simplexa Flu A / B and RSV test for the rapid detection of influenza viruses. J. Med. Vir. 85: 2160–2164.Korppi M., A. Kotaniemi-Syrjänen, M. Waris, R. Vainionpää and T.M. Reijonen. 2004. Rhinovirus-associated wheezing in infancy: comparison with respiratory syncytial virus bronchiolitis. The Pedia-tric Infectious Disease Journal 23: 995–999.L’Agence nationale de sécurité du médicament et des produits de santé. 2003. Systemic antibiotic treatment in upper and lower respi-ratory tract infections: Official French Guidelines. Clin. Microbiol. Infect. 9: 1162–78.Lean W.L., S. Arnup, M. Danchin and A.C. Steer. 2014. Rapid diag-nostic tests for Group A streptococcal pharyngitis: a meta-analysis. Pediatrics 134: 771–781.Macfarlane J., W. Holmes, P. Gard, R. Macfarlane, D. Rose, V. Weston, M. Leinonen, P. Saikku and S. Myint. 2001. Prospective study of the incidence, aetiology and outcome of adult lower respira-tory tract illness in the community. Thorax 56: 109–114. Malmvall B.E., S. Mölstad, J. Darelid, A. Hiselius, L. Larsson, J. Swanberg and P.E. Abom. 2007. Reduction of antibiotics sales and sustained low incidence of bacterial resistance: report on a broad approach during 10 years to implement evidence-based indications for antibiotic prescribing in Jönköping County, Sweden. Quality Management in Health Care 16: 60–67. Mazińska B. and W. Hryniewicz. 2010. European Antibiotic Aware-ness Day Educational Campaign – Has it changed public attitudes to antibiotic use in Poland? (in Polish) Polski Merkuriusz Lekarski 29: 296–303.National Institute of Allergy and Infectious Diseases. 2014. NIAID’S Antibacterial Resistance Program: current status and future directions. http://www.niaid.nih.gov/topics/antimicrobialresistance/documents/arstrategicplan2014.pdf, 2016.07.01.National Medicines Institute. 2010. Guidance for clinicians on the management of out-of-hospital respiratory tract infections (in Pol-ish). http://www.antybiotyki.edu.pl/pdf/RekomendacjeA42009.pdf, 2016.07.01.National Medicines Institute. 2014. Polish National Antimicrobial Surveillance Program (in Polish). http://www.antybiotyki.edu.pl, 2016.07.01.Panasiuk L., W. Lukas, P. Paprzycki, T. Verheij, M. Godycki-Ćwirko and S. Chlabicz. 2010. Antibiotics in the treatment of upper respiratory tract infections in Poland. Is there any improvement? Journal of Clinical Pharmacy and Therapeutics 35: 665–669.Slinger R., R. Milk, I. Gaboury and F. Diaz-Mitoma. 2004. Evalu-ation of the QuickLab RSV Test, a new rapid lateral-flow immuno-assay for detection of respiratory syncytial virus antigen. J. Clin. Microbiol. 42: 3731–3733.World Health Organisation (WHO). 2014a. Antimicrobial resis-tance: global report on surveillance 2014. http://www.who.int/drug-resistance/documents/surveillancereport/en/, 2016.07.01.World Health Organisation (WHO). 2014b. ATC/DDD Index 2014. http://www.whocc.no/atc_ddd_index/, 2016.07.01.

Polish Journal of Microbiology2017, Vol. 66, No 1, 125–129
SHORT COMMUNICATION
* Corresponding author: I. Sitkiewicz, Department of Molecular Microbiology, National Institute of Medicines, Warszawa, Poland; e-mail: [email protected]
Application of synthetic vascular implants has con-siderably improved treatment results in vascular surgery. However, implanting artificial bypasses might bring about complications of which graft infection seems to pose a major threat. The incidence of the infection is 7% (Herrera et al., 2009) and it is correlated with a high mortality rate (up to 75% in the aortic segment) and an extremely high risk (up to 70%) of a complete or partial loss of the limb. In most cases, the vascular implant gets contaminated by microorganisms during an operation. A surgeon makes the patient’s vessels accessible by incis-ing or puncturing the inguinal region. Being naturally colonized by numerous microorganisms, this region is considered one of the major risk factors for infection of vascular implant (Antonios et al., 2006).
Staphylococcus aureus strains and coagulase nega-tive Staphylococcus spp. are responsible for 70–90% infections of vascular bypasses (Bozoglan et al., 2016). They produce glycocalyx, which on the one hand, facil-itates their adhesion to the surface of the prosthesis, and on the other hand, it is a component of biofilm which serves as protection against phagocytes, anti-bodies and antibiotics (Bandyk et al., 1991). Of gram-
negative bacteria, Pseudomonas aeruginosa is the most common etiological factor contributing to vascular implant infections. It causes about 10% of such infec-tions. Infections caused by P. aeruginosa often result in the occurrence of false aneurysms and dissection of the vascular wall in the infection site. Esterase and alkaline protease, produced by P. aeruginosa, are responsible for these processes (Chiesa et al., 2002).
Gram-positive cocci, including Enterococcus faeca-lis, have recently become highly contributive factors in infections of vascular implants. Several years ago, these bacteria were considered relatively harmless and were characterized as possessing slight virulence traits. Despite being commonly found in human envi-ronment, they contributed only to a small percentage of infections. A characteristic feature of Enterococci is their natural resistance to cefalosporins, thus introduc-tion of cefalosporins to perioperative prophylaxis on a great scale led to a great dominance of Enterococci in intestinal flora. This, in turn, resulted in an increase in the number of dangerous infections induced by these bacteria in hospitalized patients. Pathogenicity of Enterococci is associated with production of proteins
Susceptibility of Vascular Implants to Colonization in vitro byStaphylococcus aureus, Staphylococcus epidermidis, Enterococcus faecalis
and Pseudomonas aeruginosa
WITOLD WOŹNIAK1, ALEKSANDRA KOZIŃSKA2, PIOTR CIOSTEK1 and IZABELA SITKIEWICZ3*
1 Department of General and Vascular Surgery, Second Faculty of Medicine with the English Divisionand the Physiotherapy Division, Medical University of Warsaw, Warszawa, Poland
2 Department of Epidemiology and Clinical Microbiology, National Institute of Medicines, Warszawa, Poland3 Department of Molecular Microbiology, National Institute of Medicines, Warszawa, Poland
Submitted 13 January 2017, revised 31 January 2017, accepted 2 February 2017
A b s t r a c t
We compared association of Staphylococcus aureus, Staphylococcus epidermidis, Pseudomonas aeruginosa and Enterococcus faecalis with nine vascular implants after co-culture. Vascular implants were composed of various materials such as warp knitted polyester (with or without gelatin and silver ions), expanded polytetrafluoroethylene and biological materials – surface treated porcine pericardial patch and Omniflow II. The lowest overall number of associated bacteria was detected for polytetrafluoroethylene implants and porcine pericardial patch. The highest overall number of associated bacteria was detected for Omniflow II implant. The major source of variation, i.e. primary factor influencing colonization, is the implant type (56.22%), bacterial species is responsible for only 1.81%, and interaction of those two factors – 13.09% of variation.
K e y w o r d s: biofilm, graft infection, Omniflow II, porcine pericardial patch, vascular implant
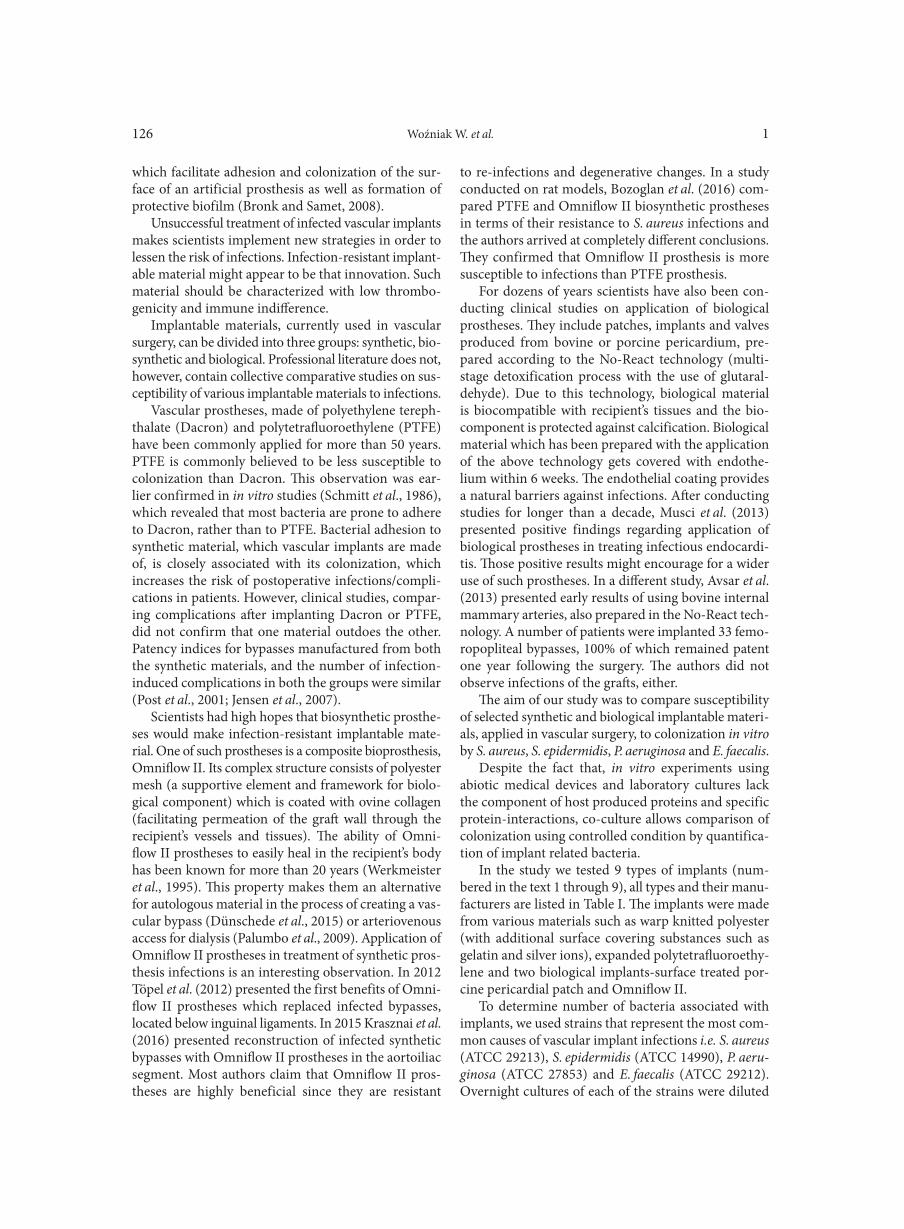
Woźniak W. et al. 1126
which facilitate adhesion and colonization of the sur-face of an artificial prosthesis as well as formation of protective biofilm (Bronk and Samet, 2008).
Unsuccessful treatment of infected vascular implants makes scientists implement new strategies in order to lessen the risk of infections. Infection-resistant implant-able material might appear to be that innovation. Such material should be characterized with low thrombo-genicity and immune indifference.
Implantable materials, currently used in vascular surgery, can be divided into three groups: synthetic, bio-synthetic and biological. Professional literature does not, however, contain collective comparative studies on sus-ceptibility of various implantable materials to infections.
Vascular prostheses, made of polyethylene tereph-thalate (Dacron) and polytetrafluoroethylene (PTFE) have been commonly applied for more than 50 years. PTFE is commonly believed to be less susceptible to colonization than Dacron. This observation was ear-lier confirmed in in vitro studies (Schmitt et al., 1986), which revealed that most bacteria are prone to adhere to Dacron, rather than to PTFE. Bacterial adhesion to synthetic material, which vascular implants are made of, is closely associated with its colonization, which increases the risk of postoperative infections/compli-cations in patients. However, clinical studies, compar-ing complications after implanting Dacron or PTFE, did not confirm that one material outdoes the other. Patency indices for bypasses manufactured from both the synthetic materials, and the number of infection-induced complications in both the groups were similar (Post et al., 2001; Jensen et al., 2007).
Scientists had high hopes that biosynthetic prosthe-ses would make infection-resistant implantable mate-rial. One of such prostheses is a composite bioprosthesis, Omniflow II. Its complex structure consists of polyester mesh (a supportive element and framework for biolo-
gical component) which is coated with ovine collagen (facilitating permeation of the graft wall through the recipient’s vessels and tissues). The ability of Omni-flow II prostheses to easily heal in the recipient’s body has been known for more than 20 years (Werkmeister et al., 1995). This property makes them an alternative for autologous material in the process of creating a vas-cular bypass (Dünschede et al., 2015) or arteriovenous access for dialysis (Palumbo et al., 2009). Application of Omniflow II prostheses in treatment of synthetic pros-thesis infections is an interesting observation. In 2012 Töpel et al. (2012) presented the first benefits of Omni-flow II prostheses which replaced infected bypasses, located below inguinal ligaments. In 2015 Krasznai et al. (2016) presented reconstruction of infected synthe tic bypasses with Omniflow II prostheses in the aortoiliac segment. Most authors claim that Omniflow II pros-theses are highly beneficial since they are resistant
to re-infections and degenerative changes. In a study conducted on rat models, Bozoglan et al. (2016) com-pared PTFE and Omniflow II biosynthetic prostheses in terms of their resistance to S. aureus infections and the authors arrived at completely different conclusions. They confirmed that Omniflow II prosthesis is more susceptible to infections than PTFE prosthesis.
For dozens of years scientists have also been con-ducting clinical studies on application of biological prostheses. They include patches, implants and valves produced from bovine or porcine pericardium, pre-pared according to the No-React technology (multi-stage detoxification process with the use of glutaral-dehyde). Due to this technology, biological material is biocompatible with recipient’s tissues and the bio-component is protected against calcification. Biological material which has been prepared with the application of the above technology gets covered with endothe-lium within 6 weeks. The endothelial coating provides a natural barriers against infections. After conducting studies for longer than a decade, Musci et al. (2013) presented positive findings regarding application of biological prostheses in treating infectious endocardi-tis. Those positive results might encourage for a wider use of such prostheses. In a different study, Avsar et al. (2013) presented early results of using bovine internal mammary arteries, also prepared in the No-React tech-nology. A number of patients were implanted 33 femo-ropopliteal bypasses, 100% of which remained patent one year following the surgery. The authors did not observe infections of the grafts, either.
The aim of our study was to compare susceptibility of selected synthetic and biological implantable materi-als, applied in vascular surgery, to colonization in vitro by S. aureus, S. epidermidis, P. aeruginosa and E. faecalis.
Despite the fact that, in vitro experiments using abiotic medical devices and laboratory cultures lack the component of host produced proteins and specific protein-interactions, co-culture allows comparison of colonization using controlled condition by quantifica-tion of implant related bacteria.
In the study we tested 9 types of implants (num-bered in the text 1 through 9), all types and their manu-facturers are listed in Table I. The implants were made from various materials such as warp knitted polyester (with additional surface covering substances such as gelatin and silver ions), expanded polytetrafluoroethy-lene and two biological implants-surface treated por-cine pericardial patch and Omniflow II.
To determine number of bacteria associated with implants, we used strains that represent the most com-mon causes of vascular implant infections i.e. S. aureus (ATCC 29213), S. epidermidis (ATCC 14990), P. aeru-ginosa (ATCC 27853) and E. faecalis (ATCC 29212). Overnight cultures of each of the strains were diluted
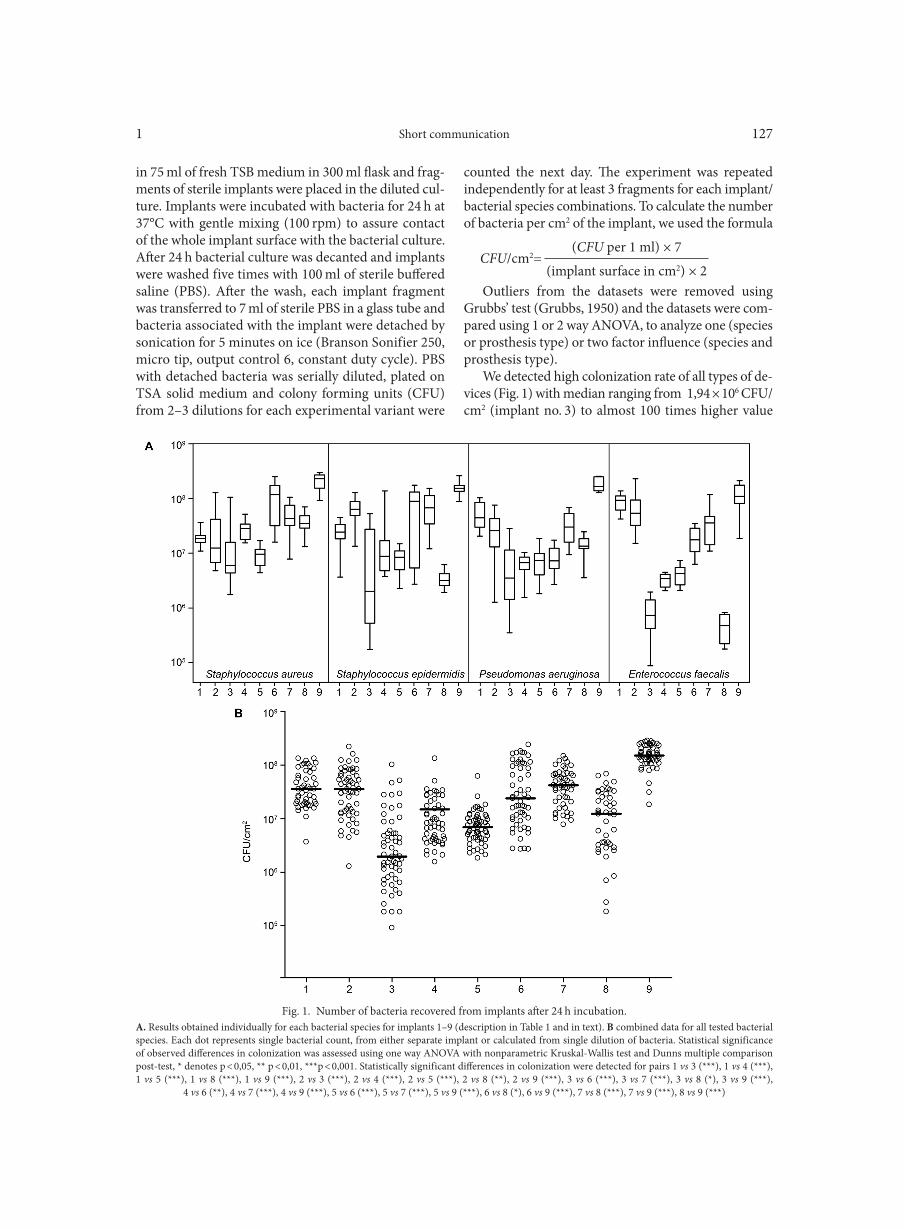
Short communication1 127
in 75 ml of fresh TSB medium in 300 ml flask and frag-ments of sterile implants were placed in the diluted cul-ture. Implants were incubated with bacteria for 24 h at 37°C with gentle mixing (100 rpm) to assure contact of the whole implant surface with the bacterial culture. After 24 h bacterial culture was decanted and implants were washed five times with 100 ml of sterile buffered saline (PBS). After the wash, each implant fragment was transferred to 7 ml of sterile PBS in a glass tube and bacteria associated with the implant were detached by sonication for 5 minutes on ice (Branson Sonifier 250, micro tip, output control 6, constant duty cycle). PBS with detached bacteria was serially diluted, plated on TSA solid medium and colony forming units (CFU) from 2–3 dilutions for each experimental variant were
counted the next day. The experiment was repeated independently for at least 3 fragments for each implant/bacterial species combinations. To calculate the number of bacteria per cm2 of the implant, we used the formula
Outliers from the datasets were removed using Grubbs’ test (Grubbs, 1950) and the datasets were com-pared using 1 or 2 way ANOVA, to analyze one (species or prosthesis type) or two factor influence (species and prosthesis type).
We detected high colonization rate of all types of de- vices (Fig. 1) with median ranging from 1,94 × 10⁶ CFU/cm2 (implant no. 3) to almost 100 times higher value
(CFU per 1 ml) × 7CFU/cm2=
(implant surface in cm2) × 2
Fig. 1. Number of bacteria recovered from implants after 24 h incubation. A. Results obtained individually for each bacterial species for implants 1–9 (description in Table 1 and in text). B combined data for all tested bacterial species. Each dot represents single bacterial count, from either separate implant or calculated from single dilution of bacteria. Statistical significance of observed differences in colonization was assessed using one way ANOVA with nonparametric Kruskal-Wallis test and Dunns multiple comparison post-test, * denotes p < 0,05, ** p < 0,01, ***p < 0,001. Statistically significant differences in colonization were detected for pairs 1 vs 3 (***), 1 vs 4 (***), 1 vs 5 (***), 1 vs 8 (***), 1 vs 9 (***), 2 vs 3 (***), 2 vs 4 (***), 2 vs 5 (***), 2 vs 8 (**), 2 vs 9 (***), 3 vs 6 (***), 3 vs 7 (***), 3 vs 8 (*), 3 vs 9 (***),
4 vs 6 (**), 4 vs 7 (***), 4 vs 9 (***), 5 vs 6 (***), 5 vs 7 (***), 5 vs 9 (***), 6 vs 8 (*), 6 vs 9 (***), 7 vs 8 (***), 7 vs 9 (***), 8 vs 9 (***)
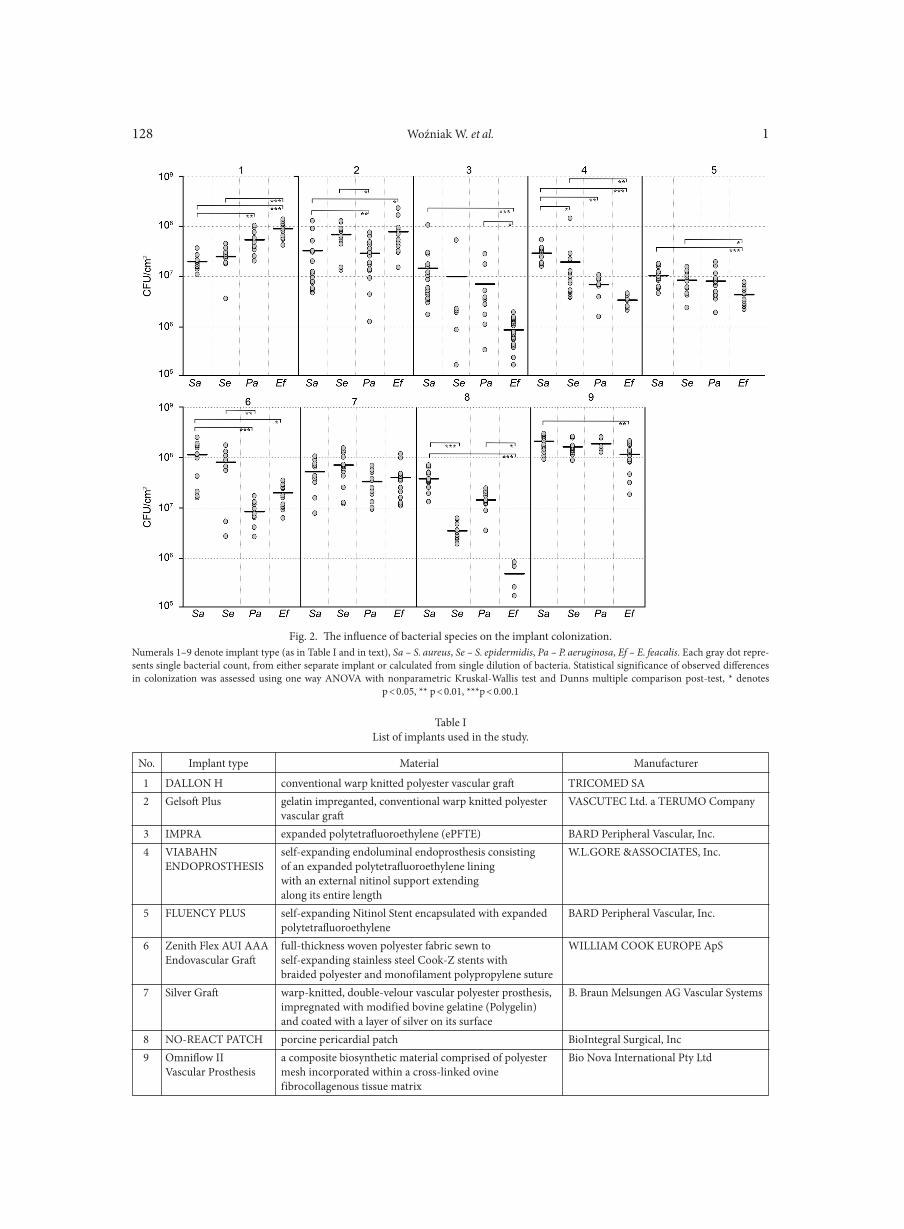
Woźniak W. et al. 1128
1 DALLON H conventional warp knitted polyester vascular graft TRICOMED SA2 Gelsoft Plus gelatin impreganted, conventional warp knitted polyester VASCUTEC Ltd. a TERUMO Company vascular graft3 IMPRA expanded polytetrafluoroethylene (ePFTE) BARD Peripheral Vascular, Inc.4 VIABAHN self-expanding endoluminal endoprosthesis consisting W.L.GORE &ASSOCIATES, Inc. ENDOPROSTHESIS of an expanded polytetrafluoroethylene lining with an external nitinol support extending along its entire length5 FLUENCY PLUS self-expanding Nitinol Stent encapsulated with expanded BARD Peripheral Vascular, Inc. polytetrafluoroethylene6 Zenith Flex AUI AAA full-thickness woven polyester fabric sewn to WILLIAM COOK EUROPE ApS Endovascular Graft self-expanding stainless steel Cook-Z stents with braided polyester and monofilament polypropylene suture7 Silver Graft warp-knitted, double-velour vascular polyester prosthesis, B. Braun Melsungen AG Vascular Systems impregnated with modified bovine gelatine (Polygelin) and coated with a layer of silver on its surface8 NO-REACT PATCH porcine pericardial patch BioIntegral Surgical, Inc9 Omniflow II a composite biosynthetic material comprised of polyester Bio Nova International Pty Ltd Vascular Prosthesis mesh incorporated within a cross-linked ovine fibrocollagenous tissue matrix
Table IList of implants used in the study.
No. Implant type Material Manufacturer
Fig. 2. The influence of bacterial species on the implant colonization.Numerals 1–9 denote implant type (as in Table I and in text), Sa – S. aureus, Se – S. epidermidis, Pa – P. aeruginosa, Ef – E. feacalis. Each gray dot repre-sents single bacterial count, from either separate implant or calculated from single dilution of bacteria. Statistical significance of observed differences in colonization was assessed using one way ANOVA with nonparametric Kruskal-Wallis test and Dunns multiple comparison post-test, * denotes
p < 0.05, ** p < 0.01, ***p < 0.00.1
Short communication1 129
1,56 × 10⁸ CFU/cm2 for Omniflow II, based on com-bined data recorded for all tested species (p < 0.0001). The lowest overall colonization was detected for implants no. 3 (Impra), 5 (Fluency) and 8 (porcine patch), regardless of the species (Fig. 1A and B). It confirms claims of porcine patch manufacturer that No-React® proprietary treatment with glutaraldehyde significantly lowers infection rate after implantation. Low colonization rate for both PFTE implants is also not surprising as lower attachment to hydrophobic sur-face can be expected.
The highest overall colonization rate was observed for Omniflow II (9) implant (Fig. 1), as shown by Bozo-glan et al. (2016).
Increased susceptibility of Dacron to colonization in vitro was usually caused by its greater porosity than that of PTFP. Smoothing the Dacron surface with gela-tin makes it less susceptible to infections in a mouse model (Yasim et al., 2006). For polyester implants, we did not observe the influence of the treatment with gelatin or gelatin and silver ions on the number of implant associated bacteria (1 vs 2, and 1 vs 7, Fig. 1B).
Two way ANOVA analysis of the whole dataset revealed that the major source of variation, i.e. pri-mary factor influencing colonization, is the implant type (56,22% of total variation, p < 0.0001) and bacterial species is responsible for only 1,81% of total variation (p < 0.0001). Interaction of those two factors is a source of 13,09% of variation (p < 0.0001).
In a conclusion, a factor that the most influences colonization is the type and the material of the implant. We show that PFTE (No. 3) is colonized to much less extent than Omniflow II. The number of bacteria of different species associated with various implants varies. For example in our experiment, the best colo-nizer is S. aureus. Aseptics and a perioperative anti- biotic therapy still remain the most common methods of combating infections of vascular prostheses (Giaco-metti et al., 2000).
Literature
Antonios V.S., A.A. Noel, J.M. Steckelberg, R.M. Wilson, J.N. Mandrekar, W.S. Harmsen and L.M. Baddour. 2006. Pro- sthe tic vascular graft infection: a risk factor analysis using a case-control study. J. Infect. 53: 49–55. Avşar M.K., H.H. Poyrazoglu, S. Demir and H. Atli. 2013. Early results of peripheral arterial performed using shelhigh no-react treated internal mammary arteries. Ital. J. Vasc. Endovasc. Surg. 20: 221–223.Bandyk D.F., T.M. Bergamini, E.V. Kinney, G.R. Seabrook and J.B. Towne. 1991. In situ replacement of vascular protheses infected by bacterial biofilms. J. Vasc. Surg. 13: 575–583.
Bozoglan O., B. Mese, E. Eroglu, S. Elveren, M. Gul, A. Celik, H.I. Yildirimdemir, H. Ciralik and A. Yasim. 2016. Which pros-thesis is more resistant to vascular graft infection: polytetrafluoro-ethylene or Omniflow II biosynthetic grafts? Surg. Today. 46: 363–370. Bronk M. and A. Samet. 2008. Hospital enterococcal bacteremias. Post. Mikrobiol. 47: 339–344.Chiesa R., D. Astore, S. Frigerio, L. Garriboli, G. Piccolo, R. Cas-tellano, M. Scalamogna, A. Odero, S. Pirrelli, G. Biasi and others. 2002. Vascular prosthetic graft infection: epidemiology, bacterio-logy, pathogenesis and treatment. Acta Chir. Belg. 102: 238–247.Dünschede F., J. Stabrauskaite, G. Weisser, C. Espinola-Klein, B. Dorweiler and C.F. Vahl. 2015. Crural bypass for critical lower limb ischemia with Omniflow II prosthesis. Thorac. Cardiovasc. Surg. 64: 311–315.Giacometti A., O. Cirioni, R. Ghiselli, L. Goffi, F. Mocchegiani, A. Riva, G. Scalise and V. Saba. 2000. Efficacy of polycationic pep-tides in preventing vascular graft infection due to Staphylococcus epidermidis. J. Antimicrob. Chemother. 46:751–756.Grubbs F.E. 1950. Sample criteria for testing outlying observations. Ann. Math. Stat. 21(1): 27–58.Herrera F.A., S. Kohanzadeh, Y. Nasseri, N. Kansal, E.L. Owens and R. Bodor. 2009. Management of vascular graft infections with soft tissue flap coverage: improving limb salvage rates – a veterans affairs experience. Am. Surg. 75: 877–881.Jensen L.P., M. Lepäntalo, J.E. Fossdal, O.C. Røder, B.S. Jensen, M.S. Madsen, O. Grenager, H. Fasting, H.O. Myhre, N. Baekgaard and others. 2007. Dacron or PTFE for above-knee femoropopliteal bypass. a multicenter randomised study. Eur. J. Vasc. Endovasc. Surg. 34: 44–49.Krasznai A.G., M. Snoeijs, M.P. Siroen, T. Sigterman, A. Kor-sten, F.L. Moll and L.H. Bouwman. 2016. Treatment of aortic graft infection by in situ reconstruction with Omniflow II biosynthetic prosthesis. Vascular. 24: 561–566.Musci M., A. Amiri, H. Siniawski, J. Stein, Y. Weng and R. Hetzer. 2013. Further experience with the “no-react” bioprosthesis in patients with active infective endocarditis: 11-year single center results in 402 patients. Thorac Cardiovasc. Surg. 61: 398–408.Palumbo R., P. Niscola, S. Calabria, S. Fierimonte, M. Bevilacqua, L. Scaramucci, B. Tolu, P. de Fabritiis and F. Bondanini. 2009. Long-term favorable results by arteriovenous graft with Omniflow II prosthesis for hemodialysis. Nephron. Clin. Pract. 1132: 76–80.Post S., T. Kraus, U. Müller-Reinartz, C. Weiss, H. Kortmann, A. Quentmeier, M. Winkler, K.J. Husfeldt and J.R. Allenberg. 2001. Dacron vs polytetrafluoroethylene grafts for femoropopliteal bypass: a prospective randomised multicentre trial. Eur. J. Vasc. Endovasc. Surg. 22: 226–231.Schmitt D.D., D.F. Bandyk, A.J.P equet and J.B. Towne. 1986. Bacterial adherence to vascular prostheses. A determinant of graft infectivity. J. Vasc. Surg. 3: 732–740.Töpel I., T. Betz, C. Uhl, M. Wiesner, S. Bröckner and M. Stein-bauer. 2012. Use of biosynthetic prosthesis (Omniflow II) to replace infected infrainguinal prosthetic grafts – first results. Vasa. 413: 215–220. Werkmeister J.A., J.F. White, G.A. Edwards and J.A. Ramshaw. 1995. Early performance appraisal of the Omniflow II Vascular Pros-thesis as an indicator of long-term function. J. Long Term. Eff. Med. Implants. 5: 1–10.Yasim A., M. Gul, H. Ciralik and Y. Ergun. 2006. Gelatin-sealed dacron graft is not more susceptible to MRSA infection than PTFE graft. Eur. J. Vasc. Endovasc. Surg. 32: 425–430.

Polish Journal of Microbiology2017, Vol. 66, No 1, 131–134
SHORT COMMUNICATION
* Corresponding author: E. Zaczyńska, Institute of Immunology and Experimental Therapy, Polish Academy of Sciences, Department of Experimental Therapy, Wrocław, Poland; e-mail: [email protected]
Senescence is associated with gradual impairment of physiological processes, although the functions of the immune cell types may not be uniformly suppressed (Kogut et al., 2012; Sansoni et al., 2008; Scholz et al., 2013). The immune ageing is correlated with preferen-tial diminution of the T-cell compartment, increased ratio of the memory cell phenotype and lower CD28 expression (Simioni et al., 2007). Although B cells from aged mice show decreased antigen-induced expansion, the ability of aged B cells to respond appropriately to T-dependent antigens and differentiate into antibody-secreting cells seems to be intact (Dailey et al., 2001). In aged humans, the antigen-presenting function of peripheral blood cells in response to staphylococcal enterotoxin is poor in comparison to young individu-als (Castle et al., 1999). The susceptibility to viral infec-tions in old animals has been a subject of consideration. Twenty two to twenty four month old mice, infected with respiratory syncytial virus, demonstrated dimin-ished virus specific CD8+ cytolytic response and IFN γ production (Zhang et al., 2002). In elderly human donors, the majority of the clonally expanded, virus-specific CD8+ cells, was dysfunctional (Ouyang et al., 2003). However, the frequency of viral antigen-spe-cific CD8+ T cells was high in the majority of subjects
older than 85 years and serologically positive for the viral epitopes (Scholz et al., 2013). These data indicate importance of a chronic antigenic stimulation, induced by persistent viral infections during a lifetime that may result in enhanced resistance to viral infections.
Lactoferrin is a multifunctional protein, present in excretory fluids and circulating neutrophils, involved in iron metabolism (Zimecki and Kruzel, 2007). The protein interferes with viral infection by means of sev-eral mechanisms, such as inhibition of virus replication and direct interaction with viruses (Välimaa et al., 2009; Picard-Jean et al., 2014) or blocking cell receptors for viruses (Pietroantoni et al., 2015; Zheng et al., 2012). The aim of this study was to compare the suscepti- bility of splenocytes from young versus aged organisms to viral infection and to investigate antiviral actions of a homologous, recombinant mouse and native bovine lactoferrin.
Three and 13 months old CBA mice, provide by the institute of Laboratory Medicine, Łódź, Poland, were used for the study. The local ethics committee approved the study. Low endotoxin (< 1.0 EU/mg) recombinant mouse lactoferrin (rmLF) produced by Chinese hamster ovary cells was obtained from PharmaReview Corpora-tion, Houston, USA, and bovine milk-derived lactoferrin
Antiviral Resistance of Splenocytes in Aged Mice
EWA ZACZYŃSKA1*, JOLANTA ARTYM1, MAJA KOCIĘBA1, TIMO BURSTER2, MARIAN KRUZEL3,MARIA PAPROCKA1 and MICHAŁ ZIMECKI1
1 Institute of Immunology and Experimental Therapy, Polish Academy of Sciences,Department of Experimental Therapy, Wrocław, Poland
2 Department of Neurosurgery, Ulm University Medical Centre, Ulm, Germany3 University of Texas, Houston Medical School, Houston, TX, USA
Submitted 3 December 2015, revised 21 March 2016, accepted 4 January 2017
A b s t r a c t
We compared the susceptibility to viral infection of splenocytes, isolated from young versus old CBA mice, and evaluated the antiviral actions of lactoferrin in splenocytes infected with Encephalomyocarditis virus (EMCV). Recombinant mouse lactoferrin (rmLF) and bovine lactoferrin (bLF) were used. There were no differences in the susceptibility to EMCV infection in the studied age categories. Both types of lactoferrins were protective in young and old mice. The study confirmed the undisturbed viral resistance in old mice and the protective actions of lactoferrin in viral infection. The antiviral action of the homologous mouse lactoferrin was demonstrated for the first time.
K e y w o r d s: immune ageing, lactoferrin, mice, splenocytes, viral resistance
Zaczyńska E. et al. 1132
(bLF) was generously provided by Morinaga Co., Japan. The culture media were purchased from Cytogen and fetal calf serum (FCS) from Gibco. L-glutamine, sodium pyruvate, 2-mercaptoethanol and antibiotics were from Sigma. Encephalomyocarditis virus (EMCV) was obtained from The Laboratory of Virology, Institute of Immunology and Experimental Therapy, Wrocław, Poland. L929 cells (ATCC CCL 1) was purchased from ATCC. We followed the procedures of preparation of splenocyte suspension and fractionation of splenocytes on glass wool columns which were described elsewhere (Russo et al., 1979). Such a procedure allowed to remove from the splenocyte suspension strongly adherent cells (macro phages), erythrocytes, debris and dead cells, as well as a part of T cell population, resulting in a B-cell enriched population. The determination of the cell phe-notype of this fraction indicated (FACS measurement, not shown) that it was about 65–72% CD19 positive (a pan B cell marker). One of the reasons, we have cho-
sen such a model, was because the activity of B cell compartment is well preserved in aged mice.
For the infection of cells we used EMCV, which was propagated and titrated in L929 cells. The titer of the virus was expressed in reference to the value of TCID50 (tissue culture infectious dose), based on the cytopathic effect caused by the virus in 50% of infected cells. In the present study we applied two approaches to evaluate the protective effects of lactoferrins. In the first model, the cells were infected with the virus, followed by the addition of lactoferrins (50 μg/ml). The viral replication was determined after 24 h and 5 days of cell culture. In the second model, the cells (2 × 10⁶/ml), re-suspended in the culture medium consisting of RPMI-1640 medium, 10% of FCS, L-glutamine, sodium pyruvate, 2-mercapto-ethanol and antibiotics, were incubated for 1 h at 37°C with the studied lactoferrins (50 μg/ml). Then, the cells were washed twice with Hanks’ medium, re-suspended in the culture medium and infected with EMCV. The
Fig. 1. The effect of lactoferrins on EMCV replication in the B-cell enriched splenocyte population from young and old mice.Lactoferrins (50 μg/ml) were added to the cells after EMCV adsorption. Samples of culture medium from LFs-treated and non-treated cells, incubated
at 37°C, were collected after 24 h (A) or 5 days (B) and titrated in L929 cells.
A
B
Short communication1 133
viral replication was determined after 5 days of culture. The cells were infected with a dose of 100 TCID50/ml of EMCV in a presence or absence of lactoferrins. After 45 min of adsorption at 37°C, the virus was disposed by 5 times wash of the cells in Hanks’ medium. The infected cells were then re-suspended in the culture medium and transferred to a 96-well plate. After 24 h or 5 days of incubation at 37°C, samples of the super-natants were collected and frozen at –20°C. The super-natants were then thawed, serially diluted and plated in the presence of target L929 cells to determine the viral titer, indicated as the TCID50. For the statistical evaluation of the data, the analysis of variance (one-way ANOVA) was applied due to a homogeneity of variance between the groups, followed by post hoc comparisons with the Tukey’s test to estimate the significance of differences between the groups. The significance was determined at p < 0.05 and indicated as*. The results are presented as mean values ± standard error (SE). The result of one representative experiment was shown, out of three experiments performed.
The splenocytes from young and old mice were investigated for their susceptibility to viral infection. The effects of lactoferrins on these parameters were also determined. In one model, the cells were infected with the virus, washed and incubated with the lactoferrins for 24 h or 5 days (Fig. 1A-B), followed by determination of the virus titer. Thus, in this model, lactoferrin was designed to act solely as an inhibitor of virus replication. It appeared that after 24 h culture the rate of infection in cells from both young and old mice was the same (Fig. 1A). Both types of lactoferrins significantly reduced the virus titer in cells derived from young and old mice. The inhibitory effects of lactoferrins were stronger in
young mice, particularly in the case of bLF. After 5-day exposure to the virus and the lactoferrins, the infection rates of cells from young and old mice were compara-ble (Fig. 1B). The inhibitory effects of lactoferrins were stronger in young mice, both lactoferrins being equally active. On the other hand, the virus replication in old mice was significantly inhibited only by bLF. In the sec-ond model the cells were incubated for 1 h with lactofer-rins, washed and exposed to the virus for 5 days (Fig. 2) in order to test an ability of this protein to interfere with virus binding to the cells. The susceptibility of cell popu-lations from both age categories was comparable. While the suppressive effects of bLF on the virus titers were statistically significant in both splenocyte populations, the action of rmLF was weaker and not significant.
Although we demonstrated more potent actions of bovine lactoferrin on resistance of splenocytes to viral infection, as compared to recombinant mouse lactofer-rin, the efficacy of the homologous lactoferrin in the antiviral resistance was shown here for the first time. Small differences in the efficacy of bovive and mouse lactoferrin in the antiviral resistance of splenic B cells could be due to different structures of glycan moieties in the two types of lactoferrins. These structures are responsible for blocking CD21 receptors on B cells (Zheng et al., 2012) which are also used for viruses to enter cells. The heparan sulfate receptors for viruses are, in turn, blocked by a highly cationic N-terminal end of lactoferrin (Pietroantoni et al., 2015).
Our results on the suceptibility to viral infection in old versus young individuals are, in part, consist-ent with a hypothesis (Scholz et al., 2013) that the viral resistance in the elderly may be even enhanced due to a cumulative, frequent contacts with viral antigens
Fig. 2. Effect of preincubation of the B-cell enriched splenocytes from young and old mice, with lactoferrins on viral replication.The cells were re-suspended in the culture medium and cultured with lactoferrins (50 μg/ml) for 1h at 37°C. After the incubation, the cells were washed twice with Hanks’ medium, re-suspended in the culture medium and infected with EMCV. Samples of culture medium were collected after 5
days and titrated in L929 cells.
Zaczyńska E. et al. 1134
resulting in a presence of a bigger pool of antigen-specific memory cells. Although mouse (Scholz et al., 2013; Zhang et al., 2002) and human studies (Labeur et al., 1991) indicated impaired susceptibility of aged organisms to viral infection, it is also clear (Dailey et al., 2001; Castle et al., 1999) that the activation status and functional capacity of B cells from old mice are higher or at least not lower than those in young ones.
EMCV infects several cell types beside lymphocytes and the mechanisms of interference with virus replica-tion by LF are probably common for most cell types. We also think that interference of other cell types and cytokines on the susceptibility of B cells to viral infec-tion may be negligible. Besides, we obtained similar results with a T-cell-enriched cell fraction (not shown).
In view of the literature on the protective role of lactoferrin in viral infection (Pietroantoni et al., 2015; Välimaa et al., 2009; Zheng et al., 2012) it was not unex-pected that also in this study lactoferrins demonstrated antiviral properties in the applied models, i.e. potential block of virus receptors on target cells and interference with virus replication. We also suggest still another mechanism of the antiviral activity of lactoferrin, since the protein is an enhancer of COX-1 expression (Kruzel et al., 2013), important in maintaining antiviral resist-ance (Carey et al., 2010). In addition, a lack of age-rela-ted difference in COX-1 protein levels found by others (Hayek et al., 1997) further supports our findings on the comparable susceptibility to viral infection in both age categories. Our results provided also the evidence that the homologous (mouse lactoferrin) may play a physio-logical role in the antiviral resistance in mice and that the protective effect of lactoferrin is not species specific. It was also encouraging to find that cells from old indi-viduals were at least equally resistant to viral infection as those derived from young ones. In conclusion, we showed that the resistance to viral infection was pre-served in the senescent mice. We also demonstrated, for the first time, the antiviral actions of the homologous mouse lactoferrin. Based on the results, regarding the protective effect of bovine lactoferrin on virally infected splenocytes from old mice, we also suggest a potential benefit of diet supplemented with bovine lactoferrin for the elderly in enhancing antiviral resistance.
StatementOn behalf of all authors, the corresponding author states that
there is no conflict of interest.
Acknowledgements This study was supported by statutory grant no. 4/2014 from the
Polish Ministry of Science and Education.
Literature
Castle S.C., K. Uyemura, W. Crawford, W. Wong and T. Maki-nodan. 1999. Antigen presenting cell function is enhanced in healthy elderly. Mech. Ageing. Dev. 107: 137–145. Carey M.A., J.A. Bradbury, Y.D. Rebolloso, J.P. Graves, D.C. Zeldin and D.R. Germolec. 2010. Pharmacologic inhibition of COX-1 and COX-2 in influenza A viral infection in mice. PLoS One. 5: e11610. Dailey R.W., S.Y. Eun, C.E. Russell and L.A. Vogel. 2001. B cells of aged mice show decreased expansion in response to antigen, but are normal in effectors function. Cell Immunol. 214: 99–109. Hayek M.G., C. Mura, D. Wu, A.A. Beharka, S.N. Han, K.E. Paul-son, D. Hwang and S.N. Meydani. 1997. Enhanced expression of inducible cyclooxygenase with age in murine macrophages. J. Immu-nol. 159: 2445–2451. Kruzel M.L., J.K. Actor, M. Zimecki, J. Wise, P. Płoszaj, S. Mirza, M. Kruzel, S.A. Hwang, X. Ba and I. Boldogh. 2013. Novel recom-binant human lactoferrin: differential activation of oxidative stress related gene expression. J. Biotechnol. 168: 666–675.Kogut I., J.L. Scholz, M.P. Cancro and J.C. Cambier. 2012. B cell maintenance and function in aging. Semin. Immunol. 24: 342–349. Labeur M., V.E. Nahmod, S. Finkielman and E. Arzt. 1991. Lesions of the medial septal nucleus produce a long-lasting inhibition of T lymphocyte proliferation. Neurosci. Lett. 125: 129–132. Picard-Jean F., S. Bouchard, G. Larivée and M. Bisaillon. 2014. The intracellular inhibition of HCV replication represents a novel mechanism of action by the innate immune Lactoferrin protein. Antiviral Res. 111: 13–22. Pietrantoni A., C. Fortuna, M.E. Remoli, M.G. Ciufolini and F. Superti. 2015. Bovine lactoferrin inhibits Toscana virus infection by binding to heparan sulphate. Viruses 29:480–495. Ouyang Q., W.M. Wagner, D. Voehringer, A. Wikby, T. Klatt, S. Walter, C.A. Müller, H. Pircher and G. Pawelec. 2003. Age-a sso-ciated accumulation of CMV-specific CD8+ T cells expressing the inhibitory killer cell lectin-like receptor G1 (KLRG1). Exp. Gerontol. 38: 911–920. Russo A.J., J.H. Howell, T. Han, P. Bealmear and M.H. Goldrosen. 1979. Isolation of T-cells, B-cells and macrophages by a two-stage adherence procedure. J. Clin. Lab. Immunol. 2: 67–72. Sansoni P., R. Vescovini, F. Fagnoni, C. Biasini, P. Sansoni, R. Vescovini, F. Fagnoni, C. Biasini, F. Zanni, L. Zanlari and others. 2008. The immune system in extreme longevity. Exp. Geron-tol. 43: 61–65. Scholz J.L., A. Diaz, R.L. Riley, M.P. Cancro and D. Frasca. 2013. A comparative review of aging and B cell function in mice and humans. Curr. Opin. Immunol. 25: 504–510. Simioni P.U., E.H. Costa and W.M. Tamashiro. 2007. Aging reduces the primary humoral response and the in vitro cytokine production in mice. Braz. J. Med. Biol. Res. 40: 1111–1120. Välimaa H., J. Tenovuo, M. Waris and V. Hukkanen. 2009. Human lactoferrin but not lysozyme neutralizes HSV-1 and inhibits HSV-1 replication and cell-to-cell spread. Virol. J. 6: 53. Zhang Y., Y. Wang, X. Gilmore and K. Xu. 2002. An aged mouse model for RSV infection and diminished CD8(+) CTL responses. Exp. Biol. Med. (Maywood). 227: 133–140. Zheng Y., W. Zhang, Q. Ye, Y. Zhou, W. Xiong, W. He, M. Deng, M. Zhou, X. Guo, P. Chen and others. 2012. Inhibition of Epstein-Barr virus infection by lactoferrin. J. Innate. Immun. 4: 387–398. Zimecki M. and M.L. Kruzel. 2007. Milk-derived proteins and peptides of potential therapeutic and nutritive value. J. Exp. Ther. Oncol. 6: 89–106.
Warszawa, 17.03.2017 r.
Szanowni Mikrobiolodzy i wszyscy Państwozainteresowani badaniami mikrobiologicznymi w Polsce
We wrześniu ub. roku ukonstytuowało się nowe Prezydium Zarządu Polskiego Towarzystwa Mikrobiologów (PTM). Głównym celem naszego Stowarzyszenia jest propagowanie rozwoju nauk mikrobiologicznych i popula-ryzowanie osiągnięć mikrobiologii wśród członków PTM oraz szerokich kręgów społeczeństwa.
Zarząd PTM stara się zaprosić do współpracy i zjednoczyć w ramach Towarzystwa wszystkie osoby wnoszące istotny wkład w rozwój rozmaitych gałęzi mikrobiologii: klinicznej, weterynaryjnej, środowiskowej, przemysłowej, farmaceutycznej, mikrobiologii żywności, wody, osoby prowadzące badania podstawowe, rozwojowe, przeglądowe, kontrolne, genetyczne i inne.
Wiele jest zagadnień wymagających wnikliwych badań i oceny przez mikrobiologów, np.: problem narastają-cej lekooporności drobnoustrojów zwłaszcza chorobotwórczych, mikrobiologiczne zanieczyszczenie środowiska, GMO, poprawa systemu jakości i metod kontroli żywności, kosmetyków, leków, wyrobów medycznych i produktów biobójczych. Do realizacji tych planów konieczna jest szeroka współpraca nie tylko mikrobiologów: naukowców, nauczycieli akademickich, lekarzy, specjalistów pracujących w przemyśle, rolnictwie, wykonujących mikrobiolo-giczne badania kontroli w rozmaitych obszarach, ale także firm diagnostycznych, farmaceutycznych, kosmetycz-nych, produkujących żywność, środki przeciwdrobnoustrojowe, odczynniki oraz aparaturę kontrolną i badawczą.
W 2017 r. z okazji 90-lecia działalności Towarzystwa planujemy zorganizować Konferencję „90 lat PTM wczoraj – dziś – jutro”, która odbędzie się w dniach 22–23 września w Krakowie i jak zakładamy zgromadzi kilkaset osób związanych z mikrobiologią.
W związku z tak szeroką działalnością, zwracamy się do Państwa z prośbą o wsparcie naszego Towarzystwa poprzez:
– darowizny na cele statutowe – udział w Konferencji z okazji 90-lecia Towarzystwa. Planujemy w trakcie jej trwania udostępnienie
powierzchni na organizację stoisk firm, pragnących reklamować swoje produkty. – przystąpienia do Polskiego Towarzystwa Mikrobiologów jako członek wspierający PTM. Prezydium PTM
podjęło decyzję o minimalnej wysokości składki rocznej członka wspierającego:Członek Zwyczajny – 3.000 zł; Członek Srebrny – 5.000 zł; Członek Złoty – 10.000 złCzłonkowie wspierający (informacje o nich: nazwa firmy, logo i adres) uzyskują następujące przywileje:● wszyscy wymienieni są na stronie PTM, na facebooku oraz w każdym numerze 3 czasopism – kwartalników
PTM: Medycyna Doświadczalna i Mikrobiologia, Postępy Mikrobiologii i Polish Journal of Microbiology, w danym roku;.
● wszyscy wymienieni są w materiałach konferencji organizowanych i współorganizowanych przez PTM. Możliwe jest dołączenie materiałów informacyjnych firm do materiałów konferencyjnych;
● wszyscy otrzymują w danym roku wszystkie numery 3 czasopism (łącznie 12 numerów – zeszytów);● otrzymują zniżki 15% (Członek Srebrny) 25% (Członek Złoty) na stoisko, jeżeli takie będą na konferencjach
organizowanych przez PTM;● możliwe jest nieodpłatne umieszczanie reklam czarno-białych i kolorowych z 50% zniżką, w kwartalnikach:
Postępy Mikrobiologii oraz Polish Journal of Microbiology (oba czasopisma z IF): Członek Srebrny – 1 reklama całostronicowa lub 2 reklamy po pół strony raz w roku, w jednym numerze jednego z ww. wymienionych czasopism Członek Złoty – 2 reklamy całostronicowe lub 3 reklamy po pół strony raz w roku, w jednym numerze obu ww. wymienionych czasopism.Niniejszy list jest informacją i jednocześnie prośbą o współpracę z Towarzystwem. W przypadku Państwa zainteresowania, możliwości udziału Państwa firmy w działalności PTM będziemy omawiać bezpośrednio ([email protected])
K O M U N I K A T Y I I N F O R M A C J E
Komunikaty i informacje 1136
INFORMACJA O SKŁADKACH CZŁONKOWSKICH PTMW 2017 ROKU
Zarząd Główny Polskiego Towarzystwa Mikrobiologów uprzejmie informuje, iż wysokość składki członka zwyczajnego PTM w roku 2017 wynosi 100 zł/rok. Wysokość składki dla emerytowanych członków zwyczajnych PTM wynosi 50 zł/rok.
W przypadku zmiany danych wcześniej przekazanych do ZG PTM (np. zmiana miejsca pracy, adresu, e-maila, przejście na emeryturę itp.), prosimy o aktualizację i wypełnienie „Formularza aktualizacji danych osobowych” (dostępny na stronie PTM). Z opłacania składki członkowskiej zwolnieni są członkowie honorowi Polskiego Towarzystwa Mikrobiologów.
SKŁADKI PROSIMY OPŁACAĆDO KOŃCA I KWARTAŁU KAŻDEGO ROKU KALENDARZOWEGO
Statut PTM §14 ust 3. „Członek zwyczajny jest zobowiązany do regularnego opłacania składki członkowskiej w wysokości ustalonej przez Walne Zgromadzenie Delegatów Towarzystwa”.Statut PTM §15 ust 3. „ Członkostwo zwyczajne ustaje na skutek skreślenia z listy członków Towarzystwa z powodu niezapłacenia składki członkowskiej przez dwa kolejne lata…”
W związku z porządkowaniem listy członków zwyczajnych PTM, osoby, które nie zapłaciły składki za lata 2015, 2016 uprzejmie są proszone o uregulowanie tych składek.
Osoby, które nie opłaciły składek za lata 2014, 2013 i wcześniejsze, proszone są o uregulowanie tych składek (można to uczynić w miesięcznych ratach w ciągu I półrocza 2017 r.), a w przypadku nie uregulowania składek do 30.06.2017 r. osoby te zostaną skreślone z listy członków zwyczajnych PTM. W przypadku, gdy dysponu-jemy aktualnym adresem, osoby te zostaną wcześniej powiadomione listem wysłanym z Oddziału Terenowego PTM, o możliwości skreślenia ich z listy członków PTM w sytuacji nie uregulowania zaległych składek PTM do dnia 30.06.2017 r.
Jednocześnie informujemy, że tylko członkowie z opłaconą składką za dany rok otrzymają nieodpłatnie kwar-talnik Postępy Mikrobiologii lub Polish Journal of Microbiology (prosimy o podanie wybranego czasopisma przy opłacaniu składki członkowskiej). W przypadku braku deklaracji przesyłany będzie kwartalnik Postępy Mikro-biologii. Istnieje możliwość rocznej prenumeraty drugiego kwartalnika koszt – 40 zł/rok (dla członków PTM).
Również tylko członkowie z opłaconą składką za dany rok mogą starać się o stypendia FEMS, niższe opłaty wpisowe na konferencje współorganizowane przez PTM oraz występować jako osoby rekomendujące: kandydatów na nowych członków PTM oraz kandydatów na stypendia FEMS.
NUMER KONTA
Składki członkowskie należy wpłacać na konto:
Polskie Towarzystwo Mikrobiologów, ul. Banacha 1 b, 02-097 WarszawaBank: BGŻ BNP Paribas, nr konta: 57 2030 0045 1110 0000 0261 2550
Na przekazie prosimy umieścić informacje:imię, nazwisko, oddział PTM, rok za który dokonywana jest opłata składki.
Otrzymaliśmy kilkanaście wpłat składek, bez określenia, kto i za jaki rok wnosi opłatę.
BIURO Polskiego Towarzystwa Mikrobiologów
ul. Banacha 1 b, 02-097 Warszawa WUM Budynek CePT, tel: 22 116 61 77,fax: 22 116 61 96, e-mail [email protected], www.microbiology.pl
https://www.facebook.com/Polskie-Towarzystwo-Mikrobiolog%C3%B3w-246114759137556/
Komunikaty i informacje1 137
CZŁONKOWIE WSPIERAJĄCYPOLSKIE TOWARZYSTWO MIKROBIOLOGÓW
Członek Złoty Wspierający PTM– od 27.03.2017 r.
HCS Europe – Hygiene & Cleaning Solutions
ul. Warszawska 9a, 32-086 Węgrzce k. Krakowatel: (12) 414 00 60, 506 184 673, fax (12) 414 00 66
www.hcseurope.pl; NIP 675-12-63-252Dyrektor Generalny: Mateusz Jurczyk
Firma projektuje profesjonalne systemy utrzymania czystości i higieny dla klientówo szczególnych wymaganiach higienicznych, m.in. kompleksowe systemy mycia, dezynfekcji,
osuszania rąk dla pracowników służby zdrowia, preparaty do dezynfekcjipowierzchni dla służby zdrowia, systemy sterylizacji narzędzi.
Komunikaty i informacje 1138
INFORMACJA O KONFERENCJACH WSPÓŁORGANIZOWANYCH PRZEZPOLSKIE TOWARZYSTWO MIKROBIOLOGÓW
ORAZ Z PATRONATEM PTM W 2017 r.
Konferencja Naukowa90 lat Polskiego Towarzystwa Mikrobiologów,
PTM wczoraj – dziś – jutro
Kraków, 22–23 września 2017 r.
Komunikat I
Konferencja Naukowa Polskiego Towarzystwa Mikrobiologów organizowana jest przede wszystkim z okazji 90. rocznicy powołania naszego Stowarzyszenia. Jednocześnie w 2017 roku przypada rocznica 160-lecia urodzin Ojca mikrobiologii polskiej profesora Odona Bujwida oraz 130-lecia wygłoszenia przez niego w Krakowie słyn-nych pięciu „odczytów o bakteryjach”. W 2017 roku upływa także 90 lat od powołania ogólnoświatowego stowa-rzyszenia towarzystw mikrobiologicznych International Society of Microbiology, obecnie International Union of Microbiological Societies (IUMS), którego współzałożycielem było PTM.
Konferencji towarzyszyć będzie Nadzwyczajne Walne Zgromadzenie Delegatów Polskiego Towarzystwa Mikro-biologów, które podejmie uchwały w sprawie wprowadzenia zmian do Statutu PTM.
Tematyka konferencji, poza częścią poświęconą historii polskiej mikrobiologii ze szczególnym uwzględnieniem roli prof. O. Bujwida oraz działalności PTM, będzie również dotyczyła przeglądu osiągnięć naukowych różnych dyscyplin mikrobiologii.
Planuje się zorganizowanie sesji wykładowej, na którą zostaną zaproszeni najwybitniejsi polscy naukowcy z różnych dyscyplin mikrobiologii oraz kilku sesji plakatowych, na których wszyscy mikrobiolodzy, a zwłaszcza Delegaci na Walne Zgromadzenie PTM będą mogli przedstawić wyniki swoich prac.
Planuje się również stworzenie warunków umożliwiających zorganizowanie stoisk wystawowych przez różne firmy działające w obszarze mikrobiologii.
Spotkanie członków Polskiego Towarzystwa Mikrobiologów będzie okazją do poznania początków polskiej mikrobiologii i serologii, do dyskusji, przeglądu sesji plakatowych, do integracji pokoleń mikrobiologów, do rekreacji w czasie spotkań koleżeńskich w uroczym klimacie dawnej stolicy Polski.
Konferencja organizowana jest przez Polskie Towarzystwo Mikrobiologów Oddział w Krakowie i Uniwersytet Jagielloński.
Termin nadsyłania streszczenia plakatu: 01.05.2017 r.Termin powiadomienia o akceptacji streszczenia: 21.05.2017 r.
Opłaty zjazdowe:
Osoby do 35 roku życia (w tym studenci) członkowie PTM W terminie do dnia 15.06.2017 r.: 100 zł; w terminie po 15.06.2017 r.: 150 zł
Osoby do 35 roku życia (w tym studenci) nie będący członkami PTM – udział czynnyW terminie do dnia 15.06.2017 r.: 200 zł; w terminie po 15.06.2017 r.: 250 zł
Członkowie PTM W terminie do dnia 15.06.2017 r.: 300 zł; w terminie po 15.06.2017 r.: 400 zł
Osoby nie będące członkami PTMW terminie do dnia 15.06.2017 r.: 400 zł; w terminie po 15.06.2017 r.: 500 zł
Komunikaty i informacje1 139
VI Konferencja Naukowo-SzkoleniowaMIKROBIOLOGIA FARMACEUTYCZNA 2017
Gdańsk 31.05–2.06.2017
Komunikat I
Szanowni Państwo,W imieniu Rady Naukowo-Programowej serdecznie zapraszamy do udziału w Konferencji – Mikrobiologia
Farmaceutyczna 2017. Tegoroczna Konferencja jest organizowana przez Polskie Towarzystwo Mikrobiologów i firmę Transpharmacia i jest kontynuacją rozpoczętego w 2009 roku cyklu spotkań naukowo szkoleniowych, którego celem jest stworzenie Forum Specjalistów zainteresowanych mikrobiologią farmaceutyczną, służącego wymianie wiedzy, poglądów i doświadczeń w obszarach oceny i zapewnienia jakości, badań mikrobiologicznych oraz bezpieczeństwa mikrobiologicznego produktów leczniczych..
Podczas naszego spotkania przedstawimy szereg zagadnień istotnych dla Mikrobiologów pracujących w wytwórniach farmaceutycznych, laboratoriach mikrobiologicznych współpracujących z przemysłem farma-ceutycznym, wydziałach farmaceutycznych uczelni, a także dla Osób Wykwalifikowanych, Specjalistów Zapew-nienia i Kontroli Jakości, Audytorów oraz Osób odpowiedzialnych za współpracę z kontraktowymi laboratoriami mikrobiologicznymi.
Do udziału w konferencji zapraszamy również mikrobiologów z wytwórni kosmetycznych.Tematem wiodącym konferencji będzie Jakość Badań Mikrobiologicznych, ale również jakość mikrobio logiczna
produktów leczniczych i wyrobów medycznych obecnych na rynku. Tradycyjnie już przedstawimy aktualne i pla-nowane zmiany w przepisach, wymaganiach farmakopealnych, oraz nowości w temacie Woda i problemy z nią związane.
Szczegółowe informacje i program zostaną zamieszczone w następnym komunikacie.
Organizatorzy konferencji Mikrobiologia Farmaceutyczna 2017 – Transpharmacia:
Tel. +48 601382182; +48 509710103 e-mail: [email protected]
KONFERENCJA BIOMILLENIUM 2017„Trendy i rozwiązania w biotechnologii i mikrobiologii”
Gdańsk, 6–8 września 2017 r.
Komunikat ISzanowni Państwo,
W imieniu Komitetu Organizacyjnego mamy zaszczyt zaprosić Państwa do udziału w Konferencji BioMille-nium 2017 – „Trendy i rozwiązania w biotechnologii i mikrobiologii”, która odbędzie się w dniach 6–8 wrze-śnia 2017 na terenie Politechniki Gdańskiej w Gdańsku.
Głównym organizatorem Konferencji jest Katedra Biotechnologii Molekularnej i Mikrobiologii Politechniki Gdańskiej oraz Gdański Oddział Polskiego Towarzystwa Mikrobiologów. Współorganizatorami są również Katedra Mikrobiologii i Katedra Immunologii Wydziału Biologii Uniwersytetu Szczecińskiego oraz Gdański Oddział Polskiego Towarzystwa Epidemiologów i Chorób Zakaźnych.
Prezentowane zagadnienia będą podzielone na pięć tematycznych sesji: Biotechnologia: w medycynie, w prze-myśle, w ochronie środowiska, Mikrobiologia: kliniczna oraz molekularna
Konferencja rozpocznie się wykładem przedstawiającym sylwetkę, zainteresowania i osiągnięcia naukowe zmarłego w tym roku Pana Prof. dr hab. Józefa Kura, założyciela Katedry Biotechnologii Molekularnej i Mikro-biologii Politechniki Gdańskiej oraz naukowca, który swoimi pracami nie tylko wiele wniósł wiele do mikrobiologii i biotechnologii, ale był ich wielkim popularyzatorem.
Przewidujemy wykłady plenarne, prezentacje ustne, sesję plakatową oraz warsztaty praktyczne prowadzone przez firmy. Mamy nadzieję, że prezentacje wyników Państwa badań naukowych pokażą, że biotechnologia nie jest wciąż dziedziną „nauki przyszłości”, ale już dziś przyniosła rozwiązania stosowane w wielu gałęziach przemysłu
Komunikaty i informacje 1140
i w medycynie oraz że mikrobiologia nie jest „skostniałą dziedziną”, ale obszarem nauki, w którym zarówno tworzy się, jak i wykorzystuje nowoczesne technologie.
Wierzymy, że Konferencja będzie okazją do nawiązania kontaktów umożliwiających efektywną współpracę. Wszystkim, którzy wezmą udział w Konferencji, życzymy miłego pobytu w Gdańsku. Szczegółowy program
i informacje zostaną przesłane w następnym komunikacie.
Organizatorzy Konferencji BioMillenium 2017Kontakt: 58 347 24 17 – sekretariat
oraz 58 347 23 83; 58 347 64 12; 58 347 24 06; 58 347 23 02
Mikrobiologia w Ochronie Zdrowia i Środowiska– MIKROBIOT 2017,
Łódź, 19–21 września 2017 r.
Microbiology in Health Care and Environmental Protection– MIKROBIOT 2017
Lódź, Poland, September 19–21, 2017.
Komunikat I
W imieniu Organizatorów, Instytutu Mikrobiologii, Biotechnologii i Immunologii Uniwersytetu Łódzkiego oraz Polskiego Towarzystwa Mikrobiologów mamy przyjemność serdecznie Państwa zaprosić do wzięcia udziału w IV edycji konferencji naukowej „Mikrobiologia w Ochronie Zdrowia i Środowiska” – MIKROBIOT 2017, która odbędzie się w Łodzi w dniach 19–21 września 2017 r.
On behalf of the Organizing Committee, The Institute of Microbiology, Immunology and Biotechnology at the University of Lodz in Poland, together with Polish Society of Microbiologists, it is our great honor and pleasure to invite you to attend the 4th edition of scientific conference “Microbiology in Health Care and Environmental Protection” – MIKROBIOT 2017. This event will take place in Lodz, Poland, September 19–21, 2017.
The goal of the meeting is to provide opportunities for exchange ideas and research experience in the fields of microbiology, immunology and biotechnology, including microbial virulence factors, human immune response to infections, epidemiology, structure and physiology of environmental microorganisms, their use in biotechno-logical processes and in the removal of environmental pollution, as well as the role of microorganisms in their habitats and their relationships with other organisms.
As in the previous edition of the conference MIKROBIOT, which enjoyed great interest of the scientific com-munity from all over Poland and met with appreciation from foreign visitors, during the upcoming 4th edition of MIKROBIOT 2017 plenary lectures will be given by eminent scientists, among others from Germany, Portugal, France or Italy. The official conference language will be English. During the conference MIKROBIOT 2017 four scientific sessions are provided for:
1. Clinical microbiology and immunology2. Microbial biotechnology3. General and environmental microbiology4. Genetics and genomics of microbes
Komunikaty i informacje1 141
Konferencja pod patronatem PTM
IX OGÓLNOPOLSKA KONFERENCJA HYDROMIKROBIOLOGICZNA
HYDROMICRO 2017: DROBNOUSTROJE – OSIĄGNIĘCIA I WYZWANIA
17–19 września 2017, Olsztyn
Szanowni Państwo!Bardzo serdecznie zapraszamy na IX Ogólnopolską Konferencję Hydromikrobiologiczną, organizowaną
w dniach od 17 do 19 września 2017 roku przez Katedrę Mikrobiologii Środowiskowej Wydziału Nauk o Środowisku Uniwersytetu Warmińsko Mazurskiego w Olsztynie. Będzie to dziewiąte ogólnopolskie spotkanie środowisk nauko-wych związanych z mikroorganizmami ekosystemów wodnych. Poprzednie spotkania odbywały się w: Słupsku- -Ustce (2000), Toruniu (2002), Zielonej Górze-Łagowie (2004), Mikołajkach (2006), Warszawie-Wierzbie (2008), Gdańsku (2010), Wrocławiu (2013) oraz Gliwicach (2015).
Tematyka konferencji obejmuje: mikroorganizmy wód śródlądowych, podziemnych i morskich, mikro orga-nizmy w inżynierii środowiska, sanitarno-bakteriologiczne aspekty oczyszczania ścieków, transmisję mikro-organizmów patogennych drogą wodną, zanieczyszczenia biologiczne w systemach wodnych biobezpieczeństwo i bioremediację wód, diagnostykę organizmów wodnych, mikrobiologię przemysłową i biotechnologię.
Językiem konferencji jest język polski lub angielski Zgłoszenia (w postaci wypełnionej karty zgłoszenia uczestnictwa – do pobrania ze strony www.hydromicro2017.pl należy przesłać do 30 maja 2017 roku na adres: [email protected]
Streszczenia w języku polskim lub angielskim przygotowane wg schematu zamieszczonego na stronie Kon-ferencji prosimy przesyłać droga mailową do 30 czerwca 2017 roku. Konferencja odbędzie się w Olsztynie, w atrakcyjnie usytuowanym hotelu Omega.
W imieniu Komitetu OrganizacyjnegoDr hab. Zofia Filipkowska, prof. UWM
Konferencja pod patronatem PTM
IV EDYCJA KONFERENCJI„WEKTORY I PATOGENY – W PRZESZŁOŚCI I PRZYSZŁOŚCI”
Wrocław, 24 listopada 2017
Szanowni Państwo,Instytut Genetyki i Mikrobiologii Uniwersytetu Wrocławskiego oraz Wrocławski Oddział Polskiego Towarzy-
stwa Mikrobiologów i Wrocławski Oddział Polskiego Towarzystwa Parazytologicznego zapraszają na IV edycję konferencji pt. „Wektory i patogeny – w przeszłości i przyszłości”.
Konferencja ma na celu prezentację badań z zakresu mikrobiologii i parazytologii jakie są prowadzone aktu-alnie w krajowych jak i zagranicznych jednostkach naukowych. Pragniemy również udokumentować historyczny dorobek polskich naukowców w tych dziedzinach. W tym roku szczególną uwagą objęty będzie problem uwa-runkowanych środowiskowo chorób infekcyjnych i inwazyjnych, których czynnikami etiologicznym są patogeny transmitowane przez stawonogi (wektory), głównie hematofagiczne kleszcze i komary, a także ukazanie skutecz-nych sposobów zapobiegania i monitorowania tych zagrożeń.
Podczas konferencji planowana jest prezentacja praktycznych osiągnięć 20-letniej współpracy Instytutu Gene-tyki i Mikrobiologii UWr z Wydziałem Środowiska i Rolnictwa Urzędu Miasta Wrocławia w zakresie biologicznego (mikrobiologicznego) zwalczania komarów na terenie Aglomeracji Wrocławskiej. Ważnym celem konferencji jest także integracja środowiska naukowego oraz ukazanie osiągnięć naukowych młodych adeptów nauki.
Szczegółowe informacje zamieszczone są na stronie: http://www.mikrobiologia.uni.wroc.pl
Organizator: Uniwersytet Wrocławski Instytut Genetyki i Mikrobiologii
Miejsce: Uniwersytet Wrocławski Instytut Genetyki i Mikrobiologiiul. Przybyszewskiego 63/77, 51-148 Wrocław
Komunikaty i informacje 1142
Konferencja pod patronatem PTM
7 MIĘDZYNARODOWA KONFERENCJA WEIGLOWSKA
Lwów, 26–29 września 2017 r.
http://cellbiol.lviv.ua/2017/
Rudolf Weigl był wybitnym polskim mikrobiologiem austriackiego pochodzenia. Pracował w czasach między-wojennych we Lwowie (dzisiejsza Ukraina) w dziedzinach mikrobiologii lekarskiej, parazytologii, immunologii oraz biotechnologii, opracowując przy tym pierwszą skuteczną szczepionkę przeciwko durowi plamistemu.
Mikrobiolodzy polscy i ukraińscy od 2003 r. organizują naprzemiennie w Polsce i Ukrainie dwustronne (później międzynarodowe) konferencje Weiglowskie w dziedzinie mikrobiologii i dyscyplinach pokrewnych. Poprzednie konferencje Weigowskie odbywały się we Lwowie (2003), Warszawie (2007), Odessie (2009), Wrocławiu (2011), Czerniowcach (2013) oraz w Gdańsku (2015). Kolejną, 7 konferencję Weiglowską zaplanowano zorganizować we Lwowie, mieście, gdzie R. Weigl pracował.
Główne tematy konferencji to mikrobiologia ogólna, mikrobiologia lekarska, mikrobiologia środowiskowa, immunologia oraz biotechnologia. Konferencja odbędzie się w przepięknym Lwowskim Budynku Uczonych. Głównymi uczestnikami konferencji będą mikrobiolodzy ukraińscy i polscy, jednak przewiduje się także udział naukowców z innych krajów (Austria, Francja, Niemcy, Szwecja, Włochy, USA, Japonia). W konferencji weźmie udział około 250 uczestników. Oprócz programu naukowego, przewidziane są: wycieczka po Lwowie, koncert, recepcja oraz na życzenie – bankiet, spektakl w Operze Lwowskiej, a także wycieczka do pobliskich zamków. Konferencja przyczyni się do nawiązania bliższych kontaktów z naukowcami z Ukrainy oraz wzmocnieniu przy-jacielskich stosunków między naszymi narodami.
Planuje się, ze opłata konferencyjna wyniesie 140 Euro oraz 110 Euro dla młodych naukowców. Koszty obejmą 3 obiady, recepcję, 5 poczęstunków podczas przerw na kawę, wycieczka po mieście oraz materiały konferencyjne. Dodatkowo płatne będą bankiet (około 40 Euro) oraz spektakl w operze Lwowskiej (10 Euro). Po konferencji można będzie odwiedzić zamek Oleski (1 dzień), Poczajow i Krzemieniec (1 dzień) lub Kamieniec Podolski (2 dni), wycieczki te są płatne dodatkowo.
7TH INTERNATIONAL WEIGL CONFERENCE(LVIV, SEPTEMBER 26–29, 2017)
Rudolf Weigl was the outstanding Polish microbiologist of Austrian descent. He worked in the interwar period in Lviv (contemporary Ukraine) in the fields of medical microbiology, parasitology, immunology and biotechno-logy and created the first successful anti-typhus vaccine. Polish and Ukrainian microbiologists started in 2003 joint initiative to organize in turn in Ukraine and Poland bilateral (later, international) Weigl conferences in the fields of microbiology and related disciplines. Previous Weigl conferences took place in Lviv (2003), Warsaw (2007), Odessa (2009), Wroclaw (2011), Chernivtsi (2013) and Gdansk (2015). The next, 7th International Weigl conference is planned to organize again in Lviv, the city, where he did his discoveries. The main topic of the conference will be general microbiology, medical microbiology, environmental microbiology, immunology and biotechnology. The conference is planned to be held in the beautiful House of Scientists. Main participants of the conference will be Polish and Ukrainian microbiologists, cell biologists and immunologists; however, participation of the scientists from many other countries is expected. Size of the conference is limited by 250 participants. In addition to scientific program, Lviv city tour, concert, get-together and optional banquet, visiting Lviv Opera House and the tours to neighboring castles are planned. Conference has to develop existing contacts and establish the new ones between Polish and Ukrainian scientists.
http://www.cellbiol.lviv.ua/2017Ukrainian Society of Cell Biology
Komunikaty i informacje1 143
For the attention of specialists in the field of microbiology, biotechnology, immunology.Institute of Cell Biology National Academy of Sciences of Ukraine, All-Ukrainian Public Organization “Ukra-
inian Society of Cell Biology” inform you about:7th International Weigl Conference that will be held on September 26–29, 2017 in Lviv, Ukraine, in the main
building of Ivan Franko Lviv National University.
List of planned sessions:
1. Microbial cell biology.2. Microbial biotechnology.3. Environmental microbiology.4. Metabolism and regulation.5. Medical microbiology.6. Immunology.7. Microbe-host cell interaction.8. Microbial genetics.
Participation of leading foreign and ukrainian scientists is expected in the Conference.Working language – English.
Conditions of participation:Deadline for Abstract submission – May 31, 2017.
Registration form and abstracts should be filled and sent to the conference e-mail:[email protected]
Early bird registration & payment (till May 31, 2017): 110 € / 90 €.Materials received after the deadline will not be accepted. Each person may submit up to 3 abstracts.Invitation letters to the participants of the conference will be sent by email before 1st September 2017.
CONTACT INFORMATION OF ORGANIZING COMMITTEE REPRESENTATIVES
Address:Institute of Cell Biology, NAS of Ukraine, Drahomanov Street, 14/16, Lviv, 79005 Ukraine.
Dmytruk K.V., Head of Secretariat PhD, Senior ScientistPhone: 00 380 32 261 21 63;
FAX: 00 380 32 261 2108,е-mail: [email protected] // [email protected]
Barska M.L., Executive Secretary of Ukrainian Society of Cell Biology, PhD,Phone: 00 380 32 261 2142;FAX: 00 380 32 261 2108,
е-mail: [email protected]

Polish Journal of Microbiology2017, Vol. 66, No 1
SCOPE
Polish Journal of Microbiology (PJM) publishes origi-nal research articles describing various aspects of basic and applied microbiological research. We are especially inter-ested in articles regarding
•basic biological properties of bacteria and archaea,viruses, and simple eukaryotic microorganisms
•geneticsandmolecularbiology•microbialecology•medicalbacteriologyandpublichealth•foodmicrobiology•industrialmicrobiology•bacterialbiotechnologyA manuscript of the original publication (full length
paper and short communication) submitted to PJM must present reports of original research that have not been pre-viously published and are not being considered for publica-tion elsewhere. All authors of manuscripts are responsible for their content and it is assumed that they all have con-tributed substantially to the presented research, read and approved the manuscript. Mini-reviews in areas of particular interests and importance in microbiology are also published.
HOW TO SUBMIT A MANUSCRIPT
Manuscripts should be submitted at http://pjm.index-copernicus.com/. The system requires one-time registration. The selected login and password allows future submission of new articles as well as checking the status of the editorial processing of a manuscript already submitted. Manuscript will be assigned a reference number, that should be used in all future correspondence with the editorial office. After manuscript registration, all correspondence to the edito-rial office should be directed via internal messaging system available throughhttp://pjm.indexcopernicus.com web page. In case of technical problems with the electronic submis-sion, please contact directly Index Copernicus at [email protected]
ARTICLE PAYMENT CHARGES
All articles require the payment of an Article Publication Charges (APC)
Publication fee for all types of articles is 250 USD, or equivalent in polish zloty (PLN) for authors from Poland. Fee for members of Polish Society of Microbiologists is reduced to 125 USD. For reduced fee, at least corresponding author must be a member of Polish Society of Microbiolo-gists, what should be stated in a cover letter and Polish Soci-ety of Microbiologists membership fee must be paid in full.
When the article is accepted for publication, corre-sponding author will receive pro forma invoice, and manu-script will be processed for printing and online publication only after payment.
FORMAL REQUIREMENTS (BASIC INFORMATION)
To ensure fast and efficient cooperation with the edito-rial office and editors, the submitted manuscript should be formatted according to details listed below and accompa-nied by cover letter.
Manuscript files
Manuscript text, tables and figures should be submitted as separate files. Manuscript should be prepared in editable text files (.doc, .docx or .rtf). Literature should be formatted in author-date format described below in details. Figures must be prepared in ready to print size, format (.tiff with LZW compression) and required resolution.
The editorial office does not accept figures embedded in text, only as separate .tiff files, resolution 300 (for photo-graphs), 600 dpi for combination art (lettering and images) and 1200 dpi for line art (graphs, vectors). That means that figure must be at least 1800/3600/7200 points wide depend-ing on the graphic type.
For instructions on creating acceptable .tiff files, refer to the Cadmus digital art website Cadmusdigital art.
As an alternative our graphics department offers profes-sional service and can prepare figures. However, the addi-tional service is 50 USD for single panel figure.
There is no charge for figures’ publication in greyscale, but there is for color illustrations.
Cover letter
The manuscript must be accompanied by a cover letter that should include:
• Atitle,arunningtitle(about50charactersinlength,including spaces), author’s names (format: Name, Ini-tial, Last name – for example Anna E. Smith) and key words (maximum 5 in alphabetical order)
• Impactofthepresentedresearch• Briefdescriptionoftheresultsandmajorconclusions
of the manuscript• Postaladdress,phoneandfaxnumbersande-mailof
the corresponding author who is responsible for all correspondence regarding the submitted paper
• To ensure rapidmanuscript review authors shouldpresent list of 5 putative reviewers, with their full affilia tions. Authors should choose specialists in their field, however they should not be co-authors within last five years or share affiliation
Instruction for Authors
Instruction for Authors 1146
• Statementthatallauthorsreadandacceptedtheman-uscript and the statement about conflict of interests.
• Statementthatthemanuscripthasnotbeenpublishedelsewhere, or is not in processing by any other journal
Submissions without cover letter will be not processed.
Language editing
The manuscript should be written in English. Gram-mar, syntax and spelling must be carefully checked before submission of the paper. Authors who are unsure of proper English usage should have their manuscript checked by someone proficient in both the English language and biological terminology. Manuscripts may be rejected on the basis of poor English or lack of conformity to accepted standards of style before the review process.
Manuscript processing
All manuscripts are subjected to pre-screening by the Editor in Chief and can be rejected at submission stage or returned for corrections before evaluation (if they do not meet the criteria given in the Instruction to Authors, includ-ing language quality or are out of the scope of PJM). After passing the pre-screening stage the manuscripts are assigned to one of the section editors and sent to at least one qualified outside referee, but the editors themselves may also act as reviewers if they are experts in the presented topic.
When the manuscript is accepted for publication the transfer of copyright to the Publisher takes effect. The arti-cles are generally printed in no more than three months after returning the corrected version and obtaining its final acceptance. The articles are usually printed within three months after final acceptance or assigned DOI number and published online ahead of print while waiting for print.
The entire process of review and manuscript preparation is carried out electronically. All messages to the editor must be sent via internal messaging system available on the http://pjm.indexcopernicus.com/ web page after login. The author can also track the status of the manuscript using journal submission system.
Preparation of Manuscripts– Regular paper/Minireview
The manuscript of the full length original paper in general:
•Shouldnotexceed30typedpages(up to1800charac-ters per page) including tables and figures
•Betypedin12pointsTimesNewRomanfont•Everyportionof themanuscript shouldbedouble-
spacedNo part of the manuscript should be underlined and
written using capital letters. Acceptable text formatting should be only restricted to:
All caps:•authors names, for exampleANNASMITH, JOHN
BROWN and ANDREW SHEPARD
Bold:•manuscripttitle,forexampleThe Oral Microbiome
in Dental Caries•Subheadings (Abstract, Introduction, Experimen-
tal, Materials and Methods, Results, Discussion, Acknowledgments, Literature)
•Authors names in the literature list for example Robert Y. and A. Sheiham. 2002. The burden of restorative dental treatment for children in Third World countries. Int Dent J 52: 01–09.
Italics:•Microorganismsnames,forexampleEscherichia coli,
E. coli•Latinexpressions,forexample in vivo, in vitro, et al.,
etc., e.g., via•journaltitleabbreviations,forexampleJ. Bacteriol., Int
Dent J;
Others:•geneticloci, for example repA, carO;•antibiotic resistance determinants such as blaOXA-23,
blaOXA-51, blaOXA-66;•Proteins:OXA-23,RecA;•Others,forexampleLD50, LC90;The full length paper should be divided into the fol-
lowing sections written in sequence: Title, Abstract, Intro-duction, Experimental: Materials and Methods, Results, Discussion, Acknowledgments, Literature.
TitleThe title should briefly describe the contents of the
paper. Below the title, the manuscript should include full name (including first name and middle initial) of each author and affiliations of all authors. Street address, tele-phone number and e-mail address should be given only for the corresponding author and placed in the footnote at the bottom of the first page. Under the authors affiliations proposed running title should be included (50 characters including spaces)
AbstractLimit the abstract to 250 words or fewer. Because the
abstract will be published separately by abstracting services, it must be complete and understandable without reference to the text. It should be written in an impersonal form. Abbreviations, diagrams and references are not allowed.
Key wordsFive keywords or short phrases should be given below
the abstract. If names of microorganisms are used, they should precede the key words, and be followed by the lat-ter in alphabetical order. All keywords should be relevantly connected with the subject matter (avoid common terms like: bacteria, medium, soil, temperature etc.) as they will be used for indexing purposes.
IntroductionThe introduction should provide background informa-
tion to allow the reader to understand and evaluate the
Instruction for Authors1 147
results of the present study and describe the purpose of the undertaken research. However, broad “academic lectures” on the subject and extensive literature reviews should be avoided.
ExperimentalMaterials and MethodsThis section should contain description of materials (bio-
logical and others) used and sufficient technical information so that the experiments can be repeated. For commonly used materials and methods (e.g. commonly used media, protein determination) a simple reference is sufficient. Novel or modified procedures should be described in detail.
When a large number of microbial strains or mutants were used in a study, include strain tables identifying the sources and properties of the strains, mutants, bacterio-phages, plasmids, etc.
In the unit description, the space should be put between the number and the unit (2 mM NOT 2mM). Units should be given in SI system, however, for practical reason:
•For a liter designation “l” not “L” should be used (1 l NOT 1 L, 20 mg/ml NOT 20 mg/mL)
•Inthedescriptionofcentrifugingconditions,thevalueshould be presented rather in “g” not in “rpm” (for example 20 000 × g)
Latin species names are written in full the first time the name appears in text; subsequently, only use the first let-ter of the genus name followed by the species epithet (e.g. Escherichia coli, then E. coli).
ResultsIn the Results section, only the results of the experi-
ments should be include; reserve extensive interpretation of the results for the Discussion section. When justified by the nature of the paper the Results and Discussion sec-tions may be combined into Results and Discussion chap-ter. The results should be presented as concisely as possible and illustrated with tables or figures if applicable (presen-tation of the same results in both tables and figures is not acceptable). The use of graphs to present data that might be more concisely presented in the text should be avoided and illustrative materials must be limited to those that are absolutely necessary to demonstrate the original experimen-tal findings. Number figures (Arabic numerals) and tables (Roman numerals) in the order in which they are cited in the text, and be sure to cite all figures and tables.
Tables. Each table must be typed on a separate page and numbered with a Roman numeral (Table I, etc.) in the order it is cited in the text. The headings should be suffi-ciently clear so that the data will be understandable without reference to the text. Explanatory footnotes are acceptable. Prepare your tables as simple as possible in text file, not in Excel. No “decorative” frames should be made.
Figures (graphs, diagrams etc.) should be submitted ready for reproduction, each in a separate file. Files should have size and resolution as intended by authors and must be saved in tiff format (with LZW compression). Proper resolution is 300 dpi for greyscale and colour, 600 dpi for
combination art (lettering and images), and 1200 dpi for line art. Instruction how to prepare figures is available at Cadmusdigital art.
Figures should be numbered as in the text (Arabic numerals, Fig. 1., etc.) and marked with the name of the first author. Figures should be understandable without referring to the text. Original recorder tracing (outprints) of NMR, IR, ESR spectra etc. are not acceptable for reproduction; they should be redrawn. Figure titles and legends must be listed on a separate page.
Black and white figures are free of charge. For current colour pages charge, please contact editorial office at [email protected].
New nucleotide sequences must be accompanied by the accession number obtained from proper databases and should be included in the text.
DiscussionThe Discussion should provide an interpretation of the
obtained results in relation to previously published work and to the experimental system at hand and should not con-tain extensive repetition of the Results section or reiteration of the introduction. In some papers the Results and Discus-sion can be combined into one section as mentioned above.
AcknowledgementsAcknowledgements for financial support and for a per-
sonal assistance (with the permission of person named) are given in two separate paragraphs below the main text.
LiteratureIn text, references should be cited by the names of
the authors and the year of publication, e.g. “Nowak and Kowalski (1999) stated that...”; “as previously described (Nowak and Kowalski, 2000; Nowak, 2005)”. When a paper has more than two authors, the first author’s name should be followed with et al. and the year of publication, e.g. Nowak et al., 2002. While references occur that are not identified by the authors’ names and year, use a, b etc. after the year (Nowak et al., 2002a; 2002b).
The list of the papers cited (Literature) must be arranged alphabetically according to the last name of the first author and not numbered. Papers with one only author are listed in chronological order (the earliest first); papers with two authors are listed alphabetically according to the last name of the first author and by the last name of the second author; paper with three or more authors appear as those with two authors and are listed chronologically. When the paper has more than ten authors, give the names of the first ten, fol-lowed by “and others”. For citations of books, books chap-ters, thesis, printed conference proceedings etc. see exam-ples given below. Please follow the punctuations, brackets, capital letters etc. exactly as shown. Put “and”, not “&” before the last author’s name.
Examples
Books and bookchapters• Last name Initial., Initial. Last name and Initial.
Last Name. Year. Title, edition. City
Instruction for Authors 1148
For example:• Sambrook J., E.F. Fritsch and T. Maniatis. 1989.
Molecular Cloning; a Laboratory Manual, 2nd ed. Cold Spring Harbor, NY: Cold Spring Harbor Laboratory.
• Snyder L. and W. Champness. 2003. Molecular Gene-tics of Bacteria. 2nd ed. ASM Press, Washington, D.C.
• Funnel B.E. and G.J. Phillips (eds). 2004. Plasmid Biology. ASM Press, Washington, D.C.
• Belfort M., V. Derbyshire, M.M. Parker, B. Cousineau and A.M. Lambowitz. 2004. Mobile introns: pathways and proteins, pp. 761–783. In: Funnel B.E. and G.J. Philips (eds). Plasmid Biology. ASM Press, Washing-ton, D.C.
Journal articles
For one author:• Last name Initial. Year. Title. Journal Name volume:
pages. For example Eckhardt T. 1978. A rapid method for
identification of plasmid desoxyribonucleic acid in bacteria. Plasmid 1:584–588.
For two authors: • Last name Initial. and Initial.Last name. Year. Title.
Journal Name volume: pages. For example Sołyga A. and D. Bartosik. 2004. Entrap-
ment vectors – how to capture a functional transpos-able element. Pol J. Microbiol 53: 139–144.
For 3–10 authors:• Last name Initial., Initial. Last name and Initial.
Last name. Year. Title. Journal Name volume: pages. For example Bartosik D., M. Szymanik and J. Baj.
2004. Identification and distribution of insertion sequences of Paracoccus ventivorans. Appl. Environ. Microbiol. 69: 7002–7008.
For morethan 10 authors:• Last name Initial., Initial. Last name, Initial. Last
name, Initial. Last name, Initial. Last name, Initial. Last name, Initial. Last name, Initial. Last name, Ini-tial. Last name, Initial. Last name and others. Year. Title. Journal Name volume: pages.
For example Roberts R.J., M. Belford, T. Bestor, A.S. Bgagwat, T.A. Bickle, J. Bitinaite, R.M. Blumen-thal, S.K. Degtyarey, D.T. Dry den, K. Dybyig and others. 2003. A nomenclature for restriction enzymes. DNA methyl-transferases, homing endonucleases and their genes. Nucleic Acids Res. 31: 1805–1812.
Articles published in other language than English – title should be translated to English, the original language should be stated in parenthesis.
• Last name Initial. Year. Title (in original language) Journal Name volume: pages.
For example Bartosik D. 2001. Bacterial plasmids sta-bility (in Polish). Post. Biochem. 47: 138–145.
Thesis• Last name Initial. Year. PhD Thesis (optional title)
Affiliation. City. Country. For example Szymanik M. 2006. Ph.D. Thesis. Warsaw
University. Warsaw. Poland
Conference proceedings (selected cases)• Last name Initial., Initial. Last name and Initial.
Last name. Year. Title. Abstracts of Conference name. City, Country, page(s).
For example Dziewit L., M. Jazurek, L. Drewniak, J. Baj and D. Bartosik. 2006. Identification of a novel family of addiction systems. Abstracts of International Plasmid Biology Conference. Plasmid Biology 2006. Fallen Leaf Lake, South Lake Tahoe California. USA. p. 163.
Internet articles• Names. Year. Title. WWW address. Access date. For example Pais V.M., T. Santora and D.B. Ruks-
talis. 2013. Fournier gangrene. http://emedicine.med-scape.com/article/2028899, 2014.08.20.
Papers in press, personal communications and unpub-lished results should not be included in the Literature cita-tion list.
Preparation of Manuscripts– Short communicationsA short communication is intended for the presenta-
tion of brief observations that do not warrant a full-length paper. Short communication should be submitted the same way as a full-length paper. Each Short communication must have an abstract of no more than 100 words and 30–35 pre-cise key words. Manuscript should be formatted without section headings in the body of the text. All the required parts (introduction, methods, results and discussion) except for the Literature must be given in single section. Total length should not exceed 10 double lined standard pages including illustrative material (in total no more than 3 fig-ures and tables). Short communications undergo the same review process as full length papers and are not printed more quickly.
ProofsProofs will be e-mailed (as.pdf file) to the correspond-
ing author. The corrections can be added as notes in .pdf file (available in the newest Adobe Reader) or as a text file with listed changes
CopyrightsSubmission of the manuscript implies that the research
presented has not been published before (except in the form of a conference abstract or a part of PhD thesis). Transfer of copyrights to the publisher becomes effective if and when the article is accepted for publication. All articles published in Polish Journal of Microbiology are protected by copy-rights which cover the exclusive rights to reproduce and distribute the article as well as the translation. No part of the published material can be reproduced without obtaining written permission from the publisher.


