Embed Size (px)
Citation preview

POLITECNICO DI TORINO Master’s Degree in Mechanical Engineering
Analysis of a bearing production line to improve performance
Thesis supervisor: Graduating student:
Prof. Maurizio Schenone Mario Casale
Thesis co-supervisor:
Dr. Paolo Silvestro
Academic year 2020-2021

2
Summary
Abstract ................................................................................................................. 5
1 The Companies: SKF Industries S.p.A. and DMI s.r.l. ............................. 9
2 The Project ................................................................................................... 11
2.1 Product and Production Process Analysis ........................................................ 13
2.1.1 The Product ............................................................................................... 13
2.1.2 The Production Process ............................................................................ 15
2.2 The Machinery .................................................................................................. 17
2.3 Layout Analysis ................................................................................................ 19
2.3.1 Layout definition ........................................................................................ 19
2.3.2 Material Handling System ......................................................................... 22
2.4 The Revamping process .................................................................................... 26
2.4.1 Advantages and disadvantages .................................................................. 28
2.4.2 Revamping procedure followed by DMI s.r.l. ........................................... 31
2.4.2.1 Revamping of mechanical components ........................................................ 31
2.4.2.1.1 The use of 3D printing .......................................................................... 32
2.4.2.2 Revamping of pneumatic circuit .................................................................. 34
2.4.2.2.1 Pneumatic cylinders choice and air consumption evaluation .............. 34
2.4.2.2.2 Limit switches choice ............................................................................ 36
2.4.2.2.3 Distribution valves choice .................................................................... 38
2.4.2.2.4 LFR unit installation ............................................................................. 39
2.4.2.3 Revamping of electrical components ........................................................... 43
2.4.2.3.1 Electrical panel composition and installation ...................................... 43
2.4.2.3.2 PLC choice ........................................................................................... 49
2.4.2.3.3 Safety PLC choice ................................................................................. 54
2.4.2.3.4 Human Machine Interface – HMI choice ............................................. 55
2.5 CE marking process .......................................................................................... 65
2.5.1 Risk Assessment and Risk Reduction procedure ....................................... 67
2.5.1.1 Risk assessment procedure from ISO 12100 standard ................................. 67
2.5.1.2 Risk reduction procedure ............................................................................. 75

3
2.5.1.2.1 Guards and safety distance choice from ISO 14120 and ISO 13857
standards .............................................................................................. 76
2.5.1.2.2 Choice of safety components different from guards ............................. 82
2.5.1.2.3 Residual risk management .................................................................... 88
2.5.1.2.4 Risk reduction through control systems from ISO 13849 ..................... 88
3 MIB OR machine ....................................................................................... 101
3.1 MIB OR machine revamping ......................................................................... 103
3.1.1 Mechanical components revamping ........................................................ 103
3.1.2 Electrical components revamping ........................................................... 103
3.2 Measurement system analysis ........................................................................ 109
3.2.1 Instrument capability analysis ................................................................. 111
3.2.2 repeatability and Reproducibility (r&R) analysis ................................... 115
3.3 MIB OR: the first key machine for process improvement ............................. 124
3.3.1 Statistical Process Control (SPC) ........................................................... 124
3.3.2 Temperature Compensation .................................................................... 127
3.3.3 Self-Tuning Control System (STCS) ........................................................ 129
3.3.4 Final Results Analysis ............................................................................. 130
4 XHM80 machine ........................................................................................ 133
4.1 XHM80 Machine Revamping ........................................................................ 135
4.1.1 Mechanical components revamping ........................................................ 135
4.1.2 Pneumatic components revamping .......................................................... 137
4.1.3 Electrical components revamping ........................................................... 139
4.2 Measurement system analysis ........................................................................ 144
4.2.1 Instrument capability analysis ................................................................. 145
4.2.2 Linearity analysis .................................................................................... 146
4.3 XHM80: the second key machine for process improvement.......................... 148
4.3.1 First option for improvement ................................................................... 149
4.3.2 Second option for improvement ............................................................... 150
5 MVM machine ........................................................................................... 152
5.1 MVM machine revamping .............................................................................. 153
5.1.1 Mechanical and Pneumatic components revamping ............................... 153
5.1.2 Electrical components revamping ........................................................... 155

4
5.2 Measurement system analysis ........................................................................ 164
5.3 MVM: the third key machine for process improvement ................................ 168
6 Conclusion and future developments ....................................................... 171
6.1 Conclusion ...................................................................................................... 171
6.2 Possible future developments ......................................................................... 171
6.2.1 Software improvement for Error & Troubleshooting functions .............. 171
6.2.2 Digitalization of production through an increase in the level of automation
in an Industry 4.0 perspective ................................................................. 173
6.2.3 Implementation of a traceability solution through a Data Matrix Code . 175
Bibliography ..................................................................................................... 178
Websites............................................................................................................. 179

5
Abstract
This thesis work was born following an internship experience at the company DMI-
Divisione Meccanica Industriale s.r.l. located in Cassino (FR), which works in the field
of development and production of industrial machinery, prototyping of components and
automated systems for the various SKF plants around the world. The project, subject of
this thesis, concerns a complete revamping of an entire production line of deep groove
ball bearings (DGBB) destined for the SKF plant in Sopot, Bulgaria.
The revamping process had as its ultimate goal to create an automated production line,
which has the following advantages:
Greater flexibility
Faster speed
Increased productivity through less set-up times, downtime and reduced errors
Higher quality and less waste thanks to sensors that monitor production in real
time
Greater product competitiveness thanks to greater functionality resulting from the
interconnection of machinery
The first step towards the realization of the project was the definition of the line layout
respecting the bearing production process, from the grinding of the rings to the final
controls, and the design of the transfers made by means of motorized conveyors.
Subsequently, a complete revamping of the pneumatic and electronic components was
carried out for each of the machines, while each worn mechanical part or in need of
improvement was designed by optimizing its characteristics through FEM analysis within
the R&D area. As regards the electronic part, importance was given to the possibility of
developing a machinery from an industry 4.0 perspective, favouring the interconnection
of machinery aimed at centralizing production data and improving the production process
which also passes through the implementation of a User-friendly Human Machine
Interface (HMI).
For the pneumatic components, on the other hand, the final objective was the optimization
of the consumption of compressed air and the improvement of the production and safety
standards of each machinery.

6
Given the large number of machines that made up the line, during the development of the
revamping activities, I concentrated on three machines, which the know-how of DMI s.r.l.
established to be key machinery for the correct operation of the line in order to maintain
a high production performance. The machines in question are:
MIB OR, measuring machine that checks and measures the outer diameter, taper
and taper of the outer ring;
XHM80, a machine that performs bearing pairing by plastically deforming the OR
and inserting the balls between the two rings;
MVM, a machine that detects and measures the vibrations and noise of the kitchen
by rotating the inner ring and holding the OR stationary.
In addition to assisting in the revamping activities, I studied the ISO 12100 and 13849
regulations which allow you to perform an assessment of the risks of the machine and a
reduction of the same with consequent management of the residual risk.
For each of the machines analysed, I performed the testing and evaluation tests, in
particular I performed statistical evaluation tests of the quality of the measurement
systems according to SKF standards, with the help of the Minitab software. At the end of
the revamping process of each of the three machines and with the results of the efficiency
tests of the machines in hand, I carried out a research activity regarding the improvements
that could be made, some then implemented and others not, to each of the three machines
in order to improve the operating performance of the line.
The MIB OR machinery, at the end of the revamping process, was analysed in terms of
instrument capability and repeatability and reproducibility and it was possible to evaluate
the reliability of the measurements of this machinery. My research, however, led to the
conclusion that the creation of an automated process control would certainly have
increased the operating performance of the line.
The MIB OR, in fact, performs a measurement activity on the outer rings which are
ground by the CL machine placed off-line and whose dimensions do not allow a large
number of machine stops given the time required to stop the wheels which amounts to
more than 5 minutes. Therefore the idea was to detect, thanks to the installation of the
GME III owned by SKF, any conditions of out of control of the grinding process and
implement the possibility of sending compensation signals of the working parameters to
the CL to try to obviate the operating problems of the machine without the need to activate

7
a machine stop every time, leaving this last possibility in the event that the feedback
command has no beneficial effect (for example in the case in which the out-of-control
conditions derive from an excessive wear of the grinding wheel).
As for the XHM80 machinery, however, the analysis of the efficiency of the operation of
the machinery consisted of an assessment of the instrument capability and linearity of the
measurement of the machinery. The results of these analyses highlighted the reliability of
the machinery. At this point I started a research activity to look for solutions that would
allow to increase line performance; none of my proposals, however, was deemed
appropriate and I report the reason below.
The first proposal was to use a probe, certainly more precise than the current conical
measuring mechanism, to detect the measurements of the IR ring before pairing the
bearing as the range of variation of the IR measurements exceeded the micron and the
number of rejects made as a result of these measurements was too high. The observation,
although correct, was not followed up as the implementation of a probe would have been
too expensive. At this point I put forward the idea of using GME III to create an automated
process control to correct the raceway lapping machinery of both the outer and inner ring,
but in this case it would have been necessary to add two Post- Process immediately after
the aforementioned grinding machines as sending a correction signal after the different
machining phases that the rings, before reaching the XHM80 had undergone, would have
led to the rejection of all the rings on the line between the grinding machines and the
XHM80. The second hypothesis of improvement was also discarded due to the costs that
its implementation would have led to sustain.
The last machine I analysed was the MVM machine. First of all, unlike the previous
machinery, the MVM machinery was subjected to a statistical analysis of quality by
attributes rather than by variables as it was sufficient for the machinery to evaluate the
ability to recognize a good bearing from a bad one simply by measuring the vibrations of
50 master bearings whose characteristics were known. Having detected the ability of the
machinery to perform reliable measurements, I concentrated on carrying out functional
tests online by analysing bearings assembled and greased in the company. These tests,
thanks to the use of the BVR+ software, capable of performing a frequency analysis of
the vibrations generated by the rotating bearing, but above all of recognizing the cause of
the bearing discard, have highlighted the presence of numerous dirty bearings. My

8
research activity has therefore concentrated on finding a solution to the dirt accumulated
in the bearing; research that led to the need to add demagnetizers and washing machines
to the line to help clean the bearing and remove dirt. This solution, as can be seen from
the layout presented initially, has been implemented and the number of waste due to dirt
has significantly decreased.
In the last days of my internship, I dedicated myself to researching further improvements
that can be made to the machinery, but also to possible applications of the line from an
industry 4.0 perspective. Therefore, at this stage I have deepened my knowledge about
SCADA systems and MES and ERP software that allow production control, but not only.
In addition to what has just been said, I have dedicated myself to the study of product
traceability using vision devices. The last chapter of this thesis is therefore dedicated to
the future developments of the line including further improvements.

9
1 The Companies: SKF Industries S.p.A. and DMI s.r.l.
This paper comes from an internship experience carried out at the DMI-Divisione
Meccanica Industriale S.r.l. which is a company located in Cassino (FR). DMI S.r.l was
founded in 2001 and replaced the previous company that had worked in collaboration
with SKF since 1960. The company has developed thirty years of experience in the
development of machinery, prototyping of components and automation systems,
refurbishment of machinery and SKF bearing production lines.
Picture 1 – DMI-Divisione Meccanica Indutriale S.r.l. plant
Thanks to the high degree of competence that the company has developed in the field and
through continuous R&D activities, it fits well into the modern production reality, being
able to complete important challenges in terms of production quality and delivery times.
Currently the company plays a fundamental role in the entire production process of
various SKF production plants around the world; in fact, although the market of DMI

10
S.r.l. has developed at 360° in the world of the closest SKF plant in Cassino with which
it shares a Just-in-Time warehouse for most of the line machinery, other collaborations
with SKF factories are important like the ones with SSBC or ATC of Shanghai and
Tortuguitas in Argentina up to those with the SKF plant in Puebla in Mexico, Pune and
Bangalore in India.
The company's know-how is mainly developed around three macro-categories of
machinery related to SKF production lines:
Grinding machinery;
Bearing assembly machinery;
Ring (both IR-Internal Ring and OR-Outer Ring) and the complete bearing control
machinery.
For each of these machines, the company develops the project in turn-key mode, starting
from feasibility and budgeting analyzes up to the production of mechanical components,
purchase of electrical and pneumatic sales, assembly and CE certification including
technical documentation.
The company carries out two types of work:
A direct proposal to the customer about prototypes aiming at optimizing both the
process and the final product;
An order, which follows a technical specification sent by the final customer; and
it is precisely to this category that the project object of this thesis belongs.

11
2 The Project
Following a request for a complete revision of a bearing production channel for SKF in
Sopot (Bulgaria), DMI evaluated the possibility of a machinery complete revamping. The
desire to upgrade the machinery towards an industry 4.0 production perspective comes
from the need to provide a qualitatively better product with reduced and optimized
production costs. The modernization of the machinery towards a 4.0 perspective is mainly
developed with the implementation of new and more performing electronics capable of
allowing the on-line data to come from the machinery in the production phase.
The possibility of completely replacing the electronic part of the machines allows you to
install the necessary technology such that on each machine it must be possible to obtain
through the hardware, in 4.0 industry application:
Digitization (Computerization): the first step is to digitalize the product, making
it capable of providing digital data that can be analyzed in the later stages of the
process. This is done through the introduction of electronic boards and sensors
which, in addition to acquiring the significant data of the machinery, make the
human-machine interface (HMI) more advanced and intuitive. With the
introduction of an electronic board of this type on board of each machine, it is
possible to obtain several advantages including: greater ergonomics, functionality,
flexibility and above all more information for the operator who manages it,
ensuring an increase in productivity;
Connectivity: the second step is to equip the machines with remote connectivity.
The initial choice of hardware is always made with this in mind, and wired or
wireless connection modules are provided such as Ethernet rather than Wi-Fi or
Bluetooth, to name just a few examples. The innovation process in this step
consists of the collection of Machine to Machine (M2M) data, from the machines
sold all round the world, that are brought together centrally on a remote server in
the cloud (Cloud Computing) or on a local server in the customer's company;
The predictive ability: the next step is to process all this huge amount of data using
analysis and forecasting algorithms. Thanks to AI and Machine Learning, it is
therefore possible to create alert systems, configure predictive maintenance and

12
failure prevention processes that have the great advantages of increasing safety
and reducing machine downtime. The advantage of this phase lies in the
possibility of predicting, on the basis of data from all the machines sold in the
world, which piece is about to break and replace it before that more damage is
created on the machine, thus avoiding an interruption of work more long and
therefore more costly in terms of lost productivity;
The other great advantage that can be obtained from the digitalization process of
its products from an Industry 4.0 perspective is the commercial one: the sale of
the machinery can be accompanied by a 4.0 after-sales assistance and maintenance
package based on remote monitoring. In this way it is possible to introduce a new
strategy from which both the producer and the customer have a benefit: a broader
commercial offer for the former, a more advanced and efficient product with better
after-sales assistance for the latter.
The objectives of the project are:
Greater flexibility;
Faster speed;
Greater productivity through less set-up times, downtime and reduced errors;
Higher quality and less waste through sensors that monitor production in real time;
Greater product competitiveness thanks to greater functionality resulting from the
interconnection of the machinery.
Thanks to the refurbishment, an integrated system will be created whose benefits are:
Bidirectionality and proactivity: production scheduling can immediately become
executive in the department and the operators in the department and / or the system
itself can alert the scheduling office in real-time on any critical issues encountered
(broken machine, problems in the order of production which is running, etc.);
Correlated and aggregated information: the system feeds and pervades the entire
company, offering multiple users the ability to operate simultaneously - each
according to the assigned skills and responsibilities - by correlating information
between factory and business processes. The algorithmic power that for years has
been the privilege of a few, is wisely distributed over several people, through
simple and immediate use interfaces;

13
Visibility: the factory ceases to be a "black box" and becomes "transparent" thanks
to a system capable of guaranteeing maximum real-time visibility to each actor
involved in Planning and Execution activities (administration, commercial area,
technical office , production planning, logistics, warehouse, shipping);
Furthermore, the interconnection of the machines with a MES "Manufacturing Execution
System" guarantees:
Precise calculation of the performance indices of production plants;
Automation of data collection, interfacing with processes and production
progress;
Real-time reporting of critical events to take corrective actions in time;
Process traceability;
Timeliness and accuracy of the data collected;
Measurement of consumption;
Real-time production OEE;
Setup of automatic production lines with considerable time reduction and
configuration errors reduced to zero.
2.1 Product and Production Process Analysis
2.1.1 The Product
As already mentioned, the revamped production line is dedicated to the production of
rolling bearings. The term rolling bearing is used to describe that class of bearings in
which the main load is transferred by means of elements in the presence of rolling contact
rather than sliding one [8]. In the particular case of study, the considered production line
has to do with radial bearings with a single row of stainless steel balls.
Single row deep groove ball bearings are particularly versatile, suitable for high or even
very high speeds, robust and they have minimal maintenance requirements. They can
support axial loads in both directions as well as radial loads, even at high speeds. Single
row deep groove ball bearings are the most widely used of all bearing types and are
available in a wide range of SKF designs and sizes.

14
In the particular case analysed we are talking about a bearing 6306 type, which is executed
by the production line in the following types:
6306-Z/2Z: bearing with a shield in stamped sheet metal on one side of the bearing
(Z) or on both sides (2Z). This type of bearings are intended for applications where
the inner ring rotates, in fact if the outer ring were to rotate there would be
problems with the lubricating grease leaking from the bearing; [9]
Picture 2 - SKF 6306-Z bearing type
6306-RZ/2RZ: bearing with low friction seal in acrylonitrile butadiene rubber
(NBR) with a stamped sheet metal reinforcement on one side of the bearing (RZ)
or on both sides of the same (2RZ). These bearings allow operation at the same
high speeds as bearings with Z shielded bearings, but are more effective in terms
of sealing. The choice of gasket material, namely NBR, guarantees good wear
resistance and a wide range of operating temperatures (-40 ÷ +100°C for
continuous use and up to 120°C for short periods); [9]
Picture 3 - SKF 6306-RZ bearing type
15
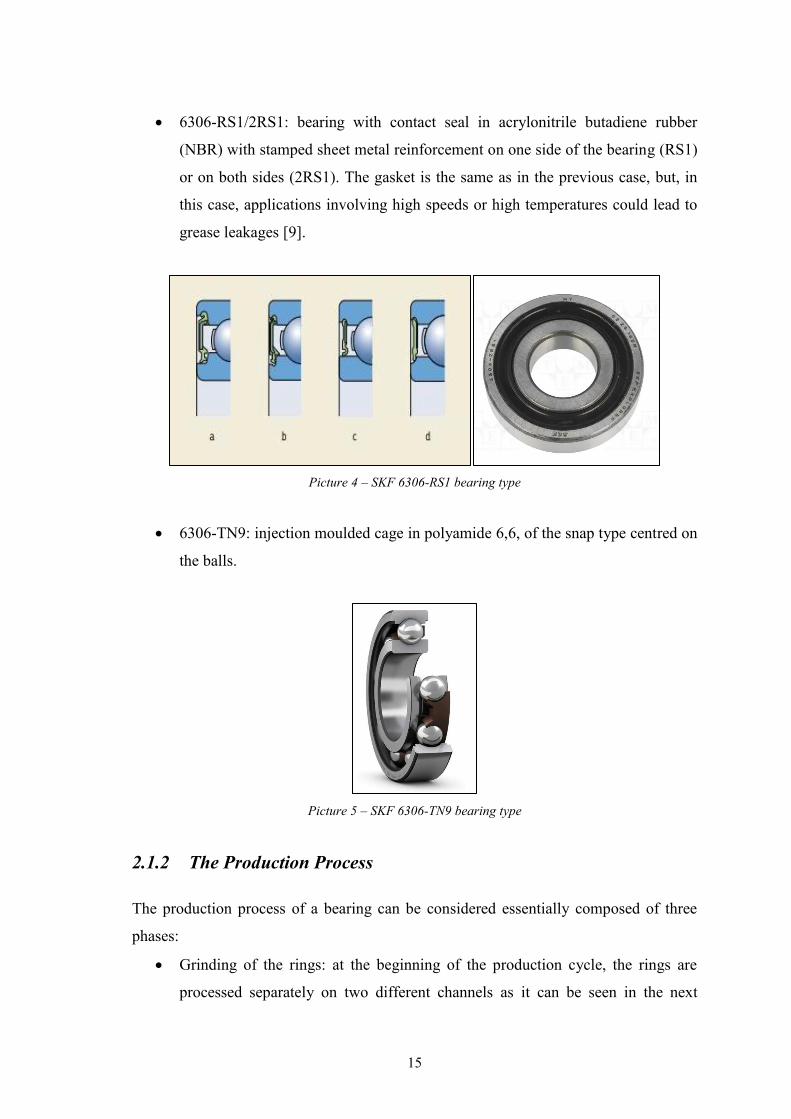
6306-RS1/2RS1: bearing with contact seal in acrylonitrile butadiene rubber
(NBR) with stamped sheet metal reinforcement on one side of the bearing (RS1)
or on both sides (2RS1). The gasket is the same as in the previous case, but, in
this case, applications involving high speeds or high temperatures could lead to
grease leakages [9].
Picture 4 – SKF 6306-RS1 bearing type
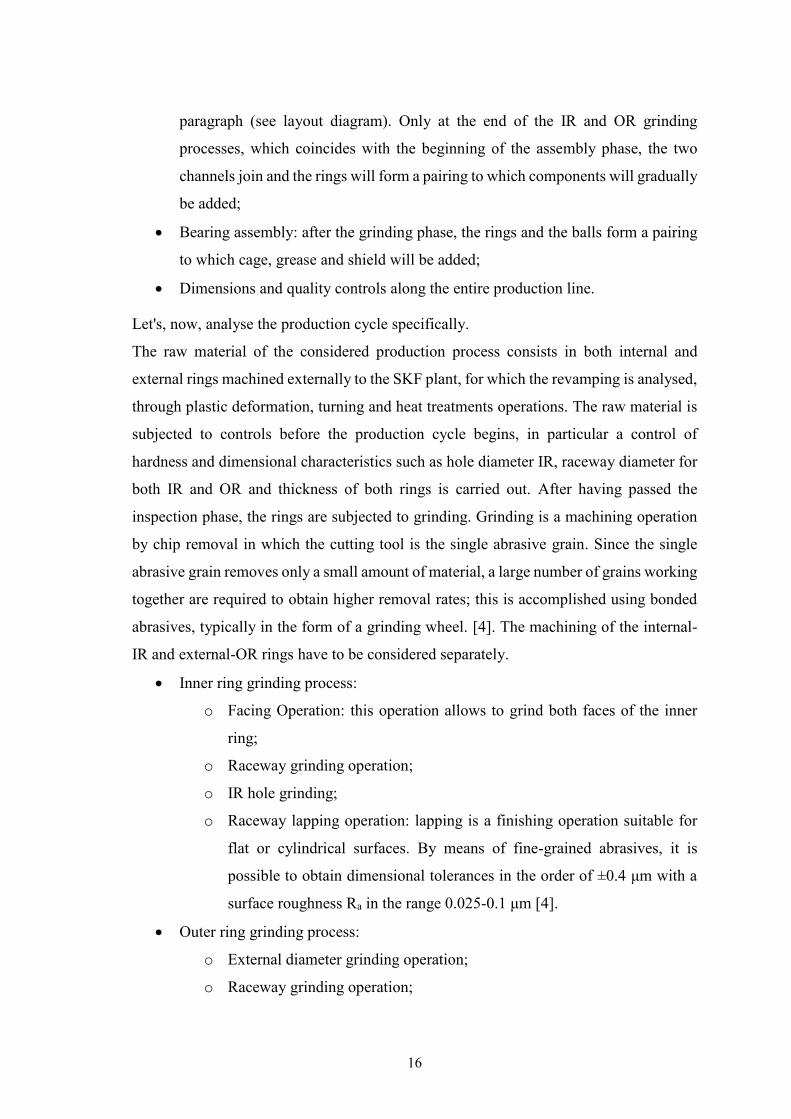
6306-TN9: injection moulded cage in polyamide 6,6, of the snap type centred on
the balls.
Picture 5 – SKF 6306-TN9 bearing type
2.1.2 The Production Process
The production process of a bearing can be considered essentially composed of three
phases:
Grinding of the rings: at the beginning of the production cycle, the rings are
processed separately on two different channels as it can be seen in the next
16
paragraph (see layout diagram). Only at the end of the IR and OR grinding
processes, which coincides with the beginning of the assembly phase, the two
channels join and the rings will form a pairing to which components will gradually
be added;
Bearing assembly: after the grinding phase, the rings and the balls form a pairing
to which cage, grease and shield will be added;
Dimensions and quality controls along the entire production line.
Let's, now, analyse the production cycle specifically.
The raw material of the considered production process consists in both internal and
external rings machined externally to the SKF plant, for which the revamping is analysed,
through plastic deformation, turning and heat treatments operations. The raw material is
subjected to controls before the production cycle begins, in particular a control of
hardness and dimensional characteristics such as hole diameter IR, raceway diameter for
both IR and OR and thickness of both rings is carried out. After having passed the
inspection phase, the rings are subjected to grinding. Grinding is a machining operation
by chip removal in which the cutting tool is the single abrasive grain. Since the single
abrasive grain removes only a small amount of material, a large number of grains working
together are required to obtain higher removal rates; this is accomplished using bonded
abrasives, typically in the form of a grinding wheel. [4]. The machining of the internal-
IR and external-OR rings have to be considered separately.
Inner ring grinding process:
o Facing Operation: this operation allows to grind both faces of the inner
ring;
o Raceway grinding operation;
o IR hole grinding;
o Raceway lapping operation: lapping is a finishing operation suitable for
flat or cylindrical surfaces. By means of fine-grained abrasives, it is
possible to obtain dimensional tolerances in the order of ±0.4 μm with a
surface roughness Ra in the range 0.025-0.1 μm [4].
Outer ring grinding process:
o External diameter grinding operation;
o Raceway grinding operation;

17
o Raceway lapping operation
After the grinding operations have been completed, the assembling phase begins.
The operations that are carried out in order to assemble the bearing also include controls
and are listed below:
Pairing operation;
Caging operation;
Free running inspection;
Vibration measurement;
Radial clearance measurement;
Greasing operation;
Shield insertion operation;
Shield control;
Laser marking operation;
Addition of the protective film operation;
Visual inspection.
The production cycle just defined is the starting point for defining the layout. In the
specific case study, the SKF production line already had a layout but a new definition of
the latter was necessary as can be seen from the next chapter.
2.2 The Machinery
In this paragraph, I want to carry out an analysis, accompanied by a quick description of
the operation, of the revamped machinery that will make up the SKF production line. As
for the description of the production process, also in this case the grinding machines will
be divided according to whether they work on internal or external rings.
For the machining of the inner ring, the machines are the following:
CD IR - The machine is designed and built for ring hardness control;
Pre-Process IR – Hole diameter, thickness and raceway diameter measuring
machine;
SPC 62B - Ring face grinding;
SGB 55 - IR raceway grinding;

18
SHG 55 - IR inner diameter hole grinding;
MIB IR - IR inner diameter and taper measuring machine;
Demagnetizing and washing machines;
IRL - IR raceway lapping;
Demagnetizing and washing machines.
For the machining of the outer ring, the machines are the following:
CD OR - Ring hardness controlling machine;
Pre-Process OR - Thickness and raceway diameter measuring machine;
CL 660 - OR outer ring grinding machine;
MIB OR - OR outer ring and taper measuring machine;
SSB 80 - OR raceway grinding;
FSF - OR raceway lapping machine
Demagnetizing and washing machine.
For the side of the line, concerning pairing and controlling machines, the machines are:
XHM 80 - Matching rings and insertion of balls;
HWA - Riveted/Clamped Cage Assembly;
TN9 - Plastic cage insertion;
Demagnetizing and washing machines;
MYD – Smoothness of the motion control;
MVM - Measurement of bearing noise and vibrations;
MGI - Radial clearance measurement of DGBB bearings;
HHM - Weighing and subsequent greasing of the bearing;
LBM - RS/Z bearing shield insertion;
MXI - Shield controlling machine;
Component control scale;
Laser marking machine;
Spray Running - Addition of protective film;
Visual inspection;
Manual Packing.

19
2.3 Layout Analysis
2.3.1 Layout definition
The first step of the revamping process covered by this thesis was the definition of the
layout. The study of plant layout has become one of the most important sectors of
industrial engineering; in general, a study of the plan layout is carried out when there is a
need to change the arrangement of the machines within the available area or when
improvements are made in correspondence with one or more production processes [5]
(both of them are characteristics of the problem of study).
The production line to be reconditioned had a linear layout for a total length of 58m and
is reported in the following picture 6.
Picture 6 – SKF production line initial Layout configuration
The first request for the work commissioned to the DMI-Divisione Meccanica Industriale
S.r.l. was the evaluation of a possible reduction in the length of the line. For this purpose,
the several layout possibilities were analysed until some were proposed to SKF and the
one in the following Picture 7 was approved with a reduced total length of 50.5 m.
At first, it was verified that the type of layout was suitable to meet the production
requirements. The layout configuration has been kept linear considering to create an
automated production line.

20
Picture 7 – Layout SKF production line
21
The use of an automated production line is justified because different products (4 bearing
types) are produced in batches by the system, since changeovers are required. Other
considerations carried out for the choice of this kind of production system are:
High demand, requiring high production quantities;
Stable product design, because frequent design changes are difficult to
accommodate on an automated production line since the sequence of the
processing operations could change requiring a change in the order of the
machines in the line;
Long product life, at least some years;
Multiple operations performed on the product during its manufacture.
It is important to highlight that the machines are installed linearly in a well-defined order,
strictly correspondent to the product production cycle. In a more deep analysis the layout
is segmented in-line, this means that it is composed by three line segments perpendicular
to each other, resulting to be, specifically, a U-shaped layout.
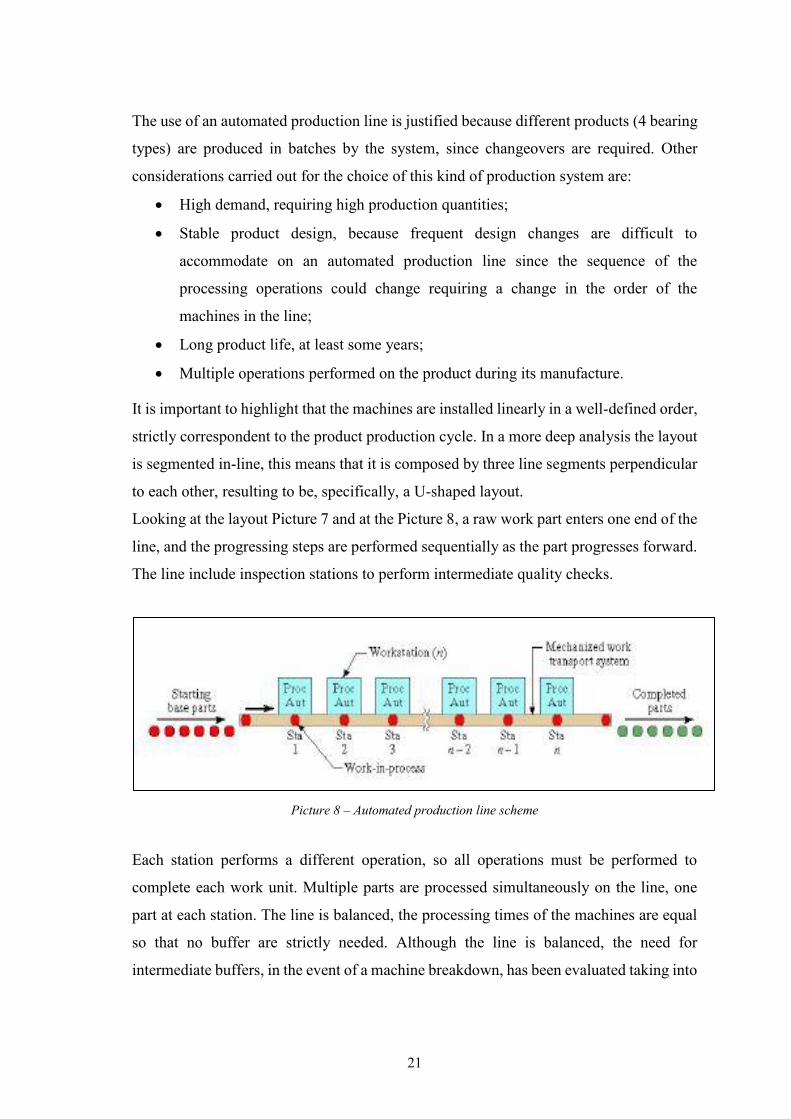
Looking at the layout Picture 7 and at the Picture 8, a raw work part enters one end of the
line, and the progressing steps are performed sequentially as the part progresses forward.
The line include inspection stations to perform intermediate quality checks.
Picture 8 – Automated production line scheme
Each station performs a different operation, so all operations must be performed to
complete each work unit. Multiple parts are processed simultaneously on the line, one
part at each station. The line is balanced, the processing times of the machines are equal
so that no buffer are strictly needed. Although the line is balanced, the need for
intermediate buffers, in the event of a machine breakdown, has been evaluated taking into

22
account the possibility of accumulating the workpieces on the belt upstream of the
machine subject to failure.
The advantages of the application of an automated production line will be:
Low amount of direct labour;
Low product cost, because the cost of the fixed equipment is spread over many
units;
High production rate;
Minimal work-in-process (WIP) and manufacturing lead time;
Minimal use of manufacturing floor space.
2.3.2 Material Handling System
Material handling system means the transport and management of materials along the
production line. From the times when transport was carried out using almost exclusively
the effort of man, the technique of transport has developed in the direction of a lower use
of human energy: the most varied devices suitable for transforming new energy sources
into useful work, have in fact replaced the effort of man.
The study of internal transport can allow the achievement of the following objectives:
Limit costs thanks to:
o A smaller number of material handling and recovery;
o Fewer routes;
o Better use of space;
o Increased productivity;
Reduce waste and losses;
Improve working conditions in the sense that
o Ensuring greater safety;
o Requiring less effort;
Increase the efficiency of the company [5].
In the case study, the handling of materials along the line was designed using a Flexlink
conveyor based on aluminium with low friction slide rails guiding a plastic multi-flexing
chain. By using this Material handling system it is possible to make the product to be
conveyed travel directly on the conveyor. The particular conveyor system used in the

23
X65-Flexlink (see Picture 9) which is suitable for a wide range of applications, such as
ball bearing or gear wheels transport, and preferable in high speed applications.
The chain used has a plain configuration characterised by a ultra-low wear and a width of
63 mm (see Picture 9).
Picture 9 - Flexlink X65
It is important to underline, from the layout, how height increases were necessary both to
load some machinery such as grinding machines and to allow the crossing of the internal
region of the production line. This crossing is necessary both for the re-joining of the two
channels IR and OR and to allow the line to close on itself in correspondence with the
machines that carry out the controls on the bearing at the end of the line. Therefore, if the
basic height of the conveyor along the line is 900 mm, with this height increase it reaches
2500 mm.
In the stretch of re-joining the IR and OR channels, the height increase is obtained using
vertical bend 90 ° as in Picture 10, which works like an elevator.

24
Picture 10 - Vertical bend 90°
On the other hand, the section of line which follows the MVM machine and crosses the
internal region of the channel is made by using the same elevator previously presented
for the raising phase, while the descent one is made by using a 180 ° curve with the
presence of the suitable wheel ( see Picture 11) and two inclined sections.
Picture 11 - Wheel bend 180°
The drawing of the path just presented is reported in the following Picture 12.

25
Picture 12 - Bearing path after MVM machine
Another important feature of the material handling system designed is the presence of
selectors along the line. These selectors allow the alternating feeding of the same
machines, as in the case of the grinding machines on the IR and OR channels, or they
allow the feeding of different machines depending on the processing operation required
by the processed bearing, as in the case of HWA or TN9, which respectively insert the
steel or plastic cage.
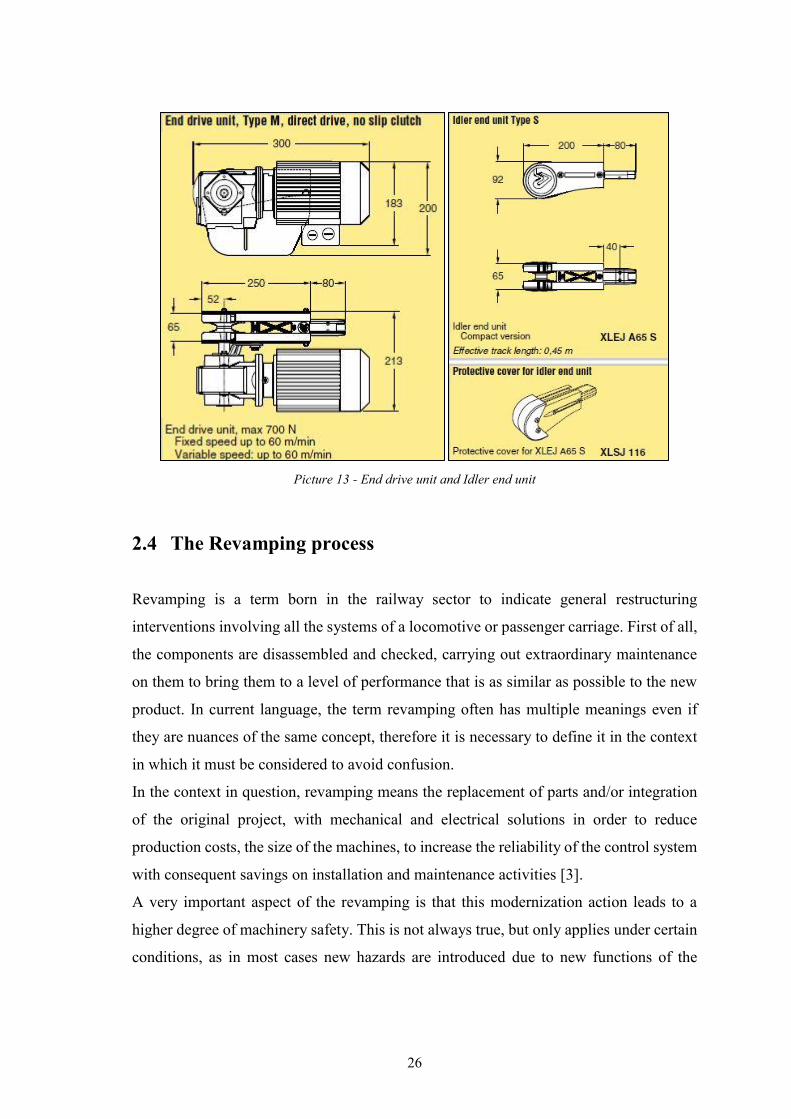
X65 conveyor system includes end drive unit and idler unit necessary to assure the
movement of the material handling mechanism. These components have been chosen
from a wide range depending on the speed and transmission required. The required
movement is a continuous movement at a medium speed, therefore the chosen
components are shown in the following Picture 13.
26
Picture 13 - End drive unit and Idler end unit
2.4 The Revamping process
Revamping is a term born in the railway sector to indicate general restructuring
interventions involving all the systems of a locomotive or passenger carriage. First of all,
the components are disassembled and checked, carrying out extraordinary maintenance
on them to bring them to a level of performance that is as similar as possible to the new
product. In current language, the term revamping often has multiple meanings even if
they are nuances of the same concept, therefore it is necessary to define it in the context
in which it must be considered to avoid confusion.
In the context in question, revamping means the replacement of parts and/or integration
of the original project, with mechanical and electrical solutions in order to reduce
production costs, the size of the machines, to increase the reliability of the control system
with consequent savings on installation and maintenance activities [3].
A very important aspect of the revamping is that this modernization action leads to a
higher degree of machinery safety. This is not always true, but only applies under certain
conditions, as in most cases new hazards are introduced due to new functions of the

27
revamped machine, which must be adequately reduced with the interventions identified
by the risk assessment [1].
A brief note should be made about the difference between these three words, often used
indistinctly without knowledge of the facts: revamping, retrofitting and restyling.
Revamping is a process intended to extend the life of a machine/plant, also in relation to
any regulatory updates on safety; retrofitting, on the other hand, is a process intended for
both the replacement of worn and obsolete components and the implementation of new
functions and systems that were previously absent.
Finally, the restyling is a process related mainly to the aesthetic aspect and can be better
interpreted as a restructuring but without actions to improve functionalities. To be precise,
it can be stated that what would actually be called retrofitting is often understood as
revamping, as it would not make sense, in most cases, to perform a pure replacement of
worn components with others of the same characteristics (otherwise would be necessary
a provision for a further replacement in a relatively short time) [1].
Picture 14 - Clear example of revamping: the original components were replaced with new components with similar characteristics, while only the control system was completely replaced

28
Picture 15 - Clear example of retrofitting: the new car has nothing to do with the original, as almost all components have been removed and replaced with equipment with additional functions
Picture 16 - Clear example of restyling: the components have been cleaned, replaced or fixed, but no functions have been added
2.4.1 Advantages and disadvantages
The choice of whether or not to carry out a revamping must be well thought out and has
both advantages and disadvantages. The first advantage is, without any doubt, the
adoption of recently built command and/or control systems and this implies the automatic
presence of interfaces ready for the 4.0 industry revolution, as well as with the new
computerized systems the average repair time decrease, since the machine directly
indicates the problem to be solved and the procedure to follow.
Another important aspect is the guarantee of compatibility: by replacing all or part of the
original components with new parts, the availability of spare parts is guaranteed for an
almost unlimited time. It can often happen that, in the event of a broken component of an

29
old machine, the owner is faced with the problem of finding a spare, if not original at least
compatible; in this case, the alternatives are custom-made manufacturing or the adoption
of additive manufacturing technologies, applicable only on condition that you have the
original design or at least the possibility of reproducing it with low cost technologies.
Last, but not least, is the advantage that comes from economic savings. Thanks to its
experience in the field, the DMI S.r.l. estimates that, for ordinary and non-special
machines, with a correctly designed and executed revamping it is possible to save from
one third to two thirds of the cost of a new machine with the same characteristics but
more recent than the one subjected to revamping.
Among the disadvantages of performing a revamping, for the company owning the
machinery/plant, the most relevant is certainly the need to temporarily block the operation
of the machine/plant to be modernized for the time necessary for maintenance
interventions. This block, which is especially necessary when complete disassembly,
sending the machinery to external companies and subsequent reassembly are needed, can
be particularly long [1].
The experience of DMI S.r.l. suggests a duration of 3-4 months for a revamping
intervention on a single machine. In the case-study, a complete revamping of a production
line, the time necessary to carry out all the operations was 6 months, but, for the line
another 1-2 months will be required to be operational again. This time is needed for
installation and setting up of the machinery.
As regards the aspects just noted, which can be considered the most important in the
choice of whether or not to execute a revamping, it seems quite obvious that performing
a revamping is always the best choice that the company that owns the machinery / plant
can make ( this is highlighted in the following figure 17).

30
Picture 17 - Convenience of revamping execution
To weigh the choice carefully, however, it is also necessary to take into account other
aspects that have not been considered so far and which can be listed as follows and they
can be divided among advantages and disadvantages.
We can therefore definitively say that the positive aspects that characterize the execution
of a revamping intervention are:
Higher revenue due to the increased productivity;
Lack of cost due to the accidents avoided following the safety measures;
Greater revenue that possibly derives from the improvement of the company's
image;
Savings on any PPE (Personal Protective Equipment) no longer necessary after
the intervention;
Savings on frequent maintenance due to sudden breakages with consequent, but
frequent, downtime;
Savings deriving from the use of easily available components for future
maintenance and on any repairs under warranty;
Savings on the purchase of a new machine and on the disposal of the old one.
The negative factors to be analysed before choosing to perform a revamping intervention
are the following:

31
Loss of money due to the stoppage of machinery for a time necessary to carry out
the intervention;
Cost of repairs, materials and labour used;
Costs due to the restarting of the machines/plant;
Costs due to the CE marking at the end of the intervention and the updating of the
risk assessment document (DVR);
Costs for the operators training;
The loss of revenue resulting from a possible resale of the old machine, as
functioning;
Cost of any software or hardware updates also for other company equipment
and/or adjustments to existing systems [1].
2.4.2 Revamping procedure followed by DMI s.r.l.
The procedure that allows the execution of a revamping, according to the company know-
how of DMI S.r.l. consists of the following passages:
Dismantling of mechanical, pneumatic and electrical parts;
Machinery Cleaning;
Painting;
Assembly of mechanical parts with completion of missing parts;
Assembly of electrical panel according to machine directive 2006/42/CE;
Assembly of the pneumatic system according to the 2006/42/CE machine
directive;
Construction of safety guards according to ISO 14120;
Machinery analysis of risks according to ISO 12100;
Machinery testing and validation;
2.4.2.1 Revamping of mechanical components
Therefore the first step involves the complete dismantling of the machinery, and the
assessment of the state of the mechanical components of the latter. The company know-

32
how foresees that the quality of the screws and their size are evaluated in order to reorder
the corresponding commercial products, the bearings are replaced as well as the springs.
The springs will be of a stabilized type as the stabilization treatment allows the product
to be guaranteed the acquisition of specific mechanical properties, as well as the
subsequent maintenance of the elastic memory typical of springs over time. The degree
of wear of the motion transmission components, from the slideways to joints and clutches,
is then immediately detected; when the degree of wear compromises the mechanical
functioning of the component, the latter will be redesigned. An example of completely
damaged transmission components is shown in the Picture 18, here are represented two
tooth clutches of a gearbox whose toothing is, for the one on the left, completely damaged
while for the other the breakage of four teeth has occurred.
Picture 18 - Damaged tooth clutches of a gearbox
2.4.2.1.1 The use of 3D printing
An important aspect of the company know-how is the use of 3D printing for the
realization of components to be replaced during the revamping phase, in particular this
technology is used for connection and fastening components. The material used for 3D
printing is photosensitive epoxy resin, specifically from the Tough and Durable family of

33
resins produced by Formlabs which includes more robust, functional and dynamic
materials, which can withstand compression, elongation, flexion and impact without
breaking. These resins are to be taken into consideration in cases where bending at limited
stress levels is preferable rather than breaking, and therefore it is ideal for designing
connectors and fastening elements. An example is shown in the figure 19, where the 3D
printed components are used to connect the pneumatic cylinder to the machine structure.
The components are shown on the left, while the application of the highlighted one is
reported on the right.
Picture 19 - Application of 3D printing on the pneumatic cylinder connection
3D printing technology also finds application in the production of components that
improve the working conditions of others. In the Picture 20 we find the use of 3D printing
to make the fixing components of the tube installed on the XHM80 machine that brings
the balls from the respective drawer, selected by the machine after the measurement of
the raceways of the rings, up to the bearing in assembly phase. In this case it was
necessary to replace the tubes necessary for the descent of the spheres and to optimize the
path of these avoiding excessive bending, the highlighted components have solved the
further problem of the orientability of the tubes.

34
Picture 20 – Application of 3D printing on the fixing of pipes on XHM80 machine
2.4.2.2 Revamping of pneumatic circuit
2.4.2.2.1 Pneumatic cylinders choice and air consumption evaluation
After the mechanical revamping is completed, the pneumatic one starts.
The revamping of the pneumatic component of the machinery begins with the dismantling
of the pneumatic circuit previously installed on the machine, and replacing all the pipes
that make up the compressed air distribution circuit to the actuators and with the
evaluation of the status of the pneumatic cylinders. When the pneumatic cylinders are to
be replaced (due to air loss and a decrease of the efficiency), they are purchased from the
same supplier as the cylinders to be replaced; when this is not possible, a compatible ones
are ordered and adapted. The cylinders installed on the machine must obviously satisfy
the request to minimize the consumption of compressed air.
The actuators are the final organs of an automatic system: their function is to perform the
operations controlled by the system; pneumatic cylinders, used in a normal revamping
process by DMI S.r.l., are the most common actuators in compressed air systems.
They represent the main means by which to push sleds, lift weights, block workpieces,
remove pieces, operate levers, etc. Pneumatic cylinders transform compressed air energy

35
into mechanical work, producing forces that are proportional to the supply pressure used;
it is therefore possible to obtain different performances with the same cylinder.
The cylinders are linear motors, as they produce a force which translates over a limited
stroke. By means of mechanical adaptations (hinges, gear systems, etc.) it is also possible
to obtain alternative angular rotations. The cylinders are divided into two groups, and are
chosen by DMI S.r.l. depending on the applications required by the machinery for which
the revamping is being carried out. The two categories are:
Double-acting pneumatic cylinders: the cylinder can perform work both in the rod
exit phase and in the re-entry phase. Obviously the two forces are different
because, at the same pressure, the two surfaces of the piston on which the
compressed fluid acts are different: in the rear chamber a part of the piston surface
is occupied by the rod [3] (Picture 21). Double-acting cylinders are recommended,
in any case, for large diameters and long strokes [2].
Picture 21 - Double-acting pneumatic cylinder
Single acting cylinder: the return of the piston is given by a spring placed in the
rear chamber. In this case the rear chamber does not have the air supply inlet and
the cylinder performs the work only in the outlet phase [3]. These cylinders
usually have a short stroke, between 20-50 mm, and are suitable for locking
mechanical parts during certain processes. The possibility of compensating, by
carrying out a more or less long stroke, any differences in size between different
pieces make them suitable for both series and single piece machining [2] (Picture
22).

36
Picture 22 - Single acting cylinder
The air consumption, having chosen the cylinders that will make up the pneumatic system
on the machine, for the machine is equal to the sum of the air consumptions calculated
for each actuator, both in the push and in the traction phase; It has been evaluated being
in the order of 1000 l/min.
For the thrust phase, the rod comes out, the following relationship applies:
𝑄𝑠 [𝑙
𝑚𝑖𝑛] =
𝜋𝐷[𝑚𝑚]2
4∙ 𝑐 ∙ (𝑝𝑟𝑒𝑙,𝑒𝑠𝑒𝑟𝑐𝑖𝑧𝑖𝑜[𝑏𝑎𝑟] + 1) ∙ 𝑛 [
𝑠𝑡𝑟𝑜𝑘𝑒
𝑚𝑖𝑛] ∙ 10−6
In case we consider the traction phase, the air consumption during the retraction of the
rod is equal to:
𝑄𝑡 [𝑙
𝑚𝑖𝑛] =
𝜋( 𝐷[𝑚𝑚]2 − 𝑑[𝑚𝑚]2 )
4∙ 𝑐 ∙ (𝑝𝑟𝑒𝑙,𝑒𝑠𝑒𝑟𝑐𝑖𝑧𝑖𝑜[𝑏𝑎𝑟] + 1) ∙ 𝑛 [
𝑠𝑡𝑟𝑜𝑘𝑒
𝑚𝑖𝑛] ∙ 10−6
where:
D[mm] is the bore diameter of the cylinder;
d[mm] is the rod diameter of the cylinder;
c[mm] is the stroke of the piston;
prel,esercizio = 4 bar is the working pressure (relative) of the machine;
t [s] is the cycle time;
n[stroke
min] =
60s
t is the number of strokes per minute of the piston.
2.4.2.2.2 Limit switches choice
The problem subsequently addressed by DMI s.r.l. in the revamping phase of the
pneumatic circuit placed on the machine was the choice of the limit switches to be

37
implemented on the circuit itself; the choice, in particular, fell on the use of magnetic
limit switches with Reed contact. Magnetic sensors, also called magnetic limit switches,
are used to detect the position of the piston of a cylinder without placing limit switch
elements in the movement area of the rod and to obtain a signal that can be used directly
in electrical circuits. The use of magnetic limit switches requires to apply permanent
magnets to the piston that produce a moving field with the piston itself (in this case DMI
srl will use cylinders from Festo which in the identification code report -A which stands
for adaptation for proximity sensor ). The magnetic field is transmitted outside the barrel
if the barrel itself is made of diamagnetic material (aluminium, brass, stainless steel).
Reed sensors are then placed on the outside of the barrel, with sheets in insulated phials,
so that when the magnet is far away the contact is open and when the plunger is in
correspondence with the Reed switch it closes [2]. The sensor used by DMI s.r.l. is a
sensor from Festo, model SME-1-LED-24-B shown in Picture 23. Using these sensors,
the examination of the status of the signals of a circuit is simpler as the latter are equipped
with LEDs that indicate the presence of the electrical output signal. The sensors are fixed
by directly using the tie rods of the cylinders (where they exist), or by introducing special
external guides on which the Reed contacts can be inserted. Position adjustment is made
easily with screw locking systems [2].
Picture 23 - Festo SME-1-LED-24-B, application and circuit

38
2.4.2.2.3 Distribution valves choice
In order to complete the process of defining the pneumatic circuit, it is necessary to
identify the type of direction control valves (distribution valves) that perform the function
of controlling the cylinders. These valves have the task of reversing the direction of the
motion of the piston by reversing the air supply to the two chambers of the cylinder and
can be controlled manually, pneumatically or electrically. The valves commonly installed
in the pneumatic circuits on the machine by DMI s.r.l. belong to the last type and are
called solenoid valves. In this case, the solenoid valves are used since a connection
between the electronic control unit and the pneumatic actuation unit is required since DMI
s.r.l. established that the control of the system will be entrusted to a PLC.
The solenoid valves installed on the machine are directly operated, this means that the
coil solenoid acts directly on the control valve, determining its position without passing
through a small pneumatic valve (in this case it would be indirect operation), and they are
powered at 24 V in direct current (DC). Depending on the application, the valves used in
the on-board system can be of two types: monostable and bistable. They are distinguished
as follows:
monostable valves: they switch when the coil is powered and therefore there is a
command signal, but when the latter fails, they automatically return to the rest
position; they are equipped with a single control coil and are provided with a
return spring;
bistable valves: they have two equilibrium positions, and to change position an
electrical impulse is required which feeds the coil and when this disappears the
valves belonging to this category maintain the last position reached; they are
equipped with two control coils each of which is entrusted with the switching of
the valves in one direction.
The on-board installation of the solenoid valves is performed by DMI s.r.l. taking
advantage of the possibility of creating valve blocks via Festo valve terminals. The valve
block can also be customized, leaving the possibility of integrating both monostable and
bistable valves in the same block. An example of a valve block is shown in the Picture
24, where the VTSA valve terminal installed on the TN9 machine is shown.

39
Picture 24 - Valve terminal by Festo installed on TN9 machine containing both monostable and bistable valves
2.4.2.2.4 LFR unit installation
The last aspect, of fundamental importance, to be kept in mind when completing the
revamping of the pneumatic component of the machinery is the need to treat the
compressed air entering the machinery. Compressed air treatment is necessary to achieve
the requirements of pneumatic equipment. The treatment operations consist either in a
more or less strong filtration, in the reduction and stabilization of the pressure, and in the
possible addition of suitable substances. In the general organization of the plant, the air
treatment groups are placed in the places of use, upstream of the pneumatic equipment.
Filtration is an essential treatment of compressed air and has the purpose of cleaning the
latter and eliminating the various impurities present. This protects the equipment and
prevents breakdowns due to a mixture of dust, water and oil. In fact, the impurities present
in the compressed air accelerate the wear of the pneumatic components, forming deposits
that damage above all the seals, with consequent leakage and pressure losses.
Pollutants are contained in the form of solid particles, oil, water. Each of these pollutants
is present in the air for specific reasons and requires a certain type of filter. Solid particles
can be extremely dangerous both for an abrasion action and for an occlusion effect of
small passage holes and are present because they are sucked in with atmospheric air.
Traces of oil are present in the compressed air because vapours or oil drops are added to
the compressor.

40
Compressed air treatment filters normally perform a double action, carrying out both
mechanical filtration for solid particles and a condensate separation action by means of a
centrifugation device. The condensate can be discharged automatically, semi-
automatically or manually [2].
In the LFR group shown in Picture 25 by way of example there is a filter with automatic
drainage which is equipped with a float that rises under the pressure of condensation
causing the opening of a valve followed by the expulsion of the condensate which occurs
thanks to the air pressure itself. The condensate level then drops, the valve closes and the
expulsion cycle can continue automatically.
Pressure reducers are used to solve the problem of pressure changes that take place in the
distribution lines of pneumatic systems; they reduce a high inlet pressure to a reduced and
stabilized outlet pressure [2] (the pressure reducer in the LFR group in Picture 25 lowers
the pressure to a value of 4 bar at the outlet) .
Lubricators are used in compressed air treatment units for equipment that requires the air
to contain traces of oil for the correct lubrication of the sliding seals. Their function is
therefore to add a certain quantity of oil, in the form of small droplets, in order to produce
an aerosol that is carried away by the compressed air. Depending on how the oil
atomization is produced, there are mist lubricators and micro mist lubricators [2]. In the
LFR group shown as an example, the lubricator is absent.

41
Picture 25 - LFR compressed air treatment group installed on the MVM machine
The LFR unit shown above and implemented for the treatment of the air entering the
MVM machine, is an integrated unit produced by Festo, model Service units LFR-K /
LFRS-K, D series. In particular, we are speaking about the LFR-1/2-D-MIDI-KG-A
model and is composed by:
On-off valve HE manually actuated;
LFR filter regulator;
On-off valve HEE solenoid actuated, 24 V DC;
Soft-start valve HEL pneumatically actuated;
Branching module FRM with pressure switch.
42
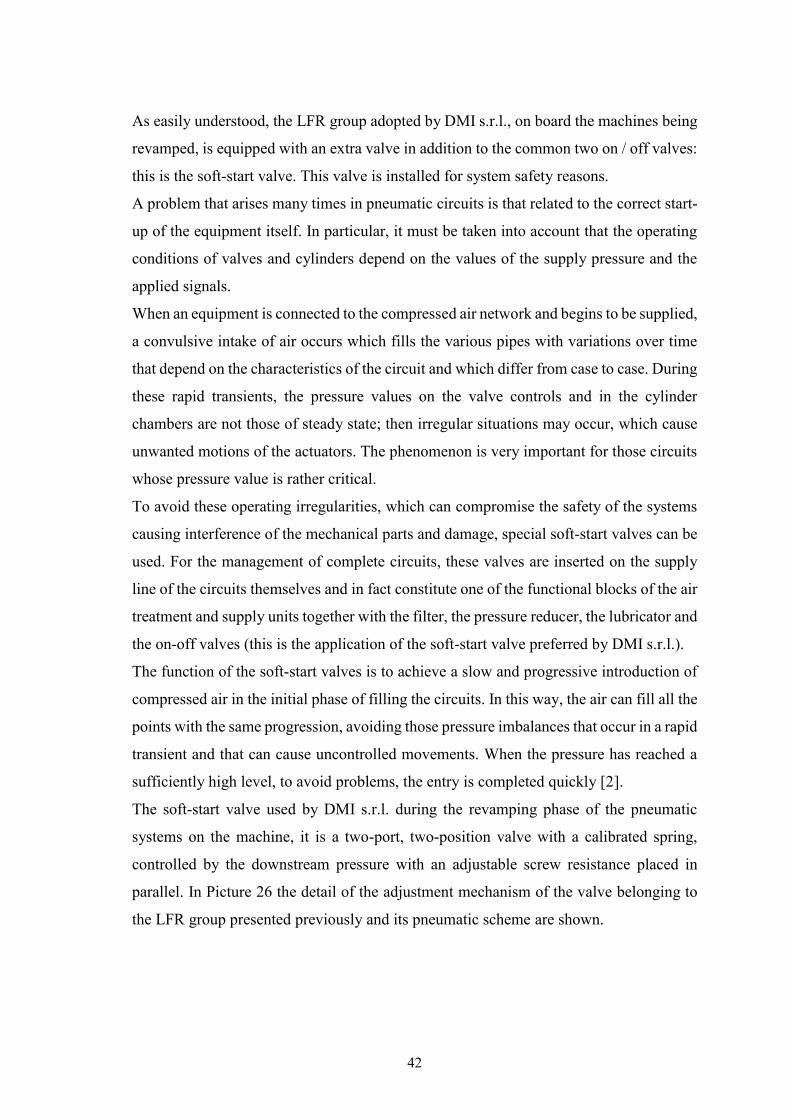
As easily understood, the LFR group adopted by DMI s.r.l., on board the machines being
revamped, is equipped with an extra valve in addition to the common two on / off valves:
this is the soft-start valve. This valve is installed for system safety reasons.
A problem that arises many times in pneumatic circuits is that related to the correct start-
up of the equipment itself. In particular, it must be taken into account that the operating
conditions of valves and cylinders depend on the values of the supply pressure and the
applied signals.
When an equipment is connected to the compressed air network and begins to be supplied,
a convulsive intake of air occurs which fills the various pipes with variations over time
that depend on the characteristics of the circuit and which differ from case to case. During
these rapid transients, the pressure values on the valve controls and in the cylinder
chambers are not those of steady state; then irregular situations may occur, which cause
unwanted motions of the actuators. The phenomenon is very important for those circuits
whose pressure value is rather critical.
To avoid these operating irregularities, which can compromise the safety of the systems
causing interference of the mechanical parts and damage, special soft-start valves can be
used. For the management of complete circuits, these valves are inserted on the supply
line of the circuits themselves and in fact constitute one of the functional blocks of the air
treatment and supply units together with the filter, the pressure reducer, the lubricator and
the on-off valves (this is the application of the soft-start valve preferred by DMI s.r.l.).
The function of the soft-start valves is to achieve a slow and progressive introduction of
compressed air in the initial phase of filling the circuits. In this way, the air can fill all the
points with the same progression, avoiding those pressure imbalances that occur in a rapid
transient and that can cause uncontrolled movements. When the pressure has reached a
sufficiently high level, to avoid problems, the entry is completed quickly [2].
The soft-start valve used by DMI s.r.l. during the revamping phase of the pneumatic
systems on the machine, it is a two-port, two-position valve with a calibrated spring,
controlled by the downstream pressure with an adjustable screw resistance placed in
parallel. In Picture 26 the detail of the adjustment mechanism of the valve belonging to
the LFR group presented previously and its pneumatic scheme are shown.

43
Picture 26 – Soft-start valve adjustement mechanism and pneumatic scheme
2.4.2.3 Revamping of electrical components
2.4.2.3.1 Electrical panel composition and installation
As regards the electrical components, DMI s.r.l. performed a 100% revamping for all the
machines of the SKF production line under study. The first step of the revamping was the
composition of the electrical panel starting from the choice of the box.
The electrical panel on the machine is the part of the electrical equipment that is normally
used by the machine operator. In fact, it contains all the power equipment (switches for
operation, contactors, automatic switches, drives, etc.) and control equipment (relays,
programmable controllers, measurement and regulation devices, etc.) essential for the
automatic operation of the machine.
Externally then, on the access door to the panel or on the other surfaces, for example the
side ones, there are the various command organs (selectors, buttons), signalling (pilot
lights), control (measuring instruments) that are normally used by the operator to operate
the machine.
Hence the fundamental importance of the machine control panel which must be designed
and built with very high standards of functionality, safety and reliability both in terms of
use and maintenance.
The Machinery Directive 2006/42/EC relating to machinery establishes the essential
requirements for the purposes of safety and health protection and, although it does not

44
establish the design criteria for electrical panels and electric motors (regulated by
Directive 2006/95 / EC) however, it should be remembered that these must be made in
such a way as to allow the satisfaction of the safety requirements applicable to the
machine as they are an integral part of it.
A fundamental aspect to consider in the construction of an electric panel is the degree of
protection provided by the external box of it, a degree of protection that concerns both
protection against mechanical impact IK and protection against contacts with parts under
a certain voltage and the entrance of solid or liquid bodies.
As an example regarding the choice of the protection of the electrical panel, the box
installed on the Pre-process IR machine is shown, which, after checking the hardness,
measures the hole diameter, ring thickness and raceway diameter of the inner ring (Picture
27). In particular, it is a steel box produced by Schneider Electric, belonging to the Spacial
CRN class, and consisting of a door with lock and side panels made of a single piece
welded on the back with double profile to form a protected sealed area.
Picture 27 – Schneider Electric steel box, class Spacial CRN installed on Pre-process IR machine
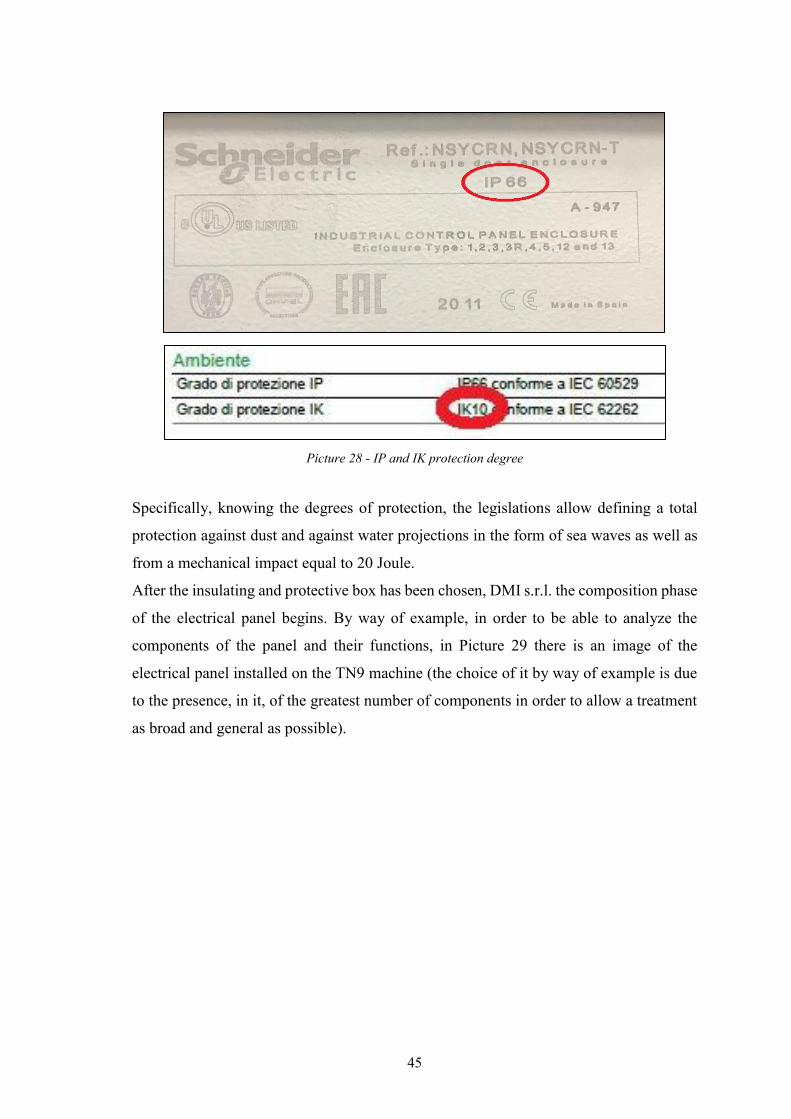
As far as the IP protection degree is concerned, with the installation of this protective
box, an IP66 degree and an IK10 degree, certified by the manufacturer (Picture 28).
45
Picture 28 - IP and IK protection degree
Specifically, knowing the degrees of protection, the legislations allow defining a total
protection against dust and against water projections in the form of sea waves as well as
from a mechanical impact equal to 20 Joule.
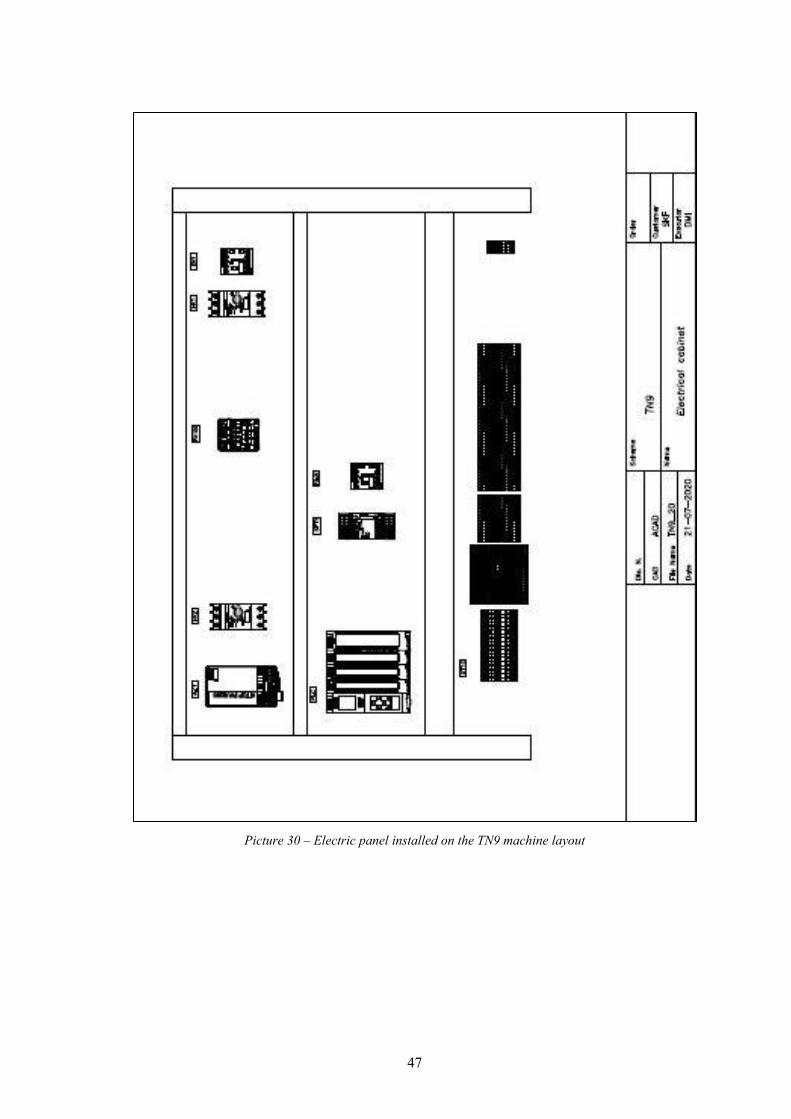
After the insulating and protective box has been chosen, DMI s.r.l. the composition phase
of the electrical panel begins. By way of example, in order to be able to analyze the
components of the panel and their functions, in Picture 29 there is an image of the
electrical panel installed on the TN9 machine (the choice of it by way of example is due
to the presence, in it, of the greatest number of components in order to allow a treatment
as broad and general as possible).

46
Picture 29 – Electric panel installed on TN9 machine
47
Picture 30 – Electric panel installed on the TN9 machine layout

48
As can be seen from the Picture just introduced, the components of a picture are:
General switch disconnector 400 V AC: it is an electro-mechanical organ inserted
in an electric circuit in order to disconnect, which means to open a circuit or a
line. The purpose is to guarantee the safety of the plant and above all of the
maintenance activities as it physically and visually interrupts the section of line
on which you are working;
Power supply 400 V AC/24 V DC: it is an alternating current-direct current
conversion component, that is an electrical apparatus that serves to rectify the
input electrical voltage at the output in order to supply electrical energy by
adapting it to the use of the downstream machinery;
Differential circuit breaker: the purpose of this switch, which trips automatically
when there is a need, is to protect the electrical system from short circuit and
overload as well as avoiding the risk of electrocution of people in the event of
current leakage;
Power supply 24 V DC: it is an electrical component that allows you to divide the
input line into several output lines depending on how many are needed with the
possibility of setting the current intensity on each line;
Safety PLC power contactor: very useful electronic device to manage the current
within a circuit and to ensure that the system performs certain actions; such an
instrument is capable of breaking or establishing current in a circuit. In the case
in question it is exclusively dedicated to the management of the safety circuit;
Terminal block 24 V DC: is a modular block mounted on a mounting rail with an
insulated frame that secures multiple wires together and allows you to
conveniently, economically and safely distribute electrical power from a single
input power source to multiple outputs. The terminals are spring loaded, a more
recent alternative to the classic screw terminals, and consist of a locking
component (precisely the spring) and a conductive metal strip. The terminal block
has three levels that allow you to make more connections on the same block,
ensuring an important saving of space. On the same terminal block we find, in the
case of DMI s.r.l. electrical panel, both the 24 V DC distribution and the I/O of
the PLC.

49
To be deeply analyzed, given the important function performed, are two components of
the electrical panel: the PLC and the Safety PLC.
2.4.2.3.2 PLC choice
A programmable logic controller or PLC is a very simple computer that performs control
functions for industrial automation. The PLC is a digitally operated electronic system,
intended for use in the industrial sector, which uses a programmable memory for the
internal storage of user-oriented instructions for the implementation of specific functions,
such as logic, sequencing, timing, counting and arithmetic calculation, to control various
types of machines and processes by means of both digital and analogue inputs and
outputs. Both the programmable controller and the associated peripherals have been
designed so that they can be easily integrated into an industrial control system and used
in all the intended functions.
Contrary to what happens in wired logic, where the various components are physically
connected, with the use of a PLC all the logic functions required for the automation of a
machine or an industrial process are carried out following a specific program. Advantages
deriving from the use of the PLC in spite of the wired logic are summarized in the
following points:
Flexibility: before the introduction of these devices, automatic machines required
the use of control systems made with electromechanical components on the basis
of a specific electrical diagram for each type of machine. With the introduction of
programmable controllers, the wiring of the control systems is much simpler and
the same type of PLC, albeit with different programs, can be mounted on machines
to perform very different tasks;
Scalability: the expansion of a system is possible by adding modules and by
changing programs;
Reliability: the probability of failure occurrence due to bad contact decreases
because of using semiconductors;
Easy change management and error correction: in the wired logic to modify the
control system it is necessary to rewire the whole circuit and change the
components that compose it. when a modification is made to the PLC, it is

50
generally not necessary to modify the wiring diagram, but it is sufficient to modify
the program with a much lower cost in terms of time;
Low costs: with the diffusion of these devices, their cost has decreased
significantly. This diffusion, combined with the technological development that
makes them more and more powerful and versatile, makes PLCs very
advantageous also in economic terms;
Miniaturization: the installation dimension is smaller;
Run test: unlike hardwired logic controllers, programmable controllers can be
easily tested before being mounted in the field;
Speed in operations;
Easiness of reprogramming: the PLC can remain connected to the programming
terminal and be reprogrammed quickly according to production needs [6].
The PLC that DMI s.r.l. installs on the machines during the revamping phase, inside the
electrical panel, is SIMATIC S7-1500 made by Siemens and previously presented in the
Picture of the electrical panel on board the TN9 as well as in the Picture 31.
Picture 31 - Siemens SIMATIC S7-1500

51
The SIMATIC S7-1500 features a modular design and can be scaled in terms of its
functionality, so you can adapt assemblies and functions perfectly to suit your machine
design.
PLC programming is performed using SIMATIC STEP 7. SIMATIC STEP 7 is a software
package created specifically for developing automation using Siemens products of the
SIMATIC series. The term TIA Portal is used to define the environment in which
STEP 7 works and means Totally Integrated Automation Portal; it is also referred to as
an engineering platform for all automation tasks.
The TIA Portal is basically a centralized design environment characterized by an interface
common user for all automation tasks with shared services (such as those of
configuration, communication and diagnostics) and a single database to which others also
access software packages such as SIMATIC WinCC, SINAMICS Startdrive and
SIMATIC STEP 7.
The two basic versions of SIMATIC STEP 7 are available: Basic (suitable for configuring
with the S7-200 model) and Professional (suitable for configuring with S7-300, S7-400
and S7-1500 models). A diagram that summarizes the hardware and software
requirements of the system for programming is shown in the following Picture 32.
Picture 32 - Hardware and software requirements for PLC programming

52
The modules that make up the PLC are:
CPU: the Central Processing unit is the heart of the PLC, it contains a card with
one or more microprocessors, which run the operating system and the programs
(software) developed by the user, and a memory where these programs are saved
[6]. The differentiation between the various CPUs occurs through the evaluation
of certain characteristics such as the amount of program memory, the amount of
data memory, the number and type of integrated functions and the number of
manageable interfaces. The peculiarity that distinguishes the PLC from other
microprocessor devices is the cyclical way of executing the program [6]. The data
processing of a PLC, in fact, takes place sequentially according to the order of the
instructions inside the program. The actuation (physical signal on the output,
detection of the input) takes place at specific times and not during program
processing. We can therefore summarize the control logic of the controller divided
into three stages: acquisition of data from the sensors, program processing, and
implementation of the outputs.
Picture 33 – Three stages of the PLC control logic
In the first phase, the condition of the inputs is acquired in a precise instant and a
copy is made in the I/O memory area. In the second phase the inputs are processed
and the outputs modified, only within the PLC memory area dedicated to them,
sequentially according to the execution of the program. The third phase is a copy

53
of the memory area, which contains the outputs, in the buffer of the output cards.
The outputs in turn feed the devices, contactors and solenoid valves, which will
control the actuators, electric motors and pneumatic cylinders;
Input / output modules: these are the means by which the PLC communicates with
the physical process to be controlled, detecting data from the sensors and
commanding actions to the actuators. Given the characteristics of the signals in an
industrial plant, there are both digital and analogue I/O modules present.
A digital signal is an ON / OFF signal which in the memory and the PLC is
interpreted as a modification of a bit 0/1 of a memory channel; the physical level
of the signal is a voltage signal. 0 V means that the bit has a value of 0 because
the contact is open, while 24 V means that the contact is closed and the logical
value of bit is 1. Examples of digital signals can be, in input, a value 1 of the limit
switch when the cylinder has reached the position or 0 when this does not happen,
or at the output, the command of the monostable valve in when the logic condition
of the bit becomes 1 otherwise both 0 and 1 to command the two positions of a
bistable valve.
An analogue signal, on the other hand, is a more complex signal as a physical
quantity needs to be converted into voltage (0-10 V) or current (0-20 mA).
An example of this signal is having the speed in rpm of a motor from the circuit
that is read in voltage or current at input, while at the output I can set the motor
speed from the HMI (Human Machine Interface) passing a value in rpm, which
the PLC converts to the motor into voltage or current according to its operating
characteristics;
Operator interface modules (integrated with the CPU adopted by DMI s.r.l.): these
are terminals consisting of a display and keyboard, which, connected to the
processor module, allow the operator to view messages, alarms, control or modify
the variables of the controlled process;
Modules for network connection (integrated in the PLC CPU used by DMI s.r.l.
for the revamping phase): these are modules that manage the communication
protocols for the various types of computer networks to which the PLC can be
connected (Ethernet, Profinet, etc.). The use of these communication protocols
will be discussed later.

54
2.4.2.3.3 Safety PLC choice
Picture 34 - Wieland Samos PRO COMPACT series safety controller
The Safety PLC shown in the Picture 34 and in the picture reported previously is the same
one used on all the machines, not just the TN9. It is a Samos PRO COMPACT SP-COP1
module safety controller by Wieland. The samosPRO Compact 24 V DC is modular and
it is suitable, and therefore used in the revamping phase, for monitoring non-contact safety
sensors, emergency stop buttons, protective door and door lock switches, two-hand
controls as well as testable optical safety barriers, barriers photo-electric and laser
scanner.
The model chosen by DMI s.r.l. allows to reach a PL (Performance Level)-e/Category 4
safety level certified by the manufacturer in accordance with EN ISO 13849-1. The
component features 20 safe inputs, 4 safe outputs, a USB port and an SD slot for program
memory. The programming phase is very simple, the USB port allows the cable
connection to the programming terminal (the programmer's PC) on which the specialized
technician performs the programming phase thanks to samosPLAN6 software from

55
Wieland. The program is then saved on the SD card, which is inserted into the Safety
PLC.
The choice of DMI s.r.l. not to use a PLC with integrated safety circuit is due to two main
reasons: firstly for economic one, secondly to avoid having to use the PLC inputs and
outputs ports for a safety circuit that could easily be controlled by a separate PLC with a
higher number of I/O available dedicated modules.
Using the USB port and SD memory card slot make sure that your machine can be flexibly
programmed and programs can be quickly duplicated or exchanged. This speeds up
commissioning and reduces machine downtimes enormously.
The Samos PLAN6 software for the samos PRO COMPACT range makes the
programming phase even easier. In particular, the advantages of its use are:
Intuitive configuration: easy entry to programming, no detailed product
knowledge required, less engineering efforts;
Simulation instead of testing: the programmed logic can be simulated real-time
on the PC instead of looking for faults on the machine;
Faster validation: in online mode with oscilloscope function, the safety functions
can be quickly validated, verified and documented on-site;
Possibility to make comfortable operations with multiple screen;
Fast set-up of the machine through emulating missing sensor hardware with the
forcing function;
Global remote diagnostic: if an Ethernet interface is integrated, the system will be
connected worldwide, saving expensive service call outs;
One-click report generation;
Protection against manipulation.
2.4.2.3.4 Human Machine Interface – HMI choice
The last step of the revamping phase is the installation of an HMI (Human Machine
Interface) or OP (Operator Panel) and its programming. As processes become more and
more complex and the needs in terms of functionality of machines and systems increase,
the operator needs an efficient tool for command and control of production facilities.
HMI systems (Human Machine Interface) they act as an interface between man (the
operator) and the process (machine/plant). Control effective on the process is entrusted

56
to the controller. There is therefore an interface between the operator and WinCC (on the
HMI device) and an interface between WinCC and the controller.
An HMI performs the following tasks:
Representation of processes through a clear and efficient page structure: the
process is displayed on the HMI device. For example, if a state changes in the
process, the display on the HMI device is updated. The process can be represented
on several pages with a clear and efficient structure;
Process management: the user can manage the process with the graphic user
interface. For example, it can set a set point for the controller or start a motor;
Display of alerts: if critical states occur in a process (for example, if a certain value
exceeds its limit) the system automatically displays a warning;
Archiving of process values and messages: the HMI system can archive alarms
and process values. This allows you to document the progress of the process and
access the previous production data also later;
Documentation of process values and messages: the HMI system can print a report
of the messages and process values. For example you can print production data at
the end of the working time;
Management of process and machine parameters in recipes: the HMI system
allows you to save parameters related to processes and machines within recipes.
Parameters can, for example, be transmitted with a single operation from the panel
operator to controller to adapt production to a different variant of the product;
User Management: user rights can be set on devices to restrict what they can do
by particular users.
The panel installed on the machine by DMI s.r.l. is the SIMATIC HMI TP900 Comfort
by Siemens with touch control, 9 '' widescreen TFT display, PROFINET interface must
be vertically mounted with the possibility of flush-mounting. It is powered at 24 V DC
directly from the terminal board located in the electrical panel, and connected to the CPU
via Ethernet. It allows you to manage 300 recipes on a number of pages that can be
extended up to 500, for each page you can have up to 400 objects.
As already mentioned, the Totally Integrated Automation Portal (TIA Portal) integrates
several SIMATIC products into one software with which it is possible to increase
productivity and efficiency. TIA products work together within the TIA portal for the
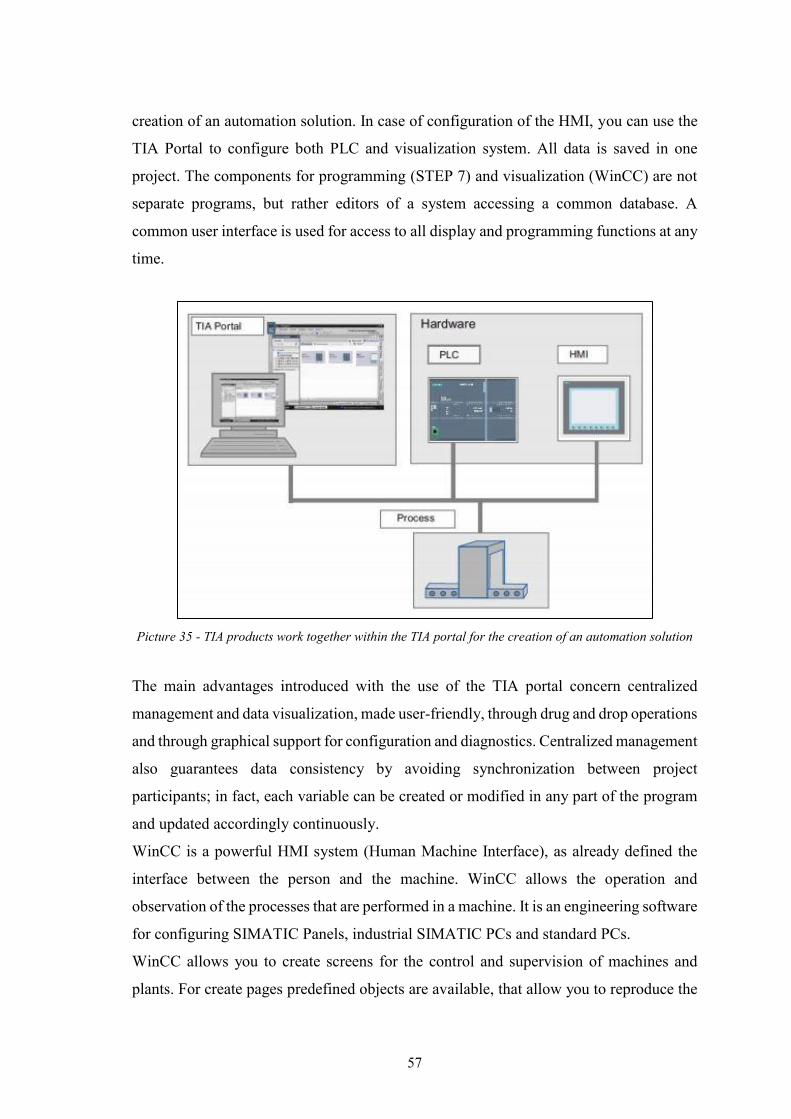
57
creation of an automation solution. In case of configuration of the HMI, you can use the
TIA Portal to configure both PLC and visualization system. All data is saved in one
project. The components for programming (STEP 7) and visualization (WinCC) are not
separate programs, but rather editors of a system accessing a common database. A
common user interface is used for access to all display and programming functions at any
time.
Picture 35 - TIA products work together within the TIA portal for the creation of an automation solution
The main advantages introduced with the use of the TIA portal concern centralized
management and data visualization, made user-friendly, through drug and drop operations
and through graphical support for configuration and diagnostics. Centralized management
also guarantees data consistency by avoiding synchronization between project
participants; in fact, each variable can be created or modified in any part of the program
and updated accordingly continuously.
WinCC is a powerful HMI system (Human Machine Interface), as already defined the
interface between the person and the machine. WinCC allows the operation and
observation of the processes that are performed in a machine. It is an engineering software
for configuring SIMATIC Panels, industrial SIMATIC PCs and standard PCs.
WinCC allows you to create screens for the control and supervision of machines and
plants. For create pages predefined objects are available, that allow you to reproduce the

58
system, view the progress of the processes and specify their values. A page can be made
up of static and dynamic elements. In runtime the static elements (for example text and
graphics) do not vary. The dynamic elements vary according to the process. These display
the current process values as follows:
From the controller memory;
From the memory of the operator panel in the form of alphanumeric displays,
curves and graphic bars.
The input fields on the HMI device are also dynamic objects. Process values and entries
are exchanged between the PLC and HMI device via tags. To create a page on the HMI,
you must have already introduced the HMI device, on which the required pages will be
created, in the project. To connect the SIMATIC panel during the programming phase, it
will be connected to the programming terminal via Ethernet, the PLC, to which it will be
connected, will be selected and then the configuration phase will begin. Once the
configuration is complete, the home page will open, with the required layout. From here
you can select colours, number of pages, objects and so on through drug and drop
operations or with a double click until you reach the desired level of complexity of the
layout.
An important aspect to keep in mind when creating the Human Machine Interface is the
need to create an interaction device between the operator and the machine as user-friendly
as possible. User-friendly has a very specific meaning: in this case it means that the
interface designed by DMI s.r.l. will be within reach of every operator, both experienced
and novice. Menu and functions are understandable, the icons are distributed in the layout
of the pages in a very precise and clear way. An example of user-friendly HMI will be
illustrated in the following pictures, in particular we speak about the HMI installed on the
TN9 machine.

59
Picture 36 - Human machine interface installed on TN9 machine complete with push-button panel, siren for alarm signals and touch control panel
On the HMI presented in the previous picture you can see the touch-screen control panel,
the push-button panel and the siren for displaying the status of the machine both for alarm
(steady red due to a stopped cycle, red flashing due to an error in the machine) and for
normal operation in case of green light. The first means of interface between the operator
and the machine is certainly the push-button panel, which is why we want to briefly
explain its composition; from left to right we find the following buttons:
Key button to enable the safety controls exclusions in case of maintenance
interventions;
White button to switch between automatic or manual operations;
Green button to control the cycle start in case of automatic operations or to control
the next operation in a manual or step-by-step cycle;

60
Red button to stop the cycle in automatic mode or to command a step back in
manual mode operations;
Yellow reset button that commands the return to the rest position of the actuators;
Button with mushroom head to control the emergency status of the machine,
whose operation will be detailed in the paragraph dedicated to machine safety.
As for the control panel, however, this must be designed as much as possible to make the
interface user-friendly; the various screens that allow the operator to manage the machine
will be presented below and their composition will be illustrated, making it clear that they
are easy to understand and very intuitive.
On the left of the control panel there is the menu consisting of seven items that allow you
to view the different screens. Starting from the top, you can see the screen corresponding
to the item “system” which allows you to view general information about the machine:
Status of machine ready when all stations are at rest and the LED next to each
station turns green;
Time of execution of the last cycle;
Counter of the total pieces processed by the machine;
Resettable partial piece counter as well as the rejection counters.
Below there is the Picture of the screen obtained directly from the HMI programming
software.
Picture 37 - Main page corresponding to the selection of the system item of the TN9 control panel menu
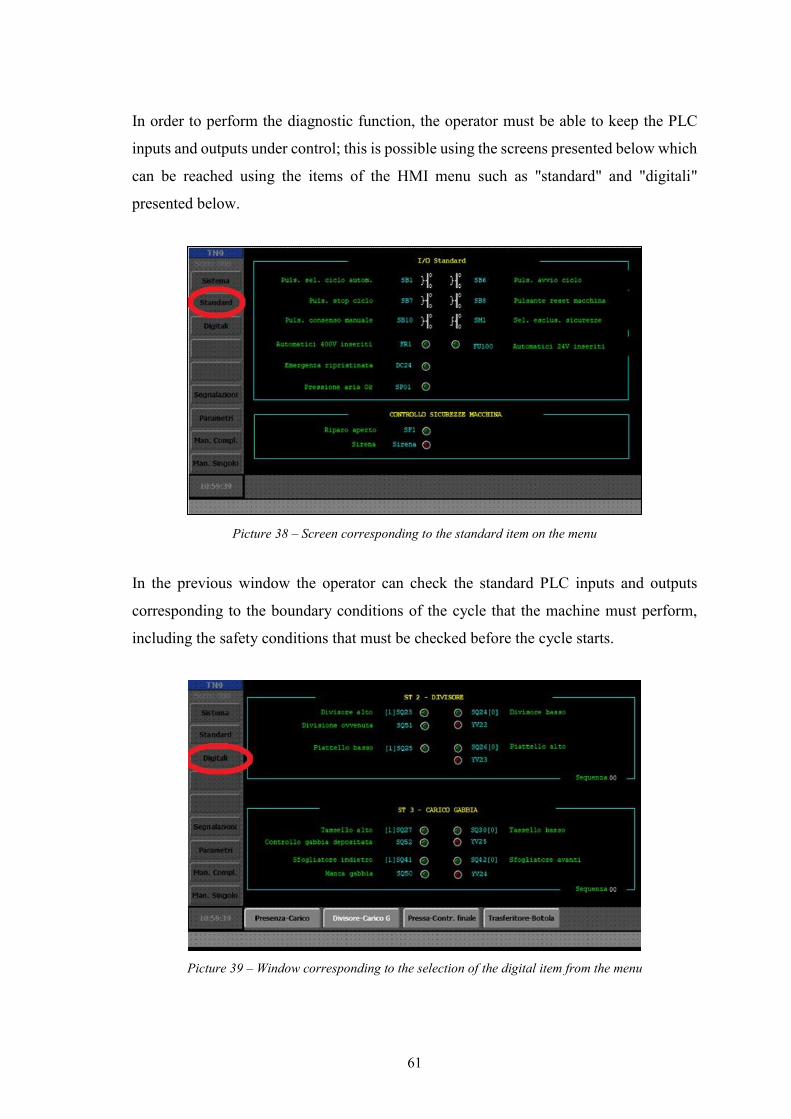
61
In order to perform the diagnostic function, the operator must be able to keep the PLC
inputs and outputs under control; this is possible using the screens presented below which
can be reached using the items of the HMI menu such as "standard" and "digitali"
presented below.
Picture 38 – Screen corresponding to the standard item on the menu
In the previous window the operator can check the standard PLC inputs and outputs
corresponding to the boundary conditions of the cycle that the machine must perform,
including the safety conditions that must be checked before the cycle starts.
Picture 39 – Window corresponding to the selection of the digital item from the menu
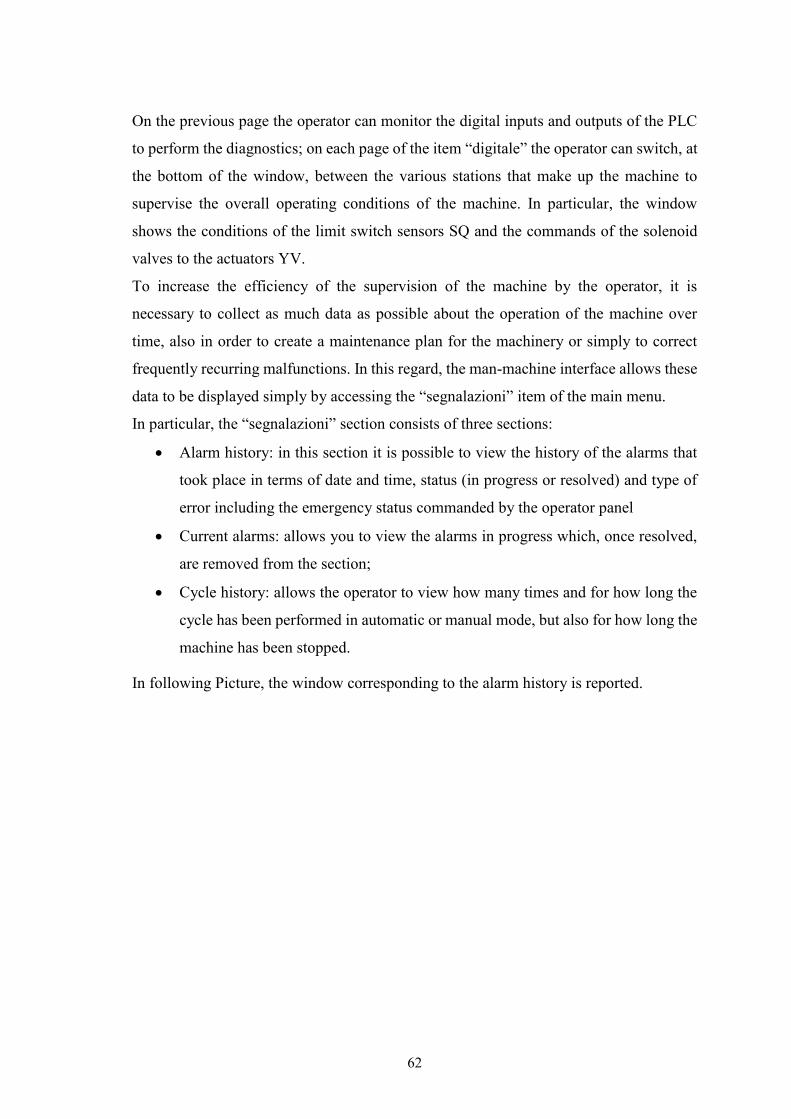
62
On the previous page the operator can monitor the digital inputs and outputs of the PLC
to perform the diagnostics; on each page of the item “digitale” the operator can switch, at
the bottom of the window, between the various stations that make up the machine to
supervise the overall operating conditions of the machine. In particular, the window
shows the conditions of the limit switch sensors SQ and the commands of the solenoid
valves to the actuators YV.
To increase the efficiency of the supervision of the machine by the operator, it is
necessary to collect as much data as possible about the operation of the machine over
time, also in order to create a maintenance plan for the machinery or simply to correct
frequently recurring malfunctions. In this regard, the man-machine interface allows these
data to be displayed simply by accessing the “segnalazioni” item of the main menu.
In particular, the “segnalazioni” section consists of three sections:
Alarm history: in this section it is possible to view the history of the alarms that
took place in terms of date and time, status (in progress or resolved) and type of
error including the emergency status commanded by the operator panel
Current alarms: allows you to view the alarms in progress which, once resolved,
are removed from the section;
Cycle history: allows the operator to view how many times and for how long the
cycle has been performed in automatic or manual mode, but also for how long the
machine has been stopped.
In following Picture, the window corresponding to the alarm history is reported.

63
Picture 40 - Alarm history section on the HMI on board of the TN9 machine
For an efficient interaction between the operator and the machine, it is necessary that the
operator can actively modify the cycle performed by the latter acting on the parameters
that characterize it. For this purpose, in the “parametri” section of the main menu it is
possible to enter and modify the cycle parameters, from the cycle execution times of the
various stations to the product parameters beyond which it will be rejected. In the same
submenu, it is possible to create recipes and view existing ones. The window that gives
the operator the opportunity to set parameters is shown below.
Picture 41 – Parameter setting window

64
To increase the machine control possibilities, the operator has complete control of both
the stations and the individual actuators. For this purpose in the main menu there are the
items “ciclo manuale completo” and “ciclo manuale singolo” in which, respectively, the
operator can command the complete cycle of a station in manual mode by selecting the
designated station, or can command an actuator as well as a motor in manual mode for
the station you are interested in, simply selecting it. Also in these two windows, the LEDs
can be green, if ready, or red, if the operation is in progress. In the following Pictures the
windows discussed are shown.
Picture 42 – Window needed for the selection of complete cycles in manual mode for each station
Picture 43 – Window needed for the selection of a single movement of an actuator in manual mode for each station

65
2.5 CE marking process
The CE marking is a physical and documentary examination of a machine, a process or a
part of work equipment, carried out within the regulatory framework of the Community
Directives. CE marking is compulsory and must be applied before any product subject to
it is placed on the market or put into service. It applies to:
all new products, whether they are manufactured in member states of the European
community or in third countries;
used and second-hand products imported from third countries;
substantially modified products that are subject to the directives as new products.
As regards the field of machine tools, a field in which the DMI s.r.l. has developed, the
responsibility to demonstrate that the machine complies with the Machinery Directive
remains with the machine manufacturer and this concerns:
machines imported into the European Union for the first time;
machines built for own use;
machines built for sale in the EU;
machines modified within their original limits;
new machines (being placed on the market or to be put into service):
old machines (if placed on the market or substantially modified).
In particular, the machines that make up the production line subject to revamping, which
this thesis work is about, must be classified as machines that have been modified within
their original limits or, in any case, modified machines so that the original Risk
Assessment it cannot be applied.
For each machine making up the line, therefore, DMI s.r.l. must:
evaluate the machinery according to the Machinery Directive;
carry out the Risk Assessment;
implement Risk Reduction measures;
create the instruction manual;
check that the machine is compliant;
validate the machine according to the Essential Health and Safety Requirements
(ESR);

66
fill in the technical file
draw up the EC Declaration of Conformity
apply the CE plate on the machine like the one shown, as example, in Picture 44
below coming from another project developed in the past.
Picture 44 – Example of CE plate to be applied on the machines
The Machinery Directive is the means that all member countries of the European Union
have adopted to establish the Essential Safety Requirements that machines must possess
in order to be placed on the community market or in service. The Machinery Directive
used by DMI s.r.l. is the Machinery Directive 2006/42/EC of the European Parliament
and of the Council, came into force on 29 December 2009, which aims to ensure identical
safety requirements for machines for each country.
For compliance with the requirements of the Machinery Directive and as part of the CE
marking process, the machine must meet the Essential Health and Safety Requirements
set out in Annex I. Annex I itself states that the manufacturer of a machine must ensure
that a risk assessment is carried out and the machine must be designed and built taking
into account the results of this assessment. The validation is completed ensuring that all
requirements applicable to the machine are met.
The risk assessment is therefore necessary in order to obtain a CE marking of the machine
and has as its purpose the identification of the dangers associated with the machine, the
weighting and estimation of all possible risks, the definition of the required safety
systems.

67
2.5.1 Risk Assessment and Risk Reduction procedure
2.5.1.1 Risk assessment procedure from ISO 12100 standard
The risk assessment process is a documented physical examination and inspection of the
machine carried out under the guidelines of national and international standards. The
purpose of the risk assessment is:
identify the dangers associated with the machine;
estimate the risk;
weighting the risk;
determine the applicable risk reduction to reduce the assessed risks.
The risk assessment must take into account the intended use of the machine, but also the
reasonably foreseeable improper use, and must also cover all the life stages of the
machinery and all the personnel who will interface with it during the life of the machine.
The reference standard for Risk Assessment is ISO 12100 which specifies the basic
terminology, describes general procedures for identifying hazards and estimating and
assessing the risks during the phases of the life cycle of the machine without, however,
defining any way a method for hazard analysis and risk estimation. The following Pictures
45 and 46 show the charts used by DMI s.r.l. for Risk Assessment and suggested by ISO
12100.

68
Picture 45 – ISO 12100 – Risk Evaluation and Reduction chart

69
Picture 46 – ISO 12100 – Risk Evaluation and Reduction chart
Looking at the chart previously reported, it can be seen that the starting point of the risk
analysis is the determination of the limits of the machine being analysed which include:
limits of use:
o operating modes and intervention procedure;
o intended use and reasonably foreseeable misuse or malfunctions;
o predictable levels of training;
o exposure of other people to the hazards when it can reasonably be
expected;
space limits:
o take into account the range of movement of the machine;

70
o space necessary for the interactions of people with the machine both
during use and during maintenance;
o human operator-machine interface;
o machine-energy source interface.
time limits:
o time limits due to the duration of the machine (it is reasonable to assume
a machine life of 20 years);
o periods of time between maintenance interventions.
o environmental limits
o limits due to routine maintenance and cleaning requirements
limits due to the properties of the materials to be processed.
After having determined the limits of the machine, the source of the danger is identified,
defined as the possible source of the damage, and an estimate of the risk is carried out.
The methods to perform the risk estimation can be different, but the most used are
certainly:
1. Risk matrix: this method defines the risk as a combination of probability of
damage occurrence and severity of damage. In this way, iso-risk zones are
outlined and a different degree is associated with each zone. In order to clarify
what has been introduced, the two following Pictures 47 and 48 are reported.
In particular, in the first Picture the risk matrix is reported, and the degree of risk
is a function of severity and probability, while the second Picture summarizes hoe
to interpret the resulting level of risk.

71
Picture 47 - Risk matrix (from https://www.necsi.it/files/read/2286-modulo-21.pdf)
Picture 48 - Interpretation of the risk level obtained from the risk matrix (from https://www.necsi.it/files/read/2286-modulo-21.pdf)
2. Risk graph: this method allows you to define the risk index by following a
graphical path on which you move by selecting the parameters characterizing the
dangerous situation. In order to better present the method, the graph that
characterizes it and a detailed description of the parameters to be selected to arrive
at a correct risk assessment are shown below.
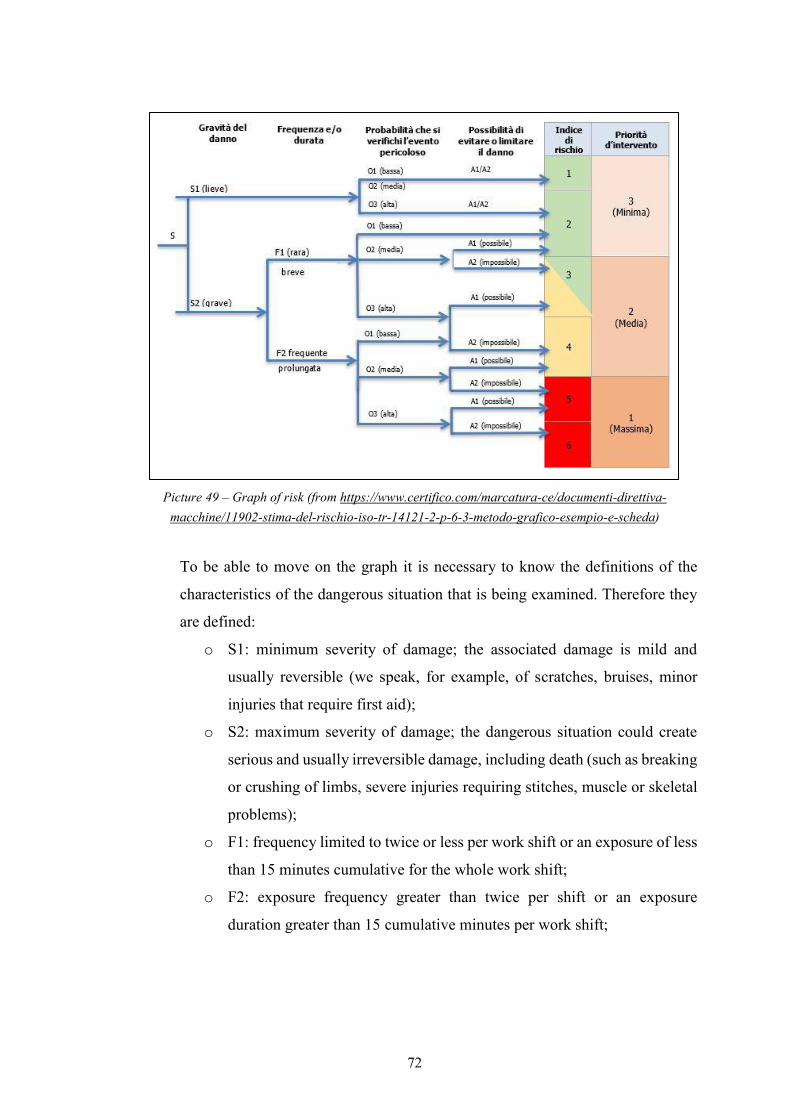
72
Picture 49 – Graph of risk (from https://www.certifico.com/marcatura-ce/documenti-direttiva-macchine/11902-stima-del-rischio-iso-tr-14121-2-p-6-3-metodo-grafico-esempio-e-scheda)
To be able to move on the graph it is necessary to know the definitions of the
characteristics of the dangerous situation that is being examined. Therefore they
are defined:
o S1: minimum severity of damage; the associated damage is mild and
usually reversible (we speak, for example, of scratches, bruises, minor
injuries that require first aid);
o S2: maximum severity of damage; the dangerous situation could create
serious and usually irreversible damage, including death (such as breaking
or crushing of limbs, severe injuries requiring stitches, muscle or skeletal
problems);
o F1: frequency limited to twice or less per work shift or an exposure of less
than 15 minutes cumulative for the whole work shift;
o F2: exposure frequency greater than twice per shift or an exposure
duration greater than 15 cumulative minutes per work shift;

73
o O1: low probability of occurrence of a dangerous event as the
inappropriate action is not foreseen and the technology used is robust and
recognized;
o O2: average probability of occurrence of the dangerous event as an
inappropriate action is foreseeable by trained personnel although in the
last two years at least one technical failure has been observed such as the
absence of a bolt;
o O3: high probability of occurrence, inappropriate action foreseeable by an
untrained person with faults observed regularly as in the case of absence
of guards placed between the operator and the source of danger;
o A1: there is the possibility of avoiding the damage under certain
conditions; such as slow speeds, and the worker has taken a training course
and is familiar with the risks;
o A2: there is no way to avoid the damage.
3. Hazard Rating Number (HRN) system: the method consists in determining the
numerical value of factors such as probability of occurrence P, frequency of
exposure F, severity of damage G and number of people at risk N to calculate the
HRN value and determine the severity of the risk.
The know-how of DMI s.r.l. he prefers to use this risk assessment method as the
two previously introduced are too interpretable and do not lend themselves well
to a precise assessment.
The formula that allows the calculation of the Hazard Rating Number is:
𝐻𝑅𝑁 = 𝑃 ∙ 𝐹 ∙ 𝐺 ∙ 𝑁
where the parameters used will have their values assigned according to the
following tables.
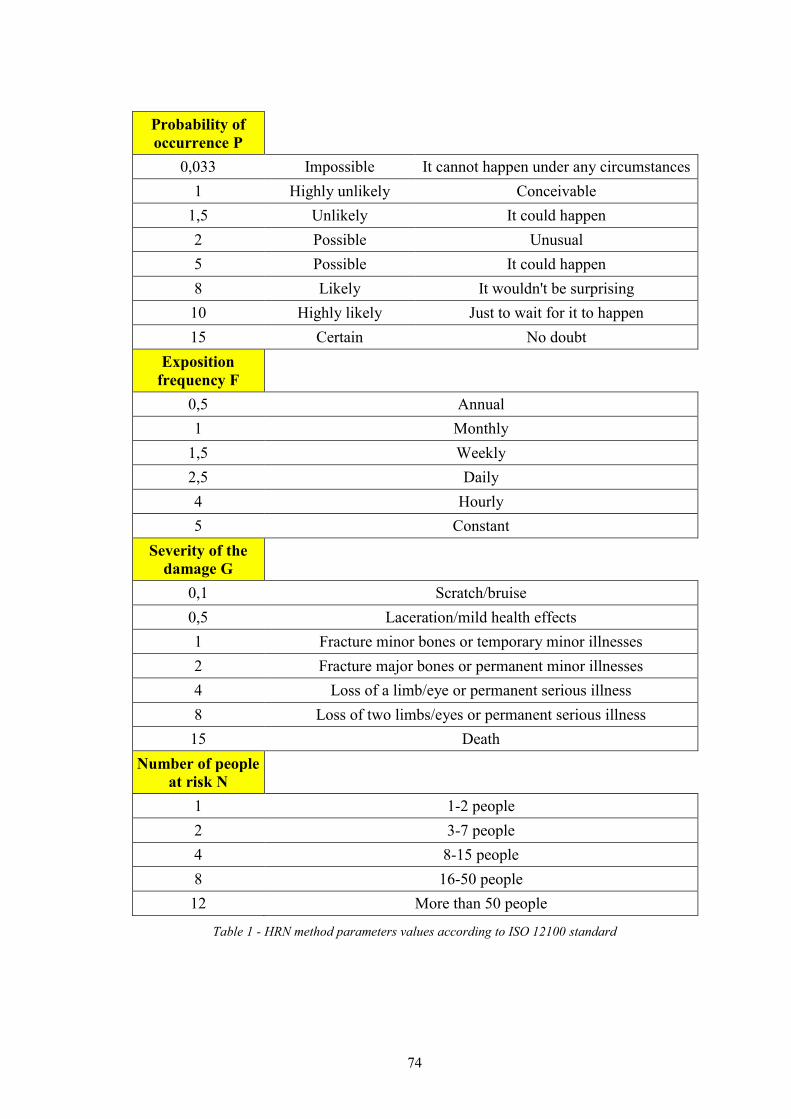
74
Probability of occurrence P
0,033 Impossible It cannot happen under any circumstances 1 Highly unlikely Conceivable
1,5 Unlikely It could happen 2 Possible Unusual 5 Possible It could happen 8 Likely It wouldn't be surprising 10 Highly likely Just to wait for it to happen 15 Certain No doubt
Exposition frequency F
0,5 Annual 1 Monthly
1,5 Weekly 2,5 Daily 4 Hourly 5 Constant
Severity of the damage G
0,1 Scratch/bruise 0,5 Laceration/mild health effects 1 Fracture minor bones or temporary minor illnesses 2 Fracture major bones or permanent minor illnesses 4 Loss of a limb/eye or permanent serious illness 8 Loss of two limbs/eyes or permanent serious illness 15 Death
Number of people at risk N
1 1-2 people 2 3-7 people 4 8-15 people 8 16-50 people 12 More than 50 people
Table 1 - HRN method parameters values according to ISO 12100 standard

75
The risk assessment is performed according to the numerical value of HRN obtained with
the formula introduced; each value of the HRN parameter is associated with a degree of
risk, which can be obtained from the following table.
HRN RISK 0-1 Negligible 2-5 Very low
6-10 Low 11-50 Significant 51-100 High 101-500 Very High 501-1000 Extreme
More than 1000 Unacceptable
Table 2 - Risk evaluation according to HRN values from ISO 12100 standard
After calculating the HRN-Hazard Rating Number and associating the dangerous
situation considered with a degree of risk in accordance with the table just introduced,
unless the risk is negligible, a risk reduction action is carried out with the methods that
will be proposed below. Once the risk reduction procedure has been completed, the new
HRN value is calculated and the method, thanks to its mathematical formulation allows
you to calculate the risk reduction in percentage using the following formula:
𝑅𝑖𝑠𝑘 𝑅𝑒𝑑𝑢𝑐𝑡𝑖𝑛 [%] = 𝐻𝑅𝑁𝑤𝑖𝑡ℎ𝑜𝑢𝑡 𝑟𝑒𝑑𝑢𝑐𝑡𝑖𝑜𝑛 − 𝐻𝑅𝑁𝑤𝑖𝑡ℎ 𝑟𝑒𝑑𝑢𝑐𝑡𝑖𝑜𝑛
𝐻𝑅𝑁𝑤𝑖𝑡ℎ𝑜𝑢𝑡 𝑟𝑒𝑑𝑢𝑐𝑡𝑖𝑜𝑛∙ 100
2.5.1.2 Risk reduction procedure
After carrying out the risk assessment by applying ISO 12100, modifications are made to
the machine in terms of safety, for example by making sure that the last roller of a roller
conveyor is not motorized in order to prevent, near the loading station, the riskof
entrapment of a finger or hand. If an adequate safety level is not reached during the design
phase, reducing any risk present in the machine, the following three standards are used in
conjunction with each other:

76
ISO 12100: in addition to guiding the risk assessment procedure and its reduction,
it also offers technical and specific principles for the selection of guards and
protective devices as well as requirements for the design of the latter;
ISO 14120: general requirements for protections; the standard defines the types
of guards and is intended to be a guide for their choice;
ISO 13857: safety distances; the standard is used to establish the correct safety
distances to prevent dangerous situations and to establish the maximum opening
allowed to the protective structures. Obviously, the distances considered are based
on people who try to reach the area where the danger is located without additional
help and under the conditions specified for each situation.
2.5.1.2.1 Guards and safety distance choice from ISO 14120 and ISO 13857
standards
Specifically considering the ISO 14120 standard, it defines that it is necessary that fixed
guards should not be used if access to the danger area is required both during normal
operation of the machine and during maintenance operations when the latter are very
frequent; the same legislation also defines that the fixed guards, intended as the only
measure to reduce the risk, are not to be used if there is a risk that the fixed guard will not
be reassembled.
As regards, however, the ISO 13857 standard presents two tables for the evaluation of the
safety distance: one refers to the upper limbs of people from three years of age and the
other refers to the upper limbs of people from 14 years of age.
An important definition, as regards the concept of protections, comes from ISO 12100
which defines guards as physical barriers integrated into the machine to provide
protection, and protective devices as a means of protection other than guards.
Excavation of guards must be inhibited as far as possible by design and must ensure good
visibility to minimize the need to remove them. In general, the guards must be rigid,
resistant to impacts, but also capable of containing the dangers that may arise by
projection from a closed area. A classification of guards coming from ISO 14120 is:
Fixed guard: it must be held in position permanently (for example it must be
welded) and can be removable when infrequent access is required. In the latter
case the guard must be held in position with fasteners for which it is impossible

77
to remove without suitable tools and, if possible, it must not be able to remain in
position without its fastening. The types of fixed guards are divided into:
o Total segregation: totally preventing access to the machine transmission
components;
o Spacing barrier / tunnel guard: for both solutions there is no total closure
of the dangerous area, but access is prevented by the size of the guard and
the distance between it and the source of danger.
Below there are the solutions adopted by DMI s.r.l. in terms of fixed guards.
Picture 50 - Metal spacer barrier that does not completely enclose the dangerous area, intended as the area of operation of the machinery, but reduces access from the side

78
Picture 51 - Removable guard held in position by four screws, necessary to prevent contact between the operator and the ring reject selectors positioned on the output channel of the Pre-Process OR machine
Picture 53 – Removable tunnel guard, held in position by screws, to allow the access to the position sensor in case of malfunctioning situations; it prevents the contact between
the operator and the acceptance/reject selector downstream of the MVM machine

79
Movable guard: connected by mechanical means, such as hinges, to the machine
structure and can, therefore, be opened without specific tools. The guards
belonging to this category can be divided into three groups, but no type of guard
is generally used by DMI s.r.l. as the company's know-how foresees that the
interlocked guards that will be presented later are used in the case of guards
subject to frequent opening; the three groups, for the sake of completeness, are:
o Manually operated guard;
o Motorized guard: operated by an energy source other than human or by
gravity;
o Automatic closing guard: movable guard activated by an element of the
machine, by the piece to be worked, or by a part of the equipment in order
to open only when the piece passes and then close again as soon as the
latter has passed.
Adjustable guard: type of fixed or mobile guard which is adjustable as a whole or
which integrates an adjustable part; the adjustment can be manual or automatic.
An example of an adjustable guard is the telescopic guard that covers the tip of
the tool while it is processing the workpiece and the adjustment, of course, is of a
different degree depending on the size of the workpiece.
Interlocked guard: the guard is associated with an interlocking device such that
the dangerous functions covered by the guard cannot start until the guard is closed
and, by opening the guard, all the dangerous functions of the machine are stopped.
An alternative solution, not used by DMI s.r.l., is the integration of the guard
locking function whereby the guard remains closed and locked until the risk
associated with the dangerous function of the machine is extinguished.
In summary, the know-how of DMI s.r.l. provides for the use of interlocked guards
which, if opened while the machine is in operation, generate a pressure drop which
causes the machine to stop; when the guard is closed, following the operator's
cycle start command, the machine cycle can resume. Below there are examples of
interlocked guard applications, with a zoom on the interlocking device, produced
by Pizzato, which the company adopts for the machines in the revamping/design
phase.

80
Picture 54 – Interlocked guard installed on the Pre-Process OR on the frontal door. When the door is opened the pressure drop and the machine stops
Picture 55 - Double application of interlocked guards on board of the MVM machine; both the front access door and the top access door are equipped with interlocking devices:
the opening of one or the other door causes the machine to stop

81
Picture 56 - Interlocking device, produced by the Pizzato Elettrica Company, which DMI s.r.l. installs on any machine that requires an application
As already mentioned, the applied ISO 12100 and ISO 14120 regulations alone do not
allow to reach an acceptable risk reduction threshold; it is therefore necessary to consider
the ISO 13857 standard which takes into account and defines the safety distance for
guards between the dangerous area and the guard itself. Specifically, the legislation
consists of two tables, one to be used when the risk is high, the other to be used when the
risk is low. The tables present in the standard are shown below as well as the meaning of
parameters a, b and c.
Picture 57 - Safety distance table for high risk situation (from https://www.certifico.com/normazione/234-documenti-riservati-normazione/3749-en-13857-distanze-di-sicurezza)

82
Picture 58 - Safety distance table for low risk situation (from https://www.certifico.com/normazione/234-documenti-riservati-normazione/3749-en-13857-distanze-di-sicurezza)
As can be easily understood, the parameters are defined as follows:
a: height of the dangerous area;
b: height of the protective structure;
c: horizontal safety distance from the dangerous area.
The know-how of DMI s.r.l. provides that when the values of a and b are not present in
the table, the parameter c is absolutely not calculated by interpolation, but, for even
greater safety reasons, the values of a and b immediately higher than those of the problem
are considered so as to obtain a horizontal distance even bigger than the minimum request.
2.5.1.2.2 Choice of safety components different from guards
I have already said that ISO 12100, which allows the assessment of the risk generated by
a dangerous situation, as well as the installation of guards to achieve an adequate risk
reduction just calculated, defines the installation of protection devices as a means of
protection different from shelters.
It is important to notice that the protection devices just mentioned are included into a
wider category of safety components. Below there is a list of the most used safety
components, with a particular focus on the solutions adopted by DMI s.r.l. on the
machinery under study.

83
Thanks to continuous technological progress, in recent years there has been an
increasingly frequent use of safety components, which make it possible to obtain an
adequate risk reduction in a more flexible way than just using guards.
The safety components are therefore to be listed as follows:
Protection devices:
o Interlocking devices;
o Safety barriers;
o Safety mats;
o Laser scanner;
o Two-hand control;
o Safety strips;
Emergency stops;
Safe command and control systems.
We now proceed to a quick analysis of the various safety components, deepening the
description of those whose use is intended and preferred by DMI s.r.l.
The interlocking devices are of the mechanical, electrical or other type and their purpose
is to prevent the operation of the dangerous functions of the machine in open door
conditions or, better said, considering the guard with associated interlocking devices, if it
is in open guard conditions, the machine is not allowed to perform dangerous actions.
A more detailed classification of the interlocking devices is provided by ISO 14119 which
at this moment will not be analysed, but for the sake of completeness we want to briefly
clarify the operation and applications of magnetic type devices, such as the SR series
device produced by Pizzato Electtrica and reported above, which are used by DMI s.r.l.
on board of the machines subjected to revamping.
The magnetic sensors of this series are of the coded type, they are composed of a sensor
for detecting the magnetic field that is connected to the structure of the machine and a
coded magnetic actuator to be connected to the movable guard. When the sensor and
actuator are approached, therefore when the guard is closed, the sensor recognizes the
actuator and activates electrical contacts that will interact with the safety PLC. The sensor
is constructed in such a way that it is activated only in the presence of the correct coded
actuator and not by any magnet.
The reasons justifying the use of these interlocking devices by DMI s.r.l. are:

84
Insensitivity to dirt: the sensors are sealed and even in non-optimal environmental
conditions the safety characteristics are not compromised;
Wide actuation area: the magnetic sensors are equipped with a wide actuation area
that makes them suitable for use with guards that are not too precise or whose
mechanical characteristics may change over time;
Operation from multiple directions: this feature allows the sensors and actuators
to be positioned with maximum flexibility;
The installation of several sensor-actuator systems on the same machine is
allowed as the minimum distance required between adjacent interlocking systems
is very low.
Photoelectric barriers, in particular those produced by Pilz, are among the safety
components, alternatives to interlocking devices, used by DMI s.r.l. under specific
conditions. These protection devices consist of a modulated light beam emitter and a
receiver. The safety barrier must be placed at a minimum distance from the dangerous
area and this distance is a function of the speed of approaching the dangerous area,
stopping time of the dangerous function and an additional distance that depends on the
resolution of the device. The functionality of the photoelectric barrier is foreseen both for
any type of approach to the dangerous area, both perpendicular, horizontal and angular.
The choice of using the safety barriers, as already mentioned, depends on the working
conditions of the machine they are combined with. They are to be used in the event that
frequent access to the dangerous area of the machine is required, for example in the
presence of very frequent loading and unloading operations, but they must absolutely not
be used when parts of the machine can be projected towards the operator (in this case, in
fact, the use of such protection devices would constitute the addition of other dangers).
An example of the use of photoelectric barriers, manufactured by Pilz and installed on
the MGI machine, is shown in the following picture.

85
Picture 59 - Photoelectric barriers installed on MGI machine
The safety mats, which consist of mats sensitive to the pressure generated by the presence
of an operator or a load in a general sense, are used to interrupt the dangerous function of
the machine if the presence is detected. Generally, therefore, these safety components are
used to generate a protection area that surrounds the dangerous area of the machine,
ensuring that the operator keeps the right distance from it. The know-how of DMI s.r.l. it
does not provide for its use as these safety devices are subject to mechanical damage
deriving for example from the fall of a tool from the operator's hands during maintenance
operations.
A safety component used by DMI s.r.l. is the two-hand control. This command, often
accompanied by other protective measures, is for the exclusive use of a single operator to
ensure that during use the operator's hands are away from the dangerous area. There are
three types of two-hand control and in the design phase DMI s.r.l. on board the machines,
when required, install the most complex type of control which includes:

86
Two devices (actuators) for control and simultaneous actuation with both hands,
which starts the dangerous operation of the machine;
Simultaneous activation in maintained;
Deactivation is generated by the release of one or both control devices;
Release of both commands before restarting;
Both devices must be pressed within a well-defined short time interval equal to
0,5 s;
If the time limit is exceeded, both devices must be released before the machine
restarts.
For two-hand control, there are conditions to be respected regarding the positioning of
the buttons on the machine: they must be far from the dangerous movements that much
to make it impossible for the operator, after their release, to reach the aforementioned
movements before they are arrested. This distance is equal to the product between the
maximum speed of approach and the stopping time of the dangerous movement.
Picture 60 – Two-hand control installed on Pre-Process IR machine
The emergency stop is a safety component whose function is not to reduce the risk present
in a specific dangerous situation such as in the case of guards and protective devices, but
to interrupt the operation of a machine as quickly as possible if it could give rise to an
emergency situation understood as a dangerous situation, caused by human interaction or
breakdowns, which needs to be urgently stopped.

87
The emergency stop is not intended as a substitute for other protective measures, but as a
complementary measure. Emergency stops are divided into two categories by ISO 13857
as follows:
Category 0: machine stop by immediate removal of energy for all machine
actuators;
Category 1: Stopping of movements and operations with the energy available to
the machine actuators to obtain the stop and therefore the interruption of the power
supply after the stop has been obtained.
The emergency stop function is held thanks to the positive mechanical action on an
actuator; the actuators can have different shapes:
Push button switch operated with the palm of the hand or with the mushroom
head;
Wires, ropes;
Pedals without mechanical protection;
Handles/bars or disconnectors.
The colours of the emergency stop buttons must be red for the actuator and yellow for the
back; an example is shown in the following figure.
Picture 61 – Emergency stop button with the mushroom head
There are basic requirements for the design of emergency stop actuators:
An actuator that executes an emergency stop command must remain locked when
it is operated;
To reset the emergency stop command, the actuator must be unlocked;

88
The emergency stop control device must keep the command until it is reset by a
manual action on the actuator.
As regards the choice of safety control devices, for the reasons already introduced in the
paragraph dedicated to the revamping of electrical components, DMI s.r.l. prefers the use
of the safety PLC to that of a standard PLC, relay or safety fieldbus.
In the latter case it would not be possible to avoid errors, but only to control them while
still guaranteeing a good level of security since communication errors are known as well
as measures to avoid them.
2.5.1.2.3 Residual risk management
Once an adequate level of safety has been reached, the residual risk remains to be
managed; for this purpose two other steps are essential which consist in the development
and implementation of working methods that control the risk and the consequent training
of the personnel assigned to the work and provide clothing and personal protective
equipment (safety shoes, safety helmet, protections for eyes, safety gloves and respiratory
protection). In order to manage the residual risk, the user manual of the machines will
report the following symbols for stimulating the use of PPE:
Picture 62 – PPE use recommendation reported on the machines user manuals
2.5.1.2.4 Risk reduction through control systems from ISO 13849
As mentioned, the reduction of risk, in addition to being performed with the use of
structures as shelters and with changes in the design phase, is achieved with the use of
control systems. In the event that the risk is reduced through a control system, it is
necessary to consider the ISO 13849 standard, necessary to assess the efficiency and
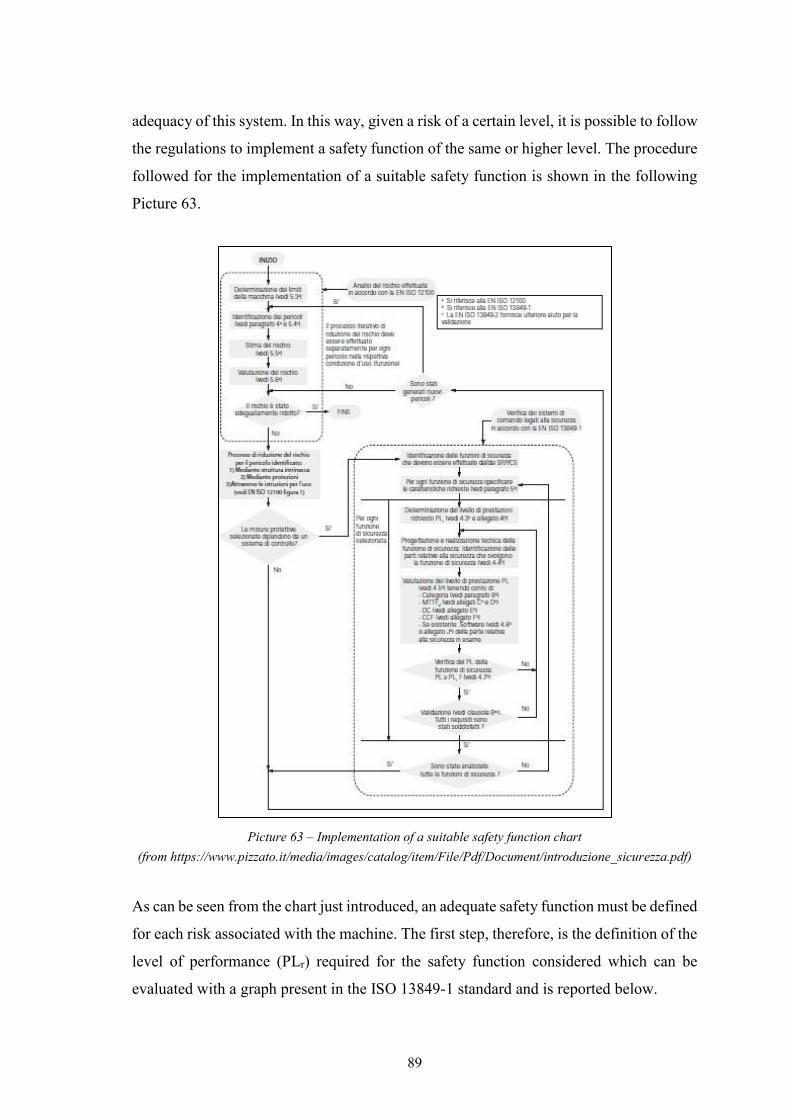
89
adequacy of this system. In this way, given a risk of a certain level, it is possible to follow
the regulations to implement a safety function of the same or higher level. The procedure
followed for the implementation of a suitable safety function is shown in the following
Picture 63.
Picture 63 – Implementation of a suitable safety function chart (from https://www.pizzato.it/media/images/catalog/item/File/Pdf/Document/introduzione_sicurezza.pdf)
As can be seen from the chart just introduced, an adequate safety function must be defined
for each risk associated with the machine. The first step, therefore, is the definition of the
level of performance (PLr) required for the safety function considered which can be
evaluated with a graph present in the ISO 13849-1 standard and is reported below.

90
Picture 64 – PLr definition chart (from https://www.pizzato.it/media/images/catalog/item/File/Pdf/Document/introduzione_sicurezza.pdf)
The manufacturer of the machinery, following the standard therefore, starts from point 1
of the chart and, following the diagram answering questions S, F and P, comes to define
the level of safety performance necessary to reduce the risk considered. The PLs are
classified on five levels, from PL-a to PL-e as the risk increases and each of them
identifies an average probability of dangerous failure per hour PFHD (1/h) as shown in
the following picture.
Picture 65 – PL and PFHD relation (from https://www.pizzato.it/media/images/catalog/item/File/Pdf/Document/introduzione_sicurezza.pdf)
After defining the required PLr, it is necessary to create a control system of the safety
function, whose PL will be calculated, verifying that it is greater than or equal to that
required. To evaluate a control system performance level, various parameters are
required, such as:

91
The safety category of the system, which in turn derives from the architecture of
the control system and its behaviour in case of failure occurrence;
MTTFD of the components;
System DC;
CCF of the system.
The control circuits can be represented by means of a logic block structure of the type:
Input or input of signals;
Logic or logic of signal processing;
Control signal output or output.
The ISO 13849-1 standard defines five circuit structures defined as system designated
architectures. The architectures, combined with the requests of behaviour in case of
system failure and with the minimum values of MTTFD, DC and CCF, indicate the safety
category of the control system as described in the following presentation.
For category B, defined the SRP / CS as the part of the control system linked to safety, it
is required that the latter be designed, built, selected and assembled according to the
applicable regulations and, for the specific application, the basic safety principles.
For this category there is no diagnostic coverage (DCavg = 0) and the MTTFD of the
channel can assume values from low to medium
Picture 66 - Category B system designated architecture (from https://www.inail.it/cs/internet/docs/alg-pubbl-sistemi-comando-macchine-secondo-norma.pdf)
Being a single channel architecture, the CCF considerations are irrelevant. The behaviour
of the system is such that the occurrence of an error or failure can lead to the loss of the
safety function. The system architecture is shown in the previous Picture.

92
For the design of the category 1 control system, in addition to the requirements of
category B, it is necessary that well-tried components and equally well-tried safety
principles are adopted. A well-proven component is thus defined as a component widely
used in the past with excellent results in similar applications or built and tested using
principles that demonstrate its high reliability when used for safety applications.
For category 1 the MTTFD of the channel must be high, while the diagnostic coverage is
still nil and the CCF is still irrelevant. The behaviour of the channel that realizes the safety
function is such that a fault can lead to the loss of the safety function, but with a higher
channel reliability than category B, as there is a mean time to dangerous failure (MTTFD)
higher: the probability of error occurrence is lower. The architecture of the control system
for the category in question is shown below.
Picture 67 - Category 1 system designated architecture (from https://www.inail.it/cs/internet/docs/alg-pubbl-sistemi-comando-macchine-secondo-norma.pdf)
For the architecture of the category 2 control system, the requirements of category B are
applied, as for category 1, with the addition of well-tested safety principles and
furthermore the safety functions implemented by category 2 structures must be tested
periodically and in particular:
When the machine is turned on;
Before the start of any dangerous situation.
The verification of the safety function must:
Allow operation if no faults have been detected;
Generate an OTE output that activates appropriate control actions if a fault is
detected.

93
For the architecture that meets the requirements of this category, the calculations of
MTTFD and DCavg must take into account only the I, L and O functional channel of the
following Picture without considering the test channel blocks TE and OTE. The average
diagnostic coverage of the functional channel can range from low to high as well as the
MTTFD depending on the required performance levels PLr. Since there are two channels,
even if one is dedicated to performing the periodic test of the safety function, measures
against CCFs must be applied. The behavior of the category 2 architecture is such that the
occurrence of a fault in the interval between two consecutive tests can lead to the loss of
the safety function, but in the presence of a test the safety function must be detected by
the test. The block diagram of the channels is shown in the following Picture.
Picture 68 - Category 2 system designated architecture (from https://www.inail.it/cs/internet/docs/alg-pubbl-sistemi-comando-macchine-secondo-norma.pdf)
For category 3, the requirements for category B must be applied and in addition well-
established safety principles must be applied. The category 3 SRP/CS must be designed
so that a single fault does not lead to the loss of the safety function and is always detected;
the single fault detection requirements do not mean that all faults must be detected.
Therefore, the accumulation of minor failures can lead to the loss of the safety function
with consequent emergence of dangerous situations. Category 3 DCavg varies from low to

94
medium and the MTTFD of each of the two redundant channels can vary from low to high
depending on the PLr. Being a two-channel architecture, it is necessary to apply measures
against CCFs. The diagram of category 3 is shown below in order to clarify what has been
said.
Picture 69 - Category 3 system designated architecture (from https://www.inail.it/cs/internet/docs/alg-pubbl-sistemi-comando-macchine-secondo-norma.pdf)
Category 4, like the previous ones, requires that the same requirements of category B and
in addition the well-tested safety principles are applied, furthermore the category 4
SRP/CS must be designed so that:
A single fault does not lead to the loss of the safety function;
The single fault must be detected in time in order to prevent the loss of the safety
function;
If detection of the fault is not possible, the accumulation of undetected faults must
not lead to the loss of the safety functions.
The overall diagnostic coverage of the SRP/CS is high and includes the accumulation of
faults as well as the mean time to dangerous failure. On the redundant dual-channel
structure, measures against CCF must be applied.
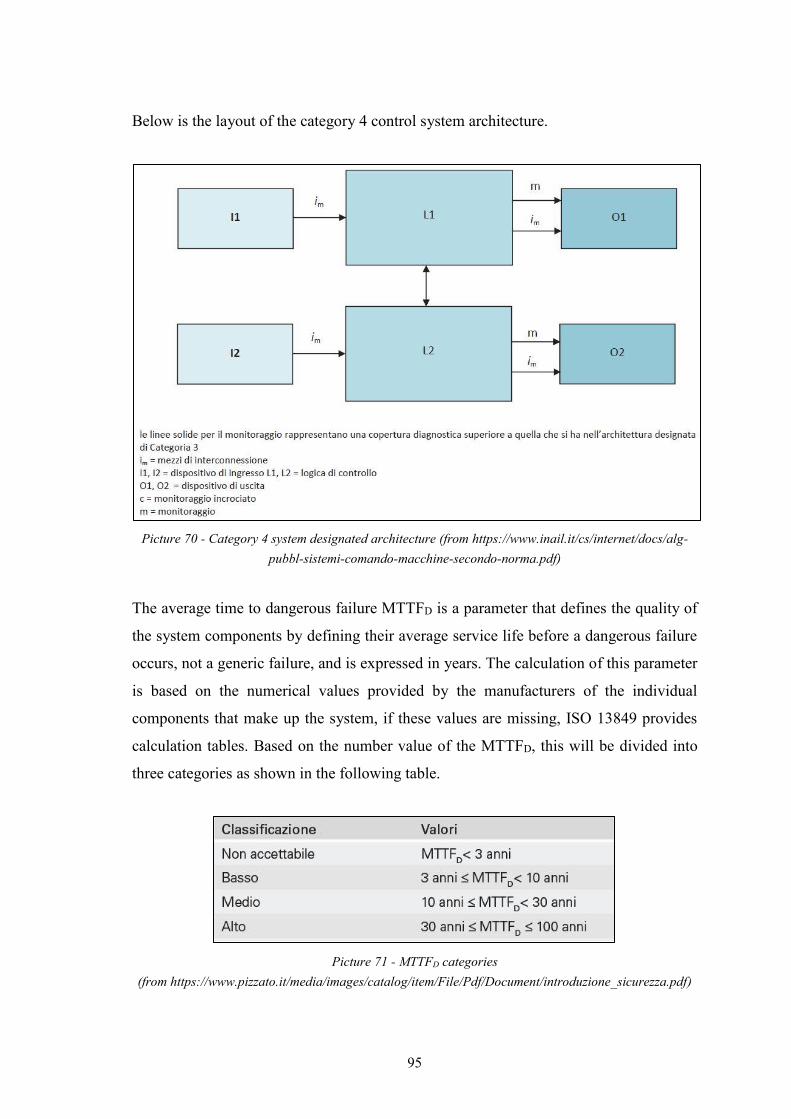
95
Below is the layout of the category 4 control system architecture.
Picture 70 - Category 4 system designated architecture (from https://www.inail.it/cs/internet/docs/alg-pubbl-sistemi-comando-macchine-secondo-norma.pdf)
The average time to dangerous failure MTTFD is a parameter that defines the quality of
the system components by defining their average service life before a dangerous failure
occurs, not a generic failure, and is expressed in years. The calculation of this parameter
is based on the numerical values provided by the manufacturers of the individual
components that make up the system, if these values are missing, ISO 13849 provides
calculation tables. Based on the number value of the MTTFD, this will be divided into
three categories as shown in the following table.
Picture 71 - MTTFD categories (from https://www.pizzato.it/media/images/catalog/item/File/Pdf/Document/introduzione_sicurezza.pdf)

96
In the case of components subject to wear, the company that supplies these components,
generally mechanical or hydraulic, provides data B10 or the number of operations that
the component within which 10% of the samples have failed in a dangerous way; the ISO
standard provides for formulas for the conversion of this data into MTTFD. What is
important for calculating the PL of the system is the calculation of the MTTFD parameter
for the whole channel starting from those of the components that compose it.
In circuits with single-channel architecture, as in the cases of categories B, 1 and 2, the
contribution of each component is linear and the calculation of the MTTFD is given by
the following formula:
1
𝑀𝑇𝑇𝐹𝐷= ∑
1
𝑀𝑇𝑇𝐹𝐷,𝑖
𝑁
𝑖=1
In the case of two-channel systems, see architectures 3 and 4, the calculation of the mean
time to dangerous failure is obtained by the symmetrization of the MTTFDs of the two
channels that make up the system under analysis according to the formula:
𝑀𝑇𝑇𝐹𝐷 = 2
3∙ [𝑀𝑇𝑇𝐹𝐷𝐶1 + 𝑀𝑇𝑇𝐹𝐷𝐶2 −
1
1𝑀𝑇𝑇𝐹𝐷𝐶1
+1
𝑀𝑇𝑇𝐹𝐷𝐶2
]
The DC diagnostic coverage is a parameter that measures how much the system is able
to self-monitor in case of its own malfunction. The diagnostic coverage was higher the
higher the number of dangerous faults that can be detected by the system. The numerical
parameter DC is a percentage value that is calculated from the data provided by the
manufacturer of the system components using the table in Annex E of ISO 13849-1. Since
in general there are more tricks in the same circuit to detect different anomalies, an
average value DCavg is calculated which will fall into four possible ranges as follows:
High DCavg, DCavg ≥ 99%;
Medium DCavg, 90% ≤ DCavg < 99%;
Low DCavg, 60% ≤ DCavg < 90%;
Null DCavg, DCavg < 60% (admitted only for categories B or 1);

97
An aspect of fundamental importance to consider in the case of dual channel control
systems, therefore from category 2 to 4, is the evaluation of any causes of common faults
CCF that can affect the operation of the system redundancy control.
Annex F of ISO 13849-1 contains a method for assessing whether sufficient measures
have been taken against CCFs. The following Picture contains a series of measures
against CCF and the values associated with them: each measure contained in the list can
only be associated with the value reported if the latter has been adopted, otherwise a null
value. If in the end an overall value of 65 or higher is obtained, then the measures adopted
are sufficient to believe that the residual fraction of the CCF is less than or equal to 2%,
vice versa it is necessary to adopt new measures.
Picture 72 - Measures and associated values against CCF (https://www.inail.it/cs/internet/docs/alg-pubbl-sistemi-comando-macchine-secondo-norma.pdf)

98
After taking into consideration the parameters just presented that contribute to the
calculation of the PL of the control system, it is possible to carry out an evaluation of the
aforementioned PL using the graph in ISO 13849-1, point 4.5 and shown in the following
picture.
Picture 73 - Relationship between PL, DCavg, Category and MTTFD (from https://www.inail.it/cs/internet/docs/alg-pubbl-sistemi-comando-macchine-secondo-norma.pdf)
The know-how of DMI s.r.l. involves the use of the PAScal software produced by Pilz.
The software allows to verify the achievement or the overcoming of the target in terms of
PL simply reproducing the architecture of the control system and inserting the component
that constitutes it in each logic block. By adding to the software the catalogs of the
manufacturers of the components to be used, the software allows a precise calculation of
all the parameters that contribute to the definition of the PL.
As an example, the calculation of the PL of the double channel system for the control of
the safety function called “door” is given. First of all, in the report extrapolated from the
software we can see the summary of the computation presented in the first page of the
same report. The summary of the computation is here reported.

99
Picture 74 - Summary report of the PL computation executed for the control system “door”
The logic carried out by the safety PLC provides that when the door is opened, controlled
by Pizzato magnetic sensors, a signal corresponds to the Serius series circuit breaker
produced by Siemens. The designated architecture of the system is shown in the figure
below.
Picture 75 - Designated architecture of the control system called “door”
As soon as the name of the components that make up the safety command and control
system have passed to the software, directly from the loaded catalogues, the software
extrapolates the data known by the manufacturers to complete the table that follows in
the Picture 76, where the results for DCavg, MTTFD and CCF computations are reported.

100
Picture 76 - Table from PAScal software reporting all the data required for the PL of the control system

101
3 MIB OR machine
The MIB OR machine has been designed to automatically perform the measurements of
the outer diameter, the ovality and the conicity of the bearing outer ring. The MIB OR
machine, according to DMI s.r.l. know-how, is the first machine, moving along the
production line which is critical for the reasons that will be presented shortly.
As a measuring machine, the machine object of this chapter is used to select the outer
rings of the bearing in production according to whether they conform to production
specifications or not. The MIB OR, therefore, is a necessary machine to quantitatively
and qualitatively evaluate the processes that the ring has undergone upstream of it.
As already illustrated in the layout presented in the dedicated paragraph, the MIB OR is
positioned after the CL machine which grinds the external diameter of the OR and
evaluates its working quality. The CL machine, due to its size, is a key point of the line
and therefore, in accordance with the know-how of DMI s.r.l., it must be subject to as few
machine stops as possible.
The stop of a grinding machine such as the CL, in fact, requires quite a long time and
therefore DMI s.r.l. has deemed it appropriate to equip the MIB OR machine with
everything necessary to avoid the CL stop by acting directly on it through a feedback
control that will be activated whenever an out of control condition is detected following
a measurement. The feedback control, as well as the evaluation of the measurement and
the statistical control of the latter are possible thanks to the use of GME III-General
Measuring Equipment whose operation will be presented shortly.
The work cycle of the machine is very simple: the ring, after arriving at the stop station,
the machine station that stops the rings that move along the line on the flexlink and
cadences their entries in the machine, enters the machine and accesses the measurement
station.
The measuring station is composed by a rotating plate, set in motion by an electric motor,
and a set of rollers, which keep the rings in position by keeping the contact with them
during the measurement. The rings start to rotate allowing the LVDT trasducer installed
on the measuring head, during the rotation of the rings, to perform two diameter
measurements at two different heights in order to allow an evaluation of the conicity of

102
the rings. Once the measurement has been detected, the software on the machine evaluates
whether it conforms to the production specifications or not and commands a rejection or
an in-line of the rings on the flexlink downstream of the MIB OR machine.
In the following Picture the measuring station is reported.
Picture 77 - Measurement station on MIB OR machine
Taking a look at the Picture above, you can see the measuring head, the probe in a
horizontal position, the rotating plate under the measuring ring and the set of rollers used
to hold the ring in position; in the background you can see the loading station pushing the
rings from the flexlink to the measuring station in the close-up.

103
3.1 MIB OR machine revamping
3.1.1 Mechanical components revamping
The revamping of the mechanical components installed on the MIB OR machine followed
a guideline already consolidated in the know-how of DMI s.r.l.
First of all, the machine was dismantled of the mechanical components, the mechanical
condition of movement of the electric axes was checked and possibly replaced, the springs
and screws were replaced with as many commercial components, but the key to the
mechanical revamping was the replacement and redesign of a measuring head more
compliant with the latest measurement standards.
For the MIB OR machine, 3D printing was used for the production of support
components, and a new electric motor on the machine was installed.
3.1.2 Electrical components revamping
The MIB OR machine appears to be a completely electric machine and therefore the
absence of pneumatic components has greatly complicated the construction of electrical
circuits and an electrical panel which, on board the aforementioned machine, is divided
into two parts. The first part of the electrical components is installed in a panel behind the
machine, while the second part of them is installed behind the operator panel.
The construction of the electrical panel is made clearer by introducing the following
Pictures.

104
Picture 78 - GME III installed on board on MIB OR machine
Picture 79 – CMME 7001 C installed on board on MIB OR machine

105
As it is easy to notice, the substantial difference between the standard application
electrical panel presented previously in chapter 2 and the one installed on board the MIB
OR machine is, in addition to the complexity, the presence of two new components: GME
III and CMME 7001. This is, in particular, the measuring box, which collects the
measurement data coming from the LVDT transducer during the cycle performed by the
machine and the on-board computer, connected to each other via Ethernet connection
usually LAN 2 (green cables), which allows data to be displayed. Manual control of the
measuring box is possible using GME III's GUI software via CMME 7001.
As done in chapter 2, if you want to describe the user-friendly HMI-Human Machine
Interface, a description of the push-button panel installed on the operator panel is given
and then a description of the most important windows that can be viewed on the on-board
computer in the control panel.
Below is a Picture of the push-button panel so as to make clear the function of each button
in the description that follows.
Picture 80 – Push-button panel installed on MIB OR machine
The functions of the buttons are:
Step forward: in manual cycle mode, each time the button is pressed it enables a
step of the cycle according to step by step;
Man.Aut: allows the selection of the cycle in automatic or manual mode; in
manual mode, the cycle can be carried out keeping the guards open as two-hand

106
control is required and the button that enables the latter is located on the side of
the operator panel away from sources of danger;
Stat cycle: allows you to start the cycle in automatic mode; when the light is on,
the cycle is running;
Power ON: when the magnetic switches connected to the machine guards are
closed and signal that the dangerous functions are safe, pressing this button
commands electrical power to the actuators;
Machine ready: the light indicates that the machine is ready to execute the cycle
as the axes are in position and the GME is ready;
Calibration: when pressed, the button enables the calibration cycle;
Reset: in automatic cycle conditions the machine returns to the machine ready
position;
Stop cycle: during the execution of the cycle in automatic mode, it allows the
machine to conclude the cycle in progress and therefore stop at the next ready
condition;
Emergency: the button with the mushroom head allows, when pressed, to block
any movement of the machine and interrupt the power supply; to be released, the
button must be turned clockwise.
As for the control panel that allows interaction between the machine and the operator in
terms of checking the machine status or setting the operating parameters, the machine is
equipped with a touch screen that allows the aforementioned interaction. On the screen,
as already extensively detailed in the paragraph dedicated to the human machine interface,
it is possible to view the various pages which can be accessed from a main menu. Below
is a brief description of the pages that allow the operator to actively interact with both the
machine and the production process.
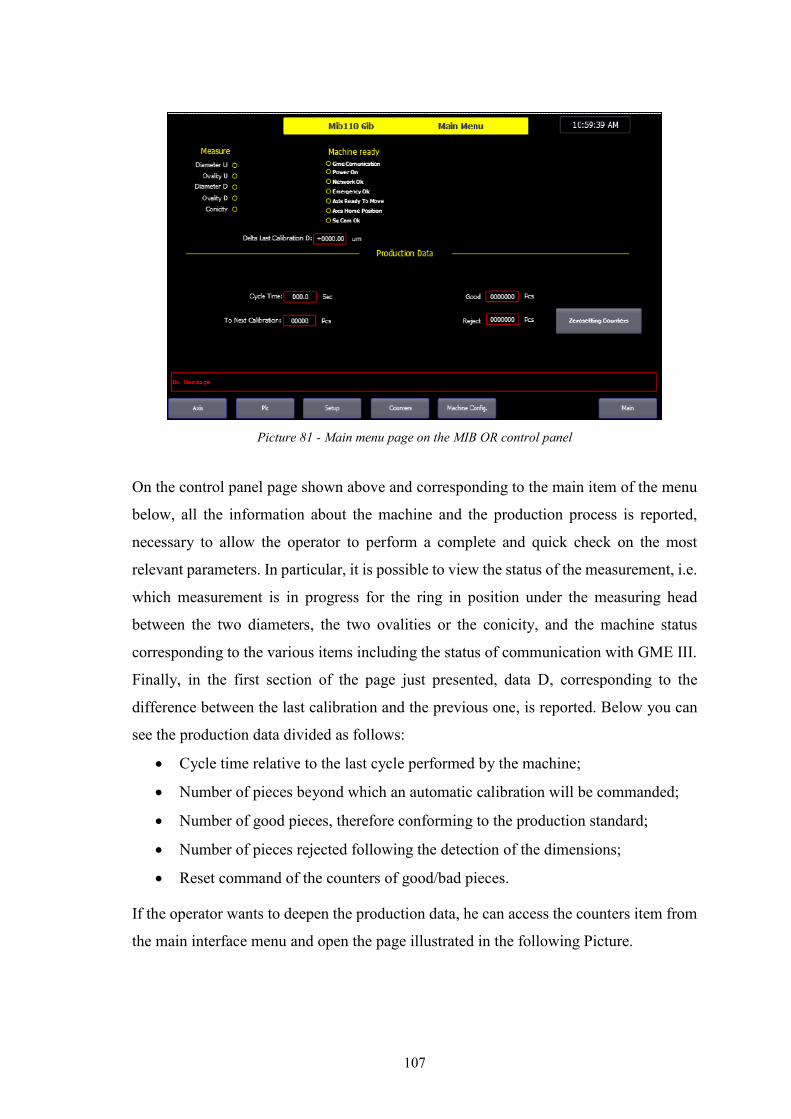
107
Picture 81 - Main menu page on the MIB OR control panel
On the control panel page shown above and corresponding to the main item of the menu
below, all the information about the machine and the production process is reported,
necessary to allow the operator to perform a complete and quick check on the most
relevant parameters. In particular, it is possible to view the status of the measurement, i.e.
which measurement is in progress for the ring in position under the measuring head
between the two diameters, the two ovalities or the conicity, and the machine status
corresponding to the various items including the status of communication with GME III.
Finally, in the first section of the page just presented, data D, corresponding to the
difference between the last calibration and the previous one, is reported. Below you can
see the production data divided as follows:
Cycle time relative to the last cycle performed by the machine;
Number of pieces beyond which an automatic calibration will be commanded;
Number of good pieces, therefore conforming to the production standard;
Number of pieces rejected following the detection of the dimensions;
Reset command of the counters of good/bad pieces.
If the operator wants to deepen the production data, he can access the counters item from
the main interface menu and open the page illustrated in the following Picture.

108
Picture 82 - Page on the MIB OR control panel corresponding to the counters item
In the previously introduced page the operator can control the status of the production
process. The data are displayed in two groups: Partial, the production data collected after
the last counter zero-setting operation, and Total, i.e. the data collected by the machine
from its installation. In particular it is possible to control the number of good parts as well
as of rejected parts, but it in the last case it is possible to deepen the reason of rejection in
terms of number of parts rejected due to diameter, ovality or conicity non-conformity
problems. The items upper and lower in the name of the counters means that the reference
dimension conforming to the production specification has been exceeded or not in
production.
The machine configuration item in the selection menu at the bottom of the control panel
corresponds to the page, not shown here, which allows the operator to select the language,
enable or disable temperature compensation, and finally enable the modification of the
set-up of the axes. Therefore, when you want to act on the set-up of the axes, you must
first pass from the page just described, which is the one corresponding to the machine
configuration item, to enable the change you want to make, and then access the page
corresponding to the axis item in the menu in bottom of the control panel. This page is
shown in the Picture below and a brief description will follow.

109
Picture 83 - MIB OR control panel page corresponding to the axis item
In the page above, it is possible to access the set-up of the axes. On the right there is the
possibility to choose which axis to set among the four available, i.e. stopper, loader,
measuring axis and axis to perform the rejection. On this page it is therefore possible to
view the position, speed and thrust force data of the cylinder, view the status of the
cylinder corresponding to the selected axis as well as the last four alarm codes for the
same cylinder. Furthermore, it is possible to move the cylinder freely in the negative or
positive direction by activating the Jog- and Jog + functions respectively, or to move the
axis in pulse mode. Finally, it is possible to set the home position value and the work
position value for the selected axis.
The page accessed by clicking on the PLC item, not further detailed and not even reported,
allows you to view the status of the PLC digital inputs/outputs and is very similar to the
one already presented in the paragraph dedicated to HMI in chapter 2.
3.2 Measurement system analysis
After the revamping process of the MIB OR machine has been completed, it is necessary
to start analyzing the measurement system. The know-how of DMI s.r.l. provides that the
guideline presented in the Measurement systems analysis-Quality Techniques QT5
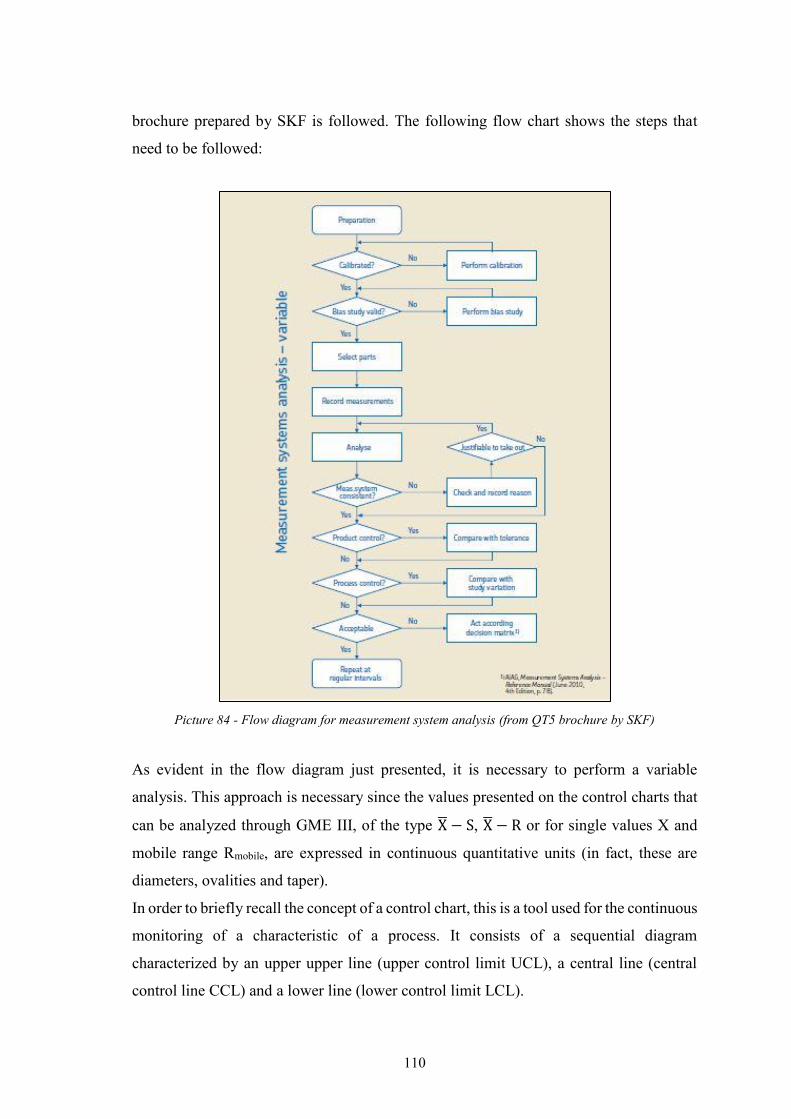
110
brochure prepared by SKF is followed. The following flow chart shows the steps that
need to be followed:
Picture 84 - Flow diagram for measurement system analysis (from QT5 brochure by SKF)
As evident in the flow diagram just presented, it is necessary to perform a variable
analysis. This approach is necessary since the values presented on the control charts that
can be analyzed through GME III, of the type X̅ − S, X̅ − R or for single values X and
mobile range Rmobile, are expressed in continuous quantitative units (in fact, these are
diameters, ovalities and taper).
In order to briefly recall the concept of a control chart, this is a tool used for the continuous
monitoring of a characteristic of a process. It consists of a sequential diagram
characterized by an upper upper line (upper control limit UCL), a central line (central
control line CCL) and a lower line (lower control limit LCL).

111
The samples considered in temporal order are shown on the abscissa axis, while the values
of the monitored characteristic appear on the ordinates. Control charts are the starting
point for assessing the out-of-control conditions of the process. The analysis of the control
charts and their monitoring are the responsibility of GME III, and we will deal with them
shortly in the dedicated paragraph. The introduction was only necessary to justify, at this
point, the use of a flow diagram by variables rather than by attributes, as knowledge of
the control charts is not necessary for the analysis of the measurement system.
The procedure followed for the study of the measurement system consists of two steps:
Evaluation of the instrument capability, which aims to evaluate the minimum
repeatability of the instrument;
r&R evaluation, necessary in order to consider the repeatability and
Reproducibility effects separately, but also as an overall error.
The first step is necessary when you want to evaluate a new measuring instrumentation
and it is carried out in the manufacturer's plant, i.e. DMI s.r.l., before the shipment and
installation of the machinery under study takes place. The second step, on the other hand,
is necessary before final acceptance and production start-up takes place.
3.2.1 Instrument capability analysis
On automatic measuring equipment it is possible to detect the variability of the measuring
instrument itself, corresponding to the instrument standard deviation sinstrument coming
from mechanical instability, part positioning, pick up system and electronic problems.
Instrument capability: the minimum repeatability of the instrument itself defined as
6sinstrument, the instrument is capable for the parameter under investigation.
When a measuring equipment is installed along a production line, the variability due to
measurement cannot be separated from variability due to product. A strategic evaluation
consists in measuring the same part in the same position more than once (specifically 50
times) avoiding, in this way, the influence due to product changes.
QT5 brochure from SKF quality standard recommend to compare the instrument variation
with the 20% of the process variation, i.e. 6sprocess, or with the 20% of the tolerance.
In the following picture the compared terms are clearly defined.

112
Picture 85 - Terms of comparison for instrument capability computation (from QT5 brochure by SKF)
The two indices capability coefficients are expressed as:
𝐶𝑔 =0,2 ∙ 𝑠𝑝𝑟𝑜𝑐𝑒𝑠𝑠
𝑠𝑖𝑛𝑠𝑡𝑟𝑢𝑚𝑒𝑛𝑡
𝐶𝑔𝑘 =0,1 ∙ 6𝑠𝑝𝑟𝑜𝑐𝑒𝑠𝑠 − |�̅�𝑖𝑛𝑠𝑡𝑟𝑢𝑚𝑒𝑛𝑡 − 𝑥𝑚𝑎𝑠𝑡𝑒𝑟|
3𝑠𝑖𝑛𝑠𝑡𝑟𝑢𝑚𝑒𝑛𝑡
The minimum acceptable criterion is Cg and Cgk = 1,33.
The results of the instrument capability analysis have been computed with Minitab
software and are here reported. Even if it might be sufficient to consider only the direct
measurements performed by the machine, i.e. the two diameters d1 and d2, the know-
how of DMI s.r.l. provides that the instrument capability is calculated for all measures
that can be obtained also for indirect ones such as ovality and taper.

113
Picture 86 - Summary report from Minitab about d1 instrument capability analysis
Picture 87 - Summary report from Minitab about d2 instrument capability analysis

114
Picture 88 - Summary report from Minitab about o1 instrument capability analysis
Picture 89 - Summary report from Minitab about o1 instrument capability analysis

115
Picture 90 - Summary report from Minitab about taper instrument capability analysis
Looking at the above reported results it has been possible to assess a good capability of
the instrument, this means that the measurement system can measure parts consistently
and accurately. The first step of the measurement system analysis has been successfully
completed so the second one can be analysed.
3.2.2 repeatability and Reproducibility (r&R) analysis
The second step of the measuring system analysis consists in the evaluation of the
repeatability and reproducibility.
The repeatability is defined as the variation in measurements obtained with one measuring
instrument when it is used several time by the same operator in the measurement of the
identical characteristic on the same part. In the following picture it is possible to make
the ideas clearer.

116
Picture 91 - Repeatability representation (from QT5 brochure by SKF)
The standard deviation of the random error occurring in every single measurement is
represented by the within standard deviation. It may be expected that this standard
deviation will have different values under the different conditions, i.e. different operators,
different occasions and different parts. The average value for the within standard
deviation for all conditions is called repeatability standard deviation which is estimated
by the term sr. The repeatability value r = sr depends solely on the repeatability standard
deviation.
On the other hand the reproducibility is defined as the variation, in the average, of the
measurements made by different operators using the same measuring instrument when
they are measuring the same characteristic on the same part.
Picture 92 - Reproducibility representation (from QT5 brochure by SKF)

117
The standard deviation of the error, which consists of both random and systematic
components is represented by the between standard deviation. It includes variabilities of
operators. The reproducibility value R = sR depends on the between operator standard
deviation and the repeatability standard deviation.
The measurement system variation for repeatability and reproducibility (r&R) is obtained
by:
𝑟&𝑅 = √𝑟2 + 𝑅2
It is important to underline that for automatic equipment there is no operator influence so
that the r&R is equal to the repeatability.
Once the repeatability and the reproducibility r&R is determined, it should be compared
to the process variation, i.e. 6sprocess:
%𝑟&𝑅 = 𝑟&𝑅
𝑠𝑝𝑟𝑜𝑐𝑒𝑠𝑠∙ 100
The computation of the parameter just presented starts from the acquisition of
measurement data with GME III end the subsequent analysis with Minitab. The
measurement process, according to DMI know-how and SKF quality standards, consist
in the measurements performed by one operator on twenty parts, numbered from 1 to 20,
repeated three times for a total of 60 measurement data.
A general guideline for the acceptance of the measuring equipment r&R, as well as the
corrective actions to be taken in order to achieve a good level of this parameter, is given
from SKF QT5 brochure like follows.

118
Picture 93 - Acceptance criteria and possible corrective actions for measuring system %r&R study
The method of analysis selected on Minitab is the ANOVA method and the typical report
is here represented.
Picture 94 - Report for d1 r&R study with Minitab
Gage name:
Date of study:
Reported by:
Tolerance:
Misc:
Part-to-PartReprodRepeatGage R&R
200
100
0
Perc
en
t
% Contribution
% Study Var
% Tolerance
2019181716151413121110987654321
8
4
0
n
1917151311 9 7 5 3 1
0,45
0,30
0,15
0,00
Part
Sam
ple
Ran
ge
_R=0,1451
UCL=0,3735
LCL=0
1917151311 9 7 5 3 1
8
4
0
Part
Sam
ple
Mean
__X=2,36UCL=2,51LCL=2,21
Components of Variation
d1 by n
R Chart
XBar Chart
Gage R&R (ANOVA) Report for d1

119
Minitab graph window output is, looking at the previously introduced Picture, composed
by the following diagrams:
Components of variations: here the sources of variations are highlighted;
R chart: here the range of measurement values obtained for each part is reported;
Characteristic by part: here the mean value obtained for each part in the three
measurements is reported;
X-bar chart.
On the other hand, in the following picture it is important to underline that looking at the
%Study Var (%SV) column it is possible to understand how much each component
accounts for as a percentage of the total variation. Another important parameter is the
number of distinct categories, which represents the number of non-overlapping
confidence intervals that will span the range of product variation. You need at least five
distinct categories to have an adequate measuring system.
Picture 95 - Results of r&R study for d1 with Minitab

120
A more simple view of the results is here reported for the other parameters:
Picture 96 – r&R study summery report for o1 with Minitab
Variation by Source
Total Gage 0,114 45,65 6,86
Repeatability 0,114 45,65 6,86
Part-to-Part 0,223 88,97 13,37
Study Variation 0,250 100,00 15,02
Tolerance (upper spec - lower spec): 10
Source StDev Variation
%Study
%Tolerance
2,01,51,0
20
19
18
17
16
15
14
13
12
11
10
9
8
7
6
5
4
3
2
1
2019181716151413121110 9 8 7 6 5 4 3 2 1
0,3
0,2
0,1
0,0
Parts
Ran
ge
Measurements by Part
Compare the test-retest data for each part.
Test-Retest Ranges (Repeatability)
Parts with larger ranges have less consistency.
Gage R&R Study for o1Variation Report

121
Picture 97 – r&R study summery report for d2 with Minitab
Variation by Source
Total Gage 0,095 2,33 5,67
Repeatability 0,095 2,33 5,67
Part-to-Part 4,064 99,97 243,85
Study Variation 4,065 100,00 243,91
Tolerance (upper spec - lower spec): 10
Source StDev Variation
%Study
%Tolerance
840-4
20
19
18
17
16
15
14
13
12
11
10
9
8
7
6
5
4
3
2
1
2019181716151413121110 9 8 7 6 5 4 3 2 1
0,45
0,30
0,15
0,00
Parts
Ran
ge
Measurements by Part
Compare the test-retest data for each part.
Test-Retest Ranges (Repeatability)
Parts with larger ranges have less consistency.
Gage R&R Study for d2Variation Report

122
Picture 98 – r&R study summery report for o2 with Minitab
Variation by Source
Total Gage 0,128 52,19 7,69
Repeatability 0,128 52,19 7,69
Part-to-Part 0,209 85,30 12,56
Study Variation 0,245 100,00 14,73
Tolerance (upper spec - lower spec): 10
Source StDev Variation
%Study
%Tolerance
1,51,00,5
20
19
18
17
16
15
14
13
12
11
10
9
8
7
6
5
4
3
2
1
2019181716151413121110 9 8 7 6 5 4 3 2 1
0,5
0,3
0,1
Parts
Ran
ge
Measurements by Part
Compare the test-retest data for each part.
Test-Retest Ranges (Repeatability)
Parts with larger ranges have less consistency.
Gage R&R Study for o2Variation Report

123
Picture 99 – r&R study summery report for taper with Minitab
Variation by Source
Total Gage 0,070 16,28 4,19
Repeatability 0,070 16,28 4,19
Part-to-Part 0,423 98,67 25,38
Study Variation 0,429 100,00 25,72
Tolerance (upper spec - lower spec): 10
Source StDev Variation
%Study
%Tolerance
1,51,00,50,0
20
19
18
17
16
15
14
13
12
11
10
9
8
7
6
5
4
3
2
1
2019181716151413121110 9 8 7 6 5 4 3 2 1
0,2
0,1
0,0
Parts
Ran
ge
Measurements by Part
Compare the test-retest data for each part.
Test-Retest Ranges (Repeatability)
Parts with larger ranges have less consistency.
Gage R&R Study for taperVariation Report
124
After having reached, also for indirect measurements, an adequate level of %r&R, the
measurement system analysis is completed and the measuring machine can be considered
acceptable and its use can be recommended in applications like sorting or classifying
parts, which is the application of the MIB OR machine in the SKF production line object
of study.
3.3 MIB OR: the first key machine for process improvement
As already mentioned, the desire to deepen the study of the MIB OR machine derives
from the fact that it is placed, along the production line, after the CL machine which
grinds the external diameter of the bearing OR. This last machine, due to its size, needs
to be stopped as little as possible due to the time that this action would require: the
dimensions of the wheels are such that it could take minutes.
The idea, according to the DMI s.r.l. know-how, is to create a system able to self-correct
after the detection of an out-of-control condition, and only in case the system control
condition can’t be reached the operator must stop the CL machine in order to verify the
occurred problem. An example is that the MIB OR machine detects a trend of measured
dimensions suggesting that the CL wheels are wearing out, the CL machine is corrected
by a feedback signal and, only in case the measurements do not return in under-control
condition, the grinding machine can be stopped.
The choice of GME III was not even accidental, in fact this is due to the need to have
numerous programmable functions available that go well beyond the collection and
representation of the measurement data.
After verifying the suitability of the MIB OR machine to perform precise and consistent
measurements, the same machine became the subject of study as I wanted to verify that,
by enabling the temperature compensation and automated process control functions,
during production simulations the process was more efficient.
3.3.1 Statistical Process Control (SPC)
The purpose of the analysis is to use the MIB OR machine to carry out a statistical process
control (SPC), which consists of a methodology that uses statistical techniques in order

125
to define, analyse and verify the criticalities of the process that involve unwanted changes
compared to normal operation. Statistical process control is based on the analysis of
control charts of the type X̅ − S, X̅ − R or for single values X and mobile range Rmobile.
As already mentioned, the upper and lower control limits are defined for the control
charts, as well as the central line (target value), following the capability study guide
reported in the SKF Quality Techniques - Process capability studies brochure QT1 and
have been set on GME III at a distance of 3sigma by definition. The process by definition
is said to be in out of control conditions when the measurement values fall outside the
graph area between the two limits, but the SKF standard provides that other out of control
conditions (OOCC) exist and are detected live by the GME III. The monitored out-of-
control conditions are as follows:
Picture 100 - OOCC representation according to SKF process quality standard (from technical documentation for general measuring equipment – GME III by SKF)

126
Picture 101 - OOCC definition according to SKF process quality standard (from technical documentation for general measuring equipment – GME III by SKF)
The main purpose of the statistical process control (SPC) is to help the operator to
undertake solutions that allow the recovery of the optimal working conditions, therefore
the first step is to enable GME III to display the OOCCs. In fact, initially used for the
simple collection and representation of measurement data, GME III did not allow the
display of out-of-control conditions, neither the simpler one of the outside. The initial
situation was the one reported in the following pictures, the out-of-control conditions
highlighted were searched for by me requiring such a time that, without a quick display,
their identification, considering the speed with which the MIB OR executes the cycle
(3.4 seconds), it would take too long for the operator.
Picture 102 – Run OOCC not detected

127
Picture 103 – Hugging OOCC not detected
After enabling the display of the OOCCs, the operator has an easier to read control chart
available, in fact it is enough to observe the following:
Picture 104 – Hugging OOCC detected
3.3.2 Temperature Compensation
At this point, after the visualization and identification of out-of-control conditions had
become very simple, all that remained was to start the simulation to verify the actual
improvement of the process. Before starting the simulation, as a first improvement step,
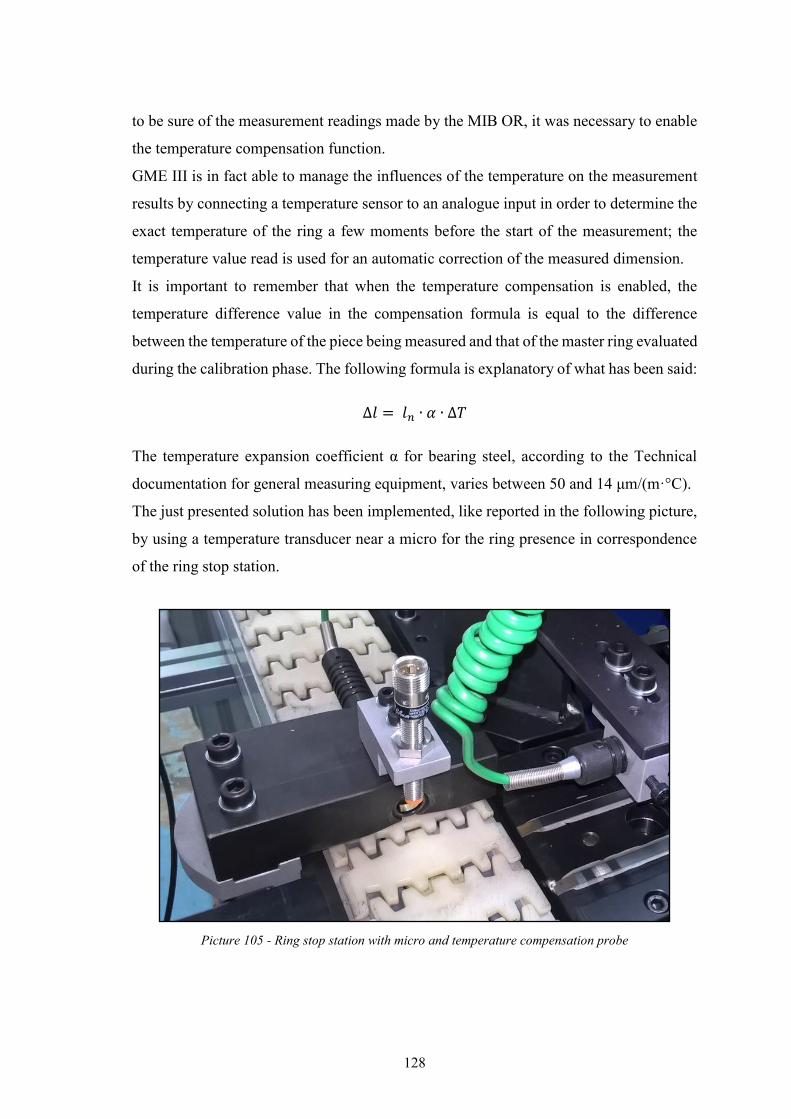
128
to be sure of the measurement readings made by the MIB OR, it was necessary to enable
the temperature compensation function.
GME III is in fact able to manage the influences of the temperature on the measurement
results by connecting a temperature sensor to an analogue input in order to determine the
exact temperature of the ring a few moments before the start of the measurement; the
temperature value read is used for an automatic correction of the measured dimension.
It is important to remember that when the temperature compensation is enabled, the
temperature difference value in the compensation formula is equal to the difference
between the temperature of the piece being measured and that of the master ring evaluated
during the calibration phase. The following formula is explanatory of what has been said:
∆𝑙 = 𝑙𝑛 ∙ 𝛼 ∙ ∆𝑇
The temperature expansion coefficient α for bearing steel, according to the Technical
documentation for general measuring equipment, varies between 50 and 14 μm/(m·°C).
The just presented solution has been implemented, like reported in the following picture,
by using a temperature transducer near a micro for the ring presence in correspondence
of the ring stop station.
Picture 105 - Ring stop station with micro and temperature compensation probe

129
3.3.3 Self-Tuning Control System (STCS)
Sure of the ring characteristics reading performed by the MIB OR, it was now possible to
configure a closed-loop control system capable of managing the production process of
the CL grinding machine without user intervention.
In this way it is possible to implement a Self-Tuning Control System (STCS): the GME
III detects a deviation from the process target, by evaluating all the possible OOCCs, and
a compensation pulse is fed back to the CL from the MIB OR PLC so that the feedback
tells the grinding machine to either increase or decrease the diameter.
Picture 106 – Logical scheme of a self-tuning control system
In the following picture the first result of the self-tuning control system is clear: the GME
III detects a run OOCC condition and immediately the process return to under control
conditions.

130
Picture 107 – After the detection of a run OOCC the MIB OR sends a feedback pulse to the CL and the process return in under-control condition
3.3.4 Final Results Analysis
The final results of the analysed and implemented improvement actions are shown in the
following screen, which shows the history of the measurements performed by the MIB
OR which shows how it was possible, after 3619 measurements, to reach an average value
of diameter equal to -6.36μm very close to the target of -6.5μm and therefore perfectly
acceptable.
The data are distributed with a standard deviation of 0.86. The effect of the creation of a
self-tuning control system is evident from the fact that a positive compensation of 281μm
and a negative compensation of 546μm were necessary, which therefore made it possible
to recover a not negligible number of rings.

131
Picture 108 - Evaluation of the implemented solutions, leading to an improvement of the process

132
The last aspect that allows to evaluate the improvements made to the process is the
evaluation of the Pp and Ppk performance indices, the calculation of which is performed
directly by GME III and continuously updated. These process performance indices are
calculated by analysing all the data collected by the MIB OR and not a part of them and
give an indication of how the process has behaved in the past, thus being particularly
suitable for the analysis of new processes being improved. .
The formulas for calculating these indices are as follows:
𝑃𝑝 = 𝑈𝑇𝐿 − 𝐿𝑇𝐿
6 ∙ 𝑠𝑡𝑜𝑡
𝑃𝑝𝑘 = 𝑚𝑖𝑛 (𝑈𝑇𝐿 − �̅�
3 ∙ 𝑠𝑡𝑜𝑡 ;
�̅� − 𝐿𝑇𝐿
6 ∙ 𝑠𝑡𝑜𝑡)
where:
stot is the total standard deviation;
x̅ is the grand average of the measurement recorded by MIB OR;
UTL − LTL is the tolerance interval. The upper and lower tolerance limits indicate
the allowable process spread according to product specification.
Giving a quick interpretation to the two formulas, it is evident that Pp is an indication of
what the number of data outside the specification limits would be if the process were
perfectly centred on the defined target value when this was at the centre of the
specification limits. Therefore, the Pp alone does not allow to perform a complete process
performance analysis because there is no information about the distance of the process
from the specification limits. For the latter case, the Ppk comes in handy.
The quality standards of SKF suggest that the process is performing when Ppk is higher
than 1.67. Therefore, looking at the results reported in the previous picture, the process
under study is perfectly capable since Ppk = 2.07 and, given Pp = 2.12, since the difference
between the two performance indices is very low it is centred without the need of further
improvements analysis.

133
4 XHM80 machine
The XHM80 machine has been designed and developed to perform bearing pairing
automatically. The operating cycle of the machine is rather complicated and is carried out
by a Siemens S7-1500 PLC; the correct operation of the machine is necessary so that the
entire SKF production line under study can have a constant operation with a high
performance: the XHM80 machine, in fact, is located in a crucial point of the line, i.e. the
one in which the ORs join together to form a single channel in which the assembled
bearing is seen advancing rather than the rings.
The internal and external rings arrive at the machine by means of a conveyor belt, as
already mentioned in the chapter dedicated to the layout, and are then loaded onto two
separate machine inlet channels. The rings are then transported to their respective
measuring stations where the IR and OR raceway diameters are measured. The machine
cycle, controlled and commanded by the PLC, foresees that the raceway diameter of the
IR is evaluated and, only if this falls within the tolerances foreseen for the bearing in
production, the dimension, compliant or not, of the OR is evaluated. Once the
measurement of the OR raceway diameter has been detected, the PLC commands the
selection of the ball and its insertion in accordance with the need to have a radial clearance
that differs as little as possible from the production specifications. The radial clearance,
according to the sphere diameter under consideration is evaluated by considering the
following Picture and formula:
𝑅𝐶 = (± 𝑑𝑒) − (± 𝐷𝑖) − (± 𝐷𝑤 ∙ 2)
Picture 109 – Bearing Assembly dimensions

134
If the ball is not available, in the sense that it is not among the balls used on the machine,
the OR is discarded and, keeping the IR available, the dimensions of the next OR and the
possibility of coupling are evaluated. This is repeated for three successive ORs and, if the
sphere is not found, then the IR and the OR are discarded together placing the IR inside
the OR. The XHM80 machine uses seven shades of spheres diameters ranging from
-3 μm to +3 μm. When, therefore, the sphere required by the coupling specifications is
provided on the machine and is available, the PLC commands the cylinder that moves the
drawer containing the eight spheres of the selected shade and the IR and OR rings can
move forward, one inside the other, at the coupling station. Once at the coupling station,
the balls are inserted between the rings thanks to the presence of the KFA group consisting
of three components of fundamental importance to ensure correct execution of the
operation of inserting the eight balls required. Specifically, the three components that
make up the group are:
Decentralizer: allows to decentralize the inner ring with respect to the outer ring
in order to create the necessary space for the insertion of the balls. The movement
of the decentralizer corresponds to the action of a press that ovalizes the OR in the
dimension of 3-4 tenths;
Half-moon: creates a support surface for the spheres that are inserted during the
coupling phase;
Nail: orientates the spheres during the insertion phase.
The KFA group is reported below:
Picture 110 - KFA group components
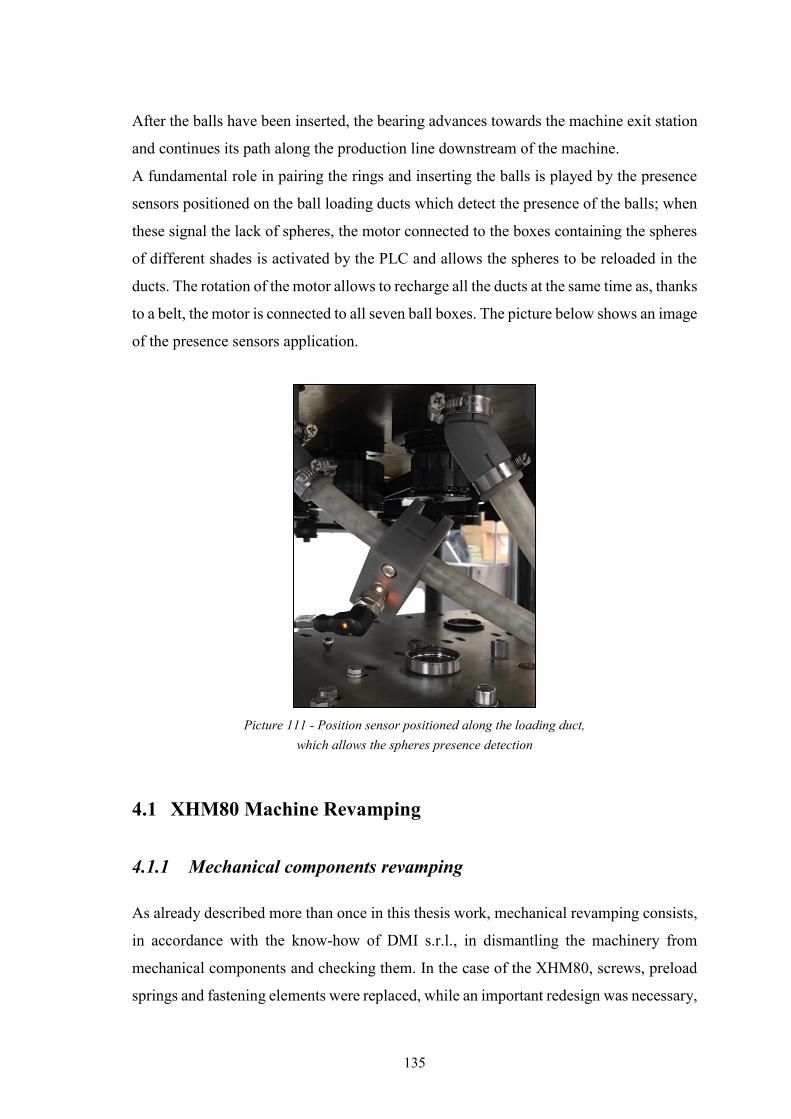
135
After the balls have been inserted, the bearing advances towards the machine exit station
and continues its path along the production line downstream of the machine.
A fundamental role in pairing the rings and inserting the balls is played by the presence
sensors positioned on the ball loading ducts which detect the presence of the balls; when
these signal the lack of spheres, the motor connected to the boxes containing the spheres
of different shades is activated by the PLC and allows the spheres to be reloaded in the
ducts. The rotation of the motor allows to recharge all the ducts at the same time as, thanks
to a belt, the motor is connected to all seven ball boxes. The picture below shows an image
of the presence sensors application.
Picture 111 - Position sensor positioned along the loading duct, which allows the spheres presence detection
4.1 XHM80 Machine Revamping
4.1.1 Mechanical components revamping
As already described more than once in this thesis work, mechanical revamping consists,
in accordance with the know-how of DMI s.r.l., in dismantling the machinery from
mechanical components and checking them. In the case of the XHM80, screws, preload
springs and fastening elements were replaced, while an important redesign was necessary,

136
carried out by the design team of DMI s.r.l., regarding the measuring heads of the raceway
diameters of the internal and external rings, of the KFA group and the ball selection
mechanism.
In particular, starting for simplicity from the KFA group already presented and visible in
the previous Picture, a design of the three components mentioned above and an
experimental evaluation of the application force of the press were required to ovalize the
OR ring of the required size.
The group for selecting and reloading the balls inside the loading tubes has been designed
thanks to a massive use of 3D printing necessary for the realization of the tubes as well
as the drawers, while the transmission of the motion to move the drawers and recharging
the ducts was obtained thanks to a belt transmission that connects all the drawers to a
single Siemens motor of small dimensions and with reduced consumption and price
thanks to the lightness of the components, obtained with 3D printing, that must be started.
A rather important work was carried out, however, in the case of the design of the
measuring heads of the raceways diameters. The measuring principle of the two heads is
based on the use of a cone on whose side surface the balls are placed, which will position
themselves inside the raceway of the measuring ring. The cone, with a taper angle defined
by the design team, allows, once the spheres have entered the raceway, to read the exact
diameter corresponding to the height reached by the cone after the spheres have
positioned themselves. The height reached by the cone is read thanks to the use of an
LVTD probe which allows to define the diameter of the raceway as it measures the
difference between the position of the spheres reached for the ring in measure and that
reached by the spheres in the measure of the master sample. When the measuring cone,
in fact, goes back to the rest position, the spheres lying on the cone enter the master ring.
In particular, I want to mention the design value of the taper angles equal for both
measuring cones and equal to almost 5°. Below are the Pictures of the IR and OR
measurement stations.

137
Picture 112 - IR raceway diameter measuring head
Picture 113 – OR raceway diameter measuring head
4.1.2 Pneumatic components revamping
The XHM80 machine, unlike the MIB OR previously analysed, is not a completely
electric machine, which is why the pneumatic circuit on the machine needed a revision.
First of all, a complete dismantling of the pneumatic components was carried out, and
these were replaced with identical commercial parts. Although some of the cylinders,

138
following the loading and unloading tests of the chambers, were still functional, the DMI
s.r.l. has preferred to perform a complete replacement, as well as for the pipes, of the
same both to ensure correct operation of the machinery necessary for its key function, and
to minimize the amount of air consumption.
The machine is therefore equipped with 26 actuators produced by Festo and the air
consumption is around 1200 l/min and controlled by a block of monostable Festo solenoid
valves powered by the terminal board present in the electrical panel on the machine,
which is reported in the following Picture.
Picture 114 – Block of solenoid valves and lubricator installed on XHM80 machine
As can be seen from the previous picture, next to the solenoid valve block there is the
Festo mist lubricator of the MS series. This component, whose pneumatic symbol is
shown in the picture below, is connected to the air treatment unit identical to the one
already presented in chapter 2 of this thesis and was necessary considering the dimensions
of the cylinders that the compressed air must operate.
Picture 115 – Lubricator pneumatic symbol

139
4.1.3 Electrical components revamping
The revamping of the electrical components consists in the dismantling of the electrical
components present on the machine and their subsequent replacement. Therefore, this
procedure began with the assembly of the electrical panel in accordance with the
provisions of the Machinery Directive in force.
The aforementioned panel, in the case of the XHM80 machine, appears to be very simple,
in the sense that it consists of only the key elements in terms of safety and command,
without the presence of additional measuring components. In the case of the XHM80, in
fact, the LVTD measurement probes necessary to detect the values of raceways diameters
are connected directly to the on-board Siemens S7-1500 PLC, without installing an on-
board computer such as the CMME 7001 present on the MIB OR machine. The electrical
panel, in the case study, appears to be composed of the same components as discussed in
chapter 2 of this thesis work as evident in the following Picture.
Picture 116 - Electrical panel installed on board of XHM80 machine

140
As regards the HMI-Human Machine Interface, also in this case we wanted to keep the
concept of user-friendly interface and therefore we came to the conclusion that it was
necessary to try to keep the same interface as standard as possible, both in the layout and
in the functionality and organization of the pages. Therefore, in this paragraph only the
pages that appear to be different from those present on the interface of the MIB OR and
characteristics of the machine being analysed are reported.
First of all, the page containing general information on the machine status is shown in the
following Picture.
Picture 117 - Main page of the XHM80 machine Human Machine Interface
Specifically, on this HMI page it is possible to view the machine ready status, the number
of pieces processed by the machine as good pieces, this counter is both resettable and not,
the number of OR and IR discarded following the raceway diameter measurements
performed by the machine. In the same page it is also possible to view the process
parameters in terms of the last cycle time, the last measured values for IR and OR raceway
diameters, the last shade of spheres used in the assembly phase and the last radial
clearance value obtained. At the same time it is possible to visualize the number of
enabled boxes, which will correspond to the number of shades of sphere diameter, and
the target radial clearance value.
As already mentioned, the XHM80 machine does not have an on-board computer, but at
the same time it must be possible for the operator to view the diameter trend in order to
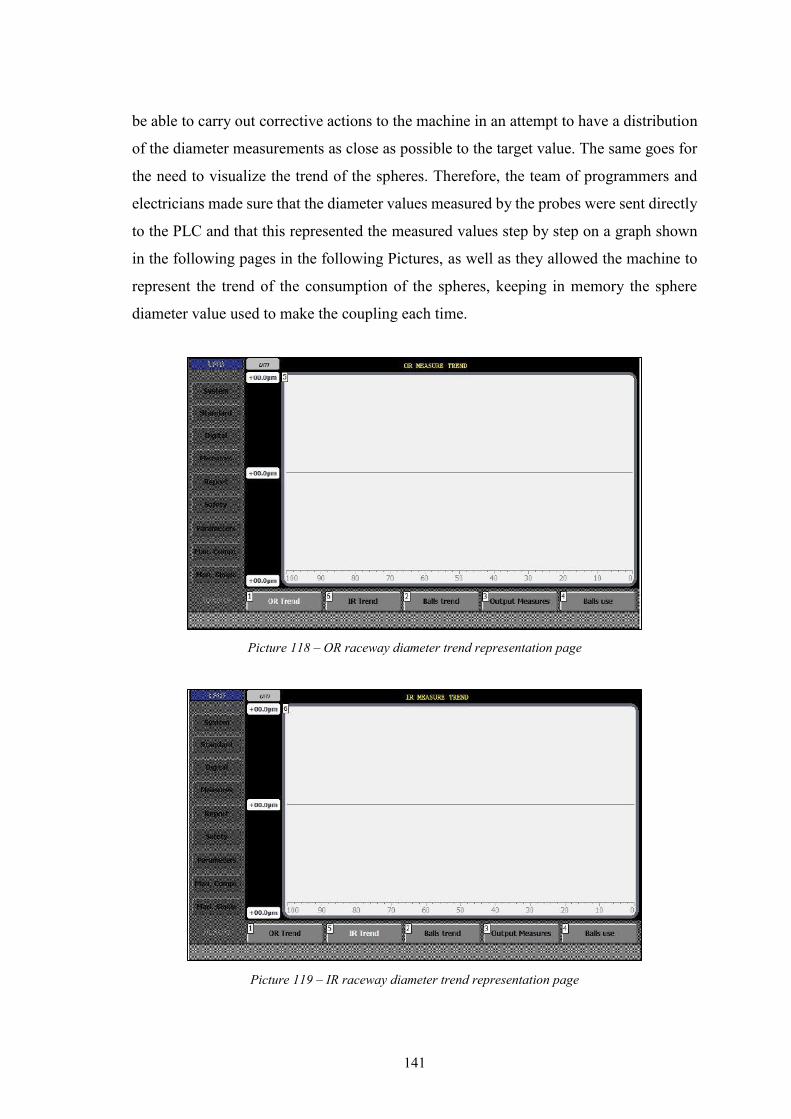
141
be able to carry out corrective actions to the machine in an attempt to have a distribution
of the diameter measurements as close as possible to the target value. The same goes for
the need to visualize the trend of the spheres. Therefore, the team of programmers and
electricians made sure that the diameter values measured by the probes were sent directly
to the PLC and that this represented the measured values step by step on a graph shown
in the following pages in the following Pictures, as well as they allowed the machine to
represent the trend of the consumption of the spheres, keeping in memory the sphere
diameter value used to make the coupling each time.
Picture 118 – OR raceway diameter trend representation page
Picture 119 – IR raceway diameter trend representation page

142
Picture 120 – Ball diameter trend representation page
At the same time, however, the operator may need more data to be able to evaluate any
malfunctions in the production process and take corrective actions. And it is precisely for
this reason that the interface presents a page dedicated to the collection of the history of
the measurements detected for the coupling to which is added the degree of tolerance T
on the radial clearance which is, from T5 to T1, increasingly narrow. This page can be
viewed in the following Picture.
Picture 121 – Pairing parameters historical data

143
For the spheres, a dedicated page has also been provided in which, to avoid confusion,
the diameter of the sphere is reported in correspondence with the number of the box that
contains it as well as the quantity of spheres consumed for each shade of diameter both
in numerical value and in green bar shape.
The diagram obtained by analysing the green bars is a histogram of consumption of the
spheres and the operator can, in a very simple way, make sure that the histogram
approximates as much as possible a Gaussian curve with the average value in
correspondence with the sphere whose diameter shade is equal to zero, corresponding to
the target ball diameter. Such page is reported in the following Picture.
Picture 122 – Ball consumption summary page
As regards the possibility of setting the production and process parameters, a dedicated
page has been designed on the HMI shown in the following Picture. On this page it is
possible to set the tolerance limits for the IR raceway diameter, the tolerance limits of the
radial clearance T5, which an SKF proprietary algorithm will then break down into the
narrowest degrees, the diameters of balls contained in each box and it is possible to enable
the box. As it is evident, the XHM80 machine is designed to be able to insert 9 shades of
possible sphere diameter, but following the customer's request, DMI s.r.l. has enabled
only 7 of them; with simple modifications to this page it is possible to modify the number
of enabled boxes.

144
Picture 123 – Page dedicated to the setting of production and process parameter on the XHM80 machine HMI
4.2 Measurement system analysis
Although the XHM80 machine is a machine that carries out the bearing assembly, this
operation is based on the results of the measurements performed by the machine.
For this reason, to ensure the correct functioning of the machinery it is necessary to
perform an analysis of the measuring system. In the case of the XHM80, the SKF-owned
QT5 brochure was followed again, but unlike the MIB OR it was not possible to carry
out an r&R study. This last study, in fact, would have had the objective of verifying that,
under the same conditions of IR and OR raceway diameter, the machine would have
proceeded with the insertion of the same shade of diameter of the sphere. This was not
practicable as it would have been necessary each time to disassemble the assembled
bearing, remove the balls and measure the rings again, with the risk of damaging them
during the disassembly phase, and verify the choice of the same ball as the previous
assembled bearing.
Therefore, for the reason just explained, the measurement system was analysed by
performing an analysis of the instrument capability and a linearity analysis.

145
4.2.1 Instrument capability analysis
As in the case of the MIB OR, the instrument capability analysis has the purpose of
verifying the ability of the measuring instrument, in this case the measuring instrument
are the two measuring heads, to measure the rings in a consistent and accurate way. Also
in this case, the analysis and calculation of the Cg and Cgk values, and the verification that
they were higher than 1,33, was performed with the software for statistical analysis
Minitab and the results are shown in the following Pictures.
Picture 124 – Summary report from Minitab about IR raceway diameter instrument capability analysis
Gage name:
Date of study:
Reported by:
Tolerance: 20
Misc:
Reference -0,098
Mean -0,09800
StDev 0,265338
6 × StDev (SV) 1,592026
Tolerance (Tol) 20
Basic Statistics
Bias -0,00000
T 0,000000
PValue 1,000
(Test Bias = 0)
Bias
Cg 2,51
Cgk 2,51
Capability
%Var(Repeatability) 7,96%
%Var(Repeatability and Bias) 7,96%
464136312621161161
2
1
0
-1
-2
Observation
IR Ref
Ref + 0,10 × Tol
Ref - 0,10 × Tol
Run Chart of IR
Type 1 Gage Study for IR

146
Picture 125 – Summary report from Minitab about OR raceway diameter instrument capability analysis
4.2.2 Linearity analysis
On SKF QT5 Measurement Systems Analysis, the linearity is defined as the difference
of bias through the expected operating range of measurement of the measuring
equipment. The term bias, on the same brochure, is defined as the difference between the
true value (reference value) and the observed average of measurements on the same
characteristic on the same part. The following Picture gives a more clear representation
of these two definition.
Picture 126 – Linearity and Bias representation (from QT5 brochure by SKF)
Reference 0,098
Mean 0,09800
StDev 0,191119
6 × StDev (SV) 1,146715
Tolerance (Tol) 20
Basic Statistics
Bias 0,00000
T 0,000000
PValue 1,000
(Test Bias = 0)
Bias
Cg 3,49
Cgk 3,49
Capability
%Var(Repeatability) 5,73%
%Var(Repeatability and Bias) 5,73%
Gage name:
Date of study:
Reported by:
Tolerance: 20
Misc:
464136312621161161
2
1
0
-1
-2
Observation
OR
Ref
Ref + 0,10 × Tol
Ref - 0,10 × Tol
Run Chart of OR
Type 1 Gage Study for OR

147
To perform a linearity study, the SKF standard requires that a number of components to
be measured greater than or equal to 5 are chosen, whose dimensions cover the
measurement range of the measuring system, and that each part must be measured a
number of times greater or equal to 10 so that the average value of the bias can be
calculated. The slope of the line that best fits the bias average versus the reference values
multiplied by process variation of the parts is an index that represents the linearity of the
measurement system. Therefore, in order to perform the study, I selected 5 master rings
of variable size between -10 μm and + 10 μm, corresponding to the process variation, and
each of them was measured 10 times. Obviously the linearity evaluation was carried out
twice for the IR raceway diameter measuring head and for the OR one respectively. The
summary report of the study are in the following Pictures.
Picture 127 - Summary report from Minitab about IR raceway diameter measuring head linearity study

148
Picture 128 - Summary report from Minitab about OR raceway diameter measuring head linearity study
Reading both reports allows to visualize the value of the slope of the regression line,
which interpolates the average bias value for each part. In both cases there is a very low
slope value, respectively -0.0012 in the IR case and -0.0106 in the OR case. The mean
bias values are also acceptable as they are respectively 0.196 in the case of the IR raceway
diameter measuring head and 0.326 in the case of the OR one.
With these data it was therefore possible to state that both measuring heads have the same
accuracy for all the dimensions of the measured objects, or rather that neither of the two
measuring heads is affected, in terms of measurement accuracy, by the dimensions of the
ring to measure; all of this is true with a 95% confidence.
4.3 XHM80: the second key machine for process improvement
As mentioned, the study of the revision plan of the XHM80 machine was not accidental:
this machine, in fact, is of crucial importance for the correct functioning of the entire
production line. In fact, this machine is placed in a crucial point of the production line as
it is the machine on which the IR and OR channels are joined and its correct functioning

149
is necessary in order to be able to place an well-assembled bearing on the remaining part
of the line which is at the same time the finished product of the two previous sections of
line and the raw material of the downstream section of line. The bearing assembled by
the XHM80 must therefore conform as closely as possible to the production target, subject
to the possibility of this being rejected in the following machines.
Essentially, my study, having completed the revamping operations, began by starting
from the fundamental operations that the XHM80 machine performs: measurement of the
raceway diameters of the IR and OR rings and selection and insertion of balls. As can be
easily understood, the operation of selecting the spheres cannot ignore the size of the
raceways and, considering that the PLC is already the best solution to choose the best
possible shade of spheres. I had nothing left to think about except how to improve either
the reading of the raceway diameters (in order make the PLC able to choose the exact
shade of ball diameter suitable to achieve the target value of radial clearance) or
modifying the dimensions of the rings that reach the machine (in order to realize a bearing
assembly which needs always the same shade of ball diameter, namely the target +0 μm,
with a subsequent reduction of the number of needed ball boxes).
At the end of my study about the possible improvements to the production process
through the XHM80 machine, I came to put forward two improvement hypotheses,
which, however, for reasons of costs necessary for their implementation, have been
rejected.
4.3.1 First option for improvement
The first possibility of improvement that I studied consisted in trying to keep the layout
intact, both from the point of view of the machines and from the point of view of the
number of them, acting exclusively on the XHM80 machine.
This improvement option aims to try to improve the reading precision of the raceway
diameters in order to be sure that the selection of the spheres performed by the PLC can
lead to the insertion of spheres whose diameter shade allows to have a bearing assembled
as close as possible to the production target. In this sense, it was useful to observe the
measurement range within which the measurements of the IR and OR rings fall by
performing further tests on the XHM80 machine, which consisted in performing a good
number of measurements on the same ring for as many rings as possible.

150
In this way, I concluded that, although the machine was linear, the measurements of the
internal rings IR, as already observed in the linearity diagram of the IR head, vary in an
amplitude range greater than 1 μm. The knowledge of DMI s.r.l. foresaw that this range
of variation of the measurements detected on the same part could be further restricted, but
it was necessary to modify the measuring head.
A valid alternative, according to my research, consisted of replacing the mechanical
measuring head with two probes, one of which connected to an LVDT probe, a solution
that with high probability would have allowed reducing by almost half the amplitude of
the variation range of the measures. Further confirmation of the validity of my hypothesis
was given by the fact that DMI s.r.l. had already applied a similar solution on a measuring
machine with excellent results. Although, however, the possibility of improvement was
concrete, both the team leader and the customer, for a matter of costs, rejected my
hypothesis of improvement.
4.3.2 Second option for improvement
The second improvement option, more complex in implementation, arises from the fact
that it would not have been possible to change the reading ability of the size of the
raceways of the rings and therefore, to make improvements to the performance of the line
it would have been necessary to look elsewhere. In particular, I focused my attention on
the possibility of improving the size of the raceways of the IR and OR rings that reach
the XHM to be coupled. This dimensional improvement has two notable advantages:
Firstly the fact that a smaller number of ring rejects are performed
Secondly that, arriving at IR and OR rings, whose dimensions are as similar as
possible to the target ones, one would have had the possibility of inserting spheres
of the target diameter (+0 μm) having a considerable saving on the purchase by
the customer of multiple shades of diameter of the spheres.
For the realization of this improvement I immediately thought about the execution of a
statistical process control (SPC), as in the case of the MIB OR, about the raceways
diameters of the IR and OR rings.

151
This was possible by installing the GME III also on the XHM80 machine so that a self-
tuning control system (STCS) on the grinding machines SGB55 and SSB80, which
perform the raceway grinding of the IR and OR ring respectively, were possible.
Therefore, starting from this observation, I concluded that it was necessary to install two
other machines along the production line, namely Post-Process machines. The just
introduced new machines needed to be installed immediately downstream of the grinding
machines with post-process function, i.e. to perform a statistical control of the dimensions
of the raceways of the IR and OR rings with the ability of sending feedback signals to the
related grinding machines. The above applies since, if it was possible to implement an
SPC on the XHM80, in the event that a bearing was found to be in out of control condition,
and therefore rejected, then all the bearings positioned along the line between the XHM80
itself and the grinders would have had to be discarded.
Considering the number of machines that are in the middle and the number of rings that
are in the aforementioned section of the line, this would have resulted in a waste of the
production capacity of the entire line. Therefore, considering the need to purchase two
new Post-Process machines and the same number of GME III and CMME 7001, the
improvement option I advanced was rejected for cost reasons. In fact to justify this
modification to the machinery and layout in terms of profit from production would have
taken a number of years not in line with the know-how of the client company.

152
5 MVM machine
The MVM machine has been designed and built to measure the noise and vibrations
generated by the bearing, by keeping the IR and OR aligned. The machinery is of primary
importance for the correct operation of the line since it is equipped with the CMME
7001A measuring and analysing electronics, with BVR+ evaluation software installed.
The on-board electronics therefore allows not only to classify the bearings according to
noise categories defined by SKF, but also to determine the cause (defect) that generates
the bearing rejection, thus allowing checking the rejection statistics and taking corrective
actions, as we will see later.
The MVM machine is very simple from a mechanical and electrical point of view, just as
the operating cycle is very simple. The rings feed the machine laterally through an inlet
channel and then move to the first of the two measuring stations, which are mirrored to
each other from the structural point of view. After being subjected to both measures (the
two measurement station are needed in order to execute the measurement of noise and
vibration from the two side on the bearing), depending on the outcome of these, the ring
will be discarded or it will move downstream of the MVM, continuing along the
production line.
The control of the eventual defects of the rings, as mentioned, takes place in the measuring
stations. Here the bearing is loaded onto a nose, then set in rotation (the inner ring will
rotate, in this way, at a speed controlled by the PLC with signals sent to the motor).
At the same time the outer ring is held in place by an appropriate shaping of the station
and on the latter will have contact between the bearing and a MEA 200 pickup, which
will send the noise and vibration data to the BVR+ software, which will perform a
processing of them, whose result will be shown on the machine monitor. The following
Picture shows an image of the measuring station, where the shape of the station that holds
the outer ring, the measuring MEA 200 pickup and the nosepiece in place are evident.

153
Picture 129 - Measuring station MVM machine
5.1 MVM machine revamping
5.1.1 Mechanical and Pneumatic components revamping
As already mentioned, the MVM machine is very simple from a construction point of
view and small in size. For this reason, the revamping activities of the mechanical and
pneumatic components took place simultaneously and included revision of the flatness of
the raceways within which the bearing rolls forward, choice of the two timing devices
(cadence) for the loading activity of the measuring stations, and the motor and the belt
transmission for the rotation of the nose during the measurement phases.
At the same time, the cylinders already installed on the machine were replaced with
commercial ones produced by Festo, the solenoid valve block and the LFR air-treatment
unit were chosen. Specifically, the cylinders that make up the pneumatic circuit on the
machine are six, as well as the valves that compose the block of solenoid valves, an image
of which is shown in the picture below.

154
Picture 130 - Block of solenoid valves installed on the MVM machine
The LFR group, on the other hand, has the standard components already presented in the
previous chapters, but in addition it features two precision pressure gauges from Festo,
which are necessary for adjusting the thrust force of the noses. The following picture
shows a representation of what has just been said.
Picture 131 - LFR group installed on the MVM machine

155
5.1.2 Electrical components revamping
As repeated several times, the revamping procedure of the electrical components present
on the machine begins with the complete dismantling and composition of a new electrical
panel. In the case of the MVM machine, the electrical panel is made up of the same
elements already presented for the MIB OR, with the exception of the fact that in this
case there is no need to install a measurement data collection box, as the pickups installed
in the measuring stations communicate directly with the CMME 7001A. Therefore, an
image of the electrical panel on board the MVM machine and one of the box of the
CMME 7001A positioned near the monitor are shown.
Picture 132 - Electrical panel installed on MVM machine
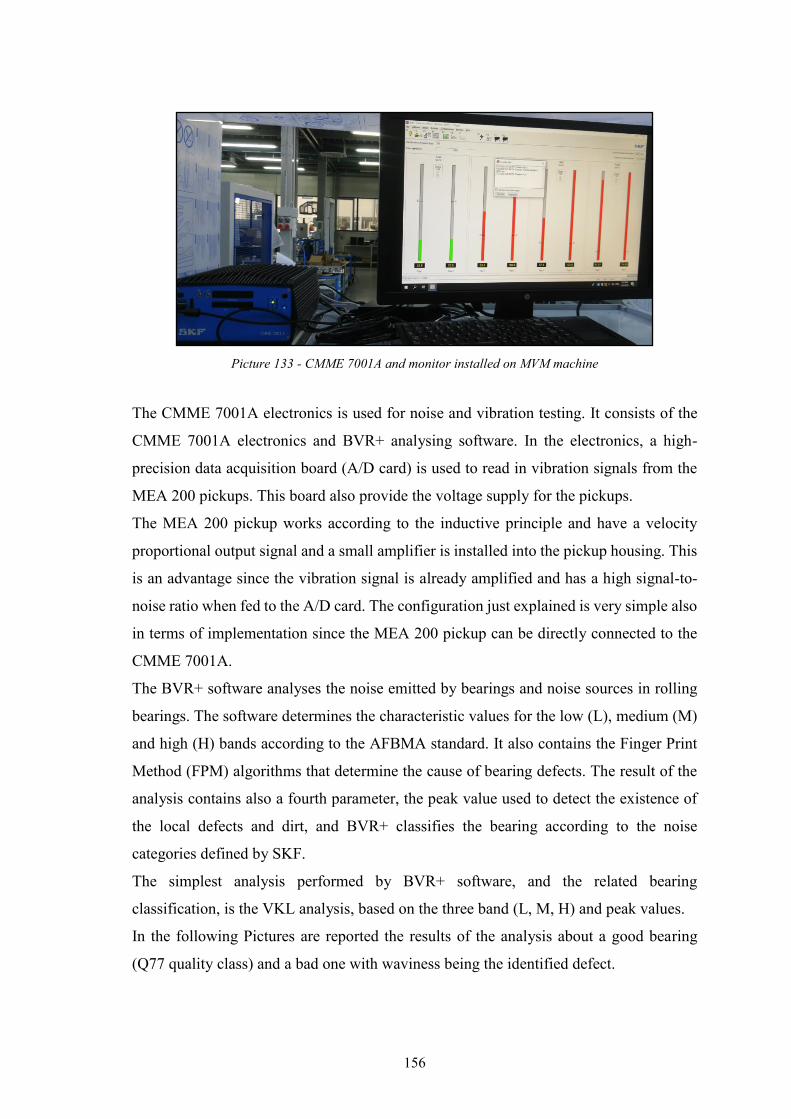
156
Picture 133 - CMME 7001A and monitor installed on MVM machine
The CMME 7001A electronics is used for noise and vibration testing. It consists of the
CMME 7001A electronics and BVR+ analysing software. In the electronics, a high-
precision data acquisition board (A/D card) is used to read in vibration signals from the
MEA 200 pickups. This board also provide the voltage supply for the pickups.
The MEA 200 pickup works according to the inductive principle and have a velocity
proportional output signal and a small amplifier is installed into the pickup housing. This
is an advantage since the vibration signal is already amplified and has a high signal-to-
noise ratio when fed to the A/D card. The configuration just explained is very simple also
in terms of implementation since the MEA 200 pickup can be directly connected to the
CMME 7001A.
The BVR+ software analyses the noise emitted by bearings and noise sources in rolling
bearings. The software determines the characteristic values for the low (L), medium (M)
and high (H) bands according to the AFBMA standard. It also contains the Finger Print
Method (FPM) algorithms that determine the cause of bearing defects. The result of the
analysis contains also a fourth parameter, the peak value used to detect the existence of
the local defects and dirt, and BVR+ classifies the bearing according to the noise
categories defined by SKF.
The simplest analysis performed by BVR+ software, and the related bearing
classification, is the VKL analysis, based on the three band (L, M, H) and peak values.
In the following Pictures are reported the results of the analysis about a good bearing
(Q77 quality class) and a bad one with waviness being the identified defect.

157
Picture 134 - VKL analysis result on a good bearing
Picture 135 - VKL analysis result on a bad bearing
As it can be seen, the VKL analysis result screen can be divided into two parts: an
information area where the classification of the bearing is reported as well as the
identified defect, and the VKL chart reporting the value of the parameters on which the
analysis is based and a bar chart of them. Obviously the analysis is performed for both
the sides of the bearing in both the measuring station and, as it is evident from the Pictures,
the classification is based on the worse side measured.
In addition to the VKL analysis, the BVR+ software performs a spectrum analysis, which
shows detailed results of the analysis of the bearing vibration signals. Specifically in the
result screen the frequency spectrum is reported, where the time signal is transformed into
the frequency spectrum using the FFT (Fast Fourier Transformation).

158
The BVR+ uses a raw spectrum with the possibility to have a high resolution, as it is clear
in the following Pictures. The frequency resolution is determined by the duration of the
time signal that has to be transformed. The measurement period determine the resolution.
The longer the measurement period, the better the spectrum resolution. In order to make
clearer what I am talking about, in the following two Pictures the spectrum analyses are
reported, that have been performed on the same bearings for which the results of the VKL
analysis have been already reported.
Picture 136 - Spectrum analysis result on a good bearing
Picture 137 - Spectrum analysis result on a bad bearing

159
For the spectrum analysis, the result screen is divided into two parts:
The result panel: this panel is composed by some windows reporting the result of
the measurement (OK or Bad), the values of the measured parameters, the noise
assigned quality class and the detected defect. In the same panel it is possible to
find some informations about the spindle speed and the unbalance, which is the
amplitude of the vibration signal due to the spindle unbalance;
The chart panel: here the chart representing the signal in the frequency domain is
reported.
As it can be easily understood, the defects that can be detected by the BVR+ software are
related to either the components of the bearing, rolling elements, inner ring, outer ring,
cage, or the dirt and waviness. In particular, the aforementioned defects are coded like
follows:
IRD: inner ring raceway defect;
ORD: outer ring raceway defect;
RED: rolling elements defect;
Dirt;
Cage;
Waviness.
For the sake of completeness, the cases of presence of defects identified by the MVM
machine in the test phases are reported, in terms of both VKL analysis and Spectrum
Analysis.

160
Picture 138 - IRD defect, resulting from the Spectrum analysis
Picture 139 - IRD defect, resulting from the VKL analysis

161
Picture 140 - ORD defect, resulting from the spectrum analysis
Picture 141 - ORD defect, resulting from the VKL analysis

162
Picture 142 - RED defect, resulting from the spectrum analysis
As already said and reported in the dedicated Picture, the BVR+ software is able to
identify waviness problems when it is related to both the IR and OR; at the same time it
is able to detect the waviness problem also in case it is related to either the IR or the OR.
In the following Picture the M-OR defect is found, which means that there is a vibration
contribution of the outer ring waviness in the M band.
Picture 143 - M-OR defect, resulting from the spectrum analysis

163
Picture 144 - M-OR defect, resulting from the VKL analysis
Another important feature of the MVM machine, in addition to the predisposition to use
the SKF-owned BVR+ software, in terms of revamping of the electrical components is
the total absence of a control panel for the HMI interface, which is therefore reduced to
just pushbutton. The on-board machine monitor, in fact, has the sole task of allowing the
execution of the noise and vibration analysis software, but does not allow to control the
operation of the machinery in any way. Therefore, unlike those installed on the MIB OR
and XHM80 machines, the push-button panel is more complex and allows the control of
actions that in the previous cases were controlled from the HMI control panel. For a more
detailed description, the push-button panel is shown in the Picture below.
Picture 145 - Push-button panel installed on board of MVM machine

164
In the previous Picture, the buttons composing the push-button panel are numbered in
order to describe them in a more accurate way. The buttons are:
1. Emergency mushroom pushbutton: when activated, it disconnects the control
circuits and power supplies to the machine;
2. Auxiliaries insertion: reset all functions after activating the emergency button;
3. SP1 in measure: indicates the presence of the bearing on the mandrel 1;
4. SP2 in measure: indicates the presence of the bearing on the mandrel 2;
5. Cycle man SP1: it commands the loading of the bearing on the nosepiece 1;
6. Cycle man SP2: it commands the loading of the bearing on the nosepiece 2;
7. Measure: when activated commands the measurement actions;
8. Reset faults: before cycle start command, it resets all the anomalies;
9. Motor ON SP1: it starts the motor 1;
10. Motor ON SP2: it starts the motor 2;
11. Man/Aut: in manual mode it commands the step-by-step cycle; otherwise, in
automatic mode it commands the automatic cycle.
12. Start cycle: when pushed it starts the cycle in automatic mode;
13. Stop cycle: when pushed it stops the cycle.
5.2 Measurement system analysis
The MVM machine, in term of quality of the measurements, had to be analysed following
the attribute analysis procedure reported in the QT5 – Measurement System Analysis
brochure by SKF, which is reported in the following Picture.

165
Picture 146 - Attribute measurement system analysis procedure (from SKF QT5 brochure)
The aforementioned analysis was required since the measuring system was an attribute
measurement system. Attribute measurement system are the class of measurement system
where the measurement value is one of a finite number of categories. The most common
of these is a Go/No go gauge, which has only two measurement results.
The measurement system, according to SKF standard are divided among three groups in
terms of type of measurement performed, as reported in the following Picture.

166
Picture 147 - Type of measurement according to SKF standard (from QT5brochure by SKF)
According to SKF standard, in this way, it is possible to define the MVM machine as a
binary measurement system since the result of the measurement is Good/Bad.
The κ (kappa) statistic has been proposed as a statistic for the evaluation of the binary
measurement system. Kappa statistic is the measure of the degree of agreement between
two raters, based on how they classify a sample of objects into a number of categories.
Therefore, in this way, it is possible to establish that the κ value, ranging from 0 to 1 in
case of perfect agreement, is the measure of the precision of the binary measurement
system. In other words, if the MVM machine, independently from the operator, gives
exact results, namely equal to actual results, it is possible to say that the machine is a good
measuring system. According to the value of kappa statistic, the quality of the
measurement is established as follow.
Picture 148 - Relation between kappa value and measurement quality table (from SKF QT5 brochure)
Thanks to the use of Minitab software it has been possible to compute the value of kappa
by selecting a sample of 100 master bearings (Standard) selected by SKF and divided in
a mix of 50/50 Good/Bad bearings. The measurements of the quality of the bearings were
performed first by me (Mario) and then by my tutor (Paolo). The results of the
measurements were passed to the software and the result of the kappa value computation
is here reported.

167
Picture 149 - Attribute agreement analysis MVM for Mario e Paolo
Each Appraiser vs Standard
Assessment Agreement
Appraiser # Inspected # Matched Percent 95% CI
Mario 100 100 100,00 (97,05; 100,00)
Paolo 100 100 100,00 (97,05; 100,00)
# Matched: Appraiser’s assessment across trials agrees with the known standard.
Assessment Disagreement
Appraiser # GOOD / BAD Percent # BAD / GOOD Percent # Mixed Percent
Mario 0 0,00 0 0,00 0 0,00
Paolo 0 0,00 0 0,00 0 0,00
# GOOD / BAD: Assessments across trials = GOOD / standard = BAD.
# BAD / GOOD: Assessments across trials = BAD / standard = GOOD.
# Mixed: Assessments across trials are not identical.
Fleiss’ Kappa Statistics
Appraiser Response Kappa SE Kappa Z P(vs > 0)
Mario BAD 1 0,1 10 0,0000
GOOD 1 0,1 10 0,0000
Paolo BAD 1 0,1 10 0,0000
GOOD 1 0,1 10 0,0000
Between Appraisers
Assessment Agreement
# Inspected # Matched Percent 95% CI
100 100 100,00 (97,05; 100,00)
# Matched: All appraisers’ assessments agree with each other.
Fleiss’ Kappa Statistics
Response Kappa SE Kappa Z P(vs > 0)
BAD 1 0,1 10 0,0000
GOOD 1 0,1 10 0,0000
All Appraisers vs Standard
Assessment Agreement
# Inspected # Matched Percent 95% CI
100 100 100,00 (97,05; 100,00)
# Matched: All appraisers’ assessments agree with the known standard.
Fleiss’ Kappa Statistics
Response Kappa SE Kappa Z P(vs > 0)
BAD 1 0,0707107 14,1421 0,0000
GOOD 1 0,0707107 14,1421 0,0000

168
Picture 150 – Assessment agreement appraisers vs standard graphical result
Looking at the result of the agreement analysis just reported it is possible to see that the
value of kappa statistic is equal to 1 and this is the reason why the binary measurement
system can be said to be excellent. In other terms, the two appraisers agree each other,
and both of them agree with the standard so that the machine is able to recognize a good
bearing from a bad one independently from the operator and perfectly agree with the
standard value corresponding to the quality of the master bearings provided by SKF.
5.3 MVM: the third key machine for process improvement
The MVM machines on the line have the task of making a final selection of the bearings
in accordance with the production standard, proceeding with the rejection of the bearings
considered non-compliant. For this reason, the MVM machine for measuring noise and
vibrations plays a key role, but its role during the revamping and line performance
evaluation process is equally key; it was in fact used to evaluate the possibility of further
improving the production line thanks to the ability of the BVR+ software to identify any
production defects. For this reason, I decided to carry out a study of the production line
by performing production simulations and analysing the results of the measurements
performed by the MVM machinery.
Date of study:
Reported by:
Name of product:
Misc:
PaoloMario
100,0
99,5
99,0
98,5
98,0
97,5
97,0
Appraiser
Perc
en
t
95,0% CI
Percent
Assessment Agreement
Appraiser vs Standard

169
I took advantage of the possibility of reading the measurement statistics directly on the
machine, deciding not to use the statistics about the quality classes of the bearings
produced as the result of the VKL analysis, but rather I decided to use the reject statistics
function, which contains the statistics about parts that were classified as rejects. An image
of the statistics that can be obtained is the following, reported in the BVR+ manual as an
example.
Picture 151 - Reject statistics from BVR+ manual
My observation of the statistics of rejected parts defects highlighted the presence of dirt,
present in the bearings in a percentage not compliant with the client request and
production standard. A screenshot of one of the dirt measurements detected is shown
below.

170
Picture 152 - Dirt defect presence evaluated thanks to the BVR+ software
In order to solve the problem of dirt in the production phase and increase the performance
of the line, my research has led to the solution that it was necessary to install washing
machinery and demagnetizing machinery.
The former are machines that perform the washing of the components using water to
prevent the accumulation of chips and dust, while the latter are necessary to demagnetize
the rings after the grinding and pairing phases, preventing them from attracting metal
particles that would damage the assembled bearing during the exercise. In the layout the
washing machine always follows the demagnetizer, and, in the case of the greasing
machine, in order to have a clean bearing, we find only a washing machine.
My improvement proposal was validated by the Research and Development (R&D) team
and accepted by the customer by presenting the new layout with the new machinery
arranged on the line in the most critical points, as evident from the Picture in the dedicated
chapter, and an analysis of the costs required to implement the improvement. Therefore,
in the near future, when the revamping processes of all the machinery on the line are
completed and these will be tested and validated, these machines will be designed and
built.

171
6 Conclusion and future developments
6.1 Conclusion
The aim of this thesis was the study and analysis of the improvements that can be made
to the machinery making up an entire bearing production line in order to increase the
performance of the line itself. Therefore, in the face of what has been said in the previous
chapters, the SKF Sopot (Bulgaria) radial ball bearing production line that arrived in DMI
s.r.l in non-operating conditions and dated for tens of years, has been overhauled in order
to running all the machines that made it up.
At the same time, during the revamping to which the entire line was subjected, the
machinery, especially those considered to be the key in terms of increasing the
performance of the line, were equipped with new hardware and software technologies.
Therefore, the line will certainly have a higher performance thanks to the improvements
made, both in terms of reducing production costs and waste, as fully described in the
chapters dedicated to the analysis of key machinery.
6.2 Possible future developments
As already mentioned, the radial bearing production line under study was revamped in
order to put all the machines back into operation by applying more modern hardware and
software solutions to increase the performance of the line.
At the same time, however, it is possible to foresee further improvements to which the
line will possibly be subject in the future; and it is precisely these improvements that will
be discussed in this paragraph.
6.2.1 Software improvement for Error & Troubleshooting functions
In the current state of the machines, as requested by the SKF Sopot customer, the
machines are able to detect errors and go into an emergency state which involves stopping
the machine. The detection of the error occurs thanks to the software that detects it by

172
commanding the emergency state, but without giving any specific indication to the
operator about how to identify and solve the error.
In fact, in the event of an error, the machine reports an error message on the HMI and the
code that identifies it. This code is indicated and explained in the operator manual.
Therefore, in order to resolve the error, if this occurs, the operator is forced to read the
machine manual and make subjective decisions on the solution, all wasting a lot of time
depending on the ability and promptness of the operator. To clarify with an example what
the current state of the machine is, an error often detected by the machines of the line is
reported, such as the non-excitation of a ring presence sensor, whose code is of the SqX
type.
Therefore, it is not difficult to imagine possible future improvements of the software in
order to speed up the process of error detection, identification and resolution of the same.
All this is possible by implementing an Error & Troubleshooting function like the one I
will present shortly.
Taking again into consideration the previous example, that is the non-excitation of a
sensor that reads the presence of the ring following the action of the loading cylinder
which moves the ring from the loading duct on board the machine. In order to be able to
implement functions of Error & Trouble shooting, it is first of all necessary to understand
how to execute and speed up the error resolution process and then transform what has
been said into an extension of the software on the machine. So let's consider the case in
which the above error is present, in order to implement the function of identifying and
solving the problem, it must be possible, through the HMI interface, to click on the name
of the error that appears on the screen. In this way will be possible to access an error
solution screen in which, first of all, there is a map of the machine showing all the sensors
and their position on the machine and an indicator of the one subject to the error search.
In this case it will be possible for the operator to immediately identify where the error is
and click again on the indicator on the map to confirm that the problem has been
identified. At this point a screen will open with the possible causes of the error, and one
at a time they can be clicked to present to the operator what are the corrective actions that
can be made in order to correct the error whose cause is the one clicked.

173
Let me clarify what has been said with an example. On the HMI screen, the message
Error: SqX appears; at this point the operator clicks on the error code and a map of the
machine opens which indicates to the operator where the error is located.
The operator clicks on the position indicator that appears confirming that he has identified
the sensor being searched. At this point a window opens with the list of possible causes
of the problem, such as the following:
Sensor malfunction;
Ring trapped in the loading channel;
Cylinder not fed correctly.
At this point, clicking, one at a time until the problem is solved, on all the possible causes,
the corresponding windows of suggested corrective actions will open. For example, in the
first case, a screen will open with possible actions as follows:
Manually check that the sensor is able to read the presence of the ring, moving the
ring closer and further away and using the LED of the sensor itself;
Check the power supply to the sensor;
Check that the sensor is still physically installed in its original position.
In the latter case, however, the operator could be advised to check the compressed air
supply to the cylinder, possibly using a digital pressure switch.
By implementing, in this way, all the possible Error & Troubleshooting functions, it will
be easier for the operator to identify and solve the error, while consequently machine
downtime will be reduced, further increasing the performance of the machine in terms of
productivity.
6.2.2 Digitalization of production through an increase in the level of
automation in an Industry 4.0 perspective
Once the line studied in this thesis is installed in the SKF Sopot plant, it is possible that
it will be necessary to achieve a high level of automation of the Bulgarian plant, requiring
the implementation of software such as SCADA, MES and ERP.
Starting, therefore, from the revamped machinery, thanks to the installation of network
cards on the machine and the use of the Siemens PROFINET protocol, it will be possible

174
to convey all the production data, through a network switch, to a SCADA server, thus
allowing you to go up the automation pyramid shown below.
Picture 153 - Automation pyramid (from http://www.miac-automation.com/mes-oee-track-and-trace/)
It is therefore possible to analyze the pyramid of industrial automation from the bottom
up.
SCADA software, acronym for Supervisory Control And Data Acquisition, is an
information system that deals with the supervision, data collection and control of an
industrial production plant. Therefore, these software acquire, process and archive a large
amount of data coming from the sensors installed on the machines and processed by the
PLCs. This data can then be used to increase the efficiency of production processes thanks
to the implementation of more complex software solutions such as MES and ERP.
The MES, acronym for Manufacturing Execution System, is a software system that arises
between ERP and SCADA systems, referring to the automation pyramid, therefore,
between the decision-making level and the production level in order to put them in
communication and avoid that what is produced does not coincide with what is planned.
The software in question, therefore, allows the organization and control of the production
department to be computerized by performing relevant functions such as:
Sequencing of production activities based on the priorities and characteristics of
each production batch;

175
Monitoring of WIP (Work In Progress) activities ensuring compliance with the
production schedule and avoiding bottlenecks;
Performance analysis in real time by analyzing resources, cycle times, production
costs;
Quality control: after verifying the conformity of the finished products, the
software indicates which corrective actions to take to correct any errors or
slowdowns that affect the production phases;
Maintenance activities, in fact, by analyzing the operating data of the machines,
the MES software warns when it detects faults and communicates the diagnosis.
A MES system such as the one just described, which communicates with the production
plant and with the ERP, is highly interconnected and is fully part of Horizontal and
Vertical Integration, one of the nine pillars of industry 4.0.
ERP software, acronym for Enterprise Resource Planning, is a business management
system that allows companies to have a 360° view of all the elements related to their
business. From this point of view, in fact, the ERP allows to control and manage, through
the dedicated modules, the inventory, orders, resources, planning, purchases, financial
implications and reporting. For what has been said, therefore, Enterprise Resource
Planning allows you to integrate all business activities into a single system, which is, by
definition, essential to support management.
The ERP - MES integration helps to increase operational efficiency, reduce production
times, increase flexibility and decision-making speed. Thanks to the ERP - MES
integration, manufacturers can place new orders before a certain product runs out. In fact,
the integration of real-time data on the availability of materials helps manufacturers to
reduce unnecessary interruptions and delays.
6.2.3 Implementation of a traceability solution through a Data Matrix
Code
In recent years, in order to ensure complete traceability of the controls and information
collected throughout the bearing manufacturing process, SKF has designed a system for
digital measurement and archiving of data using a Data Matrix code marked on the
bearing surface [http://www.disloman.it/skf/].

176
In this context, therefore, it is not difficult to think that traceability solutions like this will
be implemented in the coming months for the production of the SKF Sopot line.
The Data Matrix is a standard code (reference standard ISO / IEC TR 29158), made up
of a square or rectangular matrix of black and white cells. In SKF's design, it is laser-
marked on the outer surface of the bearing and contains a unique bearing identification
code. The latter is the access key to a Database, which contains all the information
collected station after station in digital format [http://www.disloman.it/skf/].
The rings, both IR and OR, are marked downstream of the grinding operations, where
they are machined to reach the dimensions and finishes required by the drawing and not
before as the action of the grinding machines would ruin the Data Matrix code. As already
explained in the previous chapters, downstream of the grinding machines, the rings are
subject to a series of checks and operations that begin with dimensional control and end
with packaging. It is precisely in this phase of the production process that the traceability
solution with Data Matrix is implemented.
The first step is to perform, along the line, a series of dimensional and geometric checks
whose measurement results are historicized thanks to the Data Matrix. Each station of the
production line, in fact, is equipped with a vision tool that allows the reading of the code
and the identification of the piece and that connects to the Database to update the data,
inserting the results of the records obtained at the station.
Once all the above checks have been carried out, the bearings will be paired in the
dedicated station and thanks to the sequential reading of the two rings, internal and
external, it is possible to associate the two rings and use, from this operation on, the Data
matrix of the external ring. as a reference for the assembled bearing.
This system is therefore suitable not only for the traceability of the checks carried out on
the bearing, but also for the traceability of the product and its components. In fact, in the
assembly station, the bearing Data Matrix is associated with information relating to the
batch of origin of each component, whether it is a semi-finished product, as in the case of
cages, or a product purchased outside the factory as in the case of the balls, and all
information relating to the manufacturing batch to which the customer's order code
corresponds.

177
The collection and digital archive of information is used to automate the data collection
process of a bearing and to avoid errors due to the operator in the case of filling in the
labels manually.
In conclusion, therefore, thanks to the implementation of this traceability solution, it is
possible to perform an effective management of complaints if the bearings return from
the field of application, but also to perform a real-time control on the progress of
production and implement suitable solutions in terms of maintenance of machinery.

178
Bibliography
[1] Baron, F. (2018). Obsolescenza degli impianti industriali: valutazione tecnico-
economiche di adeguamenti alla Direttiva 2006/42/CE. Case-Study: impianto a
motte a servizio della VDP Fonderia SpA.
[2] Belforte, G. (2005). Manuale di pneumatica. Tecniche nuove.
[3] Conti, A. Revamping di macchina dosatore gravimetrico (Doctoral
dissertation).
[4] Kalpakjian, S., Schmid, S. R., & Bruschi, S. (2014). Tecnologia meccanica.
Pearson.
[5] Monte, A. (2003). Elementi di impianti industriali. Cortina.
[6] Muraro, A. (2010). Utilizzo di PLC in applicazioni di automazione industriale.
[7] Salmi, A. (2020). Overview of manufacturing systems (materiale didattico).
[8] Shigley, J. E., Budynas, R. G., Nisbett, J. K., & Amodio, D. (2009). Progetto
e costruzione di macchine. McGraw-Hill.
[9] SKF Group. CATALOGO GENERALE SKF, edizione scolastica
[10] SKF Group. Quality techniques, Measurement systems analysis.
[11] SKF Group. Quality techniques, Process capability studies.
[12] SKF Group. Technical documentation for general measuring equipment,
GME III.
[13] SKF Group. Technical documentation for measuring and analyzing
electronics, CMME 7001 A.

179
Websites
https://www.dmimeccanica.com/it/chi_siamo.html
https://www.skf.com/it/products/rolling-bearings
https://www.festo.com/us/en/a/download-document/datasheet/185788/
https://www.festo.com/cat/it_it/data/doc_engb/PDF/EN/LFR-D-
COMBINATION_EN.PDF
https://www.festo.com/cat/it-ch_ch/data/doc_engb/PDF/EN/TYP4445-
G_EN.PDF
https://www.flexlink.com/it/home/products-and-services/stainless-steel-
conveyor-systems/chain-conveyor-systems
https://www.festo.com/cat/it_it/data/doc_de/PDF/DE/SME-1_DE.PDF
https://www.minetti.it/it/sme-1-led-24-b/p-G1116001666?l=G1116001666
https://www.se.com/it/it/product-range/2535-spacial-
crn/?N=399412333&filter=business-1-automazione-e-controllo&parent-
subcategory-id=88376&No=12&Nrpp=12
http://www.eta.it/wp-content/uploads/2015/12/ANIE_Quaderno-tecnico-Quadri-
Bordo-Macchina.pdf
https://it.rs-online.com/web/p/moduli-di-sicurezza/8714596/
https://www.wieland-electric.com/en/products/safety-technology/safety-
controller/#scroll-target-node-zy9z0g1g7piyn
https://www.wieland-electric.com/en/support/software-apps/samos-plan-6/
https://www.amazon.it/Siemens-SIMATIC-S7-1500-Kompakt-CPU-1511C-
1/dp/B07GQ1NFQ8
https://online.scuola.zanichelli.it/guidisistemi-2ed-
files/aggiornamenti/Zanichelli_approfondimenti-
Simatic_Ambiente_TIA_Portal.pdf
https://www.automation.siemens.com/sce-static/learning-training-documents/tia-
portal/basics-programming-s7-1500/sce-032-100-fc-programming-s7-1500-
r1703-it.pdf
180
http://www.diit.unict.it/users/scava/dispense/II_270/Manuale%20Tia%20Portal.
https://www.certifico.com/marcatura-ce/documenti-direttiva-macchine/11902-
stima-del-rischio-iso-tr-14121-2-p-6-3-metodo-grafico-esempio-e-scheda
https://www.necsi.it/files/read/2286-modulo-21.pdf
https://www.certifico.com/normazione/234-documenti-riservati-
normazione/3749-en-13857-distanze-di-sicurezza
https://www.pizzato.it/media/images/catalog/item/File/Pdf/Document/introduzio
ne_sicurezza.pdf
https://www.inail.it/cs/internet/docs/alg-pubbl-sistemi-comando-macchine-
secondo-norma.pdf
https://www.mecalux.it/blog/sistema-mes-manufacturing-execution-system
https://dmsolution.eu/erp-mes-e-plm-cosa-sono-e-come-si-
integrano/#:~:text=L'ERP%20serve%20per%20controllare,%C3%A8%20richies
to%20dal%20reparto%20vendite.

181
Ringraziamenti
Ed eccomi qui, a scrivere i ringraziamenti alla fine del mio lavoro di tesi magistrale e
soprattutto alla fine del mio percorso di studi. Guardandomi indietro vedo un ragazzo di
19 anni, di un paesino in provincia di Caserta che ambisce a diventare un grande
ingegnere e si trasferisce a Torino, da solo, un ragazzo che impara ad assumersi delle
responsabilità e che cresce, giorno dopo giorno, anno dopo anno grazie a tutte le persone
che ha conosciuto ed ai professori con i quali si è confrontato. Ad oggi posso dire di essere
soddisfatto del mio percorso, che mi ha fatto crescere sia personalmente che
professionalmente in attesa di diventare un ottimo professionista.
Voglio cogliere l’occasione per ringraziare il mio relatore, il prof. Maurizio Schenone.
Potrebbe sembrare un gesto di cortesia, ma non lo è affatto: lui non è un professore, lui è
IL PROFESSORE, capace di capirti ed aiutarti nei momenti difficili, in grado di spronarti
con le parole giuste a dare sempre il meglio anche a distanza, con una pandemia mondiale
in corso. Insomma senza di lui questo lavoro di tesi non sarebbe stato lo stesso. Colgo
quindi, come già fatto alla fine del corso di Impianti Meccanici dello scorso anno,
l’occasione per dirLe una cosa, professore: per lei solo APPLAUSI e
RINGRAZIAMENTI.
Voglio anche ringraziare tutti i ragazzi, coinquilini, amici e compagni di studio, con cui
ho condiviso i momenti più belli, ma di loro soprattutto Danilo, Marco e Matteo. Danilo
è stato un compagno di corso e di studio speciale, un amico, una spalla su cui piangere,
ma anche la mano cui aggrapparmi nei momenti più difficili. Marco è stato il leader
indiscusso di tutti i progetti, la soluzione a tutti i dubbi, ma soprattutto un compagno di
viaggio eccezionale. Matteo è stato per me l’emblema della porta sempre aperta, del caffè
sempre pronto e dell’amico che accetta di ascoltare i miei sfoghi: insomma, il coinquilino
che avrei sempre voluto, e che per mia fortuna mi ha ospitato nelle lunghe sessioni
d’esame.
Voglio ringraziare l’ufficio tecnico della DMI, che mi ha sostenuto nelle difficoltà del
tirocinio e che ancora mi sostiene nelle avversità della prima esperienza lavorativa. Paolo,
un tutor eccellente, Alberto e Vincenzo, ottimi colleghi, mi avete accolto nel migliore dei
modi ed ogni giorno mi date gli stimoli per crescere professionalmente, ma anche un
motivo per sorridere affinché le giornate passino in fretta.

182
Ringrazio la mia ragazza, Ilaria, per avermi supportato durante questo percorso, ma anche
sopportato nei miei momenti difficili, per tutte le volte che ha saputo confortarmi nelle
delusioni ed esaltarmi nei successi, sempre nel modo giusto. Senza di te, Mons, non
sarebbe stato lo stesso.
Ed infine i ringraziamenti vanno alla mia famiglia, Mamma, Papà, Leonardo e Daniele:
senza di voi non sarei il ragazzo che tutti conoscono, senza i vostri sacrifici non sarei
arrivato fin qua. Grazie per tutte le volte che mi avete sostenuto con l’amore che nessuno,
come voi, saprà mai darmi. Sono sicuro che siete orgogliosi di me, ma sappiate che lo
sono io, ancora di più, di voi. Grazie per esserci sempre, per essere l’emblema di come
l’unione fa la forza. Ed è proprio a voi, che questo lavoro di tesi è dedicato.
Mario


