Embed Size (px)
Citation preview

Polyunsaturated fatty acids, cognition and literacy in children
with ADHD with and without learning difficulties
Catherine M Milte1,3
, Natalie Sinn1,3
*, Jonathan D Buckley1,3
,
Alison M Coates1,3
, Ross M Young2,3
, Peter RC Howe1
1Nutritional Physiology Research Centre, University of South Australia,
Adelaide, South Australia, Australia
2Institute of Health and Biomedical Innovation, Queensland University of Technology, Brisbane,
Queensland, Australia
3Australian Technology Network Centre for Metabolic Fitness
* Corresponding author: E-mail [email protected]
School of Health Sciences, University of South Australia
GPO Box 2471, Adelaide, SA 5001, Australia
Phone: +61-8-8302-1757; Fax: +61- 8-8302-2178
Running title: PUFAs, cognition, and literacy in ADHD
Citation: Milte CM, Sinn N*, Buckley JD, Coates AM, Young R, Howe PRC (2011).
Polyunsaturated fatty acids, cognition and literacy in children with ADHD with and without
learning difficulties. Journal of Child Health Care. 15(4):299-311

Abstract
Suboptimal omega-3 polyunsaturated fatty acid (n-3 PUFA) levels may contribute to attention
deficit hyperactivity disorder (ADHD) and related developmental problems. Associations
between n-3 and omega-6 (n-6) PUFA levels in red blood cells (erythrocytes) and learning and
behaviour were investigated in 75 children aged 7-12 with ADHD. Children provided blood
samples and underwent cognitive assessments. Parents completed questionnaires and Conners’
Rating Scales. Controlling for covariates, higher n-3 PUFA predicted lower anxiety/shyness (β=-
.27), higher docosahexaenoic acid (DHA) better word reading (β=.22), and higher n-6 PUFA
poorer reading (β=-.34), vocabulary (β=.-.26), spelling (β=-.30) and attention (β=-.30). Thirty-six
percent of the sample with learning difficulties had lower DHA than those without
(M=3.26±0.54 vs M=3.68±0.76, p=.02). This study is the first to compare erythrocyte PUFAs (a
measure of PUFA status) in children who have ADHD with and without learning difficulties, and
supports emerging indications that the former may be more likely responders to n-3 PUFAs.
Key words:
Attention deficit hyperactivity disorder; Children; Learning difficulties; Nutrition; Omega-3
polyunsaturated fatty acids; Omega-6 polyunsaturated fatty acids

Introduction
Consumption of omega-3 polyunsaturated fatty acids (n-3 PUFAs) is essential for healthy
neural development, structure and function. Docosahexaenoic acid (DHA) particularly
constitutes a large proportion of the lipids in the brain (McNamara & Carlson, 2006). Its
metabolic precursor, the n-3 PUFA eicosapentaenoic acid (EPA), is not present in high quantities
in the brain but may still play a role in its optimal functioning (Sinn & Howe, 2008). The omega-
6 (n-6) PUFA, arachidonic acid (AA), is also required for healthy brain structure and function.
While AA produces eicosanoids with inflammatory, thrombotic, and predominantly
vasoconstrictor properties, EPA produces anti-inflammatory, anti-thrombotic and vasodilatory
eicosanoids that counter those of AA (Simopoulos, 1991). However in typical western diets,
consumption of n-6 PUFA has dramatically increased, attributable to increased consumption of
vegetable oils and processed foods, while intake of n-3 PUFAs in dark leafy vegetables, nuts,
seeds and fish has declined. This has decreased the ratio of n-6:n-3 PUFA from approximately 1
in traditional diets to around 15-16:1 (Simopoulos, 2002). Since the 1970s research has
investigated the effects of reduced n-3 PUFA intake on a range of health problems including
mental illness (Sinn et al., 2010).
Attention deficit hyperactivity disorder (ADHD) is estimated to affect 5.29% of children
worldwide (Polanczyk et al., 2007). ADHD has high co-morbidity with other disorders of
behaviour and mood (Dewey et al., 2002; Richardson, 2006) and at least one quarter of these
children have a learning disorder resulting in difficulties with reading, spelling and writing
(Pliszka, 1998).
Some small studies have found that children with ADHD symptoms have lower levels of
blood n-3 PUFAs than matched healthy controls (Richardson, 2006; Young & Conquer, 2005).

Assessment of fatty acid levels is usually through serum/plasma or erythrocyte (red blood cell)
blood fractions, the latter representing a more stable long-term intake of fatty acids (Rise et al.,
2007). In adults with ADHD symptoms, lower erythrocyte levels of DHA and total n-3 PUFAs
and higher levels of AA or saturated fatty acids have been reported compared to age- and gender-
matched controls (Antalis et al., 2006Young et al., 2004). In children, results have been mixed.
These include a greater AA/EPA ratio in total blood in 31 children with ADHD (Germano et al.,
2007); reduced levels of DHA and n-6 PUFAs but not EPA in plasma of 48 hyperactive children
(Mitchell et al., 1987); reduced EPA, DHA, total n-3 and AA and increased n-6:n-3 ratio in
plasma phospholipids, and reduced DHA and AA in erythrocytes of 53 boys aged 6-12 years
with ADHD (Stevens et al., 1995); and no differences between 30 children with ADHD and
healthy controls (Joshi et al., 2006). A Taiwanese study found lower total n-3 PUFAs, DHA and
AA in erythrocytes of children with ADHD compared with controls (Chen et al., 2004). More
recently, lower levels of DHA and total n-3 PUFAs, and higher levels of n-6 PUFAs were found
in in erythrocyte phospholipids of adolescents aged 10 to 16 years with ADHD (n = 11)
compared to aged-matched controls (n = 12) (Colter et al., 2008). Furthermore, low n-3 PUFA
status was correlated with higher scores on several sub-scales from Conners’ Parent Rating
Scales (CPRS) of ADHD symptoms. Lower erythrocyte DHA status was also associated with
higher scores on the CPRS in boys aged 6-12 years (Stevens et al., 1995) and erythrocyte levels
of DHA and total n-3 PUFAs were inversely correlated with several ratings of ADHD symptoms
(Antalis et al., 2006). Thus, several small studies have indicated that blood levels of PUFAs,
particularly DHA and total n-3 PUFAs, may be lower in populations with ADHD compared with
controls, and lower n-3 PUFA and/or higher n-6 PUFA levels might be associated with worse
symptoms.

Several randomised controlled trials have been conducted with some inconsistent results
which may be attributed to methodological differences (Sinn et al., 2010). These trials have had
varied selection criteria, but improved ADHD symptoms and literacy have been reported in
children with learning difficulties as part of a constellation of developmental problems. A 12-
week pilot study in the UK reported significant improvements in cognitive and behavioural
problems in children with dyslexia and ADHD features following fish oil supplementation
(Richardson & Puri, 2002). A large follow-up study investigated effects of n-3 PUFA
supplementation on learning and behaviour in children with dyspraxia over 12 weeks (one-third
with ADHD symptoms in the clinical range), who were on average a year behind in reading and
spelling. They found significant improvements in ADHD-related symptoms rated by teachers,
and objective assessments of reading and spelling (Richardson & Montgomery, 2005). A more
recent study in Sweden with children diagnosed with ADHD found that the subgroup with
reading and writing difficulties were among the strongest responders (Johnson et al., 2009).
Therefore, given the inconsistency in studies of blood samples in children with ADHD,
and indications from controlled trials that the subgroup with learning difficulties might be better
responders, the present study aimed to investigate whether the optimal marker of long-term
PUFA status in humans (erythrocyte phospholipid levels) predicted greater severity of problems
with behaviour and cognition in the subgroup of children with ADHD symptoms and learning
difficulties, i.e. functioning behind their age in literacy as in the Durham trial (Richardson &
Montgomery, 2005); specifically whether n-3 PUFA predicted better and n-6 PUFA poorer
outcomes.
Methods

This study reports baseline data from a placebo-controlled 3-way crossover trial that
investigated effects of supplementation with n-3 PUFAs, DHA and EPA versus an n-6 PUFA
control (linoleic acid; LA) on ADHD symptoms, cognition and literacy in children aged 7-12
with ADHD symptoms and parent-reported learning difficulties. The study was conducted in
Adelaide and Brisbane, Australia, and was approved by Human Research Ethics Committees at
the University of South Australia and Queensland University of Technology. It was performed in
accordance with the ethical standards laid down in the 1964 Declaration of Helsinki and was
conducted according to Good Clinical Research Practice Guidelines. The study was explained to
both children and their parent(s) or guardian and written informed consent was gained from the
parent/guardian. It was registered with the Australian New Zealand Clinical Trials Registry
(ACTRN12607000332426).
Participants
Children aged 7-12 with ADHD or parent-rated symptoms > 90th percentile on the CPRS
(Conners, 2000) and parent-reported learning difficulties (literacy performance behind their year
level at school) were recruited (see Table 1 for demographics). Children were excluded if they
were taking medication for mood or behaviour or had consumed n-3 PUFA supplements during
the previous 3 months. Required sample size was calculated for the 12-month intervention,
aiming for 120 participants (40 per group) to provide >80% power to detect a medium effect size
(Cohen, 1992), allowing for a 30% drop-out rate.
Procedure
Children were recruited through media releases and television interviews, newspaper
advertisements, school newsletters and flyers. Information was sent to interested parents and
guardians of 115 children following a brief phone screening interview. If they did not have an

official diagnosis of ADHD, parents were asked to complete the ADHD index, a 12-item
subscale from the CPRS, to determine if children were > 90th percentile (Conners, 2000). During
a 12-month recruitment drive, 91 children were eligible and attended baseline assessments at the
University of South Australia (Adelaide; n = 53) or the Institute of Health and Biomedical
Innovation (Brisbane; n = 38) with their parents/guardians after a minimum one hour fast (some
children who had morning assessments came in following an overnight fast). Blood samples
were collected into 6 ml EDTA tubes by venipuncture.
After the blood sample, children were given a small snack (toast and fruit juice or water)
and underwent 30-45 minutes of cognitive assessments. All researchers were trained in the
assessment tasks by the same person initially and a standardised protocol was used for all
assessments.
Assessment tools
Performance on reading and spelling, primary outcomes, were assessed using the word
reading and spelling subtests from the Wechsler Individual Achievement Test (WIAT-III)
(Wechsler, 1992). We also investigated performance on the vocabulary subtest from the
Wechsler Intelligence Scale for Children (WISC-III; Wechsler, 1991). Raw scores were
converted to age-scaled scores for analysis. Parent ratings of ADHD symptoms were assessed
using the CPRS – long version, our other primary outcome measure (Conners, 2000). CPRS
subscales were transformed into age- and gender-adjusted t-scores for analysis.
Various forms of attention were assessed as a secondary outcome measure using an
abbreviated test battery from the Test of Everyday Attention for Children (TEA-ch; Manly et al.,
1999). Focussed attention was measured using Sky Search, a timed subtest which requires
children to circle as many ‘target’ spaceships as they can on a sheet filled with similar distracter

spaceships. In part two they circle as many as they can without any distracters. Their part two
score is subtracted from the first score to eliminate effects of motor slowness. Score! measures
the ability to sustain attention during a relatively simple non-stimulating task by asking children
to keep count of the number of ‘scoring’ sounds they hear on a tape. Creature Counting
measures the ability to switch and control attention. Children are asked to count creatures in a
burrow, and when they come to an arrow they must switch their counting up or down according
to the direction of the arrow. Sky search DT measures divided attention by asking children to
combine the Sky Search and Score! tasks.
Inhibition, or the ability to hold back a response, was assessed using a computerised
Go/No-go task (Trommer et al., 1988). This task involved pressing the “h” key to respond to
predefined stimuli on a computer screen (a green man) and to withhold the response and press
the spacebar instead when a specific stimulus appears (a red man). In this task, 171 green men
were presented with 45 red men randomly dispersed among them. Number of errors was
calculated as a measure of response inhibition.
Whilst the children were completing these tasks, parents/guardians filled out the CPRS
and questionnaires regarding child and parent demographics, birth weight, length of gestation
and breastfeeding, smoking and alcohol consumption during pregnancy, parent education level,
child sleep problems (reported in Blunden et al., in press; Bruni et al., 1996), and child health (1
= fair, 5 = excellent). Children’s diets were assessed by parental completion of the Victorian
Cancer Council Food Frequency Questionnaire (FFQ; Giles et al., 2000). Frequency of soft drink
consumption was obtained separately as this is not included. Energy and carbohydrate intake
from soft drinks were calculated using data obtained from parent questionnaires and Food Works
Professional version 2005 (Xyris Software Australia Pty Ltd, Highgate Hill, Australia). An

average of energy, sugar and carbohydrate was taken for six common soft drinks. and was then
added to the respective daily intake data from the FFQ.
Assessment of fatty acid profiles
Relative proportions of individual fatty acids in erythrocyte phospholipids were assessed
using a method adapted from previously established methods (Bligh & Dyer, 1959; Folch, Lees,
& Sloane Stanley, 1957; Lepage & Roy, 1986). Erythrocytes were isolated within 2 hours of
collection by centrifugation, washed in isotonic saline and stored at -80°C. On the day of
extraction, erythrocytes were thawed and lipids extracted with 2:1 choloroform and isopropanol.
The organic phase containing the lipid was evaporated to dryness under a stream of nitrogen gas.
The lipids were then transesterified with Acetyl Chloride in methanol toluene (4:1v/v) at 100°C
for 1 hour. The resultant fatty acid methyl esters (FAMEs) were extracted with 10% Potassium
carbonate. FAMEs were separated and quantified using a Shimadzu 2010 gas chromatograph
equipped with a 50m capillary column (0.32mm ID) coated with BPX-70 (0.25µm film
thickness, SGE Pty Ltd. Victoria, Australia). The injector temperature was set at 250°C and the
detector (flame ionisation) temperature at 260°C. The initial oven temperature was 130°C and
was programmed to rise to 220°C at 5°C per minute. Hydrogen was used as the carrier gas at a
velocity of 36.4cm/second. Fatty acid methyl esters were identified based on the retention time to
authentic lipid standards (GLC-463, Nu-Chek Prep Inc. Elysian, MN, USA).
Statistical Assessment
Data were analysed using SPSS Statistics (version 17.0 Chicago, 2008). Pearson
correlations were conducted to determine associations between behaviour, cognition and levels
of EPA, DHA, total n-3 PUFA, AA and total n-6 PUFA (as % of total fatty acids in
erythrocytes). Significant correlations and covariates were entered into linear regressions to

investigate whether PUFA levels predicted behaviour and learning outcomes. Although we had
intended to recruit children with learning difficulties, only 36% of the sample was performing
behind their age level on reading and spelling, outlined below. Therefore, Chi-Square was used
to compare categorical and t-tests continuous variables between the groups, and ANCOVA was
used to compare fatty acid status between the groups, controlling for potential covariates.
Significance was set at p < 0.05.
Results
Ninety one children underwent cognitive assessments and their parents or guardians
completed questionnaires. Blood samples were obtained from 78 volunteers. Three were
excluded due to no ADHD diagnosis or ADHD symptom scores below threshold, leaving data
from 75 volunteers. Twenty four randomly missing values from the 80 CPRS questions were
replaced with the individual’s mean score from the relevant subscale (Conners, 2000), as only
one question from the subscale items was missing in each instance. Other missing data were not
replaced to minimise error (Tabachnick & Fidell, 2001).
Fifty-three percent of the children had an official diagnosis of ADHD from a medical
practitioner. Children with a formal diagnosis had poorer vocabulary scores and were slightly
older on average than children without a diagnosis; however there were no differences on parent
ratings of ADHD symptoms and other cognitive assessments. When we investigated whether
children were performing behind their age level on literacy as per our criteria for learning
difficulties, we found that 40% were behind their age level in reading, 55% in spelling, and 36%
on both. As would be expected, there was a high correlation between underperformance on
reading and spelling (r = .87, p < .001). We decided to run comparisons between those with and
without learning difficulties, defined here as behind age in reading and spelling performance.

Children with reading and/or spelling difficulties were performing on average nearly two or
more years behind their age level. See Table 1 for demographic information and average
cognitive and behavioural scores for the whole sample and each of these groups.
[Insert Table 1 about here]
Regression analyses: PUFA status as predictor of cognition and behaviour
Correlations were used to identify associations between cognitive and CPRS scores and
erythrocyte PUFA levels in the whole sample (N = 75). Better word reading was associated with
higher levels of EPA (r = .24, p = .04), DHA (r = .26, p = .03) and total n-3 PUFA (r = .24, p =
.04) and poorer word reading with higher total n-6 PUFA (r = -.33, p <. 01). Poorer spelling and
vocabulary scores were associated with higher total n-6 PUFA (r = -.30, p = .01; r = -.29, p =
.01, respectively). Poorer Creature Counting was associated with higher AA (r = -.31, p < .01),
and better Sky Search with lower DHA (r = .24, p = .04). On the CPRS, anxiety/shyness was
associated with lower total n-3 PUFA (r = -.23, p = .04), the ADHD Index with higher total n-6
(r = .26, p = .03) and cognitive problems/inattention with a higher AA/EPA ratio (r = .23, p <
.05).
Potential covariates were also investigated, including age, gender, child’s health, parent
education, length of gestation and number of weeks breastfeeding. Those PUFAs and covariates
significantly correlated with the outcome variables were entered into regression equations to
identify predictors of cognitive and CPRS scores (Table 2). Total n-6 PUFA remained a
significant predictor of poorer word reading, vocabulary and spelling; poorer Creature Counting
scores were predicted by higher AA. Total n-3 PUFA remained a significant predictor of lower
anxiety/shyness but EPA was no longer a predictor of better word reading. DHA no longer
significantly predicted better word reading at the .05 level (p = .09) although there was an
average increased reading score of 2.38 to 8.83 (10 points = 1 SD) for each percentage increase
in erythrocyte DHA.
[Insert Table 2 about here]
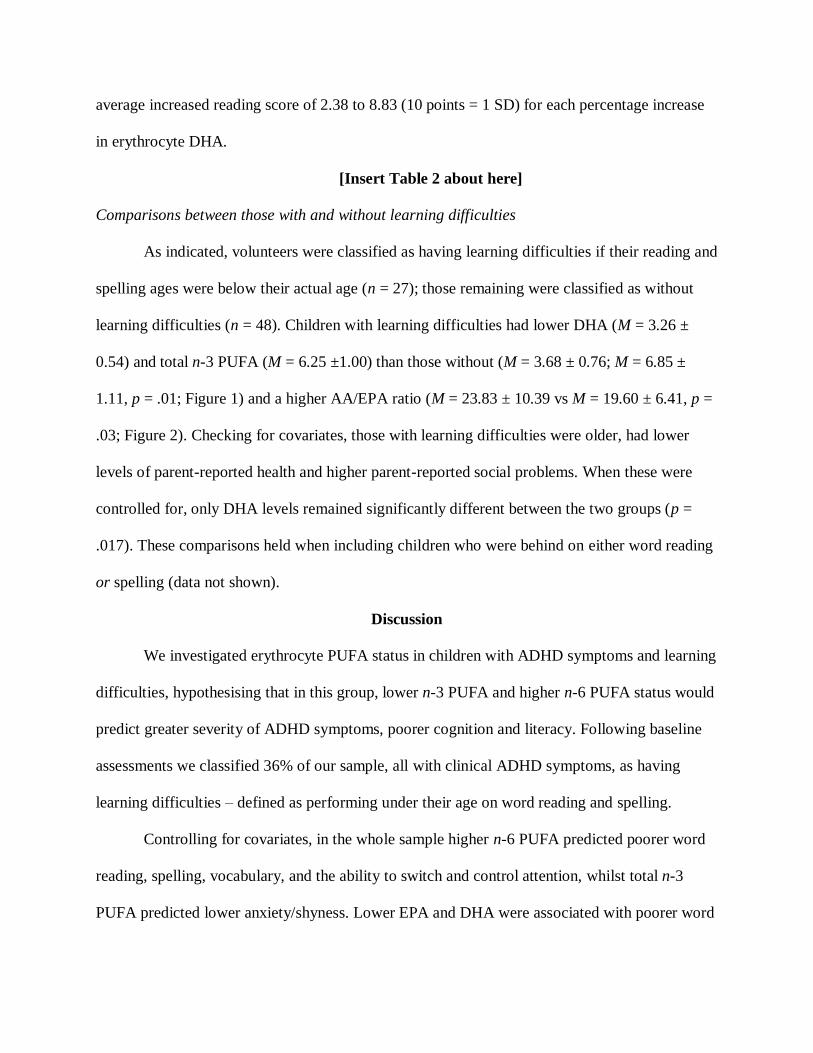
Comparisons between those with and without learning difficulties
As indicated, volunteers were classified as having learning difficulties if their reading and
spelling ages were below their actual age (n = 27); those remaining were classified as without
learning difficulties (n = 48). Children with learning difficulties had lower DHA (M = 3.26 ±
0.54) and total n-3 PUFA (M = 6.25 ±1.00) than those without (M = 3.68 ± 0.76; M = 6.85 ±
1.11, p = .01; Figure 1) and a higher AA/EPA ratio (M = 23.83 ± 10.39 vs M = 19.60 ± 6.41, p =
.03; Figure 2). Checking for covariates, those with learning difficulties were older, had lower
levels of parent-reported health and higher parent-reported social problems. When these were
controlled for, only DHA levels remained significantly different between the two groups (p =
.017). These comparisons held when including children who were behind on either word reading
or spelling (data not shown).
Discussion
We investigated erythrocyte PUFA status in children with ADHD symptoms and learning
difficulties, hypothesising that in this group, lower n-3 PUFA and higher n-6 PUFA status would
predict greater severity of ADHD symptoms, poorer cognition and literacy. Following baseline
assessments we classified 36% of our sample, all with clinical ADHD symptoms, as having
learning difficulties – defined as performing under their age on word reading and spelling.
Controlling for covariates, in the whole sample higher n-6 PUFA predicted poorer word
reading, spelling, vocabulary, and the ability to switch and control attention, whilst total n-3
PUFA predicted lower anxiety/shyness. Lower EPA and DHA were associated with poorer word

reading. However, after controlling for covariates, EPA was no longer a significant predictor.
DHA no longer reached conventional significance, although on average reading level was
improved by one to three quarters of a standard deviation for each percent increase in DHA. Post
hoc comparisons of those underperforming in reading and spelling compared with those
performing at or above their age level showed lower DHA status in the former.
In previous comparisons between adults suffering dyslexia and those suffering ADHD
(Laasonen, Hokkanen, Leppamaki, Tani, & Erkkila, 2009a), associations between n-6 PUFA and
poorer cognition occurred predominately in the ADHD group and positive associations between
n-3 and phonological processing, attention and spelling in the adults with dyslexia. Males with
ADHD had higher levels of total n-6 PUFAs, whilst those with dyslexia had a higher n-6:n-3
ratio (Laasonen, Hokkanen, Leppamaki, Tani, & Erkkila, 2009b). Previous research also showed
that boys with lower n-3 PUFAs in plasma phospholipids had higher scores on parent-reported
scales of learning problems and teacher ratings of mathematical and overall academic ability
(Stevens, Zentall, Abate, Kuczek, & Burgess, 1996).
Therefore, children with ADHD and learning difficulties may represent a subgroup with
lower n-3 PUFA levels and/or higher n-6 PUFA levels that are associated with poorer
psychological outcomes. It may be that suboptimal n-3 PUFA levels are of greater importance in
children with learning difficulties with or without a comorbid disorder. However, it should also
be remembered that improvements in ADHD symptoms such as hyperactivity, impulsivity and
inattention have been found in the absence of learning difficulties following PUFA
supplementation (Sinn & Bryan, 2007). Whether or not this applies to diagnosed learning
disabilities is not established here. The definition of learning disability is controversial (Kavale
& Forness, 2000), and indeed diagnosis of developmental disorders is somewhat arbitrary. The

high overlap between developmental disorders and attention problems that commonly co-occur
between them remain of interest within a phospholipid framework (Richardson, 2003), and could
be of particular significance if the attention problems are of a magnitude that they impact
significantly on learning.
To our knowledge, this is the first study to investigate erythrocyte PUFAs in children
with ADHD symptoms and learning difficulties, and to compare them with children who have
ADHD and no apparent learning difficulties. Although half the children did not have a medical
diagnosis of ADHD, parental ratings put them all in the clinical range for a diagnosis, and there
were no differences in severity of symptoms between those with and without a diagnosis.
Learning difficulties were defined as performing below age level on literacy rather than via
diagnosis of a learning disability, which in itself is controversial (Semrud-Clikeman et al., 1992).
The data are correlational, and although we attempted to control for relevant covariates, it is
always possible that one or more might not have been controlled for. Also, despite a year of
intensive recruitment over two sites, recruitment and obtaining of blood samples proved
challenging and we did not meet our target sample size for the intervention. Therefore the
baseline regression analyses may have also been underpowered.
However, the study adds to an emerging picture that lower n-3 PUFA and higher n-6
PUFA may be of particular importance in children with ADHD symptoms and learning
difficulties such as dyslexia (Richardson & Puri, 2002), and reading and writing difficulties
(Richardson & Montgomery, 2005), and when compared to other ADHD subtypes (Johnson et
al., 2008). As attention difficulties are a common, core component among developmental
disorders, this may account for response to supplementation in different studies with varied
recruitment criteria. Whether lower n-3 PUFA levels in children with learning difficulties are due

to lower dietary intake of n-3 PUFAs and/or metabolic difficulties and/or higher n-3 PUFA
requirements remains to be investigated further. Given the low consumption of n-3 PUFAs in
Western societies, and certainly in Australian children (Kolanu & Meyer, 2010), it may be a
combination of the above. Future studies need to further investigate this in children with learning
difficulties, and correlate improvements in learning and behaviour with increased erythrocyte n-3
PUFA and decreased n-6 PUFA status in controlled trials involving erythrocyte assessment of
PUFA status in response to treatment.

References
Antalis CJ, Stevens LJ, Campbell M, Pazdro R, Ericson K and Burgess JR (2006) Omega-3 fatty
acid status in attention-deficit/hyperactivity disorder. Prostaglandins Leukotrienes and
Essential Fatty Acids 75: 299-308.
Bligh EG and Dyer WJ (1959) A rapid method of total lipid extraction and purification.
Canadian Journal of Biochemistry and Physiology 37(8): 911-917.
Blunden SL, Milte CM, Sinn N (in press) Diet and sleep in children with attention deficit
hyperactivity disorder: Preliminary data in Australian children. Journal of Child Health
Care DOI: 10.1177/1367493510385020.
Bruni O, Ottaviano S, Guidetti V, Romoli M, Innocenzi M, Cortesi F et al. (1996). The Sleep
Disturbance Scale for Children (SDSC). Construction and validation of an instrument to
evaluate sleep disturbances in childhood and adolescence. Journal of Sleep Research 5:
251-261
Chen JR, Hsu SF, Hsu CD, Hwang LH and Yang SC (2004) Dietary patterns and blood fatty acid
composition in children with attention-deficit hyperactivity disorder in Taiwan. Journal
of Nutritional Biochemistry 15(8): 467-472.
Cohen J (1992) A power primer. Psychological Bulletin 112(1): 155-159.
Colter AL, Cutler C and Meckling KA (2008) Fatty acid status and behavioural symptoms of
attention deficit hyperactivity disorder in adolescents: a case-control study. Nutrition
Journal 7: 8.
Conners CK (2000) Conners' Rating Scales - Revised: Technical Manual. New York: Multi-
Health Systems, Inc.

Dewey D, Kaplan BJ, Crawford SG and Wilson BN (2002) Developmental coordination
disorder: associated problems in attention, learning, and psychosocial adjustment. Human
Movement Science 21(5-6): 905-918.
Folch J, Lees M and Sloane Stanley GH (1957) A simple method for the isolation and
purification of total lipides from animal tissues. Journal of Biological Chemistry 226(1):
497-509.
Germano M, Meleleo D, Montorfano G, Adorni L, Negroni M, Berra B et al. (2007) Plasma, red
blood cells phospholipids and clinical evaluation after long chain omega-3
supplementation in children with attention deficit hyperactivity disorder (ADHD).
Nutritional Neuroscience 10(1-2): 1-9.
Giles GC and Ireland PD (1996) Dietary Questionnaire for Epidemiological Studies (Version 2)
Melbourne: The Cancer Council Victoria.
Hodge A, Patterson AJ, Brown WJ, Ireland P and Giles G. (2000) The Anti Cancer Council of
Victoria FFQ: relative validity of nutrient intakes compared with weighed food records in
young to middle-aged women in a study of iron supplementation. Australian and New
Zealand Journal of Public Health 24(6): 576-583.
Johnson M, Ostlund S, Fransson G, Kadesjo B and Gillberg,C.(2009) Omega-3/omega-6 fatty
acids for attention deficit hyperactivity disorder: a randomized placebo-controlled trial in
children and adolescents. Journal of Attention Disorders 12(5): 394-401.
Joshi K, Lad S, Kale M, Patwardhan B, Mahadik SP, Patni B et al. (2006) Supplementation with
flax oil and vitamin C improves the outcome of Attention Deficit Hyperactivity Disorder
(ADHD). Prostaglandins Leukotrienes and Essential Fatty Acids 74(1): 17-21.

Kavale KA and Forness SR (2000) What definitions of learning disability say and don't say.
Journal of Learning Disabilities 33(3): 239-256.
Kolanu N and Meyer BJ (2010) The polyunsaturated fatty acid intakes of children from the Kids
Eat Kids Play Survey. Australian Medical Journal - Conference abstracts Nutrition
Society of Australia and New Zealand 2009: III, 1(1 ): 97-112.
Laasonen M, Hokkanen L, Leppamaki S, Tani P and Erkkila AT (2009a) Project DyAdd: Fatty
acids and cognition in adults with dyslexia, ADHD, or both. Prostaglandins Leukotrienes
and Essential Fatty Acids 81(1): 79-88.
Laasonen M, Hokkanen L, Leppamaki S, Tani P and Erkkila AT (2009b) Project DyAdd: Fatty
acids in adult dyslexia, ADHD, and their comorbid combination. Prostaglandins
Leukotrienes and Essential Fatty Acids 81(1): 89-96.
Lepage G and Roy CC (1986) Direct transesterification of all classes of lipids in a one-step
reaction. Journal of Lipid Research 27(1): 114-120.
Manly T, Robertson IH and Anderson V (1999) Test of everyday attention for children manual.
Suffok: Thames Valley Test Company.
McNamara RK and Carlson SE (2006) Role of omega-3 fatty acids in brain development and
function: potential implications for the pathogenesis and prevention of psychopathology
Prostaglandins Leukotrienes and Essential Fatty Acids 75(4-5): 329-349.
Mitchell EA, Aman MG, Turbott SH and Manku M (1987) Clinical characteristics and serum
essential fatty acid levels in hyperactive children. Clinical Pediatrics Philadelphia 26(8):
406-411.
Pliszka SR (1998) Comorbidity of attention-deficit/hyperactivity disorder with psychiatric
disorder: An overview. Journal of Clinical Psychiatry 59(suppl 7): 50-58.

Polanczyk G, de Lima MS, Horta BL, Biederman J and Rohde LA (2007) The worldwide
prevalence of ADHD: a systematic review and metaregression analysis. American
Journal of Psychiatry 164(6): 942-948.
Richardson AJ (2003) Clinical trials of fatty acid supplementation in ADHD. In: AIM Glen, M
Peet & DF Horrobin (eds), Phospholipid Spectrum Disorders in Psychiatry and
Neurology (pp. 529-541). Carnforth: Marius Press.
Richardson AJ (2006) Omega-3 fatty acids in ADHD and related neurodevelopmental disorders.
International Review of Psychiatry 18: 155-172.
Richardson AJ and Montgomery P (2005) The Oxford-Durham study: a randomised, controlled
trial of dietary supplementation with fatty acids in children with developmental
coordination disorder. Pediatrics 115: 1360-1366.
Richardson AJ and Puri BK (2002) A randomised double-blind, placebo-controlled study of the
effects of supplementation with highly unsaturated fatty acids on ADHD-related
symptoms in children with specific learning difficulties. Progress in Neuro-
Psychopharmacology & Biological Psychiatry 26(2): 233-239.
Rise P, Eligini S, Ghezzi S, Colli S and Galli C (2007). Fatty acid composition of plasma, blood
cells and whole blood: Relevance for the assessment of the fatty acid status in humans.
Prostaglandins Leukotrienes and Essential Fatty Acids 76(6): 363-369.
Semrud-Clikeman M, Biederman J, Sprich-Buckminster S, Lehman BK, Faraone SV and
Norman D (1992) Comorbidity between ADHD and learning disability: A review and
report in a clinical referred sample. Journal of the American Academy of Child and
Adolescent Psychiatry 31: 439-448.

Simopoulos AP (1991) Omega-3 fatty acids in health and disease and in growth and
development. American Journal of Clinical Nutrition 54: 438-463.
Simopoulos AP (2002) The importance of the ratio of omega-6/omega-3 essential fatty acids.
Biomedicine and Pharmacotherapy 56(8): 365-379.
Sinn N and Bryan J (2007) Effect of supplementation with polyunsaturated fatty acids and
micronutrients on ADHD-related problems with attention and behavior Journal of
Developmental & Behavioral Pediatrics 28(2): 82-91.
Sinn N and Howe PRC (2008) Mental health benefits of omega-3 fatty acids may be mediated by
improvements in cerebral vascular function. Bioscience Hypotheses 1: 103-108.
Sinn N, Milte C and Howe PRC (2010) Oiling the brain: A review of randomised controlled
trials of omega-3 fatty acids in psychopathology across the lifespan. Nutrients 2(2): 128-
170.
Stevens LJ, Zentall SS, Abate ML, Kuczek T and Burgess JR (1996) Omega-3 fatty acids in
boys with behavior, learning, and health problems. Physiology and Behaviour 59(4-5):
915-920.
Stevens LJ, Zentall SS, Deck JL, Abate ML, Watkins BA, Lipp SR, et al. (1995) Essential fatty
acid metabolism in boys with attention-deficit hyperactivity disorder. American Journal
of Clinical Nutrition 62(4): 761-768.
Tabachnick B and Fidell L (2001) Using Multivariate Statistics. Needham Heights, USA: Allyn
& Bacon.
Trommer BL, Hoeppner JA, Lorber R and Armstrong KJ (1988) The go-no-go paradigm in
attention deficit disorder. Annals of Neurology 24(5): 610-614.

Wechsler D (1991) Manual for the Wechsler Scale of Children’s Intelligence – III. New York:
Psychological Corporation.
Wechsler D (1992) Wechsler Individual Achievement Test Screener Manual. San Antonio:
Harcourt Brace & Company.
Young G and Conquer J (2005) Omega-3 fatty acids and neuropsychiatric disorders.
Reproduction Nutrition Development 45: 1-28.
Young GS, Maharaj NJ and Conquer JA (2004) Blood phospholipid fatty acid analysis of adults
with and without attention deficit/hyperactivity disorder. Lipids 39(2): 117-123.

Table 1. Demographics, mean PUFA levels and cognitive/behavioural scores in the whole
sample (N = 75) and children with and without learning difficulties (LD; defined here as
performing below age on reading and spelling)
Measure Total With LD Without LD
n 75 27 48
Male/female 61/14 21/6 40/8
ADHD diagnosis 39 (52%) 15 (55.6%) 24 (50%)
Mean (SD) Mean (SD) Mean (SD)
Word reading score 91.64 (17.55) 74.37 (11.50) 101.35 (12.01)**
Word reading age 8.73 (2.32) 7.85 (1.67) 9.22 (2.50)**
Spelling score 86.44 (17.71) 70.48 (12.08) 95.42 (13.59)**
Spelling age 8.15 (2.38) 7.21 (1.39) 8.68 (2.66)**
Vocabulary score 6.51 (2.32) 5.52 (1.95) 7.06 (2.35)**
Age (years) 9.05 (1.87) 9.96 (1.87) 8.46 (1.61)**
Healtha 4.08 (0.81) 3.74 (0.71) 4.28 (0.80)**
Gestation (weeks) 38.90 (3.30) 38.83 (3.10) 38.93 (3.44)
Weeks breastfed 21.30 (29.02) 17.26 (28.09) 23.47 (29.60)
Parent educationb 2.47 (1.38) 2.56 (1.58) 2.41 (1.26)
Conners Parent Rating Scalesc
Cognitive probs/inattn 76.87 (8.15) 78.52 (7.92) 75.94 (8.21)
Oppositional behaviour 71.64 (11.66) 70.81 (13.31) 72.10 (10.74)
Hyperactivity 74.60 (11.76) 71.63 (13.45) 76.27 (10.47)
Anxiety/shyness 52.01 (21.46) 53.89 (21.08) 50.95 (21.82)

Social problems 69.07 (15.55) 74.17 (13.67) 66.19 (15.93)*
ADHD Index 75.84 (6.63) 76.63 (7.75) 75.40 (5.95)
Conners Global Index 75.09 (8.51) 74.93 (9.53) 75.19 (7.98)
DSM-IV Hyper/Impuls 75.21 (11.41) 71.93 (12.83) 77.06 (10.21)
DSM-IV Inattentive 74.97 (7.98) 76.56 (9.33) 74.08 (7.06)
DSM-IV total 77.08 (8.13) 76.67 (8.65) 77.31 (7.90)
Sky search 5.37 (2.52) 5.11 (2.66) 5.53 (2.45)
Creature Counting 3.69 (2.24) 3.46 (2.10) 3.81 (2.32)
Score! No. correct 7.07 (2.39) 7.50 (2.29) 6.83 (2.44)
Sky search DT 4.68 (2.11) 4.30 (1.97) 4.89 (2.19)
Go/no-go errors 12.07 (9.87) 11.37 (10.09) 12.49 (9.83)
FFQ energy kj/day 8175 (2960) 8733 (3507) 7861 (2591)
FFQ protein g/day 90.43 (38.52) 91.41 (89.87) 89.87 (39.35)
FFQ carbohydrates g/day 214.41 (73.05) 226.79 (77.65) 207.45 (70.20)
FFQ sugar g/day 98.81 (44.03) 101.50 (53.37) 97.30 (38.34)
Sleep problems (t-scores)d 63.46 (16.00) 64.52 (14.60) 62.86 (16.89)
*p < 0.05 compared to group without learning difficulties; **p < 0.01 compared to group without
learning difficulties. aParent-reported health (1 = poor; 5 = excellent);
bHighest level of parent
education (1 = did not complete primary school; 7 = postgraduate degree); DT = divided
attention; cAge- and gender-adjusted t-scores (Conners, 2000a). Cognitive probs/inattn =
Cognitive Problems/Inattention. Hyper/Impuls = Hyperactive/Impulsive. ADHD = attention
deficit hyperactivity disorder. FFQ = food frequency questionnaire. FADS = Fatty acid

deficiency symptoms (Stevens et al., 1995). dReported by parents on the Sleep Disturbance Scale
for Children (Bruni et al., 1996).

Table 2: Baseline regressions: Predictors of cognitive performance and parent-reported ADHD
symptoms (outcomes that were significantly correlated with PUFA levels), N = 75
Measure Unstandardised
coefficients
Standardised
coefficients
B SE F R2 β p
Reading score 5.183 .231 .001
EPA 5.934 11.324 .067 .602
DHA 5.607 3.225 .222 .087
Total n-6 PUFA -2.439 0.779 -.335 .003
Child’s healtha 5.336 2.305 .245 .024
Vocabulary score 6.699 .223 .000
Total n-6 PUFA -0.254 0.103 -.263 .016
Child’s healtha 0.718 0.306 .248 .022
Gender -1.730 0.629 -.292 .008
Spelling score 7.088 .088 .010
Total n-6 PUFA -2.181 0.819 -.297 .010
Creature Counting 10.971 .320 .000
Gender -1.392 0.560 -.245 .015
Age 0.506 0.120 .417 .000
AA -0.467 0.156 -.296 .004
Sky Search pairs 5.948 .142 .004
Age 0.559 0.208 .309 .009
DHA -0.652 0.543 .138 .234

Cognitive Problems/
Inattention#
10.394 .308 .000
Health -1.933 1.013 -.190 .060
Gender 10.027 2.100 .482 .000
AA/EPA ratio 0.145 0.102 .144 .160
Anxiety/Shyness# 4.562 .202 .000
Child’s healtha -5.104 2.981 -.191 .091
Total n-3 PUFA -5.614 2.292 -.274 .017
ADHD index# 9.089 .202 .000
Total n-6 PUFA 0.075 0.291 .027 .797
Gender 7.514 1.794 .445 .000
Note: All collinearity diagnostics revealed VIF statistics < 2, therefore no multicollinearity
among predictor variables. ADHD = attention deficit hyperactivity disorder; n-3 = omega-3; n-6
= omega-6; EPA = eicosapentaenoic acid; DHA = docosahexaenoic acid; AA = arachidonic acid;
# Subscale t-scores from Conners’ Parent Rating Scales (Conners, 2000a).
aChild’s health was
reported by parents on a 5-point scale: 1 = poor, 5 = excellent.

Figure 1. n-3 PUFA levels (% of total fatty acids) in children with (n = 27) and without learning
difficulties (n = 48). *p < 0.05. LD = learning difficulties (performing behind age on reading and
spelling); EPA = eicosapentaenoic acid; DPA = docosapentaenoic acid; DHA = docosahexaenoic
acid n-3 PUFA = omega-3 polyunsaturated fatty acid. Data presented as mean with SEM. DHA
remained significantly different after controlling for differences between the groups in age,
parent-reported health and social problems (p = .017).
Figure 2. n-6 PUFA levels (% of total fatty acids) in children with (n = 27) and without learning
difficulties (n = 48), *p < 0.05. LD = learning difficulties; AA = arachidonic acid; DPA (n-6) =
docosapentaenoic acid omega-6; n-6 PUFA = omega-6 polyunsaturated fatty acid. Data
presented as mean with SEM. AA/EPA ratio no longer significantly different after controlling for
differences between groups in age, parent-reported health and social problems.


