Embed Size (px)
Citation preview
Ponderomotive narrow continuum (NCp) component in
stimulated electromagnetic emission spectra
V. L. Frolov, E. N. Sergeev, and G. P. KomrakovRadiophysical Research Institute (NIRFI), Nizhny Novgorod, Russia
P. StubbeMax-Planck-Institut fur Aeronomie, Katlenburg-Lindau, Germany
B. Thide, M. Waldenvik, E. Veszelei, and T. B. LeyserSwedish Institute of Space Physics, Uppsala, Sweden
Received 10 August 2001; revised 11 February 2002; accepted 18 December 2003; published 13 July 2004.
[1] We present experimental results concerning the ponderomotive narrow continuum(NCp) in stimulated electromagnetic emission spectra, generated in the ionosphericF region plasma by a powerful O mode electromagnetic wave. It is found that thegeneration of the NCp is determined by the development of the parametric decayinstability in the initial stage of the interaction of the HF pump wave with the plasma.The dependence of the NCp temporal and spectral characteristics on pump power, pumpfrequency, time of day, and pump schedule as well as its gyrofeatures are considered.A possible mechanism for the NCp generation is discussed. INDEX TERMS: 2403 Ionosphere:
Active experiments; 7839 Space Plasma Physics: Nonlinear phenomena; KEYWORDS: HF-heating, ionosphere
modification, plasma instabilities, HF-induced stimulated electromagnetic emissions
Citation: Frolov, V. L., E. N. Sergeev, G. P. Komrakov, P. Stubbe, B. Thide, M. Waldenvik, E. Veszelei, and T. B. Leyser (2004),
Ponderomotive narrow continuum (NCp) component in stimulated electromagnetic emission spectra, J. Geophys. Res., 109, A07304,
doi:10.1029/2001JA005063.
1. Introduction
[2] Almost 2 decades ago, it was discovered that apowerful HF heater wave of ordinary polarization,injected vertically from the ground into the F region ofthe ionosphere, gives rise to secondary electromagneticwaves [Thide et al., 1982], occurring as a result of variouswave-plasma processes, including the conversion of HFelectromagnetic waves into electrostatic waves and viceversa. Emissions of this type were termed StimulatedElectromagnetic Emissions (SEEs). A similar phenomenon,namely the generation of emissions stimulated by a short-pulsed powerful wave in the HF modified ionosphere,was found by Belikovich et al. [1981] and termed laterDiagnostic Stimulated Electromagnetic Emission (DSEE)[Erukhimov et al., 1988; Frolov et al., 1994]. By now, theSEE has become a very useful tool for the study ofnonlinear processes in ionospheric interaction experimentsbecause both the short timescale ponderomotive nonlinear-ities, giving rise to Langmuir turbulence, and the longtimescale thermal nonlinearities, leading to the excitationof large-scale and small-scale plasma density irregularities,are involved in the SEE generation (see, for example,Erukhimov et al. [1988], Frolov [1991], Waldenvik[1994], and the review by Stubbe and Hagfors [1997]and by Leyser [2001] and the papers referenced therein).Once the generation mechanism of a SEE component is
identified, one can obtain information on both the back-ground state of the ionospheric plasma and the nonlinearprocesses in question by observing the SEE evolution andvariations of the SEE features under different conditionsrealized in the experiments. SEE has also been shown to beof potential importance as a diagnostic of geophysicalprocesses [Kagan and Frolov, 1996; Sergeev et al., 1997].[3] SEE has been extensively investigated at the iono-
spheric modification facility in Tromsø, Norway [Stubbe etal., 1984, 1994; Leyser et al., 1990], at several Soviet/Russian facilities [Boiko et al., 1985; Erukhimov et al.,1987b; Leyser et al., 1993; Frolov, 1995; Frolov et al.,1999a], at the facility in Fairbanks, Alaska [Armstrong etal., 1990; Cheung et al., 1997], and at the facility in Arecibo,Puerto Rico [Thide et al., 1989, 1995]. SEE in its stationarystate, typically reached after tens of seconds followingthe HF pump wave switch-on, shows a number of distinctspectral features, many of which were named by Stubbe et al.[1984]. The major emission components on the downshiftedside of the SEE spectra are the ‘‘downshifted maximum’’(DM) and the ‘‘downshifted peak’’ (DP) [Stubbe et al.,1984], downshifted from the pump frequency, f0, by approx-imatelyDf�’ 9–15 kHz andDf�’ 2 kHz, respectively, the‘‘broad continuum’’ (BC) [Boiko et al., 1985; Leyser et al.,1993], extending up to Df� ’ 60–120 kHz below the DM,and the ‘‘narrow continuum’’ (NC) [Leyser et al., 1993;Frolov et al., 1997a], occurring in the frequency rangebetween the DM and the pump frequency, showing a rapiddecrease of the intensity with increasing Df�. The major
JOURNAL OF GEOPHYSICAL RESEARCH, VOL. 109, A07304, doi:10.1029/2001JA005063, 2004
Copyright 2004 by the American Geophysical Union.0148-0227/04/2001JA005063$09.00
A07304 1 of 21
components on the upshifted side are the ‘‘upshifted maxi-mum’’ (UM) [Stubbe et al., 1984], which is a narrow peak atfrequencies of about Df + ’ 7–12 kHz, the ‘‘broad upshiftedmaximum’’ (BUM) [Stubbe et al., 1984, 1994; Leyser et al.,1990, 1993; Frolov et al., 1996, 1998], occurring in the SEEspectra at frequency shifts Df + ’ 15–150 kHz when f0 isclose to or slightly above harmonics n of the electroncyclotron frequency fce ( fce ’ 1.3–1.35 MHz in the F layerover the Sura facility, depending on the pumpwave reflectionheight, href ’ 200–300 km), and the ‘‘broad upshiftedstructure’’ (BUS) [Frolov et al., 1997b, 2000], occurring atfrequency shifts Df + ’ 10–100 kHz for f0 far above nfce.Here and below we use the notations Df � and Df + todenote, respectively, negative and positive frequency shiftsin the SEE spectra relative to the pump wave (PW) frequencyf0. The emission intensity for these SEE spectral componentsexceed, as a rule, natural and man-made noise levels by morethan 10 dB and can be easily detected on the ground using asimple receiving antenna. The appearance of different spec-tral emission components depends strongly on the iono-spheric conditions, the pump frequency ( f0), and the pumppower [Leyser et al., 1990, 1993; Stubbe et al., 1994; Sergeevet al., 1998; Wagner et al., 1999]. In particular, the measure-ments performed have shown dramatic changes of thesteady-state SEE spectra for small variations of f0 aroundnfce. Based on the fact that the DM is not developed whenf0ffi nfce, the gyroharmonic resonance condition can be foundwith a precision of a few kHz [Leyser et al., 1994]. Such aDM property, as well as the spectral characteristics of the BCand BUM components [Leyser et al., 1993; Stubbe et al.,1994; Frolov et al., 1998], is usually used in our experimentsto determine the position of f0 relative to nfce.[4] In contrast to the DM, BC, BUM, and BUS, for which
empirical models have been elaborated in the past few years(see the papers referenced above), the study of the NC hasnot been completed yet. This is because several differentemission components were initially taken as one componentnamed the ‘‘continuum’’ [Stubbe et al., 1984]. Later, basedon investigations of the SEE temporal evolution [Boiko etal., 1985; Erukhimov et al., 1987b, 1988; Frolov, 1991;Waldenvik, 1994], it was found that in the initial stage ofpumping (during a few tens of milliseconds following HFwave turn on in the plasma) an emission component occursin the lower sideband of the pump wave with an intensitystrongly (�1–2 dB/kHz) decreasing with increasing down-shift from f0. As stated by Erukhimov et al. [1988], thegeneration of this SEE component is associated withthe development of the parametric decay instability (PDI)[Vas’kov and Gurevich, 1973; Fejer and Kuo, 1973; Alber etal., 1974; Perkins et al., 1974; Gurevich, 1978]. Thisemission component was named the ponderomotive NC,NCp [Frolov, 1991] (or the fast NC following by Leyser[2001]), implying that it is produced by the ponderomotivenonlinearity. Further, for the steady state, the continuum wasfound to be separated into two distinct spectral features,namely, the narrowcontinuum (NC) extending approximately10–20 kHz below f0 and the broad continuum (BC) havingfrequency components extending up to about 100 kHzbelow f0 [Leyser et al., 1993]. As stated by Frolov et al.[1997a], the NC, observed in the stationary SEE spectra, isproduced by the thermal parametric (resonance) instability(TPI) [Vas’kov and Gurevich, 1975; Grach et al., 1977;
Gurevich, 1978; Das and Fejer, 1979]. This emissioncomponent was named by Frolov et al. [1997a] the thermalNC, NCth. Hence by now three different SEE components(BC, NCp, and NCth) have been identified within thecontinuum. Such a separation of the continuum into threedifferent components has required a revision of the availableexperimental data. The first effort on this way was made byFrolov et al. [1997a]. However, new data, obtained in pastfew years, give reason to continue this work.[5] In the present paper we focus mainly on the NCp
features because an empirical model for this SEE compo-nent has not been elaborated yet. To fill this gap, wesummarize experimental results obtained at the Sura heatingfacility (Nizhny Novgorod, Russia) during many heatingcampaigns in the years 1988 to 1999 and published inpart by Frolov [1991, 1995], Frolov et al. [1997a, 1997c,1999a, 1999b], and Sergeev et al. [1994, 1998, 1999].For generality, we also use some experimental data of ourearlier measurements carried out at the Zimenki (NizhnyNovgorod) [Karashtin et al., 1986; Erukhimov et al., 1987a]and Gissar (Dushanbe, Tadzhkistan) [Erukhimov et al.,1987b] facilities. This is done with the goal to give thereader a comprehensive picture of NCp features, as well asto present experimental results which have been publishedearlier in Soviet/Russian journals not easily accessible inwestern countries. The elaboration of an empirical modelfor the NCp is important for the development of newmethods employing the SEE as diagnostics of HF-inducedionospheric turbulence. It should be emphasized here thatthe NCp, being generated slightly below the pump wavereflection height due to ponderomotive nonlinearities,makes it possible to investigate Langmuir turbulence, sup-plementing the incoherent scatter radar (ISR) technique, asdemonstrated by Thide et al. [1995]. In contrast to theNCp, the DM and BC are determined by the excitation ofupper hybrid (UH) waves and small-scale field-alignedirregularities (striations) in the UH resonance region [Grach,1985; Leyser et al., 1990; Stubbe et al., 1994; Gurevich etal., 1997; Mjølhus, 1998]. By this means, different types ofartificial ionospheric turbulence (AIT) can be investigatedsimultaneously in one experiment by the measurement ofdifferent SEE components (mainly DM, BC, and NCp). Thisrepresents the major advantage of the SEE method overthe ISR method, where the latter is limited by the use ofnearly vertical antenna beams which make the study of UHturbulence features impossible.[6] The organization of the paper is as follows. In section 2
the experimental arrangement is outlined, including a briefdescription of the diagnostic equipment employed in ourmeasurements. In section 3 the general features of the majorSEE components, observed in the lower sideband, are char-acterized. Experimental results concerning the features of theNCp are shown in section 4. In section 5 we present experi-ments in which an additional heating scheme is used. Anempirical model for the NCp, as well as a comparison of SEEresults with ISR results, is presented in section 6. Concludingremarks are given in section 7.
2. Experimental Arrangement
[7] The majority of the experiments discussed in thispaper were conducted at the Sura heating facility of the
A07304 FROLOV ET AL.: FEATURES OF THE PONDEROMOTIVE NARROW CONTINUUM
2 of 21
A07304
Radiophysical Research Institute (NIRFI), Nizhny Nov-gorod, Russia (geographic coordinates, 56.13�N, 44.1�E).The magnetic dip at F region heights is 71�. The Surafacility comprises three HF broadcast transmitters, each ofthem producing a maximum continuous output power of250 kW in the frequency range 4–25 MHz. Each transmitteris connected to its own subantenna array with dimensions100 � 300 m2, elongated in the E–W direction. Eachsubantenna array consists of four rows of 12 widebandcrossed dipoles operating in the frequency range 4.3–9.5 MHz. This three-module configuration allows to radiateindependently up to three pump waves of either left orright circular polarization with different frequencies,powers, and timing. When all three subantenna arrays arecombined into one (12 � 12 crossed dipoles), the facility iscapable of producing an effective radiated power (ERP) of120 MW at 4.3 MHz which increases up to 280 MW at9.3 MHz, corresponding to a pump intensity of about 0.5–1 mW/m2 at 200 km altitude if absorption in the lowerionosphere is disregarded. The antenna beam can be steeredin the geomagnetic meridian plane within the range ±40� offvertical.[8] The diagnostic equipment at the Sura facility, placed
at a receiving site situated approximately 1 km off theheater, is designed for (1) measurements of pump wave self-action effects, (2) SEE spectral and temporal evolutionmeasurements, and (3) measurements of the anomalousabsorption of probing waves sounding the disturbed iono-spheric volume. The diagnostic facility comprises a wide-band receiving antenna and different types of receivers andrecorders. The receiving antenna consists of 12 crosseddipoles operating in the frequency range 4.5–6 MHzwith approximately 15 dB gain; it is also used at higherfrequencies but with lower efficiency. With this setup, it ispossible to separate HF signals with O-mode, X-mode, orlinear polarization. When required, a choke quartz filter,tuned to the pump wave (PW) frequency, is used toattenuate the received PW signal by about 20–30 dB. Thisis important for measurements of SEE features at small(jDf j � 7 kHz) frequency shifts.[9] The SEE spectra and the pump wave signals are
monitored with a computer-controlled HP-3585A spectrumanalyzer operating in sweep mode. The temporal resolutionof such spectral measurements is, as a rule, a few seconds.To study faster processes in the PW and SEE evolution, weuse eight receivers with frequency bands of 0.3–3 kHz. Oneof the receivers is always tuned to the PW frequency, andthe others are tuned to characteristic parts of the SEEspectrum. In such measurements the highest temporalresolution is about 0.3 ms, corresponding to a 3 kHzGaussian filter. The detected signals are stored by meansof a computerized data acquisition system or are recorded inanalogue form by a seven-channel, high-speed tape recorderfor further digital processing. One of the remaining sevenreceivers is usually tuned to the DM frequency rangebecause the appearance of the DM is associated directlywith the presence of striations with cross-field scales l? �20–30 m, HF-induced in the disturbed ionospheric volumeby the TPI. In this respect the DM serves as a point ofreference in our SEE measurements aiming at diagnosingthe AIT. Besides, the DM can be used for finding thegyroharmonic frequency by the way of determining the
pump frequency range in which the DM is stronglysuppressed or absent [Leyser et al., 1994; Stubbe et al.,1994; Frolov et al., 1998].[10] During the heating campaign in September 1991, a
purpose-built wide dynamic range receiver, equipped with aquadrature detector to receive the entire signal, was used tostudy SEE features [Waldenvik et al., 1993; Waldenvik,1994]. The baseband in-phase and quadrature phase signalswere directly sampled to storage media. The nominalsampling rate used was 200 kHz. The response of thereceiving system to a step-like input signal is a sharpovershoot that vanishes within, at most, 3 ms. Thus thefirst few milliseconds of data after the arrival of the skywave, as well as after pump wave switch-off, may containerroneous information, and was therefore discarded in thedata analysis. Since typical e-folding growth and decaytimes for the high-frequency turbulence evolution are notlonger than a few milliseconds [Wong et al., 1983; Djuth etal., 1986; Sergeev et al., 1997, 1998; Cheung et al., 2001],this technique does not allow to study, by means of SEE, thefastest stage in the parametric decay processes.[11] To study the features of the NCp, which have typical
growth times less than 10–20 ms [Erukhimov et al., 1988;Sergeev et al., 1998], we used a scheme of short-pulseradiation for the PW with pulse duration tp ’ 10–200 msand interpulse period Tp ’ 1–10 s (Q = Tp/tp ’ 50–100) toensure that the pulse pump power, averaged over the pulserepetition period, h~Peffi = ~Peff, p/Q, does not exceed thethreshold value for the TPI development, ~Pth TPI, which isabout 0.5–1 MW ERP [Frolov et al., 1997c]. ‘‘Cold start’’conditions are thus realized in the experiments. Notice thatwe take into account here the power decrease by one-waywave absorption in the ionospheric D and E layers anddetermine a corrected power, denoted by ~Peff, which isappropriate for application to F region modification effects.[12] Since the SEE has a noise nature, averaging is needed
to decrease strong fluctuations of the emission intensity. Anaveraging of the SEE intensity over 10–50 pulse data setswith subsequent subtraction of the background noise isusually done in the data processing, especially when emis-sion relaxation features are studied. Results of this procedureare presented in Figures 3, 5, 6, and 10. Besides, byrecognizing that the usual duration of the measurementsshould not be longer than 5–10 min because of possiblevariations of the ionospheric conditions and, in consequence,of the experimental conditions, an upper limit for the pulserepetition period of 10–20 s should be used.[13] It should be emphasized that in studying the features
of the NCth, DM, and BC, which have typical growth timesof a few seconds [Boiko et al., 1985; Leyser et al., 1993], weoften use a quasi-continuous mode for the PW radiation withshort off times (typically 20 ms) every 100–200 ms [Sergeevet al., 1997]. Since the intensity of the small-scale striationsremains nearly constant during such short off periods, theSEE behavior is mainly determined here by evolution ofthe HF plasma turbulence. Such a quasi-continuous modefor PW radiation is employed to obtain a high temporaldiscrimination (every 100–200 ms) of the SEE character-istics during each heating cycle, and to investigate the high-frequency turbulence evolution at its different developmentstages. On the other hand, such a heating scheme allows toobtain well-averaged SEE signals at the steady state stage
A07304 FROLOV ET AL.: FEATURES OF THE PONDEROMOTIVE NARROW CONTINUUM
3 of 21
A07304
over the quasi-continuous heating period (100–200 ms) andto determine with high accuracy variations in the magnitudesof typical growth and decay times for the high-frequencyelectrostatic turbulence. By using such a heating scheme, theionospheric modification lasts, as a rule, 2–3 min with asubsequent 7–8 min off period to ensure a truly ‘‘cold start’’for the next pumping cycle.[14] In some measurements we use a so-called additional
heating scheme, in which radiation of two different pumpwaves is employed [Frolov, 1995]. One of them is the O-mode pump wave which is used for the SEE excitation and,in turn, for AIT diagnostics. Its power is chosen weak butsufficient to excite an unsaturated turbulence level, whichhas the ability to respond flexibly to an additional externalaction. One transmitter of the facility is used for thispurpose. The second powerful (heating) wave may be eitherin O-mode or X-mode polarization. It is used to createadditional ionospheric perturbations whose influence on theAIT is indicated by changes in the SEE features. One or twotransmitters of the facility are employed for this radiation.Such a scheme of additional heating allows to separate theinfluence of different factors on the AIT generation andevolution by varying the polarization, power, frequency, andtiming of the second wave.[15] Another experimental scheme consists in sounding
the disturbed ionospheric volume by short HF pulses. It wasfound that the growth time even for SEE components ofthermal origin (DM and BC, first of all) is of the order of afew milliseconds if the low-frequency ionospheric turbu-lence (striations) has been HF-induced by previous modifi-cation with continuous or quasi-continuous pumping, lastinga few minutes [Erukhimov et al., 1988; Frolov et al., 1994].This allows to measure SEE features using short (�10–20 ms) powerful (�10 MW ERP) pump pulses withfrequencies both close to and far from the PW frequency.The emission observed as ionospheric response to thesounding wave pulse has been named the diagnostic SEE(DSEE) [Erukhimov et al., 1988]. Naturally, under condi-tions of well-developed striations, DSEE and SEE spectraare copies of each other. The studies performed have shownthat applying such a scheme of pulse pumping to differentstarting conditions can induce either the ponderomotive partof the narrow continuum (NCp) when the unperturbedionosphere is modified (so-called cold-start conditions) orthermal SEE components (such as DM or BC) when apreconditioned ionosphere with well-developed striationsis used (so-called preconditioned turn-on). The term‘‘preconditioned’’ means that previous O-mode heatinghas been applied to excite the artificial ionospheric turbu-lence. In this case the long-time DSEE behavior afterPW switch-off represents primarily the evolution of artificialsmall-scale irregularities, since the collisional dampingtime of HF-induced plasma waves amounts to a few milli-seconds [Sergeev et al., 1998]. A detailed description of theDSEE technique, including the selection of diagnostic waveparameters, can be found in the work of Frolov et al. [1994].[16] For routine monitoring of the F2 layer critical
frequency, f0F2, and of the level of natural or artificial
ionospheric disturbances, an ionosonde collocated with theSura facility is used. When the situation requires, theionosonde is employed in fixed frequency mode as a lowpower pulse transmitter to determine the magnitude of the
linear absorption in the lower ionosphere and to calculatethe reduction of the HF power transported into the upperionosphere. Such measurements are necessary when the truevalue of the threshold power for the processes in question isto be determined, or when experimental results, obtainedunder different ionospheric conditions, are to be compared.
3. Some General Features of the SEE Evolutionin the Lower Sideband of the PW Frequency
[17] For a better visualization of the different evolutionstages of the SEE components of interest here (DM, BC,and NC, first of all), we give a brief summary of someprincipal experimental results concerning their generalspectral and dynamical behavior when the PW frequencyis far away from electron cyclotron harmonics. These earlierexperimental results will serve as a reference for the newresults to be presented in the subsequent sections.
3.1. Spectral Features of the SEE
[18] Figure 1 shows a sequence of emission spectra,measured at times t ’ 0.01, 0.05, 0.1, 0.2, 0.5, 1, 2, and4 s (Figures 1a–1h, respectively) after the PW switch-on inthe plasma. Here the zero offset frequency corresponds tothe PW frequency f0 = 5828 kHz, which is suppressed in thereceiver by about 80 dB in the frequency band ±60 Hzaround the carrier by means of a low-frequency narrow-band rejection filter [Waldenvik, 1994]. The time intervals towhich the spectra belong are labeled in the upper left cornerof the panels. In this experiment the heater was operated10 s on, 50 s off (for short we shall use below a notation ofthe form [+10 s; �50 s]) with pump power ~Peff = 30 MWERP. Notice that in all spectra shown in Figure 1 and belowthere is a large number of narrow spikes. These are due tointerfering HF radio stations.[19] From Figure 1 it is clearly seen that for t � 0.5 s the
lower sideband of the SEE spectrum consists solely ofthe ponderomotive part of the narrow continuum (NCp),the spectrum of which extends from f0 down to Df� ’40 kHz with a slope of about 1 dB/kHz. The spectrum at t =1 s shows the appearance of the BC, extending up to Df� ’100 kHz and having an exponential spectral form with aslope of about 0.3 dB/kHz without any discrete structures.The DM appears only slightly in the emission spectrumhere, but at t � 2 s it is the dominant feature with its spectralmaximum downshifted approximately 12 kHz from f0 =5828 kHz, with a discreteness of more than 5 dB over theBC. The NCth can be observed here between f0 and the DMin the frequency range Df� � 5–7 kHz as an emissionrapidly decreasing in intensity with the increase in Df�.Such temporal evolution and spectral features of the SEEare typical when the PW frequency lies in the frequencyrange between the 4th and 5th gyroharmonic where thethermal emission components have their highest stationaryintensities [Frolov et al., 2001]. The spectrogram in thelower panel represents the SEE intensity as a function offrequency and time, showing at one glance all features ofthe SEE temporal evolution discussed above.
3.2. Some Remarks on the SEE Temporal Evolution
[20] Figure 2 displays results of simultaneous measure-ments of the evolution of artificial small-scale field-aligned
A07304 FROLOV ET AL.: FEATURES OF THE PONDEROMOTIVE NARROW CONTINUUM
4 of 21
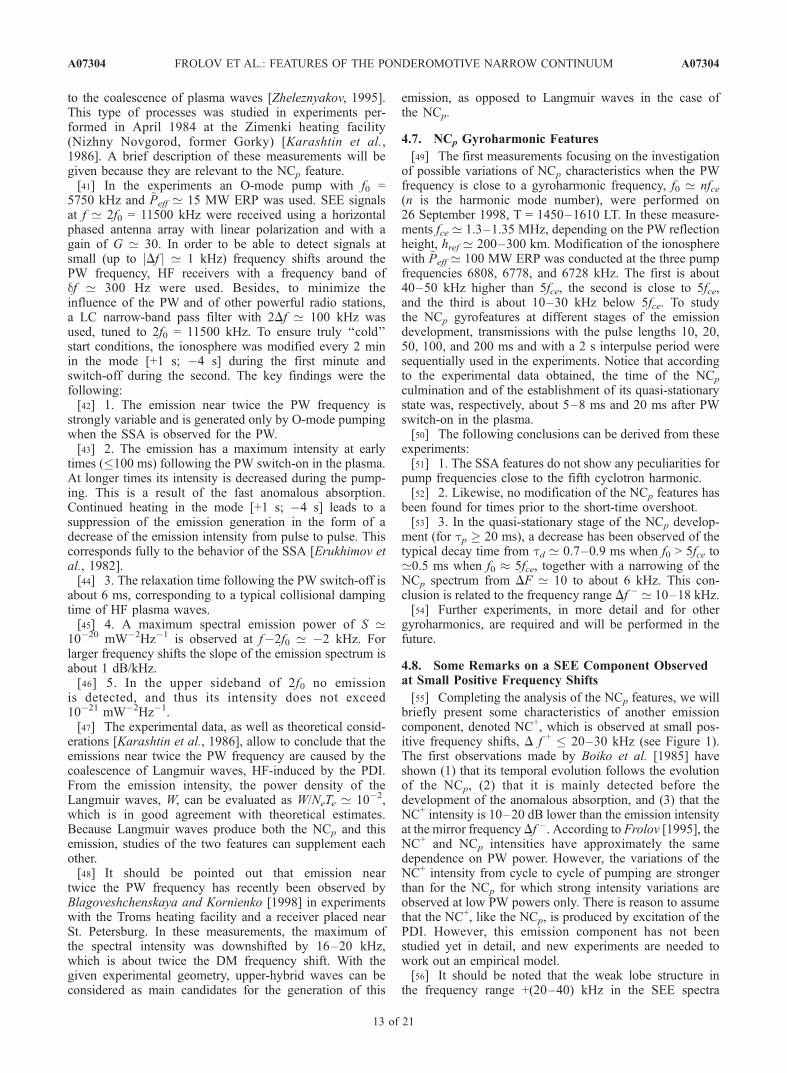
A07304
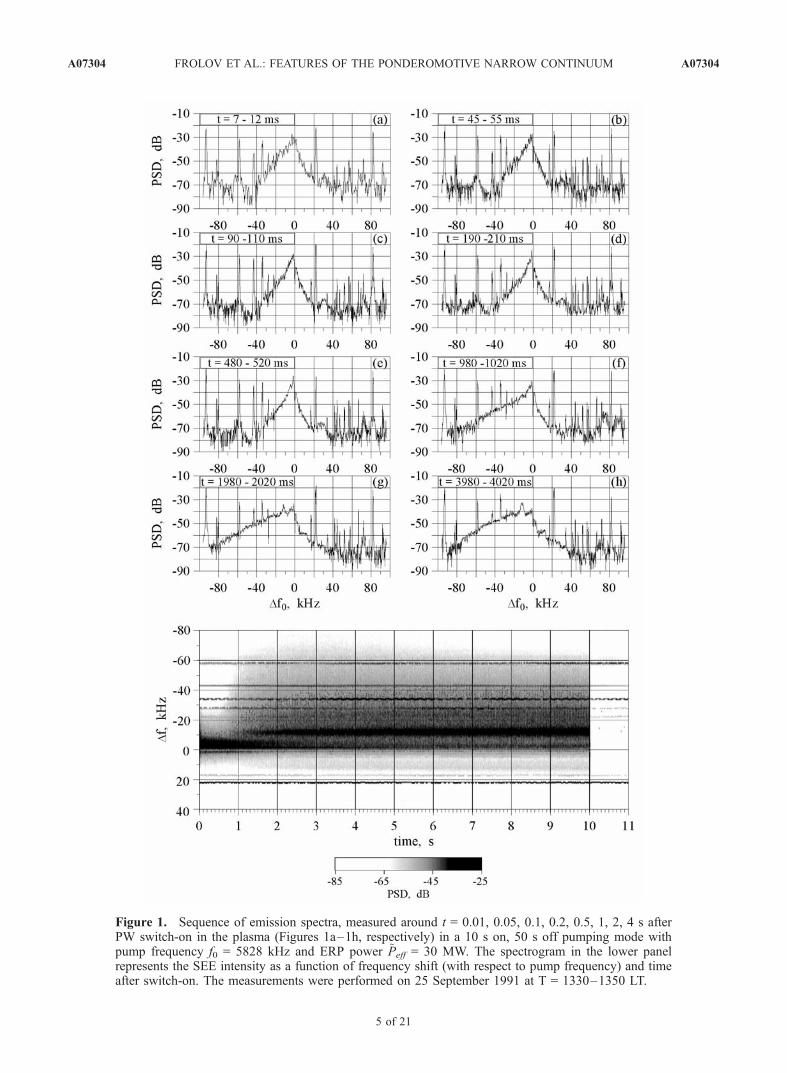
Figure 1. Sequence of emission spectra, measured around t = 0.01, 0.05, 0.1, 0.2, 0.5, 1, 2, 4 s afterPW switch-on in the plasma (Figures 1a–1h, respectively) in a 10 s on, 50 s off pumping mode withpump frequency f0 = 5828 kHz and ERP power ~Peff = 30 MW. The spectrogram in the lower panelrepresents the SEE intensity as a function of frequency shift (with respect to pump frequency) and timeafter switch-on. The measurements were performed on 25 September 1991 at T = 1330–1350 LT.
A07304 FROLOV ET AL.: FEATURES OF THE PONDEROMOTIVE NARROW CONTINUUM
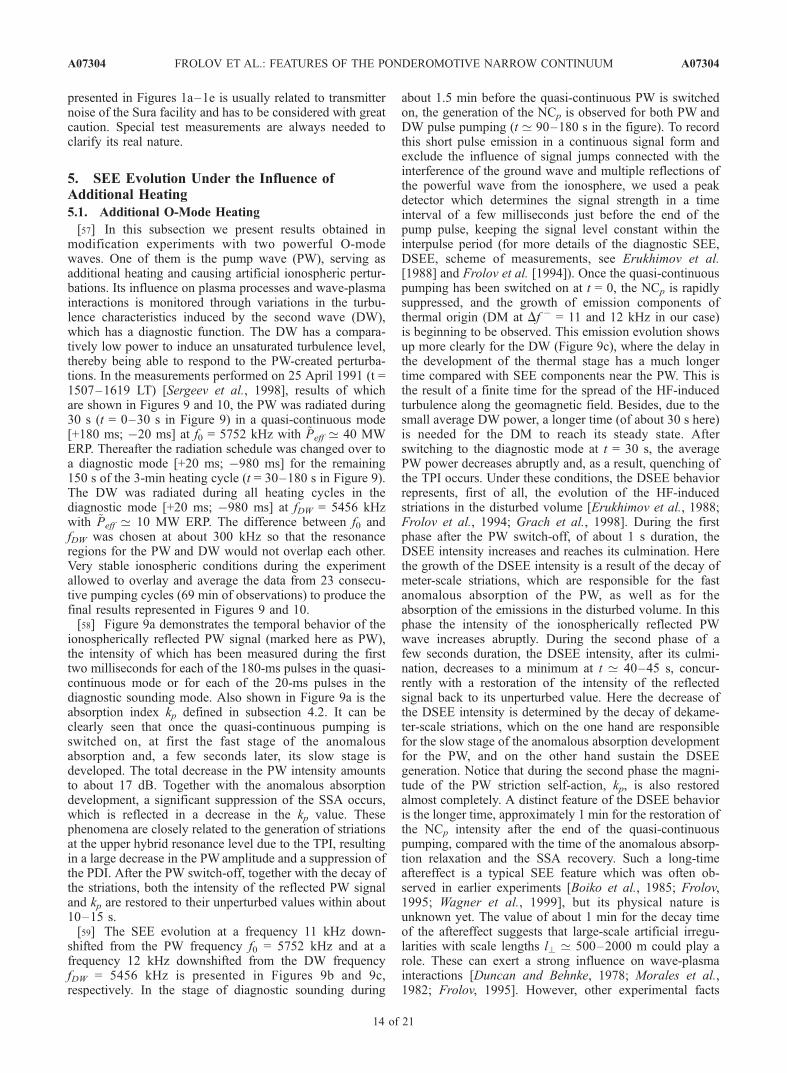
5 of 21
A07304
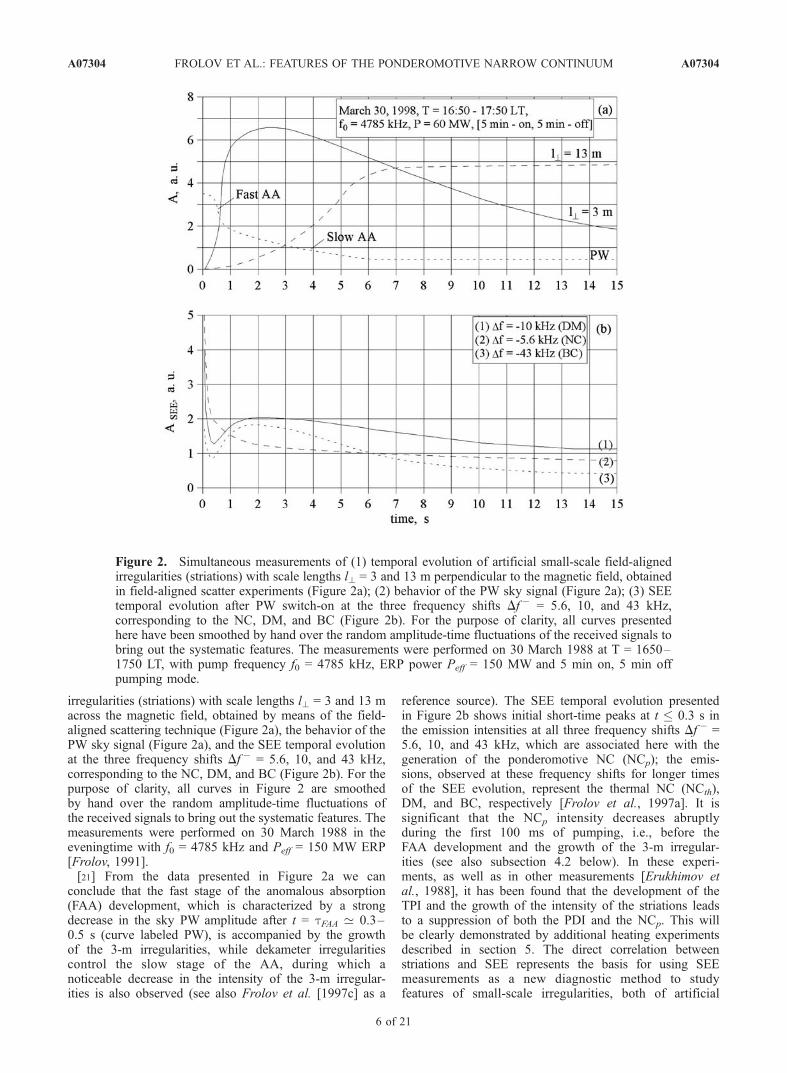
irregularities (striations) with scale lengths l? = 3 and 13 macross the magnetic field, obtained by means of the field-aligned scattering technique (Figure 2a), the behavior of thePW sky signal (Figure 2a), and the SEE temporal evolutionat the three frequency shifts Df � = 5.6, 10, and 43 kHz,corresponding to the NC, DM, and BC (Figure 2b). For thepurpose of clarity, all curves in Figure 2 are smoothedby hand over the random amplitude-time fluctuations ofthe received signals to bring out the systematic features. Themeasurements were performed on 30 March 1988 in theeveningtime with f0 = 4785 kHz and Peff = 150 MW ERP[Frolov, 1991].[21] From the data presented in Figure 2a we can
conclude that the fast stage of the anomalous absorption(FAA) development, which is characterized by a strongdecrease in the sky PW amplitude after t = tFAA ’ 0.3–0.5 s (curve labeled PW), is accompanied by the growthof the 3-m irregularities, while dekameter irregularitiescontrol the slow stage of the AA, during which anoticeable decrease in the intensity of the 3-m irregular-ities is also observed (see also Frolov et al. [1997c] as a
reference source). The SEE temporal evolution presentedin Figure 2b shows initial short-time peaks at t � 0.3 s inthe emission intensities at all three frequency shifts Df � =5.6, 10, and 43 kHz, which are associated here with thegeneration of the ponderomotive NC (NCp); the emis-sions, observed at these frequency shifts for longer timesof the SEE evolution, represent the thermal NC (NCth),DM, and BC, respectively [Frolov et al., 1997a]. It issignificant that the NCp intensity decreases abruptlyduring the first 100 ms of pumping, i.e., before theFAA development and the growth of the 3-m irregular-ities (see also subsection 4.2 below). In these experi-ments, as well as in other measurements [Erukhimov etal., 1988], it has been found that the development of theTPI and the growth of the intensity of the striations leadsto a suppression of both the PDI and the NCp. This willbe clearly demonstrated by additional heating experimentsdescribed in section 5. The direct correlation betweenstriations and SEE represents the basis for using SEEmeasurements as a new diagnostic method to studyfeatures of small-scale irregularities, both of artificial
Figure 2. Simultaneous measurements of (1) temporal evolution of artificial small-scale field-alignedirregularities (striations) with scale lengths l? = 3 and 13 m perpendicular to the magnetic field, obtainedin field-aligned scatter experiments (Figure 2a); (2) behavior of the PW sky signal (Figure 2a); (3) SEEtemporal evolution after PW switch-on at the three frequency shifts Df � = 5.6, 10, and 43 kHz,corresponding to the NC, DM, and BC (Figure 2b). For the purpose of clarity, all curves presentedhere have been smoothed by hand over the random amplitude-time fluctuations of the received signals tobring out the systematic features. The measurements were performed on 30 March 1988 at T = 1650–1750 LT, with pump frequency f0 = 4785 kHz, ERP power Peff = 150 MW and 5 min on, 5 min offpumping mode.
A07304 FROLOV ET AL.: FEATURES OF THE PONDEROMOTIVE NARROW CONTINUUM
6 of 21
A07304
and natural origin [Erukhimov et al., 1988; Frolov et al.,1994; Kagan and Frolov, 1996; Sergeev et al., 1999].
4. Features of the Ponderomotive NarrowContinuum
4.1. Spectral Characteristics
[22] Returning to Figure 1, Figures 1a–1e represent thetemporal evolution of the NCp during the first 500 ms ofmodification. On the basis of these data we can concludethat the NCp has its maximum intensity and widest spectrum(extending up to Df � ’ 40 kHz) after about 10 msfollowing PW switch-on in the plasma. For longer times(10 � t � 500 ms) some decrease in the emission intensityby 6–10 dB (so-called short-time overshoot) is observed,together with a narrowing of the NCp spectrum. We use theterms short-time (timescale of a few tens of milliseconds)and long-time (timescale of a few seconds) overshoot inplace of miniovershoot and main overshoot, as introducedby Showen and Kim [1978], to reflect more correctly theirphysical nature, associated with ponderomotive and thermalplasma processes, respectively. Notice that the NCp maxi-mum spectral intensity observed here at Df � ’ 1–2 kHz isabout 5 dB higher than the DM spectral intensity (seeFigure 1h), which is the most intensive emission in stationarySEE spectra for f0 � 4.0 MHz. The experiments consideredhere, as well as earlier measurements [Boiko et al., 1985;Erukhimov et al., 1988; Frolov et al., 1997a], have shownthat in the frequency range 0 < Df � < 40 kHz the NCp
spectral intensity decreases strongly with increasing Df �,having a constant slope of about 1 dB/kHz (up to 2 dB/kHz insome other cases).
4.2. Temporal Development
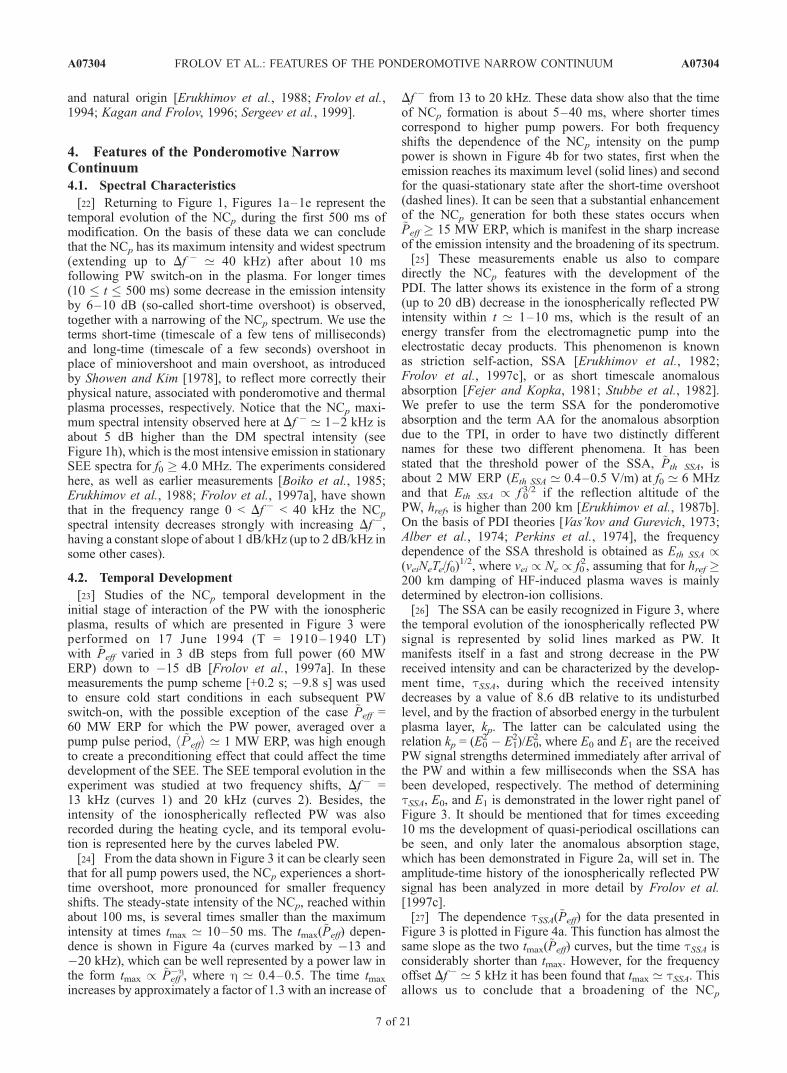
[23] Studies of the NCp temporal development in theinitial stage of interaction of the PW with the ionosphericplasma, results of which are presented in Figure 3 wereperformed on 17 June 1994 (T = 1910–1940 LT)with ~Peff varied in 3 dB steps from full power (60 MWERP) down to �15 dB [Frolov et al., 1997a]. In thesemeasurements the pump scheme [+0.2 s; �9.8 s] was usedto ensure cold start conditions in each subsequent PWswitch-on, with the possible exception of the case ~Peff =60 MW ERP for which the PW power, averaged over apump pulse period, h ~P effi ’ 1 MW ERP, was high enoughto create a preconditioning effect that could affect the timedevelopment of the SEE. The SEE temporal evolution in theexperiment was studied at two frequency shifts, Df � =13 kHz (curves 1) and 20 kHz (curves 2). Besides, theintensity of the ionospherically reflected PW was alsorecorded during the heating cycle, and its temporal evolu-tion is represented here by the curves labeled PW.[24] From the data shown in Figure 3 it can be clearly seen
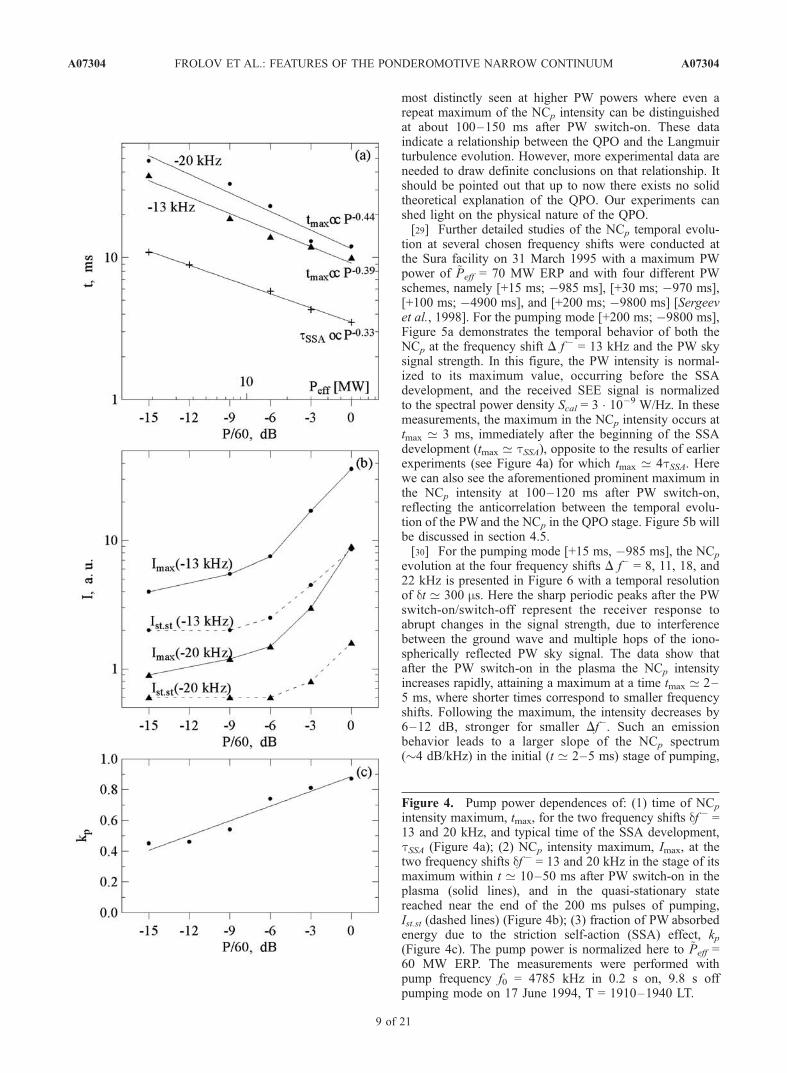
that for all pump powers used, the NCp experiences a short-time overshoot, more pronounced for smaller frequencyshifts. The steady-state intensity of the NCp, reached withinabout 100 ms, is several times smaller than the maximumintensity at times tmax ’ 10–50 ms. The tmax(~Peff) depen-dence is shown in Figure 4a (curves marked by �13 and�20 kHz), which can be well represented by a power law inthe form tmax / ~Peff
�h, where h ’ 0.4–0.5. The time tmax
increases by approximately a factor of 1.3 with an increase of
Df � from 13 to 20 kHz. These data show also that the timeof NCp formation is about 5–40 ms, where shorter timescorrespond to higher pump powers. For both frequencyshifts the dependence of the NCp intensity on the pumppower is shown in Figure 4b for two states, first when theemission reaches its maximum level (solid lines) and secondfor the quasi-stationary state after the short-time overshoot(dashed lines). It can be seen that a substantial enhancementof the NCp generation for both these states occurs when~Peff � 15 MW ERP, which is manifest in the sharp increaseof the emission intensity and the broadening of its spectrum.[25] These measurements enable us also to compare
directly the NCp features with the development of thePDI. The latter shows its existence in the form of a strong(up to 20 dB) decrease in the ionospherically reflected PWintensity within t ’ 1–10 ms, which is the result of anenergy transfer from the electromagnetic pump into theelectrostatic decay products. This phenomenon is knownas striction self-action, SSA [Erukhimov et al., 1982;Frolov et al., 1997c], or as short timescale anomalousabsorption [Fejer and Kopka, 1981; Stubbe et al., 1982].We prefer to use the term SSA for the ponderomotiveabsorption and the term AA for the anomalous absorptiondue to the TPI, in order to have two distinctly differentnames for these two different phenomena. It has beenstated that the threshold power of the SSA, ~Pth SSA, isabout 2 MW ERP (Eth SSA ’ 0.4–0.5 V/m) at f0 ’ 6 MHzand that Eth SSA / f 0
3/2 if the reflection altitude of thePW, href, is higher than 200 km [Erukhimov et al., 1987b].On the basis of PDI theories [Vas’kov and Gurevich, 1973;Alber et al., 1974; Perkins et al., 1974], the frequencydependence of the SSA threshold is obtained as Eth SSA /(veiNeTe/f0)
1/2, where vei / Ne / f02, assuming that for href �
200 km damping of HF-induced plasma waves is mainlydetermined by electron-ion collisions.[26] The SSA can be easily recognized in Figure 3, where
the temporal evolution of the ionospherically reflected PWsignal is represented by solid lines marked as PW. Itmanifests itself in a fast and strong decrease in the PWreceived intensity and can be characterized by the develop-ment time, tSSA, during which the received intensitydecreases by a value of 8.6 dB relative to its undisturbedlevel, and by the fraction of absorbed energy in the turbulentplasma layer, kp. The latter can be calculated using therelation kp = (E0
2 � E12)/E0
2, where E0 and E1 are the receivedPW signal strengths determined immediately after arrival ofthe PW and within a few milliseconds when the SSA hasbeen developed, respectively. The method of determiningtSSA, E0, and E1 is demonstrated in the lower right panel ofFigure 3. It should be mentioned that for times exceeding10 ms the development of quasi-periodical oscillations canbe seen, and only later the anomalous absorption stage,which has been demonstrated in Figure 2a, will set in. Theamplitude-time history of the ionospherically reflected PWsignal has been analyzed in more detail by Frolov et al.[1997c].[27] The dependence tSSA(~Peff) for the data presented in
Figure 3 is plotted in Figure 4a. This function has almost thesame slope as the two tmax(~Peff) curves, but the time tSSA isconsiderably shorter than tmax. However, for the frequencyoffset Df� ’ 5 kHz it has been found that tmax ’ tSSA. Thisallows us to conclude that a broadening of the NCp
A07304 FROLOV ET AL.: FEATURES OF THE PONDEROMOTIVE NARROW CONTINUUM
7 of 21
A07304
spectrum occurs in the initial stage, i.e., during the first fewtens of milliseconds of the PW-plasma interaction. As seenin Figure 4c, kp shows only a weak dependence on Peff anddoes not show any peculiarity at ~Peff ’ 15 MW ERP, asfor the NCp intensity displayed in Figure 4b. Such a weakdependence of kp on Peff can be understood as being dueto the fact that for well-developed SSA, when E1
2 E02, the
PW energy is near totally absorbed in the disturbed volume,independent of the pump wave power [Erukhimov et al.,1982]. On the other hand, the substantial enhancement ofthe NCp intensity when ~Peff � 15 MW ERP can be takenas an indication that the character of the interaction of thepowerful electromagnetic wave with the plasma undergoes
some changes. However, without additional experiments, itis presently not possible to identify the physical nature ofthese changes. One possibility could be that the Langmuirturbulence excited by the PDI goes through a change frombeing wave to caviton dominated.[28] Completing the analysis of the data represented in
Figure 3, it should be noted that the decrease in the NCp
intensity after its maximum level coincides in time with agrowth of the intensity of the reflected PW signal. The latteris a result of the occurrence of quasi-periodic oscillations,QPO, in the PW reflected signal [Frolov et al., 1997c].Comparison of the PW and NCp behavior clearly shows ananticorrelation between their temporal variations, which is
Figure 3. Examples of the NCp temporal development at two frequency shifts, D f � = 13 kHz (curves 1)and 20 kHz (curves 2), for different pump powers varying in 3-dB steps from full power, ~Peff = 60 MWERP, down to ~Peff = 1.9 MW ERP. The temporal evolution of the ionospherically reflected PW signal isrepresented here by lines marked as PW. An averaging of the SEE intensity over 22–30 pulse data setswith subsequent subtraction of the background noise has been done here in the data processing. Thetechnique for determiningthe quantities tSSA, E0, and E1 is demonstrated in the lower right panel. Themeasurements were performed with pump frequency f0 = 4785 kHz in 0.2 s on, 9.8 s off pumping modeon 17 June 1994, T = 1910–1940 LT.
A07304 FROLOV ET AL.: FEATURES OF THE PONDEROMOTIVE NARROW CONTINUUM
8 of 21
A07304
most distinctly seen at higher PW powers where even arepeat maximum of the NCp intensity can be distinguishedat about 100–150 ms after PW switch-on. These dataindicate a relationship between the QPO and the Langmuirturbulence evolution. However, more experimental data areneeded to draw definite conclusions on that relationship. Itshould be pointed out that up to now there exists no solidtheoretical explanation of the QPO. Our experiments canshed light on the physical nature of the QPO.[29] Further detailed studies of the NCp temporal evolu-
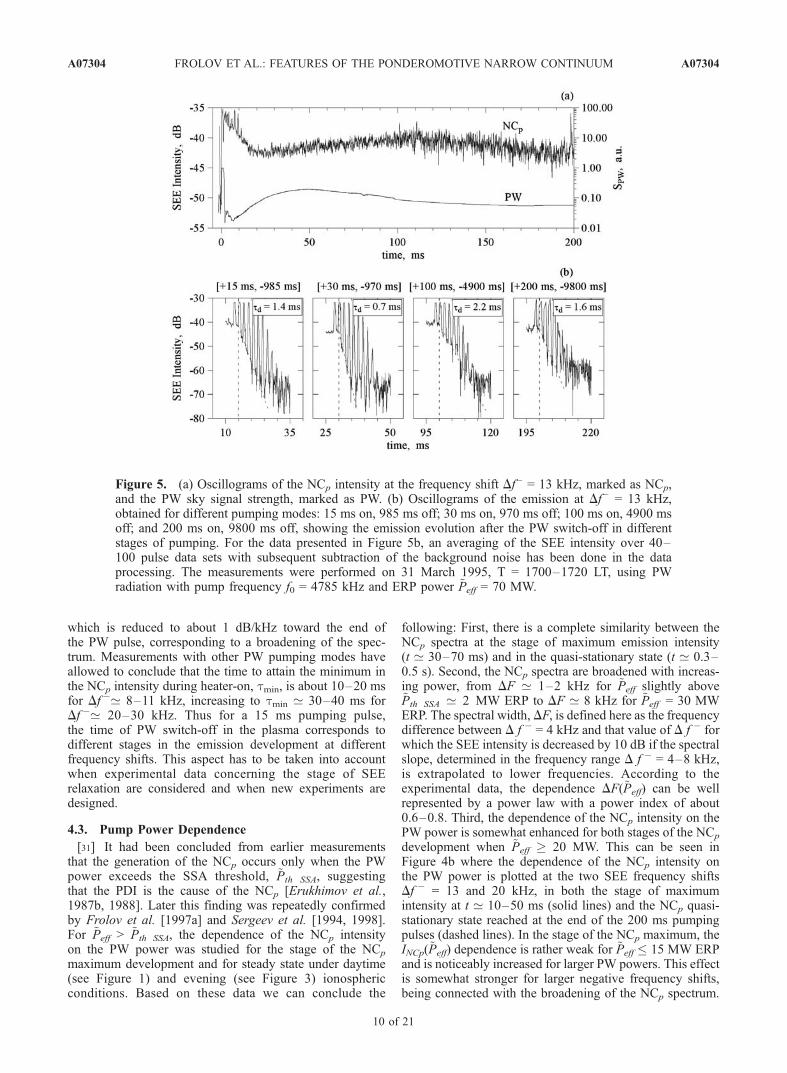
tion at several chosen frequency shifts were conducted atthe Sura facility on 31 March 1995 with a maximum PWpower of ~Peff = 70 MW ERP and with four different PWschemes, namely [+15 ms; �985 ms], [+30 ms; �970 ms],[+100 ms; �4900 ms], and [+200 ms; �9800 ms] [Sergeevet al., 1998]. For the pumping mode [+200 ms; �9800 ms],Figure 5a demonstrates the temporal behavior of both theNCp at the frequency shift D f� = 13 kHz and the PW skysignal strength. In this figure, the PW intensity is normal-ized to its maximum value, occurring before the SSAdevelopment, and the received SEE signal is normalizedto the spectral power density Scal = 3 � 10�9 W/Hz. In thesemeasurements, the maximum in the NCp intensity occurs attmax ’ 3 ms, immediately after the beginning of the SSAdevelopment (tmax ’ tSSA), opposite to the results of earlierexperiments (see Figure 4a) for which tmax ’ 4tSSA. Herewe can also see the aforementioned prominent maximum inthe NCp intensity at 100–120 ms after PW switch-on,reflecting the anticorrelation between the temporal evolu-tion of the PWand the NCp in the QPO stage. Figure 5b willbe discussed in section 4.5.[30] For the pumping mode [+15 ms, �985 ms], the NCp
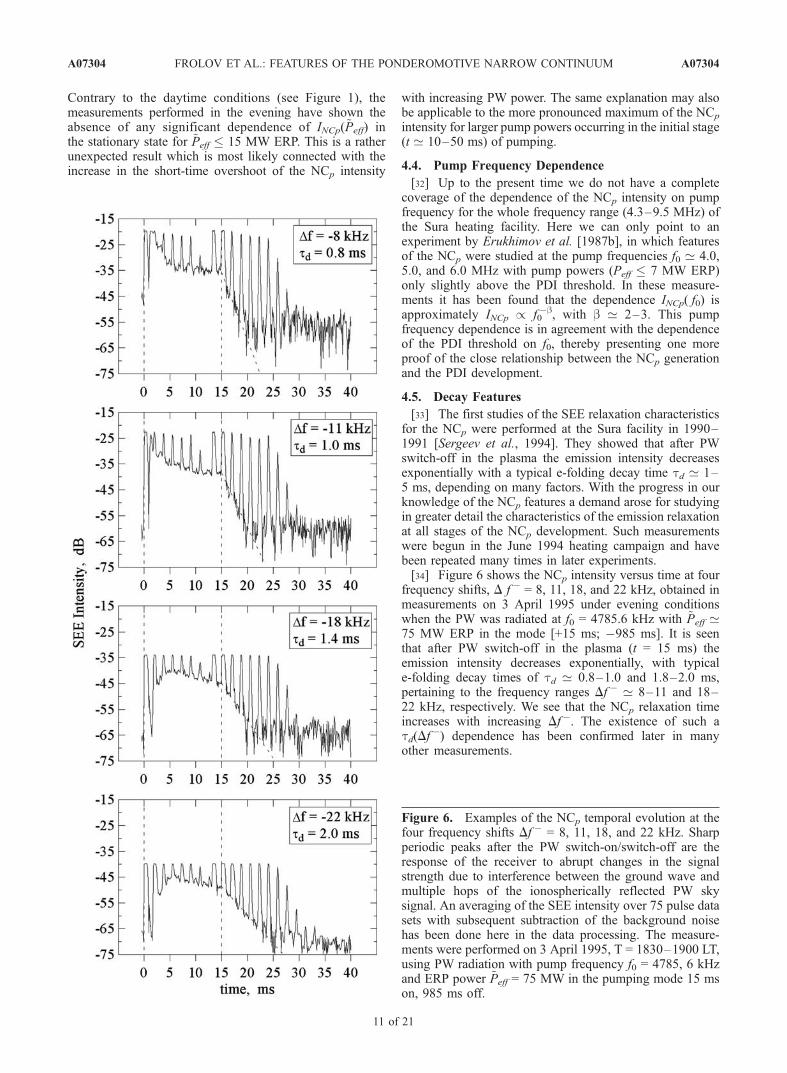
evolution at the four frequency shifts D f� = 8, 11, 18, and22 kHz is presented in Figure 6 with a temporal resolutionof dt ’ 300 ms. Here the sharp periodic peaks after the PWswitch-on/switch-off represent the receiver response toabrupt changes in the signal strength, due to interferencebetween the ground wave and multiple hops of the iono-spherically reflected PW sky signal. The data show thatafter the PW switch-on in the plasma the NCp intensityincreases rapidly, attaining a maximum at a time tmax ’ 2–5 ms, where shorter times correspond to smaller frequencyshifts. Following the maximum, the intensity decreases by6–12 dB, stronger for smaller Df�. Such an emissionbehavior leads to a larger slope of the NCp spectrum(�4 dB/kHz) in the initial (t ’ 2–5 ms) stage of pumping,
Figure 4. Pump power dependences of: (1) time of NCp
intensity maximum, tmax, for the two frequency shifts df� =13 and 20 kHz, and typical time of the SSA development,tSSA (Figure 4a); (2) NCp intensity maximum, Imax, at thetwo frequency shifts df� = 13 and 20 kHz in the stage of itsmaximum within t ’ 10–50 ms after PW switch-on in theplasma (solid lines), and in the quasi-stationary statereached near the end of the 200 ms pulses of pumping,Ist.st (dashed lines) (Figure 4b); (3) fraction of PW absorbedenergy due to the striction self-action (SSA) effect, kp(Figure 4c). The pump power is normalized here to ~Peff =60 MW ERP. The measurements were performed withpump frequency f0 = 4785 kHz in 0.2 s on, 9.8 s offpumping mode on 17 June 1994, T = 1910–1940 LT.
A07304 FROLOV ET AL.: FEATURES OF THE PONDEROMOTIVE NARROW CONTINUUM
9 of 21
A07304
which is reduced to about 1 dB/kHz toward the end ofthe PW pulse, corresponding to a broadening of the spec-trum. Measurements with other PW pumping modes haveallowed to conclude that the time to attain the minimum inthe NCp intensity during heater-on, tmin, is about 10–20 msfor Df�’ 8–11 kHz, increasing to tmin ’ 30–40 ms forDf �’ 20–30 kHz. Thus for a 15 ms pumping pulse,the time of PW switch-off in the plasma corresponds todifferent stages in the emission development at differentfrequency shifts. This aspect has to be taken into accountwhen experimental data concerning the stage of SEErelaxation are considered and when new experiments aredesigned.
4.3. Pump Power Dependence
[31] It had been concluded from earlier measurementsthat the generation of the NCp occurs only when the PWpower exceeds the SSA threshold, ~Pth SSA, suggestingthat the PDI is the cause of the NCp [Erukhimov et al.,1987b, 1988]. Later this finding was repeatedly confirmedby Frolov et al. [1997a] and Sergeev et al. [1994, 1998].For ~Peff > ~Pth SSA, the dependence of the NCp intensityon the PW power was studied for the stage of the NCp
maximum development and for steady state under daytime(see Figure 1) and evening (see Figure 3) ionosphericconditions. Based on these data we can conclude the
following: First, there is a complete similarity between theNCp spectra at the stage of maximum emission intensity(t ’ 30–70 ms) and in the quasi-stationary state (t ’ 0.3–0.5 s). Second, the NCp spectra are broadened with increas-ing power, from DF ’ 1–2 kHz for ~Peff slightly above~Pth SSA ’ 2 MW ERP to DF ’ 8 kHz for ~Peff = 30 MWERP. The spectral width, DF, is defined here as the frequencydifference between D f � = 4 kHz and that value of D f � forwhich the SEE intensity is decreased by 10 dB if the spectralslope, determined in the frequency range D f � = 4–8 kHz,is extrapolated to lower frequencies. According to theexperimental data, the dependence DF(~Peff) can be wellrepresented by a power law with a power index of about0.6–0.8. Third, the dependence of the NCp intensity on thePW power is somewhat enhanced for both stages of the NCp
development when ~Peff � 20 MW. This can be seen inFigure 4b where the dependence of the NCp intensity onthe PW power is plotted at the two SEE frequency shiftsDf � = 13 and 20 kHz, in both the stage of maximumintensity at t ’ 10–50 ms (solid lines) and the NCp quasi-stationary state reached at the end of the 200 ms pumpingpulses (dashed lines). In the stage of the NCp maximum, theINCp(~Peff) dependence is rather weak for ~Peff � 15 MW ERPand is noticeably increased for larger PW powers. This effectis somewhat stronger for larger negative frequency shifts,being connected with the broadening of the NCp spectrum.
Figure 5. (a) Oscillograms of the NCp intensity at the frequency shift Df� = 13 kHz, marked as NCp,and the PW sky signal strength, marked as PW. (b) Oscillograms of the emission at Df� = 13 kHz,obtained for different pumping modes: 15 ms on, 985 ms off; 30 ms on, 970 ms off; 100 ms on, 4900 msoff; and 200 ms on, 9800 ms off, showing the emission evolution after the PW switch-off in differentstages of pumping. For the data presented in Figure 5b, an averaging of the SEE intensity over 40–100 pulse data sets with subsequent subtraction of the background noise has been done in the dataprocessing. The measurements were performed on 31 March 1995, T = 1700–1720 LT, using PWradiation with pump frequency f0 = 4785 kHz and ERP power ~Peff = 70 MW.
A07304 FROLOV ET AL.: FEATURES OF THE PONDEROMOTIVE NARROW CONTINUUM
10 of 21
A07304
Contrary to the daytime conditions (see Figure 1), themeasurements performed in the evening have shown theabsence of any significant dependence of INCp(~Peff) inthe stationary state for ~Peff � 15 MW ERP. This is a ratherunexpected result which is most likely connected with theincrease in the short-time overshoot of the NCp intensity
with increasing PW power. The same explanation may alsobe applicable to the more pronounced maximum of the NCp
intensity for larger pump powers occurring in the initial stage(t ’ 10–50 ms) of pumping.
4.4. Pump Frequency Dependence
[32] Up to the present time we do not have a completecoverage of the dependence of the NCp intensity on pumpfrequency for the whole frequency range (4.3–9.5 MHz) ofthe Sura heating facility. Here we can only point to anexperiment by Erukhimov et al. [1987b], in which featuresof the NCp were studied at the pump frequencies f0 ’ 4.0,5.0, and 6.0 MHz with pump powers (Peff � 7 MW ERP)only slightly above the PDI threshold. In these measure-ments it has been found that the dependence INCp( f0) isapproximately INCp / f0
�b, with b ’ 2–3. This pumpfrequency dependence is in agreement with the dependenceof the PDI threshold on f0, thereby presenting one moreproof of the close relationship between the NCp generationand the PDI development.
4.5. Decay Features
[33] The first studies of the SEE relaxation characteristicsfor the NCp were performed at the Sura facility in 1990–1991 [Sergeev et al., 1994]. They showed that after PWswitch-off in the plasma the emission intensity decreasesexponentially with a typical e-folding decay time td ’ 1–5 ms, depending on many factors. With the progress in ourknowledge of the NCp features a demand arose for studyingin greater detail the characteristics of the emission relaxationat all stages of the NCp development. Such measurementswere begun in the June 1994 heating campaign and havebeen repeated many times in later experiments.[34] Figure 6 shows the NCp intensity versus time at four
frequency shifts, D f � = 8, 11, 18, and 22 kHz, obtained inmeasurements on 3 April 1995 under evening conditionswhen the PW was radiated at f0 = 4785.6 kHz with ~Peff ’75 MW ERP in the mode [+15 ms; �985 ms]. It is seenthat after PW switch-off in the plasma (t = 15 ms) theemission intensity decreases exponentially, with typicale-folding decay times of td ’ 0.8–1.0 and 1.8–2.0 ms,pertaining to the frequency ranges Df � ’ 8–11 and 18–22 kHz, respectively. We see that the NCp relaxation timeincreases with increasing Df�. The existence of such atd(Df
�) dependence has been confirmed later in manyother measurements.
Figure 6. Examples of the NCp temporal evolution at thefour frequency shifts Df � = 8, 11, 18, and 22 kHz. Sharpperiodic peaks after the PW switch-on/switch-off are theresponse of the receiver to abrupt changes in the signalstrength due to interference between the ground wave andmultiple hops of the ionospherically reflected PW skysignal. An averaging of the SEE intensity over 75 pulse datasets with subsequent subtraction of the background noisehas been done here in the data processing. The measure-ments were performed on 3 April 1995, T = 1830–1900 LT,using PW radiation with pump frequency f0 = 4785, 6 kHzand ERP power ~Peff = 75 MW in the pumping mode 15 mson, 985 ms off.
A07304 FROLOV ET AL.: FEATURES OF THE PONDEROMOTIVE NARROW CONTINUUM
11 of 21
A07304
[35] The dependence of the NCp relaxation features on thepulse length, i.e., on different stages of the NCp development,is demonstrated in Figure 5b, displaying the temporal de-crease of the emission intensity at Df � = 13 kHz after PWswitch-off for the pumping modes [+15 ms; �985 ms],[+30 ms; �970 ms], [+100 ms; �4900 ms], and [+200 ms;�9800 ms]. From these data we can conclude that thesmallest decay time, td ’ 0.7 ms, occurs after 30 ms ofpumping, corresponding to the minimum in the NCp intensityafter the short-time overshoot (see Figure 5a). Conversely,the largest decay time, td ’ 2.2 ms, occurs here when thePW pulse duration is 100 ms, which is close to the secondtemporal maximum of the NCp emission intensity.[36] In measurements performed in June 1994 (see
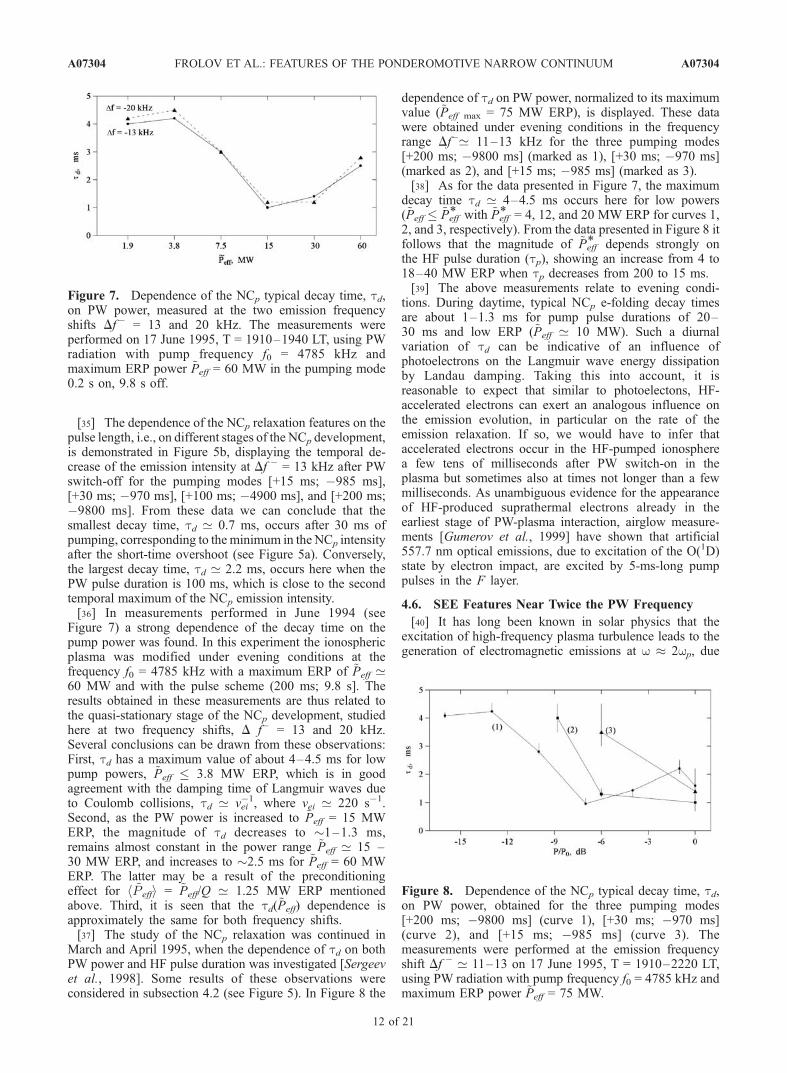
Figure 7) a strong dependence of the decay time on thepump power was found. In this experiment the ionosphericplasma was modified under evening conditions at thefrequency f0 = 4785 kHz with a maximum ERP of ~Peff ’60 MW and with the pulse scheme (200 ms; 9.8 s]. Theresults obtained in these measurements are thus related tothe quasi-stationary stage of the NCp development, studiedhere at two frequency shifts, D f� = 13 and 20 kHz.Several conclusions can be drawn from these observations:First, td has a maximum value of about 4–4.5 ms for lowpump powers, ~Peff � 3.8 MW ERP, which is in goodagreement with the damping time of Langmuir waves dueto Coulomb collisions, td ’ vei
�1, where vei ’ 220 s�1.Second, as the PW power is increased to ~Peff = 15 MWERP, the magnitude of td decreases to �1–1.3 ms,remains almost constant in the power range ~Peff ’ 15 –30 MW ERP, and increases to �2.5 ms for ~Peff = 60 MWERP. The latter may be a result of the preconditioningeffect for h ~P effi = ~Peff/Q ’ 1.25 MW ERP mentionedabove. Third, it is seen that the td(~Peff) dependence isapproximately the same for both frequency shifts.[37] The study of the NCp relaxation was continued in
March and April 1995, when the dependence of td on bothPW power and HF pulse duration was investigated [Sergeevet al., 1998]. Some results of these observations wereconsidered in subsection 4.2 (see Figure 5). In Figure 8 the
dependence of td on PW power, normalized to its maximumvalue (~Peff max = 75 MW ERP), is displayed. These datawere obtained under evening conditions in the frequencyrange Df�’ 11–13 kHz for the three pumping modes[+200 ms; �9800 ms] (marked as 1), [+30 ms; �970 ms](marked as 2), and [+15 ms; �985 ms] (marked as 3).[38] As for the data presented in Figure 7, the maximum
decay time td ’ 4–4.5 ms occurs here for low powers(~Peff � ~Peff
* with ~Peff* = 4, 12, and 20 MW ERP for curves 1,
2, and 3, respectively). From the data presented in Figure 8 itfollows that the magnitude of ~Peff
* depends strongly onthe HF pulse duration (tp), showing an increase from 4 to18–40 MW ERP when tp decreases from 200 to 15 ms.[39] The above measurements relate to evening condi-
tions. During daytime, typical NCp e-folding decay timesare about 1–1.3 ms for pump pulse durations of 20–30 ms and low ERP (~Peff ’ 10 MW). Such a diurnalvariation of td can be indicative of an influence ofphotoelectrons on the Langmuir wave energy dissipationby Landau damping. Taking this into account, it isreasonable to expect that similar to photoelectons, HF-accelerated electrons can exert an analogous influence onthe emission evolution, in particular on the rate of theemission relaxation. If so, we would have to infer thataccelerated electrons occur in the HF-pumped ionospherea few tens of milliseconds after PW switch-on in theplasma but sometimes also at times not longer than a fewmilliseconds. As unambiguous evidence for the appearanceof HF-produced suprathermal electrons already in theearliest stage of PW-plasma interaction, airglow measure-ments [Gumerov et al., 1999] have shown that artificial557.7 nm optical emissions, due to excitation of the O(1D)state by electron impact, are excited by 5-ms-long pumppulses in the F layer.
4.6. SEE Features Near Twice the PW Frequency
[40] It has long been known in solar physics that theexcitation of high-frequency plasma turbulence leads to thegeneration of electromagnetic emissions at w � 2wp, due
Figure 7. Dependence of the NCp typical decay time, td,on PW power, measured at the two emission frequencyshifts Df� = 13 and 20 kHz. The measurements wereperformed on 17 June 1995, T = 1910–1940 LT, using PWradiation with pump frequency f0 = 4785 kHz andmaximum ERP power ~Peff = 60 MW in the pumping mode0.2 s on, 9.8 s off.
Figure 8. Dependence of the NCp typical decay time, td,on PW power, obtained for the three pumping modes[+200 ms; �9800 ms] (curve 1), [+30 ms; �970 ms](curve 2), and [+15 ms; �985 ms] (curve 3). Themeasurements were performed at the emission frequencyshift Df � ’ 11–13 on 17 June 1995, T = 1910–2220 LT,using PW radiation with pump frequency f0 = 4785 kHz andmaximum ERP power ~Peff = 75 MW.
A07304 FROLOV ET AL.: FEATURES OF THE PONDEROMOTIVE NARROW CONTINUUM
12 of 21
A07304
to the coalescence of plasma waves [Zheleznyakov, 1995].This type of processes was studied in experiments per-formed in April 1984 at the Zimenki heating facility(Nizhny Novgorod, former Gorky) [Karashtin et al.,1986]. A brief description of these measurements will begiven because they are relevant to the NCp feature.[41] In the experiments an O-mode pump with f0 =
5750 kHz and ~Peff ’ 15 MW ERP was used. SEE signalsat f ’ 2f0 = 11500 kHz were received using a horizontalphased antenna array with linear polarization and with again of G ’ 30. In order to be able to detect signals atsmall (up to jDf j ’ 1 kHz) frequency shifts around thePW frequency, HF receivers with a frequency band ofdf ’ 300 Hz were used. Besides, to minimize theinfluence of the PW and of other powerful radio stations,a LC narrow-band pass filter with 2Df ’ 100 kHz wasused, tuned to 2f0 = 11500 kHz. To ensure truly ‘‘cold’’start conditions, the ionosphere was modified every 2 minin the mode [+1 s; �4 s] during the first minute andswitch-off during the second. The key findings were thefollowing:[42] 1. The emission near twice the PW frequency is
strongly variable and is generated only by O-mode pumpingwhen the SSA is observed for the PW.[43] 2. The emission has a maximum intensity at early
times (�100 ms) following the PW switch-on in the plasma.At longer times its intensity is decreased during the pump-ing. This is a result of the fast anomalous absorption.Continued heating in the mode [+1 s; �4 s] leads to asuppression of the emission generation in the form of adecrease of the emission intensity from pulse to pulse. Thiscorresponds fully to the behavior of the SSA [Erukhimov etal., 1982].[44] 3. The relaxation time following the PW switch-off is
about 6 ms, corresponding to a typical collisional dampingtime of HF plasma waves.[45] 4. A maximum spectral emission power of S ’
10�20 mW�2Hz�1 is observed at f�2f0 ’ �2 kHz. Forlarger frequency shifts the slope of the emission spectrum isabout 1 dB/kHz.[46] 5. In the upper sideband of 2f0 no emission
is detected, and thus its intensity does not exceed10�21 mW�2Hz�1.[47] The experimental data, as well as theoretical consid-
erations [Karashtin et al., 1986], allow to conclude that theemissions near twice the PW frequency are caused by thecoalescence of Langmuir waves, HF-induced by the PDI.From the emission intensity, the power density of theLangmuir waves, W, can be evaluated as W/NeTe ’ 10�2,which is in good agreement with theoretical estimates.Because Langmuir waves produce both the NCp and thisemission, studies of the two features can supplement eachother.[48] It should be pointed out that emission near
twice the PW frequency has recently been observed byBlagoveshchenskaya and Kornienko [1998] in experimentswith the Troms heating facility and a receiver placed nearSt. Petersburg. In these measurements, the maximum ofthe spectral intensity was downshifted by 16–20 kHz,which is about twice the DM frequency shift. With thegiven experimental geometry, upper-hybrid waves can beconsidered as main candidates for the generation of this
emission, as opposed to Langmuir waves in the case ofthe NCp.
4.7. NCp Gyroharmonic Features
[49] The first measurements focusing on the investigationof possible variations of NCp characteristics when the PWfrequency is close to a gyroharmonic frequency, f0 ’ nfce(n is the harmonic mode number), were performed on26 September 1998, T = 1450–1610 LT. In these measure-ments fce ’ 1.3–1.35 MHz, depending on the PW reflectionheight, href ’ 200–300 km. Modification of the ionospherewith ~Peff ’ 100 MW ERP was conducted at the three pumpfrequencies 6808, 6778, and 6728 kHz. The first is about40–50 kHz higher than 5fce, the second is close to 5fce,and the third is about 10–30 kHz below 5fce. To studythe NCp gyrofeatures at different stages of the emissiondevelopment, transmissions with the pulse lengths 10, 20,50, 100, and 200 ms and with a 2 s interpulse period weresequentially used in the experiments. Notice that accordingto the experimental data obtained, the time of the NCp
culmination and of the establishment of its quasi-stationarystate was, respectively, about 5–8 ms and 20 ms after PWswitch-on in the plasma.[50] The following conclusions can be derived from these
experiments:[51] 1. The SSA features do not show any peculiarities for
pump frequencies close to the fifth cyclotron harmonic.[52] 2. Likewise, no modification of the NCp features has
been found for times prior to the short-time overshoot.[53] 3. In the quasi-stationary stage of the NCp develop-
ment (for tp � 20 ms), a decrease has been observed of thetypical decay time from td ’ 0.7–0.9 ms when f0 > 5fce to’0.5 ms when f0 � 5fce, together with a narrowing of theNCp spectrum from DF ’ 10 to about 6 kHz. This con-clusion is related to the frequency range Df � ’ 10–18 kHz.[54] Further experiments, in more detail and for other
gyroharmonics, are required and will be performed in thefuture.
4.8. Some Remarks on a SEE Component Observedat Small Positive Frequency Shifts
[55] Completing the analysis of the NCp features, we willbriefly present some characteristics of another emissioncomponent, denoted NC+, which is observed at small pos-itive frequency shifts, D f + � 20–30 kHz (see Figure 1).The first observations made by Boiko et al. [1985] haveshown (1) that its temporal evolution follows the evolutionof the NCp, (2) that it is mainly detected before thedevelopment of the anomalous absorption, and (3) that theNC+ intensity is 10–20 dB lower than the emission intensityat the mirror frequency Df �. According to Frolov [1995], theNC+ and NCp intensities have approximately the samedependence on PW power. However, the variations of theNC+ intensity from cycle to cycle of pumping are strongerthan for the NCp for which strong intensity variations areobserved at low PW powers only. There is reason to assumethat the NC+, like the NCp, is produced by excitation of thePDI. However, this emission component has not beenstudied yet in detail, and new experiments are needed towork out an empirical model.[56] It should be noted that the weak lobe structure in
the frequency range +(20–40) kHz in the SEE spectra
A07304 FROLOV ET AL.: FEATURES OF THE PONDEROMOTIVE NARROW CONTINUUM
13 of 21
A07304
presented in Figures 1a–1e is usually related to transmitternoise of the Sura facility and has to be considered with greatcaution. Special test measurements are always needed toclarify its real nature.
5. SEE Evolution Under the Influence ofAdditional Heating
5.1. Additional O-Mode Heating
[57] In this subsection we present results obtained inmodification experiments with two powerful O-modewaves. One of them is the pump wave (PW), serving asadditional heating and causing artificial ionospheric pertur-bations. Its influence on plasma processes and wave-plasmainteractions is monitored through variations in the turbu-lence characteristics induced by the second wave (DW),which has a diagnostic function. The DW has a compara-tively low power to induce an unsaturated turbulence level,thereby being able to respond to the PW-created perturba-tions. In the measurements performed on 25 April 1991 (t =1507–1619 LT) [Sergeev et al., 1998], results of whichare shown in Figures 9 and 10, the PW was radiated during30 s (t = 0–30 s in Figure 9) in a quasi-continuous mode[+180 ms; �20 ms] at f0 = 5752 kHz with ~Peff ’ 40 MWERP. Thereafter the radiation schedule was changed over toa diagnostic mode [+20 ms; �980 ms] for the remaining150 s of the 3-min heating cycle (t = 30–180 s in Figure 9).The DW was radiated during all heating cycles in thediagnostic mode [+20 ms; �980 ms] at fDW = 5456 kHzwith ~Peff ’ 10 MW ERP. The difference between f0 andfDW was chosen at about 300 kHz so that the resonanceregions for the PW and DW would not overlap each other.Very stable ionospheric conditions during the experimentallowed to overlay and average the data from 23 consecu-tive pumping cycles (69 min of observations) to produce thefinal results represented in Figures 9 and 10.[58] Figure 9a demonstrates the temporal behavior of the
ionospherically reflected PW signal (marked here as PW),the intensity of which has been measured during the firsttwo milliseconds for each of the 180-ms pulses in the quasi-continuous mode or for each of the 20-ms pulses in thediagnostic sounding mode. Also shown in Figure 9a is theabsorption index kp defined in subsection 4.2. It can beclearly seen that once the quasi-continuous pumping isswitched on, at first the fast stage of the anomalousabsorption and, a few seconds later, its slow stage isdeveloped. The total decrease in the PW intensity amountsto about 17 dB. Together with the anomalous absorptiondevelopment, a significant suppression of the SSA occurs,which is reflected in a decrease in the kp value. Thesephenomena are closely related to the generation of striationsat the upper hybrid resonance level due to the TPI, resultingin a large decrease in the PWamplitude and a suppression ofthe PDI. After the PW switch-off, together with the decay ofthe striations, both the intensity of the reflected PW signaland kp are restored to their unperturbed values within about10–15 s.[59] The SEE evolution at a frequency 11 kHz down-
shifted from the PW frequency f0 = 5752 kHz and at afrequency 12 kHz downshifted from the DW frequencyfDW = 5456 kHz is presented in Figures 9b and 9c,respectively. In the stage of diagnostic sounding during
about 1.5 min before the quasi-continuous PW is switchedon, the generation of the NCp is observed for both PW andDW pulse pumping (t ’ 90–180 s in the figure). To recordthis short pulse emission in a continuous signal form andexclude the influence of signal jumps connected with theinterference of the ground wave and multiple reflections ofthe powerful wave from the ionosphere, we used a peakdetector which determines the signal strength in a timeinterval of a few milliseconds just before the end of thepump pulse, keeping the signal level constant within theinterpulse period (for more details of the diagnostic SEE,DSEE, scheme of measurements, see Erukhimov et al.[1988] and Frolov et al. [1994]). Once the quasi-continuouspumping has been switched on at t = 0, the NCp is rapidlysuppressed, and the growth of emission components ofthermal origin (DM at Df � = 11 and 12 kHz in our case)is beginning to be observed. This emission evolution showsup more clearly for the DW (Figure 9c), where the delay inthe development of the thermal stage has a much longertime compared with SEE components near the PW. This isthe result of a finite time for the spread of the HF-inducedturbulence along the geomagnetic field. Besides, due to thesmall average DW power, a longer time (of about 30 s here)is needed for the DM to reach its steady state. Afterswitching to the diagnostic mode at t = 30 s, the averagePW power decreases abruptly and, as a result, quenching ofthe TPI occurs. Under these conditions, the DSEE behaviorrepresents, first of all, the evolution of the HF-inducedstriations in the disturbed volume [Erukhimov et al., 1988;Frolov et al., 1994; Grach et al., 1998]. During the firstphase after the PW switch-off, of about 1 s duration, theDSEE intensity increases and reaches its culmination. Herethe growth of the DSEE intensity is a result of the decay ofmeter-scale striations, which are responsible for the fastanomalous absorption of the PW, as well as for theabsorption of the emissions in the disturbed volume. In thisphase the intensity of the ionospherically reflected PWwave increases abruptly. During the second phase of afew seconds duration, the DSEE intensity, after its culmi-nation, decreases to a minimum at t ’ 40–45 s, concur-rently with a restoration of the intensity of the reflectedsignal back to its unperturbed value. Here the decrease ofthe DSEE intensity is determined by the decay of dekame-ter-scale striations, which on the one hand are responsiblefor the slow stage of the anomalous absorption developmentfor the PW, and on the other hand sustain the DSEEgeneration. Notice that during the second phase the magni-tude of the PW striction self-action, kp, is also restoredalmost completely. A distinct feature of the DSEE behavioris the longer time, approximately 1 min for the restoration ofthe NCp intensity after the end of the quasi-continuouspumping, compared with the time of the anomalous absorp-tion relaxation and the SSA recovery. Such a long-timeaftereffect is a typical SEE feature which was often ob-served in earlier experiments [Boiko et al., 1985; Frolov,1995; Wagner et al., 1999], but its physical nature isunknown yet. The value of about 1 min for the decay timeof the aftereffect suggests that large-scale artificial irregu-larities with scale lengths l? ’ 500–2000 m could play arole. These can exert a strong influence on wave-plasmainteractions [Duncan and Behnke, 1978; Morales et al.,1982; Frolov, 1995]. However, other experimental facts
A07304 FROLOV ET AL.: FEATURES OF THE PONDEROMOTIVE NARROW CONTINUUM
14 of 21
A07304
(see, for example, the data presented in the followingsubsection 5.2) indicate that other factors have to beconsidered, too. A clarification of the physical nature of thelong-time aftereffect requires further specially designedexperiments.[60] In order to study in detail the variations in the SEE
evolution within the different phases of the heating cycle,as presented in Figure 9, we display in Figure 10 plots ofthe DSEE intensities at Df� = 12 kHz, induced by thepulse diagnostic wave at the frequency fDW = 5456 kHz.
To obtain smoothed curves, data from several consequentDW pulses for the respective time intervals have beenoverlaid and averaged. The magnitudes of the e-foldingdecay time td, derived from these data, are presented inFigure 9c. The analogous procedure performed for theemissions at the frequency shift Df � = 11 kHz from thePW frequency leads to the td values shown in Figure 9b.On the basis of these data it is found that the relaxation ofthe NCp in steady state (t = 120–180 s) as well as for thestationary DM (t = 15–30 s) proceeds in one step, with
Figure 9. (a) Temporal evolution of the ionospherically reflected PW signal at the PW frequency5752 kHz, ~Peff = 40 MW ERP (marked as PW), measured during the first two milliseconds of each180-ms pulse in the stage of quasi-continuous pumping (t = 0–30 s) or for each 20-ms pulse during thediagnostic sounding mode (t = 30–180 s), and variations of the absorbed PW energy through thepumping cycle due to the striction self-action (SSA) effect (marked as kp). (b) SEE evolution atthe frequency shift Df � = 11, downshifted from the PW frequency f0 = 5752 kHz, marked as DM, in thestage of the quasi-continuous pumping (t = 0–30 s), and as NCp during the diagnostic sounding mode.(c) SEE evolution at the frequency shift Df � = 12, downshifted from the DW frequency f0 = 5456 kHz(the ERP for the DW was here ~Peff = 10 MW), marked as DM in the stage of the quasi-continuouspumping (t = 0–30 s), and as NCp during the diagnostic sounding mode. The solid lines in Figures 9band 9c (marked as td) show the magnitudes of the emission decay times for two relaxation stages throughthe pumping cycle. The measurements were performed on 25 April 1991, T = 1500–1620 LT.
A07304 FROLOV ET AL.: FEATURES OF THE PONDEROMOTIVE NARROW CONTINUUM
15 of 21
A07304
the decay time td = t1 ’ 0.8–0.9 ms. Under conditions ofstrong variations in the DM and NCp intensities (t = 4–12 s and 30–100 s), the relaxation occurs as a two-stageprocess, containing both a fast stage with td ’ t1 and aslower stage with td = t2 ’ 2.8 ms, with the exception ofthe phase of minimum DSEE intensity (t = 40–50 s)where the fast stage is absent and the relaxation proceedsin one step with td = t2. In the phase of NCp growth (t =
50–120 s), a gradual transition from the slower relaxationstage with td = t2 to the fast stage with td = t1, via a twostage relaxation process, is observed, with a progressivelyincreasing contribution of the fast stage.[61] The following conclusions can be drawn from this
experiment: (1) When either Langmuir or upper hybridturbulence is saturated, as manifest in the attainment ofthe steady-state NCp or DM level, approximately equal
Figure 10. Examples of the SEE evolution at the frequency shift Df � = 12 kHz, downshifted from theDW frequency fDW = 5456 kHz, obtained in different stages of PW radiation. The measurements wereperformed on 25 April, T = 1500–1620 LT (see Figure 9).
A07304 FROLOV ET AL.: FEATURES OF THE PONDEROMOTIVE NARROW CONTINUUM
16 of 21
A07304
maximum damping rates of these plasma waves with g =t1�1 ’ 1000 s�1 are observed. (2) In contrast, the minimum
damping rates with g = t2�1’ 330 s�1 occur in the SEE
intensity minimum when the DM is already decreasedbut the NCp is only beginning to develop. This clearlydemonstrates once again, as for the measurements ofthe td(Peff)-dependence discussed in subsection 4.5 (seeFigures 7 and 8), the strong influence of the AIT level onthe relaxation process. Another feature worthy of beingnoted is the simultaneous occurrence of the two-stagerelaxation feature and the NCp restoration. The latter has alonger time constant than the SSA (see Figure 9). Thisdemonstrates unambiguously that small-scale striationsmust not be involved, at least not as a crucial element, inthe explanation of both the two-stage emission relaxationand the longer time restoration of the NCp. It is likely thatlonger-living aftereffects have to be taken into considerationhere. The question of why the emission relaxation has twoprominent stages with two well-defined decay times but nostage with the decay rate gradually changing jointly with theAIT relaxation and thermalization of the superthermalelectrons still remains to be answered, representing a keyproblem left to be solved for a better understanding the ofAIT features.
5.2. Additional Heating by a Powerful X-Mode Wave
[62] In the case of X-mode pumping the lack of resonantinteractions between the X-mode wave and the plasmasignificantly limits possible mechanisms of AIT generation.Among these, we can note plasma heating caused bycollisional absorption of PW energy and the generationof large-scale irregularities due to the the self-focusinginstability of an electromagnetic wave beam [Gurevich,1978].[63] However, recent experiments carried out at the Sura
heating facility [Frolov et al., 1999b] have shown thatphenomena induced in the ionosphere modified by powerfulX-mode waves are not confined to these effects but are ofa more complicated nature. In these experiments onetransmitter radiated an O-mode wave to induce the SEEwhich was used as a diagnostic tool for AIT sounding. Theother two transmitters radiated an X-mode wave which wasused to create additional ionospheric perturbations whoseinfluence on the AIT was investigated through variations inSEE intensity and the temporal evolution of the emissions.[64] The basic findings can be summarized as follows:[65] The switch-on of the additional X-heating leads to a
decrease in the O-wave-induced HF turbulence level ofboth ponderomotive and thermal origin in the form of asuppression of the NCp and DM generation.[66] The SEE suppression, which may be as large as
4 dB, is most pronounced when the reflection altitudes ofthe O-mode and X-mode waves coincide. Test measure-ments have shown that such a suppression is neither causedby additional absorption of O-mode energy in the lowerionosphere nor by remnant O-mode radiation. Further, itcannot be caused by the wave defocusing at the artificialionospheric lens. The influence of the additional X-waveheating is limited to relatively high PWX powers, PX �20 MW ERP. The typical time constant for X-heating-induced effects on the NCp is about 1–2 s. The durationof the X-heating aftereffect on the SEE features may be as
much as 30–60 s. It is unlikely that the aftereffect isdetermined by HF-induced large-scale irregularities becauseof their small magnitudes under conditions of short-timepumping.[67] Summing up the above listed properties of the
additional X-mode heating, we may conclude with certaintythat the X-mode wave effect manifests itself as a plasmamodification in the vicinity of the PWX reflection level.However, any conclusive explanation of the phenomenaobserved is still lacking, and further detailed experimentswill be necessary.
6. Empirical Model of the NCp
[68] From the experimental results presented in this paper,we can formulate the following empirical model for theNCp.[69] 1. The generation of the NCp occurs in the plasma
resonance layer near the PW reflection altitude due to thePDI. A significant enhancement of the NCp generation isobserved when the pump power is above about ~Peff ’ 10–15 MW ERP. The merging of Langmuir waves, responsiblefor the NCp generation, causes emissions near twice thePW frequency. The latter gives an opportunity to evaluatethe power density of the HF induced Langmuir waves asW/NT ’ 10�2 at ~Peff ’ 15 MW ERP, which is in goodagreement with theoretical estimates. Excitation of the TPIand of small-scale striations of thermal origin leads to asuppression of the NCp as a result of anomalous absorp-tion of HF energy a few km below the PW reflectionheight.[70] 2. After the PW switch-on in the plasma and the
development of the striction self action a few millisecondslater, the NCp intensity increases rapidly, having a maxi-mum in the time interval 2–20 ms, depending strongly onthe pump power and on the ionospheric conditions: A fasterdevelopment of the NCp is observed in the nighttimeionosphere at higher pump powers. One of the propertiesof the NCp is an intensity drop, after attaining its maximum,to a lower quasi-steady-state level within a few tens ofmilliseconds after the PW switch-on, when the TPI is notobserved yet. This is considered as an indication that thegeneration of small-scale striations, causing anomalousabsorption, has set in. Consequently, this short-time over-shoot reflects directly the evolution of HF-induced Lang-muir waves in the resonance region. Notice that theovershoot value increases with growing PW power and islarger for smaller frequency shifts Df �.[71] 3. In the initial stage of the NCp development its
maximum spectral intensity at Df � ’ 4 kHz for ~Peff �30 MW ERP is more than 10 dB higher than the maximumspectral intensity of the DM, which is the most prominentemission component in the stationary SEE spectrum. In thequasi-steady state of the NCp development its spectrumoften has a nearly exponential form with a constant slope ofabout 1 dB/kHz in the frequency shift range Df � � 20–30 kHz, with a smaller slope for larger Df �. A strongerdependence of the NCp intensity on Df � (�3 dB/kHz) isobserved in the stage of maximum intensity after about 5–50 ms of pumping. The spectral width of the NCp increaseswith growing PW power. It should be noted that for pumppowers slightly above the threshold power for the NCp
A07304 FROLOV ET AL.: FEATURES OF THE PONDEROMOTIVE NARROW CONTINUUM
17 of 21
A07304
generation (Pthr ’ 2 MW ERP at f0 ’ 5–6 MHz) the NCp
spectral intensity decreases strongly with increasing PWfrequency f0.[72] 4. The magnitude of the e-folding decay time, td, for
the NCp varies over a wide range from �0.7 ms to 4–5 ms,depending on PW power, frequency shift, pumping scheme,stage, and level of the AIT development, and showingstrong diurnal variations. The maximum value, td ’ 5 ms,which is in good agreement with the damping time ofLangmuir waves by Coulomb collisions, is observed undernighttime conditions when a rather low power, ~Peff �10 MW ERP, is used for the pumping. On the basis of theexperimental data obtained, it is reasonable to expect thatboth photo and HF-accelerated electrons are the reason forthe more rapid decay of the Langmuir waves by collision-less Landau damping. The relaxation process also shows astrong dependence on the phase of the AIT evolution, whenshorter (longer) decay times occur at times of smaller(larger) NCp intensity. An explanation of this phenomenonis still lacking.[73] 5. Experiments performed near the fifth electron
cyclotron harmonic have shown that the plasma wavesinvolved in the NCp generation do not possess anysignificant gyro features (with the possible exception ofthe quasi-stationary stage in which some decrease of thedecay time has been found when f0 ’ 5fce), in distinctionto the thermal SEE components, DM and BC, which showa crucial dependence of their properties on the PWfrequency when the latter is close to a gyroharmonicfrequency [Leyser et al., 1993, 1994; Sergeev et al.,1997; Stubbe et al., 1994; Frolov et al., 2001]. This resultcan be considered as additional evidence that the NCp isgenerated slightly below the PW reflection level whereLangmuir waves propagate almost along geomagneticfield lines and thus do not depend strongly on thegeomagnetic field.[74] 6. The restoration of the NCp intensity after long-
time pumping has a typical time of about 1 min, whichis longer than the time of the anomalous absorptionrelaxation and the recovery of the striction self actionfor the PW. These measurements, as well as experimentswith X-mode additional heating, have unambiguously dem-onstrated that the small-scale striations are not the onlyreason for the suppression of the NCp. Similarly, thisaftereffect cannot be fully related to large-scale irregularitieseither. Taken together, these experiments have shown thatmore than one agent has to be invoked in the explanation ofthe aftereffect. It appears to us that further measurementsemploying the additional heating scheme are most promisingfor obtaining clues on the physical nature of the phenomenaobserved.[75] According to Stubbe et al. [1984], the generation of
the continuum (NCp and NC+ in our case) may be inter-preted in terms of the strongest products of the PDI throughthe following processes:[76] 1. Scattering of the monochromatic electromagnetic
O-mode pump wave (symbolically written as EM) intoprimary Langmuir waves (symbolically written as L0) fromion-acoustic waves (symbolically written as IA) due to theelectromagnetic PDI, schematically written as
EM f0ð Þ �! L0 f0 � fiað Þ þ IA fiað Þ: ð1Þ
[77] 2. Decay of the primary Langmuir waves into sec-ondary Langmuir waves through the cascading process inan electrostatic PDI which is responsible for the formationof the Langmuir turbulence spectrum
L0 f0 � fiað Þ �! L1 f0 � fia � 2fiað Þ þ IA 2fiað Þ; ð2Þ
and further
Lm f0 � fia � 2mfiað Þ �! Lmþ1 f0 � fia � 2 mþ 1ð Þfiað Þ þ IA 2fiað Þ:ð3Þ
[78] 3. Reconversion of the secondary Langmuir wavesinto electromagnetic waves (SEE) escaping the disturbedvolume
L fð Þ þ IA fiað Þ �! EM f � fiað Þ: ð4Þ
[79] As shown by Stubbe et al. [1984], this generationscheme for the continuum explains the appearance of twoemission components. The first component is symmetricalaround f0 in a frequency band of a few kHz, and itsupshifted part can be related to the NC+. The secondcomponent only contributes to the downshifted portion ofthe SEE spectrum and has a frequency band of a few tens ofkHz, depending essentially on pump power and ionosphericconditions. This emission component can be related to theNCp. A quantitative analysis of the NCp generation hasnot been performed yet, and a comparison between theexperimental results presented in the paper and theoreticalstudies can therefore not be made directly.
7. Closing Remarks
[80] The temporal development of the ponderomotivepart of the narrow continuum (NCp) spectrum, as well asthe dependence of the NCp properties on pump power,pump frequency, pump pulse duration, and ionosphericconditions, has been studied using the Sura heating facilitylocated near Nizhny Novgorod, Russia. Features of the NCp
were investigated also for different additional heatingschemes using both O-mode and X-mode pumping.[81] The experiments performed have demonstrated once
again the physical richness of the SEE technique as a toolfor studying plasma turbulence in general and Langmuirturbulence in particular. The latter was previously investi-gated only by means of the incoherent scatter radar (ISR)technique in measurements of the HF-enhanced plasma line(HFPL) (see, for example, Sulzer and Fejer [1994], Ishamet al. [1996], Stubbe and Hagfors [1997], and numerousreferences given therein), as well as recent observationspublished by Isham et al. [1999], Rietveld et al. [2000], andCheung et al. [2001]. Considering the results obtained inSEE and ISR measurements, one must realize that thesemethods are distinctly different and thereby supplementary.The SEE technique provides an integrated picture of thephysical phenomena in the sense that all secondary electro-magnetic emissions from a wide spatial range, and hencefrom a wide plasma wave vector spectrum, contribute to theemission intensity observed at a given frequency. This is incontrast to the ISR technique by means of which Langmuir
A07304 FROLOV ET AL.: FEATURES OF THE PONDEROMOTIVE NARROW CONTINUUM
18 of 21
A07304
waves satisfying simultaneously the Bragg scatter conditionand the Langmuir dispersion relation in the ambient plasmacan be detected only. In monostatic operation these waveshave the wave vector jkj = 2w/c (i.e., twice the wavenumber of the ISR, where w is the radar frequency) andare either parallel or antiparallel to the radar line of sight.It should be mentioned that recent developments in theISR technique have made available measurements with ahigh-altitude discrimination of about of 150 m and a timeresolution of about of 0.5 ms [e.g., Sulzer and Fejer, 1994;Cheung et al., 2001]. One of the important advantages of theSEE technique is that the SEE equipment is comparativelysimple and can be easily implemented at any ionosphericmodification facility. Another advantage is the usefulness ofthe SEE technique for the study of upper hybrid turbulenceexcited by the TPI [Sergeev et al., 1998] and of striations[Boiko et al., 1985; Leyser et al., 1993, 1994; Frolov et al.,1994, 1997c; Sergeev et al., 1999] which are not accessibleto the available ISRs. Furthermore, the SEE measurementsusually have a higher time resolution (�0.3 ms), which is ofconsiderable importance in defining the decay features ofthe high-frequency plasma turbulence.[82] The first comparative experimental study of SEE and
HFPL has been performed by Thide et al. [1995] in Areciboby modification of the ionosphere at f0 = 3.1745 MHz.These experiments have demonstrated that in the earlierstage of pumping, during a few tens of milliseconds, the twosets of spectra possess strong similarities, having the sametotal width and exhibiting a similar overshoot. The NCp
spectra discussed here are very close in form to the SEEspectra obtained in Arecibo, demonstrating the universalnature of the NC generation process, consisting of waveplasma interactions leading to the development of the PDI.It should be mentioned that in our SEE spectral measure-ments, carried out with 3-ms temporal resolution, we havenot found any signs of strong parametric effects similar tothe SEE ‘‘strong type spectra’’ predicted and reported byCheung et al. [1997].[83] The SEE technique has opened wide opportunities to
study in detail the temporal evolution of high-frequencyplasma turbulence [Sergeev et al., 1997, 1998]. In thepresent paper it has been shown once again that the short-time overshoot (or miniovershoot introduced by Showenand Kim [1978] and studied later by Duncan and Sheerin[1985], Djuth et al. [1986], and Sulzer and Fejer [1994]) isfundamental to the evolution of HF-induced Langmuirwaves in the resonance region.[84] Theoretical aspects of the miniovershoot have been
investigated by Kuo et al. [1987], Muldrew [1988], and Kuoet al. [1990]. They have considered the influence ofanomalous damping due to electron scattering by theexcited plasma waves, evolution of Langmuir waves inmagnetic field-aligned ducts and the heating of the bulkplasma by HF-excited plasma waves. Nevertheless, thephysical nature of the miniovershoot is not completelyunderstood yet.[85] Another possible cause of the short-time overshoot is
the generation of small-scale striations during the stage ofthe ponderomotive instability development. In experimentsconducted by Boiko et al. [1990] and Frolov et al. [1997c] ithas been found that during the first 100–300 ms ofpumping the generation of meter-scale striations in the
vicinity of the PW reflection level is observed before thesubsequent development of the anomalous absorption dueto TPI growth. There are strong reasons to believe that thesestriations are of ponderomotive nature. We have denotedthis type of striations as ‘‘striction striations.’’ It is importantthat the striction striations can be excited by very short PWpulses of �10–50 ms duration only [Zyuzin et al., 1987]. Itshould be mentioned that the artificial field-aligned irregu-larities studied by Noble and Djuth [1990] very likely are ofponderomotive nature too.[86] Theoretical aspects of the generation of small-scale
striations in the initial stage of ionosphere pumping, beforethe thermal structuring of the plasma, are discussed in manypapers (see, for example, Perkins and Valeo [1974], Lee andFejer [1978], Rypdal and Cragin [1979], Vas’kov et al.[1981], Kuo et al. [1983], and Gurevich and Karashtin[1994]). It has been stated that these striations are generatedby a self-focusing mechanism of Langmuir waves andthat they might result in ducted Langmuir wave modesmodifying their saturated spectrum. It is well possible thatthe short-time overshoot in the NCp intensity (as well as inthe HFPL intensity) within 30–100 ms after PW switch-onis due to some properties of Langmuir waves trapped inthese striations. The striction striations may also greatlyinfluence the early time development of irregularities ofthermal origin by acting as ‘‘seed’’ irregularities, amplifyingthe growth of the TPI at the upper hybrid resonance leveland giving rise to the fast anomalous absorption as a resultof that [Frolov et al., 1997c]. They can also explain in anatural way the appearance of the ‘‘initial ducts’’ in theearly stage of PW-plasma interaction incorporated byMuldrew [1988, 1992] in his duct model.[87] At the present time it cannot be unambiguously
stated what kind of HF-induced perturbations mentionedabove plays a dominant role in the short-time overshoot. Itcannot be excluded also that several factors have to be takeninto account jointly for its explanation. Further theoreticaland experimental work is needed to gain an improvedunderstanding of this phenomenon.[88] An important advantage of the experiments consid-
ered in this paper is the detailed insight into the depen-dence of the NCp damping (or Langmuir turbulencedamping) on various factors and on the pump power firstof all. It has been found that only when the measurementsare conducted under nighttime conditions at rather lowpump powers, the decay of the NCp after PW switch-off isdetermined by Langmuir wave damping due to Coulombcollisions, whereas for ~Peff higher than a few megawatts aconsiderably faster relaxation of these waves is observed.We have reasons to assume that HF accelerated electronsplay an important role for such collisionless damping andthus the SEE measurements can be successfully employedfor the study of electron acceleration mechanisms in theHF-perturbed ionosphere. However, on the basis of thepresent SEE results it is difficult to decide on the nature ofthese superthermal electrons, bearing in mind that they canbe produced by either weak (wave determined) or strong(caviton determined) Langmuir turbulence. In order todecide this problem, simultaneous SEE and ISR measure-ments would be desirable in the future to provide a morecomplete diagnostic of the Langmuir turbulence HF-inducedin the ionospheric plasma.
A07304 FROLOV ET AL.: FEATURES OF THE PONDEROMOTIVE NARROW CONTINUUM
19 of 21
A07304
[89] It should be mentioned that some HFPL decay mea-surements have been carried out using the ISR technique.Based on experimental data obtained by Wong et al. [1983]and Sulzer and Fejer [1994], it may be concluded that plasmawaves of different origins decay with different damping rates.It is conceivable that in this way the results of our measure-ments with O-mode additional heating (see subsection 5.1)can be understood, when in the nonstationary stage afterlong-time pumping, i.e., in the stage of transition from thethermal to the ponderomotive nonlinearity, a two-stagerelaxation process is observed, depicting the simultaneousexistence of two types of high-frequency plasma turbulence.[90] Another interesting result of our measurements is the
exhibition of aftereffects in the SEE behavior. In thesemeasurements [see also Boiko et al., 1985; Frolov et al.,1999b; Wagner et al., 1999] it was found that typically usedapproaches, taking into account only electron temperatureenhancement and plasma density profile modification, aswell as small-scale and large-scale irregularities in theperturbed ionospheric volume, cannot adequately explainthe experimental data, and new mechanisms will have to beconsidered. At present, investigations in this field representa major point of interest in our work, and important newexperimental results pertaining to aftereffect features wererecently obtained. A detailed presentation of these resultswill be the subject of a separate publication.
[91] Acknowledgments. We gratefully acknowledge the technicalsupport from the staff of the SURA heating facility. We are very thankfulfor the financial support from the Max-Planck-Institut fur Aeronomie. Thiswork has been supported by INTAS grant 03-51-5583 and the grants fromthe Russian Basic Research Foundation 02-02-17475 and 04-02-17544.[92] Michel Blanc thanks the referees for their assistance in evaluating
this paper.
ReferencesAlber, Y. I., Z. N. Krotova, N. A. Mityakov, V. O. Rapoport, and V. Y.Trakhtengerts (1974), Stimulated scattering effects on incidence of anelectromagnetic pulse on a plasma layer, Zh. Eksp. Teor. Fiz., 66,574.
Armstrong, W. T., R. Massey, P. Argo, R. Carlos, D. Riggin, P. Y. Cheung,M. McCarrick, J. Stanley, and A. Y. Wong (1990), Continuous measure-ment of stimulated electromagnetic emission spectra from HF excitedionospheric turbulence, Radio Sci., 25, 1283–1289.
Belikovich, V. V., E. A. Benediktov, S. M. Grach, and G. I. Terina (1981),Double transformation of waves by scattering from artificial ionosphericirregurarities (in Russian), XIIIth All Soviet Union Conf. of RadiowaveProp. Abstracts, 1, 107.
Blagoveshchenskaya, N. F., and V. A. Kornienko (1998), Remote observa-tions of second harmonic stimulated emission in Tromsø heating experi-ment, paper presented at the Vth Suzdal URSI Symposium onthe Modification of the Ionosphere (ISSMI’98), Union Radio Sci. Int.,Suzdal, Russia.
Boiko, G. N., L. M. Erukhimov, V. A. Zyuzin, G. P. Komrakov, S. A.Metelev, N. A. Mityakov, V. A. Nikonov, V. A. Ryzhov, Y. V. Tokarev,and V. L. Frolov (1985), Dynamic characteristics of stimulated electro-magnetic emission from ionospheric plasma, Radiophys. QuantumElectron., 28, 259–268.
Boiko, G. N., L. M. Erukhimov, and V. L. Frolov (1990), Excitationof small-scale irregularities near the excitation wave reflection level,Geomagn. Aeron., 30, 843–846.
Cheung, P. Y., E. Mjølhus, D. F. DuBois, J. Pau, H. Zwi, and A. Y. Wong(1997), Stimulated radiation from strong Langmuir turbulence in iono-spheric modification, Phys. Rev. Lett., 79, 1273–1276.
Cheung, P. Y., M. P. Sulzer, D. F. DuBois, and D. A. Russell (2001), High-power high-frequency-induced Langmuir turbulence in the smoothionosphere at Arecibo. II. Low duty cycle, altitude-resolved, observa-tions, Phys. Plasmas, 8, 802–812.
Das, A. S., and J. A. Fejer (1979), Resonance instability of small-scalefield-aligned irregularities, J. Geophys. Res., 84, 6701–6704.
Djuth, F. T., C. A. Gonzales, and H. M. Ierkic (1986), Temporal evolutionnof the HF-enhanced plasma line in the Arecibo F region, J. Geophys.Res., 91, 12,089–12,107.
Duncan, L. M., and R. A. Behnke (1978), Observations of self-focusingelectromagnetic waves in the ionosphere, Phys. Rev. Lett., 41, 998–1001.
Duncan, L. M., and J. P. Sheerin (1985), High-resolution studies of the HFionospheric modification interaction region, J. Geophys. Res., 90,28,371–28,376.
Erukhimov, L. M., S. A. Metelev, N. A. Mityakov, and V. L. Frolov (1982),Experimental studies of the striction parametric instability in the iono-sphere, Radiophys. Quant. Electron., Engl. Transl., 25, 348–351.
Erukhimov, L. M., S. A. Metelev, E. N. Myasnikov, N. A. Mityakov, andV. L. Frolov (1987a), Artificial ionospheric turbulence (review), Radio-phys. Quant. Electron., Engl. Transl., 30, 156–171.
Erukhimov, L. M., V. Y. Kovalev, E. N. Kurakin, S. F. Marchenko, L. N.Rubtsov, E. N. Sergeev, and V. L. Frolov (1987b), Study of the interac-tion of strong radio emission with the ionospheric plasma at middlelatitudes, Geomagn. Aeron., 27, 659–663.
Erukhimov, L. M., S. A. Metelev, and D. V. Razumov (1988), Diagnosticsof ionospheric inhomogeneities with the artificial radio emission, Radio-phys. Quant. Electron., Engl. Transl., 31, 926–934.
Fejer, J. A., and H. Kopka (1981), The effect of plasma instabilities on theionospherically reflected wave from a high-power transmitter, J. Geo-phys. Res., 86, 5746–5750.
Fejer, J. A., and Y. Y. Kuo (1973), Structure in the nonlinear saturationspectrum of parametric instabilities, Phys. Fluids, 16, 1490–1496.
Frolov, V. L. (1991), Some remarks on the dynamics of artificialionospheric radio emission, paper presented at the IIIrd Suzdal URSISymposium on Modification of the Ionosphere by Powerful Radio Waves(ISIM-3), Union Radio Sci. Int., Moscow, Russia.
Frolov, V. L. (1995), Artificial plasma turbulence induced in theionospheric F region by powerful HF waves: Results of experimentalinvestigations (in Russian), Sc.D. dissertation, Radiophys. Res. Inst.,Nizhniy Novgorod, Russia.
Frolov, V. L., G. N. Boiko, S. A. Metelev, and E. N. Sergeev (1994), Onthe study of artificial ionospheric turbulence by means of stimulatedelectromagnetic emission, Radiophys. Quant. Electron., Engl. Transl.,37, 593–603.
Frolov, V. L., S. M. Grach, L. M. Erukhimov, G. P. Komrakov, E. N.Sergeev, B. Thide, and T. Carozzi (1996), Investigation of the temporalevolution of the broad upshifted maximum (BUM), Radiophys. Quant.Electron., Engl. Transl., 39, 241–254.
Frolov, V. L., G. P. Komrakov, E. N. Sergeev, B. Thide, M. Waldenvik, andE. Veszelei (1997a), Experimental results of investigation of narrow con-tinuum features in stimulated electromagnetic emission spectra, Radio-phys. Quant. Electron., Engl. Transl., 40, 731–744.
Frolov, V. L., L. M. Erukhimov, E. N. Ermakova, G. P. Komrakov, E. N.Sergeev, and P. Stubbe (1997b), A new upshifted spectral stimulatedelectromagnetic emission structure, observed between electron cyclotronharmonics, Geophys. Res. Lett., 24, 1647–1650.
Frolov, V. L., L. M. Erukhimov, S. A. Metelev, and E. N. Sergeev(1997c), Temporal behavior of artificial small-scale irregularities:Review of experimental results, J. Atmos. Sol. Terr. Phys., 59, 2317–2333.
Frolov, V. L., L. M. Erukhimov, L. M. Kagan, G. P. Komrakov, E. N.Sergeev, and P. Stubbe (1998), Two-component nature of the broad up-shifted maximum in stimulated electromagnetic emission (SEE) spectra,Phys. Rev. Lett., 81, 1630–1633.
Frolov, V. L., L. M. Kagan, and E. N. Sergeev (1999a), Review of featuresof stimulated electromagnetic emission (SEE): Recent results obtained atthe ‘‘Sura’’ heating facility, Radiophys. Quant. Electron., Engl. Transl.,42, 557–561.
Frolov, V. L., L. M. Kagan, E. N. Sergeev, G. P. Komrakov, P. A.Bernhardt, J. A. Goldstein, L. S. Wagner, C. A. Selcher, and P. Stubbe(1999b), Ionospheric observations of F region artificial plasma turbu-lence, modified by powerful X-mode radio waves, J. Geophys. Res.,104, 12,695–12,704.
Frolov, V. L., E. N. Ermakova, L. M. Kagan, G. P. Komrakov, E. N.Sergeev, and P. Stubbe (2000), Features of the broad upshifted structure(BUS) in stimulated electromagnetic emission spectra, J. Geophys. Res.,105, 20,919–20,933.
Frolov, V. L., E. N. Sergeev, E. N. Ermakova, G. P. Komrakov, andP. Stubbe (2001), Spectral features of stimulated electromagnetic emis-sions, measured in the 4.3–9.5 MHz pump wave frequency range, Geo-phys. Res. Lett., 28, 3103–3106.
Grach, S. M. (1985), Electromagnetic radiation of artificial ionosphericplasma turbulence, Radiophys. Quant. Electron., Engl. Transl., 28,470–477.
Grach, S. M., A. N. Karashtin, N. A. Mityakov, V. O. Rapoport, and V. Y.Trakhtengertz (1977), Parametric interaction between electromagnetic
A07304 FROLOV ET AL.: FEATURES OF THE PONDEROMOTIVE NARROW CONTINUUM
20 of 21
A07304
radiation and the ionospheric plasma, Radiophys. Quant. Electron., Engl.Transl., 20, 1254–1258.
Grach, S. M., M. M. Shvarts, E. N. Sergeev, and V. L. Frolov (1998), Broadcontinuum feature of stimulated electromagnetic emission, J. Atmos. Sol.Terr. Phys., 60, 1233–1246.
Gumerov, R. I., V. B. Kapkov, G. P. Komrakov, and A. M. Nasyrov (1999),Artificial luminescence of the ionosphere caused by the short-term influ-ence of powerful RF radiation, Radiophys. Quant. Electron., Engl.Transl., 42, 524–527.
Gurevich, A. V. (1978), Nonlinear Phenomena in the Ionosphere, Springer-Verlag, New York.
Gurevich, A. V., and A. N. Karashtin (1994), Self-focusing instabilityof plasma waves excited by powerful HF radiation, Phys. Lett. A, 195,362–368.
Gurevich, A. V., H. Carlson, A. V. Lukyanov, and K. P. Zybin (1997),Parametric decay of upper hybrid plasma waves trappid inside densityirregularities in the ionosphere, Phys. Lett. A, 231, 97–108.
Isham, B., C. La. Hoz, H. Kohl, T. Hagfors, T. B. Leyser, and M. T.Rietveld (1996), Recent EISCAT heating results using chirped ISR,J. Atmos. Terr. Phys., 58, 369–383.
Isham, B., C. La. Hoz, M. T. Rietveld, T. Hagfors, and T. B. Leyser (1999),Cavitating Langmuir turbulence observed during high-latitude iono-spheric wave interaction experiments, Phys. Rev. Lett., 83, 2576–2579.
Kagan, L. M., and V. L. Frolov (1996), Significance of field-alignedcurrents for F region perturbations, J. Atmos. Terr. Phys., 58, 1465–1474.
Karashtin, A. N., Y. S. Korobkov, V. L. Frolov, and M. S. Tsimring (1986),Stimulated radio emission of the ionospheric plasma at the secondharmonic of the pump wave frequency, Radiophys. Quant. Electron.,Engl. Transl., 29, 22–25.
Kuo, S. P., B. R. Cheo, and M. C. Lee (1983), The role of parametric decayinstabilities in generating ionospheric irregularities, J. Geophys. Res., 88,417–423.
Kuo, S. P., M. C. Lee, and F. T. Djuth (1987), A new interpretation ofplasma-line overshoot phenomena, Geophys. Res. Lett., 14, 961–964.
Kuo, S. P., A. Y. Ho, and M. C. Lee (1990), Temporal evolution ofHF-enhanced plasma lines, Geophys. Res. Lett., 17, 2209–2212.
Lee, M. C., and J. A. Fejer (1978), Theory of short-scale field-aligneddencity striations due to ionospheric heating, Radio Sci., 13, 893–899.
Leyser T. B. (2001), Stimulated electromagnetic emissions by high-frequency electromagnetic pumping of the ionospheric plasma, SpaceSci. Rev., 98, 223–328.
Leyser, T. B., B. Thide, H. Derblom, A. Hedberg, B. Lundborg, P. Stubbe,and H. Kopka (1990), Dependence of stimulated electromagnetic emis-sion on the ionosphere and pump wave, J. Geophys. Res., 95, 17,233–17,244.
Leyser, T. B., B. Thide, M. Waldenvik, S. Goodman, V. L. Frolov, S. M.Grach, A. N. Karashtin, G. P. Komrakov, and D. S. Kotik (1993), Spectralstructure of stimulated electromagnetic emission between electron cyclo-tron harmonics, J. Geophys. Res., 98, 17,597–17,606.
Leyser, T. B., B. Thide, M. Waldenvik, E. Veszelei, V. L. Frolov, S. M.Grach, and G. P. Komrakov (1994), Downshifted maximum features instimulated electromagnetic emission spectra, J. Geophys. Res., 99,19,555–19,568.
Mjølhus, E. (1998), Theoretical model for long time stimulated electromag-netic emission generation in ionospheric radio modification experiments,J. Geophys. Res., 103, 14,711–14,728.
Morales, G. J., A. Y. Wong, J. Santoru, L. Wang, and L. M. Duncun (1982),Dependence of plasma line enhancement on HF pulse length and iono-spheric preconditioning, Radio Sci., 17, 1313–1320.
Muldrew, D. B. (1988), Duct model explanation of the plasma line over-shoot observed at Arecibo, J. Geophys. Res., A93, 7598–7604.
Muldrew, D. B. (1992), Initial duct growth determined from cold-startplasma-line data recorded at Arecibo, Geophys. Res. Lett., 19, 65–68.
Noble, S. T., and F. T. Djuth (1990), Simultaneous measurements ofHF-enhanced plasma waves and artificial field-aligned irregularities atArecibo, J. Geophys. Res., 95, 15,195–15,207.
Perkins, F. W., and E. J. Valeo (1974), Thermal self-focusing of electro-magnetic waves in plasmas, Phys. Rel. Lett., 32, 1234–1237.
Perkins, F. W., C. Oberman, and E. J. Valeo (1974), Parametric instabilitiesand ionospheric modification, J. Geophys. Res., 79, 1478–1496.
Rietveld, M. T., B. Isham, H. Kohl, C. LaHoz, and T. Hagfors (2000),Measurements of HF-enhanced plasma and ion lines at EISCAT withhigh altitude resolution, J. Geophys. Res., 105, 7429–7439.
Rypdal, K., and B. L. Cragin (1979), HF-induced parametric decayin presence of field-aligned irregularities, J. Geophys. Res., 84, 6407–6416.
Sergeev, E. N., G. N. Boiko, and V. L. Frolov (1994), Investigation of thedynamics of HF plasma turbulence by means of artificial ionosphericradioemission, Radiophys. Quant. Electron., Engl. Transl., 37, 495–506.
Sergeev, E. N., V. L. Frolov, G. P. Komrakov, B. Thide, and T. Carozzi(1997), Temporal evolution of HF-exited plasma waves, measured atdifferent pump frequencies by stimulated electromagnetic emission,J. Atmos. Sol. Terr. Phys., 59, 2383–2400.
Sergeev, E. N., S. M. Grach, G. P. Komrakov, V. L. Frolov, and G. N.Boiko (1998), Results of the investigation of Langmuir and upperhybrid plasma turbulence evolution by means of the stimulated electro-magnetic emission, Radiophys. Quant. Electron., Engl. Transl., 41,313–347.
Sergeev, E. N., V. L. Frolov, G. N. Boiko, G. P. Komrakov, P. Stubbe,B. Thide, T. B. Leyser, and T. Carozzi (1999), Influence of small-scaleirregularities on characteristics of the overshoot-effect in the temporalevolution of stimulated electromagnetic emission. part I. Developmentstage, Radiophys. Quant. Electron., Engl. Transl., 42, 619–634.
Showen, R. L., and D. M. Kim (1978), Time variations of HF-inducedplasma waves, J. Geophys. Res., 83, 623–628.
Stubbe, P., and T. Hagfors (1997), The Earth’s ionosphere: A wall-lessplasma laboratory, Surv. Geophys., 18, 57–127.
Stubbe, P., et al. (1982), Ionospheric modification experiments in northernScandinavia, J. Atmos. Terr. Phys., 44, 1025–1041.
Stubbe, P., H. Kopka, B. Thide, and H. Derblom (1984), Stimulated elec-tromagnetic emission: A new technique to study the parametric decayinstability in the ionosphere, J. Geophys. Res., 89, 7523–7536.
Stubbe, P., A. J. Stocker, F. Honary, T. R. Robinson, and T. B. Jones (1994),Stimulated electromagnetic emission and anomalous HF wave absorptionnear electron gyroharmonics, J. Geophys. Res., 99, 6233–6246.
Sulzer, M. P., and J. A. Fejer (1994), Radar spectral observations ofHF-induced ionospheric Langmuir turbulence with improved rangeand time resolution, J. Geophys. Res., 99, 15,035–15,050.
Thide, B., H. Kopka, and P. Stubbe (1982), Observations of stimulatedscattering of a strong high-frequency radio wave in the ionosphere, Phys.Rev. Lett., 49, 1561–1564.
Thide, B., A. Hedberg, J. A. Fejer, and M. P. Sulzer (1989), First observa-tions of stimulated electromagnetic emission at Arecibo, Geophys. Res.Lett., 16, 369–372.
Thide, B., F. T. Djuth, T. B. Leyser, and H. M. Ierkic (1995), Evolutionof Langmuir turbulence and stimulated electromagnetic emission excitedwith a 3-MHz pump wave at Arecibo, J. Geophys. Res., 100, 23,887–23,889.
Vas’kov, V. V., and A. V. Gurevich (1973), Parametrical exitation of theLangmuir waves in the ionosphere by HF powerful waves, Izv. Vyssh.Uchebn. Zaved., Radiofizika, 16, 188.
Vas’kov, V. V., and A. V. Gurevich (1975), Nonlinear resonant instability ofa plasma in the field of the ordinary electromagnetic wave, J. Exp. Theor.Phys., 42, 91–97.
Vas’kov, V. V., A. V. Gurevich, and A. N. Karashtin (1981), Thermal self-focusing instability of plasma waves near resonance, Geomagn. Aeron.,21, 724–728.
Wagner, L. S., P. A. Bernhardt, J. A. Goldstein, C. A. Selcher, V. L.Frolov, and E. N. Sergeev (1999), Effect of ionospheric self-condition-ing and preconditioning on the broad upshifted maximum component ofstimulated electromagnetic emission, J. Geophys. Res., 104, 2573–2590.
Waldenvik, M., B. Thide, T. B. Leyser, E. Veszelei, V. L. Frolov, S. M.Grach, and G. P. Komrakov (1993), Studies of the temporal evolutionof SEE at the Sura ionospheric modification facility, paper presented atXXIVth General Assembly, Int. Union of Radio Sci., Kyoto, Japan.
Waldenvik, M. (1994), The dinamics of electromagnetic radiation froma HF perturbed space plasma, IRF Sci. Rep. 216, Swedish Institute ofSpace Physics, Uppsala.
Wong, A. Y., J. Santoru, C. Darrow, L. Wang, and J. G. Roederer (1983),Ionospheric caviton and related nonlinear phenomena, Radio Sci., 18,815–830.
Zheleznyakov, V. V. (1995), Radiation in Astrophysical Plasmas, KluwerAcad., Norwell, Mass.
Zyuzin, V. A., G. P. Komrakov, A. M. Nasyrov, V. A. Ryzhov, and V. A.Strekalov (1987), On development of small-scale irregularities excited inthe ionosphere under its short-time modification by powerful radio waves(in Russian), Geomagn. Aeron., 27, 942–947.
�����������������������V. L. Frolov, G. P. Komrakov, and E. N. Sergeev, Radiophysical Research
Institute, B. Pecherskaya Str. 25, 603950, Nizhny Novgorod, Russia.([email protected]; [email protected])T. B. Leyser, B. Thide, E. Veszelei, and M. Waldenvik, Swedish Institute
of Space Physics, SE-75221 Uppsala, Sweden. ([email protected]; [email protected];[email protected]; [email protected])P. Stubbe, Max-Planck-Institut fur Aeronomie, 371916 Katlenburg-
Lindau, Germany. ([email protected])
A07304 FROLOV ET AL.: FEATURES OF THE PONDEROMOTIVE NARROW CONTINUUM
21 of 21
A07304


