Embed Size (px)
Citation preview
FISH AND DIADROMY IN EUROPE
Poor water quality constrains the distributionand movements of twaite shad Alosa fallax fallax(Lacepede, 1803) in the watershed of river Scheldt
Joachim Maes Æ Maarten Stevens Æ Jan Breine
� Springer Science+Business Media B.V. 2008
Abstract Worldwide, river fragmentation is pri-
marily responsible for the decline of populations of
migrating fish. In particular, anadromous fish species,
which necessarily migrate to fresh water to repro-
duce, are endangered since many are no longer able
to reach their natural spawning sites. In addition,
pollution of rivers effectively prevents upstream or
downstream movements and blocks access to spawn-
ing grounds. This article investigates how poor water
quality interferes with the life history cycle of twaite
shad Alosa fallax fallax (Lacepede, 1803), an anad-
romous clupeid fish, in the watershed of River
Scheldt, a heavily impacted environment in West
Europe. We used two models based on known
ecological and environmental information to explain
past and present twaite shad distribution within the
watershed and to make inferences about a future
population recovery and juvenile habitat value. We
demonstrated that historical spawning areas satisfy
water quality conditions necessary to support spawn-
ing and successful development of early life history
stages of the twaite shad. However, poor water
quality conditions just upstream the freshwater–
saltwater boundary still act as an effective migration
barrier for upstream movement. As a consequence,
spawning grounds are inaccessible and the population
is dominated by seasonal adults occurring in the
lower estuarine part of the watershed. This article
provides testable and diagnostic information to the
watershed management in that it identifies habitat and
water quality requirements needed to support the
expected recovery of an endangered anadromous fish
population.
Keywords Fish migration � Twaite shad �Logistic model � Bioenergetics model �Water pollution � Freshwater tidal reach �Anadromy � River Scheldt
Introduction
Predicting changes in individual traits, population
sizes, community interactions or ecosystem function-
ing is a challenging scientific task. Too often,
Guest editors: S. Dufour, E. Prevost, E. Rochard & P. Williot
Fish and diadromy in Europe (ecology, management,
conservation)
J. Maes
Flemish Institute for Technological Research, Integrated
Environmental Studies, VITO, Boeretang 200, 2400 Mol,
Belgium
M. Stevens
Laboratory of Aquatic Ecology, Katholieke Universiteit
Leuven, Deberiotstraat 32, 3000 Leuven, Belgium
M. Stevens � J. Breine (&)
Research Institute for Nature and Forest, Duboislaan 14,
1560 Groenendaal, Belgium
e-mail: [email protected]
123
Hydrobiologia (2008) 602:129–143
DOI 10.1007/s10750-008-9279-2
ecological theory fails at application (Hansson,
2003). Large simulation models with many variables
and parameters may come closer but are hard to
develop, hard to communicate and hard to understand
(Grimm, 1999; Hansson, 2003). In a local context,
biological inference from simple observations may
still offer superior advice (Hansson, 2003). Empirical
models may be more robust in predicting possible
changes, especially when they describe changes
along ecological gradients.
In this article, we used the latter strategy to make
predictions about the future recovery of a migrating
fish population in a heavily impacted and modified
watershed. We summarized the known ecological and
environmental information into simple models in
order to predict migration opportunities and juvenile
habitat quality. In particular, we focussed on the
distribution of the twaite shad Alosa fallax fallax
(Lacepede, 1803) in the basin of River Scheldt, a
medium-sized West European lowland river with
origin in France, main drainage area in Belgium and
river delta in the Netherlands. The recent history of
River Scheldt is characterized by a century of serious
pollution and habitat deterioration. The major cause
of environmental degradation of River Scheldt and its
major tributaries can be linked to the high population
density within the watershed combined with a
historical lack of proper land use planning, especially
in Flanders, the northern part of Belgium. Fragmen-
tation of the landscape by roads and infrastructure
constrains river channel dynamics. Scattered housing
and the large amount of impervious cover limit the
efficiency of wastewater treatment facilities. Live-
stock wastes accumulate in soils or run off into
surface waters. As a result, exceptionally high
nutrient loads reach the main river, especially in
periods with increased rainfall (Struyf et al., 2004).
The direct consequence is a hypoxic zone in the
freshwater tidal area of the Scheldt. Dissolved
oxygen levels reached an absolute minimum in the
mid-1970s when the freshwater area of the river was
virtually anoxic. Since then, and due to efforts to
better treat wastewaters, average dissolved oxygen in
the river increased by about 1 mg l-1 per decade
(Van Damme et al., 1995).
Although seriously impacted, the river ecosystem
still has important nature values. The estuary has a
complete salinity gradient and includes extensive
freshwater, brackish and salt marshes to its
ecosystem. Tides penetrate as far as 160 km land
inward and influence some of the major contribu-
tories of river Scheldt. It follows that, due to the
absence of flow-regulating constructions, there are
unique opportunities for migratory fish populations
in the basin, all of which are now under threat or
locally extinct. Sturgeon (Acipenser sturio L.),
Atlantic salmon (Salmo salar L.) and allis shad
(Alosa alosa L.) all disappeared by the end of the
1930s, while populations of twaite shad, flounder
(Platichthys flesus L.) and smelt (Osmerus eperlanus
L.) are confined to the brackish and marine parts of
the estuary. Only the river lamprey (Lampetra
fluviatilis L.) seemed to have persisted, as well as
populations of more tolerant species such as eel
(Anguilla anguilla L.) and three-spined stickleback
(Gasterosteus aculeatus L.) (Van Damme et al.,
1994).
Here, we focused on the ecological status of the
twaite shad in the tidal part of the watershed of River
Scheldt. Twaite shad is an iteroparous, anadromous
fish species (Aprahamian, 1988). At maturity, adult
shad gather in estuaries in April and May and move
upstream to the head of estuaries or above to spawn
from May to July (Aprahamian & Aprahamian, 2001;
Oesmann & Thiel, 2001; Maitland & Hatton-Ellis,
2003). Once the eggs hatch nearby the spawning
sites, the young fish quickly move downstream in the
current to the quieter waters of the upper estuary,
where they start to feed and grow (Aprahamian &
Aprahamian, 2001; Gerkens & Thiel, 2001; Maitland
& Hatton-Ellis, 2003). The juveniles are present in
the estuary from July until they migrate seaward in
the autumn (Aprahamian & Aprahamian, 2001).
In the Elbe estuary, adult shad spawn in the tidal
freshwater region, so that the spawning area and
nursery for the juveniles spatially overlap. Historical
evidence (Vrielynck et al., 2003) suggests that this
was also the case for the shad population of the
Scheldt basin.
In this article, we addressed the question as to why
the life cycle of twaite shad in the watershed of the
Scheldt is interrupted. In particular, we statistically
investigated how poor water quality in the middle
part of the River Scheldt between the lower estuary
and the historical spawning grounds hinders the
spawning run of mature shad. In addition, we
modelled the future opportunities for growth of early
juveniles in the estuary provided that migration
130 Hydrobiologia (2008) 602:129–143
123
would end in successful spawning above historical
spawning grounds in the freshwater tidal reaches of
the watershed. We used field data of water quality
and fish catches to construct an empirical model that
described the presence or absence of adult fish as a
function of environmental variation. Additionally, we
modelled habitat quality for young-of-the-year fish
using a spatially explicit model of growth rate
potential. Using the models and assuming a further
rise of, particularly, dissolved oxygen concentrations
in the watershed, we illustrate how the models can be
applied to provide future spatio-temporal distribution
patterns. With this information, local watershed
managers can anticipate to expected changes by
identifying, delineating and protecting essential fish
habitats.
Materials and methods
Study area
River Scheldt has its origin in the north of France and
discharges into the North Sea near Vlissingen (The
Netherlands). It is a lowland river with a total length
of 355 km and a fall of 100 m at most. The
catchment area is approximately 21,000 km2 with a
population of 10 million inhabitants (Van den Bergh
et al., 2005). This study focuses on the tidal part of
the watershed, which is presented in Fig. 1. The
lower estuary (Westerschelde) is characterized by
flood and ebb channels, separated by sandy or muddy
intertidals. Due to the funnel shape of the lower
estuary the maximum vertical tidal range is about
100 km upstream, in the freshwater zone (Van den
Bergh et al., 2005). The tidal influence thus extends
much further land inward than does the freshwater–
saltwater boundary (Fig. 1). As a result, an extensive
freshwater region under tidal influence is present. The
tidal excursion goes as far as Gent, 160 km from the
river mouth, where the tide is stopped by sluices
(Fig. 1). Also the tributaries Durme, Rupel, Nete,
Kleine Nete, Grote Nete, Dijle and Zenne are under
tidal influence and are therefore considered as an
integral part of the estuary (Fig. 1). The historical
spawning sites, where twaite shad used to spawn until
the 1930s above sandbanks (Vrielynck et al., 2003)
are situated within the freshwater tidal reach of the
watershed (Fig. 1).
Sampling
Between 1995 and 2004, we collected fish samples
along the River Scheldt using pairs of fyke nets. Fish
sampling sites are presented on a map in Fig. 1. A
fyke net is essentially a fish trap consisting of a long
bag net distended by hoops, into which fish can pass,
without being able to return. At each sampling site a
pair of two fyke nets was deployed on the low water
mark and emptied after 24 h. The fishing gear
consisted of two 7.7 m fykes between which an 11-
m lead net was suspended. The first hoop of each fyke
is horseshoe shaped with a basis of 120 cm and a
diameter of 80 cm. Fish can be removed on the other
end of the fyke where the mesh size is 8 mm. The
fishing gear was placed parallel to the river border on
the tidal mudflats. During rising or falling tides, fish
that encounter the leader net are guided into the
fykes. Hence, both fish movements as well as mesh
size influence the selectivity of fyke nets.
All fieldwork was done by trained fish biologists
using a standardized protocol. Between 1995 and
2004 fishing occurred for 48 h at each site between
March and October, yielding a total of 114 samples.
Fish captured were identified on site using a single
field guide (Nijssen & De Groot, 1987) but quality
assurance of the fish identifications was performed by
occasional cross-examination in the laboratory, espe-
cially of small sized specimens. Fish data recorded
included species-specific fish frequencies, individual
total lengths (±1 mm) and wet weights (±1 g).
Environmental data that was included in the differ-
ent models was obtained from different sources. Water
temperature (�C) was measured coincident with the
fish sampling. Dissolved oxygen (mg l-1) data was
provided by Van Damme et al. (2005) for the period
1995–2000 and downloaded from the Flemish Envi-
ronmental Agency internet database for other months
of the study period (www.vmm.be). Freshwater flow
rate data (m3 s-1) was obtained from the Dutch
Rijkswaterstaat database (www.waterbase.nl).
Models
We used two models to predict the basin wide
distribution patterns of twaite shad and juvenile
habitat value, respectively. Presence or absence of
adult shad was modelled using logistic regression
Hydrobiologia (2008) 602:129–143 131
123
based on field samples. In the model, a binary
response variable (presence/absence) was expressed
as a linear combination of freshwater flow, temper-
ature and dissolved oxygen concentration through a
logit link function. A priori, we expected that the
response of twaite shad to oxygen concentration was
increasing, following a logistic S-shaped function. In
estuarine fish species, the avoidance of low oxygen
concentration differs, as some species exhibit an
avoidance threshold, while others exhibit a graded
response (Wannamaker & Rice, 2000). A graded
response is best modelled using linear regression, but
this technique is less appropriate to model binary
data such as the presence or absence of species. Stier
& Crance (1985) constructed habitat suitability
models for Alosa sapidissima (Wilson, 1811) and
assumed a threshold response for dissolved oxygen
following a study by Chittenden (1973). We
expected an opposite relationship with freshwater
flow, following observations that the upstream
movement behaviour of American shad decreases
at stream velocities above 1 m s-1 (Stier & Crance,
1985). Similarly, Acolas et al. (2006) observed that
migration activity in allis shad increased while
temperature increased and water flow decreased,
and slowed when temperature decreased. The
response to temperature was assumed to follow a
bell shaped curve which can be approximated by a
second order polynomial, which results in a temper-
ature optimum. The model design is:
logit p ¼ loge p= 1� pð Þ½ � ¼ b0 þ b1 � O2½ �
þ b2 � Qþ b3 � T þ b4 � T2 þ e ð1Þ
where p is the probability to capture adult twaite shad
in a fish fyke over a 24 h period; [O2] represents the
dissolved oxygen concentration (mg l-1), Q repre-
sents the average monthly freshwater flow or debit
R. Scheldt
R. Grote Nete
R. Nete
R. Dijle
R. Zenne
R. Durme
freshwater-saltwaterboundary
km 0
km 140
km 56
km 80
km 120
R. Kleine Nete
ANTWERPEN
R. Rupel
GREMBERGEN
GENT
VLISSINGEN
TERNEUZEN
migration route A
migration route B
BELGIUM
NETHERLANDS
: historical spawningsites
: fish samplingstations
: water quality samplingstations
0 10 km
N
S
W E
BASEL
HANSWEERT
ZANDVLIET
LILLO
KALLO
GROBBENDONK
BOUWEL
LIER
WALEM
NIEL
TEMSE
ST.-AMANDS
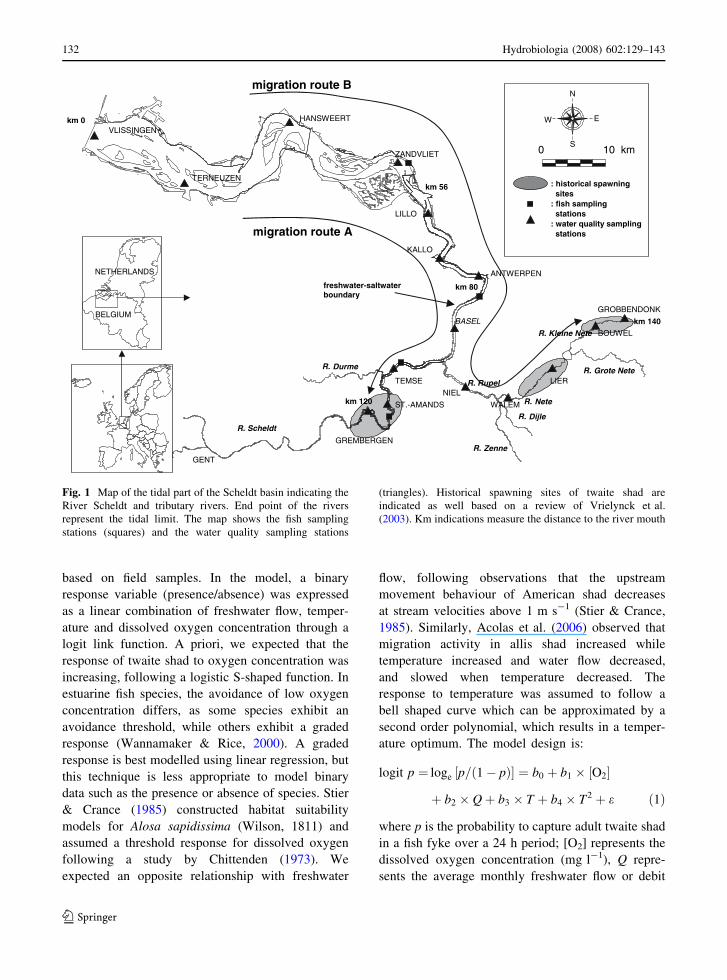
Fig. 1 Map of the tidal part of the Scheldt basin indicating the
River Scheldt and tributary rivers. End point of the rivers
represent the tidal limit. The map shows the fish sampling
stations (squares) and the water quality sampling stations
(triangles). Historical spawning sites of twaite shad are
indicated as well based on a review of Vrielynck et al.
(2003). Km indications measure the distance to the river mouth
132 Hydrobiologia (2008) 602:129–143
123
(m3 s-1) and T is the ambient temperature (�C). e is
the error term. The regression parameters bi were
estimated using the maximum likelihood procedure.
Model goodness of fit was evaluated using the model
deviance. It is defined as -2 9 (LM-LS) where LM
denotes the maximized log-likelihood value for
the model of interest, and LS is the log-likelihood
for the saturated model. Under the null hypothesis
that the logistic model is true, the deviance is v2-
distributed. The null hypothesis of bi = 0 was tested
using the Wald statistic. The fishing gear that was
used captures pelagic species at low efficiency, hence
we consider the predictions as lower limits.
Since adult shad is, at present, not able to spawn,
we assessed the possible habitat value of the estuary
for juveniles using a bioenergetic growth model. The
assumption is that growth rate potential can be used as
a criterion to evaluate habitat suitability (Brandt et al.,
1992). In spatially explicit habitat models, the growth
rate potential describes the amount of growth achiev-
able by a size and species-specific predator when
placed in a predetermined habitat characterised by a
particular suite of environmental conditions (Roy
et al., 2004). Several authors have used growth rates
potential of habitats to describe the relative quality of
habitats and environments for fish populations in
lakes, rivers and estuaries (Brandt et al., 1992; Luo
et al., 2001; Hook et al., 2003). We used the basic
Wisconsin bioenergetics-modelling framework
(described by Kitchell et al., 1977) to develop a
model of juvenile twaite shad. Bioenergetics models
balance the flow of energy through an individual fish
over consumption, growth, and energy loss (respira-
tion, specific dynamic action, egestion and excretion).
We refer to Hanson et al. (1997) for a complete
description of bioenergetic models for fish. We used
parameters of the congeneric Alosa pseudoharengus
(Wilson, 1811) (Stewart & Binkowski, 1986) and of
herring Clupea harengus L. (Rudstam, 1988) to model
the bioenergetics of twaite shad (Table 1). Following
Luo et al. (2001), oxygen dependence of maximum
consumption was modelled as a hypothetical function
based on the general concept of fish physiological
processes in response to stress (Bartell, 1990):
f DOð Þ ¼ 1þ exp 4:77� 1:59� O2½ �ð Þ�1h i
ð2Þ
This function limits consumption by 50% at a DO of
3 mg l-1 (Stier & Crance, 1985).
Environmental scenarios
Models were used to predict spatially explicit
probabilities of past and present distributions and
to assess juvenile habitat value. Past conditions
referred to the year 1990. Present conditions refer to
the situation as observed in 2003. We also made
predictions based for 2010 assuming that observed
historical trends in dissolved oxygen concentration
between 1989 and the present will continue into the
future. In each case, we focussed on two possible
migration routes, which adult shad should follow in
order to reach historical spawning sites (Fig. 1). The
first route (route A) leads shad to spawning grounds
situated in the tidal, freshwater part of river Scheldt
at 120 km of the river mouth. The second route
(route B) leads shad to an historical spawning area
in a smaller tributary river (Kleine Nete), situated
140 km upstream. We estimated future environmen-
tal conditions using a statistical model, assuming
that temperature and river flow in 2010 can be
approximated using monthly averages for the period
1993–2004 and that DO in 2010 can be approxi-
mated using monthly averages for the period 1989–
2004 superimposed on a long-term linear trend.
Predicted oxygen concentrations in 2010 satisfied
the following equation:
O2½ � ¼ a� Trendþ bj �Monthj þ e ð3Þ
Equation 3 is a general linear model with the
oxygen concentration [O2] as dependent variable,
with slope a and intercept bj 9 Monthj. Trend as
continuous predictor variable, which measures the
number of days that passed since 1 January 1989
divided by 30. The categorical variable Monthj
takes 12 different codes (January, …, December)
and was encoded into 12 binary variables. These
variables assume a value of one for samples taken
in the designated month, zero otherwise. As a
result, categorical predictors either increase or
decrease the model intercept but the slope aremains unaffected. It follows that, under the null
hypothesis of a non-significant slope a, oxygen
concentrations are estimated as monthly averages. eis the error term, which is normally distributed
around zero. Models were constructed for 16
fixed-sampling stations situated in the watershed
(Fig. 1).
Hydrobiologia (2008) 602:129–143 133
123
Results
Distribution of twaite shad in the Scheldt basin
Regular sampling of fish populations in the estuary of
River Scheldt using fyke nets started in 1995. Adult
twaite shad first appeared in samples in 1996. Since
then, annual landings, initially rose until 1999 but
fluctuated strongly during the remainder of the study
period (Fig. 2A). Pooling monthly data shows that
shad abundance generally peaked in June and August.
Twaite shad left the estuary before November to
winter in the North Sea (Fig. 2B). Total shad body
length averaged 38 cm (Fig. 2C). The 0-group shad
(\10 cm) were never caught. The spatial distribution
of twaite shad appeared to be limited to the saline and
brackish parts of the estuary. So far, no shad have
been captured in the part of the Scheldt basin
upstream the city of Antwerp. Apparently, adult shad
were unable to reach upstream historical spawning
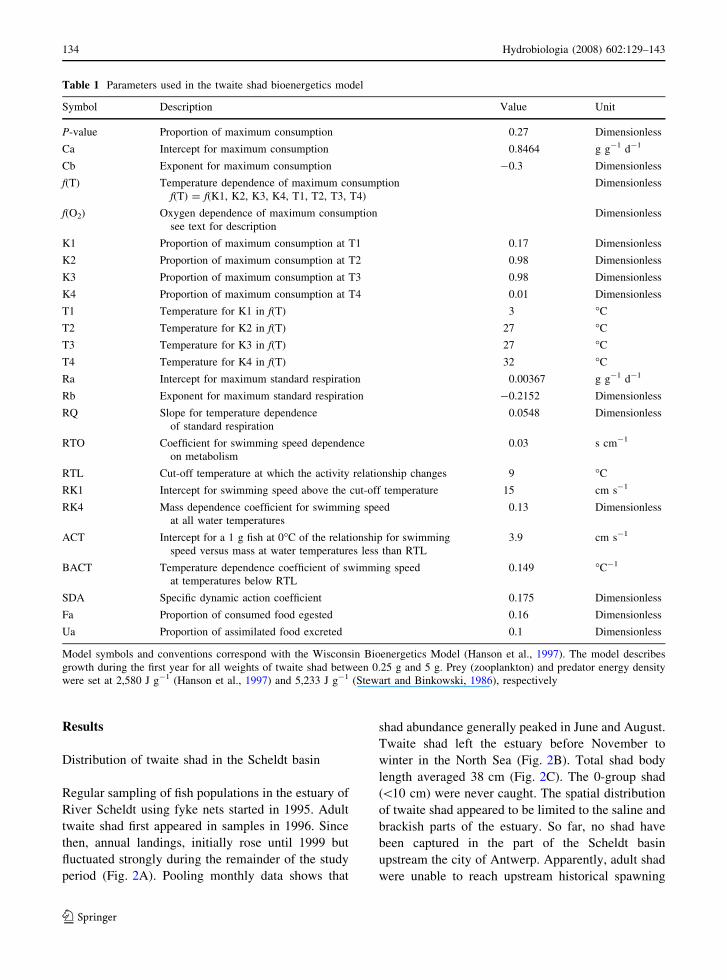
Table 1 Parameters used in the twaite shad bioenergetics model
Symbol Description Value Unit
P-value Proportion of maximum consumption 0.27 Dimensionless
Ca Intercept for maximum consumption 0.8464 g g-1 d-1
Cb Exponent for maximum consumption -0.3 Dimensionless
f(T) Temperature dependence of maximum consumption
f(T) = f(K1, K2, K3, K4, T1, T2, T3, T4)
Dimensionless
f(O2) Oxygen dependence of maximum consumption
see text for description
Dimensionless
K1 Proportion of maximum consumption at T1 0.17 Dimensionless
K2 Proportion of maximum consumption at T2 0.98 Dimensionless
K3 Proportion of maximum consumption at T3 0.98 Dimensionless
K4 Proportion of maximum consumption at T4 0.01 Dimensionless
T1 Temperature for K1 in f(T) 3 �C
T2 Temperature for K2 in f(T) 27 �C
T3 Temperature for K3 in f(T) 27 �C
T4 Temperature for K4 in f(T) 32 �C
Ra Intercept for maximum standard respiration 0.00367 g g-1 d-1
Rb Exponent for maximum standard respiration -0.2152 Dimensionless
RQ Slope for temperature dependence
of standard respiration
0.0548 Dimensionless
RTO Coefficient for swimming speed dependence
on metabolism
0.03 s cm-1
RTL Cut-off temperature at which the activity relationship changes 9 �C
RK1 Intercept for swimming speed above the cut-off temperature 15 cm s-1
RK4 Mass dependence coefficient for swimming speed
at all water temperatures
0.13 Dimensionless
ACT Intercept for a 1 g fish at 0�C of the relationship for swimming
speed versus mass at water temperatures less than RTL
3.9 cm s-1
BACT Temperature dependence coefficient of swimming speed
at temperatures below RTL
0.149 �C-1
SDA Specific dynamic action coefficient 0.175 Dimensionless
Fa Proportion of consumed food egested 0.16 Dimensionless
Ua Proportion of assimilated food excreted 0.1 Dimensionless
Model symbols and conventions correspond with the Wisconsin Bioenergetics Model (Hanson et al., 1997). The model describes
growth during the first year for all weights of twaite shad between 0.25 g and 5 g. Prey (zooplankton) and predator energy density
were set at 2,580 J g-1 (Hanson et al., 1997) and 5,233 J g-1 (Stewart and Binkowski, 1986), respectively
134 Hydrobiologia (2008) 602:129–143
123
sites which are situated in the tidal freshwater part of
the River Scheldt and in the tributaries of the Scheldt
(River Nete and River Kleine Nete, Fig. 1).
Logistic model
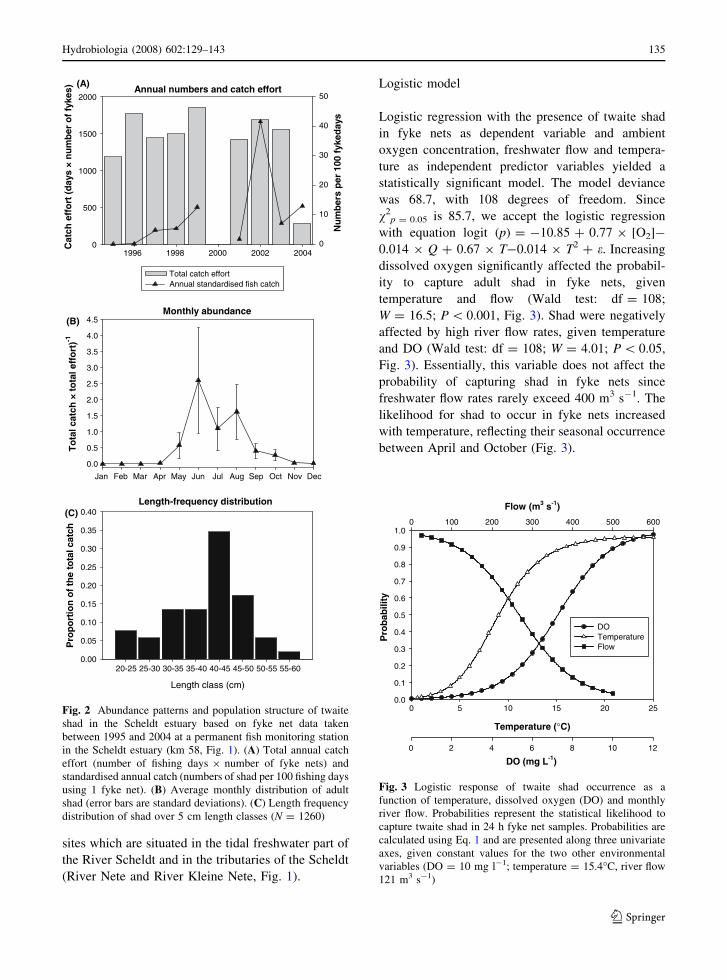
Logistic regression with the presence of twaite shad
in fyke nets as dependent variable and ambient
oxygen concentration, freshwater flow and tempera-
ture as independent predictor variables yielded a
statistically significant model. The model deviance
was 68.7, with 108 degrees of freedom. Since
v2p = 0.05 is 85.7, we accept the logistic regression
with equation logit (p) = -10.85 + 0.77 9 [O2]-
0.014 9 Q + 0.67 9 T-0.014 9 T2 + e. Increasing
dissolved oxygen significantly affected the probabil-
ity to capture adult shad in fyke nets, given
temperature and flow (Wald test: df = 108;
W = 16.5; P \ 0.001, Fig. 3). Shad were negatively
affected by high river flow rates, given temperature
and DO (Wald test: df = 108; W = 4.01; P \ 0.05,
Fig. 3). Essentially, this variable does not affect the
probability of capturing shad in fyke nets since
freshwater flow rates rarely exceed 400 m3 s-1. The
likelihood for shad to occur in fyke nets increased
with temperature, reflecting their seasonal occurrence
between April and October (Fig. 3).
Annual numbers and catch effort
1996
)sekyff
ore
bm
un
×sya
d(tr
offehcta
C 0
500
1000
1500
2000
syadekyf
0 01re
psr e
bm
uN
0
10
20
30
40
50
Total catch effortAnnual standardised fish catch
Monthly abundance
Jan
To
tal c
atch
× t
ota
l eff
ort
)-1
0.0
0.5
1.0
1.5
2.0
2.5
3.0
3.5
4.0
4.5
Length-frequency distribution
Length class (cm)
20-25
hctaclatot
eht
fo
noitr
op
orP
0.00
0.05
0.10
0.15
0.20
0.25
0.30
0.35
0.40
25-30 30-35 35-40 40-45 45-50 50-55 55-60
Feb Mar Apr May Jun Jul Aug Sep Oct Nov Dec
1998 2000 2002 2004
(C)
(B)
(A)
Fig. 2 Abundance patterns and population structure of twaite
shad in the Scheldt estuary based on fyke net data taken
between 1995 and 2004 at a permanent fish monitoring station
in the Scheldt estuary (km 58, Fig. 1). (A) Total annual catch
effort (number of fishing days 9 number of fyke nets) and
standardised annual catch (numbers of shad per 100 fishing days
using 1 fyke net). (B) Average monthly distribution of adult
shad (error bars are standard deviations). (C) Length frequency
distribution of shad over 5 cm length classes (N = 1260)
DO (mg L-1)0 2 4 6 8 10 12
Pro
bab
ility
0.0
0.1
0.2
0.3
0.4
0.5
0.6
0.7
0.8
0.9
1.0
Temperature (°C)
0 5 10 15 20 25
Flow (m3 s-1)
0 100 200 300 400 500 600
DOTemperatureFlow
Fig. 3 Logistic response of twaite shad occurrence as a
function of temperature, dissolved oxygen (DO) and monthly
river flow. Probabilities represent the statistical likelihood to
capture twaite shad in 24 h fyke net samples. Probabilities are
calculated using Eq. 1 and are presented along three univariate
axes, given constant values for the two other environmental
variables (DO = 10 mg l-1; temperature = 15.4�C, river flow
121 m3 s-1)
Hydrobiologia (2008) 602:129–143 135
123
Spatio-temporal distribution patterns of twaite
shad in the Scheldt basin
The logistic model was used to plot basin-wide
probability distributions of adult twaite shad occur-
rence under past, present and future environmental
conditions. DO concentrations for 2010 were pre-
dicted using linear regression models for 16 stations
situated in the tidal watershed of the Scheldt (Fig. 1).
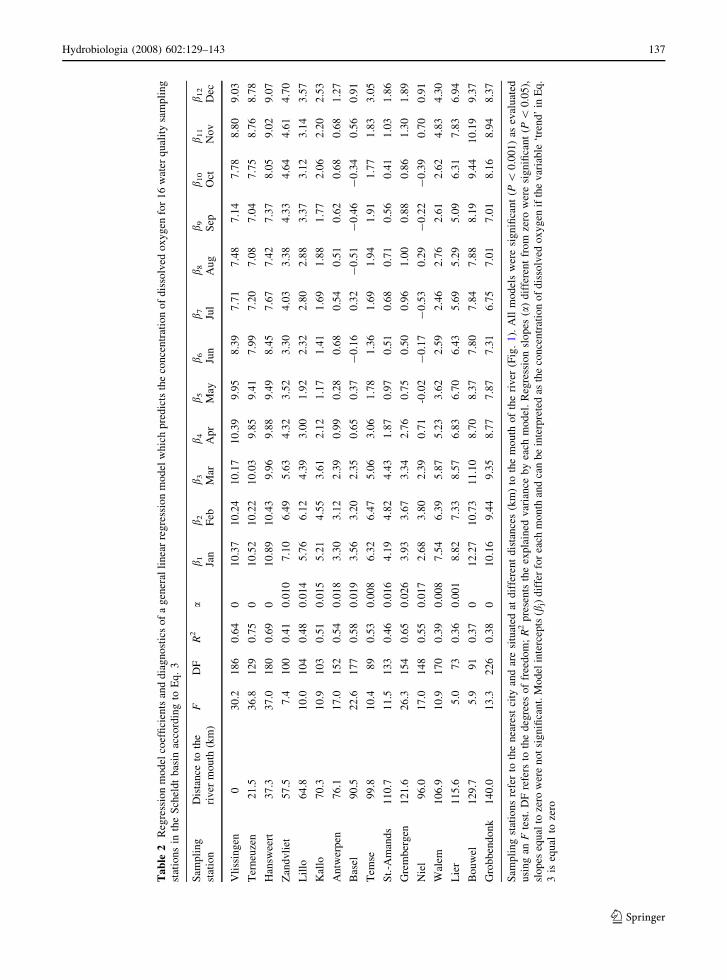
Model parameters and diagnostics of the regression
models are presented in Table 2. All models were
significant at P \ 0.001 and the explained variance
varied between 36% for station Lier to 75% for
station Terneuzen. Five stations in the watershed, of
which three in River Scheldt and two in River Kleine
Nete, displayed a slope that was not significantly
different from zero (Table 2). DO predictions for
these stations calculated for the year 2010 are
therefore approximated as monthly averages. The
regression slopes for other stations were significantly
positive (Table 2), evidencing an increasing DO
trend in the watershed. As an example, we presented
the historical and predicted time series of DO for two
water quality stations. In Fig. 4, we regressed the DO
time series against the number of days since 1
January 1989 using Eq. 3. At Basel, a station in the
River Scheldt nearby the freshwater–saltwater bound-
ary (Fig. 1), DO displays a significantly positive
trend (see slope a, Table 2). Hence DO predictions
for 2010 are based on historical monthly averages
superimposed on an increasing long-term trend. At
station Grobbendonk, situated in River Kleine Nete
(Fig. 1) at the limit of the tidal range in the Scheldt
basin, the trend in DO has a non-significant slope
(slope a, Table 2), so predictions for 2010 are
estimated using monthly means for the period
1989–2005. Figure 5 summarizes the spatial trends
in DO by presenting the annually averaged DO
concentrations as a function of distance to the river
mouth for the two possible migration routes. Data for
1990 and 2003 is based on field measurements, while
DO predictions for 2010 are based on the general
linear model. Between 1990 and 2003, the annual
average DO concentration clearly increased in the
river part upstream km 40 and DO conditions are
expected to improve by 2010.
Environmental variables (temperature, DO and
river flow) were used as input to make inferences
about the spatial and temporal distribution of shad in
the basin. Probabilities to capture shad in 24-h samples
based on fyke nets are presented in a two-dimensional
plane, where distance to sea represents a spatial axis
and time in months a temporal axis (Fig. 6). Super-
imposed on these contour plots, we indicated the
spatio-temporal spawning window, which corresponds
to the presumed geographical position of the spawning
areas along the spatial axis and the possible spawning
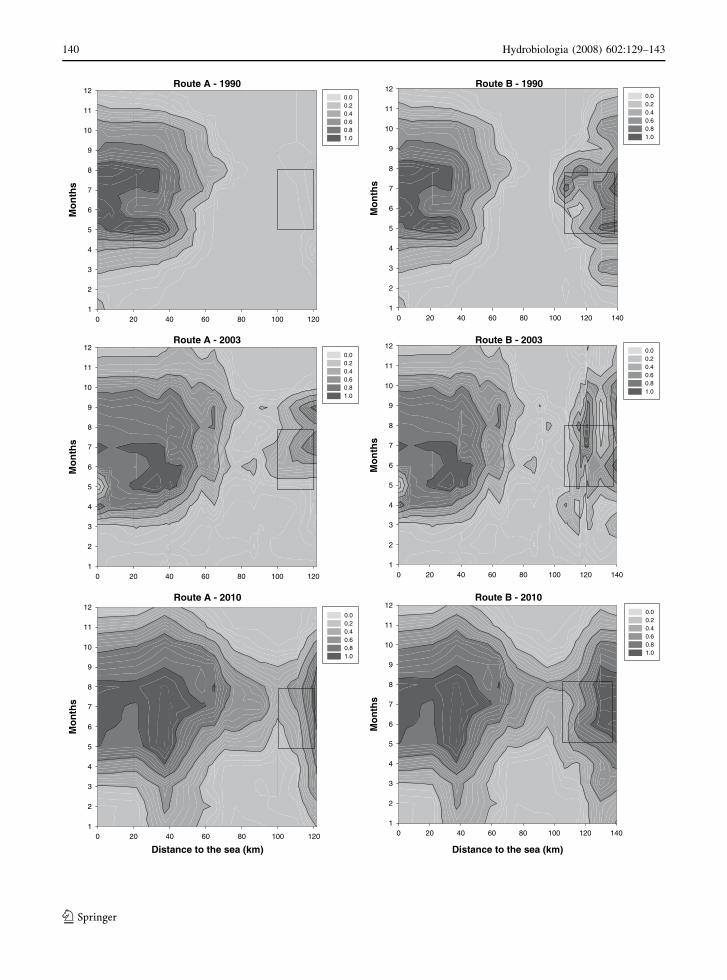
period along the temporal axis. In general, habitat
suitability of adult twaite shad in the basin was
predicted to increase with time. In 1990, poor DO
conditions, especially in the middle part of the river,
confined the distribution of twaite shad to the lower
estuary (km 0–60). Capture probabilities in more
upstream areas along migration route A, were zero
(Fig. 6). The spawning areas situated in River Kleine
Nete (migration route B) already satisfied water
quality requirements but again, a zone of hypoxia
between km 60 and km 100 was unsuitable for twaite
shad and possibly prevented movements between the
upstream river parts upstream km 100 and the lower
estuary downstream of km 60.
In 2003, the situation improved relative to 1990
and model results suggest that the spatio-temporal
distribution of available twaite shad habitat in the
basin expanded, particularly along migration route A
(Fig. 6). Conditions at historical spawning grounds
probably allowed spawning but poor water quality in
the middle estuary (km 80–km 100) was predicted to
block upstream movements. Again, twaite shad were
unable to reach historical spawning sites, although
these sites satisfy to boundary conditions for shad
presence.
The entire river gradient between the ocean and
freshwater spawning sites is predicted to become a
suitable habitat for twaite shad by the year 2010
(Fig. 6). DO in the middle estuary (at about km 100)
is expected to increase (Fig. 5), creating a time
window during which the probability to pass this part
of the river increases.
Juvenile habitat value
We used the observed and predicted environmental
data for the three years considered in order to assess
growth rate potential for young-of-the-year twaite
shad. These simulations are based on a bioenergetic
model that was parameterized for juvenile shad. We
136 Hydrobiologia (2008) 602:129–143
123
Ta
ble
2R
egre
ssio
nm
od
elco
effi
cien
tsan
dd
iag
no
stic
so
fa
gen
eral
lin
ear
reg
ress
ion
mo
del
wh
ich
pre
dic
tsth
eco
nce
ntr
atio
no
fd
isso
lved
ox
yg
enfo
r1
6w
ater
qu
alit
ysa
mp
lin
g
stat
ion
sin
the
Sch
eld
tb
asin
acco
rdin
gto
Eq
.3
Sam
pli
ng
stat
ion
Dis
tan
ceto
the
riv
erm
ou
th(k
m)
FD
FR
2a
b 1 Jan
b2
Feb
b 3 Mar
b4
Ap
r
b 5 May
b 6 Jun
b7
Jul
b 8 Au
g
b9
Sep
b 10
Oct
b11
No
v
b 12
Dec
Vli
ssin
gen
03
0.2
18
60
.64
01
0.3
71
0.2
41
0.1
71
0.3
99
.95
8.3
97
.71
7.4
87
.14
7.7
88
.80
9.0
3
Ter
neu
zen
21
.53
6.8
12
90
.75
01
0.5
21
0.2
21
0.0
39
.85
9.4
17
.99
7.2
07
.08
7.0
47
.75
8.7
68
.78
Han
swee
rt3
7.3
37
.01
80
0.6
90
10
.89
10
.43
9.9
69
.88
9.4
98
.45
7.6
77
.42
7.3
78
.05
9.0
29
.07
Zan
dv
liet
57
.57
.41
00
0.4
10
.01
07
.10
6.4
95
.63
4.3
23
.52
3.3
04
.03
3.3
84
.33
4.6
44
.61
4.7
0
Lil
lo6
4.8
10
.01
04
0.4
80
.01
45
.76
6.1
24
.39
3.0
01
.92
2.3
22
.80
2.8
83
.37
3.1
23
.14
3.5
7
Kal
lo7
0.3
10
.91
03
0.5
10
.01
55
.21
4.5
53
.61
2.1
21
.17
1.4
11
.69
1.8
81
.77
2.0
62
.20
2.5
3
An
twer
pen
76
.11
7.0
15
20
.54
0.0
18
3.3
03
.12
2.3
90
.99
0.2
80
.68
0.5
40
.51
0.6
20
.68
0.6
81
.27
Bas
el9
0.5
22
.61
77
0.5
80
.01
93
.56
3.2
02
.35
0.6
50
.37
-0
.16
0.3
2-
0.5
1-
0.4
6-
0.3
40
.56
0.9
1
Tem
se9
9.8
10
.48
90
.53
0.0
08
6.3
26
.47
5.0
63
.06
1.7
81
.36
1.6
91
.94
1.9
11
.77
1.8
33
.05
St.
-Am
and
s1
10
.71
1.5
13
30
.46
0.0
16
4.1
94
.82
4.4
31
.87
0.9
70
.51
0.6
80
.71
0.5
60
.41
1.0
31
.86
Gre
mb
erg
en1
21
.62
6.3
15
40
.65
0.0
26
3.9
33
.67
3.3
42
.76
0.7
50
.50
0.9
61
.00
0.8
80
.86
1.3
01
.89
Nie
l9
6.0
17
.01
48
0.5
50
.01
72
.68
3.8
02
.39
0.7
1-0
.02
-0
.17
-0
.53
0.2
9-
0.2
2-
0.3
90
.70
0.9
1
Wal
em1
06
.91
0.9
17
00
.39
0.0
08
7.5
46
.39
5.8
75
.23
3.6
22
.59
2.4
62
.76
2.6
12
.62
4.8
34
.30
Lie
r1
15
.65
.07
30
.36
0.0
01
8.8
27
.33
8.5
76
.83
6.7
06
.43
5.6
95
.29
5.0
96
.31
7.8
36
.94
Bo
uw
el1
29
.75
.99
10
.37
01
2.2
71
0.7
31
1.1
08
.70
8.3
77
.80
7.8
47
.88
8.1
99
.44
10
.19
9.3
7
Gro
bb
end
on
k1
40
.01
3.3
22
60
.38
01
0.1
69
.44
9.3
58
.77
7.8
77
.31
6.7
57
.01
7.0
18
.16
8.9
48
.37
Sam
pli
ng
stat
ion
sre
fer
toth
en
eare
stci
tyan
dar
esi
tuat
edat
dif
fere
nt
dis
tan
ces
(km
)to
the
mo
uth
of
the
riv
er(F
ig.
1).
All
mo
del
sw
ere
sig
nifi
can
t(P
\0
.00
1)
asev
alu
ated
usi
ng
anF
test
.D
Fre
fers
toth
ed
egre
eso
ffr
eed
om
;R
2p
rese
nts
the
exp
lain
edv
aria
nce
by
each
mo
del
.R
egre
ssio
nsl
op
es(a
)d
iffe
ren
tfr
om
zero
wer
esi
gn
ifica
nt
(P\
0.0
5),
slo
pes
equ
alto
zero
wer
en
ot
sig
nifi
can
t.M
od
elin
terc
epts
(bj)
dif
fer
for
each
mo
nth
and
can
be
inte
rpre
ted
asth
eco
nce
ntr
atio
no
fd
isso
lved
ox
yg
enif
the
var
iab
le‘t
ren
d’
inE
q.
3is
equ
alto
zero
Hydrobiologia (2008) 602:129–143 137
123
assumed young shad with total body weights of 0.5
and 1.5 g, respectively. Spatial changes of juvenile
growth rates are illustrated in Fig. 7. The calculations
were made for the entire estuary including the tidal
freshwater part which extents to Gent along route A
and to Grobbendonk along route B (Fig. 1).
Similar spatial patterns for the two considered
body weights emerged but the scales differed since
both consumption and resting metabolic rate scale
with body weight. The spatial distribution of habitat
offering optimal growth rates was predicted to
increase over the years. In the lower estuary
(\40 km) where water is fully saturated with oxygen,
differences in mean growth rates reflected differences
in mean annual temperatures. Slower growth rates in
2003 predicted for this part of the estuary were
produced by above-average summer temperatures
following the heat wave in Europe.
The opportunity for growth of young shad grad-
ually decreased in upstream direction as a result of
deteriorated DO conditions relative to the down-
stream part of the watershed. Nearby the historical
spawning sites in the upstream parts in the upstream
tributary Kleine Nete along migration route B,
environmental conditions permitted positive growth
rates for the three years that were included in the
simulation. Habitat quality nearby spawning sites in
the tidal freshwater reach of river Scheldt (Fig. 7,
route A) was low in 1990 but is expected to increase
Trend in DO at station Basel (km 90.5)
Days since 01/01/19890
Lg
m(ne
gyxo
devlossi
D1-)
0
2
4
6
8
10
12
Field dataGeneral linear modelPredictions
Trend in DO at station Grobbendonk (km 140)
Days since 01/01/1989
Lg
m(ne
gyxo
devlossi
D1-)
4
6
8
10
12
14
16Field dataGeneral linear modelPredictions
1000 2000 3000 4000 5000 6000 7000 8000
0 1000 2000 3000 4000 5000 6000 7000 8000
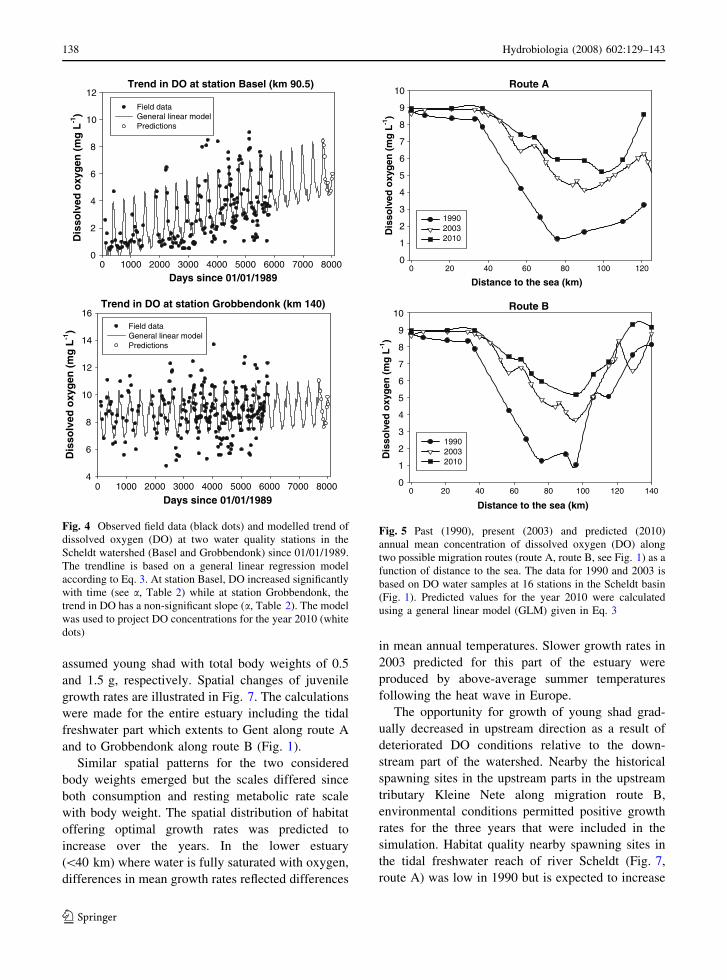
Fig. 4 Observed field data (black dots) and modelled trend of
dissolved oxygen (DO) at two water quality stations in the
Scheldt watershed (Basel and Grobbendonk) since 01/01/1989.
The trendline is based on a general linear regression model
according to Eq. 3. At station Basel, DO increased significantly
with time (see a, Table 2) while at station Grobbendonk, the
trend in DO has a non-significant slope (a, Table 2). The model
was used to project DO concentrations for the year 2010 (white
dots)
Route A
Distance to the sea (km)
0 20 40 60 80 100 120
Lg
m(ne
gyxo
devlossi
D1-)
0
1
2
3
4
5
6
7
8
9
10
199020032010
Route B
Distance to the sea (km)
0 20 40 60 80 100 120 140
Lg
m(ne
gyxo
devlossi
D1 -)
0
1
2
3
4
5
6
7
8
9
10
199020032010
Fig. 5 Past (1990), present (2003) and predicted (2010)
annual mean concentration of dissolved oxygen (DO) along
two possible migration routes (route A, route B, see Fig. 1) as a
function of distance to the sea. The data for 1990 and 2003 is
based on DO water samples at 16 stations in the Scheldt basin
(Fig. 1). Predicted values for the year 2010 were calculated
using a general linear model (GLM) given in Eq. 3
138 Hydrobiologia (2008) 602:129–143
123
by 2010 as a result of the expected increase in DO
concentration.
Discussion
Two important conclusions derived from this study.
First, historical spawning sites in the Scheldt basin
already satisfy water quality conditions necessary for
spawning and successful development of early life
history stages of twaite shad. However, available
habitat still showed a bimodal distribution along the
river gradient. Poor water quality conditions just
upstream the freshwater–saltwater boundary still
acted as an effective migration barrier for both
upstream and downstream movements. A second
conclusion is that there is a reasonable possibility that
the twaite shad population recovers by the end of this
decade. These conclusions are based on a number of
assumptions with respect to twaite shad life history,
habitat utilization and expected environmental recov-
ery. We consider these assumptions before discussing
model applications.
Model assumptions
In this article, we used water temperature, river flow
and DO as spatio-temporal input in order to make
predictions of juvenile and adult-habitat distribution
within the watershed. These variables represent key
ecological resources for the twaite shad population.
Temperature directly or indirectly controls physiolog-
ical rates, hatching success (Maitland & Hatton-Ellis,
2003), juvenile growth rate (Aprahamian, 1988), year
class strength (Aprahamian & Aprahamian, 2001),
juvenile seaward migration (Limburg, 1996), adult
upstream movements (Aprahamian, 1988). More gen-
erally, temperature also relates to natural mortality of
teleost fishes (Pauly, 1982) as well as to prey
abundance. DO influences the behaviour of twaite
shad through physiological tolerances. Twaite shad is
reported as sensitive to pollution, but few data appear
to be available (Maitland & Hatton-Ellis, 2003). The
modelled logistic response to dissolved oxygen
reported in this article suggests that adult shad become
seriously stressed at DO less than 3 mg l-1, a
concentration at which the capture probability is less
than 10%. This parallels the situation in the Elbe
estuary (Germany) where twaite shad were absent in
fish samples taken at sites where DO felt below
3 mg l-1 (Moller & Scholz, 1991). Stier & Crance
(1985) used 5 mg l-1 DO as threshold level for adult
American shad Alosa sapidissima. It is unclear
whether the relationship between low DO and twaite
shad occurrence is causal. Eggs and larvae do not
tolerate poor oxygen conditions, so there is a clear
fitness consequence when adults take the risk to
continue upstream migration and face low DO
concentrations. A similar conclusion may be drawn
to explain the negative relationship between increas-
ing river flow and shad presence. As appears to be the
case with other migratory species (Maitland, 2003),
high flows are likely to be detrimental to populations
of twaite shad by limiting the access spawning grounds
and by lowering recruitment after spawning, probably
due to downstream advection of eggs and larvae.
To model estuarine habitat suitability of young-of-
the-year twaite shad using a fresh body weight of either
0.5 g or 1.5 g, we assumed that the consumption rate
was constrained by DO. Although we did not know the
exact nature of this relationship, there is evidence low
DO directly restricts consumption in fish (Secor &
Niklitschek, 2001; Poon et al., 2001). Under hypoxia,
fish have difficulties in supporting any activity that
requires aerobic respiration and they shift to anaerobic
pathways for energy expenditure (Poon et al., 2001).
Feeding and, in particular, digestion of food are
energetically demanding processes which need to be
stopped during periods of hypoxia. Hence, it seemed
appropriate to include a sigmoid function in the
bioenergetic model to restrict food consumption.
In order to translate model results into predictions
for a nearby future, we accepted that a linear path in
the concentration of dissolved oxygen is a realistic
environmental scenario to approximate future DO
conditions. An analysis of monthly DO measure-
ments taken between 1989 and 2005 at 16 sampling
stations in the watershed corroborates the hypothesis
of linearly increasing oxygen. The increasing trend is
the result of increased efforts to clean wastewaters.
Although global warming may affect DO in rivers on
the long term, we do not expect sudden near-future
declines in DO. At present, DO simulation models are
under construction for the estuary of River Scheldt
but so far, they are unavailable for predictions. Until
then, a statistical model may be the only effective
alternative to produce extrapolations.
Hydrobiologia (2008) 602:129–143 139
123
Route A - 1990
0 20 40 60 80 100 120
sht
no
M
1
2
3
4
5
6
7
8
9
10
11
120.0 0.2 0.4 0.6 0.8 1.0
Route B - 1990
0 20 40 60 80 100 120 140
sht
no
M
1
2
3
4
5
6
7
8
9
10
11
120.0 0.2 0.4 0.6 0.8 1.0
Route A - 2003
0 20 40 60 80 100 120
sht
no
M
1
2
3
4
5
6
7
8
9
10
11
120.0 0.2 0.4 0.6 0.8 1.0
Route B - 2003
0 20 40 60 80 100 120 140
sht
no
M
1
2
3
4
5
6
7
8
9
10
11
120.0 0.2 0.4 0.6 0.8 1.0
Route A - 2010
Distance to the sea (km)0 20 40 60 80 100 120
sht
no
M
1
2
3
4
5
6
7
8
9
10
11
120.0 0.2 0.4 0.6 0.8 1.0
Route B - 2010
Distance to the sea (km)
0 20 40 60 80 100 120 140
sht
no
M
1
2
3
4
5
6
7
8
9
10
11
120.0 0.2 0.4 0.6 0.8 1.0
140 Hydrobiologia (2008) 602:129–143
123
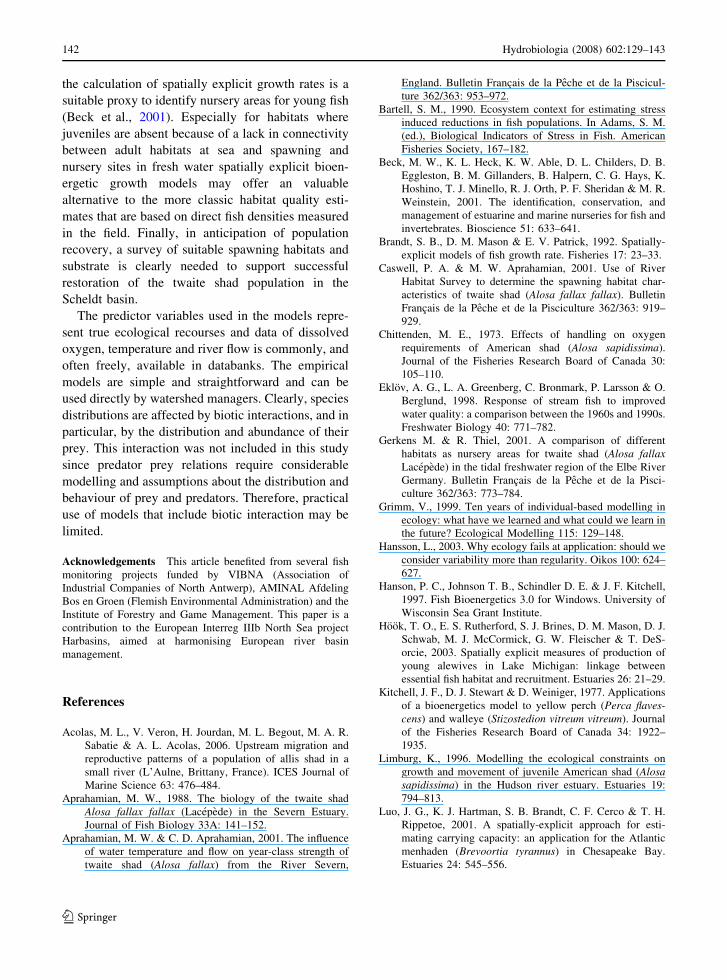
Finally, we assumed that, once shad will reach
historical spawning sites, they will successfully
spawn. Hence, twaite shad were assumed to show
sufficient plasticity in spawning behaviour and hab-
itat requirements. Historical evidence shows that in
the basin of River Scheldt twaite shad used to spawn
in or just above the tidal reach (Vrielynck et al.,
2003). Sand banks appeared to act as preferred
spawning substrate, but probably any zone in the
freshwater reach where egg retention is sufficiently
high may provide suitable spawning sites. Retention
zones may comprise areas with slower flow in
shallow fast flowing waters as well as deep areas in
the tidal part of the river where net particle
displacement is limited due to periodic upstream
flood currents. This would explain the variety of
spawning habitats and substrates that are reported for
European estuaries and rivers (Caswell & Aprahami-
an, 2001; Gerkens & Thiel, 2001).
Applications for watershed management
Once conditions are restored and ecosystem stressors
are removed, fish populations may recover and
recolonise watersheds quickly (Eklov et al., 1998).
Here, we predicted that twaite shad, an endangered
and protected fish species, will probably recover after
an absence of nearly one century. We consider twaite
shad as a indicator species showing the possibilities
of ecosystem recovery to a society, which has no
more collective memory of migrating fish species.
The species was historically abundant, is sensitive to
pollution and necessarily needs the whole river
gradient for completion of the life history. Its
predicted return to historical spawning sites would
be an important milestone after decades of decline
and an environmental success.
We demonstrated that it is possible to make
acceptable predictions about a future population
recovery with limited information. The models that
were used yielded testable predictions and should
convince river managers to take a number of
necessary steps in order to support the expected
recovery. First, it is clear that at present the mid part
of the estuary is the most critical part in which
hypoxia and high temperature conditions cause
severe habitat fragmentation. Movements of adults
are blocked and the total nursery area for young-of-
the-year fish is reduced. This part of the river should
receive prompt attention. Second, the bioenergetics
model can be applied to identify and protect essential
habitats as nursery areas for early life history stages.
The approach to couple habitat quality to growth rate
potential has proven its value in applied ecosystem
management issues (Brandt et al., 1992; Luo et al.,
2001; Hook et al., 2003; Niklitschek & Secor, 2005).
Amongst other factors such as field measurements of
fish density or an estimate of habitat related survival,
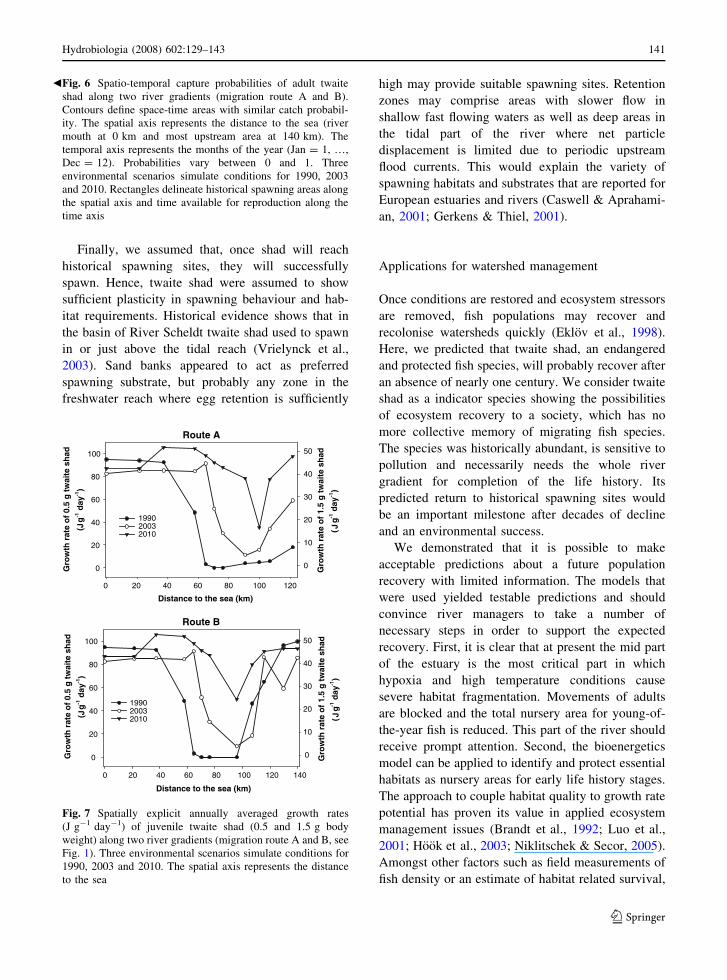
Fig. 6 Spatio-temporal capture probabilities of adult twaite
shad along two river gradients (migration route A and B).
Contours define space-time areas with similar catch probabil-
ity. The spatial axis represents the distance to the sea (river
mouth at 0 km and most upstream area at 140 km). The
temporal axis represents the months of the year (Jan = 1, …,
Dec = 12). Probabilities vary between 0 and 1. Three
environmental scenarios simulate conditions for 1990, 2003
and 2010. Rectangles delineate historical spawning areas along
the spatial axis and time available for reproduction along the
time axis
b
Route A
Distance to the sea (km)
0
dahs
etiawt
g5.0
fo
et arht
wor
G
gJ(
1-ya
d1 -)
dahs
etiawt
g5.0
fo
et arht
wor
G
gJ(
1-ya
d1 -)
0
20
40
60
80
100 dahs
eti awt
g5.1
fo
etarht
wor
G
gJ(
1-ya
d1-)
dahs
eti awt
g5.1
fo
etarht
wor
G
gJ(
1-ya
d1-)
0
10
20
30
40
50
199020032010
Route B
0
20
40
60
80
100
0
10
20
30
40
50
199020032010
20 40 60 80 100 120
Distance to the sea (km)
0 20 40 60 80 100 120 140
Fig. 7 Spatially explicit annually averaged growth rates
(J g-1 day-1) of juvenile twaite shad (0.5 and 1.5 g body
weight) along two river gradients (migration route A and B, see
Fig. 1). Three environmental scenarios simulate conditions for
1990, 2003 and 2010. The spatial axis represents the distance
to the sea
Hydrobiologia (2008) 602:129–143 141
123
the calculation of spatially explicit growth rates is a
suitable proxy to identify nursery areas for young fish
(Beck et al., 2001). Especially for habitats where
juveniles are absent because of a lack in connectivity
between adult habitats at sea and spawning and
nursery sites in fresh water spatially explicit bioen-
ergetic growth models may offer an valuable
alternative to the more classic habitat quality esti-
mates that are based on direct fish densities measured
in the field. Finally, in anticipation of population
recovery, a survey of suitable spawning habitats and
substrate is clearly needed to support successful
restoration of the twaite shad population in the
Scheldt basin.
The predictor variables used in the models repre-
sent true ecological recourses and data of dissolved
oxygen, temperature and river flow is commonly, and
often freely, available in databanks. The empirical
models are simple and straightforward and can be
used directly by watershed managers. Clearly, species
distributions are affected by biotic interactions, and in
particular, by the distribution and abundance of their
prey. This interaction was not included in this study
since predator prey relations require considerable
modelling and assumptions about the distribution and
behaviour of prey and predators. Therefore, practical
use of models that include biotic interaction may be
limited.
Acknowledgements This article benefited from several fish
monitoring projects funded by VIBNA (Association of
Industrial Companies of North Antwerp), AMINAL Afdeling
Bos en Groen (Flemish Environmental Administration) and the
Institute of Forestry and Game Management. This paper is a
contribution to the European Interreg IIIb North Sea project
Harbasins, aimed at harmonising European river basin
management.
References
Acolas, M. L., V. Veron, H. Jourdan, M. L. Begout, M. A. R.
Sabatie & A. L. Acolas, 2006. Upstream migration and
reproductive patterns of a population of allis shad in a
small river (L’Aulne, Brittany, France). ICES Journal of
Marine Science 63: 476–484.
Aprahamian, M. W., 1988. The biology of the twaite shad
Alosa fallax fallax (Lacepede) in the Severn Estuary.
Journal of Fish Biology 33A: 141–152.
Aprahamian, M. W. & C. D. Aprahamian, 2001. The influence
of water temperature and flow on year-class strength of
twaite shad (Alosa fallax) from the River Severn,
England. Bulletin Francais de la Peche et de la Piscicul-
ture 362/363: 953–972.
Bartell, S. M., 1990. Ecosystem context for estimating stress
induced reductions in fish populations. In Adams, S. M.
(ed.), Biological Indicators of Stress in Fish. American
Fisheries Society, 167–182.
Beck, M. W., K. L. Heck, K. W. Able, D. L. Childers, D. B.
Eggleston, B. M. Gillanders, B. Halpern, C. G. Hays, K.
Hoshino, T. J. Minello, R. J. Orth, P. F. Sheridan & M. R.
Weinstein, 2001. The identification, conservation, and
management of estuarine and marine nurseries for fish and
invertebrates. Bioscience 51: 633–641.
Brandt, S. B., D. M. Mason & E. V. Patrick, 1992. Spatially-
explicit models of fish growth rate. Fisheries 17: 23–33.
Caswell, P. A. & M. W. Aprahamian, 2001. Use of River
Habitat Survey to determine the spawning habitat char-
acteristics of twaite shad (Alosa fallax fallax). Bulletin
Francais de la Peche et de la Pisciculture 362/363: 919–
929.
Chittenden, M. E., 1973. Effects of handling on oxygen
requirements of American shad (Alosa sapidissima).
Journal of the Fisheries Research Board of Canada 30:
105–110.
Eklov, A. G., L. A. Greenberg, C. Bronmark, P. Larsson & O.
Berglund, 1998. Response of stream fish to improved
water quality: a comparison between the 1960s and 1990s.
Freshwater Biology 40: 771–782.
Gerkens M. & R. Thiel, 2001. A comparison of different
habitats as nursery areas for twaite shad (Alosa fallaxLacepede) in the tidal freshwater region of the Elbe River
Germany. Bulletin Francais de la Peche et de la Pisci-
culture 362/363: 773–784.
Grimm, V., 1999. Ten years of individual-based modelling in
ecology: what have we learned and what could we learn in
the future? Ecological Modelling 115: 129–148.
Hansson, L., 2003. Why ecology fails at application: should we
consider variability more than regularity. Oikos 100: 624–
627.
Hanson, P. C., Johnson T. B., Schindler D. E. & J. F. Kitchell,
1997. Fish Bioenergetics 3.0 for Windows. University of
Wisconsin Sea Grant Institute.
Hook, T. O., E. S. Rutherford, S. J. Brines, D. M. Mason, D. J.
Schwab, M. J. McCormick, G. W. Fleischer & T. DeS-
orcie, 2003. Spatially explicit measures of production of
young alewives in Lake Michigan: linkage between
essential fish habitat and recruitment. Estuaries 26: 21–29.
Kitchell, J. F., D. J. Stewart & D. Weiniger, 1977. Applications
of a bioenergetics model to yellow perch (Perca flaves-cens) and walleye (Stizostedion vitreum vitreum). Journal
of the Fisheries Research Board of Canada 34: 1922–
1935.
Limburg, K., 1996. Modelling the ecological constraints on
growth and movement of juvenile American shad (Alosasapidissima) in the Hudson river estuary. Estuaries 19:
794–813.
Luo, J. G., K. J. Hartman, S. B. Brandt, C. F. Cerco & T. H.
Rippetoe, 2001. A spatially-explicit approach for esti-
mating carrying capacity: an application for the Atlantic
menhaden (Brevoortia tyrannus) in Chesapeake Bay.
Estuaries 24: 545–556.
142 Hydrobiologia (2008) 602:129–143
123
Maitland, P. S., 2003. Ecology of the River, Brook and Sea
Lamprey. Conserving Natura 2000 Rivers Ecology Series
No. 5. English Nature, Peterborough.
Maitland, P. S. & T. W. Hatton-Ellis, 2003. Ecology of the
Allis and Twaite Shad. Conserving Natura 2000 Rivers
Ecology Series No. 3. English Nature, Peterborough.
Moller, H. & U. Scholz, 1991. Avoidance of oxygen-poor
zones by fish in the Elbe River. Journal of Applied Ich-
thyology 7: 176–182.
Nijssen, H. & S. J. De Groot, 1987. De Vissen van Nederland.
Stichting KNNV-Uitgeverij, Utrecht.
Niklitschek, E. J. & D. H. Secor, 2005. Modeling spatial and
temporal variation of suitable nursery habitats for Atlantic
sturgeon in the Chesapeake Bay. Estuarine, Coastal and
Shelf Science 64: 135–148.
Oesmann, S. & R. Thiel, 2001. Feeding of juvenile twaite shad
(Alosa fallax Lacepede, 1803) in the Elbe estuary. Bul-
letin Francais de la Peche et de la Pisciculture 362/363:
785–800.
Pauly, D., 1982. On the interrelationships between natural
mortality, growth parameters, and mean environmental
temperature in 175 fish stocks. Journal du Conseil inter-
national d’Exploration de la Mer 39: 175–192.
Poon, W. L., C. Y. Hung & D. J. Randall, 2001. The effect of
aquatic hypoxia on fish. In Thurston, R.V. (eds), Fish
Physiology, Toxicology and Water Quality. Environ-
mental Protection Agency, USA, 31–50.
Roy, D., G. D. Haffner & S. B. Brandt, 2004. Estimating fish
production potentials using a temporally explicit model.
Ecological Modelling 173: 241–257.
Rudstam, L. G., 1988. Exploring the dynamics of herring
consumption in the Baltic: applications of an energetic
model of fish growth. Kieler Meeresforschungen
Sonderheft 6: 312–322.
Secor, D. H. & E. J. Niklitschek, 2001. Sensitivity of sturgeons
to environmental hypoxia: a review of physiological and
ecological evidence. In Thurston, R. V. (ed.), Fish Phys-
iology, Toxicology and Water Quality. Environmental
Protection Agency, USA, 61–78.
Stewart, D. J. & F. P. Binkowski, 1986. Dynamics of con-
sumption and food conversion by Lake Michigan alewives
– an energetics modelling synthesis. Transactions of the
American Fisheries Society 115: 643–661.
Stier, D. J. & J. H. Crance, 1985. Habitat suitability index
models and instream flow suitability curves: American
shad. U.S. Fish and Wildlife Service Biological Report 82,
1–34.
Struyf, E., S. Van Damme & P. Meire, 2004. Possible effects of
climate change on estuarine nutrient fluxes: a case study in
the highly nutrified Schelde estuary (Belgium, The Neth-
erlands). Estuarine, Coastal and Shelf Science 60: 649–661.
Van Damme, P. A., K. Hostens & F. Ollevier, 1994. Fish
species of the lower Zeeschelde (Belgium) – a comparison
with historical checklists. Belgian Journal of Zoology
124: 93–103.
Van Damme, S., P. Meire, H. Maeckelberghe, M. Verdievel, L.
Bougoing, E. Taverniers, T. Ysebaert & G. Wattel, 1995.
De waterkwaliteit van de Zeeschelde: evolutie in de
voorbije dertig jaar. Water 85: 244–256.
Van Damme, S., E. Struyf, T. Maris, T. Ysebaert, F. Dehairs,
M. Tackx, C. Heip & P. Meire, 2005. Spatial and temporal
patterns of water quality along the estuarine gradient of
the Scheldt estuary (Belgium and the Netherlands): results
of an integrated monitoring approach. Hydrobiologia 540:
29–45.
Van den Bergh, E., S. Van Damme, J. Graveland, D. de Jong, I.
Baten & P. Meire, 2005. Ecological rehabilitation of the
Schelde Estuary (The Netherlands-Belgium; Northwest
Europe): Linking ecology, safety against floods, and
accessibility for port development Source. Restoration
Ecology 13: 204–214.
Vrielynck, S., C. Belpaire, A. Stabel, J. Breine & P. Quataert,
2003. De visbestanden in Vlaanderen anno 1840–1950.
Een historische schets van de referentietoestand van onze
waterlopen aan de hand van de visstand, ingevoerd in een
databank en vergeleken met de actuele toestand. Instituut
voor Bosbouw en Wildbeheer en Afdeling Water (AMI-
NAL), Groenendaal, 271 pp.
Wannamaker C. M. & J. A. Rice, 2000. Effects of hypoxia on
movements and behavior of selected estuarine organisms
from the southeastern United States. Journal of Experi-
mental Marine Biology and Ecology 249: 145–163.
Hydrobiologia (2008) 602:129–143 143
123


![Nitela fallax KOHL, 1883 (Hymenoptera: Sphecoidea) in Poland [Nitela fallax KOHL, 1883 (Hymenoptera: Sphecoidea) w Polsce]](https://img.pdfslide.net/doc/110x75/634be35f3093119e280b4c79/nitela-fallax-kohl-1883-hymenoptera-sphecoidea-in-poland-nitela-fallax-kohl.jpg)


