Embed Size (px)
Citation preview

Population-based cohort studyof warfarin-treated patients with atrialfibrillation: incidence of cardiovascularand bleeding outcomes
Arlene M Gallagher,1,2 Tjeerd P van Staa,1,2 Tarita Murray-Thomas,1 Nils Schoof,3
Andreas Clemens,4,5 Diana Ackermann,3 Dorothee B Bartels3,6
To cite: Gallagher AM, vanStaa TP, Murray-Thomas T,et al. Population-basedcohort study of warfarin-treated patients with atrialfibrillation: incidence ofcardiovascular and bleedingoutcomes. BMJ Open2014;4:e003839.doi:10.1136/bmjopen-2013-003839
▸ Prepublication history andadditional material for thispaper is available online. Toview these files please visitthe journal online(http://dx.doi.org/10.1136/bmjopen-2013-003839).
Received 16 August 2013Revised 10 December 2013Accepted 12 December 2013
For numbered affiliations seeend of article.
Correspondence toArlene Gallagher;[email protected]
ABSTRACTObjectives: Atrial fibrillation (AF) is the most commoncardiac rhythm disorder with a significant healthburden. The aim of this study was to characterisepatients with recently diagnosed AF and to estimate therates of comorbidities and outcome events requiringhospitalisation in routine clinical practice.Design: Pharmacoepidemiological cohort study usingobservational data.Methods/setting: This study included 16 513 patientswith a first diagnosis of AF between 1 January 2005 and28 February 2010 (newly diagnosed patients) using datafrom the UK Clinical Practice Research Datalink (CPRD)linked to Hospital Episode Statistics (HES) and theOffice for National Statistics mortality data. Exposurewas stratified by vitamin K antagonist (VKA) exposure(non-use, current, recent and past exposure) based onprescriptions and/or international normalised ratiomeasurements, and followed for outcome events ofinterest based on diagnosis codes in the databases, thatis, vascular outcomes, bleeding events and others. Themain focus of the study was on outcome eventsrequiring hospitalisation using the HES data.Results: The incidence of vascular outcomehospitalisations (myocardial infarction (MI), stroke orsystemic arterial peripheral embolism) was 3.8 (95% CI3.5 to 4.0)/100 patient-years. The incidence of strokewas 0.9 (0.8 to 1.1) during current VKA exposure, 2.2(1.6 to 2.9) for recent, 2.4 (1.9 to 2.9) for past and 3.4(3.1 to 3.7) during non-use. MI incidence was 0.7 (0.6to 0.9) for current VKA exposure, 0.7 (0.4 to 1.2) forrecent, 1.1 (0.8 to 1.5) for past and 1.9 (1.7 to 2.1)during non-use. The incidence of bleeding eventhospitalisations was 3.8 (3.4 to 4.2) for current VKAexposure, 4.5 (3.7 to 5.5) for recent, 2.7 (2.2 to 3.3) forpast and 2.9 (2.6 to 3.2) during non-use; 38% ofintracranial bleeds and 6% of gastrointestinal bleedswere fatal.Conclusions: This population-based study from recentyears provides a comprehensive characterisation ofnewly diagnosed patients with AF and incidenceestimates of common outcomes with a focus onhospitalised events stratified by VKA exposure. Thisstudy will help to place future data on new oralanticoagulants into perspective.
INTRODUCTIONAtrial fibrillation (AF) is the most commoncardiac rhythm disorder and represents a sig-nificant healthcare burden globally. There aretwo cornerstones in AF management: throm-boprophylaxis and heart rate or heart rhythmcontrol.1 The leading anticoagulation treat-ment options are vitamin K antagonists(VKAs). The main challenges of treatmentwith VKAs are close monitoring of the anti-coagulant effect (international normalisedratio (INR) measures) to maintain the rightanticoagulation level, dietary restrictions toallow for a constant dosing and several drug–drug interactions. Although VKAs are veryeffective in stroke prevention when optimallydosed, the management challenges present asignificant unmet need for other treatmentoptions.2 New oral anticoagulants (NOACs)were developed and are available for the pre-vention of stroke in patients with AF. Thereversible direct thrombin inhibitor, dabigatranetexilate, was the first approved NOAC basedon the RE-LY trial, and is available in more
Strength and limitations of this study
▪ Stratified analysis of current, recent and pastexposure, as well as periods of no vitamin Kantagonist (VKA) use, showing substantial differ-ences in comorbidities and outcome events.
▪ Analysis of only newly diagnosed patients withatrial fibrillation (AF), reducing the risk of biasand reflecting the most current population diag-nosed with AF.
▪ Patients were not randomised to a particulartreatment.
▪ Information on the diagnostic criteria used forthe diagnosis of AF is not available in the ClinicalPractice Research Datalink database.
▪ Only crude estimates were estimated which donot allow assessment of causal associations.
Gallagher AM, van Staa TP, Murray-Thomas T, et al. BMJ Open 2014;4:e003839. doi:10.1136/bmjopen-2013-003839 1
Open Access Research
group.bmj.com on January 28, 2014 - Published by bmjopen.bmj.comDownloaded from

than 90 countries worldwide.3 Recently, the factor Xa inhi-bitors rivaroxaban and apixaban were also approved.To supplement the data seen in the controlled environ-
ment of clinical trials, routine data are important todescribe the rates of comorbidities and outcome events inthe target population as seen in clinical practice. Such datashould originate from the same time frame in which thecorresponding clinical trials were conducted, since seculartrends including changes in concomitant treatments mightinfluence disease prevalence and incidence. Of particularimportance are cardiovascular diseases, which often coexistwith AF.4 In addition, known side effects of standard treat-ment such as bleeding are of importance.The objectives were to describe the characteristics of
patients with the first diagnosis of AF between 1 January2005 and 28 February 2010 (newly diagnosed patients)and to estimate the incidence of cardiovascular andother outcomes, including bleeding events, in patientswith AF, overall and in patients being exposed/non-exposed to VKA in the same time frame of the conductspecifically of the RE-LY trial.
METHODSData sourcesThis study used the Clinical Practice Research Datalink(CPRD), primary care database (GOLD), the hospitalepisode statistics (HES) and the Office for NationalStatistics (ONS) mortality data from the UK.The CPRD GOLD (formally known as General
Practice Research Database (GPRD)) comprises compu-terised medical records of general practitioners (GPs)from the UK. Patients are affiliated with a practice,which centralises the medical information from the GPs,specialist referrals and hospitalisations. The datarecorded include demographic information, prescrip-tions, clinical events, preventive care, specialist referrals,hospital admissions and their major outcomes.5 CPRDGOLD currently includes about 8% of the UK popula-tion. A recent systematic review of all validation studiesfound that the medical data in CPRD GOLD were gen-erally of high validity; this included an assessment of AFand myocardial infarction (MI).6 Practices contributingto the database are each assigned a date at which theyare considered up-to-standard (UTS). The CPRD recom-mend that analyses are performed on data following thepractice UTS date.The national HES data contain details of all admis-
sions to National Health Service (NHS) hospitals inEngland. For each hospitalised patient, the hospitalcharts are reviewed, dates of admission and dischargeand main diagnoses are extracted, coded by coding staffand collated nationally into HES. Further details onHES data can be found in the online supplement mater-ial. Data are available from April 1997.The ONS mortality data contain the date and cause of
death, from the official death certificate, for the popula-tion of England and Wales from January 2001.
HES and ONS data are linked to GOLD data via theNHS number, a unique identifier. The linkage uses acombination of the patient’s NHS number, gender andpartial date of birth. Not all patients in GOLD are eli-gible to be linked to these data sources, for example, ifthey reside in Scotland or they lack a valid NHS identi-fier. Over 40% of patients in GOLD have now beenlinked individually and anonymously to the HES and tothe ONS mortality data.
Study populationPatients were included in the study if their first AFrecord occurring during the study period (1 January2005–28 Febuary 2010) was identified in GOLD, wherethey had at least 1 year of UTS follow-up prior to thefirst AF diagnosis(ie, incident patients). The Read codesused for defining AF can be found in online supplemen-tary table S4. No free text or further information wasused to identify/validate the diagnosis of AF. The indexdate was the date of this first AF record. Patients wereexcluded if they were aged less than 18 at the index dateor if they had a history of heart valve problems/replace-ment prior. This population was further restricted tothose who were eligible for linkage with HES and ONSmortality data (ie, have a valid NHS number and areregistered at a practice that was participating in thelinkage programme), creating the study population ofinterest (figure 1). In online supplementary table S5, acomparison between the incident AF population inCPRD and the incident AF population eligible forlinkage can be found. Patients were followed from theindex date until the earliest of the respective outcome ofinterest, transfer out of the practice, last data collectionor death, whichever date came first.The total period of follow-up was analysed for pre-
scriptions for VKA and/or laboratory measurements forINR as a proxy for VKA treatment. The duration of eachanticoagulation prescription was taken as 28 days.Patients who received a repeat prescription within30 days after the expected end of a prescription wereassumed to be continuously treated. INR measurementswere treated as an indicator for VKA exposure andtherefore treated in the same way as prescriptions (ie,assigning 28 days of treatment). The follow-up periodfor each patient was divided into periods of non-use,current, recent and past exposure:i Non-use: the time between diagnosis of AF and the firstprescription of an anticoagulant/INR measurement (ifthey started treatment after diagnosis), or the wholefollow-up for the patients who never receive treatment;
ii Current exposure: the period when there is a validprescription/INR measurement; from the date of theprescription/INR measurement until day 28 after theprescription/INR measurement;
iii Recent exposure: the period between end of treat-ment and 3 months later; from the day after treat-ment ends (28 days after the last prescription/INRmeasurement) to 90 days later;
2 Gallagher AM, van Staa TP, Murray-Thomas T, et al. BMJ Open 2014;4:e003839. doi:10.1136/bmjopen-2013-003839
Open Access
group.bmj.com on January 28, 2014 - Published by bmjopen.bmj.comDownloaded from

iv Past exposure: subsequent follow-up time after recenttreatment (>90 days after the end of treatment).In the outcome analysis, patients could be assigned
different exposure status. Throughout the follow-uptime, a single patient could provide person-time to oneor more periods of non-use, current, recent or pastexposure over the course of the study period, that is, thecategories of exposure are not mutually exclusive onpatient level.
Outcomes of interestFor each outcome, we identified the first-ever recordduring follow-up after diagnosis of AF as defined above.Assessment of the incidence rate of AF in the generalpractice setting was not in the scope of this study.Patients who experienced the first-ever outcome prior tothe start of follow-up were excluded from the analysis ofthat outcome (although such patients could be includedinto the analyses of other outcomes). Four main sets ofoutcomes were examined: vascular outcomes, bleedingevents, hospitalisation due to any cause and due to AFand all-cause mortality. The vascular outcomes recordedas hospital admission in HES were stroke (categorisedinto haemorrhagic, ischaemic or unspecified stroke), sys-temic peripheral arterial embolism and MI. Fatal eventswere those where the date of death from the death cer-tificate was within 10 days of the outcome. Bleedings(from HES) were defined based on a comprehensive listof bleeding codes (96 International classification ofDiseases (ICD)-10 codes–see online supplementary tableS3) and categorised into intracranial and extracranial.Gastrointestinal (GI) bleeds (based on 23 ICD-10 codes)were analysed as a subgroup of extracranial bleeds.Hospitalisation in general and due to AF was assessedusing the primary ICD-10 code I48 from the hospitaldiagnosis. Finally, all-cause mortality was based on thedata from death certificates (from ONS).
CovariablesCovariables were assessed from before or on index date. Amedical history (at any time prior to the index date) ofacute MI, stroke, systemic peripheral arterial embolism,vascular event, coronary artery disease (CAD), congestiveheart failure (CHF), hypertension, diabetes mellitus andliver and renal impairment was recorded. The baselineCHADS2 and CHA2DS2 –VASc were also calculated.7 8 TheCHADS2 score is based on a point system, where twopoints are assigned to a history of stroke or transientischaemic attack and one point each is assigned for CHF,history of hypertension, age of 75 years or older and dia-betes mellitus.7 The CHA2DS2–VASc score extends thisscoring system by age 65–74, female sex and history of vas-cular disease.8 A recent publication of patients withchronic AF showed that the CHADS2 score is predictivefor the risk of stroke in the CPRD database.9 Smokingstatus was calculated from the CPRD records of smokingstatus and from searching for smoking records in thepatient’s history using a Read-code list.10 Only records
from before or on index date were included. Records werecategorised into non-smoker, ex-smoker and smoker.Prescriptions issued during the 3 months before the
index date of antiarrhythmics, statins, antiplatelets, antic-oagulants, diabetes medication and antihypertensives werealso captured. Antihypertensives included ACE inhibitors,angiotensin-II receptor antagonists, β-adrenoceptor block-ing drugs, calcium channel blockers, centrally acting anti-hypertensive drugs, diuretics with potassium, thiazides andrelated diuretics.Deprivation was calculated by linking the postcode of
the patient to the Index of Multiple Deprivation (IMD).The IMD combines a number of indicators into a singledeprivation score for each small area. The indicatorsdiffer between regions in the UK generally, but includeincome, employment, health and the living environ-ment. The quintiles relate to the country as a whole.
Sensitivity analysesSeveral sensitivity analyses were performed. First, werepeated the analysis of (1) cardiovascular outcomesbased on the Read-codes recorded by the GPs, and (2)all bleeding outcomes (intracranial, extracranial, GI)based on the 59 previously published ICD-10 codes.11 12
Second, we changed the time window for fatal eventsfrom 10 to 30 days, that is, the date of death from thedeath certificate was within 30 days of the outcome.
Statistical analysesIncidence rates per 100 person-years (PY) were estimatedand corresponding 95% CI were calculated assuming aPoisson distribution of events. The denominator for ratescalculation was derived as the sum of the PY of follow-up ofpatients during the study period. Person-time for treat-ment periods consisted of the sum of follow-up accruedon the index date and during probable use of anticoagula-tion treatment. Use of anticoagulation treatment wasdefined as the period during prescribing of anticoagula-tion therapy and/or laboratory measurements for INR.Follow-up was censored at the earliest of the outcome ofinterest, transfer out of the practice, last data collection ordeath. Person-time for untreated periods consisted of thesum of follow-up from the index date until the earliest ofthe start of a treatment of interest (minus 1 day), theoutcome of interest, transfer out of the practice, last datacollection or death.All analyses have been performed with Stata
version 11.2.
RESULTSA total of 48 121 patients were identified with a first AFrecord during UTS follow-up and within the studyperiod. Figure 1 describes how patients were subse-quently excluded from the study cohort. The overallcohort of incident AF patients included 42 008 patients,of whom 25 495 were excluded for not being eligible forlinkage to the HES or ONS data sources. A total of
Gallagher AM, van Staa TP, Murray-Thomas T, et al. BMJ Open 2014;4:e003839. doi:10.1136/bmjopen-2013-003839 3
Open Access
group.bmj.com on January 28, 2014 - Published by bmjopen.bmj.comDownloaded from

16 513 patients were eligible for linkage to HES andONS mortality data and were the main subject of thisstudy. There were no major differences in patientcharacteristics between the overall cohort of incident AFpatients (N=42 008) and the final study population(N=16 513) (see online supplementary table S5), otherthan a shorter follow-up in the study population: themedian (range) duration of follow-up in the overallcohort was 2.2 (0–6) vs 1.7 (0–5) years in the finallinked AF cohort.Table 1 shows the baseline characteristics for the study
population. The mean age (SD) was 77 (11) for femalepatients and 72 (12) for male patients; 48% of the patientswere women. Defining the risk of stroke based on CHADS2score resulted in 21% being at low risk (CHADS2 scoreof 0), 61% at moderate risk (CHADS2 score of 1 or 2) and18% at high risk (CHADS2 score of greater than 2).Overall, 1151 vascular events (136 fatal events and 1015
non-fatal events) were recorded (table 2). There were716 strokes (94 fatal), 68 systemic peripheral arterialembolisms (4 fatal) and 403 MIs (43 fatal). The overallincidence of vascular outcomes was 3.8 (95% CI 3.5 to4.0) per 100 PY, and was 1.8 (95% CI 1.6 to 2.1) duringcurrent exposure, 3.1 (2.4 to 3.9) for recent, 3.5 (2.9 to4.2) for past exposure and 5.5 (5.1 to 5.9) duringnon-use. The overall incidence of stroke was 2.3 (2.1 to
2.5), and 0.9 (0.8 to 1.1) during current exposure, 2.2(1.6 to 2.9) for recent, 2.4 (1.9 to 2.9) for past exposureand 3.4 (3.1 to 3.7) during non-use. The overall inci-dence of MI was 1.3 (1.2 to 1.4) and was higher duringpast-use and non-use compared to current and recentexposure (1.1, 1.9 vs 0.7, 0.7). Systemic peripheral arterialembolisms were few (0.2/100 PY). Owing to the lownumber of fatal events, there was no clear trend with VKAexposure and the incidences of any fatal vascular event orincidences of a fatal stroke, MI or systemic peripheralarterial embolism.Bleeding events occurred with an incidence of 3.3
(3.1 to 3.5) (table 3). The incidence rate during currentexposure was 3.8 (3.4 to 4.2); and 4.5 (3.7 to 5.5) forrecent, whereas non-use and past exposure to VKAresulted in similar incidences (2.9 (2.6 to 3.2) and 2.7(2.2 to 3.3)). Twelve per cent (n=120) were intracranialbleeds and overall nearly 38% of them were fatal; 50%were fatal during current exposure. More than one-thirdof the extracranial bleeds were GI bleeds (n=334), 6%of them were fatal; during current exposure 4% werefatal. GI bleed events occurred similarly frequentlyduring current/recent and past/non-use of VKAs.The incidences of hospitalisation for any cause, hospi-
talisation for AF and all-cause mortality are displayed intable 4. Overall, 71% of the patients were hospitalisedwith an incidence of 88.0 (86.4 to 89.6)/100 person-years for any hospitalisation and 16.0 (15.5 to 16.5) forhospitalisation due to AF.All-cause mortality was 8.9 (8.6 to 9.3)/100 person-
years overall and was highest during recent VKA expos-ure and lowest during current exposure (15.3 and 3.4,respectively).The sensitivity analysis for the cardiovascular events
based on diagnosis recorded by the GP showed slightlyhigher incidences than those based on hospital data forMI and stroke, and slightly lower incidences for systemicperipheral arterial embolism (see online supplementarytable S1). Bleeding events defined by previously publishedICD codes lead to lower bleeding incidences (overall 2.5(2.3 to 2.7)) and smaller differences between current (3.0(2.6 to 3.3)) and recent exposure (3.4 (2.7 to 4.3)) (seeonline supplementary table S2). Changing the timewindow for fatal events from 10 to 30 days between theoutcome of interest and the death certificate date did notchange the results substantially (data not shown).
DISCUSSIONThis study presents a detailed picture of the prevalenceand incidence of common comorbidities and outcomeevents in a large cohort of newly diagnosed patients withAF shortly prior to launch of new NOACs. Moreover,VKA use was stratified into current, recent, past expos-ure and periods of non-use, showing substantial differ-ences between those exposure groups. Another hallmarkof this study is that only newly diagnosed patients wereincluded instead of a mixture of incident and prevalent
Figure 1 Consort diagram showing the composition of the
study population—Incident atrial fibrillation Cohort. AF, atrial
fibrillation; ONS, Office of National Statistics.
4 Gallagher AM, van Staa TP, Murray-Thomas T, et al. BMJ Open 2014;4:e003839. doi:10.1136/bmjopen-2013-003839
Open Access
group.bmj.com on January 28, 2014 - Published by bmjopen.bmj.comDownloaded from
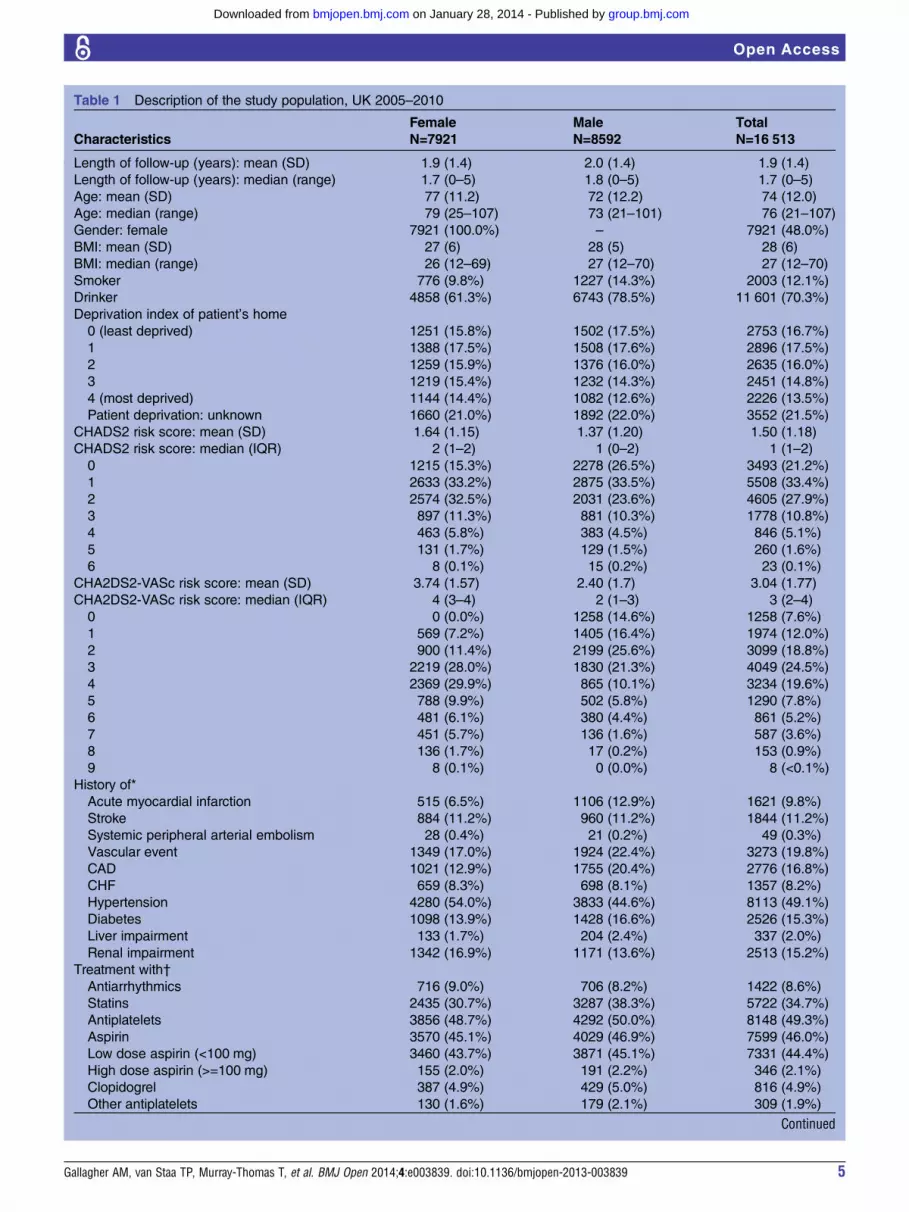
Table 1 Description of the study population, UK 2005–2010
Characteristics
Female
N=7921
Male
N=8592
Total
N=16 513
Length of follow-up (years): mean (SD) 1.9 (1.4) 2.0 (1.4) 1.9 (1.4)
Length of follow-up (years): median (range) 1.7 (0–5) 1.8 (0–5) 1.7 (0–5)
Age: mean (SD) 77 (11.2) 72 (12.2) 74 (12.0)
Age: median (range) 79 (25–107) 73 (21–101) 76 (21–107)
Gender: female 7921 (100.0%) – 7921 (48.0%)
BMI: mean (SD) 27 (6) 28 (5) 28 (6)
BMI: median (range) 26 (12–69) 27 (12–70) 27 (12–70)
Smoker 776 (9.8%) 1227 (14.3%) 2003 (12.1%)
Drinker 4858 (61.3%) 6743 (78.5%) 11 601 (70.3%)
Deprivation index of patient’s home
0 (least deprived) 1251 (15.8%) 1502 (17.5%) 2753 (16.7%)
1 1388 (17.5%) 1508 (17.6%) 2896 (17.5%)
2 1259 (15.9%) 1376 (16.0%) 2635 (16.0%)
3 1219 (15.4%) 1232 (14.3%) 2451 (14.8%)
4 (most deprived) 1144 (14.4%) 1082 (12.6%) 2226 (13.5%)
Patient deprivation: unknown 1660 (21.0%) 1892 (22.0%) 3552 (21.5%)
CHADS2 risk score: mean (SD) 1.64 (1.15) 1.37 (1.20) 1.50 (1.18)
CHADS2 risk score: median (IQR) 2 (1–2) 1 (0–2) 1 (1–2)
0 1215 (15.3%) 2278 (26.5%) 3493 (21.2%)
1 2633 (33.2%) 2875 (33.5%) 5508 (33.4%)
2 2574 (32.5%) 2031 (23.6%) 4605 (27.9%)
3 897 (11.3%) 881 (10.3%) 1778 (10.8%)
4 463 (5.8%) 383 (4.5%) 846 (5.1%)
5 131 (1.7%) 129 (1.5%) 260 (1.6%)
6 8 (0.1%) 15 (0.2%) 23 (0.1%)
CHA2DS2-VASc risk score: mean (SD) 3.74 (1.57) 2.40 (1.7) 3.04 (1.77)
CHA2DS2-VASc risk score: median (IQR) 4 (3–4) 2 (1–3) 3 (2–4)
0 0 (0.0%) 1258 (14.6%) 1258 (7.6%)
1 569 (7.2%) 1405 (16.4%) 1974 (12.0%)
2 900 (11.4%) 2199 (25.6%) 3099 (18.8%)
3 2219 (28.0%) 1830 (21.3%) 4049 (24.5%)
4 2369 (29.9%) 865 (10.1%) 3234 (19.6%)
5 788 (9.9%) 502 (5.8%) 1290 (7.8%)
6 481 (6.1%) 380 (4.4%) 861 (5.2%)
7 451 (5.7%) 136 (1.6%) 587 (3.6%)
8 136 (1.7%) 17 (0.2%) 153 (0.9%)
9 8 (0.1%) 0 (0.0%) 8 (<0.1%)
History of*
Acute myocardial infarction 515 (6.5%) 1106 (12.9%) 1621 (9.8%)
Stroke 884 (11.2%) 960 (11.2%) 1844 (11.2%)
Systemic peripheral arterial embolism 28 (0.4%) 21 (0.2%) 49 (0.3%)
Vascular event 1349 (17.0%) 1924 (22.4%) 3273 (19.8%)
CAD 1021 (12.9%) 1755 (20.4%) 2776 (16.8%)
CHF 659 (8.3%) 698 (8.1%) 1357 (8.2%)
Hypertension 4280 (54.0%) 3833 (44.6%) 8113 (49.1%)
Diabetes 1098 (13.9%) 1428 (16.6%) 2526 (15.3%)
Liver impairment 133 (1.7%) 204 (2.4%) 337 (2.0%)
Renal impairment 1342 (16.9%) 1171 (13.6%) 2513 (15.2%)
Treatment with†
Antiarrhythmics 716 (9.0%) 706 (8.2%) 1422 (8.6%)
Statins 2435 (30.7%) 3287 (38.3%) 5722 (34.7%)
Antiplatelets 3856 (48.7%) 4292 (50.0%) 8148 (49.3%)
Aspirin 3570 (45.1%) 4029 (46.9%) 7599 (46.0%)
Low dose aspirin (<100 mg) 3460 (43.7%) 3871 (45.1%) 7331 (44.4%)
High dose aspirin (>=100 mg) 155 (2.0%) 191 (2.2%) 346 (2.1%)
Clopidogrel 387 (4.9%) 429 (5.0%) 816 (4.9%)
Other antiplatelets 130 (1.6%) 179 (2.1%) 309 (1.9%)
Continued
Gallagher AM, van Staa TP, Murray-Thomas T, et al. BMJ Open 2014;4:e003839. doi:10.1136/bmjopen-2013-003839 5
Open Access
group.bmj.com on January 28, 2014 - Published by bmjopen.bmj.comDownloaded from

patients reducing the potential for bias and reflectingthe most current population diagnosed with AF.Vascular event rates were lowest during current VKA
exposure and showed increasing rates during recent andpast exposure, with the highest incidence duringnon-use, particularly observed for ischaemic stroke.Previously reported incidence rates of stroke are in thesame range as in our study but did not include detailedinformation on VKA use from newly diagnosed patientswith AF of the recent years.13 14 For ischaemic stroke,the incidence rate reported by Go et al15 in patientstaking warfarin and for patients not taking warfarin is inagreement with our study. For MI, the incidence ratewas comparable between current and recent VKA use,whereas past and non-use showed a trend to higher inci-dence in this study. It has been reported that patientswith AF are at higher risk for coronary events.16
Sensitivity analysis for cardiovascular events based ondiagnosis recorded by the GP showed a similar trendwith regard to the incidences stratified by periods ofVKA use, but resulted in slightly higher incidences thanthose based on hospital data for MI and stroke. Thismight be explained as the analysis of GP records is morelikely to include records of patients for non-hospitalisedevents, and MIs leading to death without hospitalisation.The incidence of bleeding events in this study was com-
parable during current and recent VKA use, whereaslower incidences were shown during past and non-use,which might be explained by the nature of VKA treat-ment. Go et al15 reports incidence rates of intracranialhaemorrhage based on hospitalisations of 0.5 (95% CI0.4 to 0.6) and 0.2 (0.2 to 0.3)/100 person-years (PY)among patients taking and not taking warfarin. This com-pares to 0.4 (0.3 to 0.5) and 0.6 (0.4 to 1.1)/100 PYduring current and recent exposure, and 0.2 (0.1 to 0.4)and 0.4 (0.3 to 0.5)/100 PY for past and non-use in thisstudy, respectively. The similar intracranial bleeding inci-dence during non-VKA use compared to current expos-ure might be explained by contraindications associatedwith higher risk for intracranial bleedings. For GI bleed-ings, Go et al15 did not find differences between patientstaking and not taking warfarin; this study showed a trend
towards higher incidences during recent VKA exposurecompared to current exposure, 1.0 (0.7 to 1.4) for pastand 1.1 (1.0 to 1.3)/100 PY for non-use. Thus, the bleed-ing incidence results of our study indicate a potentiallyincreased risk for patients with AF that recently stoppedVKA treatment compared to periods of past exposureand non-use. However, these findings could be related toa general worsening of health status or to the fact thatthese patients acquired additional bleeding risk factors(eg, start of aspirin use), which lead to stopping of VKAtreatment. We used a comprehensive list of 96 ICD-10codes (see online supplementary table S3) to definebleeding events including additional sites (eg, kidney,uterus, etc). Compared to the code lists published byHansen and Olesen, which we used for sensitivity ana-lyses, the bleeding rates in our main analysis were higherthan the rates observed in the sensitivity analyses (seeonline supplementary table S2).11 12 However, the ratesin our sensitivity analyses correspond well to the pub-lished data.11 The proportion of fatal bleeding events washighest among patients suffering from intracranial bleed-ings (38% overall, compared to 3% among extracranialand 6% among GI bleedings). The proportion of fatalintracranial bleeding events was higher among current(50%), recent (40%) and past (63%) VKA exposurecompared to non-use (22%); however, the number ofrecent and past exposures was small. This is in line withthe ATRIA cohort study conducted between 1996 and1997, which reported that the risk of death within 30 daysafter hospitalisation for warfarin-associated intracranialbleedings was 48.6%.17 However, there was no stratifica-tion on VKA exposure or on bleeding site. While in thisstudy, any-cause hospitalisation was lowest during currentVKA use, there was no clear pattern forAF-hospitalisations dependent on VKA treatment withlowest incidences during past VKA exposure. Mortalitywas substantially lower during current VKA exposure com-pared to other exposure periods. This might be related tothe protective effect of VKAs for stroke and to thehealthy user effect, that is, patients currently taking VKAsmight be more adherent to medication and more healthconscious.
Table 1 Continued
Characteristics
Female
N=7921
Male
N=8592
Total
N=16 513
Anticoagulants 762 (9.6%) 1054 (12.3%) 1816 (11.0%)
Antidiabetics 636 (8.0%) 862 (10.0%) 1498 (9.1%)
Oral antidiabetics 548 (6.9%) 753 (8.8%) 1301 (7.9%)
Insulin 158 (2.0%) 207 (2.4%) 365 (2.2%)
Other injectable antidiabetics 0 (0.0%) 2 (<0.1%) 2 (<0.1%)
Antihypertensives‡ 5361 (67.7%) 5386 (62.7%) 10 747 (65.1%)
*‘Ever’ diagnoses of comorbidities were measured prior to the index date in CPRD.†Treatments are measured in the 90 days prior to index date.‡Antihypertensives include ACE inhibitors, angiotensin-II receptor antagonists, β-adrenoceptor blocking drugs, calcium channel blockers,Centrally acting antihypertensive drugs, diuretics with potassium, thiazides and related diuretics.BMI, body mass index; CAD, coronary artery disease; CHF, congestive heart failure.
6 Gallagher AM, van Staa TP, Murray-Thomas T, et al. BMJ Open 2014;4:e003839. doi:10.1136/bmjopen-2013-003839
Open Access
group.bmj.com on January 28, 2014 - Published by bmjopen.bmj.comDownloaded from
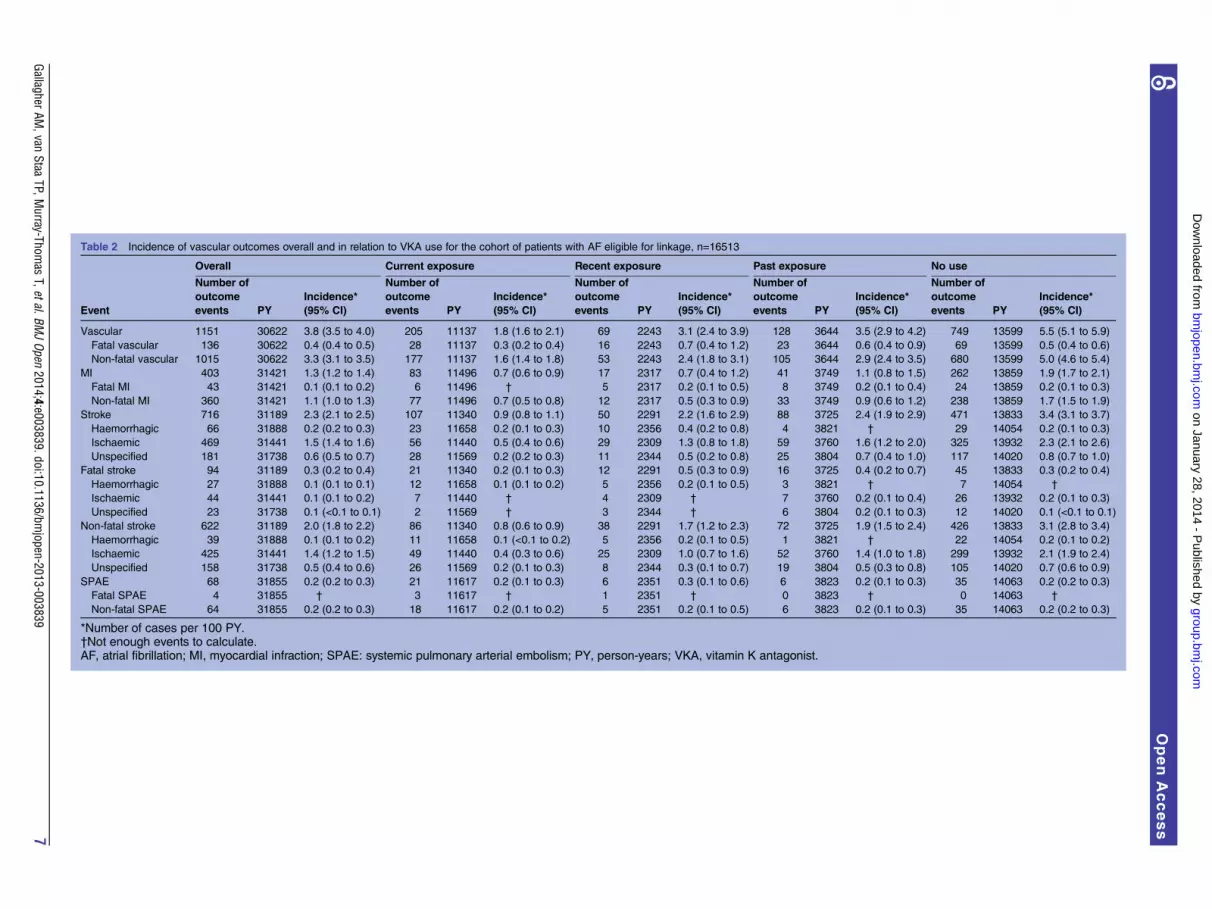
Table 2 Incidence of vascular outcomes overall and in relation to VKA use for the cohort of patients with AF eligible for linkage, n=16513
Overall Current exposure Recent exposure Past exposure No use
Event
Number of
outcome
events PY
Incidence*
(95% CI)
Number of
outcome
events PY
Incidence*
(95% CI)
Number of
outcome
events PY
Incidence*
(95% CI)
Number of
outcome
events PY
Incidence*
(95% CI)
Number of
outcome
events PY
Incidence*
(95% CI)
Vascular 1151 30622 3.8 (3.5 to 4.0) 205 11137 1.8 (1.6 to 2.1) 69 2243 3.1 (2.4 to 3.9) 128 3644 3.5 (2.9 to 4.2) 749 13599 5.5 (5.1 to 5.9)
Fatal vascular 136 30622 0.4 (0.4 to 0.5) 28 11137 0.3 (0.2 to 0.4) 16 2243 0.7 (0.4 to 1.2) 23 3644 0.6 (0.4 to 0.9) 69 13599 0.5 (0.4 to 0.6)
Non-fatal vascular 1015 30622 3.3 (3.1 to 3.5) 177 11137 1.6 (1.4 to 1.8) 53 2243 2.4 (1.8 to 3.1) 105 3644 2.9 (2.4 to 3.5) 680 13599 5.0 (4.6 to 5.4)
MI 403 31421 1.3 (1.2 to 1.4) 83 11496 0.7 (0.6 to 0.9) 17 2317 0.7 (0.4 to 1.2) 41 3749 1.1 (0.8 to 1.5) 262 13859 1.9 (1.7 to 2.1)
Fatal MI 43 31421 0.1 (0.1 to 0.2) 6 11496 † 5 2317 0.2 (0.1 to 0.5) 8 3749 0.2 (0.1 to 0.4) 24 13859 0.2 (0.1 to 0.3)
Non-fatal MI 360 31421 1.1 (1.0 to 1.3) 77 11496 0.7 (0.5 to 0.8) 12 2317 0.5 (0.3 to 0.9) 33 3749 0.9 (0.6 to 1.2) 238 13859 1.7 (1.5 to 1.9)
Stroke 716 31189 2.3 (2.1 to 2.5) 107 11340 0.9 (0.8 to 1.1) 50 2291 2.2 (1.6 to 2.9) 88 3725 2.4 (1.9 to 2.9) 471 13833 3.4 (3.1 to 3.7)
Haemorrhagic 66 31888 0.2 (0.2 to 0.3) 23 11658 0.2 (0.1 to 0.3) 10 2356 0.4 (0.2 to 0.8) 4 3821 † 29 14054 0.2 (0.1 to 0.3)
Ischaemic 469 31441 1.5 (1.4 to 1.6) 56 11440 0.5 (0.4 to 0.6) 29 2309 1.3 (0.8 to 1.8) 59 3760 1.6 (1.2 to 2.0) 325 13932 2.3 (2.1 to 2.6)
Unspecified 181 31738 0.6 (0.5 to 0.7) 28 11569 0.2 (0.2 to 0.3) 11 2344 0.5 (0.2 to 0.8) 25 3804 0.7 (0.4 to 1.0) 117 14020 0.8 (0.7 to 1.0)
Fatal stroke 94 31189 0.3 (0.2 to 0.4) 21 11340 0.2 (0.1 to 0.3) 12 2291 0.5 (0.3 to 0.9) 16 3725 0.4 (0.2 to 0.7) 45 13833 0.3 (0.2 to 0.4)
Haemorrhagic 27 31888 0.1 (0.1 to 0.1) 12 11658 0.1 (0.1 to 0.2) 5 2356 0.2 (0.1 to 0.5) 3 3821 † 7 14054 †
Ischaemic 44 31441 0.1 (0.1 to 0.2) 7 11440 † 4 2309 † 7 3760 0.2 (0.1 to 0.4) 26 13932 0.2 (0.1 to 0.3)
Unspecified 23 31738 0.1 (<0.1 to 0.1) 2 11569 † 3 2344 † 6 3804 0.2 (0.1 to 0.3) 12 14020 0.1 (<0.1 to 0.1)
Non-fatal stroke 622 31189 2.0 (1.8 to 2.2) 86 11340 0.8 (0.6 to 0.9) 38 2291 1.7 (1.2 to 2.3) 72 3725 1.9 (1.5 to 2.4) 426 13833 3.1 (2.8 to 3.4)
Haemorrhagic 39 31888 0.1 (0.1 to 0.2) 11 11658 0.1 (<0.1 to 0.2) 5 2356 0.2 (0.1 to 0.5) 1 3821 † 22 14054 0.2 (0.1 to 0.2)
Ischaemic 425 31441 1.4 (1.2 to 1.5) 49 11440 0.4 (0.3 to 0.6) 25 2309 1.0 (0.7 to 1.6) 52 3760 1.4 (1.0 to 1.8) 299 13932 2.1 (1.9 to 2.4)
Unspecified 158 31738 0.5 (0.4 to 0.6) 26 11569 0.2 (0.1 to 0.3) 8 2344 0.3 (0.1 to 0.7) 19 3804 0.5 (0.3 to 0.8) 105 14020 0.7 (0.6 to 0.9)
SPAE 68 31855 0.2 (0.2 to 0.3) 21 11617 0.2 (0.1 to 0.3) 6 2351 0.3 (0.1 to 0.6) 6 3823 0.2 (0.1 to 0.3) 35 14063 0.2 (0.2 to 0.3)
Fatal SPAE 4 31855 † 3 11617 † 1 2351 † 0 3823 † 0 14063 †
Non-fatal SPAE 64 31855 0.2 (0.2 to 0.3) 18 11617 0.2 (0.1 to 0.2) 5 2351 0.2 (0.1 to 0.5) 6 3823 0.2 (0.1 to 0.3) 35 14063 0.2 (0.2 to 0.3)
*Number of cases per 100 PY.†Not enough events to calculate.AF, atrial fibrillation; MI, myocardial infraction; SPAE: systemic pulmonary arterial embolism; PY, person-years; VKA, vitamin K antagonist.
GallagherAM
,vanStaa
TP,Murray-Thom
asT,etal.BM
JOpen
2014;4:e003839.doi:10.1136/bmjopen-2013-003839
7
OpenAccess
group.bm
j.com on January 28, 2014 - P
ublished by bm
jopen.bmj.com
Dow
nloaded from

Table 3 Incidence of bleeding outcomes overall and in relation to VKA use for the cohort of patients with AF eligible for linkage, n=16513
Overall Current exposure Recent exposure Past exposure No use
Event
Number of
outcome
events PY
Incidence*
(95% CI)
Number of
outcome
events PY
Incidence*
(95% CI)
Number of
outcome
events PY
Incidence*
(95% CI)
Number of
outcome
events PY
Incidence*
(95% CI)
Number of
outcome
events PY
Incidence*
(95% CI)
All bleed 1023 30693 3.3 (3.1 to 3.5) 426 11236 3.8 (3.4 to 4.2) 101 2238 4.5 (3.7 to 5.5) 97 3573 2.7 (2.2 to 3.3) 399 13645 2.9 (2.6 to 3.2)
Intracranial bleed 120 31854 0.4 (0.3 to 0.5) 46 11654 0.4 (0.3 to 0.5) 15 2353 0.6 (0.4 to 1.1) 8 3811 0.2 (0.1 to 0.4) 51 14036 0.4 (0.3 to 0.5)
Extracranial bleed 903 30778 2.9 (2.7 to 3.1) 380 11246 3.4 (3.0 to 3.7) 86 2245 3.8 (3.1 to 4.7) 89 3593 2.5 (2.0 to 3.0) 348 13695 2.5 (2.3 to 2.8)
GI bleed 334 31545 1.1 (0.9 to 1.2) 104 11560 0.9 (0.7 to 1.1) 35 2330 1.5 (1.0 to 2.1) 38 3733 1.0 (0.7 to 1.4) 157 13921 1.1 (1.0 to 1.3)
Fatal bleed 74 30693 0.2 (0.2 to 0.3) 33 11236 0.3 (0.2 to 0.4) 10 2238 0.4 (0.2 to 0.8) 7 3573 0.2 (0.1 to 0.4) 24 13645 0.2 (0.1 to 0.3)
Intracranial bleed 45 31854 0.1 (0.1 to 0.2) 23 11654 0.2 (0.1 to 0.3) 6 2353 0.3 (0.1 to 0.6) 5 3811 0.1 (<0.1 to 0.3) 11 14036 0.1 (<0.1 to 0.1)
Extracranial bleed 29 30778 0.1 (0.1 to 0.1) 10 11246 0.1 (<0.1 to 0.2) 4 2245 0.2 (<0.1 to 0.5) 2 3593 0.1 (<0.1 to 0.2) 13 13695 0.1 (0.1 to 0.2)
GI bleed 20 31545 0.1 (<0.1 to 0.1) 4 11560 0.0 (<0.1 to 0.1) 3 2330 0.1 (<0.1 to 0.4) 2 3733 0.1 (<0.1 to 0.2) 11 13921 0.1 (<0.1 to 0.1)
Non-fatal bleed 949 30693 3.1 (2.9 to 3.3) 393 11236 3.5 (3.2 to 3.9) 91 2238 4.1 (3.3 to 5.0) 90 3573 2.5 (2.0 to 3.1) 375 13645 2.7 (2.5 to 3.0)
Intracranial bleed 75 31854 0.2 (0.2 to 0.3) 23 11654 0.2 (0.1 to 0.3) 9 2353 0.4 (0.2 to 0.7) 3 3811 0.1 (<0.1 to 0.2) 40 14036 0.3 (0.2 to 0.4)
Extracranial bleed 874 30778 2.8 (2.7 to 3.0) 370 11246 3.3 (3.0 to 3.6) 82 2245 3.7 (2.9 to 4.5) 87 3593 2.4 (1.9 to 3.0) 335 13695 2.4 (2.2 to 2.7)
GI bleed 314 31545 1.0 (0.9 to 1.1) 100 11560 0.9 (0.7 to 1.1) 32 2330 1.4 (0.9 to 1.9) 36 3733 1.0 (0.7 to 1.3) 146 13921 1.0 (0.9 to 1.2)
*Number of cases per 100 PY.AF, atrial fibrillation; GI, gastrointestinal; PY, person-years; VKA, vitamin K antagonists.
Table 4 Incidence of hospitalisations and all-cause mortality stratified by VKA use
Overall Current exposure Recent exposure Past exposure No use
Event
Number of
outcome
events PY
Incidence*
(95% CI)
Number of
outcome
events PY
Incidence*
(95% CI)
Number of
outcome
events PY
Incidence*
(95% CI)
Number of
outcome
events PY
Incidence*
(95% CI)
Number of
outcome
events PY
Incidence*
(95% CI)
Hospitalisations
Any 11701 13291 88.0 (86.4 to 89.6) 3110 4601 67.6 (65.2 to 70.0) 599 788 76.0 (70.0 to 82.4) 836 1074 77.8 (72.7 to 83.3) 7156 6827 104.8 (102.4 to 107.3)
AF 3962 24761 16.0 (15.5 to 16.5) 1358 8487 16.0 (15.2 to 16.9) 233 1610 14.5 (12.7 to 16.5) 215 2649 8.1 (7.1 to 9.3) 2156 12015 17.9 (17.2 to 18.7)
Mortality 2858 31939 8.9 (8.6 to 9.3) 396 11663 3.4 (3.1 to 3.7) 361 2359 15.3 (13.8 to 17.0) 440 3830 11.5 (10.4 to 12.6) 1661 14086 11.8 (11.2 to 12.4)
*Number of cases per 100 PY.AF, atrial fibrillation; PY, person-years; VKA, vitamin K antagonists.
8GallagherAM
,vanStaa
TP,Murray-Thom
asT,etal.BM
JOpen
2014;4:e003839.doi:10.1136/bmjopen-2013-003839
OpenAccess
group.bm
j.com on January 28, 2014 - P
ublished by bm
jopen.bmj.com
Dow
nloaded from

The strengths of the study include the large samplesize of a population representative of the UK population.Although only a proportion of the eligible populationcould be linked to the HES/ONS data, the comparisonof patient characteristics between the overall cohort ofincident AF patients and the final study populationshowed no major differences (see online supplementarytable S5), and thus should remain representative for theincident AF population in the UK. In addition, a recentcomparison of patients included or not in the linkagefound that there were no differences in patientcharacteristics.18 Linkage of data from hospital and offi-cial death certificates added valuable information andconfirmed data validity. Another important strength isthe up-to-date data. The timing of the data collection(2005–2010) allows for the most appropriate under-standing of event rates compared to older datasets, forexample, from the 1990s, especially in the context ofchanging concomitant treatments of comorbidities (eg,intensity of use of antihypertensives, lipid-lowering drugsand newer antiarrhythmic drugs) and immediatelybefore NOACs were launched.19 This data will help toset future data on NOACs into perspective. With theintroduction of NOACs into the market, a new era hasstarted, that will change the disease and treatment land-scape and its impact on routine clinical practice needsto be established using such studies. In addition, inci-dent cohorts are the most valid basis for incidence esti-mates.20 For appropriate thromboprophylaxis, it iscrucial to assess stroke and bleeding risk using currentrisk stratification scores.21 In addition, information ofour study about current incidence rates of commoncomorbidities and outcomes in the AF patient popula-tion will help to guide clinical management decisions ofpatients with AF and put further data into perspective.Nonetheless, there are limitations to this study. We did
not have information on the diagnostic criteria used forthe AF diagnosis, such as ECG, and underdiagnosis of AFis a current public health problem. However, a previousCPRD study—although inclusion criteria of patients withAF differ slightly compared to our study—reported ahigh level of validity in the recording of AF by GPs.22 Theprocedures used to diagnose strokes and clinical presen-tation of stroke cases are not recorded in CPRD. In ourmain analysis, only hospitalised outcomes are included,likely leading to lower incidence rates as less severe out-comes will not lead to hospitalisation (eg, minor bleed-ings or transient ischaemic attack). This is also shown inour sensitivity analysis of cardiovascular outcomes.Furthermore, drug exposure was based on prescriptionsand/or INR measurements and assumptions on dosageshad to be made. We cannot exclude that patients may besupplied with VKAs for more than a month’s needs, andthat some patients currently taking VKAs were misclassi-fied under recent exposure. No over-the-counter medica-tions such as aspirin could be considered. Our analyseson haemorrhagic stroke and intracranial haemorrhageare based on low numbers of events, and no firm
conclusions can be drawn. Only crude estimates were esti-mated which do not allow any assessment of causal rela-tionships between exposures and outcomes. Finally, thisis an observational study and patients were not rando-mised to a particular treatment. Changes in the exposureto VKAs are expected to be influenced by confoundingfactors. Stopping of preventive treatments such as VKAtreatment can occur in patients with worsening of thehealth status.23–25 These patients would provide data tothe ‘recent exposure’ category, and thus might increasethe incidence of outcome events.Direct comparisons of incidence rates between CPRD
data and randomised controlled trials (RCTs) have lim-itations due to differences in inclusion/exclusion cri-teria and outcome definitions and adjudication.However, for outcomes that are more consistentlydefined (such as mortality), a comparison of incidencerates in RCTs and actual clinical practice may show theexternal validity and representativeness of the RCT evi-dence. It has been proposed that mortality rates in RCTsprovide an important guide to the representativeness ofa RCT.26 In such RCTs, mortality rates were mainlybetween 3 and 5/100 PY.3 27 28 In this CPRD study, themortality rate was well within this range for current VKAuse, but higher for recent, past and non-use. Our studyshows major differences when stratifying patient groupsinto current, recent, past and no VKA use. Patients whorecently stopped VKA treatment show the highest mor-tality rate, which might be related to the circumstancethat effective drugs are likely not used by patientsnearing death, due to selective non-prescription by phy-sicians or non-adherence by patients.23
In conclusion, this study provides a comprehensivedescription of incident AF patients and estimates of theincidence of vascular and other outcomes in patientswith AF in a GPs’ database linked to hospital data fromthe years immediately before new oral anticoagulantswere introduced.
Author affiliations1Clinical Practice Research Datalink, London, UK2Utrecht Institute for Pharmaceutical Sciences, Utrecht University, Utrecht,The Netherlands3Corp Department Global Epidemiology, Boehringer Ingelheim GmbH,Ingelheim am Rhein, Germany4Boehringer Ingelheim Pharma GmbH & Co KG, Ingelheim am Rhein,Germany5Center for Thrombosis and Hemostasis, Johannes Gutenberg University,Medical Center, Mainz, Germany6Hannover Medical School, Hannover, Germany
Acknowledgements The authors thank Tim Waterboer and Kristina Zint fortheir input and revision of the article.
Contributors AMG, TPvS, TM-T, DA, DBB and AC participated in the studydesign and data analysis. The first draft of the manuscript was written by DA,DBB and AC. All authors interpreted the results, revised the report,commented on the manuscript and approved the final version.
Funding The study was funded by Boehringer Ingelheim International GmbH.Clinical Practice Research Datalink (CPRD) is owned by the UK Department ofHealth and operates within the Medicines and Healthcare products Regulatory
Gallagher AM, van Staa TP, Murray-Thomas T, et al. BMJ Open 2014;4:e003839. doi:10.1136/bmjopen-2013-003839 9
Open Access
group.bmj.com on January 28, 2014 - Published by bmjopen.bmj.comDownloaded from

Agency (MHRA). CPRD receives funding from various regulatory authorities,universities, contract research organisations and pharmaceutical companies.The department of Pharmacoepidemiology & Pharmacotherapy, UtrechtInstitute for Pharmaceutical Sciences has received unrestricted funding forpharmacoepidemiological research from GlaxoSmithKline, Novo Nordisk, theprivate-public funded Top Institute Pharma (http://www.tipharma.nl, includescofunding from universities, government and industry), the Dutch MedicinesEvaluation Board and the Dutch Ministry of Health.
Competing interests DA, DBB, AC and NS are employees ofBoehringer-Ingelheim, the manufacturer of dabigatran etexilate. CPRD receivedfunding from Boehringer Ingelheim GmbH for the conduct of this study.
Ethics approval The CPRD has been granted Multiple Research EthicsCommittee (MREC) approval (05/MRE04/87) to undertake purelyobservational studies, with external data linkages including HES and ONSmortality data. The work of CPRD is also covered by NIGB-ECC approval ECC5-05 (a) 2012. This study was approved by the Independent ScientificAdvisory Committee for MHRA database research (ISAC) under protocolnumbers 10/018 and 12/050.
Provenance and peer review Not commissioned; externally peer reviewed.
Data sharing statement Read and ICD-10 codes, and further details onmethodology are available from the corresponding author.
Open Access This is an Open Access article distributed in accordance withthe Creative Commons Attribution Non Commercial (CC BY-NC 3.0) license,which permits others to distribute, remix, adapt, build upon this work non-commercially, and license their derivative works on different terms, providedthe original work is properly cited and the use is non-commercial. See: http://creativecommons.org/licenses/by-nc/3.0/
REFERENCES1. Camm AJ, Kirchhof P, Lip GY, et al. Guidelines for the management
of atrial fibrillation: the Task Force for the Management of AtrialFibrillation of the European Society of Cardiology (ESC): developedwith the special contribution of the European Heart RhythmAssociation (EHRA), endorsed by the European Association forCardio-Thoracic Surgery (EACTS). Eur Heart J 2010;31:2369–429.
2. Connolly SJ, Pogue J, Eikelboom J, et al. ACTIVE W investigatorsbenefit of oral anticoagulant over antiplatelet therapy in atrialfibrillation depends on the quality of international normalized ratiocontrol achieved by centers and countries as measured by time intherapeutic range. Circulation 2008;118:2029–37.
3. Connolly SJ, Ezekowitz MD, Yusuf S, et al. Dabigatran versus warfarinin patients with atrial fibrillation. N Engl J Med 2009;361:1139–51.
4. Jabre P, Jouven X, Adnet F, et al. Atrial fibrillation and deathafter myocardial infarction: a community study. Circulation2011;123:2094–100.
5. Williams T, van staa T, Puri S, et al. Recent advances in the utility anduse of the General Practice Research Database as an example of a UKPrimary Care Data resource. Ther Adv Drug Saf 2012;3:89–99.
6. Herrett E, Thomas SL, Schoonen WM, et al. Validation and validityof diagnoses in the General Practice Research Database: asystematic review. Br J Clin Pharmacol 2010;69:4–14.
7. Gage BF, Waterman AD, Shannon W, et al. Validation of clinicalclassification schemes for predicting stroke: results from the NationalRegistry of Atrial Fibrillation. JAMA 2001;285:2864–70.
8. Lane DA, Lip GYH. Use of the CHA2DS2-VASc and HAS-BLEDscores to aid decision making for thromboprophylaxis in nonvalvularatrial fibrillation. Circulation 2012;126:860–5.
9. Rietbrock S, Heeley E, Plumb J, et al. Chronic atrial fibrillation:incidence, prevalence, and prediction of stroke using the congestiveheart failure, hypertension, age >75, diabetes mellitus, and priorstroke or transient ischemic attack (CHADS2) risk stratificationscheme. Am Heart J 2008;156:57–64.
10. Lewis JD, Brensinger C. Agreement between GPRD smoking data:a survey of general practitioners and a population-based survey.Pharmacoepidemiol Drug Saf 2004;13:437–41.
11. Hansen ML, Sørensen R, Clausen MT, et al. Risk of bleedingwith single, dual, or triple therapy with warfarin, aspirin, andclopidogrel in patients with atrial fibrillation. Arch Intern Med2010;170:1433–41.
12. Olesen JB, Lip GY, Lindhardsen J, et al. Risks ofthromboembolism and bleeding with thromboprophylaxis inpatients with atrial fibrillation: a net clinical benefit analysis using a‘real world’ nationwide cohort study. Thromb Haemost2011;106:739–49.
13. Frost L, Andersen LV, Vestergaard P, et al. Trends in risk of stroke inpatients with a hospital diagnosis of nonvalvular atrial fibrillation:national cohort study in Denmark, 1980–2002. Neuroepidemiology2006;26:212–19.
14. Friberg L, Hammar N, Rosenqvist M. Stroke in paroxysmal atrialfibrillation: report from the Stockholm Cohort of Atrial Fibrillation.Eur Heart J 2010;31:967–75.
15. Go AS, Hylek EM, Chang Y, et al. Anticoagulation therapy for strokeprevention in atrial fibrillation: how well do randomized trials translateinto clinical practice? JAMA 2003;290:2685–92.
16. Ruigomez A, Johansson S, Wallander MA, et al. Risk ofcardiovascular and cerebrovascular events after atrial fibrillationdiagnosis. Int J Cardiol 2009;136:186–92.
17. Fang MC, Go AS, Chang Y, et al. Death and disability fromwarfarin-associated intracranial and extracranial hemorrhages.Am J Med 2007;120:700–5.
18. Gallagher AM, Puri S, van Staa TP. Linkage of the General PracticeResearch Database (GPRD) with Other Data Sources [528]. Posterpresentation at 27th International Conference ofPharmacoepidemiology, August 16th 2011, Chicago, IL, USA.
19. Parkinson J, Davis S, van Staa TP. The General Practice Research(GPRD) Database: now and the future. In: Mann R.Pharmacovigilance editor. 2nd edn. John Wiley & Sons,2007:341–8.
20. Schneeweiss S. A basic study design for expedited safety signalevaluation based on electronic healthcare data. PharmacoepidemiolDrug Saf 2010;19:858–68.
21. Lip GY. Stroke and bleeding risk assessment in atrial fibrillation:when, how, and why? Eur Heart J 2013;34:1041–9.
22. Ruigómez A, Johansson S, Wallander M-A, et al. Incidence ofchronic atrial fibrillation in general practice and its treatment pattern.J Clin Epidemiol 2002;55:358–63.
23. Glynn RJ, Knight EL, Levin R, et al. Paradoxical relations of drugtreatment with mortality in older persons. Epidemiology2001;12:682–9.
24. Redelmeier DA, Tan SH, Booth GL. The treatment of unrelateddisorders in patients with chronic medical diseases. N Engl J Med1998;338:1516–20.
25. Stürmer T, Rothman KJ, Avorn J, et al. Treatment effects in thepresence of unmeasured confounding: dealing with observations inthe tails of the propensity score distribution—a simulation study. AmJ Epidemiol 2010;172:843–54.
26. Silberman G, Droitcour JA, Scullin EW. Cross design synthesis: anew strategy for medical effectiveness research. Darby, USA: DianePublishing Co, 1992.
27. Patel MR, Mahaffey KW, Garg J, et al. Rivaroxaban versuswarfarin in nonvalvular atrial fibrillation. N Engl J Med2011;365:883–91.
28. Granger CB, Alexander JH, McMurray JJ, et al. Apixaban versuswarfarin in patients with atrial fibrillation. N Engl J Med2011;365:981–92.
10 Gallagher AM, van Staa TP, Murray-Thomas T, et al. BMJ Open 2014;4:e003839. doi:10.1136/bmjopen-2013-003839
Open Access
group.bmj.com on January 28, 2014 - Published by bmjopen.bmj.comDownloaded from
doi: 10.1136/bmjopen-2013-003839 2014 4: BMJ Open
Arlene M Gallagher, Tjeerd P van Staa, Tarita Murray-Thomas, et al. bleeding outcomesfibrillation: incidence of cardiovascular andwarfarin-treated patients with atrial Population-based cohort study of
http://bmjopen.bmj.com/content/4/1/e003839.full.htmlUpdated information and services can be found at:
These include:
Data Supplement http://bmjopen.bmj.com/content/suppl/2014/01/27/bmjopen-2013-003839.DC1.html
"Supplementary Data"
References http://bmjopen.bmj.com/content/4/1/e003839.full.html#ref-list-1
This article cites 25 articles, 7 of which can be accessed free at:
Open Access
non-commercial. See: http://creativecommons.org/licenses/by-nc/3.0/terms, provided the original work is properly cited and the use iswork non-commercially, and license their derivative works on different license, which permits others to distribute, remix, adapt, build upon thisCreative Commons Attribution Non Commercial (CC BY-NC 3.0) This is an Open Access article distributed in accordance with the
serviceEmail alerting
the box at the top right corner of the online article.Receive free email alerts when new articles cite this article. Sign up in
CollectionsTopic
(544 articles)Public health � (604 articles)Epidemiology �
(233 articles)Cardiovascular medicine � Articles on similar topics can be found in the following collections
http://group.bmj.com/group/rights-licensing/permissionsTo request permissions go to:
http://journals.bmj.com/cgi/reprintformTo order reprints go to:
http://group.bmj.com/subscribe/To subscribe to BMJ go to:
group.bmj.com on January 28, 2014 - Published by bmjopen.bmj.comDownloaded from

Notes
http://group.bmj.com/group/rights-licensing/permissionsTo request permissions go to:
http://journals.bmj.com/cgi/reprintformTo order reprints go to:
http://group.bmj.com/subscribe/To subscribe to BMJ go to:
group.bmj.com on January 28, 2014 - Published by bmjopen.bmj.comDownloaded from


![[Guideline of atrial fibrillation]](https://img.pdfslide.net/doc/110x75/634997ca8e60111deb0a49ae/guideline-of-atrial-fibrillation.jpg)


