Embed Size (px)
Citation preview
J. Bio. & Env. Sci. 2015
259 | Lederoun et al.
RESEARCH PAPER OPEN ACCESS
Population parameters and exploitation rate of Sarotherodon
melanotheron melanotheron rüppell, 1852 (Cichlidae) in Lake Toho,
Benin
Djiman Lederoun1,2,3, Antoine Chikou2, Emmanuel Vreven3, Jos Snoeks3,4, Jacques
Moreau5, Pierre Vandewalle1, Philippe Lalèyè2
1Laboratory of Functional and Evolutionary Morphology, University of Liège, Chemistry Institute
B6, Sart Tilman, B-4000 Liege, Belgium
2Laboratory of Hydrobiology and Aquaculture, Faculty of Agricultural Sciences, University of
Abomey-Calavi, 01 BP: 526 Cotonou, Benin
3Royal Museum for Central Africa, Vertebrate Section, Ichthyology, Leuvensesteenweg 13, 3080
Tervuren, Belgium
4KU Leuven, Laboratory of Biodiversity and Evolutionary Genomics, Charles Deberiotstraat 32,
3000 Leuven, Belgium
5Department of Aquatic Environment, INP/ENSAT, Avenue de l’Agrobiopole, BP 107 Auzeville
Tolosane, 31326 Castanet Tolosan, France
Key words: Demographic parameters, Lake Toho, Mono basin, Sarotherodon melanotheron melanotheron,
West Africa.
Article published on February 09, 2015
Abstract Aspects of the population dynamics of Sarotherodon melanotheron melanotheron, which is a commercially important fish
species in Lake Toho, were described based on 1558 specimens collected monthly between January and December 2012 from
artisanal captures. The size at first maturity was estimated at 6.9 cm for males and 7.7 cm for females. The asymptotic length
obtained by analyzing frequency data with FiSATII software (FAO-ICLARM) has been estimated at 21.5 cm. Further, the von
Bertalanffy growth coefficient was 0.58 year-1 and the overall growth performance index was 2.43. The estimates of the total,
natural and fishing mortalities were 1.95, 1.37 and 0.58 year -1 respectively. The current exploitation rate was 0.30 and as such,
remains below the maximum exploitation rate which was 0.55 according to the selection ogive procedure. However, this value
is superior to the exploitation rate at 50% of its unexploited biomass (E0.5 = 0.27). Therefore, a reduction of the current
exploitation rate is needed by, at least, 10% to maintain a sufficient biomass. The size at first capture was estimated at 6.7 cm
which is lower than the size at first maturity for both sexes, but especially for females. These parameters clearly reflect a
current trend of overexploitation.
*Corresponding Author: Djiman Lederoun [email protected]
Journal of Biodiversity and Environmental Sciences (JBES)
ISSN: 2220-6663 (Print), 2222-3045 (Online)
http://www.innspub.net
Vol. 6, No. 2, p. 259-271, 2015
J. Bio. & Env. Sci. 2015
260 | Lederoun et al.
Introduction
The Mono basin, shared between Benin and Togo,
counts many lakes within its modest surface (0.2-15
km2) in its lower course in Benin (Amoussou, 2010).
Amongst them is Lake Toho, in which Cichlidae fish
constitute about 98% of the total captures.
Sarotherodon melanotheron melanotheron Rüppell
(1852) (A.A. Brahim, unpubl. data) is the most
abundant species both in number (92%) and weight
(95%). The species abundance coupled with its
lucrative market value subjects it to intense fishing
activity by varied fishing methods, mainly large
scoops. Such an intense exploitation may cause a
depletion of this resource and further the
deterioration of social conditions of fishermen. The
annual statistics of fish (unpublished) from Benin’s
Department of Fisheries show that the species
abundance has declined between 1990 and 2012.
Therefore, knowledge of the population dynamics of
the species is necessary for its rational management
in view of its importance as a socio-economic
resource (Lowe McConnell, 1999; Al-Barwani et al.,
2007).
Prior to this study, no studies had been conducted to
estimate growth parameters and exploitation rate on
fish from Mono basin despite its importance as a
fisheries resource. One study (Niyonkuru, 2007), was
done on three species of Cichlidae i.e S. m.
melanotheron, Tilapia guineensis (Bleeker in
Günther, 1862) and Hemichromis fasciatus (Peters,
1852) in Lake Ahémé (Couffo basin) and Lake Nokoué
(Ouémé basin). The present study was undertaken to
assess the population parameters and the level of
exploitation of S. m. melanotheron in Lake Toho. The
study intends to contribute essential scientific
information for rational management and
exploitation of S. m. melanotheron.
Materials and methods
Study area
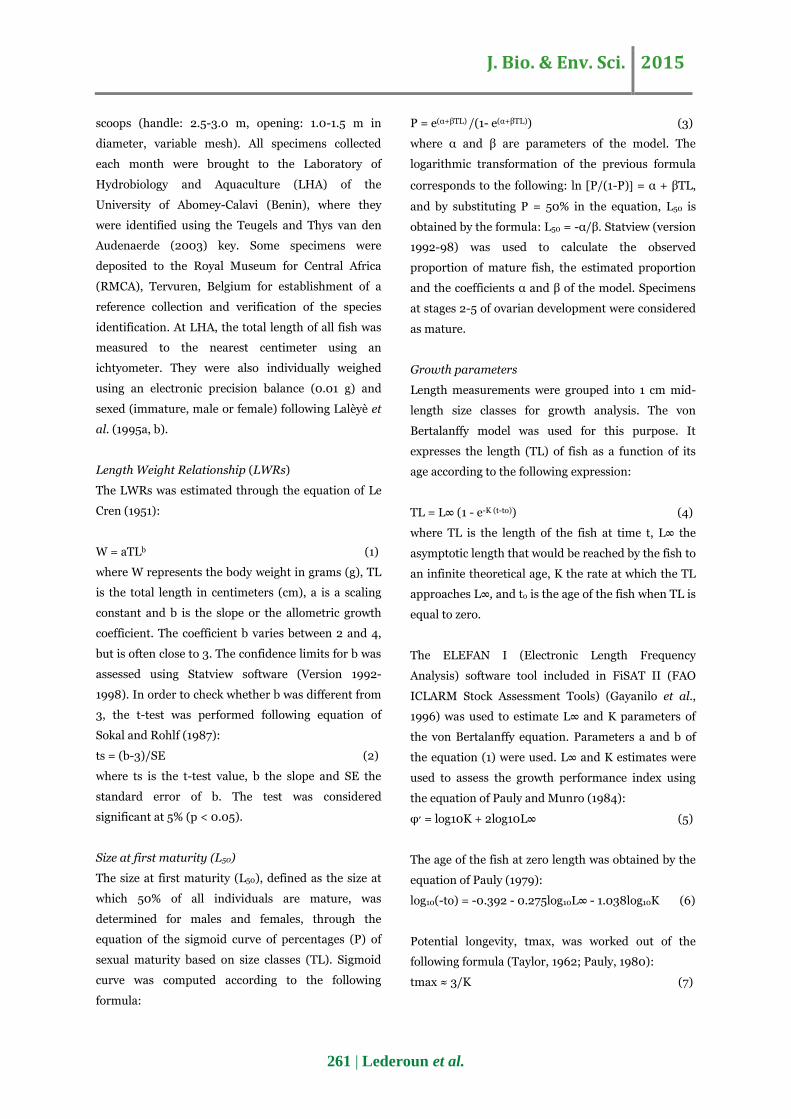
Lake Toho (6°35'-6°40'N, 1°45'-1°50'E), is located in
the lower course of the Mono basin in Southern
Benin. It covers an area of 9.6 km² at low water level
and 15 km² during the flood season (Fig. 1). Its
average length and width are 7 km and 2.5 km
respectively. The lake was once directly connected to
the Sazué River, a tributary of the left bank of the
Mono River that fed it with brackish water. This
connection is now only re-established only during
periods of extreme floods, a scenario that justifies the
presence of an isolated population of S. m.
melanotheron which forms the rationale of this study.
Due to its geographical location, Lake Toho is
influenced by a sub-equatorial climate characterized
by four distinct seasons: (1) a long rainy season from
mid-March to mid-July, (2) one dry season from mid-
July to mid-September, (3) a short rainy season from
mid-September to mid-November and (4) a long dry
season from mid-November to mid-March dominated
by continental winds and harmattan. The annual
rainfall varies between 544 mm and 1376 mm while
the temperature is between 20.6 and 33.5°C with an
annual average of 28°C. Relative humidity is very
high and varies from 65% in January to 80.6% in
June (ASECNA 1981-2010, Cotonou station).
Fig. 1. Study area.
Sampling method
Samples of S. m. melanotheron were collected from
commercial captures. The fish were caught between
January and December 2012 using locally assembled
J. Bio. & Env. Sci. 2015
261 | Lederoun et al.
scoops (handle: 2.5-3.0 m, opening: 1.0-1.5 m in
diameter, variable mesh). All specimens collected
each month were brought to the Laboratory of
Hydrobiology and Aquaculture (LHA) of the
University of Abomey-Calavi (Benin), where they
were identified using the Teugels and Thys van den
Audenaerde (2003) key. Some specimens were
deposited to the Royal Museum for Central Africa
(RMCA), Tervuren, Belgium for establishment of a
reference collection and verification of the species
identification. At LHA, the total length of all fish was
measured to the nearest centimeter using an
ichtyometer. They were also individually weighed
using an electronic precision balance (0.01 g) and
sexed (immature, male or female) following Lalèyè et
al. (1995a, b).
Length Weight Relationship (LWRs)
The LWRs was estimated through the equation of Le
Cren (1951):
W = aTLb (1)
where W represents the body weight in grams (g), TL
is the total length in centimeters (cm), a is a scaling
constant and b is the slope or the allometric growth
coefficient. The coefficient b varies between 2 and 4,
but is often close to 3. The confidence limits for b was
assessed using Statview software (Version 1992-
1998). In order to check whether b was different from
3, the t-test was performed following equation of
Sokal and Rohlf (1987):
ts = (b-3)/SE (2)
where ts is the t-test value, b the slope and SE the
standard error of b. The test was considered
significant at 5% (p < 0.05).
Size at first maturity (L50)
The size at first maturity (L50), defined as the size at
which 50% of all individuals are mature, was
determined for males and females, through the
equation of the sigmoid curve of percentages (P) of
sexual maturity based on size classes (TL). Sigmoid
curve was computed according to the following
formula:
P = e(α+βTL) /(1- e(α+βTL)) (3)
where α and β are parameters of the model. The
logarithmic transformation of the previous formula
corresponds to the following: ln [P/(1-P) = α + βTL,
and by substituting P = 50% in the equation, L50 is
obtained by the formula: L50 = -α/β. Statview (version
1992-98) was used to calculate the observed
proportion of mature fish, the estimated proportion
and the coefficients α and β of the model. Specimens
at stages 2-5 of ovarian development were considered
as mature.
Growth parameters
Length measurements were grouped into 1 cm mid-
length size classes for growth analysis. The von
Bertalanffy model was used for this purpose. It
expresses the length (TL) of fish as a function of its
age according to the following expression:
TL = L∞ (1 - e-K (t-to)) (4)
where TL is the length of the fish at time t, L∞ the
asymptotic length that would be reached by the fish to
an infinite theoretical age, K the rate at which the TL
approaches L∞, and to is the age of the fish when TL is
equal to zero.
The ELEFAN I (Electronic Length Frequency
Analysis) software tool included in FiSAT II (FAO
ICLARM Stock Assessment Tools) (Gayanilo et al.,
1996) was used to estimate L∞ and K parameters of
the von Bertalanffy equation. Parameters a and b of
the equation (1) were used. L∞ and K estimates were
used to assess the growth performance index using
the equation of Pauly and Munro (1984):
φ׳ = log10K + 2log10L∞ (5)
The age of the fish at zero length was obtained by the
equation of Pauly (1979):
log10(-to) = -0.392 - 0.275log10L∞ - 1.038log10K (6)
Potential longevity, tmax, was worked out of the
following formula (Taylor, 1962; Pauly, 1980):
tmax ≈ 3/K (7)
J. Bio. & Env. Sci. 2015
262 | Lederoun et al.
Mortality and exploitation rate
The total mortality coefficient, Z (year-1), was
estimated following the linear length-converted catch
curve method incorporated in FiSAT II software. The
final estimates of L∞ and K and the length
distribution data for the species were used in this
calculation (Pauly, 1983, 1984, 1990; Pauly et al.,
1995). Natural mortality rate M (year-1) was estimated
according to Pauly’s (1980) empirical equation:
Log10M = 0.654log10K - 0.28log10L∞ + log10T°C*
0.4634 - 0.0066 (8)
K and L∞ are the parameters of the equation (4) and
T, the average annual temperature of the water which
is 28°C. Fishing mortality rate (F) was evaluated
using the equation:
F = Z – M (9)
The exploitation rate (E), was obtained from the
relation:
E = F/Z (10)
E expressed the proportion of a given
cohort/population that ultimately dies due to existing
exploitation pressure (Beverton and Holt, 1966).
Size at first capture and optimal size
The size at first capture (Lc) was estimated from the
Ogive selection method whereby it is assumed that
the chance of capturing any fish is a function of its
length. The optimal length Lopt was estimated using
Froese’s (2004) equation:
Lopt = L∞(3/(3+(M/K))) (11)
where L∞ and K are function of the von Bertalanffy
growth and M the natural mortality rate.
Relative yield per recruit (Y'/R) and reference points
Beverton and Holt’s (1966) modified model (Pauly
and Soriano, 1986), was used to predict the relative
yield per recruit (Y/R) of the species to the fisheries
following the formula below:
Y’/R = EUM/K[1-(3U)/(1+m)+(3U²)/(1+2m)-
(U3)/(1+3m)] (12)
where E corresponds to the current exploitation rate
i.e. the fraction of death caused by fishing activity, F
the fishing mortality rate, M the natural mortality
coefficient and Z the total mortality coefficient. U = 1-
(Lc/L∞) is the fraction of growth to be completed by
the fish after its entry into the exploitation phase (Lc
= mean length at first capture, L∞ = asymptotic
length), m = (1-E)/(M/K) = K/Z (with K being the von
Bertalanffy growth parameter). Relative biomass per
recruit (B'/R) was estimated as:
B'/R = (Y'/R)/F (13)
The reference points used to determine the status of
S. m. melanotheron stock of Lake Toho were the
fishing mortality rate (F); the exploitation level at
which the marginal increase in yield per recruit
reaches 1/10 of the marginal increase computed at a
very low value of E (E0.1); the exploitation level that
will result in a reduction of the unexploited biomass
by 50% (E0.5); and the exploitation level that
produces the maximum yield per recruit (Emax).
Recruitment patterns
The recruitment patterns were obtained by projecting
length frequencies backward onto a one-year time
scale (Moreau and Cuende, 1991).
Results
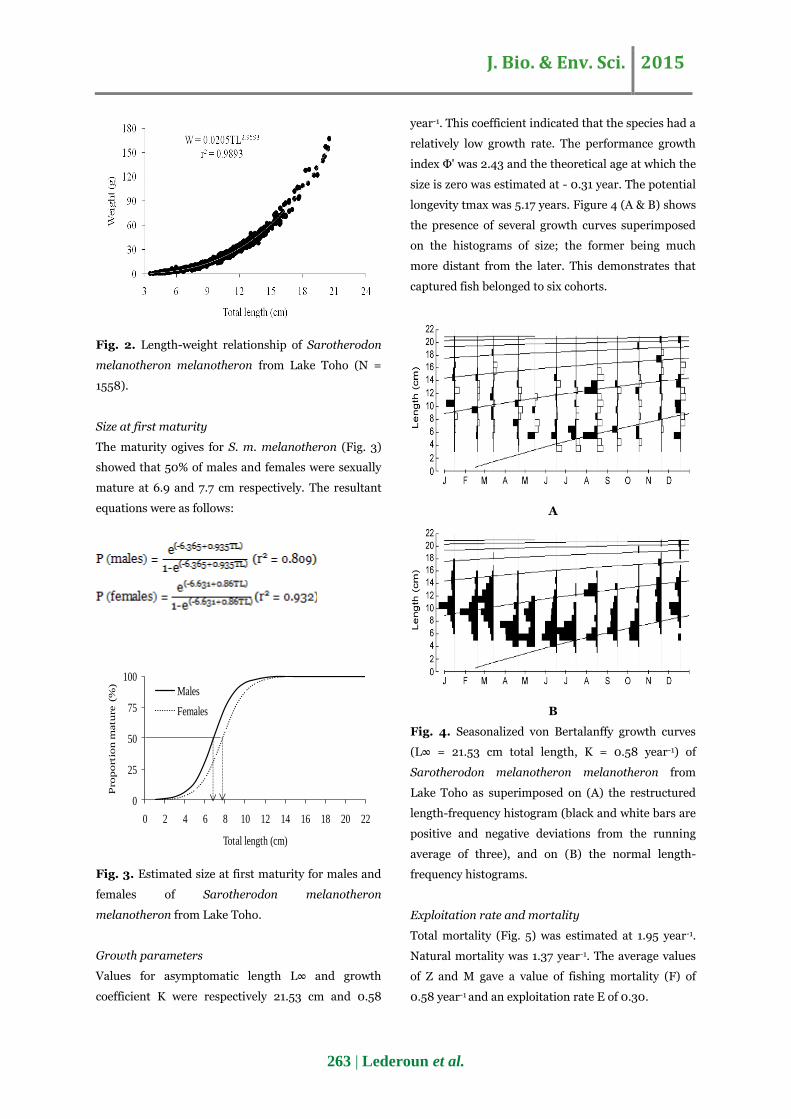
Length weight relationship
The measurements of length and weight of all
specimens (N = 1558) were used to describe the
length-weight relationship of S. m. melanotheron in
Lake Toho (Fig. 2). The total length ranged between
3.5 cm and 20.5 cm, while the total weight ranged
between 0.8 g and 167.1 g. The following equation was
obtained: W = 0.0205TL2.9593 (r2 = 0.9893, SE =
0.008). The allometric coefficient b was significantly
different from 3 (Student's t-test: p < 0.05) and
growth was of a negative allometric type (b < 3,
confidence interval 95% of b: 2.944-2.975).
J. Bio. & Env. Sci. 2015
263 | Lederoun et al.
Fig. 2. Length-weight relationship of Sarotherodon
melanotheron melanotheron from Lake Toho (N =
1558).
Size at first maturity
The maturity ogives for S. m. melanotheron (Fig. 3)
showed that 50% of males and females were sexually
mature at 6.9 and 7.7 cm respectively. The resultant
equations were as follows:
0
25
50
75
100
0 2 4 6 8 10 12 14 16 18 20 22
Pro
po
rtio
n m
atu
re (
%)
Total length (cm)
Males
Females
Fig. 3. Estimated size at first maturity for males and
females of Sarotherodon melanotheron
melanotheron from Lake Toho.
Growth parameters
Values for asymptomatic length L∞ and growth
coefficient K were respectively 21.53 cm and 0.58
year-1. This coefficient indicated that the species had a
relatively low growth rate. The performance growth
index Ф' was 2.43 and the theoretical age at which the
size is zero was estimated at - 0.31 year. The potential
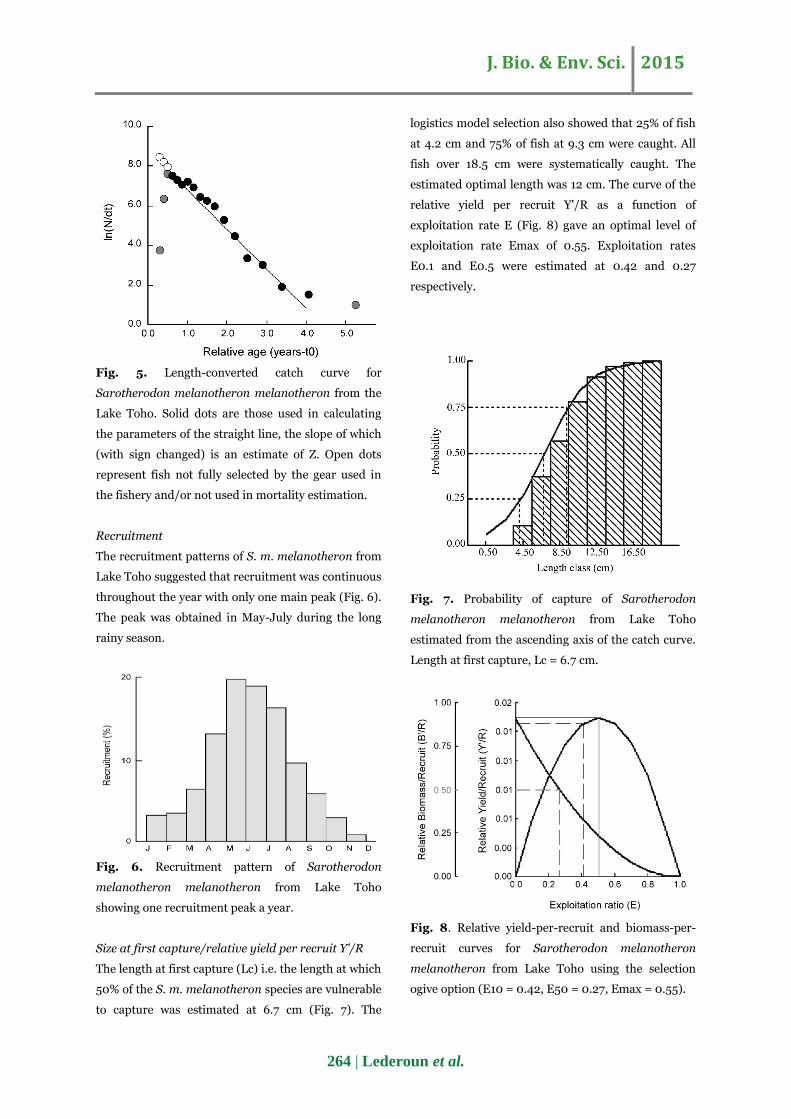
longevity tmax was 5.17 years. Figure 4 (A & B) shows
the presence of several growth curves superimposed
on the histograms of size; the former being much
more distant from the later. This demonstrates that
captured fish belonged to six cohorts.
A
B
Fig. 4. Seasonalized von Bertalanffy growth curves
(L∞ = 21.53 cm total length, K = 0.58 year-1) of
Sarotherodon melanotheron melanotheron from
Lake Toho as superimposed on (A) the restructured
length-frequency histogram (black and white bars are
positive and negative deviations from the running
average of three), and on (B) the normal length-
frequency histograms.
Exploitation rate and mortality
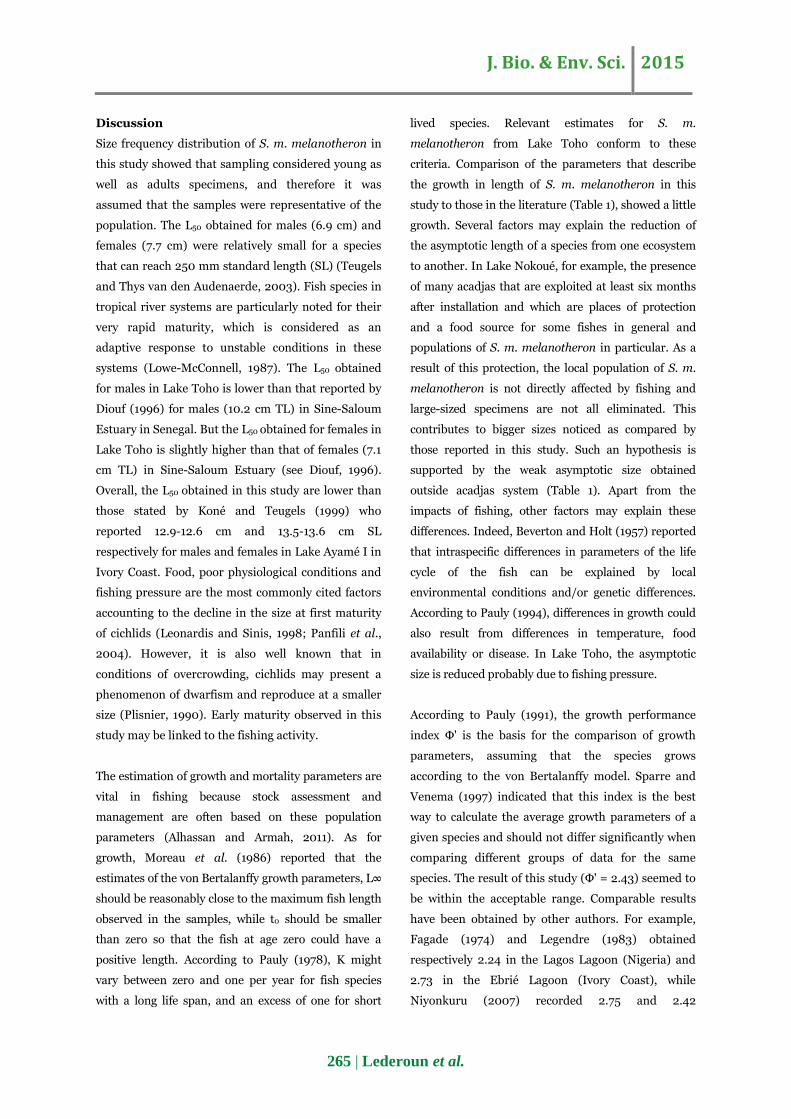
Total mortality (Fig. 5) was estimated at 1.95 year-1.
Natural mortality was 1.37 year-1. The average values
of Z and M gave a value of fishing mortality (F) of
0.58 year-1 and an exploitation rate E of 0.30.
J. Bio. & Env. Sci. 2015
264 | Lederoun et al.
Fig. 5. Length-converted catch curve for
Sarotherodon melanotheron melanotheron from the
Lake Toho. Solid dots are those used in calculating
the parameters of the straight line, the slope of which
(with sign changed) is an estimate of Z. Open dots
represent fish not fully selected by the gear used in
the fishery and/or not used in mortality estimation.
Recruitment
The recruitment patterns of S. m. melanotheron from
Lake Toho suggested that recruitment was continuous
throughout the year with only one main peak (Fig. 6).
The peak was obtained in May-July during the long
rainy season.
Fig. 6. Recruitment pattern of Sarotherodon
melanotheron melanotheron from Lake Toho
showing one recruitment peak a year.
Size at first capture/relative yield per recruit Y'/R
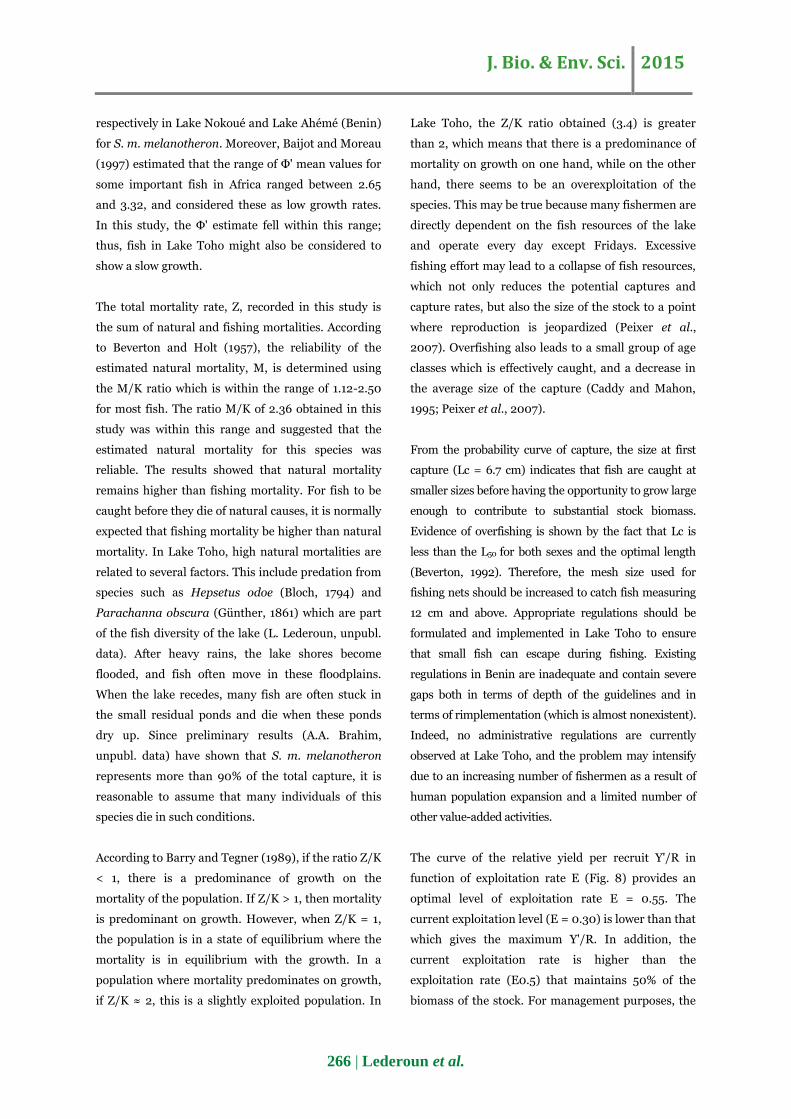
The length at first capture (Lc) i.e. the length at which
50% of the S. m. melanotheron species are vulnerable
to capture was estimated at 6.7 cm (Fig. 7). The
logistics model selection also showed that 25% of fish
at 4.2 cm and 75% of fish at 9.3 cm were caught. All
fish over 18.5 cm were systematically caught. The
estimated optimal length was 12 cm. The curve of the
relative yield per recruit Y'/R as a function of
exploitation rate E (Fig. 8) gave an optimal level of
exploitation rate Emax of 0.55. Exploitation rates
E0.1 and E0.5 were estimated at 0.42 and 0.27
respectively.
Fig. 7. Probability of capture of Sarotherodon
melanotheron melanotheron from Lake Toho
estimated from the ascending axis of the catch curve.
Length at first capture, Lc = 6.7 cm.
Fig. 8. Relative yield-per-recruit and biomass-per-
recruit curves for Sarotherodon melanotheron
melanotheron from Lake Toho using the selection
ogive option (E10 = 0.42, E50 = 0.27, Emax = 0.55).
J. Bio. & Env. Sci. 2015
265 | Lederoun et al.
Discussion
Size frequency distribution of S. m. melanotheron in
this study showed that sampling considered young as
well as adults specimens, and therefore it was
assumed that the samples were representative of the
population. The L50 obtained for males (6.9 cm) and
females (7.7 cm) were relatively small for a species
that can reach 250 mm standard length (SL) (Teugels
and Thys van den Audenaerde, 2003). Fish species in
tropical river systems are particularly noted for their
very rapid maturity, which is considered as an
adaptive response to unstable conditions in these
systems (Lowe-McConnell, 1987). The L50 obtained
for males in Lake Toho is lower than that reported by
Diouf (1996) for males (10.2 cm TL) in Sine-Saloum
Estuary in Senegal. But the L50 obtained for females in
Lake Toho is slightly higher than that of females (7.1
cm TL) in Sine-Saloum Estuary (see Diouf, 1996).
Overall, the L50 obtained in this study are lower than
those stated by Koné and Teugels (1999) who
reported 12.9-12.6 cm and 13.5-13.6 cm SL
respectively for males and females in Lake Ayamé I in
Ivory Coast. Food, poor physiological conditions and
fishing pressure are the most commonly cited factors
accounting to the decline in the size at first maturity
of cichlids (Leonardis and Sinis, 1998; Panfili et al.,
2004). However, it is also well known that in
conditions of overcrowding, cichlids may present a
phenomenon of dwarfism and reproduce at a smaller
size (Plisnier, 1990). Early maturity observed in this
study may be linked to the fishing activity.
The estimation of growth and mortality parameters are
vital in fishing because stock assessment and
management are often based on these population
parameters (Alhassan and Armah, 2011). As for
growth, Moreau et al. (1986) reported that the
estimates of the von Bertalanffy growth parameters, L∞
should be reasonably close to the maximum fish length
observed in the samples, while t0 should be smaller
than zero so that the fish at age zero could have a
positive length. According to Pauly (1978), K might
vary between zero and one per year for fish species
with a long life span, and an excess of one for short
lived species. Relevant estimates for S. m.
melanotheron from Lake Toho conform to these
criteria. Comparison of the parameters that describe
the growth in length of S. m. melanotheron in this
study to those in the literature (Table 1), showed a little
growth. Several factors may explain the reduction of
the asymptotic length of a species from one ecosystem
to another. In Lake Nokoué, for example, the presence
of many acadjas that are exploited at least six months
after installation and which are places of protection
and a food source for some fishes in general and
populations of S. m. melanotheron in particular. As a
result of this protection, the local population of S. m.
melanotheron is not directly affected by fishing and
large-sized specimens are not all eliminated. This
contributes to bigger sizes noticed as compared by
those reported in this study. Such an hypothesis is
supported by the weak asymptotic size obtained
outside acadjas system (Table 1). Apart from the
impacts of fishing, other factors may explain these
differences. Indeed, Beverton and Holt (1957) reported
that intraspecific differences in parameters of the life
cycle of the fish can be explained by local
environmental conditions and/or genetic differences.
According to Pauly (1994), differences in growth could
also result from differences in temperature, food
availability or disease. In Lake Toho, the asymptotic
size is reduced probably due to fishing pressure.
According to Pauly (1991), the growth performance
index Ф' is the basis for the comparison of growth
parameters, assuming that the species grows
according to the von Bertalanffy model. Sparre and
Venema (1997) indicated that this index is the best
way to calculate the average growth parameters of a
given species and should not differ significantly when
comparing different groups of data for the same
species. The result of this study (Ф' = 2.43) seemed to
be within the acceptable range. Comparable results
have been obtained by other authors. For example,
Fagade (1974) and Legendre (1983) obtained
respectively 2.24 in the Lagos Lagoon (Nigeria) and
2.73 in the Ebrié Lagoon (Ivory Coast), while
Niyonkuru (2007) recorded 2.75 and 2.42
J. Bio. & Env. Sci. 2015
266 | Lederoun et al.
respectively in Lake Nokoué and Lake Ahémé (Benin)
for S. m. melanotheron. Moreover, Baijot and Moreau
(1997) estimated that the range of Ф' mean values for
some important fish in Africa ranged between 2.65
and 3.32, and considered these as low growth rates.
In this study, the Ф' estimate fell within this range;
thus, fish in Lake Toho might also be considered to
show a slow growth.
The total mortality rate, Z, recorded in this study is
the sum of natural and fishing mortalities. According
to Beverton and Holt (1957), the reliability of the
estimated natural mortality, M, is determined using
the M/K ratio which is within the range of 1.12-2.50
for most fish. The ratio M/K of 2.36 obtained in this
study was within this range and suggested that the
estimated natural mortality for this species was
reliable. The results showed that natural mortality
remains higher than fishing mortality. For fish to be
caught before they die of natural causes, it is normally
expected that fishing mortality be higher than natural
mortality. In Lake Toho, high natural mortalities are
related to several factors. This include predation from
species such as Hepsetus odoe (Bloch, 1794) and
Parachanna obscura (Günther, 1861) which are part
of the fish diversity of the lake (L. Lederoun, unpubl.
data). After heavy rains, the lake shores become
flooded, and fish often move in these floodplains.
When the lake recedes, many fish are often stuck in
the small residual ponds and die when these ponds
dry up. Since preliminary results (A.A. Brahim,
unpubl. data) have shown that S. m. melanotheron
represents more than 90% of the total capture, it is
reasonable to assume that many individuals of this
species die in such conditions.
According to Barry and Tegner (1989), if the ratio Z/K
< 1, there is a predominance of growth on the
mortality of the population. If Z/K > 1, then mortality
is predominant on growth. However, when Z/K = 1,
the population is in a state of equilibrium where the
mortality is in equilibrium with the growth. In a
population where mortality predominates on growth,
if Z/K ≈ 2, this is a slightly exploited population. In
Lake Toho, the Z/K ratio obtained (3.4) is greater
than 2, which means that there is a predominance of
mortality on growth on one hand, while on the other
hand, there seems to be an overexploitation of the
species. This may be true because many fishermen are
directly dependent on the fish resources of the lake
and operate every day except Fridays. Excessive
fishing effort may lead to a collapse of fish resources,
which not only reduces the potential captures and
capture rates, but also the size of the stock to a point
where reproduction is jeopardized (Peixer et al.,
2007). Overfishing also leads to a small group of age
classes which is effectively caught, and a decrease in
the average size of the capture (Caddy and Mahon,
1995; Peixer et al., 2007).
From the probability curve of capture, the size at first
capture (Lc = 6.7 cm) indicates that fish are caught at
smaller sizes before having the opportunity to grow large
enough to contribute to substantial stock biomass.
Evidence of overfishing is shown by the fact that Lc is
less than the L50 for both sexes and the optimal length
(Beverton, 1992). Therefore, the mesh size used for
fishing nets should be increased to catch fish measuring
12 cm and above. Appropriate regulations should be
formulated and implemented in Lake Toho to ensure
that small fish can escape during fishing. Existing
regulations in Benin are inadequate and contain severe
gaps both in terms of depth of the guidelines and in
terms of rimplementation (which is almost nonexistent).
Indeed, no administrative regulations are currently
observed at Lake Toho, and the problem may intensify
due to an increasing number of fishermen as a result of
human population expansion and a limited number of
other value-added activities.
The curve of the relative yield per recruit Y'/R in
function of exploitation rate E (Fig. 8) provides an
optimal level of exploitation rate E = 0.55. The
current exploitation level (E = 0.30) is lower than that
which gives the maximum Y'/R. In addition, the
current exploitation rate is higher than the
exploitation rate (E0.5) that maintains 50% of the
biomass of the stock. For management purposes, the
J. Bio. & Env. Sci. 2015
267 | Lederoun et al.
exploitation rate of S. m. melanotheron should be
reduced from 0.30 to 0.27 (10%) to maintain
sufficient spawning biomass.
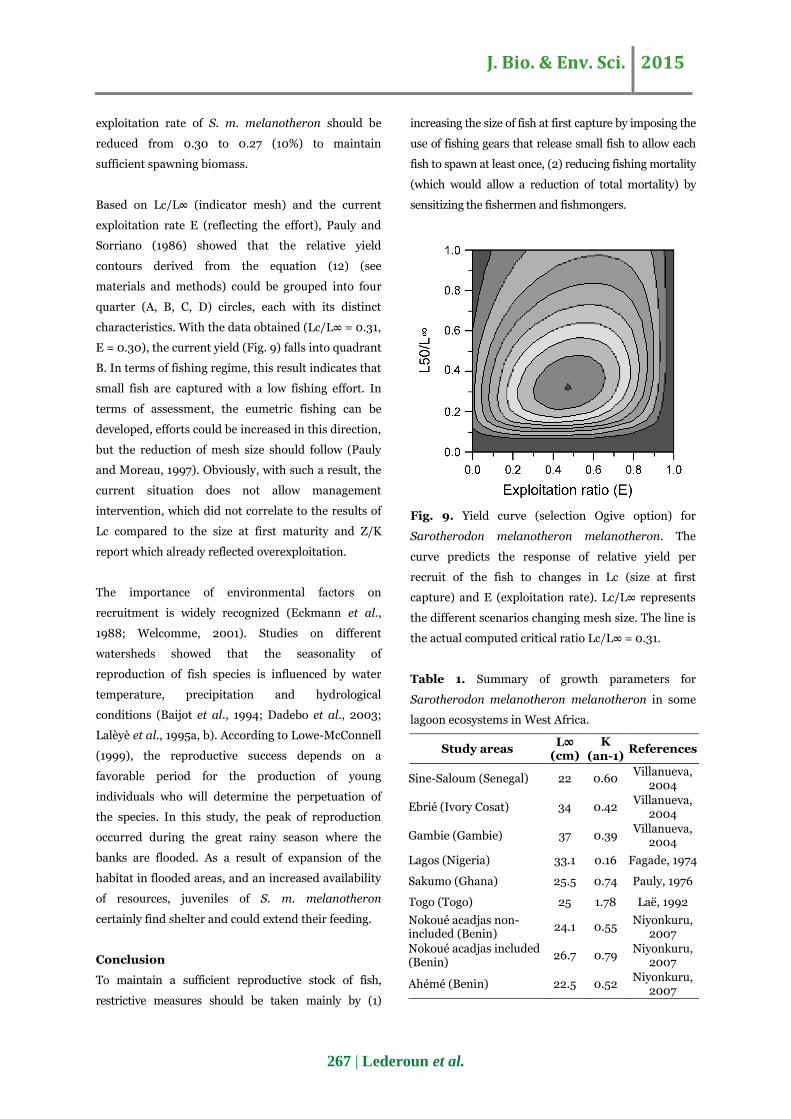
Based on Lc/L∞ (indicator mesh) and the current
exploitation rate E (reflecting the effort), Pauly and
Sorriano (1986) showed that the relative yield
contours derived from the equation (12) (see
materials and methods) could be grouped into four
quarter (A, B, C, D) circles, each with its distinct
characteristics. With the data obtained (Lc/L∞ = 0.31,
E = 0.30), the current yield (Fig. 9) falls into quadrant
B. In terms of fishing regime, this result indicates that
small fish are captured with a low fishing effort. In
terms of assessment, the eumetric fishing can be
developed, efforts could be increased in this direction,
but the reduction of mesh size should follow (Pauly
and Moreau, 1997). Obviously, with such a result, the
current situation does not allow management
intervention, which did not correlate to the results of
Lc compared to the size at first maturity and Z/K
report which already reflected overexploitation.
The importance of environmental factors on
recruitment is widely recognized (Eckmann et al.,
1988; Welcomme, 2001). Studies on different
watersheds showed that the seasonality of
reproduction of fish species is influenced by water
temperature, precipitation and hydrological
conditions (Baijot et al., 1994; Dadebo et al., 2003;
Lalèyè et al., 1995a, b). According to Lowe-McConnell
(1999), the reproductive success depends on a
favorable period for the production of young
individuals who will determine the perpetuation of
the species. In this study, the peak of reproduction
occurred during the great rainy season where the
banks are flooded. As a result of expansion of the
habitat in flooded areas, and an increased availability
of resources, juveniles of S. m. melanotheron
certainly find shelter and could extend their feeding.
Conclusion
To maintain a sufficient reproductive stock of fish,
restrictive measures should be taken mainly by (1)
increasing the size of fish at first capture by imposing the
use of fishing gears that release small fish to allow each
fish to spawn at least once, (2) reducing fishing mortality
(which would allow a reduction of total mortality) by
sensitizing the fishermen and fishmongers.
Fig. 9. Yield curve (selection Ogive option) for
Sarotherodon melanotheron melanotheron. The
curve predicts the response of relative yield per
recruit of the fish to changes in Lc (size at first
capture) and E (exploitation rate). Lc/L∞ represents
the different scenarios changing mesh size. The line is
the actual computed critical ratio Lc/L∞ = 0.31.
Table 1. Summary of growth parameters for
Sarotherodon melanotheron melanotheron in some
lagoon ecosystems in West Africa.
Study areas L∞
(cm) K
(an-1) References
Sine-Saloum (Senegal) 22 0.60 Villanueva,
2004
Ebrié (Ivory Cosat) 34 0.42 Villanueva,
2004
Gambie (Gambie) 37 0.39 Villanueva,
2004
Lagos (Nigeria) 33.1 0.16 Fagade, 1974
Sakumo (Ghana) 25.5 0.74 Pauly, 1976
Togo (Togo) 25 1.78 Laë, 1992
Nokoué acadjas non-included (Benin)
24.1 0.55 Niyonkuru,
2007
Nokoué acadjas included (Benin)
26.7 0.79 Niyonkuru,
2007
Ahémé (Benin) 22.5 0.52 Niyonkuru,
2007
J. Bio. & Env. Sci. 2015
268 | Lederoun et al.
Acknowledgement
We sincerely thank the fishermen of Lake Toho,
particularly Mr. Fulbert for his constant assistance
throughout data collection. Many thanks also to
Brahim Amba Abba (LHA) as well for his
participation. Maps and figures are the products of
the talent of Tobias Musschoot (FishBase, MRAC) to
whom we express our much gratitude. This study is
part of a PhD program financed by Agence
Universitaire de la Francophonie (AUF) (2010-2013)
and the International Foundation for Science (IFS)
(2013-2015).
References
Al-Barwani SM, Arshad A, Nurul Amin SM,
Japar SB, Siraj SS, Yap CK. 2007. Population
dynamics of the green mussel Perna viridis from the
high spat-fall coastal water of Malacca, Peninsular
Malaysia. Fisheries Research 84, 147-152.
Alhassan EH, Armah AK. 2011. Population
Dynamics of the African River Prawn,
Macrobrachium vollenhovenii, in Dawhenya
Impoundment. Turkish Journal of Fisheries and
Aquatic Sciences 11, 113-119.
Amoussou E. 2010. Variabilité pluviométrique et
dynamique hydro-sédimentaire du bassin-versant du
complexe fluvio-lagunaire Mono-Ahémé-Couffo
(Afrique de l’Ouest). Thèse présentée pour l'obtention
du doctorat en Géographie-Spécialité: Géographie
physique appliquée, Université de Bourgogne, Paris,
1-315.
Baijot E, Moreau J, Bouda S. 1994. Aspects
hydrobiologiques et piscicoles des retenues en zone
soudano-sahélienne. CTA, Wageningen, p. 1-250.
Baijot E, Moreau J. 1997. Biology and
demographic status of the main fish species in the
reservoirs of Burkina Faso. In: Baijot E, Moreau J,
Bouda S, Ed. Hydrological Aspects of Fisheries in
Small Resersoirs in the Sahel Region, Wageningen,
Netherlands: Technical Centre for Agricultural and
Rural Cooperation, p. 79-109.
Barry JP, Tegner MJ. 1989. Inferring demographic
processes from size-frequency distributions: simple
models indicate specific patterns of growth and
mortality. Fishery Bulletin 88, 13-19.
Beverton RJH, Holt SJ. 1957. On the dynamics of
exploited fish populations. Ministry of Agriculture,
Fisheries and Food, Fisheries Investigation, London.
Series 2, p. 1-533.
Beverton RJH, Holt SJ. 1966. Manual of methods for
fish stock assessment: Part II. Tables of yield function.
FAO Fisheries Biology Technical Paper, p. 1-67.
Beverton RJH. 1992. Patterns of reproductive
strategy parameters in some marine teleosts fishes.
Journal of Fish Biology, 41, 137-160.
Caddy JF, Mahon R. 1995. Reference points for
fisheries management. Roma: FAO, p.1- 83.
Dadebo E, Ahlgren G, Ahlgren I. 2003. Aspects
of reproductive biology of Labeo horie Heckel (Pisces:
Cyprinidae) in Lake Chamo, Ethiopia African Journal
of Ecology 41, 31-38.
Diouf PS. 1996. Les peuplements de poissons des
milieux estuariens de l'Afrique de l'Ouest: L'exemple
de l'estuaire hyperhalin du Sine-Saloum, Université
de Montpellier II. Thèses et Documents Microfiches.
ORSTOM, Paris, 1-267.
Eckmann R, Gaedke U, Wetzlar HJ. 1988.
Effects of climatic and density-dependent factors on
year-class strength of Coregonus lavaretus in Lake
Constance. Canadian Journal of Fisheries and Aquatic
Sciences 45, 1088-1093.
Fagade SO. 1974. Age determination in Tilapia
melanotheron (Rüppel) in the Lagos Lagoon, Lagos,
Nigeria, with a discussion of the environmental and
J. Bio. & Env. Sci. 2015
269 | Lederoun et al.
physiological basis of growth markings in the tropics.
In: Bagenal TB, Ed. The ageing of fish, Unwin
Brothers Ltd, Old Woking, Surrey, England, p. 71-77.
Fröese R. 2004. Keep it simple: three indicators to
deal with overfishing. Fish and Fisheries 5, 86-91.
Gayanilo FC, Jr Sparre P, Pauly D. 1996. FAO-
ICLARM stock assessment tools (FiSAT). User’s
Guide. FAO computerized information series
(Fisheries). FAO, Rome.
Koné T, Teugels GG. 1999. Données sur la
reproduction d’un tilapia estuarien (Sarotherodon
melanotheron) isolé dans un lac de barrage ouest
africain. Aquatic Living Resources 12, 289-293.
Laë R. 1992. Les pêcheries artisanales lagunaires
ouest-africaines : échantillonnage et dynamique de la
ressource et de l’exploitation. Thèse de Doctorat,
Editions ORSTOM, Paris, 1-201.
Lalèyè P, Philippart J-C, Heymans J-C. 1995a.
Cycle annuel de l’indice gonadosomatique et de la
condition chez deux espèces de Chrysichthys
(Siluriformes, Bagridae) au lac Nokoué et à la lagune
de Porto-Novo au Bénin. Cybium 19, 131-142.
Lalèyè P, Philippart J-C, Poncin P. 1995b.
Biologie de la reproduction de deux espèces de
Chrysichthys (Siluriformes, Bagridae) du lac Nokoué
et de la lagune de Porto-Novo au Bénin. Journal of
African Zoology 109, 213-224.
Le Cren ED. 1951. The length-weight relationship
and seasonal cycle in gonad weight and condition in
Perch (Perca fluviatilis). Journal of Animal Ecology
20, 201-219.
Legendre M. 1983. Observations préliminaires sur
la croissance et le comportement en élevage de
Sarotherodon melanotheron (Ruppel, 1852) et de
Tilapia guineensis en lagune Ebrié (Côte d'Ivoire).
Document Scientifique Centre de Recherche
Océanographique, Abidjan 14, 1-36.
Leonardis I, Sinis A. 1998. Reproductive strategy
of Aphanius fasciatus Nardo, 1827 (Pisces:
Cyprinodontidae) in the Mesolongi and Etolikon
lagoons (W. Greece). Fisheries Research 35, 171-181.
Lowe-McConnell RH. 1987. Ecological studies in
tropical fish communities, Cambridge University
Press, p. 1-382.
Lowe-McConnell RH. 1999. Estudos EcolÓgicos de
Communidades de Peixes Tropicais. Edusp, São Paulo.
Moreau J, Cuende FX. 1991. On improving the
resolution of the recruitment patterns of fishes.
Fishbyte 9, 45-46.
Moreau J, Bambino C, Pauly D. 1986. A
comparison of four indices of overall growth
performance based on 100 tilapia populations (Fam.
Cichlidae). In: Maclean J, Dizon LB, Hosillo LV, Ed.
The first Asian fisheries forum, Asian Fisheries
Society, Manila, 201-206.
Niyonkuru C. 2007. Etude comparée de
l’exploitation et de la démographie des poissons
Cichlidés dans les lacs Nokoué et Ahémé au Bénin.
Thèse de Doctorat en Gestion de l’Environnement,
Université d’Abomey-Calavi, Bénin, 1-199.
Panfili J, Mbow A, Durand JD, Diop K, Diouf
K, Thior D, Ndiaye P, Laë R. 2004. Influence on
the life-history traits of the West African black-
chinned tilapia (Sarotherodon melanotheron):
Comparison between the Gambia and the Saloum
estuaries. Aquatic Living Resources 17, 65-74.
Plisnier PD. 1990. Ecologie comparée et exploitation
rationnelle de deux populations d’Haplochromis spp.
(Teleostei, Cichlidae) des lacs Ihema et Muhazi
(Rwanda). Thèse de doctorat Sciences Agronomiques,
Université Catholique de Louvain, 1-300.
J. Bio. & Env. Sci. 2015
270 | Lederoun et al.
Pauly D. 1976. The biology, fishery and potential for
aquaculture of Tilapia melanotheron in a small West
African lagoon. Aquaculture 7, 33-49.
Pauly, D. 1978. A preliminary compilation of fish
length growth parameters. Berichte des Institut für.
Meereskunde an der Christian-Albrechtc Universität
Kiel 55, p 1-200.
Pauly, D. 1979. Theory and management of tropical
multispecies stocks: a review with emphasis on the
Southeast Asian demersal fisheries. ICLARM Sudies
Review 1.
Pauly D. 1980. On the interrelationships between
natural mortality, growth parameters and mean
environmental temperature in 175 fish stocks. Journal
du Conseil Inernational pour l’Exploration de la Mer
39, 175-192.
Pauly D. 1983. Length-converted catch curve: a
powerful tool for fisheries research in the tropics
(Part I). Fishbyte 1, 9-13.
Pauly D. 1984. Length-converted catch curve: a
powerful tool for fisheries research in the tropics
(Part II). Fishbyte 2, 17-19.
Pauly D, Munro JL. 1984. Once more on the
comparison of growth in fish and invertebrates.
Fishbyte 2, 21-22.
Pauly D, Soriano ML. 1986. Some practical
extensions to Beverton and Holt's relative yield-per-
recruit model. In: Maclean J, Dizon LB, Hosillo LV,
ed. The first Asian fisheries forum, Asian Fisheries
Society, Manila, 491-496.
Pauly D. 1990. Length-converted catch curves and
the seasonal growth of fishes. Fishbyte 8, 33-38.
Pauly D. 1991. Growth performance in fishes:
rigorous description of patterns as a basis for
understanding causal mechanisms. Aquabyte 4, 3-6.
Pauly D. 1994. Quantitative analysis of published
data on the growth, metabolism, food consumption,
and related features of the red-bellied piranha,
Serrasalmus nattereri (Characidae). Environmental
Biology of Fishes 41, 423-437.
Pauly D, Moreau J, Abad N. 1995. Comparison of
age-structured and length-converted catch curves of
brown trout Salmo trutta in two French rivers.
Fisheries Research 22, 197-204.
Pauly D, Moreau J. 1997. Méthodes pour
l’évaluation des ressources halieutiques. Cépaduès
Editions: Toulouse, 1-281.
Peixer J, Catella AC, Petrere Júnior M. 2007.
Yield per recruit of the pacu Piaractus
mesopotamicus (Holmberg, 1887) in the pantanal of
Mato Grosso do Sul, Brazil. Brazilian Journal of
Biology 67, 561-567.
Sparre P, Venema SC. 1997. Introdução á
avaliação de mananciais de peixes tropicais. Parte 1-
Manual. FAO Documento Técnico sobre as Pescas,
306/1, Ver. 2, p. 1-404.
Sokal R, Rohlf F. 1987. Introduction to
Biostatistics. Freeman, New York, USA.
Taylor CC. 1962. Growth equations with metabolic
parameters. Journal du Conseil Permanent
International pour l'Exploration de la Mer 26, 270-280.
Teugels GG, Thys van den Audenaerde DFE.
2003. Cichlidae. In: Paugy D, Lévêque C, Teugels GG,
ed. Faune des Poissons d’Eaux douces et saumâtres
de l’Afrique de l’Ouest, Vol. II. Collection Faune et
Flore Tropicales n°40. Tervuren: Musée Royale de
l’Afrique Centrale; Paris (France): Muséum National
d’Histoire Naturelle; Paris (France): Institut de
Recherche pour le Développement, p. 520-600.
Villanueva MCS. 2004. Biodiversité et relations
trophiques dans quelques milieux estuariens et

J. Bio. & Env. Sci. 2015
271 | Lederoun et al.
lagunaires de l’Afrique de l’Ouest: Adaptations aux
ressources environnementales. Thèse de doctorat
Sciences Agronomiques, Institut national
Polytechnique de Toulouse, 1-194.
Welcomme RL. 2001. Inland Fisheries. Ecology
and Management. FAO and Fishing News Books,
Blackwell Science Ltd, Oxford, p. 1-358.


