Embed Size (px)
Citation preview

JPET#71308
1
POPULATION PHARMACOKINETIC MODELLING OF BLOOD-BRAIN
BARRIER TRANSPORT OF SYNTHETIC ADENOSINE A1 RECEPTOR
AGONISTS
M.P. Schaddelee, D. Groenendaal, J. DeJongh, C.G.J. Cleypool, A.P. IJzerman,
A.G. de Boer and M. Danhof
Division of Pharmacology, Leiden/Amsterdam Center for Drug Research, Leiden
University, Einsteinweg 55, P.O. Box 9502, 2300 RA, Leiden, The Netherlands
(M.P.S., D.G., J.de J., C.G.J.C., A.G.B., M.D.)
Division of Medicinal Chemistry, Leiden/Amsterdam Center for Drug Research,
Leiden University, Einsteinweg 55, P.O. Box 9502, 2300 RA, Leiden, The
Netherlands
(A.P.IJ.)
JPET Fast Forward. Published on August 3, 2004 as DOI:10.1124/jpet.104.071308
Copyright 2004 by the American Society for Pharmacology and Experimental Therapeutics.
This article has not been copyedited and formatted. The final version may differ from this version.JPET Fast Forward. Published on August 3, 2004 as DOI: 10.1124/jpet.104.071308
at ASPE
T Journals on July 15, 2015
jpet.aspetjournals.orgD
ownloaded from

JPET#71308
2
Running title: Pharmacokinetic modelling BBB transport of A1 receptor agonists
Corresponding author:
Meindert Danhof, PharmD., Ph.D., Professor of Pharmacology
Division of Pharmacology, Leiden/Amsterdam Center for Drug Research,
Leiden University, P.O. Box 9502, 2300 RA Leiden, The Netherlands
Phone: +31 71 5276269 Fax: +31 71 5276292
Email: [email protected]
No. of text pages: 34
No. of tables: 2
No. of figures: 6
No. of references: 27
No. of words in abstract: 250
No. of words in introduction: 752
No. of words in discussion: 1512
Recommended section: Absorption, distribution, metabolism and
excretion
Non-standard abbreviations used: BBB, blood-brain barrier; CPA, N6-
cyclopentyladenosine; CNS, central nervous system; 2’dCPA, 2’-deoxy-N6-
cyclopentyladenosine; 8-(methylamino)-N6-cyclopentyladenosine; CHA, N6-
cyclohexyladenosine; HPLC, high-pressure liquid chromatography; PBS, phosphate
buffer solution.
This article has not been copyedited and formatted. The final version may differ from this version.JPET Fast Forward. Published on August 3, 2004 as DOI: 10.1124/jpet.104.071308
at ASPE
T Journals on July 15, 2015
jpet.aspetjournals.orgD
ownloaded from

JPET#71308
3
ABSTRACT
A population pharmacokinetic model is proposed for estimation of the brain
distribution clearance of synthetic A1 receptor agonists in vivo. Rats with permanent
venous and arterial cannulas in combination with a microdialysis probe in the striatum
received intravenous infusions of 8-methylamino-N6-cyclopentyladenosine (MCPA)
and 2'-deoxyribose-N6-cyclopentyladenosine (2'dCPA) (10 mg.kg-1). The clearance
for transport from blood to the brain was estimated by simultaneous analysis of the
blood and extracellular fluid concentrations using a compartmental pharmacokinetic
model. The proposed pharmacokinetic model consists of three compartments
describing the time-course of the concentration in blood in combination with three
compartments for the brain extracellular fluid concentrations. The blood clearance
was 7.4 ± 0.5 for MCPA and 7.2 ± 1.4 ml.min-1 for 2'dCPA. The in vivo microdialysis
recoveries were determined by the dynamic-no-net-flux method were independent of
time with values of 0.21 ± 0.02 and 0.22 ± 0.01 for MCPA and 2'dCPA respectively.
The values of the inter-compartmental clearance for the distribution from blood to
brain were 1.9 ± 0.4 versus 1.6 ± 0.3 µl.min-1 for MCPA and 2'dCPA, respectively. It
is concluded that on basis of the novel 6-compartment model precise estimates of the
rate of brain distribution are obtained, which are independent of eventual differences
in systemic exposure. The low brain distribution rates of MCPA and 2'CPA were
consistent with in vitro tests. Furthermore a slow elimination from the brain
compartment was observed, indicating that the duration of CNS effects may be much
longer than expected on the basis of the terminal half-life in blood.
This article has not been copyedited and formatted. The final version may differ from this version.JPET Fast Forward. Published on August 3, 2004 as DOI: 10.1124/jpet.104.071308
at ASPE
T Journals on July 15, 2015
jpet.aspetjournals.orgD
ownloaded from

JPET#71308
4
INTRODUCTION
Blood-brain barrier (BBB) transport is a major determinant of the effect of
CNS active drugs. This transport is determined by i) the morphology and functionality
of the brain capillaries and ii) the physicochemical characteristics of the drug.
Specifically the transport of hydrophilic drugs is limited due to the presence of tight
junctions between the capillary endothelial cells (Pardridge, 1991; Madara, 1998).
Characterisation of the BBB transport is therefore an important aspect of the
development of CNS-active drugs.
At present there are several approaches to the characterisation of the BBB
transport, which can broadly be divided into three categories: i) in vitro assays, ii) in
situ perfusion techniques and iii) in vivo methods. Blood-brain barrier transport is
often studied in vitro in co-cultures of brain-capillary-endothelial-cells and astrocytes
(Rubin et al., 1991; Gaillard et al., 2001). This approach is attractive because it allows
identification of the specific mechanisms (i.e. transporters) that may be involved in
the transport. However the extrapolation from especially these novel in vitro models,
consisting of a co-culture of brain-capillary-endothelial-cells and astrocytes, to the in
vivo situation has not been established. This is important since both the passive
permeability and the expression of specific transporters in in vitro models can be quite
different from the in vivo situation. Another limitation is that factors such as the
binding to plasma proteins and the cerebral perfusion rate, which may influence the
brain uptake, are not considered. This underscores the need for detailed in vivo studies
on BBB transport.
This article has not been copyedited and formatted. The final version may differ from this version.JPET Fast Forward. Published on August 3, 2004 as DOI: 10.1124/jpet.104.071308
at ASPE
T Journals on July 15, 2015
jpet.aspetjournals.orgD
ownloaded from
JPET#71308
5
To study drug transport to the brain in vivo, frequently destructive sampling
techniques have been applied. Nowadays intracerebral microdialysis is an established
technique for studying the physiology, pharmacology and pathology of a wide range
of low molecular weight substances in the brain extracellular fluid (ECF) (Bourne,
2003). Intracerebral microdialysis is also increasingly applied in pharmacokinetic
studies to characterise drug transport to the brain in vivo (Malhotra et al., 1994, De
Lange et al., 1999; Hammarlund-Udenaes, 2000). The latter approach offers the
advantage of the ability to estimate the pharmacologically active unbound
concentration close to the site of action in individual rats (De Lange et al., 1997;
Elmquist and Sawchuk, 1997). Recently intracerebral microdialysis has also been
applied in PK/PD modelling. Specifically, a compartmental model has been proposed
to describe the BBB transport of morphine-6-glucuronide to account for the delay of
the antinociceptive effect relative to the corresponding plasma concentrations (Bouw
et al., 2001). However, in most studies published so far no formal pharmacokinetic
analysis has been applied. Typically the extent of BBB transport is characterised non-
parametrically on basis of AUC values in plasma and ECF. Consequently no specific
estimate of the rate of BBB transport (i.e. the inter-compartmental clearance) is
obtained. This complicates the comparison of the in vivo BBB transport
characteristics of drugs and the examination of in vitro / in vivo correlations of BBB
transport. This concerns specifically the BBB transport of drugs with widely different
systemic pharmacokinetic properties, and situations in which the plasma kinetics have
changed as result of for example the co-administration of inhibitors of specific
transporters such as P-glycoprotein.
This article has not been copyedited and formatted. The final version may differ from this version.JPET Fast Forward. Published on August 3, 2004 as DOI: 10.1124/jpet.104.071308
at ASPE
T Journals on July 15, 2015
jpet.aspetjournals.orgD
ownloaded from

JPET#71308
6
A1 adenosine agonists are potentially useful drugs for the treatment of a variety of
CNS disorders including sleep disturbances (Strecker et al., 2000), epilepsy (Malhotra
and Gupta, 1997), cerebral ischemia and stroke (von Lubitz, 1999; von Lubitz et al.,
2001) and neuropathic pain (Sawynok, 1998). The chemical structure of A1 receptor
agonists is characterised by the presence of a ribose moiety. Consequently these
molecules are quite hydrophilic which restricts their transport across the BBB.
Recently we have characterised the BBB transport characteristics of a series of A1
adenosine agonists in an experimental in vitro model of the BBB consisting of a co-
culture bovine brain capillary endothelial cells and rat astrocytes as well as in an in
situ brain perfusion model. These investigations revealed highly restricted transport of
these compounds across the BBB. Furthermore it was shown that these compounds
are largely transported by passive diffusion and that observed differences in the
diffusion can be explained by their physicochemical characteristics (Schaddelee et al.,
2003). The objective of the present investigation was to determine, in a strict
quantitative manner, the clearance for brain distribution of synthetic A1 receptor
agonists in vivo, by population pharmacokinetic analysis of the time course of the
concentration in blood and brain ECF. The selective A1 receptor partial agonists C8-
methylamino-N6-cyclopentyladenosine (MCPA) and 2’deoxy-N6-cyclopentyl
adenosine (2’dCPA) were chosen as model drugs on basis of previous investigations
demonstrating significant differences in BBB transport between both agonists
(Schaddelee et al., 2003).
This article has not been copyedited and formatted. The final version may differ from this version.JPET Fast Forward. Published on August 3, 2004 as DOI: 10.1124/jpet.104.071308
at ASPE
T Journals on July 15, 2015
jpet.aspetjournals.orgD
ownloaded from

JPET#71308
7
METHODS
Chemicals
N6-cyclohexyladenosine (CHA) was purchased from Sigma Chemicals
(Zwijndrecht, the Netherlands). 2-deoxy-N6-cyclopentyladenosine (2’dCPA), 8-
methylamino-N6-cyclopentyladenosine (MCPA) and N6-[1S,trans-2-
hydroxycyclopentyl]-adenosine (GR79236) were kindly provided by
GlaxoSmithKline (Stevenage, United Kingdom). Ethyl acetate was purchased from
Baker Chemicals (Deventer, the Netherlands) and distilled prior to use. Acetonitrile
(DNA synthesis grade) was obtained from Biosolve (Valkenswaard, the Netherlands).
Methanol (HPLC grade) was obtained from Rathburne (Walkersburn, Scotland). All
other chemicals were of analytical grade (Baker). Water was used from a Milli-Q
system (Millipore SA, Molsheim, France).
Animals
Male Wistar rats (Broekman B.V., Someren, the Netherlands) weighting
between 250 and 300 gram were housed in groups for 10 days, under standard
environmental conditions (ambient temperature 21 °C; humidity 60%; 12/12
light/dark cycle, with light on at 7.00 a.m.). The animals had free access to food
(laboratory chow, Hope Farms, Woerden, the Netherlands) and acidified water. After
surgery, the animals were housed individually in plastic cages for 1 week.
Surgical Procedures
The rats were anaesthetised with an intramuscular injection of 0.1 mg.kg-1 of
Domitor (medetomidine hydrochloride, Pfizer, Capelle a/d IJssel, the Netherlands)
and 1 mg.kg-1 Ketalar (Ketaminebase, Parke Davis, Hoofddorp, the Netherlands).
This article has not been copyedited and formatted. The final version may differ from this version.JPET Fast Forward. Published on August 3, 2004 as DOI: 10.1124/jpet.104.071308
at ASPE
T Journals on July 15, 2015
jpet.aspetjournals.orgD
ownloaded from

JPET#71308
8
Cannulas were implanted into the right jugular vein for drug administration and into
the left femoral artery for blood sampling. The arterial cannula consisted of 4.5 cm
polyethylene tubing (Portex Limited, Hythe, United Kingdom; I.D. 0.28; O.D. 0.61
mm) heat-sealed to 18 cm polyethylene tubing (Portex Limited; I.D. 0.58, O.D. 0.96
mm). The venous cannula consisted of 12 cm polyethylene tubing (I.D. 0.58, O.D.
0.96 mm). The cannulas were subcutaneously tunneled to the back of the neck. In
order to prevent clotting, the cannulas were filled with 25% (w/v)
polyvinylpyrrolidine (PVP, Brocacef, Maarssen, the Netherlands) solution in saline
(0.9%) containing heparin (50 IU/ml, Pharmacy, Leiden University Medical Centre,
Leiden, the Netherlands). For probe implantation the rats were placed in a stereotaxic
frame and the skull was exposed. A small hole was drilled to allow implantation of a
microdialysis guide cannula (CMA/12, Aurora Borealis Control B.V., Schoonebeek,
the Netherlands) in the anterior striatum relative to bregma (AP: 0.8; L: 2.7; V: –3.5).
Two support screws were placed to hold the guide, which was glued to the skull with
dental cement (dental acrylic cement, Howmedia simplex rapid + methylacrylate,
Drijfhout, Amsterdam, the Netherlands).
Experimental procedures
Microdialysis experiment
At the start of the experiment the microdialysis probe (CMA/12, membrane
length of 4.0 mm; Aurora Borealis Control B.V.) was inserted into the guide cannula.
The inflow tubing was connected to a syringe pump (Beehive, Bas Technicol,
Congleton, United Kingdom). The probe was perfused with artificial extracellular
fluid (composition in mM: NaCl 145; KCl 2.7, CaCl2 1.2; MgCl2 1.0; ascorbic acid
This article has not been copyedited and formatted. The final version may differ from this version.JPET Fast Forward. Published on August 3, 2004 as DOI: 10.1124/jpet.104.071308
at ASPE
T Journals on July 15, 2015
jpet.aspetjournals.orgD
ownloaded from

JPET#71308
9
0.2 in a 2 mM phosphate buffer pH 7.4; Moghaddam and Bunney, 1989) at a flow rate
of 2 µl.min-1. The outlet tubing was connected to a microsamples collector (Univentor
820, Antec, Leiden, the Netherlands). After 2 hours of equilibration, the rats received
an intravenous bolus infusion of 10 mg/kg in 15 min of either MCPA or 2’d CPA via
the jugular vein cannula. A total number of between 13 and 20 dialysate fractions (10
to 30 min each) were collected and 20 arterial blood samples (20 to 200 µl) were
drawn for determination of the concentration of MCPA and 2’dCPA, respectively.
The blood samples were directly hemolysed in glass tubes containing 400 µl water
and stored at –20 °C until analysis.
In vivo recovery
To determine the drug concentration in the ECF surrounding the microdialysis
probe, the in vivo recovery was determined using the dynamic-no-net-flux method
(Olson and Justice, 1993). The experiments were conducted in a similar manner as the
microdialysis experiments described above, except that the probe was now perfused
with MCPA concentrations of 10 or 30 ng.ml-1 and 2’dCPA concentrations of 62.5,
125 or 250 ng.ml-1. Each group consisted of 3-4 rats.
Plasma Protein Binding
In the microdialysis experiments an additional blood sample of 350 µl was
taken at the end of the infusion for the determination of the plasma-to-blood
concentration ratio and the free drug concentration in plasma. The total blood
concentration was determined in a 20 µl blood sample, which was directly hemolysed
with 400 µl water. The remaining blood was centrifuged at 4 °C to separate the
plasma. A sample of 20 µl was retained for analysis and the remaining plasma was
This article has not been copyedited and formatted. The final version may differ from this version.JPET Fast Forward. Published on August 3, 2004 as DOI: 10.1124/jpet.104.071308
at ASPE
T Journals on July 15, 2015
jpet.aspetjournals.orgD
ownloaded from

JPET#71308
10
transferred into a Centrifree centrifugal filter device (Amicon Bioseparations,
Millipore, Bedford, MA, USA) and centrifuged for 10 minutes at 1100 g at 37 °C to
obtain 40 µl of plasma ultrafiltrate. The samples were stored at –20 °C until analysis.
Drug analysis
Blood samples
MCPA: The blood, plasma and ultrafiltrate samples were analysed by a
previously described reversed phase high-pressure liquid chromatography (HPLC)
method (van Schaick et al., 1997). Briefly, CHA (50 µl, 6 µM) was added to the
blood samples as internal standard. The samples were extracted with 5 ml of ethyl
acetate. After centrifugation, the organic layer was transferred into clean tubes and
500 µl water and 50 µl sodium hydroxide (3M) were added. The samples were
extracted for the second time and the organic layer was separated from the aqueous
layer. The organic layer was evaporated to dryness under reduced pressure at 37 °C.
The residue was dissolved in 100 µl of mobile phase and 75 µl was injected on to the
chromatographic system. The chromatographic system consisted of a LC-10AD
HPLC pump (Shimadzu, Kyoto, Japan), a WISP-712 autosampler (Waters, Milford,
MA) and a spectroflow 757 variable-wavelength UV detector (Applied Biosystems,
Ramsey, NJ) set at 269 nm. The output signal of the UV detector was processed with
a C-R3A reporting integrator (Shimadzu) in the peak height mode. For the analysis a
stainless-steel Microsphere C18 3-µM cartridge-column (10 mm x 4.6 mm I.D.) was
used. The mobile phase consisted of a mixture of acetate buffer (50 mm, pH 4.0) and
acetonitrile in the ratio 79:21 (v/v). TEA was added to the mobile phase (100
µl.liter-1). At a flow rate of 0.5 ml.min-1 the retention times were 9.1 an 15.2 min for
This article has not been copyedited and formatted. The final version may differ from this version.JPET Fast Forward. Published on August 3, 2004 as DOI: 10.1124/jpet.104.071308
at ASPE
T Journals on July 15, 2015
jpet.aspetjournals.orgD
ownloaded from

JPET#71308
11
MCPA and CHA, respectively. The calibration curves were analysed under weighted
linear regression (weight factor: 1/y2). The detection limit (signal-to-noise-ratio of 3)
was 15 ng.ml-1 for a 50 µl blood sample. The extraction recovery was 84%. The
within-day and between-day variations were determined in a concentration range of
50-2000 ng.ml-1 and were less than 5.2% and 6.7%, respectively.
2’dCPA: The blood, plasma and ultrafiltrate samples were analysed by a previously
described reversed phase HPLC method (Mathôt et al., 1995). Briefly, CHA (50 µl, 6
µM) was added to the blood samples as internal standard. The samples were
alkalinised with 50 µl sodium hydroxide (3 M) and extracted with 5 ml of ethyl
acetate. The organic layer was transferred to clean tubes and evaporated to dryness
under reduced pressure at 37 °C. The residue was dissolved in 100 µl mobile phase
and 75 µl was injected into the HPLC. The same chromatic system was used as in the
MCPA analysis. The mobile phase consisted of a mixture of acetate buffer (25 mM,
pH 4.0), methanol and acetonitrile (56:40:4 v/v/v). At a flow rate of 0.5 ml.min-1 the
retention times were 7.9 and 13.1 min for 2’dCPA and CHA, respectively. The
calibration curve was analysed under weighted linear regression (weight factor: 1/y2).
The detection limit (signal-to-noise-ratio of 3) was 2.5 ng.ml-1 for a 100 µl blood
sample. The extraction recovery was 70%. The within-day and between-day
variations were determined in a concentration range of 100-2500 ng.ml-1 and were
less than 1.6% and 9.6%, respectively.
Dialysate samples
The dialysate samples were analysed by HPLC with tandem mass
spectrometry. Calibration standards were prepared in water. The dialysate samples
This article has not been copyedited and formatted. The final version may differ from this version.JPET Fast Forward. Published on August 3, 2004 as DOI: 10.1124/jpet.104.071308
at ASPE
T Journals on July 15, 2015
jpet.aspetjournals.orgD
ownloaded from

JPET#71308
12
and calibration standards were transferred into a 96 well plate and dried under
nitrogen at 40 °C. The residues were dissolved in 100 µl of a mixture of water and
methanol (95:5 v/v) containing 100 ng.ml-1 GR79236 as internal standard. A volume
of 50 µl was injected into the LC system. HPLC was performed on a Hewlett Packard
1100 instrument (Hewlett Packard, Waldbronn, Germany). Chromatography was
performed on a C18 column (50 mm x 2.1 mm I.D.; 5 µM particle size) (Capital
HPLC, Broxburn, United Kingdom) at a flow rate of 0.4 ml/min. The mobile phase
consisted of 2 solvents: (A) water + 0.1% formic acid and (B) 100% acetonitile +
0.1% formic acid. The profile was 0-2 min 100% A; 2-3 min linear gradient to 90%
B; 3-3.5 min 90% B; 3.5-3.7 min linear gradient to 100% A; 3.7-5 min 100% A. Mass
spectrometry was performed on a PE-Sciex API2000 instrument (Perkin Elmer Sciex
Instruments, Foster City, CA, USA) equipped with a turbo ion spray source used in
the positive mode. Detection by tandem mass spectrometry was based on precursor
ion transitions to the strongest intensity. Instrumental conditions were optimised to
yield best sensitivity. The detection limits for a 10 µl ECF sample were for both
compounds 0.5 ng.ml-1. The within-day and between-day variations were determined
in a concentration range of 2-50 ng.ml-1 and were less than 3.9%, 9% and 6.9%, 13%
for MCPA and 2’dCPA, respectively.
Data analysis
Population pharmacokinetic model
In order to estimate the inter-compartmental clearance for the transport from blood
to the brain, the compartmental model depicted in figure 1 was fitted to the blood and
ECF concentration versus time profiles. In this approach the blood and ECF data from
all individual rats were simultaneously analysed while explicitly taking into account
This article has not been copyedited and formatted. The final version may differ from this version.JPET Fast Forward. Published on August 3, 2004 as DOI: 10.1124/jpet.104.071308
at ASPE
T Journals on July 15, 2015
jpet.aspetjournals.orgD
ownloaded from

JPET#71308
13
both the inter-individual variability in the model parameters as well as inter-individual
residual error (Schoemaker and Cohen, 1996). All fitting procedures were performed
in the nonlinear-mixed-effect-modelling software NONMEM (GloboMax, Hanover,
MD, US) using the subroutine ADVAN 7, which is a general linear model that uses
the numerical solution of the differential equations. Three compartments for
description of the kinetics in blood in combination with three additional
compartments for the kinetics in the brain were selected on basis of the Akaike
information criterion (Akaike, 1974). The blood and ECF concentration versus time
data were modelled according to the following differential equations:
1
1441114331113221112
1 *******V
ACLAKAKAKAKAKAKR
dt
dAiv −+−+−+−= (1a)
2211122 ** AKAK
dt
dA−= (1b)
3311133 ** AKAK
dt
dA−= (1c)
6644465544454411144 ****** AKAKAKAKAKAK
dt
dA+−+−−= (1d)
5544455 ** AKAK
dt
dA−= (1e)
6644466 ** AKAK
dt
dA−= (1f)
in which Riv is the zero-order infusion rate, Al is the amount in compartment l, Kmn is
the first-order transfer rate constant from compartment m to compartment n , CL is the
clearance from the central compartment and V1 is the volume of distribution of the
central compartment. The rate constants for distribution between the compartments m
This article has not been copyedited and formatted. The final version may differ from this version.JPET Fast Forward. Published on August 3, 2004 as DOI: 10.1124/jpet.104.071308
at ASPE
T Journals on July 15, 2015
jpet.aspetjournals.orgD
ownloaded from

JPET#71308
14
and n were determined from the inter-compartmental clearance (Q) and compartment
volume (V) according to:
m
mmn V
QK 1+= (2a)
n
mnm V
QK 1+= (2b)
In the modelling of both compounds, the volumes of the compartment 4 (V4) and 6
(V6) were assumed to be equal. Furthermore for 2’dCPA the volumes of the
compartment 1 (V1) and 3 (V3) were assumed equal while for MCPA this was also
assumed to be the case for the compartments 1 (V1) and 2 (V2). The parsimonious
model yielded the same minimum value of the objective function as the full model.
Inter-individual variability on the parameters was modelled according to an
exponential equation; it was assumed that the parameters were log-normally
distributed:
( )ii ηθθ exp⋅= (3)
where θ is the population mean parameter value, θi is the individual parameter (e.g.
V1, CL, Q14) and exp(ηi) is a random term from a normal distribution with mean zero
and variance ω2. The ηi-values quantify the deviation of the individual parameters
from the population mean, therefore the variance ω2 associated with parameter θ
provides a measure of inter-individual variation in θ, which relates to the biological
variation and experimental errors. The inter-individual variation was estimated for the
This article has not been copyedited and formatted. The final version may differ from this version.JPET Fast Forward. Published on August 3, 2004 as DOI: 10.1124/jpet.104.071308
at ASPE
T Journals on July 15, 2015
jpet.aspetjournals.orgD
ownloaded from

JPET#71308
15
following model parameters: CL, V1, V2 and Q14. The residual error was characterized
by a combination of a proportional and additive error model:
( ) ijijijij CCm 211 εε ++⋅= (4)
where Cij is the jth blood or ECF concentration for the ith individual predicted by the
model, Cmij is the measured blood or ECF concentration and ε1ij and ε2ij account for
the residual deviance of the model predicted value from the observed concentration.
The values for ε are normally distributed with mean zero and variance σ2.
The first-order Bayesian estimation method implemented in the NONMEM software
was used to calculate population and individual parameter estimates. All fitting
procedures were performed on an IBM-compatible personal computer (Pentium,
133 MHz) running under Windows NT using the Microsoft FORTRAN Powerstation
4.0 compiler with NONMEM version IV, level 2 (double precision) and Visual
NONMEM version 2.2.2 (RDPP, Montpellier, France).
In vivo recovery
The in vivo recovery was estimated on the basis of the linear relationship
between the perfusate concentration (Cin) and the perfusion concentration minus the
dialysate concentration (Cin-Cout). For the estimation of the in vivo recovery, a
population approach was applied utilizing all information of multiple observations for
each individual rat. The data were analysed in NONMEM (GloboMax) using the
following linear model:
baxy += (5)
This article has not been copyedited and formatted. The final version may differ from this version.JPET Fast Forward. Published on August 3, 2004 as DOI: 10.1124/jpet.104.071308
at ASPE
T Journals on July 15, 2015
jpet.aspetjournals.orgD
ownloaded from

JPET#71308
16
where x is the perfusate concentration (Cin), y is the perfusion concentration minus the
dialysate concentration (Cin - Cout), a the in vivo recovery and b is the y-ordinate
intercept. Time was included in the analyses as covariate. The data were analysed
both by subject and by time to estimate the intra-subject and the intra-time variability.
Statistical analysis
The pharmacokinetic parameter estimates were compared statistically using
the one-way t-test. A significance level of 5% was selected. All data are reported as
mean ± standard error, unless indicated otherwise.
This article has not been copyedited and formatted. The final version may differ from this version.JPET Fast Forward. Published on August 3, 2004 as DOI: 10.1124/jpet.104.071308
at ASPE
T Journals on July 15, 2015
jpet.aspetjournals.orgD
ownloaded from

JPET#71308
17
RESULTS
The novel six-compartment model was able to describe the pharmacokinetics
of MCPA and 2’dCPA in blood and brain ECF. Three compartments were required
for description of the time course of the concentrations in blood while an additional
three compartments were required to describe the kinetics in the brain. The blood
concentration time-profiles following intravenous infusion of MCPA and 2’dCPA are
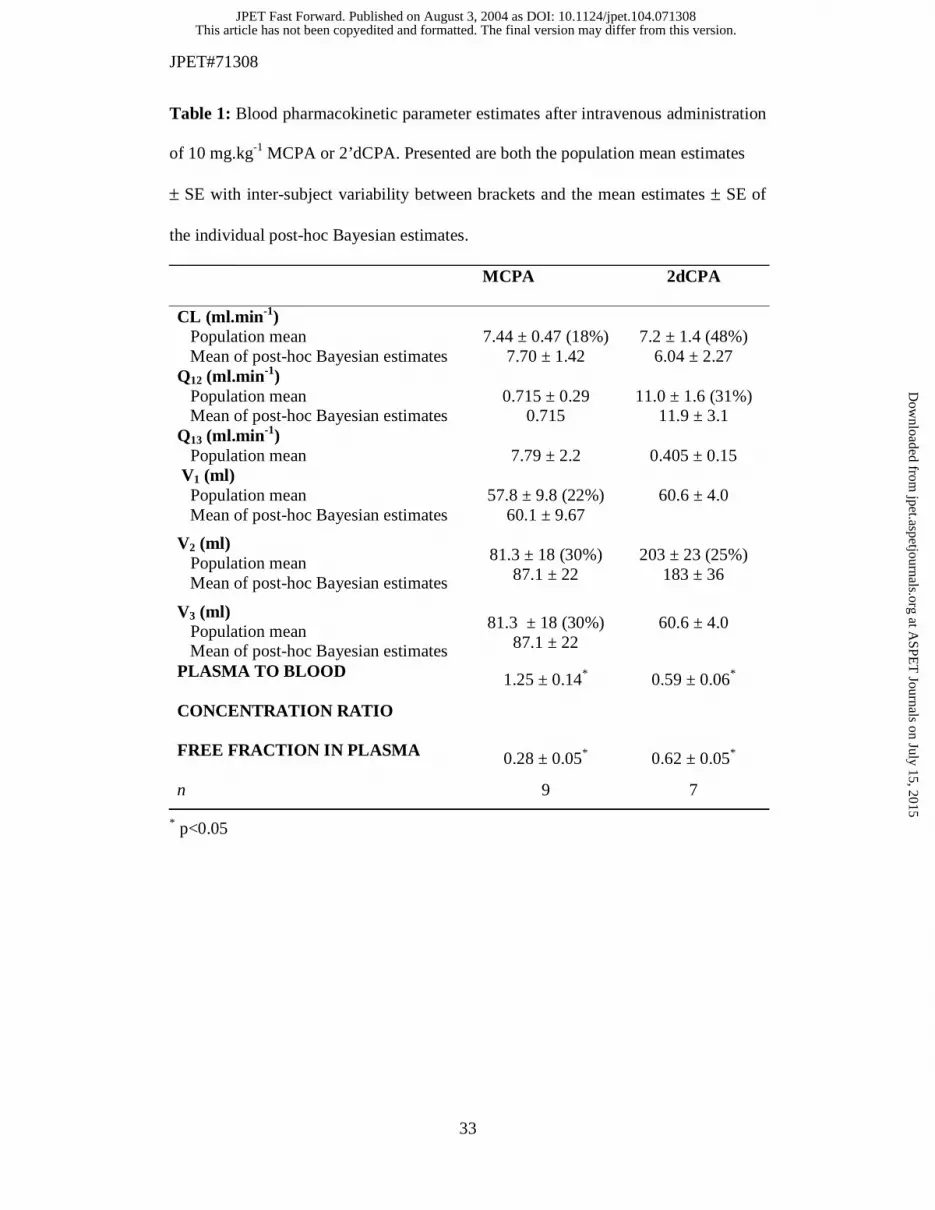
shown in figure 2. The post-hoc and population estimates for the blood
pharmacokinetics, the blood to plasma concentration ratio and the free fraction in
plasma are listed in table 1. The clearance and volume of distribution were similar
between MCPA and 2’dCPA. However the compounds differed in the plasma-to-
blood concentration ratio and the free fraction in plasma. The plasma-to-blood
concentration ratio and the free fraction in plasma were 1.3 ± 0.1, 0.59 ± 0.06 versus
0.28 ± 0.05, 0.62 ± 0.05 for MCPA and 2’dCPA, respectively.
The in vivo recovery was determined by the dynamic-no-net-flux method for both
MCPA and 2’dCPA. A population approach was used for the estimation of the in vivo
recovery on the basis of a linear model describing the relationship between Cin – Cout
as a function of Cin. The results of the in vivo recovery experiment for MCPA and
2’dCPA are shown in figure 3. The straight lines in figure 3 are the population
predictions and the slopes are the population estimates for the in vivo recovery. The
population estimates of the in vivo recovery were 0.211 ± 0.019 and 0.219 ± 0.014, of
MCPA and 2’dCPA respectively. The individual recovery estimates versus time
patterns for MCPA and 2’dCPA are depicted in figure 4. In the analysis, time was
included as covariant and appeared not to be statistically significant. The intra-subject
variability was not statistically significant from zero. Therefore the brain ECF
This article has not been copyedited and formatted. The final version may differ from this version.JPET Fast Forward. Published on August 3, 2004 as DOI: 10.1124/jpet.104.071308
at ASPE
T Journals on July 15, 2015
jpet.aspetjournals.orgD
ownloaded from

JPET#71308
18
concentrations were calculated as the ratio of the dialysate concentrations and the
population predicted in vivo recovery.
The brain ECF concentration-time profiles after intravenous infusion of MCPA or
2’dCPA are shown in figure 5. The post-hoc and population prediction estimates for
the brain ECF pharmacokinetic parameters are summarised in table 2. No statistically
significant differences in brain pharmacokinetic parameters were found between
MCPA and 2’dCPA. Previous investigations have demonstrated that the binding to
blood constituents restricts the brain uptake (Schaddelee et al., unpublished
observations). The unbound inter-compartmental clearance from blood to brain (Q14,u)
was calculated as the ratio of the total inter-compartmental clearance (Q14) divided by
the plasma-to-blood ratio and the free fraction in plasma. The values were 6.24 ± 2.78
and 4.29 ± 1.29 µl.min-1 for MCPA and 2’dCPA, respectively. The volumes of
distribution of the brain compartments were high compared to those of the peripheral
compartments. The values of the hypothetical volume of distribution of the brain
compartment were 280 ± 67 and 181 ± 39 ml for MCPA and 2’dCPA respectively.
These high values of the volume of the brain compartment reflect significant binding
of the compounds to brain tissue components. In figure 6 the concentrations in blood
and ECF for a typical rat were simulated up to 12 hours after the start of the infusion.
This figure illustrates the large differences in slope of the terminal concentration time
profiles in ECF compared to blood. The elimination out of the brain for both
compounds appears to be much slower than the elimination from blood.
This article has not been copyedited and formatted. The final version may differ from this version.JPET Fast Forward. Published on August 3, 2004 as DOI: 10.1124/jpet.104.071308
at ASPE
T Journals on July 15, 2015
jpet.aspetjournals.orgD
ownloaded from

JPET#71308
19
DISCUSSION
A1 receptor agonists are potential useful drugs for the treatment of a variety of CNS
disorders (Malhotra and Gupta, 1997; Sawynok, 1998; von Lubitz, 1999; Strecker et
al., 2000; von Lubitz et al., 2001). Due to presence of a ribose-moiety, these agonists
are quite hydrophilic which restricts the transport across the BBB. Recently we have
characterised the BBB transport of a series of A1 receptor agonists in an experimental
in vitro model of the BBB consisting of a co-culture of BCEC and astrocytes and in in
situ perfusion studies. These investigations revealed that the BBB transport of these
compounds is restricted. It was also demonstrated that these compounds are largely
transported by passive diffusion and that observed differences in diffusion can be
explained in part by their physicochemical characteristics (Schaddelee et al, 2003).
The purpose of this study was to characterise, in strict quantitative manner, the BBB
transport of synthetic A1 receptor agonists in vivo, by intracerebral microdialysis in
combination with population compartmental pharmacokinetic modelling. Two
prototype A1 receptor agonists were selected on basis of previous investigations in
which it was demonstrated that significant differences in BBB transport exist between
both agonists (Schaddelee et al., 2003).
MCPA and 2’dCPA showed similar blood concentration-time profiles. No statistically
significant differences were found in the pharmacokinetic parameters describing the
plasma concentration versus time profiles of both drugs, with exception of the
distribution into red blood cells and the plasma protein binding. MCPA binds to blood
constituents with a plasma-to-blood concentration ratio of 1.3 ± 0.14. For 2’dCPA the
plasma-to-blood concentration ratio was 0.59 ± 0.06. The free fractions in plasma
This article has not been copyedited and formatted. The final version may differ from this version.JPET Fast Forward. Published on August 3, 2004 as DOI: 10.1124/jpet.104.071308
at ASPE
T Journals on July 15, 2015
jpet.aspetjournals.orgD
ownloaded from

JPET#71308
20
were 0.28 ± 0.05 and 0.62 ± 0.05, for MCPA and 2’dCPA respectively. The values of
the pharmacokinetic parameters in the present investigation are similar to those in
previous studies (Mathôt et al., 1995; van Schaick et al., 1997)
An important issue that needs to be addressed using the microdialysis technique is the
in vivo recovery, which describes the relationship between the measured dialysate
concentrations and the ‘true’ ECF concentrations. The in vivo recovery is not only
dependent on the probe characteristics but also on periprobe processes like intra-
extracellular exchange of the compound and tissue damage (Bungay et al., 1990).
Furthermore, the in vivo recovery may change with time (Morrison et al., 1992).
In the present study a novel approach was applied to determine the in vivo recovery:
population non-linear mixed effects modelling of results obtained with the dynamic-
no-net-flux method (Olson and Justice, 1993). A unique feature of this approach is
that it allows not only the influence of time-dependency to be determined, but also
estimation of the intra-subject variability in in vivo recovery. A linear model
successfully described the relationship between Cin –Cout and Cin with the slope of this
relationship reflecting the in vivo recovery. No statistically significant difference in in
vivo recovery was found between MCPA and 2’dCPA, with population mean
estimates of 0.21 ± 0.02 and 0.22 ± 0.01, respectively. For MCPA and 2’dCPA both
the intra-time and the intra-subject variability were not statistically significant
different from zero. Since for both MCPA and 2’dCPA there was neither a significant
time-dependency nor a significant intra-subject variability in in vivo recovery, the
mean population estimates of the in vivo recovery were used for the estimation of the
periprobe in vivo ECF concentrations from the microdialysate concentrations.
This article has not been copyedited and formatted. The final version may differ from this version.JPET Fast Forward. Published on August 3, 2004 as DOI: 10.1124/jpet.104.071308
at ASPE
T Journals on July 15, 2015
jpet.aspetjournals.orgD
ownloaded from

JPET#71308
21
The proposed 6-compartment model accurately described the concentration versus
time profiles of both compounds in blood-plasma as well as brain extracellular fluid.
This model was established on the basis of an iterative analysis of the data using a
variety of different models. In this analysis it was specifically determined whether
simplified models (i.e. 1- or 2-compartment model(s)) could describe the data equally
well. However, analysis of the data with the simplified models was not justified as
reflected in a considerable loss of goodness-of fit. In the analysis, saturable brain
equilibration kinetics was also considered, by incorporation of a Michaelis-Menten
expression in the intercompartmental clearance between blood-plasma and brain. This
did not result in an improvement of the goodness-of fit, indicating that saturable
processes do not contribute significantly to the overall transport. This is consistent
with previous observations in the in vitro BBB model (Schaddelee et al., 2003) and in
in situ perfusion studies (Schaddelee et al., unpublished observations).
Another objective of this investigation was to explore the in vitro / in situ / in vivo
correlation of the BBB transport of A1 receptor agonists. The extrapolation from
novel in vitro BBB models to in vivo models has not been established. This is
important since both the passive permeability and the expression of specific
transporters in in vitro models can be quite different from the in vivo situation. In
addition, factors such as protein binding and the cerebral perfusion rate, which might
influence the brain uptake, are not considered. The comparison of in vitro and in vivo
data requires a formal quantitative pharmacokinetic analysis of the in vivo data,
allowing precise estimation of the in vivo distribution clearance between blood and
brain.
This article has not been copyedited and formatted. The final version may differ from this version.JPET Fast Forward. Published on August 3, 2004 as DOI: 10.1124/jpet.104.071308
at ASPE
T Journals on July 15, 2015
jpet.aspetjournals.orgD
ownloaded from

JPET#71308
22
The brain ECF concentration profiles of MCPA and 2’dCPA had similar profiles,
albeit that higher concentrations were observed for 2’dCPA than for MCPA. The
inter-compartmental clearance from the central blood compartment to the central
brain compartment (Q14) were 1.94 ± 0.37 and 1.64 ± 0.48 µl.min-1, for MCPA and
2’dCPA, respectively. Recent investigations using in situ brain perfusion have
provided experimental evidence that A1 receptor agonists are low-extraction ratio
compounds (E <0.01) with respect to the brain uptake (Schaddelee et al., unpublished
observations). The observations in the present investigation confirm this since the
estimated values of the brain distribution clearance are indeed much lower than
reported value of the brain perfusion in vivo of 2.2 ml.min-1.g-1 in rats (De Visscher et
al., 2003). The BBB transport for low-extraction ratio compounds is related to the
unbound blood concentration instead of the whole blood concentration (Levy and
Moreland, 1984). Therefore the unbound inter-compartmental clearance from blood to
brain (Q14,u) was calculated for both drugs. No statistically significant difference was
found between MCPA and 2’dCPA with values of 6.24 ± 2.78 and 4.29 ± 1.29
µl.min-1 for MCPA and 2’dCPA, respectively. The inter-subject variability in the
inter-compartmental clearance was 39% and 27% for MCPA and 2’dCPA,
respectively. For both agonists, large differences in the terminal concentration time
profiles in ECF compared to blood were observed. The elimination out of the ECF
was much slower for both compounds than the elimination out of blood, which can be
explained by the high volume of distribution of the brain compartments, reflecting
binding to brain tissue constituents This observation is of considerable interest, since
this might explain why duration of action in the CNS could last much longer than
expected on the basis of the terminal half-life in blood.
This article has not been copyedited and formatted. The final version may differ from this version.JPET Fast Forward. Published on August 3, 2004 as DOI: 10.1124/jpet.104.071308
at ASPE
T Journals on July 15, 2015
jpet.aspetjournals.orgD
ownloaded from

JPET#71308
23
Previous in vitro and in situ studies have demonstrated that in general A1 receptor
agonists are poorly transported across the BBB (Schaddelee et al., 2003). Interestingly
similar differences in clearances and in ranking were found in the in situ perfusion
studies as in vitro transport studies (Schaddelee, unpublished observations). The inter-
compartmental clearances of MCPA and 2’dCPA in the present study are similar to
previously found values using in situ brain perfusion (MCPA: 4.5 ± 2.1, 2’dCPA:
22.0 ± 2.8 µl.min-1.g-1; Schaddelee unpublished observations) albeit that the clearance
for 2’dCPA is somewhat higher in the in situ brain perfusion study, compared to the
presently obtained value on the basis of microdialysis. An important issue in this
respect is that in situ brain perfusion is a single pass technique. As a consequence the
in vivo brain distribution clearance obtained in this manner represents only the uptake
of the drug in the brain. In contrast, the clearance obtained by microdialysis considers
the data during the infusion and the elimination phase, and thereby reflects the
bidirectional distribution to and from the brain. As such the results obtained with the
microdialysis technique are more representative of the processes that determine the
onset and the duration of the pharmacological response in vivo. An important feature
of the microdialysis technique in combination with compartmental modelling for
qualification of the brain-equilibration kinetics is that the approach is universally
applicable, specifically also to compounds, which are chemically unrelated.
In conclusion, on basis of the novel 6-comparment model estimates of the rate of in
vivo BBB transport of synthetic A1 receptor agonists were obtained. The inter-
compartmental clearances of MCPA and 2’dCPA were similarly low and consistent
with the results of previous in vitro tests. The compartmental pharmacokinetic
analysis used in this study has the advantage over traditional non-parametric methods
This article has not been copyedited and formatted. The final version may differ from this version.JPET Fast Forward. Published on August 3, 2004 as DOI: 10.1124/jpet.104.071308
at ASPE
T Journals on July 15, 2015
jpet.aspetjournals.orgD
ownloaded from

JPET#71308
24
that this approach quantifies the rate of BBB transport independent of differences in
systemic exposure. This allows comparison of in vivo with in vitro data but also
comparison between compounds that have different systemic pharmacokinetic
properties or in situations where plasma kinetics has changed. Furthermore, the results
obtained on basis of in vivo microdialysis in combination with population
pharmacokinetic modelling consider the bidirectional distribution to and from the
brain and are therefore representative of the process that determine the time course of
the drug effect.
This article has not been copyedited and formatted. The final version may differ from this version.JPET Fast Forward. Published on August 3, 2004 as DOI: 10.1124/jpet.104.071308
at ASPE
T Journals on July 15, 2015
jpet.aspetjournals.orgD
ownloaded from

JPET#71308
25
ACKNOWLEDGEMENTS
Hereby we would like to acknowledge Florence Charpentier and Kevin Read
(GlaxoSmithKline, United Kingdom) for the analysis of all the dialysate samples and
Erica Tukker and Margret Blom-Roosemalen for their technical assistance.
This article has not been copyedited and formatted. The final version may differ from this version.JPET Fast Forward. Published on August 3, 2004 as DOI: 10.1124/jpet.104.071308
at ASPE
T Journals on July 15, 2015
jpet.aspetjournals.orgD
ownloaded from

JPET#71308
26
REFERENCES
Akaike H (1974) A new look at the statistical model identification. IEEE
Trans.Automat.Control. AC-19:716-723.
Bourne JA (2003) Intracerebral microdialysis: 30 years as a tool for the
neuroscientist. Clin.Exp.Pharmacol.Physiol. 30:16-24.
Bouw MR, Xie R, Tunblad K and Hammarlund-Udenaes M (2001) Blood-brain
barrier transport and brain distribution of morphine-6-glucuronide in relation to the
antinociceptive effect in rats -pharmacokinetic-pharmacodynamic modelling.
Br.J.Pharmacol. 134:1796-804.
Bungay PM, Morrison PF and Dedrick RL (1990) Steady state theory for quantitative
microdialysis of solutes and water in vivo and in vitro. Life Sci. 46:105-119.
De Lange ECM, Danhof M, De Boer AG and Breimer DD (1997) Methodological
considerations of intracerebral microdialysis in pharmacokinetic studies on drug
transport across the blood-brain barrier. Brain Res. Rev. 25:27-49.
De Lange ECM, De Boer AG and Breimer DD (1999) Mircodialysis for
pharmacokinetic analysis of drug transport to the brain. Adv.Drug Del.Rev. 36:211-
227.
De Visscher G, Haseldonckx M, Flameng W, Borgers M, Reneman RS and Van
Rossem K (2003) Development of a novel fluorescent microsphere technique to
This article has not been copyedited and formatted. The final version may differ from this version.JPET Fast Forward. Published on August 3, 2004 as DOI: 10.1124/jpet.104.071308
at ASPE
T Journals on July 15, 2015
jpet.aspetjournals.orgD
ownloaded from

JPET#71308
27
combine serial cerebral blood flow measurements with histology in the rat.
J.Neurosci.Methods 122:149-56.
Elmquist WF and Sawchuk RJ (1997) Application of microdialysis in
pharmacokinetic studies. Pharm.Res. 14:267-288.
Gaillard PJ, Voorwinden LH, Nielsen J, Ivanov A, Atsumi R, Engman H, Ringbom C,
De Boer AG and Breimer DD (2001) Establishment and functional characterization
of an in vitro model of the blood-brain barrier, comprising a co-culture of brain
capillary endothelial cells and astrocytes. Eur.J.Pharm.Sci., 12:215-222.
Hammarlund-Udenaes M (2000) The use of microdialysis in CNS drug delivery
studies. Pharmacokinetic perspectives and results with analgesics and
antiepileptics. Adv.Drug Del. Rev. 45:293-294.
Levy RH and Moreland TA (1984) Rationale for monitoring free drug levels. Clin.
Pharmacokinet. 9:1-9.
Madara JL (1998) Regulation of the movement of solutes across tight junctions.
Annu.Rev.Physiol. 60: 143-159.
Malhotra BK, Lemaire M and Sawchuk RJ (1994) Investigation of the distribution of
EAB 515 to cortical ECF and CSF in freely moving rats utilising microdialysis.
Pharm.Res. 11:1223-1232.
This article has not been copyedited and formatted. The final version may differ from this version.JPET Fast Forward. Published on August 3, 2004 as DOI: 10.1124/jpet.104.071308
at ASPE
T Journals on July 15, 2015
jpet.aspetjournals.orgD
ownloaded from

JPET#71308
28
Malhotra J and Gupta YK (1997) Effect of adenosine receptor modulation on
pentylenetetrazole-induced seizure rats. Br.J.Pharmacol. 120:282-288.
Mathôt RAA, Van der Wenden EM, Soudijn W, IJzerman AP and Danhof M (1995)
Deoxyribose analogues of N6-cyclopentyladenosine (CPA): partial agonists at the
adenosine A1 receptor in vivo. Br.J.Pharmacol. 116:1957-1964.
Moghaddam B and Bunney BS (1989) Ionic composition of microdialysis perfusing
solution alters the pharmacological responsiveness and basal outflow of striatal
dopamine. J.Neurochem. 53:652-654.
Morrison PF, Bungay PM, Hsiao JK, Mefford IV, Dijkstra KH and Dedrick RL
(1992) Quantitative microdialysis. In: Microdialysis in Neuroscience. Elsevier
Science Publisher B.V.
Olson J and Justice Jr, JB (1993) Quantitative microdialysis under transient
conditions. Anal. Chem.65: 1017-1022.
Pardrigde WM (1991) Peptide drug delivery into the brain. Raven Press, New York.
Rubin LL, Hall DE, Parter S, Barbu K, Cannon C, Horner HC, Janatpour M, Liaw
CW, Manning K, Morales J, Tanner LI, Tomaselli KJ, Bard F (1991) A cell culture
model of the Blood-Brain Barrier. J.Cell Biol. 115: 1725-1735.
This article has not been copyedited and formatted. The final version may differ from this version.JPET Fast Forward. Published on August 3, 2004 as DOI: 10.1124/jpet.104.071308
at ASPE
T Journals on July 15, 2015
jpet.aspetjournals.orgD
ownloaded from

JPET#71308
29
Sawynok J (1998) Adenosine receptor activation and nociception. Eur.J.Pharmacol.,
317: 1-11.
Schaddelee MP, Voorwinden HL, Groenendaal D, IJzerman AP, De Boer AG and
Danhof M (2003) Blood-brain barrier transport of adenosine A1 receptor agonists;
structure-in vitro transport relationships. Europ. J. Pharm. Sci. 20: 347-356.
Schoemaker RC and Cohen AF (1996) Estimating impossible curves using
NONMEM. Br.J.Pharamcol. 42:283-290.
Strecker RE, Morairty S, Thakkar MM, Porkka-Heiskanen T, Basheer R, Dauphin LJ,
Rainnie DG, Portas CM, Greene RW and McCarley RW (2000) Adenosinergic
modulation of basal forebrain and preoptic/anterior hypothalamic neuronal activity
in the control of behavioral state. Behav. Brain Res, 115: 183-204.
Van Schaick EA, Mathôt RAA, Gubbens-Stibbe JM, Langemeijer MWE, Roelen
HCPF, IJzerman AP and Danhof M (1997) 8-Alkylamino susbstituted analogues of
N6-cyclopentyladenosine (CPA) are partial agonists for the cardiovascular
adenosine A1 receptor in vivo. J.Pharmacol.Exp.Ther., 283: 800-809.
Von Lubitz DK (1999) Adenosine and cerebral ischemia: therapeutic future or death
of a brave concept? Eur.J.Pharmacol. 371: 85-102.
Von Lubitz DK (2001) Adenosine in the treatment of stroke: yes, maybe, or
absolutely not? Expert Opin.Investig.Drugs 10: 619-632.
This article has not been copyedited and formatted. The final version may differ from this version.JPET Fast Forward. Published on August 3, 2004 as DOI: 10.1124/jpet.104.071308
at ASPE
T Journals on July 15, 2015
jpet.aspetjournals.orgD
ownloaded from

JPET#71308
30
FOOTNOTES
Reprint Requests
Send reprint requests to: Meindert Danhof, PharmD., Ph.D. Professor of
Pharmacology
Division of Pharmacology , Leiden/Amsterdam Center for Drug Research,
Leiden University, P.O. Box 9502, 2300 RA Leiden, The Netherlands.
Phone: +31 71 5276211 Fax: +31 71 5276292.
Email: [email protected]
M.P. Schaddelee1,3, D. Groenendaal1, J. DeJongh1, C.G.J. Cleypool1, A.P.
IJzerman2, A.G. de Boer1 and M. Danhof1
1 Division of Pharmacology, Leiden/Amsterdam Center for Drug Research, Leiden
University, P.O. Box 9502, 2300 RA, Leiden, The Netherlands
2Division of Medicinal Chemistry, Leiden/Amsterdam Center for Drug Research,
Leiden University, Einsteinweg 55, P.O. Box 9502, 2300 RA, Leiden, The
Netherlands
3Present address (M.P.S.), Yamanouchi Europe BV, CPRD, P.O. Box 108, 2350 AC
Leiderdorp, The Netherlands, [email protected]
This work was supported by a grant from GlaxoSmithKline, United Kingdom.
This article has not been copyedited and formatted. The final version may differ from this version.JPET Fast Forward. Published on August 3, 2004 as DOI: 10.1124/jpet.104.071308
at ASPE
T Journals on July 15, 2015
jpet.aspetjournals.orgD
ownloaded from

JPET#71308
31
LEGENDS FOR FIGURES
Figure 1. The population pharmacokinetic model for synthetic adenosine A1 receptor
agonists comprising three compartments describing the pharmacokinetics in blood
and three compartments describing the pharmacokinetics in brain ECF. V = volume of
distribution; CL= blood clearance; Q = inter-compartmental clearance
Figure 2. The individual plasma concentration-time profiles after intravenous
administration of 10 mg/kg of MCPA or 2’dCPA in 15 min to rats. (•) Represents the
individually observed concentrations and the solid lines the individual predictions
based on the population 6-compartment pharmacokinetic model.
Figure 3. The perfusion concentration (Cin) versus the perfusion concentration minus
the dialysate concentration (Cin-Cout) for MCPA or 2’dCPA. The solid line represents
the population prediction based on the linear model describing the relationship Cin –
Cout as a function of Cin. The slope of this relationship represents the in vivo recovery.
Figure 4. The individual in vivo recovery estimates versus time for MCPA or
2’dCPA. The straight line represents the population prediction. The slope of the
straight line was not significantly different from zero indicating that the in vivo
recovery is independent of time.
Figure 5. The individual ECF concentration-time profile after intravenous
administration of 10 mg/kg MCPA or 2’dCPA to rats. (•) Represents the individually
This article has not been copyedited and formatted. The final version may differ from this version.JPET Fast Forward. Published on August 3, 2004 as DOI: 10.1124/jpet.104.071308
at ASPE
T Journals on July 15, 2015
jpet.aspetjournals.orgD
ownloaded from

JPET#71308
32
observed concentrations and the solid lines the individual predictions based on the
population 6-compartment pharmacokinetic model.
Figure 6. Simulated average blood and ECF concentration-time profiles after
intravenous administration of 10 mg/kg MCPA or 2’dCPA for a typical rat. The solid
line represents the blood and the dotted line the ECF concentration time-profile. The
data were simulated up to 12 hours after the start of infusion.
This article has not been copyedited and formatted. The final version may differ from this version.JPET Fast Forward. Published on August 3, 2004 as DOI: 10.1124/jpet.104.071308
at ASPE
T Journals on July 15, 2015
jpet.aspetjournals.orgD
ownloaded from
JPET#71308
33
Table 1: Blood pharmacokinetic parameter estimates after intravenous administration
of 10 mg.kg-1 MCPA or 2’dCPA. Presented are both the population mean estimates
± SE with inter-subject variability between brackets and the mean estimates ± SE of
the individual post-hoc Bayesian estimates.
MCPA 2dCPA
CL (ml.min-1) Population mean Mean of post-hoc Bayesian estimates
7.44 ± 0.47 (18%)
7.70 ± 1.42
7.2 ± 1.4 (48%)
6.04 ± 2.27 Q12 (ml.min-1) Population mean Mean of post-hoc Bayesian estimates
0.715 ± 0.29
0.715
11.0 ± 1.6 (31%)
11.9 ± 3.1 Q13 (ml.min-1) Population mean
7.79 ± 2.2
0.405 ± 0.15
V1 (ml) Population mean Mean of post-hoc Bayesian estimates
57.8 ± 9.8 (22%)
60.1 ± 9.67
60.6 ± 4.0
V2 (ml) Population mean Mean of post-hoc Bayesian estimates
81.3 ± 18 (30%)
87.1 ± 22
203 ± 23 (25%)
183 ± 36
V3 (ml) Population mean Mean of post-hoc Bayesian estimates
81.3 ± 18 (30%)
87.1 ± 22
60.6 ± 4.0
PLASMA TO BLOOD
CONCENTRATION RATIO
1.25 ± 0.14* 0.59 ± 0.06*
FREE FRACTION IN PLASMA 0.28 ± 0.05* 0.62 ± 0.05*
n 9 7
* p<0.05
This article has not been copyedited and formatted. The final version may differ from this version.JPET Fast Forward. Published on August 3, 2004 as DOI: 10.1124/jpet.104.071308
at ASPE
T Journals on July 15, 2015
jpet.aspetjournals.orgD
ownloaded from

JPET#71308
34
Table 2: ECF pharmacokinetic parameter estimates after intravenous administration
of 10 mg.kg-1 MCPA or 2’dCPA. Presented are both the population mean estimates
(with inter-subject variability between brackets) and the mean of the individual post-
hoc Bayesian estimates.
MCPA 2dCPA
Q14 (µl.min-1) Population mean Mean of post-hoc Bayesian estimates
1.94 ± 0.37 (39%)
2.06 ± 0.73
1.64 ± 0.48 (27%)
1.62 ± 0.44 Q14,u (µl.min-1) Population mean
6.24 ± 2.78
4.29 ± 1.29
Q45 (µl.min-1) Population mean Mean of post-hoc Bayesian estimates
0.342 ± 0.05
0.342
0.0631 ± 0.018
Q46 (µl .min-1) Population mean
0.167 ± 0.04
0.279 ± 0.10
V4 (ml) Population mean Mean of post-hoc Bayesian estimates
4.91 ± 1.61 (72%)
6.55 ± 4.7
0.278 ± 0.080
V5 (ml) Population mean
280 ± 67
181 ± 39
V6 (ml) Population mean Mean of post-hoc Bayesian estimates
4.91 ± 1.61 (72%)
6.55 ± 4.7
0.278 ± 0.080
n 9 7
p<0.05
This article has not been copyedited and formatted. The final version may differ from this version.JPET Fast Forward. Published on August 3, 2004 as DOI: 10.1124/jpet.104.071308
at ASPE
T Journals on July 15, 2015
jpet.aspetjournals.orgD
ownloaded from

FIGURE 1
Blood V1
V3
V2
V6
V4 V5
Dose
CL Q12
Q13
Q14 Q45
Q46
Blood Brain
This article has not been copyedited and formatted. The final version may differ from this version.JPET Fast Forward. Published on August 3, 2004 as DOI: 10.1124/jpet.104.071308
at ASPE
T Journals on July 15, 2015
jpet.aspetjournals.orgD
ownloaded from

JPET#71308
FIGURE 2
10
100
1000
10000
100000
0 60 120 180 240
time (min)
blo
od
co
nc.
(n
g/m
l)
MCPA
10
100
1000
10000
100000
0 60 120 180 240
time (min)
blo
od
co
nc.
(n
g/m
l)
2’dCPA
This article has not been copyedited and formatted. The final version may differ from this version.JPET Fast Forward. Published on August 3, 2004 as DOI: 10.1124/jpet.104.071308
at ASPE
T Journals on July 15, 2015
jpet.aspetjournals.orgD
ownloaded from

JPET#71308
FIGURE 3
2.15219.0 −⋅=− inoutin CCC-20
-10
0
10
0 10 20 30 40
Cin
Cin -
Cou
tMCPA
58.2211.0 −⋅=− inoutin CCC
-100
-50
0
50
100
0 100 200 300
Cin
Cin -
Cou
t
2.15219.0 −⋅=− inoutin CCC
2’dCPA
This article has not been copyedited and formatted. The final version may differ from this version.JPET Fast Forward. Published on August 3, 2004 as DOI: 10.1124/jpet.104.071308
at ASPE
T Journals on July 15, 2015
jpet.aspetjournals.orgD
ownloaded from

JPET#71308
FIGURE 4
0.19
0.21
0.23
0.25
0 60 120 180 240
time (min)
in v
ivo
reco
very
Recovery = 0.211 MCPA
0.19
0.21
0.23
0.25
0 60 120 180 240
time (min)
in v
ivo
reco
very
Recovery = 0.219 2’dCPA
This article has not been copyedited and formatted. The final version may differ from this version.JPET Fast Forward. Published on August 3, 2004 as DOI: 10.1124/jpet.104.071308
at ASPE
T Journals on July 15, 2015
jpet.aspetjournals.orgD
ownloaded from

JPET#71308
FIGURE 5
1
10
100
1000
0 60 120 180 240
time (min)
EC
F c
onc.
(ng/
ml)
MCPA
1
10
100
1000
0 60 120 180 240
time (min)
EC
F c
on
c. (
ng
/ml)
2’dCPA
This article has not been copyedited and formatted. The final version may differ from this version.JPET Fast Forward. Published on August 3, 2004 as DOI: 10.1124/jpet.104.071308
at ASPE
T Journals on July 15, 2015
jpet.aspetjournals.orgD
ownloaded from

JPET#71308
FIGURE 6
1
10
100
1000
10000
100000
0 200 400 600 800
time (min)
conc
entr
atio
n (n
g/m
l)MCPA
1
10
100
1000
10000
100000
0 200 400 600 800
time (min)
conc
entr
atio
n (n
g/m
l)
2’dCPA
This article has not been copyedited and formatted. The final version may differ from this version.JPET Fast Forward. Published on August 3, 2004 as DOI: 10.1124/jpet.104.071308
at ASPE
T Journals on July 15, 2015
jpet.aspetjournals.orgD
ownloaded from


