Embed Size (px)
Citation preview
C H A P T E R T E N
Induce your competitorsnot to invest in those
products, markets, andservices where you
expect to invest the most. That is the most
fundamental rule ofstrategy.
BRUCE D. HENDERSON
240
Portfolio Analysis
The previous chapters dealt with strategy development for individual SBUs.Different SBU strategies must ultimately be judged from the viewpoint of the
total organization before being implemented. In today’s environment, most com-panies operate with a variety of businesses. Even if a company is primarilyinvolved in a single broad business area, it may actually be operating in multipleproduct/market segments. From a strategy angle, different products/marketsmay constitute different businesses of a company because they have differentroles to play. This chapter is devoted to the analysis of the different businesses ofan organization so that each may be assigned the unique role for which it issuited, thus maximizing long-term growth and earnings of the company.
Years ago, Peter Drucker suggested classifying products into six categoriesthat reveal the potential for future sales growth: tomorrow’s breadwinners, today’sbreadwinners, products capable of becoming net contributors if something drasticis done, yesterday’s breadwinners, the “also rans,” and the failures. Drucker’s clas-sification provides an interesting scheme for determining whether a company isdeveloping enough new products to ensure future growth and profits.
In the past few years, the emphasis has shifted from product to business.Usually a company discovers that some of its business units are competitively wellplaced, whereas others are not. Because resources, particularly cash resources, arelimited, not all SBUs can be treated alike. In this chapter, three different frame-works are presented to enable management to select the optimum combination ofindividual SBU strategies from a spectrum of possible alternatives and opportuni-ties open to the company, still satisfying the resource limitations within which thecompany must operate. The frameworks may also be used at the SBU level toreview the strategic perspective of its different product/market segments.
The first framework to be discussed, the product life cycle, is a tool manymarketers have traditionally used to formulate marketing strategies for differentproducts. The second framework was developed by the Boston Consulting Groupand is commonly called the product portfolio approach. The third, the multifac-tor portfolio approach, owes its development to the General Electric Company.The chapter concludes with the Porter’s generic strategies framework.
241
10
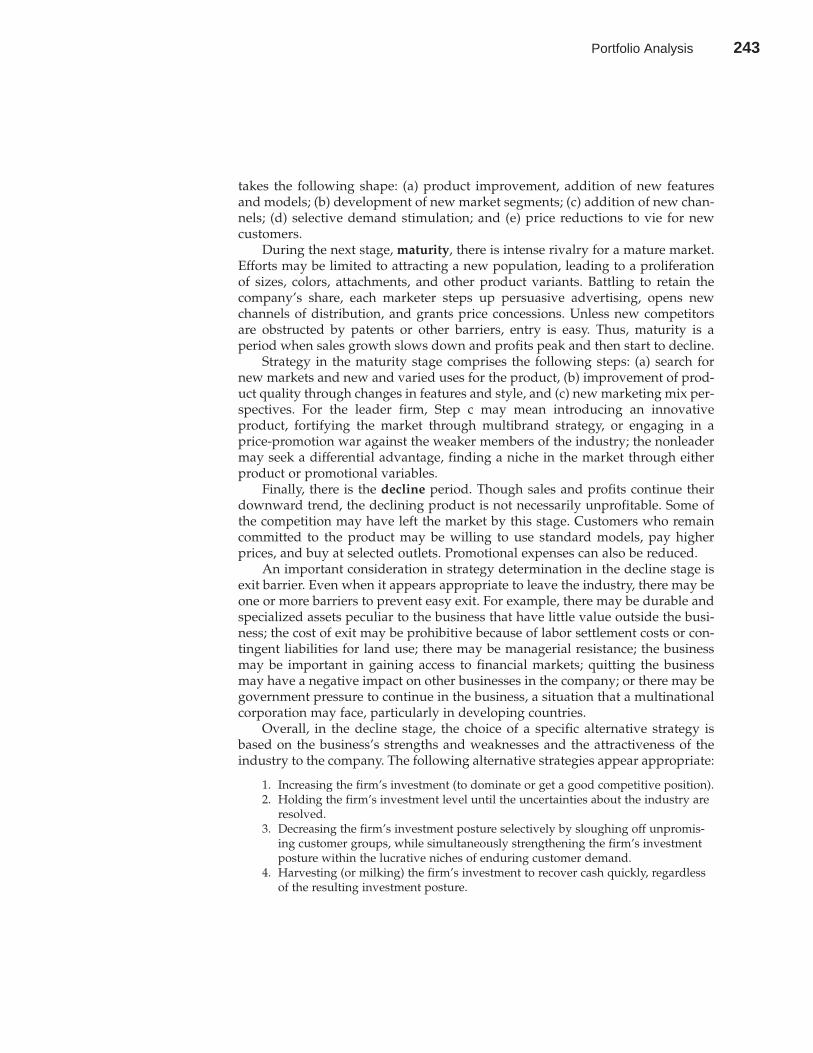
EXHIBIT 10-1Product Life Cycle
PRODUCT LIFE CYCLE
Products tend to go through different stages, each stage being affected by differ-ent competitive conditions. These stages require different marketing strategies atdifferent times if sales and profits are to be efficiently realized. The length of aproduct’s life cycle is in no way a fixed period of time. It can last from weeks toyears, depending on the type of product. In most texts, the discussion of the prod-uct life cycle portrays the sales history of a typical product as following an S-shaped curve. The curve is divided into four stages: introduction, growth,maturity, and decline. (Some authors include a fifth stage, saturation.)
However, not all products follow an S-shaped curve. Marketing scholarshave identified varying product life-cycle patterns. For example, Tellis andCrawford1 identify 17 product life-cycle patterns, while Swan and Rink name 10.2Exhibit 10-1 conceptualizes a typical product life-cycle curve, which shows therelationship between profits and corresponding sales throughout a product’s life.
Introduction is the period during which initial market acceptance is indoubt; thus, it is a period of slow growth. Profits are almost nonexistent becauseof high marketing and other expenses. Setbacks in the product’s development,manufacture, and market introduction exact a heavy toll. Marketing strategyduring this stage is based on different combinations of product, price, promo-tion, and distribution. For example, price and promotion variables may be com-bined to generate the following strategy alternatives: (a) high price/highpromotion, (b) high price/low promotion, (c) low price/heavy promotion, and(d) low price/low promotion.
Survivors of the introduction stage enjoy a period of rapid growth. Duringthis growth period, there is substantial profit improvement. Strategy in this stage
CHAPTER 10 Portfolio Analysis 241
242 Portfolio Analysis
takes the following shape: (a) product improvement, addition of new featuresand models; (b) development of new market segments; (c) addition of new chan-nels; (d) selective demand stimulation; and (e) price reductions to vie for newcustomers.
During the next stage, maturity, there is intense rivalry for a mature market.Efforts may be limited to attracting a new population, leading to a proliferationof sizes, colors, attachments, and other product variants. Battling to retain thecompany’s share, each marketer steps up persuasive advertising, opens newchannels of distribution, and grants price concessions. Unless new competitorsare obstructed by patents or other barriers, entry is easy. Thus, maturity is aperiod when sales growth slows down and profits peak and then start to decline.
Strategy in the maturity stage comprises the following steps: (a) search fornew markets and new and varied uses for the product, (b) improvement of prod-uct quality through changes in features and style, and (c) new marketing mix per-spectives. For the leader firm, Step c may mean introducing an innovativeproduct, fortifying the market through multibrand strategy, or engaging in aprice-promotion war against the weaker members of the industry; the nonleadermay seek a differential advantage, finding a niche in the market through eitherproduct or promotional variables.
Finally, there is the decline period. Though sales and profits continue theirdownward trend, the declining product is not necessarily unprofitable. Some ofthe competition may have left the market by this stage. Customers who remaincommitted to the product may be willing to use standard models, pay higherprices, and buy at selected outlets. Promotional expenses can also be reduced.
An important consideration in strategy determination in the decline stage isexit barrier. Even when it appears appropriate to leave the industry, there may beone or more barriers to prevent easy exit. For example, there may be durable andspecialized assets peculiar to the business that have little value outside the busi-ness; the cost of exit may be prohibitive because of labor settlement costs or con-tingent liabilities for land use; there may be managerial resistance; the businessmay be important in gaining access to financial markets; quitting the businessmay have a negative impact on other businesses in the company; or there may begovernment pressure to continue in the business, a situation that a multinationalcorporation may face, particularly in developing countries.
Overall, in the decline stage, the choice of a specific alternative strategy isbased on the business’s strengths and weaknesses and the attractiveness of theindustry to the company. The following alternative strategies appear appropriate:
1. Increasing the firm’s investment (to dominate or get a good competitive position).2. Holding the firm’s investment level until the uncertainties about the industry are
resolved.3. Decreasing the firm’s investment posture selectively by sloughing off unpromis-
ing customer groups, while simultaneously strengthening the firm’s investmentposture within the lucrative niches of enduring customer demand.
4. Harvesting (or milking) the firm’s investment to recover cash quickly, regardlessof the resulting investment posture.
242 PART 4 Strategy Formulation
Portfolio Analysis 243
5. Divesting the business quickly by disposing of its assets as advantageously aspossible.3
In summary, in the introduction stage, the choices are primarily with whatforce to enter the market and whether to target a relatively narrow segment ofcustomers or a broader customer group. In the growth stage, the choices appearto be to fortify and consolidate previously established market positions or todevelop new primary demand. Developing new primary demand may be accom-plished by a variety of means, including developing new applications, extendinggeographic coverage, trading down to previously untapped consumer groups, oradding related products. In the late growth and early maturity stages, the choiceslie among various alternatives for achieving a larger share of the existing market.This may involve product improvement, product line extension, finer positioningof the product line, a shift from breadth of offering to in-depth focus, invading themarket of a competitor that has invaded one’s own market, or cutting out someof the “frills” associated with the product to appeal better to certain classes of cus-tomers. In the maturity stage, market positions have become established and theprimary emphasis is on nose-to-nose competition in various segments of themarket. This type of close competition may take the form of price competition,minor feature competition, or promotional competition. In the decline stage, thechoices are to continue current product/market perspectives as is, to continueselectively, or to divest.
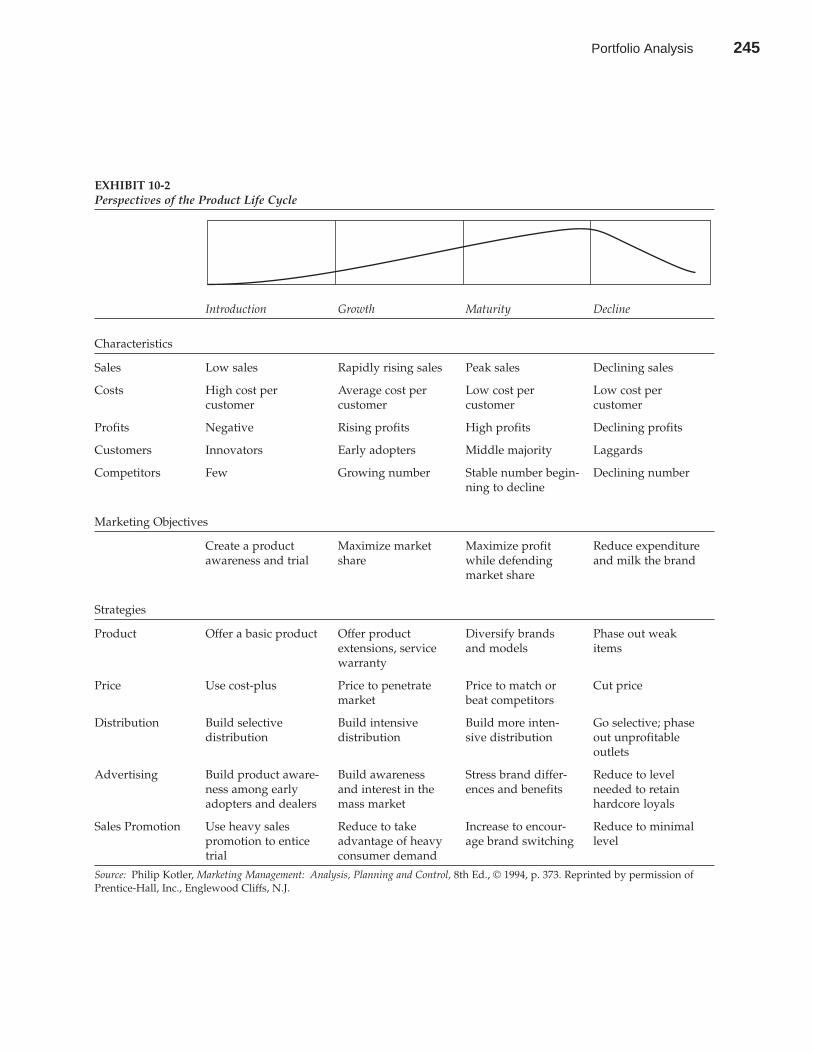
Exhibit 10-2 identifies the characteristics, marketing objectives, and market-ing strategies of each stage of the S-shaped product life cycle. The characteristicshelp locate products on the curve. The objectives and strategies indicate whatmarketing perspective is relevant in each stage. Actual choice of strategies restson the objective set for the product, the nature of the product, and environmentalinfluences operating at the time. For example, in the introductory stage, if a newproduct is launched without any competition and the firm has spent hugeamounts of money on research and development, the firm may pursue a highprice/low promotion strategy (i.e., skim the cream off the top of the market). Asthe product becomes established and enters the growth stage, the price may becut to bring new segments into the fold—the strategic perspective TexasInstruments used for its calculators.
On the other hand, if a product is introduced into a market where there isalready a well-established brand, the firm may follow a high price/high promo-tion strategy. Seiko, for example, introduced its digital watch among well-to-dobuyers with a high price and heavy promotion without any intention of compet-ing against Texas Instruments head on.
Of the four stages, the maturity stage of the life cycle offers the greatestopportunity to shape the duration of a product’s life cycle. These critical ques-tions must be answered: Why have sales tapered off? Has the product approachedobsolescence because of a superior substitute or because of a fundamental changein consumer needs? Can obsolescence be attributed to management’s failure toidentify and reach the right consumer needs or has a competitor done a better
CHAPTER 10 Portfolio Analysis 243
244 Portfolio Analysis
244 PART 4 Strategy Formulation
EXHIBIT 10-2Perspectives of the Product Life Cycle
Introduction Growth Maturity Decline
Characteristics
Sales Low sales Rapidly rising sales Peak sales Declining sales
Costs High cost per Average cost per Low cost per Low cost per customer customer customer customer
Profits Negative Rising profits High profits Declining profits
Customers Innovators Early adopters Middle majority Laggards
Competitors Few Growing number Stable number begin- Declining numberning to decline
Marketing Objectives
Create a product Maximize market Maximize profit Reduce expenditureawareness and trial share while defending and milk the brand
market share
Strategies
Product Offer a basic product Offer product Diversify brands Phase out weakextensions, service and models itemswarranty
Price Use cost-plus Price to penetrate Price to match or Cut pricemarket beat competitors
Distribution Build selective Build intensive Build more inten- Go selective; phasedistribution distribution sive distribution out unprofitable
outlets
Advertising Build product aware- Build awareness Stress brand differ- Reduce to level ness among early and interest in the ences and benefits needed to retain adopters and dealers mass market hardcore loyals
Sales Promotion Use heavy sales Reduce to take Increase to encour- Reduce to minimalpromotion to entice advantage of heavy age brand switching leveltrial consumer demand
Source: Philip Kotler, Marketing Management: Analysis, Planning and Control, 8th Ed., © 1994, p. 373. Reprinted by permission ofPrentice-Hall, Inc., Englewood Cliffs, N.J.
Portfolio Analysis 245
marketing job? Answers to these questions are crucial if an appropriate strategyis to be employed to strengthen the product’s position. For example, the productmay be redirected on a growth path through repackaging, physical modification,repricing, appeals to new users, the addition of new distribution channels, or theuse of some combination of marketing strategy changes. The choice of a rightstrategy at the maturity stage can be extremely beneficial, since a successfullyrevitalized product offers a higher return on management time and fundsinvested than does a new product.
This point may be illustrated with reference to a Du Pont product, Lycra, asuperstretching polymer invented in its labs in 1959. A little more than 30 yearsafter its humble start as an ingredient for girdles, demand for Lycra is explodingso fast that the company must allocate sales of the fiber. The product’s successmay be directly attributed to a shrewd marketing strategy, initiated during thematurity stage, that allowed Lycra’s use to expand steadily, from bathing suits inthe 1970s to cycling pants and aerobic outfits in the 1980s. Teenagers were luredto it and use it in their everyday fashion wardrobes. Avant-garde designerspicked up on the trend, using Lycra in new, body-hugging designs. Now, this dis-tinctly unnatural fiber is part of the fashion mainstream. Du Pont’s marketingstrategy has paid off well. A recent study showed that consumers would pay 20percent more for a wool-Lycra skirt than for an all-wool version.4
The product life cycle is a useful concept that may be an important aid in mar-keting planning and strategy. A concept familiar to most marketers, it is given aprominent place in every marketing textbook. Its use in practice remains limited,however, partly because of the lack of normative models available for its applica-tion and partly because of the vast amount of data needed for and the level ofsubjectivity involved in its use.
One caution that is in order when using the product life cycle is to keep inmind that not all products follow the typical life-cycle pattern. The same productmay be viewed in different ways: as a brand (Pepsi Light), as a product form (dietcola), and as a product category (cola drink), for example. Among these, the prod-uct life-cycle concept is most relevant for product forms.
The easiest way to locate a product in its life cycle is to study its past performance,competitive history, and current position and to match this information with thecharacteristics of a particular stage of the life cycle. Analysis of past performanceof the product includes examination of the following:
1. Sales growth progression since introduction.2. Any design problems and technical bugs that need to be sorted out.3. Sales and profit history of allied products (those similar in general character or
function as well as products directly competitive).4. Number of years the product has been on the market.5. Casualty history of similar products in the past.
The review of competition focuses on
CHAPTER 10 Portfolio Analysis 245
Product Life-CycleControversy
Locating Productsin Their Life-Cycle
246 Portfolio Analysis
1. Profit history.2. Ease with which other firms can get into the business.3. Extent of initial investment needed to enter the business.4. Number of competitors and their strength.5. Number of competitors that have left the industry.6. Life cycle of the industry.7. Critical factors for success in the business.
In addition, current perspectives may be reviewed to gauge whether sales areon the upswing, have leveled out for the last couple of years, or are headingdown; whether any competitive products are moving up to replace the productunder consideration; whether customers are becoming more demanding vis-à-visprice, service, or special features; whether additional sales efforts are necessary tokeep the sales going up; and whether it is becoming harder to sign up dealers anddistributors.
This information on the product may be related to the characteristics of dif-ferent stages of the product life cycle as discussed above; the product perspectivesthat match the product life cycle indicate the position of the product in its lifecycle. Needless to say, the whole process is highly qualitative in nature, and man-agerial intuition and judgment bear heavily on the final placement of the productin its life cycle. As a matter of fact, making the appropriate assumptions about thetypes of information described here can be used to construct a model to predictthe industry volume of a newly introduced product through each stage of theproduct life cycle.5
A slightly different approach for locating a product in its life cycle is to usepast accounting information for the purpose. Listed below are the steps that maybe followed to position a product in its life cycle:
1. Develop historical trend information for a period of three to five years (longer forsome products). Data included should be unit and dollar sales, profit margins,total profit contribution, return on invested capital, market share, and prices.
2. Check recent trends in the number and nature of competitors, number andmarket share rankings of competing products and their quality and performanceadvantages, shifts in distribution channels, and relative advantages enjoyed byproducts in each channel.
3. Analyze developments in short-term competitive tactics, such as competitors’recent announcements of new products or plans for expanding production capacity.
4. Obtain (or update) historical information on the life cycle of similar or relatedproducts.
5. Project sales for the product over the next three to five years, based on all infor-mation gathered, and estimate an incremental profit ratio for the product duringeach of these years (the ratio of total direct costs—manufacturing, advertising,product development, sales, distribution, etc.—to pretax profits). Expressed as aratio (e.g., 4.8 to 1 or 6.3 to 1), this measure indicates the number of dollarsrequired to generate each additional dollar of profit. The ratio typically improves(becomes lower) as the product enters its growth period, begins to deteriorate(rise) as the product approaches maturity, and climbs more sharply as it reachesdecline.
246 PART 4 Strategy Formulation
Portfolio Analysis 247
6. Estimate the number of profitable years remaining in the product’s life cycle and,based on all information at hand, fix the product’s position on its life-cycle curve:(a) introduction, (b) early or late growth, (c) early or late maturity, or (d) early orlate decline.
The current positions of different products in the product life cycle may be deter-mined by following the procedure described above, and the net results (i.e., thecash flow and profitability) of these positions may be computed. Similar analysesmay be performed for a future period. The difference between current and futurepositions indicates what results management may expect if no strategic changesare made. These results may be compared with corporate expectations to deter-mine the gap. The gap can be filled either by making strategic changes to extendthe life cycle of a product or by bringing in new products through research anddevelopment or acquisition. This procedure may be put into operation by follow-ing these steps:
1. Determine what percentage of the company’s sales and profits fall within eachphase of the product life cycle. These percentages indicate the present life-cycle(sales) profile and the present profit profile of the company’s current line.
2. Calculate changes in life-cycle and profit profiles over the past five years and pro-ject these profiles over the next five years.
3. Develop a target life-cycle profile for the company and measure the company’spresent life-cycle profile against it. The target profile, established by marketingmanagement, specifies the desirable share of company sales that should fallwithin each phase of the product life cycle. It can be determined by industryobsolescence trends, the pace of new product introductions in the field, the aver-age length of product life cycles in the company’s line, and top management’sobjectives for growth and profitability. As a rule, the target profile for growth-minded companies whose life cycles tend to be short calls for a high proportionof sales in introductory and growth phases.
With these steps completed, management can assign priorities to such func-tions as new product development, acquisition, and product line pruning, basedon the discrepancies between the company’s target profile and its present life-cycle profile. Once corporate effort has been broadly allocated in this way amongproducts at various stages of their life cycles, marketing plans can be detailed forindividual product lines.
PORTFOLIO MATRIX
A good planning system must guide the development of strategic alternatives foreach of the company’s current businesses and new business possibilities. It mustalso provide for management’s review of these strategic alternatives and for cor-responding resource allocation decisions. The result is a set of approved businessplans that, taken as a whole, represent the direction of the firm. This process startswith, and its success is largely determined by, the creation of sound strategicalternatives.
CHAPTER 10 Portfolio Analysis 247
Developing aProduct Life-Cycle
Portfolio
248 Portfolio Analysis
The top management of a multibusiness firm cannot generate these strategicalternatives. It must rely on the managers of its business ventures and on its cor-porate development personnel. However, top management can and should estab-lish a conceptual framework within which these alternatives can be developed.One such framework is the portfolio matrix associated with the BostonConsulting Group (BCG). Briefly, the portfolio matrix is used to establish the bestmix of businesses in order to maximize the long-term earnings growth of the firm.The portfolio matrix represents a real advance in strategic planning in severalways:
• It encourages top management to evaluate the prospects of each of the company’sbusinesses individually and to set tailored objectives for each business based onthe contribution it can realistically make to corporate goals.
• It stimulates the use of externally focused empirical data to supplement manager-ial judgment in evaluating the potential of a particular business.
• It explicitly raises the issue of cash flow balancing as management plans forexpansion and growth.
• It gives managers a potent new tool for analyzing competitors and for predictingcompetitive responses to strategic moves.
• It provides not just a financial but a strategic context for evaluating acquisitionsand divestitures.6
As a consequence of these benefits, the widespread application of the portfo-lio matrix approach to corporate planning has sounded the death knell for plan-ning by exhortation, the kind of strategic planning that sets uniform financialperformance goals across an entire company—15 percent growth in earnings or15 percent return on equity—and then expects each business to meet those goalsyear in and year out. The portfolio matrix approach has given top managementthe tools to evaluate each business in the context of both its environment and itsunique contribution to the goals of the company as a whole and to weigh theentire array of business opportunities available to the company against the finan-cial resources required to support them.
The portfolio matrix concept addresses the issue of the potential value of aparticular business for the firm. This value has two variables: first, the potentialfor generating attractive earnings levels now; second, the potential for growth or,in other words, for significantly increased earnings levels in the future. The port-folio matrix concept holds that these two variables can be quantified. Currentearnings potential is measured by comparing the market position of the businessto that of its competitors. Empirical studies have shown that profitability isdirectly determined by relative market share.
Growth potential is measured by the growth rate of the market segment inwhich the business competes. Clearly, if the segment is in the decline stage of itslife cycle, the only way the business can increase its market share is by takingvolume away from competitors. Although this is sometimes possible and eco-nomically desirable, it is usually expensive, leads to destructive pricing and ero-sion of profitability for all competitors, and ultimately results in a market that isill served. On the other hand, if a market is in its rapid growth stage, the business
248 PART 4 Strategy Formulation
Portfolio Analysis 249
can gain share by preempting the incremental growth in the market. So if thesetwo dimensions of value are arrayed in matrix form, we have the basis for a busi-ness classification scheme. This is essentially what the Boston Consulting Groupportfolio matrix is. Each of the four business categories tends to have specificcharacteristics associated with it. The two quadrants corresponding to highmarket leadership have current earnings potential, and the two corresponding tohigh market growth have growth potential.
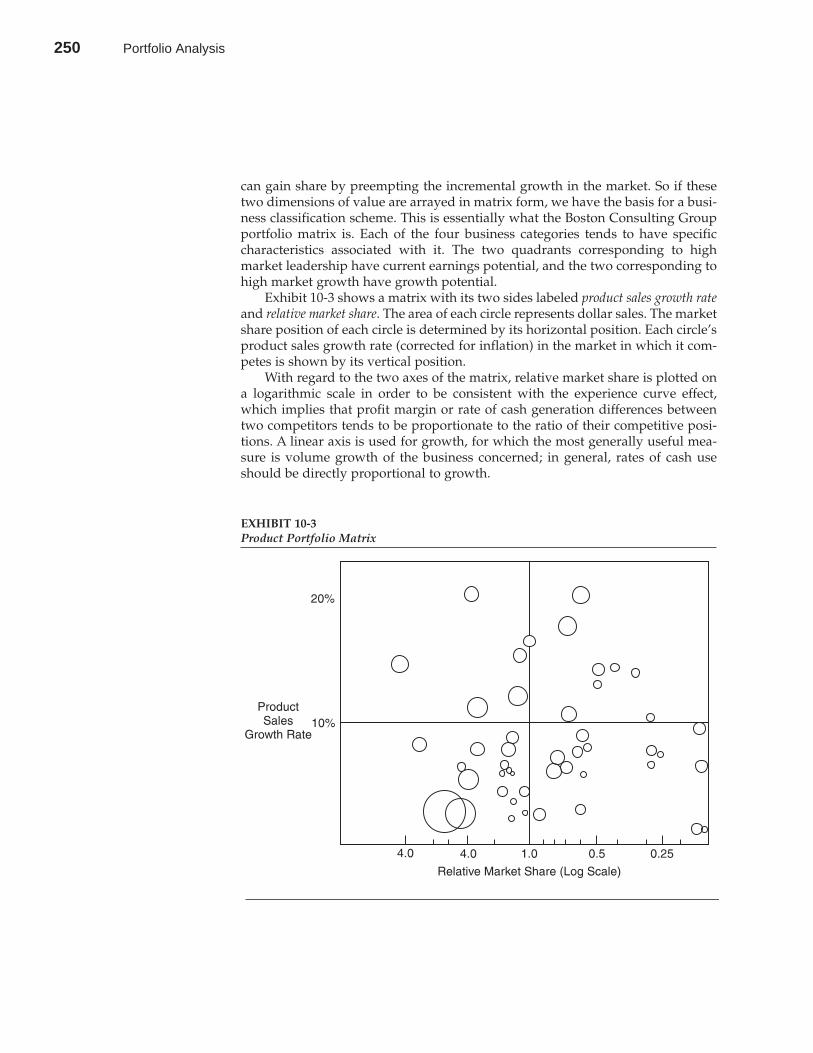
Exhibit 10-3 shows a matrix with its two sides labeled product sales growth rateand relative market share. The area of each circle represents dollar sales. The marketshare position of each circle is determined by its horizontal position. Each circle’sproduct sales growth rate (corrected for inflation) in the market in which it com-petes is shown by its vertical position.
With regard to the two axes of the matrix, relative market share is plotted ona logarithmic scale in order to be consistent with the experience curve effect,which implies that profit margin or rate of cash generation differences betweentwo competitors tends to be proportionate to the ratio of their competitive posi-tions. A linear axis is used for growth, for which the most generally useful mea-sure is volume growth of the business concerned; in general, rates of cash useshould be directly proportional to growth.
CHAPTER 10 Portfolio Analysis 249
EXHIBIT 10-3Product Portfolio Matrix
250 Portfolio Analysis
The lines dividing the matrix into four quadrants are arbitrary. Usually, highgrowth is taken to include all businesses growing in excess of 10 percent annuallyin volume. The line separating areas of high and low relative competitive positionis set at 1.0.
The importance of growth variables for strategy development is based on twofactors. First, growth is a major influence in reducing cost because it is easier togain experience or build market share in a growth market than in a low-growthsituation. Second, growth provides opportunity for investment. The relativemarket share affects the rate at which a business will generate cash. The strongerthe relative market share position of a product, the higher the margins it will havebecause of the scale effect.
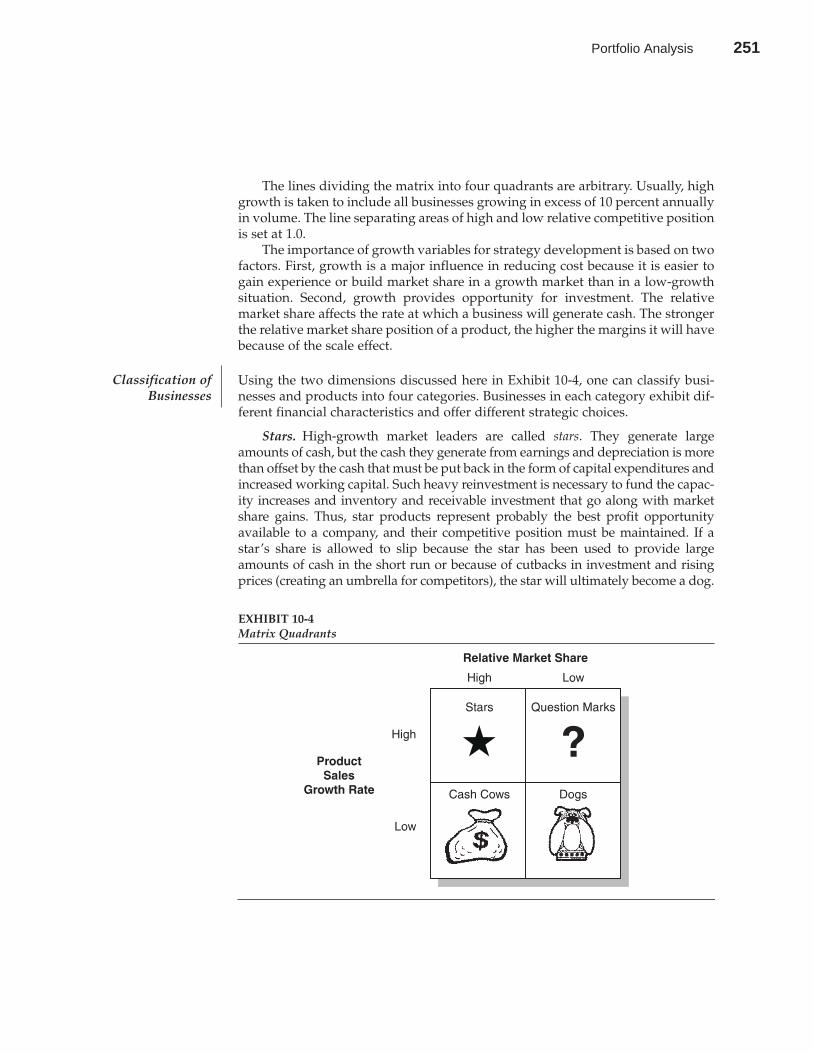
Using the two dimensions discussed here in Exhibit 10-4, one can classify busi-nesses and products into four categories. Businesses in each category exhibit dif-ferent financial characteristics and offer different strategic choices.
Stars. High-growth market leaders are called stars. They generate largeamounts of cash, but the cash they generate from earnings and depreciation is morethan offset by the cash that must be put back in the form of capital expenditures andincreased working capital. Such heavy reinvestment is necessary to fund the capac-ity increases and inventory and receivable investment that go along with marketshare gains. Thus, star products represent probably the best profit opportunityavailable to a company, and their competitive position must be maintained. If astar’s share is allowed to slip because the star has been used to provide largeamounts of cash in the short run or because of cutbacks in investment and risingprices (creating an umbrella for competitors), the star will ultimately become a dog.
250 PART 4 Strategy Formulation
Classification ofBusinesses
EXHIBIT 10-4Matrix Quadrants
Portfolio Analysis 251
The ultimate value of any product or service is reflected in the stream of cashit generates net of its own reinvestment. For a star, this stream of cash lies in thefuture—sometimes in the distant future. To obtain real value, the stream of cashmust be discounted back to the present at a rate equal to the return on alterna-tive opportunities. It is the future payoff of the star that counts, not the presentreported profit. For GE, the plastics business is a star in which it keeps investing.As a matter of fact, the company even acquired Thomson’s plastics operations (a French company) to further strengthen its position in the business.
Cash Cows. Cash cows are characterized by low growth and high market share.They are net providers of cash. Their high earnings, coupled with their depreciation,represent high cash inflows, and they need very little in the way of reinvestment.Thus, these businesses generate large cash surpluses that help to pay dividends andinterest, provide debt capacity, supply funds for research and development, meetoverheads, and also make cash available for investment in other products. Thus,cash cows are the foundation on which everything else depends. These productsmust be protected. Technically speaking, a cash cow has a return on assets thatexceeds its growth rate. Only if this is true will the cash cow generate more cash thanit uses. For NCR Company, the mechanical cash register business is a cash cow. Thecompany still maintains a dominant share of this business even though growth hasslowed down since the introduction of electronic cash registers. The company usesthe surplus cash from its mechanical cash registers to develop electronic machineswith a view to creating a new star. Likewise, the tire business can be categorized asa cash cow for Goodyear Tire and Rubber Company. The tire industry is character-ized by slow market growth, and Goodyear has a major share of the market.
Question Marks. Products in a growth market with a low share are catego-rized as question marks. Because of growth, these products require more cash thanthey are able to generate on their own. If nothing is done to increase market share,a question mark will simply absorb large amounts of cash in the short run andlater, as the growth slows down, become a dog. Thus, unless something is doneto change its perspective, a question mark remains a cash loser throughout itsexistence and ultimately becomes a cash trap.
What can be done to make a question mark more viable? One alternative is togain share increases for it. Because the business is growing, it can be funded todominance. It may then become a star and later, when growth slows down, a cashcow. This strategy is a costly one in the short run. An abundance of cash must bepoured into a question mark in order for it to win a major share of the market, butin the long run, this strategy is the only way to develop a sound business from thequestion mark stage. Another strategy is to divest the business. Outright sale isthe most desirable alternative. But if this does not work out, a firm decision mustbe made not to invest further in the business. The business must simply beallowed to generate whatever cash it can while none is reinvested.
When Joseph E. Seagram and Sons bought Tropicana from Beatrice Co. in1988, it was a question mark. The product had been trailing behind Coke’s MinuteMaid and was losing ground to Procter & Gamble’s new entry in the field, Citrus
CHAPTER 10 Portfolio Analysis 251
252 Portfolio Analysis
Hill. Since then, Seagram has invested heavily in Tropicana to develop it into astar product. After just two years, Tropicana has emerged as a leader in the not-from-concentrate orange juice market, far ahead of Minute Maid, and has beentrying to make inroads into other segments.7
Dogs. Products with low market share positioned in low-growth situationsare called dogs. Their poor competitive position condemns them to poor profits.Because growth is low, dogs have little potential for gaining sufficient share toachieve viable cost positions. Usually they are net users of cash. Their earningsare low, and the reinvestment required just to keep the business together eats cashinflow. The business, therefore, becomes a cash trap that is likely to regularlyabsorb cash unless further investment is rigorously avoided. An alternative is toconvert dogs into cash, if there is an opportunity to do so. GE’s consumer elec-tronics business had been in the dog category, maintaining only a small percent-age of the available market in a period of slow growth, when the companydecided to unload the business (including the RCA brand acquired in late 1985)to Thomson, France’s state-owned, leading electronics manufacturer.
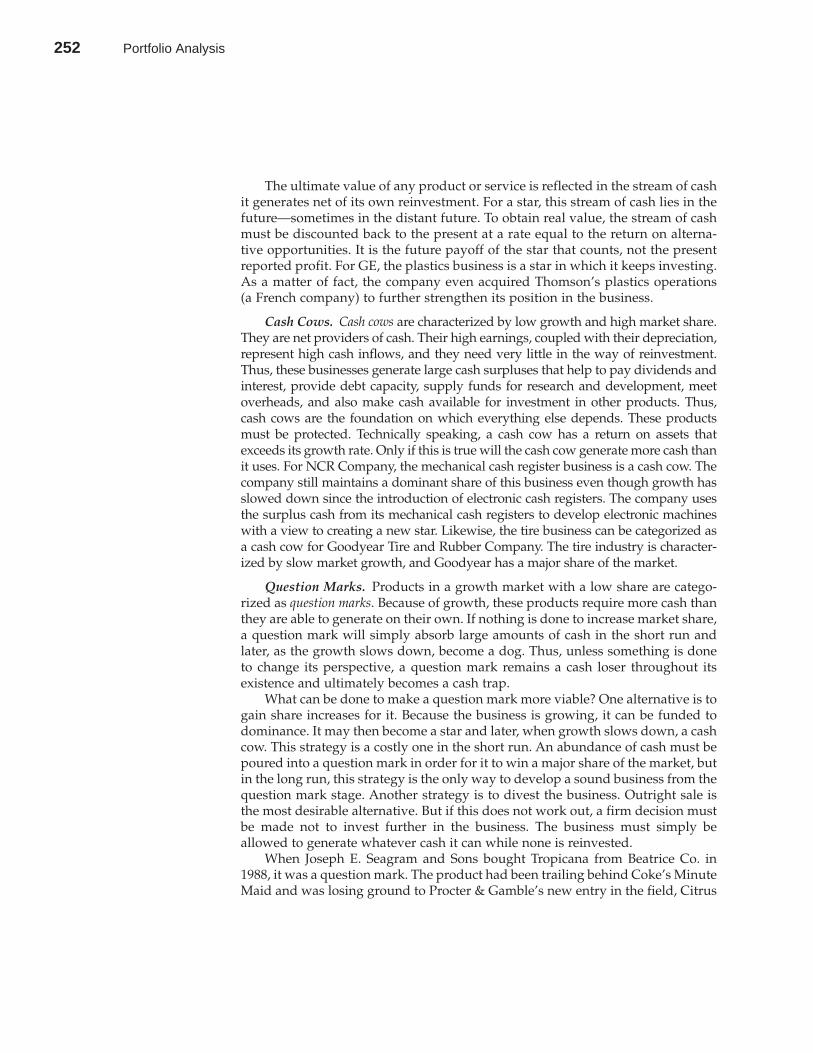
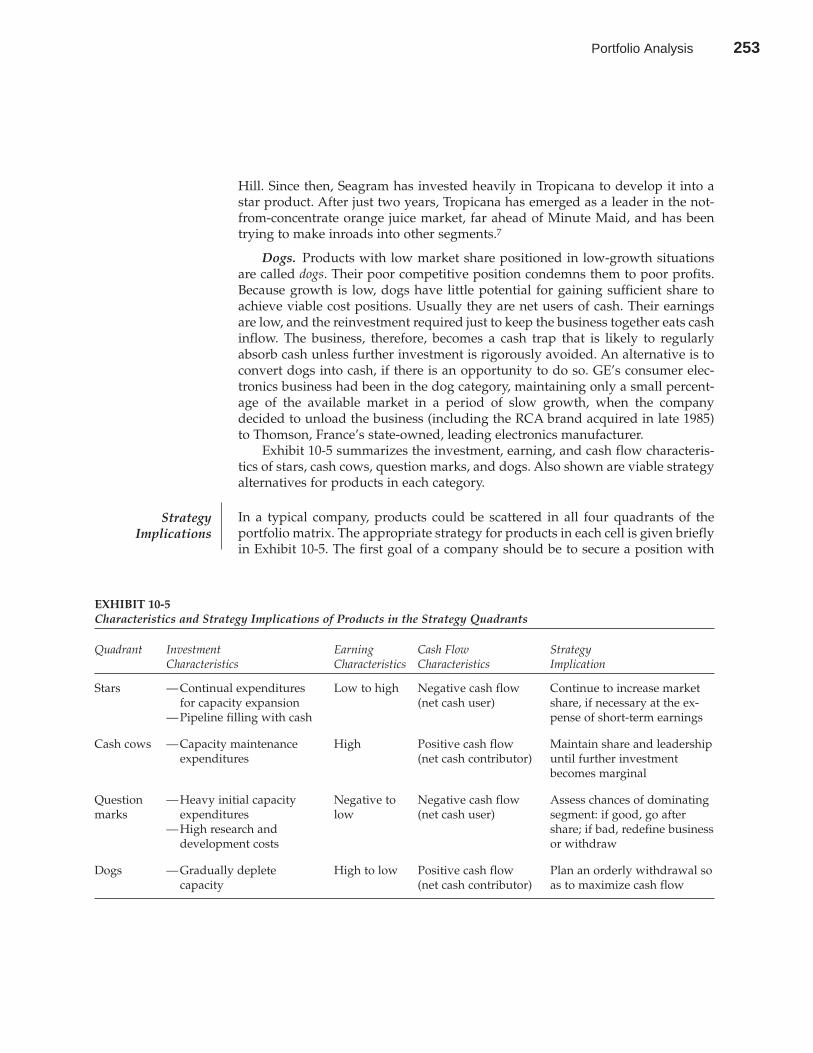
Exhibit 10-5 summarizes the investment, earning, and cash flow characteris-tics of stars, cash cows, question marks, and dogs. Also shown are viable strategyalternatives for products in each category.
In a typical company, products could be scattered in all four quadrants of theportfolio matrix. The appropriate strategy for products in each cell is given brieflyin Exhibit 10-5. The first goal of a company should be to secure a position with
252 PART 4 Strategy Formulation
EXHIBIT 10-5Characteristics and Strategy Implications of Products in the Strategy Quadrants
Quadrant Investment Earning Cash Flow Strategy Characteristics Characteristics Characteristics Implication
Stars — Continual expenditures Low to high Negative cash flow Continue to increase market for capacity expansion (net cash user) share, if necessary at the ex-
— Pipeline filling with cash pense of short-term earnings
Cash cows — Capacity maintenance High Positive cash flow Maintain share and leadership expenditures (net cash contributor) until further investment
becomes marginal
Question — Heavy initial capacity Negative to Negative cash flow Assess chances of dominatingmarks expenditures low (net cash user) segment: if good, go after
— High research and share; if bad, redefine business development costs or withdraw
Dogs — Gradually deplete High to low Positive cash flow Plan an orderly withdrawal so capacity (net cash contributor) as to maximize cash flow
StrategyImplications
Portfolio Analysis 253
cash cows but to guard against the frequent temptation to reinvest in them exces-sively. The cash generated from cash cows should first be used to support thosestars that are not self-sustaining. Surplus cash may then be used to financeselected question marks to dominance. Any question mark that cannot be fundedshould be divested. A dog may be restored to a position of viability by shrewdlysegmenting the market; that is, by rationalizing and specializing the business intoa small niche that the product may dominate. If this is not practical, a firm shouldmanage the dog for cash; it should cut off all investment in the business and liq-uidate it when an opportunity develops.
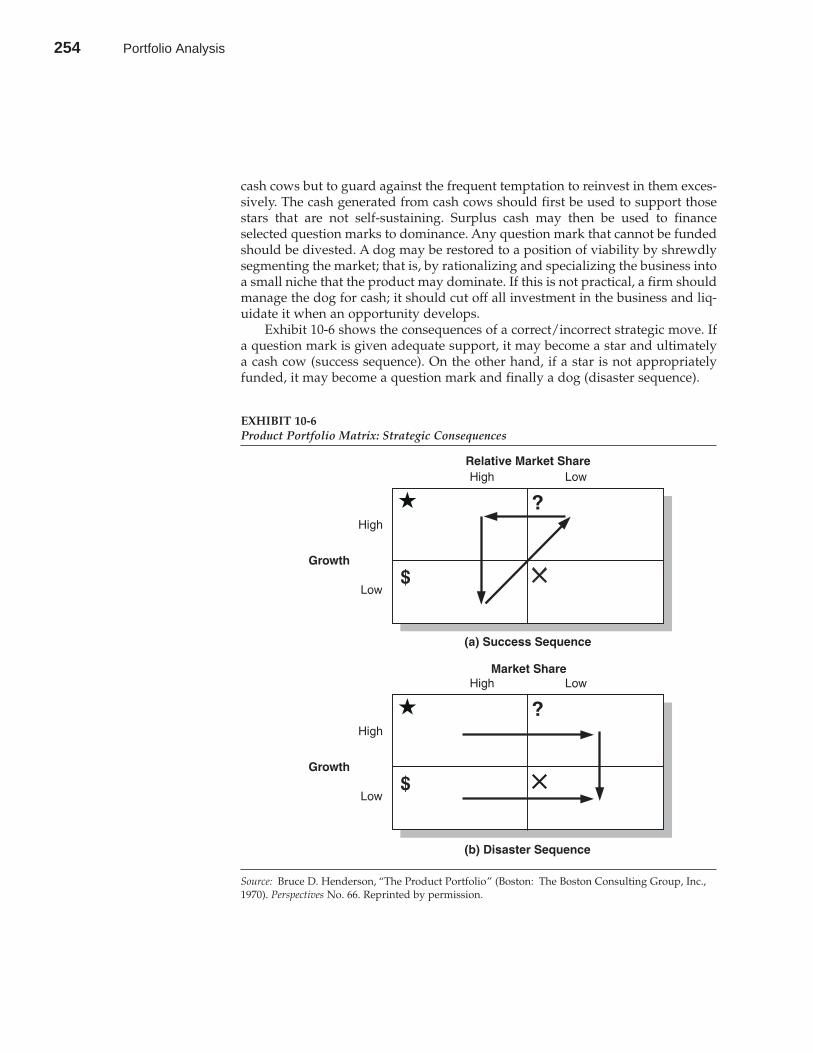
Exhibit 10-6 shows the consequences of a correct/incorrect strategic move. Ifa question mark is given adequate support, it may become a star and ultimatelya cash cow (success sequence). On the other hand, if a star is not appropriatelyfunded, it may become a question mark and finally a dog (disaster sequence).
CHAPTER 10 Portfolio Analysis 253
EXHIBIT 10-6Product Portfolio Matrix: Strategic Consequences
Source: Bruce D. Henderson, “The Product Portfolio” (Boston: The Boston Consulting Group, Inc.,1970). Perspectives No. 66. Reprinted by permission.
254 Portfolio Analysis
Top management needs to answer two strategic questions: (a) How promis-ing is the current set of businesses with respect to long-term return and growth?(b) Which businesses should be developed? maintained as is? liquidated?Following the portfolio matrix approach, a company needs a cash-balanced port-folio of businesses; that is, it needs cash cows and dogs to throw off sufficient cashto fund stars and question marks. It needs an ample supply of question marks toensure long-term growth and businesses with return levels appropriate to theirmatrix position. In response to the second question, capital budgeting theoryrequires the lining up of capital project proposals, assessment of incremental cashflows attributable to each project, computation of discounted rate of return oneach, and approval of the project with the highest rate of return until availablefunds are exhausted. But the capital budgeting approach misses the strategic con-tent; that is, it ignores questions of how to validate assumptions about volume,price, cost, and investment and how to eliminate natural biases. This problem issolved by the portfolio matrix approach.
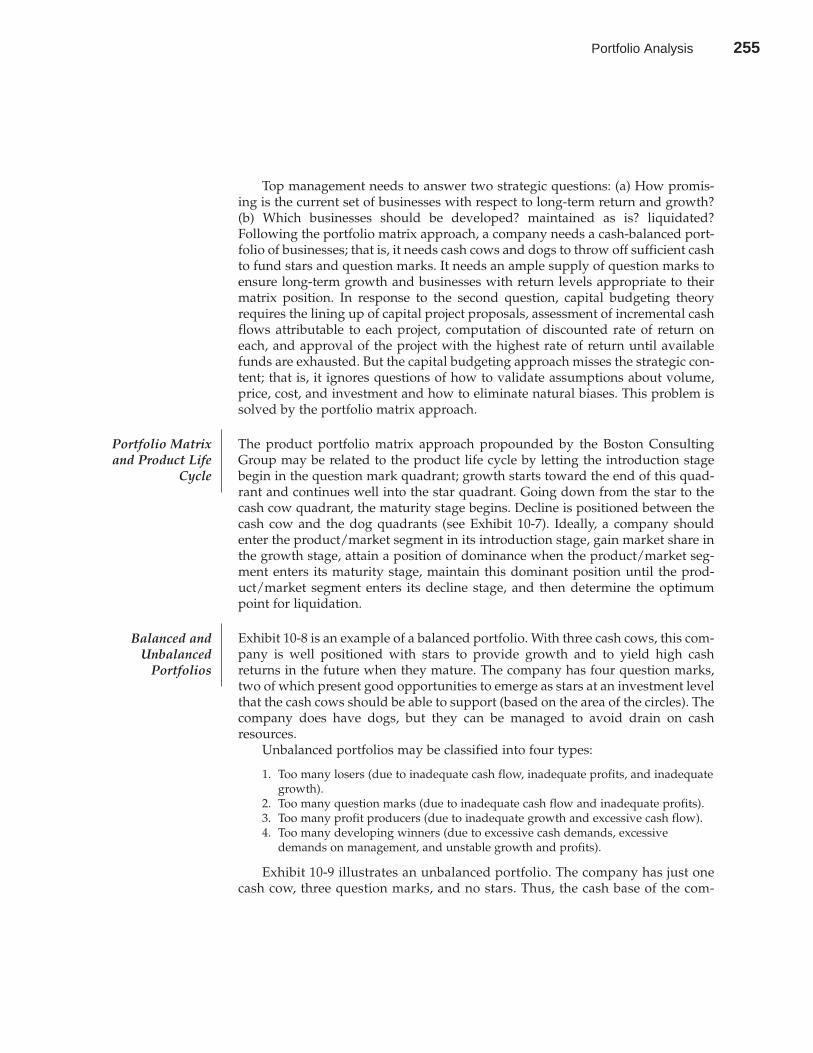
The product portfolio matrix approach propounded by the Boston ConsultingGroup may be related to the product life cycle by letting the introduction stagebegin in the question mark quadrant; growth starts toward the end of this quad-rant and continues well into the star quadrant. Going down from the star to thecash cow quadrant, the maturity stage begins. Decline is positioned between thecash cow and the dog quadrants (see Exhibit 10-7). Ideally, a company shouldenter the product/market segment in its introduction stage, gain market share inthe growth stage, attain a position of dominance when the product/market seg-ment enters its maturity stage, maintain this dominant position until the prod-uct/market segment enters its decline stage, and then determine the optimumpoint for liquidation.
Exhibit 10-8 is an example of a balanced portfolio. With three cash cows, this com-pany is well positioned with stars to provide growth and to yield high cashreturns in the future when they mature. The company has four question marks,two of which present good opportunities to emerge as stars at an investment levelthat the cash cows should be able to support (based on the area of the circles). Thecompany does have dogs, but they can be managed to avoid drain on cashresources.
Unbalanced portfolios may be classified into four types:
1. Too many losers (due to inadequate cash flow, inadequate profits, and inadequategrowth).
2. Too many question marks (due to inadequate cash flow and inadequate profits).3. Too many profit producers (due to inadequate growth and excessive cash flow).4. Too many developing winners (due to excessive cash demands, excessive
demands on management, and unstable growth and profits).
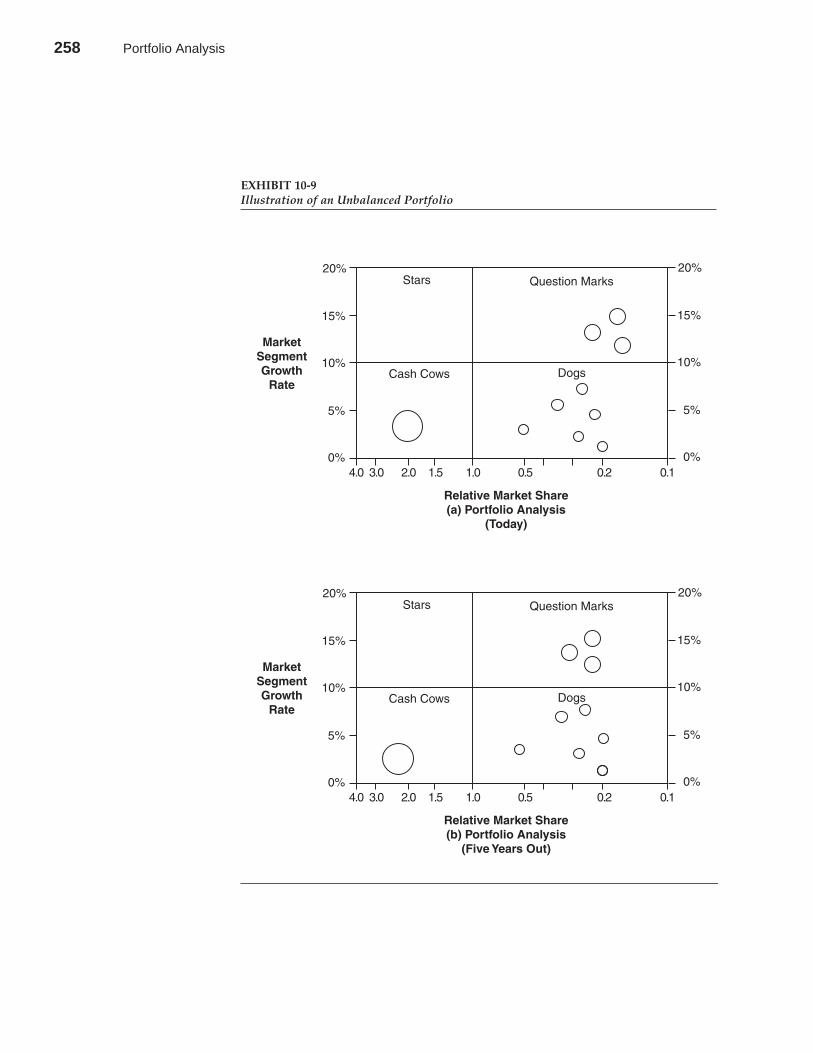
Exhibit 10-9 illustrates an unbalanced portfolio. The company has just onecash cow, three question marks, and no stars. Thus, the cash base of the com-
254 PART 4 Strategy Formulation
Portfolio Matrixand Product Life
Cycle
Balanced andUnbalanced
Portfolios
Portfolio Analysis 255
pany is inadequate and cannot support the question marks. The company mayallocate available cash among all question marks in equal proportion. Dogsmay also be given occasional cash nourishment. If the company continues itscurrent strategy, it may find itself in a dangerous position in five years, partic-ularly when the cash cow moves closer to becoming a dog. To take correctiveaction, the company must face the fact that it cannot support all its questionmarks. It must choose one or maybe two of its three question marks and fundthem adequately to make them stars. In addition, disbursement of cash in dogsshould be totally prohibited. In brief, the strategic choice for the company, con-sidered in portfolio terms, is obvious. It cannot fund all question marks anddogs equally.
The portfolio matrix focuses on the real fundamentals of businesses and theirrelationships to each other within the portfolio. It is not possible to develop effec-tive strategy in a multiproduct, multimarket company without considering themutual relationships of different businesses.
CHAPTER 10 Portfolio Analysis 255
EXHIBIT 10-7Relationship between Product Portfolio Matrix and Product Life Cycle
256 Portfolio Analysis
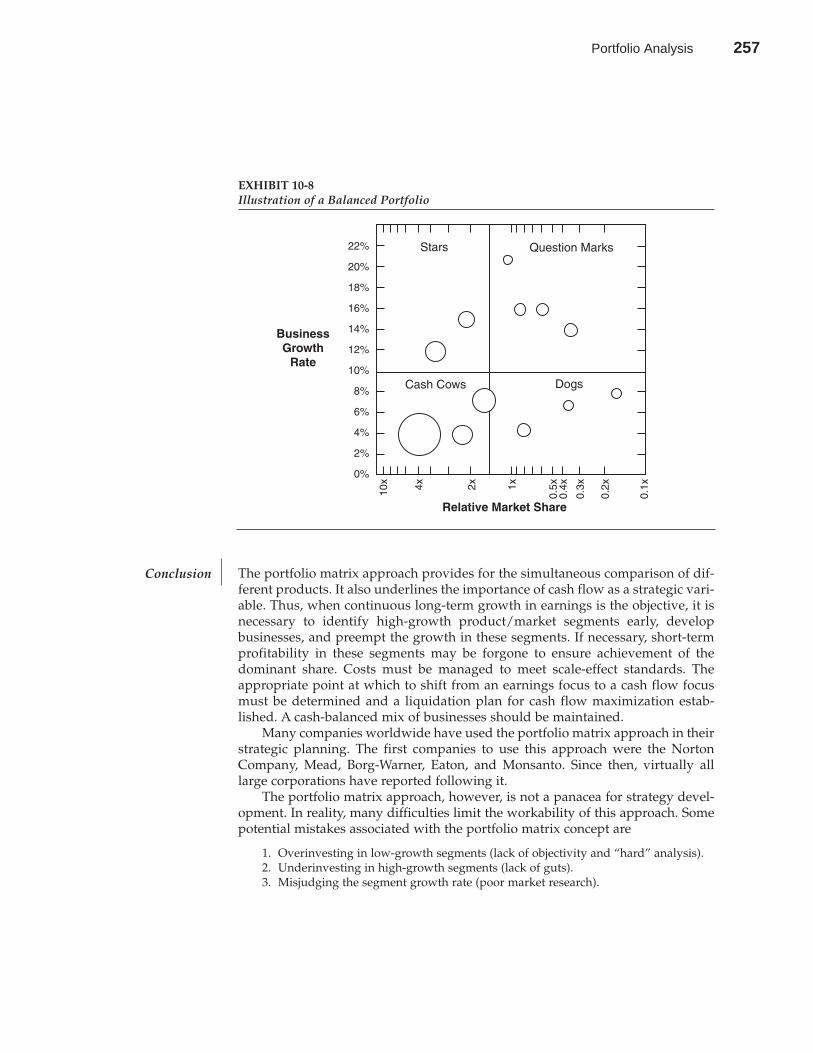
The portfolio matrix approach provides for the simultaneous comparison of dif-ferent products. It also underlines the importance of cash flow as a strategic vari-able. Thus, when continuous long-term growth in earnings is the objective, it isnecessary to identify high-growth product/market segments early, developbusinesses, and preempt the growth in these segments. If necessary, short-termprofitability in these segments may be forgone to ensure achievement of thedominant share. Costs must be managed to meet scale-effect standards. Theappropriate point at which to shift from an earnings focus to a cash flow focusmust be determined and a liquidation plan for cash flow maximization estab-lished. A cash-balanced mix of businesses should be maintained.
Many companies worldwide have used the portfolio matrix approach in theirstrategic planning. The first companies to use this approach were the NortonCompany, Mead, Borg-Warner, Eaton, and Monsanto. Since then, virtually alllarge corporations have reported following it.
The portfolio matrix approach, however, is not a panacea for strategy devel-opment. In reality, many difficulties limit the workability of this approach. Somepotential mistakes associated with the portfolio matrix concept are
1. Overinvesting in low-growth segments (lack of objectivity and “hard” analysis).2. Underinvesting in high-growth segments (lack of guts).3. Misjudging the segment growth rate (poor market research).
256 PART 4 Strategy Formulation
EXHIBIT 10-8Illustration of a Balanced Portfolio
Conclusion
Portfolio Analysis 257
CHAPTER 10 Portfolio Analysis 257
EXHIBIT 10-9Illustration of an Unbalanced Portfolio
258 Portfolio Analysis
4. Not achieving market share (because of improper market strategy, sales capabili-ties, or promotion).
5. Losing cost effectiveness (lack of operating talent and control system).6. Not uncovering emerging high-growth segments (lack of corporate development
effort).7. Unbalanced business mix (lack of planning and financial resources).
Thus, the portfolio matrix approach should be used with great care.
MULTIFACTOR PORTFOLIO MATRIX
The two-factor portfolio matrix discussed above provides a useful approach forreviewing the roles of different products in a company. However, the growth rate-relative market share matrix approach leads to many difficulties. At times, factorsother than market share and growth rate bear heavily on cash flow, the mainstayof this approach. Some managers may consider return on investment a more suit-able criterion than cash flow for making investment decisions. Further, the two-factor portfolio matrix approach does not address major investment decisionsbetween dissimilar businesses. These difficulties can lead a company into toomany traps and errors. For this reason, many companies (such as GE and the ShellGroup) have developed the multifactor portfolio approach.
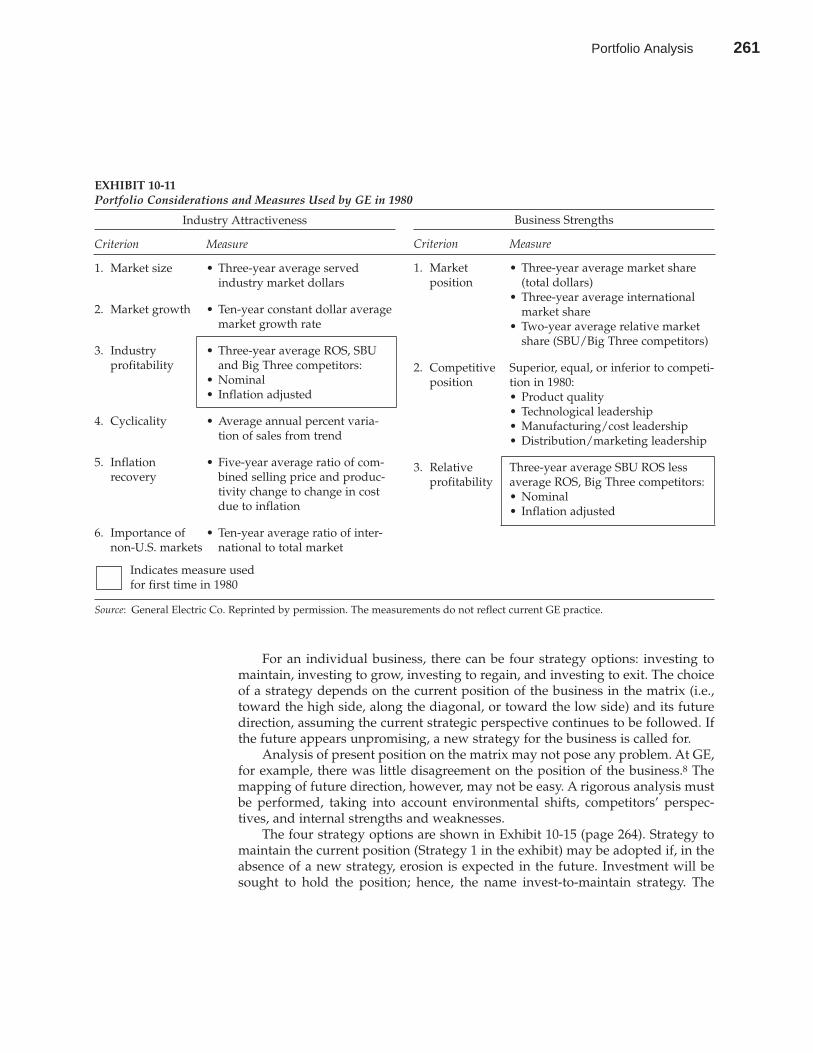
Exhibit 10-10 illustrates the GE matrix. Its two dimensions, industry attrac-tiveness and business strengths, are based on a variety of factors. It is this multi-factor characteristic that differentiates this approach from the one discussed in theprevious section. In its early attempts with the portfolio matrix, GE used the cri-teria and measures shown in Exhibit 10-11 to determine industry attractivenessand business strengths. These criteria and measures are only suggestions; anothercompany may adopt a different list. For example, GE later added cyclicality as acriterion under industry attractiveness. The measure of relative profitability, asshown in the exhibit, was used for the first time in 1985.
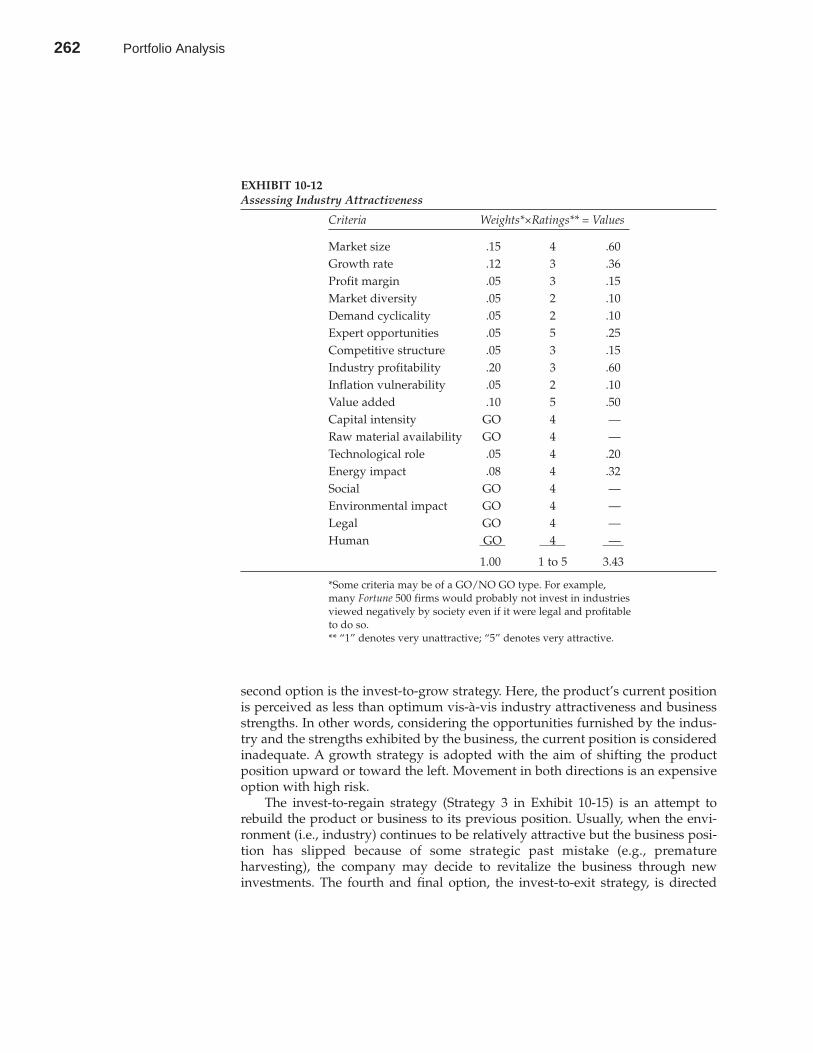
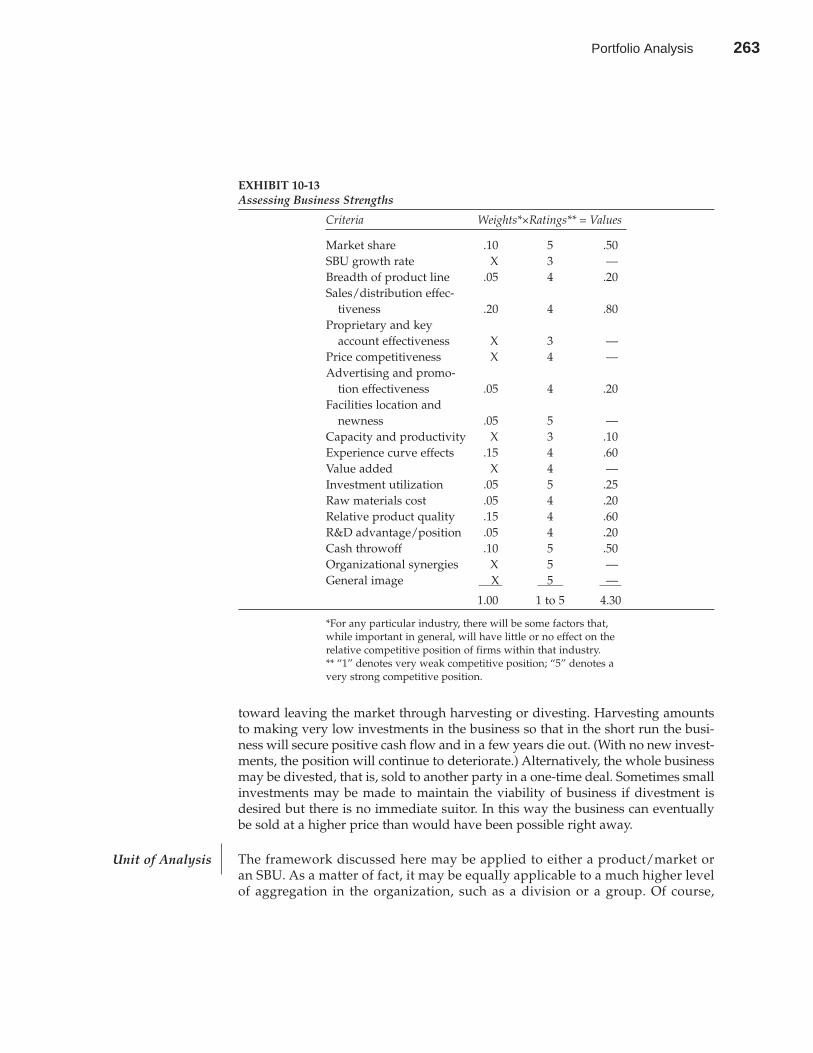
Exhibits 10-12 and 10-13 (pages 261 and 262) illustrate how the factors may beweighed and how a final industry attractiveness and business strengths scoremay be computed. Management may establish cutoff points for high, medium,and low industry attractiveness and competitive position scores.
It is worthwhile to mention that the development of a multifactor matrix maynot be as easy as it appears. The actual analysis required may take a considerableamount of foresight and experience and many, many days of work. The major dif-ficulties lie in identifying relevant factors, relating factors to industry attractive-ness and business strengths, and weighing the factors.
The overall strategy for a business in a particular position is illustrated in Exhibit10-10. The area of the circle refers to the business’s sales. Investment priority isgiven to products in the high area (upper left), where a stronger position is sup-ported by the attractiveness of an industry. Along the diagonal, selectivity isdesired to achieve a balanced earnings performance. The businesses in the lowarea (lower right) are the candidates for harvesting and divestment.
258 PART 4 Strategy Formulation
StrategyDevelopment
Portfolio Analysis 259
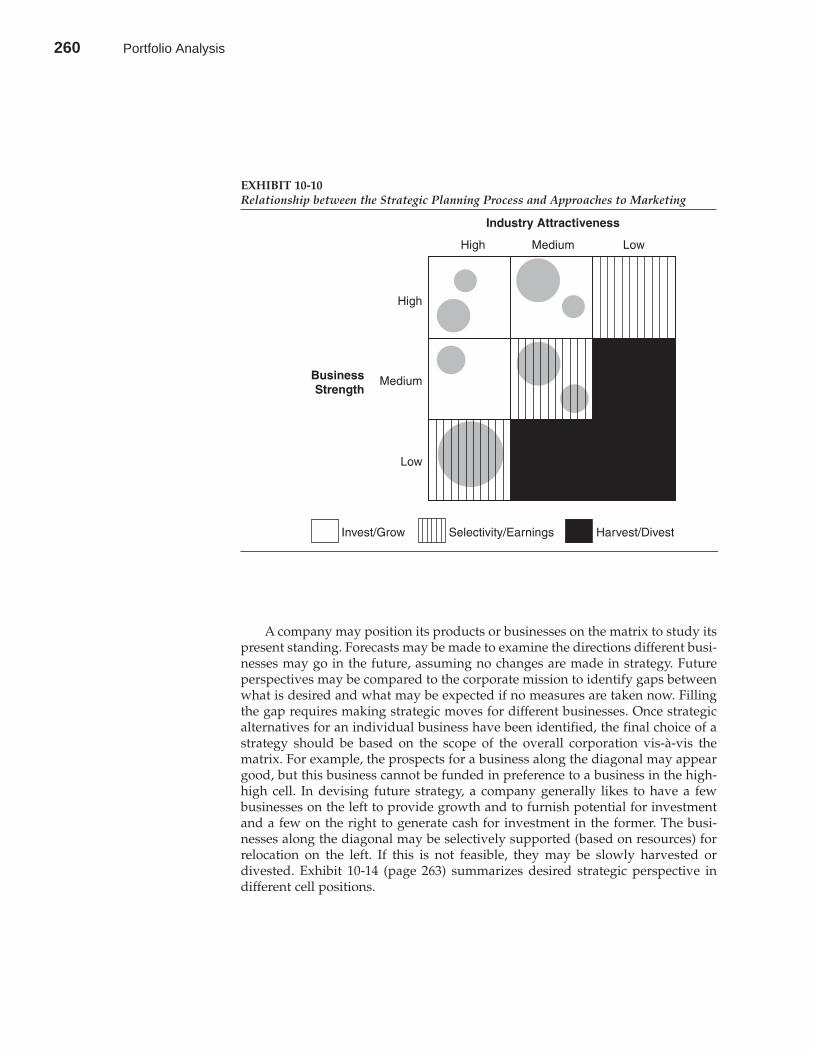
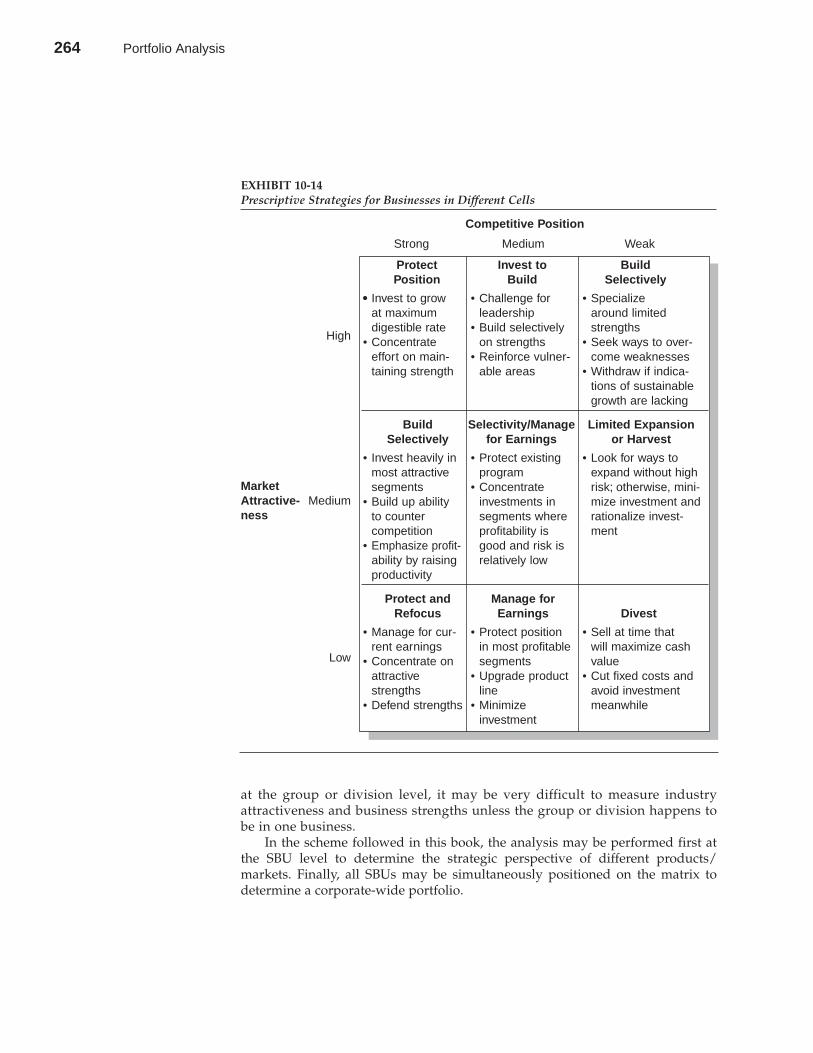
A company may position its products or businesses on the matrix to study itspresent standing. Forecasts may be made to examine the directions different busi-nesses may go in the future, assuming no changes are made in strategy. Futureperspectives may be compared to the corporate mission to identify gaps betweenwhat is desired and what may be expected if no measures are taken now. Fillingthe gap requires making strategic moves for different businesses. Once strategicalternatives for an individual business have been identified, the final choice of astrategy should be based on the scope of the overall corporation vis-à-vis thematrix. For example, the prospects for a business along the diagonal may appeargood, but this business cannot be funded in preference to a business in the high-high cell. In devising future strategy, a company generally likes to have a fewbusinesses on the left to provide growth and to furnish potential for investmentand a few on the right to generate cash for investment in the former. The busi-nesses along the diagonal may be selectively supported (based on resources) forrelocation on the left. If this is not feasible, they may be slowly harvested ordivested. Exhibit 10-14 (page 263) summarizes desired strategic perspective indifferent cell positions.
CHAPTER 10 Portfolio Analysis 259
EXHIBIT 10-10Relationship between the Strategic Planning Process and Approaches to Marketing
260 Portfolio Analysis
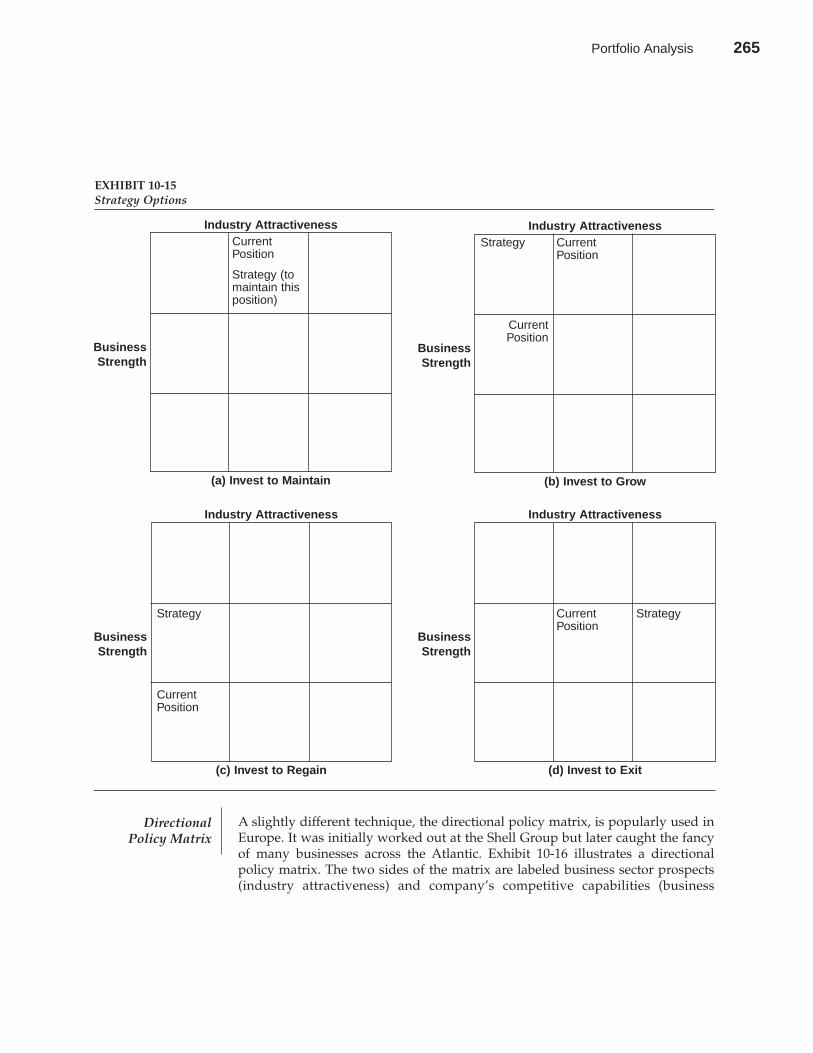
For an individual business, there can be four strategy options: investing tomaintain, investing to grow, investing to regain, and investing to exit. The choiceof a strategy depends on the current position of the business in the matrix (i.e.,toward the high side, along the diagonal, or toward the low side) and its futuredirection, assuming the current strategic perspective continues to be followed. Ifthe future appears unpromising, a new strategy for the business is called for.
Analysis of present position on the matrix may not pose any problem. At GE,for example, there was little disagreement on the position of the business.8 Themapping of future direction, however, may not be easy. A rigorous analysis mustbe performed, taking into account environmental shifts, competitors’ perspec-tives, and internal strengths and weaknesses.
The four strategy options are shown in Exhibit 10-15 (page 264). Strategy tomaintain the current position (Strategy 1 in the exhibit) may be adopted if, in theabsence of a new strategy, erosion is expected in the future. Investment will besought to hold the position; hence, the name invest-to-maintain strategy. The
260 PART 4 Strategy Formulation
Business Strengths
Criterion Measure
1. Market • Three-year average market share position (total dollars)
• Three-year average international market share
• Two-year average relative marketshare (SBU/Big Three competitors)
2. Competitive Superior, equal, or inferior to competi-position tion in 1980:
• Product quality • Technological leadership • Manufacturing/cost leadership • Distribution/marketing leadership
3. Relative Three-year average SBU ROS less profitability average ROS, Big Three competitors:
• Nominal • Inflation adjusted
EXHIBIT 10-11Portfolio Considerations and Measures Used by GE in 1980
Industry Attractiveness
Criterion Measure
1. Market size • Three-year average served industry market dollars
2. Market growth • Ten-year constant dollar average market growth rate
3. Industry • Three-year average ROS, SBU profitability and Big Three competitors:
• Nominal • Inflation adjusted
4. Cyclicality • Average annual percent varia-tion of sales from trend
5. Inflation • Five-year average ratio of com-recovery bined selling price and produc-
tivity change to change in cost due to inflation
6. Importance of • Ten-year average ratio of inter-non-U.S. markets national to total market
Indicates measure used for first time in 1980
Source: General Electric Co. Reprinted by permission. The measurements do not reflect current GE practice.
Portfolio Analysis 261
second option is the invest-to-grow strategy. Here, the product’s current positionis perceived as less than optimum vis-à-vis industry attractiveness and businessstrengths. In other words, considering the opportunities furnished by the indus-try and the strengths exhibited by the business, the current position is consideredinadequate. A growth strategy is adopted with the aim of shifting the productposition upward or toward the left. Movement in both directions is an expensiveoption with high risk.
The invest-to-regain strategy (Strategy 3 in Exhibit 10-15) is an attempt torebuild the product or business to its previous position. Usually, when the envi-ronment (i.e., industry) continues to be relatively attractive but the business posi-tion has slipped because of some strategic past mistake (e.g., prematureharvesting), the company may decide to revitalize the business through newinvestments. The fourth and final option, the invest-to-exit strategy, is directed
CHAPTER 10 Portfolio Analysis 261
EXHIBIT 10-12Assessing Industry Attractiveness
Criteria Weights*×Ratings** = Values
Market size .15 4 .60Growth rate .12 3 .36Profit margin .05 3 .15Market diversity .05 2 .10Demand cyclicality .05 2 .10Expert opportunities .05 5 .25Competitive structure .05 3 .15Industry profitability .20 3 .60Inflation vulnerability .05 2 .10Value added .10 5 .50Capital intensity GO 4 —Raw material availability GO 4 —Technological role .05 4 .20Energy impact .08 4 .32Social GO 4 —Environmental impact GO 4 —Legal GO 4 —Human . GO . . 4 . —
1.00 1 to 5 3.43
*Some criteria may be of a GO/NO GO type. For example,many Fortune 500 firms would probably not invest in industriesviewed negatively by society even if it were legal and profitableto do so. ** “1” denotes very unattractive; “5” denotes very attractive.
262 Portfolio Analysis
toward leaving the market through harvesting or divesting. Harvesting amountsto making very low investments in the business so that in the short run the busi-ness will secure positive cash flow and in a few years die out. (With no new invest-ments, the position will continue to deteriorate.) Alternatively, the whole businessmay be divested, that is, sold to another party in a one-time deal. Sometimes smallinvestments may be made to maintain the viability of business if divestment isdesired but there is no immediate suitor. In this way the business can eventuallybe sold at a higher price than would have been possible right away.
The framework discussed here may be applied to either a product/market oran SBU. As a matter of fact, it may be equally applicable to a much higher levelof aggregation in the organization, such as a division or a group. Of course,
262 PART 4 Strategy Formulation
EXHIBIT 10-13Assessing Business Strengths
Criteria Weights*×Ratings** = Values
Market share .10 5 .50SBU growth rate X 3 —Breadth of product line .05 4 .20Sales/distribution effec-
tiveness .20 4 .80Proprietary and key
account effectiveness X 3 —Price competitiveness X 4 —Advertising and promo-
tion effectiveness .05 4 .20Facilities location and
newness .05 5 —Capacity and productivity X 3 .10Experience curve effects .15 4 .60Value added X 4 —Investment utilization .05 5 .25Raw materials cost .05 4 .20Relative product quality .15 4 .60R&D advantage/position .05 4 .20Cash throwoff .10 5 .50Organizational synergies X 5 —General image . X . . 5 . —
1.00 1 to 5 4.30
*For any particular industry, there will be some factors that,while important in general, will have little or no effect on therelative competitive position of firms within that industry.** “1” denotes very weak competitive position; “5” denotes avery strong competitive position.
Unit of Analysis
Portfolio Analysis 263
at the group or division level, it may be very difficult to measure industryattractiveness and business strengths unless the group or division happens tobe in one business.
In the scheme followed in this book, the analysis may be performed first atthe SBU level to determine the strategic perspective of different products/markets. Finally, all SBUs may be simultaneously positioned on the matrix todetermine a corporate-wide portfolio.
CHAPTER 10 Portfolio Analysis 263
Protect Invest to BuildPosition Build Selectively
• Invest to grow • Challenge for • Specializeat maximum leadership around limiteddigestible rate • Build selectively strengths
• Concentrate on strengths • Seek ways to over-effort on main- • Reinforce vulner- come weaknessestaining strength able areas • Withdraw if indica-
tions of sustainablegrowth are lacking
Build Selectivity/Manage Limited ExpansionSelectively for Earnings or Harvest
• Invest heavily in • Protect existing • Look for ways tomost attractive program expand without highsegments • Concentrate risk; otherwise, mini-
• Build up ability investments in mize investment andto counter segments where rationalize invest-competition profitability is ment
• Emphasize profit- good and risk is ability by raising relatively lowproductivity
Protect and Manage forRefocus Earnings Divest
• Manage for cur- • Protect position • Sell at time thatrent earnings in most profitable will maximize cash
• Concentrate on segments valueattractive • Upgrade product • Cut fixed costs andstrengths line avoid investment
• Defend strengths • Minimize meanwhile investment
EXHIBIT 10-14Prescriptive Strategies for Businesses in Different Cells
Competitive Position
Strong Medium Weak
High
MarketMediumAttractive-
ness
Low
264 Portfolio Analysis
A slightly different technique, the directional policy matrix, is popularly used inEurope. It was initially worked out at the Shell Group but later caught the fancyof many businesses across the Atlantic. Exhibit 10-16 illustrates a directionalpolicy matrix. The two sides of the matrix are labeled business sector prospects(industry attractiveness) and company’s competitive capabilities (business
264 PART 4 Strategy Formulation
Industry Attractiveness
Industry Attractiveness
Industry Attractiveness
Strategy
CurrentPosition
Strategy Current Position
CurrentPosition
EXHIBIT 10-15Strategy Options
Industry Attractiveness
(a) Invest to Maintain
BusinessStrength
(b) Invest to Grow
BusinessStrength
(c) Invest to Regain
BusinessStrength
Current StrategyPosition
(d) Invest to Exit
BusinessStrength
Directional Policy Matrix
Current Position
Strategy (tomaintain thisposition)
Portfolio Analysis 265
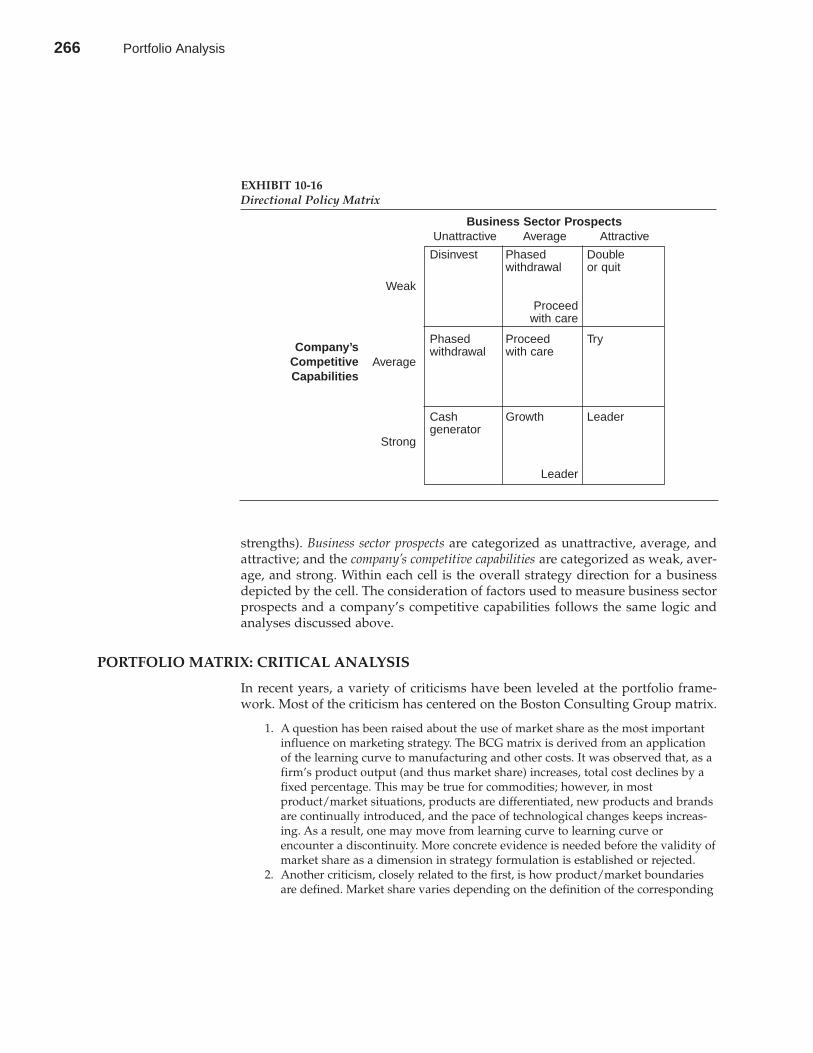
strengths). Business sector prospects are categorized as unattractive, average, andattractive; and the company’s competitive capabilities are categorized as weak, aver-age, and strong. Within each cell is the overall strategy direction for a businessdepicted by the cell. The consideration of factors used to measure business sectorprospects and a company’s competitive capabilities follows the same logic andanalyses discussed above.
PORTFOLIO MATRIX: CRITICAL ANALYSIS
In recent years, a variety of criticisms have been leveled at the portfolio frame-work. Most of the criticism has centered on the Boston Consulting Group matrix.
1. A question has been raised about the use of market share as the most importantinfluence on marketing strategy. The BCG matrix is derived from an applicationof the learning curve to manufacturing and other costs. It was observed that, as afirm’s product output (and thus market share) increases, total cost declines by afixed percentage. This may be true for commodities; however, in mostproduct/market situations, products are differentiated, new products and brandsare continually introduced, and the pace of technological changes keeps increas-ing. As a result, one may move from learning curve to learning curve orencounter a discontinuity. More concrete evidence is needed before the validity ofmarket share as a dimension in strategy formulation is established or rejected.
2. Another criticism, closely related to the first, is how product/market boundariesare defined. Market share varies depending on the definition of the corresponding
CHAPTER 10 Portfolio Analysis 265
Business Sector ProspectsUnattractive Average Attractive
EXHIBIT 10-16Directional Policy Matrix
Disinvest Phased Doublewithdrawal or quit
Proceedwith care
Phased Proceed Trywithdrawal with care
Cash Growth Leadergenerator
Leader
Weak
Average
Strong
Company’sCompetitiveCapabilities
266 Portfolio Analysis
product/market. Hence, a product may be classified in different cells, dependingon the market boundaries used.
3. The stability of product life cycles is implicitly assumed in some portfolio models.However, as in the case of the learning curve, it is possible for the product lifecycle to change during the life of the product. For example, recycling can extendthe life cycle of a product, sparking a second growth stage after maturity. Arelated subissue concerns the assumption that investment is more desirable inhigh-growth markets than in low-growth ones. There is insufficient evidence tosupport this proposition.9 This overall issue becomes more problematic for inter-national firms because a given product may be in different stages of its life cyclein different countries.
4. The BCG portfolio framework was developed for balancing cash flows. It ignoresthe existence of capital markets. Cash balancing is not always an important con-sideration.
5. The portfolio framework assumes that investments in all products/markets areequally risky, but this is not the case. In fact, financial portfolio managementtheory does take risk into account. The more risky an investment, the higher thereturn expected of it. The portfolio matrix does not consider the risk factor.
6. The BCG portfolio model assumes that there is no interdependency betweenproducts/markets. This assumption can be questioned on various grounds. Forinstance, different products/markets might share technology or costs.10 Theseinterdependencies should be accounted for in a portfolio framework.
7. There is no consensus on the level at which portfolio models are appropriatelyused. Five levels can be identified: product, product line, market segment, SBU,and business sector. The most frequent application has been at the SBU level;however, it has been suggested that the framework is equally applicable at otherlevels. Because it is unlikely that any one model could have such wide applica-tion, the suggestion that it does casts doubt on the model itself.
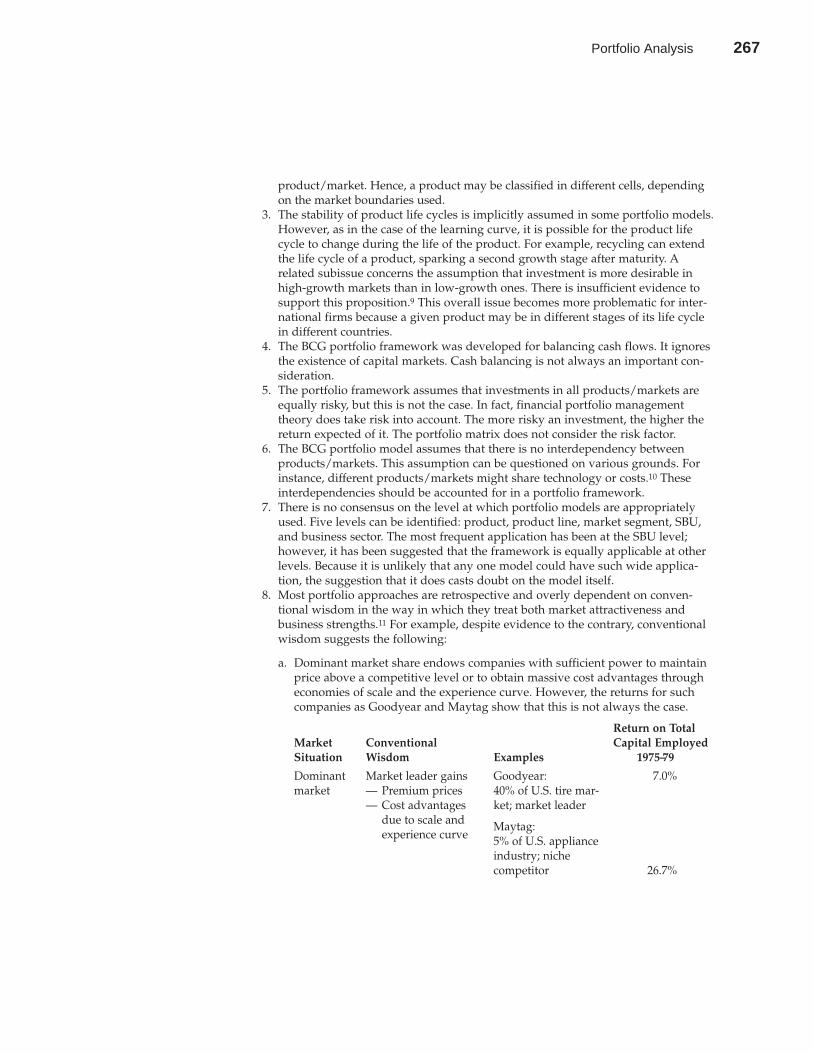
8. Most portfolio approaches are retrospective and overly dependent on conven-tional wisdom in the way in which they treat both market attractiveness andbusiness strengths.11 For example, despite evidence to the contrary, conventionalwisdom suggests the following:
a. Dominant market share endows companies with sufficient power to maintainprice above a competitive level or to obtain massive cost advantages througheconomies of scale and the experience curve. However, the returns for suchcompanies as Goodyear and Maytag show that this is not always the case.
Return on TotalMarket Conventional Capital EmployedSituation Wisdom Examples 1975–79
Dominant Market leader gains Goodyear: 7.0%market — Premium prices 40% of U.S. tire mar-
— Cost advantages ket; market leader due to scale and experience curve
Maytag: 5% of U.S. appliance industry; niche competitor 26.7%
266 PART 4 Strategy Formulation
Portfolio Analysis 267
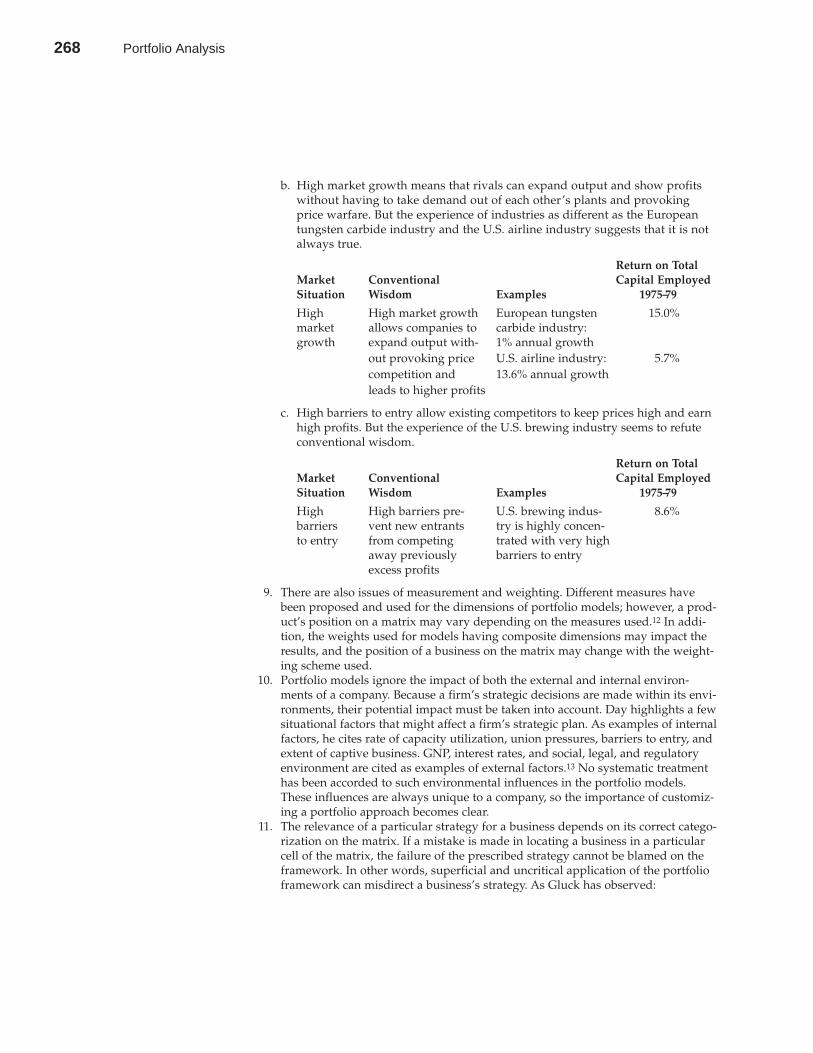
b. High market growth means that rivals can expand output and show profitswithout having to take demand out of each other’s plants and provokingprice warfare. But the experience of industries as different as the Europeantungsten carbide industry and the U.S. airline industry suggests that it is notalways true.
Return on TotalMarket Conventional Capital EmployedSituation Wisdom Examples 1975–79
High High market growth European tungsten 15.0%market allows companies to carbide industry: growth expand output with- 1% annual growth
out provoking price U.S. airline industry: 5.7%competition and 13.6% annual growthleads to higher profits
c. High barriers to entry allow existing competitors to keep prices high and earnhigh profits. But the experience of the U.S. brewing industry seems to refuteconventional wisdom.
Return on TotalMarket Conventional Capital EmployedSituation Wisdom Examples 1975–79
High High barriers pre- U.S. brewing indus- 8.6%barriers vent new entrants try is highly concen-to entry from competing trated with very high
away previously barriers to entryexcess profits
9. There are also issues of measurement and weighting. Different measures havebeen proposed and used for the dimensions of portfolio models; however, a prod-uct’s position on a matrix may vary depending on the measures used.12 In addi-tion, the weights used for models having composite dimensions may impact theresults, and the position of a business on the matrix may change with the weight-ing scheme used.
10. Portfolio models ignore the impact of both the external and internal environ-ments of a company. Because a firm’s strategic decisions are made within its envi-ronments, their potential impact must be taken into account. Day highlights a fewsituational factors that might affect a firm’s strategic plan. As examples of internalfactors, he cites rate of capacity utilization, union pressures, barriers to entry, andextent of captive business. GNP, interest rates, and social, legal, and regulatoryenvironment are cited as examples of external factors.13 No systematic treatmenthas been accorded to such environmental influences in the portfolio models.These influences are always unique to a company, so the importance of customiz-ing a portfolio approach becomes clear.
11. The relevance of a particular strategy for a business depends on its correct catego-rization on the matrix. If a mistake is made in locating a business in a particularcell of the matrix, the failure of the prescribed strategy cannot be blamed on theframework. In other words, superficial and uncritical application of the portfolioframework can misdirect a business’s strategy. As Gluck has observed:
CHAPTER 10 Portfolio Analysis 267
268 Portfolio Analysis
Portfolio approaches have their limitations, of course. First, it’s just not all thateasy to define the businesses or product/market units appropriately beforeyou begin to analyze them. Second, some attractive strategic opportunities canbe overlooked if management treats its businesses as independent entitieswhen there may be real advantages in their sharing resources at the researchor manufacturing or distribution level. And third, like more sophisticatedmodels, when it’s used uncritically the portfolio can give its users the illusionthat they’re being rigorous and scientific when in fact they’ve fallen prey tothe old garbage-in, garbage-out syndrome.14
12. Most portfolio approaches suggest standard or generic strategies based on theportfolio position of individual SBUs. But these kinds of responses can oftenresult in lost opportunities, turn out to be impractical or unrealistic, and stifle cre-ativity. For example, the standard strategy for managing dogs (SBUs that have alow share of a mature market) is to treat them as candidates for divestment or liq-uidation. New evidence demonstrates, however, that, with proper management,dogs can be assets to a diversified corporation. One recent study of the perfor-mance of more than a thousand industrial-product businesses slotted into thefour cells of the BCG matrix found that the average dog had a positive cash floweven greater than the cash needs of the average question mark. Moreover, in aslow-growth economy, more than half of a company’s businesses might qualify asdogs. Disposing of them all would be neither feasible nor desirable. Yet the port-folio approach provides no help in suggesting how to improve the performanceof such businesses.15
13. Portfolio models fail to answer such questions as (a) how a company may deter-mine whether its strategic goals are consistent with its financial objectives, (b)how a company may relate strategic goals to its affordable growth, and (c) howrelevant the designated strategies are vis-à-vis competition from overseas compa-nies. In addition, many marketers have raised other questions about the viabilityof portfolio approaches as a strategy development tool. For example, it has beenclaimed that the BCG matrix approach is relevant only for positioning existingbusinesses and fails to prescribe how a question mark may be reared to emerge asa star, how new stars can be located, and so on. Empirical support for the limita-tions of portfolio planning methods come from the work of Armstrong andBrodie. According to them, the limitations are so serious that portfolio matricesare detrimental since they produce poorer decisions.16
In response to these criticisms, it should be pointed out that the BCG portfolioframework was developed as an aid in formulating business strategies in com-plex environments. Its aim was not to prescribe strategy, though many executivesand academicians have misused it in this way. As one writer has noted:
No simple, monolithic set of rules or strategy imperatives will point automati-cally to the right course. No planning system guarantees the development ofsuccessful strategies. Nor does any technique. The Business Portfolio (thegrowth/share matrix) made a major contribution to strategic thought. Today itis misused and overexposed. It can be a helpful tool, but it can also be mis-leading or, worse, a straitjacket.17
268 PART 4 Strategy Formulation
Portfolio Analysis 269
A NEW PRODUCT PORTFOLIO APPROACH: PORTER’S GENERIC STRATEGIES FRAMEWORK
Porter has identified three generic strategies: (a) overall cost leadership (i.e.,making units of a fairly standardized product and underpricing everybody else);(b) differentiation (i.e., turning out something customers perceive as unique—anitem whose quality, design, brand name, or reputation for service commandshigher-than-average prices); and (c) focus (i.e., concentrating on a particulargroup of customers, geographic market, channel of distribution, or distinct seg-ment of the product line).18
Porter’s choice of strategy is based on two factors: the strategic target atwhich the business aims and the strategic advantage that the business has inaiming at that target. According to Porter, forging successful strategy begins withunderstanding of what is happening in one’s industry and deciding which of theavailable competitive niches one should attempt to dominate. For example, a firmmay discover that the largest competitor in an industry is aggressively pursuingcost leadership, that others are trying the differentiation route, and that no one isattempting to focus on some small specialty market. On the basis of this informa-tion, the firm might sharpen its efforts to distinguish its product from others orswitch to a focus game plan. As Porter says, the idea is to position the firm “so itwon’t be slugging it out with everybody else in the industry; if it does it right, itwon’t be directly toe-to-toe with anyone.” The objective is to mark out a defensi-ble competitive position—defensible not just against rival companies but alsoagainst the forces driving industry competition (discussed in Chapter 4).
What it means is that the give-and-take between firms already in the businessrepresents only one such force. Others are the bargaining power of suppliers, thebargaining power of buyers, the threat of substitute products or services, and thethreat of new entrants. In conclusion, Porter’s framework emphasizes not onlythat certain characteristics of the industry must be considered in choosing ageneric strategy, but that they in fact dictate the proper choice.
PORTFOLIO ANALYSIS CONCLUSION
Portfolio approaches provide a useful tool for strategists. Granted, theseapproaches have limitations, but all these limitations can be overcome with a littleimagination and foresight. The real concern about the portfolio approach is thatits elegant simplicity often tempts managers to believe that it can solve all prob-lems of corporate choices and resource allocation. The truth is that it addressesonly half of the problem: the back half. The portfolio approach is a powerful toolfor helping the strategist select from a menu of available opportunities, but it doesnot put the menu into his or her hands. That is the front half of the problem. Theother critical dimension in making strategic choices is the need to generate a richarray of business options from which to choose. No simple tool is available that
CHAPTER 10 Portfolio Analysis 269
270 Portfolio Analysis
can provide this option-generating capability. Here only creative thinking aboutone’s environment, one’s business, one’s customers, and one’s competitors canhelp.
For a successful introduction of the portfolio framework, the strategist shouldheed the following advice:
1. Once introduced, move quickly to establish the legitimacy of portfolio analysis.2. Educate line managers in its relevance and use.3. Redefine SBUs explicitly because their definition is the “genesis and nemesis” of
adequately using the portfolio framework.4. Use the portfolio framework to seek the strategic direction for different busi-
nesses without haggling over the fancy labels by which to call them.5. Make top management acknowledge SBUs as portfolios to be managed.6. Seek top management time for reviewing different businesses using the portfo-
lio framework.7. Rely on a flexible, informal management process to differentiate influence pat-
terns at the SBU level.8. Tie resource allocation to the business plan.9. Consider strategic expenses and human resources as explicitly as capital invest-
ment.10. Plan explicitly for new business development.11. Make a clear strategic commitment to a few selected technologies or markets
early.
SUMMARY A diversified organization needs to examine its widely different businesses at thecorporate level to see how each business fits within the overall corporate purposeand to come to grips with the resource allocation problem. The portfolioapproaches described in this chapter help management determine the role thateach business plays in the corporation and allocate resources accordingly.
Three portfolio approaches were introduced: product life cycle, growth rate-relative market share matrix, and multifactor portfolio matrix. The product life-cycle approach determines the life status of different products and whether thecompany has enough viable products to provide desired growth in the future. Ifthe company lacks new products with which to generate growth in coming years,investments may be made in new products. If growth is hurt by the early matu-rity of promising products, the strategic effort may be directed toward extensionof their life cycles.
The second approach, the growth rate-relative market share matrix, suggestslocating products or businesses on a matrix with relative market share andgrowth rate as its dimensions. The four cells in the matrix, whose positions arebased on whether growth is high or low and whether relative market share ishigh or low, are labeled stars, cash cows, question marks, and dogs. The strategyfor a product or business in each cell, which is primarily based on the business’scash flow implications, was outlined.
The third approach, the multifactor portfolio matrix, again uses two variables(industry attractiveness and business strengths), but these two variables are
270 PART 4 Strategy Formulation
Portfolio Analysis 271
based on a variety of factors. Here, again, a desired strategy for a product/busi-ness in each cell was recommended. The focus of the multifactor matrix approachis on the return-on-investment implications of strategy alternatives rather than oncash flow, as in the growth rate-relative market share matrix approach.
Various portfolio approaches were critically examined. The criticisms relatemainly to operational definitions of dimensions used, weighting of variables, andproduct/market boundary determination. The chapter concluded with a discus-sion of Porter’s generic strategies framework.
DISCUSSION 1. What purpose may a product portfolio serve in the context of marketing strategy?QUESTIONS 2. How can the position of a product in its life cycle be located?
3. What is the strategic significance of products in the maturity stage of the prod-uct life cycle?
4. What is the meaning of relative market share?5. What sequence should products follow for success? What may management
do to ensure this sequence?6. What factors may a company consider when measuring industry attractive-
ness and business strengths? Should these factors vary from one business toanother in a company?
7. What is the basic difference between the growth rate-relative market sharematrix approach and the multifactor portfolio matrix approach?
8. What major problems with portfolio approaches have critics identified?9. What generic strategies does Porter recommend? Discuss.
NOTES 1 Gerald J. Tellis and C. Merle Crawford, “An Evolutionary Approach to Product GrowthTheory,” Journal of Marketing (Fall 1981): 125–34.
2 John E. Swan and David R. Rink, “Fitting Market Strategy to Varying Product LifeCycles,” Business Horizons (January–February 1982): 72–76; and Yoram J. Wind,Product Policy: Concepts, Methods, and Strategy (Reading, MA: Addison-WesleyPublishing Co., 1982).
3 Kathryn Rudie Harrigan, “Strategies for Declining Industries,” Journal of BusinessStrategy (Fall 1980): 27.
4 “How Du Pont Keeps Them Coming Back for More,” Business Week (20 August 1990):80.
5 Stephen G. Harrell and Elmer D. Taylor, “Modeling the Product Life Cycle forConsumer Durables,” Journal of Marketing (Fall 1981): 68–75.
6 See Philippe Haspeslagh, “Portfolio Planning: Uses and Limits,” Harvard BusinessReview (January–February 1982): 60, 73.
7 “They’re All Juiced Up at Tropicana,” Business Week (13 May 1991). Informationupdated through company sources.
8 Organizing and Managing the Planning Function (Fairfield, CT: GE Company, n.d.).9 Robin Wensley, “Strategic Marketing: Betas, Boxes, or Basics,” Journal of Marketing
(Summer 1981): 173–182.10 Michael E. Porter, Competitive Strategy (New York: The Free Press, 1981).
CHAPTER 10 Portfolio Analysis 271
272 Portfolio Analysis
11 Fred Gluck, “A Fresh Look at Strategic Management,” Journal of Business Strategy (Fall1985): 23.
12 Yoram Wind, Vijay Mahajan, and Donald J. Swire, “An Empirical Comparison ofStandardized Portfolio Models,” Journal of Marketing (Spring 1983): 89–99.
13 George Day, “Diagnosing the Product Portfolio,” Journal of Marketing (April 1977):29–38.
14 Frederick W. Gluck, “Strategic Choice and Resource Allocation,” McKinsey Quarterly(Winter 1980): 24.
15 Donald Hambrick and Ian MacMillan, “The Product Portfolio and Man’s Best Friend,”California Management Review (Fall 1982): 16–23.
16 J. Scott Armstrong and Roderick J. Brodie, “Effects of Portfolio Planning Methods onDecision Making: Experimental Results,” International Journal of Research in Marketing11 (1994): 73–84.
17 The Boston Consulting Group Annual Perspective (Boston: Boston Consulting Group,1981).
18 Porter, Competitive Strategy.
272 PART 4 Strategy Formulation
Portfolio Analysis 273


